
MEDICAL DEVICES AND INSTRUMENTATION - WordPress ...
644
ENCYCLOPEDIA OF MEDICAL DEVICES AND INSTRUMENTATION Second Edition VOLUME 4 Hydrocephalus, Tools for Diagnosis and Treatment of – Monoclonal Antibodies
-
Upload
khangminh22 -
Category
Documents
-
view
0 -
download
0
Transcript of MEDICAL DEVICES AND INSTRUMENTATION - WordPress ...

ENCYCLOPEDIA OF
MEDICAL DEVICES ANDINSTRUMENTATION
Second Edition
VOLUME 4
Hydrocephalus, Tools for Diagnosis and Treatment of – Monoclonal Antibodies

ENCYCLOPEDIA OF MEDICAL DEVICES AND INSTRUMENTATION, SECOND EDITION
Editor-in-ChiefJohn G. WebsterUniversity of Wisconsin–Madison
Editorial BoardDavid BeebeUniversity of Wisconsin–Madison
Jerry M. CalkinsUniversity of Arizona College of Medicine
Michael R. NeumanMichigan Technological University
Joon B. ParkUniversity of Iowa
Edward S. SternickTufts–New England Medical Center
Editorial StaffVice President, STM Books: Janet BaileyAssociate Publisher: George J. TeleckiEditorial Director: Sean PidgeonDirector, Book Production and Manufacturing:Camille P. CarterProduction Manager: Shirley ThomasIllustration Manager: Dean GonzalezSenior Production Editor: Kellsee ChuEditorial Program Coordinator: Surlan Murrell

ENCYCLOPEDIA OF
MEDICAL DEVICES ANDINSTRUMENTATION
Second EditionVolume 4
Hydrocephalus, Tools for Diagnosis and Treatment of – Monoclonal Antibodies
Edited by
John G. Webster
University of Wisconsin–Madison
The Encyclopedia of Medical Devices and Instrumentation is available online athttp://www.mrw.interscience.wiley.com/emdi
A John Wiley & Sons, Inc., Publication

Copyright # 2006 by John Wiley & Sons, Inc. All rights reserved.
Published by John Wiley & Sons, Inc., Hoboken, New Jersey
Published simultaneously in Canada
No part of this publication may be reproduced, stored in a retrieval system, or transmitted in any form or by any means, electronic,mechanical, photocopying, recording, scanning, or otherwise, except as permitted under Section 107 or 108 of the 1976 United StatesCopyright Act, without either the prior written permission of the Publisher, or authorization through payment of the appropriateper-copy fee to the Copyright Clearance Center, Inc., 222, Rosewood Drive, Danvers, MA 01923, (978) 750-8400, fax (978)750-4470, or on the web at www.copyright.com. Requests to the Publisher for permission should be addressed to the PermissionsDepartment, John Wiley & Sons, Inc., 111 River Street, Hoboken, NJ 07030, (201) 748-6011, fax (201) 748-6008, or online athttp://www.wiley.com/go/permission.
Limit of Liability/Disclaimer of Warranty: While the publisher and author have used their best efforts in preparing this book, theymake no representations or warrnaties with respect to the accuracy or completeness of the contents of this book and specifically disclaimany implied warranties of merchantability or fitness for a particular purpose. No warranty may be created or extended by salesrepresentatives or written sales materials. The advice and strategies contained herein may not be suitable for your situation. You shouldconsult with a professional where appropriate. Neither the publisher nor author shall be liable for any loss of profit or any other commercialdamages, including but not limited to special, incidental, consequential, or other damages.
For general information on our other products and services or for technical support, please contact our Customer Care Departmentwithin the United States at (800) 762-2974, outside the United States at (317) 572-3993 or fax (317) 572-4002.
Wiley also publishes its books in a variety of electronic formats. Some content that appears in print may not be available inelectronic formats. For more information about Wiley products, visit our web site at www.wiley.com.
Library of Congress Cataloging-in-Publication Data:
Library of Congress Cataloging-in-Publication DataEncylopedia of medical devices & instrumentation/by John G. Webster,
editor in chief. – 2nd ed.p. ; cm.
Rev. ed. of: Encyclopedia of medical devices and instrumentation. 1988.Includes bibliographical references and index.ISBN-13 978-0-471-26358-6 (set : cloth)ISBN-10 0-471-26358-3 (set : cloth)ISBN-13 978-0-470-04069-0 (v. 4 : cloth)ISBN-10 0-470-04069-6 (v. 4 : cloth)
1. Medical instruments and apparatus–Encyclopedias. 2. Biomedical engineering–Encyclopedias. 3. Medical physics–Encyclopedias.4. Medicine–Data processing–Encyclopedias. I. Webster, John G.,1932- . II. Title: Encyclopedia of medical devices and instrumentation.
[DNLM: 1. Equipment and Supplies–Encyclopedias–English. W 13
E555 2006]R856.A3E53 2006610.2803–dc222005028946
Printed in the United States of America
10 9 8 7 6 5 4 3 2 1

CONTRIBUTOR LIST
ABDEL HADY, MAZEN, McMaster University, Hamilton,Ontario Canada, Bladder Dysfunction, Neurostimulationof
ABEL, L.A., University of Melbourne, Melbourne, Australia,Ocular Motility Recording and Nystagmus
ABREU, BEATRIZ C., Transitional Learning Center at Gal-veston, Galveston, Texas, Rehabilitation, Computers inCognitive
ALEXANDER, A.L., University of Wisconsin–Madison, Madi-son, Wisconsin, Magnetic Resonance Imaging
ALI, ABBAS, University of Illinois, at Urbana-Champaign,Bioinformatics
ALI, MÜFTÜ, School of Dental Medicine, Boston, Massachu-setts, Tooth and Jaw, Biomechanics of
ALPERIN, NOAM, University of Illinois at Chicago, Chicago,Illinois, Hydrocephalus, Tools for Diagnosis and Treat-ment of
ANSON, DENIS, College Misericordia, Dallas, Pennsylvania,Environmental Control
ARENA, JOHN C., VA Medical Center and Medical College ofGeorgia, Biofeedback
ARIEL, GIDEON, Ariel Dynamics, Canyon, California, Biome-chanics of Exercise Fitness
ARMSTRONG, STEVE, University of Iowa, Iowa City, Iowa,Biomaterials for Dentistry
ASPDEN, R.M., University of Aberdeen, Aberdeen, UnitedKingdom, Ligament and Tendon, Properties of
AUBIN, C.E., Polytechniquie Montreal, Montreal Quebec,Canada, Scoliosis, Biomechanics of
AYRES, VIRGINIA M., Michigan State University, East Lan-sing, Michigan, Microscopy, Scanning Tunneling
AZANGWE, G., Ligament and Tendon, Properties of
BACK, LLOYD H., California Institute of Technology, Pasa-dena, California, Coronary Angioplasty and GuidewireDiagnostics
BADYLAK, STEPHEN F., McGowan Institute for RegenerativeMedicine, Pittsburgh, Pennsylvania, Sterilization of Bio-logic Scaffold Materials
BANDYOPADHYAY, AMIT, Washington State University, Pull-man, Washington, Orthopedic Devices, Materials andDesign for
BANERJEE, RUPAK K., University of Cincinnati, Cincinnati,Ohio, Coronary Angioplasty and Guidewire Diagnostics
BARBOUR, RANDALL L., State University of New York Down-state Medical Center, Brooklyn, New York, PeripheralVascular Noninvasive Measurements
BARKER, STEVEN J., University of Arizona, Tucson, Arizona,Oxygen Monitoring
BARTH, ROLF F., The Ohio State University, Columbus,Ohio, Boron Neutron Capture Therapy
BECCHETTI, F.D., University of Michigan, Ann Arbor, Michi-gan, Radiotherapy, Heavy Ion
BELFORTE, GUIDO, Politecnico di Torino – Department ofMechanics, Laryngeal Prosthetic Devices
BENKESER, PAUL, Georgia Institute of Technology, Atlanta,Georgia, Biomedical Engineering Education
BENNETT, JAMES R., University of Iowa, Iowa City, Iowa,Digital Angiography
BERSANO-BEGEY, TOMMASO, University of Michigan, AnnArbor, Michigan, Microbioreactors
BIGGS, PETER J., Harvard Medical School, Boston, Massa-chusetts, Radiotherapy, Intraoperative
BIYANI, ASHOK, University of Toledo, and Medical College ofOhio, Toledo, Ohio, Human Spine, Biomechanics of
BLOCK, W.F., University of Wisconsin–Madison, Madison,Wisconsin, Magnetic Resonance Imaging
BLUE, THOMAS E., The Ohio State University, Columbus,Ohio, Boron Neutron Capture Therapy
BLUMSACK, JUDITH T., Disorders Auburn University,Auburn, Alabama, Audiometry
BOGAN, RICHARD K., University of South Carolina, Colum-bia, South Carolina, Sleep Laboratory
BOKROS, JACK C., Medical Carbon Research Institute, Aus-tin, Texas, Biomaterials, Carbon
BONGIOANNINI, GUIDO, ENT Division Mauriziano Hospital,Torino, Italy, Laryngeal Prosthetic Devices
BORAH, JOSHUA, Applied Science Laboratories, Bedford,Massachusetts, Eye Movement, Measurement Techni-ques for
BORDEN, MARK, Director of Biomaterials Research, Irvine,California, Biomaterials, Absorbable
BORTON, BETTIE B., Auburn University Montgomery, Mont-gomery, Alabama, Audiometry
BORTON, THOMAS E., Auburn University Montgomery, Mont-gomery, Alabama, Audiometry
BOSE SUSMITA,, Washington State University, Pullman,Washington, Orthopedic Devices, Materials and Designfor
BOVA, FRANK J., M. D. Anderson Cancer Center Orlando,Orlando, FL, Radiosurgery, Stereotactic
BRENNER, DAVID J., Columbia University Medical Center,New York, New York, Computed Tomography Screening
BREWER, JOHN M., University of Georgia, Electrophoresis
BRIAN, L. DAVIS, Lerner Research Institute, The ClevelandClinic Foundation, Cleveland, Ohio, Skin, Biomechanicsof
BRITT, L.D., Eastern Virginia Medical School, Norfolk, Vir-ginia, Gastrointestinal Hemorrhage
BRITT, R.C., Eastern Virginia Medical School, Norfolk,Virginia, Gastrointestinal Hemorrhage
BROZIK, SUSAN M., Sandia National Laboratories, Albuquer-que, New Mexico, Microbial Detection Systems
BRUNER, JOSEPH P., Vanderbilt University MedicalCenter, Nashville, Tennessee, Intrauterine SurgicalTechniques
BRUNSWIG NEWRING, KIRK A., University of Nevada, Reno,Nevada, Sexual Instrumentatio n
BRUYANT, PHILIPPE P., University of Massachusetts, NorthWorcester, Massachusetts, Nuclear Medicine, Computersin
BUNNELL, BERT J., Bunnell Inc., Salt Lake City, Utah, HighFrequency Ventilation
CALKINS, JERRY M., Defense Research Technologies, Inc.,Rockville, Maryland, Medical Gas Analyzers
CANNON, MARK, Northwestern University, Chicago, Illinois,Resin-Based Composites
v

CAPPELLERI, JOSEPH C., Pfizer Inc., Groton, Connecticut,Quality-of-Life Measures, Clinical Significance of
CARDOSO, JORGE, University of Madeira, Funchal, Portugal,Office Automation Systems
CARELLO, MASSIMILIANA, Politecnicodi Torino – Departmentof Mechanics, Laryngeal Prosthetic Devices
CASKEY, THOMAS C., Cogene Biotech Ventures, Houston,Texas, Polymerase Chain Reaction
CECCIO, STEVEN, University of Michigan, Ann Arbor, Michi-gan, Heart Valve Prostheses, In Vitro Flow Dynamics of
CHAN, JACKIE K., Columbia University, New York, NewYork, Photography, Medical
CHANDRAN, K.B., University of Iowa, Iowa City, Iowa, HeartValve Prostheses
CHATZANDROULIS, S., NTUA, Athens, Attiki, Greece, Capaci-tive Microsensors for Biomedical Applications
CHAVEZ, ELIANA, University of Pittsburgh, Pittsburgh, Penn-sylvania, Mobility Aids
CHEN, HENRY, Stanford University, Palo Alto, California,Exercise Stress Testing
CHEN, JIANDE, University of Texas Medical Branch, Galves-ton, Texas, Electrogastrogram
CHEN, YAN, Lerner Research Institute, The Cleveland ClinicFoundation, Cleveland, Ohio, Skin, Biomechanics of
CHEYNE, DOUGLAS, Hospital for Sick Children ResearchInstitute, Biomagnetism
CHUI, CHEN-SHOU, Memorial Sloan-Kettering Cancer Cen-ter, New York, New York, Radiation Therapy TreatmentPlanning, Monte Carlo Calculations in
CLAXTON, NATHAN S., The Florida State University, Talla-hassee, Florida, Microscopy, Confocal
CODERRE, JEFFREY A., Massachus etts Institute of Technol-ogy, Cambridge, Massachusetts, Boron Neutron CaptureTherapy
COLLINS, BETH, University of Mississippi Medical Center,Jackson, Mississippi, Hyperbaric Medicine
COLLINS, DIANE, University of Pittsburgh, Pittsburgh, Penn-sylvania, Mobility Aids
CONSTANTINOU, C., Columbia University Radiation Oncol-ogy, New York, New York, Phantom Materials in Radi-ology
COOK, ALBERT, University of Alberta, Edmonton, Alberta,Canada, Communication Devices
COOPER, RORY, University of Pittsburgh, Pittsburgh, Penn-sylvania, Mobility Aids
CORK, RANDALL C., Louisiana State University,Shreveport, Louisiana, Monitoring, Umbilical Arteryand Vein, Blood Gas Measurements; Transcuta neousElectrical Nerve Stimulation (TENS); AmbulatoryMonitoring
COX, JOSEPHINE H., Walter Reed Army Institute of Research,Rockville, Maryland, Blood Collection and Processing
CRAIG, LEONARD, Feinberg School of Medicine of Northwes-tern University, Chicago, Illinois, Ventilators, Acute Med-ical Care
CRESS, CYNTHIA J., University of Nebraska, Lincoln,Nebraska, Communicative Disorders, Computer Applica-tions for
CUMMING, DAVID R.S., University of Glasgow, Glasgow,United Kingdom, Ion-Sensitive Field-Effect Transistors
CUNNINGHAM, JOHN R., Camrose, Alberta, Canada, Cobalt 60Units for Radiotherapy
D’ALESSANDRO, DAVID, Montefiore Medical Center, Bronx,New York, Heart–Lung Machines
D’AMBRA, MICHAEL N., Harvard Medical School, Cambridge,Massachusetts, Cardiac Output, Thermodilution Mea-surement of
DADSETAN, MAHROKH, Mayo Clinic, College of Medicine,Rochester, Minnesota, Microscopy, Electron
DALEY, MICHAEL L., The University of Memphis, Memphis,Tennessee, Monitoring, Intracranial Pressure
DAN, LOYD, Linköping University, Linköping, Sweden, Ther-mocouples
DAS, RUPAK, University of Wisconsin, Madison, Wisconsin,Brachytherapy, High Dosage Rate
DATTAWADKAR, AMRUTA M., University of Wisconsin,Madison, Madison, Wisconsin, Ocular Fundus Reflecto-metry
DAVIDSON, MICHAEL W., The Florida State University, Tal-lahassee, Florida, Microscopy, Confocal
DE LUCA, CARLO, Boston University, Boston, Massachusetts,Electromyography
DE SALLES, ANTONIO A.F., UCLA Medical School, LosAngeles, California, Stereotactic Surgery
DECAU, SABIN, University of Maryland, School of Medicine,Shock, Treatment of
DECHOW, PAUL C., A & M University Health Science Center,Dallas, Texas, Strain Gages
DELBEKE, JEAN, Catholique University of Louvain, Brussels,Belgium, Visual Prostheses
DELL’OSSO, LOUIS F., Case Western Reserve University,Cleveland, Ohio, Ocular Motility Recording and Nystag-mus
DELORME, ARNAUD, University of San Diego, La Jolla, Cali-fornia, Statistical Methods
DEMENKOFF, JOHN, Mayo Clinic, Scottsdale, Arizona, Pul-monary Physiology
DEMIR, SEMAHAT S., The University of Memphis and TheUniversity of Tennessee Health Science Center, Memphis,Tennessee, Electrophysiology
DEMLING, ROBERT H., Harvard Medical School, Skin Sub-stitute for Burns, Bioactive
DENNIS, MICHAEL J., Medical University of Ohio, Toledo,Ohio, Computed Tomography
DESANTI, LESLIE, Harvard Medical School, Skin Substitutefor Burns, Bioactive
DEUTSCH, STEVEN, Pennsylvania State University, Univer-sity Park, Pennsylvania, Flowmeters
DEVINENI, TRISHUL, Conemaugh Health System, Biofeedback
DI BELLA EDWARD, V.R., University of Utah, Tracer Kinetics
DIAKIDES, NICHOLAS A., Advanced Concepts Analysis, Inc.,Falls Church, Virginia, Thermography
DOLAN, PATRICIA L., Sandia National Laboratories, Albu-querque, New Mexico, Microbial Detection Systems
DONOVAN, F.M., University of South Alabama, Cardiac Out-put, Indicator Dilution Measurement of
DOUGLAS, WILSON R., Children’s Hospital of Philadelphia,Philadelphia, Pennsylvania, Intrauterine Surgical Tech-niques
DRAPER, CRISSA, University of Nevada, Reno, Nevada, Sex-ual Instrumentation
DRZEWIECKI, TADEUSZ M., Defense Research Technologies,Inc., Rockville, Maryland, Medical Gas Analyzers
DURFEE, W.K., University of Minnesota, Minneapolis, Min-nesota, Rehabilitation and Muscle Testing
DYRO, JOSEPH F., Setauket, New York, Safety Program,Hospital
vi CONTRIBUTOR LIST

DYSON, MARY, Herts, United Kingdom, Heat and Cold,Therapeutic
ECKERLE, JOSEPH S., SRI International, Menlo Park, Cali-fornia, Tonometry, Arterial
EDWARDS, BENJAMIN, University of Wisconsin-Madison,Madison, Wisconsin, Codes and Regulations: Radiation
EDWARDS, THAYNE L., University of Washington, Seattle,Washington, Chromatography
EKLUND, ANDERS, University of Illinois at Chicago, Chicago,Illinois, Hydrocephalus, Tools for Diagnosis and Treat-ment of
EL SOLH, ALI A., Erie County Medical Center, Buffalo, NewYork, Sleep Studies, Computer Analysis of
ELMAYERGI, NADER, McMaster University, Hamilton,Ontario, Canada, Bladder Dysfunction, Neurostimula-tion of
ELSHARYDAH, AHMAD, Louisiana State University, BatonRouge, Louisiana, Ambulatory Monitoring; Monitoring,Umbilical Artery and Vein, Blood Gas Measurements
FADDY, STEVEN C., St. Vincents Hospital, Sydney, Darlin-ghurst, Australia, Cardiac Output, Fick Technique for
FAHEY, FREDERIC H., Childrens Hospital Boston, ComputedTomography, Single Photon Emission
FAIN, S.B., University of Wisconsin–Madison, Madison,Wisconsin, Magnetic Resonance Imaging
FELDMAN, JEFFREY, Childrens Hospital of Philadelphia,Philadelphia, Pennsylvania, Anesthesia Machines
FELLERS, THOMAS J., The Florida State University, Talla-hassee, Florida, Microscopy, Confocal
FERRARA, LISA, Cleveland Clinic Foundation, Cleveland,Ohio, Human Spine, Biomechanics of
FERRARI, MAURO, The Ohio State University, Columbus,Ohio, Drug Delivery Systems
FONTAINE, ARNOLD A., Pennsylvania State University, Uni-versity Park, Pennsylvania, Flowmeters
FOUST, MILTON J., JR, Medical University of South CarolinaPsychiatry and Behavioral Sciences, Charleston, SouthCarolina, Electroconvulsive Therapy
FRASCO, PETER, Mayo Clinic Scottsdale, Scottsdale, Arizona,Temperature Monitoring
FRAZIER, JAMES, Louisiana State University, Baton Rouge,Louisiana, Ambulatory Monitoring
FREIESLEBEN DE BLASIO, BIRGITTE, University of Oslo, Oslo,Norway, Impedance Spectroscopy
FRESTA, MASSIMO, University of Catanzaro Magna Græcia,Germaneto (CZ), Italy, Drug Delivery Systems
FREYTES, DONALD O., McGowan Institute for RegenerativeMedicine, Pittsburgh Pennsylvania, Sterilization of Bio-logic Scaffold Materials
FROEHLICHER, VICTOR, VA Medical Center, Palo Alto, Cali-fornia, Exercise Stress Testing
FUNG, EDWARD K., Columbia University, New York,New York, Photography, Medical
GAGE, ANDREW A., State University of New York at Buffalo,Buffalo, New York, Cryosurgery
GAGLIO, PAUL J., Columbia University College of Physiciansand Surgeons, Liver Transplantation
GARDNER, REED M., LDS Hospital and Utah University, SaltLake City, Utah, Monitoring, Hemodynamic
GEJERMAN, GLEN, Hackensack University Medical, Hacken-sack, New Jersey, Radiation Therapy, Quality Assurancein
GEORGE, MARK S., Medical University of South CarolinaPsychiatry and Behavioral Sciences, Charleston, SouthCarolina, Electroconvulsive Therapy
GHARIEB, R.R., Infinite Biomedical Technologies, Baltimore,Maryland, Neurological Monitors
GLASGOW, GLENN P., Loyola University of Chicago, May-wood, Illinois, Radiation Protection Instrumentation
GLASGOW, GLENN, University of Wisconsin-Madison, Madi-son, Wisconsin, Codes and Regulations: Radiation
GOEL, VIJAY K., University of Toledo, and Medical College ofOhio, Toledo, Ohio, Human Spine, Biomechanics of
GOETSCH, STEVEN J., San Diego Gamma Knife Center, LaJolla, California, Gamma Knife
GOLDBERG, JAY R., Marquette University Milwaukee, Wis-consin, Minimally Invasive Surgery
GOLDBERG, ZELENNA, Department of Radiation Oncology,Davis, California, Ionizing Radiation, Biological Effectsof
GOPALAKRISHNAKONE, P., National University of Singapore,Singapore, Immunologically Sensitive Field-Effect Tran-sistors
GOPAS, JACOB, Ben Gurion University of the Negev, BeerSheva, Israel, Monoclonal Antibodies
GORGULHO, ALESSANDRA, UCLA Medical School, LosAngeles, California, Stereotactic Surgery
GOUGH, DAVID A., University of California, La Jolla, Cali-fornia, Glucose Sensors
GOUSTOURIDIS, D., NTUA, Athens, Attiki, Greece, CapacitiveMicrosensors for Biomedical Applications
GRABER, HARRY L., State University of New York DownstateMedical Center, Brooklyn, New York, Peripheral VascularNoninvasive Measurements
GRAÇA, M., Louisiana State University, Baton Rouge,Louisiana, Boron Neutron Capture Therapy
GRANT, WALTER III, Baylor College of Medicine, Houston,Texas, Radiation Therapy, Intensity Modulated
GRAYDEN, EDWARD, Mayo Health Center, Albertlea, Minne-sota, Cardiopulmonary Resuscitation
GREEN, JORDAN R., University of Nebraska, Lincoln,Nebraska, Communicative Disorders, Computer Applica-tions for
HAEMMERICH, DIETER, Medical University of South Carolina,Charleston, South Carolina, Tissue Ablation
HAMAM, HABIB, Université de Moncton, Moncton New Bruns-wick, Canada, Lenses, Intraocular
HAMMOND, PAUL A., University of Glasgow, Glasgow, UnitedKingdom, Ion-Sensitive Field-Effect Transistors
HANLEY, JOSEPH, Hackensack University Medical, Hacken-sack, New Jersey, Radiation Therapy, Quality Assurancein
HARLEY, BRENDAN A., Massachusetts Institute of Technol-ogy, Skin Tissue Engineering for Regeneration
HARPER, JASON C., Sandia National Laboratories, Albu-querque, New Mexico, Microbial Detection Systems
HASMAN, ARIE, Maastricht, The Netherlands, Medical Edu-cation, Computers in
HASSOUNA, MAGDY, Toronto Western Hospital, Toronto,Canada, Bladder Dysfunction, Neurostimulation of
HAYASHI, KOZABURO, Okayama University of Science,Okayama, Japan, Arteries, Elastic Properties of
HENCH, LARRY L., Imperial College London, London, UnitedKingdom, Biomaterials: Bioceramics
HETTRICK, DOUGLAS A., Sr. Principal Scientist Medtronic,Inc., Minneapolis, Minnesota, Bioimpedance in Cardio-vascular Medicine
HIRSCH-KUCHMA, MELISSA, University of Central FloridaNanoScience Technology Center, Orlando, Florida,Biosurface Engineering
CONTRIBUTOR LIST vii

HOLDER, GRAHAM E., Moorfields Eye Hospital, London,United Kingdom, Electroretinography
HOLMES, TIMOTHY, St. Agnes Cancer Center, Baltimore,Maryland, Tomotherapy
HONEYMAN-BUCK, JANICE C., University of Florida, Gaines-ville, Florida, Radiology Information Systems
HOOPER, BRETT A., Areté Associates, Arlington, Virginia,Endoscopes
HORN, BRUCE, Kaiser Permanente, Los Angeles, California,X-Rays Production of
HORNER, PATRICIA I., Biomedical Engineering SocietyLandover, Maryland, Medical Engineering Societiesand Organizations
HOROWITZ, PAUL M., University of Texas, San Antonio,Texas, Fluorescence Measurements
HOU, XIAOLIN, Risø National Laboratory, Roskilde, Den-mark, Neutron Activation Analysis
HOVORKA, ROMAN, University of Cambridge, Cambridge,United Kingdom, Pancreas, Artificial
HUANG, H.K., University of Southern California, Teleradiol-ogy
HUNT, ALAN J., University of Michigan, Ann Arbor, Michi-gan, Optical Tweezers
HUTTEN, HELMUT, University of Technology, Graz, Australia,Impedance Plethysmography
IAIZZO, P.A., University of Minnesota, Minneapolis, Minne-sota, Rehabilitation and Muscle Testing
IBBOTT, GEOFFREY S., Anderson Cancer Center, Houston,Texas, Radiation Dosimetry, Three-Dimensional
INGHAM, E., University of Leeds, Leeds, United Kingdom,Hip Joints, Artificial
ISIK, CAN, Syracuse University, Syracuse, New York, BloodPressure Measurement
JAMES, SUSAN P., Colorado State University, Fort Collins,Colorado, Biomaterials: Polymers
JENSEN, WINNIE, Aalborg University, Aalborg, Denmark,Electroneurography
JIN, CHUNMING, North Carolina State University, Raleigh,North Carolina, Biomaterials, Corrosion and Wearof
JIN, Z.M., University of Leeds, Leeds, United Kingdom, HipJoints, Artificial
JOHNSON, ARTHUR T., University of Maryland College Park,Maryland, Medical Engineering Societies and Organiza-tions
JONES, JULIAN R., Imperial College London, London, UnitedKingdom, Biomaterials: Bioceramics
JOSHI, ABHIJEET, Abbott Spine, Austin, Texas, SpinalImplants
JUNG, RANU, Arizona State University, Tempe, Arizona,Functional Electrical Stimulation
JURISSON, SILVIA S., University of Missouri Columbia,Missouri, Radionuclide Production and RadioactiveDecay
KAEDING, PATRICIA J., Godfrey & Kahn S.C., Madison,Wisconsin, Codes and Regulations: Medical Devices
KAMATH, CELIA C., Mayo Clinic, Rochester, Minnesota,Quality-of-Life Measures, Clinical Significance of
KANE, MOLLIE, Madison, Wisconsin, Contraceptive Devices
KATHERINE, ANDRIOLE P., Harvard Medical School, Boston,Massachusetts, Picture Archiving and CommunicationSystems
KATSAGGELOS, AGGELOS K., Northwestern University, Evan-ston, Illinois, DNA Sequencing
KATZ, J. LAWRENCE, University of Missouri-Kansas City,Kansas City, Missouri, Bone and Teeth, Properties of
KESAVAN, SUNIL, Akebono Corporation, Farmington Hills,Michigan, Linear Variable Differential Transformers
KHANG, GILSON, Chonbuk National University, Biomaterials:Tissue Engineering and Scaffolds
KHAODHIAR, LALITA, Harvard Medical School, Boston, Mas-sachusetts, Cutaneous Blood Flow, Doppler Measurementof
KIM, MOON SUK, Korea Research Institutes of ChemicalTechnology, Biomaterials: Tissue Engineering and Scaf-folds
KIM, YOUNG KON, Inje University, Kimhae City, Korea,Alloys, Shape Memory
KINDWALL, ERIC P., St. Luke’s Medical Center, Milwaukee,Wisconsin, Hyperbaric Oxygenation
KING, MICHAEL A., University of Massachusetts, North Wor-cester, Massachusetts, Nuclear Medicine, Computers in
KLEBE, ROBERT J., University of Texas, San Antonio, Texas,Fluorescence Measurements
KLEIN, BURTON, Burton Klein Associates, Newton, Massa-chusetts, Gas and Vacuum Systems, Centrally PipedMedical
KNOPER, STEVEN R., University of Arizona College of Med-icine, Ventilatory Monitoring
KONTAXAKIS, GEORGE, Universidad Politécnica de Madrid,Madrid, Spain, Positron Emission Tomography
KOTTKE-MARCHANT, KANDICE, The Cleveland Clinic Founda-tion, Cleveland, Ohio, Vascular Graft Prosthesis
KRIPFGANS, OLIVER, University of Michigan, Ann Arbor,Michigan, Ultrasonic Imaging
KULKARNI, AMOL D., University of Wisconsin–Madison,Madison, Wisconsin, Ocular Fundus Reflectometry,Visual Field Testing
KUMARADAS, J. CARL, Ryerson University, Toronto, Ontario,Canada, Hyperthermia, Interstitial
KUNICKA, JOLANTA, Bayer HealthCare LLC, Tarrytown, NewYork, Differential Counts, Automated
KWAK, KWANJ JOO, University of Miami Miller School ofMedicine, Miami, Florida, Microscopy, Scanning Force
LAKES, RODERIC, University of Wisconsin-Madison, Boneand Teeth, Properties of
LAKKIREDDY, DHANUNJAYA, The Cleveland Clinic Founda-tion, Cleveland, Ohio, Hyperthermia, Ultrasonic
LARSEN, COBY, Case Western Reserve University, Cleveland,Ohio, Vascular Graft Prosthesis
LASTER, BRENDA H., Ben Gurion University of the Negev,Beer Sheva, Israel, Monoclonal Antibodies
LATTA, LOREN, University of Miami, Coral Gables, Florida,Rehabilitation, Orthotics in
LEDER, RON S., Universidad Nacional Autonoma de MexicoMexico, Distrito Federal, Continuous Positive AirwayPressure
LEE, CHIN, Harvard Medical School, Boston, Massachusetts,Radiotherapy Treatment Planning, Optimization of;Hyperthermia, Interstitial
LEE, HAI BANG, Korea Research Institutes of ChemicalTechnology, Biomaterials: Tissue Engineering andScaffolds
LEE, SANG JIN, Korea Research Institutes of ChemicalTechnology, Biomaterials: Tissue Engineering andScaffolds
LEI, LIU, Department of General Engineering, Urbana,Illinois, Bioinformatics
viii CONTRIBUTOR LIST

LEI, XING, Stanford University, Stanford, California, Radia-tion Dose Planning, Computer-Aided
LEWIS, MATTHEW C., Medical College of Wisconsin, Milwau-kee, Wisconsin, Hyperbaric Oxygenation
LI, CHAODI, University of Notre Dame, Notre Dame, Indiana,Bone Cement, Acrylic
LI, JONATHAN G., University of Florida, Gainesville, Florida,Radiation Dose Planning, Computer-Aided
LI, QIAO, University of Michigan, Ann Arbor, Michigan,Immunotherapy
LI, YANBIN, University of Arkansas, Fayetteville, Arkansas,Piezoelectric Sensors
LIBOFF, A.R., Oakland University, Rochester, Michigan,Bone Ununited Fracture and Spinal Fusion, ElectricalTreatment of
LIGAS, JAMES, University of Connecticut, Farmington, Con-necticut, Respiratory Mechanics and Gas Exchange
LIMOGE, AIME, The René Descartes University of Paris, Paris,France, Electroanalgesia, Systemic
LIN, PEI-JAN PAUL, Beth Israel Deaconess Medical Center,Boston, Massachusets, Mammography
LIN, ZHIYUE, University of Kansas Medical Center, KansasCity, Kansas, Electrogastrogram
LINEAWEAVER, WILLIAM C., Unive rsity of Mississippi Med-ical Center, Jackson, Mississippi, Hyperbaric Medicine
LIPPING, TARMO, Tampere University of Technology, Pori,Finland, Monitoring in Anesthesia
LIU, XIAOHUA, The University of Michigan, Ann Arbor,Michigan, Polymeric Materials
LLOYD, J.J., Regional Medical Physics Department, New-castle-upon-Tyne, United Kingdom, Ultraviolet Radiationin Medicine
LOEB, ROBERT, University of Arizona, Tuscon, Arizona,Anesthesia Machines
LOPES DE MELO, PEDRO, State University of Rio de Janeiro,Térreo Salas, Maracanã, Thermistors
LOUDON, ROBERT G., Lung Sounds
LOW, DANIEL A., Washington University School of Medicine,St. Louis, Missouri, Radiation Therapy Simulator
LU, LICHUN, Mayo Clinic, College of Medicine, Rochester,Minnesota, Microscopy, Electron
LU, ZHENG FENG, Columbia University, New York, NewYork, Screen-Film Systems
LYON, ANDREW W., University of Calgary, Calgary, Canada,Flame Atomic Emission Spectrometry and AtomicAbsorption Spectrometry
LYON, MARTHA E., University of Calgary, Calgary, Canada,Flame Atomic Emission Spectrometry and AtomicAbsorption Spectrometry
MA, C-M CHARLIE, Fox Chase Cancer Center, Philadelphia,Pennsylvania, X-Ray Therapy Equipment, Low and Med-ium Energy
MACIA, NARCISO F., Arizona State University at the Poly-technic Campus, Mesa, Arizona, Pneumotachometers
MACKENZIE, COLIN F., University of Maryland, School ofMedicine, Shock, Treatment of
MACKIE, THOMAS R., University of Wisconsin, Madison,Wisconsin, Tomotherapy
MADNANI, ANJU, LSU Medical Centre, Shreveport, Louisi-ana, Transcutaneous Electrical Nerve Stimulation(TENS)
MADNANI, SANJAY, LSU Medical Centre, Shreveport, Louisi-ana, Transcutaneous Electrical Nerve Stimulation(TENS)
MADSEN, MARK T., University of Iowa, Iowa City, Iowa,Anger Camera
MAGNANO, MAURO, ENT Division Mauriziano Hospital,Torino, Italy, Drug Delivery Systems
MANDEL, RICHARD, Boston University School of Medicine,Boston, Massachusetts, Colorimetry
MANNING, KEEFE B., Pennsylvania State University, Uni-versity Park, Pennsylvania, Flowmeters
MAO, JEREMY J., University of Illinois at Chicago, Chicago,Illinois, Cartilage and Meniscus, Properties of
MARCOLONGO, MICHELE, Drexel University, Philadelphia,Pennsylvania, Spinal Implants
MAREK, MIROSLAV, Georgia Institute of Technology, Atlanta,Georgia, Biomaterials, Corrosion and Wear of
MARION, NICHOLAS W., University of Illinois at Chicago,Chicago, Illinois, Cartilage and Meniscus, Properties of
MASTERS, KRISTYN S., University of Wisconsin, Madison,Wisconsin, Tissue Engineering
MAUGHAN, RICHARD L., Hospital of the University of Penn-sylvania, Neutron Beam Therapy
MCADAMS, ERIC, University of Ulster at Jordanstown, New-townabbey, Ireland, Bioelectrodes
MCARTHUR, SALLY L., University of Sheffield, Sheffield,United Kingdom, Biomaterials, Surface Properties of
MCEWEN, MALCOM, National Research Council of Canada,Ontario, Canada, Radiation Dosimetry for Oncology
MCGOWAN, EDWARD J., E.J. McGowan & Associates, Bio-feedback
MCGRATH, SUSAN, Dartmouth College, Hanover, New Hamp-shire, Oxygen Analyzers
MEEKS, SANFORD L., University of Florida, Gainesville,Florida, Radiosurgery, Stereotactic
MELISSA, PETER, University of Central Florida NanoScienceTechnology Center, Orlando, Florida, Biosurface Engi-neering
MENDELSON, YITZHAK, Worcester Polytechnic Institute,Optical Sensors
METZKER, MICHAEL L., Baylor College of Medicine, Houston,Texas, Polymerase Chain Reaction
MEYEREND, M.E., University of Wisconsin–Madison,Madison, Wisconsin, Magnetic Resonance Imaging
MICHLER, ROBERT, Montefiore Medical Center, Bronx, NewYork, Heart–Lung Machines
MICIC, MIODRAG, MP Biomedicals LLC, Irvine, California,Microscopy and Spectroscopy, Near-Field
MILLER, WILLIAM, University of Missouri Columbia,Missouri, Radionuclide Production and RadioactiveDecay
MITTRA, ERIK, Stony Brook University, New York, BoneDensity Measurement
MODELL, MARK, Harvard Medical School, Boston, Massa-chusetts, Fiber Optics in Medicine
MORE, ROBERT B., RBMore Associates, Austin, Texas Bio-materials Carbon
MORE, ROBERT, Austin, Texas, Heart Valves, Prosthetic
MORROW, DARREN, Royal Adelaide Hospital, Adelaide,Australia, Intraaortic Balloon Pump
MOURTADA, FIRAS, MD Anderson Cancer Center, Houston,Texas, Brachytherapy, Intravascular
MOY, VINCENT T., University of Miami, Miller School ofMedicine, Miami, Florida, Microscopy, Scanning Force
MÜFTÜ, SINAN, Northeastern University, Boston, Massachu-setts, Tooth and Jaw, Biomechanics of
MURPHY, RAYMOND L.H., Lung Sounds
CONTRIBUTOR LIST ix

MURPHY, WILLIAM L., University of Wisconsin, Madison,Wisconsin, Tissue Engineering
MURRAY, ALAN, Newcastle University Medical Physics, New-castle upon Tyne, United Kingdom, Pace makers
MUTIC, SASA, Washington University School of Medicine, St.Louis, Missouri, Radiation Therapy Simulator
NARAYAN, ROGER J., University of North Carolina, ChapelHill, North Carolina, Biomaterials, Corrosion and Wear of
NATALE, ANDREA, The Cleveland Clinic Foundation,Cleveland, Ohio, Hyperthermia, Ultrasonic
NAZERAN, HOMER, The University of Texas, El Paso, Texas,Electrocardiography, Computers in
NEUMAN, MICHAEL R., Michigan Technological University,Houghton, Houghton, Michigan, Fetal Monitoring, Neo-natal Monitoring
NEUZIL, PAVEL, Institute of Bioengineering and Nanotech-nology, Singapore, Immunologically Sensitive Field-Effect Transistors
NICKOLOFF, EDWARD L., Columbia University, New York,New York, X-Ray Quality Control Program
NIEZGODA, JEFFREY A., Medical College of Wisconsin,Milwaukee, Wisconsin, Hyperbaric Oxygenation
NISHIKAWA, ROBERT M., The University of Chicago,Chicago, Illinois, Computer-Assisted Detection and Diag-nosis
NUTTER, BRIAN, Texas Tech University, Lubbock, Texas,Medical Records, Computers in
O’DONOHUE, WILLIAM, University of Nevada, Reno, Nevada,Sexual Instrumentation
ORTON, COLIN, Harper Hospital and Wayne State University,Detroit, Michigan, Medical Physics Literature
OZCELIK, SELAHATTIN, Texas A&M University, Kingsville,Texas, Drug Infusion Systems
PANITCH, ALYSSA, Arizona State University, Tempe, Arizona,Biomaterials: An Overview
PAOLINO, DONATELLA, University of Catanzaro MagnaGræcia, Germaneto (CZ), Italy, Drug Delivery Systems
PAPAIOANNOU, GEORGE, University of Wisconsin, Milwaukee,Wisconsin, Joints, Biomechanics of
PARK, GRACE E., Purdue University, West Lafayette, Indi-ana, Porous Materials for Biological Applications
PARMENTER, BRETT A., State University of New York atBuffalo, Buffalo, New York, Sleep Studies, ComputerAnalysis of
PATEL, DIMPI, The Cleveland Clinic Foundation, Cleveland,Ohio, Hyperthermia, Ultrasonic
PEARCE, JOHN, The University of Texas, Austin, Texas,Electrosurgical Unit (ESU)
PELET, SERGE, Massachusetts Institute of Technology, Cam-bridge, Massachusetts, Microscopy, Fluorescence
PERIASAMY, AMMASI, University of Virginia, Charlottesville,Virginia, Cellular Imaging
PERSONS, BARBARA L., University of Mississippi MedicalCenter, Jackson, Mississippi, Hyperbaric Medicine
PIPER, IAN, The University of Memphis, Memphis,Tennessee, Monitoring, Intracranial Pressure
POLETTO, CHRISTOPHER J., National Institutes of Health,Tactile Stimulation
PREMINGER, GLENN M., Duke University Medical Center,Durham, North Carolina, Lithotripsy
PRENDERGAST, PATRICK J., Trinity College, Dublin, Ireland,Orthopedics, Prosthesis Fixation for
PREVITE, MICHAEL, Massachusetts Institute of Technology,Cambridge, Massachusetts, Microscopy, Fluorescence
PURDY, JAMES A., UC Davis Medical Center, Sacramento,California, Radiotherapy Accessories
QI, HAIRONG, Advanced Concepts Analysis, Inc., FallsChurch, Virginia, Thermography
QIN, YIXIAN, Stony Brook University, New York, Bone Den-sity Measurement
QUAN, STUART F., University of Arizona, Tucson, Arizona,Ventilatory Monitoring
QUIROGA, RODRIGO QUIAN, University of Leicester, Leicester,United Kingdom, Evoked Potentials
RAHAGHI, FARBOD N., University of California, La Jolla,California, Glucose Sensors
RAHKO, PETER S., University of Wisconsin Medical School,Echocardiography and Doppler Echocardiography
RALPH, LIETO, University of Wisconsin–Madison, Madison,Wisconsin, Codes and Regulations: Radiation
RAMANATHAN, LAKSHMI, Mount Sinai Medical Center, Ana-lytical Methods, Automated
RAO, SATISH S.C., University of Iowa College of Medicine,Iowa City, Iowa, Anorectal Manometry
RAPOPORT, DAVID M., NYU School of Medicine, New York,New York, Continuous Positive Airway Pressure
REBELLO, KEITH J., The Johns Hopkins University AppliedPhysics Lab, Laurel, Maryland, Micro surgery
REDDY, NARENDER, The University of Akron, Akron, Ohio,Linear Variable Differential Transformers
REN-DIH, SHEU, Memorial Sloan-Kettering Cancer Center,New York, New York, Radiation Therapy Treatment Plan-ning, Monte Carlo Calculations in
RENGACHARY, SETTI S., Detroit, Michigan, Human Spine,Biomechanics of
REPPERGER, DANIEL W., Wright-Patterson Air Force Base,Dayton, Ohio, Human Factors in Medical Devices
RITCHEY, ERIC R., The Ohio State University, Columbus,Ohio, Contact Lenses
RIVARD, MARK J., Tufts New England Medical Center, Bos-ton, Massachusetts, Imaging Devices
ROBERTSON, J. DAVID, University of Missouri, Columbia,Missouri, Radionuclide Production and Radioactive Decay
ROTH, BRADLEY J., Oakland University, Rochester, Michi-gan, Defibrillators
ROWE-HORWEGE, R. WANDA, University of Texas MedicalSchool, Houston, Texas, Hyperthermia, Systemic
RUMSEY, JOHN W., University of Central Florida, Orlando,Florida, Biosurface Engineering
RUTKOWSKI, GREGORY E., University of Minnesota, Duluth,Minnesota, Engineered Tissue
SALATA, O.V., University of Oxford, Oxford, United King-dom, Nanoparticles
SAMARAS, THEODOROS, Aristotle University of ThessalonikiDepartment of Physics, Thessaloniki, Greece, Thermo-metry
SANGOLE, ARCHANA P., Transitional Learning Center atGalveston, Galveston, Texas, Rehabilitation, Computersin Cognitive
SARKOZI, LASZLO, Mount Sinai School of Medicine, Analy-tical Methods, Automated
SCHEK, HENRY III, University of Michigan, Ann Arbor,Michigan, Optical Tweezers
SCHMITZ, CHRISTOPH H., State University of New York Down-state Medical Center, Brooklyn, New York, PeripheralVascular Noninvasive Measurements
SCHUCKERS, STEPHANIE A.C., Clarkson University, Potsdam,New York, Arrhythmia Analysis, Automated
x CONTRIBUTOR LIST

SCOPE, KENNETH, Northwestern University, Chicago,Illinois, Ventilators, Acute Medical Care
SCOTT, ADZICK N., University of Pennsylvania, Philadelphia,Pennsylvania, Intrauterine Surgical Techniques
SEAL, BRANDON L., Arizona State University, Tempe,Arizona, Biomaterials: An Overview
SEALE, GARY, Transitional Learning Center atGalveston, Galveston, Texas, Rehabilitation, Computersin Cognitive
SEGERS, PATRICK, Ghent University, Belgium, Hemody-namics
SELIM, MOSTAFA A., Cleveland Metropolitan General Hospi-tal, Palm Coast, Florida, Colposcopy
SETHI, ANIL, Loyola University Medical Center, Maywood,Illinois, X-Rays: Interaction with Matter
SEVERINGHAUS, JOHN W., University of California in SanFrancisco, CO2 Electrodes
SHALODI, ABDELWAHAB D., Cleveland Metropolitan GeneralHospital, Palm Coast, Florida, Colposcopy
SHANMUGASUNDARAM, SHOBANA, New Jersey Institute of Tech-nology, Newark, New Jersey, Polymeric Materials
SHARD, ALEXANDER G., University of Sheffield, SheffieldUnited Kingdom, Biomaterials, Surface Properties of
SHEN, LI-JIUAN, National Taiwan University School of Phar-macy, Taipei, Taiwan, Colorimetry
SHEN, WEI-CHIANG,University of Southern California Schoolof Pharmacy, Los Angeles, California, Colorimetry
SHERAR, MICHAEL D., London Health Sciences Centre andUniversity of Western Ontario, London, Ontario, Canada,Hyperthermia, Interstitial
SHERMAN, DAVID, The Johns Hopkins University, Baltimore,Maryland, Electroencephalography
SHI, DONGLU, University of Cincinnati, Cincinnati, Ohio,Biomaterials, Testing and Structural Properties of
SHUCARD, DAVID W.M., State University of New York atBuffalo, Buffalo, New York, Sleep Studies, ComputerAnalysis of
SIEDBAND, MELVIN P., University of Wisconsin, Madison,Wisconsin, Image Intensifiers and Fluoroscopy
SILBERMAN, HOWARD, University of Southern California, LosAngeles, California, Nutrition, Parenteral
SILVERMAN, GORDON, Manhattan College, Computers in theBiomedical Laboratory
SILVERN, DAVID A., Medical Physics Unit, Rabin MedicalCenter, Petah Tikva, Israel, Prostate Seed Implants
SINHA, PIYUSH, The Ohio State University, Columbus, Ohio,Drug Delivery Systems
SINHA, ABHIJIT ROY, University of Cincinnati, Cin-cinnati, Ohio, Coronary Angioplasty and GuidewireDiagnostics
SINKJÆR, THOMAS, Aalborg University, Aalborg, Denmark,Electroneurography
SLOAN, JEFFREY A., Mayo Clinic, Rochester, Minnesota,Quality-of-Life Measures, Clinical Significance of
SO, PETER T.C., Massachusetts Institute of Technology,Cambridge, Massachusetts, Microscopy, Fluorescence
SOBOL, WLAD T., University of Alabama at BirminghamHealth System, Birmingham, Alabama, Nuclear Mag-netic Resonance Spectroscopy
SOOD, SANDEEP, University of Illinois at Chicago, Chicago,Illinois, Hydrocephalus, Tools for Diagnosis and Treat-ment of
SPECTOR, MYRON, Brigham and Women’s Hospital, Boston,Massachusetts, Biocompatibility of Materials
SPELMAN, FRANCIS A., University of Washington, CochlearProstheses
SRINIVASAN, YESHWANTH, Texas Tech University, Lubbock,Texas, Medical Records, Computers in
SRIRAM, NEELAMEGHAM, University of Buffalo, Buffalo, NewYork, Cell Counters, Blood
STARKO, KENTON R., Point Roberts, Washington, Physiolo-gical Systems Modeling
STARKSCHALL, GEORGE, The University of Texas, Radiother-apy, Three-Dimensional Conformal
STAVREV, PAVEL, Cross Cancer Institute, Edmonton, Alberta,Canada, Radiotherapy Treatment Planning, Optimiza-tion of
STENKEN, JULIE A., Rensselaer Polytechnic Institute, Troy,New York, Microdialysis Sampling
STIEFEL, ROBERT, University of Maryland Medical Center,Baltimore, Maryland, Equipment Acquisition
STOKES, I.A.F., Polytechniquie Montreal, Montreal Quebec,Canada, Scoliosis, Biomechanics of
STONE, M.H., University of Leeds, Leeds, United Kingdom,Hip Joints, Artificial
SU, XIAo-LI, BioDetection Instruments LLC, Fayetteville,Arkansas, Piezoelectric Sensors
SUBHAN, ARIF, Masterplan Technology Management,Chatsworth, California, Equipment Maintenance,Biomedical
SWEENEY, JAMES D., Arizona State University, Tempe,Arizona, Functional Electrical Stimulation
SZETO, ANDREW Y.J., San Diego State University, San Diego,California, Blind and Visually Impaired, Assistive Tech-nology for
TAKAYAMA, SHUICHI, University of Michigan, Ann Arbor,Michigan, Microbioreactors
TAMUL, PAUL C., Northwestern University, Chicago, Illinois,Ventilators, Acute Medical Care
TAMURA, TOSHIYO, Chiba University School of Engineering,Chiba, Japan, Home Health Care Devices
TANG, XIANGYANG, GE Healthcare Technologies, Wankesha,Wisconsin, Computed Tomography Simulators
TAYLOR, B.C., The University of Akron, Akron, Ohio, CardiacOutput, Indicator Dilution Measurement of
TEMPLE, RICHARD O., Transitional Learning Center atGalveston, Galveston, Texas, Rehabilitation, Computersin Cognitive
TEN, STANLEY, Salt Lake City, Utah, Electroanalgesia, Sys-temic
TERRY, TERESA M., Walter Reed Army Institute ofResearch, Rockville, Maryland, Blood Collection andProcessing
THAKOR, N.V., Johns Hopkins University, Baltimore, Mary-land, Neurological Monitors
THIERENS, HUBERT M.A., University of Ghent, Ghent, Bel-gium, Radiopharmaceutical Dosimetry
THOMADSEN, BRUCE, University of Wisconsin–Madison,Madison, Wisconsin, Codes and Regulations: Radiation
TIPPER, J.L., University of Leeds, Leeds, United Kingdom,Hip Joints, Artificial
TOGAWA, TATSUO, Waseda University, Saitama, Japan, Inte-grated Circuit Temperature Sensor
TORNAI, MARTIN, Duke University, Durham, North Carolina,X-Ray Equipment Design
TRAN-SON-TAY, ROGER, University of Florida, Gainesville,Florida, Blood Rheology
CONTRIBUTOR LIST xi

TRAUTMAN, EDWIN D., RMF Strategies, Cambridge, Massa-chusetts, Cardiac Output, Thermodilution Measurementof
TREENA, LIVINGSTON ARINZEH, New Jersey Institute of Tech-nology, Newark, New Jersey, Polymeric Materials
TRENTMAN, TERRENCE L., Mayo Clinic Scottsdale, SpinalCord Stimulation
TROKEN, ALEXANDER J., University of Illinois at Chicago,Chicago, Illinois, Cartilage and Meniscus, Properties of
TSAFTARIS, SOTIRIOS A., Northwestern University, Evanston,Illinois, DNA Sequence
TSOUKALAS, D., NTUA, Athens, Attiki, Greece, CapacitiveMicrosensors for Biomedical Applications
TULIPAN, NOEL, Vanderbilt University Medical Center,Nashville, Tennessee, Intrauterine Surgical Techniques
TUTEJA, ASHOK K., University of Utah, Salt Lake City, Utah,Anorectal Manometry
TY, SMITH N., University of California, San Diego, Califor-nia, Physiological Systems Modeling
TYRER, HARRY W., University of Missouri-Columbia, Colum-bia, Missouri, Cytology, Automated
VALVANO, JONATHAN W., The University of Texas, Austin,Texas, Bioheat Transfer
VAN DEN HEUVAL, FRANK, Wayne State University, Detroit,Michigan, Imaging Devices
VEIT, SCHNABEL, Aalborg University, Aalborg, Denmark,Electroneurography
VELANOVICH, VIC, Henry Ford Hospital, Detroit, Michigan,Esophageal Manometry
VENKATASUBRAMANIAN, GANAPRIYA, Arizona StateUniversity, Tempe, Arizona, Functional ElectricalStimulation
VERAART, CLAUDE, Catholique University of Louvain, Brus-sels, Belgium, Visual Prostheses
VERDONCK, PASCAL, Ghent University, Belgium, Hemody-namics
VERMARIEN, HERMAN, Vrije Universiteit Brussel, Brussels,Belgium, Phonocardiography, Recorders, Graphic
VEVES, ARISTIDIS, Harvard Medical School, Boston, Mass-achusetts, Cutaneous Blood Flow, Doppler Measurementof
VICINI, PAOLO, University of Washington, Seattle, Washing-ton, Pharmacokinetics and Pharmacodynamics
VILLE, JÄNTTI, Tampere University of Technology, Pori,Finland, Monitoring in Anesthesia
VRBA, JINI, VSM MedTech Ltd., Biomagnetism
WAGNER, THOMAS, H., M. D. Anderson Cancer CenterOrlando, Orlando, Florida, Radiosurgery, Stereotactic
WAHLEN, GEORGE E., Veterans Affairs Medical Center andthe University of Utah, Salt Lake City, Utah, AnorectalManometry
WALKER, GLENN M., North Carolina State University,Raleigh, North Carolina, Microfluidics
WALTERSPACHER, DIRK, The Johns Hopkins University, Bal-timore, Maryland, Electroencephalography
WAN, LEO Q., Liu Ping, Columbia University, New York,New York, Cartilage and Meniscus, Properties of
WANG, GE, University of Iowa, Iowa City, Iowa, ComputedTomography Simulators
WANG, HAIBO, Louisiana State University Health CenterShreveport, Louisiana, Monitoring, Umbilical Arteryand Vein, Ambulatory Monitoring
WANG, HONG, Wayne State University, Detroit, Michigan,Anesthesia, Computers in
WANG, LE YI, Wayne State University, Detroit, Michigan,Anesthesia, Computers in
WANG, QIAN, A & M University Health Science Center,Dallas, Texas, Strain Gages
WARWICK, WARREN J., University of Minnesota MedicalSchool, Minneapolis, Minnesota, Cystic Fibrosis SweatTest
WATANABE, YOICHI, Columbia University RadiationOncology, New York, New York, Phantom Materials inRadiology
WAXLER, MORRIS, Godfrey & Kahn S.C., Madison, Wiscon-sin, Codes and Regulations: Medical Devices
WEBSTER, THOMAS J., Purdue University, West Lafayette,Indiana, Porous Materials for Biological Applications
WEGENER, JOACHIM, University of Oslo, Oslo, Norway, Impe-dance Spectroscopy
WEI, SHYY, University of Michigan, Ann Arbor, Michigan,Blood Rheology
WEINMEISTER, KENT P., Mayo Clinic Scottsdale, Spinal CordStimulation
WEIZER, ALON Z., Duke University Medical Center, Durham,North Carolina, Lithotripsy
WELLER, PETER, City University , London, United Kingdom,Intraaortic Balloon Pump
WELLS, JASON, LSU Medical Centre, Shreveport, Louisiana,Transcutaneous Electrical Nerve Stimulation (TENS)
WENDELKEN, SUZANNE, Dartmouth College, Hanover, NewHampshire, Oxygen Analyzers
WHELAN, HARRY T., Medical College of Wisconsin, Milwau-kee, Wisconsin, Hyperbaric Oxygenation
WHITE, ROBERT, Memorial Hospital, Regional NewbornProgram, South Bend, Indiana, Incubators, Infant
WILLIAMS, LAWRENCE E., City of Hope, Duarte, California,Nuclear Medicine Instrumentation
WILSON, KERRY, University of Central Florida, Orlando,Florida, Biosurface Engineering
WINEGARDEN, NEIL, University Health Network MicroarrayCentre, Toronto, Ontario, Canada, Microarrays
WOJCIKIEWICZ, EWA P., University of Miami Miller Schoolof Medicine, Miami, Florida, Microscopy, ScanningForce
WOLBARST, ANTHONY B., Georgetown Medical School,Washington, DC, Radiotherapy Treatment Planning,Optimization of
WOLF, ERIK, University of Pittsburgh, Pittsburgh, Pennsyl-vania, Mobility Aids
WOOD, ANDREW, Swinburne University of Technology, Mel-bourne, Australia, Nonionizing Radiation, BiologicalEffects of
WOODCOCK, BRIAN, University of Michigan, Ann Arbor,Michigan, Blood, Artificial
WREN, JOAKIM, Linköping University, Linköping, Sweden,Thermocouples
XIANG, ZHOU, Brigham and Women’s Hospital, Boston, Mas-sachusetts, Biocompatibility of Materials
XUEJUN, WEN, Clemson University, Clemson, SouthCarolina, Biomaterials, Testing and Structural Proper-ties of
YAN, ZHOU, University of Notre Dame, Notre Dame, Indiana,Bone Cement, Acrylic
YANNAS, IOANNIS V., Massachusetts Institute of Technology,Skin Tissue Engineering for Regeneration
YASZEMSKI, MICHAEL J., Mayo Clinic, College of Medicine,Rochester, Minnesota, Microscopy, Electron
xii CONTRIBUTOR LIST

YENI, YENER N., Henry Ford Hospital, Detroit, Michigan,Joints, Biomechanics of
YLI-HANKALA, ARVI, Tampere University of Technology, Pori,Finland, Monitoring in Anesthesia
YOKO, KAMOTANI, University of Michigan, Ann Arbor, Michi-gan, Microbioreactors
YOON, KANG JI, Korea Institute of Science and Technology,Seoul, Korea, Micropower for Medical Applications
YORKE, ELLEN, Memorial Sloan-Kettering Cancer Center,New York, New York, Radiation Therapy Treatment Plan-ning, Monte Carlo Calculations in
YOSHIDA, KEN, Aalborg University, Aalborg, Denmark, Elec-troneurography
YOUNGSTEDT, SHAWN D., University of South Carolina,Columbia, South Carolina, Sleep Laboratory
YU, YIH-CHOUNG, Lafayette College, Easton, Pennsylvania,Blood Pressure, Automatic Control of
ZACHARIAH, EMMANUEL S., University of Medicine and Den-tistry of New Jersey, New Brunswick, New Jersey, Immu-nologically Sensitive Field-Effect Transistors
ZAIDER, MARCO, Memorial Sloan Kettering Cancer Center,New York, New York, Prostate Seed Implants
ZAPANTA, CONRAD M., Penn State College of Medicine,Hershey, Pennsylvania, Heart, Artificial
ZARDENETA, GUSTAVO, University of Texas, San Antonio,Texas, Fluorescence Measurements
ZELMANOVIC, DAVID, Bayer HealthCare LLC, Tarrytown,New York, Differential Counts, Automated
ZHANG, MIN, University of Washington, Seattle, Washington,Biomaterials: Polymers
ZHANG, YI, University of Buffalo, Buffalo, New York, CellCounters, Blood
ZHU, XIAOYUE, University of Michigan, Ann Arbor, Michi-gan, Microbioreactors
ZIAIE, BABAK, Purdue University, W. Lafayette, Indiana,Biotelemetry
ZIELINSKI, TODD M., Medtronic, Inc., Minneapolis, Minne-sota, Bioimpedance in Cardiovascular Medicine
ZIESSMAN, HARVEY A., Johns Hopkins University, ComputedTomography, Single Photon Emission
CONTRIBUTOR LIST xiii


PREFACE
This six-volume work is an alphabetically organized compi-lation of almost 300 articles that describe critical aspects ofmedical devices and instrumentation.
It is comprehensive. The articles emphasize the contri-butions of engineering, physics, and computers to each of thegeneral areas of anesthesiology, biomaterials, burns, cardi-ology, clinical chemistry, clinical engineering, communica-tive disorders, computers in medicine, critical caremedicine, dermatology, dentistry, ear, nose, and throat,emergency medicine, endocrinology, gastroenterology,genetics, geriatrics, gynecology, hematology, heptology,internal medicine, medical physics, microbiology, nephrol-ogy, neurology, nutrition, obstetrics, oncology, ophthalmol-ogy, orthopedics, pain, pediatrics, peripheral vasculardisease, pharmacology, physical therapy, psychiatry, pul-monary medicine, radiology, rehabilitation, surgery, tissueengineering, transducers, and urology.
The discipline is defined through the synthesis of the coreknowledge from all the fields encompassed by the applica-tion of engineering, physics, and computers to problems inmedicine. The articles focus not only on what is now usefulbut also on what is likely to be useful in future medicalapplications.
These volumes answer the question, ‘‘What are thebranches of medicine and how does technology assist eachof them?’’ rather than ‘‘What are the branches of technologyand how could each be used in medicine?’’ To keep this workto a manageable length, the practice of medicine that isunassisted by devices, such as the use of drugs to treatdisease, has been excluded.
The articles are accessible to the user; each benefits frombrevity of condensation instead of what could easily havebeen a book-length work. The articles are designed not forpeers, but rather for workers from related fields who wish totake a first look at what is important in the subject.
The articles are readable. They do not presume a detailedbackground in the subject, but are designed for any personwith a scientific background and an interest in technology.Rather than attempting to teach the basics of physiology orOhm’s law, the articles build on such basic concepts to showhow the worlds of life science and physical science meld toproduce improved systems. While the ideal reader might bea person with a Master’s degree in biomedical engineering ormedical physics or an M.D. with a physical science under-graduate degree, much of the material will be of value toothers with an interest in this growing field. High schoolstudents and hospital patients can skip over more technicalareas and still gain much from the descriptive presentations.
The Encyclopedia of Medical Devices and Instrumenta-tion is excellent for browsing and searching for those newdivergent associations that may advance work in a periph-eral field. While it can be used as a reference for facts, thearticles are long enough that they can serve as an educa-tional instrument and provide genuine understanding of asubject.
One can use this work just as one would use a dictionary,since the articles are arranged alphabetically by topic. Crossreferences assist the reader looking for subjects listed underslightly different names. The index at the end leads thereader to all articles containing pertinent information onany subject. Listed on pages xxi to xxx are all the abbrevia-tions and acronyms used in the Encyclopedia. Because ofthe increasing use of SI units in all branches of science, theseunits are provided throughout the Encyclopedia articles aswell as on pages xxxi to xxxv in the section on conversionfactors and unit symbols.
I owe a great debt to the many people who have con-tributed to the creation of this work. At John Wiley & Sons,Encyclopedia Editor George Telecki provided the idea andguiding influence to launch the project. Sean Pidgeon wasEditorial Director of the project. Assistant Editors RoseannZappia, Sarah Harrington, and Surlan Murrell handled themyriad details of communication between publisher, editor,authors, and reviewers and stimulated authors andreviewers to meet necessary deadlines.
My own background has been in the electrical aspects ofbiomedical engineering. I was delighted to have the assis-tance of the editorial board to develop a comprehensiveencyclopedia. David J. Beebe suggested cellular topics suchas microfluidics. Jerry M. Calkins assisted in defining thechemically related subjects, such as anesthesiology.Michael R. Neuman suggested subjects related to sensors,such as in his own work—neonatology. Joon B. Park haswritten extensively on biomaterials and suggested relatedsubjects. Edward S. Sternick provided many suggestionsfrom medical physics. The Editorial Board was instrumen-tal both in defining the list of subjects and in suggestingauthors.
This second edition brings the field up to date. It isavailable on the web at http://www.mrw.interscience.wiley.com/emdi, where articles can be searched simultaneously toprovide rapid and comprehensive information on all aspectsof medical devices and instrumentation.
JOHN G. WEBSTERUniversity of Wisconsin, Madison
xv


LIST OF ARTICLES
ALLOYS, SHAPE MEMORYAMBULATORY MONITORINGANALYTICAL METHODS, AUTOMATEDANESTHESIA MACHINESANESTHESIA, COMPUTERS INANGER CAMERAANORECTAL MANOMETRYARRHYTHMIA ANALYSIS, AUTOMATEDARTERIES, ELASTIC PROPERTIES OFAUDIOMETRYBIOCOMPATIBILITY OF MATERIALSBIOELECTRODESBIOFEEDBACKBIOHEAT TRANSFERBIOIMPEDANCE IN CARDIOVASCULAR MEDICINEBIOINFORMATICSBIOMAGNETISMBIOMATERIALS, ABSORBABLEBIOMATERIALS: AN OVERVIEWBIOMATERIALS: BIOCERAMICSBIOMATERIALS: CARBONBIOMATERIALS, CORROSION AND WEAR OFBIOMATERIALS FOR DENTISTRYBIOMATERIALS: POLYMERSBIOMATERIALS, SURFACE PROPERTIES OFBIOMATERIALS, TESTING AND STRUCTURAL
PROPERTIES OFBIOMATERIALS: TISSUE ENGINEERING AND
SCAFFOLDSBIOMECHANICS OF EXERCISE FITNESSBIOMEDICAL ENGINEERING EDUCATIONBIOSURFACE ENGINEERINGBIOTELEMETRYBLADDER DYSFUNCTION, NEUROSTIMULATION
OFBLIND AND VISUALLY IMPAIRED, ASSISTIVE
TECHNOLOGY FORBLOOD COLLECTION AND PROCESSINGBLOOD GAS MEASUREMENTSBLOOD PRESSURE MEASUREMENTBLOOD PRESSURE, AUTOMATIC CONTROL OFBLOOD RHEOLOGYBLOOD, ARTIFICIALBONE AND TEETH, PROPERTIES OFBONE CEMENT, ACRYLICBONE DENSITY MEASUREMENTBONE UNUNITED FRACTURE AND SPINAL FUSION,
ELECTRICAL TREATMENT OFBORON NEUTRON CAPTURE THERAPYBRACHYTHERAPY, HIGH DOSAGE RATEBRACHYTHERAPY, INTRAVASCULARCAPACITIVE MICROSENSORS FOR BIOMEDICAL
APPLICATIONS
CARDIAC OUTPUT, FICK TECHNIQUE FORCARDIAC OUTPUT, INDICATOR DILUTION
MEASUREMENT OFCARDIAC OUTPUT, THERMODILUTION
MEASUREMENT OFCARDIOPULMONARY RESUSCITATIONCARTILAGE AND MENISCUS, PROPERTIES OFCELL COUNTERS, BLOODCELLULAR IMAGINGCHROMATOGRAPHYCO2 ELECTRODESCOBALT 60 UNITS FOR RADIOTHERAPYCOCHLEAR PROSTHESESCODES AND REGULATIONS: MEDICAL DEVICESCODES AND REGULATIONS: RADIATIONCOLORIMETRYCOLPOSCOPYCOMMUNICATION DEVICESCOMMUNICATIVE DISORDERS, COMPUTER
APPLICATIONS FORCOMPUTED TOMOGRAPHYCOMPUTED TOMOGRAPHY SCREENINGCOMPUTED TOMOGRAPHY SIMULATORSCOMPUTED TOMOGRAPHY, SINGLE PHOTON
EMISSIONCOMPUTER-ASSISTED DETECTION AND DIAGNOSISCOMPUTERS IN THE BIOMEDICAL LABORATORYCONTACT LENSESCONTINUOUS POSITIVE AIRWAY PRESSURECONTRACEPTIVE DEVICESCORONARY ANGIOPLASTY AND GUIDEWIRE
DIAGNOSTICSCRYOSURGERYCUTANEOUS BLOOD FLOW, DOPPLER
MEASUREMENT OFCYSTIC FIBROSIS SWEAT TESTCYTOLOGY, AUTOMATEDDEFIBRILLATORSDIFFERENTIAL COUNTS, AUTOMATEDDIGITAL ANGIOGRAPHYDNA SEQUENCEDRUG DELIVERY SYSTEMSDRUG INFUSION SYSTEMSECHOCARDIOGRAPHY AND DOPPLER
ECHOCARDIOGRAPHYELECTROANALGESIA, SYSTEMICELECTROCARDIOGRAPHY, COMPUTERS INELECTROCONVULSIVE THERAPYELECTROENCEPHALOGRAPHYELECTROGASTROGRAMELECTROMYOGRAPHYELECTRONEUROGRAPHYELECTROPHORESIS
xvii

ELECTROPHYSIOLOGYELECTRORETINOGRAPHYELECTROSURGICAL UNIT (ESU)ENDOSCOPESENGINEERED TISSUEENVIRONMENTAL CONTROLEQUIPMENT ACQUISITIONEQUIPMENT MAINTENANCE, BIOMEDICALESOPHAGEAL MANOMETRYEVOKED POTENTIALSEXERCISE STRESS TESTINGEYE MOVEMENT, MEASUREMENT TECHNIQUES FORFETAL MONITORINGFIBER OPTICS IN MEDICINEFLAME ATOMIC EMISSION SPECTROMETRY AND
ATOMIC ABSORPTION SPECTROMETRYFLOWMETERSFLUORESCENCE MEASUREMENTSFUNCTIONAL ELECTRICAL STIMULATIONGAMMA KNIFEGAS AND VACUUM SYSTEMS, CENTRALLY PIPED
MEDICALGASTROINTESTINAL HEMORRHAGEGLUCOSE SENSORSHEART VALVE PROSTHESESHEART VALVE PROSTHESES, IN VITRO FLOW
DYNAMICS OFHEART VALVES, PROSTHETICHEART, ARTIFICIALHEART–LUNG MACHINESHEAT AND COLD, THERAPEUTICHEMODYNAMICSHIGH FREQUENCY VENTILATIONHIP JOINTS, ARTIFICIALHOME HEALTH CARE DEVICESHUMAN FACTORS IN MEDICAL DEVICESHUMAN SPINE, BIOMECHANICS OFHYDROCEPHALUS, TOOLS FOR DIAGNOSIS
AND TREATMENT OFHYPERBARIC MEDICINEHYPERBARIC OXYGENATIONHYPERTHERMIA, INTERSTITIALHYPERTHERMIA, SYSTEMICHYPERTHERMIA, ULTRASONICIMAGE INTENSIFIERS AND FLUOROSCOPYIMAGING DEVICESIMMUNOLOGICALLY SENSITIVE FIELD-EFFECT
TRANSISTORSIMMUNOTHERAPYIMPEDANCE PLETHYSMOGRAPHYIMPEDANCE SPECTROSCOPYINCUBATORS, INFANTINTEGRATED CIRCUIT TEMPERATURE SENSORINTRAAORTIC BALLOON PUMPINTRAUTERINE SURGICAL TECHNIQUESIONIZING RADIATION, BIOLOGICAL EFFECTS OFION-SENSITIVE FIELD-EFFECT TRANSISTORSJOINTS, BIOMECHANICS OFLARYNGEAL PROSTHETIC DEVICESLENSES, INTRAOCULARLIGAMENT AND TENDON, PROPERTIES OF
LINEAR VARIABLE DIFFERENTIAL TRANSFORMERSLITHOTRIPSYLIVER TRANSPLANTATIONLUNG SOUNDSMAGNETIC RESONANCE IMAGINGMAMMOGRAPHYMEDICAL EDUCATION, COMPUTERS INMEDICAL ENGINEERING SOCIETIES
AND ORGANIZATIONSMEDICAL GAS ANALYZERSMEDICAL PHYSICS LITERATUREMEDICAL RECORDS, COMPUTERS INMICROARRAYSMICROBIAL DETECTION SYSTEMSMICROBIOREACTORSMICRODIALYSIS SAMPLINGMICROFLUIDICSMICROPOWER FOR MEDICAL APPLICATIONSMICROSCOPY AND SPECTROSCOPY, NEAR-FIELDMICROSCOPY, CONFOCALMICROSCOPY, ELECTRONMICROSCOPY, FLUORESCENCEMICROSCOPY, SCANNING FORCEMICROSCOPY, SCANNING TUNNELINGMICROSURGERYMINIMALLY INVASIVE SURGERYMOBILITY AIDSMONITORING IN ANESTHESIAMONITORING, HEMODYNAMICMONITORING, INTRACRANIAL PRESSUREMONITORING, UMBILICAL ARTERY AND VEINMONOCLONAL ANTIBODIESNANOPARTICLESNEONATAL MONITORINGNEUROLOGICAL MONITORSNEUTRON ACTIVATION ANALYSISNEUTRON BEAM THERAPYNONIONIZING RADIATION, BIOLOGICAL EFFECTS OFNUCLEAR MAGNETIC RESONANCE SPECTROSCOPYNUCLEAR MEDICINE INSTRUMENTATIONNUCLEAR MEDICINE, COMPUTERS INNUTRITION, PARENTERALOCULAR FUNDUS REFLECTOMETRYOCULAR MOTILITY RECORDING AND NYSTAGMUSOFFICE AUTOMATION SYSTEMSOPTICAL SENSORSOPTICAL TWEEZERSORTHOPEDIC DEVICES, MATERIALS AND
DESIGN FORORTHOPEDICS, PROSTHESIS FIXATION FOROXYGEN ANALYZERSOXYGEN MONITORINGPACEMAKERSPANCREAS, ARTIFICIALPERIPHERAL VASCULAR NONINVASIVE
MEASUREMENTSPHANTOM MATERIALS IN RADIOLOGYPHARMACOKINETICS AND PHARMACODYNAMICSPHONOCARDIOGRAPHYPHOTOGRAPHY, MEDICALPHYSIOLOGICAL SYSTEMS MODELING
xviii LIST OF ARTICLES

PICTURE ARCHIVING AND COMMUNICATIONSYSTEMS
PIEZOELECTRIC SENSORSPNEUMOTACHOMETERSPOLYMERASE CHAIN REACTIONPOLYMERIC MATERIALSPOROUS MATERIALS FOR BIOLOGICAL
APPLICATIONSPOSITRON EMISSION TOMOGRAPHYPROSTATE SEED IMPLANTSPULMONARY PHYSIOLOGYQUALITY-OF-LIFE MEASURES, CLINICAL
SIGNIFICANCE OFRADIATION DOSE PLANNING, COMPUTER-AIDEDRADIATION DOSIMETRY FOR ONCOLOGYRADIATION DOSIMETRY, THREE-DIMENSIONALRADIATION PROTECTION INSTRUMENTATIONRADIATION THERAPY, INTENSITY MODULATEDRADIATION THERAPY SIMULATORRADIATION THERAPY TREATMENT PLANNING,
MONTE CARLO CALCULATIONS INRADIATION THERAPY, QUALITY ASSURANCE INRADIOLOGY INFORMATION SYSTEMSRADIONUCLIDE PRODUCTION AND
RADIOACTIVE DECAYRADIOPHARMACEUTICAL DOSIMETRYRADIOSURGERY, STEREOTACTICRADIOTHERAPY ACCESSORIESRADIOTHERAPY, HEAVY IONRADIOTHERAPY, INTRAOPERATIVERADIOTHERAPY, THREE-DIMENSIONAL CONFORMALRADIOTHERAPY TREATMENT PLANNING,
OPTIMIZATION OFRECORDERS, GRAPHICREHABILITATION AND MUSCLE TESTINGREHABILITATION, COMPUTERS IN COGNITIVEREHABILITATION, ORTHOTICS INRESIN-BASED COMPOSITESRESPIRATORY MECHANICS AND GAS EXCHANGESAFETY PROGRAM, HOSPITALSCOLIOSIS, BIOMECHANICS OFSCREEN-FILM SYSTEMS
SEXUAL INSTRUMENTATIONSHOCK, TREATMENT OFSKIN SUBSTITUTE FOR BURNS, BIOACTIVESKIN TISSUE ENGINEERING FOR REGENERATIONSKIN, BIOMECHANICS OFSLEEP LABORATORYSLEEP STUDIES, COMPUTER ANALYSIS OFSPINAL CORD STIMULATIONSPINAL IMPLANTSSTATISTICAL METHODSSTEREOTACTIC SURGERYSTERILIZATION OF BIOLOGIC SCAFFOLD
MATERIALSSTRAIN GAGESTACTILE STIMULATIONTELERADIOLOGYTEMPERATURE MONITORINGTHERMISTORSTHERMOCOUPLESTHERMOGRAPHYTHERMOMETRYTISSUE ABLATIONTISSUE ENGINEERINGTOMOTHERAPYTONOMETRY, ARTERIALTOOTH AND JAW, BIOMECHANICS OFTRACER KINETICSTRANSCUTANEOUS ELECTRICAL NERVE
STIMULATION (TENS)ULTRASONIC IMAGINGULTRAVIOLET RADIATION IN MEDICINEVASCULAR GRAFT PROSTHESISVENTILATORS, ACUTE MEDICAL CAREVENTILATORY MONITORINGVISUAL FIELD TESTINGVISUAL PROSTHESESX-RAY EQUIPMENT DESIGNX-RAY QUALITY CONTROL PROGRAMX-RAY THERAPY EQUIPMENT, LOW AND
MEDIUM ENERGYX-RAYS: INTERACTION WITH MATTERX-RAYS, PRODUCTION OF
LIST OF ARTICLES xix


ABBREVIATIONS AND ACRONYMS
AAMI Association for the Advancement ofMedical Instrumentation
AAPM American Association of Physicists inMedicine
ABC Automatic brightness controlABET Accreditation board for engineering
trainingABG Arterial blood gasesABLB Alternative binaural loudness balanceABS Acrylonitrile–butadiene–styreneac Alternating currentAC Abdominal circumference; Affinity
chromatographyACA Automated clinical analyzerACES Augmentative communication evaluation
systemACL Anterior chamber lensACLS Advanced cardiac life supportACOG American College of Obstetrics and
GynecologyACR American College of RadiologyACS American Cancer Society; American
College of SurgeonsA/D Analog-to-digitalADC Agar diffusion chambers; Analog-to-
digital converterADCC Antibody-dependent cellular
cytotoxicityADCL Accredited Dosimetry Calibration
LaboratoriesADP Adenosine diphosphateA-D-T Admission, discharge, and transferAE Anion exchange; Auxiliary electrodeAEA Articulation error analysisAEB Activation energy barrierAEC Automatic exposure controlAED Automatic external defibrillatorAEMB Alliance for Engineering in Medicine
and BiologyAES Auger electron spectroscopyAESC American Engineering Standards
CommitteeAET Automatic exposure terminationAFO Ankle-foot orthosisAGC Automatic gain controlAHA American Heart AssociationAI Arterial insufficiencyAICD Automatic implantable cardiac
defibrillatorAID Agency for International DevelopmentAIDS Acquired immune deficiency syndromeAL Anterior leafletALG Antilymphocyte globulin
ALS Advanced life support; Amyotropiclateral sclerosis
ALT Alanine aminotransferaseALU Arithmetic and logic unitAM Amplitude modulationAMA American Medical Associationamu Atomic mass unitsANOVA Analysis of varianceANSI American National Standards InstituteAP Action potential; Alternative pathway;
AnteroposteriorAPD Anterioposterior diameterAPL Adjustable pressure limiting valve;
Applied Physics LaboratoryAPR Anatomically programmed radiographyAR Amplitude reduction; Aortic
regurgitation; AutoregressiveAra-C ArabinosylcytosineARD Absorption rate densityARDS Adult respiratory distress syndromeARGUS Arrhythmia guard systemARMA Autoregressive-moving-average modelARMAX Autoregressive-moving-average model
with external inputsAS Aortic stenosisASA American Standards AssociationASCII American standard code for information
interchangeASD Antisiphon deviceASHE American Society for Hospital EngineeringASTM American Society for Testing and
MaterialsAT Adenosine-thiamide; Anaerobic threshold;
AntithrombinATA Atmosphere absoluteATLS Advanced trauma life supportATN Acute tubular necrosisATP Adenosine triphosphateATPD Ambient temperature pressure dryATPS Ambient temperature pressure
saturatedATR Attenuated total reflectionAUC Area under curveAUMC Area under moment curveAV AtrioventricularAZT Azido thymidineBA Biliary atresiaBAEP Brainstem auditory evoked potentialBAPN Beta-amino-proprionitrylBAS Boston anesthesis systemBASO BasophilBB Buffer baseBBT Basal body temperature
xxi

BCC Body-centered cubicBCD Binary-coded decimalBCG BallistocardiogramBCLS Basic cardiac life supportBCRU British Commitee on Radiation Units
and MeasurementsBDI Beck depression inventoryBE Base excess; Binding energyBET Brunauer, Emmett, and Teller methodsBH His bundleBI Biological indicatorsBIH Beth Israel HospitalBIPM International Bureau of Weights and
MeasurementsBJT Bipolar junction transistorBMDP Biomedical ProgramsBME Biomedical engineeringBMET Biomedical equipment technicianBMO Biomechanically optimizedBMR Basal metabolic rateBOL Beginning of lifeBP Bereitschafts potential; Break pointBR PolybutadieneBRM Biological response modifierBRS Bibliographic retrieval servicesBSS Balanced salt solutionBTG Beta thromboglobulinBTPS Body temperature pressure saturatedBUN Blood urea nitrogenBW Body weightCA Conductive adhesivesCABG Coronary artery by-pass graftingCAD/CAM Computer-aided design/computer-aided
manufacturingCAD/D Computer-aided drafting and designCADD Central axis depth doseCAI Computer assisted instruction;
Computer-aided instructionCAM Computer-assisted managementcAMP Cyclic AMPCAPD Continuous ambulatory peritoneal
dialysisCAPP Child amputee prosthetic projectCAT Computerized axial tomographyCATS Computer-assisted teaching system;
Computerized aphasia treatment systemCAVH Continuous arteriovenous hemofiltrationCB Conjugated bilirubin; Coulomb barrierCBC Complete blood countCBF Cerebral blood flowCBM Computer-based managementCBV Cerebral blood volumeCC Closing capacityCCC Computer Curriculum CompanyCCD Charge-coupled deviceCCE Capacitance contact electrodeCCF Cross-correlation functionCCL Cardiac catheterization laboratoryCCM Critical care medical servicesCCPD Continuous cycling peritoneal
dialysis
CCTV Closed circuit television systemCCU Coronary care unit; Critical care unitCD Current densityCDR Complimentary determining regionCDRH Center for Devices and Radiological
HealthCEA Carcinoembryonic antigenCF Conversion factor; Cystic fibrosisCFC Continuous flow cytometerCFR Code of Federal RegulationsCFU Colony forming unitsCGA Compressed Gas AssociationCGPM General Conference on Weights and
MeasuresCHO CarbohydrateCHO Chinese hamster ovaryCI Combination indexCICU Cardiac intensive care unitCIF Contrast improvement factorCIN Cervical intraepithelial neoplasiaCK Creatine kinaseCLAV ClavicleCLSA Computerized language sample analysisCM Cardiomyopathy; Code modulationCMAD Computer managed articulation diagnosisCMI Computer-managed instructionCMRR Common mode rejection ratioCMV Conventional mechanical ventilation;
CytomegalovirusCNS Central nervous systemCNV Contingent negative variationCO Carbon monoxide; Cardiac outputCOBAS Comprehensive Bio-Analysis SystemCOPD Chronic obstructive pulmonary diseaseCOR Center of rotationCP Cerebral palsy; Closing pressure; Creatine
phosphateCPB Cardiopulmonary bypassCPET Cardiac pacemaker electrode tipsCPM Computerized probe measurementsCPP Cerebral perfusion pressure;
Cryoprecipitated plasmaCPR Cardiopulmonary resuscitationcps Cycles per secondCPU Central Processing unitCR Center of resistance; Conditioned response;
Conductive rubber; CreatinineCRBB Complete right bundle branch blockCRD Completely randomized designCRL Crown rump lengthCRT Cathode ray tubeCS Conditioned stimulus; Contrast scale;
Crown seatCSA Compressed spectral arrayCSF Cerebrospinal fluidCSI Chemical shift imagingCSM Chemically sensitive membraneCT Computed tomography; Computerized
tomographyCTI Cumulative toxicity response indexCV Closing volume
xxii ABBREVIATIONS AND ACRONYMS

C.V. Coefficient of variationCVA Cerebral vascular accidentCVP Central venous pressureCVR Cardiovascular resistanceCW Continuous waveCWE Coated wire electrodesCWRU Case Western Reserve UniversityDAC Digital-to-analog converterDAS Data acquisition systemdB DecibelDB Direct bodyDBMS Data base management systemDBS Deep brain stimulationdc Direct currentDCCT Diabetes control and complications trialDCP Distal cavity pressureDCS Dorsal column stimulationDDC Deck decompression chamberDDS Deep diving systemDE Dispersive electrodeDEN Device experience networkDERS Drug exception ordering systemDES Diffuse esophageal spasmd.f. Distribution functionDHCP Distributed Hospital Computer ProgramDHE Dihematoporphyrin etherDHEW Department of Health Education and
WelfareDHHS Department of Health and Human ServicesDHT Duration of hypothermiaDI Deionized waterDIC Displacement currentDIS Diagnostic interview scheduleDL Double layerDLI Difference lumen for intensityDM Delta modulationDME Dropping mercury electrodeDN Donation numberDNA Deoxyribonucleic acidDOF Degree of freedomDOS Drug ordering systemDOT-NHTSA Department of Transportation Highway
Traffic Safety AdministrationDPB Differential pencil beamDPG DiphosphoglycerateDQE Detection quantum efficiencyDRESS Depth-resolved surface coil spectroscopyDRG Diagnosis-related groupDSA Digital subtraction angiographyDSAR Differential scatter-air ratioDSB Double strand breaksDSC Differential scanning calorimetryD-T Deuterium-on-tritiumDTA Differential thermal analysisd.u. Density unitDUR DurationDVT Deep venous thrombosisEA Esophageal accelerogramEB Electron beamEBCDIC Extended binary code decimal interchange
code
EBS Early burn scarEBV Epstein–Barr VirusEC Ethyl celluloseECC Emergency cardiac care; Extracorporeal
circulationECCE Extracapsular cataract extinctionECD Electron capture detectorECG ElectrocardiogramECM Electrochemical machiningECMO Extracorporeal membrane oxygenationECOD Extracranial cerebrovascular occlusive
diseaseECRI Emergency Care Research InstituteECS Exner’s Comprehensive SystemECT Electroconvulsive shock therapy;
Electroconvulsive therapy; Emissioncomputed tomography
EDD Estimated date of deliveryEDP Aortic end diastolic pressureEDTA Ethylenediaminetetraacetic acidEDX Energy dispersive X-ray analysisEEG ElectroencephalogramEEI Electrode electrolyte interfaceEELV End-expiratory lung volumeEER Electrically evoked responseEF Ejection fractionEF Electric field; Evoked magnetic fieldsEFA Estimated fetal ageEGF Epidermal growth factorEGG ElectrogastrogramEIA Enzyme immunoassayEIU Electrode impedance unbalanceELF Extra low frequencyELGON Electrical goniometerELISA Enzyme-linked immunosorbent assayELS Energy loss spectroscopyELV Equivalent lung volumeEM ElectromagneticEMBS Engineering in Medicine and Biology
Societyemf Electromotive forceEMG ElectromyogramEMGE Integrated electromyogramEMI Electromagnetic interferenceEMS Emergency medical servicesEMT Emergency medical technicianENT Ear, nose, and throatEO Elbow orthosisEOG ElectrooculographyEOL End of lifeEOS EosinophilEP Elastoplastic; Evoked potentiateEPA Environmental protection agencyER Evoked responseERCP Endoscopic retrograde
cholangiopancreatographyERG Electron radiography;
ElectroretinogramERMF Event-related magnetic fieldERP Event-related potentialERV Expiratory reserve volume
ABBREVIATIONS AND ACRONYMS xxiii

ESCA Electron spectroscopy for chemicalanalysis
ESI Electrode skin impedanceESRD End-stage renal diseaseesu Electrostatic unitESU Electrosurgical unitESWL Extracorporeal shock wave lithotripsyETO, Eto Ethylene oxideETT Exercise tolerance testingEVA Ethylene vinyl acetateEVR Endocardial viability ratioEW Extended wearFAD Flavin adenine dinucleotideFARA Flexible automation random analysisFBD Fetal biparietal diameterFBS Fetal bovine serumfcc Face centered cubicFCC Federal Communications CommissionFct FluorocritFDA Food and Drug AdministrationFDCA Food, Drug, and Cosmetic ActFE Finite elementFECG Fetal electrocardiogramFEF Forced expiratory flowFEL Free electron lasersFEM Finite element methodFEP Fluorinated ethylene propyleneFES Functional electrical stimulationFET Field-effect transistorFEV Forced expiratory volumeFFD Focal spot to film distanceFFT Fast Fourier transformFGF Fresh gas flowFHR Fetal heart rateFIC Forced inspiratory capacityFID Flame ionization detector; Free-induction
decayFIFO First-in-first-outFITC Fluorescent indicator tagged polymerFL Femur lengthFM Frequency modulationFNS Functional neuromuscular stimulationFO Foramen ovaleFO-CRT Fiber optics cathode ray tubeFP Fluorescence polarizationFPA Fibrinopeptide AFR Federal RegisterFRC Federal Radiation Council; Functional
residual capacityFSD Focus-to-surface distanceFTD Focal spot to tissue-plane distanceFTIR Fourier transform infraredFTMS Fourier transform mass spectrometerFU FluorouracilFUDR FloxuridineFVC Forced vital capacityFWHM Full width at half maximumFWTM Full width at tenth maximumGABA Gamma amino buteric acidGAG GlycosaminoglycanGBE Gas-bearing electrodynamometer
GC Gas chromatography; Guanine-cytosineGDT Gas discharge tubeGFR Glomerular filtration rateGHb Glycosylated hemoglobinGI GastrointestinalGLC Gas–liquid chromatographyGMV General minimum varianceGNP Gross national productGPC Giant papillary conjunctivitisGPH Gas-permeable hardGPH-EW Gas-permeable hard lens extended wearGPO Government Printing OfficeGSC Gas-solid chromatographyGSR Galvanic skin responseGSWD Generalized spike-wave dischargeHA HydroxyapatiteHAM Helical axis of motionHb HemoglobinHBE His bundle electrogramHBO Hyperbaric oxygenationHC Head circumferenceHCA Hypothermic circulatory arrestHCFA Health care financing administrationHCL Harvard Cyclotron Laboratoryhcp Hexagonal close-packedHCP Half cell potentialHDPE High density polyethyleneHECS Hospital Equipment Control SystemHEMS Hospital Engineering Management
SystemHEPA High efficiency particulate air filterHES HydroxyethylstarchHETP Height equivalent to a theoretical plateHF High-frequency; Heating factorHFCWO High-frequency chest wall oscillationHFER High-frequency electromagnetic radiationHFJV High-frequency jet ventilationHFO High-frequency oscillatorHFOV High-frequency oscillatory ventilationHFPPV High-frequency positive pressure
ventilationHFV High-frequency ventilationHHS Department of Health and Human
ServicesHIBC Health industry bar codeHIMA Health Industry Manufacturers
AssociationHIP Hydrostatic indifference pointHIS Hospital information systemHK HexokinaseHL Hearing levelHMBA Hexamethylene bisacetamideHMO Health maintenance organizationHMWPE High-molecular-weight polyethyleneHOL Higher-order languagesHP Heating factor; His-PurkinjeHpD Hematoporphyrin derivativeHPLC High-performance liquid chromatographyHPNS High-pressure neurological syndromeHPS His-Purkinje systemHPX High peroxidase activity
xxiv ABBREVIATIONS AND ACRONYMS

HR Heart rate; High-resolutionHRNB Halstead-Reitan Neuropsychological
BatteryH/S Hard/softHSA Human serum albuminHSG HysterosalpingogramHTCA Human tumor cloning assayHTLV Human T cell lymphotrophic virusHU Heat unit; Houndsfield units; HydroxyureaHVL Half value layerHVR Hypoxic ventilatory responseHVT Half-value thicknessIA Image intensifier assembly; Inominate
arteryIABP Intraaortic balloon pumpingIAEA International Atomic Energy AgencyIAIMS Integrated Academic Information
Management SystemIASP International Association for the Study
of PainIC Inspiratory capacity; Integrated circuitICCE Intracapsular cataract extractionICD Intracervical deviceICDA International classification of diagnosesICL Ms-clip lensICP Inductively coupled plasma;
Intracranial pressureICPA Intracranial pressure amplitudeICRP International Commission on
Radiological ProtectionICRU International Commission on Radiological
Units and MeasurementsICU Intensive care unitID Inside diameterIDDM Insulin dependent diabetes mellitusIDE Investigational device exemptionIDI Index of inspired gas distributionI:E Inspiratory: expiratoryIEC International Electrotechnical
Commission; Ion-exchangechromatography
IEEE Institute of Electrical and ElectronicsEngineers
IEP Individual educational programBETS Inelastic electron tunneling spectroscopyIF ImmunofluorescentIFIP International Federation for Information
ProcessingIFMBE International Federation for Medical and
Biological EngineeringIGFET Insulated-gate field-effect transistorIgG Immunoglobulin GIgM Immunoglobulin MIHP Inner Helmholtz planeIHSS Idiopathic hypertrophic subaortic stenosisII Image intensifierIIIES Image intensifier input-exposure
sensitivityIM IntramuscularIMFET Immunologically sensitive field-effect
transistor
IMIA International Medical InformaticsAssociation
IMS Information management systemIMV Intermittent mandatory ventilationINF InterferonIOL Intraocular lensIPC Ion-pair chromatographyIPD Intermittent peritoneal dialysisIPG Impedance plethysmographyIPI Interpulse intervalIPPB Intermittent positive pressure breathingIPTS International practical temperature scaleIR Polyisoprene rubberIRB Institutional Review BoardIRBBB Incomplete right bundle branch blockIRPA International Radiation Protection
AssociationIRRAS Infrared reflection-absorption
spectroscopyIRRS Infrared reflection spectroscopyIRS Internal reflection spectroscopyIRV Inspiratory reserve capacityIS Image size; Ion-selectiveISC Infant skin servo controlISDA Instantaneous screw displacement axisISE Ion-selective electrodeISFET Ion-sensitive field effect transistorISIT Intensified silicon-intensified target tubeISO International Organization for
StandardizationISS Ion scattering spectroscopyIT IntrathecalITEP Institute of Theoretical and Experimental
PhysicsITEPI Instantaneous trailing edge pulse
impedanceITLC Instant thin-layer chromatographyIUD Intrauterine deviceIV IntravenousIVC Inferior vena cavaIVP Intraventricular pressureJCAH Joint Commission on the Accreditation
of HospitalsJND Just noticeable differenceJRP Joint replacement prosthesisKB Kent bundleKerma Kinetic energy released in unit massKO Knee orthosisKPM Kilopond meterKRPB Krebs-Ringer physiological bufferLA Left arm; Left atriumLAD Left anterior descending; Left axis
deviationLAE Left atrial enlargementLAK Lymphokine activated killerLAL Limulus amoebocyte lysateLAN Local area networkLAP Left atrial pressureLAT Left anterior temporalisLBBB Left bundle branch blockLC Left carotid; Liquid chromatography
ABBREVIATIONS AND ACRONYMS xxv

LCC Left coronary cuspLCD Liquid crystal displayLDA Laser Doppler anemometryLDF Laser Doppler flowmetryLDH Lactate dehydrogenaseLDPE Low density polyethyleneLEBS Low-energy brief stimulusLED Light-emitting diodeLEED Low energy electron diffractionLES Lower esophageal sphincterLESP Lower esophageal sphincter pressureLET Linear energy transferLF Low frequencyLH Luteinizing hormoneLHT Local hyperthermiaLL Left legLLDPE Linear low density polyethyleneLLPC Liquid-liquid partition chromatographyLLW Low-level wasteLM Left masseterLNNB Luria-Nebraska Neuropsychological
BatteryLOS Length of stayLP Late potential; LumboperitonealLPA Left pulmonary arteryLPC Linear predictive codingLPT Left posterior temporalisLPV Left pulmonary veinsLRP Late receptor potentialLS Left subclavianLSC Liquid-solid adsorption chromatographyLSI Large scale integratedLSV Low-amplitude shear-wave
viscoelastometryLTI Low temperature isotropicLUC Large unstained cellsLV Left ventricleLVAD Left ventricular assist deviceLVDT Linear variable differential transformerLVEP Left ventricular ejection periodLVET Left ventricular ejection timeLVH Left ventricular hypertrophyLYMPH LymphocyteMAA Macroaggregated albuminMAC Minimal auditory capabilitiesMAN ManubriumMAP Mean airway pressure; Mean arterial
pressureMAST Military assistance to safety and trafficMBA Monoclonal antibodyMBV Maximum breathing ventilationMBX Monitoring branch exchangeMCA Methyl cryanoacrylateMCG MagnetocardiogramMCI Motion Control IncorporatedMCMI Millon Clinical Multiaxial InventoryMCT Microcatheter transducerMCV Mean corpuscular volumeMDC Medical diagnostic categoriesMDI Diphenylmethane diisocyanate;
Medical Database Informatics
MDP Mean diastolic aortic pressureMDR Medical device reportingMDS Multidimensional scalingME MyoelectricMED Minimum erythema doseMEDPAR Medicare provider analysis and reviewMEFV Maximal expiratory flow volumeMEG MagnetoencephalographyMeSH Medline subject headingMETS Metabolic equivalentsMF Melamine-formaldehydeMFP Magnetic field potentialMGH Massachusetts General HospitalMHV Magnetic heart vectorMI Myocardial infarctionMIC Minimum inhibitory concentrationMIFR Maximum inspiratory flow rateMINET Medical Information NetworkMIR Mercury-in-rubberMIS Medical information system;
Metal-insulator-semiconductorMIT Massachusetts Institute of TechnologyMIT/BIH Massachusetts Institute of Technology/
Beth Israel HospitalMMA Manual metal arc weldingMMA Methyl methacrylateMMECT Multiple-monitored ECTMMFR Maximum midexpiratory flow ratemm Hg Millimeters of mercuryMMPI Minnesota Multiphasic Personality
InventoryMMSE Minimum mean square errorMO Membrane oxygenationMONO MonocyteMOSFET Metal oxide silicon field-effect
transistorMP Mercaptopurine; Metacarpal-phalangealMPD Maximal permissible doseMR Magnetic resonanceMRG MagnetoretinogramMRI Magnetic resonance imagingMRS Magnetic resonance spectroscopyMRT Mean residence timeMS Mild steel; Multiple sclerosisMSR Magnetically shielded roomMTBF Mean time between failureMTF Modulation transfer functionMTTR Mean time to repairMTX MethotroxateMUA Motor unit activityMUAP Motor unit action potentialMUAPT Motor unit action potential trainMUMPI Missouri University Multi-Plane
ImagerMUMPS Massachusetts General Hospital utility
multiuser programming systemMV Mitral valveMVO2 Maximal oxygen uptakeMVTR Moisture vapor transmission rateMVV Maximum voluntary ventilationMW Molecular weight
xxvi ABBREVIATIONS AND ACRONYMS

NAA Neutron activation analysisNAD Nicotinamide adenine dinucleotideNADH Nicotinamide adenine dinucleotide,
reduced formNADP Nicotinamide adenine dinucleotide
phosphateNAF Neutrophil activating factorNARM Naturally occurring and accelerator-
produced radioactive materialsNBB Normal buffer baseNBD Neuromuscular blocking drugsN-BPC Normal bonded phase chromatographyNBS National Bureau of StandardsNCC Noncoronary cuspNCCLS National Committee for Clinical
Laboratory Standards; NationalCommittee on Clinical LaboratoryStandards
NCRP National Council on Radiation ProtectionNCT Neutron capture theoryNEEP Negative end-expiratory pressureNEMA National Electrical Manufacturers
AssociationNEMR Nonionizing electromagnetic radiationNEQ Noise equivalent quantaNET NorethisteroneNEUT NeutrophilNFPA National Fire Protection AssociationNH Neonatal hepatitisNHE Normal hydrogen electrodeNHLBI National Heart, Lung, and Blood InstituteNIR Nonionizing radiationNIRS National Institute for Radiologic ScienceNK Natural killerNMJ Neuromuscular junctionNMOS N-type metal oxide siliconNMR Nuclear magnetic resonanceNMS Neuromuscular stimulationNPH Normal pressure hydrocephalusNPL National Physical LaboratoryNR Natural rubberNRC Nuclear Regulatory CommissionNRZ Non-return-to-zeroNTC Negative temperature coefficientNTIS National Technical Information ServiceNVT Neutrons versus timeNYHA New York Heart Associationob/gyn Obstetrics and gynecologyOCR Off-center ratio; Optical character
recognitionOCV Open circuit voltageOD Optical density; Outside diameterODC Oxyhemoglobin dissociation curveODT Oxygen delivery truckODU Optical density unitOER Oxygen enhancement ratioOFD Object to film distance; Occiputo-frontal
diameterOHL Outer Helmholtz layerOHP Outer Helmholtz planeOIH Orthoiodohippurate
OPG Ocular pneumoplethysmographyOR Operating roomOS Object of known size; Operating systemOTC Over the counterOV Offset voltagePA Posterioanterior; Pulmonary artery;
Pulse amplitudePACS Picture archiving and communications
systemsPAD Primary afferent depolarizationPAM Pulse amplitude modulationPAN PolyacrylonitrilePAP Pulmonary artery pressurePAR Photoactivation ratioPARFR Program for Applied Research on
Fertility RegulationPARR Poetanesthesia recovery roomPAS Photoacoustic spectroscopyPASG Pneumatic antishock garmentPBI Penile brachial indexPBL Positive beam limitationPBT Polybutylene terephthalatePC Paper chromatography; Personal
computer; PolycarbonatePCA Patient controlled analgesia; Principal
components factor analysisPCG PhonocardiogramPCI Physiological cost indexPCL Polycaprolactone; Posterior chamber
lensPCR Percent regurgitationPCRC Perinatal Clinical Research CenterPCS Patient care systemPCT Porphyria cutanea tardaPCWP Pulmonary capillary wedge pressurePD Peritoneal dialysis; Poly-p-dioxanone;
Potential difference; Proportional andderivative
PDD Percent depth dose; Perinatal DataDirectory
PDE Pregelled disposable electrodesp.d.f. Probability density functionPDL Periodontal ligamentPDM Pulse duration modulationPDMSX Polydimethyl siloxanePDS PolydioxanonePE PolyethylenePEEP Positive end-expiratory pressurePEFR Peak expiratory now ratePEN Parenteral and enteral nutritionPEP Preejection periodPEPPER Programs examine phonetic find
phonological evaluation recordsPET Polyethylene terephthalate;
Positron-emission tomographyPEU PolyetherurethanePF Platelet factorPFA Phosphonoformic addPFC PetrofluorochemicalPFT Pulmonary function testingPG Polyglycolide; Propylene glycol
ABBREVIATIONS AND ACRONYMS xxvii

PGA Polyglycolic addPHA Phytohemagglutinin; Pulse-height
analyzerPHEMA Poly-2-hydroxyethyl methacrylatePI Propidium iodidePID Pelvic inflammatory disease;
Proportional/integral/derivativePIP Peak inspiratory pressurePL Posterior leafletPLA Polylactic acidPLATO Program Logic for Automated Teaching
OperationsPLD Potentially lethal damagePLED Periodic latoralized epileptiform dischargePLT PlateletPM Papillary muscles; Preventive
maintenancePMA Polymethyl acrylatep.m.f. Probability mass functionPMMA Polymethyl methacrylatePMOS P-type metal oxide siliconPMP Patient management problem;
Poly(4-methylpentane)PMT Photomultiplier tubePO Per osPo2 Partial pressure of oxygenPOBT Polyoxybutylene terephthalatePOM PolyoxymethylenePOMC Patient order management and
communication systemPOPRAS Problem Oriented Perinatal Risk
Assessment SystemPP Perfusion pressure; Polyproplyene;
Postprandial (after meals)PPA Phonemic process analysisPPF Plasma protein fractionPPM Pulse position modulationPPSFH Polymerized phyridoxalated stroma-free
hemoglobinPR Pattern recognition; Pulse ratePRBS Pseudo-random binary signalsPRP Pulse repetition frequencyPRO Professional review organizationPROM Programmable read only memoryPS PolystyrenePSA Pressure-sensitive adhesivePSF Point spread functionPSI Primary skin irritationPSP Postsynaptic potentialPSR Proton spin resonancePSS Progressive systemic sclerosisPT Plasma thromboplastinPTB Patellar tendon bearing orthosisPTC Plasma thromboplastin component;
Positive temperature coefficient;Pressurized personal transfer capsule
PTCA Percutaneous transluminal coronaryangioplasty
PTFE PolytetrafluoroethylenePTT Partial thromboplastin timePUL Percutaneous ultrasonic lithotripsy
PURA Prolonged ultraviolet-A radiationPUVA Psoralens and longwave ultraviolet light
photochemotherapyP/V Pressure/volumePVC Polyvinyl chloride; Premature ventricular
contractionPVI Pressure–volume indexPW Pulse wave; Pulse widthPWM Pulse width modulationPXE Pseudo-xanthoma elasticumQA Quality assuranceQC Quality controlR-BPC Reverse bonded phase chromatographyR/S Radiopaque-sphericalRA Respiratory amplitude; Right armRAD Right axis deviationRAE Right atrial enlargementRAM Random access memoryRAP Right atrial pressureRAT Right anterior temporalisRB Right bundleRBBB Right bundle branch blockRBC Red blood cellRBE Relative biologic effectivenessRBF Rose bengal fecal excretionRBI Resting baseline impedanceRCBD Randomized complete block diagramrCBF Regional cerebral blood flowRCC Right coronary cuspRCE Resistive contact electrodeR&D Research and developmentr.e. Random experimentRE Reference electrodeREM Rapid eye movement; Return electrode
monitorREMATE Remote access and telecommunication
systemRES Reticuloendothelial systemRESNA Rehabilitation Engineering Society of
North AmericaRF Radio frequency; Radiographic-
nuoroscopicRFI Radio-frequency interferenceRFP Request for proposalRFQ Request for quotationRH Relative humidityRHE Reversible hydrogen electrodeRIA RadioimmunoassayRM Repetition maximum; Right masseterRMR Resting metabolic rateRMS Root mean squareRN RadionuclideRNCA Radionuclide cineagiogramROI Regions of interestROM Range of motion; Read only memoryRP Retinitis pigmentosaRPA Right pulmonary arteryRPP Rate pressure productRPT Rapid pull-through techniqueRPV Right pulmonary veinsRQ Respiratory quotient
xxviii ABBREVIATIONS AND ACRONYMS

RR Recovery roomRRT Recovery room time; Right posterior
temporalisRT Reaction timeRTD Resistance temperature deviceRTT Revised token testr.v. Random variableRV Residual volume; Right ventricleRVH Right ventricular hypertrophyRVOT Right ventricular outflow tractRZ Return-to-zeroSA Sinoatrial; Specific absorptionSACH Solid-ankle-cushion-heelSAD Source-axis distance; Statistical
Analysis SystemSAINT System analysis of integrated network
of tasksSAL Sterility assurance level; Surface
averaged leadSALT Systematic analysis of language
transcriptsSAMI Socially acceptable monitoring
instrumentSAP Systemic arterial pressureSAR Scatter-air ratio; Specific absorption rateSARA System for anesthetic and respiratory
gas analysisSBE Subbacterial endocarditisSBR Styrene-butadiene rubbersSC Stratum corneum; SubcommitteesSCAP Right scapulaSCE Saturated calomel electrode; Sister
chromatid exchangeSCI Spinal cord injurySCRAD Sub-Committee on Radiation DosimetrySCS Spinal cord stimulationSCUBA Self-contained underwater breathing
apparatusSD Standard deviationSDA Stepwise discriminant analysisSDS Sodium dodecyl sulfateS&E Safety and effectivenessSE Standard errorSEC Size exclusion chromatographySEM Scanning electron microscope; Standard
error of the meanSEP Somatosensory evoked potentialSEXAFS Surface extended X-ray absorption
fine structureSF Surviving fractionSFD Source-film distanceSFH Stroma-free hemoglobinSFTR Sagittal frontal transverse rotationalSG Silica gelSGF Silica gel fractionSGG Spark gap generatorSGOT Serum glutamic oxaloacetic transaminaseSGP Strain gage plethysmography;
Stress-generated potentialSHE Standard hydrogen electrodeSI Le Système International d’Unités
SEBS Surgical isolation barrier systemSID Source to image reception distanceSIMFU Scanned intensity modulated focused
ultrasoundSIMS Secondary ion mass spectroscopy; System
for isometric muscle strengthSISI Short increment sensitivity indexSL Surgical lithotomySLD Sublethal damageSLE Systemic lupus erythemotodesSMA Sequential multiple analyzerSMAC Sequential multiple analyzer with
computerSMR SensorimotorS/N Signal-to-noiseS:N/D Signal-to-noise ratio per unit doseSNP Sodium nitroprussideSNR Signal-to-noise ratioSOA Sources of artifactSOAP Subjective, objective, assessment, planSOBP Spread-out Bragg peakSP Skin potentialSPECT Single photon emission computed
tomographySPL Sound pressure levelSPRINT Single photon ring tomographSPRT Standard platinum resistance
thermometerSPSS Statistical Package for the Social SciencesSQUID Superconducting quantum interference
deviceSQV Square wave voltammetrySR Polysulfide rubbersSRT Speech reception thresholdSS Stainless steelSSB Single strand breaksSSD Source-to-skin distance; Source-to-surface
distanceSSE Stainless steel electrodeSSEP Somatosensory evoked potentialSSG Solid state generatorSSP Skin stretch potentialSSS Sick sinus syndromeSTD Source-tray distanceSTI Systolic time intervalsSTP Standard temperature and pressureSTPD Standard temperature pressure drySV Stroke volumeSVC Superior vena cavaSW Standing waveTAA Tumor-associated antigensTAC Time-averaged concentrationTAD Transverse abdominal diameterTAG Technical Advisory GroupTAH Total artificial heartTAR Tissue-air ratioTC Technical CommitteesTCA Tricarboxylic acid cycleTCD Thermal conductivity detectorTCES Transcutaneous cranial electrical
stimulation
ABBREVIATIONS AND ACRONYMS xxix

TCP Tricalcium phosphateTDD Telecommunication devices for the
deafTDM Therapeutic drug monitoringTE Test electrode; Thermoplastic elastomersTEAM Technology evaluation and acquisition
methodsTEM Transmission electron microscope;
Transverse electric and magnetic mode;Transverse electromagnetic mode
TENS Transcutaneous electrical nervestimulation
TEP Tracheoesophageal punctureTEPA Triethylenepho-sphoramideTF Transmission factorTFE TetrafluorethyleneTI Totally implantableTICCIT Time-shared Interaction Computer-
Controlled Information TelevisionTLC Thin-layer chromatography; Total
lung capacityTLD Thermoluminescent dosimetryTMJ Temporomandibular jointTMR Tissue maximum ratio; Topical
magnetic resonanceTNF Tumor necrosis factorTOF Train-of-fourTP Thermal performanceTPC Temperature pressure correctionTPD Triphasic dissociationTPG Transvalvular pressure gradientTPN Total parenteral nutritionTR Temperature risetRNA Transfer RNATSH Thyroid stimulating hormoneTSS Toxic shock syndromeTTD Telephone devices for the deafTTI Tension time indexTTR Transition temperature rangeTTV Trimming tip versionTTY TeletypewriterTUR Transurethral resectionTURP Transurethral resections of the
prostrateTV Television; Tidal volume; Tricuspid valveTVER Transscleral visual evoked responseTW Traveling waveTxB2 Thrombozame B2
TZ Transformation zoneUES Upper esophageal sphincterUP Urea-formaldehydeUfflS University Hospital Information SystemUHMW Ultra high molecular weight
UHMWPE Ultra high molecular weight polyethyleneUL Underwriters LaboratoryULF Ultralow frequencyULTI Ultralow temperature isotropicUMN Upper motor neuronUO Urinary outputUPTD Unit pulmonary oxygen toxicity dosesUR Unconditioned responseUS Ultrasound; Unconditioned stimulusUSNC United States National CommitteeUSP United States PharmacopeiaUTS Ultimate tensile strengthUV Ultraviolet; Umbilical vesselUVR Ultraviolet radiationV/F Voltage-to-frequencyVA Veterans AdministrationVAS Visual analog scaleVBA Vaginal blood volume in arousalVC Vital capacityVCO Voltage-controlled oscillatorVDT Video display terminalVECG VectorelectrocardiographyVEP Visually evoked potentialVF Ventricular fibrillationVOP Venous occlusion plethysmographyVP VentriculoperitonealVPA Vaginal pressure pulse in arousalVPB Ventricular premature beatVPR Volume pressure responseVSD Ventricular septal defectVSWR Voltage standing wave ratioVT Ventricular tachycardiaVTG Vacuum tube generatorVTS Viewscan text systemVV Variable versionWAIS-R Weschler Adult Intelligence
Scale-RevisedWAK Wearable artificial kidneyWAML Wide-angle mobility lightWBAR Whole-body autoradiographyWBC White blood cellWG Working GroupsWHO World Health Organization; Wrist hand
orthosisWLF Williams-Landel-FerryWMR Work metabolic ratew/o Weight percentWORM Write once, read manyWPW Wolff-Parkinson-WhiteXPS X-ray photon spectroscopyXR XeroradiographYAG Yttrium aluminum garnetZPL Zero pressure level
xxx ABBREVIATIONS AND ACRONYMS

CONVERSION FACTORS AND UNIT SYMBOLS
SI UNITS (ADOPTED 1960)
A new system of metric measurement, the International System of Units (abbreviated SI), is being implemented throughoutthe world. This system is a modernized version of the MKSA (meter, kilogram, second, ampere) system, and its details arepublished and controlled by an international treaty organization (The International Bureau of Weights and Measures).
SI units are divided into three classes:
Derived Units and Other Acceptable Units
These units are formed by combining base units, supplementary units, and other derived units. Those derived units havingspecial names and symbols are marked with an asterisk (*) in the list below:
xxxi
Base Unitslength metery (m)massz kilogram (kg)time second (s)electric current ampere (A)thermodynamic temperature§ kelvin (K)amount of substance mole (mol)luminous intensity candela (cd)
Supplementary Unitsplane angle radian (rad)solid angle steradian (sr)
Quantity Unit Symbol Acceptable equivalent*absorbed dose gray Gy J/kgacceleration meter per second squared m/s2
*activity (of ionizing radiation source) becquerel Bq 1/sarea square kilometer km2
square hectometer hm2 ha (hectare)square meter m2
yThe spellings ‘‘metre’’ and ‘‘litre’’ are preferred by American Society for Testing and Materials (ASTM); however, ‘‘�er’’ will beused in the Encyclopedia.z‘‘Weight’’ is the commonly used term for ‘‘mass.’’§Wide use is made of ‘‘Celsius temperature’’ ðtÞ defined t ¼ T � T0 where T is the thermodynamic temperature, expressed inkelvins, and T0 ¼ 273:15K by definition. A temperature interval may be expressed in degrees Celsius as well as in kelvins.

xxxii CONVERSION FACTORS AND UNIT SYMBOLS
Quantity Unit Symbol Acceptableequivalent*capacitance farad F C/Vconcentration (of amount of substance) mole per cubic meter mol/m3
*conductance siemens S A/Vcurrent density ampere per square meter A/m2
density, mass density kilogram per cubic meter kg/m3 g/L; mg/cm3
dipole moment (quantity) coulomb meter C�m*electric charge, quantity of electricity coulomb C A�selectric charge density coulomb per cubic meter C/m3
electric field strength volt per meter V/melectric flux density coulomb per square meter C/m2
*electric potential, potential difference,electromotive force volt V W/A
*electric resistance ohm V V/A*energy, work, quantity of heat megajoule MJ
kilojoule kJjoule J N�melectron volty eVy
kilowatt houry kW�hy
energy density joule per cubic meter J/m3
*force kilonewton kNnewton N kg�m/s2
*frequency megahertz MHzhertz Hz 1/s
heat capacity, entropy joule per kelvin J/Kheat capacity (specific), specific entropy joule per kilogram kelvin J/(kg�K)heat transfer coefficient watt per square meter W/(m2�K)
kelvin*illuminance lux lx lm/m2
*inductance henry H Wb/Alinear density kilogram per meter kg/mluminance candela per square meter cd/m2
*luminous flux lumen lm cd�srmagnetic field strength ampere per meter A/m*magnetic flux weber Wb V�s*magnetic flux density tesla T Wb/m2
molar energy joule per mole J/molmolar entropy, molar heat capacity joule per mole kelvin J/(mol�K)moment of force, torque newton meter N�mmomentum kilogram meter per second kg�m/spermeability henry per meter H/mpermittivity farad per meter F/m*power, heat flow rate, radiant flux kilowatt kW
watt W J/spower density, heat flux density,
irradiance watt per square meter W/m2
*pressure, stress megapascal MPakilopascal kPapascal Pa N/m2
sound level decibel dBspecific energy joule per kilogram J/kgspecific volume cubic meter per kilogram m3/kgsurface tension newton per meter N/mthermal conductivity watt per meter kelvin W/(m�K)velocity meter per second m/s
kilometer per hour km/hviscosity, dynamic pascal second Pa�s
millipascal second mPa�syThis non-SI unit is recognized as having to be retained because of practical importance or use in specialized fields.

In addition, there are 16 prefixes used to indicate order of magnitude, as follows:
CONVERSION FACTORS TO SI UNITS
A representative list of conversion factors from non-SI to SI units is presented herewith. Factors are given to four significantfigures. Exact relationships are followed by a dagger (y). A more complete list is given in ASTM E 380-76 and ANSI Z210.1-1976.
CONVERSION FACTORS AND UNIT SYMBOLS xxxiii
Quantity Unit Symbol Acceptable equivalentviscosity, kinematic square meter per second m2/s
square millimeter per second mm2/scubic meter m3
cubic decimeter dm3 L(liter)cubic centimeter cm3 mL
wave number 1 per meter m�1
1 per centimeter cm�1
Multiplication factor Prefix Symbol Note1018 exa E
1015 peta P
1012 tera T
109 giga G
108 mega M103 kilo k102 hecto ha
10 deka daa
10�1 deci da
10�2 centi ca
10�3 milli m10�6 micro m10�9 nano n10�12 pico p10�15 femto f10�18 atto a
aAlthough hecto, deka, deci, and centi areSI prefixes, their use should be avoidedexcept for SI unit-multiples for area andvolume and nontechnical use ofcentimeter, as for body and clothingmeasurement.
For a complete description of SI and its use the reader is referred to ASTM E 380.
To convert from To Multiply byacre square meter (m2) 4:047 � 103
angstrom meter (m) 1:0 � 10�10y
are square meter (m2) 1:0 � 102y
astronomical unit meter (m) 1:496 � 1011
atmosphere pascal (Pa) 1:013 � 105
bar pascal (Pa) 1:0 � 105y
barrel (42 U.S. liquid gallons) cubic meter (m3) 0.1590Btu (International Table) joule (J) 1:055 � 103
Btu (mean) joule (J) 1:056 � 103
Bt (thermochemical) joule (J) 1:054 � 103
bushel cubic meter (m3) 3:524 � 10�2
calorie (International Table) joule (J) 4.187calorie (mean) joule (J) 4.190calorie (thermochemical) joule (J) 4.184y
centimeters of water (39.2 8F) pascal (Pa) 98.07centipoise pascal second (Pa�s) 1:0 � 10�3y
centistokes square millimeter per second (mm2/s) 1.0y

xxxiv CONVERSION FACTORS AND UNIT SYMBOLS
cfm (cubic foot per minute) cubic meter per second (m3/s) 4:72 � 10�4
cubic inch cubic meter (m3) 1:639 � 10�4
cubic foot cubic meter (m3) 2:832 � 10�2
cubic yard cubic meter (m3) 0.7646curie becquerel (Bq) 3:70 � 1010y
debye coulomb-meter (C�m) 3:336 � 10�30
degree (angle) radian (rad) 1:745 � 10�2
denier (international) kilogram per meter (kg/m) 1:111 � 10�7
tex 0.1111dram (apothecaries’) kilogram (kg) 3:888 � 10�3
dram (avoirdupois) kilogram (kg) 1:772 � 10�3
dram (U.S. fluid) cubic meter (m3) 3:697 � 10�6
dyne newton(N) 1:0 � 10�6y
dyne/cm newton per meter (N/m) 1:00 � 10�3y
electron volt joule (J) 1:602 � 10�19
erg joule (J) 1:0 � 10�7y
fathom meter (m) 1.829fluid ounce (U.S.) cubic meter (m3) 2:957 � 10�5
foot meter (m) 0.3048y
foot-pound force joule (J) 1.356foot-pound force newton meter (N�m) 1.356foot-pound force per second watt(W) 1.356footcandle lux (lx) 10.76furlong meter (m) 2:012 � 102
gal meter per second squared (m/s2) 1:0 � 10�2y
gallon (U.S. dry) cubic meter (m3) 4:405 � 10�3
gallon (U.S. liquid) cubic meter (m3) 3:785 � 10�3
gilbert ampere (A) 0.7958gill (U.S.) cubic meter (m3) 1:183 � 10�4
grad radian 1:571 � 10�2
grain kilogram (kg) 6:480 � 10�5
gram force per denier newton per tex (N/tex) 8:826 � 10�2
hectare square meter (m2) 1:0 � 104y
horsepower (550 ft�lbf/s) watt(W) 7:457 � 102
horsepower (boiler) watt(W) 9:810 � 103
horsepower (electric) watt(W) 7:46 � 102y
hundredweight (long) kilogram (kg) 50.80hundredweight (short) kilogram (kg) 45.36inch meter (m) 2:54 � 10�2y
inch of mercury (32 8F) pascal (Pa) 3:386 � 103
inch of water (39.2 8F) pascal (Pa) 2:491 � 102
kilogram force newton (N) 9.807kilopond newton (N) 9.807kilopond-meter newton-meter (N�m) 9.807kilopond-meter per second watt (W) 9.807kilopond-meter per min watt(W) 0.1635kilowatt hour megajoule (MJ) 3.6y
kip newton (N) 4:448 � 102
knot international meter per second (m/s) 0.5144lambert candela per square meter (cd/m2) 3:183 � 103
league (British nautical) meter (m) 5:559 � 102
league (statute) meter (m) 4:828 � 103
light year meter (m) 9:461 � 1015
liter (for fluids only) cubic meter (m3) 1:0 � 10�3y
maxwell weber (Wb) 1:0 � 10�8y
micron meter (m) 1:0 � 10�6y
mil meter (m) 2:54 � 10�5y
mile (U.S. nautical) meter (m) 1:852 � 103y
mile (statute) meter (m) 1:609 � 103
mile per hour meter per second (m/s) 0.4470
To convert from To Multiply by

CONVERSION FACTORS AND UNIT SYMBOLS xxxv
millibar pascal (Pa) 1:0 � 102
millimeter of mercury (0 8C) pascal (Pa) 1:333 � 102y
millimeter of water (39.2 8F) pascal (Pa) 9.807minute (angular) radian 2:909 � 10�4
myriagram kilogram (kg) 10myriameter kilometer (km) 10oersted ampere per meter (A/m) 79.58ounce (avoirdupois) kilogram (kg) 2:835 � 10�2
ounce (troy) kilogram (kg) 3:110 � 10�2
ounce (U.S. fluid) cubic meter (m3) 2:957 � 10�5
ounce-force newton (N) 0.2780peck (U.S.) cubic meter (m3) 8:810 � 10�3
pennyweight kilogram (kg) 1:555 � 10�3
pint (U.S. dry) cubic meter (m3) 5:506 � 10�4
pint (U.S. liquid) cubic meter (m3) 4:732 � 10�4
poise (absolute viscosity) pascal second (Pa�s) 0.10y
pound (avoirdupois) kilogram (kg) 0.4536pound (troy) kilogram (kg) 0.3732poundal newton (N) 0.1383pound-force newton (N) 4.448pound per square inch (psi) pascal (Pa) 6:895 � 103
quart (U.S. dry) cubic meter (m3) 1:101 � 10�3
quart (U.S. liquid) cubic meter (m3) 9:464 � 10�4
quintal kilogram (kg) 1:0 � 102y
rad gray (Gy) 1:0 � 10�2y
rod meter (m) 5.029roentgen coulomb per kilogram (C/kg) 2:58 � 10�4
second (angle) radian (rad) 4:848 � 10�6
section square meter (m2) 2:590 � 106
slug kilogram (kg) 14.59spherical candle power lumen (lm) 12.57square inch square meter (m2) 6:452 � 10�4
square foot square meter (m2) 9:290 � 10�2
square mile square meter (m2) 2:590 � 106
square yard square meter (m2) 0.8361store cubic meter (m3) 1:0y
stokes (kinematic viscosity) square meter per second (m2/s) 1:0 � 10�4y
tex kilogram per meter (kg/m) 1:0 � 10�6y
ton (long, 2240 pounds) kilogram (kg) 1:016 � 103
ton (metric) kilogram (kg) 1:0 � 103y
ton (short, 2000 pounds) kilogram (kg) 9:072 � 102
torr pascal (Pa) 1:333 � 102
unit pole weber (Wb) 1:257 � 10�7
yard meter (m) 0.9144y
To convert from To Multiply by


Hcontinued
HYDROCEPHALUS, TOOLS FOR DIAGNOSISAND TREATMENT OF
SANDEEP SOOD
ANDERS EKLUND
NOAM ALPERIN
University of Illinois at ChicagoChicago, Illinois
INTRODUCTION
Epidemiology
A congenital form of hydrocephalus occurs in roughly 50in 100,000 live births (6). Hydrocephalus may also beacquired later in life as a result of a brain tumor, followingmeningitis, trauma, or intracranial hemorrhage. It has beenestimated that prevalence of shunted hydrocephalus isabout 40/100,000 population in the United States (7).Untreated hydrocephalus has a poor natural history witha mortality rate of 20–25% and results in severe physicaland mental disabilities in survivors (8,9). There has been asignificant reduction in mortality and morbidity with use ofshunting. However, shunting is associated with a highfailure rate; a 40% failure rate occurs within the first yearafter shunting (10). Advances in the technology have lead tothe development of a diverse type of shunt systems tocircumvent problems related to long-term shunting, suchas obstruction, infection, and overdrainage. Yet, studies doneto evaluate these devices have not shown a significant long-or short-term benefit from their use compared with theconventional devices (10). It is estimated that, during theyear 2000, the cost associated with shunting exceeded onebillion dollars in the United States alone (11). Shunt replace-ment accounted for 43% of shunt procedures. Endoscopicsurgery has provided an alternative strategy in patients withobstructive hydrocephalus. However, limited data in theliterature suggest that long-term survival of third ventricu-lostomy is not significantly superior to that of a shunt (12).
Physiology
The CSF flow in the craniospinal system is influencedby two separate processes: (1) the circulation of the CSFfrom its formation sites to its absorption sites (i.e., bulkflow) and (2) an oscillatory (back and forth) flow duringthe cardiac cycle (pulsatile flow). The first process governsthe overall volume of CSF and thereby influences intra-cranial pressure (ICP). The second process, the oscillatorymovement of the CSF within the craniospinal com-partments, is caused by the pulsatile blood flow enteringand leaving the intracranial compartment during thecardiac cycle. These two processes occur over differenttime scales; circulation and replenishing of CSF occursover minutes, whereas the time scale of the pulsatile CSFflow is milliseconds.
CSF Circulation. Unlike other organ systems, the brainand the spinal cord are unique in being bathed in a clearfluid called cerebrospinal fluid. The exact role that it playsin maintaining the necessary environment for the func-tioning of the nervous system is unclear. It has beenascribed a role in providing nutrition, removing excesswaste, circulating neurotransmitters, maintaining thenecessary electrolyte environment, and acting as a shockabsorber against trauma.
The distribution of nutrients, or neurotransmitters, andremoval of waste products of metabolism, is an unlikelyfunction of CSF, because these chemicals are present invery low concentrations in the CSF. The main function ofCSF is to provide buoyancy to support the brain and act asa cushion against trauma. The normal brain weighs about1500 g; however, supported by the buoyancy of the CSF, itsapparent weight is reduced to about 50 g in the cranium.Support for its role in cushioning the brain and spinal cordagainst trauma comes from clinical conditions like severespinal canal stenosis. The CSF cushion around at the site ofstenosis is markedly reduced. As a result, spinal cord injuryoften occurs even with minor trauma as the shock waves aredirectly transmitted from the bone to the spinal cord.
Cerebrospinal fluid is made through a complex processthat occurs in the cells of the choroid plexus, whichlines the margin of the four fluid-filled spaces in the braincalled the ventricles. First, an ultrafilterate of plasma isformed in the connective tissue surrounding the choroidalcapillaries. Next, this is converted into a secretion bycarbonic anhydrase enzyme present in the choroids epithe-lium. The CSF is made at a fairly constant rate of about 10mL/h. Most of the CSF is made in the choroids plexus of thelateral ventricles. Roughly, 20% of the CSF comes from theventricular walls. As most CSF is made in the lateralventricles, it is traditionally believed that the CSF bulkflow occurs from the lateral ventricles to the third ventricle,fourth ventricle, and then through the foramen of Magen-die and Lushka into the cerebello-pontine cistern and on tothe surface of the brain and spinal cord (Fig. 1). A fifth ofthe CSF runs down around the spinal cord and then back tothe cranial subarachnoid space.
The CSF is absorbed by the cells of the arachnoidgranulations (13). These are present in the superior sagit-tal sinus. The process involves pinocytosis of a smallquanta of CSF, on the subarachnoid side of the granula-tions, and discharge into the blood on the venous side. Theprocess is driven by a pressure difference of at least 5 mmHg between the subarachnoid CSF and the superior sagit-tal sinus. A small proportion of CSF is also absorbed alongthe perivascular spaces and along the nerve sheaths exit-ing the spinal canal (14).
This traditional view has been recently challenged.Johnston et al. in experimental and cadaveric studies havedemonstrated that a large amount of CSF is presentaround the olfactory nerve and the cribriform plate area
1
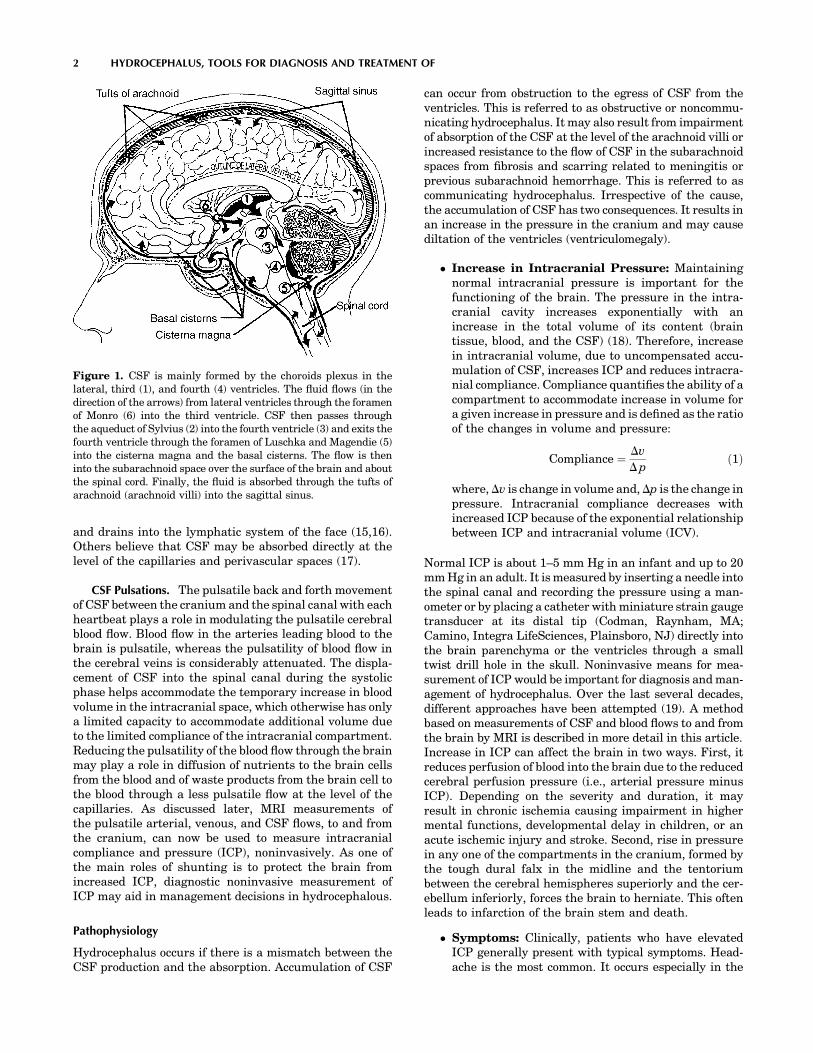
and drains into the lymphatic system of the face (15,16).Others believe that CSF may be absorbed directly at thelevel of the capillaries and perivascular spaces (17).
CSF Pulsations. The pulsatile back and forth movementof CSF between the cranium and the spinal canal with eachheartbeat plays a role in modulating the pulsatile cerebralblood flow. Blood flow in the arteries leading blood to thebrain is pulsatile, whereas the pulsatility of blood flow inthe cerebral veins is considerably attenuated. The displa-cement of CSF into the spinal canal during the systolicphase helps accommodate the temporary increase in bloodvolume in the intracranial space, which otherwise has onlya limited capacity to accommodate additional volume dueto the limited compliance of the intracranial compartment.Reducing the pulsatility of the blood flow through the brainmay play a role in diffusion of nutrients to the brain cellsfrom the blood and of waste products from the brain cell tothe blood through a less pulsatile flow at the level of thecapillaries. As discussed later, MRI measurements ofthe pulsatile arterial, venous, and CSF flows, to and fromthe cranium, can now be used to measure intracranialcompliance and pressure (ICP), noninvasively. As one ofthe main roles of shunting is to protect the brain fromincreased ICP, diagnostic noninvasive measurement ofICP may aid in management decisions in hydrocephalous.
Pathophysiology
Hydrocephalus occurs if there is a mismatch between theCSF production and the absorption. Accumulation of CSF
can occur from obstruction to the egress of CSF from theventricles. This is referred to as obstructive or noncommu-nicating hydrocephalus. It may also result from impairmentof absorption of the CSF at the level of the arachnoid villi orincreased resistance to the flow of CSF in the subarachnoidspaces from fibrosis and scarring related to meningitis orprevious subarachnoid hemorrhage. This is referred to ascommunicating hydrocephalus. Irrespective of the cause,the accumulation of CSF has two consequences. It results inan increase in the pressure in the cranium and may causediltation of the ventricles (ventriculomegaly).
� Increase in Intracranial Pressure: Maintainingnormal intracranial pressure is important for thefunctioning of the brain. The pressure in the intra-cranial cavity increases exponentially with anincrease in the total volume of its content (braintissue, blood, and the CSF) (18). Therefore, increasein intracranial volume, due to uncompensated accu-mulation of CSF, increases ICP and reduces intracra-nial compliance. Compliance quantifies the ability of acompartment to accommodate increase in volume fora given increase in pressure and is defined as the ratioof the changes in volume and pressure:
Compliance ¼ Dv
Dpð1Þ
where,Dv is change in volume and,Dp is the change inpressure. Intracranial compliance decreases withincreased ICP because of the exponential relationshipbetween ICP and intracranial volume (ICV).
Normal ICP is about 1–5 mm Hg in an infant and up to 20mm Hg in an adult. It is measured by inserting a needle intothe spinal canal and recording the pressure using a man-ometer or by placing a catheter with miniature strain gaugetransducer at its distal tip (Codman, Raynham, MA;Camino, Integra LifeSciences, Plainsboro, NJ) directly intothe brain parenchyma or the ventricles through a smalltwist drill hole in the skull. Noninvasive means for mea-surement of ICP would be important for diagnosis and man-agement of hydrocephalus. Over the last several decades,different approaches have been attempted (19). A methodbased on measurements of CSF and blood flows to and fromthe brain by MRI is described in more detail in this article.Increase in ICP can affect the brain in two ways. First, itreduces perfusion of blood into the brain due to the reducedcerebral perfusion pressure (i.e., arterial pressure minusICP). Depending on the severity and duration, it mayresult in chronic ischemia causing impairment in highermental functions, developmental delay in children, or anacute ischemic injury and stroke. Second, rise in pressurein any one of the compartments in the cranium, formed bythe tough dural falx in the midline and the tentoriumbetween the cerebral hemispheres superiorly and the cer-ebellum inferiorly, forces the brain to herniate. This oftenleads to infarction of the brain stem and death.
� Symptoms: Clinically, patients who have elevatedICP generally present with typical symptoms. Head-ache is the most common. It occurs especially in the
2 HYDROCEPHALUS, TOOLS FOR DIAGNOSIS AND TREATMENT OF
Figure 1. CSF is mainly formed by the choroids plexus in thelateral, third (1), and fourth (4) ventricles. The fluid flows (in thedirection of the arrows) from lateral ventricles through the foramenof Monro (6) into the third ventricle. CSF then passes throughthe aqueduct of Sylvius (2) into the fourth ventricle (3) and exits thefourth ventricle through the foramen of Luschka and Magendie (5)into the cisterna magna and the basal cisterns. The flow is theninto the subarachnoid space over the surface of the brain and aboutthe spinal cord. Finally, the fluid is absorbed through the tufts ofarachnoid (arachnoid villi) into the sagittal sinus.

early hours of the morning in initial stages. Lowrespiratory rate during sleep results in buildup of bloodCO2 and vasodiltation. This aggravates the increasedICP in the early stages of the disease. Vomiting is thenext common symptom and probably results eitherfrom the distortion of the brain stem vomiting centeror its ischemia. Vomiting is often associated withretching and rapid respiration that lowers the bloodCO2 level. This in turn leads to vasoconstriction andlowers the ICP and often results in a transient relief inheadaches. Diplopia or double vision is also commonlyencountered in a setting of increased ICP. It is a resultof stretch of the sixth cranial nerve, which controls theabduction of the eyes. Weakness of ocular abductiondisturbs the normal axial alignment of the two eyesresulting in defective fusion of the two images by thebrain. Blurring of vision and visual loss may occur inpatients with long-standing intracranial hypertension.This results from edema of the optic nerve head as theaxoplasmic flow in the neurons of the optic nerve isimpaired by the high ICP that is transmitted to thenerve through the patent nerve sheath. Hearingdeficits related to similar effect on the cochlea are,however, less frequent. Lethargy or sleepiness is fre-quently observed in patients with high ICP and isprobably from a combination of decreased cerebralperfusion and distortion of the brain stem.
� Ventricular Enlargement: Depending on thepathophysiology of hydrocephalus, CSF may accumu-late only in the ventricles as in obstructive hydroce-phalus or in both the ventricles and the subarachnoidspace in communicating hydrocephalus. The increasedpressure within the ventricle is transmitted to theperiventricular region and results, over time, in lossof neurons, increase inperiventricular interstitial fluid,and subsequent gliosis with loss of white matter (20).
When onset of hydrocephalus occurs early in infancy,before the skull sutures have closed, the enlarging ven-tricles are associated with a progressive increase in headcircumference and developmental delay. In later childhoodand adults, the increasing ventricular size is associatedwith symptoms of increased ICP. However, ventricularenlargement may also occur with normal mean ICP, inthe elderly patients (21). This is referred to as normalpressure hydrocephalus (NPH). The enlarging ventriclestretches the periventricular nerve fibers. The patientpresents not with signs of increase in ICP but with pro-gressive gait ataxia, bladder incontinence, and dementia.Similar presentation may also be observed in adolescentswith aqueductal stenosis and obstructive hydrocephalus.These patients with compensated long-standing hydroce-phalus have been referred to as long-standing hydrocepha-lus of adults (LOVA) (22).
It is not clear why the ventricles enlarge preferentially,compared with the subarachnoid space, even though thepressure distributes equally in a closed system. It has beenargued that, rather than the actual mean ICP, it is the pulsepressure that determines ventricular diltation. Di Rocco etal. (23) have shown that ventricular enlargement could beinduced by an intraventricular pulsatile balloon with a high
pulse pressure, despite the mean ICP being normal. It maybe argued that in a pulsatile system, it is the root meansquare (RMS) of the pressure, rather than the mean pres-sure, that is the cause of enlarged ventricles. It has beensuggested that, in communicating hydrocephalus, decreasein compliance may be responsible for preferential transmis-sion of the pulsations to the ventricles (24,25). However,others have shown that in acute or chronic communicatinghydrocephalus, the pulse pressure and the pressure wave-forms in the SAS and the ventricles are similar (26,27).Alternative explanations offered are that the pia over thecortical surface is more resilient than ependyma that linesthe ventricular wall; the venous pressure in the periventri-cular region is lower, making it more deformable than thesubcortical area (28).
DIAGNOSTIC METHODS
Measurement of Resistance to CSF Reabsorption
The hydrodynamics of the craniospinal system is governedby patient-specific properties like CSF formationrate, CSF reabsorption resistance (historically termedas outflow resistance), venous pressure in the sinus, andcraniospinal compliance. Together with the periodic var-iations in ICP, due to blood volume variation from theheartbeat and vasomotion, these properties describe theCSF dynamics, which provide the working environment ofthe brain. When this environment is disturbed, it affectsthe function of the brain resulting in the clinical symptomsof hydrocephalus. After shunting, symptoms areoften eliminated or reduced. It shows that a clinicalimprovement can be accomplished by actively changingthe brain’s working environment. This link among CSFdynamics, brain function, symptoms, and shunting hasmade researchers look for CSF dynamical means to iden-tify patients that would benefit from a shunt surgery.Outflow resistance has been suggested as a strong predictiveparameter in communicating hydrocephalus. Invasive infu-sion tests in conjunction with a mathematical model of thecraniospinal system can be used to estimate CSF absorptionrate. The mostaccepted model for the system hydrodynamicshas been proposed by Marmarou (29).
The basic assumptions for the model are as follows:
� CSF reabsorption rate is linearly dependent on thedifference between the intracranial and venous pres-sures (the outflow resistance describes this linearrelationship)
� A pressure-dependent compliance
� A constant formation rate of CSF, independent of ICP
The model can be displayed as an electrical analogy(Fig. 2). The model is described mathematically as a differ-ential equation of the time-dependent ICP as a functionof external infusion and the governing physical parameters:
dPICðtÞdt
þ K
Rout½PICðtÞ�2 � K IinfusionðtÞþ
K Pr
Rout
� �PICðtÞ ¼ 0
ð2Þ
HYDROCEPHALUS, TOOLS FOR DIAGNOSIS AND TREATMENT OF 3
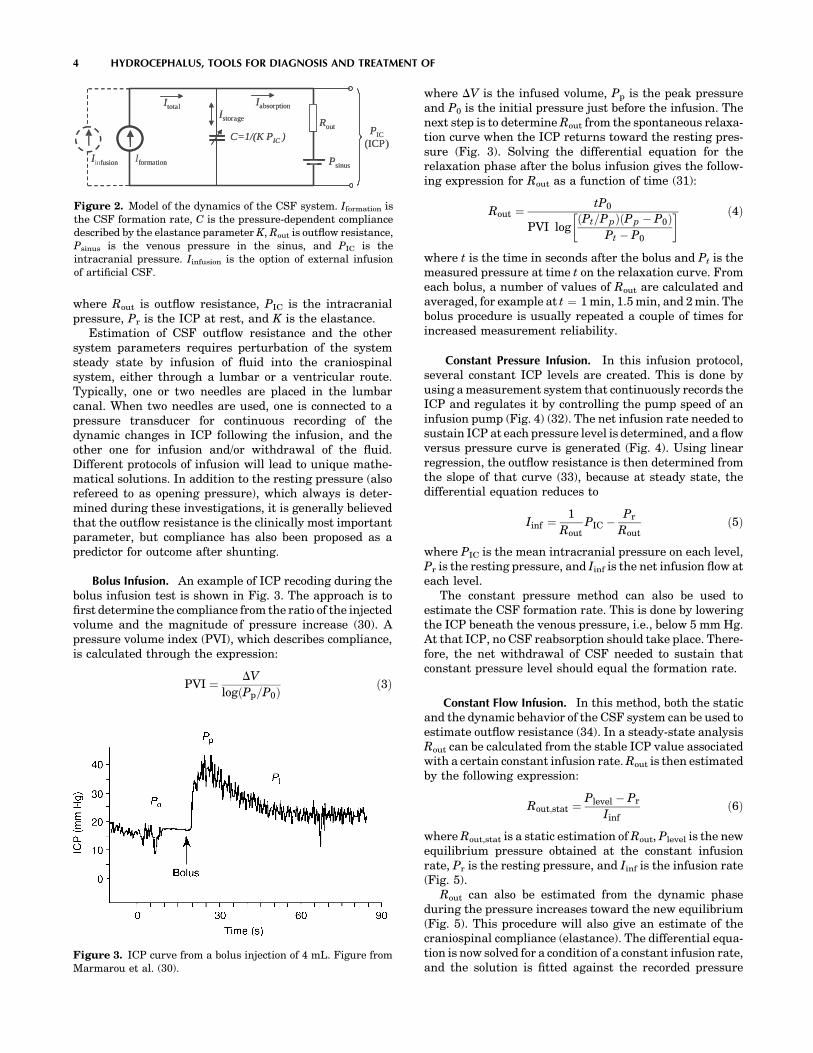
where Rout is outflow resistance, PIC is the intracranialpressure, Pr is the ICP at rest, and K is the elastance.
Estimation of CSF outflow resistance and the othersystem parameters requires perturbation of the systemsteady state by infusion of fluid into the craniospinalsystem, either through a lumbar or a ventricular route.Typically, one or two needles are placed in the lumbarcanal. When two needles are used, one is connected to apressure transducer for continuous recording of thedynamic changes in ICP following the infusion, and theother one for infusion and/or withdrawal of the fluid.Different protocols of infusion will lead to unique mathe-matical solutions. In addition to the resting pressure (alsorefereed to as opening pressure), which always is deter-mined during these investigations, it is generally believedthat the outflow resistance is the clinically most importantparameter, but compliance has also been proposed as apredictor for outcome after shunting.
Bolus Infusion. An example of ICP recoding during thebolus infusion test is shown in Fig. 3. The approach is tofirst determine the compliance from the ratio of the injectedvolume and the magnitude of pressure increase (30). Apressure volume index (PVI), which describes compliance,is calculated through the expression:
PVI ¼ DV
logðPp=P0Þð3Þ
where DV is the infused volume, Pp is the peak pressureand P0 is the initial pressure just before the infusion. Thenext step is to determine Rout from the spontaneous relaxa-tion curve when the ICP returns toward the resting pres-sure (Fig. 3). Solving the differential equation for therelaxation phase after the bolus infusion gives the follow-ing expression for Rout as a function of time (31):
Rout ¼tP0
PVI logðPt=P pÞðP p � P0Þ
Pt � P0
� � ð4Þ
where t is the time in seconds after the bolus and Pt is themeasured pressure at time t on the relaxation curve. Fromeach bolus, a number of values of Rout are calculated andaveraged, for example at t ¼ 1 min, 1.5 min, and 2 min. Thebolus procedure is usually repeated a couple of times forincreased measurement reliability.
Constant Pressure Infusion. In this infusion protocol,several constant ICP levels are created. This is done byusing a measurement system that continuously records theICP and regulates it by controlling the pump speed of aninfusion pump (Fig. 4) (32). The net infusion rate needed tosustain ICP at each pressure level is determined, and a flowversus pressure curve is generated (Fig. 4). Using linearregression, the outflow resistance is then determined fromthe slope of that curve (33), because at steady state, thedifferential equation reduces to
Iinf ¼1
RoutPIC � Pr
Routð5Þ
where PIC is the mean intracranial pressure on each level,Pr is the resting pressure, and Iinf is the net infusion flow ateach level.
The constant pressure method can also be used toestimate the CSF formation rate. This is done by loweringthe ICP beneath the venous pressure, i.e., below 5 mm Hg.At that ICP, no CSF reabsorption should take place. There-fore, the net withdrawal of CSF needed to sustain thatconstant pressure level should equal the formation rate.
Constant Flow Infusion. In this method, both the staticand the dynamic behavior of the CSF system can be used toestimate outflow resistance (34). In a steady-state analysisRout can be calculated from the stable ICP value associatedwith a certain constant infusion rate. Rout is then estimatedby the following expression:
Rout;stat ¼Plevel � Pr
Iinfð6Þ
where Rout,stat is a static estimation of Rout, Plevel is the newequilibrium pressure obtained at the constant infusionrate, Pr is the resting pressure, and Iinf is the infusion rate(Fig. 5).
Rout can also be estimated from the dynamic phaseduring the pressure increases toward the new equilibrium(Fig. 5). This procedure will also give an estimate of thecraniospinal compliance (elastance). The differential equa-tion is now solved for a condition of a constant infusion rate,and the solution is fitted against the recorded pressure
4 HYDROCEPHALUS, TOOLS FOR DIAGNOSIS AND TREATMENT OF
PIC(ICP)
Rout
Psinus
IabsorptionIstorage
Itotal
Iformation
C=1/(K PIC )
Iinfusion
PIC(ICP)
Rout
Psinus
IabsorptionIstorage
Itotal
formation
C=1/(K PIC )
I fusion
Figure 2. Model of the dynamics of the CSF system. Iformation isthe CSF formation rate, C is the pressure-dependent compliancedescribed by the elastance parameter K, Rout is outflow resistance,Psinus is the venous pressure in the sinus, and PIC is theintracranial pressure. Iinfusion is the option of external infusionof artificial CSF.
Figure 3. ICP curve from a bolus injection of 4 mL. Figure fromMarmarou et al. (30).
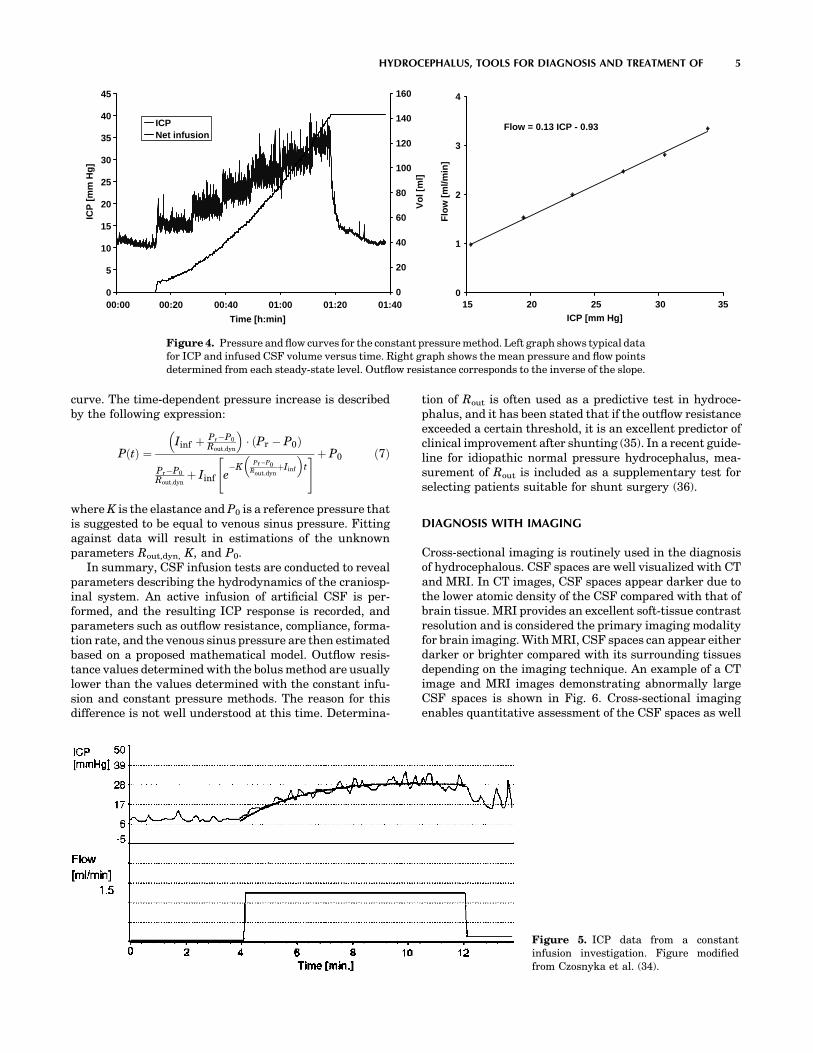
curve. The time-dependent pressure increase is describedby the following expression:
PðtÞ ¼Iinf þ Pr�P0
Rout;dyn
� � ðPr � P0Þ
Pr�P0
Rout;dynþ Iinf e
�KPr�P0
Rout;dynþIinf
� �t
" #þ P0 ð7Þ
where K is the elastance and P0 is a reference pressure thatis suggested to be equal to venous sinus pressure. Fittingagainst data will result in estimations of the unknownparameters Rout,dyn, K, and P0.
In summary, CSF infusion tests are conducted to revealparameters describing the hydrodynamics of the craniosp-inal system. An active infusion of artificial CSF is per-formed, and the resulting ICP response is recorded, andparameters such as outflow resistance, compliance, forma-tion rate, and the venous sinus pressure are then estimatedbased on a proposed mathematical model. Outflow resis-tance values determined with the bolus method are usuallylower than the values determined with the constant infu-sion and constant pressure methods. The reason for thisdifference is not well understood at this time. Determina-
tion of Rout is often used as a predictive test in hydroce-phalus, and it has been stated that if the outflow resistanceexceeded a certain threshold, it is an excellent predictor ofclinical improvement after shunting (35). In a recent guide-line for idiopathic normal pressure hydrocephalus, mea-surement of Rout is included as a supplementary test forselecting patients suitable for shunt surgery (36).
DIAGNOSIS WITH IMAGING
Cross-sectional imaging is routinely used in the diagnosisof hydrocephalous. CSF spaces are well visualized with CTand MRI. In CT images, CSF spaces appear darker due tothe lower atomic density of the CSF compared with that ofbrain tissue. MRI provides an excellent soft-tissue contrastresolution and is considered the primary imaging modalityfor brain imaging. With MRI, CSF spaces can appear eitherdarker or brighter compared with its surrounding tissuesdepending on the imaging technique. An example of a CTimage and MRI images demonstrating abnormally largeCSF spaces is shown in Fig. 6. Cross-sectional imagingenables quantitative assessment of the CSF spaces as well
HYDROCEPHALUS, TOOLS FOR DIAGNOSIS AND TREATMENT OF 5
0
5
10
15
20
25
30
35
40
45
00:00 00:20 00:40 01:00 01:20 01:40
Time [h:min]
ICP
[m
m H
g]
0
20
40
60
80
100
120
140
160
Vo
l [m
l]
ICPNet infusion
Flow = 0.13 ICP - 0.93
0
1
2
3
4
15 20 25 30 35ICP [mm Hg]
Flo
w [
ml/m
in]
Figure 4. Pressure and flow curves for the constant pressure method. Left graph shows typical datafor ICP and infused CSF volume versus time. Right graph shows the mean pressure and flow pointsdetermined from each steady-state level. Outflow resistance corresponds to the inverse of the slope.
Figure 5. ICP data from a constantinfusion investigation. Figure modifiedfrom Czosnyka et al. (34).

as 3D reconstruction of the geometry of the ventricularsystem. The 3D model is obtained by segmentation of theCSF spaces in each of the 2D slices. An example of 3Dmodels of the ventricular system from MRI data demon-strating normal size ventricles and enlarged ventricles areshown in Fig. 7a and b, respectively.
MRI-based motion-sensitive techniques capable of ima-ging flow are gaining an important role in the diagnosisof hydrocephalus. In particular, dynamic phase-contrasttechniques provide images of velocities (velocity-encodedimages). The degree of brightness in these images is pro-portional to the direction and the speed of the moving fluidor tissue. Dynamic (cine) phase contrast images are used tovisualize the back and forth flow through the different CSFpathways. The cine phase contrast MRI (PCMRI) techni-que is also used to derive quantitative parameters such asCSF volumetric flow rate through the aqueduct of Sylvius,from which the CSF production rate in the lateral ventri-cles can be estimated (37), and intracranial compliance andpressure (19,30).
MRI-Based Measurement of Intracranial Compliance andPressure
The noninvasive measurement of compliance and pressureuses the cardiac pulsations of the intracranial volume and
pressure (30,38). This method is the noninvasive analogs tothe measurement of intracranial compliance with the pre-viously described bolus infusion method where the volumeand pressure changes are calculated from the MRI mea-surements of CSF and blood flows to and from the brain.Intracranial elastance, i.e., a change in pressure due to asmall change in volume, or the inverse of compliance, isderived from the ratio of the magnitudes of the changes involume and pressure, and the pressure is then derivedthrough the linear relationship between elastance andpressure. The MRI method measures the arterial, venous,and CSF flows into and out of the cranial vault. A small-volume change, on the order of 1 mL, is calculated from themomentary differences between inflow and outflow at eachtime points in the cardiac cycle. The pressure change isproportional to the pressure gradient change, which iscalculated from time and spatial derivatives of the CSFvelocities using fluid dynamics principles.
A motion-sensitive MRI technique, cine phase con-trast, provides a series of images where the value at eachpicture element is proportional to the velocity at thatlocation. The phase contrast MRI technique is based onthe principle that the precession frequency of the protonsis proportional to the magnetic field strength. Therefore,velocity can be phased-encoded by varying the magneticfield in space and time, i.e., generating magnetic field
6 HYDROCEPHALUS, TOOLS FOR DIAGNOSIS AND TREATMENT OF
Figure 6. An example of a (a) CT image and (b and c) MRI images demonstrating abnormally largeCSF spaces. The appearance of CSF in MRI depends on the technique used to acquire the images; its(b) dark with a T1 technique and (c) bright with a T2 technique.
Figure 7. Volume rendering of theCSF spaces inside the brain (i.e., ven-tricles) generated using segmentedMRI data from a (left) healthy vol-unteer and from a (right) hydroce-phalic patient.

gradients. When a gradient field is applied along an axisfor a short time, the proton’s phase will change based onits location along that axis. When a bipolar (positive andthen negative) gradient field is applied, the phase of thestationary protons will increase during the positive por-tion (lobe) of the bipolar gradient and then will decreaseduring the negative lobe. If the lobes were of equal area,no net phase change would occur. However, moving pro-tons, such as those in the blood or CSF, will experiencedifferent field strength during each lobe due to their
change in position; this will result in a net phase changeproportional to the proton velocity.
Examples of MRI phase contrast images of CSF andblood flow are shown in Figs. 8 and 9, respectively. Theoscillatory CSF flow between the cranial and the spinalcompartments is visualized in images taken in a transverseanatomical orientation through the upper cervical spinalcanal. The location of this plane is indicated on a mid-sagittal scout MR image shown in Fig. 8a. Fig. 8b depictsoutflow (white pixels) during systole, and Fig. 8c depicts
HYDROCEPHALUS, TOOLS FOR DIAGNOSIS AND TREATMENT OF 7
Figure 8. (a) Anatomical mid-sagittal T1-weighted MR imageshowing the location of the axial planeused for CSF flow measure- ment (darkline). (b and c) Phase-contrast MRIimages of CSF flow in the spinal canal.(b) CSF flow during systole. (c) CSF flowduring diastole.Thepixelvalues in theseimages are proportional to velocities in adirection perpendicular to the imageplane. Gray-static tissue, white-outward flow (caudal direction), andblack-inward flow (cranial direction).(d) A 3D plot of the CSF velocitiesduring systole.
Figure 9. (a) A blood vessel MRI scout imageshowing the location of the axial plane for bloodflow measurement (dash line). (b) A phase con-trast MRI image of blood flow through thatlocation. Black pixels indicate arterial inflow,and white are venous outflow. (c) A 3D plot ofthe blood flow velocities.

inflow (black pixels) during diastole. Fig 9d depicts a 3Dplot of the velocities in a region of interest containing theCSF space and an epidural vein. The CSF flow is imagedwith a low-velocity encoding, and the faster blood flowthrough the neck arteries and veins is imaged usinghigh-velocity encoding. The location of the imaging planeused for blood flow measurement is shown in Fig. 9a, anda velocity encoded image of blood flow is shown in Fig. 9b.Fig 9c depicts a 3D plot of the velocities in a region ofinterest containing the internal carotid and vertebralarteries and the jugular vein.
Volumetric flow rates are obtained by integration of thevelocities throughout a lumen cross-sectional area. Thetotal volumetric arterial flow rate—that is, total cerebralblood flow—is calculated directly from the sum of thevolumetric flow through the four vessels carrying bloodto the brain (internal carotid and vertebral arteries). Thevenous blood outflow is obtained by summation of the flowthrough the jugular veins, and through secondary venousoutflow channels such as the epidural, vertebral, and deepcervical veins when venous drainage occurs through theseveins. An example of the volumetric flow waveforms forCSF, arterial inflow, and venous outflow measured in ahealthy volunteer is shown in Fig. 10.
The rate of the time-varying intracranial volume change(net transcranial volumetric flow rate) is obtained by sub-
tracting outflow rates from inflow rates at each time point.The intracranial volume change (delta of volume from agiven reference point) is obtained by integrating that wave-form with respect to time. Waveforms of the net transcra-nial volumetric flow rate and the change in the intracranialvolume are shown in Fig. 11.
The magnitude of the change in intracranial pressureduring the cardiac cycle (pulse pressure) is proportional tothat of the CSF pressure gradient waveform. A method tomeasure pressure gradient of pulsatile flow in tubes withMRI was reported by Urchuk and Plewes (39). Pulsatilepressure gradients are derived from the MRI velocity-encoded phase contrast images using the Navier–Stokesrelationship between pressure gradient and temporal andspatial derivatives of the fluid velocity for incompressiblefluid in a rigid tube (40). Pressure traces from invasiverecordings obtained invasively in patients with low andelevated ICP with an intraventricular pressure transducerand the corresponding CSF pressure gradient waveformsderived from the MRI measurements of the CSF velocitiesat low- and high-pressure states are shown in Fig 12. Theratio of the magnitude of the pressure and volume changes,i.e., intracranial elastance, is then expressed in terms ofMR-ICP based on the linear relationship between ela-stance and ICP.
DEVICES FOR TREATMENT
Despite significant advances in understanding of thepathophysiology of hydrocephalus, the gold standard forthe treatment of hydrocephalus still continues to be CSFdiversion through a tube shunt to another body cavity.Unfortunately, treatment with CSF shunts is associatedwith multiple complications and morbidity. The rate ofshunt malfunction in the first year of shunt placement is40%, and, thereafter, about 10% per year. The cumulativerisk of infection approaches 20% per person although therisk of infection per procedure is only 5–8% (41). Thetechnological advances in shunt valve designs and materi-als have had only a marginal impact on the rate of com-plications. Third ventriculostomy has become popular inrecent years for management of obstructive hydrocepha-lus, but many questions about its long-term permanenceremain controversial. Choroid plexectomy (42,43) aimed atarresting hydrocephalus by reducing CSF production orpharmacotherapy with similar intentions have had verylimited success in selected patients.
8 HYDROCEPHALUS, TOOLS FOR DIAGNOSIS AND TREATMENT OF
–200
0
200
400
600
800
1000
1200
1400
0 200 400 600 800 1000
Time (ms)
Flo
w (
mL
/min
)
csf
a
v
Figure 10. The volumetric flows into and out of the cranial vaultduring the cardiac cycle derived from the MRI phase contrastscans. Total arterial inflow (filled circles), venous outflow (open),and the cranial-to-spinal CSF volumetric flow rate (diamonds)during the cardiac cycle. Note that arterial inflow is greaterthan venous outflow during systole.
Figure 11. (Left) The MRI-derivednet transcranial volumetric flow ratewaveform. (Right) The intra cranialvolume change during the cardiaccycle derived by integrating the nettranscranial volumetric flow waveformon the left. Note that the maximalvolumechange inthis subject is0.5mL.
–500
–250
0
250
500
0 200 400 600 800 1000
Flo
w (
mL
/min
)
–0.4
0
0.4
0.8
0 200 400 600 800 1000Time (ms)Time (ms)
ICV
C (
mL
) dV = 0.5mL

Nonobstructive Hydrocephalus
No treatment other than CSF diversion has been effective inmanagement of this form of hydrocephalus. The CSF may bediverted from the ventricles through a catheter that runs inthe subcutaneous tissue into the abdominal cavity where itis absorbed by the peritoneum (ventriculo- peritoeal shunt)(Fig. 13). It may also be diverted from the spinal subarach-noid space by a lumbar shunt that diverts it to the perito-neum (Lumbar-peritoneal shunt). Lumbar CSF diversionavoids the potential risk of brain injury by the ventricularcatheter. Lumbar shunts have a lower risk of obstructionand infection (44) but are more prone to malfunction frommechanical failures (45), and, the development of hind brainherniation, over a period of time, has been well documented(46,47). Evaluation of a lumbar shunt for function is morecumbersome than that of a ventricular shunt. The lumbarshunt is usable in patients with communicating hydroce-phalus, small ventricles, and patients who have had multi-ple ventricular shunt malfunctions.
In patients who cannot absorb CSF from the peritoneumdue to scarring from previous operations or infections, theCSF may be diverted to the venous system through a
catheter placed at the junction of superior vena cava andthe right atrium (ventriculo/lumbar-atrial shunt).
A typical shunt system consists of three parts (Fig. 14).First, the proximal catheter, i.e, the catheter, is inserted intothe ventricle or the lumbar subarachnoid space. Second, thevalve controls the amount of CSF that flows through theshunt system, and third, the distal catheter drains the CSFfrom the valve to the peritoneum or the atrium.
Proximal Catheter
Three basic types of proximal catheter designs areavailable: simple with multiple perforations (Codman,Raynham, MA; PS Medical, Goleta, CA), simple Flanged(Heyer-Schulte), Integra, Plainsboro, NJ; Anti-Blok(Phoenix Vygon Neuro, Valley Forge, PA) with recededperforations. The last two have been designed to minimizethe growth of choroid plexus into the perforations andcausing obstruction. There is no controlled study to sug-gest that these two designs are in any way superior tosimple perforations. The flanged catheters can get stuck,as choroid plexus grows around it, making removal of anobstructed catheter difficult (48).
HYDROCEPHALUS, TOOLS FOR DIAGNOSIS AND TREATMENT OF 9
Figure 12. Invasive pressure traces (top) obtained with an intra-ventricular catheter from twopatients with (left) low and (right) elevated ICP. The corresponding MRI-derived CSF pressuregradients are shown at the bottom.
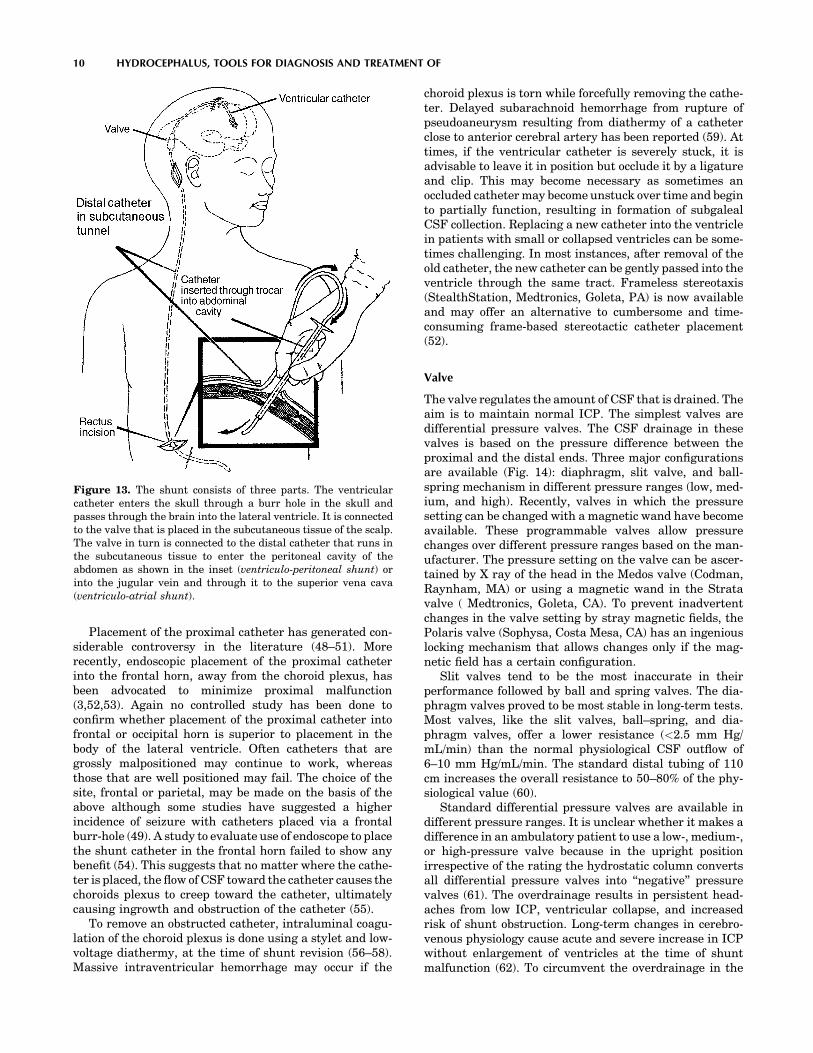
Placement of the proximal catheter has generated con-siderable controversy in the literature (48–51). Morerecently, endoscopic placement of the proximal catheterinto the frontal horn, away from the choroid plexus, hasbeen advocated to minimize proximal malfunction(3,52,53). Again no controlled study has been done toconfirm whether placement of the proximal catheter intofrontal or occipital horn is superior to placement in thebody of the lateral ventricle. Often catheters that aregrossly malpositioned may continue to work, whereasthose that are well positioned may fail. The choice of thesite, frontal or parietal, may be made on the basis of theabove although some studies have suggested a higherincidence of seizure with catheters placed via a frontalburr-hole (49). A study to evaluate use of endoscope to placethe shunt catheter in the frontal horn failed to show anybenefit (54). This suggests that no matter where the cathe-ter is placed, the flow of CSF toward the catheter causes thechoroids plexus to creep toward the catheter, ultimatelycausing ingrowth and obstruction of the catheter (55).
To remove an obstructed catheter, intraluminal coagu-lation of the choroid plexus is done using a stylet and low-voltage diathermy, at the time of shunt revision (56–58).Massive intraventricular hemorrhage may occur if the
choroid plexus is torn while forcefully removing the cathe-ter. Delayed subarachnoid hemorrhage from rupture ofpseudoaneurysm resulting from diathermy of a catheterclose to anterior cerebral artery has been reported (59). Attimes, if the ventricular catheter is severely stuck, it isadvisable to leave it in position but occlude it by a ligatureand clip. This may become necessary as sometimes anoccluded catheter may become unstuck over time and beginto partially function, resulting in formation of subgalealCSF collection. Replacing a new catheter into the ventriclein patients with small or collapsed ventricles can be some-times challenging. In most instances, after removal of theold catheter, the new catheter can be gently passed into theventricle through the same tract. Frameless stereotaxis(StealthStation, Medtronics, Goleta, PA) is now availableand may offer an alternative to cumbersome and time-consuming frame-based stereotactic catheter placement(52).
Valve
The valve regulates the amount of CSF that is drained. Theaim is to maintain normal ICP. The simplest valves aredifferential pressure valves. The CSF drainage in thesevalves is based on the pressure difference between theproximal and the distal ends. Three major configurationsare available (Fig. 14): diaphragm, slit valve, and ball-spring mechanism in different pressure ranges (low, med-ium, and high). Recently, valves in which the pressuresetting can be changed with a magnetic wand have becomeavailable. These programmable valves allow pressurechanges over different pressure ranges based on the man-ufacturer. The pressure setting on the valve can be ascer-tained by X ray of the head in the Medos valve (Codman,Raynham, MA) or using a magnetic wand in the Stratavalve ( Medtronics, Goleta, CA). To prevent inadvertentchanges in the valve setting by stray magnetic fields, thePolaris valve (Sophysa, Costa Mesa, CA) has an ingeniouslocking mechanism that allows changes only if the mag-netic field has a certain configuration.
Slit valves tend to be the most inaccurate in theirperformance followed by ball and spring valves. The dia-phragm valves proved to be most stable in long-term tests.Most valves, like the slit valves, ball–spring, and dia-phragm valves, offer a lower resistance (<2.5 mm Hg/mL/min) than the normal physiological CSF outflow of6–10 mm Hg/mL/min. The standard distal tubing of 110cm increases the overall resistance to 50–80% of the phy-siological value (60).
Standard differential pressure valves are available indifferent pressure ranges. It is unclear whether it makes adifference in an ambulatory patient to use a low-, medium-,or high-pressure valve because in the upright positionirrespective of the rating the hydrostatic column convertsall differential pressure valves into ‘‘negative’’ pressurevalves (61). The overdrainage results in persistent head-aches from low ICP, ventricular collapse, and increasedrisk of shunt obstruction. Long-term changes in cerebro-venous physiology cause acute and severe increase in ICPwithout enlargement of ventricles at the time of shuntmalfunction (62). To circumvent the overdrainage in the
10 HYDROCEPHALUS, TOOLS FOR DIAGNOSIS AND TREATMENT OF
Figure 13. The shunt consists of three parts. The ventricularcatheter enters the skull through a burr hole in the skull andpasses through the brain into the lateral ventricle. It is connectedto the valve that is placed in the subcutaneous tissue of the scalp.The valve in turn is connected to the distal catheter that runs inthe subcutaneous tissue to enter the peritoneal cavity of theabdomen as shown in the inset (ventriculo-peritoneal shunt) orinto the jugular vein and through it to the superior vena cava(ventriculo-atrial shunt).
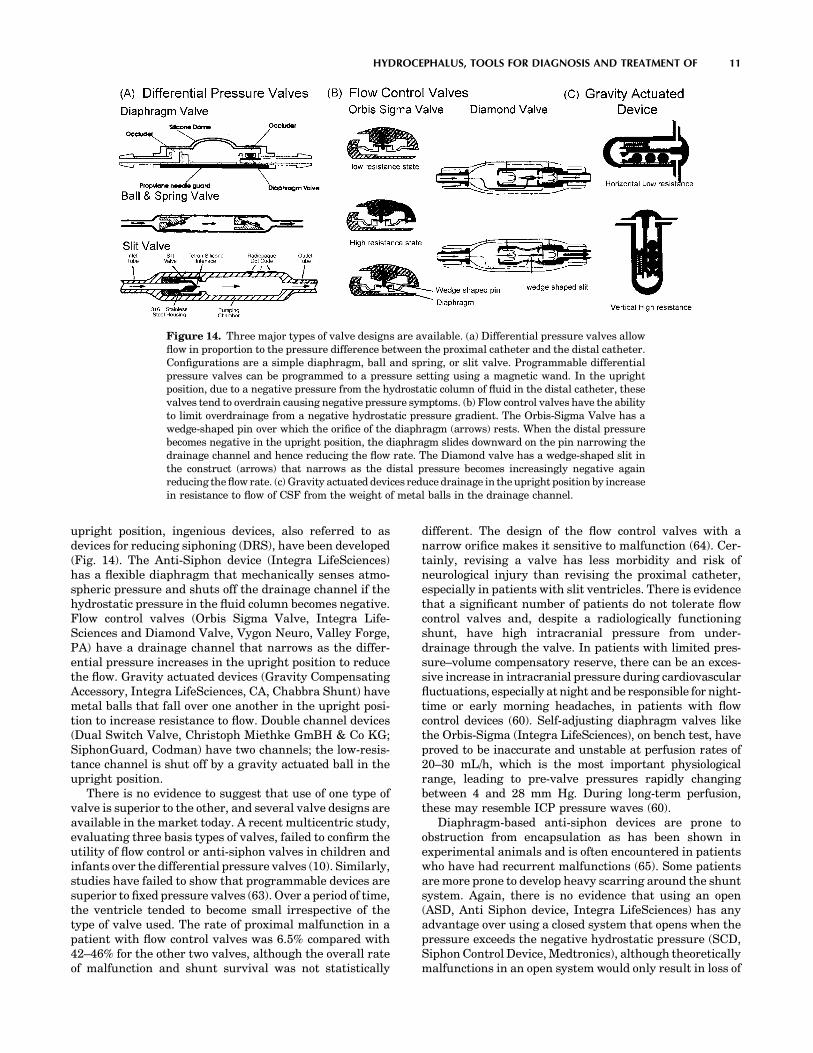
upright position, ingenious devices, also referred to asdevices for reducing siphoning (DRS), have been developed(Fig. 14). The Anti-Siphon device (Integra LifeSciences)has a flexible diaphragm that mechanically senses atmo-spheric pressure and shuts off the drainage channel if thehydrostatic pressure in the fluid column becomes negative.Flow control valves (Orbis Sigma Valve, Integra Life-Sciences and Diamond Valve, Vygon Neuro, Valley Forge,PA) have a drainage channel that narrows as the differ-ential pressure increases in the upright position to reducethe flow. Gravity actuated devices (Gravity CompensatingAccessory, Integra LifeSciences, CA, Chabbra Shunt) havemetal balls that fall over one another in the upright posi-tion to increase resistance to flow. Double channel devices(Dual Switch Valve, Christoph Miethke GmBH & Co KG;SiphonGuard, Codman) have two channels; the low-resis-tance channel is shut off by a gravity actuated ball in theupright position.
There is no evidence to suggest that use of one type ofvalve is superior to the other, and several valve designs areavailable in the market today. A recent multicentric study,evaluating three basis types of valves, failed to confirm theutility of flow control or anti-siphon valves in children andinfants over the differential pressure valves (10). Similarly,studies have failed to show that programmable devices aresuperior to fixed pressure valves (63). Over a period of time,the ventricle tended to become small irrespective of thetype of valve used. The rate of proximal malfunction in apatient with flow control valves was 6.5% compared with42–46% for the other two valves, although the overall rateof malfunction and shunt survival was not statistically
different. The design of the flow control valves with anarrow orifice makes it sensitive to malfunction (64). Cer-tainly, revising a valve has less morbidity and risk ofneurological injury than revising the proximal catheter,especially in patients with slit ventricles. There is evidencethat a significant number of patients do not tolerate flowcontrol valves and, despite a radiologically functioningshunt, have high intracranial pressure from under-drainage through the valve. In patients with limited pres-sure–volume compensatory reserve, there can be an exces-sive increase in intracranial pressure during cardiovascularfluctuations, especially at night and be responsible for night-time or early morning headaches, in patients with flowcontrol devices (60). Self-adjusting diaphragm valves likethe Orbis-Sigma (Integra LifeSciences), on bench test, haveproved to be inaccurate and unstable at perfusion rates of20–30 mL/h, which is the most important physiologicalrange, leading to pre-valve pressures rapidly changingbetween 4 and 28 mm Hg. During long-term perfusion,these may resemble ICP pressure waves (60).
Diaphragm-based anti-siphon devices are prone toobstruction from encapsulation as has been shown inexperimental animals and is often encountered in patientswho have had recurrent malfunctions (65). Some patientsare more prone to develop heavy scarring around the shuntsystem. Again, there is no evidence that using an open(ASD, Anti Siphon device, Integra LifeSciences) has anyadvantage over using a closed system that opens when thepressure exceeds the negative hydrostatic pressure (SCD,Siphon Control Device, Medtronics), although theoreticallymalfunctions in an open system would only result in loss of
HYDROCEPHALUS, TOOLS FOR DIAGNOSIS AND TREATMENT OF 11
Figure 14. Three major types of valve designs are available. (a) Differential pressure valves allowflow in proportion to the pressure difference between the proximal catheter and the distal catheter.Configurations are a simple diaphragm, ball and spring, or slit valve. Programmable differentialpressure valves can be programmed to a pressure setting using a magnetic wand. In the uprightposition, due to a negative pressure from the hydrostatic column of fluid in the distal catheter, thesevalves tend to overdrain causing negative pressure symptoms. (b) Flow control valves have the abilityto limit overdrainage from a negative hydrostatic pressure gradient. The Orbis-Sigma Valve has awedge-shaped pin over which the orifice of the diaphragm (arrows) rests. When the distal pressurebecomes negative in the upright position, the diaphragm slides downward on the pin narrowing thedrainage channel and hence reducing the flow rate. The Diamond valve has a wedge-shaped slit inthe construct (arrows) that narrows as the distal pressure becomes increasingly negative againreducing the flow rate. (c) Gravity actuated devices reduce drainage in the upright position by increasein resistance to flow of CSF from the weight of metal balls in the drainage channel.

anti-siphon function without obstruction to the flow ofCSF. In the open system (ASD), the flow through the valvestops only after the intracranial pressure has becomenegative in the upright position, which is more physiolo-gical, than with SCD, in which the flow stops once thepressure reaches zero. In the multicentric shunt study, theincidence of overdrainage was 7.8% in the SCD group and2.6% in the Standard valve group. The study suggests thatdiaphragm-based anti-siphon devices may not be any super-ior to differential pressure valves in reducing overdrainage(10). Considerable controversy also revolves around the mostoptimum site for placement for the anti-siphon devices(66,67). The classic position is at the level of the skull base:however, the bench test suggests a marked tendency to over-drain if the SCD is below the level of the proximal catheter.These factors may be minor when considered in light of theexcessive sensitivity of the SCD to external pressure fromscar or when the patient is lying on the device (64).
The gravity actuated device (GAD) is used in conjunctionwith a differential pressure valve to limit overdrainage (68).It is similar to the horizontal vertical valve used in lumbarshunts but constructed to fit in-line with a ventriculoper-itoneal shunt. There is no literature to prove or disproveits utility; however, in individual cases, we have found iteffective. Experimental evidence suggests that motion andvibration (35) make the mechanism of these devices ineffec-tive although clinical studies are lacking. The position of theGAD device is critical for optimum functioning. Slightangulation of the device to vertical can cause underdrainagein the horizontal position and overdrainage in the verticalposition. Examples of pressure flow characteristics of astandard differential pressure valve, a flow control valve,and a valve containing a GAD are shown in Fig. 15.
Distal Catheter
Distal shunt malfunction is reported to occur in 12% to 34%of shunts (51,69). Three types of distal catheters have beenused: the closed ended with side slits, open ended with sideslits, and open ended. A higher incidence of distal catheterobstruction has been noted in catheters with side slitswhether closed ended or open ended (51,70). Omental in-growth is responsible for the peritoneal catheter obstruc-
tion; possibly the distal slits act as collection points for thedebris and provide a channel for trapping the omentum. Itis unclear whether using open-ended distal cathetersincreases the likelihood of small ventricle malfunction.Use of extended length catheters (110–120 cm) is notassociated with an increase in the complications and elim-inates the need to lengthen the peritoneal catheter forgrowth of the patient (71). However, care must be takento identify patients who may have enough length of tubingin the abdomen but may underdrain due to a narrow andtaught segment of tubing from subcutaneous tethering as aresult of scarring and calcification.
It is difficulty to justify use of atrial over the peritonealsite for distal absorption (72,73). Data on 887 patientssuggested that atrial shunts have a higher rate of mal-function although some studies have not shown a signifi-cant difference. However, when the same information wasstratified by age, shunt type, and time period, there was nosignificant difference in shunt durability. Cardio-pulmonarycomplication, such as irreversible pulmonary hyperten-sion, endocarditis, and glomerulonephritis, are some ofthe more serious complications that may occur with atrialshunts (73). Alternative sites, like pleura, may result insignificant negative pressures in the shunt system (74).Poor absorption from the pleura may result in large pleuraleffusions in small children (74). The gall bladder has alsobeen effectively used in patients in whom peritoneal, atrial,or pleural sites have been exhausted (75,76). Potentialcomplications of these shunts, notably biliary ventriculitisand biliary meningitis, have been reported in the literature(77,78). The ventriculo-femoral shunt may be tried inpatients with a difficult access to the atrium from thesubclavian or jugular route (79). Trans-diaphragmatic pla-cement of the distal catheter in the sub-hepatic spaceworked successfully in one reported patient with poorperitoneal access due to scarring (80).
Shunt Material
Ideal shunt material should be completely biocompatible,be easy to handle, flexible, resistant to infection, and non-metallic but radio-opaque (metals interfere with MRI ima-ging). From a manufacturing standpoint, it should be easy
12 HYDROCEPHALUS, TOOLS FOR DIAGNOSIS AND TREATMENT OF
400
300
200
100
00 10 20 30 40 50 60 0 10 20 30 40 50 60 0 10 20 30 40 50 60
Flow (cc/hr) Flow (cc/hr) Flow (cc/hr)
Pres
sure
(m
m H
2O)
400
300
200
100
0
Pres
sure
(m
m H
2O)
400
300
200
100
0
Pres
sure
(m
m H
2O)
High
Medium
Low
High resistance
Low resistance
Low resistance (safety Valve)
3 Balls vertical
2 Balls vertical
All valveshorizontal
4 Balls vertical
Figure 15. Pressure flow characteristics of (a). Standard differential pressure valve; note thatwith increasing differential pressure, such as from upright posture, there is an increase in the flowrate. (b) The flow control valve has a sigmoid flow-pressure relationship; in the upright position, thevalve works at the high resistance stage and maintains a relatively steady flow rate despite increasein differential pressure. (c) Gravity actuated device, in vertical position acts as a very high-resistance differential pressure valve (depending on the number of balls in the device) and as alow-resistance differential pressure valve in the supine position.

to mold into tubing and making valve components. Siliconepolymer is probably the best available material for thispurpose.
Some studies have suggested development of siliconeallergy in some patients with ventricular shunts (81–84). Itis unclear whether it represents a true immunologicalreaction or a nonspecific foreign body type granulomatousreaction (85). In patients with suspected or documentedsilicone allergy, use of polyurethane (86) or, more recentlyCO2 extracted silicone catheters has been postulated butnot proven to offer some advantage in reducing risk ofrecurrent malfunctions.
Subcutaneous location of the distal catheters makesthem susceptible to degradation from a foreign-body reac-tion mounted by the body (87). Scarring around the catheter,calcification, and stress fractures are long-term conse-quences of this reaction (88,89). Unless there is someamount of surface degradation, the adhesions to the sub-cutaneous tissues do not occur (87). Evidence suggests thatbarium used in the silicone catheters is probably not animportant factor in promoting calcification and degradation(90). Use of barium-free catheters, however, makes it diffi-cult to evaluate a shunt system on radiological imaging.
To minimize colonization of shunt catheters and infec-tion, recently antibiotic-coated catheters have become avail-able. The catheters are available coated with rifampin andminocycline (Medtronics, Goleta, CA) and another withrifampin and clindamycin (Bactiseal, Codman, Raynham,MA). The antibiotic is most active against Staph epidermi-dis, which is the cause of shunt infection in most patients.The antibiotic gradually leaches out of the catheter over a30–60 day period providing added advantage. Control stu-dies have shown a significant reduction in rate of infectionwith use of these catheters (91,92). The major drawback isthe excessive cost of the antibiotic-coated catheters.
Shunt Malfunction
About 30–40% of the shunts malfunction within the firstyear of placement (10) and 80% of malfunctions are prox-imal malfunctions. Although most patients with a mal-functioning shunt will present with the classic features ofraised pressure, headache, and vomiting, in 20%, theremay be no signs of raised pressure (93). Instead, this groupof patients present with a subtle change in behavior,decline in school performance, gait disturbances, andincontinence. Some patients may present with aggravationin the signs and symptoms of Chiari malformation orsyringomyelia. Parents are often more sensitive to thesesubtle changes. In a study comparing the accuracy ofreferral source in diagnosing shunt malfunction, parentswere more likely to be correct about the diagnosis ascompared with a hospital or general practitioner (94).
At examination, a tense fontanelle, split sutures, andswelling at the shunt site are very strongly suggestive of amalfunctioning shunt. Shunt pumping has a positive pre-dictive value of only 20% (95). A shunt valve that fails to fillup in 10 minutes is very strongly suggestive of shuntmalfunction. Radiological assessment may demonstrate afracture or dislocation. Presence of double-backing of thedistal catheter, wherein the distal catheter tip loops out of
the peritoneal through the same spot that it enters it, isdiagnostic of distal malfunction (96). The shunt tap givesuseful information about the proximal and distal shuntsystem. The absence of spontaneous flow and poor drip rateindicate proximal malfunction, whereas a high openingpressure is suggestive of distal malfunction (97). The pre-sence of increase in size of the ventricles on CT scanconfirms a malfunctioning shunt; however, a large numberof patients with long-standing shunt have altered braincompliance and may not dilate the ventricles at the time ofpresentation. In children, similar symptoms occur in thecommon illnesses like otitis media; gastroenteritis of viralfevers often confound the diagnosis. Radiological assess-ment of shunt flow using radionuclide or iodide contrastmedia injected into the shunt may help (2,98–100). Unfor-tunately, although some studies have shown an accuracy of99% with combined pressure and radionuclide evaluation(98,101), others have shown a 25–40% incidence of decep-tive patency when evaluated by radionuclide cisternogram(97). This could stem from a partial but inadequatelyfunctioning shunt, intermittent malfunction, or presenceof isolated ventricle. Similar problems are encounteredwith an iodide contrast-based shuntogram or shunt injec-tion tests. In the absence of normative data with regard toadequate flow in the shunt, which may vary significantlywith the individual, time of the day, and activity (102), useof Doppler-based flow devices, flow systems that workbased on differential temperature-gradient or MRI-basedflow systems becomes irrelevant for an individual patient.Lumbar infusion tests and shunt infusion tests to assessthe outflow resistance through the shunt are cumbersomeand require a laboratory-based setup and may not bepossible in an ER setting (103–105). Infusion through areservoir to assess outflow resistance through the shuntsuggests a cutoff of less than 12 mm Hg/mL/min as reliablefor distinguishing a clinically suspected high probability ofmalfunction from those with a low probability of shuntmalfunction (104). However, this is the group of patientswho may not really need the test, and patients who have aquestionable malfunction on clinical grounds often haveequivocal results on the infusion study.
In childhood hydrocephalus, ICP is the only accurateguide to shunt function other than the symptoms (105).Again the ability to measure ICP through the valve tapbecomes unreliable with a partial proximal malfunction. Asimilar problem may be encountered with in-line tele-metric ICP monitors (106,107). In-addition, the telemetrictransducers may develop a significant drift over time. Indifficult cases, the only way to resolve the issue may be toexplore the shunt, to measure ICP through a lumbarpuncture if the patient has communicating hydrocephalus,or to place an ICP monitor. Noninvasive monitoring of ICPis going to have a major role in assessment of thesepatients. For patients who have a very compliant brain,ventricular diltation on the CT scan easily confirms inade-quate shunt function.
Despite advances in shunt technology, the incidence ofshunt malfunction has not changed over the last 50 years.Nulsen and Becker (3) reported a rate of malfunction of44%, in 1967, which is similar to that reported in recentstudies. To improve on the existing shunt systems, it is
HYDROCEPHALUS, TOOLS FOR DIAGNOSIS AND TREATMENT OF 13

important to understand the factors that reduce shuntsurvival. Although the location of the proximal catheterhas not been clearly shown to influence shunt survival(50,51), the presence of a small amount of fluid around theproximal catheter is associated with longer shunt survival.In a study that looked at shunt over a 11 year period,statistically significant differences were noted in shuntsurvival in patients with tumor versus post-hemorrhagicand aqueductal stenosis; shunts in infants and the pedia-tric age group survive shorter than in adults; shunt aftermultiple revisions survive shorter, and additional shuntsplaced for isolated ventricles have shorter survival(70,108). Chronic inflammatory changes of granular epen-dymitis often seen at the time of endoscopic shunt place-ment in patients with multiple revisions probablycontribute to recurrent malfunction and progressive short-ening of the interval between revisions as the number ofsurgeries increase (108).
The nature of the valve clearly influences the risk ofproximal catheter malfunction. It is much lower with flowcontrol valves (10,109). Overdrainage from the differentialpressure valves pulls the choroid plexus toward the prox-imal catheter and may promote malfunction (55). However,the increased rate of valve malfunction in flow controldevices balances out this advantage (10).
THIRD VENTRICULOSTOMY
In patients with an obstructive type of hydrocephalus,third ventriculostomy offers an alternative to shunt. Theprocedure involves making an opening in the relatively
thin membrane of the floor of the third ventricle. This isaccomplished by passing an endoscope through the lateralventricle and guiding it through the foramen of Munro tothe floor of the third ventricle (Fig. 16). The opening allowsCSF to bypass the obstruction at the level of the aqueductor the fourth ventricle and directly enter the subarachnoidspace.
Although third ventriculostomy has been recommendedas a procedure of choice for obstructive hydrocephalus;data from some prospective studies have failed to showan improved cure rate (110,111). A retrospective analysis ofventriculographic versus endoscopic third ventriculostomyin 213 cases does show the superiority of the endoscopicprocedure over the ventriculographic operation both interms of reduced risk and improved survival of the proce-dure (112). Despite the theoretical advantages, evidencesuggests that third ventriculostomy may not be effective incontrolling raised intracranial pressure in all patients(112,113). Early failures in a radiologically proven caseof obstructive hydrocephalus may relate to multifactorialetiology of hydrocephalus; associated absorption defects,obliteration of subarachnoid space from long-standing ven-tricular diltation, and unidentified infectious cause of aqe-ductal stenosis may be responsible. Late failures mayrelate to gliotic scarring over the ventriculostomy, whichhas been visually confirmed by endoscope in some cases.Does the ventriculostomy close from scarring, or is it asecondary response to lack of flow through the ventricu-lostomy due to poor absorption, therefore, a lack of gradientbetween the ventricle and the subarachnoid space, isunclear. In a small prospective study comparing the shuntfailure rate with the failure rate of third ventriculostomy,
14 HYDROCEPHALUS, TOOLS FOR DIAGNOSIS AND TREATMENT OF
Figure 16. Third ventriculostomy is usefulin patients with obstructive hydrocephalussuch as observed with aqueductal stenosis(arrows). An endoscope is passed through asmall hole in the skull into the frontal horn ofthe ventricle and navigated into the thirdventricle. The floor of the third ventricle isthen perforated under vision (arrow, in theinset) so as to bypass the obstruction at theaqueduct. Iohexol, a nonionic iodinated dye, isthen instilled into the ventricle to demonstrategood communication between the ventriclesand the subarachnoid space.

no statistical difference was found between the two (12).Likewise, no controlled study has compared laser, blunt, orsharp fenestration of the floor or demonstrated usefulnessof balloon diltation of the fenestration. The success rate ofthird ventriculostomy of 49–100%, as reported in the litera-ture, may not be a true representative of the efficacy of thirdventriculostomy(12).Evaluationafter thirdventriculostomyand defining success is difficult in the absence of documentedreduction in ICP or improvement on neuropyschologicaltests. This is so because the ventricles may not reduce insize, and to and from motion through the patent fenestrationmay still be observed on MRI CSF flow studies even thoughthe patient may be symptomatic. In the absence of clearevidence in literature, third ventriculostomy is often advo-cated for patients with obstructive hydrocephalus, and iffailuresoccur,shunting ispreferredoverrepeat fenestration.
It is hoped that close collaboration between the industryand medicine will help develop ‘‘smart shunts’’ that wouldbe able to mimic physiological CSF dynamics. These deviceswill possibly incorporate nanotechnology and would besuperior to the presently available devices. It is likely thatbetter understanding of CSF drainage mechanism in thefuture may help develop alternatives such as drugs thatimprove drainage of CSF through lymphatic/arachnoidalvenous channels or promote proliferation of new lympha-tic/arachnoidal venous channels. Until that time, it seemsthat shunts are the best available alternative for manage-ment of communicating hydrocephalus.
BIBLIOGRAPHY
1. Dandy WE, Blackfan KD. Internal hydrocephalus: An experi-mental, clinical and pathological study. Am J Dis Child1914;30:406–482.
2. Graham P, Howman-Giles R, Johnston I, Besser M. Evalua-tion of CSF shunt patency by means of technetium-99m DTPA.J Neurosurg 1982;57:262–266.
3. Nulsen FE, Becker DP. Control of hydrocephalus by valve-regulated shunt. J Neurosurg 1967;26:362–374.
4. Pudenz RH, Russell FE, Hurd AH, Shelden CH. Ventriculo-auriculostomy; a technique for shunting cerebrospinal fluidinto the right auricle; preliminary report. J Neurosurg1957;14:171–179.
5. Nulsen FE, Spitz EB. Treatment of hydrocephalus by directshunt from ventricle to jugular vain. Surg Forum 1951;94:399–403.
6. Fernell E, Hagberg B, Hagberg G, von Wendt L. Epidemiologyof infantile hydrocephalus in Sweden. I. Birth prevalence andgeneral data. Acta Paediatr Scand 1986;75:975–981.
7. Bondurant CP, Jimenez DF. Epidemiology of cerebrospinalfluid shunting. Pediatr Neurosurg 1995;23:254–258; discus-sion 259.
8. Foltz EL, Shurtleff DB. Five-year comparative study of hydro-cephalus in children with and without operation (113 Cases). JNeurosurg 1963;20:1064–1079.
9. Laurence KM, Coates S. The natural history of hydrocephalus.Detailed analysis of 182 unoperated cases. Arch Dis Child1962;37:345–362.
10. Drake JM, Kestle JR, Milner R, Cinalli G, Boop F, Piatt J, Jr.Haines S, Schiff SJ, Cochrane DD, Steinbok P, MacNeil N.Randomized trial of cerebrospinal fluid shunt valve designin pediatric hydrocephalus. Neurosurgery 1998;43:294–303;discussion 303–295.
11. Patwardhan RV, Nanda A. Implanted ventricular shunts inthe United States: The billion-dollar-a-year cost of hydroce-phalus treatment. Neurosurgery 2005;56:139–144; discussion144–135.
12. Tuli S, Alshail E, Drake J. Third ventriculostomy versuscerebrospinal fluid shunt as a first procedure in pediatrichydrocephalus. Pediatr Neurosurg 1999;30:11–15.
13. Bell WO. Cerebrospinal fluid reabsorption. A critical apprai-sal. 1990. Pediatr Neurosurg 1995;23:42–53.
14. Edsbagge M, Tisell M, Jacobsson L, Wikkelso C. Spinal CSFabsorption in healthy individuals. Am J Physiol Regul IntegrComp Physiol 2004;287:R1450–1455.
15. Koh L, Zakharov A, Johnston MG. Integration of the subar-achnoid space and lymphatics: Is it time to embrace a newconcept of cerebrospinal fluid absorption? Cerebrospinal FluidRes 2005;2:6.
16. Johnston M, Zakharov A, Papaiconomou C, Salmasi G, Arm-strong D. Evidence of connections between cerebrospinal fluidand nasal lymphatic vessels in humans, non-human primatesand other mammalian species. Cerebrospinal Fluid Res2004;1:2.
17. Greitz D, Greitz T, Hindmarsh T. We need a new understand-ing of the reabsorption of cerebrospinal fluid—II. Acta Pae-diatr 1997;86:1148.
18. Marmarou A, Shulman K, LaMorgese J. Compartmental ana-lysis of compliance and outflow resistance of the cerebrospinalfluid system. J Neurosurg 1975;43:523–534.
19. Raksin PB, Alperin N, Sivaramakrishnan A, Surapaneni S,Lichtor T. Noninvasive intracranial compliance and pressurebased on dynamic magnetic resonance imaging of blood flow andcerebrospinal fluid flow: Review of principles, implementation,and other noninvasive approaches. Neurosurg Focus 2003;14:e4.
20. McAllister JP2nd, Chovan P. Neonatal hydrocephalus.Mechanisms and consequences. Neurosurg Clin N Am 1998;9:73–93.
21. Adams RD, Fisher CM, Hakim S, Ojemann RG, Sweet WH.Symptomatic occult hydrocephalus with ‘‘normal’’ cerebrospinal-fluid pressure. A treatable syndrome. N Engl J Med 1965;273:117–126.
22. Oi S, Shimoda M, Shibata M, Honda Y, Togo K, Shinoda M,Tsugane R, Sato O. Pathophysiology of long-standing overtventriculomegaly in adults. J Neurosurg 2000;92:933–940.
23. Di Rocco C, Pettorossi VE, Caldarelli M, Mancinelli R, VelardiF. Experimental hydrocephalus following mechanicalincrement of intraventricular pulse pressure. Experientia1977;33:1470–1472.
24. Egnor M, Rosiello A, Zheng L. A model of intracranial pulsa-tions. Pediatr Neurosurg 2001;35:284–298.
25. Egnor M, Zheng L, Rosiello A, Gutman F, Davis R. A model ofpulsations in communicating hydrocephalus. Pediatr Neuro-surg 2002;36:281–303.
26. Linninger AA, Tsakiris C, Zhu DC, Xenos M, Roycewicz P,Danziger Z, Penn R. Pulsatile cerebrospinal fluid dynamics inthe human brain. IEEE Trans Biomed Eng 2005;52:557–565.
27. Stephensen H, Tisell M, Wikkelso C. There is no transmantlepressure gradient in communicating or noncommunicatinghydrocephalus. Neurosurgery 2002;50:763–771; discussion771–763.
28. Portnoy HD, Branch C, Castro ME. The relationship of intra-cranial venous pressure to hydrocephalus. Childs Nerv Syst1994;10:29–35.
29. Marmarou A. A theoretical model and experimental evalua-tion of the cerebrospinal fluid system. 1973.
30. Alperin N, Lichtor T, Mazda M, Lee SH. From cerebrospinalfluid pulsation to noninvasive intracranial compliance andpressure measured by MRI flow studies. Curr Med ImagingRev. In press.
HYDROCEPHALUS, TOOLS FOR DIAGNOSIS AND TREATMENT OF 15

31. Marmarou A, Shulman K, Rosende RM. A nonlinear analysisof the cerebrospinal fluid system and intracranial pressuredynamics. J Neurosurg 1978;48:332–344.
32. Ekstedt J. CSF hydrodynamic studies in man. 1. Method ofconstant pressure CSF infusion. J Neurol Neurosurg Psych1977;40:105–119.
33. Lundkvist B, Eklund A, Kristensen B, Fagerlund M, KoskinenLO, Malm J. Cerebrospinal fluid hydrodynamics after place-ment of a shunt with an antisiphon device: A long-term study.J Neurosurg 2001;94:750–756.
34. Czosnyka M, Batorski L, Laniewski P, Maksymowicz W,Koszewski W, Zaworski W. A computer system for the identi-fication of the cerebrospinal compensatory model. Acta Neu-rochirurgica 1990;105:112–116.
35. Borgesen SE, Gjerris F. The predictive value of conductance tooutflow of CSF in normal pressure hydrocephalus. J Neurol1982;105:65–86.
36. Marmarou A, Bergsneider M, Klinge P, Relkin N, Black PM.The value of supplemental prognostic tests for the preopera-tive assessment of idiopathic normal-pressure hydrocephalus.Neurosurgery 2005;57:17–28.
37. Huang TY, Chung HW, Chen MY, Giiang LH, Chin SC, LeeCS, Chen CY, Liu YJ. Supratentorial cerebrospinal fluidproduction rate in healthy adults: Quantification with two-dimensional cine phase-contrast MR imaging with high tem-poral and spatial resolution. Radiology 2004;233:603–608.
38. Alperin NJ, Lee SH, Loth F, Raksin PB, Lichtor T. MR-Intracranial pressure (ICP): A method to measure intracranialelastance and pressure noninvasively by means of MR imaging:Baboon and human study. Radiology 2000;217:877–885.
39. Urchuk SN, Plewes DB. MR measurements of pulsatile pres-sure gradients. J Magn Reson Imaging 1994;4:829–836.
40. Bird R, Stewart W, Lightfoot E. Transport Phenomena. NewYork: Wiley Sons; 1960.
41. Walters BC, Hoffman HJ, Hendrick EB, Humphreys RP.Cerebrospinal fluid shunt infection. Influences on initial man-agement and subsequent outcome. J Neurosurg 1984;60: 1014–1021.
42. Pople IK, Ettles D. The role of endoscopic choroid plexuscoagulation in the management of hydrocephalus. Neurosur-gery 1995;36:698–701; discussion 701–692.
43. Weiss MH, Nulsen FE, Kaufman B. Selective radionecrosis ofthe choroid plexus for control of experimental hydrocephalus.J Neurosurg 1972;36:270–275.
44. Aoki N. Lumboperitoneal shunt: Clinical applications, com-plications, and comparison with ventriculoperitoneal shunt.Neurosurgery 1990;26:998–1003; discussion 1003–1004.
45. Selman WR, Spetzler RF, Wilson CB, Grollmus JW. Percuta-neous lumboperitoneal shunt: Review of 130 cases. Neurosur-gery 1980;6:255–257.
46. Chumas PD, Armstrong DC, Drake JM, Kulkarni AV, Hoff-man HJ, Humphreys RP, Rutka JT, Hendrick EB. Tonsillarherniation: The rule rather than the exception after lumbo-peritoneal shunting in the pediatric population. J Neurosurg1993;78:568–573.
47. Payner TD, Prenger E, Berger TS, Crone KR. Acquired Chiarimalformations: Incidence, diagnosis, and management. Neu-rosurgery 1994;34:429–434; discussion 434.
48. Ausman JI. Shunts: Which one, and why? Surg Neurol1998;49:8–13.
49. Albright AL, Haines SJ, Taylor FH. Function of parietal andfrontal shunts in childhood hydrocephalus. J Neurosurg1988;69:883–886.
50. Bierbrauer KS, Storrs BB, McLone DG, Tomita T, Dauser R. Aprospective, randomized study of shunt function and infec-tions as a function of shunt placement. Pediatr Neurosurg1990;16:287–291.
51. Sainte-Rose C, Piatt JH, Renier D, Pierre-Kahn A, Hirsch JF,Hoffman HJ, Humphreys RP, Hendrick EB. Mechanical com-plications in shunts. Pediatr Neurosurg 1991;17:2–9.
52. Pang D, Grabb PA. Accurate placement of coronal ventricularcatheter using stereotactic coordinate-guided free-hand pas-sage. Technical note. J Neurosurg 1994;80:750–755.
53. Yamamoto M, Oka K, Nagasaka S, Tomonaga M. Ventriculoscope-guided ventriculoperitoneal shunt and shunt revision.Technical note. Acta Neurochir (Wien) 1994;129:85–88.
54. Kestle JR, Drake JM, Cochrane DD, Milner R, Walker ML,Abbott R, 3rd, Boop FA. Lack of benefit of endoscopic ventri-culoperitoneal shunt insertion: A multicenter randomizedtrial. J Neurosurg 2003;98:284–290.
55. Hakim S. Observations on the physiopathology of the CSFpulse and prevention of ventricular catheter obstruction invalve shunts. Dev Med Child Neurol Suppl 1969;20:42–48.
56. Martinez-Lage JF, Lopez F, Poza M, Hernandez M. Preven-tion of intraventricular hemorrhage during CSF shunt revi-sions by means of a flexible coagulating electrode. Apreliminary report. Childs Nerv Syst 1998;14:203–206.
57. Steinbok P, Cochrane DD. Removal of adherent ventricularcatheter. Pediatr Neurosurg 1992;18:167–168.
58. Whitfield PC, Guazzo EP, Pickard JD. Safe removal of retainedventricular catheters using intraluminal choroid plexus coagu-lation. Technical note. J Neurosurg 1995;83: 1101–1102.
59. Handler MH. A complication in removing a retained ventri-cular catheter using electrocautery. Pediatr Neurosurg 1996;25:276.
60. Czosnyka M, Czosnyka Z, Whitehouse H, Pickard JD. Hydro-dynamic properties of hydrocephalus shunts: United KingdomShunt Evaluation Laboratory. J Neurol Neurosurg Psych1997;62:43–50.
61. Trost HA. Is there a reasonable differential indication fordifferent hydrocephalus shunt systems? Childs Nerv Syst1995;11:189–192.
62. Sood S, Kumar CR, Jamous M, Schuhmann MU, Ham SD,Canady AI. Pathophysiological changes in cerebrovasculardistensibility in patients undergoing chronic shunt therapy.J Neurosurg 2004;100:447–453.
63. Pollack IF, Albright AL, Adelson PD. A randomized, controlledstudy of a programmable shunt valve versus a conventionalvalve for patients with hydrocephalus. Hakim-Medos Inves-tigator Group. Neurosurgery 1999;45:1399–1408; discussion1408–1311.
64. Aschoff A, Kremer P, Benesch C, Fruh K, Klank A, Kunze S.Overdrainage and shunt technology. A critical comparison ofprogrammable, hydrostatic and variable-resistance valves andflow-reducing devices. Childs Nerv Syst 1995;11:193–202.
65. Drake JM, da Silva MC, Rutka JT. Functional obstruction ofan antisiphon device by raised tissue capsule pressure. Neu-rosurgery 1993;32:137–139.
66. Fox JL, Portnoy HD, Shulte RR. Cerebrospinal fluid shunts:An experimental evaluation of flow rates and pressure valuesin the anti-siphon valve. Surg Neurol 1973;1:299–302.
67. Tokoro K, Chiba Y. Optimum position for an anti-siphondevice in a cerebrospinal fluid shunt system. Neurosurgery1991;29:519–525.
68. Chabbra DK, Agarwal GD, Mittal P. ‘‘Z’’ flow hydrocephalusshunts, a new approach to the problem of hysrocephalus. Therationale behind its design and the initial results of pressuremonitoring after ‘‘Z’’ flow shunt implantation. Acta Neurochir(Wien) 1993;121:43–47.
69. Sekhar LN, Moossy J, Guthkelch AN. Malfunctioning ventri-culoperitoneal shunts. Clinical and pathological features. JNeurosurg 1982;56:411–416.
70. Cozzens JW, Chandler JP. Increased risk of distal ventricu-loperitoneal shunt obstruction associated with slit valves or
16 HYDROCEPHALUS, TOOLS FOR DIAGNOSIS AND TREATMENT OF

distal slits in the peritoneal catheter. J Neurosurg 1997;87:682–686.
71. Couldwell WT, LeMay DR, McComb JG. Experience with useof extended length peritoneal shunt catheters. J Neurosurg1996;85:425–427.
72. Borgbjerg BM, Gjerris F, Albeck MJ, Hauerberg J, BorgesenSV. A comparison between ventriculo-peritoneal andventriculo-atrial cerebrospinal fluid shunts in relation to rateof revision and durability. Acta Neurochir (Wien) 1998;140:459–464; discussion 465.
73. Lam CH, Villemure JG. Comparison between ventriculoa-trial and ventriculoperitoneal shunting in the adult popula-tion. Br J Neurosurg 1997;11:43–48.
74. Willison CD, Kopitnik TA, Gustafson R, Kaufman HH. Ven-triculopleural shunting used as a temporary diversion. ActaNeurochir (Wien) 1992;115:67–68.
75. Ketoff JA, Klein RL, Maukkassa KF. Ventricular cholecysticshunts in children. J Pediatr Surg 1997;32:181–183.
76. Novelli PM, Reigel DH. A closer look at the ventriculo-gallbladder shunt for the treatment of hydrocephalus.Pediatr Neurosurg 1997;26:197–199.
77. Barami K, Sood S, Ham SD, Canady AI. Postural changes inintracranial pressure in chronically shunted patients.Pediatr Neurosurg 2000;33:64–69.
78. Bernstein RA, Hsueh W. Ventriculocholecystic shunt. Amortality report. Surg Neurol 1985;23:31–37.
79. Philips MF, Schwartz SB, Soutter AD, Sutton LN. Ventricu-lofemoroatrial shunt: A viable alternative for the treatmentof hydrocephalus. Technical note. J Neurosurg 1997;86:1063–1066.
80. Rengachary SS. Transdiaphragmatic ventriculoperitonealshunting: Technical case report. Neurosurgery 1997;41:695–697; discussion 697–698.
81. Goldblum RM, Pelley RP, O’Donell AA, Pyron D, Heggers JP.Antibodies to silicone elastomers and reactions to ventricu-loperitoneal shunts. Lancet 1992;340:510–513.
82. Gower DJ, Lewis JC, Kelly DL, Jr. Sterile shunt malfunction.A scanning electron microscopic perspective. J Neurosurg1984;61:1079–1084.
83. Snow RB, Kossovsky N. Hypersensitivity reaction associatedwith sterile ventriculoperitoneal shunt malfunction. SurgNeurol 1989;31:209–214.
84. Sugar O, Bailey OT. Subcutaneous reaction to silicone inventriculoperitoneal shunts. Long-term results. J Neurosurg1974;41:367–371.
85. Kalousdian S, Karlan MS, Williams MA. Silicone elastomercerebrospinal fluid shunt systems. Council on ScientificAffairs, American Medical Association. Neurosurgery 1998;42:887–892.
86. Jimenez DF, Keating R, Goodrich JT. Silicone allergy inventriculoperitoneal shunts. Childs Nerv Syst 1994;10: 59–63.
87. Del Bigio MR. Biological reactions to cerebrospinal fluidshunt devices: A review of the cellular pathology. Neurosur-gery 1998;42:319–325; discussion 325–316.
88. Echizenya K, Satoh M, Murai H, Ueno H, Abe H, Komai T.Mineralization and biodegradation of CSF shunting systems.J Neurosurg 1987;67 :584–591.
89. Elisevich K, Mattar AG, Cheeseman F. Biodegradation ofdistal shunt catheters. Pediatr Neurosurg 1994;21:71–76.
90. Irving IM, Castilla P, Hall EG, Rickham PP: Tissue reactionto pure and impregnated silastic. J Pediatr Surg 1971;6:724–729.
91. Aryan HE, Meltzer HS, Park MS, Bennett RL, Jandial R,Levy ML. Initial experience with antibiotic-impregnated sili-cone catheters for shunting of cerebrospinal fluid in children.Childs Nerv Syst 2005;21:56–61.
92. Govender ST, Nathoo N, van Dellen JR: Evaluation of anantibiotic-impregnated shunt system for the treatment ofhydrocephalus. J Neurosurg 2003;99:831–839.
93. Fried A, Shapiro K. Subtle deterioration in shunted childhoodhydrocephalus. A biomechanical and clinical profile. J Neu-rosurg 1986;65:211–216.
94. Watkins L, Hayward R, Andar U, Harkness W. The diagnosisof blocked cerebrospinal fluid shunts: A prospective study ofreferral to a paediatric neurosurgical unit. Childs Nerv Syst1994;10:87–90.
95. Piatt JH, Jr. Physical examination of patients with cere-brospinal fluid shunts: Is there useful information in pump-ing the shunt? Pediatrics 1992;89:470–473.
96. Martinez-Lage JF, Poza M, Izura V. Retrograde migration oftheabdominal catheter asacomplicationof ventriculoperitonealshunts: The fishhook sign. Childs Nerv Syst 1993;9: 425–427.
97. Sood S, Canady AI, Ham SD. Evaluation of shunt malfunc-tion using shunt site reservoir. Pediatr Neurosurg 2000;32:180–186.
98. Hayden PW, Rudd TG, Shurtleff DB. Combined pressure-radionuclide evaluation of suspected cerebrospinal fluidshunt malfunction: A seven-year clinical experience. Pedia-trics 1980;66:679–684.
99. Sweeney LE, Thomas PS. Contrast examination of cerebrosp-inal fluid shunt malfunction in infancy and childhood.Pediatr Radiol 1987;17:177–183.
100. Vernet O, Farmer JP, Lambert R, Montes JL. Radionuclideshuntogram: Adjunct to manage hydrocephalic patients. JNucl Med 1996;37:406–410.
101. Savoiardo M, Solero CL, Passerini A, Migliavacca F. Deter-mination of cerebrospinal fluid shunt function with water-soluble contrast medium. J Neurosurg 1978;49:398–407.
102. Kadowaki C, Hara M, Numoto M, Takeuchi K, Saito I. CSFshunt physics: factors influencing inshunt CSF flow. ChildsNerv Syst 1995;11:203–206.
103. Czosnyka M, Whitehouse H, Smielewski P, Simac S, PickardJD. Testing of cerebrospinal compensatory reserve inshunted and non-shunted patients: A guide to interpretationbased on an observational study. J Neurol Neurosurg Psych1996;60:549–558.
104. Morgan MK, Johnston IH, Spittaler PJ. A ventricular infu-sion technique for the evaluation of treated and untreatedhydrocephalus. Neurosurgery 1991;29:832–836; discussion836–837.
105. Fouyas IP, Casey AT, Thompson D, Harkness WF, HaywardRD. Use of intracranial pressure monitoring in the manage-ment of childhood hydrocephalus and shunt-related pro-blems. Neurosurgery 1996;38:726–731; discussion 731–722.
106. Woodford J, Saunders RL, Sachs E, Jr. Shunt system patencytesting by lumbar infusion. J Neurosurg 1976;45:60–65.
107. Cosman ER, Zervas NT, Chapman PH, Cosman BJ, ArnoldMA. A telemetric pressure sensor for ventricular shunt sys-tems. Surg Neurol 1979;11:287–294.
108. Miyake H, Ohta T, Kajimoto Y, Matsukawa M. A new ventri-culoperitoneal shunt with a telemetric intracranial pressuresensor: Clinical experience in 94 patients with hydrocephalus.Neurosurgery 1997;40:931–935.
109. Lazareff JA, Peacock W, Holly L, Ver Halen J, Wong A,Olmstead C. Multiple shunt failures: An analysis of relevantfactors. Childs Nerv Syst 1998;14:271–275.
110. Decq P, Barat JL, Duplessis E, Leguerinel C, Gendrault P,Keravel Y. Shunt failure in adult hydrocephalus: Flow-con-trolled shunt versus differential pressure shunts–a coopera-tive study in 289 patients. Surg Neurol 1995;43:333–339.
111. Garton HJ, Kestle JR, Cochrane DD, Steinbok P. A cost-effectiveness analysis of endoscopic third ventriculostomy.Neurosurgery 2002;51:69–77; discussion 77–68.
HYDROCEPHALUS, TOOLS FOR DIAGNOSIS AND TREATMENT OF 17
112. Santamarta D, Diaz Alvarez A, Goncalves JM, Hernandez J.Outcome of endoscopic third ventriculostomy. Results froman unselected series with noncommunicating hydrocephalus.Acta Neurochir (Wien) 2005;147:377–382.
113. Cinalli G, Sainte-Rose C, Chumas P, Zerah M, Brunelle F,Lot G, Pierre-Kahn A, Renier D. Failure of third ventricu-lostomy in the treatment of aqueductal stenosis in children. JNeurosurg 1999;90:448–454.
114. Hirsch JF, Hirsch E, Sainte Rose C, Renier D, Pierre-Khan A.Stenosis of the aqueduct of Sylvius. Etiology and treatment. JNeurosurg Sci 1986;30:29–39.
See also INTRAUTERINE SURGICAL TECHNIQUES; MICRODIALYSIS SAMPLING;MONITORING, INTRACRANIAL PRESSURE.
HYPERALIMENTATION. See NUTRITION, PARENTERAL.
HYPERBARIC MEDICINE
BARBARA L. PERSONS
BETH COLLINS
WILLIAM C. LINEAWEAVER
University of MississippiMedical CenterJackson, Mississippi
INTRODUCTION
The goal of hyperbaric oxygen (HBO) therapy is to deliverhigh concentrations of oxygen under pressure to increasethe amount of dissolved oxygen in the blood. The physio-logic repercussions of this increased plasma oxygen havewidespread effects that translate into a variety of clinicalapplications. Initially, the use of hyperbaric medicine sur-rounded acute decompression illness and gas embolism.Later, the increased oxygen under pressure was shown tohave use in a variety of clinical situations. The deliveredpressure can be two to six times ambient atmosphericpressure (ATM) or atmospheres absolute (ATA) dependingon the indication. The current Undersea and HyperbaricMedical Society approved uses of HBO are shown in Table 1,and many of these indications will be discussed individually.
HBO in the treatment of these conditions is supported bycontrolled medical trials published in peer-reviewed jour-nals and, as such, is evidence-based. Numerous otherexperimental uses exist for HBO, such as for stroke andfor cardiac ischemia, but these uses have not yet beensufficiently proven to be supported by the Undersea andHyperbaric Medicine Society or by the American Collegeof Hyperbaric Medicine. The goal of this chapter is tooutline the physical principles underlying the use of HBOtherapy, to discuss its medical indications for HBO, andto familiarize the reader with the mechanical, safety,and regulatory issues involved in operating a hyperbaricmedicine program.
HISTORICAL BACKGROUND
British physician and clergyman Henshaw was the first touse alteration in atmospheric pressure to treat medical con-ditions when he used his domicilium chamber in 1862.Hyperbaric medicine also surrounded diving and divingmedicine. Triger, in 1841, gave the first human descriptionof decompression sickness (1). In 1934, U.S. Naval Submar-ine Officer Dr. Albert Behnke was the first to use oxygenrecompression to treat decompression sickness in navaldivers (2). Later, in 1943, Gagnon and Cousteau inventedSCUBA (self-contained underwater breathing apparatus).Dr. Boerma, a Dutch thoracic surgeon, removed the bloodcells from pigs in 1955 and found they could survive with theoxygen dissolved in plasma by use of HBO. An upsurge inhyperbaric surgery followed in 1956, when Boerma per-formed cardiovascular surgery in a hyperbaric chamber,which along with hypothermia, allowed for periods of circu-latory arrest of 7–8 min. The large chamber developed atWilhelmina Gasthuis in Amsterdam in 1959, headed byBoerma, allowed a wide variety of research to be carriedout on the uses of HBO therapy on many diseases (3). By1966, it was indicated for the treatment of protection duringinduced circulatory arrest, homotransplantation, clostridialinfection, acute arterial insufficiency, chronic arterial insuf-ficiency, and hypovolemic shock. Shortly thereafter, theadvent of cardiopulmonary bypass obviated hyperbaricchambers for cardiac protecton. In 1967, the Undersea Med-ical Society was founded by the U.S. Navy diving and sub-marine medical officers. This organization originally focusedon undersea and diving medicine but, later, came to includeclinical hyperbaric medicine. In 1986, the name was changedto the Undersea and Hyperbaric Medical Society or UHMSwith more than 2500 physician and scientist members in50 countries. More recently, the American College of Hyper-baric Medicine has come to offer board certification to U.S.physicians in the specialty of hyperbaric medicine.
PHYSICS
To understand HBO therapy, one must understand a fewbasic laws of physics, namely, Boyle’s law, Charles law,Dalton’s law, and Henry’s law. Boyles law explains how gasvolume shrinks with increasing pressure. Charles lawexplains that the volume of a gas decreases with decreasingtemperature. Dalton’s law explains that each gas in a
18 HYPERBARIC MEDICINE
Table 1. Approved Uses for HyperbaricOxygen Therapy
acute decompression illnessgas embolismcarbon monoxide poisioningclostridial gas gangrenenecrotizing soft tissue infectionscompromised skin grafts and skin flapscrush injurycompartment syndromeacute traumatic ischemiasradiation tissue damagerefractory osteomyelitisselected problem woundsacute exceptional blood loss anemiaacute thermal burnsintracranial abscess
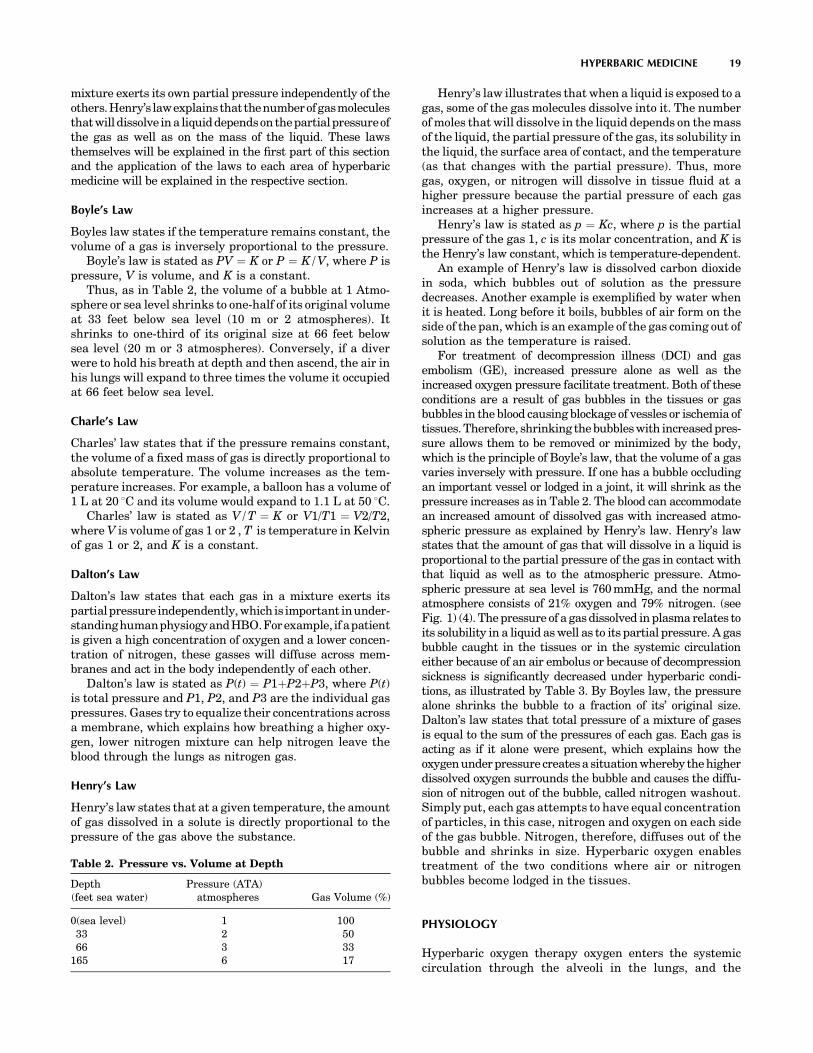
mixture exerts its own partial pressure independently of theothers.Henry’s lawexplainsthatthenumberofgasmoleculesthatwill dissolve in a liquid dependson the partial pressureofthe gas as well as on the mass of the liquid. These lawsthemselves will be explained in the first part of this sectionand the application of the laws to each area of hyperbaricmedicine will be explained in the respective section.
Boyle’s Law
Boyles law states if the temperature remains constant, thevolume of a gas is inversely proportional to the pressure.
Boyle’s law is stated as PV ¼ K or P ¼ K/V, where P ispressure, V is volume, and K is a constant.
Thus, as in Table 2, the volume of a bubble at 1 Atmo-sphere or sea level shrinks to one-half of its original volumeat 33 feet below sea level (10 m or 2 atmospheres). Itshrinks to one-third of its original size at 66 feet belowsea level (20 m or 3 atmospheres). Conversely, if a diverwere to hold his breath at depth and then ascend, the air inhis lungs will expand to three times the volume it occupiedat 66 feet below sea level.
Charle’s Law
Charles’ law states that if the pressure remains constant,the volume of a fixed mass of gas is directly proportional toabsolute temperature. The volume increases as the tem-perature increases. For example, a balloon has a volume of1 L at 20 8C and its volume would expand to 1.1 L at 50 8C.
Charles’ law is stated as V/T ¼ K or V1/T1 ¼ V2/T2,where V is volume of gas 1 or 2 , T is temperature in Kelvinof gas 1 or 2, and K is a constant.
Dalton’s Law
Dalton’s law states that each gas in a mixture exerts itspartial pressure independently, which is important inunder-standinghumanphysiogyandHBO.Forexample, ifapatientis given a high concentration of oxygen and a lower concen-tration of nitrogen, these gasses will diffuse across mem-branes and act in the body independently of each other.
Dalton’s law is stated as P(t) ¼ P1þP2þP3, where P(t)is total pressure and P1, P2, and P3 are the individual gaspressures. Gases try to equalize their concentrations acrossa membrane, which explains how breathing a higher oxy-gen, lower nitrogen mixture can help nitrogen leave theblood through the lungs as nitrogen gas.
Henry’s Law
Henry’s law states that at a given temperature, the amountof gas dissolved in a solute is directly proportional to thepressure of the gas above the substance.
Henry’s law illustrates that when a liquid is exposed to agas, some of the gas molecules dissolve into it. The numberof moles that will dissolve in the liquid depends on the massof the liquid, the partial pressure of the gas, its solubility inthe liquid, the surface area of contact, and the temperature(as that changes with the partial pressure). Thus, moregas, oxygen, or nitrogen will dissolve in tissue fluid at ahigher pressure because the partial pressure of each gasincreases at a higher pressure.
Henry’s law is stated as p ¼ Kc, where p is the partialpressure of the gas 1, c is its molar concentration, and K isthe Henry’s law constant, which is temperature-dependent.
An example of Henry’s law is dissolved carbon dioxidein soda, which bubbles out of solution as the pressuredecreases. Another example is exemplified by water whenit is heated. Long before it boils, bubbles of air form on theside of the pan, which is an example of the gas coming out ofsolution as the temperature is raised.
For treatment of decompression illness (DCI) and gasembolism (GE), increased pressure alone as well as theincreased oxygen pressure facilitate treatment. Both of theseconditions are a result of gas bubbles in the tissues or gasbubbles in the blood causing blockage of vessles or ischemia oftissues. Therefore, shrinking the bubbles with increased pres-sure allows them to be removed or minimized by the body,which is the principle of Boyle’s law, that the volume of a gasvaries inversely with pressure. If one has a bubble occludingan important vessel or lodged in a joint, it will shrink as thepressure increases as in Table 2. The blood can accommodatean increased amount of dissolved gas with increased atmo-spheric pressure as explained by Henry’s law. Henry’s lawstates that the amount of gas that will dissolve in a liquid isproportional to the partial pressure of the gas in contact withthat liquid as well as to the atmospheric pressure. Atmo-spheric pressure at sea level is 760 mmHg, and the normalatmosphere consists of 21% oxygen and 79% nitrogen. (seeFig. 1) (4). The pressure of a gas dissolved in plasma relates toits solubility in a liquid as well as to its partial pressure. A gasbubble caught in the tissues or in the systemic circulationeither because of an air embolus or because of decompressionsickness is significantly decreased under hyperbaric condi-tions, as illustrated by Table 3. By Boyles law, the pressurealone shrinks the bubble to a fraction of its’ original size.Dalton’s law states that total pressure of a mixture of gasesis equal to the sum of the pressures of each gas. Each gas isacting as if it alone were present, which explains how theoxygen under pressure creates a situation whereby the higherdissolved oxygen surrounds the bubble and causes the diffu-sion of nitrogen out of the bubble, called nitrogen washout.Simply put, each gas attempts to have equal concentrationof particles, in this case, nitrogen and oxygen on each sideof the gas bubble. Nitrogen, therefore, diffuses out of thebubble and shrinks in size. Hyperbaric oxygen enablestreatment of the two conditions where air or nitrogenbubbles become lodged in the tissues.
PHYSIOLOGY
Hyperbaric oxygen therapy oxygen enters the systemiccirculation through the alveoli in the lungs, and the
HYPERBARIC MEDICINE 19
Table 2. Pressure vs. Volume at Depth
Depth(feet sea water)
Pressure (ATA)atmospheres Gas Volume (%)
0(sea level) 1 10033 2 5066 3 33
165 6 17

diffusion is mediated by the pressure differential betweenthe alveolar oxygen content and the oxygen content ofvenous blood. Alveolar oxygen content is 100 mmHg andvenous oxygen content is 40 mm Hg (5). Normally, 97% ofoxygen iscarried in the arterial blood bound to hemoglobinmolecules and only 3% of the oxygen is dissolved in plasma,illustrated by the formula for oxygen content in arterialblood. CaO2 ¼ (1.34HbSaO2) þ (0.003PaO2), whereCaO2 is oxygen content, Hb is Hemoglobin in grams, andSaO2 is arterial O2 saturation expressed as a fraction not apercentage (0.95, not 95%). 1.34 is the realistic bindingcapacity of hemoglobin, although 1.39 is the actual bindingcapacity. 0.003 times the PaO2 is the amount of oxygensoluble in plasma at normal atmospheric pressure. Withhyperbaric oxygen, the amount of oxygen dissolved in arter-ial blood is dramatically increased. Conversely, the amountcarried by hemoglobin remains about the same as thatachieved by inspiring oxygen at 1 atmosphere absolute(ATA) (4). As measured in ml O2 per deciliter of whole blood,the oxygen content increases significantly under hyperbaricconditions as shown in Table 3. The oxygen content of bloodincreases from 0.31 at 1 atmosphere to 6.80ml/dl vol% at3 atmospheres. Note that 100% oxygen is not used atpressures greater than 3 ATA to minimize the risk of oxygentoxicity. The alveolar type 1 cells in the lungs and theneurons in the brain are sensitive to excessive concentra-tions of oxygen. Again, to prevent oxygen toxicity, which canlead to alveolar damage or seizure, 100% oxygen is not givenat pressures greater than 3 ATA. Even in these pressureranges, air breaks are given to patients and they breathe airas opposed to concentrated oxygen under pressure for 10minutes during many of the protocols, which in theory, givesthe xanthine oxidese system a chance to deal with thecurrent load of free radicals in the lungs and tissues andthe Gaba amino buteric acid (GABA) depletion in the brain achance to normalize. As mentioned, the blood’s ability tocarry more dissolved oxygen molecules under higher atmo-spheric pressure is a function of Henry’s law. It states thatthe amount of gas that will dissolve in a liquid is propor-
tional to the partial pressure of the gas in contact with thatliquid as well as to the atmospheric pressure. Thus, moregas, oxygen, or nitrogen will dissolve in tissue fluid at higheratmospheric pressure. %X is the percentage of gas X dis-solvedinthe liquid,P(t) istheatmosphericpressure,andP(X)is the partial pressure of gas X.
TRANSCUTANEOUS OXYMETRY (TcPO2 OR TCOM)
In order for the patient to benefit from HBO therapy, theymust have adequate perfusion of blood to the affected area.This perfusion can be assessed prior to hyperbaric oxygentherapy by checking transcutaneous oxygen tension,TcPO2. Transcutaneous oxygen tension values of less than40, which increase to more than 100 mmHg while breath-ing 100% oxygen or to more than 200 during HBO therapy,will likely benefit from hyperbaric oxygen therapy (6). Thedetailed mechanisms by which the elevated oxygen tensionis felt to improve wound healing and the body’s ability tocombat bacterial pathogens will be discussed under eachindication for HBO therapy. Briefly, Hunt and Pa: (7)showed, in 1976, that increased oxygen tension stimulatedcollagen synthesis and fiberblast proliferation. Then, stu-dies revealed improved ability of leukocytes to clear infectedwounds of bacteria with hyperbaric oxygen (8,9). Then, in1989, Zamboni et al. (10) showed that HBO therapy in thereduction of tissue flap necrosis was a systemic phenomenonthat involved inhibition of neutrophil adherence and pre-vention of arteriolar vasoconstriction thought to be via anitric oxide-mediated mechanism. In addition, it increasesplatelet-derived growth factor Beta (PDGF B), vascularendothelial growth factor (VEGF), Epidermal growth factor(EGF), and other factors.
APPROVED INDICATIONS
The following indications are approved uses of hyperbaricoxygen therapy as defined by the Hyperbaric Oxygen
20 HYPERBARIC MEDICINE
Table 3. Oxygen Levels During Hyperbaric Oxygen Treatment Breathing Air (4)
ATA Chamber Pressure Chamber PO2 (mmHg) Chamber PAO2 (mmHg) Lung O2 ml/dl vol % Plasma
1 760 160 100 0.312 1520 319 269 0.832.36 1794 377 322 1.002.82 2143 450 400 1.243 2280 479 429 1.334 3040 638 588 1.825 3800 798 748 2.326 4560 958 908 2.81
Breathing 100% Oxygen
1 760 760 673 2.082 1520 1520 1433 4.442.36 1794 1794 1707 5.292.82 2143 2143 2056 5.803 2280 2280 2193 6.804 3040 100% oxygen is not used above 3ATA to minimize the risk of oxygen toxicity.5 38006 4560
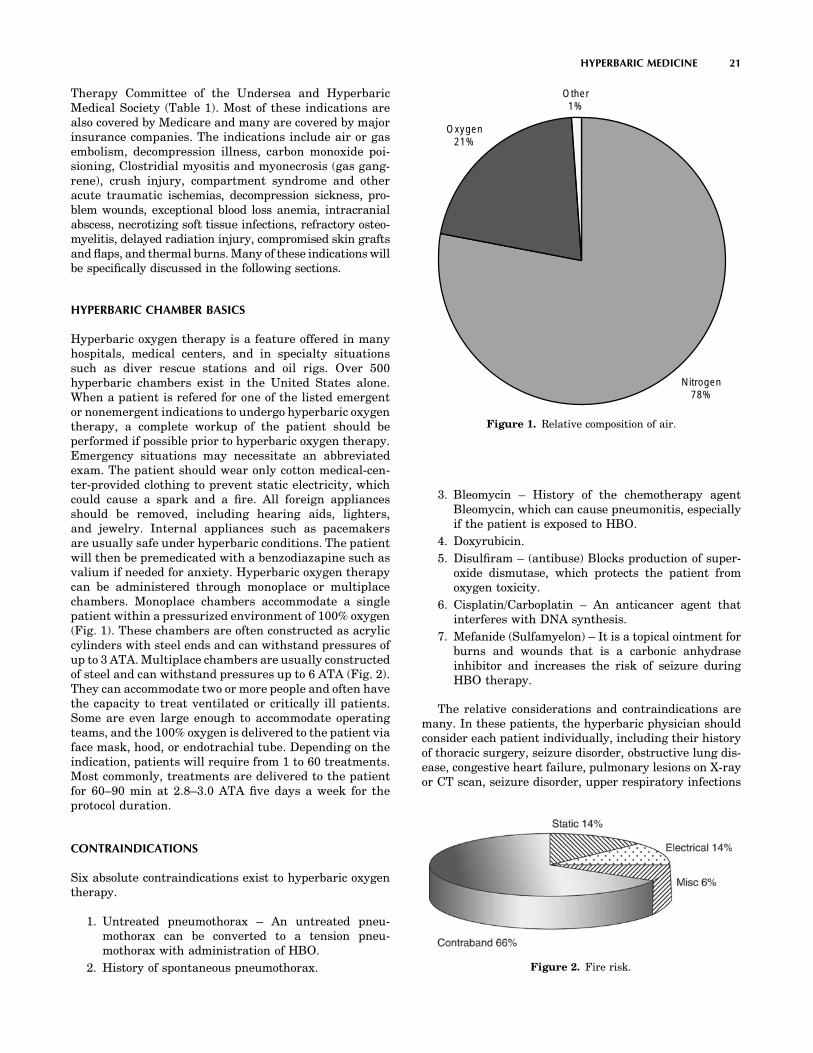
Therapy Committee of the Undersea and HyperbaricMedical Society (Table 1). Most of these indications arealso covered by Medicare and many are covered by majorinsurance companies. The indications include air or gasembolism, decompression illness, carbon monoxide poi-sioning, Clostridial myositis and myonecrosis (gas gang-rene), crush injury, compartment syndrome and otheracute traumatic ischemias, decompression sickness, pro-blem wounds, exceptional blood loss anemia, intracranialabscess, necrotizing soft tissue infections, refractory osteo-myelitis, delayed radiation injury, compromised skin graftsand flaps, and thermal burns. Many of these indications willbe specifically discussed in the following sections.
HYPERBARIC CHAMBER BASICS
Hyperbaric oxygen therapy is a feature offered in manyhospitals, medical centers, and in specialty situationssuch as diver rescue stations and oil rigs. Over 500hyperbaric chambers exist in the United States alone.When a patient is refered for one of the listed emergentor nonemergent indications to undergo hyperbaric oxygentherapy, a complete workup of the patient should beperformed if possible prior to hyperbaric oxygen therapy.Emergency situations may necessitate an abbreviatedexam. The patient should wear only cotton medical-cen-ter-provided clothing to prevent static electricity, whichcould cause a spark and a fire. All foreign appliancesshould be removed, including hearing aids, lighters,and jewelry. Internal appliances such as pacemakersare usually safe under hyperbaric conditions. The patientwill then be premedicated with a benzodiazapine such asvalium if needed for anxiety. Hyperbaric oxygen therapycan be administered through monoplace or multiplacechambers. Monoplace chambers accommodate a singlepatient within a pressurized environment of 100% oxygen(Fig. 1). These chambers are often constructed as acryliccylinders with steel ends and can withstand pressures ofup to 3 ATA. Multiplace chambers are usually constructedof steel and can withstand pressures up to 6 ATA (Fig. 2).They can accommodate two or more people and often havethe capacity to treat ventilated or critically ill patients.Some are even large enough to accommodate operatingteams, and the 100% oxygen is delivered to the patient viaface mask, hood, or endotrachial tube. Depending on theindication, patients will require from 1 to 60 treatments.Most commonly, treatments are delivered to the patientfor 60–90 min at 2.8–3.0 ATA five days a week for theprotocol duration.
CONTRAINDICATIONS
Six absolute contraindications exist to hyperbaric oxygentherapy.
1. Untreated pneumothorax – An untreated pneu-mothorax can be converted to a tension pneu-mothorax with administration of HBO.
2. History of spontaneous pneumothorax.
3. Bleomycin – History of the chemotherapy agentBleomycin, which can cause pneumonitis, especiallyif the patient is exposed to HBO.
4. Doxyrubicin.
5. Disulfiram – (antibuse) Blocks production of super-oxide dismutase, which protects the patient fromoxygen toxicity.
6. Cisplatin/Carboplatin – An anticancer agent thatinterferes with DNA synthesis.
7. Mefanide (Sulfamyelon) – It is a topical ointment forburns and wounds that is a carbonic anhydraseinhibitor and increases the risk of seizure duringHBO therapy.
The relative considerations and contraindications aremany. In these patients, the hyperbaric physician shouldconsider each patient individually, including their historyof thoracic surgery, seizure disorder, obstructive lung dis-ease, congestive heart failure, pulmonary lesions on X-rayor CT scan, seizure disorder, upper respiratory infections
HYPERBARIC MEDICINE 21
Nitrogen78%
Oxygen21%
Other1%
Figure 1. Relative composition of air.
Figure 2. Fire risk.
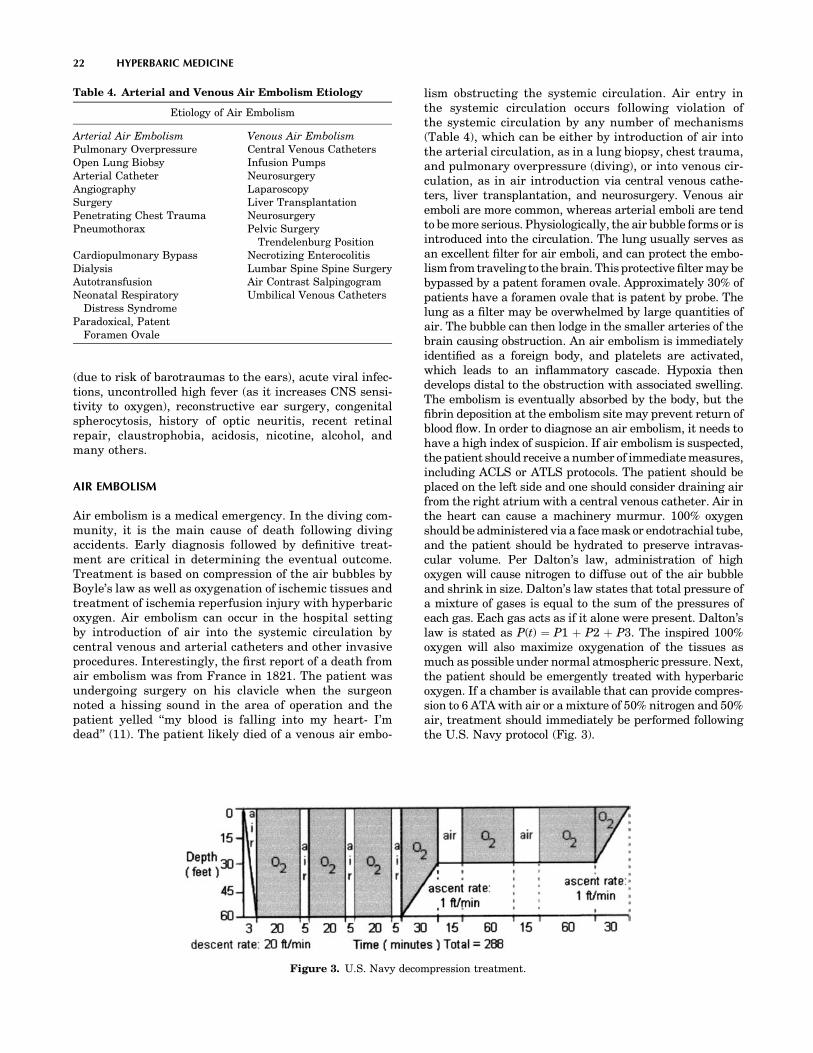
(due to risk of barotraumas to the ears), acute viral infec-tions, uncontrolled high fever (as it increases CNS sensi-tivity to oxygen), reconstructive ear surgery, congenitalspherocytosis, history of optic neuritis, recent retinalrepair, claustrophobia, acidosis, nicotine, alcohol, andmany others.
AIR EMBOLISM
Air embolism is a medical emergency. In the diving com-munity, it is the main cause of death following divingaccidents. Early diagnosis followed by definitive treat-ment are critical in determining the eventual outcome.Treatment is based on compression of the air bubbles byBoyle’s law as well as oxygenation of ischemic tissues andtreatment of ischemia reperfusion injury with hyperbaricoxygen. Air embolism can occur in the hospital settingby introduction of air into the systemic circulation bycentral venous and arterial catheters and other invasiveprocedures. Interestingly, the first report of a death fromair embolism was from France in 1821. The patient wasundergoing surgery on his clavicle when the surgeonnoted a hissing sound in the area of operation and thepatient yelled ‘‘my blood is falling into my heart- I’mdead’’ (11). The patient likely died of a venous air embo-
lism obstructing the systemic circulation. Air entry inthe systemic circulation occurs following violation ofthe systemic circulation by any number of mechanisms(Table 4), which can be either by introduction of air intothe arterial circulation, as in a lung biopsy, chest trauma,and pulmonary overpressure (diving), or into venous cir-culation, as in air introduction via central venous cathe-ters, liver transplantation, and neurosurgery. Venous airemboli are more common, whereas arterial emboli are tendto be more serious. Physiologically, the air bubble forms or isintroduced into the circulation. The lung usually serves asan excellent filter for air emboli, and can protect the embo-lism from traveling to the brain. This protective filter may bebypassed by a patent foramen ovale. Approximately 30% ofpatients have a foramen ovale that is patent by probe. Thelung as a filter may be overwhelmed by large quantities ofair. The bubble can then lodge in the smaller arteries of thebrain causing obstruction. An air embolism is immediatelyidentified as a foreign body, and platelets are activated,which leads to an inflammatory cascade. Hypoxia thendevelops distal to the obstruction with associated swelling.The embolism is eventually absorbed by the body, but thefibrin deposition at the embolism site may prevent return ofblood flow. In order to diagnose an air embolism, it needs tohave a high index of suspicion. If air embolism is suspected,the patient should receive a number of immediate measures,including ACLS or ATLS protocols. The patient should beplaced on the left side and one should consider draining airfrom the right atrium with a central venous catheter. Air inthe heart can cause a machinery murmur. 100% oxygenshould be administered via a face mask or endotrachial tube,and the patient should be hydrated to preserve intravas-cular volume. Per Dalton’s law, administration of highoxygen will cause nitrogen to diffuse out of the air bubbleand shrink in size. Dalton’s law states that total pressure ofa mixture of gases is equal to the sum of the pressures ofeach gas. Each gas acts as if it alone were present. Dalton’slaw is stated as P(t) ¼ P1 þ P2 þ P3. The inspired 100%oxygen will also maximize oxygenation of the tissues asmuch as possible under normal atmospheric pressure. Next,the patient should be emergently treated with hyperbaricoxygen. If a chamber is available that can provide compres-sion to 6 ATA with air or a mixture of 50% nitrogen and 50%air, treatment should immediately be performed followingthe U.S. Navy protocol (Fig. 3).
22 HYPERBARIC MEDICINE
Table 4. Arterial and Venous Air Embolism Etiology
Etiology of Air Embolism
Arterial Air Embolism Venous Air EmbolismPulmonary Overpressure Central Venous CathetersOpen Lung Biobsy Infusion PumpsArterial Catheter NeurosurgeryAngiography LaparoscopySurgery Liver TransplantationPenetrating Chest Trauma NeurosurgeryPneumothorax Pelvic Surgery
Trendelenburg PositionCardiopulmonary Bypass Necrotizing EnterocolitisDialysis Lumbar Spine Spine SurgeryAutotransfusion Air Contrast SalpingogramNeonatal Respiratory
Distress SyndromeUmbilical Venous Catheters
Paradoxical, PatentForamen Ovale
Figure 3. U.S. Navy decompression treatment.

DECOMPRESSION ILLNESS
By definition, decompression illness (DCI), also calledbends or caisson disease, occurs when gas bubbles exitin the blood or body tissues. At depth, more gas candissolve in the tissues than in the blood. When the diverascends too quickly, the gas comes out of solution andforms bubbles in the tissues and in the blood, much likepopping a soda can and releasing its pressure causes thecarbon dioxide bubbles to come out of the solution. In1994, Diver’s Alert Network (DAN) recorded 1164 diving-related injuries and 97 diving-related deaths, manyrelated to DCI (12). The severity of DCI depends on thevolume and location of gas bubbles. The range of symp-toms is from vague constitutional complaints or limb painto cardiopulmonary arrest and coma, the pathophysiologyof which is explained by Henry’s law. As previouslyexplained, Henry’s law is p ¼ Kc, where p is the partialpressure of the gas 1, c is its molar concentration, and K isthe Henry’s law constant, which is temperature-depen-dent. Thus, simply stated, more inert gas can be dissolvedin a liquid at higher atmospheric pressure and, conver-sely, less under lower atmospheric pressure, which occurson decompression when gas must be removed from tis-sues, and rapid decompression leads to bubble formation.Using the Henry’s law equation, one can calculate theestimated amount of nitrogen a diver must clear from thebloodstream (about 5 L) in rising from 100 ft to the sur-face. The amout would be approximately 750 ml nitrogenassuming room temperature, which is a significantvolume of nitrogen that must be eliminated from thedivers bloodstream. The onset of symptoms is usuallyrapid and 75% of patients experience symptoms within1 h of decompression and 90% within 12 h of decompres-sion (13). A small number of patients may present evenlater, particularly if they have flown in commercial air-craft after diving and not followed the recommendation ofthe major diving organizations not to fly within 24 hoursof one’s last dive. Interestingly, up to 10% of the inert gasthat is absorbed in the tissues is released as bubbles afterthe diver’s decompression (14). Patients experience symp-toms depending on the location and concentration of the
bubbles (see Table 5). Bubbles forming in or near jointscause the joint pain of a classical ‘‘bend.’’ These muscu-loskeletal effects are called type 1 DCS. When theseeffects occur in the spinal cord or brain, numbness,paralysis, and disorders of higher cerebral function mayresult. If large numbers of bubbles enter the venousbloodstream, congestive symptoms in the lung and circu-latory shock can then occur. These pulmonary and neu-rologic effects are termed type 2 DCS. Treatment shouldinvolve immediate administration of 100% oxygen, whichfacilitates nitrogen washout by the previously explainedprinciples of Dalton’s law. Rehydration as well asadvanced cardiac or trauma life-support protocols shouldbe followed by transfer to a hyperbaric facility emer-gently. The patient should be treated with hyperbaricoxygen following U.S. Navy guidelines (Fig. 3), even ifthe inspired oxygen and rehydration alone have improvedthe patient’s signs and symptoms because tiny bubblesmay be left that can cause tissue necrosis. Hyperbaricoxygen shrinks the size of the mostly nitrogen-filled bub-bles by the principles of Boyle’s law, and the increasedpressure also increases the partial pressure of the gas byDalton’s law, hastening complete elimination of the bubble(Table 2). If the U.S. Navy (Fig. 3) recompression regimenfails to lead to symptom resolution, the Diver’s AlertNetwork or a medical expert on DCI should be contacted,and one of a number of recompression tables may befollowed.
PROBLEM WOUNDS
The management of problem wounds should alwaysinclude infection control, debridement, aggressive woundcare, and correction of perfusion and oxygenation defi-ciencies. When an oxygenation deficiency of the wound isfound, in the face of nonreconstructable vascular disease,hyperbaric oxygen should be considered as an adjunctivetherapy. An increase in tissue oxygen tension by HBOtherapy enhances wound healing by increasing neutro-phil bactericidal capacity, inhibiting toxin formation inand even killing some anaerobes, encouraging fibroblastactivity, and promoting angiogenesis (15). In normal phy-siology, the oxygen gradient across a wound is essential tostimulate these components of healing. Oxygen consump-tion is relatively low in wounds, and microvasculaturedamage and peripheral vasoconstriction increase diffu-sion distances. Partial pressure via Dalton’s law is thedriving force of diffusion. Hyperbaric oxygen creates asteep tissue oxygenation gradient, providing a strongerstimulus than lactate or moderate hypoxia, to initiate andfacilitate wound healing (16,17). These stimulated factorsare thought to include platelet-derived growth factor B(PDGF-B), Vascular endothelial growth factor (VEGF),Epidermal growth factor, and others. Several clinicalstudies support the use of hyperbaric oxygen to promotewound healing. Perhaps the studies involving diabeticlower extremity wounds have been most informative.Several studies have shown an increased number ofhealed wounds, decreased wound size, and decreasedrates of amputation among patients receiving hyperbaric
HYPERBARIC MEDICINE 23
Table 5. Signs and Symptoms of Decompression Illness
Symptoms ofDecompression Illness
Signs ofDecompression Illness
Unusual fatigue Blotchy skin rashSkin itching Paralysis, muscle weaknessPain in joints/
muscles of arms,legs or torso
Difficulty urinating
Dizziness Confusion, personalitychanges, bizarre behavior
Vertigo Amnesia,Ringing in the ears, (Tinnitus) StaggeringNumbness, tingling
and paralysisCoughing up bloody,
frothy sputumShortness of breath (Dyspnea) Collapse or unconsciousness
Tremors

oxygen therapy as an adjunctive treatment (18,19). Bar-oni et al. reported in a controlled study that a significantnumber of subjects receiving HBO went on to heal theirwounds and fewer required amputation when comparedwith subjects not receiving HBO (20). In another studyinvolving 151 diabetic patients with wounds of the lowerextremity, Oriani et al. showed that 130 of these patientscompletely healed their wounds with adjunctive HBO(21). When compared with conventionally treatedwounds, HBO-treated patients had an accelerated rateof healing, reduced rate of amputation, and an increasedrate of completely healed wounds on a long-term basis(21). Transcutaneous Oxymetry (TcPO2) is currently thebest tool available to evaluate tissue hypoxia and to selectpatients appropriate for HBO therapy. It can also be usedto monitor progress during hyperbaric oxygen therapy.TcPO2 measurements should be taken with the patientbreathing room air. A value of greater than 50 mmHgaround the wound site indicates that the wound hasadequate oxygenation and hyperbaric oxygen is not likelyto improve healing. Values below 40 at the wound siteshould be considered for HBO therapy. Patients withmarginal TcPO2 should be further tested while breathing100% oxygen. TcPO2 values of greater than 100 whilebreathing 100% oxygen is an indicator that they are likelyto respond to HBO therapy. If this challenge TcPO2 is lessthan 100, they still may benefit if the tested TcPO2 at thewound site is greater than 200 mmHg while they arebreathing 100% oxygen at 2.0 ATA in the hyperbaricchamber (22). A TcPO2 value of less than 30 around awound that does not exhibit this response, which indicatesvascular compromise and the patient should be consid-ered for revascularization if possible. Of note, 96% of limbswith TcPO2 values below 30 mmHg had abnormal arter-iograms. It is also important to follow TcPO2 valuesweekly, and diabetic patients may have normal or falselyelevated noninvasive Doppler studies and a low TcPO2,implying satisfactory perfusion and inadequate oxygena-tion of the wound and, as such, may pose a diagnosticdelimma. The diabetic patient with normal noninvasiveDoppler and low TcPO2 will respond best to HBO. HBOtherapy should be reserved for those diabetic wounds notresponding to traditional management of debridement,antibiotics, and general wound care, including vascularreconstruction. The use of HBO therapy is necessary inonly 15–20% of these patients. HBO therapy increaseswound oxygen tension, enhancing host antibacterialmechanisms and promoting wound healing and isreserved for wounds in which the primary etiologies aretissue hypoxia or infection (13). Treatments are deliveredat 2.0–2.4 atmospheres for 90–120 min once or twice daily.When serious infections are present, patients are typi-cally hospitalized and given IV antibiotics and hyperbarictreatments twice daily five days a week. The TcPO2 valuesshould be checked weekly because hyperbaric oxygenfacilitates angiogenesis by a nitric oxide and vascularendothelial growth factor Beta (VEGF-B). When the roomair TcPO2 is greater than 40 mmHg, the hyperbaric oxy-gen therapy can safely be discontinued. HBO is an adju-vant treatment; therefore, diabetic control, debridement,and aggressive wound treatment are given first priority.
When the wound bed has adequate granulation tissue,application of grafts can shorten morbidity, hospital stay,and health-care costs. The underlying problem in failureof a wound to heal is usually hypoxia and infection.Hyperbaric oxygen treatments in selected patients canfacilitate healing by increasing tissue oxygen tension,thus providing the wound with a more favorable environ-ment for healing. Therefore, hyperbaric oxygen therapycan be an important component to any comprehensivewound care program.
COMPROMISED FLAPS AND GRAFTS
Skin grafts and flaps with adequate blood supply do notrequire HBO. Hyperbaric oxygen therapy is extremelyuseful in situations where the skin grafts or flaps sufferfrom compromised microcirculation or hypoxia.
Flaps
The benefits of HBO on flaps develop from a systemicelevation in oxygen tension (23–25). In addition, HBOtherapy prevents neutrophil adherence and subsequentvasoconstriction following ischemia. Too often, a compro-mised flap is allowed to progress over the days followingsurgery until visible signs of necrosis obviate the use ofHBO, because delayed treatment with HBO cannot revivedead tissue. The resulting disappointment, as well as theassociated patient dissatisfaction, can be avoided by rapiddiagnosis of the flap problem and early involvement of thehyperbaric physician. The keys to successful treatment ofcompromised flaps with HBO are accurate diagnosis of thespecific flap problem and appropriate and expedient initia-tion of hyperbaric oxygen treatment. Awareness of thedifferent etiologies of flap compromise is necessary to planfor effective HBO treatment. A random flap with distalnecrosis is completely different from a free flap with totalvenous occlusion. Proper classification of flaps, differentetiologies of flap compromise, and understanding of howHBO is thought to effect ischemia reperfusion injurydefines which patients will benefit from HBO. Flap classi-fication is based on an assessment of blood supply, tissuecomposition, and method of movement. Each of theseelements must be evaluated, but it is blood supply thatis most important. The blood supply to the flap is eitheraxial, based on a named vessel, or random, based on thesubdermal plexus. Commonly, flap compromise occurswhen the surgeon tries to mobilize tissue outside thedefined arterial supply, when there is a pedicle problemexists, or when free flaps are exposed to prolonged ische-mia. The tissue composition of a flap may include skin,subcutaneous tissue, fascia, muscle, bone, other tissues, ora combination of these. Flap composition is very importantbecause different tissue types have different tolerances toischemia. For instance, a myocutaneous flap will be moresusceptible to ischemia than a fasciocutaneous flap,because muscle is much more sensitive to ischemic injurythan fascia and skin (26). In those circumstances where aprolonged primary ischemia or any secondary ischemiaresulting from vessel thrombosis and revision anastomosisexists, the flaps will undergo ischemia reperfusion injury.
24 HYPERBARIC MEDICINE
Whentreatingcompromisedflaps,amultimodalityapproachshould be initiated. This approach should include the useof vasodilators if arterial vasospasm is suspected, removalof sutures if tension or compression are suspected, dextranand pentoxifylline for rheological purposes, medicinal andchemical leeching for venous congestion, and the earlyuse of hyperbaric oxygen if blood flow can be documented.The use of HBO therapy is appropriate only when theflap problem has been defined, documented perfusion oftheflapexists, appropriatesurgical salvagemeasures havebeen first considered, and HBO therapy can be performedin an expedient manner. Specifically with respect to freeflaps, extended primary ischemia time greater than 2 hor any secondary ischemia time may result in partial ortotal flap necrosis. This injury is usually reversible ifrecognized early and treated expeditiously. Essentially,it is ischemia reperfusion injury. Numerous researchstudies support the use of HBO in the salvage of compro-mised free tissue transfers (27,28). A rat free-flap modelshowed similar improvement in flap survival (27). A clin-ical study evaluated free-flap salvage in the face of pro-longed primary or any secondary ischemia (28). Salvagewas significantly better in the HBO treatment group vs.controls, but only if initiated within 24 h. Free flaps com-promised by prolonged primary or secondary ischemiahave responded favorably to HBO treatment with com-plete salvage, in most cases, if HBO is started early. Thetreatment regimen is 2.0–2.4 ATA, 90 min q 8 h x 24 h, thenq 8–12 h x 48 h (29). Treatment duration is based on clinicalevaluation.
Grafts
Skingraftsareanatomically different fromflaps in thatskingrafts lack an inherent blood supply. Skin grafts are com-posed of avascular tissue that depends entirely on the reci-pient bed for oxygenation. HBO is useful in preparing therecipientbedand inpromotinghealthygranulationtissue tosupport split-thickness skin grafts. One controlled studyshowed a significant improvement in skin graft survivalfrom 17% to 64% with the addition of HBO treatment.Although literature exists to support the use of HBO forcomposite grafts, a study by the University of MississippiMedical Center found no significant effect of HBO on rat-earcomposite grafts larger than 1 cm (30,31) Further researchis needed to better understand the effects of HBO oncomposite graft survival. The rational for use of HBO incrush injury, compartment syndrome, frostbite, and othertraumatic ischemias is similar to those for compromisedflaps as they are all cases of ischemia and ischemia reper-fusion injury.
CRUSH INJURY, COMPARTMENT SYNDROME, ANDOTHER ACUTE TRAUMATIC ISCHEMIAS
These conditions are trauma-related situations in whichthe underlying pathophysiology is that of ischemia reper-fusion (IR) injury. Ischemia times of greater than 4 hwillresult in some degree of permanent necrosis. Thephysiologic basis of IR injury has become better under-
stood in recent years. Most of the animal research centersaround the production of oxygen-free radicals. Althoughthe endothelial xanthine oxidase pathway has receivedmuch attention in the literature (32), more recent evi-dence supports the fact that neutrophils are a moreimportant source of oxygen-free radicals via membraneNADPH oxidase and degranulation. Also, neutrophiladhesion is felt to cause ischemia reperfusion IR-asso-ciated vasoconstriction.
A perceived paradox exists related to HBO for IR injury.The less-informed observer often does not understand whyHBO improves reperfusion injury and might think HBOinstead increases free radical formation. (An oxygen-freeradical is an oxygen molecules with an unpaired electronin its outer shell.) During ischemia, ATP is ultimatelydegraded to hypoxanthine and xanthine, which are anae-robic metabolites. With reperfusion, oxygenated blood isreintroduced into the ischemic tissue, and the hypox-anthine and xanthine plus oxygen creates oxygen-freeradicals. Superoxide and hydroxyl oxygen-free radicalsare formed, which can cause extensive tissue damage.The authors believe that the major mediator of damageis, in fact, neutrophil adherence to postcapillary venulessignificant and progressive vasoconstriction occurs inarterioles adjacent to leukocyte-damaged venules. Neutro-phil adherence and vasoconstriction lead to a low flow statein the microcirculation and then vessel thrombosis, whichis the endpoint of IR injury. The leukocyte-damaged venuleis thought to be responsible for the arterial vasoactiveresponse. HBO inhibits neutrophil adherence to theendothelial cells and thereby inhibits the ultimate throm-bosis of microvessels, but the complete mechanism is stillpoorly understood, but is thought to involve the elevationin nitric oxide mediated by an increase in nitric oxidesyntase (33). Free radical formation is not felt to be wor-sened with HBO as fewer adherent neutrophils actuallyexist to contribute to the neutrophil oxygen-free radical-generating system.
Treatment with hyperbaric oxygen in the face of IRinjury carried the concern that that providing extra oxy-gen would increase free radical production and tissuedamage. This query has been resolved by studies thathave shown that HBO actually antagonizes the ill effectsof IR injury in a variety of tissues (33–35). One of the firststudies evaluating HBO and IR injury showed that HBO,immediately upon reperfusion, significantly improvedskin flap survival following 8 h of global ischemia in arat axial skin flap model with increased microvascularblood flow during reperfusion. Free-flap survivalimproves with HBO treatment during reperfusion evenfollowing ischemia times of up to 24 h (36). Hyperbaricoxygen administered during and up to 1 h following 4 hglobal ischemia significantly reduced neutrophil endothe-lial adherence in venules and also blocked the progressivearteriolar vasoconstriction associated with reperfusioninjury (37). HBO inhibited in vitro beta-2-integrin(CD18)-induced neutrophil adherence function, but didnot alter other important neutrophil functions such asoxidative burst or stimulus-induced chemotaxis andmigration. This latter finding is very important, becauseHBO, through its action on the CD18 adhesion molecule,
HYPERBARIC MEDICINE 25

blocks the neutrophil adherence associated with IR injurywithout interfering with other neutrophil functions thatwould increase the risk of infectious complications. Initi-ally, the focus in acute ischemia caused by trauma shouldbe restoration of blood supply. The authors, therefore,recommend HBO therapy for all patients with muscleischemia time greater than 4 h and skin ischemia timegreater than 8 h. The major effects of IR injury are felt tooccur within the first 4–7 h of reperfusion. 2 ATA hyper-baric oxygen increases the tissue oxygen tension 1000%.Treatment protocol is 2.0–2.5 ATA for 60 min, q 8 h x 24 h,then q 8–12 h x 48 h with clinical re-evaluation. If pro-gressive signs of ischemic injury are still present, thetreatment is continued at 2.0 ATA, q 12 h for 2–3 moredays. Usually, 72 h of treatment is adequate as long as thefirst treatment is initiated within 4 h of surgery.
RADIATION TISSUE DAMAGE ANDOSTEORADIONECROSIS
1.2 million cases of invasive cancer are diagnosed yearly,half of which will receive radiation therapy and 5% ofwhich will have serious radiation complications, whichrepresents 30,000 cases per year of serious radiationsequellae (38). HBO is also well studied for its use intreating osteoradionecrosis in conjunction with adequatedebridement of necrotic bone. Carl et al. also reportedsuccess is applying HBO to 32 women with radiationinjury following lumpectomy and radiation comparedwith controls (39). Feldmeier and his colleagues reviewedthe literature and found no evidence to support the poten-tiation of malignant cells or the engancement of cancergrowth (40). The treatment protocol is 2.5 ATA for 90 mindaily for 20–50 treatments. HBO can also be used as aradiosensitizer and are as much as three timesmore sensitive to radiation kisses than are hypoxic cells(41).
REFRACTORY OSTEOMYELITIS
Chronic refractory osteomyelitis (CROM) is infection ofthe medullary and cortical portions of the bone thatpersists or recurs following treatment with debridementand antibiotics. The principles of treatment are fairlysimple. First, the dead bone is debrided and bone culturesshould be taken along with administration of appropriateantibiotics. Next, the interface or cicatrix, which sepa-rates the compromised bone from adequate blood supply,is removed. Finally, hypoxia in the wound must be cor-rected, which may be accomplished by HBO. The treat-ment protocol is 2.0 ATA for 90 min daily for 20–60treatments. Note that CROM and refractory osteomyelitisrequire the longest treatment protocols. HBO is believedto oxygenate hypoxic/ischemic tissues, augment host anti-microbial responses, augment osteoclastic activity, andinduce osteogenesis in normal and infected bone andantibiotic synergism.
ACUTE THERMAL BURNS
HBO is approved by the USMS but it is not covered byMedicare.Gruberdemonstratedin1970thattheareaaroundand under a third-degree burn was hypoxic and could only beraised by oxygen at increased pressure (42). HBO has beenfound to prevent extension, reduce edema, increase healingrates, and decrease total cost in several randomized studies(43,44). HBO is also thought to decrease the rate of burnsepsis based on several early studies. The controversy, inpart,surroundscurrentguidelines forearlydebridementandgrafting of burns. Once excised, a burn no longer exists andHBO will not be helpful. In case burns are not easily amen-able to excision such as flash burns to the face or groin, HBOmay be helpful to prevent extension of the burn and to aidhealing. Treatment must be started within 24 h. The recom-mended regimen is 2.0 ATA for 90 min every 8 h on the firstday, then every 12 hours for 5 or 6 days.
ACUTE EXCEPTIONAL BLOOD LOSS ANEMIA
Hyperbaric oxygen for treatment of acute blood loss anemiais reserved for those patients whose anemia is not immedi-ately treatable for practical, disease process, or religiousreasons, which may include warm antibody hemolytic dis-ease, Jehova’s Witnesses, those with rare blood types, andthose who refuse transfusion for other personal reasons. Asexplained in the physiology section, HBO dramaticallyincreases the amount of solublized oxygen the blood cancarry. In fact, Boerema showed, in 1955, that pigs could beexsanguinated to four-tenths of one gram of hemoglobin perdeciliter and be maintained in a hyperbaric environment of3 ATA without hypoxia. The goal in HBO therapy for theseconditions is to improve the oxygen depth with the daily ortwice daily HBO treatments until the anemia can beimproved. In between the treatments, the patients shouldbe maintained a lower FIO2 of inspired oxygen if possible tohelp reduce oxygen toxicity.
CARBON MONOXIDE POISONING
In 1966, Wada first used HBO to treat survivors of coal minedisasters with carbon monoxide poisoning and burns. Themodern-day sources of carbon monoxide include automobileexhaust, home heaters, portable generators, propaneengines, charcoal burners and camp stoves, and methylenechloride paint strippers. The initial treatment for carbonmonoxide poisoning is 100% oxygen. The administrationof 100% oxygen via a nonrebreather mask facilitates thedissociation of CO from hemoglobin to approximately 1.5h. Hyperbaric oxygen delivered at 2.8–3.0 ATA reducedthe halflife of CO-bound hemoglobin further to 23 min. Inaddition, patients who had one hyperbaric treatment forCO poisoning had 46% neuropsychiatric sequelae at dis-charge and 50% at one month versus two HBO treatmentsat 2.8–3.0 ATA having 13% at discharge and 18% at onemonth. The current recommendation is 3.0 ATA for 90min with air breaks delivered every 8 h for a total of 3treatments (called theWeaver protocol). Some authorsstill feel one treatment may be adequate (45).
26 HYPERBARIC MEDICINE

CYANIDE POISONING
Hydrocyanide gas or HCN is formed when any number ofsubstances burns, including furniture, asphalt, paper, car-peting (nylon), lighting baths (acrylic), plastic(polystyrene),and insulation (melamine resins). The antidote for cyanidepoisoning begins with breathing 100% oxygen, ATLS pro-tocols, and administration of IV sodium thiosulphate and iscontinued with a slow infusion of sodium nitrate and simul-taneous HBO therapy if it is available. The sodium nitratecreates methemoglobin, which can impair the oxygen-carry-ing capacity of hemoglobin. HBO increases the amount ofoxygen dissolved in plasma and may offer a direct benefit.The treatment regimin is 3.0 ATA with 30/10 airbreaks.
HYPERBARIC CHAMBER FACILITY DESIGNAND SAFETY
Over 500 hyperbaric facilities exist in the United States,and the number of hyperbaric chambers is steadily increas-ing worldwide. Hyperbaric chambers are classified aseither monoplace or multiplace. They differ functionallyin that the monoplace chamber instills oxygen into theentire chamber environment, whereas in a multiplacechamber, patients breathe 100% oxygen via a breathingmask or oxygen hood and exhaled gases are vented outsidethe chamber. Monoplace chambers are constructed eitheras an acrylic cylinder with metal ends or are primarilyconstructed of metal. Most commonly, the monoplacechambers are formed from an acrylic cylinder from 20 to40 inches in diameter with tie rods connecting it to endcaps. The opening is a rotating lock or a cam action leverclosure. Separate oxygen and air sources provide the oxy-gen sources and air for air breaks during therapy. Anoxygen vent must be exhausted outside the building.The through ports on the HBO chamber door allow passageof specially made intravenous monitoring devices andventilators. The larger diameter monoplace chambersare more comfortable; however, they require more oxygenand can be heavier and more expensive to install. Theacrylic chambers can provide a maximum of 3 ATA pres-sure. Alternatively, some monoplace chambers are con-structed mostly of steel with acrylic view ports, whichcan accommodate pressures of up to 6 ATA and are oftenused in special situations such as offshore rigs where acompact chamber is needed to treat decompression illnessrequired in U.S. Navy Table 5. Multiplace chambers aremuch larger and are designed to provide treatment tomultiple people or to manage complex conditions. Somecan even house operating rooms with special precautions.They are typically made of steel with acrylic view portsand are designed for operation up to 6 ATA or 165 feet ofsea water. The gauges are reported in feet of sea water onthese multiplace chambers to facilitate the use of divetables for staff or patients. These multiplace chambersare, therefore, best-suited to treat deep water decom-pression illness. These chambers can accommodate from2 to 20 people and have variable configurations includinghorizontal cylinders, spherical shapes, and rectangularchambers.
The primary professional hyperbaric medicine societiesin the United States are the Undersea and HyperbaricMedical Society (UHMS) and the American College ofHyperbaric Medicine. The UHMS has developed a clinicalhyperbaric medicine facility accreditation program. Thisprogram can be accessed via the UHMS website at http://www.uhms.org, and it was designed to assure that clinicalfacilities are:
1. Staffed with well-trained specialists;
2. Using high quality equipment that is properlyinstalled, maintained, and operated to the highestpossible safety standards;
3. Providing high quality care;
4. Maintaining proper documentation of informed con-sent, treatment protocols, physician participation,training, and so on (46).
Safety Elements for Equipment and Facilities
TheAmerican SocietyofMechanical Engineers (ASME)andthe Pressure Vessel for Human Occupancy Committee(PVHO) define the design and fabrication guidelines forhyperbaric chambers. Although not required in all statesor worldwide, it is accepted as the international standard(46). Next, the National Fire Protection Association (NFPA)has established a safety standard for hyperbaric facilities.The publication, NFPA 99, Safety Standard for Health CareFacilities, Hyperbaric Facilities, Chapter 20 explains thedetails of and criteria for equipment associated with ahyperbaric chamber facility. The requirements include fireabatement systems, air quality, and electrical require-ments. These requirements apply to any hyperbaric cham-ber placed within a health-care facility. Each site must havea safety director. It is important to have only cotton clothingand to avoid any sources of sparks or static electricity giventhe 100% oxygen (Fig. 2). In addition to these guidelines,hyperbaric chambers are pressure vessels and, as such, aresubject to boiler and pressure vessel laws. They are alsomedical devices and, in the United States, are also subject toFDArules forclass IImedicaldevices.Achamber isrequiredto have a clearance from the FDA before the device can belegally marketed or distributed, which is often called a 510 kclearance, denoting the form onwhich the clearancemust besubmitted. To check on whether a device has received clear-ance in the United States, one must contact the manufac-turer or the Food and Drug Administration (FDA) mosteasily via their website, http://www.fda.gov/scripts/cdrh/cfdocds/cfpmn/dsearch.cfm.
Facilities must develop defined safety protocols andemergency plans that are available through both theUndersea and Hyperbaric Medicine Society (UHMS) andthe American College of Hyperbaric Medicine (ACHM).
FRONTIERS AND INVESTIGATIONAL USES
The use of hyperbaric oxygen therapy has, at times, beensurrounded with controversy and spurious claims fromimproving athletic performance to slowing the agingprocess. It is essential that the hyperbaric medicine
HYPERBARIC MEDICINE 27

physician, staff, and potential patients understand andfollow the principles of evidence-based practice, whichmeans prescribing HBO therapy for the conditions provento benefit from such treatment. The UHMS website, atwww.UHMS. org, and AHCM are good resources for addi-tional information as are numerous publications on hyper-baric medicine such as the hyperbaric medicine textbookavailable through the UHMS website. Investigational usesfor hyperbaric oxygen therapy include carbon tetrachloridepoisoning, hydrogen sulfide poisioning, sickle cell crisis,spinal cord injury, closed head injury, cerebral palsy, pur-pura fulminans, intraabdominal and intracranial abscess,mesenteric thrombosis, retinal artery occlusion, cystoidmacular edema, bell’s palsy, leprosy, lyme disease, strokeand traumatic brain injury, and brown recluse spider bite.Some of the many investigational uses for HBO therapy mayhave merit, but these must be rigorously studied using well-designed trials. As the field of hyperbaric medicine con-tinues to advance, so will our understanding of the complexphysiologic effects of delivering oxygen under pressure.
AKNOWLEDGMENT
Special thanks to Bob Bartlet, MD, for his help in prepar-ing this chapter.
BIBLIOGRAPHY
1. Bakker DJ, Cramer FS. Hyperbaric surgery. Perioperativecare. p 2.
2. Behnke AR, Shaw LA. Use of hyperbaric oxygen in treatmentof compressed air illness. Nav Med Bull 1937;35:1–12.
3. Boerma I. High tension oxygen therapy. Proc Royal Soc Med1964;57(9):817–818.
4. Bakker DJ, Cramer FS. Hyperbaric Surgery PerioperativeCare. p. 67.
5. Jain KK. Physical Physiological, and Biochemical Aspects ofHyperbaric Oxygenation. Textbook of Hyperbaric Medicine.Toronto: Hogrefe & Huber Publishers; 1990. p 11.
6. Matos L, Nunez A. Enhancement of healing in selectedproblem wounds. In: Kindwall EP, Whelan HT, eds. Hyper-baric Medicine Practice, 2nd ed. Flagstaff AZ; Best; 1999.
7. Hunt TK, Pai MP. The effect of varying ambient oxygentensions on wound metabolism and collagen synthesis. SurgGynecol Obstet 1972;135:561–567.
8. Knighton DR, Halliday BJ, Hunt TK. Oxygen as an antibio-tic: A comparison of the effects of inspired oxygen concentra-tion and antibiotic administration on in vivo bacterialclearance. Arch Surg 1986;121:191–195.
9. Zamboni WA, Roth AC, Russell RC, Graham B, Suchy H,Kucan JO. Morphologic analysis of the microcirculation duringreperfusion of ischemic skeletal muscle and the effect of hyper-baric oxygen. Plast Reconstr Surg 1993;91(6):1110–23.
10. Zamboni WA, et al. The effect of acute hyperbaric oxygentherapy on axial pattern skin flap survival when adminis-tered during and after total ischemia. J Reconstr Microsurg1989;5:343–347.
11. Muth CM. Gas embolism (Review). New Eng J Med 342:476–482.
12. Divers Alert Network: Report on 1994 Diving Accidents.Durham, NC: Duke University; 1995.
13. Barnard EEP, Hanson JM, et al. Post decompression shockdue to extravasation of plasma. BMJ 1966;2:154.
14. Powel MR, Spencer MP, Von Ramm OT. Ultrasonic surveil-lance of decompression. In: Bennett PB, Elliott DH, eds. ThePhysiology of Diving and Compressed Air Work, 3rd ed.London Bailliere: Tindall; 1982. pp 404–434.
15. Zamboni WA. Applications of hyperbaric oxygen therapy inplastic surgery. In: Oriani G, Marroni A, eds. Handbook onHyperbaric Medicine, 1st ed. New York: Springer; 1995.p. 443–484.
16. Hunt TK. The physiology of wound healing. Ann Emerg Med1988;17:1265–1273.
17. Hunt TK, Hopf HW. Wound healing and wound infection.Surg Clinics N Am 1997;77(3):587–606.
18. Oriani G, Micheal M, Meazza D, et al. Diabetic foot andhyperbaric oxygen therapy: A ten-year experience. J Hyper-bar Med 1992;7:213–221.
19. Wattel FE, Mathieu DM, Fossati P, et al. Hyperbaric oxygenin the treatment of diabetic foot lesions: Search for healingpredictive factors. J Hyperbar Med 1991;6:263–267.
20. BaroniG,Porro T,FagliaE, PizziG,etal.Hyperbaricoxygen indiabetic gangrene treatment. Diabetes Care 1987;10:81–86.
21. Oriani G, Micheal M, Meazza D, et al. Diabetic foot andhyperbaric oxygen therapy: A ten-year experience. J Hyper-bar Med 1992;7:213–221.
22. Strauss MB, Bryant BJ, Hart GB. Transcutaneous oxygenmeasurements under hyperbaric oxygen conditions as a pre-dictor for healing of problem wounds. Foot Ankle Int. 2002Oct; 23(10):933–7.
23. Zamboni WA, Roth AC, Russel RC, Nemiroff PM, Casas L,Smoot EC. Hyperbaric oxygen improves axial skin flap sur-vival when administered during and after total ischemia. JReconstr Micro 1989;5:343–347.
24. Hunt TK, Pai MP. The effect of varying ambient oxygentensions on wound metabolism and collagen synthesis. SurgGyn Obstet 1972;135:561–567.
25. Niinikoski J, Hunt TK. Oxygen Tension in Human Wounds. JSurg Res 1972;12:77–82.
26. Mathieu D, et al. Pedicle musculocutaneous flap transplan-tation: prediction of final outcome by transcutaneous oxygenmeasurements in hyperbaric oxygen. Plast Reconstr Surg1993;91:329–334.
27. Waterhouse MA, et al. The use of HBO in compromised freetissue transfer and replantation: A clinical review. UnderseaHyperb Med 1993;20(Suppl):54 (Abstract).
28. Perrins DJD, Cantab MB. Influence of hyperbaric oxygen onthe survival of split skin grafts. Lancet 1967;1:868–871.
29. Persons BL, Zamboni WA. Hyperbaric oxygen in plastic andreconstructive surgery. In: Bakker DJ, Cramer FS, eds.Hyperbaric Surgery Perioperative Care. Flagstaff, AZ: Best;2002.
30. Mazelowski MC, Zamboni WA, Haws MF, Smoot EC, Ste-phenson LL. Effect of hyperbaric oxygen on composite graftsurvival in a rat ear model. Undersea and Hyperbaric MedSuppl 1995;22:50.
31. McFarlane RM, Wermuth RE. The use of hyperbaric oxygento prevent necrosis in experimental pedicle flaps and compo-site skin grafts. Plast Reconstr Surg 1966; 37:422–430.
32. Angel MF, et al. Free radicals: Basic concepts concerningtheir chemistry, pathophysiology, and relevance to plasticsurgery. Plast Reconstr Surg 79:990.
33. Lozano DD, Zamboni WA, Stephenson LL. Effect of hyper-baric oxygen and medicinal leeching on survival of axial skinflaps subjected to total venous occlusion. Undersea HyperbMed suppl 1997;24:86.
34. Thom SR, Bhopale V, Fisher D, Manevich Y, Huang PL,Buerk DG. Stimulation of nitric oxide synthase in cerebralcortex due to elevated partial pressures of oxygen: an oxida-tive stress response. J Neurobiol 2002;51(2):85–100.
28 HYPERBARIC MEDICINE

35. Jones S, Wang WZ, Natajaraj C, Khiabani, Stephenson LL,Zamboni WA. HBO inhibits IR induced Neutrophil CD 18Polarization by a nitric oxide mechanism. Undersea HyperbMed 2002;35 (Suppl):75.
36. Zamboni WA, Roth AC, Russel RC, Nemiroff PM, Casas L,Smoot EC. Hyperbaric oxygen improves axial skin flap survi-val when administered during and after total ischemia. JReconstr Micro 1989;5:343–347.
37. Gimbel M, Hunt TK. Wound healing and hyperbaric oxygen.In: Kindwall EP, Whelan HT, eds. Hyperbaric Medicine Prac-tice, 2nd ed. Flagstaff, AZ: Best; 1999. p 169–204.
38. Bartlett B. Hyperbaric therapy. Radiation Injury 1994:2–3.HBO has been shown to increase angiogenesis and blood flowin previously irradiated tissue or bone. (Marx RE, Ehler WJ,Taypongsak PT, Pierce LW. Relationship of oxygen dose toangiogenesis induction in irradiated tissue. Am J Surg 1990;160:519–524.
39. Carl UM, Feldmeier JJ, Schmitt G, Hartmann KA. Hyperbaricoxygen therapy for late sequelae in women receiving radiationafter breast conserving surgery. Int J Radiat Oncol Biol Phys2001;49:1029–1031.
40. Feldmeier JJ. Hyperbaric oxygen: Does it have a cancercausing or growth enhancing effect. Proceedings of the con-sensus conference sponsored by the European society fortherapeutic radiology and oncology and the European com-mittee for hyperbaric medicine. Portugal, 2001:129–146.
41. Gray KH, Conger AD, Ebert M, Hornsey S, Scott OCA. Theconcentration of oxygen dissolved in tissues at the time ofirradiation as a factor in radiotherapy. Br J Radiol 1953;26:638–648.
42. Wada J, Ikeda T, Kamata K, Ebuoka M. Oxygen hyperbarictreatment for carbon monoxide poisoning and severe burn incoal mine gas explosion. Igakunoaymi (Japan) 1965;54–68.
43. Germonpre P, Reper P, Vanderkelen A. Hyperbaric oxygentherapy and piracetam decrease the early extension of deeppartial thickness burns. Burns 1996;6:468–473.
44. CianciP,SatoR,GreenB.Adjunctivehyperbaricoxygenreduceslength of hospital stay, surgery and the cost of care in severeburns. Undersea Biomed Research Suppl 1991;18:108.
45. Bartlett R. Carbon monoxide poisoning. In: Haddad M, Shan-non M, Winchester J, eds. Poisoning and Drug Overdose, 3rded. New York: WB Saunders Company; 2002.
46. Bakker DJ, Cramer FS. Hyperbaric Surgery PerioperativeCare. Flagstaff, AZ: Best Publishing; 2002.
See also BLOOD GAS MEASUREMENTS; HYPERBARIC OXYGENATION; OXYGEN
MONITORING; PULMONARY PHYSIOLOGY; RESPIRATORY MECHANICS AND GAS
EXCHANGE; VENTILATORY MONITORING.
HYPERBARIC OXYGENATION
HARRY T. WHELAN
JEFFREY A. NIEZGODA
MATTHEW C. LEWIS
Medical College of WisconsinMilwaukee, Wisconsin
ERIC P. KINDWALL
BERNADETTE CABIGAS
St. Luke’s Medical CenterMilwaukee, Wisconsin
INTRODUCTION
Hyperbaric oxygen (HBO) is simply the delivery of mole-cular oxygen in very high dosage. Even though experience
has shown HBO to be very useful in a number of conditions,the exact mechanism of action at the molecular level is notfully understood. Studies done by Thom et al. (1) demon-strated that elevated oxygen tensions stimulated neuronalnitric oxide synthase (NOS1) and increased steady-statenitric oxide concentration in their microelectrode-implanted rodents. Buras et al. (2) in their studies withhuman umbilical vein endothelial cells (HUVEC) andbovine aortic endothelial cells (BAEC) showed that hyper-baric oxygen (HBO) down-regulated intracellular adhesionmolecule 1 (ICAM 1) expression via the induction ofendothelial nitric oxide synthase (NOS3), which provedbeneficial in treating ischemia reperfusion injuries. Otherstudies talk about interactions between nitric oxide andoxygen species and their role in various disease states.Clearly, interest in HBO is growing.
Boerema (3) introduced hospital use of the hyperbaricchamber in the late 1950s in Holland, simply to maintain asemblance of normoxia in patients undergoing cardiacsurgery. Heart–lung machines had not yet been invented,and the use of the chamber made certain kinds of cardiacsurgery possible for the first time. Boerema felt that ifenough oxygen could be driven physically into solution inthe tissues, which he termed ‘‘drenching’’, the circulation tothe brain could be interrupted longer than 3–4 min. It alsorendered surgery on many pediatric patients less risky. Forexample, if the normal arterial pO2 in a patient withTetralogy of Fallot was 38 mmHg, placing him in thechamber might raise it to 94 mmHg. Operating on thepatient under hyperbaric conditions posed much less riskof ventricular fibrillation when the heart or great vesselswere manipulated.
This idea caught on quickly, and soon large surgicalhyperbaric chambers were built in Glasgow, New York, LosAngeles, Chicago, Minneapolis, and at Boston Children’sHospital. By the early 1960s, however, heart–lungmachines became more common, and the need to do sur-gery in the hyperbaric chamber diminished substantially.Many large surgical chambers were left to gather dust orwere dismantled, as hospital floor space is always at apremium. During this time the surgeons, who had beendoing most of the research, left the field. Of the nondivingconditions, only carbon monoxide poisoning and gas gang-rene seemed to be likely candidates for hyperbaric oxygentreatment based on credible research.
In 1969, however, a double-blind controlled study on theuse of hyperbaric oxygen in senility was published in TheNew England Journal of Medicine. Results seemed pro-mising, and this initiated the propagation of hyperbaricquackery. The original investigators made no sweepingclaims for the research, but simply felt that the areamerited further investigation. Eventually, furtherresearch showed that the results of the study reported inthe New England Journal article were a statistical anom-aly and could not be reproduced. However, hyperbaricenthusiasts seized upon the earlier report, and senilitybegan to be treated in hyperbaric chambers, along witha host of other diseases. Most of these were not in medicalcenters. Fly-by-night ‘‘clinics’’ suddenly appeared claimingto cure anything and everything. Patients were treated forskin wrinkles, loss of sexual vigor, and a host of other
HYPERBARIC OXYGENATION 29

maladies. As there were few investigators doing goodresearch in the area at that time, the field fell into dis-repute.
Fortunately, a few legitimate investigators persisted intheir work, looking at the effects of hyperbaric oxygen ingreater detail. Soon it became clear that under hyperbaricconditions oxygen had some unusual effects. The Underseaand Hyperbaric Medical Society created a committee toinvestigate the field. After careful study, the committeelaid down guidelines for what should be reimbursed bythird-party payers and what conditions should be consid-ered investigational. Their report appeared in 1977 andwas adopted as a source document for Blue Cross/BlueShield (4). About the same time, Jefferson C. Davis of theUnited States Air Force School of Aerospace Medicineedited the first textbook in hyperbaric medicine (5). Itwas only then that a firm scientific basis was reestablishedfor the field, leading to increased acceptance by the medicalcommunity. The number of chambers operating in hospi-tals has risen dramatically from only 37 in 1977 to > 500today. The Undersea and Hyperbaric Medical Society(www.UHMS.org) and the American College of HyperbaricMedicine (www.ACHM.org) have taken responsibility forsetting standards in this field and for encouraging addi-tional research. At this time, � 13 clinical disorders havebeen approved for hyperbaric treatment. They include airor gas embolism, carbon monoxide poisoning, clostridialmyonecrosis, crush injury or compartment syndrome,decompression sickness, problem wounds, severe blood lossanemia, necrotizing soft tissue infections, osteomyelitis,radiation tissue damage, skin grafts or flaps, thermalburns and brain abscess.
Remember that hyperbaric oxygen was introducedinitially into hospitals in order to simply maintain nor-moxia or near-normoxia in patients undergoing surgery.It was only later, and quite serendipitously that research-ers discovered that oxygen under increased atmosphericpressure gained some of the attributes of a pharmacologicagent. Oxygen begins to act like a drug when given atpressures of 2 atm or greater. For example, oxygen underpressure can terminate lipid peroxidation in vivo (6), itcan enhance the bacteriocidal capabilities of the normalleukocyte (7,8), and it can stimulate the growth of newcapillaries in chronically ischemic tissue, such as in thediabetic foot, or in tissue that has undergone heavy radia-tion. It can reduce intracranial pressure on the order of50% within seconds of its initiation, and this effect isadditive to that of hypocapnia (9–11). HBOT can increasethe flexibility of red cells, augmenting the effects of pen-toxifylline (12). It can decrease edema formation by afactor of 50% in postischemic muscle and prevent sec-ond-degree burn from advancing to full-thickness injury(13–15). Hyperbaric oxygen has also been shown to hastenfunctional recovery of traumatized peripheral nerves byalmost 30% following repair. Many of these discoverieshave been made only in the last decade.
In a number of these areas, we are beginning to under-stand the basic mechanisms of action, but overall verylittle is understood at the molecular level. It is anticipatedthat studies involving nitric oxide synthase will provideinsight regarding the elusive molecular mechanistic
explanation. Also, many contributions to our understand-ing have come from advances made in the biochemistry ofnormal wound healing. We understand that normal oxy-gen pressures are 80–90-mmHg arterially, that oxygenenters our tissues from the capillaries, and that at thisinterface carbon dioxide (CO2) is removed. Under hyper-baric conditions, all of this changes. At a chamber pres-sure of 2.4 atm (ATA), the arterial oxygen pressure (pO2)reaches � 1500 mmHg, immediately saturating the redblood cells (RBCs). Upon reaching the tissues, these RBCsnever unload their oxygen. At this high partial pressure ofgas, oxygen diffuses into the tissues directly from theplasma. Returning to the heart, the RBCs are bathed inplasma with a pO2 of 150–200 mmHg. Tissue oxygenrequirements are completely derived from the plasma.In theory, one might think that this condition could provefatal, as red cells no longer can carry CO2 away from thetissues. However, we are fortunate that CO2 is 50 timesmore soluble in plasma than are oxygen and nitrogen, andthe body has a very capable buffering system whichovercomes the loss of the Haldane effect, which is theincrease in CO2 carrying capacity of deoxygenated redcells (16).
Another factor to be considered is the actual part of thecirculatory system that overcomes the loss of the Haldaneeffect. Traditionally, we think of this exchange occurring inthe capillaries. Under very high pressures, however, com-puter modeling has shown that nitrogen exchange underpressure (as in deep sea divers) is probably complete by thetime the blood reaches the arteriolar level. Whether this istrue when hyperbaric oxygen is breathed has not yet beendetermined. The rate of metabolism under hyperbaricconditions appears to be unchanged, and the amount ofCO2 produced appears to be about the same as whenbreathing air. It would be interesting to know just at whatlevel oxygen exchange is accomplished in the tissues, asthis might have practical implications when treating peo-ple with severe capillary disease.
Oxygen can be toxic under pressure. Pulmonary toxi-city and lung damage can be seen at oxygen pressures> 0.6 atm during chronic exposure. Central nervous sys-tem (CNS) toxicity can manifest as generalized seizureactivity when oxygen is breathed at pressures of 3 atm orgreater. The CNS toxicity was first observed by Paul Bertin 1878, and is termed the ‘‘Paul Bert Effect’’ (17). Despiteyears of research into this phenomenon, the exact under-lying or molecular cause of the seizure has not yet beendiscovered. There is a generalized vasoconstriction thatoccurs when oxygen is breathed at high pressure, redu-cing blood flow to muscle, heart, and brain by a factor of� 20%, as a defense against toxic quantities of oxygen.The exact mechanism responsible for this phenomenon isnot fully understood.
Central nervous system oxygen toxicity was evaluatedby the Royal Navy. The purpose of this research was todetermine the time until convulsion so that combat swim-mers would know their endurance limits under variousconditions. Volunteer research subjects swam in a testtank using closed-circuit oxygen rigs until convulsionoccurred and thus established safe oxygen toleranceboundaries.
30 HYPERBARIC OXYGENATION
Also related to the effect of oxygen, the ‘‘off ’’ phenom-enon (18) was first described by Donald in 1942. Heobserved that seizures sometimes occurred when the cham-ber pressure was reduced or when a diver surfaced andoxygen breathing under pressure was suddenly termi-nated. Lambertsen (19) provided a description of this typeof seizure activity:
The convulsion is usually but not always preceded by theoccurrence of localized muscular twitching, especiallyabout the eyes, mouth and forehead. Small muscles ofthe hands may also be involved, and incoordination ofdiaphragm activity in respiration may occur. After theybegin, these phenomena increase in severity over a periodwhich may vary from a few minutes to nearly an hour, withessentially clear consciousness being retained. Eventuallyan abrupt spread of excitation occurs and the rigid tonicphase of the convulsion begins. Respiration ceases at thispoint and does not begin again until the intermittentmuscular contractions return. The tonic phase lasts forabout 30 seconds and is accompanied by an abrupt loss ofconsciousness. It is followed by vigorous clonic contractionsof the muscle groups of the head and neck, trunk and limbs.As the incoordinated motor activity stops, respiration canproceed normally.
Within the wound healing community, current doc-trine holds that a tissue pO2 of 30–40 mmHg is necessaryfor adequate wound healing (20,21). Below 30 mmHg,fibroblasts are unable to replicate or produce collagen.Additionally, when the pO2 drops < 30 mmHg, leukocytesare unable to utilize oxidative mechanisms to kill bac-teria. We have noted that the tissue pO2 is critical, butthat the actual quantity of oxygen consumed in woundhealing is relatively small. The amount of oxygen used toheal a wound is only � 10% of that required for brainmetabolism.
Production of new collagen is also a requirement forcapillary ingrowth or proliferation (22). As capillariesadvance, stimulated by angiogenic growth factor, theymust be supported by an extracellular collagen matrix tofacilitate ingrowth into tissue. In the absence of newcollagen, capillary ingrowth cannot occur. This effect iscrucial in treating radionecrosis (23–25), where the tissueis primarily hypovascular, and secondarily hypoxic andhypocellular. It has been discovered that when collagenproduction can be facilitated, new capillaries will invadethe previously irradiated area, and healing will then occur.The tissue pO2 rises to � 80% of normal and plateaus;however, this is sufficient for healing and will even supportbone grafting. Historically, the only means of managingradionecrosis was to excise the radiated area and bring infresh tissue with its own blood supply. New collagen for-mation and capillary ingrowth also account for the rise intissue pO2, which can be achieved in patients with diabeticfoot lesions.
It is now well understood that the stimulus for growthfactor production by the macrophage is hypoxia and/orthe presence of lactic acid (26,27). Wounds managed inhyperbaric units are typically ischemic and hypoxic.Periods of relative hypoxia, required for the stimulation
of growth factor production, exist between hyperbarictreatments.
Surprisingly, oxygen levels remain high in tissues forlonger than one would expect following hyperbaric treat-ment. In a study by George Hart (28) at Long BeachMemorial Hospital, a mass spectrometer probe wasinserted in the unanesthetized thigh tissues of normalvolunteers. Muscle and subcutaneous tissue pO2 valuesin study subjects remained significantly elevated for 2–3 hfollowing hyperbaric oxygen treatment. Arterial pO2 wasalso measured and found to rise immediately and signifi-cantly under hyperbaric conditions but returned to normallevels within a couple of minutes upon egress from thechamber (Fig. 1). Thus, multiple daily HBO treatments canmaintain useful oxygen levels for up to 12 h/day.
Mention has been made of enhanced leukocyte killing ofbacteria under hyperbaric conditions. Jon Mader of theUniversity of Texas-Galveston (29) carried out a rathersimple, but elegant, experiment to demonstrate this. Thefascinating part of this study is that in the evolution of thehuman body, a leukocyte has never been exposed to apartial pressure of 150 mmHg while in tissues. This levelis impossible to attain breathing air. Nevertheless, whenone artificially raises the pO2 far beyond the leukocyte’snormal functional parameters, it becomes even morelethal to bacteria. This is an anomaly, as one rarely canimprove on Mother Nature. Of some interest in thisregard is that if one bites one’s tongue, one is neverconcerned about possible infection, even though it is ahuman bite. Similarly, hemorrhoidectomies rarely, ifever, become infected. The reason is that the pO2 of thetissues in and around the oral cavity are very high, andthe pO2 in hemorrhoidal veins is nearly arterial. TomHunt has shown it is impossible to infect tissue that isinjected with raw staphylococci if the pO2 in the sametissue is > 50 mmHg. Both he and David Knighton havedescribed oxygen as an antibiotic (30,31).
The reduction of intracranial pressure is facilitated byvasoconstriction. Experimentally, Rockswold has shownthat mortality can be halved in victims of closed headinjury with Glasgow Coma Scales in the range of 4–6.One of the major mechanisms here is a reduction of intra-cranial pressure while continuing to oxygenate hypoxicbrain (32–36). Sukoff et al. (37) administered 100% O2,1.5 ATA � 60 min every 24 h (maximum of 7 h) to severelybrain injured patients. This resulted in a 50% reduction inmortality.
A paper published by Mathieu (38) has shown that theflexibility index of red cells can be changed from 23.2 to 11.3within 15 hyperbaric treatments. This increase in flexibil-ity can prove quite useful in people with narrowed capil-laries. However, whether this phenomenon plateaus at 15treatments, its duration and underlying mechanism arestill unknown.
Nylander et al. (39) demonstrated that following com-plete occlusion of the blood flow to rat leg for 3 h, post-ischemic edema could be reduced by 50% if the animals arepromptly treated with hyperbaric oxygen. He also demon-strated that the mechanism for this was preservation ofadenosine triphosphate (ATP) in the cells, which providesthe energy for the cells to maintain their osmolarity. Cianci
HYPERBARIC OXYGENATION 31

(40,41). Yamaguchi, and others have underscored theimportance of ATP in preventing edema in burn. Treat-ment twice daily has shown to be more efficacious thantreatment once a day.
Zamboni (42) and Gingrass, working at the Universityof Southern Illinois, have shown the effects of hyperbaricoxygen on speeding functional return in peripheral nerverepair and grafting. At 6 weeks, there is a 28% improve-ment of function in the affected leg of these rats.
Niezgoda (43) performed a randomized and double-blinded study in human volunteers investigating the effectof hyperbaric oxygen in a controlled burn wound model. Hedemonstrated statistically significant decreases in edemaformation and wound exudate in the hyperbaric oxygentreated group.
Finally, the mechanism for the effects of hyperbaricoxygen in carbon monoxide poisoning (44,45) is now betterunderstood. Traditionally, it was felt that the mere pre-sence of carboxyhemoglobin blocked transport of oxygen tothe tissues. However, studies by Goldbaum et al. (46) at theArmed Forces Institute of Pathology in 1975 lead us todifferent conclusions. Impairment of cytochrome A3 oxi-dase and lipid peroxidation occurring following a reperfu-sion injury are now suggested as the primary pathways inthe pathophysiology causing fatality. Stephen Thom (47–50) at the University of Pennsylvania pioneered researchin this area. It appears that as carbon monoxide levels fall,the products of lipid peroxidation rise, indicating thatbrain damage is occurring only during the resuscitativephase, thus becoming reperfusion injury. Thom demon-strated that a period of hypotension (even though it mayonly be a matter of seconds) is enough to initiate lipidperoxidation. Oxygen at 1 atm has no effect on halting theprocess. However, oxygen at 3 atm terminates lipid per-oxidation. Patients who have been treated acutely withhyperbaric oxygen rarely exhibit signs of delayed dete-rioration, reported in 30–40% of severe cases treated onlywith normobaric oxygen. The probable mechanism for this
is the ability of hyperbaric oxygen at three ATA to termi-nate lipid peroxidation.
Finally, in many ways it seems paradoxical that oxygenat high pressure, which intuitively would seem to providemore substrate for free-radical formation, still benefitstissues from crush injury and postischemic states. Butironically, it is precisely this hyperbaric environment thatpromotes certain so-called reactive oxygen species withinherent protective qualities (51). More studies are cer-tainly needed to investigate the underlying pharmacologicbenefits afforded by hyperbaric oxygen. We have only justbegun to explore and utilize a treatment modality whosetime has come.
BIBLIOGRAPHY
1. Thom SR, Fisher D, Zhang J, Bhopale VM, Ohnishi ST, KotakeY, Ohnishi T, Buerk DG. Stimulation of perivascular nitricoxide synthesis by oxygen. Am J Physiol Heart Circ Physiol2003;284:H1230–1239.
2. Buras JA, Stahl GL, Svoboda KKH, Reenstra WR. Hyperbaricoxygen downregulates ICAM-1 expression induced by hypoxiaand hypoglycemia: the role of NOS. Am J Physiol Cell Physiol2000;278:C292–C302.
3. Boerema I, Kroll JA, Meijne NG, Lokin E, Kroon B, HuiskesJW. High atmospheric pressure as an aid to cardiac surgery.Arch Chir Neerl 1956;8:193–211.
4. Kindwall EP. Report of the committee on hyperbaric oxygena-tion. Bethesda: Undersea Medical Society; Bethesda 1977.
5. Davis JC, Hunt TK. Hyperbaric oxygen therapy. UnderseaMedical Society; Bethesda 1977.
6. Thom SR. Molecular mechanism for the antagonism of lipidperoxidation by hyperbaric oxygen. Undersea Biom Res(Suppl) 1990;17:53–54.
7. Andersen V, Hellung-Larsen P, Sorensen SF. Optimal oxygentension for human lymphocytes in culture. J Cell Physiol1968;72:149–152.
8. Gadd MA, McClellan DS, Neuman TS, Hansbrough JF. Effectof hyperbaric oxygen on murine neutrophil and T-lymphocytefunctions. Crit Care Med 1990;18:974–979.
32 HYPERBARIC OXYGENATION
Figure 1. Arterial, muscle and subcuta-neous pO2 after HBO treatment.
1
1
2
2 3 4
Time (in hours)
Pre
ssur
e (in
atm
osph
eres
)
HB
O
Oxygenation
Sub cutaneousMuscle
Plug 1

9. Hayakawa T, Kanai N, Kuroda R, et al. Response of cere-brospinal fluid to hyperbaric oxygenation. J Neurol NeurosurgPsych 1971;34:580–356.
10. Miller JD, Fitch W, Ledingham IM, et al. Reduction of increasedintracranial pressure. Neurosurgery 1970;33: 287–296.
11. Sukoff MH, Ragatz RE. Hyperbaric oxygenation for thetreatment of acute cerebral edema. Neurosurgery 1982;10:29–38.
12. Nemiroff PM. Synergistic effects of pentoxifylline and hyper-baric oxygen on skin flaps. Arch Otolaryngol Head Neck Surg1988;114:977–981.
13. Cianci P, Lueders H, Shapiro R, Sexton J, Green B. Currentstatus of adjunctive hyperbaric oxygen in the treatment ofthermal wounds. In: Proceedings of the second Swiss sympo-sium on hyperbaric medicine; Baker DJ, JS, editors. Founda-tion for Hyperbaric Medicine; Basel: 1988. p 163–172.
14. Grossman AR. Hyperbaric oxygen in the treatment of burns.Ann Plast Surg 1978;1:163–171.
15. Hart GB, O’Reilly RR, Broussard ND, Cave RH, Goodman DB,Yanda RL. Treatment of burns with hyperbaric oxygen. SurgGynacol Obstet 1974;139:693–696.
16. Coburn RF, Forster RE, Kane PB. Considerations of thephysiological variables that determine the blood carboxyhe-moglobin concentrations in man. J Clin Invest 1965;44: 1899–1910.
17. Bert P. Barometric Pressure. 1879. p 579. (translated byHitchcock MS, Hitchcock FA) Bethesda: Reprinted by theUndersea and Hyperbaric Medicine Society; 1978.
18. Donald KW. Oxygen poisoning in man. Br Med J 1947;712–717.
19. Lambertsen CJ. In: Fenn WO, Rahn H, editors. Handbook ofPhysiology, Respiration. Washington, D.C.: American Physio-logical Society; Section 3, Volume II. p 1027–1046.
20. Knighton DR, Hunt TK, Scheuenstuhl H, Halliday B, Werb Z,Banda MJ. Oxygen tension regulates the expression of angio-genesis factor by macrophages. Science 1983;221:1283–1285.
21. Knighton DR, Oredsson S, Banda MJ, Hunt TK. Regulation ofrepair: hypoxic control of macrophage mediated angiogenesis.In: Hunt TK, Heppenstall RB, Pines E, Rovee D, editors. Softand hard tissue repair. New York: Praeser; 1948. p 41–49.
22. Knighton DR, Hunt TK, Thakral KK, Goodson WH. Role ofplatelets and fibrin in the healing sequence, an in vivo studyof angiogenesis and collagen synthesis. Ann Surg 1982;196:379–388.
23. Davis JC. Soft tissue radiation necrosis: The role of hyperbaricoxygen. HBO Rev 1987;2(3):153–167.
24. Davis JC, et al. Hyperbaric oxygen: A new adjunct in themanagement of radiation necrosis. Arch Otol 1979;105:58–61.
25. Hart GB, Mainous EG. The treatment of radiation necrosiswith hyperbaric oxygen (OHP). 1976;37:2580–2585.
26. Jensen JA, Hunt TK, Scheuenstuhl H, Banda MJ. Effect oflactate, pyruvate, and physician on secretion of angiogenesisand mitogenesis factors by macrophages. Lab Invest 1986;54:574–578.
27. Knighton DR, Schumerth S, Fiegel VD. Microenvironmentalregulation of macrophage growth factor production. Inpreparation.
28. Hart GB, Wells CH, Strauss MB. Human skeletal muscle andsubcutaneous tissue carbon dioxide, nitrogen and oxygen gastension measurement under ambient and hyperbaric condi-tions. J App Res Clin Exper Therap Spring 2003;3(2).
29. Wang J, Corson K, Mader J. Hyperbaric oxygen as adjunctivetherapy in vibrio vulnificus septicemia and cellulites. Under-sea Hyperbaric Med Spring 2004, 31(1):179–181.
30. Hunt TK, Linsey M, Grislis G, Sonne M, Jawetz E. The effect ofdiffering ambient oxygen tensions on wound infections. AnnSurg 1975;181:35–39.
31. Knighton DR, Halliday B, Hunt TK. Oxygen as an antibiotic. Acomparison of the effects of inspired oxygen concentration andantibiotic administration on in vivo bacterial clearance. ArchSurg 1986;121:191–195.
32. Miller JD, et al.The effect of hyperbaric oxygen on experimen-tally increased intracranial pressure. J Neurosurg 1970;32:51–54.
33. Miller JD, Ledingham IM. Reduction of increased intracranialpressure: Comparison between hyperbaric oxygen and hyper-ventilation. Arch Neurol 1971;24:210–216.
34. Mogami H, et al.Clinical application of hyperbaric oxygenationin the treatment of acute cerebral damage. J Neurosurg1969;31:636–643.
35. Sukoff MH, et al.The protective effect of hyperbaric oxygena-tion in experimental cerebral edema. J Neurosurg 1968;29:236–241.
36. Sukoff MH, Ragatz RE. Hyperbaric oxygen for the treatmentof acute cerebral edema. Neurosurgery 1982;10(1):29–38.
37. Sukoff MH. Effects of hyperbaric oxygenation [comment]. JNeurosurg 2001;94(3):403–411.
38. Mathieu D, Coget J, Vinkier L, Saulnier F, Durocher A, WattelF. Red blood cell deformability and hyperbaric oxygen therapy.(Abstract) HBO Rev 1985;6:280.
39. Nylander G, Lewis D, Nordstrom H, Larsson J. Reduction ofpostischemic edema with hyperbaric oxygen. Plast ReconstrSurg 1985;76:596–601.
40. Cianci P, Lueders HW, Lee H, Shapiro RL, Sexton J,Williams C, Green B. Adjunctive hyperbaric oxygen reducesthe need for surgery in 40-80% burns. J Hyper Med 1988;3:97–101.
41. Cianci P, Lueders HW, Lee H, Shapiro RL, Sexton J, WilliamsC, Green B. Hyperbaric oxygen and burn fluid requirements:Observations in 16 patients with 40-80% TBSA burns. Under-sea Biomed Res (Suppl) 1988;15:14.
42. Zamboni WA, Roth AC, Russell RC, Nemiroff PM, Casa L,Smoot C. The effect of acute hyperbaric oxygen therapy onaxial pattern skin flap survival when administered duringand after total ischemia. J Reconst Microsurg 1989;5:343–537.
43. Niezgoda JA, Cianci P. The effect of hyperbaric oxygen on aburn wound model in human volunteers. J Plast ReconstructSurg 1997;99:1620–1625.
44. Brown SD, Piantadosi CA. Reversal of carbon monoxide-cyto-chrome C oxidase binding by hyperbaric oxygen in vivo. AdvExp Biol Med 1989;248:747–754.
45. End E, Long CW. Oxygen under pressure in carbon monoxidepoisoning. J Ind Hyg Toxicol 1942;24:302–306.
46. Goldblum LR, Ramirez RG, Absalon KB. Joint Committee onAviation Pathology XII. What is the mechanism of carbonmonoxide toxicity? Aviat Space Environ Med 1975;46(10):1289–1291.
47. Thom SR. Antagonism of carbon monoxide-mediated brainlipid peroxidation by hyperbaric oxygen. Toxicol Appl Phar-macol 1990;105:340–344.
48. Thom SR, Elbuken ME. Oxygen-dependent antagonism oflipid peroxidation. Free Rad Biol Med 1991;10:413–426.
49. Thom SR. Carbon-monoxide mediated brain lipid peroxidationin the rat. J Appl Physiol 1990;68:997–1003.
50. Thom SR. Dehydrogenase conversion to oxidase and lipidperoxidation in brain after carbon monoxide poisoning. J ApplPhysiol 1992;73:1584–1589.
51. Thom SR, Bhopale V, Fisher D, Manevich Y, Huang PL, BuerkDG. Stimulation of nitric oxide synthase in cerebral cortex dueto elevated partial pressures of oxygen: An oxidative stressresponse. J Neurobiol 2002;51:85–100.
See also HYBERBARIC MEDICINE; OXYGEN MONITORING.
HYPERBARIC OXYGENATION 33

HYPERTENSION. See BLOOD PRESSURE MEASUREMENT.
HYPERTHERMIA, INTERSTITIAL
MICHAEL D. SHERAR
London Health Sciences Centreand University of WesternOntarioLondon, Ontario, Canada
LEE CHIN
University of TorontoToronto, Ontario, Canada
J. CARL KUMARADAS
Ryerson UniversityToronto, Ontario, Canada
INTRODUCTION
Interstitial hyperthermia or thermal therapy is a mini-mally invasive method for the treatment of cancer. Radiofrequency (RF), microwave, laser light, or ultrasoundenergy is delivered through one or more thin needle devicesinserted directly into the tumor.
Interstitial devices have the significant advantageover external devices of being able to deliver thermalenergy directly into the target region, thereby avoidingdepositing energy into intervening nontarget tissue.Their main disadvantage is that the needle devicesemployed often deposit energy over only a small volume.This can make it challenging to deliver an adequatethermal dose to large target regions. This problem washighlighted in an early radiation therapy oncology group(RTOG) phase III trial in which only 1 out of 86 patientswas deemed to have received an adequate thermal treat-ment (1).
These early challenges in interstitial hyperthermiahave been addressed, to some extent, through the devel-opment of improved heating devices and more detailedmonitoring of applicator placement and dose delivery.Quality assurance guidelines have been developed bythe RTOG to raise the quality of heating (2). The guide-lines recommend pretreatment planning and equipmentchecks, the implantation of considerations and documen-tation, the use of thermometry, and the development ofsafety procedures. Treatment procedures have also beenimproved through the use of more detailed thermometry,especially using magnetic resonance imaging approaches(3,4).
THERMAL DOSE AND HEAT TRANSFER
The goal of interstitial thermal therapy is to deliver aprescribed dose to a target volume. Thermal dose is definedas equivalent minutes at 43 8C, or TD. The units of TD areminutes, which represents the time tissue would needto be maintained at a constant temperature of 43 8C tohave the same effect as the particular time–temperaturehistory that the tissue was exposed to. The thermal doseafter & minutes of heating can be calculated if the time–
temperature history is known (5),
TDðtÞ ¼Z t
0R43�TðtÞdt where
R ¼0:25 for T � 43 �C
0:5 for T> 43 �C
ð1Þð2Þ
�
The dose prescribed for treatment depends on whether theheating is being used as an adjuvant to radiation or sys-temic therapy, or whether it is being used as a stand-alonetreatment to coagulate tissue. For the former use, the doseprescribed is typically 10–60 min (Eq. 1) and for the latter itis usually prescribed to be > 240 min (Eq. 2). This isbecause temperatures employed for adjuvant treatment(usually referred to as hyperthermia) are in the 40–45 8C range. For stand-alone coagulation (usually referredto as thermal therapy or thermal ablation), temperaturesin the range of 55–90 8C are used.
The temperature (T) produced in tissue depends on theheat deposition by the applicator, heat conduction, andblood flow according to
rc@T
@t�r ðkrTÞ þ v rT ¼ Q
where r is the tissue mass density, r is the heat capacity ofthe tissue, k is the thermal conductivity of the tissue, v isthe blood velocity profile, and Q is the heat absorbed perunit volume. Detailed knowledge of the blood velocityprofile at the capillary level is generally unknown, andeven if it were known the calculations would requireimpractically large computational resources. While severalmodels have been proposed to calculate heat transfer due toperfusion, the Pennes bioheat transfer equation is mostoften employed (6)
rc@T
@t�r ðkrTÞ þ wcbðT � TbÞ ¼ Q
where w is blood mass perfusion rate, cb is the blood heatcapacity, and Tb is the temperature of the blood enteringthe treatment field, and v is the velocity field of anyconvective flow (e.g., as the blood in large vessels). Thisequation can be used to predict the temperature in tissue,and therefore plan thermal therapy or hyperthermia treat-ments if the perfusion rate is known. Penne’s equation doesnot accurately predict for the effect of large blood vesselsthat must be modeled individually.
ELECTROMAGNETIC HEATING
The heat absorbed (or deposited) in tissue is often describedin terms of the power per unit mass. It is called the specificabsorption rate or SAR. For electromagnetic devices heat isdeposited by the motion of charges or ions. The movementof charge depends on the electric field produced by theapplicator in tissue. In microwave and RF hyperthermia,the applicators are driven by sinusoidally time-varyingsignals. In this case, the electric field can be written inphasor form E such that the electric field is given by,EðtÞ ¼ RðEe jvtÞ, where R(x) is the real part of the complexvector x, and v is the angular frequency of the driving
34 HYPERTHERMIA, INTERSTITIAL

signal. The SAR is then
SAR ¼ Q
r¼ s
2rðE E�Þ
where s is the electrical conductivity of the tissue.The calculation of the electric field E is based on
Maxwell’s equations. For microwave devices, these equa-tions are combined to produce the Helmholtz vector waveequation
r�r� E � k2E ¼ 0
where k is the complex-valued wavenumber given byk2 ¼ v2me� jvms and m is the magnetic permeabilityof the medium, which for tissue is the same as thefree-space value, and e is the electrical permittivity ofthe medium. The divergence free condition, rE ¼ 0,may have to also be explicitly imposed if the solutiontechnique does not inherently do this.
For RF devices, the frequency is sufficiently low that thedisplacement currents can be ignored. In this case, it isusually simpler to determine the scalar electric potential Vand from this derive the electric field, E ¼ � rV. Theelectric potential obeys a Poisson-type equation
�r ðkrVÞ ¼ 0
For models of both microwave and RF devices, thegoverning Helmholtz or Poisson equation is imposed in adomain with a known electric field or electric potentialspecified as a boundary condition to represent the powersource. Another condition that is often imposed on thesurface of metals is that the tangential component of theelectric field is zero, n̂�E ¼ 0.
The solution of the governing equations with appropri-ate boundary conditions is impossible for all but the sim-plest geometries. For most practical cases, numericalmethods and computational tools are required. The finitedifference time domain (FDTD) method (7), the finite ele-ment (FE) method (8,9), and the volume surface integralequation (VSIE) method (10) are the most commonly uti-lized methods for solving the governing equations in elec-tromagnetic hyperthermia and thermal therapy. In theFDTD method, the domain is discretized into rectangularelements. The accuracy of a FDTD solution depends on thesize of the mesh spacing. Smaller elements produce moreaccurate solutions, but also require more memory to storethe system of equations. Since the grids are rectangular,their nonconformation to curved tissue boundaries pro-duces a stair-casing effect. Therefore, a large number ofelements are required to model such geometries accurately.Unlike the FDTD method, the FE method uses tetrahedralmeshes in the domain and the VSIE method uses triangularmeshes on domain surfaces. Tetrahedral and triangularmeshes are more suitable than regular finite differencegrids for three-dimensional (3D) modeling since they donot have the stair casing effect at tissue boundaries.
RADIO FREQUENCY DEVICES
In RF, thermal therapy tissue is heated by electrical resis-tive (or J) heating. The heating devices, or applicators, are
inserted interstitially to produce currents in the tissue. Thecurrents typically oscillate sinusoidally in the kilohertz orlow megahertz frequency range. As a result, this modalityis often referred to as radio frequency or RF heating. Theredevices have an advantage over other interstitial devices intheir simplicity and low cost. They can operate at lowfrequency, and therefore do not require complex powergenerators. The RF probes, due their simplicity, tend tohave the smallest diameter of all the types of interstitialheating probes. The RF heating technique has been exten-sively reviewed by others (11–15).
There are several designs of RF interstitial devices,which may be categorized into three groups. The simplestdesign consists of a single electrode at a probe tip (oftenreferred to as a needle electrode) (9,16–20). The currentflows between a single electrode at the end of an applicatorand a large ground plate placed at a distal site. Since thecurrent flows between a small electrode and a large plate,the currents are concentrated near the electrodes resultingin SAR patterns that are localized to the electrodes asillustrated in Fig. 1.
With these single electrode probes the coagulation dia-meter is usually limited to � 1.6 cm. Therefore severalprobes are needed to cover a larger area (21), or a singleprobe can be inserted into several locations, sequentially,during a treatment.
Since it is desirable to avoid the insertion of multipleinterstitial probes, single probes that release multipleelectrodes outward from the probe tip have been designedto produce large coagulation volumes. Two examples ofthese are the Boston Scientific (Watertown, MA; formerlyRadio Therapeutics Corporation, Mountain View, CA) RF3000 system in which 10–12 tines are deployed from acannula to form an umbrella shape (Fig. 2) and the RITAMedical Systems (Mountain View, CA) Starburst probeswith up to 9 tines. In some configurations, some of the tinesin the Starburst probes are replaced with dedicated ther-mocouples while others are hollow electrodes throughwhich saline can be infused into the target region toenhance heating. These multielectrode probes are able toproduce coagulation regions with diameters up to 7 cm,although complete coverage of a large region can be diffi-cult in high blood flow organs, such as the kidney (22).
The negative RTOG phase III trial, in which only 1 outof 86 patients was deemed to have received an adequatethermal dose (1) illustrated the need to not only increasethe target volume coverage, but also to control the heating.
HYPERTHERMIA, INTERSTITIAL 35
Figure 1. The heating in RF devices is caused by current flow.Since the current flows from the heating electrode to the groundpad, there is a high current density near the electrode due to itssmall size compared to the ground pad. This results in heating thatis localized to the heating electrode.

Control is needed to enable the conformation of the heatingto irregularly shaped target volumes while avoiding nearbyorgans at risk and to compensate for heterogeneous coolingby the vasculature (23). Partial control can be achieved byappropriate positioning of the probes and the adjustmenttheir power. Further control along the direction of theprobe is also needed (24,25) and multielectrode currentsource (MECS) applicators have been developed to providethis capability (26). The MECS applicators contain severalelectrodes placed along their length with the amplitudeand phase of each electrode independently controlled. Inthe most common configuration, the electrodes are capaci-tively coupled (insulated) with the tissue. The electric fieldsinduced by the electrodes produce currents in the tissuethat cause heating. Since the electrodes are capacitivelycoupled, the probes can be inserted into brachytherapycatheters, for example, making it feasible to add interstitialheating as a simultaneous adjuvant to brachytherapy(interstitial radiation therapy). The electric field (andhence current) may be induced between electrodes onthe same probe or on separate probes, or it may be inducedbetween the probe electrodes and a grounding plane.
MICROWAVE DEVICES
Microwave applicators can produce larger coagulationregions than RF applicators due to their radiative nature.However, the construction of the power generator andmatching circuitry makes these devices more complex,and therefore more expensive. Due to this, microwaveinterstitial hyperthermia has been used less often in theclinic than RF interstitial hyperthermia.
Ryan et al. reviewed and compared several types ofmicrowave interstitial applicators (27) and several excel-lent reviews of microwave interstitial thermal therapyexist (28–32). The two most commonly used devices arethe dipole antenna and the helical antenna. The dipoleantenna is the simplest form of microwave interstitialantenna (7,8,33). It is usually constructed from a coaxialcable with the outer conductor removed from an endsection (typically 1 or 2 cm in length) to expose the innerconductor (Fig. 3). A power generator feeds a sinusoidallyoscillating signal into the cable at one of the ISM fre-quency bands between 400 MHz and 3 GHz. The inner- and
outer-conductor electrodes at the tip of the coaxial cableact as an antenna that produces microwaves that radiateout into the tissue. Tissue is an attenuating medium thatabsorbs microwaves, and this absorbed energy is convertedinto heat in the tissue.
The radiative or active length of a typical dipole inter-stitial device is 1–3 cm. The devices produce a coagulationregion that is ellipsoidal shaped with a large axis of up to3 cm along the length of the antenna and a small axis ofup to 2 cm diameter. The drawback of the dipole appli-cator is that the region of highest SAR, or hot spot, islocated at the point at which the outer conductor is cutaway. Therefore, the tips of these antennas have to beinserted past the center of the target region, and this canbe a problem if the target region is located adjacent to acritical structure.
A further problem with dipole antennas is that the SARpatterns are sensitive to the depth to which the antenna isinserted into tissue (8). A second common microwaveapplicator design, referred to as a helical antenna (34–36), has been designed to make the applicator insensitive toits insertion depth. In this applicator, one electrode iswrapped in a helix pattern around an exposed coaxial cable(Fig. 4). The antennas are also designed to extend theheating pattern along the applicator and toward the tipof the antenna compared to the dipole antenna. The SARpattern from a BSD Medical (Salt Lake City, UT) helicalantenna is shown in (Fig. 5). The antenna was operating at915 MHz. The measurement was performed using thethermographic imaging technique (37) and demonstrates
36 HYPERTHERMIA, INTERSTITIAL
Figure 2. A Boston Scientific (Watertown, MA; formerly Radio Therapeutics Corporation,Mountain View, CA) insterstital RF probe with 10 tines that are deployed from the cannulusafter insertion into a target region. The deployed tines produce a coagulation zone that is larger thanthe zone that can be produced by a single electrode probe. The top probe is shown with the tinesundeployed (ready for insertion) and the bottom probe shows the probe with the tines deployed (asthey would be after insertion).
Figure 3. A schematic representation of a microwave interstitialdipole antenna applicator. The outer conductor of a coaxial cable isstripped away to produce a radiating section.

that the heating extends along the length of the helix andthat the hot spot is close to the tip of the applicator.
Interstitial microwave applicators have the advantageover RF applicators in the ability to use arrays of applica-tors to dynamically steer the SAR pattern (33). For largetarget volumes, several applicators can be inserted. Theheating pattern can then be adjusted by not only adjustingthe power to each applicator, but also by adjusting therelative phase of the signal to each applicator. The phasecan be adjusted such that the microwaves produced bythe applicators interfere constructively in regions thatrequire heating and interfere destructively in regions thatshould be spared. The predetermination of the phaserequired for each applicator can be calculated during treat-ment planning. This is a challenging calculation for appli-cations in which tissue is electrically heterogeneous orthe placement of the applicators cannot be accuratelypredicted. In these cases real-time monitoring of the treat-ment is required and a manual or computer run feedbackcontrol is used to set the phase of the applicators to producethe desired heating profile.
The size of the coagulation volume is limited by themaximum temperature in the treatment field. Since themaximum temperature is usually located at the applicator,it is possible to increase the coagulation volume by coolingadjacent to the applicator. Using this technique, the cross-
section area of a coagulation volume has been noted toincrease by a factor of 2.5 in one study (38) and thecoagulation volume diameter was found to increase from1.2 to 2.4 cm (39). In microwave heating, the cooling isusually done by passing water or air through the cathetercontaining the antenna (29,38,40). In RF heating, coolingwater is passed inside the electrode to cool the tissue nearthe electrode (41,42).
In RF heating, it is also possible to increase the coagula-tion volume by saline injection from the lumen of theelectrode (43). Since saline is electrically conductive, inject-ing it into the tumor increases the electrical conductivity ofthe tumor, and hence the SAR in the tumor. This techniquehas not gained popularity due to the inability of control theflow of saline in the tumor, resulting in irregular andunpredictable coagulation regions being produced.
CLINICAL STUDIES WITH MICROWAVE AND RF DEVICES
Interstitial microwave and RF heating systems have beenwidely used to clinically treat a variety of tumors in phase I(34,44–47), phase II (18,32,44–49) and phase III trials(1,50). The RF systems have been used to treat a largerange of sites, including brain (45), head and neck (1),breast (1), myocardium (51), lung (14), liver (11,52), pan-creas (18), prostate (48), and kidney (44,53). Microwavesystems have also been used to treat a large range of sites,including liver (4), prostate (both carcinoma and benignhyperplasia) (29,36), head and neck (1,32,49), brain(34,50), breast (1), and other pelvic areas (1). The heattreatments are used alone (29,36), or combined with exter-nal beam radiation (54), interstitial radiotherapy (brachy-therapy) (1,32,46), and/or chemotherapy (17). The heattreatments are used alone (29,36), or combined with exter-nal beam radiation (29,36,48,54,55), combined with externalbeam radiation (54) or interstitial radiotherapy (brachyther-apy) (1,32,46,48,55), and with chemotherapy (17).
The interstitial hyperthermia treatments are usuallyadministered under ultrasound, CT or MR guidance. Dur-ing the treatment the hyperechoginicity of microbubblesthat can be produced at sufficiently high temperatures canprovide some real-time ultrasound feedback of the treat-ment. Posttreatment evaluation can be performed usingcontrast enhanced ultrasound, CT or MR. The vasculaturein the coagulated volume is destroyed and the destroyedvolume can be identified as an unenhanced region in theimage (41,56,57).
LASER DEVICES
First described in 1983 by Bown (58), Interstitial LaserPhotocoagulation (ILP) [sometimes referred to as LaserInduced Thermal Therapy (LITT)] involves the use visibleor near infra-red (IR) light delivered through fibre opticcables to heat tissue for therapeutic purposes. The ILP hasbeen investigated as an experimental treatment for avariety of solid tumors including liver, breast, stomach,pancreas, kidney, lung, and bone (59). The tissue tempera-ture is raised causing coagulation of the target volume.Similar to the microwave and RF cases, the production of
HYPERTHERMIA, INTERSTITIAL 37
Figure 4. Shown here is a BSD Medical (Salt Lake City, UT)helical microwave applicator. The inner conductor of a coaxialcable is extended backward in a helical pattern around thedielectric insulator. There is no connection between the helicalsection and the outer conductor.
Figure 5. The normalized SAR pattern along the coronal plane ofa BSD Medical (Salt Lake City, UT) helical applicator operating at915 MHz. The image was provided courtesy of Claire McCann.

heat in a local volume of tissue results from the amount ofabsorbed laser energy, S(r). In biomedical treatments, suchas LITT, it is the total absorbed laser energy that typicallydetermines the therapeutic outcome. It is equal to theproduct of the local fluence rate, f(r) which is the totalphoton power over all directions that pass through a pointarea of space, and the absorbing characteristics, ma(r) of thetissue (60):
SðrÞ ¼ maðrÞfðrÞ
The absorbed optical energy deposition pattern is governedby the absorption and scattering characteristics of thetissue. An absorption event causes the interacting mole-cule to enter a vibrational–rotational state that results in atransfer of energy to surrounding molecules that manifestsas a local increase in temperature (61). Absorption occursdue to interactions with native molecules called chromo-phores with examples including melanin, hemoglobin, andwater. In a given tissue, the concentration weighted sum ofthe absorption of different chromophores leads to its bulkmacroscopic absorption. Scattering refers to a directionalchange in light propagation and likely results from differ-ences in the index of refraction in the various cellularcomponents, such as the between cell membranes andthe extracellular space. Here the scattering is assumedto be elastic with no change in energy occurring during theinteraction. The statistical quantities that govern lightinteractions are the scattering coefficient, ma(cm�1) andabsorption coefficient, ma(cm�1) and are defined, respec-tively, as the probability of scattering or absorption peraverage distance traveled (also known as the mean freepath). In the case of scattering, consideration is given to theprobability of scatter in a particular direction. An addi-tional parameter known as the anisotropy factor, g, quan-tifies this directionality by integrating the average cosineof the scattering probability over all directions. Wheng ¼ 0, scattering is isotropic. However, in the case ofbiological tissues g typically lies within the range of 0.7and 0.99 meaning that scattering typically occurs in theforward direction. The reduced scattering coefficient,m0
s ¼ msð1 � gÞ, allows light scattering to be approximatedas isotropic although scattering events are actually in theforward direction. The inverse of the reduced scatteringcoefficient is, therefore, the average distance that lighttravels before it changes direction from its original direc-tion of propagation (62).
In theory, Maxwell’s equations could be used to calcu-late the scattering and absorption of the EM vector fieldsdue to the underlying tissue components (63). In this case,the tissue microstructure could be modeled as randomperturbations, e1(r) in the dielectric constant around amean value, e0(r), with the total dielectric constant, e(r),given by the sum of these quantities. However, in practice,due to the complex and random composition of tissue, acomplete and accurate description of e(r) has yet to berealized. Instead a more commonly used solution is toconsider light as a stream of neutral particles or photonswith individual quanta of energy that propagate elasticallythroughout the medium. This formalism is governed byradiative transport theory (64), and assumes light to be
monochromatic while ignoring its conventional wave char-acteristics, such as polarization, diffraction, interference,and fluorescence. Although incomplete, the photon modelhas been shown to be consistent with experimental mea-surements in turbid media (65).
A commonly employed model of photon propagation isthe Monte Carlo (MC) method (66), which utilizes prob-ability distributions to simulate the propagation of thou-sands to millions of individual photon packets based on theoptical properties of tissue to arrive at a statistical repre-sentation of the overall light distribution. The MC is amen-able to heterogeneous and arbitrary geometries and doesnot suffer from the limiting assumptions of analyticalsolutions. However, its primary disadvantage is therequirement of long computational times, on the order ofhours to days, to achieve reasonable statistics. Regardless,with the increasing speed of modern computers, the MonteCarlo method remains a viable option for photon simula-tions. The reader is referred to an excellent review byRoggan and Muller (67) for the implementation of theMC model for treatment planning of LITT.
Alternatively, one may employ formal solutions to thegoverning equations for photon transport. The energy flowof photons in a scattering and absorbing medium isdescribed by the radiative transfer equation (RTE) (64).The RTE is an integro differential equation that describesthe energy conservation of photons within an infinitesi-mally small volume that result from losses due to absorp-tion and scattering as well as gains arising from photonsscattered from other directions and from the laser source.Analytical solutions to the RTE are difficult to obtain.Hence, various approximations have been proposed toconvert the RTE to a more mathematically tractable andpractical form. A standard technique, called the Pn approx-imation, expands the radiance and source as a finite seriesof spherical harmonics to nth order. The P1 approximationis the simplest of these expansions and in the steady stateis also known as the diffusion approximation (63,64):
r2fð r* Þ � ma
Dð r* Þfð r
* Þ ¼ � 1
DSð r
* Þ
Here fð r*Þ is the photon fluence rate, while D is the photon
diffusion coefficient given by
D ¼ 1
3½m0s þ ma�
The primary assumption of the diffusion equation, that islinear flux anisotropy, is only accurate when the scatteringproperties of the medium are much larger than the absorp-tion properties and at locations > 1/m0
s from the source. Anumber of analytical solutions to the diffusion equationexist for simple but practical geometries. The solution for apoint source in an infinite homogeneous medium is givenby (63)
fð r* Þ ¼ Poeð�meff rÞ
4pr
This solution is particularly useful as, assuming aninfinite medium, it may be integrated numerically to pro-vide the light distribution of cylindrical or extended source
38 HYPERTHERMIA, INTERSTITIAL

of arbitrary geometries. However, it is well known thattissue optical properties often change from their nativestate after undergoing thermal coagulation. This results inheterogeneities in optical properties that effect the overalllight distribution (68). In such cases, analytical solutionsare available only for the simplest geometries and numericalmethods such as the finite element (69), finite difference(70), and boundary element method (71) must be employed.A thorough discussion of these methods was given in thepreceding section for microwaves and their implementationin the case of photon propagation is the same.
Initially, bare tipped optical fibers were used to deliverlaser light to the tumor. High temperatures immediatelyadjacent to the fiber tip cause the tissue to char and form azone of carbonization. The charred fiber then acts as a pointheat source and the temperature of the fiber increasessignificantly leading to vacuolization of the surroundingtissue. The volume of coagulation around the fiber growsuntil thermal equilibrium is reached at the edges of thelesion. Here, the conduction of heat from the fiber isbalanced by the tissue’s ability to remove energy throughblood flow and thermal conduction.
The size of the lesion depends on the thermal conductionproperties of the tissue, but would normally be limited to� 2 cm in diameter. Larger tumors require multiple opticalfiber implants to enable complete coverage of the tumorvolume. For example, a 4 cm diameter tumor wouldrequire at least eight fibers to fully coagulate the tumor.
The limitations of the bare tipped fibers have beenaddressed in two ways. The first was to employ a linesource geometry instead of a point source. This can beachieved by using a diffusing tip fiber where light gradu-ally leaks out of the fiber over an extended distance of a fewcentimeters. The second approach is to restrict the tem-perature of the fiber to lower than the charring thresholdby controlling the power delivered to the fiber. If charring isavoided, light can propagate into the tissue resulting inheating at a distance from the fiber and a broader SARpattern. These two approaches can be combined to achievegreater lesion volumes from single fibers. Heisterkamp etal. (72) demonstrated an almost doubling of the coagulatedvolume from 4.32 cm3 (bare tipped) to 8.16 cm3 (tempera-ture restricted diffusing tip) using such an approach.
The other major factor that affects the lesion size is thewavelength of the light used. Somewhat counterintui-tively, light that is less absorbed by tissue, results ingreater lesion sizes. This is because the light can penetratefurther into the tissue, and therefore directly heat atgreater distances from the fiber. The availability of highpower sources at two specific wavelengths (810 nm asproduced by diode lasers and 1064 nm as produced byNd:YAG lasers) has dominated the development of inter-stitial laser thermal therapy. Wyman et al. (73) haveshown that 1064 nm light can enable the creation ofgreater lesion sizes due to its greater penetration. How-ever, Nd:YAG lasers are large, generally immobile andinconvenient and so many have adopted 810 nm as thewavelength of choice due to the availability of compact andinexpensive sources. More recently 980 nm lasers havebeen employed to combine mobility with greater lightpenetration (74,75).
Differences between Nd:YAG and Diode lasers are onlyrealized if charring is avoided. Once charring and carbo-nization has occurred the fiber acts as a point or line heatsource. There is no further light propagation into the tissueand subsequent heating has no wavelength dependency.In order to exploit the penetration of light into the tissue,the fiber tip temperature must be controlled to avoidcharring. Achieving such control is somewhat challengingasthetemperatureof thetipcanriseveryquickly inapositivefeedback loop. As charring begins, the rate of temperaturerise increases that causes an increasing rate of charring.Robust, automatic feedback control mechanisms are neces-sary to ensure controlled heating and lesion formation.
INTERSTITIAL ULTRASOUND
The possibility of developing interstitial ultrasounddevices for hyperthermia applications was proposed byHynynen in 1992 (76). The initial studies examined variousdesign parameters including the choice of ultrasound fre-quency, electric and acoustic power, and catheter cooling.As Hynynen showed (76), thin interstitial ultrasoundapplicators were likely capable of heating perfused tissueto therapeutic temperatures.
Ultrasound is a high frequency longitudinal pressurewave that can pass relatively easily through soft tissue.Consequently, it has been useful as an energy source fordiagnostic imaging where focussed ultrasound radiatorsare used to produce high resolution images of soft tissueabnormalities. During transmission through tissue energyis lost due to absorption and to a much lesser extent toscattering. The absorption is caused by friction as thepressure wave causes relative motion of the tissue compo-nents. These frictional forces cause heating that can besignificant if the incident ultrasound power is high enough.The absorption, a is frequency dependent where
a ¼ a f m
and a and m are coefficients that are variable betweentissues although m is � 1.5 for most soft tissues. Rapidlyincreasing absorption with frequency is the main reasonthat the penetration of diagnostic imaging is limited atvery high ultrasound frequencies. Higher penetration isalso the reason that relatively low ultrasound frequenciesare used for ultrasound heating. Typically, frequencies inthe range 0.5–2 MHz have been used in external focusedultrasound heating applications. However, this becomesproblematic for interstitial devices that are small andresonate at high ultrasound frequencies.
Interstitial ultrasound applicators have since beendeveloped and are usually designed as thin tubular radia-tors. The radiator consists of a piezoelectric material thatwill resonate acoustically at a frequency f determined bythe wall diameter d:
f ¼ v
2d
where v is the speed of sound in the piezoelectric material(e. g., 4000 ms�1 in the piezoelectric material PZT 4A). Forinterstitial applicators, thin radiators are required. A wall
HYPERTHERMIA, INTERSTITIAL 39

thickness of 0.2 mm, for example, would translate into anoperating frequency of � 10 MHz (76). The SAR for acylindrical applicator is dependent on its dimensions andthe frequency of operation as given by
SAR ¼ 2a fI0r
r0
� �e�2m f ðr�r0Þ
wherea is the ultrasound absorption coefficient in tissue, I0
is the intensity of ultrasound at the applicator surface, r0 isthe radius of the applicator, r is the distance from thecentre of the applicator to the point of interest and m is theattenuation coefficient of ultrasound that includes absorp-tion and scattering. Skinner et al. (77) have calculated andcompared the SAR of ultrasound, laser, and microwaveapplicators assuming a simple cyclindrical radiation pat-tern for each. The SAR of all these applicators is dominatedby the thin cylindrical geometry so that despite the largerpenetration depth of ultrasound, only slightly larger dia-meter lesions can be produced. In order to overcome thelimiting geometry, new interstitial ultrasound applicatorshave been developed that take advantage of the focusingability of ultrasound (78) or that employs acoustic match-ing that can result in efficient transmission at multiplefrequencies (79).
The development of interstitial ultrasound applicatorsis still at the preclinical stage (80,81) although larger,intracavitary applicators are being applied in the treat-ment of prostate cancer using a transrectal technique (82).
BIBLIOGRAPHY
1. Emami BC,et al. Phase III studyof interstitial thermoradiother-apy compared with interstitial radiotherapy alone in the treat-ment of recurrent or persistent human tumors: A prospectivelycontrolledrandomizedstudybytheRadiationTherapyOncologyGroup. Inte J Rad Oncol Biol Phy 1996;34(5): 1097–1104.
2. Emami BP, et al. RTOG Quality Assurance Guidelines forInterstitial Hyperthermia. Inter J Rad Oncol Biol Phy 1991;20(5):1117–1124.
3. Peters RD, et al. Magnetic resonance thermometry for pre-dicting thermal damage: An application of interstitial lasercoagulation in an in vivo canine prostate model. Magn ResonMed 2000;44(6):873–883.
4. Morikawa S, et al. MR-guided microwave thermocoagulationtherapy of liver tumors: Initial clinical experiences using a 0.5 Topen MR system. J Magn Reson Imaging 2002;16(5):576–583.
5. Sapareto SA, Dewey WC. Thermal dose determination in cancertherapy. Int J Radiat Oncol Biol Phys 1984;10(6): 787–800.
6. Pennes HH .Analysis of tissue and arterial blood temperaturesin the resting human forearm. 1948. J Appl Physiol 1998;85(1):5–34.
7. Camart JC, et al. New 434 MHz interstitial hyperthermiasystem monitored by microwave radiometry: theoretical andexperimental results. Intern J Hypertherm 2000;16(2):95–111.
8. Mechling JA, Strohbehn JW. 3-Dimensional Theoretical SARand Temperature Distributions Created in Brain-Tissue by915 and 2450 MHz Dipole Antenna-Arrays with VaryingInsertion Depths. Intern J Hypertherm 1992;8(4):529–542.
9. Uzuka T, et al. Planning of hyperthermic treatment for malig-nant glioma using computer simulation. Int J Hypertherm2001;17(2):114–122.
10. Wust P, et al. Simulation studies promote technological devel-opment of radiofrequency phased array hyperthermia. Int JHypertherm 1996;12(4):477–494.
11. Haemmerich D, Lee Jr FT. Multiple applicator approaches forradiofrequency and microwave ablation. Int J Hypertherm2005;21(2):93–106.
12. McGahan JP, Dodd GD, 3rd. Radiofrequency ablation of theliver: current status. AJR Am J Roentgenol 2001;176(1):3–16.
13. Friedman MI, et al. Radiofrequency ablation of cancer. Car-diovasc Intervent Radiol 2004;27(5):427–434.
14. Lencioni RL, et al. Radiofrequency ablation of lung malignancies:where do we stand? Cardiovasc Intervent Radiol 2004;27(6):581–590.
15. Gazelle GS, Goldberg SN, Solbiati L, Livraghi T. Tumorablation with radio-frequency energy. Radiology 2000;217(3):633–646.
16. Goletti O, et al. Laparoscopic radiofrequency thermal ablationof hepatocarcinoma: preliminary experience. Surg LaparoscEndosc Percutan Tech 2000;10(5):284–290.
17. Morita K, et al. Combination therapy of rat brain tumoursusing localized interstitial hyperthermia and intra-arterialchemotherapy. Inter J Hypertherm 2003;19(2):204–212.
18. Matsui Y, et al. Selective thermocoagulation of unresectablepancreatic cancers by using radiofrequency capacitive heat-ing. Pancreas 2000;20(1):14–20.
19. Aoki H, et al. Therapeutic efficacy of targeting chemotherapyusing local hyperthermia and thermosensitive liposome: eva-luation of drug distribution in a rat glioma model. Int JHypertherm 2004;20(6):595–605.
20. Lencioni R, et al. Radio-frequency thermal ablation of livermetastases with a cooled-tip electrode needle: results of a pilotclinical trial. Eur Radiol 1998;8(7):1205–1211.
21. Haemmerich D, et al. Large-volume radiofrequency ablation ofex vivo bovine liver with multiple cooled cluster electrodes.Radiology 2005;234(2):563–568.
22. Rendon RA, et al. The uncertainty of radio frequency treat-ment of renal cell carcinoma: Findings at immediate anddelayed nephrectomy. J Urol 2002;167(4):1587–1592.
23. Crezee J, Lagendijk JJ. Temperature uniformity duringhyperthermia: the impact of large vessels. Phys Med Biol1992;37(6):1321–1337.
24. vanderKoijk JF, et al. Dose uniformity in MECS interstitialhyperthermia: The impact of longitudinal control in modelanatomies. Phys Med Biol 1996;41(3):429–444.
25. VanderKoijk JF, et al. The influence of vasculature on tem-perature distributions in MECS interstitial hyperthermia:Importance of longitudinal control. Intern J Hypertherm1997; 13(4):365–385.
26. Kaatee RSJP. Development and evaluation of a 27 MHz multi-electrode current-source interstitial hyperthermia system.Med Phys 2000;27(12):2829–2829.
27. Ryan TP. Comparison of 6 Microwave Antennas for Hyperther-mia Treatment of Cancer—SAR Results for Single Antennasand Arrays. Intern J Rad Oncol Biol Phys 1991; 21(2):403–413.
28. Roemer RB. Engineering aspects of hyperthermia therapy.Annu Rev Biomed Eng 1999;1:347–376.
29. Sherar MD, Trachtenberg J, Davidson SRH, Gertner MR.Interstitial microwave thermal therapy and its applicationto the treatment of recurrent prostate cancer. Intern JHypertherm 2004;20(7):757–768.
30. Fabre JJ, et al. 915 MHz Microwave Interstitial Hyperthermia.1. Theoretical and Experimental Aspects with TemperatureControl by Multifrequency Radiometry. Intern J Hypertherm1993;9(3):433–444.
31. Camart JC, et al. 915 MHz Microwave Interstitial Hyper-thermia. 2. Array of Phase-Monitored Antennas. Intern JHypertherm 1993;9(3):445–454.
40 HYPERTHERMIA, INTERSTITIAL

32. Prevost B, et al. 915 MHz Microwave Interstitial Hyperther-mia. 3. Phase-II Clinical-Results. Intern J Hypertherm 1993;9(3):455–462.
33. Camart JC, et al. Coaxial Antenna-Array for 915 MHz Inter-stitial Hyperthermia—Design and Modelization Power Deposi-tion and Heating Pattern Phased-Array. IEEE TransMicrowave Theory Tech 1992;40(12):2243–2250.
34. Fike JR, Gobbel GT, Satoh T, Stauffer PR. Normal BrainResponse after Interstitial Microwave Hyperthermia. InternJ Hypertherm 1991;7(5): 795–808.
35. McCann C, et al. Feasibility of salvage interstitial microwavethermal therapy for prostate carcinoma following failed bra-chytherapy: studies in a tissue equivalent phantom. Phys MedBiol 2003;48(8):1041–1052.
36. Sherar MD, et al. Interstitial microwave thermal therapy forprostate cancer. J Endourol 2003;17(8):617–625.
37. Guy A. Analysis of Electromagnetic Fields Induced inBiological Tissues by Thermographic Studies on EquivalentPhanton Models. IEEE Trans Biomed Eng 1971;19:205–214.
38. Trembly BS, Douple EB, Hoopes PJ. The Effect of Air Coolingon the Radial Temperature Distribution of a Single MicrowaveHyperthermia Antenna In vivo. Intern J Hypertherm1991;7(2):343–354.
39. Goldberg SN, et al. Radiofrequency tissue ablation: increasedlesion diameter with a perfusion electrode. Acad Radiol1996;3(8):636–644.
40. Eppert V, Trembly BS, Richter HJ. Air Cooling for an Inter-stitial Microwave Hyperthermia Antenna—Theory andExperiment. IEEE Trans Biomed Eng 1991;38(5):450–460.
41. Goldberg SN, et al. Treatment of intrahepatic malignancywith radiofrequency ablation: Radiologic-pathologic correla-tion. Cancer 2000;88(11):2452–2463.
42. Solbiati L, et al. Hepatic metastases: percutaneous radio-frequency ablation with cooled-tip electrodes. Radiology 1997;205(2):367–373.
43. Livraghi T, et al. Saline-enhanced radio-frequency tissueablation in the treatment of liver metastases. Radiology1997;202(1):205–210.
44. Michaels MJ, et al. Incomplete renal tumor destruction usingradio frequency interstitial ablation. J Urol 2002;168(6):2406–2409.
45. Takahashi H, et al. Radiofrequency interstitial hyperthermiaof malignant brain tumors: Development of heating system.Exper Oncol 2000;22(4):186–190.
46. Seegenschmiedt MH, et al. Clinical-Experience with InterstitialThermoradiotherapy for Localized Implantable Pelvic Tumors.Am J Clin Oncol Cancer Clin Trials 1993;16(3): 210–222.
47. Seegenschmiedt MH, et al. Multivariate-Analysis of Prognos-tic Parameters Using Interstitial Thermoradiotherapy(Iht-Irt)—Tumor and Treatment Variables Predict Outcome.Intern J Rad Oncol Biol Phys 1994;29(5):1049–1063.
48. van Vulpen M, et al. Radiotherapy and hyperthermia in thetreatment of patients with locally advanced prostate cancer:Preliminary results. Bju Inter 2004;93(1):36–41.
49. Engin K, et al. Thermoradiotherapy with Combined Intersti-tial and External Hyperthermia in Advanced Tumors in theHead and Neck with Depth Greater-Than-or-Equal-to 3 Cm.Intern J Hyperther 1993;9(5):645–654.
50. Sneed PK, et al. Thermoradiotherapy of Recurrent MalignantBrain-Tumors. Int J Radiat Oncol Biology Physics. 1992.
51. Wonnell TL, Stauffer PR, Langberg JJ. Evaluation of Micro-wave and Radio-Frequency Catheter Ablation in a Myocar-dium-Equivalent Phantom Model. IEEE Trans Biomed Eng1992;39(10):1086–1095.
52. Buscarini L, Buscarini E. Therapy of HCC-radiofrequencyablation. Hepato-Gastroenterol 2001;48(37):15–19.
53. Rendon RA, et al. Development of a radiofrequency basedthermal therapy technique in an in vivo porcine model for thetreatment of small renal masses. J Urol 2001;166(1):292–298.
54. Blute ML, Larson T. Minimally invasive therapies for benignprostatic hyperplasia. Urology 2001;58(6A):33–40.
55. Van Vulpen M, et al. Three-dimensional controlled interstitialhyperthermia combined with radiotherapy for locallyadvanced prostate carcinoma—A feasibility study. Intern JRad Oncol Biol Phy 2002;53(1):116–126.
56. Belfiore G, et al. CT-guided radiofrequency ablation: a poten-tial complementary therapy for patients with unresectableprimary lung cancer—a preliminary report of 33 patients.AJR Am J Roentgenol 2004;183(4):1003–1011.
57. Cioni D, Lencioni R, Bartolozzi C, Percutaneous ablation ofliver malignancies: Imaging evaluation of treatment response.Eur J Ultrasound 2001;13(2):73–93.
58. Bown SG. Phototherapy in tumors. World J Surg 1983;7(6):700–709.
59. Witt JD, et al. Interstitial laser photocoagulation for thetreatment of osteoid osteoma. J Bone Joint Surg Br 2000;82(8):1125–1128.
60. Welch A. The thermal response of laser irradiated tissue.IEEE J Quantum Electr 1984;20(12):1471–1481.
61. Boulnois J. Photophysical processes in recent medical laserdevelopments: A review. Lasers Med Sci 1986;1(1):47–66.
62. Wyman D, Patterson M, Wilson B. Similarity relations for theinteraction parameters in radiation transport and their appli-cations. Appl Op 1989;28:5243–5249.
63. Ishimaru A. Diffusion Approximation, in Wave Propagationand Scattering in Random Media. New York: Academic Press;1978. p. 178.
64. Duderstadt JH. Nuclear Reactor Analysis. New York: JohnWiley & Sons; 1976.
65. Rinzema K, Murrer L. Direct experimental verification of lighttransport theory in an optical phantom. J Opt Soc Am A1998;15(8):2078–2088.
66. Wilson BC, Adam G. A Monte Carlo model for the absorptionand flux distributions of light in tissue. Med Phys 1983;10(6):824–830.
67. Roggan A, Muller G. Dosimetry and computer based irradia-tion planning for laser-induced interstitial thermotherapy(LITT). In: Roggan A, Muller G, editors. Laser-Induced Inter-stitial Thermotherapy. Bellingham, (WA): SPIE Press;114–156.
68. Jaywant S, et al. Temperature dependent changes in theoptical absorptio nand scattering spectra of tissue. SPIE Proc1882. 1993;
69. Arridge SR, Schweiger M, Hiraoka M, Delpy DT. A finiteelement approach for modeling photon transport in tissue.Med Phys 1993;20(2 Pt. 1):299–309.
70. Pogue BW, Patterson MS, Jiang H, Paulsen KD. Initial assess-ment of a simple system for frequency domain diffuse opticaltomography. Phys Med Biol 1995;40(10):1709–1729.
71. Ripoll J, Nieto-Vesperinas M. Scattering Integral Equationsfor Diffusive Waves. Detection of Objects Buried in DiffusiveMedia in the Presence of Rough Interfaces. J Opt Soc of Am A1999;16:1453–1465.
72. Heisterkamp J, van Hillegersberg R, Sinofsky E. Heat-resistant cylindrical diffuser for interstitial laser coagulation:Comparison with the bare-tip fiber in a porcine liver model.Lasers Surg Med 1997;20(3):304–309.
73. Wyman DR, Schatz SW, Maguire JA. Comparison of 810 nmand 1064 nm wavelengths for interstitial laser photocoagula-tion in rabbit brain. Lasers Surg Med 1997;21(1):50–58.
74. McNichols RJ, et al. MR thermometry-based feedback controlof laser interstitial thermal therapy at 980 nm. Lasers SurgMed 2004;34(1):48–55.
HYPERTHERMIA, INTERSTITIAL 41
75. Kangasniemi M, et al. Thermal therapy of canine cerebraltumors using a 980 nm diode laser with MR temperature-sensitive imaging feedback. Lasers Surg Med 2004;35(1):41–50.
76. Hynynen K. The Feasibility of Interstitial UltrasoundHyperthermia. Med Phys 1992;19(4):979–987.
77. Skinner MG, Iizuka MN, Kolios MC, Sherar MD. A theoreticalcomparison of energy sources—microwave, ultrasound andlaser—for interstitial thermal therapy. Phys Med Biol 1998;43(12):3535–3547.
78. Chopra R, Bronskill MJ, Foster FS. Feasibility of linear arraysfor interstitial ultrasound thermal therapy. Med Phys 2000;27(6):1281–1286.
79. Chopra R, Luginbuhl C, Foster FS, Bronskill MJ. Multi-frequency ultrasound transducers for conformal interstitialthermal therapy. IEEE Trans Ultrason Ferroelectr Freq Con-trol 2003;50(7):881–889.
80. Nau WH, et al. MRI-guided interstitial ultrasound thermaltherapy of the prostate: A feasibility study in the canine model.Med Phys 2005;32(3):733–743.
81. Diederich CJ, et al. Catheter-based ultrasound applicatorsfor selective thermal ablation: Progress towards MRI-guidedapplications in prostate. Int J Hyperther 2004;20(7):739–756.
82. Uchida T, et al. Transrectal high-intensity focused ultrasoundfor treatment of patients with stage T1b-2NOMO localizedprostate cancer: A preliminary report. Urology 2002; 59(3):394–398.
See also BRACHYTHERAPY, HIGH DOSAGE RATE; HEAT AND COLD, THERA-
PEUTIC; HYPERTHERMIA, SYSTEMIC; HYPERTHERMIA, ULTRASONIC; PROSTATE
SEED IMPLANTS.
HYPERTHERMIA, SYSTEMIC
R. WANDA ROWE-HORWEGE
University of Texas MedicalSchoolHouston, Texas
INTRODUCTION
Systemic hyperthermia is deliberate heating of the wholebody to achieve an elevated core temperature for thera-peutic purposes. Other terms used are whole-bodyhyperthermia, systemic or whole body thermal therapy,and hyperpyrexia. The goal of systemic hyperthermia is toreproduce the beneficial effects of fever. Typically, corebody temperatures of 41–42 8C are induced for 1–2 h, oralternatively 39–40 8C for 4–8 h. Systemic hyperthermia,by virtue of application to the whole body, aims to alleviatesystemic disease conditions, in contrast to local or regionalhyperthermia that treats only a specific tissue, limb, orbody region.
HISTORICAL BACKGROUND
The use of heat to treat disease goes back to ancient times.Application of fire to cure a breast tumor is recorded in anancient Egyptian papyrus, and the therapeutic value ofelevated body temperature in the form of fever was appre-ciated by ancient Greek physicians. Hippocrates wrote,‘‘What medicines do not heal, the lance will; what thelance does not heal, fire will,’’ while Parmenides stated,
‘‘Give me a chance to create a fever and I will cure anydisease.’’ In the first century AD, Rufus (also written asRefus or Ruphos) of Ephesus advocated fever therapy fora variety of diseases. Hot baths were considered thera-peutic in ancient Egypt, Greece, Rome, China, and Indiaas they still are in many aboriginal cultures today, alongwith burying diseased individuals in hot sand or mud.Hot baths and saunas are an integral part of healthtraditions throughout the Orient, in Indian Ayurvedicmedicine, as well as in Eastern European and Scandina-vian countries. Following several earlier anecdotalreports, several nineteenth century German physiciansobserved regression or cure of sarcoma in patients whosuffered prolonged, high fevers due to infectious diseases.This led to efforts to induce infectious fevers in cancerpatients, for example, by applying soiled bandages or theblood of malaria patients to wounds. The late nineteenthcentury New York physician, William Coley, achievedcancer cures by administration of erysipelas and otherbacterial endotoxins, now known as Coley’s toxins, andattempted to create standardized preparations of thesepyrogens (1). At around the same time, treatment ofsyphilis by placing the patient in a stove-heated room,or a heat box, became commonplace. Successful hyperther-mic treatment of other sexually transmitted diseases, suchas gonorrhea, and neurological conditions, such as choreaminor, dementia paralytica, and multiple sclerosis alongwith arthritis, and asthma were widely reported. Interest-ingly, it was noted by Italian physicians that upon comple-tion of the draining of the Pontine Swamps near Rome byMussolini in the 1930s, not only was malaria eradicated,but the prevalence of cancer in the area was the same as inthe rest of Italy, whereas earlier the whole malaria-infected region was noted for its absence of cancer. Itwas concluded that the frequent fever attacks commonin malaria stimulated the immune system to prevent thedevelopment of cancers.
The science of hyperthermia became grounded in thefirst few decades of the twentieth century when some of thebiological effects of elevated body temperature were eluci-dated and attempts were made to understand and controlthe therapeutic application of heat. Numerous deviceswere developed to produce elevated temperatures of thebody, by a variety of physical means. After a shift in focus tolocal and regional hyperthermia, there is now a resurgenceof interest in systemic hyperthermia for treatment of cancer,as well as other systemic diseases. Whole-body hyperther-mia treatment is now carried out at several universitycenters in the United States, and Europe (Table 1), wherecontrolled clinical trials are being carried out. Numerousprivate clinics, principally in North America, Germany,Austria, Eastern Europe, Japan, and China also performsystemic hyperthermia, mostly as part of holistic, alterna-tive, treatment regimens.
PHYSICS OF SYSTEMIC HYPERTHERMIA
As shown schematically in Fig. 1, in order to achieve bodytemperature elevation, there must be greater depositionof heat energy in the body than heat energy lost from
42 HYPERTHERMIA, SYSTEMIC

Ta
ble
1.
Cli
nic
al
Aca
dem
ic/R
eg
ion
al
Sy
stem
icH
yp
erth
erm
iaC
en
ters
Cou
ntr
yC
ity
Inst
itu
tion
Pri
nci
pal
Inves
tigato
rH
eat
Typ
e,M
ach
inea
Pro
toco
l(t
ime,
tem
p)
Asi
aC
hin
aB
aod
ing
Sec
ond
Hos
pit
al
ofB
aod
ing
Ch
un
zhu
Yin
RF
3.5
–6
h,
40–40.5
8CC
hin
aC
han
gch
un
Jil
inT
um
orH
osp
ital
Ch
an
ggu
oH
ong
RF
3.5
–6
h,
40–40.5
8CC
hin
aJia
ngm
enG
uan
gd
ong
Jia
ngm
enR
enm
inH
osp
ital
Wen
pin
gW
uIR
Ch
ina
Sh
an
gh
ai
Ch
an
gh
ai
Hos
pit
al,
Sec
ond
Mil
itary
Med
ical
Sch
ool
Yaji
eW
an
gC
hin
aS
han
gh
ai
Dep
art
men
tof
Tu
mor
Hyp
erth
erm
iaC
ente
rK
ai-
shen
gH
ouIR
,E
T-S
pace
extr
aco
rpor
eal
1–2
h,
41.8
–42.5
8C
Ch
ina
Sh
an
gh
ai
Sh
an
gh
ai
Jin
gan
Cen
tral
Hos
pit
al
Wei
pin
gT
ao
IR,
ET
-Sp
ace
extr
aco
rpor
eal
2h
,41.6
8C4
h,
42.1
8C
Ch
ina
Tai’an
Cit
y88th
Hos
pit
al
ofP
LA
Yon
gP
eng
1–2
h,
41.8
8C6
h,
39.5
–408C
Ch
ina
Zh
engzh
ouM
oder
nH
osp
ital,
Zh
engzh
ouD
ingji
uL
iR
F3.5
–6
h,
40–40.5
8CJap
an
Tok
yo
Lu
ke
Hos
pit
al
Ak
ira
Tak
euch
iIR
Eu
rop
eB
elaru
sM
insk
Bel
aru
sC
ente
rfo
rP
edia
tric
On
colo
gy
an
dH
emato
logy
Rei
man
nIs
-zad
eH
FE
M,
Yak
hta
-52
h,
41.8
–42.5
8C1
h,
42.5
–438C
Ger
man
yB
erli
nL
ud
wig
Maxim
ilia
nU
niv
ersi
tyC
hari
téM
edic
al
Cen
ter
Ber
tH
ild
ebra
nd
t,H
an
no
Rie
ss,
Pet
erW
ust
IR,
Irath
erm
1h
,41.8
8C
Ger
man
yF
ran
kfu
rtK
ran
ken
hau
sN
ord
wes
tE
lke
Jäger
,A
kin
Atm
ata
IR,
Aqu
ath
erm
1h
,41.8
8CG
erm
an
yM
un
ich
Lu
dw
igM
axim
ilia
nU
niv
ersi
tyH
osp
ital
Cli
nic
Hara
ldS
omm
erIR
,Ir
ath
erm
1h
,41.8
8CH
un
gary
Kec
skem
étIn
stit
ute
ofR
ad
iolo
gy
ofK
ecsk
emét
Mik
lós
Szü
csIR
,O
nco
Th
erm
1h
,41.8
8CN
orw
ay
Ber
gen
Un
iver
sity
ofB
ergen
,H
au
kel
an
dU
niv
ersi
tyH
osp
ital
Baard
-Ch
rist
ian
Sch
emIR
,Ir
ath
erm
1h
,41.8
8CR
uss
iaN
ovos
ibir
skS
iber
ian
Sci
enti
fic
Res
earc
hIn
stit
ute
ofH
yp
erth
erm
iaR
oman
Tch
ervov
Wate
rbath
43.5
–44.0
8CR
uss
iaO
bn
insk
Med
ical
Rad
iolo
gic
al
Res
earc
hC
ente
rof
Ru
ssia
nA
cad
emy
ofM
edic
al
Sci
ence
s,O
bn
insk
Yu
riM
ard
yn
sky
HF
EM
,Y
ak
hta
51–2
h,
41.0
–42.3
8C
Nort
hA
mer
ica
Un
ited
Sta
tes
Galv
esto
n,
TX
Un
iver
sity
ofT
exas
Med
ical
Bra
nch
Jos
eph
Zw
isch
enber
ger
extr
aco
rpor
eal
2h
,42.5
8CU
nit
edS
tate
sH
oust
on,
TX
Un
iver
sity
ofT
exas
Med
ical
Sch
ool
Joa
nM
.B
ull
IR,
Hec
kel
6h
,408C
Un
ited
Sta
tes
Bu
ffalo
,N
YR
osw
ell
Park
Can
cer
Inst
itu
teW
illi
am
G.
Kra
ybil
lIR
,H
eck
el6
h,
408C
Un
ited
Sta
tes
Du
rham
,N
CD
uk
eC
omp
reh
ensi
ve
Can
cer
Cen
terb
Zel
jko
Vu
jask
ovic
IR,
Hec
kel
6h
,408C
aR
ad
iofr
equ
ency
¼R
F;
infr
are
d¼
IR.
bS
tart
ing
in2006.
43
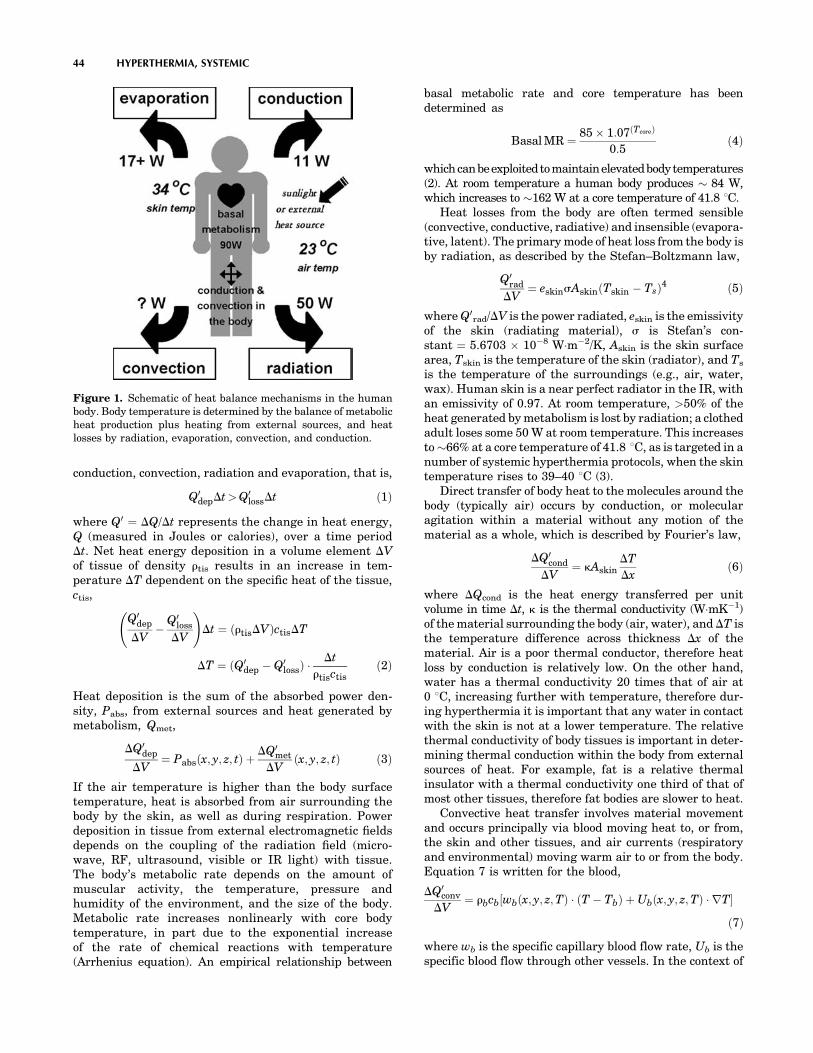
conduction, convection, radiation and evaporation, that is,
Q0depDt>Q0
lossDt ð1Þ
where Q0 ¼ DQ/Dt represents the change in heat energy,Q (measured in Joules or calories), over a time periodDt. Net heat energy deposition in a volume element DVof tissue of density rtis results in an increase in tem-perature DT dependent on the specific heat of the tissue,ctis,
Q0dep
DV�
Q0loss
DV
!Dt ¼ ðrtisDVÞctisDT
DT ¼ ðQ0dep � Q0
lossÞ Dt
rtisctisð2Þ
Heat deposition is the sum of the absorbed power den-sity, Pabs, from external sources and heat generated bymetabolism, Qmet,
DQ0dep
DV¼ Pabsðx; y; z; tÞ þ
DQ0met
DVðx; y; z; tÞ ð3Þ
If the air temperature is higher than the body surfacetemperature, heat is absorbed from air surrounding thebody by the skin, as well as during respiration. Powerdeposition in tissue from external electromagnetic fieldsdepends on the coupling of the radiation field (micro-wave, RF, ultrasound, visible or IR light) with tissue.The body’s metabolic rate depends on the amount ofmuscular activity, the temperature, pressure andhumidity of the environment, and the size of the body.Metabolic rate increases nonlinearly with core bodytemperature, in part due to the exponential increaseof the rate of chemical reactions with temperature(Arrhenius equation). An empirical relationship between
basal metabolic rate and core temperature has beendetermined as
Basal MR ¼ 85 � 1:07ðTcoreÞ
0:5ð4Þ
whichcanbeexploited tomaintainelevatedbodytemperatures(2). At room temperature a human body produces � 84 W,which increases to �162 W at a core temperature of 41.8 8C.
Heat losses from the body are often termed sensible(convective, conductive, radiative) and insensible (evapora-tive, latent). The primary mode of heat loss from the body isby radiation, as described by the Stefan–Boltzmann law,
Q0rad
DV¼ eskinsAskinðTskin � TsÞ4 ð5Þ
where Q0rad/DV is the power radiated, eskin is the emissivity
of the skin (radiating material), s is Stefan’s con-stant ¼ 5.6703 � 10�8 Wm�2/K, Askin is the skin surfacearea, Tskin is the temperature of the skin (radiator), and Ts
is the temperature of the surroundings (e.g., air, water,wax). Human skin is a near perfect radiator in the IR, withan emissivity of 0.97. At room temperature, >50% of theheat generated by metabolism is lost by radiation; a clothedadult loses some 50 W at room temperature. This increasesto �66% at a core temperature of 41.8 8C, as is targeted in anumber of systemic hyperthermia protocols, when the skintemperature rises to 39–40 8C (3).
Direct transfer of body heat to the molecules around thebody (typically air) occurs by conduction, or molecularagitation within a material without any motion of thematerial as a whole, which is described by Fourier’s law,
DQ0cond
DV¼ kAskin
DT
Dxð6Þ
where DQcond is the heat energy transferred per unitvolume in time Dt, k is the thermal conductivity (WmK�1)of the material surrounding the body (air, water), and DT isthe temperature difference across thickness Dx of thematerial. Air is a poor thermal conductor, therefore heatloss by conduction is relatively low. On the other hand,water has a thermal conductivity 20 times that of air at0 8C, increasing further with temperature, therefore dur-ing hyperthermia it is important that any water in contactwith the skin is not at a lower temperature. The relativethermal conductivity of body tissues is important in deter-mining thermal conduction within the body from externalsources of heat. For example, fat is a relative thermalinsulator with a thermal conductivity one third of that ofmost other tissues, therefore fat bodies are slower to heat.
Convective heat transfer involves material movementand occurs principally via blood moving heat to, or from,the skin and other tissues, and air currents (respiratoryand environmental) moving warm air to or from the body.Equation 7 is written for the blood,
DQ0conv
DV¼ rbcb½wbðx; y; z;TÞ ðT � TbÞ þ Ubðx; y; z;TÞ rT�
ð7Þ
where wb is the specific capillary blood flow rate, Ub is thespecific blood flow through other vessels. In the context of
44 HYPERTHERMIA, SYSTEMIC
Figure 1. Schematic of heat balance mechanisms in the humanbody. Body temperature is determined by the balance of metabolicheat production plus heating from external sources, and heatlosses by radiation, evaporation, convection, and conduction.

systemic hyperthermia, where a patient is in a closedchamber, environmental air currents can be minimized.Heat loss by respiration, however, can amount to almost10% of metabolic heat generation.
Another route of heat loss from the body is evaporationof perspiration from the skin. Because of the very largeheat of vaporization of water, cooling of the blood in skincapillaries occurs due to evaporation of sweat. Evaporationfrom exhaled moisture also results in cooling of the sur-rounding air.
DQ0evap
DV¼ mw
Lv
Dtð8Þ
where mw is the mass of the water and Lv is the latent heatof vaporization (2.4 � 106 Jkg�1 at 34 8C). In hot condi-tions with maximal rates of evaporation, heat loss throughevaporation of sweat can be as much as 1100 W. Heat lossin the lungs is �10 W.
Combining the heat generation and heat loss termsleads to a general heat transfer equation, an extensionof the classic Pennes bioheat transfer equation.
DQ0met
DVþ Pabs
� ��
�DQ0
rad
DVþDQ0
cond
DVþ DQ0
conv
DVþDQ0
resp
DVþDQ0
evap
DV
� ��¼ rtisctisDT ð9Þ()
into which the expressions given in Eqs. 2–8 may be sub-stituted. Precise solution of this equation for temperaturedistribution is complex and requires a number of simplifyingassumptions which have generated significant controversyin bioheat transfer circles. Modeling of temperature distri-butions within a body subjected to hyperthermia is alsocomplex because of the heterogeneity of thermal character-istics between and within tissue, the directionality of powerapplication, and the dynamic nature of thermoregulation byhuman body. Nonetheless, the factors governing systemicheating of the body can be appreciated.
INDUCTION OF SYSTEMIC HYPERTHERMIA
Apart from the induction of biological fever by pathogens ortoxins, all methods of hyperthermia involve transfer ofheat into the body from an external energy source. Therequired net power to raise the temperature of a 70 kghuman from 37 to 41.8 8C (2) is 400 W (5.7 mW). While theheat absorption from these sources is highly nonuniform,distribution of thermal energy by the vascular systemquickly results in a uniform distribution of temperature.Indeed, systemic hyperthermia is the only way to achieveuniform heating of tissues. Because physiological thermo-regulation mechanisms such as vasodilation and perspira-tion counteract attempts to increase core body temperature,careful attention must be paid to optimizing the physicalconditions for heating such that there is efficient depositionof heat energy in the body and, even more importantly,minimization of heat losses. Wrapping the body in reflectiveblankets, foil, or plastic film to reduce radiative and eva-porative losses, or keeping the surrounding air moist to
minimize losses by perspiration are key techniques forachieving a sustained increase in body temperature.
Noninvasive methods of heating include immersing thebody in hot water or wax, wrapping the body in a blanket orsuit through which heated water is pumped, placing thepatient on a heated water mattress, surrounding the bodywith hot air, irradiating with IR energy, and applying RFor microwave electromagnetic energy. These techniquesmay be applied singly or in combination. For example, thePomp–Siemens cabinet used until recently throughoutEurope, as well as in the United States, a modificationof a device originally developed by Siemens in the 1930s,has the patient lying on a heated water mattress underwhich an inductive loop generates an RF field, all inside achamber through which hot air is circulated. The RussianYakhta-5 system applies a high frequency (13.56 MHz)electromagnetic field through a water-filled mattress topermit whole body heating up to 43.5 8C and simultaneousdeep local hyperthermia through additional applicators pro-viding 40.6 MHz electromagnetic radiation. The majority ofwhole-body hyperthermia systems currently in clinical useemploy IR radiation to achieve systemic heating. Invasiveapproaches to systemic hyperthermia are extracorporealheating of blood, removed from the body via an arteriovenousshunt, prior to returning it to the circulation, as well asperitoneal irrigationwithheatedfluid (4).A useful schematicsummary of whole-body hyperthermia induction techniquesalong with references is provided by van der Zee (5).
All of these approaches involve a period of steadytemperature increase, followed by a plateau or equilibriumphase where the target temperature is maintained for any-where from 30 min to several hours, and finally a cool-downphase. Depending on the method of hyperthermia induction,the patient may be anesthetized, consciously sedated, admi-nistered analgesia, or not given any kind of medication atall. An epidural block is sometimes given to induce orincrease vasodilation. During radiant heat induction, thetemperature of the skin and superficial tissues (includingtumors) is higher than the core (rectal) temperaturewhereas during the plateau (maintenance) phase, theskin–superficial tissue temperature drops below the coretemperature. As already described, heat losses due to phy-siological mechanisms limit the rate of heating that can beachieved. When insulation of the patient with plastic foilwas added to hot air heating, the heating time to 41.8 8C wasdecreased from 230 to 150 min (65%), and further to 110 min(48%) by addition of a warm water perfused mattress (5).The homogeneity of the temperature distribution was alsosignificantly increased by the addition of insulation and thewater mattress. Noninvasive systemic hyperthermia meth-odologies typically produce heating rates of 1–10 8Ch�1
with 2–3 8Ch�1 being most common. More rapid heatingcan be achieved by the invasive techniques, at the expense ofgreater risk of infection and morbidity.
COMMERCIALLY AVAILABLE WHOLE-BODYHYPERTHERMIA SYSTEMS
A number of commercially available devices have resultedfrom the development of these initially experimental
HYPERTHERMIA, SYSTEMIC 45

systems. The Siemens–Pomp system has already been men-tioned, but is no longer commercially available. Similarly,neither the radiant heat chamber developed by Robins (3),and marketed as the Aquatherm system, nor the similarEnthermics Medical Systems RHS-7500 radiant heatdevice, both producing far IR radiation (IR C) in a moistair chamber, are currently being sold, though they arestill in use in several centers. A close relative is theIratherm2000 radiant heat chamber originally developedby von Ardenne and co-workers (6). In this device, water-filtered infrared radiators at 2400 8C emit their energy fromabove and below the patient bed, producing near-IR (IR A)radiation that penetrates deeper into tissue than far IRradiation, causing direct heating of the subcutaneous capil-lary bed. Thermal isolation is ensured by reflective foilsplaced around the patient. However, note that significantevaporative heat loss through perspiration can be a problemwith this system. Also with a significant market share is theHeckel HT 2000 radiant heat device in which patients lie ona bed enclosed within a soft-sided rectangular tent whoseinner walls are coated with reflective aluminum foil thatensures that the short wavelength infrared A and B radia-tion emitted by four radiators within the chamber uniformlybathes the body surface. Once the target temperature isreached, the chamber walls are collapsed to wrap around thebody, thereby preventing radiative and evaporative heatloss, and permitting maintenance of the elevated tempera-ture, as shown in Fig. 2.
Another radiant heat device, used mainly in Germany,is the HOT-OncoTherm WBH-2000 whole-body hyperther-mia unit which is a chamber that encloses all but thepatient’s head. Special light-emitting diode (LED) radia-tors deliver computer-generated, alloy-filtered IR A wave-lengths that penetrate the skin to deliver heat to thecapillary bed. The manufacturer claims that these wave-lengths also preferentially stimulate the immune system.Recently, Energy Technology, Inc. of China has releasedthe ET-SPACE whole-body hyperthermia system, which
produces IR A radiation in a small patient chamber intowhich warm liquid is infused to help increase the airhumidity and thereby reduce perspiration losses. A num-ber of low cost, far infrared, or dry, saunas are being soldto private clinics, health clubs, and even individuals fortreatment of arthritis, fibromyalgia, detoxification, andweight loss. Examples are the Smarty HyperthermicChamber, the TheraSauna, the Physiotherm, and theBiotherm Sauna Dome. Table 2 summarizes features ofthese commercially available whole-body hyperthermiadevices.
BIOLOGICAL EFFECTS OF SYSTEMIC HYPERTHERMIA
An understanding of the biological effects of systemichyperthermia is critical to both its successful inductionand to its therapeutic efficacy. Systemic responses to bodyheating, if not counteracted, undermine efforts to raisebody temperature, while cellular effects underlie boththe rationale for the use of hyperthermia to treat specificdiseases, and the toxicities resulting from treatment.Although improved technology has allowed easier andmore effective induction of systemic hyperthermia, mostof the recent clinical advances are due to better under-standing and exploitation of specific biological phenomena.
Physiological Effects of Elevated Body Temperature
The sympathetic nervous system attempts to keep all partsof the body at a constant temperature, tightly controlled bya central temperature ‘set point’ in the preoptic–anteriorhypothalamus and a variety of feedback mechanisms. Thethermostat has a circadian rhythm and is occasionallyreset, for example, during fever induced by infectiousagents and endotoxins, but not in endogenously inducedhyperthermia. Occasionally, it breaks down completely asin malignant hyperthermia or some neurological disordersaffecting the hypothalamus. Ordinarily, when core bodytemperature rises, the blood vessels initially dilate, heartrate rises, and blood flow increases in an effort to transportheat to the body surface where it is lost by radiation,conduction, and convection. Heart rate increases on averageby 11.7 beatsmin�1 8C�1 and typically remains elevated forseveral hours after normal body temperature is regained.Systolic blood pressure increases to drive the blood flow, butdiastolic pressure decreases due to the decreased resistanceof dilated vessels, thus there is an increase in cardiacoutput. Heart rate and blood pressure must therefore bemonitored during systemic hyperthermia, and whole-bodyhyperthermia is contraindicated in most patients withcardiac conditions. Interestingly, hyperthermia increasescardiac tolerance to ischemia/reperfusion injury probablydue to activation of manganese superoxide dismutase(Mn-SOD) and involvement of cytokines.
Respiration rate also increases and breathing becomesshallower. Perspiration results in evaporation of sweatfrom the skin and consequent cooling, while the respirationrate increases in order to increase cooling by evaporation ofmoisture from expired air. Weight loss occurs despite fluidintake. There is a decrease in urinary output and the urinehas a high specific gravity, concentrating urates and
46 HYPERTHERMIA, SYSTEMIC
Figure 2. Heckel HT-2000 radiant heat whole body hyperthermiasystem. Unit at the University of Texas Medical School at Houston.Patient is in the heat maintenance phase of treatment, wrapped inthe thermal blankets which form the sides of the chamber duringactive heating.
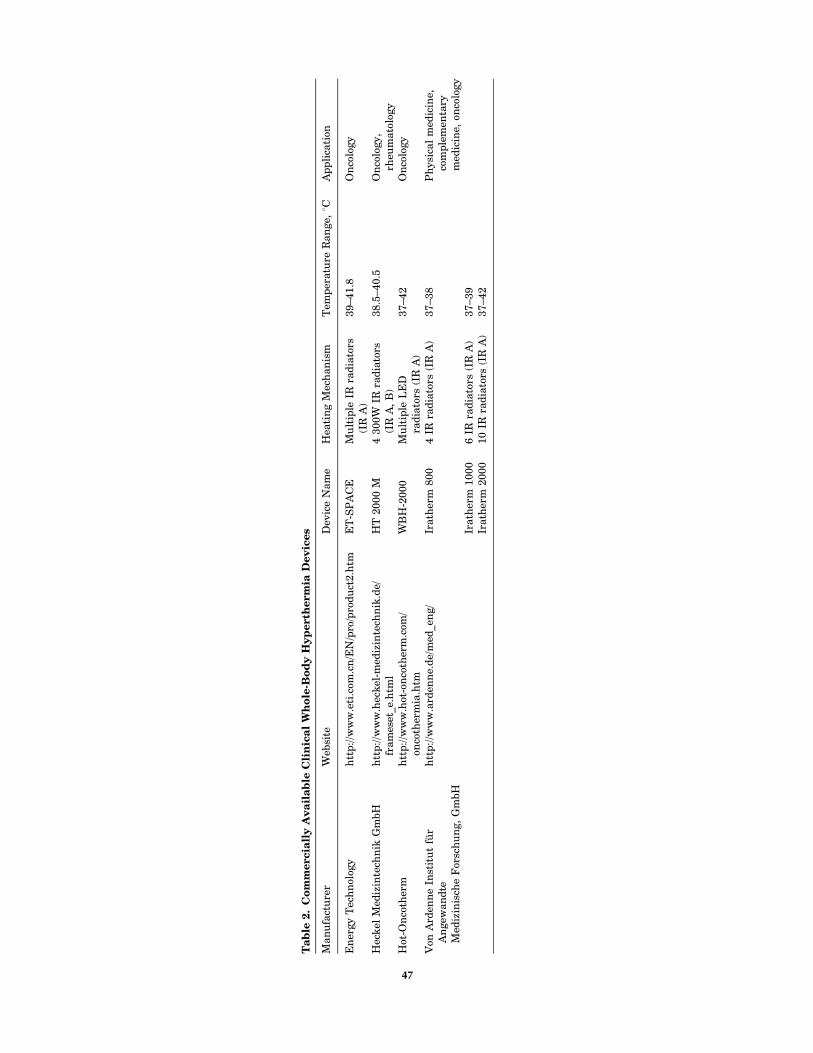
Ta
ble
2.
Co
mm
erc
iall
yA
va
ila
ble
Cli
nic
al
Wh
ole
-Bo
dy
Hy
perth
erm
iaD
ev
ices
Man
ufa
ctu
rer
Web
site
Dev
ice
Nam
eH
eati
ng
Mec
han
ism
Tem
per
atu
reR
an
ge,
8CA
pp
lica
tion
En
ergy
Tec
hn
olog
yh
ttp
://w
ww
.eti
.com
.cn
/EN
/pro
/pro
du
ct2.h
tmE
T-S
PA
CE
Mu
ltip
leIR
rad
iato
rs(I
RA
)39–41.8
On
colo
gy
Hec
kel
Med
izin
tech
nik
Gm
bH
htt
p://w
ww
.hec
kel
-med
izin
tech
nik
.de/
fram
eset
_e.h
tml
HT
2000
M4
300W
IRra
dia
tors
(IR
A,
B)
38.5
–40.5
On
colo
gy,
rheu
mato
logy
Hot
-On
coth
erm
htt
p://w
ww
.hot
-on
coth
erm
.com
/on
coth
erm
ia.h
tmW
BH
-2000
Mu
ltip
leL
ED
rad
iato
rs(I
RA
)37–42
On
colo
gy
Von
Ard
enn
eIn
stit
ut
für
An
gew
an
dte
Med
izin
isch
eF
orsc
hu
ng,
Gm
bH
htt
p:/
/ww
w.a
rden
ne.
de/
med
_en
g/
Irath
erm
800
4IR
rad
iato
rs(I
RA
)37–38
Ph
ysi
cal
med
icin
e,co
mp
lem
enta
rym
edic
ine,
onco
logy
Irath
erm
1000
6IR
rad
iato
rs(I
RA
)37–39
Irath
erm
2000
10
IRra
dia
tors
(IR
A)
37–42
47
phosphates. In endogenously induced hyperthermia, butnot in fever, glomerular filtration, as evidenced by thecreatinine clearance, decreases with increasing tempera-ture. As already mentioned, metabolic rate increases non-linearly with temperature, which leads to an increase inblood sugar, decreased serum potassium levels, andincreased lactic acid production. All the above normalphysiological effects may be enhanced or counteracted byanesthesia or sedation, as well as by disease states such ascancer because of drugs used in treatment or intrinsicpathophysiological consequences of the disease.
At �42.5 8C, the normal thermocompensatory mechan-isms break down and the body displays the symptoms ofadvanced heat stroke, namely, lack of sweating, rapidheart beat, Cheyne–Stokes breathing, central nervoussystem disfunction, and loss of consciousness. Ultimately,breathing ceases despite the continuation of a heart beat.
Cellular Thermal Damage
When temperature is increased by a few degrees Celcious,there is increased efficiency of enzyme reactions (Arrhe-nius equation), leading to increased metabolic rates, but attemperatures > 40 8C molecular conformation changesoccur that lead to destabilization of macromolecules andmultimolecular structures, for example, to the side chainsof amino acids in proteins, which in turn inhibit enzymeaction. Small heat shock proteins (HSP) interact with theunfolding proteins to stabilize them and prevent theiraggregation and precipitation. Eventually, however, at�42 8C, complete denaturation of proteins begins thattotally disrupts many molecular processes, including deox-yribonucleic acid (DNA) repair. Thus systemic hyperther-mia can have significant effects when paired with drugsthat cause DNA damage (e.g., for chemotherapy of cancer).
Membranes are known to be extremely sensitive toheat stress because of their complex molecular composi-tion of lipids and proteins. At a certain temperature, lipidschange from the tightly packed gel phase to the lesstightly packed liquid crystalline phase, and permeabilityof the cell membrane (membrane fluidity) increases. Astemperature increases further, the conformation of proteinsalso becomes affected, eventually resulting in disorderlyrearrangement of the lipid bilayer structure and receptorinactivation or loss. Temperature changes of �5 8C arenecessary to cause measurable changes in normal cellmembrane permeability. Heat-induced cell membrane per-meability can be exploited to increase drug delivery, forexample, transdermally, or into tumor cells. Increased vas-cular permeability due to thermal increase of endothelialgap size also aids drug delivery into tumors. At highertemperatures, heat damage to membranes can cause celldeath, but it will also interfere with therapeutic approachesthat depend on membrane integrity (e.g., receptor targeteddrug delivery, antibodies, etc.). Irreversible disruption ofcytoplasmic microtubule organization and eventual disag-gregation, as well as disruption of actin stress fibers andvimentin filaments, occur at high temperatures (43–45 8C)above those used in whole-body hyperthermia, but thesecytoskeletal effects are of concern with loco-regional hyper-thermia.
A variety of effects in the cell nucleus also occur at hightemperatures (>41 8C) including damage to the nuclearmembrane, increases in nuclear protein content, changesin the structure of nucleoli, inhibition of DNA synthesisand chromosomal damage in S-phase. These changes innuclear structure compromise nuclear function and maycause cell death, though they are unlikely to be significantat the temperatures achieved in systemic hyperthermia.Disaggregation of the spindle apparatus of mitotic cellsmay be responsible for the high thermal sensitivity of cellsin mitosis, as well as in S phase. Hyperthermic inactivationof polymerase b, an enzyme primarily involved in DNArepair, is sensitized by anesthetics and may have a role toplay in the enhancement of the effects of ionizing radiationby systemic hyperthermia, as well as in augmenting thecytotoxic effect of drugs that cause DNA damage.
Metabolic Effects
Moderate increases in temperature lead to increased cel-lular reaction rates, which may be seen as increased oxy-gen consumption and glucose turnover. In consequence,cells may become deprived of nutrients, the intracellularATP concentration falls, accumulation of acid metabolitesincreases pH, and thermal sensitivity increases. Suchconditions are found in tumors and may contribute to theirsensitivity to heat. Further acidifying tumor cells duringhyperthermic treatment seems a promising approach as isdiscussed further below. At high temperatures, the citricacid cycle may be damaged leading to other acidic meta-bolites. Increased plasma acetate has been measured fol-lowing clinical whole-body hyperthermia treatments,which reduces both release of fatty acids from adiposetissue into plasma and subsequent lipid oxidation.
Endocrine Function
Increases in plasma levels of an array of hormones havebeen noted after whole-body hyperthermia. IncreasedACTH levels appear to be accompanied by increased levelsof circulating endorphins. This may explain the sense ofwell-being felt by many patients after systemic hyperther-mia treatment, and the palliative effect of hyperthermiatreatments for cancer. Increased secretion of somatotropichormone after systemic hyperthermia has also been mea-sured (7).
Thermal Tolerance
Thermal tolerance is a temporary state of thermal resis-tance, common to virtually all mammalian cells, whichdevelops after a prolonged exposure to moderate tempera-tures (40–42 8C), or a brief heat shock followed by incuba-tion at 37 8C, and also certain chemicals. The decay ofthermotolerance occurs exponentially and depends on thetreatment time, the temperature, and the proliferativestatus of the cells. Several days are usually required forbaseline levels of heat sensitivity to be regained, which hasimportant implications for fractionated therapy. When pHis lowered, less thermal tolerance develops, and its decay isslower. Thus the long periods at moderate temperatureachieved by clinical systemic hyperthermia systems should
48 HYPERTHERMIA, SYSTEMIC

induce thermal resistance in normal cells, while the acidicparts of tumors should be relatively unaffected. This hasnot, however, been studied clinically. The mechanismsinvolved in the induction of thermotolerance are not wellunderstood, but there is mounting evidence that heat shockproteins are involved.
Step-Down Sensitization
Another distinct phenomenon is step-down sensitization inwhich an exposure of cells to temperatures >43 8C resultsin increased sensitivity to subsequent temperatures of42 8C or lower. This can be important clinically for localand regional hyperthermia if there are marked variationsin temperature during the course of treatment, the mag-nitude of the effect depending on the magnitude of thetemperature change. It has been suggested that this phe-nomenon could be exploited clinically by administering ashort, high temperature treatment prior to a prolongedtreatment at a lower temperature, thereby reducing painand discomfort. Since temperatures >43 8C cannot be tol-erated systemically, a local heat boost would be required totakeadvantageof this effect for whole bodyhyperthermia. Sofar, there is no evidence that tumor cells are differentlysensitized by step-down heating than normal cells.
Effect of Hyperthermia on Tumors
It was initially thought that tumor cells have intrinsicallyhigher heat sensitivity than normal cells, but this is notuniversally true. Although some neoplastic cells are moresensitive to heat than their normal counterparts, thisappears to be the case at temperatures higher than thoseused in systemic hyperthermia. Tumors in vivo, on theother hand, often do have a higher thermal sensitivity thannormal tissues because of abnormal vasculature (reducedblood flow), anaerobic metabolism (acidosis), and nutrientdepletion. Due to their tortuous and poorly constructedvasculature, tumors have poor perfusion, thus heat dis-sipation by convection is reduced. At high temperatures(43 8C and up) this means that tumors become a heatreservoir with a consequent rise in temperature, whichif maintained for too long damages the microcirculationand further impairs convective heat loss. Also increasedfibrinogen deposition at damaged sites in the vascular wallleads to clusion of tumor microvessels. Significant heatingof the tumor cells results, which may be directly cytotoxic.Additionally, the impaired blood flow brings about acidosis,increased hypoxia and energy depletion all of whichincrease the heat sensitivity of tumor cells (8). At lowertemperatures, typical of those achieved in whole-bodyhyperthermia, blood flow increases (9) though the mechan-ism is not well understood. For these reasons, along withthe historical evidence for antitumor effects of fever and themetastatic nature of malignant disease, cancer has becomethe main focus of systemic hyperthermia.
Systemic hyperthermia results in increased delivery ofdrugs to tumor sites because of increased systemic bloodflow. It can also increase blood vessel permeability byincreasing the effective pore size between the loosely boundendothelial cells forming tumor microvessels, permittinglarger molecules, such as nanoparticles and gene therapyvectors, to pass into the interstitium (10). Figure 3 showsincreased uptake of 210 nm liposomes in rat breast tumorsafter 1 h of 41.5 8C whole-body hyperthermia. Heat mayalso be toxic to endothelial cells, resulting in a transientnormalization of vascular architecture and improvementin blood flow (11). Another barrier to drug delivery is thehigh interstitial pressure of many tumors. Since whole-body hyperthermia, even at fever-range temperatures,causes cell death (apoptosis and necrosis) within tumorsit reduces the oncotic pressure allowing greater penetrationof large molecules. Table 3 summarizes the interactions ofsystemic hyperthermia which facilitate nanoparticle deliv-ery to tumors.
HYPERTHERMIA, SYSTEMIC 49
0.0
1.0
2.0
100 nm 210 nm
41.5
˚C/3
7˚C
up
take
rat
io
Liposome size
Figure 3. Increase in tumor uptake of large liposomes after 1 hof 41.5 8C whole-body hyperthermia. Systemic heat treatmentincreased the effective pore size from �210 to 240 nm. Becauseof the large pore size in MTLn3 tumors, 100 nm (average diameter)liposomes were able to pass into the tumor equally well at normaland elevated temperatures. The increased effective pore size dueto hyperthermia allowed larger 200 nm liposomes, which werepartially blocked at normal temperatures, to pass more effectivelyinto the tumor.
Table 3. Whole-Body Hyperthermia Facilitates Nanoparticle Therapy
Heat Interaction Therapeutic Effect
" Blood flow " Nanoparticle delivery to tumor" In endothelial gap size " Nanoparticles in interstitium" Endothelial cell apoptosis/necrosis ! transient normalization of vasculature " Nanoparticles in interstitium" Tumor cell apoptosis/necrosis # oncotic pressure " Nanoparticles in interstitiumTemperature-dependent " in permeability of liposome bilayer " And synchronization of drug releaseCellular and molecular effects in tumor " Drug in tumor cell " drug efficacyDirect interactions with drug " Drug efficacy
Whole-Body Hyperthermia and the Immune System
An increase in ambient temperature can serve as a naturaltrigger to the immune system and it appears that the thermalmicroenvironment plays a critical role in regulating events inthe immune response. The early work of Coley on cancertherapy with infectious pyrogens implicated fever-inducedimmune stimulation as the mediator of tumor responses (1).While there have been numerous in vitro studies of the effectof temperature on components of the immune system, indi-cating that the thermal milieu regulates T lymphocytes,natural killer (NK) cells, and dendritic cells (DC), in vivoexaminations of the immune effects of systemic hyperther-mia are relatively few. Initial animal model studies con-cluded that whole-body hyperthermia resulted inimmunosuppression, but high temperatures were used,tumors were mostly immunogenic, and immune responsewas merely inferred from the incidence of metastatic spreadrather than from measurement of specific markers ofimmune system activation. The majority of in vivo studiesin animals provide evidence of a nonspecific host reactionin response to hyperthermia in which both T and Blymphocytes, as well as macrophages, are involved (12).Although NK cells are intrinsically more sensitive in vitroto heat than B and T cells, their activation by systemichyperthermia has been observed. Microwave inducedwhole-body hyperthermia of unrestrained, unanesthe-tized mice at 39.5–40 8C for 30 min, three or six timesweekly, resulted in increased NK cell activity and reducedpulmonary metastasis in tumor-bearing mice, but none innormal mice (13). Evidence for hyperthermia-inducedhuman tumor lysis by IL-2 stimulated NK cells activatedby HSP72 expression also exists (14). Increased numbersof lymphocyte-like cells, macrophages, and granulocytesare observed in the tumor vasculature and in the tumorstroma of xenografts and syngeneic tumors in mice imme-diately following a mild hyperthermia exposure for 6–8 h.In the SCID mouse/human tumor system tumor cellapoptosis seen following treatment was due largely tothe activity of NK cells. The investigators hypothesizeheat dilatation of blood vessels and increased vessel per-meability may also give immune effector cells greateraccess to the interior of tumors (15). In balb/C mice,fever-range whole-body hyperthermia increased lympho-cyte trafficking, resulting in early responsiveness to anti-gen challenge (16). Thus systemic hyperthermia may bean effective, nontoxic adjuvant to immunotherapy.
A recent clinical study examined the effect of whole-body hyperthermia combined with chemotherapy on theexpression up to 48 h later of a broad range of activationmarkers on peripheral blood lymphocytes, as well as serumcytokines and intracellular cytokine levels in T cells, andthe capacity of these cells to proliferate. Immediately aftertreatment with 60 min of 41.8 8C WBH as an adjunct tochemotherapy, a drastic but transient, increase in periph-eral NK cells and CD56þ cytotoxic T lymphocytes wasobserved in the patients’ peripheral blood. The numberof T cells then briefly dropped below baseline levels, aphenomeonon that has also been observed by others (17).A marked, but short-lived, increase in the patients’ serumlevels of interleukin-6 (IL-6) was also noted. Significantly
increased serum levels of tumor necrosis factor-alpha(TNF-alpha) were found at 0, 3, 5 and 24 h posttreatment.Further immunological consequences of the treatmentconsisted of an increase in the percentage of peripheralcytotoxic T lymphocytes expressing CD56, reaching a max-imum at 48 h post-WBH. Furthermore, the percentage ofCD4+ T cells expressing the T cell activation marker CD69increased nearly twofold over time, reaching its maximumat 48 h. Since similar changes were not observed inpatients receiving chemotherapy alone, this study pro-vided strong evidence for prolonged activation of humanT cells induced by whole-body hyperthermia combined withchemotherapy (18).
Activation of monocytes has been observed following hotwater bath immersion such that response to endotoxinstimulation is enhanced with concomitant release ofTNF-a. Macrophage activation and subsequent lysosomalexocytosis were observed in the case of a patient treated forliver metastases by hyperthermia. Lysosomal exocytosisinduced by heat may be an important basic reaction of thebody against bacteria, viruses, and tumor growth and wasproposed as a new mechanism of thermally induced tumorcell death mediated by an immune reaction (19).
Several investigators have suggested that the immunechanges seen during in vivo whole-body hyperthermia aremediated by elevations in the plasma concentrations ofeither catecholamines, growth hormone, or beta-endorphins.In volunteers immersed in a heated water bath, neitherrecruitment of NK cells to the blood, nor the percentagesor concentrations of any other subpopulations of blood mono-nuclear cells were altered by hormone blockade. However,somatostatin partly abolished the hyperthermia inducedincrease in neutrophil number. Based on these data andprevious results showing that growth hormone infusionincreases the concentration of neutrophils in the blood, itwas suggested that growth hormone is at least partlyresponsible for hyperthermia induced neutrophil increase.A similar study suggested that hyperthermic inductionof T lymphocytes and NK cells is due to increased secre-tion of somatotropic hormone (7).
The peripheral blood level of prostaglandin E2 (PGE2),which may act as an angiogenic switch, transforming alocalized tumor into an invasive one by stimulating newblood vessel growth, and which also has an immunosup-pressive effect, is elevated in patients with tumors com-pared to healthy control subjects. In a clinical study ofcancer patients receiving 1–2 h of 41.8–42.5 8C whole-bodyhyperthermia, or extracorporeal hyperthermia, bloodlevels of PGE2 decreased markedly after treatment andcorrelated with tumor response (20).
In addition to their role as protectors of unfoldingproteins, extracellular heat shock proteins (HSP) can actsimultaneously as a source of antigen due to their ability tochaperone peptides and as a maturation signal for dendri-tic cells, thereby inducing dendritic cells to cross-presentantigens to CD8þ T cells (21). Heat shock proteins can alsoact independently from associated peptides, stimulatingthe innate immune system by eliciting potent proinflam-matory responses in innate immune cells. The heat shockresponse also inhibits cyclooxygenase-2 gene expression atthe transcriptional level by preventing the activation of
50 HYPERTHERMIA, SYSTEMIC
nuclear factor-kappaB (NFkB) (22). Thermal upregulationof HSPs (HSP70 and HSP110) is strongest in lymphoidtissues and may relate to the enhanced immune responsesthat are observed during febrile temperatures. It has beenproposed that local necrosis induced by hyperthermictreatment induces the release of HSPs, followed by uptake,processing and presentation of associated peptides by den-dritic cells. By acting as chaperones and as a signal fordendritic cell maturation, HSP70 might efficiently primecirculating T cells. Therefore, upregulating HSP70 andcausing local necrosis in tumor tissue by hyperthermiaoffers great potential as a new approach to directly activatethe immune system, as well as to enhance other immu-notherapies (23,24).
CLINICAL TOXICITIES OF WHOLE-BODY HYPERTHERMIATREATMENT
At fever-range temperatures, adverse effects of systemichyperthermia treatment are minimal however, at highertemperatures they can be significant, even fatal. On theother hand, the teratogenic effects (birth defects, stillbirths, spontaneous abortions) and 8Cular damage (catar-act induction) resulting from electromagnetic fields used inlocal hyperthermia are not seen in systemic hyperthermia.The transient cardiorespiratory effects of elevated tem-perature can, however, lead to severe toxicity. Elevatedheart rate, especially at high temperatures may result inarrythmias or ischemic heart failure, consequentlypatients have to be very carefully screened with regardto their cardiac status. Beta blockade has generally beenfound to be deleterious although infusion of esmolol hasbeen safely carried out (25). Pulmonary hypertension andedema due to capillary leak may also be seen, but like thecardiac effects, these return to baseline a few hours aftertreatment. Increased serum hepatic enzymes have beennoted, but these may be cancer related. All these toxicitiesare less prevalent or less severe with radiant heat systems,particularly at lower temperatures, and when light con-scious sedation is used rather than general anesthesia. Forexample, decreased platelet count, decreased plasma fibri-nogen, and other factors leading to increased blood clottinghave been noted, particularly in extra-corporeal hyper-thermia, but also with other methods of heating carriedout under inhalation-administered anesthesia drugs.On the other hand, with whole-body hyperthermia underconscious sedation there is no evidence of plateletdrops (26) and animal studies even show platelet stimula-tion providing protection against radiation inducedthrombocytopenia.
Since systemic hyperthermia is almost never used as asingle treatment modality, it is important to recognize thatwhole-body hyperthermia combined with radiation andchemotherapy can enhance some of the toxicities asso-ciated with these modalities. For example, the cardiotoxi-city of doxorubicin and both the renal toxicity andhematological toxicity of platinum agents may increaseunder hyperthermia (27), while the muscle and peripheralnervous system effects of radiation and some drugs can alsobe enhanced (28). Bone marrow suppression is the limiting
toxicity of many chemotherapy drugs but there is little datato suggest that whole body hyperthermia exacerbates thiseffect. On the contrary, the synergy of hyperthermia withseveral chemotherapy agents may mean that lower dosescan be used, resulting in less toxicity. For example, sys-temic hyperthermia combined with carboplatin achievestherapeutic results without elevation of myelosuppressionand responses have occurred at lower than normal doses(29). Pressure sores can easily develop at elevatedtemperatures thus care must be taken not only in patientplacement and support, but also with application of mon-itoring devices. If heat dissipation is locally impaired, forexample, at pressure points, hot spots occur that can lead toburns. This is rarely a problem with fever-range whole-body hyperthermia, but in anesthetized patients under-going high heat regimens burns are not uncommon.
Following systemic hyperthermia treatments, malaiseand lethargy are almost universally experienced althoughthese may be counteracted by pain relief and a sense ofwell-being due to released endorphins. However, the fasterthe target temperature is reached, the less the exhaustion(6), thus attention to minimizing heat dissipation duringthe heat-up phase and using efficient heating devices, suchas those that generate heat by several mechanisms (e.g.,radiant heat and EM fields), add a regional heat boost, orproduce near-IR radiation that is preferentially absorbed,is advantageous to patient well being. Fever after treat-ment in the absence of infectious disease is not uncommonand may be associated with an inflammatory response totumor regression. Nausea and vomiting during the firstcouple of days after treatment are also common. Outbreaksof herpes simplex (cold sores) in susceptible individualshave also been noted, but are easily resolved with acyclovir.
THERMAL DOSE
The definition of dose for systemic hyperthermia is proble-matic. An applied dose would be the amount of heat energygenerated or delivered to the body but even if it can bemeasured, this quantity does not predict biological effects.By analogy with ionizing radiation, the absorbed dosewould be amount of thermal energy absorbed per unitmass of tissue (Jkg�1), however, this is not a quantitythat can be readily measured, or controlled, neither wouldit necessarily predict biological effects. As indicated in theprevious sections, the effects of systemic hyperthermiadepend on (1) the temperature, and (2) the duration ofheating, but not on the energy required to produce thetemperature rise. This leads to the concept of time at agiven temperature as a practical measure of dose. Inreality, however, temperature is seldom constant through-out a treatment, even in the plateau phase of systemichyperthermia, so time at temperature is at best a crudemeasure. Nonetheless, it is the one that is used most oftenclinically for whole-body hyperthermia because of its sim-plicity. Ideally, the dose parameter should allow for com-parison of treatments at different temperatures. Based onthe Arrhenius relationship and measured cell growth inhi-bition curves, the heating time at a given temperaturerelative to the heating time at a standard temperature or
HYPERTHERMIA, SYSTEMIC 51

thermal dose equivalent (TDE), was defined empirically as,
T1 ¼ t2 RðT1�T2Þ ð10Þ
A discontinuity occurs in the temperature-time curvesbetween 42 and 43 8C for both cells in culture and heatedtissues, thus the value of R changes for temperatures abovethe transition: R � 2< 42.5 8C and R � 5> 42.5 8C in vitrowhile for in vivo heating studies, R ¼ 2.1 below the transi-tion temperature and 6.4 above 42.5 8C. In practice, a finitetime is required for the body or tissue of interest to reach thetarget temperature, temperature fluctuates even after thetarget temperature is reached, and there is a cooling periodafter heating ceases. If the temperature is measured fre-quently throughout treatment, the temperature–timecurves can be integrated to provide the accumulated ther-mal dose that produces an equivalent effect to that resultingfrom holding the cells–tissue at a constant reference tem-perature for a given a period of time:
t43 ¼Zt f
ti
R43�TðtÞdt ð11Þ
where ti and tf are the initial and final times of the heatingprocedure (30). This thermal isoeffect dose (TID) is usuallyexpressed in minutes is sometimes known as the tdm43 orthe cumulative equivalent minutes (CEM 43 8C). While abiological factor has now been built in to the dose measure,and the integrated TID allows for temperature variationsduring heat-up and cool-down phases, it does not take intoaccount thermal tolerance and step-down sensitization. Noris it particularly relevant to clinical whole-body hyperther-mia where multiple physical and biological effects combinein a complex manner although for a given patient, time–temperature profiles are generally reproducible from onetreatment to another. A further modification attempts totake into account temperature inhomogeneity through themeasurement of temperature at multiple sites and definingT90, namely, that temperature exceeded by 90% of themeasurements (or correspondingly 20%: T20; or 50%:T50). The TID is then expressed as cumulative equivalentminutes that T90 is equal to 43 8C (CEM 43 8C T90) (31).
The efficiency of adjuvant hyperthermia in enhancingthe biological effectiveness of other treatments is oftenreported in terms of the thermal enhancement factor(TEF) or thermal enhancement ratio (TER). This quantityis defined in terms of the isoeffect dose as,
TER ¼
dose of treatment to achieve
a given endpoint
dose of treatment with heat
to achieve the same endpoint
ð12Þ
In clinical and laboratory studies, the TER is oftencomputed on the basis of isodose rather than isoeffect,for example, in the case of hyperthermia plus druginduced arrest of tumor growth, TER ¼ TGDHT/TGTRT,where TGDHT is the tumor growth delay due tohyperthermia plus chemotherapy, and TGTRT is thetumor growth delay resulting from chemotherapy at roomtemperature. Similarly, the enhancing effect of hyperther-
mia on radiation treatment may be expressed throughTER ¼ D0HT/D0RT or TER ¼ LD50HT/LD50RT, where D0is the time required to reduce survival to 1/e of its initialvalue, and LD50 is the lethal dose to 50% of cells.
TEMPERATURE MEASUREMENT
Since systemic hyperthermia achieves a uniform tempera-ture distribution, except for possible partial sanctuary sites,thermometry for systemic hyperthermia is much less chal-lenging than for regional or intracavitary hyperthermia, butit is still important to prevent adverse effects, especiallyburns. Also, convection can induce steep thermal gradients,especially around major blood vessels, so that careful place-ment of temperature probes is required. Most practitionersof whole-body hyperthermia measure temperature in sev-eral locations, typically the rectum, the esophagus, and atseveral skin sites. During heat-up, the esophageal tempera-ture is usually 1–2 8C higher than the rectal temperature,but during plateau phase it drops to 0.5–1.5 8C below therectal temperature. Continuous and accurate temperaturemeasurement is particularly important when temperatures>418C are to be achieved, as critical, life-threateningchanges can occur in minutes or even seconds and overchanges in temperature of as little as 0.1–0.2 8C because ofthe nonlinear response to temperature. For moderate tem-perature systemic hyperthermia, temperature measure-ment to within 0.1 8C is usually adequate, but a precisionof 0.01 8C is desirable when heating to >41 8C and alsoallows determination of the specific absorption rate from theslope of the temperature versus time curve. The tempera-ture measuring device must be insensitive to all otherinfluences, such as ambient temperature, moisture, nearbyelectromagnetic fields, and so on and satisfying this criter-ion can be difficult. Frequent calibration of thermometers inthe working range of temperatures is important since somethermometers appear fine at 30 8C, but drift substantially at40 8C and above. Stringent quality control of any thermo-metry system is required to monitor accuracy, precision,stability, and response time.
Table 4 summarizes the different types of thermometerprobes available for internal and external body tempera-ture measurements, and their relative merits and disad-vantages for systemic hyperthermia. Thermistors are mostoften used for standard temperature monitoring sites whilethermocouples are used for tumor or other intra-tissuemeasurements. Recently, noninvasive methods of tem-perature measurement have been developed that arebeginning to see application in hyperthermia. Thermogra-phy provides a two-dimensional (2D) map of surface tem-perature by measurement of infrared emission from thebody, though deep-seated hot structures may be visualizedbecause of heat carried by blood flow from the interior heatsource to the skin. It is useful to detect skin hotspots andtherefore in burn prevention. Since temperature-inducedchanges in the mechanical properties of tissue lead toaltered ultrasound propagation velocity, mapping of ultra-sound velocity can also provide a visual map of tempera-ture. Tomographic reconstruction of 2D or 3D temperatureis theoretically possible, but it is difficult in practicebecause of the heterogeneity of tissue characteristics. A
52 HYPERTHERMIA, SYSTEMIC

Ta
ble
4.
Tem
pera
tures
Pro
bes
for
Sy
stem
icH
yp
erth
erm
ia
Pro
be
Typ
eM
easu
rem
ent
Pri
nci
ple
Acc
ura
cyS
ensi
tivit
yS
tabil
ity
Ad
van
tages
orD
isad
van
tages
Cli
nic
al
Exp
an
sion
ofm
ercu
ryor
alc
ohol
ingla
ssM
oder
ate
�0.1
8CL
owH
igh
Larg
esi
ze,
infl
exib
le.
Slo
wre
spon
se.
Pla
tin
um
resi
stan
ceth
erm
omet
erL
inea
rre
sist
an
cech
an
ge
wit
hte
mp
eratu
reH
igh�
0.0
28C
Use
das
stan
dard
for
cali
bra
tion
ofot
her
typ
esof
ther
mom
eter
s.
Exp
ensi
ve.
Dif
ficu
ltto
cali
bra
te.
Larg
esi
ze.
Sen
siti
ve
tosh
ock
.
Th
erm
ocou
ple
See
bec
kef
fect
:te
mp
eratu
red
epen
den
tvol
tage
dif
fere
nce
bet
wee
ntw
oco
nd
uct
ors
mad
eof
dif
fere
nt
met
als
Mod
erate
�0.1
8CM
oder
ate
toh
igh
Mod
erate
Sm
all
sen
sor.
Non
lin
ear
vol
tage
chan
ge
wit
hte
mp
.S
ensi
tive
toE
Mfi
eld
s.C
an
’th
an
dle
stee
pte
mp
.gra
die
nts
.
Th
erm
isto
r(e
.g.,
Bow
man
Loo
pL
ars
enp
robe)
Inver
sere
lati
onsh
ipbet
wee
nte
mp
eratu
rean
dse
mic
ond
uct
orre
sist
an
ce
Hig
h<
0.0
58C
Hig
hP
oor
Req
uir
efr
equ
ent
reca
libra
tion
Sh
ort
tim
eco
nst
an
t.N
otin
terc
han
gea
ble
.S
ensi
tive
toE
Mfi
eld
s.
GaA
sT
emp
eratu
resp
ecifi
cabso
rpti
onM
oder
ate
Low
Sm
all
size
Op
tica
l(fi
ber
opti
cp
robe)
:C
han
ge
w/t
emp
.:N
otse
nsi
tive
toE
Mfi
eld
s.S
ma
llsi
ze.
LC
Dbir
efri
ngen
tcr
yst
al
flu
ores
cen
tp
hos
ph
orC
olor
refl
ecta
nce
Low
Low
Un
stable
Ref
ract
ion
ofp
olari
zed
ligh
tL
owD
ecay
offl
uor
esce
nce
Ver
yh
igh
53

Ta
ble
5.
Su
mm
ary
of
Cli
nic
al
Tria
lso
fW
ho
le-B
od
yH
yp
erth
erm
iaa
Fir
stA
uth
orP
ubli
cY
ear
Stu
dy
Typ
eN
um
ber
ofP
ati
ents
Dis
ease
Pro
toco
lR
esu
ltof
WB
HR
efer
ence
,P
MID
WB
HA
lon
eK
raybil
l,W
.G.
2002
Ph
ase
IA
dvan
ced
soli
dtu
mor
s3–6
hat
39.5
–40.0
8CW
ell
tole
rate
dN
osi
gn
ifica
nt
ad
ver
seev
ents
#in
circ
ula
tin
gly
mp
hoc
yte
s
16,
12028640
Ste
inh
au
sen
,D
.1994
Ph
ase
I103
Ad
van
ced
refr
act
ory
orre
curr
ent
can
cers
1h
at
41.8
8Cþ
hyp
ergly
cem
iaþ
hyp
erox
emia
Min
imal
sid
eef
fect
s52
resp
onse
s(5
0%
)8023241
WB
Hþ
Ch
emoth
era
py
Bak
shan
deh
,A
.2003
Ph
ase
II25
Non
met
ast
ati
cm
ali
gn
an
tp
leu
ral
mes
oth
elio
ma
1h
at
41.8
8Cþ
ifos
fam
ide
þca
rbop
lati
nþ
etop
osid
eG
rad
eII
I/IV
neu
trop
enia
an
dth
rom
boc
yto
pen
ia5
part
ial
rem
issi
ons
(20%
)
12609573
Bu
ll,
J.M
.1992
Ph
ase
II17
Ad
van
ced
met
ast
ati
csa
rcom
a2
hat
41.8
–42.0
8Cþ
BC
NU
Lim
itin
gto
xic
ity
¼th
rom
boc
yto
pen
ia7
resp
onse
s/S
D(4
1%
)"
surv
ival
33,
1607734
Bu
ll,
J.M
.2002
Ph
ase
I13
Vari
ous
chem
oth
erap
yre
sist
an
tca
nce
rs6
hat
40.0
8Cþ
dox
ilþ
5-F
Uþ
met
ron
omic
inte
rfer
on-a
Gra
de
III
toxic
itie
s9
resp
onse
s/S
D(6
9%
)
60
Bu
ll,
J.M
.2004
Ph
ase
I33
Ad
van
ced
met
ast
ati
cca
nce
rs(G
I,bre
ast
,h
ead
an
dn
eck
,sa
rcom
a,
neu
roen
doc
rin
e)
6h
at
40.0
8Cþ
cisp
lati
nþ
gem
cita
bin
eþ
inte
rfer
on-a
20
resp
onse
s/S
D(6
6%
)"
surv
ival"
qu
ali
tyof
life
35
Dou
wes
,F
.2004
Pil
ot21
Ovari
an
can
cer
1-2
hat
41.5
–42.0
8Cþ
cisp
lati
nor
carb
opla
tin
þh
yp
ergly
cem
ia
18
resp
onse
s/S
D(8
6%
)"
qu
ali
tyof
life
15108039
En
gel
hard
t,R
.1990
Pil
ot23
Ad
van
cem
etast
ati
cm
elan
oma
1h
at
41.0
8Cþ
cisp
lati
nþ
dox
oru
bic
inS
ligh
t"
inm
yel
otox
icit
y10
resp
onse
s/S
DR
esp
onse
rate
¼th
at
inli
tera
ture
for
chem
oalo
ne
52,
2198312
Gu
an
,J.
2005
Ph
ase
II32
Ad
van
ced
can
cers
94%
resp
onse
s/S
DP
ain
red
uct
ion
inall
pts
.In
crea
sed
KP
SD
ecre
ase
dtu
mor
mark
ers
65
Heg
ewis
ch-B
eck
er,
S.
2002
Ph
ase
II41
Pre
trea
ted
ad
van
ced
met
ast
ati
cco
lore
ctal
can
cer
1h
at
41.8
þox
ali
pla
tin
þle
uco
vor
inþ
5F
UN
oex
cess
toxic
ity
31
resp
onse
s/S
D(7
6%
)55,
12181242
Hil
deb
ran
dt,
B.
2004
Ph
ase
I/II
28
Met
ast
ati
cco
lore
ctal
can
cer
1h
at
41.8
–42.1
8Cþ
hyp
ergly
cem
iaþ
hyp
erox
emia
þfo
lin
icaci
dþ
5-F
Uþ
mit
omyci
nC
Gra
de
III/
IVto
xic
itie
s11
resp
onse
s/S
D(3
9%
)44,
15204528
54
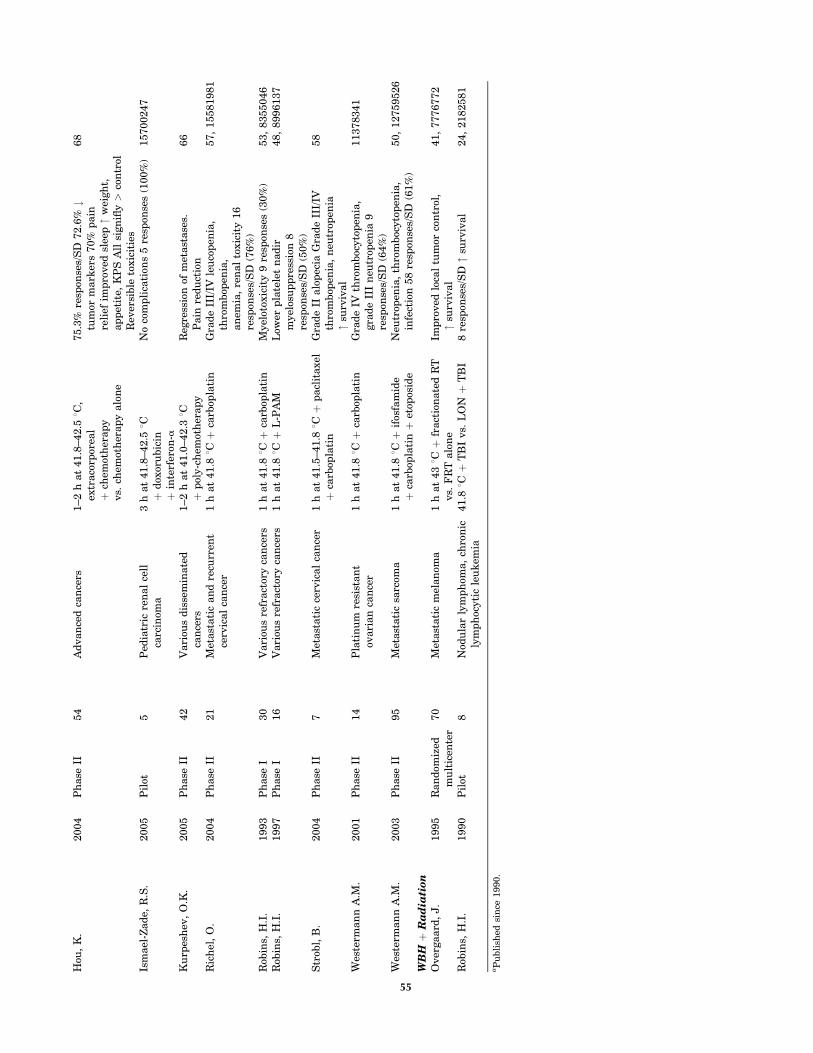
Hou
,K
.2004
Ph
ase
II54
Ad
van
ced
can
cers
1–2
hat
41.8
–42.5
8C,
extr
aco
rpor
eal
þch
emot
her
ap
yvs.
chem
oth
erap
yalo
ne
75.3
%re
spon
ses/
SD
72.6
%#
tum
orm
ark
ers
70%
pain
reli
efim
pro
ved
slee
p"
wei
gh
t,ap
pet
ite,
KP
SA
llsi
gn
ifly>
con
trol
Rev
ersi
ble
toxic
itie
s
68
Ism
ael
-Zad
e,R
.S.
2005
Pil
ot5
Ped
iatr
icre
nal
cell
carc
inom
a3
hat
41.8
–42.5
8Cþ
dox
oru
bic
inþ
inte
rfer
on-a
No
com
pli
cati
ons
5re
spon
ses
(100%
)15700247
Ku
rpes
hev
,O
.K.
2005
Ph
ase
II42
Vari
ous
dis
sem
inate
dca
nce
rs1–2
hat
41.0
–42.3
8Cþ
pol
y-c
hem
oth
erap
yR
egre
ssio
nof
met
ast
ase
s.P
ain
red
uct
ion
66
Ric
hel
,O
.2004
Ph
ase
II21
Met
ast
ati
can
dre
curr
ent
cerv
ical
can
cer
1h
at
41.8
8Cþ
carb
opla
tin
Gra
de
III/
IVle
uco
pen
ia,
thro
mbop
enia
,an
emia
,re
nal
toxic
ity
16
resp
onse
s/S
D(7
6%
)
57,
15581981
Rob
ins,
H.I
.1993
Ph
ase
I30
Vari
ous
refr
act
ory
can
cers
1h
at
41.8
8Cþ
carb
opla
tin
Myel
otox
icit
y9
resp
onse
s(3
0%
)53,
8355046
Rob
ins,
H.I
.1997
Ph
ase
I16
Vari
ous
refr
act
ory
can
cers
1h
at
41.8
8Cþ
L-P
AM
Low
erp
late
let
nad
irm
yel
osu
pp
ress
ion
8re
spon
ses/
SD
(50%
)
48,
8996137
Str
obl,
B.
2004
Ph
ase
II7
Met
ast
ati
cce
rvic
al
can
cer
1h
at
41.5
–41.8
8Cþ
pacl
itaxel
þca
rbop
lati
nG
rad
eII
alo
pec
iaG
rad
eII
I/IV
thro
mbop
enia
,n
eutr
open
ia"
surv
ival
58
Wes
term
an
nA
.M.
2001
Ph
ase
II14
Pla
tin
um
resi
stan
tov
ari
an
can
cer
1h
at
41.8
8Cþ
carb
opla
tin
Gra
de
IVth
rom
boc
yto
pen
ia,
gra
de
III
neu
trop
enia
9re
spon
ses/
SD
(64%
)
11378341
Wes
term
an
nA
.M.
2003
Ph
ase
II95
Met
ast
ati
csa
rcom
a1
hat
41.8
8Cþ
ifos
fam
ide
þca
rbop
lati
nþ
etop
osid
eN
eutr
open
ia,
thro
mboc
yto
pen
ia,
infe
ctio
n58
resp
onse
s/S
D(6
1%
)50,
12759526
WB
Hþ
Ra
dia
tion
Over
gaard
,J.
1995
Ran
dom
ized
mu
ltic
ente
r70
Met
ast
ati
cm
elan
oma
1h
at
438C
þfr
act
ion
ate
dR
Tvs.
FR
Talo
ne
Imp
roved
loca
ltu
mor
con
trol
,"
surv
ival
41,
7776772
Rob
ins,
H.I
.1990
Pil
ot8
Nod
ula
rly
mp
hom
a,
chro
nic
lym
ph
ocyti
cle
uk
emia
41.8
8Cþ
TB
Ivs.
LO
Nþ
TB
I8
resp
onse
s/S
D"
surv
ival
24,
2182581
aP
ubli
shed
sin
ce1990.
55

number of magnetic resonance (MR) techniques have beenused for thermal mapping and BSD Medical and SIEMENSMedical Systems have collaborated to develop a hybridhyperthermia/MRI system, although it is not a whole-bodyhyperthermia machine. Currently, the most widelyaccepted MR technique is the proton resonance frequency(PRF) method that exploits the temperature dependence ofthe chemical shift of water. Unlike the value of the waterspin-lattice relaxation time or the molecular diffusioncoefficient, both of which have been used for MRI tempera-ture measurements, the thermal coefficient relating tem-perature to the water chemical shift has been shown to beessentially independent of tissue type and physiologicalchanges induced by temperature (32). Recently an inter-leaved gradient echo–echo planar imaging (iGE-EPI)method for rapid, multiplanar temperature imaging wasintroduced that provided increased temperature contrast-to-noise and lipid suppression without compromising spa-tio-temporal resolution (33).
CLINICAL EXPERIENCE
Cancer
Systemic hyperthermia has been used mostly for treatmentof cancer because of its potential to treat metastatic dis-ease. Initial treatments aimed to produce direct killing oftumor cells based on the premise, now understood not to beuniversally true, that cancer cells are more susceptible toelevated temperatures than normal cells, and the higherthe temperature the greater the tumor cell kill. Maximallytolerated temperatures of 41.5–42 8C were therefore main-tained for 1–2 h as the sole treatment. Response rates were,however, disappointing. Tumor regressions were observedin less than half the cases, no tumor cures were achieved,and remissions were of short duration. It became apparentthat the heterogeneity of cell populations within tumors,along with micro-environmental factors, such as blood/nutrient supply, pH, and oxygen tension prevent the ther-motoxic results achieved in the laboratory. Consequently,the focus of research on systemic hyperthermia shifted tousing hyperthermia as an adjunct to other cancer thera-pies, principally chemotherapy and radiotherapy. It isimportant to note that because of the experimental statusof systemic hyperthermia treatment for cancer, almost allclinical trials, summarized in Table 5, have been performedon patients with advanced disease for whom whole-bodyhyperthermia, either as a sole therapy, or as an adjunct, isa treatment of last resort. In these cases, any responsewhatsoever is often remarkable. Nonetheless, a number ofhyperthermia centers in Europe have discontinued sys-temic hyperthermia because the high temperature proto-cols required intensive patient care and led to unacceptabletoxicities, especially in light of the efficacy and reducedtoxicities of newer generation chemotherapies. Large, ran-domized, multicenter, Phase III trials are, however, neededto firmly establish the benefits of systemic hyperthermia inconjunction with chemotherapy and radiation. Also, vali-dation and optimization of fever-range temperature proto-cols are much needed.
Systemic Hyperthermia and Chemotherapy. The bene-ficial interaction of hyperthermia with several classes ofchemotherapy agents, acting via several mechanisms assummarized in Table 6, has spurred a variety of thermo-chemotherapy regimens and several clinical trials of sys-temic hyperthermia and chemotherapy are ongoing. Whilethe results have been mixed, elevated response rates wererecorded in the treatment of sarcoma when systemichyperthermia was combined with doxorubicin and cyclo-phosphamide (54) or BCNU (34). Systemic hyperthermia isthe only way to heat the lung uniformly, and impressiveresponse rates and increased durations of response havebeen achieved in both small cell and nonsmall cell lungcancer treated with the combination of whole bodyhyperthermia at 41 8C for 1 h with adriamycin, cyclopho-sphamide, and vincristine (ACO protocol) (34). Neuroendo-crine tumors also appear to have increased sensitivity tosystemic hyperthermia and multidrug chemotherapy (51).
Optimal combination of whole-body hyperthermia withchemotherapy requires an understanding of the mechan-isms of interaction of heat with individual drugs or drugs incombination. Preclinical data is consistent with the conceptthat the timing of chemotherapy during whole-bodyhyperthermia should affect therapeutic index. For exam-ple, Fig. 4 shows the effect on tumor cures in mammarycarcinoma bearing rats of 6 h of 40 8C whole-bodyhyperthermia administered with, or 24 or 48 h after gem-citabine. A synergistic response was obtained whenhyperthermia was begun with gemcitabine administrationor 48 h later. The effect of gemcitabine was completelynegated, however, when hyperthermia was administered24 h after the start of heating, perhaps due to cell cycleeffects. With cisplatin, the greatest therapeutic index isachieved if the drug is given 24 h before the start of whole-body hyperthermia, thereby preventing thermal augmen-tation of cisplatin induced nephrotoxicity (55). In a clinicalinvestigation of multiple cycles of radiant heat whole-bodyhyperthermia combined with carboplatin, Ifosfamide, eto-poside, and granulocyte colony stimulating factor, it wasfound that toxicity was minimized when carboplatin was
56 HYPERTHERMIA, SYSTEMIC
0.0
1.0
2.0
3.0
4.0
5.0
GEM+WBH schedule
TE
R fo
r tu
mo
r cu
res
GEM+WBH(0) GEM+WBH(+24) GEM+WBH(+48)
GEM+WBH(0 h) GEM+WBH(+24 h) GEM+WBH(+48 h)
0.06
2.983.57
Figure 4. Schedule dependence of fever range whole-bodyhyperthermia enhanced gemcitabine tumor cures. A supraaddi-tive cure rate occurred when whole-body hyperthermia (WBH)was given at the same time as gemcitabine administration or 48 hlater. When hyperthermia followed gemcitabine by 24 h the numberof cures droppedtoalmostzero, wellbelow thenumber achieved withgemcitabine alone.

given during the plateau phase of WBH, 10 min after targettemperature was reached (56).
A major rationale for whole-body hyperthermia in can-cer treatment is the ability to treat metastases, but this isactually a controversial issue. There have been no clinicalstudies specifically designed to study the effect of systemichyperthermia on either the efficacy against metastaticdisease or prevention of development of metastases.Increased survival in advanced malignancies is often inter-preted to mean a reduction in metastatic disease, but directmeasurement of the incidence and response of metastasesis rare. Based on some animal studies, it has been sug-gested that systemic hyperthermia could actually promotethe metastatic spread of tumor cells, but this has not beenconfirmed. One clinical study found an increase of tumorcells in blood 24 h after 41.8 8C WBH, but there was no
evidence that this caused metastatic spread of disease (57).Several animal experiments do support the efficacy ofwhole-body hyperthermia against metastases. In mousemodels of lung cancer and melanoma, the number of lungmetastases was scored after repeated systemic microwaveheating. It was found that the number of lung metastaseswas significantly reduced, and NK-cell activity was higher,in treated animals. The authors hypothesized that WBHinterferes with the spread of organ metastases, possiblythrough a mechanism involving NK cells (13). Anotherstudy of mouse Lewis lung carcinoma in which the animalswere treated with 60 min of systemic hyperthermia at42 8C, demonstrated a reduction in the number andpercentage of large metastases (>3 mm) on day 20 post-tumor implantation. Addition of radiation led to a reduc-tion to 50% of control of the number of lung metastases as
HYPERTHERMIA, SYSTEMIC 57
Table 6. Chemotherapy Agents Used with Whole-Body Hyperthermia
Class of AgentLikely Mechanismof Heat Interaction
Drugs Used withWBH in Clinical Studies
InvestigatorReferencesa
Alkylating agents Impaired DNA repair Cyclophosphamide (CTX) Parks, 1983 (4)Improved pharmacokinetics Engelhardt, 1988 (34)
Dacarbazine (DTIC) Lange, 1983 (35)Melphalan (L-PAM) Robins, 1997 (36)Ifosfamide (IFO) Engelhardt, 1988 (34)
Issels, 1990 (37)Westermann, 2003 (38)
Nitrosoureas Impaired DNA repair BCNU Parks, 1983 (4)Improved pharmacokinetics Bull, 1992 (39)
Me-CCNU Bull, 1992 (39)Platinum agents Impaired DNA repair Cisplatin (CDDP) Parks, 1983 (4)
Altered plasma protein binding Herman, 1982 (40)Engelhardt, 1990 (41)Robins, 1993 (42)Douwes, 2004 (43)
Carboplatin (CBDCA) Westermann, 2003 (38)Hegewisch-Becker, 2002 (44)Hegewisch-Becker, 2003 (45)Douwes, 2004 (43)Richel, 2004 (46)Strobl, 2004 (47)
Oxaliplatin Elias, 2004 (48)Hegewisch-Becker, 2002 (44)
Anthracyline antibiotics Impaired DNA repair Adriamycin Engelhardt, 1990 (41)Enzyme activation Bull, 2002 (49)
Bleomycin Herman, 1982 (40)Antimetabolites Increased drug transport 5-FU Lange, 1983 (35)
Cell cycle arrest Larkin, 1979 (50)Impaired DNA repair Bull, 2002 (49)
Hegewisch-Becker, 2002 (44)Gemcitabine Bull, 2004 (51)
Antiproliferatives Impaired DNA repair Etoposide (VP-16) Barlogie, 1979 (52)Issels, 1990 (37)Westermann, 2003 (42)
Topoisomerase inhibitors Impaired DNA repair Irinotecan (CPT-11) Hegewisch-Becker, 2003 (45)Elias, 2004 (48)
Taxanes Microtubule disruption Paclitacel Strobl, 2004 (49)Apoptosis Docetaxel Strobl, 2004 (49)
Biological responsemodifiers
Increased anti-viral andantiproliferative activity
Interferon Robins, 1989 (53)
Bull, 2002, 2004 (34,49)
aReferences prior to 1980, or not in English, are not provided in the Bibliography at the end of this article.

well as the percent of large metastases on day 20 (58). In abreast cancer ocult metastasis model in rats, 6 h of 40 8Cwhole-body hyperthermia combined with daily, low dose,metronomic irinotecan resulted in delayed onset, andreduced incidence, of axillary lymph node metastases com-pared to control in rats, as did treatment with 40 8C WBHalone. The combination therapy also reduced axillarymetastasis volume. Interestingly, none of the therapiessignificantly affected inguinal lymph node metastases,but lung metastases were decreased in both the combina-tion therapy and WBH alone groups. Rats treated withfever-range whole-body hyperthermia and metronomicirinotecan also survived significantly longer (36%) thancontrol animals (59).
Systemic Hyperthermia and Radiotherapy. The augmen-tation of ionizing radiation induced tumor kill byhyperthermia is well documented for local hyperthermiaand has led to numerous protocols combining whole-bodyhyperthermia with radiation therapy (60,61). Hyperther-mia is complementary to radiation in several regards:ionizing radiation acts predominantly in the M and G1
phases of the cell cycle while hyperthermia acts largelyin S phase; radiation is most effective in alkaline tissueswhereas hyperthermic cytotoxicity is enhanced underacidic conditions; radiation is not effective in hypoxicregions yet hyperthermia is most toxic to hypoxic cells.Thus when hyperthermia is combined with radiotherapy,both the hypoxic, low pH core of the tumor is treated as wellas the relatively well perfused outer layers of the tumor.Furthermore, because of its vascular effects, hyperthermiaenhances tumor oxygenation thus potentiating radiationcell kill. Hyperthermia also increases the production of oxy-gen radicals by radiation, and reduces the repair of DNAdamage caused by ionizing radiation. Thus hyperthermiaand radiotherapy together often have a synergistic effect,and this combination is now well accepted for treatment of anumber of tumors.
Fever-Range WBH. Like systemic hyperthermia alone,combined modality treatments were initially aimed toachieve maximally tolerated temperatures. Such regi-mens, however, carry significant risk to the patient,require general anesthesia, and necessitate experienced,specialist personnel to provide careful monitoring of vitalsigns and patient care during the treatment. Morerecently, it has been appreciated that lower core bodytemperatures (39–40 8C) maintained for a longer time(4–8 h), much like fever, can indirectly result in tumorregression through effects on tumor vasculature, theimmune response, and waste removal (detoxification).The optimum duration and frequency of mild hyperther-mia treatment has, however, not yet been determined.Protocols range from single treatments of 4–6 h, or similarlong duration treatments given once during each cycle ofchemotherapy, to daily treatments of only 1 h. Severalstudies of mild, fever-range, whole-body hyperthermiawith chemotherapy have demonstrated efficacy against abroad range of cancers (34,17) and clinical trials are cur-rently being conducted at the University of Texas HealthScience Center at Houston, Roswell Park Cancer Institute,
New York, and by the German Interdisciplinary WorkingGroup on Hyperthermia (62).
Systemic Hyperthermia and Metabolic Therapy.Increased rates of metabolic reactions lead to rapid turn-over of metabolites, causing cellular energy depletion,acidosis, and consequent metabolic disregulation. Tumors,which have increased metabolic rates [glucose, adenominetriphosphate (ATP)] compared to normal cells, may beparticularly sensitive to thermally induced energy deple-tion and this has been exploited in the Cancer MultistepTherapy developed by von Ardenne, which is a combinedhyperthermia–chemotherapy–metabolic therapy approachto cancer (63). The core of this approach is systemichyperthermia at 40–42 8C, sometimes with added localhyperthermia to achieve high temperatures within thetumor. A 10% solution of glucose is infused into the patientto achieve a high accumulation of lactic acid within thetumor that cannot be cleared because of sluggish blood flowand confers an increased sensitivity to heat to the tumorcells. Administration of oxygen increases the arterial oxy-gen pressure and stimulates lysozymal cytolysis. Finallylow dose chemotherapy is added.
Palliation. Pain relief is reported by many patientsreceiving systemic hyperthermia treatment, whether withchemotherapy or radiation. Indeed, almost all patientsundergoing thermoradiotherapy report pain relief.Immediate pain relief following treatment is likely to stemfrom an increased level of circulating b-endorphins, whilelonger term pain relief may be due to increased blood flow,direct neurological action, and disease resolution, forexample, tumor regression in cancer patients, or detoxifi-cation. Meaningful improvements in quality of life typi-cally result from such pain relief. Localized infraredtherapy using lamps radiating at 2–25 mm is used forthe treatment and relief of pain in numerous medicalinstitutes in China and Japan.
Diseases Other than Cancer. Therapeutic use of heatlamps emitting IR radiation is commonplace throughoutthe Orient for rheumatic, neurological and musculoskele-tal conditions, as well as skin diseases, wound healing, andburns. The improvements reported appear to be largelydue to increased blood flow bringing nutrients to areas ofischemia or blood vessel damage, and removing wasteproducts. Scientific reports of these treatments are, how-ever, difficult to find. Application of heat via hot baths orultrasound has long been standard in physical therapy forarthritis and musculoskeletal conditions, though ice packsare also used to counter inflammatory responses. Heatdecreases stiffness in tendons and ligaments, relaxes themuscles, decreases muscle spasm, and lessens pain. Unfor-tunately, few clinical trials of efficacy have been performed,and methodological differences or lack of rigor in thestudies hinder comparisons (64). A clinical trial inJapan reported a supposedly successful solution for sevenout of seven cases of rheumatoid arthritis treated withwhole-body IR therapy, and it is reported that the King ofBelgium was cured of his rheumatoid arthritis in threemonths due IR treatments. Systemic hyperthermia with
58 HYPERTHERMIA, SYSTEMIC

whole-body radiant heat units is being carried out inclinical centers as well as many private clinics in Germanyfor the purpose of alleviating rheumatoid arthritis. It hasbeen proposed that the induction of TNF receptors by WBHmay induce a remission in patients with active rheumatoidarthritis. The use of heat packs has long been standard torelieve the pain of fibromyalgia. Again, the therapeuticeffect is believed to be due to increased circulation flushingout toxins and speeding the healing process. Whole-bodyhyperthermia treatment for fibromyalgia and chronic fati-gue syndrome (CFS) is to be found in a number of privateclinics. Hyperthermia increases the number and activity ofwhite blood cells, stimulating the depressed immune sys-tem of the CFS patient.
Because of its immune stimulating effects, whole-bodyhyperthermia is a strong candidate for treatment of chronicprogressive viral infections, such as HIV and hepatitis C. Aclinical trial at the University Medical Center Utrecht, TheNetherlands has evaluated extracorporeal heating to inducesystemic hyperthermia of 41.8 8C for 120 min under propo-fol anesthesia for treatment of hepatitis C (65). Humanimmunodeficiency virus (HIV)-infected T cells are moresensitive to heat than healthy lymphocytes, and suscept-ibility increases when the cells are presensitized by expo-sure to tumor necrosis factor. Thus, induction of whole-bodyhyperthermia or hyperthermia specifically limited to tissueshaving a high viral load is a potential antiviral therapy foracquired immunodeficiency syndrome (AIDS). An Italianstudy has found treatment of AIDS with beta-carotene andhyperthermia to be synergistic, preventing progression ofearly disease and also increasing the survival time inpatients with severe AIDS. A single treatment of low flowextracorporeal hyperthermia was found effective againstAIDS associated Kaposi’s sarcoma, though there was sig-nificant toxicity. Core temperature was raised to 42 8C andheld for 1 h with extracorporeal perfusion and ex vivoblood heating to 49 8C. Complete or partial regressionswere seen in 20/29 of those treated at 30 days post-treat-ment, with regressions persisting in 14/29 of those treatedat 120 days post-treatment. At 360 days, 4/29 maintainedtumor regressions with 1 patient being in complete remis-sion still at 26 months (66).
THE FUTURE OF SYSTEMIC HYPERTHERMIA
While there is a resurgence of interest in systemichyperthermia, this modality has not yet been adopted asa mainstream therapy, and optimal clinical trials havenot yet been carried out. Well-designed, well-controlled,multicenter clinical trials need to be conducted. In order tounequivocally demonstrate the utility of whole-body hyper-thermia inthetreatmentofcanceraswellasotherdiseases, itwill be important to accrue a sufficiently large number ofpatients who do not have end-stage disease. Thanks to thecommercial availability of systemic hyperthermia systems,the variability between induction techniques at differentinstitutions can be removed. Newer instrumentation, parti-cularlynear-IR radiantheatdevices,alongwithtreatmentatlower temperatures (fever-range thermal therapy) shouldlead to significantly reduced toxicity. Better exploitation of
the narrow window of effective temperatures within whichthe cellular effects of heat can be exploited yet damageremains minimal, and improved understanding of the biolo-gical interactions invivoof systemicheatwithchemotherapyand radiation will be essential to optimize therapy.
The effects of systemic hyperthermia on tumor bloodflow and vascular permeability have the potential toincrease delivery of various small molecules, nanoparticles,and gene therapy vectors to tumors. Ferromagnetic nano-particles can be heated by external magnetic fields and offerthe potential for internal hyperthermia, both locally andsystemically. Thermally sensitive liposomes that releasetheir contents at designated temperatures are also of inter-est. The ability of systemic hyperthermia to aid in systemicdelivery of gene therapy vectors (the holy grail of genetherapy) and enhance transfection of cells with therapeuticgene plasmids is under investigation in several laboratories(67,68), and shows potential along with targeted gene ther-apy via the heat shock response. For example, Fig. 5 shows afourfold hyperthermic increase of therapeutic gene deliveryto tumor when plasmid DNA was injected intravenouslyinto mammary carcinoma bearing rats immediately after 6h of whole-body hyperthermia at 40 8C. Thus systemichyperthermia is likely to see increasing application as anenhancer of drug delivery.
There is a great deal of interest in the immunologicalconsequences of whole-body hyperthermia, and as theybecome better understood, the combination of systemichyperthermia with specific immunotherapies will undoubt-edly be pioneered, not just for cancer but also, by analogywith fever, in a broad range of diseases.
SUMMARY
Systemic hyperthermia is founded on solid physical andbiological principles and shows promise in the treatmentof a number of diseases. Modern whole-body hyperther-mia devices use IR-A radiation sources together witheffective heat loss techniques to achieve a controlled,uniform temperature distribution throughout the bodywith minimal patient toxicity. A shift in paradigm hasoccurred away from achieving direct cell killing with short
HYPERTHERMIA, SYSTEMIC 59
0
1
2
3
4
5
Liver Tumor
40˚C
/37˚
C r
atio
of
HS
Vtk
m
ole
cule
s p
er c
ell
grp78-HSVtk
Figure 5. Fever range whole-body hyperthermia increasestherapeutic gene (grp78-HSVtk) delivery in tumor.

bouts of maximally tolerated temperatures, to inducingindirect curative effects through longer duration treatmentsat lower temperatures, and synergy with other modalities,such as radiotherapy. Better understanding of the interac-tions of elevated temperature with metabolic and geneticpathways will allow thermally driven targeted therapies.Of particular promise is the use of systemic hyperthermiaas an immune system stimulator and adjunct to immu-notherapy. Application of systemic hyperthermia to nano-particle delivery and gene therapy is emerging. Whole-bodyhyperthermia is moving from being dubbed an alternativetherapy to becoming a standard treatment and clinicalhyperthermia centers are to be found all over the world.
Useful Websites
http://www.ncbi.nlm.nih.gov/books/bv.fcgi?rid=hstat6.section.40680
Techniques andDevices Usedto ProduceHyperthermia
http://www.ncbi.nlm.nih.gov/books/bv.fcgi?rid=cmed.section.7813
Physics andPhysiology ofHeating
http://www.duke.edu/~dr3/hyperthermia_general.html
Clinical HyperthermiaBackground
http://www.eurekah.com/isbn.php?isbn=1-58706-248-8&bookid=143&catid=50
Online book:LocoregionalRadiofrequency-perfusionaland Whole BodyHyperthermia inCancer Treatment:New Clinical Aspects,E.F. Baronzio andA. Gramaglia (eds.),Eurekah BioscienceDatabase
http://www.esho.info/professionals/
European Society forHyperthermicOncology
http://www.hyperthermie.org/index2.html
GermanInterdisciplinaryWorking group onhyperthermia
http://www.uth.tmc.edu/thermaltherapy/
Systemic ThermalTherapy at theUniversity of Texas
BIBLIOGRAPHY
1. Nauts HC. Bacterial pyrogens: beneficial effects on cancerpatients. In: Gautherie M, Albert E, editors. Biomedical Ther-mology, Progress in Clinical Biological Research. New York:Alan R. Liss; 1982. p 687–696.
2. Law HT, Pettigrew RT. Heat transfer in whole bodyhyperthermia. Ann NY Acad Sci 1980;335:298–310.
3. Robins HI, et al. A non-toxic system for 41.8 8C whole bodyhyperthermia: results of a phase I study using a radiant heatdevice. Cancer Res 1985;45:3937–3944.
4. Parks LC, Smith GV. Systemic hyperthermia by extracorpor-eal induction techniques and results. In: Storm FK, editor.
Hyperthermia in Cancer Therapy. Boston: Hall; 1983.pp 407–446.
5. van der Zee J, van Rhoon GC, Faithfull NS, van den Berg AP.Clinical hyperthermic practice: whole body hyperthermia. In:Field SB, Hand JW, editors. An Introduction to the PracticalAspects of Clinical Hyperthermia. London: Taylor & Francis;1990.
6. Wust P, et al. Feasibility and analysis of thermal parametersfor the whole-body-hyperthermia system IRATHERM-2000.Int J Hyperthermia 2000 Jul–Aug; 16(4):325–339.
7. Blazickova S, Rovensky J, Koska J, Vigas M. Effect ofhyperthermic water bath on parameters of cellular immunity.Int J Clin Pharmacol Res 2000;20(1–2):41–46.
8. Vaupel P, Kallinowski F. Physiological effects of hyperthermia. In:Streffer C, editor. Hyperthermia and the Therapy of MalignantTumors. Berlin/Heidelberg, Germany: Springer-Verlag; 1987.
9. Dudar TE, Jain RK. Differential response of normal and tumormicrocirculation to hyperthermia. Cancer Res 1984;44(2):605–612.
10. Kong G, Braun RD, Dewhirst MW. Characterization of theeffect of hyperthermia on nanoparticle extravasation fromtumor vasculature. Cancer Res 2001;61:3027–3032.
11. Jain RK. Normalization of tumor vasculature: an emerging con-cept in antiangiogenic therapy. Science 2005;307(5706): 58–62.
12. Urano M, et al. Effect of whole body hyperthermia on cellsurvival, metastasis frequency, and host immunity in moder-ately and weakly immunogenic murine tumors. Cancer Res1983;43:1039–1043.
13. Shen RN, et al. Whole-body hyperthermia decreases lungmetastases in lung tumor-bearing mice, possibly via amechanism involving natural killer cells. J Clin Immunol1987;7(3):246–253.
14. Roigas J, Wallen ES, Loening SA, Moseley PL. Heat shockprotein (HSP72) surface expression enhances the lysis of ahuman renal cell carcinoma by IL-2 stimulated NK cells. AdvExp Med Biol 1998;451:225–229.
15. Burd R, et al. Tumor cell apoptosis, lymphocyte recruitmentand tumor vascular changes are induced by low temperature,long duration (fever-like) whole body hyperthermia. J CellPhysiol 1998;177(1):137–147.
16. Ostberg JR, Gellin C, Patel R, Repasky EA. Regulatory poten-tial of fever-range whole body hyperthermia on Langerhanscells and lymphocytes in an antigen-dependent cellularimmune response. J Immunol 2001;167(5):2666–2670.
17. Kraybill WG, et al. A phase I study of low temperature, longduration (fever-range) whole body hyperthermia (WBH) inpatients with advanced solid tumors: correlation with mousemodels. Int J Hyperthermia 2002;18:253–266.
18. Atanackovic D, et al. 41.8 degrees C whole body hyperthermiaas an adjunct to chemotherapy induces prolonged T cell acti-vation in patients with various malignant diseases. CancerImmunol Immunother Epub 2002 Oct 18 2002;51(11–12):603–613.
19. Barni S, et al. Lysosomal exocytosis induced by hyperthermia:a new model of cancer death. III. effect on liver metastasis.Biomed Pharmacother 1996;50:79–84.
20. Hou K. The level changes of peripheral blood PGE2 and clinicalsignificance in patients with malignant tumor before and afterwhole body hyperthermia. Proceedings of the 26th Congress ofthe International Clinical Hyperthermia Society, September9–12, 2004, Shenzhen, China, 2004; p 66.
21. Manjili MH, et al. Subjeck, Cancer immunotherapy: stressproteins and hyperthermia. Int J Hyperthermia 2002;18(6):506–520.
22. Ialenti A, et al. Inhibition of cyclooxygenase-2 gene expressionby the heat shock response in J774 murine macrophages. EurJ Pharmacol 2005;509(2–3):89–96.
60 HYPERTHERMIA, SYSTEMIC

23. Repasky EA, Issels R. Physiological consequences ofhyperthermia: Heat, heat shock proteins and the immuneresponse. Int J Hyperthermia 2002;18:486–489.
24. Ostberg JR, Repasky EA. Emerging evidence indicates thatphysiologically relevant thermal stress regulates dendritic cellfunction. Cancer Immunol Immunother [Epub ahead of print];Apr 28, 2005.
25. Berry JM, Michalsen A, Nagle V, Bull JM. The use of esmololin whole-body hyperthermia: cardiovascular effects. Int JHyperthermia 1997;13(3):261–268.
26. Robins HI, et al. Adjunctive therapy (whole body hyperther-mia versus Ionidamine) to total body irradiation for the treat-ment of favorable B-cell neoplasms: a report of two pilotclinical trials and laboratory investigations. Int J Radiat OncoBiophys 1990;18:909–920.
27. Ohno S, et al. Haematological toxicity of carboplatin andcisplatin combined with whole body hyperthermia in rats.Br J Cancer 1993;68:469–474.
28. Haveman J, et al. Effects of hyperthermia on the peripheralnervous system: a review. Int J Hyperthermia 2004;20(4):371–391.
29. Calvert AH, et al. Early clinical studies with cis-diammine-1,1-cyclobutane dicarboylate platinum II. Cancer ChemotherPharmacol 1982;9:140–147.
30. Sapareto SA, Dewey WC. Thermal dose determination in cancertherapy. Int J Radiat Oncol Biol Phys 1984;10(6):787–800.
31. Thrall DE, et al. Using units of CEM 43 degrees C T90, localhyperthermia thermal dose can be delivered as prescribed. IntJ Hyperthermia 2000;16(5):415–428.
32. Webb AG. Temperature measurement using nuclear magneticresonance. Ann Reports NMR Spectrosc 2001;45:1–67.
33. Stafford RJ, Hazle JD, Glover GH. Monitoring of high-inten-sity focused ultrasound-induced temperature changes in vitrousing an interleaved spiral acquisition. Magn Reson Med2000;43(6):909–912.
34. Engelhardt R. Summary of recent clinical experience in whole-body hyperthermia combined with chemotherapy. RecentResults Cancer Res 1988;107:200–224.
35. Lange J, Zanker KS, Siewert JR, Eisler K, Landauer B, KolbE, Blumel G. and Remy, W. Extracorporeally induced whole-body hyperthermia in conventionally incurable malignanttumor patients Med Wochenschr. 1983;108(13):504–509.
36. Robins HI, et al. Phase I clinical trial of melphalan and 41.8degrees C whole-body hyperthermia in cancer patients. J ClinOncol 1997;15:158–164.
37. Issels RD, Wilmanns W, editors. Recent Results in CancerResearch, Vol. 107: Application of Hyperthermia in theTreatment of Cancer.Berlin/Heidelberg: Springer Verlag; 1988.
38. Westermann AM, et al. Systemic Hyperthermia OncologicWorking Group, A Systemic Hyperthermia Oncologic WorkingGroup trial, Ifosfamide, carboplatin, and etoposide combinedwith 41.8 degrees C whole-body hyperthermia for metastaticsoft tissue sarcoma. Oncology 2003;64(4):312–321.
39. Bull JM, et al. Chemotherapy resistant sarcoma treated withwhole body hyperthermia (WBH) combined with 1-3-bis(2-chloroethyl)-1-nitrosourea (BCNU). Int J Hyperthermia 1992;8(3):297–304.
40. Herman TS, Sweets CC, White DM, Gerner EW. Effectof heating on lethality due to hyperthermia and selectedchemotherapeutic drugs. J Natl Cancer Inst 1982;68(3):487–491.
41. Engelhardt R, et al. Treatment of disseminated malignantmelanoma with cisplatin in combination with whole-bodyhyperthermia and doxorubicin. Int J Hyperthermia 1990;6(3):511–515.
42. Robins HI, et al. Phase I clinical trial of carboplatin and 41.8degrees C whole-body hyperthermia in cancer patients. J ClinOncol 1993;11:1787–1794.
43. Douwes F, et al. Whole-body hyperthermia in combinationwith platinum-containing drugs in patients with recurrentovarian cancer. Int J Clin Oncol 2004;9(2):85–91.
44. Hegewisch-Becker S, et al. Whole-body hyperthermia(41.8 8C) combined with bimonthly oxaliplatin, high-dose leu-covorin and 5-fluorouracil 48-hour continuous infusion inpretreated metastatic colorectal cancer: a phase II study.Ann Onc 2002;13(8):1197–1204.
45. Hegewisch-Becker S, et al. Whole body hyperthermia (WBH,41.8 8C)combinedwithcarboplatinandetoposide inadvancedbiliarytract cancer. Proc Am Soc Clin Oncol 2003; (abstr. 1247), 22:311.
46. Richel O, et al. Phase II study of carboplatin and whole bodyhyperthermia (WBH) in recurrent and metastatic cervicalcancer. Gynecol Oncol 2004;95(3):680–685.
47. Strobl B, et al. Whole body hyperthermia combined with carbo-platin/paclitaxel in patients with ovarian carcinoma–Phase-II-study. J Clin Oncol -Proc Am Soc Clin Oncol 2004;22(14S).
48. Elias D, et al. Heated intra-operative intraperitoneal oxali-platin plus irinotecan after complete resection of peritonealcarcinomatosis: pharmacokinetics, tissue distribution and tol-erance. Ann Oncol 2004;15:1558–1565.
49. Bull JM, et al. Phase I study of long-duration, low-tempera-ture whole-body hyperthermia (LL-WBH) with liposomal dox-orubicin (Doxil), 5-fluorouracil (5-FU), & interferon-a (IFN-a),Proc Amer. Soc Clin Oncol 2002;(Abst. 2126).
50. Larkin JM, A clinical investigation of total-body hyperthermiaas cancer therapy. Cancer Res, 1979;39(6 Pt 2):2252–2254.
51. Bull JM, et al. Update of a phase I clinical trial using fever-range whole-body hyperthermia (FR-WBH) þ cisplatin (CIS) þgemcitabine (GEM) þ metronomic, low-dose interferon-alpha(IFN-alpha), Proceedings of the International Congress onHyperthermic Oncology, 20.-24.04., St. Louis, (Session 21and Poster 689); 2004.
52. Barlogie B, Corry PM, Lip E, Lippman L, Johnston DA,Tenczynski TF, Reilly E, Lawson R, Dosik G, Rigor B,Hankenson R, Freireich EJ Total-body hyperthermia withand without chemotherapy for advanced human neoplasms.Cancer Res 1979;39(5):1481–1489.
53. Robins HI, et al. Phase I trial of human lymphoblastoidinterferon with whole body hyperthermia in advanced cancer.Cancer Res 1989;49(6):1609–1615.
54. Gerad H, van Echo DA, Whitacre M, Ashman M, Helrich M, FoyJ, Ostrow S, Wiernik PH, Aisner J. Doxorubicin, cyclophospha-mide, and whole body hyperthermia for treatment of advancedsoft tissue sarcoma. Cancer. 1984 Jun 15;53(12):2585–91.
55. Baba H, et al. Increased therapeutic gain of combined cis-diamminedichloroplatinum (II) and whole body hyperthermiatherapy by optimal heat/drug scheduling. Cancer Res1989;49(24 Pt. 1):7041–7044.
56. Katschinski DM, et al. Optimization of chemotherapy admin-istration for clinical 41.8 degrees C whole body hyperthermia.Cancer Lett 1997;115(2):195–199.
57. Hegewisch-Becker S, et al. Effects of whole body hyperthermia(41.8 degrees C) on the frequency of tumor cells in the per-ipheral blood of patients with advanced malignancies. ClinCancer Res 2003;9(6):2079–2084.
58. Teicher BA, Holden SA, Ara G, Menon K. Whole-bodyhyperthermia and lonidamine as adjuvant therapy to treat-ment with cisplatin with or without local radiation in mousebearing the Lewis lung carcinoma. Int J Hyperthermia1995;11(5):637–645.
59. Sumiyoshi K, Strebel FR, Rowe RW, Bull JM. The effectof whole-body hyperthermia combined with ‘metronomic’ che-motherapy on rat mammary adenocarcinoma metastases. IntJ Hyperthermia 2003;19(2):103–118.
60. Overgaard J, et al. Randomised trial of hyperthermiaas adjuvant to radiotherapy for recurrent or metastatic
HYPERTHERMIA, SYSTEMIC 61
malignant melanoma, European Society for HyperthermicOncology. Lancet 1995;345(8949):540–543.
61. Hehr T, Wust P, Bamberg M, Budach W. Current and poten-tial role of thermoradiotherapy for solid tumours. Onkologie2003;26(3):295–302.
62. Hildebrandt B, et al. Current status of radiant whole-bodyhyperthermia at temperatures > 41.5 degrees C and practicalguidelines for the treatment of adults. The German Interdis-ciplinary Working Group on Hyperthermia. Int J Hyperther-mia 2005;21(2):169–183.
63. Hildebrandt B, et al. Whole-body hyperthermia in the scope ofvon Ardenne’s systemic cancer multistep therapy (sCMT)combined with chemotherapy in patients with metastaticcolorectal cancer: a phase I/II study. Int J Hyperthermia2004;20(3):317–333.
64. Robinson V, et al. Thermotherapy for treating rheumatoidarthritis. Cochrane Database Syst Rev 1: CD002826; 2002.
65. van Soest H, van Hattum J. New treatment options for chronichepatitis C. Adv Exp Med Biol 2003;531:219–226.
66. Pontiggia P, Rotella GB, Sabato A, Curto FD. Therapeutichyperthermia in cancer and AIDS: an updated survey. JEnviron Pathol Toxicol Oncol 1996;15(2–4):289–297.
67. Li CY, Dewhirst MW. Hyperthermia-regulated immunogenetherapy. Int J Hyperthermia 2002;18(6):586–596.
68. Okita A, et al. Efficiency of lipofection combined with hyperther-mia in Lewis lung carcinoma cells and a rodent pleural dissemi-nation model of lung carcinoma. Oncol Rep 2004;11:1313–1318.
Further Reading
Bakhshandeh A, et al. Year 2000 guidelines for clinical practice ofwhole body hyperthermia combined with cytotoxic drugs fromthe University of Lübeck and the University of Wisconsin. JOncol Pharm Practice 1999;5(3):131–134.
Field SB, Hand JW, editors. An Introduction to the Practical Aspectsof Clinical Hyperthermia. London: Taylor & Francis; 1990.
Gautherie M, editor. Methods of External Hyperthermic Heating.Berlin/Heidelberg: Springer Verlag; 1990.
Gautherie M, editor. Whole Body Hyperthermia: Biological andClinical Aspects. Berlin/Heidelberg: Springer Verlag; 1992.
Hahn GM. Hyperthermia and Cancer. New York: Plenum Press, 1982.Hildebrandt B, et al. Current status of radiant whole-body
hyperthermia at temperatures > 41.5 degrees C and practicalguidelines for the treatment of adults. The German Interdisci-plinary Working Group on Hyperthermia. Int J Hyperthermia2005;21(2):169–183.
Issels RD, Wilmanns W, editors. Recent Results in CancerResearch, Vol. 107: Application of Hyperthermia in theTreatment of Cancer. Berlin/Heidelberg: Springer Verlag;1988.
Nussbaum GH, editor. Physical Aspects of Hyperthermia. AmericanAssociationofPhysicists inMedicineMedicalPhysicsMonographNo. 8. New York: American Institute of Physics; 1982.
Guan J, et al. The clinical study of whole-body hyperthermia(WBH) improving the survival state of patients with advancedcancer. Proc 26th Congress of the International ClinicalHyperthermia Society, Sept. 9–12, 2004, Shenzhen, China;2004; p 66.
Kurpeshev OK, Tsyb AF, Mardynsky YS. Whole-body hyperthermiafor treatment of patients with disseminated tumors- Phase II. In:P.H. Rehak, K.H. Tscheliessnigg, editors. Proceedings 22nd.Annual Meeting of the European Society for HyperthermicOncology, June 8–11, 2005, Graz, Austria, 2005; p 103.
Hou K. Assessment of the effects and clinical safety of the treat-ment of advanced malignant tumor with extracorporeal wholebody hyperthermia. Proceedings of the 26th Congress of the
International Clinical Hyperthermia Society, Sept. 9–12, 2004,Shenzhen, China; 2004 p 71.
See also BIOHEAT TRANSFER; HEAT AND COLD, THERAPEUTIC; HYPERTHER-
MIA, INTERSTITIAL; HYPERTHERMIA, ULTRASONIC; RADIATION DOSIMETRY FOR
ONCOLOGY.
HYPERTHERMIA, ULTRASONIC
DIMPI PATEL
DHANUNJAYA LAKKIREDDY
ANDREA NATALE
The Cleveland Clinic FoundationCleveland, Ohio
INTRODUCTION
The use of elevated temperature as a form of medicaltreatment has been fairly ubiquitous across culturesthroughout the course of time. The earliest record of heatfor therapeutic use was found in an Egyptian surgicalpapyrus dated to 3000 BC (1). Hippocrates, consideredby many to be the father of medicine, used heat to treatbreast cancer. He based his practice of medicine on anancient Greek ideology that advises using heat after trialsof surgery and medications have failed (2). German phy-sicians in the 1800s noted cases where cancer patients haddeveloped high fevers secondary to infections that resultedin a miraculous disappearance of their tumors (3). Theseobservations provided inspiration for the development ofseveral techniques that attempted to induce hyperthermia.One such popular method entailed wrapping a patient’sbody in plastic and then dipping him in hot wax. Anotherpopular technique involved removing a portion of thepatient’s blood, heating it, and then transfusing the warmedblood back to the patient’s body, thereby creating systemichyperthermia (4). These treatments had varied successrates, often culminating in fatality, and were subsequentlydiscarded. Thus, the interest in hyperthermia lessened inthe face of more conventional cancer treatments (e.g., che-motherapy and radiation). The current revival of interest inhyperthermia has resulted from a combination of clinicianssearching for a therapeutic mode other than chemotherapyand radiation, in tandem with several preliminary rando-mized clinical trials in a small selected group of patients thathave shown marked improvement in disease states with theuse of either hyperthermia alone or particularly as anadjuvant to other more traditional modalities.
Traditionally, conventional hyperthermia has beendefined as a therapeutic elevation of whole body temperatureor target tissue while maintaining low enough temperaturesto avoid tissue coagulation (3). This definition of hyperther-mia can be broadened to include the therapeutic elevation oftemperature to cause tissue destruction and coagulation,such as that implemented in HIFU (high intensity focusultrasound) procedures. Classically, microwaves, radio fre-quency (RF), electromagnetic radiations, or ultrasounds havebeen used to heat tissue to 40–44 8C (5). This article comparesand contrasts electromagnetic waves to ultrasonic waves as aheating modality, explain the physics behind ultrasound
62 HYPERTHERMIA, ULTRASONIC
generation, and explores the thermal and mechanical bio-physics involved with ultrasound delivery to tissue. Then, themedical fields that are currently benefitting from conven-tional ultrasound hyperthermia and HIFU are considered,and finally some of the many applicators involved withthermal ultrasound delivery are evaluated.
ULTRASOUND VERSUS ELECTROMAGNETIC RADIATION
Electromagnetic waves were often used in various applica-tions of conventional hyperthermia treatments. However,ultrasound has emerged as a better option because of itsshorter wavelength and lower energy absorption rate,which make it easier to control and to localize the areathat is being heated. For example, for a half-power pene-tration depth of 4 cm, the ultrasound wavelength in tissues(e.g., muscle) is 1 mm; however, electromagnetic wave-length required for the same transmission is 500 mm.Focusing energy into a volume smaller than a wavelengthis generally not possible. Using 500 mm (�40 MHz) ofelectromagnetic waves to heat a tumor that is situated4 cm below the skin with proportions of 6 cm in diameter inthe upper abdomen results in a temperature elevation ofthe entire abdomen including the spleen, liver, and allmajor vessels. More than one-half of the body’s cardiacoutput circulates through the abdominal area, and thiswidespread heating results in a systemic elevation of tem-perature, thereby limiting the use of electromagneticradiation for tumors in the body cavity (3). Electromagneticwaves are currently limited to regional hyperthermia andtreating very superficial tumors (6). Conversely, ultra-sound that has a wavelength of 1 mm can be focused withinthe area of the tumor, thus allowing less energy to beradiated to other areas of the body, resulting in lessdamage to surrounding healthy tissue. The current fabri-cation technology allows for practical applicator dimen-sions and multiple transducer configurations that makesit possible to control and shape a wide variety of ultrasoundbeams. The use of focused transducers or electronicallyphased arrays allow for better localization and tempera-ture control of the target tissue (7). In contrast to thesepositive attributes, high acoustic absorption at bone–softtissue interface and reflection from gas surfaces may makecertain therapeutic scenarios difficult.
GENERATION AND PROPAGATION OF ULTRASOUND
Ultrasonic Transducers
In order to generate ultrasonic waves for tissue warming, atransducer containing piezoelectric crystals is required.Piezoelectric crystals are found in Nature or can be artifi-cially grown. Quartz and synthetic ferroelectric ceramics(e.g., lead metanobiate, lead zirconate, and titanates ofbarium) all have strong piezoelectric properties (8). Theceramic most commonly used in the fabrication of ultra-sound transducers is synthetic plumbium zirconiumtitante (PZT). Transducers are manufactured by applyingan external voltage to these ferroelectric materials toorient their internal dipole structure. They are then cooledto permanently maintain their dipole orientation. Finally,
they are cut into any desired shape, such as spherical bowlsfor focused ultrasonic fields (3,8). Ultrasound transducershave electrodes attached to the front and back for applica-tion and detection of electrical fields. With the applicationof an alternating electrical field parallel to the surface ofpiezoelectric material, the crystals will contract andvibrate for a short time with their resonant frequency.The frequency at which the transducer is able to vibrateis indirectly proportional to its thickness; higher frequen-cies are a result of thinner transducers, lower frequencies aresult of thicker transducers (8).
Piezoelectric crystals are able to contract or expandwhen an electrical field is applied to them because dipoleswithin the crystal lattice will realign themselves as a resultof attractive and repulsive forces causing a change inphysical dimension of the material in the order of nan-ometers (electrostriction or reverse piezoelectric effect).When echos are received, the ultrasound waves will com-press and expand the crystals (8). This mechanical stresscauses the dipoles to realign on the crystal surface creatinga net charge (piezoelectric effect) (Fig. 1).
Transducers function optimally when there is broadbandwidth in the frequency domain and short impulseresponse in the time domain. Also, when there is littleelectroacoustical conversion inefficiency, and little mis-match between the electrical impedances of the generatorand the transducer (3,9). A transducer’s ability to transmitenergy is dependent on the characteristics of acoustic impe-dances and its contact medium. Both the density of thematerial and propagation velocity of ultrasound waves willdetermine its impedance. When both impedances match,then less energy is lost through reflection back into thetransducer. For example, at the interface between air andthe transducer, most of the energy will be reflected back tothe transducer and will travel to the opposite directionbecause air has �16 times less impedance than the trans-ducer. If the transducer is a half wavelength in thickness,the reflected wave arrives at the opposite surface in phasewith the direction of its motion and can then be transmittedinto the medium. Since the efficiency at which a transducertransmits energy has a direct relationship to the degree ofimpedance match, efficiency can be increased significantlyby adding an impedance matching layer of a quarter wave-length thickness, subsequently making the characteristicimpedance equal to the geometric average of those of thetransducer and the loading medium (3,8).
RADIATION FIELD OF ULTRASONIC TRANSDUCERS
The radiation field of an ultrasonic transducer depends on itsphysical properties and the transmission characteristics ofthe medium through which it will pass. Conventional planartransducers create a nonfocused field, whereas some mod-ifications to the same transducer can create a focused field.
NONFOCUSED FIELDS
Planar Transducers
Ultrasonic waves that are radiated from the transducersurface can be described as a tightly packed array of
HYPERTHERMIA, ULTRASONIC 63

separate point sources of sound energy (Fig. 2a). Each ofthese points emits a spherical wavelet (Fig. 3). Thesewaves interact both constructively and destructivelycreating a diffraction pattern. Any point in the mediumis a compilation of all the sources that reach that target atthat period of time. This diffraction pattern can be calcu-lated using Huygen’s principle. Two separate transducerswhose emission fields interact in the same media aresubject to the same laws of construction and destruction.Planar transducers operating in continuous wave modeare shown in (Fig. 2). In the Fresnel zone or the near field,the beam energy distribution is collimated, which is aresult of the many destructive and constructive inter-actions of the spherical wavelets (Figs. 2c and 3). The
beam path is a function of the dimension of the activepart of the transducer surface, thus the beam diameterthat is converging at the end of the near field is appro-ximately one-half of the size of transducer diameter.The intensity and pressure amplitudes fluctuate greatlyat small distances from the surface transducer (Fig. 2b).As the distance from the transducer surface increases,the beam path diverges (Fig. 2c and 3). In large diameter,high frequency transducers, there is less beam diver-gence in the far field. After a certain distance from thetransducer surface, the intensity stabilizes; however,intensity along the axis deteriorates along with beamdivergence (Fig. 2b). Circular, square, and rectangulartransducers have similar fields; albeit, circular trans-ducers have more pronounced fluctuations of intensityin the near field (3,8).
64 HYPERTHERMIA, ULTRASONIC
Constructive and destructive interference patterns confine beam in the near field
Direction of beamNear field Far field
Figure 3. Ultrasonic waves that are radiated from the trans-ducer surface are described as a tightly packed array of separatepoint sources. Each of these points radiates a spherical wavelet(Huygen’s principle). These spherical wavelets will interact con-structively and destructively. In the near field, these interactionsresult in a convergentbeam pattern. In the far field, the beam patterndiverges. (Published with permission from Ref. 8).
Figure 2. A planar transducer operating in a continuous wavemode. (a) The envelope containing almost all of the ultrasonicenergy. (b) The relative intensity of the ultrasonic beam along acentral axis. The intensity across the field fluctuates greatly atsmall distances from the surface of the transducer. At greaterdistances along the central axis the intensity distribution acrossthe field stabilizes and deteriorates with beam divergence. (c) Ringdiagrams illustrating the energy distribution at positionsindicated in (b). In the near field, the ring beam pattern iscollimated, but at greater distances from the transducer surfacethe beam diverges. (Published with permission from Ref. 3).
Figure 1. A piezoelectric compound consists of aligned moleculardipoles. (a) At equilibrium, the dipoles are arranged in aconfiguration that results in a neutral net charge. When thepiezoelectric compound is mechanically stressed (e.g., anultrasound wave) the element changes its physical dimensions. Atpeak pressure amplitudes, the element will contract. When no stressis placed upon the element it is in equilibrium. At peak rarefaction,the element will expand. This realignment of dipoles results in theproduction of a net positive or negative surface charge. (b) When anelectrical field is applied to the piezoelectric element the dipoles canbe realigned in response to attractive or repulsion forces. Thisrearrangement results in either expansion or contraction of theelement. In the absence of an applied electrical field the elementis in equilibrium and has a neutral net charge. (Published with thepermission from Ref. 8).
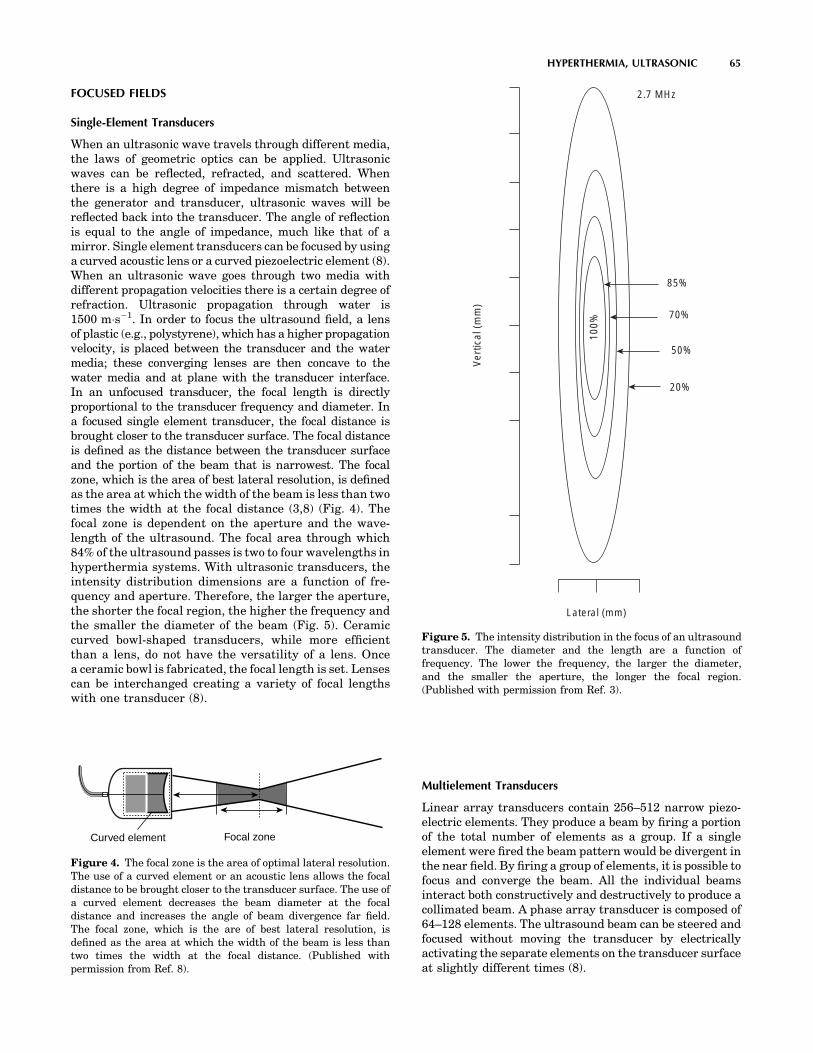
FOCUSED FIELDS
Single-Element Transducers
When an ultrasonic wave travels through different media,the laws of geometric optics can be applied. Ultrasonicwaves can be reflected, refracted, and scattered. Whenthere is a high degree of impedance mismatch betweenthe generator and transducer, ultrasonic waves will bereflected back into the transducer. The angle of reflectionis equal to the angle of impedance, much like that of amirror. Single element transducers can be focused by usinga curved acoustic lens or a curved piezoelectric element (8).When an ultrasonic wave goes through two media withdifferent propagation velocities there is a certain degree ofrefraction. Ultrasonic propagation through water is1500 m�s�1. In order to focus the ultrasound field, a lensof plastic (e.g., polystyrene), which has a higher propagationvelocity, is placed between the transducer and the watermedia; these converging lenses are then concave to thewater media and at plane with the transducer interface.In an unfocused transducer, the focal length is directlyproportional to the transducer frequency and diameter. Ina focused single element transducer, the focal distance isbrought closer to the transducer surface. The focal distanceis defined as the distance between the transducer surfaceand the portion of the beam that is narrowest. The focalzone, which is the area of best lateral resolution, is definedas the area at which the width of the beam is less than twotimes the width at the focal distance (3,8) (Fig. 4). Thefocal zone is dependent on the aperture and the wave-length of the ultrasound. The focal area through which84% of the ultrasound passes is two to four wavelengths inhyperthermia systems. With ultrasonic transducers, theintensity distribution dimensions are a function of fre-quency and aperture. Therefore, the larger the aperture,the shorter the focal region, the higher the frequency andthe smaller the diameter of the beam (Fig. 5). Ceramiccurved bowl-shaped transducers, while more efficientthan a lens, do not have the versatility of a lens. Oncea ceramic bowl is fabricated, the focal length is set. Lensescan be interchanged creating a variety of focal lengthswith one transducer (8).
Multielement Transducers
Linear array transducers contain 256–512 narrow piezo-electric elements. They produce a beam by firing a portionof the total number of elements as a group. If a singleelement were fired the beam pattern would be divergent inthe near field. By firing a group of elements, it is possible tofocus and converge the beam. All the individual beamsinteract both constructively and destructively to produce acollimated beam. A phase array transducer is composed of64–128 elements. The ultrasound beam can be steered andfocused without moving the transducer by electricallyactivating the separate elements on the transducer surfaceat slightly different times (8).
HYPERTHERMIA, ULTRASONIC 65
Ver
tical
(m
m)
100%
85%
70%
50%
20%
Lateral (mm)
2.7 MHz
Figure 5. The intensity distribution in the focus of an ultrasoundtransducer. The diameter and the length are a function offrequency. The lower the frequency, the larger the diameter,and the smaller the aperture, the longer the focal region.(Published with permission from Ref. 3).
Curved element Focal zone
Figure 4. The focal zone is the area of optimal lateral resolution.The use of a curved element or an acoustic lens allows the focaldistance to be brought closer to the transducer surface. The use ofa curved element decreases the beam diameter at the focaldistance and increases the angle of beam divergence far field.The focal zone, which is the are of best lateral resolution, isdefined as the area at which the width of the beam is less thantwo times the width at the focal distance. (Published withpermission from Ref. 8).
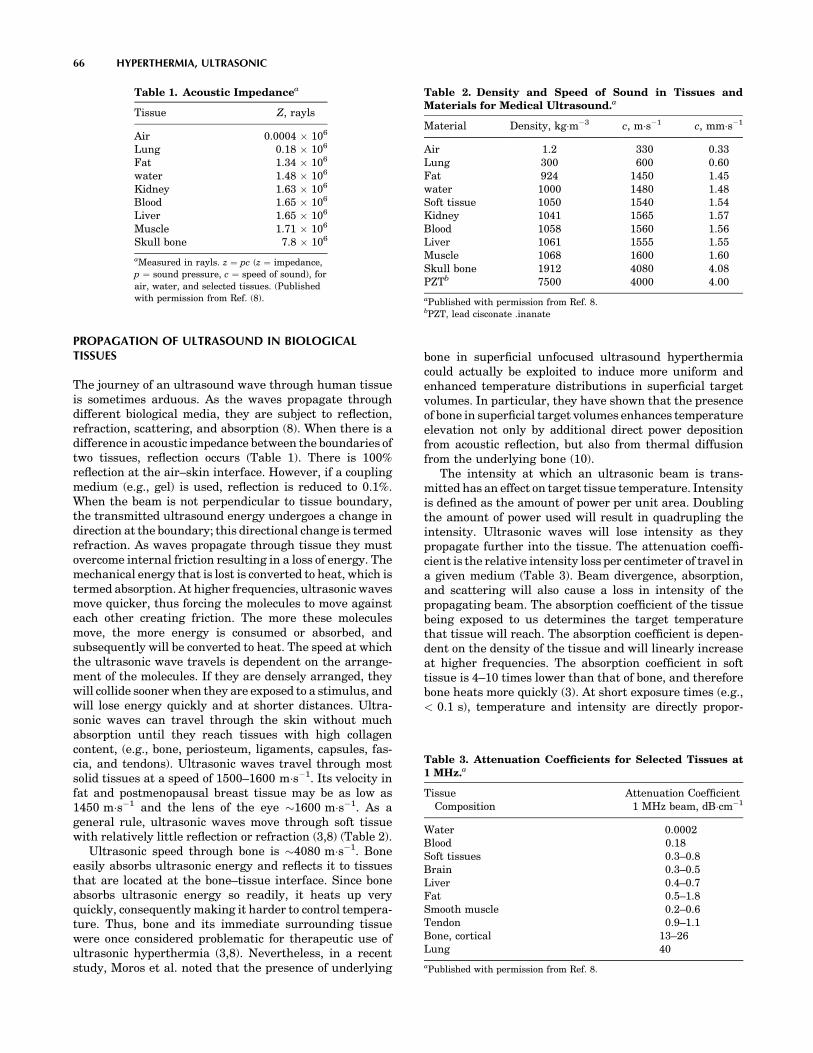
PROPAGATION OF ULTRASOUND IN BIOLOGICALTISSUES
The journey of an ultrasound wave through human tissueis sometimes arduous. As the waves propagate throughdifferent biological media, they are subject to reflection,refraction, scattering, and absorption (8). When there is adifference in acoustic impedance between the boundaries oftwo tissues, reflection occurs (Table 1). There is 100%reflection at the air–skin interface. However, if a couplingmedium (e.g., gel) is used, reflection is reduced to 0.1%.When the beam is not perpendicular to tissue boundary,the transmitted ultrasound energy undergoes a change indirection at the boundary; this directional change is termedrefraction. As waves propagate through tissue they mustovercome internal friction resulting in a loss of energy. Themechanical energy that is lost is converted to heat, which istermed absorption. At higher frequencies, ultrasonic wavesmove quicker, thus forcing the molecules to move againsteach other creating friction. The more these moleculesmove, the more energy is consumed or absorbed, andsubsequently will be converted to heat. The speed at whichthe ultrasonic wave travels is dependent on the arrange-ment of the molecules. If they are densely arranged, theywill collide sooner when they are exposed to a stimulus, andwill lose energy quickly and at shorter distances. Ultra-sonic waves can travel through the skin without muchabsorption until they reach tissues with high collagencontent, (e.g., bone, periosteum, ligaments, capsules, fas-cia, and tendons). Ultrasonic waves travel through mostsolid tissues at a speed of 1500–1600 m�s�1. Its velocity infat and postmenopausal breast tissue may be as low as1450 m�s�1 and the lens of the eye �1600 m�s�1. As ageneral rule, ultrasonic waves move through soft tissuewith relatively little reflection or refraction (3,8) (Table 2).
Ultrasonic speed through bone is �4080 m�s�1. Boneeasily absorbs ultrasonic energy and reflects it to tissuesthat are located at the bone–tissue interface. Since boneabsorbs ultrasonic energy so readily, it heats up veryquickly, consequently making it harder to control tempera-ture. Thus, bone and its immediate surrounding tissuewere once considered problematic for therapeutic use ofultrasonic hyperthermia (3,8). Nevertheless, in a recentstudy, Moros et al. noted that the presence of underlying
bone in superficial unfocused ultrasound hyperthermiacould actually be exploited to induce more uniform andenhanced temperature distributions in superficial targetvolumes. In particular, they have shown that the presenceof bone in superficial target volumes enhances temperatureelevation not only by additional direct power depositionfrom acoustic reflection, but also from thermal diffusionfrom the underlying bone (10).
The intensity at which an ultrasonic beam is trans-mitted has an effect on target tissue temperature. Intensityis defined as the amount of power per unit area. Doublingthe amount of power used will result in quadrupling theintensity. Ultrasonic waves will lose intensity as theypropagate further into the tissue. The attenuation coeffi-cient is the relative intensity loss per centimeter of travel ina given medium (Table 3). Beam divergence, absorption,and scattering will also cause a loss in intensity of thepropagating beam. The absorption coefficient of the tissuebeing exposed to us determines the target temperaturethat tissue will reach. The absorption coefficient is depen-dent on the density of the tissue and will linearly increaseat higher frequencies. The absorption coefficient in softtissue is 4–10 times lower than that of bone, and thereforebone heats more quickly (3). At short exposure times (e.g.,< 0.1 s), temperature and intensity are directly propor-
66 HYPERTHERMIA, ULTRASONIC
Table 3. Attenuation Coefficients for Selected Tissues at1 MHz.a
TissueComposition
Attenuation Coefficient1 MHz beam, dB�cm�1
Water 0.0002Blood 0.18Soft tissues 0.3–0.8Brain 0.3–0.5Liver 0.4–0.7Fat 0.5–1.8Smooth muscle 0.2–0.6Tendon 0.9–1.1Bone, cortical 13–26Lung 40
aPublished with permission from Ref. 8.
Table 1. Acoustic Impedancea
Tissue Z, rayls
Air 0.0004 � 106
Lung 0.18 � 106
Fat 1.34 � 106
water 1.48 � 106
Kidney 1.63 � 106
Blood 1.65 � 106
Liver 1.65 � 106
Muscle 1.71 � 106
Skull bone 7.8 � 106
aMeasured in rayls. z ¼ pc (z ¼ impedance,
p ¼ sound pressure, c ¼ speed of sound), for
air, water, and selected tissues. (Published
with permission from Ref. (8).
Table 2. Density and Speed of Sound in Tissues andMaterials for Medical Ultrasound.a
Material Density, kg�m�3 c, m�s�1 c, mm�s�1
Air 1.2 330 0.33Lung 300 600 0.60Fat 924 1450 1.45water 1000 1480 1.48Soft tissue 1050 1540 1.54Kidney 1041 1565 1.57Blood 1058 1560 1.56Liver 1061 1555 1.55Muscle 1068 1600 1.60Skull bone 1912 4080 4.08PZTb 7500 4000 4.00
aPublished with permission from Ref. 8.bPZT, lead cisconate .inanate
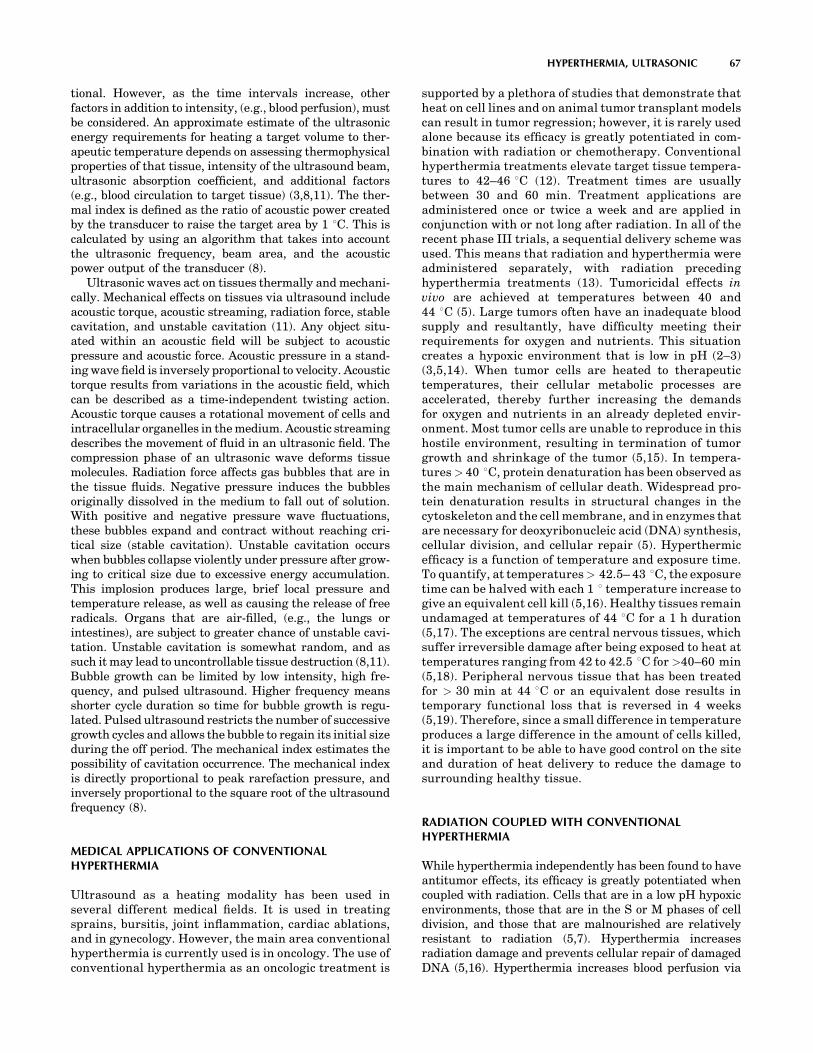
tional. However, as the time intervals increase, otherfactors in addition to intensity, (e.g., blood perfusion), mustbe considered. An approximate estimate of the ultrasonicenergy requirements for heating a target volume to ther-apeutic temperature depends on assessing thermophysicalproperties of that tissue, intensity of the ultrasound beam,ultrasonic absorption coefficient, and additional factors(e.g., blood circulation to target tissue) (3,8,11). The ther-mal index is defined as the ratio of acoustic power createdby the transducer to raise the target area by 1 8C. This iscalculated by using an algorithm that takes into accountthe ultrasonic frequency, beam area, and the acousticpower output of the transducer (8).
Ultrasonic waves act on tissues thermally and mechani-cally. Mechanical effects on tissues via ultrasound includeacoustic torque, acoustic streaming, radiation force, stablecavitation, and unstable cavitation (11). Any object situ-ated within an acoustic field will be subject to acousticpressure and acoustic force. Acoustic pressure in a stand-ing wave field is inversely proportional to velocity. Acoustictorque results from variations in the acoustic field, whichcan be described as a time-independent twisting action.Acoustic torque causes a rotational movement of cells andintracellular organelles in the medium. Acoustic streamingdescribes the movement of fluid in an ultrasonic field. Thecompression phase of an ultrasonic wave deforms tissuemolecules. Radiation force affects gas bubbles that are inthe tissue fluids. Negative pressure induces the bubblesoriginally dissolved in the medium to fall out of solution.With positive and negative pressure wave fluctuations,these bubbles expand and contract without reaching cri-tical size (stable cavitation). Unstable cavitation occurswhen bubbles collapse violently under pressure after grow-ing to critical size due to excessive energy accumulation.This implosion produces large, brief local pressure andtemperature release, as well as causing the release of freeradicals. Organs that are air-filled, (e.g., the lungs orintestines), are subject to greater chance of unstable cavi-tation. Unstable cavitation is somewhat random, and assuch it may lead to uncontrollable tissue destruction (8,11).Bubble growth can be limited by low intensity, high fre-quency, and pulsed ultrasound. Higher frequency meansshorter cycle duration so time for bubble growth is regu-lated. Pulsed ultrasound restricts the number of successivegrowth cycles and allows the bubble to regain its initial sizeduring the off period. The mechanical index estimates thepossibility of cavitation occurrence. The mechanical indexis directly proportional to peak rarefaction pressure, andinversely proportional to the square root of the ultrasoundfrequency (8).
MEDICAL APPLICATIONS OF CONVENTIONALHYPERTHERMIA
Ultrasound as a heating modality has been used inseveral different medical fields. It is used in treatingsprains, bursitis, joint inflammation, cardiac ablations,and in gynecology. However, the main area conventionalhyperthermia is currently used is in oncology. The use ofconventional hyperthermia as an oncologic treatment is
supported by a plethora of studies that demonstrate thatheat on cell lines and on animal tumor transplant modelscan result in tumor regression; however, it is rarely usedalone because its efficacy is greatly potentiated in com-bination with radiation or chemotherapy. Conventionalhyperthermia treatments elevate target tissue tempera-tures to 42–46 8C (12). Treatment times are usuallybetween 30 and 60 min. Treatment applications areadministered once or twice a week and are applied inconjunction with or not long after radiation. In all of therecent phase III trials, a sequential delivery scheme wasused. This means that radiation and hyperthermia wereadministered separately, with radiation precedinghyperthermia treatments (13). Tumoricidal effects invivo are achieved at temperatures between 40 and44 8C (5). Large tumors often have an inadequate bloodsupply and resultantly, have difficulty meeting theirrequirements for oxygen and nutrients. This situationcreates a hypoxic environment that is low in pH (2–3)(3,5,14). When tumor cells are heated to therapeutictemperatures, their cellular metabolic processes areaccelerated, thereby further increasing the demandsfor oxygen and nutrients in an already depleted envir-onment. Most tumor cells are unable to reproduce in thishostile environment, resulting in termination of tumorgrowth and shrinkage of the tumor (5,15). In tempera-tures > 40 8C, protein denaturation has been observed asthe main mechanism of cellular death. Widespread pro-tein denaturation results in structural changes in thecytoskeleton and the cell membrane, and in enzymes thatare necessary for deoxyribonucleic acid (DNA) synthesis,cellular division, and cellular repair (5). Hyperthermicefficacy is a function of temperature and exposure time.To quantify, at temperatures > 42.5– 43 8C, the exposuretime can be halved with each 1 8 temperature increase togive an equivalent cell kill (5,16). Healthy tissues remainundamaged at temperatures of 44 8C for a 1 h duration(5,17). The exceptions are central nervous tissues, whichsuffer irreversible damage after being exposed to heat attemperatures ranging from 42 to 42.5 8C for >40–60 min(5,18). Peripheral nervous tissue that has been treatedfor > 30 min at 44 8C or an equivalent dose results intemporary functional loss that is reversed in 4 weeks(5,19). Therefore, since a small difference in temperatureproduces a large difference in the amount of cells killed,it is important to be able to have good control on the siteand duration of heat delivery to reduce the damage tosurrounding healthy tissue.
RADIATION COUPLED WITH CONVENTIONALHYPERTHERMIA
While hyperthermia independently has been found to haveantitumor effects, its efficacy is greatly potentiated whencoupled with radiation. Cells that are in a low pH hypoxicenvironments, those that are in the S or M phases of celldivision, and those that are malnourished are relativelyresistant to radiation (5,7). Hyperthermia increasesradiation damage and prevents cellular repair of damagedDNA (5,16). Hyperthermia increases blood perfusion via
HYPERTHERMIA, ULTRASONIC 67

vasodilation which results in increased oxygenation, thusallowing increased radiosensitivity (5,7,16). Responserates with hyperthermia alone are �15%, with radiother-apy �35%, with combined radiotherapy, and hyperthermia�70% (20). There have been many U.S. and Europeanclinical trials that support substantial improvement inpatients who have been treated with a combination ofradiation and hyperthermia. Examples of some recenttrials include randomized multiinstitutional phase IIItrials for treating melanoma (20,21), glioblastoma multi-forme (20,22), chest wall recurrence of breast cancer(20,23), head and neck cancer (20,24,25), head and neckin superficial measurable tumors (20,26,27), in variousrecurrent persistent tumors (20,28), cervical cancer (29),uterine cancer (30) and in locally advanced pelvic tumors(20,31) (Table 4). Trial success rates were very dependenton the uniformity of temperature delivery. In the past,trials had often provided mediocre results becausetemperatures were �1–1.5 8C too low and consequentlynot able achieve adequate tumoricidal levels (7). It is oftendifficult to uniformly heat larger tumor (3,7). When radia-tion and hyperthermia are used simultaneously excellentradiation delivery is achieved, often resulting in tumorregression; however, its delivery is equally as toxic tohealthy cells that necessitate the need for a very precisedelivery system.
CHEMOTHERAPY IN CONJUNCTION WITHCONVENTIONAL HYPERTHERMIA
Chemotherapeutic efficacy is enhanced by hyperthermia(5,20,34,35) (Table 5). As areas are heated, perfusion isincreased, thus allowing an increase in drug concentra-tions in areas of the tumor that are poorly vascularized,increased intracellular drug uptake, and enhanced DNAdamage. Drugs (e.g., mitomycin C, nitrosureas, cisplatin,doxorubicin, and mitoxantrone) are subject to less drugresistance when used with heat. The synergistic effect ofchemotherapy and hyperthermia was demonstrated invirtually all cell lines treated at temperatures >40 8C foralkylating drugs, nitroureas, and platin analogs dependenton exposure time and temperature. Chemotherapeuticagents can be revved up 1.2–10 times with the additionof heat (5). In vivo, experiments showed improvementwhen doxorubicin and mitoxantrone were combined withhyperthermia. However, antimetabolites vinblastine, vin-cristine, and etoposide did not show improvement with theaddition of hyperthermia. In animal studies, increasedtoxicities were seen in skin (cyclophosphamide, bleomycin),heart (doxorubicin), kidney (cisplatin, with a core tempera-ture >41 8C), urinary tract (carmustine, with core tem-peratures >41 8C), and bone marrow (alkylating agentsand nitroureas) (5,34). Lethal toxicity was enhanced whensystemic hyperthermia was applied in combination withcyclophosphamide, methyl-CCNU, and carmustine (5). Thesuccess of hyperthermia and chemotherapy combinationsdepends on the temperature increase in the organs forwhich the drug is used and its subsequent toxicity, all ofwhich are can be influenced by the accuracy of the heatingdevice and the operator.
MODES OF CONVENTIONAL HYPERTHERMIAAPPLICATION
Externally Applied Techniques
In the past, single planar transducers were used to applylocal heat. A disk shaped piezoelectric transducer (rangefrom 0.3–6.0 MHz in frequency and up to 16 cm in dia-meter) is mounted above a chamber of cooled degassedwater. This device has a coupling chamber which allowswater to circulate (3) (Fig. 6). It is coupled to the body via aplastic or latex membrane. Unfortunately, these types ofdevices are unable to achieve homogenous therapeuticthermal levels. The reason is that this system uses anunfocused energy source. When an unfocused energysource is applied to the skin, the intensity and the tem-perature will be the highest at the contact point and willsubsequently lose intensity as it travels deeper into thetissue. However, by cooling the skin, the ‘‘hot spot’’ isshifted to the subcutaneous fatty tissue that is poorlyvascularized. Fat is an insulator and as a result muchenergy is conserved rather than lost. Furthermore, coolingthe skin will produce vasoconstriction which conserveseven more heat and facilitates the heating of deeper tissues(3) (Figs. 7, 8a and b). However, even with this strategyadequate temperatures could not be reached. The reasonfor this is that large tumors often consist of three zones, acentral necrotic core, an intermediate zone that is normallyperfused, and a marginal zone that has a greater number ofvessels due to proliferation induced angiogenesis. Due tothe abundance of vasculature on the marginal surface,much heat is dissipated to the surrounding tissue. Therelatively avascular center will heat to a higher tempera-ture than the marginal or intermediate zone because thereis little dissipation of heat, creating hot spots (Fig. 9) (7,54).Thus, it is not possible to therapeutically heat a tumor witha single planar source. This theory is substantiated by asignificant number of clinical trials (7,55–61). Most trialsreported that patients had some difficulty with dose-limiting pain, extensive central tumor necrosis, blistering,and ulceration (7). Conversely, a focused ultrasound sourcelocalizes energy within the tumor volume while sparing thesurrounding tissue (Fig. 10). The use of a focused beamallows for homogenous heating and higher intensity whichallows the generation of greater temperatures within thetarget area. Attenuation and beam divergence cause rapiddeterioration of intensity beyond the focal zone (3) (Fig. 11a and b). Focused ultrasound sources overcome some of thelimitations of planar heating. Focusing allows for control-ling the amount of heat that is delivered to the poorlyperfused areas thus limiting hot spots and some of the sideeffects. For a heating system to be successful clinically on alarge scale, it must account for geometric and dimensionalvariations of target tissue, possess the ability to heat thesites that need it, and avoid side effects and complicationsas much as possible (3).
Technological advances in hyperthermia devices havepaved the way for better therapeutic options. The use ofmosaics or separately controlled transducers allowed bet-ter spatial and temperature control to target bulky irre-gularly shaped tumors. The multielement planar
68 HYPERTHERMIA, ULTRASONIC

ultrasound applicators met these demands and are capableof treating tumors at depths up to 8 cm. The multisectorapplicator allows for heating to the edge of the apertureand the acoustic beams are nondiverging in the near field,
thus allowing large tumor heating with lateral measure-ments of 15 � 15 cm. Each of these 16 sectors can be variedfrom 0 to 100% power to uniformly heat across the tumor. Ifan area of the tumor is too difficult to treat, more energy
HYPERTHERMIA, ULTRASONIC 69
Table 4. Hyperthermia and Radiation Clinical Trials
Reference/name oftrial Tumor Entity (stage) Type of Trial
No. ofPatients
Type ofHyperthermia
Results ofControl Arm(RT only)a
Results ofHyperthermiaArm (RTþHT)a
Significanceof Results( p<0.05)
(26,32)RTOG
Head and neck(superficial measurable
tumor)
Prospectiverandomizedmulticenter
106 Superficial(915 MHz
microwave)
34% CR 34% CR �
(25) Head and neck untreatedlocoregional tumor
Prospectiverandomized
65 Superficial(27-12 MHzmicrowave)
32% DR 55% CR þ
19% DFS at1.5 years
33% DFSat 1.5 years
þ
(24,33) Head and neck(N3locoregional tumor)
Prospectiverandomized
41 Superficial(280 MHz
microwave)
41% CR 83% CR þ
24% LRFS 68% LRFS þ0% OS at
5 years53% OS at
5 yearsþ
(21) ESHO-3 Melanoma (skinmetastases or recurrent
skin lesions)
ProspectiverandomizedMulticenter
70 Superficial(various
techniques)
35% CR 62% CR þ
28% LRFS at5 years
46% LRFS at5 years
þ
(23) MRC/ESHO-5
Breast cancer (localrecurrences or inoperable
primary lesions)
Randomizedmulticenter
306 Superficial(various
techniques)
41% CR 59% CR þ
ca. 30% LRFS ca. 50% LRFS þca. 40% AS
at 2 yearsca. 40% AS at
2 years�
(31) Rectal cancer Prospectiverandomizedmulticenter
143 Deep regionalHT (varioustechniques)
15% CR 21% CR �
22% OS at3 years
13% OS at3 years
�
Bladder cancer 101 51% CR 73% CR þ22% OS at
3 years28% OS at
3 years�
Cervical cancer 114 57% CR 83% CR þ27% OS at
3 years51% OS at
3 yearsþ
(28) Various (recurrent orprogressive lesions)
Prospectiverandomizedmulticenter
174 Interstitial HT(300-2450 MHz
microwaveor RF)
54% CR 57% CR �
34% OS at2 years
35% OS at2 years
(25) Gioblastoma(postoperative)
Prospectiverandomized
79 Interstitial HT 15% OS at2 years
31% OS at2 years
þ
(29) Stage IIIButerine cervix
Prospectiverandomized
40 Deep regionalHT
50% CR 80% CR þ
45% CR at3 years
79.7% CR at3 years
(27) Superficial tumors Prospectiverandomized
122 EM 42.3% CR 66.1% CR þ
(30) Uterine cervical Prospectiverandomizedmulticenter
110 RF 68.5% CR 73.2% CR þ
aAS ¼ actuarial survival; CR ¼ complete remission; DFS ¼ disease free survival; HT ¼ hyperthermia; LRFS ¼ local relapse free survival; OS ¼ overall
survival; RF ¼ radio frequency electric currents; RT ¼ radiotherapy. (Published with permission from Ref 20).

70 HYPERTHERMIA, ULTRASONIC
Table 5. Hyperthermia and Chemotherapy Clinical Trials
Reference Tumor EntityType ofTrial
No. ofPatients
Type ofHyperthermiaa
Type ofChemotherapya Resultsa
(36) Oesophaguscancer
(preoperative)
Phase II 32 localHT/Endoluminal MW
CDDP þ Bleo þCyc
8 CR/13 PR(65% RR)
(37) Oesophaguscancer
(preoperative)
Phase III 20 localHT/Endoradiotherm
CDDP þ Bleo 1 CR/5 PR/4 MR(50% RR);
FHR (41.2%)20 Control CDDP þ Bleo 0CR/5 PR/0 MR
(25% RR);FHR (18.8%)
(38) Stomach cancer Phase II 33 RHT/thermotron Mitomycin þ 5FU 3 CR þ 10 PR(39% RR)
pancreatic cancer 22 8 MHz Mitomycin þ 5FU 3 CR þ 5 PR(36% RR)
(39) Pancreatic cancer Phase II 77 RHT 13.5 MHz Mitomycin þ 5FU þ/- immunostimulation
27..3% survivalat 1 year
(40,41) Sarcomas(pretreated withchemotherapy)
Phase II(RHT 86)
38 RHT/BSD 100060-110 MHz
VP16 þ IFO 6 pCR þ 4PR þ 4FHR(37% RR)
Follow-up 65 VP16 þ IFO 9pCR þ 4PR þ 8FHR(32% RR)
(42,43) High risk softtissue sarcomas
Phase II(RHT 91)
59 RHT/BSD 200080-110 MHz
VP16 þ IFO þ ADR ICR/6pCR þ 8PR þ 13 MR(47%)
OS: 46% at 5 years(44) High risk soft
tissue sarcomaPhase III
(EORTC62961)
112 RHT/BSD 200080-110 MHz
(randomized)
VP16 þ IFO þ ADR (08/00)
(45) Soft tissuesarcoma
Phase II 55 ILP with HT TNF þ IFN þ L-PAM 10CR/35PR (82% RR)
(46) Sarcoma/teratomas
(metastatic)
Phase I/II 19 WBH IFO þ CBDCA 6PR (32% RR)
(47) Sarcoma(metastatic)
Phase II 12 WBH IFO þ CBDCA þ VP16 7PR (58% RR)
(48) Refractorycancers
(advanced ormetastatic)
Phase I 16 WBH(Aquatherm)
L-PAM(dose-escalation)
ICR/2PR (19% PR)
(49) Pediatricsarcomas
Phase II 34 RHT/BSD 200080-110 MHz
V16 þ IFO þ CBDCA 12 NED(‘best response’)/7 CR Duration:
7-64 months(50) Pediatric
nontesticulargerm celltumours
Phase II 10 RHT/BSD 200080-110 MHz
CDDP þ VP16 þ IFO(¼PEI)
5CR þ 2PR(70% RR) Sixpatients alive
without evidenceof tumour
(10-33 months)(51) Cervical cancer
(recurrences)Phase II 23 RHT/array-system
70 MHzCDDP (weekly) 2pCR/ICR þ 9PR
(52% RR)(52) Rectal cancer Phase II 27 Intraoperative IHP Mitomycin C 3 LR
(Dukes Cpreoperative)
35 Control Mitomycin C 13LR
(53) Metastatic Sarcoma Phase II 108 whole bodyHyperthermia
IFO/CBDCA/VP16 68% success at 1 year
aP ¼ intraoperitoneal hyperthermic perfusion; WBH ¼ whole body hyperthermia; 5FU ¼ 5-flurouracil; VP16 ¼ etoposide; IFO ¼ ifosfamide;
ADR ¼ Adriamycin ¼ Doxorubin; CDDP ¼ Cisplatin; CBDCA ¼ Carboplatin; Bleo ¼ Bleomycin; L-PAM ¼ Melphan; TNF ¼ tumor necrosis factor alpha;
IFN ¼ interferon gamma; p ¼ pathohistological; RR ¼ response rate; CR ¼ complete remission; PR ¼ partial remission; MR ¼ minor response;
FHR ¼ favorable histological response >75%; LR ¼ local recurrence; NED ¼ no evidence of disease.(Published with permission from Ref. 20).

can be directed to just that target segment. The tempera-tures can be adjusted in relation to variations in tempe-rature distribution due to blood flow, variations in targettissue morphology, and based on the patient’s comfortlevel. These devices have the ability to contour the energyfield to match the tumor outline. These systems generallyhave two frequencies: 1 MHz (used to heat 3–6 cm) and3.4 MHz (used for more superficial 2–3 cm) (7,62). Exam-ples of heating temperatures for different ultrasoundhyperthermia devices are shown (Table 6). These planararray systems have been adapted to allow for thermoradia-tion in conjunction with an external beam radiation (7). Anextended bolus configuration with an internal reflectingsystem was created to direct the ultrasound energy intodesired tissue. This configuration allows the ultrasoundtransducer to be outside the radiation beam thus prevent-ing potential interference of the two (7,70).
Another approach to achieving greater spatial control isto use a larger variety of small transducers in a nonplanargeometric configuration. This approach has been used in
treating intact breast with cancer (7,71). The patient liesprone while the breast is immersed within the water filledcylindrical applicator (Fig. 12). The cylindrical applicator iscomposed of eight rings (each ring is 25 cm in diameter by1.6 cm in height), with up to 48 transducers (1.5 �1.5 cmplane transducers), which are interspersed around the
HYPERTHERMIA, ULTRASONIC 71
Necrotic/ischemic core
Tumor
Well-perfusedmargin
Skin
Figure 9. Temperature distribution in a subcutaneous tumorby plane wave transducer. The temperature at the necrotic zone ishigher than in the surrounding tissues. (Published with permissionfrom Ref. 3).
Planewave
energy
Tissue Tumor
Figure 7. The pattern of ultrasound delivery via plane waveradiation targeting a tumor that is located deep within thetissue. (Published with permission from Ref. 3).
Inte
nsity
Depth, x
I = Ioe – mx
I o
I(a)
Tem
pera
ture
rise
No coolingSkin cooling
Depth, x
(b)
Figure 8. (a) Ultrasound intensity is greatest at the surface.Intensity will deteriorate exponentially due to attenuation as thedepth from the surface increases. Published with the permission of(3). (b) Since temperature and intensity are directly proportional,temperature will decrease exponentially as depth increases. Coolingthe skin will cause the ‘‘hot spot’’ to shift to the poorly perfused fattytissue. (Published with permission from Ref. 3).
RFinput Cooling
wateroutlet
Coolingchannel
Coolingbaffle
Coolingwaterinlet
Piezoeletricelement
Latexmembrane Retaining
‘O’ ring
10 cm
25 cm
Figure 6. A cross-sectional diagram of a single planar elementhyperthermia applicator. The chamber between the latex mem-brane and the piezoelectric element contains cooled degassed water.During local hyperthermia treatment an ultrasonic conducing gel isapplied to the target site that is then coupled to the latex membrane.(Published with permission from Ref. 3).
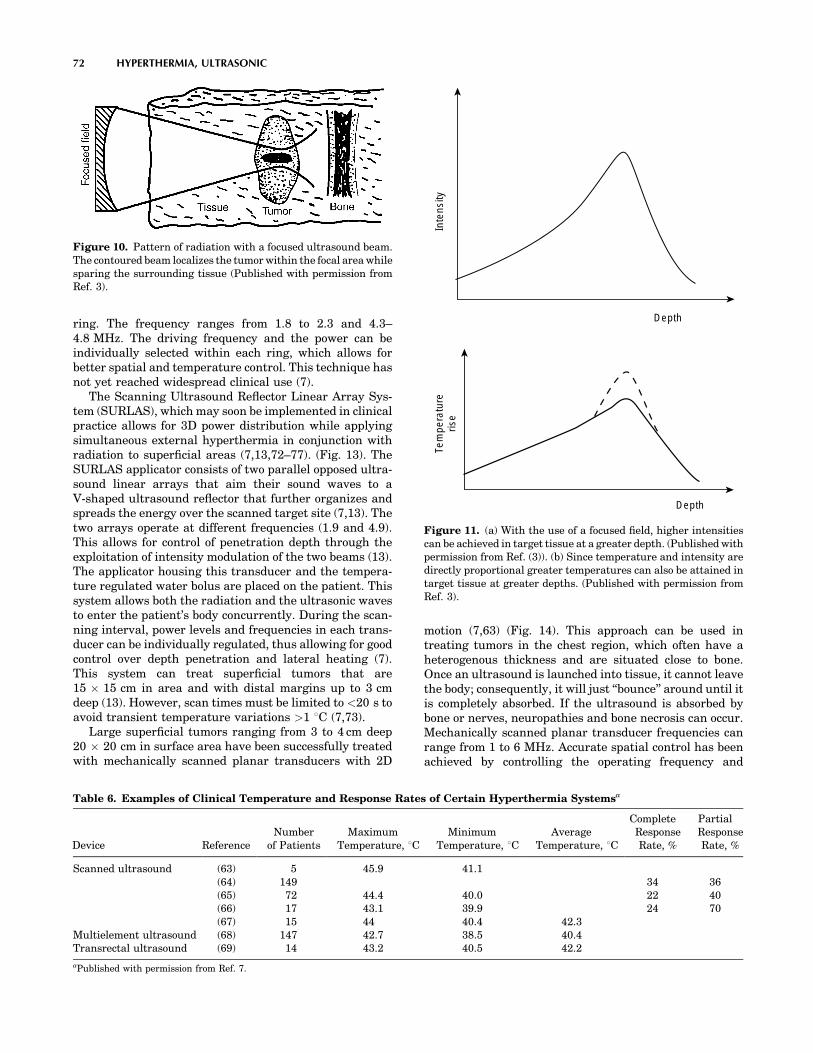
ring. The frequency ranges from 1.8 to 2.3 and 4.3–4.8 MHz. The driving frequency and the power can beindividually selected within each ring, which allows forbetter spatial and temperature control. This technique hasnot yet reached widespread clinical use (7).
The Scanning Ultrasound Reflector Linear Array Sys-tem (SURLAS), which may soon be implemented in clinicalpractice allows for 3D power distribution while applyingsimultaneous external hyperthermia in conjunction withradiation to superficial areas (7,13,72–77). (Fig. 13). TheSURLAS applicator consists of two parallel opposed ultra-sound linear arrays that aim their sound waves to aV-shaped ultrasound reflector that further organizes andspreads the energy over the scanned target site (7,13). Thetwo arrays operate at different frequencies (1.9 and 4.9).This allows for control of penetration depth through theexploitation of intensity modulation of the two beams (13).The applicator housing this transducer and the tempera-ture regulated water bolus are placed on the patient. Thissystem allows both the radiation and the ultrasonic wavesto enter the patient’s body concurrently. During the scan-ning interval, power levels and frequencies in each trans-ducer can be individually regulated, thus allowing for goodcontrol over depth penetration and lateral heating (7).This system can treat superficial tumors that are15 � 15 cm in area and with distal margins up to 3 cmdeep (13). However, scan times must be limited to <20 s toavoid transient temperature variations >1 8C (7,73).
Large superficial tumors ranging from 3 to 4 cm deep20 � 20 cm in surface area have been successfully treatedwith mechanically scanned planar transducers with 2D
motion (7,63) (Fig. 14). This approach can be used intreating tumors in the chest region, which often have aheterogenous thickness and are situated close to bone.Once an ultrasound is launched into tissue, it cannot leavethe body; consequently, it will just ‘‘bounce’’ around until itis completely absorbed. If the ultrasound is absorbed bybone or nerves, neuropathies and bone necrosis can occur.Mechanically scanned planar transducer frequencies canrange from 1 to 6 MHz. Accurate spatial control has beenachieved by controlling the operating frequency and
72 HYPERTHERMIA, ULTRASONIC
Inte
nsity
Depth
Tem
pera
ture
rise
Depth
Figure 11. (a) With the use of a focused field, higher intensitiescan be achieved in target tissue at a greater depth. (Published withpermission from Ref. (3)). (b) Since temperature and intensity aredirectly proportional greater temperatures can also be attained intarget tissue at greater depths. (Published with permission fromRef. 3).
Figure 10. Pattern of radiation with a focused ultrasound beam.The contoured beam localizes the tumor within the focal area whilesparing the surrounding tissue (Published with permission fromRef. 3).
Table 6. Examples of Clinical Temperature and Response Rates of Certain Hyperthermia Systemsa
Device ReferenceNumber
of PatientsMaximum
Temperature, 8CMinimum
Temperature, 8CAverage
Temperature, 8C
CompleteResponseRate, %
PartialResponseRate, %
Scanned ultrasound (63) 5 45.9 41.1(64) 149 34 36(65) 72 44.4 40.0 22 40(66) 17 43.1 39.9 24 70(67) 15 44 40.4 42.3
Multielement ultrasound (68) 147 42.7 38.5 40.4Transrectal ultrasound (69) 14 43.2 40.5 42.2
aPublished with permission from Ref. 7.

applied power levels, as a function of location, to accountfor variations of tumor thickness. Separate transducers,which are driven at different frequencies or by time multi-plexing the driving frequency of a given transducerbetween its fundamental and odd harmonic frequencies,are able to create a situation that allows control overpenetration depth (7). The penetration depth, as well asthe temperature distribution resulting as a function ofdepth, can be controlled online during the scanning byregulating the frequency amplitude. In the clinical setting,all these biophysical properties must be coupled with thepatient’s ability to tolerate the treatment to create a func-tional algorithm (7,63).
Scanned focus ultrasound systems (SFUs) provide themost flexibility for clinical applications (7,64–67,78,79).These systems provide the greatest possibility of overcom-ing the challenges of tissue heating. The SFUs systemsgenerally use four to six 1 MHz spherically focused trans-ducers each overlapped so that a common focal zone of3 mm o.d. to treat deep tissue. This focal zone is mechani-cally scanned in circular or octagonal patterns within thetumor at rates of 20–100 mm�s�1. In order to guaranteethat there is a consistency in temperature, scan cycles mustbe shorter than 10 s. During scanned focused ultrasoundhyperthermia treatments, temperature distributions canbe controlled by utilizing the measured temperatures tovary the power output as a function of the location. Theresolution is determined by a variety of thermometry
points, scanning, and computer control speed (7). Theregulation of temperature can be controlled by the clinicianor the computer (7,80).
External applicator systems for hyperthermia have nowbeen developed that use electrically phased focused trans-ducer arrays. The advantages of using an electricallyphased focused transducer array is that it allows for bettersynthesis of complex beam patterns and the ability toelectronically focus and steer. The 3D complex beam-form-ing techniques result in higher scanning speeds, smallerapplicators, and better reliability due to more static parts(7). Examples of electrically phased focused transducerarrays include concentric ring arrays (7,81), sector-vortexphased arrays (7,82), spherical and cylindrical arrays(7,83,84), and tapered phased arrays (7,85).
Intracavitary Techniques
Conventional ultrasonic hyperthermia can be used forintracavitary applications. This modality can be used totreat tumors that are situated deep within the body orwith those that situated close to a body cavity. Clinically,prostrate cancer and benign prostate hyperplasia are thebest suited for this treatment (7). The transrectal appli-cator consists of one-half cylindrical transducer segments10–20 mm o.d. � 10 mm long. It is sectored for betterangular control with frequency range of 1.0–1.6 MHz.The transducers are housed in a plastic head; also, atemperature regulated degassed water within an extend-able bolus is attached (7,86–88) (Fig. 15). The heatingenergy is emitted radially from the length of each trans-ducer segment, and the power is applied along the length ofthe applicator. This technique is able to heat tissues thatare 3–4 cm deep from the cavity wall. The temperaturecontrolled water bolus maintains a safe temperature for
HYPERTHERMIA, ULTRASONIC 73
Expandable bolus
Temperature regulatedDegassed water
1/2 Cylindrical transducer segments10-20 mm OD x 10 mm longsectored for angular control
frequency=1.0–1.6 MHz
Figure 15. A nonfocused multielement applicator withlongitudinal and angular power deposition abilities. This deviceis used in the treatment of the prostate cancer or BPH. (Publishedwith permission from Ref. 7).
Linear accelerator
Scanning reflector
Low-frequencytransducer array
Tumor
High-frequencytransducer array
Radiation beam
Figure 13. A schematic diagram of a multielement low profilescanning reflector system. (Published with permission from Ref. 7).
Degassed temperaturecontrolled waterMultiple planar transducers
3.9 MHz1.0 MHz
Imaging transducer1.0 MHz
3.9 MHz
Plastic membraneMulti- transducer applicationX-Y-Z translation& Frequency modulation
Patient
Tumor
Figure 14. A schematic diagram of mechanically scannedultrasound system for superficial hyperthermia. (Published withpermission from Ref. 7).
Tumor
Intra-operationcone/cylinder
Circumferentialultrasound array
Radiation
Reflector andcompensator
Degassed water
Figure 12. A schematic diagram of an intraoperative multielementtransducer system with a circumferential transducer array andreflector configuration. (Published with permission from Ref. 7).
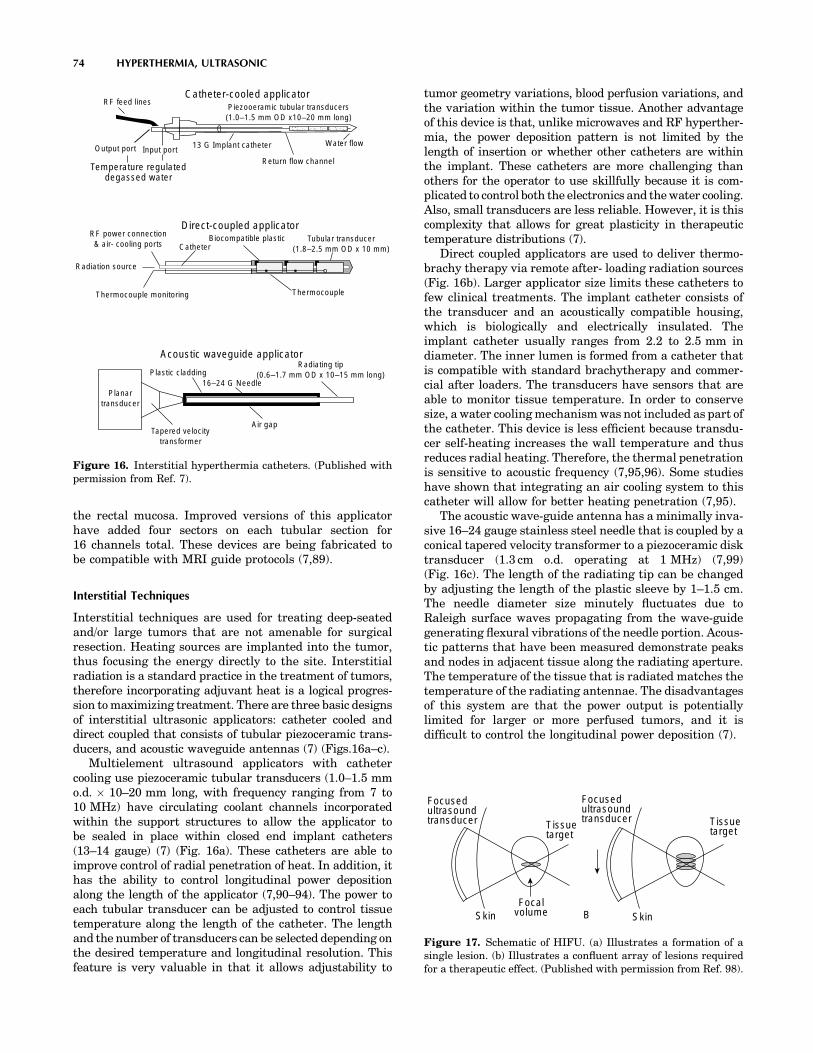
the rectal mucosa. Improved versions of this applicatorhave added four sectors on each tubular section for16 channels total. These devices are being fabricated tobe compatible with MRI guide protocols (7,89).
Interstitial Techniques
Interstitial techniques are used for treating deep-seatedand/or large tumors that are not amenable for surgicalresection. Heating sources are implanted into the tumor,thus focusing the energy directly to the site. Interstitialradiation is a standard practice in the treatment of tumors,therefore incorporating adjuvant heat is a logical progres-sion to maximizing treatment. There are three basic designsof interstitial ultrasonic applicators: catheter cooled anddirect coupled that consists of tubular piezoceramic trans-ducers, and acoustic waveguide antennas (7) (Figs.16a–c).
Multielement ultrasound applicators with cathetercooling use piezoceramic tubular transducers (1.0–1.5 mmo.d. � 10–20 mm long, with frequency ranging from 7 to10 MHz) have circulating coolant channels incorporatedwithin the support structures to allow the applicator tobe sealed in place within closed end implant catheters(13–14 gauge) (7) (Fig. 16a). These catheters are able toimprove control of radial penetration of heat. In addition, ithas the ability to control longitudinal power depositionalong the length of the applicator (7,90–94). The power toeach tubular transducer can be adjusted to control tissuetemperature along the length of the catheter. The lengthand the number of transducers can be selected depending onthe desired temperature and longitudinal resolution. Thisfeature is very valuable in that it allows adjustability to
tumor geometry variations, blood perfusion variations, andthe variation within the tumor tissue. Another advantageof this device is that, unlike microwaves and RF hyperther-mia, the power deposition pattern is not limited by thelength of insertion or whether other catheters are withinthe implant. These catheters are more challenging thanothers for the operator to use skillfully because it is com-plicated to control both the electronics and the water cooling.Also, small transducers are less reliable. However, it is thiscomplexity that allows for great plasticity in therapeutictemperature distributions (7).
Direct coupled applicators are used to deliver thermo-brachy therapy via remote after- loading radiation sources(Fig. 16b). Larger applicator size limits these catheters tofew clinical treatments. The implant catheter consists ofthe transducer and an acoustically compatible housing,which is biologically and electrically insulated. Theimplant catheter usually ranges from 2.2 to 2.5 mm indiameter. The inner lumen is formed from a catheter thatis compatible with standard brachytherapy and commer-cial after loaders. The transducers have sensors that areable to monitor tissue temperature. In order to conservesize, a water cooling mechanism was not included as part ofthe catheter. This device is less efficient because transdu-cer self-heating increases the wall temperature and thusreduces radial heating. Therefore, the thermal penetrationis sensitive to acoustic frequency (7,95,96). Some studieshave shown that integrating an air cooling system to thiscatheter will allow for better heating penetration (7,95).
The acoustic wave-guide antenna has a minimally inva-sive 16–24 gauge stainless steel needle that is coupled by aconical tapered velocity transformer to a piezoceramic disktransducer (1.3 cm o.d. operating at 1 MHz) (7,99)(Fig. 16c). The length of the radiating tip can be changedby adjusting the length of the plastic sleeve by 1–1.5 cm.The needle diameter size minutely fluctuates due toRaleigh surface waves propagating from the wave-guidegenerating flexural vibrations of the needle portion. Acous-tic patterns that have been measured demonstrate peaksand nodes in adjacent tissue along the radiating aperture.The temperature of the tissue that is radiated matches thetemperature of the radiating antennae. The disadvantagesof this system are that the power output is potentiallylimited for larger or more perfused tumors, and it isdifficult to control the longitudinal power deposition (7).
74 HYPERTHERMIA, ULTRASONIC
Focusedultrasoundtransducer
Focusedultrasoundtransducer
Tissuetarget
Tissuetarget
Skin SkinFocal
volume B
Figure 17. Schematic of HIFU. (a) Illustrates a formation of asingle lesion. (b) Illustrates a confluent array of lesions requiredfor a therapeutic effect. (Published with permission from Ref. 98).
Catheter-cooled applicator
Return flow channel
Water flow13 G Implant catheterInput portOutput port
Temperature regulateddegassed water
RF feed linesPiezooeramic tubular transducers(1.0–1.5 mm OD x10–20 mm long)
RF power connection& air- cooling ports
Radiation source
Thermocouple monitoring
Catheter
Direct-coupled applicatorBiocompatible plastic Tubular transducer
(1.8–2.5 mm OD x 10 mm)
Thermocouple
Planartransducer
Tapered velocitytransformer
Air gap
Acoustic waveguide applicatorRadiating tip
(0.6–1.7 mm OD x 10–15 mm long)Plastic cladding16–24 G Needle
Figure 16. Interstitial hyperthermia catheters. (Published withpermission from Ref. 7).
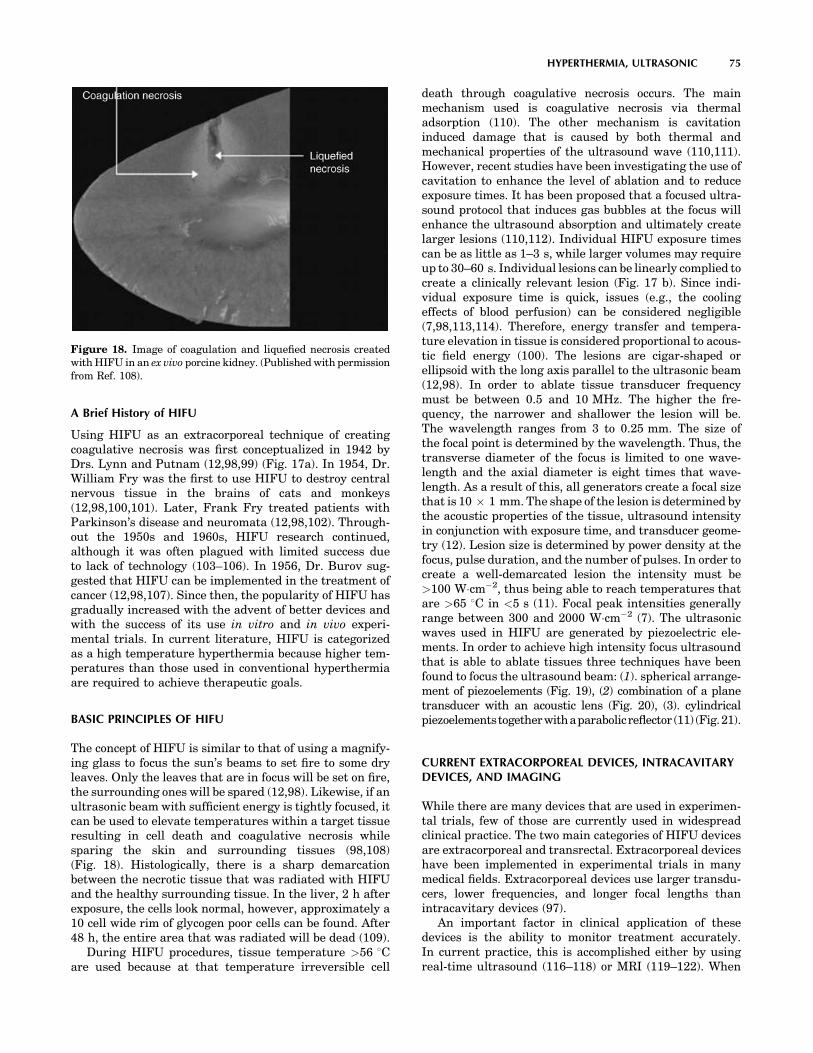
A Brief History of HIFU
Using HIFU as an extracorporeal technique of creatingcoagulative necrosis was first conceptualized in 1942 byDrs. Lynn and Putnam (12,98,99) (Fig. 17a). In 1954, Dr.William Fry was the first to use HIFU to destroy centralnervous tissue in the brains of cats and monkeys(12,98,100,101). Later, Frank Fry treated patients withParkinson’s disease and neuromata (12,98,102). Through-out the 1950s and 1960s, HIFU research continued,although it was often plagued with limited success dueto lack of technology (103–106). In 1956, Dr. Burov sug-gested that HIFU can be implemented in the treatment ofcancer (12,98,107). Since then, the popularity of HIFU hasgradually increased with the advent of better devices andwith the success of its use in vitro and in vivo experi-mental trials. In current literature, HIFU is categorizedas a high temperature hyperthermia because higher tem-peratures than those used in conventional hyperthermiaare required to achieve therapeutic goals.
BASIC PRINCIPLES OF HIFU
The concept of HIFU is similar to that of using a magnify-ing glass to focus the sun’s beams to set fire to some dryleaves. Only the leaves that are in focus will be set on fire,the surrounding ones will be spared (12,98). Likewise, if anultrasonic beam with sufficient energy is tightly focused, itcan be used to elevate temperatures within a target tissueresulting in cell death and coagulative necrosis whilesparing the skin and surrounding tissues (98,108)(Fig. 18). Histologically, there is a sharp demarcationbetween the necrotic tissue that was radiated with HIFUand the healthy surrounding tissue. In the liver, 2 h afterexposure, the cells look normal, however, approximately a10 cell wide rim of glycogen poor cells can be found. After48 h, the entire area that was radiated will be dead (109).
During HIFU procedures, tissue temperature >56 8Care used because at that temperature irreversible cell
death through coagulative necrosis occurs. The mainmechanism used is coagulative necrosis via thermaladsorption (110). The other mechanism is cavitationinduced damage that is caused by both thermal andmechanical properties of the ultrasound wave (110,111).However, recent studies have been investigating the use ofcavitation to enhance the level of ablation and to reduceexposure times. It has been proposed that a focused ultra-sound protocol that induces gas bubbles at the focus willenhance the ultrasound absorption and ultimately createlarger lesions (110,112). Individual HIFU exposure timescan be as little as 1–3 s, while larger volumes may requireup to 30–60 s. Individual lesions can be linearly complied tocreate a clinically relevant lesion (Fig. 17 b). Since indi-vidual exposure time is quick, issues (e.g., the coolingeffects of blood perfusion) can be considered negligible(7,98,113,114). Therefore, energy transfer and tempera-ture elevation in tissue is considered proportional to acous-tic field energy (100). The lesions are cigar-shaped orellipsoid with the long axis parallel to the ultrasonic beam(12,98). In order to ablate tissue transducer frequencymust be between 0.5 and 10 MHz. The higher the fre-quency, the narrower and shallower the lesion will be.The wavelength ranges from 3 to 0.25 mm. The size ofthe focal point is determined by the wavelength. Thus, thetransverse diameter of the focus is limited to one wave-length and the axial diameter is eight times that wave-length. As a result of this, all generators create a focal sizethat is 10 � 1 mm. The shape of the lesion is determined bythe acoustic properties of the tissue, ultrasound intensityin conjunction with exposure time, and transducer geome-try (12). Lesion size is determined by power density at thefocus, pulse duration, and the number of pulses. In order tocreate a well-demarcated lesion the intensity must be>100 W�cm�2, thus being able to reach temperatures thatare >65 8C in <5 s (11). Focal peak intensities generallyrange between 300 and 2000 W�cm�2 (7). The ultrasonicwaves used in HIFU are generated by piezoelectric ele-ments. In order to achieve high intensity focus ultrasoundthat is able to ablate tissues three techniques have beenfound to focus the ultrasound beam: (1). spherical arrange-ment of piezoelements (Fig. 19), (2) combination of a planetransducer with an acoustic lens (Fig. 20), (3). cylindricalpiezoelementstogetherwithaparabolicreflector (11) (Fig.21).
CURRENT EXTRACORPOREAL DEVICES, INTRACAVITARYDEVICES, AND IMAGING
While there are many devices that are used in experimen-tal trials, few of those are currently used in widespreadclinical practice. The two main categories of HIFU devicesare extracorporeal and transrectal. Extracorporeal deviceshave been implemented in experimental trials in manymedical fields. Extracorporeal devices use larger transdu-cers, lower frequencies, and longer focal lengths thanintracavitary devices (97).
An important factor in clinical application of thesedevices is the ability to monitor treatment accurately.In current practice, this is accomplished either by usingreal-time ultrasound (116–118) or MRI (119–122). When
HYPERTHERMIA, ULTRASONIC 75
Figure 18. Image of coagulation and liquefied necrosis createdwith HIFU in an ex vivo porcine kidney. (Published with permissionfrom Ref. 108).
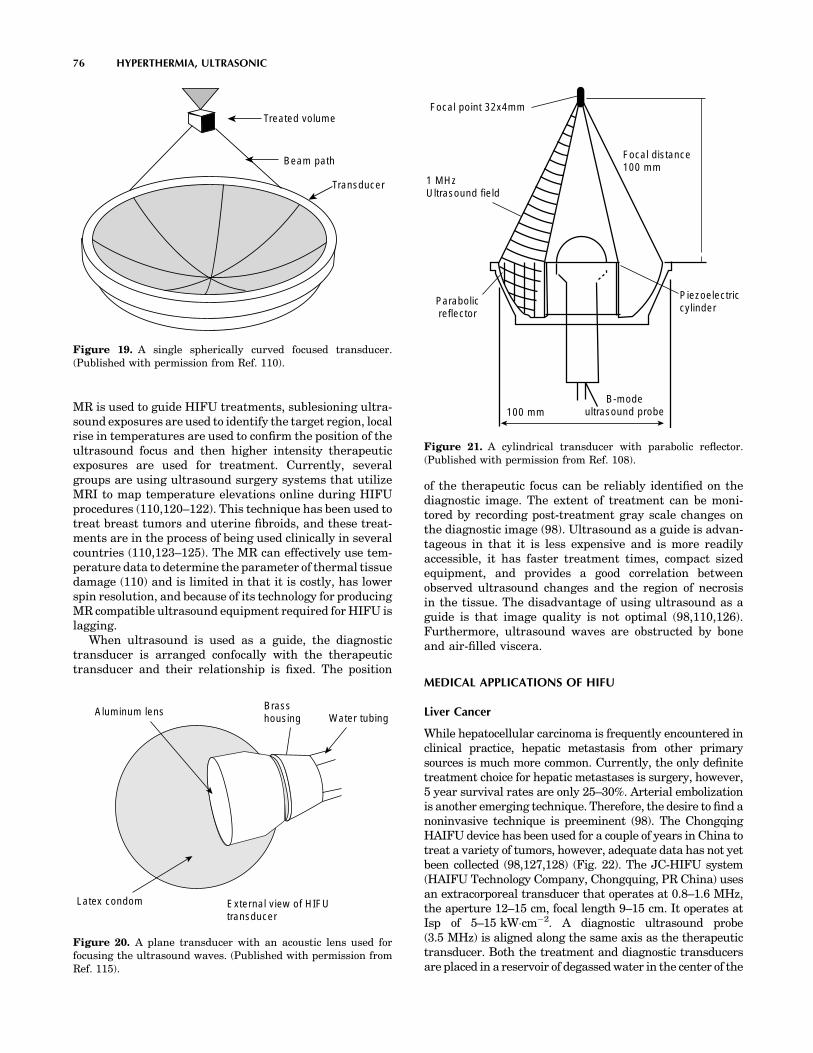
MR is used to guide HIFU treatments, sublesioning ultra-sound exposures are used to identify the target region, localrise in temperatures are used to confirm the position of theultrasound focus and then higher intensity therapeuticexposures are used for treatment. Currently, severalgroups are using ultrasound surgery systems that utilizeMRI to map temperature elevations online during HIFUprocedures (110,120–122). This technique has been used totreat breast tumors and uterine fibroids, and these treat-ments are in the process of being used clinically in severalcountries (110,123–125). The MR can effectively use tem-perature data to determine the parameter of thermal tissuedamage (110) and is limited in that it is costly, has lowerspin resolution, and because of its technology for producingMR compatible ultrasound equipment required for HIFU islagging.
When ultrasound is used as a guide, the diagnostictransducer is arranged confocally with the therapeutictransducer and their relationship is fixed. The position
of the therapeutic focus can be reliably identified on thediagnostic image. The extent of treatment can be moni-tored by recording post-treatment gray scale changes onthe diagnostic image (98). Ultrasound as a guide is advan-tageous in that it is less expensive and is more readilyaccessible, it has faster treatment times, compact sizedequipment, and provides a good correlation betweenobserved ultrasound changes and the region of necrosisin the tissue. The disadvantage of using ultrasound as aguide is that image quality is not optimal (98,110,126).Furthermore, ultrasound waves are obstructed by boneand air-filled viscera.
MEDICAL APPLICATIONS OF HIFU
Liver Cancer
While hepatocellular carcinoma is frequently encountered inclinical practice, hepatic metastasis from other primarysources is much more common. Currently, the only definitetreatment choice for hepatic metastases is surgery, however,5 year survival rates are only 25–30%. Arterial embolizationis another emerging technique. Therefore, the desire to find anoninvasive technique is preeminent (98). The ChongqingHAIFU device has been used for a couple of years in China totreat a variety of tumors, however, adequate data has not yetbeen collected (98,127,128) (Fig. 22). The JC-HIFU system(HAIFU Technology Company, Chongquing, PR China) usesan extracorporeal transducer that operates at 0.8–1.6 MHz,the aperture 12–15 cm, focal length 9–15 cm. It operates atIsp of 5–15 kW�cm�2. A diagnostic ultrasound probe(3.5 MHz) is aligned along the same axis as the therapeutictransducer. Both the treatment and diagnostic transducersare placed in a reservoir of degassed water in the center of the
76 HYPERTHERMIA, ULTRASONIC
Aluminum lens
Latex condom External view of HIFUtransducer
Brasshousing Water tubing
Figure 20. A plane transducer with an acoustic lens used forfocusing the ultrasound waves. (Published with permission fromRef. 115).
Focal point 32x4mm
1 MHzUltrasound field
Parabolicreflector
100 mmB-mode
ultrasound probe
Piezoelectriccylinder
Focal distance100 mm
Figure 21. A cylindrical transducer with parabolic reflector.(Published with permission from Ref. 108).
Treated volume
Beam path
Transducer
Figure 19. A single spherically curved focused transducer.(Published with permission from Ref. 110).

treatment table. The degassed water provides acoustic cou-pling between the patient and the transducer. Horizontalmovement of the transducer is possible along three orthogo-nal axes of the bed because it is facilitated by the cylindricalgantry at one end of the table. All movement is controlled bythe adjacent computer terminals (128). In a recent clinicaltrial carried out in Churchill Hospital in Oxford, England inconjunction with Chongqing University of Medical Sciencesin Chongqing China, 11 patients with liver metastases weretreated with the JC-HIFU device. While it is not possible tohave a good statistical analysis with such a small subject pool,some general observations were made about the safety of thisdevice. Of the 11 patients treated, 7 out of 11 patientscomplained of transient pain and 3 out of 11 complained ofsuperficial burns. Out of the 7 patients that experienced pain,oral analgesia brought relief to 6. Burn sites were treatedwith ice-packs and aloe gel. Two of the three burn sites wereonly millimeters across. One of the burns was 2 � 3 cm andhad healed by the 2 week follow-up period. It appears thatfrom a safety standpoint the JC-HIFU is a feasible treatmentoption for hepatic metastases, however, larger trials will beneeded to determine the true efficacy of the treatment (128).
Another study by Wu et al looked at 55 patients withhepatocellular carcinoma with cirrhosis. Tumor size ran-ged 4–14 cm in size with an average size of 8.14 cm.Patients were classified according to progression of disease:15 patients had stage II, 16 had stage IIIA, and 24 hadstage IIIC. All patients were treated with an extracorpor-eal HIFU device similar to the one previously mentionedfor the treatment of liver metastases. The average numberof treatment applications was 1.69. There were no seriousside effects. Imaging following HIFU treatment evaluatedfor the absence of tumor vascular supply and shrinkage oftreated lesions. Serum alpha-fetoprotein returned to normalin 34% of patients. At 6 months, 86.1% of the patients werestill alive, at 12 months 61.5% of the patients were still alive,and at 18 months 35.3% of the patients were still alive. Thesurvival rates were the highest in patients who were stage
II. Therefore, this study demonstrated that HIFU is a safeoption in the treatment of hepatocellular carcinoma (129).
Prostate Cancer
Prostate cancer is one of the common types of cancer inmales, and it is frequently the cause of cancer-relateddeath (130). Since physicians are able to detect prostatecancer early, there has been an increase in the number ofpatients needing treatment. Radical prostatectomy is thetreatment of choice in patients who have organ-confineddisease and a life expectancy of >10 years. Radical pros-tectectomy offers excellent results 5 and 10 years after theoperation, although there is still risk of morbidity asso-ciated with the operation, thus precipitating the need fora noninvasive procedure. Currently, brachytherapy, cryo-surgery, 3D conformal radiotherapy, and laparoscopicradical prostatectomy have been implemented with goodresults (130,131). However, if a cure is not achieved, thesetreatments cannot be repeated and there is high risk ofmorbidity associated with salvage radical prostatectomy,thus necessitating the need for another treatment option.In 1995, Madersbacher reported that they were able todestroy the entire tumor within the prostate (98,132). Earlyreports showed success rates of controlling local tumors at50% at 8 months and then approaching 90% in later studies(98,133,134). In the later years, as clinicians gained moreexperience and as technology has improved, treatment ofthe entire gland was performed (98,135,136).
A recent report was published that looked at 5 yearresults with transrectal high intensity focused ultrasoundin the treatment of localized prostate cancer. One hundredand forty six patients were treated with Ablatherm device(EDAP, Lyon, France). The tablespoon-shaped intracavi-tary applicator contains both a 7.5 MHz retractable ultra-sound scanner for diagnosis and a piezoelectric therapeutictransducer that can be driven at frequencies of 2.25–3.0 MHz. The computer-controlled treatment head is able
HYPERTHERMIA, ULTRASONIC 77
Figure 22. A Hifu System that is used both clinically and experimentally in the treatment of livermetastates. (Published with permission from Ref. 128).
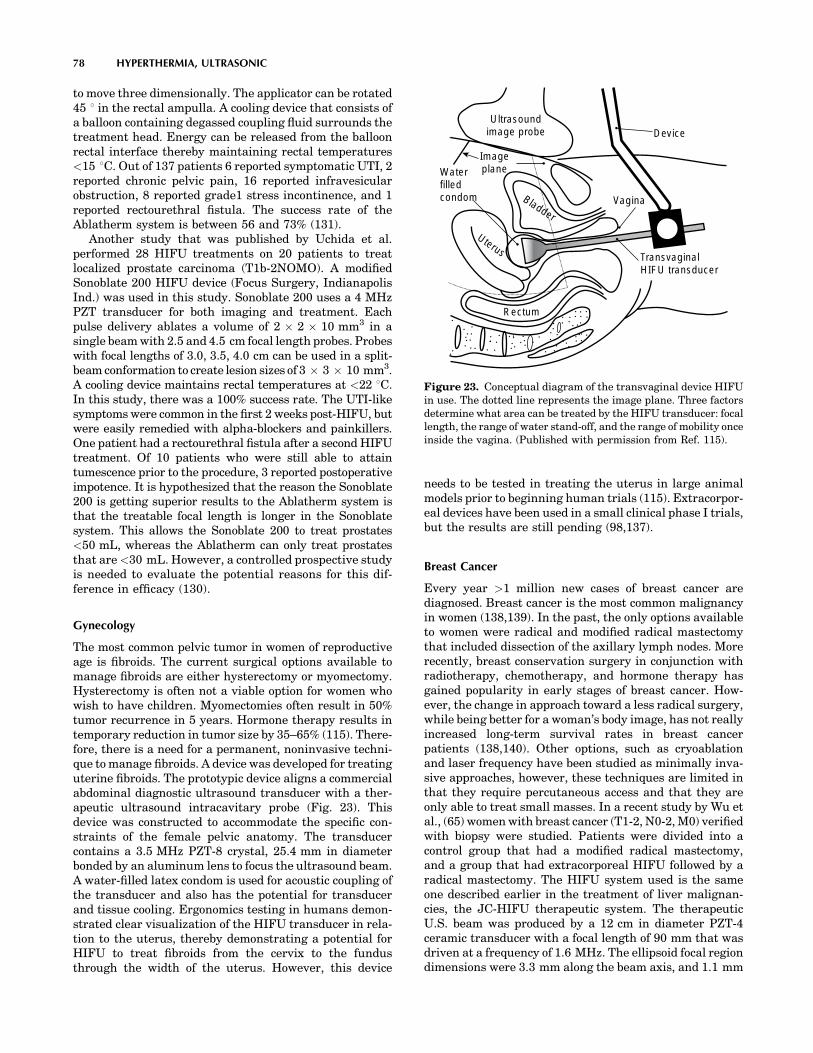
to move three dimensionally. The applicator can be rotated45 8 in the rectal ampulla. A cooling device that consists ofa balloon containing degassed coupling fluid surrounds thetreatment head. Energy can be released from the balloonrectal interface thereby maintaining rectal temperatures<15 8C. Out of 137 patients 6 reported symptomatic UTI, 2reported chronic pelvic pain, 16 reported infravesicularobstruction, 8 reported grade1 stress incontinence, and 1reported rectourethral fistula. The success rate of theAblatherm system is between 56 and 73% (131).
Another study that was published by Uchida et al.performed 28 HIFU treatments on 20 patients to treatlocalized prostate carcinoma (T1b-2NOMO). A modifiedSonoblate 200 HIFU device (Focus Surgery, IndianapolisInd.) was used in this study. Sonoblate 200 uses a 4 MHzPZT transducer for both imaging and treatment. Eachpulse delivery ablates a volume of 2 � 2 � 10 mm3 in asingle beam with 2.5 and 4.5 cm focal length probes. Probeswith focal lengths of 3.0, 3.5, 4.0 cm can be used in a split-beam conformation to create lesion sizes of 3 � 3 � 10 mm3.A cooling device maintains rectal temperatures at <22 8C.In this study, there was a 100% success rate. The UTI-likesymptoms were common in the first 2 weeks post-HIFU, butwere easily remedied with alpha-blockers and painkillers.One patient had a rectourethral fistula after a second HIFUtreatment. Of 10 patients who were still able to attaintumescence prior to the procedure, 3 reported postoperativeimpotence. It is hypothesized that the reason the Sonoblate200 is getting superior results to the Ablatherm system isthat the treatable focal length is longer in the Sonoblatesystem. This allows the Sonoblate 200 to treat prostates<50 mL, whereas the Ablatherm can only treat prostatesthat are <30 mL. However, a controlled prospective studyis needed to evaluate the potential reasons for this dif-ference in efficacy (130).
Gynecology
The most common pelvic tumor in women of reproductiveage is fibroids. The current surgical options available tomanage fibroids are either hysterectomy or myomectomy.Hysterectomy is often not a viable option for women whowish to have children. Myomectomies often result in 50%tumor recurrence in 5 years. Hormone therapy results intemporary reduction in tumor size by 35–65% (115). There-fore, there is a need for a permanent, noninvasive techni-que to manage fibroids. A device was developed for treatinguterine fibroids. The prototypic device aligns a commercialabdominal diagnostic ultrasound transducer with a ther-apeutic ultrasound intracavitary probe (Fig. 23). Thisdevice was constructed to accommodate the specific con-straints of the female pelvic anatomy. The transducercontains a 3.5 MHz PZT-8 crystal, 25.4 mm in diameterbonded by an aluminum lens to focus the ultrasound beam.A water-filled latex condom is used for acoustic coupling ofthe transducer and also has the potential for transducerand tissue cooling. Ergonomics testing in humans demon-strated clear visualization of the HIFU transducer in rela-tion to the uterus, thereby demonstrating a potential forHIFU to treat fibroids from the cervix to the fundusthrough the width of the uterus. However, this device
needs to be tested in treating the uterus in large animalmodels prior to beginning human trials (115). Extracorpor-eal devices have been used in a small clinical phase I trials,but the results are still pending (98,137).
Breast Cancer
Every year >1 million new cases of breast cancer arediagnosed. Breast cancer is the most common malignancyin women (138,139). In the past, the only options availableto women were radical and modified radical mastectomythat included dissection of the axillary lymph nodes. Morerecently, breast conservation surgery in conjunction withradiotherapy, chemotherapy, and hormone therapy hasgained popularity in early stages of breast cancer. How-ever, the change in approach toward a less radical surgery,while being better for a woman’s body image, has not reallyincreased long-term survival rates in breast cancerpatients (138,140). Other options, such as cryoablationand laser frequency have been studied as minimally inva-sive approaches, however, these techniques are limited inthat they require percutaneous access and that they areonly able to treat small masses. In a recent study by Wu etal., (65) women with breast cancer (T1-2, N0-2, M0) verifiedwith biopsy were studied. Patients were divided into acontrol group that had a modified radical mastectomy,and a group that had extracorporeal HIFU followed by aradical mastectomy. The HIFU system used is the sameone described earlier in the treatment of liver malignan-cies, the JC-HIFU therapeutic system. The therapeuticU.S. beam was produced by a 12 cm in diameter PZT-4ceramic transducer with a focal length of 90 mm that wasdriven at a frequency of 1.6 MHz. The ellipsoid focal regiondimensions were 3.3 mm along the beam axis, and 1.1 mm
78 HYPERTHERMIA, ULTRASONIC
Ultrasoundimage probe
ImageplaneWater
filledcondom Bladder
Vagina
Device
TransvaginalHIFU transducer
Rectum
Uterus
Figure 23. Conceptual diagram of the transvaginal device HIFUin use. The dotted line represents the image plane. Three factorsdetermine what area can be treated by the HIFU transducer: focallength, the range of water stand-off, and the range of mobility onceinside the vagina. (Published with permission from Ref. 115).

along the transverse axis. A real-time imaging U.S. device,the AU3 (Esaote, Genoa, Italy) was used at frequencies of3.5–5.0 MHz. The diagnostic transducer is placed in thecenter of the therapeutic transducer. Real-time imagingcan accomplish three separate tasks. It can locate thetumor that needs to be treated, it can guide the depositionof U.S. energy into the tumor, and it can provide real-timeassessment of the coagulation necrosis during therapy.The results demonstrated that there were no severe sideeffects. Those that were reported included mild local pain,warmth, and a sensation of heaviness in the affectedbreast. However, only 4 of the 23 HIFU patients hadsignificant pain to require a 3–5 day course of oral analge-sics. Only one patient had a minor skin burn. Pathologicexamination of the breast tissue revealed complete coagu-lative necrosis, and the tumor vasculature was damaged.The immunohistological staining revealed that no expres-sion PCNA, MMP-9, and CD44v6 was found, indicatingthat the tumor cells had lost their ability to proliferate,invade, and metastasize. Therefore, this study demon-strated the safety and efficacy of HIFU in the treatmentof breast cancer (138).
Neurology
Recently, there have been some published studies thatpropose using large array ultrasound transducers to over-come distortions caused by the skull (110). The goal hasbeen to be able to create an array that can focus to destroytarget tissue while preserving surrounding tissue. A 320element array has been used to focus ultrasound through10human skulls. This approach is completely noninvasive.This technique is modeled after a layered wave vector-frequency domain-model and uses a hemisphere-shapedtransducer to propagate ultrasound through the skullusing CT scans as a guide (110,141,142). The ability tofocus energy has implications that are not limited to justtumor treatment. It has been shown that focused ultra-sound can selectively and consistently open the blood brainbarrier (BBB) (110).
Another neurological area that may benefit from HIFUis in the treatment of nerve spasticity and pain. Spasti-city, which is signified by uncontrollable muscle contrac-tions, is difficult to treat. In a recent study, HIFU wasused to treat and suppress the sciatic nerve complex ofrabbits in vivo. An image-guided HIFU device including a3.2 MHz spherically curved therapeutic transducer andan ultrasound diagnostic device were used. A focal inten-sity of 1480–1850 W/CM2 was used to create a completeconduction block in the 22 nerve complexes. Treatmenttimes averaged 36 s. Gross histological examinationrevealed blanched nerve complex with lesion dimensionsof 2.8 cm3. Further histological examination revealed theprobable cause of nerve block as axonal demyelinationand necrosis of Schwann cells. This study illustrates thepotential that HIFU may have in the treatment of nervespasticity (143).
Cardiovascular System
The role of ultrasound in cardiology has been instrumentalto the increasing knowledge of the cardiovascular system.
Diagnostic ultrasound technology has led to a greaterunderstanding of the anatomy and physiology of thehuman heart and vascular systems. Over the years, inaddition to diagnostic use, the role of ultrasound has beenexpanded to the therapeutic realm. Both conventionalultrasound and HIFU modalities have been used withvaried success in many cardiovascular therapeutic appli-cations. These applications range from harvesting theinternal mammary artery for coronary artery bypass sur-gery to ablation of cardiac arrhythmias. An ultrasonicallyactivated (vibrating up to 55,000 Hz) harmonic scalpel(Ethicon Endosurgery, Cincinnati, OH) produces low heat(<100 8C) thereby effectively coagulating and dividing thetissue and has a wide range of applications in cardiothor-acic surgery (144). By using a 1 MHz phased array trans-ducer with an acoustic intensity of 1630 W�cm�2 or 22547W�cm�2 one can successfully create precise defects rangingfrom 3 to 4 mm in diameter ex vivo in porcine valve leaflet,canine pericardium, human newborn atrial septum, andright atrial appendage (145). Cardiac arrhythmia is onearea where significant work has been done using ultrasonichyperthermia for therapeutic purposes. Strickberger et al.demonstrated an extracorporeal HIFU ablation of theatrioventricular junction of beating canine heart afterthoracotomy (146). Their experimental system consistedof a polyvinyl membrane covering the heart and lungs. Thethoracic cavity was filled with degassed water serving as acoupling medium. A 7.0 MHz diagnostic 2D ultrasound(Diasonics VST Master Series, Diasonics/Vingmed Ultra-sound Inc) attached to a spherically focused single piezo-electric element therapeutic ultrasound transducer(1.4 MHz frequency; 1.1 � 8.3 mm focal length and63.5 cm focal zone) with the maximum intensity of2.8 kW�cm�2 was applied during the diastole for 30 s toachieve complete AV nodal junctional block (Fig. 24a–c).Experience with HIFU application is very preliminary andhas not been tried for AV nodal ablation in humans yet.
Ultrasound had also been used clinically in the treat-ment of atrial fibrillation (AF), which is the most commonarrhythmia affecting 0.5–2.5% of the population globally.Over the last decade, ablation procedures by isolating thepulmonary veins and eliminating electrical triggers fromthe atria has become a popular and effective mode oftherapy for AF. Traditionally, RF energy has been usedas an energy source for ablation. Radio frequency catheterablation of AF requires good tissue contact, multiplelesions, significant experience and manual skills with longprocedure time. Complications related to RF application inAF ablation include pulmonary vein stenosis, atrioesopha-geal fistula, left atrial rupture due catheter perforation orinappropriate amount of power. The limitations of theexisting RF technology could be overcome with the useof HIFU balloon systems (147).
Our group performed the initial work on pulmonaryvein isolation in humans using a through-the-balloon cir-cumferential ultrasound (conventional-unfocused) abla-tion system for treatment of recurrent atrial fibrillation(148). Fifteen patients with drug refractory atrial fibrilla-tion underwent a PVI using a novel transballoon ultra-sound ablation catheter (Atronix, Inc) (Fig. 25a–c). Theablation system was composed of a 0.035 in. diameter
HYPERTHERMIA, ULTRASONIC 79

80 HYPERTHERMIA, ULTRASONIC
Figure 24. (a) Schematic of the experimental HIFU apparatus. The therapeutic ultrasoundtransducer is mounted 63.5 mm from the target (X). A polyvinyl chloride membrane covers theheart and the lungs. Degassed water flows in and out of the thoracic cavity at a rate of 600 mL�min�1.Combined diagnostic/ablation transducers are placed into degassed water. (Published withpermission from Ref. 146). (b) ECG and Echocardiogram of a canine heart. Prior to ablation of theAV node. (c) After ablation of the AV node using HIFU, the ECG shows complete AV block and the echoimage depicts an increased density of the ablated tissue. (Published with permission from Ref. 146).

luminal catheter with a distal balloon (2.2 cm at maximumdiameter) housing a centrally located ultrasound trans-ducer (8 MHz). The ultrasound ablation system wasadvanced over a guide wire (0.035 in., 0.088 cm) to theintended pulmonary vein. The ablation performance andtissue temperature are monitored by thermocouples on theballoon and the therapeutic transducer. The ablationtime was 2 min with an additional minute to deflate theballoon. The energy was delivered perpendicularly to thesurface of the balloon and ablation at the funnel portion ofthe pulmonary vein (antrum) could not be achieved withthe original design. Additionally, other anatomical char-acteristics of the target sites like ostial diameter largerthan the balloon size, inability to reach the right inferior orother pulmonary vein ostia, ostial instability, early branch-ing of the vein, and eccentric position of the ultrasoundtransducer in the vein made it difficult to deliver energyeffectively (Fig. 26). These technical limitations have beenaddressed in some of the newer balloon systems where theenergy delivery could be accomplished in a divergentangle enabling ablation around the antrum with the tipof the balloon sitting at the pulmonary vein ostium. Earlyanimal studies on HIFU mediated AF ablation haveshown promising results with an experimental device thatfocuses ultrasonic energy via a parabolic balloon, usinggas or fluid as a reflector (ProRhythm INC.) (Fig. 25c–e).(149,150).
Since 2003 �60 patients were treated using this system.With improved catheter design the success rate of AFablation has increased from �50 up to 80% without evi-dence of pulmonary vein stenosis. These preliminaryhuman study results need to be confirmed in larger series.Since there are no large clinical trials on AF ablation withthis technology, it is still somewhat premature to predict ifHIFU is the complete answer. This device is expected to bereleased in Europe in 2005 (149,150).
Attempts have been made to harness HIFU for trans-myocardial revascularization (TMR) to improve blood sup-ply to damaged myocardium caused by advanced heartdisease. Using a 10 cm diameter transducer operating afrequency of 2.52 MHz, intensity of 2300 W�cm�2 and pulserepetition period of 40 ms at 50% duty cycle, small chan-
nels were successfully created in canine myocardium (151).This shows the potential for future application for HIFU inTMR in a noninvasive fashion.
Other Applications of HIFU
Several branches of medicine have already begun to benefitfrom the use of HIFU with the prospect of many moreapplications in the future. Thus far the greatest influenceof HIFU has been in oncology, with other fields now explor-ing and experimenting with HIFU to determine its poten-tial utility. The HIFU has been proposed as a tool forsynovectomy in the treatment of rheumatoid arthritis(RA) (98,152) and has been used to control opiate refractorypain in pancreatic cancer patients (98,127) and internalbleeding in organs and vessels (98,153). A hand-held HIFUdevice has been successfully used to perform vasectomiesin dogs as a 1–2 min procedure (98,154).
Future Perspectives in Conventional Hyperthermiaand HIFU Use
Heat as therapeutic entity has had a rich history punctu-ated with many successes and failures. The evolution andintegration of therapeutic hyperthermia in the clinicalsetting have been the product of clinical trials, develop-ment of new devices, and education of the medical person-nel. Conventional hyperthermia has been used for a longtime with many energy sources such as electromagnetic,ultrasound, and microwaves. Similarly, it has been >50years since HIFU was first conceptualized and actualized.Many subspecialties of medicine have benefitted from theuse of hyperthermia. Some of the limitations that weremiring conventional hyperthermia and HIFU have onlyrecently begun to be overcome and now these therapies canreach a wider patient population. Both of these techniquesshare similar obstacles due to the limitations that areinherent to ultrasound. Indeed, ultrasound hyperthermiaprocedures are limited in that ultrasound cannot propa-gate through air-filled cavities (e.g., lung or bowel). Con-sequently, lung tumors other than those that are at theperiphery are not likely to be amenable to treatment withHIFU or conventional hyperthermia. Also, tumors that arein close proximity to the bowel or within the bowel wallpose an increased chance of visceral perforation with HIFUuse. In addition, other side effects such as pain, soft tissueand bone damage, and skin burns have been reported.Often these side effects can be minimized by varying scanpaths, altering frequency, power deposition, or the appli-cator position (7). The success of both hyperthermia tech-niques is determined by whether ultrasound energy can beproperly directed to the site of interest, or if therapeutictemperatures are achieved, and if other factors can becompensated for, such as hemodynamic changes. Otherchallenges facing ultrasound hyperthermia systemsinclude the ability to gain control over spatial distributionof heat, tissue temperature monitoring, and improveddiagnostic visualizations in order to better treat the tumorsite. The HIFU treatment times also need to be shortened.Despite this, treatment times of 1 h for a 2 cm superficialtumor using HIFU is preferable to surgical resection; con-versely, at present the same tumor can be treated much
HYPERTHERMIA, ULTRASONIC 81
Figure 25. Anatomical pulmonary vein variations and technicallimitations. (Published with permission from Refs. 148 and 149).
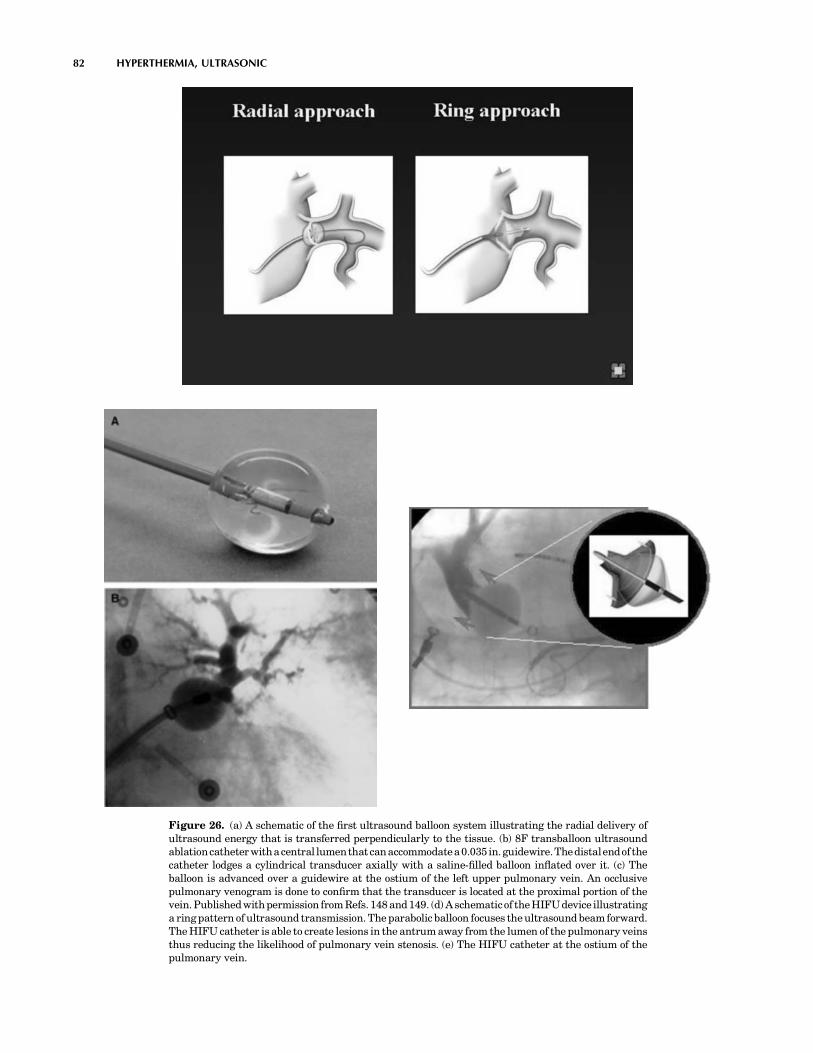
82 HYPERTHERMIA, ULTRASONIC
Figure 26. (a) A schematic of the first ultrasound balloon system illustrating the radial delivery ofultrasound energy that is transferred perpendicularly to the tissue. (b) 8F transballoon ultrasoundablationcatheterwithacentral lumenthatcanaccommodatea0.035 in.guidewire.Thedistalendofthecatheter lodges a cylindrical transducer axially with a saline-filled balloon inflated over it. (c) Theballoon is advanced over a guidewire at the ostium of the left upper pulmonary vein. An occlusivepulmonary venogram is done to confirm that the transducer is located at the proximal portion of thevein. Published with permission from Refs. 148 and 149. (d) A schematicof the HIFU device illustratinga ring pattern of ultrasound transmission. The parabolic balloon focuses the ultrasound beam forward.The HIFU catheter is able to create lesions in the antrum away from the lumen of the pulmonary veinsthus reducing the likelihood of pulmonary vein stenosis. (e) The HIFU catheter at the ostium of thepulmonary vein.

more quickly with radiofrequency ablation. However, inlarge tumors longer treatment times are justified becausethere are very low mortality and morbidity rates associatedwith the use of HIFU (98).
The benefits of both conventional hyperthermia andHIFU are limitless, but both need more testing in largerpatient populations to fully delineate their clinical role.At present, the scarcity of available equipment, therequired technical expertise and the lack of thoroughlytrained providers, the increased complexity and difficultyinvolved in using conventional hyperthermia and HIFUwhen compared to other systems (e.g., electromagnetic)have limited the widespread use of this treatment modality(7). Issues, such as accurate delivery of focused ultrasoundto the target tissue, the ability to monitor and controltemperatures, and reasonable treatment times, have allbeen improved upon and will continue to be refined withfurther testing and research. Imaging modalities likeMRI and high resolution CT scan will enhance the preci-sion of HIFU in various system applications. In the future,HIFU could emerge as a good alternative to traditionalsurgery, and conventional hyperthermia may become amainstay as an adjunct to chemotherapy and radiationto ultimately improve the arsenal of methodologies avail-able to better treat patients.
BIBLIOGRAPHY
1. Seegenschmiedt MH, Vernon CC. A historical perspectiveon hyperthermia in oncology. In: Seegenschmiedt MH,Fessenden P, Vernon CC, editors. Thermoradiotherapy andThermochemotherapy Vol 1. Berlin: Springer Verlag; 1995.pp 3–44.
2. Modern cancer treatment by oncothermia and hyperthermia.2003. Available at http://www.hot-oncotherm.com/historical.htm. Accessed 2005, Feb 4.
3. Lele P. Hyperthermia Ultrasonics. Encyclopedia of MedicalDevices. New York: John Wiley, Sons; 1998.
4. History of Hyperthermia. Available at http://www.starfarm.it/hyperthermia/history.htm. Accessed 2005, April 4.
5. van der Zee J. Heating the patient: A promising approach?Ann Oncol 2002;13:1173–1184.
6. Fesseden P, Hand JW. Hyperthermia therapy physics. In:Smith AR, editor. Medical radiology: Radiation therapy phy-sics. Berlin: Springer Verlag; 1995. pp 315–363.
7. Diederich CJ, Hynynen K. Ultrasound technology forhyperthermia. Ultrasound Med Biol 1999;25:871–887.
8. Bushberg J, Seibert J, Leidholdt E, Boone J. The EssentialPhysics of Medical Imaging. Philadelphia Lippincott,Williams, and Wilkins; 2002. pp 469–553.
9. Chapelon JY, et al. New Piezoelectric transducers for thera-peutic ultrasound. Ultrasound Med. Biol. 2000;26:153–159.
10. Moros E, et al. Thermal contribution of compact bone tointervening tissue-like media exposed to planar ultrasound.Phys Med Biol 2004; 869–886.
11. Madersbacher S, Marberger M. High-energy shockwaves andextracorporeal high-intensity focused ultrasound. J Endourol2003;17:667–672.
12. ter Haar G. High intensity focused ultrasound for the treat-ment of tumors. Echocardiography 2001;18:317–321.
13. Novak P, et al. SURLAS: A new clinical grade ultrasoundsystem for sequential or concomitant thermoradiotherapy ofsuperficial tumors: Applicator description.
14. Reinhold H, Endrich B. Tumour microcirculation as a targetfor hyperthermia. Int J Hypertherma 1986;2:111–137.
15. Vaupel PW, Kelleher DK. Metabolic status and reaction toheat of normal and tumor tissue. In: Seegenschmiedt MH,Fessenden P, Vernon CC. editors. Thermoradiation and Ther-mochemotherapy, Vol. 1. Berlin: Springer Verlag; 1995. pp157–176.
16. Raaphorst GP. Fundamental aspects of hyperthermic biology.In: Field SB, Hand JW, editors. An Introduction to the Prac-tical Aspects of Clinical Hyperthermia. London: Taylor andFrancis; 1990. pp 10–54.
17. Fajardo LF, Pathological effects of Hyperthermia in normaltissue. Cancer Res 1984;44:4826s–4835s.
18. Sminia P, et al. Effects of hyperthermia on the central nervoussystem: A review. Int J Hyperthermia 1994;10:1–130.
19. Wondergem J, et al. Effects of local hyperthermia on the motorfunction of the rat sciatic nerve. Int J Rad Bio 1988;53:429–439.
20. Falk MH, Issels RD. Hyperthermia in oncology. Int JHyperthermia 2001;17:1–18.
21. Overgaard J, et al. Randomised trial of hyperthermia asadjuvant to radiotherapy for recurrent or metastatic malig-nant melanoma. The Lancet 1995;345:540–543.
22. Sneed PK, et al. Survival benefit of hyperthermia in a pro-spective randomized trial of brachytherapy boost (hyperther-mia for glioblastoma multiforme). Int J Rad Oncol Biol Phys1998;40:287–295.
23. Vernon CC, et al. Radiotherapy with or without hyperthermiain the treatment of superficial localized breast cancer: Resultsfrom five randomized controlled trials. Int J Rad Oncol BiolPhys 1996;35:713–744.
24. Valdagni R, Amichetti M, Pani G. Radical Radiation aloneversus radical radiation plus microwave hyperthermia for N3(TNM-UICC) neck nodes: A prospective randomized clinicaltrial. Int J Rad Oncol Biol Phys 1988;15:13–24.
25. Datta N, et al. Head and Neck cancers: Results of thermo-radiotherapy versus radiotherapy. Int J Hyperthermia1990;6:479–486.
26. Perez et al. Randomised phase III study comparing irradiationand hyperthermia with irradiation alone in superficial mea-surable tumors. Am J Clin Oncol 1991;14:133–141.
27. Jones E, et al. Randomized Trial of Hyperthermia and radiationfor superficial tumors. J Clin Oncol 2005;23(13):3079–3085.
28. Emami B, et al. Phase III study of interstitial thermoradiother-apy compared with interstitial radiotherapy alone in the treat-ment of recurrent or persistent human tumors: A prospectivelycontrolled randomized study by the radiation therapy oncologygroup. Int J Rad Oncol Biol Phys 1996;34:1097–1104.
29. Harima Y, et al. A randomized clinical trial of radiationtherapy versus thermoradiotherapy in stage IIIB cervicalcarcinoma. Int J Hyperthermia 2001;17(2):97–105.
30. Vasanthan A, et al. Regional hyperthermia combined with radio-therapy for uterine cervical cancers: A multi-institutional pro-spective randomized trial of international atomic energy agency.Int J Rad Oncol Biol Phys 2005;61(1):145–153.
31. Van der Zee J, et al. Comparison of radiotherapy alone withradiotherapy plus hyperthermia in locally advanced pelvictumors: a prospective, randomized, multicentre trial. DutchDeep Heat Hyperthermic Group. Lancet 2000; 1119–1125.
32. Perez CA, Gillespie B, et al. Quality assurance problems in clinicalhyperthermia and their impact on therapeutic outcome: a reportby the radiation oncology group. International Journal of Radia-tion Oncology, Biology, and Physics, 16:551–558.
33. Voldagni R, Amichetti M. 1994 Report of long-term follow-upin a randomized trial comparing radiation therapy plushyperthermia to metastatic lymphnodes in stage IV headand neck patients. International Journal of Radiation Oncol-ogy, Biology, and Physics, 28:163–169.
HYPERTHERMIA, ULTRASONIC 83

34. Dahl O. Interaction of heat and drugs in vitro and in vivo. In:Seegenschmiedt MH, Fessenden P, Vernon CC, editors. Ther-moradiotherapy and Thermochemotherapy, Vol 1. Berlin:Springer Verlag; 1995. pp 103–121.
35. Westermann AM, Grosen EA, et al. A pilot study of whole bodyhyperthermia and carboplatin in platinum-resistant ovariancancer. Eur J Cancer 2001;37:1111–1117.
36. Li DJ, Hou BS. A preliminary report on the treatment ofesophageal cancer by intraluminal microwave hyperthermiaand chemotherapy. Cancer Treatment Reports 1987;71: 1013–1019.
37. Sugemachi K, et al. Chemotherapy combined with or withouthyperthermia for patients with oesophageal carcinoma: aprospective randomized trial. International Journal ofHyperthermia 10:485–493.
38. Kakehi M, et al. Multi-institutional clinical studies onhyperthermia combined with radiotherapy or chemotherapyin advanced cancer of deep-seated organs. International Jour-nal of Hyperthermia 6:719–740.
39. Falk RE, et al. Combination therapy for resectable andunresectable adenocarcinoma of the pancres. Cancer 57:685–688.
40. Issels RD, et al. Ifosfamide plus etoposide combined withregional hyperthermia in patients with locally advanced sar-comas: a phase II study. Journal of Clinical Oncology1990;8:1818–1829.
41. Issels RD, et al. Improvement of local control by regionalhyperthermia combined with systemic chemotherapy(ifosfa-mide plus etoposide) in advanced sarcomas: updated report on65 patients. Journal of Cancer Research and Clinical Oncology1991;117:141–147.
42. Issels RD, et al. Preoperative systemic etoposide/ifosfamide/doxorubicin chemotherapy combined with regional hyperther-mia in high-risk sarcoma: a pilot study. Cancer Chemotherapyand Pharmacology 1993;31(suppl. 2) S233–S237.
43. Issels RD, et al. Neoadjuvant chemotherapy combinedwith regional hyperthermia (RHT) followed by surgeryand radiation in primary and recurrent high-risk soft-tissuesarcomas (HR-STS) of adults (updated report). Journal ofCancer Research and Clinical Oncology 1998;124(suppl.)R105.
44. Issels RD. Soft Tissues Sarcomas-What is Currently BeingDone. European Journal of Surgical Oncology 21(suppl) 471–474.
45. Eggermont A MM, et al. Isolated Limb Perfusion with high-Dose tumor necrosis factor alpha in combination with inter-feron gamma and melphalan for nonresectable extremity softtissue sarcomas: a multicenter trial. Journal of Clinical Oncol-ogy 14:2653–2665.
46. Wiedemann GJ, et al. Ifosfamide and carboplatin combinedwith 41.8 8C whole body hyperthermia in patients with refrac-tory sarcoma and malignant teratoma. Cancer Research54:5346–5350.
47. Weidemann GJ, et al. Ifosfamide carboplantin, and etopside(ICE) combined with 41.8 8C whole-body hyperthermia inpatients with refractory sarcoma. European Journal of Cancer32A:888-891.
48. Robins HI, et al. Phase I Clinical Trail of Melphalan and41.8 8C whole-body hyperthermia in cancer patients. Journalof Clinical Oncology 1993;15:154–164.
49. Romanowski R, Schott C. Regionale hyperthermie mitsystemischer Chemotherapie bei Kindern und Jugendlichen:Durchfuhrbarkeit und Klinische Verlaufe bei 34 intensiv vor-behandelten Patienten mit prognostisch ungunstigen Tumor-erkrankkungen. Klinische Padiatrie 205:249–256.
50. Wessalowski R, Kruck H. Hyperthermia for the treatment ofpatients with malignant germ cell tumors. A phase I/II study
in ten children and adolescents with recurrent or refractorytumors. Cancer 82:793–800.
51. Rietbroek RC, Schilthuis MS. Phase II trial of weekly locor-egional hyperthermia and cisplantin in patients with pre-viously irridated recurrent carcinoma of the uterine cervix.Cancer 1997;79:935–942.
52. Takahashi M, Fujimot S. Clinical outcome of intraoperativepelvic hyperthermochemotherapy for patients with Dukes’ Crectal cancer. International Journal of Hyperthermia 10:749–754.
53. Westermann AM, Wiedemann GJ. A Systemic HyperthermiaOncologic Working Group trial. Ifosfamide, carboplatin, andetoposide combined with 41.8 degrees C whole-bodyhyperthermia for metastatic soft tissue sarcoma. Oncology.2003;64(4):312–21.
54. Anhalt DP, Hynynen K, Roemer RB. Patterns of changesof tumour temperatures during clinical hyperthermia:Implications for treatment planning, evaluation and control.Int J Hyperthermia 1995;11:425–436.
55. Corry PM, Barlogie B, Tilchen EJ, Armour EP. Ultrasoundinduced hyperthermia or the treatment of human superficialtumors. Int J Rad Oncol Biol Phys 1982;8:1225–1229.
56. Corry PM, et al. Combined ultrasound and radiation therapytreatment of human superficial tumors. Radiology 1982b;145:165–169.
57. Harrison GH. Ultrasound hyperthermia applicators: Intensitydistributions and quality assurances. Int J Hyperthermia1990;6:169–174.
58. Marmor JB, Hahn GM. Ultrasound heating in previouslyirradiated sites. Int J Rad Oncol Biol Phys 1978;4:1029–1032.
59. Marmor JB, Hahn GM. Combined radiation and hyperthermiain superficial human tumors. Cancer 1980;46:1986–1991.
60. Marmor JB, Pounds D, Hahn GM. Clinical studies with ultra-sound induced hyperthermia. Natl Cancer Inst Monogram1982;61:333–337.
61. Marmor JB, Pounds D, Hahn GM. Treatment of superficialhuman neoplasms by local hyperthermia induced by ultra-sound. Cancer 1979;43:188–197.
62. Labthermics Technologies Online.1998–1999. Available athttp://www.labthermics.com/hyper.html. Accessed 2005 Jan26.
63. Anhalt DP, et al. Scanned ultrasound hyperthermia for treat-ing superficial disease. Hyperthermic oncology. vol 2. Proceed-ings of the 6th international Congress on HyperthermicOncology, Tucson, (AZ); 1992. p 191-192.
64. Lele PP. Advanced ultrasonic techniques for local tumorhyperthermia. Radiol Clin N Am 1989;27:559–575.
65. Harari PM, et al. Development of scanned focused ultrasoundhyperthermia: clinical response evaluation. Int J Rad OncolBiol Phys 1991;21:831–840.
66. Hand JW, Vernon CC, Prior MV. Early experience of a com-mercial scanned focused ultrasound hyperthermia system. IntJ Hyperthermia 1992;8:587–607.
67. Guthkelch AN, et al. Treatment of malignant brain tumorswith focused ultrasound hyperthermia and radiation: Resultsof a phase I trial. J Neuro Oncol 1991;10:271–284.
68. Duthkelch et al.69. Formine et al.70. Straube WL, et al. An ultrasound system for simultaneous
ultrasound hyperthermia and photon beam irradiation. Int JRad Oncol Biol Phys 1996;36:1189–1200.
71. Lu XQ, et al. Design of an ultrasonic therapy system for breastcancer treatment. Int J Hyperthermia 1996;12:375–399.
72. Moros EG, Fan X, Straube WL. An investigation of penetrationdepth control using parallel opposed ultrasound hyperther-mia. J Accoust Soc Am 1997;101:1734–1741.
84 HYPERTHERMIA, ULTRASONIC

73. Moros EG, Fan X, Straube WL, Myerson RJ. Numerical andin vitro evaluation of temperature fluctuations duringreflected-scanned planar ultrasound hyperthermia. Int JHyperthermia 1998;14:367–382.
74. Moros EG, Myerson RJ, Straube WL. Aperture size to ther-apeutic volume relation for a multi-element ultrasound sys-tem: Determination of applicator adequacy for superficialhyperthermia. Med Phys 1993;20:1399–1409.
75. Moros EG, Roemer RB, Hynynen K. Simulations of scannedfocused ultrasound hyperthermia. The effects of scanningspeed and pattern on the temperature fluctuations at focaldepth. IEEE Trans Ultrason Ferroelec Frequency Control1988;35:552–560.
76. Moros EG, et al. Simultaneous delivery of electronic beamtherapy and ultrasound hyperthermia using scanning reflec-tors: a feasibility study. Int J Rad Oncol Biol Phys 1995;31: 893–904.
77. Moros EG, Straube WL, Myerson RJ. Potential for powerdeposition conformability using reflected-scanned planarultrasound. Int J Hyperthermia 1996;12:723–736.
78. Lele PP, Parker KJ. Temperature distributions in tissuesduring local hyperthermia by stationary or steered beams ofunfocused or focused ultrasound. Br J Cancer 1982;45(Suppl):108–121.
79. Hynynen K, et al. A scanned, focused, multiple transducerultrasonic system for localized hyperthermia treatments. IntJ Hyperthermia 1987;3:21–35.
80. Lin W, Roemer RB, Hynynen K. Theoretical and experimen-tal evaluation of a temperature controller for scanned focusedultrasound hyperthermia. Med Phys 1990;17:615–625.
81. Ibbini MS, Cain CA. The concentric-ring array for ultrasoundhyperthermia: combined mechanical and electrical scanning.Int J Hyperthermia 1990;6:401–419.
82. Umemura S, Cain CA. The sector-vortex phased array: acous-tic field synthesis for hyperthermia. IEEE Trans UltraonFerroelec Frequency Control 1989;36:249–257.
83. Ebbini ES, Cain CA. Experimental evaluation of a prototypecylindrical section ultrasound hyperthermia phased arrayapplicator. IEEE Trans Ultrason Ferroelec Frequency Con-trol 1991a;38:510–520.
84. Ebbini ES, Cain CA. A spherical-section ultrasound phasedarray applicator for deep localized hyperthermia. IEEETrans Biomed Eng 1991b;38:634–643.
85. Benkeser PJ, Frizzell LA, Goss SA, Cain CA. Analysis of amultielement ultrasound hyperthermia applicator. IEEETrans Ultrason Ferroelec Frequency Control 1989;36:319–325.
86. Diederich CJ, Hynynen K. Induction of hyperthermia usingan intracavitary ultrasonic applicator. IEEE Ultrason Sym-pos Proc 1987;2:871–874.
87. Diederich CJ, Hynynen K. Induction of hyperthermia usingan intracavitary multielement ultrasonic applicator. IEEETrans Biomed Eng 1989;36:432–438.
88. Diederich CJ, Hynynen K. The development of intracavitaryultrasonic applicators for hyperthermia: A design and experi-mental study. Med Phys 1990;17:626–634.
89. Smith NB, Buchanan MT, Hynynen K. Transrectal ultra-sound applicator for prostate heating monitored using MRIthermometry. Int J Rada Oncl Biol Phys 1999;33:217–225.
90. Diederich CJ. Ultrasound applicators with integrated catheter-cooling for interstitial hyperthermia: Theory and preliminaryexperiments. Int J Hyperthermia 1996;12:279–297.
91. Diederich CJ, Hynynen K. Ultrasound technology for inter-stitial hyperthermia. In: Seegenschmiedt MH, Sauer R, edi-tors. Interstitial and intracavitary thermoradiotherapy. Berlin:Springer-Verlag; 1993. pp 55–61.
92. Hynynen K. The feasibility of interstitial ultrasoundhyperthermia. Med Phys 1992;19:979–987.
93. Hynynen K, Davis KL. Small cylindrical ultrasound sourcesfor induction of hyperthermia via body cavities or interstitialimplants. Int J Hyperthermia 1993;9:263–274.
94. Lee RJ, Klein LJ, Hynynen K. A multi-element and multi-catheter ultrasound system for interstitial hyperthermia.IEEE Trans Biomed Eng 1999.
95. Deardorff DL, Diederich CJ, Nau WH. Air-cooling of direct-coupled ultrasound for interstitial hyperthermia and thermalcoagulation. Med Phys 1998;25:2400–2409.
96. Diederich CJ, et al. Direct coupled interstitial ultrasoundapplicators for simultaneous thermobrachytherapy: A feasi-bility study. Int J Hyperthermia 1996;12:401–419.
97. Jarosz BJ. Feasibility of ultrasound hyperthermia withwaveguide interstitial applicator. IEEE Trans Biomed Eng1996;6:1106–1115.
98. Kennedy J, et al. High intensity ultrasound: Surgery of thefuture? Br J Rad 2003;76:590–599.
99. Lynn JG, Zwemer RL, Chick AJ, Miller AG. A new method forgeneration and use of focused ultrasound in experimentalbiology. J Gen Physiol 1942;26:179–193.
100. Fry WJ, et al. Ultrasonic lesions in the mammalian centralnervous system. Science 1955;122:517–518.
101. Fry WJ, Mosberg WH, Barnard JW, Fry FJ. Production offocal destructive lesions in the central nervous system withultrasound. J Neurosurg 1954;11:471–478.
102. Fry FJ. Precision high-intensity focusing ultrasonicmachines for surgery. Am J Phys Med 1958;37:152–156.
103. Ballantine HT, Bell E, Manlapaz J. Progress and problems inthe neurological application of focused ultrasound. J Neuro-surg. 1960;17:858–876.
104. Warwick R, Pond JB. Trackless lesions in nervous tissuesproduced by HIFU (high-intensity mechanical waves). J Anat1968;102:387–405.
105. Lele PP. Concurrent detection of the production of ultrasoniclesions. Med Biol Eng 1966;4;451–456.
106. Lele PP. Production of deep focal lesions by focused ultra-sound-current status. Ultrasonics 1967;5:105–112.
107. Burov AK. High-intensity ultrasonic vibrations for action onanimal and human malignant tumours. Dokl Akad NaukSSSR 1956;106:239–241.
108. Kohrmann KU, et al. Technical characterization of an ultra-sound source for noninvasive thermoablation by high-inten-sity focused ultrasound. BJU Int 2002;90:248–252.
109. ter Haar G. Robertson D: Tissue destruction with focusedultrasound in vivo. Eur Urol 1993;23(Suppl. 1):8–11.
110. Clement GT, Perspectives in clinical uses of high-intensityfocused ultrasound. Ultrasonics 2004;42:1087–1093.
111. Holt RG, Roy RA, Edson PA, Yang X. Bubbles and HIFU: thegood, the bad, and the ugly. In: Andrew MA, Crum LA, VaezyS, editors. Proceedings of the 2nd International Symposiumon Therapeutic Ultrasound; 2002. pp 120–131.
112. Sokka SD, King R, Hynynen K. MRI-guided gas bubbleenhanced ultrasound heating in in vivo rabbit thigh. PhysMed Biol 2003;48:223–241.
113. Billard BE, Hynynen K, Roemer RB. Effects of physicalparameters on high temperature ultrasound hyperthermia.Ultrasound Med Biol 1990;16:409–420.
114. Kolios MC, Sherar MD, Hunt JW. Blood Flow cooling andUltrasonic lesion formation. Med Phys 1996;23:1287–1298.
115. Chan A, et al. An image-guided high intensity focused ultra-sound device for uterine fibroids treatment. Med Phys2002;29:2611–2620. Otsuka R, et al. In vitro ablation ofcardiac valves using high intensity focused ultrasound.Ultrasound Med Biol 2005;31:109–114.
HYPERTHERMIA, ULTRASONIC 85

116. Wu F, et al. Pathological changes in human malignantcarinoma treated with high-intensity focused ultrasound.Ultrasound Med Biol 2001;27:1099–1106.
117. Chaussy C, Thuroff S. High-intensity focused ultrasound inprostate cancer: Results after 3 years. Mol Urol 2000;4:179–182.
118. Madersbacher S, et al. Tissue ablation in benign hyperplasiawith high-intensity focused ultrasound. Eur Urol 1993;23(Suppl. 1):39–43.
119. Hynynen K, et al. MR imaging-guiding focused ultrasoundsurgery of fibroadenomas in the breast: A feasibility study.Radiology 2001;219:176–185.
120. Hynynen K, et al. A clinical noninvasive MRI monitoredultrasound surgery method. RadioGraphics 1996;16:185–195.
121. Hazel JD, Stafford RJ, Price RE. Magnetic resonanceimaging-guided focused ultrasound thermal therapy inexperimental animal models: Correlation of ablation volumeswith pathology in rabbit muscle and VX2 tumors. J MagnetReson Imag 2002;15:185–194.
122. Weidensteiner C, et al. Real time MR temperature mappingof rabbit liver in vivo during thermal ablation. Mag ResonImag 2003;50:322–330.
123. Chan AH, et al. An Image-guided high intensity focusedultrasound device for uterine fibroids treatment. Med Phys2002;29:2611–2620.
124. Tempany CMC, et al. MR imaging-guided focused ultrasoundsurgery of uterine leiomyomas: A feasibility study. Radiology2003;226:897–905.
125. Stewart EA, et al. Focused Ultrasound treatment of uterinefibroid tumors: Safety and feasibility of a noninvasive ther-moablative technique. Am J Obstet Gynecol 2003;189:48–54.
126. Wu F, et al. Changes in ultrasonic image of tissue damagedby high intensity ultrasound in vivo. J acoustic Soc Am1998;103:2869.
127. Wu F, Wang ZB, Chen WZ, Zou JZ. Extracorporeal High-Intensity Focused Ultrasound for treatment of solid carcino-mas: Four-year Chinese clinical experience. Proceedings ofthe 2nd International Symposium on Therapeutic Ultra-sound; July 29-Aug1; Seattle; 2002.
128. Kennedy JE, et al. High- Intensity focused ultrasound for thetreatment of liver tumours. Ultrasonics 2004;42:931–935.
129. Wu F, et al. Extracorporeal high intensity focused ultrasoundablation in the treatment of patients with large hepatocel-lular carcinoma. Ann Surg Oncol 2004;11(12): 1061–1069.
130. Uchida T, et al. Transrectal high-intensity focused ultra-sound for treatment of patients with stage T1b-2NOMOlocalized prostate cancer: A preliminary report. Urology2002;59:394–399.
131. Blana A, Walter B, Rogenhofer S, and Wieland W. High-Intensity focused ultrasound for the treatment of localizedprostate cancer: 5-year experence. Urology 2004;63:297–300.
132. Madersbacher S, et al. Effect of high intensity focused ultra-sound on human prostate cancer in vivo. Cancer Res1995;55:3346–3351.
133. Gelet A, et al. Treatment of prostate cancer with transrectalfocused ultrasound: Early clinical experience. Eur Urol1996;29:174–183.
134. Chaussy C, Thuroff S, Lacoste F, Gelet A. HIFU and prostatecancer: The European experience. Proceedings of the 2ndInternational Symposium on Therapeutic Ultrasound; July29–Aug 1; Seattle; 2002.
135. Beerlage HP, et al. High-intensity focused ultrasoundfollowed after one to two weeks by radical retropubic prosta-tectomy: Results of a prospective study. Prostate 1999;39:41–46.
136. Beerlage HP, et al. Transrectal high-intensity focused ultra-sound using the Ablatherm device in treatment of localisedprostate carcinoma. Urology 1999;54:273–277.
137. Kohrmann KU, et al. High-intensity focused ultrasound fornoninvasive tissue ablation in the kidney, prostate, anduterus. J Urol 2000;163 (4Suppl.):156.
138. Wu F, et al. A randomized clinical trial of high-intensityfocused ultrasound ablation for the treatment of patientswith localised breast cancer. BJC 2003;89:2227–2233.
139. Mc Pherson K, Steel CM, Dixon JM. Breast cancer epide-miology, risk factors, and genetics. Br J Med 2000;321:624–628.
140. Curran D, et al. Quality of life in early stage breastcancer patients treated with radical mastectomy or breast-converging procedure: Results of EORTC trial 10801. TheEuropean Organization for Research and Treatment ofCancer (EORTC), Breast Cancer Cooperative Group (BCCG).Eur J Cancer 1998;34:307–314.
141. Aubry J, et al. Experimental demonstration of noninvasivetransskull adaptive focused based on prior computed tomo-graphy scans. J Acoust Soc Am 2003;113:84–93.
142. Clement GT, Hynynen K. A noninvasive method for focusingultrasound through the human skull. Phys Med Biol2002;47:1219–1236.
143. Foley J, et al. Image-guided HIFU neurolysis of peripheralnerves to treat spasticity and pain. Ultrasound Med Bio2004;30:1199–1207.
144. Ohtsuka T, et al. Thoracoscopic internal mammary arteryharvest for MICABG using the Harmonic Scalpel. AnnThorac Surg 1997 June; 63 (6Suppl):S10.
145. Lee LA, et al. High intensity focused ultrasound effect oncardiac tissues: Potential for clinical application. Echocardio-graphy 2000 Aug; 17(6 Pt 1):563–566.
146. Strickberger SA, et al. Extracardiac ablation of the canineatrioventricular junction by use of high-intensity focusedultrasound. Circulation 1999;100:203–208.
147. Natale A. Cleveland Clinic Foundation. Personal Interview.March 5, 2005.
148. Natale A, et al. First Human Experience with Pulmonaryvein isolation using a through-the-balloon circumferentialultrasound ablation system for recurrent atrial fibrillation.Circulation 2000;102:1879.
149. Saliba W, et al. Circumferential ultrasound ablation for pulmon-ary vein isolation: Analysis of acute and chronic failures. J ofCardiovasc Electrophysiol 2002;13:957–961.
150. Ayoma H, et al. Circumferential lesion characteristic of highintensity focused ultrasound balloon catheter for pulmonaryvein isolation. Heart Rhythm 2004;1:S430.
151. Smith NB, Hynyen K. The feasibility of using focused ultra-sound for transmyocardial revascularization UltrasoundMed Biol 1998;24:1045–1054.
152. Foldes K, et al. Magnetic resonance imaging-guided focusedultrasound synovectomy. Scand J Rheumal 1999;28:233–237.
153. Vaezy S, et al. Hemostasis of punctured blood vessels usinghigh-intensity focused ultrasound. Ultrasound Med Biol1998;24:903–910.
154. Roberts WW, et al. High-Intensity focused ultrasoundablation of the vas deferens in canine model. J Urol 2002;167:2613–2617.
See also HYPERTHERMIA, INTERSTITIAL; HYPERTHERMIA, SYSTEMIC;THERMOMETRY.
HYPOTHERMIA. See TEMPERATURE MONITORING.
86 HYPOTHERMIA.

I
IABP. See INTRAAORTIC BALLOON PUMP.
IMAGE INTENSIFIERS AND FLUOROSCOPY
MELVIN P. SIEDBAND
University of WisconsinFitchburg, Wisconsin
INTRODUCTION
Early fluoroscopic systems used a phosphor-coated sheet orscreen to convert incident X-ray photons to light. Theradiologist observed the image through a lead glass pro-tective screen. A film camera was often used to record theimage. There are two serious disadvantages to this method:the radiologist had to be dark adapted so that image detailswere hard to see and the collection solid angle of the eye orcamera lens was small. The small collection angle meantthat the X-ray exposure had to be increased by almost 100times to have the same diagnostic quality as a conventionalradiograph. Photographing the fluoroscopic screen, photo-fluorography, is no longer used because of the high expo-sure to the patients. All X-ray images are noise limited bythe finite number of X-ray quanta detected and seen. A 50keV X-ray photon can, at best, produce �1000 visible lightphotons, if absorbed by the old-type phosphor. About 5–10% of the incident X-ray photons are stopped and con-verted to light by the fluorescent screen. The quantumdetection efficiency, (QDE) of the screen is the product ofthe ability to absorb the incident X-ray photon and theprobability of emitting light. A thicker screen would absorbmore photons, but would also cause more lateral spreadingof the light and reduce the resolution of the image. The 5–10% QDE figure is a practical compromise between resolu-tion and sensitivity. If it is assumed that the visible lightphotons are emitted isotropically, then the lens of the eyeor camera subtends only a very small fraction of this lightradiation hemisphere. A sheet of film in a radiographiccassette has a phosphor-coated sheet on either side and cancollect light photons far more efficiently.
The invention of the image intensifier overcame theseobjections. The concept of the early image intensifiers wasto use a thin, curved, glass meniscus, �15 cm diameter,coated on the convex side with a scintillator, originally ofthe same composition as the zinc:cadmium sulfide fluoro-scopic phosphor plates, and a photoemitter on the concavesurface. Light produced by the scintillator did not have farto travel to excite the photoemitter. This assembly wasplaced in a vacuum tube and the photoelectrons wereaccelerated toward an output viewing screen where a smalland very bright image was produced. Because the photo-emitter was in close optical contact with the scintillator,the collection angle was very large so that a higher radia-tion exposure was not needed and the image at the viewingscreen was bright enough so that dark adaptation was
obviated and fine details could be seen. An optical viewercomprising an objective lens and relay lens, similar indesign to a submarine periscope, was used to observethe image.
Modern image intensifiers use an epitaxially grownscintillator of CsI with the photoemitter deposited directlyon the surface of that layer. Because the epitaxial layer canbe made much thicker than the powdery deposit of theolder type scintillator for the same resolution, the newimage intensifiers require less exposure–image than con-ventional radiographs. The thicker layer has a higher QDEthan the fluoroscopic screens (Fig. 1).
Many modern image intensifiers use a thin curved steelwindow on which the scintillator and photoemitter aredeposited. This geometry eliminates the X-ray scatterproduced by the glass window of the older tubes andimproves image contrast. Larger tubes up to 35 cm sensordiameter have been made with variable magnification orzoom capability. The window of thin steel is the flash with acoating of aluminum or other metal and etched to create adomain structure, similar to the domains seen in the zinccoating of galvanized steel. The domains here are verysmall, � 100 mm diameter. Cesium iodide is then vapordeposited on this surface and forms epitaxially (i.e., crystalgrowth follows the orientation of the metallic substrate),and grows as a collection of optically isolated fibers. Thisscintillator can be made quite thick with little light spread-ing. The greater thickness means higher quantum effi-ciency (i.e., a measure of the fraction of incident X-rayphotons converted to light photons), when compared toconventional phosphor plate scintillators. A thin layer ofsilver and antimony is vapor deposited on top of the scin-tillator and the final sensitization is accomplished bydepositing cesium from heated tubes or reservoirs afterassembly in the vacuum tube. The AgCs:Sb photoemitteron the surface of the scintillator is similar to the photo-cathode of a photomultiplier (PMT), tube.
Figure 1. In the image intensifier, X rays strike the inputphosphor screen, thus generating light. Light stimulates thephotocathode to emit electrons, which are accelerated through25 kV to strike the output phosphor screen. Brightness gain isdue to both geometric gain and electronic gain.
87

The vacuum tube uses a series of metal cylinders betweenthe photoemitter and the output phosphor. The photoemit-ter, cylinders, and output phosphor are connected to voltagesources to create shaped electric fields. The field potential atany point affects an electron beam in the same way that theindex of refraction of a glass lens affects a beam of light.These cylinders and their potentials form electrostaticlenses to focus the photoelectrons to produce the smalland bright image on the output phosphor. Like optical lenselements, the metal cylinders can make compound electro-static lenses so that focal length can be varied to change thesize of the output image: variable zoom.
The brightness gain of an image intensifier is a measurethat compares the brightness of the image at the smalloutput screen to that of the older fluoroscopic screens. Thisgain is a result of the added energy imparted to thephotoelectrons, the higher probability of stopping an inci-dent X-ray photon, and the effect of compressing the largeinput area signal to the small area of the output screen. Theolder term, brightness gain, has been replaced by conver-sion efficiency. This term is defined as the output lumi-nance in candela�m�2 for an input exposure rate of1 mR�s�1 or 10 mGy�s�1. If assumed it is that a single50 keV input X-ray photon has a 50% probability of inter-acting with the input scintillator and producing light (i.e.,QDE is 50%) and produces 2000 visible light photons, ofwhich � 1000 reach the photoemitter. About 100 of thesewill produce electrons that will be accelerated by theelectric field across the tube and strike the output phosphoras 25 keV electrons. Each 25 keV photoelectron has abouta 10% probability of converting its energy into 2.2 eVvisible light photons. The QDE, quantum detection effi-ciency, of the image intensifier is assumed to be 50%because of the thicker CsI scintillator.
An input exposure rate in the diagnostic range produces�200,000 X-ray photons�mm�2�s�1, converts to 100,000light photons/X-ray photon. In the visible range, �1010
photons/mm2 have a light intensity of 1 candela/m2. Sub-stituting in the above, a 1 mR (10 mGy) input would pro-duce �1 candela�m�2 for an output screen the same size asthe input scintillator. This is >200 times brighter than theolder fluoroscopic screens. Because the output screen areaof an image intensifier is 25 mm diameter for an inputscreen of diameter of 220 mm, the same number of outputlight photons are emitted from a smaller area resulting inan additional gain factor of �75. This yields a total bright-ness gain of >15,000 over the old fluoroscopic screen!
A fluoroscopic television system is used for dynamicstudies, to enable the viewer to see how a contrast agentis swallowed, how blood flows, to locate objects for a surgi-cal procedure, and so on. During the study, an image record(formerly a film record) could be made for later examina-tion using a video recorder or computer. A rapid successionof images could be recorded and then viewed to find the fewimages revealing the particular problem, for example, howa heart valve functioned or to diagnose an eroded region inthe esophagus as the contrast medium sped by. Or a singleimage could be made to show the problem for later correc-tion.
A fast optical lens optically collimates the small outputimage of the image intensifier. Collimation, in this case,
means that the optical object is at the focal plane of thecollimating lens and its image is focused on an infinitedistance away. Any optical device with its own objectivelens, such as a TV or film camera, could be aimed throughthe collimating lens and its image size would be the originalintensified image size times the ratio of (objective focallength)/(collimator focal length). The lenses could be sepa-rated by several centimeters before image vignettingoccurs. A beam splitting mirror can be interposed on thecollimator and the objective lenses so that image light issimultaneously apportioned between a TV and film cam-era. A small mirror or prism and lens could sample the lightand form an image over a small hole in the cover of a PMTtube. The hole would permit only light from the center ofthe image to reach the PMT. The output of the PMT is usedto control the X-ray tube current to maintain constantimage brightness for continuous viewing or for automaticexposure control of one or a sequence of recorded images.This automatic brightness stabilizer scheme is similarin concept to automatic exposure control of most digitalcameras.
The quality of an X-ray image is a compromise betweenexposure to the patient and the noise or ‘‘graininess’’ of theimage. Most images are made using the ALARA principal(As Low As Reasonably Achievable). For any given X-rayexposure, there are a finite number of X-ray photonsincident on the patient and then, through the patient,incident on the image sensor. The statistics of photons–area follow the Poisson distribution, so that the variance(noise) is the square root of the average number of photonsin a pixel (picture element). To produce a second imagehaving twice the linear resolution (detail) as the firstrequires four times the exposure. Because the eye averagesexposure time >0.2 s, to record an equivalent image in 0.02s requires an exposure rate 10 times greater. X-ray expo-sure requirements are determined by the by the X-rayabsorption of the patient, diagnostic needs and are differ-ent for continuous viewing (real-time fluoroscopy), asequence of images (video or motion pictures), or singleimages for later diagnoses.
Before the rapid growth and improvement of digitalcameras and computer technologies, still and motion pic-ture film cameras were the only practical means to recordimages. Because of differences of integrating capability ofthe eye and detail required of the recorded film images, theX-ray beam current, pulse width (exposure time/image),and so on, the ratio of transmission/reflection of the beamsplitting mirror, and other operating parameters, must, beadjusted to obtain the required image quality for eachimage application requirement while minimizing totalexposure to the patient.
Most modern systems use charge-coupled image sensorswith a high dynamic range and pulse the X-ray beamcurrent to the required level while digitally recording videoimages. Computer display of selected images or a dynamicsequence of images has largely displaced motion picturefilm techniques. Video tape recorders are used in simplesystems. The automatic brightness control–automaticexposure control of the digital system uses signals fromselected image areas derived from the computer image tooptimize image quality in the region of interest.
88 IMAGE INTENSIFIERS AND FLUOROSCOPY

BIBLIOGRAPHY
Further Reading
Gebauer A, Lissner J, Schott O. Roentgen Television. New York:Grune & Stratton; 1966.
Siedband MP. Image storage subtraction techniques and contrastenhancement by electronic means. Symposium on the Physicsof Diagnostic Radiology; University of California, June 1968.
Siedband MP. Image intensification and television. In: Taveras,Ferrucci, editors. Radiology, Diagnosis, Imaging, Intervention.Chapt. 10. New York: Lippincott; 1990.
Siedband MP, Duffy PA. Brightness Stabilizer with ImprovedImage Quality, US patent No. 3,585,391. Accessed 1971.
Siedband MP. X-ray image storage, reproduction and comparisonsystem. US patent No. 3,582,651, 1971.
IMAGING, CELLULAR. See CELLULAR IMAGING.
IMAGING DEVICES
MARK J. RIVARD
Tufts New England MedicalCenterFRANK VAN DEN HEUVAL
Wayne State University
INTRODUCTION
Historically, external radiation treatment of deep-seatedmalignancies was performed using ortho-voltage equip-ment. The radiological characteristics of these beamscaused maximum dose deposition to occur on the skin ofthe patient. At that time, skin damage was the limitingfactor for dose delivery to the tumor. When the skin turnedred due to radiation damage (erythema), the physician hadto find another area or portal through which to deliverradiation. The portal was then defined by its orientationand the surface of skin it irradiated.
Nowadays, the treatment is performed with higherphoton energies that permit a skin-sparing effect (i.e.,the dose at the skin is lower than that deposited a fewcentimeters deeper) due to the absence of electronic equili-brium. The historic name ‘‘portal’’ still denotes a radio-therapy treatment beam oriented for entry within apatient. Physicians verify whether the treatment is correctusing megavoltage treatment beams (4–20 MV photons) asan imaging tool. A transmission image, obtained much likea diagnostic transmission image, provides informationdescribing the patient anatomy and gives clues on thebeam orientation and positioning, but also on the extentand shape of the treated area (or portal field). As such,portal imaging is the most direct manner to confirm accu-racy of treatment delivery.
Traditional portal verification is done using radio-graphic films, much like the classical diagnostic films.Films are positioned at the beam exit side of the irradiatedpatient. Portal image analysis involves comparison with asimulation image that is typically obtained using diagnos-
tic quality X rays (60–120 kV photons). The simulationimage serves as the reference image, showing anatomicalinformation clearly and delineating the intended treat-ment field. Comparison of the simulation image with theportal image is complicated due to the inherent poor qual-ity obtained when imaging using high energy photons (1).The whole procedure of patient positioning, artifact remov-ing, imaging processing, and evaluation using film repre-sents a significant fraction of the total treatment time. Thisprocedure increases the workload per patient, and as aresult, the number of images taken is minimized due toeconomic concerns rather than concerns for efficiency ortreatment quality. Indeed, studies have demonstrated thatweekly portal image verification, which is the currentclinical standard, does not guarantee accurate treatmentsetup for a population of patients (2).
Portal imaging differs considerably from diagnostictransmission imaging. The main difference is the photonenergies used to generate the images. In diagnostic ima-ging, photons having energies ranging from 50 to 120 kVinteract in patients primarily via the photoelectric effect.The cross-section for these interactions is highly dependenton the atomic number of the medium in which they tra-verse: A higher atomic number increases the probability ofinteraction. The average atomic number of bony anatomyis higher than that of soft-tissue, yielding good contrast forthe bony anatomy. At treatment energies (1–10 MeV) thepredominant photon interaction is Compton scattering.The cross-section for this interaction is largely dependenton the media density, and the resulting image will show thelargest contrast when large differences in density arepresent. In practice, this means that differences in softtissues will contribute most to the visible signal.
These considerations imply that the dynamic range ofan electronic portal imaging detector (EPID) is used toobtain information on soft-tissue variations (3), divergenceeffects (4), scatter contributions (5), field-edge information,and in the case of fluoroscopic imagers: vignetting andglare. With the exception of field-edge information, all ofthese factors are nonlocalized and tend to change graduallywithin an image. Not only are these features slowly vary-ing, but they also have a large contrast-to-noise ratio (CNR)compared to the clinically important bone–soft-tissue con-trast.
The EPIDs permit the same tasks as film-based ima-ging, but increase the efficiency and provide added value byusing digital imaging techniques. The EPIDs are devicesthat electronically capture the photon energy fluencetransmitted through a patient irradiated during treat-ment, and allow direct digitization of the image. This imageis then immediately available for visualization on a com-puter screen and electronic storage. When the treatmentverification process uses EPIDs, departmental efficiency isincreased and quality is improved at the same cost as whenusing film-based imaging.
Proposals to generate electronic images started in thebeginning of the 1980s mainly through the work of Baileyet al. (6), who used systems based on video techniques. Thisseminal work was then further developed toward moreclinically applicable systems by Shalev and co-workers(7), Leong (8), Munro et al. (9), and Visser et al. (10). All
IMAGING DEVICES 89
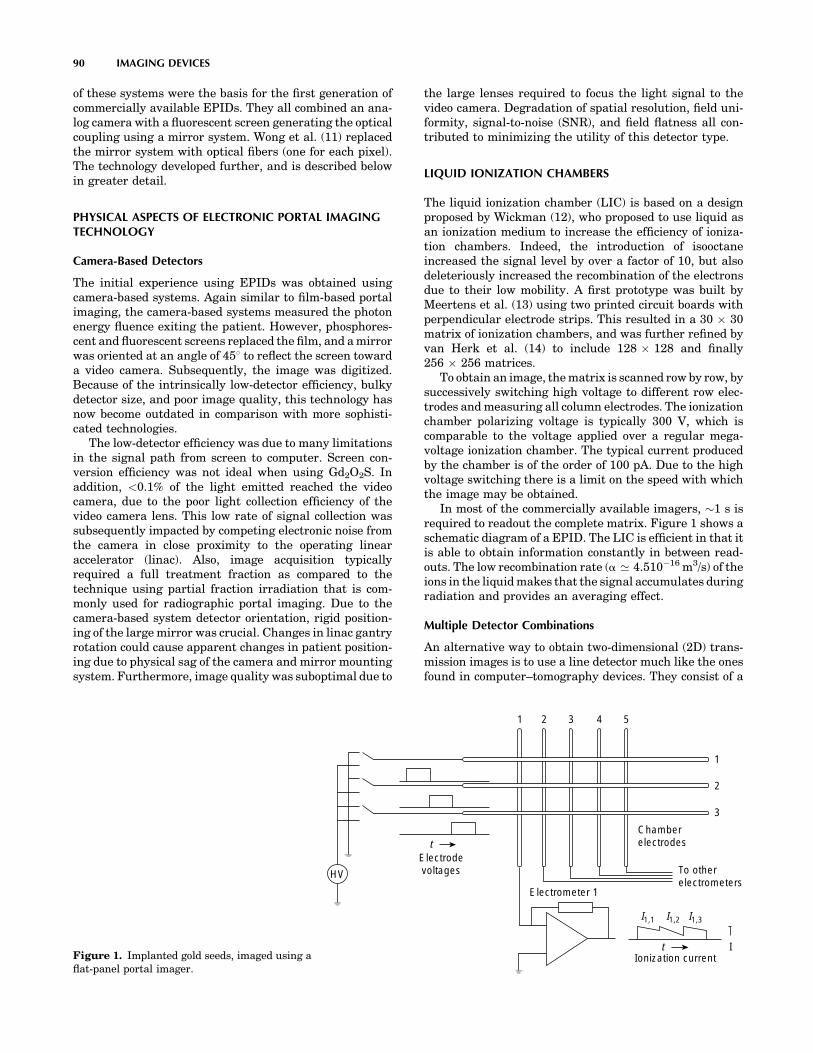
of these systems were the basis for the first generation ofcommercially available EPIDs. They all combined an ana-log camera with a fluorescent screen generating the opticalcoupling using a mirror system. Wong et al. (11) replacedthe mirror system with optical fibers (one for each pixel).The technology developed further, and is described belowin greater detail.
PHYSICAL ASPECTS OF ELECTRONIC PORTAL IMAGINGTECHNOLOGY
Camera-Based Detectors
The initial experience using EPIDs was obtained usingcamera-based systems. Again similar to film-based portalimaging, the camera-based systems measured the photonenergy fluence exiting the patient. However, phosphores-cent and fluorescent screens replaced the film, and a mirrorwas oriented at an angle of 458 to reflect the screen towarda video camera. Subsequently, the image was digitized.Because of the intrinsically low-detector efficiency, bulkydetector size, and poor image quality, this technology hasnow become outdated in comparison with more sophisti-cated technologies.
The low-detector efficiency was due to many limitationsin the signal path from screen to computer. Screen con-version efficiency was not ideal when using Gd2O2S. Inaddition, <0.1% of the light emitted reached the videocamera, due to the poor light collection efficiency of thevideo camera lens. This low rate of signal collection wassubsequently impacted by competing electronic noise fromthe camera in close proximity to the operating linearaccelerator (linac). Also, image acquisition typicallyrequired a full treatment fraction as compared to thetechnique using partial fraction irradiation that is com-monly used for radiographic portal imaging. Due to thecamera-based system detector orientation, rigid position-ing of the large mirror was crucial. Changes in linac gantryrotation could cause apparent changes in patient position-ing due to physical sag of the camera and mirror mountingsystem. Furthermore, image quality was suboptimal due to
the large lenses required to focus the light signal to thevideo camera. Degradation of spatial resolution, field uni-formity, signal-to-noise (SNR), and field flatness all con-tributed to minimizing the utility of this detector type.
LIQUID IONIZATION CHAMBERS
The liquid ionization chamber (LIC) is based on a designproposed by Wickman (12), who proposed to use liquid asan ionization medium to increase the efficiency of ioniza-tion chambers. Indeed, the introduction of isooctaneincreased the signal level by over a factor of 10, but alsodeleteriously increased the recombination of the electronsdue to their low mobility. A first prototype was built byMeertens et al. (13) using two printed circuit boards withperpendicular electrode strips. This resulted in a 30 � 30matrix of ionization chambers, and was further refined byvan Herk et al. (14) to include 128 � 128 and finally256 � 256 matrices.
To obtain an image, the matrix is scanned row by row, bysuccessively switching high voltage to different row elec-trodes and measuring all column electrodes. The ionizationchamber polarizing voltage is typically 300 V, which iscomparable to the voltage applied over a regular mega-voltage ionization chamber. The typical current producedby the chamber is of the order of 100 pA. Due to the highvoltage switching there is a limit on the speed with whichthe image may be obtained.
In most of the commercially available imagers, �1 s isrequired to readout the complete matrix. Figure 1 shows aschematic diagram of a EPID. The LIC is efficient in that itis able to obtain information constantly in between read-outs. The low recombination rate (a ’ 4.510�16 m3/s) of theions in the liquid makes that the signal accumulates duringradiation and provides an averaging effect.
Multiple Detector Combinations
An alternative way to obtain two-dimensional (2D) trans-mission images is to use a line detector much like the onesfound in computer–tomography devices. They consist of a
90 IMAGING DEVICES
Figure 1. Implanted gold seeds, imaged using aflat-panel portal imager.
HV
tElectrodevoltages
Electrometer 1
1 2 3 4 5
1
2
3
Chamberelectrodes
To otherelectrometers
Ionization currentt I
I1,1 I1,2 I1,3

line of point detectors, which usually contain a phosphor-escent material and an optical light detector (15). Alter-natively, Lam et al. (16) constructed a device containing256 silicon diodes. The line of detectors is scanned throughthe field in a mechanical fashion. However, this approach istime intensive and not appropriate for clinical techniquessuch as respiratory gated radiotherapy for treatment oflung cancer where the exiting photon energy fluence is of adynamic nature.
Flat Panel Technology
The advance of flat-panel displays, where the use ofamorphous silicon created surfaces that locally behavedas a crystalline material, allowed for lithography of inte-grated circuits. The same thin-film technology (TFT) wasused to generate photodiode circuits detecting opticallight. The TFT is deposited on a glass substrate of �1mm thick as is shown in Fig. 2. One of the major advan-
tages of these circuits is that they are highly radiationresistant and can be placed directly in a radiation beam.As with computer integrated circuit chip technology, theTFT EPID can be etched with a resolution of a fewmicrometers, permitting construction of a large detectormatrix. As the photodiodes only detect visible light, aphosphorescent screen is used to perform the conversionmuch as for camera-based EPIDs. The TFT EPID is non-conducting during the radiation. To read out the TFT, avoltage bias is applied to allow collected charge to flowbetween the photodiode and an external amplifier. Anamplifier records this charge, which is proportional tothe light intensity. The TFT EPID array has a maximumreadout rate of 25 Hz. In comparison to the camera-basedEPID system, the large TFT detectors are designed tobe in direct contact with the conversion screen, thuseliminating the poor optical coupling and efficiency intrin-sic to the camera-based systems.
IMAGING DEVICES 91
Incident X ray
TFT Photodiode
Converting phosphorIndium tin oxidep-doped Sia-Si:Hn-doped SiMetalDielectric
Glass substrate
Passivation
(a)
Figure 2. Schematic cross-section (not to scale) of a single a-Si:H imaging pixel.

The resolution and efficiency of flat-panel imagers aretheoretically superior to those from camera-based and LICEPIDs. Research performed by Munro et al. (17) indicatesthat the amorphous silicon imager is X-ray quantum lim-ited, and that the resolution is limited by the spread of theoptical photons in the imager. The increase in quality andthe compact size of TFT EPIDs means that they may beeasily installed onto a linac using a robotic arm. Conse-quently, TFT EPIDs are now the only type of detectorscommercially available. Efforts are underway to replacethe current conversion screens, which usually are Gd2O2Sphosphors, with CsI, which can be grown as single crystalsthe size of a pixel. The optical light is then trapped in amanner similar to an optical fiber, and therefore opticalspread is eliminated, as shown in Fig. 3.
Figure 4 shows pelvic images taken with a camera-based detector, LIC, and flat-panel imager.
EPID APPLICATIONS
Replacement of Radiographic Film
Just as is common in radiology departments, electronicacquisition and management of imaging data is quicklybecoming standard practice. Because of the fast pace ofdetector evolution in the past decade, EPID technology isfacilitating hospital-wide imaging digitization. However,to understand why widespread implementation of EPIDsystems has not yet occurred, it is important to perform abrief cost analysis.
Compared to radiographic film-based portal imaging,up-front capital expenditures for EPID systems areabout a factor of 5 larger (e.g., $25,000 vs. 125,000).However, on-going costs associated with an EPID sys-tem as compared to a radiographic film-based portalimaging program are much less. For example, regularpurchasing of film and maintenance of a film processor(including silver harvesting) is not required with anEPID program. This cost-analysis makes EPID highlycompetitive given the digital direction facing modernhealth care.
With direct image digitization comes the ability totransmit data as required for telemedicine. Furthermore,imaging data storage and retrieval, as required for radi-
ology picture archiving and communication systems(PACS), has additional advantages over conventionalradiographic film storage. In radiation oncology depart-ments, it is now commonplace for record-and-verify sys-tems to be coupled to an electronic patient charting system.By storing the EPID images in this domain, many of theconcerns for patient record keeping, retrieval, and preser-vation of treatment confidentiality are overcome.
Improvement of Patient Positioning
The original purpose of portal imaging is to reduce theincidence and extent of errors made during radiation treat-ment. The type of errors can be categorized as gross errorsand stochastic errors. Examples of such errors are shown inFig. 5. The gross errors occur only once and when detectedcan be removed from the treatment after one fraction.Stochastic errors contain a random component, whichimplies that the error changes from day to day. Errorsand QA-problems can also introduce a systematic compo-nent hidden by the random component, which can only becorrected for if it’s extent is known.
To reduce stochastic errors, there are two general meth-odologies, on- or off-line corrections. The most straightfor-ward methodology uses on-line correction where an imageis obtained in ‘‘localization mode’’ where minimal dose tothe patient is applied. If a discrepancy is observed in thepatient setup, and if this discrepancy is larger than apredetermined threshold or action level, efforts are takento eliminate the error by changing the patient position orchanging the treatment configuration. The aforementionedthreshold is based on the precision to which position can bedetermined and with which the patient setup correctioncan be applied. Given the digital nature of EPID images, itis possible to increase the accuracy using computerizedalgorithms to objectively measure patient positioning withrespect to the treatment field (18–21). This approach hasnot been widely adopted, mainly due to the perceived laborintensity and some medico-legal aspects. However, thismay change with the advent of other on-line repositioningtechniques (cf. ultrasound-based repositioning) andincreased process automation.
Weekly port-filming is the standard procedure in the QAof external beam radiation therapy, which generally
92 IMAGING DEVICES
(a) (b)
Figure 3. Illustration of EPID conversion screens used to trap optical light. Fig. 3a shows a regularGd2O2S-screen with optical spread, while Fig. 3b shows a CsI screen which limits optical spread andincreases detector resolution.

implies that a sample of 4 positions is taken out of a 20fraction treatment. Errors are corrected after the firstimage. An interesting study by Valicente et al. (2), showedthat this practice is suboptimal. The use of EPIDs allows usto obtain images in a more economical way. Most off-linecorrection strategies assume that the distribution formedby all consecutive errors is a normal distribution charac-terized by the mean error and the standard deviationcalculated as in
Mean:
hxi ¼ 1
N
XNi¼1
xi ð1Þ
Standard Deviation:
s ¼
ffiffiffiffiffiffiffiffiffiffiffiffiffiffiffiffiffiffiffiffiffiffiffiffiffiffiffiffiffiffiffiffiffiffiffiffiffiffiffiffiffiffiffiffiffiffi1
ðN � 1ÞXNi¼1
ðhxi � xiÞ2vuut
IMAGING DEVICES 93
Figure 4. A comparison of pelvic images taken with three different types of EPIDs: 4a) a camera-based system, 4b) a liquid ionization chamber system, and 4c) a amorphous silicon (a-Si:H) flat panelimaging system.

Figure 5. Examples of setup errors. Reference images on the right are digitally reconstructedradiographs with the correct setup. On the left are the measured portal images. (a) Faulty collimatorangle. (b) Wrong blocking used. (c) Wrong MLC file. (d) Patient positioning error.
94

Figure 5. (Continued)
95

By repeated sampling of the distribution (e.g., taking portfilms), the strategy estimates the value of hxi as close aspossible and corrects for the error, which will reduce thesystematic error in the treatment. Several groups havestudied the implications of this strategy and its variations.The most successful approach seems to be the followingstrategy: The set-up variations are recorded and averaged.This is compared to an action level that depends on howmany samples have been taken already (the level shrinksas the the amount of information on the systematic errorincreases). These studies showed that systematic errorscould be reduced to �2 mm (22).
Organ Motion
One of the major reasons for use of EPIDs is the fact thatthe patients anatomy and position vary from those used fortreatment planning purposes. The factors involving thisvariation are
� Patient movement.
� Patient positioning inaccuracies.
� Organ motion.
Any of these factors will influence the actual dose dis-tribution to be different from that obtained using treat-ment planning. It is straightforward to correct for the firsttwo problems using portal imaging as the patients positionis typically well-characterized using bony anatomy. Anexcellent compilation on the incidence, extent, and reper-cussions of organ movement was performed by Langen andJones (23). Efforts to incorporate organ movement duringradiotherapy treatment planning involves enlarging thetarget to be treated. Sophisticated algorithms that calcu-late the extent of these enlargements were developedindependently by Stroom et al. (24) and by van Herket al. (25). The general framework for this enlargementis given in ICRU 50 and ICRU 60 (26,27). In these reportsthe gross target volume (GTV) is defined as the volumecontaining demonstrated tumor. A margin is added to theGTV to account for suspected microscopic tumor involve-ment, and is defined as the clinical target volume (CTV).Finally, the planning target volume (PTV) is defined by theCTV and an additional margin to allow for geometricalvariations such as patient movement, positioning errors,and organ motion. The margins added to GTV and CTV cansubstantially increase the PTV since the margins areapplied in three dimensions. Because of volume effects ofradiation therapy, there is a tendency to minimize the PTVby increasing the precision of the treatment. As explainedabove, EPIDs are able to minimize uncertainties caused bypatient motion and positioning errors using off- or on-linecorrection strategies.
Except in a few cases like in lung or where air pocketsare present (24,28), the target is virtually indiscernibleusing X rays. To solve this problem, other modalities, likeCT (29) and ultrasound (30,31), have been used to deter-mine the position of the organ. The EPIDs can also beused to image the position of organs if radioopaquemarkers are implanted. The markers need to be of highdensity and migration needs to be limited. The efficacy
and feasibility of using markers with EPIDs was studiedby Balter et al. (32), application of the use of markershave been extensively studied by Pouliot and co-workers(33). The use of markers is becoming more popular andEPID systems are being augmented with software todetect markers as well as perform the requisite posi-tional calculations.
Quality Assurance and In Vivo Dosimetry
In 2001, Task Group No. 58 of the American Association ofPhysicists in Medicine Radiation Therapy Committeeissued a protocol to define the standard-of-care for per-forming EPID QA on a daily, monthly, and annual basis(34). In this protocol, a quality assurance program isproposed where daily checks of EPID system perfor-mance, image quality, and safety interlocks are performedby a radiation therapy technologist. In addition to review-ing results and independently performing checks con-ducted by the technologist, a medical physicist shouldconduct the following checks on a monthly basis: performconstancy check of SNR, resolution, and localization;inspect images for artifacts; do a mechanical inspectionof all EPID components; and maintain the computersystem. The annual QA tasks are also performed by themedical physicist, and include all of the above tasks plus afull check of the EPID geometric localization accuracy. Byperforming these QA tasks, the radiotherapy departmentmay be reasonably assured of a reliable EPID system forclinical use.
The QA tests typically utilize a vendor-supplied phan-tom designed to facilitate evaluation of the aforementionedtasks. Since clinical linacs are typically dual energy (e.g., 6and 15 MV) in design, tests are applied to both photonenergies. As expected, the lower photon energy will demon-strate improved image quality (e.g., SNR and spatial reso-lution). Since many EPID systems utilize sophisticatedcomputer software utilities, testing of this software in arealistic setting is an integral component of the EPIDquality management program. As can be expected withtests that are subjective in nature, it is recommended thatmultiple users be employed to evaluate the subjectivecriteria so as to minimize user bias.
In addition to the aforementioned advantages, an EPIDsystem permits unique opportunities of radiotherapy treat-ment QA. Treatment fields are typically blocked with beammodifiers to account for irregularities in patient shape.These beam modifiers include compensating materialswhen minor changes are required, or beam wedges whengross changes are required. Because modern linacs havefeatures like dynamic wedges and dynamic multileaf col-limators, the nonintegral approach that EPIDs offer overradiographic film (i.e., the ability to obtain several imagesat different stages during a dynamic process) permitscontinued high-quality QA. Due to the electronic natureof EPID measurement of the photon energy fluence exitinga patient, one can perform exit dosimetry and quantitativecomparisons with treatment planning intentions (35).However, these efforts are currently research driven,and widespread clinical implementation may not beexpected for a few years.
96 IMAGING DEVICES

BIBLIOGRAPHY
1. AAPM report No. 24: Radiotherapy portal imaging quality,1987.
2. Valicenti RK, Michalski JM, Bosch WR, Gerber R, Graham MV,Cheng A, Purdy JA, Perez CA. Is weekly port filming adequatefor verifying patient postion in modern radiation therapy? Int JRad Oncol Biol Phys 1994;30(2):431–438.
3. Moseley J, Munro P. Display equalization: A new displaymethod for portal images. Med Phys 1993;20(1):99–102.
4. Van den Heuvel F, Han I, Chungbin S, Strowbridge A, Tekyi-Mensa S, Ragan D. Development and clinical implementation ofan enhanced display algorithm for use in networked electronicportal imaging. Int J Rad Oncol Biol Phys 1999;45:1041–1053.
5. Jaffray DA, Batista JJ, Fenster A, Munro P. X-ray scatter inmegavoltage transmission radiography: Physical characteristicsand influence on image quality. Med Phys 1994;21(1):45–60.
6. Bailey NA, Horn RA, Kamp TD. Fluoroscopic visualization ofmegavoltage therapeutic x-ray beams. Int J Radiat Oncol BiolPhys 1980;6:935–939.
7. Leszczynski KW, Shalev S, Cosby S. A digital video system foron-line portal verification. Medical Imaging IV: Image Forma-tion. SPIE 1990;1231:401–405.
8. Leong J. Use of digital fluorscopy as an on-line verificationdevice in radiation therapy. Phys Med Biol 1986;31:985–992.
9. Munro P, Rawlinson JA, Fenster A. A digital fluoroscopicimaging device for radiotherapy localization. Int J Rad OncolBiol Phys 1990;18:641–649.
10. Visser AG, Huizenga H, Althof VGM, Swanenburg BN. Per-formance of a prototype fluoroscopic radiotherapy imagingsystem. Int J Rad Oncol Biol Phys 1990;18:43–50.
11. Wong JW, Slessinger ED, Hermes RE, Offutt CJ, Roy T,Vannier MW. Portal dose images I: Quantitative treatmentplan verification. Int J Rad Oncol Biol Phys 1990;18:1455–1463.
12. Wickman GA. A liquid filled ionisation chamber with highspatial reslution. Phys Med Biol 1974;19:66–72.
13. Meertens H, van Herk M, Weeda J. A liquid ionisation detectorfor digitital radiography of therapeutic megavoltage photonbeams. Phys Med Biol 1985;30:313–321.
14. Van Herk M, Meertens H. A matrix ionization chamber ima-ging device for on-line patient set-up verification during radio-therapy. Radiother Oncol 11:369–378.
15. Morton EJ, Swindell W, Evans PM. A linear array, scintilla-tion crystal-photodiode detector for megavoltage imaging.Med Phys 1991;18:681–691.
16. Lam KS, Partowmah M, Lam WC. An on-line electronic portalimaging system for external beam radiotherapy. Br J Radiol1986;59:1007–1013.
17. Munro P, Bouius DC. X-ray quantum limited portal imagingusing amorphous silicon flat-panel arrays. Med Phys1998;25(5):689–702.
18. De Neve W, Van den Heuvel F, De Beukeleer M, Coghe M,Verellen D, Thon L, De Roover P, Roelstraete A, Storme G.Interactive use of on-line portal imaging in pelvic radiation.Int J Rad Oncol Biol Phys 1993;25:517–524.
19. Van den Heuvel F, De Neve W, Verellen D, Coghe M, Coen V,Storme G. Clinical implementation of an objective computer-aided protocol for intervention in intra-treatment correctionusing electronic portal imaging. Radiother Oncol 1995;35:232–239.
20. Balter JM, Pelizarri CA, Chen GTY. Correlation of projectionradiographs in radiation therapy using open curve segmentsand points. Med Phys Mar.–Apr. 1992;19(2): 329–334.
21. Bijhold J, Lebesque JV, Hart AAM, Vijlbrief RE. Maximizingsetup accuracy using portal images as applied to a conformal
boost technique for prostate cancer. Radiother Oncol1992;24:261–271.
22. Bel A, Vos PH, Rodrigus PTR, Creutzberg CL, Visser AG,Stroom JC, Lebesque JV. High-precision prostate cancer irra-diation by clinical application of an offine patient setup ver-ification procedure, using portal imaging. Int J Rad Oncol BiolPhys 1996;35(2).
23. Langen KM, Jones DT. Organ motion and its management.Int J Radiat Oncol Biol Phys May 1 2001;50(1):265–278.
24. Stroom JC, Boer de HC, Huizenga H, Visser AG. Inclusion ofgeometrical uncertainties in radiotherapy treatment planningby means of coverage probability. Int J Radiat Oncol Biol PhysMar 1 1999;43(4):905–919.
25. van Herk M, Remeijer P, Lebesque JV. Inclusion of geometricuncertainties in treatment plan evaluation. Int J Radiat OncolBiol Phys Apr 1 2002;52(5):1407–1422.
26. ICRU and International Commission on Radiation Units andMeasurements. Prescribing, recording and reporting photonbeam therapy. ICRU Report 1993; 50.
27. ICRU and International Commission on Radiation Units andMeasurements. Prescribing, recording and reporting photonbeam therapy, Supplement to ICRU 50. ICRU Report 1999;62.
28. Erridge SC, Seppenwoolde Y, Muller SH, van Herk M, DeJaeger K, Belderbos JSA, Boersma LJ, Lebesque JV. Portalimaging to assess set-up errors, tumor motion and tumorshrinkage during conformal radiotherapy of non-small celllung cancer. Radiother Oncol 2003;66(1):75–85.
29. Jaffray DA, Drake DG, Moreau M, Martinez AA, Wong JW.Radiographic and tomographic imaging system integratedinto a medical linear accelerator for localization of bone andsoft-tissue targets. Int J Radiat Oncol Biol Phys Oct 11999;45(3):773–789.
30. Lattanzi J, McNeeley S, Hanlon A, Schultheiss TE,Hanks GE. Ultrasound-based stereotactic guidance ofprecision conformal external beam radiation therapy in clini-cally localized prostate cancer. Urology Jan 2000;55(1):73–78.
31. Serago CF, Chungbin SJ, Buskirk SJ, Ezzell GA, Collie AC,Vora SA. Initial experience with ultrasound localization forpositioning prostate cancer patients for external beam radio-therapy. Int J Radiat Oncol Biol Phys Aug 1 2002;53(5):1130–1138.
32. Balter JM, Sandler HM, Lam K, Bree RL, Lichter AS,ten Haken RK. Measurement of prostate movementover the course of routine radiotherapy using implantedmarkers. Int J Rad Oncol Biol Phys 1995;31(1):113–118.
33. Vigneault E, Pouliot J, Laverdiere J, Roy J, Dorion M. Elec-tronic portal imaging device detection of radioopaque markersfor the evaluation of prostate position during megavoltageirradiation: A clinical study. Int J Radiat Oncol Biol PhysJan 1 1997;37(1): 205–212.
34. Herman MG, Balter JM, Jaffray DA, McGee KP, MunroP, Shalev S, van Herk M, Wong JW. Clinical use ofelectronic portal imaging: report of radiation therapycommittee task group 58. Med Phys May 2001;28(5):712–737.
35. Boellaard R, Van Herk M, Mijnheer BJ. A convolution model toconvert transmission dose images to exit dose distributions.Med Phys 1997;24(2):189–199.
See also COMPUTED TOMOGRAPHY; MAGNETIC RESONANCE IMAGING;PHOTOGRAPHY, MEDICAL; POSITRON EMISSION TOMOGRAPHY; ULTRASONIC
IMAGING.
IMAGING DEVICES 97

IMMUNOLOGICALLY SENSITIVE FIELD–EFFECTTRANSISTORS
EMMANUEL S. ZACHARIAH
University of New JerseyNew Brunswick, New Jersey
P. GOPALAKRISHNAKONE
National University of SingaporeSingapore
PAVEL NEUZIL
Institute of Bioengineeringand NanotechnologySingapore
INTRODUCTION
Diagnostics as a whole represent a large, well-established,and continually expanding market. Methods for the selec-tive determination of analytes in biological fluids, such asblood and urine, are important. When a foreign substance(antigen) invades the human body, the immune systemproduces antibodies that interact with the antigen. Such arecognizing process involves the formation of an immuno-complex based on interactions between the immunospe-cies. The recognition is specific for the antibody-antigensystem and, thus, for the measurement of antigen concen-tration (1,2). This determination is of importance for diag-nosis because the antigens can be viruses, bacteria that areinvolved in many human illnesses, such as cancer andAIDS. The analytes detected and measured have alsoincluded many other medical diagnostic molecules suchas hormones, clinical disease biomarkers, drugs, and envir-onment pollutants such as pesticides. Antibody diversity isso great that virtually any biomolecule can be recognized(3). The range of analyte concentrations encountered isextremely large, from greater than 10�3 M for species suchas glucose and cholesterol and to less than 10�12 M forcertain drugs and hormones (4). It is for the detection ofthese low level analytes that the application of immuno-logical techniques is essential.
An immunoassay is a multistep diagnostic test based onthe recognition and binding of the analyte by the antibody.Most immunoassay techniques are based on the separationof free and bound immunospecies (5). In these techniques,one of the immunoagents (antibody or antigen) is immobi-lized on a solid phase. The solid phase facilitates the separa-tion and washing steps required to differentiate bound andfree fractions of the label. Quantification of a bound immu-noagent is conducted by using labels covalently bound to theimmunoagent with specific properties suitable for detec-tion. The most common labels are radioactive markers,enzymes, and fluorescent labels. For many of the noniso-topic labels, the reagents have been designed such thatbinding of labeled antigen to antibody in some way mod-ulates the activity of the label, resulting in a homogenousimmunoassay without the need for a separation step. Themost familiar type of enzyme immunoassay in clinicalanalysis is known as enzyme-linked immunosorbent assay(ELISA) (6). Different schemes of enzyme immunoassayexist, and, in clinical laboratory practice, the most popularare the ‘‘Sandwich’’ method for large analytes, and compe-
titive binding immunoassay methods for the determination‘‘haptens’’ (low molecular weight analytes).
The advent of biosensor technology, with the possibilityof direct monitoring of immunoreactions, provides oppor-tunity to gain new insight into antigen-antibody reactionkinetics and create rapid assay devices with wider applica-tions. A biosensor is composed of (1) a biochemical receptor,which uses biosubstances such as enzymes, antibodies, ormicrobes to detect an analyte, (2) a transducer, whichtransforms changes in physical or chemical value accom-panying the reaction into a measurable response, mostoften in the form of electrical signal (7–9). The term immu-nosensor is used when antibodies are immobilized to recog-nize their appropriate antigens (or vice versa) (10).Immunosensors possess several unique features, such ascompact size, simplicity of use, one-step reagentless ana-lysis, and absence of radioactivity, which make themattractive alternatives to conventional immunoassay tech-niques. Immunosensors can be divided, in principle, intotwo categories: nonlabeled and labeled (11). Nonlabeled ordirect-acting immunosensors are designed in a way thatthe immunocomplex (i.e., the antibody-antigen complex) isdirectly determined by measuring physical changesinduced by the formation of the complex. In contrast,labeled or indirect-sensing immunosensors have incorpo-rated a sensitively detectable label. The immunocomplex isthus entirely determined through measurement of thelabel. In order to determine an antigen, the correspondingantibody is immobilized on the membrane matrix, which isheld on an amperometric-or potentiometric-sensing trans-ducer used to measure the rate of the enzymatic reaction(12–14).
Of the electrochemical technologies for biosensors, theIon-Sensitive Field Effect Transistor (ISFET) has beenthe center of special attention as a transducer. ISFETswere introduced by Bergveld in 1970 (15), and were thefirst type of this class of sensor in which a chemicallysensitive layer was integrated with solid-state electronics.A field effect transistor (FET) can be considered as acharge-sensitive device (i.e., any change in the excessinterfacial charge at the outer insulator surface will bemirrored by an equal and opposite charge change in theinversion layer of the FET). By excluding the gate metal ina FET and using a pH-sensitive gate insulator, a pH-sensitive FET was constructed (16,17). After the inventionof the ISFET, many different types of FET-based sensorshave been presented. The application of enzymes as theselecting agent in ISFET-based sensing systems leads tothe development of highly sensitive sensors. Such enzyme-modified ISFETs (EnFETs) can, in principle, be con-structed with any enzyme that produces a change in pHon conversion of the concerning substrate (18). By combin-ing the ISFET with a membrane that contains a biologicalsubstance, like an antibody, the sensor can detect a specificantigen (19). The ISFET immunosensors or Immunologi-cally sensitive FETs (IMFETs) have several advantagesover the conventional enzyme immunoassay. The ISFETcould be mass-produced by an integrated circuits (IC)process, which makes it very small and economical. Anelectric circuit can be integrated on the same chip. Thebiosensor platform finds many applications in various
98 IMMUNOLOGICALLY SENSITIVE FIELD–EFFECT TRANSISTORS

fields, such as medical diagnostics, fermentation processcontrol, and environmental monitoring.
THEORY
In order to understand the operation of the IMFET, onemust trace its origins back to the ISFET or ChemFET(Fig.1). The latter devices have been described in depthelsewhere (20–22). A packaged ISFET is shown inFig. 2 (23). ISFETs and ChemFETs have, in turn, evolvedfrom the Metal Oxide Semiconductor Field Effect Transis-tor (MOSFET), currently the most popular active device inthe entire semiconductor industry. It is a unipolar device,where the current is given by the flow of majority carriers,either holes in PMOS type or electrons in NMOS type. Theoperation of the MOSFET can be considered as a resistorcontrolled by the status of a gate region, so-called MISstructure. It is a sandwich consisting of a stacked-gate
metal layer, an insulator (typically silicon oxide), and asemiconductor. Assume a low-level doped p-type (NMOSdevice). Three different states of charge distribution canoccur, depending on the voltage Vg , applied between themetal and a semiconductor. A negative value of Vg causespositive holes to accumulate at the semiconductor-insulator interface. A positive value of Vg of a low magni-tude leads to the ‘‘depletion’’ condition in which mobileholes are driven away from the interface, resulting in anegative charge of low density due to the presence ofimmobile acceptor atoms. Finally, if the Vg exceeds acertain threshold voltage (Vth), electrons accumulate atthe semiconductor-insulator interface at a density greaterthat the hole density, a situation opposite to that normallyfound with p-type semiconductors. This depletion of mobilecharge carriers followed by surface inversion is known asthe ‘‘field effect.’’ It forms an electrically conductive chan-nel between two other terminals, a source and a drain (seeFigure 1a). The drain current Id through the transistor is afunctions of drain and gate voltage. Without surface inver-sion (i.e., Vg < Vth,) the drain current is negligible, becausethe drain-to-substrate PN junction is reverse biased.
The MOSFET and its descendants are charge-controlleddevices. In analytical applications (e.g., ISFETs, Chem-FETs, and IMFETs), the change in charge density isbrought about by adsorption of one or more species presentin the solution onto the FET structure. In the ISFET, thegate metal is replaced with a conventional reference elec-trode (Ag/AgCl or Hg/Hg2Cl2), a solution containing anionic species of interest, and an electroactive material(membrane) capable of selective ion exchange with theanalyte (Fig. 1b), which is an example of a nonpolarizableinterface, that is, reversible charge transfer occursbetween the solution and the membrane. The analytegenerates a Nernst potential at the membrane-solutioninterface, which then modulates the drain current analo-gous to the manner in which changing the externallyapplied voltage does for the MOSFET.
IMMUNOLOGICALLY SENSITIVE FIELD–EFFECT TRANSISTORS 99
Figure 1. The hierarchy of field effect transistor. a. MOSFET. b.ISFET. c. IMFET.
Figure 2. Photomicrograph of an ISFET device packaged on PCB(23).

Direct-Acting (Label-Free) IMFET
The structure of the direct-acting IMFET is similar to thatof the ISFET, except that the solution-membrane interfaceis polarized rather than unpolarized. If the solution-mem-brane interface of the ISFET is ideally polarized (i.e.,charge cannot cross the interface), then the ISFET canmeasure the adsorption of charged species at the interfaceas shown below. As antibodies, antigens, and proteins aregenerally electrically charged molecules, the polarizedISFET could be used to monitor their nonspecific adsorp-tion at the solution-membrane interface. To render thepolarized ISFET selective for a given antigen and thuscreate the so-called IMFET, the specific antibody for thatantigen has to be immobilized on the surface of the ISFET(see Fig. 1c). The adsorption of this antigen would then bespecifically enhanced over other molecules in the solutionand the signal measured by the ISFET would be mostly dueto the adsorption of that particular antigen. The ISFETinteracts with the analyte through an ion-exchangemechanism, whereas the IMFET interaction is based onthe antigen-antibody reaction.
This design for the measurement of the adsorption ofcharged molecules is practicable only if charge cannot crossthe interface, which, thus, acts as an ideal capacitor. Aswill be seen, failure to achieve a perfectly polarizableinterface has a detrimental effect on the specificity ofthe IMFET. Few reports exist on direct-acting IMFETs;a brief analysis on the work of Janata research group willbe presented here (24–26). The capacitance of a polarizedinterface is described by electrical double-layer theory andis usually modeled as a series combination of two capaci-tors, CG and CH, where CG is the capacitance of the diffuseGouy–Chapman part of the double layer and CH is thecapacitance of the Helmholtz part of the double layer (27).The total capacitance, Cdl, is therefore
1=Cdl ¼ 1=CG þ 1=CH (1)
The electrical circuit through the gate of an ISFET with anideally polarized interface can be modeled, therefore, as aseries combination of CG, CH, and C0, as drawn in Fig. 3,where C0 is the capacitance of the insulator. A gate voltageVG is applied through a reference electrode between thesolution and the semiconductor. The process of adsorptionof charged molecules can be modeled as the transfer of a
quantity of charge from the solution to the surface of thetransistor as would occur if the switch were closed for ashort time period allowing the current source to transferthe charge. As adsorption occurs, the charge on each plateof the capacitors will change to accommodate the newcharge balance. The charge change on capacitor C0 isthe quantity of interest as it represents the charge inthe inversion layer of the FET, Qi, and will affect the draincurrent of the transistor, which can be directly measured.If a quantity of charge, Qads, is transferred by the adsorp-tion of charged molecules, then the charge change on C0,Qi, can be represented by
Qi ¼ QadsfC0=ðC0 þ CdlÞg (2)
Hence, only a fraction of the adsorbed charge will bemirrored in the transistor. When adsorption occurs,because electroneutrality must be observed in the system,an equal quantity of the opposite charge must either enterthe inversion layer of the FET or enter the double layerfrom the solution. Equation 2 predicts that part of theimage charge will come from the solution as ions enteringthe double layer with the adsorbing molecules. This frac-tion of charge, which is mirrored in the inversion layer ofthe FET, will be defined as b, and it is defined as
b ¼ Qi=Qads ¼ C0=ðC0 þ CdlÞ (3)
According to this model, only 0.3% of the charge on theadsorbing molecules will be mirrored in the inversion layerof the FET. The authors conservatively estimated b to be10�4. Considering the Id current as a function of thepotential at the solution-membrane interface, it is clearthat a relationship between the adsorbed charge and inter-facial potential, FSol-mem, is necessary to describe the che-mical response of the IMFET. This potential is merely thecharge change induced in the inversion layer divided by theinsulator capacitance:
FSol�mem ¼ Qi=C0 ¼ bQads=C0 (4)
Substitution of this expression in to Equations 5 and 6yields the response equations for the polarized ISFET. Theauthors derived the following expressions for the polarizedChemFET relating to Qi to the observed parameter, thedrain current (Id):
Id ¼ mnWC0
LVg � Vt � Er � fsol�mem � Vd
2
� �Vd
Vd <Vdsat (5)
and
Id ¼ mnWC0
2LðVg � Vt � Er � fsol�memÞ2 Vd >Vdsat (6)
where W is the width of the source-drain conductingchannel, mn is the effective electron mobility in thechannel, C0 isthe capacitance per unit area of the gateinsulator, L is the channel length, Vd is the drain-to-source voltage, Vg is the applied gate voltage, Vt is thethreshold voltage (for surface inversion), and Er is thepotential of the reference electrode.
The antibody-antigen binding reaction in itssimplest form can be expressed in terms of the following
100 IMMUNOLOGICALLY SENSITIVE FIELD–EFFECT TRANSISTORS
VG
Solution
CG CH C0
Semiconductor
Current source Switchi
Figure 3. Electrical model for the measurement of chargeadsorption with the CHEMFET.

biomolecular reaction:
Ab þ Ag@AbAg
where Ab is the antibody, Ag is the antigen, and AbAg is thecomplex. The reaction is characterized by the equilibriumconstant K,
K ¼ ½AbAg=½Ab½Ag (7)
The total charge change at the interface due to the binding,Qi, can be shown to be
Qi ¼ bQads ¼ bzFK½Ag½S1 þ ½Ag (8)
where z is the ionic charge of the antigen and [S] is thesurface concentration of binding sites (the surface concen-tration of immobilized antibodies before binding). Substi-tution of this expression into Equation 4 yields
FSol�mem ¼ bzFK½Ag½SC0ð1 þ ½AgÞ (9)
From Equation 9, the limit and range of the detection forthe IMFET can be predicted. Assume that the equilibriumconstant is in typical range from 105 to 109 (28), which givesa value of b ¼ 10�4. If the antibodies are immobilized witha surface concentration of 1 molecule per 10 nm2 and thecharge on an antigen is five electronic charges of an anti-body, the IMFET’s detection limit would be in the range of10�7 � 10�11M of concentration antibody concentration.The antigen concentration that gives 90% surface coveragecan similarly be calculated to be in the range of10�4 � 10�8 M. Similar equations can be derived for thecase where the antigen is immobilized at the interfacerather than the antibody. However, it has been arguedby many researchers that a static measurement concerningthe presence of a protein layer on an electrode is difficult,because the charged groups are, of course, neutralized bysurrounding counter ions (29). In order to avoid interfer-ence from other charged species present in the solution, thesubstrate for immobilization should preferably be inertand nonionic (24–30), which in aqueous solutions impliesa hydrophobic surface (31). Ideal conditions that arerequired in this coherence are a truly capacitive interfaceat which the immunological binding sites can be immobi-lized, a nearly complete antibody coverage, highly chargedantigens, and a low ionic strength.
Schasfoort et al. (32) extensively studied the require-ments for the construction of IMFET, which would oper-ate on the direct potentiometric sensing of proteincharges. The charge redistribution around immobilizedproteins at the insulator-solution interface can bedescribed by the double-layer theory (33). On adsorption,the diffuse layer of counter ions around the proteincharges may overlap with the diffuse layer of the electro-lyte-insulator interface. The thickness of diffuse-chargelayers is described by the Debye theory (34) and defined bythe distance where the electrostatic field has dropped to 1/e of its initial value:
k�1 ¼ e0ekT
2q2I
� �1=2
where k�1 is the Debye length, q the elementary change, kBoltzmann’s constant, T absolute temperature, e0 thepermittivity of vacuum, e the dielectric constant, and I ¼1=2
Pciz
2i represents the ionic strength in which ci is the
concentration of ion i with valency z (for 1-1 salt, I can bereplaced by c).
It can be seen from the equation that the Debye length isstrongly dependent on the ionic strength of the solution;more precisely, the Debye length is inversely proportionalto the square root of the ionic strength. Therefore, one canexpect that the chance of overlapping of the double layers ofthe substrate-solution interface and the adsorbed proteinscan be substantial only if low electrolyte concentrations areused, owing to the dimensions of the proteins (Fig. 4). In aphysiological salt solution, the Debye length is limited toca. 0.8 nm. It is obvious that only charge density changesthat occur within the order of a Debye length of the ISFETsurface can be detected. With the macromolecules, such asprotein, the dimensions are much larger (about 10 nm)than those of the double layer of the electrolyte-insulatorinterface, which means that, in such a case, most of theprotein charge will be at a distance greater than the Debyelength from the surface. If, moreover, on top of a monolayerof antibody molecules a second layer on antigens incoupled, it is obvious that the chance of overlap of thediffuse layers of antigens with electrolyte-substrate inter-face will decrease even more. At high ionic strength, theadditional charges of the antigen are nearly always locatedfar outside the diffuse layer at the ISFET surface and pureelectrostatic detection of these antigenic charges, there-fore, is impossible. In addition, a theoretical approach is
IMMUNOLOGICALLY SENSITIVE FIELD–EFFECT TRANSISTORS 101
Figure 4. Schematic representation of the potential distributionin a direct-acting IMFET. K�1 is the Debye length; dAb, dimensionof macromolecule (e.g., antibody).

given based on the Donnan equilibrium description, whichprovides an insight into the potential and ion distributionin the protein layer on the IMFET (32). It is shown that theDonnan potential and the internal pH shift, induced by theprotein charges, compensate each other to a greater extent.If the ISFET shows Nernstian behavior, it can be concludedthat a direct detection of protein charge is impossible. Inorder to construct an IMFET, a reference FET or ISFETwith a low sensitivity would satisfy the detection of thepartially compensated Donnan potential in the presence ofan adsorbed protein layer. However, the application of suchas IMFET is limited to samples with low ionic strength.
An alternative, indirect approach is proposed by Schas-foort et al. (35,36) for the detection of an immunologicalreaction taking place in a membrane, which covers the gatearea of an ISFET (Figs. 5a and 5b). The protein layer on thegate is exposed to pulse-wise increases in electrolyte con-centration.Asaresult, ionswilldiffuse into theprotein layerand, because of a different mobility of anions and cations,transients in potential will occur at the protein-membranesolution interface. The ISFET, being a voltage-sensitivedevice, is suitable for the measurement of these transients.As the mobility of ions is a function of the charge density inthe protein membrane, changes in the charge density willinfluence the size and direction of the transients. By expos-ing the ISFETtoapH gradientanda continuousseriesof ionconcentration pulses, the isolectric point of the protein layercan be detected and, thus, changes as the result of animmunological reaction. When a membrane separates two
compartments with different electrolyte concentrations, apotential gradient can be measured. The different diffusionrates of anions and cations through the membrane set up astatic membrane potential, which can be expressed by theNernst–Planck equation (33):
fm ¼ RT
F:U:In
a2
a1U ¼ Dþ � D�
Dþ þ D�
where fm ¼ the membrane potential, RT and F have theircommon meaning, U ¼ the ratio of the diffusion coefficients(Dþ and D�) of cations and anions, and a1 and a2 are theelectrolyte activities in the respective compartments. Theion-step method is further developed by Schasfoort andEijsma (37), and a detailed theoretical understanding ofthe ion-step response has been presented by Eijiki et al. (38).Recently, an impedance spectroscopy method was usedtocharacterize immobilized protein layers on the gate ofan ISFET and to detect an antigen-antibody recognitionevent (39).
Indirect-Sensing IMFET
Although the ion-step method is an indirect way of mea-suring antigen-antibody reaction that occurs on the gateregion of an ISFET, it does not involve any reagents thatenhance or amplify the signal intensity. Many approachesto transduction of the antibody-antigen combining eventare indirect. They are based on the ability of an enzymelabel to produce electroactive substances within a shortspan of time. Antibody or antigen is immobilized on thegate area of pH-FET. In the competitive binding assay, thesample antigen competes with enzyme-labeled antigen forthe antibody-binding sites on the membrane. The mem-brane is then washed, and the probe is placed in a solutioncontaining the substrate for the enzyme. IMFETs based onthe sandwich assay are applicable for measuring largeantigens that are capable of binding two different antibo-dies. Such sensors use an antibody that binds analyte-antigen, which then binds an enzyme-labeled second anti-body. After removal of the nonspecifically adsorbed label,the probe is placed into the substrate-containing solution,and the extent of the enzymatic reaction is monitoredelectrochemically. Gate voltage is supplied by referenceelectrode, such as Ag/AgCl or a Hg/Hg2Cl2 electrode, that isimmersed in a sample solution. It is, however, difficult tomake a small conventional electrode, which prevented theIMFET from being miniaturized as a whole. When a noblemetal, such as platinum or gold, is used as a referenceelectrode, the potential between the metal electrode andsample solution fluctuates. The fluctuation makes stablemeasurement impossible. A method to cancel the fluctua-tion using a reference ISFET (REFET) is reported. A com-bination of two kinds of ISFET is used, one of which detects aspecific substance whereas the other (REFET) does notdetect it (Fig. 6). Thus, measuring the differential outputbetweenthetwoISFETscancancel thepotentialfluctuationin the sample solution and drift due ISFET (40–42).
Most of the indirect-sensing IMFET studies are carriedout using urease-conjugated antibodies. Urea is used as asubstrate. The immunosensor uses a reaction wherein ureais hydrolyzed by the urease-labeled second antibody. The
102 IMMUNOLOGICALLY SENSITIVE FIELD–EFFECT TRANSISTORS
Time (s)
C1
C2
0 2 4
(mV)
ø
Figure 5. An ion-step arrangement: an ISFET exposed to anincreased electrolyte concentration. Transient potential canbemeasured, developing from transient transport of ions acrossthe membrane, which is caused by stepwise changes inelectrolyte concentration. The ISFET response f as a result ofthe stepwise changes in electrolyte concentration (C1–C2).

reaction is
H2NCONH2 þ 2H2O þ Hþ! 2NHþ4 þ HCO�
3
According to the reaction, the pH value in the membranebecomes high. On the other hand, on the ISFET surfacewith inactive antibody membrane, the above reaction doesnot occur and pH remains constant. Hence, by measuringthe differential output between two ISFETs, only pHchanges due to urea hydrolysis are detected. In some cases,the authors used antibodies conjugated with the glucoseoxidase. These sensors use oxidation of glucose by glucoseoxidase. In the reaction, gluconic acid is produced and thepH value in the glucose oxidase immobilized membranebecomes low. To achieve a high sensitivity of horseradishperoxidase (HRP) detection, various substrates, eitheralone or in combination, are tested and the result is shownin Fig. 7.
PRACTICE
Direct-Acting IMFET
The rationale for attempting to combine the fields ofimmunology and electrochemistry in the design of analy-tical devices is that such a system should be sensitive due tothe characteristics of the electrochemical detector whileexhibiting the specificity inherent in the antigen-antibodyreaction. The ideal situation would be to detect the bindingof immunoreagents directly at an electrode, for example, bychanges in surface potential, which could be trulydescribed as an immunosensor (43,44). Much more efforthas been committed to develop transducers, which rely ondirect detection of antigen by the antibody immobilized onits surfaces (or vice versa). In 1975, Janata immobilized asugar-binding protein Concanavalin A on a PVC-coatedplatinum electrode and studied its responses in the pre-sence of sugar (30). The potential of the electrode withrespect to an Ag/AgCl electrode changed owing to adsorp-tion of the charged macromolecule. Although the systemreported was not based on an immunochemical reaction,the finding of a potentiometric response stimulated furtherinvestigations in this field. Direct potentiometric sensing ofantigen human choriogonadotropin (hCG) with an anti-hCG antibody sensitized titanium wire resulted in 5 mVshifts with respect to a saturated calomel electrode (45).The change in potential was explained by a simple chargetransfer model.
In 1978, Schenck first proposed a concept of directimmunosensing by an ISFET (46,47). He suggested usingFET with, on the gate region, a layer of antibody specific toa particular antigen. Replacement of electrolyte solutionwith another electrolyte solution-containing antigenshould alter the charge of the protein surface layer dueto the antigen-antibody reaction, thus affecting the chargeconcentration in the inversion layer of the transistor. Thecorresponding change in the drain current would thenprovide a measure of the antigenic protein concentrationin the replacement solution. Many research groups havetried to realize the proposed concept of Schenck, but theresults obtained are meager (48,49). Collins and Janataimmobilized a PVC membrane containing cardiolipin anti-gen onto the gate of a previously encapsulated ChemFET(50). They demonstrated that the solution-membraneinterface was somewhere between a polarized and a non-polarized interface, based on the measured membraneexchange current density. The measured potential wastherefore a mixed potential deriving out of the permeationof Naþ and Cl� ions into and out of the membrane. Thechange in potential following specific binding of antibody tothe membrane was due primarily to a perturbation of themixed potential, rather than to the adsorbed charge fromthe antibody itself. Therefore, the device could not beconsidered selective for the immunoreactive species ofinterest. Besides, Janata reported that it is impossible toconstruct an IMFET without having an ideal polarizedsolution-insulator interface. He proclaimed all of his ear-lier results as artifacts (51). In spite of these practicaldifficulties, Gotoh et al. (52) published results obtainedwith an IMFET sensitive to Human serum albumin (HSA).
IMMUNOLOGICALLY SENSITIVE FIELD–EFFECT TRANSISTORS 103
Figure 6. Differential measurement setup for an IMFET.
pH-c
hang
e (∆
pH
)
0.8
0.6
0.4
0.2
0
0 20 40 60 80 100
3
4
2
1
H2O2
Time, S
Figure 7. Typical ISFET responses for HRP (10�9 M) substrates(1) Ascorbic Acid þ O-phenylenediamine (OPD); (2) OPD; (3)piodophenolþ luminol; (4) catechol.
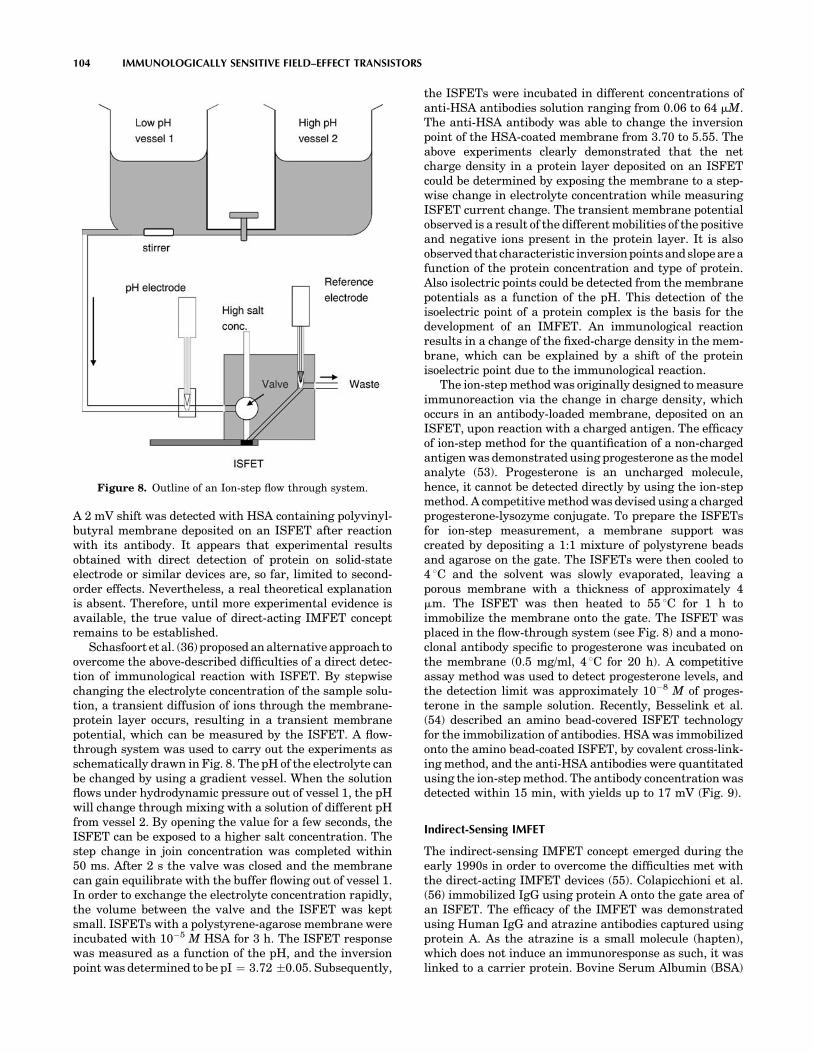
A 2 mV shift was detected with HSA containing polyvinyl-butyral membrane deposited on an ISFET after reactionwith its antibody. It appears that experimental resultsobtained with direct detection of protein on solid-stateelectrode or similar devices are, so far, limited to second-order effects. Nevertheless, a real theoretical explanationis absent. Therefore, until more experimental evidence isavailable, the true value of direct-acting IMFET conceptremains to be established.
Schasfoort et al. (36) proposed an alternative approach toovercome the above-described difficulties of a direct detec-tion of immunological reaction with ISFET. By stepwisechanging the electrolyte concentration of the sample solu-tion, a transient diffusion of ions through the membrane-protein layer occurs, resulting in a transient membranepotential, which can be measured by the ISFET. A flow-through system was used to carry out the experiments asschematically drawn in Fig. 8. The pH of the electrolyte canbe changed by using a gradient vessel. When the solutionflows under hydrodynamic pressure out of vessel 1, the pHwill change through mixing with a solution of different pHfrom vessel 2. By opening the value for a few seconds, theISFET can be exposed to a higher salt concentration. Thestep change in join concentration was completed within50 ms. After 2 s the valve was closed and the membranecan gain equilibrate with the buffer flowing out of vessel 1.In order to exchange the electrolyte concentration rapidly,the volume between the valve and the ISFET was keptsmall. ISFETs with a polystyrene-agarose membrane wereincubated with 10�5 M HSA for 3 h. The ISFET responsewas measured as a function of the pH, and the inversionpoint was determined to be pI ¼ 3.72 �0.05. Subsequently,
the ISFETs were incubated in different concentrations ofanti-HSA antibodies solution ranging from 0.06 to 64 mM.The anti-HSA antibody was able to change the inversionpoint of the HSA-coated membrane from 3.70 to 5.55. Theabove experiments clearly demonstrated that the netcharge density in a protein layer deposited on an ISFETcould be determined by exposing the membrane to a step-wise change in electrolyte concentration while measuringISFET current change. The transient membrane potentialobserved is a result of the different mobilities of the positiveand negative ions present in the protein layer. It is alsoobserved that characteristic inversion points and slope are afunction of the protein concentration and type of protein.Also isolectric points could be detected from the membranepotentials as a function of the pH. This detection of theisoelectric point of a protein complex is the basis for thedevelopment of an IMFET. An immunological reactionresults in a change of the fixed-charge density in the mem-brane, which can be explained by a shift of the proteinisoelectric point due to the immunological reaction.
The ion-step method was originally designed to measureimmunoreaction via the change in charge density, whichoccurs in an antibody-loaded membrane, deposited on anISFET, upon reaction with a charged antigen. The efficacyof ion-step method for the quantification of a non-chargedantigen was demonstrated using progesterone as the modelanalyte (53). Progesterone is an uncharged molecule,hence, it cannot be detected directly by using the ion-stepmethod. A competitive method was devised using a chargedprogesterone-lysozyme conjugate. To prepare the ISFETsfor ion-step measurement, a membrane support wascreated by depositing a 1:1 mixture of polystyrene beadsand agarose on the gate. The ISFETs were then cooled to4 8C and the solvent was slowly evaporated, leaving aporous membrane with a thickness of approximately 4mm. The ISFET was then heated to 55 8C for 1 h toimmobilize the membrane onto the gate. The ISFET wasplaced in the flow-through system (see Fig. 8) and a mono-clonal antibody specific to progesterone was incubated onthe membrane (0.5 mg/ml, 4 8C for 20 h). A competitiveassay method was used to detect progesterone levels, andthe detection limit was approximately 10�8 M of proges-terone in the sample solution. Recently, Besselink et al.(54) described an amino bead-covered ISFET technologyfor the immobilization of antibodies. HSA was immobilizedonto the amino bead-coated ISFET, by covalent cross-link-ing method, and the anti-HSA antibodies were quantitatedusing the ion-step method. The antibody concentration wasdetected within 15 min, with yields up to 17 mV (Fig. 9).
Indirect-Sensing IMFET
The indirect-sensing IMFET concept emerged during theearly 1990s in order to overcome the difficulties met withthe direct-acting IMFET devices (55). Colapicchioni et al.(56) immobilized IgG using protein A onto the gate area ofan ISFET. The efficacy of the IMFET was demonstratedusing Human IgG and atrazine antibodies captured usingprotein A. As the atrazine is a small molecule (hapten),which does not induce an immunoresponse as such, it waslinked to a carrier protein. Bovine Serum Albumin (BSA)
104 IMMUNOLOGICALLY SENSITIVE FIELD–EFFECT TRANSISTORS
Figure 8. Outline of an Ion-step flow through system.

was conjugated to ametryn sulfoxide, which has structuralsimilarity with atrazine, and the ametryn-BSA conjugatewas injected into rabbit to raise antibodies. A sandwichassay format was used to detect Human IgG and a compe-titive assay format was used to quantitate atrazine con-centration. The antigen-antibody reaction was monitoredby the addition antihuman IgG-GOD conjugate andametryn-GOD, respectively. Glucose was used as the sub-strate and the pH variation was detected by the ISFET.The sensitivity of the assay was 0.1 mg/ml and 1 ppb forhuman IgG and atrazine, respectively. An ISFET-basedimmunosensor was demonstrated for the detection of bac-terial (Clostridium thermocellum) cells. The analysisincluded the reaction of antibacterial antibodies with cellsin suspension or after covalent immobilization of cells onporous photoactivated membranes and, subsequently, therevelation of bound antibodies by the conjugate of protein Aand HRP and the quantitation of enzyme activity withISFET. The sensitivity of the sensor was within a rangeof 104–107 cells per ml (57). Selvanaygam et al. (23)reported ISFET-based immunosensors for the qunatitationof b-Bungarotoxin (b-BuTx), a potent presynaptic neuro-toxin from the venom of Bungarus multicinctus. A murinemonoclonal antibody (mAb 15) specific to b-BuTx wasimmobilized on the gate area, and the antigen-antibodyreaction was monitored by the addition of urease-conju-gated rabbit anti-b-BuTx antibodies. The sensor detectedtoxin level as low as 15.6 ng/ml. The efficacy of the sensorfor the determination of b-BuTx from B. multicinctusvenom was demonstrated in the mouse model.
An immunological Helicobacter pylori urease analyzer(HPUA), based on solid-phase tip coated with a monoclonalantibody specific to H. pylori’s urease and ISFET, wasreported by Sekiguchi et al. (58). A solid-phase tip,with an inner diameter of 0.55 mm, coated with the mono-clonal antibody, was incubated for 15 min at room tem-perature in an endoscopically collected gastric mucussample. The activity of urease captured on the inner sur-face of the solid-phase tip was measured by coupling it withan ISFET in a measuring cell containing urea solution. ThepH change of urea solution after 55 s of the enzymatic
reaction inside the tip was measured by withdrawing 1.1 mlof solution toward the upstream of the tip, where themeasuring ISFET was installed. One cycle of measurementwas completed in 17.5 s, and the sensitivity of system was0.2 m IU/ml. The calibration curve for the quantitation ofurease is shown in Fig. 10. Clinical studies were carried outwith 119 patients (75 males and 44 females with an aver-age age of 51, ranging from 13 to 79) who underwentgatroduodenoscopy and judged necessary to evaluate theinfection of H. pylori and urea breath test (UBT) was usedas a gold standard. Thirty-three of the UBT positive 36patients were positive, and 81 of UBT negative 83 patientswere negative by HPUA resulting in the 92% sensitivityand 98% specificity.
An IMFET for the detection of HIV-specific antibodiesbased on a combination of ELISA principle and ISFET flowinjection analysis setup was presented by Aberl et al. (59).The active sensing components consist of a reaction car-tridge containing a carrier with the immobilized receptorlayer and an ISFET sensor mounted in a flow-through cell.A flow cell was constructed using two ISFET sensors onone in a two-channel configuration (Fig. 11). The liquid
IMMUNOLOGICALLY SENSITIVE FIELD–EFFECT TRANSISTORS 105
0
–5
–10
–15
–200.00 0.10 0.20 0.30 0.40 0.50
Time (s)
Pot
entia
l (m
V)
Figure 9. Ion-step responses of HSA-coated ISFET before (uppersolid curve) and after incubation (for 15 min) with undiluted anti-HSA (lower solid curve) and anti-BSA (dashed curve). Ion steppingwas performed at pH 4.02.
∆pH
2.4
2.2
2.0
1.8
1.6
1.4
1.2
1.0
0.8
0.6
0.4
0.2
0
Final concentration of Hp urease (mIU/ml)
0.01 0.1 1 10 100 1000 10000
Cut off: ∆pH =0.010
Figure 10. A standard curve for HPUA.
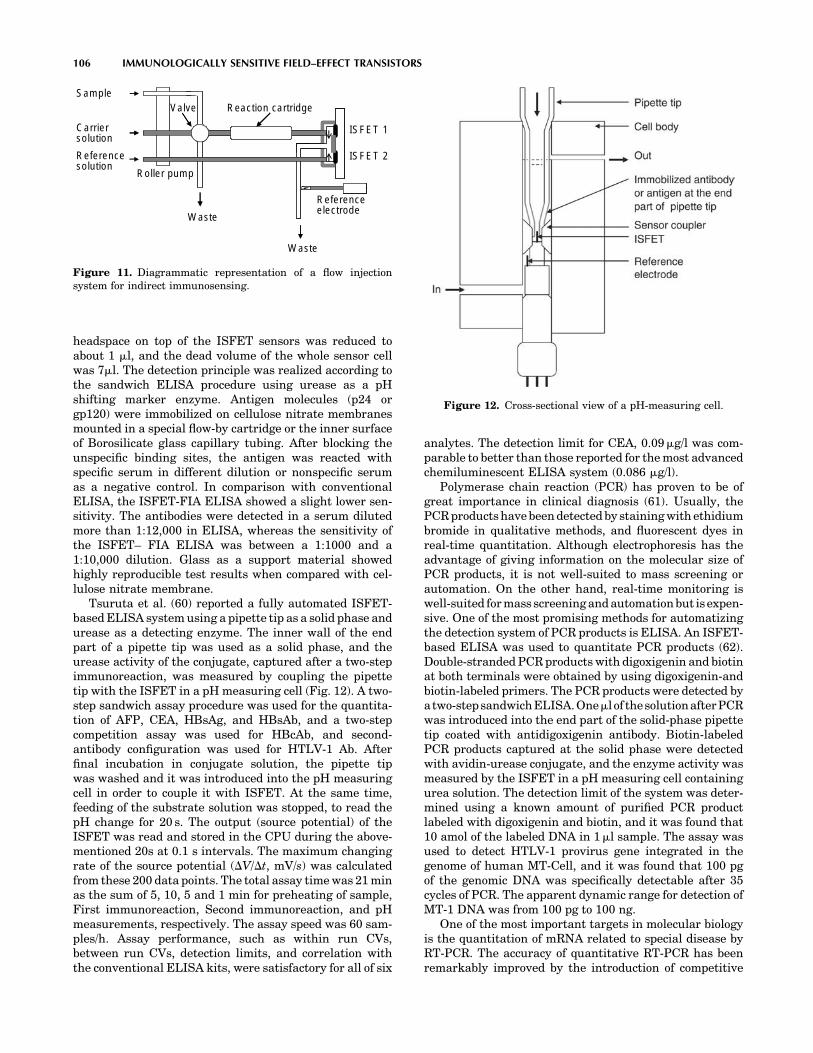
headspace on top of the ISFET sensors was reduced toabout 1 ml, and the dead volume of the whole sensor cellwas 7ml. The detection principle was realized according tothe sandwich ELISA procedure using urease as a pHshifting marker enzyme. Antigen molecules (p24 orgp120) were immobilized on cellulose nitrate membranesmounted in a special flow-by cartridge or the inner surfaceof Borosilicate glass capillary tubing. After blocking theunspecific binding sites, the antigen was reacted withspecific serum in different dilution or nonspecific serumas a negative control. In comparison with conventionalELISA, the ISFET-FIA ELISA showed a slight lower sen-sitivity. The antibodies were detected in a serum dilutedmore than 1:12,000 in ELISA, whereas the sensitivity ofthe ISFET– FIA ELISA was between a 1:1000 and a1:10,000 dilution. Glass as a support material showedhighly reproducible test results when compared with cel-lulose nitrate membrane.
Tsuruta et al. (60) reported a fully automated ISFET-based ELISA system using a pipette tip as a solid phase andurease as a detecting enzyme. The inner wall of the endpart of a pipette tip was used as a solid phase, and theurease activity of the conjugate, captured after a two-stepimmunoreaction, was measured by coupling the pipettetip with the ISFET in a pH measuring cell (Fig. 12). A two-step sandwich assay procedure was used for the quantita-tion of AFP, CEA, HBsAg, and HBsAb, and a two-stepcompetition assay was used for HBcAb, and second-antibody configuration was used for HTLV-1 Ab. Afterfinal incubation in conjugate solution, the pipette tipwas washed and it was introduced into the pH measuringcell in order to couple it with ISFET. At the same time,feeding of the substrate solution was stopped, to read thepH change for 20 s. The output (source potential) of theISFET was read and stored in the CPU during the above-mentioned 20s at 0.1 s intervals. The maximum changingrate of the source potential (DV/Dt, mV/s) was calculatedfrom these 200 data points. The total assay time was 21 minas the sum of 5, 10, 5 and 1 min for preheating of sample,First immunoreaction, Second immunoreaction, and pHmeasurements, respectively. The assay speed was 60 sam-ples/h. Assay performance, such as within run CVs,between run CVs, detection limits, and correlation withthe conventional ELISA kits, were satisfactory for all of six
analytes. The detection limit for CEA, 0.09mg/l was com-parable to better than those reported for the most advancedchemiluminescent ELISA system (0.086 mg/l).
Polymerase chain reaction (PCR) has proven to be ofgreat importance in clinical diagnosis (61). Usually, thePCR products have been detected by staining with ethidiumbromide in qualitative methods, and fluorescent dyes inreal-time quantitation. Although electrophoresis has theadvantage of giving information on the molecular size ofPCR products, it is not well-suited to mass screening orautomation. On the other hand, real-time monitoring iswell-suited for mass screening and automation but is expen-sive. One of the most promising methods for automatizingthe detection system of PCR products is ELISA. An ISFET-based ELISA was used to quantitate PCR products (62).Double-stranded PCR products with digoxigenin and biotinat both terminals were obtained by using digoxigenin-andbiotin-labeled primers. The PCR products were detected byatwo-stepsandwichELISA.Oneml of thesolutionafterPCRwas introduced into the end part of the solid-phase pipettetip coated with antidigoxigenin antibody. Biotin-labeledPCR products captured at the solid phase were detectedwith avidin-urease conjugate, and the enzyme activity wasmeasured by the ISFET in a pH measuring cell containingurea solution. The detection limit of the system was deter-mined using a known amount of purified PCR productlabeled with digoxigenin and biotin, and it was found that10 amol of the labeled DNA in 1ml sample. The assay wasused to detect HTLV-1 provirus gene integrated in thegenome of human MT-Cell, and it was found that 100 pgof the genomic DNA was specifically detectable after 35cycles of PCR. The apparent dynamic range for detection ofMT-1 DNA was from 100 pg to 100 ng.
One of the most important targets in molecular biologyis the quantitation of mRNA related to special disease byRT-PCR. The accuracy of quantitative RT-PCR has beenremarkably improved by the introduction of competitive
106 IMMUNOLOGICALLY SENSITIVE FIELD–EFFECT TRANSISTORS
ISFET 1
ISFET 2
Reaction cartridge
Roller pump
Sample
Waste
Reference electrode
Valve
Waste
Carriersolution
Referencesolution
Figure 11. Diagrammatic representation of a flow injectionsystem for indirect immunosensing.
Figure 12. Cross-sectional view of a pH-measuring cell.

RT-PCR, in which a synthetic RNA is used as an internalstandard (63). Tsuruta et al. (64) developed a ISFET-ELISA method for the qantitatiion of mRNA in clinicalsamples. In this method, a fixed amount of a syntheticRNA, pRSET RNA, was added as internal standard to thesolution of target RNA (IL-1b) after reverse transcription,PCR was carried out using digoxigenin-labeled sense pri-mer and biotin-labeled antisense primer for IL-1b, andFITC-labeled sense primer and a biotin-labeled antisenseprimer for pRSET. The double-stranded PCR products ofIL-1b and pRSET were captured by two solid-phase pipettetips, one coated with antidigoxigenin antibody and anotherwith anti-FITC antibody, respectively, and sandwiched byan avidin-urease conjugate, whose activity was measuredwith ISFET. The ratio of the signal intensity for IL-1b tothat for pRSET was used to quantitate the concentration ofIL-1b. A calibration curve was obtained using a knownamount of AW109 RNA as an external standard in place ofIL-1b m RNA. It was found that 102–106 copies of IL-1bmRNA were measurable by the present method. Expres-sion levels of IL-1b mRNA in clinical samples, such asmonocytes of peripheral blood or synovial cells frompatients with RA or OA, were determined.
Practical Limitations
In this section, we shall address some practical problemsthat have been limiting factors in the commercial applica-tion of IMFETs. The widespread use of IMFETs for appli-cations ranging from medical diagnosis to industrialprocess control or environmental monitoring has not actu-ally happened. The underlying reasons for this situationfall into two main categories, those that are inherent to thetransistor, such as material, encapsulation, and referenceelectrode, and those problems common to its application asan immunosensor function, such as, antibody immobiliza-tion, stability, and durability. The pH sensing propertiesand drift behavior of the ISFET is the main limiting factorin the commercial breakthrough of ISFET. After the inven-tion of the ISFET, initially the only gate material used wasSiO2. Although SiO2 showed pH, sensitivity of 20 to 40 mV/pH, the thermally grown gate oxide loses its isolationproperty within a few hours of immersion in a solution.In order to isolate this gate oxide from the solution, anotherisolating layer, such as Si3N4, Al2O3, or Ta2O5, has to beplaced on top of this gate oxide. A layer of Si3N4 on top ofSiO2 showed 45–50 mV/pH, and other layers, such as Al203
and Ta2O5, showed even higher pH sensitivity, 53–57 mV/pH and 55–59 mV/pH, respectively (65). Drift rate for Si3N4
is reported as 1 mV/h and for Al2O3 and Ta2O5 0.1–0.2 mV/h after 1000 min of operation at pH 7.0. In most of the workon IMFETs published so far, these three gate materials,Si3N4, Al2O3, and Ta2O5, have been used. IMFETs are alsosensitive to light and temperature (66).
The pH-sensitive ISFETs can be fabricated by means ofstandard MOS technology, except for the metallizationstep. However, after dicing the wafers into single chips,the substrate becomes exposed at the edges of the senor.Encapsulation and packaging are two final processingsteps that determine reliability and durability (lifetime)of the IMFETs. In order to achieve high quality sensors, all
electrical components have to be isolated from their sur-roundings. Several reports exist on the encapsulation andpackaging of ISFET devices for pH application (21). Thesimplest method of isolating these sides is encapsulationwith epoxy-type resins. The most important ISFET char-acteristics, such as stability, accuracy, and durability, alsopertain to the reference electrode. One of the major hurdlesin IMFETs is the lack of a solid-state reference electrode.The small IMFETs have to be combined with a conven-tional KCl-solution-filled reference electrode. In order toachieve miniaturized IMFET, it is important to miniatur-ize the reference electrode. In general, two approacheshave been followed: reference FETs (REFETs), which areused in an ISFET/REFET/quasi-reference electrode setup,and miniaturized conventional reference electrodes. In thefirst approach, attempts have been made to cover theISFET surface with a pH-insensitive layer or to renderthe surface pH insensitive by chemical modification. In thesecond approach, the structure of a conventional electrode(mostly Ag/AgCl type) is miniaturized partially or comple-tely on a silicon wafer. Its potential is a function of con-centration of chloride ions. They are supplied either froman internal electrolyte reservoir formed by an anisotropicetching in the silicon wafer or by adding chloride ions intothe test solution.
Some of the technological factors such as pH sensitivityand drift can now be overcome with the existing technol-ogy. A hurdle peculiar to direct-acting IMFET is the need toprovide a thin but fully insulating layer (membrane)between the antigen or antibody coating and the semicon-ductor surface. Such a membrane must be thin enough toallow a small charge redistribution occurring as a result ofanalyte (antigen-antibody) binding to exert a detectablechange in electrical field. Conversely, it must also provideadequate insulation to prevent dissipation of the field byleakage of ions. Even assuming that the ideal insulatingmembrane can be developed, a further hurdle may need tobe overcome. Surface charges and hydrogen binding sites ofproteins cause a counter-ion shell (double-layer) and struc-tured water shells to surround the molecules; these regionsof structured charge will inevitably contribute to the elec-trical field affecting the FET gate. Pending these break-throughs, the development of direct-acting IMFETsappears to be stagnant.
The immobilization methods used for immunosensorsinclude a variety of adsorption, entrapment, cross-linking,and covalent methods. In general, a covalent immobiliza-tion method consisting of silanization step and subsequentcoupling procedure via glutaraldehyde has been used toimmobilize antibodies onto the gate region (67,68). How-ever, no methodical investigation about antibody stability,storage, and lifetime exists. Reproducible regeneration ofthe sensing area is one of the major problems met withIMFETs that have been used for continual monitoring orrepeat usage. The need for renewal of the sensing surfacederives from the high affinity constants derived from thestrong antigen-antibody reaction. Two different strategieshave been used to achieve the renewal of the sensing sur-face, breakage of the antigen-antibody bond and reusing theimmunologic reagent immobilized on the solid phase. Asecond alternative is the elimination of antigen-antibody
IMMUNOLOGICALLY SENSITIVE FIELD–EFFECT TRANSISTORS 107

complex from the solid support and immobilization of freshimmunologic material. Dissociation of antigen from anti-body is usually carried out in low pH and high ionic strengthsolutions. Protein A was chemically immobilized onto thegate surface by using a polysiloxane layer of [3-(2-ami-noethyl)aminopropyl]trimethoxysilane (APTES) andcross-linking agent such as glutaraldehyde. Reversibilityof the linkage between Protein A and antibodies in order torestore the device for the next measurement was studied bybreaking the antibody-antigen complex formed on Protein Ausing a variety of reagents. Glycine buffer pH 2 and 3 andMgCl2 3.5 M were found to be more effective when comparedwith other tested reagents due to high ionic strength (55).Selvanayagam et al. (23) studied the reusability of anISFET sensor by removing the antibody membrane fromthe gate area. The regenerated devices tested were reportedto function normally five times, although a considerableamount of time was required for the regeneration process.Recently, IMFET using magnetic particle and integrated toflow injection system has been described to overcome theproblem of regeneration (69,70). The immunological mate-rial was immobilized on the surface of magnetic particlesand were transported by a flow system, and were retainedon the gate area of the ISFET by a magnetic field producedby a magnet (Fig. 13). The regeneration of immunologicmaterials was achieved by releasing the magnetic field,thus freeing those particles that were washed by the flowsystem, and new magnetic particles were injected andretained on the surface of transducer by reacting the mag-netic field. A fresh and reproducible surface was thus pro-duced, ready for the next analytical cycle.
The main barrier to the successful introduction ofIMFETs for clinical testing is undoubtedly the high per-formance and automation level of the machines thatalready exist in centralized laboratories. They have beendeveloped specifically for use with either immunoassay orclinical chemistry. Immunoassay performance is continu-ally being optimized and assay times have been reducedover the past few years. Depending on the parameter, theassay time can be as low as 6 min and the majority of thelarger machines could carry out between 100 to 200 testesper hour. IMFETs must be compared with these methodswith respect to assay time, sensitivity, and cost. The needfor in-built calibration has been frequently encountered insophisticated quantitative IMFETs. Although feasible andacceptable in laboratory-based instrumentation, it remains
a major problem in small disposable IMFET devices. Tofacilitate the increased use of IMFETs, one should look forreal tests and standards that prototypes can meet, based oncurrent diagnostic needs and perceived future develop-ment. The progress of IMFET beyond the experimentallaboratory level is mainly dependent on how skillfully itsdevelopment and marketing are combined with parameterselection.
FUTURE DIRECTIONS
A key consideration in antibody immobilization to the gatearea is to maintain, reproducibly, the highest possiblebinding activity after immobilization while conservingthe amount of antibody used. However, many aspects, bothfundamental and more applied, require in-depth studybefore IMFETs can become successful commercial device,including improved control of biomolecule immobilizationand novel immobilization strategies; enhancement of bio-molecule stability and retention of activity in vitro; and theability to reproduce the high signal-to-noise ratios obtainedin simple test solutions in ‘‘real’’ samples such as blood orwater. The IMFETs tends to respond nonspecifically to anymolecule bound to the surface; hence, it affects the mea-surement parameter to some extent. The specificity ofanalyte detection, therefore, relies entirely on achievinghigh ratios of specific to nonspecific binding, which, in thecontext of low concentrations of analyte in blood, canrepresent a formidable problem. Reduction of nonspecificbinding is another area that will continue to be of majorimportance. The ability to immobilize ordered antibodieswill maximize antigen binding to a given surface whilereducing the availability of nonbinding site sections of theimmobilized antibody, or uncovered surface areas, whichcan promote nonspecific interaction with other componentsin the sample. The potential advantages of using Fabfragments rather than more complex intact antibodies(such as IgG) could be explored.
IMFETs, similar to immunoassays, involve multistepprocedures, including washing steps, incubation periods,and quite complex signal generation protocols. It is likelythat research efforts into a novel signal amplificationsystem, without the normally associated complicationsof multi-reagents or multistep protocol will be of increas-ing importance. The irreversibility of antigen-antibodyinteraction presents a major challenge in designingIMFETs for continual monitoring or repeated usage.Treatment of an antibody-antigen complex with a mildlydenaturing medium for a short time interval has shownsome promise in regenerating sensor surfaces. Develop-ment of enhanced denaturation conditions, which opti-mize dissociation of antigen while minimizing irreversibleloss of antibody structural integrity, may be possible inthe near future. The use of catalytic antibodies in immu-nosensors has been proposed. The ability of catalyticantibodies to catalyze the hydrolysis of phenyl acetatewith the formation of acetic acid allows integration of pH-sensitive microelectrodes to give a potentiometric immu-nosensing system (71). The advantage of catalytic anti-bodies over normal antibodies is that reversibility of
108 IMMUNOLOGICALLY SENSITIVE FIELD–EFFECT TRANSISTORS
Magnetic particle
ISFETMagnet
Rabbit IgG
Ureaseconjugate2nd antibody
CO2 + 2NH3
H2 N-CO-NH2
H2O
Figure 13. Schematic representation of the magnetoIMFET.

response is readily achieved, because bound antigenreacts to form a product with a low affinity for the anti-body, resulting in dissociation. As the binding event isfollowed immediately by a catalytic reaction and release ofthe reaction products, the molecular recognition site isregenerated with each molecular reaction; as a conse-quence, catalytic antibodies can be used to create rever-sible IMFETs for continuous monitoring of analyteconcentrations. Improvements in sensitivity and cross-reactivity are likely to be achieved as a result of theincreasing interest in this field of research.
CONCLUSION
Although the ISFET concept has existed for over 30 years,its practical applications such as the IMFETs are stillemerging very slowly. The relatively slow rate of progressof IMFET technology from inception to fully functionalcommercial devices for these applications is a reflection oftechnology-related and market factors. In general, twoapproaches have been followed in the past to realizeIMFETs. In the first approach, antigen-antibody reactionon an immonbilized membrane was monitored withoutany addition of labels. The second approach takes theadvantage of an enzyme label to indirectly monitoringthe antigen-antibody reaction using pH-sensitive FET.The development of IMFETs that directly detectantigen-antibody reaction is extremely challenging;only a few examples exist, the majority of which arewithout valid theoretical explanation. Although it showsenormous promise in the early stages of development, aneffective, reliable, and analyte-selective direct-actingIMFET sensor is yet to be constructed. The ion-stepmethod represents a novel measurement concept forpotentiometric detection and quantification of anadsorbed antigen or antibody molecule in which modifiedISFETs are used. Many approaches to transduction of theantibody-antigen combining event are indirect, necessa-rily involving the use of reagents admixed with analyte,and therefore cannot be seen as routes to development of‘‘True’’ IMFETs. Nevertheless, such reagent-dependent,indirect-sensing IMFETs may offer real commercialadvantages over the current generation direct-actingIMFET readout technologies. The clinical diagnostic fieldoffers real opportunities for the exploitation of IMFET,but because it is a highly competitive and well-establishedmarket, those who wish to introduce new products mustcarefully target their market niche. IMFETs will have tocompete with such technology on the basis of factors suchas cost, ease of use, sensitivity, operational stability,robustness, and shelf-life.
BIBLIOGRAPHY
1. Catty D. editor, Antibodies Volume 1. A Practical Approach.Washington, DC: IRL; 1988.
2. Mayforth RD. Designing Antibodies. New York: AcademicPress; 1993.
3. Johnstone AP, Turner MW. Immunochemistry 1. A PracticalApproach. New York: IRL; 1997.
4. Bluestein BI, Walczak IM, Chen SY. Fiber optic evanescentwave immunosensors for medical diagnostics. Trends Biotech-nol 1990;8:161–168.
5. Gosling JP, A decade of development in immunoassay meth-odology. Clin Chem 1990;36:1408–1427.
6. Kemeny DM, A Practical Guide to ELISA. New York: Perga-mon Press; 1991.
7. Turner APF, Karube I, Wilson GS. editors. Biosensors: Fun-damentals and Applications. New York: Oxford UniversityPress; 1987.
8. Buerk DG, Biosensors: Theory and Applications. Lancester,PA: Technomic; 1993.
9. Eggins BR. Biosensors: An Introduction. New York: Wiley;1996.
10. Aizawa M. Principles and applications of electrochemical andoptical biosensors. Anal Chim Acta 1991;250:249–256.
11. North JR. Immunosensors: Antibody-based biosensors.Trends Biotechnol 1985;3:180–186.
12. Aizawa M. Immunosensors for clinical analysis. Adv ClinChem 1994;31:247–275.
13. Morgan LC, Newman DJ, Price CP. Immunosensors: Technol-ogy and opportunities in laboratory medicine. Clin Chem1996;42:193–209.
14. Ghindilis AL, Atanasov P, Wilkins M, Wilkins E. Immuno-sensors: Electrochemical sensing and other engineeringapproaches. Biosens Bioelecton 1998;13:113–131.
15. Bergveld P. Future applications of ISFETs. Sens Actuators B1991;4:125–133.
16. Kuriyama T, Kimura J. An ISFET biosensor. In: Wise DL,editor, Applied Biosensors. Boston, MA: Butterworth; 1989.
17. Kimura J, Kuriyama T. FET biosensors. J Biotechnol1990;15:239–254.
18. Van der Schoot BH, Bergveld P. ISFET based enzyme sensors.Biosensors 1987/88;3:161–186.
19. Yuquing M, Jianguo G, Jianrong C. Ion-sensitive field effecttransducer-based biosensors. Biotechnol Advances 2003;21:527–534.
20. Janata J, Moss SD. Chemically sensitive field-effect transis-tors. Biomed Eng 1976;11:241–245.
21. Bergveld P, Sibbald A. Comprehensive Analytical Chemistry,XXIII: Analytical and Biomedical Applications of Ion-SelectiveField-Effect Transistors. New York: Elsevier; 1988.
22. Bergveld P. Thirty years of ISFETOLOGY. What happened inthe past 30 years and what may happen in the next 30 years.Sens Actuators B 2003;88:1–20.
23. Selvanayagam ZE, Neuzil P, Gopalakrishnakone P, SridharU, Singh M, Ho LC. An ISFET-based immunosensor for thedetection of b-Bungaraotoxin. Biosens Bioelectron 2003;10:405–414.
24. Janata J, Huber RJ. Chemically sensitive field effect transis-tors. In: Freiser H, editor. Ion-Sensitive Electrodes in Analy-tical Chemistry, vol. II, New York: Plenum Press; 1980.
25. Janata J, Blackburn GF. Immunochemical potentiometricsensors. Ann N Y Acad Sci 1984;428:286–292.
26. Blackburn GF. Chemically sensitive Field effect transistors.In: Turner APF, Karube I, Wilson S. editors. Biosensors:Fundamentals and Applications. Oxford: Oxford Science Pub-lications; 1987.
27. Bockris JOM, Reddy AKN. Modern Electrochemistry, vol. 2.New York: Plenum Press; 1970.
28. Eisen HN. Immunology. An Introduction to Molecular andCellular Principles of the Immune Response. New York:Harper and Row; 1974.
29. Bergveld P. A critical evaluation of direct electrical proteindetection methods. Biosens Bioelecton 1991;6:55–72.
30. Janata J. An immunoelectrode. J Am Chem Soc 1975;97:2914–2916.
IMMUNOLOGICALLY SENSITIVE FIELD–EFFECT TRANSISTORS 109

31. Janata J, Janata J. Novel protein-immobilizing hydrophobicpolymeric membrane, process for producing same and appa-ratus employing same. U.S. Patent 3,966,580, 1976.
32. Schasfoort RBM, Bergveld P, Kooyman RPH, Greve J. Possi-bilities and limitations of direct detection of protein changes bymeans of immunological field-effect transistor. Anal ChimActa 1990;238:323–329.
33. Moore WJ. Physical Chemistry. London: Longman; 1976.34. Davies JT, Rideal EK. Interfacial Phenomena. London: Aca-
demic Press; 1963.35. Schasfoort RBM, Bergveld P, Bomer J, Kooyman RPH, Greve
J. Modulation of the ISFET response by an immunologicalreaction. Sens Actuators 1989;17:531–535.
36. Schasfoort RBM, Kooyman RPH, Bergveld P, Greve J. A newapproach to ImmunoFET operation. Biosens Bioelecton 1990;5:103–124.
37. Schasfoort RBM, Eijsma B. The ions-step method applied todisposable membranes for the development of ion-respondingimmunosensors. Sens Actuators 1992;6:308–311.
38. Eijkel JCT, Olthuis W, Bergveld P. An ISFET-based dipstickdevice for protein detection using the ion-step method. BiosensBioelectron 1997;12:991–1001.
39. Kharitonov AB, Wasserman J, Katz E, Willner I. The use ofimpedance spectroscopy for the characterization of protein-modified ISFET devices: Application of the method for theanalysis of biorecognition processes. J Phys Chem 2001; B-105:4205–4213.
40. Sergeyeva TA, Soldatkin AP, Rachkov AE, Tereschenko MI,Piletsky SA, Elskaya AV. b-Lactamase label-based potentio-metric biosensor for a-2 interferon detection. Anal Chim Acta1999;390:73–81.
41. Yacoub-George E, Wolf H, Koch S, Woias P. A miniaturizedISFET-ELISA system with a pre-treated fused silica capillaryas reaction cartridge. Sens Actuators B 1996;34:429–434.
42. Starodub NF, Dzantiev BB, Starodub VN, Zherdev AV. Immu-nosensor for the determination of the herbicide simazine basedon an ion-selective field-effect transistor. Anal Chim Acta2000;424:37–43.
43. Wang J. Electroanalytical Techniques in Clinical Chemistryand Laboratory Medicine, New York: VCH; 1988.
44. Luppa PB, Sokoll LJ, Chan DW. Immunosensors — principlesand applications to clinical chemistry. Clin Chim Acta2001;314:1–26.
45. Yamamoto N, Nagasawa Y, Sawai M, Sudo T, Tsubomura H.Potentiometric investigations of antigen-antibody andenzyme-enzyme inhibitor reactions using chemically modifiedmetal electrodes. J Immunol Methods 1978;22:309–317.
46. Schenck JF. Technical difficulties remaining to the applicationof ISFET devices. In: Cheung PW, editor. Theory, Design andBiomedical Applications of Solid State Chemical Sensors. NewYork: CRC; 1978.
47. Schenck JF. Field effect transistor for detection of biologicalreactions. U.S. Patent 4,238, 757, 1980.
48. Schoning MJ, Poghossiana A. Recent advances in biologicallysensitive field-effect transistors (BioFETs). Analyst 2002;127:1137–1151.
49. Janata J, Thirty years of CHEMFETs — a personal view.Electroanalysis 2004;16:1831–1835.
50. Collins S, Janata J. A critical evaluation of the mechanism ofpotential response of antigen polymer membrane to the cor-responding antiserum. Anal Chim Acta 1982;136:93–99.
51. Janata J. Proceedings of the 2nd International Meeting onChemical Sensors; 1986:25–31.
52. Gotoh M, Tamiya E, Karube I. Micro-FET biosensors usingpolyvinylbutyral membrane. J Membrane Sci 1989;41:291–303.
53. Schasfoort RBM, Keldermans CEJM, Kooyman RPH, Berg-veld P, Greve J, Competitive immunological detection of pro-gesterone by means of the ion-step induced response of animmunoFET. Sens Actuators 1990;BI:368–372.
54. Besselink GAJ, Schasfoort RBM, Bergveld P. Modification ofISFETs with a monolayer of latex beads for specific detectionof proteins. Biosens Bioelecton 2003;18:1109–1114.
55. Toshihide K. Electrochemical sensors in immunological mea-surement. E.U. Patent 0,328,380, 1998.
56. Colapicchioni C, Barbaro A, Porcelli F, Giannini I. Immunoen-zymatic assay using CHEMFET devices. Sens ActuatorsB 1991;6:186–191.
57. Akimeno VK, Khomutov SM, Obraztsova AY, VishnivetskiiSA, Chuvilskaya NA, Laurinavichus KS, Reshetilov AN. Arapid method for detection of Clostridium thermocellum byfield-effect transistor immunodetection. J Microbiol Methods1996;24:203–209.
58. Sekiguchi T, Nakamura M, Kato M, Nishikawa K, Hokari K,Sugiyama T, Asaka M. Immunological Helicobacter pyloriurease analyzer based on ion-sensitive field effect transistor.Sens Actuators 2000;B67:265–269.
59. Aberl F, Modrow S, Wolf H, Koch S, Woias P. An ISFET-basedFIA system for immunosensing. Sens Actuators 1992;B6:186–191.
60. Tsuruta H, Yamada H, Motoyashiki Y, Oka K, Okada C,Nakamura M. An automated ELISA system using a pipettetip as a solid phase and a pH-sensitive field effect transistor asa detector. J Immunol Methods 1995;183:221–229.
61. Saiki R, Scharf S, Faloona F, Mullis K, Horn G, Erlich H,Arnheim N. Enzymatic amplification beta-globulin genomicsequences and restriction analysis for diagnosis of sickle cellanemia. Science 1985;230:1350–1354.
62. Tsuruta H, Matsui S, Hatanaka T, Namba T, Miyamoto K,Nakamura M. Detection of the products of polymerase chainreaction by an ELISA system based on an ion-sensitive fieldeffect transistor. J Immunol Methods 1994;176:45–52.
63. Wang AM, Doyle MV, Mark DF. Quantitation of mRNA by thepolymerase chain reaction. Proc Natl Acd Sci USA 1989;86:9717–9721.
64. Tsuruta H, Matsui S, Oka K, Namba T, Shinngu M, Naka-mura M. Quantitation of IL-1-beta mRNA by a method of RT-PCR and an ELISA based on ion-sensitive field effect transis-tor. J Immunol Methods 1995;180:259–264.
65. Gopel W, Hesse J, Zemel JN editorss. Sensors: A Comprehen-sive Survey, Chemical and Biochemical Sensors, Part I. Ver-lagsgesellschaft Mbh: VCH; 1991.
66. Neuzil P. ISFET integrated sensor technology. Sens Actuators1995;B24-25:232–235.
67. Filippo P, Antonio NC. Sensor with antigen chemically bondedto a semiconductor device. E.U. Patent 0,395,137, 1990.
68. Starodub NF, Samodumova IM, Starodub VN. Usage of orga-nosilanes for integration of enzymes and immunocomponentswith electrochemical and optical transducers. Sens Actuators1995;B24-25:173–176.
69. Santandreu M, Sole S, Fabregas E, Alegret S. Development ofelectrochemical immunosensing systems with renewable sur-faces. Biosens Bioelectron 1998;13:7–17.
70. Sole S, Alegret S, Cespedes F, Fabregas E. Flow injectionimmunoanalysis based on a magnetoimmunosensor system.Anal Chem 1998;70:1462–1467.
71. Blackburn GF, Talley DB, Booth PM, Durfor CN, Martin MT,Napper AD, Rees AR. Potentiometric biosensor employingcatalytic antibodies as the molecular recognition element.Anal Chem 1990;62:2211–2216.
See also ION-SENSITIVE FIELD EFFECT TRANSISTORS.
110 IMMUNOLOGICALLY SENSITIVE FIELD–EFFECT TRANSISTORS

IMMUNOTHERAPY
QIAO LI
University of MichiganAnn Arbor, Michigan
INTRODUCTION
Immunotherapy of cancer, infectious disease, and autoim-mune disease has opened a new area for disease manage-ment. This approach has developed very fast lately due tothe advances and involvements of modern technology inmolecular biology, cell biology, immunology, biochemistry,and bioengineering. Adoptive T cell immunotherapy ofcancer involves passive administration of lymphoid cellsfrom one host to another, or back to itself in order totransfer tumor immunity for cancer treatment. It was firstrealized >20 years ago that adoptive immunotherapymay be feasible to treat human malignancies. However,the early form of this practice was quite simple. It could beas easy as a straightforward blood cell transfer. The appar-ent inefficiency of antitumor immune responses, and thefailure to successfully combat the disease laid the founda-tion for current concepts of immunotherapy. It did not taketoo long before it was realized that boosting the antitumorimmune response by deliberate vaccination could increasethe potential benefits of immune cell-based therapies. Inaddition, activation of lymphoid cells with monoclonalantibodies (mAb) toward the molecules involved in T cellsignaling pathways has resulted in therapeutic effector Tcells. The use of immune adjuvants coadministrated withthe cell infusion has enhanced the antitumor efficacy of thetransferred cells and has made adoptive cellular immu-notherapy a promising strategy for cancer treatment. Stu-dies on the trafficking of adoptively transferred cells in vivoas well as the identification and characterization of T cellsubsets responsible for antitumor reactivity have providedvaluable insights toward the development of novel immu-notherapeutic strategies. The adoptive immunotherapy ofestablished tumors with the transfer of tumor-reactivelymphoid cells has now been shown to be highly effectiveagainst significant tumor burdens both in animal modelsand in clinical trials. This is, at least in part, due to recentdevelopments in this area, such as treating cancer inspecial settings (e.g., in lymphopenic hosts induced by priorconditioning); redirecting the effector cells to tumorthrough genetic engineered chimerical T cell receptors(TCRs) or by transferred tumor antigen-specific TCRs;and the use of these strategies in combination. This articleintends to review the above developments that have madeadoptive T cell immunotherapy an attractive alternativefor cancer treatment.
INDUCTION OF TUMOR-REACTIVE PRE-EFFECTORT CELLS IN VIVO
Successful induction of tumor-reactive ‘‘pre-effector‘‘ cellsin a tumor-bearing host represents the first step toward theconduct of an effective adoptive T cell immunotherapy ofcancer. This procedure provides a source of ‘‘pre-effector’’cells for subsequent T cell activation and expansion in vitro
to generate large numbers of ‘‘effector’’ cells to be infusedback to the tumor-bearing host or cancer patient fortherapy. Due to the relative lack of immunogenicity andpotential immunosuppressive mechanisms of humanmalignancies, application of tumor T cell therapy in theclinical setting has been hampered for a long time bydifficulties to reliably isolate tumor-sensitized lymphoidcells from the cancer-bearing host. Nevertheless, recentobservations in animal studies and clinic trials have led tothe development of strategies to induce T cell sensitizationin vivo.
Peripheral blood lymphocytes (PBL) represents a con-venient source of pre-effector cells. However, in most cases,particularly in the case of solid tumors, the frequency oftumor-specific pre-effector cells in PBL is extremely low,generally far below what is observed in response to viralinfection. Experimental studies and clinical experiencewith adoptive immunotherapy have demonstrated thattumor-draining lymph node (TDLN) cells are potentiallyeffective antitumor reagents. Chang et al. was the first toevaluate vaccine-primed LN (VPLN) as a source of lym-phoid cells that could be secondarily sensitized by in vitromethods to generate effector cells capable of mediatingregression of established tumors upon adoptive transferin clinical trials (1–3). These trials included subjects withmetastatic melanoma, renal cell cancer, and head and necksquamous cell cancers, and have resulted in prolonged,durable, complete responses.
In murine models, it has been observed that TDLNharbor lymphoid cells that are functionally capable ofmediating rejection of immunogenic tumors in adoptivetransfer after in vitro activation (4,5). However, bothtumor-infiltrating lymphocytes (TIL) and TDLN cells werefound to be incapable of mediating the regression of poorlyimmunogenic tumors such as the B16–BL6 melanoma, ahighly invasive tumor of spontaneous origin. It was thendiscovered that the subcutaneous inoculation of B16–BL6tumor cells admixed with the bacterial adjuvant, Coryne-bacterium parvum, resulted in reactive TDLN cells thatdifferentiated into therapeutic effector T cells upon activa-tion in vitro (6,7). Upon adoptive transfer, these LN cellssuccessfully mediated the regression of establishedtumors. In addition to the ability to mediate regressionof experimentally induced pulmonary metastases, theseactivated cells were effective in the treatment of sponta-neous visceral metastases originating from a primarytumor, a condition that more closely approximates humanmalignancy. These studies thus demonstrated that vacci-nation of animals with irradiated tumor cells admixed witha bacterial adjuvant was capable of inducing tumor-reactive T cells in the draining LN.
We have applied these methods to generate vaccine-primed LN in patients with advanced melanoma and renalcell cancer (RCC) for therapy (3,8). Patients with RCC ormelanoma received intradermal inoculation of irradiatedautologous tumor cells admixed with Bacillus Calmette–Guerin (BCG) as a vaccine. Seven to ten days later, drain-ing LN were removed for in vitro activation and expansion.Activated LN cells were then administrated intravenouslywith the concomitant administration of IL-2 for immu-notherapy with defined success (3).
IMMUNOTHERAPY 111

Studies demonstrated that tumor cells genetically mod-ified with immunostimulatory genes are capable of sensi-tizing T cells. Transfection of cytokine genes into murinetumor cells have resulted in reduced tumorigenicity follow-ing inoculation of the modified tumor cells into animals (9).In these studies, animals that rejected the inoculum ofmodified tumor cells also rejected a subsequent challengeof unmodified parental tumor cells, thus demonstrating thedevelopment of tumor immunity. We performed a clinicalstudy of patients with melanoma to evaluate the immuno-biological effects of GM–CSF transduced autologous tumorcells given as a vaccine to prime draining lymph nodes (10).There was an increased infiltration of dendritic cells (DCs)in the GM–CSF-secreting vaccine sites compared with thewild type (WT) vaccine sites. This resulted in a greaternumber of cells harvested from the GM–CSF–VPLNs com-pared with the WT–VPLNs. Patients received adoptivelytransferred GM–CSF–VPLN cells secondarily activatedand expanded in vitro. A complete clinical response wasobserved in one of five patients. This work documentedmeasurable immunobiologic differences of GM–CSF-transduced tumor cells given as a vaccine compared withWT tumor cells.
Collectively, these observations suggested that TDLNor VPLN cells may represent an ideal source of tumor-reactive T cells. They also established the rationale fordeveloping tumor vaccines utilizing autologous tumorsadmixed with bacterial adjuvant or genetically modifiedwith cytokine genes, which may prove useful in facilitatingthe generation of immune T cells for adoptive immunother-apy.
ACTIVATION AND POLARIZATION OF EFFECTORT CELLS IN VITRO
A major challenge in T cell immunotherapy of cancer is howto activate and expand the relatively low numbers oftumor-specific T cells obtained from the tumor-bearinghost. Previous studies demonstrated that freshly isolatedTDLN cells had defects in TCR-mediated signal transduc-tion and were not immediately competent in adoptivetransfer models (11,12). It has therefore become a criticalprerequisite in adoptive immunotherapy to expand the pre-effector cells into large numbers of effector cells whileaugmenting their antitumor reactivity.
In vitro T cell activation using monoclonal antibodies inthe absence of antigen takes advantage of common signaltransduction pathways that are ubiquitous to T cells. Thisprinciple has been used to expand tumor-primed T cellscontained within TDLN or VPLN. The initial effortsinvolved the use of anti-CD3 mAb as a surrogate antigento activate tumor-primed lymphoid cells, followed byexpansion in IL-2 (12). This approach resulted primarilyin the generation of CD8þ effector cells that mediatedtumor regression in vivo. Subsequent clinical studies uti-lizing this method to activate VPLN cells demonstratedthat this cellular therapy can result in achieving durabletumor responses in subjects with advanced cancer (1,3). Wehave extended these investigations in animal models andwith human samples by examining other mAbs that deliver
costimulatory signals in concert with anti-CD3 to activatetumor-primed lymphoid cells. These other antibodies haveinvolved anti-CD28 and anti-CD137 (13–16). The results ofthese investigations have indicated that costimulation canincrease the proliferation of tumor-primed lymphoid cellsand their ability to mediate tumor regression in vivo.
Several important principles in animal models that arerelevant for the treatment of human malignancies havebeen identified. For example, the in vitro cytokine profilesreleased by effector T cells when cocultured with tumorcells are found to be predictive of their ability to mediatetumor regression in vivo. Effector cells that mediate a type1 (i.e., IFNg) and GM–CSF response to tumor antigen arecapable of eradicating tumor upon adoptive transfer. Incontrast, cells that demonstrate a type 2 profile (i.e., IL-10,IL-4) appear suppressive, and do not mediate tumor regres-sion (16,17). We have determined the importance of IFNg
in mediating tumor regression both in animal studies (16)and in clinical trials (3). In a phase II adoptive cellular trialin patients with advanced renal cell cancer, we demon-strated that IFNg secretion and the IFNg: IL-10 ratio ofcytokine released by effector T cells in response to tumorantigen was associated with clinical outcomes. Specifically,activated T cells that have an increased IFNg:IL-10 ratiocorrelated with tumor response (3). Although effector Tcells can be generated through antibody activation tomediate tumor regression in animal models, clinicalresponses in adoptive immunotherapy have been confinedto a minority of patients. One potential reason for theselimited responses is that antibody-activation proceduresgenerally stimulate T cells broadly without discriminatingbetween type1 and type 2 cells, presumably due to thepolyclonal expansion characteristics of antibodies directedto the TCR common chain, for example, CD3e of the TCR/CD3 complex or CD28. As a result, both type 1 cytokines,such as IL-2, IFNg, and type 2 cytokines, for example,IL-4, IL-5, and IL-10, are modulated (13,18). Therefore,alternative protocols need to be defined that will prefer-entially stimulate the type 1 cytokine profile to generatemore potent tumor-reactive T cells for cancer immunother-apy. Toward this end, various in vitro strategies have beeninvestigated utilizing additional signaling stimuli to pro-mote Th1/Tc1 cell proliferation and antitumor reactivity(19,20). We reported that costimulation of TDLN cellsthrough newly induced 4-1BB and CD3/CD28 signalingcan significantly increase antitumor reactivity by shiftingT cell responses toward a type 1 cytokine pattern, whileconcomitantly decreasing type 2 response (16). Using theproinflammatory cytokines, we recently reported that IL-12 and IL-18 can be used to generate potent CD4þ andCD8þ antitumor effector cells by synergistically polarizingantibody-activated TDLN cells toward a Th1 and Tc1phenotype, and that the polarization effect was NF-kBdependent (21).
The recognition and use of cell polarization strategiesduring and /or post antibody activation of T cells representsanother significant change and addition to the traditionalpractice of adoptive therapy. While adoptive immunother-apy of cancer requires large numbers of therapeutic T cellsfor transfer into cancer patients, the phenotype and cyto-kine profile of these cells are crucial in determining the
112 IMMUNOTHERAPY
outcomes of the therapy. The use of polarizing reagents tomodulate T cell function toward the type 1 response pro-vides a rational strategy to enhance the efficacy of cellulartherapy.
USE OF IMMUNE ADJUVANT IN CONCERTWITH T CELL ADMINISTRATION
In the course of adoptive immunotherapy of cancer, admin-istration of T cell growth factors accompanying T cell trans-fer may promote T cell activation, proliferation, and tumorkilling, and therefore augment clinical outcomes for thetherapy. These growth factors, as well as other immunemodulatory reagents used in concert with T cell transfer,function as immune adjuvants in eliciting antitumor acti-vities in vivo. The most useful adjuvant to T cell transferto date has been the exogenous administration of IL-2(1–3,22,23).
Nearly 20 years ago, Rosenberg and colleagues per-formed a pilot protocol to investigate the feasibility andpracticality of immunotherapy of patients with advancedcancer using TIL and recombinant IL-2 (22). The studyrepresents an initial attempt to use TIL plus IL-2 admin-istration with enhanced tumoricidal capacity in the adop-tive immunotherapy of human malignancies. Twelvepatients with melanoma, renal cell carcinoma, breast car-cinoma, or colon carcinoma were treated with varyingdoses and combinations of TIL, IL-2, and cyclophospha-mide. Three partial responses (PR) to therapy wereobserved. No toxic effects were directly attributable toTIL infusions. However, the toxicities of therapy weresimilar to those ascribed to IL-2. Indeed, the use of IL-2has resulted in significant morbidity associated with cel-lular therapies (3,24). Moreover, a few recent studiesshowed that IL-2 may negatively regulate effector cellsthrough activation-induced cell death (23,25), expandingthe frequency of CD4þCD25þ T cells, or cause cell redis-tribution secondary to Ag-induced cell death (26,27). Thesestudies suggest that novel reagents need to be identified toserve as alternative immune adjuvants for adoptive T celltherapy.
In a recent study (25), failed adoptive T cell therapycould be reversed with low dose IL-15 administration, butnot IL-2. A related T cell growth factor, IL-15, protected Tcells against activation-induced cell death and promotedhomeostatic maintenance of memory T cells and, therefore,may be advantageous to T cell-based cancer treatment.Similarly, the role of IL-15 in early activation of memoryCD8þ CTLs has been described (28). In this study, memoryCD8þ T cells expressing OVA-specific TCR were trans-ferred into IL-15-transgenic (Tg) mice, IL-15 knockout(KO) mice, or control C57BL/6 mice followed by challengewith recombinant Listeria monocytogenes expressing OVA(rLM-OVA). In vivo CTL activities were significantlyhigher in the IL-15 Tg mice, but lower in the IL-15 KOmice than those in control mice at the early stage afterchallenge with rLM-OVA. In vivo administration of rIL-15conferred robust protection against reinfection via activa-tion of the memory CD8þ T cells. In addition, IL-27 is anovel IL-12 family member that plays a role in the early
regulation of Th1 initiation and synergizes with IL-12 inIFNg production (29). Mechanistic studies revealed thatalthough a comparable proliferative response to IL-27 wasobserved between STAT1-deficient and wild-type CD4þ Tcells, synergistic IFNg production by IL-27 and IL-12 wasimpaired in STAT1-deficient CD4þ T cells. IL-27 alsoaugmented the expression of MHC class I on CD4þ T cellsin a STAT1-dependent manner (29).
Although the in vivo administration of proinflammatorycytokines has demonstrated antitumor efficacy, theirpotent antitumor activity is often achieved at the expenseof unacceptable toxicity. For example, IL-12 and IL-18administration was found to be associated with lethalorgan damages, attributed in part to extremely high levelsof host-induced IFNg production (30). It is anticipated thatadministration of low doses of proinflammatory cytokinesin the context of passively transferred TDLN cells will leadto increased therapeutic efficacy. To this end, the adjuvanteffect of low dose cytokine administration over a longperiod of time can be compared with that of a high doseover a short period of time. These experiments should helpto determine if prolonged administration of low dose cyto-kines can enhance the therapeutic efficacy by improvingtrafficking, survival, and proliferation of the adoptivelytransferred T cells.
While toxicity of traditionally used IL-2 limits its clin-ical utility at high doses, use of novel cytokines at tolerablelow doses in conjunction with cellular therapy may providealternative strategies that are less toxic. If the newlyidentified proinflammatory cytokines, such as IL-15 andIL-27 prove to be useful adjuvants to T cell therapy, theymay result in more effective antitumor responses withreduced morbidity.
TRAFFICKING AND PROLIFERATION OF EFFECTORT CELLS AFTER ADOPTIVE TRANSFER
Adoptive T cell therapy has been used for treatment of viraland malignant diseases with encouraging results. How-ever, little is known about the fate and trafficking of thetransferred effector cells. A study performed at NCIassessed the trafficking of gp100-specific pmel-1 cells tolarge, vascularized tumors that express or do not expressthe target Ag (31). It was found that approximately equalnumbers of pmel-1 T cells infiltrated the Ag-positive and-negative tumors. Massive infiltration and proliferation ofactivated antitumor pmel-1 cells were observed in a varietyof peripheral tissues, including lymph nodes, liver, spleen,and lungs, but not peripheral blood. However, T cell func-tion, as measured by production of IFNg, release of per-forin, and activation of caspase-3 in target cells, wasconfined to Ag-expressing tumor. It was thus concludedthat adoptively transferred CD8þ T cells traffic indiscrimi-nately and ubiquitously while mediating specific tumordestruction.
We recently characterized the infiltration of adoptivelytransferred TDLN cells in the host bearing pulmonarymetastases (21). The TDLN cells were activated withanti-CD3/anti-CD28 followed by cell culture in IL-12 þIL-18 before transfer into tumor-bearing host. The TDLN
IMMUNOTHERAPY 113
cells were labeled with CFSE immediately before infusion.Immunohistochemical evaluation of adoptively transferredTDLN cells accumulating in pulmonary tumor nodules wasperformed. Infused TDLN cells were observed to (1) attachto venules, (2) mix with host leukocytes in perivenularcollections, and (3) infiltrate tumor nodules. Active migra-tion of infused cells into pulmonary tumor nodules wasfound to be correlated with significant tumor regression.This corroborates a previous report by Plautz et al. showingthat infused TDLN cells must infiltrate pulmonary nodulesto suppress tumor growth (32).
Several other reports support the hypothesis that effi-cient tumor regression needs the in situ accumulation oftransferred effector cells. Another study conducted at theUniversity of Michigan demonstrated that the infused cellsmust accumulate in metastatic lesions to suppress tumorgrowth, and that the process is dynamic (33). In studiestreating murine lung metastases with adoptively trans-ferred TDLN cells, the TDLN donor cells were initiallyconfined to alveolar capillaries with no movement intometastases after infusion. However, within 4 h, TDLNcells began migrating across pulmonary postcapillaryvenules and first appeared within metastases. After 24 h,most donor cells in the lung were associated with tumornodules. Donor cell proliferation both within the lung andin the lymphoid organs was detected. Importantly, T cellsthat had proliferated in the lymphoid organs traffickedback to the tumor-bearing lungs, accounting for � 50% ofthe donor cells recovered from these sites. These studiesdemonstrate that adoptively transferred TDLN cellsmigrate directly into tumor-bearing organs and seed therecirculating pool of lymphocytes after infusion. Cells thathave differentiated in lymphoid organs eventually migrateinto the tumor site. Additionally, in vitro-generated Melan-A-specific CTLs were found to survive intact in vivo forseveral weeks and localize preferentially to tumor (34).Over all, these studies suggest that methods to improvetrafficking and recruitment of donor T cells to the tumormay improve therapeutic efficacy of cellular therapy.
The availability of congenic strains of mice bearing Tcell markers that differ by epitopes that can be identified bymonoclonal antibodies allows us to track adoptively trans-ferred cells in a semisyngeneic host. In order to performquantitative tracking studies of the infused cells, the con-genic strain of B6 mouse that expresses CD45.1 can be usedto generate TDLN for transfer into CD45.2 hosts. Analysisof the infiltrate can be performed by mechanical dissocia-tion of the tumors in order to recover viable lymphoidinfiltrates. By FACS analysis, the number of transferredCD4/CD8 T cells can be quantified. Proliferation of infusedcells can be assessed by labeling them with CFSE. Con-firmed correlation between effective tumor regression andthe infiltration of infused cells to tumor should encouragefurther attempts to modulate T cell trafficking by biochem-ical controls or by genetic modification of well-identifiedadhesion molecules, for example, LFA, ICAM, and selec-tins. Furthermore, a very recent study described the reg-ulation of T cell trafficking by sphingosine 1-phosphate(S1P) receptor 1 (S1P1) (35). Mature T cells from S1P1transgenic mice exhibited enhanced chemotactic responsetoward S1P, and preferentially distributed to the blood
rather than secondary lymphoid organs, such as draininglymph nodes. This work suggests that S1P1 affectssystemic trafficking of peripheral T cells, and thereforemakes the S1P/S1P1 signaling pathway a novel target forT cell trafficking modulation.
IDENTIFICATION AND CHARACTERIZATION OF T CELLSUBSETS RESPONSIBLE FOR ANTITUMOR REACTIVITY
The CD8þ CTLs have long been recognized as the effectorcells that mediate tumor regression. In addition, CD4þ
effector T cells and NK cells have also been identified todirectly or indirectly mediate tumor regression. Wereported that CD28 costimulation of tumor-primed lym-phoid cells promotes the generation of potent tumor-reac-tive effector cells, particularly CD4þ T cells. These anti-CD3/anti-CD28 activated CD4þ TDLN cells could indepen-dently mediate tumor regression in adoptive immunother-apy (13,14,21).
It has to be presumed that any source of antitumorreactive T cells derived from the tumor-bearing host, thatis, TDLN, will represent a small percentage of the totalpopulation of retrieved cells. Therefore, a theoreticallypractical approach would be the identification, isolation,activation and expansion of subsets of T cells capable ofmediating tumor regression. In this endeavor, Shu and co-workers found that the down-regulation of the homingmolecule L-selectin could serve as a surrogate marker forthe isolation of specific tumor-sensitized T cells (18). Inadoptive immunotherapy of established intracranial MCA205 tumors, L-selectinlow (CD62Llow) cells displayed at least30-fold greater therapeutic efficacy than unfractionatedcells. The L-selectinhigh cells did not demonstrate any anti-tumor effects. These results demonstrate that the purifica-tion of L-selectinlow cells led to the generation of immuneeffector cells with unusually high therapeutic efficacyagainst chemically induced tumors. After that, Plautzet al. used advanced tumor models in a stringent compar-ison of efficacy for the L-selectinlow subset versus the totalpopulation of TDLN cells following culture in high dose IL-2. L-selectinlow subset comprised 5–7% of the TDLN cells.Adoptive transfer of activated L-selectinlow cells eliminated14-day pulmonary metastases and cured 10-day subcuta-neous tumors, whereas transfer of maximally toleratednumbers of unfractionated TDLN cells was not therapeutic(36). At the same time, it was identified that tumor-inducedL-selectinhigh cells were suppressor T cells that mediatedpotent effector T cell blockade and caused failure of other-wise curative adoptive immunotherapy (37). The treat-ment failure using unfractionated TDLN cells was dueto cotransfer of the L-selectinhigh suppressor T cells presentin TDLN. However, the L-selectinhigh suppressor T cellswere only found in day-12 TDLN. In contrast, day-9 TDLNand normal spleens lacked L-selectinhigh cells.
It was not long before a second surrogate marker wasidentified for the isolation of tumor-specific T cells. Stool-man et al. described that tumor-specific responses in TDLNwere concentrated in cells expressing P-selectin ligand(Plighigh T cells) (38). This study found that the minorsubset of TDLN T cells expressing binding sites for the
114 IMMUNOTHERAPY

adhesion receptor P-selectin (Plighigh T cells) producedT lymphoblasts with the most tumor-specific IFNg synth-esis in vitro and antitumor activity following adoptivetransfer in vivo. The cultured Plighigh TDLN cells were10- to 20-fold more active against established pulmonarymicrometastases than cultured, unfractionated TDLN, and>30-fold more active than cultured TDLN cells depleted ofthe Plighigh fraction. The Plighigh T cells expressed highlevels of CD69 and low levels of CD62L (L-selectinlow),which agrees with the previous studies on L-selectin inTDLN. Further supporting these observations is a recentstudy indicating that recruitment of IFNg-producing cellsinto the inflamed retina in vivo is preferentially regulatedby P-selectin glycoprotein ligand (39).
In a different attempt to selectively activate tumor-sensitized T cells, superantigens were utilized in vitro tostimulate effector cell generation in a murine model (40).The TDLN cells stimulated with staphylococcal enterotox-ins A (SEA), B (SEB) or C2 (SEC2) resulted in the selectiveexpansion of Vb3 and 11, Vb3 and 8, or Vb8.2 T cells,respectively. Adoptive transfer studies revealed that SEB-and SEC2-, but not SEA- stimulated cells mediated tumor-specific regression. These results suggested that T cellsbearing Vb8 may preferentially respond to the growingtumor than T cells bearing Vb3 or 11 elements of the T cellreceptor. Similarly, stimulating TDLN cells with differentanti-Vb mAbs instead of the pan-T cell reagent anti-CD3mAb enabled the selective activation of Vb T cell subsets(17). Enrichment of Vb subsets of TDLN cells revealed thatVb8þ cells released high amounts of IFNg and GM–CSFwith minimal amount of IL-10 in response to tumor, andmediated tumor regression in vivo. In contrast, enrichedpopulation of Vb5þ, Vb7þ, and Vb11þ cells released lowamounts of IFNg and GM–CSF with high levels of IL-10,and had no in vivo antitumor reactivity. In vitro depletionof specific Vb subsets from the whole TDLN pool confirmedthat the profile of cytokine released correlated with in vivoantitumor function. These studies indicate that functionalVb subpopulations of effector cells express differentialantitumor reactivity, and that selective stimulation oftumor-sensitized T cells is feasible and may represent amore efficient method of generating therapeutic T cells fortherapy.
Application of cell subsets for successful T cell therapyshould include two approaches: identification of T cellsubsets responsible for mediating antitumor reactivity asdiscussed above, and simultaneously, the elimination ofthose subsets that are non-reactive or even suppressive.Characterization of regulatory CD4þCD25þ T cell subpo-pulation in terms of their potential suppressive effects onanticancer effector cells would warrant further investiga-tions in this area. A current study showed that CD8þ T cellimmunity against a tumor self-antigen is augmented byCD4þ T helper cells, but hindered by naturally occurringCD4þCD25þ T regulatory cells (Treg cells)(41). Adoptivetransfer of tumor-reactive CD8þ T cells plus CD4þCD25�
Th cells into CD4-deficient hosts induced autoimmunityand regression of established melanoma. However, trans-fer of CD4þ T cells that contained a mixture of CD4þCD25�
and CD4þCD25þ Treg cells or Treg cells alone preventedeffective adoptive immunotherapy. These findings thus
suggest that adoptive immunotherapy requires theabsence of naturally occurring CD4þCD25þ Treg cells tobe effective, and the optimal composition of a cellular agentshould be composed of CD8þ cells plus CD4þCD25� cells.
ADOPTIVE T CELL IMMUNOTHERAPY OF CANCERIN LYMPHOPENIC HOST
Studies in the late 1970s demonstrated that the inductionof lymphopenia by sublethal total body irradiation can bebeneficial for the treatment of tumors in mice (42). Changet al. reported that the adoptive transfer of immune cells inthe irradiated host confers improved therapeutic effectscompared to the normal host (43). The role of lymphodeple-tion on the efficacy of T cell therapy is incompletely under-stood and may depend on the destruction of CD4þCD25þ
regulatory cells, interruption of homeostatic T cell regula-tion, or abrogation of other normal tolerogenic mechan-isms. A report by Dummer et al. indicated that thereconstitution of the lymphopenic, sublethally irradiatedmurine host with syngeneic T cells triggered an antitumorautoimmune response that required expansion withinlymph nodes (44).
There are several different animal models of lympho-penia that can be utilized. These include the use of wholebody irradiation (WBI), chemotherapy-induced, or geneti-cally altered hosts (i.e., RAG1 knockout mice) that aredeficient of T and B cells. The use of various chemother-apeutic agents to induce lymphopenia would simulate theclinical setting. Cyclophosphamide (CTX) is an agent thathas been extensively used in murine models and is activelyused in the therapy of certain human cancers. It has beendescribed to eliminate tumor-induced suppressor cells inboth animal and human settings.
A few years ago, a report described a phase I study of theadoptive transfer of cloned melanoma antigen-specific Tlymphocytes for therapy of patients with advanced mela-noma (45). Clones were derived from peripheral bloodlymphocytes or TILs of patients. Twelve patients receivedtwo cycles of cells. Peripheral blood samples were analyzedfor persistence of transferred cells by TCR-specific PCR.Transferred cells reached a maximum level at 1 h aftertransfer, but rapidly declined to undetectable levels by 2weeks. The lack of clinical effectiveness of this protocolsuggested that transfer of different or additional cell types,or that modulation of the recipient host environment wasrequired for successful therapy. Relevant to these studiesis the clinical experience reported by Rosenberg and co-workers who infused tumor-reactive T cells in melanomapatients after a nonmyeloablative conditioning regimen(cyclophosphamide/fludarabine) (46). Conditioning withthe nonmyeloablative chemotherapy before adoptive trans-fer of activated tumor-reactive T cells enhanced tumorregression and increased the overall rates of objective clini-cal responses. Six of thirteen patients demonstrated signi-ficant clinical responses as well as autoimmune melanocytedestruction. In a follow up of this experience in 25 patients,the conditioning regimen was given prior to adoptive T celltherapy as before (47). Examination of the T cell persis-tence through analysis of the specific TCR demonstrated
IMMUNOTHERAPY 115
that there was a significant correlation between tumorregression and the degree of persistence in peripheralblood of adoptively transferred T cell clones. Transferredcells persisted for as long as 2 months in the lymphopenicsetting induced by the conditioning regimen. In contrast,they presented in the blood for only 2 or 3 weeks withoutthe prior chemotherapy. These series of studies stronglysuggest that the lymphopenic host induced by the non-myeloablative conditioning regimen may provide a betterenvironment for the functioning of the transferred T cells,and hence improve their therapeutic efficacy. Examinationof the mechanisms involved in the reconstitution of thelymphodepleted host after adoptive T cell transfer will beimportant in identifying methods to improve the efficacy ofT cell therapies for cancer.
REDIRECT EFFECTOR T CELLS TO TUMOR
As mentioned earlier, the low precursor frequency oftumor-specific T cells in patients hampers routine isola-tion of these cells for adoptive transfer. To overcome thisproblem, ‘‘targeted adoptive immunotherapy’’ or ‘‘geneticadoptive immunotherapy’’ has become an attractive optionfor cancer treatment. This strategy can be approached intwo ways: introduction of a chimeric TCR into effector cells;or introduction of a tumor-specific TCR into naı̈ve cells.
The T-body approach uses patient-derived lymphocytestransfected with chimeric receptor genes constructed withthe variable domains of monoclonal antibodies or cytokineslinked to the constant regions of TCR. The rationale for thisnovel approach to redirect effector cells combines theeffector functions of T lymphocytes with the ability ofantibodies or cytokines to recognize predefined surfaceantigens or cytokine receptors with high specificity andin a non-MHC restricted manner.
Eshhar et al. (48) was one of the first to describe thisapproach by developing a chimeric receptor gene whichrecognized trinitrophenyl (TNP). Retroviral transductionof the anti-TNP/TCR chimeric gene into a T cell hybridomaline resulted in gene expression. These gene modified T cellswere cytolytic and released IL-2 in response to TNP-labeledDaudi cells, but not unlabeled cells. Also among the pioneersin this area, Hwu et al. (49) developed a recombinantchimeric receptor against an epitope expressed on themajority of ovarian cancer cell lines. The TIL were trans-duced with this chimeric gene and evaluated for immuno-logic function. The gene modified TIL showed specific lysis ofan ovarian carcinoma cell line, but not nonovarian cell lines.In a direct comparison, the gene modified TIL showedgreater therapeutic efficacy in vivo than the nontransducedTIL (49). Pinthus et al. evaluated the therapeutic efficacy ofanti-erbB2 chimeric receptor-bearing human lymphocyteson human prostate cancer xenografts in a SCID mousemodel (50). Local delivery of erbB2-specific transgenic Tcells to well-established subcutaneous and orthotopictumors resulted in retardation of tumor growth and pro-longation of animal survival. In a setting of metastaticcancer (51), anti-erbB2 chimeric receptor-modified T cellskilled breast cancer cells and secreted IFNg in an Ag-specificmanner in vitro. Treatment of established metastatic dis-
ease in lung and liver with these genetically engineered Tcells resulted in dramatic increases in survival of the xeno-grafted mice. In another report, CD4þ cells isolated from theperipheral blood and engrafted with a recombinant immu-noreceptor specific for carcinoembryonic Ag (CEA) effi-ciently lysed target cells in a MHC-independent fashion,and the efficiency was similar to that of grafted CD8þ T cells(52). In an attempt to further improve the therapeutic utilityof redirected T cells, T lymphocytes were transferred withCEA-reactive chimeric receptors that incorporate bothCD28 and TCR-zeta signaling domains. T cells expressingthe single-chain variable fragment of Ig (scFv)-CD28-zetachimera demonstrated a far greater capacity to control thegrowth of CEAþ xenogeneic and syngeneic colon carcinomasin vivo compared with scFv-CD28 or scFv-zeta transfected Tcells. This study has illustrated the ability of a chimeric scFvreceptor capable of harnessing the signaling machinery ofboth TCR-zeta and CD28 to augment T cell immunityagainst tumors (53).
In addition to antibodies, cytokines could also be used toreconstruct chimeric TCRs. The IL-13 receptor alpha2 (IL-13Ra2) is a glioma-restricted cell-surface epitope not other-wise detected within the central nervous system. Kahlon etal. (54) described a novel approach for targeting glioblas-toma multiforme (GBM) with IL-13Ra2-specific CTLs. Thechimeric TCR incorporates IL-13 for selective binding toIL-13Ra2. This represents a new class of chimeric immu-noreceptors that signal through an engineered immunesynapse composed of membrane-tethered cytokine (IL-13)bound to cell-surface cytokine receptors (IL-13Ra2) ontumors. Human IL-13-redirected CD8þ CTL transfectantsdisplay IL-13Ra2-specific antitumor effector functionincluding tumor cell cytolysis and cytokine production.In vivo, the adoptive transfer of genetically modifiedCTL clones resulted in the regression of established humanglioblastoma orthotopic xenografts.
The second genetic approach to redirect T cells involvesthe introduction of tumor-specific TCRs into naı̈ve cells.Genes encoding tumor antigen-specific TCRs can be intro-duced into primary human T cells as a potential method ofproviding patients with a source of autologous tumor-reac-tive T cells. Several tumor-associated antigens have beenidentified and cloned from human tumors, such as mela-noma, breast cancers, and RCC. The antigens have beenidentified by their ability to induce T cell reactivity by theirbinding to the TCR ab complex. The subsequent cloning offunctional TCR genes capable of recognizing tumor-asso-ciated antigens offers a potential opportunity to geneticallymodify naive cells that have not been previously exposed totumor antigen and to become competent in recognizingtumor. Cole et al. (55) transfected the cDNA for the TCR a
and b chains of an HLA-A2 restricted, melanoma-reactiveT cell clone into the human Jurkat T cell line. The trans-fected line was able to mediate recognition of the melanomaantigen, MART-1, when presented by antigen-presentingcells. This represented the first report of a naive cellularconstruct designed to mediate functional tumor antigenrecognition. A recent study explored the simultaneousgeneration of CD8þ and CD4þ melanoma-reactive T cellsby retroviral-mediated transfer of a TCR specific for HLA-A2-restricted epitope of the melanoma antigen tyrosinase
116 IMMUNOTHERAPY

(56). The TCR-transduced normal human peripheral bloodlymphocytes secreted various cytokines when stimulatedwith tyrosinase peptide-loaded antigen-presenting cells ormelanoma cells in an HLA-A2-restricted manner. Rosen-berg and co-worker (57) isolated the a and b chains of theTCR from a highly avid anti-gp100 CTL clone and con-structed retroviral vectors to mediate gene transfer intoprimary human lymphocytes. The biological activity oftransduced cells was confirmed by cytokine productionfollowing coculture with stimulator cells pulsed withgp100 peptides, but not with unrelated peptides. The abil-ity of the TCR gene to transfer Ag recognition to engineeredlymphocytes was confirmed by HLA class I-restrictedrecognition and lysis of melanoma tumor cell lines. Inaddition, nonmelanoma-reactive TIL cultures developedantimelanoma activity following anti-gp100 TCR genetransfer. Together, these studies suggest that lymphocytesgenetically engineered to express melanoma antigen-spe-cific TCRs may be of value in the adoptive immunotherapyof patients with melanoma.
The HPV16 (human papilloma virus type 16) infection ofthe genital tract is associated with the development ofcervical cancer in women. The HPV16-derived oncoproteinE7 is expressed constitutively in these lesions and repre-sents an attractive candidate for T cell mediated adoptiveimmunotherapy. In a recent study, Scholten et al. reportedthat HPV16E7 TCR gene transfer is feasible as an alter-native strategy to generate human HPV16E7-specific T cellsfor the treatment of patients suffering from cervical cancerand other HPV16-induced malignancies (58). These TCRgenes specific for HPV16E7 were isolated and transferredinto peripheral blood-derived CD8þ T cells. Biological activ-ity of the transgenic CTL clones was confirmed by lyticactivity and IFNg secretion upon antigen-specific stimula-tion. Most importantly, the endogenously processed andHLA-A2 presented HPV16E7 CTL epitope was recognizedby the TCR-transgenic T cells. In a separate study, ovalbu-min (OVA)-specific CD4þ cells were successfully generated.Chamoto et al. (59) prepared mouse antigen-specific Th1cells from nonspecifically activated T cells after retroviraltransfer of TCR genes. These Th1 cells transduced with thea and b genes of the I-A (d)-restricted OVA-specific TCRproduced IFNg in response to stimulation with OVA pep-tides or A20 B lymphoma cells expressing OVA as a modeltumor antigen. The TCR-transduced Th1 cells also exhibitedcytotoxicity against tumor cells in an antigen-specific man-ner. In addition, adoptive transfer of TCR-transduced Th1cells exhibited potent antitumor activity in vivo.
Genetic alteration of T cells with chimeric receptorgenes or antigen-specific TCR genes confers the redirectionof effector cells to the tumor for its destruction. Theseapproaches may offer novel opportunities to develop immu-nocompetent effector cellular reagents and improve theefficacy of adoptive immunotherapy of cancer.
COMBINED THERAPY
Cancer is a disease that involves multiple gene malfunc-tions and numerous biochemical and cellular event errorsduring its development and metastasis within an indivi-
dual. Therefore, it is difficult to achieve success utilizingadoptive T cell transfer as a monotherapy. The above-reviewed use of vaccination to induce tumor-reactivepre-effector in vivo; the coadministration of immune adju-vant with T cell transfer; and the gene therapy to redirect Tcells to tumor are all among the strategies taken to elicitand/or strengthen the efficacy of T cell therapy. Combina-tion therapy is a very common practice during the treat-ment of diseases. Active vaccine therapy, for example, canbe used in concert with chemotherapy, radiotherapy, orantibody therapy. Combining a glioma tumor vaccine engi-neered to express the membrane form of macrophagecolony-stimulating factor with a systemic antiangiogenicdrug-based therapy cured rats bearing 7 day old intracra-nial gliomas (60). We successfully demonstrated thatlocal radiotherapy potentiates the therapeutic efficacy ofintratumoral dendritic cell (DC) administration (61),and that anti-CD137 monoclonal antibody administrationaugments the antitumor efficacy of DC-based vaccines(62).
In order to enhance the efficiency of T cell therapy,various strategies have been employed accompanying celltransfer. These combined therapies include cell transfer incombination with intratumoral expression of lymphotactin(63), DC vaccination (64), or blockade of certain moleculesexpressed in tumor cells, such as B7-H1 (65).
One of the major obstacles to successful adoptive T celltherapy is the lack of efficient T cell infiltration of tumor.Combined intratumoral lymphotactin (Lptn) gene transferinto SP2/0 myeloma tumors and adoptive immunotherapywith tumor specific T cells eradicated well-establishedSP2/0 tumors in six of eight mice, and dramatically sloweddown tumor growth in the other two mice (63). Cell track-ing using labeled T cells revealed that T cells infiltratedbetter into the Lptn-expressing tumors than non-Lptn-expressing ones. These data provide solid evidence of apotent synergy between adoptive T cell therapy and Lptngene therapy as a result of facilitated T cell targeting.Dendritic cells are well-known potent antigen-presentingcells. Hwu and co-workers (64) reported that DC vaccina-tion could improve the efficacy of adoptively transferred Tcells to induce an enhanced antitumor immune response.Mice bearing B16 melanoma tumors expressing the gp100tumor antigen were treated with activated T cells trans-genic for a TCR specifically recognizing gp100, with orwithout concurrent peptide-pulsed DC vaccination. Anti-gen-specific DC vaccination induced cytokine production,enhanced cell proliferation, and increased tumor infiltra-tion of adoptively transferred T cells. The combination ofDC vaccination and adoptive T cell transfer led to a morerobust antitumor response than the use of each treatmentindividually. This work shows that in addition to theirability to initiate cell-mediated immune responses bystimulating naive T cells, dendritic cells can strongly boostthe antitumor activity of activated T cells in vivo duringadoptive immunotherapy. Certain cell surface molecules,expressed either on tumor cells or on T cells, have demon-strated have demonstrated potential suppressive impacton the adoptive T cell immunotherapy. For example, dur-ing the last few years, new members of the B7 familymolecules have been identified, for example, B7-H1, which
IMMUNOTHERAPY 117

is constitutively expressed on 66% of freshly isolated squa-mous cell carcinomas of the head and neck (SCCHN) (65).When B7-H1-negative mouse SCC line, SCCVII, was trans-fected to express B7-H1, all of the animals succumbed toB7-H1/SCCVII tumors even after adoptive T cell immu-notherapy. However, the infusion of B7-H1 blocking mono-clonal antibody with activated T cells cured 60% ofanimals. The data support B7-H1 blockade as a newapproach to enhance the efficacy of T cell immunotherapy.These findings also illuminate a new potential applicationfor the blockade of certain ‘‘negative costimulation mole-cules’’ on T cells, for example, CTLA-4 and programmeddeath-1 (PD-1) molecules. This kind of blocking may aug-ment the therapeutic efficacy mediated by the transferredT cells. The blockade can be done using specific monoclonalantibodies, soluble ligands for CTLA-4 or PD-1, or bysynthesized antagonists. In addition, effector cells can bederived from the animals deficient in the relevant mole-cules for preclinical investigations.
Immune tolerance of tumor-bearing host representsanother major obstacle for the successful use of adoptiveT cell immunotherapy. A recent study examined therequirement for assistance to the low affinity tumor-spe-cific CD8þ T cells transferred into tumor-bearing mice(66). The TCR transgenic mice expressing a class I-restricted hemagglutinin (HA)-specific TCR (clone 1TCR) were generated. Upon transfer into recipient micein which HA is expressed at high concentrations as atumor-associated Ag, the clone 1 TCR CD8þ T cells exhib-ited very weak effector function and were soon tolerized.However, when HA-specific CD4þ helper cells were co-transferred with clone 1 cells and the recipients werevaccinated with influenza, clone 1 cells were found toexert a significant level of effector function and delayedtumor growth. This work shows that in order to optimizethe function of low avidity tumor-specific T cells afteradoptive transfer, additional measures need to be takento help break the host tolerance.
Effective tumor therapy requires a proinflammatorymicroenvironment that permits T cells to extravasateand to destroy the tumor. Proinflammatory environmentcan be induced by various chemical, physical, and immu-nological protocols. Greater extent of success can beexpected by combining adoptive T cell therapy with thetraditional cancer treatment methods, for example, sur-gery, chemotherapy, and radiation therapy, as well as withdifferent forms of immunotherapeutic strategies, such asvaccine, antibody, cytokines, gene therapy, and so on. Thefactors to be combined can involve two or more approaches.
In summary, adoptive immunotherapy utilizing tumor-reactive T cells offers a promising alternative approach forthe management of cancer. Through the endeavors ofclinical and basic research scientists during the last twodecades, the process of adoptive T cell therapy of cancer hasevolved from its original single-step approach into itscurrent multiple-step procedure. Successful T cell immu-notherapy of cancer is the outcome of this multi-stepprocess that depends on successful Ag priming, numericalamplification of low frequency Ag-specific precursors, useof immune adjuvants, and efficient infiltration of tumors inall metastatic sites by effector T cells. New directions in
this field include the identification and application oftumor-reactive subpopulation of T cells, creation of a lym-phopenic environment in the recipient host, and the redir-ection of the effector cells toward the tumor. Developmentof these latter techniques and the combined use of differenttherapeutic strategies may further improve the efficacy ofthe immunotherapy of human cancer employing adoptive Tcell transfer. Studies and developments of immunotherapyfor cancer should accelerate the application of this strategyin infectious disease, autoimmune disease and other dis-ease managements.
BIBLIOGRAPHY
1. Chang AE, et al. Adoptive Immunotherapy with vaccine-primed lymph node cells secondarily activated with anti-CD3 and interleukin-2. J Clin Oncol 1997;15:796.
2. Chang AE., et al. Generation of vaccine-primed lymphocytesfor the treatment of head and neck cancer. Head and Neck2003;25:198.
3. Chang AE, et al. Phase II trial of autologous tumor vaccina-tion, Anti-CD3-activated vaccine-primed lymphocytes, andInterleukin-2 in stage IV renal cell cancer. J Clin Oncol2003;21:884.
4. Shu S, Chou T, Rosenberg SA. Generation from tumor-bearingmice of lymphoid cells with in vivo therapeutic efficacy. JImmunol 1987;139:295–304.
5. Chou T, Chang AE, Shu S. Generation of therapeutic T lym-phocytes from tumor-bearing mice by in vitro sensitization:Culture requirements and characterization of immunologicspecificity. J Immunol 1988;140:2453–2461.
6. Geiger J, Wagner P, Shu S, Chang AE. A novel role forautologous tumor cell vaccination in the immunotherapy ofthe poorly immunogenic B16-BL6 melanoma. Surg Oncol1992;1:199–208.
7. Geiger J, et al. Generation of T- cells reactive to the poorlyimmunogenic B16-BL6 melanoma with efficacy in the treat-ment of spontaneous metastases. J Immunother 1993;13:153–65.
8. Li Q, et al. Immunological effects of BCG as an adjuvant inautologous tumor vaccines. Clin Immunol 2000;94:64–72.
9. Restifo N, et al. A nonimmunogenic sarcoma induced with thecDNA for interferon-g elicits CD8þ T cells against the wild-type tumor: Correlation with antigen presentation capability.J Exp Med 1992;175:1423–1431.
10. Chang AE, et al. Immunogenetic therapy of human melanomautilizing autologous tumor cells transduced to secrete GM–CSF. Hum Gene Ther 2000;11:839–850.
11. Liu J, et al. Ex vivo activation of tumor-draining lymph node Tcells reverses defects in signal transduction molecules. CanImmunol Immunother 1998;46:268.
12. Yoshizawa H, Chang AE, Shu S. Specific adoptive immu-notherapy mediated by tumor-draining lymph node cellssequentially activated with anti-CD3 and IL-2. J Immunol1991;147:729–37.
13. Li Q, Furman SA, Bradford CR, Chang AE. Expanded tumor-reactive CD4þ T-Cell responses to human cancers induced bysecondary anti-CD3/anti- CD28 activation. Clin. Can. Res.1999;5:461.
14. Li Q, et al. Therapeutic effects of tumor-reactive CD4þ cellsgenerated from tumor-primed lymph nodes using anti-CD3/anti-CD28 monoclonal antibodies. J Immunother 2002;25:304.
15. Ito F, et al. Antitumor therapy reactivity of Anti-CD3/Anti-CD28 bead-activated lymphoid cells: Implications for cell in amurine model. J Immunother 2003;26:222.
118 IMMUNOTHERAPY

16. Li Q, et al. Polarization effects of 4-1BB during CD28 costi-mulation in generating tumor-reactive T Cells for cancerimmunotherapy. Can. Res. 2003;63:2546.
17. Aruga A, et al. Type 1 versus type 2 cytokine release by Vb Tcell subpopulations determines in vivo antitumor reactivity:IL-10 mediates a suppressive role. J Immunol 1997;159:664–673.
18. Kagamu H, Shu S. Purification of L-selectinlow cells promotesthe generation of highly potent CD4 antitumor effector Tlymphocytes. J Immunol; 1998;160:3444–3452.
19. Hart-Meyers J, et al. Cutting Edge: CD94/NKG2 is expressedon Th1 but not Th2 cells and costimulates Th1 effector func-tions. J Immunol 2002;169:5382–5386.
20. Hou W, et al. Pertussis toxin enhances Th1 responses bystimulation of dendritic cells. J Immunol 2003;170:1728–1736.
21. Li Q, et al. Synergistic effects of IL-12 and IL-18 in skewingtumor-reactive T-cell responses towards a type 1 pattern. Can.Res. 2005;65:1063.
22. Topalian SL. et al. Immunotherapy of patients with advancedcancer using tumor-infiltrating lymphocytes and recombinantinterleukin-2: a pilot study. J. Clin. Oncol. 1988;6:839.
23. Shrikant P, Mescher MF. Opposing effects of IL-2 in tumorimmunotherapy: promoting CD8 T cell growth and inducingapoptosis. J. Immunol. 2002;169:1753.
24. Rosenberg SA, et al. Experience with the use of high-doseIL-2 in the treatment of 652 cancer patients. Ann Surg1989;210:474.
25. Roychowdhury S, et al. Failed adoptive immunotherapy withtumor-specific T cells: Reversal with low-dose interleukin 15but not low-dose interleukin 2. Can Res 2004;64:8062.
26. Nacsa J, et al. Contrasting effects of low-dose IL-2 on vaccine-boosted Simian Immunodeficiency Virus (SIV)-specific CD4þ
and CD8þ T cells in macaques chronically infected in SIV-mac251. J Immunol 2005;174:1913.
27. Poggi A, et al. Tumor-induced apoptosis of human IL-2-activated NK cells: role of natural cytotoxicity receptors. JImmunol 2005;174:2653.
28. Yajima T, et al. A novel role of IL-15 in early activation ofmemory CD8þ CTL after reinfection. J Immunol 2005;174:3590–3597.
29. Kamiya S, et al. An indispensable role for STAT1 in IL-27-induced T-bet expression but not proliferation of naı̈ve CD4þ Tcells. J Immunol 2004;173:3871–3877.
30. Osaki T, et al. IFN-g-inducing factor/IL-18 administrationmediates IFN-g-and IL-12-independent antitumor effects. JImmunol 1998;160:1742.
31. Palmer DC, et al. Vaccine-stimulated adoptively transferredCD8þ T cells traffic indiscriminately and ubiquitously whilemediating specific tumor destruction. J Immunol 2004;173:7209–7216.
32. Mukai S, Kjaergaard J, Shu S, Plautz GE. Infiltration oftumors by systemically transferred tumor-reactive T lympho-cytes is required for antitumor efficacy. Can Res 59: 5245.
33. Skitzki J, et al. Donor cell cycling, trafficking, and accumula-tion during adoptive immunotherapy for murine lung metas-tases. Can Res 2004;64:2183.
34. Meidenbauer N, et al. Survival and tumor localization ofadoptively transferred melan-A-specific T cells in melanomapatients. J Immunol 2003;170:2161–2169.
35. Chi H, Flavell RA. Cutting Edge: Regulation of T cell traffick-ing and primary immune responses by sphingosine 1-phos-phate receptor 1. J Immunol 2005;174:2485–2488.
36. Wang LX, Chen BG, Plautz GE. Adoptive immunotherapy ofadvanced tumors with CD62 L-selectinlow tumor-sensitized Tlymphocytes following ex vivo hyperexpansion. J Immunol2002;169:3314–3320.
37. Peng L, et al. Tumor-induced L-selectinhigh suppressor T cellsmediate potent effector T cell blockade and cause failure ofotherwise curative adoptive immunotherapy. J Immunol2002;169:4811–4821.
38. Tanigawa K, et al. Tumor-specific responses in lymph nodesdraining murine sarcomas are concentrated in cells expressingP-selectin binding sites. J Immunol 2001;167:3089–3098.
39. Xu H, et al. Recruitment of IFN-g-producing (Th1-like) cellsinto the inflamed retina in vivo is preferentially regulated byP-selectin glycoprotein ligand 1:P/E-selectin interactions. JImmunol 2004;172:3215–3224.
40. Shu S, et al. Stimulation of tumor-draining lymph node cellswith superantigenic staphyloccocal toxins leads to the genera-tion of tumor-specific effector cells. J Immunol 1994;152:1277–1288.
41. Antony PA, et al. CD8þ T cell immunity against a tumor/self-antigen is augmented by CD4þ T helper cells and hindered bynaturally occurring T regulatory cells. J Immunol 2005;174:2591–2601.
42. Mule JJ, Jones FR, Hellstrom I, Hellstrom KE. Selectivelocalization of radio-labeled immune lymphocytes into syn-geneic tumors. J Immunol 1979;123:600.
43. Chang AE, et al. Differences in the effects of host suppressionon the adoptive immunotherapy of subcutaneous and visceraltumors. Can Res 1986;46:3426.
44. Dummer W, et al. T cell homeostatic proliferation elicitseffective antitumor autoimmunity. J Clin Inves 2002;110:185.
45. Dudley ME, et al. Adoptive transfer of cloned melanoma-reactive T lymphocytes for the treatment of patients withmetastatic melanoma. J Immunoth 2001;24:363–373.
46. Dudley ME, et al. Cancer regression and autoimmunity inpatients after clonal repopulation with antitumor lympho-cytes. Science 2002;298:850.
47. Robbins PF, et al. Cutting Edge: Persistence of transferredlymphocyte clonotypes correlates with cancer regression inpatients receiving cell transfer therapy. J Immunol 2004;173:7125–7130.
48. Eshhar Z, Waks T, Schindler DG, Gross G. Specific activationand targeting of cytotoxic lymphocytes through chimeric sin-gle chains consisting of antibody binding domains and the g orz subunits of the immunoglobulin and T cell receptors. ProcNatl Acad Sci USA 1993;90:720–724.
49. Hwu P, et al. In vivo antitumor activity of T cells redirectedwith chimeric antibody/T cell receptor genes. Can Res1995;55:3369–3373.
50. Pinthus JH, et al. Immuno-gene therapy of established pros-tate tumors using chimeric receptor-redirected human lym-phocytes. Can Res 2003;63:2470–2476.
51. Kershaw MH, et al. Gene-engineered T cells as a superioradjuvant therapy for metastatic cancer. J Immunol 2004;173:2143–2150.
52. Hombach A, et al. CD4þ T cells engrafted with a recombinantimmunoreceptor efficiently lyse target cells in a MHC antigen-and-fas independent fashion. J Immunol 2001;167:1090–1096.
53. Haynes NM, et al. Rejection of syngeneic colon carcinoma byCTLs expressing single-chain antibody receptors codeliveringCD28 costimulation. J Immunol 2002;169:5780–5786.
54. Kahlon KS, et al. Specific recognition and killing of glioblas-toma multiforme by interleukin 13-zetakine redirected cyto-lytic T cells. Can Res 2004;64:9160–9166.
55. Cole DJ, et al. Characterization of the functional specificity ofa cloned T cell receptor heterodimer recognizing the MART-1melanoma antigen. Can Res 1995;55:748–752.
56. Roszkowski JJ, et al. Simultaneous generation of CD8þ andCD4þ melanoma-Reactive T cells by retroviral-mediatedtransfer of a single T-cell receptor. Can Res 2005;65:1570–1576.
IMMUNOTHERAPY 119

57. Morgan RA, et al. High efficiency TCR gene transfer intoprimary human lymphocytes affords avid recognition of mel-anoma tumor antigen glycoprotein 100 and does not alter therecognition of autologous melanoma antigens. J Immunol2003;171:3287–3295.
58. Scholten KB, et al. Preservation and redirection of HPV16E7-specific T cell receptors for immunotherapy of cervical cancer.Clin Immunol 2005;114:119–129.
59. Chamoto K, et al. Potentiation of tumor eradication by adop-tive immunotherapy with T-cellreceptor gene-transduced T-helper type 1 cells. Can Res 2004;64:386–390.
60. Jeffes EWB, et al. Antiangiogenic drugs synergize with amembrane macrophage colony-stimulating factory-basedtumor vaccine to therapeutically treat rats with an establishedmalignant intracranial glioma. J Immunol 2005;174:2533–2543.
61. Teitz-Tennenbaum S. et al. Radiotherapy potentiates thetherapeutic efficacy of intratumoral dendritic cell adminis-tration. Can Res 2003;63:8466–8475.
62. Ito F, et al. Anti-CD137 monoclonal antibody administrationaugments the antitumor efficacy of dendritic cell-based vac-cines. Can Res 2004;64:8411.
63. Huang H, Li F, Gordon JR, Xiang J. Synergistic enhancementof antitumor immunity with adoptively transferred tumor-specific CD4þ and CD8þ T cells and intratumoral lymphotac-tin transgene expression. Can Res 2002;62:2043.
64. Lou Y, et al. Dendritic cells strongly boost the antitumoractivity of adoptively transferred T cells in vivo. Can Res2004;64:6783.
65. Strome SE. B7-H1 blockade augments adoptive T-cell immu-notherapy for squamous cell carcinoma. Can Res 2003;63:6501.
66. Lyman MA, et al. The fate of low affinity tumor-specific CD8þ
T cells in tumor-bearing mice. J Immunol 2005;174:2563–2572.
See also BORON NEUTRON CAPTURE THERAPY; MONOCLONAL ANTIBODIES.
IMPEDANCE PLETHYSMOGRAPHY
HELMUT HUTTEN
University of TechnologyGraz, Australia
INTRODUCTION
Plethysmography is a volumetric method, that is, a methodfor the assessment of a volume (the Greek words plethysand plethora mean full and fullness, respectively). Impe-dance plethysmography is based on the measurement ofpassive electrical properties of biological tissues. Thosepassive electrical properties are parameters of the so-calledbioimpedance. The first publication about impedanceplethysmography by Nyboer et al. (1) dates back to 1943.Pioneering contributions to the basic understanding of therelations between the assessment of volumes by impedanceplethymosgraphy and the electrical properties of biologicaltissue have been provided by Schwan et al. (2) already in1955. But already by the end of the nineteenth centuryStewart had used the recording of electrical conductivity tostudy transit times between different sites of the body afterinjection of saline into the circulation (3). Blood flow record-
ing is one of the most relevant fields for the clinical appli-cation of impedance plethysmography nowadays.
Impedance plethysmography is a volumetric methodthat aims to assess a volume or changes of a volume.Usually, a volume is the filling volume of a space that isenclosed by geometric boundaries. In this case, volumetrymeans the determination of the boundaries with subse-quent assessment of the volume within the boundaries.Those boundaries can be determined by the impedancemethod if the electrical properties of the substances onboth sides of the boundaries are different.
Impedance plethysmography, however, can also beapplied to the assessment of volumes that are not lumpedcompartments within geometric boundaries, for example,it can be used for the volumetric measurement of a certaincomponent within a mixture. Such components may becells (e.g., the volume of cells in blood), tissues (e.g., thevolume of fat tissue in the body), spaces with differentcomposition (e.g., intra- and extracellular spaces), or thevolume of the air that is enclosed in the alveoli of lungtissue. In that case, volumetry means the estimation of thespace that would be occupied by the respective componentif it would be concentrated in one single lumped compart-ment. Usually, this volume is estimated as a percentage ofthe whole distribution volume, for example, the volume ofcells in blood or the content of water in the whole body. Theelectrical properties of the respective component must bedifferent from those of all other components. The volu-metric assessment does not require a homogeneous dis-tribution of the considered component within the givenspace if the actual distribution can be taken into account,for example, by a model. Under certain conditions, a tissuecan be identified by specific features like morphologicalstructure and/or chemical composition if those features arerelated with its electrical properties.
The typical application of plethysmography in clinicalroutine is the diagnosis of those diseases for which themeasurement of volumes or changes of volume renderspossible the interpretation of functional disorders or func-tional parameters. The most widely and routinely applieddiagnostic examinations are concerned with:
1. Heart: Cardiac mechanical disorders by impedancecardiography (i.e., pumping insufficiency by measur-ing cardiac stroke volume, including heart rate andother cardiac parameters like ejection period). Thisapplication is discussed in another article.
2. Peripheral circulation: Vascular disorders by impe-dance rheography (i.e., deep venous thrombosis byimpedance phlebography, and estimation of bloodflow in the brain or other peripheral vessels).
3. Lung: Ventilatory disorders by impedance pneumo-graphy (i.e., insufficient ventilation by monitoringthe tidal volume and/or respiratory rate).
METHODOLOGY
Impedance plethysmography is a noninvasive method thatemploys contacting, usually disposable electrodes, in mostcases metal-gel electrodes, for example, with Ag/AgCl for
120 IMPEDANCE PLETHYSMOGRAPHY
the metal plate. Usually, the electrodes have circulargeometry; however, other geometries might be preferable,for example, band-like geometry for segmental measure-ment at the extremities. It must be considered that themetal plates of electrodes are areas with the same poten-tial, and therefore may affect the electromagnetic fielddistribution in the considered object. Electrodes with smallareas help to reduce that effect, whereas electrodes withlarge areas render it possible to reach a more homogenouscurrent field in the measured object.
Contacting electrodes can easily be attached to the skinor surface of the measurement object, usually by an adhe-sive material that is already fixed to the electrode. Only inspecial cases, for example, for research purposes, does themeasurement require invasive application.
Different contactless measurement modes gain increas-ing attention, for example,
1. Microwave-based methods with antennas as appli-cators and measurement of the scattered electromag-netic field.
2. Methods based on exploiting the magnetic instead ofthe electrical properties: inductive plethysmographythat uses coils and records the changes in the induc-tance and magnetic susceptibility plethysmographythat employs strong magnetic fields and records thechanges in the magnetic flux, for example, by super-conducting quantum interference devices (SQUID).
All bioimpedance-based methods are aiming at record-ing either the effect on the applied electromagnetic field bythe measurement object or the response of the measure-ment object to the application of the electromagnetic field.The directly measured quantities are electrical quantities,for example, voltages or currents. Those quantities areactually imaging electrical coefficients, for example, con-ductivity, permittivity, or resistivity, which are material-specific parameters of the tissue impedance and monitor itsmorphological structure and/or chemical composition.With these material-specific parameters the geometricboundaries are determined and used for the estimationof the volume or volume changes. Relations between themeasured electrical parameters and the volume areusually based on models. The employed models can be verysimple, for example, described by simple geometric bound-aries like cylinders, spheres, or ellipsoids. More complex3D models may be described by the finite element method(FEM) or similar approaches, which allows simulating thedistribution of the electromagnetic field in the measuredobject, that is, the current pathways and the iso-potentialplanes. Sophisticated iterative optimization procedures areemployed to match the simulated values with the mea-sured ones (4).
Electrical impedance tomography (EIT) is a directapproach for determining the 3D geometry of those com-partments with the same material-specific parameters in abiological object like the human torso or an extremity. Thistechnique uses multiple electrodes, usually arranged in aplane. Mapping (or imaging) of the impedance distributionin the examined cross-sectional layer requires the solutionof the inverse or back-projection problem. Actually, the
obtained 2D image is a pseudo-3D image since the currentpathways are not constrained to the examined layer. Elec-trical impedance tomography supplies a comparable near-anatomic cross-sectional image comparable to those ofother CT-based procedures [e.g., X-ray CT, NMR, or ultra-sound (US)], however, with very poor spatial resolution.Boundaries of compartments with the same material-spe-cific coefficients are found by segmentation. Segmentedareas with assumed thickness of the single layers are usedfor volume estimation. Changes in the volume can beassessed by comparing the volumes obtained in consecutiveimages.
It is a characteristic feature of all methods that recordthe electrical bioimpedance that the evoked responsedepends on the strength of the local electromagnetic field.For this reason, it has to be taken into account that theresulting current density may be inhomogeneous in theconsidered tissue volume. Causes for such nonhomogeneitymay be geometric constraints (e.g., a nonregular shape ofthe considered volume); the composition of the tissuewithin the considered volume that may be a mixture oftissues with different electrical properties (e.g., blood withlow resistivity, or bone with high resistivity, as comparedwith skeletal muscle). Those different tissues may electri-cally be switched in parallel or serial order; and the sizeand the location of the current-feeding electrodes. Thecurrent density is higher in regions near to the feedingelectrodes than in distant regions. Consequently, theregions near to the feeding electrodes give the strongestcontribution to the measured voltage.
This requires (1) careful selection of the current-feedingsite. In the tetrapolar mode also the position of the voltage-sensing electrodes must be taken into account; and (2)appropriate consideration of the inhomogeneous distribu-tion of the electrical parameters within the consideredtissue volume, that is, the course of blood vessels.
Special electrode arrangements have been developed forcertain applications in order to minimize the measurementerrors. Concentric multielectrode arrangements with theouter electrodes on a potential different from that of theinner electrode have been proposed with the objective tooptimize the current distribution in the measured volume.
The frequency that can be used for the measurement ofthe passive electrical properties of biological tissue rangesfrom very low frequencies to some gigahertz. The mostpopular frequency band for impedance plethysmography isbetween 1 kHz and 10 MHz. This frequency band enclosesthe so-called b-dispersion, which is actually a dielectric orstructural relaxation process. The b-dispersion is alsoknown as Maxwell–Wagner relaxation. It is characterizedby a transition in the magnitude of the electrical para-meters with frequency. This transition is caused by the factthat cellular membranes have high impedance below andlow impedance above that b-dispersion. For frequenciesdistinctly below the b-dispersion, the current flow isrestricted to the extracellular space. For frequencies dis-tinctly above the b-dispersion, the current can passthrough the cellular membrane. Consequently, with fre-quencies distinctly below the b-dispersion only the volumeor volume changes of the extracellular space will be mon-itored, whereas with frequencies distinctly above the
IMPEDANCE PLETHYSMOGRAPHY 121

b-dispersion, the total volume (i.e., both extra- and intra-cellular space) or changes of this total volume can berecorded. Using at least one frequency below and anotherone above the b-dispersion allows determining the ratio ofextra- and intracellular spaces, and hence also fluid shiftsbetween these spaces.
Special applications of this approach are the monitoringof fluid exchange processes during hemodialysis (5) andorthostatic challenges (6), the control and management offluid infusion therapy, the detection of lung edema, and theviability surveillance of organs after blood flow has beenstopped during surgery or when the organs are preservedfor transplantation (7,8). The viability surveillance isbased on the fact that oxygen deficiency with the subse-quent lack of energy-rich substrates causes a failure of theactive transmembraneous ionic transport mechanismsand, as a consequence, leads to an intracellular edema(i.e., an increase of the intracellular volume). Thisapproach has also been investigated for graft rejectionmonitoring.
The passive electrical properties are specific for eachtissue. They are mainly depending on the content of water,the ratio of extra- and intracellular space, the concentra-tion of electrolytes, and the shape of the cells and theirorientation in the electrical field (e.g., of the fibers ofskeletal and cardiac muscle). Table 1 shows a compilationof typical values of resistivity of various body tissues. Itmust be taken into account, however, that these values donot represent exact figures. Exact figures need detailedinformation about species, preparation of the sample, timeafter excision, measurement temperature, the employedmethod, and the protocol for the measurement. Compre-hensive data compilations with the supplement of thosedetails are found in Refs. 9 and 10.
These tissue-specific properties can be used for specialapplications, such as the analysis of the tissue compositionor for tissue characterization by Impedance Spectroscopy.Those methods are the subject of another article and willnot be discussed here in detail. A very popular applicationis the determination of total body water (11) or of wholebody composition, for example, the determination of thepercentage of body fat in order to support adequate nutri-tion management or control of physical exercises. Suchapproaches aim for the estimation of the compartmentalvolume of a certain tissue (e.g., fat) that is mixed with
another tissue (e.g. fat-free tissue) in a common space (i.e.,the body or an extremity).
FUNDAMENTALS OF BIOIMPEDANCE MEASUREMENT
The most important principle for bioimpedance measure-ments is the adequate modeling of the passive electricalbehavior of the tissue by an equivalent electrical circuit.The validity of simple models is restricted to narrow fre-quency ranges (e.g., the b-dispersion) and/or to simplegeometric shapes of the biological object (e.g., cylindersas a model for extremities). The most widely acceptedmodels for the bioimpedance in the frequency range aroundthe b- dispersion are the RC-networks shown in Fig. 1.These models represent the spatially distributed electricalproperties by discrete components. Actually, they are onlysimplified 2D models. The network shown in Fig. 1a ismimicking the biological system and its histological struc-ture. It represents both the extracellular and intracellularspace by the resistors Re and Ri, respectively, and the cellmembrane by the capacitor Cm. Since the current passestwice the membrane when flowing through the cell, the twocapacitors Cm* in series with Ri can equivalently beexpressed by one single capacitor Cm in series with Ri.This network is usually replaced by the one shown in Fig.1b in which Rs is arranged in series with the parallel circuitof Rp and Cp. These components have no relation with realhistological structures. The parameter Rs corresponds tothe parallel circuitry of Re and Ri as can be demonstratedfor high frequencies. The parameter Rs can be considered tobe very small as compared with Rp. In many cases, RS may
122 IMPEDANCE PLETHYSMOGRAPHY
Table 1. Compilation of Typical Values of Resistivity (V�m) of Various Body Tissuesa
Frequency
10 Hz 100 Hz 1 kHz 10 kHz 100 kHz 1 MHz 10 MHz 100 MHz
Muscle, skeletal 9.6 8.8 8.1 7.6 2.0 1.8 1.6 1.4Muscle, heart 9.6 9.3 8.0 6.0 2.1 2.0 1.6 1.5Liver 10.0 8.7 8.6 7.6 4.6 2.8 2.8 1.7Kidney 1.9 1.8 1.4 1.3Brain 6.1 6.0 5.3 3.7 1.5Fatty tissue 23.2Blood 1.6 1.5 1.5 1.4 0.9 0.8
aNote that those values must not be assumed to represent exact figures since they do not consider important details like species, preparation of sample, time
after excision, temperature, or the procedure and protocol for their measurement. The values are compiled from many different sources and, if necessary
transformed to resistivity.
Figure 1. RC-networks modeling tissue impedance. The model in(a) mimicks morphological structures, whereas the model in (b)shows the electrically equivalent, but, more usual circuitry.

even be neglected for cases of simplification, that is, theelectrical model is simply a parallel circuit of a resistor anda capacitor (e.g., RpkCp).
When using contacting electrodes, different approachesare possible for the measurement of the bioimpedance. Themost important feature is the number of employed electro-des, usually two or four electrodes. More than 4 electrodes,up to 128 electrodes, are primarily used for CT-basedimpedance imaging like EIT. The two-electrode configura-tion is called the bipolar mode, and the four-electrodeconfiguration is the tetrapolar mode (Fig. 2). The bipolarmode can be compared with the usual method for impe-dance measurement by feeding a current into the measure-ment object and recording the voltage or vice versa. In thetetrapolar mode, two electrodes are the feeding electrodes(usually the outer electrodes) and the other two electrodesare the sensing electrodes (usually the inner ones). In thetetrapolar mode, more than two sensing electrodes can beemployed, for example, if monitoring of serial segments atthe extremities are to be achieved.
The interface between the electrode with the metallicplate on the one side and the electrolyte on the other side isthe boundary where a current carried by electrons istransformed into a current carried by ions. The electrolytemay either be contained in the gel of the electrodes or be theelectrolytic fluid in the tissue. The basic process of thecharge transfer from electrons to ions is a chemical reaction(12). The simplest model of such an interface is again animpedance consisting of a parallel circuit with a resistor RF
(the Faraday resistance) and a capacitor CH (the Helmholtzcapacitance), i.e., RFkCH (Fig. 3b). Real electrodes show apolarization effect that is caused by a double layer ofopposite charges at the interface, actually the Helmholtzcapacitance (Fig. 3a). Therefore, the electrode model withRFkCH has to be supplemented with an additional voltagesource EP. The steady-state condition is reached if thetendency of metallic ions to enter the electrolyte and leavebehind free electrons is balanced by the electrostatic vol-tage originating from the double layer. After disturbances,for example, by charge transfer forced by an externallyapplied voltage, another equilibrium for the double-layervoltage is reached with a time constant depending on RF
and CH. All these components may have poor stability withtime, especially in the period immediately after attachingthe electrode on the skin. For surface electrodes, it mustalso be taken into account that the impedance of the skin,especially the stratum corneum, which is the outmost
epidermal layer, can be much larger than the impedanceof the deeper tissue (e.g., skeletal muscle), which is in acomplex parallel-serial arrangement with the skin. Sweat-ing underneath the electrode lowers the electrode-tissuetransimpedance. For the measurement of the impedance ofdeeper tissues the adequate preparation of the skin byabrasion, stripping, or puncturing at the site of the elec-trodes might be necessary in order to diminish the tran-simpedance. This transimpedance depends on the size ofthe electrode (i.e., the contacting area) and the measure-ment frequency, and . . . additionally on the pressure withwhich the electrode is attached to the skin. For electrodes, atypical value for the transimpedance is �100–200 V�cm2.
In the bipolar mode, the two electrode–electrolyte inter-faces are in series with the actual bioimpedance of themeasured object. Therefore, the recorded impedance isalways the sum of at least three impedances. The impe-dance of the biological sample cannot be calculated as anindividual quantity from the recorded impedance value.This is the most serious shortcoming of the bipolar mode.
In the tetrapolar mode, the electrode–electrolyte inter-face usually can be neglected if the measurement is per-formed with a device with high input impedance (i.e., withvery low current passing across the electrode–tissue inter-
IMPEDANCE PLETHYSMOGRAPHY 123
Sine wave signalgenerator
Sine wave signalgenerator
(a) (b)Measuringdevice
Measuringdevice
Electrode FE FESE
Skin
Tissue
Currentpathways
Currentpathways
FE...Feeding electrodeSE...Sensing electrode
∼ ∼
Figure 2. Bioimpedance measurement set-up. (a)Shows the two-electrode configuration, whereasthe four-electrode configuration is depicted in (b).
(b)
RF
CH
e−
e−
e−
e−
Me+
Me+
Me+
Me+
Metal electrode Electrolyte(a)
Figure 3. Metal electrode: electrolyte interface. (a) Illustratesthe steady-state condition at the boundary. Following thetendency of metallic ions (Meþ) to enter the electrolyte and toleave behind free electrons, the steady state is reached when thistendency is balanced by the electrostatic voltage originating fromthe double layer. (b) Shows the simplified model with only thepassive electrical components, that is, the Faraday resistance RF
and the Helmholtz capacitance CH.

face). A drawback of the tetrapolar mode, however, is thatthe measured impedance value cannot be exactly assignedwith a certain volume of the tissue between the sensingelectrodes, even if the sensing electrodes are positioned ona straight line connecting the two feeding electrodes. Bandelectrodes that are attached at the whole circumference(e.g., at the extremities), yield more valid results. If cir-cular electrodes are applied and both the feeding and thesensing electrodes are placed on the circumference of across-section (e.g., around the thorax or the head), it isnearly impossible to assign the actually measured impe-dance value with a certain volume within that cross-sectiondue to the complex current field. In those cases, the mon-itored volume consists of a serial-parallel circuitry of dif-ferent tissue layers with different electrical properties(e.g., skin, subcutaneous soft tissue, bone, deeper tissues).For this reason, the result of ventilation measurementswith electrodes, either disk or band electrodes, placed onthe thorax may be affected by the higher conductivity ofextra-thoracic muscles as compared with the very lowconductivity of the rib cage, which prevents the entranceof current into the pulmonary tissue that is actually theobject of interest. Sweating may additionally cause anotherlow impedance parallel circuit along the skin and, thus,yield considerable measurement errors. The situation issimilar for the measurement of brain parameters, forexample, brain–blood flow or brain edema, with electrodesplaced on the scalp. Since the conductivity of the extra-cranial soft tissue (e.g., skin, muscle) is much higher thanthe conductivity of the bony skull, only few current path-ways will pass through the brain.
The different instrumental approaches for measuringthe bioimpedance in the frequency range of the b-disper-sion are the impedance bridge (e.g., an extension of theclassical Wheatstone bridge); the self-balanced activebridge; the resonance method that is mainly a compensa-tion method; the pulse method that is a time domainprocedure and not widely used; the voltage-currentmethod, based either on feeding a constant voltage (i.e.,from a generator with low source impedance) and monitor-ing the resulting current or on feeding a constant current(i.e., from a generator with a sufficiently high sourceimpedance, �100 kV since the load impedance may beup to 1 kV) and monitoring the resulting voltage. Ifemploying the bipolar mode, it would be more correct inthis case to use the term transimpedance than impedancefor the actually measured quantity between the electrodes.
For the tetrapolar configuration only the voltage-cur-rent method is applicable. Phase angle measurementsemploy an ohmic resistor in series with the measuringobject as reference. Absolute phase angle measurementsare questionable even for the bipolar configuration sincethe measured phase angle always includes the phase shiftsthat are caused by the two electrode–skin contacts anddepend on the actual values of the Faraday resistance andthe Helmholtz capacitance. If the Faraday resistance issmall and the Helmholtz capacitance is fairly large, thephase shift by the electrode–skin interface may becomenegligible. This is one of the advantages of electrodes withartificially increased surfaces, for example, electrodes withporous or fractally coated surfaces that might be obtained
by sputtering or chemical processes, as compared withpolished surfaces.
Usually, the measurement is performed with a con-stant-voltage generator for technical reasons. The appliedfeeding signal, whether voltage or current, should be sinu-soidal with a very low distortion factor (i.e., with a lowcontent of harmonics) and with high stability both inamplitude and frequency. Any modulation of the feedingsignal may provoke an additional response for this unde-sired modulation frequency that has to be avoided withregard to the frequency dependence of the impedancespecific variables. The voltage amplitude is in the rangeof some volts, the current amplitude is in the range of somemicroamps to milliamps (mA to mA). The changes in theimpedance caused by volume changes can be very small,<0.001%. This means that very small changes in themeasured current or voltage have to be processed. Hence,the sensitivity and stability of the input amplifier must bevery high in order to detect such small changes in themeasured signal.
Independent from the measurement method, carefulconsideration of measurement errors is necessary. A mainsource of measurement errors may be parasitic compo-nents, such as stray capacitances between neighboringwires leading to the sensing electrodes, or between wiresand their shielding, or stray capacitances between metalliccomponents of the measuring system and ground, whichbecome the more effective the higher the measuringfrequency.
The risk for undesired stimulation of the heart or per-ipheral nerves if such electrical voltages or currents areapplied for monitoring purposes, is negligible, both withregard to the high frequency and the low current density.Furthermore, heating and heat-induced secondary effectscan be neglected.
However, proper attention must be paid for the selectionof the equipment and its performance data for the intendedapplication. Furthermore, the employed devices must besafe even in case of technical failure. Patient-near devicesare directly connected with the patient whereby the con-necting impedance is rather low.
CHARACTERISTICS OF BIOIMPEDANCE
The microscopic electrical properties that describe theinteraction of an electromagnetic wave with biologicaltissue are the complex conductivity s� with the unitV�1�m�1, mho�m�1, S�m�1, or 1�(V�m)�1
s�ðvÞ ¼ s0ðvÞ þ js00ðvÞ
and the complex dielectric permittivity e� with the unit F/m
e�ðvÞ ¼ e0ðvÞ � je00ðvÞ
v is radian frequency with the unit hertz. The electricalproperties are depending on the frequency with strongdependence in the range of a dispersion.
The relation between these two quantities can bedescribed in accordance with Ref. 13 by
s�ðvÞ ¼ jv e�ðvÞ
124 IMPEDANCE PLETHYSMOGRAPHY

With the conduction current that is related with the basicconductivity s0, that is, the current carried by the mobilityof ions in the extracellular space, and the polarizationcurrent (sometimes called displacement current) that isrelated with permittivity, the following equations areobtained
s0 ¼ s0 þ v e00ðvÞs00 ¼ v e0ðvÞ ¼ e0 erðvÞ
where e0 is the dielectric permittivity of free space withe0 ¼ 8.85 10�12 F�m�1, and er is the relative dielectricpermittivity (with er ¼ 1 for the free space and er ¼ 81 forwater in the low and medium frequency range).
Instead of the complex conductivity s�, the inversecomplex resistivity r� with the unit V�m can be used.The resistivity is usually preferred in the context of impe-dance plethysmography:
r�ðvÞ ¼ r0ðvÞ þ j r00ðvÞ
The complexity of these quantities considers the fact thatin the alternating current (ac) range the biological tissuecannot adequately be described by a simple resistance (orits inverse conductance), but needs the extension to acomplex quantity, that is, impedance or admittance. Someauthors prefer the term Admittance Plethysmographyinstead of Impedance Plethysmography (14,15). Thesimplest adequate model for such an impedance is repre-sented by a resistance and a reactance. The resistancecauses the loss in power, whereas the reactance causesthe delay (or 18 phase shift) between voltage and current.The dominating reactance of bioimpedance in the fre-quency range of interest is capacitive and becomes morerelevant for higher frequencies. Only for very high fre-quencies that usually are not employed for impedanceplethysmography, can the reactance be composed by botha capacitive and an inductive component.
Bioimpedance can be described like any technical impe-dance in different forms, for example, by its magnitude (ormodulus) Z0 and its phase angle (or argument) w, (i.e., thedelay between voltage and current):
Z ¼ Z0 e jw
or by its real part (or resistance) Re{Z} and its imaginarypart (or reactance) Im{Z}:
Z ¼ RefZg þ j ImfZg
Alternating current voltages and ac currents, too, can beexpressed as complex quantities, that is, by their magni-tude and phase angle, or by their real and imaginary partalthough this is rather unusual. The magnitude of theimpedance Z0 corresponds to the quotient of the magni-tudes of voltage V0 and current I0, that is,
Z0 ¼ V0=I0
Appropriate modeling of the electrical properties of biolo-gical tissue by discrete and lumped electrical componentsrenders possible the proper consideration of multilayer orcompartmentally composed tissues with different electricalproperties of each layer or compartment. Such tissues can
be modeled as serial, parallel, or serial–parallel equivalentcircuits in 2D presentation. More recently, the modelinghas been extended to 3D models using the FEM or compar-able approaches.
The impedance parameters can be depicted in differentmodes as a function of frequency (Fig. 4). The presentationof the magnitude (usually in logarithmic scale with regardto its wide range) and the phase angle against the fre-quency over several decades, and therefore in logarithmicscale is known as the Bode plot. A similar presentation isused for both the real and imaginary part versus thefrequency on the x axis. This mode of presentation issometimes called the spectrum (e.g., modulus spectrumand phase angle spectrum). A different form of presenta-tion is in a plane with the real part along the x axis and theimaginary part along the y axis, both in linear scaling, withthe frequency as parameter. This mode of presentation isfrequently called the Cole–Cole-plot (but also the Nyquistplot, locus plot, or Wessel graph). The same modes of
IMPEDANCE PLETHYSMOGRAPHY 125
104
103
102
10−1 10−0 101 102 103 104 105 106
10−1 10−0 101 102 103 104 105 106
10−1 10−0 101 102 103 104 105 106
10−1 10−0 101 102 103 104 105 106
Mag
nitu
de
0
−20
−40
−60
6000
4000
2000
−1000
0
−2000
−3000
−3000
−2000
−1000
0
0Rea
l Par
t Re
{Z}
Imag
inar
y P
art I
m {
Z}
Imag
inar
y P
art I
m {
e ∗}
= e
″
Pha
se (
degr
ees)
0 2000 4000Real Part Re {e ∗} = e ′
ω = ∞ ω = 0
ω
f [Hz] in logarithmic scaling
f [Hz] in logarithmic scaling
f [Hz] in logarithmic scaling
f [Hz] in logarithmic scaling(a)
(b)
(c)
Figure 4. Different modes for the presentation of impedancequantities. (a) Shows the magnitude (in logarithmic scaling)and the phase angle of impedance as functions of frequency inlogarithmic scaleing (Bode plot). (b) Shows the real and imaginarypart of impedance depicted versus the frequency in logarithmicscaling. (c) Presents the Cole–Cole plot with the real part at the xaxis, the imaginary part at the y axis, and the frequency asparameter along the curve. The results shown are not frombiological tissue, but calculated for the circuit of Fig. 1b withRs ¼ 500 V, Rp ¼ 5 kV, and Cp ¼ 500 nF.
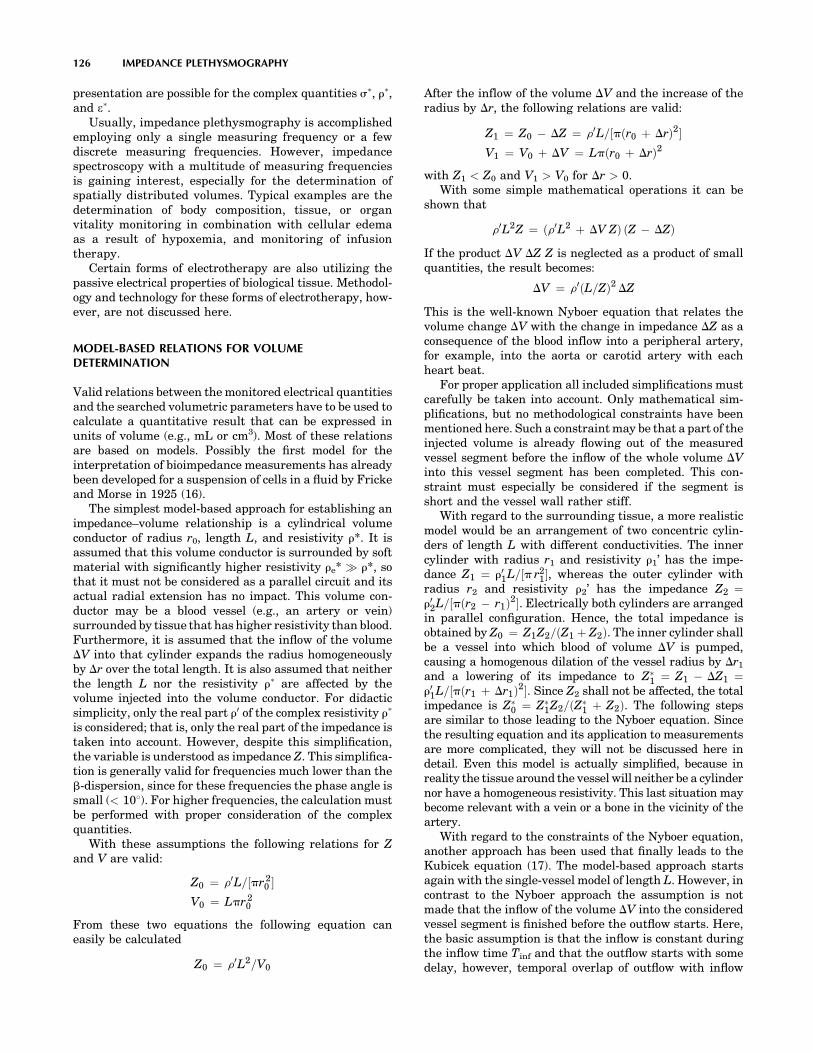
presentation are possible for the complex quantities s�, r�,and e�.
Usually, impedance plethysmography is accomplishedemploying only a single measuring frequency or a fewdiscrete measuring frequencies. However, impedancespectroscopy with a multitude of measuring frequenciesis gaining interest, especially for the determination ofspatially distributed volumes. Typical examples are thedetermination of body composition, tissue, or organvitality monitoring in combination with cellular edemaas a result of hypoxemia, and monitoring of infusiontherapy.
Certain forms of electrotherapy are also utilizing thepassive electrical properties of biological tissue. Methodol-ogy and technology for these forms of electrotherapy, how-ever, are not discussed here.
MODEL-BASED RELATIONS FOR VOLUMEDETERMINATION
Valid relations between the monitored electrical quantitiesand the searched volumetric parameters have to be used tocalculate a quantitative result that can be expressed inunits of volume (e.g., mL or cm3). Most of these relationsare based on models. Possibly the first model for theinterpretation of bioimpedance measurements has alreadybeen developed for a suspension of cells in a fluid by Frickeand Morse in 1925 (16).
The simplest model-based approach for establishing animpedance–volume relationship is a cylindrical volumeconductor of radius r0, length L, and resistivity r*. It isassumed that this volume conductor is surrounded by softmaterial with significantly higher resistivity re* r*, sothat it must not be considered as a parallel circuit and itsactual radial extension has no impact. This volume con-ductor may be a blood vessel (e.g., an artery or vein)surrounded by tissue that has higher resistivity than blood.Furthermore, it is assumed that the inflow of the volumeDV into that cylinder expands the radius homogeneouslyby Dr over the total length. It is also assumed that neitherthe length L nor the resistivity r� are affected by thevolume injected into the volume conductor. For didacticsimplicity, only the real part r0 of the complex resistivity r�
is considered; that is, only the real part of the impedance istaken into account. However, despite this simplification,the variable is understood as impedance Z. This simplifica-tion is generally valid for frequencies much lower than theb-dispersion, since for these frequencies the phase angle issmall (< 108). For higher frequencies, the calculation mustbe performed with proper consideration of the complexquantities.
With these assumptions the following relations for Zand V are valid:
Z0 ¼ r0L=½pr20 �
V0 ¼ Lpr 20
From these two equations the following equation caneasily be calculated
Z0 ¼ r0L2=V0
After the inflow of the volume DV and the increase of theradius by Dr, the following relations are valid:
Z1 ¼ Z0 � DZ ¼ r0L=½pðr0 þ DrÞ2�V1 ¼ V0 þ DV ¼ Lpðr0 þ DrÞ2
with Z1 < Z0 and V1 > V0 for Dr > 0.With some simple mathematical operations it can be
shown that
r0L2Z ¼ ðr0L2 þ DV ZÞ ðZ � DZÞ
If the product DV DZ Z is neglected as a product of smallquantities, the result becomes:
DV ¼ r0ðL=ZÞ2 DZ
This is the well-known Nyboer equation that relates thevolume change DV with the change in impedance DZ as aconsequence of the blood inflow into a peripheral artery,for example, into the aorta or carotid artery with eachheart beat.
For proper application all included simplifications mustcarefully be taken into account. Only mathematical sim-plifications, but no methodological constraints have beenmentioned here. Such a constraint may be that a part of theinjected volume is already flowing out of the measuredvessel segment before the inflow of the whole volume DVinto this vessel segment has been completed. This con-straint must especially be considered if the segment isshort and the vessel wall rather stiff.
With regard to the surrounding tissue, a more realisticmodel would be an arrangement of two concentric cylin-ders of length L with different conductivities. The innercylinder with radius r1 and resistivity r1’ has the impe-dance Z1 ¼ r01L=½p r2
1�, whereas the outer cylinder withradius r2 and resistivity r2’ has the impedance Z2 ¼r02L=½pðr2 � r1Þ2�. Electrically both cylinders are arrangedin parallel configuration. Hence, the total impedance isobtained by Z0 ¼ Z1Z2=ðZ1 þ Z2Þ. The inner cylinder shallbe a vessel into which blood of volume DV is pumped,causing a homogenous dilation of the vessel radius by Dr1
and a lowering of its impedance to Z�1 ¼ Z1 � DZ1 ¼
r01L=½pðr1 þ Dr1Þ2�. Since Z2 shall not be affected, the totalimpedance is Z�
0 ¼ Z�1Z2=ðZ�
1 þ Z2Þ. The following stepsare similar to those leading to the Nyboer equation. Sincethe resulting equation and its application to measurementsare more complicated, they will not be discussed here indetail. Even this model is actually simplified, because inreality the tissue around the vessel will neither be a cylindernor have a homogeneous resistivity. This last situation maybecome relevant with a vein or a bone in the vicinity of theartery.
With regard to the constraints of the Nyboer equation,another approach has been used that finally leads to theKubicek equation (17). The model-based approach startsagain with the single-vessel model of length L. However, incontrast to the Nyboer approach the assumption is notmade that the inflow of the volume DV into the consideredvessel segment is finished before the outflow starts. Here,the basic assumption is that the inflow is constant duringthe inflow time Tinf and that the outflow starts with somedelay, however, temporal overlap of outflow with inflow
126 IMPEDANCE PLETHYSMOGRAPHY

must not be excluded. With this assumption, the change inthe intravascular volume and, hence, in the impedance, ismaximal when there is only inflow into and no outflow fromthe segment. This maximal change of the impedance can beexpressed by its first time derivative [i.e., by (dZ/dt)max].The total inflowing volume DV can then be taken intoaccount by multiplying (dZ/dt)max with the inflow timeTinf. With regard to the aorta this inflow time is equivalentwith the ejection time of the left ventricle. In many caseseven the inflow time can additionally be obtained from theimpedance curve. This leads finally to the Kubicek equa-tion:
DV ¼ r0ðL=ZÞ2Tinf ðdZ=dtÞmax
Obviously, the only relevant difference in both approachesis the Nyboer assumption that the total volume change DVhas already been injected into the measured vessel seg-ment before the outflow starts against the Kubicekassumption that this volume DV is entering the measuredvessel segment with constant rate during the whole inflowperiod. The Kubicek equation is more realistic for a shortvessel segment with a rather stiff wall. For such vessels,the Nyboer equation leads to an underestimation of thereal volume change. In contrast, if the inflow is decreasingat the end of the inflow period, for example, at the end of theventricular ejection period, the Kubicek equation yields anoverestimation of the volume change.
All other model-based assumptions are identical orcomparable. Both approaches consider only a single vesselwith homogeneous dilation over the total length within themeasured tissue and neglect the surrounding tissue and itscomposition with regard to nonhomogeneous resistivity.Blood resistivity is taken as constant although there issome evidence that it depends on the flow velocity.
Although the Kubicek equation has primarily beenproposed for the monitoring of cardiac output, both equa-tions have also been applied to the monitoring of pulsatileperipheral blood flow. Both models, however, do not con-sider that in the peripheral circulation a basic or nonpul-satile blood flow may exist as well.
Different modifications have been suggested in order toovercome relevant drawbacks. Most of these modificationsare optimized with regard to the monitored quantity, geo-metric constraints, modes of application, or positioning andshape of electrodes. They will not be discussed here.
No valid impedance–volume models have been proposedfor the quantitative monitoring of ventilation by the appli-cation of impedance plethysmography. Statistical modelsare used for the impedance–volume relationship regardingbody composition. Some first approaches have been sug-gested for the volume changes due to fluid shifts.
INSTRUMENTATION AND APPLICATIONS
The typical basic equipment for impedance plethysmogra-phy consists of the signal generator, either a constantvoltage generator or a constant current generator; thefrequency-selective measuring device, either for currentor voltage, in combination with AD conversion. The equip-ment may be supplied with more than one signal channel
for certain applications, for example, with two channels forsimultaneous and symmetric monitoring at both extremi-ties or one channel for each frequency in multifrequencymeasurements; the signal processor, for example, for pro-cessing the impedance quantities; the processing unit forcalculating the volumetric quantities; the monitor and/ordata recorder; multiple electrodes and shielded leads; spe-cific auxiliary equipment, for example, venous occlusionmachine with cuff and pump.
Devices for impedance plethysmography are small,light, usually portable, and battery powered. The devicesfor patient-near application are much cheaper than com-petitive equipment based on nuclear magnetic resonance(NMR), X ray, or US. Also, the running costs are muchlower than for the competitive technologies, usually thesecosts are mainly required by the single-use electrodes.
Peripheral Hemodynamics
The objective is the detection of deficiencies either in thearterial or venous peripheral circulation. The applicationof impedance plethysmography to peripheral vascular stu-dies has already been in the interest of Nyboer in 1950 (18).
In the peripheral circulation, the most interesting quan-tity is arterial blood flow or perfusion. Impedance measure-ment is performed either in the bipolar or, more frequently,in the tetrapolar configuration. The tetrapolar configura-tion requires a longer segment for measurement in order toplace the sensing electrodes in proper distance from thefeeding electrodes with the nonhomogenous current field intheir vicinity. Electrodes are either of the circular or disk orthe band type. Disk electrodes can be placed directly abovethe monitored vessel and therefore provide high sensitiv-ity, but the magnitude and the reproducibility of the mea-sured signal in repeated measurements are stronglydependent on exact electrode placement (19–21). Bandelectrodes are preferred for the measurements at extremi-ties because they can be placed around the extremities. Inthis case, the measured object is the whole segmentbetween the sensing electrodes including the extravasculartissue and may include more than only one vessel. Flow canbe estimated by application of the Nyboer, the Kubicek orany modified impedance–volume equation. Competitivemethods are utilizing ultrasound Doppler, contrast X-rayangiography, or NMR.
Some diagnostic information about the stiffness of thearterial vessel wall can be obtained by the impedancemethod from the measurement of the pulse wave propaga-tion velocity, usually executed at two different sites of thesame arterial pathway. The pulse that is actually recordedwith the impedance method is the intravascular volumepulse, that is, the dilation of the vessel with each heart beat(22). Simple formalistic models are used to relate the pulsewave propagation velocity with the stiffness of the vesselwall. If the intravascular blood pressure is also monitored,then it is possible to calculate the stiffness or its inverse,the compliance as ratio of the volume change and pressurechange DV/Dp, directly.
Another problem is the diagnosis of proximal or deepvenous thrombosis and of other obstacles for the venousreturn flow to the heart from the extremities (23). One
IMPEDANCE PLETHYSMOGRAPHY 127

approach is actually a modification of the venous occlusionplethysmography that has already been introduced in 1905by Brodie and Russel (24). A cuff is placed around theextremity and connected with a pump. The cuff pressure isenhanced abruptly so that it occludes the vein and stopsvenous outflow without affecting the arterial inflow. Thevolume increase following venous occlusion allows estimat-ing the arterial inflow. When the occlusion is stopped after� 20 s, the venous outflow starts again and thereby leadsto a reduction in volume. The slope or the time constant ofthis postocclusion emptying process are used to assess theoutflow resistance, for example, the hydrodynamicallyobstructive impact of deep venous thrombosis, or thevenous wall tension. However, other pathological effectsmust be carefully considered, for example, increased cen-tral venous pressure. For this reason, the recording isfrequently and simultaneously performed on both extre-mities, so that the results can be compared with each other.The measurement is usually executed with band electro-des. Competitive methods are ultrasound Doppler, con-trast X-ray venography, or NMR.
A similar impedance-based approach is employed to testthe performance of the drainage system in extremities.Changes in the hydrostatic pressure are used to shiftvolume between the trunk and an extremity, for examplefirst by bringing down an arm before raising it above thehead. The affected volume shifts can be recorded andrender possible the assessment of the performance of thedraining system. This approach is frequently used to studyfluid shifts caused by tilting experiments, during micro-gravity experiments, or after long periods of bedrest.
Brain Perfusion and Edema
The most important objectives are monitoring of cerebralbloodflow and the detection of cerebral edema. First pub-lications about rheoencephalography are dating back to1965 (25,26).
The volume of the brain with its enclosed fluid spaces,for example, the intravascular volume and the cerebrosp-inal fluid volume, is kept constant by its encapsulation inthe bony skull. The expansion of the volume of one com-partment, for example, increase of the intravascularvolume by augmented arterial blood pressure, the space-demanding growth of a brain tumor or intracerebral bleed-ing, can only be compensated by the diminution of thevolume of other compartments. If the space-demandingprocess is of nonvascular origin, the most affected compart-ment will be the intravascular volume. Due to the compres-sion of blood vessels, the cerebral bloodflow and thusmetabolism will be reduced.
Impedance measurements aiming for the brain as organare difficult because the encapsulating bony skull has avery high resistivity as compared with the soft extracranialtissue of the face and the scalp. If the tetrapolar mode isused, more than two sensing electrodes may be applied.Different electrode arrangements have been described toforce the current pathways through the skull into thebrain, but also the application of the feeding electrodesto the closed eyelids. However, the measurement of thetranscephalic impedance has not become a routinely
applied clinical method with the exception of neonates inwhich the thickness of the bony skull is very small. Com-petitive methods based on NMR, X ray, US, and evenphotoplethysmography have gained more attention inthe recent past. Some expectations are related to thedevelopment of contactless applications, especially forthe continuous monitoring of edema (27). This might allowcontrol treatment by hyperosmolaric infusion therapy.
Ventilation and Lung Performance
Impedance pneumography were among the first applica-tions of impedance plethysmography and had already beendescribed by Geddes et al. in 1962 (28,29).
The objective of impedance pneumography is to recordthe tidal volume under resting conditions or during exer-cise. Additionally, the breathing rate can be obtained bythe impedance method. The principle is based on themeasurement of the transthoracic impedance thatincreases during inspiration as a consequence of increasingalveolar air filling, and decreases during expiration (30).The conductivity of lung tissue at the end of a normalexpiration is �0.10 V�1�m�1 as compared with0.05 V�1�m�1 at the end of normal inspiration. The appli-cation of impedance pneumography is very simple and alsoapplicable for critically ill patients, since it allows contin-uous recording without requiring a breathing tube. How-ever, the quantitative determination of the tidal volume isdifficult and needs calibration by another spirometricmethod. No realistic model-based interpretation of quan-titative assessment is available until now. Some expecta-tions are related with multifrequency measurement (31).
The impedance measurement can be performed with thebi- or tetrapolar configuration. It is usually performedseparately for each side of the lung in order to detectdifferences. Even with more electrodes, however, the spa-tial resolution is too poor to allow detection of regionalinhomogeneities of alveolar air filling. For that reason, thisfield is gaining growing interest for the application of EIT(4). Also, EIT has limited spatial resolution, as comparedwith other CT-based imaging procedures. Despite thisdrawback, it has some potential for the detection of regio-nal inhomogeneities in ventilation. Such an approachwould be of high relevance for diagnostic purposes andfor the efficiency control of artificial ventilation. Seriousdrawbacks for EIT, however, are the costs of the equipmentand the necessity to attach up to 64 or 128 electrodesaround the thorax.
Since pulmonary edema is usually a general and not alocalized phenomenon, its monitoring might be possible byutilizing the transthoracic impedance measurement. Mea-surement of extravascular lung water is investigated as amethodological approach to guide the fluid management ofpatients with noncardiogenic pulmonary edema (32). Theconductivity of lung edema fluid is �1 V�1�m�1, and there-fore is distinctly different from alveolar tissue filled withmore or less air.
The impedance coefficients of tumor tissue are differentfrom normal lung tissue. Hence, cancer detection might bepossible by bioimpedance measurement. But with regard toits poor spatial resolution, the bi- or tetrapolar transthor-
128 IMPEDANCE PLETHYSMOGRAPHY
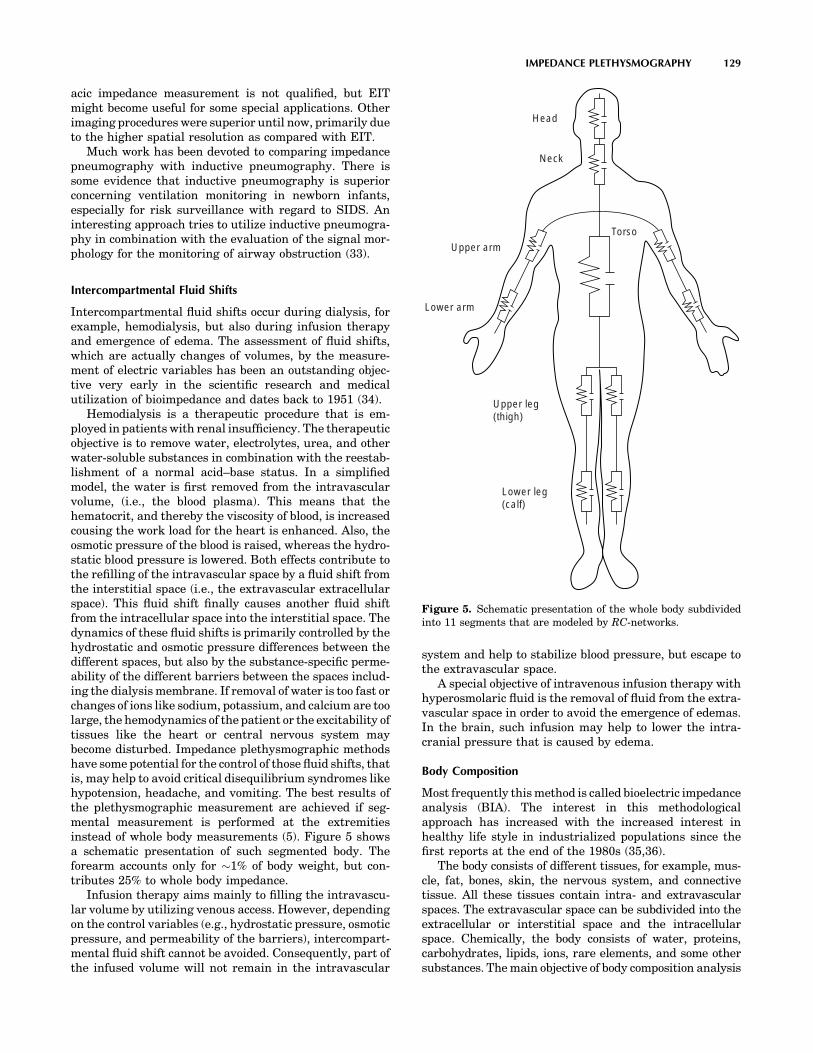
acic impedance measurement is not qualified, but EITmight become useful for some special applications. Otherimaging procedures were superior until now, primarily dueto the higher spatial resolution as compared with EIT.
Much work has been devoted to comparing impedancepneumography with inductive pneumography. There issome evidence that inductive pneumography is superiorconcerning ventilation monitoring in newborn infants,especially for risk surveillance with regard to SIDS. Aninteresting approach tries to utilize inductive pneumogra-phy in combination with the evaluation of the signal mor-phology for the monitoring of airway obstruction (33).
Intercompartmental Fluid Shifts
Intercompartmental fluid shifts occur during dialysis, forexample, hemodialysis, but also during infusion therapyand emergence of edema. The assessment of fluid shifts,which are actually changes of volumes, by the measure-ment of electric variables has been an outstanding objec-tive very early in the scientific research and medicalutilization of bioimpedance and dates back to 1951 (34).
Hemodialysis is a therapeutic procedure that is em-ployed in patients with renal insufficiency. The therapeuticobjective is to remove water, electrolytes, urea, and otherwater-soluble substances in combination with the reestab-lishment of a normal acid–base status. In a simplifiedmodel, the water is first removed from the intravascularvolume, (i.e., the blood plasma). This means that thehematocrit, and thereby the viscosity of blood, is increasedcousing the work load for the heart is enhanced. Also, theosmotic pressure of the blood is raised, whereas the hydro-static blood pressure is lowered. Both effects contribute tothe refilling of the intravascular space by a fluid shift fromthe interstitial space (i.e., the extravascular extracellularspace). This fluid shift finally causes another fluid shiftfrom the intracellular space into the interstitial space. Thedynamics of these fluid shifts is primarily controlled by thehydrostatic and osmotic pressure differences between thedifferent spaces, but also by the substance-specific perme-ability of the different barriers between the spaces includ-ing the dialysis membrane. If removal of water is too fast orchanges of ions like sodium, potassium, and calcium are toolarge, the hemodynamics of the patient or the excitability oftissues like the heart or central nervous system maybecome disturbed. Impedance plethysmographic methodshave some potential for the control of those fluid shifts, thatis, may help to avoid critical disequilibrium syndromes likehypotension, headache, and vomiting. The best results ofthe plethysmographic measurement are achieved if seg-mental measurement is performed at the extremitiesinstead of whole body measurements (5). Figure 5 showsa schematic presentation of such segmented body. Theforearm accounts only for �1% of body weight, but con-tributes 25% to whole body impedance.
Infusion therapy aims mainly to filling the intravascu-lar volume by utilizing venous access. However, dependingon the control variables (e.g., hydrostatic pressure, osmoticpressure, and permeability of the barriers), intercompart-mental fluid shift cannot be avoided. Consequently, part ofthe infused volume will not remain in the intravascular
system and help to stabilize blood pressure, but escape tothe extravascular space.
A special objective of intravenous infusion therapy withhyperosmolaric fluid is the removal of fluid from the extra-vascular space in order to avoid the emergence of edemas.In the brain, such infusion may help to lower the intra-cranial pressure that is caused by edema.
Body Composition
Most frequently this method is called bioelectric impedanceanalysis (BIA). The interest in this methodologicalapproach has increased with the increased interest inhealthy life style in industrialized populations since thefirst reports at the end of the 1980s (35,36).
The body consists of different tissues, for example, mus-cle, fat, bones, skin, the nervous system, and connectivetissue. All these tissues contain intra- and extravascularspaces. The extravascular space can be subdivided into theextracellular or interstitial space and the intracellularspace. Chemically, the body consists of water, proteins,carbohydrates, lipids, ions, rare elements, and some othersubstances. The main objective of body composition analysis
IMPEDANCE PLETHYSMOGRAPHY 129
Torso
Head
Neck
Upper arm
Upper leg(thigh)
Lower leg(calf)
Lower arm
Figure 5. Schematic presentation of the whole body subdividedinto 11 segments that are modeled by RC-networks.

is the assessment of total body water, of lean or fat freetissue mass, and of fat tissue. Those measurements haveclinical relevance, but they are also gaining growing atten-tion in the field of sports, physical fitness, wellness, nutri-tion, and for life science in aerospace research.
The methodological approaches are different, for exam-ple bipolar or tetrapolar mode, single-or multiple-frequency measurement, whole body or segmental mea-surement. In single-frequency measurements, a sinussoi-dal current with usually < 1 mA (range 0.02–10 mA) and afrequency with typically 50 kHz (range 20–100 kHz) isemployed. The basic assumption is that resistivity of fattissue is higher than that of the so-called lean tissue thathas a higher content of water. In the nonclinical field, thedetermination of body composition is frequently combinedwith the measurement of body weight using a scale withtwo integrated electrodes in the foot platform. In that case,however, only the two legs and the lower part of the trunkwill be included into the estimation. In more advanceddevices, additional electrodes are available in the form ofhand grips. Detailed segmental measurements are morevalid since the trunk of the body may contribute �70% tothe total body weight and up to 90% to the total body fat,but only 5% to the measured whole body impedance. Moresophisticated equipment utilize multifrequency measure-ment (11).
The applied statistically based predictive equations areof the linear regression type and consider individual para-meters like sex, age, height, and weight. They are primar-ily used to assess the lean muscle mass, the body fat, the fatfree mass, the water content, and the body mass index. Forphysically based segmental calculations, the extremities,the body trunk, and even the head are modeled by cyclind-ric shape with uniform cross-section over the total length.
Competitive methods include antropometric measureslike the girth, simple skin-fold measurements by mechan-ical calipers, but also highly advanced methods, such asNMR, X ray (dual energy X-ray absorptiometry, or nuclearimaging), and for certain purposes even the hydrostaticweighing in a water tank that is assumed to be the mostaccurate method.
Laboratory Applications
Blood Cell Counting. The employed methodologicalprinciple is frequently called the Coulter principle (37).Blood cells (e.g., erythrocytes, leucocytes) are passingthrough a capillary (diameter < 100 mm) filled with bloodplasma. For frequencies below the b-dispersion the impe-dance of the cell is higher than that of the surroundingplasma. Consequently, the passage of each cell affects therecorded impedance. Those impedance changes are usedfor cell counting. In sophisticated devices the impedancechanges are quantitatively measured and allow cell volumeestimation, which also renders possible the determinationof the cell volume distribution function (frequently calledthe Price – Jones distribution function with the cell dia-meter as variable). Since the number of leucocytes is verysmall compared with that of the erythrocytes (usually< 0.1%), leucocytes do not really disturb the counting oferythrocytes. In contrast, however, the erythrocytes must
be destroyed before the leucocytes can be counted. This isusually achieved by chemical hemolysis of the erythro-cytes. Furthermore, chemical substances are utilized torender possible the differentiation between the differentpopulations of leucocytes (e.g., granulocytes, monocytes,lymphocytes).
Hematocrit. The objective is the estimation of theintracellular volume of blood. The hematocrit is definedas the ratio of the volume of blood cells to total bloodvolume, although frequently the hematocrit is taken as ameasure for the ratio of only the volume of erythrocytes tototal blood volume. However, since the partial volume of allother blood cells (i.e., leucocytes, platelets) is very smallcompared with that of the erythrocytes, the results are notdistinctly different. Determination of the ratio between theextracellular volume and the total blood volume is possibleby application of at least one measuring frequency belowand another one above the b-disperion. Problems that needfurther consideration as possible sources of error are theelectrolytic conductivity of blood plasma, which is depen-dent on the actual concentration of ions, and the sedimen-tation of the cells as a consequence of their higher specificweight that may take place during the measuring period.The measurement requires the withdrawal of a sample ofblood from a vein or another blood vessel. Measurement ofthe hematocrit can be achieved either with the impedanceor the dielectric technique (38).
Several modifications of the impedance method for thenoninvasive determination of the hematocrit have beenproposed. In one approach, impedance measurement isperformed at the finger by application of two differentfrequencies (i.e., 100 kHz and 10 MHz). The hematocritis determined by an algorithm that uses both the pulsatileand the baseline component of both measuring frequencies(39). In another remarkable methodological approach, thepatient puts a finger in a temperature-stabilized bath. Afluid with gradually increasing ionic concentration ispumped through the bath chamber, thus leading to adecrease in the impedance of the bath fluid. The pulsatilevolume changes of the finger are recorded by impedancemeasurement in the bath chamber. These pulsatile impe-dance fluctuations disappear only if the impedance of thebath fluid is identical with that of the blood in the finger.The conclusion is made from the actual impedance of thebath fluid on the hematocrit (40).
Others
Cell Imaging. Nanotechnology-based on bioimpedancesensing, chip devices have been described that allows usto rapidly detect and image cells with a specific pheno-type in a heterogeneous population of cells (41). This mightbe useful for screening purposes, recognition of cell irre-gularities, and detection of risk patients like humanimmunodeficiency virus (HIV)-infected individuals. Cellidentification is made possible by administration of markersubstances. A promising measurement procedure is elec-trochemical cyclic voltammetry. When a sinusoidal voltagewith constant amplitude and a variable frequency in therange of some kilohertz is applied, the impedance is plotted
130 IMPEDANCE PLETHYSMOGRAPHY

in the spectrographic mode. Among other effects, volumechanges might be the dominating measured effect if themarker binds with a receptor in the cell membrane, andherewith affects membrane properties like its permeabilityfor water or ions or the transmembraneous active iontransport mechanisms.
Inductive Plethysmography. Inductive plethysmogra-phy is employed for respiratory monitoring, so-calledrespiratory inductance plethysmography (RIP). It is basedon the measurement of the thoracic crosssection that isenclosed by coils and includes both the rib cage and abdom-inal compartments (42–45). In the medium frequencyrange (30–500 kHz), changes in the volume are monitoredby the influenced inductance. In the higher frequencyrange (�100 MHz), the inductively provoked signals (i.e.,eddy currents depending on the alveolar air filling) arerecorded by appropriately arranged coils.
Magnetic Susceptibility Plethysmography. Magnetic sus-ceptibility plethysmography is a contactless method. It isbased on the application of a strong magnetic field andmonitors the variation of the magnetic flux. The measure-ment is accomplished with superconduting quantum inter-ference device (SQUID) magnetometers. This approachmay primarily be utilized for the assessment of bloodvolume changes in the thorax, but until now it is notemployed for clinical routine (46).
SUMMARY
In comparison with biomedical engineering as a recognizeddiscipline, the research activities in the field of bioimpedanceare much older. It can be assumed that Nikola Tesla, a formerstudent of physics in Graz (Austria) and the inventor of the actechnology, already knew about the passive electrical proper-ties of biological tissues when he demonstrated his famousand public performances with the administration of highvoltage pulses ‘‘���I demonstrated that powerful electricaldischarges of several hundred thousand volts which at thattime were considered absolutely deadly, could be passedthrough the body without inconvenience or hurtful conse-quences’’ in the 1880s. This knowledge was utilized byd’Arsonval since 1892 for therapeutic purposes, mainly aim-ing for heat induction in certain parts of the body. In 1913,Rudolf Hoerber, at that time a physiologist at the Universityof Kiel (Germany), measured the electrical conductance offrog muscle at 7 MHz and found that at this frequency themembrane resistance is short circuited.
Since its beginning, bioimpedance remained to be achallenge to physicists, medical doctors, and of courseengineers. The most relevant basic research was performedin the second half of the twentieth century. The progressthat has been reached has been and is still utilized both fordiagnostic and therapeutic purposes in medicine. Impe-dance plethysmography is one of the different fields ofbioimpedance application. If impedance plethysmographyis correctly understood, it does not only mean the determi-nation of a solid volume with well-defined boundaries, butalso the volumetric determination of one component con-tained in a mixture of different components.
Progress in technology has rendered possible applica-tions that are of great interest for medicine. The mostrelevant progress is in the field of signal acquisition,including advanced electrode technology, signal proces-sing, and model-based signal interpretation. Not allattempts to utilize the passive electrical properties ofbiological tissue for diagnostic purposes have been success-ful. In many cases, other technologies have been shown tobe superior. But there is no doubt that the whole potentialof impedance plethysmography has not been exhausted.New challenges in the medical field are cellular imagingand possibly even molecular imaging. In all applications,however, impedance plethysmography will have to proveits validity and efficiency.
BIBLIOGRAPHY
1. Nyboer J, Bango S, Nims LF. The Impedance Plethysmographand Electrical Volume Recorder. CAM Report OSPR 1943;149.
2. Schwan HP. Electrical properties of body tissues and impe-dance plethysmography. IRE Trans Biomed Electron 1955;3:32–46.
3. Stewart GN. Researches on the circulation time in organs andon the influence which affect it. J Physiol 1894;15:1–89.
4. Li J. Multifrequente Impedanztomographie zur Darstellung derelektrischen Impedanzverteilung im menschlichen Thorax.PhD thesis, University of Stuttgart, 2000. Available at http://elib.uni-stuttgart.de/opus/volltexte/2000/736/pdf/li_diss.pdf.
5. Kanai H, Haeno M, Sakamoto K. Electrical measurement offluid distribution in legs and arms. Med Prog Technol1987;12:159–170.
6. Osten H. Impedanz-Plethysmographie im Orthostasetest.Münchn Med Wochenschr 1977;119:897–900.
7. Gersing E. Measurement of electrical impedance in organs.Biomed Techn 1991;36:6–11.
8. Dzwonczyk R, et al. Myocardial electrical impedance res-ponds to ischemia in humans. IEEE Trans Biomed Eng2004;BME-51:2206–2209.
9. Durney CH, Massoudi H, Iskander MF. RadiofrequencyRadiation Dosimetry. 4th ed. USAFSAM-TR-85–73; 1985.
10. Gabriel S. 1997. Appendix B: Part 1: Literature Survey. Avail-able at http://niremf.ifac.cnr.it/docs/DIELECTRIC/AppendixB1.html.
11. Segal KR. Estimation of extracellular and total body waterby multiple-frequency bioelectrical impedance measurement.Am J Clin Nutr 1991;V54-1:26–29.
12. Neuman MR. Biopotential electrodes. In: Webster JG, editor.Medical Instrumentation—Application and Design. 3rd ed.New York: Wiley; 1998.
13. Rigaud B, Morucci J-P, Chauveau N. Bioimpedance measure-ment. In: Morucci J-P, et al. edition. Bioelectrical ImpedanceTechniques in Medicine. Crit. Rev. Biomed. Eng. 1996;24: 257–351.
14. Yamakoshi KI, Shimazu H, Togawa T, Ito H. Admittanceplethysmography for accurate measurement of human limbblood flow. Am J Physiol 1978;235:H821–H829.
15. Shimazu H, et al. Evaluation of the parallel conductor theoryfor measuring human limb blood flow by electrical admittanceplethysmography. IEEE Trans Biomed Eng 1982;BME-29:1–7.
16. Fricke H, Morse S. The electrical resistance of blood be-tween 800 and 4.5 million cyclces. J Gen Physiol 1925;9:153–157.
IMPEDANCE PLETHYSMOGRAPHY 131

17. Kubicek WG, et al. Development and evaluation of an impe-dance cardiac output system. Aerospace Med 1966;37:1208–1212.
18. Nyboer J. Electrical impedance plethysmography: a physicaland physiological aproach to peripheral vascular studies.Circulation 1950;2:811–821.
19. Yamamoto Y, Yamamoto T, Öberg PA. Impedance plethysmo-graphy in human limbs. Part 1: On electrodes and electrodegeometry. Med Biol Eng Comput 1991;29:419–424.
20. Yamamoto Y, Yamamoto T, Öberg PA. Impedance plethysmo-graphy in human limbs. Part 2: Influence of limb crosssec-tional areas. Med Biol Eng Comput 1992;30:518–524.
21. Lozano A, Rosell J, Pallas-Areny R. Errors in prolonged elec-trical impedance measurement due to electrode repositioningand postural changes. Physiol Meas 1995;16:121–130.
22. Risacher F, et al. Impedance plethysmography for the evalua-tion of pulse wave velocity in limbs. Med Biol Eng Comput1992;31:318–322.
23. Hull R, et al. Impedance plethysmography: The relationshipbetween venous filling and sensitivity and specificity for prox-imal vein thrombosis. Circulation 1978;58:898–902.
24. Brodie TG, Russel AE. On the determination of the rate of bloodflow through an organ. J Physiol 1905;33:XLVII–XLVIII.
25. Seipel JH, Ziemnowicz SAR, O’Doherty DS. Cranial impe-dance plethysmography—rheoencephalography as a methodfor detection of cerebrovascular disease. In: Simonson E,McGavack TH, editors. Cerebral Ischemia. Springfield, IL:Charles C Thomas; 1965; p 162–179.
26. Hadjiev D. A new method for quantitative evaluation of cere-bral blood flow by rheoencephalography. Brain Res1968;8:213–215.
27. Netz J, Forner E, Haagemann S. Contactless impedance mea-surement by magnetic induction—a possible method for inves-tigation of brain impedance. Physiol Meas 1993;14:463–471.
28. Geddes LA, Hoff HE, Hickman DM, Morre AG. The impedancepneumograph. Aerospace Med 1962;33:28–33.
29. Baker LE, Geddes LA, Hoff HE. Quantitative evaluation ofimpedance spirometry in man. Am J Med Elect 1965;4:73–77.
30. Nopp P, et al. Dielectric properties of lung tissue as a functionof air content. Phys Med Biol 1993;38:699–716.
31. Brown BH, et al. Multifrequency imaging and modelling ofrespiratory related electrical impedance changes. PhysiolMeas 1994;15(Suppl. A):1–12.
32. Nierman DM, et al. Transthoracic bioimpedance can measureextravascular water in acute lung injury. J Surg Res1996;65:101–108.
33. Brack Th et al. Continuous and cooperation-independentmonitoring of airway obstruction by a portable inductiveplethysmograph. AJRCCM 2004;169:1.
34. Löfgren B. The electrical impedance of a complex tissue and itsrelation to changes in volume and fluid distribution. ActaPhysiol Scand 1951;23(Suppl. 81):1–51.
35. Schloerb PR, et al. Bioimpedance as a measure of total bodywater and body cell in surgical nutrition. Eur Surg Res1986;18:1.
36. van Loan MD, et al. Association of bioelectric resistive impe-dance with fat-free mass and total body water estimates ofbody composition. Amer J Human Biol 1990;2:219–226.
37. Coulter WH. High speed automatic blood cell counter and cellsize analyzer. Proc Nat Electron Conf 1956;12:1034.
38. Treo EF, et al. Comparative analysis of hematocrit measure-ments by dielectric and impedance techniques. IEEE TransBiomed Eng 2005;MBE-52:549–552.
39. http://www.patentalert.com/docs/001/z00120411.shtml.40. Yamakoshi KI, et al. Noninvasive measurement of hematocrit
by electrical admittance plethysmography technique. IEEETrans Biomed Eng 1989;27:156–161.
41. Mishra NN, et al. Bio-impedance sensing device (BISD) fordetection of human CD4þ cells. Nanotech 2004, vol. 1, Proc2004 NSTI Nanotechnology Conf 2004, p 228–231.
42. Brouillette RT, Morrow AS, Weese-Mayer DE, Hunt CE.Comparison of respiratory inductive plethysmography andthoracic impedance for apnea monitoring. J Ped 1987;111:377–383.
43. Valta P, et al. Evaluation of respiratory inductive plethysmo-graphy in the measurement of breathing pattern and PEEP-induced changes in lung volume. Chest 1992;102:234–238.
44. Cohen KP, et al. Design of an inductive plethysmograph forventilation measurement. Physiol Meas 1994;15:217–229.
45. Strömberg TLT. Respiratory Inductive Plethysmography.Linköping Studies in Science and Technologies DissertationsNo. 417, 1996.
46. Malmivuo J, Plonsey R. Impedance plethysmography. In:Malmivuo J, Plonsey R, editors, Bioelectromagnetism. NewYork: Oxford University Press; 1995. Chapt. 25.
Further Reading
Foster KR, Schwan HP. Dielectric properties of tissue and biolo-gical materials. A critical review. Crit Rev Biomed Eng1989;17:25–102.
Kaindl F, Polzer K, Schuhfried F. (1958, 1966, 1979): Rheographie.Darmstadt, Dr: Dietrich Steinkopff Verlag; 1958 (1st ed), 1966(2nd ed), 1979 (3rd ed).
Morucci J-P, et al. Bioelectrical impedance techniques in medicine.Crit Rev Biomed Eng 1996;24:223–681.
Pethig R. Dielectric and Electronic Properties of Biological Mate-rials. Chichester: Wiley; 1979.
Schwan HP. Determination of biological impedances. In: NastukWL, editor. Physical Techniques in Biological Research. Vol. VI(ptB) New York: Academic Press; 1963; p 323–407.
Schwan HP. Biomedical engineering: A 20th century interscience.Its early history and future promise. Med Biol Eng Comput1999;37(Suppl. 2):3–13.
Stuchly MA, Stuchly SS. Dielectric properties of biologicalsubstances—tabulated. J Microw Power 1980;15:19–26.
Webster JG, editor. Medical Instrumentation—Application andDesign. 3rd ed. New York: Wiley; 1998.
Gabriel C, Gabriel S. Compilation of the Dielectric Properties ofBody Tissues at RF and Microwave Frequencies, 1996. Availableat http://www.brooks.af.mil/AFRL/HED/hedr/reports/dielectric/Report/Report.html.
See also BIOIMPEDANCE IN CARDIOVASCULAR MEDICINE; PERIPHERAL
VASCULAR NONINVASIVE MEASUREMENTS.
IMPEDANCE SPECTROSCOPY
BIRGITTE FREIESLEBEN DE BLASIO
JOACHIM WEGENER
University of OsloOslo, Norway
INTRODUCTION
Impedance spectroscopy (IS), also referred to as electro-chemical impedance spectroscopy (EIS), is a versatileapproach to investigate and characterize dielectric andconducting properties of materials or composite samples(1). The technique is based on measuring the impedance
132 IMPEDANCE SPECTROSCOPY

(i.e., the opposition to current flow) of a system that is beingexcised with weak alternating current or voltage. Theimpedance spectrum is obtained by scanning the sampleimpedance over a broad range of frequencies, typicallycovering several decades.
In the 1920, researchers began to investigate the impe-dance of tissues and biological fluids, and it was earlyknown that different tissues exhibit distinct dielectricproperties, and that the impedance undergoes changesduring pathological conditions or after excision (2,3).
The advantage of IS is that it makes use of weakamplitude current or voltage that ensures damage-freeexamination and a minimum disturbance of the tissue.In addition, it allows both stationary and dynamic elec-trical properties of internal interfaces to be determined,without adversely affecting the biological system. Thenoninvasive nature of the method combined with its highinformation potential makes it a valuable tool for biome-dical research and many medical applications are currentlyunder investigation and development; this will be reviewedat the end of the article.
This article starts with providing a general introductionto the theoretical background of IS and the methodologyconnected to impedance measurement. Then, the focus willbe on applications of IS, particularly devises for in vitromonitoring of cultured cell systems that have attractedwidespread interest due to demand for noninvasive, mar-ker-free, and cost-effective methods.
THEORY
Impedance, Z, is a complex-valued vector that describesthe ability of a conducting medium to resist flow of alter-nating current (ac). In a typical IS experiment (Fig. 1), asinusoidal current I(t) signal with angular frequency v
(v ¼ 2pf ) is passed through the sample and theresulting steady-state voltage U(t) from the excitation is
measured. According to the ac equivalent of Ohm’s law, theimpedance is given by the ratio of these two quantities
Z ¼ UðtÞIðtÞ (1)
The impedance measurement is conducted with use ofweak excitation signals, and in this case the voltageresponse will be sinusoid at the same frequency v as theapplied current signal, but shifted in phase w. Introducingcomplex notation, Eq. 1 translates into
Z ¼ U0
I0expðiwÞ ¼ jZjexpðiwÞ (2)
with U0 and I0 being the amplitudes of the voltage andcurrent, respectively, and i ¼
ffiffiffiffiffiffiffi�1
pbeing the imaginary
unit. Thus, at each frequency of interest the impedanceis described by two quantities: (1) its magnitude jZj, whichis the ratio of the amplitudes of U(t) and I(t); and (2) thephase angle w between them. The impedance is measuredover a range of frequencies between hertz and gigahertz,dependent on the type of sample and the problem to study.
The measured impedance can be divided into its realand imaginary components, that is, the impedance contri-bution arising from current in-phase with the voltage and908 out-of-phase with the voltage
R ¼ ReðZÞ ¼ jZjcosðwÞ; X ¼ ImðZÞ ¼ jZjsinðwÞ (3)
The real part is called resistance, R, and the imaginarypart is termed reactance, X. The reactive impedance iscaused by presence of storage elements for electricalcharges (e.g., capacitors in electrical circuit).
In some cases it is convenient to use the inverse quan-tities, which are termed admittance Y ¼ 1/Z, conductanceG ¼ Re(Y), and susceptance B ¼ Im(Y), respectively. Inthe linear regime (i.e., when the measured signal is pro-portional to the amplitude of the excitation signal), thesetwo representation are interchangeable and contain thesame information. Thus, IS is also referred to as admit-tance spectroscopy.
INSTRUMENTATION
The basic devices for conducting impedance measurementsconsist of a sinusoid signal generator, electrodes, and aphase-sensitive amplifier to record the voltage or current.Commonly, a four-electrode configuration is used, with twocurrent injecting electrodes and two voltage recordingelectrodes to eliminate the electrode–electrolyte interfaceimpedance. As discussed below, some applications of ISmake use of two-electrode arrangements in which the sameelectrodes are used to inject current and measure thevoltage.
Since the impedance is measured by a steady-statevoltage during current injection, some time is needed whenchanging the frequency before a new measurement can beperformed. Therefore, it is very time consuming if eachfrequency has to be applied sequentially. Instead, it iscommon to use swept sine wave generators, or spectrumanalyzers with transfer function capabilities and awhite noise source. The white noise signal consists of the
IMPEDANCE SPECTROSCOPY 133
Figure 1. Schematic of a two-electrode setup to measure thefrequency-dependent impedance of a sample that is sandwichedbetween two parallel plate electrodes.

superposition of sine waves for each generated frequency,and the system is exposed to all frequencies at the sametime. Fourier analysis is then used to extract the real andimaginary parts of the impedance.
The electrodes used for impedance experiments aremade from biocompatible materials, such as noble metals,which in general is found not to have deleterious effect onbiological tissue function. Electrode design is an importantand complicated issue, which depends on several factors,including the spatial resolution required, the tissue depth,and so on. It falls beyond the scope of this article to gofurther into details. The interested readers are referred tothe book by Grimnes and Martinsen (4) for a generaldiscussion.
Common error sources in the measurements includeimpedance drift (e.g., caused by adsorption of particleson the electrodes or temperature variations). Ideally, thesystem being measured should be in steady-state through-out the time required to perform the measurement, but inpractice this can be difficult to achieve. Another typicalerror source is caused by pick-up of electrical noise from theelectronic equipment, and special attention must be paid toreduce the size of electric parasitics arising, for example,from cables and switches.
DATA PRESENTATION AND ANALYSIS
The most common way to analyze the experimental data isby fitting an equivalent circuit model to the impedancespectrum. The model is made by a collection of electricalelements (resistors, capacitors) that represents the elec-trical composition in the system under study.
As a first step, it is useful to present the measured databy plotting log jZj and w versus log f in a so-called Bode-diagram (Fig. 2a), and by plotting ImjZj versus RejZjnamed a Nyquist diagram or an impedance locus (Fig.2b). The examples provided in Fig. 2 are made for anelectrical circuit (insert Fig. 2b). While the first way ofpresenting the data shows the frequency-dependenceexplicitly, the phase angle w is displayed in the latter.
The impedance spectrum gives many insights to theelectrical properties of the system, and with experience it ispossible to make a qualified guess of a proper model basedon the features in the diagrams (cf. Fig. 4). Similar to otherspectroscopic approaches like infrared (IR) or ultraviolet(UV)/visible (vis), the individual components tend to showup in certain parts of the impedance spectrum. Thus,variations in the values of individual components alterthe spectrum in confined frequency windows (Fig. 3).
For a given model, the total impedance (transfer func-tion) is calculated from the individual components with useof Ohm’s and Kirchhoff’s laws. The best estimates for theparameters, that is, the unknown values of the resistorsand capacitors in the circuit, are then computed with use ofleast-square algorithms. If the frequency response of thechosen model fits the data well, the parameter values areused to characterize the electrical properties of the system.
In order to fit accurately the equivalent circuit modelimpedance to the impedance of biomaterials, it is oftennecessary to include nonideal circuit elements, that is,
elements with frequency dependent properties. Such ele-ments are not physically realizable with standard technicalelements. Table 1 provides a list of common circuit ele-ments that are used to describe biomaterials with respectto their impedance and phase shift. The constant phaseelement (CPE) portrays a nonideal capacitor, and wasoriginally introduced to describe the interface impedanceof noble metal electrodes immersed in electrolytic solutions(5). The physical basis for the CPE in living tissue (and atelectrode interfaces) is not clearly understood, and it is besttreated as an empirical element. Another example is theWarburg impedance s that accounts for the diffusion lim-itation of electrochemical reactions (4).
It is important to place a word of caution concerning theequivalent circuit modeling approach. Different equivalentcircuit models (deviating with respect to components or inthe network structure) may produce equally good fits to theexperimental data, although their interpretations are verydifferent. It may be tempting to increase the number ofelements in a model to get a better agreement betweenexperiment and model. However, it may then occur that themodel becomes redundant because the components cannotbe quantified independently. Thus, an overly complex
134 IMPEDANCE SPECTROSCOPY
Figure 2. Different representations of impedance spectra. (a andb) visualize the frequency-dependent complex impedance of theelectrical circuit shown in (b) with the network components:R1 ¼ 250 V; R2 ¼ 1000 V; C1 ¼ 10 mF; C2 ¼ 1 mF. (a) Bode-diagram presenting frequency-dependent impedance magnitudejZj together with the phase shift w of the sample underinvestigation. (b) Wessel diagram locus of the same electricalnetwork. The imaginary component of the impedance(reactance) is plotted against the real component (resistance).The arrow indicates the direction along which the frequencyincreases.

model can provide artificially good fits to the impedancedata, while at the same time highly inaccurate values forthe parameters. Therefore, it is sound to use equivalentcircuits with a minimum number of elements that candescribe all aspects of the impedance spectrum (6).
Alternatively, the impedance data can be analyzed byderiving the current distribution in the system with use ofdifferential equations and boundary values (e.g., the givenexcitation at the electrode surfaces). The parameters of themodel impedances are then fitted to the data like describedabove. An example of this approach is be presented below,where it is used to analyze the IS of a cell-covered gold filmelectrode.
IMPEDANCE ANALYSIS OF TISSUE AND SUSPENDED CELLS
The early and pioneering work on bioimpedance is asso-ciated with the names of Phillipson, et al. (5). In thesestudies blood samples or pieces of tissue were examined inan experimental setup as shown in Fig. 1, and the dielectricproperties of the biological system were investigated over abroad range of frequencies from hertz to gigahertz.
To understand the origin of bioimpedance, it is neces-sary to look at the composition of living material. Anytissue is composed of cells that are surrounded by anextracellular fluid. The extracellular medium containsproteins and polysaccharides that are suspended in anionic solution and the electrical properties of this fluid
are determined by the mobility and concentration of theions, primarily Naþ and Cl�. The cell membrane marks theboundary between the interior and exterior environment,and consists of a 7–10 nm phospholipid bilayer. The mem-brane allows diffusion of water and small nonpolar mole-cules, while transport of ions and polar molecules requiresthe presence of integral transport proteins. On the inside,the cell contains a protein-rich fluid with specialized mem-brane-bound organelles, like the nucleus. For most pur-poses the fluid behaves as a pure ionic conductor. Thus, thecell membrane is basically a thin dielectric sandwichedbetween two conducting media and in a first approximationits impedance characteristics are mainly capacitive.
The simplest possible explanatory model for biologicaltissue (Fig. 4a-1) therefore consists of two membrane capa-
IMPEDANCE SPECTROSCOPY 135
Figure 3. Calculated spectra of theimpedance magnitude jZj for theelectrical circuit shown in theinsert of Fig. 2b when the networkparameters have been variedindividually. The solid line in eachfigure corresponds to the networkparameters: R1 ¼ 250 V; R2 ¼1000 V; C1 ¼ 10 mF; C2 ¼ 1 mF. (a)Variation of C1: 10 mF (solid), 20 mF(dashed), 50 mF (dotted). (b) Vari-ation of C2: 1 mF (solid), 0.5 mF(dashed), 0.1 mF (dotted). (c)Variation of R1: 1000 V (solid),2000 V (dashed), 5000 V (dotted).(d) Variation of R2: 250 V (solid),500 V (dashed), 1000 V (dotted).
Table 1. Individual Impedance Contributions of Ideal andEmpirical Equivalent Circuit Elements
Component ofEquivalentCircuit Parameter
Impedance,Z
PhaseShift, w
Resistor R R 0Capacitor C (ivC)�1 �p/2Coil L ivL þ p/2
Constant phaseelement (CPE)
a(0 � a � 1) 1/(iCv)a � ap/2
Warburg impedance, s s s(1 � i)v�0.5 � p/4

citors Cm1 and Cm2 in series with a resistor of the cytosolicmedium Rcyt, which in turn acts in parallel with theresistance of the conducting extracellular medium Rext.Since the two series capacitances of the membrane cannotbe determined independently, they are combined to anoverall capacitance Cm. The equivalent circuit model ofthis simple scenario (Fig. 4a-2) gives rise to a characteristicimpedance spectrum, as shown with the Bode-diagram(Fig. 4b) and the Nyquist diagram (Fig. 4c). Impedancedata for biological tissue is also often modeled by the so-called Cole–Cole equation (7)
Z ¼ R1 þ DR
1 þ DRðivCÞa DR ¼ R0 � R1 (4)
This simple empirical model is identical to the circuit ofFig. 4, except that the capacitor is replaced by a CPEelement. The impedance spectrum is characterized by fourparameters ðDR;R1;a; tÞ, where R0;R1 is the low- andhigh frequency intercepts on the x axis in the Nyquist plot(cf. Fig. 4d), t is the time constant t ¼ DR C, and a is theCPE parameter. The impedance spectrum will be similarto Fig. 4b, c, but when a 6¼ 1, the semicircle in the Nyquistdiagram is centered below the real axis, and the arc willappear flattened. For macroscopically heterogeneousbiological tissue, the transfer function is written as asum of Cole–Cole equations.
The features of the impedance spectrum Fig. 4b can beintuitively understood: at low frequencies the capacitorprevents current from flowing through Rcyt and the mea-sured impedance arises from Rext. At high frequencies,with the capacitor having a very low impedance, the cur-rent is free to flow through both Rcyt, Rext. Thus, there is a
transition from constant-level impedance at low frequen-cies to another constant level. This phenomenon is termeddispersion, and will be discussed in the following.
A homogenous conducting material is characterized by abulk property named the resistivity r0 having the dimen-sions of ohm centimeters (Vcm). Based on this intrinsicparameter, the resistance may be defined by
R ¼ r0L
A(5)
where A is the cross-sectional area and L is the length ofthe material. Thus, by knowing the resistivity of the mate-rial and the dimensions of the system being studied, it ispossible to estimate the resistance. Similarly, a homoge-neous dielectric material is characterized by an intrinsicproperty called the relative permittivity e0, and the capa-citance is defined by
C ¼ e0 e0 A
d(6)
where e0 is the permittivity of free space with dimensionF/m, and A, d are the dimensions of the system as above.For most biological membranes, the area-specific capaci-tance is found to be quite similar, with a value of 1mF cm�2 (8).
For historical reasons the notation of conductivity s0
with dimensions Sm�1 and conductance (G ¼ s0A=d) hasbeen preferred over resistance R and resistivity r, but theinformation content is the same, it is just expressed in adifferent way.
It is possible to recombine e0 and s0 by defining a complexpermittivity e ¼ e0 þ e00, with ReðeÞ ¼ e0 and ImðeÞ ¼ e00. The
136 IMPEDANCE SPECTROSCOPY
Figure 4. (a) Schematics of theimpedance measurement on livingtissue. The arrows indicate thepathway of current flow for lowfrequencies (solid line) and highfrequencies (dashed). Only at highfrequencies the current flowsthrough the cells. The electricalstructure of tissue can be directlytranslated into equivalent circuit1, which can be simplified toequivalent circuit 2. (b) Bode-diagram for network 2 in Fig. 4a,using Rext ¼ 1000 V; Rcyt ¼ 600 V;Cm ¼ 100 nF. (c) Impedance locusgenerated with the same values.
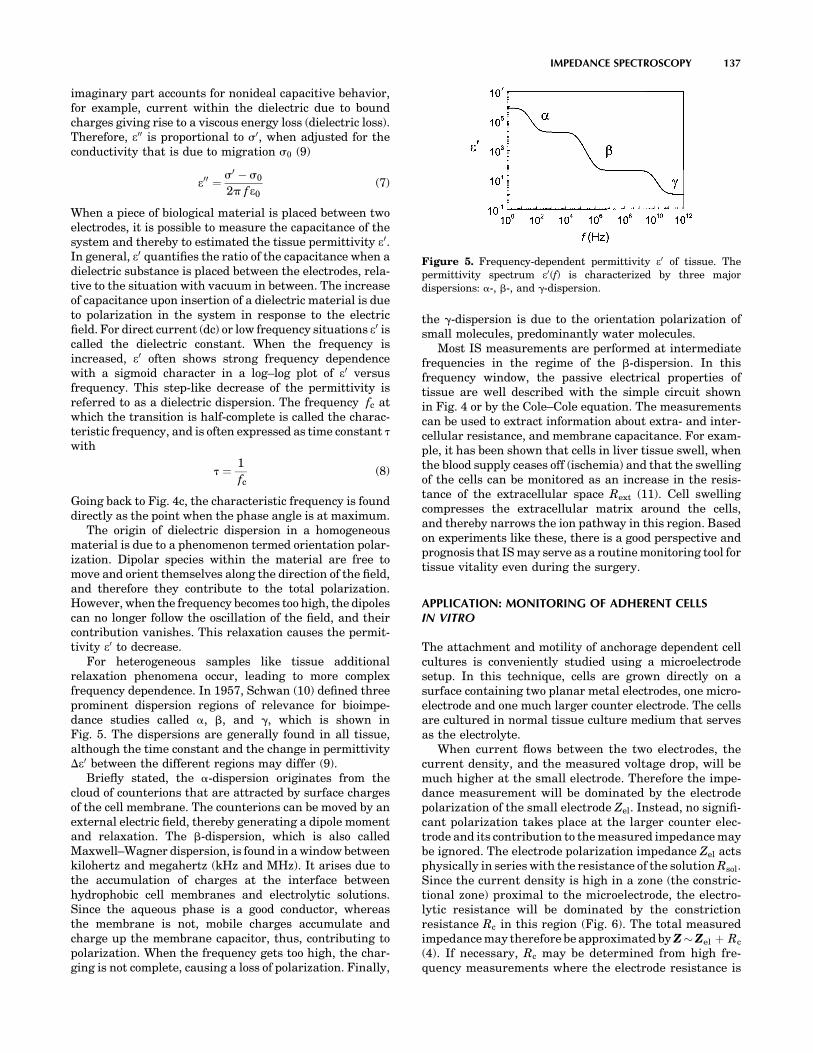
imaginary part accounts for nonideal capacitive behavior,for example, current within the dielectric due to boundcharges giving rise to a viscous energy loss (dielectric loss).Therefore, e00 is proportional to s0, when adjusted for theconductivity that is due to migration s0 (9)
e00 ¼ s0 � s0
2p f e0(7)
When a piece of biological material is placed between twoelectrodes, it is possible to measure the capacitance of thesystem and thereby to estimated the tissue permittivity e0.In general, e0 quantifies the ratio of the capacitance when adielectric substance is placed between the electrodes, rela-tive to the situation with vacuum in between. The increaseof capacitance upon insertion of a dielectric material is dueto polarization in the system in response to the electricfield. For direct current (dc) or low frequency situations e0 iscalled the dielectric constant. When the frequency isincreased, e0 often shows strong frequency dependencewith a sigmoid character in a log–log plot of e0 versusfrequency. This step-like decrease of the permittivity isreferred to as a dielectric dispersion. The frequency fc atwhich the transition is half-complete is called the charac-teristic frequency, and is often expressed as time constant twith
t ¼ 1
fc(8)
Going back to Fig. 4c, the characteristic frequency is founddirectly as the point when the phase angle is at maximum.
The origin of dielectric dispersion in a homogeneousmaterial is due to a phenomenon termed orientation polar-ization. Dipolar species within the material are free tomove and orient themselves along the direction of the field,and therefore they contribute to the total polarization.However, when the frequency becomes too high, the dipolescan no longer follow the oscillation of the field, and theircontribution vanishes. This relaxation causes the permit-tivity e0 to decrease.
For heterogeneous samples like tissue additionalrelaxation phenomena occur, leading to more complexfrequency dependence. In 1957, Schwan (10) defined threeprominent dispersion regions of relevance for bioimpe-dance studies called a, b, and g, which is shown inFig. 5. The dispersions are generally found in all tissue,although the time constant and the change in permittivityDe0 between the different regions may differ (9).
Briefly stated, the a-dispersion originates from thecloud of counterions that are attracted by surface chargesof the cell membrane. The counterions can be moved by anexternal electric field, thereby generating a dipole momentand relaxation. The b-dispersion, which is also calledMaxwell–Wagner dispersion, is found in a window betweenkilohertz and megahertz (kHz and MHz). It arises due tothe accumulation of charges at the interface betweenhydrophobic cell membranes and electrolytic solutions.Since the aqueous phase is a good conductor, whereasthe membrane is not, mobile charges accumulate andcharge up the membrane capacitor, thus, contributing topolarization. When the frequency gets too high, the char-ging is not complete, causing a loss of polarization. Finally,
the g-dispersion is due to the orientation polarization ofsmall molecules, predominantly water molecules.
Most IS measurements are performed at intermediatefrequencies in the regime of the b-dispersion. In thisfrequency window, the passive electrical properties oftissue are well described with the simple circuit shownin Fig. 4 or by the Cole–Cole equation. The measurementscan be used to extract information about extra- and inter-cellular resistance, and membrane capacitance. For exam-ple, it has been shown that cells in liver tissue swell, whenthe blood supply ceases off (ischemia) and that the swellingof the cells can be monitored as an increase in the resis-tance of the extracellular space Rext (11). Cell swellingcompresses the extracellular matrix around the cells,and thereby narrows the ion pathway in this region. Basedon experiments like these, there is a good perspective andprognosis that IS may serve as a routine monitoring tool fortissue vitality even during the surgery.
APPLICATION: MONITORING OF ADHERENT CELLSIN VITRO
The attachment and motility of anchorage dependent cellcultures is conveniently studied using a microelectrodesetup. In this technique, cells are grown directly on asurface containing two planar metal electrodes, one micro-electrode and one much larger counter electrode. The cellsare cultured in normal tissue culture medium that servesas the electrolyte.
When current flows between the two electrodes, thecurrent density, and the measured voltage drop, will bemuch higher at the small electrode. Therefore the impe-dance measurement will be dominated by the electrodepolarization of the small electrode Zel. Instead, no signifi-cant polarization takes place at the larger counter elec-trode and its contribution to the measured impedance maybe ignored. The electrode polarization impedance Zel actsphysically in series with the resistance of the solution Rsol.Since the current density is high in a zone (the constric-tional zone) proximal to the microelectrode, the electro-lytic resistance will be dominated by the constrictionresistance Rc in this region (Fig. 6). The total measuredimpedance may therefore be approximated by Z Zel þ Rc
(4). If necessary, Rc may be determined from high fre-quency measurements where the electrode resistance is
IMPEDANCE SPECTROSCOPY 137
Figure 5. Frequency-dependent permittivity e0 of tissue. Thepermittivity spectrum e0(f) is characterized by three majordispersions: a-, b-, and g-dispersion.
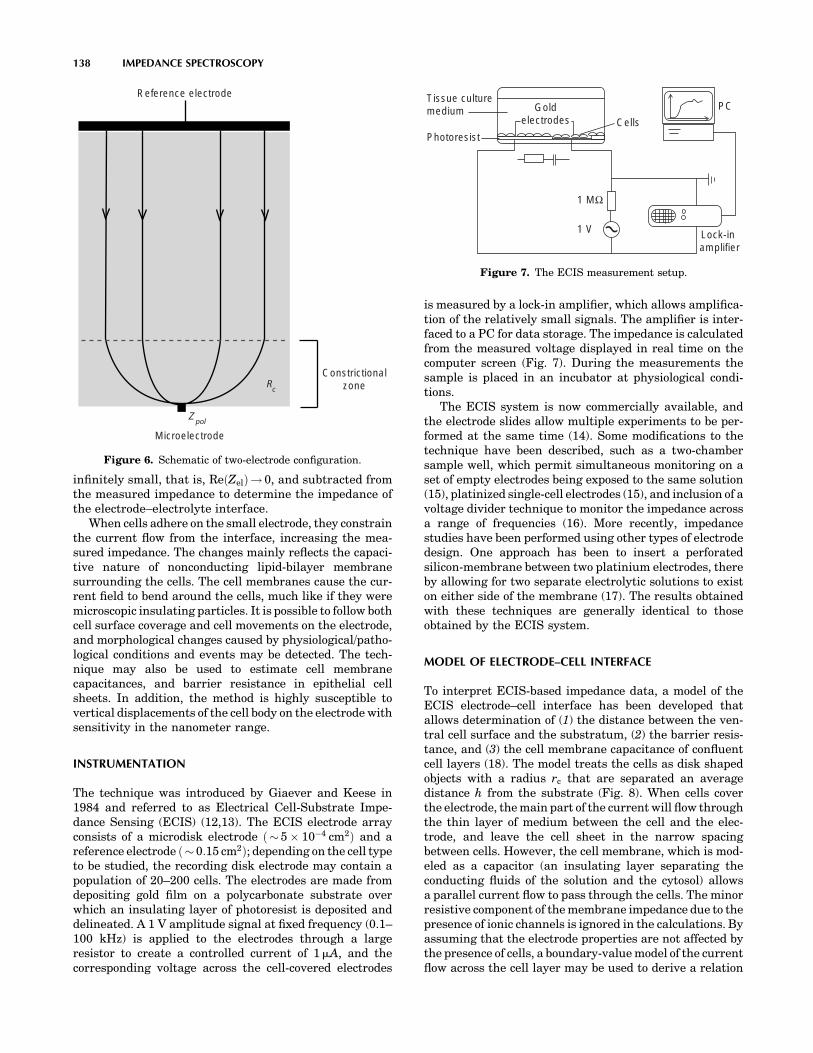
infinitely small, that is, ReðZelÞ! 0, and subtracted fromthe measured impedance to determine the impedance ofthe electrode–electrolyte interface.
When cells adhere on the small electrode, they constrainthe current flow from the interface, increasing the mea-sured impedance. The changes mainly reflects the capaci-tive nature of nonconducting lipid-bilayer membranesurrounding the cells. The cell membranes cause the cur-rent field to bend around the cells, much like if they weremicroscopic insulating particles. It is possible to follow bothcell surface coverage and cell movements on the electrode,and morphological changes caused by physiological/patho-logical conditions and events may be detected. The tech-nique may also be used to estimate cell membranecapacitances, and barrier resistance in epithelial cellsheets. In addition, the method is highly susceptible tovertical displacements of the cell body on the electrode withsensitivity in the nanometer range.
INSTRUMENTATION
The technique was introduced by Giaever and Keese in1984 and referred to as Electrical Cell-Substrate Impe-dance Sensing (ECIS) (12,13). The ECIS electrode arrayconsists of a microdisk electrode ð 5 � 10�4 cm2Þ and areference electrode ð 0:15 cm2Þ; depending on the cell typeto be studied, the recording disk electrode may contain apopulation of 20–200 cells. The electrodes are made fromdepositing gold film on a polycarbonate substrate overwhich an insulating layer of photoresist is deposited anddelineated. A 1 V amplitude signal at fixed frequency (0.1–100 kHz) is applied to the electrodes through a largeresistor to create a controlled current of 1mA, and thecorresponding voltage across the cell-covered electrodes
is measured by a lock-in amplifier, which allows amplifica-tion of the relatively small signals. The amplifier is inter-faced to a PC for data storage. The impedance is calculatedfrom the measured voltage displayed in real time on thecomputer screen (Fig. 7). During the measurements thesample is placed in an incubator at physiological condi-tions.
The ECIS system is now commercially available, andthe electrode slides allow multiple experiments to be per-formed at the same time (14). Some modifications to thetechnique have been described, such as a two-chambersample well, which permit simultaneous monitoring on aset of empty electrodes being exposed to the same solution(15), platinized single-cell electrodes (15), and inclusion of avoltage divider technique to monitor the impedance acrossa range of frequencies (16). More recently, impedancestudies have been performed using other types of electrodedesign. One approach has been to insert a perforatedsilicon-membrane between two platinium electrodes, thereby allowing for two separate electrolytic solutions to existon either side of the membrane (17). The results obtainedwith these techniques are generally identical to thoseobtained by the ECIS system.
MODEL OF ELECTRODE–CELL INTERFACE
To interpret ECIS-based impedance data, a model of theECIS electrode–cell interface has been developed thatallows determination of (1) the distance between the ven-tral cell surface and the substratum, (2) the barrier resis-tance, and (3) the cell membrane capacitance of confluentcell layers (18). The model treats the cells as disk shapedobjects with a radius rc that are separated an averagedistance h from the substrate (Fig. 8). When cells coverthe electrode, the main part of the current will flow throughthe thin layer of medium between the cell and the elec-trode, and leave the cell sheet in the narrow spacingbetween cells. However, the cell membrane, which is mod-eled as a capacitor (an insulating layer separating theconducting fluids of the solution and the cytosol) allowsa parallel current flow to pass through the cells. The minorresistive component of the membrane impedance due to thepresence of ionic channels is ignored in the calculations. Byassuming that the electrode properties are not affected bythe presence of cells, a boundary-value model of the currentflow across the cell layer may be used to derive a relation
138 IMPEDANCE SPECTROSCOPY
Reference electrode
Microelectrode
Constrictionalzone
Z pol
Rc
Figure 6. Schematic of two-electrode configuration.
Tissue culturemedium
Photoresist
Goldelectrodes Cells
Lock-in amplifier
PC
1 MΩ
1 V
Figure 7. The ECIS measurement setup.

between the specific impedance of a cell-covered electrodeZcell and the empty electrode Zel
1
Zcell¼ 1
Zel
Zel
Zel þ Zmþ
Zm
ZelþZm
�rc2
I0ð�rÞI1ð�rÞ þRb
1Zel
þ 1Zm
� �0@
1A
� ¼
ffiffiffiffiffiffiffiffiffiffiffiffiffiffiffiffiffiffiffiffiffiffiffiffiffiffiffiffiffi
h
1
Zelþ 1
Zm
� sð9Þ
where I0; I1 are the modified Bessel functions of the firstkind of order zero and one, Rb and r are the specific barrierresistance and resistivity of the solution, and Zm ¼�2i=ðvCmÞ is the specific membrane impedance of the cells.A parameter a ¼ rcðr=hÞ0:5 is introduced as an assessmentof the constraint of current flow under the cells. Theimpedance spectrum of an empty electrode and a cell-covered electrode is used to fit the three adjustable para-meters ðRb;a;CmÞ.
The model outlined above has been further refined todescribe polar epithelial cell sheets, treating separately thecapacitance of the apical, basal, and lateral membranes(19). Some applications of the model will be discussed in thefollowing sections.
MONITORING ATTACHMENT AND SPREADING
As a cell comes into contact with a solid surface, it formsfocal contacts, primarily mediated by transmembraneproteins that anchor structural filaments in the cellinterior to proteins on the substrate. During this process,the rounded cell spreads out and flattens on the surface,greatly increasing its surface area in contact with theelectrode. The cell will also establish contacts with neigh-boring cells through particular cell–cell junctions, such astight junctions, where strands of transmembrane proteinssew neighboring cells together, and gap junctions formed byclusters of intercellular channels, connecting the cytosol ofadjacent cells.
The attachment process is normally studied using sin-gle-frequency measurements. Figure 9a and b show Bode
plots for ECIS data of an empty electrode and an electrodewith a confluent layer of epithelial MDCK cells. It is seenthat the presence of cells primarily affects the impedancespectrum for intermediate frequencies between 1 and 100kHz (Fig. 9a). At the highest frequencies, the two plotsapproach a horizontal plateau that represents the ohmicsolution resistance between the working and the counterelectrode. Within the relevant frequency window, the
IMPEDANCE SPECTROSCOPY 139
Cm
Rb
Ih
microelectrode
α
Figure 8. Model of current flow paths. The impedance changesassociated with the presence of cells, arise in three differentregions: from current flow under the cells quantified by a, fromcurrent flow in the narrow intercellular spacings causing thebarrier resistance Rb. In parallel, some current will passthrough the cell membranes giving rise to capacitive reactance Cm.
Figure 9. (a, b) Bode-diagrams of an ECIS electrode withconfluent MDCK cells and an empty electrode. (c) Plot showingthe division of the measured resistance of an ECIS electrode withconfluent MDCK cells with the corresponding values of the emptyelectrode plotted versus log f.

phase-shift plot for the data of the cell-covered electrodedisplays two extrema. At frequencies 200 Hz, the phaseshift w is closest to zero, indicating that the contribution ofthe cells on the measured impedance is mainly resistive. Athigher frequencies, the effect of the cell layer becomes morecapacitive, and w starts approaching �908. The impedancespectrum of the empty electrode displays a single disper-sion related to double-layer capacitance at the electrodeinterface.
The ideal measurement frequencies, where the presenceof cells is most pronounced, are determined by dividing theimpedance spectrum of a cell-covered electrode with thespectrum of a naked electrode. The same can be done forthe resistance or capacitance spectrum, respectively. Themost sensitive frequency for resistance measurements istypically found between 1 and 4 kHz (Fig. 9c), where theratio Rcell(f) / Rel(f) is at maximum. The capacitive con-tribution peaks at much larger frequencies, typically on theorder of 40 kHz, so that capacitance measurements areoften performed at this higher frequency.
During the initial hours following the initial electrode–cell contact, the monitored impedance undergoes a char-acteristic steep increase. Once the spreading is complete,the impedance continues to fluctuate, reflecting the con-tinuous morphological activities of living cells, for example,movements of cells on the electrode, either by local protru-sions or directed movements of the entire cell body, or celldivisions (Fig. 10). The signal characteristics of the impe-dance during the spreading phase are generally found to bedistinct for different cell cultures, both in terms of theduration of the initial gradient and its relative size incomparison to the impedance recorded from a the nakedelectrode (20). Also, characteristic impedance curves can beobtained by coating the electrode with different proteins(e.g., fibronectin, vitronectin) (21).
Simultaneous optical monitoring of a transparent ECISelectrode has allowed systematic comparison of cell con-fluence and measured impedance (22). Analysis of datafrom subconfluent MDCK epithelial cultures revealed astrong linear association between the two variables withcross-correlation coefficients > 0.9; the correlation wasfound to be equally strong in early and late cultures. Thisresult indicates that 80% of the variance in the measured
resistance (4 kHz) can be attributed to changes in cellcoverage area (Fig. 11). Moreover, it was possible to linkresistance variations to single-cell behavior during cellattachment, including cell-division (temporary impedanceplateau) and membrane ruffling (impedance increase). Themeasured cell confluence was compared to the theoreticalmodel (Eq. 9), neglecting the barrier resistance (i.e.,Rb ¼ 0), and the calculated values were found to agreewell with the data (Fig. 12). Studies like these might pavethe way for standardized use of ECIS to quantify attach-ment and spreading of cell cultures.
IMPEDANCE SPECTROSCOPY AS A TRANDUCERIN CELL-BASED DRUG SCREENING
Another application of impedance spectroscopy with strongphysiological and medical relevance is its use as transducerin ECIS-like experiments for cell-based drug screeningassays. Here, the impedance readout can be used to moni-tor the response of cells upon exposure to a certain drug or adrug mixture. In these bioelectric hybrid assays the cellsserve as the sensory elements and they determine thespecificity of the screening assay while the electrodes areused as transducer to make the cell behavior observable. Inthe following example, endothelial cells isolated frombovine aorta (BAEC ¼ bovine aortic endothelial cells) weregrown to confluence on gold-film electrodes since they
140 IMPEDANCE SPECTROSCOPY
Spreading complete
Spreading complete
NRK cells
BSC cellsAttachment
andspreading
No cells
Fluctuationsmicromotions
20
15
10
5
00 5 10 15
Time (h)
Res
ista
nce
(kΩ
)
Figure 10. Attachment assay of BSC and NRK fibroblastic cellsfollowed for an interval of 15 h. The graph shows the measuredresistance (4 kHz) as function of time; the spreading phase isindicated with arrows.
Figure 11. Correlation between resistance and cell coverage. Thenormalized resistance (4 kHz) versus time (upper panel), and theelectrode coverage versus time (lower panel) during the same timeinterval. The measurement was started 32 h after the cells hadbeen seeded out; the cross-correlation factor was r ¼ 0.94.

express cell-surface receptors (b-adrenoceptors) that arespecific for adrenalin and derivatives (23,24). These b-adrenoceptors belong to the huge family of G-proteincoupled receptors (GPCR) that are of great pharmaceuticalrelevance and impact. By measuring the electrical impe-dance of the cell-covered electrode, the stimulation of thecells by the synthetic adrenaline analogue isoprenaline(ISO) can be followed noninvasively in real time withoutany need to apply costly reagents or to sacrifice the culture(25). Experimentally, the most sensitive frequency fortime-resolved impedance measurements is first deter-mined from a complete impedance spectrum along anextended frequency range as depicted in Fig. 13. The figurecompares the impedance spectrum of a circular gold-filmelectrode (d ¼ 2 mm) with and without a confluent mono-layer of BAECs. The contribution of the cell layer to thetotal impedance of the system is most pronounced atfrequencies close to 10 kHz, which is, thus, the mostsensitive sampling frequency for this particular system.It is noteworthy that the most sensitive frequency may
change with the electrode size and the individual electricalproperties of the cells under study.
Figure 14a traces the time course of the impedancemagnitude at a frequency of 10 kHz when confluent BAECmonolayers were either challenged with 10 mM ISO or avehicle control solution at the time indicated by the arrow.The exchange of fluids produces a transient rise of theimpedance by 10–20 V that is not caused by any cellularresponse, but mirrors the reduced fluid height within themeasuring chamber. As expected, no response of the cells isseen in the control experiment. The cell population exposedto 10 mM of ISO shows a significant increase in electricalimpedance that goes through a maximum 10 min after ISOapplication, and then slowly declines. The reason for theincrease in impedance as observed after ISO stimulation issimilar to what has been described for three-dimensional(3D) tissues above. The adrenaline derivative induces arelaxation of the cytoskeleton that in turn makes the cellsflat out a bit more. As a consequence the extracellular spacebetween adjacent cells narrows and increases the impe-dance of the cell layer. Note that the time resolution inthese measurements is 1 s so that even much faster cellresponses than the one studied here can be monitored inreal time. Moreover, no labeled probe had to be applied and
IMPEDANCE SPECTROSCOPY 141
Figure 12. Theoretical prediction of cell coverage. Theoreticalcurve of normalized resistance plotted as function of cell coverageon the electrode. Normalized resistance and corresponding celldensity are shown for four different registrations with circles.Time points indicate when the recordings were initiated withrespect to the start of the culture; each circle corresponds toaverage values for 15 min time intervals.
Figure 13. Frequency-dependent impedance magnitude for aplanar gold-film electrode (d ¼ 2 mm) with and without aconfluent monolayer of BAEC directly growing on the electrodesurface. The difference in impedance magnitude is maximum at afrequency of 10 kHz.
Figure 14. (a) Time course of the impedance magnitude at asampling frequency of 10 kHz when a confluent monolayer ofBAECs is exposed to 10 mM ISO or a corresponding vehiclecontrol. (b) Dose-response relationship between the increase ofimpedance magnitude DZ and the concentration of isoproterenolapplied. Quantitative analysis reveals an EC50 of 0.3 mM similar tothe binding constant of ISO to b-adrenoceptors.
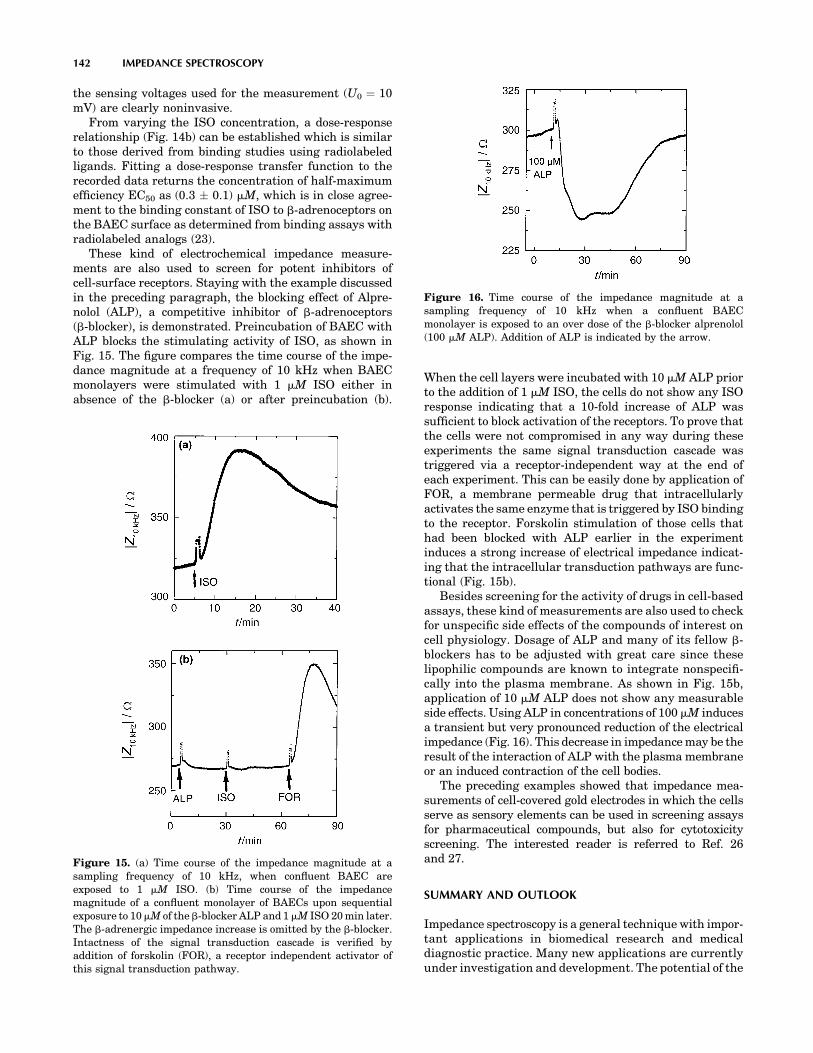
the sensing voltages used for the measurement (U0 ¼ 10mV) are clearly noninvasive.
From varying the ISO concentration, a dose-responserelationship (Fig. 14b) can be established which is similarto those derived from binding studies using radiolabeledligands. Fitting a dose-response transfer function to therecorded data returns the concentration of half-maximumefficiency EC50 as (0.3 � 0.1) mM, which is in close agree-ment to the binding constant of ISO to b-adrenoceptors onthe BAEC surface as determined from binding assays withradiolabeled analogs (23).
These kind of electrochemical impedance measure-ments are also used to screen for potent inhibitors ofcell-surface receptors. Staying with the example discussedin the preceding paragraph, the blocking effect of Alpre-nolol (ALP), a competitive inhibitor of b-adrenoceptors(b-blocker), is demonstrated. Preincubation of BAEC withALP blocks the stimulating activity of ISO, as shown inFig. 15. The figure compares the time course of the impe-dance magnitude at a frequency of 10 kHz when BAECmonolayers were stimulated with 1 mM ISO either inabsence of the b-blocker (a) or after preincubation (b).
When the cell layers were incubated with 10 mM ALP priorto the addition of 1 mM ISO, the cells do not show any ISOresponse indicating that a 10-fold increase of ALP wassufficient to block activation of the receptors. To prove thatthe cells were not compromised in any way during theseexperiments the same signal transduction cascade wastriggered via a receptor-independent way at the end ofeach experiment. This can be easily done by application ofFOR, a membrane permeable drug that intracellularlyactivates the same enzyme that is triggered by ISO bindingto the receptor. Forskolin stimulation of those cells thathad been blocked with ALP earlier in the experimentinduces a strong increase of electrical impedance indicat-ing that the intracellular transduction pathways are func-tional (Fig. 15b).
Besides screening for the activity of drugs in cell-basedassays, these kind of measurements are also used to checkfor unspecific side effects of the compounds of interest oncell physiology. Dosage of ALP and many of its fellow b-blockers has to be adjusted with great care since theselipophilic compounds are known to integrate nonspecifi-cally into the plasma membrane. As shown in Fig. 15b,application of 10 mM ALP does not show any measurableside effects. Using ALP in concentrations of 100 mM inducesa transient but very pronounced reduction of the electricalimpedance (Fig. 16). This decrease in impedance may be theresult of the interaction of ALP with the plasma membraneor an induced contraction of the cell bodies.
The preceding examples showed that impedance mea-surements of cell-covered gold electrodes in which the cellsserve as sensory elements can be used in screening assaysfor pharmaceutical compounds, but also for cytotoxicityscreening. The interested reader is referred to Ref. 26and 27.
SUMMARY AND OUTLOOK
Impedance spectroscopy is a general technique with impor-tant applications in biomedical research and medicaldiagnostic practice. Many new applications are currentlyunder investigation and development. The potential of the
142 IMPEDANCE SPECTROSCOPY
Figure 15. (a) Time course of the impedance magnitude at asampling frequency of 10 kHz, when confluent BAEC areexposed to 1 mM ISO. (b) Time course of the impedancemagnitude of a confluent monolayer of BAECs upon sequentialexposure to 10mM of the b-blocker ALP and 1mM ISO 20 min later.The b-adrenergic impedance increase is omitted by the b-blocker.Intactness of the signal transduction cascade is verified byaddition of forskolin (FOR), a receptor independent activator ofthis signal transduction pathway.
Figure 16. Time course of the impedance magnitude at asampling frequency of 10 kHz when a confluent BAECmonolayer is exposed to an over dose of the b-blocker alprenolol(100 mM ALP). Addition of ALP is indicated by the arrow.

technique is obviously great, since it is noninvasive, easilyapplied, and allows on-line monitoring, while requiringlow cost instrumentation. However, there are also diffi-culties and obstacles related to the use of IS. Foremost,there is no separate access to the individual processes andcomponents of the biological system, only the total impe-dance is measured, and this signal must be interpreted bysome chosen model. There are many fundamental issuesyet to be solved, both connected with understanding theorigin of bioimpedance, methodological problems withfinding standardized ways of comparing different sam-ples, as well as technical issues connected with the equip-ment used to probe bioimpedance.
Prospective future in vivo applications include quanti-fication of ischemia damage during cardiac surgery (28)and organ transplantation (29), as well as graft rejectionmonitoring (30). Impedance spectroscopy are also usedfor tissue characterization, and recently a device forbreast cancer screening became commercially available.Multifrequency electrical impedance tomography (EIT)performing spatially resolved IS is a potential candidatefor diagnostic imaging devices (31), but due to poor resolu-tion power compared to conventional methods like MR,only few clinical applications are described.
The use of impedimetric biosensor techniques for invitro monitoring of cell and tissue culture is promising.With these methods, high sensitivity measurements of cellreactions in response to various stimuli have been realized,and monitoring of physiological–pathological events ispossible without use of marker substances. The potentialapplications cover pharmaceutical screening, monitoringof toxic agents, and functional monitoring of food additives.Microelectrode-based IS is interesting also for scientificreasons since it allows studying the interface between cellsand technical transducers and supports the development ofimplants and new sensor devices (32).
Finally, affinity-based impedimetric biosensors repre-sent an interesting and active research field (33) withmany potential applications, for example, immunosensorsmonitoring impedance changes in response to antibody–antigen reactions taking place on electrode surfaces.
BIBLIOGRAPHY
1. Macdonald JR. Impedance Spectroscopy. New York: JohnWiley & Sons; 1987.
2. Fricke H, Morse S. The electrical capacity of tumors of thebreast. J Cancer Res 1926;10:340–376.
3. Schwan H. Mechanisms Responsible for Electrical Propertiesof Tissues and Cell Suspensions. Med Prog Technol 1993;19:163–165.
4. Grimnes S, Martinsen ØG. Bioimpedance and Bioelectricitybasics. Cornwall: Academic Press; 2000.
5. McAdams E, Lackermeier A, McLaughlin J, Macken D, Jossi-net J. The linear and non-linear electrical properties of theelectrode-electrolyte-interface. Biosens Bioelectron 1995;10:67–74.
6. Kottra G, Fromter E. Rapid determination of intraepithelialresistance barriers by alternating current spectroscopy. II.Test of model circuits and quantification of results. PflugersArch 1984;402:421–432.
7. Cole K, Cole R. Dispersion and adsorption in dielectrics. I..alternating current characteristics. J Chem Phys 1941;9:341–351.
8. Cole Ks. Membrane, Ions and Impulses. Berkeley (CA): Uni-versity of California Press; 1972.
9. Kell D. Biosensor. Fundamentals and Applications. Turner A,Karube I, Wilson G, editors. Oxford Science Publications;1987. pp 427–468.
10. Schwan H. Electrical properties of tissue and cell suspensions.Advances in biological and medical physics. Lawrence J,Tobias C, editors. New York: Academic Press; 1957. pp 147–209.
11. Gersing E. Impedance spectroscopy on living tissues for deter-mination of the state of organs. Bioelectrochem Bioenenerg1998;45:149.
12. Giaever I, Keese CR. Monitoring fibroblast behavior in tissueculture with an applied electric field. Proc Natl Acad Sci1984;81:3761–3764.
13. Giaever I, Keese CR. A morphological biosensor for mamma-lian cells. Nature (London) 1993;366:591–592.
14. Applied Biophysics, Inc. 2002.15. Connolly P, et al. Extracellular electrodes for monitoring cell
cultures. IOP Publishing; 1989.16. Wegener J, Sieber M, Galla HJ. Impedance analysis of epithe-
lial and endothelial cell monolayers cultured on gold surfaces.J Biochem Biophys Methods 1996;76:327–330.
17. Hagedorn R, et al. Characterization of cell movement byimpedance measurements on fibroblasts grown on perforatedSi-membranes. Biochem Biophys Acta—Molecular Cell Res1955;1269:221–232.
18. Giaever I, Keese C. Micromotion of mammalian cells mea-sured electrically. Proc Natl Acad Sci USA 1991;88:7896–7900.
19. Lo CM, Keese CR, Giaever I. Impedance analysis of MDCKcells measured by electric cell-substrate impedance sensing.Biophys J 1995;69:2800–2807.
20. Giaever I, Keese CR. Use of electric fields to monitor thedynamical aspect of cell behavior in tissue culture. IEEETrans Biomed Eng 1986;33:242–247.
21. Mitra P, Keese CR, Giaever I. Electrical measurements can beused to monitor the attachment and spreading of cells in tissueculture. BioTechniques 1991;11:504–510.
22. De Blasio BF, Laane M, Walmann T, Giaever I. Combiningoptical and electrical impedance techniques for quantitativemeasurements of confluence in MDCK-I cell cultures. Bio-Techniques 2004;36:650–662.
23. Zink S, Roesen P, Sackmann B, Lemoine H. Regulation ofendothelial permeability by beta-adrenoceptor agonists: Con-tribution of beta 1- and beta 2-adrenoceptors. Biochim BiophysActa 1993;1178:286–298.
24. Zink S, Roesen P, Lemoine H. Micro- and macrovascularendothelial cells in beta-adrenergic regulation of transen-dothelial permeability. Am J Physiol 1995;269:C1209–C1218.
25. Wegener J, Zink S, Roesen P, Galla H. Use of electrochemicalimpedance measurements to monitor beta- adrenergic stimu-lation of bovine aortic endothelial cells. Pflugers Arch1999;437:925–934.
26. Arndt S, et al. Bioelectrical impedance assay to monitorchanges in cell shape during apoptosis. Biosens Bioelectron2004;19:583–594.
27. Keese C, Karra N, Dillon B, Goldberg A, Giaever I. Cell-substratum interactions as a predictor of cytotoxity. In VitroMol Toxicol 1998;11:183–191.
28. Benvenuto, et al. Impedance microprobes for myocardialischemia monitoring. 1st Annual International IEEE-EMBS.Lyon, France; 2000. p 234–238.
IMPEDANCE SPECTROSCOPY 143
29. Haemmerich D, et al. Changes in electrical resistivity ofswine liver after occlusion and postmortem. Med Biol EngComput 2002;40:29–33.
30. Ollmar S. Noninvasive monitoring of transplanted kidneys byimpedance spectroscopy—a pilot study. Med Biol Eng Comput1997;35:1–336.
31. Brown B. Electrical impedance tomography (EIT): A review. JMed Eng Technol 2003;27:97–108.
32. Borkholder D. Cell based biosensors using microelectrodes.Ph.D. Dissertation. 1998. Stanford University.
33. Katz E, Wilner I. Probing biomolecular interactions at con-ducting and semiconducting surfaces by impedance spectro-scopy: routes to impedimetric immunosensors. Electroanalysis2003;15:913–947.
See also CAPACITIVE MICROSENSORS FOR BIOMEDICAL APPLICATIONS.
IMPLANT, COCHLEAR. See COCHLEAR PROSTHESES.
INCUBATORS, INFANTS
ROBERT WHITE
Memorial Hospital South BendSouth Bend, Indiana
INTRODUCTION
Providing newborn infants with appropriate thermal pro-tection is known to improve their growth rates (1–3),resistance to disease (4,5) and survival (6–11). Keepingpremature, sick, or otherwise high risk babies warm isparticularly critical and, when their care precludes cover-ing them with protective swaddling clothing, especiallydifficult. Incubators are devices used during the care ofsuch high-risk infants and are designed with the intent ofproducing environmental conditions that are consistentlysuitable to each unique infant’s particular needs. There aremany different kinds of incubators that differ in detail inthe way they are constructed, heated, and controlled(12–16). All provide a mattress for the infant to lie upon,surrounded by a warmed microclimate that is controlled bya logical system governing the amount of heat needed tokeep the environmental temperature within a limitedrange. In some incubators, this microclimate is producedwithin a rigid walled chamber; such devices are calledclosed incubators. When they are heated by using a fanto force air over a metallic heating coil prior to its entry intothe infant’s chamber, these closed incubators are alsocalled forced convection incubators. There also are openincubators; those have no walls and, therefore, no chambersurrounding the mattress. There is nothing delimiting theconvective environment in an open device, so they need tobe heated by using a radiant warmer directed to themattress area. These devices, therefore, are commonlycalled open radiant incubators, radiant warmer beds, orradiant heaters.
Each of these types of incubators provides certainunique advantages. The convectively heated incubator
provides a caretaker with a far easier method for control-ling the humidification of the infant’s microclimate, whencompared to the open radiant warmer bed. Therefore, ababy under an open radiant heater loses more body fluidthan does an infant within a closed convectively heatedchamber (17). But conversely, a baby in an open incubator,while more complicated to care for in terms of medicalfluids administration, is physically more accessible interms of other kinds of care that sometimes are equallyimportant to the well being of sick babies. Current ‘‘top ofthe line’’ incubators incorporate the advantages of bothtypes, utilizing a radiant warmer bed with a removableenclosure that allows full physical access to the infantwhen the incubator is operated in the radiant heater mode,and better control of humidification and noise when theenclosure is placed around the baby and operated in theconvectively heated mode.
An incubator, in many respects, is just a very littlehouse sized to fit the space and functional requirementsof an infant occupant. As choices must be made whenconditioning the environment in any house, differentoptions must be considered when designing the climatecontrol system in an incubator. In the following review,some of these considerations will be explained from theperspective of how environmental manipulators affectnewborn infants who are not just little human adults,but also developing individuals with special physical,physiologic, metabolic, and neurological capabilitiesand limitations that make them unique. In great measureincubator manufacturers have been successful in translat-ing present day knowledge of babies and their special needsinto technical solutions that make today’s incubatorsremarkably functional. But any infant caretaker or incu-bator manufacturer can attest to the limitations of today’sdevices which, as they are approximate to our presentscientific knowledge and the existing level of technology,are flawed by our considerable remnant ignorance and thefailure of existing technology to meet certain imperativeneeds already known.
HISTORY
It is ancient knowledge that infants who are allowed to getcold have a greater chance of dying than do infants keptwarm. Prior to the nineteenth century, keeping smallbabies warm meant swaddling with multiple layers ofcloth, providing body contact with the mother, or place-ment of the infant near a warm, roaring fireplace. Suchclassic thermal care served lusty, healthy babies well, butwas inadequate to provide for the special needs of prema-ture or otherwise enfeebled newborns. These special needswere not met because, until the last century, there wasalmost no recognizable major medical or social commit-ment toward enhancing the survival of babies born pre-maturely. The infant mortality rate was high and accepted.However, in response to various politicosocial events thatoccurred in the late 1700s and early 1800s, the value ofimproving premature infant survival increased, stimulat-ing the development of special incubators in which to carefor these fragile, newly valued babies.
144 INCUBATORS, INFANTS

The first serious attempt to improve on the thermalprotection provided newborns was reflected in a warmingtub developed in 1835 by Johann Georg von Ruehl(1769–1846) in Russia (Fig. 1). The von Ruehl tub wassimply a double-walled sheet-iron open cradle that waskept warm by filling the space between the walls withwarm water. Variations on von Ruehl’s design were sub-sequently developed throughout Europe, and this type ofprimitive open incubator remained a standard device forcare until 1878.
Although the von Ruehl device must be recognized as adevelopmental milestone, to be truly accurate, the devel-opmental history of modern infant incubators must betraced back centuries to Egypt where the artificial incuba-tion of eggs was refined and remained a closely guardedsecret and uniquely Egyptian profession. Not until 1799were these secrets introduced into Europe by membersof Napoleon’s expedition. Professor Stephane Tarnier(1828–1897) of the Paris Maternity Hospital in 1878 sawa chicken incubator at the Paris Zoo. The incubator, basedon old Egyptian designs, had been constructed by OdileMartin. Dr. Tarnier perceived how such a device, withmodifications, could be used to keep premature infantswarm. Odile Martin subsequently built the first approx-imation of the modern enclosed infant incubator initiallyused at the Paris Maternity Hospital in 1880 (Fig. 2)
The Tarnier incubator was simple in its design. Theinfant lay in the upper chamber of a two-chambereddouble-walled box insulated to slow the loss of heat. Theinfant chamber was topped with a removable cover throughwhich the infant could be observed while remaining pro-tected from cooling room drafts. The heating of the upperchamber was achieved by warming a large supply of watercontained in the lower chamber of the incubator. The waterwas heated by an alcohol or gas lamp thermosyphon thatwas external to the incubator chambers and connected bypiping that allowed convection driven water flow betweenthe heater and the water reservoir. Cool room air freelyflowed into the lower warming chamber where the airpicked up heat from the surface of the warm water reser-voir and then, by natural convection, rose to enter andwarm the upper chamber containing the infant.
The Tarnier incubator was neither elegant nor efficient,and even when within the device, infants needed the extra
protection of swaddling blankets. It did, however, reflectthe technology of its day and, in the climate of a newcommitment toward the study and welfare of feebleinfants, stimulated others to refine the basic Tarnierdesign to correct deficiencies discovered through acquiredpractical experience with the incubator in clinical settings.The historical progression in this development has beenilluminated by Dr. Thomas Cone, and the reader is referredto Dr. Cone’s excellent treatise for a more detailed descrip-tion of the many design variations introduced and testedalong this early path leading to today’s equipment (18).
The modernization of incubators has not only led tomarked improvement in the thermal protection providedinfants, but it also has been pivotal in increasing ourknowledge of diseases unique to newborn babies. In turn,each increment of knowledge has required manufacturersto modify incubators in order to provide solutions toproblems the new scientific discovery imposed. For exam-ple, when electric fans became available and forced airconvection systems were developed, incubator heatingbecame so improved that infants for the first time couldbe undressed during care. This along with the use of newtransparent plastics in the construction of incubator wallsallowed clinicians to make observations that led to detaileddescriptions of illnesses about which little was knownwhen infants were hidden within the predominately opa-que wooden and metal chambers of the past. But while theemployment of clear plastic in incubator constructionenhanced the ability to observe infants, its poor insulatingqualities made the task of maintaining the incubatorchamber in a warm and stable state more difficult. Andas improved visibility led to new lifesaving therapies, suchas the administration of intravenous fluids, the use ofrespirators in care, and the development of new diagnosticprocedures and surgical interventions, the transparentplastic walls that provided caretakers with visual accessto sick babies during these therapeutic processes alsoserved as impediments. Incubators had to be modified sothat catheters, tubes, and wires could be connected to aninfant’s body. Increasing numbers of access holes were
INCUBATORS, INFANTS 145
Figure 1. von Ruehl warming tub (1835). Reprinted with per-mission from T. E. Cone, Jr., History of the Care and Feeding of thePremature Infant, Boston, MA: Little, Brown, 1985.
Figure 2. Tarnier incubator (1880). Reprinted with permissionfrom T. E. Cone, Jr., History of the Care and Feeding of thePremature Infant, Boston, MA: Little, Brown, 1985.

drilled through the walls of the incubator to provide portalsof entry for these therapeutic tools, but the new fenestra-tions also produced new exits for life-sustaining heat. Moremodifications were needed and, as each problem wassolved, a new dilemma emerged.
Even today, infant caretakers and incubator manufac-turers continue to struggle with these and other problemscontributing to the strengths and weaknesses in incubatordevices. In this article, the physiologic, clinical, and tech-nical factors leading to the design of existing incubatorswill be outlined further and some of the limitations ofincubators explained in greater detail. Throughout, wehope that it remains clear that incubator development isan ongoing process requiring frequent and critical reviewof existing methods to assure that the thermal protectionbeing provided is still appropriate during the delivery ofother and especially newer forms of care also deemednecessary to a baby’s well being. The ideal incubator oftomorrow is one that neither impedes care nor can itself,when providing thermal protection, be impeded by otherforms of care. This has always been and remains the majorchallenge to health care providers and engineers com-mitted to incubator development.
FACTORS CONSIDERED IN INCUBATOR DESIGN
Physiological Heat Balance
Even though some controversy exists concerning the exactdefinition of the body temperature limits within which anewborn’s body functions optimally, in general, any tem-perature between 35.5 and 37.5 8C is probably within thatnormal range and can be referenced to published dataavailable on the subject. Body temperature is determinedby the balance between the heat produced within and lostfrom the body tissues. In order to design or even under-stand the design and limitations of modern incubators, aknowledge of these basic factors is required to provide thecontext for how infants differ from adults in their thermo-regulatory capabilities.
Heat Production
All animals, including human babies, produce body heat asa by-product of the biochemical processes that sustain life.The basic amount of heat produced by a newborn infant is 1.5–2 Wkg�1. During the first weeks of life, this minimalrate of heat production is both weight and age related, withsmaller and younger babies capable of producing less heatthan larger and older infants (19–23).
In addition to this basic capacity, most healthy babieshave the capability to generate additional heat to amaximum production rate of 4.5–5 Wkg�1 (21–23). Thisadditional heat-producing capacity is often called upon forprotective purposes, as, for example, when the infant ischallenged to fight off infection or when stressed by situa-tions that cause an exorbitant amount of heat to be lostfrom the body. The capability to increase the amount ofheat produced to replace body heat losses is called home-othermy. In contrast to homeotherms, some creatures,such as lizards, reptiles, and fish, are poikilotherms that
do not produce more heat when cooled, but actuallydecrease their metabolic rates when exposed to cold.
When considering thermoregulatory problems asso-ciated with newborn care, both homeothermy and poi-kilothermy must be understood, because under somecircumstances, it is possible for a homeothermic animalto behave like a poikilotherm. Sometimes during the med-ical care of humans this possibility is used to a patient’sbenefit; for example, during some heart operations patientsare given drugs that prevent their nervous systems fromresponding to the cold. In this circumstance, it is desirableto slow the body’s metabolic rate, which can be achieved bycooling the drug treated patient who, by intent, has beenchanged to a temporary poikilotherm.
At times, a homeotherm may revert temporarily to apoikilothermic state. This is particularly common in imma-ture or very sick newborns, and especially those withneurologic damage (24) or with breathing problems thatlead to inadequate blood and tissue oxygen levels (25,26).Poikilothermy in a newborn can also occur because of drugsadministered to a mother in labor with subsequent pla-cental transport of those drugs to the infant (27).
In spite of their occasional reversion to poikilothermy, itnonetheless is commonly advised that newborns should bethought of as homeotherms and protected from environ-ments that would unduly stimulate homeothermic tenden-cies. This is because homeotherms increase heatproduction by increasing metabolic work which can causeexcess utilization of finite fat, sugar, and protein storesneeded to sustain other vital body functions and to meetgrowth and developmental milestones. Moreover, extrametabolic work produces more than just extra heat; acidicand other metabolic by-products produced at the same timecan cause severe imbalances in the body’s critical acid–basebalance (4). As a consequence of the self-protective reactionto cold stress a newborn may, therefore, be faced with anequally life-threatening biochemical stress (Fig. 3).
It has been suggested that one reason cold-exposedinfants have higher mortality rates is that they becomemetabolically exhausted and incapable, in part because ofthe consequent acidosis, to fight off the stresses placed ontheir bodies by other threatening events. But problems canarise when attempts are made to provide infants withprotection from cold stress, since it is unclear how to besure that a given environment minimizes the infant’smetabolic efforts to maintain homeothermy. Theoretically,this could be achieved by measuring the infant’s metabolicrate continuously and making adjustments in the environ-mental supports whenever the infant’s rate of metabolismchanged, but measurement of heat production by a new-born is very difficult in the clinical setting.
In any case, few infant caretakers would consider theinfant’s metabolic rate as the only measure of success whenproviding a baby with thermal protection. The infant’sactual body temperature is also considered important(21) and it is well known that metabolic rate is only onefactor contributing to the body temperature measured.Body temperature also is influenced by the rate at whichheat is lost from the body and, if one wishes to produce adevice that contributes to the maintenance of an infant’sbody temperature, it is necessary, by virtue of its balancing
146 INCUBATORS, INFANTS

effect on the final body temperature achieved, to under-stand how heat loss occurs in newborns.
Heat Loss
In the final analysis, incubators actually protect infantsonly by modifying the factors that contribute to heat lossvia the well-known conductive, convective, radiant, andevaporative mechanisms.
The flow of heat occurs only when there is a difference inthe temperatures of adjacent structures. Heat can only belost by a warmer object to a cooler one. Conductive heatlosses occur when an infant comes in physical contact witha cooler solid surface. A baby loses heat by conduction to acooler mattress, blanket, diaper, or other clothing.Convective losses are similar to, but independent of, con-ductive losses and occur when a baby is exposed to aircurrents that are cooler than the infant. Convective lossesare influenced not only by temperature differences, butalso by the wind chill factor determined by speed at whichthe air is flowing. In a practical sense, this means that if anincubator has a fan as part of a forced convection heatingsystem, air movement produced by the fan can cause acooling effect in excess that which would occur if air at thesame temperature was still.
Heat loss in infants also occurs by radiation in theinfrared (IR) spectrum to cooler solid objects surrounding,but not in contact with their skin. The incubator and roomwalls, windows, and furniture all contribute to heat loss viaradiant mechanisms. Finally, evaporative heat losses occur
as infants transpire water from their skin into the sur-rounding environment. They can also lose heat by evapora-tion as residual amniotic fluid or bath water dries fromtheir skin and hair, and they lose heat from their lungs asthey exhale warm humid air.
Gross estimates of the magnitude of heat loss can becalculated by physical heat-transfer equations for eachmechanism. The reader is referred to thermal transferbooks for the details of these mechanisms, but examinationof these equations here in a simplified form is a useful wayto discover some of the special features that influence heattransfer as applied to newborn care.
All nonevaporative heat losses are quantitatively pro-portional to the magnitude of the temperature differencebetween the warmer object (To) losing heat and the coolerenvironmental feature (Te) that will receive the heat intransfer:
Heat loss ¼/ ðT0 � TeÞ
This equation becomes equality by adding to it an objectspecific constant called a thermal transfer coefficient (k):
Heat loss ¼ kðT0 � TeÞ
Different materials at the same temperature lose heatat different rates when exposed at the same thermal envir-onment; for example, a block of wood has a lower thermaltransfer coefficient than a block of steel. Newborn infantshave higher thermal transfer coefficients than do adultsand therefore lose body heat more rapidly than adultswhen exposed to any environment that is cooler than bodytemperature, so in a room temperature that feels comfor-table to an adult, a newborn can get cold.
It must be emphasized that the heat loss equation aswritten above is grossly simplified and omits numerousother factors important to actual heat exchange. A moreaccurate equation would have to include a factor account-ing for the infant’s exposed surface area, which is a quan-tity that changes with changes in an infant’s position and ismodified if the infant is swaddled in blankets, wears adiaper, booties, hat, or, if in the course of surgical care, hasa bandage applied. The equation as simplified particularlyfails to reflect the true degree of complexity describing thethermal relationship between an infant’s skin and theradiant surfaces of a room or incubator. The relationshipis modified, for example, by complex factors describing theexact path and distance traveled by infrared (IR) waves intheir transfer from object to object.
Radiant heat loss is also modified by the emissivities ofthe objects exchanging energy. Like black carbon, aninfant’s skin, no matter what its actual color, is presumedto have an emissivity of 1, which means it absorbs andemits IR rays perfectly and completely. The emissivities ofthe materials used in incubator manufacture or in nurserywall coverings also modify the amount of radiant exchangeoccurring with the infant’s radiant surface. The emissiv-ities of these objects become particularly important in anincubator chamber in which the surface area of the interiorwalls surrounds the exposed surface area of the infant’sradiating skin.
The following equation, although still simplified, pro-vides a better approximation of expected radiant losses (Hr)
INCUBATORS, INFANTS 147
Figure 3. Schematic of homeothermy in newborns. On sensingloss of body heat, the infant minimizes heat loss from the skin byvasoconstricting blood vessels, changing body positions, andincreasing metabolic rate. The increase in metabolism canproduce acidosis and depletion of energy substrate stores.Reproduced by permission from P. H. Perlstein, ‘‘Routine andspecial care–Physical environment.’’ In A. A. Fanaroff and R. J.Martin (Eds.), Behrman’s Neonatal-Perinatal Medicine, 3rd ed.,St. Louis, MO: C. V. Mosby Co., 1983.

from an infant in an incubator (28). In this equation, Ab isthe exposed surface area of the infant, Ar is the area of thewalls surrounding the infant, Es is the emissivity ofthe infant’s skin, and Er is the emissivity of the walls.The symbol o is the Stefan–Boltzmann constant, 5.67 �10�8 W�1m�2K�4. When using this equation, tempera-tures are expressed in kelvin and the heat loss in watts.
Hr ¼ Ab1
Esþ Ab
Ar
1
Er� 1
� � ��1
sðT4s � T4
r Þ
Radiant exchange relationships are so variable becauseof differences between infants and different incubatorenvironments that, even using this more complex equation,only poor and static quantitative approximation of actualradiant flux can be made in clinical settings. This proves tobe a practical problem when considering incubator designs,since it has been documented that in many situationsradiant losses can account for >60% of the total heat lossfrom an infant (29).
Evaporative heat losses are not specifically related totemperature difference and occur instead because of differ-ences that exist between the partial pressures of water inthe boundary layer of air next to the infant’s skin and thatin the environment beyond the boundary layer limits.
Evap loss ¼ Kðpartial pressure skin
� partial pressure airÞðaresÞPartial pressures are not the same as relative humid-
ities, so even in an environment at 100% relative humidity,an infant can lose water and heat if the skin surface iswarmer than the environment. For each milliliter of fluidlost from the body, 580 gcal (2.4 kJ) of heat are lost in thevaporization process. This route of heat loss accounts for 25% of the total heat loss when an infant is dry. Whenlying unclothed on an open bed heated only by a radiantheater, up to 300 mL�1kg�1day�1 of fluid can be lost byevaporation from the skin of very immature infants in thefirst days of life. In an enclosed incubator that is poorlyhumidified, up to 150 mL�1kg�1day�1 of water can be lostby this mechanism in very immature infants. Followingbirth when the infant is wet with amniotic fluid, or follow-ing a bath, this can become the predominant route of heatloss (30–34,34).
Environmental Temperature
It should be obvious from the previous discussion that sinceconduction, convection, radiation, and evaporation areeach relatively independent mechanisms, no single mea-surable quantity can be used to calculate their combinedcontribution to heat loss. Air temperature, for example, canbe used to estimate only the convective component of heatloss from a baby, while measurements of incubator insidewall temperatures can only be helpful in determiningapproximate losses due to radiation. This means that ifthe incubator walls are cold, a baby in an incubator can loseheat even if the air temperature is warmer than the infant.The only feature necessary for this to be true is for radiantlosses to be higher than convective heat gains.
Environmental temperature, although frequently usedloosely to describe any ambient thermal value, must be
understood to be a specific reference to the combination oftemperatures actually experienced by an infant in thermalexchange relationships via multiple mechanisms. Unfortu-nately, few guidelines exist at present to help caretakersknow the true environmental temperature for an infantwithin an incubator in a clinical setting. When certainconditions are met, however, some of the guidelines seemto be useful. Dr. Hey, for example, determined that in awell-humidified enclosed convectively heated incubatorwith single-layer Plexiglas walls, the environmental tem-perature perceived by a contained infant is 1 8C lowerthan the measured midincubator chamber air temperaturefor every 7 8C difference that exists between the incubatorair temperature and the air temperature of the roomwithin which the incubator stands (35).
Heat Transfer within the Body
Since the skin of the newborn is the major heat-losingsurface in exchange with the environment, mechanismsby which heat transfers from interior tissues to the skinplay an important part in the heat loss process. The rate atwhich internally produced heat is transferred from thebody core temperature TB through body tissues to the outerbody skin surface at temperatures Ts is computed using thefollowing equation:
Heat transfer ¼ CðTB � TsÞ
Where C is an individual’s specific thermal conductancecoefficient, which is affected by the absolute thickness andcharacter of the skin, subcutaneous fat, and other subcu-taneous tissue, and by the blood flow rate from the bodycore to its surface. Obviously, babies are smaller and havethinner body coverings than do adults, and, therefore, asthey lose heat more rapidly from their surfaces than doadults, they also transfer heat more rapidly to their sur-faces from their internal heat-producing organs. In addi-tion, an infant’s blood vessels are relatively close to thebody surface. Since the vascularity of a particular bodysurface determines the rate at which blood will shunt coreheat around intervening insulating tissues to the skinsurface, such shunting contributes heavily to the highthermal conductance of a baby.
Heat can also be lost rapidly from an infant’s body corevia the respiratory system. This route of loss is of relativelyminor significance in a healthy and spontaneous breathinginfant, but in a baby who is ill and especially one beingmechanically assisted by a respirator, this can become themajor route by which body heat is lost or gained. Body heattransferred by this route is dependent on the infant’stemperature, breathing rate, the flow rate and tempera-ture of gases reaching the lungs, and the water content ofthe gas delivered to the airway. If temperatures and humi-dification are not properly monitored and controlled, theheat losses from the respiratory passages can be so greatthat they exceed the capacity of the incubator heater.
The Concept of a Neutral Thermal Environment
Theoretically and as demonstrated by several authors(21,36,37), it is possible for a competent homeothermicbaby to have a body temperature that is below the normal
148 INCUBATORS, INFANTS
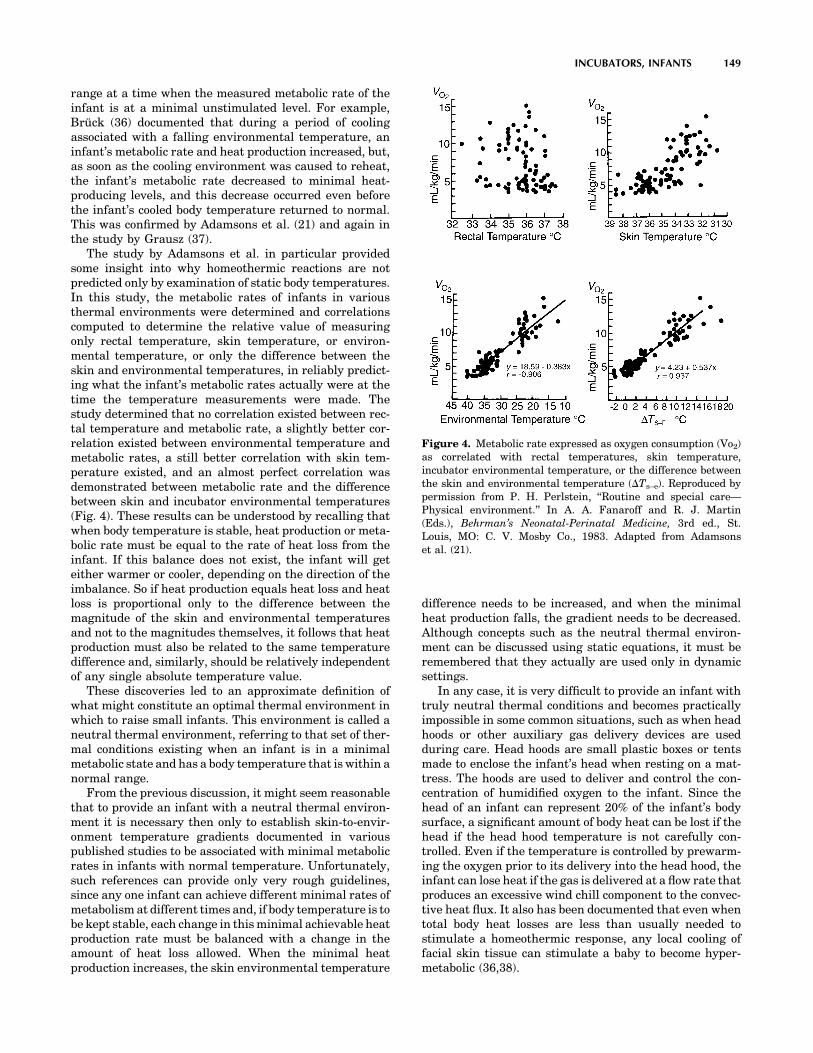
range at a time when the measured metabolic rate of theinfant is at a minimal unstimulated level. For example,Brück (36) documented that during a period of coolingassociated with a falling environmental temperature, aninfant’s metabolic rate and heat production increased, but,as soon as the cooling environment was caused to reheat,the infant’s metabolic rate decreased to minimal heat-producing levels, and this decrease occurred even beforethe infant’s cooled body temperature returned to normal.This was confirmed by Adamsons et al. (21) and again inthe study by Grausz (37).
The study by Adamsons et al. in particular providedsome insight into why homeothermic reactions are notpredicted only by examination of static body temperatures.In this study, the metabolic rates of infants in variousthermal environments were determined and correlationscomputed to determine the relative value of measuringonly rectal temperature, skin temperature, or environ-mental temperature, or only the difference between theskin and environmental temperatures, in reliably predict-ing what the infant’s metabolic rates actually were at thetime the temperature measurements were made. Thestudy determined that no correlation existed between rec-tal temperature and metabolic rate, a slightly better cor-relation existed between environmental temperature andmetabolic rates, a still better correlation with skin tem-perature existed, and an almost perfect correlation wasdemonstrated between metabolic rate and the differencebetween skin and incubator environmental temperatures(Fig. 4). These results can be understood by recalling thatwhen body temperature is stable, heat production or meta-bolic rate must be equal to the rate of heat loss from theinfant. If this balance does not exist, the infant will geteither warmer or cooler, depending on the direction of theimbalance. So if heat production equals heat loss and heatloss is proportional only to the difference between themagnitude of the skin and environmental temperaturesand not to the magnitudes themselves, it follows that heatproduction must also be related to the same temperaturedifference and, similarly, should be relatively independentof any single absolute temperature value.
These discoveries led to an approximate definition ofwhat might constitute an optimal thermal environment inwhich to raise small infants. This environment is called aneutral thermal environment, referring to that set of ther-mal conditions existing when an infant is in a minimalmetabolic state and has a body temperature that is within anormal range.
From the previous discussion, it might seem reasonablethat to provide an infant with a neutral thermal environ-ment it is necessary then only to establish skin-to-envir-onment temperature gradients documented in variouspublished studies to be associated with minimal metabolicrates in infants with normal temperature. Unfortunately,such references can provide only very rough guidelines,since any one infant can achieve different minimal rates ofmetabolism at different times and, if body temperature is tobe kept stable, each change in this minimal achievable heatproduction rate must be balanced with a change in theamount of heat loss allowed. When the minimal heatproduction increases, the skin environmental temperature
difference needs to be increased, and when the minimalheat production falls, the gradient needs to be decreased.Although concepts such as the neutral thermal environ-ment can be discussed using static equations, it must beremembered that they actually are used only in dynamicsettings.
In any case, it is very difficult to provide an infant withtruly neutral thermal conditions and becomes practicallyimpossible in some common situations, such as when headhoods or other auxiliary gas delivery devices are usedduring care. Head hoods are small plastic boxes or tentsmade to enclose the infant’s head when resting on a mat-tress. The hoods are used to deliver and control the con-centration of humidified oxygen to the infant. Since thehead of an infant can represent 20% of the infant’s bodysurface, a significant amount of body heat can be lost if thehead if the head hood temperature is not carefully con-trolled. Even if the temperature is controlled by prewarm-ing the oxygen prior to its delivery into the head hood, theinfant can lose heat if the gas is delivered at a flow rate thatproduces an excessive wind chill component to the convec-tive heat flux. It also has been documented that even whentotal body heat losses are less than usually needed tostimulate a homeothermic response, any local cooling offacial skin tissue can stimulate a baby to become hyper-metabolic (36,38).
INCUBATORS, INFANTS 149
Figure 4. Metabolic rate expressed as oxygen consumption (Vo2)as correlated with rectal temperatures, skin temperature,incubator environmental temperature, or the difference betweenthe skin and environmental temperature (DTs–e). Reproduced bypermission from P. H. Perlstein, ‘‘Routine and special care—Physical environment.’’ In A. A. Fanaroff and R. J. Martin(Eds.), Behrman’s Neonatal-Perinatal Medicine, 3rd ed., St.Louis, MO: C. V. Mosby Co., 1983. Adapted from Adamsonset al. (21).

Since no studies have been published to provide guide-lines for establishing neutral thermal conditions in anincubator containing auxiliary sources of heating and cool-ing, and because such sources are very commonly usedduring infant care, no incubator manufacturer can guar-antee, when an auxiliary devices are used, that such con-ditions can be produced by any incubator on the markettoday. As a corollary, unless both body temperatures andinfant metabolic rates are continuously monitored, infantcaretakers and medical researchers are similarly con-strained from claiming precision in their delivery of con-tinuous and certifiable thermal protection that isconsistent with the concept of thermoneutrality.
Before we leave this subject, it should also be noted thata significant number of knowledgeable baby care specia-lists disagree with the idea that a neutral thermal envir-onment represents an optimal goal for incubator control.Their arguments are numerous, but most often include theirrefutable fact that no one has ever documented scienti-fically that such protection is really beneficial. They alsocite the studies by Glass et al. (2,3) in which it wasdocumented that babies tend to lose their very importantself-protective ability to react as homeotherms if notexposed to periodic cold stresses. This means that one pricepaid by an infant raised in a neutral thermal environmentis adaptation to that environment and, much as a pro-longed stay in the tropics diminishes an adult’s capacity totolerate the northern winters, a baby so adapted may bemore susceptible to the damaging effects of unavoidableoccasional exposures to the cold.
It must be emphasized that the arguments against theneutral thermal environment are not arguments in favor ofletting all babies stay cold; the debate primarily concernswhether a baby is better off in an environment thattheoretically maximizes growth by reducing metabolicwork to an absolute minimum but might increase theinfant’s susceptibility to subsequent stresses, or betteroff in an environment that very mildly stimulates theinfant to metabolically contribute to his own ongoing ther-mal welfare so that important self-protective capabilitiesare not forgotten. As yet there are insufficient scientificdata to resolve this issue. A more recent observation is thatthe body temperatures of the fetus and older infant arehigher than the typical neutral thermal environment pro-posed for preterm infants, and in both cases, follow acircadian rhythm that is not observed or supported inthe typical infant incubator. These considerations implythat while the ‘‘neutral thermal environment’’ is a usefulconcept for current incubator design, it is not yet knownhow the ‘‘optimal thermal environment’’ should be defined,especially for the preterm infant.
INCUBATOR STUDIES
In spite of the difficulties encountered when attempting todefine, let alone achieve, the optimal environmental con-ditions that are protective for small babies, it is clear thatbabies raised in different environments do have differentsurvival rates. The scientific studies documenting thesedifferences in survival in different environments are worth
reviewing, since they have provided insight into featuresdistinguishing some incubators from others and ways inwhich these features may produce environments that canprove to be both protective to some infants and dangerousfor others. These studies have also been the major impetusto changes in designs that have resulted in the kinds ofincubator devices in use today.
With few exceptions, until the early 1970s, incubatordesigners relied only on convective heaters to warm thechamber within which a baby was contained. Such deviceswere relatively simple to construct and provided a methodwhereby the chamber mattress could be kept warm therebylimiting conductive heat losses, and a method to keep thesurrounding air warm, limiting convective losses. The useof wet sponges early in the history, and later evaporationpans, over which the convective currents of warmed airpassed before entering the infant’s chamber, provided thehumidity needed to limit evaporative losses. Additionally,the warmed air contained in the chamber produced somewarming of the chamber walls thereby reducing to somedegree radiant heat losses from the infant. The heatingunits in early models of these incubators were controlledonly by simple air temperature-sensitive thermostatmechanisms.
Such an incubator with clear plastic walls for enhancingvisualization of the contained infant was used in a famousseries of infant survival studies published between 1957and 1965. In this incubator, a fan was used to force theconvective air currents into the infant’s chamber afterpassage over a heating element through a turbulenceproducing baffle resting in a humidifying pan of water.A highlight of these studies was published in 1958 bySilverman et al. (7) who compared the survival rates oftwo groups of premature infants cared for in this convec-tively heated and humidified device. For one group ofinfants the incubator air was heated to 28 8C and for theother group the air was heated to a warmer 32 8C. Thestudy resulted in a conclusion that infants cared for in thewarmer incubator had a higher survival rate than didinfants cared for in the cooler incubator. During the studyit was observed that although babies in the warmer incu-bator had a greater chance of surviving, not all of theinfants who survived in the warmer incubator had warmbody temperatures; in fact, 10% of the babies in the 32 8Cincubator had body temperatures 35.5 8C. Dr. Silvermandeduced that the reason some of the babies got cold was dueto excessive radiant heat losses to the thin plastic chamberwalls that were cooled by virtue of their exterior surfacesbeing exposed to the cooler nursery environment.
Dr. Silverman wished to test whether even better sur-vival rates could be achieved by assuring that an infantwas not only in a warm incubator, but that the infant’s bodytemperature also was always kept within a normal range.Along with Dr. Agate and an incubator manufacturer hehelped develop a new incubator that was radiantly heatedto reduce the radiant losses observed when the incubatorwas only convectively heated (39). To assure that thecontained infant’s temperature was maintained withinnormal range, the new incubator employed an electronicfeedback servo-control mechanism that responded tochanges in the temperature of a thermistor attached to
150 INCUBATORS, INFANTS
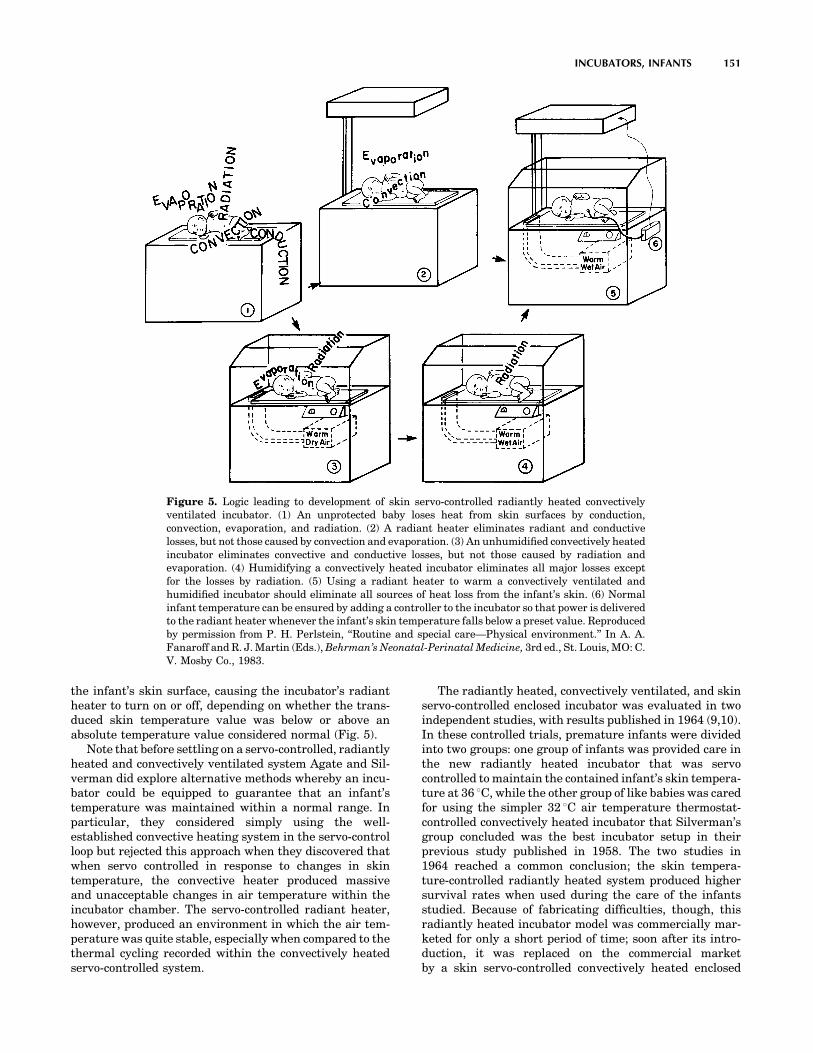
the infant’s skin surface, causing the incubator’s radiantheater to turn on or off, depending on whether the trans-duced skin temperature value was below or above anabsolute temperature value considered normal (Fig. 5).
Note that before settling on a servo-controlled, radiantlyheated and convectively ventilated system Agate and Sil-verman did explore alternative methods whereby an incu-bator could be equipped to guarantee that an infant’stemperature was maintained within a normal range. Inparticular, they considered simply using the well-established convective heating system in the servo-controlloop but rejected this approach when they discovered thatwhen servo controlled in response to changes in skintemperature, the convective heater produced massiveand unacceptable changes in air temperature within theincubator chamber. The servo-controlled radiant heater,however, produced an environment in which the air tem-perature was quite stable, especially when compared to thethermal cycling recorded within the convectively heatedservo-controlled system.
The radiantly heated, convectively ventilated, and skinservo-controlled enclosed incubator was evaluated in twoindependent studies, with results published in 1964 (9,10).In these controlled trials, premature infants were dividedinto two groups: one group of infants was provided care inthe new radiantly heated incubator that was servocontrolled to maintain the contained infant’s skin tempera-ture at 36 8C, while the other group of like babies was caredfor using the simpler 32 8C air temperature thermostat-controlled convectively heated incubator that Silverman’sgroup concluded was the best incubator setup in theirprevious study published in 1958. The two studies in1964 reached a common conclusion; the skin tempera-ture-controlled radiantly heated system produced highersurvival rates when used during the care of the infantsstudied. Because of fabricating difficulties, though, thisradiantly heated incubator model was commercially mar-keted for only a short period of time; soon after its intro-duction, it was replaced on the commercial marketby a skin servo-controlled convectively heated enclosed
INCUBATORS, INFANTS 151
Figure 5. Logic leading to development of skin servo-controlled radiantly heated convectivelyventilated incubator. (1) An unprotected baby loses heat from skin surfaces by conduction,convection, evaporation, and radiation. (2) A radiant heater eliminates radiant and conductivelosses, but not those caused by convection and evaporation. (3) An unhumidified convectively heatedincubator eliminates convective and conductive losses, but not those caused by radiation andevaporation. (4) Humidifying a convectively heated incubator eliminates all major losses exceptfor the losses by radiation. (5) Using a radiant heater to warm a convectively ventilated andhumidified incubator should eliminate all sources of heat loss from the infant’s skin. (6) Normalinfant temperature can be ensured by adding a controller to the incubator so that power is deliveredto the radiant heater whenever the infant’s skin temperature falls below a preset value. Reproducedby permission from P. H. Perlstein, ‘‘Routine and special care—Physical environment.’’ In A. A.Fanaroff and R. J. Martin (Eds.), Behrman’s Neonatal-Perinatal Medicine, 3rd ed., St. Louis, MO: C.V. Mosby Co., 1983.

incubator that was easier to fabricate and, like theradiantly heated device, was also capable of keeping aninfant’s skin temperature at a value considered normal.
The introduction of this convectively heated servo-controlled device on the market was justified by an extra-polated interpretation of the studies reported in 1964. Thiscommon interpretation led to a conclusion that the studiessimply demonstrated that, in terms of survival, it was onlyimportant to keep a baby’s skin temperature warm andstable. The interpretation ignored the fact that more thanjust a difference in skin temperatures distinguished thetwo study groups. Infants in the two different study envir-onments, the one produced by an air temperature refer-enced thermostat controlling a convective heater and theother by a skin temperature referenced servo system con-trolling a radiant heater, were also, as previously welldiscussed by Agate and Silverman, exposed to environ-ments that differed in the frequency and amplitude ofthermal cycling produced by the different systems (39).The radiantly protected infants, who survived better, not
only had warmer and more stable skin temperatures as agroup, but were also exposed to a much more stable envir-onment than were the convectively protected infants withthe less favorable group outcomes.
The commercially released convectively heated and skintemperature referenced servo-controlled incubator was themost common incubator in clinical use during the late1960s; not until 1970 was the characteristic rapidly chan-ging air temperatures within the incubator chamber rede-scribed and shown to cause some sick small babies to stopbreathing (40). These episodes of respiratory arrest, calledapneic spells, were specifically observed during the incu-bator’s heating cycles. The mechanism whereby a suddenrise in temperature causes some babies to become apneicremains unknown, but was an observation well reportedeven prior to the 1970 publication. Even without knowingthe mechanism of this relationship, it remains undisputed,so incubator manufacturers have continued to search forways to produce stabilization of the incubator environmen-tal temperatures (Fig. 6).
152 INCUBATORS, INFANTS
Figure 6. Skin and air temperature characteristics recorded using four different incubatorsystems.(1) A convectively heated and humidified incubator in which air temperature isthermostatically controlled. This was the device studied by Silverman in 1958 (7). Note cyclievariations in air temperature and wide variation in recorded skin temperatures.(2) A radiantlyheated convectively ventilated and humidified incubator that is servo controlled to maintain skintemperature at specified value. This was the device studied by Day (9) and Beutow (10) in 1964. Notethat the walls are warm, limiting radiant heat losses and that air temperature is stable and skintemperature variations are minimal. (3) A convectively heated and humidified incubator in whichthe air temperature heating is servo controlled to maintain skin temperature at specified value. Thiswas the device reported to cause some babies to stop breathing (40) as a response to erratic heatingcycles that produces rapid increases in air temperature. (4) A convectively heated and humidifiedincubator that is computer controlled using Alcyon algorithm (11). Note the stable air temperatureand minimal variability in skin temperature.

INCUBATOR DYNAMICS
There are many reasons why attempts to stabilize incu-bator heating have been only partially successful. It isfairly simple to build a box within which the temperaturescan be predictably controlled and stabilized for prolongedperiods of time if the box is never opened and the thermalcharacteristics of both the box and its contents neverchange, but these simplifying conditions never exist whencaring for a sick infant. When infants are cleaned, fed,examined, or otherwise cared for, they must be touched,and the incubator box must be entered. Infant’s bodypositions frequently change, exposing different surfaceareas with different shapes to the incubator environmentcausing changes in convective flow patterns and alteringthe view factors influencing radiant heat flow to the incu-bator walls. Incubator openings necessitated by the need totouch a contained infant cause both environmental coolingand increased infant heat loss that, in an incubator heatedin response to either air temperature or infant temperaturechanges, causes a logical increase in the incubator’s heatoutput. If any such heating requirement is sustained, theincubator heating element warms to the point where it willretain and release heat even after the incubator is closedand the need for additional heating has passed. Such heatretention and release contributes to what is commonlyreferred to as the thermal lag characteristic of a heatingsystem and can cause temperatures to overshoot, that is torise above the temperature level targeted when the heaterwas activated. This is the same phenomenon observedwhen an electric stove is turned off, and yet the heatingelement continues to glow brightly prior to cooling. As withan electric stove heating element, the heater in an incu-bator is not only slow to cool, but also relatively slow towarm up when first energized after the heater is turned on.Again, just as unintended overheating can occur, the ther-mal lag due to the mass of the heater can result in anincubator getting colder than intended because of thischaracteristic delay between action and reaction.
Besides the heater element, there are numerous otherplaces where heat is stored in the incubator system. Forexample, heat storage occurs in the water used for humi-dification and in the air masses between the heater and theincubator chamber. Since these must be heated to a tem-perature higher than the incubator chamber in order toraise the chamber temperature, the heat stored in theseparts also will continue to raise the chamber temperatureseven after the heater power supply has been turned off.Conversely, when the heater power is turned back on, notonly the heater but also the air in the spaces leading to thechamber must heat up before the temperature of the air inthe chamber can rise.
It is these delays between the time the heater power ischanged and the time the air temperature responds thatdetermines the magnitude and frequency of the air tem-perature cycles to which an incubated infant is exposed.Thermal lag obviously contributes to the tendency forincubator environments to become unstable and, thereby,potentially threatening to the contained infant. Manyhardware and logical software solutions to this problemhave been tried in commercially available devices, but all
have been frustrated by the complex nature of newborncare, which results in a degree of unpredictability beyondthe compensating capability of any solution thus far tried.The implementation of feedback control on incubator heat-ing is an example of one way to attempt to respond to manyof these problems. However, examining how servo mechan-isms actually work in a little more detail provides a deeperappreciation of why this logical technology often fails in thedynamic setting of an incubator and may even contribute toinstability in the incubator environment.
Feedback Control
Feedback control systems are commonly referred to asclosed loop control systems, as contrasted to open loopsystems. A cooking stove again can be used to give anexample of each type of control system. Stove top heatersare typically controlled by an open loop system. That is, adial is adjusted controlling the quantity of gas or electricitygoing to the heater unit. In this manner, a fixed rate of heatproduction by the heater unit is specified. This is called anopen-loop control system because after once setting therate of heat production, the heater will continue to producethe same heat output regardless of how hot the object onthe stove gets.
In contrast, the oven of a modern stove is equipped witha closed-loop temperature control system, in which a dial isadjusted to specify the desired oven temperature. In con-trol system parlance, this specified temperature is referredto as the set point. A temperature sensor inside the ovenworks in conjunction with the temperature setting dial tocontrol the rate of heat production in the oven heating unitand when the temperature measured by the oven tempera-ture sensor rises to the set point value on the control dial,the oven heat production is reduced or stopped entirely.After the heat production is stopped, the oven temperatureslowly falls as the heat escaped from the oven to thesurrounding area. At some point, the oven temperaturewill fall below the temperature set on the control and theheater will again be turned on; this on–off cycling willcontinue as long as the oven is in operation.
Feedback Control and Incubators
An incubator heated in automatic feedback response tochanges in electronically transduced infant temperature iscalled an infant skin servo-controlled (ISC) incubator. Inone type of ISC incubator the heater is instructed to turncompletely on when the infant’s skin temperature fallsbelow a preset lower limit or turn completely off when skintemperature exceeds a defined upper limit. Because powerapplied to the heater is either maximal or zero, this form ofservo mechanism is called nonlinear or ‘‘on–off control’’.Another form of control is designated as linear proportionalservo control. In a proportional control system the amountof power applied to the incubator heater is graduated in amanner to be proportional in some linear fashion to thetransduced skin temperature deviation from a predeter-mined value. The amount of power actually applied to theheater for each incremental change in skin temperaturecan be different in different realizations of this controlmethod, and this increment determines the amount of
INCUBATORS, INFANTS 153

deviation in skin temperature that can occur before full orzero power is applied.
The theoretical advantage of a proportional over anon–off servo-control system is the possibility of limitingthe tendency that a large heating element has to overshootor undershoot a desired heater temperature. In a propor-tional system, the heater is turned off slowly as the infant’sskin temperature warms toward the set point temperature.This contrasts with an on–off system that remains fullyenergized until the set point is reached. In an incubatorsystem, a properly designed skin temperature referencedproportional control unit will produce very stable environ-mental temperatures as long as the infant is stable, thetemperature sensing the thermistor attached to the skinremains undisturbed, and the incubator chamber is keptclosed and protected from outside environmental perturba-tions. In a clinical setting such stable and undisturbedconditions exists infrequently, so the theoretical advan-tages of proportional control over on–off control are diffi-cult to demonstrate. In fact, the cycling of temperaturesrecorded within a proportionally controlled incubator in adynamic clinical setting can be indistinguishable from thatrecorded in an on–off controlled incubator, and this func-tional behavior is predicted in basic feedback control theory(Fig, 7).
The thermal cycles recorded in servo-controlled incuba-tors are produced as a combined consequence of (1) aninherent characteristic of closed-loop feedback systems; (2)periodic extreme perturbations of the skin thermistor thattrigger either full or zero energization of the incubatorheater; and (3) the incubator’s thermal lag characteristic,which causes repetitive over-and undershoot of tempera-tures targeted by the control logic. Following the initiationof a cycling pattern, the time it takes the system to settledown and reestablish stable control is variable and relatedto the heat-dissipating speed of the heater material and thethermal buffering capability of the homeothermic infant.In some situations, the cycling, when induced by a singleperturbation, has been observed to continue for many
hours and, when an incubator is repeatedly perturbated,for many days. The published evidence that some babiesreact to these thermal cycles by becoming apneic justifies areminder that these characteristic thermal cycles repre-sent a profound problem negating some of the advantagesintended when feedback control is applied in incubatordesigns. At least in incubator servo systems that use skintemperature as a reference value to determine heaterstatus, even the theoretical negative effects often outweighany theoretical or demonstrable effects that are positive.This can be appreciated by recalling that a sine qua non ofoptimal control in a skin temperature referenced servosystem is the reliable and accurate measurement of aninfant’s skin temperature and, using today’s technology ina clinical setting, the ability to transduce skin tempera-tures accurately for prolonged periods of time is marginalat best and, perhaps, even impossible.
Skin Temperature Measurement
Skin temperature measurement accuracy is limited byvariability in the characteristics of infant, transducers,and infant care techniques. The surface temperatures ofinfants are not homogeneous because of difference in (1)skin and subcutaneous tissue thickness over different bodyparts, (2) differences in structures underlying differentskin surfaces, and (3) difference in the vascularity andvasoreactivity-characterizing different body regions.Different skin surfaces have different temperatures, andwhen temperature transducers are connected to the skinsurface, they measure the temperature only at the specificsite of their connection. Moreover, thermistors areattached using devices that can compression of superficialskin vessels underlying the thermistor element. Thus, bytheir very attachment, thermistors modify both the abso-lute temperature they are expected to measure and thespontaneous dynamic variability in the measured skintemperature that is normally affected by the changingamounts of warm blood flowing through the skin overdifferent time periods. Additional factors also affect ther-mistor accuracy. Thermistors are faulted as preciseskin temperature measuring devices because they aremanufactured in various shapes and sizes and are pro-tected using different materials so that each affects trans-duction in a specific and different way. Thermistors alsogenerally measure temperature three dimensionally (3D).They are affected not only by the temperature of the sur-face to which they are attached, but also by the environ-ment to which their unattached surfaces are exposed.Depending on the amount and type of insulation used intheir manufacture, they are also affected by the tempera-ture of the wires used to connect the thermistor to electro-nic signal conditioners.
These inherent characteristics of thermistors, added tothe fact that they are freely moved during clinical care fromone site of attachment to another, provide sufficient causeto explain why the skin temperature-dependent heater-controlling servo mechanism in an incubator can easily bedirected into an unstable state that produces thermalcycling in the environment. This environmental instabilityis even further exacerbated by infant care practices that,
154 INCUBATORS, INFANTS
Figure 7. Example of variations in dynamic air temperaturechanges when an enclosed incubator that was initially servocontrolled to maintain a stable air temperature was switched toa skin temperature referenced servo control mode and thenwas perturbated by changing the site of attachment of theskin temperature-sensing thermistor. The wide thermal cyclingillustrated as a consequence of this sequence continued for 3 hbefore returning to a more stable pattern.

for examples, cause thermistors to be removed from theskin when X rays are taken, or to be covered with steriletowels during surgical procedures. During such care-related events, the thermistor is fooled into measuringenvironmental and not skin temperature. Obviously, ifthe thermistor provides the servo electronics with misin-formation, the servo control decisions based on this infor-mation can be nonsensical.
THE NONTHERMAL ENVIRONMENT
Although infant incubators were initially designed solely tomaintain body temperature in high risk infants, they arenow seen in a much more complex role, as devices thatprovide a complete ‘‘microenvironment’’ for high riskinfants. To one extent or another, they are used to modifythe sensory input an infant receives through visual, audi-tory, olfactory, and kinesthetic pathways. In addition,incubators are now appreciated as the source of exposureto potentially unwanted environmental toxins, such aselectromagnetic radiation (EMR) and chemical compoundsused in the manufacture and operation of the incubator.Closed incubators are often used as delivery systems foroxygen and humidification, sometimes in ways unantici-pated at the time of their design and manufacture.Incubators have been developed for specialized purposes,such as transport, use in an magnetic resonance imaging(MRI) suite, or cobedding twin infants. Incubators haveincreasingly been designed as a platform for a modularsystem of support equipment including ventilators, IVpumps, and monitors. As these devices become increas-ingly controlled by digital components, they also gain thecapability of integrating their data output, so that incu-bator-derived information, such as air temperature and theinfant’s skin temperature, can be continuously recorded inan electronic medical record. Incubators have had a role ininfection control since their earliest days, but this functionis now being increasingly emphasized as infection hasemerged as the leading cause of late morbidity in prema-ture infants. These multiple functions of modern incuba-tors increase their complexity exponentially, since many ofthese factors interact with one another, often in waysunanticipated by either the designers or the users. Becauseof the recent nature of these nonthermal applications of theinfant incubator, there is only a limited scientific founda-tion to guide designers and caregivers, so not all of thesetopics will be discussed in greater depth below.
The Infant Incubator as a Sensory Microenvironment
Although the comparison of an incubator to a uterus, theenvironment it replaces, has been noted since the earliestdays of incubator design, it will be evident from the pre-ceding sections of this article that temperature regulationhas been the first and primary design consideration: andnecessarily so, since it had immediate implications forinfant survival. When incubators became used as devicesfor delivery of supplemental oxygen in the mid-twentethcentury, morbidity and mortality were again the primaryendpoints: first for improved survival as the benefits ofoxygen supplementation were identified, and then for
increased morbidity as an epidemic of oxygen-inducedblindness from retinopathy of prematurity followed, againchronicled most eloquently by Dr. Silverman (41). Onlyrecently have the other environmental features of theuterus been compared to the micro and macro environ-ments of the NICU and the implications for design beenconsidered.
Taste, smell, and touch are the earliest fetal senses todevelop, beginning in the second trimester of pregnancy,followed closely by auditory development, and finally byvisual development as the baby approaches term gestation.While thus far there appears to be no reason to suspect thatthe sense of taste is stimulated or influenced by the incu-bator, there is accumulating evidence that the other sensesare indeed affected by this microenvironment.
Infants can develop a conditioned response to certainodors that they come to associate with painful procedures,such as alcohol, whereas a pleasant odor has been shown toreduce apnea, and babies will orient preferentially to odorsfrom their mother (42).
In utero, infants are exposed to a fluid environment,frequent movement with circadian rhythmicity, and asthey approach term, increasing contact with a firm bound-ary, features absent in the typical incubator. After-marketadaptations that caused the bed or the entire incubator tomove in one fashion or another have been introducedsporadically, often with the intent of reducing infantapnea, but none have been documented to be efficacious.Additional modifications of the infant mattress to make itmore suitable for the skin and developmental needs ofpreterm infants have been introduced, again without clearbenefit to this point.
Sound is a constant although variable stimulus in theuterus, and different in many ways from that of the modernincubator. In utero sounds are delivered via a fluid mediumwhere lower pitched sounds predominate, and the mother’svoice, heartbeat and bowel sounds are far more prevalentthan any extraneous noise. As such, there is a definitecircadian rhythm both to the sounds and to movementassociated with them. In the closed incubator, the predomi-nant sound is that of the incubator fan that produces aconstant white noise, usually in excess of 50 dB, a level thathas been shown to interfere with infant sleep (43) andspeech recognition (44). Depending on the NICU in whichit is used, this may be louder or softer than the NICUambient noise level, so the closed incubator may be usedas a haven from a noisy NICU, or itself could be noisier thanthe external environment, in which case the open radiantwarmer might provide a more suitable auditory environ-ment. A number of after-market modifications have beensuggested to reduce both fan noise and intrusion of noisefrom outside the incubator, including blankets or quilts tocover the incubator and sound-absorbing panels (45,46), buttheir use is problematic to the degree that they affect air flowand other operating characteristics of the incubator.
The visual environment of the incubator may be pre-sumed to be neutral, but incubators are often used tocontrol the visual environment of the NICU, particularlyin conjunction with the use of incubator covers, to producea dimly lit environment which may enhance infant sleep(47). Light penetration into the incubator may also affect
INCUBATORS, INFANTS 155
circadian rhythmicity in the preterm infant (48), and maybe a source of heat gain through the greenhouse effect.
Electromagnetic Radiation in the Infant Incubator
Any electrically powered device emits electromagneticradiation (EMR), usually at intensities far below thoseconsidered to constitute a risk. Since the organs of preterminfants are in a crucial and rapid phase of growth, however,concern about EMR emitted by incubator and radiantwarmer heaters and other components has merited specialattention. Several studies have documented EMR levels inincubators, with proposed strategies to reduce exposureincluding shielding panels (49) and increasing the distancebetween the baby and the EMR source (50).
Incubators for Specialized Purposes
The conventional closed incubator or radiant warmer isused as a static device in the NICU, but the same needs fortemperature control and a safe microenvironment existfor infants who require transport from one hospital toanother, or to an MRI suite. Transport incubators place apremium on space (so that multiple modular componentscan be mounted) and weight (especially those used for airtransport). Incubators developed for use in an MRI suitemust be similarly portable, but use almost exclusivelyplastic materials and have an integrated coil for scanning(51,52).
SUMMARY
Infant incubators are specially heated devices that providea bed surface or chamber within which an infant can becared for and kept warm. Throughout this article both thepositive and negative features of today’s incubators havebeen noted and placed into both a context of what istheoretically desirable and of what is practically feasible.It is apparent that, at present, our knowledge of infantphysiology and the availability of technical solutions areseverely limited, and that all existing incubator devicesreflect and are faulted by these limitations. In historicalperspective, however, it is clear that incubators over thepast 100þ years have steadily been improved by manu-facturers to incorporate new items of knowledge andtechnology as they become available. This historicalpath has been fruitful and provides, in its continuingcourse, direction for the future in incubator development.Future iterations of the infant incubator will need toincorporate new information on the optimal microenvir-onment for the high-risk newborn as well as new capabil-ities made possible by the ongoing quantum changes indigital technology.
BIBLIOGRAPHY
1. Meystán J, Járai I, Fekete M. The total energy expenditureand its components in premature infants maintained underdifferent nursery and environmental conditions. Pediatr Res1968;2:161.
2. Glass L, Silverman WA, Sinclair JC. Effect of the thermalenvironment on cold resistance and growth of small infantsafter the first week of life. Pediatrics 1968;41:1033.
3. Glass L, Silverman WA, Sinclair JC. Relationship of thermalenvironment and caloric intake to growth and resting meta-bolism in the late neonatal period. Biol Neonate 1969;14:324.
4. Gandy GM, et al. Thermal environment and acid base home-ostasis in human infants during the first few hours of life. JClin Invest 1964;43: 751.
5. Cornblath J, Schwartz R. Disorders of carbohydrate metabo-lism in infancy. In: Shaffer JA, editors. Major Problems inClinical Pediatrics. Vol. 3. Philadelphia: Saunders; 1966. p 34.
6. Silverman WA, Blanc WA. The effect of humidity on survival ofnewly born premature infants. Pediatrics 1957;20:477.
7. Siverman WA, Ferrig JW, Berger AP. The influences of thethermal environment upon the survival of newly born pre-mature infants. Pediatrics 1958;22:876.
8. Silverman WA, Agate FJ, Ferrig JW. A sequential trial of thenonthermal effect of atmospheric humidity on survival ofnewborn infants of low birth weight. Pediatrics 1964;34:171.
9. Day RL, Caliguiri L, Kamenski C, Ehrlich F. Body tempera-ture and survival of premature infants. Pediatrics 1964;34:171.
10. Beutow KC, Klein SW. Effect of maintenance of normal skintemperature on survival of infants of low birth weight. Pedia-trics 1964;34:163.
11. Perlstein PH, Edwards NK, Atherton HD, Sutherland JM.Computer assisted newborn intensive care. Pediatrics 1976;57:494.
12. Evaluation of infant radiant warmers. Health Devices,1973;3:4.
13. Perstein PH. Thermal control. Rep Ross Conf Pediatr Res1976;69:75.
14. Edwards NK. Radiant warmers. Rep Ross Conf Pediatr Res,1976;69:79.
15. Evaluation of infant incubators. Health Devices. 1981;11:47.16. Evaluation of infant incubators. Health Devices 1982;11:191.17. Wu PYR, Hodgman JE. Insensible water loss in preterm
infants. Pediatrics 1974;54:704.18. Cone Jr. TE, History of the Care and Feeding of the Premature
Infant. Boston: Little, Brown; 1985.19. Scopes JW. Metabolic rate and temperature control in the
human body. Br Med Bull 1966;22:88.20. Scopes JW, Ahmed I. Minimal rates of oxygen consumption in
sick and premature newborn infants. Arch Dis Child1966;41:407.
21. Adamsons K Jr., Gandy GM, James LS. The influence ofthermal factors upon oxygen consumption of newborn infants.J Pediatr 1965;66:495.
22. Hill JR, Rahimtulla KA. Heat balance and the metabolic rateof newborn babies in relation to environmental temperature:And the effect of age and weight on basal metabolic rate. JPhysiol(London) 1965;180:239.
23. Dawes GS. Oxygen consumption and temperature regulationin the newborn. I Foetal and Neonatal Physiology. Chicago:Year Book Medical Publishersh; 1968. p 191.
24. Cross K, et al. Lack of temperature control in infants withabnormalities of the central nervous system. Arch Dis Child1971;46:437.
25. Dawkins MJR, Hull D. Brown fat and the response of thenewborn rabbit to cold. J Physiol (London) 1963;169:101.
26. Hill JR. Oxygen consumption of newborn and adult mammals:Its dependence on oxygen tension in inspired air and on envir-onmental temperatures. J Physiol (London) 1959;149: 346.
27. Cree JE, Meyer J, Hailey DM. Diazepam in Labour: Itsmetabolism and effect on the clinical condition and thermo-genesis of the newborn. Br Med J 1973;3:251.
156 INCUBATORS, INFANTS

28. Brück K. Heat production and temperature regulation. In:Stave U, editor. Pernatal Physiology. New York: PlenumPress; 1978. p 474.
29. Day RL. Respiratory metabolism in infancy and childhood. AmJ Child 1943;65:376.
30. Hey EN, Katz G. Evaporative water loss in the newborn baby.J Physiol (London) 1969;200:605.
31. Sulyok E, Jéquier E, Ryser G. Effect of relative humidity onthermal balance of the newborn infant. Biol Neonate 1972;21:210.
32. Belgaumkar TR, Scott KE. Effects of low humidity on smallpremature infants in servo control incubators. Biol Neonate1975;26:337.
33. Hammarlund K, Nilsson GE, Öberg PA, Sedin G. Transepi-dermal water loss in newborn infants. Acta Paediatr Scand1977;66:553.
34. Hammarlund K, Nilsson GE, Öberg PA, Sedin G. Transepi-dermal water loss in newborn infants: Evaporation from theskin and heat exchange during the first hours of life. ActaPaediatr Scan 1980;69:385.
35. Hey EN, Mount LE. Heat losses from babies in incubators.Arch Dis Child 1967;42:75.
36. Brück K. Temperature regulation in the newborn infant. BiolNeonate 1961;3:65.
37. Grausz JP. The effects of environmental temperature changeson the metabolic rate of newborn babies. Acta Paediatr. Scand1968;57:98.
38. Mestán J, Jrai I, Bata G, Fekete M. The significance of facialskin temperature in the chemical heat regulation of prematureinfants. Biol Neonate 1964;7:243.
39. Agate FJ, Silverman WA. The control of body temperature inthe small newborn infant by low-energy infra-red radiation.Pediatrics 1963;37:725.
40. Perlstein PH, Edwards NK, Sutherland JM. Apnea in pre-mature infants and incubator air temperature changes. NEngl J Med 1970;282:461.
41. Silverman WA. The lesson of retrolental fibroplasias. Sci Am1977;236:100.
42. Schaal B, Hummel T, Soussignan R. Olfaction in the fetal andpremature infant: Functional status and clinical implications.Clin Perinatol. 2004;31:261.
43. Morris BH, Philbin MK, Bose C. Physiologic effects of sound onthe newborn. J Perinatol 2000;20:S55.
44. Robertson A, Stuart A, Walker L. Transmission loss of soundinto incubators: implications for voice perception by infants. JPerinatol 2001;21:236.
45. Johnson AN. Neonatal response to control of noise inside theincubator. Pediatr Nurse 2001;27:600.
46. Bellini CV, et al., Use of sound-absorbing panel to reduce noisyincubator reverberating effects. Biol Neonate 2003;84:293.
47. Hellstrom-Westas L, et al., Short-term effects of incubatorcovers on quiet sleep in stable premature infants. Acta Pae-diatr 2001;90:1004.
48. Rivkees SA. Emergence and influences of circadian rhythmi-city in infants. Clin Perinatol 2004;31:217.
49. Bellieni CV, et al. Reduction of exposure of newborns andcaregivers to very high electromagnetic fields produced byincubators. Med Phys 2005;32:149.
50. Bellieni CV, et al. Increasing the engine-mattress distance inneonatal incubators: A way to decrease exposure of infants toelectromagnetic fields. Ital J Pediatr 2005;29:74.
51. Blumi S, et al. MR imaging of newborns by using an MR-compatible incubator with integrated radiofrequency coils:Initial experience. Radiology, 2004;231:594.
52. Whitby EH, et al. Ultrafast magnetic resonance imaging of theneonate in a magnetic resonance-compatible incubator with abuilt-in coil. Pediatrics 2004;113:e150.
Further Reading
Adamsons K. The role of thermal factors in fetal and neonatal life.Pediatr Clin North Am 1966;13:599.
Ahlgren EW. Environmental control of the neonate receivingintensive care. Int Anesthesiol Clin 1974;12:173.
Brück K. Heat production and temperature regulation. In: StaveU, editor. Perinatal Physiology New York: Plenum Press; 1978p 455.
Dawes GS, Oxygen consumption and temperature regulation inthe newborn. I Foetal and Neonatal Physiology. Chicago: YearBook Medical Publisher; 1968. p 191.
Delue NA. Climate and environment concepts. Clin Perinatal1976;3:425.
Hey EN, Katz G. The optimum thermal environment for nakedbabies. Arch Dis Child 1970;45:328.
Holman JP. Heat Transfer, New York: McGraw-Hill; 1981.Klaus M, Fanaroff A, Martin RJ. The physical environment. In:
Klaus MH, Fanaroff AA, editors. Care of the High Risk Neo-nate. Philadelphia: Saunders; 1979. p 94.
Lutz L, Perlstein PH. Temperature control in newborn babies.Nurs Clin North Am 1971;6:15.
Mayr O. The Origins of Feedback Control. Cambridge, (MA): MITPress; 1970.
Ogata K. Modern Control Engineering, Englewood Cliffs (NJ):Prentice-Hall; 1970.
Oliver TK. Temperature regulation and heat production in thenewborn. Pediatr Clin North Am 1965;12:765.
Oppenheim AV, Willsky A, Young IT. Signals and Systems, Engle-wood Cliffs (NJ): Prentice-Hall; 1983.
Perstein PH. Thermal regulation. In: Fanaroff AA, Martin RJ,editors. Behrman’s Neonatal-Perinatal Medicine, 3rd ed. St.Louis (MO): Mosby; 1983. p 259–277.
Scopes JW. Thermoregulation in the newborn. In: Avery GB,editors. Neonatology, Philadelphia: Lippincott; 1975. p 99.
Sinclair JC. The effect of the thermal environment on neonatalmortality and morbidity. In: Adamson K, Fox HA, editors.Preventability of Perinatal Injury. New York: Alan R. Liss;1975. p 147.
Sinclair JC. Metabolic rate and temperature control. In: Smith CA,Nelson NM, editors. The Physiology of the Newborn Infant.Springfield (IL) : Thomas; 1976. p 354.
Todd JP, Ellis HB. Applied Heat Transfer. New York: Harper &Row; 1982.
See also BIOHEAT TRANSFER; NEONATAL MONITORING; TEMPERATURE
MONITORING.
INFANT INCUBATORS. See INCUBATORS, INFANT.
INFORMATION SYSTEMS FORRADIOLOGY. See RADIOLOGY INFORMATION SYSTEMS.
INFUSION PUMPS. See DRUG INFUSION SYSTEMS.
INTEGRATED CIRCUIT TEMPERATURE SENSOR
TATSUO TOGAWA
Waseda UniversitySaitama, Japan
INTRODUCTION
Temperature can affect the electronic characteristics ofsemiconductor devices. Although this is a disadvantage
INTEGRATED CIRCUIT TEMPERATURE SENSOR 157
in many applications, especially for analogue devices, itmay be turned into an advantage if such a device is used asa temperature sensor. In principle, any parameter in sucha device having a temperature coefficient can be used fortemperature measurement. For example, a temperaturetelemetry capsule, in which a blocking oscillator frequencyvaries with temperature, has been developed for measur-ing gastrointestinal temperature (1). In this system, thetemperature affects the reverse-bias base-collector cur-rent, which determines the period of relaxation oscillation.However, it has been shown that the voltage across a p–njunction of a diode or transistor under a constant forward-bias current shows excellent linear temperature depen-dency over a wide temperature range. Many conventionalor specially designed diodes or transistors composed ofGe, Si, or GaAs have been studied for use as thermometers(2–4).
The advantages of diodes and transistors as tempera-ture sensors are their high sensitivity and low nonlinear-ity. The temperature sensitivity under normal operation isca �2 mV/K, which is �50 times higher than that of acopper-constantan thermocouple. The nonlinearity is lowenough for many applications, although its value dependson the structure and material of the device. It is known thata Schottky diode, which has a structure composed of arectifying metal-semiconductor contact, possesses goodvoltage–temperature linearity (5). Some transistors usedas two-terminal devices by connecting the base to thecollector also possess good linearity (6,7), and a transistorthat has been especially developed for temperature sensingis commercially available (8). This has a linearity that iscomparable to that of a platinum-resistance temperaturesensor.
It is advantageous to have a diode and a transistortemperature sensor fabricated on a chip with associatedinterfacing electronics using integrated circuit (IC) tech-nology. Several integrated temperature sensors that pro-vide either analogue or digital outputs have been developedand are commercially available. A diode or transistortemperature sensor fabricated on a central processing unit(CPU) chip is especially useful when used to monitor thetemperature of the chip. Such a sensor has been used todetect overheating, and to protect the CPU system bycontrolling a fan used to cool the chip or to slow downthe clock frequency.
THEORY
The characteristics of p–n junctions are well known (9,10).In p–n junction diodes, the current flowing through theforward-biased junction is given by
I ¼ IsðeqV=mkT � 1Þ ð1Þ
where Is is the saturation current, q is the electron charge,V is the voltage across the junction, k is the Boltzmannconstant, m is the ideality factor having a value between 1and 2, which is related to the dominant current componentunder the operating conditions used, and T is the absolutetemperature. At a temperature close to room temperature,and when the current is relatively high, so that the current
due to the diffusion of the carrier dominates, m ¼ 1, and sothe second term in Eq. 1 given in parentheses can beneglected. Equation 1 can then be simplified to
I ¼ IseqV=kT ð2Þ
The temperature dependence of the saturation current,Is, is given by
Is ¼ Ae�Eg=kT ð3Þ
where Eg is the bandgap energy at T ¼ 0 K, and A is aconstant dependent on the geometry and material of thedevice. Strictly speaking, A also depends on the tempera-ture. However, the temperature dependency is very weakcompared to the exponential term in Eq. 3. Thus,
I ¼ AeðqV�EgÞ=kT ð4Þ
For a constant current, I, (qV–Eg)/kT is constant. Thus, thevoltage across a p–n junction, V, is a linear function of theabsolute temperature, T. On extrapolating to T ¼ 0, thenqV ¼ Eg.
The temperature coefficient of V can be derived fromEq. 4 as
dV
dT
����I ¼ const
¼ V � Eg=q
Tð5Þ
Since the value of qV–Eg is always negative, V decreaseswith increasing T. For silicon, Eg �1.17 eV, and for T �300K, V �600 mV, and dV/dT ��1.9 mV/K. In actual diodes,the current–voltage characteristics have been studied indetail over a wide temperature range. The forward voltageexhibits a linear dependence for T > 40 K for a constantcurrent (11). The observed value of dV/dT in a typical smallsignal silicon p–n junction diode ranges between �1.3 and�2.4 mV/K for I ¼ 100 mA (11). In germanium and galliumarsenide p–n junction diodes, and for silicon Schottkydiodes, the forward voltage exhibits a similar sensitivity(3–5).
In most p–n junctions, the current through the junctioncontains components other than those due to carrier diffu-sion, and therefore, Eq. 4 does not hold. The base-emitterp–n junction in transistors is advantageous in this respect.Here, the diffusion component forms a larger fraction of thetotal current than that in diodes, even for a diode connec-tion in which the base is connected to the collector. Thenonlinear temperature dependence in the forward voltagein diode-connected transistors is lower than that of mostdiodes (7). Further improvement in linearity is attainedunder constant collector current operation, since only thediffusion component flows to the collector, while othercomponents flow to the base (12).
From Eq. 2, one can obtain the following expression
ln I ¼ ln Is þ qV=kT ð6Þ
The value of T can be obtained from the gradient of a plot ofln I versus V, as q and k are known universal constants.This implies that the current–voltage characteristics canbe used as an absolute thermometer (6). If ln I is a linearfunction of V, only two measurements are required todetermine the gradient. If V1 and V2 are voltages corre-
158 INTEGRATED CIRCUIT TEMPERATURE SENSOR

sponding to different current levels, I1 and I2, the differ-ence between these two voltages is calculated using
V1 � V2 ¼ ðkT=qÞlnðI1=I2Þ ð7Þ
Thus, the difference in voltage corresponding to the differ-ent current levels for a constant ratio is proportional to theabsolute temperature, without any offset. Using this rela-tionship, a thermometer providing an output proportionalto the absolute temperature can be realized, either byapplying a square wave current to a p–n junction (12),or by using two matched devices operating at differentcurrent levels (13).
FUNDAMENTAL CIRCUITS AND DEVICES
A schematic drawing of the fundamental circuit of thethermometer with a short-circuited transistor or a diodeis shown in Fig. 1. A constant current is applied to thetransistor or diode in the forward bias direction, and thevoltage across the junction is amplified using a differentialamplifier. By adjusting the reference voltage applied toanother input of the differential amplifier, an output vol-tage proportional to either the absolute temperature inkelvin or in degrees Celsius or any other desired scale canbe obtained. The operating current of small signal diodesand transistors is typically 40–100 A. If the currentbecomes too high, a self-heating error may be produceddue to the power dissipated in the junction. If the currentbecomes too small, problems due to leakage and the inputcurrent of the first stage amplifier may become significant(7).
The nonlinearity in the temperature dependency of theforward voltage is not a serious problem for most applica-tions, and it can be reduced by appropriate circuit design.In a Schottky diode, this nonlinearity is < 0.1 K over the
temperature range �65 to 50 8C (5), and a comparableperformance is expected for diode-connected silicon tran-sistors (7). Further improvement in the linearity can beattained by linearization of the circuit. Linearization usinga logarithmic ratio module reduces the error to <0.05 8C inthe temperature range �65 to 100 8C (7). Linearity is alsoimproved using a constant collector current, as pointed outpreviously. An example of an actual circuit is shown inFig. 2. In this circuit, the operational amplifier drives thebase-emitter voltage to maintain a constant collector cur-rent. By applying a square-wave current and measuringthe amplitude of the resulting square-wave base-emittervoltage, a linear output proportional to the absolute tem-perature is obtained, as expected from Eq. 7(12). Furtherimprovement in accuracy can be attained by employing acurve fitting with three-point calibration, the error due tothe nonlinearity can be reduced to 0.01 8C in the tempera-ture range of �50 to 125 8C (14).
Three-terminal monolithic IC temperature sensors thatprovide a voltage output proportional to temperature usingthe Celsius scale are commercially available, examplesbeing LM45 (National Semiconductor) and AD22100/22103 (Analog Devices). The LM45 device operates usinga single power supply voltage in the range 4–10 V, andprovides a voltage output that corresponds to the tempera-ture in degrees Celsius multiplied by a factor of 10 mV, forexample, 250 mV ¼ 25 8C. The AD22100 and AD22103devices provide a ratiometric output, that is, the outputvoltage is proportional to the temperature multiplied bythe power supply voltage. For example, AD22100 has asensitivity of 22.5 mV/ 8C giving output voltages of 0.25 Vat �50 8C and 4.75 V at 150 8C when the power supplyvoltage is 5.0 V.
Two matched transistors operated using different col-lector currents can be used to obtain an output proportionalto the absolute temperature (15). The difference in thebase-emitter voltages of the two transistors is a linearfunction of temperature, as shown in Eq. 7. Convenienttwo-terminal current-output devices using this techniqueare commercially available. Figure 3 shows an idealizedscheme representing such devices. If the transistors Q1 andQ2 are assumed to be identical and have a high common-emitter current gain, their collector currents will be equal,and will constrain the collector currents Q3 and Q4. If Q3
has r-fold base-emitter junctions, and each one is identical
INTEGRATED CIRCUIT TEMPERATURE SENSOR 159
Referencevoltageinput
Output
–
+
Sensortransistoror diode
I
Currentsource
Figure 1. A fundamental interfacing circuit of a thermometermaking use of a transistor or a diode as a temperature sensor toprovide a voltage output proportional to temperature, with a zerovoltage output at a specific temperature dependent on thereference voltage selected.
Figure 2. A circuit for constant collector current operation in asensor transistor.

to that of Q4, the emitter current of a junction in Q3 is 1/rthat of Q4. From Eq. 7, the voltage across resistance R isobtained from
RI ¼ ðkT=qÞln r ð8Þ
Thus, the total current, 2I, is proportional to the absolutetemperature. Although the actual components are notideal, practical devices are available as monolithic ICs,such as AD590 and AD592 (Analog Devices) (16). In thesedevices, r ¼ 8 and R is trimmed to have a sensitivity ofabout 1 A/K. The output current is unchanged in the sup-ply-voltage range 4.0 to 30 V. A voltage output proportionalto the absolute temperature can be obtained by connectinga resistor in series with the ICs. For example, a sensitivityof 1 mV/K is obtained by connecting 1 kV resistor in series.By trimming the series resistor, the error in temperaturereading can be adjusted to zero at any desired temperature.After trimming, the maximum error depends on the rangein temperature under consideration. For example, a max-imum error of <0.1, 0.2, and 0.3 8C is obtained for tem-perature ranges of 10, 25, and 50 8C, respectively (17).
Monolithic temperature sensors that provide a digitaloutput are also commercially available. For example,TMP06 (Analog Devices) sensors provide a pulse-widthmodulated output. The output voltage assumes either ahigh or low level, so that the high period (T1) remainsconstant at 40 ms for all temperatures, while the low period(T2) varies with temperature. In the normal operationmode, the temperature on the Celsius scale, T, is given by
T ¼ 406 � ½731 � ðT1=T2Þ ð9Þ
According to Analog Devices’ TMP06 data sheet, for anoperating supply voltage between 2.7 and 5.5 V, the abso-lute temperature accuracy is 1 8C in the temperaturerange 0–70 8C, with a temperature resolution of 0.02 8C.
The National Semiconductor LM75 device is also amonolithic temperature sensor that provides a digital out-put. It includes a nine-bit analog-to-digital converter, andprovides a serial output in binary format so that the leastsignificant bit corresponds to a temperature difference of0.5 8C.
Newer devices will come along in the future that may bemore appropriate than the ones mentioned here. Informa-tion about such devices, together with their data sheets,will be available from the internet sites of manufactures.
APPLICATIONS
Although thermistors are still widely used for thermome-try in the medical field, IC temperature sensors havepotential advantages over thermistors. Integrated circuitsensors can be fabricated using IC technology encompass-ing interfacing electronics on a single IC chip, and manygeneral purpose IC temperature sensors are now commer-cially available.
Current-output-type IC temperature sensors, such asAD590, are convenient for use as thermometer probes forbody core and skin temperature measurements. Figure 4shows a scheme for such a simple thermometer. Accordingto the manufacturer’s data sheet, although the sensitivityand zero offset are adjustable independently in this circuit,an accuracy of 0.1 8C is attainable with L- or M-gradeAD590 devices using a single-trim calibration if the tem-perature span is 10 8C or less. If a regulating resistor isincluded in the probe, interchangeability can be realized.Because of the current output capacity, the resistance of
160 INTEGRATED CIRCUIT TEMPERATURE SENSOR
Figure 3. An idealized scheme of a two-terminal IC temperaturesensor that provides a current output proportional to the absolutetemperature.
Figure 4. A simple thermometer that makes use of a two-terminal current output-type IC temperature sensor.

the cable or connector does not affect the temperaturemeasurement.
This type of device is also convenient for temperaturemeasurements at many other points, especially when theoutput data are processed using a PC. All the sensors canbe connected to a single resistor, as shown in Fig. 5, and byswitching the excitation the outputs from each sensor canbe multiplexed. To calibrate each sensor individually, allthe sensors are maintained at an appropriate temperature,together with a standard thermometer. The outputs fromeach sensor as well as that from a standard thermometerare input into a PC. Then, the temperature offsets for eachsensor can be stored, and all the measurement data can becorrected using these correction factors. Two-point calibra-tion is also realized by using data at two known tempera-tures. A matrix arrangement of the sensors can be formedusing two decoder drivers.
Temperature measurements at many different pointscan be performed easier using IC temperature sensors thatgenerate serial digital outputs, such as TMP05/TMP06.Connecting these devices as shown in Fig. 6 allows for therealization of a daisy chain operation. When a start pulse isapplied to the input of the first sensor, the temperaturedata from all the sensors is generated serially, so that thetemperatures of each sensor are represented in a ratio-metric form, which is the ratio of the duration of the highand low output levels for each period. It is a remarkableadvantage of this sensor that a thermometer can be rea-lized without using any analogue parts.
An important application of IC temperature sensors isthe monitoring of CPU temperatures to protect a systemfrom overheating. The temperature of a CPU chip can bedetected by a p–n junction fabricated on the same siliconchip as the CPU, as shown in Fig. 7. The advantage offabricating the temperature sensor on the CPU chip is tomake the temperature measurement accurate enough andto minimize the time delay due to heat conduction so as toprevent overheating. The CPU can be protected from over-heating by controlling a cooling fan or by slowing down theclock speed. Interfacing devices for this purpose arecommercially available. For example, the MAX6656 (Dal-las Semiconductor) device can detect temperatures at threelocations, such as the CPU, the battery, and the circuitboard, and the output can be used to control a cooling fan.To control the clock frequency, a specially designed fre-quency generator can be used. For example, the AV9155(Integrated Circuit Systems) device allows for a gradualtransition between frequencies, so that it obeys the CPU’scycle-to-cycle timing specifications.
FUTURE
It is �25 years since convenient IC temperature sensorswere introduced for scientific and industrial temperaturemeasurements. In medicine, the application of this type ofsensor is in its infancy. There are many applications where
INTEGRATED CIRCUIT TEMPERATURE SENSOR 161
Figure 5. A multiplexing scheme for a current output-type ICtemperature sensor.
VDD
GND
#1 #2
Start pulse
TMP05#1
TMP05#2
TMP05#N Output
#N
T1 T2
(a)
(b)
Celsius temperature = 406 – (731 × (T1/T2 ))
Figure 6. (a) The connecting scheme for adaisy chain operation of a serial-digital-output-type temperature sensor, and (b)the output waveform. The temperatureusing the Celsius scale at each sensorcan be determined from the ratio of theduration of the highest and lowest pointsin each cycle.
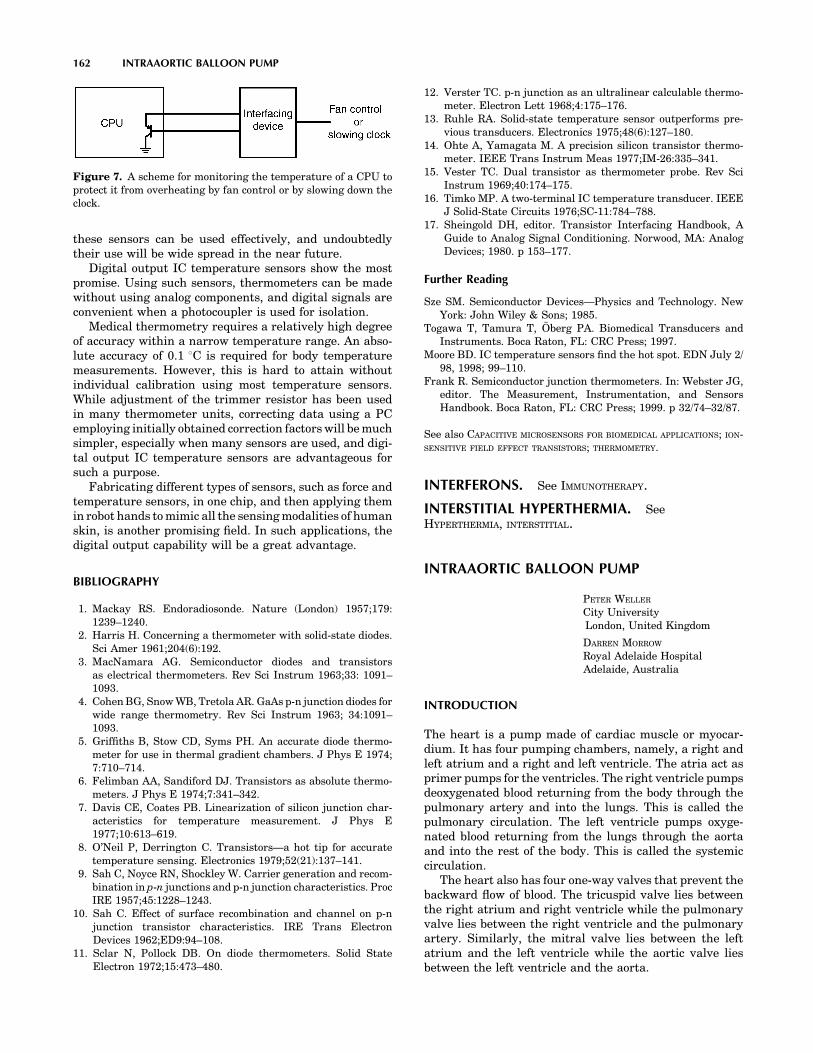
these sensors can be used effectively, and undoubtedlytheir use will be wide spread in the near future.
Digital output IC temperature sensors show the mostpromise. Using such sensors, thermometers can be madewithout using analog components, and digital signals areconvenient when a photocoupler is used for isolation.
Medical thermometry requires a relatively high degreeof accuracy within a narrow temperature range. An abso-lute accuracy of 0.1 8C is required for body temperaturemeasurements. However, this is hard to attain withoutindividual calibration using most temperature sensors.While adjustment of the trimmer resistor has been usedin many thermometer units, correcting data using a PCemploying initially obtained correction factors will be muchsimpler, especially when many sensors are used, and digi-tal output IC temperature sensors are advantageous forsuch a purpose.
Fabricating different types of sensors, such as force andtemperature sensors, in one chip, and then applying themin robot hands to mimic all the sensing modalities of humanskin, is another promising field. In such applications, thedigital output capability will be a great advantage.
BIBLIOGRAPHY
1. Mackay RS. Endoradiosonde. Nature (London) 1957;179:1239–1240.
2. Harris H. Concerning a thermometer with solid-state diodes.Sci Amer 1961;204(6):192.
3. MacNamara AG. Semiconductor diodes and transistorsas electrical thermometers. Rev Sci Instrum 1963;33: 1091–1093.
4. Cohen BG, Snow WB, Tretola AR. GaAs p-n junction diodes forwide range thermometry. Rev Sci Instrum 1963; 34:1091–1093.
5. Griffiths B, Stow CD, Syms PH. An accurate diode thermo-meter for use in thermal gradient chambers. J Phys E 1974;7:710–714.
6. Felimban AA, Sandiford DJ. Transistors as absolute thermo-meters. J Phys E 1974;7:341–342.
7. Davis CE, Coates PB. Linearization of silicon junction char-acteristics for temperature measurement. J Phys E1977;10:613–619.
8. O’Neil P, Derrington C. Transistors—a hot tip for accuratetemperature sensing. Electronics 1979;52(21):137–141.
9. Sah C, Noyce RN, Shockley W. Carrier generation and recom-bination in p-n junctions and p-n junction characteristics. ProcIRE 1957;45:1228–1243.
10. Sah C. Effect of surface recombination and channel on p-njunction transistor characteristics. IRE Trans ElectronDevices 1962;ED9:94–108.
11. Sclar N, Pollock DB. On diode thermometers. Solid StateElectron 1972;15:473–480.
12. Verster TC. p-n junction as an ultralinear calculable thermo-meter. Electron Lett 1968;4:175–176.
13. Ruhle RA. Solid-state temperature sensor outperforms pre-vious transducers. Electronics 1975;48(6):127–180.
14. Ohte A, Yamagata M. A precision silicon transistor thermo-meter. IEEE Trans Instrum Meas 1977;IM-26:335–341.
15. Vester TC. Dual transistor as thermometer probe. Rev SciInstrum 1969;40:174–175.
16. Timko MP. A two-terminal IC temperature transducer. IEEEJ Solid-State Circuits 1976;SC-11:784–788.
17. Sheingold DH, editor. Transistor Interfacing Handbook, AGuide to Analog Signal Conditioning. Norwood, MA: AnalogDevices; 1980. p 153–177.
Further Reading
Sze SM. Semiconductor Devices—Physics and Technology. NewYork: John Wiley & Sons; 1985.
Togawa T, Tamura T, Öberg PA. Biomedical Transducers andInstruments. Boca Raton, FL: CRC Press; 1997.
Moore BD. IC temperature sensors find the hot spot. EDN July 2/98, 1998; 99–110.
Frank R. Semiconductor junction thermometers. In: Webster JG,editor. The Measurement, Instrumentation, and SensorsHandbook. Boca Raton, FL: CRC Press; 1999. p 32/74–32/87.
See also CAPACITIVE MICROSENSORS FOR BIOMEDICAL APPLICATIONS; ION-SENSITIVE FIELD EFFECT TRANSISTORS; THERMOMETRY.
INTERFERONS. See IMMUNOTHERAPY.
INTERSTITIAL HYPERTHERMIA. SeeHYPERTHERMIA, INTERSTITIAL.
INTRAAORTIC BALLOON PUMP
PETER WELLER
City UniversityLondon, United Kingdom
DARREN MORROW
Royal Adelaide HospitalAdelaide, Australia
INTRODUCTION
The heart is a pump made of cardiac muscle or myocar-dium. It has four pumping chambers, namely, a right andleft atrium and a right and left ventricle. The atria act asprimer pumps for the ventricles. The right ventricle pumpsdeoxygenated blood returning from the body through thepulmonary artery and into the lungs. This is called thepulmonary circulation. The left ventricle pumps oxyge-nated blood returning from the lungs through the aortaand into the rest of the body. This is called the systemiccirculation.
The heart also has four one-way valves that prevent thebackward flow of blood. The tricuspid valve lies betweenthe right atrium and right ventricle while the pulmonaryvalve lies between the right ventricle and the pulmonaryartery. Similarly, the mitral valve lies between the leftatrium and the left ventricle while the aortic valve liesbetween the left ventricle and the aorta.
162 INTRAAORTIC BALLOON PUMP
Figure 7. A scheme for monitoring the temperature of a CPU toprotect it from overheating by fan control or by slowing down theclock.
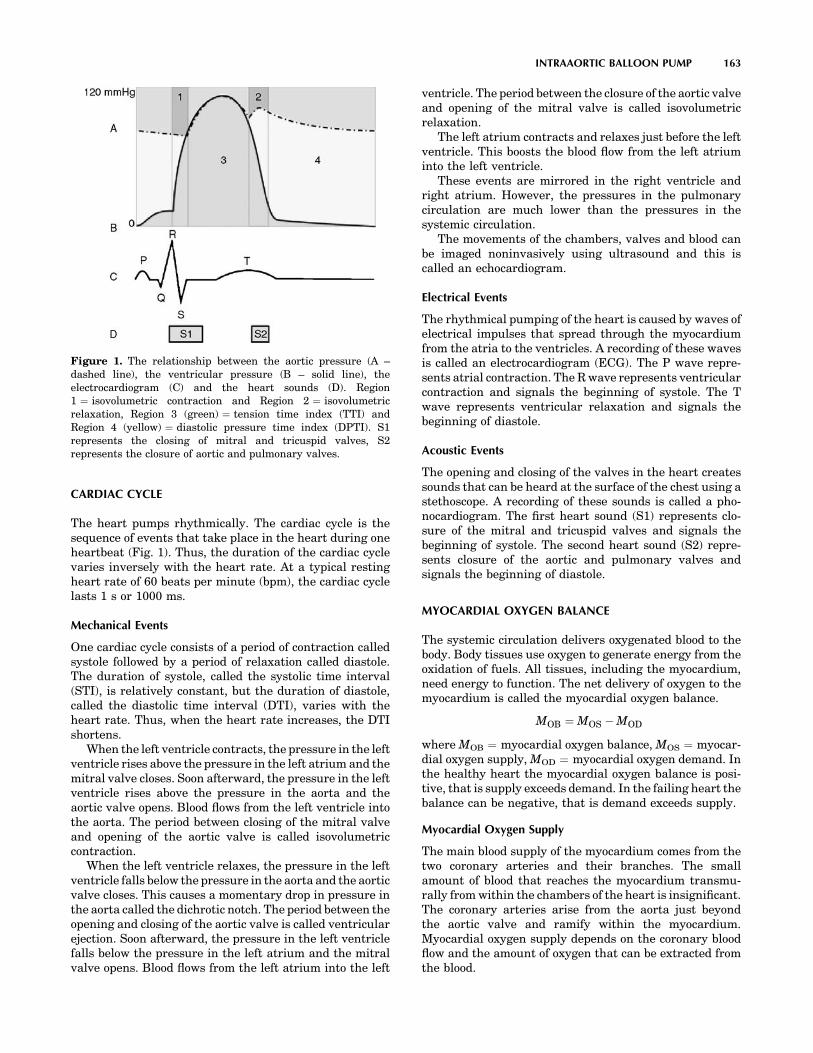
CARDIAC CYCLE
The heart pumps rhythmically. The cardiac cycle is thesequence of events that take place in the heart during oneheartbeat (Fig. 1). Thus, the duration of the cardiac cyclevaries inversely with the heart rate. At a typical restingheart rate of 60 beats per minute (bpm), the cardiac cyclelasts 1 s or 1000 ms.
Mechanical Events
One cardiac cycle consists of a period of contraction calledsystole followed by a period of relaxation called diastole.The duration of systole, called the systolic time interval(STI), is relatively constant, but the duration of diastole,called the diastolic time interval (DTI), varies with theheart rate. Thus, when the heart rate increases, the DTIshortens.
When the left ventricle contracts, the pressure in the leftventricle rises above the pressure in the left atrium and themitral valve closes. Soon afterward, the pressure in the leftventricle rises above the pressure in the aorta and theaortic valve opens. Blood flows from the left ventricle intothe aorta. The period between closing of the mitral valveand opening of the aortic valve is called isovolumetriccontraction.
When the left ventricle relaxes, the pressure in the leftventricle falls below the pressure in the aorta and the aorticvalve closes. This causes a momentary drop in pressure inthe aorta called the dichrotic notch. The period between theopening and closing of the aortic valve is called ventricularejection. Soon afterward, the pressure in the left ventriclefalls below the pressure in the left atrium and the mitralvalve opens. Blood flows from the left atrium into the left
ventricle. The period between the closure of the aortic valveand opening of the mitral valve is called isovolumetricrelaxation.
The left atrium contracts and relaxes just before the leftventricle. This boosts the blood flow from the left atriuminto the left ventricle.
These events are mirrored in the right ventricle andright atrium. However, the pressures in the pulmonarycirculation are much lower than the pressures in thesystemic circulation.
The movements of the chambers, valves and blood canbe imaged noninvasively using ultrasound and this iscalled an echocardiogram.
Electrical Events
The rhythmical pumping of the heart is caused by waves ofelectrical impulses that spread through the myocardiumfrom the atria to the ventricles. A recording of these wavesis called an electrocardiogram (ECG). The P wave repre-sents atrial contraction. The R wave represents ventricularcontraction and signals the beginning of systole. The Twave represents ventricular relaxation and signals thebeginning of diastole.
Acoustic Events
The opening and closing of the valves in the heart createssounds that can be heard at the surface of the chest using astethoscope. A recording of these sounds is called a pho-nocardiogram. The first heart sound (S1) represents clo-sure of the mitral and tricuspid valves and signals thebeginning of systole. The second heart sound (S2) repre-sents closure of the aortic and pulmonary valves andsignals the beginning of diastole.
MYOCARDIAL OXYGEN BALANCE
The systemic circulation delivers oxygenated blood to thebody. Body tissues use oxygen to generate energy from theoxidation of fuels. All tissues, including the myocardium,need energy to function. The net delivery of oxygen to themyocardium is called the myocardial oxygen balance.
MOB ¼ MOS � MOD
where MOB ¼ myocardial oxygen balance, MOS ¼ myocar-dial oxygen supply, MOD ¼ myocardial oxygen demand. Inthe healthy heart the myocardial oxygen balance is posi-tive, that is supply exceeds demand. In the failing heart thebalance can be negative, that is demand exceeds supply.
Myocardial Oxygen Supply
The main blood supply of the myocardium comes from thetwo coronary arteries and their branches. The smallamount of blood that reaches the myocardium transmu-rally from within the chambers of the heart is insignificant.The coronary arteries arise from the aorta just beyondthe aortic valve and ramify within the myocardium.Myocardial oxygen supply depends on the coronary bloodflow and the amount of oxygen that can be extracted fromthe blood.
INTRAAORTIC BALLOON PUMP 163
Figure 1. The relationship between the aortic pressure (A –dashed line), the ventricular pressure (B – solid line), theelectrocardiogram (C) and the heart sounds (D). Region1 ¼ isovolumetric contraction and Region 2 ¼ isovolumetricrelaxation, Region 3 (green) ¼ tension time index (TTI) andRegion 4 (yellow) ¼ diastolic pressure time index (DPTI). S1represents the closing of mitral and tricuspid valves, S2represents the closure of aortic and pulmonary valves.

When the heart contracts the coronary arteries arecompressed and the coronary blood flow is decreased.The net driving force for coronary blood flow is calledthe coronary perfusion pressure.
CPP ¼ AP � VP
where CPP ¼ coronary perfusion pressure, AP ¼ aorticpressure, VP ¼ ventricular pressure. The coronary circula-tion is unique because more blood flows during diastolewhen the ventricular pressure is low than during systolewhen the ventricular pressure is high. Thus, the coronaryblood flow depends on the coronary perfusion pressure, thediastolic time interval and the patency of the coronaryarteries. Myocardial oxygen supply is represented by thearea between the aortic pressure wave and the left ven-tricular pressure wave, called the diastolic pressure timeindex (DPTI).
Myocardial Oxygen Demand
The myocardium uses energy to perform the work of pump-ing. The work performed by the heart can be estimated bythe mean aortic blood pressure multiplied by the cardiacoutput. Myocardial oxygen demand depends on the heartrate, the systolic wall tension and the cardiac contractility.Systolic wall tension is developed during isovolumetriccontraction and depends upon the preload, the afterloadand the wall thickness. The preload is the degree to whichthe left ventricle is filled before it contracts, that is the leftventricular end diastolic volume. The afterload is thepressure in the aorta or the systemic vascular resistanceagainst which the left ventricle contracts. Myocardial oxy-gen demand is represented by the area under the leftventricular pressure curve, called the tension time index(TTI).
The myocardial oxygen balance is represented by theratio DPTI:TTI.
THE PATHOPHYSIOLOGY OF LEFT VENTRICULARPUMP FAILURE
When the left ventricle begins to fail as a pump, the cardiacoutput falls. Compensatory physiological mechanismsbring about an increase in left ventricular end diastolicvolume, heart rate, and systemic vascular resistance. Theresult is an increase in preload and afterload with adecrease in coronary blood flow. Thus, the myocardialoxygen demand increases while the myocardial oxygensupply decreases. There may come a point when demandexceeds supply resulting in a negative myocardial oxygenbalance. The left ventricle is then deprived of oxygen andcannot generate sufficient energy to do the work requiredof it. The pump failure is therefore exacerbated and thiscan precipitate a downward spiral of decline eventuallyending in death. The therapeutic goal is to reverse thisdecline and help the failing left ventricle to recover byrestoring a positive myocardial oxygen balance. Diureticsto decrease the preload, inotropic drugs to increase themyocardial contractility and vasodilators to decrease thepreload and afterload are the mainstay of treatment. How-ever, in the most severely ill patients, pharmacological
measures alone may be insufficient and it is in theseextreme circumstances that counterpulsation therapymay be effective.
THE PRINCIPLE OF COUNTERPULSATION
The principle of counterpulsation is the incorporation of anadditional pump into the systemic circulation in series withthe left ventricle. The pump is operated in synchrony, butout of phase, with the cardiac cycle. Pump systole occursduring ventricular diastole and pump diastole occurs dur-ing ventricular systole.
The primary physiological effects of counterpulsationare twofold (Fig. 2): A decrease in the aortic pressureduring systole (called systolic unloading). This is evidencedby a decrease in the end diastolic pressure (EDP), the peaksystolic pressure (PSP) and the mean systolic pressure(MSP). An increase in the aortic pressure during diastole(called diastolic augmentation). This is evidenced by anincrease in the mean diastolic pressure (MDP).
Systolic unloading reduces the work of the left ventriclebecause it pumps against a lower pressure. This decreasesmyocardial oxygen demand. Diastolic augmentationincreases coronary blood flow because it increases thecoronary perfusion pressure. This increases myocardialoxygen supply. Thus, the myocardial oxygen balance isimproved.
Among the secondary physiological effects of counter-pulsation are increases in the stroke volume (SV, thevolume of blood pumped with each heartbeat), the CO(equal to the SV multiplied by the heart rate) and theblood flow to the other vital organs.
HISTORICAL PERSPECTIVE
Counterpulsation was first described in theory in 1958 byHarken (1). It was to be achieved by cannulating thefemoral arteries, rapidly withdrawing a set volume of bloodduring systole and rapidly reinfusing the same volume ofblood during diastole. Clauss et al. (2) reported this inclinical practice in 1961 but it was unsuccessful becausethe rapid movements of blood were difficult to implementand caused severe hemolytic damage to the red blood cells.
164 INTRAAORTIC BALLOON PUMP
Figure 2. The relationship between the ventricular pressure withcounterpulsation (A – solid line), without counterpulsation (B-dashed line), IABP balloon inflation (C) and ventricular systole(D). Region 1 (green) ¼ systolic unloading and Region 2(yellow) ¼ diastolic augmentation.
In 1958, Kantrowitz and McKennin (3) described coun-terpulsation achieved by wrapping a part of the diaphragmaround the thoracic aorta and stimulating the phrenicnerve, causing contraction of the diaphragm, during dia-stole. Moulopoulos et al. (4) and Clauss et al.(5) describedcounterpulsation achieved by intra-aortic balloon pumpingin 1962. Operative insertion of the balloon through a surgi-cally exposed femoral artery was necessary. It was inflatedduring diastole and deflated during systole. In 1968, Kan-trowitz et al. (6) reported a successful clinical study.
In 1963, Dennis et al.(7) described external counter-pulsation achieved using a pneumatic compression gar-ment that enclosed the legs and lower torso. It was inflatedduring diastole and deflated during systole. It was reportedto be as successful as the IABP in clinical studies but it isnot commonly used. Kantrowitz et al. (8) described coun-terpulsation achieved by a permanently implantable intra-aortic balloon in 1972. It was unsuccessful in clinicalpractice because there remained the need for a connectionto an external pump and this provided a portal of entry forinfection.
In 1979, following the development of thinner catheters,percutaneous insertion of the intra-aortic balloon througha femoral artery puncture was introduced. This could beperformed at the bedside and avoided the need for asurgical operation in most patients. Consequently, intra-aortic balloon pumping became the most widely adoptedmethod of counterpulsation.
CLINICAL APPLICATIONS
Indications
The IABP was first used clinically in 1968 by Kantrowitz tosupport patients with cardiogenic shock after acute myo-cardial infarction(9). During the 1970s the indicationsbroadened (Table 1) and by 1990 �70,000 pump procedureswere performed worldwide each year (10) although there iswide variation between different countries and centres.The IABP support has been used successfully in patientswith left ventricular failure or cardiogenic shock frommany causes including myodarditis, cardiomyopathy,severe cardiac contusions and drug toxicity but the com-monest are myocardial infarction and following cardiacsurgery. The trend has been a move away from hemody-namic support in pump failure towards the treatment, andeven prophylaxis of, acute myocardial ischaemia. Patientscan be maintained on the IABP for hours, days or evenweeks, particularly when used as a bridge to cardiactransplantation or other definitive treatment (11). Ofthose who survive to hospital discharge, long-term survivalis satisfactory (12).
An early series of 747 IABP procedures in 728 patientsbetween 1968 and 1976 was reported by McEnany et al.
(13). Over the course of the study, they observed thatcardiogenic shock or chronic ischaemic left ventricularfailure as the indication for IABP fell from 79 to 26% ofpatients whilst overall in-hospital survival rose from 24 to65% of patients. They also noted an increase from 38 to 58%of patients undergoing cardiac surgery following IABPinsertion. They postulated that broadened indicationsfor, and earlier insertion of, the IABP together with moreaggressive surgical treatment of any underlying cardiaclesion led to the improvement in survival. In the laterBenchmark Registry of nearly 17,000 IABP proceduresperformed in 203 hospitals worldwide between 1996 and2000, the main indications were support for coronaryangioplasty (21%), cardiogenic shock (19%), weaning fromcardiopulmonary bypass (16%), preoperative support inhigh risk patients (13%), and refractory unstable angina(12%) (14). The overall in-hospital mortality was 21%.
High risk patients undergoing cardiac surgery mayhave a better outcome if treated preoperatively with IABPtherapy. In a series of 163 patients with a left ventricularejection fraction of <0.25 and undergoing coronary arterybypass grafting (CABG), the 30 day mortality was reducedfrom 12 to 3% (15). Similar results were obtained in a smallrandomized study (16). In a series of 133 patients whounderwent CABG off cardiopulmonary bypass between2000 and 2003, the use of adjuvant preoperative IABPtherapy in the 32 highest risk patients led to outcomescomparable with the lower risk patients (17). The use ofIABP therapy to improve outcome after coronary angio-plasty for acute myocardial infarction remains controver-sial. Early studies suggested an improved outcome (18–20),but two recent large randomized trials have shown nobenefit in haemodynamically stable patients (21,22). Areport from the SHOCK Trial Registry showed that thein-hospital mortality in patients with cardiogenic shockafter acute myocardial infarction could be reduced from77% to 47% by combined treatment with thrombolysis andIABP, particularly when followed by coronary revascular-ization (23).
IABP therapy is used infrequently in children, whocommonly suffer from predominantly right ventricularfailure associated with congenital heart disease. Thegreater elasticity of the aorta may limit diastolic augmen-tation and the more rapid heart rate may make ECGtriggering difficult. Echocardiographic triggering hasbeen used as an effective alternative (24,25). Survivalrates of 57% (26) and 62% (27) have been reported in smallseries of carefully selected patients.
Contraindications
The only absolute contraindications to IABP therapy aresevere aortic regurgitation and aortic aneurysm or dissec-tion. In patients with severe aorto-iliac vascular disease
INTRAAORTIC BALLOON PUMP 165
Table 1. Indications for IABP Therapy
Left ventricular failure or cardiogenic shock Preoperative support before cardiac or non-cardiac surgeryRefractory unstable angina or ischaemic ventricular arrhythmias Adjunct to coronary angioplasty or thrombolyisWeaning from cardiopulmonary bypass Adjunct to off-bypass cardiac surgeryBridge to cardiac transplantation

the balloon should not be inserted through the femoralartery.
Complications
The IABP therapy continues to cause a significant numberof complications (Table 2), but serious complications areuncommon and directly attributable deaths are rare.Nevertheless, some have argued against its indiscriminateuse, feeling that for many patients the risks outweigh thebenefits. Kantrowitz reported rates of 41 and 4% for minorand major complications, respectively, in his series of 733patients. Of these, 29% were vascular (including 7%hemorrhagic) and 22% were infections (28). Vascular com-plications include haemorrhage from the insertion site andlower limb ischaemia caused by the balloon catheter orsheath occluding the iliac or femoral artery. The vascularstatus of the lower limbs should be observed closely inpatients on IABP therapy. Ischaemia may resolve when thecatheter or sheath is removed but surgical interventionincluding femoral thromboembolectomy, femorofemoralbypass or even amputation is required in up to half ofcases (29).
Several risk factors for vascular complications havebeen identified. They are female gender, diabetes, hyper-tension, peripheral vascular disease, obesity, old age,sheathed insertion, percutaneous insertion, and insertionvia the femoral artery compared to directly into the ascend-ing aorta (13,14,19,28–30). In one study of patients withperipheral vascular disease, the rate of vascular complica-tions was 39% for percutaneous insertion compared to 18%for open insertion (29).
Complications caused by perforation of the balloon arerare, but potentially serious. Embolization of the heliumshuttle gas can result in stroke or death. Coagulation ofblood within the balloon can result in balloon entrapment.In this situation the instillation of thrombolytic agents mayallow the balloon to be retrieved percutaneously but other-wise open surgery is required. It is therefore mandatory toremove the balloon immediately if any blood is detectedwithin the pneumatic system.
Thrombocytopenia (a reduction in the number of plate-lets) developed in one-half of patients but they rapidlyrecovered when the balloon was removed (31).
EQUIPMENT FOR CLINICAL APPLICATION
The IABP consists of a balloon catheter and movable driveconsole. A monitor on the drive console displays the arterialpressure wave and the ECG. Commercial consoles have
controls that allow the operator to select the assist ratioand trigger mode and adjust the timing of inflation anddeflation and the inflation volume of the balloon. The driveconsole also contains a helium tank for balloon inflationand a battery as a backup power source in the event thatthe mains electricity supply is interrupted. In commonwith medical equipment the IABP console conforms tointernational safety standards. Figure 3 shows a currentcommercial model.
The balloon is made of inelastic polyurethane and iscylindrical in shape. Balloons are available in volumesfrom 25 to 40 cm3 and the correct size is selected accordingto the height of the patient. The balloon is mounted at theend of a double-lumen catheter. Modern catheters have anouter diameter of 7–8 French gauge. The inner lumen isopen at the tip to allow insertion over a guidewire anddirect measurement of the aortic blood pressure after theguidewire is removed. The outer lumen forms a closedsystem connecting the balloon to a pneumatic pump cham-ber within the drive console. Two views of a current ballooncatheter are shown in Fig. 4.
The balloon catheter is most commonly inserted percu-taneously through the femoral artery in the groin over aguidewire using a traditional or modified Seldinger tech-nique. An intra-arterial sheath is used to secure and
166 INTRAAORTIC BALLOON PUMP
Table 2. Complications of IABP Therapy
Vascular Balloon-Related Other
Hemorrhage Gas embolism InfectionAortoiliac dissection
or perforationEntrapment Thrombocytopenia
ParaplegiaLimb ischaemiaVisceral ischaemia
Figure 3. A commercial IABP device. (Courtesy of DatascopeCorp.)

protect the access site before insertion of the balloon cathe-ter. However, because the sheath has a larger outer dia-meter than the balloon catheter it can increase the risk ofvascular complications and sheathless insertion has nowbeen introduced. Under fluoroscopic guidance the balloonis positioned in the descending thoracic aorta just beyondthe origin of the left subclavian artery. Alternatively, theballoon can be inserted through the iliac, axillary or sub-clavian arteries or directly into the ascending aorta duringopen surgery.
A shuttle gas is pumped back and forth between thepump chamber and the balloon to cause inflation anddeflation. The ideal shuttle gas would have a low densitycombined with a high solubility in blood. A dense gas isslow to move along the catheter. This introduces a signifi-cant delay between the opening of the valves in the pumpchamber and the inflation or deflation of the balloon mak-ing correct timing more difficult to achieve. An insolublegas is unsafe if the balloon was to leak or burst allowing itto escape into the blood. There it may form bubbles leadingto potentially fatal gas embolism. Originally, carbon diox-ide was used as the shuttle gas. It is a dense gas butdissolves easily in blood. More recently, helium has beenused as the shuttle gas. It is a less dense gas but dissolvesless easily in blood.
Pumping is initiated with an assist ratio of 1:2, whichmeans that one in every two heartbeats is assisted. Thisallows the arterial pressure wave of each assisted beat to becompared with an unassisted beat to facilitate correcttiming.
Pumping is continued with an assist ratio of 1:1, whichmeans that every beat is assisted. As the patient recovers,they can be weaned from the IABP by periodically decreas-ing the assist ratio until pumping is eventually disconti-nued.
Weaning can also be achieved by periodically decreasingthe inflation volume of the balloon. However, this can leadto problems with blood clotting in the folds of the under-inflated balloon and it is not commonly used.
CONTROL OF IABP
The inflation/deflation cycle of the intra-aortic balloonpump is controlled by a closed loop circuit as illustratedin Fig. 5.
The physiological variables required for determiningtriggering are measured, filtered and converted into digitalsignals. These are used in enable the control strategy todetermine the appropriate inflation and deflation times ofthe balloon. This information is then passed to the pneu-matic circuit for balloon operation. The results of thisstrategy are then feed back to the console via a new setof patient variables. The actions of the controller are dis-
played on the console monitor. Additionally the controlstrategy can be set by the clinician.
TRIGGERING
The drive console requires a trigger signal to synchronisewith the cardiac cycle. The trigger signal indicates the startof ventricular systole.
Commercial consoles have several modes of triggering:The ECG trigger, where the trigger signal is the R wave ofthe ECG. This is the most commonly used mode of trigger-ing. Blood pressure trigger, where the trigger signal is theupstroke of the arterial pressure wave. This is used whenthe ECG signal is too noisy to allow reliable R waverecognition. Pacer trigger, where the trigger signal isthe pacing spike of the ECG. This is used when the patienthas an implanted cardiac pacemaker. Internal trigger,where the trigger signal is generated internally by theconsole at a set rate. This is used during cardiac surgerywhen the heartbeat is temporarily arrested.
TIMING
The safety and efficacy of balloon pumping is dependentupon the correct timing of balloon inflation and deflationduring the cardiac cycle. Inflation should occur during theisovolumetric relaxation period of ventricular diastole. Tooearly inflation is unsafe because it overlaps the ejectionperiod of ventricular systole, impedes ejection andincreases the work of the heart. Too late inflation is lesseffective because it reduces diastolic augmentation.
INTRAAORTIC BALLOON PUMP 167
Figure 4. An IABP catheter. (Courtesy of Datascope Corp.) Inboth inflated (top image) and uninflated (bottom image) modes.
Inflation &Deflation strategy
Balloon inflation & deflation
Analogue to Digital Converters and Filters
Pneumatic System
Control Strategy
Monitor Console
Measurements of physiological variables
Information for displaying to user
Enhanced physiological measurements
Control strategy from user
Figure 5. Closed-loop circuit for IABP control. The arrowsindicate the flow of information for controlling the IABP.

Safe and effective inflation timing is fairly easy toachieve because the systolic time interval is relativelyconstant, regardless of heart rate or rhythm. The operatoris trained to adjust the time of inflation until it visiblycorresponds with the dichrotic notch on the arterial pres-sure wave display.
Deflation should occur at the end of ventricular diastoleor during the isovolumetric contraction period of ventricularsystole. Too late deflation is unsafe because it overlaps theejection period of ventricular systole, impedes ejection andincreases the work of the heart. Too early deflation is lesseffective because it reduces diastolic augmentation.
Safe and effective deflation timing is more difficult toachieve because the length of diastole is variable, depend-ing on the heart rate and rhythm. The operator is trained toadjust the time of deflation until it visibly reduces the EDPand PSP on the arterial pressure wave display. Commer-cial consoles have two modes of timing:
Conventional Timing
Under conventional timing, the balloon is inflated anddeflated at set time intervals after the R wave is detected(called manual timing). This copes badly with alterationsin heart rate of >10 bpm. The problem is that when theheart rate increases, the diastolic time interval shortensand the balloon now deflates too late. Conversely, when theheart rate decreases, the diastolic time interval lengthensand the balloon deflates too early.
Conventional timing can be improved by predicting theduration of the current cardiac cycle by averaging the R–Rinterval of the previous 5–20 heartbeats. The balloon isthen deflated at a set time interval before the next R waveis predicted to arrive (called predictive timing). This copesfairly well with alterations in heart rate and is the mostcommonly used mode of timing.
Both manual and predictive timing cope badly withalterations in heart rhythm, when the length of diastolecan vary from beat to beat in an entirely unpredictableway. Unfortunately, cardiac arrhythmias such as atrialfibrillation and frequent ectopic beats are common in thesepatients making optimal timing difficult to achieve.
Real Timing
Under real timing (also called R wave deflation), the bal-loon is deflated when the R wave is detected and inflated aset time interval later. This copes very well with altera-tions in heart rate and rhythm but it tends to cause too latedeflation. The problem is that when the R wave is detectedthere may be insufficient time to fully deflate the balloonbefore overlapping the ejection period.
The R wave deflation is usually used as a safety mechan-ism in conjunction with conventional timing. It ensuresthat the balloon is deflated if an R wave arrives unexpect-edly due to a sudden change in heart rate or rhythm.
OPTIMIZATION
As was seen above the standard timing strategies bothsuffer from problems in certain scenarios and thus control
of IABPs are not efficient in providing the best patienttreatment. A natural solution to this is to develop timingstrategies that optimize the balloon inflation regimeaccording to the current patient condition. Several teamshave reported work in this area.
Jaron et al. in 1979 (32) developed a multielementmathematical model of the canine circulation and theIABP. They expressed inflation and deflation times interms of the total duration of inflation (DUR) and the timefrom the R wave to the middle of pump systole (TMPS).Duration of inflation and TMPS were expressed in terms ofpercentages of the duration of the cardiac cycle.
The model was validated by comparison with anesthe-tized dogs. They varied DUR and TMPS and measured theeffects on EDP, MDP, and CO. Each of the three dependentvariables (z axis) were plotted against the two independentvariables (x and y axes) to create a three-dimensional (3D)urface. In general, there was considerable similaritybetween the surfaces obtained from the model and fromthe dogs. In particular, the similarity was closer for mea-surements of pressure (EDP, MDP) than for measurementsof flow (CO).
Their results indicated that the locations of the desiredoptima for EDP (75% DUR, 45% TMPS) & CO (55% DUR,75% TMPS) did not coincide. Furthermore, some combina-tions of DUR and TMPS within the range used clinicallyproduced detrimental effects. Because not all variablescould be optimised at same time, they suggested that thechoice of timing settings involved balancing the clinicalneeds of the patient.
Jaron et al. in 1983 (33) subsequently developed alumped model of the canine circulation and the IABP. Itwas validated by comparison with their previous model.They varied the timing of inflation and deflation, the speedof inflation and deflation and the volume of the balloon. Thespeed was either fast or slow, taking 7% or 33% of theduration of the cardiac cycle, respectively. The fast speedrepresented the ideal console with near instantaneousballoon inflation and deflation. The slow speed representedcommercial consoles with significant inflation and defla-tion delay due to the movement of the shuttle gas. Theymeasured the effects on EDP, SV, and coronary blood flow.
Inflation at end systole maximized SV and coronaryblood flow for fast and slow speeds. Deflation at end dia-stole minimized EDP for fast speeds. At slow speed, defla-tion timing involved a trade-off between decreased EDPwith early deflation and increased SV and coronary bloodflow with late deflation. The overall benefit of the IABP wasgreater with fast speeds than slow speeds. It was alsoproportional to balloon volume.
In later experiments (34), they classified dependentvariables as either internal, reflecting myocardial oxygendemand, or external, reflecting myocardial oxygen supply.Internal variables measured were TTI and EDP. Externalvariable measured were SV and MDP. They showed thatearly deflation minimizes internal variables while latedeflation maximizes external variables.
Niederer and Schilt in 1988(35) used a mechanical mockcirculation and a mathematical model to investigate theninfluence of timing of inflation and deflation, speed ofinflation and deflation and balloon volume on the efficacy
168 INTRAAORTIC BALLOON PUMP

of the IABP. Timing was again expressed in terms ofpercentage of cardiac cycle duration. The default settingsof the model were fast inflation at 30% time, fast deflationat 90% time and a volume of 40 cm3. These were found toproduce an increase in SV of 25%, a decrease in leftventricular systolic pressure of 10% and an increase inaortic diastolic pressure of 50%.
The time of inflation was varied between 20% and 50%.This had little effect on SV when the speed was fast, butinflation after 30% caused a slight decrease in SV comparedto default when the speed was slow. A time of deflationbefore 80% caused a slight decrease in SV compared todefault. Fast inflation and deflation speeds caused openingand closing shock waves that could be harmful were they tooccur in humans. Balloon volume was varied between 10and 50 mL. There was a nonlinear relationship with SV,but 40 mL was adequate for optimal performance in themock circulation.
Barnea et al. in 1990 (36) developed a sophisticatedcomputer simulation of the normal, failing and IABP-assisted failing canine circulation. It included simple phy-siological reflexes involved in the regulation of the cardi-ovascular system. The failing heart was simulated byreducing the contractility of the normal heart. Myocardialoxygen supply and demand were calculated from themodel. They were balanced in the normal circulationand imbalanced in the failing circulation. IABP assistanceof the failing circulation was shown to restore the balance.
Sakamoto et al. in 1995 (37) investigated the effect ofdeflation timing on the efficiency of the IABP in anaesthe-tized dogs. They compared a deflation time before the Rwave (during late diastole) with deflation times after the Rwave (during isovolumetric contraction). Deflation duringthe middle of isovolumetric contraction was the most effec-tive in obtaining optimal systolic unloading.
Morrow and Weller (38) successfully used genetic algo-rithms and the fitness function proposed by Kane et al.(39)to evolve a fuzzy controller that optimized cardiac assis-tance in a computer simulation of the IABP-assisted failingheart. The inputs were MDP and PSP and the output wasdeflation time.
Automatic Control
Kane et al. in 1971 (39) proposed a performance index orfitness function that reflected the overall benefit of IABPassistance at different timing combinations. Inflation anddeflation times were expressed in terms of the delay beforeinflation after the R wave and the duration of inflation. Thefunction included weighted MDP, MSP, and EDP.
Fitness ¼ k1MDP þ k2MSP þ k4dðk3 � EDPÞ2
where; k1 ¼ 100
MDP0; k2 ¼ 100
MDP0; k3 ¼ EDP0;
k4 ¼ �5001
k3
� �2
; d ¼1 ifðk3 � EDPÞ< 0
0 otherwise
�MDP0 ¼ unassisted MDP; EDP0 ¼ unassisted EDP
It was tested in a mechanical mock circulation andfitness was found to be a unimodal function of delay and
duration. An automatic controller was developed that useda gradient descent search algorithm to improve the fitnessby adjusting the delay and duration at each heartbeat. Theperformance of the controller was compared with the per-formance of R wave deflation in simulated cases of heartfailure. The controller was considerably better in moderateheart failure and marginally better in severe failure. Insevere failure the trade-off between systolic unloading ordiastolic augmentation was particularly apparent. In mod-erate failure, the fitness function emphasized systolicunloading (early deflation) while in severe failure itadapted to emphasize diastolic augmentation (late defla-tion). Thus, in severe failure the controller tended tosimulate R wave deflation.
Martin and Jaron in 1978 (40) developed a manualcontroller for the IABP that allowed DUR and TMPS tobe adjusted. It was tested successfully on anesthetized dogsand was capable of linking to a computer for automaticcontrol.
Jaron et al. in 1985 (34) suggested that SV and TTIindex were suitable choices for a fitness function for the fineadjustment of inflation time. Both MDP and EDP weresuitable choices for the adjustment of deflation time. How-ever, later work showed that PSP correlated better withmyocardial oxygen demand than EDP.
Barnea (41,42), Smith (43) and their co-workers in1989 proposed a fitness function for optimal control ofdeflation time. It included weighted MDP and PSP. Thepermitted interval for deflation time was �200 ms toþ100 ms relative to the predicted arrival of the next Rwave. An automatic controller was developed that used asearch and approximation algorithm to converge upon theoptimum fitness after a number of heartbeats. It wastested successfully on computer simulations and anaes-thetised dogs. It was able to follow a moving optimum,both within the same patient over time and betweendifferent patients.
Zelano et al. in 1990 (44) developed an automatic con-troller for the IABP that used different trigger signals.Balloon inflation occurred either upon detection of S2 or ata set time prior to the predicted time of the next S2. Balloondeflation occurred either during the P–R interval at a settime after the P wave or after the R wave. The advantage ofusing the P wave, R wave and S2 for triggering is that allcan be detected in real time. This allows the controller tofollow changes in heart rate and rhythm. It was testedsuccessfully in a semiautomatic open loop operation inanaesthetised dogs with a coronary artery tied to simulatea myocardial infarction. They proposed a fitness functionfor automatic closed loop control. It used weighted MSPand MDP.
Kantrowitz et al. in 1992 (45) reported a clinical trial ofautomatic closed loop control of the IABP. They used a rule-based algorithm to adjust the time of inflation and defla-tion. Its safety was verified in anaesthetized dogs and itwas then tested on 10 human patients. Their aims were forinflation to occur at dichrotic notch and for deflation tooverlap the first half of ventricular ejection. They weresuccessful in 99 and 100% of recordings respectively. Eightof the patients survived. Neither of the two deaths wasattributed to the controller.
INTRAAORTIC BALLOON PUMP 169

Sakamoto et al. in 1995 (46) developed a new algorithmto cope with atrial fibrillation, the most unpredictablecardiac arrhythmia sometimes described as irregularlyirregular. The aim was for inflation to occur at the dichroticnotch. They were able to predict the time of arrival of thedichrotic notch from mathematical analysis of the R–Rinterval from the previous 60 heartbeats. Deflationoccurred at the R wave. It was tested on ECG recordingsfrom real patients and performed better than conventionaltiming.
FUTURE DEVELOPMENTS
The use of IABP therapy for preoperative support and as anadjunct to coronary angioplasty or bypass and off-bypasscardiac surgery is likely to increase although larger studiesare required to identify which patients will benefit most. Therole of the IABP in left ventricular failure is likely to decreasewith the increasing use of left ventricular assist devices.
Manufacturers recent research and development hasfocused on: Improved automatic control algorithms thatbetter cope with alterations in heart rate and rhythm andadjust inflation and deflation times to optimize cardiacassistance. Better catheter designs that cause fewer vas-cular complications and permit more rapid movement ofthe shuttle gas.
BIBLIOGRAPHY
1. Harken DE. Presentation at the International College of Car-diology, Brussels; 1958.
2. Clauss RH, et al. Assisted circulation. I. The arterial counter-pulsator. J Thorac Cardiovasc Surg 1961;41:447.
3. Kantrowitz A, McKinnen WMP. Experimental use of dia-phragm as experimental myocardium. Surg Forum 1958;9:266.
4. Moulopoulos SD, Topaz S, Kolff WJ. Diastolic balloon pumping(with carbon dioxide) in the aorta. A mechanical assistance tothe failing circulation. Am Heart J 1962;63:669.
5. Clauss RH, Missier P, Reed GE, Tice D. Assisted circulation bycounterpulsation with intra-aortic balloon: Methods andeffects. Proceeding of the 4th ACEMB; 1962.
6. Kantrowitz A, et al. Initial clinical experience with intraaorticballoon pumping in cardiogenic shock. J Am Med Ass1968;203:113.
7. Dennis C, Moreno JR, Hall DP. Studies on external counter-pulsation as a potential measure for acute left heart failure.Trans Am Soc Artif Intern Organs 1963;9:186.
8. Kantrowitz A, et al. Initial clinical experience with a newpermanent mechanical auxiliary ventricle: The dynamic aorticpatch. Trans Am Soc Artif Intern Organs 1972;18(0):159–167,179.
9. Kantrowitz A, et al. Jr. Initial clinical experience withintraaortic balloon pumping in cardiogenic shock. JAMA1968;203(2):113–118.
10. Kantrowitz A. Origins of intraaortic balloon pumping. AnnThoracic Surg 1990;50(4):672–674.
11. Freed PS, Wasfie T, Zado B, Kantrowitz A. Intraaortic balloonpumping for prolonged circulatory support. Am J Cardiol1988;61(8):554–557.
12. Lund O, et al. Intraaortic balloon pumping in the treatment oflow cardiac output following open heart surgery–immediateresults and long-term prognosis. Thoracic CardiovascularSurg 1988;36(6):332–337.
13. Meharwal ZS, Trehan N.Vascular complications of intra-aor-tic balloon insertion in patients undergoing coronary reavscu-larization: Analysis of 911 cases.[See comment]. Eur J Cardio-Thoracic Surg 2002;21(4):741–747.
14. Ferguson JJ. 3rd, et al. The current practice of intra-aorticballoon counterpulsation: Results from the benchmark regis-try. J Am College Cardiol 2001;38(5):1456–1462.
15. Dietl CA, et al. Efficacy and cost-effectiveness of preoperativeiabp in patients with ejection fraction of 0.25 Or less. AnnThorac Sur 1996;62(2):401–408.
16. Christenson JT, Simonet F, Badel P, Schmuziger M. Evalua-tion of preoperative intra-aortic balloon pump support in highrisk coronary patients. Eur J Cardio-Thoracic Sur 1997;11(6):1097–1103.
17. Suzuki T, et al. Usefulness of preoperative intraaorticballoon pump therapy during off-pump coronary artery bypassgrafting in high-risk patients. Ann Thoracic Surg 2004;77(6):2056–2059.
18. Brodie BR, Stuckey TD, Hansen C, Muncy D. Intra-aorticballoon counterpulsation before primary percutaneoustransluminal coronary angioplasty reduces catheterizationlaboratory events in high-risk patients with acute myocardialinfarction. Am J Cardiol 1999;84(1):18–23.
19. Ishihara M, Sato H, Tateishi H, Uchida T, Dote K. Intraaorticballoon pumping as the postangioplasty strategy inacute myocardial infarction. Am Heart J 1991;122(2):385–389.
20. Ohman EM, et al. Use of aortic counterpulsation to improvesustained coronary artery patency during acute myocardialinfarction. Results of a randomized trial. The randomized iabpstudy group Circulation 1994;90(2):792–799.
21. Stone GW, et al. A prospective, randomized evaluation ofprophylactic intraaortic balloon counterpulsation in high riskpatients with acute myocardial infarction treated with pri-mary angioplasty. Second primary angioplasty in myocardialinfarction (pami-ii) trial investigators. J Am College Cardiol1997;29(7):1459–1467.
22. van’t Hof AW, et al. A randomized comparison of intra-aorticballoon pumping after primary coronary angioplasty in highrisk patients with acute myocardial infarction. [See comment].Eur Heart J 1999;20(9):659–665.
23. Sanborn TA, et al. Impact of thrombolysis, intra-aortic balloonpump counterpulsation, and their combination in cardiogenicshock complicating acute myocardial infarction: A report fromthe shock trial registry. Should we emergently revascularizeoccluded coronaries for cardiogenic shock? J Am College Car-diol 2000;36(3 Suppl. A):1123–1129.
24. Minich LL, et al. Intra-aortic balloon pumping in children withdilated cardiomyopathy as a bridge to transplantation. J HeartLung Transplant 2001;20(7):750–754.
25. Pantalos GM, et al. Estimation of timing errors for theintraaortic balloon pump use in pediatric patients. ASAIOJournal 1999;45(3):166–671.
26. Akomea-Agyin C, et al. Intraaortic balloon pumping in chil-dren. Ann Thoracic Surg 1999;67(5):1415–1420.
27. Pinkney KA, et al. Current results with intraaortic balloonpumping in infants and children. Ann Thoracic Surg2002;73(3):887–891.
28. Kantrowitz A, et al. Intraaortic balloon pumping 1967 through1982: analysis of complications in 733 patients. Am J Cardiol1986;57(11):976–983.
29. Miller JS, Dodson TF, Salam AA, Smith RB3rd. Vascularcomplications following intra-aortic balloon pump insertion.Am Surg 1992;58(4):232–238.
30. Macoviak J, et al. The intraaortic balloon pump: an analysis offive years’ experience. Ann Thoracic Surg 1980;29(5):451–458.
170 INTRAAORTIC BALLOON PUMP

31. Vonderheide RH, Thadhani R, Kuter DJ. Association of throm-bocytopenia with the use of intra-aortic balloon pumps. Am JMed 1998;105(1):27–32.
32. Jaron D, Ohley W, Kuklinski W. Efficacy of counterpulsation:model and experiment. Trans Am Soc Artificial Inter Organs1979;25:372–377.
33. Jaron D, Moore TW, He P. Theoretical considerations regard-ing the optimization of cardiac assistance by intraaortic balloonpumping. IEEE Trans Biome Eng 1983;30(3):177–185.
34. Jaron D, Moore TW, He P. Control of intraaortic balloonpumping: theory and guidelines for clinical applications.Ann Biomed Eng 1985;13(2):155–175.
35. Niederer P, Schilt W. Experimental and theoretical modellingof intra-aortic balloon pump operation. Med Biol Eng Comput1988;26(2):167–174.
36. Barnea O, Smith B, Moore TW, Jaron D. Simulation andoptimization of intra-aortic balloon pumping. Proceedings.Computers in Cardiology (Cat. No.89CH2932-2). Los Alamitos(CA): IEEE Computer Society Press; 1990. p 237–240.
37. Sakamoto T, et al. Effects of timing on ventriculoarterialcoupling and mechanical efficiency during intraaortic balloonpumping. ASAIO Journal 1995;41(3):M580–MM583.
38. Weller PR, Morrow DR, LeFèvre JE. Evolution of a fuzzycontroller for the intra-aortic balloon pump. Proceedings of2nd European Medical and Biological Engineering Confer-ence, EMBEC’02, Vienna, Austria, Hutten H, Krosl P. editors.ISBN 3-901351-62-0;4–8. December 2002; p 1588–1589.
39. Kane GR, Clark JW, Bourland HM, Hartley CJ. Automaticcontrol of intra-aortic balloon pumping. Trans Am Soc Artif IntOrgans 1971;17:148.
40. Martin PJ, Jaron D. New controller for in-series cardiac-assistdevices. Med Biol Eng Computing 1978;16(3):243–249.
41. Barnea O, Smith B, Moore TW, Jaron D. An optimal controlalgorithm for intra-aortic balloon pumping. Images of theTwenty-First Century. Proceedings of the Annual Interna-tional Conference of the IEEE Engineering in Medicine andBiology Society (Cat. No.89CH2770-6). New York: Vol. 5.IEEE; 1989. p 1419–1420.
42. Barnea O, et al. Optimal controller for intraaorticballoon pumping. IEEE Trans. Biomed Eng 1992;39(6):629–634.
43. Smith B, Barnea O, Moore TW, Jaron D. An algorithm foroptimal control of the intra-aortic balloon pump. Proceedingsof the Fifteenth Annual Northeast Bioengineering Conference(Cat. No.89-CH2689-8). New York; IEEE. 1989; p 75–76.
44. Zelano JA, Li JK, Welkowitz W. A closed-loop control schemefor intraaortic balloon pumping. IEEE Trans Biomed Eng1990;37(2):182–192.
45. Kantrowitz A, et al. Initial clinical trial of a closed loop, fullyautomatic intra-aortic balloon pump. ASAIO Journal 1992;38(3):M617–M621.
46. Sakamoto T, Arai H, Maruyama T, Suzuki A. New algorithm ofintra aortic balloon pumping in patients with atrial fibrilla-tion. ASAIO Journal 1995;41(1):79–83.
Further Reading
Goldberger M, Tabak SW, Shah PK. Clinical experience withintra-aortic balloon counterpulsation in 112 consecutivepatients. Am Heart J 1986;111(3):497–502.
McEnany MT, et al. Clinical experience with intraaortic balloonpump support in 728 patients. Circulation 1978;58(3 Pt 2):I124–I132.
See also ARTERIES, ELASTIC PROPERTIES OF; HEMODYNAMICS; VASCULAR GRAFT
PROSTHESIS.
INTRACRANIAL PRESSURE MONITORING. SeeMONITORING, INTRACRANIAL PRESSURE.
INTRAOCULAR LENSES. See LENSES, INTRAOCULAR.
INTRAOPERATIVE RADIOTHERAPY. SeeRADIOTHERAPY, INTERAOPERATIVE.
INTRAUTERINE DEVICES (IUDS). SeeCONTRACEPTIVE DEVICES.
INTRAUTERINE SURGICAL TECHNIQUES
JOSEPH P. BRUNER
Department of Obstetrics andGynecologyNashville, Tennessee
R. DOUGLAS WILSON
N. SCOTT ADZICK
University of PennsylvaniaPhiladelphia, Pennsylvania
LOUISE WILKINS-HAUG
AUDREY C. MARSHALL
Women’s and Children’s HospitalBoston, Massachusetts
RUBEN A. QUINTERO
Florida Institute for FetalDiagnosis and TherapyTampa, Florida
M. YAMAMOTO
Y. VILLE
University of ParisParis, France
ANTHONY JOHNSON
University of North CarolinaChapel Hill, North Carolina
JULIE S. MOLDENHAUER
Wayne State UniversityDetroit, Michigan
INTRODUCTION
Intrauterine surgery of the fetus or fetal adnexae is spread-ing rapidly throughout the world. In a broad sense, intrau-terine surgery includes any procedure in which a medicaldevice is purposely placed within the uterine cavity. Formost physicians, however, the concept of intrauterine sur-gery excludes such commonly performed procedures asamniocentesis and chorionic villous sampling. Rather,the term usually refers to techniques requiring specializedknowledge, experience, and most especially, instrumenta-tion. Procedures most commonly mentioned in discourseson intrauterine surgery include those specifically devel-oped for the treatment of such serious anatomic defectsas congenital cystic adenomatoid malformation (CCAM),sacrococcygeal teratoma (SCT), lower urinary tractobstruction (LUTO), myelomeningocele, aortic or pulmonicstenosis, gastroschisis, iatrogenic amniorhexis, twin-to-twin transfusion syndrome (TTTS), and twins discordantfor severe anomalies. As no one person in the world is anexpert in every one of these procedures, the remainder of
INTRAUTERINE SURGICAL TECHNIQUES 171
this chapter is divided into individual sections, eachauthored by someone widely recognized as a leader inthe treatment of that particular anomaly.
CONGENITAL CYSTIC ADENOMATOID MALFORMATIONAND SACROCOCCYGEAL TERATOMA
Most prenatally diagnosed malformations are managed byappropriate medical and surgical evaluation and treat-ment following planned delivery near term, with somecases requiring transfer of the mother to a tertiary referralcenter with obstetrics, maternal fetal medicine, medicalgenetics, neonatology, and pediatric surgery subspecialties.Certain anatomic abnormalities can have significant fetaldevelopmental consequences, with emergency in utero ther-apy being required due to gestational age and mortalityrisks for the fetus. Open maternal fetal surgery poses addi-tional risks to the mother. Maternal fetal surgery (1–4)should not be attempted until (1) the natural history ofthe fetal disease is established by following up on untreatedcases, (2) selection criteria for cases requiring interventionare developed, (3) pathophysiology of the fetal disorder andits correction are defined in fetal animal models, and (4)hysterotomy and fetal surgery can be performed withoutundue risk to the mother and her reproductive potential.
Congenital cystic adenomatoid malformation of the lung(CCAM) (5) is a rare lesion characterized by a multicysticmass of pulmonary tissue with proliferation of bronchialstructures. CCAM is slightly more common in males and isunilobar in 80–95% of cases. CCAMs derive their arterialblood supply from the normal pulmonary circulation.CCAMs are divided clinically into cystic and solid lesions,but have been divided traditionally into three types basedon their pathological characteristics. Type 1 CCAM lesionsaccount for 50% of postnatal CCAM cases and consist ofsingle or multiple cysts lined by ciliated pseudostratifiedepithelium (5). These cysts are usually 3–10 cm in size and1–4 in number (5). Type II CCAM lesions account for 40% ofpostnatal cases of CCAM and consist of more numerouscysts of smaller diameter, usually less than 1 cm. They arelined by ciliated, cuboidal, or columnar epithelium (5).Type III CCAM lesions account for only 10% of CCAMcases and are usually large, homogenous, microcysticmasses that cause mediastinal shift. These lesions havebronchiolar-like structures lined by ciliated cuboidalepithelium separated by masses of alveolar-sized struc-tures lined by nonciliated cuboidal epithelium (5). Prog-nosis in Type III CCAM is related to size.
Sacrococcygeal teratoma (SCT) (6) is defined as a neo-plasm composed of tissues from either all three germ layersor multiple foreign tissues lacking an organ specificity.SCT is thought to develop from a totipotent somatic celloriginating in Hensen’s node. SCT has been classified bythe relative amounts of presacral and external tumor pre-sent, with Type I completely external with no presacralcomponent, Type II external component with internalpelvic component, Type III external component with inter-nal component extending into the abdomen, and Type IVcompletely internal with no external component (7). A TypeI SCT is evident at birth and is usually easily resected and
has a low malignant potential (6). Type II and III SCTs arerecognized at birth, but resection may be difficult requiringan anterior and posterior approach (6). A Type IV SCT canhave a delayed diagnosis until symptomatic at a later age(6). SCT is one of the most common tumors in newborns andhas an incidence of 1 per 35,000 to 40,000 live births (6).
Evaluation of the fetal status for CCAM and SCTrequires multiple imaging and functional techniques(8–10), including fetal ultrasound, fetal MRI, and fetalechocardiogram with arterial and venous Doppler assess-ments (umbilical artery, umbilical vein, ductus venosus).Measurements include combined cardiac output, cardi-othoracic ratio, descending aortic blood flow, inferior venacava diameter, placental thickness, umbilical artery sys-tolic to diastolic Doppler ratio, and amniotic fluid index.Presence of ascites, pleural or pericardial effusion, andskin or scalp edema are important markers for the extentof fetal hydrops and its overall effect on fetal stability.Specific ultrasound imaging of the CCAM and SCT looksfor the percentage of cystic and solid components in thetumors as well as an overall mass volume (cc) estimate (APcm � transverse cm � height cm � 0.52). The SCT consis-tency and size can be reflected directly in the combinedcardiac output and amount of vascular shunting. TheCCAM overall size can cause mediastinal shift with cardiacdysfunction and pulmonary deformation. Validated ratio ofCCAM/head circumference (CVR) can be used for prognosisand follow-up planning (10). The specific lobar location forthe CCAM may have a differential impact on cardiacfunction. The development of fetal hydrops is due mainlyto cardiac dysfunction secondary to compression.
The physiologic changes required in the fetal status tomove from expectant management to open maternal fetalsurgery is generally dictated by fetal (gestational age andextent of fetal hydrops) and maternal factors (8–10). Cri-teria for consideration of maternal fetal surgery for CCAMresection (fetal lobectomy) require the absence of maternalrisk factors for anesthesia and surgery, a singleton preg-nancy with a normal karyotype (amniocentesis, chorionicvillus sampling, or percutaneous umbilical blood sampling),no other anatomical abnormalities beyond the associatedhydrops, gestationalageof21–31weeks,andmassivemulti-cystic or predominantly solid CCAM (CVR > 1.6) (8–10). Inselected cases, the failure of in utero therapy techniques,such as thoracoamniotic shunting or cyst aspiration for thelarge Type I lesions, to reverse the fetal hydrops would berequired. Criteria for consideration of maternal fetal sur-gery for debulking of a SCT require the absence of maternalrisk factors for anesthesia and surgery, a singleton preg-nancy with a normal karyotype, the absence of significantassociated anomalies, evidence of impending high outputcardiac failure, gestational age of 21–30 weeks, and favor-able SCT anatomy classification (Type I or II) (9).
The technique for maternal hysterotomy to allow accessto the fetus has been well described and has evolved over 25years of experimental and clinical work (1,8,9). The uterusis exposed through a maternal low transverse abdominalincision. If a posterior placenta is present, superior andinferior subcutaneous flaps are raised and a vertical mid-line fascial incision is made to expose the uterus for aconvenient anterior hysterotomy with the uterus remaining
172 INTRAUTERINE SURGICAL TECHNIQUES
in the abdomen. Conversely, the presence of an anteriorplacenta necessitates the division of the rectus muscles sothe uterus can be tilted out of the abdomen for a posteriorhysterotomy. A large abdominal ring retractor (Turner–Warwick) is used to maintain exposure and prevent lateralcompression of the uterine vessels. Sterile interoperativeultrasound is used to delineate the fetal position and pla-cental location. The edge of the placenta is marked undersonographic guidance using electrocautery or a markingpen. The position and orientation of the hysterotomy isplanned to stay parallel to and at least 6 cm from theplacental edge but still allow exposure of the appropriatefetal anatomy. The hysterotomy is facilitated by the place-ment of two large monofilament sutures (PDS II 1 Ethicon;Somerville, NJ) parallel to the intended incision site andthrough the full thickness of the uterine wall and mem-branes under sonographic guidance. The electrocautery isused to incise the myometrium between the two stay suturesdown to the level of the amniotic membranes. A uterinestapler device (US Surgical Corporation; Norwalk, CT) withabsorbable Lactomer staples is then directly introducedthrough the point of fixation and into the amniotic cavityby using a piercing attachment on the lower limb of thestapler. The stapler is fired, thereby anchoring theamniotic membranes (chorion, amnion) to the uterine wallcreating a hemostatic hysterotomy. Careful evaluation forthe membrane adhesion status and for any myometrialbleeding sites is undertaken. If required, interrupted PDSsutures are used to control bleeding and membraneseparation. The fetus and the internal uterine cavityare continually bathed in warmed lactated Ringers at38–408C using a level I warming pump connected to ared rubber catheter that is placed in the uterine cavitythrough the hysterotomy.
For CCAM resection (1,8,11), once the appropriate fetalarea is visualized in the hysterotomy site, the fetal arm isbrought out for pulse oximeter monitoring, IV access, andfetal position control. Intraoperative fetal echocardiogra-phy is used throughout to monitor cardiac function. Thefetal chest is entered by a fifth intercostal space thoracot-omy. The lesion usually decompresses out through thethoracotomy wound consistent with the increase in thethoracic pressure from the mass (8). Using techniquesinitially developed on experimental animals, the appropri-ate pulmonary lobes containing the lesion are resected(1,11). Fetal resuscitation is performed if needed throughintravenous administration of crystalloid, blood, and code-blue medications with fetal echocardiography providingfunctional information. The fetal thoracotomy is closedand the fetal arm is returned to the uterus.
The technique for debulking of an external fetal SCT hasbeen described in detail previously (1,9,12,13). The fetalfoot is used for pulse oximeter monitoring and IV accesswith intraoperative echocardiography. The fetal SCT isexposed and a Hagar dilator is placed in the rectum. Fetalskin is incised circumferentially around the base of thetumor and a tourniquet is applied to constrict blood flow.The tumor is debulked externally, usually with a 90 mmthick tissue stapler (US Surgical Corporation; Norwalk,CT). The objective of the fetal SCT resection is to occludethe tumor vascular supply and remove the low resistance
tumor vascular bed from the fetal circulation. No attempt ismade to dissect the intrapelvic component of the tumor orto remove the coccyx (done with a second procedure afterbirth). Fetal resuscitation is performed if needed throughintravenous administration of crystalloid, blood, and code-blue medications with fetal echocardiography providingfunctional information. The fetal sacral wound is closed.
Repair of the hysterotomy after fetal surgery (1–4) usesa water-tight two-layered uterine closure, with interruptedfull thickness stay sutures placed first and untied usingPDS II 1 (Ethicon; Somerville, NJ), and the uterus is thenclosed with a running continuous stitch PDSII 0 (Ethicon;Somerville, NJ) including the chorion-amnion membranelayer. The interrupted stay sutures are then tied after theamniotic fluid volume has been corrected with warm lac-tated Ringers through a red rubber catheter and volumeconfirmed by ultrasound visualization. The omentum issutured in place over the hysterotomy closure to help sealthe hysterotomy site with vascularized tissue and to pre-vent bowel adherence to the site, especially when a poster-ior hysterotomy is performed. The maternal laparotomyincision is closed in layers. It is important to use a sub-cuticular skin closure covered with a transparent dressingso that monitoring devices can be placed on the maternalabdomen postoperatively.
In some specific cases, when the CCAM lesion is notresected in utero, it continues to be a large space-occupyinglesion with mediastinal shift. Thus, it might be anticipatedthat respiratory compromise will be present at birth, thedelivery may be facilitated with an EXIT procedure(ex utero intrapartum therapy) (14). Uterine relaxationis maintained by high concentration inhalational anes-thetics, with additional tocolysis if necessary. The EXITrequires only the head and chest to be initially deliveredthrough, preferably, a low transverse hysterotomy woundthereby preserving uterine volume with the lower fetalbody and continuous warmed lactated Ringers infusion toprevent cord compression. These maneuvers preserve theuterine-placental circulation and continue placental gasexchange. The EXIT procedure can be done through ananterior or posterior hysterotomy, but its location in theuterus may require that all future pregnancies be deliveredby cesarean section with no trial of labor if a low anteriortransverse location is not available.
All future pregnancies following maternal hysterotomyfor maternal-fetal surgery require cesarean section at termwith no trial of labor. Maternal obstetrical risks in asubsequent pregnancy are similar to risks following for aclassic cesarean section (15).
LOWER URINARY TRACT OBSTRUCTION
The diagnosis and treatment of fetal lower urinary tractobstruction (LUTO) requires knowledge of the differentialdiagnosis and the natural history of the condition, a thor-ough understanding of the criteria for therapy, and man-agement expertise. Fetal LUTO is one of the mostcommonly diagnosed birth defects. Untreated, and depend-ing on the level of the obstruction, it may lead to hydro-nephrosis, renal dysplasia, pulmonary hypoplasia, and
INTRAUTERINE SURGICAL TECHNIQUES 173

perinatal death (16,17). The prognosis depends on theextent of preexisting renal damage and the effectivenessof therapy. Treatment with fetal urinary diversion proce-dures is aimed at preventing renal damage and pulmonaryhypoplasia (18–20).
Obstruction to urine flow has been shown in animalmodels to result in hydronephrosis and renal dysplasia(21). Release of the obstruction is associated with no orvariable renal damage depending on the timing of therelease or the creation of the defect (21,22). Pulmonaryhypoplasia is another major potential complication offetuses with obstructive uropathy (23). The associationprobably results from the attendant oligohydramnios.
Urethral obstruction may result from posterior urethralvalves (PUV), anterior urethral valves, megalourethra,urethral duplications, urethral atresia, obstructive ureter-ocele, or cloacal dysgenesis. Posterior urethral valves(PUV), first described by Young et al. (24), constitute themost common cause of lower urinary tract obstruction inmale neonates, with an incidence of 1:8000 to 1:25,000livebirths (25). The lesions occur only in males becausethe female counterpart of the verumontanum, from whichthe valves originate, is the hymen.
In utero therapy is usually limited to fetuses withbladder outlet obstruction. Fetuses with unilateralobstruction are not typically considered candidates for inutero therapy, regardless of the magnitude of the obstruc-tion or renal findings. In these patients, the risk/benefitratio of in utero intervention favors expectant manage-ment, even if it means loss of the affected renal unit.
Fetal renal function may be assessed by analysis of fetalurinary parameters via vesicocentesis. Patients are con-sidered candidates for in utero therapy if fetal urinaryparameters are below the threshold for renal cystic dys-plasia. If the values are above the threshold, therapyshould not be offered.
The application of selection criteria in patients withfetal LUTO for possible in utero therapy results in a sig-nificant attrition rate. Disqualification from therapy mayresult both from ‘‘too healthy’’ or ‘‘too sick’’ conditions.Examples of too healthy conditions include normal amnio-tic fluid volume or suggestion of nonobstructive dilatationof the urinary tract. Examples of too sick conditions includesonographic evidence of renal cystic dysplasia, abnormalfetal urinary parameters, abnormal karyotype, or the pre-sence of associated major congenital anomalies. Of 90patients referred to the Florida Institute for Fetal Diag-nosis and Therapy from October 1996 to October 2003,more than one-half were disqualified from therapy fromsingle or overlapping conditions.
Percutaneous ultrasound-guided vesicoamniotic shunt-ing of fetuses with LUTO began in the early 1980s(16,19,23). The goal of therapy is to avoid developmentof pulmonary hypoplasia from the attendant oligohydram-nios as well as to preserve renal function. Fetal bladdershunting should be offered only to patients without sono-graphic or biochemical evidence consistent with renal cys-tic dysplasia, normal karyotype, and lack of associatedmajor congenital anomalies.
The procedure can be performed under local, regional,or general anesthesia. A minimal skin incision is made.
Ultrasound is used to identify the ideal site of entry into thefetal bladder, below the level of the umbilicus. Color Dop-pler ultrasonography is used to identify the umbilicalvessels around the distended bladder and avoid them.Under ultrasound guidance, the trocar is directed throughthe maternal tissues and up to the fetal skin. Fetal analge-sia is achieved with pancuronium 0.2 mg/kg and fentanyl10 mcg/kg. The trocar stylet is used to enter the fetalbladder with a sharp, swift, and controlled maneuver. Ifa prior vesicocentesis had been performed, it is advisable toobtain a sample of fetal urine for microbiological purposesto rule out preexisting infection. A sample of fetal urine issent for further biochemical testing. Placement of thedouble-pigtail catheter is monitored with ultrasound. Afterthe distal loop is deployed in the bladder, the trocar isretrieved to the level of the bladder wall. A small amount ofthe straight portion of the catheter may be advanced intothe bladder to avoid retracting the distal loop into thebladder wall. The trocar shaft is retrieved slowly whilesimultaneously maintaining pressure on the catheter todeploy the straight portion within the bladder wall andfetal skin. Once the shaft of the trocar reaches the fetalskin, entrance of the catheter, including the proximal loop,can be safely deployed. If complete anhydramnios is pre-sent prior to insertion of the catheter, it is advantageous toattempt an amnioinfusion with an 18 gauge needle prior toshunting to create the space for deployment of the proximalloop. Amnioinfusion is aimed at preventing misplacementof the proximal loop within the myometrium and fetalmembranes.
Despite adequate placement, malfunction of vesicoam-niotic shunting may occur up to 60% of the time (26). Theshunt may pull from the skin into the fetal abdomen,resulting in iatrogenic ascites, or out of the fetal bladder,with no further drainage of urine. The shunt may pull outof the fetus altogether as well. Replacement of the shunt isassociated with an additive risk of fetal demise, chorioam-nionitis, premature rupture of membranes, and miscar-riage or preterm delivery, for a total perinatal loss rate ofapproximately 5% per instance.
In 1995, we proposed the use of endoscopy to assess thefetal bladder for diagnostic and surgical purposes (27,28).Endoscopic visualization of the fetal bladder with a largerendoscope can be justified during vesicoamniotic shunting.Currently, we use a 3 mm or a 3.9 mm trocar with a2.7 mm or 3.3 mm diagnostic or operating endoscope. Thisdiameter is slightly larger than the 14 gauge (approxi-mately 2.1 mm) needle used for the insertion of the dou-ble-pigtail catheter. Access to the fetal bladder allowsremarkable evaluation of the bladder, ureteral orifices,and urethra as well as the opportunity to perform surgicalprocedures.
In normal fetuses, the urethra is not dilated, appearingas a small hole within the bladder. In patients with a trueurethral obstruction, endoscopy will show a variable dila-tation of the urethra at the level of the bladder neck. Theurethra is located using a 258 or a 708 diagnostic rigidendoscope. Alternatively, a flexible/steerable endoscopemay be used. The anatomical landmarks to identify at thislevel include the verumontanum and the urethral valves.The diagnostic endoscope is then exchanged for a rigid
174 INTRAUTERINE SURGICAL TECHNIQUES

operating endoscope. A 600 mm YAG-laser fiber is passedthrough the operating channel of the endoscope, and thenablated using 5–10 w and 0.2 s pulses in successive steps.The fiber is placed as anterior and medial as possible. It isnot necessary to evaporate the entire valvular tissue.Instead, only a few defects to either side of the midlineare necessary to establish urethral patency (27,29). Thedilated urethra may collapse intraoperatively once patencyis re-established, which may obscure the field of view andrequire frequent instillation of saline to the side port of thetrocar to distend it. Color Doppler may also be used todocument fetal urination through the penis.
A urethrorectal fistula may occur from thermaldamage beyond the posterior wall of the urethra intothe perirectal space. To avoid this complication, only 5–10 w of energy in short bursts should be used while ablat-ing the valves.
The management of fetuses with lower obstructiveuropathy continues to be one of the most challengingsubjects in fetal therapy. The difficulties include establish-ing the correct differential diagnosis, accurately predict-ing subsequent renal function, and providing the besttreatment.
MYELOMENINGOCELE
Myelomeningocele results from the failure of caudal neuraltube closure during the fourth week of gestation. The lesionis characterized by protrusion of the meninges through amidline bony defect of the spine, forming a sac containingcerebrospinal fluid and dysplastic neural tissue. Affectedinfants exhibit varying degrees of somatosensory loss,neurogenic sphincter dysfunction, paresis, and skeletaldeformities (30). Virtually all such infants also have theChiari II malformation, and up to 95% develop hydroce-phalus (31). Although myelomeningocele is not a lethaldisorder, the neurologic sequelae are progressive, andworsen until the lesion is closed. Observational and cohortstudies have demonstrated improvement of the Chiari IImalformation (32,33), decreased hydrocephalus (34), andimproved lower extremity function after intrauterinerepair of myelomeningocele (35).
On the day of surgery, the pregnant patient is taken to astandard obstetrical operating room. An epidural catheteris placed and, after induction of general endotrachealanesthesia, she is prepared as if for a cesarean section.Many of the general anesthetic agents cross the placentaand provide analgesia for the fetus, and the epiduralcatheter enables the administration of continuous post-operative analgesics if needed. The gravid uterus isexposed with a Pfannenstiel incision and exteriorized.The uterine contents are then mapped with a sterile ultra-sound transducer, and the location of the fetus and theplacenta are determined. Initial uterine entry is obtainedwith a specialized trocar developed at Vanderbilt Univer-sity Medical Center (Cook Incorporated; Bloomington, IN).The Tulipan–Bruner trocar consists of a tapered centralintroducer covered by a peel-away Teflon sheath. Use ofthis trocar has demonstrated to reduce operative time andblood loss while providing atraumatic entry into the uter-
ine cavity (36). Two through-and-through chromic suturesare passed through the uterine wall and membranes oneither side of the selected entry point. The introducer isthen passed into the uterine cavity under direct ultrasono-graphic guidance using a modified Seldinger technique.The central introducer is then removed, leaving only thetrocar sheath. Excess amniotic fluid may be aspirated andstored in sterile, warm syringes. The footplate of a U.S.surgical CS-57 autostapling device (United States SurgicalCorporation; Norwalk, CT) is then inserted through thepeel-away sheath, and the sheath is removed, leaving thestapler in proper position. When activated, the staplercreates a 6–8 cm uterine incision. At the same time, allthe layers of the uterine wall are held together, much likethe binding of a book.
The fetus is directly visualized and manually positionedwithin the uterus so that the myelomeningocele sac islocated in the center of the hysterotomy. Proper positionis maintained by grasping the fetal head and trunkthrough the flaccid uterine wall. During the procedure,the fetal heart rate is monitored by continuous ultrasono-graphic visualization.
The myelomeningocele is closed in routine neurosurgicalfashion. Approximately 20% of patients will not have a well-formed myelomeningocele sac, but a crater-like lesiontermed myeloschisis. As fetuses with myeloschisis have lessviable skin for closure, it may be necessary to use bilateralvertical relaxing incisions in the flanks to create bipedicularflaps that can be advanced and closed over the dural sac. Theresulting full-thickness cutaneous defects are covered withcadaveric skin (37).
After repair of the spina bifida lesion, the uterus is closedin layers using #1 PDS sutures. The first layer incorporatesthe absorbable polyglycolic acid staples left by the autosta-pling device. As the last stitches of this layer are placed, thereserved amniotic fluid or physiologic crystalloid solution,mixed with 500 mg of nafcillin or an equivalent dosage of anantibiotic effective against Staphylococcus species, isreplaced in the uterus. The sterile, warm fluid is addeduntil the uterine turgor, as determined by manual palpa-tion, is restored to the preoperative level, which is followedby an imbricating layer. A sheet of Interceed absorbableadhesion barrier (Johnson & Johnson Medical, Inc.; Arling-ton, TX) or omentum is attached over the incision to preventadhesion formation. The uterus is returned to the abdomen.The fascial layer is closed in routine fashion, and the dermisclosed with a running subcuticular suture or staples. Thefetus is monitored postoperatively using continuous elec-tronic fetal monitoring (EFM) and intermittent transab-dominal ultrasonography.
Postoperative uterine contractions are monitored usingcontinuous EFM. Uterine contractions are initially con-trolled with intravenous magnesium sulfate and oral orrectal indomethacin, and subsequently with subcutaneousterbutaline or oral nifedipine, supplemented by indo-methacin as needed. Patients are monitored with weeklytransabdominal ultrasonographic examinations. Deliveryof each child is accomplished via standard cesarean section.Although the same abdominal incision is used for thecesarean section as for the fetal surgery, the fetus ispreferably delivered via a lower uterine segment incision.
INTRAUTERINE SURGICAL TECHNIQUES 175
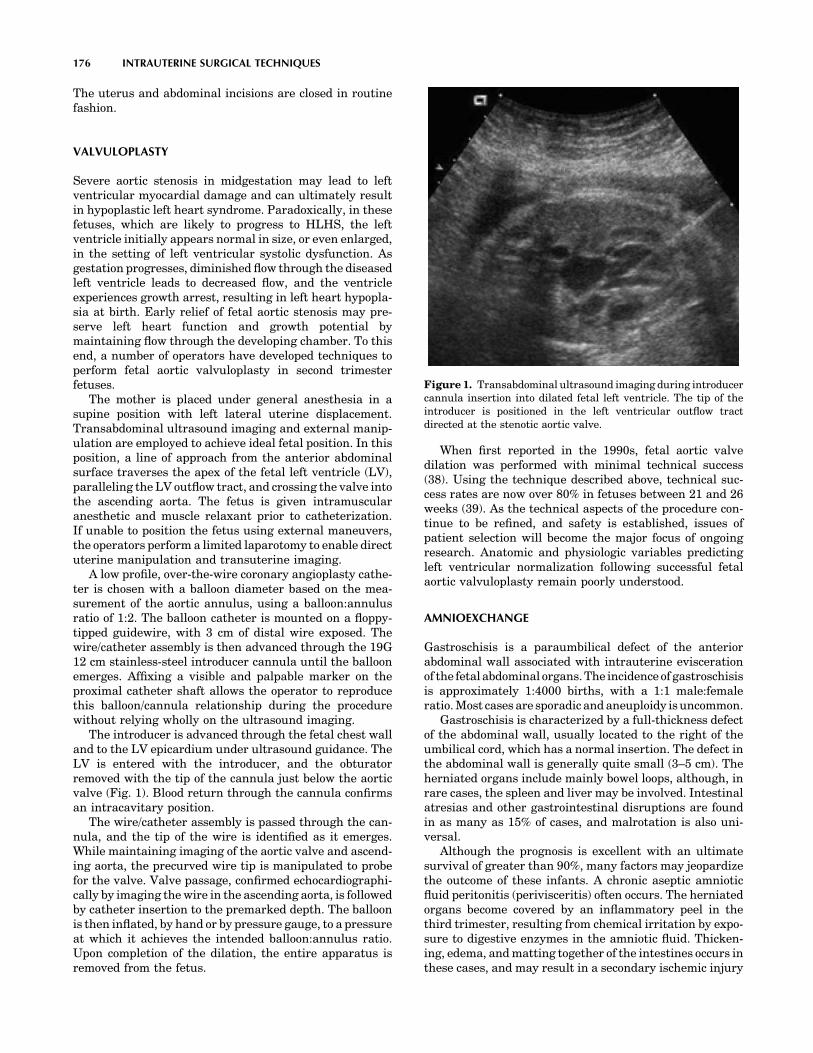
The uterus and abdominal incisions are closed in routinefashion.
VALVULOPLASTY
Severe aortic stenosis in midgestation may lead to leftventricular myocardial damage and can ultimately resultin hypoplastic left heart syndrome. Paradoxically, in thesefetuses, which are likely to progress to HLHS, the leftventricle initially appears normal in size, or even enlarged,in the setting of left ventricular systolic dysfunction. Asgestation progresses, diminished flow through the diseasedleft ventricle leads to decreased flow, and the ventricleexperiences growth arrest, resulting in left heart hypopla-sia at birth. Early relief of fetal aortic stenosis may pre-serve left heart function and growth potential bymaintaining flow through the developing chamber. To thisend, a number of operators have developed techniques toperform fetal aortic valvuloplasty in second trimesterfetuses.
The mother is placed under general anesthesia in asupine position with left lateral uterine displacement.Transabdominal ultrasound imaging and external manip-ulation are employed to achieve ideal fetal position. In thisposition, a line of approach from the anterior abdominalsurface traverses the apex of the fetal left ventricle (LV),paralleling the LV outflow tract, and crossing the valve intothe ascending aorta. The fetus is given intramuscularanesthetic and muscle relaxant prior to catheterization.If unable to position the fetus using external maneuvers,the operators perform a limited laparotomy to enable directuterine manipulation and transuterine imaging.
A low profile, over-the-wire coronary angioplasty cathe-ter is chosen with a balloon diameter based on the mea-surement of the aortic annulus, using a balloon:annulusratio of 1:2. The balloon catheter is mounted on a floppy-tipped guidewire, with 3 cm of distal wire exposed. Thewire/catheter assembly is then advanced through the 19G12 cm stainless-steel introducer cannula until the balloonemerges. Affixing a visible and palpable marker on theproximal catheter shaft allows the operator to reproducethis balloon/cannula relationship during the procedurewithout relying wholly on the ultrasound imaging.
The introducer is advanced through the fetal chest walland to the LV epicardium under ultrasound guidance. TheLV is entered with the introducer, and the obturatorremoved with the tip of the cannula just below the aorticvalve (Fig. 1). Blood return through the cannula confirmsan intracavitary position.
The wire/catheter assembly is passed through the can-nula, and the tip of the wire is identified as it emerges.While maintaining imaging of the aortic valve and ascend-ing aorta, the precurved wire tip is manipulated to probefor the valve. Valve passage, confirmed echocardiographi-cally by imaging the wire in the ascending aorta, is followedby catheter insertion to the premarked depth. The balloonis then inflated, by hand or by pressure gauge, to a pressureat which it achieves the intended balloon:annulus ratio.Upon completion of the dilation, the entire apparatus isremoved from the fetus.
When first reported in the 1990s, fetal aortic valvedilation was performed with minimal technical success(38). Using the technique described above, technical suc-cess rates are now over 80% in fetuses between 21 and 26weeks (39). As the technical aspects of the procedure con-tinue to be refined, and safety is established, issues ofpatient selection will become the major focus of ongoingresearch. Anatomic and physiologic variables predictingleft ventricular normalization following successful fetalaortic valvuloplasty remain poorly understood.
AMNIOEXCHANGE
Gastroschisis is a paraumbilical defect of the anteriorabdominal wall associated with intrauterine eviscerationof the fetal abdominal organs. The incidence of gastroschisisis approximately 1:4000 births, with a 1:1 male:femaleratio. Most cases are sporadic and aneuploidy is uncommon.
Gastroschisis is characterized by a full-thickness defectof the abdominal wall, usually located to the right of theumbilical cord, which has a normal insertion. The defect inthe abdominal wall is generally quite small (3–5 cm). Theherniated organs include mainly bowel loops, although, inrare cases, the spleen and liver may be involved. Intestinalatresias and other gastrointestinal disruptions are foundin as many as 15% of cases, and malrotation is also uni-versal.
Although the prognosis is excellent with an ultimatesurvival of greater than 90%, many factors may jeopardizethe outcome of these infants. A chronic aseptic amnioticfluid peritonitis (perivisceritis) often occurs. The herniatedorgans become covered by an inflammatory peel in thethird trimester, resulting from chemical irritation by expo-sure to digestive enzymes in the amniotic fluid. Thicken-ing, edema, and matting together of the intestines occurs inthese cases, and may result in a secondary ischemic injury
176 INTRAUTERINE SURGICAL TECHNIQUES
Figure 1. Transabdominal ultrasound imaging during introducercannula insertion into dilated fetal left ventricle. The tip of theintroducer is positioned in the left ventricular outflow tractdirected at the stenotic aortic valve.

to the bowel as the abdominal defect becomes too small.Meconium is frequently found in the amniotic fluid ofaffected fetuses. Its presence probably reflects intestinalirritation. Intrauterine growth restriction (IUGR) is fre-quent, occurring in up to 60% of fetuses. Oligohydramnioscan occur, and may lead to fetal stress by cord compression.Premature birth is a frequent and still poorly understoodcomplication. At birth, infants have low serum albuminand total protein levels, which probably results fromchronic peritonitis.
The obstetrical management of the fetus with gastro-schisis is controversial. Some studies have shown no clearbenefit of cesarean delivery over vaginal delivery, where asothers demonstrate an improved perinatal outcome ininfants delivered by elective cesarean section prior to labor.Postoperative infection and delayed total enteral nutritionare the major acute complications of the newborn.Although all neonates with gastroschisis require surgeryshortly after birth, repair may be by primary fascial clo-sure, or by delayed fascial closure using temporary cover-age with a silastic/Dacron intra-abdominal pouch. Therepair as a primary or secondary procedure depends onthe degree of chemical peritonitis with matting of the bowelthat is present. Delayed intestinal function with poorenteral nutrition is expected in most patients. Centralvenous access and early total parenteral nutrition aretherefore usually required.
In a study by Luton et al. (40), gastroschisis was createdat mid gestation in 21 lamb fetuses. Saline was amnioin-fused in some fetuses every 10 days until term. Thicknessof the bowel muscularis, thickness of the serous fibrosis,and plasma cell infiltration were all significantly improvedin amnioexchanged animals when compared with fetallambs that were not amnioexchanged (40). Histologic ana-lysis of appendices removed from human newborns demon-strated increased fibrosis in those with gastroschisis; afteramnioinfusion, the serosa was still edematous, but noinflammation was seen (41). In a pilot study in humanpregnancies (42), the same authors investigated the effectof amnioinfusion on the outcome of prenatally diagnosedgastroschisis. Following up on their work showing that aninflammatory response exists in the amniotic fluid offetuses with gastroschisis, they hypothesized that amnioticfluid exchange would improve the outcomes of prenatallydiagnosed cases. The outcome of 10 amnioinfused fetuseswith gastroschisis was compared with 10 nonamnioinfusedmatched controls. Results showed that fetuses undergoingamnioinfusion had a shorter duration of curarization aftersurgical repair (2.2 1.9 versus 6.8 6.9 days,þ ¼ 0.019), a shorter delay before full oral feeding(49.7 21.5 versus 72.3 56.6 days, NS) and a shorteroverall length of hospitalization (59.5 19.7 versus88.5 73.6 days, NS). The authors confirmed their pre-vious data showing that amniotic fluid displays a chronicinflammatory profile, and they speculated that a reductionof the inflammatory response could improve the outcome ofhuman fetuses with gastroschisis (42).
Amnioexchange for treatment of gastroschisis beginsafter 30 weeks’ gestation, and is repeated approximatelyevery two weeks until delivery. A complete obstetricalultrasound examination is performed prior to the amnioex-
change. The patient is admitted to the labor and deliverysuite, and a nonstress test is performed before and after theamnioexchange. An intravenous line or a heplock is placed,and a single vial of blood is obtained and held for routineadmission laboratory studies, in the case that urgentdelivery is required. Prophylactic tocolysis may be givenin the form of intravenous or subcutaneous terbutaline.Light IV sedation may also be given if desired.
After performing a sterile abdominal prep and drape,amnioexchange is performed using a ‘‘closed system.’’ Theclosed tubing system materials are illustrated in Fig. 2. Allof the materials are sterile except the graduated cylinder.Two sterile three-way stopcocks (b and c) are connectedend-to-end. Sterile IV solution (a) is connected to stopcock(c) by way of sterile IV tubing (a). Three lengths of sterileconnecting IV tubing (b) are connected to the remainingexposed ports of the stopcock assembly. Tubing from theside port of stopcock (b) is allowed to drain to the graduatedcylinder (d). A 60 mL syringe (e) is connected to the tubingattached to the inline port of stopcock (b). The tubingattached to the inline port of stopcock (c) will connect tothe therapeutic amniocentesis needle. Stopcock (c) is closedoff to the IV solution (a). Stopcock (b) is closed off to thegraduate (d). Amniocentesis is performed under continu-ous ultrasound guidance. Once access is obtained, thestylet is removed from within the needle lumen and theconnection tubing is attached. With the stopcocks posi-tioned as noted above, amniotic fluid is withdrawn intothe syringe (e) until the syringe is filled. Stopcock (b) isthen closed off to the patient and the fluid is expelled intothe graduate (d). Stopcock (b) is then turned off to thegraduate (d), and this step is repeated until the desiredamount of amniotic fluid has been withdrawn (300–900ml). With stopcock (b) closed to the graduate (d), stopcock(c) is closed off to the patient. The syringe is then filled withsterile warmed saline. Stopcock (c) is then closed to the IVsolution (a) and the fluid is infused into the patient. Thisstep is repeated until the desired amount of fluid is infused.These steps are repeated serially until the infusion proce-dure is complete. If the amniotic fluid volume falls withinnormal range, the amniotic fluid volume at the end of theamnioexchange should be the same as at the beginning ofthe procedure. In the presence of oligohydramnios, addi-tional sterile warmed fluid can be added to the uterinecavity in order to achieve a normal fluid volume by the endof the procedure.
INTRAUTERINE SURGICAL TECHNIQUES 177
Anterior
Posterior
Up Down LeftRight
Longitudinal view of the uterus Transversal view of the uterus
pp
r
d
r
d
Figure 2. Views of the uterus.

If the fluid volume is normal, the placenta is locatedposteriorly or fundally, and the fetus is quiescent, all of thetoxic amniotic fluid planned for removal might be aspiratedin one step. With an anteriorly implanted placenta, how-ever, or in the presence of oligohydramnios or an activefetus, it may be necessary to remove a small amount ofamniotic fluid, and then replace it with warmed normalsaline, repeating the procedure serially until the amnioex-change is completed.
After completion of the amnioexchange, electronic mon-itoring of the fetal heart rate and uterine activity continuesuntil the patient fulfills the usual criteria for discharge.
AMNIOPATCH
Iatrogenic preterm premature rupture of membranes(PPROM) occurs in approximately 1.2% of patients aftergenetic amniocentesis (43), 3–5% of patients after diagnos-tic fetoscopy (44), and approximately 5–8% of patients afteroperative fetoscopy. Although the membranes might sealspontaneously in this setting (45,46), most patients con-tinue to leak fluid and are at a risk for pregnancy loss.
The overall perinatal mortality of previable PPROMmanaged expectantly is 60% (47,48). Nearly one-third ofthese deaths occurs in utero. Pulmonary hypoplasia occursin 50% of cases diagnosed before 19 weeks (49). Serioussequelae in surviving infants include blindness, chroniclung disease, and cerebral palsy.
Patients with iatrogenic PPROM between 16 and 24weeks gestation who do not have clinical evidence of intra-amniotic infection are candidates for amniopatch therapy.PPROM is confirmed with a sterile speculum examinationshowing vaginal pooling of fluid, ferning, and a positiveNitrazine test. The maximum vertical pocket of amnioticfluid is measured sonographically. Patients are placed onintravenous antibiotics and bed rest for one week to allowfor spontaneous sealing of the membranes. If spontaneoussealing does not occur, 1 unit of autologous platelets andcryoprecipitate are prepared if the patient is eligible forautologous donation. Otherwise, donor platelets and cryo-precipitate are prepared.
After informed consent, an amniocentesis is performedusing a 22 gauge needle. The needle is directed into anavailable pocket of fluid regardless of the site of the pre-vious invasive procedure. A K-51 tubing extensionattached to a three-way stopcock is connected to the hubof the needle. Platelets are administered first, followed bycryoprecipitate. In our original protocol, 1 whole unit ofplatelets was injected. We have subsequently reduced thedose of platelets to one-half a unit because of an unex-plained fetal death demise, an adverse effect probablycaused by sudden activation of a large number of platelets.
In our series of 28 cases, the average gestational age atthe time of the procedure was 19 weeks and 3 days. Theaverage gestational age of delivery in patients who did nothave an intrauterine fetal demise was 33 weeks and 4 days.Overall, membrane sealing occurred in 19 of 28 patients(67.9%). Of the 28 patients treated, 11 had a large mem-brane detachment but no overt leakage of fluid. Thedetachment of the membrane occurred from fluid escaping
the amniotic cavities through the membrane defect, caus-ing dissection of the chorionic cavity. In these patients,only the chorion separates this fluid from leaking grossly tothe vagina. In this group, the amniopatch was successful inresealing the amniotic membrane in 7 of the 11 patients(63.6%).
The precise mechanism by which the amniopatch worksis unknown. Presumably, platelet activation at the site ofrupture and fibrin formation initiates a healing processthat enables the membranes to seal.
TTTS
Feto-fetal transfusion syndrome can be described in allmonochorionic multiple pregnancies but has been exten-sively reported in twins. Twin-to-twin transfusion syn-drome (TTTS) develops in approximately 15% of allmonochorionic pregnancies (50), and carries a high peri-natal mortality rate (50). The fetuses are morphologicallynormal, and inter-twin vascular communications on thechorionic plate are thought to be responsible for thedevelopment of the disease through unidirectional bloodtransfusion from the donor to the recipient twin. Besidesthe primary hemodynamic imbalance between the twins,the disease may lead to disruptive lesions in both twins.Before the development of antenatal ultrasound, TTTSwas diagnosed at birth as a discordance of at least 20% inweight and 5 g/dL in the hemoglobin concentrations of twotwins of the same sex (52). These criteria were abandonedbecause these features could not be consistently recog-nized in utero. With the development of ultrasound, thepolyhydramnios-oligohydramnios sequence has beenfound to be the condition carrying one of the highestperinatal mortality rates in obstetrics, up to 90% withouttreatment.
Laser coagulation of placental anastomoses by fetoscopyis the most effective first-line treatment of FFTS, whichleads to at least one survivor at birth and intact survival at6 months of age in 76% and 76% respectively, as comparedwith 56% and 51% in cases treated by serial amnioreduc-tion in the Eurofetus randomized trial (53).
The selection criteria to qualify for percutaneous endo-scopy-directed laser coagulation of placental anastomosesinclude:
1. Gestational age of less than 26 weeks.
2. Ultrasound diagnosis of a single monochorionic pla-centa by ultrasound in the first trimester of preg-nancy.
3. Polyhydramnios in the recipient’s amniotic cavitywith a deepest vertical pool �8 cm or �10 cm beforeor after 20 weeks of gestation, respectively.
4. Oligohydramnios in the donor’s amniotic sac with adeepest vertical pool �2 cm.
Preoperative evaluation consists of ultrasound exami-nation, including morphological examination, fetal Dop-pler, cardiothoracic index, identification of placentallocation, and cord insertions. Amniocentesis or amniore-
178 INTRAUTERINE SURGICAL TECHNIQUES

duction prior to laser may cause intra-amniotic bleedingand therefore make the procedure more difficult, or evenimpossible, due to impaired visualization. The site of entryis chosen as demonstrated in Fig. 1, for the scope to beentered at a right angle to the long axis of the small twin inorder to maximize the chance to ensure adequate visuali-zation of the placental surface and intertwin membranes.Ideally, the scope should also be entered alongside a virtualline joining the two cord insertions. When these criteria aremet, the vascular equator of the placenta as well as thevascular anastomoses on the chorionic plate are morelikely to be visualized in the operative field.
Prophylactic cefazolin 2 g, indomethacin suppository100 mg, and oral flunitrazepam are given before surgeryand local anesthesia with nonadrenalinized xylocaine isinjected down to the myometrium. A 10 Fr cannula for acentral venous catheter loaded with a trocar is introducedpercutaneously under continuous ultrasound guidance. A 2mm 08 fetoscope (Storz 26008 AA) is passed down a straightor curved sheath to operate on posterior or anterior pla-centas, respectively. The sheath also has a working chan-nel carrying a 1 mm diode laser fiber.
A systematic examination of the chorionic plate along-side the insertion of the inter-twin membrane is per-formed. Identification of crossing vessels and of theirarterial or venous nature is possible because arteries crossover veins and show a darker red color than veins owing toa lower oxygen saturation in the circulating blood (54).Selective coagulation of anastomotic vessels is performedwith the aim of separating the monochorionic placentainto two distinct fetal-placental circulations, sparing thenormal cotyledons of each placental territory. Nonselec-tive coagulation of crossing vessels is only performedwhen the distal end or the origin of the vessel cannotbe identified. The power of the diode laser is set at 30–50w. At the end of theprocedure, excessive amniotic fluid isdrained through the sheath of the fetoscope until normalamniotic fluid volume is obtained with a deepest verticalpool of 5–6 cm.
BIPOLAR UMBILICAL CORD OCCLUSION
Selective reduction in complicated monochorionic (MC)multifetal pregnancies is performed to prevent the deliveryof an anomalous or severely compromised fetus andimprove the perinatal outcome for the surviving co-twinby delaying delivery or risk associated with spontaneousloss of the affected. The use of cardiotoxic agents, such aspotassium chloride, is contraindicated in MC pregnanciesbecause of the potential vascular transmission of the agentand compromise of the co-twin due to the presence ofplacental vascular anastomoses. Thermal vascular occlu-sive techniques, such as bipolar umbilical cord occlusion(BPC), have been shown to achieve the stated goals withminimal maternal morbidity. Indications for BPC that areunique to MC gestations include twin reverse arterialperfusion, discordant fetal anomalies, and isolated severegrowth lag. BPC has also been used as a primary inter-vention in advanced twin-twin transfusion syndrome or asa secondary procedure when alternative therapies such as
amnioreduction or laser have failed to correct the diseaseprocess.
The procedure was originally described by Deprest et al.(55). In brief, using the standard sterile technique, thepatient’s abdomen is properly prepared and draped. Anabdominal ultrasound is performed to confirm fetal posi-tion, viability, and umbilical cord locations. General andconduction anesthesia may be used; however, intravenoussedation with local infiltration of 1% lidocaine or 0.25%bupivicane for subcutaneous, deep muscle, and fasciaanesthesia is usually sufficient and is associated with lessmaternal morbidity. A small skin incision is made to allowinsertion of an endoscopic trocar. Under continuous ultra-sound guidance, the instrument is inserted through aplacental free window toward the targeted umbilical cord,ideally avoiding the gestational sac of the normal co-twin.Once the trocar is secured in the amniotic sac, the obtura-tor is removed. The bipolar forceps are inserted andadvanced to the umbilical cord.
The cord is grasped and positioned away from theamnion before thermal energy is applied. The durationand wattage (W) necessary for occlusion will vary, from20–60 s and 20–50 W, respectively, based on the gesta-tional age and umbilical cord thickness. When a full-thick-nessgrasp exists, application of the thermal energy willresult in turbulence and ‘‘streaming’’ of amniotic fluidadjacent to the forceps. It is not uncommon to have anaudible ‘‘pop’’ secondary to the heating of Wharton’s jellyand subsequent rupture of amnion at the site of occlusion,which should not be perceived as a sign of completedcoagulation. As a result of the natural spiral of the umbi-lical cord, complete occlusion of all vessels requires 2–3applications of the forceps at adjacent sites. Pulse and colorflow Doppler blood flow studies are performed to confirmcord occlusion at each site.
The size of the BPC forceps that have been used for theseprocedures has varied from 2.2–5.0 mm. The majority ofprocedures have been performed with commercially avail-able single-use 3.0 mm bipolar diathermy forceps (55–58).
Intravenous prophylactic antibiotics and indomethacinfor tocolysis are generally given prior to the procedure.Postoperative monitoring for uterine contractions and,depending on the gestational age, continuous or intermit-tent fetal heart rate should be done for at least 2 hours. Themajority of programs will observe patients for an extendedperiod of 12–24 h with limited activity. Subsequent doses ofantibiotics and tocolytic treatment are given during thistime. Prior to discharge, a limited ultrasound is performedto determine the amniotic fluid volume and assess for signsof hydrops and anemia, including Doppler velocemitry ofthe middle cerebral artery and, where appropriate, similarstudies of the umbilical artery and ductus venosus. If noevidence of preterm labor, leaking of amniotic fluid, orbleeding exists, the patient is discharged with instructionsto continue with modified bed rest at home for 7–10 days,take her temperature bid, and report an elevation, leakingof vaginal fluid, bleeding, or contractions. An ultrasound isperformed in 10–14 days and then at a minimum every 4weeks thereafter. Additional ultrasounds and fetal mon-itoring should be performed as clinically indicated by theprimary disease and gestational age.
INTRAUTERINE SURGICAL TECHNIQUES 179

BIBLIOGRAPHY
1. Harrison MR, Adzick NS. Open Fetal Surgery Techniques.The Unborn Patient: The Art and Science of Fetal Therapy,3rd ed. Harrison MR, Evan MI, Adzick NS, Holzgreve W,editors. New York: WB Saunders Company; 2001. pp 247–255.
2. Harrison MR, Anderson J, Rosen MA, et al. Fetal surgery inthe primate I. Anesthetic, surgical and tocolytic managementto maximize fetal-neonateal survival. J Pediatr Surg1982;17:115–122.
3. Nakayama DK, Harrison MR, Seron-Ferre M, et al. Fetalsurgery in the primate II. Uterine electromyographic responseto operative procedure and pharmacologic agents. J PediatrSurg 1984;19:333–339.
4. Adzick NS, Harrison MR, Glick PL, et al. Fetal surgery in theprimate III. Maternal outcome after fetal surgery. J PediatrSurg 1986;21:477–480.
5. Bianchi DW, Crombleholme TM, D’Alton ME. CysticAdenomatoid Malformation. In: Bianchi DW, CrombleholmeTM, D’Alton ME, editors. Fetology-Diagnosis & Managementof the Fetal Patient. New York: McGraw-Hill; 2000. pp 289–297.
6. Bianchi DW, Crombleholme TM, D’Alton ME. Sacrococcygealteratoma. In: Bianchi DW, Crombleholme TM, D’Alton ME,editors. Fetology-Diagnosis & Management of the FetalPatient. New York: McGraw-Hill; 2000. pp 867–877.
7. Altman RP, Randolph JG, Lilly JR. Sacrococcygeal teratoma:American Academy of Pediatrics Surgical Section Survey1973. J Pediatr Surg 1974;9:389–398.
8. Adzick NS. Management of fetal lung lesions. Clin Perinatol2003;30:481–492.
9. Hedrick HL, Flake AW, Crombleholme TM, et al. Sacrococcy-geal teratoma: Prenatal assessment, fetal intervention, andoutcome. J Pediatr Surg 2004;39(3):430–438.
10. Crombleholme TM, Coleman B, Hedrick H, et al. Cystic ade-nomatoid malformation volume ratio predicts outcome in pre-natally diagnosed cystic adenomatoid malformation of thelung. J Pediatr Surg 2002;27(3):331–338.
11. Rice HE, Estes JM, Hedrick MH, et al. Congenital cysticadenomatoid malformations: A sheep model. J Pediatr Surg1994;29:692–696.
12. Flake AW. Fetal sacrococcygeal teratoma. Sem Pediatr Surg1993;2:113–120.
13. Adzick NS, Crombleholme TM, Morgan MA, et al. A casereport. A rapidly growing fetal teratoma. Lancet 1997;349:538.
14. Hedrick HL. Ex utero intrapartum therapy. Semi Ped Surg2003;10(3):190–195.
15. Wilson RD, Johnson MP, Flake AW, et al. Reproductive out-comes after pregnancy complicated by maternal-fetal surgery.Am J Obstet Gynecol 2004;191:1430–1436.
16. Harrison MR, Filly RA, Parer JT, et al. Management of thefetus with a urinary tract malformation. JAMA 1981;246(6):635–639.
17. Nakayama D, Harrison M, deLorimier A. Prognosis of poster-ior urethral valves present at birth. J Ped Surg 1986;21:43–45.
18. Golbus MS, Harrison MR, Filly RA, et al. In utero treatment ofurinary tract obstruction. Am J Obstet Gynecol 1982; 383–388.
19. Berkowitz RL, Glickman MG, Smith GJ, et al. Fetal urinarytract obstruction: What is the role of surgical intervention inutero? Am J Obstet Gynecol 1982;144(4):367–375.
20. Rodeck C, Nicolaides K. Ultrasound guided invasive proce-dures in obstetrics. Clin Obstet Gynecol 1983;10:515.
21. Beck AD. The effect of intra-uterine urinary obstruction uponthe development of the fetal kidney. Urol 1971;105:784–789.
22. Pringle KC, Bonsib SM. Development of fetal lamb lung andkidney in obstructive uropathy: A preliminary report. FetalTher 1988;3(1-2):118–128.
23. Manning FA, Harman CR, Lange IR, et al. Antepartumchronic fetal vesicoamniotic shunts for obstructive uropathy:A report of two cases. Am J Obstet Gynecol 1983;145(7):819–822.
24. Young H, Frontz W, Baldwin J. Congenital obstruction of theposterior urethra. J Urol 1919;3:289–365.
25. Reuss A, Wladimiroff J, Niermeyer M. Antenatal diagnosis ofrenal tract anomalites by ultrasound. Pediat Nephrol1987;1:546–552.
26. Johnson MP, Bukowski TP, Reitleman C, et al. In uterosurgical treatment of fetal obstructive uropathy: A new com-prehensive approach to identify appropriate candidates forvesicoamniotic shunt therapy. Am J Obstet Gynecol1994;170(6):1770–1776; discussion 1776–1779.
27. Quintero RA, Hume R, Smith C, et al. Percutaneous fetalcystoscopy and endoscopic fulguration of posterior urethralvalves [see comments]. Am J Obstet Gynecol 1995;172(1 Pt1):206–209.
28. Quintero RA, Johnson MP, Romero R, et al. In-utero percu-taneous cystoscopy in the management of fetal lower obstruc-tive uropathy. Lancet 1995;346(8974):537–540.
29. Quintero RA, Shukla AR, Homsy YL, et al. Successful inutero endoscopic ablation of posterior urethral valves: Anew dimension in fetal urology. Urology (Online) 2000;55(5):774.
30. Steinbok P, Irvine B, Cochrane DD, Irwin BJ. Long-termoutcome and complications of children born with myelome-ningocele. Child’s Nerv Syst 1992;8:92–96.
31. McLone DG. Continuing concepts in the management of spinabifida. Pediare Neurosurg 1992;18:254–257.
32. Tulipan N, Hernanz-Schulman M, Bruner JP. Reducedhindbrain herniation after intrauterine myelomeningocelerepair: A report of four cases. Pediatr Neurosurg 1998;29:274–278.
33. Tulipan N, Hernanz-Schulman M, Bruner JP. Intrauterinemyelomeningocele repair reverses preexisting hindbrain her-niation. Pediatr Neurosurg 1999;31:137–142.
34. Bruner JP, Tulipan N, Paschall RL, Boehm FH, WalshWF, Silva SR, Hernanz-Schulman M, Lowe LH, Reed GW.Fetal surgery for myelomeningocele and the incidenceof shunt-dependent hydrocephalus. JAMA 1999;282:1819–1825.
35. Johnson MP, Sutton LN, Rintoul N, Crombleholme TM, FlakeAW, Howell LJ, Hedrick HL, Wilson RD, Adzick NS. Fetalmyelomeningocele repair: Short-term clinical outcomes. Am JObstet Gynecol 2003;189:482–487.
36. Bruner JP, Boehm FH, Tulipan N. The Tulipan-Bruner trocarfor uterine entry during fetal surgery. Am J Obstet Gynecol1999;181:1188–1191.
37. Mangels KJ, Tulipan N, Bruner JP, Nickolaus D. Use ofbipedicular advancement flaps for intrauterine closure ofmyeloschisis: Technical report. Pediatr Neurosurg 2000;32:52–56.
38. Kohl T, Sharland G, Allan LD, Gembruch U, Chaoui R, LopesLM, Zielinsky P, Huhta J, Silverman NH. World experience ofpercutaneous ultrasound-guided balloon valvuloplasty inhuman fetuses with severe aortic valve obstruction. Am JCardiol 2000;85:1230–1233.
39. Tworetzky W, Wilkins-Haug L, Jennings RW, van der VeldeME, Marshall AC, Marx GR, Colan SD, Benson CB, Lock JE,Perry SB. Balloon dilation of severe aortic stenosis in the fetus:Potential for prevention of hypoplastic left heart syndrome:candidate selection, technique, and results of successful inter-vention. Circulation 2004;110:2125–2131.
180 INTRAUTERINE SURGICAL TECHNIQUES

40. Luton D, de Lagausie P, Guibourdenche J, Peuchmaur M,Sibony O, Aigrain Y, Oury IF, Blot P. Influence of amnioinfu-sion in a model of in utero created gastroschisis in the preg-nant ewe. Fetal Diagn Ther 2000;15:224–228.
41. Luton D. Etude de L’inflammation, dans le Laparoschisis,Humain et dans un Modele de Laparoschisis de Bredis. These;2001.
42. Luton D, de Lagausie P, Guibourdenche J, Oury IF, Sibony O,Vuillard E, Boissinot C, Aigrain Y, Beaufils F, Navarro J, BlotP. Effect of amnioinfusion on the outcome of prenatally diag-nosed gastroschisis. Fetal Diagn Ther 1999;14:152.
43. The NICHD National Registry for Amniocentesis StudyGroup. Midtrimester amniocentesis for prenatal diagnosis.Safety and accuracy. JAMA 1976;236:1471–1476.
44. Rodeck C. Fetoscopy guided by real-time ultrasound for purefetal blood samples, fetal skin samples, and examination of thefetus in utero. Br J Ob Gyn 1980;87:449–456.
45. Quintero R, Reich H, Puder K, et al. Brief report: Umbilical-cord ligation of an Acardiac twin by fetoscopy at 19 weeks ofgestation. N Engl J Med 1994;33:469–471.
46. Gold R, Goyert G, Schwartz D. Conservative management ofsecond-trimester post-amniocentesis fluid leakage. ObstetGynecol 1989;74:745–747.
47. Bengtson J, VanMarter L, Barss V. Pregnancy outcome afterpremature rupture of the membranes at or before 26 weeks’gestation. Obstet Gynecol 1989;73:921–927.
48. Beydoun S, Yasin S. Premature rupture of the membranesbefore 28 weeks: Conservative management. Am J ObstetGynecol 1986;155:471–479.
49. Rotschild A, Ling E, Puterman M. Neonatal outcome afterprolonged preterm rupture of the membranes. Am J ObstetGynecol 1990;162:46–52.
50. Sebire NJ, Snijders RJ, Hughes K, et al. The hidden mortalityof monochorionic twin pregnancies. Br J Obstet Gynecol1997;104(10):1203–1207.
51. Patten RM, et al. Disparity of amniotic fluid volume and fetalsize: Problem of the stuck twin-US studies. Radiology1989;172:153–157.
52. Danskin FH, Neilson JP. Twin-to-Twin transfusion syndrome:What are appropriate diagnostic criteria? Am J Obstet Gyne-col 1989;161:365–369.
53. Senat MV, Deprest J, Boulvain M, Paupe A, Winer N, Ville Y.Endoscopic laser surgery versus serial amnioreduction forsevere twin-to-twin transfusion syndrome. N Engl J Med2004;351:136–144.
54. Benirschke K, Driscoll S. The Pathology of the Human Pla-centa. New York: Springer-Verlag; 1967.
55. Deprest JA, Audibert F, Van Schoubroeck D, Hecher K,Mahieu-Caputo D. Bipolar coagulation of the umbilical cordin complicated monochorionic twin pregnancy. Am J ObstetGynecol 2000;182:340–345.
56. Nicolini U, Poblete A, Boschetto C, Bonati F, Roberts A.Complicated monochorionic twin pregnancies: Experiencewith bipolar cord coagulation. Am J Obstet Gynecol2001;185:703–707.
57. Taylor MJO, Shalev E, Tanawattanacharoen S, Jolly M,Kumar S, Weiner E, Cox PM, Fisk NM. Ultrasound-guidedumbilical cord occlusion using bipolar diathermy for Stage III/IV twin-twin transfusion syndrome. Prenat Diagn 2002;22:70–76.
58. Johnson MP, Crombleholme TM, Hedrick H, et al. Bipolarumbilical cord cauterization for selective termination of com-plicated monochorionic pregnancies. Am J Obstet Gynecol2001;185(6):S245.
See also FETAL MONITORING; HYDROCEPHALUS, TOOLS FOR DIAGNOSIS
AND TREATMENT OF; MONITORING, UMBILICAL ARTERY AND VEIN.
OIL. See LENSES, INTRAOCULAR.
ION-EXCHANGE CHROMATOGRAPHY. SeeCHROMATOGRAPHY.
IONIZING RADIATION, BIOLOGICALEFFECTS OF
ZELENNA GOLDBERG
Department of RadiationOncologyDavis, California
INTRODUCTION
Radiation biology refers to all biologic responses induced incells and tissues by ionizing radiation, a term that encom-passes the study of all action of ionizing radiation on livingthings. Ionizing radiation (IR) is radiation that has suffi-cient energy to cause the ejection of an orbital electron fromits path around the nucleus, which indicates that thephoton or charged particle can release large amounts ofenergy in a very small space. IR is separated into electro-magnetic radiation and particulate radiation. Electromag-netic radiation consists of X rays or g rays, which differ onlyin their mode of production, not in their physical effects ininteracting with biologic tissue. X rays are produced bymachines that accelerate electrons and then focus them tohit a target usually made of tungsten or gold. The kineticenergy is transferred from the electrons to the target andthen is released as photons. These are the most commonmedical exposures through diagnostic or therapeutic radia-tion. In contrast, g-radiation is produced within thenucleus from radioactive isotopes. The g rays result fromthe unstable nuclear configuration decaying to a morestable state and releasing the ‘‘extra’’ energy in this transi-tion in the form of the g ray. Natural background radiationis of this type. Particulate radiation is those radiationsources that are not photons and consist of electrons,protons, a-particles, neutrons, and heavy charged particlessuch as the nuclei of carbon, neon, argon, or iron. Theseparticles are positively charged because the orbiting elec-trons have been stripped from them.
As noted, IR is defined by its causing the ejection of anorbital electron when the radiation interacts with tissue.These ionizing events can be further subdivided by beingdirectly ionizing or indirectly ionizing. Directly ionizingevents are those in which a charged particle with sufficientkinetic energy interacts with the tissue, directly resultingin the ejection of the orbital electron. These events happenfrequently within an exposed tissue, so the charged parti-cle rapidly transfers its energy to the tissue, a conceptcodified as linear energy transfer (LET). Charged particleshave a high LET. In contrast, indirectly ionizing radiationsuch as g- or X-radiation is first absorbed in the materialand secondary, energetic charged particles (electrons) arereleased. Because this latter process only occurs when thephoton is close enough to an atom to interact, it is referredto as sparsely ionizing radiation and has a low linearenergy transfer (LET).
IONIZING RADIATION, BIOLOGICAL 181

A longstanding paradigm in radiation biology has beenthat many effects induced by IR, including its carcinogeniceffects and ability to kill cancer cells, are the result of DNAdamage arising from the actions of IR in cell nuclei, espe-cially interactions of IR and its products with nuclear DNA(1–3). When a charged particle or secondary electron pro-duced by the interaction of a photon with an orbital elec-tron damages DNA itself, it is known as the direct action ofIR. Yet, DNA represents a small fraction of the actual sizeof the cell. Therefore, it was recognized that most of theinteraction of IR within a cell would be with more abundantbiomolecules, specifically water. If the action is mediatedthrough the intracellular production of radiolytic reactiveproducts, e.g., OH�, H�, O�
2, and H2O2, that are generated inaqueous fluid surrounding DNA, then the DNA damage iscalled indirect action. These processes unquestionably canresult in a variety of types of DNA damage, including DNAsingle- and double-strand breaks, modifications of deoxyr-ibose rings and bases, intra- and inter-strand DNA–DNAcross-links, and DNA–protein cross-links (1,4,5). About athird of all DNA damage is caused by the direct effects ofsparsely ionizing g and X rays, with the remaining balancebeing attributable to the indirect actions of IR. With high-LET radiation such as the more densely ionizing a-parti-cles that are emitted by radon and radon progeny, thedirect actions of IR on DNA become more predominantand the nature of the DNA modifications become muchmore complex. Regardless of the type of IR, all of the aboveforms of DNA damage can lead to untoward effects in cellsif unrepaired or misrepaired. With specific regard to carci-nogenesis, genomic mutations caused by IR are widelythought to arise from DNA damage that is subsequentlyconverted into a mutation as a result of misprocessing byDNA repair mechanisms or that is converted into a heri-table mutation when DNA undergoes replication.
This classic view of radiation biology is giving way to amore complex and complete understanding that the cellmembrane and other intracellular compartments, as wellas the tissue vasculature, are important targets of IR.Furthermore, as detailed below, although intracellulareffects are better defined, we now recognize that the extra-cellular environment and cell–cell contact play importantroles in modulating the effects of IR at the cellular andtissue levels.
MOLECULAR RADIATION BIOLOGY/BYSTANDER EFFECTS
IR is a cellular toxin that is sensed at the cellular levelthrough the ATM-p53-p21 pathway (6,7). Although theupstream sensor of ATM remains to be definitively eluci-dated, the initial radiation sensing protein likely has aredox sensor and undergoes a conformational change, orpossibly is phosphorylated, resulting in the phosphoryla-tion of ATM (8). This, in turn, activates the p53 pathwayleading to cell cycle arrest, nuclear translocation of tran-scription factors such as NF-kB, and either cellular repairor apoptosis. How an individual cell commits to a given fate(repair or apoptosis) remains unclear, but undoubtedly itrepresents the final integrated response to many simulta-neous intracellular events. Several excellent reviews on
this topic have been written (9,10). It should be noted thatIR also affects the 26s proteosome, which is another level ofnon-nuclear intracellular response affecting cell survival,presumably through alterations in the removal of activated(phosphorlyated) proteins, or proteins active in apoptoticprocesses such as Bcl2 (11,12).
Radiation effects in cells not directly hit by a radiationionizing event are called bystander effects. Although initialinterest in this effect can be found in the medical literatureas far back as into the 1950s, the current interest in thearea was stimulated by a study published in 1992 in whichNagasawa and Little (13) observed increases in the fre-quency of sister chromatid exchanges in �30% of immor-talized Chinese hamster ovary cells that received low-doseexposure to a-particles, even though less than 1% of thecells’ nuclei were estimated to actually receive directnuclear hits by an a-particle. That a relatively low percen-tage of the cells experienced one or more direct ‘‘hits’’ by thea-particles, be they in the cytoplasm or in the nuclei,suggested the possibility that some mechanism was con-veying a radiation-associated response to unirradiatedcells. Other groups went on to confirm and extend on thisfinding. It is now well recognized that cells do not require adirect nuclear traversal to result in radiation changes.There are extracellular responses, predominantly TGF-bmediated through media (cell culture experiments) orextracellular fluids (tissues), but other factors cannot beexcluded (14). Furthermore, it is recognized that cell–cellcontact and gap junctional communications are critical intransmitting the signal from the directly irradiated cell tothe neighboring, bystander cells (15).
TIME, DOSE, AND FRACTIONATION
The biologic effects of IR in tissue relate to the size of thedose delivered, time between radiation exposures and thetotal dose of IR given. Although environmental exposuresare chronic and (usually) low level, medical exposures areacute and can be repetitive when given for the treatment ofcancer. Radiation therapy for the treatment of malignancyremains the most effective anti-cancer agent discovered,and treatment schedules are predicated on the ‘‘4 R’s ofradiobiology’’: repair, repopulation, redistribution, andreoxygenation.
Repair of radiation-induced damage underlies theintrinsic radiation sensitivity of the cell to radiation cellkilling. Cells can be broadly grouped into those that canrepair significant amounts of damage and those with morelimited repair capacity. The former descriptive categorycorresponds to tissue types where there is limited normalcell turnover, such as lung, kidney, or brain, and these aretissues that display damage after a more prolonged timeand are therefore known as late responding tissues. Thecells with more limited intrinsic repair capacity are knownas acute responding tissues and are typified by skin or gut.These cell types have a limited life span and are constantlybeing replaced within normal physiologic functioning.
Repopulation refers to the generation of new cells toreplace those killed by the IR exposure. Although thera-peutically beneficial for containing normal tissue toxicity,
182 IONIZING RADIATION, BIOLOGICAL

repopulation is also active in malignant tissue and therebyallows greater numbers of tumor clonogens to develop aftertreatment. For some types of tumors, an acceleration ofrepopulation begins after 4 weeks of radiation therapy,which can compromise clinical outcome if prolonged ther-apeutic IR fractionation schemes are used.
Redistribution refers to the changes in cell assortmentacross the cell cycle. It has long been established that cellsvary in their sensitivity to the cytotoxic effects of IR depend-ing on where in the cell cycle they are at the time ofirradiation (16,17). Cells are most sensitive to IR effectsin the G2/M phase and are most resistant during the S-phase. G1 is intermediate between these two. Thus, clinicalradiation therapy schedules use multiple fractions to over-come the relative resistance of the cells in S-phase of the cellcycle on a given treatment day. This difference in radio-resistance across stages in the cell cycle also underlies onemechanism of the synergy between radiation therapy andmany chemotherapeutic agents in the treatment of malig-nant disease. Although S-phase cells resist killing from theIR, they are more sensitive to some chemotherapeutics thatare active during S-phase when the DNA is most exposedand is replicating. Furthermore, this alteration of cell cyclesensitivity to IR cytotoxicity also has been an area ofresearch for IR-biologic response modifiers. If one canincrease the percentage of cells in G2/M at the time of IR,then the relative cell kill per fraction of IR will increase.
Reoxygenation refers to the presence or absence ofmolecular oxygen within the cell at the time of IR delivery.As detailed at the beginning, most of the cellular damagefrom IR is mediated through the production of free radicalswithin the cell. If molecular oxygen is present, these freeradicals can be transformed into more complex peroxideradicals, which are more difficult for the cell to repair. Thisis classically known as ‘‘fixing the radiation damage’’ in theBritish use of the term ‘‘fix’’ (make more solid), not theAmerican (repair). The increase in cell killing from IR inthe presence of oxygen versus under hypoxic conditions isknown as the oxygen enhancement ratio, and it is approxi-mately a factor of 2–3, dependent on where in the cell cyclethe irradiated cell sits. Although normal tissues have awell-maintained vascular supply so that oxygenation isessentially constant, tumors have a tortuous and unstablevasculature, so that the vessels can open and close erra-tically. This type of hypoxia is referred to as ‘‘acutehypoxia.’’ Chronic hypoxia occurs when the tumor out-grows its blood supply and the tumor cells are simplybeyond the diffusion capability of molecular oxygen.Attempts to exploit this differential, either by sensitizingthe hypoxic cells or by specifically targeting them, havebeen explored and remain active areas of research.Furthermore, identification of the presence of hypoxiaremains a significant clinical strategy (18).
The four R’s of radiobiology reflect intracellular controlsof overall radiation response. The tissue level effects fromIR in the treatment of cancer are dependent on severalparameters: volume, dose per fraction, total dose, and timebetween fractions. The volume of tissue irradiated is cri-tical for determining the long-term repair by repopulationby normal cells to fill in for those irreparably damaged bythe IR. Each cell type has its own intrinsic radiation
sensitivity, and the tissue organization (serial or parallelcellular arrangement) as well as the tissue vasculatureplay critical roles in tissue repair and thus radiosensitivity.Tissues are subdivided into two categories of radiosensi-tivity based on when they display their damage. Tissuesthat display their radiation induced damage during astandard course of medical radiation therapy are knownas ‘‘acute responding tissues.’’ These tissues naturally havea large amount of cellular turnover, such as skin or gut,and at a cellular level, this corresponds to lesser ability torepair sublethal DNA damage (i.e., a larger proportion ofDNA damage is lethal and nonrepairable). In contrast,tissues where there is little or no normal cellular turnover,such as brain, kidney, lung, or spinal cord, there is asubstantial ability to repair sublethal damage, and tissuetoxicity from radiation therapy is displayed late, long aftertherapy has finished. These tissues are therefore labeled‘‘late responding tissues.’’ Therapeutic strategies aredesigned to separate these two types of responses as malig-nant tumors are models of acute responding tissues,whereas the dose limiting side effects from radiationtherapy are secondary to late responding tissue effects(19,20).
THE LINEAR NO-THRESHOLD MODEL OF RADIATIONEFFECTS
Based on the data collected from the victims of the bombdetonations at Hiroshima and Nagasaki, a linear no-threshold model of radiation effects was developed andadopted for public policy applications. In essence, themodel states that (1) all radiation exposures are biologi-cally active, (2) the response in the cells/tissue is linearwith dose, and (3) there is no threshold below which there isno or negligible effects. The model was developed from themoderately low-dose exposure ranges of 0.5–2 Gy and themedically significant sequelae of increased mortality (car-cinogenic and noncarcinogenic, predominantly cardiovas-cular) (21–23). Hiroshima and Nagasaki data represent theeffects of a single acute dose exposure delivered to thewhole body with the nutritional deprivation from WW2;as such, they are subject to criticism and questions of theirapplicability to modern healthy populations where low-dose radiation exposure is often of a more chronic nature.Nevertheless, they remain the best available population-based data, and they have been painstakingly collected andanalyzed. As detailed below, however, the shape of theresponse curve at the lowest doses remains controversial.
LOW-DOSE EXPOSURES
Low-dose ionizing radiation (LDIR) in the 1–10 cGy rangehas largely unknown biological activity in the human.Current modeling for health and safety regulations, aswell as prediction of carcinogenesis, presupposes a linear,no-threshold model of radiation effects based on thenuclear bomb explosion data, which estimates the effectand risk at low dose by extrapolation from measured effectsat high doses. Yet the scientific literature presents amore complex picture, and few data clearly support a linear
IONIZING RADIATION, BIOLOGICAL 183

dose-response model and none in humans. Numerous stu-dies suggest some effects of LDIR may be benign or evenbeneficial under some circumstances (24,25). Reportedbenefits include stimulated growth rates in animals,increased rates of wound healing, reductions in cell apop-tosis, enhancements in the repair of damaged DNA, andincreases in radioresistance via the induction of an adap-tive response, among others (26–28). Other lines of evi-dence, however, suggest LDIR can be hazardous, and if athreshold for detrimental responses does exist, it is opera-tional only at very low dose levels, e.g., �1 cGy. Schiestl etal. (29) found that 1–100 cGy doses of X rays could causegenetic deletions in mice in a linear dose-response manner.This remains an active area of research (30).
Little is known regarding individual variability in sen-sitivity to radiation exposure. Studies are actively ongoingto develop methods to best assess interindividual varia-bility. This understanding will have both a health riskassessment and medical applications (31).
GENOMIC INSTABILITY
Radiation-induced genomic instability encompasses arange of measurable endpoints such as chromosome desta-bilization, sister chromatid exchanges, gene mutation andamplification, late cell death, and aneuploidy, all of whichmay be causative factors in the development of clinicaldisease, including carcinoma.
Kadhim et. al. identified the persistence of radiation-induced chromosomal instability following a-particle irra-diation in clonal populations of murine bone marrow cells(32). The same group followed up this seminal work with anexamination of four human bone marrow samples, subjectedto an ex vivo a-particle IR (33). Further research thendemonstrated that the genomic instability phenotype couldbe transmitted in vivo when murine hemopoietic cells thathad been irradiated in vitro were transplanted into micethat had previously had their native bone marrow purged(34). However, when Whitehouse and Tawn examinedradiation workers in Sellafield, England, who had bonemarrow plutonium deposition evidence for genomic instabil-ity was not found (35). Whether g-IR could induce genomicinstability was then examined. The original reports fromKadhim et al. were negative (32,33), but further researchexamining hprt locus mutations convincingly demonstratedthat genomic instability was inducible by g-irradiation (36).Thus, although genomic instability can clearly be demon-strated in the laboratory, whether it occurs in humans afterIR exposure remains uncertain (37).
Our understanding of the biologic effects of IR is evol-ving and ever growing. Research has been active in thisfield for over 100 years, and it remains a vibrant researcharea with the new molecular tools now available. Thetarget of interest and concern is as small as the individualDNA base or as large as the whole organism. Mechanisticstudies of the subcellular targets of IR and the cellularresponse signaling cascades must be matched with morecomplex system evaluations so that the summative effect ofthese pathways becomes known. Cell signaling existswithin and between cells, and this cross-talk affects the
ultimate response to IR exposure. Improving our under-standing of radiation response at the cellular and tissuelevels will undoubtedly yield advances for medical/thera-peutic radiation as well as general cellular biology.
BIBLIOGRAPHY
1. Goodhead DT. Initial events in the cellular effects of ionizingradiations: Clustered damage in DNA. Int J Radiation Biol1994;65(1):7–17.
2. Iliakis G. The role of DNA double strand breaks in ionizingradiation-induced killing of eukaryotic cells. Bioessays1991;13(12):641–648.
3. Sutherland BM, et al. Clustered DNA damages induced by xrays in human cells. Radiat Res 2002;157(6):611–616.
4. Ward JF. DNA damage produced by ionizing radiation inmammalian cells: identities, mechanisms of formation, andreparability. Prog Nucleic Acid Res Mol Biol 1988;35:95–125.
5. Sutherland BM, et al. Clustered DNA damages induced inisolated DNA and in human cells by low doses of ionizingradiation. Proc Natl Acad Sci USA 2000;97(1):103–108.
6. Fernandes N, et al. DNA damage-induced association of ATMwith its target proteins requires a protein interaction domainin the N terminus of ATM. J Biol Chem 2005;280(15):15158–15164.
7. Kang J, et al. Functional interaction of H2AX, NBS1, and p53in ATM-dependent DNA damage responses and tumor sup-pression. Mol Cell Biol 2005;25(2):661–670.
8. Lavin MF, et al. ATM signaling and genomic stability inresponse to DNA damage. Mutat Res 2005;569(1–2):123–132.
9. McBride WH, et al. A sense of danger from radiation. RadiatRes 2004;162(1):1–19.
10. Li L, Zou L. Sensing, signaling, and responding to DNAdamage: Organization of the checkpoint pathways in mam-malian cells. J Cell Biochem 2005;94(2):298–306.
11. Ghobrial IM, Witzig TE, Adjei AA. Targeting apoptosis pathwaysin cancer therapy. CA Cancer J Clin 2005;55(3):178–194.
12. Pervan M, et al. Molecular pathways that modify tumorradiation response. Am J Clin Oncol 2001;24(5):481–485.
13. Nagasawa H, Little JB. Induction of sister chromatidexchanges by extremely low doses of alpha- particles. CancerRes 1992;52(22):6394–6396.
14. Barcellos-Hoff MH. Integrative radiation carcinogenesis:Interactions between cell and tissue responses to DNAdamage. Semin Cancer Biol 2005;15(2):138–148.
15. Goldberg Z, Lehnert BE. Radiation-induced effects in unirra-diated cells: A review and implications in cancer. Int J Oncol2002;21:337–349.
16. Brown JM. The effect of acute x-irradiation on the cell pro-liferation kinetics of induced carcinomas and their normalcounterpart. Radiat Res 1970;43(3):627–653.
17. Brown JM, Berry RJ. Effects of X-irradiation on the cellpopulation kinetics in a model tumour and normal tissuesystem: Implications for the treatment of human malignan-cies. Br J Radiol 1969;42(497):372–377.
18. Brown JM, Wilson WR. Exploiting tumour hypoxia in cancertreatment. Nat Rev Cancer 2004;4(6):437–447.
19. Fowler JF. The eighteenth Douglas Lea lecture. 40 years ofradiobiology: Its impact on radiotherapy. Phys Med Biol1984;29(2):97–113.
20. Fowler JF. Potential for increasing the differential responsebetween tumors and normal tissues: Can proliferationrate be used? Int J Radiat Oncol Biol Phys 1986;12(4):641– 645.
21. Hayashi T, et al. Long-term effects of radiation dose oninflammatory markers in atomic bomb survivors. Am J Med2005;118(1):83–86.
184 IONIZING RADIATION, BIOLOGICAL

22. Preston DL, et al. Effect of recent changes in atomic bombsurvivor dosimetry on cancer mortality risk estimates. RadiatRes 2004;162(4):377–389.
23. Yamada M, et al. Noncancer disease incidence in atomic bombsurvivors, 1958–1998. Radiat Res 2004;161(6):622–632.
24. Loken MK, Feinendegen LE. Radiation hormesis. Its emer-ging significance in medical practice. Invest Radiol1993;28(5):446–450.
25. Jaworowski Z. Hormesis: The beneficial effects of radiation.21st Century Sci Tech 1994;7:22–27.
26. Shadley JD, Afzal V, Wolff S. Characterization of the adaptiveresponse to ionizing radiation induced by low doses of X rays tohuman lymphocytes. Radiat Res 1987;111(3):511–517.
27. Liu SZ, Liu WH, Sun JB. Radiation hormesis: Its expression inthe immune system. Health Phys 1987;52(5):579–583.
28. Sagan LA, Cohen JJ. Biological effects of low-dose radiation:Overview and perspective. Health Phys 1990;59(1): 11–13.
29. Schiestl RH, Khogali F, Carls N. Reversion of the mouse pink-eyed unstable mutation induced by low doses of x-rays. Science1994;266(5190):1573–1576.
30. Goldberg Z, et al. Effects of low-dose ionizing radiation on geneexpression in human skin biopsies. Int J Radiat Oncol BiolPhys 2004;58(2):567–574.
31. Rocke DM, et al. A Method for Detection of Differential GeneExpression in the Presence of Inter-Individual Variability inResponse. Bioinformatics. In press.
32. Kadhim MA, et al. Transmission of chromosomal instabilityafter plutonium alpha-particle irradiation. Nature 1992;355(6362):738–740.
33. Kadhim MA, et al. Alpha-particle-induced chromosomalinstability in human bone marrow cells. Lancet 1994;344(8928):987–988.
34. Watson GE, et al. Chromosomal instability in unirradiatedcells induced in vivo by a bystander effect of ionizing radiation.Cancer Res 2000;60(20):5608–5611.
35. Whitehouse CA, Tawn EJ. No evidence for chromosomalinstability in radiation workers with in vivo exposure toplutonium. Radiat Res 2001;156(5 Pt 1):467–475.
36. Kadhim MA, Marsden SJ, Wright EG. Radiation-inducedchromosomal instability in human fibroblasts: Temporaleffects and the influence of radiation quality. Int J RadiatBiol 1998;73(2):143–148.
37. Goldberg Z. Clinical implications of radiation-induced genomicinstability. Oncogene 2003;22(45):7011–7017.
See also CODES AND REGULATIONS: RADIATION; NONIONIZING RADIATION,BIOLOGICAL EFFECTS OF; RADIATION DOSIMETRY FOR ONCOLOGY; RADIATION
PROTECTION INSTRUMENTATION; RADIATION THERAPY, QUALITY ASSURANCE IN.
ION-PAIR CHROMATOGRAPHY. SeeCHROMATOGRAPHY.
ION–SENSITIVE FIELD-EFFECT TRANSISTORS
PAUL A. HAMMOND
DAVID R.S. CUMMING
University of GlasgowGlasgow, United Kingdom
INTRODUCTION
The pH of a solution is defined as
pH ¼ �log½Hþ� (1)
where [Hþ] is the concentration of hydrogen ions in thesolution. The standard laboratory method of measuring thepH of a solution uses a glass electrode with a thin-walled,bulb-shaped membrane at the bottom. The electrode isfilled with a standard solution (usually 0.1 M HCl), intowhich a silver wire coated with silver chloride is dipped(Fig. 1). Hydrolysis of both the inside and outside of theglass membrane forms thin gel layers, separated by dryglass inside the membrane. Hydrogen ions from the testsolution are able to diffuse into the outside gel layer. Theglass is doped with mobile ions (e.g., Liþ), which are able tocross the membrane and ‘‘relay’’ the concentration of Hþ
ions in the test solution to the inside of the bulb. To makepH measurements, the potential of the internal silver wireis measured with respect to a reference electrode. Since theglass membrane is selective toward [Hþ] ions, the overallcell potential (at room temperature) is given by the Nernstequation:
c ¼ const þ kT
qln½Hþ� (2a)
¼ const þ 25:7 10�3 ln 10 log½Hþ� (2b)
¼ const � 0:0592 pH (2c)
where k is the Boltzmann constant, T the absolutetemperature, and q the electronic charge.
A conventional reference electrode consists of a glasstube containing a filling solution of known composition(e.g., saturated KCl). In an Ag/AgCl electrode, electricalcontact is made to the filling solution by a silver wire thathas been coated with silver chloride. If saturated KCl isused, the wire develops a potential of 199 mV versus thestandard hydrogen electrode (SHE). This potentialremains constant as long as the chloride concentrationremains constant. The internal filling solution is separatedfrom the test solution by a permeable membrane or ‘‘liquidjunction’’, usually made from porous glass or ceramic.Diffusion of ions through the junction provides the con-ductive path between the reference electrode and the testsolution. The KCl is usually used as the filling solution, asthe mobility of the Kþ and Cl� ions are nearly equal,minimising any build-up of junction potential.
The glass-electrode, with its complicated materials andinternal reference solution, does not lend itself to minia-turization. However, with the arrival of the metal oxidesemiconductor field-effect transistor (MOSFET) in 1960,another method of measuring the interface potentialbecame available. The MOSFET is a three-terminal devicein which the voltage on a gate electrode controls the cur-rent flowing between source and drain electrodes. TheMOSFET has a metal or polysilicon gate electrode, separa-ted from the bulk silicon by a thin, insulating gate oxidelayer to provide an extremely high input impedance (Fig. 2a).In an n-channel MOSFET, a positive voltage applied to thegate electrode attracts electrons from the bulk of the p-typesilicon to the surface beneath the oxide and creates aninversion region that is rich in mobile electrons. Thisinversion region forms a channel that allows current toflow between source and drain. The minimum gate voltage
ION–SENSITIVE FIELD-EFFECT TRANSISTORS 185

that is required to produce ‘‘strong’’ inversion is termed thethreshold voltage and is given by
VT ¼ FM �FS
q� QI
CI� QS
CIþ 2cF (3)
The threshold voltage incorporates the work function dif-ference between the metal gate and the silicon (FM �FS),any fixed charge in the oxide or in the oxide–silicon inter-face QI and the charge in the depletion region of the siliconQS. The term 2cF is twice the Fermi level of the p-typesilicon and arises from the definition of strong inversion,that is the inverted material must have a free-electrondensity that is equivalent to the acceptor density in the p-type material (1). The parameter CI is the capacitance ofthe oxide (insulator) layer, and all charges and capaci-tances are expressed per unit area.
In 1970, Bergveld (2) recognized that the MOSFETstructure could be adapted to create an ion-sensitiveFET (ISFET) by omitting the metal gate. He found thatby applying a voltage between the source and drain of thisdevice and placing it in solution, the current flowing wouldvary with the pH of the solution. This first ISFET used thenative gate oxide (SiO2) as the ion-sensing layer and wassensitive to the concentration of both Naþ and Hþ ions inthe solution (3). The silicon dioxide, used to insulate themetal gate from the silicon substrate, has a similar struc-
ture to the permselective membrane used in the glasselectrode, and will therefore respond to the concentrationof hydrogen ions in a solution. A reference electrode, theelectrical contact of which can be regarded as the gateterminal, is used to bias the ISFET (Fig. 2b).
A model for an ISFET, made by excluding the metal gatefrom a MOSFET, will include all the contributions to itsthreshold voltage considered in equation 3. There are anadditional two terms, one due to the potential of thereference electrode cREF, and the other due to the potentialat the solution–oxide interfaceDc þ xSOL. Here, xSOL is theconstant surface dipole potential of the solvent (usuallywater), and Dc is the concentration-dependent interfacepotential. The threshold voltage of the ISFET is then
VT ¼ cREF � Dcþ xSOL �FS
e� QI
CI� QS
CIþ 2cF (4)
since the gate metal of the MOSFET is replaced by themetal in the reference electrode and its work function hasbeen included in cREF.
The only term in equation 4 that varies with ionicconcentration is Dc, so measuring the concentration issimply a matter of measuring VT. The ISFET is then anideal transducer with which to measure ionic concentra-tions since it has an extremely high input impedance, andhence does not require any bias current to flow in thesolution. It also uses the same fabrication process as aMOSFET, suggesting that not only can it be made verysmall, but that it can be integrated on the same substrateas the sensor electronics.
THE SITE-BINDING MODEL
Initially, it was assumed that the silicon dioxide insulatorused in the ISFET would obey the Nernst equation, in thesame way as the membrane used in the glass electrode did.This meant that, for a pH-ISFET, Dc, and hence VT, wouldbe a linear function of pH with a response of 59 mV�pH�1.The model for the ISFET simply substituted the Nernstequation in place of Dc in equation 4 (4). While this
186 ION–SENSITIVE FIELD-EFFECT TRANSISTORS
Figure 1. Diagram of the glass electrodetogether with a silver–silver chloride referenceelectrode.
Glasselectrode
Referenceelectrode
0.1 M HCl
Glass membrane
AgCl coated Ag wire
KCl crystals
AgCl coated Ag wire
Saturated KCl
Liquid junction
Source Drain
p-substrate
Gate
SiO2
Bulk
Channel
(a) MOSFET.
Gate
Source Drain
p-substrate
SiO2
Bulk
Current
(b) ISFET.
Figure 2. Diagrams showing the similarity in cross-sectionbetween a MOSFET and an ISFET.

suggested how to operate the ISFET in a circuit, it did notprovide any insight into the chemical processes that occurat the solution–oxide interface. Nor did it provide anexplanation for the sub-Nernstian and pH dependent sen-sitivities that were measured for SiO2 ISFETs (5).
The so-called site-binding model assumes that the insu-lator surface has ionizable sites that react directly with theelectrolyte to bind or release hydrogen ions. The surfacebecomes more or less charged depending on the concentra-tion of ions in the solution. The charged surface induces alayer of complementary charge in the solution that formsa double-layer capacitance across which the interfacepotential is developed. The solution side of the insulator–electrolyte interface is thought to be made up of several‘‘layers’’ as shown in Fig. 3. The solvent molecules and anyions that are specifically adsorbed onto the surface make upan inner layer. The locus of the electrical centers of theadsorbed ions is called the inner Helmholtz plane (IHP) orStern layer. The total surface charge density in this planedue to the ions is s0. Solvated ions in the solution cannotapproach as close to the surface, and their locus of closestapproach forms the outer Helmholtz plane (OHP). Theinteraction of the solvated ions with the surface is purelyelectrostatic and they are referred to as nonspecificallyadsorbed ions. Because of thermal mixing in the solution,these ions are distributed throughout the diffuse layer thatextends from the OHP into the bulk of the electrolyte. Theexcess charge density in the diffuse layer is sD so that thetotal charge in the solution is sD þ s0.
The charge density in the semiconductor region is sS, soapplying the requirement of charge neutrality:
sD þ s0 þ sS ¼ 0 (5)
If the potential in the semiconductor bulk is defined to bezero and the potential of the electrolyte bulk is fixed atcREF, then
cREF þ ðcD � cREFÞ þ ðc0 � cDÞ þ ðcS � c0Þ � cS ¼ 0 (6)
In addition,
c0 � cS ¼ �sS
CI(7)
c0 � cD ¼ � sD
CH(8)
cD � cREF ¼ � 2kT
esinh�1 sDffiffiffiffiffiffiffiffiffiffiffiffiffi
8ekTcp (9)
where k is the Boltzmann constant, e is the permittivity,and c is the total ionic concentration of the solution. Thelast equality (eq. 9) is the Gouy–Chapman model forthe diffuse layer (6), and CH is the capacitance formedbetween the inner and outer Helmholtz planes. Combin-ing equations 6–9 produces:
cREF þ�2kT
esinh�1 sDffiffiffiffiffiffiffiffiffiffiffiffiffi
8ekTcp� �
� sD
CH|fflfflfflfflfflfflfflfflfflfflfflfflfflfflfflfflfflfflfflfflfflfflfflfflfflfflfflffl{zfflfflfflfflfflfflfflfflfflfflfflfflfflfflfflfflfflfflfflfflfflfflfflfflfflfflfflffl}cEI �Dc
þsS
CI� cS|fflfflfflfflffl{zfflfflfflfflffl}cIS
¼ 0 (10)
This equation provides a link between the interfacepotential Dc and the charge density of the EIS system.
The ‘‘site-binding’’ model was developed by Yates et al. (7)to describe the interactions at a general oxide–electrolyte
interface. It was later applied to the electrolyte–SiO2–Sisystem by Siu and Cobbold (8) and Bousse et al. (9), whoseapproach is outlined here. When an SiO2 surface is incontact with an aqueous solution, it hydrolyzes to formsurface silanol (SiOH) groups. These groups are ampho-teric, meaning that they can react with either an acid or abase. The acidic and basic character of a neutral SiOH siteis described by the following reactions (Fig. 4) and disso-ciation constants. (The dissociation constant is the equili-brium constant for a reversible dissociation reaction. Itexpresses the amount by which the equilibrium favors the
ION–SENSITIVE FIELD-EFFECT TRANSISTORS 187
Specificallyadsorbed
cation
Solvatedanion
IHP
OH
P
σD
σ0
σS
σ
EREFψD
ψ0
ψS
V
Ele
ctro
lyte
Insu
lato
r
Sem
icon
duct
or
Solventmolecule
Charge density
Potential
-
-
-
+
+
+
-
-
+
+
+
+
+
Figure 3. Model of the electrolyte–insulator–semiconductor(EIS) system.
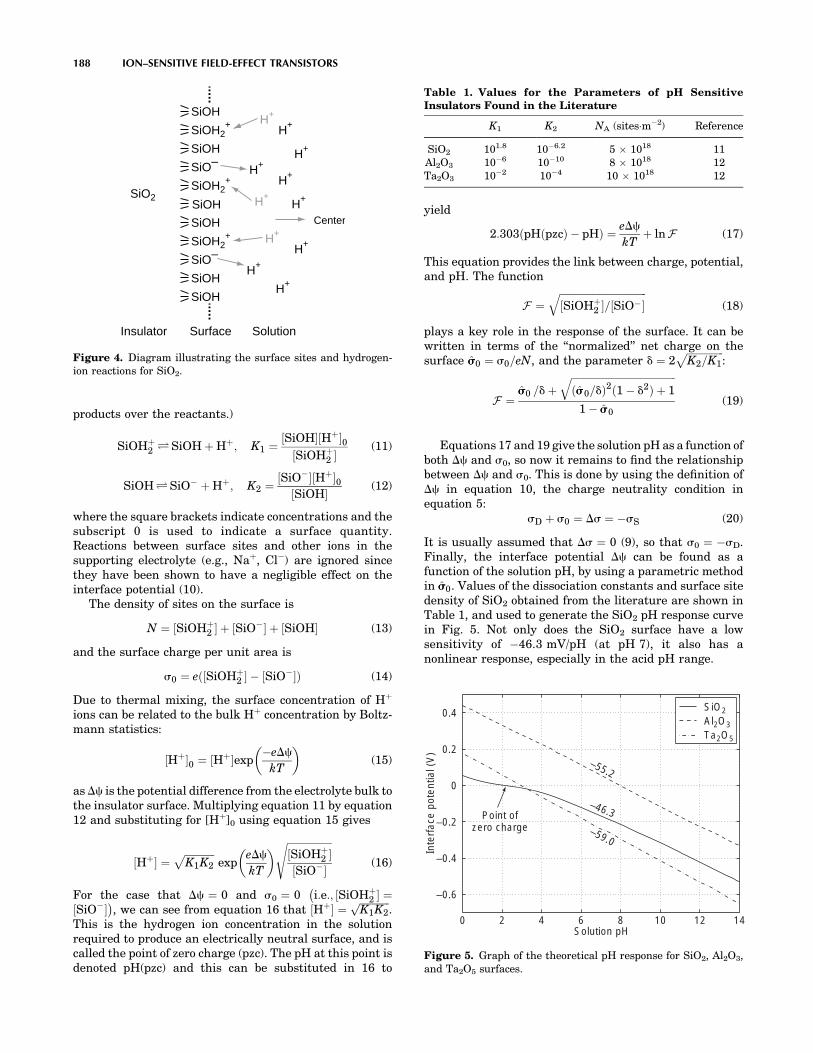
products over the reactants.)
SiOHþ2 ÐSiOH þ Hþ; K1 ¼ ½SiOH�½Hþ�0
½SiOHþ2 �
(11)
SiOHÐSiO� þ Hþ; K2 ¼ ½SiO��½Hþ�0½SiOH� (12)
where the square brackets indicate concentrations and thesubscript 0 is used to indicate a surface quantity.Reactions between surface sites and other ions in thesupporting electrolyte (e.g., Naþ, Cl�) are ignored sincethey have been shown to have a negligible effect on theinterface potential (10).
The density of sites on the surface is
N ¼ ½SiOHþ2 � þ ½SiO�� þ ½SiOH� (13)
and the surface charge per unit area is
s0 ¼ eð½SiOHþ2 � � ½SiO��Þ (14)
Due to thermal mixing, the surface concentration of Hþ
ions can be related to the bulk Hþ concentration by Boltz-mann statistics:
½Hþ�0 ¼ ½Hþ�exp�eDc
kT
� �(15)
as Dc is the potential difference from the electrolyte bulk tothe insulator surface. Multiplying equation 11 by equation12 and substituting for [Hþ]0 using equation 15 gives
½Hþ� ¼ffiffiffiffiffiffiffiffiffiffiffiffiK1K2
pexp
eDc
kT
� � ffiffiffiffiffiffiffiffiffiffiffiffiffiffiffiffiffiffi½SiOHþ
2 �½SiO��
s(16)
For the case that Dc ¼ 0 and s0 ¼ 0 i:e:; ½SiOHþ2 � ¼
�½SiO��
�, we can see from equation 16 that ½Hþ� ¼
ffiffiffiffiffiffiffiffiffiffiffiffiK1K2
p.
This is the hydrogen ion concentration in the solutionrequired to produce an electrically neutral surface, and iscalled the point of zero charge (pzc). The pH at this point isdenoted pH(pzc) and this can be substituted in 16 to
yield
2:303ðpHðpzcÞ � pHÞ ¼ eDc
kTþ lnF (17)
This equation provides the link between charge, potential,and pH. The function
F ¼ffiffiffiffiffiffiffiffiffiffiffiffiffiffiffiffiffiffiffiffiffiffiffiffiffiffiffiffiffiffiffiffiffiffiffi½SiOHþ
2 �=½SiO��q
(18)
plays a key role in the response of the surface. It can bewritten in terms of the ‘‘normalized’’ net charge on thesurface ŝs0 ¼ s0=eN, and the parameter d ¼ 2
ffiffiffiffiffiffiffiffiffiffiffiffiffiffiffiK2=K1
p:
F ¼ŝs0 =dþ
ffiffiffiffiffiffiffiffiffiffiffiffiffiffiffiffiffiffiffiffiffiffiffiffiffiffiffiffiffiffiffiffiffiffiffiffiffiffiffiffiffiffiðŝs0=dÞ2ð1 � d2Þ þ 1
q1 � ŝs0
(19)
Equations 17 and 19 give the solution pH as a function ofboth Dc and s0, so now it remains to find the relationshipbetween Dc and s0. This is done by using the definition ofDc in equation 10, the charge neutrality condition inequation 5:
sD þ s0 ¼ Ds ¼ �sS (20)
It is usually assumed that Ds ¼ 0 (9), so that s0 ¼ �sD.Finally, the interface potential Dc can be found as afunction of the solution pH, by using a parametric methodin ŝs0. Values of the dissociation constants and surface sitedensity of SiO2 obtained from the literature are shown inTable 1, and used to generate the SiO2 pH response curvein Fig. 5. Not only does the SiO2 surface have a lowsensitivity of �46.3 mV/pH (at pH 7), it also has anonlinear response, especially in the acid pH range.
188 ION–SENSITIVE FIELD-EFFECT TRANSISTORS
SiOH
SiOH2+
SiOH2+
SiOH
SiOH2+
SiOH
SiO–
SiOH
SiOH
SiO–SiOH
H+
H+
H+
H+
H+
H+
H+
H+
SiO2
Surface SolutionInsulator
H+
H+
H+
Center
Figure 4. Diagram illustrating the surface sites and hydrogen-ion reactions for SiO2.
Table 1. Values for the Parameters of pH SensitiveInsulators Found in the Literature
K1 K2 NA (sites�m�2) Reference
SiO2 101.8 10�6.2 5 1018 11Al2O3 10�6 10�10 8 1018 12Ta2O3 10�2 10�4 10 1018 12
0 2 4 6 8 10 12 14
–0.6
–0.4
–0.2
0
0.2
0.4
Solution pH
Inte
rfac
e po
tent
ial (
V)
–46.3
–59.0
–55.2
Point ofzero charge
SiO2Al2O3Ta2O5
Figure 5. Graph of the theoretical pH response for SiO2, Al2O3,and Ta2O5 surfaces.

The insulators Al2O3 and Ta2O5 also have amphotericsurface groups, so can be modelled using the same para-metric method. As shown in Fig. 5, these surfaces produce alinear response with sensitivities much closer to the Nerns-tian ideal of �59.2 mV�pH�1. As a result, Al2O3 and Ta2O5
have been widely used as the pH sensitive layer for fabri-cating ISFETs. The measured sensitivities for these insu-lators (53–57 mV�pH�1 for Al2O3, 56–57 mV�pH�1 forTa2O5; see Table 2) are close to the theoretical valuesshown in Fig. 5.
DEVELOPMENT OF THE ISFET
Much of the subsequent work on ISFETs has concentratedon measuring pH, as this plays a vital role in manybiochemical systems. Because silicon dioxide has a lowpH sensitivity, the magnitude of which varies with pH(5), Matsuo and Wise (13) experimented with the use ofsilicon nitride (Si3N4) instead. Their ISFET was made bydepositing a layer of nitride on top of the thermally growngate oxide. The ISFET was located at the tip of a needle-shaped probe, which was covered in a thick layer of SiO2 toinsulate it from the solution (Fig. 6). The ISFET was foundto have an almost ideal pH response and very low sensi-tivity to sodium and potassium ion concentrations. Selecti-vity between ion species is important to differentiatechanges in pH from changes in the total ionic concentrationof the solution.
In a sense, silicon nitride was an obvious material toinvestigate as it was, and still is, widely used as a passiva-tion layer to protect devices, such as integrated circuitsfrom the ingress of moisture. Other well-known materialsincluded the oxides of aluminium and tantalum (Al2O3 andTa2O5). The pH sensitivity, ion selectivity, response times,and drift rates for these materials have been extensivelystudied (5). Silicon oxynitride (SiOxNy) and other moreexotic insulators, such as zirconium and tin oxides(ZrO2, SnO2), and even diamond-like carbon (DLC) haveall been used to make pH ISFETs. Oxides and nitrides ofmetals have also been investigated to try and improveparameters, such as response time and maximum operat-
ing temperature. These include platinum oxide (PtO2),titanium nitride (TiN), iridium oxide (Ir2O3), and indiumtin oxide (ITO). The published pH sensitivity and driftrates (where available) for these materials are summarizedin Table 2.
Apart from the choice of pH sensitive material, devel-opment of the ISFET has mostly focused on achievingcompatibility with the CMOS process. CMOS devices usecomplementary pairs of n-type and p-type MOSFETs toimplement circuits. The CMOS process is the dominanttechnology for integrated circuits (ICs), so achieving com-patibility would allow complex devices containing ISFETsto be fabricated by a standard, industrial process. Figure 7is a simplified cross-section of a CMOS invertor, showingthe polysilicon gate electrodes, the source and drainregions and the metal interconnections.
ISFETs have been made using both NMOS and PMOStransistors. However, in a p-substrate process, the bulkterminal of a PMOS ISFET can be biased above the sub-strate ground potential, permitting more flexibility in cir-cuit design. The reverse is true for an n-substrate CMOSprocess. It has also been shown that the noise performanceof an ISFET is dominated by 1/f or ‘‘flicker’’ noise (23),which is lower in PMOS transistors (24).
Initial attempts to integrate ISFETs involved signifi-cant modifications to the standard CMOS process. Wongand White (15) followed the standard sequence of CMOSprocess steps, until the metallization stage. They thenremoved the oxide, the polysilicon gate electrode, andthe gate oxide above the ISFETs by wet etching. A thinner
ION–SENSITIVE FIELD-EFFECT TRANSISTORS 189
Gate window
NitrideOxide
OxideAluminium
p-substrate
p+ n+n+ p+
D S
Figure 6. Diagram of the cross-section through an ISFET formedby depositing silicon nitride directly on top of the gate oxide (13).
Table 2. Values of pH Sensitivity and Drift Rates for ISFETs Made Using a Arange of Materials, Obtainedfrom the Literature
Material pH Range Sensitivity, (mV�pH�1) Drift, (mV�h�1) Reference
SiO2 4–10 25–35 (pH < 7) Unstable 537–48 (pH > 7)
SiOxNy 2–8.3 57.4 � 0.4 0.8 (pH 7) 144–9 18–20 Not mentioned 15
PtO2 1–10 40.5 � 4.0 0.5 (pH 6.86) 16Si3N4 1–13 45–56 1.0 (pH 7) 5ZrO2 2–10 50 Slow response 17Al2O3 1–13 53–57 0.1–0.2 (pH 7) 5Ta2O5 1–13 56–57 0.1–0.2 (pH 7) 5DLC 1–12 54–59 3 mV/h (pH 3) 18SnO2 2–10 55–58 Not mentioned 19ITO 2–12 58 Not mentioned 20TiN 1.68–10.01 59 < 1 21
Ir2O3 3–10 59.5 Unclear 22

oxide layer was regrown and the sensing layer of Si3N4 orTa2O5 was deposited on top of this. The contact windowswere then opened and the aluminum deposited to form theinterconnects as for a normal CMOS process.
Bousse et al. (25) took a similar approach, but completedthe CMOS process before etching away the deposited SiO2
above the polysilicon gate of the ISFET. They then depos-ited Si3N4 over the whole wafer so that the polysilicon wasretained as a floating electrode in the ISFET. This floatingelectrode did not reduce the ISFET sensitivity to pH, andhad the additional benefit of making the ISFET less sensi-tive to changes in light levels. It does this by shielding thechannel from photons that can generate electron–holepairs, which contribute to the ISFET current. However,since the nitride they used was deposited by low pressurechemical vapor deposition (LPCVD) at 785 8C, the alumi-nium interconnect had to be replaced with tungsten sili-cide, which was able to withstand this high temperaturestep. This meant that a specially modified CMOS processhad to be used to fabricate the ISFETs.
Bausells et al. (26) extended the floating electrode ideato a two-metal CMOS process by connecting the polysilicongate and both metal layers together. In addition, they usedthe silicon oxynitride passivation layer as the pH sensitivematerial for the ISFET (Fig. 8). This meant that the ISFETcould be fabricated by a commercial foundry using a stan-dard CMOS process, without the need for any processmodifications. The fabricated ISFETs had a sensitivity of47 mV�pH�1 and a lifetime of > 2 months. As well as theadvantages of using of a well-characterized industrialprocess, there are additional ‘‘system-on-chip’’ design ben-
efits. These include access to libraries of components suchas amplifiers and digital gates that greatly ease the designof the whole system.
Unfortunately, the unmodified CMOS ISFETs werefound to have large threshold voltages; they were alsobased on silicon oxynitride, a material that has been foundto have a widely varying sensitivity, depending on thedeposition conditions (Table 2). The large threshold voltagehas been shown to be caused by trapped charge left on thefloating electrode during fabrication (27). To avoid theseproblems, Jakobson et al. (28) removed the passivationlayer by using the aluminum of the floating electrode asan etch-stop. They then experimented with low tempera-ture evaporation of pH sensitive layers onto the exposedaluminium. The best performance was obtained by using alayer of platinum (to prevent the aluminum from corrod-ing), followed by a layer of tantalum oxide.
The floating-electrode ISFETs can be considered asspecial cases of the extended-gate ISFET that was firstproposed in 1983. The idea was to separate the electronicsfrom the chemically active region, and by doing so make thedevice easier to passivate and package than a standardISFET with an exposed gate insulator. A coaxial polysiliconstructure was used to provide a screened connectionbetween the chemically sensitive area and the gate of aMOSFET (29). A more recent CMOS extended-gate ISFETdesign used a long (unscreened) aluminium track with oneend connected to the polysilicon gate and the other exposedby the final pad-etch step (21). This idea has been taken to itslimit by using a discrete, off-the-shelf MOSFET and con-necting the gate terminal to the pH-sensitive material witha length of wire (20). This method is clearly not applicable toa sensor system-on-chip design, but it does provide a simplemethod of characterizing the behavior of the material.
The floating-electrode ISFET has also been used toprotect against electrostatic discharge (ESD). In the firstESD-protected devices, the polysilicon gate was left intactand connected to a terminal via a MOSFET switch. Thisprovided a reverse-biased diode between the floating elec-trode and the substrate that would breakdown (reversibly)before the gate insulator was damaged (30). However,current leakage through the ‘‘off’’ MOSFET was such thatany response to changing pH decayed to zero in a matter ofseconds. To achieve a steady-state response, a large plati-num electrode was connected to the ISFET gate to supplycurrent from the solution to replace that being lost thoughthe MOSFET. To avoid the problem of leakage currentaltogether, ESD-protected ISFETs have been fabricatedwith a separate platinum ring electrode around the sensi-tive gate area (31). The platinum electrode is a preferentialdischarge path to the substrate, protecting the ISFET in thesame manner that a lightning conductor protects a building.
ISFETs have also been adapted to create chemicallymodified FETs (CHEMFETs), which are sensitive to theconcentration of ions other than hydrogen. This is achievedby attaching a polymer membrane containing a suitableionophore to the pH sensing surface of the ISFET. Thestability of the ISFET–membrane interface is improved bythe addition of an intermediate hydrogel layer. In this way,CHEMFETs sensitive to Kþ (32), Naþ (33), and othercations have been developed.
190 ION–SENSITIVE FIELD-EFFECT TRANSISTORS
Polysilicon
Aluminum
p-substrate n-well
n+ n+ p+ p+
Oxide
G
S D D S
G
NMOS PMOS
Figure 7. Diagram of the cross-section through a CMOS invertor.
p substrate
G
S D S D
G G
Oxynitride passivation layer
Aluminum
Oxide
Sensing area
H+H+
H+
H+ H+ H+
H+H+
H+H+H+H+
H+
n+ n+ n+ n+
Floating electrode
Figure 8. Diagram of the cross-section through an ISFETfabricated by an unmodified commercial CMOS process (26).The floating electrode allows the passivation layer to be used asa pH sensitive insulator.
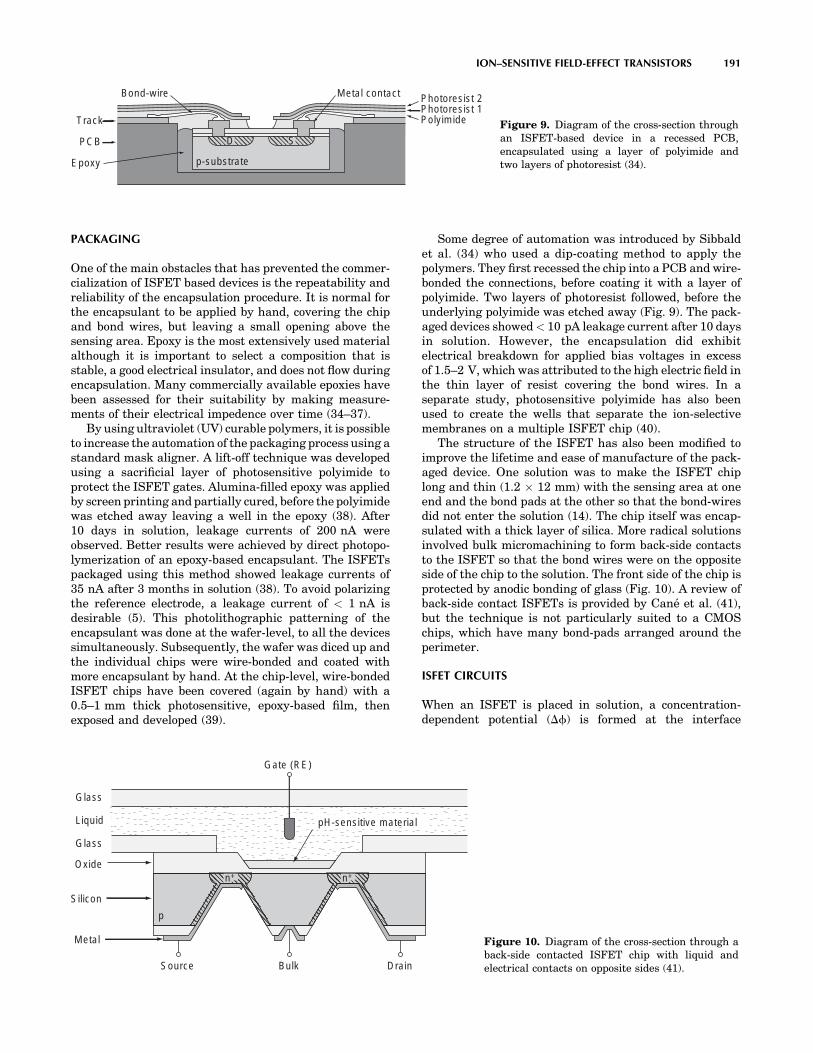
PACKAGING
One of the main obstacles that has prevented the commer-cialization of ISFET based devices is the repeatability andreliability of the encapsulation procedure. It is normal forthe encapsulant to be applied by hand, covering the chipand bond wires, but leaving a small opening above thesensing area. Epoxy is the most extensively used materialalthough it is important to select a composition that isstable, a good electrical insulator, and does not flow duringencapsulation. Many commercially available epoxies havebeen assessed for their suitability by making measure-ments of their electrical impedence over time (34–37).
By using ultraviolet (UV) curable polymers, it is possibleto increase the automation of the packaging process using astandard mask aligner. A lift-off technique was developedusing a sacrificial layer of photosensitive polyimide toprotect the ISFET gates. Alumina-filled epoxy was appliedby screen printing and partially cured, before the polyimidewas etched away leaving a well in the epoxy (38). After10 days in solution, leakage currents of 200 nA wereobserved. Better results were achieved by direct photopo-lymerization of an epoxy-based encapsulant. The ISFETspackaged using this method showed leakage currents of35 nA after 3 months in solution (38). To avoid polarizingthe reference electrode, a leakage current of < 1 nA isdesirable (5). This photolithographic patterning of theencapsulant was done at the wafer-level, to all the devicessimultaneously. Subsequently, the wafer was diced up andthe individual chips were wire-bonded and coated withmore encapsulant by hand. At the chip-level, wire-bondedISFET chips have been covered (again by hand) with a0.5–1 mm thick photosensitive, epoxy-based film, thenexposed and developed (39).
Some degree of automation was introduced by Sibbaldet al. (34) who used a dip-coating method to apply thepolymers. They first recessed the chip into a PCB and wire-bonded the connections, before coating it with a layer ofpolyimide. Two layers of photoresist followed, before theunderlying polyimide was etched away (Fig. 9). The pack-aged devices showed < 10 pA leakage current after 10 daysin solution. However, the encapsulation did exhibitelectrical breakdown for applied bias voltages in excessof 1.5–2 V, which was attributed to the high electric field inthe thin layer of resist covering the bond wires. In aseparate study, photosensitive polyimide has also beenused to create the wells that separate the ion-selectivemembranes on a multiple ISFET chip (40).
The structure of the ISFET has also been modified toimprove the lifetime and ease of manufacture of the pack-aged device. One solution was to make the ISFET chiplong and thin (1.2 12 mm) with the sensing area at oneend and the bond pads at the other so that the bond-wiresdid not enter the solution (14). The chip itself was encap-sulated with a thick layer of silica. More radical solutionsinvolved bulk micromachining to form back-side contactsto the ISFET so that the bond wires were on the oppositeside of the chip to the solution. The front side of the chip isprotected by anodic bonding of glass (Fig. 10). A review ofback-side contact ISFETs is provided by Cané et al. (41),but the technique is not particularly suited to a CMOSchips, which have many bond-pads arranged around theperimeter.
ISFET CIRCUITS
When an ISFET is placed in solution, a concentration-dependent potential (Df) is formed at the interface
ION–SENSITIVE FIELD-EFFECT TRANSISTORS 191
p-substrate
D S
PolyimidePhotoresist 1Photoresist 2Bond-wire
Track
PCB
Epoxy
Metal contact
Figure 9. Diagram of the cross-section throughan ISFET-based device in a recessed PCB,encapsulated using a layer of polyimide andtwo layers of photoresist (34).
Source DrainBulk
Gate (RE)
Silicon
Oxide
Glass
pH-sensitive material
Metal
Liquid
Glass
p
n+n+
Figure 10. Diagram of the cross-section through aback-side contacted ISFET chip with liquid andelectrical contacts on opposite sides (41).

between the gate insulator and the solution. This potentialmodulates the threshold voltage (VT) of the ISFET (eq. 4),an internal quantity that cannot be directly measured.Some circuitry is therefore required to convert changesin the threshold voltage into changes of a measurablesignal. The solution to this problem lies in the use offeedback control to maintain a constant drain current inthe ISFET. For a FET, operating in the linear region3, thedrain current is given by:
ID ¼ k0 W
LðVGS � VTÞVDS �
V2DS
2
" #(21)
where k0 is a process-dependent constant, and W, L arethe width, length of the device. (In the linear region,0 < VDS � (VGS � VT) and ID varies with VDS.) The para-meters VGS and VDS are, respectively, the gate-source anddrain-source voltages applied to the FET. For an ISFET, areference electrode in the solution acts as the gate terminalas shown symbolically in Fig. 11a. The ID vs. VGS curves foran ISFET as measured by Moss et al. (4) are shown inFig. 11b. It is clear from this graph that biasing an ISFETat a constant drain current is only possible if both VDS andVGS (¼ VG � VS) are maintained constant. If a reference
electrode is used to control VG, then from equation 21, as VT
changes with ID held constant, VS must change by an equaland opposite amount to compensate. Measuring Dc (andhence pH) then becomes a straightforward matter of mea-suring the terminal voltage VS.
In his original paper on the operation of the ISFET,Bergveld (3) stated that one of the important advantages ofISFETs, compared with conventional pH electrodes, is thatthere is no need for a reference electrode. Instead, he used afeedback circuit to control the bulk terminal of the ISFETand maintain a constant drain current. However, thismakes the assumption that the solution is perfectly iso-lated from the ISFET source and drain terminals, as wellas the circuit. Any current (even leakage current throughthe packaging), that flows into the solution will affect itspotential. To a bulk-feedback circuit, this will be indistin-guishable from a change in solution concentration. It istherefore safer to assume that the solution is grounded, orat least at some well-defined potential with respect to thecircuit, and use a reference electrode to ensure that this isthe case. For this reason, all of the subsequently publishedcircuits relating to ISFETs include a reference electrode.
The probe fabricated by Matsuo and Wise (13) containedan ISFET and a MOSFET of identical dimensions. TheISFET was configured as a source follower with the MOS-FET acting as a constant current source. A saturatedcalomel electrode (SCE, shown in Fig. 1) was used as areference, and the output voltage measured at the sourceterminal of the ISFET. Bergveld (42) used a groundedreference electrode to avoid the problem of a short circuitif the solution is already at ground potential (e.g., in anearthed metal container). He used an instrumentationamplifier arrangement to maintain a constant current ata constant drain-source voltage (Fig. 12). Amplifiers A1 andA2 set VDS as determined by the fixed current flowing in R1.Current feedback from amplifier A4 adjusts the drainvoltage via R2 to keep the current constant as the thresholdvoltage changes. One disadvantage of this circuit is thatthe output (measured across R9) is not referenced to a fixedvoltage such as ground.
There have been many other circuit topologies proposedto keep the drain current and/or the drain-source voltageconstant. A straightforward circuit that achieves both of
192 ION–SENSITIVE FIELD-EFFECT TRANSISTORS
S
D
B
G
(a) Symbol.
–1.0 0 1.00
1
2
3
Dra
in c
urre
nt (
mA
)
Gate (RE) voltage (V)
VD = 0.5 V
VD = 1.5 VV D
= 2.5 VV D =
3.5
VVS = 0 V
(b) I–V characteristics.
Figure 11. Diagram of the circuit symbol and a graph of the I–Vtransfer characteristics (4) for an n-type ISFET.
Figure 12. Circuit diagram of an ISFET source anddrain follower circuit used to maintain a constantdrain current at a constant drain-source voltage (42).
R2
R1
R3
R4
R5
R7 R8
R6
R9
VREF
ISFET
RE
A1
A2
A3A4
VOUT
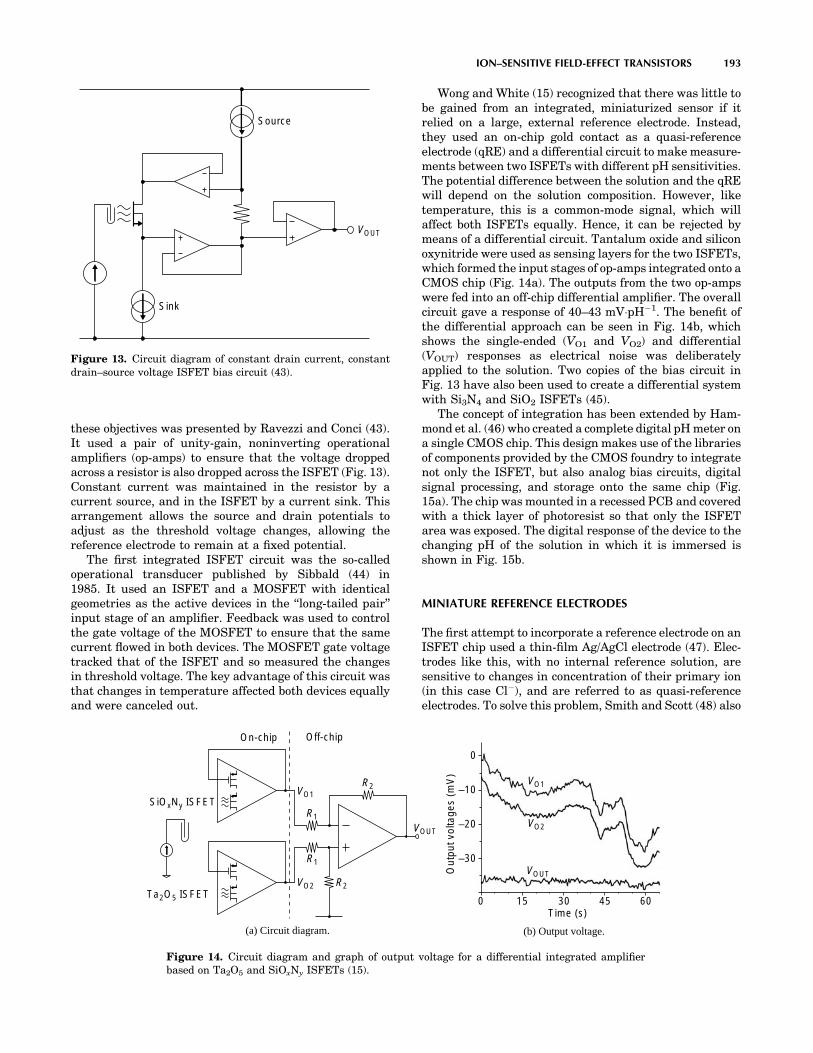
these objectives was presented by Ravezzi and Conci (43).It used a pair of unity-gain, noninverting operationalamplifiers (op-amps) to ensure that the voltage droppedacross a resistor is also dropped across the ISFET (Fig. 13).Constant current was maintained in the resistor by acurrent source, and in the ISFET by a current sink. Thisarrangement allows the source and drain potentials toadjust as the threshold voltage changes, allowing thereference electrode to remain at a fixed potential.
The first integrated ISFET circuit was the so-calledoperational transducer published by Sibbald (44) in1985. It used an ISFET and a MOSFET with identicalgeometries as the active devices in the ‘‘long-tailed pair’’input stage of an amplifier. Feedback was used to controlthe gate voltage of the MOSFET to ensure that the samecurrent flowed in both devices. The MOSFET gate voltagetracked that of the ISFET and so measured the changesin threshold voltage. The key advantage of this circuit wasthat changes in temperature affected both devices equallyand were canceled out.
Wong and White (15) recognized that there was little tobe gained from an integrated, miniaturized sensor if itrelied on a large, external reference electrode. Instead,they used an on-chip gold contact as a quasi-referenceelectrode (qRE) and a differential circuit to make measure-ments between two ISFETs with different pH sensitivities.The potential difference between the solution and the qREwill depend on the solution composition. However, liketemperature, this is a common-mode signal, which willaffect both ISFETs equally. Hence, it can be rejected bymeans of a differential circuit. Tantalum oxide and siliconoxynitride were used as sensing layers for the two ISFETs,which formed the input stages of op-amps integrated onto aCMOS chip (Fig. 14a). The outputs from the two op-ampswere fed into an off-chip differential amplifier. The overallcircuit gave a response of 40–43 mV�pH�1. The benefit ofthe differential approach can be seen in Fig. 14b, whichshows the single-ended (VO1 and VO2) and differential(VOUT) responses as electrical noise was deliberatelyapplied to the solution. Two copies of the bias circuit inFig. 13 have also been used to create a differential systemwith Si3N4 and SiO2 ISFETs (45).
The concept of integration has been extended by Ham-mond et al. (46) who created a complete digital pH meter ona single CMOS chip. This design makes use of the librariesof components provided by the CMOS foundry to integratenot only the ISFET, but also analog bias circuits, digitalsignal processing, and storage onto the same chip (Fig.15a). The chip was mounted in a recessed PCB and coveredwith a thick layer of photoresist so that only the ISFETarea was exposed. The digital response of the device to thechanging pH of the solution in which it is immersed isshown in Fig. 15b.
MINIATURE REFERENCE ELECTRODES
The first attempt to incorporate a reference electrode on anISFET chip used a thin-film Ag/AgCl electrode (47). Elec-trodes like this, with no internal reference solution, aresensitive to changes in concentration of their primary ion(in this case Cl�), and are referred to as quasi-referenceelectrodes. To solve this problem, Smith and Scott (48) also
ION–SENSITIVE FIELD-EFFECT TRANSISTORS 193
VOUT
Source
Sink
Figure 13. Circuit diagram of constant drain current, constantdrain–source voltage ISFET bias circuit (43).
Off-chip
SiOxNy ISFET
Ta2O5 ISFET
R1
R2
R1
R2
On-chip
VOUT
VO1
VO2
(a) Circuit diagram.
0
–10
–20
–30
0 15 30 45 60Time (s)
Out
put v
olta
ges
(mV
)
VO2
VO1
VOUT
(b) Output voltage.
Figure 14. Circuit diagram and graph of output voltage for a differential integrated amplifierbased on Ta2O5 and SiOxNy ISFETs (15).

integrated the reference solution and porous membraneinto the chip. Wells were etched into the back-side of asilicon wafer, to leave a membrane 10–70 mm thick. Themembranes were anodized to porous silicon in a bath ofconcentrated hydrofluoric acid. The wells were filled withsaturated KCl and sealed with glass coverslips that hadbeen coated with thin films of Ag/AgCl. The referenceelectrode exhibited a low drift rate of 80 mV�h�1 (worst-case) and a lifetime of > 2 weeks. However, a method ofmass producing an integrated, liquid-filled electrode hasyet to be developed.
Recent developments of miniature reference electrodeshave focused on the use of polymer-supported electrolytegels, to replace the liquid filling solution. Suzuki et al. (49)developed an electrode that uses finely ground KCl powdersupported in a matrix of poly(vinylpyrrolidone) (PVP). Anexploded diagram of the electrode is shown in Fig. 16. First,a layer of silver was evaporated onto a glass substrate,inside a U-shaped gold backbone. A layer of polyimide wasapplied to protect the silver and to define the electrodestructure. The AgCl was grown through a slit in the poly-imide, and a liquid junction was formed by casting ahydrophilic polymer into the square recess. The electrolytelayer, containing the KCl powder, was then screen-printedover the AgCl and the liquid junction. Finally, a passivat-ing layer of silicone rubber was applied. The electrode canbe stored dry, and activated when required by the injectionof a saturated solution of KCl and AgCl through thesilicone. This miniature reference electrode showed a sta-bility of �1.0 mV over a period of 100 h. No difference wasobserved between experimental data obtained with theminiature reference electrode and with a large, commercialreference electrode.
REFERENCE FETs
The sensitivity of the differential circuits already discussedcan be increased if one of the devices has no response to
194 ION–SENSITIVE FIELD-EFFECT TRANSISTORS
PCB track
Bond-wire
Photoresist well ISFET
Recess
PCB
Microchip
1 mm
Signal processing
Analogcircuits
Memory
(a) Chip layout
0 2 4 6 8 10 12$00
$3F
$7F
$BF
$FF
Time (min)
pH m
eter
out
put v
alue
(he
x)
0 2 4 6 8 10 12
1
2
3
4
5
6
7
Sol
utio
n pH
(b) pH response
Figure 15. Chip layout and pH response of a single-chip digitalpH meter.
Figure 16. Exploded diagram showing theconstruction of a miniature Ag/AgCl referenceelectrode based on a polymer-supported electrolytegel (49).
Electrolyte layer
Polyimide layer
Silver layer
Glass substrate
Au/Cr layer
Pad
Silicone layer
Liquid junction
End of junction
AgCl
slit
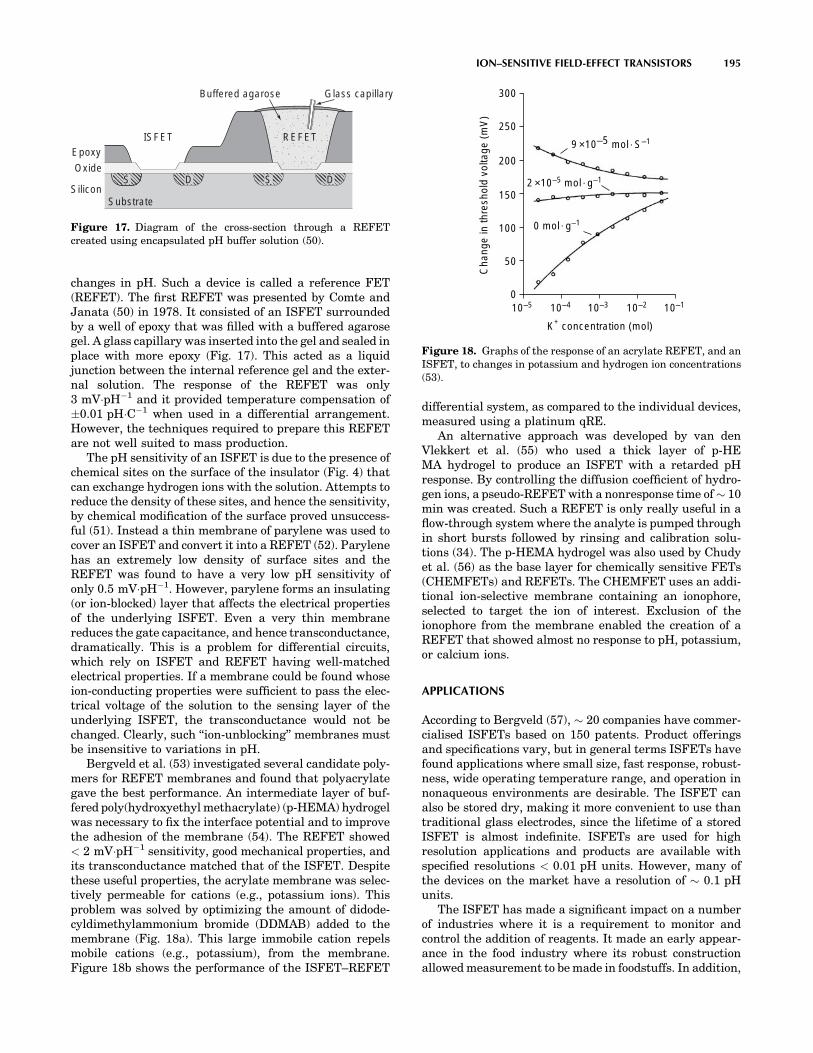
changes in pH. Such a device is called a reference FET(REFET). The first REFET was presented by Comte andJanata (50) in 1978. It consisted of an ISFET surroundedby a well of epoxy that was filled with a buffered agarosegel. A glass capillary was inserted into the gel and sealed inplace with more epoxy (Fig. 17). This acted as a liquidjunction between the internal reference gel and the exter-nal solution. The response of the REFET was only3 mV�pH�1 and it provided temperature compensation of�0.01 pH�C�1 when used in a differential arrangement.However, the techniques required to prepare this REFETare not well suited to mass production.
The pH sensitivity of an ISFET is due to the presence ofchemical sites on the surface of the insulator (Fig. 4) thatcan exchange hydrogen ions with the solution. Attempts toreduce the density of these sites, and hence the sensitivity,by chemical modification of the surface proved unsuccess-ful (51). Instead a thin membrane of parylene was used tocover an ISFET and convert it into a REFET (52). Parylenehas an extremely low density of surface sites and theREFET was found to have a very low pH sensitivity ofonly 0.5 mV�pH�1. However, parylene forms an insulating(or ion-blocked) layer that affects the electrical propertiesof the underlying ISFET. Even a very thin membranereduces the gate capacitance, and hence transconductance,dramatically. This is a problem for differential circuits,which rely on ISFET and REFET having well-matchedelectrical properties. If a membrane could be found whoseion-conducting properties were sufficient to pass the elec-trical voltage of the solution to the sensing layer of theunderlying ISFET, the transconductance would not bechanged. Clearly, such ‘‘ion-unblocking’’ membranes mustbe insensitive to variations in pH.
Bergveld et al. (53) investigated several candidate poly-mers for REFET membranes and found that polyacrylategave the best performance. An intermediate layer of buf-fered poly(hydroxyethyl methacrylate) (p-HEMA) hydrogelwas necessary to fix the interface potential and to improvethe adhesion of the membrane (54). The REFET showed< 2 mV�pH�1 sensitivity, good mechanical properties, andits transconductance matched that of the ISFET. Despitethese useful properties, the acrylate membrane was selec-tively permeable for cations (e.g., potassium ions). Thisproblem was solved by optimizing the amount of didode-cyldimethylammonium bromide (DDMAB) added to themembrane (Fig. 18a). This large immobile cation repelsmobile cations (e.g., potassium), from the membrane.Figure 18b shows the performance of the ISFET–REFET
differential system, as compared to the individual devices,measured using a platinum qRE.
An alternative approach was developed by van denVlekkert et al. (55) who used a thick layer of p-HEMA hydrogel to produce an ISFET with a retarded pHresponse. By controlling the diffusion coefficient of hydro-gen ions, a pseudo-REFET with a nonresponse time of � 10min was created. Such a REFET is only really useful in aflow-through system where the analyte is pumped throughin short bursts followed by rinsing and calibration solu-tions (34). The p-HEMA hydrogel was also used by Chudyet al. (56) as the base layer for chemically sensitive FETs(CHEMFETs) and REFETs. The CHEMFET uses an addi-tional ion-selective membrane containing an ionophore,selected to target the ion of interest. Exclusion of theionophore from the membrane enabled the creation of aREFET that showed almost no response to pH, potassium,or calcium ions.
APPLICATIONS
According to Bergveld (57), � 20 companies have commer-cialised ISFETs based on 150 patents. Product offeringsand specifications vary, but in general terms ISFETs havefound applications where small size, fast response, robust-ness, wide operating temperature range, and operation innonaqueous environments are desirable. The ISFET canalso be stored dry, making it more convenient to use thantraditional glass electrodes, since the lifetime of a storedISFET is almost indefinite. ISFETs are used for highresolution applications and products are available withspecified resolutions < 0.01 pH units. However, many ofthe devices on the market have a resolution of � 0.1 pHunits.
The ISFET has made a significant impact on a numberof industries where it is a requirement to monitor andcontrol the addition of reagents. It made an early appear-ance in the food industry where its robust constructionallowed measurement to be made in foodstuffs. In addition,
ION–SENSITIVE FIELD-EFFECT TRANSISTORS 195
Oxide
Substrate
D
Epoxy
Buffered agarose Glass capillary
ISFET REFET
SiliconSDS
Figure 17. Diagram of the cross-section through a REFETcreated using encapsulated pH buffer solution (50).
10–50
50
100
150
200
250
300
10–110–210–310–4
K+ concentration (mol)
Cha
nge
in th
resh
old
volta
ge (
mV
)
9 ×10⁻⁵ mol S–1
2 ×10⁻⁵ mol g–1
0 mol g–1
Figure 18. Graphs of the response of an acrylate REFET, and anISFET, to changes in potassium and hydrogen ion concentrations(53).
its ability to operate in nonaqueous environments is anadvantage when working with meat and dairy products.The ISFET has also found applications in the pharma-ceutical industry, where a fast re-sponse and high operat-ing temperatures are required. It has also been used inelectroplating where it is able to withstand the corrosiveplating solutions. In addition to manufacturing industries,the ISFET is also used in waste water management and inthe treatment of effluent.
Early researchers considered medical applications ran-ging from monitoring the pH in the mouth (particularly inthe context of tooth decay), to direct measurement of ionicbalance in the blood. ISFETs been built into dental pros-thetics to enable the direct measurement of pH in thepresence of plaque (58). Recent data on tooth decay wasobtained using a pH imaging microscope (59) although,unlike the ISFET device, this does not allow for in situobservations to be made. ISFETs are also used indirectlyfor dental applications, for example, in the evaluation ofpotential prosthetic materials (60). The ISFET has beenmodified in a manner similar to that for the REFET for usein blood analysis beyond measuring ionic concentrations.In this embodiment, the ISFET can be made into a sensi-tive enzyme sensor. In their paper, Sant et al. (61) demon-strated a sensor for creatinine based on an ISFET with asensitivity of 30 mV�pCreatinine�1. The application is inrenal failure and haemodialysis in particular.
Recently, there has been a growth of interest in the useof ISFETs in a device known as a diagnostic pill. Theconcept of a diagnostic pill was developed in the 1950sand 1960s (62). Such devices are small enough to beswallowed by a patient, and once inside the gastrointest-inal tract, can measure and wirelessly transmit data to anexternal receiver over a period of many hours or even days.The earliest devices were used to measure pressurechanges in the gut, but glass-electrode-based pills werealso made to measure gut pH. The diagnostic pill has madesomething of a comeback in recent years, particularly withthe invention of the video pill (63), a device that is capableof wirelessly transmitting images of the gut with consider-ably less patient discomfort than would be caused by anendoscopic procedure. Various new examples of pH mea-suring pills have also been developed. The Bravo capsule,which does not actually use an ISFET, is designed for use inthe esophagus (64). During operation it is pinned to thelining of the esophagus so that it can monitor conditionssuch as gastro-esophageal reflux disease (GERD) over aperiod of 2–3 days. The IDEAS capsule (65) that does usean ISFET, has been built for use in the lower gastrointest-inal tract. The device is designed pass naturally throughthe gut with as little intervention as possible and isrequired to be able to operate in difficult conditions wherebiofouling of the sensor is a potential problem.
CONCLUSIONS
The ISFET first appeared in 1970 as an offshoot of therapidly growing capability of the microelectronics indus-try. In its simplest form, the ISFET is a modification of thetraditional MOSFET in which the gate electrode is
removed and the gate oxide exposed to solution. TheISFET uses changes in the surface chemistry of the gateoxide to modify the threshold voltage of the transistor andproduce an electronic signal. The sensitivity and perfor-mance of the ISFET is highly dependent on the materialused to form the gate oxide layer. The behavior of suchmaterials is best modeled using a site-binding approach tocalculate the variation in surface charge with solution pH.A wide variety of materials have been experimented with,those found to give the best performance are the oxides ofaluminium and tantalum. However, in a standard CMOSmanufacturing process, the passivation layer is made ofsilicon nitride, which is also a good pH sensitive material.It is therefore possible to make good ISFETs using astandard foundry process with little or no additionaleffort. As a result it has become possible to implementintegrated ISFET circuits. A number of circuit topologiesfor detecting the change in ISFET threshold voltage havebeen designed, those using voltage followers to maintainthe ISFET bias conditions produce the best results.Further development of ISFET integrated circuits hasenabled complete instruments to be fabricated on a singleIC. To avoid the use of a bulky reference electrode, differ-ential circuits using matched pairs of ISFET and REFEThave been designed. However, difficulties in creating agood REFET have increased interest in developing min-iature reference electrodes that are compatible with ICprocessing. The ISFETs have already found widespreadapplication in manufacturing industries, environmentalmonitoring and medicine. It is expected that withimproved miniaturization, integration, and packagingtechnologies, new applications will emerge.
BIBLIOGRAPHY
1. Streetman BG, Banerjee S. Solid State Electronic Devices.5th ed. New Jersey: Prentice Hall; 2000.
2. Bergveld P. Development of an ion-sensitive solid-state devicefor neurophysiological measurements. IEEE Trans BiomedEng 1970;BM17:70.
3. Bergveld P. Development, operation, and application of ion-sensitive field effect transistor as a tool for electrophysiology.IEEE Trans Biomed Eng 1972;BM19:342.
4. Moss SD, Johnson CC, Janata J. Hydrogen, calcium, andpotassium ion-sensitive FET transducers—preliminary-report. IEEE Trans Biomed Eng 1978;25:49–54.
5. Matsuo T, Esashi M. Methods of ISFET fabrication. SensActuator 1981;1:77–96.
6. Bard AJ, Faulkner LR. Electrochemical Methods—Funda-mentals and Applications. Hoboken (NJ), John Wiley; 2001.
7. Yates DE, Levine S, Healy TW. Site-binding model of electricaldouble-layer at oxide-water interface. J Chem Soc FaradayTrans 1974;70:1807–1818.
8. Siu WM, Cobbold RSC. Basic properties of the electrolyte-SiO2-Si system-physical and theoretical aspects. IEEE TransElectron Devices 1979;26:1805–1815.
9. Bousse L, de Rooij NF, Bergveld P. Operation of chemicallysensitive field-effect sensors as a function of the insulator-electrolyte interface. IEEE Trans Electron Devices 1983;30:1263–1270.
10. Bousse L, de Rooij NF, Bergveld P. The influence of counterionadsorption on the c0/pH characteristics of insulator surfaces.Surf Sci 1983;135:479–496.
196 ION–SENSITIVE FIELD-EFFECT TRANSISTORS

11. Harame DL, Bousse LJ, Shott JD, Meindl JD. Ion-sensingdevices with silicon-nitride and borosilicate glass insulators.IEEE Trans Electron Devices 1987;34:1700–1707.
12. van Hal REG, Eijkel JCT, Bergveld P. A general model todescribe the electrostatic potential at electrolyte oxide inter-faces. Adv Colloid Interface Sci 1996;69:31–62.
13. Matsuo T, Wise KD. Integrated field-effect electrode for bio-potential recording. IEEE Trans Biomed Eng 1974;BM21:485–487.
14. Rocher V, et al. An oxynitride ISFET modified for working in adifferential-mode for pH detection. J Electrochem Soc 1994;141:535–539.
15. Wong HS, White MH. A CMOS-integrated ISFET-operationalamplifier chemical sensor employing differential sensing.IEEE Trans Electron Devices 1989;36:479–487.
16. Tsukada K, Miyahara Y, Miyagi H. Platinum-platinum oxidegate pH ISFET. Jpn J Appl Phys Part 1-Regul Pap Short NotesRev Pap 1989;28:2450–2453.
17. Akiyama T, et al. Ion-sensitive field-effect transistors withinorganic gate oxide for pH sensing. IEEE Trans ElectronDevices 1982;29:1936–1941.
18. Voigt H, et al. Diamond-like carbon-gate pH-ISFET. SensActuator B-Chem 1997;44:441–445.
19. Liao HK, et al. Study of amorphous tin oxide thin films forISFET applications. Sens Actuator B-Chem 1998;50:104–109.
20. Yin LT, et al. Study of indium tin oxide thin film for separativeextended gate ISFET. Mater Chem Phys 2001;70:12–16.
21. Chin YL, et al. Titanium nitride membrane application toextended gate field effect transistor pH sensor using VLSItechnology. Jpn J Appl Phys Part 1-Regul Pap Short Notes RevPap 2001;40:6311–6315.
22. Katsube T, Lauks I, Zemel JN. pH-sensitive sputtered iridiumoxide-films. Sens Actuator 1982;2:399–410.
23. Jakobson CG, Nemirovsky Y. 1/f noise in ion sensitive fieldeffect transistors from subthreshold to saturation. IEEE TransElectron Devices 1999;46:259–261.
24. Jolly RD, McCharles RH. A low-noise amplifier for switchedcapacitor filters. IEEE J Solid-State Circuit 1982;17:1192–1194.
25. Bousse L, Shott J, Meindl JD. A process for the combinedfabrication of ion sensors and CMOS circuits. IEEE ElectronDevice Lett 1988;9:44–46.
26. Bausells J, Carrabina J, Errachid A, Merlos A. Ion-sensitivefield-effect transistors fabricated in a commercial CMOStechnology. Sens Actuator B-Chem 1999;57:56–62.
27. Hammond PA, Ali D, Cumming DRS. Design of a single-chippH sensor using a conventional 0.6 mm CMOS process. IEEESens J 2004;4:706–712.
28. Jakobson CG, Dinnar U, Feinsod M, Nemirovsky Y. Ion-sensitive field-effect transistors in standard CMOS by postprocessing. IEEE Sens J 2002;2(4):279–287.
29. van der Spiegel J, Lauks I, Chan P, Babic D. The extended gatechemically sensitive field-effect transistor as multi-speciesmicroprobe. Sens Actuator 1983;4:291–298.
30. Smith R, Huber RJ, Janata J. Electrostatically protectedion sensitive field-effect transistors. Sens Actuator 1984;5:127–136.
31. Baldi A, Bratov A, Mas R, Domı́nguez C. Electrostatic dis-charge sensitivity tests for ISFET sensors. Sens ActuatorB-Chem 2001;80:255–260.
32. Reinhoudt DN, et al. Development of durable Kþ-selectivechemically-modified field-effect transistors with functiona-lized polysiloxane membranes. Anal Chem 1994;66:3618–3623.
33. Brunink JAJ, et al. Chemically modified field-effect transis-tors - a sodium-ion selective sensor based on calix[4]arenereceptor molecules. Anal Chim Acta 1991;254:75–80.
34. Sibbald A, Whalley PD, Covington AK. A miniature flow-through cell with a 4-function CHEMFET integrated-circuitfor simultaneous measurements of potassium, hy-drogen, cal-cium and sodium-ions. Anal Chim Acta 1984;159:47–62.
35. Chovelon JM, Jaffrezic-Renault N, Fombon JJ, Pedone D.Monitoring of ISFET encapsulation aging by impedance mea-surements. Sens Actuator B-Chem 1991;3:43–50.
36. Grisel A, Francis C, Verney E, Mondin G. Packaging technol-ogies for integrated electrochemical sensors. Sens Actuator1989;17:285–295.
37. Gràcia I, Cané C, Lora-Tamayo E. Electrical characterizationof the aging of sealing materials for ISFET chemical sensors.Sens Actuator B-Chem 1995;24:206–210.
38. Muñoz J, et al. Planar compatible polymer technology forpackaging of chemical microsensors. J Electrochem Soc1996;143:2020–2025.
39. Bratov A, Muñoz J, Dominguez C, Bartrolı́ J. Photocurablepolymers applied as encapsulating materials for ISFET pro-duction. Sens Actuator B-Chem 1995;25:823–825.
40. TsukadaK,SebataM,MiyaharaY,MiyagiH.Long-lifemultiple-ISFETs with poly-meric gates. Sens Actuator 1989;18: 329–336.
41. Cané C, Gràcia I, Merlos A. Microtechnologies for pH ISFETchemical sensors. Micro-electron J 1997;28:389–405.
42. Bergveld P. The operation of an ISFET as an electronic device.Sens Actuator 1981;1:17–29.
43. Ravezzi L, Conci P. ISFET sensor coupled with CMOS read-out circuit microsystem. Electron Lett 1998;34:2234–2235.
44. Sibbald A. A chemical-sensitive integrated-circuit - the opera-tional transducer. Sens Actuator 1985;7:23–38.
45. Palán B, et al. New ISFET sensor interface circuit for biome-dical applications. Sens Actuator B-Chem 1999;57:63–68.
46. Hammond PA, Ali D, Cumming DRS. A system-on-chip digitalpH meter for use in a wireless diagnostic capsule. IEEE TransBiomed Eng 2005;52:687–694.
47. Harame DL, Shott JD, Bousse L, Meindl JD. Implantable ion-sensitive transistors. IEEE Trans Biomed Eng 1984;31:572–572.
48. Smith RL, Scott DC. An integrated sensor for electrochemicalmeasurements. IEEE Trans Biomed Eng 1986;33:83–90.
49. Suzuki H, Shiroishi H, Sasaki S, Karube I. Microfabricatedliquid junction Ag/AgCl reference electrode and its applicationto a one-chip potentiometric sensor. Anal Chem 1999;71:5069–5075.
50. Comte PA, Janata J. Field-effect transistor as a solid-statereference electrode. Anal Chim Acta 1978;101:247–252.
51. van den Berg A, Bergveld P, Reinhoudt DN, Sudhölter EJR.Sensitivity control of ISFETs by chemical surface modifica-tion. Sens Actuator 1985;8:129–148.
52. Matsuo T, Nakajima H. Characteristics of reference electrodesusing a polymer gate ISFET. Sens Actuator 1984;5:293–305.
53. Bergveld P, et al. How electrical and chemical requirementsfor REFETs may coincide. Sens Actuator 1989;18:309–327.
54. Sudhölter EJR, et al. Modification of ISFETs by covalentanchoring of poly(hydroxyethyl methacrylate) hydrogel-intro-duction of a thermodynamically defined semiconductor-sen-sing membrane interface. Anal Chim Acta 1990;230:59–65.
55. van den Vlekkert HH, de Rooij NF, van den Berg A, Grisel A.Multi-ion sensing system based on glass-encapsulatedph-ISFETs and a pseudo-REFET. Sens Actuator B-Chem1990;1:395–400.
56. Chudy M, Wróblewski W, Brzózka Z. Towards REFET. SensActuator B-Chem 1999;57:47–50.
57. Bergveld P. Thirty years of ISFETOLOGY-what happened inthe past 30 years and what may happen in the next 30 years.Sens Actuator B-Chem 2003;88:1–20.
58. Visch LL, Bergveld P, Lamprecht W, Sgravenmade EJ. pHmeasurements with an ion sensitive field-effect transistor in
ION–SENSITIVE FIELD-EFFECT TRANSISTORS 197

the mouth of patients with xerostomia. IEEE Trans BiomedEng 1991;38:353–356.
59. Hiraishi N, et al. Evaluation of active and arrested cariousdentin using a pH-imaging microscope and an X-ray analyticalmicroscope. Oper Dent 2003;28:598–604.
60. De Aza PN, Luklinska ZB, Anseau M. Bioactivity of diopsideceramic in human parotid saliva. J Biomed Mater Res Part B2005;73B:54–60.
61. Sant W, et al. Development of a creatinine-sensitive sensor formedical analysis. Sens Actuator B-Chem 2004;103:260–264.
62. Mackay RS. Radio telemetering from within the body. Science1961;134:1196–1202.
63. Iddan G, Meron G, Glukhovsky A, Swain P. Wireless capsuleendoscopy. Nature (London) 2000;405:417–417.
64. Pandolfino JE, et al. Ambulatory esophageal pH monitoringusing a wireless system. Am J Gastroenterol 2003;98:740–749.
65. Johannessen EA, et al. Implementation of multichannelsensors for remote biomedical measurements in a microsys-tems format. IEEE Trans Biomed Eng 2004;51:525–535.
See also IMMUNOLOGICALLY SENSITIVE FIELD-EFFECT TRANSISTORS;INTEGRATED CIRCUIT TEMPERATURE SENSOR.
ISFET. See ION-SENSITIVE FIELD-EFFECT TRANSISTORS.
198 ION–SENSITIVE FIELD-EFFECT TRANSISTORS

J
JOINTS, BIOMECHANICS OF
GEORGE PAPAIOANNOU
University of WisconsinMilwaukee, Wisconsin
YENER N. YENI
Henry Ford HospitalDetroit, Michigan
INTRODUCTION
The human skeleton is a system of bones joined together toform segments or links. These links are movable andprovide for the attachment of muscles, ligaments, tendons,and so on. to produce movement. The junction of two ormore bones is called an articulation. There are a greatvariety of joints even within the human body and a multi-tude of types among living organisms that use exo- andendoskeletons to propel. Articulation can be classifiedaccording to function, position, structure and degrees offreedom for movement they allow, and so on. Joint biome-chanics is a division of biomechanics that studies the effectof forces on the joints of living organisms.
Articular Anatomy, Joint Types, and Their Function
Anatomic and structural classification of joints typicallyresults in three major categories, according to the predo-minant tissue or design supporting the articular elementstogether, that is, joints are called fibrous, cartilaginous, orsynovial.
Synovial joints are cavitated. In general, two rigidskeletal segments are brought together by a capsule ofconnective tissue and several other specialized tissues,that form a cavity. The joints of the lower and upper limbsare mainly synovial since these are the most mobile joints.Mobility varies considerably and a number of subcate-gories are defined based on the specific shape or architec-ture and topology of the surfaces involved (e.g., planar,saddle, ball and socket) and on the types of movementpermitted (e.g., flexion and extension, medial and lateralrotation) (Table 1). The basic structural characteristicsthat define a synovial joint can be summarized in fourfeatures: a fibrous capsule that forms the joint cavity, aspecialized articular cartilage covering the articular sur-faces, a synovial membrane lining the inner surface of thecapsule that also secretes a special lubricating fluid, thesynovial fluid. Additional supportive structures in synovialjoints include disks, menisci, labra, fat pads, tendons, andligaments.
Cartilaginous joints are also solid and are more com-monly known as synchondroses and symphyses, a classi-fication based on the structural type of cartilage thatintervenes between the articulating parts (Table 2). Thiscartilage is hyaline and fibrocartilage for synchondrosesand symphyses, respectively. Synchondroses allow very
little movement as in the case of the rib cage that con-tributes to the ability of this area to expand with respira-tion. Most symphyses are permanent; those of sacrum andcoccyx can, however, degenerate with subsequent fusionbetween adjacent vertebral bodies as part of the normaldevelopment of these bones.
Fibrous joints are solid. The binding mechanism thatdominates the connectivity of the articulating elements isprincipally fibrous connecting tissue, although other tissuetypes also may be present. Length, specific arrangement,and fiber density vary considerably according to the loca-tion of the joint and its functional requirements. Fibrousjoints are classified in three groups: sutures, gomphoses,and syndesmoses (Table 3);
In addition to the obligatory components that all thesynovial joints possess, several joints contain intraarticu-lar structures. Discs and menisci are examples of suchstructures. They differ from one another mainly in thata disc is a circular structure that may completely subdividea joint cavity so that it is, in reality, two joints in series,whereas a meniscus is usually a crescent-shaped structurethat only partially subdivides the joint. Complete discs arefound in the sternoclavicular and in the radiocarpal joint. Avariety of functions have been proposed for intraarticulardiscs and menisci. They are normally met at locationswhere bone congruity is poor, and one of their main func-tions is to improve congruity and, therefore stabilitybetween articular surfaces. Shock absorption facilitationand combination of movements are among their likelyroles. They may limit a movement or distribute the weightover a larger surface or facilitate synovial fluid circulationthroughout the joint.
The labrum is another intraarticular structure. Inhumans, this structure is only found in the glenohumeraland hip joints. They are circumferential structuresattached to the rim of the glenoid and acetabular sockets.Labra are distinct from articular cartilage because theyconsist of fibrocartilage and are triangular in their middlesection. Their bases are attached to the articular marginsand their free apical surfaces lined by synovial membrane.Like discs, their main function is to improve fit and protectthe articular margins during extremes of movement.
Fat pads are localized accumulations of fat that arefound around several synovial joints, although only thosein the hip (acetabular pad) and the knee joint (infrapatellarpad) are named. Suggested functions for fat pads includeprotection of other intraarticular structures (e.g., theround ligament of the head of the femur) and serving ascushions or space-fillers thus facilitating more efficientmovement throughout the entire available range.
Bursae are enclosed, self-contained, flattened sacs typi-cally with a synovial lining. They facilitate movement ofmusculoskeletal tissues over one another and thus arelocated between pairs of structures (e.g., between ligamentand tendon, two ligaments, two tendons or skin, and bone).Deep bursae, such as the illiopsoas bursa or the deep
199
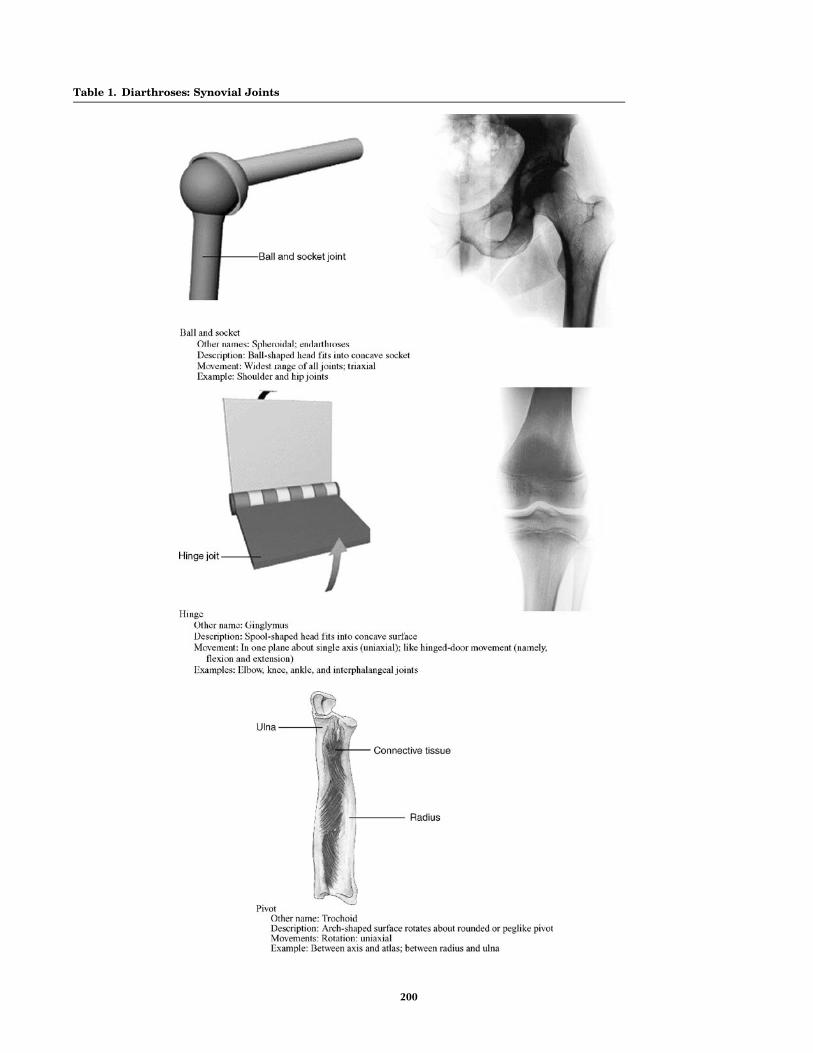
Table 1. Diarthroses: Synovial Joints
(continued)
200

retrocalcaneal bursa, develop along with joints and by asimilar series of events during the embryonic period.
Tendons are located at the ends of many muscles andare the means by which these muscles are attached to boneor other skeletal elements. The primary structural compo-nent of tendons is type I collagen. Tendons almost exclu-sively operate under tensile forces.
Ligaments are dense bands of connective tissue thatconnect skeletal elements to each other, either creating(as in the case of syndesmoses) or supporting joints.According to their location they are classified as intra-capsular, capsular, or extracapsular. Structurally, theyresemble the tendons in that they consist predominantlyof type I collagen.
JOINTS, BIOMECHANICS OF 201
Table 1. (Continued )

Articular Cartilage
Articular cartilage, the resilient load-bearing tissue thatforms the articulating surfaces of synovial joints functionsthrough load distribution mechanism by increasing thearea of contact (thereby reducing the stress) and providesthese surfaces with the low friction, lubrication, and wearcharacteristics required for repetitive gliding motion.
Biomechanically, cartilage is another intraarticularabsorption mechanism that dampens mechanical shocksand spreads the applied load onto subchondral bone(Fig. 2). Articular cartilage should be viewed as a multi-phasic material. It consists primarily of a large extracellularmatrix (ECM) with a sparse population of highly specializedcells (chondrocytes) distributed throughout the tissue. The
primary components of the ECM are water, proteoglycans,and collagens, with other proteins and glycoproteins presentin lower amounts (1). The solid phase is comprised by thisporous-permeable collagen-PG matrix filed with freelymovable interstitial fluid (fluid phase) (2). A third phaseis the ion phase, necessary to describe the electromechanicalbehaviors of the system. The structure and composition ofthe articular cartilage vary throughout its depth (Fig. 2),from the articular surface to the subchondral bone. Thesedifferences include cell shape and volume, collagen fibrildiameter and orientation, proteoglycan concentration, andwater content. These all combine to provide the tissue withits unique and complex structure and mechanical proper-ties. A fine mechanism of interstitial fluid pressurization
202 JOINTS, BIOMECHANICS OF
Table 2. Amphiarthroses: Cartilaginous Joints

JOINTS, BIOMECHANICS OF 203
Table 3. Synarthroses: Fibrous Joints
Figure 1. Basic structure and components of a synovial joint (alsocalled diarthroses). Figure 2. Zones of articular cartilage.

results from the flow of interstitial fluid through the porous-permeable solid matrix that in turn defines the rate depen-dent load-bearing response of the material. It is noteworthythat articular cartilage provides its essential biomechanicalfunctions for eight decades or more in most of the humansynovial joints and no synthetic material performs this wellas a joint surface.
The frictional characteristics between two surfaces slid-ing over each other are significantly influenced by thetopography of the given surfaces. Anatomical shapechanges affect the way in which loads are transmittedacross joints, altering the lubrication mode in that jointand, thus, the physiologic state of cartilage. Articularsurfaces are relatively rough, compared to machined bear-ing surfaces, at the microscopic level. The natural surfacesare surprisingly much rougher than joint replacementprostheses. The mean of the surface roughness for articularcartilage ranges from 1 to 6 mm, while the metal femoralhead of a typical artificial hip has a value of �0.025 mm,indicating that the femoral head is apparently muchsmoother. Topographic features on the joint surfaces arecharacterized normally by primary anatomic contours,secondary roughness (<0.5 mm in diameter and <50mmdeep), tertiary hollows on the order of 20–45 mm deep; and,finally, quaternary ridges 1–4 mm in diameter and 0.1–0.3mm deep. Scanning electron micrographs (SEMs)ofarthritic cartilage usually depict a large degree of surfaceirregularity and anomalous microtopography. These sur-face irregularities have profound effects on the lubricationmechanism. They accelerate the effects of friction and therate of degradation of the articular cartilage. The types ofjoint surface interactions vary greatly between differentjoints in the body, different animals, between different sizeanimals of the same species, different genders, and differ-ent ages. For example, the human hip joint is a deepcongruent ball and socket joint (where the cartilage thick-ens peripherally at the acetabulum); this differs greatlyfrom the bcondylar nature of the distal femur in the kneejoint, and the saddle shape of the carpometacarpal joint inthe thumb. The degree of shape matching between thevarious bones and articulating cartilage surfaces compos-ing a joint is a major factor affecting the distribution ofstresses in the cartilage and subchondral bone.
Effects of Motion and External Loading on Joints
The articular joint is viewed as an organ with complicatedmechanisms of memory and adaptation that accommo-dates changes in its function. Joint loading results inmotion and the couple load–motion is required to maintainnormal adult articular cartilage composition, structure,and mechanical properties. The type, intensity, and fre-quency of loading necessary to maintain normal articularcartilage vary over a broad range. The intensity or fre-quency of loading should not exceed or fall below thesenecessary levels, since this will disturb the balancebetween the processes of synthesis and degradation.Changes in the composition and microstructure of cartilagewill result. Reduced joint loading, as has been observed incases of immobilization by casting or external fixation,leads to atrophy or degeneration of the cartilage. The
changes affect both the contact and noncontact areas.Changes in the noncontact areas resulting from rigidimmobilization include fibrillation, decreased proteoglycancontent and synthesis, and altered proteoglycan conforma-tion, such as a decrease in the size of aggregates and amountof aggregate. Normal nutritive transport to cartilage fromthe synovial fluid by means of diffusion and convection hasbeen diminished, resulting in these changes. Increased jointloading, either through excessive use, increased magnitudesof loading, or impact, also may affect articular cartilage.Catabolic effects can be induced by a single-impact orrepetitive trauma, and may serve as the initiating factorfor progressive degenerative changes. Osteoarthritis, a jointdisease of epidemic proportions in the western world, ischaracterized by erosive cartilage lesions, cartilage loss anddestruction, subchondral bone sclerosis and cysts, and largeosteophyte formation at the margins of the joint (3).
Moderate running exercise may increase the articularcartilage proteoglycan content and compressive stiffness,decrease the rate of fluid flux during loading, and increasethe articular cartilage thickness in skeletally immatureanimals. However, no significant changes in articular car-tilage mechanical properties were observed in dogs inresponse to lifelong increased activity that did not includehigh impact or torsional loading of their joints. Disruptionof the intraarticular structures (e.g., menisci or ligaments)will alter the forces acting on the articular surface in bothmagnitude and areas of loading. The resulting jointinstability is associated with profound and progressivechanges in the biochemical composition and mechanicalproperties of articular cartilage. In experimental animalmodels, responses to transection of the anterior cruciateligament or meniscectomy have included fibrillation of thecartilage surface, increased hydration, changes in the pro-teoglycan content, reduced number and size of proteogly-can aggregates, joint capsule thickening, and osteophyteformation. It seems likely that some of these changes resultfrom the activities of the chondrocytes, because their ratesof synthesis of matrix components, breakdown of matrixcomponents, and secretion of proteolytic enzymes are allincreased. In vitro studies have shown that loading of thecartilage matrix can cause all of these mechanical, electric,and physicochemical events, but thus far it has not beenclearly demonstrated which signals are most important instimulating the anabolic and catabolic activity of the chon-drocytes. A holistic physicochemical and biomechanicalmodel of cartilage function in health and disease remainsa challenge in the scientific community.
KINEMATICS OF JOINTS
General Comments
Mechanical analysis can refer to kinetics (forces) and/orkinematics (movement), with kinetics being the cause andkinematics the result. Mechanical analysis can developmodels proceeding from forces to movements or vice versa.The analysis that starts from the cause (force) is calleddirect or forward dynamics, and produces a defined set offorces that caused the unique movement. This approachhas one solution, and hence is deterministic. Starting from
204 JOINTS, BIOMECHANICS OF

the movement the analysis is called inverse dynamics. Inthis case, an infinite number of combinations of individualforces acting on the system can be the causes of the sameunique movement, which makes the inverse dynamicsapproach not deterministic. The simplest and most essen-tial system of mechanical formulations for explaining anddescribing motion is the Newton’s second law. Moreadvanced techniques include the Lagrange, d’Alembert,and Hamilton’s methods. In general all of these methodsstart by describing equations of motion for a rigid body fortranslation, rotation, or combinations of them for both two(2D) and three-dimensional (3D) space. If the modelassumes that the articulated segments that create thearticulation are modeled as rigid bodies the remaining taskis to calculate the relative motion between the two seg-ments by applying graphics or joint kinematic analysis.
Kinematics is the study of the movements of rigidstructures, independent of the forces that might beinvolved. Two types of movement, translation (linear dis-placement) and rotation (angular displacement), occurwithin three orthogonal planes; that is, movement hassix degrees of freedom. Humans belong to the vertebrateportion of the phylum chordata, and as such possess a bonyendoskeleton that includes a segmented spine and pairedextremities. Each extremity is composed of articulatedskeletal segments linked together by connective tissueelements and surrounded by skeletal muscle. Motionbetween skeletal segments occurs at joints. Most jointmotion is minimally translational and primarily rotational.The deviation from absolute rotatory motion may be notedby the changes in the path of a joint’s ‘‘instantaneous centerof rotation’’. These paths have been measured for most ofthe joints in the body and vary only slightly from true arcsof rotation. For human motion to be effective, not only musta comparatively rigid segment rotate its position relative toan adjacent segment, but many adjacent limb movementsmust interact as well. Whether the hand is trying to writeor the foot must be lifted high enough to clear an obstacle onthe ground, the activity is achieved via coordinated move-ments of multiple limb segments. To provide for the greatestpossible function of an extremity, the proximal joint musthave the widest range of motion to position the limb in space.This joint must allow for rotatory motions of large degreesin all three planes about all three axes. A means is alsoprovided to translate the limb, so that an extremity canfunction at all locations within its global range. Rotationalmotion of the elbow and knee joints allows such overallchanges as adjacent limb segments move. Finally, to fine-tune the use of this mechanism with respect to the extre-mities, for their functional purposes, the hand and footare required to have a vast amount of movement about allthree axes, although the rigid segments are relatively small.Such movement requires the presence of relatively uni-versal joints at the terminal aspect of each extremity.
Characterization of the General Mechanical Joint System:Terminology and Definitions
The displacement of a point is simply the differencebetween its position after a motion and its position beforethat motion. It can be represented by a 3D vector drawn
from the initial position of the point to its final position. Thecomponents of the displacement vector will be the changesin the coordinates of the point’s position from measurementin the reference coordinate system. It is apparent that notonly the positions, but also displacements measured arerelative to some reference. Rigid body (RB) displacementsare more complicated than point displacements since for arigid body a displacement is a change in its position relativeto some reference, but more than three parameters areneeded to describe it. Two simple types of RB displacementcan be described: translation and rotation. An importantproperty of pure translation of a RB is that the displacementvectors of all points in the body are identical and are nonzero.In pure rotation of a RB, although points in the body experi-ence nonzero displacements, one point in that body experi-ences zero displacement. In addition to that rule, Euler’stheorem shows that in pure rotation all points along aparticular line through that undisplaced point also experi-ence zero displacement. This line is also known as the axisof rotational displacement. Chasles theorem further statesthat any displacement of a RB can be accomplished by atranslation along a line parallel to the axis of rotation that isdefined by Euler’s theorem plus a rotation about that sameparallel axis. Simply that suggests that any displacement in3Disequivalentto themotionofanut,representingthebody,on an appropriate stationary screw that was centered on theline described above. Indeed, it can be shown that any dis-placement in3Disequivalent toa translationplus a rotation.
Degrees of Freedom
The biological organisms capable of propelling themselvesthrough different media consist of more than one rigidbody. A system consisting of a 3D reference frame andan isolated rigid body in space has six degrees of freedom(DOF). To describe the position of each body relative to theground reference frame it would be necessary to use sixparameters, so for two unconnected rigid bodies 12 para-meters would be necessary. The system consisting of thesetwo unconnected bodies and the fixed -ground referencewould have 12 DOF. The human–animal body consists of acombination of suitably connected bodies. The connections,joints between the bodies, serve to constrain the motions ofthe bodies so that they are not free to move with whatwould otherwise be six DOF for each body. Therefore, wecan define the number of DOF that the joint removes asthe number of degrees of constraint that it provides. It canbe shown that every time a joint is added to a system, thenumber of degrees of freedom in that system is reduced bythe number of degrees of constraint provided by that joint.This suggests the following generic formula for the calcu-lation of the degrees of freedom of a system:
F ¼ 6ðL � 1Þ � 5J1 � 4J2 � 3J3 � 2J4 � J5
where F¼ is the number of degrees of freedom in thesystem of connected joints; L¼ is the number of joints inthe system, including the ground joint (which has nodegrees of freedom), and Jn¼ the number of joints havingn degrees of freedom each.
Table 4 contains a description of the major joints in thehuman body along with the segments-bones that they
JOINTS, BIOMECHANICS OF 205

206 JOINTS, BIOMECHANICS OF
Table 4. Characteristics of Major Human Joints
Joint Bones Type DOF Type of motion Range of Motion (deg)
Shoulder Humerus-Scapula Diarthrosis (spheroidal) 3 Flexion 150Extension 50–60Abduction 90–120Abduction CompleteRotation
Elbow Humerus-ulna Diarthrosis (ginglymus) 2 Flexion 145–160Extension 0–5Rotation (radius)
Radioulnar Superior radius-ulna Diarthrosis (trochoid) 1 Pronation 70–75Supination 85–90
Wrist Radius-carpal Diarthrosis (condyloid) 2 Flexion 90–95Extension 60–70Radial deviation 20–25Ulnar deviation 55–65Circumduction Complete
Metacarpal-phalangeal Metacarpal-phalanges Diarthrosis (condyloid) 2 Flexion 80–90Extension 20–30Radial deviation 20–25Ulnar deviation 15–20
Finger Interphalanges Diarthrosis (ginglymus) 1 Flexion 80–90Extension 0–10
Thumb First metacarpal-carpal Diarthrosis (reciprocal) 2 Flexion 80–90Extension 20–25Abduction 40–45Abduction 0–10Circumduction Complete
Hip Femur-acetabulum Diarthrosis (spheroidal) 3 Flexion 90–120Extension 10–20Abduction 30–45Abduction 30Medial rotation 30–40Lateral rotation 60Circumduction Complete
Knee Tibia-femur Diarthrosis (ginglymus) 2 Flexion 120–140Extension 0Medial rotation 30Lateral rotation 40
Ankle Tibia-fibula-talus Diarthrosis (ginglymus) 1 Flexion 20–30Extension 40–45
Intertarsal Tarsals Diarthrosis (arthroidal) 2 Gliding Limited motionMetatarsal-phalangeal Metatarsals-phalanges Diarthrosis (condyloid) 2 Flexion 25–30
Extension 80–90Abduction 15–20Abduction Limited
Interphalangeal Phalanges Diarthrosis (arthroidal) 1 Flexion 90Extension 0
Tibio-fibular Distal tibia-fibula Synarthrosis (syndesmosis) 0 Slight movement GiveSkull Cranial Synarthrosis (suture) 0 No movementSterno-costal Ribs-sternum Amphiarthrosis (synchondrosis) 0 Slight movementSacroiliac Sacrum-ilium Amphiarthrosis (synchondrosis) 0 No movement ElasticIntervertebral Cervical vertebrae Diarthrosis (arthroidal) 3 Flexion 40
Extension 75Lateral flexion 35–45Axial rotation 45–50
Thoracic vertebrae Diarthrosis (arthroidal) 3 Flexion 105Extension 60Lateral flexion 20Axial rotation 35
Lumbar vertebrae Diarthrosis (arthroidal) 3 Flexion 60Extension 35Lateral flexion 20Axial rotation 5
Atlas axis Diarthrosis (trochoid) 1 Pivoting motion
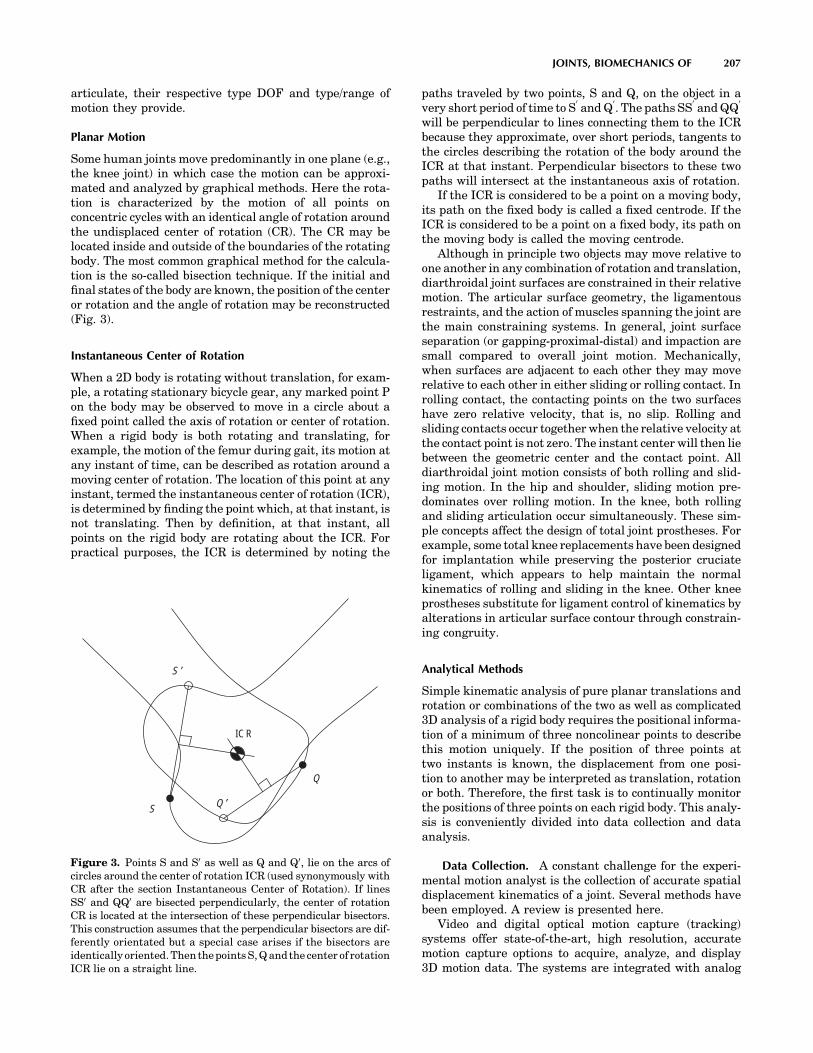
articulate, their respective type DOF and type/range ofmotion they provide.
Planar Motion
Some human joints move predominantly in one plane (e.g.,the knee joint) in which case the motion can be approxi-mated and analyzed by graphical methods. Here the rota-tion is characterized by the motion of all points onconcentric cycles with an identical angle of rotation aroundthe undisplaced center of rotation (CR). The CR may belocated inside and outside of the boundaries of the rotatingbody. The most common graphical method for the calcula-tion is the so-called bisection technique. If the initial andfinal states of the body are known, the position of the centeror rotation and the angle of rotation may be reconstructed(Fig. 3).
Instantaneous Center of Rotation
When a 2D body is rotating without translation, for exam-ple, a rotating stationary bicycle gear, any marked point Pon the body may be observed to move in a circle about afixed point called the axis of rotation or center of rotation.When a rigid body is both rotating and translating, forexample, the motion of the femur during gait, its motion atany instant of time, can be described as rotation around amoving center of rotation. The location of this point at anyinstant, termed the instantaneous center of rotation (ICR),is determined by finding the point which, at that instant, isnot translating. Then by definition, at that instant, allpoints on the rigid body are rotating about the ICR. Forpractical purposes, the ICR is determined by noting the
paths traveled by two points, S and Q, on the object in avery short period of time to S
0and Q
0. The paths SS
0and QQ
0
will be perpendicular to lines connecting them to the ICRbecause they approximate, over short periods, tangents tothe circles describing the rotation of the body around theICR at that instant. Perpendicular bisectors to these twopaths will intersect at the instantaneous axis of rotation.
If the ICR is considered to be a point on a moving body,its path on the fixed body is called a fixed centrode. If theICR is considered to be a point on a fixed body, its path onthe moving body is called the moving centrode.
Although in principle two objects may move relative toone another in any combination of rotation and translation,diarthroidal joint surfaces are constrained in their relativemotion. The articular surface geometry, the ligamentousrestraints, and the action of muscles spanning the joint arethe main constraining systems. In general, joint surfaceseparation (or gapping-proximal-distal) and impaction aresmall compared to overall joint motion. Mechanically,when surfaces are adjacent to each other they may moverelative to each other in either sliding or rolling contact. Inrolling contact, the contacting points on the two surfaceshave zero relative velocity, that is, no slip. Rolling andsliding contacts occur together when the relative velocity atthe contact point is not zero. The instant center will then liebetween the geometric center and the contact point. Alldiarthroidal joint motion consists of both rolling and slid-ing motion. In the hip and shoulder, sliding motion pre-dominates over rolling motion. In the knee, both rollingand sliding articulation occur simultaneously. These sim-ple concepts affect the design of total joint prostheses. Forexample, some total knee replacements have been designedfor implantation while preserving the posterior cruciateligament, which appears to help maintain the normalkinematics of rolling and sliding in the knee. Other kneeprostheses substitute for ligament control of kinematics byalterations in articular surface contour through constrain-ing congruity.
Analytical Methods
Simple kinematic analysis of pure planar translations androtation or combinations of the two as well as complicated3D analysis of a rigid body requires the positional informa-tion of a minimum of three noncolinear points to describethis motion uniquely. If the position of three points attwo instants is known, the displacement from one posi-tion to another may be interpreted as translation, rotationor both. Therefore, the first task is to continually monitorthe positions of three points on each rigid body. This analy-sis is conveniently divided into data collection and dataanalysis.
Data Collection. A constant challenge for the experi-mental motion analyst is the collection of accurate spatialdisplacement kinematics of a joint. Several methods havebeen employed. A review is presented here.
Video and digital optical motion capture (tracking)systems offer state-of-the-art, high resolution, accuratemotion capture options to acquire, analyze, and display3D motion data. The systems are integrated with analog
JOINTS, BIOMECHANICS OF 207
S ′
S Q ′
Q
ICR
Figure 3. Points S and S0 as well as Q and Q0, lie on the arcs ofcircles around the center of rotation ICR (used synonymously withCR after the section Instantaneous Center of Rotation). If linesSS0 and QQ0 are bisected perpendicularly, the center of rotationCR is located at the intersection of these perpendicular bisectors.This construction assumes that the perpendicular bisectors are dif-ferently orientated but a special case arises if the bisectors areidentically oriented. Then the points S, Q and the center of rotationICR lie on a straight line.

data acquisition systems to enable simultaneous acquisi-tion (1–300 Hz) of force plate and electromyographic data.Clinically validated software analysis packages are used toanalyze and display kinematic, kinetic, and electromyo-graphic data in forms that are easy to interpret.
The major components of a video and digital motioncapture system are the cameras, the controlling hardwaremodules, the software to analyze and present the data, andthe host computer to run the software. These systems aredesigned to be flexible, expandable (from 3 to up to 200cameras in motion analysis tracking for Hollywood animationmovies) and easy to integrate into any working environment.This system collects and processes coordinate data in theleast amount of time and requires minimal operator inter-vention. This system uses motion capture cameras to rapidlyacquire 3D coordinate positions from reflective markersplaced on subjects. Illuminating strobes with differing wave-lengths are used to track the spatial displacement (between 1and 10 mm resolution) of spherical reflective markersattached to the subject’s skin at appropriately chosen loca-tions, preferably on bony landmarks on the human body tominimize skin movement. They can be infrared (IR), visiblered, or near-IR strobes to fit the lighting conditions of thecapture environment. Also, the lenses can be of fixed orvariable focal length for total adaptability. Images areprocessed within the optical capture cameras where mar-kers are identified and coordinates are calculated beforebeing transferred to the computers. After the completionof the movement, the system provides 3D coordinate andkinematic data. The disadvantages of the system includethe skin movement error whose effect is more prominent(3 cm error) at high movement speeds. These high speedmotion tasks (impact biomechanics, e.g.) are handled byhigh speed cine cameras with data acquisition rates sev-eral orders of magnitude greater than clinical motionanalysis systems. The processing method that is almostreal time uses combinations of skin markers (minimumthree at each segment) to produce coordinate systems foreach segment and eventually describe intersegmentalrelative motion or relate all the different segment motionsto the laboratory fixed-coordinate system. Recently, methodsemploying clusters of markers have shown to somewhatreduce the skin marker artifact but are yet to be adoptedin the clinical practice.
A more accurate method (<1 mm translation and up to1000 Hz) is the cineradiographical method, which employsan X-ray machine and uses special cameras for capture ofsequences of the digital radiographs. In addition to accu-racy, these systems directly access the in vivo skeletalkinematics so that the resulting analysis can be directlyrelated to bony landmarks. Radiation issues, magnifica-tion, and distortion factors are some drawbacks that can beovercome by appropriate image analysis techniques. Thismethod is, however, prone to occlusion errors when twosegments overlap and simultaneously cross the field ofview of the X-ray source. Stereosystems with more thanone X-ray sources can limit this artifact. A biplane radio-graphic system consists of two X-ray generators and twoimage intensifiers optically coupled to synchronized highspeed video cameras that can be configured in a customgantry to enable a variety of motion studies. The system
can be set up with various set-up modes (e.g., a 608 inter-beam angle), an X-ray source to object distance of 1.3 m,and an object to intensifier distance of 0.5 m. Images areacquired with the generators in continuous radiographicmode (typically 100 mA, 90 kVp). The video cameras areelectronically shuttered to reduce motion blur. Short (0.5 s)sequences are recorded to minimize radiation exposure.X-ray exposure and image acquisition are controlled byan electronic timer–sequencer to capture only the desiredphase of movement.
CODA is an acronym of Cartesian Opto-electronicDynamic Anthropometer, a name first coined in 1974 togive a working title to an early research instrument devel-oped at Loughborough University, United Kingdom. The3D capability is an intrinsic characteristic of the design ofthe sensor units, equivalent to but much more accuratethan the stereoscopic depth perception in normal humanvision. The system is precalibrated for 3D measurement,which means that the lightweight sensor can be set up at anew location in a matter of minutes, without the need torecalibrate using a space-frame. Each sensor unit must beindependently capable of measuring the 3D coordinates ofskin markers in real-time. As a consequence, there is greatflexibility in the way the system can be operated. Forexample, a single sensor unit can be used to acquire 3Ddata in a wide variety of projects, such as unilateral gait. Upto six sensor units can be used together and placed around acapture volume to give ‘‘extra sets of eyes’’ and maximumredundancy of viewpoint. This enables the system to track3608 movements that often occur in animation and sportsapplications. The calculation of the 3D coordinates of mar-kers is done in real-time with an extremely low delay of 5ms. Special versions of the system are available with latencyshorter than 1 ms. This opens up many applications thatrequire real-time feedback, such as research in neuro-physiology and high quality virtual reality systems, as wellas tightly coupled real-time animation. It is also possible totrigger external equipment using the real-time data. Theautomatic intrinsic identification of markers combined withprocessing of all 3D coordinates in real-time means thatgraphs and stick figures of the motion and many types ofcalculated data can be displayed on a computer screenduring and immediately after the movement occurs. Thedata are also immediately stored to file on the hard drive.
A new concept in measuring movement disorders uti-lizes a unique miniature solid-state gyroscope, not to beconfused with gravity sensitive accelerometers. The instru-ment is fixed with straps directly on the skin surface of thestructure whose motion is of interest. It has been success-fully used to quantify: tremor (resting, posture, kinetic),rapid pronation–supination of the hand, arm swing, lateraltruncal sway, leg stride, spasticity (pendulum drop test),dyskinesia, and alternating dystonia. The system (Motus)senses rotational motion only and is ideal for quantifyinghuman movement since most skeletal joints produce rota-tional motion. This disadvantage is outweighed by itsminiature size that allows it to be of great value for certaintypes of studies. A different system (Gypsy Gyro) uses 18small solid-state inertial sensors (gyros) to accuratelymeasure the exact rotations of the actor’s bones in real-timefor motion capture. The system can easily be worn beneath
208 JOINTS, BIOMECHANICS OF

normal clothing. With wireless range these systems–suitscan be used to record up to 64 actors simultaneously.
Another concept for 3D motion analysis is the measure-ment system CMS10 (Zebris) designed as a compact devicefor everyday use. The measurement procedure is based onthe travel time measurement of ultrasonic pulses that areemitted by miniature transmitters (markers placed on theskin) to the three microphones built into the compactdevice. A socket for the power pack (supplied with thedevice) as well as the interface to a computer are locatedon the back of the device. The evaluation and display of themeasurement data are carried out in real-time. It is pos-sible to use either a table clamp or a mobile floor stand withtwo joints to support the measurement system.
Data AnalysisCoordinate Systems and Transformation. In the analysis
of experimental joint mechanics data, the transformationof point coordinates from one coordinate system to anotheris a frequent task (4). A typical application of such atransformation would be gait analysis data recorded in alaboratory fixed coordinate system (by means of film orvideo sequences) that must be converted to a referencesystem fixed to the skeleton of the test subject. The labora-tory fixed coordinate system may be designated by xyz andthe body reference system by abc (Fig. 4). The location of apoint S(a/b/c) in the body reference system is defined bythe radius vector s ¼ a � ea þ b � eb þ c � ec. Consider thereference system to be embedded into the laboratory sys-tem. Then the radius vector rm ¼ xm � ex þ ym � ey þ zm � ez
describes the origin of the reference system in the labora-tory system. The location of S(x/y/z) is now expressed bythe coordinates a, b, c. The vector equation r¼ rmþ s givesthe radius vector for point S in the laboratory system (Fig. 4).Employing the full notation we have: r ¼ ðx � ex þ y � eyþz � ezÞ ¼ ðxm � ex þ ym � ey þ zm � ezÞ þ ða � ea þ b � eb þ c � ecÞ. Aset of transformation equations results after some inter-mediate matrix algebra to describe the coordinates. Thescalar products of the unit vectors in the xyz and abc
systems produce a set of nine coefficients Cij. The cosineof the angle between the coordinate axes of the twosystems corresponds to the value of the scalar products.Three ‘‘direction cosines’’ define the orientation of eachunit vector in one system with respect to the three unitvectors of the other system. Due to the inherent propertiesof orthogonality and unit length of the unit vectors, thereare six constraints on the nine direction cosines, whichleaves only three independent parameters describing thetransformation. Employing the matrix notation of thetransformation equation we have
x
y
z
264375 ¼
xm
ym
zm
264
375þ
c11 c12 c13
c21 c22 c23
c31 c32 c33
264
375
a
b
c
264375
In coordinate transformations, the objects remainunchanged and only their location and orientation aredescribed in a rotated and possibly translated coordinatesystem. If a measurement provides the relative spatial loca-tion and orientation of two-coordinate systems the relativetranslation of the two systems and the nine coefficients Cij
can be calculated. The coefficients are adequate to describethe relative rotation between the two coordinate systems.
Translation in Three-Dimensional Space. In translationin 3D space, the rigid object moves parallel to itself (Fig. 5).Pure translation in 3D space leaves the orientation of thebody unchanged as in the case of pure 2D translation.
Rotations about the Coordinate Axes. A rotation in 3Dspace is defined by specifying an axis and an angle ofrotation (Fig. 6). The axis can be described by its 3Dorientation and location (5). A rotation, as does the trans-lation explained earlier, leaves all the points on the axisunchanged; all other points move along circular arcs inplanes oriented perpendicular to the axis (6,7).
This rotation moves an arbitrary point P to location P0
with constant distance z from the xy plane (z¼ z0). Thisproduces the following matrix notation for the respectiveequations for the rotation that changes x and y coordinates
JOINTS, BIOMECHANICS OF 209
ez
ey
ex
ec
eb
earm
r
S
S
Figure 4. Changing the coordinate systems, transformation ofpoint coordinates from one coordinate system to another.
t
t
t
R
R ′
P ′
P
Q ′
Q
Figure 5. A rigid body (shoebox) moves parallel to itself. Theradius vectors from O to P and from O to P0 are designated by r andr0 so that r0 ¼ rþ t, where t is the difference vector.
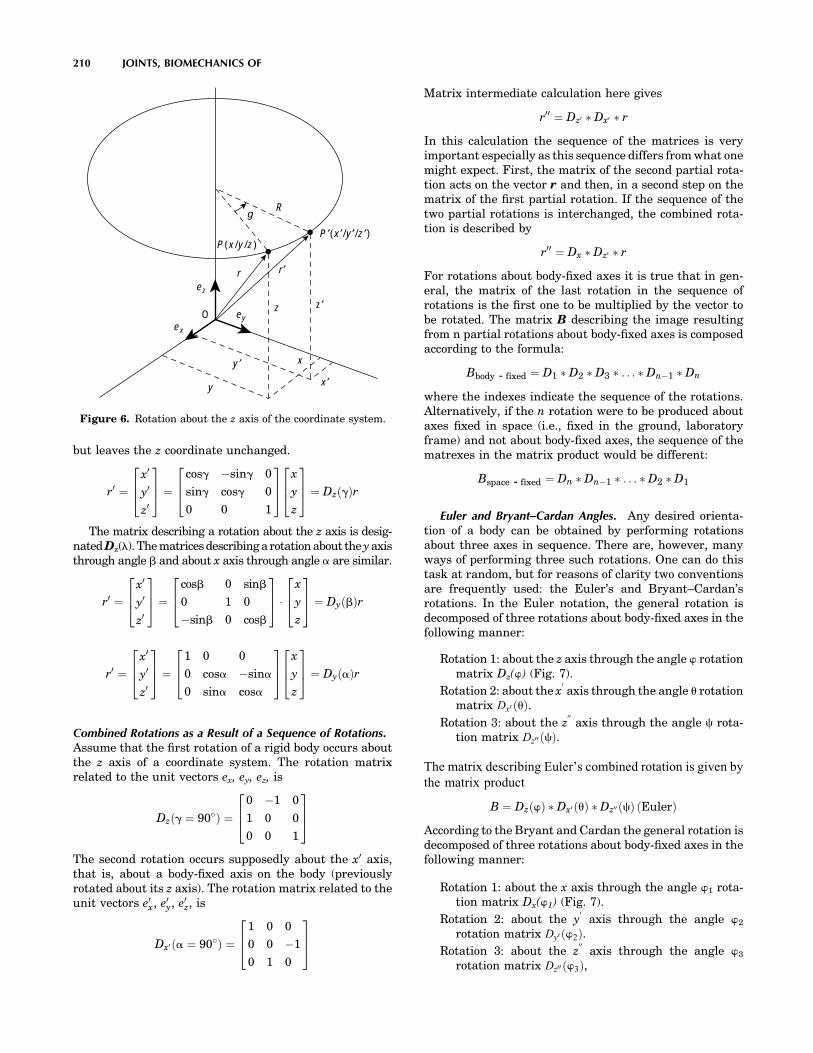
but leaves the z coordinate unchanged.
r0 ¼x0
y0
z0
264
375 ¼
cosg �sing 0
sing cosg 0
0 0 1
264
375
x
y
z
264375 ¼ DzðgÞr
The matrix describing a rotation about the z axis is desig-nated Dz(l). The matrices describing a rotation about the y axisthrough angle b and about x axis through angle a are similar.
r0 ¼x0
y0
z0
264
375 ¼
cosb 0 sinb
0 1 0
�sinb 0 cosb
264
375 �
x
y
z
264375 ¼ DyðbÞr
r0 ¼x0
y0
z0
264
375 ¼
1 0 0
0 cosa �sina
0 sina cosa
264
375
x
y
z
264375 ¼ DyðaÞr
Combined Rotations as a Result of a Sequence of Rotations.Assume that the first rotation of a rigid body occurs aboutthe z axis of a coordinate system. The rotation matrixrelated to the unit vectors ex, ey, ez, is
Dzðg ¼ 90Þ ¼0 �1 0
1 0 0
0 0 1
264
375
The second rotation occurs supposedly about the x0 axis,that is, about a body-fixed axis on the body (previouslyrotated about its z axis). The rotation matrix related to theunit vectors e0x, e0y, e0z, is
Dx0 ða ¼ 90Þ ¼1 0 0
0 0 �1
0 1 0
264
375
Matrix intermediate calculation here gives
r00 ¼ Dz0 Dx0 r
In this calculation the sequence of the matrices is veryimportant especially as this sequence differs from what onemight expect. First, the matrix of the second partial rota-tion acts on the vector r and then, in a second step on thematrix of the first partial rotation. If the sequence of thetwo partial rotations is interchanged, the combined rota-tion is described by
r00 ¼ Dx Dz0 r
For rotations about body-fixed axes it is true that in gen-eral, the matrix of the last rotation in the sequence ofrotations is the first one to be multiplied by the vector tobe rotated. The matrix B describing the image resultingfrom n partial rotations about body-fixed axes is composedaccording to the formula:
Bbody - fixed ¼ D1 D2 D3 . . . Dn�1 Dn
where the indexes indicate the sequence of the rotations.Alternatively, if the n rotation were to be produced aboutaxes fixed in space (i.e., fixed in the ground, laboratoryframe) and not about body-fixed axes, the sequence of thematrexes in the matrix product would be different:
Bspace - fixed ¼ Dn Dn�1 . . . D2 D1
Euler and Bryant–Cardan Angles. Any desired orienta-tion of a body can be obtained by performing rotationsabout three axes in sequence. There are, however, manyways of performing three such rotations. One can do thistask at random, but for reasons of clarity two conventionsare frequently used: the Euler’s and Bryant–Cardan’srotations. In the Euler notation, the general rotation isdecomposed of three rotations about body-fixed axes in thefollowing manner:
Rotation 1: about the z axis through the angle w rotationmatrix Dz(w) (Fig. 7).
Rotation 2: about the x0axis through the angle u rotation
matrix Dx0 ðuÞ.Rotation 3: about the z
00axis through the angle c rota-
tion matrix Dz00 ðcÞ.
The matrix describing Euler’s combined rotation is given bythe matrix product
B ¼ DzðwÞ Dx0 ðuÞ Dz00 ðcÞ ðEulerÞ
According to the Bryant and Cardan the general rotation isdecomposed of three rotations about body-fixed axes in thefollowing manner:
Rotation 1: about the x axis through the angle w1 rota-tion matrix Dx(w1) (Fig. 7).
Rotation 2: about the y0
axis through the angle w2
rotation matrix Dy0 ðw2Þ.Rotation 3: about the z
00axis through the angle w3
rotation matrix Dz00 ðw3Þ,
210 JOINTS, BIOMECHANICS OF
Rg
ez
ex
O ey
r
z
y ′
x ′
x
y
z′
r ′
P (x /y /z )P ′(x ′/y ′/z ′)
Figure 6. Rotation about the z axis of the coordinate system.
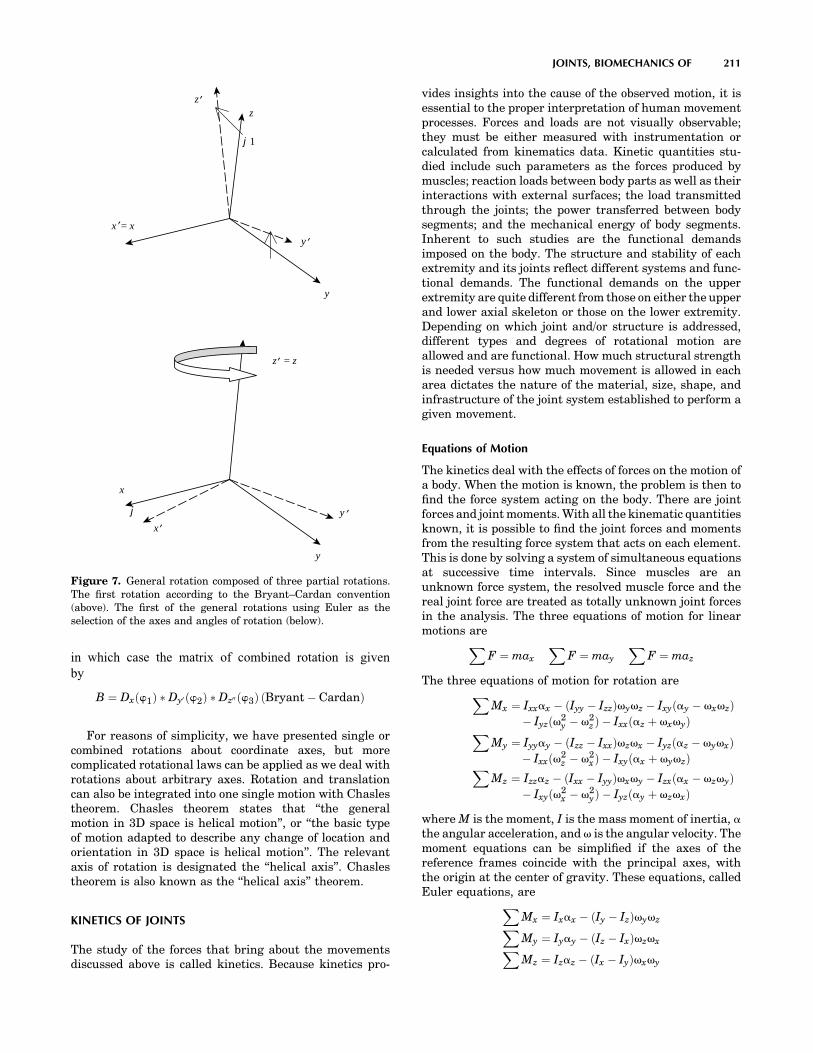
in which case the matrix of combined rotation is givenby
B ¼ Dxðw1Þ Dy0 ðw2Þ Dz00 ðw3Þ ðBryant � CardanÞ
For reasons of simplicity, we have presented single orcombined rotations about coordinate axes, but morecomplicated rotational laws can be applied as we deal withrotations about arbitrary axes. Rotation and translationcan also be integrated into one single motion with Chaslestheorem. Chasles theorem states that ‘‘the generalmotion in 3D space is helical motion’’, or ‘‘the basic typeof motion adapted to describe any change of location andorientation in 3D space is helical motion’’. The relevantaxis of rotation is designated the ‘‘helical axis’’. Chaslestheorem is also known as the ‘‘helical axis’’ theorem.
KINETICS OF JOINTS
The study of the forces that bring about the movementsdiscussed above is called kinetics. Because kinetics pro-
vides insights into the cause of the observed motion, it isessential to the proper interpretation of human movementprocesses. Forces and loads are not visually observable;they must be either measured with instrumentation orcalculated from kinematics data. Kinetic quantities stu-died include such parameters as the forces produced bymuscles; reaction loads between body parts as well as theirinteractions with external surfaces; the load transmittedthrough the joints; the power transferred between bodysegments; and the mechanical energy of body segments.Inherent to such studies are the functional demandsimposed on the body. The structure and stability of eachextremity and its joints reflect different systems and func-tional demands. The functional demands on the upperextremity are quite different from those on either the upperand lower axial skeleton or those on the lower extremity.Depending on which joint and/or structure is addressed,different types and degrees of rotational motion areallowed and are functional. How much structural strengthis needed versus how much movement is allowed in eacharea dictates the nature of the material, size, shape, andinfrastructure of the joint system established to perform agiven movement.
Equations of Motion
The kinetics deal with the effects of forces on the motion ofa body. When the motion is known, the problem is then tofind the force system acting on the body. There are jointforces and joint moments. With all the kinematic quantitiesknown, it is possible to find the joint forces and momentsfrom the resulting force system that acts on each element.This is done by solving a system of simultaneous equationsat successive time intervals. Since muscles are anunknown force system, the resolved muscle force and thereal joint force are treated as totally unknown joint forcesin the analysis. The three equations of motion for linearmotions areX
F ¼ max
XF ¼ may
XF ¼ maz
The three equations of motion for rotation areXMx ¼ Ixxax � ðIyy � IzzÞvyvz � Ixyðay � vxvzÞ
� Iyzðv2y � v2
z Þ � Ixxðaz þ vxvyÞXMy ¼ Iyyay � ðIzz � IxxÞvzvx � Iyzðaz � vyvxÞ
� Ixxðv2z � v2
xÞ � Ixyðax þ vyvzÞXMz ¼ Izzaz � ðIxx � IyyÞvxvy � Izxðax � vzvyÞ
� Ixyðv2x � v2
yÞ � Iyzðay þ vzvxÞ
where M is the moment, I is the mass moment of inertia, athe angular acceleration, and v is the angular velocity. Themoment equations can be simplified if the axes of thereference frames coincide with the principal axes, withthe origin at the center of gravity. These equations, calledEuler equations, areX
Mx ¼ Ixax � ðIy � IzÞvyvzXMy ¼ Iyay � ðIz � IxÞvzvxXMz ¼ Izaz � ðIx � IyÞvxvy
JOINTS, BIOMECHANICS OF 211
y
z
y ′x ′= x
z ′
z ′ = z
y ′
x
y
x ′
j
j1
Figure 7. General rotation composed of three partial rotations.The first rotation according to the Bryant–Cardan convention(above). The first of the general rotations using Euler as theselection of the axes and angles of rotation (below).

Continuity conditions are derived based on the fact thatequal and opposite forces and moments occur at the jointbetween the two segments.
The anthropometric data for the mass, the center ofgravity, the moment of inertia, and so on for the differentparts of the human body are available in the literature(8,9).
Motion and Forces on Diarthroidal Joints
In vivo experimental measurements on the relative motionsbetween articulating surfaces of a joint, which correspond todaily activities, are limited. Most quantitative informationis obtained from gait studies that do not provide the accu-racy and precision for the detailed information required forlubrication studies. However, even simple calculations showthat translational speeds between two articulating surfacescan range from � 0.06 m.s�1 between the femoral headsurface and the acetabulum surface during normal walking,to � 0.6 m.s�1 between the humeral head surface and theglenoid surface of the shoulder when a baseball pitcherthrows a fastball. Cartilage to cartilage contact or fluid-filmlayers, or a mixture of both are normally the contactmechanisms at the joint. During a normal walking cycle,the human hip, knee, and ankle joints can be subjected toloads on the order of six times body weight, with these peakloads occurring just after heel-strike and just before toe-off.The average load on the joint is approximately three to fivetimes body weight, which lasts as long as 60% of the walkingcycle. During the swing phase of walking, only light loadsare carried. During this phase, the articular surfaces moverapidly over each other. In addition, extremely high forcesoccur across the joints in the leg during jumping. Descend-ing stairs can load the knee with up to 10 times body weight,suggesting that the load on the joint surface is dependent onthe task performed, that is, the loading sites change drasti-cally as the articulating surfaces move relative to each other.
MATHEMATICAL AND MECHANICAL MODELS OF JOINTS
Locomotion results from complex, high dimensional, non-linear, dynamically coupled interactions between anorganism and its environment. Simple models called tem-plates have been and can be made to resolve the redun-dancy of multiple legs, joints, and muscles by seekingsynergies and symmetries. The simplest model (least num-ber of variables and parameters) that exhibits a targetedbehavior is called a template (10). Templates can be used totest control strategies against empirical data. Templatesmust be based in more detailed morphological and physio-logical models to ask specific questions about multiple legs,the joint torques that actuate them, the recruitment ofmuscles that produce those torques and the neural net-works that activate the ensemble. These more elaboratemodels are called anchors. They introduce representationsof specific biological details of the organism. The control ofslow, variable-frequency locomotion appears to be domi-nated by the nervous system, whereas during rapid, rhyth-mic locomotion, the control may reside more within themechanical system. Anchored templates of many-legged,sprawled-postured animals may suggest that passive,
dynamic self-stabilization from a feedforward, tunedmechanical system can reject rapid perturbations andsimplify control. Future progress would benefit from thecreation of a field embracing comparative neuromechanics.Both templates and anchors are part of a system of math-ematical and structural definitions and standard methodsof description and dissemination of knowledge. In the nextfew sessions an attempt is made to describe some of thosemethods.
The human musculoskeletal system is often modeled byjoining rigid links with continuous mass distribution. Thejoint may be of the revolute or spherical type, with restric-tions consistent with body construction. Usually, thehuman segments form an open linkage.
Knowing all the kinematics at the center of mass of thesegments, the joint force and the moment analysis proceedsby drawing free-body diagrams of the segments involved.The free body diagrams for the hip joint, the knee joint,and the ankle joint in a sagittal plane are illustrated inFig. 8 as an example:
Assessment of Mechanical Factors Associated With JointDegeneration: Limitations and Future Work
Joint degeneration results from complex, multidimen-sional, nonlinear, dynamically coupled interactionsbetween the organism and its environment. The assess-ment of mechanical factors associated with joint degen-eration has traditionally combined longitudinal clinicalstudies with carefully designed experimental techniquesand theoretical computational analyses. The quality of
212 JOINTS, BIOMECHANICS OF
Figure 8. Relationship between the free body diagram and thelink-segment model. Each segment is ‘‘broken’’ at the joints, andthe reaction forces and moments of force acting at each joint areshown.

such assessments depends both on the accuracy–precisionof the measurement methodology and the theoretical fra-mework for its interpretation (i.e. joint mathematical mod-els). To capitalize on the increasing level of measurementaccuracy, theoretical analysis requires more detailed mor-phological and physiological models (11). For example,because of variations between individuals, the detailed,morphological analysis required for accurate modeling ofcartilage stresses must be patient specific. In addition, thedynamics of the human task to be modeled (for e.g., humanjumping) as expressed in the strain rate of tissue deforma-tion must be accounted for in the analysis. Once the errorestimate (simulation versus experiment) is established,model predictions can address specific clinical-biologicalquestions. Traditionally, in situ methodology (cadavericexperiments and in vitro tests) is applied when an in vivomeasurement is impossible. This limitation presents anumber of implications and assumptions that weakenthe theoretical analysis. Recent developments have furtherimproved accuracy in the experimental measurement of invivo knee kinematics. These developments allow signifi-cant improvements upon previous limitations by applyingpatient-specific task-dependent models in the study of jointpathogenesis.
The vast majority of dynamic knee studies have beenperformed with conventional motion analysis techniques,using markers attached to the skin. Conventional motionanalysis is not sufficiently accurate to enable analysis ofcartilage stress. Previous studies have shown that skinmarkers move substantially relative to underlying bone,with RMS errors of 2–7 mm and peak errors as large as14 mm in estimates of tibial position during gait (12). Astudy of four subjects during running and hopping (using250 frame�s�1 stereo radiography) has demonstrated skinmarker motion relative to the femur averaging 1–5 mmthroughout the motion, with peak-to-peak errors of theoscillation at impact averaging 7–14 mm (13). Errors wereboth subject and activity specific (14). Techniques havebeen developed for improving estimates of bone dynamicsfrom skin markers using large numbers of markers andoptimization–modeling of soft tissue deformation (15,16)but the performance of these methods for in vivo studieshas only been validated for the tibia (during a slow, impact-free 10 cm step-up movement of a single patient with anexternal fixator). Average errors were low, but peak errorsroutinely exceeded 1 mm. Errors would likely increasesignificantly during faster movements and movementsinvolving impact, and also where the soft tissue layerbetween skin and bone is thicker (e.g., for the femur).However, if the kinematic measurements are to be usedin conjunction with musculoskeletal models to estimatedynamic loads and stresses on joint tissues, then evenerrors as small as 1 mm may be unacceptable. For example,when estimating strains in the ACL, a �1 mm error intibio–femoral displacement could introduce uncertainty inthe ligament length of approximately �3% (assuming anominal ligament length of 30 mm). This error is similar inmagnitude to estimated peak ligament elongation occur-ring during common activities, such as stair climbing (17).For investigating cartilage deformation, this error magni-tude would be even less acceptable. A 1 mm displacement
would be equivalent to a cartilage strain of � 25%, relativeto the average thickness of healthy tibio–femoral cartilage(18). A displacement error of this magnitude would trans-late into huge differences in estimates of contact forces.Thus, efforts to model, predict and correct for soft tissuedeformation are unlikely to achieve sufficient accuracy forassessing soft tissue behavior. Alternatively, kinematicsfrom a high speed stereoradiographic system capable oftracking implanted tantalum markers in vivo with 3Daccuracy and precision better than 0.072 mm in translationand 0.358 in rotation (19) are more appropriate in use withadvanced computational models. This accuracy is an orderof magnitude or greater of improvement over conventionalmotion analysis techniques, and is uniquely capable ofproviding the accuracy necessary to model joint stresses.
From Experimental to Advanced Theoretical Analysis in JointMechanics
In addition to measuring joint kinematics and contactareas, investigators have attempted to measure articularcontact stresses and pressures. However, stresses through-out the cartilage layer cannot be measured experimentally.Direct measurements of stress can be made at the articularsurface using pressure sensing devices (20–22) (e.g., pres-sure sensitive Fuji film, piezoresistive contact pressuretransducers, dye staining, silicone rubber casting). Forcadaver studies, Fuji film sheets (Fuji Prescale Film; Itoh,New York, NY) are inserted in a joint and if pressedproduce a stain whose intensity depends on the staticapplied pressure. Alternatively, digital electronic pressuresensors (e.g., K-scan, Tekscan, Boston, MA) can be placedonto the articular surface. These sensors are thin andflexible, and can be made to conform to the anatomy ofthe medial and lateral knee compartments. They consist ofprinted circuits divided into grids of load-sensing regions.Each load-sensing region within the grid has a piezoresis-tive pigment that can be used to determine the totalcompressive load within that region. After appropriatecalibration procedures, dynamic pressure distributionscan be calculated. In addition to providing a continuous,dynamic readout, K-scan has been reported to more accu-rately estimate contact areas than Fuji film (23,24).
There are significant concerns with the use of thesesensors for estimating actual contact pressures. Thesetechniques measure only surface-layer stresses, they alterthe nature of cartilage surface interactions and are tooinvasive for in vivo human use. Thus, the clinical validity ofarticular pressure measurement with such sensors is ques-tionable. They can, however, be important tools for theevaluation of the predictive power of joint models (2). Byincluding the sensor in a finite element model, the effects ofthe sensor film on the actual contact mechanics can beaccounted for (25). Thus, contact pressure predictions fromsuch models can be directly compared to the pressure sensormeasurements for finite element (FE) model validation.
Many in situ experimental studies have been conductedto obtain 3D knee joint kinematics and force-displacementdata (21,26–30). Cadaver studies, however, cannot repro-duce the complex loading seen by the joint during stren-uous movements, since the muscle forces driving the
JOINTS, BIOMECHANICS OF 213

movement cannot be simulated. Because of these funda-mental limitations of experimental measures, mathemati-cal models are favored for obtaining comprehensivedescriptions of the spatial and temporal variations of car-tilage stresses. A numerical model could be used to performparametric studies of geometry, loading or material prop-erties in controlled ways that would not be possible withtissue samples.
Theoretical Analysis of Joint Mechanics
During the last two decades, a number of theoretical jointmechanics studies with different degrees of accuracy andpredictive power have been presented in the literature (31–39). Computational modeling work has included anatomi-cal or geometrical observation (40,41) and analytical math-ematical modeling (42–46). More recently, advanced FEmodeling approaches allowed for improvements in thepredictive power of localized tissue deformation (47–54).Joint biomechanics problems are characterized by movingcontacts between two topologically complex soft tissuelayers separated by a thin layer of non-Newtonian synovialfluid. A prime example is the multibody sliding contactproblem between the tibia, femur, and menisci. The com-plexity of such problems requires implementation ofsophisticated numerical methods for solutions (55–58).The finite element method is ideally suited for obtainingsolutions to joint contact problems. Thus far, much of thefinite element analysis has been applied to the study ofhard tissue structures, often as it relates to prostheticdevices (59,60). When addressed, soft tissue layers aretreated as single-phase elastic materials. As a consequenceof the relative dearth of precise patient specific geometricdata, material properties and insufficiency in accuracy of invivo kinematics for input, no patient specific computationalmodels have been reported for longitudinal clinical jointstudies.
Surface Modeling
Surface modeling methods calculate the shape variationsof joints and visualize the proximity of subchondral bonesurfaces during static loading or dynamic movement.These methods can combine in situ data, motion analysisoptical system data or high speed biplane radiographicimage data and 3D bone surface information derived fromcomputed tomography to determine subchondral bonemotion. This method can be used to identify the regionsof contact during static loading or dynamic motion, tocalculate the surface area of subchondral bone withinclose contact, and to determine the changing position ofthe close contact area during dynamic activities (Fig. 9).
In vivo dynamic joint surface interaction informationwould be useful in the study of osteoarthritis changes injoint space and contact patterns over time, in biomechani-cal modeling to assist in finite element modeling, and inidentifying normal and pathological joint mechanics pre-and postsurgery. Previous attempts to quantify the inter-action between bones have utilized various methodsincluding castings (62,63), pressure sensitive film (64),mathematical surface modeling (65,66), implant registra-
tion (67) and cine phase contrast magnetic resonanceimaging (MRI) (68). The casting method can only beapplied to cadaver models under static loading conditions.Pressure sensitive film also requires a cadaver model andnecessitates inserting material into the joint space. Math-ematical surface modeling allows analysis of dynamicmotions in vivo, however, the joint must be disarticulatedafter testing. Implant registration requires either surgicalimplants or nonsubject specific image matching algo-rithms. Cine phase contrast MRI requires repeatedly per-forming the same motion pattern during testing and islimited to a small range of motion. The process describedbelow is an improvement on these previous techniquesbecause it utilizes live subjects performing dynamic taskswith unrestricted motion. Direct measurement of articularcartilage behavior in vivo during dynamic loading is pro-blematic. In order to estimate the behavior of articularcartilage, the surface proximity interaction method thatprecisely tracks the motion of subchondral bone surfaces invivo. Articular cartilage behavior is then estimated fromthese subchondral bone measurements.
Anderst et al. (61) described a method to estimate in vivodynamic articular surface interaction by combining jointkinematics from high-speed biplane radiography with 3Dbone shape information derived from computed tomogra-phy (CT). Markers implanted in the bones were visible inboth the CT scans and the radiographic images, and wereused to register the subchondral bone surfaces with the 3Dbone motion. Joint surface interactions were then esti-mated by analyzing the relative proximity of the subchon-dral bone surfaces during the rendered movement.Computed Tomography data can be also used for jointgeometry–shape characterization. The method is referredas reconstruction of volumetric models into rendered jointsurface geometry models.
Computed Tomography data are typically collected forthis method with slice spacing between the differentimages of � 0.625 – 1.25 mm and the in-plane resolution
214 JOINTS, BIOMECHANICS OF
Figure 9. Example applications showing dynamic in vivo tibio-femoral bone surface motion using joint proximity (Euclidiandistance) mapping during human one-legged hopping.

is � 0.293–0.6 mm depending on the size of the bone. TheCT scans are reconstructed into 3D solid figures usingsoftware that employs reconstruction techniques, that is,the regularized marching tetrahedra algorithm by Treeceet al. (70). If necessary, threshold values are adjusted toensure the entire bone surface appeared in the reconstruc-tion and the opposing bone surfaces never overlapped incomputer animations of the motion.
Anterior–posterior and lateral radiographs are com-monly used to preoperatively determine prosthetic sizeand proper donor selection for osteochondral allografts.By using 3D computer aided design tools and the recon-structed 3D joint geometry from CT described above, sizedetermination is less prone to out-of-plane imaging errorsassociated with sagittal and coronal roentgenograms.Assessment of surface size, curvature analysis and kneeincongruity is possible with in vivo CT [Fig. 10 (69,71,72)].After the 3D joint surface reconstruction models thedistal articular femur (n¼ 16) can be represented by sixcircles, the diameters of these circles, their angular arcs,and the distances between their centers varied with thesize of the femur (Fig. 11; Table 5). There is a statisticallysignificant association between several geometry para-meters when the lateral or the medial distal femur isstudied independently. These associations do not existwhen we correlate medial versus lateral compartmentsacross the population.
The Joint Distribution Problem
Much attention has been devoted to the solution to whathas become known as the general joint distribution pro-blem that is, the problem of estimating the in vivo forcestransmitted by the individual anatomical structures in thejoint neighborhood during some activity of interest (73).The prediction of forces in joint structures has manyapplications. In the field of medicine, these predictionsare useful for obtaining a better understanding of muscleand ligament function, mechanical environment withinwhich prosthetic components must operate, and mechan-ical effects of musculoskeletal diseases. In the realm ofsport biomechanics, these predictions are useful for betterunderstanding of the kinetic demands, performanceconstraints, and mechanisms for improving athleticperformance. Industrial applications include the optimiza-tion of occupational performance and safety considera-tions. Although the general techniques for predictingforces in joint structures may be used throughout thisbroad range of applications, the particular method of choiceand the details of the analysis depend on the application.
The general force distribution problem normally arisesin the following way. The musculoskeletal system or arelevant portion thereof is modeled as a mechanical systemconsisting of a number of essentially rigid elements (bodysegments) subjected to forces due to the presence of agravitational field, and segmental contact with externalobjects, neighboring segments, and soft tissue structuresthat produce and constrain system motion. The associatedinverse dynamics problem is then formulated and solvedto determine the variable intersegmental (joint) forceand moment resultants during the activity of interest.The joint resultants are abstract kinetic quantities thatrepresent the net effect of all the forces transmitted bythe anatomic structures crossing the joint. At a typicaljoint, these forces normally include the forces transmittedby the muscles, ligaments, and articular (bony) contactsurfaces.
The unknown forces transmitted by the joint structureare next related to the known intersegmental resultants bywriting the joint equilibrium equations. These equationsexpress the fact that the vector sum of all the forces in theindividual anatomic structures, and the vector sum of allthe moments about the joint center produced by thoseforces, are equal to the intersegmental resultant forceand moment, respectively. Assuming that all joint geome-try (point of application and orientation of forces) is knownand that these two independent vector equations (or sixindependent scalar equations) involve as unknowns the Mmuscle and L ligament forces, together with the 3C scalarcomponents of the C bony contact forces, these joint equili-brium equations are indeterminate whenever the sum(MþLþ 3C) of the unknown forces exceeds six. Thus, ifthe system model includes only one bony contact force(C¼ 1) and more than three muscle and/or ligament forces(MþL> 3), the corresponding joint distribution problemwill be indeterminate and therefore have an infinite num-ber of solutions.
Finally, the joint resultants are decomposed or distrib-uted to the individual joint structures at each instant of
JOINTS, BIOMECHANICS OF 215
DA
DC
DP(b)
X
A
F E
Anterior
Posterior
Y
Figure 11. All the sagittal view measured parameters in thestudy of femoral head congruity (69).
Figure 10. Articular surface matching (femoral condyle on topand tibial plateau below) using geometrical objects (69).
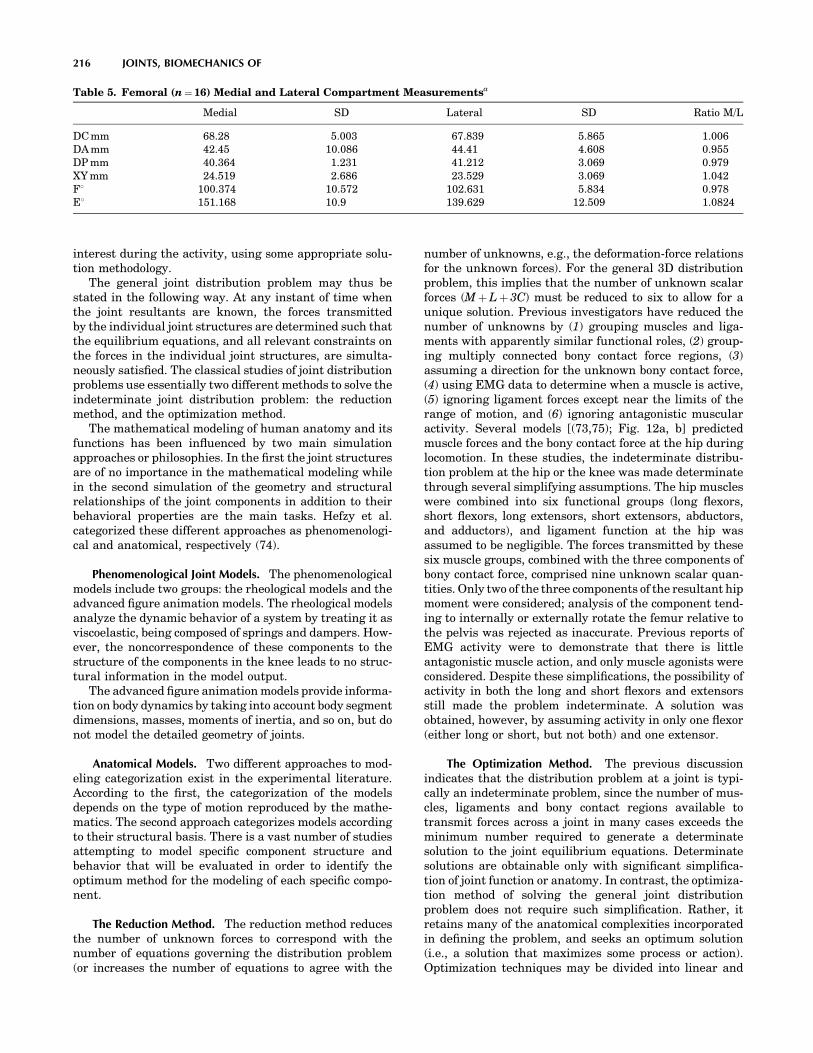
interest during the activity, using some appropriate solu-tion methodology.
The general joint distribution problem may thus bestated in the following way. At any instant of time whenthe joint resultants are known, the forces transmittedby the individual joint structures are determined such thatthe equilibrium equations, and all relevant constraints onthe forces in the individual joint structures, are simulta-neously satisfied. The classical studies of joint distributionproblems use essentially two different methods to solve theindeterminate joint distribution problem: the reductionmethod, and the optimization method.
The mathematical modeling of human anatomy and itsfunctions has been influenced by two main simulationapproaches or philosophies. In the first the joint structuresare of no importance in the mathematical modeling whilein the second simulation of the geometry and structuralrelationships of the joint components in addition to theirbehavioral properties are the main tasks. Hefzy et al.categorized these different approaches as phenomenologi-cal and anatomical, respectively (74).
Phenomenological Joint Models. The phenomenologicalmodels include two groups: the rheological models and theadvanced figure animation models. The rheological modelsanalyze the dynamic behavior of a system by treating it asviscoelastic, being composed of springs and dampers. How-ever, the noncorrespondence of these components to thestructure of the components in the knee leads to no struc-tural information in the model output.
The advanced figure animation models provide informa-tion on body dynamics by taking into account body segmentdimensions, masses, moments of inertia, and so on, but donot model the detailed geometry of joints.
Anatomical Models. Two different approaches to mod-eling categorization exist in the experimental literature.According to the first, the categorization of the modelsdepends on the type of motion reproduced by the mathe-matics. The second approach categorizes models accordingto their structural basis. There is a vast number of studiesattempting to model specific component structure andbehavior that will be evaluated in order to identify theoptimum method for the modeling of each specific compo-nent.
The Reduction Method. The reduction method reducesthe number of unknown forces to correspond with thenumber of equations governing the distribution problem(or increases the number of equations to agree with the
number of unknowns, e.g., the deformation-force relationsfor the unknown forces). For the general 3D distributionproblem, this implies that the number of unknown scalarforces (MþLþ 3C) must be reduced to six to allow for aunique solution. Previous investigators have reduced thenumber of unknowns by (1) grouping muscles and liga-ments with apparently similar functional roles, (2) group-ing multiply connected bony contact force regions, (3)assuming a direction for the unknown bony contact force,(4) using EMG data to determine when a muscle is active,(5) ignoring ligament forces except near the limits of therange of motion, and (6) ignoring antagonistic muscularactivity. Several models [(73,75); Fig. 12a, b] predictedmuscle forces and the bony contact force at the hip duringlocomotion. In these studies, the indeterminate distribu-tion problem at the hip or the knee was made determinatethrough several simplifying assumptions. The hip muscleswere combined into six functional groups (long flexors,short flexors, long extensors, short extensors, abductors,and adductors), and ligament function at the hip wasassumed to be negligible. The forces transmitted by thesesix muscle groups, combined with the three components ofbony contact force, comprised nine unknown scalar quan-tities. Only two of the three components of the resultant hipmoment were considered; analysis of the component tend-ing to internally or externally rotate the femur relative tothe pelvis was rejected as inaccurate. Previous reports ofEMG activity were to demonstrate that there is littleantagonistic muscle action, and only muscle agonists wereconsidered. Despite these simplifications, the possibility ofactivity in both the long and short flexors and extensorsstill made the problem indeterminate. A solution wasobtained, however, by assuming activity in only one flexor(either long or short, but not both) and one extensor.
The Optimization Method. The previous discussionindicates that the distribution problem at a joint is typi-cally an indeterminate problem, since the number of mus-cles, ligaments and bony contact regions available totransmit forces across a joint in many cases exceeds theminimum number required to generate a determinatesolution to the joint equilibrium equations. Determinatesolutions are obtainable only with significant simplifica-tion of joint function or anatomy. In contrast, the optimiza-tion method of solving the general joint distributionproblem does not require such simplification. Rather, itretains many of the anatomical complexities incorporatedin defining the problem, and seeks an optimum solution(i.e., a solution that maximizes some process or action).Optimization techniques may be divided into linear and
216 JOINTS, BIOMECHANICS OF
Table 5. Femoral (n¼16) Medial and Lateral Compartment Measurementsa
Medial SD Lateral SD Ratio M/L
DC mm 68.28 5.003 67.839 5.865 1.006DA mm 42.45 10.086 44.41 4.608 0.955DP mm 40.364 1.231 41.212 3.069 0.979XY mm 24.519 2.686 23.529 3.069 1.042F8 100.374 10.572 102.631 5.834 0.978E8 151.168 10.9 139.629 12.509 1.0824

nonlinear methods Simultaneous use of linear cost andconstraint functions in the model formulation constitutesthe so-called linear optimization method. In contrast, ifthe cost function and/or one or more of the constraintfunctions is nonlinear, solution of the problem requiresthe use of nonlinear optimization methods. Both of theseoptimization methods have been made practical withhigh speed computers, since the techniques require manyiterations of equation-solving to find an optimum solution.Neuromuscular function is complex and poorly under-stood at the conceptual, if not detailed level. However,it is generally assumed that physiological functions areoptimized in some way. In 1836, the Weber brotherscommented that we walk and run in ‘‘the way that affordsus the least energy expenditure for the longest time andwith the best results’’. Experimental evidence suggeststhat oxygen consumption (and presumably energy expen-diture) is minimal at freely selected walking speeds,supporting the assumptions of optimal physiologicalneuromuscular function.
The optimization criteria that the neuromuscular con-trol system ‘‘chooses’’, either consciously or unconsciously,to select muscle action may vary considerably with thenature of the physical activity to be performed and thephysical capabilities of the individual. For example, musclecontrol in sprint running may serve to maximize velocity,while in walking the control process may serve to maximizeendurance. In a painful pathological situation, such asdegenerative joint disease, muscular control may serveto minimize pain. If this pain occurs due to the joint surfacepressure, the appropriate optimization criterion may be tominimize to bony contact force. Muscular control may alsoserve to minimize the forces transmitted by passive jointstructures such as ligaments. These examples indicate thatthere are possible optimization criteria to choose from, andthe choice of a criterion to solve a particular distributionproblem may not be obvious.
Given that gait presents a relatively unambiguous per-formance criterion, one can claim that it fits into theframework of optimum control theory. Additionally, gaitpresents a characteristic bilateral symmetry that leads torelatively simple representation of the dynamic system.
Activity in the stance phase of gait is described by equalityconstraints on the ‘‘states’’, knowing that each gait stageinvolves dynamic constraints that reflect the particularnature of the phasic activity. However, our motivation inthe use of optimum control for the study of movement reliesupon the belief that it is currently the most sophisticatedmethodology available for solving extremely complex pro-blems. Optimal control theory requires not only that thesystem dynamics are precisely determined and formulatedbut also that an appropriate performance criterion is cho-sen. Therefore, deficiencies in the modeling that are pre-sent in either the system dynamics or the performancecriterion are indicated by differences between model andexperiment.
Forward Analysis. The technique of forward simulationallows the study of the causal relationship betweenforces acting on a mechanical structure and the resultingmovement (79). A first approach requires the descriptionof joint moments, initial positions and velocities for eachbody segment as input variables. The forward dynamicsproblem then is expressed as a set of differential equationsof motion with associated restraints and solved to yieldangular accelerations. Angular velocities and displace-ments are then determined by integration (80). Modi-fications to input variables, either joint moment profilesor initial segmental configuration, can then be intro-duced and the resulting changes in the movement patternevaluated.
Due to recent improvements in musculoskeletal model-ing, forward simulation driven by muscle activity ratherthan joint moments is now possible. The definition ofmuscle activation sequences and the initial configurationof the mechanical system (angles and angular velocities)are entered into the forward simulation. A physiologicalmodel describing muscle excitation characteristics aswell as muscle mechanics is used for calculating the indi-vidual muscle force production and the resulting motion iscalculated.
Because of the inherent complexity of the musculoske-letal model and the multiple interaction of parameters,forward simulation alone is unlikely to contribute to the
JOINTS, BIOMECHANICS OF 217
Figure 12. Forward and inverse analysis driven mathematical models, (a) the Strathclyde modelanimated using SIMM Musculographics-Motion Analysis Software. (From Ref. (77)) (b) Forcedistribution method-inverse dynamics, the vector of bony contact force is shown on the tibialplateau. (From Refs. (71) and (77)). (c) the Delft forward and Inverse shoulder model (78).

identification of aberrant muscle action which affects tim-ing or force production, causing an aberrant gait pattern.Matching the system response to the joint movementprofiles observed in an individual patient would requireextensive trial and error with no guarantee of ever findingthe parameter setting responsible for the aberrant jointmovement.
Optimization has been used previously as a curve-fittingtool in addition to forward simulation techniques to repro-duce the movement pattern observed in an individualsubject. In the studies of Chao and Rim (81), and alsoTownsend (82), optimization techniques were used todetermine the applied joint moments by iteratively varyingthem until the theoretical limb displacement fits thosemeasured in the laboratory. Chou et al. (83) predictedthe minimum energy consumption trajectory of the swinglimb using a similar approach. Using approximate muscle-force and/or joint moment trajectories, Pandy and Berme(84,85) evaluated body segment motion and ground reac-tion forces during single stance, based on a 3D modelincorporating 7 DOF. In Jonkers et al. (76), initial inputsto the forward simulation process were the normalizedquantified muscle activation patterns of 22 muscles, andthe initial segmental configuration (both angles and angu-lar velocity) derived from Winter (86). Two distinct mus-culoskeletal models (one including 6 DOF, the other 7DOF) were defined and a muscle driven forward simulationwas implemented. A series of optimization sequences thenwere executed to modify the muscle activation patterns andinitial segmental configuration, until the system output ofthe forward simulation approximated the angle datareported by Winter (86). The accuracy and effectivenessof the analysis sequence proposed and the model responseobtained using two distinct musculoskeletal models wereverified and analyzed with respect to the kinesiology ofnormal walking.
Based on the integrated use of optimization and for-ward simulation techniques, a causal relation betweenmuscle action, initial segmental configuration and result-ing joint kinematics during single limb stance phase ofgait was successfully established for a musculoskeletalmodel incorporating 22 muscles and 7 DOF (Fig. 12).Despite the inherent simplifications of the planar modelsused in this study, several kinesiological principles ofnormal walking were confirmed by the analysis and areference base for exploring the causal relation betweenmuscle function and resulting movement pattern wasestablished.
Finite Element Analysis of Human Joints. Adaptation offinite element analysis (FEA) to the analysis of stressin human joints, requires fundamental studies in thefollowing areas: (1) three dimensional FEA of movingcontact problems utilizing finite deformation laws (linearelastic versus biphasic) for cartilage and non-Newtonianlaws for synovial fluid; (2) automated adaptive methodsfor the generation and control of 3D computational modelsusing error estimates and controls that account fornonlinearities, singularities, and boundary layer effects;(3) improvements in geometry of FE models by usingpatient specific MRI and CT imaging data. Recently
available semiautomatic 3D mesh generation tools(reconstructed mesh from the volumetric imaging data),and numerical methods for processing the material andgeometric data required for the contact analysis con-siderably reduce the time requirements of such efforts;(4) implementation of recently available high accuracy3D joint in vivo kinematics to calibrate the FE models,and to assist in simulating strenuous activities; (5)Parallel solution algorithms for the nonlinear time-dependent problems utilizing high performance computerarchitectures.
Several models of articular cartilage have been pro-posed to describe its mechanical behavior; however, noneof these models have been able to address the full spectrumof this tissue’s complex mechanical responses. Typically,these models implement a subset of known tissue behavior,for which material properties must be determined fromexperiments. Experimental results indicate that cartilageexhibits flow-dependent viscoelasticity, anisotropy, andtension compression nonlinearity due to its ultrastructureand composition (87). These characteristics are furthercompounded by the inhomogeneity of the tissue throughits thickness. It is widely accepted that the time-dependentresponse of cartilage can be accurately represented by thebiphasic theory derived by Mow et al. (21). Under isotonicconditions, this biphasic theory of incompressible solid andfluid phases is appropriate for most applications involvingcartilage modeling for infinitesimal or finite deformations(26,88). Numerical methods are required to solve thesenonlinear problems, even for relatively simple geometries.Linear 3D elements (89) and nonlinear 3D formulationshave been presented for the biphasic theory (90–92). How-ever, full nonlinear 3D analysis for joints of realistic geo-metry and strains remains a computationally challengingproblem.
Hirsch (1944) proposed to use the Hertz contact theoryfor contacting elastic spheres to model cartilage indenta-tion (28). Askew and Mow (1978) analyzed the problem of astationary parabolically-distributed normal surface trac-tion acting on a layered transversely isotropic elastic med-ium to assess the function of the stiff surface layer ofcartilage (29). More recently, complex, biphasic modelshave been developed that target slow, quasistatic loadingresponse (89,90,93–95). Under high loading rates, how-ever, the cartilage demonstrates a mechanical behaviorthat does not deviate substantially from a linear elasticmodel (38,96), so complex and numerically unwieldy bipha-sic models may not be necessary for rapid loading events.Eberhardt et al. (1990) (36) and (1991) (97) developed asolution for the contact problem of normal and tangentialloading of elastic spheres, with either one or two isotropicelastic layers to model cartilage. A modified Hertzian (MH)theory that takes into account the thickness effect of theelastic layer has been used for articular joint contactanalysis by several investigators (23,32,37,97). The resultsfrom the studies listed above have demonstrated thatconsiderable differences may be found in cartilage stresspredictions depending on the particular cartilage consti-tutive model being employed, that is linear elasticity the-ory versus linear biphasic theory. In view of the above, ithas been proposed that it is adequate to use a transversely
218 JOINTS, BIOMECHANICS OF

isotropic, linearly elastic, homogeneous constitutive rela-tionship to model the normal contact pressure distributionof the tibial plateau (33,98).
In the case of FE modeling applied to impacts and veryrapid movements, model formulation problems must beaccounted for by the solution. Implicit techniques are notwidely used as they can be limited by problems of con-vergence. This method does not use kinematics to verifywhether contact occurs at the calculated points at theassociated load levels. For those applications, explicittechniques have proven useful in their ability to simulatedeformations and contact conditions simultaneouslyas well as large segmental displacements (70,99–101)(Figs. 13b and 14). Explicit finite element analysis wasalso proven to be a valuable tool when simulating totalknee replacement motions due to loads applied by a kneesimulator (44,45). Stability of solution and low computa-tional cost are the two main advantages of the explicitmethods over classic implicit techniques when forces areused to drive the models (44,98,103–109). The main lim-itation of the explicit technique is that the method is onlyconditionally stable. Combination of both techniques issuggested so that the explicit formulation will be used to
‘‘educate’’ the implicit algorithms. Implicit formulationsare used when the localized effect of articular stressneeds to be addressed at the cartilage level with increasedsubject specific refined geometry since these techniquesare more appropriate for the task (Fig. 13a).
Toward Patient-Specific and Task-Dependent Morpholo-gical FE Models. In order to apply FE computational meth-ods to problems of joint mechanics, precisely measuredanatomical data must be used to construct a 3D solid modelfrom which the appropriate finite mesh can be constructedand analysis performed (110,111). Computed tomography(112) and MRI (113,114), or reshaped digital calipers andmachine–controlled contact digitization (23) are commonlyused methods to obtain soft–hard tissue geometry. Clinicalmodalities of these imaging techniques have resolutions thatare typically limited to 500mm. Considering that the articu-lar cartilage of the knee joint is only � 4 mm thick (14), aresolution of 500 mm is generally inadequate and specialprotocols are required for the imaging procedure (19). Notethat all properly calibrated 3D FE knee joint models to date,have been developed from images of cadaveric knees (43,115).Models with patient specific geometry are possible using
JOINTS, BIOMECHANICS OF 219
Figure 13. (a) Knee FE model compo-nents shown in different color-implicitformulation (102) (b) the knee FE modelduring simulation of single leg-hopping-explicit formulation (103).
Figure 14. Tibial plateau pressure at 10and 30 degrees flexion during single-leggedhopping (103).

combined appropriate MR and CT imaging modalities thatwill result in increased model detail (100).
With recent technological advances in 3D imaging,computer hardware, and FE formulations, it has becomepossible to estimate human tissue properties (100,103).Estimation of the stiffness of hard tissue (i.e., cancellousbone) using large-scale finite element (LSFE) models ormicroFEs at both the apparent and trabecular levels istherefore possible (47,52,70,116–122). This direct analysisapproach has advantages over traditional statistical meth-ods in that (1) all morphometric measurements availablefrom the 3D image data are contained in the FE model, and(2) the FE model of the structure is a mechanistic ratherthan statistical approach to the prediction of biologicaltissue properties. Application to these techniques in theclinical environment with in vivo data is gaining consider-able ground. These recent improvements in imaging, allowthe generation of 3D models in a semi-automatic fashion(23,69,123,124). Models now provide the opportunity tostudy the mechanical effects of individual geometricalvariation (125). Such subject specific finite elementmodels are mainly useful under two conditions: (1) Inthe statistical analysis, if the differences between subjectsare large relative to the differences in model predictionsrelated to the choice of input parameters that can only beestimated. (2) In a contact FE problem with high accuracy3D kinematics refined meshes are needed in the vicinity ofthe contact zone (114).
The inherent ability of FEM to overcome geometricaland topological modeling problems is no longer burdenedby some of the limitations apparent in early studies. Suchlimitations have been overcome by recent computationaland experimental advances. These limitations includedinsufficient accuracy of in vivo kinematics–kinetics inputdata, inadequate hard–soft tissue imaging, excessive com-putational cost and the inherently complex process ofmaterial characterization in relation to some of the com-ponents of the stress tensor in biological material.
JOINT STABILITY
Newton’s third law states that forces always exist in pairsthat are equal and opposite in direction, such that if onebody pushes against another, the second body will pushback against the first with a force of equal magnitude if thestate of motion is constant. This would mean that in orderfor muscles to be able to pass movement on to a limbsegment, there has to be an interaction between the seg-ment and another bone, and a joint structure that willallow the desired rotational direction and force. Such amechanism prevents translational movements, which can‘‘dislocate’’ one rigid bony limb segment from another.
Bones, ligaments, and muscles all contribute to jointstability. The extent each structure participates in main-taining joint stability differs between joints. Because bonesare rigid relative to the other tissues in the joint, they canprovide great stability to the joint. In general, the greaterthe circumference of the bony segment enclosed by itscounterpart, the greater the amount of translational sta-bility that exists in the joint. For example, the femoral headis almost completely enclosed by the acetabulum in the hip
joint, whereas the humeral head is only slightly enclosed bythe glenoid in the shoulder. It is obviously easier to dis-locate the shoulder than the hip.
Ligaments, much like cables, can restrict rotational ortranslational motions depending on their location and thedirection of the force. For example, the cruciate ligamentslimit the anterioposterior translation of the tibia on thefemur at the knee joint, while talocalcaneofibular liga-ments prevent rotational motions as well as translationalmotions between talus, fibula and calcaneus. However,ligaments, unlike bones, cannot provide rigid constraintsas they are relatively soft and flexible.
Muscles–tendons are also soft and flexible and, likeligaments, provide nonrigid constraints to the joint. Asignificant difference between the two, however, is thatmuscles are active in controlling the joint motion whereasligaments are only passive stabilizers. Muscle action isusually complementary to that of ligaments and, in fact,can protect ligaments from damage or can protect the jointfrom further damage in case that the ligament is ruptured.Tensile forces exerted on muscles are counterbalanced bycompressive forces across the joint surfaces providing sta-bility to the joint against forces acting to open up the jointspace. Thus, muscles can support or limit motions andserve the dual function of providing desired movementswhile contributing to joint stability.
The Hip Joint
The hip joint is the link of the upper body and the pelvis–trunk with the lower limbs, the main locomotion facility ofthe body. It is a ball-and-socket joint (Table 4) in which thehead of the femur resides in the acetabulum of the pelvis,making one of the largest and most stable joints in thebody. The surface area and the radius of curvature of thearticular surface of the acetabulum closely match that ofthe articular surface of the femoral head. The hip joint isstructurally a highly constrained joint. Because of theinherent stability conferred by its bony architecture, thisjoint is well suited for performing the weightbearing sup-portive tasks that are imposed on it.
The femoral ball is embraced by the acetabular socket,allowing rotation to occur with virtually no translation.The cartilage that covers the acetabulum thickens per-ipherally (126). A plane through the circumference of theacetabulum immediately at its opening would project withthe sagittal plane intersections at an angle of 408 (openingposterior) and 608 (opening laterally). This architecturalconstraint imparted by the bony shapes almost eliminatesthe need for ligamentous and soft-tissue constraints tomaintain the stability of the hip articulation. Althoughthis increased constraint provides stability to the hip,there is a structural drawback. Such constraint limitsthe global range of motion of this joint at the fulcrum ofthe lower extremity. Fortunately, human biomechanicsand everyday tasks performed by the hip do not violatethese limitations and the hip’s range of motion is veryrarely subjected to extremes. During most ambulatoryactivities, such as normal bipedal locomotion, the lowerextremity is positioned anteriorly in the sagittal planewith only small rotations necessary in the other two
220 JOINTS, BIOMECHANICS OF

planes. Hip flexion of at least 1208, abduction of at least208, and external rotation of at least 208 are necessary forcarrying out normal daily activities. Activities such asdescending stairs sitting, rising from a chair, and dressingrequire greater degrees of flexion and rotation at the hipjoint. For example descending stairs requires 368 ofmotion whereas squatting requires 1228 of motion inthe sagittal plane (127).
The hip joint reaction force (at a neutral position) canreach three times body weight (BW) in single leggedstance, but could get up to six times BW during the stancephase of gait and increases significantly with gait velo-city. The main mechanism influencing this magnitude isthe ratio of the abductor muscle force and the effect ofthe gravitational force moment arms. The rule normallysuggests greater reaction forces expected at low ratios(128). Bracing and use of a cane can decrease the hip jointforce.
The Knee Joint
The knee consists of a two joint structure: the femorotibialjoint and the patellofemoral joint. The femorotibial jointis the largest joint in the body and is considered to be amodified hinged joint containing the articulating ends ofthe femur and tibia. The patellofemoral joint consistsof the patella, the largest sesamoid bone, and the trochleaof the femur. Taken together, the knee joints function tocontrol the distance between the pelvis and the foot as acontrol link. Because of the role of the knee in weight-bearing, its surrounding of very strong musculature andits location between the two longest bones in the body,tremendous forces are generated across it. Surface motionoccurs simultaneously in both sagittal and the transverseplane with the first being the dominant plane of motion(129). During activities such as running, landing, andpivoting, the knee functions to maintain a given leglength and acts as a shock absorber. During stair climb-ing, crouching, and jumping, large propulsive forces atthe knee (several times BW) are generated to control thedegree and speed of shortening and lengthening of theleg. In these situations, knee stability is a dynamic pro-cess maintained through fixed bony and ligamentousconstraints and modified by the action of the musclescrossing the joint. The higher the rate of the loadingthe more demanding the role of the knee in sustaining
stability. The bony morphology of the femur, tibia,menisci, cruciate–collateral ligaments, and patella con-tribute to joint stability, but to a lesser extent than that ofother more constrained joints such as the hip. Staticconstraints play a very significant role in knee stabilityas compared with the shoulder for example where stabi-lity is maintained through the dynamic action of thesurrounding muscles. The cruciate and collateral liga-ments are the major structures limiting motion at theknee. The posteromedial and posterolateral capsular com-plexes augment the four primary ligaments, with themenisci playing a lesser role. The muscles crossing theknee contribute to dynamic stability and are particularlyimportant in the presence of pathologic laxity. A methodthat describes the constraining mechanism of the anteriorand posterior ligament has used the notion of the 2D‘‘four bar linkage’’. The instant center of rotation, desig-nated primarily by the femoral condyle surface shape,follows a semicircular pathway, and the direction of dis-placement of the femorotibial contact points is tangentialto the surface of the tibia, indicating gliding throughoutthe range of motion. However, the axis of rotation at theknee does not remain fixed during flexion. Indeed, as theknee flexes the screw axis will sweep out a ruled surface inspace, known as the axode. This fluctuation in the screwaxis signifies that the knee is not truly a hinge joint, forwhich the axode would degenerate to a fixed line in space.Usually, the knee is approximated as a hinge joint, asimplification that may be acceptable for flexion anglesbetween 45 and 908 where the moving screw axis remainsvery close to the line passing through the centers ofcurvature of the two posterior femoral condyles. Themotion at the articular surfaces is not one of pure rolling,but a combination of rolling and sliding as indicated by thescrew axis that never lies near the articular surfaces ofthe tibiofemoral joint.
The Foot Structure; the Ankle Joint
The ankle joint can be described as a saddle-shaped lowerend structure of a long bone (tibia and fibula) Fig. 15. Itsinferior transverse ligament encloses the superior aspectof the body of the talus (the trochlea). It is the joint thatfirst receives the transient impact that travels throughthe tibia in gait or other movement. It alternates in bothform and function to receive load as a shock absorbing
JOINTS, BIOMECHANICS OF 221
Figure 15. The Wayne State University Ankle joint and foot Finite element model (130).

mechanism and to propel significant leverage basedforce during fast locomotion. The subtalar and ankle jointact like a mitered hinge. The tibial surface formingthe superior dome of the ankle is concave sagittally, isslightly convex from side to side, and is oriented � 938from the long axis of the tibia (it is higher on the lateralthan the medial side). The upper articulating surfaces ofthe talus appear to match closely that of the cavity formedby the tibiofibular mortise. The superior part of the body ofthe talus is wedge-shaped. It is about one-fourth wider infront than behind, with an average difference of 2.4 mm;anteriorly a minimal difference of 1.3 mm and a maximaldifference of 6 mm. From front to back, the articular sur-face spans an arc of �1058. This surface contour, having asmaller diameter medially than laterally, has been com-pared to a section or rostrum of a cone. The primarymotion of the ankle joint is dorsiflexion–plantarflexion.Its axis of rotation is obliquely oriented with respect to allthree anatomic planes with ankle dorsiflexion and tibialinternal rotation being associated with subtalar eversion(pronation) whereas the ankle plantarflexion and tibialexternal rotation are associated with subtalar inversion(supination). The axis extends from anterior, superior,and medial to inferior, posterior, and lateral as it ispassing through the inferior tips of the malleoli. It is atangles of 938 with respect to the long axes of the tibia and�128 to the joint surface. However, rather than a truesingle ICR, the ankle has been noted to have multipleinstant centers, all of which perturbate and fall very closeto a single point within the body of the talus. Through acomplete arc of ankle rotation, the center may be dis-placed anywhere from 4 to 7 mm. The oblique orientationof the axis of rotation to the sagittal, coronal, and trans-verse planes, translation of the talus in the mortise canoccur in all three directions. The talus has been observedin vitro to rotate easily in the ankle mortise implyingrelative movement between the malleoli. Because thetrochlea is wider anteriorly than posteriorly, it has beensuggested that lateral play of the talus within its mortiseoccurs only when the ankle is in plantarflexion. Subtalarmotion has been described as screw-like influencing theflexibility of the transverse tarsal joint. Others suggestthat instability exists in dorsiflexion, while others yetbelieve that with intact ligaments translation, occurs onlyin the sagittal direction. These differences can beexplained by behavior of >100 ligaments and by the rolesplayed by the subtalar joint, the kinematic chain of thehindfoot, and the muscles that traverse this area intransmitting forces across this area during plantarflexionand dorsiflexion. The talus is unique because this bonehas seven articulations that connect it to four other bones,it lies between the foot and the leg, and contains nomuscular attachments. The stability of the talus and itsarticulations, therefore, relies heavily on the ligamentousattachments and musculotendinous complexes that tra-verse the talus and attach distally. Therefore the maincharacteristic of ankle joint is its strong passive stabilityattributed to a variety of factors. First is the bony stabilityprovided by contact of the trochlea with the tibial plafond.Second are the medial and lateral cartilaginous slightlyconcave surfaces that articulate with the two malleoli.
Third are the ligamentous connections between the tibia,fibula, talus, and calcaneus. Ankle stability increasesduring weight bearing and depends more on articularsurface congruency.
The tarsometatarsal joints are relatively mobile andintrinsically stable joints that produce the arch-like con-figuration allowing wide range of motion at the first meta-tarsophalangeal joint with gliding during most of its rangeand jamming artful extension. The medial longitudinalarch functions as a beam and a truss.
The mode of foot–ankle mobility and muscular control isthe most significant determinant of both limb stability andbody progression (131).
Standing barefooted we load our heels with two-thirds ofthe load while the other third is loading the forefoot.During walking and at the early phase of stance, the centerof pressure moves from the posterolateral heel rapidlyacross the midfoot, a phenomenon coupled with the firingof the anterior tibial musculature to slow foot plantarflex-ion and prevent foot slap. Then, at mid- and late stance theposterior calf musculature fires, propelling the body overthe foot towards toe-off phase where the hallux bears themost pressure.
At higher speeds/rates of mobility it is the intrinsicmechanical properties that provide control rather thanthe neuromuscular control system. The force at the anklejoint can reach magnitudes up to six times body weightduring walking and thirteen times BW during running. Theheel fat pad is a very effective shock absorbing mechanismand it has been shown that high heels, or narrow shoes,narrow toebox, can lead to altered foot mechanics thatultimately result in foot deformities and pain.
The Spine
The spine is composed of a series of vertebrae (7 cervical, 12thoracic, 5 lumbar, the sacrum and coccyx) and interveningsoft tissues, such as intervertebral disks, ligaments, andmuscle attachments. It provides important functionsincluding support of the body structure and protection ofvital tissues such as the spinal cord, nerves and arteries.Yet it is flexible and allows mobility to the torso. Severalstudies have described the passive and active range ofmotion of spinal segments differently (Table 4). The motionof the spine is usually analyzed through consideration ofmotion segments that are comprised of two adjacent ver-tebrae with the intervertebral disk and other interveningsoft tissues. These structures, also called functional spinalunits (FSU), move with 6 DOF, however, the motion isquite complex due to six articulate faces between the twobony segments and attachment of multiple ligaments andmuscles. Normally simultaneous translations and rota-tions of FSU are coupled in the analyses (134). Creep,relaxation and hysteresis are the three prevailing viscoe-lastic characteristics of the intervertebral disks (1). At highrates of loading the disks serve as a shock absorber withcompression strength being higher from upper cervical tolower lumbar levels. Although this is true for most joints,vibrational properties of spinal segments have attractedparticular attention as they are thought to be related toinjury and pain. The spinal cord exhibits some longitudinal
222 JOINTS, BIOMECHANICS OF

elasticity but very poor axial translation. These tran-slational forces are the ones primarily associated withneurological injury. Apparently muscular support is ofvital importance is stability. If for example bilateral facetresection exceeds 50% the significant increase in annulusstresses may occur. Seatbelts can adequately protect frontseat occupants against frontal impact in an airbagequipped vehicle (135).
Several models of the spine have been developed(130,135). A nonlinear finite element model of lumbar spinesegment L3–L5 is shown in Fig. 16. The effects of upper-body mass, nucleus injury, damping, and different vibra-tion frequency loads were analyzed for the whole bodyvibration (WBV) using this model. Anterior regions ofL3–L5 segment show small vibration amplitudes, but pos-terior regions show large amplitudes. The posterior regionsof intervertebral discs of lumbar spine are easy to injuryduring long-term WBV compared with anterior regions.The vibration of the human spine is more dangerous tofacets, especially during WBV approximating a sympa-thetic vibration, which may lead to abnormal remodelingand disorders of lumbar spine.
The Shoulder
The shoulder complex allows the arm to move with respectto the thorax. The biomechanics of the shoulder involvesthe study of four different articulations, namely, the acro-mioclavicular, sternoclavicular, glenohumeral joints, andthe scapulothoracic joints. The shoulder complex has thegreatest range of motion among joints in the body (Table 4).Traditional descriptions of humeral motion are based onthe angle between the humerus and the thorax in thesagittal plane (flexion and extension) and the coronal plane(abduction), with one very common characteristic: theglenohumeral articulation is inherently unstable due tothe shallow nature of the glenoid fossa, containing onlyone-third of the diameter of the humeral head. The liga-ments, capsular and muscular structures are the main
stability mechanisms. Axial rotation of the humerus isconventionally described by the degrees of internal orexternal rotation when the humeral axis is parallel tothe thorax, or perpendicular to the thorax (abducted908). The primary anterior stabilizers of the shoulder whenthe arm is abducted at 908 are the inferior glenohumeralligaments. Horizontal abduction and adduction, alsoknown as horizontal extension and flexion, respectively,are commonly used to describe arm position when the axisof the humerus is perpendicular to the thorax. The musclessurrounding the structure produce a barrier effect byapplying compressive forces and by eccentric contractionresulting is active stability. The level of elevation of thenormal arm is 167–1688 and 171–1758 for men and women,respectively. Average extension or posterior elevation isapproximately 608. When the arm is adducted by the side ofthe body, it is possible to achieve approximately 1808 ofrotation. With abduction of the arm to 908, however, thetotal arc of rotation is reduced to 1208. The range of motionof the shoulder decreases with normal aging. The max-imum loads that are characteristic for the glenohumeraljoint can reach magnitudes of one and a half body weight(132).
The Elbow
The elbow joint consists of the proximal end of ulna and thecapitulum of the humerus. Three articulations are present:Humeroulnar, humeroradial, and proximal radioulnar(133). It is a hinge-type joint whose functions includepositioning and stabilizing the hand, providing lever-typesupport during lifting and weight-bearing during activ-ities, such as a pommel horse exercise. The humerus-ulnajoint itself has only one degree of freedom, however, therotational motion of the radius over ulna provides anotherdegree of freedom to the elbow. Thus the elbow can beconsidered to have two degrees of freedom. Basically itschanging center of rotation during flexion-extension makesit more than a hinge joint: flexion-extension (0–1608)
JOINTS, BIOMECHANICS OF 223
Figure 16. The Wayne State University full body impact model and the spine model (130,135).

and axial rotation, or pronation–supination (70–808 and80–858, respectively). The functional range of motion formost activities of daily living is 1008 for flexion–extension(30–1308) and pronation–supination (�508) at the elbowjoint. The instantaneous axes of rotation for flexion–extensionare localized at the center of the lateral projected curvature ofthe trochlea and capitulum. The size of this region measuresonly 2–3mm.
The axis of forearm rotation passes through the capi-tulum and head of the radius, extending to the distal ulna.The carrying angle, the angle between the long axis of thehumerus and the long axis of the ulna, averages 78 in menand 138 in women.
Motion in the plane of varus–valgus rotation at theelbow indicates joint instability and such motions arerestricted. The rotational forces are mainly resisted bythe anterior and posterior oblique fibers of the medialcollateral ligament; the former is stretched during flex-ion and extension, whereas the latter is stretchedonly during flexion. In addition to the medial collateralligament, the shape of the articular surface and theanterior capsule contribute to the resistance to valgusstress while the articular congruity and the radial headprovide stability in flexion. The same structures resistvalgus stress in extension as well. It is the lateral collat-eral ligament, anconeus, and joint capsule that providestability under varus stress. Force generated at the elbowcan reach up to three times body weight in everydayactivities (136).
The Wrist
The wrist or carpus is a very complicated joint consisting ofmultiple articulations. It provides a stable support for thehand, allowing for the transmission of grip forces as well aspositioning of the hand and digits for fine movements.Wrist position affects the ability of the fingers to operate(flex-extend) and to effectively grasp. The main function ofthe wrist is to fine-tune grasp by controlling the length–tension relationship in the extrinsic muscles to the hand(137). The hand is the principal instrument of touch and itscombination of sensibility and motor function has classifiedit as the ultimate supportive organ of information, accom-plishment, and evolution. The self-selected wrist positionfor maximal power grip has been shown to be 358 ofextension with 78 of ulnar deviation. In addition, full wristflexion deteriorates the efficiency of the finger flexors andthe grip strength to 25% of that available when the wrist isin extension. Martial arts experts have exploited thisknowledge for a long time to disarm assailants. Whenthe wrist is positioned in flexion, the combination of apassive extensor tenodesis effect, increasing resistanceto flexion, and decreasing excursion of the flexors resultsin a weakened grip. The assailant, therefore, is unable tomaintain a grip on the weapon. The strength of the fingerflexors is more than twice that of extensors. The uniquefeature of the metacarpophalangeal (MCP) joints is theirstructural asymmetry, which assisted by the ligamentpositions and the bony configuration of the metacarpalheads results in effective stabilization and finely tunedmotion.
OVERVIEW
Human diarthroidal joints can support high levels ofmechanical load for several decades, yet degenerative jointdiseases occur in epidemic proportions every year. Under-standing the role of mechanics in diseases, such as osteoar-thritis, requires analysis of the behavior of both healthyand pathological joints under a full range of physiologicalloading conditions. Relationships between joint function,meniscus injury, and osteoarthritis after trauma (e.g., ACLinjury–reconstruction) requires detailed knowledge ofinternal tissue stresses. Such knowledge is necessary toadvance our understanding of cartilage–ligament–menis-cus failure mechanisms at the macroscopic level, as well asmechanotransduction at the cellular level.
Experimental measurements alone are not sufficient todelineate the detailed biomechanics of the human joint.Recent publications have confirmed that mathematicalmodeling can be an effective tool for the simulation andanalysis of complex biological structures (e.g., the humanknee). However, existing modeling strategies, based ongeneric geometry and/or driven with simplistic kinematicsand loading assumptions, have been of limited value inaddressing clinical hypotheses. Research efforts in thebiomechanics community have focused on cadaveric stu-dies for the characterization of tolerances on material,geometry, and attachment parameters that will restorecontact pressure distribution to within a specified devia-tion from accepted normal values. Models driven directlyby in vivo kinematic data have not been possible due to therelatively poor accuracy available from traditional motionanalysis methods, limiting the predictive power of FEmodeling techniques in the study of knee pathogenesis.New advances in modeling problem formulations that takeadvantage of patient-specific geometry and unique motionanalysis systems (cineradiography) for high accuracy 3Dknee kinematics can overcome limitations of previousapproaches. This should generate high quality estimatesof internal tissue stresses, providing new insight into therole of tissue loading in the development and progression ofmusculoskeletal diseases such as osteoarthrosis.
BIBLIOGRAPHY
1. Maroudas A. Physical chemistry of articular cartilage and theintervertebral disc. In: Sokoloff L, ed. The Joints and Syno-vial Fluid. New York: Academic; 1980: 239–291.
2. Ateshian GA, Lai WM, Zhu WB, Mow VC. An asymptoticsolution for the contact of two biphasic cartilage layers. JBiomech 1994;27:1347–1360.
3. Mow VC, Ratcliffe A. Structure and function of articularcartilage and meniscus. In: Mow VC, Hayes WC, eds. BasicOrthopedic Biomechanics. 2nd ed. Philadelphia: Lippincott-Raven; 1997. p 113–177.
4. Wittenburg J. Dynamics of Systems of Rigid Bodies. Stutt-gart, Germany: B.G. Teubner; 1977.
5. Woltring HJ. Planar control in multi-camera calibration for3-D gait studies. J Biomech 1980;13:39–48.
6. Woltring HJ. Representation and calculation of 3-D jointmovement. Human Movement Sci 1991;10:603–616.
7. Goldstein H. Classical Mechanics. Reading (MA): Addison-Wesley; 1980.
224 JOINTS, BIOMECHANICS OF

8. Dempster WT. Space Requirements of the Seated Operator.Wright Patterson Air Force Base, OH, 1955.
9. Drillis R, Contini R, Bluestein M. Body segment parameters;A survey of measurement techniques. Artif Limbs 1964;25:44–66.
10. Full RJ, Koditschek DE. Templates and anchors: neurome-chanical hypotheses of legged locomotion on land. J Exp Biol1999;202:3325–3332.
11. Nigg BM, Herzog W. Biomechanics of the musculoskeletalsystem. West Sussex (UK): Wiley; 1999.
12. Manal K, McClay Davis I, Galinat B, Stanhope S. Theaccuracy of estimating proximal tibial translation duringnatural cadence walking: bone vs. skin mounted targets. ClinBiomech (Bristol, Avon) 2003;18:126–131.
13. Tashman S, Anderst W. Skin motion artifacts at the kneeduring impact movements. Seventh Annu Meet, Gait andClinical Movement Analysis Soc. Chattanooga (TN); 2002.
14. Tashman S, Anderst W. Skin motion artifacts at the kneeduring impact movements. Gait Posture 2002;16:11–12.
15. Alexander EJ, Andriacchi TP. Correcting for deformation inskin-based marker systems. J Biomech 2001;34:355–361.
16. Andriacchi TP, Toney MK. A point cluster method for in vivomeasurement of limb segment movement. Adv Bioeng 1994;28:185–186.
17. Fleming BC et al. The strain behavior of the anterior cruciateligament during stair climbing: An in vivo study. Arthroscopy1999;15:185–191.
18. Shepherd DE, Seedhom BB. Thickness of human articularcartilage in joints of the lower limb. Ann Rheum Dis 1999;58:27–34.
19. Tashman S, Anderst W. In-vivo measurement of dynamicjoint motion using high speed biplane radiography and CT:Application to canine ACL deficiency. J Biomech Eng2003;125:238–245.
20. Jurvelin JS, Arokoski JP, Hunziker EB, Helminen HJ.Topographical variation of the elastic properties of arti-cular cartilage in the canine knee. J Biomech 2000;33:669–675.
21. Mow VC, Kuei SC, Lai WM, Armstrong CG. Biphasiccreep and stress relaxation of articular cartilage in com-pression? Theory and experiments. J Biomech Eng 1980;102:73–84.
22. Mow VC, Lai WM, Holmes MH. Advanced theoretical andexperimental techniques in cartilage research. Biomecha-nics: Principles and Applications. Boston: Martinus NijhoffPublishers; 1982. p 47–74.
23. Fregly BJ, Sawyer WG. Estimation of discretization errorsin contact pressure measurements. J Biomech 2003;36:609–613.
24. Harris ML, Morberg P, Bruce WJ, Walsh WR. An improvedmethod for measuring tibiofemoral contact areas in totalknee arthroplasty: A comparison of K-scan sensor and Fujifilm. J Biomech 1999;32:951–958.
25. Wu JZ, Herzog W, Epstein M. Articular joint mechanics withbiphasic cartilage layers under dynamic loading. J BiomechEng 1998;120:77–84.
26. Vermilyea ME, Spilker RL. Hybrid and mixed-penalty finite-elements for 3-D analysis of soft hydrated tissue. Int J NumerMethods Eng 1993;36:4223–4243.
27. Prendergast PJ, van Driel WD, Kuiper JH. A comparison offinite element codes for the solution of biphasic poroelasticproblems. Proc Inst Mech Eng [H] 1996;210:131–136.
28. Hirsch C. A contribution to the pathogenesis of chondroma-lacia of the patella. Acta Chir Scand 1944;83:1–106.
29. Askew MJ, Mow VC. The Biomechanical Function of theCollagen Ultrastructure of articular cartilage. J BiomechEng 1978;100:105–115.
30. Spilker RL, Maxian TA. A mixed-penalty finite-element for-mulation of the linear biphasic theory for soft-tissues. Int JNumer Methods Eng 1990;30:1063–1082.
31. van der Voet A. A comparison of finite element codes for thesolution of biphasic poroelastic problems. Proc Inst Mech Eng[H] 1997;211:209–211.
32. Wu JZ, Herzog W, Ronsky J. Modeling axi-symmetrical jointcontact with biphasic cartilage layers–an asymptotic solu-tion. J Biomech 1996;29:1263–1281.
33. Donzelli PS, Spilker RL, Ateshian GA, Mow VC. Contactanalysis of biphasic transversely isotropic cartilage layersand correlations with tissue failure. J Biomech 1999;32:1037–1047.
34. Wu JZ, Herzog W, Epstein M. Evaluation of the finite elementsoftware ABAQUS for biomechanical modelling of biphasictissues. J Biomech 1998;31:165–169.
35. Blankevoort L, Kuiper JH, Huiskes R, Grootenboer HJ.Articular contact in a three-dimensional model of the knee.J Biomech 1991;24:1019–1031.
36. Eberhardt AW, Keer LM, Lewis JL, Vithoontien V. Ananalytical model of joint contact. J Biomech Eng 1990;112:407–413.
37. Hirokawa S. Three-dimensional mathematical modelanalysis of the patellofemoral joint. J Biomech 1991;24:659–671.
38. Oloyede A, Flachsmann R, Broom ND. The dramatic influ-ence of loading velocity on the compressive response ofarticular cartilage. Connect Tissue Res 1992;27:211–224.
39. Buschmann MD et al. Confined compression of articularcartilage: linearity in ramp and sinusoidal tests and theimportance of interdigitation and incomplete confinement.J Biomech 1998;31:171–178.
40. Bursac PM, Obitz TW, Eisenberg SR, Stamenovic D. Con-fined and unconfined stress relaxation of cartilage: appro-priateness of a transversely isotropic analysis. J Biomech1999;32:1125–1130.
41. Haut Donahue TL, Hull ML, Rashid MM, Jacobs CR. How thestiffness of meniscal attachments and meniscal materialproperties affect tibio-femoral contact pressure computedusing a validated finite element model of the human kneejoint. J Biomech 2003;36:19–34.
42. Beaugonin M, Haug E, Cesari D. Improvement of numericalankle/foot model: Modeling of deformable bone. Proc 199741st Stapp Car Crash Conf. Lake Buena Vista (FL): SAE,Warrendale (PA); 1997. p 225–237.
43. Beillas P, et al. Limb: Advanced FE model and new experi-mental data. Stapp Car Crash J 2001;45:469–494.
44. Godest AC et al. Simulation of a knee joint replacementduring a gait cycle using explicit finite element analysis. JBiomech 2002;35:267–275.
45. Halloran J, Petrella A, Rullkoetter P. Explicit finite elementmodel predicts TKR mechanics. 49th Annu Meet, Orthopae-dic Res Soc. New Orleans (LA); 2003. p 1312.
46. Benvenuti J-F. Modélisation tridimensionnelle du genouhumain. Laboratoire de Génie Médical. Lausanne, Switzerland:EPF Lausanne; 1998.
47. Beillas P et al. Foot and ankle finite element modeling usingCT-scan data. 43rd Stapp Car Crash Conf. San Diego; 1999.p 217.
48. Keyak JH, Skinner HB. Three-dimensional finite elementmodelling of bone: Effects of element size. J Biomed Eng1992;14:483–489.
49. Ulrich D et al. The quality of trabecular bone evaluated withmicro-computed tomography, FEA and mechanical testing.Stud Health Technol Inform 1997;40:97–112.
50. Ulrich D, van Rietbergen B, Weinans H, Ruegsegger P. Finiteelement analysis of trabecular bone structure: a comparison
JOINTS, BIOMECHANICS OF 225

of image-based meshing techniques. J Biomech 1998;31:1187–1192.
51. Beillas P. Modélisation des membres inférieurs en situationde choc automobile. Laboratoire de Biomécanique. Paris,France: École Nationale Supérieure d’Arts et Métiers; 1999.
52. Noailles J. Modélisation mécanique par éléments finisde l’articulation du genou. Laboratoire de Biomécanique.Paris, France: École Nationale Supérieure d’Arts et Métiers;1999.
53. Limbert GMT, Freeman MAR. Three dimensional finite ele-ment model of the human ACL. Simulation of a passive kneeflexion cycle. Analysis of deformations and stresses. 47thAnnu Meet Orthopaedic Res Soc. San Francisco (CA);2001. p 794.
54. Hirokawa S, Tsuruno R. Hyper-elastic model analysisof anterior cruciate ligament. Med Eng Phys 1997;19:637–651.
55. Butler DL et al. Location-dependent variations in the mate-rial properties of the anterior cruciate ligament. J Biomech1992;25:511–518.
56. Yamamoto K, Hirokawa S, Kawada T. Strain distribution inthe ligament using photoelasticity. A direct application to thehuman ACL. Med Eng Phys 1998;20:161–168.
57. Pioletti DP. Viscoelastic properties of soft tissues: Applicationto knee ligaments and tendons. Departement de physiqueEcole polytechnique federale de Lausanne. Lausanne: Ecolepolytechnique federale de Lausanne; 1997.
58. Hirokawa S, Tsuruno R. Three-dimensional deformationand stress distribution in an analytical/computationalmodel of the anterior cruciate ligament. J Biomech 2000;33:1069–1077.
59. Taylor M, Tanner KE, Freeman MA, Yettram AL. Cancellousbone stresses surrounding the femoral component of a hipprosthesis: An elastic-plastic finite element analysis. MedEng Phys 1995;17:544–550.
60. Aspden RM. A model for the function and failure of themeniscus. Eng Med 1985;14:119–122.
61. Anderst WJ, Tashman S. A method to estimate in vivodynamic articular surface interaction. J Biomech 2003;36:1291–1299.
62. Walker PS, Hajek JV. The load-bearing area in the knee joint.J Biomech 1972;5:581–589.
63. Fukubayashi T, Kurosawa H. The contact area and pressuredistribution pattern of the knee. A study of normal andosteoarthrotic knee joints. Acta Orthop Scand 1980;51:871–879.
64. Warner JJ. Articular contact patterns of the normal gleno-humeral joint. J Shoulder Elbow Surg 1998;7:381–388.
65. Scherrer PK, Hillberry BM, Van Sickle DC. Determining thein vivo areas of contact in the canine shoulder. J Biomech Eng1979;101:271–278.
66. Soslowsky LJ et al. Quantitation of in situ contact areas atthe glenohumeral joint: A biomechanical study. J Orthop Res1992;10:524–534.
67. Dennis DA, Komistek RD, Hoff WA, Gabriel SM. In vivo kneekinematics derived using an inverse perspective technique.Clin Orthop Relat Res 1996: 107–117.
68. Sheehan FT, Zajac FE, Drace JE. Using cine phase contrastmagnetic resonance imaging to non-invasively study in vivoknee dynamics. J Biomech 1998;31:21–26.
69. Papaioannou G, Tashman S, Nelson F. Morphology propor-tional differences in the medial and lateral compartment ofthe distal femur. 50th Ann Meet, Orthopaedic Res Soc. SanFrancisco, (CA); 2004. p 1256.
70. Treece GM, Prager RW, Gee AH. Regularised marchingtetrahedra: Improved iso-surface extraction. Comput Graph1999;23:583–598.
71. Papaioannou G, Tashman S. Validation of a lower limb modelbased on 3D knee kinematics from a high speed biplanedynamic radiography. In: Fotiadis DI, Dassios G, KiriakiK, Massalas CV, eds. Scattering Theory and BiomedicalEngineering Modelling and Applications. World Scientific;2001.
72. Ateshian GA. A B-spline least-squares surface-fitting methodfor articular surfaces of diarthrodial joints. J Biomech Eng1993;115:366–373.
73. Paul JP, Poulson J. The analysis of forces transmitted byjoints in the human body. 5th Int Conf Experimental StressAnalysis. Udine, Italy; 1974.
74. Hefzy MS, Zoghi M, Jackson WT, DiDio LJA. Method tomeasure the three-dimensional patello-femoral tracking.Adv Bioeng 1988;8:47–49.
75. Papaioannou G, Daly D, Spaepen A. Use of new optimaliza-tion tools in knee joint modelling. In: Dassios G, Fotiadis DI,Kiriaki K, Massalas CV, eds. Scattering Theory and Biome-dical Engineering Modelling and Applications. Singapore:World Scientific; 2000. pp 282–295.
76. Jonkers I, Spaepen A, Papaioannou G, Stewart C. An EMG-based, muscle driven forward simulation of single supportphase of gait. J Biomech 2002;35:609–619.
77. Papaioannou G. A Three Dimensional Mathematical Model ofthe Knee Joint. Bioengineering Ph.D. Thesis. Glasgow, (UK):University of Strathclyde; 2000.
78. Van der Helm FC, Veeger HE, Pronk GM, Van der WoudeLH, Rozendal RH. Geometry parameters for musculo-skeletal modelling of the shoulder system. J Biomech 1992;25:129–144.
79. Zajac FE. Muscle coordination of movement: a perspective. JBiomech 1993;26(Suppl 1):109–124.
80. Pandy MG, Berme N. A numerical method for simulating thedynamics of human walking. J Biomech 1988;21:1043–1051.
81. Chao EY, Rim K. Application of optimization principles indetermining the applied moments in human leg joints duringgait. J Biomech 1973;6:497–510.
82. Townsend MA, Tsai TC. Biomechanics and modelling ofbipedal climbing and descending. J Biomech 1976;9:227–239.
83. Chou LS, Song SM, Draganich LF. Predicting the kinematicsand kinetics of gait based on the optimum trajectory of theswing limb. J Biomech 1995;28:377–385.
84. Pandy MG, Berme N. Quantitative assessment of gait deter-minants during single stance via a three-dimensional model—Part 2. Pathological gait. J Biomech 1989;22:725–733.
85. Pandy MG, Berme N. Quantitative assessment of gaitdeterminants during single stance via a three-dimensionalmodel—Part 1. Normal gait. J Biomech 1989;22:717–724.
86. Winter DA. The Biomechanics and Motor Control of HumanGait. Waterloo: University of Waterloo Press; 1987.
87. Huang CY, Stankiewicz A, Ateshian GA, Mow VC. Aniso-tropy, inhomogeneity, and tension-compression nonlinearityof human glenohumeral cartilage in finite deformation. JBiomech 2005;38:799–809.
88. Chan B, Donzelli PS, Spilker RL. A mixed-penalty biphasicfinite element formulation incorporating viscous fluids andmaterial interfaces. Ann Biomed Eng 2000;28:589–597.
89. Zhang H, Totterman S, Perucchio R, Lerner AL. Magneticresonance image based 3D poroelastic finite element model oftibio-menisco-femoral contact. Proc 23rd Annu Meet Am SocBiomechanics. Pittsburgh; 1999.
90. Perie D, Hobatho MC. In vivo determination of contactareas and pressure of the femorotibial joint using non-linearfinite element analysis. Clin Biomech (Bristol, Avon) 1998;13:394–402.
91. Eckstein F et al. Quantitative relationships of normal car-tilage volumes of the human knee joint—assessment by
226 JOINTS, BIOMECHANICS OF

magnetic resonance imaging. Anat Embryol (Berlin) 1998;197:383–390.
92. Eckstein F, Reiser M, Englmeier KH, Putz R. In vivo mor-phometry and functional analysis of human articular carti-lage with quantitative magnetic resonance imaging—fromimage to data, from data to theory. Anat Embryol (Berlin)2001;203:147–173.
93. Rudert MJ, et al. Articular cartilage thickness measurementwith MRI and multi-detector computed tomography (MDCT).49th Annu Meet, Orthopaedic Res Soc. New Orleans (Lo);2003. p 0571.
94. Bendjaballah MZ, Shirazi-Adl A, Zukor DJ. Biomechanics ofthe human knee joint in compression: Reconstruction, meshgeneration and finite element analysis. Knee 1995;2:69–79.
95. Xia Y. Magic-angle effect in magnetic resonance imaging ofarticular cartilage: A review. Invest Radiol 2000;35:602–621.
96. DiSilvestro MR, Zhu Q, Suh JK. Biphasic poroviscoelasticsimulation of the unconfined compression of articular carti-lage: II—Effect of variable strain rates. J Biomech Eng2001;123:198-200.
97. Eberhardt AW, Lewis JL, Keer LM. Normal contact of elasticspheres with two elastic layers as a model of joint articula-tion. J Biomech Eng 1991;113:410–417.
98. Donahue TL, Hull ML, Rashid MM, Jacobs CR. A finiteelement model of the human knee joint for the study oftibio-femoral contact. J Biomech Eng 2002;124:273–280.
99. Weinans H, Sumner DR, Igloria R, Natarajan RN. Sensitivityof periprosthetic stress-shielding to load and the bone den-sity-modulus relationship in subject-specific finite elementmodels. J Biomech 2000;33:809–817.
100. Papaioannou G, Yang K, Fyhrie D, Tashman S. Validation ofa subject specific finite element model of the human kneedeveloped for in-vivo tibio-femoral contact analysis. 50thAnnu Meet, Orthopaedic Res Soc. San Francisco; 2004. p0358.
101. Couteau B et al. Finite element modelling of the vibrationalbehaviour of the human femur using CT-based individua-lized geometrical and material properties. J Biomech1998;31:383–386.
102. Papaioannou G, Anderst W, Tashman S. Elevated joint con-tact forces in ACL-reconstructed knees: A finite elementanalysis driven by in vivo kinematic data. IMECE003:2003ASME Int Mech Eng Cong Exposition. Washington, DC;2003.
103. Beillas P, Papaioannou G, Tashman S, Yang KH. A newmethod to investigate in vivo knee behavior using a finiteelement model of the lower limb. J Biomech 2004;37:1019–1030.
104. Li G, Lopez O. Reliability of a 3D finite element modelconstructed using magnetic resonance images of a knee forjoint contact stress analysis. 23rd Proc Am Soc Biomech.Pittsburgh; 1999.
105. Charras GT, Guldberg RE. Improving the local solutionaccuracy of large-scale digital image-based finite elementanalyses. J Biomech 2000;33:255–259.
106. Dunbar WL, Jr., Un K, Donzelli PS, Spilker RL. An evalua-tion of three-dimensional diarthrodial joint contact usingpenetration data and the finite element method. J BiomechEng 2001;123:333–340.
107. Spilker RL, Donzelli PS, Mow VC. A transversely isotropicbiphasic finite element model of the meniscus. J Biomech1992;25:1027–1045.
108. Morrison JB. The mechanics of the knee joint in relation tonormal walking. J Biomech 1970;3:51–61.
109. Kettelkamp DB, Jacobs AW. Tibiofemoral contact area—determination and implications. J Bone Joint Surg Am1972;54:349–356.
110. Radin EL et al. Relationship between lower limb dynamicsand knee joint pain. J Orthop Res 1991;9:398–405.
111. Collins JJ, Whittle MW. Impulsive forces during walking andtheir clinical implications. Clin Biomech 1989;4:179–187.
112. Tashman S, Leisen JC, Sherlitz C, Radin EL. Methods for thereduction of heelstrike impulsive loading. Second WorldCong Biomech. Amsterdam, The Netherlands; 1994.
113. Rolf C et al. An experimental in vivo method for analysisof local deformation on tibia, with simultaneous measuresof ground reaction forces, lower extremity muscle activityand joint motion. Scand J Med Sci Sports 1997;7:144–151.
114. Tashman S, Anderst W. Internal/external and varus/valgusknee rotations are different in ACL-reconstructed and con-tralateral (intact) limbs during running. 49th Annu Meet,Orthopaedic Res Soc. New Orleans (LA); 2003. p 0124.
115. Papaioannou G, Fyhrie D, Tashman S. Effects ofpatient-specific cartilage geometry on contact pressure: Anin-vivo finite element model Of ACL reconstruction. 50thAnnu Meet, Orthopaedic Res Soc. San Francisco; 2004. p 1289.
116. Hollister SJ, Fyhrie DP, Jepsen KJ, Goldstein SA. Applica-tion of homogenization theory to the study of trabecular bonemechanics. J Biomech 1991;24:825–839.
117. Jacobs CR et al. NACOB presentation to ASB Young ScientistAward: Postdoctoral. The impact of boundary conditions andmesh size on the accuracy of cancellous bone tissue modulusdetermination using large-scale finite- element modeling.North American Congress on Biomechanics. J Biomech1999;32:1159–1164.
118. van Rietbergen B et al. Tissue stresses and strain in trabe-culae of a canine proximal femur can be quantified fromcomputer reconstructions. J Biomech 1999;32:443–451.
119. Yeni YN, Fyhrie DP. Finite element calculated uniaxialapparent stiffness is a consistent predictor of uniaxial appar-ent strength in human vertebral cancellous bone tested withdifferent boundary conditions. J Biomech 2001;34: 1649–1654.
120. Blankevoort L, Huiskes R, de Lange A. The envelope ofpassive knee joint motion. J Biomech 1988;21:705–720.
121. Ahmed AM, Burke DL. In-vitro measurement of staticpressure distribution in synovial joints—Part I: Tibial sur-face of the knee. J Biomech Eng 1983;105:216–225.
122. Besnault B, et al. A parametric finite element of the humanpelvis. 42nd Stapp Car Crash Conf Proc. Tempe (AZ); 1998. p337.
123. Anderst W, Tashman S. A unique method to determinedynamic in vivo articular surface interaction. 4th World CongBiomecha. Calgary, Alberta, Canada; 2002. p 520.
124. Anderst WJ, Les C, Tashman S. In vivo serial joint spacemeasurements during dynamic loading in a canine model ofosteoarthritis. Osteoarth Cartilage 2005;13(9):808–816.
125. Demetropoulos CK. Dynamic evaluation of contact pressureand effect of graft harvest at osteochondral donor site in theknee, personal communication. 2003.
126. Kempson GE, Spivey CJ, Swanson SA, Freeman MA. Pat-terns of cartilage stiffness on normal and degenerate humanfemoral heads. J Biomech 1971;4:597–609.
127. Johnston RC, Smidt GL. Hip motion measurements forselected activities of daily living. Clin Orthop Relat Res1970;72:205–215.
128. Bergmann G, Graichen F, Rohlmann A. Is staircase walking arisk for the fixation of hip implants? J Biomech 1995;28:535–553.
129. Andriacchi TP, Mikosz RP, Hampton SJ, Galante JO. Modelstudies of the stiffness characteristics of the human kneejoint. J Biomech 1983;16:23–29.
130. King AI. A review of biomechanical models. J Biomech Eng1984;106:97–104.
131. Cavanagh PR et al. The relationship of static foot structureto dynamic foot function. J Biomech 1997;30:243–250.
JOINTS, BIOMECHANICS OF 227

132. Matsen FA, Fu FH, Hawkins RJ. The Shoulder: A Balance ofMobility and Stability. Rosemont: AAOS; 1992.
133. Chao EY, Morrey BF. Three-dimensional rotation of theelbow. J Biomech 1978;11:57–73.
134. Panjabi MM, Krag MH, Goel VK. A technique for measure-ment and description of three-dimensional six degree-of-freedom motion of a body joint with an application to thehuman spine. J Biomech 1981;14:447–460.
135. Yang KH, Latouf BK, King AI. Computer simulation ofoccupant neck response to airbag deployment in frontalimpacts. J Biomech Eng 1992;114:327–331.
136. Walker PS. Human Joints and Their Artificial Replacements.Springfield (IL): Thomas; 1977.
137. Youm Y, Yoon YS. Analytical development in investigation ofwrist kinematics. J Biomech 1979;12:613–621.
See also CARTILAGE AND MENISCUS, PROPERTIES OF; HIP JOINTS, ARTIFICIAL;HUMAN SPINE, BIOMECHANICS OF; LIGAMENT AND TENDON, PROPERTIES OF.
JOINT REPLACEMENT. See MATERIALS AND DESIGN FOR
ORTHOPEDIC DEVICES.
228 JOINTS, BIOMECHANICS OF

L
LAPARASCOPIC SURGERY. See MINIMALLY INVASIVE
SURGERY.
LARYNGEAL PROSTHETIC DEVICES
GUIDO BELFORTE
MASSIMILIANA CARELLO
Politecnico di TorinoTorino, Italy
GUIDO BONGIOANNINI
MAURO MAGNANO
ENT Division MaurizianoHospitalTorino, Italy
INTRODUCTION
The larynx is a uniquely complicated organ strategicallylocated at the division of the upper aerodigestive tract intothe gastrointestinal tract and the airways. Alteration of itsfunction can have a significant impact on vocal, digestive,and respiratory physiology (1–6). The hyoid bone, thethyroid cartilage, and the cricoid cartilage form the outsideframework of the larynx. The mobile interior frameworkconsists of the leaf-shaped epiglottis and the arytenoidcartilages. Each vocal cord stretches from an anteriorprojection of the arytenoid to the anterior midline of theinside thyroid cartilage. The arytenoid cartilages move inboth a rocking and sliding motion on the cricoid cartilage toabduct and adduct the truevocal cords.The intrinsicmusclesof the larynx control the movement of the vocal cords.
A section of the larynx is shown in Fig. 1, which is aposterior view of the cartilages and membranes (skeleton oflarynx).
The larynx has three important functions: protection ofthe lower airways during swallowing; respiration; andphonation.
Phonation is a complicated process in which sound isproduced for speech. During phonation, the vocal folds arebrought together near the center of the larynx by musclesattached to the arytenoids. As air is forced through thevocal folds, they vibrate and produce sound. The tone andlevel of the sound can be changed by contracting or relaxingthe muscles of the arytenoids. As the sound produced by thelarynx travels through the throat and mouth, it is furthermodified to produce speech.
Cancer of the larynx represented �0.7% of the totalcancer risk in 2001, and is the most common of all head andneck cancers. However, head and neck cancers account foronly �9% of all cancers diagnosed annually.
Laryngeal cancer occurs about five times more fre-quently in males than females. It is rare prior to age 40,after which the incidence in males increases rapidly withage. Cigarette smoking is the most important cause oflaryngeal cancer, with smokers having a roughly 10-foldhigher risk than nonsmokers. Heavy alcohol consumptionalso is a well-established risk factor.
Though laryngeal cancer is infrequent compared tocancer of the breast, lung, and prostate, the literatureregarding this disease is substantial. This apparently dis-proportionate body of writing reflects the perceived impor-tance of this neoplasm, which is in turn related to itspotential impact on people’s communicative ability: thethreat to a patient’s vocal organ is associated with profoundpsychological and socioeconomic overtones.
Originally, larynx cancer treatment focused primarilyon cure by relentless and aggressive surgery. That era hasbeen followed by the emergence of conservative partiallaryngectomy, the development of more sophisticatedradiation methods, and organ-sparing strategies in whichchemotherapeutic, radiotherapeutic, and surgical techni-ques are used in a variety of combinations.
Total laryngectomy is one of the standard operations forlaryngeal carcinomas. The prognosis associated with lar-yngeal carcinoma has improved: As the curability of lar-yngeal carcinoma is now > 60%, many patients thussurvive for a long time after surgery.
Laryngectomy changes the anatomy: The lower respira-tory tract is separated from the vocal tract and from theupper digestive tract, and the laryngectomee breathesthrough a tracheostoma. The direct connection betweenthe vocal tract and the upper digestive tract remainsunchanged.
Figure 2 shows the anatomic structure before laryngect-omy (a) and after laryngectomy (b). Before laryngectomy(Fig. 2a), air can travel from the lungs to the mouth (asrepresented by the arrows), and the voice can be producedand modulated. After the laryngectomy (Fig. 2b), air issu-ing from the tracheostoma cannot reach the mouth, andsounds cannot be produced.
Figure 1. Section of the larynx: posterior view of cartilages andmembranes.
229

THE VOICE AFTER A LARYNGECTOMY
After laryngectomy, the patient is deprived of both thevibrating sound source (the vocal folds) and the energysource for voice production, as the air stream from thelungs is no longer connected to the vocal tract (1–9).
For some laryngectomy patients, the loss of speech ismore important than survival itself. Consequently, a num-ber of different methods for recovering phonation havebeen developed, including: esophageal speech; artificiallarynx; and surgical laryngoplasty.
Numerous internal or external mechanical vibrationsources have been developed that cause the air in the vocaltract to vibrate. These vibration sources can be powered byair pressure (expired air from the tracheostoma in somecases) or by an electric source with battery, and are thusclassified as pneumo-larynges or electrical larynges.
ESOPHAGEAL SPEECH
Rehabilitation of the laryngectomized patient is usually adelayed process following recovery from surgery. Aftersurgery, some patients try aphonic lip speech enhancedby buccal air trapping, while others choose written lan-guage as the method of communication.
Though most laryngectomized patients begin to learnesophageal speech, this method of speech rehabilitationrequires a sequence of training sessions to develop theability to insufflate the esophagus by inhaling or injectingair through coordinated muscle activity of the tongue,cheeks, palate, and pharynx.
Patients are encouraged to attempt esophageal soundsoon after they are able to swallow food comfortably andlearn to produce esophageal sound by trapping air in themouth and forcing it into the esophagus. This produces a‘‘burp-like’’ tone that can be developed into the esophagealvoice.
There are various techniques for transporting air intothe esophagus.
With the injection technique, the tongue forces air backinto the pharynx and esophagus. This takes place in twostages, with the tongue forcing the air from the mouth back
into the pharynx in the first stage, and the back of thetongue propelling the air into the esophagus in the secondstage. For air to be transported into the esophagus, it isextremely important that these two stages be correctlysynchronized.
With the inhalation method of esophageal speech, thepatient creates a pressure in the esophagus that is lowerthan atmospheric pressure. As a result of this pressuredifference, air will flow through the mouth past the uppersegment of the esophagus into the lower esophagus. Thepatient will need to inhale air to be able to create a lowendothoracic and esophageal pressure.
The last technique of capturing air is by swallowing airinto the stomach.
Voluntary air release or ‘‘regurgitation’’ of smallvolumes vibrates the cervical esophageal inlet, hypophar-yngeal mucosa, and other portions of the upper aerodiges-tive tract to produce a ‘‘burp-like’’ sound. Articulation bythe lips, teeth, palate, and tongue produces intelligiblespeech.
Esophageal speech training is time consuming, frustrat-ing, and sometimes ineffective.
Its main disadvantage is the low success rate in acquir-ing useful voice production, which varies from 26 to 55%. Inaddition, esophageal speech results in low-pitched (60–80 Hz) and low intensity speech, whose intelligibility isoften poor. Age is the most important factor in determiningsuccess or failure: older patients are less successful inlearning esophageal speech.
The airway used to create the esophageal voice is shownin Fig. 3. Direction of flow is indicated by the arrows,making it possible to distinguish between the pulmonaryair used for breathing and the mouth air used for speech.
THE ELECTRONIC ARTIFICIAL LARYNX
Wright introduced the first electrolarynx in 1942. The mostwidely used electronic artificial larynx is the handheldtranscervical device, or electrolarynx. This electrical devicecontains a vibrating diaphragm, which is held against thethroat and activated by a button to inject vibratory energythrough the skin and into the hypopharynx. By mouthing
230 LARYNGEAL PROSTHETIC DEVICES
Figure 2. Anatomy before (a) and after(b) laryngectomy. (From Ref. 6.)

words, the laryngectomee converts the vibrations into anew, low frequency voice for speech.
An example of electrolarynx application is shown inFig. 4, where it is possible to distinguish the airway fromthe sound way and the positioning of the device in contactwith the neck. Examples of commercial electrolarynges areshown in Fig. 5.
The same operating principle has been used in recentyears to develop a transoral device (Fig. 6), which is placedin the mouth, where it is housed in an upper denture or anorthodontic retainer. The system consists of a controlcircuit, a loud speaker, and rechargeable batteries posi-tioned inside the denture, as well as a charging port so thatthe batteries can be recharged outside the mouth.
FROM THE PNEUMOLARYNX TO THE VOICE PROSTHESIS
The artificial larynx has undergone many transformationsover the years, and continues to do so today. The first types
of pneumolarynges, which included neck or mouth typesand internal or external types were developed in 1860,when the first attempts at voice rehabilitation throughsurgery or prosthetization were made. A device was usedto direct air from the lungs via a small tube to the mouth(1,3,5,7,9).
Experimental research started in 1860 with Ozermackand Burns, though it was not until 1874 that Billroth usedan internal prosthesis designed by Gussenbauer (Fig. 7).This device was fitted in the trachea via the stoma with acannula featuring a branch that entered the oral cavity.
Other similar prostheses were developed and used(Gosten, Gluck, etc.). Results, however, were not particu-larly satisfactory, as these devices were plagued by pro-blems, such as tissue necrosis and leakage of food andliquids into the windpipe and lungs, thus causing infec-tions (i.e., pneumonia).
Figure 8 shows the external prosthesis developed byCaselli in 1876. Figure 9 shows the application of theexternal prosthesis developed by Briani in 1950.
LARYNGEAL PROSTHETIC DEVICES 231
Figure 6. Transoral device. (From Ref. 5.)
Figure 5. Examples of commercial electrolarynx. (From Ref. 5.)
Figure 4. Electrolarynx speech. (From Ref. 6.)
Figure 3. Oesophageal speech. (From Ref. 6.)

Since 1960, surgical technique has been improved and anumber of different types of prosthesis have been inventedthat take the importance of reproducing a voice that issimilar to the original voice into account.
Tracheoesophageal puncture (TEP) or fistula with a voiceprosthesis is the most popular of the new techniques, and hasbecome the standard method of voice restoration after lar-yngectomy. However, it is usable only for selected patients.
Singer and Blom introduced the first TEP in 1980 (7,8).Theaimwastocreateapermanentfistula (punctureorshunt)into the posterior tracheoesophageal wall between the tra-chea and the esophagus tract, so the pulmonary air can shuntfrom the airway into and up the esophagus. In this way, thevibration of the anatomic structures produces a noise.
A removable or fixed one-way type prosthesis can bepositioned in the fistula.
The removable, or nonindwelling, prosthesis (Bivona,Blom-Singer duckbill) can be removed daily for cleaning bythe patient, and is taped to the peritracheostomal skin.Figure 10 shows a photo of two Bivona valves; lengthsdiffer in order to adapt the prosthesis to the patient.
The fixed, or indwelling, prosthesis cannot be removeddaily, but is surgically placed in the fistula under localanesthesia. The operating principle of this type of prosthe-sis (known as a phonatory valve or voice button) can beexplained with reference to Fig. 11.
Pulmonary air can be pushed through the valve into theesophagus for speech during expiration in two ways: by thelaryngectomee, who covers the tracheal stoma with a finger(bottom left, Fig. 11) or automatically by a tracheostomabreathing valve (bottom right, Fig. 11).
232 LARYNGEAL PROSTHETIC DEVICES
Figure 9. The Briani prosthesis. (From Ref. 3.)
Figure 10. Example of removable prosthesis (Bivona).
Figure 8. The Caselli prosthesis. (From Ref. 3.)
Figure 7. The Gussembauer prosthesis. (From Ref. 3.)
Figure 11. Speech with phonatory prosthesis. (From Ref. 6.)

The tracheostoma breathing valve contains an elasticdiaphragm installed in a peristomal housing, which permitsnormal respiration during silent periods. Expiratory air forspeech shuts off the pressure-sensitive diaphragm, and is thusdiverted through the valve into the esophagus. This deviceeliminates theneed formanual stomaocclusionduringspeech.
In both cases, air from the lung reaches the esophagusand causes the mucosal tissue tovibrate. The resultingsound can be modulated by the mouth, teeth, oral cavity,and so on, to produce the new voice.
Most speakers that have prosthesis do not have difficul-ties with articulation, rate of speech, or phonatory duration.
If esophageal speech depends on gulping or trapping airusing the phonatory valve, the resulting speech depends onexpiratory capacity. Voice quality is very good, and mayresemble the ‘‘original’’ voice.
Poor digital occlusion of the tracheostoma as well aspoor tracheostoma valve adherence allows pulmonary airto escape from the stoma prior to its diversion through theprosthesis into the oesophagus for voice production. In fact,the bleeding off of pulmonary air limits phonatory durationand, therefore, the number of words that can be spoken.
The one-way valve design of the prosthesis preventsaspiration (of food and liquid) from the esophagus to thetrachea. An example of a phonatory valve is shown inFig. 12 (11,12). The prosthesis illustrated in this sketchconsists of an air-flow tracheal entry, whereby an endo-
tracheal retention collar is connected to the mucosa (ortracheal flange), a hollow cylindrical tube (whose lengthdepends on the patient’s physical characteristics) connect-ing the trachea to the esophagus, an endoesophagealflange, and a dome (or hat) that closes the proximal endoe-sophageal end of the tube. Via the razor-thin slit (oresophagus exit), the hat enables airflow to pass from thetrachea to the esophagus when there is a positive differ-ential pressure, and prevents the reverse flow of liquid (orfood) when the differential pressure becomes negative. Thearrows represent the airflow paths.
Hat shape and the extension of the razor-thin slit candiffer according to valve type. The razor-thin slit may belocated at the base of the hat (Staffieri, Groningen lowpressure), at the center of the hat (Panje, Groningenstandard), or inside the hollow tube (Provox, Blom-Singer).
Though valve geometry and shape may vary, the oper-ating principle remains the same.
Several commercial prostheses are shown in Fig. 13:from left to right, they include the Staffieri, Groningenstandard, Groningen low pressure, Panje, and Provox types.
Fixed and removable prostheses are available in differ-ent lengths, which usually range from 6 to 12 mm to enablethe surgeon to select the dimensions that are best suited tothe patient’s physical characteristics, for example, poster-ior tracheoesophageal wall thickness.
To compare valve performance in the laboratory, mostauthors use valve airflow resistance (7,11), which is definedas the ratio of pressure to flow-rate. Figure 14 show anexample of resistance versus flow-rate characteristicsobtained with experimental tests on commercial valves (11).
Low resistance allows air to pass freely though theprosthesis with little effort on the part of the patient, and
LARYNGEAL PROSTHETIC DEVICES 233
Figure 12. Sketch of phonatory valve or prostheses.
Figure 13. Examples of fixed commercial prosthesis. (Staffieri,Groningen standard, Groningen low pressure, Panje, Provox).
0
10
20
30
40
50
60
70
80
0 0,05 0,1 0,15 0,2 0,25 0,3 0,35
Flow-rate [dm3/s (ANR)]
Res
ista
nce
[kP
a/(d
m3 /
s)]
Staffieri
Provox
Groningenstandard
Groningen lowpressure
Panje
Figure 14. Resistance of commercial valves.

is thus the most favorable condition. Different materialshave been used for phonatory prostheses. For indwellingprostheses, silicone rubber is the material of choice, thoughother materials such as polyurethane have also been used.The most significant problem affecting voice prostheses isthe formation of a thick biofilm on the esophageal surface, asthe esophageal environmental around the prosthesis pro-vides ideal growing conditions for bacteria, fungi, and yeast.
In this area, secretions from the trachea, the mucousmembranes in the oropharynx and esophagus, and salivafrom the oral cavity create an optimal ‘‘pabulum’’ formicroorganisms, which can thus adhere to the prosthesissurface. Though biofilm does not lead immediately to valve,malfunction, colonies growing around the prosthesis canincrease airflow resistance, blocking the valve or prevent-ing it from closing correctly. This causes saliva to leak fromthe oral cavity through the esophagus lumen. The biofilmalso grows into the valve material (silicone rubber).
Massive microorganism growth is more frequent inindwelling prostheses than in non-indwelling types, asthe latter are regularly removed and cleaned.
The first step of this colonization is the formation of avery thin layer of organic origin, called a conditioning film.Microorganisms adhere to the thin layer of saliva condi-tioning film on the inner esophageal surface of the deviceand form the first stratum of biofilm, which is nearlyimpossible to eradicate. There are few methods for redu-cing the growth of bacteria and fungi: One possibility is toapply (through oral instillations) antimycotic drugs thatreduce biofilm formation and increase prosthesis life(1,2,7,8,13,14). The valve has a limited life, varying from�4 to 8 months. After this period, the valve must beremoved and changed in an outpatient procedure becauseof a dysfunctional mechanism caused by the biofilm, whichcauses food and liquids to leak from the esophageal area tothe trachea.
Figure 15 shows a new Provox valve (left) and a Provoxvalve after eight months of use by a patient (right). Siliconrubber deterioration caused by microbial action and adher-ent deposits of microorganisms is clearly apparent.
Current work with voice prostheses focuses on improv-ing their aerodynamic characteristics (low airflow resis-tance) and developing more resistant materials that canextend the life of the device. For the patient, in any case,the most important thing after a total laryngectomy is to behopeful: a prosthesis can provide a new voice, improvingthe quality of life.
BIBLIOGRAPHY
1. Mahieu HF. Voice and speech rehabilitation following laryn-gectomy. Ph.D. dissertation, Rijksuniversiteit Groningen; 1988.
2. Pighi GP, Cristoferi V. Protesi tacheo-esofagee. Bologna:Arianna Editrice; 1998.
3. Societé Francaise d’Oto-Rhino-Laryngologie et de Pathologiecervico-faciale. Réhabilitation de la voix et de la déglutitionaprès chirurgie du larynx. Arnette, Paris; 1992.
4. Testut L, Jacob O. Trattato di anatomia topografica. Vol. IICollo - Torace –Addome, Utet, Torino, 1998.
5. Harrison LB, Sessions RB, Hong WK. Head and neck cancer.Lippinocott Williams & Wilkins; 2004; 178–189.
6. http://www.orl.nl7. Blom ED. Tracheoesophageal voice restoration: origin, evolution,
state of the art. Folia Phonatrica Logopaedica 2000; 52:14–23.8. Blom ED, Singer MI, Hamaker RC. Tracheoesophageal voice
restoration following total laryngectomy. San Diego: SingularPublishing Group Inc.; 1998.
9. Brown DH, et al. Postlaryngectomy voice rehabilitation: stateof the art at the millennium. World J Surg 2003;27(7):824–831.
10. Nakamura T, Shimizu Y. Thacheal, laryngeal and esophagealreplacement device. The Biomedical Engineering HandbookCRC and IEEE Press; 2000, p 136/1–136/13.
11. Belforte G, Carello M, Miani C, Staffieri A. Staffieri tracheo-oesophageal prosthesis for voice rehabilitation after laryngect-omy: an evaluation of characteristics. Med Biol Eng Comput1998;36:754–760.
12. Staffieri M, Staffieri A. A new voice button for post-totallaryngectomy speech rehabilitation. Laryngoscope 1988;98(9):1027–1029.
13. Schwandt LQ, et al. Prevention of biofilm formation by dairyproducts and N-acetylcysteine on voice prostheses in an arti-ficial throat. Acta Otolaryngol 2004;124:726–731.
14. Leunisse C, et al. Biofilm formation and design features ofindwelling silicone rubber tracheoesophageal voice pros-theses—An electron microscopical study. J Biomed MaterRes 2001;58(5):556–563.
See also COMMUNICATION DEVICES; PULMONARY PHYSIOLOGY.
LASER SURGERY. See ELECTROSURGICAL UNIT (ESU).
LASERS, IN MEDICINE. See FIBER OPTICS IN MEDICINE.
LENSES, CONTACT. See CONTACT LENSES.
LENSES, INTRAOCULAR
HABIB HAMAM
Université de MonctonMoncton, New Brunswick,Canada
INTRODUCTION
Ridley’s implantation (1949) of the first intraocular lens(IOL) marked the beginning of a major change in thepractice of ophthalmology. The IOLs are microlensesplaced inside the human eye to correct cataracts, near-sightedness, farsightedness, astigmatism, or presbyopia.There are two types of IOLs: anterior chamber lenses,
234 LENSES, INTRAOCULAR
Figure 15. Provox valve: (a) new and (b) old.
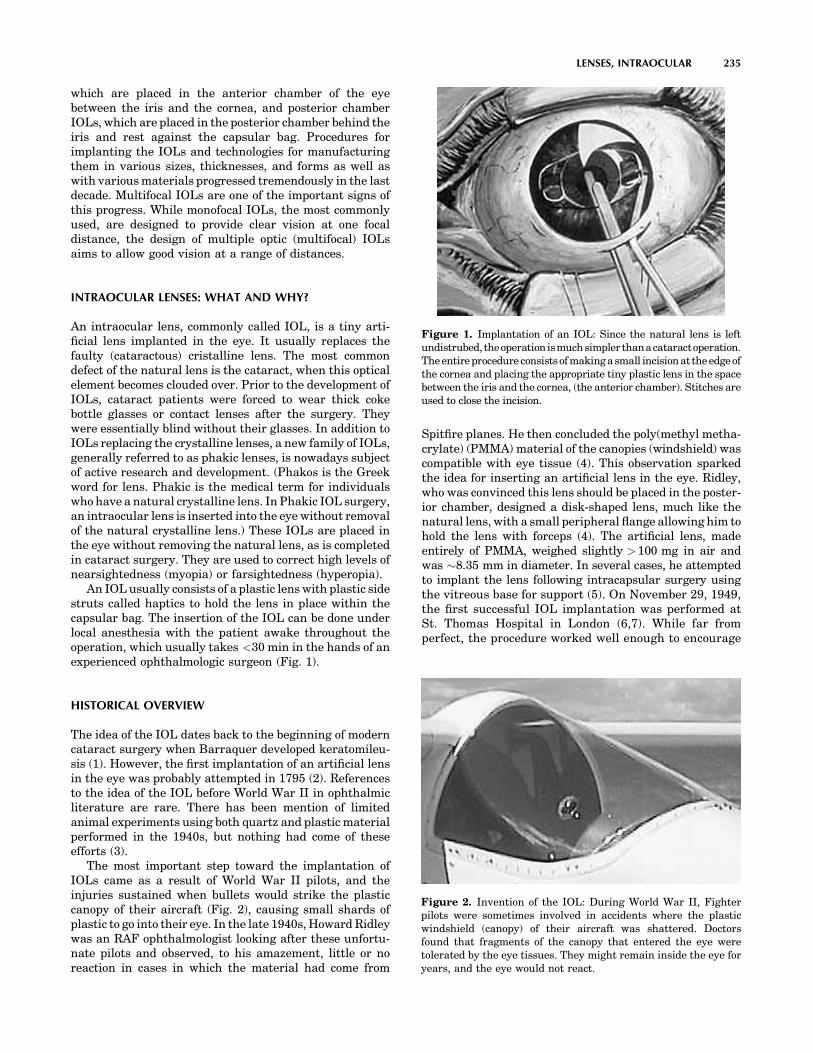
which are placed in the anterior chamber of the eyebetween the iris and the cornea, and posterior chamberIOLs, which are placed in the posterior chamber behind theiris and rest against the capsular bag. Procedures forimplanting the IOLs and technologies for manufacturingthem in various sizes, thicknesses, and forms as well aswith various materials progressed tremendously in the lastdecade. Multifocal IOLs are one of the important signs ofthis progress. While monofocal IOLs, the most commonlyused, are designed to provide clear vision at one focaldistance, the design of multiple optic (multifocal) IOLsaims to allow good vision at a range of distances.
INTRAOCULAR LENSES: WHAT AND WHY?
An intraocular lens, commonly called IOL, is a tiny arti-ficial lens implanted in the eye. It usually replaces thefaulty (cataractous) cristalline lens. The most commondefect of the natural lens is the cataract, when this opticalelement becomes clouded over. Prior to the development ofIOLs, cataract patients were forced to wear thick cokebottle glasses or contact lenses after the surgery. Theywere essentially blind without their glasses. In addition toIOLs replacing the crystalline lenses, a new family of IOLs,generally referred to as phakic lenses, is nowadays subjectof active research and development. (Phakos is the Greekword for lens. Phakic is the medical term for individualswho have a natural crystalline lens. In Phakic IOL surgery,an intraocular lens is inserted into the eye without removalof the natural crystalline lens.) These IOLs are placed inthe eye without removing the natural lens, as is completedin cataract surgery. They are used to correct high levels ofnearsightedness (myopia) or farsightedness (hyperopia).
An IOL usually consists of a plastic lens with plastic sidestruts called haptics to hold the lens in place within thecapsular bag. The insertion of the IOL can be done underlocal anesthesia with the patient awake throughout theoperation, which usually takes <30 min in the hands of anexperienced ophthalmologic surgeon (Fig. 1).
HISTORICAL OVERVIEW
The idea of the IOL dates back to the beginning of moderncataract surgery when Barraquer developed keratomileu-sis (1). However, the first implantation of an artificial lensin the eye was probably attempted in 1795 (2). Referencesto the idea of the IOL before World War II in ophthalmicliterature are rare. There has been mention of limitedanimal experiments using both quartz and plastic materialperformed in the 1940s, but nothing had come of theseefforts (3).
The most important step toward the implantation ofIOLs came as a result of World War II pilots, and theinjuries sustained when bullets would strike the plasticcanopy of their aircraft (Fig. 2), causing small shards ofplastic to go into their eye. In the late 1940s, Howard Ridleywas an RAF ophthalmologist looking after these unfortu-nate pilots and observed, to his amazement, little or noreaction in cases in which the material had come from
Spitfire planes. He then concluded the poly(methyl metha-crylate) (PMMA) material of the canopies (windshield) wascompatible with eye tissue (4). This observation sparkedthe idea for inserting an artificial lens in the eye. Ridley,who was convinced this lens should be placed in the poster-ior chamber, designed a disk-shaped lens, much like thenatural lens, with a small peripheral flange allowing him tohold the lens with forceps (4). The artificial lens, madeentirely of PMMA, weighed slightly > 100 mg in air andwas �8.35 mm in diameter. In several cases, he attemptedto implant the lens following intracapsular surgery usingthe vitreous base for support (5). On November 29, 1949,the first successful IOL implantation was performed atSt. Thomas Hospital in London (6,7). While far fromperfect, the procedure worked well enough to encourage
LENSES, INTRAOCULAR 235
Figure 1. Implantation of an IOL: Since the natural lens is leftundistrubed, theoperation ismuchsimpler thanacataractoperation.The entire procedure consistsof making a small incisionat the edgeofthe cornea and placing the appropriate tiny plastic lens in the spacebetween the iris and the cornea, (the anterior chamber). Stitches areused to close the incision.
Figure 2. Invention of the IOL: During World War II, Fighterpilots were sometimes involved in accidents where the plasticwindshield (canopy) of their aircraft was shattered. Doctorsfound that fragments of the canopy that entered the eye weretolerated by the eye tissues. They might remain inside the eye foryears, and the eye would not react.
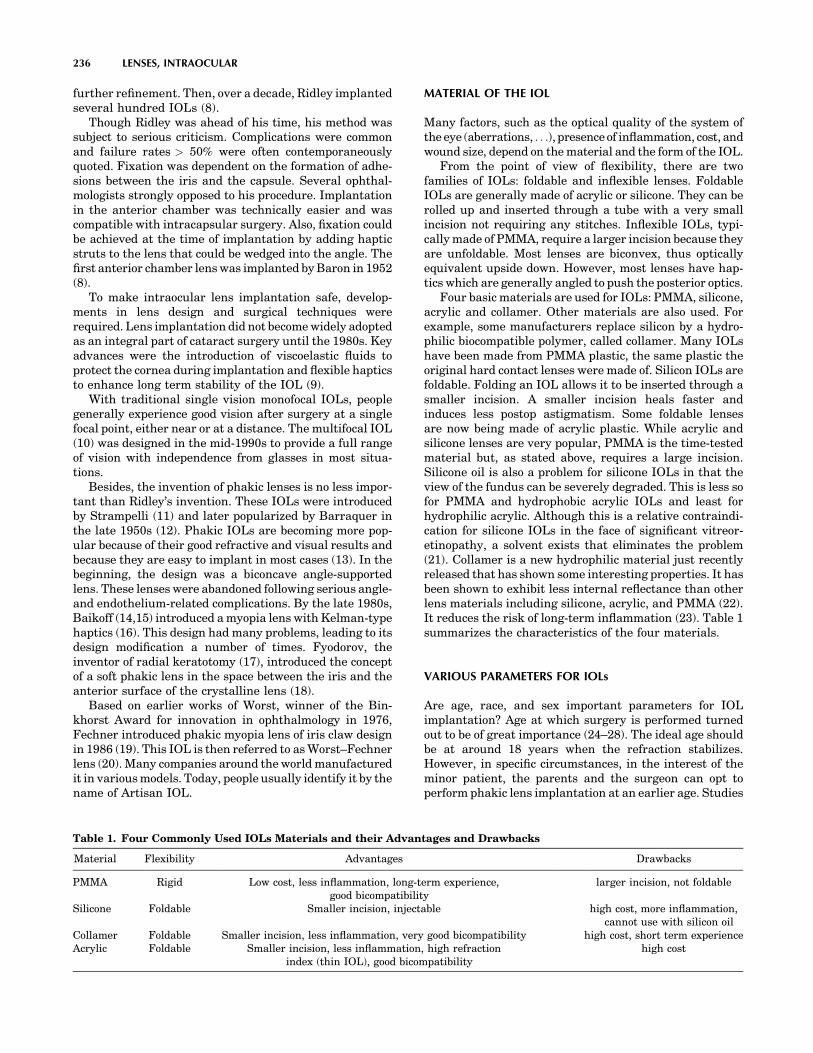
further refinement. Then, over a decade, Ridley implantedseveral hundred IOLs (8).
Though Ridley was ahead of his time, his method wassubject to serious criticism. Complications were commonand failure rates > 50% were often contemporaneouslyquoted. Fixation was dependent on the formation of adhe-sions between the iris and the capsule. Several ophthal-mologists strongly opposed to his procedure. Implantationin the anterior chamber was technically easier and wascompatible with intracapsular surgery. Also, fixation couldbe achieved at the time of implantation by adding hapticstruts to the lens that could be wedged into the angle. Thefirst anterior chamber lens was implanted by Baron in 1952(8).
To make intraocular lens implantation safe, develop-ments in lens design and surgical techniques wererequired. Lens implantation did not become widely adoptedas an integral part of cataract surgery until the 1980s. Keyadvances were the introduction of viscoelastic fluids toprotect the cornea during implantation and flexible hapticsto enhance long term stability of the IOL (9).
With traditional single vision monofocal IOLs, peoplegenerally experience good vision after surgery at a singlefocal point, either near or at a distance. The multifocal IOL(10) was designed in the mid-1990s to provide a full rangeof vision with independence from glasses in most situa-tions.
Besides, the invention of phakic lenses is no less impor-tant than Ridley’s invention. These IOLs were introducedby Strampelli (11) and later popularized by Barraquer inthe late 1950s (12). Phakic IOLs are becoming more pop-ular because of their good refractive and visual results andbecause they are easy to implant in most cases (13). In thebeginning, the design was a biconcave angle-supportedlens. These lenses were abandoned following serious angle-and endothelium-related complications. By the late 1980s,Baikoff (14,15) introduced a myopia lens with Kelman-typehaptics (16). This design had many problems, leading to itsdesign modification a number of times. Fyodorov, theinventor of radial keratotomy (17), introduced the conceptof a soft phakic lens in the space between the iris and theanterior surface of the crystalline lens (18).
Based on earlier works of Worst, winner of the Bin-khorst Award for innovation in ophthalmology in 1976,Fechner introduced phakic myopia lens of iris claw designin 1986 (19). This IOL is then referred to as Worst–Fechnerlens (20). Many companies around the world manufacturedit in various models. Today, people usually identify it by thename of Artisan IOL.
MATERIAL OF THE IOL
Many factors, such as the optical quality of the system ofthe eye (aberrations, . . .), presence of inflammation, cost, andwound size, depend on the material and the form of the IOL.
From the point of view of flexibility, there are twofamilies of IOLs: foldable and inflexible lenses. FoldableIOLs are generally made of acrylic or silicone. They can berolled up and inserted through a tube with a very smallincision not requiring any stitches. Inflexible IOLs, typi-cally made of PMMA, require a larger incision because theyare unfoldable. Most lenses are biconvex, thus opticallyequivalent upside down. However, most lenses have hap-tics which are generally angled to push the posterior optics.
Four basic materials are used for IOLs: PMMA, silicone,acrylic and collamer. Other materials are also used. Forexample, some manufacturers replace silicon by a hydro-philic biocompatible polymer, called collamer. Many IOLshave been made from PMMA plastic, the same plastic theoriginal hard contact lenses were made of. Silicon IOLs arefoldable. Folding an IOL allows it to be inserted through asmaller incision. A smaller incision heals faster andinduces less postop astigmatism. Some foldable lensesare now being made of acrylic plastic. While acrylic andsilicone lenses are very popular, PMMA is the time-testedmaterial but, as stated above, requires a large incision.Silicone oil is also a problem for silicone IOLs in that theview of the fundus can be severely degraded. This is less sofor PMMA and hydrophobic acrylic IOLs and least forhydrophilic acrylic. Although this is a relative contraindi-cation for silicone IOLs in the face of significant vitreor-etinopathy, a solvent exists that eliminates the problem(21). Collamer is a new hydrophilic material just recentlyreleased that has shown some interesting properties. It hasbeen shown to exhibit less internal reflectance than otherlens materials including silicone, acrylic, and PMMA (22).It reduces the risk of long-term inflammation (23). Table 1summarizes the characteristics of the four materials.
VARIOUS PARAMETERS FOR IOLs
Are age, race, and sex important parameters for IOLimplantation? Age at which surgery is performed turnedout to be of great importance (24–28). The ideal age shouldbe at around 18 years when the refraction stabilizes.However, in specific circumstances, in the interest of theminor patient, the parents and the surgeon can opt toperform phakic lens implantation at an earlier age. Studies
236 LENSES, INTRAOCULAR
Table 1. Four Commonly Used IOLs Materials and their Advantages and Drawbacks
Material Flexibility Advantages Drawbacks
PMMA Rigid Low cost, less inflammation, long-term experience,good bicompatibility
larger incision, not foldable
Silicone Foldable Smaller incision, injectable high cost, more inflammation,cannot use with silicon oil
Collamer Foldable Smaller incision, less inflammation, very good bicompatibility high cost, short term experienceAcrylic Foldable Smaller incision, less inflammation, high refraction
index (thin IOL), good bicompatibilityhigh cost

of the suitable age of IOL implantation in children havebeen carried out (24). A 3-year-old child has been qualifiedwith IOL implantation, the child younger than 9 years oldshould be implanted with a normal adult IOL and thencorrected with glasses, and a child after 10 years old shouldbe directly implanted with a proper dioptric IOL (24). Someresearchers evaluated the influence of cataract surgery onthe eyes of children between 1 and 5 years old. Theyconcluded that cataract surgery, either extraction withor without IOL implantation, did not retard axial elonga-tion in children above 1 year old (25). Comparisons betweenchildren with congenital or developmental lens opacitieswho underwent extracapsular cataract extraction and chil-dren with normal eyes have been carried out (26). Thepattern of axial elongation and corneal flattening wassimilar in the congenital and developmental groups to thatobserved in normal eyes. No significant retardation oracceleration of axial growth was found in the eyesimplanted with IOLs compared with normal eyes. A myopicshift was seen particularly in eyes operated on at 4–8 weeksof age and it is recommended that these eyes are made 6 Dhyperopic initially with the residual refractive error beingcorrected with spectacles (26).
To our knowledge, IOL implantation does not depend onrace and sex.
OPTICAL QUALITY
Two optical qualities are distinguinshed: the intrinsicoptical quality of the IOL and the optical quality of thesystem of the eye including the IOL. Many factors, such asthe material and the geometrical profile of the IOL, influ-ence the intrinsic quality of this optical element. Axial shift(decentration), transversal rotation (not around the opticalaxis), and deformation (mechanical stresses, . . .) of the IOLare examples of factors affecting the optical quality of thewhole system of the eye even in case the IOL alone is aperfect optical element. Thus, the optical quality of the IOLis certainly important. However, for vision, the determi-nant factor is the optical quality of the whole system of theeye in which the IOL is implanted. Several studies havebeen undertaken to assess the optical quality of the IOLand the optical quality of the whole system of the eye.Before progressing in this section, let us briefly introducethe notion of optical quality.
Aberrations
Stated in wave optics, the system of the eye should trans-form the input wavefront into a perfect convergent sphe-rical wavefront that has the image point as center (29–31).Note that an optical wavefront represents a continuoussurface composed of points of equal phase. Thus all image-forming rays, which travel normal to the exit sphericalwavefront, meet in the focal point in phase, resulting inmaximum radiant energy being delivered to that point. Inreality, this situation never occurs. The rays modified bythe optical system do not converge entirely to a commonpoint image. For one object point correspond several imagepoints that form a blurred image. This deviation from theideal case is called optical aberration, or merely aberration,
and is a measure of the optical quality of the system.Aberration can be quantified either with respect to theexpected image point or to the wavefront corresponding tothis ideal point. If the real output wavefront is compared tothe ideal one, it is called the difference between themwavefront aberration (29). All human eyes suffer fromoptical aberrations that limit the quality of the retinalimage (32–36). Several metrics have been proposed tomeasure the optical quality of the system of the eye(37–41). Let us return back to IOLs now. Optical qualityof multifocal IOLs will be treated in the section devoted tothis kind of lens.
Optical Quality of the IOL
The optical quality of IOL was the subject of intensivestudies. Several common but some contrasted results havebeen obtained. An exhaustive study goes beyond the scope ofthis document. We limit our attention to some recent results.Tognetto et al. (42) evaluated the optical quality of differentIOLs by using an optical test bench. The purpose of the studywastoevaluatetheopticalqualityof IOLsandnot toevaluatethe optical performance of these lenses once implanted.Three randomly acquired samples of 24 different models offoldableIOLswerecompared.TheconclusionisthatdifferentIOLs can transmit different spectra of spatial frequencies.The best frequency response was provided by acrylic IOLs,particularly those with an asymmetrically biconvex profile.This could be due to a reduction of optical degradationprovidedbythis typeofprofile.A lenswithahigher frequencyresponse should create a better quality of vision onceimplanted, and the frequency response should therefore beconsidered when choosing the intraocular lens model (42).
Negishi et al. (43) evaluated the effect of chromaticaberrations in pseudophakic eyes with various types ofIOLs. Their results show that longitudinal chromatic aber-rations of some IOLs may degrade the quality of the retinalimage. They concluded that attention must be paid to thedetailed optical performance of IOL materials to achievegood visual function.
In a comparative study (44), Martin found that thecollamer IOL reduced the number of induced higher orderaberrations when compared with acrylic and silicone lenses.Indeed, he found that the collamer IOL has 55–117%fewer induced higher order aberrations than acrylic orsilicone materials. As a consequence, it produces lesspostop glare. He concluded the collamer lens providesclearer vision than the other lenses.
Optical Quality of ARTISAN Lenses
Brunette et al. (45) evaluated the optical quality of the eyebefore and after the insertion of an ARTISAN phakicintraocular lens for the treatment of high myopia (range�20.50 to �9.75D). Consecutive patients implanted withthe ARTISAN lens by a single surgeon were prospectivelyenrolled. One eye per subject was tested. The wavefrontaberration was calculated from images recorded with aHartmann-Shack sensor (46,47). The PSF and the MTFwere also computed from the wavefront aberration. It wasconcluded that preliminary data using the Hartmann–Shack wavefront sensor have not revealed a tendency
LENSES, INTRAOCULAR 237
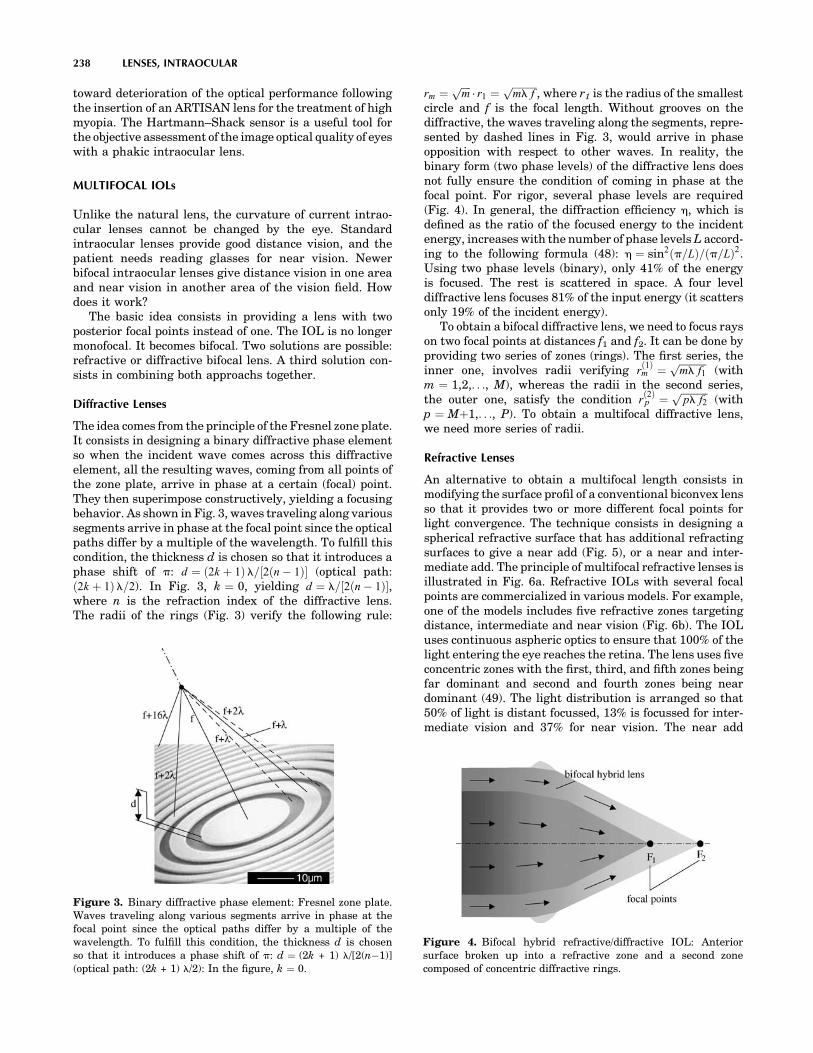
toward deterioration of the optical performance followingthe insertion of an ARTISAN lens for the treatment of highmyopia. The Hartmann–Shack sensor is a useful tool forthe objective assessment of the image optical quality of eyeswith a phakic intraocular lens.
MULTIFOCAL IOLs
Unlike the natural lens, the curvature of current intrao-cular lenses cannot be changed by the eye. Standardintraocular lenses provide good distance vision, and thepatient needs reading glasses for near vision. Newerbifocal intraocular lenses give distance vision in one areaand near vision in another area of the vision field. Howdoes it work?
The basic idea consists in providing a lens with twoposterior focal points instead of one. The IOL is no longermonofocal. It becomes bifocal. Two solutions are possible:refractive or diffractive bifocal lens. A third solution con-sists in combining both approachs together.
Diffractive Lenses
The idea comes from the principle of the Fresnel zone plate.It consists in designing a binary diffractive phase elementso when the incident wave comes across this diffractiveelement, all the resulting waves, coming from all points ofthe zone plate, arrive in phase at a certain (focal) point.They then superimpose constructively, yielding a focusingbehavior. As shown in Fig. 3, waves traveling along varioussegments arrive in phase at the focal point since the opticalpaths differ by a multiple of the wavelength. To fulfill thiscondition, the thickness d is chosen so that it introduces aphase shift of p: d ¼ ð2k þ 1Þl=½2ðn � 1Þ� (optical path:ð2k þ 1Þl=2). In Fig. 3, k ¼ 0, yielding d ¼ l=½2ðn � 1Þ�,where n is the refraction index of the diffractive lens.The radii of the rings (Fig. 3) verify the following rule:
rm ¼ ffiffiffiffim
p r1 ¼ffiffiffiffiffiffiffiffiffiffiml f
p, where r1 is the radius of the smallest
circle and f is the focal length. Without grooves on thediffractive, the waves traveling along the segments, repre-sented by dashed lines in Fig. 3, would arrive in phaseopposition with respect to other waves. In reality, thebinary form (two phase levels) of the diffractive lens doesnot fully ensure the condition of coming in phase at thefocal point. For rigor, several phase levels are required(Fig. 4). In general, the diffraction efficiency h, which isdefined as the ratio of the focused energy to the incidentenergy, increases with the number of phase levels L accord-ing to the following formula (48): h ¼ sin2ðp=LÞ=ðp=LÞ2.Using two phase levels (binary), only 41% of the energyis focused. The rest is scattered in space. A four leveldiffractive lens focuses 81% of the input energy (it scattersonly 19% of the incident energy).
To obtain a bifocal diffractive lens, we need to focus rayson two focal points at distances f1 and f2. It can be done byproviding two series of zones (rings). The first series, theinner one, involves radii verifying r
ð1Þm ¼
ffiffiffiffiffiffiffiffiffiffiffiml f1
p(with
m ¼ 1,2,. . ., M), whereas the radii in the second series,the outer one, satisfy the condition r
ð2Þp ¼
ffiffiffiffiffiffiffiffiffiffiffipl f2
p(with
p ¼ Mþ1,. . ., P). To obtain a multifocal diffractive lens,we need more series of radii.
Refractive Lenses
An alternative to obtain a multifocal length consists inmodifying the surface profil of a conventional biconvex lensso that it provides two or more different focal points forlight convergence. The technique consists in designing aspherical refractive surface that has additional refractingsurfaces to give a near add (Fig. 5), or a near and inter-mediate add. The principle of multifocal refractive lenses isillustrated in Fig. 6a. Refractive IOLs with several focalpoints are commercialized in various models. For example,one of the models includes five refractive zones targetingdistance, intermediate and near vision (Fig. 6b). The IOLuses continuous aspheric optics to ensure that 100% of thelight entering the eye reaches the retina. The lens uses fiveconcentric zones with the first, third, and fifth zones beingfar dominant and second and fourth zones being neardominant (49). The light distribution is arranged so that50% of light is distant focussed, 13% is focussed for inter-mediate vision and 37% for near vision. The near add
238 LENSES, INTRAOCULAR
Figure 3. Binary diffractive phase element: Fresnel zone plate.Waves traveling along various segments arrive in phase at thefocal point since the optical paths differ by a multiple of thewavelength. To fulfill this condition, the thickness d is chosenso that it introduces a phase shift of p: d ¼ (2k + 1) l/[2(n�1)](optical path: (2k + 1) l/2): In the figure, k ¼ 0.
Figure 4. Bifocal hybrid refractive/diffractive IOL: Anteriorsurface broken up into a refractive zone and a second zonecomposed of concentric diffractive rings.
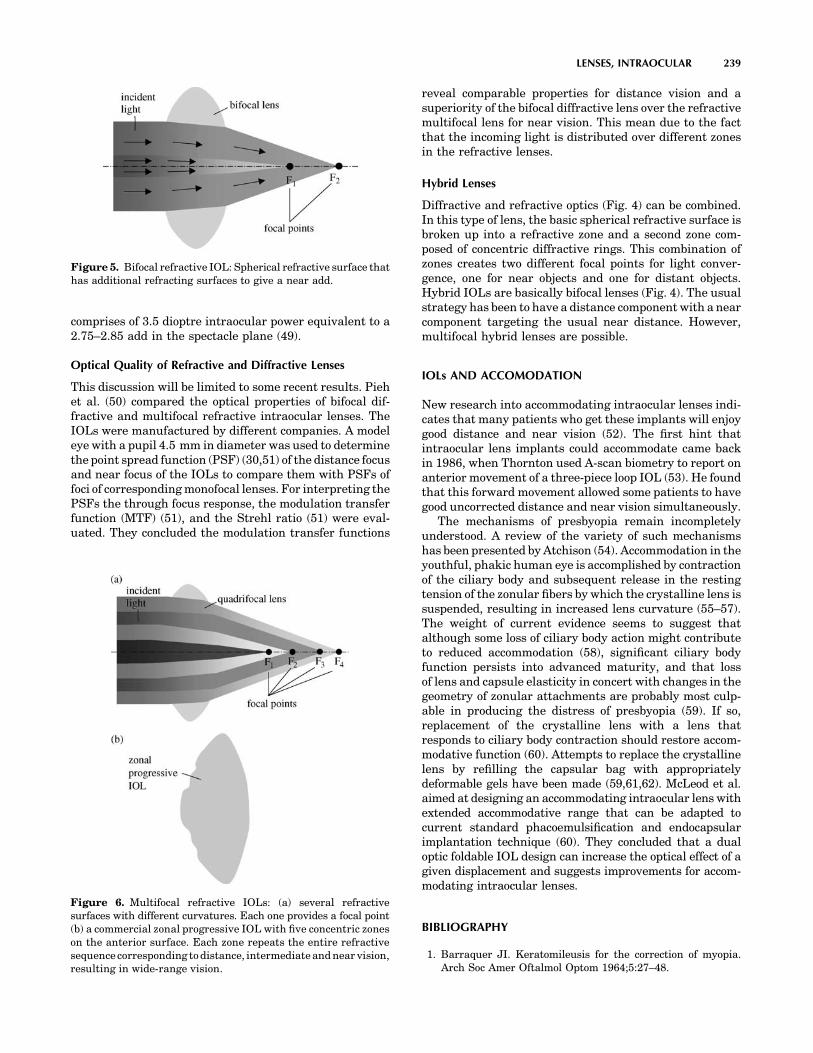
comprises of 3.5 dioptre intraocular power equivalent to a2.75–2.85 add in the spectacle plane (49).
Optical Quality of Refractive and Diffractive Lenses
This discussion will be limited to some recent results. Piehet al. (50) compared the optical properties of bifocal dif-fractive and multifocal refractive intraocular lenses. TheIOLs were manufactured by different companies. A modeleye with a pupil 4.5 mm in diameter was used to determinethe point spread function (PSF) (30,51) of the distance focusand near focus of the IOLs to compare them with PSFs offoci of corresponding monofocal lenses. For interpreting thePSFs the through focus response, the modulation transferfunction (MTF) (51), and the Strehl ratio (51) were eval-uated. They concluded the modulation transfer functions
reveal comparable properties for distance vision and asuperiority of the bifocal diffractive lens over the refractivemultifocal lens for near vision. This mean due to the factthat the incoming light is distributed over different zonesin the refractive lenses.
Hybrid Lenses
Diffractive and refractive optics (Fig. 4) can be combined.In this type of lens, the basic spherical refractive surface isbroken up into a refractive zone and a second zone com-posed of concentric diffractive rings. This combination ofzones creates two different focal points for light conver-gence, one for near objects and one for distant objects.Hybrid IOLs are basically bifocal lenses (Fig. 4). The usualstrategy has been to have a distance component with a nearcomponent targeting the usual near distance. However,multifocal hybrid lenses are possible.
IOLs AND ACCOMODATION
New research into accommodating intraocular lenses indi-cates that many patients who get these implants will enjoygood distance and near vision (52). The first hint thatintraocular lens implants could accommodate came backin 1986, when Thornton used A-scan biometry to report onanterior movement of a three-piece loop IOL (53). He foundthat this forward movement allowed some patients to havegood uncorrected distance and near vision simultaneously.
The mechanisms of presbyopia remain incompletelyunderstood. A review of the variety of such mechanismshas been presented by Atchison (54). Accommodation in theyouthful, phakic human eye is accomplished by contractionof the ciliary body and subsequent release in the restingtension of the zonular fibers by which the crystalline lens issuspended, resulting in increased lens curvature (55–57).The weight of current evidence seems to suggest thatalthough some loss of ciliary body action might contributeto reduced accommodation (58), significant ciliary bodyfunction persists into advanced maturity, and that lossof lens and capsule elasticity in concert with changes in thegeometry of zonular attachments are probably most culp-able in producing the distress of presbyopia (59). If so,replacement of the crystalline lens with a lens thatresponds to ciliary body contraction should restore accom-modative function (60). Attempts to replace the crystallinelens by refilling the capsular bag with appropriatelydeformable gels have been made (59,61,62). McLeod et al.aimed at designing an accommodating intraocular lens withextended accommodative range that can be adapted tocurrent standard phacoemulsification and endocapsularimplantation technique (60). They concluded that a dualoptic foldable IOL design can increase the optical effect of agiven displacement and suggests improvements for accom-modating intraocular lenses.
BIBLIOGRAPHY
1. Barraquer JI. Keratomileusis for the correction of myopia.Arch Soc Amer Oftalmol Optom 1964;5:27–48.
LENSES, INTRAOCULAR 239
Figure 5. Bifocal refractive IOL: Spherical refractive surface thathas additional refracting surfaces to give a near add.
Figure 6. Multifocal refractive IOLs: (a) several refractivesurfaces with different curvatures. Each one provides a focal point(b) a commercial zonal progressive IOL with five concentric zoneson the anterior surface. Each zone repeats the entire refractivesequence corresponding to distance, intermediate and near vision,resulting in wide-range vision.

2. Ascher K. Prothetophakia two hundred years ago. Am JOphthalmol 1965;59:445–446.
3. Nordlohne ME. The Intraocular Lens Development andResults with Special Reference to the Binkhorst Lens, 2nded. The Hague: Dr. W. Junk b.v.; 1975: p 14–17
4. Ridley H. Intraocular acrylic lenses—past, present and future.Trans Ophthal Soc UK 1964;84:5–14.
5. Kwitko ML, Kelman CD, editors. Intraocular lens implanta-tion: The Beginnings: The History of Modern Cataract Sur-gery. The Hague: Kugler Publications; 1998: p 35–52.
6. Apple DJ, Sims J. Harold Ridley and the invention of theintraocular lens. Surv Ophthalmol 1996;40:279–292.
7. Rosen E. History in the making. J Cataract Refract Surg1997;23:4–5.
8. Choyce P. Intraocular Lenses and Implants. London; H KLewis & Co. Ltd; 1964.
9. Apple DJ et al. Complications of intraocular lenses: A historicaland histopathological review. Surv Ophthalmol 1984;29: 1–54.
10. Javitt JC, et al. Outcomes of cataract extraction with multi-focal intraocular lens implantation. Functional status andquality of life. Ophthalmology 1997;104:589–599.
11. Strampeli B. Sopportabilità di lenti acrilichi in camera ante-riore nella afachia e nei vizi di refrazione. Ann Oftalmol ClinOcul 1954;80:75–82.
12. Barraquer J. Anterior chamber plastic lenses. Results andconclusions from five years experience. Trans Ophthalmol SocUK 1959;79:393–424.
13. Neuhann T, et al. Phakic intraocular lenses, J Refract Surg1998;14:272–279.
14. Baikoff G, Joly P. Correction chirurgicale de la myopie fortepar un implant de chambre anterior dans l’oeil phake. Bull SocBelge Ophthalmol 1989;233:109–125.
15. Baikoff G. Phakic anterior chamber intraocular lenses. IntOphthalmol Clin 1991;31:75–86.
16. Rosen ES, Haining WM, Arnott EJ editors. Intraocular LensImplantation. London, New York: Mosby; 1984.
17. Fyodorov SN, Durnev VV. Operation of dosaged dissection ofcorneal circular ligament in cases of myopia of mild degree.Ann Ophthalmol 1979;11:1885–1890.
18. Fyodorov SN, Zuev VK, Aznavayez VM. Intraokuliarnaiakorrektsia miopii vysokoi stepeni zadnekamernmi otritsate-limi linzami. Oftalmochirugia 1991;3:57–58.
19. Fechner PU, Alpar J. Iris Claw Lens or Lobster Claw Lens ofWorst; 1986.
20. Fechner P, Worst J. A New concave intraocular lens for thecorrection of myopia. Eur J Implant Refract Surg 1989;1:41–43.
21. Hoerauf H, Menz DH, Dresp J, Laqua H. Use of 044 as asolvent for silicone oil adhesions on intraocular lenses. JCataract Refract Surg 1999;25:1392–1396.
22. Ossipov A. Comparison of internal reflectance patterns of Colla-mer, acrylic and silicone. 1997. Data on file, STAAR Surgical.
23. Davis EA. Study of post-cataract surgery inflammation with 3different IOLs (Collamer, SI40NB, AR40). Summary of datafound in all patients. Presented at OSN Meeting: New York:October 2003.
24. Jia S, Wang X, Wang E. A study of suitable age for intraocular lensimplantation in children according to ocular anatomy and devel-opment, Zhonghua Yan Ke Za Zhi. 1996 Sept; 32(5): 336–338.
25. Zou Y, Chen M, Lin Z, Yang W, Li S. Effect of cataract surgeryon ocular axial length elongation in young children. Yan KeXue Bao 1998;14(1) : 17–20.
26. Flitcroft DI, Knight-Nanan D, Bowell R, Lanigan B, O’Keefe M.Intraocular lenses in children: changes in axial length, cornealcurvature, and refraction. Br J Ophthalmol 1999;83(3):265–269.
27. Kora Y, et al. Eye growth after cataract extraction and intrao-cular lens implantation inchildren.OphthalmicSurg 1993;24(7):467–475.
28. Pan Y, Tang P. Refraction shift after intraocular lens implanta-tion in children. Zhonghua Yan Ke Za Zhi 2001;37(5):328–331.
29. Welford W. Aberrations of Optical Systems. Bristol: AdamHilger; 1962.
30. Born M, Wolf E. The Diffraction Principles of Optics: Electro-magnetic Theory of Propagation, Interference, and Diffractionof Light, 6th ed. New York: Pergamon Press; 1989.
31. Hamam H. Aberrations and their impact on image quality.Wavefront Analysis, Aberrometers & Corneal Topography,Agarwal’s edition, 2003.
32. Castejon-Mochon JF, Lopez-Gil N, Benito A, Artal P. Ocularwave-front aberration statistics in a normal young population.Vision Res 2002;42(13):1611–1617.
33. Howland HC, Howland B. A subjective method for the mea-surement of monochromatic aberrations of the eye. J Opt SocAm 1977;67(11):1508–1518.
34. Porter J, Guirao A, Cox IG, Williams DR Monochromaticaberrations of the human eye in a large population. J OptSoc Am A Opt Image Sci Vis 2001;18(8):1793–1803.
35. Paquin MP, Hamam H, Simonet P, Objective measurement ofthe optical aberrations for myopic eyes, Opt Vis Sci 2002;79:285–291.
36. Thibos LN, Hong X, Bradley A, Cheng X. Statistical variationof aberration structure and image quality in a normal popula-tion of healthy eyes. J Opt Soc Am A 2002;19:2329–2348.
37. Françon M Vision dans un instrument entaché d’aberrationsphérique. Thèse, éditions de la Revue d’Optique, 1945.
38. Smith WJ Modern optical engineering, the design of opticalsystem. New York: Me Graw-Hill, 1990.
39. Maréchal A. Étude des effets combinés de la diffraction et desaberrations géométriques sur l’image d’un point lumineux.Revue d’Optique; 1947.
40. Hamam H, New metric for optical performance. Opt Vis Sci2003;80:175–184.
41. Marsack JD, Thibos LN, Applegate RA Metrics of opticalquality derived from wave aberrations predict visual perfor-mance. J Vis 2004;4(4):322–328.
42. Tognetto D, et al. Analysis of the optical quality of intraocularlenses. Inv. Ophthalmol & Vis Sci (IOVS) 2004;45/8:2682–2690.
43. Negishi K, Ohnuma K, Hirayama N, Noda T. Effect of chro-matic aberration on contrast sensitivity in pseudophakic eyes.Arch Ophthalmol 2001;119:1154–1158.
44. Matin RG. Higher-Order Aberrations and Symptoms withPseudophakia, Symposium on Cataract, IOL and RefractiveSurgery, April 12–16, 2003 San Francisco, CA.
45. Brunette I, et al. Optical quality of the eye with the artisanphakic lens for the correction of high myopia. Optomol Vis Sci2003 Feb; 80(2):167–174.
46. Liang J, Grimm B, Goelz S, Bille JF. Objective measurement ofwave aberrations of the human eye with the use of a Hart-mann-Shack wave-front sensor. JOSA A 1994;11:1949–1957.
47. Hamam H. An apparatus for the objective measurement ofocular image quality in clinical conditions. Opt Commun2000;173:23–36.
48. Hamam H, de Bougrenet JL. Efficiency of programmablequantized diffractive phase elements. Pure and Appl Opt1996;5:389–403.
49. Wilson K. New Technology Removes Cataract and ImprovesVision. Geriatr and Aging 1998;1: p 15.
50. Pieh S, et al. Quantitative performance of bifocal and multi-focal intraocular lenses in a model eye: Point spread function inmultifocal intraocular lenses. Arch-Ophthalmol. 2002;120(1):23–28.
51. Malacara D, Malacara Z. Handbook of Lens Design. New York;Marcel Dekker 1994.
52. Karpecki PM. The future of IOLs that accommodate. Rev OptDec 2002.
240 LENSES, INTRAOCULAR
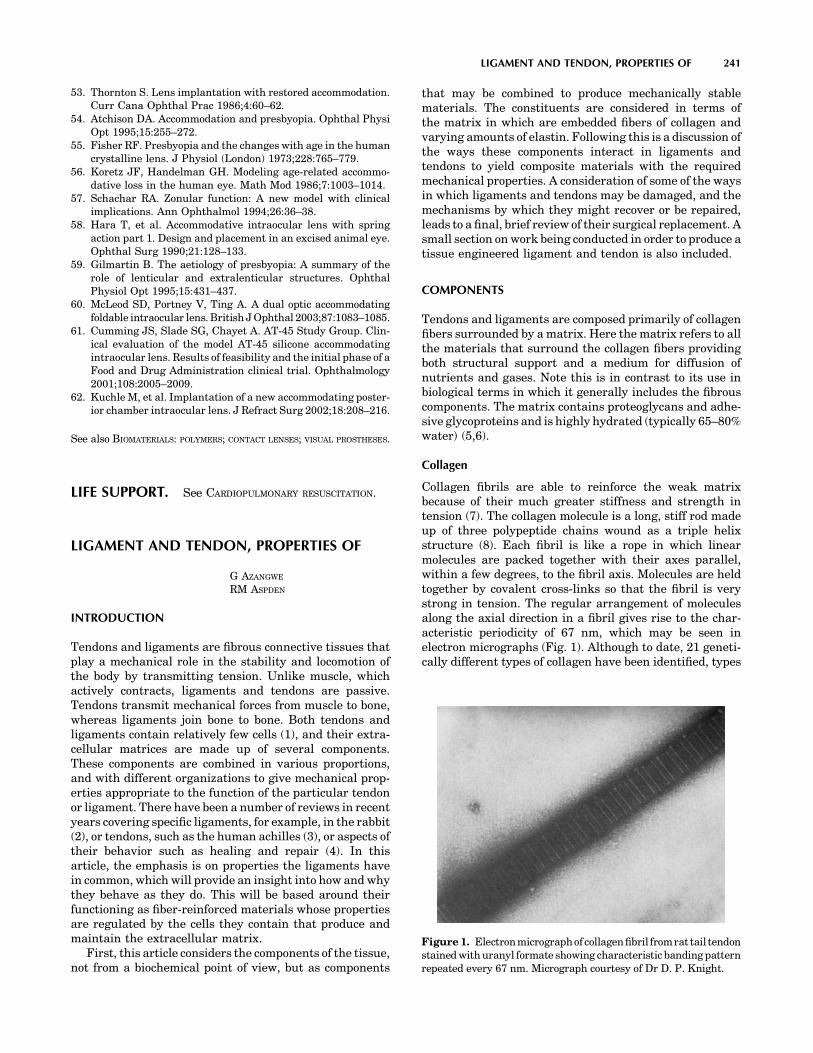
53. Thornton S. Lens implantation with restored accommodation.Curr Cana Ophthal Prac 1986;4:60–62.
54. Atchison DA. Accommodation and presbyopia. Ophthal PhysiOpt 1995;15:255–272.
55. Fisher RF. Presbyopia and the changes with age in the humancrystalline lens. J Physiol (London) 1973;228:765–779.
56. Koretz JF, Handelman GH. Modeling age-related accommo-dative loss in the human eye. Math Mod 1986;7:1003–1014.
57. Schachar RA. Zonular function: A new model with clinicalimplications. Ann Ophthalmol 1994;26:36–38.
58. Hara T, et al. Accommodative intraocular lens with springaction part 1. Design and placement in an excised animal eye.Ophthal Surg 1990;21:128–133.
59. Gilmartin B. The aetiology of presbyopia: A summary of therole of lenticular and extralenticular structures. OphthalPhysiol Opt 1995;15:431–437.
60. McLeod SD, Portney V, Ting A. A dual optic accommodatingfoldable intraocular lens. British J Ophthal 2003;87:1083–1085.
61. Cumming JS, Slade SG, Chayet A. AT-45 Study Group. Clin-ical evaluation of the model AT-45 silicone accommodatingintraocular lens. Results of feasibility and the initial phase of aFood and Drug Administration clinical trial. Ophthalmology2001;108:2005–2009.
62. Kuchle M, et al. Implantation of a new accommodating poster-ior chamber intraocular lens. J Refract Surg 2002;18:208–216.
See also BIOMATERIALS: POLYMERS; CONTACT LENSES; VISUAL PROSTHESES.
LIFE SUPPORT. See CARDIOPULMONARY RESUSCITATION.
LIGAMENT AND TENDON, PROPERTIES OF
G AZANGWE
RM ASPDEN
INTRODUCTION
Tendons and ligaments are fibrous connective tissues thatplay a mechanical role in the stability and locomotion ofthe body by transmitting tension. Unlike muscle, whichactively contracts, ligaments and tendons are passive.Tendons transmit mechanical forces from muscle to bone,whereas ligaments join bone to bone. Both tendons andligaments contain relatively few cells (1), and their extra-cellular matrices are made up of several components.These components are combined in various proportions,and with different organizations to give mechanical prop-erties appropriate to the function of the particular tendonor ligament. There have been a number of reviews in recentyears covering specific ligaments, for example, in the rabbit(2), or tendons, such as the human achilles (3), or aspects oftheir behavior such as healing and repair (4). In thisarticle, the emphasis is on properties the ligaments havein common, which will provide an insight into how and whythey behave as they do. This will be based around theirfunctioning as fiber-reinforced materials whose propertiesare regulated by the cells they contain that produce andmaintain the extracellular matrix.
First, this article considers the components of the tissue,not from a biochemical point of view, but as components
that may be combined to produce mechanically stablematerials. The constituents are considered in terms ofthe matrix in which are embedded fibers of collagen andvarying amounts of elastin. Following this is a discussion ofthe ways these components interact in ligaments andtendons to yield composite materials with the requiredmechanical properties. A consideration of some of the waysin which ligaments and tendons may be damaged, and themechanisms by which they might recover or be repaired,leads to a final, brief review of their surgical replacement. Asmall section on work being conducted in order to produce atissue engineered ligament and tendon is also included.
COMPONENTS
Tendons and ligaments are composed primarily of collagenfibers surrounded by a matrix. Here the matrix refers to allthe materials that surround the collagen fibers providingboth structural support and a medium for diffusion ofnutrients and gases. Note this is in contrast to its use inbiological terms in which it generally includes the fibrouscomponents. The matrix contains proteoglycans and adhe-sive glycoproteins and is highly hydrated (typically 65–80%water) (5,6).
Collagen
Collagen fibrils are able to reinforce the weak matrixbecause of their much greater stiffness and strength intension (7). The collagen molecule is a long, stiff rod madeup of three polypeptide chains wound as a triple helixstructure (8). Each fibril is like a rope in which linearmolecules are packed together with their axes parallel,within a few degrees, to the fibril axis. Molecules are heldtogether by covalent cross-links so that the fibril is verystrong in tension. The regular arrangement of moleculesalong the axial direction in a fibril gives rise to the char-acteristic periodicity of 67 nm, which may be seen inelectron micrographs (Fig. 1). Although to date, 21 geneti-cally different types of collagen have been identified, types
LIGAMENT AND TENDON, PROPERTIES OF 241
Figure 1. Electronmicrographof collagenfibril fromrat tail tendonstained with uranyl formate showing characteristic banding patternrepeated every 67 nm. Micrograph courtesy of Dr D. P. Knight.
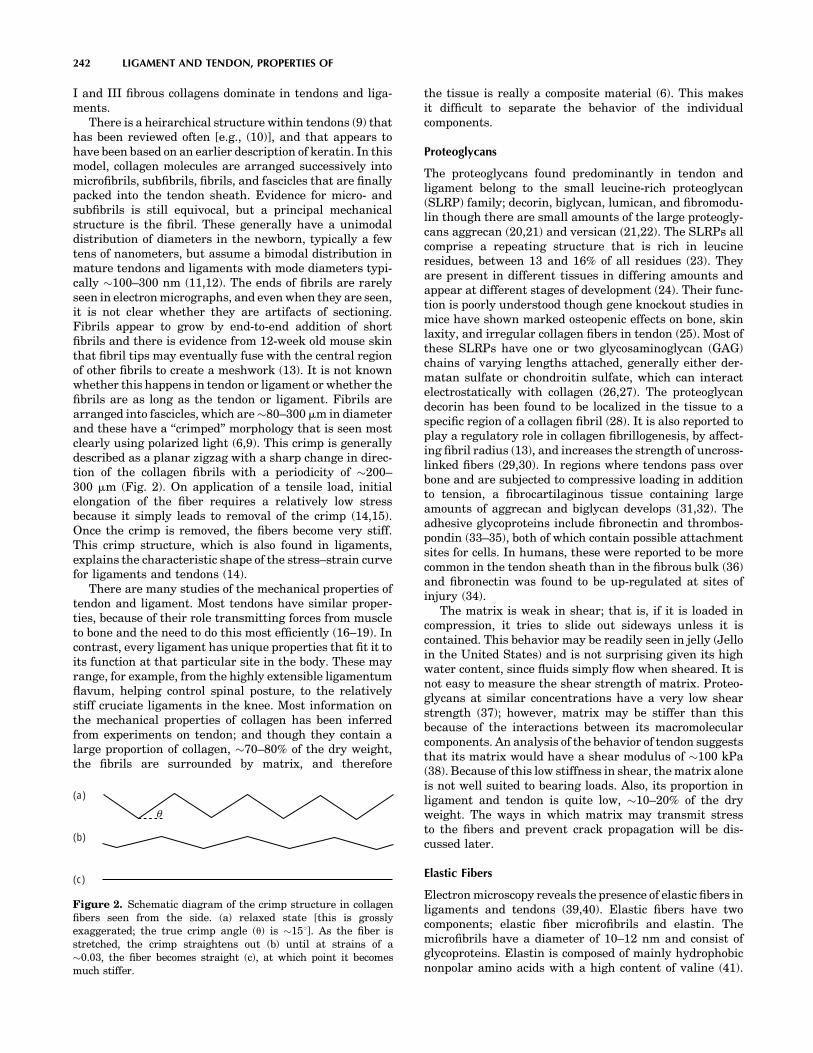
I and III fibrous collagens dominate in tendons and liga-ments.
There is a heirarchical structure within tendons (9) thathas been reviewed often [e.g., (10)], and that appears tohave been based on an earlier description of keratin. In thismodel, collagen molecules are arranged successively intomicrofibrils, subfibrils, fibrils, and fascicles that are finallypacked into the tendon sheath. Evidence for micro- andsubfibrils is still equivocal, but a principal mechanicalstructure is the fibril. These generally have a unimodaldistribution of diameters in the newborn, typically a fewtens of nanometers, but assume a bimodal distribution inmature tendons and ligaments with mode diameters typi-cally �100–300 nm (11,12). The ends of fibrils are rarelyseen in electron micrographs, and even when they are seen,it is not clear whether they are artifacts of sectioning.Fibrils appear to grow by end-to-end addition of shortfibrils and there is evidence from 12-week old mouse skinthat fibril tips may eventually fuse with the central regionof other fibrils to create a meshwork (13). It is not knownwhether this happens in tendon or ligament or whether thefibrils are as long as the tendon or ligament. Fibrils arearranged into fascicles, which are �80–300 mm in diameterand these have a ‘‘crimped’’ morphology that is seen mostclearly using polarized light (6,9). This crimp is generallydescribed as a planar zigzag with a sharp change in direc-tion of the collagen fibrils with a periodicity of �200–300 mm (Fig. 2). On application of a tensile load, initialelongation of the fiber requires a relatively low stressbecause it simply leads to removal of the crimp (14,15).Once the crimp is removed, the fibers become very stiff.This crimp structure, which is also found in ligaments,explains the characteristic shape of the stress–strain curvefor ligaments and tendons (14).
There are many studies of the mechanical properties oftendon and ligament. Most tendons have similar proper-ties, because of their role transmitting forces from muscleto bone and the need to do this most efficiently (16–19). Incontrast, every ligament has unique properties that fit it toits function at that particular site in the body. These mayrange, for example, from the highly extensible ligamentumflavum, helping control spinal posture, to the relativelystiff cruciate ligaments in the knee. Most information onthe mechanical properties of collagen has been inferredfrom experiments on tendon; and though they contain alarge proportion of collagen, �70–80% of the dry weight,the fibrils are surrounded by matrix, and therefore
the tissue is really a composite material (6). This makesit difficult to separate the behavior of the individualcomponents.
Proteoglycans
The proteoglycans found predominantly in tendon andligament belong to the small leucine-rich proteoglycan(SLRP) family; decorin, biglycan, lumican, and fibromodu-lin though there are small amounts of the large proteogly-cans aggrecan (20,21) and versican (21,22). The SLRPs allcomprise a repeating structure that is rich in leucineresidues, between 13 and 16% of all residues (23). Theyare present in different tissues in differing amounts andappear at different stages of development (24). Their func-tion is poorly understood though gene knockout studies inmice have shown marked osteopenic effects on bone, skinlaxity, and irregular collagen fibers in tendon (25). Most ofthese SLRPs have one or two glycosaminoglycan (GAG)chains of varying lengths attached, generally either der-matan sulfate or chondroitin sulfate, which can interactelectrostatically with collagen (26,27). The proteoglycandecorin has been found to be localized in the tissue to aspecific region of a collagen fibril (28). It is also reported toplay a regulatory role in collagen fibrillogenesis, by affect-ing fibril radius (13), and increases the strength of uncross-linked fibers (29,30). In regions where tendons pass overbone and are subjected to compressive loading in additionto tension, a fibrocartilaginous tissue containing largeamounts of aggrecan and biglycan develops (31,32). Theadhesive glycoproteins include fibronectin and thrombos-pondin (33–35), both of which contain possible attachmentsites for cells. In humans, these were reported to be morecommon in the tendon sheath than in the fibrous bulk (36)and fibronectin was found to be up-regulated at sites ofinjury (34).
The matrix is weak in shear; that is, if it is loaded incompression, it tries to slide out sideways unless it iscontained. This behavior may be readily seen in jelly (Jelloin the United States) and is not surprising given its highwater content, since fluids simply flow when sheared. It isnot easy to measure the shear strength of matrix. Proteo-glycans at similar concentrations have a very low shearstrength (37); however, matrix may be stiffer than thisbecause of the interactions between its macromolecularcomponents. An analysis of the behavior of tendon suggeststhat its matrix would have a shear modulus of �100 kPa(38). Because of this low stiffness in shear, the matrix aloneis not well suited to bearing loads. Also, its proportion inligament and tendon is quite low, �10–20% of the dryweight. The ways in which matrix may transmit stressto the fibers and prevent crack propagation will be dis-cussed later.
Elastic Fibers
Electron microscopy reveals the presence of elastic fibers inligaments and tendons (39,40). Elastic fibers have twocomponents; elastic fiber microfibrils and elastin. Themicrofibrils have a diameter of 10–12 nm and consist ofglycoproteins. Elastin is composed of mainly hydrophobicnonpolar amino acids with a high content of valine (41).
242 LIGAMENT AND TENDON, PROPERTIES OF
(a)
(b)
(c)
θ
Figure 2. Schematic diagram of the crimp structure in collagenfibers seen from the side. (a) relaxed state [this is grosslyexaggerated; the true crimp angle (u) is �158]. As the fiber isstretched, the crimp straightens out (b) until at strains of a�0.03, the fiber becomes straight (c), at which point it becomesmuch stiffer.

Elastic fibers are highly extensible, they do not creep andtheir extension is reversible at high strains. Their mechan-ical properties are thus very different from collagen. Mostof our knowledge of elastic fibers comes from experimentson ligamentum nuchae, a ligament from the cervical spine,which contains �70% elastin by dry weight (42). Elastinclosely resembles a rubber in many respects and itsmechanical properties are certainly very similar (43). Pur-ified samples of ligamentum nuchae will extend to roughlytwice their resting length before breaking.
The extensibility of a tendon or ligament depend in parton the elastin content of the tissue. Ligamentum flavum,from the spine, which may typically be strained to �50%contains roughly 70% elastin, by dry weight (44), whereastendon, which works at strains <4% contains only 2%elastic fibers by dry weight (1). It is fairly easy to seewhy highly extensible tissues have a high proportion ofelastin, but not quite as easy to explain the presence ofelastic fibers in a relatively inextensible tissue such astendon. A clue is provided by some synthetic fibrous com-posite materials that contain two different kinds of fiber(45). Here a small proportion of strong, low stiffness fibersadded to the composite produces a material that is lesssusceptible to failure under sudden application of load thanone that contains only stiff fibers; that is, it makes thematerial less brittle. It may be that the small proportion ofelastic fibers in tendon provide some protection against thesudden application of load that may occur, for example, ifan animal is startled.
Fiber–Matrix Interactions
The combination of strong fibers in a weak matrix leads tomaterials that are less susceptible to mechanical damagewhile maintaining a high proportion of the strength of thefibers. In particular, they are less susceptible to suddenfailure than a homogeneous material would be; a propertycalled ‘‘toughness’’ (46). This composite nature has beenrecognized for many years (6) and provides a theoreticalframework for understanding the properties of the tissues.It also enables some useful comparisons to be madebetween relatively simple synthetic composites and biolo-gical tissues in which the complexities of composition andstructure make modeling very difficult. The aim is to obtainan understanding of how the similarities in the tissues,fibers in a matrix, enable them to function in general termsbefore considering the differences (in composition, andorganization), which give them their specific properties.The function of collagen fibrils and fibers in such a compo-site is to withstand axial tension, since, like any rope, theyhave little resistance compression and flexion (7). As thetissue is stretched the matrix will try to flow and this willexert a shear force along the surface of the collagen fiberstending to stretch and orient them (7,47). This lengthincrease, which is normally expressed as a fraction ofthe original length and is then termed ‘‘strain’’, leads toa restoring force in the fiber that balances the applied force.The behavior is rather like a loaded spring that stretches toenable it to bear load, but returns to its relaxed length onremoving the load. Similarly, collagen fibers are able toreinforce a tissue if they are oriented so that an applied
load tends to stretch them. The nature of the shear forceexerted by the gel is unknown, but two simple models,those of elastic and plastic (or frictional) stress transfer,have been used to investigate stresses in the fibers and theforce that has to be generated at the fiber surface to enablethem to function in this way (47–49). Fibers that areshorter than the tissue are still able to provide reinforce-ment (50). Some fibrils observed in tissues (51) and thosegrown in vitro (52,53) appear to be tapered, rather thanhaving a uniform radius. Analytical and finite elementmodels of idealized single-fiber composites have shownthat tapered fibers have two distinct advantages over uni-form fibers: the axial stresses within the fiber are moreuniformly distributed and they contain a much smalleramount of material, though their effectiveness at reinfor-cing is just as great. A more uniform stress within the fibermeans more of the fiber is carrying a significant stress, thusmaking better use of the fiber, and avoids the generation ofstress concentrations that are potentially damaging andcould lead to fiber fracture. In addition, the volume ofmaterial in a cone, for example, is only one-third of thatin a straight cylinder and, therefore, a tapered fiber incursa far smaller metabolic cost by the cells to produce it. Instraight-cylindrical fibers it has been calculated that inter-actions at the fiber surface do not have to be great in orderto load fully the fiber. In tendon, assuming conservativelyonly one interaction per 67 nm D-period, it was estimatedthat fiber–matrix interaction forces of the order of only 10pN was sufficient to load fully the fiber (47). These forcesare similar in magnitude to van der Waals forces or hydro-gen bonds. This suggests that permanent bonds or covalentinteractions between fiber and matrix are not essential forthe mechanical functioning of the tissue though, of course,it does not preclude them. Regulating the interactionbetween fibers and matrix is clearly important in thismodel of how the tissues function and decorin, as describedabove, is a prime candidate for a role in this. Changes in theconcentration and orientation of collagen and its interac-tions with the matrix have been used to explain the dra-matic changes in a similar fibrous tissue, the uterinecervix, that occur during parturition (54). The presenceof the matrix around the collagen fibrils is also importantwhen it comes to preventing crack propagation. This will beconsidered in more detail in the context of the tissuesthemselves.
LIGAMENT
Ligaments are short bands of tough, but flexible, fibrousconnective tissue that bind bones together and guide jointmotion, or support organs in place. The word ligament isderived from the Latin word ‘‘ligare,’’ which means to bind.Generally, ligaments can be classified into two major sub-groups. There are those connecting the elements of theskeletal system (usually crossing joints) and those connect-ing other soft tissues, such as the suspensory ligaments inthe abdomen. This section only considers skeletal liga-ments. The main function of the skeletal ligaments, suchas the anterior cruciate ligament (ACL) of the knee joint, isto stabilize and control normal kinematics, to prevent
LIGAMENT AND TENDON, PROPERTIES OF 243

abnormal displacements and rotation that may damage thearticular surfaces (2,55). At the insertion to bone, theligaments change from flexible ligamentous tissue to rigidbone, mediated by a transitional zone of fibrocartilage andmineralized cartilage. This helps to prevent stress concen-tration at the attachment site by allowing gradual changein stiffness (56,57).
Similar to tendon, ligaments are primarily composed ofcollagen embedded in a weak matrix (7). The collagenmolecules in ligaments pack together to form fibrils andthe fibrils aggregate into larger fibrous bundles (2). Asdescribed previously, the function of collagen fibrils is toprovide tensile reinforcing for the matrix. The proportion offibers within the ligamentous structure and the orientationof the collagen fibers are the main factors that govern themechanical behavior of the tissue (7). In contrast to tendon,there is commonly less collagen, which is less highlyoriented than in tendon, conferring a generally greaterextensibility to these tissues.
The collagen fibrils also prevent damaged tissues fromfailing suddenly. For example, most ligaments do not tearstraight across when they are damaged (Fig. 3). Instead,small tears in the matrix are diverted when they encounterthe strong collagen fibrils (see below on failure). There isthen a possibility that a damaged ligament can heal while,in the meantime, retaining the ability to withstand someload. Some ligaments, however, (e.g., the ACL), have alimited ability to heal when ruptured and this meansthat it often needs to be replaced or reconstructed whenruptured. A brief summary of different options availablefor treating ruptured ligaments will be presented in alater section.
Unlike tendons that all have very similar composition,structure, and function, the same cannot be said of liga-ments, and it is far harder to make general commentsabout their properties. Much less is known, too, aboutthe relationship between their structures and functionsas the arrangements of their collagen fibrils are morecomplex than those in tendons (58,59). This greater com-plexity is understandable when it is realized that thefunction of a ligament is very dependent on its positionin the body; for example, the medial collateral ligament inthe knee of a sheep operates at strains of �0.02 (60),
whereas the ligamentum flavum of the human spine oper-ates at strains of up to 0.6. Figure 4 shows that ligamentumflavum is much less stiff than tendon.
It is not surprising that some ligaments contain a highproportion of elastin (�60–70% of the dry weight), whichenables them to withstand the high strains to which theyare subjected without fracture (61). Ligaments are viscoe-lastic, that is their properties are time dependent and theyappear stiffer if stretched more rapidly. These ligamentsexhibit hysteresis, that is, they lose energy on being takenthrough a cycle of stretching and relaxing. Tkaczuk (61)published a detailed account of the mechanical propertiesof longitudinal ligaments from the human spine. Thesedeform elastically up to strains of �0.25, when the stress is�5 MPa, and rupture at a stress of �20 MPa. Shahet al.(62) also showed that, like tendons, the collagen fibersare crimped and this crimp disappears at strains of �1.2–2.8% depending on the ligament. When ligaments are cutfrom the joint, they can often be seen to contract rapidly,suggesting that they are held in a state of tension evenwhen the joint is in a relaxed state.
244 LIGAMENT AND TENDON, PROPERTIES OF
Figure 3. (a) Video image showing a ligamentfailing under tensile strain. (b) A schematic diagramshowing a longitudinal section through a fiber com-posite illustrating how a weak matrix prevents crackpropagationfromonefibertoanotheranddissipatesitsenergy by creating cracks in directions other thanacross the composite.
1.00.80.60.40.200
20
40
60
80
100
For
ce (
N)
Tendon
Strain
Ligamentumflavum
Figure 4. Comparison of force–strain curves obtained forextension of tendon and ligamentum flavum.
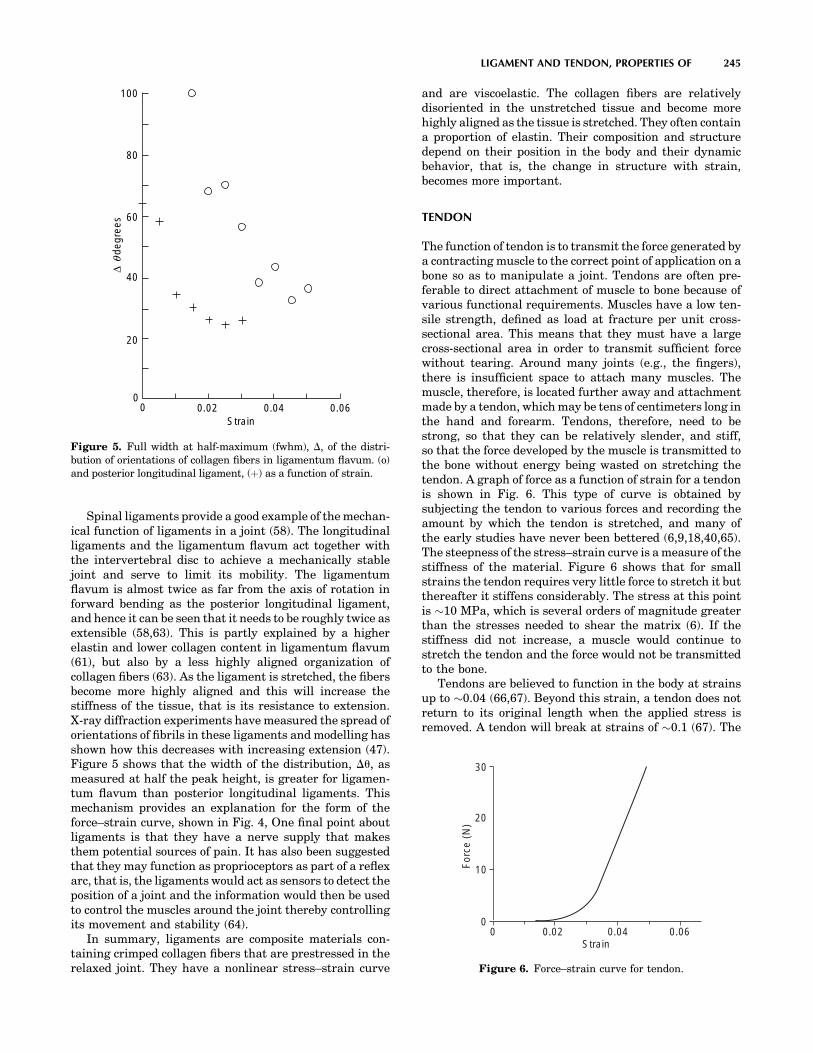
Spinal ligaments provide a good example of the mechan-ical function of ligaments in a joint (58). The longitudinalligaments and the ligamentum flavum act together withthe intervertebral disc to achieve a mechanically stablejoint and serve to limit its mobility. The ligamentumflavum is almost twice as far from the axis of rotation inforward bending as the posterior longitudinal ligament,and hence it can be seen that it needs to be roughly twice asextensible (58,63). This is partly explained by a higherelastin and lower collagen content in ligamentum flavum(61), but also by a less highly aligned organization ofcollagen fibers (63). As the ligament is stretched, the fibersbecome more highly aligned and this will increase thestiffness of the tissue, that is its resistance to extension.X-ray diffraction experiments have measured the spread oforientations of fibrils in these ligaments and modelling hasshown how this decreases with increasing extension (47).Figure 5 shows that the width of the distribution, Du, asmeasured at half the peak height, is greater for ligamen-tum flavum than posterior longitudinal ligaments. Thismechanism provides an explanation for the form of theforce–strain curve, shown in Fig. 4, One final point aboutligaments is that they have a nerve supply that makesthem potential sources of pain. It has also been suggestedthat they may function as proprioceptors as part of a reflexarc, that is, the ligaments would act as sensors to detect theposition of a joint and the information would then be usedto control the muscles around the joint thereby controllingits movement and stability (64).
In summary, ligaments are composite materials con-taining crimped collagen fibers that are prestressed in therelaxed joint. They have a nonlinear stress–strain curve
and are viscoelastic. The collagen fibers are relativelydisoriented in the unstretched tissue and become morehighly aligned as the tissue is stretched. They often containa proportion of elastin. Their composition and structuredepend on their position in the body and their dynamicbehavior, that is, the change in structure with strain,becomes more important.
TENDON
The function of tendon is to transmit the force generated bya contracting muscle to the correct point of application on abone so as to manipulate a joint. Tendons are often pre-ferable to direct attachment of muscle to bone because ofvarious functional requirements. Muscles have a low ten-sile strength, defined as load at fracture per unit cross-sectional area. This means that they must have a largecross-sectional area in order to transmit sufficient forcewithout tearing. Around many joints (e.g., the fingers),there is insufficient space to attach many muscles. Themuscle, therefore, is located further away and attachmentmade by a tendon, which may be tens of centimeters long inthe hand and forearm. Tendons, therefore, need to bestrong, so that they can be relatively slender, and stiff,so that the force developed by the muscle is transmitted tothe bone without energy being wasted on stretching thetendon. A graph of force as a function of strain for a tendonis shown in Fig. 6. This type of curve is obtained bysubjecting the tendon to various forces and recording theamount by which the tendon is stretched, and many ofthe early studies have never been bettered (6,9,18,40,65).The steepness of the stress–strain curve is a measure of thestiffness of the material. Figure 6 shows that for smallstrains the tendon requires very little force to stretch it butthereafter it stiffens considerably. The stress at this pointis �10 MPa, which is several orders of magnitude greaterthan the stresses needed to shear the matrix (6). If thestiffness did not increase, a muscle would continue tostretch the tendon and the force would not be transmittedto the bone.
Tendons are believed to function in the body at strainsup to �0.04 (66,67). Beyond this strain, a tendon does notreturn to its original length when the applied stress isremoved. A tendon will break at strains of �0.1 (67). The
LIGAMENT AND TENDON, PROPERTIES OF 245
100
60
80
40
20
00 0.02 0.04 0.06
Strain
∆
degr
ees
θ
Figure 5. Full width at half-maximum (fwhm), D, of the distri-bution of orientations of collagen fibers in ligamentum flavum. (o)and posterior longitudinal ligament, (þ) as a function of strain.
00
0.02 0.04 0.06Strain
10
20
30
For
ce (
N)
Figure 6. Force–strain curve for tendon.

initial stages of tendon extension involve straightening thecrimp of the collagen fibers described previously.
The energy stored in the stretched tendon is given by thearea under the stress–strain curve, as shown in Fig. 7, andit is this energy that must be used to create a tear in thetissue. This energy is lower in a material with a J-shapedstress–strain relationship than if, for example, it werelinear. Minimizing the energy available to cause a fracturein this way gives the tissue a property known as resilience,that is, a tendon does not suddenly fail if it is overloaded—unlike a steel wire. While the crimped collagen fibers arebeing straightened, the weak matrix must be sheared.Because of the fluid-like nature of the matrix, it tends toflow. The rate of flow depends on the force applied to it andthe amount of flow is greater the longer the force is applied.The result is that tendons are ‘‘viscoelastic’’ (18,38,68). Theeffect of the rate at which force is applied to the tendon isshown in Fig. 8.
This time dependence of mechanical behavior leads to aphenomenon known as ‘‘creep’’. For example, when a loadof 10 N was applied to a human flexor digitorum tendon,the initial strain was 0.015, but 100 s later under the sameload, the strain had increased to 0.016 (69). Thus, if a
tendon is stretched rapidly, the matrix has less chanceto flow and creep in the material is less resulting in thetendon being stiffer as shown in Fig. 8. Viscous flow of thematrix also provides a mechanism for dissipating energy;more work is done in stretching a tendon than is recoveredwhen the tendon is allowed to relax. This phenomenon isknown as hysteresis and is illustrated in Fig. 9. The beha-vior of a tendon is therefore intermediate between that ofa steel wire that stores all the energy used to stretch it, and aviscous liquid that simply flows to a new position and doesnot store any of the energy put in to cause it to flow.
MEASURING THE PROPERTIES OF LIGAMENTSAND TENDONS
To quantify the physical properties of ligaments and ten-dons, mechanical testing of bone–ligament/tendon–bonecomplexes is often performed (70–73). That this methodis often used is partly due to the difficulty in testingisolated ligaments and tendons. Ideally, testing isolatedligaments and tendons would provide measures of thematerial properties of the tissue alone, but such testsare complicated by difficulties in effectively securing thecut ends (2). Putting the free ends in clamps often results instress concentrations at the grips, which may contribute topremature failure. Although the use of bone–ligament/tendon–bone complexes still provides more secure clamp-ing, it also increases the difficulty of separating the proper-ties of the ligament from those of the insertion sites. Whensuch complexes are subjected to tensile loading, the result-ing load-displacement curve represents the mechanicalproperties of the bone–ligament/tendon–bone complex aswhole rather than specifically about the material thatmakes up the ligament or tendon.
In order to obtain the material properties of the liga-ments, one needs to measure their length (to calculatestrain from deformation divided by original length) andcross-sectional area (to calculate stress from applied forcedivided by original area). From stress–strain curves mate-rial properties such as Young’s modulus (slope of stress–strain curve), maximum stress, maximum strain, andenergy density (area under stress–strain curve) can be
246 LIGAMENT AND TENDON, PROPERTIES OF
Strain
Str
ess
Figure 7. Schematic of stress–strain showing energy stored in astretched tendon.
0 0.02 0.04 0.06Strain
Str
ess
Figure 8. Schematic stress–strain curves for tendon to show theeffects of different loading rates. These curves correspond to slowloading (continuous curve) and rapid loading (dashed curve).
Strain
stre
ss
Figure 9. Stress–strain curves for tendon that is stretched(continuous curve) and then relaxed (dashed curve), showinghysteresis; that is, not as much energy is recovered on relaxingas was initially used to stretch the tissue.

determined. Special devices such as buckle transducers(74) and Hall-effect displacement transducers (75) havebeen used to measure ligament strains during testing. Thedrawback of such devices is that they rely on direct contactwith the tissue sample and that may influence the results.Optical analysers have also been employed as a noncontactmethod to measure ligament strains (2). However, inac-curacies may occur because the irregular dye blobs used asmarkers change shape on stretching making it difficult todefine unique points. Another technique that has beenemployed to measure strain is the use of video dimensionanalyser (VDA) (76,77). This method requires no directcontact with the specimen, but relies on a recorded videoimage.
The irregular and complex shape and geometry of liga-ments and tendons also make it difficult to measure theircross-sectional area. Although flexible callipers, which areable to follow contours better, have been used to measureligament cross-sectional areas (2), they still require con-tact, and this results in errors in measurements. Otherinvestigators have calculated the cross-sectional area of aknown length of ligament from measurements of its den-sity by floatation in a mixture of xylene and carbon tetra-chloride (78). A number of noncontact methods, such as theuse of a rotating microscope (79), use of the VDA (80) andthe laser micrometer (81) have also been employed tomeasure the cross-sectional area.
When mechanical properties of ligaments and tendonsare being determined, it is important to consider the rate atwhich they are loaded since they are viscoelastic, that is,their mechanical properties depend on the rate at whichthey are deformed (82–86). This sensitivity to strain ratemeans that ligaments and tendons exhibit properties ofstress relaxation (decreased stress with time under con-stant deformation) and creep (increased deformation withtime under constant load) (87,88).
Because of the complex geometry of tendons and liga-ments, the orientation of the specimens during mechan-ical testing affects their physical properties and themanner in which they fail, and should therefore be takeninto account when performing mechanical tests. Torsionhas been implicated as a factor in the rupture of the ACLduring sporting injuries (89–91). Cyclic loading has alsobeen found to lower the yield point or soften the ligamentby increasing its compliance (decrease the slope of thelinear region of the stress–strain curve) (55). Azangweet al. (92) showed that, when combined, tension–torsionloading affects both structural and mechanical propertiesof anterior cruciate ligaments.
LIGAMENT AND TENDON FAILURE MECHANISMS
Since ligaments and tendons consist of collagen fibersreinforcing a weak matrix, it is reasonable to comparetheir behavior under tensile loading with that of syntheticfiber-reinforced composites, since their failure mechan-isms are well established. This section describes someof the modes of failure of fiber-reinforced compositesand how they are related to those of the ligaments andtendons. Detailed accounts of failure modes of synthetic
fiber-reinforced composites can be found in textbooks, forexample, Agarwal and Broutman (45), and Kelly andMacmillan (50). When a material is subjected to any kindof loading, it can absorb energy by two basic mechanisms:
1. Material deformation.
2. Creation of new surfaces.
Material deformation occurs whenever a material is sub-jected to load. However, if the energy supplied is suffi-ciently large, cracks may be initiated. Whether theypropagate depends on the relative amounts of energyrequired to create new surfaces compared with that storedin the deformed matrix. For brittle materials such as glass,the energy required to create a new fracture surface issmall and though only a small amount of deformation takesplace, this is elastic and the associated energy is sufficientto propagate the crack. This means that brittle materialshave a low energy-absorption capability. On the otherhand, for ductile materials, large plastic deformationsoccur, which dissipate energy, resulting in large energiesbeing absorbed rather than being available to drive afracture. This finding shows that the total energy-absorb-ing capability or ‘‘toughness’’ of a material can be enhancedby increasing either the length of the path of the crackduring separation or the material-deformation capability.In metals, the latter mechanism frequently occurs andmetallurgical processes are developed to maintain ducti-lity. In composites, replacing low energy-absorbing consti-tuents with greater energy-absorbing constituents canenhance the toughness.
As is the case with many materials, failure in a fiber-reinforced composite emanates from small inherent defectsin the material. Several failure events may occur duringthe fracture of a fiber reinforced composite material,such as,
1. Microcracking of the matrix.
2. Separation of fibers from the matrix (debonding andpull-out).
3. Breaking of fibers,
Forcing a crack to take a longer path is the main mechanismencountered in fiber composites to increase toughness. Infibrous materials, when a matrix crack encounters a strongfiber placed perpendicular to the direction of crack propaga-tion, if the crack cannot cross the fiber because it is toostrong, the crack is forced to branch to run parallel with thefiber (Fig. 10). If the crack goes right around the fiber, thismay result in fiber debonding, and pull-out, that is, becom-ing detached from the matrix and pulled out leaving fiberends showing as the material is stretched. In many casesthe surface area produced by secondary cracks is muchlarger than the area of the primary cracks. This mayincrease the fracture energy many times and is an effectiveway of increasing the toughness of composites or the totalenergy absorbed during fracture. Fibers may eventuallyfracture when their strength is exceeded. For mostsynthetic fiber-reinforced composites, fibers are separatedby matrix and therefore are unable to pass energy directly
LIGAMENT AND TENDON, PROPERTIES OF 247
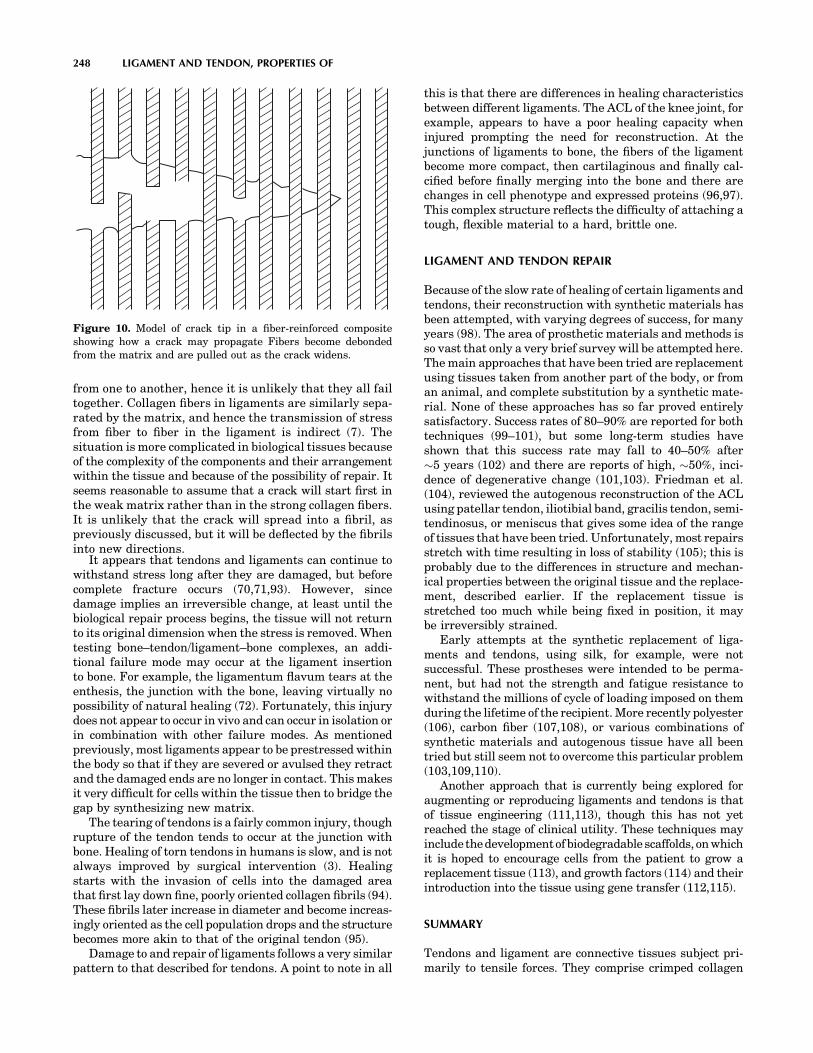
from one to another, hence it is unlikely that they all failtogether. Collagen fibers in ligaments are similarly sepa-rated by the matrix, and hence the transmission of stressfrom fiber to fiber in the ligament is indirect (7). Thesituation is more complicated in biological tissues becauseof the complexity of the components and their arrangementwithin the tissue and because of the possibility of repair. Itseems reasonable to assume that a crack will start first inthe weak matrix rather than in the strong collagen fibers.It is unlikely that the crack will spread into a fibril, aspreviously discussed, but it will be deflected by the fibrilsinto new directions.
It appears that tendons and ligaments can continue towithstand stress long after they are damaged, but beforecomplete fracture occurs (70,71,93). However, sincedamage implies an irreversible change, at least until thebiological repair process begins, the tissue will not returnto its original dimension when the stress is removed. Whentesting bone–tendon/ligament–bone complexes, an addi-tional failure mode may occur at the ligament insertionto bone. For example, the ligamentum flavum tears at theenthesis, the junction with the bone, leaving virtually nopossibility of natural healing (72). Fortunately, this injurydoes not appear to occur in vivo and can occur in isolation orin combination with other failure modes. As mentionedpreviously, most ligaments appear to be prestressed withinthe body so that if they are severed or avulsed they retractand the damaged ends are no longer in contact. This makesit very difficult for cells within the tissue then to bridge thegap by synthesizing new matrix.
The tearing of tendons is a fairly common injury, thoughrupture of the tendon tends to occur at the junction withbone. Healing of torn tendons in humans is slow, and is notalways improved by surgical intervention (3). Healingstarts with the invasion of cells into the damaged areathat first lay down fine, poorly oriented collagen fibrils (94).These fibrils later increase in diameter and become increas-ingly oriented as the cell population drops and the structurebecomes more akin to that of the original tendon (95).
Damage to and repair of ligaments follows a very similarpattern to that described for tendons. A point to note in all
this is that there are differences in healing characteristicsbetween different ligaments. The ACL of the knee joint, forexample, appears to have a poor healing capacity wheninjured prompting the need for reconstruction. At thejunctions of ligaments to bone, the fibers of the ligamentbecome more compact, then cartilaginous and finally cal-cified before finally merging into the bone and there arechanges in cell phenotype and expressed proteins (96,97).This complex structure reflects the difficulty of attaching atough, flexible material to a hard, brittle one.
LIGAMENT AND TENDON REPAIR
Because of the slow rate of healing of certain ligaments andtendons, their reconstruction with synthetic materials hasbeen attempted, with varying degrees of success, for manyyears (98). The area of prosthetic materials and methods isso vast that only a very brief survey will be attempted here.The main approaches that have been tried are replacementusing tissues taken from another part of the body, or froman animal, and complete substitution by a synthetic mate-rial. None of these approaches has so far proved entirelysatisfactory. Success rates of 80–90% are reported for bothtechniques (99–101), but some long-term studies haveshown that this success rate may fall to 40–50% after�5 years (102) and there are reports of high, �50%, inci-dence of degenerative change (101,103). Friedman et al.(104), reviewed the autogenous reconstruction of the ACLusing patellar tendon, iliotibial band, gracilis tendon, semi-tendinosus, or meniscus that gives some idea of the rangeof tissues that have been tried. Unfortunately, most repairsstretch with time resulting in loss of stability (105); this isprobably due to the differences in structure and mechan-ical properties between the original tissue and the replace-ment, described earlier. If the replacement tissue isstretched too much while being fixed in position, it maybe irreversibly strained.
Early attempts at the synthetic replacement of liga-ments and tendons, using silk, for example, were notsuccessful. These prostheses were intended to be perma-nent, but had not the strength and fatigue resistance towithstand the millions of cycle of loading imposed on themduring the lifetime of the recipient. More recently polyester(106), carbon fiber (107,108), or various combinations ofsynthetic materials and autogenous tissue have all beentried but still seem not to overcome this particular problem(103,109,110).
Another approach that is currently being explored foraugmenting or reproducing ligaments and tendons is thatof tissue engineering (111,113), though this has not yetreached the stage of clinical utility. These techniques mayinclude the developmentof biodegradable scaffolds, on whichit is hoped to encourage cells from the patient to grow areplacement tissue (113), and growth factors (114) and theirintroduction into the tissue using gene transfer (112,115).
SUMMARY
Tendons and ligament are connective tissues subject pri-marily to tensile forces. They comprise crimped collagen
248 LIGAMENT AND TENDON, PROPERTIES OF
Figure 10. Model of crack tip in a fiber-reinforced compositeshowing how a crack may propagate Fibers become debondedfrom the matrix and are pulled out as the crack widens.

fibrils and some elastin embedded in a weak matrix. Col-lagen fibers in tendon, composed of bundles of fibrils, arehighly aligned along the direction of applied force. Theinitial structural response to the application of force isstraightening of the crimp, which occurs at a strain of�2%, after which the tendon stiffens considerably. Higherstrains are not immediately reversibly and may lead tostructural damage to the tissue. The function of the crimpappears to be to minimize the energy stored in thestretched tissue thus reducing the energy available tocause fracture. Many ligaments can be stretched morethan tendons, because of their more complex collagen fibrilorganization and, sometimes, the high proportion of elastinpresent. Tendons and ligaments are viscoelastic; they donot store all the energy used to stretch them, their responseto load depends on the rate at which it is applied, and theycontinue to deform even if the applied load remains con-stant. Because a lot of energy is required to produce a largefracture surface, they do not break easily, that is, they aretough materials. Because some ligaments do not heal wellwhen injured, there is a need to replace them. However,success in this area is still limited. Future replacementsmay include tissue engineered ligaments.
ACKNOWLEDGMENTS
We thank Professor D.W.L. Hukins for valuable discus-sions over many years and the many other colleagues whohave contributed to some of the work we have describedhere. We also thank the Medical Research Council, theEngineering and Physical Sciences Research Council, andthe Arthritis Research Campaign for financial support.
BIBLIOGRAPHY
1. Fank CB, Shrive NG. Ligament. In: Nigg BM, Herzog W,editors. Biomechanics of the Musculo-Skeletal System. Chi-chester: J Wiley; 1999.
2. Frank CB, Hart DA, Shrive NG. Molecular biology andbiomechanics of normal and healing ligaments—a review.Osteoarthritis Cartilage 1999;7:130–140.
3. Maffulli N. Rupture of the Achilles tendon. J Bone Joint Surg1999;81-A:1019–1036.
4. Woo SL, Debski RE, Zeminski J, Abramowitch SD, Saw SS,Fenwick JA. Injury and repair of ligaments and tendons.Annu Rev Biomed Eng 2000;2:83–118.
5. Nachemson AL, Evans JH. Some mechanical properties of thethird human lumbar interlaminar ligament (ligamentumflavum). J Biomech 1968;1:211–220.
6. Elliott DH. Structure and function of mammalian tendon.Biol Rev 1965;40:392–421.
7. Hukins DWL, Aspden RM. Composition and properties ofconnective tissues. Trends Biochem Sci 1985;10:260–264.
8. Brodsky B, Ramshaw JA. The collagen triple-helix structure(Review). Matrix Biol 1997;15:545–554.
9. Kastelic J, Galeski A, Baer E. The multicomposite structureof tendon. Connect Tissue Res 1978;6:11–23.
10. Vincent JFV. Structural Biomaterials Princeton. 2nd ed.New Jersey: Princeton University Press; 1990.
11. Parry DA, Barnes GR, Craig AS. A comparison of the sizedistribution of collagen fibrils in connective tissues as afunction of age and a possible relation between fibril size
distribution and mechanical properties. Proc R Soc LondonSer B Biol Sci 1978;203:305–321.
12. Patterson-Kane JC, Wilson AM, Firth EC, Parry DA, Good-ship AE. Comparison of collagen fibril populations in thesuperficial digital flexor tendons of exercised and nonexer-cised thoroughbreds. Equine Vet J 1997;29:121–125.
13. Kadler KE, Holmes DF, Graham H, Starborg T. Tip-mediatedfusion involving unipolar collagen fibrils accounts for rapidfibril elongation, the occurrence of fibrillar branched net-works in skin and the paucity of collagen fibril ends invertebrates. Matrix Biol 2000;19:359–365.
14. Buckley CP, Lloyd DW, Konopasek M. On the Deformation ofSlender Filaments with Planar Crimp: Theory, NumericalSolution and Applications to Tendon Collagen and TextileMaterials. Proc R Soc London Ser A, Math Phys Sci 1980;372:33–64.
15. Diamant J, Keller A, Baer E, Litt M, Arridge RGC. Ultra-structure of collagen as a function of ageing. Proc R SocLondon Ser B Biol Sci 1972;180:293–312.
16. Betsch DF, Baer E. Structure and mechanical properties ofrat tail tendon. Biorheology 1980;17:83–94.
17. Haut RC, Lancaster RL, Decamp C. Mechanical properties ofthe canine patellar tendon—some correlations with age andthe content of collagen. J Biomech 1992;25:163.
18. Woo SL. Mechanical properties of tendons and ligaments. I.Quasi-static and nonlinear viscoelastic properties. Biorheol-ogy 1982;19:385–396.
19. Woo SLY, Sites TJ. Current advances on the study of thebiomechanical properties of tendons and ligaments. In:Nimni ME, editor. Collagen, Volume II, Biochemistry Bio-mechanics. Boca Raton: CRC Press; 1988.
20. Campbell MA, Tester AM, Handley CJ, Checkley GJ, ChowGL, Cant AE, Winter AD, Cain WE. Characterization of a largechondroitin sulfate proteoglycan present in bovine collateralligament. Arch Biochem Biophys 1996;329:181–190.
21. Robbins JR, Vogel K. Regional expression of mRNA for pro-teoglycans and collagen in tendon. Eur J Cell Biol 1994;64:264–270.
22. Thomopoulos S, Hattersley G, Rosen V, Mertens M, Galatz L,Williams GR, Soslowsky LJ. The localized expression of extra-cellular matrix components in healing tendon insertion sites:an in situ hybridization study. J Orthop Res 2002;20:454–463.
23. Hocking AM, Shinomura T, McQuillan DJ. Leucine-richrepeat glycoproteins of the extracellular matrix. Matrix Biol1998;17:1–19.
24. Wilda M, Bachner D, Just W, Geerkens C, Kraus P, Vogel W,Hameister H. A comparison of the expression pattern of fivegenes of the family of small leucine-rich proteoglycans duringmouse development. J Bone Miner Res 2000;15:2187–2196.
25. Corsi A, Xu T, Chen XD, Boyde A, Liang J, Mankani M,Sommer B, Iozzo RV, Eichstetter I, Robey PG, Bianco P, YoungMF. Phenotypic effects of biglycan deficiency are linked tocollagen fibril abnormalities, are synergized by decorin defi-ciency, and mimic Ehlers-Danlos-like changes in bone andotherconnective tissues.J BoneMinerRes2002;17:1180–1189.
26. Gelman RA, Blackwell J. Collagen-mucopolysaccharideinteractions at acid pH. Biochim Biophys Acta 1974;342:254–261.
27. Lindahl U, Hook M. Glycosaminoglycans and their bindingto biological macromolecules. Annu Rev Biochem 1978;47:385–417.
28. Scott JE, Orford CR. Dermatan sulphate-rich proteoglycanassociates with rat tail tendon collagen at the d band in thegap region. Biochem J 1981;197:213–216.
29. Weber IT, Harrison RW, Iozzo RV. Model structure of decorinand implications for collagen fibrillogenesis. J Biol Chem1996;271:31767–31770.
LIGAMENT AND TENDON, PROPERTIES OF 249

30. Pins GD, Christiansen DL, Patel R, Silver FH. Self-assemblyof collagen fibers. Influence of fibrillar alignment and decorinon mechanical properties. Biophys J 1997;73:2164–2172.
31. Evanko SP, Vogel KG. Proteoglycan synthesis in fetal tendonis differentially regulated by cyclic compression in vitro.Arch Biochem Biophys 1993;307:153–164.
32. Koob TJ, Clark PE, Hernez DJ, Thurmond FA, Vogel KG.Compression loading in vitro regulates proteoglycan synth-esis by tendon fibrocartilage. Arch Biochem Biophys 1992;298:303–312.
33. Cockburn CG, Barnes MJ. Characterization of thrombospon-din binding to collagen (type I) fibers: role of collagen telopep-tides. Matrix 1991;11:168–176.
34. Amiel D, Gelberman R, Harwood F, Siegel D. Fibronectin inhealing flexor tendons subjected to immobilization or earlycontrolled passive motion. Matrix 1991;11:184–189.
35. Kannus P, Jozsa L, Jarvinen TA, Jarvinen TL, Kvist M, NatriA, Jarvinen M. Location and distribution of non-collagenousmatrix proteins in musculoskeletal tissues of rat. HistochemJ 1998;30:799–810.
36. Jozsa L, Lehto M, Kannus P, Kvist M, Reffy A, Vieno T,Jarvinen M, Demel S, Elek E. Fibronectin and laminin inAchilles tendon. Acta Orthop Scand 1989;60:469–471.
37. Mow VC, Mak AF, Lai WM, Rosenberg LC, Tang LH. Vis-coelastic properties of proteoglycan subunits and aggregates invarying solution concentrations. J Biomech 1984;17:325–338.
38. Hooley CJ, Cohen RE. A model for the creep behaviour oftendon. Int J Biol Macromol 1979;1:123–132.
39. Kannus P. Structure of the tendon connective tissue. Scand JMed Sci Sports 2000;10:312–320.
40. Parry DA, Craig AS, Barnes GR. Tendon and ligament fromthe horse: an ultrastructural study of collagen fibrils andelastic fibers as a function of age. Proc R Soc London Ser BBiol Sci 1978;203:293–303.
41. Ross R. The elastic fiber. J Histochem Cytochem 1973;21:199–208.
42. Minns RJ, Soden PD, Jackson DS. The role of the fibrouscomponents and ground substance in the mechanical proper-ties of biological tissues: a preliminary investigation. J Bio-mech 1973;6:153–165.
43. Gosline JM. The elastic properties of rubber-like proteins andhighly extensible tissues. Symp Soc Exp Biol 1980;34:331–357.
44. Evans JH, Nachemson AL. Biomechanical study of humanlumbar ligamentum flavum. J Anat 1969;105:188–189.
45. Agarwal BD, Broutman LJ. Analysis and performance offiber composites New York: Wiley; 1980.
46. Gordon JE. The new science of stronmg materials. Har-mondsworth: Penguin Books Ltd.; 1976.
47. Aspden RM. Fiber reinforcing by collagen in cartilage andsoft connective tissues. Proc R Soc London Ser B Biol Sci1994;B-258:195–200.
48. Goh KL, Aspden RM, Mathias KJ, Hukins DWL. Effect offiber shape on the stresses within fibers in fiber-reinforcedcomposite materials. Proc R Soc London Ser 1999;A-455:3351–3361.
49. Goh KL, Mathias KJ, Aspden RM, Hukins DWL. Finiteelement analysis of the effect of fiber shape on stresses inan elastic fiber surrounded by a plastic matrix. J Mater Sci2000;35:2493–2497.
50. Kelly A, Macmillan NH. Strong Solids. 3rd ed.; Oxford:Oxford University Press; 1986.
51. DeVente JE, Lester GE, Trotter JA, Dahners LE. Isolation ofintact collagen fibrils from healing ligament [letter]. J Elec-tron Microsc 1997;46:353–356.
52. Holmes DF, Chapman JA, Prockop DJ, Kadler KE. Growingtips of type-I collagen fibrils formed in vitro are near para-boloidal in shape, implying a reciprocal relationship between
accretion and diameter. Proc Natl Acad Sci USA 1992;89:9855–9859.
53. Kadler KE, Holmes DF, Trotter JA, Chapman JA. Collagenfibril formation. Biochem J 1996;316 (Pt 1): 1–11.
54. Aspden RM. The theory of fiber reinforced composite materi-als applied to changes in the mechanical properties of thecervix during pregnancy. J Theor Biol 1988;130:213–221.
55. Cabaud HE. Biomechanics of the anterior cruciate ligament.Clin Orthop 1983; 26–31.
56. Dodds JA, Arnoczky SP. Anatomy of the anterior cruciateligament: a blueprint for repair and reconstruction. Arthro-scopy 1994;10:132–139.
57. Noyes FR, DeLucas JL, Torvik PJ. Biomechanics of anteriorcruciate ligament failure: an analysis of strain-rate sensitiv-ity and mechanisms of failure in primates. J Bone Joint SurgAm 1974;56:236–253.
58. Hukins DWL, Kirby MC, Sikoryn TA, Aspden RM, Cox AJ.Comparison of structure, mechanical properties and func-tions of lumbar spinal ligaments. Spine 1990;15:787–795.
59. Viidik A. Functional properties of collagenous tissues. IntRev Connect Tissue Res 1973;6:127–215.
60. Claes L, Neugebauer R. In vivo and in vitro investigation ofthe long-term behaviour and fatigue strength of carbon fiberligament replacement. Clin Orthop 1985;186:99–111.
61. Tkaczuk H. Tensile properties of human lumbar longitudinalligaments. Acta Orthop Scand Suppl 1968; 115.
62. Shah JS, Jayson MIV, Hampson WGJ. Mechanical implica-tions of crimping in collagen fibers of human spinalligaments. Proc Instn Mech Eng [H], J Eng Med 1979;8:95–102.
63. Kirby MC, Sikoryn TA, Hukins DWL, Aspden RM. Structuresand mechanical properties of the longitudinal ligaments andligamenta flava of the spine. J Biomed Eng 1989;11:192–196.
64. Brand RA. Knee ligaments: a new view. J Biomech Eng1986;108:106–110.
65. Viidik A. Tensile strength properties of Achilles tendon sys-tems in trained and untrained rabbits. Acta Orthop Scand1969;40:261–272.
66. Rigby J, Hirai N, Spikes JD, Eyring M. The mechanicalproperties of rat tail tendon. J Gen Physiol 2003;43:265–283.
67. Haut RC, Little RW. A constitutive equation for collagenfibers. J Biomech 1972;5:423–430.
68. Dorrington KL. The theory of viscoelasticity in biomaterials.Symp Soc Exp Biol 1980;34:289–314.
69. Cohen RE, Hooley CJ, McCrum NG. Viscoelastic creep ofcollagenous tissue. J Biomech 1976;9:175–184.
70. Kennedy JC, Hawkins RJ, Willis RB, Danylchuck KD. Ten-sion studies of human knee ligaments. Yield point, ultimatefailure, and disruption of the cruciate and tibial collateralligaments. J Bone Joint Surg Am 1976;58:350–355.
71. Neumann P, Keller TS, Ekstrom L, Perry L, Hansson TH,Spengler DM. Mechanical properties of the human lumbaranterior longitudinal ligament. J Biomech 1992;25:1185–1194.
72. Sikoryn TA, Hukins DWL. Mechanism of failure of theligamentum flavum of the spine during in vitro tensile tests.J Orthop Res 1990;8:586–591.
73. Azangwe G, Mathias KJ, Marshall D. Macro and microscopicexamination of the ruptured surfaces of anterior cruciateligaments of rabbits. J Bone Joint Surg Br 2000;82:450–456.
74. Barry D, Ahmed AM. Design and performance of a modifiedbuckle transducer for the measurement of ligament tension. JBiomech Eng 1986;108:149–152.
75. Beynnon B, Howe JG, Pope MH, Johnson RJ, Fleming BC.The measurement of anterior cruciate ligament strain invivo. Int Orthop 1992;16:1–12.
76. Woo SL, Newton PO, MacKenna DA, Lyon RM. A compara-tive evaluation of the mechanical properties of the rabbit
250 LIGAMENT AND TENDON, PROPERTIES OF

medial collateral and anterior cruciate ligaments. J Biomech1992;25:377–386.
77. Lam TC, Shrive NG, Frank CB. Variations in rupture siteand surface strains at failure in the maturing rabbit medialcollateral ligament. J Biomech Eng 1995;117:455–461.
78. Sikoryn TA, Hukins DWL. Failure of the longitudinal liga-ments of the spine. J Mater Sci Lett 1988;7:1345–1349.
79. Gupta P, Subramanian KN, Brinker WO, Gupta AN. Tensilestrength of canine cruciate ligaments inthe dog. Am J Vet Res1971;32:183–190.
80. Njus GO, Njus NM. A non-contact method for determiningcross-sectional area of soft tissue. Trans Orthopaed Res Soc1984;32:126–131.
81. Woo SL, Danto MI, Ohland KJ, Lee TQ, Newton PO. The useof a laser micrometer system to determine the cross-sectionalshape and area of ligaments: a comparative study with twoexisting methods. J Biomech Eng 1990;112:426–431.
82. King GJ, Pillon CL, Johnson JA. Effect of in vitro testing overextended periods on the low-load mechanical behaviour ofdense connective tissues. J Orthop Res 2000;18:678–681.
83. Kwan MK, Lin TH, Woo SL. On the viscoelastic properties ofthe anteromedial bundle of the anterior cruciate ligament. JBiomech 1993;26:447–452.
84. Provenzano P, Lakes R, Keenan T, Vanderby, Jr. R. Non-linear ligament viscoelasticity. Ann Biomed Eng 2001;29:908–914.
85. Silver FH, Christiansen DL, Snowhill PB, Chen Y. Role ofstorage on changes in the mechanical properties of tendonand self-assembled collagen fibers. Connect Tissue Res 2000;41:155–164.
86. Woo SL, Gomez MA, Akeson WH. The time and history-dependent viscoelastic properties of the canine medical col-lateral ligament. J Biomech Eng 1981;103:293–298.
87. Thornton GM, Oliynyk A, Frank CB, Shrive NG. Ligamentcreep cannot be predicted from stress relaxation at low stress:a biomechanical study of the rabbit medial collateral liga-ment. J Orthop Res 1997;15:652–656.
88. Thornton GM, Shrive NG, Frank CB. Altering ligamentwater content affects ligament pre-stress and creep beha-viour. J Orthop Res 2001;19:845–851.
89. Speer KP, Warren RF, Wickiewicz TL, Horowitz L, HendersonL. Observations on the injury mechanism of anterior cruciateligament tears in skiers. Am J Sports Med 1995;23:77–81.
90. Fischer JF, Leyvraz PF, Bally A. A dynamic analysis of kneeligament injuries in alpine skiing. Acta Orthop Belg1994;60:194–203.
91. Emerson RJ. Basketball knee injuries and the anterior cruci-ate ligament. Clin Sports Med 1993;12:317–328.
92. Azangwe G, Mathias KJ, Marshall D. The effect of torsion onthe appearance of the rupture surface of the ACL of rabbits.Knee 2002;9:31–39.
93. Woo SL, Orlando CA, Gomez MA, Frank CB, Akeson WH.Tensile properties of the medial collateral ligament as afunction of age. J Orthop Res 1986;4:133–141.
94. Davison PF. The organization of collagen in growing tensiletissues. Connect Tissue Res 1992;28:171.
95. Greenlee, Jr. TK, Pike D. Studies on tendon healing in therat. J Plast Reconstr Surg 1071;48:260–270.
96. Matyas JR, Anton MG, Shrive NG, Frank CB. Stress governstissue phenotype at the femoral insertion of the rabbit MCL. JBiomech 1995;28:147–157.
97. Moriggl B, Kumai T, Milz S, Benjamin M. The structure andhistopathology of the ‘‘enthesis organ’’ at the navicular inser-tion of the tendon of tibialis posterior. J Rheumatol2003;30:508–517.
98. Cotton FJ, Morrison GM. Artifical ligaments at the knee: atechnique. N Engl J Med 1934;210:1331–1332.
99. Fujikawa K, Kobayashi T, Sasazaki Y, Matsumoto H, Seed-hom BB. Anterior cruciate ligament reconstruction with theLeeds-Keio artificial ligament. J Long Term Eff MedImplants 2000;10:225–238.
100. Chen CH, Chen WJ, Shih CH. Arthroscopic reconstruction ofthe posterior cruciate ligament: a comparison of quadricepstendon autograft and quadruple hamstring tendon graft.Arthroscopy 2002;18:603–612.
101. Ruiz AL, Kelly M, Nutton RW. Arthroscopic ACL reconstruc-tion: a 5-9 year follow-up. Knee 2002;9:197–200.
102. Schroven IT, Geens S, Beckers L, Lagrange W, Fabry G.Experience with the Leeds-Keio artificial ligament for ante-rior cruciate ligament reconstruction. Knee Surg SportsTraumatol Arthrosc 1994;2:214–218.
103. Drogset JO, Grontvedt T. Anterior cruciate ligament recon-struction with and without a ligament augmentation device:results at 8-Year follow-up. Am J Sports Med 2002;30:851–856.
104. Friedman MJ, Sherman OH, Fox JM, Del PW, Snyder SJ.Ferkel RJ. Autogeneic anterior cruciate ligament (ACL)anterior reconstruction of the knee. A review. Clin OrthopRelat Res 1985;9–14.
105. Alexander H, Weiss AB. Editorial Comment. Clin OrthopRelat Res 1985;2–3.
106. Fujikawa K, Ohtani T, Matsumoto H, Seedhom BB. Recon-struction of the extensor apparatus of the knee with theLeeds-Keio ligament. J Bone Joint Surg Br 1994;76:200–203.
107. Jenkins DH, Forster IW, McKibbin B, Ralis ZA. Induction oftendon and ligament formation by carbon implants. J BoneJoint Surg Br 1977;59:53–57.
108. Turner IG, Thomas NP. Comparative analysis of four types ofsynthetic anterior cruciate ligament replacement in the goat:in vivo histological and mechanical findings. Biomaterials1990;11:321–329.
109. Marumo K, Kumagae Y, Tanaka T, Fujii K. Long-termresults of anterior cruciate ligament reconstruction usingsemitendinosus and gracilis tendons with Kennedy ligamentaugmentation device compared with patellar tendon auto-grafts. J Long Term Eff Med Implants 2000;10:251–265.
110. Fukubayashi T, Ikeda K. Follow-up study of Gore-Tex arti-ficial ligament—special emphasis on tunnel osteolysis. JLong Term Eff Med Implants 2000;10:267–277.
111. Woo SL, Hildebrand K, Watanabe N, Fenwick JA, Papageor-giou CD, Wang JH. Tissue engineering of ligament andtendon healing. Clin Orthop 1999; S312–S323.
112. Huard J, Li Y, Peng H, Fu FH. Gene therapy and tissueengineering for sports medicine. J Gene Med 2003;5:93–108.
113. Gentleman E, Lay AN, Dickerson DA, Nauman EA, LivesayGA, Dee KC. Mechanical characterization of collagen fibersand scaffolds for tissue engineering. Biomaterials 2003;24:3805–3813.
114. DesRosiers EA, Yahia L, Rivard CH. Proliferative and matrixsynthesis response of canine anterior cruciate ligament fibro-blasts submitted to combined growth factors. J Orthop Res1996;14:200–208.
115. Martinek V, Latterman C, Usas A, Abramowitch S, Woo SL,Fu FH, Huard J. Enhancement of tendon-bone integration ofanterior cruciate ligament grafts with bone morphogeneticprotein-2 gene transfer: a histological and biomechanicalstudy. J Bone Joint Surg Am 2002;84-A:1123–1131.
Further Reading
Akeson WH, Pedowitz R, O‘Connor JJ, editors. Knee Ligaments:Structure, Function, Injury and Repair. 2nd ed. New York:Lippincott Williams & Wilkins; 2003.
Mow VC, Hayes WC, editors. Basic Orthopaedic Biomechanics.New York: Raven Press; 1991.
LIGAMENT AND TENDON, PROPERTIES OF 251
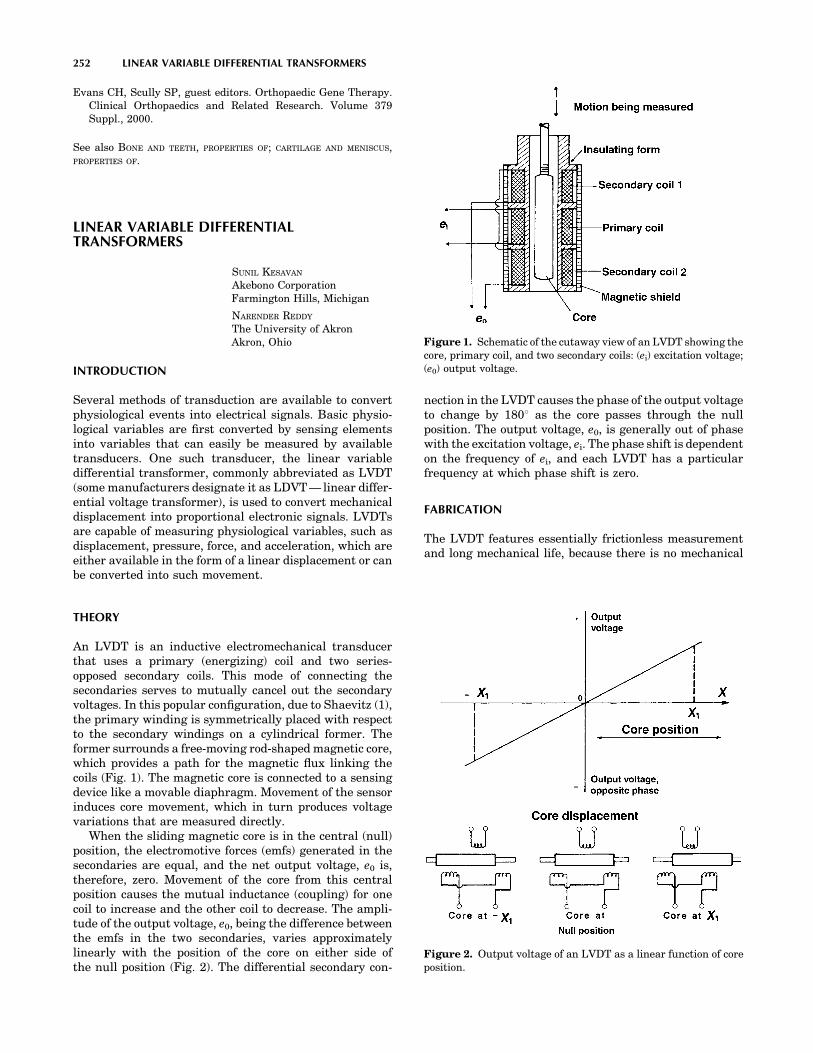
Evans CH, Scully SP, guest editors. Orthopaedic Gene Therapy.Clinical Orthopaedics and Related Research. Volume 379Suppl., 2000.
See also BONE AND TEETH, PROPERTIES OF; CARTILAGE AND MENISCUS,PROPERTIES OF.
LINEAR VARIABLE DIFFERENTIALTRANSFORMERS
SUNIL KESAVAN
Akebono CorporationFarmington Hills, Michigan
NARENDER REDDY
The University of AkronAkron, Ohio
INTRODUCTION
Several methods of transduction are available to convertphysiological events into electrical signals. Basic physio-logical variables are first converted by sensing elementsinto variables that can easily be measured by availabletransducers. One such transducer, the linear variabledifferential transformer, commonly abbreviated as LVDT(some manufacturers designate it as LDVT — linear differ-ential voltage transformer), is used to convert mechanicaldisplacement into proportional electronic signals. LVDTsare capable of measuring physiological variables, such asdisplacement, pressure, force, and acceleration, which areeither available in the form of a linear displacement or canbe converted into such movement.
THEORY
An LVDT is an inductive electromechanical transducerthat uses a primary (energizing) coil and two series-opposed secondary coils. This mode of connecting thesecondaries serves to mutually cancel out the secondaryvoltages. In this popular configuration, due to Shaevitz (1),the primary winding is symmetrically placed with respectto the secondary windings on a cylindrical former. Theformer surrounds a free-moving rod-shaped magnetic core,which provides a path for the magnetic flux linking thecoils (Fig. 1). The magnetic core is connected to a sensingdevice like a movable diaphragm. Movement of the sensorinduces core movement, which in turn produces voltagevariations that are measured directly.
When the sliding magnetic core is in the central (null)position, the electromotive forces (emfs) generated in thesecondaries are equal, and the net output voltage, e0 is,therefore, zero. Movement of the core from this centralposition causes the mutual inductance (coupling) for onecoil to increase and the other coil to decrease. The ampli-tude of the output voltage, e0, being the difference betweenthe emfs in the two secondaries, varies approximatelylinearly with the position of the core on either side ofthe null position (Fig. 2). The differential secondary con-
nection in the LVDT causes the phase of the output voltageto change by 1808 as the core passes through the nullposition. The output voltage, e0, is generally out of phasewith the excitation voltage, ei. The phase shift is dependenton the frequency of ei, and each LVDT has a particularfrequency at which phase shift is zero.
FABRICATION
The LVDT features essentially frictionless measurementand long mechanical life, because there is no mechanical
252 LINEAR VARIABLE DIFFERENTIAL TRANSFORMERS
Figure 1. Schematic of the cutaway view of an LVDT showing thecore, primary coil, and two secondary coils: (ei) excitation voltage;(e0) output voltage.
Figure 2. Output voltage of an LVDT as a linear function of coreposition.

contact between the enclosed coil assembly and the sepa-rate freely moving core within the coil assembly (Fig. 1).
A typical alternating current (ac) LVDT core consists ofa uniformly dense cylindrical slug of a high permeabilitynickel–iron alloy. The core is internally threaded to acceptnonmagnetic core rods from an external sensing or actuat-ing element. The core moves within a cylindrical coilassembly. Hollow cores are employed when a low masscore is desired. Recently, researchers have developed light-weight glass-covered amorphous wire cores that can beused to fabricate high sensitivity LVDTs with goodmechanical and corrosion resistance (2). The primaryand secondary windings are spaced symmetrically by wind-ing them on a slotted cylindrical former. To avoid materialcorrosion or insulation leakage, the windings are impreg-nated with an insulating varnish under a vacuum. Thecoils are encapsulated in epoxy for further mechanical andmoisture protection. Magnetic or ferromagnetic materialsin the proximity of an LVDT can disrupt its magnetic field.The magnetic field of an LVDT may also induce eddycurrents into nonmagnetic materials in its vicinity. Thesecurrents in turn would create a magnetic flux that wouldinterfere with the LVDT output. These problems areavoided in practice by enclosing the LVDT in a case fab-ricated from an alloy, a high permeability iron, or a stain-less steel. The LVDT assembly is then mounted in a C- orsplit block. LVDTs that can measure rotational movementare also available.
In addition to the ac LVDTs described in the previoussections, direct current (dc) LVDTs are also available (3,4).These LVDTs, in addition to having all the advantages of acLVDTs, possess the simplicity of dc operation. They consistof two integral parts: an ac-operated LVDT and a carriergenerator–signal conditioning module. The small carriersystem eliminates the need for the ac excitation, demodu-lation, and amplification equipment required for conven-tional ac LVDTs. This cuts down the cost and reduces thevolume of LVDT instrumentation; dc units can be batteryoperated or be supplied by a simple dc power supply (3,4).Also, any dc meter can be employed to read the LVDToutput. These advantages, coupled with the small size ofthe dc LVDTs, make them attractive for use in hospitalsand other medical environments.
The LVDTs have several advantages and a few disad-vantages (3–6) as briefly reviewed next.
1. Essentially frictionless operation and long mechan-ical life: As described in the previous section, theLVDT has no moving mechanical contact betweenthe moving core and the windings. This ensures thatLVDTs have a fast dynamic response as no additionalload apart from the core mass is imposed on themeasured event. In addition, this helps LVDTs tohave a long, essentially infinite, mechanical life.
2. Good in hostile environments: LVDTs can be man-ufactured to withstand the vagaries of chemicalcorrosion and extremes of temperature and pres-sure. This is facilitated by the separation betweenthe core and windings of the LVDT. Only a staticseal is required to isolate the coil assembly fromhostile environments.
3. Extremely high resolution: LVDTs can respond toextremely small displacements. MicrodisplacementLVDT transducers capable of measuring displace-ments down to 100 pm have been fabricated (7).
4. Null repeatability: The null position of an LVDT isvery repeatable, even with large temperature varia-tions.
5. Input–Output isolation: Since the primary and sec-ondary windings are isolated from each other, thesignal ground can be isolated from the excitationground.
6. Cross-axis rejection: The LVDT is only responsive toaxial core motion. Cross-axis motion induced by con-ditions such as jarring or continuous vibration willnot affect the LVDT output.
7. Overtravel damage resistance: As the LVDT corecan pass completely through the coil assembly, thetransducer is inherently immune to damage fromunanticipated overtravel that can be encountered inapplications where materials or structures can yieldor fail.
8. Absolute output: Unlike a lot of other transducersthat are incremental output devices, LVDTs areabsolute output devices, that is, the displacementinformation from an LVDT is not lost if the systemloses power. When the measuring system is restarted,the LVDTs output value will be the same as it wasbefore the power failure occurred.
All these advantages, in addition to their reasonablecost, have made the LVDT an attractive displacementmeasurement technique. However, LVDTs for use in med-ical applications have the following disadvantages: (1)They require a constant amplitude excitation of high fre-quency. (2) They cannot be used in the vicinity of equip-ment that creates strong magnetic fields.
LVDT INSTRUMENTATION
Instrumentation normally used with an ac LVDT shouldperform the following functions (3,4).
Excitation
An LVDT needs an ac input of constant amplitude at afrequency that is not readily available. Hence, an oscillatorof the appropriate frequency has to be connected to anamplifier with amplitude regulation on its output.
Amplification
As in the case of most transducers, the low level outputs ofLVDTs require amplification. One procedure for amplifica-tion employs two steps: (1) use of an ac carrier–amplifierbefore demodulation; and (2) a dc amplifier after the demo-dulator (3,4).
Demodulation
As discussed earlier, the output of an LVDT remainsproportional to the displacement while it undergoes a
LINEAR VARIABLE DIFFERENTIAL TRANSFORMERS 253
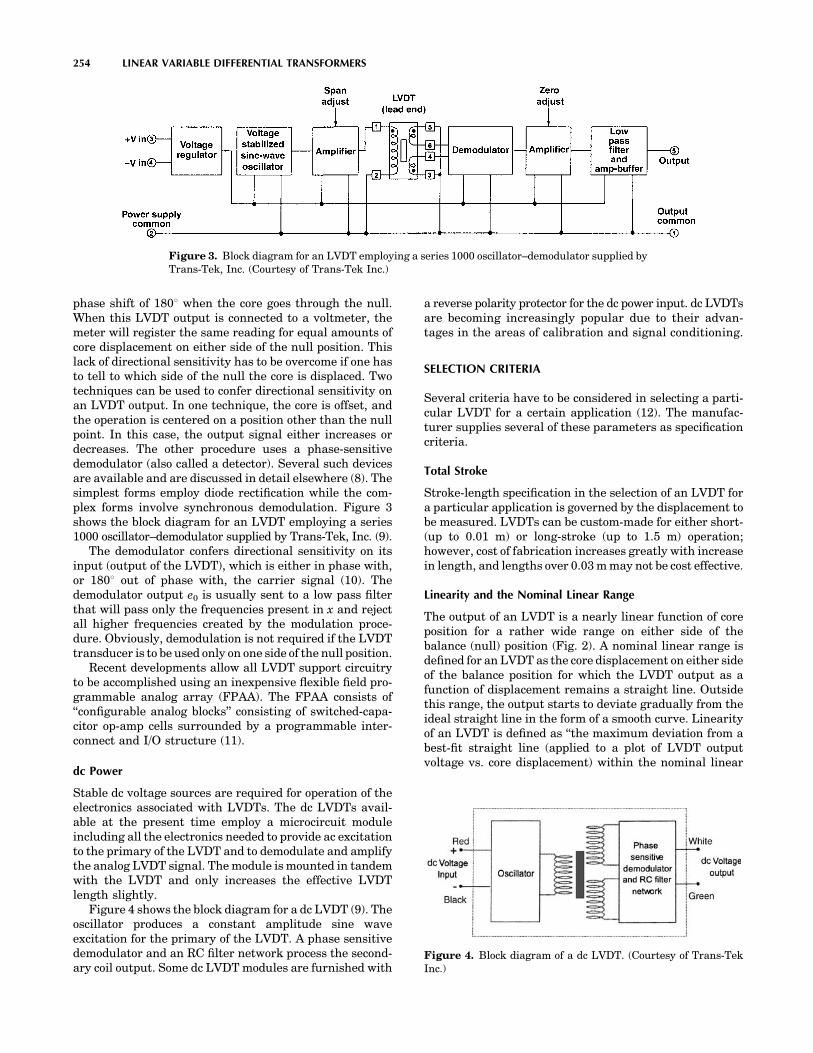
phase shift of 1808 when the core goes through the null.When this LVDT output is connected to a voltmeter, themeter will register the same reading for equal amounts ofcore displacement on either side of the null position. Thislack of directional sensitivity has to be overcome if one hasto tell to which side of the null the core is displaced. Twotechniques can be used to confer directional sensitivity onan LVDT output. In one technique, the core is offset, andthe operation is centered on a position other than the nullpoint. In this case, the output signal either increases ordecreases. The other procedure uses a phase-sensitivedemodulator (also called a detector). Several such devicesare available and are discussed in detail elsewhere (8). Thesimplest forms employ diode rectification while the com-plex forms involve synchronous demodulation. Figure 3shows the block diagram for an LVDT employing a series1000 oscillator–demodulator supplied by Trans-Tek, Inc. (9).
The demodulator confers directional sensitivity on itsinput (output of the LVDT), which is either in phase with,or 1808 out of phase with, the carrier signal (10). Thedemodulator output e0 is usually sent to a low pass filterthat will pass only the frequencies present in x and rejectall higher frequencies created by the modulation proce-dure. Obviously, demodulation is not required if the LVDTtransducer is to be used only on one side of the null position.
Recent developments allow all LVDT support circuitryto be accomplished using an inexpensive flexible field pro-grammable analog array (FPAA). The FPAA consists of‘‘configurable analog blocks’’ consisting of switched-capa-citor op-amp cells surrounded by a programmable inter-connect and I/O structure (11).
dc Power
Stable dc voltage sources are required for operation of theelectronics associated with LVDTs. The dc LVDTs avail-able at the present time employ a microcircuit moduleincluding all the electronics needed to provide ac excitationto the primary of the LVDT and to demodulate and amplifythe analog LVDT signal. The module is mounted in tandemwith the LVDT and only increases the effective LVDTlength slightly.
Figure 4 shows the block diagram for a dc LVDT (9). Theoscillator produces a constant amplitude sine waveexcitation for the primary of the LVDT. A phase sensitivedemodulator and an RC filter network process the second-ary coil output. Some dc LVDT modules are furnished with
a reverse polarity protector for the dc power input. dc LVDTsare becoming increasingly popular due to their advan-tages in the areas of calibration and signal conditioning.
SELECTION CRITERIA
Several criteria have to be considered in selecting a parti-cular LVDT for a certain application (12). The manufac-turer supplies several of these parameters as specificationcriteria.
Total Stroke
Stroke-length specification in the selection of an LVDT fora particular application is governed by the displacement tobe measured. LVDTs can be custom-made for either short-(up to 0.01 m) or long-stroke (up to 1.5 m) operation;however, cost of fabrication increases greatly with increasein length, and lengths over 0.03 m may not be cost effective.
Linearity and the Nominal Linear Range
The output of an LVDT is a nearly linear function of coreposition for a rather wide range on either side of thebalance (null) position (Fig. 2). A nominal linear range isdefined for an LVDT as the core displacement on either sideof the balance position for which the LVDT output as afunction of displacement remains a straight line. Outsidethis range, the output starts to deviate gradually from theideal straight line in the form of a smooth curve. Linearityof an LVDT is defined as ‘‘the maximum deviation from abest-fit straight line (applied to a plot of LVDT outputvoltage vs. core displacement) within the nominal linear
254 LINEAR VARIABLE DIFFERENTIAL TRANSFORMERS
Figure 3. Block diagram for an LVDT employing a series 1000 oscillator–demodulator supplied byTrans-Tek, Inc. (Courtesy of Trans-Tek Inc.)
Figure 4. Block diagram of a dc LVDT. (Courtesy of Trans-TekInc.)
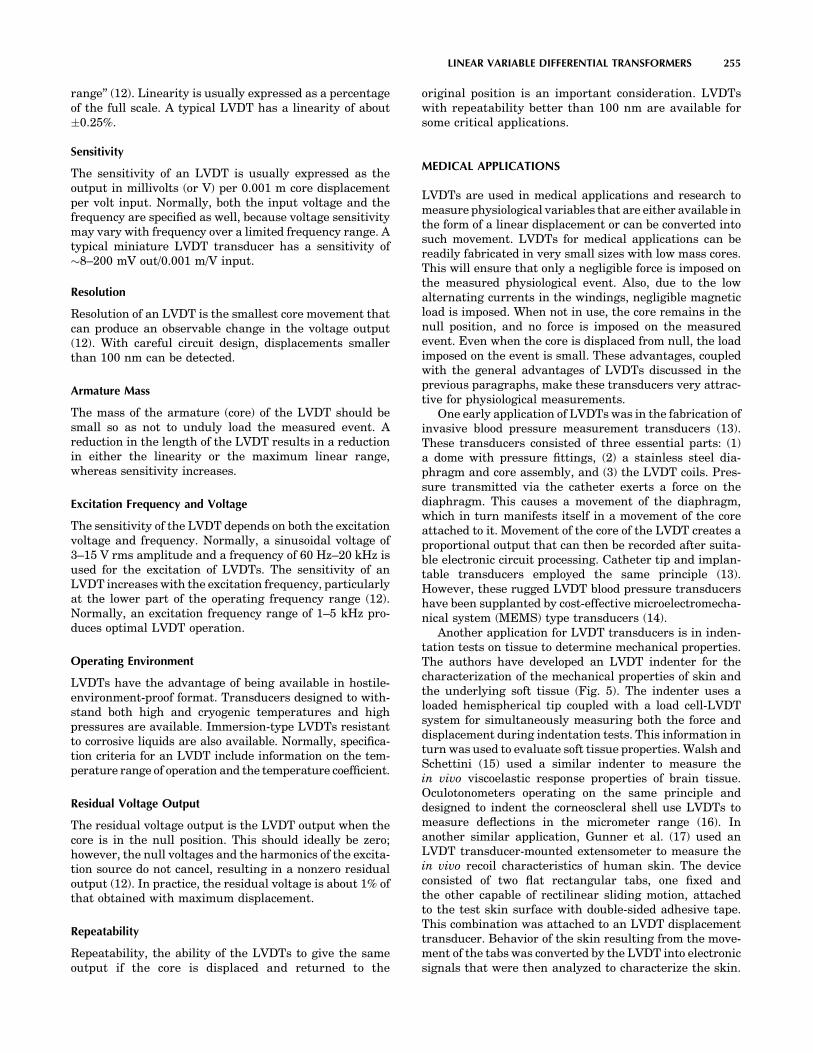
range’’ (12). Linearity is usually expressed as a percentageof the full scale. A typical LVDT has a linearity of about�0.25%.
Sensitivity
The sensitivity of an LVDT is usually expressed as theoutput in millivolts (or V) per 0.001 m core displacementper volt input. Normally, both the input voltage and thefrequency are specified as well, because voltage sensitivitymay vary with frequency over a limited frequency range. Atypical miniature LVDT transducer has a sensitivity of�8–200 mV out/0.001 m/V input.
Resolution
Resolution of an LVDT is the smallest core movement thatcan produce an observable change in the voltage output(12). With careful circuit design, displacements smallerthan 100 nm can be detected.
Armature Mass
The mass of the armature (core) of the LVDT should besmall so as not to unduly load the measured event. Areduction in the length of the LVDT results in a reductionin either the linearity or the maximum linear range,whereas sensitivity increases.
Excitation Frequency and Voltage
The sensitivity of the LVDT depends on both the excitationvoltage and frequency. Normally, a sinusoidal voltage of3–15 V rms amplitude and a frequency of 60 Hz–20 kHz isused for the excitation of LVDTs. The sensitivity of anLVDT increases with the excitation frequency, particularlyat the lower part of the operating frequency range (12).Normally, an excitation frequency range of 1–5 kHz pro-duces optimal LVDT operation.
Operating Environment
LVDTs have the advantage of being available in hostile-environment-proof format. Transducers designed to with-stand both high and cryogenic temperatures and highpressures are available. Immersion-type LVDTs resistantto corrosive liquids are also available. Normally, specifica-tion criteria for an LVDT include information on the tem-perature range of operation and the temperature coefficient.
Residual Voltage Output
The residual voltage output is the LVDT output when thecore is in the null position. This should ideally be zero;however, the null voltages and the harmonics of the excita-tion source do not cancel, resulting in a nonzero residualoutput (12). In practice, the residual voltage is about 1% ofthat obtained with maximum displacement.
Repeatability
Repeatability, the ability of the LVDTs to give the sameoutput if the core is displaced and returned to the
original position is an important consideration. LVDTswith repeatability better than 100 nm are available forsome critical applications.
MEDICAL APPLICATIONS
LVDTs are used in medical applications and research tomeasure physiological variables that are either available inthe form of a linear displacement or can be converted intosuch movement. LVDTs for medical applications can bereadily fabricated in very small sizes with low mass cores.This will ensure that only a negligible force is imposed onthe measured physiological event. Also, due to the lowalternating currents in the windings, negligible magneticload is imposed. When not in use, the core remains in thenull position, and no force is imposed on the measuredevent. Even when the core is displaced from null, the loadimposed on the event is small. These advantages, coupledwith the general advantages of LVDTs discussed in theprevious paragraphs, make these transducers very attrac-tive for physiological measurements.
One early application of LVDTs was in the fabrication ofinvasive blood pressure measurement transducers (13).These transducers consisted of three essential parts: (1)a dome with pressure fittings, (2) a stainless steel dia-phragm and core assembly, and (3) the LVDT coils. Pres-sure transmitted via the catheter exerts a force on thediaphragm. This causes a movement of the diaphragm,which in turn manifests itself in a movement of the coreattached to it. Movement of the core of the LVDT creates aproportional output that can then be recorded after suita-ble electronic circuit processing. Catheter tip and implan-table transducers employed the same principle (13).However, these rugged LVDT blood pressure transducershave been supplanted by cost-effective microelectromecha-nical system (MEMS) type transducers (14).
Another application for LVDT transducers is in inden-tation tests on tissue to determine mechanical properties.The authors have developed an LVDT indenter for thecharacterization of the mechanical properties of skin andthe underlying soft tissue (Fig. 5). The indenter uses aloaded hemispherical tip coupled with a load cell-LVDTsystem for simultaneously measuring both the force anddisplacement during indentation tests. This information inturn was used to evaluate soft tissue properties. Walsh andSchettini (15) used a similar indenter to measure thein vivo viscoelastic response properties of brain tissue.Oculotonometers operating on the same principle anddesigned to indent the corneoscleral shell use LVDTs tomeasure deflections in the micrometer range (16). Inanother similar application, Gunner et al. (17) used anLVDT transducer-mounted extensometer to measure thein vivo recoil characteristics of human skin. The deviceconsisted of two flat rectangular tabs, one fixed andthe other capable of rectilinear sliding motion, attachedto the test skin surface with double-sided adhesive tape.This combination was attached to an LVDT displacementtransducer. Behavior of the skin resulting from the move-ment of the tabs was converted by the LVDT into electronicsignals that were then analyzed to characterize the skin.
LINEAR VARIABLE DIFFERENTIAL TRANSFORMERS 255
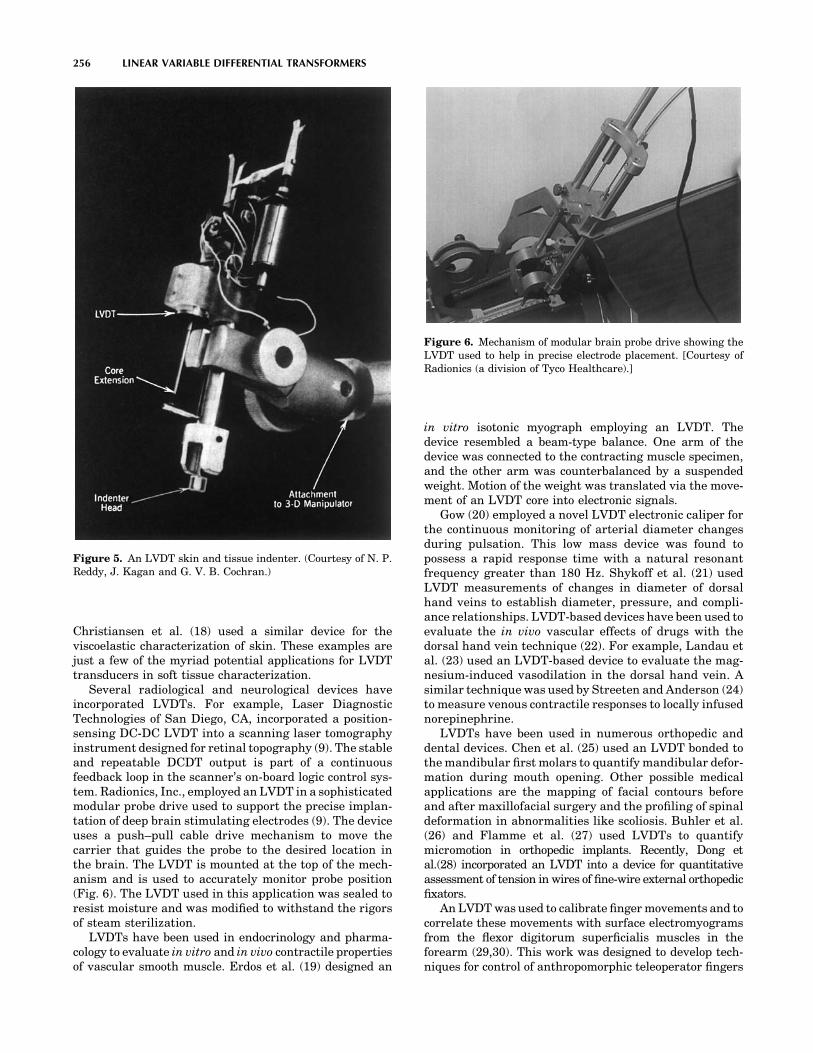
Christiansen et al. (18) used a similar device for theviscoelastic characterization of skin. These examples arejust a few of the myriad potential applications for LVDTtransducers in soft tissue characterization.
Several radiological and neurological devices haveincorporated LVDTs. For example, Laser DiagnosticTechnologies of San Diego, CA, incorporated a position-sensing DC-DC LVDT into a scanning laser tomographyinstrument designed for retinal topography (9). The stableand repeatable DCDT output is part of a continuousfeedback loop in the scanner’s on-board logic control sys-tem. Radionics, Inc., employed an LVDT in a sophisticatedmodular probe drive used to support the precise implan-tation of deep brain stimulating electrodes (9). The deviceuses a push–pull cable drive mechanism to move thecarrier that guides the probe to the desired location inthe brain. The LVDT is mounted at the top of the mech-anism and is used to accurately monitor probe position(Fig. 6). The LVDT used in this application was sealed toresist moisture and was modified to withstand the rigorsof steam sterilization.
LVDTs have been used in endocrinology and pharma-cology to evaluate in vitro and in vivo contractile propertiesof vascular smooth muscle. Erdos et al. (19) designed an
in vitro isotonic myograph employing an LVDT. Thedevice resembled a beam-type balance. One arm of thedevice was connected to the contracting muscle specimen,and the other arm was counterbalanced by a suspendedweight. Motion of the weight was translated via the move-ment of an LVDT core into electronic signals.
Gow (20) employed a novel LVDT electronic caliper forthe continuous monitoring of arterial diameter changesduring pulsation. This low mass device was found topossess a rapid response time with a natural resonantfrequency greater than 180 Hz. Shykoff et al. (21) usedLVDT measurements of changes in diameter of dorsalhand veins to establish diameter, pressure, and compli-ance relationships. LVDT-based devices have been used toevaluate the in vivo vascular effects of drugs with thedorsal hand vein technique (22). For example, Landau etal. (23) used an LVDT-based device to evaluate the mag-nesium-induced vasodilation in the dorsal hand vein. Asimilar technique was used by Streeten and Anderson (24)to measure venous contractile responses to locally infusednorepinephrine.
LVDTs have been used in numerous orthopedic anddental devices. Chen et al. (25) used an LVDT bonded tothe mandibular first molars to quantify mandibular defor-mation during mouth opening. Other possible medicalapplications are the mapping of facial contours beforeand after maxillofacial surgery and the profiling of spinaldeformation in abnormalities like scoliosis. Buhler et al.(26) and Flamme et al. (27) used LVDTs to quantifymicromotion in orthopedic implants. Recently, Dong etal.(28) incorporated an LVDT into a device for quantitativeassessment of tension in wires of fine-wire external orthopedicfixators.
An LVDT was used to calibrate finger movements and tocorrelate these movements with surface electromyogramsfrom the flexor digitorum superficialis muscles in theforearm (29,30). This work was designed to develop tech-niques for control of anthropomorphic teleoperator fingers
256 LINEAR VARIABLE DIFFERENTIAL TRANSFORMERS
Figure 5. An LVDT skin and tissue indenter. (Courtesy of N. P.Reddy, J. Kagan and G. V. B. Cochran.)
Figure 6. Mechanism of modular brain probe drive showing theLVDT used to help in precise electrode placement. [Courtesy ofRadionics (a division of Tyco Healthcare).]

using surface electromyographic signals obtained from theforearm.
Wang et al. (31) used six spring-loaded LVDTs in anexperimental technique to measure three-dimensional (3D),six-degrees-of-freedom motion of human joints. RotaryLVDTs are useful for measuring joint angles. For measuring3D rotations, rotary LVDTs are incorporated into six-degree-of-freedom motion linkages.
As illustrated in the applications discussed above, LVDTsare highly suited for biomedical device and research appli-cations requiring accurate displacement measurementswith high resolution, input–output isolation, and cross-axis rejection. Although LVDTs are being replaced byminiaturized, cost-effective transducers utilizing advancedfabrication technologies in many applications, their advan-tages still render them excellent candidates for biomedicalapplications.
ACKNOWLEDGMENT
The authors would like to acknowledge the help providedby Rema Menon in the preparation of this manuscript.
BIBLIOGRAPHY
1. Schaevitz H. The linear variable differential transformer.Proc Soc Stress Anal 1947;4:79–88.
2. Chiriac H, Hristoforou E, Neagu M, Pieptanariu M. Linearvariable differential transformer sensor using glass-coveredamorphous wires as active core. J Magn Magn Mater 2000;215:759–761.
3. Schaevitz Engineering. Technical bulletins 1002D and 7007.Pennsauken (NJ) 1986.
4. Schaevitz Sensors. Shaevitz Sensor Solutions. Catalog No.SCH-2001 Hampton (VA) 2000.
5. [Anonymous]. No date. An LVDT Primer. [Online]. MacroSensors. Available at www.macrosensors.com. 2005 March 8.
6. Weinstein E. LVDTs on the factory floor. Instrum ControlSyst 1982;55:59–61.
7. Sydenham PH. Microdisplacement transducers. J Phys E1972;6:721–733.
8. Szczyrbak J, Schmidt EDD. LVDT signal conditioning tech-niques. Meas Control 1997;183:103–111.
9. [Anonymous]. No date. LVDT application. [Online]. Trans-Tek Inc. Available at www.transtekinc.com. 2005 March 8.
10. Doebelin EO. Measurement Systems: Application andDesign. 4th ed. New York: McGraw-Hill; 1990.
11. Severn J, October. 2001. New analog interface for LVDTs.[Online]. Industrial Technology. Available at www.indus-trialtechnology.co.uk. 2005 March 8.
12. Anonymous, Finding the right LVDT. Instrum Control Syst1977;50:61–62.
13. [Anonymous]. No date. LVDT Applications. [Online]. MacroSensors. Available at www.macrosensors.com. 2005 March 8.
14. Seeley RS. 1996. The future of medical microelectromecha-nical systems. [Online]. Available at www.devicelink.com/mem/archive/96/01/003.html. 2005 March 8.
15. Walsh EK, Schettini A. A pressure-displacement transducerfor measuring brain tissue properties in vivo. J Appl Physiol1975;38:187–189.
16. Stepanik J. The Mackay-Marg Tonometer. Acta Ophthal1970;48:1140.
17. Gunner CW, Hutton WC, Burlin TE. An apparatus for mea-suring the recoil characteristics of human skin in vivo. MedBiol Eng Comput 1979;17:142–144.
18. Christiansen MS, Hargens III CW, Nacht S, Gans EH. Vis-coelastic properties of intact human skin: Instrumentation,hydration effects, and the contribution of the stratum cor-neum. J Invest Dermatol 1977;69:282–286.
19. Erdos EG, Jackman V, Barnes WC. Instrument for recordingisotonic contractions of smooth muscles. J Appl Physiol1962;17: 307–308.
20. Gow BS. An electrical caliper for measurement of pulsatilearterial diameter changes in vivo. J Appl Physiol 1966;21:1122–1126.
21. Shykoff BE, Hawari FI, Izzo JL. Diameter, pressure andcompliance relationships in dorsal hand veins. Vasc Med2001;6(2):97–102.
22. Pang YC. Autonomic control of venous system in health anddisease: effect of drugs. Pharmacol Therapeut 2001;90:179–230.
23. Landau R, Scott JA, Smiley RM. Magnesium-induced vaso-dilation in the dorsal vein. BJOG (Bri J Obst Gyn) 2004;111:446–451.
24. Streeten DHP, Anderson GH. Mechanisms of orthostatichypotension and tachycardia in patients with pheochromo-cytoma. AJH 1996;9:760–769.
25. Chen DC, Lai YL, Chi LY, Lee SY. Contributing factors ofmandibular deformation during mouth opening. J Dent2000;28(8):583–588.
26. Buhler DW, Oxland TR, Nolte LP. Design and evaluation of adevice for measuring three-dimensional motions of press-fitfemoral stem prosthesis. Med Eng Phys 1999;19:187–199.
27. Flamme CH, Kohn D, Kirsch L, Hurschler C. Primary sta-bility of different implants used in conjunction with hightibial osteomy. Arch Orth Trauma Surg 1999;119:450–455.
28. Dong Y, Saleh M, Yang L. Quantitative assessment of tensionin wires of fine-wire external fixators. Med Eng Phys2005;27:63–66.
29. Gupta V, Reddy NP. Surface electromyogram for the controlof anthropometric teleoperator fingers. Weghorst SJ, Soe-burg HB, Morgan KS, editors. Medicine Meets Virtual Rea-lity: Healthcare in the Information Age. Amsterdam: IOPPress; 1996.
30. Devavaram A, Reddy NP. Intelligent systems for control oftelemanipulators using surface EMG signals, submitted forpublication.
31. Wang M, Bryant JT, Dumas GA. A new in vitro measure-ment technique for small three-dimensional joint motion andits application to the sacroiliac joint. Med Eng Phys1996;18(6): 495–501.
Further Reading
Herceg ED. Handbook of Measurement and Control, Pennsauken(NJ): Schaevitz Engineering; 1972.
Anonymous. LVDTs remain ‘‘State-of-the-art. Meas Inspect Tech-nol 1982;4(2):13–16.
Anonymous. Displacement transducers (linear variable differen-tial transformer products review). Control Instrum 1984;16(8):23–25.
Geddes LA, Baker LE. Principles of Applied Biomedical Instru-mentation. 3rd ed. New York: Wiley-Interscience; 1989.
Webster JG. Medical Instrumentation: Application and Design.3rd ed. New York: John Wiley & Sons; 1998.
See also BLOOD PRESSURE MEASUREMENT; INTEGRATED CIRCUIT
TEMPERATURE SENSOR.
LINEAR VARIABLE DIFFERENTIAL TRANSFORMERS 257

LITERATURE, MEDICAL PHYSICS. See MEDICAL
PHYSICS LITERATURE.
LITHOTRIPSY
ALON Z. WEIZER
GLENN M. PREMINGER
Duke University Medical CenterDurham, North Carolina
INTRODUCTION
The clinical introduction of shock wave lithotripsy (SWL)by Chaussy in 1980 has revolutionized the way in whichpatients with renal and ureteral calculi are treated. Shockwave lithotripsy is a noninvasive method of fragmentingstones located inside the urinary tract. Since its initialintroduction, SWL technology has advanced rapidly interms of the means for shock wave generation, shock wavefocusing, patient coupling, and stone localization. Despiterapid technological advances, most current commerciallithotripters are fundamentally the same; they produce asimilar pressure waveform at the focus, which can becharacterized by a leading shock front with a compressivewave followed by a trailing tensile wave (Fig. 1). Theacoustic fields produced by different lithotripters differfrom each other in terms of the peak amplitudes of thepressure waveform, pulse duration, beam size, total acous-tic energy, and therefore, their overall performance.
Clinical experience has guided the technical developmentof second and third generation lithotripters with the aim ofproviding user convenience and multifunctionality of thedevice, rather than on further understanding of how SWLfragments calculi or injures surrounding renal tissue.Furthermore, the evolution of lithotripter design thus farhas overwhelmingly relied upon the importance of the com-pressive wave component of the shock wave (positive portionof the sound wave), with almost total neglect of the contribu-tion of the tensile component of the waveform. Consequently,
current lithotripters have suffered from inferior fragmenta-tion rates compared to the original HM3 lithotripter.
In contrast, significant progress in SWL basic scienceresearch has been made in the past 5 years to improve ourunderstanding of the primary mechanisms for stone com-minution (fragmentation) and tissue injury. It is nowrecognized that the disintegration of renal calculi in alithotripter field is the consequence of dynamic and syner-gistic interaction of two fundamental mechanisms: stresswave-induced dynamic fracture in the form of nucleation,growth, and coalescence of preexisting microcracks insidethe stone (1) and cavitation erosion caused by the violentcollapse of bubbles near the stone surface (2,3). Similarly,two different mechanisms have been proposed for SWL-induced tissue injury: shear stress due to shock frontdistortion (4) and cavitation induced inside blood vessels,especially the expansion of intraluminal bubbles (5).
To understand how SWL fragments stones and causestissue injury, the basic components of current lithotripters,the mechanisms behind stone fragmentation and kidneyinjury, and clinical results of the original electrohydrauliclithotripter in fragmenting kidney stones in patients willbe described. In addition, the future directions of SWL willbe reviewed based on current research that is investigatingways to make lithotripters more efficient and safer.
HISTORY AND EVOLUTION OF SWL
Physicists at Dornier Systems, Ltd. and Friedrich Shafen,Germany began experimenting with shock waves and theirtravel through water and tissue in 1963. Throughout the1970s, numerous experimental lithotripters were devel-oped that used new methods of shock wave generationand focusing as well as different techniques of stone loca-lization. In addition, experimental studies were being per-formed in vitro and in vivo (in animal models) examiningthe effects of shock waves on various organs and tissues.
In 1980, Chaussy and associates successfully treated thefirst human and reported their first series of 72 patients in1982 (6). Subsequently, > 1800 articles have been publishedin the peer-reviewed literature, detailing the use of SWL forthe management of renal and ureteral calculi. Moreover,numerous second and third generation devices have beenintroduced and are currently being used throughout theworld. To understand how SWL results in stone fragmenta-tion, the fundamentals of this technology are reviewed.
SWL PRINCIPLES
Despite the tremendous number of lithotripters currentlyavailable for fragmentation of renal and ureteral stones, allof these devices rely on the same laws of acoustic physics.Shock waves (i.e., high pressure sound waves) consisting ofa sharp peak in positive pressure followed by a trailingnegative wave are generated extracorporeally and passedthrough the body to fragment stones. Sounds waves readilypropagate from a water bath or water medium into thehuman body, due to similar acoustic impedances.
As a consequence, all lithotripters share four mainfeatures: an energy source to generate the shock wave, a
258 LITHOTRIPSY
Figure 1. Pressure–time relationship of typical shock waves.Typical pattern of a lithotripter-generated shock wave. The shockwave is characterized by a leading positive or compressivecomponent (Pþ) followed by a negative or tensile component (P�).

device to focus the shock wave at a focal point, a couplingmedium, and a stone localization system. (Fig. 2a) Theoriginal electrohydraulic lithotripter utilized a spark plugenergy generator with an elliptical reflector for focusingthe shock waves. A water bath transmitted the shockwaves to the patient with stone localization provided bybiplanar fluoroscopy. Modification of the four basic compo-nents of this first generation lithotripter has provided thedevelopment of second and third generation devices thatare currently available.
Shock Wave Generation and Focusing
While all lithotripters share the four aforementioned features,it is the mode of shock wave generation that determines theactual physical characteristics of that particular device. Thetypes of energy sources differ on how efficient they are infragmenting stones and how many treatments are required toadequately treat the stone. Figure 2 diagrammatically
summarizes the three different shock wave generationsources used in commercially available lithotripters.
Electrohydraulic Generator. In the original DornierHM3 lithotripter, the electrohydraulic generator (Fig. 2a)was located at the base of a water bath and produced shockwaves by electric spark discharges of 15,000–25,000 V of1 ms duration. This high voltage spark discharge producedthe rapid evaporation of water that created a shock wave byexpanding the surrounding fluid. The generator was locatedin an ellipsoidal reflector that concentrated the reflectedshock waves at a second focal point, F2, with F1 being thepoint of origin of the primary shock waves. While the HM3continues to be the gold standard lithotripter for stonefragmentation, the short half-life of its electrode resultsin variable pressure between shocks the longer it is used.In addition, minimal displacement of the electrode, as itdeteriorates at F1, results in displacement of the F2resulting in inaccurate focusing of the shock wave on the
LITHOTRIPSY 259
Ellipsoid reflector and fluoroscopy(focusing)
Spark electrode (F1) (shock wave)
Water Bath (coupling)
Kidney stone (F2)
Kidney stone (F2)
Spherical focusing of piezo-ceramic elements
(F1)
Electromagnetic coil (F1) vibrates sending out shock wave
Acoustic lens
(focusing)
Kidney stone (F2)
Parabolic reflector
(focusing)
Kidney stone (F2)
Electromagnetic cylinder vibrates (F1)
2a
2d2c
2b
Figure 2. Schematic of different shock wave lithotripters. (2a) Electrohydraulic lithotripsy. Sparkelectrode generates shock wave which is focused at F2 by an ellipsoid reflector. In the originalelectrohydraulic lithotripter, a water bath served as a coupling medium to allow passage of theshock wave from the source (F1) to the patient and stone (F2). Fluoroscopy or ultrasound can be usedto focus to identify and focus the shock waves on the stone. 2b) Piezoelectric lithotripsy. Many ceramicelements are arranged in a spherical pattern. When energy passes through them, they vibrate andsend shock waves through a coupling medium to the stone. 2c and d) Electromagnetic lithotripsy. Anelectromagnetic coil (2c) or cylinder (2d) are stimulated to vibrate by passage of electric current. Theirshock waves are focused on the stone (F2) by an acoustic lens (2c) or a parabolic reflector.
stone. The need for frequent replacement of the electrodeincreases the cost of electrohydraulic lithotripsy.
Piezoelectric Generator. Piezoelectric shock waves aregenerated (Fig. 2b) by the sudden expansion of ceramicelements excited by a high frequency, high voltage pulse.Thousands of these elements are placed along the innersurface of a hemisphere at the base of a pool of water. Whileeach of these elements moves only slightly in response to apulse of electrical energy, the summation of the simulta-neous expansion of multiple elements results in a highenergy shock wave directed to the focal area, at the centerof the sphere. The shock wave is propagated through eithera small water basin or a water-filled bag to the focal point,F2. The spherical focusing mechanism of the piezoelectriclithotripters provides a wide area of shock wave entry atthe skin surface, which causes minimal patient discomfort,but a very small focal area with the smallest amount ofenergy at F2 compared to other energy sources (7). Thesmall focal area necessitates greater precision to focus andfragment the stone inside the kidney.
Electromagnetic Generator. In electromagnetic devices(Fig. 2c and d), shock waves are generated when an elec-trical impulse moves a thin, spherical metallic membrane,which is housed within a cylindrical shock tube. The result-ing shock wave, produced in the water-filled shock tube,passes through an acoustic lens and is thereby directed tothe focal point, F1 (Fig. 2c). The shock wave is coupled to thebody surface with a moveable water cushion and couplinggel (8). Alternatively, when energy is passed through acylindrical coil, the resulting magnetic field pushes awaythe surrounding cylindrical membrane producing a shockwave that can be focused by a parabolic reflector (Fig. 2d).While these devices produce reliable shock waves withconsistent pressures and focus on F2, they also producesmall focal regions that may result in reduced stone frag-mentation and higher tissue parenchymal injury.
Shock Wave Focusing. Shock waves must be focused inorder to concentrate their energy on a calculus. The type ofshock wave generation dictates the method of focusingused. Machines that utilize point sources, such as spark-gap electrodes (electrohydraulic lithotripters), generateshock waves that travels in an expanding circular pattern.All of these machines use ellipsoid reflectors for focusingshock waves at the second focal point, F2.
Since a single piezoelement produces a very smallamount of energy, larger transducers with multiple cera-mic elements are required for piezoelectric lithotripters.The array of elements is positioned in a spherical dish thatallows focusing in a very small focal region, F1. Finally, thevibrating metal membranes of the electromechanical litho-tripters produce an acoustical plane wave that uses anacoustic lens for focusing the shock wave at F1.
Coupling Medium
The original Dornier HM3 machine utilized a 1000 L waterbath to transmit shock waves into the patient. This methodof patient coupling required unique positioning of thepatient, since the anesthetized subject had to be lowered
into the tub and the calculus accurately positioned at thesecond focal point. Second generation lithotripters weredesigned to alleviate the physiologic, functional, and eco-nomic problems of a large water bath. Current models utilizean enclosed water cushion, or a totally contained shock tube,to allow simplified positioning and ‘‘dry’’ lithotripsy (9).
Stone Localization
Stone localization during lithotripsy is accomplished witheither fluoroscopy or ultrasonography. Fluoroscopy pro-vides the urologist with a familiar modality and has theadded benefits of effective ureteral stone localization. How-ever, fluoroscopy requires more space, carries the inherentrisk of ionizing radiation to both the patient and medicalstaff and is not useful in localizing radiolucent calculi(certain noncalcium-containing stones are not seen onfluoroscopy or conventional radiographs).
Ultrasonography utilizes sound waves to locate stones.These sound waves are generated at a source. When theyencounter different tissue densities, part of the sound waveis reflected back and these reflected waves are used togenerate a two dimensional image that can be used tofocus the shock wave on a calculus. Sonography-basedlithotripters offer the advantages of stone localization withcontinuous monitoring and effective identification of radi-olucent stones, without radiation exposure (7). Addition-ally, ultrasound has been documented to be effective inlocalizing stone fragments as small as 2–3 mm, and is asgood or better than routine radiographs to assess patientsfor residual stone fragments following lithotripsy (8). Themajor disadvantages of ultrasound stone localizationinclude the basic mastery of ultrasonic techniques by theurologist and the inherent difficulty in localizing ureteralstones. While there are several systems that utilize bothultrasound and fluoroscopy to aid in stone localization,many commercially available lithotripters now use a mod-ular design in which the fluoroscopy unit is not attached tothe lithotripter reducing storage space as well as allowinguse of the fluoroscopy unit for other procedures.
MECHANISMS OF STONE FRAGMENTATION
Due to recent advances made in the basic science of shockwave lithotripsy, there is a better understanding of howshock waves result in stone fragmentation. Both the posi-tive and negative portions of the shock wave (Fig. 1) arecritical in stone fragmentation and also play a role in renaltissue injury. The four mechanisms described for stonecomminution include compressive fracture, spallation,cavitation, and dynamic fatigue. As the calculus developsin vivo, it is formed by both crystallization of minerals aswell as organic matrix material. This combination forms aninhomogeneous and imperfect material that has naturaldefects. When the shock wave encounters this inhomoge-neous structure, the force generated in the plane of theshock wave places stress on these imperfections resultingin compression-induced tensile cracking. This mechanismis known as compressive fracture. Spallation, anothermechanism of shock wave induced stone fragmentation,occurs when the shock wave encounters fluid behind the
260 LITHOTRIPSY

stone and part of the wave is reflected back onto the stoneplacing tensile stress on the same imperfections.
Shock waves cause bubbles to form on the surface of thestone. These bubbles grow during the negative or tensilecomponent of the shock wave. When the positive componentof the next wave passes, these bubbles violently collapsereleasing their energy against the stone surface as secondaryshock waves and/or microjets. This phenomenon, known ascavitation, represents the third mechanism of stone fragmen-tation. Dynamic fatigue describes the sum of accumulateddamage to the stone that coalesce to result in stone fragmen-tation and eventually destruction of the stone (10,11).
CLINICAL RESULTS OF SHOCK WAVE LITHOTRIPSY
Because many experts continue to consider the DornierHM3 (the original electrohydraulic lithotripter, DornierMedTech America, Inc., Kennesaw, GA) the gold standardin lithotripsy, the available clinical literature comparing theDornier HM3 (first generation) lithotripter to other commer-cially available lithotripters is summarized in Table 1. Thistype of summary does not truly allow a comparison betweendifferent lithotripters currently in use. Yet, this comparisondemonstrates that modifications to second and third gen-eration lithotripters have traded better patient comfort for alessening of stone free rates. This current clinical data hasbeen one of the driving forces behind the modifications thatare currently being investigated to improve SWL.
Summarized results of five large early series on theclinical efficacy of SWL using the unmodified DornierHM3 lithotripter demonstrate stone free rates for renalpelvis (RP), upper calyx (UC), middle calyx (MC), and lowercalyx (LC) stones were 76% (48–85), 69% (46–82), 68% (52–76), and 59% (42–73), respectively. Stone free rates in theseseries were better for smaller stones (0–10 mm) and RPstones with relatively poorer stone free rates for LC stones.In comparison, results of five large published series on theSiemens Lithostar, a lower power machine demonstratedstone free rates for RP, UC, MC, and LC stones of 69% (55–80), 67% (46–90), 63% (43–82), and 60% (46–73). A compar-ison of integrated stone free rates stratified by size in aregression model of the HM3 and Lithostar found signifi-cantly greater stone free rates across all stone sizes for theHM3 lithotripter (11). While most studies have evaluatedthe efficacy of SWL for adults, stone free rates with the HM3are similar for children (21). The limited number of com-parative studies of newer machines and the explosion in thenumber of commercially available lithotripters makes itdifficult to assess their clinical efficacy.
While the HM3 has been shown to produce excellentstone free rates for renal calculi, there continues to bedebate on the clinical efficacy of SWL for ureteral stones.The main problem is that stones in the ureter are moredifficult to locate and therefore more difficult to target withthe shock wave. However, several studies have demon-strated stone free rates close to 100% for the treatmentof proximal ureteral stones with SWL (22). However, stonefree rates appear to decline to 70% for mid-ureteral stonesfor many lithotripters (23). Treatment of distal ureteralstones with SWL typically involves a prone or a modified
sitting position to allow shock wave targeting of the stonebelow the pelvic brim. Stone free rates of distal ureteralstones with the HM-3 lithotripter have been as high as85–96% (24). Endoscopic methods (ureteroscopy) can alsobe employed for ureteral stones, especially those located inthe distal ureter with equivalent or better stone free rates.
While many of the lithotripters sighted in Table 1 are nolonger in clinical use or have been updated, these studiesclearly demonstrated several key points. The HM3 con-tinues to provide equivalent and likely superior stone freerates when compared to other lithotripters in studies.While most commercially available lithotripters provideacceptable stone free rates for stones located within thekidney, these stones often require more treatment sessionsand adjunctive procedures to achieve the stone free rates ofthe HM3 device. Additionally, success rates with all litho-tripters declines the further the stone progresses down theureter and poses positioning challenges with alternativemethods indicated to remove ureteral stones.
TISSUE INJURY WITH CLINICAL LITHOTRIPSY
Clinical experience treating patients with SWL has demon-strated that while SWL is generally safe, shock waves cancause acute and chronic renal injury. This concept has beenconfirmed by multiple animal studies and a few humanclinical studies (11). Originally, shear stress to the tissuewas believed to be the main cause of this renal injury.However, recent studies have sugggested that SWLinduced renal injury is a vascular event induced by vaso-constriction or cavitation-induced injury to the microvas-culature (25). Additionally, this initial tissue damage maypromote further renal injury via the effects of free radicalproduction (26). Acute damage to the kidney appears to bemainly a vascular insult.
While clinicians have long recognized the acute effectsof SWL, most have believed that there was no long-termsequela to shock wave treatment. The> 25 years of clinicalexperience with SWL serves as a testament to its safetyand effectiveness. However, several chronic problems maydevelop as a consequence of SWL. Table 2 summarizes theacute and chronic effects of SWL. Perhaps the most seriouslong-term problem of SWL is the increased risk of hyper-tension. A review of 14 studies on the impact of SWL on bloodpressure demonstrated that when stratified according to thenumber of shock waves administered, higher doses of shockwaves seem to correlate with a greater likelihood of increasedrates of new-onset hypertension or changes in diastolic bloodpressure (11). The impact of hypertension on cardiovasculardisease including the risk of myocardial infarction, stroke,and renovascular disease make this a serious long-term effectthat needs further investigation.
Three mechanisms of SWL induced tissue injury havebeen reported: cavitation, vasoconstriction, and free radi-cal induced tissue injury. Investigators have demonstratedin vitro that cavitation bubble expansion can ruptureartificial blood vessels (5). Other investigators have shownin animal models that cavitation takes place in kidneysexposed to shock waves (27). While cavitation bubbles thatform on the stone surface contribute to stone fragmentation,
LITHOTRIPSY 261

Table 1. Literature Comparison of Lithotripters to Gold Standard Dornier HM3
Study Type Reference HM3 Compared to:
StoneLocation
Number ofPatients
Stone Free Rates(SFR), %
AuxiliaryProcedures
RetreatmentRate, % Comment
Prospective 12 Wolf Piezolith Kidney HM3: 334Wolf: 378
HM3: 75Wolf: 72 HM3: 15.5Wolf: 45
Wolf required moreretreatment, more shocks,treatment ratesdecreased dramaticallyfor ureteral stoneswith Wolf
13 EDAP LT01 Kidney HM3: 500EDAP: 500
HM3:77.2-90.4EDAP: 42.5-87.5
> with EDAP More sessions, increasedshocks requiredwith EDAP
14 MFL 5000 Kidney 198 total HM3: 80MFL: 56 Increased subcapsularhematoma and longertreatment timeswith MFL
15 Wolf Piezolith 2300 Ureter 70 total HM3: 74Wolf: 76.6 Comparable 3 monthSFR but used plainradiographs forcomparison
16 Siemens Lithostar Kidney HM3: 91Siemens:85 HM3: 91Siemens: 65 HM3: 4Siemens: 13
SFR comparable at3 months, Increasedtissue injury withHM3 by urinaryenzymes
Retrospective 17 EDAP LT01Sonolith 2000
Kidneyand ureter
HM3: 70EDAP:113Sono: 104
HM3: 79EDAP:82Sono: 79
HM3: 12EDAP:13Sono: 9
HM3: 4EDAP:42Sono: 26
SFR at 3 monthscomparable withHM3 and EDAP, lowerfor Sonolith, lowerretreatment with HM3
18 Siemens Lithostar,Dornier HM4,Wolf Piezolith 2300,Direx Tripter X-L,Breakstone
Kidney andureter
Multicenter comparable between2nd generation
All were deemed inferiorto HM3 in terms of stonefree rates
19 Medstone STS Kidney HM3: 5698Med:8166
HM3: 70Med: 81.5 HM3: 3.1Med: 5.5 HM3: 4.4Med: 5.2
Slightly better retreatmentand need for auxiliaryprocedures with HM3
20 Lithotron Kidney 38 matched pairs HM3: 79Lithotron:58
> for Lithotron > for Lithotron HM3 superior to Lithotronusing matched pairanalysis
11 Siemens Lithostar Meta-analysis HM3: 59-76Siemens: 60-69
Using regression model,SFR better withHM3 across allstone sizes
262
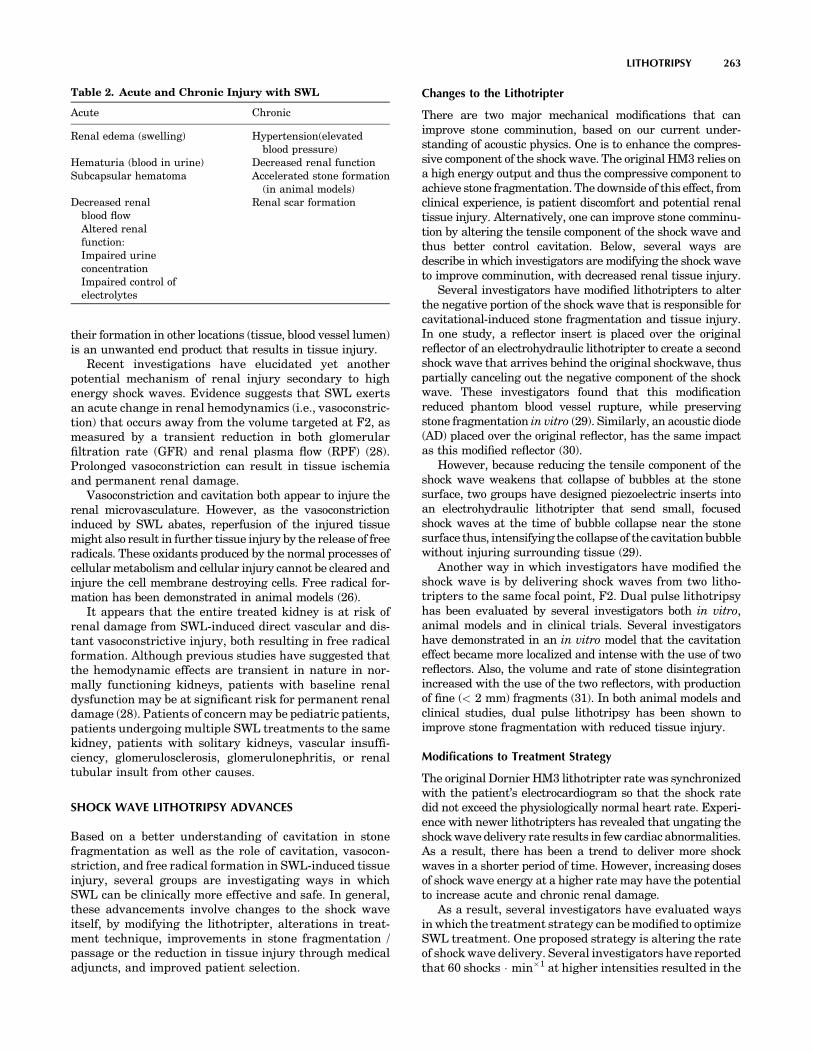
their formation in other locations (tissue, blood vessel lumen)is an unwanted end product that results in tissue injury.
Recent investigations have elucidated yet anotherpotential mechanism of renal injury secondary to highenergy shock waves. Evidence suggests that SWL exertsan acute change in renal hemodynamics (i.e., vasoconstric-tion) that occurs away from the volume targeted at F2, asmeasured by a transient reduction in both glomerularfiltration rate (GFR) and renal plasma flow (RPF) (28).Prolonged vasoconstriction can result in tissue ischemiaand permanent renal damage.
Vasoconstriction and cavitation both appear to injure therenal microvasculature. However, as the vasoconstrictioninduced by SWL abates, reperfusion of the injured tissuemight also result in further tissue injury by the release of freeradicals. These oxidants produced by the normal processes ofcellular metabolism and cellular injury cannot be cleared andinjure the cell membrane destroying cells. Free radical for-mation has been demonstrated in animal models (26).
It appears that the entire treated kidney is at risk ofrenal damage from SWL-induced direct vascular and dis-tant vasoconstrictive injury, both resulting in free radicalformation. Although previous studies have suggested thatthe hemodynamic effects are transient in nature in nor-mally functioning kidneys, patients with baseline renaldysfunction may be at significant risk for permanent renaldamage (28). Patients of concern may be pediatric patients,patients undergoing multiple SWL treatments to the samekidney, patients with solitary kidneys, vascular insuffi-ciency, glomerulosclerosis, glomerulonephritis, or renaltubular insult from other causes.
SHOCK WAVE LITHOTRIPSY ADVANCES
Based on a better understanding of cavitation in stonefragmentation as well as the role of cavitation, vasocon-striction, and free radical formation in SWL-induced tissueinjury, several groups are investigating ways in whichSWL can be clinically more effective and safe. In general,these advancements involve changes to the shock waveitself, by modifying the lithotripter, alterations in treat-ment technique, improvements in stone fragmentation /passage or the reduction in tissue injury through medicaladjuncts, and improved patient selection.
Changes to the Lithotripter
There are two major mechanical modifications that canimprove stone comminution, based on our current under-standing of acoustic physics. One is to enhance the compres-sive component of the shock wave. The original HM3 relies ona high energy output and thus the compressive component toachieve stone fragmentation. The downside of this effect, fromclinical experience, is patient discomfort and potential renaltissue injury. Alternatively, one can improve stone comminu-tion by altering the tensile component of the shock wave andthus better control cavitation. Below, several ways aredescribe in which investigators are modifying the shock waveto improve comminution, with decreased renal tissue injury.
Several investigators have modified lithotripters to alterthe negative portion of the shock wave that is responsible forcavitational-induced stone fragmentation and tissue injury.In one study, a reflector insert is placed over the originalreflector of an electrohydraulic lithotripter to create a secondshock wave that arrives behind the original shockwave, thuspartially canceling out the negative component of the shockwave. These investigators found that this modificationreduced phantom blood vessel rupture, while preservingstone fragmentation in vitro (29). Similarly, an acoustic diode(AD) placed over the original reflector, has the same impactas this modified reflector (30).
However, because reducing the tensile component of theshock wave weakens that collapse of bubbles at the stonesurface, two groups have designed piezoelectric inserts intoan electrohydraulic lithotripter that send small, focusedshock waves at the time of bubble collapse near the stonesurface thus, intensifying the collapse of the cavitation bubblewithout injuring surrounding tissue (29).
Another way in which investigators have modified theshock wave is by delivering shock waves from two litho-tripters to the same focal point, F2. Dual pulse lithotripsyhas been evaluated by several investigators both in vitro,animal models and in clinical trials. Several investigatorshave demonstrated in an in vitro model that the cavitationeffect became more localized and intense with the use of tworeflectors. Also, the volume and rate of stone disintegrationincreased with the use of the two reflectors, with productionof fine (< 2 mm) fragments (31). In both animal models andclinical studies, dual pulse lithotripsy has been shown toimprove stone fragmentation with reduced tissue injury.
Modifications to Treatment Strategy
The original Dornier HM3 lithotripter rate was synchronizedwith the patient’s electrocardiogram so that the shock ratedid not exceed the physiologically normal heart rate. Experi-ence with newer lithotripters has revealed that ungating theshock wave delivery rate results in few cardiac abnormalities.As a result, there has been a trend to deliver more shockwaves in a shorter period of time. However, increasing dosesof shock wave energy at a higher rate may have the potentialto increase acute and chronic renal damage.
As a result, several investigators have evaluated waysin which the treatment strategy can be modified to optimizeSWL treatment. One proposed strategy is altering the rateof shock wave delivery. Several investigators have reportedthat 60 shocks � min�1 at higher intensities resulted in the
LITHOTRIPSY 263
Table 2. Acute and Chronic Injury with SWL
Acute Chronic
Renal edema (swelling) Hypertension(elevatedblood pressure)
Hematuria (blood in urine) Decreased renal functionSubcapsular hematoma Accelerated stone formation
(in animal models)Decreased renal
blood flowAltered renalfunction:Impaired urineconcentrationImpaired control ofelectrolytes
Renal scar formation

most efficient stone fragmentation than 120 shocks � min�1.This has been confirmed in vitro, in animal models and alsoin randomized clinical trials. These studies speculate that atincreased rates, more cavitation bubbles were formed inboth the fluid and tissue surrounding the stone that didnot dissipate between shocks. As a result, these bubblesscattered the energy of subsequent shocks resulting indecreased efficiency of stone fragmentation (32).
In order to acclimate patients to shock waves in clinicaltreatment, lower energy settings are typically used andgradually increased. A study investigating whetherincreasing voltage (and thus increasing treatment dose)impacted on stone fragmentation has been performed invitro and in animal models. Stones fragmented into smallerpieces when they were exposed to increasing energy com-pared to decreasing energy. The authors speculate that thelow voltage shock waves ‘‘primed’’ the stone for fragmenta-tion at higher voltages (33). In addition, animals exposed toan increasing voltage had less tissue injury than thosekidneys exposed to a decreasing or stable dose of energy.While this treatment strategy has not been tested clini-cally, it might be able to improve in vivo stone comminutionwhile decreasing renal parenchymal injury (34).
In the same vein, several studies have reported thatpretreating the opposite pole of a kidney with a low voltagedose of shock waves (12 kV), prior to treating a stone in theother pole of a kidney with a normal dosage of shock waves,reduced renal injury when as little as 100 low voltage shockswere delivered to the lower pole. It is believed that the lowvoltage shock waves causes vasoconstriction which protectsthe treated pole of the kidney from hemorrhagic injury (35).
Other SWL treatment modifications being tested includealigning the shock wave in front of the stone in order toaugment cavitation activity at the stone surface or applyoverpressure in order to force cavitation bubble collapse.While these techniques have only been investigated in vitro,these alterations in shock wave delivery, as well as theprevious treatment strategies demonstrate how an improvedunderstanding of the mechanisms of SWL can enhance stonecomminution and potential reduce renal tissue injury (36,37).
Adjuncts to Improve SWL Safety and Efficacy
Antioxidants. A number of studies have investigatedthe role of antioxidants in protecting against free radicalinjury to renal parenchyma (38). Table 3 summarizes theresults of various in vitro and in vivo studies on the use ofantioxidants to protect against SWL-induced renal injurydue to free radicals. While these studies are intriguing,further clinical trials will be needed to evaluate potentialantioxidants for use in patients undergoing SWL.
Improving Stone Fragmentation. Another potential wayto improve stone fragmentation is to alter the stone’ssusceptibility to shock wave energy. One group has demon-strated that after medically pretreating stone in an in vitroenvironment, one could achieve improved stone fragmen-tation. These data suggest that by altering the chemicalenvironment of the fluid surrounding the stones it ispossible to increase the fragility of renal calculi in vitro(49). Further studies are warranted to see if calculi can be
clinically modified, prior to SWL therapy, in the hopes ofenhanced stone fragmentation.
Improving Stone Expulsion. Several reports have demon-strated that calcium channel blockers, steroids, and alphablockers all may improve spontaneous passage of ureteralstones. (ref) Compared to a control group, investigators foundimproved stone clearance and shorter time to stone free inpatients treated with nifedipine or tamsulosin following SWLcompared to the control group. Additionally, retreatment rateswere lower (31%) for the medical treatment group compared tothe control group (51%). While expulsive therapy appears tooffer improved outcomes following SWL for ureteral stones,confirmation with a randomized controlled study is needed(50). Another intriguing report from the same group involvesthe use of Phyllanthus niruri (Uriston) to improve stoneclearance of renal stones following SWL. This medication isderived from a plant used in Brazilian folk medicine that hasbeen used to treat nephrolithiasis. Again, stone free rates wereimproved with the administration of Uriston following SWLcompared to a control group with apparently the greatesteffect seen in those patients treated with lower pole stones (51).
Improving Stone/Patient Selection for SWL. Another wayto enhance the efficacy of SWL is improve patient selection.Advances in computed tomography (CT) have allowed betterdetermination of internal stone architecture (52). As a con-sequence, a few studies have demonstrated that determiningthe Hounsefield units (i.e., density unit of material on CT) ofrenal stones on pretreatment, noncontrasted CT could pre-dict stone free rates of patients treated with SWL (53).Current micro-CT and newer multidetector CT scannershave the potential to identify stone composition based onCT attenuation. Therefore, stone compositions that are SWLresistant, such as calcium oxalate monohydrate or cystinestones, can be identified and those patients can be treatedwith endoscopic modalities, therebye avoiding additionalprocedures in these patients (54). Clinical trials utilizing thisconcept will need to be performed.
Other factors, such as the distance of the stone from theskin, weight of the patient, and other imaging modalities,are being investigated to help determine who is likely tobenefit the most from SWL and which patients should betreated initially with other modalities.
264 LITHOTRIPSY
Table 3. Investigated Antioxidants Providing Protectionagainst SWL-Induced Free Radical Injury
Reference Study Type Antioxidant
39 In vitro nifedipine, verapamil,diltiazem
40 In vitro Vitamin E, citrate41 In vitro, animal Selenium42 Animal Verapamil43 Animal Verapamil26 Animal Allopurinol44 Animal Astragulus membranaceus,
verapamil45 Human Antioxidant vitamin46,47 Human Verapamil, nifedipine48 Human Mannitol

CONCLUSIONS
Shock wave lithotripsy has revolutionized the way in whichurologists manage urinary calculi. Patients can now betreated with minimal discomfort using an outpatient pro-cedure. While all lithotripters rely on the same funda-mental principles of acoustic physics, second and thirdgeneration lithotripters appear to have traded patientcomfort and operator convenience for reduced stone freerates, as compared to the original HM3 lithotripter. Inaddition, mounting evidence demonstrates that SWL hasboth acute and chronic impact on renal function and bloodpressure as a result of renal scarring.
Basic science research has provided insight into howSWL results in stone comminution as well as renal tissueinjury. While the compressive component of the shockwave causes stone comminution, it is apparent that thetensile component plays a critical role in creating passablestone fragments. These same forces cause tissue injury bydamaging the microvasculature of the kidney. This knowl-edge has resulted in several novel modifications toimprove both stone free rates as well as SWL safety.Mechanical modifications to lithotripsy have focused oncontrolling cavitation. Preventing bubble expansion inblood vessels while intensifying bubble collapse near thestone surface has been demonstrated to achieve improvedstone comminution with decreased tissue injury in vitroand in animal models. Many of these designs could beadapted to conventional lithotripters. Modification oftreatment techniques have also stemmed from our betterunderstanding of SWL. Slowing treatment rates may limitthe number of cavitation bubbles that can interfere withthe following shock wave. Voltage stepping and alterna-tive-site pretreatment with low dose shock waves, maycause global renal vasoconstriction that prevents cavita-tional injury to small vessels during treatment. In addi-tion, our understanding that free radicals may be the endculprit in parenchymal damage has suggested that pre-treatment with antioxidants may prevent SWL-inducedrenal injury. Finally, improved CT imaging may allow usto predict which stones and patients are best suited forSWL versus endoscopic stone removal. Further advanceswill continue to make SWL a major weapon in the waragainst stone disease for years to come.
BIBLIOGRAPHY
1. Lokhandwalla M, Sturtevant B. Fracture mechanics model ofstone comminution in ESWL and implications for tissuedamage. Phys Med Biol 2000;45:1923–1940.
2. Coleman AJ, Saunders JE, Crum LA, Dyson M. Acousticcavitation generated by an extracorporeal shockwave litho-tripter. Ultrasound Med Biol 1987;13:69–76.
3. Zhu S, Cocks FH, Preminger GM, Zhong P. The role of stresswaves and cavitation in stone comminution in shock wavelithotripsy. Ultrasound Med Biol 2002;28:661–671.
4. Howard D, Sturtevant B. In vitro study of the mechanicaleffects of shock-wave lithotripsy. Ultrasound Med Biol1997;23:1107–1122.
5. Zhong P, Zhou Y, Zhu S. Dynamics of bubble oscillation inconstrained media and mechanisms of vessel rupture in SWL.Ultrasound Med Biol 2001;27:119–134.
6. Chaussy C, et al. First clinical experience with extracorpore-ally induced destruction of kidney stones by shock waves. JUrol 1982;127:417–420.
7. Preminger GM. Sonographic piezoelectric lithotripsy: Morebang for your buck. J Endourol 1989;3:321–327.
8. Abernathy BB, et al. Evaluation of residual stone fragmentsfollowing lithotripsy: Sonography versus KUB. In: LingemanJE, Newman DM., editors. Shock Wave Lithotripsy II.New York: Plenum Press; 1989. pp 247–254.
9. Cartledge JJ, Cross WR, Lloyd SN, Joyce AD. The efficacy of arange of contact media as coupling agents in extracorporealshockwave lithotripsy. BJU Int 2001;88:321–324.
10. Eisenmenger W. The mechanisms of stone fragmentation inESWL. Ultrasound Med Biol 2001;27:683–693.
11. Lingeman JE, Lifshitz DA, Evan AP. Surgical Management ofUrinary Lithiasis. In: Walsh PC, Retik AB, Vaughan ED, Jr.,Wein AJ., editors. Campbell’s Urology. Philadelphia: Saun-ders; 2002. p 3361–3451.
12. Rassweiler J, et al. Wolf Piezolith 2200 versus the modifiedDornier HM3. Efficacy and range of indications. Eur Urol1989;16:1–6.
13. Sofras F, et al. Extracorporeal shockwave lithotripsy or extra-corporeal piezoelectric lithotripsy? Comparison of costs andresults. Br J Urol 1991;68:15–17.
14. Chan SL, et al. A prospective trial comparing the efficacy andcomplications of the modified Dornier HM3 and MFL 5000 litho-triptors for solitary renal calculi. J Urol 1995;153:1794–1797.
15. Francesca F, et al. Ureteral lithiasis: In situ piezoelectricversus in situ spark gap lithotripsy. A randomized study. ArchEsp Urol 1995;48:760–763.
16. Graber SF, Danuser H, Hochreiter WW, Studer UE. A prospec-tive randomized trial comparing 2 lithotriptors for stone disin-tegration and induced renal trauma. J Urol 2003;169: 54–57.
17. Tan EC, Tung KH, Foo KT. Comparative studies of extracor-poreal shock wave lithotripsy by Dornier HM3, EDAP LT 01and Sonolith 2000 devices. J Urol 1991;146:294–297.
18. Bierkens AF, et al. Efficacy of second generation lithotriptors:A multicenter comparative study of 2,206 extracorporeal shockwave lithotripsy treatments with the Siemens Lithostar, DornierHM4, Wolf Piezolith 2300, Direx Tripter X-1 and Breakstonelithotriptors. JUrol1992;148:1052–1056.Discussion1056–1057.
19. Cass AS. Comparison of first generation (Dornier HM3) andsecond generation (Medstone STS) lithotriptors: Treatmentresults with 13,864 renal and ureteral calculi. J Urol1995;153:588–592.
20. Portis AJ, et al. Matched pair analysis of shock wave litho-tripsy effectiveness for comparison of lithotriptors. J Urol2003;169:58–62.
21. Cass AS. Comparison of first-generation (Dornier HM3) andsecond-generation (Medstone STS) lithotripters: Treatmentresults with 145 renal and ureteral calculi in children. JEndourol 1996;10:493–499.
22. Robert M, A’Ch S, Lanfrey P, Guiter J, Navratil H. Piezo-electric shockwave lithotripsy of urinary calculi: Comparativestudy of stone depth in kidney and ureter treatments. JEndourol 1999;13:699–703.
23. Marguet CG, Springhart WP, Auge BK, Preminger GM.Advances in the surgical management of nephrolithiasis.Minerva Urol Nefrol 2004;56:33–48.
24. Rodrigues Netto Junior N, Lemos GC, Claro JF. In situextracorporeal shock wave lithotripsy for ureteral calculi. JUrol 1990;144:253–254.
25. Evan AP, et al. Shock wave lithotripsy-induced renal injury.Am J Kidney Dis 1991;17:445–450.
26. Munver R, et al. In vivo assessment of free radical activityduring shock wave lithotripsy using a microdialysis system: Therenoprotective action of allopurinol. J Urol 2002;167:327–334.
LITHOTRIPSY 265

27. Evan AP, et al. In vivo detection of cavitation in parenchyma ofthe pig kidney during shock wave lithotripsy. American Urolo-gical Association Annual Meeting. Orlando (FL): 2002. p 1500.
28. Willis LR, et al. Effects of SWL on glomerular filtration rateand renal plasma flow in uninephrectomized minipigs. JEndourol 1997;11:27–32.
29. Zhou Y, Cocks FH, Preminger GM, Zhong P. Innovations inshock wave lithotripsy technology: updates in experimentalstudies. J Urol 2004;172:1892–1898.
30. ZhuS,etal.Reductionoftissueinjuryinshock-wavelithotripsybyusing an acoustic diode. Ultrasound Med Biol 2004; 30:675–682.
31. Sheir KZ, et al. Evaluation of synchronous twin pulse techniquefor shock wave lithotripsy: determination of optimal parametersfor in vitro stone fragmentation. J Urol 2003; 170:2190–2194.
32. Paterson RF, et al. Stone fragmentation during shock wavelithotripsy is improved by slowing the shock wave rate: studieswith a new animal model. J Urol 2002;168:2211–2215.
33. McAteer JA, et al. Voltage-Stepping During SWL InfluencesStone Breakage Independent of Total Energy Delivered:
In vitro studies with model stones. American Urological Asso-ciation Annual Meeting. Chicago: 2003. p 1825.
34. Maloney M, et al. Treatment strategy improves the in vivostone comminution efficiency and reduces renal tissue injuryduring shock wave lithotripsy. American Urological Associa-tion Annual Meeting. San Antonio (TX): 2005. p 1108.
35. Willis LR, et al. Same-pole application of low- and high-energyshock waves protects kidney from swl-induced tissue injury.American Urological Association Annual Meeting. SanFrancisco: 2004. p 1114.
36. Sapozhnikov OA, et al. Effect of overpressure and pulse repe-tition frequency on cavitation in shock wave lithotripsy. JAcoust Soc Am 2002;112:1183–1195.
37. Sokolov DL, et al. Prefocal alignment improves stone commi-nution in shockwave lithotripsy. J Endourol 2002;16:709–715.
38. Preminger GM. Review: in vivo effects of extracorporeal shockwave lithotripsy: animal studies. J Endourol 1993;7: 375–378.
39. Jan CR, Chen WC, Wu SN, Tseng CJ. Nifedipine, verapamiland diltiazem block shock-wave-induced rises in cytosoliccalcium in MDCK cells. Chin J Physiol 1998;41:181–188.
40. Delvecchio F, et al. Citrate and Vitamin E Blunt the SWLInduced Free radical surge in an in-vitro MDCK cell culturemodel. American Urological Association Annual Meeting. SanFrancisco: 2004. p 1120.
41. Strohmaier WL, Lahme S, Bichler KH. Amelioration of highenergy shock wave induced renal tubular injury by selenium-an in vivo study in rats. American Urological AssociationAnnual Meeting. Anaheim (CA): 2004. p 1529.
42. Yaman O, et al. Protective effect of verapamil on renal tissueduring shockwave application in rabbit model. J Endourol1996;10:329–333.
43. Willis LR, et al. Effects of extracorporeal shock wave litho-tripsy to one kidney on bilateral glomerular filtration rate andPAH clearance in minipigs. J Urol 1996;156:1502–1506.
44. Sheng BW, et al. Astragalus membranaceus reduces freeradical-mediated injury to renal tubules in rabbits receivinghigh-energy shock waves. Chin Med J (Engl) 2005;118:43–49.
45. Kehinde EO, et al. The effects of antioxidants on renal damageoccuring during treatment of renal calculi by lithotripsy.American Urological Association Annual Meeting. San Anto-nio (TX): 2005. p 1698.
46. Strohmaier WL, et al. Protective effect of verapamil on shockwave induced renal tubular dysfunction. J Urol 1993;150:27–29.
47. Strohmaier WL, et al. Limitation of shock-wave-induced renaltubular dysfunction by nifedipine. Eur Urol 1994;25:99–104.
48. Ogiste JS, et al. The role of mannitol in alleviating renal injuryduring extracorporeal shock wave lithotripsy. J Urol 2003;169:875–877.
49. Heimbach D, et al. The use of chemical treatments for improvedcomminution of artificial stones. J Urol 2004;171: 1797–1801.
50. Micali S, et al. Efficacy of expulsive medical therapy usingnifedipine or tamsulosin after shock wave lithotripsy of uret-eral stones. American Urological Association Annual Meeting.San Antonio (TX): 2005. p 1680.
51. Antonio C, et al. May Phyllanthus niruri (Uriston) affect theefficacy of ESWL on renal stnoes? A prospective, randomisedshort term study. American Urological Association AnnualMeeting. San Antonio (TX): 2005. p 1696.
52. Zarse CA, et al. Nondestructive analysis of urinary calculiusing micro computed tomography. BMC Urol 2004;4:15.
53. Saw KC, et al. Calcium stone fragility is predicted by helicalCT attenuation values. J Endourol 2000;14:471–474.
54. Williams JC, et al. Progress in the use of helical CT for imagingurinary calculi. J Endourol 2004;18:937–941.
See also MINIMALLY INVASIVE SURGERY; ULTRASONIC IMAGING.
LIVER TRANSPLANTATION
PAUL J. GAGLIO
Columbia University Collegeof Physicians and SurgeonsNew York, New York
INTRODUCTION
From a conceptual perspective, liver transplantation involvesthe replacement of a diseased or injured liver with a neworgan. Historically, liver transplantation has emerged froman experimental procedure deemed ‘‘heroic’’ therapy forpatients not expected to survive, to the treatment of choicewith anticipated excellent long-term outcomes for patientswith end stage liver disease. This article will outline thehistory of and indications for liver transplantation, delineateshort- and long-term complications associated with the pro-cedure, and discuss the role of immunosuppressive therapy,intrinsic to the long-term success of the procedure.
HISTORY
Historically, the most significant and persistent impedi-ment to liver transplantation has been the availability ofsuitable organs. Up until the early 1960s, ‘‘death’’ wasdefined as cessation of circulation, and thus, donation fromdeceased donors was thought to be both impractical andimpossible, as organs harvested from pulseless, nonperfus-ing donors would not function when transplanted, due tomassive cellular injury. The concept of ‘‘brain death’’ andability to harvest organs from individuals defined as suchfirst occurred at Massachusetts General Hospital in theearly 1960s, when a liver was harvested from a patientwhose heart was beating despite central nervous systemfailure. This seminal event led to the development of a newconcept; death was defined when cessation of brain functionoccurred, rather than the cessation of circulation. Thus, braindead donors with stable blood pressure and the absence ofcomorbid disease could serve as potential organ donors.Improvements in the ability to preserve and transport organsdramatically increased organ availability, necessitating a
266 LIVER TRANSPLANTATION

centralized system to facilitate procurement and allocation oforgans to individuals waiting for transplantation. This wasinitially provided by SEOPF (the Southeast Organ Procure-ment Foundation), founded in 1968, from which UNOS (theUnited Network for Organ Sharing) arose. At present, UNOSoperates the OPTN (Organ Procurement and Transplanta-tion Network), providing a centralized agency that facilitatesrecovery and transportation of organs for transplantation,and appropriately matches donors and recipient.
LIVER TRANSPLANTATION: INITIAL RESULTS
The first reported liver transplantation occurred in 1955, inthe laboratory of Dr. Stuart Welch (1). In a dog model, an‘‘auxiliary’’ liver was transplanted into the abdominal cavity,leaving the native liver in situ. Between 1956 and 1960,various investigators initiated experiments in different animalmodels whereby ‘‘orthotopic’’ liver transplantation was per-formed, achieved by removal of the native liver and implanta-tion of a ‘‘new’’ liver in its place, requiring anastamoses of thedonor and recipient hepatic vein and artery, bile duct, andportal vein (see Fig. 1). These initial attempts at liver trans-plantation refined the surgical procedure, however, graft dys-function and death of the animals occurred quickly, due toineffective immunosuppression and eventual rejection of theliver mediated by the animal’s immune system (2).
The first human liver transplants were performed byDr. Thomas Starzl in 1963, at the University of Colorado(3). These early attempts at transplantation highlightedthe difficulties associated with extensive abdominal sur-gery in desperately ill patients, and were associated withpoor outcomes, largely due to technical difficulties and theinability to effectively prevent rejection. Similar negativeexperiences at other centers led to a worldwide moratoriumon liver transplantation. However, a major breakthroughin the ability to prevent rejection and prolong the survivalof the transplanted liver occurred following the availabilityof Cyclosporine in 1972 (described below). With continuedrefinement of the surgical techniques required to performliver transplantation, combined with the ability to minimize
organ rejection, posttransplant outcomes improved signifi-cantly. From 1963 to 1979, 170 patients underwent livertransplantation at the University of Colorado; 56 survivedfor 1 year, 25 for 13–22 years, and several remain alive today30 years after their surgery. Continued improvement inposttransplantation outcomes were achieved, and thus, in1983, the National Institutes of Health (NIH) establishedthat liver transplantation was no longer considered an‘‘experimental’’ procedure, rather, as definitive therapy forappropriately selected patients with end-stage liver disease.Additional advances in immunosuppression (reviewed below)including the discovery of polyclonal and monoclonal anti-bodies to T-cells or their receptors, and other agents such asTacrolimus, Mycophenolate Mofetil, and Sirolimus havefurther improved outcomes.
INDICATIONS FOR LIVER TRANSPLANTATION
Liver transplantation is an accepted therapeutic modality forcomplications of chronic liver disease, or acute liver failure. Ingeneral, liver transplantation is recommended when apatient with end stage liver disease manifests signs andsymptoms of hepatic decompensation, not controlled by alter-native therapeutic measures. This is evidenced by
1. Esophageal and/or gastric variceal bleeding, orbleeding from portal hypertensive gastropathy.
2. Hepatic encephalopathy.
3. Spontaneous bacterial peritonitis.
4. Significant ascites.
5. Coagulopathy.
Patients with liver disease complicated by early stagehepatocellular carcinoma (HCC), often defined as either asingle lesion <5 cm or not more than three lesions, each <3cm are also considered candidates for liver transplantationirrespective of evidence of concomitant hepatic decompen-sation (4).
If a patient meets these initial criteria, further require-ments must be realized. It is generally accepted that livertransplantation is indicated if the patient is not moribundand the transplant is likely to prolong life with a > 50%chance of 5-year survival. Furthermore, it is anticipatedthat the transplant will restore the patient to a range ofphysical and social function suitable for the activities ofdaily living. Patients who are suitable candidates shouldnot have comorbid disease with involvement of anothermajor organ system, which would preclude surgery orindicate a poor potential for rehabilitation.
Transplant candidates undergo a thorough psychologicalassessment prior to liver transplantation. Adequate familyand social support must be demonstrated to ensure adher-ence to the difficult long-term medical regimen that will berequired posttransplant. In addition, if a history of substanceabuse is present, most transplantation programs require thatthe patient complete at least 6 months of documented reha-bilitation with displayed freedom from alcohol and/or drugrecidivism. ‘‘Psycho-social’’ assessment is usually performedby several individuals, including a Psychiatrist or Psycholo-gist and an experienced social worker. In addition, living
LIVER TRANSPLANTATION 267
Suprahepaticvena cava
Infrahepaticvena cava
Portal vein
Hepatic artery
Bile duct
Figure 1. Schematic representation of an orthotopic livertransplant.

donor liver transplantation (LDLT), discussed in greaterdetail below, requires a detailed psychosocial assessment ofboth recipient and potential donor. In most transplantationcenters, an independent donor advocate team consisting of asocial worker, internist, and surgeon who are independent ofthe team evaluating the recipient performs the difficult taskof educating a potential donor regarding the risks and ben-efits of LDLT, assessing motivation to be a donor, anddetermining if coercion is present.
Another indication for liver transplantation is fulmi-nant hepatic failure, defined as hepatic encephalopathy(confusion) arising in the setting of massive liver injury in apatient without preexisting liver disease. This condition israpidly fatal unless recovery of hepatic function occursspontaneously, and thus, emergent liver transplantationmay be required. Conditions associated with fulminanthepatic are listed in Table 1.
ETIOLOGY OF LIVER DISEASES REQUIRING LIVERTRANSPLANTATION
Diseases associated with hepatic dysfunction in adults andchildrenareoutlined inTables2and3, respectively. Ingeneral,any disease process in adults or children that induces eitheracute or chronic hepatocellular, biliary, or vascular injury maynecessitate liver transplantation. The indications for livertransplantation in children are identical to those in adults, thatis, liver transplantation is indicated in the presence of progres-sive liver disease in patients who fail medical management.
Manyof thediseaseprocesses inadults that induce liver failureare recapitulated in children. However, specific disease statesseen in children including metabolic diseases and congenitalbiliary anomalies represent additional indications for livertransplant. Moreover, liver transplantation is indicated ininfants and children if the transplant will prevent or attenuatederangements in cognition, growth, and nutrition. Therefore,children should be considered for liver transplantation whenthere is evidence that hepatic decompensation is either una-voidable(basedonknowledgeofthehistoryofthediseaseitself),imminent, or has already occurred. The clinical scenarios thatdetermine when liver transplantation is required in childrencan include one or more of the following:
1. Intractable cholestasis.
2. Portal hypertension with or without variceal bleeding.
3. Multiple episodes of ascending cholangitis.
4. Failure of synthetic function (coagulopathy, lowserum albumin, low cholesterol).
5. Failure to thrive or achieve normal growth, and/orthe presence of cognitive impairment due to meta-bolic derangements, and malnutrition.
6. Intractable ascites.
7. Encephalopathy.
8. Unacceptable quality of life including failure to beable to attend school, intractable pruritis.
9. Metabolic defects for which liver transplantationwill reverse life-threatening illness and/or preventirreversible central nervous system damage.
268 LIVER TRANSPLANTATION
Table 1. Diseases Associated with Fulminant HepaticFailure
Viral InfectionFrequent Hepatitis A, B, D, E, Hepatitis Non A-G
Rare Hepatitis CCytomegalovirusEpstein Barr virusHerpes simplex virus
Metabolic Acute fatty liver of pregnancyReye’s SX
Toxin, Drugs AcetaminophenNsaid’sCCL4IsoniazidSodium valproateMethyl DOPATetracyclineHalothaneAmanita phalloides (mushroom poisoning)Yellow Phosphorus‘‘Herbal Medication’’
Drug Combos Acetaminophen and ETOHAcetaminophen and barbiturates,
isoniazid trimethoprim, andsulamethoxazole amoxicillinand clavulinic acid
Ischemic Hepatic artery thrombosisBudd-Chiari SyndromeRight ventricular failure, cardiac
tamponade shockMiscellaneous Hyperthermia
Hellp SX
Table 2. Indications for Liver Transplantation
Diseases Effecting Hepatic ParenchymaViral hepatitis with cirrhosis (Hepatitis B with or without
Delta Virus, Hepatitis C, Non A-E hepatitis)Autoimmune hepatitisAlcoholic cirrhosisMetabolic disorders (Wilson’s disease, hemochromatosis, alpha 1
Antitrypsin, Tyrosinemia, protoporphyria, Cystic fibrosis,familial amyloidosis, Neiman-Pick disease)
Fulminant hepatic failure due to any causeDrug induced liver disease
Diseases Effecting Biliary SystemPrimary and secondary biliary cirrhosisSclerosing cholangitisCaroli’s diseaseRelapsing cholangiohepatitisCholedochal cysts with obstruction and bilary cirrhosis
Hepatic Neoplasia/MalignanciesPatients with nonmetastatic primary hepatocellular carcinoma,
with;A single tumor not > 5 cmNo more than three lesions with the largest lesion < 3 cmNo thrombosis of the portal or hepatic vein
Hemangioendothelioma (confined to the liver)Neuro endocrine tumors with hepatic involvementLarge hepatic Hemangioma
Miscellaneous CausesHepatic vein thrombosis (Budd-Chiari syndrome)Portal vein thrombosisHepatic artery thrombosisTrauma

10. Life threatening complications of stable liver dis-ease (e.g., hepatopulmonary syndrome).
CONTRAINDICATIONS TO LIVER TRANSPLANTATION(ADULTS AND CHILDREN)
At present, ‘‘absolute exclusion’’ criteria for liver trans-plantation are evolving. In general, patients with advancedcardiac or pulmonary disease, severe pulmonary hyper-tension, active substance abuse, coma with evidence ofirreversible central nervous system injury, sepsis, oruncorrectable congenital abnormalities that are severeand life threatening are not transplant candidates. Inaddition, individuals with evidence of extrahepatic malig-nancy do not meet criteria for transplantation, unless thepatient meets standard oncologic criteria for ‘‘cure’’. ‘‘Rela-tive’’ exclusion criteria include renal insufficiency whenrenal transplantation is not feasible, prolonged respiratoryfailure requiring > 50% oxygen, advanced malnutrition,primary biliary malignancy, inability to understand therisk/benefits of the procedure, and inability to comply withmedications and conform to follow-up regimens. Recentdata indicates successful outcomes in HIV infected patientswho undergo liver transplantation, a population formerlyconsidered noncandidates for the procedure. However,initial enthusiasm regarding successful transplantation out-
comes must be restrained by evidence that HCV recurrencein HIV–HCV coinfected patients may be problematic (5).
RECIPIENT CHARACTERISTICS AND PRIORITIZATION FORTRANSPLANTATION
Given the relatively stable number of available donororgans in the setting of a rapidly expanding pool of poten-tial recipients, the timing of transplantation is critical.Liver transplantation in a stable patient who is anticipatedto do well for many years while waiting for an availableorgan may not be appropriate, while liver transplantationin a moribund patient with a low probability of posttrans-plantation survival is similarly inappropriate. Prior to1997, prioritization for liver transplantation was basedon the location where patients received their care (i.e.,home, hospital, intensive care unit) and waiting time onthe transplant list. In 2002, several policies were institutedby UNOS in an attempt to produce a more equitable organallocation scheme. Waiting time and whether the patientwas hospitalized were eliminated as determinants of prior-itization of organ allocation. The ‘‘MELD’’ score (Model forEnd Stage Liver Disease) a logarithmic numerical scorebased on the candidate’s renal function (creatinine), totalbilirubin, and INR (international normalized ratio for pro-thrombin time) has been shown to be the best predictor of
LIVER TRANSPLANTATION 269
Table 3. Additional Indications for Liver Transplantation in Infants and Children
Cholestatic Liver DiseaseObstructive: Biliary Atresia (most common indication for liver transplantation in children)Intrahepatic: Alagille’s Syndrome, Bylers disease, familial cholestatic symptoms
OtherCongenital hepatic fibrosisMetabolic Diseases
Disease Defect Inheritance Comments
Alpha 1 antitrypsin Decreased serum A1AT Codominant May reverse both liver and lung diseaseWilsons’s Disease Decreased Ceruloplasmin Autosomal
Recessive (AR)Tyrosinemia Fumarylacetoacetate hyrolase AR Transplant in fulminant liver failure,
or to prevent hepatic neoplasiaUrea cycle defects Example: ornithine
transcarbamylasex-linked
dominantPrevent CNS injury
Arginosuccinate synthetase ARGalactosemia Galactose phosphate uridyl transferase AR Prevent development of cirrhosis and HepatomaGlycogen storage Diseases Glucose 6 phosphatase AR Consider transplant if dietary management not
successfulType 1A
Type IVBrancher enzyme
Familialhypercholesteroloemia
Type 2 A-LDL receptor deficiency AR Avoids ASHD
Gaucher’s Disease Glucocerebrosidase AR May need combined liver/bone marrow t-plantNieman-Pick disease Sphingomyelinase ARCrigler-Najjar type 1 Uridine diphosphate glucoronly
transferaseAR prevents fatal Kernicterus
Cystic fibrosis Chloride ion transfer gene AR May need combined liver/lung transplantHyperoxaluria type 1 Alanine glyoxalate aminotransferase AR Usually requires combined liver/kidneyNeonatal Fe storage Unknown Varies Transplant as infantHemophilia A and B Factor VIII/IX x-linked Transplant indication varies (?iron overload,
factor inhibitor present)Disorders of bile acid
synthesis (Bylers disease)Unknown Varies Transplant indicated if associated with end stage
liver disease

mortality among cirrhotic patients, including those on thetransplant waiting list. It was therefore adopted by UNOSas a mechanism to prioritize waiting list candidates.MELD had been validated as a predictor of 3-month sur-vival in diverse groups of patients with various etiologiesand manifestations of liver disease (6). Presently, apatient’s position on the liver transplantation waiting listis now determined by their MELD score; patients withhighest MELD scores are ranked highest on the list.Prospective analysis of the impact of MELD indicatesimprovement in both the rate of transplantation, pretrans-plantation mortality, and short-term posttransplantationmortality rates (7). However, retrospective analysis hassuggested that posttransplantation survival may bereduced in patients with very high pretransplantationMELD score, particularly in Hepatitis C infected patients(8). Conversely, MELD score effectively delineates when apatient is ‘‘too well’’ for transplantation. A recent reviewindicates that posttransplantation survival in patientstransplanted with a MELD score of <15 is lower than anontransplanted cohort with similar MELD score (9).Thus, it is clear that careful recipient selection, withattention to pressor and ventilatory requirements, needfor dialysis, age, and MELD score are important factors inselecting appropriate candidates for liver transplantation.
LIVER TRANSPLANTATION: SOURCE OF ORGANS
At present, there are three potential types of organ donorsspecific to liver transplantation, identified as deceased, liv-ing, or non-heart beating. Deceased donors (DD) comprisethe majority of liver donors. Either by self-identificationwhile living, or after discussion with ‘‘next of kin’’ whendonor brain death has been declared, individuals areacknowledged as potential organ donors. Recent data fromUNOS indicate that 1- and 3-year patient survival in reci-pients of DD liver transplant is 81 and 71%, respectively(10). However, despite efforts to maximize utilization oforgans acquired from DD including the use of older donors,steatotic (fatty) livers, and livers infected with Hepatitis Cor B, a growing disparity exists between the number ofavailable livers and the number of individuals waitingfor transplantation. This critical shortage of organs hasresulted in both an increase in the waiting time for livertransplantation and death rate among patients on thewaiting list. In response, the modalities of adult-to-childand adult-to-adult LDLT have emerged as alternatives todeceased donor liver transplantation (11,12). Adult-to-childLDLT usually involves the removal of the left lateral seg-ment of the liver (�20% of hepatic mass) from an adult donorfor implantation into a child, while adult to adult livingdonor liver transplantation requires that the larger, rightlobe of the liver (which accounts for �50–60% of the hepaticmass) be removed from the donor to ensure adequate hepa-tic mass in the recipient. Rapid regeneration of the liverremnant in the donor and the partial allograft transplantedinto the recipient occurs, to the extent that appropriate livervolume is restored within 1–2 months in both donor andrecipient following surgery. Since most pediatric LDLTrecipients are <2-years old, they receive a liver graft of
adequate or even excessive size, and thus liver insufficiencydue to the receipt of inadequate liver mass is rare. Incontradistinction, as the recipient of an adult-to-adult livingdonor liver transplantation receives a graft that must overtime grow to an appropriate volume, selection of recipientsbest able to tolerate transplantation of a ‘‘partial’’ graft isnecessary. In appropriately selected pediatric and adultrecipients, 1- and 3-year graft and patient survival in indi-viduals who undergo LDLT is similar or superior to DD (10).However, when comparing postoperative complications inrecipients of DD versus LDLT, recipients of LDLT have agreater rate of biliary complications including bile leaks andbiliary strictures, which occur in 15–32% of patients (13). Inaddition, the ‘‘small-for-size syndrome’’ manifested as pro-longed posttransplantation cholestasis with or without por-tal hypertension may occur following LDLT, if the graft is ofinadequate size (14). Fortunately, the majority of patientswho experience this syndrome recover without the require-ment of retransplantation.
Recently, significant interest in the utilization of ‘‘non-heart beating’’ donors (donation after cardiac death,DACD) as a potential modality to further increase the poolof available organs has emerged. In contrast to DD who aredeclared brain dead, DACD are critically ill patients whoare not brain dead, but have no expectation of recovery andwho based on their own prior wishes or families request areremoved from life support. Following cardiac arrest anddeclaration of death, organs are harvested. There are twotypes of DACD, ‘‘controlled’’ and ‘‘uncontrolled’’. In thecontrolled DACD (Maastricht category 3 ‘‘death antici-pated’’) the patient is removed from life support and deathoccurs in the operating room. Once death has beendeclared, organs deemed suitable for transplantation arerapidly perfused with preservation solution and removedsurgically. The uncontrolled DACD (Maastricht category1 and 2 ‘‘death not anticipated’’) is declared dead aftercardiac arrest, rushed to the operating room, and organsare harvested. Uncontrolled DACD are usually not uti-lized for liver transplantation due to the high rate ofprimary nonfunction (defined below), usually due to pro-longed ischemia of the graft. When utilizing controlledDACD for transplantation, emerging data indicates thatrecipient and graft survival are diminished when com-pared to deceased and living donor liver transplantationwith a higher incidence of primary nonfunction, biliaryinjury, and requirement for retransplantation. However,several centers have reported acceptable outcomes whenutilizing controlled DACD organs, particularly those withoutsignificant ischemia in well-selected recipients (15).
Finally, ‘‘domino’’ transplantation is an option forpatients afflicted with familial amyloidotic polyneuropathy(FAP). Familial amyloidotic polyneuropathy is a fatal dis-ease caused by an abnormal amyloidogenic transthyretin(TTR) variant generated by the liver. Liver transplantationin these patients removes the source of the variant TTRmolecule, and represents the only known curative treat-ment. As no intrinsic liver disease exists in patientsaffected by FAP, the liver explanted from a patient withFAP may be transplanted into another patient, thus,allowing ‘‘domino’’ transplantation. Survival in both reci-pients of FAP livers and transplanted FAP patients has
270 LIVER TRANSPLANTATION

been reported to be excellent and comparable to survivalwith OLT performed for other chronic liver disorders (16).
POSTTRANSPLANTATION MANAGEMENT
The complex nature of the surgical procedure utilized to bothexplant (remove) the diseased, cirrhotic liver and implant(transplant) the new allograft into the recipient make itintuitive that the majority of the early complications fol-lowing liver transplantation are technical and related to thesurgical procedure itself. However, following the first post-operative days, and as patients progress to the first monthposttransplantation and beyond, the nature and variety ofcomplications change. Early complications (within the first2 months) and late complications (beyond 2 months) maynegatively affect patient and graft survival (Table 4). Com-plications specific to the surgical procedure and those thatdirectly affect the transplanted organ are discussed below.
EARLY COMPLICATIONS
Primary Nonfunction and Early Graft Dysfunction
A major threat to the newly transplanted liver is primarygraft nonfunction (PNF). This syndrome defined as acido-sis, rising INR, progressive elevation in liver transami-nases and creatinine, and decreases in mentation occurswhen the newly transplanted liver allograft fails to func-tion normally. The mechanisms responsible for this phe-nomenon are complex, and relate to donor factors,
inadequate preservation of the liver, prolonged ischemia,extensive steatosis of the graft, hepatic artery thrombosis(see below) or immune response to the implanted organ(17). In the setting of PNF, a rapid assessment of hepaticartery flow needs to occur, as immediate surgical repair of athrombosed hepatic artery may reverse PNF. In theabsence of hepatic artery thrombosis, emergent retrans-plantation is required for PNF.
In contrast to PNF, early graft dysfunction (EGD) ismanifested by an early rise in serum transaminases to values> 2000–3000 IU/L, cholestasis with rising Bilirubin levels,without marked coagulopathy or impairment in mental sta-tus and renal function. EGD may occur in the setting ofischemic injury or steatosis in the graft, and typically occurswithin the first 24–48 h after the transplant. Unlike PNF, themanifestations of EGD usually improve with supportive care,and emergency retransplantation is not necessary.
Hepatic Artery Thrombosis
A potentially devastating posttransplantation complica-tion is hepatic artery thrombosis (HAT). Hepatic arterythrombosis occurs more commonly in pediatric transplantrecipients compared to adults due to the technical diffi-culties associated with the anastomosis of smaller sizevessels. In HAT, the immediate postoperative period maybe associated with graft failure, elevation in serum livertransaminases, bile leak, hepatic necrosis, and sepsis.Since the blood supply to the biliary tree in the earlyposttransplant period is principally from the hepaticartery, HAT is frequently associated with irreversibleinjury to the biliary tract (18). Thus, HAT in the first 7days after liver transplantation is an indication for emer-gent artery repair or retransplantation.
Due to the potentially devastating consequences of HAT,most transplant centers screen for this complication withduplex-ultrasound (US) in the immediate posttransplant per-iod. If duplex-US suggests HAT, angiography is usuallyperformed to confirm the diagnosis, and if present, surgicalrevision of the hepatic artery is required. If surgical repaircannot be achieved, liver retransplantation may be necessary.
PORTAL AND HEPATIC VEIN THROMBOSIS
Though less common than HAT, thrombosis of the portaland/or hepatic veins in the immediate posttransplant per-iod can also adversely affect patient and graft survival.Acute ‘‘Budd-Chiari’’ syndrome due to hepatic vein or venacava thrombosis is associated with abdominal pain, per-ipheral edema, and the threat of graft failure, as hepaticcongestion in the newly transplanted liver is poorly toler-ated. In this circumstance, emergency thrombectomy andsurgical revision is required. Acute portal vein occlusionmay be associated with exacerbation of preexisting portalhypertension, associated with gastrointestinal bleedingfrom porto-systemic collateral vessels such as esophagealand gastric varices. Acute portal vein thrombosis is man-aged by surgical repair, while chronic portal vein throm-bosis may be well tolerated. A potential alternative tosurgical repair for both hepatic and portal vein stenosisor occlusion is thrombolysis and/or the placement of
LIVER TRANSPLANTATION 271
Table 4. Early and Late Complications Following LiverTransplantation
EarlyGraft Specific
Primary nonfunctionEarly graft dysfunctionHepatic artery thrombosisHepatic and portal vein thrombosisPreservation injuryBiliary complications: bile leak, biliarystenosisAcute cellular rejection
OtherBacterial and fungal infectionCMV infectionRecurrent Hepatitis B and C
LateGraft Specific
Chronic rejectionRecurrence of primary disease
OtherHypertensionHyperlipidemiaDiabetesObesityCardiac diseaseRenal dysfunctionFungal infection (Cryptococcus, Aspergillus)CMVPosttransplant lymphoproliferative disorderNonhepatic malignancy: i.e., skin cancer
endovascular stents by an experienced interventional radi-ologist (19).
ACUTE CELLULAR REJECTION
Rejection of any transplanted organ is a constant threat, asimmunologic recognition of the graft as ‘‘foreign’’ may beassociated with injury. However, compared to otherorgans, liver allografts are relatively privileged immuno-logically, and thus, the incidence and consequences ofacute cellular rejection (ACR) are diminished when com-pared to other solid organs utilized for transplantation.The reported incidence of ACR within the first posttrans-plant year is 30–50%, in most cases, usually occurringwithin the first 2–3 weeks postoperatively. The clinicalpresentation is variable; ACR may be asymptomatic, orassociated with fever or abdominal pain. Laboratory find-ings include elevation or failure of normalization of serumtransaminases, usually in association with a rising alka-line phosphatase and/or bilirubin. The diagnosis of acuteliver graft rejection is confirmed by liver biopsy and exam-ination of liver histology (20). Conventional histologiccriteria associated with ACR include the presence of peri-portal lymphocytic infiltrate, as well as bile duct andhepatic vascular endothelial cell injury. Most cases ofACR respond to treatment with intravenous bolus gluco-corticoids. Approximately 10% of patients with ACR willnot improve with intravenous glucocorticoids, requiringthe administration of monoclonal or polyclonal anti-T cellantibodies (reviewed below). Mild and moderate ACR mayalso respond to either increasing the dose of the primaryimmunosuppressive agent, or switching to an alternatecalcineurin inhibitor. This approach has been used withincreasing frequency, particularly in patients transplantedfor HCV and HBV due to concerns regarding the negativeimpact of over-immunosuppression on viral recurrence.
BILIARY COMPLICATIONS
Bile leaks and strictures generally occur at the anastomo-sis of the donor and recipient bile ducts, recognized by a risein serum bilirubin and/or alkaline phosphatase or by thepresence of bile in surgical drains in the immediate post-transplantation period. The incidence of biliary complica-tions is between 5 and 15% following deceased donor livertransplantation. However, between 15 and 30% of patientswho undergo living donor liver transplantation developbiliary complications, due to the complexity of the biliaryreconstruction required (21). In both deceased and livingdonor recipients, the majority of bile leaks resolve sponta-neously without the need for reoperation. As previouslystated, the biliary tree receives the vast majority of itsblood supply from the hepatic artery, and thus, the ade-quacy of hepatic artery blood flow needs to be evaluated inthe setting of any biliary injury. If spontaneous resolutionof the bile leak does not occur, endoscopic or radiologicplacement of a biliary stent across the biliary anastamosesis often successful (22). In some cases, surgical explorationand revision of the biliary anastamoses with a Roux-en-Ycholedochojejunostomy may be required.
Anastamotic biliary strictures require careful attention,as if left untreated, cholangitis, graft dysfunction, andeventually secondary biliary cirrhosis may occur. Techni-ques for management include dilatation and stenting viabiliary endoscopy or percutaneous transhepatic cholangio-gram by an interventional radiologist. If these modalitiesare unsuccessful, surgical revision of the biliary anasta-mosis with a Roux-en-Y choledochojejunostomy may berequired. In rare cases with diffuse stricturing, retrans-plantation may be necessary.
ISCHEMIC AND PRESERVATION INJURY
The newly transplanted liver is always subjected to somedegree of ischemic injury (23). Cold (or hypothermic) ische-mia is unavoidable, as it occurs prior to transplantationwhile the liver is cooled in preservation solution, awaitingimplantation. Warm (normothermic) ischemia occurs dur-ing the transplantation procedure itself, when hepaticblood flow is interrupted to minimize blood loss duringtransplantation, or when the formerly ‘‘cooled’’ liver issubjected to body temperature during transplantation.Cold ischemia is usually well tolerated, while in contrast,warm ischemia often leads to death of hepatocytes, withresultant elevation in serum transaminases, apoptosis andcentrilobular necrosis. In the setting of significant warmischemia, graft failure may result. Several investigatorshave noted improvement in ischemic injury and enhancedgraft and patient outcomes by employing a techniquedescribed as ‘‘ischemic preconditioning’’ defined as a briefperiod of controlled ischemia followed by a short interval ofreperfusion before the actual surgical procedure (24). Thisis accomplished during liver transplantation by transientlyinterrupting hepatic inflow by placing a vascular clamp ora loop around the portal triad (i.e., portal vein, hepaticartery, and bile duct), rendering the whole organ ischemicfor 10–15 min, after which the clamp is removed and theliver is reperfused. This technique may be of particularbenefit in organs with significant steatosis.
Complications Beyond Two Months
Progress in the surgical techniques required to performtransplantation, the treatment of postoperative complica-tions and prevention of rejection have been associated withsignificant improvements in short-term morbidity and mor-tality following transplantation. Coincident with improve-ments in short-term outcomes has been a rise in long-termcomplications. These complications, including side effects ofchronic immunosuppression, neoplasia, and infections arediscussed in detail elsewhere. Long-term complications thataffect the transplanted liver are discussed below.
CHRONIC REJECTION
Chronic allograft rejection or ‘‘vanishing bile duct syn-drome’’ is rare, but in contradistinction to acute cellularrejection, a much more difficult to treat complication.Diagnostic criteria for chronic rejection include bile ductatrophy affecting the majority of bile ducts, with or with-out bile duct loss. Arterial and venous injury affecting the
272 LIVER TRANSPLANTATION

large branches of the hepatic artery or portal vein (foamyarteriopathy) may also be present (24). Risk factors forchronic liver rejection include transplantation for pri-mary sclerosing cholangitis, primary biliary cirrhosis,HLA mismatch between donor and recipient, and cytome-galovirus infection. Chronic rejection is usually a harbingerof poor outcomes, often resulting in the requirement forretransplantation; altering immunosuppression is rarelyassociated with improvement.
Recurrence of Primary Disease Following LiverTransplantation
A major challenge to the liver transplant community is recur-rence of the primary disease that caused the patients nativeliver to fail. Diseases that do not recur following liver trans-plantation include congenital anatomic anomalies (e.g., biliaryatresia, polycystic liver disease, Caroli’s disease, Alagillessyndrome, congenital hepatic fibrosis) and metabolic diseasesof the liver (e.g., Wilson’s disease, alpha 1 antitrypsin defi-ciency). However, all other causes of liver disease includingprimary biliary cirrhosis, primary sclerosing cholangitis, auto-immune hepatitis, nonalcoholic fatty liver disease, hemochro-matosis and alcohol related liver disease have been reported torecur after liver transplantation. In some cases, recurrentdisease may lead to significant liver injury with resultantgraft failure (26–30). Disease processes most commonly asso-ciated with recurrence include viral hepatitis B (HBV) and C(HCV). The recurrence of HBV is associated with uniformlypoor outcomes with graft failure and death. Fortunately,recurrence of HBV after liver transplantation can be pre-vented by administering hepatitis B immune globulin (HBIG)at the time of transplantation and at regular intervals there-after, with or without the use of antiviral agents such asLamivudine and Adefovir. In contradisctinction to HBV,HCV recurrence following liver transplantation remains asignificant source of morbidity and mortality, with negativeimpact on post-transplantation outcomes. In patients withactive HCV replication prior to transplantation, reacquisitionof viremia following transplantation is universal, and histo-logic injury due to HCV occurs in up to 90% of patientsfollowed for 5 years (31). Although histologic injury in theallograft due to HCV is exceedingly common, disease pro-gression after the development of hepatitis is variable, withsome patients experiencing indolent disease and othersrapidly progressing to cirrhosis and liver failure. In patientsthat develop HCV associated cirrhosis posttransplantation,up to 42% will experience decompensation manifested asascites, encephalopathy, or hepatic hydrothorax, and <50%of patients survive > 1 year after the development of decom-pensation (32). It is important to contrast the natural his-tory of HCV before and after transplant; prospective andretrospective data are emerging which indicate that theprogression of HCV following liver transplantation isaccelerated when compared to the nonimmunosuppressedpretransplant patient population.
Whether HCV recurrence is more severe in recipients ofLDLT than in DD recipients is controversial. Althoughseveral recent reports indicate that HCV recurrence maybe more problematic in recipients of LDLT when comparedto DD (33), particularly the cholestatic variant of HCV (34),
other authors have noted no differences in outcomes inHCV infected patients who undergo LDLT when comparedto DD (35,36). At present, both the optimal timing fortransplant in HCV patients and the therapy for recurrentHCV following liver transplantation are incompletelydescribed. Theoretically, eradication of HCV prior to livertransplantation in patients with decompensated liver dis-ease would be beneficial, although in practice, this strategyhas been marred by exacerbation of encephalopathy, infec-tions, and other serious adverse events, particularly inpatients treated with high dose Interferon and ribavirin(37). A novel approach including initiating therapy withlow dose interferon (including Pegylated interferon pre-parations) and ribavirin with slow escalation in dose maybe associated with improved tolerability and efficacy (38).Following liver transplantation, both preemptive therapyprior to the development of histologic injury and directedtherapy after the onset of liver injury have been attemptedwith varying degrees of success. It is important to note,however, that posttransplantation, tolerability of inter-feron preparations, and ribavirin is suboptimal. Significantleucopenia and anemia are common, likely due to druginduced bone marrow suppression and renal insufficiencypotentiating ribavirin induced hemolysis (39).
Immunosuppressive Medications
A cornerstone to posttransplantation management is the abil-ity to prevent or attenuate immunologic rejection ofthe transplanted graft, which when left untreated, can beassociated with graft failure. From a conceptual standpoint,understanding how recognition of the newly engrafted liver as‘‘foreign’’ occurs, how to modulate immune mediated injury,and at the same time prevent ‘‘overimmunosuppression’’are critical to achieve optimal post transplantation out-comes. The various immunosuppressive medications andtheir mechanism of action currently utilized in liver trans-plant recipients are listed in Table 5. Unfortunately, allimmunosuppressive therapy is associated with undesiredeffects, with the potential for additive effects when agentsare combined. In general, most transplant centers utilizethree agents to prevent allograft rejection in the immediateposttransplant period, utilizing a combination of a calci-neurin inhibitor such as Cyclosporine (CYA) or Tacrolimus(TAC), a second agent such as Mycophenolate mofetil (MMF)or Azathioprine (AZA), and a glucocorticoid such as Predni-sone. As patients achieve adequate liver function and free-dom from rejection beyond 6-months posttransplantation,satisfactory immunosuppression can be achieved in manypatients with monotherapy, usually with a calcineurin inhi-bitor, although in patients who are at increased risk ofrejection such as those with autoimmune hepatitis, primarybiliary cirrhosis, or sclerosing cholangitis, long-term immu-nosuppression is achieved with a combination of a calcineurininhibitor with either low dose MMF or Prednisone (40).
Corticosteroids
Corticosteroids achieve their desired immunosuppressiveaffects by the suppression of leukocyte, macrophage, andcytotoxic T-cell activity, and diminution of the effect of
LIVER TRANSPLANTATION 273
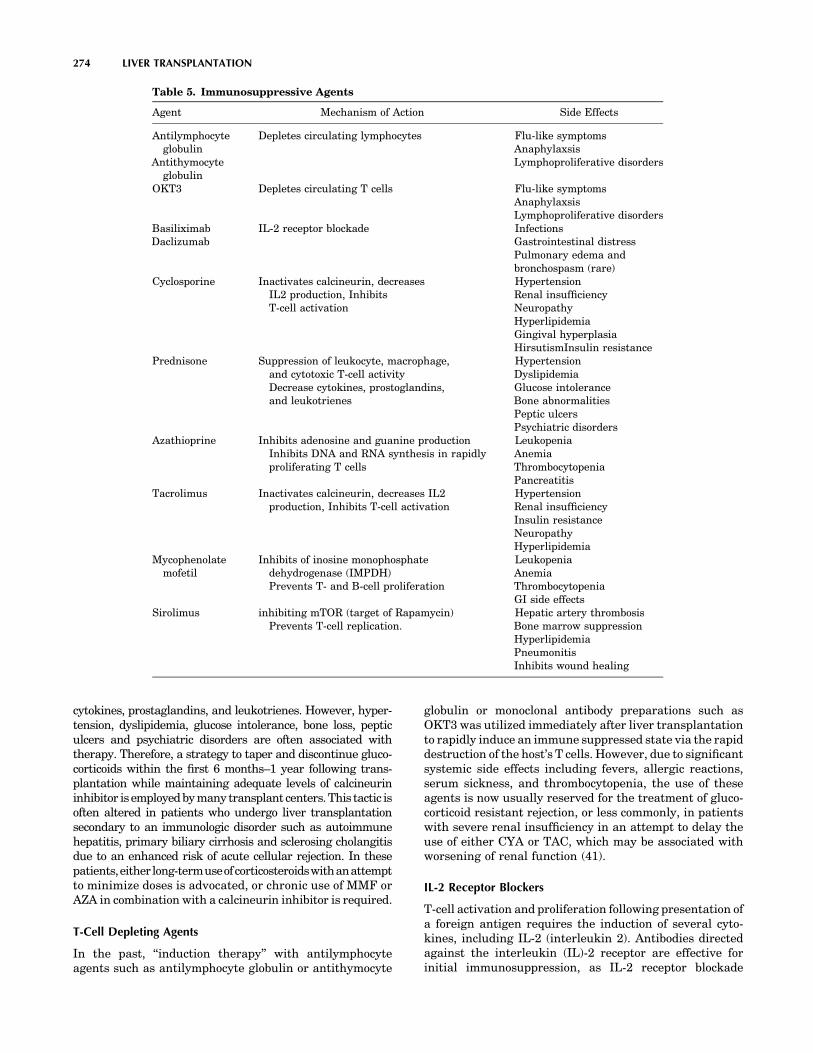
cytokines, prostaglandins, and leukotrienes. However, hyper-tension, dyslipidemia, glucose intolerance, bone loss, pepticulcers and psychiatric disorders are often associated withtherapy. Therefore, a strategy to taper and discontinue gluco-corticoids within the first 6 months–1 year following trans-plantation while maintaining adequate levels of calcineurininhibitor is employed by many transplant centers. This tactic isoften altered in patients who undergo liver transplantationsecondary to an immunologic disorder such as autoimmunehepatitis, primary biliary cirrhosis and sclerosing cholangitisdue to an enhanced risk of acute cellular rejection. In thesepatients,eitherlong-termuseofcorticosteroidswithanattemptto minimize doses is advocated, or chronic use of MMF orAZA in combination with a calcineurin inhibitor is required.
T-Cell Depleting Agents
In the past, ‘‘induction therapy’’ with antilymphocyteagents such as antilymphocyte globulin or antithymocyte
globulin or monoclonal antibody preparations such asOKT3 was utilized immediately after liver transplantationto rapidly induce an immune suppressed state via the rapiddestruction of the host’s T cells. However, due to significantsystemic side effects including fevers, allergic reactions,serum sickness, and thrombocytopenia, the use of theseagents is now usually reserved for the treatment of gluco-corticoid resistant rejection, or less commonly, in patientswith severe renal insufficiency in an attempt to delay theuse of either CYA or TAC, which may be associated withworsening of renal function (41).
IL-2 Receptor Blockers
T-cell activation and proliferation following presentation ofa foreign antigen requires the induction of several cyto-kines, including IL-2 (interleukin 2). Antibodies directedagainst the interleukin (IL)-2 receptor are effective forinitial immunosuppression, as IL-2 receptor blockade
274 LIVER TRANSPLANTATION
Table 5. Immunosuppressive Agents
Agent Mechanism of Action Side Effects
Antilymphocyteglobulin
Antithymocyteglobulin
Depletes circulating lymphocytes Flu-like symptomsAnaphylaxsisLymphoproliferative disorders
OKT3 Depletes circulating T cells Flu-like symptomsAnaphylaxsisLymphoproliferative disorders
BasiliximabDaclizumab
IL-2 receptor blockade InfectionsGastrointestinal distressPulmonary edema andbronchospasm (rare)
Cyclosporine Inactivates calcineurin, decreasesIL2 production, InhibitsT-cell activation
HypertensionRenal insufficiencyNeuropathyHyperlipidemiaGingival hyperplasiaHirsutismInsulin resistance
Prednisone Suppression of leukocyte, macrophage,and cytotoxic T-cell activityDecrease cytokines, prostoglandins,and leukotrienes
HypertensionDyslipidemiaGlucose intoleranceBone abnormalitiesPeptic ulcersPsychiatric disorders
Azathioprine Inhibits adenosine and guanine productionInhibits DNA and RNA synthesis in rapidlyproliferating T cells
LeukopeniaAnemiaThrombocytopeniaPancreatitis
Tacrolimus Inactivates calcineurin, decreases IL2production, Inhibits T-cell activation
HypertensionRenal insufficiencyInsulin resistanceNeuropathyHyperlipidemia
Mycophenolatemofetil
Inhibits of inosine monophosphatedehydrogenase (IMPDH)Prevents T- and B-cell proliferation
LeukopeniaAnemiaThrombocytopeniaGI side effects
Sirolimus inhibiting mTOR (target of Rapamycin)Prevents T-cell replication.
Hepatic artery thrombosisBone marrow suppressionHyperlipidemiaPneumonitisInhibits wound healing

down regulates IL-2 mediated T-cell proliferation. The IL-2receptor antibodies such as Basiliximab and Daclizumab,given intravenously at the time of transplant and duringthe first posttransplantation week can reduce the incidenceof acute liver graft rejection when utilized in combinationwith a calcineurin inhibitor, although these agents may notbe sufficient to prevent rejection when utilized alone. TheIL-2 receptor antibodies are generally well tolerated,although side effects may include infections, gastrointest-inal distress, and rarely, pulmonary edema and bronchos-pasm. As these agents rarely induce renal dysfunction,many transplant programs utilize IL-2 receptor antibodiesas ‘‘induction’’ therapy in individuals with renal insuffi-ciency at the time of transplantation (42), in an attempt todelay initiation or diminish dose of calcineurin inhibitors,which may exacerbate renal insufficiency.
Calcineurin Inhibitors
IL-2 inhibition effectively suppresses T-Cell activation.Cyclosporine and TAC achieve this by binding to cytoplas-mic receptors, forming complexes which inactivate calci-neurin, a key enzyme in T-cell signaling. The major sideeffects of both CYA and TAC include hypertension, renalinsufficiency, and neurologic complications. However,there is evidence to suggest that obesity, hyperlipidemia,hirsutism, and gingival hyperplasia occur more commonlyin patients who receive CYA, while a higher rate of diar-rhea, insulin resistance, and diabetes is seen in patientswho receive TAC. In response to inconsistent absorption ofstandard Cyclosporine, the development of a microemulsi-fied formulation of cyclosporine (e.g., Neoral) has allowedconsistent blood levels (43). Given their efficacy and oraladministration, calcineurin inhibitors have a central rolein posttransplant immunosuppression.
Safety and efficacy of calcineurin inhibitors is generallyassessed by monitoring blood levels drawn prior to the dose(trough), although several investigators describe that bloodlevels drawn 2 h after a dose of Cyclosporine (i.e., C2 levels)rather than trough levels more accurately indicate exposureto drug. At many transplantation centers, the definition ofappropriate target level of calcineurin inhibitor is linked tothe patients time posttransplantation; in general, higherlevels are required in the first several months postoperativelywhile the threat of rejection is acute. The target levels forcalcineurin inhibitors can be appropriate adjusted downwardas patients achieve both normal liver function and freedomfrom rejection months to years following surgery. In addi-tion, a philosophy of minimizing exposure to high levels ofcalcineurin inhibitors in HBV or HCV infected patients isadopted by many transplant centers, due to the negativeimpact of ‘‘overimmunosuppression’’ on viral replicationand disease recurrence.
Antiproliferative Agents
Antiproliferative agents such as AZA and MMF preventthe expansion of activated T cells and B cells and regulateimmune mediated injury. Azathioprine, a purine analogue,is metabolized in the liver to its active compound, 6-mer-captopurine, which inhibits adenosine and guanine pro-duction, thus inhibiting DNA and RNA synthesis in rapidly
proliferating T cells. Mycophenolate Mofetil is a potentnoncompetitive inhibitor of inosine monophosphate dehy-drogenase (IMPDH), an enzyme necessary for the synth-esis of guanine, a purine nucleotide. MycophenolateMofetil, when used in combination with a calcineurininhibitor and steroids has been shown to be associatedwith lower rejection rates in the first 6 months posttrans-plantation when compared to AZA (44). The major toxi-cities associated with the use of either MMF or AZA arebone marrow suppression with resultant leukopenia, ane-mia, and thrombocytopenia, though this is more markedwith AZA. Mycophenolate Mofetil has been associated witha greater incidence of dyspepsia, peptic ulcers, and diar-rhea when compared to AZA, while pancreatitis may occurin individuals prescribed AZA. These side effects usuallyabate by dose reduction or discontinuation. The majority oftransplant centers utilize a combination of a Calcineurininhibitor with either MMF or, less commonly, AZA for atleast the first 3–6 months posttransplantation. Since AZAand MMF do not cause renal insufficiency, they can beutilized in a strategy to minimize or avoid calcineurin inhi-bitor use, particularly in patients with renal dysfunction.
Other Immunosuppressive Agents
The limitations and untoward effects of available immuno-suppressive agents have induced research and developmentof alternative agents. Sirolimus (Rapamycin) (RAPA) and itsderivative Everolimus represent a new class of compounds,which achieve their immuosuppressive effect by inhibitingmTOR (target of Rapamycin). Inhibition of mTOR dimini-shes intracellular signaling distal to the IL-2 receptor andprevents T-cell replication. As the lymphoproliferative path-ways inhibited by RAPA and Everolimus are distinct fromthose affected by calcineurin inhibitors, investigators haveutilized these agents in combination with calcineurin inhibi-tors to achieve synergistic effect. However, enthusiasm forRAPA has been tempered by recent data showing higherrates of hepatic arterial thrombosis in patients who receiveRAPA in the weeks immediately following transplantation(45). In addition, impaired wound healing has been noted inpatients who receive RAPA, potentially due to impairment ofgranulation mediated by inhibition of TGF-b. Leukopenia,thrombocytopenia, and hyperlipidemia are the principal toxi-cities associated with RAPA and Everolimus. Recent reportsof pneumonitis in RAPA treated patients have also emerged.A positive attribute of both RAPA and Everolimus is theabsence of renal toxicity; some data suggest that post trans-plantation renal insufficiency can be reversed when calci-neurin inhibitors are withdrawn and RAPA is initiated (46).Newer immunosuppressive agents will continue to be devel-oped; it is hoped that these agents will be associated withdiminished short- and long-term toxicity and facilitate a stateof ‘‘immune tolerance’’ of the graft that will ultimately allowminimization of the requirement for immunosuppressivemedications.
SUMMARY
Liver transplantation is the treatment of choice for appro-priately selected patients with end stage liver disease.
LIVER TRANSPLANTATION 275

Over the last several decades, significant advances insurgical technique and immunosuppression, selection ofappropriate donors, grafts, and recipients, and improvedtherapies to prevent and treat postoperative complicationshave greatly improved posttransplantation outcomes.Despite these impressive achievements, many challengesremain. It is becoming increasingly apparent that thegrowing disparity between the number of liver transplantcandidates and available organs will be associated withescalating death rates on the transplant waiting list.Enhanced posttransplantation survival has led to theemergence of complications associated with patient long-evity, including nonhepatic disease, complications ofimmunosuppression, infections, neoplasia, and recurrenceof the primary disease for which the liver transplantationwas indicated. Further progress in liver transplantationwill be achieved by maximizing the use of available organs,refinement and exploration of alternatives to deceaseddonor liver transplantation, improvements in immunosup-pression, and enhanced recognition and treatment of long-term complications, particularly recurrent liver disease.
BIBLIOGRAPHY
1. Welch CS. A note on transplantation of the whole liver in dogs.Transplant Bull 1955;2:54.
2. Kukral JC, Littlejohn MH, Williams RK, Pancer RJ, Butz GWJr, Starzl TE. Hepatic function after canine liver transplanta-tion. Arch Surg 1962;85:157–165.
3. Starzl TE, Marchioro TL, Porter KA, Brettschneider L.Related Articles, Homotransplantation of the liver. Transplan-tation 1967;5(Suppl):790–803.
4. Mazzaferro V, Regalia E, Doci R, Andreola S, Pulvirenti A,Bozzetti F, Montalto F, Ammatuna M, Morabito A, Gennari L.Liver transplantation for the treatment of small hepatocellularcarcinomas in patients with cirrhosis. N Engl J Med 1996;334:693–699.
5. Moreno S, Fortun J, Quereda C, Moreno A, Perez-Elias MJ,Martin-Davila P, de Vicente E, Barcena R, Quijano Y, GarciaM, Nuno J. Martinez Liver transplantation in HIV-infectedrecipients. Liver Transpl 2004;11:76–81.
6. Kamath PS, Wiesner RH, Malinchoc M, Kremers W, TherneauTM, Kosberg CL, D’Amico G, Dickson ER, Kim WR. A model topredict survival in patients with endstage liver disease. Hepa-tology 2001;33:464–470.
7. Freeman RB, Wiesner RH, Edwards E, Harper A, Merion R,Wolfe R. United Network for Organ Sharing Organ Procure-ment and Transplantation Network Liver and Transplanta-tion Committee. Results of the first year of the new liverallocation plan. Liver Transpl 2004;10:7–15.
8. Onaca NN, Levy MF, Sanchez EQ, Chinnakotla S, Fasola CG,Thomas MJ, Weinstein JS, Murray NG, Goldstein RM,Klintmalm GB. A correlation between the pretransplantationMELD score and mortality in the first two years after livertransplantation. Liver Transpl 2003;9:117–123.
9. Merion RM, Schaubel DE, Dykstra DM, Freeman RB, Port FK,Wolfe RA. The survival benefit of liver transplantation. Am JTranspl 2005;5:307–313.
10. http://www.UNOS.org.11. Broelsch CE, Whitington PF, Emond JC, Heffron TG,
Thistlethwaite JR, Stevens L, Piper J, Whitington SH, LichtorJL. Liver transplantation in children from living relateddonors. Surgical techniques and results. Ann Surg 1991;214:428–437.
12. Marcos A. Right-lobe living donor liver transplantation. LiverTranspl 2000;6:S59–S63.
13. Shiffman ML, Brown RS Jr., Olthoff KM, Everson G, Miller C,Siegler M, Hoofnagle JH. Living donor liver transplantation:summary of a conference at The National Institutes of Health.Liver Transpl 2002;8:174–188.
14. Emond JC, Renz JF, Ferrell LD, Rosenthal P, Lim RC, RobertsJP, Lake JR, Ascher NL. Functional analysis of grafts fromliving donors. Implications for the treatment of older recipi-ents. Ann Surg 1996;224:544–552.
15. Otero A, Gomez-Gutierrez M, Suarez F, Arnal F, Fernandez-Garcia A, Aguirrezabalaga J, Garcia-Buitron J, Alvarez J,Manez R. Liver transplantation from maastricht category 2non-heart-beating donors: A source to increase the donor pool?Transpl Proc 2004;36:747–750.
16. Ericzon BG, Larsson M, Herlenius G, Wilczek HE. FamilialAmyloidotic Polyneuropathy World Transplant Registry.Report from the Familial Amyloidotic Polyneuropathy WorldTransplant Registry (FAPWTR) and the Domino Liver Trans-plant Registry (DLTR). Amyloid 2003;10:67–76.
17. Schemmer P, Mehrabi A, Kraus T, Sauer P, Gutt C, Uhl W,Buchler MW. New aspects on reperfusion injury to liver–impact of organ harvest. Nephrol Dial Transpl 2004;19:26–35.
18. Bhattacharjya S, Gunson BK, Mirza DF, Mayer DA, BuckelsJA, McMaster P, Neuberger JM. Delayed hepatic arterythrombosis in adult orthotopic liver transplantation-a 12-yearexperience. Transplantation 2001;71:1592–1596.
19. Vignali C, Cioni R, Petruzzi P, Cicorelli A, Bargellini I, PerriM, Urbani L, Filipponi F, Bartolozzi C. Role of interventionalradiology in the management of vascular complications afterliver transplantation. Transpl Proc 2004;36:552–554.
20. Lefkowitch JH. Diagnostic issues in liver transplantationpathology. Clin Liver Dis 2002;6:555–570.
21. Fondevila C, Ghobrial RM, Fuster J, Bombuy E, Garcia-Valdecasas JC, Busuttil RW. Biliary complications after adultliving donor liver transplantation. Transpl Proc 2003;35:1902–1903.
22. Denys A, Chevallier P, Doenz F, Qanadli SD, Sommacale D,Gillet M, Schnyder P, Bessoud B. Interventional radiology inthe management of complications after liver transplantation.Eur Radiol 2004;14:431–439.
23. Selzner N, Rudiger H, Graf R, Clavien PA. Protective strate-gies against ischemic injury of the liver. Gastroenterology2003;125:917–936.
24. Clavien PA, Yadav S, Sindram D, Bentley RC. Protectiveeffects of ischemic preconditioning for liver resection per-formed under inflow occlusion in humans. Ann Surg 2000;232:155–162.
25. Demetris A, Adams D, Bellamy C, Blakolmer K, Clouston A,Dhillon AP, Fung J, Gouw A, Gustafsson B, Haga H, HarisonD, Hart J, Hubscher S, Jaffe R, Khettry U, Lassman C, LewinK, Martinez O, Nakazawa Y, Neil D, Pappo O, Parizhskaya M,Randhawa P, Rasoul-Rockenschaub S, Reinholt F, Reynes M,Robert M, Tsamandas A, Wanless I, Wiesner R, Wernerson A,Wrba F, Wyatt J, Yamabe H. Update of the international banffschema for liver allograft rejection: Working recommenda-tions for the histopathologic staging and reporting of chronicrejection. An International Panel. Hepatology 2000 Mar;31(3):792–799.
26. Neuberger J. Recurrent primary biliary cirrhosis. BaillieresBest Pract. Res Clin Gastroenterol 2000;14:669–680.
27. Wiesner RH. Liver transplantation for primary sclerosingcholangitis: timing, outcome, impact of inflammatory boweldisease and recurrence of disease. Best Pract Res Clin Gastro-enterol 2001;15:667–680.
28. Molmenti EP, Netto GJ, Murray NG, Smith DM, Molmenti H,Crippin JS, Hoover TC, Jung G, Marubashi S, Sanchez EQ,
276 LIVER TRANSPLANTATION

Gogel B, Levy MF, Goldstein RM, Fasola CG, Gonwa TA,Klintmalm GB. Incidence and recurrence of autoimmune/alloimmune hepatitis in liver transplant recipients. LiverTranspl 2002;8:519–526.
29. Burke A, Lucey MR. Non-alcoholic fatty liver disease, non-alcoholic steatohepatitis and orthotopic liver transplantation.Am J Transplant 2004;4:686–693.
30. Mackie J, Groves K, Hoyle A, Garcia C, Garcia R, Gunson B,Neuberger J. Orthotopic liver transplantation for alcoholicliver disease: A retrospective analysis of survival, recidivism,and risk factors predisposing to recidivism. Liver Transpl 2001;7:418–427.
31. Berenguer M, Prieto M, Rayon J, Mora J, Pastor M, Vicente O,et al. Natural history of clinically compensated hepatitis C virusrelated graft cirrhosis after liver transplantation. Hepatology2000;32:852–858.
32. Gane E. The natural history and outcome of liver transplanta-tion in hepatitis C virusinfected recipients. Liver Transpl2003;9:S28–S34.
33. Garcia-Retortillo M, Forns X, Llovet JM, Navasa M, Feliu A,Massaguer A, Bruguera M, Fuster J, Garcia-Valdecasas JC,Rimola A. Hepatitis C recurrence is more severe after livingdonor compared to cadaveric liver transplantation. Hepatol-ogy 2004;40:699–707.
34. Gaglio PJ, Malireddy S, Levitt BS, Lapointe-Rudow D, Lefko-witch J, Kinkhabwala M, Russo MW, Emond JC, Brown RS Jr.Increased risk of cholestatic hepatitis C in recipients of graftsfrom living versus cadaveric liver donors. Liver Transpl2003;9:1028–1035.
35. Shiffman ML, Stravitz RT, Contos MJ, Mills AS, Sterling RK,Luketic VA, Sanyal AJ, Cotterell A, Maluf D, Posner MP,Fisher RA. Histologic recurrence of chronic hepatitis C virus inpatients after living donor and deceased donor liver trans-plantation. Liver Transpl 2004;10:1248–1255.
36. Russo MW, Galanko J, Beavers K, Fried MW, Shrestha R.Patient and graft survival in hepatitis C recipients after adultliving donor liver transplantation in the United States. LiverTranspl 2004;10:340–346.
37. Crippin JS, McCashland T, Terrault N, Sheiner P, CharltonMR. A pilot study of the tolerability and efficacy of antiviraltherapy in hepatitis C virus-infected patients awaiting livertransplantation. Liver Transpl 2002;8:350–355.
38. Everson GT. Treatment of chronic hepatitis C in patients withdecompensated cirrhosis. Rev Gastroenterol Disord 2004;4:S31–S38.
39. Gane E. Treatment of recurrent hepatitis C. Liver Transpl2002;8:S28–S37.
40. Conti F, Morelon E, Calmus Y. Immuosuppressive therapy inliver transplantation. J Hepatol 2003;39:664–678.
41. Tector AJ, Fridell JA, Mangus RS, Shah A, Milgrom M, Kwo P,Chalasani N, Yoo H, Rouch D, Liangpunsakul S, Herring S,Lumeng L. Promising early results with immunosuppressionusing rabbit anti-thymocyte globulin and steroids withdelayed introduction of tacrolimus in adult liver transplantrecipients. Liver Transpl 2004;10:404–407.
42. Liu CL, Fan ST, Lo CM, Chan SC, Ng IO, Lai CL, Wong J.Interleukin 2 receptor antibody (basiliximab) for immunosup-pressive induction therapy after liver transplantation: A pro-tocol with early elimination of steroids and reduction ofTacrolimus dosage. Liver Transpl 2004;10:728–733.
43. Lilly LB, Grant D. Optimization of cyclosporine for livertransplantation. Transpl Proc 2004;36:267S–270S.
44. Wiesner R, Rabkin J, Klintmalm G, McDiarmid S, Langnas A,Punch J, McMaster P, Kalayoglu M, Levy G, Freeman R,Bismuth H, Neuhaus P, Mamelok R, Wang W. A randomizeddouble-blind comparative study of mycophenolate mofetiland azathioprine in combination with cyclosporine and
corticosteroids in primary liver transplant recipients. LiverTranspl 2001;7:442–450.
45. Trotter JF. Sirolimus in liver transplantation. TransplantProc 2003;35:193–200.
46. Nair S, Eason J, Loss G. Sirolimus monotherapy in nephro-toxicity due to calcineurin inhibitors in liver transplant reci-pients. Liver Transpl 2003;9:126–129.
See also DIFFERENTIAL COUNTS, AUTOMATED; PHARMACOKINETICS AND
PHARMACODYNAMICS; IMMUNOTHERAPY.
LONG BONE FRACTURE. See BONE UNUNITED
FRACTURE AND SPINAL FUSION, ELECTRICAL TREATMENT OF.
LUNG MECHANICS. See RESPIRATORY MECHANICS AND
GAS EXCHANGE.
LUNG PHYSIOLOGY. See PULMONARY PHYSIOLOGY.
LUNG SOUNDS
ROBERT G. LOUDON
RAYMOND L. H. MURPHY
INTRODUCTION
Medical devices and instrumentation have developed rapidlyin the last few decades, yet the first diagnostic medicalinstrument, the stethoscope, is still the most widely used,and it has changed only superficially in design and function.
The lungs, as we breathe, produce sounds that aretransmitted to the body surface and to the mouth. Thecharacteristics of these sounds convey information aboutthe sound-producing and -transmitting structures. Thisinformation often has diagnostic value. Auscultation of thelungs is therefore widely taught and practiced. Textbooks ofphysical diagnosis present a body of information that hasbeen derived by careful workers since the introduction ofthe stethoscope by R.T.H. Laennec in 1819. Much of thatinformation was indeed presented by Laennec himself inhis remarkable treatise, De l‘Auscultation Mediate(1,2).
In this article, the medical devices and instruments thathave been applied to the study of lung sounds, includingthe traditional acoustic stethoscope are reviewed. Thissurvey will include sound transducers and their place-ment, methods, and equipment used for the recordingand analysis of lung sounds, results obtained by the useof these techniques, and their clinical meaning. Recentwork on this subject helps in the understanding of whatwe hear with the stethoscope; some is aimed at answeringspecific questions in physiology or pathology, and some isdesigned to provide new diagnostic and monitoring tools.Much of this work has been done in the past three decades,reflecting the enormous increase in the availability andquality of sound recording and processing techniques dur-ing that period. Reviews of lung sounds (3–5) and thesuccess of the International Lung Sounds Associationand its annual meetings bear witness to the upsurge ofinterest in the subject. Recommended standards for termsand techniques used in computerized respiratory sound
LUNG SOUNDS 277
analysis (CORSA) have been prepared by a Task Force ofthe European Respiratory Society and published in theEuropean Respiratory Review series (6). Better under-standing of the meaning of current and future observationspromises a larger place in the future for clinical andresearch applications.
THE STETHOSCOPE
The introduction of the stethoscope is an interesting story,well described in a bicentenary appreciation of Laennec’sbirth (7). Laennec, a young physician practicing in Paris,had occasionally found it useful to listen directly to apatient’s chest, as had been done by physicians at leastsince the time of Hippocrates. In 1816, he wished to listen toan obese young lady’s heart, but was reluctant to do so. Herecollected (and this part of the story may be apocryphal)having seen boys playing on a park bench, one listening to thewooden bench at one end with his ear, and the other scratch-ing the other end. Laennec’s own words were that ‘‘hehappened to recollect a simple and well know fact in acous-tics, that sound could be transmitted through solid materialor along a tube. He rolled a quire of paper into a sort ofcylinder’’, placed one end over her heart, and listened at theother end. He was ‘‘not a little surprised and pleased’’ to hearthe sounds more clearly in this ‘‘mediate’’ fashion than he hadever been able to do by the immediate application of his ear(2). Over the next 3 years he amassed an enormous amount ofinformation about the sounds heard over the chests of hispatients. As he did all of the autopsies at the Hopital Neckerin Paris where he worked, he could often relate these soundsto the underlying pathology.
The first edition of Laennec’s book (1) cost 13 francs forthe two volumes; for an extra 2.50 francs, one received awooden stethoscope. This ‘‘cylinder’’ served its purposewell. Modifications were introduced over the years, suchas earpieces, flexible tubing, binaural stethoscopes, and adiaphragm on the chest piece. The relative merits of dia-phragm and bell, the effect of the length and bore of thetubing, and the convenience of different patterns have beendebated over the years, and the design of modern stetho-scopes has been largely empirical, better models survivingbecause of their popularity with auscultators. Some char-acteristics that acousticians might think of as defects mayindeed be advantageous from the physician’s point of view.Those using them tend to feel comfortable listening tosounds with which they are familiar and may reject astethoscope that lets them hear too much.
The assessment of acoustical performance of stetho-scopes is not as simple as it might seem, and approachesto this problem have been described by several authors(8–10). The value of the traditional stethoscope is in no wayreduced by the recent introduction of devices and instru-ments that can record and analyze the sounds that we hear.Rather, its value is increased. Appropriate use on newmedical devices and instrumentation adds science to art,measurement to impression, and recordings to memory.Better understanding of what lung sounds mean, and ofhow much the simple stethoscope can tell us and how muchit cannot, will make the use of the simple stethoscope in
examining rooms or on clinical rounds more importantthan ever.
SOUND TRANSDUCERS
Microphones transform mechanical energy to electricalenergy, in the sound frequency range. Mechanical move-ment at the chest wall, resulting from the transmission ofvibrations representing lung sounds to the chest wall sur-face, may be detected by any one of several devices. Themain categories are ceramic, condenser (capacitor), andelectret microphones. Ceramic microphones use a piezo-electric ceramic element that produces voltage when it isstressed. They tend to be stable and rugged and do not needa bias voltage for operation. Condenser microphones of theconventional type act as a variable capacitor that requiresa bias voltage. They have good sensitivity and frequency-response characteristics. Electret microphones are a morerecent type; a permanent charge on the diaphragm and nofree electrostatic charge on its surface relieve the needfor a polarizing (bias) voltage and reduce sensitivity tohumidity.
Most microphones are designed to receive sound trans-mitted through air. Air coupling has been used by severalinvestigators recording sounds from the surface of thechest wall, or from the trachea, and it is not surprisingthat stethoscope chest-pieces have been used for this pur-pose. The sound transmitted through the air column instethoscope tubing can be applied to a microphone just as itcan to an auscultating eardrum. Direct mechanical cou-pling of the transducer to the signal site (chest wall ortracheal surface) is an alternative to air coupling.
Several authors have reviewed the relative advantagesand disadvantages of the various types of microphones aslung sound transducers (11,12). Desirable characteristicsinclude sensitivity, rejection of ambient noise and surfacenoise, appropriate frequency response, insensitivity to var-iation in pressure of application, ease of attachment, rug-gedness, and low price. Sensitivity is necessary because ofthe low level of the sound signal. Vesicular breath soundswill on occasion be virtually inaudible, for example, whenairflow rates at the mouth are <0.27 L/s (13).
It is not always possible to study lung sounds in idealcircumstances, and rejection of ambient noise is importantfor many applications. Microphone housing can be helpfulin this regard. Heart sounds are often of greater amplitudethan lung sounds and may obscure them. They can be madeless troublesome by the frequency response of the micro-phone because heart sounds are in a lower frequencyrange. Air coupling or inherent microphone characteristicsmay help by increasing the high frequency response.Microphone placement can also reduce the interferencefrom heart sounds, which are, of course, loudest over thefront of the chest, particularly in the left lower zone, andare less obtrusive on the right side, especially at the base ofthe right lung posteriorly. One method that has beenadopted to reduce contamination of lung sounds by theheart sounds is to record the electrocardiogram simulta-neously and to use some form of gating to delete segmentswhere the heart sounds are present (14). The periodicity of
278 LUNG SOUNDS

the heart sound makes this an attractive alternative forsome purposes. Muscle noise can also contaminate lungsounds; again the frequency content of muscle noise isconsiderably lower than that of lung sounds, and a micro-phone that is insensitive to low frequency noise, or sub-sequent filtration of the signal, can be helpful. Muscle noisehas the disadvantage of being timed with respirationbecause it arises from respiratory muscle activity, and thisprevents it from being gated out on a time base. Mostinvestigators have found that the frequency range of mostinterest in the recording and analysis of lung sounds liesbetween 100 and 1000 Hz, well within the frequency rangeof most microphones.
Surface noise is another important source of difficultythat can arise in recording and interpreting lung sounds.The movements associated with respiration make it easyfor the microphone to slide over the skin surface in phasewith respiration, producing sounds that are in phase withrespiration, may be in the same frequency range as lungsounds, and may be very difficult to distinguish fromfriction sounds such as a pleural friction rub. Surface noiseis more likely to arise when the microphone is mechanicallyin contact with, but not firmly fixed to, the chest wall. Aircoupling may have advantages over mechanical coupling inthis respect, but not always if the chest piece is of thediaphragm type commonly used in stethoscopes. Respira-tory movement may also cause changes in the pressurewith which a microphone is applied to the chest wall; if themicrophone is strapped to the chest by a circumferentialband, pressure on the microphone will increase as inspira-tion occurs and the chest diameter increases. Variation inpressure of the microphone against the chest wall is liableto alter the acoustic coupling, particularly if mechanicalcoupling is used to transmit surface movement to thesensitive microphone element. If the pressure exerted issufficient, the deformation of the sensitive element mayapproach the limit of its range, damping the signal. Air-coupled microphones are less sensitive to changes in pres-sure of application, provided that the air chamber betweenchest wall surface and microphone element is vented totheoutside, usually by a small-bore needle; but too large avent may increase the amount of ambient sound recorded(15).
For some purposes, the sound transducer is applied onlybriefly at a specific site on the chest wall while a fewbreaths are recorded. For monitoring purposes, attach-ment of a sound recording device for a period of hours orovernight may be necessary. Lightness and small bulk areimportant in this type of application, and in some casestwo-sided adhesive tape or an adhesive patch similar tothat used for electrocardiograph electrodes is adequate forattachment.
If chest wall surface movement is unimpeded, the vibra-tions that correspond to the lung sound do not involveactual mechanical displacement of the chest wall surfaceby more than a few micrometers. A sensor applied to thesurface may measure displacement or, if it applies a load tothe chest wall surface, it may measure pressure ratherthan displacement, or a combination of the two. Somesound transducers measure acceleration rather thanactual physical displacement. In each case, the reaction
of the sensor to the signal being sensed will influence itscharacteristics. Inertia, rigidity, or counterpressure by thesensing element may cause distortion of the sound. Parti-cularly in the case of accelerometers, the mass of thesensing element will determine its frequency responsecharacteristics. It is not always clear what criteria areused in making a decision about microphone type. Thehuman ear is remarkably good at separating out the dif-ferent sounds that may be combined to form a mixed signal,and often the final judgment may be made by listening toreplay of a recorded signal. The efficiency of a particularsound system depends on the purpose for which it isintended, but unless the signal is listened to with aneducated ear it is easy to be misled by, for example,frequency components whose origin is not obvious frominspection of a graphic or calculated spectrum.
RECORDING AND DISPLAY SYSTEMS
Those using devices and instruments to study lung soundswill choose recording and display systems appropriate totheir purpose. Audio tape and strip-chart recorders havenow virtually all been replaced by computers or systemsdesigned or modified for the purpose. The signals of inter-est may be presented to the observer audibly, visually, or ina variety of forms during and after analysis. Standardphysical examination of the chest does, in a sense, presentaudible and visual displays to the clinician. The stetho-scope presents an audible signal at the earpieces, and theclinician observes his patient breathe to get a visual displayof respiratory movement.
For teaching purposes at the bedside, an electronic stetho-scope or microphone may be connected to several headsetsworn by students, by telemetry if preferred, giving the instruc-tor an opportunity to share the sounds with them. In this way,a realistic learning experience is provided with less impositionon the patient’s patience. Recording of sounds for teachingpurposes usually involves a computer system, or an electronicstethoscope and audio tape recorder. Standard audiovisualequipment has been used for editing, for adding comments,and for preparation of cassettes or disks for distribution (16,17)for teaching purposes.
For research purposes, arrays of microphones are nowavailable with computer recording, analysis, and displaysystems to show the distribution of sound signals over thesurface of the chest (18–20). Brief differences in time ofsound signals have clinical relevance by allowing compar-ison in timing of the same sound signal of a crackle or thestart of a wheeze arriving at different surface sites in thesame patient. And on a longer time base, in asthmatics, forexample, the site, the frequency pattern, and the soundamplitude of wheezing may change during exercise, sleep,exposure to cold air or to inhalants such as pollen, orindustrial exposure, or in response to drug treatment.Sleep disorders such as nocturnal asthma, the sleep apneasyndrome, and snoring, may be studied by sound monitor-ing. Nocturnal asthma and snoring are present in the samepatient more often than would be expected as a result ofchance alone, especially in asthmatics under the age of 40(21). Snoring is a respiratory, but not a lung sound, as it
LUNG SOUNDS 279

rises in the upper airways, at or above the larynx. Possibleexplanations for the association with asthma, and soundmonitoring methods and devices, have been reviewed (22).
Comparisons over long periods of time were once madeby recording the results of analyses of wheezes, rather thanby comparing the actual recorded sounds. The developmentand proliferation of computers with rapidly increasingaudiovisual capability and storage capacity are now, how-ever, changing the situation to allow storage of originaldata on tape or disk together with derived values. Kramanet al. (23) evaluated minidisk recorders, with their con-siderable increase of storage capacity for music, for lungsound recording. They found no distortion of frequency orwaveforms that would interfere with this use. For somestudies, analyzing sound signals in real time as they arebeing acquired makes it simpler to monitor results as theyaccrue, and helps direct the course of an experiment.
An early example of audiovisual recording is in a paper byKrumpe et al. (24), in which the authors discuss the evaluationof bronchial air leaks by auscultation and phonopneumogra-phy. They describe three patients who develop air leaks fromthe bronchi after resectional lung surgery and in whom‘‘videophonopneumography’’ provided more precise correlationof abnormal sounds with the underlying visibly leaking bron-chial abnormalities. Audiovisual tapes or disks are useful forteaching or demonstration purposes, by providing examples ofclassical or of unusual sounds.
Simultaneous sound recordings at several sites havebeen used to study the spatial distribution of lung sounds.This has provided information on regional ventilation, andon the localization of abnormalities in disease such aspneumonia, airways obstruction, bullae, or small areasof infarction, atelectasis, fibrosis, or interstitial lung dis-ease. Indeed, lung imaging by sound production provides apotential alternative to chest X rays and computed tomo-graphy (CT) scans, without the need to inject possiblydamaging energy or drugs.
For research purposes, analysis of sound signals and anyassociated physiological measurements were formerly con-ducted off-line. The signals were recorded on tape or diskand replayed for analysis. This allowed editing for selection ofrelevant segments of data and for quality control and signalconditioning, such as amplification, filtering, or attenuation.The purpose of each study will determine the equipmentneeds, but most current lung sound research uses computerswith high speed audiovisual capabilities. These can be adaptedto record lung sounds along with physiological respiratoryvariables, such as airflow, lung volume, and esophageal pres-sure, measured simultaneously, which can then be related tothe lung sounds. If relationships in time are to be studied withany precision, it is necessary to record signals together on onemedium and it is necessary to know the frequency character-istics of the items of equipment used, and the time delaysintroduced by filters, envelope detectors, integrators, fre-quency analyzers, and other acquisition or processing devices.
SOUND ANALYSIS
Sound amplitude and frequency content are the two mea-surements that most commonly form the basis of lung
sound analysis systems. Early studies presented the soundsignal as a time-amplitude plot. If such plots represent arespiratory cycle on a few centimeters of paper, the result isa compressed representation that superimposes many suc-cessive sound signal cycles to form an envelope. Simpleintegrating and rectifying circuits can provide the outlineof the envelope as a single line, thus acting as an envelopedetector, ac–dc converter, or sound-level meter. Filtersincorporated in such circuitry can yield a method forcomparing sound amplitude in different frequency bands(14,17) or to provide a signal believed to represent theimportant band range of vesicular sound from the ventila-tion point of view (25).
The sound spectrogram is really an extension of thisprinciple, the signal of interest being passed repetitivelythrough a narrow bandpass filter with slowly changingcenter frequency and the signals passed being assembled topresent a graphic display of time on the horizontal axis,sound frequency on the vertical axis, and sound amplitudeby the degree of blackening of the paper. Sound spectro-grams of this type, used routinely in the speech sciences,were applied to heart and lung sounds extensively byMcKusick et al. (26) and are still widely used to good effect.
The time-amplitude plot of a sound signal has been usedto advantage in a different way by Murphy et al. (27).Features of the sound waveform cannot be studied in detailwithout using a rapid time sweep on an oscilloscope, andonly a brief (a few milliseconds) segment can be viewed inthis way. By digitizing a sound signal at a rapid rate andplaying the signal back through a digital-to-analogue con-verter (DAC), a ‘‘time-expanded’’ waveform was prepared.This has proved of particular value in studying crackles(rales), the brief sounds heard over fibrotic, edematous,consolidated, or atelectatic lung. Measurable characteris-tics of these crackles, such as the initial or the largestdeflection width, show diagnostic value and automaticmethods for their measurement are now being applied.
The sound characteristics of rhonchi, as opposed tocrackles (continuous versus discontinuous adventitioussounds) require an additional approach. Essentially, theyare longer in duration, possessed of perceptible pitch, andhave a repetitive waveform pattern. Waveform analysis isa rapidly moving field. Sound frequency spectrum analysisof lung sounds has most frequently been reported in termsof discrete Fourier analysis. Several workers have used afast Fourier transform algorithm to measure frequencycontent of signal segments. One way of representingtime-variant sound signals is to assemble a sequence ofspectra with frequency on the horizontal axis, sound ampli-tude or power on the vertical axis, and time on an obliqueaxis. Usually, some overlapping of the sequential segmentsand appropriate windowing (e.g., Hanning) are used. Theresulting ‘‘bird’s-eye view’’ has proved to be readily relatedto sounds, providing a mental image that can evoke amental image of the sounds represented. Individual peakson a frequency spectrum may be related to individualwheezes coming from the chest, and peak detection pro-grams have been used (28,29) to compare them statisti-cally. The fast Fourier transform is the most frequentlyreported type of waveform analysis, but other techniques,such as those of linear predictive coding (LPC), the
280 LUNG SOUNDS

maximal entropy method of waveform analysis, fractal-dimension analysis, wavelet networks, and artificialneural networks, are being explored. They are most likelyto prove useful in brief sounds, in timing the onset or rapidchanges in complex sounds, or in noting time relationshipsamong sounds recorded at separate or at adjacent sensors.Any graphic form of waveform analysis is more readilyinterpreted when it can be combined with visual examina-tion of a simultaneous time-amplitude plot.
RESULTS AND CLINICAL APPLICATIONS
Increasing attention and techniques for more exact repre-sentation have led to a rapid growth in information avail-able about lung sounds. The meaning of these variousitems of information will emerge more slowly, as willclinical applications. The objective, quantitative study oflung sounds, is still at an interesting rapid growth phase ofdevelopment. It is clear that a good deal of information iscontained in the signals that we hear emerging from thechest (2) and that auscultation is one of the safest ofdiagnostic procedures, since no external energy or chemi-cal is inserted into the body. It is also clear that some of theinformation conveyed would be difficult to obtain in anyother way. Much of it is regional or local and may be able totell us about mechanical events and structural character-istics at specific sites in the chest (30,31). The vesicularlung sounds have been studied in sufficient detail that wenow know more about the probable general range of bron-chial dimensions involved in the production of thesesounds, but not the exact site; the effects of flow rateand lung volume, but not the exact nature of the relation-ships; and we know that there are relationships betweenvesicular lung sound intensity and regional ventilation,but not their exact nature. The roles of production and oftransmission of these sounds are not always easy to dis-tinguish from one another in the end-product, sensed at thesite of their detection, but recent work by Kiyokawa andPasterkamp (32) shows progress in this distinction.
We know that wheezing indicates airflow obstructionand roughly its levels in the bronchial tree. We know thatseveral factors, such as airway dimensions, geometry, andcompressibility, are important. Endobronchial surfacecharacteristics and the presence and nature of secretionsmay also have some effect. We know that flow rates andintrathoracic pressure and volume history affect wheezes;but we do not know the relative importance of these factorsand the extent of variation from one disease state toanother. Crackles are known to be associated with certaindiseases and not with other radiographically similar dis-eases, but we are not sure why. We know that crackles fromdifferent types of abnormal lungs have different character-istics, but a great deal of clinical observation will be neededto test their diagnostic value: and physiological or patho-logical studies to understand the basic mechanismsinvolved.
Laennec’s stethoscope—and for that matter the stetho-scope pulled currently from the pocket of a white coat—allows the user to consider the sound of one breath at oneplace at one time. Medical devices and equipment are now
being developed that can expand the observations in time,in space, in content, and in information; for example, fromone or two breaths to hundreds of breaths, and from onespecific point on the chest to the entire chest. From onebreath described or remembered as vesicular, reduced involume, with a few end-expiratory crackles the informationmay expand to an assembly of pages of tables and graphsshowing a variety of measured features. These can includediagrams of the chest showing where and how the lungsand ventilation vary, where and how much airflow obstruc-tion or lung collapse is present, and can offer a regionaldescription of airways’ diameters and other characteristics.
Que et al. (33) developed a system to measure trachealflow from tracheal sounds, and to use this to estimate tidalvolume, minute ventilation, respiratory frequency, meaninspiratory flow rate, and duty cycle. Careful observationsand comparison of the results with simultaneouslyrecorded pneumotachygraph-derived volumes in variouspostures allowed them to address the problems inherent inthe adverse signal/noise ratio and the low level of the flow-derived sound at flow rates seen in quiet breathing. Thesystem that they developed suggests that their method ofphonospirometry measures overall ventilation reasonablyaccurately without mouthpiece, noseclip, or rigid posturalconstraints.
The study by Kiyokawa and Pasterkamp (32) in a sensecomplements this by measuring lung sounds at two closelyspaced sensors on the chest surface. In five healthy sub-jects, volume-dependent variations in phase and amplitudeof signals recorded over the lower lobe might reflect spatialvariations of airways and diaphragm during breathing.These authors noted similar variations in phase and ampli-tude on passive sound transmission, suggesting that a differ-ence in sound transmission was a more likely cause of thevariations than a difference in sound generation. Their obser-vations compare local sounds that reflect local circumstances;the observations discussed in the previous paragraph concerncentral sounds that reflect total ventilation.
Several systems are now available or under develop-ment that can record sound signals simultaneously from anumber of sites, with or without associated physiologicalsignals, and present the observations for read-out by thephysician. Lung sound documentation and analysis cannow be done on personal digital assistants (PDAs) as wellas on laptop computers. Stethoscopes can be connected tothese devices wirelessly or by a short cable. This allowsobjective quantification of these sounds at the bedside(34,35). A personal computer based ‘‘telemedicine’’ systemhas been described in which two remote hemodialysis siteswere connected by high speed telephone lines to allow videoand audio supervision of dialysis from a central site (36).Such equipment may eventually be used to supplement—or perhaps in some circumstances replace—other diagnos-tic devices such as fluoroscopy or other types of radio-graphic imaging. They have the great advantage ofavoiding the subjection of a patient to any potentiallyharmful radiation or other energy, and can therefore beused over prolonged periods of time.
Transthoracic speed of sound introduced at the mouthor the supraclavicular space (35) can be mapped at sev-eral sites on the chest using sound input with specific
LUNG SOUNDS 281

characteristics. This may allow noninvasive monitoring ofconditions such as pneumonia, congestive heart failure,or pleural effusion that increase intrathoracic density.Chronic obstructive lung disease may be detected byreading lung sound maps showing time intensity plotsat several sites over the chest; this appears to be moreaccurate than current clinical diagnostic methods. Theability to detect diaphragmatic movement by multichan-nel lung sound analysis suggests that it may prove to bean inexpensive bedside test. It may also have usefulapplications in ventilator management.
It seems clear that wider application of these newdevelopments in lung sound analysis will lead to safe,useful, and rewarding forms of clinical and physiologicalinformation that can answer many imaging, diagnostic,and monitoring problems.
BIBLIOGRAPHY
1. Laennec RTH. De l’auscultation mediate ou traite du diag-nostic des maladies des poumon et du coeur, fonde principale-ment sur ce nouveau moyen d’exploration. 1st French ed.,Volumes 2, Paris: Brosson et Chaude; 1819.
2. Laennec RTH, trans. by Forbes J 1st American ed. Philadel-phia: James Webster; 1823. p 211.
3. Mikami R, Murao M, Cugell DW, Chretien J, Cole P, Meier-Sydow J, Murphy RL, Loudon RG. International symposium onlung sounds. Synopsis of proceedings. Chest 1987;92:342–345.
4. Bettencourt PE, Del Bono EA, Spiegelman D, Herzmark E,Murphy RL. Clinical utility of chest auscultation in commonpulmonary diseases. Am J Respir Crit Care Med 1994;150:1291–1297.
5. Pasterkamp H, Kraman SS, Wodicka GR. Respiratory sounds.Advances beyond the stethoscope. Am J Respir Crit Care Med1997;156:974–987.
6. Sovijarvi AHA, Vanderschoot J, Earis JE. ComputerizedRespiratory Sound Analysis (CORSA): Recommended stan-dards for terms and techniques. Eur Respir Rev 2000;10:77:585–649.
7. Sakula A. Laennec RTH 1781–1926. His life and work. Abicentenary appreciation. Thorax 1981;36:81.
8. Ertel PY. Stethoscope acoustics and the engineer: Conceptsand problems. J Audio Eng Soc 1971;19:182–188.
9. Charbonneau G, Sudraud M. Measurement of the frequencyresponse of some commonly used stethoscopes. Consequencesto cardiac and pulmonary auscultation. Bull Eur Physiol1985;21:49–55.
10. Abella M, Formolo J, Penney DG. Comparison of the acousticproperties of six popular stethoscopes. J Acoust Soc Am1992;91:2224–2228.
11. Charbonneau G, Racineux JL, Sudraud M, Tuchais E. Anaccurate recording system and its use in breath sounds spec-tral analysis. J Appl Physiol 1983;55:1120–1127.
12. Pasterkamp H, Kraman SS, DeFrain PD, Wodika GR. Mea-surement of respiratory acoustical signals. Comparison ofsensors. Chest 1993;104:1518–1993.
13. Kraman SS. Lung sounds: Relative sites of origin and com-parative amplitude in normal subjects. Lung 1983;161:57–64.
14. Pasterkamp H, Fenton R, Tal A, Chernick V. Interference ofcardiovascular sounds with phonopneumography in children.Am Rev Respir Dis 1985;131:61–64.
15. Kraman SS, Wodicka GR, Oh Y, Pasterkamp H. Measurementof respiratory acoustic signals. Effect of microphone air cavitywidth, shape, and venting. Chest 1995;108:1004–1008.
16. Cugell DW. Use of tape recordings of respiratory sound andbreathing pattern for instruction in pulmonary auscultation.Am Rev Respir Dis 1971;104:948–950.
17. Banaszak EF, Kory RC, Snider GL. Phonopneumography. AmRev Respir Dis 1973;107:449–455.
18. Kompis M, Pasterkamp H, Wodicka GR. Acoustic imaging ofthe human chest. Chest 2001;120:1309–1321.
19. Sun X, Cheetam BM, Earis JE. Real time analysis of lungsounds. Technol Health Care 1998;6:11–22.
20. Bergstresser T, Ofengeim D, Vyshedskiy A, Shane J, MurphyR. Sound transmission in the lung as a function of lungvolume. J Appl Physiol 2002;93:667–674.
21. Fitzpatrick MF, Martin K, Fossey E, Shapiro CM, Elton RA,Douglas NJ. Snoring, asthma and sleep disturbance in Brit-ain: a community-based survey. Eur Respir J 1993;6:531–535.
22. Dalmasso F, Prota R. Snoring: analysis, measurement, clinicalimplications and applications. Eur Respir J 1996;9:146–159.
23. Kraman SS, Wodicka GR, Kiyokawa H, Pasterkamp H. Areminidisc recorders adequate for the study of respiratorysounds?. Biomed Instrum Technol 2002;36:177–182.
24. Krumpe PE, Hadley J, Marcum RA. Evaluation of bronchialair leaks by auscultation and phonopneumography. Chest1984;85:777–781.
25. Ploysongsang Y, Martin RR, Ross RD, Loudon RG, MacklemPT. Breath sounds and regional ventilation. Am Rev RespirDis 1977;116:187–199.
26. McKusick VA, Jenkins JT, Webb GN. The acoustic basis of thechest examination: Studies by means of sound spectrography.Am Rev Tuberc 1955;72:122–134.
27. Murphy RLH, Holford SK, Knowler WC. Visual lung soundcharacterization by time-expanded wave-form analysis. NEngl J Med 1977;296:968–971.
28. Baughman RP, Loudon RG. Lung sound analysis for contin-uous evaluation of airflow obstruction in asthma. Chest1985;88:364–368.
29. Pasterkamp H, Tal H, Leahy F, Fenton R, Chernik V. Theeffect of anticholinergic treatment on post exertional wheezingin asthma studied by phonopneumography and spirometry.Am Rev Respir Dis 1985;132:16–21.
30. Nath AR, Capel LH. Inspiratory crackles and the mechanicalevents of breathing. Thorax 1974;29:695–698.
31. Murphy RLH, Jr., Gaensler EA, Holford SK, Delbono EA,Eppler G. Crackles in the early detection of asbestosis. AmRev Respir Dis 1984;129:375–379.
32. Kiyokawa H, Pasterkamp H. Volume-dependent variations ofregional lung sound, amplitude, and phase. J Appl Physiol2002;93:1030–1038.
33. Que C-L, Kolmaga C, Durand L-G, Kelly SM, Macklem PT. Pho-nospirometry for noninvasive measurement of ventilation: Metho-dologyandpreliminaryresults.JApplPhysiol2002;93:1515–1526.
34. Bergstresser T, Ofengeim D, Vyshedskiy A, Shane J, MurphyR. Sound transmission in the lung as a function of lungvolume. J Appl Physiol 2002;93:667–674.
35. Paciej R, Vyshedskiy A, Shane J, Murphy R. Transpulmonaryspeed of sound input into the supraclavicular space. J ApplPhysiol 2002;94:604–611.
36. Winchester JF, Tohme WG, Schulman KA, Collman J, John-son A, Meissner MC, Rathore S, Khanafer N, Eisenberg JM,Mun SK. Hemodialysis patient management by telemedicine:Design and implementation. ASAIO J 1997;43:M763–766.
See also PULMONARY PHYSIOLOGY; RESPIRATORY MECHANICS AND GAS
EXCHANGE.
LVDT. See LINEAR VARIABLE DIFFERENTIAL TRANSFORMERS.
282 LUNG SOUNDS
M
MAB. See MONOCLONAL ANTIBODIES.
MAGNETIC RESONANCE IMAGING
W. F. BLOCK
A. L. ALEXANDER
S. B. FAIN
M. E. MEYEREND
C. J. MORAN
S. B REEDER
K. K. VIGEN
O. WIEBEN
University ofWisconsin–MadisonMilwaukeeMadison, Wisconsin
J. H. BRITTAIN
General Electric HealthcareMilwaukee, Wisconsin
INTRODUCTION
The principle of nuclear magnetic resonance (NMR) wasdiscovered by Felix Bloch and Edward Purcell indepen-dently in 1946. The two were awarded the Nobel Prize inPhysics for the discovery, which had numerous applica-tions in studying molecular structure and diffusion. Atomicnuclei with an odd number of protons or an odd number ofneutrons behave like spinning particles, which, in turn,create a small nuclear spin angular momentum. Thisangular momentum of an electrically charged particle suchas the nucleus of a proton leads to a magnetic dipolemoment. In the absence of an external magnetic field,the orientation of these magnetic moments is randomdue to thermal random motion. These magnetic momentsare referred to as spins, because the fundamentals of thephenomena can be explained using classical physics wherethe moments act similarly to toy tops or gyroscopes. TheNMR phenomenon exists in several atoms and is usedtoday to study metabolism via imaging. However, hydro-gen is the simplest and most imaged nucleus in MR exam-inations of biological tissues because of its prevalence andhigh signal compared with other nuclei.
NMR imaging was renamed Magnetic resonanceimaging (MRI) to remove the word nuclear, which thegeneral public associated with ionizing radiation. MRIcan be explained as the interaction of spins with threemagnetic fields: a large static field referred to as B0, whichorganizes the orientation of the spins; a radio frequency(RF) magnetic field referred to as B1, which perturbs thespins so that a signal can be created; and spatially varyingmagnetic fields referred to as gradients, which encode thespatial location of the spins. These subsystems are shown inFig. 1.
When an external magnetic field is present, the distribu-tion of the magnetic moments is no longer random.Current technology allows large, homogenous static
magnetic fields to be created using superconductingmagnets, whereas smaller fields are possible withpermanent magnets. In most conventional systems, thestatic field is aligned along the longitudinal axis or the longaxis of the body, as shown in the z axis in Fig. 1. Clinical MRIscanners have been built with static fields ranging from0.1 to 7 T, but the vast majority of scanners are between0.5 and 3.0 T.
THEORY
Creating Net Magnetization
Consider a static field oriented along the z axis with mag-nitude B0, or represented as a vector B¼B0k. Hydrogenprotons have a quantum operator whose z component isquantized to �½. According to quantum mechanics, onlytwo discrete sets of orientations exist for the magneticdipole of each hydrogen nucleus. In the parallel energystate, the magnetic moment vector m orients itself so thatits projection on the z axis aligns with the direction of themain magnetic field B0. In the antiparallel energy state,this projection aligns in the opposite direction of themain field. It can be shown that the two allowed anglesbetween magnetic dipoles and the static field are u¼�548(1), and thus a population of spins will be oriented as inFig. 2b.
The ratio of spins in the parallel state n� to the spins inantiparallel state nþ is given by the Boltzmann equation
n�
nþ ¼ e�DEkT ¼ e�
g2ph B0kT (1)
where g is a nuclei-specific constant referred to as thegyromagnetic ratio, k denotes the Boltzmann constant,and T is the absolute temperature. There are only slightlymore spins in the parallel state than in the antiparallelstate because this state is of lower energy; however, theprevalence of water in biological tissue can create anadequate signal with this differential. This distributionof spin orientations in a small volume element results inan average or net magnetization M, which aligns alongthe longitudinal or z axis, as shown in Fig. 2b. The entireprocess is referred to as polarization. The contributions inthe transverse (x�y) plane sum to zero. As the argumentof the exponential in Equation 1 is small and thedifference in energy levels varies proportionally with fieldstrength, the length of the net magnetization vector varieslinearly with field strength. A quantum mechanicsdescription of the spin distribution can be foundelsewhere (2).
Signal Generation
The behavior of the net magnetization vector in an externalfield can be described by the classical model according to
283

the Bloch equation.
dM
dt¼ gðM � BÞ (2)
A useful parallel description is a spinning toy top where theaxis of the top is analogous to M and gravity is analogous toB. In the equilibrium state, the net magnetization M andthe static magnetic field B0 are parallel so that M does notexperience a torque and consequently the direction of Mdoes not change. Similarly, the axis of a spinning toporiented vertically remains vertical.
The second magnetic field in MRI is an RF field that iscreated using an RF amplifier that supplies oscillatingcurrent into a coil that surrounds the patient. The coil isdesigned to create a magnetic field, referred to as B1
field, oriented in the transverse plane and approximatelyon the order of 10 T. By having the RFenergy oscillate atthe resonant frequency of the nuclei, this relatively lowfield can perturb and rotate the net magnetization awayfrom its orientation along the longitudinal axis. Theresonant or Larmor frequency v0 is related to the staticfield strength such that v0 ¼ gB0. For protons, the gyro-magnetic ratio g/2p¼ 42.57 MHz/T. The field created bythe tuned RF coil, referred to as an excitation, can be
viewed as an applied torque that tips or flips spins awayfrom the longitudinal axis by an angle referred to as theflip angle. The strength of the B1 field and the length oftime it is applied determine the flip angle. The flip angleusually varies between 5 and 1808 depending on theapplication.
Once the magnetization is no longer parallel to the staticfield, the right-hand side of Equation 5 is no longer zero andthe direction of the net magnetization will change. In fact,it will begin to precess about the axis of the static magneticfield and at the Larmor frequency. In general, the preces-sional frequency is directly proportional to the magneticfield experienced by the spin, such that v¼ gB. Similar to atoy top that is tipped an angle u off its vertical axis, the topwill maintain an angle of u as it rotates about the verticalforce supplied by gravity.
The net magnetization can be described by its long-itudinal component Mz and its transverse componentMxy, a complex value whose magnitude describes the com-ponent’s strength and whose angle describes the location ofthe component in the x–y plane. The rapid rotation of thetransverse component will create a time-varying magneticflux. A properly oriented receiver coil will detect this time-varying flux as a time-varying voltage, in agreement withFaraday’s law of induction. Often, the same coil used forexcitation can also be used for reception. This voltagesignal, known as a Free Induction Decay, or FID, is shownafter a 908 excitation in Fig. 3, which is the most basic formof a MR signal. Although the entire magnetization vector istipped into the transverse plane in this example, smallerflip angles will also create a transverse magnetization andthus an FID.
284 MAGNETIC RESONANCE IMAGING
Figure 2. (a) shows the precession of a spin with a magneticmoment m in a static field with magnetic flux density of B0. Anassembly of spins in parallel and antiparallel states is shown in (b).The Boltzmann equation determines the ratio of the spins in thetwo states. As the components in x and y compensate each other,the net magnetization M has a component in the z direction only(parallel to B0). The coordinate system is shown with its unitvectors i, j, and k along x, y, and z.
Figure 3. Generation of a free induction decay after a 908 RFexcitation.
Figure 1. Clinical 1.5 T MRI scanner with staticfield oriented along long axis of the body (z).Patient’s head lies in RF coil, which is used toboth perturb and receive MR signal. Scannerbed will move patient into middle of cylinderbefore imaging begins. MR gradient coils for ydimension are shown, which have mirrored coilson the opposite side of the magnet. A portion of thez gradient, based on solenoid design, is also shown.
z
y
x
RF Transmitter and Receiver
Superconducting magnet
Z gradient coil
Y gradient coil
B0

The complex motion of the net magnetization, and thusthe recorded FID signal, can be described in a simplifiedmanner by using a rotating reference frame that rotates atthe Larmor frequency about the static B0 field. In thisrotating frame, the FID will decay as a simple exponential.The causes of this decay, and its use as potential imagecontrast mechanism, will be described after spatial encod-ing is described. Most MR signals are demodulating usingthe Larmor frequency and, thus are effectively acquired inthe rotating frame.
Spatial Encoding
The first two magnetic fields described above allowbiological tissue to be polarized, perturbed, and measured.In terms of clinical imaging, however, these fields merelyallow us to integrate the signal derived throughout thebody, a measure of little value. The field of MRI developedonly when a third spatially varying magnetic field, referredto as a gradient field, was invented to spatially encodethe MRI signal. This method allows us to achieve sub-millimeter resolution while using RF energy whose wave-lengths are on the order of tens of centimeters to meters.
Dr. Paul Lauterbur realized, in 1973, that, instead ofworking like others to build a more homogenous field forNMR spectroscopy, spatially varying the strength of themagnetic field could provide a means to build an imagingsystem. For this work, he won the Nobel Prize in Medicinealong with Sir Peter Mansfield in 2003.
The three gradient coils in a cylindrical MRI system, twoof which are shown in Fig. 1, are laid out concentrically on acylinder. The cylinder surrounds the patient as he or she liesinside of the static B0 field. The three coils are designed tocreate longitudinal magnetic fields in z that vary in strengthlinearly with the x, y, and z dimensions, respectively. Thedigital scanner hardware controls the current waveforms,which are amplified by three respective gradient amplifiersbefore being sent to the gradient coils. The strength of eachcomponent gradient field, Gx,Gy, or Gz, is measured in G/cmor mT/m and is directly proportional to the current suppliedto the coil. Changing gradient strengths quickly on clinicalscanners is possible with amplifiers capable of slew rates ofapproximately 200 mT/m/s.
As the resonant frequency of an MR spin is directlyproportional to the magnetic field it experiences, a gradientcoil allows us to linearly vary the frequency of spinsaccording to their position within the magnet. For example,a gradient of strength Gx, which does not vary in time,causes the frequency of spins to vary linearly with the xcoordinate.
wðxÞ ¼ g½B0 þ Gxx ð3Þ
Spins to the left of the magnet center rotate slower, spinsat the exact magnet center remain unchanged, andspins to the right rotate faster than they did withoutthe gradient.
Gradients can be used to selectively excite only spinsfrom a slice or slab of tissue. Slice thicknesses in 2D MRIrange from 1 to 20 mm. To select a transverse slice, the zgradient can be applied during RF excitation, which willcause the resonant frequency to vary as a function of z in
the magnet, such that wðzÞ ¼ g½B0 þ Gzz. Instead of excit-ing all the spins within the magnet, only spins whosefrequency matches the narrow bandwidth of a pulsed-RF excitation will be excited within a slice at the centerof the magnet. Modulating the frequency of the RF pulseup will move the slice superior in the body, whereasmodulating it down will excite an inferior slice. Likewise,slices perpendicular to the x or y axis can be excited byapplying a Gx or Gy gradient, respectively, simultaneouslywith RF excitation. In fact, an oblique slice orientation canbe achieved with a combination of two or more gradients.The ability to control from which tissue signal is obtained,without any patient movement, is a major advantage ofMRI.
Simplified MR Spatial Encoding. Once a slice of tissue isselected, the two remaining spatial dimensions must beencoded. A somewhat simplified method of visualizingencoding follows. For a transverse slice, receiver datacould be obtained after RF excitation while a constantgradient was applied in the x direction. Tuning a receiverto select a very narrowband frequency range would deter-mine which spins were present within a spatial range x1<x< x1 þ Dx. By repeating the experiment while changingthe narrowband frequency range, a projection of the spindensities along the x axis could be determined. Likewise,the same experiment could be repeated while applying aconstant y gradient to obtain a projection of spin densitiesalong the y axis. Likewise, projections along arbitraryaxes could be achieved by acquiring data while applyinga combination of x and y gradients after RF excitation. In amatter very similar to computed tomography (CT) ima-ging, an image could be reconstructed from this set ofacquired projections.
MR Spatial Encoding in the Fourier Domain. Althoughpossible, the proposed method would be very slow becauseeach sample point within each projection would require itsown MR experiment or excitation. Time between excita-tions in MR vary in duration from 2 ms to 4 s depending onthe desired image contrast. Even with the shortest excita-tion, each slice would require over 3 min of scan time. Allthe data for an entire projection can be acquired withinmilliseconds by considering how the phase of the trans-verse magnetization varies, instead of the frequency, withspatial position. This description also uses the concept thatposition in MR is encoding using an alternative Fourierdomain where signal location is mapped onto spatial fre-quencies.
Integrating the frequency expression in Equation 3indicates how the spin phase, or location of the transversemagnetization within the transverse plane, will vary withthe x coordinate during a general time-varying gradientGx(t) applied after excitation. Ignoring the phase term dueto the B0 field, which will be removed during demodulationof the received signal, gives a phase term for each spin thatvaries with the spatial position x and the integral of theapplied gradient at each point in time.
Mxyðx; tÞ ¼ MxyðxÞe� j2pg
2p
R t
t0¼0½Gxðt0Þxdt0 (4)
MAGNETIC RESONANCE IMAGING 285

The signal received by the MR coil can be expressed as anintegration of all the excited spins in the x–y plane usingthe following equation:
SðtÞ ¼Zy
� Zx
Mxyðx; yÞe� j2pkxðtÞxdx
�dy (5)
where a Fourier spatial frequency, termed kx(t) in MR, hasbeen substituted for g
2p
R tt0¼oðGxðt0ÞxÞdt0. In this example,
the coil simply integrates all the spins in the y dimension,and thus only spatial information in x is available. Thereceived signal can be seen as a 1D Fourier transform of theprojection of transverse magnetization Mxy(x, y) onto the xaxis. The corresponding coordinate in the Fourier domainat each point in time t is determined by the ongoing integralof the gradient strength. Thus, we can acquire an entireprojection in one experiment rather than numerous MRexperiments as in the simplified example with the narrow-band receiver.
The last spatial dimension for this 2D imaging exampley has a corresponding Fourier dimension termed ky, whichcan be similarly traversed by designing the integral of theGy gradient current.
SðtÞ ¼Zy
Zx
Mxyðx; tÞe� j2pkxðtÞx e� j2pkyðtÞydxdy (6)
where kyðtÞ ¼ g2p
R tt0¼oðGxðt0ÞxÞdt0. The integral of the gra-
dients determines location in the Fourier space known as kspace in MRI. Numerous strategies can be used to traverseand sample k space before transforming the data, oftenwith a Fast Fourier Transform (FFT), into the imagedomain. The method can be extended to three dimensionsby exciting a slab of tissue and using the Gz gradient toencode the third dimension.
As in the simplified example, a combination of Gx and Gy
can be used to sample the 1D Fourier expression of projec-tions of Mxy at arbitrary angles. This data can be trans-formed into the actual projections using 1D inverse Fouriertransforms. Methods very similar to computed tomographycan translate the projection data into an image. Alth-ough acquiring data in this manner, known as radialimaging, has interesting properties, by far the most pop-ular method in clinical imaging traverses the Fourier spacein a Cartesian raster pattern known as spin-warp imaging.
This sampling is typically completed in a seriesof experiments, where the time between consecutive
excitations is referred to as the repetition time TR. Inmany MR acquisition schemes, a complete k space line isacquired along kx, known as the frequency-encoding orreadout direction, for each TR. During each subsequentTR, a line parallel to the previous one is sampled afterapplying a short, pulsed Gy gradient. By changing thestrength of the pulsed Gy gradient by equal incrementsduring each MR experiment, a different phase shift isplaced on spins depending on their position in y. In termsof the k space formalism, the area under the Gy gradientpulse causes a vertical displacement in k space such that adifferent horizontal line in k space is acquired in each MRexperiment, as shown in Fig. 4. Here, the vertical directionin k space is known as the phase-encoding direction. Byapplying 1D Fourier transforms in the kx direction, spinposition is resolved based on their frequency during read-out. An image is formed by following these horizontaltransforms with 1D Fourier transforms in the ky dimen-sion. Here, the y position of spins is resolved due to thedifferent phase shifts experienced in each experiment priorto the readout gradient.
The image coverage, or field of view, in MRI decreases asthe sampling rate decreases. As MR samples in the fre-quency domain, failure to sample fast enough in k spaceleads to aliasing in the image domain. Higher resolution inMRI requires obtaining higher spatial frequencies or lar-ger extents of k space. Achieving adequate resolution andcoverage then increases the amount of k space samplingthat is required and increases imaging time. Unlike othermodalities where hundreds to thousands of detectors canbe used at a time, encoding spatial position in this methodonly allows one point of data to be taken at a time, whichexplains MR’s relatively slow acquisition speed. Industrialscanners have only recently determined how to partiallybypass this limitation by using up to 32 different receiverswho have different spatial sensitivities to different tissues.The differences of each receiver in proximity, and thussensitivity to each spin, can be used to synthesize unac-quired regions of k space.
Image Contrast Through Varying Decay Rates
Imaging the spatial density distribution of hydrogen oftenproduces a very low contrast image, as the density ofhydrogen is relatively consistent in soft tissue. However,the imaging experiments described above can be easilymodified to exploit the differences in time for which the
286 MAGNETIC RESONANCE IMAGING
Figure 4. 2D spin-warp imaging with onereadout per TR. One complete line issampled along the readout direction on arectilinear grid in the Fourier domain (kspace) with a resolution of Dkx (circles onthe arrow). The next line is acquiredparallel at a distance of Dky on the grid byincreasing the phase-encoding gradient. Thisscheme is repeated until the desired grid issampled. Images are reconstructed by aninverse 2D Fourier transform (FT).

MR spins remain perturbed. The differences account forthe vast majority of image contrast in standard clinicalMRI.
After the spins are perturbed, the transverse magneti-zation decays toward zero, whereas, the longitudinal mag-netization returns toward its equilibrium magnetization.As more mechanisms exist for the loss of transverse mag-netization than for the regrowth of longitudinal magneti-zation, the length of the magnetization vector M does notremain constant after excitation. Although related, therate of longitudinal relaxation time, termed T1, is alwayslarger than the rate of transverse relaxation time, termedT2.
If the magnetization has been completely tipped in thetransverse plane with a flip angle of 908, then the long-itudinal magnetization recovers as
Mz ¼ M0½1 � e�t=T1 (7)
T1 is also called the spin–lattice relaxation time, because itdepends on the properties of the nucleus and its interac-tions with its local environment. The transverse relaxationtime T2 is also referred to as the spin–spin relaxationtime, reflecting dephasing due to interactions between
neighboring nuclei.
Mxy ¼ Mxyð0Þe�t=T2 (8)
where Mxy(0) is the initial transverse magnetization(Mxy(0)¼M0 for a 908 pulse). The temporal evolution ofthe longitudinal and transverse magnetization is shown inFig. 5. In general, hydrogen protons in close proximity tomacromolecules have lower relaxation times than bulkwater that is freer to rotate and translate its position.
Delaying the encoding and acquisition of the transversemagnetization until some time after RF excitation gener-ates T2 image contrast. As injured and pathological tissuesgenerally have higher T2 relaxation rates, T2-weightedimages have positive image contrast. T1-weighting canbe achieved by using an interval between MR experiments,the TR parameter, which does not allow enough time fortissue to fully recover its longitudinal magnetization. Thus,tissues with shorter T1 relaxation rates will recover morequickly and thus have more signal present in the subse-quent experiments used to build the image than tissueswith longer T1. In general, T1-weighting provides negativecontrast for pathological tissue. An example is shown inFig. 6 for a human brain tumor. The differing rates of
MAGNETIC RESONANCE IMAGING 287
Figure 5. The regrowth of the longitudinal magnetization Mz (a) and the decay of the transversemagnetization Mxy (b) after an RF excitation.
Figure 6. The flexibility of MR to image in different planes with different types of image contrast isshown in these sagittal and axial brain tumor (arrows) images.

recovery can also be used to null out an unwanted tissue,such as fat, by inverting all the spins 1808 prior to imaging.As the point where unwanted tissue passes through thenull of the recovery phase, an imaging experiment isbegun. This technique is referred to as inversion recoverymagnetization preparation or simply inversion recovery.Table 1 lists representative relaxation times for sometissues (3). Extensive reviews of the relaxations times (4)and methods for their measurement (3,4) are available.
Spin Echoes
Ideally, the transverse magnetization decays according toT2. However, the signal dephasing in the transverse planeis significantly accelerated by field inhomogeneities due todifference in magnetic susceptibility between tissue typesor the presence of paramagnetic iron. The largest inhomo-geneities occur at air/tissue interfaces, such as near thesinuses or near the diaphragm. These effects lead to dif-ferent precession frequencies and loss of coherence that aredescribed by a T2
� relaxation time
1
T�2
¼ 1
T2þ 1
T02
(9)
where T02 represents the decay due to the effects described
above.A method to reverse these often undesirable dephasing
effects uses a 908 pulse followed by a 1808 spin refocusingpulse after a time delay td, as shown in Fig. 7b. Thefirst pulse rotates the longitudinal magnetization intothe transverse plane as in the case of the FID. Priorto the second pulse, the magnetization dephases in thetransverse plane due to T2
� effects, with some spins
rotating faster than the Larmor frequency and othersspinning slower. The second pulse flips all magneticmoments about an axis in the transverse plane, effectivelyinverting the phase accruals due to different rotationalfrequencies. Over the second interval td, the faster spinswill catch up with the slower spins. As a result, a spin echois said to form at the time 2td, also known as the echo timeor TE time. The amplitude of the signal at time TE is onlydecreased due to T2 decay whereas the T2
�effects have been
reversed. A simplified pulse sequence for the generation ofa spin echo is shown in Fig. 7b without the gradientwaveforms necessary for spatial encoding.
Signal-to-Noise Ratios
Signal in MR is generally proportional to the number ofnuclei and, thus, to the volume of the image voxel. Noise inMR is caused by the random fluctuations of electrons in thepatient, and thus the source of noise is independent fromthe signal generating sources. The data acquisition systemis designed such that the noise level from properly designedMR electronics will be dominated by patient noise. Overall,SNR ¼ voxel volume �
ffiffiffiffiffiffiffiffiffiffiffiffiffiffiffiffiffiffiffiffiffiffiffiffiffiffiffiffiffiffiffiffiffiffiffiffiffiffiffiffiffiffiffiffiffiffiffiffiffiffiffiffiffiffiffiffitotal data sampling time
p.
Imaging Sequences
Ideally, all MRI would be performed with high spatialresolution, a high signal-to-noise ratio (SNR), ultrashortimaging time, and no artifacts. The difficulty in achievingall of these properties simultaneously has led to the devel-opment of many acquisition methods that differ in imagecontrast, acquisition speed, SNR, susceptibility to and typeof artifacts, energy deposited in the imaged patient, andsuppression of unwanted signal such as fat. Their corre-sponding images represent a combination of tissue-specificparameters T1, T2, proton density r, and scan-specificparameters such as repetition time (TR), echo time (TE),flip angle, field of view (FOV), spatial resolution, andmagnetization preparation.
Gradient Recalled Echo (GRE) Imaging
Spin-echo imaging is desirable because signal voids due tomagnetic field inhomogeneity are avoided that could maskpathological tissue or injury. Long repetition times, andthus long scan times, are necessary in spin-echo imaging toallow longitudinal magnetization to return after the rela-tively high flip angles used. Long scan times hinder thecapture of dynamic processes such as the beating heart,cause discomfort to the patient, and limit the number ofpatients who can be imaged with this expensive resource.Thus, other methods of imaging have been developed. Ingradient recalled echo (GRE) imaging, the echo is formedby dephasing and rephasing of the signal with gradientfields as shown in Fig. 8. In these diagrams, known as pulsesequence diagrams, plots of the time-varying gradient andRF waveforms are shown as function of time. Comparedwith the spin-echo sequences, gradient recalled echo ima-ging does not have a refocusing RF pulse. The absence ofthis pulse allows for a reduced minimal repetition time andecho time compared with spin-echo imaging, but the signalbecomes susceptible to T2
* decay rather than T2 decay.
288 MAGNETIC RESONANCE IMAGING
Figure 7. Generation of a (a) free induction decay and (b) a spinecho. In (a), other local factors dephase signal faster according to aT2� decay rate. If a second RF pulse is applied at time td¼TE//2 to
flip the magnetization by 1808, the spins will refocus and form anecho at TE¼ 2td, which is only subject to T2 decay.
Table 1. Longitudinal (T1) and Transverse (T2) ProtonNuclear Magnetic Resonance Relaxation Times for Sev-eral Tissues and Blood at 1.5 T
Tissue T1/ms T2/ms
Gray brain matter (3) 950 100White brain matter (3) 600 80Cerebrospinal fluid (CSF) (3) 4500 2200Muscle (3) 900 50Fatty tissue (3) 250 60Oxygenated blood 1200 220De-oxygenated blood 1200 120
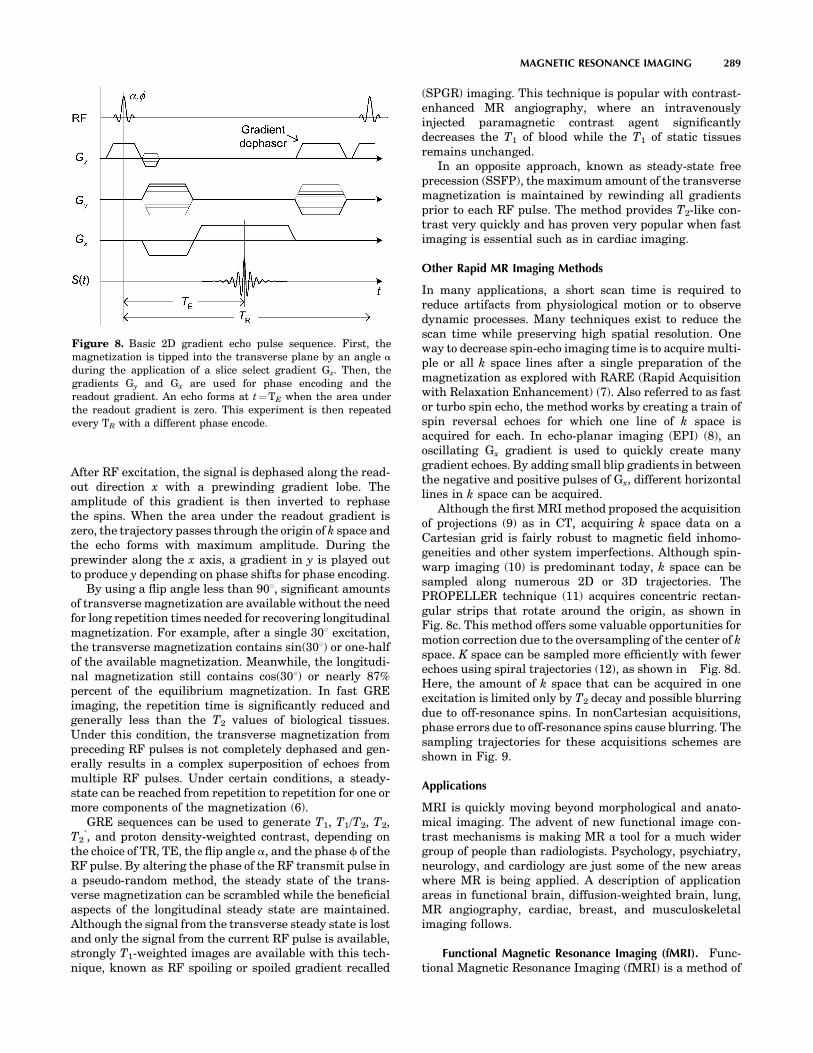
After RF excitation, the signal is dephased along the read-out direction x with a prewinding gradient lobe. Theamplitude of this gradient is then inverted to rephasethe spins. When the area under the readout gradient iszero, the trajectory passes through the origin of k space andthe echo forms with maximum amplitude. During theprewinder along the x axis, a gradient in y is played outto produce y depending on phase shifts for phase encoding.
By using a flip angle less than 908, significant amountsof transverse magnetization are available without the needfor long repetition times needed for recovering longitudinalmagnetization. For example, after a single 308 excitation,the transverse magnetization contains sin(308) or one-halfof the available magnetization. Meanwhile, the longitudi-nal magnetization still contains cos(308) or nearly 87%percent of the equilibrium magnetization. In fast GREimaging, the repetition time is significantly reduced andgenerally less than the T2 values of biological tissues.Under this condition, the transverse magnetization frompreceding RF pulses is not completely dephased and gen-erally results in a complex superposition of echoes frommultiple RF pulses. Under certain conditions, a steady-state can be reached from repetition to repetition for one ormore components of the magnetization (6).
GRE sequences can be used to generate T1, T1/T2, T2,T2
�, and proton density-weighted contrast, depending on
the choice of TR, TE, the flip angle a, and the phase f of theRF pulse. By altering the phase of the RF transmit pulse ina pseudo-random method, the steady state of the trans-verse magnetization can be scrambled while the beneficialaspects of the longitudinal steady state are maintained.Although the signal from the transverse steady state is lostand only the signal from the current RF pulse is available,strongly T1-weighted images are available with this tech-nique, known as RF spoiling or spoiled gradient recalled
(SPGR) imaging. This technique is popular with contrast-enhanced MR angiography, where an intravenouslyinjected paramagnetic contrast agent significantlydecreases the T1 of blood while the T1 of static tissuesremains unchanged.
In an opposite approach, known as steady-state freeprecession (SSFP), the maximum amount of the transversemagnetization is maintained by rewinding all gradientsprior to each RF pulse. The method provides T2-like con-trast very quickly and has proven very popular when fastimaging is essential such as in cardiac imaging.
Other Rapid MR Imaging Methods
In many applications, a short scan time is required toreduce artifacts from physiological motion or to observedynamic processes. Many techniques exist to reduce thescan time while preserving high spatial resolution. Oneway to decrease spin-echo imaging time is to acquire multi-ple or all k space lines after a single preparation of themagnetization as explored with RARE (Rapid Acquisitionwith Relaxation Enhancement) (7). Also referred to as fastor turbo spin echo, the method works by creating a train ofspin reversal echoes for which one line of k space isacquired for each. In echo-planar imaging (EPI) (8), anoscillating Gx gradient is used to quickly create manygradient echoes. By adding small blip gradients in betweenthe negative and positive pulses of Gx, different horizontallines in k space can be acquired.
Although the first MRI method proposed the acquisitionof projections (9) as in CT, acquiring k space data on aCartesian grid is fairly robust to magnetic field inhomo-geneities and other system imperfections. Although spin-warp imaging (10) is predominant today, k space can besampled along numerous 2D or 3D trajectories. ThePROPELLER technique (11) acquires concentric rectan-gular strips that rotate around the origin, as shown inFig. 8c. This method offers some valuable opportunities formotion correction due to the oversampling of the center of kspace. K space can be sampled more efficiently with fewerechoes using spiral trajectories (12), as shown in Fig. 8d.Here, the amount of k space that can be acquired in oneexcitation is limited only by T2 decay and possible blurringdue to off-resonance spins. In nonCartesian acquisitions,phase errors due to off-resonance spins cause blurring. Thesampling trajectories for these acquisitions schemes areshown in Fig. 9.
Applications
MRI is quickly moving beyond morphological and anato-mical imaging. The advent of new functional image con-trast mechanisms is making MR a tool for a much widergroup of people than radiologists. Psychology, psychiatry,neurology, and cardiology are just some of the new areaswhere MR is being applied. A description of applicationareas in functional brain, diffusion-weighted brain, lung,MR angiography, cardiac, breast, and musculoskeletalimaging follows.
Functional Magnetic Resonance Imaging (fMRI). Func-tional Magnetic Resonance Imaging (fMRI) is a method of
MAGNETIC RESONANCE IMAGING 289
Figure 8. Basic 2D gradient echo pulse sequence. First, themagnetization is tipped into the transverse plane by an angle a
during the application of a slice select gradient Gz. Then, thegradients Gy and Gx are used for phase encoding and thereadout gradient. An echo forms at t¼TE when the area underthe readout gradient is zero. This experiment is then repeatedevery TR with a different phase encode.

measuring the flow of oxygenated blood in the brain (13–15). FMRI is based on the blood oxygen-level-dependent, orBOLD, effect. BOLD MRI is accomplished by first exposinga patient or volunteer to a stimulus or having them engagein a cognitive activity while acquiring single-shot images oftheir brain. The region of the brain that is responding tothe stimulus or is engaged in the activity will experience anincrease in metabolism. This metabolic increase willrequire additional oxygen. Therefore, an increase in oxy-genated blood flow will occur (oxyhemoglobin) to the localbrain area that is active. Oxyhemoglobin differs in itsmagnetic properties from deoxyhemoglobin. Oxyhemoglo-bin is diamagnetic like water and cellular tissue. Deoxy-hemoglobin is more paramagnetic than tissue, so itproduces a stronger MR interaction. These differencesbetween oxyhemoglobin and deoxyhemoglobin in BOLDimaging are exploited by acquiring images during an
‘‘active’’ state (more oxyhemoglobin) and in a ‘‘resting’’state (more deoxyhemoglobin), which creates a signalincrease in the ‘‘active’’ state and a signal decrease inthe resting state. Figure 10 shows a typical BOLD timecourse (shown in black) where four ‘‘active’’ states and four‘‘resting’’ states exist. With prior knowledge of the activa-tion timing (shown in red), we can perform a statistical teston the data to determine which areas of the brain areactive. This statistical map (shown in color) is superim-posed on a high resolution MR image so that one canvisualize the functional information in relation to relevantanatomical landmarks.
Diffusion Imaging. The random motion of water mole-cules may cause the MRI signal intensity to decrease. TheNMR signal attenuation from molecular diffusion was firstobserved more than a half century ago by Hahn (1950) (16).
290 MAGNETIC RESONANCE IMAGING
Figure 9. 2D k space sampling trajectories. Shown are the spin-warp (a), radial sampling (b),PROPELLER (c), and interleaved spiral imaging (d) examples.
Figure 10. Color brain activation map issuperimposed on high resolution MR image. Signallevels of the activated pixels are shown to increaseduring cognitive activity periods, whereas they falloff during periods of rest.

Subsequently Stejskal and Tanner (1965) described theNMR signal attenuation in the presence of field gradients(17). More recently, field gradient pulses have been used tocreate diffusion-weighted MR images (18).
Diffusion-Weighted Pulse Sequences. Typically, diffu-sion-weighting is performed using two gradient pulseswith equal magnitude and duration on each side of a1808 refocusing pulse, as shown in Fig. 11. The first gra-dient pulse dephases the magnetization as a function ofposition, and the second pulse rephases the magnetization.For stationary (e.g., no flow or diffusion) molecules, thephases induced by both gradient pulses will completelycancel, no signal attenuation will occur. In the case ofmotion in the direction of the applied gradient, a net phasedifference will occur, Df¼ gvGdD, which is proportional tothe velocity v, the area of the gradient pulses defined by theamplitude G, and the duration d, and the spacing betweenthe pulses D. For the case of diffusion, the water moleculesare also moving, but in arbitrary directions and withvariable effective velocities. Thus, in the presence of diffu-sion gradients, the signal from each diffusing molecule willaccumulate a different amount of phase, which, after sum-ming over a voxel, will cause signal attenuation. For simpleisotropic Gaussian diffusion, the signal attenuation forthe diffusion gradient pulses in Fig. 11 is described byS ¼ Soe�bD where S is the diffusion-weighted signal, So isthe signal without any diffusion-weighting gradients(but otherwise identical imaging parameters), D is theapparent diffusion coefficient, and b is the diffusion-weighting described by the properties of the pulse pairb¼ (gGd)2(D-d/3).
Diffusion Tensor Imaging. The diffusion of water infibrous tissues (e.g., white matter, nerves, and muscle) isanisotropic, which means the diffusion properties changeas a function of direction. A convenient mathematicalmodel of anisotropic diffusion is using the diffusion tensor(19), which uses a 3� 3 matrix to describe diffusion using ageneral 3D multivariate normal distribution. The diffusion
tensor matrix describes the magnitude, anisotropy, andorientation of the diffusion distribution. In a diffusiontensor imaging (DTI) experiment, six or more diffusion-weighted images are acquired along noncollinear diffusiongradient directions. Maps of the apparent diffusivity foreach encoding direction are calculated by comparing thesignal in an image without diffusion-weighting and thesignal with diffusion-weighting. The diffusion tensor maythen be estimated for each voxel, and maps of the meandiffusion, anisotropy, and orientation may be constructed,as shown in Fig. 12.
The primary clinical applications of diffusion-weightedimaging and DTI are ischemic stroke (20,21) and mappingthe white matter anatomy relative to brain tumors andother lesions (22). DTI is also highly sensitive to subtlechanges in tissue microstructure and, therefore, hasbecome a popular tool for investigating changes or differ-ences in the microstructure as a function of brain devel-opment and aging, as well as disease.
Vascular Imaging. Magnetic Resonance Angiography(MRA) describes a series of techniques that can be used toimage vascular morphology and provide quantitative bloodflow information in high detail. Two widely used techni-ques, phase contrast angiography and time-of-flight angio-graphy, use the inherent properties of blood flow in the MRenvironment to create angiograms. A third technique,contrast-enhanced angiography, uses the injection of a
MAGNETIC RESONANCE IMAGING 291
Figure 11. Temporal schematic of a diffusion-weighted, spin-echopulse sequence with an EPI readout. The diffusion gradient pulsesare shown as gray boxes on the gradient axes. The direction ofdiffusion-weighting can be changed by changing the relativeweights of the diffusion gradients along Gx, Gy, and Gz.
Figure 12. Representative diffusion tensor images. The imagesare (top-left): a T2-weighted (or nondiffusion-weighted) image;(bottom-left): a mean diffusivity map (note similar contrast toT2-weighted image with cerebral spinal fluid appearing hyper-intense); (top-right): a fractional anisotropy map (hyperintense inwhite matter); and (bottom-right) the major eigenvector directionindicated by color (red¼R/L, green¼A/P, blue¼S/I) weighted bythe anisotropy (note that specific tract groups can be readily identified).

paramagnetic contrast agent into the vascular system tospecifically alter the magnetic properties of the blood inrelation to the surrounding tissue.
Phase-contrast (PC) angiography (23) usually uses apair of gradient pulses of equal strength and oppositepolarity, placed in the MRI sequence between the RFexcitation pulse and the data acquisition window. Duringthe imaging sequence, stationary nuclei accumulate phaseduring the first gradient pulse, and accumulate the oppo-site phase during the second gradient pulse, resulting inzero net phase. Moving nuclei accumulate phase during thefirst gradient pulse, but during the second pulse are indifferent positions, and accumulate phase different fromthat obtained during the first pulse. The net accumulatedphase is proportional to the strength of the gradient pulsesand the velocity of the nuclei. From the resulting data,images can be formed of both blood vessel morphology andblood flow.
TOF angiography techniques (24) (more accuratelycalled ‘‘inflow’’ techniques) typically use a conventionalgradient-echo sequence to acquire a thin 3D volume or aseries of 2D slices. The nuclei in stationary tissue areexcited by many consecutive slice-selective RF pulses. Asa short TR is used, the longitudinal magnetization is notable to return to equilibrium, resulting in saturation ofmagnetization and low signal. Moving nuclei in the bloodflow into the slice during each TR period, having beenexcited by zero or very few RF pulses. As these nucleiarrive in the imaging slice at or near full equilibriummagnetization, high signal is obtained from blood.Figure 13 shows a projection image of a 3D TOF datasetacquired in the head. The TOF technique can produce high
quality MRA images in many situations, but slow or in-plane blood flow can result in blood signal saturation andreduced the quality of the images.
Contrast-enhanced MRA (CE-MRA) is performed usingan injection of a paramagnetic contrast agent into theintravenous bloodstream (25). Although several transitionand rare-earth metal ions can be used, the most common isGadolinium (Gd+3) chelated to a biologically compatiblemolecule. The compound is paramagnetic, having a strongdipole moment and generating strong local magnetic fieldperturbations, which increase the transfer of energybetween the excited hydrogen nuclei and the lattice, pro-moting T1 relaxation and return to equilibrium of thelongitudinal magnetization.
The contrast agent is injected intravenously in a limbaway from the area of interest and circulates into thearterial system. The longitudinal relaxation rate is typi-cally enhanced by a factor of 15 to 25 during this initialarterial phase, resulting in a much shorter T1 for bloodcompared with the surrounding tissue. As the longitudinalmagnetization in blood is much higher after each TRperiod, background tissue is suppressed in a manner simi-lar to TOF imaging, and blood vessels have a comparablybright signal on the resulting images. Imaging is typicallyperformed so that the central k space lines, which containmost of the image contrast information, are acquired whilethe contrast agent is distributed in the arteries of interest,but before it can circulate into the neighboring veins.
MRA data consist of large volumetric sets of image data,which are stored in the format of contiguous image slices.Specialized image display techniques are used to displaythe data in a manner that can be interpreted by theradiologist. Maximum Intensity Pixel (MIP) projectionsare widely used and are formed by projecting the volumeset of data onto a single image plane. Here, each imagepixel is obtained as the maximum value along the corre-sponding projection, as shown in Fig. 13. Volume renderingis beginning to be used more often to display MR angio-grams. The individual slices of data are always availablefor detailed review by the radiologist and can be refor-matted into any plane on the computer workstation tooptimally display the vasculature of interest.
Cardiac MRI. Cardiac magnetic resonance (CMR) ima-ging is an evolving technique with the unprecedentedability to depict both detailed anatomy and detailed func-tion of the myocardium with high spatial and temporalresolution. The past decade has seen tremendous develop-ment of phased array coil technology, ultra-fast imagingsequences, and parallel imaging techniques, all of whichhave facilitated ultra-fast imaging methods capable ofcapturing cardiac motion during breath-holding. The abil-ity to perform imaging in arbitrary oblique planes, the lackof ionizing radiation, and the excellent soft tissue contrastof MR make it an ideal method for cardiac imaging.Comprehensive cardiac imaging is performed routinelyin both in-patient and out-patient settings across thecountry and is widely considered the gold standard forclinical evaluation of many cardiac diseases (26).
Ischemic heart disease caused by atherosclerotic coron-ary artery disease (CAD) is the leading cause of mortality,
292 MAGNETIC RESONANCE IMAGING
Figure 13. Time-of-flight (TOF) angiography in the head usesinflow of fresh blood to produce contrast between blood and thesurrounding tissue. A Maximum Intensity Projection (MIP)reformatted image is used to compress the acquired volumedata into a single slice for display.

morbidity, and disability in the United States, with over 7million myocardial infarctions and 1 million deaths everyyear (27). Consequently, ischemic heart disease is theprimary indication for CMR. Accurate visualization of wallthickness and global function (ejection fraction), as well asfocal wall motion abnormalities, is performed with retro-spectively ECG-gated ultra-fast short TR pulse sequences,especially steady-state gradient recalled echo imaging (28),as shown in Fig. 14. Breath-held cinemagraphic or CINEimages have high SNR, excellent blood to myocardialcontrast, and excellent temporal resolution (< 40–50 ms)capable of detecting subtle wall motion abnormalities.Areas of myocardial infarction (nonviable tissue) are exqui-sitely depicted with inversion recovery (IR) RF-spoiledgradient echo imaging, acquired 10–20 minutes after intra-venous injection of gadolinium contrast (29), as shown in
Fig. 14. Areas of normal myocardium appear dark, whereasregions of nonviable myocardium appear bright (delayedhyper-enhancement). Accurate depiction of subtle myocar-dial infarction is possible because of good spatial resolutionacross the heart wall. The combination of motion andviability imaging is a powerful combination. Areas withwall motion abnormalities but without delayed hyper-enhancement may be injured or under-perfused from acritical coronary artery stenosis but are viable and maybenefit from revascularization.
Cardiac ‘‘stress testing’’ using CMR has seen increasinguse for the evaluation of hemodynamically significantcoronary artery stenoses (30). Imaging of the heart duringthe first pass of a contrast bolus injection using rapidT1-weighted RF-spoiled gradient echo sequences is ahighly sensitive method for the detection of alterations
MAGNETIC RESONANCE IMAGING 293
Figure 14. End-diastolic (a), mid-systolic (b), and end-systolic (c) short axis CINE images of theheart in a patient with a myocardial infarction in the anterior wall and septum, demonstrated bydecreased wall thickening (arrows in b, c). The corresponding T1-weighted RF-spoiled gradientrecalled echo first-pass perfusion image (d) shows a fixed perfusion deficit (darker myocardium) inthe corresponding territory (arrows). Finally, an inversion recovery RF-spoiled gradient echo imageacquired at the same location (e) demonstrates a large region of delayed hyper-enhancement(arrows) indicating a full wall thickness region of nonviable myocardium that corresponds to theregion of decreased perfusion and decreased contraction.

in myocardial blood flow (perfusion). Perfusion imagingduring both stress (pharmacologically induced) and restcan reveal ‘‘reversible’’ perfusion defects that reflect arelative lack of perfusion during stress. In this way,coronary ‘‘reserve’’ can be evaluated and CAD can beuncovered, leading to further evaluation with coronarycatheterization and possible angioplasty and stenting.Direct imaging of coronary arteries with CMR has showntremendous technical advances, but is not commonlyused, except for imaging of proximal coronary arteriesin the evaluation of anomalous coronary arteries.
Other important indications of CMR include congenitalheart disease, primarily, but not exclusively, in thepediatric population (31). Accurate diagnosis of a widevariety of congenital abnormalities requires high resolu-tion, high contrast imaging that permits depiction of com-plex anatomical variants seen with congenital heartdisease. Although anatomic imaging can be performedaccurately with cardiac-gated CINE sequences, conven-tional sequences such as cardiac-gated black-blood fastspin-echo (FSE) and T1-weighted spin-echo imaging areinvaluable tools. Equally important to accurate anatomicalimaging is functional imaging. With altered anatomycomes radically altered hemodynamics, requiring visuali-zation of myocardial function with CINE imaging. Phase-contrast velocity imaging permits flow quantificationthrough the heart, including the great vessels (pulmonaryartery, aorta, etc.). An important example includes quan-tification of left-to-right ‘‘shunts’’ with resulting over-cir-culation of the pulmonary circulation. With a wide varietyof pulse sequences, flexible scan plane prescription and thelack of ionizing radiation, CMR is ideally suited for evalua-tion of congenital heart disease.
Other important applications of CMR include visualiza-tion of valvular disease, pericardial disease, valvular dis-ease, and cardiac masses. The latter two are particularlywell evaluated with CMR; however, they are relativelyuncommon and will not be discussed here.
Hyperpolarized Contrast Agents in MRI. ConventionalMR imaging measures the resonant signal from the hydro-gen nuclei of water, the most ubiquitous and highly con-centrated component of the body. However, many othernuclei exist with magnetic dipole moments that produceMR signals. Many of these nuclei, such as phosphorous-31and sodium-23, are biologically important in disease pro-cesses. However, these species typically exist at a very lowconcentration in the body, making them difficult to imagewith sufficient signal. One approach is to align, or polarize,the nuclei preferentially using physical processes otherthan the intrinsic magnetic field of the MR scanner. Insome cases, these polarization processes can align manymore nuclei than otherwise possible. These hyperpolarizednuclei can then act as contrast agents to better visualizeblood vessels or lung airways on MRI. For example,helium-3 and xenon-129 are inert gases whose magneticdipole moments can be hyperpolarized using spin-exchange optical pumping—a method of generating a pre-ferred alignment of the nuclear dipoles using polarizedlaser light (32). As they are inert gases, polarizedhelium-3 and xenon-129 are used as inhaled contrast
agents for visualizing the lung airspaces (upper-rightpanel) using MRI (33),(34). Unlike other parts of the body,conventional MRI of the lungs suffers from poor signal dueto low water proton density and the multiple air-tissueinterfaces that further degrade the MR signal in the upperleft of Fig. 15. Hyperpolarized gas MRI has been particu-larly useful for depicting airway obstruction in several lungdiseases including asthma (lower panel of Fig. 15) (35),emphysema (36), and cystic fibrosis (37). Additional tech-niques based on this technology show promise for MRimaging of blood vessels using injected xenon-129 dissolvedin lipid emulsion (38), gas-filled microvesicles (39) andliquid-polarized carbon-13 (40). Hyperpolarized carbon-13 agents are of particular interest because of the widerange of biologically active carbon compounds in the body.Another important advantage of this technology is itsability to maintain high signal using low magnetic field(0.1–0.5 T) scanners (41). These systems are much cheaperto purchase and maintain than the high field (1.5–3.0 T)MRI scanners in common clinical use today.
Breast MRI. Breast MRI is presently used as an adjunctto mammography and ultrasound for the detection anddiagnosis of breast cancer. Dynamic contrast-enhanced(DCE) MRI has been shown to have high sensitivity(83%–96%) to breast cancer but has also demonstratedvariable levels of specificity (37–89%) (42). DCE-MRIrequires an injection of a contrast agent and acquisitionof a subsequent series of images to enable the analysis ofthe time course of contrast uptake in suspect lesions.Lesion morphology is also important in discerning benignfrom malignant lesions in breast MRI. Standard in-planespatial resolution is sub-millimeter. A typical clinicalbreast MRI includes a spoiled gradient echo (SPGR) T1-weighted sequence both precontrast (Fig. 16a) and, atminimum, at 30 second intervals postcontrast (Fig. 16b).Along with their morphologic characteristics, lesions canbe further described by the shape of their contrast uptakecurve. The three general categories of contrast uptake are(1) slow, constant contrast uptake (2) rapid uptake andsubsequent plateau of contrast, and (3) rapid uptake andrapid washout of contrast (43). Although the slowly enhan-cing lesions are usually benign and fast uptake and wash-out is a strong indication of malignancy, time course lesioncharacterization is not absolute. The ambiguity of timecourse data for certain classes of lesions drives the inves-tigation into higher temporal resolution imaging methods.A standard clinical breast MRI also includes acquisition ofa T2-weighted sequence for the identification of cysts(Fig. 16c). Present research in breast DCE-MRI is focusedon development and application of pulse sequences thatprovide high temporal and spatial resolution. Also, inves-tigation is ongoing into more specific characterization ofuptake curves. Diffusion-weighted MRI, blood-oxygen-level-dependent imaging, and spectroscopy are also beinginvestigated as possible methods to improve the specificityof DCE-MRI in the breast. In some circumstances, the highsensitivity of breast DCE-MRI outweighs the variablespecificity leading to the present use of DCE-MRI to deter-mine the extent of disease, with equivocal mammographicfindings, and for the screening of high risk women.
294 MAGNETIC RESONANCE IMAGING

MAGNETIC RESONANCE IMAGING 295
Figure 16. Fat-suppressed (a) pre-contrast T1-weighted image (b) postcontrast T1-weighted image(c), and noncontrast T2- weighted image. Images are from different patients.
Figure 15. Upper left shows normal lack of signal in parenchyma of lungs in MRI. Ventilated areasare clearly seen after imaging inhaled hyperpolarized helium. Rapid imaging during inhalation andexhalation shows promise for capturing dynamic breathing processes.

MRI of Musculoskeletal Disease. Musculoskeletal imagingstudies traumatic injury, degenerative changes, tumors,and inflammatory conditions of the bones, tendons, liga-ments, muscles, cartilage, and other structures of joints.Although X-ray imaging is the work-horse imaging mod-ality for many musculoskeletal diseases, MRI plays acritical role in several aspects of diagnosis, staging, andtreatment monitoring.
Fast spin-echo (FSE) pulse sequences are typicallyused to acquire T1, T2, and proton density-weightedimages of the joints. For the assessment of joint structures,images are acquired in multiple planes to ensure adequatespatial resolution in all dimensions. These MR imagescan be used to evaluate tissues including ligaments,bone, cartilage, meniscus, and labrum. As a result oftheir high spatial resolution and excellent soft tissuecontrast, MR images can provide accurate diagnosis thatcan prevent unnecessary surgeries and can facilitatepre-operative planning when surgical intervention isrequired.
Osteoarthritis is a degenerative disease thataffects approximately 20 million Americans and countlessothers around the world. Currently, this debilitating dis-ease is often not detected until the patient experiencespain that can be reflective of morphologic changes to jointcartilage. MR can be used to accurately measure cartilage
thickness and volume. New MR techniques are alsounder development that may provide insight into bio-chemical changes in cartilage at the earlier stages ofosteoarthritis that precede gross morphologic changesand patient pain.
Fortunately, primary bone tumors are relatively rare.However, bone is a common site for metastatic disease,which is especially true for breast, lung, prostate, kidney,and thyroid cancers. MR is a sensitive test for metastaticbone disease and is being adopted as a standard of care insome parts of the world, replacing nuclear scintigraphy. Atypical approach employs inversion recovery pulsesequences to generate fat-suppressed, T2-weighted images.Diffusion-weighted imaging also shows promise to detecthemotalogic cancers such as multiple myeloma, leukemia,and lymphoma.
Inflammatory diseases include infection and inflamma-tory forms of arthritis. Infection of the foot is a commoncomplication of microvascular disease often seen with dia-betes, a disease afflicting 18 million Americans. MR can beused to assess the vasculature of the foot as well as diag-nose infection and evaluate treatment efficacy. Two millionAmericans have rheumatoid arthritis, a common form ofinflammatory arthritis. Inflammation from a conditionknown as synovitis, which often occurs in rheumatoidarthritis patients, is shown in Fig. 17. New MR methods
296 MAGNETIC RESONANCE IMAGING
Figure 17. Axial knee image in apatient with inflamed synoviumshows excellent soft tissue contrastavailable in MRI. The thickenedintermediate signal intensity forsynovium (arrowheads) is well dis-tinguished from the adjacent highsignal intensity of joint fluid (arrow).

are being developed to detect rheumatoid arthritis earlierand to gauge treatment success.
BIBLIOGRAPHY
1. Liang Z-P. Lauterbur PC. In: Akay M, ed. Principles ofMagnetic Resonance Imaging—A Signal Processing Perspec-tive. IEEE Press Series in Biomedical Engineering. NewYork: IEEE Press; 2000. p 416.
2. Abragam A. Principles of Nuclear Magnetism. Oxford, UK:Oxford University Press; 1994.
3. Haacke EM, et al. Magnetic Resonance Imaging-PhysicalPrinciples and Sequence Design. New York: Wiley; 1999. p 914.
4. Bottomley PA, et al. A review of H-1 nuclear-magnetic-resonance relaxation in pathology—are T1 and T2 diagnostic.Med Phys 1987;14(1):1–37.
5. Kingsley PB. Methods of measuring spin-lattice (T-1) relaxa-tion times: An annotated bibliography. Concepts Magn Reson1999;11(4):243–276.
6. Scheffler K. A pictorial description of steady-states in rapidmagnetic resonance imaging. Concepts Magn Reson 1999;11(5):291–304.
7. Hennig J, Nauerth A, Friedburg H. RARE imaging: A fastimaging method for clinical MR. Magn Reson Med 1986;3(6):823–833.
8. Mansfield P. Multi-planar image formation using NMR spinechoes. J Phys C: Solid State Phys 1977;10:L55–L58.
9. Lauterbur PC. Image formations by induced local interac-tions: Examples employing nuclear magnetic resonance. Nat-ure 1973;242:190–191.
10. Edelstein WA, et al. Spin warp NMR imaging and applica-tions to human whole-body imaging. Phys Med Biol1980;25(4):751–756.
11. Pipe JG. Motion correction with PROPELLER MRI: Applica-tion to head motion and free-breathing cardiac imaging.Magn Reson Med 1999;42(5):963–969.
12. Meyer CH. et al. Fast spiral coronary artery imaging. MagnReson Med 1992;28(2):202–213.
13. Ogawa S, Lee T-M, Nayak A, Glynn P. Oxygenation-sensitivecontrast in magnetic resonance image of rodent brain at highmagnetic fields. Magn Reson Med 1990;14:68–78.
14. Ogawa S, et al. Brain magnetic resonance imaging withcontrast dependent on blood oxygenation. Proc Natl AcadSci USA 1990;87:9868–9872.
15. Bandettini PA, et al. Time course EPI of human brain func-tion during task activation. Magn Reson Med 1992;25(2):390–397.
16. Hahn E. Spin echoes. Phys Rev 1950;80(4):580–594.17. Stejskal E, Tanner J. Spin diffusion measurements: Spin
echoes in the presence of a time-dependent field gradient.J Chem Phys 1965;42(1):288–292.
18. Le Bihan D, Breton E, Lallemand D, Grenier P, Cabanis E,Laval-Jeantet M. MR imaging of intravoxel incoherentmotions: Application to diffusion and perfusion in neurologicdisorders. Radiology 1986: 161(2):401–407.
19. Basser PJ, Mattiello J, LeBihan D. MR diffusion tensorspectroscopy and imaging. Biophys J 1994;66:259–267.
20. Moseley ME, Kucharczyk J, Mintorovitch J, Cohen Y, Kur-hanewicz J, Derugin N, Asgari H, Norman D. Diffusion-weighted MR imaging of acute stroke: Correlation with T2-weighted and magnetic susceptibility-enhanced MR imagingin cats. AJNR Am J Neuroradiol 1990;11(3):423–429.
21. Warach S, Dashe JF, Edelman RR. Clinical outcome inischemic stroke predicted by early diffusion-weighted andperfusion magnetic resonance imaging: A preliminary ana-lysis. J Cereb Blood Flow Metab 1996;16(1):53–59.
22. Witwer BP, Moftakhar R, Hasan KM, Deshmukh P, Haugh-ton V, Field A, Arfanakis K, Noyes J, Moritz CH, MeyerandME, Rowley HA, Alexander AL, Badie B. Diffusion-tensorimaging of white matter tracts in patients with cerebralneoplasm. J Neurosurg 2002;97(3):568–575.
23. Dumoulin CL, Hart HR. Magnetic resonance angiography.Radiology 1986;161:717–720.
24. Keller PJ, Drayer BP, Fram EK, Williams KD, Dumoulin CL,Souza SP. MR angiography with two-dimensional acquisitionand three-dimensional display. Radiology 1989;173:527–532.
25. Prince MR, Yucel EK, Kaufman JA, Harrison DC, GellerSC. Dynamic gadolinium-enhanced three-dimensional abdom-inal MR arteriography. J Magn Reson Imaging 1993;3:877–881.
26. Gibbons RJ, Araoz PA. The year in cardiac imaging. J AmColl Cardiol 2005;46(3):542–551.
27. Association AH, ed. 2005: Heart Disease and Stroke Statistics—2005 Update. Dallas, TX: A.H. Association; 2005.
28. Carr JC, Simonetti O, Bundy J, Li D, Pereles S, Finn JP. CineMR angiography of the heart with segmented true fast imagingwith steady-state precession. Radiology 2001;219(3):828–834.
29. Kim RJ, Wu E, Rafael A, Chen EL, Parker MA, Simonetti O,Klocke FJ, Bonow RO, Judd RM. The use of contrast-enhanced magnetic resonance imaging to identify reversiblemyocardial dysfunction. N Engl J Med 2000;343(20):1445–1453.
30. Ray T. Magnetic resonance imaging in the assessment ofcoronary artery disease. Curr Atheroscler Rep 2005;7(2):108–114.
31. Rickers C, Kraitchman D, Fischer G, Kramer HH, Wilke N,Jerosch-Herold M, et al. Cardiovascular interventional MRimaging: A new road for therapy and repair in the heart.Magn Reson Imaging Clin N Am 2005;13(3):465–479.
32. Bouchiat M, Carver T, Varnum C. Nuclear polarization in3He gas induced by optical pumping and dipolar exchange.Phys Rev Lett 1960;5:373–375.
33. Albert MS, Cates GD, Driehuys B, et al. Biological magneticresonance imaging using laser-polarized 129Xe. Nature1994;370:199–201.
34. van Beek E, Wild J, Kauczor H, Schreiber W, Mugler J, LangeE. Functional MRI of the lung using hyperpolarized 3-heliumgas. J Mag Reson Imag 2004;20:540–554.
35. Samee S, Altes T, Powers P, et al. Imaging the lungs inasthmatic patients by using hyperpolarized helium-3 mag-netic resonance: Assessment of response to methacholine andexercise challenge. J Allergy Clin Immunol 2003;111: 1205–1211.
36. Salerno M, Lange E, Altes T, Truwit J, Brookeman J, MuglerJ. Emphysema: Hyperpolarized helium 3 diffusion MR ima-ging of the lungs compared with spirometric indexes—initialexperience. Radiology 2002;222:252–260.
37. Altes TA, de Lange EE. Applications of hyperpolarizedhelium-3 gas magnetic resonance imaging in pediatric lungdisease. Top Magn Reson Imaging 2003;14:231–236.
38. Moller HE, Chawla MS, Chen XJ, et al. Magnetic resonanceangiography with hyperpolarized 129Xe dissolved in a lipidemulsion. Magn Reson Med 1999;41:1058–1064.
39. Callot V, Canet E, Brochot J, et al. MR perfusion imagingusing encapsulated laser-polarized 3He. Magn Reson Med2001;46:535–540.
40. Goldman M, Johannesson H, Axelsson O, Karlsson M. Hyper-polarization of 13C through order transfer from parahydro-gen: A new contrast agent for MRI. Magn Reson Imag2005;23:153–157.
41. Parra-Robles J, Cross AR, Santyr GE. Passive shimming ofthe fringe field of a superconducting magnet for ultra-low
MAGNETIC RESONANCE IMAGING 297

field hyperpolarized noble gas MRI. J Magn Reson 2005;174:116–124.
42. Kvistad KA, et al. Breast lesions: Evaluation with dynamiccontrast-enhanced T1-weighted MR imaging and with T2�-weighted first-pass perfusion MR imaging. Radiology 2000;216:545–553.
43. Kuhl CK, Schild HH. Dynamic interpretation of MRI of thebreast. JMRI 2000;12:965–974.
MAGNETOCARDIOGRAPHY. See BIOMAGNETISM.
MANOMETRY, ANORECTAL. See ANORECTAL
MANOMETRY.
MANOMETRY, ESOPHAGEAL. See ESOPHAGEAL
MANOMETRY.
MAMMOGRAPHY
PEI-JAN PAUL LIN
Beth Israel DeaconessMedical CenterBoston, Massachusetts
INTRODUCTION
It has been shown that reduced breast cancer mortalityin the past decade can be attributed to the high sensitivityof screening mammography in detecting nonpalpablelesions (1,2). There has been a wide variety of equipmentand imaging modalities employed in the breast cancerdetection and imaging; ranging from ultrasound imager,X-ray mammography, computed tomography scanner (CT),to magnetic resonance imager (MRI). Additionally, ther-mography, light diaphanography, electron radiography,and microwave radiometry have also been utilized, experi-mentally, to detect breast cancer without much success.Brief explanations of these imaging modalities have beendescribed in the first edition of this Encyclopedia, NCRPReport No.85, and in a review article by Jones (3–5).Among those modalities; ultrasound, X-ray mammogra-phy, CT, and MRI, X-ray mammography is the most prac-tical and relatively inexpensive, and is the only mainstream of equipment available for breast cancer detection.At present, the ultrasound imager is often employed as anadjunct to the X-ray mammography and is not the primaryscreening imaging device. However, when mammographyis mentioned, it is normally meant to say ‘‘X-ray mammo-graphy’’. For these reasons, this article will devote all of itseffort to X-ray mammography.
THE MAMMOGRAPHY QUALITY STANDARDS ACTOF 1992 (MQSA), (PUBLIC LAW 102–539)
Breast cancer was a major public health issue in theearly 1990s; U.S. Congress enacted MQSA ‘‘to ensure thatall women have access to quality mammography for the
detection of breast cancer in its earliest, most treatablestages’’. Thus, it is required by law that facilities providingmammography services be properly accredited and becertified by the U.S. Food and Drug Administration(FDA). ‘‘Accreditation and Certification’’ of mammogra-phy facilities are beyond the scope of this article, andinterested readers are requested to refer to the FDAsWEB Site (6), and the American College of Radiology(ACR) WEB Site (7).
X-RAY MAMMOGRAPHY
Conventional X-ray equipment was initially employed forbreast cancer imaging with industrial (thick) emulsion film,or portal imaging film for use in radiation therapy as theimage receptor in order to visualize the small microcalcifica-tions, prior to, as late as 1970s. The breast entrance dose ofthis imaging process exceeded well over 85 mGy per film(�10 R per film) and the radiographic techniques weretypically in the range of 45–55 kVp, and �1000 mAS witha radiation beam quality of half-value layer (HVL)¼ 1.0–1.5 mm of aluminum (mmAl) (8). The X-ray beam spectrumproduced by a conventional X-ray tube, equipped with tung-sten anode, is not necessarily optimized for breast cancerdetection. The mammography images obtained in this man-ner had the desired spatial resolution (�20 lp mm�1), buthad a less than desirable radiographic contrast. This com-bination of ‘‘high entrance dose’’ with ‘‘low radiographiccontrast’’ was not an acceptable approach. The radiologycommunity was searching for a new breast imaging solution.In the 1970s, xeromammography imaging plates providedthe much needed improvement in image quality and low-ered the breast entrance dose by a factor of two thirds toone half compared to using the thick emulsion industrialtype film (9).
Due to its unique patient positioning of breast imaging,the geometrical arrangement of dedicated mammographyunits should be pointed out. As shown in Fig. 1, with the
298 MAMMOGRAPHY
X-ray tube
Collimator
Radiaion field
Patient
Examination table
Screen-film cassette
Anti-scatter grid
Figure 1. Geometric arrangement of conventional radiography.The X-ray system, the anatomy of interest, and the screen-filmcassette are centered and aligned for exposure.
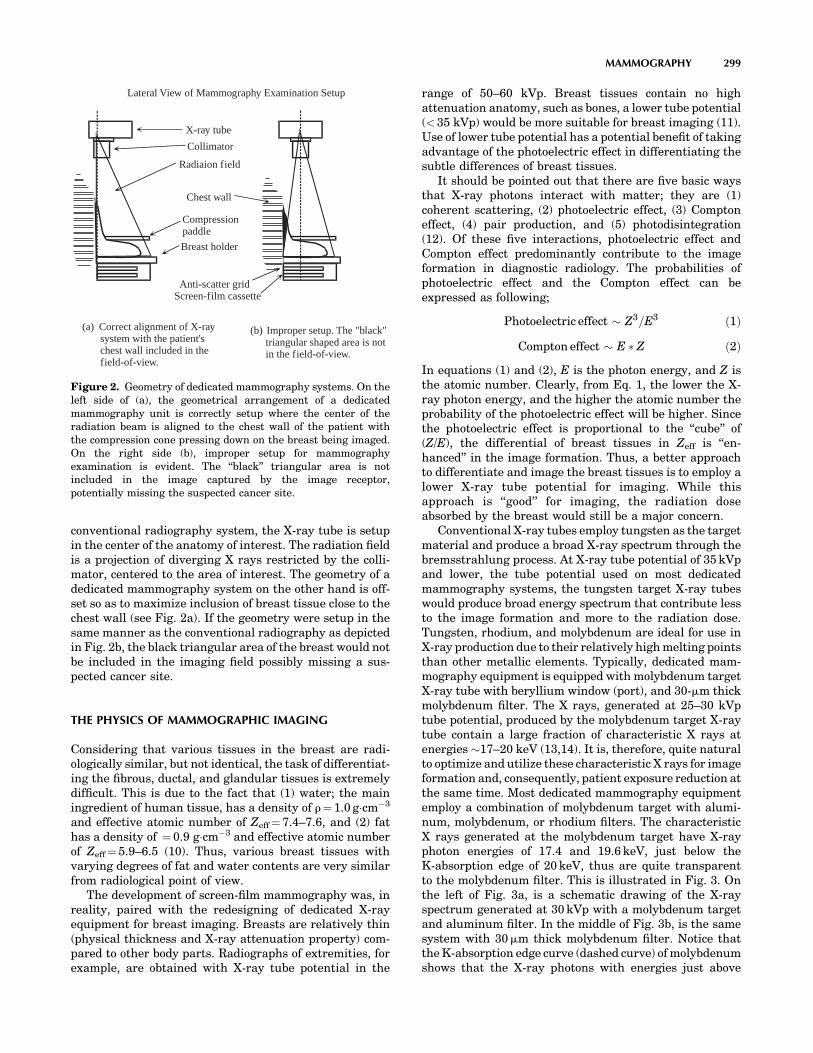
conventional radiography system, the X-ray tube is setupin the center of the anatomy of interest. The radiation fieldis a projection of diverging X rays restricted by the colli-mator, centered to the area of interest. The geometry of adedicated mammography system on the other hand is off-set so as to maximize inclusion of breast tissue close to thechest wall (see Fig. 2a). If the geometry were setup in thesame manner as the conventional radiography as depictedin Fig. 2b, the black triangular area of the breast would notbe included in the imaging field possibly missing a sus-pected cancer site.
THE PHYSICS OF MAMMOGRAPHIC IMAGING
Considering that various tissues in the breast are radi-ologically similar, but not identical, the task of differentiat-ing the fibrous, ductal, and glandular tissues is extremelydifficult. This is due to the fact that (1) water; the mainingredient of human tissue, has a density of r¼ 1.0 g cm�3
and effective atomic number of Zeff¼ 7.4–7.6, and (2) fathas a density of ¼ 0.9 g cm�3 and effective atomic numberof Zeff¼ 5.9–6.5 (10). Thus, various breast tissues withvarying degrees of fat and water contents are very similarfrom radiological point of view.
The development of screen-film mammography was, inreality, paired with the redesigning of dedicated X-rayequipment for breast imaging. Breasts are relatively thin(physical thickness and X-ray attenuation property) com-pared to other body parts. Radiographs of extremities, forexample, are obtained with X-ray tube potential in the
range of 50–60 kVp. Breast tissues contain no highattenuation anatomy, such as bones, a lower tube potential(< 35 kVp) would be more suitable for breast imaging (11).Use of lower tube potential has a potential benefit of takingadvantage of the photoelectric effect in differentiating thesubtle differences of breast tissues.
It should be pointed out that there are five basic waysthat X-ray photons interact with matter; they are (1)coherent scattering, (2) photoelectric effect, (3) Comptoneffect, (4) pair production, and (5) photodisintegration(12). Of these five interactions, photoelectric effect andCompton effect predominantly contribute to the imageformation in diagnostic radiology. The probabilities ofphotoelectric effect and the Compton effect can beexpressed as following;
Photoelectric effect � Z3=E3 ð1Þ
Compton effect � E � Z ð2Þ
In equations (1) and (2), E is the photon energy, and Z isthe atomic number. Clearly, from Eq. 1, the lower the X-ray photon energy, and the higher the atomic number theprobability of the photoelectric effect will be higher. Sincethe photoelectric effect is proportional to the ‘‘cube’’ of(Z/E), the differential of breast tissues in Zeff is ‘‘en-hanced’’ in the image formation. Thus, a better approachto differentiate and image the breast tissues is to employ alower X-ray tube potential for imaging. While thisapproach is ‘‘good’’ for imaging, the radiation doseabsorbed by the breast would still be a major concern.
Conventional X-ray tubes employ tungsten as the targetmaterial and produce a broad X-ray spectrum through thebremsstrahlung process. At X-ray tube potential of 35 kVpand lower, the tube potential used on most dedicatedmammography systems, the tungsten target X-ray tubeswould produce broad energy spectrum that contribute lessto the image formation and more to the radiation dose.Tungsten, rhodium, and molybdenum are ideal for use inX-ray production due to their relatively high melting pointsthan other metallic elements. Typically, dedicated mam-mography equipment is equipped with molybdenum targetX-ray tube with beryllium window (port), and 30-mm thickmolybdenum filter. The X rays, generated at 25–30 kVptube potential, produced by the molybdenum target X-raytube contain a large fraction of characteristic X rays atenergies �17–20 keV (13,14). It is, therefore, quite naturalto optimize and utilize these characteristic X rays for imageformation and, consequently, patient exposure reduction atthe same time. Most dedicated mammography equipmentemploy a combination of molybdenum target with alumi-num, molybdenum, or rhodium filters. The characteristicX rays generated at the molybdenum target have X-rayphoton energies of 17.4 and 19.6 keV, just below theK-absorption edge of 20 keV, thus are quite transparentto the molybdenum filter. This is illustrated in Fig. 3. Onthe left of Fig. 3a, is a schematic drawing of the X-rayspectrum generated at 30 kVp with a molybdenum targetand aluminum filter. In the middle of Fig. 3b, is the samesystem with 30mm thick molybdenum filter. Notice thatthe K-absorption edge curve (dashed curve) of molybdenumshows that the X-ray photons with energies just above
MAMMOGRAPHY 299
Radiaion field
Breast holder
Anti-scatter gridScreen-film cassette
Compressionpaddle
X-ray tube
Collimator
Chest wall
Lateral View of Mammography Examination Setup
(a) Correct alignment of X-raysystem with the patient'schest wall included in thefield-of-view.
(b) Improper setup. The "black"triangular shaped area is notin the field-of-view.
Figure 2. Geometry of dedicated mammography systems. On theleft side of (a), the geometrical arrangement of a dedicatedmammography unit is correctly setup where the center of theradiation beam is aligned to the chest wall of the patient withthe compression cone pressing down on the breast being imaged.On the right side (b), improper setup for mammographyexamination is evident. The ‘‘black’’ triangular area is notincluded in the image captured by the image receptor,potentially missing the suspected cancer site.

20 keV would be preferentially absorbed than those justbelow 20 keV. Similarly, the same can be said for therhodium target with rhodium filter as shown in Fig. 3c.Figure 3b and c are graphically speaking quite similar. It isnoteworthy to point out that a careful study of Fig. 3b, and cwill reveal that X-ray beams generated from rhodiumtarget X-ray tube ‘‘must not’’ be filtered with molybdenum!The intensity of rhodium K-characteristic X rays (Ka, andKb) would be in the energy range where the molybdenum Kabsorption is high. Taking advantage of the spectral infor-mation, in 1991,GE introduced the Senographe DMR unitequipped with a dual track and dual filter (molybdenumand rhodium) X-ray tube for mammography applications.Some of the physical characteristics and the spectralenergy data of molybdenum, rhodium, and tungsten aresummarized in Table 1.
For illustration purposes and descriptions of imagingcomponents, following this paragraph, the screen-filmmammography (SFM) system manufactured by GE, theSenogaphe DMR mammography unit, is shown in Fig. 4.The photograph in Fig. 4 represents the overall external
and mechanical design of a typical ‘‘dedicated’’ X-raymammography unit. It represents ‘‘the overall’’ design withrespect to the tilting gantry with the X-ray tube housing atthe top and the image receptor at the bottom. And, thegantry is attached to a column (or stand), which houses theelevation mechanism of entire gantry.
THE SCREEN-FILM MAMMOGRAPHY
The screen-film mammography employs the same basicimage receptor system as conventional radiographic ima-ging. While conventional radiography employs a double-emulsion film sandwiched between two intensifying \screens yielding a spatial resolution of (up to) 8 lp mm�1
for a detailed screen (15), a typical SFM image receptorconsists of a single-emulsion film and a single thin rare-earth phosphor intensifying screen yielding a spatial reso-lution of �20 lp mm�1 (16).
In order to optimize the efficiency of the SFM, manu-facturers including Agfa, Kodak, Konica, and Fuji, haveproduced matching pairs of the intensifying screen andfilm specifically for use with mammography. And, tofurther improve the sensitometric characteristics of thescreen-film, the processing chemistry, particularly thedeveloper, have also been carefully prescribed along withits development conditions. Note that the sensitometriccharacteristics of screen-film system refers to the ‘‘photo-graphic effect or blackening effect’’ of the screen-filmsystem in response to the X-ray absorption (17). Anexample of this matching pair of intensifying screen andfilm is depicted in Fig. 5, the emission and absorption
300 MAMMOGRAPHY
Rel
ativ
eIn
tens
ity
1.0
0.8
0.6
0.4
0.2
010 20 30
Photon Energy (keV)
Kα=17.4
K
(a) Mo Target/Al Filter
Rel
ativ
eIn
tens
ity
1.0
0.8
0.6
0.4
0.2
010 20 30
Photon Energy (keV)
K-edge=20.0
(b) Mo Target/Mo Filter
Rel
ativ
eIn
tens
ity
1.0
0.8
0.6
0.4
0.2
010 20 30
Photon Energy (keV)
Kα=20.2
Kβ=22.7
(c) Rh Target/Rh Filter
K-edge=23.2
β=19.6
Figure 3. The spectrum of X rays generated with molybdenum and rhodium. On the far left (a) isthe X-ray spectrum generated by a molybdenum target at 30 kVp and filtered with aluminum filter.The characteristic X rays Ka (17.4 keV), and Kb (19.6 keV) appear as the two peaks in the graph. Inthe middle (b) is the X-ray spectrum generated by the same X-ray system in part a, but is filteredwith 30mm thick molybdenum. The K-absorption edge curve is shown in dashed line. On the farright (c) is an X-ray spectrum generated by a rhodium target at 30 kVp and filtered with 20mm thickrhodium. The general shapes of middle figure and far right figure are similar with differences in thepeak energies of K-characteristic X rays (Ka¼20.2 keV, and Kb¼22.7 keV), and the K-absorptionedge energy (23.2 keV).
Table 1. K-Characteristic X Rays and K-Absorption Edgeof Molybdenum, Rhodium, and Tungsten
Molybdenum Rhodium Tungsten
Atomic Number 42 45 74Ka
a 17.4 20.2 59.3Kb
a 19.6 22.7 69.1K-edgea 20.0 23.7 69.5
aEnergy in keV.

characteristics of intensifying screen and film employed inSFM. Note that the emission of 550 nm wavelength lightfrom AD Mammo Screens is matched by the absorptionspectra of the AD-M Film.
In order to accommodate the varying size of breasts, twoimaging cassette sizes are available with dedicated mam-mography equipment, they are 18� 24 cm (8� 10 in.), and24� 30 cm (10� 12 in.). The film is loaded on the topside ofthe cassette with the emulsion side facing the intensifyingscreen. Figure 6 is a schematic drawing showing the cross-section of a typical screen-film mammography cassette (thesingle emulsion film, single intensifying screen) withenlarged views of the film (top, right), and the screen(bottom, right). The ‘‘sponge’’, in the cassette, is employedto assure good screen-film contact.
THE ANTISCATTER GRID
The antiscatter grid is placed between the breast holder,and the cassette slot, refer to Fig. 4. Scattered radiation isone of the main causes of degrading the image quality inX-ray imaging. The antiscatter grid is employed to mini-mize the scattered radiation from reaching the screen-filmsystem while allowing the primary radiation to passthrough. Although, mammography examinations are typi-cally conducted with X-ray potentials <30 kVp, would stillrequire a moving (reciprocating) antiscatter grid to cleanupthe scattered radiation. Typically, the antiscatter grid usedin mammography has a grid ratio of 5 : 1, or 4 : 1. While theexposure time in X-ray mammography imaging is rela-tively long (�1 s), the speed of the moving grid must be
MAMMOGRAPHY 301
Figure 4. A typical dedicated mammography unit; GESenographe DMR. (Courtesy of GE Healthcare.) The overallmechanical design of a typical dedicated X-ray mammographyshowing the tilting gantry with the X-ray tube housing at thetop and the image receptor at the bottom. The gantry (or theelongated C arm) is normally attached to a column or a stand inwhich the elevation mechanism of entire gantry is housed.
AD-M film
AD mammo screensSLG-8U
400 500 600 700350 450 550 650
1.0
0.5
0Rel
ativ
e se
nsiti
vity
Wavelength (nm)
Filter transmittance
20
10
0
Spectral characteristics
Figure 5. Spectral characteristics of screen-film mammographysystem. The AD Mammo screens are green-emitting and the AD-Mfilm is orthochromatic. The figure shows the light-emitting spec-trum of the AD Mammo Screens, the spectral sensitivity curve ofthe AD-M film, and the transmittance spectrum of SLG-8U safetylight filter. (Courtesy of Fujifilm Medical Systems USA, Inc.)
Cassette front
Cassette back
Sponge(for film-screen contact)
Intensifying screenScreen base
EmulsionFilm base
Protective coatingAntihalation layer
Film baseLower emulsionUpper emulsionProtective coating
Phosphor layer(Gd2O2:Tb)Fine grainHighly transparent binderHigh packing density
Screen base
Figure 6. The cross-sectional view of screen-film cassette. (Courtesy of Fujifilm MedicalSystems USA, Inc.)

carefully adjusted to avoid artifact associated with grids.For the antiscatter grids, the grid line rate must be suffi-ciently high, or the attenuation material structure must beso designed to avoid being imaged as grid artifacts on themammograms. The honeycomb design antiscatter grid;Cellular (HTC) Grid utilized in LoRad mammographysystems and marketed by Hologic is well known for itshigh transmission of useful primary radiation withincreased absorption of scattered radiation (18).
THE COMPUTED RADIOGRAPHY FOR MAMMOGRAPHY
Computed radiography was introduced to radiology in 1981and the ‘‘digitization’’ of routine radiographic examinationshad started in earnest. The CR image plate housed incassette replaced, directly, the screen-film cassette in rou-tine radiography applications. This direct replacementdesign required no mechanical modifications on the exist-ing radiographic equipment. With the introduction of CR, awhole new set of technology including the optical CR read-ers, image processing software programs, image displaysubsystems, and so on, made the filmless radiology depart-ment within an achievable reality (19).
The difference between the routine CR and the CR formammography (CR-M) is largely due to the opticalresponse of the CR phosphor; thus, the radiation doserequired to reduce the image noise, and the spatial resolu-tion capability for mammography applications. In 2001,Fuji introduced the FCR 5000MA, which was used in theAmerica College of Radiology Imaging Network (ACRIN);Digital versus Screen-Film Mammography (DMIST) study(20,21). While the study had already been concluded, theofficial results are in the final preparation stage, and havenot been released yet. The FCR 5000MA differentiateditself from the previous generation of CR products byutilizing a 50 mm pixel spot size for the laser and intro-duced dual side IP reading to the market.
In January 2004, Fuji introduced the Profect CS, or‘‘ClearView-CS’’ in the United States. Clear View CS ispending FDA approval and not yet commercially availablein the United States. Fuji recently finished the Premarket-ing Approval (PMA) application to FDA, and the approvalis anticipated sometime during the second half of 2005 (22).Note, however, that the 100mm pixel spot size digitalmammography system has been in use for the past fewyears in Europe, Australia, and Japan. The mechanism inwhich ‘‘how’’ the IP and the CR reader work together toproduce an image is beyond the scope of this article andreaders are suggested to turn to publications available(23,24), or corresponding articles in this Encyclopedia.
The obvious advantage of CR-M, and the full field digitalmammography (FFDM) systems, is its wide dynamic rangeand its linear response to radiation. In screen-film mam-mography, over-or underexposure was one of the maincauses of ‘‘repeat’’ examinations. Such exposure relatedrepeats can be minimized due to the wide latitude inexposure acceptable for imaging. Furthermore, the imagesare no longer ‘‘fixed’’ or ‘‘limited’’; the subject contrast andthe overall image brightness can be adjusted for imageinterpretation by adjusting the display window ‘‘level’’, and
‘‘width’’. The display ‘‘window level’’ corresponds to the filmoptical density in SFM, and the ‘‘widow width’’ correspondsto the contrast. In digital imaging systems, both windowlevel and width may be adjusted to optimize the imagerendered on the monitor. Figure 7 shows the response dif-ferences of these two image receptor systems to the radia-tion exposure. The exposure range for the CRs ‘‘ImagePlate’’ is wider than that of a typical screen-film combina-tion by an order of 2 to 3 in magnitude.
THE STEREOTACTIC BREAST BIOPSY MAMMOGRAPHY
Breast biopsy is often required when an area of suspiciousmalignancy site is revealed after a mammography isobtained. In order to accurately extract the specimen, astereo mammogram may be obtained so that the biopsyneedle can be accurately inserted to the site where it issuspected of malignancy; core biopsy (25). Most dedicatedmammography equipment are designed to perform routine(screen-film, or FFDM) mammography, and with anattachment to perform stereotactic mammography andcore biopsy in an ‘‘up right’’ posture; either the patient isstanding or sitting on a chair.
From a pair of stereo images separated by 308 (�158from the centerline), using the triangulation technique, thethree-dimensional (3D) coordinates of the suspicious sitecan be calculated within an accuracy of 1 mm (25), see theschematic diagram of stereotactic imaging geometry inFig. 8. It is essential that the patient remain still beforeand after the acquisition of the stereo images. The corebiopsy can be localized accurately only if the patient posi-tioning remain the same.
Stereotactic mammography requires that the breastbeing examined is compressed (just as in routine mammo-graphy), but the patient should remain standing still whilethe mammogram is being processed. The processing timealone takes at least 90 s with typical automatic film pro-cessor. Thereafter, the best location of the biopsy needleentrant site, and the coordinates of the sampling must bedetermined. The prolonged time represents substantial
302 MAMMOGRAPHY
105
104
103
102
101
100
3
1
2
10–2 10–1 102101100
Screen-film
Imaging plate (IP)
IP's
rel
ativ
elu
min
esce
nce
Optical density
Exposure (mR)
Comparison of dynamic range
Figure 7. Comparison of dynamic range of CR and screen-filmimage receptors. (Courtesy of Fuzifilm Medical Systems, USA,Inc.) The image plate (IP) has wider linear response to radiationextends over four decades of dose and eliminates the inherentlimitations of the ‘‘toe’’ and ‘‘shoulder’’ portions of the film’s H&DCurve. (Courtesy of Fujifilm Medical Systems USA, Inc.)

discomfort on the part of the patient not to mention theanxiety of fear for the possibility of being diagnosed andconfirmed as having breast cancer.
DIGITAL SPOT MAMMOGRAPHY
Before the introduction of FFDM, in order to ease thediscomfort of undergoing the biopsy process, a small detec-tor with imaging area of 5� 5 cm had been developed byLoRad, for example, so that the stereo images of the breastcan be displayed immediately after exposures are made.This is one of the successful biomedical applications thathave resulted from collaborative technology transfer pro-grams between the National Aeronautics and SpaceAdministration (NASA), the National Cancer Institute(NCI), and the U. S. Department of Health and HumanServices Office on Women’s Health (OWH) (26). Since theimaging area is only 5� 5 cm, it is referred to as DigitalSpot Mammography. The biopsy coordinate is then calcu-lated via the built-in software program with a shorteroverall examination time.
In addition, dedicated breast biopsy systems have beendeveloped where the patient would be lying on her stomach(recumbent). The breast under examination is positionedthrough a hole in the examination table and aligned withthe X-ray equipment and the biopsy needle gun. Therecumbent core biopsy mammography unit manufacturedby LoRad is depicted in Figs. 9 and 10. LoRad is now one ofthe brand names sold under Hologic. A similar recumbentcore biopsy unit, called Mammo Test Biopsy System, isavailable from Fisher Imaging.
FULL FIELD DIGITAL MAMMOGRAPHY
The CR-M is a direct replacement of the screen-film cas-sette. In other words, the IP cassette replaced the screen-
film cassette. Therefore, no major mammography equip-ment modification would be necessary. In DR on the otherhand, just as in conventional radiography and fluoroscopyapplications, the image receptor system may be built intothe image receptor compartment as an integral part of theimaging assembly (27,28). Manufacturers had attempted tophysically fit the DR detector assembly, or more accurately;the Flat Panel (FP) detector assembly, into the space occu-pied by the SFM cassette. To date, no commercial product ofFP detector assembly has been fitted as a direct physicalreplacement of the SFM cassette is available (29). In otherwords, due to technical difficulties, there is no FP detectorassembly that is sufficiently compact to fit into the spacedesigned to accommodate the SFM cassette. The imageacquired with FP detector is transmitted to and processedby the image processing chain thereafter.
While there are a hand full of FFDM systems eitherunder development or manufactured for clinical applica-tions, three FFDM units are currently available in theUnited States, and are described here (27). The fact that
MAMMOGRAPHY 303
X
Y
Z
Compressed breast
Breast holder
Imaging plane/film
+/– 15°
TargetRight image Left image
Figure 8. Schematic drawing of geometrical setup for stereotacticmammography. From the stereo images, with known geometryand the X–Y coordinates, the depth in Z direction is calculated viatriangulation.
Figure 9. The recumbent stereotactic core biopsy system. Arecumbent design provides a stable patient positioning toacquire a pair of stereo images for accurate localization ofbiopsy site while the patient lays flat on her stomach withcomfort during the entire examination. (Courtesy of Hologic.)
Figure 10. The zoomed view of the recumbent stereotactic corebiopsy system. In the zoomed view, the breast under theexamination is positioned through the opening in the tabletop.(Courtesy of Hologic.)
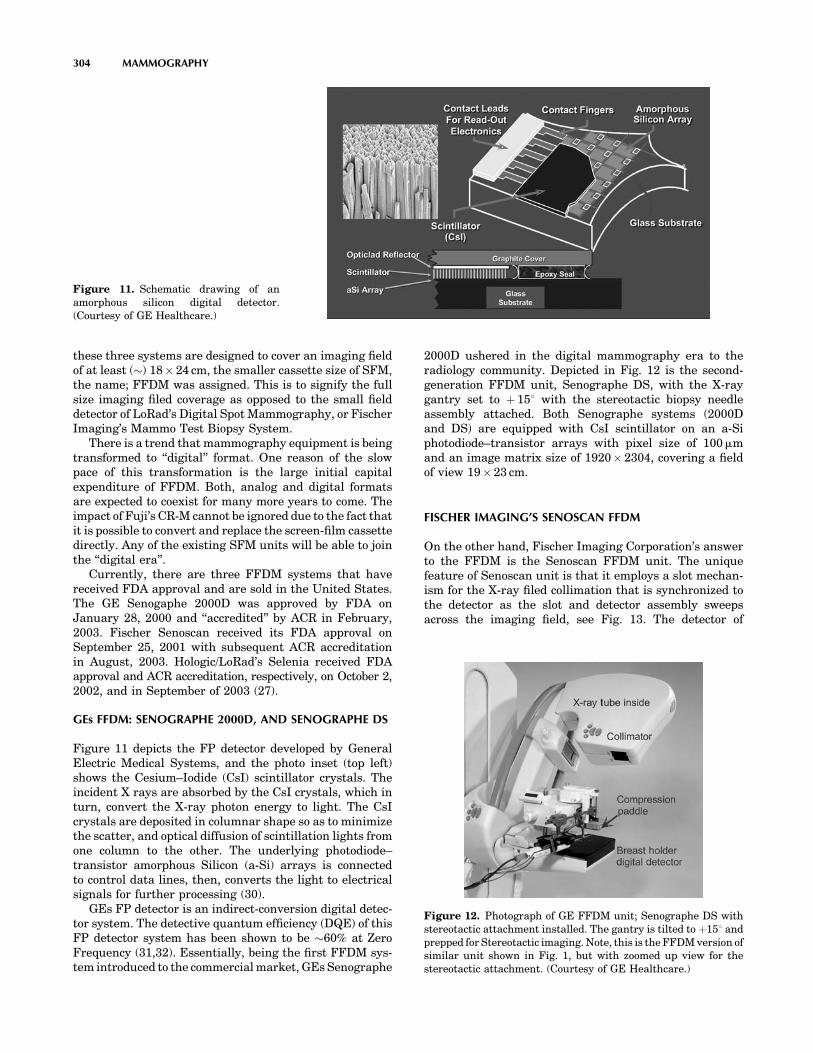
these three systems are designed to cover an imaging fieldof at least (�) 18� 24 cm, the smaller cassette size of SFM,the name; FFDM was assigned. This is to signify the fullsize imaging filed coverage as opposed to the small fielddetector of LoRad’s Digital Spot Mammography, or FischerImaging’s Mammo Test Biopsy System.
There is a trend that mammography equipment is beingtransformed to ‘‘digital’’ format. One reason of the slowpace of this transformation is the large initial capitalexpenditure of FFDM. Both, analog and digital formatsare expected to coexist for many more years to come. Theimpact of Fuji’s CR-M cannot be ignored due to the fact thatit is possible to convert and replace the screen-film cassettedirectly. Any of the existing SFM units will be able to jointhe ‘‘digital era’’.
Currently, there are three FFDM systems that havereceived FDA approval and are sold in the United States.The GE Senogaphe 2000D was approved by FDA onJanuary 28, 2000 and ‘‘accredited’’ by ACR in February,2003. Fischer Senoscan received its FDA approval onSeptember 25, 2001 with subsequent ACR accreditationin August, 2003. Hologic/LoRad’s Selenia received FDAapproval and ACR accreditation, respectively, on October 2,2002, and in September of 2003 (27).
GEs FFDM: SENOGRAPHE 2000D, AND SENOGRAPHE DS
Figure 11 depicts the FP detector developed by GeneralElectric Medical Systems, and the photo inset (top left)shows the Cesium–Iodide (CsI) scintillator crystals. Theincident X rays are absorbed by the CsI crystals, which inturn, convert the X-ray photon energy to light. The CsIcrystals are deposited in columnar shape so as to minimizethe scatter, and optical diffusion of scintillation lights fromone column to the other. The underlying photodiode–transistor amorphous Silicon (a-Si) arrays is connectedto control data lines, then, converts the light to electricalsignals for further processing (30).
GEs FP detector is an indirect-conversion digital detec-tor system. The detective quantum efficiency (DQE) of thisFP detector system has been shown to be �60% at ZeroFrequency (31,32). Essentially, being the first FFDM sys-tem introduced to the commercial market, GEs Senographe
2000D ushered in the digital mammography era to theradiology community. Depicted in Fig. 12 is the second-generation FFDM unit, Senographe DS, with the X-raygantry set to þ 158 with the stereotactic biopsy needleassembly attached. Both Senographe systems (2000Dand DS) are equipped with CsI scintillator on an a-Siphotodiode–transistor arrays with pixel size of 100mmand an image matrix size of 1920� 2304, covering a fieldof view 19� 23 cm.
FISCHER IMAGING’S SENOSCAN FFDM
On the other hand, Fischer Imaging Corporation’s answerto the FFDM is the Senoscan FFDM unit. The uniquefeature of Senoscan unit is that it employs a slot mechan-ism for the X-ray filed collimation that is synchronized tothe detector as the slot and detector assembly sweepsacross the imaging field, see Fig. 13. The detector of
304 MAMMOGRAPHY
Figure 11. Schematic drawing of anamorphous silicon digital detector.(Courtesy of GE Healthcare.)
Figure 12. Photograph of GE FFDM unit; Senographe DS withstereotactic attachment installed. The gantry is tilted to þ158 andprepped for Stereotactic imaging. Note, this is the FFDM version ofsimilar unit shown in Fig. 1, but with zoomed up view for thestereotactic attachment. (Courtesy of GE Healthcare.)

Senoscan unit consists of a layer of thallium activated CsIscintillator connected to charge-coupled-device (CCD)chips via fiber optics (33). Hence, this is also an indirect-conversion digital detector system.
The use of slot mechanism also means ‘‘restricting’’ theX-ray beams for exposure. It offers an advantage of lessscattered radiation for improved image contrast (34).Therefore, no antiscatter grid is necessary with Senoscanunit. The absence of the antiscatter grid compensate for aless efficient use of the available X rays. In addition, atungsten anode X-ray tube (35) is employed with this unit,since the tungsten anode X-ray tube would produce X raysmore efficiently than a molybdenum or rhodium target.Senoscan is equipped with CCD chips having pixel size of(1) 27mm, covering a field of view 11� 15 cm under the highresolution mode, and (2) pixel size of 54 mm, covering a fieldof view 19� 29 cm for the normal mode. The image matrixsize of this system is 4096� 5625.
HOLOGIC/LORAD’S FFDM; SELENIA
Selenia’s image receptor is a 250mm thick amorphousSelenium (a-Se) photoconductor. Underneath a layer ofa-Se photoconductor is a thin-film transistor (TFT) arraysthat serves as an active readout mechanism. The TFTarrays are typically deposited onto a glass substrate, whichprovides a physical support for the entire detector compo-nents. Selenia uses a 250mm thick a-Se photoconductor tocapture the X-ray photons impinging on the detector sur-
face without the aid of a scintillator. It is said that athickness of 250mm a-Se photoconductor is adequate tostop 95% of the X-ray photons in the mammographicenergy range (36). The photon energy is converted to apair of electron, which is negatively charged, and a posi-tively charged ‘‘hole’’. With bias voltage applied, the signalis read off by the TFT arrays. Thus, this is a direct-conversion digital detector system. The detector is ana-Se photoconductor and TFT arrays with pixel size of70mm, covering a field of view 24� 29 cm, resulting inan image matrix size of 3328� 4096. A summary of thedetector characteristics for these three FFDM systems isgiven in Table 2, (37).
READING MAMMOGRAPHY IMAGES
Initially, the FFDM images were printed on dry laserprinters and read on high luminance view boxes (ACRaccreditation required of a luminance of > 3000 cd m�2)(38). All three FFDM systems are equipped with work-stations where images are soft-copy read. The workstationsare commonly equipped with two 5-megapixel high resolu-tion monitors. With the soft-copy reading, an assortment ofimage manipulation are possible including, but not limitedto, basic window width and window level adjustments,zooming, image reversal, and so on for viewing the detailsof the pathology. More importantly, the impact of imageprocessing in transforming the acquired raw data set to theimage displayed for soft-copy reading should be recognized(39). For example, as can be seen in Fig. 14, substantialdifferences not only in the brightness and contrast of theimage but also in the impression of pathology in the imagescan be noticed. While all three images are acceptable anddiagnostic, the two enhanced images are easier to recog-nize various details.
SUMMARY
A brief history of mammography was described as theintroduction to the X-ray mammography. The SFM con-tinues to play its major role in breast cancer detection whileFFDM is gaining its installed base. Upon the anticipatedFDA approval, the CR-M is poised for introduction forclinical applications in the second-half of 2005. However,all three modalities employed in breast cancer detection,namely; the SFM, FFDM, and the CR-M are expected to
MAMMOGRAPHY 305
.88 in77 i
84 in
1.69 in
14.5 cm29 cm
10.5 cm
21 cm
Swing arm pivot pointX-ray tube
Filter/collimatorassembly
Detector
Figure 13. A schematic drawing of the scanning mechanism ofFischer Senoscan FFDM. (Adapted from Fisher Imaging Sanoscanuser’s manual with permission. Courtesy of Fischer Imaging.)
Table 2. Summary of Imaging Characteristics of FFDM Units
Manufacturer Model Name Scintillator Detector Pixel Size, mm Image Matrix Size Imaging Size, L�W cm
GE Senographe 2000D, DS CsI (Tl)a TFT 100 1920�2304 19� 23Fisher Imaging Senoscan CsI (Tl) CCD 24/48 4096�5625 22� 30Hologic/LoRad Selenia a-Seb TFT 70 3328�4096 25� 29
DSM CsI (Tl) CCD 48 1025�1024 5� 5Fuji CR-M BaFBr(Eu)c Computed 50 1770�2370 18� 24
radiography 2364�2964 24� 30
aCsI(Tl)¼Talium Activated Cesium Iodide.ba-Se¼Amorphous Selenium.cBaFBr(Eu)¼Barium Fluorobromide with Europium.

play their roles in contributing to reduction of breastcancer deaths through the early detection of mammogra-phy screening.
Display of FFDM images and its workstations areimportant components of the total picture of FFDM(40,41). However, monitors and workstations associatedwith diagnostic radiology imaging including mammogra-phy are in a domain of their own and no attempt is made toinclude these subjects in this article. Such subject mattersbelong to digital image processing and display. Finally,archiving of the acquired digital images is also a veryimportant aspect of digitized diagnostic images in theoverall operation of radiology. However, this subject isbetter handled in Picture Archiving and CommunicationSystems (PACS), and readers are refered to articles underPACS for additional information.
ACKNOWLEDGMENT
The information and materials presented here had beenprovided by numerous numbers of representatives andscientists from respective manufacturers mentioned inthe main text. The author would like to express his thanksand sincere appreciation by listing the manufacturershere, (in alphabetical order) in lieu of listing the indi-viduals who had provided their supports: General Elec-tric Healthcare, Fischer Imaging Corporation, FujifilmMedical Systems USA, Inc., and Hologic Inc. (LoRad).
BIBLIOGRAPHY
1. Nystrom L, et al. Breast cancer screening with mammo-graphy: Overview of Swedish randomised trial, Lancet1993; 341:973–978.
2. Hendrick RE, et al. Benefit of screening mammography inwomen aged 40–49: A new meta-analysis of randomized con-trolled trial. J Nat Cancer Inst Monograph 1997; (22):87–92.
3. Mammography–-A User’s Guide, Washington, DC: NationalCouncil on Radiation Protection and Measurements, 1986.NCRP Report No. 85.
4. Zermenhof RA. Mammography, Encyclopedia of MedicalDevices and Instrumentation, Vol 3. New York: John Wiley& Sons; 1988.
5. Jones CH. Methods of breast imaging. Phys Med Biol1982;27(4)463–499.
6. FDA Home page. [Online]. Available at http://www.fda.gov/cdrh/mammography/frmamcom2.html.
7. ACR Home page. [Online]. Available at http://www.acr.org/s_acr/sec.asp?CID¼589&DID¼14253.
8. Speiser RC, Zanrosso EM, Jeromin LS. Dose comparisonsfor mammographic systems. Med Phys 1986;13(5):667–673.
9. Boag JW. Xeroradiography. Phys Med Biol 1973;18:3.10. Wolbarst AB. Dependence of attenuation on atomic number
and photon energy. Physics of Radiology. Appleton & Lange;1992. Chapt. 14.
11. Hoeffken W. Soft tissues–-mammography. The invisible lightapplied, the advancing diagnostic evaluation of the skeletonand thorax following Roentgen’s discovery. In: Rosenbusch G,Oudekerk M, Ammann E, editors. Radiology in MedicalDiagnostics, Evolution of X-ray Applications 1895–1995.Oxford: Blackwell Science Ltd.; 1995. Chapt. 2.
12. Curry III TS, Dowdey JE, Murry Jr. RC. Christensen’sPhysics of Diagnostic Radiology, 4th ed., Philadelphia: Lea& Febiger; 1990.
13. Fewell TR, Shuping RE. Handbook of Mammographic X-raySpectra. Rockville, MD: HEW Publication (FDA) 79–8071;1978.
14. Boone JM, Fewell TR, Jennings RJ. Molybdenum, rhodium,and tungsten anode spectral modeling using interpolatingpolynomials with application to mammography. Med PhysDec. 1997:24(12).
15. Sprawls Jr. P. Chapter 18: Blur, Resolution, and Visibility ofDetail. Physical Principles of Medical Imaging. Aspen Pub-lishers, Inc.; 1987.
16. Haus AG. Technologic improvements in screen-film mammo-graphy. Radiology 1990;174:628–637.
17. Chapter V. Film Response. The Fundamentals of Radiogra-phy, 4th ed., Rochester, N.Y.: Eastman Kodak Co.; 1980.
18. Rezentes PS, de Almeida A, Barnes GT. Mammography gridperformance. Radiology 1999;210:227.
19. Sonoda M, Takano M, Miyahara J, Kato H. Computed radio-graphy utilizing laser stimulated luminescence. Radiology1983;148:833–838.
20. Pisano ED, et al. American College of Radiology ImagingNetwork Digital Mammographic Imaging Screening Trial:Objectives and Methodology. Radiology published online.June 16, 2005.
21. ACRIN Home Page. [Online]. Available at http://www.acrin.org.
22. Communication with National Program Manager, Women’sHealthcare Imaging Systems, Fuji Photo Film Ltd.
23. FCR (Fuji Computed Radiography) General Description ofImage Processing, Fuji Photo Film Co., Ltd.
24. Tateno Y, Iinuma T, Takano M, editors. Computed Radio-graphy. Tokyo: Springer-Verlag; 1987.
25. Carr JJ, et al. Stereotactic localization of breast lesions: Howit works and methods to improve accuracy. RadioGraphics2001;21:463.
26. Winfield DL. Aerospace technology transfer to breast cancerimaging. Acta Astronau 1997;41(4–10):515–523.
27. Pisano ED, Yaffe MJ. Digital Mammography. Radiology2005;234:353–362.
28. Pisano ED. Current status of full-field digital mammography.Radiology 2000;214:26.
29. Personal communications with various X-ray industry mar-keting departments.
306 MAMMOGRAPHY
Figure 14. Comparison of ‘‘processed’’ images. The unprocessedimage (a) can be dramatically improve its appearance with‘‘Thickness Equalzation’’ processing (b), or the ‘‘Premium View’’processing (c). The impact of image processing is quite evident.(Courtesy of GE Healthcare.)

30. Vedantham S, et al. Full Breast digital mammography withanamorphous silicon-based flat panel detector: Physicalcharacteristics of a clinical prototype. Med Phys 2000;27(3):558–567.
31. Albagli D, et al. Performance of advanced a-Si/CsI-based flatpanel X-ray detectors for mammography. In: Yaffe MJ, Anto-nuk LE, editors. Proceedings of SPIE. Medical Imaging 2003:Physics of Medical Imaging, Vol. 5030, June 2003. p 553–563.
32. Shaw J, Albagil D, Wei C-Y. Enhanced a-Si/CsI-based flatpanel X-ray detector for mammography. In: Yaffe MJ, FlynnMJ, editors. Proceeding of SPIE. Medical Imaging 2004:Physics of Medical Imaging. Vol. 5368, May 2004. p 370–378.
33. Tesic MM, Picaro MF, Munier B. Full field digital mammo-graphy scanner. Eur J Rad 1997;31:2–17.
34. Boone JM, et al. Grid and slot scan scatter reduction inmammography: Comparison by using Monte Carlo techni-ques. Radiology 2002;222:519–527.
35. Operator Manual, SenoScan: Full Field Digital Mammogra-phy System, Fischer Imaging Corporation, Denver, CO, Dec.2002.
36. Smith AP. Fundamentals of digital mammography: Physics,technology and practical considerations. Radiol Manager2003, Sep.–Oct.; 25(5):18–24, 26–31.
37. Mahesh M. AAPM/RSNA physics tutorial for residents,Digital mammography: an overview. Radiographics2004;24: 1747–1760.
38. The ACR Mammography Quality Control Manual. Preston,VA: ACR, 1999.
39. Pisano ED, Yaffe MJ. Digital mammography. Radiology2005;234:353–362.
40. Hemminger BM, et al. Evaluation of the effect of displayluminance on the feature detection of simulated masses inmammograms. Proc SPIE 1997;3036:12.
41. Pisano ED, et al. Radiologists’ preferences for digital mam-mographic display. Radiology 2000;216:820–830.
Further Reading
Mahesh M, AAPM/RSNA physics tutorial for residents, Digitalmammography: An overview. Radiographics 2004;24:1747–1760.
Smith AP, Hall PA, Marcello DM. Emerging technologies in breastcancer detection. Radiology Manager 2004, July.–Aug.; 26(4):16–24.
Shramchencko N, Blin P, Mathey C, Klausz R. Optimized exposurecontrol in digital mammography. In: Yaffe MJ, Flynn MJ,editors. Proceedings of SPIE. Medical Imaging 2004: Physicsof Medical Imaging. May 2004; Vol. 5368, p 445–456.
Curry III TS, Dowdey JE, Murry Jr. RC. Christensen’s Physics ofDiagnostic Radiology. 4th ed., Philadelphia: Lea & Febiger;1990. (This is a textbook used in various radiology residencyprograms across the United States.)
Online References
FDA Home page. [Online]. Available at http://www.fda.gov/cdrh/mammography/frmamcom2.html.
ACR Home page. [Online]. Available at http://www.acr.org/.ACRIN Home Page. [Online]. Available at http://www.acrin.org.GE Healthcare Home Page. [Online]. Available at http://www.
gehealthcare.com/usen/whc/whcindex.html.Fischer Imaging Home Page. [Online]. Available at http://www.
fischerimaging.com/default/default.asp.Fujifilm Medical Systems USA Home Page. [Online]. Available at
http://www.fujimed.com.Hologic Home Page. [Online]. Available at http://www.hologic.
com/.
MATERIALS, BIOCOMPATIBILITY OF. SeeBIOCOMPATIBILITY OF MATERIALS.
MATERIALS, PHANTOM, IN RADIOLOGY. SeePHANTOM MATERIALS IN RADIOLOGY.
MATERIALS, POLYMERIC. See POLYMERIC MATERIALS.
MATERIALS, POROUS. See POROUS MATERIALS FOR
BIOLOGICAL APPLICATIONS.
MEDICAL EDUCATION, COMPUTERS IN
ARIE HASMAN
MaastrichtThe Netherlands
INTRODUCTION
The amount of knowledge is increasing rapidly in manydisciplines. Medicine is not an exception. Because of scien-tific research new knowledge comes available at such apace, that physicians should read 19 articles a day, everyday of the week, to keep up to date. Since that is notpossible the results of scientific research often are appliedclinically only years later. Computers can support physi-cians in finding relevant recent information. In the nextsection, the reasons for using computers in medical educa-tion are presented. Then the roles computers can play inmedical education are reviewed. Since health profes-sionals increasingly use computer systems for their work,they need to know the benefits and limitations of thesesystems. The discipline of medical informatics is respon-sible for developing these systems and therefore is dis-cussed. The next sections discuss the use of Internet andelectronic patient records. Also, it is discussed why knowl-edge of information systems is important for health pro-fessionals.
THE REASONS FOR USING COMPUTERSIN MEDICAL EDUCATION
The goal of academic medical education is to educatestudents to become physicians. During the study knowl-edge, skills and attitudes have to be mastered. Studentsare taught academic skills like critical reading, they areacquainted with the principles of research methods, andthey should know the scientific background of the basicdisciplines (like anatomy, molecular cell biology and genet-ics, endocrinology and metabolism, immunology andinflammation, growth, differentiation and aging) as faras they are related to the study of abnormalities and todiagnosis and therapy. Because of the explosive growth ofbiomedical knowledge, it is not possible anymore to teachall the currently available knowledge. This does not have tobe a problem since part of the knowledge presented tomedical students during their formal education may bemore or less obsolete by the time they are in their mainprofessional practice. Moreover, it is difficult to teachmedicine for the coming era, since most of the future’s
MEDICAL EDUCATION, COMPUTERS IN 307

technology is probably nonexistent today. Students there-fore must be taught how to become life-long learners.Computers can support this process.
Computers play an increasing role in the practice ofmedicine too. No doctor—whether a general practitioner ora specialist in advanced or social care—will be able toescape the confrontation with some form of informationprocessing. The work of health professionals is dominatedby information collection, storage, retrieval, and reason-ing. Health professionals both use individual patient dataand general medical or nursing knowledge. The amount ofmedical and nursing knowledge increases so quickly thathealth professionals cannot stay fully up to date. Tools aretherefore needed to acquire relevant knowledge at the timeit is needed.
Computer systems are installed in many hospitaldepartments and physician offices. Hospital informationsystems support, for example, financial, administrative,and management functions. Clinical departmental sys-tems are used to collect, store, process, retrieve, and com-municate patient information. Clinical support systemsare used in function laboratories [for electroencephalogram(EEG), electrocardiogram (ECG), electromyogram (EMG),and spirometry analysis], for imaging [magnetic resonanceimaging (MRI), computerized tomography (CT), nuclearmedicine, ultrasound], and in clinical laboratories (analy-sis of electrolytes, etc.). The results of clinical supportsystems are increasingly stored in so-called electronicpatient records, together with the medical history, resultsof physical examination, and progress notes. Electronicpatient records gradually replace the paper patient record.Apart from the fact that electronic paper records are betterreadable they also support functions (like decision support)paper records cannot provide. Students must learn thebenefits and limitations of these kinds of systems.
Decision support systems are used to support cliniciansduring the diagnostic or therapeutic process and for pre-ventive purposes to prevent either errors of omission(when, eg, the physician does not order a mammographywhen indicated) or commission (when, eg, the physicianprescribes the wrong drug).
Clinical patient data are increasingly stored in theabove mentioned electronic patient records (EPRs), fromwhich they can be later retrieved by physicians or nurseswho are in need of the data. Also, information systems canretrieve relevant data from the electronic patient recordwhen a suitable interface between system and EPR isavailable. When a standard vocabulary is used for repre-senting data values in the EPR, decision support systemscan interpret these data and remind, alert, or critique thephysician or provide access to relevant knowledge, basedon patient data available in the EPR. Health professionalsshould have insight in and knowledge of the principles,concepts, and methods underlying electronic patientrecords.
Also, patients become active players in the field andincreasingly demand access to the EPR.
Patient management increasingly has become the com-bined task of a group of healthcare workers. Therefore thememory-aid role of the patient record more and morechanges into a communication role. Paper records have
several limitations in this respect. In addition, since theappearance of the report ‘‘To err is human’’ of the IOM (1) itis apparent that due to miscommunication (among whichare problems with reading handwritten information, withincomplete information, etc.) medical errors are made thateven may lead to the death of patients. Electronic patientrecords and order entry systems can reduce the number oferrors because they are not only more readable, butbecause they can also be interfaced with decision supportsystems when standardized terminology is used.
Decision support can be passive in the sense that thedecision support system contains information that has tobe searched by the physician. In this case, the healthcareprofessional takes the initiative to search for information,for example, via PubMed or the Cochrane Library. Decisionsupport can also be active. In this case, the decision supportsystem volunteers advice based on information it canretrieve from the EPR. Decision support systems can eitherproactively suggest the next step in a diagnostic or treat-ment process or reactively remind the healthcare profes-sional that a (preventive) procedure was not performed or astep in the protocol was not carried out.
ROLES FOR COMPUTERS IN MEDICAL EDUCATION
What roles can computers play in medical education? Inthe first place, information systems can be used to managethe learning process. Students can get access to the curri-culum via so-called learning environments (e.g., Black-board or WebCT), can get overviews of their marks, canaccess computer aided instruction programs, can accessPowerPoint presentations of their teachers, and so on.Computers provide access to the internet so that theycan search for content knowledge.
Computer-aided instruction can be used to teach stu-dents certain subjects. For example, computers are used tosimulate regulatory mechanisms occurring in the humanbody. With a simulation program, students can treat‘‘patients’’ without risking their patient lives. The simula-tion is often based on models that present (patho)physio-logic processes in the form of mathematical equations.When the models become increasingly accurate they caneven be used in patient care. Also, patient managementproblems can be simulated. In this case, usually no mathe-matics is involved, but the patient’s signs and symptoms asthey develop as a function of time are expressed astext.
There are simulation tools that allow users to evaluate,plan, or redesign hospital departments, or parts of otherhealthcare systems. Physicians will be confronted with theresults of simulations. The model that is used in thesimulation has to be checked for validity. Some tools pre-sent the modeled processes visually so that physicians ornurses can easily determine the correctness of the model.An example is the modeling of a phlebography service. Onthe screen, the cubicles and other rooms are displayed andthe movements of patients, physicians, and nurses can befollowed. In this way, the users can judge whether themodel represents the situation of a phlebography service inan adequate way.
308 MEDICAL EDUCATION, COMPUTERS IN

Note that computers should not be considered as surro-gate teachers controlling students’ learning. Computersshould enrich the learning environment by expandingthe student’s control over their self-learning and by pro-viding a better learning environment as a supplement totraditional methods of learning. The effectiveness of CAIhas always been a subject of controversy. Studies haveclaimed both that CAI is superior and that CAI is inferior totraditional methods. The majority of the publications, how-ever, support the notion that CAI is as effective as tradi-tional educational methods (2).
Although decision making is the pre-eminent function ofa physician, hardly anywhere is the student confrontedwith a systematic exposition of procedures of good decisionmaking. The use of computers can facilitate the teaching ofthese procedures. Computer support offers new possibili-ties to teach problem solving techniques and analyticalmethods that are presently learned by the student throughpractice and the observation of mentors.
MEDICAL INFORMATICS
Education concerning the advantages and limitations ofthe use of computers for supporting the work of healthprofessionals is the responsibility of medical informaticsdepartments. Medical informatics can also be instrumentalin developing computer-aided instruction programmes andsimulation packages. Medical informatics is the disciplinethat deals with the systematic processing of data, informa-tion, and knowledge in the domains of medicine and health-care. The objects of study are the computational andinformational aspects of processes and structures in med-icine and healthcare (3). Medical informatics is a verybroad discipline covering subjects like applied technology(bioinformatics, pattern recognition, algorithms, humaninterfaces, etc.) and services and products (quality man-agement, knowledge-based systems, electronic patientrecords, operations–resource management, etc.). Alsohuman and organizational factors (managing change, legalissues, needs assessment, etc.) should be taken intoaccount.
Informatics can be either a systems-oriented disciplinein which computer systems, operating systems and pro-gramming languages are the object of study or a methods-oriented discipline in which the methods are studied thatcan be used to create algorithms that solve problems insome application domain. In the case of the methods-oriented approach, a problem is studied and formalizedsolutions are determined. Medical informatics is an exam-ple of this approach: it studies the processing of data,information, and knowledge in medicine and healthcare.Medical informatics focuses on the computational andinformational aspects of (patho)physiological processesoccurring in the patient, cognitive processes going on inthe brain of physicians, and organizational processes thatcontrol healthcare systems.
The resulting knowledge can be used to design informa-tion systems that can support healthcare professionals. Itis clear that healthcare professionals need to have somemedical informatics knowledge in order to optimally use
information systems. Medical informatics educationshould therefore be part of the medical curriculum.
Various groups of professionals with quite differentbackgrounds can be identified who carry out medical infor-matics tasks ranging from the use of IT to developinginformation systems. Users of information systems natu-rally need less medical informatics knowledge than healthinformatics experts who develop health information sys-tems or support other healthcare workers in designingterminology servers, coding systems, and so on.
There exists a wide range of job opportunities in the fieldof medical informatics. These jobs require various medicalinformatics capabilities. In addition to medical informatics,students (and graduate students) with other backgroundsmay prefer a job in the field of medical informatics. In orderto obtain the relevant capabilities these students have tolearn additional subjects depending on their previous edu-cation and the type of specialization they want to achieve.These students can be graduates from healthcare relatedprograms or from informatics–computer science programs.Graduates from healthcare related programs possess therelevant medical knowledge, but need to increase theirmedical informatics knowledge. Graduates with an infor-matics or computer science background must learn how thehealthcare system is organized and how healthcare profes-sionals are working in order to develop systems that areappreciated by healthcare professionals. Medical infor-matics is therefore taught in different ways (4) dependingon the type of students and the type and extent of specia-lization that they want to achieve.
USE OF THE INTERNET
Much knowledge can be found on the internet. Browsersallow health professionals and patients to access sitescontaining (references to) medical knowledge. PubMed isan example. It contains references to the medical litera-ture. The web contains a lot of information of which thequality is not always guaranteed. Especially in the medicalarena, this is a big disadvantage. The internet has becomeone of the most widely used communication media. Withthe availability of Web server software, anyone can set up aWeb site and publish any kind of data that is then acces-sible to all. The problem is therefore no longer findinginformation, but assessing the credibility of the publisheras well as the relevance and accuracy of a documentretrieved from the net. The Health On the Net Code ofConduct (HONcode) has been issued in response to con-cerns regarding the quality of medical and health informa-tion (5). The HONcode sets a universally recognizedstandard for responsible self-regulation. It defines a setof voluntary rules to make sure that a reader always knowsthe source and the purpose of the information they arereading. These rules stipulate, for example, that any med-ical or health advice provided and hosted on a site will onlybe given by medically trained and qualified professionalsunless a clear statement is made that a piece of advice isoffered from a nonmedically qualified individual or orga-nization. Another guideline states that support for the Website should be clearly identified, including the identities of
MEDICAL EDUCATION, COMPUTERS IN 309
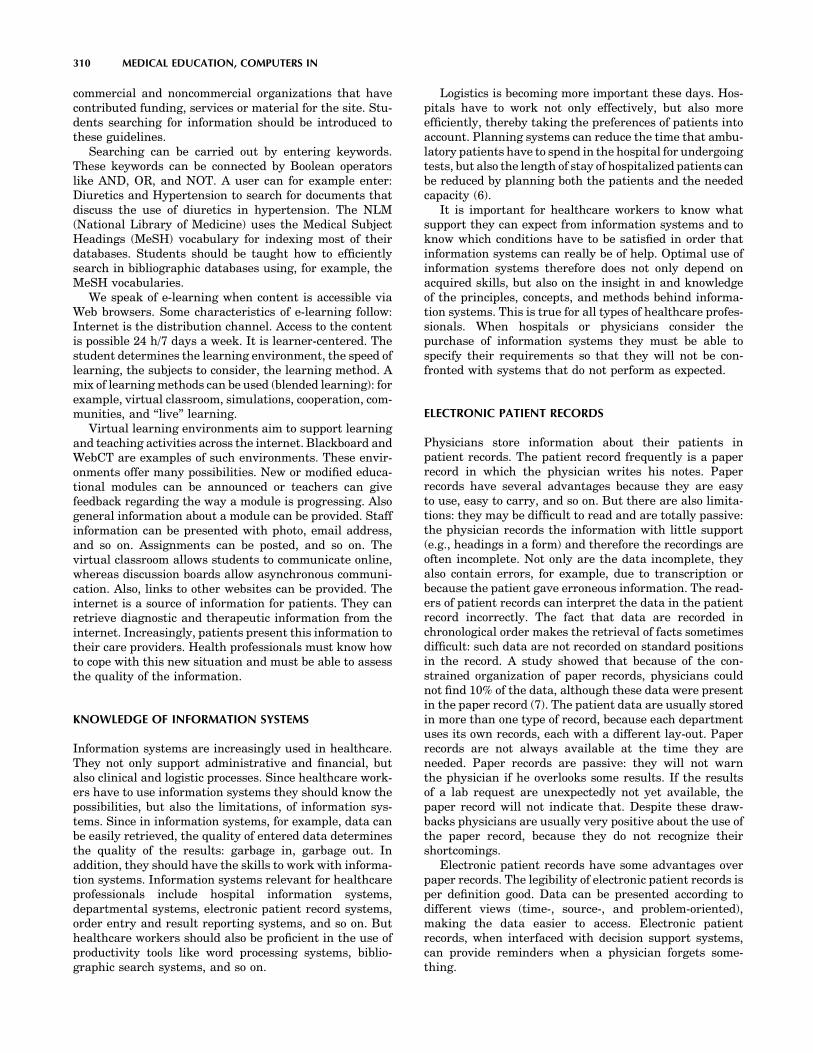
commercial and noncommercial organizations that havecontributed funding, services or material for the site. Stu-dents searching for information should be introduced tothese guidelines.
Searching can be carried out by entering keywords.These keywords can be connected by Boolean operatorslike AND, OR, and NOT. A user can for example enter:Diuretics and Hypertension to search for documents thatdiscuss the use of diuretics in hypertension. The NLM(National Library of Medicine) uses the Medical SubjectHeadings (MeSH) vocabulary for indexing most of theirdatabases. Students should be taught how to efficientlysearch in bibliographic databases using, for example, theMeSH vocabularies.
We speak of e-learning when content is accessible viaWeb browsers. Some characteristics of e-learning follow:Internet is the distribution channel. Access to the contentis possible 24 h/7 days a week. It is learner-centered. Thestudent determines the learning environment, the speed oflearning, the subjects to consider, the learning method. Amix of learning methods can be used (blended learning): forexample, virtual classroom, simulations, cooperation, com-munities, and ‘‘live’’ learning.
Virtual learning environments aim to support learningand teaching activities across the internet. Blackboard andWebCT are examples of such environments. These envir-onments offer many possibilities. New or modified educa-tional modules can be announced or teachers can givefeedback regarding the way a module is progressing. Alsogeneral information about a module can be provided. Staffinformation can be presented with photo, email address,and so on. Assignments can be posted, and so on. Thevirtual classroom allows students to communicate online,whereas discussion boards allow asynchronous communi-cation. Also, links to other websites can be provided. Theinternet is a source of information for patients. They canretrieve diagnostic and therapeutic information from theinternet. Increasingly, patients present this information totheir care providers. Health professionals must know howto cope with this new situation and must be able to assessthe quality of the information.
KNOWLEDGE OF INFORMATION SYSTEMS
Information systems are increasingly used in healthcare.They not only support administrative and financial, butalso clinical and logistic processes. Since healthcare work-ers have to use information systems they should know thepossibilities, but also the limitations, of information sys-tems. Since in information systems, for example, data canbe easily retrieved, the quality of entered data determinesthe quality of the results: garbage in, garbage out. Inaddition, they should have the skills to work with informa-tion systems. Information systems relevant for healthcareprofessionals include hospital information systems,departmental systems, electronic patient record systems,order entry and result reporting systems, and so on. Buthealthcare workers should also be proficient in the use ofproductivity tools like word processing systems, biblio-graphic search systems, and so on.
Logistics is becoming more important these days. Hos-pitals have to work not only effectively, but also moreefficiently, thereby taking the preferences of patients intoaccount. Planning systems can reduce the time that ambu-latory patients have to spend in the hospital for undergoingtests, but also the length of stay of hospitalized patients canbe reduced by planning both the patients and the neededcapacity (6).
It is important for healthcare workers to know whatsupport they can expect from information systems and toknow which conditions have to be satisfied in order thatinformation systems can really be of help. Optimal use ofinformation systems therefore does not only depend onacquired skills, but also on the insight in and knowledgeof the principles, concepts, and methods behind informa-tion systems. This is true for all types of healthcare profes-sionals. When hospitals or physicians consider thepurchase of information systems they must be able tospecify their requirements so that they will not be con-fronted with systems that do not perform as expected.
ELECTRONIC PATIENT RECORDS
Physicians store information about their patients inpatient records. The patient record frequently is a paperrecord in which the physician writes his notes. Paperrecords have several advantages because they are easyto use, easy to carry, and so on. But there are also limita-tions: they may be difficult to read and are totally passive:the physician records the information with little support(e.g., headings in a form) and therefore the recordings areoften incomplete. Not only are the data incomplete, theyalso contain errors, for example, due to transcription orbecause the patient gave erroneous information. The read-ers of patient records can interpret the data in the patientrecord incorrectly. The fact that data are recorded inchronological order makes the retrieval of facts sometimesdifficult: such data are not recorded on standard positionsin the record. A study showed that because of the con-strained organization of paper records, physicians couldnot find 10% of the data, although these data were presentin the paper record (7). The patient data are usually storedin more than one type of record, because each departmentuses its own records, each with a different lay-out. Paperrecords are not always available at the time they areneeded. Paper records are passive: they will not warnthe physician if he overlooks some results. If the resultsof a lab request are unexpectedly not yet available, thepaper record will not indicate that. Despite these draw-backs physicians are usually very positive about the use ofthe paper record, because they do not recognize theirshortcomings.
Electronic patient records have some advantages overpaper records. The legibility of electronic patient records isper definition good. Data can be presented according todifferent views (time-, source-, and problem-oriented),making the data easier to access. Electronic patientrecords, when interfaced with decision support systems,can provide reminders when a physician forgets some-thing.
310 MEDICAL EDUCATION, COMPUTERS IN
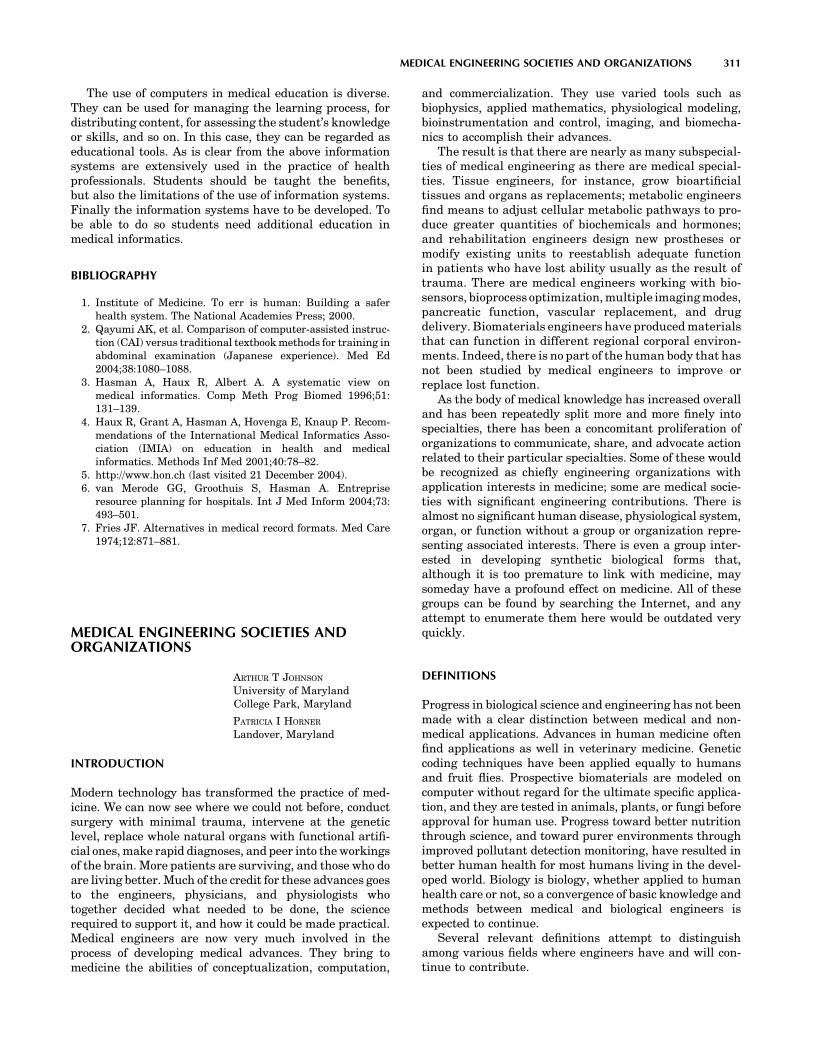
The use of computers in medical education is diverse.They can be used for managing the learning process, fordistributing content, for assessing the student’s knowledgeor skills, and so on. In this case, they can be regarded aseducational tools. As is clear from the above informationsystems are extensively used in the practice of healthprofessionals. Students should be taught the benefits,but also the limitations of the use of information systems.Finally the information systems have to be developed. Tobe able to do so students need additional education inmedical informatics.
BIBLIOGRAPHY
1. Institute of Medicine. To err is human: Building a saferhealth system. The National Academies Press; 2000.
2. Qayumi AK, et al. Comparison of computer-assisted instruc-tion (CAI) versus traditional textbook methods for training inabdominal examination (Japanese experience). Med Ed2004;38:1080–1088.
3. Hasman A, Haux R, Albert A. A systematic view onmedical informatics. Comp Meth Prog Biomed 1996;51:131–139.
4. Haux R, Grant A, Hasman A, Hovenga E, Knaup P. Recom-mendations of the International Medical Informatics Asso-ciation (IMIA) on education in health and medicalinformatics. Methods Inf Med 2001;40:78–82.
5. http://www.hon.ch (last visited 21 December 2004).6. van Merode GG, Groothuis S, Hasman A. Entreprise
resource planning for hospitals. Int J Med Inform 2004;73:493–501.
7. Fries JF. Alternatives in medical record formats. Med Care1974;12:871–881.
MEDICAL ENGINEERING SOCIETIES ANDORGANIZATIONS
ARTHUR T JOHNSON
University of MarylandCollege Park, Maryland
PATRICIA I HORNER
Landover, Maryland
INTRODUCTION
Modern technology has transformed the practice of med-icine. We can now see where we could not before, conductsurgery with minimal trauma, intervene at the geneticlevel, replace whole natural organs with functional artifi-cial ones, make rapid diagnoses, and peer into the workingsof the brain. More patients are surviving, and those who doare living better. Much of the credit for these advances goesto the engineers, physicians, and physiologists whotogether decided what needed to be done, the sciencerequired to support it, and how it could be made practical.Medical engineers are now very much involved in theprocess of developing medical advances. They bring tomedicine the abilities of conceptualization, computation,
and commercialization. They use varied tools such asbiophysics, applied mathematics, physiological modeling,bioinstrumentation and control, imaging, and biomecha-nics to accomplish their advances.
The result is that there are nearly as many subspecial-ties of medical engineering as there are medical special-ties. Tissue engineers, for instance, grow bioartificialtissues and organs as replacements; metabolic engineersfind means to adjust cellular metabolic pathways to pro-duce greater quantities of biochemicals and hormones;and rehabilitation engineers design new prostheses ormodify existing units to reestablish adequate functionin patients who have lost ability usually as the result oftrauma. There are medical engineers working with bio-sensors, bioprocess optimization, multiple imaging modes,pancreatic function, vascular replacement, and drugdelivery. Biomaterials engineers have produced materialsthat can function in different regional corporal environ-ments. Indeed, there is no part of the human body that hasnot been studied by medical engineers to improve orreplace lost function.
As the body of medical knowledge has increased overalland has been repeatedly split more and more finely intospecialties, there has been a concomitant proliferation oforganizations to communicate, share, and advocate actionrelated to their particular specialties. Some of these wouldbe recognized as chiefly engineering organizations withapplication interests in medicine; some are medical socie-ties with significant engineering contributions. There isalmost no significant human disease, physiological system,organ, or function without a group or organization repre-senting associated interests. There is even a group inter-ested in developing synthetic biological forms that,although it is too premature to link with medicine, maysomeday have a profound effect on medicine. All of thesegroups can be found by searching the Internet, and anyattempt to enumerate them here would be outdated veryquickly.
DEFINITIONS
Progress in biological science and engineering has not beenmade with a clear distinction between medical and non-medical applications. Advances in human medicine oftenfind applications as well in veterinary medicine. Geneticcoding techniques have been applied equally to humansand fruit flies. Prospective biomaterials are modeled oncomputer without regard for the ultimate specific applica-tion, and they are tested in animals, plants, or fungi beforeapproval for human use. Progress toward better nutritionthrough science, and toward purer environments throughimproved pollutant detection monitoring, have resulted inbetter human health for most humans living in the devel-oped world. Biology is biology, whether applied to humanhealth care or not, so a convergence of basic knowledge andmethods between medical and biological engineers isexpected to continue.
Several relevant definitions attempt to distinguishamong various fields where engineers have and will con-tinue to contribute.
MEDICAL ENGINEERING SOCIETIES AND ORGANIZATIONS 311

The U.S. National Institutes for Health (NIH) has thefollowing definition of bioengineering:
Bioengineering integrates physical, chemical, mathematical,and computational sciences and engineering principles tostudy biology, medicine, behavior, and health. It advancesfundamental concepts; creates knowledge from the molecularto the organ systems levels; and develops innovativebiologics, materials, processes, implants, devices, and infor-matics approaches for the prevention, diagnosis, and treat-ment of disease, for patient rehabilitation, and for improvinghealth.
The U.S. National Science Foundation program in Bio-chemical Engineering and Biotechnology (BEB) describesits program in the following way:
Advances the knowledge base of basic engineering and scien-tific principles of bioprocessing at both the molecular level(biomolecular engineering) and the manufacturing scale (bio-process engineering). Many proposals supported by BEB pro-grams are involved with the development of enablingtechnologies for production of a wide range of biotechnologyproducts and services by making use of enzymes, mammalian,microbial, plant, and/or insect cells to produce useful biochem-icals, pharmaceuticals, cells, cellular components, or cell com-posites (tissues).
The Whitaker Foundation definition of biomedical engi-neering is as follows:
Biomedical engineering is a discipline that advances knowl-edge in engineering, biology, and medicine, and improves hu-man health through cross-disciplinary activities that integratethe engineering sciences with the biomedical sciences andclinical practice. It includes: 1) The acquisition of new knowl-edge and understanding of living systems through the innova-tive and substantive application of experimental and analyticaltechniques based on the engineering sciences, and 2) Thedevelopment of new devices, algorithms, processes, and sys-tems that advances biology and medicine and improve medicalpractice and health care delivery.
And, finally, the Institute of Biological Engineering(IBE) defines biological engineering as follows:
Biological engineering is the biology-based engineering disci-pline that integrates life sciences with engineering in theadvancement and application of fundamental concepts of bio-logical systems from molecular to ecosystem levels. The emer-ging discipline of biological engineering lies at the interfaces ofbiological sciences, engineering sciences, mathematics and com-putational sciences. It applies biological systems to enhance thequality and diversity of life.
HISTORICAL DEVELOPMENTS
In 1948, in New York City, a group of engineers from theInstrument Society of America (ISA) and the AmericanInstitute of Electrical Engineers (AIEE), with professionalinterests in the areas of X-ray and radiation apparatusused in medicine, held the First Annual Conference onMedical Electronics. Soon thereafter the Institute of RadioEngineers (IRE), joined with the ISA and AIEE, and the
series of annual meetings continued. Subsequent yearswitnessed a remarkable growth of interest in biomedicalengineering and participation by other technical associa-tions. By 1968 the original core group evolved into the JointCommittee on Engineering in Medicine and Biology(JCEMB), with five adherent national society members:the Instrument Society of America (ISA), the Institute ofElectrical and Electronics Engineers, Inc. (IEEE), theAmerican Society of Mechanical Engineers (ASME), theAmerican Institute of Chemical Engineers (AIChE),and the Association for the Advancement of MedicalInstrumentation (AAMI), who jointly conducted theAnnual Conference on Engineering in Medicine and Biol-ogy (ACEMB).
Professional groups responded vigorously to thedemands of the times. Attendance at the annual conferenceby natural scientists and medical practitioners grew toapproximately 40% of the total; medical associationsrequested formal participation with their technical coun-terparts on the JCEMB. New interdisciplinary organiza-tions were formed. New intrasociety and intersocietygroups, committees, and councils became active; meetingsfilled the calendar; and publications overflowed theshelves.
In 1968, a document was prepared that read as follows:WHEREAS:
1. Common interdisciplinary purposes cannot be wellserved by individual groups working independentlyfrom each other;
2. Certain associations have developed in attempts tomeet the need;
3. Conferences and publications have proliferated inattempts to meet the needs;
4. At present, no mutually satisfactory mechanismexists for the coordination of the relevant groupsand functions;
5. There does exist an annual meeting and proceedingspublication sponsored by a limited number of socie-ties through the Joint Committee on Engineering inMedicine and Biology (JCEMB);
6. The JCEMB is formally structured with a constitu-tion, plural societal representati9on, and an estab-lished pattern of operation. This structure andpattern of operation, however, are not deemed ade-quate to fulfill present and future needs. To thebest of our knowledge, there exists no other singleorganization that seems capable of fulfilling theseneeds.
THEREFORE, it is appropriate that a new organizationbe established.
On July 21, 1969, at the 22nd ACEMB in Chicago,Illinois, representatives of 14 national engineering, scien-tific, and medical associations founded the Alliance forEngineering in Medicine and Biology (AEMB). It wasincorporated on December 24, 1969, in Washington, D.C.Lester Goodman, Ph.D., served as Founder President in
312 MEDICAL ENGINEERING SOCIETIES AND ORGANIZATIONS

1970–197l; Arthur C. Beall, MD(1972); Alan R. Kahn,MD(1973); Harry S. Lipscomb, MD(1974); Anthony Sances,Jr., Ph.D. (1975); Charles Weller, MD(1976–1977); EdwardJ. Hinman, MD MPH(1978–1979); Paul W. Mayer,MD(1980–1982); Francis M. Long, Ph.D., (1983–1984);Arthur T. Johnson, PE, Ph.D. (1985–1988); and AlfredR. Potvin, PE Ph.D. served as the final President in1989–1990.
The Alliance operations were determined by an Admin-istrative Council composed of delegates from each of itsaffiliates. Later the Alliance was to consist of more than 20such organizations:
Aerospace Medical Association (ASMA)
American Academy of Orthopaedic Surgeons (AAOS)
American Association of Physicists in Medicine(AAPM)
American College of Chest Physicians (ACCP)
American College of Physicians (ACP)
American College of Radiology (ACR)
American College of Surgeons (ACP)
American Institute of Aeronautics and Astronautics(AIAA)
American Institute of Biological Sciences (AIBS)
American Institute of Chemical Engineers (AIChE)
American Institute of Ultrasound in Medicine(AIUM)
American Society for Artificial Internal Organs(ASAIO)
American Society for Engineering Education (ASEE)
American Society for Hospital Engineers of theAmerican Hospital Association (ASHE)
American Society for Testing and Materials(ASTM)
American Society of Agricultural Engineers (ASAE)
American Society of Civil Engineers (ASCE)
American Society of Heating, Refrigerating and AirConditioning Engineers (ASHRAE)
American Society of Internal Medicine (ASIM)
American Society of Mechanical Engineers (ASME)
Association for the Advancement of Medical Instrumen-tation (AAMI)
Biomedical Engineering Society (BMES)
Institute of Electrical and Electronics Engineers (IEEE)
Instrument Society of America (ISA)
National Association of Bioengineers (NAB)
Neuroelectric Society (NES)
RESNA—Rehabilitation Engineering & Assistive Tech-nology Society of North America
Society for Advanced Medical Systems, now AmericanMedical Informatics Association (AMIA)
Society for Experimental Stress Analysis (SESA)
SPIE—International Society for Optical Engineering
Alpha Eta Mu Beta—National Biomedical EngineeringStudent
Honor Society, established under the auspices of AEMB.
The Alliance headquarters office opened on November 1,1973. John H. Busser served as the first Executive Direc-tor. Patricia I. Horner served as Assistant Director, asAdministrative Director, and succeeded Busser as theExecutive Director. Among its goals, is the followingexcerpted in part from its constitution, bylaws, andrecorded minutes:
to promote cooperation among associations that have an activeinterest in the interaction of Engineering and the physicalsciences with medicine and the biological sciences in enhance-ment of biomedical knowledge and health care.
to establish an environment and mechanisms whereby peo-ple from relevant various disciplines can be motivated andstimulated to work togetherto respond to the needs of its member societies, as expressed bytheir delegates, rather than to seek authoritative preeminencein its domain of interest. . .
to support and enhance the professional activities of itsmembership. . .
The 23rd ACEMB in Washington, D.C., in 1970, was thefirst held under the aegis of the Alliance. From 1979 to1984, the IEEE Engineering in Medicine and BiologySociety (EMBS) held their conferences immediately pre-ceding the ACEMB. The Society for Advanced MedicalSystems, later to become AMIA, and the Biomedical Engi-neering Society also held their meetings for several yearsin conjunction with the ACEMB.
The accomplishments of the Alliance far outstripped theexpectations of its founders. The Alliance more than ful-filled responsibilities for the annual conference inheritedfrom the predecessor JCEMB, but the Alliance madeimportant contributions through a variety of studies andpublications ranging from a 5-year ultrasound researchand development agendum to a guideline for technologyprocurement in health-care institutions:
� First International Biomedical Engineering Work-shop Series held in Dubrovnik, Yugoslavia, underthe sponsorship of the National Science Foundation.This project was in cooperation with AIBS and theInternational Institute of Biomedical Engineering inParis. Five workshops were held, and planning hand-books were completed.
� Assessment of selected medical instrumentation;Tasks 1–4, ultrasonic diagnostic imaging; Task 5,radiologic and radionuclide imaging technology.
� Summary guidelines and courses on technology pro-curement; practices and procedures for improvingproductivity in research and health-care institu-tions.
� Information exchange and problem assessments inmedical ultrasound, including preparation and dis-tribution of a directory of federal activities, conductedinstrumentation conferences, delineated trainingneeds, assessed technology transfer potential, andprepared guidelines for the establishment of clinicalultrasound facilities.
MEDICAL ENGINEERING SOCIETIES AND ORGANIZATIONS 313

� Joint U.S.–Egypt international technology transferproject in medical diagnostic ultrasound, includinginternational workshops and the design and supportof a focus laboratory for ultrasonic diagnosis at CairoUniversity Medical School.
� Short courses for continuing education at theannual conference on engineering in medicine andbiology.
� International directory of biomedical engineers.
Before long, the proliferation of medical engineers, andcompeting interests among societies, led to a fragmenta-tion of the field. It became clear that the Alliance no longerrepresented positions of the entire field. No organizedgroup could speak for the entire profession, and the spiritof unity that had led to the development of AEMB no longerexisted. It was time for a new beginning.
AMERICAN INSTITUTE FOR MEDICALAND BIOLOGICAL ENGINEERING
In 1988, the National Science Foundation funded a grantto develop an infrastructure for bioengineering in theUnited States. The AEMB, jointly with the U.S. NationalCommittee on Biomechanics (USNCB), was to develop aunifying organization for bioengineering in the UnitedStates. The co-principal investigators were Robert M.Nerem and Arthur T. Johnson, and Patricia Horner servedas Project Director. The AEMB/USNCB Steering Commit-tee consisted of Robert M. Nerem, Arthur T. Johnson,Michael J. Ackerman, Gilbert B. Devey, Clifford E. Bru-baker, Morton H. Friedman, Dov Jaron, Winfred M. Phil-lips, Alfred R. Potvin, Jerome S. Schultz, and Savio L-YWoo. The Steering Committee met in January andMarch 1989, and the first workshop was held in August1989. Two more Steering Committee meetings were heldin December 1989 and March 1990, and the second work-shop was held in July 1990. The outcome of these twoworkshops was to establish the American Institute forMedical and Biological Engineering (AIMBE). All AEMBmembers voted to cease operation of the Alliance forEngineering in Medicine and Biology in 1990 and totransfer the AEMB assets and 501(c)3 status to AIMBEin 1991.
AIMBE opened an office in Washington, D.C., in 1995with Kevin O’Connor as Executive Director. He was suc-ceeded by Arthur T. Johnson in 2004 and Patricia Ford-Roegner in 2005. AIMBE Presidents have been as follows:Robert Nerem (1992–1993), Pierre Galletti (1994), JeromeSchultz (1995), Winfred Phillips (1996), Larry McIntire(1997), William Hendee (1998), John Linehan (1999),Shu Chien (2000), Peer Portner (2001), Buddy Ratner(2002), Arthur Coury (2003), Don Giddens (2004), ThomasHarris (2005), and Herbert Voigt (2006).
Representing over 75,000 bioengineers, the AIMBEseeks to serve and coordinate a broad constituency ofmedical and biological scientists and practitioners, scien-tific and engineering societies, academic departments, andindustries. Practical engagement of medical and biological
engineers within the AIMBE ranges from the fields ofclinical medicine to food, agriculture, and environmentalbioremediation.
AIMBE’s mission is to
� Promote awareness of the field and its contributionsto society in terms of new technologies that improvemedical care and produce more and higher qualityfood for people throughout the world.
� Work with lawmakers, government agencies, andother professional groups to promote public policiesthat further advancements in the field.
� Strive to improve intersociety relations and coopera-tion within the field.
� Promote the national interest in science, engineering,and education.
� Recognize individual and group achievementsand contributions to medical and biological engineer-ing.
AIMBE is composed of four sections:
� The College of Fellows—1000 Persons who are theoutstanding bioengineers in academic, industry, andgovernment. These leaders in the field have distin-guished themselves through their contributions inresearch, industrial practice, and/or education. MostFellows come from the United States, but there areinternational Fellows.
� The Academic Council—Universities with educa-tional programs in bioengineering at the graduateor undergraduate level. Currently there are approxi-mately 85 member institutions. Representative to theCouncil generally are chairs of their departments.Many also are members of the College of Fellows.The Council considers issues ranging from curricularstandards and accreditation to employment of grad-uates and funding for graduate study.
� The Council of Societies—The AIMBE’s mechanismcoordinating interaction among 19 scientific organi-zations in medical and biological engineering. Thepurposes of the Council are to provide a collaborativeforum for the establishment of society member posi-tions on issues affecting the field of medical andbiological engineering, to foster intersociety dialogeand cooperation that provides a cohesive public repre-sentation for medical and biological engineering, andto provide a way to coordinate activities of membersocieties with the activities of academia, government,the health-care sector, industry, and the public andprivate biomedical communities.
� The Industry Council—A forum for dialog amongindustry, academia, and government to identifyand act on common interests that will advance thefield of medical and biological engineering and con-tribute to public health and welfare. Industrial orga-nizations may be members of the Industry Council ifthey have substantial and continuing professional
314 MEDICAL ENGINEERING SOCIETIES AND ORGANIZATIONS

interest in the field of medical and biological engi-neering.
Current members of the Council of Societies are as follows:
American Association of Physicists in Medicine
American College of Clinical Engineering
American Institute of Chemical Engineers; Food, Phar-maceutical and Bioengineering Division
American Medical Informatics Association
American Society of Agricultural and Biological Engi-neers
American Society for Artificial Internal Organs
American Society for Biomechanics
American Society of Mechanical Engineers, Bioengi-neering Division
Biomedical Engineering Society
Controlled Release Society
IEEE Engineering in Medicine and Biology Society
Institute of Biological Engineering
International Society for Magnetic Resonance inMedicine
Orthopaedic Research Society
Rehabilitation Engineering and Assistive TechnologySociety of North America
Society for Biomaterials
SPIE: The International Society for Optical Engineer-ing
Surfaces in Biomaterials Foundation
Current members of the Industry Council are as follows:
Biomet, Inc.
Boston Scientific Corporation
Genzyme Corporation
Medtronic, Inc.
Pequot Ventures
SmithþNephew
Vyteris, Inc.
Wright Medical Technology, Inc.
Zimmer, Inc.
The AIMBE Board of Directors oversees the work of theCollege of Fellows and the three councils. The Board con-sists of a President who is assisted by two Past Presidents,the President-Elect, four Vice-Presidents at Large, a Secre-tary-Treasurer, and the Chair of the College of Fellows—all of whom are elected by the Fellows. The Board alsoincludes chairs of the other councils and chairs of allstanding committees. AIMBE’s day-to-day operations aresupervised by the Executive Director in the Washingtonheadquarters.
AIMBE’s Annual Event each winter in Washington,D.C., provides a forum on the organization’s activitiesand is a showcase for key developments in medical and
biological engineering. The annual event includes a 1-dayscientific symposium sponsored by the College of Fellows, aceremony to induct the newly elected Fellows, and a 1-dayseries of business meetings focused on public policy andother issues of interest to AIMBE’s constituents. For addi-tional information about AIMBE’s mission, memberships,and accomplishments, visit http://www.aimbe.org.
The AIMBE has focused on public policy issues asso-ciated with medical and biological engineering. TheAIMBE enjoys high credibility and respect based on thestature of its Fellows, support from constituent societies,and its intention to be a forum for the best interests of theentire field. The AIMBE has taken positions on severalimportant issues and advocated that they be adopted byvarious agencies and by Congress. A few of the AIMBE’Spublic policy initiatives that have met with success are asfollows:
� National Institute of Biomedical Imaging and Bioen-gineering (NIBIB)—Created in 2000 with the help ofAIMBE advocacy, the NIBIB has received strongsupport from the AIMBE and other institutions thatvalue the role of technology in medicine, particularlythe Academy of Radiological Research. The NIBIBhas experienced rapid growth and development in allareas, including scientific programs, science admin-istration, and operational infrastructure. The prog-nosis for the near future is continued growth anddevelopment especially in bioengineering, imaging,and interdisciplinary biomedical research and train-ing programs.
� FDA Modernization Act (FDAMA)—Enacted in 1997,this legislation amended the Federal Food, Drug, andCosmetic Act relation to the regulation of food, drugs,devices, and biological products. FDAMA enhancedthe FDA’s mission in ways that recognized the Agencywould be operating in a twenty-first century charac-terized by increasing technological, trade, and publichealth complexities.
� Biomaterials Access Assurance Act—The 1998 legis-lation provides relief for materials suppliers to man-ufacturers of implanted medical devices by allowingthose suppliers to be dismissed from lawsuits in whichthey are named if they meet the statutory definition ofa ‘‘biomaterials supplier.’’
� National Institutes of Health Bioengineering Consor-tium (BECON)—This is the focus of bioengineeringactivities at the NIH. The Consortium consists ofsenior-level representatives from all NIH institutes,centers, and divisions plus representatives of otherFederal agencies concerned with biomedical researchand development. The BECON is administered byNIBIB.
The AIMBE Hall of Fame was established in 2005 torecognize and celebrate the most important medical andbiological engineering achievements contributing to thequality of life. The Hall of Fame provides tangible evidenceof the contributions of medical and biological engineeringduring the following decades:
MEDICAL ENGINEERING SOCIETIES AND ORGANIZATIONS 315

1. 1950s and earlier
� Artificial kidney
� X ray
� Cardiac pacemaker
� Cardiopulmonary bypass
� Antibiotic production technology
� Defibrillator
2. 1960s
� Heart valve replacement
� Intraocular lens
� Ultrasound
� Vascular grafts
� Blood analysis and processing
3. 1970s
� Computer-assisted tomography (CT)
� Artificial hip and knee replacement
� Balloon catheter
� Endoscopy
� Biological plant/food engineering
4. 1980s
� Magnetic resonance imaging (MRI)
� Laser surgery
� Vascular stents
� Recombinant therapeutics
5. 1990s
� Genomic sequencing and micro-arrays
� Positron emission tomography
� Image-guided surgery
The AIMBE has now turned its attention to Barriers toFurther Innovation. It is providing forums and platformsfor identification and discussion of obstacles standing inthe way of advances in medical and biological engineering.Barriers could be procedures, policies, attitudes, or infor-mation and education, anything that can yield whenAIMBE constituents apply pressure at appropriate levels.
OTHER SOCIETIES
These are other general biomedical engineering societiesthat operate within the United States Among these, theBiomedical Engineering Society (BMES), Engineering inMedicine and Biology Society (EMBS), and the Institutefor Biological Engineering (IBE) are probably the mostinclusive. Others direct their attentions to specific parts ofthe discipline. There are trade organizations that have an
industry perspective (such as AdvaMed for the medicaldevice industry and the Biotechnology Industry Organiza-tion (BID) for the biotech industry), and there are peripheralorganizations that deal with public health, the environment,and biotechnology. Many of these organizations publishexcellent journals, newsletters, and information sheets.Those from trade organizations are often distributed freeof charge, but they do not include peer-reviewed articles.Information about these can be found on the Internet.
Internationally, an organizational hierarchy exists.National and transnational organizations can belong tothe International Federation for Medical and BiologicalEngineering (IFMBE), and that confers membershipprivileges to all AIMBE members and constituent societymembers. The IFMBE and the International Organizationfor Medical Physics (IOMP) together jointly sponsor aWorld Congress on Medical Physics and Biomedical Engi-neering every 3 years. The IOMP and IFMBE are membersof the International Union for Physical and EngineeringSciences in Medicine (IUPESM), and the IUPESM, inturn, is a member of the International Council for Science(ICSU). ICSU members are national and internationalscientific unions and have a very broad and global out-reach.
THE FUTURE
At least for the foreseeable future, new groups will beformed representing medical engineering specialties.Whether these groups organize formally and persist willdepend on the continuing importance of their areas offocus. The organizations with a more general foci willcontinue to function and may spawn splinter groups. Giventhe political importance of concerted effort, organizationssuch as the AIMBE will continue to be active in promotingpolicy. Competitive pressures among different organiza-tions, especially when expectations of continuing growthcannot be sustained, will always be a threat to the currentorder. Given that the cycle of competition and disorderleading to a realization that some ordered structure ispreferable has been repeated at least once, there willcontinue to be some undercurrent of turmoil within thecommunity of medical engineering organizations.
U.S. PROFESSIONAL SOCIETIES AND ORGANIZATIONS
Biomedical Engineering Associations and Societies
Advamed. 1200 G Street NW, Suite 400, Washington,D.C. 20005. 202-783-8700, http://www.advamed.org. Ste-phen J. Ubl, President. 1300 Members.
Represents manufacturers of medical devices,diagnostic products, and medical information systems.AdvaMed’s members manufacture nearly 90% of the $80billion of health-care technology purchased annually in theUnited States. Provides advocacy, information, education,and solutions necessary for success in a world of increas-ingly complex medical regulations.
Alpha Eta Mu Beta. 8401 Corporate Drive, Suite 140,Landover, MD 20785. 301-459-1999, http://www.ahmb.org.
316 MEDICAL ENGINEERING SOCIETIES AND ORGANIZATIONS

Herbert F. Voigt, National President; Patricia I. Horner,Executive Director. 20 chapters.
Alpha Eta Mu Beta, the National BiomedicalEngineering Honor Society, was founded by Daniel Reneauat Louisiana Tech University in 1979. This organizationwas sponsored by the AEMB. The AEMB was establishedto mark in an outstanding manner those biomedical engi-neering students who manifested a deep interest andmarked ability in their chosen life work to promote anunderstanding of their profession and to develop its mem-bers professionally.
American Institute for Medical and Biological Engineer-ing. 1901 Pennsylvania Ave NW, Suite 401, Washington,D.C. 20006. 202-496-9660, http://www.aimbe.org. PatriciaFord Roegner, Executive Director. 1000 Fellows; 18 Scien-tific Organizations; 85 Universities.
Founded in 1991 to establish an identity for the field ofmedical and biological engineering, which is the bridgebetween the principles of engineering science and practiceand the problems and issues of biological and medicalscience and practice. The AIMBE comprises four sections.The College of Fellows with over 1000 persons who are theoutstanding bioengineers in academia, industry, and gov-ernment. The Academic Council is 85 universities witheducational programs in bioengineering at the graduate orundergraduate level. The Council of Societies is 18 scien-tific organizations in medical and biological engineering.The Industry Council is a forum for dialog among industry,academia, and government. Principal activities includeparticipation in formulation of public policy, disseminationof information, and education. Affiliated with the Interna-tional Federation for Medical and Biological Engineering.Annual event each winter in Washington, D.C.
American Association of Engineering Societies. 1828 LStreet NW, Suite 906, Washington, D.C. 20036. 202-296-2237, http://www.aaes.org. Thomas J. Price, ExecutiveDirector. 26 Engineering Societies.
Founded in 1979 in New York City. Member societiesrepresent the mainstream of U.S. engineering with morethan one million engineers in industry, government, andacademia. The AAES has four primary programs: commu-nications, engineering workforce commission, interna-tional, and public policy. Governance consists of tworepresentatives from each of 26 member societies. Con-venes diversity summits, publishes engineering and tech-nology degrees, and holds annual awards ceremony.
American Academy of Environmental Engineers. 130Holiday Court, Suite 100, Annapolis, MD 21401. 410-266-3311, http://www.aaee.net. David A. Asselin, Execu-tive Director.
The American Sanitary Engineering Intersociety Boardincorporated in 1955 became the American Academy ofEnvironmental Engineers in 1966; and in 1973, it mergedwith the Engineering Intersociety Board. Principal pur-poses are improving the practice, elevating the standards,and advancing public recognition of environmental engi-neering through a program of specialty certification ofqualified engineers.
American Academy of Orthopaedic Surgeons. 600 NorthRiver Road, Rosemont, IL 60018. 847-823-7186, http://www.aaos.org. Karen L. Hackett, Chief Executive Officer.24,000 Members.
Founded in Chicago in 1933. Provides education andpractice management services for orthopedic surgeons andallied health professionals. Maintains a Washington, D.C.,office. Annual spring meeting.
American Academy of Orthotists and Prosthetists. 526King Street, Suite 201, Alexandria, VA 22314. 703-836-0788, http://www.oandp.org. Peter D. Rosenstein, Execu-tive Director. 3000 Members.
Founded in 1970 to further the scientific and educa-tional attainments of professional practitioners in the dis-ciplines of orthotics and prosthetics. Members have beencertified by the American Board for Certification in Ortho-tics and Prosthetics. Annual spring meeting.
American Association of Physicists in Medicine. OnePhysics Ellipse, College Park, MD 20740. 301-209-3350,http://www.aapm.org. Angela R. Keyser, Executive Direc-tor. 4700 Members.
Founded in Chicago in 1958 and incorporated inWashington in 1965. Promotes the application of physicsto medicine and biology. Member society of the AmericanInstitute of Physics. Annual summer meeting.
American Chemical Society. 1155 Sixteenth Street NW,Washington, D.C. 20036. 800-227-5558, http://www.che-mistry.org. Madeleine Jacobs, Executive Director, andCEO. 159,000 Members.
Founded in 1877 in New York City. Granted a nationalcharter by Congress in 1937. Encourages the advancementof chemistry. Semiannual spring and fall meetings.
American College of Nuclear Physicians. 1850 SamuelMorse Drive, Reston, VA 20190. 703-326-1190, http://www.acnponline.org. Virginia M. Pappas, Executive Direc-tor. 500 Members.
Established in 1974, the organization provides access toactivities that encompass the business and economics ofnuclear medicine as they impact nuclear medicine physi-cians. Semiannual meetings fall and winter.
American College of Physicians. 190 N. IndependenceMall West, Philadelphia, PA 19106. 215-351-2600, http://www.acponline.org. John Tooker, Executive Vice Presi-dent. 119,000 Members.
Founded in New York City in 1915. Merged with theCongress of Internal Medicine in 1923 and merged in 1998with the American Society of Internal Medicine. Patternedafter England’s Royal College of Physicians. Members arephysicians in general internal medicine and related sub-specialties. Maintains a Washington, D.C., office. Annualspring meeting.
American College of Radiology. 1891 Preston WhiteDrive, Reston, VA 20191. 703-648-8900, http://www.acr.org. Harvey L. Neiman, Executive Director. 30,000Members.
MEDICAL ENGINEERING SOCIETIES AND ORGANIZATIONS 317

Founded in 1923 in San Francisco and incorporated inCalifornia in 1924. Purpose is to improve the health ofpatients and society by maximizing the value of radiologyand radiologists by advancing the science, improvingpatient service, and continuing education. Annual fallmeeting.
American College of Surgeons. 633 N. St. Clair Street,Chicago, IL 60611. 312-202-5000, http://www.facs.org.Thomas R. Russell, Executive Director. 64,000 Fellows,5000 Associate Fellows.
Founded in 1913 and incorporated in Illinois. U.S.member of the International Federation of Surgical Col-leges. Members are Fellows who must meet high standardsestablished by the College. Purpose is to improve thequality of care for the surgical patient by setting highstandards for surgical education and practice. Annual fallclinical congress.
American Congress of Rehabilitation Medicine. 6801Lake Plaza Drive, Suite B-205, Indianapolis, IN 46220.317-915-2250, http://www.acrm.org. Richard D. Morgan,Executive Director. 1700 Members, 15 Companies.
Founded in 1923 as the American College of Radiologyand Physiotherapy. Name changed in 1926 to AmericanCollege of Physical Therapy and in 1930 to AmericanCongress of Physical Therapy. Changed again in 1945 toAmerican Congress of Physical Therapy and in 1953became American Congress of Physical Medicine andRehabilitation. Adopted its current name in 1967. Provideseducation for professionals in medical rehabilitation. Fallannual meeting.
American Institute of Biological Sciences. 1444 I StreetNW, Suite 200, Washington, D.C. 20005. 202-628-1500,http://www.aibs.org. Richard O’Grady, Executive Director.80 Societies, 6000 Members.
Founded in 1947 as part of the National Academy ofSciences. Incorporated as an independent nonprofit since1954. Absorbed America Society of Professional Biologistsin 1969. Represents more than 80 professional societieswith combined membership exceeding 240,000 scientistsand educators. Also more than 6000 individual members.Purpose is to better serve science and society. Annualmeeting in August.
American Institute of Chemical Engineers. 3 Park Ave-nue, New York, NY 10016. 212-591-8100, http://www.ai-che.org. John Sofranko, Executive Director. 40,000Members.
Organized in 1908 and incorporated in 1910. Member ofAccreditation Board for Engineering and Technology,American National Standards Institute, American Asso-ciation of Engineering Societies, and other related organi-zations. Purpose is to advance the chemical engineeringprofession. Annual meeting in November.
American Institute of Physics. One Physics Ellipse,College Park, MD 20740. 301-209-3131, http://www.ai-p.org. Marc H. Brodsky, Executive Director, and ChiefExecutive Officer. 10 Societies and 24 Affiliates.
Chartered in 1931 to promote the advancement of phy-sics and its application to human welfare. Federation of 10Member Societies representing spectrum of physicalsciences.
American Institute of Ultrasound in Medicine. 14750Sweitzer Lane, Suite 100, Laurel, MD 20707. 301-498-4100, http://www.aium.org. Carmine Valente, ChiefExecutive Officer.
Began in 1951 at a meeting of 24 physicians attendingthe American Congress of Physical Medicine and Rehabi-litation. Membership includes biologists, physicians, andengineers concerned with the use of ultrasound for diag-nostic purposes. Provides continuing education, CMEtests, and accreditation of ultrasound laboratories. Annualfall meeting.
American Medical Informatics Association. 4915 St.Elmo Avenue, Suite 401, Bethesda, MD 20814. 301-657-1291, http://www.amia.org. Don Detmer, President, andCEO. 3000 Members.
Founded in 1990 through a merger of three existinghealth informatics associations. Members represent allbasic, applied, and clinical interests in health-care infor-mation technology. Promotes the use of computers andinformation systems in health care with emphasis on directpatient care. Semiannual meetings: spring congress in theWest and fall annual symposium in the East.
American Society for Artificial Internal Organs. P.O. BoxC, Boca Raton, FL 33429. 561-391-8589, http://www.asaio.net. 1400 Members.
Established in 1955 in Atlantic City, NJ. Annual Juneconference.
American Society for Engineering Education. 1818 NStreet NW, Suite 600, Washington, D.C. 20036. 202-331-3500, http://www.asee.org. Frank L. Huband, Execu-tive Director. 12,000 Members, 400 Colleges, 50 Corpora-tions.
Founded in 1893 as the Society for Promotion of Engi-neering Education. Incorporated in 1943 and merged in1946 with Engineering College Research Association.Members include deans, department heads, faculty mem-bers, students, and government and industry representa-tives from all disciplines of engineering and engineeringtechnology. Member of the American Association of Engi-neering Societies, Accreditation Board for Engineeringand Technology, American Institute for Medical andBiological Engineering, and American Council onEducation. Participating society of World Federation ofEngineering Associations. Purpose is to further educationin engineering and engineering technology. Annual Junemeeting.
American Society for Healthcare Engineering of the Amer-ican Hospital Association. One North Franklin, 28th Floor,Chicago, IL 60606. 312-422-3800, http://www.ashe.org.Albert J. Sunseri, Executive Director.
Affiliate of the American Hospital Association. AnnualJune meeting.
318 MEDICAL ENGINEERING SOCIETIES AND ORGANIZATIONS

American Society for Laser Medicine and Surgery. 2404Stewart Avenue, Wausau, WI 54401. 715-845-9283, http://www.aslms.org. Dianne Dalsky, Executive Director. 3000Members.
Founded in 1980 to promote excellence in patient careby advancing laser applications and related technologies.Annual spring meeting.
American Society of Agricultural and Biological Engi-neers. 2950 Niles Road, St. Joseph, MI 49085. 269-429-0300, http://www.asabe.org. Melissa Moore, Executive VicePresident. 9000 Members.
Founded in 1907 as the American Society of Agricul-tural Engineers and changed its name in 2005. Dedicatedto the advancement of engineering applicable to agricul-tural, food, and biological systems. Annual meeting inJuly.
American Society of Civil Engineers. 1801 AlexanderBell Drive, Reston, VA 20191. 703-295-6000, http://www.asce.org. Patrick J. Natale, Executive Director.137,500 Members.
Founded in 1852 as the American Society of Civil Engi-neers and Architects. Dormant from 1855 to 1867, but itrevived in 1868 and incorporated in 1877 as the AmericanSociety of Civil Engineers. Over 400 local affiliates, 4Younger Member Councils, 230 Student Chapters, 36 Stu-dent Clubs, and 6 International Student Groups. Semi-annual spring and fall meetings.
American Society of Heating, Refrigerating and Air-Con-ditioning Engineers, Inc. 1791 Tullie Circle NE, Atlanta, GA30329. 404-636-8400, http://www.ashrae.org.
Incorporated in 1895 as the American Society of Heatingand Ventilating Engineers, known after 1954 as AmericanSociety of Heating and Air-Conditioning Engineers.Merged in 1959 with American Society of RefrigeratingEngineers to form American Society of Heating, Refriger-ating and Air-Conditioning Engineers. Annual summermeeting.
American Society of Mechanical Engineers. Three ParkAvenue, New York, NY 10016. 212-591-7722, http://www.asme.org. Virgil R. Carter, Executive Director.120,000 Members.
Founded in 1880 and incorporated in 1881. Focuses ontechnical, educational, and research issues of engineeringand technology. Sets industrial and manufacturing codesand standards that enhance public safety. Conducts one ofthe world’s largest technical publishing operations. Semi-annual summer and winter meetings.
American Society of Neuroradiology. 2210 MidwestRoad, Suite 207, Oak Brook, IL 60523. 630-574-0220,http://www.asnr.org. James B. Gantenberg, ExecutiveDirector/CEO. 2700 Members.
Founded in 1962. Supports standards for training in thepractice of neuroradiology. Annual spring meeting.
American Society of Safety Engineers. 1800 E. OaktonStreet, Des Plaines, IL 60018. 847-699-2929, http://
www.asse.org. Fred Fortman, Executive Director. 30,000Members.
Founded in 1911 as the United Association of CasualtyInspectors and merged with the National Safety Council in1924, becoming its engineering section. Became indepen-dent again in 1947 as the American Society of SafetyEngineers and incorporated in 1962. There are 13 practicespecialties, 150 chapters, 56 sections, and 64 student sec-tions. Annual spring meeting.
Association for Computing Machinery. 1515 Broadway,New York, NY 10036. 212-626-0500, http://www.acm.org.John R. White, Executive Director. 80,000 Members.
Founded in 1947 at Columbia University as EasternAssociation for Computing Machinery and incorporated inDelaware in 1954. Affiliated with American Association forAdvancement of Science, American Federation of Informa-tion Processing Societies, Conference Board of Mathema-tical Sciences, National Academy of Sciences-NationalResearch Council, and American National Standards Insti-tute. Advancing the skills of information technology pro-fessionals and students. Annual fall meeting.
Association for the Advancement of Medical Instrumenta-tion. 1100 North Glebe Road, Suite 220, Arlington, VA22201. 703-525-4890, http://www.aami.org. Michael J.Miller, President. 6000 Members.
Founded in 1967, the AAMI is an alliance of over 6000members united by the common goal of increasing theunderstanding and beneficial use of medical instrumenta-tion and technology. Annual spring meeting.
Association of Biomedical Communications Directors.State University of New York at Stony Brook, MediaServices L3044 Health Sciences Center, Stony Brook,NY 11794. 631-444-3228. Kathleen Gebhart, AssociationSecretary. 100 Members.
Formed in 1974 as a forum for sharing information;adopted a Constitution and Bylaws in 1979, and incorpo-rated in April 1979 in North Carolina. Members are direc-tors of biomedical communication in academic healthscience settings. Annual spring meeting.
Association of Environmental Engineering and ScienceProfessors. 2303 Naples Court, Champaign, IL 61822.217-398-6969, http://www.aeesp.org. Joanne Fetzner,Secretary. 700 Members.
Formerly, in 1972, the American Association of Profes-sors in Sanitary Engineering. Professors in academic pro-grams throughout the world who provide education in thesciences and technologies of environmental protection.Biennial conference in July.
Biomedical Engineering Society. 8401 Corporate Drive,Suite 140, Landover, MD 20785. 301-459-1999, http://www.bmes.org. Patricia I. Horner, Executive Director.3700 Members.
Founded in 1968 in response to a need to give equalrepresentation to both biomedical and engineering inter-ests. The purpose of the Society is to promote the increaseof biomedical engineering knowledge and its use. Member
MEDICAL ENGINEERING SOCIETIES AND ORGANIZATIONS 319

of American Institute for Medical and Biological Engineer-ing. Annual fall meeting.
Biophysical Society. 9650 Rockville Pike, Bethesda,MD 20814. 301-634-7114, http://www.biophysics.org. RoKampman, Executive Officer. 7000 Members.
Founded in 1957 in Columbus, OH, to encourage devel-opment and dissemination of knowledge in biophysics.Annual winter meeting.
Health Physics Society. 1313 Dolley Madison Boule-vard, Suite 402, McLean, VA 22101. 703-790-1745, http://www.hps.org. Richard J. Burk, Jr, Executive Secretary.7000 Members.
Founded in 1956 in the District of Columbia and rein-corporated in Tennessee in 1969. Society specializes inoccupational and environmental radiation safety.Affiliated with International Radiation Protection Associa-tion. Annual summer meeting.
Human Factors and Ergonomics Society. P.O. Box 1369,Santa Monica, CA 90406. 310-394-1811, http://www.hfes.org. Lynn Strother, Executive Director. 50 ActiveChapters and 22 Technical Groups.
Founded in 1957, formerly known as the Human Fac-tors Society. An interdisciplinary organization of profes-sional people involved in the human factors field. Memberof the International Ergonomics Association. Annual meet-ing in September-October.
Institute for Medical Technology Innovation. 1319 FStreet NW, Suite 900, Washington, D.C. 20004. 202-783-0940, http://www.innovate.org. Martyn W.C. Howgill,Executive Director.
The concept was developed in 2003 by leaders in themedical device industry, and the Institute was incorpo-rated and opened its offices in 2004. Purpose is to demon-strate the role, impact, and value of medical technology onhealth care, economy, and society, for the benefit ofpatients.
Institute of Electrical and Electronics Engineers. 3 ParkAvenue, 17th Floor, New York, NY 10016. 212-419-7900,http://www.ieee.org. Daniel J. Senese, Executive Director.365,000 Members.
The American Institute of Electrical Engineers wasfounded in 1884 and merged in 1963 with the Instituteof Radio Engineers. Three Technical Councils, 300 localorganizations, 1300 student branches at universities, and39 IEEE Societies including the Engineering inMedicine and Biology Society with 8000 members andmeets annually in the fall. Maintains Washington, D.C.office.
Institute of Environmental Sciences and Technology. 5005Newport Drive Suite 506, Rolling Meadows, IL 60008. 847-255-1561, http://www.iest.org. Julie Kendrick, ExecutiveDirector.
Formed by a merger of the Institute of EnvironmentalEngineers and the Society of Environmental Engineers in1953. Annual spring meeting.
Instrument Society of America. 67 Alexander Drive, Re-search Triangle Park, NC 27709. 919-549-8411, http://www.isa.org. Rob Renner, Executive Director. 30,000 Members.
Founded in Pittsburgh in 1945. Charter member ofAmerican Automatic Control Council, affiliate of Amer-ican Institute of Physics, member of American Federationof Information Processing Societies, member of AmericanNational Standards Institute, and U.S. representative tothe International Measurement Confederation. Developsstandards, certifies industry professionals, provides edu-cation and training, publishes books and technical arti-cles, and hosts largest conference for automationprofessionals in the Western Hemisphere. Annual meet-ing in October.
International Biometric Society ENAR. 12100 SunsetHills Road, Suite 130, Reston, VA 22090. 703-437-4377,http://www.enar.org. Kathy Hoskins, Executive Director.6500 Members.
Founded in September 1947. Became the InternationalBiometric Society in 1994. Annual March and June meet-ings.
International College of Surgeons. 1516 North LakeShore Drive, Chicago, IL 60610. 312-642-3555, http://www.icsglobal.org. Max C. Downham, Executive Director.10,000 Members.
Founded in Geneva, Switzerland, in 1935 and incorpo-rated in the District of Columbia in 1940. Federation ofgeneral surgeons and surgical specialists. Annual springmeeting of U.S. section and biennial international meet-ings.
International Society for Magnetic Resonance in Medi-cine. 2118 Milvia Street, Suite 201, Berkeley, CA 94704.510-841-1899, http://www.ismrm.org. Roberta A. Kravitz,Executive Director. 6,000 Members.
Formed as a merger of the Society for Magnetic Reso-nance Imaging and Society of Magnetic Resonance inMedicine in 1995. Promotes the application of magneticresonance techniques to medicine and biology. Annualmeetings in April/May.
Medical Device Manufacturers Association. 1919 Penn-sylvania Avenue NW, Suite 660, Washington, D.C. 20006.202-349-7171, http://www.medicaldevices.org. Mark B.Leahey, Executive Director. 140 Companies.
Created in 1992. Supersedes Smaller ManufacturersMedical Device Association. Represents manufacturersof medical devices. Annual May meeting.
Radiation Research Society. 810 East 10th Street,Lawrence, KS 666044. 800-627-0629, http://www.radres.org. Becky Noordsy, Executive Director. 2025Members.
Founded in 1952 as a professional society of personsstudying radiation and its effects. Annual spring-summermeetings.
Radiological Society of North America. 820 Jorie Bou-levard, Oak Brook, IL 60523. 630-571-2670, http://
320 MEDICAL ENGINEERING SOCIETIES AND ORGANIZATIONS

www.rsna.org. Dave Fellers, Executive Director. 37,577Members.
Founded as Western Roentgen Society and assumed itscurrent name in 1918. Members are interested in theapplication of radiology to medicine. Holds the largestmedical meeting in the world annually in November withmore than 60,000 in attendance.
RESNA—Rehabilitation Engineering & Assistive Technol-ogy Society of North America. 1700 N. Moore Street, Suite1540, Arlington, VA 22209. 703-524-6686, http://www.res-na.org. Larry Pencak, Executive Director. 1000 Members.
Founded in 1979 as the Rehabilitation EngineeringSociety of North America. In June 1995, the name waschanged to the Rehabilitation Engineering and AssistiveTechnology Society of North American—RESNA. Twenty-one special interest groups and seven professional speci-alty groups. Annual meeting in June.
SPIE—International Society for Optical Engineering. P.O.Box 10, Bellingham, WA 98227. 360-676-3290, http://www.spie.org. Eugene G. Arthurs, Executive Director.14,000 Members, 320 Companies.
Founded in 1956 in California as the Society of Photo-graphic Instrumentation Engineers, it later became theSociety of Photo-Optical Instrumentation Engineers andassumed its current name in 1981. Members are scientists,engineers, and companies interested in application of opti-cal, electro-optical, fiber-optic, laser, and photographicinstrumentation systems and technology. Semiannualmeetings.
Society for Biological Engineering of the American Instituteof Chemical Engineers. 3 Park Avenue, New York, NY10016. 212-591-7616, http://www.bio.aiche.org.
Established by the AIChE for engineers and appliedscientists integrating biology with engineering.
Society for Biomaterials. 15000 Commerce Parkway,Suite C, Mt. Laurel, NJ 08054. 856-439-0826, http://www.biomaterials.org. Victoria Elliott, Executive Director.2100 Members.
Founded in 1974. Promotes biomaterials and theiruses in medical and surgical devices. Annual springmeeting.
Society for Biomolecular Screening. 36 Tamarack Ave-nue, #348, Danbury, CT 06811. 203-743-1336, http://www.sbsonline.org. Christine Giordano, Executive Direc-tor. 1080 Members, 230 Companies.
Supports research in pharmaceutical biotechnology andthe agricultural industry that use chemical screening pro-cedures. Annual fall meeting.
Society for Modeling and Simulation International. P.O.Box 17900, San Diego, CA 92177. 858-277-3888, http://www.scs.org. Steve Branch, Executive Director.
Established in 1952 as the Simulation Council andincorporated in California in 1957 as the Simulation Coun-cils. Became Society for Computer Simulation in 1973 andlater changed its name to the current one. A founding
member of the Information Processing Societies andNational Computer Confederation Board, and affiliatedwith American Association for the Advancement ofScience. Holds regional simulation multiconferences.
Society of Interventional Radiology. 3975 Fair RidgeDrive, Suite 400 North, Fairfax, VA 22033. 703-691-1805,http://www.sirweb.org. Peter B. Lauer, Executive Director.
Society of Nuclear Medicine. 1850 Samuel Morse Drive,Reston, VA 20190. 703-709-9000, http://www.interacti-ve.snm.org. Virginia Pappas, Executive Director.
Society of Rheology. Suite 1N01, 2 Huntington Quad-rangle, Melville, NY 11747. 516–2403, http://www.rheolo-gy.org. Janis Bennett, Executive Director.
Permanent address is at the American Institute ofPhysics and is one of five founding members of the AIP.Members are chemists, physicists, biologists, and othersconcerned with theory and precise measurement of flow ofmatter and response of materials to mechanical force.Annual meeting held in October or November.
Professional Societies and Organizations of Other Countries
Pick up from IFMBE Affiliates on www.ifmbe.org.
Further Reading
Biomedical Engineers, Brief 519, G.O.E. 02.02.01; D.O.T. (4th ed.)019. Chronicle Guidance Publications, Moravia, NY 13118,1994.
Biomedical Engineers. Occupational Outlook Handbook, 2004-05Edition. Bureau of Labor Statistics, US. Department of Labor.http://www.bls.gov/oco/ocos262.htm.
Boykin D. Biomedical engineering takes center stage. EngineeringTimes 2004; 26 (9). National Society of Professional Engineers,1420 King Street, Alexandria, VA 22314.
Collins CC. The retrospectroscope: Notes on the history of biome-dical engineering in America. IEEE Eng Med Biol Mag Dec.1988. IEEE Engineering in Medicine & Biology Society, 445Hoes Lane, Piscataway, NJ 08854.
Enderle J, editor. Charting the milestones of biomedical engineer-ing. IEEE Eng Med Biol Mag, May 2002. IEEE Engineering inMedicine and Biology Society, 445 Hoes Lane, Piscataway, NJ08854.
Fagette PH je, Homer PI, editor. The Biomedical EngineeringSociety: An Historical Perspective. Landover, MD: The Biome-dical Engineering Society; 2004.
Goodman L. The International Federation for Medical and Biolo-gical Engineering—20 years on. Med Biol Eng Comput Jan.1978. International Federation for Medical and BiologicalEngineering.
Katona P. The Whitaker Foundation: The end will be just thebeginning. IEEE Trans Med Imaging 2002;21(8). IEEE Engi-neering in Medicine & Biology Society, 445 Hoes Lane, Piscat-away, NJ 08854.
Johnson AT. Executive Director’s Report: What is ASMBE allabout? ASMBE Newslett 2004:1.
Planning a Career in Biomedical Engineering (2004). BiomedicalEngineering Society, 8401 Corporate Drive, Suite 140, Land-over, MD 20785. http://www.bmes.org
Tompkins W. From the President. IEEE Eng Med Biol Mag,December 1988. IEEE Engineering in Medicine & BiologySociety, 445 Hoes Lane, Piscataway, NJ 08854.
MEDICAL ENGINEERING SOCIETIES AND ORGANIZATIONS 321

MEDICAL GAS ANALYZERS
TADEUSZ M. DRZEWIECKI
JERRY M. CALKINS
Defense Research Technologies,Inc.Rockville, Maryland
INTRODUCTION
Medical gas monitoring has been so successful in improv-ing patient safety and reducing patient risk that it hasbecome standard medical practice today in every part ofmedical practice from hospital to home. The argument forproviding additional patient safety will continue to be apowerful incentive to improve and enhance the methodsand techniques to provide increased knowledge of themonitoring of respiratory and anesthetic gases. Researchon gas markers to aid in diagnosis is an equally importantapplication, and with the capability to measure gases atparts per billion or even trillion, heretofore unobservedgases can point to early diagnosis of such nearly alwaysfatal neonatal diseases as necrotizing enterocolitis andother difficult-to-diagnose states.
Medical gas analyzers are used to sample and measuregases of medical importance, such as anesthesia andrespiratory monitoring, and detection of trace gases fordiagnostic purposes. This article predominantly discussesthese two cases. The estimation of arterial blood gases isconsidered only in terms of measurement of respired gases.Two basic categories of sensor/analyzers exist: continuousand batch. Gas analyzers are further broken down bytheir sensing mechanisms into two fundamental modesof operation, specific and analytic.
Continuous devices are used where real-time informa-tion is needed. Batch systems operate on a bolus of gas,usually when real-time information is not needed. Manyapplications may have to live with the offline, longerduration of a batch test because nothing else is available.
Specific-type sensors rely on particular physical phe-nomena that are activated in the presence of a particulargas. Electrochemical devices, for example, are representa-tive of a specific sensor wherein a voltage is developed by achemical reaction between the sensor material and the gasbeing analyzed in some identified or known proportion tothe amount of gas present. The same is true of fuel cells andother galvanic devices where an electric potential is devel-oped in the presence of a difference in partial pressuresacross a conducting medium.
Specificity is a major issue and is of particular impor-tance to the medical community. At this point in time, notruly specific sensors exist. All sensors exhibit some form ofcross-sensitivity to a variety of gases, some in the samefamily, some with similar physical properties, and some forextraneous reasons not always obvious to the user. Nitrousoxide (N2O) and carbon dioxide (CO2) have practically thesame molecular weight, 44.0128 versus 44.0098. Conse-quently, they have near-identical physical characteristicssuch as specific heat and viscosity. Interestingly, they alsohave almost exactly the same absorption wavelengths,although not necessarily because the atomic weights are
the same but rather because the orbital electron transitionenergetics are similar. Thus, it is difficult to distinguish thetwo with most conventional techniques, and a carbondioxide sensor that is based on absorption at 4.3 mm willbe affected by the presence of nitrous oxide with its peakabsorption at 4.5 mm. Unless a very narrow wavelengthlight source is used, such as a laser, the nitrous oxide willabsorb some of the energy and make it appear that morecarbon dioxide is present than there really is.
Analytic devices imply an ability to assay a gas or gasmixture and tell the user not only how much of a particulargas is present, but also which gases or elements are presentand in what relative quantities, of which optical spectro-scopy is a good example where a large number of absorptionlines exist for different gases, so one can scan the entirespectrum from ultraviolet (UV) to far infrared (IR) andcompare absorption lines to see what is present. This exam-ple is interesting because IR spectroscopy can also be thebasis for a specific sensor when only a single or a particularwavelength of light is monitored looking only for a gas atthat absorption line. Gas chromatography (GC) is also abatch process where a bolus of gas to be assayed is separatedinto its constituent parts in time by a molecular sieve andthe binary pairs (the carrier and the separated gas) aredetected and quantized upon exiting the GC column.
Perhaps the most common use of and need for contin-uous gas analysis or sensing is in real-time respiratoryapplications where inspired and expired (end-tidal) con-centrations of respiratory gases are measured to validatethat the appropriate standards of care are being appliedand that proper ventilation and oxygenation of a patient isbeing achieved. An example would be monitoring of aventilated patient in the ICU or recovery room. In addition,the monitoring of anesthetic gases during and immediatelyfollowing anesthetic administration in the operating roomis a critical application that can mean the differencebetween life and death. Too much can lead to brain damageor death, and too little can result in unnecessary pain andmemory recall. And, of course, the detection and warning ofthe presence of toxic gases such as carbon monoxidereleased from desiccated soda lime CO2 scrubbers due tointeractions between the anesthetic agents and variousscrubbers, or the production of the highly toxic CompoundA, is critical to patient safety.
Continuous medical gas monitoring provides theclinician with information about the patient’s physiologicstatus, estimates of arterial blood gases, verifies that theappropriate concentrations of delivered gases are adminis-tered, and warns of equipment failure or abnormalities inthe gas delivery system. Monitors display inspired andexpired gas concentrations and sound alarms to alertclinical personnel when the concentration of oxygen (O2),carbon dioxide (CO2), nitrous oxide (N2O), or volatile anes-thetic agent falls outside the desired set limits.
Medical gas analysis has been driven by a need forsafety and patient risk reduction through respiratorygas analysis and identification and quantification of vola-tile anesthetic vapors. Perhaps one of the earliest anes-thetic agent sensors was the Drager Narkotest, whichcomprised a polymer rubber membrane that contractedand moved a needle as it absorbed agent. It did not require
322 MEDICAL GAS ANALYZERS

an electrical power supply and its slow response was notany slower than the rate of change of gas composition.Much has transpired since those early days.
Currently, numerous methods and techniques of gasmonitoring are in place, and new techniques and para-digms are constantly being developed to meet a new need orto serve the community with better performance or lowercost. In this review, many of the intrinsic advantages anddisadvantages of these methods and techniques are dis-cussed. A brief comparison, which includes stand-aloneand multioperating room gas monitors that can determineconcentrations of anesthetic and respiratory gases inthe patient breathing circuit during anesthesia, is alsopresented.
Much of the research and development of these monitorshave followed the long use of similar detector principlesfrom analytical chemistry. As a result of the fast pace ofsensor development, to a great extent driven by the needfor hazardous gas sensors in the face of terrorist threatsand being spearheaded by agencies such as the DefenseDepartment’s Defense Advanced Research Projects Agency(DARPA), an attempt is made to cover the most commonsystems and provide insights into the future based on solidtechnological developments.
The current development of gas analyzers is describedin the extensive anesthesia and biomedical engineeringliterature. Complete and specific historical informationabout the principles and applications of these devices iswell reviewed in several texts [e.g., Ref. (1)], manufac-turers’ and trade publications [(2) (ECRI)], and an exten-sive open literature describing equipment and operatingprinciples, methods, and techniques that is available on theInternet. Societies and professional associations also existthat deal with just one method of gas analysis that canprovide in-depth information about their particularinterests. The Chromatographic Society is one such orga-nization. It is the purpose of this article to concisely sum-marize such a large selection of information sources to amanageable few, but with enough references and pointersto allow even the casual reader to obtain whatever relevantinformation at whatever level is required.
CURRENT GAS MONITOR METHODS AND TECHNIQUES
As a result of the chemically diverse substances to bemeasured, medical gas analyzers commonly combine morethan one analytical method. Methods of interest to themedical practitioner, clinician, researcher, or operatorinclude, in alphabetical order:
� Colorimetry
� Electrochemistry
� Fuel cells
� Polarography
� Gas chromatography
� Flame ionization
� Photoionization Detectors
� Thermal conductivity
� Infrared/Optical Spectroscopy
� Luminescence/fluorescence
� Mass spectrometry
� Nuclear Magnetic Resonance
� Paramagnetism
� Radioactive ionization
� Raman Laser Spectroscopy
� Solid-state sensors
� Semiconductor metal oxides
� ChemFETs
� Solid-state galvanic cells
� Piezoelectric/Surface Acoustic Wave
Each of these methods will be described in the followingtext. Illustrative examples of typical devices may bementioned.
COLORIMETRY
Colorimetry is one of the oldest methods of gas analysisthat is typically used to detect the presence of carbondioxide in a breath as a means of determining if propertracheal intubation has been performed. Basically, it workson the principle of changing the color of a material such aspaper or cloth impregnated with a reagent in the presenceof a known analyte. An example is the changes in litmuspaper from purple to red in the presence of an acid and bluein the presence of a base. Carbon dioxide (CO2) in thepresence of water vapor in the exhaled breath producescarbonic acid, which turns the litmus paper toward red,usually some shade of pink. The degree of color change canbe quite subjective, but a color scale usually accompaniesmost devices so that a coarse estimate, roughly � 0.5% CO2
by volume, can be made. More expensive, sophisticateddevices offer an electronic colorimetric analyzer that doesthe comparison automatically and can even provide adigital output.
Reagents may be tuned to a variety of specific gases andare quite commonly used in the semiconductor business tomonitor levels of hydride gases to include arsine andphosphene. Hydrogen sulfide (H2S) is also a commonanalyte for colorimetric sensors (1).
Cross-sensitivity can be additive or subtractive withcolorimetric devices. For example, a colorimetric capn-ometer (CO2 sensor) may register false-positives andfalse-negatives. Color may change in the presence of acidicreflux or the ingestion of acidic liquids (lemonade, wine,etc.). Conversely, the presence of bases could negate theacid response, which is true in other applications as well.For example, in hydrogen sulfide detection, the presence ofmethyl mercaptan (CH4S) compounds can cancel out anyreading of H2S. Clearly, any chemical reactions betweenthe selected analyte and a reactive contaminant can affectreadings one way or another.
Figure 1 shows a photograph of one of the newer colori-metric capnometers on the market manufactured byMercury Medical (www.mercurymed.com). A color-changing tape used in this device turns yellow in the
MEDICAL GAS ANALYZERS 323
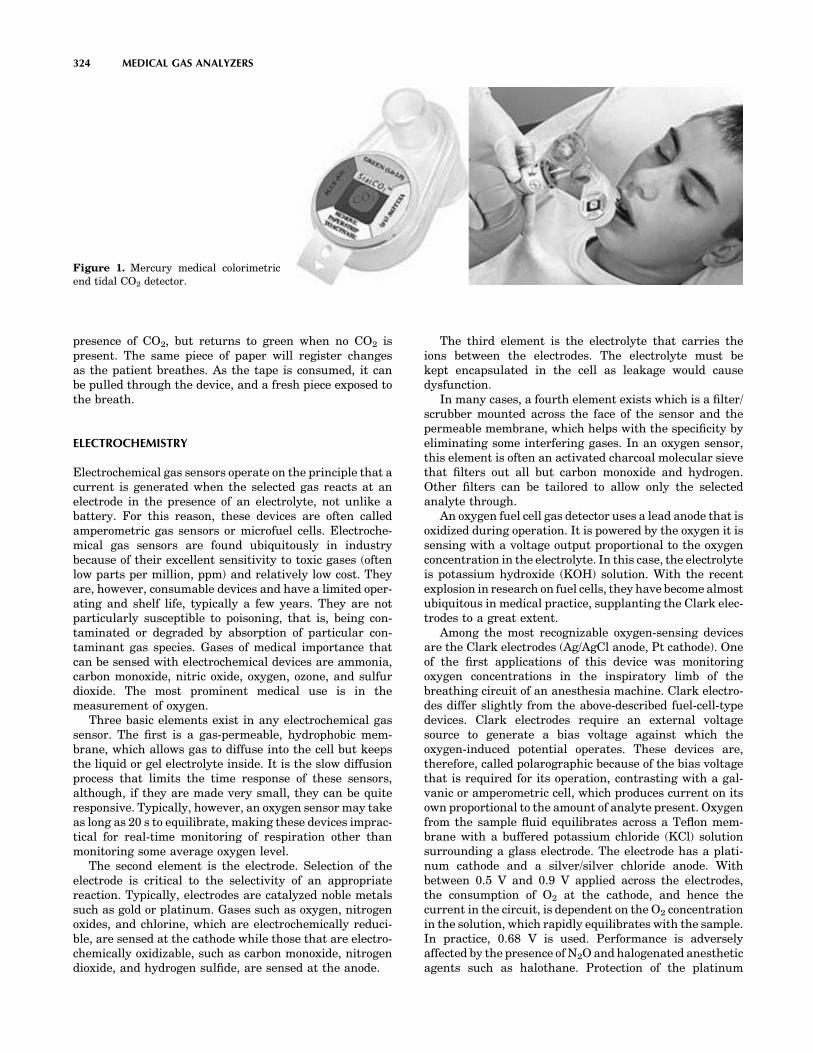
presence of CO2, but returns to green when no CO2 ispresent. The same piece of paper will register changesas the patient breathes. As the tape is consumed, it canbe pulled through the device, and a fresh piece exposed tothe breath.
ELECTROCHEMISTRY
Electrochemical gas sensors operate on the principle that acurrent is generated when the selected gas reacts at anelectrode in the presence of an electrolyte, not unlike abattery. For this reason, these devices are often calledamperometric gas sensors or microfuel cells. Electroche-mical gas sensors are found ubiquitously in industrybecause of their excellent sensitivity to toxic gases (oftenlow parts per million, ppm) and relatively low cost. Theyare, however, consumable devices and have a limited oper-ating and shelf life, typically a few years. They are notparticularly susceptible to poisoning, that is, being con-taminated or degraded by absorption of particular con-taminant gas species. Gases of medical importance thatcan be sensed with electrochemical devices are ammonia,carbon monoxide, nitric oxide, oxygen, ozone, and sulfurdioxide. The most prominent medical use is in themeasurement of oxygen.
Three basic elements exist in any electrochemical gassensor. The first is a gas-permeable, hydrophobic mem-brane, which allows gas to diffuse into the cell but keepsthe liquid or gel electrolyte inside. It is the slow diffusionprocess that limits the time response of these sensors,although, if they are made very small, they can be quiteresponsive. Typically, however, an oxygen sensor may takeas long as 20 s to equilibrate, making these devices imprac-tical for real-time monitoring of respiration other thanmonitoring some average oxygen level.
The second element is the electrode. Selection of theelectrode is critical to the selectivity of an appropriatereaction. Typically, electrodes are catalyzed noble metalssuch as gold or platinum. Gases such as oxygen, nitrogenoxides, and chlorine, which are electrochemically reduci-ble, are sensed at the cathode while those that are electro-chemically oxidizable, such as carbon monoxide, nitrogendioxide, and hydrogen sulfide, are sensed at the anode.
The third element is the electrolyte that carries theions between the electrodes. The electrolyte must bekept encapsulated in the cell as leakage would causedysfunction.
In many cases, a fourth element exists which is a filter/scrubber mounted across the face of the sensor and thepermeable membrane, which helps with the specificity byeliminating some interfering gases. In an oxygen sensor,this element is often an activated charcoal molecular sievethat filters out all but carbon monoxide and hydrogen.Other filters can be tailored to allow only the selectedanalyte through.
An oxygen fuel cell gas detector uses a lead anode that isoxidized during operation. It is powered by the oxygen it issensing with a voltage output proportional to the oxygenconcentration in the electrolyte. In this case, the electrolyteis potassium hydroxide (KOH) solution. With the recentexplosion in research on fuel cells, they have become almostubiquitous in medical practice, supplanting the Clark elec-trodes to a great extent.
Among the most recognizable oxygen-sensing devicesare the Clark electrodes (Ag/AgCl anode, Pt cathode). Oneof the first applications of this device was monitoringoxygen concentrations in the inspiratory limb of thebreathing circuit of an anesthesia machine. Clark electro-des differ slightly from the above-described fuel-cell-typedevices. Clark electrodes require an external voltagesource to generate a bias voltage against which theoxygen-induced potential operates. These devices are,therefore, called polarographic because of the bias voltagethat is required for its operation, contrasting with a gal-vanic or amperometric cell, which produces current on itsown proportional to the amount of analyte present. Oxygenfrom the sample fluid equilibrates across a Teflon mem-brane with a buffered potassium chloride (KCl) solutionsurrounding a glass electrode. The electrode has a plati-num cathode and a silver/silver chloride anode. Withbetween 0.5 V and 0.9 V applied across the electrodes,the consumption of O2 at the cathode, and hence thecurrent in the circuit, is dependent on the O2 concentrationin the solution, which rapidly equilibrates with the sample.In practice, 0.68 V is used. Performance is adverselyaffected by the presence of N2O and halogenated anestheticagents such as halothane. Protection of the platinum
324 MEDICAL GAS ANALYZERS
Figure 1. Mercury medical colorimetricend tidal CO2 detector.

cathode and the need for semipermeable membranesreduces their effectiveness.
Fuel cell and polarographic devices both require tem-perature and pH compensation and, as indicated before,have limited life spans because of the consumable nature ofthe reaction and the propensity of the permeable mem-branes to eventually lose the effectiveness of the Clarkelectrodes.
Datex-Ohmeda, one of the largest manufacturersof anesthesia equipment, sells many of their systems,included with which is a galvanometric fuel cell oxygensensor. Figure 2 shows a Smart Vent 7900TM (3) displayshowing the level of oxygen being delivered. The oxygensensor life is specified at 18 months.
GAS CHROMATOGRAPHY
Gas chromatography (GC) is an analytic tool that providesthe user with an assay of what is in the gas sample ofinterest. It consists of two parts: (1) separation of differentspecies by differential travel times through a separationcolumn and (2) analytic detection of the quantity of eachanalyte at the end of the column using any one of a varietyof methods. That is, GC provides a quantification of theconstituent gases as well as an identification of what theconstituent gases are. It is actually a very simple process,and, were it not for the relatively long analysis time,usually on the order of several minutes to as long asan hour, and its batch nature, it would be used morefrequently.
GC requires the separation of a gas sample into itsconstituent gases, which is accomplished by mixing thesample with a carrier gas, usually some inert gas likehelium or nitrogen, which is not adsorbed by theGC column, and passing it through a column or longimpermeable, nonreacting (e.g., stainless steel) capillaryfilled with a zeolite, molecular sieve, or other material thatseparates the sample gases according to their physical orchemical properties. The different gas constituents travelthrough the column at different speeds and exit as binary
pairs (a constituent and the carrier) in order of theiradsorption properties. The time it takes for a constituentto exit the column identifies the constituent. The capillarycolumns can be as short as a few centimeters to tens andeven hundreds of meters long. The capillary columns areheated to maintain a constant temperature, as the trans-port characteristics tend to be temperature-dependent.
Calibration is required to determine the transit timesfor each analyte, which is done by injecting known gassamples at the start of the column and physically timingthem at the exit. At the exit of the column, a gas detectorexists usually a flame ionization or thermal conductivitydetector that measures the amount of constituent relativeto the carrier. After all the constituents have beenaccounted for, the assay of the original sample can be madeby summation of the relative amounts of each constituentand then taking the ratio of each constituent relative to thesummation, which then gives the concentrations and thefinal assay.
Usually, this summation is accomplished by summingthe areas under the detector output peaks and then ratio-ing the areas under the individual peaks relative to thetotal area. The choice of gas chromatographic detectorsdepends on the resolution and accuracy desired andincludes (roughly, in order from most common to the least):the flame ionization detector (FID), thermal conductivitydetector (TCD or hot wire detector), electron capture detec-tor (ECD), photoionization detector (PID), flame photo-metric detector (FPD), thermionic detector, and a fewmore unusual or expensive choices like the atomic emissiondetector (AED) and the ozone- or fluorine-induced chemi-luminescence detectors.
The Flame Ionization Detector (FID) is widely used todetect molecules with carbon-hydrogen bonds and has goodsensitivity to low ppm. Basically, in operation, the analyteis injected into a hydrogen carrier and ignited inside agrounded metal chamber. Hydrogen is used because itburns clean and is carbon-free. The latter is importantbecause output is proportional to the ionized carbon atoms.An electrode is situated just above the flame and a voltagepotential is applied. The current produced is proportionalto the number of carbon atoms in the analyte. Whenapplied at the exit of a GC, very accurate measures ofhydrocarbon gases can be made.
Photoionization Detectors (PIDs) are used to detect thevolatile organic compound (VOC) outputs of GCs but arealso widely used in industry and science to detect environ-mental and hazardous gases. They operate on a similarprinciple to that of the FID, but use ultraviolet light (UV) asopposed to a flame to ionize the flowing gas betweeninsulated electrodes. As UV energy is a much higherfrequency (lower wavelength) than IR or visible light, itcan be larger and, consequently, can readily ionize gases.The ionization potentials of the analyte gases are matchedby adjusting the frequency of the emitted light. The outputpower of the lamp is roughly the product of the number ofphotons and the energy per photon divided by the area andtime, although changing the output frequency will changethe photon energy (E¼hv), thereby changing the power.The output power can be changed independently byincreasing the fluence of photons.
MEDICAL GAS ANALYZERS 325
Figure 2. Datex-Ohmeda Smart Vent 7900 ventilator monitoruses a galvanic cell O2 sensor.
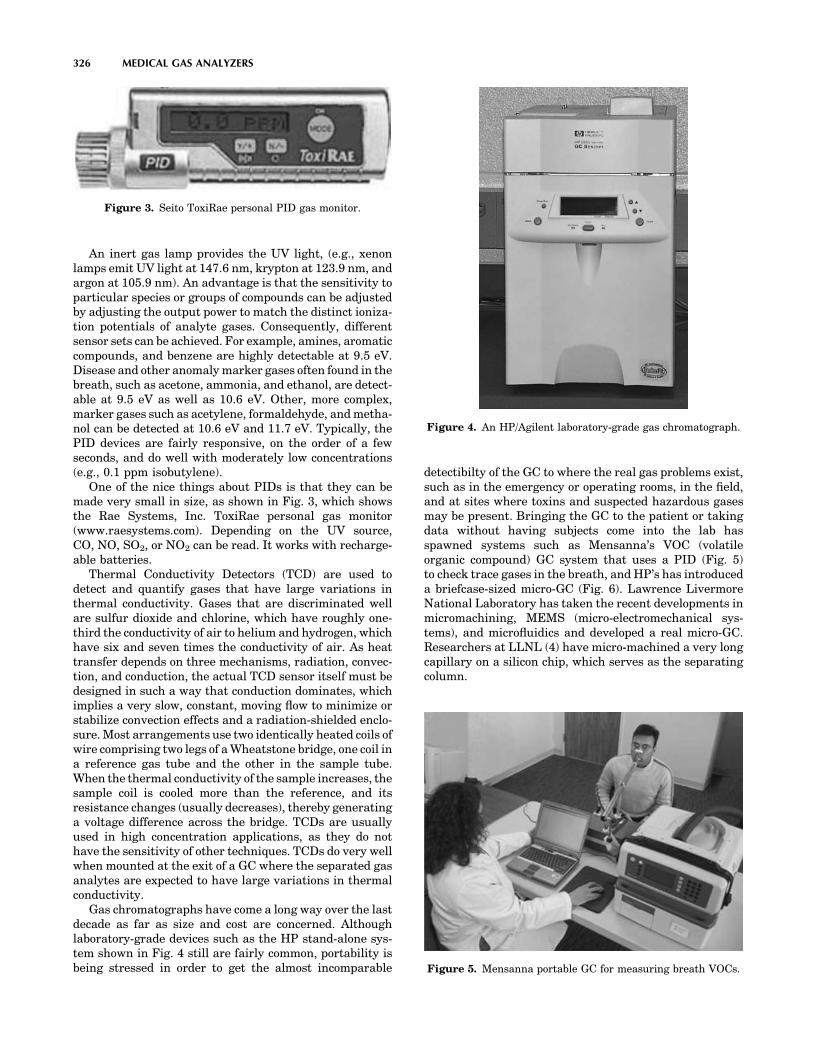
An inert gas lamp provides the UV light, (e.g., xenonlamps emit UV light at 147.6 nm, krypton at 123.9 nm, andargon at 105.9 nm). An advantage is that the sensitivity toparticular species or groups of compounds can be adjustedby adjusting the output power to match the distinct ioniza-tion potentials of analyte gases. Consequently, differentsensor sets can be achieved. For example, amines, aromaticcompounds, and benzene are highly detectable at 9.5 eV.Disease and other anomaly marker gases often found in thebreath, such as acetone, ammonia, and ethanol, are detect-able at 9.5 eV as well as 10.6 eV. Other, more complex,marker gases such as acetylene, formaldehyde, and metha-nol can be detected at 10.6 eV and 11.7 eV. Typically, thePID devices are fairly responsive, on the order of a fewseconds, and do well with moderately low concentrations(e.g., 0.1 ppm isobutylene).
One of the nice things about PIDs is that they can bemade very small in size, as shown in Fig. 3, which showsthe Rae Systems, Inc. ToxiRae personal gas monitor(www.raesystems.com). Depending on the UV source,CO, NO, SO2, or NO2 can be read. It works with recharge-able batteries.
Thermal Conductivity Detectors (TCD) are used todetect and quantify gases that have large variations inthermal conductivity. Gases that are discriminated wellare sulfur dioxide and chlorine, which have roughly one-third the conductivity of air to helium and hydrogen, whichhave six and seven times the conductivity of air. As heattransfer depends on three mechanisms, radiation, convec-tion, and conduction, the actual TCD sensor itself must bedesigned in such a way that conduction dominates, whichimplies a very slow, constant, moving flow to minimize orstabilize convection effects and a radiation-shielded enclo-sure. Most arrangements use two identically heated coils ofwire comprising two legs of a Wheatstone bridge, one coil ina reference gas tube and the other in the sample tube.When the thermal conductivity of the sample increases, thesample coil is cooled more than the reference, and itsresistance changes (usually decreases), thereby generatinga voltage difference across the bridge. TCDs are usuallyused in high concentration applications, as they do nothave the sensitivity of other techniques. TCDs do very wellwhen mounted at the exit of a GC where the separated gasanalytes are expected to have large variations in thermalconductivity.
Gas chromatographs have come a long way over the lastdecade as far as size and cost are concerned. Althoughlaboratory-grade devices such as the HP stand-alone sys-tem shown in Fig. 4 still are fairly common, portability isbeing stressed in order to get the almost incomparable
detectibilty of the GC to where the real gas problems exist,such as in the emergency or operating rooms, in the field,and at sites where toxins and suspected hazardous gasesmay be present. Bringing the GC to the patient or takingdata without having subjects come into the lab hasspawned systems such as Mensanna’s VOC (volatileorganic compound) GC system that uses a PID (Fig. 5)to check trace gases in the breath, and HP’s has introduceda briefcase-sized micro-GC (Fig. 6). Lawrence LivermoreNational Laboratory has taken the recent developments inmicromachining, MEMS (micro-electromechanical sys-tems), and microfluidics and developed a real micro-GC.Researchers at LLNL (4) have micro-machined a very longcapillary on a silicon chip, which serves as the separatingcolumn.
326 MEDICAL GAS ANALYZERS
Figure 3. Seito ToxiRae personal PID gas monitor.
Figure 4. An HP/Agilent laboratory-grade gas chromatograph.
Figure 5. Mensanna portable GC for measuring breath VOCs.

Figure 7 shows the implementation of this device that isreported to have a response time of less than 2 min.
INFRARED/OPTICAL SPECTROSCOPY
Gases absorb light or photon energy at different wave-lengths depending on the complexity of their molecularstructure. When a molecule is subjected to light energy of aparticular frequency, the atoms involved in the atomicbonds will vibrate at the light frequency. If the frequencymatches their resonant frequency, or a harmonic, they willresonate, thereby becoming highly absorbent as more ofthe light energy is used to feed the motion of the resonatingmolecules. The more complex a molecule, the greaternumber of different atomic bonds it will have and,consequently, the more absorption frequencies it will have.Table 1 provides some guidelines for absorption for differ-ent molecules.
Most infrared analyzers measure concentrations ofvolatile fluorocarbon halogenated anesthetic agents, car-bon dioxide, and nitrous oxide using nondispersive infrared(NDIR) absorption technology. The transduction meansmay differ. Most use an electronic IR energy detector ofone sort or another, such as a bolometer, solid-state photondetectors, and thermopiles; however, one monitor uses
another IR detection principle, photoacoustic spectroscopy,based on the level of sound produced when an enclosed gasis exposed to pulsed/modulated IR energy.
Infrared analyzers have been used for many years toidentify and assay compounds for research applications.More recently, they have been adapted for respiratorymonitoring of CO2, N2O, and halogenated anestheticagents.
Dual-chamber NDIR spectrometers pass IR energy froman incandescent filament through the sample chamber andan identical geometry but air-filled reference chamber.Each gas absorbs light at several wavelengths, but onlya single absorption wavelength is selected for each gas todetermine the gas concentration. The light is filtered afterit passes through the chambers, and only that wavelengthselected for each gas is transmitted to the detector. Thelight absorption in the analysis chamber is proportional tothe partial pressure (concentration) of the gas. Most man-ufacturers use a wavelength range around 3.3 mm, thepeak wavelength at which the hydrogen-carbon bondabsorbs light, to detect halogenated anesthetic hydrocar-bons (halothane, enflurane, isoflurane, etc.).
In one monitor that identifies and quantifies haloge-nated anesthetic agents, the analyzer is a single-channel,four-wavelength IR filter photometer. Each of four filters(one for each anesthetic agent and one to provide a baselinefor comparison) transmits a specific wavelength of IRenergy. Each gas absorbs differently in the selected wave-length bands so that the four measurements produce aunique signature for each gas. In another monitor, potentanesthetic agents are assessed by determining theirabsorption at only three wavelengths of light. Normally,only one agent is present so this process reduces totagentID. However, the use of ‘‘cocktails,’’ mixtures of agents,usually to reduce undesired side effects of one or anotheragent, require very special monitoring because of the pos-sibility of accidental overdosing.
The Datex-Ohmeda Capnomac (www.us.datex-ohmeda.com), a multigas anesthetic agent analyzer, isbased on the absorption of infrared radiation. This unitaccurately analyzes breath-to-breath changes in concen-trations of CO2, NO2, and N2O and anesthetic vapors. It isaccurate with CO2 for up to 60 breaths/min, and 30 breaths/min for O2 (using a slower paramagnetic sensor), but N2Oand anesthetic vapors show a decrease in accuracy atfrequencies higher than 20 breaths/min. The use of narrowwave-band filters to increase specificity for CO2 and N2Omakes the identification of the anesthetic vapors, whichare measured in the same wave band more difficult. It isinteresting to note that IR spectroscopy can also be used on
MEDICAL GAS ANALYZERS 327
Figure 6. Agilent (formerly HP) Micro-GC.
Figure 7. LLNL MEMS-based micro-GC.
Table 1. Infrared Absorption Bands for Gases of MedicalInterest
Wavelength(microns)
Elements of AtomicBonds
TypicalGases
2.7–4mm X-H (X¼C, N, O, S) H2O, CH4,4.3–5mm C-X (X¼C, N, O) CO2, N2O
5.26–6.6mm C-X (X¼C, N, O) fluorocarbons7.7–12.5mm C-X (X¼C, N, O) fluorocarbons

liquids, as exemplified by the Inov 3100 near-infraredspectroscopy monitor that has been offered as a monitorfor intracerebral oxygenation during anesthesia and sur-gery. Studies with this monitor indicate that it needs awide optode separation and the measurements are morelikely those of the external carotid flow rather than thedivided internal carotid circulation (5).
A subset of NDIR is photoacoustic spectroscopy, whichmeasures the energy produced when a gas expands byabsorption of IR radiation, which is modulated at acousticfrequencies. A rotating disk with multiple concentricslotted sections between the IR source and the measure-ment chamber may be used tmodulate the light energy.The acoustic pressure fluctuations created occur with afrequency between 20 and 20,000 Hz, producing sound thatis detected with a microphone and converted totan elec-trical signal. Each gas (anesthetic agent, CO2, N2O) exhi-bits this photoacoustic effect most strongly at a differentwavelength. This method cannot distinguish which halo-genated agent is present, however. The microphone detectsthe pulsating pressures from all four gases simultaneouslyand produces a four-component magnetic signal. A monitorusing IR photoacoustic technology has been developed thatcan quantify all commonly respired/anesthetic gasesexcept N2 and water vapor. Similarly, a microphone detectsthe pulsating pressure changes in a paramagnetic oxygensensor (magnetoacoustics).
The Bruel & Kjaer Multigas Monitor 1304 (6) measure-ments use photoacoustic spectroscopy and also incorporatea pulse oximeter. It has some advantages over the DatexOhmeda Capnomac because it uses the same single micro-phone for detection of all gases, displaying gas concentra-tion in real-time.
With the development of both fixed frequency and tun-able solid-state lasers, a revolution in IR spectroscopy hasoccured with new technical approaches appearing everyyear. Tuned diode laser spectroscopy, and Laser-inducedPhoto Acoustic Spectroscopy (a DARPA initiative) aredevelopments that bear close watching as they mature.The ability to produce IR energy at extremelynarrow bandwidths allows discrimination of very closelyrelated gas species such as CO2 and N2O. In addition, mostof the volatile anesthetic agents such as halothane, des-flurane, isoflurane, and sevoflurane can also be thus dis-tinguished.
An advantage of NDIR is that the sensing mechanismdoes not interfere or contact the sample, thus minimalchance exists that the sample would be affected. The costsof these devices have continued to decrease, with numerouscompanies competing to keep the prices low and attractive.Disadvantages are the susceptibility to dirt and dust in theoptical path and cross-sensitivities to interfering gases.
Companies marketing anesthesia and respiratorymechanics monitors are involved in either developmentor promotion of NDIR. Figure 8 shows a Datex-OhmedaCapnomac Ultima that uses NDIR for CO2, N2O andanesthetic analysis, and agent identification. The topwaveform is the plethysmograph, the next down is theO2 (measured with a fast paramagnetic sensor), and thebottom waveform is the capnographic CO2 waveform. As anadded capability beyond gas analysis, to the right of the
capnogram is the pressure-volume loop that is used toassess the lung compliance.
Another limitation of NDIR is its relatively low sensi-tivity due, for the most part, to the short path length overwhich the IR energy is absorbed. The short path length andsmall chamber size is dictated by the need for fast responsein order to be able to monitor human physiological andrespiratory response.
Breath rates are normally about 10 breaths per min(bpm) but, under acute hyperventilation conditions, canreach 100 bpm and higher. Also, neonates and small ani-mals naturally exhibit high breathing rates, whichrequires a sensor with a millisecond response in order tobe able to detect breath-by-breath variations. However, incases where a fast response is not the driving factor, thesampling chamber may be lengthened or the path lengthincreased.
Notwithstanding this limitation, the recent inventionof Cavity Ring-Down Spectroscopy (CRDS) by Princetonchemist Kevin Lehmann (7,8) is based on absorption oflaser energy over huge path lengths but is extremely fast.By bouncing laser energy between near-perfect mirrors ina sample or test chamber, the light can pass through thegas of interest multiple times, often for total distances ofup to 100 km, which creates the opportunity to detectminiscule trace amounts of the gas species of interest.The time it takes for the light energy to get attenuatedto zero provides a measure of the amount of the gas speciespresent. The shorter the Ring-Down time, the more of thegas is present. These times are, however, on the order ofonly milliseconds. In fact, Tiger Optics of Warrington, PA,the company that has licensed Dr. Lehmann’s technolo-gical development, claims that trace gases can be detectedin the hundreds of parts per trillion. The LaserTracemulti-point, multi-species, multi-gas analyzer (shown inFig. 9) is capable of detecting many species such as H2O,O2, CH4, H2, CO, NH3, H2S, and HF. The O2 modulemeasures down to 200 parts-per-trillion (ppt), in millise-conds, noninvasively and can readily be adapted torespiratory breath measurements. Methane can bedetected at the parts per billion level.
328 MEDICAL GAS ANALYZERS
Figure 8. A Datex-Ohmeda Capomac Ultima multiple gasanalyzer.

Although of interest in the detection and quantificationof oxygen, spectroscopy has not been widely considered forthis application. However, an oxygen absorption line existin the center of the visible spectrum at 760 nm. Oftenneglected because of the problems associated with thenarrowness of the absorption band (0.01 nm versus100 nm for CO2 in the IR) as well as with spurious inter-ference from visible light, it is nonetheless an opportunitybecause no interference exists from any other gases ofmedical interest. The development of low cost, very nar-row-band lasers has resulted in the successful introductionof Laser-based Absorption Spectroscopy from Oxigraf(www.oxigraf.com). With 100 ms response and � 0.02%resolution traces, such as that shown in Fig. 10, are pos-sible. Cost is relatively low in comparison with othertechnical approaches with similar capabilities.
LUMINESCENCE/FLUORESCENCE
Gas sensors that use luminescence or fluorescence basi-cally take advantage of the phenomenon of excitation of amolecule and the subsequent emission of radiation. Photo-luminescence implies optical excitation and re-emission oflight at a different, lower frequency. Chemiluminescenceimplies the emission of light energy as a result of a che-mical reaction. In both cases, the emitted light is a functionof the presence of the gas species of interest and is detectedby optical means. Most industrial sensors use photomul-tiplier tubes to detect the light, but the needs of the medicalcommunity are being met with more compact fiber-opticsystems and solid-state photodetectors.
Fluorescence quenching is a subset of luminescence-based sensors, the difference being that the presence ofthe analyte, rather than stimulating emission of light,
actually diminishes the light output. Fundamentally,fluorescence occurs when incoming light excites an electronin a fluorescent molecule to a higher energy state, and, inturn, when the electron returns to its stable state, itreleases energy in the form of light.
Two important characteristics of fluorescence are thatthe light necessary to excite a fluorescent molecule has ashorter wavelength than that of the fluorescent emission,and that the fluorescence of a particular molecule may besuppressed (quenched) or enhanced (dequenched) by thepresence of one or more specific molecules. Consequently,the presence of such other molecules (called analytes) maybe detected.
A few companies exist that use one form or another ofluminescence sensing, in particular, of oxygen in themedical arena, although the sensors are ubiquitous forother gases. For example, Ocean Optics (www.oceanop-tics.com) FOXY Fiber Optic Oxygen Sensors use the fluor-escence of a ruthenium complex in a sol-gel to measure thepartial pressure of oxygen. First, a pulsed blue LED sendslight, at �475 nm, to and through an optical fiber, whichcarries the light to the probe. The distal end of the probe tipconsists of a thin layer of a hydrophobic sol-gel material. Aruthenium complex is trapped in the sol-gel matrix, effec-tively immobilized and protected from water. The lightfrom the LED excites the ruthenium complex at the probetip and the excited ruthenium complex fluoresces, emit-ting energy at �600 nm. When the excited rutheniumcomplex encounters an oxygen molecule, the excess energyis transferred to the oxygen molecule in a nonradiativetransfer, decreasing or quenching the fluorescence signal.The degree of quenching is a function of the level of oxygenconcentration pressure in the film, which is in dynamicequilibrium with oxygen in the sample. Oxygen as a tripletmolecule is able to efficiently quench the fluorescence andphosphorescence of certain luminophores. This effect iscalled ‘‘dynamic fluorescence quenching.’’ When an oxygenmolecule collides with a fluorophore in its excited state, anonradiative transfer of energy occurs. The degree offluorescence quenching relates to the frequency of colli-sions and, therefore, to the concentration, pressure, andtemperature of the oxygen-containing media. The energyis collected by the probe and carried through an opticalfiber to a spectrometer where an analog-to-digital (A/D)converter converts the data to digital data for use with aPC.
MASS SPECTROSCOPY
Mass spectroscopy provides, what many consider, the bestaccuracy and reliability of all of the gas analyzing/assayingschemes. The basic concept is to assay the analyte byreducing it into ionized component molecules and separat-ing them according to their mass-to-charge ratio. By thistechnique, the constituents of the sample gas are ionized.The resulting ions are accelerated through an electrostaticfield and then passed through a deflecting magnetic field.The lighter ions will deflect more than the heavier ions.Detecting the displacement and counting the ions canachieve the assay of the gas sample.
MEDICAL GAS ANALYZERS 329
Figure 9. Tiger Optics Cavity Ring-Down Spectrometer.
Figure 10. Oxigraf Fast Oxygen Sensor trace of respired O2.

Ion detectors usually comprise an electric circuit wherethe impinging ions generate a current, which can bemeasured with a conventional circuit. The more current,the more ions are impinging. In practice, the ionizationmust be conducted in a high vacuum of the order of 10�6
torr. The gas is ionized with a heated filament, or by othermeans as have been discussed before.
A number of different mass spectroscopic configura-tions have been developed over the years. Time-of-flight(TOF) systems differ from the magnetically deflecteddevices in that the ions are free to drift across a neutrallycharged evacuated flight chamber after having been accel-erated electrostatically by a series of gratings that sepa-rate the ions. The time it takes for the ions to travel acrossthe chamber is a function of their mass. An output notunlike that of a GC is developed. Quadrupole mass spectro-meters focus the ions through an aperture onto a quadru-pole filter. The ion-trap mass spectrometer traps ions in asmall volume using three electrodes. An advantage of theion-trap mass spectrometer over other mass spectro-meters is that it has a significantly increased signal-to-noise ratio because it is able to accumulate ions in the trap.It also does not require the same kind of large dimensionsthat the TOF and magnetically deflected devices need, so,as a consequence, it can be made in a fairly compact size.Finally, the Fourier-transform mass spectrometer takesadvantage of an ion-cyclotron resonance to select anddetect ions. Single-focusing analyzers use a circular beampath of 1808, 908, or 608. The various forces influencing theparticle separate ions with different mass-to-chargeratios. Double-focusing analyzers have an electrostaticanalyzer added to separate particles with difference inkinetic energies.
A particular advantage of the mass spectrometer is thatit can operate with an extremely small gas sample and candetect minute quantities. Response was long comparedwith most continuous sensors, but with the developmentof high speed microprocessors, analysis times have steadilydecreased to where, today, it is not unusual to have assaysin less than one minute. With the development of MEMSTOF devices, the time-of-flight is measured in microse-conds.
Mass spectrometers have always tended to be bulky andexpensive and, thus, rarely used on a single patient basis.Multiplexing up to 30 patients using a complex valvingswitching system has been shown to be feasible and hasmade the system much more cost-effective. Figure 11shows a conventional ThermoElectron laboratory-grademass spectrometer setup.
The move to miniature mass spectrometers has beenrapid over the last decade, from a suitcase-sized miniatureTOF mass spectrometer, developed at Johns HopkinsApplied Physics laboratory (Fig. 12) (9), to a micro-electro-mechanical system (MEMS) device smaller than a penny,developed in Korea at the MicroSystems Lab of Ajou Uni-versity (Fig. 13) (10).
Mass spectroscopy is often used as the detector incombination with gas chromatography to enhance thesensitivity down to ppb, because in a GC, detection limitsthe capability.
NUCLEAR MAGNETIC RESONANCE
Nuclear Magnetic Resonance (NMR) is the process bywhich a relatively low intensity radio-frequency (RF) sig-nal at the resonant frequency of the species of gas ofinterest interacts with the atoms in a gas and aligns themmomentarily, which requires some energy. When the RF
330 MEDICAL GAS ANALYZERS
Figure 11. A ThermoElectron laboratory-grade quadrupole massspectrometer.
Figure 12. JHU Teeny mass spectrometer.
Figure 13. MEMS TOF mass spectrometers developed at AjouUniversity in Korea.

signal is removed, the atoms release the energy that hadbeen stored in the alignment resonance, return to theirchaotic orientations, and re-emit an RF signal at the sameresonant frequency at which they were excited. Eachatomic bond has its own characteristic frequency so thata spectroscopic analysis can be made by scanning through alarge number of frequencies. A variant of NMR, nuclearquadrupole resonance (NQR) is used for detecting explo-sive vapors, which could be very useful in military medicinewhere explosives in clothing during triage pose a majorhazard. The hydrogen bonds in TNT have a resonance at� 760 kHz and the vapors of plastic explosives have reso-nances at low MHz frequencies. NMR is very attractivebecause gas analysis can be performed without having tophysically take a sample of the analyte in question. As theinitiating and re-emitted RF signals can pass through mostnonferrous materials with little attenuation, gas, liquid,and solid chemical species can be interrogated noninva-sively. By summing the returns from a number of signals,sensitivity to the low ppm can be achieved.
In dirty environments where optical or infrared devicessuffer significant degradation of performance, NMR isparticularly useful. Compared with chromatographicapproaches, NMR eliminates the need for solvents, col-umns, carrier gases, or separations. Also, NMR analysiscan be performed in real-time because typical atomicrelaxation times, the time it takes for the atomic spin axesto return to their original orientations, is on the order ofmilliseconds for many gases of interest.
PARAMAGNETISM
Many gases exhibit magnetic sensitivity, paramagnetism,due to their polar nature, which means that they areattracted to a magnetic field. For oxygen, its paramagneticsensitivity is due to its two outer electrons in unpairedorbits. Most of the gases used in anesthesia are repelled bya magnetic field (diamagnetism).
Paramagnetic sensors are typically used specifically formeasuring oxygen concentration. The high degree of sen-sitivity of oxygen (compared with other gases) to magneticforces reduces the cross-sensitivity to other gases of para-magnetic sensors. Sensors come in two variants, the olderbalance type and the newer pressure type. The balancetypes of sensors are relatively frail and have been replacedby the pressure types. Nevertheless, some of these olderdevices are still being used. The balance type of sensor usesa mechanical approach that has a dried gas sample flowingthrough a chamber in which a nitrogen-filled dumbbell isbalanced in a magnetic field. The paramagnetic force on theoxygen in the sample puts a torque on the dumbbell. Theoutput can be read either as a spring-loaded displacementor, in newer devices, electronically by measuring the cur-rent required to keep the dumbbell centered.
Most modern paramagnetic oxygen sensors consist of asymmetrical, two-chambered cell with identical chambersfor the sample and reference gas (often air or nitrogen).These cells are joined at an interface by a responsivedifferential pressure transducer or microphone. Sampleand reference gases are pumped through these chambers
in which a strong, usually varying, magnetic field sur-rounding the region acts on the oxygen molecules andgenerates a static pressure or a time-varying (acoustic)difference between the two sides of the cell, causing thetransducer to produce a DC or AC voltage proportional tothe oxygen concentration. When the magnetic field ismodulated at acoustic frequencies, these devices maysometimes be referred to as magnetoacoustic.
Paramagnetic oxygen analyzers are very accurate,highly sensitive, and responsive, often with a step responseof 200 ms to 90% of maximum. However, they requirecalibration, usually with pure nitrogen and oxygen. Amajor drawback is that they are adversely affected bywater vapor and, consequently, require a water trap incor-porated into their design. The frequency response makesthen useful for measurement of oxygen on a breath-by-breath basis. The Datex Ohmeda Capnomac Ultima thatwas previously shown in Fig. 8 uses a paramagnetic oxygensensor, as do many of the other mainline medical gasmonitor manufacturers.
RADIOACTIVE IONIZATION
The ubiquitous smoke detector found in every house, hos-pital, and facility has spawned detectors for other gasessuch as carbon monoxide, a very important marker gas inmedical diagnosis. Although usually used as devices thatare set to alarm when a preset level is detected, they arealso used as calibrated sensors. A very low level radioactivealpha particle source (such as Americium-241) can ionizecertain gases so that, in the presence of an analyte, a circuitcan be completed and current caused to flow in the detectorcircuit.
Ionization detectors detect the presence of invisibleparticles (less than 0.01 micron in size) in the air. Insidethe detector, a small ionization chamber exists that con-tains an extremely small quantity of radioactive isotope.Americium-241 emits alpha particles at a fairly constantrate. The alpha particles, which travel at an extremelyhigh rate of speed, knock off an electron from the oxygenand nitrogen molecules in the air passing through theionization chamber. The free electron (negative charge)is then attracted to a positively charged plate, and thepositively charged oxygen or nitrogen is attracted to anegatively charged plate, which creates a very small butconstant current between the plates of a detector circuit,which in itself is a gas detection mechanism much in thesame way that the other ionization detectors operated.However, when particles, such as soot particles, dust,fumes, or steam, enter the ionization chamber, the currentis disrupted. If the current decreases too mid, an alarm istriggered.
The disadvantage of these devices is clearly the healthhazard associated with the presence of the radioactivematerial. However, because the detector contains only atiny amount of radioactive material, exposure is unlikelywith proper care in handling. Another disadvantage ofthese sensitive detectors is the false-positive alarms thatcan be triggered by spurious dust and other nontoxicfumes. However, the big advantage is that ionizationdetectors are very sensitive and, given that false alarms
MEDICAL GAS ANALYZERS 331
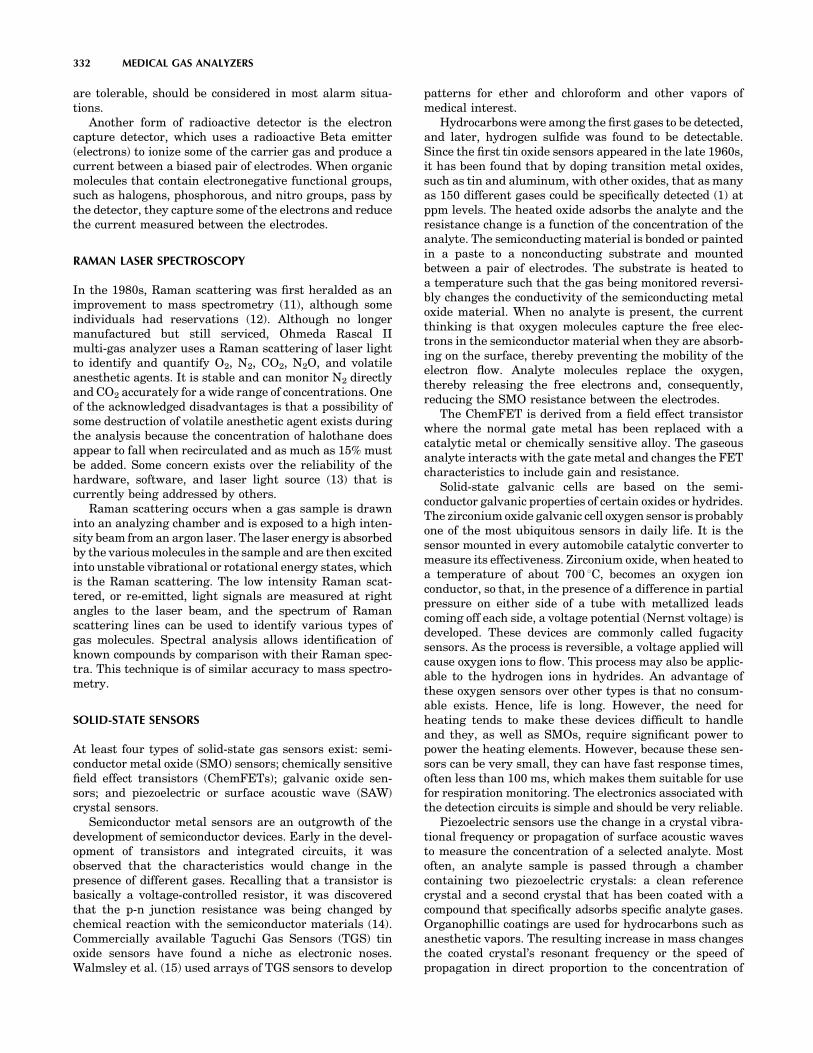
are tolerable, should be considered in most alarm situa-tions.
Another form of radioactive detector is the electroncapture detector, which uses a radioactive Beta emitter(electrons) to ionize some of the carrier gas and produce acurrent between a biased pair of electrodes. When organicmolecules that contain electronegative functional groups,such as halogens, phosphorous, and nitro groups, pass bythe detector, they capture some of the electrons and reducethe current measured between the electrodes.
RAMAN LASER SPECTROSCOPY
In the 1980s, Raman scattering was first heralded as animprovement to mass spectrometry (11), although someindividuals had reservations (12). Although no longermanufactured but still serviced, Ohmeda Rascal IImulti-gas analyzer uses a Raman scattering of laser lightto identify and quantify O2, N2, CO2, N2O, and volatileanesthetic agents. It is stable and can monitor N2 directlyand CO2 accurately for a wide range of concentrations. Oneof the acknowledged disadvantages is that a possibility ofsome destruction of volatile anesthetic agent exists duringthe analysis because the concentration of halothane doesappear to fall when recirculated and as much as 15% mustbe added. Some concern exists over the reliability of thehardware, software, and laser light source (13) that iscurrently being addressed by others.
Raman scattering occurs when a gas sample is drawninto an analyzing chamber and is exposed to a high inten-sity beam from an argon laser. The laser energy is absorbedby the various molecules in the sample and are then excitedinto unstable vibrational or rotational energy states, whichis the Raman scattering. The low intensity Raman scat-tered, or re-emitted, light signals are measured at rightangles to the laser beam, and the spectrum of Ramanscattering lines can be used to identify various types ofgas molecules. Spectral analysis allows identification ofknown compounds by comparison with their Raman spec-tra. This technique is of similar accuracy to mass spectro-metry.
SOLID-STATE SENSORS
At least four types of solid-state gas sensors exist: semi-conductor metal oxide (SMO) sensors; chemically sensitivefield effect transistors (ChemFETs); galvanic oxide sen-sors; and piezoelectric or surface acoustic wave (SAW)crystal sensors.
Semiconductor metal sensors are an outgrowth of thedevelopment of semiconductor devices. Early in the devel-opment of transistors and integrated circuits, it wasobserved that the characteristics would change in thepresence of different gases. Recalling that a transistor isbasically a voltage-controlled resistor, it was discoveredthat the p-n junction resistance was being changed bychemical reaction with the semiconductor materials (14).Commercially available Taguchi Gas Sensors (TGS) tinoxide sensors have found a niche as electronic noses.Walmsley et al. (15) used arrays of TGS sensors to develop
patterns for ether and chloroform and other vapors ofmedical interest.
Hydrocarbons were among the first gases to be detected,and later, hydrogen sulfide was found to be detectable.Since the first tin oxide sensors appeared in the late 1960s,it has been found that by doping transition metal oxides,such as tin and aluminum, with other oxides, that as manyas 150 different gases could be specifically detected (1) atppm levels. The heated oxide adsorbs the analyte and theresistance change is a function of the concentration of theanalyte. The semiconducting material is bonded or paintedin a paste to a nonconducting substrate and mountedbetween a pair of electrodes. The substrate is heated toa temperature such that the gas being monitored reversi-bly changes the conductivity of the semiconducting metaloxide material. When no analyte is present, the currentthinking is that oxygen molecules capture the free elec-trons in the semiconductor material when they are absorb-ing on the surface, thereby preventing the mobility of theelectron flow. Analyte molecules replace the oxygen,thereby releasing the free electrons and, consequently,reducing the SMO resistance between the electrodes.
The ChemFET is derived from a field effect transistorwhere the normal gate metal has been replaced with acatalytic metal or chemically sensitive alloy. The gaseousanalyte interacts with the gate metal and changes the FETcharacteristics to include gain and resistance.
Solid-state galvanic cells are based on the semi-conductor galvanic properties of certain oxides or hydrides.The zirconium oxide galvanic cell oxygen sensor is probablyone of the most ubiquitous sensors in daily life. It is thesensor mounted in every automobile catalytic converter tomeasure its effectiveness. Zirconium oxide, when heated toa temperature of about 700 8C, becomes an oxygen ionconductor, so that, in the presence of a difference in partialpressure on either side of a tube with metallized leadscoming off each side, a voltage potential (Nernst voltage) isdeveloped. These devices are commonly called fugacitysensors. As the process is reversible, a voltage applied willcause oxygen ions to flow. This process may also be applic-able to the hydrogen ions in hydrides. An advantage ofthese oxygen sensors over other types is that no consum-able exists. Hence, life is long. However, the need forheating tends to make these devices difficult to handleand they, as well as SMOs, require significant power topower the heating elements. However, because these sen-sors can be very small, they can have fast response times,often less than 100 ms, which makes them suitable for usefor respiration monitoring. The electronics associated withthe detection circuits is simple and should be very reliable.
Piezoelectric sensors use the change in a crystal vibra-tional frequency or propagation of surface acoustic wavesto measure the concentration of a selected analyte. Mostoften, an analyte sample is passed through a chambercontaining two piezoelectric crystals: a clean referencecrystal and a second crystal that has been coated with acompound that specifically adsorbs specific analyte gases.Organophillic coatings are used for hydrocarbons such asanesthetic vapors. The resulting increase in mass changesthe coated crystal’s resonant frequency or the speed ofpropagation in direct proportion to the concentration of
332 MEDICAL GAS ANALYZERS

anesthetic gas in the sample. Using either some form ofbeat frequency measurement or detection of the phase shiftbetween the two crystals, a detection circuit can generate asignal that can be processed and displayed as a concentra-tion.
EMERGING TECHNOLOGIES—MEMS—MICROFLUIDICS–NANOTECHNOLOGY
The development of a variety of microfluidic labs-on-a-chipis leading the charge in the state-of-the-art in gas sensing.It was noted in the gas chromatography section that micro-fluidic channels are being used as GC columns and in themass spectrometry section that microfluidics plays a majorrole in the TOF passages and chambers. The ability tominiaturize classic technologies has opened the door tomass production as well as the ability to mix-and-matchsensors and technologies. The development of electronicnoses that can discriminate between thousands of differentchemicals and gases is driving the need to detect odors andminute quantities of dangerous or toxic gases.
Patient safety in medicine continues to be a majordriver. MEMS (micro-electromechanical systems) andnanotechnology have become the enabling technologiesfor placing thousands of sensors in microdimensionalarrays that can be placed inside a capsule and swallowedor implanted to monitor physiological and metabolicprocesses. IR bolometers that can sense incredibly smalltemperature differences as low as 0.02 8C are already a partof today’s inventory (Fig. 14), and in the future, nanotech-nology elements that are merely one molecule thick anddust particle-sized may provide IR spectroscopic capabilityin implantable or inhaled micro-packages.
A new paradigm for gas analysis that has been enabledby the development of microfluidics was originally sug-gested in the 1960s by Mapleson (16), who suggestedmeasuring a physical gas property as a way of inferringbinary gas mixture composition. This concept has beenextended and implemented for ternary and quaternarygas mixtures with a microfluidic gas multiple gas propertyanalyzer (17–20). Ternary mixtures are assayed with achip that measures viscosity with a microcapillary visc-ometer and density with a micro-orifice densitometer. Anearly prototype microfluidic lab-on-a-chip showing themicrocapillaries is shown in Fig. 15. By measuring proper-ties possessed in common by all gases, such as density,viscosity, and specific heat, a single chip can be used to
analyze mixtures of any four gases. The concentrations ofthe constituents can be determined by simultaneouslysolving the equations that relate the mixture propertiesto the concentrations, thereby determining the relativeconcentrations of the mixture gases required to producethe measured properties. The only limitation to such anapproach is that one must know what at least all but one ofthe constituents are. Microfluidic property sensors such acapillary viscometers, orifice densitometers, and speed-of-sound calorimeters can provide real-time simultaneousassays of respiratory gases (O2, CO2, and N2), the simul-taneity of which then enables the reduction to practice of avariety of physiologic analyzers such as metabolic rate,cardiac output, and cardio-pulmonary function that hadbeen postulated back in the 1960s (21) but never practicallyimplemented.
Advances in optics and optical fiber technology, greaterexpansion of solid-state sensing, and the revolutionaryaspects of nanotechnology will provide gas analysis andsensing with new capabilities, provided that the lessonslearned from the past are appropriately heeded.
OTHER CONSIDERATIONS IN GAS ANALYSIS
Most continuous gas analysis devices are side-streammonitors that acquire gas samples from a breathing circuitthrough long, narrow-diameter tubing lines. These linesmay incorporate moisture removal to allow moisture topass through the sampling line and into the atmosphere, asis the case with Nafion tubing. A water trap or filter mayalso be used to remove condensation from the sample inorder to reduce water vapor before the gas sample reachesthe analysis chamber. Gas samples are aspirated into themonitor at either an adjustable or a fixed-flow rate, typi-cally from 50 to 250 ml/min. Lower rates minimize theamount of gas removed from the breathing circuit and,therefore, from the patient’s tidal volume; however, lowersampling flow rates increase the response time and typi-cally reduce the accuracy of conventional measurements.
MEDICAL GAS ANALYZERS 333
Figure 14. 25 micron wide longwave IR microbolometer detector.
Figure 15. Microfluidic chip that measures the density andviscosity of three-component respired gases from which theconstituent gas concentrations of oxygen, nitrogen, and carbondioxide are deduced.

Gas monitors have to eliminate the exhaust gas through ascavenging system or back to the patient’s breathing cir-cuit.
DISPLAYS, ALARMS, CALIBRATION, AND CONTROLS
Many gas monitors provide a graphic display of breath-by-breath concentrations and a hardcopy of trends of gasconcentrations from the beginning to the end of an event(e.g., anesthesia delivery during an operation). The usertypically calibrates or verifies calibration of the sensorswith a standard gas mixture from an integral or externalgas cylinder. Gas monitors are usually microprocessor-controlled and have user-adjustable alarms that typicallyinclude factory-preset default alarms or alarm-set pro-grams for both high and low concentrations of the gasesmeasured. Some monitors also have alarms for systemmalfunctions, such as disconnection from a gas source,and leaks can often be identified from trending of O2
and CO2. Occlusion, apnea, or inadvertent rebreathingcan also be identified. Most monitors typically have amethod for temporarily, but not indefinitely, silencingaudible alarms for low O2, high N2O, and high agent,whereas other, less critical audible alarms can be perma-nently silenced. Most monitors typically display real-timewaveforms and long-term trends. They have integral dis-play capability and are also commonly equipped with out-put jacks to interface with computerized record-keepingsystems or with additional analog or digital display unitssuch as chart recorders and printers.
PATIENT SAFETY
A review of the background and significance of medical gassensors and monitors would be incomplete without anexpression of the context that patient safety has had onthe impetus for recent gains in technology and the need foradditional improvements. Clearly the intrinsic dangers inthe conduct of anesthesia have been long understood. Itbecame evident in the early 1980s that patient safety andreduction to risk was possible if respiratory and anestheticgas monitoring was routinely available and used. As aresult of improved and increased availability of medicalgas monitoring technology and professional activity lead bythe Anesthesia Patient Safety Foundation (APSF) with thesupport of the American Society of Anesthesiologists(ASA), a standard for monitoring has been adopted andis routinely used in today’s clinical practice. This standardrequires assessment of the patient’s ventilation and oxy-genation in addition to circulation and temperature. Theuse of such monitors has resulted in a significant decreasein the risk of anesthesia-related deaths and morbidity inthe ICU and other critical care situations.
CONCLUSION
Medical gas monitoring has been so successful in improv-ing patient safety and reducing patient risk that medicalmalpractice liability insurance companies have lowered
their risk liabilities and premiums to anesthesiologistswho guarantee the routine implementation of these stan-dards whenever possible (22). The argument for providingadditional patient safety will continue to be a powerfulincentive to improve and enhance the methods and tech-niques to provide increased knowledge of the monitoring ofrespiratory and anesthetic gases.
The availability of gas sensors and monitors is a boon tothe medical profession from both a clinical as well as aresearch point of view. In addition to patient safety, newdiagnostic capabilities are emerging every year. Inresearch, new gas-sensing capabilities are enhancing thediscovery of markers for all kinds of disease states andmetabolic functions.
Looking to the future, MEMS, microfluidics, and nano-technology will provide growth in our understanding ofphysiologic processes at levels of detail never before con-ceived of, from inside the body as well as supplantingtoday’s conventional techniques.
BIBLIOGRAPHY
1. Chou J, Hazardous Gas Monitors, A Practical Guide to Selec-tion, Operation and Applicationsy. New York: McGraw-Hill;2000.
2. ECRI. Multiple medical gas monitors, respired/anesthetic.Product Comparison System, ECRI Product Code 17–445,August 1993.
3. Datex Ohmeda Smart Vent 7900. Product DescriptionAN2842-B/7 01 1999 Datex-Ohmeda, Inc.
4. Yu CM, Sheem SK. (1995). Miniature gas chromatographysensor. Lawrence Livermore National Lab. www.llnl.gov/sen-sor_technology/STR72.html.
5. Harris D, Bailey S. Near infrared spectroscopy in adults.Anaesthesia 1993;48:694–696.
6. McPeak HB, Palayiwa E, Robinson GC, Sykes MK. An eva-luation of the Bruel and Kjaer monitor 1304. Anaesthesia1992; 47(1):41–47.
7. Lehmann KK, Rabinowitz P. High-finesse optical resonatorfor cavity ring-down spectroscopy based upon Brewster’sangle prism retroreflectors. U.S. Patent 5,973,864, October26, 1999.
8. Lehmann KK, Romanini D. The superposition principle andcavity ring-down spectroscopy. J Chem Phys 1996;105(23):10263–10277.
9. Ecelberger SA, Cornish TJ, Bryden W. The improved teeny-TOF mass spectrometer for chemical and biological sensing,3rd Harsh-Environment Mass Spectrometry Workshop,March 25–28, 2002 Pasadena, CA.
10. Yoon HY, Kim JH, Choi ES, Yang SS, Jung KW. Fabricationof a novel micro time-of-flight mass spectrometer. SensActuators A 2002;97–98:441–447.
11. Westenskow DR, Smith KW, Coleman DL, et al. Clinicalevaluation of a Raman scattering multiple gas analyzer.Anesthesiology 1989;70:350–355.
12. Severinghaus JW, Ozanne GM. Multi-operating room mon-itoring with one mass spectrometer. Acta Anaesthesiol Scan1987; (Suppl) 70:186–187.
13. Lockwood G, Landon MJ, Chakrabarti MK, Whitwam JG.The Ohmeda Rascal II. Anaesthesia 1994;49:44–53.
14. Kress-Rogers E, ed. Handbook of Biosensors and ElectronicNoses—Medicine, Food and the Environment. Boca Raton,FL: CRC Press; 1996.
334 MEDICAL GAS ANALYZERS

15. Walmsley AD, Haswell SJ, Metcalfe E. Methodology for theselection of suitable sensors for incorporation into a gassensor array. Analytica Chimica Acta 1991;242:31.
16. Mapleson WW. Physical methods of gas analysis. Brit JAnaesth 1962;34:631.
17. Drzewiecki TM. Fluidic multiple medical gas monitor. NIHBioEngineering Symposium, Bethesda, MD, February 1998.
18. Drzewiecki TM, Polcha M, Koser M, Calkins J. A novelinexpensive respiratory and anesthetic gas monitor. Societyfor Technology in Anesthesia 1999 Annual Meeting. SanDiego, CA: January 1999.
19. Drzewiecki TM, Calkins J. Real time, simultaneous analysisof multiple gas mixtures using microfluidic technology. ProcInstrument Society of America AD 2000 Symposium, Char-leston, WV: April 2000.
20. Drzewiecki TM. Method and apparatus for real time gasanalysis. U.S. Patent 6,076,392, June 2000.
21. Kim TS, Rahn H, Farhi LE. Estimation of true venous andarterial PCO2 by gas analysis of a single breath. J ApplPhysiol 1966;21(4):1338–1344.
22. Swedlow DB. Respiratory gas monitoring. In: Saidman L,Smith N, eds. Monitoring in Anesthesia. 3rd ed. Boston, MA:Butterworth-Heinemann; 1993. pp 27–50.
See also BLOOD GAS MEASUREMENTS; RESPIRATORY MECHANICS AND GAS
EXCHANGE.
MEDICAL PHOTOGRAPHY. See PHOTOGRAPHY,MEDICAL.
MEDICAL PHYSICS LITERATURE
COLIN ORTON
Harper Hospital and WayneState UniversityDetroit, Michigan
INTRODUCTION
Medical physicists are responsible for the application ofphysics to the diagnosis and treatment of disease and otherdisabilities although, in some countries, the treatment ofpatients with disabilities is a separate field, often referredto as ‘‘biomedical engineering’’ or words to that effect. Here,we restrict ourselves to applications in the diagnosis andtreatment of disease.
The major applications in diagnosis are the use ofX-rays for imaging (diagnostic radiology, includingcomputerized tomography (CT), etc.); radioactive isotopesfor imaging and uptake measurements [nuclear medicine,single photon emission computed tomography (SPECT),positron emission tomography (PET), etc.]; magnetic reso-nance magnetic resonance imaging (MRI) and spectro-scopy (MRS); ultrasound (ultrasonography).
Applications of physics to the treatment of diseaseinclude the following: external beams of X-rays, gamma-rays, or electrons for the treatment of cancer radiationoncology, including stereotactic radiosurgery, intensity
modulated radiation therapy (IMRT), total body irra-diation (TBI), etc.; external beams of heavy particlesfor the treatment of cancer (neutrons, protons, heavyions); internal radioisotope treatments for cancer(brachytherapy, systemic radiotherapy, and radioimmu-notherapy) and other problems (intravascular brachy-therapy, hyperthyroidism, etc.); hyperthermia for thetreatment of cancer.
Other topics of major interest for medical physicistsinclude various medical applications of light and lasers,radiation protection, radiation measurements, radiationbiology, and the applications of computers to all of theabove.
Throughout the world there are medical physics orga-nizations that represent medical physicists and provideinformation to help them in their profession. Most ofthese are national associations, with about 70 of theserepresented by the International Organization for MedicalPhysics (IOMP). In terms of publications, by far the twomost prolific organizations are the Institute of Physicsand Engineering in Medicine (IPEM) in the UnitedKingdom, and the American Association of Physicists inMedicine (AAPM) in North America. These two orga-nizations between them have published hundreds ofreports, monographs, and meeting proceedings that areused as reference materials throughout the world. Fromthe IPEM many of these are published by the Institute ofPhysics Publishing (IOPP) in Bristol, UK, and from theAAPM many are published by either the American Insti-tute of Physics (AIP) or Medical Physics Publishing(Madison, WI).
JOURNALS
Several national and international organizations andindependent publishers publish journals used by medicalphysicists. Some of these journals are used extensivelyfor medical physics papers in which at least 25% of themanuscripts are medical physics articles. These are cate-gorized as ‘‘Primary’’ journals below. Others contain somemedical physics articles (<25%) and are categorized as‘‘Secondary’’.
PRIMARY MEDICAL PHYSICS JOURNALS
Australasian Physical & Engineering Sciences in Med-icine, Australasian College of Physical Scientists andEngineers in Medicine and the College of BiomedicalEngineers.
Journal of Applied Clinical Medical Physics, AmericanCollege of Medical Physics (http://www.jacmp.org).
Journal of Medical Physics, Association of Medical Phy-sicists of India.
Medical Dosimetry, American Association of MedicalDosimetrists (Elsevier).
Medical Physics, American Association of Physicists inMedicine (AIP).
Physica Medica, Istituti Editoriali e Poligrafici Inter-nazionali Casella Postale n.1, Succursale n.8, 56123Pisa, Italy (http://www.iepi.it).
MEDICAL PHYSICS LITERATURE 335

Physics in Medicine and Biology, Institute of Physicsand Engineering in Medicine (IOPP).
Polish Journal of Medical Physics and Engineering,Polish Society of Medical Physics.
Zeitschrift für Medizinische Physik, Deutschen, Öster-reichischen und Schweizerischen Gesellschaft fürMedizinische Physik (Elsevier).
SECONDARY MEDICAL PHYSICS JOURNALS
Acta Radiologica, Scandinavian Society of Radiology(Taylor & Francis).
American Journal of Roentgenology, American Roent-gen Ray Society.
Applied Radiation and Isotopes (Elsevier).
Australasian Radiology, Royal Australian and NewZealand College of Radiologists (Blackwell).
Biomedical Imaging and Interventional Journal (Uni-versity of Malaya: http://www.biij.org).
Biomedical Instrumentation & Technology, Associationfor the Advancement of Medical Instrumentation.
Brachytherapy, American Brachytherapy Society(Elsevier).
British Journal of Radiology, British Institute ofRadiology.
Canadian Association of Radiologists Journal, Cana-dian Association of Radiologists.
Cancer Radiothérapie, Société Française de Radiothér-apie Oncologique (Elsevier).
Cardiovascular and Interventional Radiology, Cardio-vascular and Interventional Radiological Society ofEurope, Japanese Society of Angiography and Inter-ventional Radiology, and British Society of Interven-tional Radiology (Springer).
Cardiovascular Radiation Medicine (Elsevier).
Clinical Imaging (Elsevier).
Clinical Radiology, Royal College of Radiologists(Elsevier).
Critical Reviews in Computed Tomography (Taylor &Francis).
Computerized Medical Imaging and Graphics, Compu-terized Medical Imaging Society (Elsevier).
Computers in Biology and Medicine (Elsevier).
Current Problems in Diagnostic Radiology (Mosby).
European Journal of Nuclear Medicine and MolecularImaging, European Association of Nuclear Medicine(Springer).
European Journal of Radiology (Elsevier).
European Journal of Ultrasound, European Federationof Societies for Ultrasound in Medicine and Biology(Elsevier).
European Radiology, European Congress of Radiology(Springer).
Health Physics, Health Physics Society (LippincottWilliams & Wilkins).
IEEE Transactions on Medical Imaging, IEEE.
International Journal of Radiation Biology (Taylor &Francis).
International Journal of Radiation Oncology, Biology,Physics, American Society of Therapeutic Radiologyand Oncology (Elsevier).
Investigative Radiology (Lippincott Williams & Wilkins).
Journal of Biomedical Optics, International Society forOptical Engineering (SPIE).
Journal of Cardiovascular Magnetic Resonance, Societyfor Cardiovascular Magnetic Resonance (Taylor &Francis).
Journal of Clinical Ultrasound (Wiley).
Journal of Computer Assisted Tomography (LippincottWilliams & Wilkins).
Journal of Diagnostic Radiography and Imaging, RoyalSociety of Medicine.
Journal of Digital Imaging, Society for Computer Appli-cations in Radiology (Springer).
Journal of Electronic Imaging, International Society forOptical Engineering (SPIE).
Journal of Labelled Compounds and Radiopharmaceu-ticals (Wiley).
Journal of Magnetic Resonance Imaging, InternationalSociety for Magnetic Resonance Medicine (Wiley)
Journal of Neuroimaging, American Society of Neuroi-maging (Sage Publications).
Journal of Nuclear Cardiology, American Society ofNuclear Cardiology (Elsevier).
Journal of Nuclear Medicine, Society of NuclearMedicine.
Journal of Nuclear Medicine Technology, Society ofNuclear Medicine.
Journal of Radiological Protection, Society for Radiolo-gical Protection (IOPP, Bristol, U.K.).
Journal of the Acoustical Society of America, AcousticalSociety of America (American Institute of Physics,New York).
Journal of the American Society of Echocardio-graphy, American Society of Echocardiography(Mosby).
Journal of Thoracic Imaging, Society of ThoracicRadiology (Lippincott Williams & Wilkins).
Journal of Ultrasound in Medicine, American Instituteof Ultrasound in Medicine.
Journal of Vascular and Interventional Radiology,Society of Interventional Radiology (LippincottWilliams & Wilkins).
Journal of X-Ray Science and Technology (IOS Press,Amsterdam).
Lasers in Medical Science (Springer).
Lasers in Surgery and Medicine, American Society forLaser Medicine and Surgery (Wiley).
Medical Engineering & Physics (Elsevier).
Magnetic Resonance Imaging (Elsevier).
336 MEDICAL PHYSICS LITERATURE

Magnetic Resonance in Medicine, International Societyfor Magnetic Resonance in Medicine (Wiley).
Medical Engineering & Physics, Institute of Physics andEngineering in Medicine (Elsevier).
Medical Image Analysis (Elsevier).
Molecular Imaging and Biology, Academy of MolecularImaging (Springer).
Neuroradiology, European Society of Neuroradiology(Springer).
NMR in Biomedicine (Wiley).
Nuclear Medicine and Biology, Society of Radiopharma-ceutical Sciences (Elsevier).
Pediatric Radiology, European Society of PediatricRadiology, Society for Pediatric Radiology, Asianand Oceanic Society for Pediatric Radiology(Springer).
Photomedicine and Laser Surgery, World Associationfor Laser Therapy (Mary Ann Liebert, Inc.).
Physiological Measurement, Institute of Physics andEngineering in Medicine (IOPP).
Progress in Nuclear Magnetic Resonance Spectroscopy(Elsevier).
Radiation Measurements (Elsevier).
Radiation Physics and Chemistry (Elsevier).
Radiation Research, Radiation Research Society.
Radiographics, Radiological Society of NorthAmerica.
Radiography, College of Radiographers (Elsevier).
Radiology, Radiological Society of North America.
Radiotherapy and Oncology, European Societyfor Therapeutic Radiology and Oncology(Elsevier).
Seminars in Interventional Radiology (Thieme).
Seminars in Nuclear Medicine (Elsevier).
Seminars in Radiation Oncology (Saunders).
Seminars in Roentgenology (Elsevier).
Seminars in Ultrasound, CT and MRI (Elsevier).
Techniques in Vascular and Interventional Radiology(Elsevier).
Topics in Magnetic Resonance Imaging (LippincottWilliams & Wilkins).
Ultrasound in Medicine & Biology, World Federation forUltrasound in Medicine and Biology (Elsevier).
Ultrasound in Obstetrics and Gynecology (Wiley).
Year Book of Diagnostic Radiology (Elsevier).
Year Book of Nuclear Medicine (Elsevier).
BOOKS AND REPORTS
As with journals, books and reports are published by bothmedical physics organizations, especially the AAPM andthe IPEM, and independent publishers. Most of the booksand reports in the following lists can be purchased directly
from the publishers or, alternatively, through bookstoresusing the ISBN number provided.
MEDICAL AND RADIOLOGICAL PHYSICS
General
A Century of X-Rays and Radioactivity in Medicine:With Emphasis on Photographic Records of the EarlyYears, Richard F. Mould, ISBN 0-7503-0224-0, 1993,236 pp, IOPP, Bristol (UK).
Essentials of Radiology Physics, Charles A. Kelsey,ISBN: 0875273548, 1985, 467 pp, W.H. Green.
Introduction to Radiological Physics and RadiationDosimetry, Frank Herbert Attix, ISBN: 0-471-01146-0, 1986, 640 pp, Advanced Medical Publishing,Madison (WI).
Meandering in Medical Physics: A Personal Accountof Hospital Physics, J.E. Roberts, N.G. Trott,ISBN: 0750304944, 1999, 181 pp, IOPP, Bristol(UK).
Medical Physics and Biomedical Engineering, BrownBH, Smallwood RH, Barber DC, Lawford PV; HoseDR, ISBN: 0750303670, 1998, 768 pp, IOPP, Bristol(UK).
Medical Physics Handbook of Units and Measures,Freim J, Jr, ISBN: 0944838308, 1992, 47 pp, MedicalPhysics Publishing, Madison (WI).
Medical Radiation Physics: Roentgenology, Nuclear Medi-cine & Ultrasound, Hendee WR, ISBN: 0815142404,1979, 517 pp, Year Book Medical Publishers.
Physics in Medicine and Biology Encyclopedia (2Volume Set), T.F. McAinsh, (editor), ISBN:0080264972, 1986, Pergamon, Elmsfood (NY).
Physics and Engineering in Medicine in the New Mil-lennium, Sharp PF, Perkins AC editors., ISBN:0904181952, 2000, 156 pp, IPEM, York, (UK).
Physics of Radiology, 4th ed., Johns H E, John RobertCunningham, ISBN: 0398046697, 1983, 796 pp,Charles C. Thomas.
Physics of Radiology, second edition, Wolbarst A B,ISBN: 1-930524-22-6. Published: 2005, 660 pp, Med-ical Physics Publishing, Madison (WI).
Physics of the Body, Cameron JR, Skofronick JG, GrantRM, ISBN: 094483891X, 1999, 394 pp, Medical Phy-sics Publishing, Madison (WI).
Principles and Practice of Clinical Physics & Dosimetry,Michael L.F. Lim, ISBN: 1-883526-11-6, 2005, 500pp, Advanced Medical Publishing, Madison (WI).
Principles of Radiological Physics, 4th ed., Graham D,Cloke P, ISBN: 0443070733, 2003, 576 pp, ChurchillLivingstone.
Radiation Biophysics, Alpen EL, ISBN: 0120530856,1998, 484 pp, Academic Press.
Radiation Physics Handbook for Medical Physicists,Ervin B. Podgorsak, ISBN: 3540250417, 2005, 360pp, Springer, New York.
MEDICAL PHYSICS LITERATURE 337

Review of Radiological Physics, Walter Huda, RichardM. Slone, ISBN: 0781736757, 2002, 350 pp, Lippin-cott Williams & Wilkins, Philadelphia.
Topical
How the Body Works, Lenihan J, ISBN: 0944838-48-0,1995, 200 pp, Medical Physics Publishing, Madison(WI).
Physics of the Body 2nd ed., Cameron J, et al., ISBN: 0-944838-91-X, 1999, 394 pp, Medical Physics Publish-ing, Madison (WI).
Medical Applications of Nuclear Physics, Bethge K,Kraft G, Kreisler P, Walter G, ISBN: 3540208054,2004, 208 pp, Springer.
Progress in Medical Radiation Physics, Orton CG,ISBN: 0306417898, 1985, 248 pp, Plenum, New York.
RADIATION ONCOLOGY PHYSICS
General
AAPM Monograph No. 15, Radiation Oncology Physics,Kereiakes J, Elson H, Born C, editors, ISBN:0-883185-33-4, 1986, 812 pp, Medical Physics Pub-lishing, Madison (WI).
AAPM Monograph No. 26, General Practice of Radia-tion Oncology Physics in the 21st Century, AlmonShiu & David Mellenberg, ISBN: 0-944838-98-7,2000, 368 pp, Medical Physics Publishing, Madison(WI).
Applied Physics for Radiation Oncology, Robert Stanton& Donna Stinson ISBN: 0-944838-60-X, 1996, 375 pp,Medical Physics Publishing, Madison (WI).
Biomedical Particle Accelerators, Scharf WH, SiebersJV, ISBN: 1563960893, 1994, 480 pp, Springer.
Blackburn’s Introduction to Clinical Radiation TherapyPhysics, Benjamin Blackburn ISBN: 0-944838-06-5,1989, 218 pp, Medical Physics Publishing, Madison(WI).
Clinical Radiotherapy Physics, 2nd ed., Jayaraman S,Lanzl LH, Lanzl EF, ISBN: 3540402845, 2004, 523pp, Springer.
Handbook of Radiotherapy Physics: Theory andPractice, Mayles P, Nahum A, Rosenwald J-C,ISBN: 0750308605, 2005, 700 pp, IOPP, Bristol(UK).
Modern Technology of Radiation Oncology, Van Dyk J,ISBN: 0-944838-38-3, 1999, 1072 pp, Medical PhysicsPublishing, Madison (WI).
Practical Radiotherapy: Physics and Equipment,Cherry P, Duxbury A, ISBN: 1900151065, 1998,224 pp, Cambridge University Press, New York.
Radiation Therapy Physics, Hendee WR, Ibbott GS,Hendee EG, ISBN: 0471394939, 2004, 450 pp, Wiley,New York.
Radiotherapy Physics and Equipment, Morris S,Williams A, ISBN: 0443062110, 2001, 176 pp,Churchill Livingstone.
Radiotherapy Physics: In Practice, Williams JR,Thwaites DI, editors, ISBN: 0-19-262878-X, 2000,362 pp, Oxford University Press, New York.
Review of Radiation Oncology Physics, Prasad SC,ISBN: 1-930524-08-0, 2002, 95 pp, Medical PhysicsPublishing, Madison (WI).
Study Guide for Radiation Oncology Physics BoardExams, Berman B, ISBN: 0-944838-94-4, 2000, 112pp, Medical Physics Publishing, Madison (WI).
The Physics of Radiation Therapy, Hardbound 3rd ed.,Khan F, ISBN: 0-7817-3065-1, 2003, 511 pp, Wiley,New York.
Walter & Miller’s Textbook of Radiotherapy RadiationPhysics, Therapy and Oncology, 6th ed., Bomford CKet al., ISBN: 0443062013, 2003, 660 pp, Elsevier.
Topical
3-D Conformal and Intensity Modulated RadiationTherapy: Physics and Clinical Applications, PurdyJA, Grant W III, Palta JR, Butler EB, Perez CA,editors, ISBN: 1-883526-10-8, 2001, 650 pp,Advanced Medical Publishing, Madison (WI).
A Practical Guide to 3-D Planning and ConformalRadiation Therapy, Purdy JA, Starkschall G, ISBN:1-883526-07, 1999, 400 pp, Advanced Medical Pub-lishing, Madison (WI).
A Practical Guide to Intensity-Modulated RadiationTherapy, Memorial Sloan-Kettering Cancer Center,ISBN: 1-930524-13-7, 2003, 450 pp. Medical PhysicsPublishing, Madison (WI).
AAPM Manual No. 2: Workbook on Dosimetry andTreatment Planning for Radiation Oncology Resi-dents, Wu RK, Gerbi BJ, Doppke KP, editors, ISBN:0-88318-916-X, 1991, 32 pp, Medical Physics Publish-ing, Madison (WI).
AAPM Monograph No. 2, Practical Aspects of ElectronBeam Treatment Planning, Orton CG, Bagne F,editors, ISBN: 0-88318-247-5, 1978, 109 pp, MedicalPhysics Publishing, Madison (WI).
AAPM Monograph No. 7, Recent Advances inBrachytherapy Physics, Shearer DR, editors, ISBN:0-88318-285-8, 1981, 202 pp, Medical Physics Pub-lishing, Madison (WI).
AAPM Monograph No. 8, Physical Aspects ofHyperthermia, Nussbaum GH, editors, ISBN: 0-88318-414-1, 1982, 656 pp, Medical Physics Publish-ing, Madison (WI).
AAPM Monograph No. 9, Advances in Radiation Ther-apy Treatment Planning, Wright AE, Boyer A, edi-tors, ISBN: 0-883184-23-0, 1982, 626 pp, MedicalPhysics Publishing, Madison (WI).
AAPM Monograph No. 16, Biological, Physical and Clin-ical Aspects of Hyperthermia, Paliwal BR, Hetzel FW,Dewhirst M, editors, ISBN: 0-88318-558-X, 1988, 483pp, Medical Physics Publishing, Madison (WI).
AAPM Monograph No. 28, Intravascular Brachyther-apy/Fluoroscopically Guided Interventions, Balter S,
338 MEDICAL PHYSICS LITERATURE

Chan RC, Shope TB Jr, editors, ISBN: 1-930524-10-2,2002, 930 pp, Medical Physics Publishing, Madison(WI).
AAPM Monograph No. 29, Intensity-Modulated Radia-tion Therapy: The State of the Art, Palta JR, Rock-well Mackie T, editors, ISBN: 1-930524-16-1, 2003,904 pp. Medical Physics Publishing, Madison (WI).
AAPM Proceedings No. 2, Proceedings of the Sympo-sium on Electron Dosimetry and Arc Therapy,Paliwal BR, editor, ISBN: 0-88318-404-4, 1981, 384pp, Medical Physics Publishing, Madison (WI).
AAPM Proceedings No. 3, Proceedings of a Symposiumon Quality Assurance of Radiotherapy Equipment,Starkschall G, editor, ISBN: 0-88318-422-2, 1982,242 pp, Medical Physics Publishing, Madison (WI).
AAPM Proceedings No. 5, Optimization of CancerRadiotherapy, Paliwal BR, Herbert DE, Orton CG,editors, ISBN: 0-88318-483-4, 1984, 556 pp, MedicalPhysics Publishing, Madison (WI).
AAPM Proceedings No. 12, Biological & Physical Basisof IMRT & Tomotherapy, Paliwal BR, Herbert DE,Fowler JF, Mehta M, editors, ISBN: 1-930524-11-0,2002, 390 pp, Medical Physics Publishing, Madison(WI).
AAPM Report No. 7, Protocol for Neutron Beam Dosi-metry, Radiation Therapy Committee Task Group18; ISBN: 0-88318-276-9, 1980, 51 pp, Medical Phy-sics Publishing, Madison (WI).
AAPM Report No. 13, Physical Aspects of Quality Assur-ance in Radiation Therapy, Radiation Therapy Com-mittee Task Group 24, with contribution from TaskGroup 22, ISBN: 0-88318-457-5, 1984, 63 pp, MedicalPhysics Publishing, Madison (WI).
AAPM Report No. 17, The Physical Aspects of Total anda Half Body Photon Irradiation, Radiation TherapyCommittee Task Group 29; ISBN: 0-88318-513-X,1986, 55 pp, Medical Physics Publishing, Madison(WI).
AAPM Report No. 21, Specification of BrachytherapySource Strength, Radiation Therapy CommitteeTask Group 32; ISBN: 0-88318-545-8, 1987, 21 pp,Medical Physics Publishing, Madison (WI).
AAPM Report No. 23, Total Skin Electron Therapy:Technique and Dosimetry Radiation Therapy Com-mittee Task Group 30; ISBN: 0-88318-556-3, 1987, 55pp, Medical Physics Publishing, Madison (WI).
AAPM Report No. 24, Radiotherapy Portal ImagingQuality, Radiation Therapy Committee Task Group28; ISBN: 0-88318-557-1, 1987, 29 pp, Medical Phy-sics Publishing, Madison (WI).
AAPM Report No. 26, Performance Evaluation ofHyperthermia Equipment, Hyperthermia Commit-tee Task Group 1; ISBN: 0-88318-636-5, 1989, 46pp, Medical Physics Publishing, Madison (WI).
AAPM Report No. 27, Hyperthermia Treatment Plan-ning, Hyperthermia Committee Task Group 2; ISBN:0-88318-643-8, 1989, 57 pp, Medical Physics Publish-ing, Madison (WI).
AAPM Report No. 32, Clinical Electron-Beam Dosime-try, Radiation Therapy Committee Task Group 25,ISBN: 0-88318-905-4, 1990, 40 pp, Medical PhysicsPublishing, Madison (WI).
AAPM Report No. 40, Radiolabeled Antibody TumorDosimetry (Reprinted from Medical Physics, Vol.20, Issue 2), Nuclear Medicine Committee TaskGroup 2; ISBN: 1-56396-233-0, 1993, 112 pp, MedicalPhysics Publishing, Madison (WI).
AAPM Report No. 41, Remote Afterloading Technology,Remote Afterloading Technology Task Group 41;ISBN: 1-56396-240-3, 1993, 107 pp, Medical PhysicsPublishing, Madison (WI).
AAPM Report No. 45, Management of RadiationOncology Patients with Implanted Cardiac Pace-makers (Reprinted from Medical Physics, Vol. 21,Issue 1), Task Group 34. ISBN: 1-56396-380-9,1994, 6 pp, Medical Physics Publishing, Madison(WI).
AAPM Report No. 46, Comprehensive QA for RadiationOncology (Reprinted from Medical Physics, Vol. 21,Issue 4), Radiation Therapy Committee Task Group40; ISBN: 1-56396-401-5, 1994, 37 pp, Medical Phy-sics Publishing, Madison (WI).
AAPM Report No. 47, AAPM Code of Practice for Radio-therapy Accelerators (Reprinted from Medical Phy-sics, Vol. 21, Issue 4), Radiation Therapy Task Group45; ISBN: 1-56396-402-3, 1994, 37 pp, Medical Phy-sics Publishing, Madison (WI).
AAPM Report No. 48, The Calibration and Use of Plane-Parallel Ionization Chambers for Dosimetry of Elec-tron Beams (Reprinted from Medical Physics, Vol. 21,Issue 8) Radiation Therapy Committee Task Group39; ISBN: 1-56396-461-9, 1994, 10 pp, Medical Phy-sics Publishing, Madison (WI).
AAPM Report No. 50, Fetal Dose from Radiotherapywith Photon Beams (Reprinted from Medical Phy-sics, Vol. 22, Issue 1), Radiation Therapy CommitteeTask Group 36; ISBN: 1-56396-453-8, 1995, 20 pp,Medical Physics Publishing, Madison (WI).
AAPM Report No. 54, Stereotactic Radiosurgery, Radia-tion Therapy Committee Task Group 42; ISBN:1-56396-497-X, 1995, 100 pp, Medical Physics Pub-lishing, Madison (WI).
AAPM Report No. 55, Radiation Treatment PlanningDosimetry Verification, AAPM ISBN: 1-56396-534-8,1995, 200 pp, Medical Physics Publishing, Madison(WI).
AAPM Report No. 56, Medical Accelerator Safety Con-siderations (Reprinted from Medical Physics, Vol. 20,Issue 4), Radiation Therapy Committee Task Group35; ISBN: 1-888340-01-0, 1993, 15 pp, Medical Phy-sics Publishing, Madison (WI).
AAPM Report No. 59, Code of Practice for Brachyther-apy Physics (Reprinted from Medical Physics,Vol. 24, Issue 10), Radiation Therapy Committee TaskGroup 56; ISBN: 1-888340-14-2, 1997, 42 pp, MedicalPhysics Publishing, Madison (WI).
MEDICAL PHYSICS LITERATURE 339

AAPM Report No. 61, High Dose-Rate BrachytherapyTreatment Delivery (Reprinted from Medical Phy-sics, Vol. 25, Issue 4), Radiation Therapy CommitteeTask Group 59; ISBN: 1-888340-17-7, 1998, 29pp, Medical Physics Publishing, Madison (WI).
AAPM Report No. 62, Quality Assurance for ClinicalRadiotherapy Treatment Planning (Reprintedfrom Medical Physics, Vol. 25, Issue 10), RadiationTherapy Committee Task Group 53; ISBN:1-888-340-18-5, 1998, 57 pp, Medical Physics Pub-lishing, Madison (WI).
AAPM Report No. 66, Intravascular BrachytherapyPhysics (Reprinted from Medical Physics, Vol. 26,Issue 2), Radiation Therapy Committee Task Group60; ISBN: 1-888340-23-1, 1999, 34 pp, Medical Phy-sics Publishing, Madison (WI).
AAPM Report No. 67, Protocol for Clinical ReferenceDosimetry of High-Energy Photon and ElectronBeams (Reprinted from Medical Physics, Vol. 26,Issue 9) Task Group 51; ISBN: 1-888340-25-8,1999, 24 pp, Medical Physics Publishing, Madison(WI).
AAPM Report No. 68, Permanent Prostate SeedImplant Brachytherapy (Reprinted from MedicalPhysics, Vol. 26, Issue 10), Task Group 64; ISBN:1-888340-26-6, 1999, 23 pp, Medical Physics Publish-ing, Madison (WI).
AAPM Report No. 69, Recommendations of the AAPMon 103Pd Interstitial Source Calibration and Dosime-try: Implications for Dose Specification and Prescrip-tion, AAPM, ISBN: 1-888340-27-4, 2000, 9 pp,Medical Physics Publishing, Madison (WI).
AAPM Report No. 71, A Primer for Radioimmunother-apy and Radionuclide Therapy Task Group 7, ISBN:1-888340-29-0, 2001, 73 pp, Medical Physics Publish-ing, Madison (WI).
AAPM Report No. 72, Basic Applications of MultileafCollimators, Task Group 50 ISBN: 1-888340-30-4,2001, 54 pp, Medical Physics Publishing, Madison(WI).
AAPM Report No. 75, Clinical Use of Electronic PortalImaging, Radiation Therapy Committee Task Group58, ISBN: 1-888340-34-7, 2001, 26 pp, Medical Phy-sics Publishing, Madison (WI).
AAPM Report No. 76, AAPM Protocol for 40-300 kVX-ray Beam Dosimetry in Radiotherapy and Radio-biology, AAPM, ISBN: 1-888340-35-5, 2001, 26 pp,Medical Physics Publishing, Madison (WI).
AAPM Report No. 81, Dosimetric Considerations forPatients with Hip Prostheses Undergoing PelvicIrradiation, Radiation Therapy Committee TaskGroup 63 (Reprinted from Medical Physics, Vol. 30,Issue 6), ISBN: 1-888340-42-8, 2003, 21 pp, MedicalPhysics Publishing, Madison (WI).
AAPM Report No. 82, Guidance Document on Delivery,Treatment Planning, and Clinical Implementation ofIMRT, AAPM Radiation Therapy Committee, ISBN:1-888340-43-6, 2003, 25 pp, Medical Physics Publish-ing, Madison (WI).
AAPM Report No. 83, Quality Assurance for Computed-Tomography Simulators and the Computed-Tomography-Simulation Process, Radiation TherapyCommittee Task Group 66, ISBN: 1-888340-44-4,2003, 31 pp, Medical Physics Publishing, Madison(WI).
AAPM Report No. 84, A Revised AAPM Protocol forBrachytherapy Dose Calculations (Reprinted fromMedical Physics, Vol. 31, Issue 3, pp. 633-674), Radia-tion Therapy Committee, ISBN: 1-888340-46-0, 2004,42 pp, Medical Physics Publishing, Madison (WI).
AAPM Report No. 85, Tissue Inhomogeneity Correc-tions for Megavoltage Photon Beams, Task GroupNo. 65 of the Radiation Therapy Committee, ISBN: 1-888340-47-9, 2004, 124 pp, Medical Physics Publish-ing, Madison (WI).
AAPM Report No. 86, Quality Assurance for ClinicalTrials: A Primer for Physicists, Subcommittee onQuality Assurance Physics for Cooperative Trialsof the Radiation Therapy Committee, ISBN: 1-88340-48-7, 2004, 68 pp, Medical Physics Publishing,Madison (WI).
Achieving Quality in Brachytherapy, BR Thomadsen,ISBN: 0750305541, 1999, pp, 268, Advanced MedicalPublishing, Madison (WI).
A Practical Guide to CT-Simulation, Edited by: Coia L,Schultheiss T, Hanks G, ISBN: 1-883526-04-3, 1995,216 pp, Advanced Medical Publishing, Madison (WI).
Brachytherapy Physics (1994 AAPM Summer School),Williamson J et al., ISBN: 0-944838-50-2, 1995, 715pp, Medical Physics Publishing, Madison (WI).
Clinical Target Volumes in Conformal and Inten-sity Modulated Radiation Therapy, Gregorie V,Scalliet and P, Ang KK, ISBN: 3540413804, 2003,300 pp, Springer Verlag.
Contemporary IMRT: Developing Physics and ClinicalImplementation, Webb S, ISBN: 0750310049, 2004,478 pp, IOPP, Bristol (UK).
CT Simulation for Radiotherapy, Jani S, ISBN:0-944838-32-4, 1993, 172 pp, Medical Physics Pub-lishing, Madison (WI).
Geometric Uncertainties in Radiotherapy, BIR, 2003,ISBN: 0905749537, The British Institute of Radiology.
Intraoperative Irradiation, Techniques and Results,Gunderson LL, Wilett CG, Harrison LB, Calvo FA,editors ISBN: 0-89603-523-9, 1999, 560 pp, AdvancedMedical Publishing, Madison (WI).
Intraoperative Radiation Therapy, Ralph Dobelbower,Jr. and Mitsuyuki Abe, ISBN: 0849368464, 1989, 432pp, CRC Press, Boca Raton (FL).
Introduction to Clinical Radiation Oncology, 3rd ed.,Coia L, Moylan D, ISBN: 0-944838-70-7, Published:March 1998, 568 pp, Medical Physics Publishing,Madison (WI).
IPEM Report No. 68, A Guide to Commissioning &Quality Control of Treatment Planning Systems,Shaw J, editor, ISBN: 0904181839, 1996, IPEM, York(UK).
340 MEDICAL PHYSICS LITERATURE

IPEM Report No. 81, Physics Aspects of Quality Controlin Radiotherapy, Mayles WPM, Lake RA, McKenzieAL, Macaulay EM, Morgan HM, Powley SK, ISBN:0904181928, 1998, IPEM, York (UK).
IPEM Report No. 83, Targeted Radiotherapy, FlemingJS, Perkins AC, ISBN: 0904181979, Published: 2000,112 pp, IPEM, York (UK).
Linac and Gamma Knife Radiosurgery, Isabelle M.Germano, ISBN: 1879284707, 2000, 295 pp,Advanced Medical Publishing, Madison (WI).
Linear Accelerators for Radiation Therapy, D. Greene,ISBN: 0750304766, 1997, 288 pp, IOPP, Bristol (UK).
Monitor Unit Calculations for External Photon andElectron Beams, Gibbon JP, editor, ISBN: 1-883526-08-6, 2000, 152 pp, Advanced Medical Pub-lishing, Madison (WI).
Physical Aspects of Brachytherapy, Godden TJ, ISBN:0852745117, 1988, 304 pp, IOPP, Bristol (UK).
Physical Aspects of Stereotactic Radiosurgery, PhillipsM H, ISBN: 0306445352, 1993, 286 pp, Plenum, NewYork.
Physics and Technology of Hyperthermia, Field SB,Franconi C, ISBN: 9024735092, 1999, 668 pp,Springer.
Physics of Electron Beam Therapy, Klevenhagen SC,ISBN: 0852747810, 1985, 214 pp, IOPP, Bristol (UK).
Physics of Radiotherapy X-Rays from Linear Accelera-tors, Metcalfe P et al., ISBN: 0-944838-76-6, 1997,493 pp, Medical Physics Publishing, Madison (WI).
Practical Essentials of Intensity Modulated RadiationTherapy, Chao KSC, Smith Apisarnthanarax, andGokhan Ozyigit, ISBN: 0-7817-5279-5, 2004, 324 pp,Advanced Medical Publishing, Madison (WI).
Practical Manual of Brachytherapy, Pierquin B,Marinello G, ISBN: 0-944838-73-1, 1997, 296 pp,Medical Physics Publishing, Madison (WI).
Primer on Theory and Operation of Linear Accelerators,2nd ed., Karzmark CJ, Morton R, ISBN: 0-944838-66-9, 1998, 50 pp, Medical Physics Publishing,Madison (WI).
Principles and Practice of Brachytherapy, Nag S, editor,ISBN: 0879936541, 1997, 752 pp, Futura.
Principles and Practice of Brachytherapy Using After-loading Systems, Joslin CA, Flynn A, Hall EJ, edi-tors, ISBN: 0-340-74209-7, 2001, 464 pp, EdwardArnold, London.
Protocol and Procedures for Quality Assurance of LinearAccelerators, Constantinou, ISBN: 0-9638266-0-3,1993, 92 pp, Medical Physics Publishing, Madison(WI).
Quality Assurance in Radiotherapy Physics,Starkschall G, ISBN: 0944838219, 1991, 387 pp,Medical Physics Publishing, Madison (WI).
Radiation Therapy Planning, Bentel GC, ISBN:0070051151, 1995, 643 pp, McGraw-Hill, New York.
Radiotherapy In Practice – Brachytherapy, Hoskin PJ,Coyle C, ISBN: 0198529406, 2005, 224 pp, OxfordUniversity Press, New York.
Study Guide for Radiation Oncology Physics BoardExams, Berman B, Thomadsen B, ISBN: 0-944838-94-4, 2000, 112 pp, Medical Physics Publishing,Madison (WI).
The Physics and Radiobiology of Fast Neutron Beams,Bewley DK, ISBN: 085274093x, 1989, 192 pp, IOPP,Bristol (UK).
The Physics of Conformal Radiotherapy: Advances inTechnology, Webb S, ISBN: 0750303972, 1997, 382pp, IOPP, Bristol (UK).
The Physics of Modern Brachytherapy for Oncology,Baltas D, Kreiger H, Zamboglou N, ISBN:0750307080, 2005, 450 pp, IOPP, Bristol (UK).
The Physics of Three Dimensional Radiation Therapy:Conformal Radiotherapy, Radiosurgery and Treat-ment Planning, Webb S, ISBN: 075030247x, 1993,373 pp, IOPP, Bristol (UK).
The Q Book – The Physics of Radiotherapy X-Rays:Problems and Solutions Metcalfe P et al., ISBN: 0-944838-86-3, 1998, 100 pp, Medical Physics Publish-ing, Madison (WI).
The Theory & Practice of Intensity Modulated RadiationTherapy, Sternick S, editor, ISBN: 1-883526-05-1,1997, 256 pp, Advanced Medical Publishing, Madison(WI).
The Use of Computers in Radiation Therapy: SchlegelW, Bortfeld T, editors, ISBN: 3540671765, 2000, 604pp, Springer, New York.
The Use of Plane Parallel Ionization Chambers in HighEnergy Electron and Photon Beams: An Interna-tional Code of Practice for Dosimetry, IAEA, ISBN:9201048963, 1997, 125 pp, IAEA.
Therapy Physics Review, Paliwal B, ISBN: 0-944838-67-7, 1996, 65 pp, Medical Physics Publishing, Madison(WI).
Three-Dimensional Radiation Treatment: Technologi-cal Innovations and Clinical Results, KneschaurekP, Molls M, Feldmann HJ, ISBN: 3805569475, 2000,S. Karger.
Topics in Dosimetry & Treatment Planning for NeutronCapture Therapy, Zamenhof RG, Solares GR,Harling OK, editors, ISBN: 1-883526-02-7, 1994,245 pp, Advanced Medical Publishing, Madison (WI).
Treatment Planning in Radiation Oncology, Khan F M,Potish R, editors, ISBN: 0-683-04607-1, 1997, 608 pp,Lippincott, New York.
DIAGNOSTIC RADIOLOGICAL PHYSICS
General
AAPM Monograph No. 3, The Physics of Medical Ima-ging: Recording System Measurements and Techni-ques (1979 Summer School), Haus AG, editor, ISBN:0-88318-260-2, 624 pp, Medical Physics Publishing,Madison (WI).
AAPM Monograph No. 23, The Expanding Role of Med-ical Physics in Diagnostic Imaging, Frey GD,
MEDICAL PHYSICS LITERATURE 341
Sprawls P, editors, ISBN: 1-888340-09-6, 1997, 583pp, Medical Physics Publishing, Madison (WI).
Christensen’s Physics of Diagnostic Radiology, Curry TS III, Dowdey JE, Murry RC Jr, ISBN: 0812113101,1990, 522 pp, Lippincott, New York.
IPEM Report 61, Physics in Diagnostic Radiology,Faulkner K, Cranley K, Starritt HC, WanklingPF, editors, ISBN: 090418160X, 1990, 150 pp,IPEM, York (UK).
Physics for Diagnostic Radiology, Dendy P P, Heaton B,ISBN: 0750305916, 1999, 446 pp, IOPP, Bristol (UK).
Practical Radiography, Robert Ward, ISBN: 0-944838-49-9, (1996 reprint), 112 pp, Medical Physics Publish-ing, Madison (WI).
The Physics of Diagnostic Imaging, Dowsett DJ,Johnston RE, Kenny PA, ISBN: 0412460602, 1998,609 pp, Edward Arnold, London.
Topical
AAPM Monograph No. 4, Quality Assurance in Diag-nostic Radiology, Waggener R, Wilson C, editors,ISBN: 0-883182-68-8, 1977, 190 pp, Medical PhysicsPublishing, Madison (WI).
AAPM Monograph No. 30, Specifications, PerformanceEvaluation and Quality Assurance of Radiographicand Fluoroscopic Systems in the Digital Era,Goldman L, Yester M, editors, ISBN: 1-930524-21-8, 2004, 300 pp, Medical Physics Publishing, Madison(WI).
AAPM Report No. 4, Basic Quality Control in DiagnosticRadiology, Task Force On Quality AssuranceProtocol; ISBN: 0-88318-251-3, 1977, 57 pp, MedicalPhysics Publishing, Madison (WI).
AAPM Report No. 14, Performance Specifications andAcceptance Testing for X-Ray Generators andAutomatic Exposure Control Devices, AAPM, ISBN:0-88318-461-3, 1985, 96 pp, Medical Physics Publish-ing, Madison (WI).
AAPM Report No. 15, Performance Evaluation andQuality Assurance in Digital Subtraction Angio-graphy, Diagnostic X-Ray Imaging Committee/DigitalRadiography/Fluorography Task Group;ISBN: 0-88318-482-6, 1985, 36 pp, Medical PhysicsPublishing, Madison (WI).
AAPM Report No. 29, Equipment Requirements andQuality Control for Mammography, DiagnosticX-Ray Imaging Committee Task Group 7, ISBN: 0-88318-807-4, 1990, 72 pp, Medical Physics Publish-ing, Madison (WI).
AAPM Report No. 31, Standardized Methods for Mea-suring Diagnostic X-Ray Exposures, DiagnosticX-Ray Imaging Committee Task Group 8, ISBN: 0-88318-874-0, 1990, 22 pp, Medical Physics Publish-ing, Madison (WI).
AAPM Report No. 58, Managing the Use of Fluoroscopyin Medical Institutions, Radiation ProtectionCommittee Task Group 6; ISBN: 1-888340-13-4,
1998, 42 pp, Medical Physics Publishing, Madison(WI).
AAPM Report No. 60, Instrumentation Requirements ofDiagnostic Radiological Physicists, Diagnostic X-RayImaging Committee Task Group 4; ISBN: 1-888340-15-0, 1998, 40 pp, Medical Physics Publishing,Madison (WI).
AAPM Report No. 70, Cardiac Catheterization Equip-ment Performance, Diagnostic X-ray ImagingCommittee, Task Group 17, ISBN: 1-888340-28-2,2001, 71 pp, Medical Physics Publishing, Madison(WI).
AAPM Report No. 74, Quality Control in DiagnosticRadiology, Task Group 12 ISBN: 1-888340-33-9,2002, 77 pp, Medical Physics Publishing, Madison(WI).
Advances in Film Processing Systems Technology andQuality Control in Medical Imaging, Haus AG, ISBN:1-930524-01-3, 2001, 245 pp., Medical Physics Pub-lishing, Madison (WI).
Basics of Film Processing in Medical Imaging, Haus A,Jaskulski S, ISBN: 0-944838-78-2, 1997, 338 pp,Medical Physics Publishing, Madison (WI).
Digital Mammography Proceedings, Yaffe M, ISBN:1-930524-00-5, 2001, 856 pp Medical Physics Pub-lishing, Madison (WI).
Interventional Fluoroscopy: Physics, Technology,Safety, Balter S, ISBN: 0471390100, 2001, 284 pp,Wiley, New York.
IPEM Report No. 32, Measurement of the PerformanceCharacteristics of Diagnostic X-Ray Systems Used inMedicine. Part 1: X-Ray Tubes and Generators,Cranley K ISBN: 090418174X, 1995, 28 pp, IPEM,York (UK).
IPEM Report No. 32, Measurement of the PerformanceCharacteristics of Diagnostic X-Ray Systems Used inMedicine. Part II: X-Ray Image Intensifier TelevisionSystems, Starritt H C, ISBN: 0904181758, 1996, 61pp, IPEM, York (UK).
IPEM Report No. 32, Measurement of the PerformanceCharacteristics of Diagnostic X-Ray Systems Used inMedicine. Part IV: X-Ray Intensifying Screens,Films, Processors and Automatic Exposure ControlSystems, Holubinka M R, ISBN: 0904181774, 1996,43 pp, IPEM, York (UK).
IPEM Report No. 32, Measurement of the PerformanceCharacteristics of Diagnostic X-Ray Systems Used inMedicine. Part V: Conventional Tomographic Equip-ment, ISBN: 0904181782, 1996, 18 pp, IPEM, York(UK).
IPEM Report No. 32, Measurement of the PerformanceCharacteristics of Diagnostic X-Ray Systems Used inMedicine. Part VI: X-Ray Image Intensifier Fluoro-graphy Systems, Robertson J, ISBN: 0904181790,1995, 21 pp, IPEM, York (UK).
IPEM Report No. 59, The Commissioning & RoutineTesting of Mammographic X-Ray Systems 2nd ed.,Law J, Dance DR, Faulkner K, Fitzgerald MC,
342 MEDICAL PHYSICS LITERATURE

Ramsdale ML, Robinson A, ISBN: 0904181723, 1994,119 pp, IPEM, York (UK).
IPEM Report No. 67 Quality Assurance in DentalRadiology, Starritt HC, Faulkner K, Wankling PF,Cranley K, Robertson J, Young K, ISBN:0904181677, 1994, 25 pp, IPEM, York (UK).
IPEM Report No. 77, Recommended Standards forRoutine Testing of Diagnostic X-Ray Imaging Sys-tems, ISBN: 0904181871, 1997, 64 pp, IPEM, York(UK).
IPEM Report No. 78, Catalogue of Diagnostic X-RaySpectra & Other Data Cranley K, Gilmore BJ,Fogarty GWA, Desponds L, ISBN: 090418188X,1997, IPEM, York (UK).
IPEM Report No. 79, The Critical Examination of X-RayGenerating Equipment in Diagnostic Radiology,ISBN: 0904181898, 1998, 17 pp, IPEM, York (UK).
Mammography Quality Control: The Why & How Book,Calvin Myers, ISBN: 0-944838-83-9, 1997, 43 pp,Medical Physics Publishing, Madison (WI).
Medical Imaging and Radiation Protection for MedicalStudents and Clinical Staff, Martin CJ, Dendy PP,Corbett RH, 2003, The British Institute of Radiology.
Practical Digital Imaging and PACS (1999 AAPM Sum-mer School), Seibert A et al., ISBN: 0-944838-92-8,1999, 577 pp, Medical Physics Publishing, Madison(WI).
Principles of Radiographic Imaging: An Art and aScience, Carlton RR, Adler A, ISBN: 0766813002,2000, 752 pp, Thomson Delmar Learning.
Radiation Exposure and Image Quality in X-Ray Diag-nostic Radiology: Physical Principles and ClinicalApplications, Aichinger H, Dierker J, Joite-BarfußS, Säbel M, ISBN: 3540442871, 2003, 212 pp,Springer, New York.
Radiology Review: Radiologic Physics, Nickoloff EL,Naveed Ahmad, ISBN: 1416022600, 2005, 272 pp,Saunders, Philadelphia.
Screen Film Mammography: Imaging Considerationsand Medical Physics Responsibilities, Gary Barnesand G. Donald Frey, ISBN: 0-944838-12-X, 1991, 127pp, Medical Physics Publishing, Madison (WI).
IMAGING
General
3D Imaging in Medicine, 2nd ed., Udupa JK, HermanGT, ISBN: 084933179X, 1999, 384 pp, CRC Press,Boca Raton (FL).
Essentials of Diagnostic Imaging, Guebert G M, PirtleOL, Yochum TR, ISBN: 0801674557, 1995, 252 pp,Mosby, Philadelphia.
Foundations of Image Science, Barrett HH, Myers K,ISBN: 0471153001, 2003, 1100 pp, Wiley, New York.
Fundamentals of Medical Imaging, Paul Suetens, ISBN:0521803624, 2002, 294 pp, Cambridge UniversityPress, New York.
Handbook of Medical Imaging, Volume 1: Physics andPsychophysics, Beutel J, Kundel HL, Van Metter RL,ISBN: 0819436216, 2000, 968 pp, SPIE.
Introduction to Biomedical Imaging, Webb AG, ISBN:0471237663, 2002, 264 pp, Wiley, New York.
Introduction To The Principles of Medical Imaging, GuyC, ISBN: 1860945023, 2005, 400 pp, Imperial CollegePress, London.
Medical Imaging 2004: Physics of Medical Imaging(SPIE Proceedings), Yaffe MJ, ISBN: 0819452815,2004, SPIE.
Medical Imaging Physics, 4th ed., Hendee WR, RitenourER, ISBN: 0-471-38226-4, 2002, 536 pp, Wiley, NewYork.
Physics for Medical Imaging, Farr RF, Allisy-RobertsPJ, ISBN: 0702017701, 1997, 276 pp, BailliereTindall.
Physics of Medical Imaging, Dobbins JT, Boone JM,ISBN: 0819427810, 1998, 842 pp, SPIE.
Principles of Imaging Science and Protection, Thomp-son MA, Hattaway MP, Hall JD, ISBN: 0721634281,1994, 522 pp, Saunders, Philadelphia.
Principles of Medical Imaging, Kirk Shung K, SmithMB, Tsui BMW, ISBN: 0126409706, 1992, 289 pp,Academic Press.
The Essential Physics of Medical Imaging, Hardbound,2nd ed., Bushberg JT, Seibert JA, Leidholdt EM Jr,Boone JM, ISBN: 0-683-30118-7, 2001, 965 pp,Lippincott.
The Physics of Diagnostic Imaging, 2nd ed., Dowsett DJ,Kenny PA, Johnston RE, ISBN: 0412460602, 2005,Hodder Headline (Arnold).
The Physics of Medical Imaging, Webb S, ISBN:0852743491, 1988, 633 pp, IOPP, Bristol (UK).
Topical
AAPM Monograph No. 11, Electronic Imaging in Med-icine, Fullerton GD, Hendee W, Lasher J, ProperzioW, Riederer S, editors, ISBN: 0-88318-454-0, 1983,484 pp, Medical Physics Publishing, Madison (WI).
AAPM Monograph No. 12, Recent Developments inDigital Imaging (1984 Summer School), Doi K, LanzlL, Lin P-J P, editors, ISBN: 0-88318-463-X, 1984,576 pp, Medical Physics Publishing, Madison (WI).
AAPM Monograph No. 25, Practical Digital Imagingand PACS (1999 AAPM Summer School), Seibert Aet al., ISBN: 0-944838-92-8, 1999, 577 pp, MedicalPhysics Publishing, Madison (WI).
Electrical Impedance Tomography: Methods, Historyand Applications, Holder DS, ISBN: 0750309520,2005, 456 pp, IOPP, Bristol (UK).
Mathematics of Medical Imaging, Epstein CL, ISBN:0130675482, 2003, 768 pp, Prentice Hall, New York.
Medical Imaging Signals and Systems, Prince JL, LinksJ, ISBN: 0130653535, 2005, 550 pp, Prentice Hall,New York.
MEDICAL PHYSICS LITERATURE 343

Wavelet Analysis with Applications to Image Proces-sing, Lakshman Prasad and S. Sitharama Iyengar,ISBN: 0849331692, 1997, 304 pp, CRC Press, BocaRaton (FL).
COMPUTERIZED TOMOGRAPHY
General
AAPM Monograph No. 6, Medical Physics of CT andUltrasound: Tissue Imaging and Characterization(1980 Summer School), Fullerton GD, Zagzebski J,editors, ISBN: 1-888340-08-8, 1980, 717 pp, MedicalPhysics Publishing, Madison (WI).
Computed Tomography: Fundamentals, System Tech-nology, Image Quality, Applications, Kalender WA,ISBN: 3-8957-8081-2, 2000, 220 pp, Advanced Med-ical Publishing, Madison (WI).
CT Physics: The Basics, Villafana T, ISBN: 0683307118,2002, 250 pp, Lippincott.
Topical
AAPM Report No. 1, Phantoms for Performance Eva-luation and Quality Assurance of CT Scanners,AAPM, ISBN: 1-888340-04-5, 1977, 23 pp, MedicalPhysics Publishing, Madison (WI).
AAPM Report No. 39, Specification and AcceptanceTesting of Computed Tomography Scanners, Diag-nostic X-Ray Imaging Committee Task Group 2;ISBN: 1-56396-230-6, 1993, 95 pp, Medical PhysicsPublishing, Madison (WI).
IPEM Report No. 32, Measurement of the PerformanceCharacteristics of Diagnostic X-Ray Systems Used inMedicine. Part III: Computed Tomography X-RayScanners, ISBN: 0904181766, 2003, 94 pp, IPEM,York (UK).
NUCLEAR MEDICINE
General
AAPM Monograph No. 10, Physics of Nuclear Medicine:Recent Advances (1983 Summer School), Rao D,Chandra R, Graham M, editors, ISBN: 0-88318-440-0, 1983, 560 pp, Medical Physics Publishing,Madison (WI).
Diagnostic Nuclear Medicine: A Physics Perspective,Hamilton DI, ISBN: 3540006907, 2004, 465 pp,Springer, New York.
Essentials of Nuclear Medicine Physics, Powsner RA,Powsner ER, ISBN: 0632043148, 1998, 199 pp,Blackwell, Cambridge (MA).
Handbook of Nuclear Medicine, Madsen M, Ponto J,ISBN: 0-944838-14-6, 1992, 114 pp, Medical PhysicsPublishing, Madison (WI).
Introductory Physics of Nuclear Medicine, RameshChandra, ISBN: 0812114426, 1992, 221 pp, Lea &Febiger, Philadelphia (PA).
Nuclear Medicine and PET: Technology and Techni-ques, Christian PE, Bernier D, Langan JK, ISBN:0323019641, 2003, 640 pp, Mosby.
Nuclear Medicine Physics: The Basics, Ramesh Chandra,ISBN: 068330092X, 1998, 182 pp, Lippincott, NewYork.
Physics in Nuclear Medicine, Cherry SR, Sorenson J,Phelps M, ISBN: 072168341X, 2003, 523 pp, Saun-ders, Philadelphia.
Practical Nuclear Medicine, 3rd ed., Sharp PF, GemmellHG, Murray AD, ISBN: 185233875X, 2005, 352 pp,Springer, New York.
Principles and Practice of Nuclear Medicine, Early PJ,Bruce D,. Sodee MD, ISBN: 0801625777, 1995,877 pp, Mosby.
Topical
AAPM Manual No. 1: Nuclear Medicine Instrumenta-tion Laboratory Exercises for Radiology ResidencyTraining, Van Tuinen R J, Grossman LW, KereiakesJG, editors, ISBN: 0-88318-0001, 1994, 81 pp, Med-ical Physics Publishing, Madison (WI).
AAPM Monograph No. 1, Biophysical Aspects of MedicalUse of Technetium-99m, Kereiakes JG, Corey KR,editors, ISBN: 1-888340-05-3, 1976, 126 pp, MedicalPhysics Publishing, Madison (WI).
AAPM Monograph No. 18, Expanding the Role of Med-ical Physics in Nuclear Medicine (1989 SummerSchool), Frey GD, Yester MV, editors, ISBN:0-883189-15-1, 1989, 368 pp, Medical Physics Pub-lishing, Madison (WI).
AAPM Report No. 6, Scintillation Camera AcceptanceTesting & Performance Evaluation, Nuclear Medi-cine Committee; ISBN: 0-88318-275-0, 1980, 23 pp,Medical Physics Publishing, Madison (WI).
AAPM Report No. 9, Computer-Aided ScintillationCamera Acceptance Testing, Nuclear MedicineCommittee Task Group; ISBN: 0-88318-407-9,1981, 40 pp, Medical Physics Publishing, Madison(WI).
AAPM Report No. 22, Rotating Scintillation CameraSPECT Acceptance Testing and Quality Control,Nuclear Medicine Committee Task Group; ISBN:0-88318-549-0, 1987, 26 pp, Medical Physics Publish-ing, Madison (WI).
AAPM Report No. 52, Quantitation of SPECT Perfor-mance (Reprinted from Medical Physics, Vol. 2, Issue4), Nuclear Medicine Committee Task Group 4;ISBN: 1-56396-485-6, 1995, 10 pp, Medical PhysicsPublishing, Madison (WI).
IPEM Report No. 65, Quality Standards in NuclearMedicine, Edited by Hart GC and Smith AH, ISBN:0904181642, 1992, 123 pp, IPEM, York (UK).
IPEM Report No. 66, Quality Control of Gamma Cam-eras & Associated Computer Systems, Hannan J,editor, ISBN: 0904181650, 1992, 62 pp, IPEM, York(UK).
344 MEDICAL PHYSICS LITERATURE

IPEM Report No. 85, Radioactive Sample Counting –Principles and Practice, Driver I, editor, ISBN:0904181995, 2002, 63 pp, IPEM, York (UK).
IPEM Report No. 86, Quality Control of Gamma CameraSystems, Bolster A, ISBN: 1903613132, 2003, 130 pp,IPEM, York (UK).
IPEM Report No. 87, Basics of Gamma Camera PositronEmission Tomography Hillel P, editor, ISBN:1903613183, 2004, 73 pp, IPEM, York (UK).
Positron Emission Tomography: Basic Sciences,Bailey DL, Townsend DW, Valk PE, Maisey MN,ISBN: 1852337982, 2005, 382 pp, Springer, NewYork.
Principles and Practice of Positron Emission Tomogra-phy, Wahl RL, ISBN: 0781729041, 2002, 442 pp,Lippincott, New York.
Therapeutic Applications of Monte Carlo Calculationsin Nuclear Medicine, Habib Zaidi, ISBN:0750308168, 2003, 363 pp, IOPP, Bristol (UK).
MAGNETIC RESONANCE IMAGING AND SPECTROSCOPY
General
AAPM Monograph No. 14, NMR in Medicine: TheInstrumentation and Clinical Applications (1985Summer School), Thomas SR, Dixon RL, editors,ISBN: 0-88318-497-4, 1985 595 pp, Medical PhysicsPublishing, Madison (WI).
AAPM Monograph No. 21, The Physics of MRI, MichaelBronskill, Sprawls P, editor, ISBN: 1-563962-05-5,1992, 784 pp, Medical Physics Publishing, Madison(WI).
Magnetic Resonance Imaging: Physical Principles andSequence Design, Haacke EM et al., ISBN:0471351288, 1999, 914 pp, John Wiley & Sons,Inc., New York.
Magnetic Resonance Imaging: Principles, Methods, andTechniques, Sprawls P, ISBN: 0-944838-97-9, 2000,200 pp, Medical Physics Publishing, Madison (WI).
Magnetic Resonance Imaging: Theory and Practice,Vlaardingerbroek MT, Den Boer JA, ISBN:3540600809, 1996, 347 pp, Springer, New York.
Magnetic Resonance in Medicine, 4th ed., Peter Rinck,ISBN: 0632059869, 2001, 245 pp, Blackwell.
Non-Mathematical Approach to Basic MRI, Smith H,Ranallo F, ISBN: 0-944838-02-2, Published: 1989,203 pp, Medical Physics Publishing, Madison (WI).
Topical
AAPM Report No. 20, Site Planning for Magnetic Reso-nance Imaging Systems, Nuclear Magnetic Reso-nance Committee Task Group 2; ISBN: 0-88318-530-X, 1986, 60 pp, Medical Physics Publishing,Madison (WI).
AAPM Report No. 28, Quality Assurance Methods andPhantoms for Magnetic Resonance Imaging (Rep-rinted from Medical Physics, Vol. 17, Issue 2),
Nuclear Magnetic Resonance Committee Task Group1, ISBN: 0-88318-800-7, 1990, 9 pp, Medical PhysicsPublishing, Madison (WI).
AAPM Report No. 34, Acceptance Testing of MagneticResonance Imaging Systems (Reprinted from Medi-cal Physics, Vol. 19, Issue 1), Nuclear MagneticResonance Committee Task Group 6; ISBN:1-56396-028-1, 1992, 13 pp, Medical Physics Publish-ing, Madison (WI).
AAPM Report No. 77, Practical Aspects of FunctionalMRI, Nuclear Medicine Committee Task Group 8,ISBN: 1-888340-37-1, 2002, 22 pp, Medical PhysicsPublishing, Madison (WI).
AAPM Report No. 78, Proton Magnetic Resonance Spec-troscopy in the Brain, Magnetic Resonance TaskGroup 9, ISBN: 1-888340-38-X, 2002, 21 pp, MedicalPhysics Publishing, Madison (WI).
Handbook of MRI Pulse Sequences, Matt Bernstein,Kevin King, Xiaohong Joe Zhou, ISBN:0120928612, 2004, 1040 pp, Academic Press.
Introduction to Functional Magnetic Resonance Ima-ging: Principles and Techniques, Buxton RB, ISBN:0521581133, 2001, 536 pp, Cambridge UniversityPress, New York.
IPEM Report No. 80, Quality Control in Magnetic Reso-nance Imaging, RA Lerski, J De Wilde, D Boyce and JRidgeway, ISBN: 0904181901, 1999, 50 pp, IPEM,York (UK).
Principles of Magnetic Resonance Imaging: A SignalProcessing Perspective, Liang Z-P, Lauterbur PC,ISBN: 0780347234, 1999, 416 pp, Wiley, New York.
ULTRASOUND PHYSICS
General
AAPM Monograph No. 6, Medical Physics of CT andUltrasound: Tissue Imaging and Characterization(1980 Summer School), Fullerton GD, Zagzebski J,editors, ISBN: 1-888340-08-8, 1980, 717 pp, MedicalPhysics Publishing, Madison (WI).
Advances in Ultrasound Techniques and Instrumenta-tion, Wells PNT, ISBN: 0443088535, 1993, 192 pp,Saunders, Philadelphia.
Clinical Ultrasound Physics: A Workbook for Physicists,Residents, and Students, Kofler JMJr, et al., ISBN:1-930524-06-4a, 2001, 85 pp, Medical Physics Pub-lishing, Madison (WI).
Diagnostic Ultrasound: Physics and Equipment,Hoskins P, Thrush A, Martin K, Whittingam T,Hoskins PR, Thrush A, Whittingham T, ISBN:1841100420, 2002, 208 pp, Cambridge UniversityPress, New York.
Essentials of Ultrasound Physics, Zagzebski J A, ISBN:0815198523, 1996, 220 pp, Mosby.
Physical Principles of Medical Ultrasonics, Hill CR,Bamber JC, ter Haar GR, ISBN: 0471970026,2002, 528 pp, Wiley, New York.
MEDICAL PHYSICS LITERATURE 345
Physics and Instrumentation of Diagnostic MedicalUltrasound, Fish P, ISBN: 0471958956, 2005, 250pp, Wiley, New York.
Principles and Applications of Ultrasound, LangtonCM, ISBN: 0750308052, 2005, 252 pp, IOPP, Bristol(UK).
The Physics of Clinical MR Taught Through Images,Runge VM, Nitz WR, Schmeets SH, Faulkner WH,Desai NK, ISBN: 1588903222, 2004, 221 pp, ThiemeMed. Pub.
Ultrasound in Medicine, Duck FA, Baker AC, StarrittHC, editors, ISBN: 0750305932, 1998, 314 pp, IOPP,Bristol (UK).
Ultrasound Physics Mock Exam, Owen CA, ZagzebskiJA, ISBN: 0941022633, 2004, Davies, Inc.
Topical
AAPM Report No. 8, Pulse Echo Ultrasound ImagingSystems: Performance Tests and Criteria, GeneralMedical Physics Committee Ultrasound Task Group;ISBN: 0-88318-283-1, 1980, 73 pp, Medical PhysicsPublishing, Madison (WI).
AAPM Report No. 65, Real-Time B-Mode Ultra-sound Quality Control Test Procedures (Reprintedfrom Medical Physics, Vol. 25, Issue 8),Ultrasound Task Group 1; ISBN: 1-888340-22-3,1998, 22 pp, Medical Physics Publishing, Madison(WI).
Basic Doppler Physics, Smith H, Zagzebski J, ISBN:0-944838-15-4, 1991, 136 pp, Medical Physics Pub-lishing, Madison (WI).
Doppler Ultrasound: Physics, Instrumental, and Clin-ical Applications, 2nd ed., Evans DH, McDickenWN, ISBN: 0471970018, 2000, 456 pp, Wiley, NewYork.
IPEM Report No. 70, Testing of Doppler UltrasoundEquipment, Hoskins PR, Sherriff SB, Evans JA,ISBN: 0904181715, 1994, 136 pp, IPEM, York(UK).
IPEM Report No. 71, Routine Quality Assurance ofUltrasound Imaging Systems ISBN: 0904181820,1995, 66 pp, IPEM, York (U.K.).
IPEM Report No. 84, Guidelines for the Testing andCalibration of Physiotherapy Ultrasound Machines,Pye S, Zequiri B, ISBN: 0904181987, 2001, 67 pp,IPEM, York (UK).
Safety of Diagnostic Ultrasound, Barnett SB, Kossoff G,editors, ISBN: 1850706468, 1997, 147 pp, Taylor &Francis.
The Safe Use of Ultrasound in Medical Diagnosis, terHaar G, Duck FA, ISBN 0-905749-42-1, 2000, 120 pp,British Medical Ultrasound Society and British Insti-tute of Radiology, London (UK).
Three-Dimensional Ultrasound, Downey B, Pre-torius DH, Fenster A, ISBN: 0-7817-1997-6, 1999,272 pp, Lippincott Williams & Wilkins, Philadel-phia.
LIGHT AND LASERS
General
AAPM Report No. 3, Optical Radiations in Medicine: ASurvey of Uses, Measurement and Sources, AAPM,ISBN: 1-888340-06-1, 1977, 28 pp, Medical PhysicsPublishing, Madison (WI).
An Introduction to Biomedical Optics, Splinter R, ISBN:0750309385, 2005, 350 pp, IOPP, Bristol (UK).
Applied Laser Medicine, Breuer H, Krasner N, OkunataT, Sliney D, Berlien H-P, Müller GJ, ISBN:354067005X, 2004, 740 pp, Springer, New York.
Laser-Tissue Interactions: Fundamentals and Applica-tions, Niemz MH, ISBN: 3540405534, 2003, 305 pp,Springer, New York.
Light, Visible and Invisible, and Its Medical Applica-tions, Newing A, ISBN: 1860941648, 1999, 212 pp,World Scientific, River Edge (NJ).
Topical
AAPM Report No. 57, Recommended Nomenclature forPhysical Quantities in Medical Applications of Light,General Medical Physics Committee Task Group 2;ISBN: 1-888340-02-9, 1996, 6 pp, Medical PhysicsPublishing, Madison (WI).
AAPM Report No. 73, Medical Lasers: Quality Control,Safety, Standards, and Regulations, Task Group 6,ISBN: 1-888340-31-2, 2001, 68 pp, Medical PhysicsPublishing, Madison (WI).
IPEM Report No. 76, Ultraviolet and Blue-Light Photo-therapy-Principles, Sources, Dosimetry and Safety,Diffey B, Hart G, ISBN: 0904181863, Published:1997, 56 pp, IPEM, York (U.K.).
Laser Safety, Henderson R, ISBN: 0750308591, 2003,480 pp, IOPP, Bristol (U.K.).
Laser Systems for Photobiology and Photomedicine,Chester AN, Martellucci S, Scheggi AM, ISBN:0306438860, 1991, 311 pp, Plenum, New York.
Ultraviolet Radiation in Medicine, Diffey BL, ISBN:0852745354, 1982, 172 pp, IOPP, Bristol (U.K.).
RADIATION PROTECTION
General
Atoms, Radiation, and Radiation Protection, 2nd ed.,Turner JE, ISBN: 0-471-59581-0, 1995, 576 pp,Wiley, New York.
Basic Health Physics: Problems and Solutions,Bevelacqua J, ISBN: 0471297119, 1999, 559 pp,Wiley, New York.
Basic Radiation Protection Technology (2nd edition),Gollnick DA, ISBN: 0916339033, 1988, Pacific Radia-tion Corp.
Contemporary Health Physics: Problems and Solutions,Bevelacqua J, ISBN: 0471018015, 1995, 456 pp,Wiley, New York.
346 MEDICAL PHYSICS LITERATURE
CRC Handbook of Management of Radiation ProtectionPrograms, 2nd ed., Miller KL, ISBN: 0849337704,1992, 496 pp, CRC Press, Boca Raton (FL).
Exposure Criteria for Medical Diagnostic Ultrasound:2. Criteria Based on All Known Mechanisms(NCRP Report, No. 140), ISBN: 0929600738, 2003,NCRP.
Handbook of Health Physics and Radiological Health,Shleien B, Slaback LA Jr, Birky B, ISBN:0683183346, 1997, 700 pp, Lippincott.
Introduction to Health Physics, 3rd ed., Cember H,ISBN: 00-71054618, 1996, 731 pp, McGraw-Hill,New York.
Medical Effects of Ionizing Radiation, 2nd ed., MettlerFA Jr, Upton AC, ISBN: 0721666469, 1995, 440 pp,Elsevier.
Physics for Radiation Protection, Martin JE, ISBN:0-471-35373-6, 2000, 713 pp, Wiley, New York.
Practical Radiation Protection and Applied Radio-biology, 2nd ed., Dowd SB, Tilson ER, editors,ISBN: 0721675239, 1999, 368 pp, Saunders, NewYork.
Practical Radiation Protection in Healthcare, MartinCJ, Sutton DG, editors, ISBN: 0192630822, 2002,440 pp, Oxford University Press, New York.
Radiation Protection, Seeram E, Travis E, ISBN: 0-397-55032-4, 1996, 320 pp, Lippincott.
Radiation Protection, Kathren RL, ISBN: 0852745540,1985, 212 pp, IOPP, Bristol (UK).
Radiation Protection, Hallenbeck WH, ISBN:0873719964, 1994, 288 pp, CRC Press, Boca Raton(FL).
Radiation Protection: A Guide for Scientists and Phy-sicians, Shapiro J, ISBN: 0674745868, 1990, 494 pp,Harvard University Press, Cambridge (MA).
Radiofrequency Radiation Standards: BiologicalEffects, Dosimetry, Epidemiology, and Public HealthPolicy, Klauenberg BJ, Grandolfo M, Erwin DN,ISBN: 0306449196, 1995, 476 pp, Kluwer, Norwell(MA).
Topical
AAPM Proceedings No. 4, Radiotherapy Safety,Thomadsen B, editor, ISBN: 0-88318-443-5, Pub-lished: 1984, 169 pp, Medical Physics Publishing.Madison (WI).
AAPM Report No. 19, Neutron Measurements AroundHigh Energy X-Ray Radiotherapy Machines, Radia-tion Therapy Committee Task Group 27, ISBN:0-88318-518-0, 1986, 34 pp, Medical Physics Publish-ing. Madison (WI).
AAPM Report No. 25, Protocols for the Radiation SafetySurveys of Diagnostic Radiological Equipment, Diag-nostic X-Ray Imaging Committee Task Group 1;ISBN: 0-88318-574-1, 1988, 55 pp, Medical PhysicsPublishing. Madison (WI).
AAPM Report No. 35, Recommendations on Perfor-mance Characteristics of Diagnostic Exposure
Meters (Reprinted from Medical Physics, Vol. 19,Issue 1), Diagnostic X-Ray Imaging Committee TaskGroup 6; ISBN: 1-56396-029-X, 1992, 11 pp, MedicalPhysics Publishing. Madison (WI).
Exposure of the Pregnant Patient to Diagnostic Radia-tions, Wagner L, et al., ISBN: 0-944838-72-3, 1997,259 pp, Medical Physics Publishing, Madison(WI).
How Clean is Clean, How Safe is Safe? Eisenbud M,ISBN: 0-944838-33-2, 1993, 63 pp, Medical PhysicsPublishing. Madison (WI).
IPEM Report No. 50, Chernobyl: Response of MedicalPhysics Departments in the UK, Haywood JK,editor, ISBN: 0904181456, 1986, 99 pp, IPEM, York(UK).
IPEM Report No. 63, Radiation Protection in NuclearMedicine & Pathology Goldstone KE, Jackson PC,Myers MJ, Simpson A E, editors, ISBN: 0904181626,1991, 190 pp, IPEM, York (UK).
IPEM Report No. 69, Recommendations for the Pre-sentation of Type Test Data for Radiation Protec-tion Instruments in Hospitals, The RadiationProtection Instrument Calibration Working Partyof the IPEM, ISBN: 0904181707, 1994, 12 pp, IPEM,York (UK).
IPEM Report No. 72, Safety in Diagnostic Radiology,ISBN: 904181812, 1995, 119 pp, IPEM, York (UK).
IPEM Report No. 75, The Design of Radiotherapy Treat-ment Room Facilities, Stedeford B, Morgan HM,Mayles WPM, ISBN: 1903613855, 1997, 161 pp,IPEM, York (UK).
IPEM Report No. 82, Cost-Effective Methods of PatientDose Reduction in Diagnostic Radiology, ISBN:0904181944, 2001, 50 pp, IPEM, York (UK).
IPEM Report No. 88, Guidance on the Establishmentand Use of Diagnostic Reference Levels for MedicalX-Ray Examinations, ISBN: 1903613205, 2004, 44pp, IPEM, York (UK).
Management and Administration of Radiation SafetyPrograms (HPS 1998 Summer School), CharlesRoessler, ISBN: 0-944838-01-4, 1998, 603 pp, Medi-cal Physics Publishing, Madison (WI).
Public Protection from Nuclear, Chemical, and Biologi-cal Terrorism, Brodsky A, Johnson RH, Goans RE,editors, ISBN: 1-930524-23-4, Published: July 2004,872 pp, Medical Physics Publishing, Madison (WI).
Radiation Injuries, Gooden D, ISBN: 33333, 1991, 239pp, Medical Physics Publishing, Madison (WI).
Radiation Protection Dosimetry: A Radical Reappraisal,Simmons J, Watt D, ISBN: 0-944838-87-1, 1999, 160pp, Medical Physics Publishing, Madison (WI).
Radiation Protection in Medical Radiography,Statkiewicz Sherer MA, Visconti PJ, Ritenour RE,ISBN: 0323014526, 2002, 336 pp, Mosby.
Radiation Safety and ALARA Considerations for the21st Century, HPS Midyear Symposium, 2001,ISBN: 1-930524-02-1, 2001, 280 pp, Medical PhysicsPublishing. Madison (WI).
MEDICAL PHYSICS LITERATURE 347

Shielding Techniques for Radiation Oncology Facilities,2nd ed., McGinley PH, ISBN: 1-930524-07-2, 2002,184 pp, Medical Physics Publishing. Madison (WI).
Subject Dose in Radiological Imaging, Ng K-H, BradleyDA, Warren-Forward HM, ISBN: 0-444-82989-x,1998, Elsevier.
The Invisible Passenger, Radiation Risks for PeopleWho Fly, Barish RJ, ISBN: 188352606X, 1999, 119pp, Advanced Medical Publishing, Madison (WI).
University Health Physics, Belanger R, Papin PJ, edi-tors, ISBN: 1-930524-15-3, 2003, 408 pp, MedicalPhysics Publishing. Madison (WI).
RADIATION MEASUREMENTS
General
Applications of New Technology: External Dosimetry,Higginbotham JF, ISBN: 0-944838-68-5, 1996, 464pp, Medical Physics Publishing, Madison (WI).
Fundamentals of Radiation Dosimetry, Green S, ISBN:075030913x, 2005, 275 pp, IOPP, Bristol (UK).
Medical Radiation Detectors: Fundamental and AppliedAspects, Kember NF, ISBN: 0750303190, 1994, 236pp, IOPP, Bristol (UK).
Radiation Detection and Measurement, 3rd ed., KnollGF, ISBN: 0-471-07338-5, 1999, 816 pp, Wiley, NewYork.
Radiation Dosimetry: Physical and Biological Aspects,Orton CG, ISBN: 0306420562, 1986, 344 pp, Plenum,New York.
Radiation Instruments, Cember H, ISBN: 1-930524-03-X, 2001, 472 pp, Medical Physics Publishing,Madison (WI).
Topical
A Procedural Guide to Film Dosimetry, Yeo IJ, Kim JO,ISBN: 1-930524-19-6, 2004, 65pp, Medical PhysicsPublishing, Madison (WI).
AAPM Proceedings No. 11, Kilovoltage X-Ray Dosime-try for Radiotherapy and Radiobiology, Ma C-M,Seuntjens J, editors, ISBN: 1-888340-16-9, 1998,220 pp, Medical Physics Publishing, Madison(WI).
AAPM Proceedings No. 13, Recent Developments inAccurate Radiation Dosimetry, Seuntjens JP, MobitPN, editors, ISBN: 1-930524-12-9, 2002, 353 pp,Medical Physics Publishing, Madison (WI).
AAPM Report No. 12, Evaluation of Radiation ExposureLevels in Cine Cardiac Catheterization Laboratories,Diagnostic Radiology Committee Cine Task Force;ISBN: 0-88318-439-7, 1984, 28 pp, Medical PhysicsPublishing, Madison (WI).
AAPM Report No. 63, Radiochromic Film Dosimetry(Reprinted from Medical Physics, Vol. 25, Issue11), Radiation Therapy Committee Task Group 55;ISBN: 1-888340-20-7, 1998, 23 pp, Medical PhysicsPublishing, Madison (WI).
Instrumentation, Measurements and Electronic Dosi-metry, (HPS Midyear 2000) ISBN: 0-944838-93-6,2000, 271 pp, Medical Physics Publishing, Madison(WI).
Internal Radiation Dosimetry (1994 HPS SummerSchool), Raabe O, ISBN: 0-944838-47-2, 1994,667 pp, Medical Physics Publishing, Madison(WI).
Microdosimetry and Its Applications, Rossi HH, ZaiderM, ISBN: 3540585419, 1996, 321 pp, Springer, NewYork.
Practical Applications of Internal Dosimetry, Bolch WE,editor, ISBN: 1-930524-09-9, 2002, 480 pp, MedicalPhysics Publishing, Madison (WI).
RADIATION BIOLOGY
General
An Introduction to Radiobiology, Nias AHW, ISBN:0471975907, 1998, 400 pp, Wiley, New York.
Basic Clinical Radiobiology, Steel GG, ISBN:0340807830, 2002, 266 pp, Edward Arnold, London.
Biological Risks of Medical Irradiations, Fullerton G,ISBN: 0883182793, 1987, 335 pp, American Instituteof Physics, New York.
Effects of Atomic Radiation, Schull WJ, ISBN:0471125245, 1995, 97 pp, Wiley, New York.
Handbook of Radiobiology, Prasad KN, ISBN:0849325013, 1995, 352 pp, CRC Press, Boca Raton(FL).
Primer of Medical Radiobiology, Travis E, ISBN:0815188374, 1989, 302 pp, Mosby, Philadelphia.
Radiobiology for the Radiologist, 5th ed., Hall E J, ISBN:0-7817-2649-2, 2000, 608 pp, Lippincott.
Topical
A Compilation of Radiobiology Practice Examinationsfor Residents in Diagnostic Radiology and RadiationOncology, Chapman JD, Shahabi S, Chapman BA,ISBN: 1 883526 09 4, 2000, 163 pp, Advanced MedicalPublishing, Madison (WI).
AAPM Proceedings No. 7, Prediction of Responsein Radiation Therapy: Analytical Models andModelling, Paliwal B et al., ISBN: 0-883186-24-1,1989, 757 pp, Medical Physics Publishing, Madison(WI).
AAPM Proceedings No. 9, Prediction of Response inRadiation Therapy: Radiosensitivity, Repopulation,Paliwal BR, Herbert D, Fowler JF, Kinsella TJ,editors, ISBN: 1-56396-271-3, 1993, 383 pp, MedicalPhysics Publishing, Madison (WI).
AAPM Proceedings No. 10, Volume & Kinetics inTumor Control & Normal Tissue Complications:5th International Conference on Dose, Time,and Fractionation in Radiation Oncology, PaliwalBR, Herbert D, editors, ISBN: 1-888340-11-8, 1998,483 pp, Medical Physics Publishing, Madison(WI).
348 MEDICAL PHYSICS LITERATURE
AAPM Report No. 18, A Primer on Low-Level IonizingRadiation and Its Biological Effects, BiologicalEffects Committee; ISBN: 0-88318-514-1, 1986,103 pp, Medical Physics Publishing, Madison(WI).
AAPM Report No. 43, Quality Assessment and Improve-ment of Dose Response Models: Some Effects of StudyWeaknesses on Study Findings, Biological EffectsCommittee Task Group 1; ISBN: 0-944838-45-6,1993, 351 pp, Medical Physics Publishing, Madison(WI).
Applied Radiobiology and Bioeffect Planning, Wigg D,ISBN: 1-930524-05-6, 2001, 486pp, Medical PhysicsPublishing, Madison (WI).
Biological Models and Their Applications inRadiation Oncology, Olsen KJ, ISBN: 10883526-03-5, 1994, 61 pp, Advanced Medical Publishing,Madison (WI).
BJR Supplement 26: Chronic Irradiation: Tolerance andFailure in Complex Biological Systems, 2002, TheBritish Institute of Radiology.
Health Effects of Exposure to Low-level Ionizing Radia-tion, Hendee WR, Edwards FM, editors, ISBN:0750303492, 1996, 640 pp, IOPP, Bristol (UK).
Health Effects of Exposure to Low Levels of IonizingRadiation: BEIR V, National Research Council,ISBN: 0309039959, 1989, 436 pp, National Acade-mies Press.
Physics and Radiobiology of Nuclear Medicine, GopalSaha, 2nd ed., ISBN: 0387950214, 2003, 253 pp,Springer, New York.
Prediction of Tumor Treatment Response, ChapmanDJ, Peters LJ, Withers RH, ISBN: 0080346898,1989, 336 pp, Elsevier.
Radiation Oncology – Radiobiological and PhysiologicalPerspectives, Awwad H K, ISBN: 0792307836, 1990,688 pp, Kluwer, Norwell (MA).
The Radiation Biology of the Vascular Endothelium,Rubin DB, ISBN: 0849348404, 1997, 272 pp, CRCPress, Boca Raton (FL).
RADIOLOGICAL PHYSICS FOR RADIOLOGICALTECHNOLOGISTS
General
Introduction to Radiologic Sciences and Patient Care,3rd ed., Adler AM, Carlton RR, ISBN 0721697828,2003, 520 pp, Saunders, Philadelphia.
Radiologic Physics and Radiographic Imaging,Bushong SC, ISBN: 0323032648, 2004, Mosby,Philadelphia.
Radiologic Science for Technologists: Physics, Biologyand Protection, Bushong SC, ISBN: 0323025552,2004, 704 pp, Mosby.
The Fundamentals of X-Ray and Radium Physics,Joseph Selman, ISBN: 0398058709, 1994, 637 pp,Charles C. Thomas.
Topical
Magnetic Resonance Imaging: Physical and BiologicalPrinciples, Bushong SC, ISBN: 0323014852, 2003,528 pp, Mosby, Philadelphia.
MRI for Technologists, Woodward P, ISBN:0071353186, 2000, 408 pp, McGraw-Hill, New York.
Principles and Practice of Radiation Therapy,Washington CM, Leaver D, ISBN: 0323017487,2004, 992 pp, Elsevier, New York.
Rad Tech’s Guide to Mammography: Physics, Instru-mentation, and Quality Control, Jacobson DR,Seeram E, ISBN: 0632044993, 2001, 120 pp, Black-well.
Radiation Protection: Essentials of Medical ImagingSeries, Stewart C. Bushong, ISBN: 0070120137,1998, 288 pp, McGraw-Hill, New York.
The Basic Physics of Radiation Therapy, Selman J,ISBN: 0398056854, 1990, 749 pp, Charles C. Thomas.
The Fundamentals of Imaging Physics and Radiobiol-ogy for the Radiologic Technologist, Selman J, ISBN:0398069875, 2000, 484 pp, Charles C. Thomas.
MATHEMATICS AND STATISTICS
AAPM Monograph No. 13, Multiple Regression Analy-sis: Applications in the Health Sciences, Herbert DE,Meyers R H, editors, ISBN: 0-88318-490-7, 1984, 598pp, Medical Physics Publishing, Madison (WI).
Chaos and the Changing Nature of Science and Medi-cine: An Introduction, Herbert D, editor, ISBN:1-56396-442-2, 1995, American Institute of Physics,New York.
Mathematical and Computer Modeling of PhysiologicalSystems, Rideout V, ISBN: 0-13-563354-0, 1991, 155pp, Prentice Hall, New York.
COMPUTERS
General
AAPM Monograph No. 17, Computers in Medical Phy-sics (1988 Summer School), Benedetto A R, HuangHK, Ragan DP, editors, ISBN: 0-88318-802-3, 1988,417 pp, Medical Physics Publishing, Madison (WI).
Topical
AAPM Report No. 10, A Standard Format for DigitalImage Exchange, Task Force on Digital Image DataExchange of the Science Council; ISBN: 0-88318-408-7, 1982, 11 pp, Medical Physics Publishing,Madison (WI).
AAPM Report No. 30, E-Mail and Academic ComputerNetworks, Computer Committee Task Group 1,ISBN: 0-88318-806-6, 1990, 54 pp, Medical PhysicsPublishing, Madison (WI).
PACS: Basic Principles and Applications, Huang HK,ISBN: 0471253936, 1998, 519 pp, Wiley, New York.
MEDICAL PHYSICS LITERATURE 349

PUBLIC EDUCATION
AAPM Report No. 53, Radiation Information for Hospi-tal Personnel, Radiation Safety Committee; ISBN:1-56396-480-5, 1995, 24 pp, Medical Physics Publish-ing, Madison (WI).
Cancer Patient’s Guide to Radiation Therapy, SteevesR, ISBN: 0-944838-26-X, 1991, 87 pp, Medical Phy-sics Publishing, Madison (WI).
Radiation and Health, Thormod Henrikson, H. DavidMaillie, David H. Maillie, ISBN: 0415271622, 2002,240 pp, Taylor & Francis.
MEDICAL PHYSICS EDUCATIONAL ANDPROFESSIONAL ISSUES
AAPM Monograph No. 27, Accreditation Programs andthe Medical Physicist: 2001 AAPM Summer SchoolProceedings, Dixon R, Butler P, Sobol W, editors,ISBN: 1-930524-04-8, 2001, 364 pp. Medical PhysicsPublishing, Madison (WI).
AAPM Report No. 33, Staffing Levels and Responsibil-ities of Physicists in Diagnostic Radiology, Diagnos-tic X-Ray Imaging Committee Task Group 5; ISBN:0-88318-913-5, 1991, 30 pp, Medical Physics Publish-ing, Madison (WI).
AAPM Report No. 36, Essentials and Guidelines forHospital Based Medical Physics Residency TrainingPrograms, Presidential Ad Hoc Committee on Clin-ical Training of Radiological Physicists; ISBN:1-56396-032-X, 1990, 147 pp, Medical Physics Pub-lishing, Madison (WI).
AAPM Report No. 38, The Role of a Physicist in Radia-tion Oncology, Professional Information and ClinicalRelations Committee Task Group 1; ISBN: 1-56396-229-2, 1993, 12 pp, Medical Physics Publishing,Madison (WI).
AAPM Report No. 42, The Role of the Clinical MedicalPhysicist in Diagnostic Radiology, Professional Infor-mation and Clinical Relations Committee; ISBN:1-56396-311-6, 1994, 20 pp, Medical Physics Publish-ing, Madison (WI).
AAPM Report No. 64, A Guide to the Teaching ofClinical Radiological Physics to Residents in Diag-nostic and Therapeutic Radiology, Committee on theTraining of Radiologists; ISBN: 0-944838-09-X,1999, 32 pp, Medical Physics Publishing, Madison(WI).
AAPM Report No. 79, Academic Program Recommenda-tions for Graduate Degrees in Medical Physics,Education and Training of Medical Physicists Com-mittee, ISBN: 1-888340-39-8, 2002, 72 pp, MedicalPhysics Publishing, Madison (WI).
AAPM Report No. 80, The Solo Practice of MedicalPhysics in Radiation Oncology, Professional Infor-mation and Clinical Relations Committee TaskGroup 11, ISBN: 1-888340-41-X, 2003, 18 pp, MedicalPhysics Publishing, Madison (WI).
Current Regulatory Issues in Medical Physics, MartinM, Smathers J, ISBN: 0-944838-29-4, 1992, 458 pp,Medical Physics Publishing, Madison (WI).
Medical Physicists and Malpractice, Shalek R, GoodenD, ISBN: 0-944838-64-2, 1996, 140 pp, Medical Phy-sics Publishing, Madison (WI).
RADIATION PHYSICS
AAPM Proceedings No. 8, Biophysical Aspects of AugerProcesses, Howell RW, Narra V, Sastri K, Rap D,editors, ISBN: 1-56396-095-8, 1992, 418 pp, MedicalPhysics Publishing, Madison (WI).
AAPM Report No. 37, Auger Electron Dosimetry (Rep-rinted from Medical Physics, Vol. 19, Issue 6),Nuclear Medicine Committee Task Group 6; ISBN:1-56396-186-5, 1992, 25 pp, Medical Physics Publish-ing, Madison (WI).
AAPM Report No. 49, Dosimetry of Auger-Electron-Emitting Radionuclides (Reprinted from MedicalPhysics, Vol. 21, Issue 12), Nuclear Medicine Com-mittee Task Group 6; ISBN: 1-56396-451-1, 1994, 15pp, Medical Physics Publishing, Madison (WI).
Bluebells and Nuclear Energy, Reynolds A, ISBN: 0-944838-63-4, 1996, 302 pp, Medical Physics Publish-ing, Madison (WI).
Chernobyl Record: The Definitive History of the Cher-nobyl Catastrophe, Mould RF, 075030670x, 2000,350 pp, IOPP, Bristol (UK).
My Life with Radiation, Ralph Lapp, ISBN: 0-944838-52-9, 1995, 168 pp, Medical Physics Publishing,Madison (WI).
Radiological Physicists, del Regato JA, ISBN: 0-88318-469-9, 1985, 188 pp, Medical Physics Publishing,Madison (WI).
Understanding Radiation, Wahlstrom B, ISBN:0-944838-62-6, 1996, 120 pp, Medical Physics Pub-lishing, Madison (WI).
Medical Physics Online Resources
Electronic Medical Physics World, InternationalOrganization for Medical Physics (http://www.medphysics.wisc.edu/�empw).
Medical Physics World, International Organization forMedical Physics (http://www.iomp.org); also avail-able in hardcopy.
Global Online Medical Physics Book (http://www.iomp.org).
Organizations That Publish in Medical Physics
American Association of Physicists in Medicine(AAPM), One Physics Ellipse, College Park, MD20740 (http://www.aapm.org).
American Institute of Physics, 2 Huntington Quadran-gle, Melville, NY 11747-4502 (http://aip.org).
American Institute of Ultrasound in Medicine, 14750Sweitzer Lane, Suite 100, Laurel, MD 20707 (http://www.aium.org).
350 MEDICAL PHYSICS LITERATURE

American Roentgen Ray Society, 44211 Slatestone Court,Leesburg, VA 20176-5109 (http://www.arrs.org).
American Society for Therapeutic Radiology and Oncol-ogy, 12500 Fair Lakes Circle, Suite 375, Fairfax, VA22033-3882 (http://www.astro.org).
British Institute of Radiology, 36 Portland Place,London, W1B 1AT, (http://www.bir.org.uk).
Health Physics Society, 1313 Dolley Madison Boulevard,Suite 402, McLean, Virginia 22101 (http://hps.org).
Institute of Physics and Engineering in Medicine(IPEM), Fairmount House, 230 Tadcaster Road,York, YO24 1ES, UK (http://www.ipem.ac.uk).
International Atomic Energy Agency, P.O. Box 100,Wagramer Strasse 5, A-1400 Vienna, Austria(http://www.iaea.org).
International Commission on Radiation Units and Mea-surements, Inc., ICRU, 7910 Woodmont Avenue,Suite 400, Bethesda, MD 20814-3095, USA (http://www.icru.org).
International Commission on Radiological Protection,SE-171 16 Stockholm Sweden (Elsevier).
International Society for Magnetic Resonance in Med-icine, 2118 Milvia Street, Suite 201, Berkeley, CA94704, USA (http://www.ismrm.org).
International Society for Optical Engineering (SPIE),PO Box 10, Bellingham WA 98227-0010 USA (http://spie.org).
National Council on Radiation Protection and Measure-ments, 7910 Woodmont Avenue, Suite 400, Bethesda,MD 20814-3095 (http://www.ncrponline. org).
Radiation Research Society, 10105 Cottesmore Court,Great Falls, VA 22066 (http://www.radres.org).
Radiological Society of North America, Inc., 820 JorieBoulevard, Oak Brook, IL 60523-2251 (http://rsna.org).
Society of Nuclear Medicine, 1850 Samuel Morse Dr.Reston, VA 20190 (http://snm.org).
See also BIOMEDICAL ENGINEERING EDUCATION; MEDICAL EDUCATION,COMPUTERS IN; MEDICAL ENGINEERING SOCIETIES AND ORGANIZATIONS.
MEDICAL RECORDS, COMPUTERS IN
YESHWANTH SRINIVASAN
BRIAN NUTTER
Texas Tech UniversityLubbock, Texas
INTRODUCTION
Computers play a vital role in almost every aspect ofmodern medical science. If we begin with a primitivedefinition of a computer, as a system with a processor unitcapable of performing arithmetic and logical operationsand a memory unit to store programs and data, then almostevery sophisticated piece of modern medical equipmentcomes with a computer. Most standard medical procedures[e.g., magnetic resonance imaging (MRI), computed tomo-
graphy (CT), positron emission tomography (PET), ultra-sonography] use computers to record and to process data.Computer-based medical records would seem a naturalchoice for documentation of the recorded data. Moreover,the association of this data with computers presentsnumerous advantages including easy and random accessto the data by multiple distributed users, globally search-able databases, and automated batch processing. However,the use of computer-based medical records is not as pre-valent in today’s medical community as one would expect.In this article, we explain the reasons for this anomaly, andwe present methods to circumvent the problems associatedwith computer-based medical records and to allow medicalpractitioners to achieve the real potential of computer-based systems.
PAPER-BASED MEDICAL RECORD SYSTEMS
Medical records chronicle the transactions between health-care professionals and their patients. They record everydetail of a patient’s visit to a hospital, clinic, or office fromthe time of the patient’s arrival to the time the patient isdischarged. Details recorded include the condition of thepatient at the time of examination, procedures and med-ications administered to the patient, symptoms and obser-vations, diagnoses and test results, together with the exacttime of each relevant activity.
Traditionally, medical records have consisted of hand-written documents called charts. This remains the mostprevalent form of recording patient information, especiallyin small hospitals and clinics. These charts typically recordevery piece of information that is judged potentially rele-vant to a patient’s case. When a patient visits a hospital or aprimary care physician for the first time, a new chart ismade, and the patient name and contact information arerecorded on it. When the patient is discharged from thehospital, a discharge note is made on the chart. Duringsubsequent visits, new charts are added. All patient chartsare maintained in a labeled file bearing the patient’s nameand other information to enable easy identification andretrieval.
However, paper-based records exhibit shortcomings insix important areas that are necessary to ensure adequatelong-term care to patients and easy preservation of treat-ments administered.
1. Accessibility: Accessibility refers to the immediateavailability of patient-related information at alltimes to all parties with a need to know. It is impor-tant to review a patient’s medical history beforecommencing any new treatment. If a patient decidesto visit a specialist, emergency room, clinic, or hos-pital other than the primary care physician, arequest may be made for the patient’s medical historyto be faxed or couriered to the second facility. Thisinformation transfer may take between hours to daysto complete, depending on the distance and arrange-ments between the two locations, available modes ofcommunication, availability of authorized personnelto promptly respond to the request, and so on. During
MEDICAL RECORDS, COMPUTERS IN 351

emergencies, a delay of just a few minutes in admin-istering the correct treatment to a patient could havevery serious ramifications. A situation in whichadverse reactions to particular medications knownby a primary care physician simply are not madeavailable in a timely fashion to emergency roompersonnel is all easy to imagine. The delay in dis-seminating accurate detailed background informa-tion is perhaps the biggest drawback of paper-basedmedical record systems.
2. Legibility: Paper-based records are generally hand-written documents, and one person’s handwriting isoften not readily understood by another. The fact thatentries may be made by many different people makesunderstanding a chart even more difficult. Further-more, paper-based records are subject to wear andtear, accidental immersion in water or other liquidsdue to leaks, misfortune or negligence, smudging ofink, and so on. These factors lead to reduced legibilityof the entries on the charts and consequently makeinterpreting the charts more subjective.
3. Bulkiness: Paper-based records for a single patientinitially consist of just a few charts, but they canquickly become a thick file with subsequent visits.Assuming that a small clinic sees � 10 new patientsdaily, that the physicians in the clinic take rotatingholidays and that it is not a leap year,� 3650 new fileswill be added over a period of 1 year. The files of manyof the existing patients also become bulkier and sub-sequently occupy more space. All of this paper forcesthe addition of storage space in the clinic for these newrecords, even though the space could often be betterutilized for clinical purposes through the addition ofmuch more profitable and useful treatment or diag-nostic capabilities.
4. Data Dimensionality: Data dimensionality refers tothe ability to interpret the available information inmultiple, complementary fashions. The data con-tained in paper-based records simply provide informa-tion about the medical history of a particular patient.In order to obtain trends, distributions or statisticalpatterns about a particular patient or even groups ofpeople in a geographical area, the required informa-tion has to be manually compiled from each record.This can be extremely laborious and time consuming.Furthermore, even a simple text search for a particu-lar word or phrase can take impractically long if thesearch must be conducted visually through paper-based handwritten records.
5. Integrity: A patient will have multiple medical files,maintained simultaneously at every hospital or clinicever visited, yet none of these records contain thecomplete medical history of the patient. Usually, thepatient’sprimary care physician is the one who has therecords that will provide the most accurate long-terminformation, and during times of emergency the pri-mary care physician will frequently be the first onecontacted for patient records. However, medical facil-ities rarely have in place any mechanism to update theprimary care physician. If, for example, during a visit
toa specialist it was foundthata patient wasallergic toa particular class of medications, the primary carephysician’s records will often not be updated to showthis information. Even if the patient records frommultiple sources were summoned, there will stillremain a very realistic chance of missing one or moresources, leaving the completeness of paper-basedrecords questionable. Paper-based systems also riskinadvertent loss or misfile of complete pages in copy-ing, transporting, photocopying, faxing, and handlingof records.
6. Replication: Paper-based medical records are prone todestruction by natural disasters, fires, leaks, and pestsin storage areas. Because paper-based records arebulky, it is both expensive and tedious to replicatethem and store back-up copies. Hence, if they aredestroyed, patient medical histories can be completelylost.
Several research papers have been devoted to explain-ing the shortcomings of paper-based medical records (1,2).Nevertheless, paper-based records are still the most widelyused method for maintaining patient information. Theprocess of recording information in charts is a naturalprocess of making notes, and it requires little specializedtraining. Once recorded, the information is relatively per-manent and cannot be distorted easily. Furthermore, thechart often bears the signatures of both the patient and theappropriate medical personnel who treated the patient,which may be an important legal requirement. Such legalissues are a significant reason that many organizationsresist wholesale changes to their paper-based recordsystems.
COMPUTER-BASED MEDICAL RECORD SYSTEMS
Paper-based records were the only method of storingpatient medical information in use until � 25 years ago.Since that time, computer technology has experiencedexponential growth, creating endless possibilities for devel-opments within allied fields. The fields of medicine ingeneral and medical records in particular have been noexception. Computer-based records were introduced toovercome the inherent limitations and problems ofpaper-based records and to alter patient medical recordkeeping in order to incorporate advancements in computertechnology. The computer-based medical record is com-monly given several names within differing environments,including Computer-based Patient Record (CPR), Electro-nic Health Record (EHR), and Electronic Medical Record(EMR). Throughout this article, we will use the namecomputer-based patient record and the abbreviation CPRto refer to computer-based medical records. The CPRs arefundamental to the role of computers in medical records,and a significant portion of this article deals with them.
A CPR is an electronic patient record that resides in acomputer-based information system. Such systems areoften specifically designed to augment medical practi-tioners by providing accessibility to complete and accuratelong-term data, alerts, reminders, clinical decision support
352 MEDICAL RECORDS, COMPUTERS IN

systems, links to medical knowledge databases, and otheraids (3,4). The CPRs are essentially digital equivalents ofpaper-based records. Because this patient information isstored digitally, the enormous information processing andnetworking capabilities of computers can be utilized todrastically increase the efficacy of patient treatment. Theyeasily overcome the shortcomings of paper-based recordson the six key issues outlined in the previous section, andthey provide several other fascinating features exclusive tothem.
1. Accessibility: With the advent of the Internet and theWorld Wide Web, information on virtually any topiccan be quickly and easily obtained. CPR databasescan be stored in networked servers, which can besearched from any properly networked location. Withproperly designed databases and network systems,the complete medical history of a patient can beretrieved in a matter of seconds. This helps in ensur-ing the most prompt and accurate treatment possi-ble, which is one of the fundamental reasons formaintaining a medical record.
2. Legibility: The information recorded on CPRs is pre-sented using digitally reproduced fonts, which arethen independent of the handwriting of the personentering the data into the system. Anytime patientinformation is required, it can be readily visualizedon a viewing device, such as a CRT monitor or PDA,which does not introduce any wear and tear in therecord itself. If a paper copy of a patient record isrequired for a particular activity, a new printout canbe generated every time. Thus there is no subjectiveelement in understanding the information.
3. Bulkiness: CPRs can be stored on a variety of media,including Compact Disc (CD), Digital Versatile Disc(DVD), and Hard Disk Drive (HDD). A single CD,11.4 cm in diameter and weighing �15 g, can store700 megabytes (MB) of data. This translates into>100,000 pages of raw text or two hundred 500-pagebooks, which would occupy >10 m of shelf space. TheDVDs have >10 times the density of CDs, and HDDsoffer >100 times the information content of a CD.This means that with proper database design, all ofthe medical records of all of 1 year’s new patients atthe aforementioned small clinic can now be stored ona single CD, and several years of patient data for allongoing patient activities can be stored on just oneDVD.
4. Data Dimensionality: Data on CPRs can be exploitedand interpreted in many more ways than can asimple paper-based record. Entire databases can besubjected to automated search, and specific informa-tion from a single record or a collection of records canbe retrieved in a matter of seconds. Trends andpatterns in disease occurrence and treatment admin-istration and effectiveness can readily be extractedand processed for limited or wide-ranging popula-tions. Database Management System (DBMS) soft-ware can be used to plot the available information ongraphs and pie charts, which greatly simplify the
contents of medical records into a form that can beinterpreted by laymen. All these operations can bedone automatically using state-of-the-art softwareand require little, if any, human intervention. Tech-niques in data mining, for example, allow automateddetermination and analysis of data correlationsamong very large numbers of variables.
5. Integrity: CPRs are generally stored on local systemswithin hospitals, clinics, and physician offices, whichmeans that medical records of a particular patientcould be distributed across many systems throughoutthe world. Using modern networking techniques,these systems can be easily yet securely networked,and widely dispersed CPRs can be located and madeavailable for inclusion in patient diagnosis and treat-ment. It would also be practical to develop a systemin which all patient records are stored in a centralrepository, and any time new records of thepatient are created or updated, they can be addedto this central repository. Using either of these meth-ods in a well-designed system, the complete medicalhistory of a patient can be very rapidly retrieved fromany of the authorized locations connected to thenetwork.
6. Replication: Due to the high densities for computer-ized storage of data, CPRs occupy very little spacewhen compared to paper-based systems. It is veryeasy and inexpensive to create back-up copies and tostore these copies in geographically diverse locations.In a well-designed computer-based system with auto-mated, networked backup, the complete medical his-tory of every patient can still be retrieved even if arecord storage facility is completely destroyed.
Exclusive Features of CPR
With considerable manual effort, the performance of paper-based records can be made comparable to that of CPRswithin the six major requirements of a medical recordoutlined above. The efficiency advantages of computer-based medical record systems will nevertheless offer sig-nificant cost advantages over paper-based systems inachieving comparable performance levels. Significantimprovements in patient treatment can result when CPRsare incorporated into expert systems and DBMS frame-works that engender an entirely new set of features formedical records.
1. Content-Based Data Retrieval: If a large hospitalsystem is informed that a popular drug has beendetermined to cause serious side effects and thatthe manufacturer has consequently issued animmediate recall, the hospital system may hesitateto issue a broad public warning, because that actionwould lead to unnecessary panic and to patientsflooding the system seeking confirmation on theirprescriptions, even when their medications are com-pletely unrelated to the recall. If the hospital main-tained only paper-based records, it would take weeksto pore through patient charts to obtain the names
MEDICAL RECORDS, COMPUTERS IN 353

and locations of the patients to whom the drug wasprescribed. Such a situation presents a perfect casefor content-based data retrieval. With properly con-structed CPRs, the same information can be muchmore rapidly retrieved through querying the data-base to fetch all patient records with the name of therecalled drug in the ‘Drugs Prescribed’ field. Then,only the patients who actually have been prescribedthe recalled medication can be individually contactedwith explicit instructions by a qualified staff member.This data search technique is known as Content-Based Data Retrieval (CBDR).
2. Automatic Scheduling: With CPR-based systems,routine periodic check-up or follow-up visits can beautomatically scheduled, and e-mail reminders orautomated telephone recordings can be sent directlyto the patients. This automation will relieve health-care professionals of a significant administrativeburden.
3. Knowledge-Based Systems: Every physician attemptsto solve a particular condition to the best of hislimited knowledge (5). It is reported that there are> 5,000,000 medical facts, which are constantlybeing appended, updated and questioned by over30,000 medical journal publications each year (6).It is humanly impossible to remember all of thesefacts and to reproduce them accurately as needed.However, CPR databases all over the world can berapidly and effectively searched in order to findinformation about patients who were previouslydiagnosed with the same condition, how they weretreated and the end result. While the presidingdoctor still makes the decisions and retains res-ponsibility, he can have experimental evidence andexperiential knowledge from other experts to assisthis analysis (7). Diagnostic decision support sys-tems like Quick Medical Reference (QMR) andMassachusetts General Hospital’s DXplain provideinstant access to knowledge bases of diseases,diagnoses, findings, disease associations and labinformation.
4. Expert Systems: Human errors in recording informa-tion can be greatly reduced by programming thedata-entry interface to reject anomalous valuesand to restrict the input to a finite set of possiblechoices. For example, a pulse rate of 300 beats min�1
would be highly unlikely. Potentially dangerous spel-ling mistakes in generating a prescription can beidentified. Dates for follow-up activities can bechecked against reasonable parameters. A well-designed interface would prompt a message torecheck such entries.
5. In situ Data Access: A medical records system inwhich a physician accesses a wireless PDA whileconversing with a patient could allow direct bidirec-tional communication between a physician and apharmacy, a laboratory, or a specialist. Collaboratorson a complex case can simultaneously access eachother’s progress, even when the collaborators aregeographically separated.
In 1991, the United States Institute Of Medicine (IOM)conducted a study on the advantages and disadvantages ofCPRs and published its findings (3). The IOM concludedthat CPRs greatly enhance the health of citizens and greatlyreduce costs of care, and it called for widespread implemen-tation of CPRs by 2001. However, 4 years past that deadline,widespread implementation still remains only a concept.Figures for CPR adoption rates in hospitals range from 3%to 21%, while CPR adoption rates for physician offices rangefrom 20% to 25% (8). It is safe to say that these figures arenot representative of the popularity that one would reason-ably expect from the benefits of CPRs. The following sectionis devoted to explaining this anomaly.
ROADBLOCKS IN CPR IMPLEMENTATION
Recording and processing of information with CPRsrequires installation of computer systems and software,and, in general, more training of healthcare professionalsis required to get them acquainted with CPR systems thanwith paper-based record systems. Furthermore, realizingthe full potential of CPR systems requires not only thatpatient records issued in the future should be CPRs butalso that previously taken paper-based records should beconverted into CPRs. Some of the important factors affect-ing this onerous large-scale conversion will now be dis-cussed.
1. Cost: Expense is usually the major obstacle to thefull-fledged incorporation of CPRs. Depending onwhether the application is for the office of a singlephysician or for a large hospital, the basic infrastruc-ture needed to establish a CPR system could varyfrom a single PC to a complete network of work-stations and servers loaded with expensive network,database and records management software. Bothhardware and software computer technologiesbecome outmoded very quickly, and these technolo-gies require constant update, increasing mainte-nance and operation costs. There is also asignificant cost factor involved in hiring data-entryoperators to convert existing paper-based records toCPRs and in training healthcare professionals tothen operate the new systems and software.Although several studies have shown that CPRsare effective in the long run (9,10), both hospitalsand physician offices remain apprehensive aboutinvesting many thousands of dollars on a new tech-nology while the tried and tested paper-based recordswork reasonably effectively.
2. Abundance of Choices and Lack of Standards: Thereare > 100 CPR management software systems avail-able in the market today, and additional entriesarrive in the marketplace annually. Each softwareapproach will have its advantages and disadvan-tages, and it is never easy to decide which one is bestsuited for a particular application. Furthermore,different software interfaces use different templatesfor the patient record, recording slightly differentpatient data within very different structures. A
354 MEDICAL RECORDS, COMPUTERS IN

standardized CPR format independent of the specifichardware and software running on a particular sys-tem is yet to be developed. This lack of standardiza-tion in CPR formats severely cripples cross-systeminteraction and comprehensive integration of CPRsystems. The marketplace has, to date, failed toproduce a clear market leader or an industrial bodywith the ability to enforce such standards. A custo-mer contemplating a purchase and the subsequentinvestments in training and maintenance may haveserious reservations concerning the ability to changefrom the products of one manufacturer to another.
3. Confidentiality: The United States governmentpassed the Health Insurance Portability and Account-ability Act (HIPAA) in 1996, protecting a patient’sright to confidentiality and specifying the informa-tion on a medical record that can be shared and theinformation that must be considered confidential. Arecord can be made available only on a ‘‘need toknow’’ basis, wherein only personnel who absolutelyneed to know the data are granted access. For exam-ple, physicians participating in the diagnosis andtreatment process of a specific patient are grantedcomplete access to the entire medical record, whilehealth agencies involved in conducting demographicstudies are granted access only to information thatdoes not and can not reveal the identity of thepatient.
4. Security: In the case of paper-based records, it isrelatively easy to control access and to ensure secur-ity by keeping those records under lock and key. Thesecurity of CPRs will be constantly threatened byhackers, trying to break into a system in order toretrieve confidential patient information. Unlessproperly protected, CPRs are also vulnerable to beingcompromised during transmission across a network.Unlike paper-based records, CPRs can be easily mani-pulated, intentionally or unintentionally, in fashionsthat do not appear obvious. These vulnerabilitiesrepresent an enormous security problem, and effec-tive solutions are required before CPRs can be put towidespread use. Furthermore, efforts to provide net-work security have significant costs, requiring man-power, equipment, and frequent software upgrades.
5. Apprehension Among Patients: Even in developedcountries like the United States, considerable unea-siness exists among patients about the use of com-puters to maintain patient medical records. Whilesome of this phenomenon can be ascribed to thereluctance of the older generation in accepting newtechnology, the most important reason for this appre-hension is the lack of clear understanding by patientsabout the benefits of CPRs. One of the easiest ways toovercome this fear is for healthcare professionals todirectly reach out to the patients and explain thelong-term advantages of CPRs.
6. Legal Issues: The validity of CPRs in a court of law isstill questionable. The Millennium Digital Com-merce Act, otherwise known as the Electronic Sig-nature Act, was passed in 2000 (although the portion
relating to records retention was passed in 2001). Theact established that the electronic signature andelectronic records cannot be denied legal effect sim-ply because they are electronic and are not signed inink on paper. However, legal implications in CPRtransactions extend far beyond this act. For example,if it is found that the software system used to manageCPRs does not comply with stipulated securityrequirements, the validity of a CPR can be ques-tioned in court, even if no indication of tamperingcan be identified. The CPR systems are also prone tocomputer viruses, worms and Trojans, which exploitloopholes in the computer security defenses to gainunauthorized access to sensitive data and/or to mali-ciously corrupt the information.
Despite significant progress toward overcoming thesehurdles, complete transition from paper-based records toCPRs is a time-consuming and capital-intensive process,and during the midst of this transition, the benefits areunlikely to be immediately apparent. In the followingsection, some of the options available to healthcare profes-sionals in implementing a CPR system, and several techno-logies available to ensure secure storage and transmissionof confidential medical information are reviewed.
FEATURES OF CPR SYSTEMS
A complete CPR system can consist of individual work-stations, data input devices (keyboards, mice, light pens,scanners, cameras), output devices (printers, plotters, anddisplay monitors), Database Management System (DBMS)software, text, image and video processing hardware andsoftware, and the networking infrastructure for intra- andintersystem communication. The security and reliabilityrequirements of these systems should never be under-stated. With so many factors involved, there is alwaysroom for improvement, and a universally perfect combina-tion has yet to be implemented. Nevertheless, a widevariety of CPR systems have been successfully implemen-ted, tested and put to everyday use, with most such systemsworking successfully in the environment for which theywere designed. We will now explore some of the generalfeatures of CPR systems and their components, and wewill present advantages and disadvantages of the choicesavailable.
System Architecture
A fundamental decision that must be made before imple-menting a CPR system is the choice of the system archi-tecture to be used. There are two broad choices, which wenow discuss.
1. Centralized Architecture: A block schematic of a cen-tralized architecture as implemented in CPR systemsis shown in Fig. 1. A CPR system based on thecentralized architecture has a central server thatcontains complete medical records of all patients inthe system. Any modification to a record must be
MEDICAL RECORDS, COMPUTERS IN 355
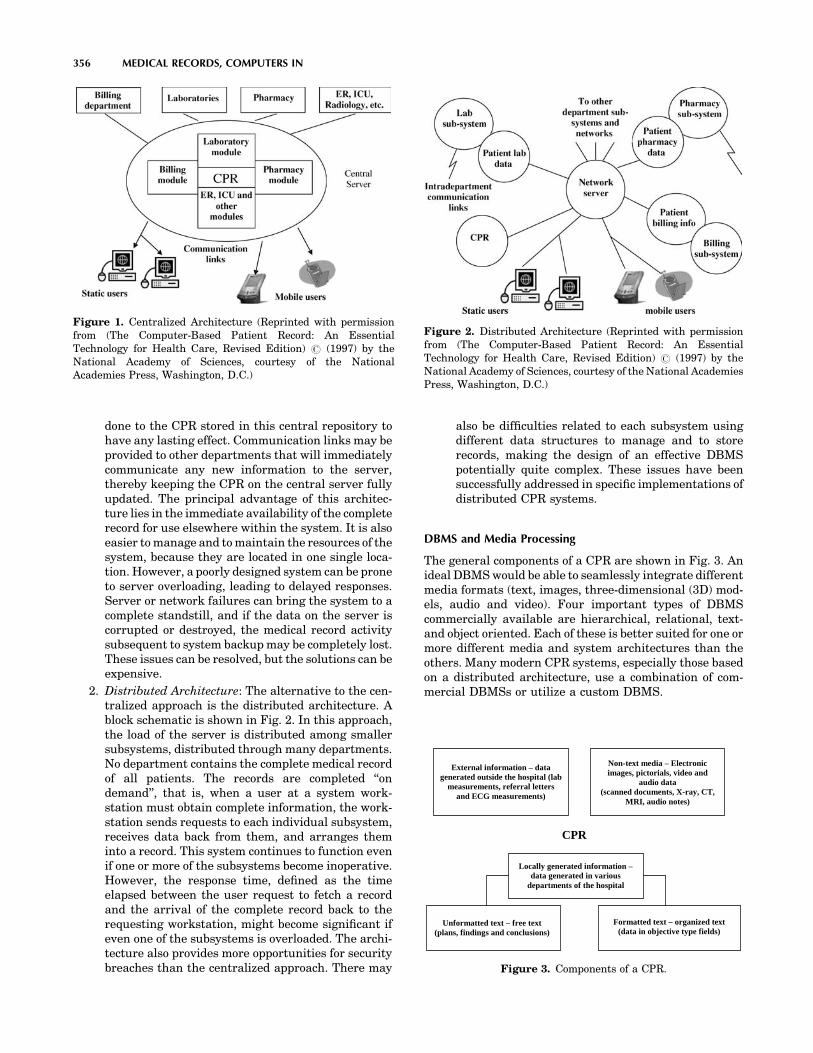
done to the CPR stored in this central repository tohave any lasting effect. Communication links may beprovided to other departments that will immediatelycommunicate any new information to the server,thereby keeping the CPR on the central server fullyupdated. The principal advantage of this architec-ture lies in the immediate availability of the completerecord for use elsewhere within the system. It is alsoeasier to manage and to maintain the resources of thesystem, because they are located in one single loca-tion. However, a poorly designed system can be proneto server overloading, leading to delayed responses.Server or network failures can bring the system to acomplete standstill, and if the data on the server iscorrupted or destroyed, the medical record activitysubsequent to system backup may be completely lost.These issues can be resolved, but the solutions can beexpensive.
2. Distributed Architecture: The alternative to the cen-tralized approach is the distributed architecture. Ablock schematic is shown in Fig. 2. In this approach,the load of the server is distributed among smallersubsystems, distributed through many departments.No department contains the complete medical recordof all patients. The records are completed ‘‘ondemand’’, that is, when a user at a system work-station must obtain complete information, the work-station sends requests to each individual subsystem,receives data back from them, and arranges theminto a record. This system continues to function evenif one or more of the subsystems become inoperative.However, the response time, defined as the timeelapsed between the user request to fetch a recordand the arrival of the complete record back to therequesting workstation, might become significant ifeven one of the subsystems is overloaded. The archi-tecture also provides more opportunities for securitybreaches than the centralized approach. There may
also be difficulties related to each subsystem usingdifferent data structures to manage and to storerecords, making the design of an effective DBMSpotentially quite complex. These issues have beensuccessfully addressed in specific implementations ofdistributed CPR systems.
DBMS and Media Processing
The general components of a CPR are shown in Fig. 3. Anideal DBMS would be able to seamlessly integrate differentmedia formats (text, images, three-dimensional (3D) mod-els, audio and video). Four important types of DBMScommercially available are hierarchical, relational, text-and object oriented. Each of these is better suited for one ormore different media and system architectures than theothers. Many modern CPR systems, especially those basedon a distributed architecture, use a combination of com-mercial DBMSs or utilize a custom DBMS.
356 MEDICAL RECORDS, COMPUTERS IN
Figure 1. Centralized Architecture (Reprinted with permissionfrom (The Computer-Based Patient Record: An EssentialTechnology for Health Care, Revised Edition) # (1997) by theNational Academy of Sciences, courtesy of the NationalAcademies Press, Washington, D.C.)
Figure 2. Distributed Architecture (Reprinted with permissionfrom (The Computer-Based Patient Record: An EssentialTechnology for Health Care, Revised Edition) # (1997) by theNational Academy of Sciences, courtesy of the National AcademiesPress, Washington, D.C.)
External information – data generated outside the hospital (lab
measurements, referral letters and ECG measurements)
Locally generated information –data generated in various
departments of the hospital
Unformatted text – free text (plans, findings and conclusions)
Non-text media – Electronic images, pictorials, video and
audio data (scanned documents, X-ray, CT,
MRI, audio notes)
Formatted text – organized text (data in objective type fields)
CPR
Figure 3. Components of a CPR.

An important aspect of a DBMS is the mechanism that ituses for data retrieval. The details of record constructioncan play a significant role in creation of databases that canbe efficiently and accurately searched. Entries in formattedfields can be searched much more easily than scanneddocuments, images or nonformatted text. A DBMS shouldalso provide organization of the data in a manner that issensible and easy to comprehend. Well-organized data-bases will prove easier to manage and faster to search.
Security and Legal Issues
A core issue in the design of CPR systems is security. Asingle security breach could be used to access thousands ofcomplete CPRs, which are then vulnerable to many mal-icious activities. Thus, it is extremely critical to protectindividual CPRs from unauthorized access, as well as toprotect the CPR system itself from hackers attempting toaccess the system or attempting to cause it to fail. Inaddition, the CPR data must be protected before it canbe sent across a network, due to potential communicationleaks that can land sensitive information in the wronghands. Tools such as network packet sniffers are extremelypowerful if an unauthorized party can achieve physicalaccess to network interconnection hardware or cabling. Ingeneral, five conditions must be satisfied before patients orhealth care personnel are granted access to the records on anetwork (11):
1. The patient must not have recorded an explicit pro-hibition of CPR transmission across the network.
2. The patient must have consented to the transfer ofthe partial or complete CPR to the recipient institu-tion.
3. The identity of the patient must be accurately ver-ified and authenticated.
4. The identities of the healthcare provider andthe recipient institution must be accuratelyverified.
5. It must be verified that the patient is mentallycompetent. If the patient is found to be mentallyincompetent, then the need for the patient recordmust be sufficiently urgent that if it is not madeavailable immediately, serious harm could result tothe patient’s health.
For a CPR produced by a CPR system to be a legallyvalid document, the CPR should be able to answer thefollowing questions (12).
1. Who Wrote It? A single CPR is frequently handled bymany different people, with several healthcare pro-viders entering, updating, or removing information.A CPR must include the identities of all the peoplewho have modified the record, together with theinformation that they have modified. This involvessecure access control using smart cards, PINs, fin-gerprints, passwords, etc. to verify the identity ofrequestors before they will be allowed to access or tomodify the information on the records.
2. When Was It Written? Time and date information ismaintained by automatically attaching timestampsto the CPRs. The system must be designed to ensurethat unauthorized personnel cannot change the sys-tem time or any timestamp in any CPR.
3. What Does It Say? Computer technology is rein-vented roughly every 5 years. Data storage andretrieval media become obsolete very quickly. Forexample, the magnetic tapes that were very popular25 years ago can be found only in museums today.It is thus important for CPR systems to incorporatethese technological developments, and yet notbecome outmoded too quickly, so that the contentsof current CPRs and archived CPRs can both be readand processed to obtain the same information.
4. Has the Information Been Altered? Undocumentedalteration of information will prove to be the mostimportant legal issue, and hence, the mostdifficult one to solve. A CPR system must be designedto allow determination of whether the information isindeed as originally recorded or whether it hasbeen subsequently modified in a manner thatwould affect possible legal proceedings. Several effec-tive solutions, based on cryptographic techniques,exist.
A very reliable solution to ensure that a particular CPRprovides answers to all of these four questions is to attachdigital signatures to them. Just as an ink-based signatureprovides legal acceptability for paper-based records, digitalsignatures can ensure the legal acceptability of a CPR.Digital signatures offer both signatory and documentauthentication, and they have been proven to be moreeffective than the ink-based signature (13). Signer authen-tication provides the capability to identify the person whosigned the document, while document authenticationoffers the capability to determine whether a documentwas altered after it was signed.
Digital signatures use public-key encryption schemes toprovide this functionality. In public-key encryptionschemes (14), every user gets a pair of keys: a publickey, which everybody is allowed to know, and a privatekey, which is kept as a secret known only by the individualand the authority that issues and verifies the keys. Adigital signature is computed using the data bytes of thedocument and both the private and public keys andattached to the document. Consider that person A createsa CPR and attaches a digital signature to it using his publicand private keys. Anybody with access to A’s public key canverify that the CPR was actually created by A using theCPR, the digital signature and A’s public key. If the resultis correct, according to a straightforward mathematicalrelationship, A is authenticated as the signatory of theCPR, and the CPR is authenticated as accurate. Anyalteration of the CPR after the calculation and attachmentof the digital signature would corrupt the digital signatureand would then cause the CPR to be identifiable as mod-ified. In this case, the CPR would be considered fraudulent,although the source of the fraud would not necessarily beidentifiable.
MEDICAL RECORDS, COMPUTERS IN 357

Public-key encryption can also be used to secure CPRsbefore transmitting them across a network. Consider thatperson A desires to send a CPR to person B. Person A looksup the public key of B and encrypts the CPR using B’spublic key. The CPR can only be decrypted using B’sprivate key. Since only B has access to his private key,only he can decrypt the CPR. The principle of public-keyencryption can be extended to CPRs to protect the authen-ticity of the information, to identify malicious alterations ofthe CPR, and to secure transmission across a network.
POINTERS TO THE FUTURE
Much of this article has been devoted to explaining thebenefits of the CPRs and the factors hindering their wide-spread implementation. Despite their tremendous poten-tial, the development of commercial CPR systems has notreflected the progress made in many related fields incomputer technology. In this section, some of these relatedtechnologies that, in the future, the authors feel will havegreat potential to broaden the range of advantages ofcomputer-based medical record services and to make themsufficiently secure are presented.
Radio Frequency Identification Tags
Radio Frequency (RF) identification (RFID) refers to anautomatic ID system that uses small RF devices to identifyand to track individual people, pets, livestock, and com-mercial products. These systems are used to automaticallycollect highway tolls and to control access to buildings,offices and other nonpublic sites. An RFID tagging systemincludes the tags themselves, a device to write informationto the tags, one or more devices to read the data from thetags, and a computer system with appropriate software tocollect and to process information from the tag. Manyapplications can use the same devices to both read andwrite the RFID tags. While the physical layout of the tagmay vary according to the application, its basic componentswill include an intelligent controller chip with some mem-ory and an antenna to transmit and receive information.According to its power requirements, an RFID tag will beclassified into one of two types. Active tags have their ownpower source and hence provide greater range. Passivetags will be powered by RF pulses from the tag reader (orwriter) and thus exhibit no shelf life issues due to batteryexhaustion.
While plans are underway to replace bar codes withRFID tags on virtually every single commercial product,the field of medical informatics has found some uniqueapplications for RFID tags. The U.S. Food and DrugAdministration (FDA) recently approved the implantationof RFID tags on humans (15). These tags are similar to thetags being used on animals, and they are implanted underthe skin in the triceps area. The chip contains a 16-digitnumber that can be readily traced back to a databasecontaining the patient’s information. One such chip madeby VeriChip costs � $125, exclusive of the cost of implanta-tion. This technology is expected to be a boon to individualswith life-threatening medical conditions and to lower med-ical costs by reducing errors in medical treatment.
Testing of replacement of bar codes with RFID tags inpatient bracelets is ongoing. Unlike bar codes, RFID tagsdo not require clear line of sight between the bar code andthe bar code reader, nor do they require active operatorintervention. This ensures that healthcare workers will notfail to scan a patient ID bracelet. One such successfullytested system is Exavera’s eShepherd, which combinesRFID tags with Wireless Fidelity (Wi-Fi) networks andVoice over IP (VoIP) to implement a single system that willtrack patients, staff and hospital assets (16). The Wi-Firouters can deliver patient information directly to a phy-sician’s handheld PDA every time any RFID transceiverdetects a patient. Physicians and hospital staff can havethe patient information whenever and wherever theywant, and they do not have to refer repeatedly to a securephysical filing area to retrieve patient records.
A major factor impeding widespread implementation ofRFID tags is the legal and ethical issue of keeping suchdetailed records of people, their activities, and all thethings they buy and use, without their consent. However,once this issue has been resolved, RFID tags will changethe way patient records are processed.
Biometrics
Biometrics refers to automatic recognition of people basedon their distinctive anatomical and behavioral character-istics including facial structure, fingerprint, iris, retina,DNA, hand geometry, signature, gait and even the chemi-cal composition of sweat (17). Biometric systems have beenused in wide ranging applications like user authenticationbefore entry into buildings and offices, criminal investiga-tion, and identification of human remains.
Biometric systems will also find an excellent applicationin management of medical records. Individual traits ofpeople who are authorized to access the record can bestored along with the record. When the system receivesa request from a user to retrieve the record, the system willattempt to match the biometrics of the user to the databaseof biometrics of all the people who are authorized to accessthe record. The record is fetched only if the match ispositive. In this manner, a CPR can be viewed and modifiedonly by authorized personnel. This is potentially an effec-tive application for biometric systems, because the systemcan be trained with as many samples as needed fromauthorized personnel. Biometric system applicationswhere a strong need exists to verify the authenticity ofclaimed membership in a preidentified population havebeen successfully tested with almost 100% accuracy. Suchsystems also offer a deterrent to would-be intrudersbecause the biometric information associated with anunsuccessful access attempt can be retained and used toidentify the intruder.
Generally, the biometric information of a user isencoded on a smart card that the user must use to gainaccess into the system. This provides a far better authen-tication solution than using just a user name and a pass-word, because both of these can be forged fairly easily.Most current biometric systems are based on the unique-ness of human fingerprints, and systems based on morecomplicated biometric features are currently undergoing
358 MEDICAL RECORDS, COMPUTERS IN

investigation. The development of superior biometric sys-tems holds the key to more secure CPR authentication.
Content-Based Image Retrieval
Content-Based Image Retrieval (CBIR) is the process ofretrieving images from a database based on the degree ofsimilarity in content between an example image (the queryimage) and the various images contained in the database.Traditional non-CBIR data retrieval mechanisms applytext-based methods, in which a string query is matchedto user-generated descriptions of documents or to contentsof specific fields in a record. When patient images areintegrated into patient records, simple text-based searcheswill not serve the same purpose. Text descriptions ofimages are very subjective and require data entry by aknowledgeable user. If that same image is to be added to adifferent database, the accompanying description alsomust be added if the image is to be retrievable.
These techniques utilize both global properties, such asimage statistics and color distributions, and local proper-ties, such as position and texture, to retrieve images thatappear ‘‘similar’’ to the query image. This is a powerful toolfor physicians, because CBIR enables them to compare theimage of a current patient (query image) to similar imagesof other patients in the database, to examine descriptionsattached to those images in their corresponding CPRs, andto study the treatment administered in those cases, all in amatter of seconds.
More and more frequently, scanned documents such asreferral letters and scanned paper-based records are beingadded to CPRs. These documents can be treated as images,and CBIR systems based on character recognition technol-ogies can search for text descriptions on these documents,making these documents compatible with text-basedsearches. This technology can save a great deal of time,money and errors in converting historical or ongoingpaper-based records to CPRs, because the records cansimply be scanned and need not be entered again intothe CPR system. As more and more visual aids are addedto medical diagnostics, CBIR will become indispensable toCPR management.
Steganography and Watermarking
Steganography and cryptography are related but distinctmethods that are used to ensure secure transmission andsecure archival of information. In cryptography, messagesare encrypted in such a manner that unauthorized recipi-ents may not decrypt the messages easily, using long,secure passwords and complex mathematical algorithmsto drastically alter the data. Often, however, the encryptedmessages themselves may be obtained fairly easily,because they are transmitted over insecure networksand archived on insecure servers. In steganography, thevery presence of secure information is masked by hidingthat information inside a much larger block of data, typi-cally an image.
If an oncologist wishes to get a second opinion from agynecological specialist concerning a diagnosis of cervicalcancer, he might elect to send a digital image of the cervixof the patient. He would also include his diagnosis, relevant
patient details including other complications the patientmay have, and a referral letter, all of which are sensitiveand confidential information. The traditional method tosend the supplemental information electronically would beto encrypt the information using public-key encryptiontechniques and to transmit it as separate files togetherwith the image. If the transmission is intercepted by amalicious party seeking private data, the transmissionwould garner interest, because it would be quite obviousthat any encrypted information following the image infor-mation would likely be related to that image. The data thiefmust still work to decrypt the transmission and to revealthe confidential information. Decryption itself is difficultwithout extensive computational capacity, but data thieveswill often find getting the necessary password to be a mucheasier method to access the data. The disadvantage ofencryption is that the data thief knows what to try.
An alternate data transmission method would use ste-ganography. The sensitive information can be embedded ininconspicuous areas of the image (18). Thus, no additionalinformation or files are transmitted, and the image willraise less suspicion that associated sensitive data can belocated. Although the embedded data is computationallyeasier to decode than the encrypted messages, it will onlybe decoded by people with foreknowledge that there isinformation embedded in the image. Furthermore, theembedded data can be encrypted before it is embedded,so that the data thief has another level of barrier. Theinformation is much more difficult to locate, and the thiefstill has to decrypt or to steal the password.
Usually, the clinically important sections of the imagewill be identified, and only the remaining regions will beused for embedding the secret information. Several sophis-ticated steganography techniques, like BPCS, ABCDE, andmodified ABCDE (19–21) have been successfully imple-mented. These methods can hide significant amounts ofinformation without clinically altering the image, althoughhiding too much data leaves evidence that can be detectedmathematically using tools from the field of steganalysis.Figure 4 shows an example of data hiding using the
MEDICAL RECORDS, COMPUTERS IN 359
Figure 4. Steganography. (a) Original digital image of the cervix.(b) Section of clinically unimportant segment of image in a. (c)Section in b encoded with secret information.

modified ABCDE scheme. Figure 4a is a digital image of acervix, and Fig. 4b shows the bottom right section of thisimage, which contains no clinically important information.This section forms an 864�432 RGB image, which requires1,119,744 bytes to represent directly or 295,727 bytes torepresent when losslessly compressed to PNG format.Figure 4c is the section in Fig. 4b after 216,326 bytes ofsensitive information have been embedded. This hiddendata corresponds to >40 pages of pure text, at 5000 cha-racters per page. Figure 4c visually appears very similar tothe section in Fig. 4b, even with this extensive additionaldata embedded. An even more secure solution wouldencrypt the sensitive information before embedding itinside the carrier image. This way, even if steganalysismethods detected that the carrier image containsembedded information, the decryption problem stillremains.
Watermarking techniques are similar to digital signa-tures in the sense that they can provide owner and docu-ment authentication for digital media. They are usuallynonvisibly detectable signals embedded into the media thatcan be checked, by authorized personnel, to verify thevalidity of the media and to trace its copyright holders.Watermarking and steganography techniques can also beused to identify times, dates, locations, and informationthat could be used to cross-reference to a patient, so thatmisidentification or misfiling of image data under thewrong patient file can be detected and corrected. It isthe opinion of the authors that both these technologieswill provide valuable solutions for secure CPR systems.
CONCLUDING REMARKS
This article attempted to provide a brief overview of theapplications of computers in medical records, the benefitsof computerization, and issues concerning widespreaddeployment of computer-based medical record systems.The computerization of medical records is a vast area ofresearch, employing many people from diverse fields ofmedicine, science and engineering. While we haveattempted to summarize and present the material fromour own perspective, the topic itself is explored in greatdetail by several worthy publications. There are literallythousands of publications that attempt to explain or tosolve one or more of the issues presented in this article andto provide much greater detail than is possible in thisarticle. Thus, the authors felt it appropriate to leave thereader with a few resources, both in print and on the WorldWide Web (WWW), to obtain more information about com-puters in medical records.
Much of the material in this article has been inspiredfrom the extensive discussions in Refs. 3 and 22. Thesebooks provide interesting observations and refer to awealth of references that pioneered the computer revolu-tion in the medical field. Two more recent books, (23 and24), also provide excellent insight into the various aspectsof using computers to manage medical records. The WWWcontains many websites that provide solid insight intovarious aspects of medical records management. Ref. 6 isone such site that is constantly updated with information
about upgrading to CPR systems, cost benefit calculators,software vendor surveys, and from basic tutorials on everyaspect of CPR management. Refs. 25 and 26 provide excel-lent evaluations of commercially available software forCPR management.
ACKNOWLEDGMENT
The authors would like to thank Mr. Rodney Long at theU.S. National Library of Medicine, Bethesda, Maryland,for providing the images of the cervix used in the exampleon steganography.
BIBLIOGRAPHY
1. Shortliffe EH. The evolution of electronic medical records.Acad Med 1999;74(4):414–419.
2. Burnum JF. The misinformation era: The fall of the medicalrecord. Ann Intern Med 1989;110:482–484.
3. Dick RS, Steen EB, Detmer DE, editors. Institute of Medi-cine. The Computer-Based Patient Record—An EssentialTechnology for Health Care. Washington (DC): NationalAcademy Press; 1997.
4. Shortliffe EH, Perreault LE, Fagan LM, Wiederhold G. Med-ical Informatics Computer Applications in Health Care andBiomedicine. 2nd ed. New York: Springer-Verlag; 2000.
5. Covell DG, Uman GC, Manning PR. Information needs inoffice practice: Are they being met? Ann Intern Med 1985;103:596–599.
6. Voelker KG. (None). Electronic Medical Records [online].http://www.emrupdate.com. Accessed 2005, April 10.
7. Weed LL. Medical records that guide and teach. New Engl JMed 278(11):593–600 and 278(12):652–657.
8. Brailer DJ, Terasawa EL. Use and adoption of computer-based patient records, California Healthcare Foundationreport, Oct. 2003, ISBN 1-932064-54-0.
9. Wang SJ, et al. A cost-benefit analysis of electronic medicalrecords in primary care. Am J Med Apr 1 2003;114(5):397–403.
10. Classen DC, Pestonik SL, Evans RS, Burke JP. Computer-ized surveillance of adverse drug events in hospital patients.J Am Med Assoc 1991;266:2847–2851.
11. David MR, et al. Maintaining the confidentiality of medicalrecords shared over the Internet and the World Wide Web.Ann Intern Med 1992;127(2):138–141.
12. Cheong I. The legal acceptability of an electronic medicalrecord. Aust Fam Phys Jan. 1997;26(1).
13. Askew RA. Understanding Electronic Signatures [online]. RealLegal. Available at http://www.reallegal.com/downloads/pdf/ESigAskewWhitePaper.pdf. Accessed 2005. April 10.
14. Dent AW, Mitchell CJ. User’s Guide to Cryptography andStandards. Boston: Artech House; 2004.
15. Sullivan L. FDA approves RFID tags for humans. InformWeek Oct. 2004.
16. Collins J. RFID remedy for medical errors. RFID J May 2004.17. Jain AK, et al. Biometric: A grand challenge. IEEE Confer-
ence on Pattern Recognition, Vol. 2; Aug. 2004. pp 935–26.18. Johnson NF, Duric Z, Jajodia S. Information hiding: Stega-
nography and Watermarking—Attacks and Countermea-sures. Norwell (MA): Kluwer Academic; 2001.
19. Kawaguchi E, Eason RO. Principle and Applications ofBPCS-Steganography. Proc SPIE Int Symp Voice, Video DataCommunications; 1998.
20. Hirohisa H. A Data Embedding Method Using BPCS PrincipleWith New Complexity Measures. Proc Pacific Rim Workshop onDigital Steganography. July 2002; p 30–47.
360 MEDICAL RECORDS, COMPUTERS IN
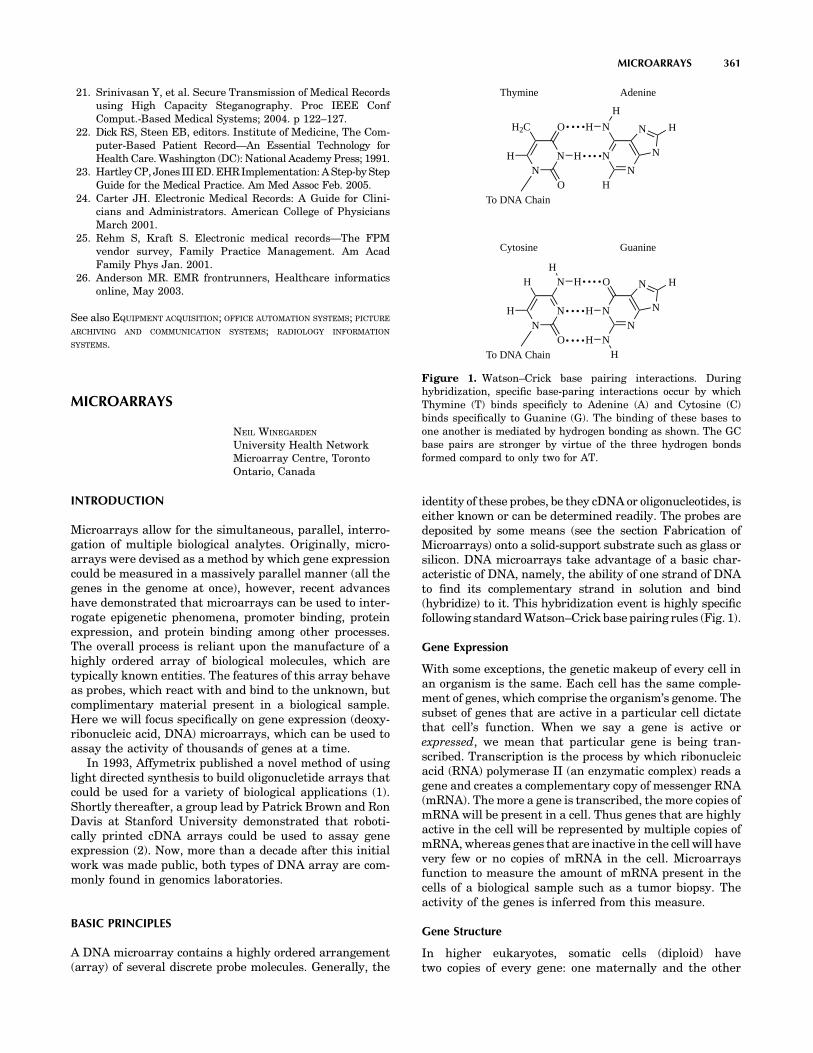
21. Srinivasan Y, et al. Secure Transmission of Medical Recordsusing High Capacity Steganography. Proc IEEE ConfComput.-Based Medical Systems; 2004. p 122–127.
22. Dick RS, Steen EB, editors. Institute of Medicine, The Com-puter-Based Patient Record—An Essential Technology forHealth Care. Washington (DC): National Academy Press; 1991.
23. Hartley CP, Jones III ED. EHR Implementation: A Step-by StepGuide for the Medical Practice. Am Med Assoc Feb. 2005.
24. Carter JH. Electronic Medical Records: A Guide for Clini-cians and Administrators. American College of PhysiciansMarch 2001.
25. Rehm S, Kraft S. Electronic medical records—The FPMvendor survey, Family Practice Management. Am AcadFamily Phys Jan. 2001.
26. Anderson MR. EMR frontrunners, Healthcare informaticsonline, May 2003.
See also EQUIPMENT ACQUISITION; OFFICE AUTOMATION SYSTEMS; PICTURE
ARCHIVING AND COMMUNICATION SYSTEMS; RADIOLOGY INFORMATION
SYSTEMS.
MICROARRAYS
NEIL WINEGARDEN
University Health NetworkMicroarray Centre, TorontoOntario, Canada
INTRODUCTION
Microarrays allow for the simultaneous, parallel, interro-gation of multiple biological analytes. Originally, micro-arrays were devised as a method by which gene expressioncould be measured in a massively parallel manner (all thegenes in the genome at once), however, recent advanceshave demonstrated that microarrays can be used to inter-rogate epigenetic phenomena, promoter binding, proteinexpression, and protein binding among other processes.The overall process is reliant upon the manufacture of ahighly ordered array of biological molecules, which aretypically known entities. The features of this array behaveas probes, which react with and bind to the unknown, butcomplimentary material present in a biological sample.Here we will focus specifically on gene expression (deoxy-ribonucleic acid, DNA) microarrays, which can be used toassay the activity of thousands of genes at a time.
In 1993, Affymetrix published a novel method of usinglight directed synthesis to build oligonucletide arrays thatcould be used for a variety of biological applications (1).Shortly thereafter, a group lead by Patrick Brown and RonDavis at Stanford University demonstrated that roboti-cally printed cDNA arrays could be used to assay geneexpression (2). Now, more than a decade after this initialwork was made public, both types of DNA array are com-monly found in genomics laboratories.
BASIC PRINCIPLES
A DNA microarray contains a highly ordered arrangement(array) of several discrete probe molecules. Generally, the
identity of these probes, be they cDNA or oligonucleotides, iseither known or can be determined readily. The probes aredeposited by some means (see the section Fabrication ofMicroarrays) onto a solid-support substrate such as glass orsilicon. DNA microarrays take advantage of a basic char-acteristic of DNA, namely, the ability of one strand of DNAto find its complementary strand in solution and bind(hybridize) to it. This hybridization event is highly specificfollowing standard Watson–Crick base pairing rules (Fig. 1).
Gene Expression
With some exceptions, the genetic makeup of every cell inan organism is the same. Each cell has the same comple-ment of genes, which comprise the organism’s genome. Thesubset of genes that are active in a particular cell dictatethat cell’s function. When we say a gene is active orexpressed, we mean that particular gene is being tran-scribed. Transcription is the process by which ribonucleicacid (RNA) polymerase II (an enzymatic complex) reads agene and creates a complementary copy of messenger RNA(mRNA). The more a gene is transcribed, the more copies ofmRNA will be present in a cell. Thus genes that are highlyactive in the cell will be represented by multiple copies ofmRNA, whereas genes that are inactive in the cell will havevery few or no copies of mRNA in the cell. Microarraysfunction to measure the amount of mRNA present in thecells of a biological sample such as a tumor biopsy. Theactivity of the genes is inferred from this measure.
Gene Structure
In higher eukaryotes, somatic cells (diploid) havetwo copies of every gene: one maternally and the other
MICROARRAYS 361
NN
H2C O
H
O
H NN
N
H
H
H
N
N H
Thymine Adenine
To DNA Chain
NN
H N
H
O
NN
O
N
N
N H
Cytosine Guanine
To DNA Chain
HH
H
HH
Figure 1. Watson–Crick base pairing interactions. Duringhybridization, specific base-paring interactions occur by whichThymine (T) binds specificly to Adenine (A) and Cytosine (C)binds specifically to Guanine (G). The binding of these bases toone another is mediated by hydrogen bonding as shown. The GCbase pairs are stronger by virtue of the three hydrogen bondsformed compard to only two for AT.

paternally derived. In the context of the diploid cell, eachcopy is termed an allele. In the case where both inheritedalleles are the same for a given gene, that gene is said to behomozygous. If the two alleles are different, then the geneis heterozygous. Alleles may be either dominant (pheno-typically manifested regardless of what the other allele is),or recessive (phenotypically manifested only in the absenceof a dominant allele). In the case of a heterozygous gene,the dominant allele will be phenotypically manifested andthe recessive allele will not. If both alleles are different, butdominant, they are termed codominant and both alleleswill elicit a phenotype. The gene is comprised of DNA,which is double stranded. One strand is the sense strand orthe strand that encodes the information, which will beultimately represented in mRNA. The other strand is saidto be anti-sense and is the strand of DNA that is actuallyread by the RNA polymerase to generate the mRNA. DNAhas directionality: A gene is transcribed starting at the 30
end of the antisense strand of the DNA and is read towardthe 50 end. The resultant mRNA is made from the 50 to the 30
end.Genes are regulated by specific sequences of DNA that
lie outside the coding region of the gene. The first suchsequence is the promoter. Promoters bind the transcrip-tional machinery (RNA polymerase II) that performs tran-scription. Promoters are found 50 (upstream) of the geneand are proximal to the transcription start site. An addi-tional class of regulatory sequence called an enhancer maybe associated with the gene. Enhancers may lie upstream,downstream, or internal (usually in noncoding regionstermed introns) to the gene (3). Specific transcriptionfactors bind enhancers and promote recruitment or activa-tion of the basal transcriptional machinery. It is the coor-dinated function of the promoter and enhancer, with thetranscription factors that bind them, that control if a geneis active or not within the cell. Thus, genes are regulated,and can be turned on, off, or modulated up or down by theregulatory mechanisms of the cell.
RNA Isolation
Ribonucleic acid must be isolated from cells in order toprepare the material for hybridization to the array. A cellcontains three major species of RNA: mRNA, transfer RNA(tRNA), and ribosomal RNA (rRNA). Together they arerefered to as total RNA. For the purpose of gene expressionexperiments with microarrays, the mRNA is the species weare interested in and represents � 1% of total RNA. Inorder to isolate total RNA from cells, one of two mainmodalities is used: solution- or solid-phase extraction. Insolution-phase methods, cells are lysed in the presence ofisothiocyanate in order to inactivate any RNases (naturallyoccurring enzymes that nonspecifically degrade RNA). Thelysate is then extracted with an acidified phenol:chlorophorm:isoamyl alcohol solution. The RNA selectivelypartitions to the aqueous phase of this mixture away fromproteins and DNA. The aqueous phase is removed and RNAis precipitated out of solution using isopropyl alcohol athigh salt concentrations. Solid-phase methods make use ofthe variable binding activity of RNA to a silica matrix athigh and low salt conditions. Cells are again lysed in the
presence of isothiocyanate. The high concentration of iso-thiocyante used in this methodology not only inactivatesthe RNases, it also selectively precipitates proteins out ofsolution. The lysate is applied to a column containing asilica filter at the bottom. The lysate is pulled through thecolumn via vacuum or centrifugation, thereby removingthe proteins and cellular debris. In this method, DNA mayalso bind to the column, and as such contaminating DNA isremoved by the application of DNase. The column iswashed to remove any further contaminants, and thenthe RNA is eluted from the filter using water.
mRNA Structure
In eukaryotic cells, mRNA has a unique feature that allowsresearchers to either purify it away from the rest of theRNA or to direct enzymes to it specifically while avoidingthe other RNA species. This feature is the polyA tail. ThepolyA tail is a long stretch of adenine nucleotides found atthe 30 end of mRNA, which is added post-transcriptionally.Such stretches of adenine nucleotides do not typically occurnaturally in genes or other RNA species. The polyA tail willhybridize to an artificially generated oligonucleotide madeup of a series of deoxythymine nucleotides (oligo-dT). If theoligo-dT is coupled to a support matrix (e.g., beads) themRNA can be pulled out of solution thereby purifying itaway from the rest of the total RNA. While some research-ers prefer to include this step in their process, it is gen-erally not a requirement for microarray analysis. Ratherthan purify the mRNA, the oligo-dT can be used as a primerfor creating an enzymatically labeled complement of themRNA.
Labeling
In order to render the RNA visible to a detection system, itis necessary to label it in some manner. While somelaboratories choose a direct methodology of chemicallylabeling the mRNA itself, it is most common to work viaa cDNA or cRNA intermediate that is labeled enzymati-cally.
The simplest methodology involves creating labeledcDNA. In this technique, the RNA is reverse-transcribed(DNA is made from an RNA template) by an enzyme namedreverse transcriptase (RT) (for sample protocols, see Ref.4). Reverse transcriptase requires a small oligonuclotideprimer that binds to the RNA creating a short double-stranded region (an RNA:DNA hybrid). In order to ensurethat the RT enzyme reads only the mRNA, the polyA tail ofmRNA is exploited by using a primer made of a stretch ofseveral (usually 20–25) thymine residues. The resultantDNA is the complement of the RNA and it is thus referredto as complementary DNA (cDNA). The RT reactionrequires that free nucleotides (each of A, C, G, and T)are present to create the DNA. If one of these nucleotidesis chemically modified with some detectable molecule (suchas a fluorophore), then it will be incorporated into thecDNA strand, and that cDNA will be detectable with afluorescent reader. Alternatively, it is possible to use areactive molecule (such as amino-allyl) in place of a fluor-escent molecule. After incorporation into the DNA, theDNA is then coupled to a reactive form of a fluorophore
362 MICROARRAYS

(usually a reactive ester). This latter implementation of themethod has an advantage in that the amino-allyl modifieris a much smaller chemical group that is incorporatedmuch more efficiently into DNA than a bulky fluorescentmoiety.
Often the amount of RNA available is limiting andcannot be detected by standard means. In this case, it isgenerally necessary to amplify the amount of materialpresent. A typical microarray experiment usually requires5–10 mg of total RNA in order to be able to obtain usefuldata. When researchers are working with diminishinglysmall samples, such as from a needle biopsy or a fine needleaspirate, it is often not possible to obtain this amount oftotal RNA. To overcome this limitation, various amplifica-tion strategies have been adopted. The most popularmethod of amplification is based on the protocols of Dr.James Eberwine from the University of Pennsylvania (5).In this technique, RNA is converted into cDNA using thesame method described above with two key differences: (1)there is no labeled nucleotide incorporated and (2) theoligo-dT primer has another short sequence of DNAappended to it that represents a T7 promoter region.The T7 promoter is a bacteriophage-derived sequence thatinitiates transcription by T7 polymerase. After the cDNA iscreated, a second strand is generated creating a double-stranded artificial gene with a T7 promoter on one end.This artificial gene is then transcribed by the addition of T7polymerase, which is allowed to make numerous tran-scripts of the gene. The transcripts that are obtained caneither be labeled directly, or they in turn can be turned intolabeled cDNA using standard methodologies describedabove. The resultant RNA is now actually the oppositesequence of the original mRNA, so it is said to be cRNA(complementary RNA).
The Affymetrix GeneChips utilize an amplification sys-tem based on T7 transcription as described above. Duringthe production of cRNA, biotin modified nucleotides areincorporated. Posthybridization (see the section on Hybri-dization) the arrays are stained with a streptavidin boundfluorophore. Streptavidin is a protein that specifically andtightly binds to biotin molecules, allowing the fluorophoreto be attached to the cRNA.
A clean-up step is required to remove any free, unbounddetection molecules. This step helps to ensure that back-ground signal is kept to a minimum. There are two mainmethods by which such purification is performed, one isbased on standard nucleic acid purification systems, simi-lar to the RNA isolation method described earlier, and theother is based on size exclusion. For the first method, anucleic acid purification column is utilized. The cRNA orcDNA binds to the silica filter, but the less charged freenucleotides flow through. After a series of washes, thecRNA or cDNA is eluted from the column. The secondmethodology utilizes a membrane filter (usually incorpo-rated into a column) that has a defined pore size. The largecRNA and cDNA molecules are retained on the membrane;where as the small free nucleotides flow through. Thecolumn is then inverted and the cDNA or cRNA is theneluted off the column by flowing wash buffer in the oppositedirection. This purified labeled material is then ready forhybridization to the array.
Hybridization
Microarray technology relies on the natural ability ofsingle-stranded nucleic acids to find and specifically bindcomplementary sequences. Purified labeled material isexposed to the spotted microarray and the pool of labeledmaterial ‘‘self-assembles’’ onto the array, with each indi-vidual nucleic acid (cDNA or cRNA) species hybridizing to aspecific spot on the array containing its complement. Thespecificity of this interaction needs to be controlled, asthere may be several similar and related sequences presenton the array. The control of hybridization specificity isaccomplished through the adjustment of the hybridizationstringency. Highly stringent conditions promote exactmatches where as low stringency will allow some related,but nonexact matches to occur. In a microarray experi-ment, stringency is typically controlled by two factors: theconcentration of salt in the hybridization solution and thetemperature at which hybridization is allowed to occur.
High salt concentrations tend to lead to lower strin-gency of hybridization. Both strands of nucleic acidinvolved in the hybridization event contain a net negativecharge. As such, there is a small repulsion between thesetwo strands, which needs to be overcome to bring thelabeled nucleic acid into proximity of the arrayed probe.The salt ions cluster around the nucleic acid strands creat-ing a mask and shielding the electrostatic forces. Highersalt concentrations have a greater masking effect, thusallowing hybridization to occur more easily. If salt concen-trations are high enough, the repulsion effects are com-pletely masked and even strands of DNA that have lowdegrees of homology may bind to one another.
Temperature is another important factor. Every double-stranded nucleotide has a specific temperature at whichthe two strands will ‘‘melt’’ or separate. The temperature atwhich exactly 50% of a population of pure double-strandedmaterial separates is termed the melting temperature(Tm). The Tm of a nucleic acid is controlled partially bythe length of the strand and partially by the percentage ofG and C residues (termed the GC content). The G and Cresidues bind to one another as a Watson–Crick base pair.This pairing interaction is the result of three hydrogenbonds forming. The other potential base pair in a DNAhybrid, A:T, only has two such hydrogen bonds and thusthe greater the GC content of the nucleotide, the morestable the hybrid. At very low temperatures, nonstandardWatson–Crick base pair interactions can also occur causingnoncomplementary sequences or sequences that are<100% matched to form hybrids. It is necessary thereforeto find a temperature that will prevent or melt nonspecifichybrids, but allow the specific interactions to occur. For amicroarray, this presents a challenge as there are thou-sands of specific interactions that must be accommodated.In the case of oligonucleotide arrays, the design of theoligonucleotides to be spotted takes this issue into accountand probes are designed that tend to fall within a narrowwindow of potential melting temperatures. cDNA arraysare more difficult because the sequences spotted varygreatly in both GC content and length. In such cases, itis often true that conditions that represent somewhat of a‘‘compromise’’ are necessary.
MICROARRAYS 363

Hybridization kinetics can generally be modeled asshown in Eq. 1(6). The change in the amount of hybridiza-tion product LS over time is a function of the decrease inthe concentration of labeled target L and free spotted DNAS over time. To simplify the equation, the rate of hybridiza-tion is equal to some rate constant k multiplied by theproduct of the concentrations of L and S. Thus hybridiza-tion rate is a direct function of the concentrations of thelabeled target molecule and the DNA probe in the spot.
d½LS�dT
¼ �d½L�dT
� d½S�dT
¼ d½L � S�dT
¼ k ½L�½S� ð1Þ
In the case of an oligonucleotide microarray, it is often thecase that the number of spotted DNA molecules is in greatexcess to the number of target molecules. As such, theconcentration of the spotted DNA probe remains fairlyconstant and can be considered part of the constant k.Thus the equation for hybridization can be simplified asshown in Eq. 2 (6), where the rate of hybridization istypically driven by the concentration of the labeled targetmolecules alone.
d½LS�dT
¼ k0½L� ð2Þ
In the case of two color oligonucleotide arrays, the twolabeled samples compete for hybridization to the probe thatremains in excess and thus hybridization is simply areflection of the concentrations of each of the two labeledtargets L1 and L2 [Eq. 3(6)].
d½L1S�d½L2S� ¼
k01½L1�
k02½L2�
ð3Þ
The situation becomes somewhat more complex when theprobe molecules are not in excess of the target molecules.This is often the case with cDNA arrays. In these cases, theconcentration of the spotted probe does change signifi-cantly as hybridization occurs and thus each of the labeledtargets L1 and L2 hybridize in a manner described by Eqs. 4and 5 (7).
d½L1S�dT
¼ k1½S�½L1� ¼ k1ð½S0� � ½L1S� � ½L2S�Þð½L01� � ½L1S�Þ
ð4Þ
d½L2S�dT
¼ k2½S�½L2� ¼ k2ð½S0� � ½L2S� � ½L1S�Þð½L02� � ½L2S�Þ
ð5Þ
In such a case, the rate of hybridization is affected by thechange in the concentrations of the spotted probe from theinitial concentration S0, where S0 changes as the probemolecules are bound by either L1 and L2.
When looking at differential hybridization between thetwo targets, we can represent the kinetics as shown inEq. 6 (7).
d½L1S�d½L2S� ¼
k1ð½L01� � ½L1S�Þ
k2ð½L02� � ½L2S�Þ
ð6Þ
If one is to assume that the two fluorescent moleculesused in a two-color experiment behave similarly, and thatthe rate of hybridization of the two labeled targets is thesame, we can say k1¼ k2. It has been demonstrated thatunder ideal conditions and when the hybridization reaction
is allowed to continue to equilibrium that the ratio of theconcentrations of each possible hybrid L1S and L2S isequivalent to the ratio of the original concentrations ofthe two targets L1 and L2 [Eq. 7 (7)]. This point is importantbecause it is the basis for microarrays to work, assumingthat the ratios read from the scans during data analysis arereflective of an actual biological condition.
½L1S�½L2S� ¼
½L01�
½L02�
ð7Þ
The goal of microarray hybridization is to produce aresult for which the signal obtained from specific hybridi-zation is very strong when compared to any backgroundsignal that may be obtained by a nonspecific adsorption oflabeled material to the substrate, or nonspecific binding tospotted elements. To reach this goal, it is common to usecertain nonspecific blocking reagents in the hybridizationsolution. Frequently, nucleic acids from sources known notto contain any sequences that will interfere with specifichybridization are used. For example, in a hybridization of ahuman sample to an array, one might use yeast tRNA andsalmon sperm RNA as competitors to bind any regions ofthe substrate or probes that have a generic nucleic acidbinding capacity. These nucleic acids are nonlabeled andwill therefore not contribute any signal when the array isscanned.
Washing
Unlike traditional northern blots, the majority of thestringency of a microarray assay is accomplished at thehybridization step. The washing step of a microarrayexperiment is a critical operation, but is important moreas a means to remove unbound material in order to reducebackground signal than it is to control the specificity of thesignal obtained.
Wash buffers generally contain two components: a saltsolution and a detergent. The salt solution, frequentlysodium chloride sodium citrate (SSC), is set to a concen-tration that supports the maintenance of the hybridizedmolecules. This concentration most frequently falls in the1� to 2� concentration range with some labs using as lowof a concentration as 0.1� (1� SSC contains 0.15 M NaCland 0.015 M Na-citrate).
The detergents used in wash buffers help to removethe unbound fluorescent molecules that would normallystick to the surface of the slide. The detergent acts as asurfactant and helps to isolate and remove the unboundfluorescent material. Typically, an anionic detergentsuch as sodium dodecyl sulfate (SDS) is used for thispurpose.
The temperature for the washes varies depending on thestringency of the wash solution being used. As with hybri-dization, the combination of temperature and salt concen-tration determines the overall stringency of the washes.
After washing the microarrays, it is generally necessaryto perform a rinse. The rinse is typically a solution similarto the wash solutions without the detergent. If detergentremains on the slide after drying, the solution may fluor-esce particularly if the labeled material has been trapped indetergent micelles.
364 MICROARRAYS

Scanning
It is necessary to use an imaging device to detect thefluorescent labels present on the hybridized microarray.In general, the imaging device must contain an excitationlight source, an emission filter, and a light gatheringdevice.
During scanning, the labeled material, be it fluorescentor some other form of detectable molecule, is imaged andthe resultant data is converted to a digital image. Theoptimal resolution at which the image is scanned is depen-dent on the size of the features and on their interspotspacing. A general rule of thumb is that the resolution ofthe image should be such that the pixels represent one-tenth of the diameter of the spot. For spotted arrays, forexample, the features tend to be on the order of 100 mm indiameter and thus 10 mm resolution is frequently used.Affymetrix’s technology, however, can generate featuresthat are 11 mm square; in this case, a much higher resolu-tion of down to 1 mm is required.
Most commonly, the image that is generated is a 16-bitgrayscale TIFF (Tagged Image File Format) image(Fig. 2). The 16-bit depth of the image provides a totalof 65,536 gray levels providing a possibility of more thanfive orders of magnitude range. The TIFF format is impor-tant because it is a universally accepted format that isLOSSLESS; that is, even with compression, this formatretains all image information. The images can thenbe imported into the appropriate image quantificationsoftware.
Image Quantification
After scanning, it is necessary to extract data from theimages. Image quantification generally starts withsegmentation. Segmentation is the process by whichpixels that represent the signal are isolated from thosethat represent background. During segmentation, thediscrete areas of the image that represent the spottedDNA material are identified and digitally isolated fromthe remainder of the image. The intensities of all of the
pixels in the individual spot are averaged to determinethe overall spot intensity. This spot intensity is propor-tional to the amount of material hybridized to thatregion, with higher intensities resulting from increasednumbers of hybridized molecules. Each spot, for eachchannel (in the case of two color microarrays) isquantified, and the resultant data are tabulated. Otherdata may also be extracted at this stage. It is common toalso obtain intensity data for the area outside of theindividual spots. This value represents the backgroundof the image and indicates the amount of signal that wouldhave been obtained regardless of a specific hybridizationevent. It is common, however, not universal, to subtractthe background values from the signal intensities of thespots.
There are several means by which segmentation can becarried out. In the most basic setup, a fixed shape (usually acircle) is placed over each spot. The entire complement ofpixels lying within the circle is used to determine theaverage intensity. Pixels lying outside of one of thesecircles are deemed to be background signal. More advancedsegmentation algorithms attempt to account for the factthat most of the spotted features on a microarray are in factnot perfectly uniform. Spots may deviate from a truecircular shape, or may have regions within the circle inwhich DNA was not attached (creating a spot that isreminiscent of a doughnut). In addition, it is not uncommonfor each of the spots to have some degree of variance intheir diameter. The more advanced methods utilize variousalgorithms and statistics to determine which pixels actu-ally represent signal and which are more representative ofbackground.
Image quantitation software then processes the entireimage and produces a table of results that represents thesignal, and the background for each feature on the array.These packages may also export various other data, whichcan be used in quality control analysis such as standarddeviations, coefficients of variance, circularity, or unifor-mity of the spot, and so on. This data table can then beprocessed as part of the data analysis.
MICROARRAYS 365
Figure 2. Arrays imaged on amicroarray scanner are presented as16-bit grayscale TIFF images. Thepicture shown represents a smallsubsection of a larger array. Eachspot is 100 mm in diameter and thespot-to-spot spacing is 200 mm in thisimage. The image was scanned at10-mm resolution.
Data Analysis
An exhaustive description of the process of DNA micro-array data analysis is far beyond the scope of this article(for an excellent review see Ref. 8). The exact processfollowed depends greatly on the experimental design andthe question being addressed. There are, however, somebasic principles that tend to be fairly common in dealingwith microarray data: statistical analysis of data, super-vised and/or nonsupervised data mining, data visualiza-tion, and validation are all key components.
Statistical analysis of microarray data comes into playin two main areas. The first is to determine which spots arereliable and provide sufficient data. Spots that have a highdegree of variance across replicates, for example, are likelynot able to provide reliable data. These hypervariablegenes or signals need to be filtered from the data so asto not skew the results of data mining. Statistics may alsoplay a role in supervised data analysis.
There are two major categories of data mining: super-vised and nonsupervised. Supervised data mining utilizesalgorithms in which the user imparts restrictions on howthe data is grouped. For example, in an experiment where acohort of patients was tested in which one groupwas healthy and the other group was afflicted with aparticular disease, one would indicate to the algorithmwhich arrays were from the healthy patients and whichwere from the patients with disease. The algorithm thentests the data to find genes that are markers for thediseases. Specifically, each gene is tested to see if theexpression levels for that gene are statistically signifi-cantly different in each of the two patient groups. The goalis to find a series of genes that can act as markers that arediagnostic of the disease.
In nonsupervised clustering, the algorithm is not givenany indication as to how the individual samples arerelated. In true nonsupervised clustering, the algorithmis not even told how many groups exist. The data areanalyzed and the samples are grouped based on similaritymetrics. The classical methods of nonsupervised clusteringinclude hierarchical clustering and principal componentsanalysis (PCA). The algorithms generally display the datavia some visualization pattern such as the canonical‘‘plaid’’ expression patterns seen from hierarchical cluster-ing. The researcher then overlays the grouping informa-tion onto the patterns provided to see if the individualgroups naturally separate from one another. In other cases,this methodology may be being used to determine howmany groups there truly are, as the researcher may nothave this information a priori. In such cases, the groupscan then be further examined to see if there are differencesin treatment response, survival, or any other characteristicdesired. Generally, after this technique is performed onewill attempt to look for clusters of genes in the patternsthat distinguish between the different groups and againuse these genes as markers.
Regardless of the methodology utilized, it is extremelyimportant to validate the data. Cross-validation strategiesare various, but in their most basic form, one obtains acohort of patients to profile. A subset of this cohort is usedto look for potential markers. Once the markers have been
identified, the remaining patients are tested and only theidentified markers are used to try and group the patients. Ifthe markers are able to stratify the patients into theirappropriate groups, then the markers are considered to beviable and may provide beneficial diagnostic ability. Onoccasion, however, the validation set is not properlygrouped. In such cases, the markers are only useful forthe narrow set of patients used in the initial tests and moretesting is required to find a viable set of markers.
FABRICATION OF MICROARRAYS
There are two main methodologies for manufacturingmicroarrays, which differ in the means by which the probematerial spotted onto the arrays is prepared. In one meth-odology, the DNA to be spotted is generated in situ usingeither standard or modified phosphoramidite chemistry.(Phospohoramidites are reactive forms of each of thenucleotides that make up DNA. Phosphoramidite chemis-try is a well-defined process by which moderate lengthstretches of DNA can be created with any specificsequence.) This method is used by Affymetrix and Agilent,the two largest commercial suppliers of microarrays,although both groups use a different approach to thein situ synthesis.
Other groups use ex situ synthesis, whereby the DNAmaterial is either prepared as PCR products (cDNA) oroligonucleotides manufactured using standard phosphor-amidite synthesis. Once this material is prepared it isspotted onto the array substrate using either contact ornoncontact printing methodologies. Amersham (now GEHealthcare) and Applied Biosystems use this methodologyto make microarrays as do almost all of the ‘‘homebrew’’laboratories that make microarrays in house.
Fabrication of DNA Arrays In Situ
There are two main approaches to the generation of micro-arrays by in situ synthesis of DNA: photolithography andinkjetting. Affymetrix, the industry leader uses a proprie-tary photolithography process to mask off areas of thearray, protecting some areas, and leaving others availablefor the DNA synthesis reaction to occur (1). This is amultistep process requiring several masks per array tobe made. Each synthesis reaction is performed sequen-tially. For each nucleotide position, there are four possiblemasks (one for each of A, G, C, and T). Thus, an arraycomprised of 25-mer oligonucleotides would require �100masks to complete the process (typically �70 are requiredfor an array due to the sequences used). Affymetrix uses amodified phosphoramidite chemistry for synthesis of theoligonucleotide chains; whereas standard phospohorami-dite chemistry uses acid labile protection groups, the Affy-metrix technology utilizes groups that can be removed byultraviolet (UV) light. The Affymetrix technology allows forextremely high density arrays of hundreds of thousands offeatures to be prepared on very small substrates of <1 cm2.
Other groups have developed technologies that allowthem to get around the need for multiple masks to bemade for each array design. The pioneer in this areawas Nimblegen, who uses digital light processor (DLP)
366 MICROARRAYS

micromirrors to create the masks (9). Each of these DLPunits (used typically in AV projectors and large screentelevisions) comprises thousands of tiny (10 mm2) micro-mirrors. The micromirrors can be individually addressedand the angle of the mirrors changed to allow light to passthrough. In the ‘‘open state’’, the micromirror directs lightonto the surface of the microarray, allowing DNA synthesisto occur. In the ‘‘closed state’’, the micromirror reflects lightaway from the surface, disallowing DNA synthesis. Acomputer controls the mirrors and thus each DLP unithas a near infinite number of combinations that can eachbe controlled, and as such, a single unit can create anypattern desired on the array. Nimblegen uses the samechemistry as Affymetrix, using light activated deprotectionof the phosphoramidites. A somewhat newer entry into thisarea is Xeotron (now part of Invitrogen). Xeotron also usesmicromirror DLPs to address the masks, however, theyhave also incorporated small microfluidic channels on theirchips. Each feature is placed in a microscopic well on thechip. Rather than using the modified phosphoramiditechemistry of Affymetrix and Nimblegen, Xeotron usesstandard chemistry, but has instead employed a caged acidthat can be freed by light (10,11). As such, the acid thatcontrols deprotection of the nascent oligonucleotide can bedirected to specific locations by light. The Nimblegen andXeotron technologies have the advantage of being highlyamenable to custom array generation, however the Affy-metrix technology is particularly well suited to mass pro-duction of a standard array. Each of these approaches hasfound customers in the marketplace.
A third approach to in situ synthesis of the oligonucleo-tides involves ink-jet spotting. Agilent uses this technology(developed by Rosetta Inpharmatics) in which each of thereactive phosphoramidites (A, G, C, and T) are loaded in toa separate ‘‘ink-cartridge’’ to allow for control of whichnucleotide is added to each spot during the synthesis stage(12,13). This methodology eliminates the need for masks,but does require very high precision robotics as the printhead must return to the same spot many times, withinmicron accuracy, during the course of synthesis. Thistechnology draws from the strength of each of the othersmentioned in that it is relatively easy to customize thedesign of arrays, and yet, mass production of arrays ispossible using a large robotic system.
Fabrication of DNA Arrays Ex Situ
Some of the commercial vendors and nearly all of the‘‘homebrew’’ microarray centers utilize and approach ofspotting DNA that was prepared ex situ. In the case ofcDNA arrays, the spotted material is prepared by poly-merase chain reaction (PCR), whereas oligonucleotidearrays are generated using oligos created via high through-put oligo synthesis. The DNA material is purified andplaced into a specific spotting buffer that is compatiblewith the substrates being used.
The DNA is typically aliquoted out into multiwell plates(96, 384, or 1536 wells /plate) to facilitate transfer by thearraying robot. The buffer that the DNA is placed in hasseveral functions. First, the buffer stabilizes the DNA toprevent it from degradation. Second, the buffer must
provide an appropriate surface tension to ensure thatthe spots that are placed on the substrate are of a con-trollable size and uniform in shape. Of similar importance,however, is that the buffer must provide conditions that arecompatible with the attachment chemistry that is going tobe utilized.
The DNA may either be coupled to the slide throughrather simple electrostatic interactions or via a specificcoupling reaction. Electrostatic interactions are mediatedby using a uniform positively charged substrate thatattracts the negatively charged DNA. Often the substratesused are silylated to provide reactive amine groups on thesurface. Alternatively, one may coat the slides with achemical such as poly-L-lysine, which simply adsorbs ontothe substrate and provides a net positive charge. This typeof interaction is mass based. As such, there is a maximummass of DNA that can bind to any one spot on the substrate.Longer DNAs will be represented by fewer copies thanshorter DNAs. To overcome this, it is possible to use morespecific interactions by using modifiers on the DNA thatwill react with certain groups on the slide. The two mostcommon such modalities involve aldehyde or epoxide chem-istry. In this method, the DNA is modified with a primaryamine group. The substrate has reactive aldehydes orepoxides that will react specifically with the primary amineto form a covalent bond (Fig. 3). This type of interaction ismolarity based, and as such, with the exception of stericeffects, the number of DNAs that bind per spot is relativelyequivalent regardless of length.
EQUIPMENT
The manufacture of microarrays, and their subsequent userequires some very specialized equipment. Generally, afacility that produces microarrays will require someadvanced robotics for fabrication. A laboratory that usesarrays will require scanning devices to read the arrays.Due to the relatively high costs of these pieces of equipmentit is common for many people to rely on core facilities forsome or all of the process.
Arraying Robots
Ex situ prepared DNAs are spotted onto the microarraysubstrates via robotics (Fig. 4). Robotics are required toaccurately position the printing devices over the slides tocreate the arrays. The majority of systems utilize pins anddirect contact to deposit the DNA material. In this system,a printhead with several spotting pins in a defined arrange-ment is used to dip into the multiwell plates and pick up thematerial to be spotted. The typical operation sequence of anarrayer robot may include:
1. Dipping the printing applicators (pins) into a sourceplate to pick up DNA samples. Each applicator picksup a separate DNA sample from an individual well inthe plate. Typically 32–48 pins are used at one time.
2. Movement to a blot-station to preprint from the pins.This step removes excess solution from the pins toensure that the spots that are printed onto the arrays
MICROARRAYS 367

are uniform in size and do not run into one anothercausing contamination.
3. Movement to the slide platform. The print head thenmoves over the slide platform taking position overthe first slide.
4. Printing onto the arrays. The print head moves downbringing the pins in contact with the slide. The DNAsolution held in the pins by capillary action is spottedonto the slide. The printhead then moves to the nextslide position and again spots onto the slide. This
process is repeated until all of the slides on theplatform have been printed.
5. Washing the pins. The print head then moves thepins to a wash station. Although there are manyconfigurations possible, the basic principle is to usewater or some other solution to remove the excessliquid from the pins and then to dry the pins (undervacuum or stream of air). This process may berepeated several times to make sure there is nocarryover.
368 MICROARRAYS
Figure 3. Covalent attachment of amino-modified DNAs to aledhyde (a) or epoxide (b)slides is possible. An amino-modified DNAreacts with an aldehyde surface by a Schiff’sbase reaction. The resultant Schiff base mustbe reduced with an agent such as sodiumborohydride (NaBH4) to prevent reversal of thereaction.
O
HC CH2
SlideNH2 DNA
(a) (b)NaBH4
O
CSlide H
NH
CSlide H
DNA
HNH2 DNA
O
CSlide N+H2-DNA
H(c)
OH
CSlide NH-DNA
H O−
HC CH2
Slide N+H2 DNAH2O
O+H2
CSlide NH-DNA
H
HO
HC CH2
Slide NH DNA
H2O
OHHDNA
CSlide H
N+
N
DNA
CSlide H
H3O
−
Proton Transfer
Carbinolamine
−
Iminium Ion
+
Imine (Schiff Base)

6. Loading the next sample. The print head returns tothe source plate to pick up the next set of samples.
In a typical high throughput system, such as thoseoffered by Bio-Rad, BioRobotics, GeneMachines, Genetix,and Telechem International, 48 pins are used at one time.The entire operation sequence described above may take3–4 min to complete for 100 arrays. Often arrays maycontain 20,000–40,000 spots. As such, a typical print runmay require 600 or more cycles through the operationsequence, which can take as long as 30 h or more tocomplete.
Hybridization and Fluidics Stations
Certain array platforms require that a specific hybridiza-tion and/or fluidics station be utilized. In the case of spottedarrays (home-brew in particular), this is usually an optionand often a case of personal preference. In these cases, ahybridization station may be utilized to improve mixing ofthe hybridization solution over the array. The rate ofdiffusion of a labeled nucleic acid in solution is actuallyvery low, and as such, some researchers prefer to use anautomated station that performs mixing of the solution.
In the case of Affymetrix GeneChip technology, a spe-cific hybridization and fluidics station are required. Thehybridization station is simply a rotating incubator inwhich the chips are placed. A bubble that is introducedinto the sealed array cartridge moves around during
rotation creating a mixing effect. The fluidics station is amore advanced system that is required to introduce thevarious labeling components and wash solutions required.This station allows the user to keep the cartridge sealedwithout having to attempt to pipette solutions in and out.
Scanners
While some microarray imagers such as the Perkin ElmerScanArray and GeneFocus DNAScope are confocal scan-ners, this is not a strict requirement. Confocal imagingserves to eliminate extraneous signals, but reduces thelight gathering ability of the device. There are >10,000commercial microarray scanners in the field capable ofreading standard glass microarrays. The leading scannermakers include Agilent, Axon, Bio-Rad, GeneFocus, Per-kinElmer, and other vendors. The laser scanner uses one ormore lasers with wavelengths appropriate to the fluoro-phores being used. The most commonly used fluorophoresfor microarrays are cyanine 3 and cyanine 5 (or fluors withequivalent spectra). Cyanine 3 has an absorbance max-imum of 550 nm and emission maximum of 570 nm. Thereare 2 main lasers used in scanners to excite this fluorphore:‘‘Gre-Ne’’ (green neon) gas lasers and Nd:YAG (neodymiumdoped yttrium aluminum garnet) frequency doubled solid-state diode lasers. Cyanine 5 has an absorbance maximumof 650 nm and an emission maximum of 670 nm. There aretwo main lasers used in scanners to excite this fluorophore:standard He–Ne gas lasers and red diode lasers. Table 1shows some of the characteristics of these two dyes, alongwith two other popular dyes, Alexa 555 and Alexa 647,which have spectra that are very similar to those of Cy3and Cy5 respectively (Fig. 5).
Cyanine 3 and 5 have some important features thatmake these dyes particularly suitable for use in microarrayanalysis. The spectra of these dyes have little over lap andcan generally be separated from one another with little tono cross-talk. In addition, these fluors have a somewhatunique property in that they are brighter when dry thanwhen wet. Most fluorophores have the opposite behavior,which is impractical for microarrays because the scannersgenerally cannot handle wet preparations.
The other major class of microarray imager is a CCD(charge coupled device) based system. In general, theseimagers use a white light source to excite the fluorophores.The fluorescent light that is emitted is captured by theCCD and converted into a digital image. Rather thanscanning the slide, a CCD based imager tiles togetherseveral sections of the slide to create an image of the entiresurface. This tiling can create a stitching effect wherebythe ‘‘seams’’ of the images may not be completely smooth.
MICROARRAYS 369
Figure 4. A microarraying robot. The robotic arrayer prints DNAonto glass slides with very high precision. Robots such as this haveextremely high accuracy, on the order of 10 mm or less.
Table 1. Key Characteristics of the Most Commonly Used Fluorophores for Microarray Analysis
Fluorophore Excitation Max, nm Emission Max, nm Molar Extinction Coefficient Molecular Weight
Cy3 550 570 150,000 766Cy5 649 670 250,000 792Alexa555 555 565 150,000 1,250Alexa647 650 668 239,000 1,250Phycoerytherin 566 575 19,600,000 240,000

This problem can be overcome with advanced lightingsystems and software.
Affymetrix arrays use a different labeling chemistry fordetection relying on the naturally occurring fluorescentprotein phycoerytherin. Phycoerythrin is a naturallyoccurring pigment protein from light harvesting algae thatabsorbs strongly at 566 nm and has an emission peak at575 nm. It is a very bright fluorophore having a molarextinction coefficient that is 80 times as high as the stan-dard Cy3 and Cy5 molecules. The limitation of this mole-cule is that it is also 200 times larger, making the numberof molecules that can be incorporated per sequencemuch less. As such, this molecule can only be applied tothe DNA posthybridization for fear that it would createsteric interference.
MICROARRAYS AS MEDICAL DEVICES
To date, microarrays have mostly found use in basicresearch applications, and have yet to make a strongimpact on the diagnostic market. [During the preparationof this text, Roche received FDA clearance for the first everarray based diagnostic chip. The AmpliChip CYP450 basedon the Affymetrix platform was approved in Januaryof 2005 (see http://www.roche.com/med-cor-2005-01-12).]Microarrays have indeed been used to study many diseasesincluding various cancers, cardiovascular disease, inflam-matory disease, psychiatric disorders and infectious dis-ease. This basic research will ultimately lead to theidentification of potential therapeutic markers for drugsof for diagnostics. The potential of microarrays extendsbeyond target discovery, however, and will eventuallyimpact on the way that medical care is performed.
Target Discovery
The use of microarrays in basic research laboratorieshas often focused on target discovery. In these applica-tions, microarrays are used to profile a particular
disease where disease tissues are compared to healthytissues either from the same patient or from a separatetest population. In such experiments, the goal is to findgenes that are differentially regulated (either up or down)in the disease state compared to a healthy tissue. Suchgenes are thought to be involved in the disease state or inthe cellular response to the disease. As such, these genesare potential diagnostic markers and may also representdrug targets.
Drug/Lead Discovery
Microarrays can also be used once the target has beenidentified. It is possible to use microarrays to screen poten-tial therapeutic compounds, for example, to determinewhich candidates reverse the pattern of gene expressionthat is indicative of disease. Microarrays have been evenmore effective in looking at toxicity of lead compounds. Oneof the leading contributors to failure of a pharmaceuticalcompound is toxic or off target events. Microarrays haveproven useful in screening for the up-regulation in toxicityrelated genes. In addition, it is possible to determine if thecompound creates other effects that while not toxic per secould cause undesirable side effects from nonspecific inter-actions. Often toxicity models are tested in model organ-isms such as rats or dogs. Several toxicity specific arrayshave been developed that allow for profiling of genes inthese model systems rather than human cells.
Diagnostics and Prognostics
One of the more promising areas for microarrays tohave direct impact as a medical device is in the area ofdiagnostics and prognostics. As mentioned under targetdiscovery, basic research has often strived to look for apanel of genes that can be used as a molecular fingerprintof a disease. There are numerous publications inwhich researchers have attempted to use molecularprofiles to correlate to patient outcome, diseasestate, tumor type, or any of several other factors. DNA
370 MICROARRAYS
Alexa Fluor 555
Cy3
500 550 600 650
wavelength (nm)
exci
tatio
n/ab
sorp
tion
(–)
(- -) emission/fluorescence
500 600 700 800
wavelength (nm)
exci
tatio
n/ab
sorp
tion
(–)
(- -) emission/fluorescence
Alexa Fluor 647/Cy5
Figure 5. Representative spectra of the fluors commonly used in spotted microarray experiments.Alexa Fluor 555 and Cy3 are excited by green wavelengths of light whereas Alexa Fluor 647 and Cy5are excited by red wavelengths of light. One green excited and one red excited fluor may be used atthe same time as there is little overlap in their excitation spectra.

microarrays are particularly well suited to this type ofanalysis. Many complex diseases are multifactoral;rather than a single prognostic or diagnostic marker beingpresent, it may be necessary to look at several genes at onetime. Microarrays allow for identification of a panel ofgenes, which when looked at together may provide diag-nostic or prognostic power. Although it has not becomecommon practice yet, there are examples of microarraysbeing used to prescreen patients on the basis of a molecularprofile (14).
Other attempts are being made at using microarrays tostudy infectious disease. Often times a patient may presentwith a set of symptoms that could be indicative of severaldifferent infectious agents. It is possible to prepare amicroarray that would identify the agent as well as tosubtype the bacterium or virus on the basis of pathogeni-city. This particular application may prove very useful inidentifying not only the infectious agent, but also the bestcourse of treatment.
Pharmacogenomics and Theranostics
A concept that is gaining in popularity is pharmacoge-nomics or theranostics (15). Both of these terms refer tothe idea of tailoring a patient’s treatment or therapy on thebasis of their genetic makeup. Many pharmaceuticals onthe market have not known any potentially serious sideeffects in a subset of patients. In addition, there are typi-cally at least some patients that are nonresponders to aparticular treatment. These effects are often times theresult of the patient’s genetic make-up. Most of the workin this area has focused on genotyping: looking at certainvariable regions of DNA and determining which variantsare present in people who have negative reactions or inpeople who respond well to a treatment. It is hoped that inthe near future it will be possible to screen a patient anddetermine which of a panel of drugs will be most beneficial.Perhaps even more important, it will be possible to preventserious negative outcomes by avoiding treatment of apatient that will have a poor reaction to a drug. Theranos-tics also involves monitoring a patient through a course oftreatment. It is possible that a patient can be screenedduring treatment to ensure that the therapy is working asexpected. If a change occurs, the physician would be able toalter the therapy to ensure that the disease is treated in themost effective way possible.
SUMMARY
Microarrays provide a means to screen hundreds to thou-sands of biological analytes in parallel. These analytes canbe DNA, RNA, or protein. DNA microarrays allow for rapidprofiling of gene expression. While there are a few compet-ing platforms that can be utilised, the basic principles arethe same: RNA from a biological sample is extracted,labeled and applied to an array of DNA probes. Signalsgenerated from the array indicate which genes are activeand which are not. The ability to screen multiple tissues orpatients make microarrays particularly well suited touncovering the complex gene networks involved in disease.While typically used in basic research applications for
target or marker discovery, the future will most likelysee microarrays used in diagnostic applications and fortailoring medical treatment.
BIBLIOGRAPHY
1. Fodor SP, Rava RP, Huang XC, Pease AC, Holmes CP, AdamsCL. Multiplexed biochemical assays with biological chips.Nature (London) 1993;364:555–556.
2. Schena M, Shalon D, Davis RW, Brown PO. Quantitativemonitoring of gene expression patterns with a complemen-tary DNA microarray. Science 1995;270:467–470.
3. Cawley S, Bekiranov S, Ng HH, Kapranov P, Sekinger EA,Kampa D, Piccolboni A, Sementchenko V, Cheng J,Williams AJ, Wheeler R, Wong B, Drenkow J, YamanakaM, Patel S, Brubaker S, Tammana H, Helt G, Struhl K,Gingeras TR. Unbiased mapping of transcription factorbinding sites along human chromosomes 21 and 22 pointsto widespread regulation of noncoding rnas. Cell 2004;116:499–509.
4. Hegde P, Qi R, Abernathy K, Gay C, Dharap S, Gaspard R,Hughes JE, Snesrud E, Lee N, Quackenbush J. A conciseguide to cdna microarray analysis. Biotechniques 2000;29:548–550, 552–544, 556 passim.
5. Van Gelder RN, von Zastrow ME, Yool A, Dement WC,Barchas JD, Eberwine JH. Amplified rna synthesized fromlimited quantities of heterogeneous CDNA. Proc Natl AcadSci USA 1990;87:1663–1667.
6. Schena M. Microarray analysis. Hoboken: John Wiley &Sons; 2003.
7. Wang Y, Wang X, Guo SW, Ghosh S. Conditions to ensurecompetitive hybridization in two-color microarray: A theore-tical and experimental analysis. Biotechniques 2002;32:1342–1346.
8. Quackenbush J. Computational analysis of microarray data.Nature Rev Genet 2001;2:418.
9. Singh-Gasson S, Green RD, Yue Y, Nelson C, BlattnerF, Sussman MR, Cerrina F. Maskless fabrication of light-directed oligonucleotide microarrays using a digital micro-mirror array. Nat Biotechnol 1999;17:974–978.
10. Gao X, LeProust E, Zhang H, Srivannavit O, Gulari E, Yu P,Nishiguchi C, Xiang Q, Zhou X. A flexible light-directedDNA chip synthesis gated by deprotection using solutionphotogenerated acids. Nucleic Acids Res 2001;29:4744–4750.
11. LeProust E, Pellois JP, Yu P, Zhang H, Gao X, Srivannavit O,Gulari E, Zhou X. Digital light-directed synthesis. Amicroarray platform that permits rapid reaction optimiza-tion on a combinatorial basis. J Comb Chem 2000;2:349–354.
12. Hughes TR, Mao M, Jones AR, Burchard J, Marton MJ,Shannon KW, Lefkowitz SM, Ziman M, Schelter JM, MeyerMR, Kobayashi S, Davis C, Dai H, He YD, Stephaniants SB,Cavet G, Walker WL, West A, Coffey E, Shoemaker DD,Stoughton R, Blanchard AP, Friend SH, Linsley PS. Expressionprofiling using microarrays fabricated by an ink-jet oligonucleo-tide synthesizer. Nat Biotechnol 2001;19:342–347.
13. Hughes TR, Shoemaker DD. DNA microarrays for expressionprofiling. Curr Opin Chem Biol 2001;5:21–25.
14. Schubert CM. Microarray to be used as routine clinicalscreen. Nat Med 2003;9:9.
15. Picard FJ, Bergeron MG. Rapid molecular theranostics ininfectious diseases. Drug Discov Today 2002;7:1092–1101.
See also DNA SEQUENCE; MICROBIOREACTORS; POLYMERASE CHAIN
REACTION.
MICROARRAYS 371

MICROBIAL DETECTION SYSTEMS
PATRICIA L. DOLAN
JASON C. HARPER
SUSAN M. BROZIK
Sandia National LaboratoriesAlbuquerque, New Mexico
INTRODUCTION
Infectious diseases accounted for 25–33% of the estimated54 million deaths worldwide in 1988 (1), of which morethan half are attributed to tuberculosis, malaria, chronichepatitis B, diarrheal diseases, and human immunodefi-ciency virus/Acquired Immune Deficiency Syndrome HIV/AIDS. The incidence of more than 30 diseases identifiedsince the mid-1970s continues to grow, which include HIV/AIDS, liver disease due to hepatitis C virus, cholera, tick-transmitted Lyme disease, foodborne illness caused by E.coli O157:H7 and Cyclospora, waterborne disease due toCryptosporidium, and the hantavirus pulmonary syn-drome. Additionally, the first known cases of human influ-enza caused by the avian influenza virus, H5N1, wereidentified in Hong Kong in 1997 (2).
Although death due to infectious diseases in the UnitedStates remains low relative to that of noninfectious dis-eases, their occurrence is increasing. In 2000, the Federa-tion of American Scientists reported that infectious-disease-related death rates nearly doubled from 1980 to170,000 annually (1). Many of these diseases, most recentlythe West Nile virus, were introduced from outside the U.S.borders by international travelers, immigrants, returningU.S. military personnel, or imported animals and food-stuffs. Still, the most dangerous infectious microbes residewithin U.S. borders. Four million Americans are chroniccarriers of the hepatitis C virus, a significant cause of livercancer and cirrhosis. It is predicted that the death rate dueto hepatitis C virus infection may surpass that of HIV/AIDS in the next five years. Influenza viruses are respon-sible for approximately 30,000 deaths annually. In addi-tion, hospital-acquired infections are surging due to highlyvirulent and resistant pathogens such as Staphylococcusaureus.
The burden of identifying and treating infected indivi-duals and controlling disease outbreaks generally lies withphysicians, hospitals, and first responders. Table 1 con-tains important characteristics for several of the morecommon pathogenic microorganisms. As evidenced by thisnoninclusive table, a wide variety of microorganisms existsfrom which the specific diseasecausing microbe must beidentified. In addition, the number of cells or particles thatcan provide an infectious dose is often extremely low. Forexample, the infectious dose of E. coli O157:H7 is as low as10 cells (3), which poses a significant challenge to health-care professionals and first responders who must quicklyidentify the infectious agent. Antimicrobial treatmentsthat attempt to neutralize all possible infectious pathogensare often not possible or safe. Depending on the nature andseverity of the infection, a delay of only a few hours inproviding the proper therapy may lead to death.
Medical Microbiology
Medical microbiology is the discipline of science devoted toidentifying microbial agents that are responsible for infec-tious disease and elucidating the mechanism of interactionbetween the microorganism and human host. Historically,microbiologists have used plating, microscopy, cell culture,and susceptibility tests to identify and study microorgan-isms. In the hospital and clinical diagnostic laboratory,these, methods are still widely used and will be brieflydiscussed in this article. The general procedure for isola-tion and identification of infectious and parasitic microbesis (1) specimen collection and streaking onto culture platesfor production of isolated bacteria colonies, (2) staining andmicroscopic analysis, (3) cell culture in various media, and(4) antibiotic susceptibility testing.
Plating. Plating entails the streaking of a specimenonto a solid nutrient media-filled Petri dish and incubationat 35–37 8C. Under these conditions, a single bacteriumdivides and eventually produces a colony that is visible tothe eye (Fig. 1). A visible colony generally contains morethan 107 organisms. The colony morphology, color, timerequired for growth, appropriate media, and other growthconditions are used to characterize the microbe. The incu-bation time required for growth of a colony from a singlecell is dependent on the growth rate of the microorganism.Fast-growing organisms such as E. coli, with a doublingtime of 30 minutes, would require approximately 13 hoursto produce a colony of 107 organisms. More typically, micro-organisms require several days to a week to generate visiblecolonies. The plated specimen is often a complex solutionsuch as blood, urine, feces, or sputum containing diversenative flora in addition to the infectious microbe. Platingserves as a method to isolate the infectious microbe as each
372 MICROBIAL DETECTION SYSTEMS
Figure 1. Colonies of E. coli grown on LB þampicillin and X-galþIPTG agar media in a Petri dish.

Ta
ble
1.
Ch
ara
cte
ris
tics
of
co
mm
on
pa
tho
gen
ico
rg
an
ism
s
Org
an
ism
Sit
e(s)
Dis
ease
(s)
Incu
bati
onp
erio
dM
ode
oftr
an
smis
sion
Infe
ctio
us
Dos
e
Ba
cte
ria
,G
ra
mp
osi
tiv
eC
oryn
eba
cter
ium
dip
hth
eria
eu
pp
erre
spir
ato
rytr
ack
,sk
ind
iph
ther
ia2–7
days
dir
ect
con
tact
,d
rop
let
spre
ad
un
kn
own
Str
epto
cocc
us
pn
eum
onia
elo
wer
resp
irato
rytr
act
pn
eum
onia
,m
enin
git
is1–3
days
dir
ect
con
tact
,d
rop
let
spre
ad
un
kn
own
Lis
teri
am
onoc
ytog
enes
mon
ocyte
s,le
uk
ocyte
s,blo
od,
inte
stin
e,sk
in
list
erio
sis,
men
ingoe
nce
ph
ali
tis
vari
able
;3–70
days
inges
tion
,d
irec
tco
nta
ct,
neo
nata
lco
nta
ct(b
irth
),tr
an
spla
cen
tal
un
kn
own
,<
1000
cell
s
Ba
cill
us
an
thra
cis
low
erre
spir
ato
rytr
act
,sk
inle
sion
s,in
test
ine
an
thra
xfe
wh
ours
�7
days
dir
ect
con
tact
,air
bor
ne,
inges
tion
8,0
00–50,0
00
spor
esS
tap
hyl
ococ
cus
au
reu
ssk
in,
oste
omyel
itis
,blo
od,
hea
rtboi
ls,
furu
ncl
es,
absc
esse
s,im
pet
igo,
oste
omyel
itis
,se
psi
s,to
xic
shoc
ksy
nd
rom
e
vari
able
;4–10
days
dir
ect
con
tact
,in
ges
tion
,au
toin
fect
ion
,n
eon
ata
lco
nta
ct(b
irth
)
10
2–
10
6ce
lls
Str
epto
cocc
us
pyo
gen
esth
roat,
skin
,blo
od,
mid
dle
ear
ph
ary
ngit
is,
sep
tice
mia
,er
ysi
pel
as,
rheu
mati
cfe
ver
,sc
arl
etfe
ver
,ot
itis
med
ia,
food
bor
ne
illn
ess
1–3
days
dir
ect
con
tact
,d
rop
let
spre
ad
,in
ject
ion
<1000
cell
s
Ba
cte
ria
,G
ra
mn
eg
ati
ve
Bor
det
ella
per
tuss
isor
oph
ary
nx
wh
oop
ing
cou
gh
6–20
days
dir
ect
con
tact
,d
rop
let
spre
ad
,air
bor
ne
un
kn
own
Esc
her
ich
iaco
li(O
157:H
7)
larg
ein
test
ine
hem
orrh
agic
coli
tis
2–8
days
inges
tion
�10
cell
sL
egio
nel
lasp
p.
low
erre
spir
ato
rytr
act
Leg
ion
ello
sis,
Pon
tiac
fever
2–10
days
air
bor
ne
(non
–co
mm
un
icable
)u
nk
now
nN
eiss
eria
gon
orrh
oea
egen
itou
rin
ary
tract
,ey
egon
orrh
oea,
pel
vic
infl
am
mato
ryd
isea
se,
sep
tice
mia
,p
hary
ngit
is2–7
days
dir
ect
con
tact
(usu
all
yse
xu
al)
,n
eon
ata
lco
nta
ct(b
irth
)u
nk
now
n
Nei
sser
iam
enin
git
idis
men
inges
men
ingit
is2–10
days
dir
ect
con
tact
,d
rop
let
spre
ad
un
kn
own
Sa
lmon
ella
spp
.sm
all
inte
stin
egast
roen
teri
tis
6–72
hou
rsin
ges
tion
10–100,0
00
cell
sS
alm
onel
laty
ph
ism
all
inte
stin
ety
ph
oid
fever
1–3
wee
ks
inges
tion
1,0
00–100,0
00
cell
sS
hig
ella
spp
.in
test
ine
shig
ello
sis
(en
teri
tis)
;B
aci
llary
dyse
nte
ry1–7
days
inges
tion
10–200
cell
s
Yer
sin
iasp
p.
inte
stin
een
tero
coli
tis,
acu
tem
esen
teri
cly
mp
had
enit
is3–7
days
inges
tion
10
6ce
lls
Vib
rio
spp
.in
test
ine
chol
era,
ente
riti
s4–96
hou
rsin
ges
tion
�10
6ce
lls
An
aero
bes,
Gra
mp
osi
tiv
eA
ctin
omyc
essp
p.
jaw
,th
orax,
abd
omen
chro
nic
abce
sses
,d
rain
ing
sin
use
svari
able
;d
ays
orm
onth
sd
irec
tco
nta
ct(m
outh
),air
bor
ne,
fom
ites
un
kn
own
Clo
stri
diu
mbot
uli
nu
mn
erves
,m
usc
le,
skin
,in
test
ine
(in
fan
ts)
bot
uli
sm,
acu
tebil
ate
ral
cran
ial
ner
ve
imp
air
men
t
12–36
hou
rsd
irec
tco
nta
ct,
inges
tion
(non
–co
mm
un
icable
)u
nk
now
n
Clo
stri
diu
md
iffi
cile
inte
stin
ep
seu
dom
embra
nou
sco
liti
s6–24
hou
rsen
vir
onm
enta
lu
nk
now
nC
lost
rid
ium
per
frin
gen
ssk
inle
sion
,la
rge
inte
stin
egas
gan
gre
ne,
food
poi
son
ing
1–4
days
inges
tion
10
5–10
8ce
lls
Clo
stri
diu
mte
tan
in
erves
,m
usc
lete
tan
us
3–21
days
dir
ect
con
tact
(non
–co
mm
un
icable
)p
oten
tto
xin
373
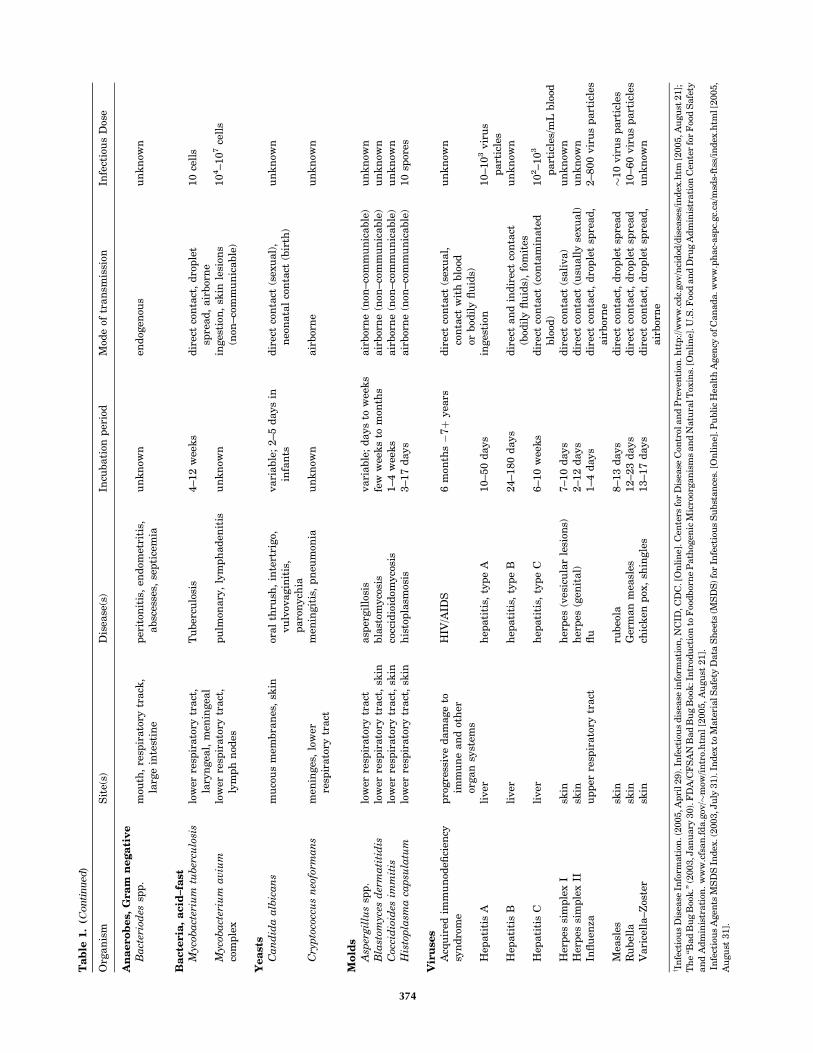
Ta
ble
1.
(Co
nti
nu
ed)
Org
an
ism
Sit
e(s)
Dis
ease
(s)
Incu
bati
onp
erio
dM
ode
oftr
an
smis
sion
Infe
ctio
us
Dos
e
An
aero
bes,
Gra
mn
eg
ati
ve
Ba
cter
iod
essp
p.
mou
th,
resp
irato
rytr
ack
,la
rge
inte
stin
ep
erit
onit
is,
end
omet
riti
s,absc
esse
s,se
pti
cem
iau
nk
now
nen
dog
enou
su
nk
now
n
Ba
cte
ria
,a
cid
–fa
stM
ycob
act
eriu
mtu
ber
culo
sis
low
erre
spir
ato
rytr
act
,la
ryn
gea
l,m
enin
gea
lT
uber
culo
sis
4–12
wee
ks
dir
ect
con
tact
,d
rop
let
spre
ad
,air
bor
ne
10
cell
s
Myc
oba
cter
ium
aviu
mco
mp
lex
low
erre
spir
ato
rytr
act
,ly
mp
hn
odes
pu
lmon
ary
,ly
mp
had
enit
isu
nk
now
nin
ges
tion
,sk
inle
sion
s(n
on–co
mm
un
icable
)10
4–10
7ce
lls
Yea
sts
Ca
nd
ida
alb
ica
ns
mu
cou
sm
embra
nes
,sk
inor
al
thru
sh,
inte
rtri
go,
vu
lvov
agin
itis
,p
aro
nych
ia
vari
able
;2–5
days
inin
fan
tsd
irec
tco
nta
ct(s
exu
al)
,n
eon
ata
lco
nta
ct(b
irth
)u
nk
now
n
Cry
pto
cocc
us
neo
form
an
sm
enin
ges
,lo
wer
resp
irato
rytr
act
men
ingit
is,
pn
eum
onia
un
kn
own
air
bor
ne
un
kn
own
Mo
lds
Asp
ergil
lus
spp
.lo
wer
resp
irato
rytr
act
asp
ergil
losi
svari
able
;d
ays
tow
eek
sair
bor
ne
(non
–co
mm
un
icable
)u
nk
now
nB
last
omyc
esd
erm
ati
tid
islo
wer
resp
irato
rytr
act
,sk
inbla
stom
yco
sis
few
wee
ks
tom
onth
sair
bor
ne
(non
–co
mm
un
icable
)u
nk
now
nC
occi
dio
ides
imm
itis
low
erre
spir
ato
rytr
act
,sk
inco
ccid
ioid
omyco
sis
1–4
wee
ks
air
bor
ne
(non
–co
mm
un
icable
)u
nk
now
nH
isto
pla
sma
cap
sula
tum
low
erre
spir
ato
rytr
act
,sk
inh
isto
pla
smos
is3–17
days
air
bor
ne
(non
–co
mm
un
icable
)10
spor
es
Vir
use
sA
cqu
ired
imm
un
odefi
cien
cysy
nd
rom
ep
rogre
ssiv
ed
am
age
toim
mu
ne
an
dot
her
organ
syst
ems
HIV
/AID
S6
mon
ths�
7þ
yea
rsd
irec
tco
nta
ct(s
exu
al,
con
tact
wit
hblo
odor
bod
ily
flu
ids)
un
kn
own
Hep
ati
tis
Ali
ver
hep
ati
tis,
typ
eA
10–50
days
inges
tion
10–10
3vir
us
part
icle
sH
epati
tis
Bli
ver
hep
ati
tis,
typ
eB
24–180
days
dir
ect
an
din
dir
ect
con
tact
(bod
ily
flu
ids)
,fo
mit
esu
nk
now
n
Hep
ati
tis
Cli
ver
hep
ati
tis,
typ
eC
6–10
wee
ks
dir
ect
con
tact
(con
tam
inate
dblo
od)
10
2–10
3
part
icle
s/m
Lblo
odH
erp
essi
mp
lex
Isk
inh
erp
es(v
esic
ula
rle
sion
s)7–10
days
dir
ect
con
tact
(sali
va)
un
kn
own
Her
pes
sim
ple
xII
skin
her
pes
(gen
ital)
2–12
days
dir
ect
con
tact
(usu
all
yse
xu
al)
un
kn
own
Infl
uen
zau
pp
erre
spir
ato
rytr
act
flu
1–4
days
dir
ect
con
tact
,d
rop
let
spre
ad
,air
bor
ne
2–800
vir
us
part
icle
s
Mea
sles
skin
rubeo
la8–13
days
dir
ect
con
tact
,d
rop
let
spre
ad
�10
vir
us
part
icle
sR
ubel
lask
inG
erm
an
mea
sles
12–23
days
dir
ect
con
tact
,d
rop
let
spre
ad
10–60
vir
us
part
icle
sV
ari
cell
a–Z
oste
rsk
inch
ick
enp
ox,
shin
gle
s13–17
days
dir
ect
con
tact
,d
rop
let
spre
ad
,air
bor
ne
un
kn
own
y In
fect
iou
sD
isea
seIn
form
ati
on.(
2005,A
pri
l29).
Infe
ctio
us
dis
ease
info
rmati
on,N
CID
,CD
C.[
On
lin
e].C
ente
rsfo
rD
isea
seC
ontr
olan
dP
reven
tion
.htt
p://w
ww
.cd
c.gov
/nci
dod
/dis
ease
s/in
dex
.htm
[2005,A
ugu
st21];
Th
e‘‘B
ad
Bu
gB
ook
.’’(2
003,J
an
uary
30).
FD
A/C
FS
AN
Bad
Bu
gB
ook
:In
trod
uct
ion
toF
oodbor
ne
Path
ogen
icM
icro
organ
ism
san
dN
atu
ralT
oxin
s.[O
nli
ne]
.U.S
.Foo
dan
dD
rug
Adm
inis
trati
onC
ente
rfo
rF
ood
Safe
ty
an
dA
dm
inis
trati
on.
ww
w.c
fsan
.fd
a.g
ov/�
mow
/in
tro.
htm
l[2
005,
Au
gu
st21].
Infe
ctio
us
Agen
tsM
SD
SIn
dex
.(2003,J
uly
31).
Ind
exto
Mate
rialS
afe
tyD
ata
Sh
eets
(MS
DS
)fo
rIn
fect
iou
sS
ubst
an
ces.
[On
lin
e].P
ubli
cH
ealt
hA
gen
cyof
Can
ada.w
ww
.ph
ac-
asp
c.gc.
ca/m
sds-
ftss
/in
dex
.htm
l[2
005,
Au
gu
st31].
374

colony originates from a single cell and is therefore pure ofany other cell types. A colony can subsequently be used as apure sample for microscopy, cell culture, and other analy-tical tests. Additionally, as only viable cells divide, platingcan differentiate between dead microbes and those that areviable and may be the source of infection.
Staining. Microscopic observation of microorganisms isgenerally preceded by staining a specimen on a microscopeslide. The microbe response to various stains (gram-posi-tive/negative, acid-fast, etc.), size, grouping (single, double,chains), and morphology (bacillus, coccus, spirillum, pleo-morphic) provide characteristic information helpful inidentifying the microorganism. However, several patho-genic species appear similar, or are indistinguishable,under the microscope. For effective observation under amicroscope, at least 105 cells per milliliter of sample shouldbe present. A colony specimen usually meets this require-ment, and preconcentration is generally necessary forviewing a nonplated specimen. Still, very small cells canbe difficult to observe and may be overlooked. Finally,microscopic observation usually cannot distinguishbetween dead and live cells.
Cell Culture. Cell culture is used to ascertain thebiochemical properties of a microorganism. A single colonyis inoculated into a liquid media broth and incubated.Incubation is usually performed near 37 8C with agitationvia shaking or gas sparging to facilitate gas transport intothe liquid media for uptake by the microbes. Signs ofmicrobial growth in liquid media include turbidity andgas formation. Turbidity can be used as a simple andnondestructive method to measure cell growth. An opticaldensity measurement provides the degree of light scatter-ing at a particular wavelength through a given path lengthof liquid media. Increasing cell density due to growthusually increases the degree of light scattered. The mea-sured optical density can, therefore, be directly related tothe total cell mass. A calibration curve for each bacterialspecies is required as various sizes and shapes of differentmicrobes scatter light to varying extents.
Microbial growth in several different media is used todetermine a specific microbe’s biochemical and physiologi-cal characteristics. Definitive identification can require 20or more media tests. Such tests often use selective media. Amedia can be made selective by addition of chemicals thatinhibit microbe and native flora growth while allowinggrowth of a specific organism. For example, Thayer–Mar-tin medium selectively isolates pathogenic Neisseria gonor-rhea and Neisseria meningitides (4). The medium containsvancomycin to inhibit growth of gram-positive bacteria,anisomycin to inhibit fungi growth, colistin to inhibit mostgramnegative bacilli growth, and trimethoprim-sulfa-methoxazole to inhibit Proteus growth. The Neisseria spe-cies are resistant to these inhibitors at the concentrationspresent in the medium and grow freely.
Antibiotic Susceptibility Testing. Upon isolation andidentification of the infectious microbe, antibiotic suscept-ibility testing can be performed to identify antimicrobialagents that inhibit growth. Additionally, the minimal
inhibitory concentration (MIC) is determined by exposingbacteria in media broth to various concentrations of anantimicrobial agent. The lowest antibiotic concentrationthat inhibits growth is the MIC. A concentration of theantibiotic in the blood at or above the MIC should success-fully treat an infection.
Development
Plating, microscopy, cell culture, and susceptibility testingtechniques for identifying and treating infectious micro-organisms have proven effective against a plethora ofpathogens, hence its continued use today. However, theseclinical microbiology methods have changed very little overthe past century, often require days to obtain confirmedresults, and cannot be used successfully to characterizeseveral significant infectious agents including the hepatitisvirus. However, with the recent and significant advances inmolecular biotechnology, two additional microbe identifi-cation methods have found wide use, immunoassay andpolymerase chain reaction.
Developed in 1959, the utility of the immunoassay wasnot fully realized by the medical diagnostic communityuntil the late 1970s and early 1980s. The immunoassaytakes advantage of an immune system reaction, the highlyspecific and strong binding of antibody to antigen. Anti-bodies are developed that specifically bind a given micro-organism, chemical byproducts or proteins produced by agiven microorganism, or antibodies produced by the hostin response to infection caused by a given microorganism.The developed antibodies are tagged with a reportermolecule. Reporters can be radioisotopes, chemilumines-cent or fluorescent molecules, or enzymes (i.e., alkalinephosphatase, horseradish peroxidase) that can produce aradiographic, colorimetric, or fluorescent signal. In thepresence of the antigen, the antibody will bind and willremain bound through washes that remove unbound anti-body. Detection of the reporter after washes indicates thatthe antigen was present, as bound antibody was notremoved during washing. Although rapid, highly specific,and sensitive, immunoassays cannot differentiatebetween viable and dead cells and are limited to testsfor which antibodies can be developed. They also can beaffected by contaminants in the test specimen and do notprovide quantitative information regarding the number ofpathogenic agents present.
Serological assays are the most commonly used immu-noassay in the medical laboratory and by the Centers forDisease Control and Prevention (CDC). The mechanism ofSerodiagnosis entails binding of lab-developed antibodiesto antibodies produced in the host in response to a specificinfection. This indirect method of detecting infectiousagents allows identification of microbes that are currentlydifficult or impossible to isolate and culture. For example,because HIV-1 virus requires advanced containment facil-ities and is difficult to isolate and culture, it is serologicallydiagnosed via detection of antibodies produced by the hostagainst the virus. Additionally, a method to effectivelyisolate and culture hepatitis virus has not yet been devised.Therefore, diagnosis of hepatitis virus infection is doneserologically. A lag phase of several weeks often exists
MICROBIAL DETECTION SYSTEMS 375

between onset of infection and production of antibodies bythe host against the microbial agent and, thus, possiblyleads to false negatives. False positives are also a concernas antibodies produced by the host during a previousinfection may be present and detected.
Immunoassays were the primary diagnostic methodused for microbial detection by the CDC until the devel-opment of polymerase chain reaction (PCR) (5). PCR is atechnique that specifically amplifies DNA sequences (formore information, see page 8). This technology has trans-formed molecular biology and genetics and has changeddiagnostic approaches to the identification, detection, andcharacterization of infectious agents. With PCR, extremelysmall quantities of DNA from a microorganism can beamplified and detected. Detection of amplified DNA canoccur through gel electrophoresis or via genetic probes.Based upon the highly specific binding between compli-mentary nucleobases of DNA and RNA, genetic probes arenucleic acid sequences that bind to DNA or RNA unique toa given microorganism. Genetic probes are marked withradioisotopes, chemiluminescent or fluorescent molecules,or enzymes and will produce a quantitative signal onlywhen the complimentary microorganism DNA or RNA ispresent in the sample (for more information, see page 9).Ou et al. (6) used PCR to amplify and detect HIV sequencesfrom seropositive individuals. Subsequently, PCR amplifi-cation and sequence analysis of HIV amplicons (amplifiedDNA sequences) became the first use of comparativenucleic acid sequence information in a disease outbreaksetting (7). Although PCR is very sensitive and sequenceanalysis provides specific identification capability, thesetechnologies are expensive, time-consuming, labor-inten-sive, and require expertise in molecular biology. Conse-quently, use of PCR and genetic probes for identification ofmicrobes is common in research laboratories and academicinstitutions, but, to date, is not widely used in hospital ormedical diagnostic laboratories.
To address rising national and worldwide public healthneeds, it is desirable that a sensitive, specific, fast, andsimple-to-operate device be employed to detect infectiousagents. Microbial detection systems that attempt to meetthis need have been commercially available since the late1970s and have progressed significantly with the molecularbiotechnology revolution. Still, microbial detection systemsface three major challenges: time, sensitivity, and specifi-city of analysis. Microbial testing and detection must berapid to allow adequate time for treating the infection andbe highly sensitive as a single pathogenic organism may beinfectious. Additionally, as a low number of pathogenicmicrobes may be present in complex biological samples,such as blood or urine, high specificity remains an essentialrequirement. To tackle these problems, alternative nucleicacid-based approaches have been integrated into user-friendly microbial detection systems that are commerciallyavailable for diagnostic purposes.
Contemporary microbial detection systems or biosen-sors typically consist of a selective biorecognition moleculeconnected to a transducer that converts a biochemicalinteraction into a measurable signal. Recognition mole-cules include nucleic acids, antibodies, and peptides. Com-monly used transducers include electrochemical, optical,
and piezoelectric. The following sections will discussnumerous commercially available microbial detection sys-tems used in clinical and field settings, including (1) nucleicacid-based, optical technologies and systems; (2) fiber-optic, waveguide-based fluoroimmunoassay systems; (3)a chip- and nanoparticle-based bio-barcode optical technol-ogy; (4) an electronic microchip-based technology; and (5)an electronic nose microbial detector.
NUCLEIC ACID-BASED OPTICAL TECHNOLOGIES
Line Immunoprobe Assay (LIPA)
The line immunoprobe assay (LIPA) is a nucleic acidrecombinant immunoblotting assay (RIBA) (i.e., oligonu-cleotides that differentiate different genetic variants aretransferred onto a nitrocellulose membrane in a straightline) (8,9). PCR is performed from the clinical sample usingprimers that selectively amplify a DNA region containingnucleotide differences. The amplicons are hybridized withthe immobilized oligonucleotides on the membrane, and anenzyme-based colorimetric method is used to detect bind-ing and positive reactivity. The nucleotide differences con-tained within the amplified sample DNA provide a uniquesignature that differentiates target genotypes or mutantmicroorganisms. These assays were among the first com-mercially available assays using nucleic acid hybridizationfor diagnostic purposes.
COBAS AMPLICOR Analyzer
A second commercially available system using PCR tech-nology is the COBAS AMPLICOR Analyzer (Roche Diag-nostics; Rotkreuz, Switzerland). This system automatesamplification and detection of target DNA from infectiousagents by combining five instruments into one: a thermalcycler, automatic pipettor, incubator, washer, and reader.Amplified biotinylated products are captured on oligonu-cleotide-coated magnetic microparticles and detected color-imetrically with use of an avidin-horseradish peroxidase(HRP) conjugate. The system can detect a broad range ofagents including Bacillus anthracis, Chlamydia trachoma-tis, Neiserria gonorrhea, Mycobacterium tuberculosis, cyto-megalovirus, hepatitis B and hepatitis C viruses, and HIVin clinical specimens including serum, urine, and sputum.The manufacturer reports that more than 4000 COBASAMPLICOR Analyzers are currently used in clinical set-tings worldwide (10).
Real-Time PCR (RT-PCR)
A number of commercially available systems for the diag-nosis of infectious diseases make use of a third nucleic acid-based approach (i.e., RT-PCR). As the name implies, RT-PCR, pioneered by Applied Biosystems (Foster City, CA) inthe mid-1990s (11), amplifies and measures agent-specificDNA as the reaction proceeds in real-time. It is used toquantify the amount of agent-specific input DNA or cDNAby correlating the amount of DNA with the time it takes todetect a fluorescent signal. This technology uses fluores-cent reporter probes (i.e., molecular beacons) that are
376 MICROBIAL DETECTION SYSTEMS

detected and quantitated at each cycle of the PCR. Mole-cular beacons are single-stranded, dual-labeled fluorogenicDNA or RNA probes that form a stem loop structure. Theloop hybridizes to the target nucleic acid, whereas the stemis end-labeled with a fluorophore at the 50-end adjacent to aquencher at the 30-end. Fluorescence resonance energytransfer (FRET) is the process by which energy from anexcited fluorophore (donor) is transferred to the adjacentfluorophore (acceptor) at close proximity, resulting in thequenching of fluorescence. Hybridization of the targetsequence to the loop separates fluorophore and quencher,and the fluorescence is measured.
The GeneXpert System (Cepheid; Sunnyvale, CA) fullyautomates and integrates sample preparation with the RT-PCR detection processes. It uses microfluidics technologyintegrated into disposable assay cartridges. The cartridgescontain all the specific reagents required to detect diseaseorganisms such as Bacillus anthracis, Chlamydia tracho-matis, or foodborne pathogens. The system provides quan-titative results from unprocessed clinical samples in 30minutes or less and is capable is self-cleaning and decon-tamination before its next use. The GeneXpert moduleforms the core of the Biohazard Detection System deployednationwide by the United States Postal Service for anthraxtesting in mail-sorting facilities (12). It is also used inhospital laboratories, physician offices, and public healthclinics.
Idaho Technology (Salt Lake City, UT) manufactures anautomated, field-ready RT-PCR instrument, the R.A.P.I.D.(ruggedized advanced pathogen identification device) sys-tem, which is based on the Light Cycler Instrument fromRoche Diagnostics (Alameda, CA). The R.A.P.I.D. is devel-oped for military field hospitals and first responders inharsh field environments. Amplification of DNA in real-time can be performed on environmental and blood sam-ples. Idaho Technology claims a 15 minute set-up time anda 20 minute PCR run for a total of 35 minutes using theR.A.P.I.D. Pathogen Test Kit. This instrument is reportedto be very sensitive (i.e., Pseudomonas aeruginosa wasdetected in blood culture samples at 10 cfu (colony-formingunits)/ml (13). (A colony-forming unit is a single viable cellthat forms a colony of identical cells when plated.) Thistechnology is well-established and has been in use world-wide since 1998.
The R.A.P.I.D. technology was recently put to the test atthe Prince Sultan Air Base in Saudi Arabia (14). Medicalpersonnel observed a clustering of diarrhea cases andthought them to be due to influenza. However, testing ofpatient samples with the R.A.P.I.D. identified the cause tobe foodborne Salmonella within hours of sample submis-sion. Due to the prompt response by medical and servicespersonnel, the outbreak was limited to less than 3% of thebase population.
Nucleic Acid Sequence-Based Amplification (NASBA)
A fourth approach for nucleic acid-based detection of infec-tious organisms is nucleic acid sequence-based amplifica-tion (NASBA), a bioMérieux, Inc. (Marcy-l’Etoile, France)proprietary isothermal amplification technology. Thismethod is based on specific amplification of RNA by the
simultaneous activity of three RNA-specific enzymes,AMV-reverse transcriptase, T7 RNA polymerase, andRNase H, generating single-stranded RNA as the endpro-duct (15). NASBA is an isothermal amplification proce-dure, carried out at 418C.
Two commercially available systems, NucliSensReader and NucliSens EasyQ Analyzer (bioMérieux,Inc.), make use of the NASBA technology. Although bothsystems use NASBA for selective amplification of RNA,as well as a bioMérieux proprietary Boom silica-basednucleic acid extraction method, the NucliSens Readerrelies on an electrochemiluminescence (ECL) detectiontechnology, and the NucliSens EasyQ uses fluorescentdetection by incorporating specific molecular beacons towhich amplicons hybridize. With this method, amp-lification and detection occur simultaneously in asingle tube.
The ECL-based NucliSens Reader employs a sandwichhybridization method for the detection of amplified targetRNA (Fig. 2) (16). Two target-specific DNA probes are used:a capture probe bound to magnetic beads and a detectionprobe labeled with tris (2,20-bipyridine) ruthenium (Ru).Each of these probes bind to a different region of the targetRNA. After the hybridized sample is drawn into the ECLflow cell and the beads are magnetically immobilized on theelectrode, a voltage is applied, and the resulting emittedlight is detected by a photomultiplier tube (PMT). Accord-ing to the manufacturer, measurement of 50 reactionstakes approximately 50 minutes.
Real-time NASBA and fluorescent detection of target-bound molecular beacons are accomplished by the Nucli-Sens Basic Kit and EasyQ Analyzer (Fig. 3) (17). Thistechnique is most often used to detect RNA viruses. Usinga multiplexed NASBA technique to detect four humanimmunodeficiency virus type 1 (HIV-1) subtypes, DeBaaret al. (18) reported an 89% correct subtype identificationrelative to sequence analysis and a sensitivity of 92%. Thelimit of detection was approximately 103 copies of HIV-1RNA per reaction. Lanciotti and Kerst (19) conducted astudy comparing TaqMan RT-PCR (Applied Biosystems)and standard reverse-transcription PCR (Roche Molecu-lar Biochemicals) assays with NucliSens NASBA assays
MICROBIAL DETECTION SYSTEMS 377
electrode
ECL detection schematic diagram
captureoligo
RNA amplicon
Ru
NS4NUCI. S
PMT Ru(bpy) -oligomagneticparticle
32
Figure 2. NucliSens Reader ECL detection scheme (16).

for detecting West Nile (WN) virus and St. Louis encepha-litis virus. The ECL-based and molecular beacon-basedNASBA assays demonstrated equal or greater sensitiv-ities and specificities than reverse-transcription PCR inhuman cerebral spinal fluid. The NASBA-ECL assay forWN virus was 10-fold more sensitive than either the Taq-Man or NASBA-molecular beacon assay, detecting 0.01pfu of WN virus. Moreover, the NASBA molecular beacon-based assay performed significantly faster than eitherPCR procedures (i.e., a positive signal was detected within14–45 minutes).
Strand Displacement Amplification (SDA)
A fifth approach for nucleic acid-based detection of infec-tious organisms is strand displacement amplification(SDA). SDA, first reported by Walker et al. in 1992 (20),is an isothermal process that amplifies DNA or RNA usinga restriction enzyme and a DNA polymerase plus severalprimers, without requiring temperature cycling. Availablesince 1999, the BDProbeTecET System (Becton, Dickinson& Co.; Franklin Lakes, NJ) couples the proprietary tech-nology, SDA, and real-time fluorescent detection in a rapidone-hour format. This high throughput, chip-based, closedsystem was developed for detection of Chlamydia tracho-matis and Neisseria gonorrhea in urine samples, endocer-vical swabs, and male urethral swabs in a one-hour assaytime. The complete system includes a sample preparationmodule, a priming and warming heater unit, and anamplification and fluorescence detection unit. The opticalsystem consists of a fiber-optic bundle with eight branches,and the fluorescent detection reader monitors real-timefluorescence by FRET. Emitted light passes through acustom optical band-pass filter, is detected by a PMT,and is analyzed by software.
Little et al. (1999) (21) reported a sensitivity of 10–15 N.gonorrhea cells or C. trachomatis elementary bodies.Akduman et al. (22) reported that out of 3544urine samples tested, 152 were positive using the BDPro-
beTecET System, and 130 were positive by standard cul-ture techniques resulting in a sensitivity of 99.2% and aspecificity of 99.3%.
FIBER-OPTIC FLUOROIMMUNOASSAY SYSTEMS
Analyte 2000 and RAPTOR
The Analyte 2000 and its sister field model, RAPTOR(Research International; Monroe, WA), detection systemsuse a fiber-optic, waveguide-based sandwich fluoroimmu-noassay for the near real-time detection of pathogens in avariety of raw fluid samples (23). Optical fibers are long,thin strands of either glass or plastic that can transmitlight over long distances. In the RAPTOR, a monolayer ofcapture antibodies are immobilized on the surface of acylindrical waveguide (Fig. 4)(23). The waveguide is incu-bated with a clinical sample for three to five minutes,washed, and re-incubated with a fluorophore-labeled anti-body to form an antibody/antigen/labeled-antibody ‘‘sand-wich.’’ Excitation light, injected into the waveguide,creates an evanescent wave electric field in the fluid andgenerates an optical emission from the antibody-antigencomplexes. The fluorescent signals are then monitored by aphotodetector.
Using the Analyte 2000, the detection limits for Bacil-lus anthracis (vegetative cells) was reported as 30 cfu/mlin water, and for the avirulent strain of B. anthracis (i.e.,Sterne strain), 100 cfu/ml in whole blood. For spores, thedetection limit was 5� 104/ml (23). The infectious dose ofB. anthracis in a healthy individual requires inhalation ofabout �8,000–50,000 spores (24). This number is reducedin more vulnerable individuals, such as the elderly orthose with respiratory problems. Vaccinia virus (a surro-gate of the Smallpox virus) from throat swabs wasdetected at 2.1� 104 pfu (plaque-forming units, the viralequivalent of bacterial colonies)/ml (25). The infectiousdose of smallpox is thought to be low (i.e., 10–100 organ-isms) (26).
378 MICROBIAL DETECTION SYSTEMS
Figure 3. NucliSens EasyQ detection scheme(17).
Real-time Detection in NASBA
Target specific molecular beacons
sense RNA
Oligo Pl
Reverse Transcriptase
RNase H & oligo P2
Reverse Transcriptase
T7 RNA Polymerase
Molecular beaconhybridization
T7 RNAPanti-sense
RNA
RT
RNase Holigo PT

NANOPARTICLE-BASED BIO-BARCODE TECHNOLOGY
Verigene System
The Verigene System (Nanosphere; Northbrook, IL) is anautomated device for the chip-based detection of proteinsand nucleic acids using an innovative gold nanoparticle-based bio-barcode technology. For proteins, the assay usestwo types of probes (Fig. 5 (27): (1) magnetic microparticles(MMPs) functionalized with monoclonal antibodies (mAbs)specific for a target antigen and (2) gold nanoparticles (NP)functionalized with polyclonal antibodies specific for thesame target and DNA oligonucleotides (the ‘‘bio-barcodes’’)with a sequence that is a unique identification tag for thetarget. The Au nanoparticles and the MMPs sandwichthe target, generating a complex with a large ratio ofbarcode DNA to protein target. A magnetic field is applied,allowing the separation of all the MMP/target/NPcomplexes from the reaction mixture. After a wash to
dehybridize the barcode DNA from the nanoparticles,another magnetic field removes the NPs, leaving onlythe barcode DNA. Detection and identification of the bar-codes occurs next through a PCR-less process of amplifica-tion. Chip-immobilized capture DNA, complementarywith half of the target barcode DNA sequence, is used tobind the barcode DNA. Then, gold nanoparticles, functio-nalized with oligonucleotides that are complementary tothe other half of the barcode DNA, are hybridized to thecaptured barcode strands. The signal is amplified by thecatalytic electrodeposition of Ag onto the Au nanoparti-cles, and the results are recorded with the Verigene IDsystem, which measures scattered light intensity fromeach barcode/Au/Ag complex.
Like protein detection, DNA detection via the nanopar-ticle bio-barcode approach uses two types of probes(Fig. 6)(28): (1) magnetic microparticles functionalizedwith oligonucleotides that are complementary to one-half
MICROBIAL DETECTION SYSTEMS 379
Figure 4. Optical and biomolecular processes ofRAPTOR technology (23).
Figure 5. Prostate-specific antigen(PSA) detection and barcode DNAamplification and identification (27).

of a target sequence and (2) gold nanoparticles functiona-lized with two types of oligonucleotides, one that is com-plementary to the other half of the target sequence and onethat is complementary to a barcode sequence that is aunique identification tag for the target sequence. The assayproceeds in the same manner as with protein targets, withthe analysis also accomplished by the scanometric methodwith a Verigene ID system.
The nanoparticle-based bio-barcode approach isreported to provide a sensitivity of 500 zeptomolar,approximately 10 target DNA strands in a 30ml sample(27). Prostate-specific antigen was detected at 30 attomolarlevels with this method, and PCR on the DNA barcodesboosted sensitivity to 3 attomolar (28). The entire assay canbe carried out in 3–4 h.
MICROCHIP TECHNOLOGY
NanoChip System
The NanoChip System (Nanogen; San Diego, CA) is anelectronic microarray device based on the electrophoretictransport of proteins and nucleic acids on a microchip tospecific sites where traditional immunoassays or nucleicacid hybridization reactions occur (Fig. 7) (29). The elec-tronic microchip is a planar array of microelectrodes thatelectrophoretically transport-charged biomolecules to anyindividually-electrically-addressed microsite on the sur-face of the device. Each microsite has an agarose-strepta-vidin permeation layer coated on top of a platinummicroelectrode to bind biotinylated capture molecules.The microchips are referred to as ‘‘active electronic micro-chips’’ because electric fields are generated for thepurpose of transporting biomolecules to and from specific
380 MICROBIAL DETECTION SYSTEMS
Figure 6. The DNA-bio-barcode assay. (a) Nanoparticle andmagnetic microparticle probe preparation. (b) Nanoparticle-based PCR-less DNA amplification scheme (28).
Figure 7. Active electronic microchip technology. (a) Basicchip layout; (b) Cross-section of microchip for electro-phoresis of proteins (29).
+
Assay microlocation
Immobilizedcapture antibody Permeation layer
Auxiliary electrodesAssay microlocations
+ Electrode – Electrode
Si Substrate
Si O2
Analyte
a
b

microsites in a process the manufacturer terms ‘‘electronicaddressing’’ (29). As the electric field is generated only inthe immediate vicinity of the electrodes, not affecting thesolution in other parts of the device, each microsite is anindependent assay site allowing for the detection of multi-ple analytes. Also, the generated electric fields can be usedto selectively dehybridize nonspecifically bound analytesfrom assay sites, which greatly improves the selectivity ofthe assay. When the biotinylated capture probes areattached to the array, fluorescently labeled analytes areintroduced, and further electrical adjustments are made todirect the analytes to concentrate at the microsites forrapid hybridization or antibody-antigen interactions. Thefluorescent signal is monitored in a laserinduced fluores-cence scanner, and the analytes are identified based on themicrolocation of the fluorescence.
Nanogen researchers performed a diagnostic immu-noassay for two fluorescently labeled toxins simulta-neously, staphylococcal enterotoxin B (SEB) and choleratoxin B. They reported a sensitivity of better than 20 nMconcentrations of toxins (29). High specificity was alsodemonstrated by low nonspecific binding and cross-bind-ing. This assay took 6 minutes to perform, 1 minute forelectronic addressing to bind analytes and 5 minutes forwashing to reduce nonspecific binding.
More recently, Nanogen researchers reported onan integrated ‘‘stacked’’ microlaboratory for performingautomated electric field-driven immunoassays and DNAhybridization assays (30). This device is composed of aCMOS-based electronic microarray chip, a dielectrophor-esis microchip, and several modules for DNA samplepreparation, strand displacement amplification, andhybridization. E. coli bacteria and Alexa-labeled staphy-lococcal enterotoxin B were detected in the device withspecific-to-nonspecific signal ratios of 4.2:1 and 3.0:1,respectively. Identification of the Shiga-like toxin genefrom E. coli was accomplished in a 2.5 h comprehensiveprotocol including the dielectrophoretic concentration ofintact bacteria, DNA amplification, electronic DNA hybri-dization to fluorescently-labeled probes, and detectionwith a fluorescent microscope. This experiment used bac-teria cell suspensions of 109 cells/ml with a specific-to-nonspecific signal ratio of 22.5:1, showing outstandingspecificity.
ELECTRONIC NOSE
Osmetech Microbial Analyzer
An electronic nose is a device that consists of an array of gassensors with different selectivity patterns, a signal collect-ing unit, and data analysis by pattern recognition software.When microorganisms grow and metabolize, they emitvolatile organic compounds and gases that can be moni-tored by a biosensor array. The Osmetech Microbial Ana-lyzer (OMA; Osmetech; London, UK) is an automatedheadspace analyzer using arrays of organic conductingpolymers as sensors. The device samples the headspaceabove the surface of the specimen and detects volatilecompounds with an array of up to 48 conducting polymersensors. Each polymer has unique adsorptive properties,and, once adsorbed, the volatile components modulate theconduction mechanism of the polymer resulting in rever-sible changes in resistance (Fig. 8) (31). The signal ismeasured as a percentage change of the original resistanceof the polymer. Multivariate data algorithms are used tocompare the responses and establish a diagnosis.
When 534 clinical urine samples were analyzed by theOMA, 22.5% had significant bacteriuria (i.e., >105 cfu/ml),resulting in a sensitivity of 84% and a specificity of 88%relative to standard culture methods (32). Alhough lessthan optimal, this device shows promise for automated,rapid screening. The company’s second FDA approval fordetection of bacterial vaginosis was secured in January2003. Clinical trials with more refined versions of theinstrument are in progress. Although electronic nose tech-nology is still in its infancy, it clearly has the potential forproviding rapid, sensitive, and simultaneous detection ofdifferent strains of bacteria.
FUTURE TRENDS IN MICROBIAL DETECTION SYSTEMS
In the development of the microbial detection systemsmentioned, researchers have begun to focus on buildingintegrated devices that combine a pre or post-processingstep such as PCR-based amplification, with post-derivati-zation (fluorescent labeling) and detection. Microarraytechnologies are being developed to overcome limitationsof sample volume and high throughput analysis. In the
MICROBIAL DETECTION SYSTEMS 381
Figure 8. Osmetch Microbial Analyzer detectiontechnology (31).

near future, biomedical science can realize the integrationof all laboratory equipment used in molecular biology on achip-based platform arrayed to detect large numbers ofpathogens in a high throughput, portable device. BiologicalMicro-Electro-Mechanical systems (BioMEMS), alsoreferred to as lab-on-a-chip and micro total analyticalsystems (m-TAS), is an area rapidly advancing due to theintegration of micro and nanotechnology with biotechnol-ogy. Current reviews for this technology are abundant inthe literature (33,34). Microfluidic-based devices have beenon the market since 1999, but much work is still underwayto build modular-type systems with complete integration ofsample collection, concentration, pre and post-processingsteps, separation, selective capture, viability detection,lysing, and protein and DNA analysis. Development ofsuch systems in a high throughput fashion capable ofdetecting and discriminating between hundreds of patho-genic agents would impact not only medical diagnostics buthomeland security and public health, including home mon-itoring, medicine, and veterinary diagnostics. As the fieldmoves toward lab-on-a-chip systems, cost, limited samplethroughput, ease-of-use, and limited waste production(reagentless systems) will be considered in design strate-gies. The second progression toward advanced microbialdetection systems will be the incorporation of nanotechnol-ogy. Current nanotechnologies such as quantum dots,nanoparticles, and synthetic nanopores are already beingincorporated into current chip-based diagnostic systems.CellTracks technology (Immunicon Corporation, Hunting-don Valley, PA) has developed magnetic nanoparticlescalled ferrofluids, which consist of a magnetic core encom-passed by a polymer coating tagged with antibodies forwhole cell and pathogen detection. Up-Converting Phos-phor Technology (UPT), by OraSure Technologies, Inc.,makes use of proprietary ceramic nanoparticles for DNAdetection. These particles have been shown to be a 1000times more sensitive than fluorescent technologies.Finally, a trend exists to build detection systems fromthe bottom up rather than the top down. Small buildingblocks such as protein motors are being designed to movecargo including peptides and antibody fragments as amethod of patterning arrays. ‘‘Switchable’’ materials suchas poly-n-isopropylacrylamide (PNIPAM) are used to pat-tern antibodies, capture proteins, and move fluids, repla-cing mechanical components of BioMEMS systems.PNIPAM has a thermally activated lower critical solubilitytemperature (LCST) of 32 8C. At temperatures below theLCST, the polymer swells in water to create a hydrophilicsurface that resists protein adsorption. Above the LCST,the polymer collapses to form a hydrophobic surface thatpromotes protein adsorption. Whether the bottom upapproach based solely on nanomaterials will hold in thelong run remains to be seen. However, it is clear thatnanotechnology that complements and extends currentMEMS detection methods will revolutionize the field ofmedical diagnostics. Early examples of lab-on-a-chip tech-nologies integrating nanotechnologies already exists,which address the current limitations of detection systems.The approach is toward development of portable micro-systems that are reagentless; handle small sample size;eliminate the need of labels and probes; are specific, sensi-
tive, and high throughput; perform multiple functionsfrom sample concentration to final detection; and are easyto use.
Briefly, some of these technologies include cantileverarrays, which operate by a slight bending of the cantileverbeam at the nanoscale level upon analyte binding. Proti-veris, Inc. (Rockville, MD) is developing microcantileverarrays for combined detection of DNA and protein. Capturemolecules are attached to the beams and, as samples movesacross the device, binding of a target molecule results in nmbending of the beam. These devices can be integrated intomicrofluidic systems, require no labels or reagents, and arevery sensitive and specific. Nanowires, nanoneedles, andnanoelectrode arrays are additional technologies that candetect multiple analytes simultaneously. Electronic sig-nals can be averaged over thousands of electrodes elim-inating the need for PCR amplification, and no reagents arerequired. These devices are coated with selective molecularrecognition molecules and change in conductance occursduring a binding/recognition event. Aside from integrationinto lab-on-a-chip systems, these technologies have appli-cations in in vivo medical diagnostics.
Over the next few years, nanotechnologies will continueto evolve and become integrated into chip-based microsy-tems for detection, diagnostics, and drug delivery. Later, inperhaps 20– 30 years, the introduction of nanomachines forin vivo diagnostics and treatment may well emerge, chan-ging the current way of conducting medical and health-care practice.
BIBLIOGRAPHY
1. Gannon JC. The Global Infectious Disease Threat and ItsImplications for the United States. [Online]. Federation ofAmerican Scientists. http://www.fas.org/irp/threat/nie99-17d.htm.
2. Fauci AS. Global Health: The United States Response toInfectious Diseases, Testimony before the U.S. Senate Laborand Human Resources Subcommittee on Public Health andSafety. [Online]. National Institute of Allergy and InfectiousDiseases, National Institutes of Health. http://www3.niaid.-nih.gov/about/directors/congress/1998/0303/default.htm.
3. Ivnitski D, Abdel-Hamid I, Atanasov P, Wilkins E. Biosensorsfor detection of pathogenic bacteria. Biosens Bioelectron1999;14:599–624.
4. Washington JA. Principles of Diagnosis. [Online]. Universityof Texas Medical Brach. http://gsbs.utmb.edu/microbook/ch010.htm.
5. Saiki RK, Gelfand DH, Stoffel S, Scharf SJ, Higuchi R, HornGT, Mullis KB, Erlich HA. Primer-directed enzymatic ampli-fication of DNA with a thermostable DNA polymerase.Science 1988;239:487–491.
6. Ou CY, Kwok S, Mitchell SW, Mack DH, Sninsky JJ, KrebsJW, Feorino P, Warfield D, Schochetman G. DNA amplifica-tion for direct detection of HIV-1 in DNA of peripheral-bloodmononuclear-cells. Science 1988;239:295–297.
7. Ou CY, Ciesielski CA, Myers G, Bandea CE, Luo CC, KorberBTM, Mullins JI, Schochetman G, Berkelman RL, EconomouAN, Witte JJ, Furman LJ, Satten GA, Macinnes KA, CurranJW, Jaffee HW. Molecular epidemiology of HIV transmissionin a dental practice. Science 1992;256:1165–1171.
8. Stuyver L, Van Geyt C, De Gendt S, Van Reybroeck G, ZoulimF, Leroux-Roels G, Rossau R. Line probe assay for monitoring
382 MICROBIAL DETECTION SYSTEMS

drug resistance in hepatitis B virus-infected patients duringantiviral therapy. J Clin Microbiol 2000;38:702–707.
9. Stuyver L, Wyseur A, Vanarnhem W, Lunel F, LaurentpuigP, Pawlotsky JMM, Kleter B, Bassit L, Nkengasong J, Van-doorn LJ, Maertens G. Hepatitis C virus genotyping bymeans of 50-UR/core line probe assays and molecular analysisof untypeable samples. Virus Res 1995;38:137–157.
10. Roche Diagnostics - Roche Molecular Diagnostics - Products.Automated PCR Systems. [Online]. Roche MolecularDiagnostics. http://www.rochediagnostics. com/ba_rmd/rmd_ products_automated_pcr_systems23.html.
11. Heid CA, Stevens J, Livak KJ, Williams PM. Real timequantitative PCR. Genome Res 1996;6:986–994.
12. Cepheid – Products. (No date). GeneXpert Technology, Sys-tem Overview. [Online]. Cepheid. http://www.cepheid.com/Sites/cepheid/content.cfm?id¼164.
13. Jaffe RI, Lane JD, Bates CW. Real-time identification ofPsuedomonas aeruginosa direct from clinical samples usinga rapid extraction method and polymerase chain reaction(PCR). J Clin Lab Analysis 2001;15:131–137.
14. Idaho Technology - R.A.P.I.D. Successes using the R.A.P.I.D.[Online]. Idaho Technology. http://www.idahotechnology.-com/rapid/success.htm.
15. NucliSens Key Technologies. (2005). bioMérieux – ClinicalMicrobiology Products. [Online]. bioMérieux, Inc. http://www.biomerieuxusa. com/clinical/nucleicacid/technology. htm.
16. NucliSens Reader. (2005). bioMérieux – Clinical MicrobiologyProducts. [Online]. bioMérieux, Inc. http://www.biomerieux-usa.com/clinical/nucleicacid/reader.htm.
17. NucliSens EasyQ. (2005). bioMérieux – Clinical MicrobiologyProducts. [Online]. bioMérieux, Inc. http://www.biomerieux-usa.com/clinical/nucleicacid/easyq/easyq_technology.htm.
18. DeBaar MP, Timmermans EC, Bakker M, Rooij E, vanGemen B, Goudsmit J. One-tube real-time isothermal ampli-fication assay to identify and distinguish human immunode-ficiency virus type 1 subtypes A, B, and C and circulatingrecombinant forms AE and AG. J Clin Microbiol2001;39:1895–1902.
19. Lanciotti RS, Kerst AJ. Nucleic acid sequence-based ampli-fication assays for rapid detection of West Nile and St. Louisencephalitis viruses. J Clin Microbiol 2001;39:4506–4513.
20. Walker GT, Little MC, Nadeau JG, Shank DD. Isothermal invitro amplification of DNA by a restriction enzyme/DNApolymerase system. Proc Natl Acad Sci USA 1992;89:392–396.
21. Little MC, Andrews J, Moore R, Bustos S, Jones L, Embres C,Durmowicz G, Harris J, Berger D, Yanson K, Rostkowski C,Yursis D, Price J, Fort T, Walters A, Collis M, Llorin O, WoodJ, Failing F, O’Keefe C, Scrivens B, Pope B, Hansen T, MarinoK, Williams K, Boenisch M. Strand displacement amplifica-tion and homogeneous real-time detection incorporated in asecond-generation DNA probe system, BDProbeTecET. ClinChem 1999;45:777–784.
22. Akduman D, Ehret M, Messina K, Ragsdale S, Judson FN.Evaluation of a strand displacement amplification assay(BD ProbeTec-SDA) for detection of Neisseria gonorrhoeaein urine specimens. J Clin Microbiol 2002;40:281–283.
23. RAPTOR. RAPTOR, Portable, Multianalyte Bioassay Sys-tem. [Online]. Research International. http://www.resrch-intl.com/raptor.html.
24. Bacillus anthracis. (June 2, 2003). Bacillus anthracis(anthrax). [Online]. http://microbes.historique.net/anthracis.html.
25. Donaldson KA, Kramer MF, Lim DV. A rapid detectionmethod for Vaccinia virus, the surrogate for smallpox virus.Biosens Bioelectron 2004;20:322–327.
26. Franz DR, Jahrling PB, Friedlander AM, McClain DJ, HooverDL, Bryne WR, Pavlin JA, Christopher GW, Eitzer EM, Jr..Clinical recognition and management of patients exposed tobiological warfare agents. JAMA 1997;278:399–411.
27. Nam J-M, Thaxton CS, Mirkin CA. Nanoparticle-based bio-barcodes for the ultrasensitive detection of proteins. Science2003;301:1884–1886.
28. Nam J-M, Stoeva SI, Mirkin CA. Bio-bar-code-based DNAdetection with PCR-like sensitivity. J Am Chem Soc2004;126:5932–5933.
29. Ewalt KL, Haigis RW, Rooney R, Ackley D, Krihak M.Detection of biological toxins on an active electronic micro-chip. Anal Biochem 2001;289:162–172.
30. Yang JM, Bell J, Huang Y, Tirado M, Thomas D, Forster AH,Haigis RW, Swanson PD, Wallace RB, Martinsons B, KrihakM. An integrated, stacked microlaboratory for biologicalagent detection with DNA and immunoassays. Biosens Bioe-lectron 2002;17:605–618.
31. Osmetech. (2005). eNose Technology. [Online]. Osmetech.http://www.osmetech.plc.uk/enose.htm.
32. Aathithan S, Plant JC, Chaudry AN, French GL. Diagnosis ofbacteriuria by detection of volatile organic compounds inurine using an automated headspace analyzer with multipleconducting polymer sensors. J Clin Microbiol 2001;39:2590–2593.
33. Bashir R. BioMEMS: State-of-the-art in detection, opportu-nities and prospects. Adv Drug Delivery Rev 2004;56:1565–1586.
34. Lee SJ, Lee SY. Micro total analysis system (m-TAS) inbiotechnology. Appl Microbiol Biotechnol 2004;64:289–299.
See also COLORIMETRY; COMPUTER-ASSISTED DETECTION AND DIAGNOSIS;COMPUTERS IN THE BIOMEDICAL LABORATORY; FLUORESCENCE MEASURE-
MENTS; SAFETY PROGRAM, HOSPITAL.
MICROBIOREACTORS
XIAOYUE ZHU
TOMMASO BERSANO-BEGEY
YOKO KAMOTANI
SHUICHI TAKAYAMA
University of MichiganAnn Arbor, Michigan
INTRODUCTION
This article defines microbioreactors as micrometer scalereaction vessels in which biological reactions are per-formed. Whereas large-scale bioreactors mainly focus onefficiently producing desired end products, microbioreac-tors have additional targeted applications such as studyingcellular processes under simulated physiological microen-vironments, and functioning as portable cellular biosen-sors or implantable devices inside the body to restore tissuefunctions. Increasing needs in developing personalizedcell-based therapies and medicines together with rapidadvances in micro- and nanotechnologies ensure that thefield of microbioreactors will continue to flourish. Althoughmost microbioreactors are still in their infancy, relativelysimple compared to their macroscopic counterparts, andoften not fully integrated or packaged into compact self-contained platforms, they already have started to have an
MICROBIOREACTORS 383
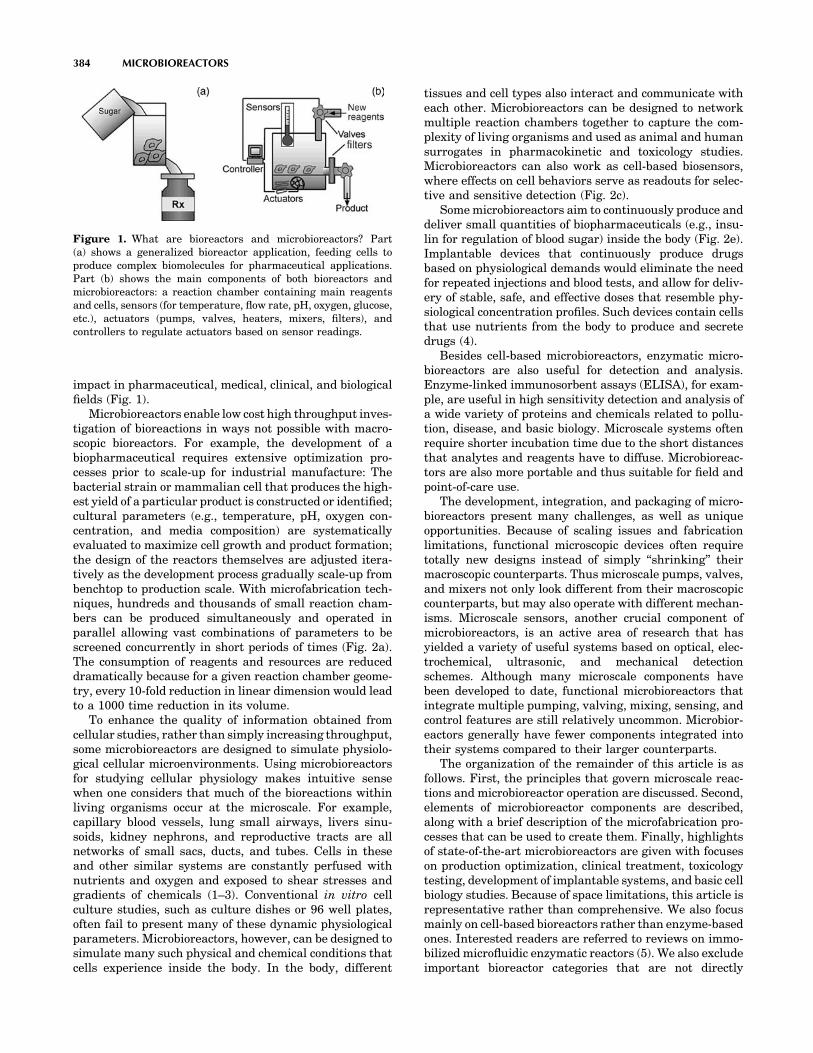
impact in pharmaceutical, medical, clinical, and biologicalfields (Fig. 1).
Microbioreactors enable low cost high throughput inves-tigation of bioreactions in ways not possible with macro-scopic bioreactors. For example, the development of abiopharmaceutical requires extensive optimization pro-cesses prior to scale-up for industrial manufacture: Thebacterial strain or mammalian cell that produces the high-est yield of a particular product is constructed or identified;cultural parameters (e.g., temperature, pH, oxygen con-centration, and media composition) are systematicallyevaluated to maximize cell growth and product formation;the design of the reactors themselves are adjusted itera-tively as the development process gradually scale-up frombenchtop to production scale. With microfabrication tech-niques, hundreds and thousands of small reaction cham-bers can be produced simultaneously and operated inparallel allowing vast combinations of parameters to bescreened concurrently in short periods of times (Fig. 2a).The consumption of reagents and resources are reduceddramatically because for a given reaction chamber geome-try, every 10-fold reduction in linear dimension would leadto a 1000 time reduction in its volume.
To enhance the quality of information obtained fromcellular studies, rather than simply increasing throughput,some microbioreactors are designed to simulate physiolo-gical cellular microenvironments. Using microbioreactorsfor studying cellular physiology makes intuitive sensewhen one considers that much of the bioreactions withinliving organisms occur at the microscale. For example,capillary blood vessels, lung small airways, livers sinu-soids, kidney nephrons, and reproductive tracts are allnetworks of small sacs, ducts, and tubes. Cells in theseand other similar systems are constantly perfused withnutrients and oxygen and exposed to shear stresses andgradients of chemicals (1–3). Conventional in vitro cellculture studies, such as culture dishes or 96 well plates,often fail to present many of these dynamic physiologicalparameters. Microbioreactors, however, can be designed tosimulate many such physical and chemical conditions thatcells experience inside the body. In the body, different
tissues and cell types also interact and communicate witheach other. Microbioreactors can be designed to networkmultiple reaction chambers together to capture the com-plexity of living organisms and used as animal and humansurrogates in pharmacokinetic and toxicology studies.Microbioreactors can also work as cell-based biosensors,where effects on cell behaviors serve as readouts for selec-tive and sensitive detection (Fig. 2c).
Some microbioreactors aim to continuously produce anddeliver small quantities of biopharmaceuticals (e.g., insu-lin for regulation of blood sugar) inside the body (Fig. 2e).Implantable devices that continuously produce drugsbased on physiological demands would eliminate the needfor repeated injections and blood tests, and allow for deliv-ery of stable, safe, and effective doses that resemble phy-siological concentration profiles. Such devices contain cellsthat use nutrients from the body to produce and secretedrugs (4).
Besides cell-based microbioreactors, enzymatic micro-bioreactors are also useful for detection and analysis.Enzyme-linked immunosorbent assays (ELISA), for exam-ple, are useful in high sensitivity detection and analysis ofa wide variety of proteins and chemicals related to pollu-tion, disease, and basic biology. Microscale systems oftenrequire shorter incubation time due to the short distancesthat analytes and reagents have to diffuse. Microbioreac-tors are also more portable and thus suitable for field andpoint-of-care use.
The development, integration, and packaging of micro-bioreactors present many challenges, as well as uniqueopportunities. Because of scaling issues and fabricationlimitations, functional microscopic devices often requiretotally new designs instead of simply ‘‘shrinking’’ theirmacroscopic counterparts. Thus microscale pumps, valves,and mixers not only look different from their macroscopiccounterparts, but may also operate with different mechan-isms. Microscale sensors, another crucial component ofmicrobioreactors, is an active area of research that hasyielded a variety of useful systems based on optical, elec-trochemical, ultrasonic, and mechanical detectionschemes. Although many microscale components havebeen developed to date, functional microbioreactors thatintegrate multiple pumping, valving, mixing, sensing, andcontrol features are still relatively uncommon. Microbior-eactors generally have fewer components integrated intotheir systems compared to their larger counterparts.
The organization of the remainder of this article is asfollows. First, the principles that govern microscale reac-tions and microbioreactor operation are discussed. Second,elements of microbioreactor components are described,along with a brief description of the microfabrication pro-cesses that can be used to create them. Finally, highlightsof state-of-the-art microbioreactors are given with focuseson production optimization, clinical treatment, toxicologytesting, development of implantable systems, and basic cellbiology studies. Because of space limitations, this article isrepresentative rather than comprehensive. We also focusmainly on cell-based bioreactors rather than enzyme-basedones. Interested readers are referred to reviews on immo-bilized microfluidic enzymatic reactors (5). We also excludeimportant bioreactor categories that are not directly
384 MICROBIOREACTORS
Figure 1. What are bioreactors and microbioreactors? Part(a) shows a generalized bioreactor application, feeding cells toproduce complex biomolecules for pharmaceutical applications.Part (b) shows the main components of both bioreactors andmicrobioreactors: a reaction chamber containing main reagentsand cells, sensors (for temperature, flow rate, pH, oxygen, glucose,etc.), actuators (pumps, valves, heaters, mixers, filters), andcontrollers to regulate actuators based on sensor readings.

related to medicine, such as those used for food testing,plant cell culture, and wastewater treatment.
MICROBIOREACTOR DESIGN PRINCIPLES
Basic principles of bioreactor operations, such as thermo-dynamics, kinetics, mass transfer, sterilization, and struc-
tural considerations, are similar for both macro- andmicrobioreactors. The implementation of these principlesinto actual practice, however, can differ greatly.
Scaling Effects
At first glance, development of microbioreactors may seemto be a matter of simply shrinking macroscopic components
MICROBIOREACTORS 385
Figure 2. Advantages and new applications of microbioreactors over large scale bioreactors:(a) microscale parallel cell culture and testing in a microchip configuration can be used to testand compare hundreds of conditions and parameters simultaneously, to optimize a reaction orscreen potential treatments. (b) Microdevices containing interconnected chambers andmicrocultured cells from different tissues can be used to test drug effects on entire organisms,taking into account systemic impact of organs such as liver on drug metabolism, possibly replacingsome stages of animal and human testing. (c) Microbioreactors can be used as detectors for bioactivecompounds (e.g., toxins, endocrine disruptors, drugs) or biodisruptive conditions (e.g., radiation)with the advantage that all the steps of a test can be integrated in a single device that requires onlytrace amounts of samples and reagents. Cell-based sensors may be able to detect unknown reagentsthat affect living organisms. (d) Microfabrication can also provide microbioreactors with morephysiologically accurate microenvironments, thus making in vitro testing more reliable and closer toin vivo conditions: for example, in actual tissues, each cell is held in its three-dimensional (3D) shapeby tension through connected cytoplasmic fibers (the cytoskeletons), and cells have many surfaceinteractions with other surface microfeatures and other cells. In contrast, in conventional cellculture that cannot microfabricate these features, cells configuration, and environment conditions,such as the amount of surface contacts, are drastically different. (e) Implantable devices containingcells such as insulin-producing pancreatic islets can be used as an improved treatment thatcontinuously produce insulin based on the body’s minute-by-minute needs, eliminating the needfor periodical blood tests and consequent injections of insulin mass-produced in conventionalbioreactors.

into smaller ones. Directly downsizing systems and com-ponents, however, compromise their functions. Operationsat microscales are often altered in unexpected ways com-pared to those at macroscales because the relative impor-tance of physical effects that determine the functions of themicrobioreactor components is size dependent. For exam-ple, if the linear dimensions of an object are reducedequally by a factor of 100, the surface area decreases bya factor of 10,000, and the volume decreases by a factor of1,000,000 (Fig. 3a). The resulting increase in surface/volume ratio leads to prominence of surface effects suchas surface tension and viscous drag over gravity andmomentum. Thus, at the microscale, laminar flow, diffu-sive mixing, and capillary forces dominate over turbulence,convective mixing, and gravitational forces (Fig. 3c, d) (6).Scaling laws affect almost every aspect of microbioreactoroperation. For example, it is more difficult to performturbulent mixing at the microscale compared to at themacroscale (7–9), but more convenient to use electroosmo-sis flow to transport fluid samples through microchannels(10). More details of how scaling laws affect the design andoperation of the microbioreactor components are noted ineach section below.
Microbioreactor Operation Principles
The main challenge in bioreactor operation lies in itsdynamic nature. Optimal reaction conditions must bemaintained even as multiple parameters, such asconcentration of molecules, activity of enzymes, quantityand quality of cells, and heat production are changing.Understanding the reaction mechanisms is helpful for
optimizing reactor designs. It is also desirable to con-stantly monitor and control reaction environments inreal time.
Mass And Heat Balance. In bioreactor processes, it iscommon to assume steady state, that is, a balance of input,output flow of materials, and thermal homeostasis. Assubstrate input is converted into product, mass balancesneed to be closely monitored and controlled. In manyenzymatic processes, for example, the reactions are rever-sible or are inhibited by products. In such cases, it isbeneficial to favor the forward enzymatic reaction by keep-ing the upstream reagent concentrations high and con-stantly removing downstream products. This type ofbalance can be achieved to different extents by fed-batchsystems or continuous flow systems that constantly replen-ish and remove reactor contents. Even in so-called batchreactors, where there is no flow of liquid in and out of thereaction chamber, it is often crucial to aerate and maintainsufficient levels of oxygen at all times.
As dimensions are diminished, the conductive resis-tance at the channel wall/fluid interface decreases, andtemperature gradient increases, leading to a greater effi-ciency of thermal conductivity (11). Because heat fluxscales with surface area while heat capacity scales withvolume, thermal time constants and heat flux scale linearlywith decreasing dimensions. The small thermal mass andassociated fast thermal response allows for quick tempera-ture control. On the other hand, since the microsystemscan be heated and cooled quickly, it is difficult to maintain aconstant temperature; external temperatures must be setat the desired temperature, or constant heating and cooling
386 MICROBIOREACTORS
Figure 3. Microscale physics usefulfor microbioreactors. (a) As dimens-ions of devices scale down to micro-scopic scales, surfaces and volumesscale at different rate, so that smallerdevices have a much greater surface/volume ratio. This change affectsmany physical phenomena such ascapillary force (c) and produceseffects such as laminar flow (d),which allows two liquids to flowside by side with minimal turbulentmixing. These microscale pheno-mena can be useful for micro-bioreactor opera tion. For example,capillary force can be used to pumpliquid through microchannels, andlaminar flows can be used toselectively deliver different re-agents to different parts of singlecells. (b) Microfabrication canfurther increase the surface/volumeratio, in a biomimetic manner, bycreating microporous structures.This is useful since many biologicalreactions occur on surfaces.

of the microbioreactor will be required to avoid fluctua-tions.
A phenomenon that may not impact macroscopic bior-eactors considerably, but has a significant effect on micro-bioreactors, is evaporation. Unless carefully monitored,evaporation will greatly affect reactant concentrationsand osmolarity because of the small volume that a micro-bioreactor can hold.
A variety of mathematical models have been developedto analyze and control bioreactor thermodynamics andstoichiometry. Interested readers are referred to existingtexts on the topic (12). For example, Roels (13,14) devel-oped correlations to estimate some of the important ther-modynamic parameters to predict yields, substrate andoxygen requirements, and heat dissipation for cellularreactions.
Reaction Kinetics. Bioreaction kinetics depends criti-cally on temperature, pH, dissolved oxygen concentrations,and presence of inhibitors or enhancers. Oxygen fluctua-tion affects the metabolic and signaling pathways of cells.For bacterial bioreactors, the main concern is often toachieve a high enough oxygen transfer rate to match theoxygen uptake rate and maintain sufficiently high dis-solved oxygen concentrations. For mammalian cell cul-tures, it is necessary to maintain an appropriatedissolved oxygen concentration. In expansion of stem cells,for example, lower oxygen concentrations that mimic phy-siological values gives higher yields and purity of cells(15,16). Microbioreactors present unique challenges andopportunities in terms of oxygen transfer. Microbial andeukaryotic cell cultures require constant replenishment ofdissolved oxygen into the medium because of the lowsolubility of oxygen in aqueous solutions (8 mg/L�1 at35 8C in distilled water) (17). For larger bioreactors, bub-bling oxygen or passing ambient gas through the cellculture suspension are commonly used (18). Microscalegas formation is more challenging, but has been demon-strated elegantly using electrolysis by Maharbiz et al. (19)(see Components section for details). For microbioreactorswith submilliliter volumes, bubbles are generally avoidedbecause they can clog channels and are difficult to dislodgefrom microchannel walls. For such systems, it is common touse a gas-permeable membrane to oxygenate the culturemedium (20,21). The large surface/volume ratio ofmicrodevices provides an advantage for such membrane-based oxygen transfer processes. Poly(dimethylsiloxane)(PDMS), a biocompatible polymer material commonly usedfor microdevice fabrication, is particularly advantageous inthis regards due to its high permeability to oxygen.
Enzyme performance and cell growth and function areparticularly sensitive to pH changes. When the reaction isnot within the optimal pH range, the reaction rate declinesdramatically (12). Substrates, products, or contaminantscan reversibly or irreversibly affect enzyme activity. Sur-face interactions can also alter the kinetics of enzymereactions, stability of enzymes (22), as well as growthand function of cells (23). Precisely dispensing nano- orpicoliters of acids and bases into the tiny reaction chamberto adjust pH is technically challenging. Furthermore,because it is difficult to perform convective mixing in
microbioreactors, there may be local variations in the pHand in the reaction kinetics.
Mechanical Considerations. When microbioreactors arecoupled with microfluidic systems, cells are subjected toshear stresses. For a given maximum flow velocity, smallerchannels will give rise to larger shear stresses (1).Although excess forces can damage cells, moderate shearstresses on genetically engineered cells have actuallyenhanced the production yield of recombinant proteins(24). Cells in the body are also often exposed to stretchingand/or compression. These forces are critical factors thatregulate function of cells in muscles, hearts, blood vessels,lungs, and other tissues (25,26). For example, shear stressregulates morphology, gene expression and function ofendothelial cells, the monolayers of cells lining the insideof blood vessels (27–30). Shear stress is physiologicallyimportant for maintaining vascular homeostasis (31), rege-nerate bone and healing fractures (32), differentiateembryonic stem cells into cardiovascular fate, leukocytesrolling and tethering to endothelial cells (33). Nuclearfactor-kb (NF-kb), for example, has been identified as ashear stress- responsive transcription factor that enhancesthe transcription of many genes including cytokines,growth factors, adhesion molecules, and immunoreceptorsin response to shear stress (34).
Some of the biochemical and structural responses ofcells to stretch include enhanced expression of endothelin(35), nitric oxide (36), and integrin (37) in vascularendothelial cells, and increased extracellular matrix pro-duction in cardiac fibroblasts (38) and in smooth musclecells (39). Mechanical loading influence cellular functionsin vitro, including proliferation (40,41), differentiation(42), hypertrophy (40,43), alignment (41,44), G proteinactivation, second messenger activity (45), and geneexpression (43,46).
Cells in the body are constantly subjected to physicalforces, such as cyclic mechanical deformation involvingtension, compression, shear stress, or all three. Cell pro-liferation, differentiation, migration, signal transduction,and gene expression are all affected by such mechanicalforces (47). Although it is largely unknown how mechanicalstimuli are converted into intracellular signals of geneexpression (48), there are many efforts to recreate physio-logical mechanical signals in vitro, either in the form ofshear stresses from fluid flow, hydrodynamic pressures, ormechanical stresses applied to cells through the sub-strates. An ideal microbioreactor would provide optimalbiomechanical and biodynamic stimuli for cell and tissuegrowth.
Material Considerations. The material used to fabricatethe reaction chambers is crucial because they directlycontact cells, enzymes, and products of bioreactors. Some-times, it is also necessary to mimic physiological cellularenvironments (Fig. 2d) by altering the properties of thechamber surface to resemble that of the extracellularmatrix (ECM). Proteins or enzymes can be immobilizedonto surfaces to manipulate cell growth. Topographicalfeatures can also be incorporated to further mimic theECM environment.
MICROBIOREACTORS 387

Surface Chemistry. As the size of devices decreases, theirsurface/volume ratio increases, making surface propertiesincreasingly important in defining the performances ofsmaller bioreactors because cell function is intimatelylinked to the properties of the surfaces to which cellsattach. Depending on the application, it is necessary topromote specific adsorption of proteins that mediate cellattachment and growth onto surfaces, or to prevent adsorp-tion of proteins and cells. Because cellular receptors thatbind to surfaces are nanoscale in size, it is also important tobe able to pattern adhesive surfaces with resolutions frommicrons to nanometers (2,49–51). Surface properties arealso important for enzyme-based microbioreactors becausesurface properties alter enzyme activity and stability.Enzymes are commonly immobilized through physicaladsorption or covalent binding onto high surface areamaterials, such as carbon, silica, and polymers. Use ofimmobilized enzymes is often favored over free enzymesbecause of reduction in enzyme costs, ease of recovery,stability, and ability to be incorporated into microsystems.Ratner’s recent review covers important topics includingsurface modification of materials to prevent nonspecificprotein adsorption, immobilizing functional groups on sur-face, and development of synthetic materials (52).
A useful model surface for studying biomaterials inter-actions is a self-assembled monolayer (SAM). Often formedon gold using alkane thiols, SAMS are highly orderedarrays of linear molecules that have one end attached tothe surface of gold or other bulk materials and the otherend exposed to the environment. A useful feature of SAMsis that their surface properties are determined predomi-nantly by the very terminal functional group. By alteringthe nature of these terminal groups, SAMs can preventprotein and cell attachment or promote binding of specificones (53). Other types of systems that are useful for con-trolling protein adsorption include covalent bonding, viasilanes, to silica or metal. Micropatterns of biopolymers canalso be generated using photolithography, which uses pat-terns of light to induce region-selective chemical reactionson a surface. A more recent technique is microcontactprinting, which involves transfer of small molecules orproteins onto solid substrates from an elastomeric stamp(53). Microfluidic networks have also been used for proteinpatterning: elastomers with embedded channel featuresare used to direct small volumes of protein solutions intonetworks of channels to create protein patterns corre-sponding to the path of fluid flow (54–56). Surface pat-terned microfluidic channels can then be used directly asmicrobioreactors in which micropatterned cell culture canbe performed.
Topography Control. Living organisms are not flat. Theendothelial lining of blood vessels, for example, exhibit anirregular wave-like topography to prevent build-up of fattydeposits (57). Endothelial monolayers have been modeledas a wavy surface by computational methods to estimatethe influence of the waviness on local flow forces (58).Muscle fibers form microscale ridges and grooves ontowhich myoblasts can attach and proliferate (59). Micro-fabricated topographical features, regardless of whetherthey mimic physiological microtopographies or not, can be
used in microbioreactors to modulate adhesion, align ororient cells, and even affect cell growth and differentiation.Examples of topographical features that have been studiedinclude single cliffs, grooves/ridges, spikes, hills, tunnelsand tubes, fibers, cylinders, mesh, waves, and randomroughness. Materials used for topographical controlsinclude gold, silicon, carbon, inorganic compounds, suchas silica, lithium niobate, silicon nitride, and polymers,such as polymethylmethacrylate, silicones, cellulose acet-ate, collagen, fibrin, and PDMS (51). Microtopography canalso affect surface wetting and fluidic flow patterns. Evenfor a simple groove structure, variations of the aspect ratioand contact angle of the underlying substrate materialscan dramatically alter the morphology of liquid dropletscontacting the surface (60).
Sterilization. Similar to larger scale bioreactors, micro-bioreactors and their solutions and gases can be sterilizedusing heat, chemicals, radiation, or through the filtrationof agents. The small reaction volumes of microbioreactorsprovide an advantage in terms of sterilization, because fora given concentration, the total number of cells, spores, orother contaminants depends on the volume. Then, assum-ing that the ‘‘death rate’’ of the contaminant is independentof reactor size or contaminant numbers, the sterilizationtime needed to extinct the contaminants will decrease withdecreasing reactor size. In this respect, microbioreactorsare more time efficient in batch sterilization than macro-scopic ones. Ultraviolet (UV) sterilization is particularlyconvenient for transparent microbioreactors, such as thosefabricated in PDMS. When pH sensors or dissolved oxygensensors are packaged into the microbioreactor, autoclaveand UV radiation may not be feasible, and alternativemethods may need to be used. Flowing 70% ethanolthrough the chambers/channels and subsequently dryingis also sufficient for many microbioreactor applications.
Other Considerations. Phototrophic microorganismsconsume light energy to survive; they can grow in simpleand inexpensive nutrient media. The light requirementsof phototrophic microorganisms, however, impose othersignificant constraints on photobioreactor designs (61).These constraints are due to an exponential attenuationof the light flow passing through an optically absorbingmedium. Microbioreactors, given their large surface/volume ratios, are promising for photobioreactor applica-tions. Cultivation of phototrophic microorganisms in opti-mized photobioreactors would increase the product yieldseveral folds by maintaining the culture under appropri-ate conditions.
Ultrasound irradiation can change both the structureand function of biologic molecules such as proteins anddeoxyribonucleic acid (DNA) (62). At mild intensity, ultra-sound irradiation can increase the activity of free enzymes(63). For example, significant enhancement of reaction ratecan be achieved when exposing subtilisin power to ultra-sound irradiation (64). Low energy ultrasound wave irra-diation can also optimize the efficiency in ethanolproduction by yeast from mixed office waste paper inbioreactors (65). A variety of microscale ultrasoundsystems have been reported. Advanced microbioreactor
388 MICROBIOREACTORS
systems with ultrasound components may be developed tomake bioreactors more efficient.
MICROBIOREACTOR COMPONENTS
Components For Heat Transfer
External heating elements can be incorporated into micro-bioreactors to control temperatures. External controls oftemperature include the use of standard cell culture incu-bators that can accommodate the whole microbioreactor(66), heating tapes, and water-to-water heat exchangers(67). Internal, embedded heaters can be comprised ofmaterials such as thin platinum films (68) or opticallytransparent indium–tin oxide (ITO) (69). Temperaturemeasurements can also be made on chip using metallic,semiconducting, or optical materials.
An important application where heaters are crucial andmicrobioreactors have an advantage is the polymerasechain reaction (PCR), a temperature-controlled andenzyme-mediated DNA amplification technology (70). Poly-merase chain reaction requires multiple cycles of high, low,and medium temperatures to separate DNA strands,anneal the primer to the template DNA, and make com-plementary copies of the template DNA. Since microsys-tems usually have high heat conductivity and low heatcapacity, the time for raising and lowering the temperatureis shortened and time will be saved when cyclic tempera-ture fluctuations during the PCR reaction is necessary.Northrup et al. (71) integrated microfabricated polysiliconheaters into a micromachined silicon reaction chamber.Schneegass et al. (68) used a thermocycler chip with inte-grated thin platinum film heaters and sensors for tempera-ture. Kopp et al. (72) used external copper blocks andheating cartridges with the surface temperature monitoredby a platinum thin-film resistor. Burns and co-workers (73)developed a very simple and elegant PCR device thatutilizes Rayleigh–Benard convection—a steady, buoy-ancy-driven circulatory flow that occurs between two sur-faces, one on top and one on the bottom, maintained at twofixed temperatures—to perform temperature cycling.
Components For Aeration
Electrolytic gas generation provides a compact, scalableapproach for gas delivery to microbioreactors (19). In brief,a pair of interdigitated Ti/Pt electrodes hydrolyzes electro-lyte to generate oxygen gases at the narrow end of agradually widened hydrophilic microchannel. The oxygenbubbles move along the conical microchannels and transferinto culture medium because of the positive pressure builtup during gas generation and the different surface tensionforces at the front and back of the bubbles formed in thegradually widening channel. The rate of oxygen generationcan be precisely controlled by pulse width modulation ofthe electrode potential.
The smaller the bioreactor, the more crucial it is to avoidbubble formation to prevent blockage of microchannels.For such systems, it is advantageous to use gas permeablemembranes that allow diffusion of gases through it withoutintroduction of bubbles. Because the surface/volume ratio
is large in microsystems, oxygen transfer through gas-permeable membranes is often sufficient to ensure ade-quate oxygenation for biomass production. A straight-forward method to fabricate gas-permeable membranesis to spincoat PDMS prepolymer onto silanized siliconwafers, cure and harden to generate a thin membrane,then peel it off (20,21).
Components For Fluid Control
Valves. Valves can be categorized into active andpassive valves. A passive valve is a flow-dependent obstruc-tion that functions without any external actuation. Passivevalves are mostly unidirectional. In an active valve, fluidflow is directed by active actuation (74). The advantagethat active valves have over passive valves is the degree ofcontrol one has over the timing, rate, and direction of fluidflow. This type of control is necessary to make real-timeadjustments and for feedback control of microbioreactors.Although a large variety of valves have been reported, it isstill a challenge to integrate multiple valves into a func-tional bioreactor system. Difficulties arise because manyvalves are incompatible with other components to be inte-grated, or because the valves require large external sys-tems for actuation.
Passive valves have been used for restricting flow toone direction, removing air from liquid, or making flowsstop at select channel regions. Although the level ofcontrol is lower compared to active valves, passive valveshave the advantages of having few or no moving parts, lesscomplexity, easy fabrication, and less chance to break dueto fatigue (75). Recent approaches for passive controlvalves involve the use of hydrophobic materials, surfacepatterning, and changing channel fluid resistance (bychanging channel geometry) (11). Passively moving micro-piston valves have also been fabricated in situ insidemicrochannels using laser polymerization of a nonstickpolymer (76).
Most conventional active microvalves couple a flexiblediaphragm (77,78) to, thermopneumatic (79), piezoelectric(80), electrostatic, electromagnetic (81), bimetallic, orother types of actuators. The scaling of these actuationforces to the microscale, however, is often unfavorable andrequires macroscale external actuators for operation. Aninteresting alternative to active valves is the use of auton-omously regulated valves made of hydrogels that swell inresponse to pH or other specific chemical or thermalenvironment (11,82). The volume changes of the hydrogelcan valve or obstruct fluid flow directly, or indirectly,through deformation of a thin PDMS membrane. ThePDMS, when deformed, partially occludes an orifice toregulate the feedback stream of compensating buffer solu-tion (17). By altering their chemistry, hydrogels can alsovalve in response to the changes of temperature, light,electric fields, carbohydrates, or antigens. Ehrick et al.(83) incorporated genetically engineered proteins withinhydrogels that swell in response to various ligands aspotential valves for microfluidic channels. Other typesof valves include the use of commercially available Brailledisplays (84) or a pneumatic valve system to deform flex-ible microchannels (85).
MICROBIOREACTORS 389
Pumps. A micropump should ideally be able to pump awide range of fluids and gases, be self-priming, and be pro-grammable. Ideal micropumps are still lacking; thus, manymicrofluidic applications use macroscopic pumps, such assyringe pumps. Micropumps can be classified into two maintypes: mechanical pumps and nonmechanical pumps (71).Mechanical pumps use electromagnetic, piezoelectric,pneumatic, shape memory, electrostatic, thermopneu-matic, or thermomechanic components to deliver fluid.Mechanical pumps provide higher control over averageflow rates, but the flow is often pulsed and the fabricationrelatively complex (53,85). Many types of nonmechanicalmicropumps have also been successfully developed. Theflow from nonmechanical pumps is usually pulse-free witha wide range of flow rates at low pressures and the fabrica-tion is often less complex compared to mechanical pumps.An electrokinetic pump that utilizes an electric field forpumping conductive fluids by electrophoresis or electroos-motic flow (EOF) is the most common method to controlflow in microfluidic systems (71). Electrokinetic pumpshave the advantages of direct control, fast response, andsimplicity. However, the substrate material, joule heatingeffect, and microchannel charge have to be considered.Other types of nonmechanical pumps include electrohy-drodynamic pumps that use electrostatic forces acting ondielectric fluids, phase-transfer pumps that use pressuregradient between gas and liquid phases, electrowettingfluid actuation systems that use interfacial forces, electro-chemical pumps that use the pressure of gas bubblesgenerated by electrolysis of water (71), magnetohydrody-namic pumps (86), capillary force, gravity-driven pumps(87), pneumatic pumps (85), and pumps that use actionof piezoelectric pin arrays in refreshable Braille displays(84).
Multiple Laminar Streams. For most flows in small chan-nels, viscous forces dominate; thus flow is laminar andlacks turbulence. When two or more streams pass throughmicrochannels, they flow in parallel as if they are sepa-rated by physical boundaries. Laminar flow is a challengefor mixing, but a useful phenomenon for microscale fluidpatterning (Fig. 3d) (55,88). By taking advantage of diffu-sive mixing (but not turbulent mixing) and laminar flows,spatiotemporally defined gradients can be generated andhave been used to study chemotaxis (89,90). Multiplelaminar flows have also been used for developing micro-fluidic assay systems [i.e., T-sensor (91)], and studyingsubcellular processes when the interfaces of the laminarstreams are positioned over a single cell (92).
Mixers. Mixing is challenging in microfluidic systemsbecause laminar flows preclude turbulent mixing (Fig. 3d).Microscale mixers, therefore, generally use elongationalflows or laminar shears to increase interfacial areasbetween different fluids and mixing by diffusion. Distribu-tive mixing physically splits the fluid streams into smallersegments and redistributes them to reduce the striationthickness. Passive and active mixers have been developedfor microfluidic systems, including laminating mixers (93),rotary mixers (94), mixing based on out of phase forwardand backward pumping of different liquids (84), plume
mixers (nozzle arrays), chaotic advection mixers (9,95),movement of liquid plugs (96), and an electroosmoticallydriven micromixer that uses multiple intersecting chan-nels to enhance lateral transport (97). Thorough reviews onmicromixers have been given by Hessel et al. (98) andNguyen and Wu (99).
Components For Mechanical Stimulation
Shear. Methods commonly used to impart shear stresson cells include cone viscometers, parallel plates, andcapillary tube flow chambers (100,101). Gradients of shearstress can also be generated in a curved D-shape micro-channel (102). Flow-induced cytoskeleton rearrangementswere shown to depend on the geometry of the channel(D-shape channel versus flat surfaces, representing experi-ence in microcirculation and large veins, respectively) andthe presence of inflammatory drugs (103).
Stretch. When subjecting cultured cells to mechanicalstretch, proper design and application of a strain device arerequired to provide a well-defined and reproducible strainfield to study mechanotransduction. Information from suchin vitro models, which facilitate systematic variations inmechanical conditions and allow rapid analyses, wouldyield tremendous insights into mechanical parametersthat may be important in vivo (104). Biaxial cell straindevices have been used to strain lung cells (105,106) byrepeated mechanical deformations of a membrane onwhich cells are attached. Strain could also be applied usinga magnetic force (107), or via uniaxial cyclical stretch (108).
Components For Separation And Purification
Lysing. Cell contents are separated from their sur-rounding environment by a cell membrane. The membraneand an underlying cytoskeletal network provide mechan-ical strength to the cell and preserve its integrity. The firststep in many analyses or isolation of cell contents is todisrupt the cell membrane. There are a variety of mechan-ical (homogenization, milling, ultrasonic disruption, andblenders) and nonmechanical (detergent, organic solvent,osmotic shock, enzymatic permeabilization, electricaldischarge, heating, and pressure cycling) methods for dis-rupting cell membranes on the macroscopic scale. Demon-stration of cell lysis on the microscopic scale insidemicrofluidic devices, however, has mostly been with non-mechanical methods that use detergents (96,109), electri-cal discharges, or lasers (110). Miniaturized cellelectrolysis devices can work with small amounts of cellsand reduce the amount of purification compared to otherprotocols (111,112). For example, Waters et al. (113) devel-oped a microchip that is capable of performing Escherichiacoli lysis, PCR amplification, and eletrophoretic analysison a single device.
Separation. Cell separation techniques are funda-mental to clinical diagnosis, therapy, and biotechnologicalproduction (114). For example, it is crucial to havepurified cells before proliferation and production ofcellular products. Current approaches include opticaltweezers (115), centrifugation (116,117), filtration
390 MICROBIOREACTORS

(109,116,118), fluorescence-based cell sorting (FACS)(119,120) or magnetically activated cell sorting (MACS)(121), electric field-based manipulations and separations(114,122–124), and cell-motility based sorting (125,126).Microtechnology opens new opportunities in cell and bio-molecule sorting that take advantage of laminar flowbehaviors (125), electrical field properties (127), or othermicroscale phenomena. It also provides the opportunity tocombine multiple modes of separation into an integratedsystem. Researchers have used physiological fluid mechan-ical phenomenon observed in blood microcirculation(plasma skimming and leukocyte margination) to filterleukocytes from whole blood (128). Petersson et al. (129)combined acoustic wave forces and laminar flow to con-tinuously sort erythrocytes from lipid particles in the wholeblood. Because these two components were different indensity and responsiveness to pressure, erythrocytes wereenriched at the pressure node (along the center of thechannel) and lipid particles were gathered at the pressureantinodes (along the side walls). Finally, the erythrocytesand lipid microemboli separated into different branches atthe end of the main channel. Because of the variety ofdifferent properties by which cells of interest need to besorted, it is important to develop multiple modes of cellsorting. Reviews about microfluidic cell analysis and sort-ing devices can be found elsewhere (130,131).
Filtration. Microfabrication techniques have beendeveloped to integrate filters and membranes inside micro-bioreactors. Zhao et al. (132) and Hisamoto et al. (133)successfully produced semipermeable nylon membranesinside microfluidic channels, by taking advantage of lami-nar flow so that a polymerization reaction would occur atthe liquid interface of the two flows and produce a thinmembrane in predetermined areas of a microfluidic device.
Components For Monitoring And Control
A key requirement for microbioreactors is the ability tomeasure parameters, such as temperature, dissolved oxy-gen, pH, and flow rate. For systems involving cells, massbalances are even more complex than with enzyme bior-eactors because of the larger number of products andbyproducts produced and the complex responses of cellsto the changes in material concentrations. In smallvolumes, it is difficult or impossible to use standard,macroscopic, industrial probes. Miniaturized sensors mustbe developed (17). Sensors that do not consume the ana-lytes are also preferred to avoid depletion and also becausesample extraction is hard to achieve in closed and compactmicrosystems without disrupting the devices.
Optical, electrochemical, and thin-film solid-state con-ductivity are the three main categories of microsensingschemes. Many of the most useful microdetection schemesare based on optical measurements such as fluorescenceintensity (134), fluorescence lifetime, chemiluminescence(135), and bioluminescence (136). Optical sensing is con-venient because molecular or nanoscale ‘‘sensors’’ are sim-ple to introduce inside microchannels and readout can bedetected from a distance without direct external contacts.In addition, many optical probes can sense without con-
suming oxygen or perturbing pH. Nonperturbing sensorsare important for maintaining a constant microenviron-ment because the quantities of chemicals are small inmicrobioreactors. Bioluminescence and chemilumines-cence are sensitive with the detection limits down to10�18–10�21 mol, which offers great advantage over otherspectroscopic-based detection mechanisms. Laser-inducedfluorescence detections in microsystems have beenreviewed by Johnson and Landers (137). Other opticaldetection methods for microfluidic systems have beenreviewed by Mogensen et al. (138).
Sol–gel-based probes encapsulated by biologically loca-lized embedding (PEBBLEs) allow real-time measurementof molecular oxygen, pH, and ions inside and around livingcells (139). Kostov et al. (17) used an optical sensing systemintegrated with semiconductor light sources and detectorsto perform continuous measurements of pH, optical den-sity, and dissolved oxygen in miniature bioreactors. Adrawback of optical sensing is the need for light sources,lenses for focusing, and detectors, which are more challen-ging to miniaturize compared to the sensor probes them-selves. A useful solution is to use optical fiber-basedsystems, which allows decoupling of the probes from thelight sources and detectors, and enables detection at sitesinaccessible by conventional spectroscopic sensors (140).Compared with silicon micromachining techniques, thefabrication and integration of polymeric optical elements(waveguides, lenses and fiber-to-waveguide couplers) withmicrofluidic channels are fast and simple (141). An oxygen-sensitive fluorescent dye has been developed to monitordissolved oxygen levels in a system. This provides advan-tages over electrochemically based sensors [for a review,see Ref. 142] due to their size, ease of fabrication, andsensitivity (141).
Electronic microsensor is another category that con-tains a large number of useful biochemical detectors(143). Electronic microsensors usually require direct hardwiring of sensors to a readout system but can be easier tomultiplex and are often smaller overall compared to opticalsystems. For example, Walther et al. (144) integrated a pH-ISFET (ion-sensitive field-effect transistor), a tempera-ture-sensitive diode, and a thin-film platinum redox elec-trode on a single chip. The chip is mounted on a carrier andinserted into the chamber to monitor various biologicalparameters such as pH and redox potential. Brown and co-workers developed polymer membrane-based solid-statesensors to measure pH, and ions (145).
Microfabricated ultrasensitive nanocalorimeters canmeasure heat generation to monitor cell metabolic activityin response to agonist and antagonist using as few as 10cells and without prior knowledge of the mode of action ofthese drugs. This measurement is noninvasive and quan-titative and is envisioned to be useful for pharmaceuticalcompanies to find drug candidate (146).
Li et al. (147) developed a microfabricated acoustic wavesensor to measure the stiffness of a single cell. This sensoris promising for drug screening and toxicology studies. Forexample, the acoustic wave sensor is envisioned to measurethe rigidity of a heart cell to distinguish the effect ofpositive and negative ionotropic drugs. Positive ionotropicdrugs are useful for treating congestive heart failure and
MICROBIOREACTORS 391

negative ionotrpic drugs for hypertension. The acousticwave sensor is also interesting for single cell muscle phy-siology.
Cells themselves can be used to sense and amplifybiological signals. Several groups have developed hista-mine sensors by integrating cells on microfluidic devices(148,149). This chip-based detector caters to the need for asimple, rapid, and safe method for allergy identification.Cells can be engineered to have a variety of biologicalrecognition events coupled to reporter genes to specificallysense analytes of interest (150).
Some new exciting prospects for future biosensors arein the area of nanotechnology. For example, quantum dots(151) and nanoscale PEBBLES (139) are extending thelimits of sensitivity, stability, biocompatibility, and flex-ibility in optical sensing. Quantum dots are small semi-conductor nanocrystals (on the order of nanometers to afew micrometers). Fluorescent quantum dots are able todetect biological species by fluorescing only when comingin contact with viable cells, making them useful probes formany types of labeling studies. These quantum dots arephotobleached very slowly and can be manufactured toemit a wide range of wavelengths. They can be used in cellbiology for the labeling of cellular structures, tracking thefate of individual cells, or as contrast agents (152). Nano-wire-based sensors with their small size and higher sen-sitivity would also be ideal for integration intomicrobioreactors (153). Many microsensors have beendeveloped and are ready for integration into microbior-eactors.
Fabrication
A variety of methods and types of substrates are availablefor microfabrication. The most traditional and widely usedmethod of microfabrication is photolithography. Originallydeveloped for the microelectronics industry, photolithogra-phy is precise, highly reproducible, and capable of massproduction. Photolithography uses patterns of UV lightcoming through a photomask to area-selectively inducechemical reactions in a polymeric, light-sensitive photo-resist coated onto a semiconductor substrate. During devel-opment, the light exposed regions of the photoresist areselectively removed or selectively left behind generatingmicropatterned photoresist structure. The exposed areas ofthe substrate are then chemically etched to provide fea-tures of various depths and shapes.
Due to the high equipment costs involved in photolitho-graphy and because silicon and glass substrates used inelectronic and mechanical devices are not necessarily thebest materials for biological applications, alternative typesof microfabrication have been developed. A cost-effectiveand experimentally straightforward method called softlithography has been particularly useful for biologicalapplications (2,53). Soft lithography uses elastomericmaterials, such as PDMS to create microstructures, andto pattern and manipulate surfaces. The process involvescasting PDMS against a photolithographically definedmaster mold to yield a polymeric replica. The PDMS replicais then sealed against another material to form channelsand reservoirs. Alternatively, the replica can be used in a
technique called microcontact printing, where the PDMSmold is used as a stamp to transfer protein or molecular inkto a substrate. The PDMS has several properties, whichmake it useful for biological applications: (1) biocompat-ibility allows cell culture on and inside PDMS structures,(2) optical transparency allows optical inspection and sen-sing, (3) gas permeability allows long-term growth of cellswithout depletion of oxygen, (4) flexibility allows cell cul-tured on PDMS to be mechanically stretched (2,50,53).
Other polymer based microfabrication techniquesinclude hot embossing, injection molding, and laser abla-tion. A hot embossing technique called nano-imprint litho-graphy developed by Chou et al. (154) has the ability tofabricate sub-10 nm nanometer features. This processcreates nanostructures in a resist by deforming the resistshape with embossing (155). Moriguchi et al. (156) devel-oped a unique photothermal microfabrication technique,where agar microchamber arrays with living cells insidethem can be remolded in situ during cell cultivation.
Integration
The development of a microbioreactor requires assemblingmultiple functional units (for electronic, mechanical, bio-logical, and chemical processing) into a compact device.Integration and packaging poses a whole new challenge ontop of the challenges to develop individual components.With macroscopic bioreactors, it is relatively straightfor-ward to connect different components together with littleor no worries of space organization. As one scales down,the placement of components must be performed strate-gically as the room around the reactor chamber decreasesdramatically (because volume scales as length cubed, a 10time reduction in linear dimensions, e.g., will lead to a1000 time reduction in the available space). There are alsotechnical challenges to fabricate microscale fittings andconnectors, or to join two components via connectors evenif they could be fabricated. A variety of processes used tobuild integrated circuits and microelectromechanical sys-tems have played a major role in fabricating integratedmicrofluidic systems and microbioreactors. Thesetechnologies, known collectively as micromachinging,selectively etch away or deposit structural layers on sili-cone wafers.
Recent efforts to reduce costs, enhance material biocom-patibility, and needs for diverse chemical and mechanicalproperties have also led to the use of a wide variety ofpolymeric materials in microfabricated devices. Integration,unless planned carefully, can lead to material incompat-ibilities in fabrication or operation. Notable accomplish-ments of integrated microfluidic systems includeDNA analysis chips (78,157), pneumatically driven micro-fluidic cell sorters and protein recrystallization chips(77,119,158,159), portable cell-based biosensor systems(160), microfermentors with integrated sensors (17,20,21),and a computerized microfluidic cell culture system actu-ated using the pins of a refreshable Braille display (84).Integrating fluid control components for cell-culture micro-bioreactors is rapidly progressing, but still underdeve-loped. Interested readers are referred to recent reviewarticles on integrated microfluidic devices (161).
392 MICROBIOREACTORS
SPECIFIC EXAMPLES OF MICROBIOREACTORS
This section presents select examples of microbioreactors.The examples are not exhaustive, but are meant to showrepresentative examples in each of the following four cate-gories: (1) microbioreactors that are used to optimize bio-production, (2) microbioreactors that provide cells withphysiological microenvironments to more accurately pre-dict physiological drug kinetics and toxicity, (3) microbior-eactors that are used to develop cell-based therapies, and(4) microbioreactors for mechanistic studies. Because thefield is still young, the devices are relatively simple andmany are still prototypes rather than refined productsready for real world applications. The rapid advances,however, promise an increasing role of microbioreactorsin the clinic, laboratory, and at home or other points ofneed.
Microbioreactors For Optimizing Production Conditions
With the development of microtechnologies, more andmore bioprocess optimization is performed in smallvolume bioreactors with integrated detection systems.For example, Rao and co-workers (17) have demonstratedparallel fermentations of E. coli. in a milliliter-size micro-bioreactor. A smaller, microliter-size fermentor has beendeveloped recently by the Jensen’s group (20). The perfor-mances of these microbioreactors are comparable to tradi-tional liter-size fermentors: Measurements of pH,dissolved oxygen (DO) and optical density (OD) of biomassin these microbioreactors have similar profiles as those inbenchtop fermentors. Similarities in cellular metabolismand growth show the potential of using microbioreactorsfor bioprocess optimization. Arrays of microfermentorswith integrated sensors and actuators are envisioned todrastically reduce the cost and time for developing newbioprocesses.
Microbioreactors For Toxicological And Drug Testing
Drugs need to be tested for toxicity and efficacybefore administration to humans. Accurate prediction,however, is a challenge because most current drug testsare performed only on human cells or animals. Animaltests are expensive and time consuming, and efficacy of adrug obtained from an animal surrogate study can still bedifficult to extrapolate to humans (162). Even when oneuses human cells for analysis, the result may betotally different from what occurs physiologically becausecells cultured in flasks or dishes experience a totallydifferent microenvironment. Therefore, a microscalehuman surrogate with microcirculatory systems, three-dimensional (3D) tissue organizations, and appropriatecell–cell and tissue–tissue interactions would be beneficialin predicting human responses to drug treatmentmore precisely. Below are two notable examples of suchefforts.
Bioartificial Livers. There are two major applications forwhich artificial livers are developed: one is to replace organfunctions in patients with liver failure, and the other is toperform toxicology testing of drug candidates. Organ repla-
cement functions require large bioartificial livers (BALs),whereas the toxicology studies would benefit from micro-scale BALs capable of conducting high throughput ana-lyses. Microscale BALs are promising as convenient andlow cost in vitro models for screening drug toxicities parti-cularly in light of the fact that approximately one-half of alldrug toxicities involve the liver.
Liver failure is the seventh leading cause of death bydisease in the United States. About 26, 000 people diedeach year because of liver failure. Transplantation is lim-ited by the supply of donor organs and the cost of thesurgery (163). Extracorporeal BAL devices have been pro-posed as substitutes for transplantation. MacroscopicBALs have been tested in clinical trials (164). In an attemptto maximize the efficacy of the BALs, and to develop in vitroliver systems for biological and toxicological studies, sev-eral groups have microfabricated liver cell culture systems(165).
Microbioreactors for liver cell cultures have severalconfigurations, ranging from flat-plate (163) or matrix-sandwiched monolayer designs (166) to 3D perfusion cul-tures (165). A flat-plate microbioreactor with an oxygenpermeable membrane was shown to support viability andsynthetic functions of hepatocytes cocultured with 3T3-J2fibroblasts (163). This microchannel bioreactor was alsofunctional when connected extracorporeally to a rat (162).The results indicate that this device can potentially beused as a liver support device and for the eventual scale-upto clinical devices. Compared with other configurations,monolayer designs excel in mass transfer, easy fabrica-tion, and easy optical analysis of cells (165), although cellsmight be damaged by exposure to shear stress (167).Griffith and co-workers (165) developed an array of micro-bioreactors (with each channel 300� 300� 230 mm,L�W�H in dimension) that support 3D culture of livercells by perfusion. Liver cells cultured in this deviceshowed viable tissue structures and tight junctions, glyco-gen storage, and bile canaliculi. Membrane-based 3D per-fusion hepatocyte culture systems have also beendeveloped (66).
Micro CCA. It is important to integrate cells fromdifferent tissues together to simulate physiologicaldrug metabolism. Shuler and co-workers developed CellCulture Analogs (CCAs) that combine mathematicalpharmacokinetics models with cell culture-based experi-mental studies to mimic human responses. The CCAshave compartmentalized cell cultures representing dif-ferent tissues. Interconnections between these compart-ments allow circulation of media and metabolites. Sincethe CCAs mimic the time-dependent exposure and themetabolic interaction between multiple types of tissuesand cells, predictions from the CCAs may be more accu-rate compared to existing in vitro models. Shuler and co-workers proved the concept of CCA with a macroscopicthree-compartment (liver, lung, and other tissues) systemand showed the feasibility and potential usefulness ofsuch devices in testing naphthalene toxicity (168,169).MicroCCAs with three (liver, lung, and other tissues) andfour (liver, lung, fat, and other tissues) compartmentshave also been reported (170,171).
MICROBIOREACTORS 393
Microbioreactors For Therapeutical Applications
Microfluidic Systems As Assisted Reproductive Techno-logies. Microdevices provide unique platforms for artificialreproduction and may ultimately increase the efficiency,safety, and cost-effectiveness of in vitro fertilizationprocedures. Currently, many embryo experiments are per-formed in macroscopic culture dishes, where human oranimal oocytes (eggs) and embryos are manipulated manu-ally. Use of pipettes for cellular manipulations is laborintensive and low in accuracy, reproducibility, and effi-ciency. In addition, the practice of transferring embryosfrom one type of media into another is abrupt and mayshock the embryo due to the sudden change of environment(172–174); inside the female tract, the supply of nutrients,growth factors, and hormones changes gradually as theembryo development progresses. An alternative to manualpipetting is the use of microfluidic channels. Microfluidicsis ideal for use in artificial reproduction, because it is aprocedure that occurs physiologically inside small tubesand ducts, the size and numbers of cells (oocytes, sperms)required match well with dimensions of microsystems.
Beebe et al. (175) demonstrated manipulations ofembryos and oocytes within microfluidic channels. Themicrofluidic systems can transport single mouse embryosthrough a channel network (176), remove the zona pellu-cida by chemical treatment (177), remove cumulus cellsfrom oocytes via mechanical suction (178), and cultureembryos in static or dynamic fluid environments (179).In some cases, embryos cultured in microfluidic channelsdevelop faster compared to embryo grown in culture dishesand with growth kinetics that are closer to what is observedin vivo.
Cho et al. (125) developed a Microscale IntegratedSperm Sorter (MISS) that isolates motile sperms basedon the ability of the motile sperms, but not the nonmotileones, to cross-laminar flow streamlines. The device allowssmall volume samples that are difficult to handle withconventional sperm-sorting techniques to be sorted effi-ciently using a mild biomimetic sorting mechanism. TheMISS integrates power source, sample injection ports, andsorting channel into one disposable polymer device makingthe device potentially useful not only clinically, but also asan at-home male infertility test (180).
Implantable Microcapsules. Microbioreactors that pro-duce and release natural or recombinant bioagents areuseful for delivering therapeutic agents in vivo to enhancemetabolic function (181) or treat neurological disorders(182) and cancers (183,184). Mammalian cells, plant cells,microorganisms, enzymes, and biochemical compoundshave been encapsulated in a variety of semipermeablecontainers mainly made of synthetic and natural hydrogels(e.g., poly(vinyl alchohol), poly(hydroxyl ethyl methacry-late), calcium alginate k-carrageenan, chitosan, collagen,and gelatin). Here we focus on the application of micro-encapsulated mammalian cells. The outer membranes ofthe microspheres encapsulating the cells serve as selectivebarriers that allow exchange of nutrients, wastes, andtherapeutic agents but block the passage of encapsulatedcells as well as macromolecular components of the immune
system. This approach has been effective in deliveringgenetically engineered cells that secrete growth hormoneto partially correct growth retardation (185), recombinanthuman bone morphogenetic protein-2 (rhBMP-2) to inducebone formation and regeneration (186), interleukin-2 todelay tumor progression and prolong survival (187), coa-gulation factor IX for treatment of hemophilia B (188),dopamine to treat Parkinson’s disease (182), insulin tomaintain blood glucose level (189), and analgesic sub-stances to relief pain (190). Most of these works are aidedby using murine and canine models. Some of the mostadvanced systems are in early clinical trials. Biocompat-ibility (191,192) mechanical stability of the capsule mate-rial (193–195), efficacy (196), safety (197), and cost are stillunder evaluation and optimization. Reviews of therapeuticuses of microencapsulated genetically engineered cells canbe found elsewhere (198).
Microbioreactors For Understanding Biological Responses
Use Of Multiple Laminar Streams To Study SubcellularBiology And Chemotaxis. Physiological cell environmentsare heterogeneous with local production and consumptionof key growth factors, nutrients, and signaling molecules.Microfluidic systems are useful for mimicking such micro-patterns of chemicals around cells. A particularly simpleand useful method is to take advantage of small channeldimensions to generate multiple laminar streams that flowin parallel and adjacent to each other inside the samemicrochannel with minimum mixing (Fig. 3d). Such tech-niques can be even used to treat different parts of singleliving cells with different small molecular drugs, proteins,and small particles such as low density lipoprotein (LDL)(88).
Cancer and normal cells receive similar local stimuliinside the body, but behave totally differently. A criticalquestion is why these differences arise. Taking advantageof multiple laminar flows to perform subcellular epidermalgrowth factor (EGF) stimulation, Sawano et al. (92)revealed differences in signal propagation between carci-noma and normal cells in response to local EGF stimula-tion.
Many cells direct their motion in response to chemicalgradients. This phenomenon, called chemotaxis, protectsmicroorganisms by allowing them to move toward morefavorable conditions. In mammals, chemotaxis is impor-tant for guiding cell migration during development,embryogenesis, cancer metastasis, and inflammation. Achallenge for analyzing chemotaxis is the lack of methodsto generate well-defined chemical gradients that are stableand do not change with time. This difficulty arises due tothe diffusivity of molecules and resulting changes of con-centration profiles over time. Jeon et al. (90) demonstratedthe use of microfluidic systems with branched networks ofchannels to generate stable gradients of interleukin-8(IL-8) with linear, parabolic, and periodic concentrationprofiles. The position and shape of the concentration gra-dients were controlled by adjusting the flow rates and thepositions to which reagent of interest were added into thechannel network (89,199). The well-defined gradientsallowed straightforward quantification of chemotaxis
394 MICROBIOREACTORS

coefficients as well as to observe complex migration beha-viors of leukocytes in response to different concentrationgradient profiles.
Studies Of Vascular Diseases In Microfluidic Channels.The mechanical forces that accompany blood flow andpressure fluctuation influence vascular cellular biologyand pathology in many ways. As the blood flow along avessel, the viscous drag forces constantly expose endothe-lial cells (ECs) to shear stress. The pulsatility of the bloodflow also induces a periodic change of circumferentialstrain on ECs and their underlying smooth muscle cells(SMCs). These mechanical forces have been found to causeimportant biological changes in endothelial cell morphol-ogy and function, such as alignment and elongation(30,200), low density lipoprotein uptake (201), tissue plas-minogen activator synthesis and secretion (202), and pro-liferation (67). There has also been studies about thecombined effect of shear stress and cyclic strain on ECs(203–205) and SMCs (206–208). While much has beenrevealed about the alterations in EC function induced bymechanical stresses, relatively little is known about themechanism mechanical signaling.
Capillary-size microfluidic channels were used to modelmalaria, a potentially vital disease caused by loss ofdeformability of red blood cells due to P. falciparum para-sites infection. Erythrocytes exhibited increased rigidityand decreased deformability with the progression of thedisease, as demonstrated by their increased difficulties totransverse through 2 to 8 mm wide PDMS channels. Thistype of microfluidic system may potentially be useful toscreen antimalaria drugs (209).
CONCLUSION AND FUTURE PROSPECTS
The convergence of bioreactors with advances in micro-technology is starting an exciting revolution in medicine.With microfabrication technologies, many copies of adevice can be generated and operated with quick proce-dures and reduced cost. The ability to perform parallelassays allows high throughput optimization of bioprocessconditions, opening the way for cost-efficient biopharma-ceuticals production.
Humans and other living organisms are inherentlymicroscopic in their essence, being comprised of networksof microscopic reactors (i.e., the cells), and interconnectedby microfluidic vasculatures. Efforts to miniaturize bior-eactors would lead to not only the development of smallerpharmaceutical production and screening systems, butalso the construction of more physiological in vitro cellculture systems where the ultimate goal is to developmicrobioreactors as animal or human surrogates. Evenfor cullture of single cell types, the ability of microfluidicsystems to simulate physiological microenvironments isuseful for revealing disease mechanisms, drug testing,use as biosensors, and single-cell-based clinical proceduressuch as in vitro fertilization. More complex microbioreactorsystems with multiple cell types are being developed fortoxicology studies. So-called animals-on-a-chip or minihu-mans provides exciting prospects for efficient drug discov-ery and personalized medicine.
Current state-of-the-art microbioreactors are still rela-tively simple with few components and limited sensing andcontrol. Many are highly specialized and nonroutine intheir use. The overall footprints of the systems are alsooften still macroscopic. Current advances in micro- andnanotechnologies as well as in medicine, however, promiserapid improvements in performance, accessibility, andsophistication of microbioreactors. Current trends pointto a future where the gap between manmade devicesand living organisms will narrow and applications of micro-bioreactors to medicine will grow.
ACKNOWLEDGMENTS
We thank the Whitaker Foundation, National ScienceFoundation (BES-0238625, DMI-0403603), National Insti-tutes of Health (EB00379-01, HD049607-01), NASA(NNC04AA21A), and the U.S. Army Research Laboratoryand the U.S. Army Research Office under contract/grantnumber DAAD19-03-1-0168 for financial support. Wethank G. D. Smith, S. C. Chang, H. Chen, P.Y. Choi,B. H. Chueh, T. Kable, E. O. Kass, K. Ke, J.H. Kim,S. M. K. Lau, E.C. Lee, W.H. Lee, S.R. Mandal, J.A. Miller,Y. Murgha, S.O. Charoen, A.B. Ozel, S.J. Segvich, P.D.Settimi, D. Sud, B. Teply, M. Zhang, C. Zhong forassistance.
BIBLIOGRAPHY
1. Walker GM, Zeringue HC, Beebe DJ. Microenvironmentdesign considerations for cellular scale studies. Lab Chip2004;4:91–97.
2. Shim J, et al. Micro- and nanotechnologies for studying cel-lular function. Curr Top Med Chem 2003;3:687–703.
3. Bhadriraju K, Chen CS. Engineering cellular microenviron-ments to cell-based drug testing improve. Drug Discov Today2002;7:612–620.
4. Desai TA, et al. Microfabricated immunoisolating biocapsules.Biotechnol Bioeng 1998;57:118–120.
5. Krenkova J, Foret F. Immobilized microfluidic enzymaticreactors. Electrophoresis 2004;25:3550–3563.
6. Madou MJ. Fundamentals of Microfabrication. Boca Raton(FL): CRC Press; 2002.
7. Tabeling P, et al. Chaotic mixing in cross-channel micromix-ers. Philos Trans R Soc London Ser A-Math Phys Eng Sci2004;362:987–1000.
8. Stremler MA, Haselton FR, Aref H. Designing for chaos: Appli-cations of chaotic advection at the microscale. Philos. Trans RSoc Lond Ser A-Math Phys Eng Sci 2004;362:1019–1036.
9. Stroock AD, et al. Chaotic mixer for microchannels. Science2002;295:647–651.
10. Squires TM, Bazant MZ. Induced-charge electro-osmosis. JFluid Mech 2004;509:217–252.
11. Ehrfeld W, Hessel V, Lowe H. Microreactors: New Technologyfor Modern Chemistry. Chichester : Wiley-VCH; 2000.
12. McDuffie NG. Bioreactor Design Fundamentals. Boston:Butterworth-Heinemann; 1991.
13. Roels JA. Macroscopic Thermodynamics and the Description ofGrowth and Product Formation in Microorganisms. Washing-ton, (D.C.): American Chemical Society; 1983.
14. Roels JA. Energetics and Kinetics in Biotechnology. Amster-dam: Elsevier Biomedical Press; 1983.
MICROBIOREACTORS 395

15. Ezashi T, Das P, Roberts RM. Low O-2 tensions and theprevention of differentiation of hES cells. Proc Natl Acad SciU S A 2005;102:4783–4788.
16. Csete M, et al. Oxygen-mediated regulation of skeletal mus-cle satellite cell proliferation and adipogenesis in culture. JCell Physiol 2001;189:189–196.
17. Kostov Y, Harms P, Randers-Eichhorn L, Rao G. Low-costmicrobioreactor for high-throughput bioprocessing. Biotech-nol Bioeng 2001;72:346–352.
18. Blanch HW, Clark DS. Biochemical Engineering. New York:Marcel Dekker; 1997.
19. Maharbiz MM, et al. A microfabricated electrochemical oxy-gen generator for high-density cell culture arrays. J Micro-electromech Syst 2003;12:590–599.
20. Zanzotto A, et al. Membrane-aerated microbioreactor forhigh-throughput bioprocessing. Biotechnol Bioeng 2004;87:243–254.
21. Maharbiz MM, Holtz WJ, Howe RT, Keasling JD. Micro-bioreactor arrays with parametric control for high-through-put experimentation. Biotechnol Bioeng 2004;85:376–381.
22. Irazogui G, Villarino A, Batista-Viera F, Brena BM. Gener-ating favorable nano-environments for thermal and solventstabilization of immobilized beta-galactosidase. BiotechnolBioeng 2002;77:430–434.
23. Hara M, Adachi S, Higuchi A. Enhanced production of carci-noembryonic antigen by CW-2 cells cultured on polymericmembranes immobilized with extracellular matrix proteins.J Biomater Sci-Polym Ed 2003;14:139–155.
24. Keane JT, Ryan D, Gray PP. Effect of shear stress on expres-sion of a recombinant protein by Chinese hamster ovary cells.Biotechnol Bioeng 2003;81:211–220.
25. Dardik A, et al. Shear stress-stimulated endothelial cellsinduce smooth muscle cell chemotaxis via platelet-derivedgrowth factor-BB and interleukin-1 alpha. J Vasc Surg2005;41:321–331.
26. Kher N, Marsh JD. Pathobiology of atherosclerosis—abrief review. Semin Thromb Hemostasis 2004;30:665–672.
27. Butcher JT, Penrod AM, Garcia AJ, Nerem RM. Uniquemorphology and focal adhesion development of valvularendothelial cells in static and fluid flow environments. Arter-ioscler Thromb Vasc Biol 2004;24:1429–1434.
28. Kladakis SM, Nerem RM. Endothelial cell monolayer forma-tion: Effect of substrate and fluid shear stress. Endothelium2004;11:29–44.
29. Imberti B, Seliktar D, Nerem RM, Remuzzi A. The responseof endothelial cells to fluid shear stress using a co-culturemodel of the arterial wall. Endothelium-New York 2002;9:11–23.
30. Song J, et al. A Computer-Controlled Microcirculatory Sup-port System for Endothelial Cell Culture and Shearing. AnalChem 2005, In press.
31. Krizanac-Bengez L, Mayberg MR, Janigro D. The cerebralvasculature as a therapeutic target for neurological disordersand the role of shear stress in vascular homeostatis andpathophysiology. Neurol Res 2004;26:846–853.
32. Richards M, et al. Bone regeneration and fracture healing—Experience with distraction osteogenesis model. Clin OrthopRelated Res 1998; S191–S204.
33. Kim MB, Sarelius IH. Role of shear forces and adhesionmolecule distribution on P-selectin-mediated leukocyte roll-ing in postcapillary venules. Amer J Physiol-Heart Circ Phy2004;287:H2705–H2711.
34. Blackwell TS, Christman JW. The role of nuclear factor-kappa B in cytokine gene regulation. Amer J Respir CellMolec Biol 1997;17:3–9.
35. Awolesi MA, Sessa WC, Sumpio BE. Cyclic Strain up-Reg-ulates Nitric-Oxide Synthase in Cultured Bovine AorticEndothelial-Cells. J Clin Invest 1995;96:1449–1454.
36. Suzuki N, et al. Up-regulation of integrin beta (3) expressionby cyclic stretch in human umbilical endothelial cells. Bio-chem Biophys Res Commun 1997;239:372–376.
37. Booz GW, Baker KM. Molecular signaling mechanisms con-trolling growth and function of cardiac fibroblasts. Cardio-vasc Res 1995;30:537–543.
38. Kolpakov V, et al. Effect of mechanical forces on growth andmatrix protein-synthesis in the in-vitro pulmonary-artery—analysis of the role of individual cell-types. Circ Res1995;77:823–831.
39. Desrosiers EA, Methot S, Yahia LH, Rivard CH. Response ofligamentous fibroblasts to mechanical stimulation. Ann Chir1995;49:768–774.
40. Komuro I, et al. Mechanical loading stimulates cell hyper-trophy and specific gene-expression in cultured rat cardiacmyocytes—possible role of protein-kinase-C activation. J BiolChem 1991;266:1265–1268.
41. Neidlingerwilke C, Wilke HJ, Claes L. Cyclic stretching ofhuman osteoblasts affects proliferation and metabolism—anew experimental—method and its application. J OrthopaedRes 1994;12:70–78.
42. Vandenburgh HH, Karlisch P. Longitudinal growth ofskeletal myotubes in vitro in a new horizontal mechanicalcell stimulator. In Vitro Cell Develop Biol 1989;25:607–616.
43. Reusch P, et al. Mechanical strain increases smooth muscleand decreases nonmuscle myosin expression in rat vascularsmooth muscle cells. Circ Res 1996;79:1046–1053.
44. Stauber WT, Miller GR, Grimmett JG, Knack KK. Adapta-tion of rat soleus muscles to 4-wk of intermittent strain.J Appl Physiol 1994;77:58–62.
45. Gudi SRP, Lee AA, Clark CB, Frangos JA. Equibiaxialstrain and strain rate stimulate early activation of G proteinsin cardiac fibroblasts. Amer J Physiol-Cell Physiol 1998;43:C1424–C1428.
46. Vandenburgh HH, Hatfaludy S, Sohar I, Shansky J. Stretch-induced prostaglandins and protein-turnover in culturedskeletal-muscle. Amer J Physiol 1990;259:C232–C240.
47. Cowan DB, Lye SJ, Langille BL. Regulation of vascularconnexin43 gene expression by mechanical loads. Circ Res1998;82:786–793.
48. Davies PF, Flow-mediated endothelial mechanotransduc-tion. Physiol Rev 1995;75:519–560.
49. Blawas AS, Reichert WM. Protein patterning. Biomaterials1998;19:595–609.
50. Zhu XY, et al. Fabrication of reconfigurable protein matricesby cracking. Nat Mater 2005.
51. Zhu XY, Bersano-Begey TF, Takayama S. Nanomaterials forCell Engineering. In: Nalwa HS. editor, Encyclopedia ofNanoscience and Nanotechnology. American Scientific Pub-lishers; 2004. p 857–-878.
52. Ratner BD, Bryant SJ. Biomaterials: Where we have beenand where we are going. Annu Rev Biomed Eng 2004;6:41–75.
53. Whitesides GM, et al. Soft lithography in biology and bio-chemistry. Annu Rev Biomed Eng 2001;3:335–373.
54. Delamarche E, et al. Microfluidic networks for chemicalpatterning of substrate: Design and application to bioassays.J Am Chem Soc 1998;120:500–508.
55. Takayama S, et al. Patterning cells and their environmentsusing multiple laminar fluid flows in capillary networks. ProcNatl Acad Sci U S A 1999;96:5545–5548.
56. Folch A, Toner M. Cellular micropatterns on biocompatiblematerials. Biotechnol Prog 1998;14:388–392.
396 MICROBIOREACTORS

57. Grigioni M, et al. Pulsatile flow and atherogenesis: Resultsfrom in vivo studies. Int J Artif Organs 2001;24:784–792.
58. Satcher RL, Bussolari SR, Gimbrone MA, Dewey CF. Thedistribution of fluid forces on model arterial endotheliumusing computational fluid-dynamics. J Biomech Eng1992;114:309–316.
59. Evans DJR, Britland S, Wigmore PM. Differential responseof fetal and neonatal myoblasts to topographical guidancecues in vitro. Dev Genes Evol 1999;209:438–442.
60. Seemann R, et al. Wetting morphologies at microstructuredsurfaces. Proc Natl Acad Sci USA 2005;102:1848–1852.
61. Ogbonna JC, Tanaka H. Night biomass loss and changes inbiochemical composition of cells during light/dark cyclic cul-ture of Chlorella pyrenoidosa. J Ferment Bioeng 1996;82:558–564.
62. Macleod RM, Dunn F. Ultrasonic irradiation of enzyme solu-tions. J Acoust Soc Amer 1966;40:1202.
63. Ishimori Y, Karube I, Suzuki S. Acceleration of immobilizedalpha-chymotrypsin activity with ultrasonic irradiation.J Mol Catal 1981;12:253–259.
64. Vulfson EN, Sarney DB, Law BA. Enhancement of subtilisin-catalyzed interesterification in organic-solvents by ultra-sound irradiation. Enzyme Microb Technol 1991;13:123–126.
65. Wood BE, Aldrich HC, Ingram LO. Ultrasound stimulatesethanol production during the simultaneous saccharificationand fermentation of mixed waste office paper. BiotechnolProg 1997;13:232–237.
66. Ostrovidov S, Jiang JL, Sakai Y, Fujii T. Membrane-basedPDMS microbioreactor for perfused 3D primary rat hepato-cyte cultures. Biomed Microdevices 2004;6:279–287.
67. Geiger RV, Berk BC, Alexander RW, Nerem RM.Flow-induced calcium transients in single endothelial-cells—spatial and temporal analysis. Amer J Physiol1992;262:C1411–C1417.
68. Schneegass I, Brautigam R, Kohler JM. Miniaturized flow-through PCR with different template types in a silicon chipthermocycler. Lab Chip 2001;1:42–49.
69. Shivashankar GV, Liu S, Libchaber A. Control of the expres-sion of anchored genes using micron scale heater. Appl PhysLett 2000;76:3638–3640.
70. Shen KY, Chen XF, Guo M, Cheng J. A microchip-based PCRdevice using flexible printed circuit technology. Sensors andActuators B-Chem 2005;105:251–258.
71. Northrup MA, Ching MT, White RM, Watson RT. DNAamplification with a microfabricated reaction chamber. ProcIEEE Int Conf Solid-state Sensors Actuators 1993; 924–926.
72. Kopp MU, de Mello AJ, Manz A. Chemical amplification:Continuous-flow PCR on a chip. Science 1998;280:1046–1048.
73. Krishnan M, Ugaz VM, Burns MA. PCR in a Rayleigh-Benard convection cell. Science 2002;298:793–793.
74. Elwenspoek M, Lammerink TSJ, Miyake R, Fluitman JHJ.Towards integrated microliquid handling systems. J Micro-mechanic Microengineer 1994;4:227–245.
75. Lao AIK, Lee TMH, Hsing IM, Ip NY. Precise temperaturecontrol of microfluidic chamber for gas and liquid phasereactions. Sensors and Actuators A-Phys 2000;84:11–17.
76. Altman GH, et al. Advanced bioreactor with controlled appli-cation of multi-dimensional strain for tissue engineering.J Biomech Eng 2002;124:742–749.
77. Thorsen T, Maerkl SJ, Quake SR. Microfluidic large-scaleintegration. Science 2002;298:580–584.
78. Grover WH, et al. Monolithic membrane valves and dia-phragm pumps for practical large-scale integration into glassmicrofluidic devices. Sensors and Actuators B-Chem 2003;89:315–323.
79. Vandepol FCM, Wonnink DGJ, Elwenspoek M, FluitmanJHJ. A thermo-pneumatic actuation principle for a micro-
miniature pump and other micromechanical devices. Sensorsand Actuators 1989;17:139–143.
80. Smits GJ. A piezoelectric micropump with three valves work-ing peristalitically. Sensors and Actuators 1990;15:203–206.
81. Bosch D, et al. A silicon microvalve with combined electro-magnetic/electrostatic actuation. Sensors and Actuators A-Phys 1993;37-8:684–692.
82. Liu RH, Yu Q, Beebe DJ. Fabrication and characterization ofhydrogel-based microvalves. J Microelectromech Syst 2002;11:45–53.
83. Ehrick JD, et al. Genetically engineered protein in hydrogelstailors stimuli-responsive characteristics. Nat Mater 2005;4:298–302.
84. Gu W, et al. Computerized microfluidic cell culture usingelastomeric channels and Braille displays. Proc Natl Acad SciU S A 2004;101:15861–15866.
85. Unger MA, et al. Monolithic microfabricated valves andpumps by multilayer soft lithography. Science 2000;288:113–116.
86. Lemoff AV, Lee AP. An AC magnetohydrodynamic micro-pump. Sens Actuators B-Chem 2000;63:178–185.
87. Zhu XY, et al. Arrays of horizontally-oriented mini-reservoirsgenerate steady microfluidic flows for continuous perfusioncell culture and gradient generation. Analyst 2004;129:1026–1031.
88. Takayama S, et al. Selective chemical treatment of cellularmicrodomains using multiple laminar streams. Chem Biol2003;10:123–130.
89. Dertinger SKW, Chiu DT, Jeon NL, Whitesides GM. Gen-eration of gradients having complex shapes using microflui-dic networks. Anal Chem 2001;73:1240–1246.
90. Jeon NL, et al. Neutrophil chemotaxis in linear and complexgradients of interleukin-8 formed in a microfabricated device.Nat Biotechnol 2002;20:826–830.
91. Hatch A, et al. A rapid diffusion immunoassay in a T-sensor.Nat Biotechnol 2001;19:461–465.
92. Sawano A, Takayama S, Matsuda M, Miyawaki A. Lateralpropagation of EGF signaling after local stimulation isdependent on receptor density. Dev Cell 2002;3:245–257.
93. Bessoth FG, deMello AJ, Manz A. Microstructure for efficientcontinuous flow mixing. Anal Commun 1999;36:213–215.
94. Hong JW, et al. A nanoliter-scale nucleic acid processor withparallel architecture. Nat Biotechnol 2004;22:435–439.
95. Liu RH, et al. Passive mixing in a three-dimensional serpen-tine microchannel. J Microelectromech Syst 2000;9:190–197.
96. Song H, Tice JD, Ismagilov RF. A microfluidic system forcontrolling reaction networks in time. Angew Chem Int EdEngl 2003;42:768–772.
97. Burke BJ, Regnier FE. Stopped-flow enzyme assays on a chipusing a microfabricated mixer. Anal Chem 2003;75:1786–1791.
98. Hessel V, Lowe H, Schonfeld F. Micromixers—a review onpassive and active mixing principles. Chem Eng Sci2005;60:2479–2501.
99. Nguyen NT, Wu ZG. Micromixers—a review. J Micromecha-nic Microengineer 2005;15:R1–R16.
100. Frangos JA, McIntire LV, Eskin SG. Shear-Stress Inducedstimulation of mammalian-cell metabolism. BiotechnolBioeng 1988;32:1053–1060.
101. Blackman BR, Barbee KA, Thibault LE. In vitro cell shearingdevice to investigate the dynamic response of cells in a con-trolled hydrodynamic environment. Ann Biomed Eng2000;28:363–372.
102. Frame MDS, Chapman GB, Makino Y, Sarelius IH. Shearstress gradient over endothelial cells in a curved microchan-nel system. Biorheology 1998;35:245–261.
MICROBIOREACTORS 397

103. Frame MD, Sarelius IH. Flow-induced cytoskeletal changesin endothelial cells growing on curved surfaces. Microcircu-lation 2000;7:419–427.
104. Chien S, Li S, Shyy JYJ. Effects of mechanical forces onsignal transduction and gene expression in endothelial cells.Hypertension 1998;31:162–169.
105. Clark CB, Burkholder TJ, Frangos JA. Uniaxial strainsystem to investigate strain rate regulation in vitro. RevSci Instr 2001;72:2415–2422.
106. Buck RC. Reorientation response of cells to repeated stretchand recoil of the substratum. Exp Cell Res 1980;127:470–474.
107. Mourgeon E, et al. Mechanical strain-induced posttran-scriptional regulation of fibronectin production in fetal lungcells. Amer J Physiol-Lung Cell M Ph 1999;277:L142–L149.
108. Kato T, et al. Up-regulation of COX2 expression by uni-axialcyclic stretch in human lung fibroblast cells. Biochem Bio-phys Res Commun 1998;244:615–619.
109. Schilling EA, Kamholz AE, Yager P. Cell lysis and proteinextraction in a microfluidic device with detection by afluorogenic enzyme assay. Anal Chem 2002;74:1798–1804.
110. Soughayer JS, et al. Characterization of cellular optopora-tion with distance. Anal Chem 2000;72:1342–1347.
111. Lee SW, Tai YC. A micro cell lysis device. Sens ActuatorsA-Phys 1999;73:74–79.
112. Heo J, Thomas KJ, Seong GH, Crooks RM. A microfluidicbioreactor based on hydrogel-entrapped E. coli: Cell viabi-lity, lysis, and intracellular enzyme reactions. Anal Chem2003;75:22–26.
113. Waters LC, et al. Microchip device for cell lysis, multiplexPCR amplification, and electrophoretic sizing. Anal Chem1998;70:158–162.
114. Huang Y, et al. Electric manipulation of bioparticles andmacromolecules on microfabricated electrodes. Anal Chem2001;73:1549–1559.
115. Leitz G, Weber G, Seeger S, Greulich KO. The lasermicrobeam trap as an optical tool for living cells. PhysiolChem Phys Med Nmr 1994;26:69–88.
116. Hogman CF. Preparation and preservation of red cells. VoxSang 1998;74:177–187.
117. Bauer J. Advances in cell separation: Recent developmentsin counterflow centrifugal elutriation and continuous flowcell separation. J Chromatogr B 1999;722:55–69.
118. Cheng J, Kricka LJ, Sheldon EL, Wilding P. Sample pre-paration in microstructured devices, microsystem techno-logy in chemistry and life science. Top Curr Chem 1998;215–231.
119. Fu AY, et al. A microfabricated fluorescence-activated cellsorter. Nat Biotechnol 1999;17:1109–1111.
120. Rathman M, et al. The development of a FACS-based strat-egy for the isolation of Shigella flexneri mutants that aredeficient in intercellular spread. Mol Microbiol2000;35:974–990.
121. Handgretinger R, et al. Isolation and transplantation ofautologous peripheral CD34(þ) progenitor cells highly pur-ified by magnetic-activated cell sorting. Bone MarrowTransplant 1998;21:987–993.
122. Volkmuth WD, Austin RH. DNA electrophoresis in micro-lithographic arrays. Nature(London) 1992;358:600–602.
123. Li PCH, Harrison DJ. Transport, manipulation, and reac-tion of biological cells on-chip using electrokinetic effects.Anal Chem 1997;69:1564–1568.
124. Wang XB, et al. Cell separation by dielectrophoretic field-flow-fractionation. Anal Chem 2000;72:832–839.
125. Cho BS, et al. Passively driven integrated microfluidicsystem for separation of motile sperm. Anal Chem2003;75: 1671–1675.
126. Horsman KM, et al. Separation of sperm and epithelial cellsin a microfabricated device: Potential application to forensicanalysis of sexual assault evidence. Anal Chem 2005;77:742–749.
127. Chou CF, et al. Electrodeless dielectrophoresis of single- anddouble-stranded DNA. Biophys J 2002;83:2170–2179.
128. Shevkoplyas SS, Yoshida T, Munn LL, Bitensky MW. Bio-mimetic autoseparation of leukocytes from whole blood in amicrofluidic device. Anal Chem 2005;77:933–937.
129. Petersson F, et al. Continuous separation of lipid particlesfrom erythrocytes by means of laminar flow and acousticstanding wave forces. Lab Chip 2005;5:20–22.
130. Minc N, Viovy JL. Microfluidics and biological applications:the stakes and trends. C R Phys 2004;5:565–575.
131. Huh D, et al. Microfluidics for flow cytometric analysis ofcells and particles. Physiol Meas 2005;26:R1–R26.
132. Zhao B, Viernes NOL, Moore JS, Beebe DJ. Control andapplications of immiscible liquids in microchannels. J AmChem Soc 2002;124:5284–5285.
133. Hisamoto H, et al. Chemicofunctional membrane for inte-grated chemical processes on a microchip. Anal Chem 2003;75:350–354.
134. Kawabata T, Washizu M. Dielectrophoretic detection of mole-cular bindings. IEEE Trans Ind Appl 2001;37:1625–1633.
135. Wu XZ, Suzuki M, Sawada T, Kitamori T. Chemilumines-cence on a microchip. Anal Sci 2000;16:321–323.
136. Roda A, et al. Biotechnological applications of biolumines-cence and chemiluminescence. Trends Biotech 2004;22:295–303.
137. Johnson ME, Landers JP. Fundamentals and practice forultrasensitive laser-induced fluorescence detection inmicroanalytical systems. Electrophoresis 2004;25:3513–3527.
138. Mogensen KB, Klank H, Kutter JP. Recent developments indetection for microfluidic systems. Electrophoresis 2004;25:3498–3512.
139. Xu H, et al. A real-time ratiometric method for the deter-mination of molecular oxygen inside living cells using sol-gel-based spherical optical nanosensors with applications torat C6 glioma. Anal Chem 2001;73:4124–4133.
140. Wolfbeis OS. Fiber-optic chemical sensors and biosensors.Anal Chem 2002;74:2663–2677.
141. Chang-Yen DA, Gale BK. An integrated optical oxygensensor fabricated using rapid-prototyping techniques. LabChip 2003;3:297–301.
142. Vandaveer WR, et al. Recent developments in electroche-mical detection for microchip capillary electrophoresis. Elec-trophoresis 2004;25:3528–3549.
143. Bakker E, Telting-Diaz M. Electrochemical sensors. AnalChem 2002;74:2781–2800.
144. Walther I, et al. Development of a miniature bioreactor forcontinuous-culture in a space laboratory. J Biotechnol1994;38:21–32.
145. Yoon HJ, et al. Solid-state ion sensors with a liquidjunction-free polymer membrane-based reference elec-trode for blood analysis. Sens Actuators B-Chem 2000;64:8–14.
146. Johannessen EA, et al. Micromachined nanocalorimetricsensor for ultra-low-volume cell-based assays. Anal Chem2002;74:2190–2197.
147. Li PCH, Wang WJ, Parameswaran M. An acoustic wavesensor incorporated with a microfluidic chip for analyzingmuscle cell contraction. Analyst 2003;128:225–231.
148. Kurita R, et al. Differential measurement with a microflui-dic device for the highly selective continuous measurementof histamine released from rat basophilic leukemia cells(RBL-2H3). Lab Chip 2002;2:34–38.
398 MICROBIOREACTORS

149. Matsubara Y, et al. Application of on-chip cell cultures forthe detection of allergic response. Biosens Bioelectron2004;19: 741–747.
150. Daunert S, et al. Genetically engineered whale-cell sensingsystems: Coupling biological recognition with reportergenes. Chem Rev 2000;100:2705–2738.
151. Wu XZ, et al. Immunofluorescent labeling of cancer markerher2 and other cellular targets with semiconductor quan-tum dots. Nat Biotechnol 2003;21:41–46.
152. Parak WJ, Pellegrino T, Plank C. Labelling of cells withquantum dots. Nanotechnology 2005;16:R9–R25.
153. Cui Y, Wei QQ, Park HK, Lieber CM. Nanowire nanosensorsfor highly sensitive and selective detection of biological andchemical species. Science 2001;293:1289–1292.
154. Chou SY, Krauss PR, Renstrom PJ. Imprint lithographywith 25-nanometer resolution. Science 1996;272:85–87.
155. Raiteri R, Grattarola M, Butt HJ, Skladal P. Micromecha-nical cantilever-based biosensors. Sens Actuators B-Chem2001;79:115–126.
156. Moriguchi H, et al. An agar-microchamber cell-cultivationsystem:flexible change of microchamber shapes during culti-vation by photo-thermal etching. Lab Chip 2002;2:125–130.
157. Burns MA, et al. An integrated nanoliter DNA analysisdevice. Science 1998;282:484–487.
158. Hansen CL, Skordalakes E, Berger JM, Quake SR. A robustand scalable microfluidic metering method that allows pro-tein crystal growth by free interface diffusion. Proc NatlAcad Sci USA 2002;99:16531–16536.
159. Chou HP, Spence C, Scherer A, Quake S. A microfabricateddevice for sizing and sorting DNA molecules. Proc Natl AcadSci USA 1999;96:11–13.
160. DeBusschere BD, Kovacs GTA. Portable cell-based biosen-sor system using integrated CMOS cell-cartridges. BiosensBioelectron 2001;16:543–556.
161. Erickson D, Li DQ. Integrated microfluidic devices. AnalChim Acta 2004;507:11–26.
162. Shito M, et al. In vitro and in vivo evaluation of albuminsynthesis rate of porcine hepatocytes in a flat-plate bior-eactor. Artif Organs 2001;25:571–578.
163. Tilles AW, et al. Effects of oxygenation and flow on theviability and function of rat hepatocytes cocultured in amicrochannel flat-plate bioreactor. Biotechnol Bioeng2001;73:379–389.
164. Nyberg SL, et al. Primary hepatocytes outperform Hep G2cells as the source of biotransformation functions in abioartificial liver. Ann Surg 1994;220:59–67.
165. Powers MJ, et al. Functional behavior of primary rat livercells in a three-dimensional perfused microarray bioreactor.Tissue Eng 2002;8:499–513.
166. Bader A, et al. Development of a small-scale bioreactor fordrug metabolism studies maintaining hepatospecific func-tions. Xenobiotica 1998;28:815–825.
167. Allen JW, Bhatia SN. Improving the next generation ofbioartificial liver devices. Semin Cell Dev Biol 2002;13:447–454.
168. Ghanem A, Shuler ML. Combining cell culture analoguereactor designs and PBPK models to probe mechanisms ofnaphthalene toxicity. Biotechnol Prog 2000;16:334–345.
169. Ghanem A, Shuler ML. Characterization of a perfusionreactor utilizing mammalian cells on microcarrier beads.Biotechnol Prog 2000;16:471–479.
170. Park TH, Shuler ML. Integration of cell culture and micro-fabrication technology. Biotechnol Prog 2003;19:243–253.
171. Viravaidya K, Shuler ML. Incorporation of 3T3-L1 cells tomimic bioaccumulation in a microscale cell culture analogdevice for toxicity studies. Biotechnol Prog 2004;20:590–597.
172. Kruip TAM, Bevers MM, Kemp B. Environment of oocyteand embryo determines health of IVP offspring. Theriogen-ology 2000;53:611–618.
173. Bavister BD. Interactions between embryos and the culturemilieu. Theriogenology 2000;53:619–626.
174. Fukui Y, Lee ES, Araki N. Effect of medium renewal duringculture in two different culture systems on development toblastocysts from in vitro produced early bovine embryos. JAnim Sci 1996;74:2752–2758.
175. Beebe D, et al. Microfluidic technology for assisted repro-duction. Theriogenology 2002;57:125–135.
176. Glasgow IK, et al. Handling individual mammalian embryosusing microfluidics, IEEE Trans Biomed Eng 2001;48:570–578.
177. Zeringue HC, Wheeler MB, Beebe DJ. Zona pellucidaremoval of mammalian embryos in a microfluidic systems.Micro Total Analysis Syst 2000; 214–217.
178. Zeringue HC, Beebe DJ, Wheeler MB. Removal of cumulusfrom mammalian zygotes using microfluidic techniques.Biomed Microdevices 2001;3:219–224.
179. Hickman DL, Beebe DJ, Rodriguez-Zas SL, Wheeler MB.Comparison of static and dynamic medium environmentsfor culturing of pre-implantation mouse embryos. Compara-tive Med 2002;52:122–126.
180. Suh RS, et al. Rethinking gamete/embryo isolation andculture with microfluidics. Hum Reprod Update2003;9:451–461.
181. Korbutt GS, et al. Improved survival of microencapsulatedislets during in vitro culture and enhanced metabolic func-tion following transplantation. Diabetologia 2004;47:1810–1818.
182. Vallbacka JJ, Nobrega JN, Sefton MV. Tissue engineeringas a platform for controlled release of therapeutic agents:implantation of microencapsulated dopamine producingcells in the brains of rats. J Control Release 2001;72:93–100.
183. Takenaga M, et al. A single treatment with microcapsulescontaining a CXCR4 antagonist suppresses pulmonarymetastasis of murine melanoma. Biochem Biophys ResCommun 2004;320:226–232.
184. Yu BL, Chang TMS. Effects of long-term oral administra-tion of polymeric microcapsules containing tyrosinase onmaintaining decreased systemic tyrosine levels in rats. JPharm Sci 2004;93:831–837.
185. AlHendy A, Hortelano G, Tannenbaum GS, Chang PL.Growth retardation—an unexpected outcome from growthhormone gene therapy in normal mice with microencapsu-lated myoblasts. Hum Gene Ther 1996;7:61–70.
186. Zilberman Y, et al. Polymer-encapsulated engineered adultmesenchymal stem cells secrete exogenously regulatedrhBMP-2, and induce osteogenic and angiogenic tissue for-mation. Polym Adv Technol 2002;13:863–870.
187. Cirone P, Bourgeois JM, Austin RC, Chang PL. Anovel approach to tumor suppression with microencapsu-lated recombinant cells. Hum Gene Ther 2002;13:1157–1166.
188. Hortelano G, Wang L, Xu N, Ofosu FA. Sustained andtherapeutic delivery of factor IX in nude haemophilia Bmice by encapsulated C2C12 myoblasts: Concurrenttumourigenesis. Haemophilia 2001;7:207–214.
189. Chen JP, et al. Microencapsulation of islets in PEG-aminemodified alginate-poly(L-lysine)-alginate microcapsules forconstructing bioartificial pancreas. J Ferment Bioeng1998;86:185–190.
190. Xue YL, et al. Pain relief by xenograft of subarachnoidmicroencapsulated bovine chromaffin cells in cancerpatients. Prog Nat Sci 2000;10:919–924.
MICROBIOREACTORS 399

191. Cole DR, et al. Transplantation of microcapsules (a potentialbioartificial organ)—biocompatibility and host-reaction. JMater Sci-Mater Med 1993;4:437–442.
192. Lou WH, Qin XY, Wu ZG. Preliminary research on biocom-patibility of alginate-chitosan-polyethyleneglycol microcap-sules. Minerva Biotecnol 2000;12:235–240.
193. Van Raamsdonk JM, Cornelius RM, Brash JL, Chang PL.Deterioration of polyamino acid-coated alginate microcap-sules in vivo. J Biomater Sci-Polym Ed 2002;13:863–884.
194. Sakai S, Ono T, Ijima H, Kawakami K. Behavior of enclosedsol- and gel-alginates in vivo. Biochem Eng J 2004;22:19–24.
195. Koch S, et al. Alginate encapsulation of genetically engi-neered mammalian cells:comparison of production devices,methods and microcapsule characteristics. J Microencapsul2003;20:303–316.
196. Arica B, et al. Carbidopa/levodopa-loaded biodegradablemicrospheres:in vivo evaluation on experimental Parkin-sonism in rats. J Control Release 2005;102:689–697.
197. Leblond FA, et al. Studies on smaller (similar to 315 (mM)microcapsules: IV. Feasibility and safety of intrahepaticimplantations of small alginate poly-L-lysine microcap-sules. Cell Transplant 1999;8:327–337.
198. Chang TMS, Prakash S. Therapeutic uses of microencapsu-lated genetically engineered cells. Mol Med Today 1998;4:221–227.
199. Jeon NL, et al. Whitesides GM. Generation of solution andsurface gradients using microfluidic systems. Langmuir2000;16:8311–8316.
200. Sprague EA, Steinbach BL, Nerem RM, Schwartz CJ. Influ-ence of a laminar steady-state fluid-imposed wall shear-stress on the binding, internalization, and degradation oflow-density lipoproteins by cultured arterial endothelium.Circulation 1987;76:648–656.
201. Diamond SL, Eskin SG, McIntire LV. Fluid-flow stimulatestissue plasminogen-activator secretion by cultured human-endothelial cells. Science 1989;243:1483–1485.
202. Levesque MJ, Sprague EA, Schwartz CJ, Nerem RM. Theinfluence of shear-stress on cultured vascular endothelial-cells—the stress response of an anchorage-dependent mam-malian-cell. Biotechnol Prog 1989;5:1–8.
203. Gomes N, et al. Shear stress modulates tumour cell adhe-sion to the endothelium. Biorheology 2003;40:41–45.
204. Davies PF, Tripathi SC. Mechanical-stress mechanisms andthe cell—an endothelial paradigm. Circ Res 1993;72:239–245.
205. Ikeda M, et al. Extracellular signal-regulated kinases 1and 2 activation in endothelial cells exposed to cyclicstrain. Am J Physiol-Heart Circul Physiol 1999;276:H614–H622.
206. Smith PG, Roy C, Zhang YN, Chauduri S. Mechanical stressincreases RhoA activation in airway smooth muscle cells.Am J Respir Cell Mol Bio 2003;28:436–442.
207. Lee T, Kim SJ, Sumpio BE. Role of PP2A in the regulationof p38-MAPK activation in bovine aortic endothelialcells exposed to cyclic strain. J Cell Physiol 2003;194:349–355.
208. Han O, Takei T, Basson M, Sumpio BE. Translocation ofPKC isoforms in bovine aortic smooth muscle cells exposedto strain. J Cell Biochem 2001;80:367–372.
209. Shelby JP, et al. A microfluidic model for single-cell capil-lary obstruction by Plasmodium falciparum infected ery-throcytes. Proc Natl Acad Sci USA 2003;100:14618–14622.
See also MICROARRAYS; MICROFLUIDICS; NANOPARTICLES; TISSUE ENGI-
NEERING.
MICRODIALYSIS SAMPLING
JULIE A. STENKEN
Rensselaer Polytechnic InstituteTroy, New York
MICRODIALYSIS SAMPLING: NON-SPECIALIST VIEW
Microdialysis sampling devices are minimally invasiveminiature dialyzers that can be implanted into a distincttissue region to obtain a chemical snapshot over an inte-grated time period. In combination with appropriate che-mical detection methods for the targeted substances, amicrodialysis sampling device may be considered to be auniversal biosensor. Obtaining chemical information fromdifferent tissues can often lead to either a greater under-standing of the underlying chemistry involved with thephysiological function of the organ or the origin of a parti-cular disease process. A simplified view of the microdialysissampling device is shown in Fig. 1. The central part of themicrodialysis sampling device is a single semipermeablehollow fiber membrane with dimensions that rangebetween 200 and 500 mm for its external diameter and 1and 30 mm in length. A perfusion solution is passedthrough the device at microliter per minute flow rates.Compounds diffuse from the tissue space into the dialysisprobe and are carried to an outlet to undergo chemicalanalysis. Originally microdialysis sampling was developedto obtain real-time chemical information from rodent brainand was termed intracranial dialysis. Microdialysis sam-pling has now been applied for chemical collection fromnearly every single organ. In addition to neurotransmittercollection, the device has been used for endocrinology,immunology, metabolism, and pharmacokinetic applica-tions as shown in Table 1. The biomedical literature cites
400 MICRODIALYSIS SAMPLING
~ 0.5 to 2 µl/min A
AAA
AA
A
PERFUSATE DIALYSATE
APAP
AP
A AAP APAP
P PP
P
o.d. 200-500microns
Length 1–30 mm
[A]outlet
BloodVessel
A
Figure 1. Microdialysis sampling process. A perfusion fluid thatclosely matches the ionic strength and composition of the fluidexternal to the microdialysis membrane is passed through at flowrates between 0.5 and 2.0 mL�min�1. Analytes, A, that are notprotein bound, AP, diffuse through the extracellular fluid space(wavy lines) and can pass through the pores of the semipermeablemembrane are collected into the device. The analyte outletconcentration [A]outlet can then be quantified using a suitabledetection method.

thousands of research articles that have used microdialysissampling devices to study many different basic and clinicalresearch problems with perhaps 90% or greater of theseapplications focused in neuroscience. As more life scientistsrealize that microdialysis sampling devices exist, thisdevice will be used more often to solve many additionalclinical problems outside of the neurosciences.
INTRODUCTION
Mammalian organs are highly complex systems thatachieve their functions through a multifaceted chemicalcommunication network. For laboratory studies focused onunderstanding these chemical networks, the organ is oftenbroken down into its component parts (cells, subcellularcomponents, extracellular matrix components, etc.) to cre-ate more controlled conditions. These types of studies haveallowed for a great understanding of the individual com-ponent parts, but do not address how the chemical com-munication may occur within the intact organ. Commondiagnostic collection methods, such as blood or urine sam-pling, are too far removed from organs to be able to providedesired information about localized organ biochemistry.Gaining chemical information from an organ system priorto the creation of microdialysis sampling devices requiredeither organ dissection or noninvasive analysis methods.Removing organs to access chemical content is fraughtwith many concerns including the preparation of the sam-ple that involves in most cases sacrifice of the animal (or abiopsy for humans) as well as concerns about chemicalstability and loss during the sample preparation process.For nearly all organs, the changes in localized tissuechemistry caused during sacrifice may severely altersome chemical communication systems. Finally, organdissection does not allow for temporal studies of targetedanalytes.
An increasing number of medical devices and instru-ments are becoming available to noninvasively measure invivo chemical composition at spatially defined sites. Non-invasive measurements typically use spectroscopic instru-ments that are highly analyte specific. In particular, themost well-known medical devices for achieving these tasks
are positron emission tomography (PET) and magneticresonance imaging (MRI). Positron emission tomographyscanning requires production of special isotopes (11C, 13N,15O, 18F) with limited half-lives. Similarly, MRI uses 1H tocreate an image and is a useful imaging technique becausethe concentration of hydrogen nuclei in water and fat isroughly 100 M (mol�/L�1). Magnetic resonance spectro-scopy (MRS) can be used to noninvasively detect otherisotopes (1H, 13C, 15N, 19F, 31P), but requires very highconcentrations of these nuclei for detection. Fluorescenceimaging has also been used for noninvasive measurementsin conjunction with near-infrared (IR) tags or with enzymesubstrates that become fluorescent when cleaved (1–3).While these spectroscopic techniques hold significant pro-mise for some areas of clinical medicine (cardiovascularand oncology), they are quite limited with respect to therange of analytes that can be detected and thus potentialapplications. While not noninvasive, minimally invasivemicrodialysis sampling devices coupled with appropriatedialysate analytical detection methods allow for measure-ments of localized tissue chemistry with significantlygreater analyte flexibility and spatial resolution.
Microdialysis sampling originated as an alternative topush–pull perfusion devices for use in mammalian brain.Push–pull perfusion devices were used to collect fluidrelevant to synaptic transmission (4). During a push–pullperfusion, a solution that closely matches the ionic chemi-cal composition of the extracellular fluid (ECF) is loadedinto a syringe and this is gently infused into the implanta-tion site. This perfusion fluid mixes with the existing ECFand then is pulled back into the device. The analysis ofpush–pull samples became a useful tool for tracking neu-rotransmitter activities coupled with allowing for aremarkable understanding of the underlying chemicalevents associated with a wide variety of behavioral andphysiological stimuli. Insertion of push–pull cannula couldpotentially cause tissue damage or lesions, which raisedmany concerns among researchers since this type ofdamage could limit the usefulness of the neurochemicaldata collected. In other words, researchers were oftenconcerned that sampling was really taking place in a ‘‘lake’’of fluid that may not contain the representative chemicalcomponents of the extracellular fluid space.
The push–pull sampling method was principally appliedto neurochemical sampling. For other tissues, other extra-cellular fluid sampling methods have been described.These other methods include open-flow microperfusionand wick methods. Both of these methods have been usedin muscle, as well as dermal sampling. Additionally, blistermethods are common for obtaining interstitial fluid fromthe skin. Open-flow microperfusion is similar to push–pullperfusion. A cannula device contains an inner tube and anouter tube with open pores (typically �500 mm) is placedover this inner tube. A peristaltic pump then simulta-neously delivers and withdraws fluid through the device(5). Open-flow microperfusion has primarily been used forsampling the extracellular fluid in muscle and skin. Alter-natives to perfusion methods are wick methods, which usenylon wicks to sample the extracellular fluid space inanimals and humans (6–8). To obtain multiple samplesover a specified time period would require insertion and
MICRODIALYSIS SAMPLING 401
Table 1. Typical Microdialysis Sampling Uses
Collection of endogenous analytes from brain including neuro-transmitters (dopamine, norepinephrine, serotonin, glutamate,GABAa, glucose, peptides and proteins (cytokines).
Collection of endogenous small hydrophilic analytes from othertissues (e.g., glucose for diabetics).
Collection of peptides and proteins from perphiral tissues, forexample, glutathione, neuropeptides, and different cytokinesand growth factors (e.g., VEGF).
Collection of xenobiotic analytes for pharmacokinetic or phar-macodynamic studies from numerous tissue sites (brain, dermis,muscle, and tumors) in both animals and humans.
Localized delivery of analytes followed by concomitant recovery ofendogenous analytes or metabolized products (e.g., spin traps,metabolites).
aGABA ¼ r-aminobutyric acid
removal of individual wick devices. This repeated insertionand removal might cause additional trauma to the sam-pling site.
To overcome the tissue damage concerns associatedwith push–pull perfusion for neuroscience applications,the use of semipermeable dialysis membranes at the tipsof the push–pull cannula were used (9,10). These originaldialysis bags eventually led to flow-through microdialysisprobes introduced by Pycock and Ungerstedt in 1974 (11).The advantage of microdialysis sampling over the push–pull cannula is that fluid is not pushed into sensitive braintissue. Unlike a push–pull perfusion, microdialysis sam-pling is a continuous process that provides a samplethat excludes many of the components from the ECF. Thisexclusion process serves to provide a relatively cleansample for chemical analysis. Today, this technique hasbeen widely used by life scientists to attain site-specificaccess to numerous tissue sites to study and solve manyproblems, which include, but are not limited to the fol-lowing applications: (1) To elucidate the role of differentneurotransmitters and neuropeptides in specificallydefined brain regions; (2) To collect glucose continuouslyover many days to give a better chemical picture to diabetesspecialists to determine the efficacy of an insulin regimenfor individual patients; (3) To collect energy metabolites(glucose, lactate, pyruvate) as well as administered drugs(morphine) to understand diseased energy metabolism andblood-brain barrier transport from head trauma patients;(4) To determine if an efficacious drug concentration isreaching a specific infection site or diseased tissue sites forantineoplastic therapy or antimicrobial therapy; (5) Todetermine pharmacokinetic parameters in single animals;(6) To determine metabolite formation and accumulation invarious tissues after a drug dose in a single animal overtime; (7) To determine the extent of drug blood–brainbarrier permeation of new drugs in animal models; (8)To collect various endogenous peptides and proteins(e.g., cytokines and growth factors) from different periph-eral sites in animals and humans (12).
To newcomers to this device, the principles of micro-dialysis sampling operation at first seem deceptively sim-ple. At the most basic level, the microdialysis samplingdevice may be considered to behave as an artificiallyimplanted blood vessel that allows free analyte diffusioninto the inner fiber lumen. However, as will be discussed inthis article, numerous considerations that involve both anunderstanding of the localized biology and physiology, aswell as the underlying mass transport processes are essen-tial to microdialysis sampling data interpretation.
MICRODIALYSIS SAMPLING PRINCIPLES OF OPERATION
In principle, as long as the microdialysis probe can beimplanted, it can be used for sampling localized tissuebiochemistry. Microdialysis sampling requires only a fewpieces of equipment. This equipment is not cost-prohibi-tive, which is the reason that many different researcherscan perform microdialysis sampling experiments in theirown laboratories. For most experiments, the necessaryequipment includes a perfusion pump to deliver the perfu-
sion fluid and a microdialysis probe. In addition to thepump and probe, for animal studies, a device to hold eitheran anesthetized animal (e.g., stereotaxic unit for neu-roscience procedures) or a bowl with appropriate swivelsto prevent tangled tubing for freely moving animals may benecessary.
Microdialysis Sampling Instrumentation Components
The basic components needed to perform microdialysissampling experiments in an awake-freely moving animalshas been described (13). The components required for thistype of experiment includes the microperfusion pump, aninlet and outlet fluid swivel that prevents the fluid linesfrom becoming tangled, and a bowl system to allow theanimal to freely move. Additional components can includerefrigerated fraction collectors to allow collection and sto-rage of sensitive samples. Microperfusion pumps used todeliver the perfusion fluid through the microdialysis probeare capable of delivering volumetric flow rates between 0.1and 20 mL�min�1. Flow rates between 0.5 and 2.0 mL�min�1
are commonly used during most microdialysis samplingexperiments.
Microdialysis sampling perfusion fluids are chosen toclosely match the ionic strength and composition of theexternal tissue extracellular fluid surrounding the micro-dialysis probe. Perfusion fluids passed through microdia-lysis sampling probes are a form Ringer’s solution forwhich there are numerous published chemical composi-tions (14,15). Typical Ringer’s solutions contain �150 mMNaCl, 4 mM KCl, and 2.4 mM CaCl2 and can also besupplemented with glucose and other ionic salts (MgCl2).These solutions are used both to maintain fluid balance, aswell as ion balance across the dialysis membrane. Main-taining fluid balance across the dialysis membrane isimportant so that large osmotic pressures are not created.Significant osmotic pressure differences will cause fluid tobe gained or lost during microdialysis sampling (16). Fluidloss is often undesirable for analytical as well as biologicalreasons. From an analytical perspective, oftentimes theanalysis requires a set volume. For example, a liquidchromatographic analysis may require 10 mL of sampleand a standard enzyme-linked immunosorbent assay(ELISA) may require 100 mL of sample. From a biologicalperspective, fluid loss can be undesirable in some tissuesthat are particularly sensitive, such as the brain. Further-more, brain tissue is also highly sensitive to ionic concen-tration alterations since such changes can alterneurotransmitter release (17). By maintaining an osmoticbalance, the fundamental mass transport mechanism formoving an analyte from the extracellular fluid space (ECF)to the dialysate lumen is principally diffusion.
Probe Geometry
Microdialysis sampling is typically considered to be synon-ymous with the term intracranial dialysis samplingbecause of its neuroscience origins. The first intracranialdialysis device was a linear design that traversed long-itudinally through different brain regions. A variety ofdifferent probe designs have been described in many dif-ferent review articles (18–20). Microdialysis probe design
402 MICRODIALYSIS SAMPLING

has evolved to allow use of the device for biomedicalapplications beyond neuroscience. Linear geometry micro-dialysis sampling devices for neuroscience were not asuseful as the push–pull cannula that could be inserted intoknown brain regions (e.g., striatum, hippocampus, sub-stantia nigra) based on known stereotaxic coordinates thatin some cases are < 1 mm wide in rat brain. To overcomethis challenge for neurochemistry studies, more rigid can-nula designs were created that can be inserted into specificbrain regions and are now commercially available from avariety of sources (21).
As microdialysis sampling devices became a standardtool used by neuroscientists, researchers in other fieldsbegan to realize its great in vivo analysis potential. Prin-cipally, the use of the probes for collection of endogenous orxenobiotic components in blood and peripheral tissuesbecame of interest (22). In these tissues, a rigid stainlesssteel cannula causes tissue damage and may make awakeand freely moving experiments with animals quite diffi-cult. Cannula designs using Teflon or fused silica arecommonly used for to make flexible probes for either sam-pling in soft peripheral tissues (e.g., skin or liver) or forblood sampling. Linear probe designs have also been rein-troduced after originally being applied to brain studies andare now used for insertion into soft peripheral tissues. Anadditional advantage of these flexible designs is they alsoallow for studies in awake and freely moving animals inperipheral tissues. Recent research interests in transgenicmice have forced the creation of smaller microdialysissampling devices (23).
Probe Materials
Semipermeable hollow fiber membranes used for micro-dialysis sampling are the same as those used for kidneydialysis. Different polymeric semipermeable membraneshave been used in microdialysis sampling probes and arelisted in Table 2. Typical materials include cellulose-basedmembranes (cuprophan or cellulose acetate), polycarbo-nate/polyether blends, polyacrylonitrile, and polyethersul-fone. These membranes span a wide range of molecularweight cutoffs (MWCO) from 5000 to 100,000 Da. Choice ofthe membrane to be used during microdialysis samplingrequires both analyte molecular weight information, aswell as where the probe will be implanted as some tissue
regions (particularly in the brain) are too narrow for > 500mm external diameter membranes.
Semipermeable hollow fiber dialysis membranes can beobtained with a known molecular weight cut off (MWCO).The MWCO can be experimentally determined for a hollowfiber using several different experimental methods. Theprimary method used to determine MWCO for hollow fibermembranes is to continuously pass through the fiberlumen over a long period of time (24 h or greater) a solutioncontaining known molecular weight markers. Knownsolutes that are rejected by the membrane are then usedto calculate membrane MWCO. In practice, the MWCO isreally not an absolute number, but rather the median of arange. This molecular weight rejection range is highlydependent on the semipermeable membrane materialspore distribution and can exhibit either a narrow or broadMWCO range (24).
Originally, the purpose of microdialysis sampling was touse the dialysis membrane as a means to provide a samplefor chemical analysis that did not require further samplepreparation steps such as protein removal. Intracranicaldialysis applications typically target hydrophilic analyteswith molecular weights < 500 Da. For these applications,dialysis membranes with low MWCO of � 5000–6000 Dawere commonly used to reject larger analytes and proteinsso to allow liquid chromatographic analysis withoutfurther sample purification.
Recently, there has been a greater interest of applyingmicrodialysis sampling to collect peptides and proteins.There have only been a few reports describing the use ofdifferent types of dialysis membranes towards the collec-tion of large molecules, such as peptides and proteins (25).This is unfortunate as the types of commercially availablemembranes that are capable of providing the performancecharacteristics necessary for protein collection are rela-tively few. Kendrick extensively compared the recoveryperformance of different amino acids and peptides amongdifferent types of dialysis membranes (26). Torto et al.compared the dialysis collection efficiency for a series ofsaccharides [glucose (DP1), maltose (DP2), though mal-toheptaose (D7)] among many different types of dialysismembranes (polyamide, polyethersulfone, and polysul-fone) as well as different MWCO between 6 and 100kDa (27). In some cases, membranes with similar MWCOand different chemistry exhibited similar recovery values.Whereas, some of the polysulfone membranes with 100kDa MWCO exhibited quite low recovery for these lowmolecular weight analytes when compared to membraneswith similar chemistry, but lower MWCO.
A set of model proteins including insulin (5.7 kDa),cytochrome c (12.4 kDa), ribonuclease A (13.7 kDa), lyso-zyme (14.4 kDa), and human serum albumin (67 kDa)were tested with different polymeric membranes andmolecular weight cutoffs ranging between 20 and 150kDa (28). All the membranes had similar external dia-meters (500 mm). Among the different membranes, onlythe polyethersulfone (100 kDa MWCO) commerciallyavailable from CMA Microdialysis, Inc and a Freseniuspolysulfone membrane (150 kDa MWCO) exhibited simi-lar recovery characteristics for the above-mentioned set ofmodel proteins.
MICRODIALYSIS SAMPLING 403
Table 2. Commercially Available Microdialysis MembraneDimensionsa
PC PES PAN CUP
Outer radius, mm 250 250 170 120Inner radius, mm 200 205 120 95Wall thickness, mm 50 45 50 25Molecular weight cutoff 20,000 100,000 29,000 6,000Outer surface area, mm2 6.28 6.28 4.27 3.01
aThe data provided here is that given by the manufacturers of the micro-
dialysis probes. It is not known if the radii are for dry or wet membranes.
The abbreviations are as follows: PC ¼ polyether/polycarbonate, PES ¼polyethersulfone, PAN ¼ polyacrylonitrile (or AN-69), CUP ¼ cuprophan.
CMA Microdialysis, Inc sells PC, PES, and CUP membranes. Bioanalytical
Systems, Inc sells PAN membrane probes.

Membrane MWCO cannot be used as a means to spe-cifically predict how well an analyte will be recoveredduring a microdialysis sampling procedures. New micro-dialysis sampling practitioners sometimes mistakenlybelieve that analytes near the membrane MWCO will berecovered. Although a membrane with 100 kDa MWCOallows some transport of molecules of this molecularweight, the recovery of an analyte of this size will besignificantly < 1% (if at all) of the external sample con-centration during microdialysis sampling. Dialysate ana-lyte concentrations rarely reach equilibrium with theexternal sample concentrations except under unique con-ditions (very low flow rates and long membranes). Fordialysate concentrations to reach those of the tissue med-ium surrounding the probe and thus approach equilibriumwith the surrounding tissue concentrations, low perfusionfluid flow rates or long membranes are required in order toachieve residence times sufficient to obtain equilibration.During microdialysis sampling, the perfusion fluid onlypasses once through the inner membrane lumen withresidence times on the order of seconds. Since this is incontrast to the methods used to obtain membrane MWCO,it is not surprising that sampled analyte molecular weightrange is reduced due to the perfusion fluid making only onepass through the device. In general, the analyte molecularweight that easily passes through the membrane with 10%or greater recovery is roughly one tenth of the MWCO asshown in Fig. 2 (29). However, this is not an absolute valueand different analytes have been reported to be difficult todialyze across particular membranes. With rare exception(30), hydrophobic analytes typically are poorly dialyzedduring microdialysis sampling (31,32). Furthermore, AN-69 membranes (polyacrylonitrile), which are sometimesused for kidney dialysis and have been used for in-housemicrodialysis probes, carry a negative charge that maycause rejection of certain negatively charged analytes(33,34).
Microdialysis sampling requires an inlet and outlet tubeto be attached to the membrane. The length and innerdiameter of the outlet tube attached to the membrane
affects membrane backpressure. For some hollow fibermembranes, convective fluid loss (ultrafiltration) across
Jv ¼ PðDp � DpÞ=l (1)
these hollow fiber semipermeable membranes is possibleand the extent of this ultrafiltration is related to thevolumetric flux (Jv) shown in Eq. 1, where P is the perme-ability coefficient for the membrane, l is the length acrossthe membrane (e.g., the membrane thickness), and Dp andDp the hydrostatic and osmotic pressure differences (35).Different membranes have difference permeability coeffi-cients. The physical manifestation of this fluid loss is thatthe probe appears as if it is sweating during the dialysisprocedure and is often observed with larger MWCO mem-branes.
Peptides and proteins diffuse very slowly across thesmall pores of membranes with MWCO between 5000and 30,000 Da. To improve the relative recovery of theseanalytes, larger 100 kDa dialysis membranes have becomecommercially available. The disadvantage of these largerMWCO membranes is that they often exhibit ultrafiltra-tion due to their larger pore sizes. Ultrafiltration fluidlosses across 100 kDa or larger MWCO dialysis membranesshould be determined prior to in vivo experiments. Inparticular, the ultrafiltration is exacerbated by the useof long outlet tubing with narrow diameter (a commonneed with awake and freely moving animal experiments).Osmotic balancing agents, such as dextrans or albumin,are commonly added to microdialysis perfusion fluidspassed through 100 kDa or larger MWCO membranes toprevent excessive ultrafiltration as well as to prevent non-specific adsorption on the device materials (36,37). Whilethese agents are passed through the membrane, theirpotential loss to the surrounding tissue space has not beenreported.
Recovery, Delivery, and Localized Infusion
Sensor devices are highly specific analytical detectors andcan only be used to detect analytes that physically contact
404 MICRODIALYSIS SAMPLING
0 200 400 600 800 1000 1200 14000.1
1
10
100
PC Membrane
Molecular Weight
Rel
ativ
e R
ecov
ery
%
0 200 400 600 800 1000 1200 14000.1
1
10
100
Molecular Weight
Rel
ativ
e R
ecov
ery
%
0 200 400 600 800 1000 1200 14000.1
1
10
100
Molecular Weight
Rel
ativ
e R
ecov
ery
%
PAN Membrane CUP Membrane
Figure 2. Semilog graph of relative recovery versus molecular weight for PC, PAN, and CUPmembranes using different perfusion fluid flow rates. Flow rates are 0.5mL�min�1 (&), 1.0mL�min�1
(�), 2.0 mL�min�1 (~) and 5.0 mL�min�1 (~). Adapted from Ref. 29).

the sensor. Microdialysis sampling provides extensive flex-ibility with respect to ways in which it can be applied.Typical microdialysis sampling applications use what istermed the recovery mode where the device is placed into asample matrix and analytes diffuse into the inner-fiberlumen of the probe (Fig. 1). Alternatively, the device can beused as a delivery device where a compound is infusedthrough the probe causing either some alteration in abiochemical event (enzymatic reaction, enzymatic inhibi-tion, or receptor binding) followed by collection of an endo-genous analyte or enzymatic product. The probe can also beused to pass a substrate for a chemical or biochemicalreaction and the products of that reaction can then belocally sampled as shown in Fig. 3. Unlike a specific sensor,microdialysis sampling devices allow for many physiologi-cal and biochemical processes to be studied within livingtissue. Different examples of this approach for a variety ofdifferent tissues are shown in Table 3.
DEVICE CALIBRATION
Theoretical Foundations
Typical microdialysis sampling operating conditions (flowrates between 0.5 and 2.0 mL�min�1) will yield a represen-
tative fraction of the analyte concentration in the sur-rounding ECF. Since most microdialysis conditions aresuch that equilibrium between the dialysate and the sam-ple is not obtained, a calibration has to be used to relatedialysis concentrations to external sample concentrations.Extraction efficiency (Ed) is used to relate the dialysisconcentration to the sample concentration. The steady-state Ed equation is
Ed ¼ Coutlet � Cinlet
Ctissue,1 � Cinlet
¼ 1 � exp�1
QdðRd þ Rm þ Re þ RtÞ
(2)
shown below in Eq. 2, where Coutlet is the analyte concen-tration exiting the microdialysis probe, Cinlet is the analyteconcentration entering the microdialysis probe, Ctissue,1 isthe analyte tissue concentration far away from the probe,Qd is the perfusion fluid flow rate and Rd, Rm, Re, and Rt area series of mass transport resistances for the dialysate,membrane, external sample, and a trauma layer thatexists at the interface of the probe membrane and thetissue as defined in Scheme 1 (48,49).
The resistance terms are additive and understandinghow these resistance terms affect Ed is vitally importantwith respect to experimental design. Throughout themicrodialysis sampling process, collected analytes mustdiffuse through at least three regions (tissue, membraneand dialysate) in order to exit the microdialysis probe. Eachmass transport resistance term defined in Scheme 1 has adiffusive component, which indicates that analytes withsmaller diffusion coefficients will exhibit much lower Ed.The combined resistance contributions from Rd and Rm canbe experimentally determined in vitro by collecting dialy-sates at different flow rates. A plot of the natural log of(1-Ed) versus 1/Qd should yield a straight line, which can beregressed to determine the additive values for Rd and Rm.In addition to this information, an in vitro Ed experimentperformed at 37 8C with stirring to cause the sample resis-tance, Re, to approach a zero value, will yield the highestpossible in vivo Ed.
The variables shown in Eq. 2 illustrate that a combina-tion of perfusion fluid flow rate (Qd), as well as masstransport resistances for the dialysate, membrane, andtissue medium external to the microdialysis probe affectEd. Decreasing Qd allows for a greater fluid residence timewithin the dialysis membrane thus allowing analyteconcentration to increase along the membrane axis.
MICRODIALYSIS SAMPLING 405
Substrate orInhibitor
Q (µL/min)
LUMEN ECF
Substrate + Reactant
Inhibitor More Endogenous Analyte
Product
ProductorEndogenousAnalyte
ProductorEndogenousAnalyte
DialysisMembrane
Figure 3. Localized infusion. A substrate or drug is locallyinfused through the microdialysis sampling probe. It diffusesinto the ECF and then either reacts to form a product or causesa biochemical event to increase the concentrations of othermolecules.
Table 3. Some Examples of Localized Infusion Using Microdialysis Sampling
Type (substrate orinhibitor) Infused Compound Measured Analyte or Application Tissue References
Inhibitor Cocaine Dopamine Brain 38Substrate Substance P and other neuropeptides Proteolytic Products Brain 39,40Substrate Salicylic acid or 4-hydroxybenzoic acid 2,3-DHBA, 2,5-DHBA, 3,4-DHBA In Vitro, Brain 41–43Substrate Phenol or acetaminophen Metabolites Liver 44,45Substrate and
inhibitorAngiotensin, phosphoramidon, captopril Metabolites and enzymatic inhibition Renal Cortex 46
Substrate Suc-(Ala)3-pNA Elastase (protease) activity In Vitro 47

Fig. 4 shows a typical Ed curve simulated using the aboveequations (only Rd and Rm assuming a well-stirred sys-tem) for analytes with different aqueous diffusion coeffi-cients. Fig. 4 clearly shows how microdialysis samplingmembranes even for a hypothetical case perform in amanner that is consistent with diffusion being the majorcontributor affecting recovery. This scenario for the dif-fusivity is especially true for protein collection as manyproteins of interest such as the cytokines have molecularweight values that can begin to approach the molecularweight cutoff limit for the dialysis membrane. In thesecases, the protein diameter can begin to approach thevalues for the pore diameters resulting in restricted diffu-sion through the membrane, higher membrane masstransport resistances and thus reduced analyte recovery.
The parameter Ed is highly dependent on several phy-siochemical parameters (analyte diffusion coefficient,perfusion fluid flow rate, membrane pore size, and mem-brane surface area), kinetic uptake into cells (50) and themicrovasculature (51), as well as the overall ECFvolume fraction. The mass transport, resistances shownin Scheme 1 include analyte diffusivity terms for all threeregions of mass transport, as well as kinetic terms for
the tissue space, as shown in the above equations. Tissuediffusive and kinetic properties of the sample surroundingan implanted microdialysis probe will dictate the howreduced the in vivo Ed will be from the maximum possiblein vitro Ed value at any particular flow rate. For hydro-philic analytes, it is generally assumed they diffuse only inthe ECF that surrounds the tissue cellular components.This ECF space comprises approximately 20% of the over-all tissue volume (52). Typically hydrophilic analytes haveto diffuse around the cells en route to the microdialysisprobe, the overall effective diffusive path length isincreased due to the tortuous path traversed by the ana-lyte. This tortuosity alters the tissue diffusion coefficientwhich can be approximated using Decf¼Daq/l2, where l
has a value of � 1.5. In addition to the alteration indiffusive characteristics, tissues are vascularized and haveactive cellular components. Depending on the analyte, theactive components will affect the overall microdialysis Ed.
In addition to these parameters influencing microdia-lysis Ed, analyte properties affect the shape and the time toreach steady state for the concentration profile to themicrodialysis probe. Analytes that diffuse rapidly and havea rapid supply to the tissue have narrow concentrationprofiles to the dialysis probe. Conversely, analytes thatslowly diffuse and are not readily supplied to the tissuespace will have concentration profiles to the dialysis probethat are not as steep. During microdialysis material isremoved from the sampling site and the extent to whichmatter is removed is a function diffusive and kinetic para-meters applied to that particular analyte, for example, howrapidly it the analyte replenished to the ECF from eithercapillaries (drugs) or cellular release processes. This hasbeen a concern by others particularly as it relates to theunderstanding of dopamine transmission in the brain (53).However, dopamine is a special case and has rapid releaseand uptake kinetics in the ECF. For analytes that arepoorly transported across the capillary space in the brainalong with analytes that do not undergo significant uptake(e.g., drugs), their relative recoveries are generally lowerthan those with higher uptake/kinetic rates. It may appearto be counterintuitive to think that analytes with veryrapid kinetic removal from the space surrounding themicrodialysis probe have increased relative recovery. How-ever, the higher removal rates cause the concentrationprofile to the dialysis probe to have a much greater gradientto the device as compared to a poorly removed analytewhich would have a much shallower concentration profileto the device. For analytes with similar ability to diffusethrough the membrane, that is, their membrane diffusioncoefficients are nearly equal, the flux should be greater forthe sharper concentration gradient thus causing greaterrelative recovery.
The theoretical foundations for microdialysis samplingduring steady state operations derived by Bungay et al.have been widely used to corroborate many different in vivoexperimental observations. In a series of papers focused onneurotransmitters, Justice’s group has studied how uptakeinhibition decreases microdialysis Ed 38,54,55. Stenkenet al. 56 showed that since kinetic removal of targetedanalyte may in some cases be additive, the inhibition of aparticular cytochrome P450 isoform for phenacetin and
406 MICRODIALYSIS SAMPLING
0 1 2 3 4 5 6
0
20
40
60
80
100
Sim
ula
ted
Ed
%
Perfusion Flow Rate (µL/min)
1.0 E-5 cm 2/s (e.g., glucose) 1.0 E-6 cm 2/s (e.g., neuropeptide) 2.7 E-7 cm 2/s (e.g., TNF-α)
Figure 4. Simulated Ed using Bungay et al. (48) model with thefollowing aqueous diffusion (Daq) coefficients and with amembrane diffusion value of 0.2Daq with length of 10 mm andRi (200 mm) and Ro (250 mm).
Scheme 1. The multiple mass transport equations used todescribe microdialysis sampling. D is the diffusion coefficientthrough the dialysate, Dd, membrane, Dm, and sample, Ds. Theparameter L is the membrane length; G (cm) is a compositefunction; kep(r), km(r), and kc(r) are kinetic rate constants as afunction of radial position (r) from the microdialysis probe.Additional term definitions can be found in Ref. 48.

antipyrine metabolism did not significantly alter Ed. Thissuggested that multiple kinetic components (capillary per-meability plus metabolism) are important for analyteremoval from liver tissue. Elmquist has shown that trans-porter inhibition in brain causes alterations in Ed fordifferent drugs (57).
Calibration Methods
If the different variables shown in Eq. 2 and Scheme 1 areknown prior to experimentation, then it is possible topredict the in vivo Ed. However, the difficulty with in vivoexperiments is that obtaining values for variables is highlychallenging. Furthermore, it is difficult to obtain an abso-lute value for Ctissue and an in vivo calibration requires thatCtissue (Eq. 2) be known. Even today, many experimentsemploying microdialysis sampling are semiquantitativeand dialysate concentrations obtained are approximationsof Ctissue at best. Since quite often ratios of dialysateanalyte concentrations are obtained before and after someinput (e.g., pharmacological or physical) with no attempt tomeasure the Ctissue during the experiment. To date, the invivo calibration of implanted devices, including microdia-lysis probes, is an active area of research in the analyticalchemistry and bioengineering communities and manyauthors have reviewed this subject (58,59). The principaldifficulty with respect to obtaining a reliable device cali-bration is the inability to fully reproduce in vitro all thesalient physiological features of tissue including permea-tion across capillaries and uptake processes (60,61).
Initial microdialysis sampling calibration focused onusing an in vitro Ed calculation to estimate tissue analyteconcentration. This approach gives a rough estimate of Ed
and may provide an incorrect calibration factor. Further-more, in vitro methods used for Ed measurement areaffected by temperature (microdialysis sampling again isinherently a diffusion separation method), as well as sam-ple stirring. A well-stirred buffer medium provides a masstransport external medium mass transport resistance (Re)that approaches a value of zero. It is important to note thata quiescent medium does provide diffusional mass trans-port resistance and thus relative recoveries performed invitro under stirred conditions will be different than thoseperformed using quiescent conditions (48). How close aquiescently determined in vitro Ed is to the in vivo Ed
would be wholly dependent upon the tissue kinetic proper-ties for the targeted analyte. In other words, an analyte,such as dopamine, may exhibit higher in vivo Ed than invitro quiescent Ed due to its extensive uptake kineticscausing a steeper concentration gradient to the dialysisprobe as compared to the in vitro quiescent Ed measure-ment. Differences in the ability of the analyte to diffusethrough the tissue space due to increased tortuosity anddecreased volume fraction led to empirical methods thatcould be used to amend in vitro relative recovery calibra-tion determinations (62). These methods focused on differ-ences in tissue diffusion properties, but did not include therole of kinetic affects on microdialysis Ed causing signifi-cant errors for estimating in vivo values for Ctissue.
Jacobson et al. (63) were the first to try to create a moreanalyte-specific calibration procedure for microdialysis
sampling. In their work, varying the perfusion fluid flowrates through the dialysis probe derived an analyte-specificmembrane mass transport coefficient, K, shown below inEq. 3, where A is the membrane surface area and Qd is thedialysate volumetric flow rate. Eq. 3
Coutlet
Ctissue¼ 1 � expð�KA=QdÞ (3)
is similar to Eq. 2, showing how the model of Bungay et al.incorporated previously known experimental results. Inthis case, the product (-KA) is related to the sum of thefraction of the mass transport resistance terms. Experi-mental results from this work immediately showed thatunderstanding the underlying in vivo mechanisms affect-ing microdialysis Ed was more complicated than initiallyexpected. These researchers found that different aminoacids exhibited different in vivo mass transport coeffi-cients. This was unexpected since the amino acids wouldbe expected to have very similar diffusion coefficients dueto their similar molecular weight. This data began to leadto the understanding that analyte properties (diffusion andkinetics) in the tissue play a major role with respect tomicrodialysis sampling calibration. An extension of cali-bration approach of Jacobson et al. is to pass the perfusionfluid through the dialysis probe so slowly that zero flow isapproached and nearly 100% relative recovery as shown inFig. 5. In this case, the goal is to calculate Csample byattempting to reach an equilibrium state across the micro-dialysis membrane (64).
The most widely used calibration method for microdia-lysis sampling is based on knowing that diffusive fluxshould not occur across the dialysis membrane when theanalyte concentration inside the perfusion fluid matchesthe concentration external to the microdialysis probe. Thismethod was originally demonstrated by Lönnroth and hasbeen called by a variety of names including Lönnroth plot,
MICRODIALYSIS SAMPLING 407
0 1 2 3 4 50
20
40
60
80
100
Flow Rate (µL min–1)
Ed %
Figure 5. Mathematically modeled Ed for an approach to zeroflow.

method of no net flux (NNF) and method of zero net flux(ZNF). The ZNF method requires the tissue analyte con-centration be at a steady state and has been used todetermine basal concentrations for many analytes. Theprobe is perfused with different analyte concentrationsthat are either above or below the targeted analyte con-centration. With these different perfusion studies, the lossor gain of analyte across the microdialysis probe can bedetermined and then plotted versus the inlet concentrationas shown in Fig. 6. The analyte concentration is deter-mined by the x-axis intercept and the relative recovery isthe absolute value of the calibration line slope. A majordrawback with this approach is the extensive amount ofresearch time that has to be invested during the differentperfusion studies. In particular, this is quite difficult toachieve with exogenous analytes (drugs) that wouldrequire a continuous infusion to achieve steady-stateconcentrations.
Quite often what is desired from a microdialysis sam-pling procedure is the analyte concentration during somesort of pharmacological challenge to an animal. This muchneeded analyte temporal information is not possible tocollect with the requirement of steady state for the ZNFmethod. To overcome this problem and to gain informationregarding the probe calibration from sample to sample,internal standards have been used during microdialysissampling. Typically, internal standards have been chemi-cals with similar physicochemical properties as the tar-geted analyte. Some early work in internal standardsproposed using one standard, such as antipyrine or 3H–water to allow assessment of sample-to-sample differencesshould they arise throughout the duration of the micro-dialysis sampling events (65). Antipyrine would be a sui-table reference for probe-to-probe variability because of itshighly hydrophilic nature and ease of chemical detection.Urea has also been used as a microdialysis calibrationreference for different metabolism studies (66–68). It isagain important to note that the extraction efficiency of anyparticular analyte is a combined function of the differentmass transport regions : dialysate, membrane, and mostimportantly tissue. Most likely during an in vivo micro-
dialysis sampling experiment, the variability from sampleto sample will occur due to alterations in tissue physiology,such as blood flow, metabolism, and uptake, which wouldserve to alter the tissue resistance and thus Ed. For thisreason, it is generally preferred to have internal standardswith similar tissue diffusion and kinetic properties as theanalyte. Finding an appropriate internal standard is not atrivial task since analytes with similar structure and dif-fusive properties may also compete for enzymatic sites andmay inhibit metabolic pathways that are important toremoval and thus Ed values. However, this possibility mustbe considered in context of the tissue being sampled, as wellas other additive kinetic properties (e.g., uptake into cellsor capillaries) that may have a much greater impact on theEd. For example, in the brain, the kinetic process that hasbeen shown for several neurotransmitters to be mostweighted towards affecting Ed are the neuronal uptakeprocesses rather than metabolism processes. Additionally,in the liver, it appears that capillary blood flow and perme-ability are the primary contributors toward the Ed valueobtained. Internal standards for peptides and proteins maybe much harder to devise as receptor binding or for thecytokines, binding to the proteoglycan components of theECF space may affect Ed and thus using molecular weightmarkers, such as inulin (69,70) or higher molecular weightfluorescein-labeled dextrans (e.g., FITC-Dextran 3000,FITC-Dextran 10,000) may only serve to report back diffu-sional mass transport differences during the duration ofmicrodialysis sampling.
Effect of Probe Insertion Trauma
Insertion of microdialysis probes causes tissue damage(71,72). Although this has been known for quite some time,it has generally been overlooked by many microdialysissampling users. The extent to which this insertion traumaaffects the integrity of the microdialysis sampling concen-trations and its true overall importance has been debatedin the literature. The biomaterials literature is full ofdescriptions of the cellular events that occur after a foreignbody implantation (73). It is known that edema occurs atthe site of probe implantation (74) along with the recruit-ment of polymorphonuclear leukocytes (75,76) and matrixmetalloproteinases (extracellular matrix remodelingenzymes) (77). Moderately reduced analyte flux to micro-dialysis probe chronically implanted has been reported forglucose (78).
The validity of the ZNF calibration methods for in vivocalibration, as well as determination of Ctissue for someanalytes, has recently been a concern for neuroscientistsinterested in dopamine. Many careful studies performed byMichael’s group illustrated that dopamine concentrationmeasurements obtained with microelectrodes and micro-dialysis sampling devices were quite different (79,80). Inparticular, microdialysis sampling devices often exhibitedmuch lower basal concentrations of dopamine than micro-electrodes. Additional concerns have been raised for drugblood–brain barrier studies (81,82). Between these twoexamples, dopamine collection via microdialysis samplingappears to be the most severely affected because of itsrelease and uptake sites being compromised due to the
408 MICRODIALYSIS SAMPLING
0 50 100 150 200
–20
–10
0
10
20
Point of no-net-flux
∆ C
once
ntra
tion
(Cou
t - C
in )
Inlet Concentration (µM)
Figure 6. Lonnroth plot using hypothetical data.

insertion trauma (49,83,84). In essence, the creation of atrauma layer creates four separate mass transport regionsduring microdialysis sampling : the dialysate, membrane,trauma layer, and normal tissue that need to be accountedfor during data interpretation.
ANALYSIS OF MICRODIALYSIS SAMPLES
Microdialysis sampling is essentially married to appropri-ate detection methods for the collected dialysates. In addi-tion to providing a means to sample from an in vivo site,microdialysis sampling also provides a relatively proteinfree or clean sample for chemical analysis. The only selec-tivity imparted into a microdialysis membrane is its mole-cular weight cutoff. For this reason, as long as a targetedanalyte can diffuse through the membrane, the microdia-lysis sampling probe can be used as an in vivo chemicalcollection device. Thus, assuming the targeted analyte canpass through the dialysis membrane pores coupled withthe appropriate analytical methods, a microdialysis sam-pling device could be considered to be essentially an all-purpose in vivo sensor (85). There is an extensive literaturethat has reviewed the associated analytical chemistry formaking measurements in microdialysis samples (86). Addi-tional reviews include: Adell et al. (87), Chaurasia (88),Church and Justice (89), Davies and Lunte (90), Horn (91),Kennedy (92), Kennedy et al. (93). Lunte et al. (94), Lunteand Lunte (95), Obrenovitch (96), Parkin et al. (97), andParrot et al. (98).
Sample Volume Limitations
The major bottleneck 25 years ago for microdialysis sam-pling gaining more wide-spread and universal acceptancehad to do with the analytical detection method samplevolume limitations. During the early stages of microdia-lysis sampling, the primary analytical detection methodsused for analyte quantification were liquid chromatogra-phy (LC) coupled with various types of detectors [ultravio-let–visible (UV–Vis), fluorescence, and electrochemical]. Inaddition to LC methods, radioimmunoassay (RIA) wasoccasionally used for peptides and proteins. Twenty-fiveyears ago, it was not uncommon to require 25–50 mL ofsample for LC analyses. Today, 50–100 mL of sample is stillneeded for standard immunoassays. The trade off that hadto occur became one of either obtaining higher concentra-tion recovery across the membrane by using low perfusionflow rates (1 mL�min�1 or less) or gaining sufficient tem-poral resolution by going to faster flow rates to achievesufficient sample volumes for chemical analysis.
With the exception of glucose and lactate, many of theendogenous as well as xenobiotic analytes sampled usingmicrodialysis had either micromolar (mM; 10-6 M) to nano-molar (nM 10-9 M) concentrations. These low concentra-tions often pushed the limitations of common analyticalequipment since for most analytes an approximate detec-tion limit with most UV-Vis detectors is roughly in the lowmM range and for fluorescence and electrochemical detec-tors their detection limits are approximately in the nMrange. The need to be able perform analytical measure-ments from such low volume dialysates drove analytical
method development in multiple directions towards sys-tems that could accommodate the low volumes withoutsacrificing method sensitivity, as well as development ofhigh throughput methods that allowed for increased tem-poral resolution. Presently, there are many commerciallyavailable technologies that allow for samples that are<1 mL (e.g., capillary electrophoresis) or have duty cyclesthat are <1 min.
Separations-Based Methods for Microdialysis SampleQuantitation
Using separation methods, such as LC or capillary electro-phoresis, for the quantitation of microdialysis samples ishighly advantageous since these methods can be quicklyadapted to many different analytes. Before the extensiveuse of microdialysis sampling for studies of neurochemicaltransmission, the use of in vivo voltammetry for analysis ofneurotransmitters was just beginning to be described as amethod for catecholamine (dopamine and norepinephrine)(99,100). The difficulty with using these methods was thatelectrode potentials needed to oxidize the catecholamines,as well as their metabolites (3, 4-dihydroxyphenylaceticacid, DOPAC) were similar. Furthermore, it was soondiscovered that during vesicular release of dopamine, veryhigh concentrations of ascorbic acid were released (101).For this reason, in vivo voltammetry of these importantneurochemicals became more challenging since all of thesechemicals can be oxidized at or below the same potential.The advantage of separations methods with appropriatedetectors is that components including targeted analytes,as well as endogenous and exogenous interferences (seeFig. 7) can be appropriately separated and quantified.Thus, an additional advantage of using chromatographicmethods is that chromatographic methods provide intrin-sic multiplexing capabilities for the chemical analysis ofmicrodialysis samples if different analytes are expected inthe same samples.
Liquid Chromatography. Liquid chromatographic meth-ods have been used for analyzing a broad class of analytesfrom microdialysis samples including catecholamines,amino acids, pharmaceuticals, and their metabolites. Sev-eral articles are available that describe the necessaryrequirements for microdialysis sample analysis using LC(102,103). Liquid chromatographic separations methodsare well suited to microdialysis samples because of thehigh salt content contained in the perfusion fluids. Saltsare generally not retained by the LC stationary phase andare therefore eluted in the chromatographic void volume.The resolving power of LC stationary phases allows formultiple analytes to be quantified during a single chroma-tographic run. Different detectors have been applied to LCseparations for quantitation of dialysis samples.
Capillary Electrophoresis. Capillary electrophoresis(CE) is a separation method that involves passing anelectric field across a micron-sized (�25 to 75 mm internaldiameter) capillary so as to allow separation of analytesbased on their additive electrophoretic and electrosmoticmobilities. Neutral components in capillary electrophoresis
MICRODIALYSIS SAMPLING 409

will elute based on their electroosmotic mobility. Comparedto LC analysis, CE provides greater separation efficiencyand the possibility of faster separations. An additionaladvantage of CE is that an enormous research effort hasbeen placed into microfabrication of CE devices onto micro-chips. This suggests the possibility for point-of-care tech-nologies to be integrated with microdialysis sampling.
Like LC, CE has been used for a wide range of micro-dialysis sampling analyses including catecholamine neu-rotransmitters, amino acid neurotransmitters, andpharmaceutical compounds. Capillary electrophoresishas one main disadvantage and that has to do with thepoor UV detection limits due to the path length beingsignificantly reduced. However, sensitive detection canbe achieved using electrochemical or laser-induced fluor-escence detection approaches.
Although there are several disadvantages with CEdetection, that is, no standard equipment, requirementof expertise, there is one advantage to this detectionmethod for microdialysis samples. By using pH-stackingmethods, significant on-column preconcentration (100 orgreater) can be achieved (104). The mismatch of pHserves to greatly concentrate the sample zone on thehead of the capillary column. This allows for onlinepreconcentration to occur during the CE experiment.For collection and detection of peptides or proteinsthis preconcentration can serve to be highly useful.An additional advantage of CE is that extremely fastseparations on the order of seconds can be achieved mak-ing this technology similar to that of a separations-basedbiosensor (105).
Fast Separations. Microdialysis sampling can be a slowtemporal process due to the need to collect sufficient sam-ple with sufficient relative recovery. To make microdialysissampling more sensor like in terms of its response time, anumber of groups have worked on achieving high speedseparations, as well as direct coupling dialysate outflow thedetection method. This is particularly important for stu-dies of neurotransmitter dynamics. While electrochemicalapproaches for studies of catecholamine neurotransmis-
sion provide millisecond time resolution, microdialysissampling is hindered by the turn-around time for theanalytical method. High speed detection capability of cycletimes of <1 min have been reported by many differentgroups using both liquid chromatographic, as well ascapillary electrophoresis separations including 1 s timeresolution with neurotransmitters (106) and <1 min reso-lution with pharmacokinetic analyses (107).
Examples of Different Types of Detection
Electrochemical Detection. Liquid chromatographycoupled with electrochemical detection (LC–EC) is both ahighly sensitive and selective method for analysis of com-pounds that can undergo an electrochemical reaction (oxi-dation or reduction). In this sense, LC–EC is highly suitedto the chemical analysis of important biogenic amines(dopamine, norepinephrine, etc) obtained from microdia-lysis probes implanted into the brain (108). For thesemeasurements, the electrochemical detector has a glassycarbon electrode that allows for oxidation of the amines atpotentials of roughly 700 mV versus a Ag/AgCl referenceelectrode. The LC–EC excels in this analysis task becausethese analytes can be oxidized and furthermore their basalconcentrations are in the low to mid-nanomolar range. Theadvantage of the separation is evident when consideringthat catecholamine metabolites (DOPAC, HVA) have basalconcentrations that are � 100–1000 times greater than theclinically relevant catecholamines (dopamine, norepi-nephrine, serotonin).
In addition to catecholamine detection of microdialysissamples, LC–EC analysis has been applied to low concen-tration analytes obtained under varying conditions of oxi-dative stress. In these cases, typically either salicylic acidor 4-hydroxybenzoic acid is directly infused through themicrodialysis probe to locally deliver a trapping agent asshown in Fig. 3 (109). These benzoic acids react withhydroxyl radical to form catechols which can then beseparated and detected by LC–EC (110). The LC–EC hasalso been used to quantify the DNA oxidative damagebiomarker, 8-dOH–dGuanosine (111,112).
410 MICRODIALYSIS SAMPLING
Figure 7. Example of different analytesthat can be oxidized at approximately thesame potential using a carbon electrodeunder physiological conditions. The formalpotential for dopamine, norepinephrine, andDOPAC are � 0.7 V versus Ag/AgCl. Foracetominophen, the formal potential is�þ0.8 V versus Ag/AgCl. For ascorbic acid,the oxidation formal potential is �þ 0.15 Vversus Ag/AgCl.
OH
OH
CH2
CH2
NH2
DOPAMINE
OH
OH
CH2
COOH
3,4-DIHYDROXYPHENYLACETIC ACID(DOPAC)
OH
OH
CH2
NH2
OH
H
NOREPINEPHRINE
O
OH OH
O
HOCH2 OHH
ASCORBIC ACID
OH
NH
OCH3
ACETAMINOPHEN(PARACETAMOL)

Electrochemical detection can be made to be more selec-tive by altering the electrode surface. Gold electrodescoated with Hg to create an amalgam are highly selectivetoward thiols such as cysteine and glutathione with lowpotentials needed for oxidation � 150 mV versus Ag/AgCl(113). Lunte and O’Shea used this approach for glutathionedetection using CE (114).
In addition to electrode modification, packed enzymebeds containing specific oxidase can be used prior to elec-trochemical detection. This is commonly applied to detec-tion of the neurotransmitters choline and acetylcholine.Acetylcholine and choline can be separated chromatogra-phically and then an enzymatic bed containing acetylcho-line oxidase and choline oxidase is placed at the end of thecolumn. These specific enzymatic reactions produce hydro-gen peroxide which is then detected downstream at aplatinum electrode (115). Note that more recent develop-ments have attempted to immobilize the enzymes specifi-cally to the electrode (116).
Examples of Fluorescence for Dialysates. Fluorescencedetection is often employed when a known derivatizationmethod can be applied to dialysate samples to improvemethod detection limits or to create a molecule that has abetter handle for detection. For microdialysis samples,fluorescence derivatization is commonly applied to impor-tant amino acid neurotransmitters such as glutamate andGABA (117–119) and occasionally to biogenic amines (e.g.,dopamine and norepinephrine) (120).
Examples of Mass Spectrometry for Dialysates. Massspectrometry (MS) is a unique LC detector in that as longas the analyte has the ability to form an ion, MS can be usedfor analysis. However, mass spectrometric detection can bedifficult with microdialysis samples because of the high saltcontent. This method has been particularly useful withneuropeptides because of their low concentrations. A pro-blem with mass spectrometric detection is that salts fromthe dialysis perfusion fluid can cause analyte ionizationsuppression that leads to dramatically decreased detectioncapability for the method (121). Salts from dialysates areoften removed via a column-switching technique that pre-concentrates the analyte onto a C18 phase followed bydesorption and detection (122). However, the use of nanoe-lectrospray devices can also reduce some of the problemsassociated with salt adducts (123–125). A particularlypowerful method of LC-MS has been the ability to performionization in stages, which allows for structural elucidationof unknowns. The Kennedy group has been particularlysuccessful with this approach for sequencing neuropep-tides obtained from microdialysis samples (39,126).
Sensor Attachment to Microdialysis Probes
The microdialysis sampling process results in a relativelyanalytically clean (little to no protein) sample. Separationsmethods provide extensive analysis flexibility because theycan be quickly optimized to the targeted analytes. How-ever, there are in vivo monitoring situations where onlyone or a few analytes are targeted and highly specificanalysis methods are available. A particular case in point
is the continuous detection of glucose or lactate fromdiabetic humans (127). The primary advantage of couplinga sensing device to the end of the microdialysis samplingdevice is the sample matrix is simply saline passing acrossthe analytical sensor. This prevents many of the difficultiesassociated with biofouling of implanted sensors (128).However, a critical problem for glucose sensing using thisapproach is that it can only provide information regardingthe glucose concentration fluctuations throughout the day,but cannot really serve as an alarm system because of thelag times that are �20–30 min as compared to normalglucose sensors of a few minutes (129). Despite this con-cern, there is great value in using specialized sensors to amicrodialysis device because of the clean sample deliveredto the sensing device.
The use of biosensors attached to the end of microdia-lysis probes has become highly useful for clinical neu-roscience where measuring glucose and lactate and insome cases other neurotransmitters are needed to under-stand homeostatic mechanisms (130,131). Most biosensorsattached to dialysis probes have been for glucose, lactate, orglutamate detection (132–134). Cook has published aninteresting approach combining immunoassay with elec-trochemical detection for specific measurements of coritsol(135).
Immunoassay for Peptide and Protein Detection
Peptide and protein analysis of microdialysis samples ischallenging since the concentrations of these targetedanalytes are often in the ng�mL�1 to pg�mL�1 levels. Thisrequires either highly sensitive fluorescence derivatiza-tion techniques for use with capillary electrophoresis (136)or sensitive immunoassays. Conventional immunoassaysrequire 50–100 mL of sample. To obtain these volumesrequires the use of high flow rates (2 mL�min�1 or greater)or very long collection times. In most cases, becausehighly sensitive radioimmunoassays (RIA) are used,higher flow rates are used to achieve moderate temporalresolution.
It is becoming increasingly evident that cellular com-munication in biological systems is highly complex andnetworked. Despite the tremendous growth in microdialy-sis sampling to monitor cellular biochemistry and anincreased interest in peptide and protein detection indialysates, there has been relatively little research towardsnew analytical methods that can detect peptides and pro-teins in low volume dialysate samples. A few approacheshave been published that require 80–100 mL of sample fordetection of several different proteins (137,128). Multi-plexed assays (up to 25 analytes or more) that can beperformed on a single sample have been recently createdfor immunology studies of the important inflammatorymediator class of cytokine proteins.
Highly sensitive multiplexed immunoassay platformsbased on particle-based flow cytometry has become com-mercially available that allows cytokine measurements in50-mL sample volumes (139,140). The limit of detection forthese assays fall into the low pg/mL range comparable andhave been compared and validated against standardELISA methods (141). The use of these particle-based
MICRODIALYSIS SAMPLING 411

immunoassays is highly advantageous to the sample-limited microdialysis process and the sample volumeneeded has been decreased to < 25 mL by our group forcytokine detection. The advantage of these bead-basedimmunoassays for microdialysis samples is that severalanalytes can be analyzed in a single low volume sample. Toillustrate the significant advantage that the bead-basedimmunoassay provides, if six separate cytokines were to bequantified in microdialysis samples using standard ELISAtechniques more than 600 mL of sample would be needed.Using a flow rate of 1 mL�min�1, this would require 10 h ofmicrodialysis sampling.
Mass versus Concentration Recovery
Microdialysis sampling Ed is a concentration recovery termand Ed increases as fluid flows decrease through the dia-lysis fiber creating longer residence times. Conversely,overall mass recovery typically increases as the flow rateincreases as shown in Fig. 8. For some analytical applica-tions, this increase in mass recovery may prove to be highlybeneficial since it opens up possibilities for analytical pre-concentration methods for the increased dialysatevolumes.
MICRODIALYSIS SAMPLING APPLICATIONS
Microdialysis sampling applications have now been widelyused in many different mammalian species includinghumans. The applications in humans have included stu-dies in cancer, dermatology, immunology, pharmacoki-netics and neuroscience. Many of these applicationshave been extensively reviewed by others and thereforewill not be extensively discussed here. It is again importantto note that microdialysis sampling has to date been prin-cipally applied to applications in neuroscience for the past
three decades. However, over the past decade, more micro-dialysis sampling applications in other areas are now beingdescribed.
Neuroscience Applications
Microdialysis sampling has been in the neuroscientist tool-box for > 25 years. This device has been principally appliedto neurotransmitter collection. Early on, the primary focuswas in rat and more recently with probe redesigns and thebiomedical value of knockouts, additional studies havebeen performed in mice (23,142). Current research inter-ests focus on bridging the gap between animal models andhuman studies.
Reviewing all the microdialysis literature for neu-roscience applications is a daunting task since the micro-dialysis sampling technique is now in wide use. Some of theapplications have already been mentioned in the Analysissection of this article. However, several reviews and a book(see Bibliography section) are available as background.These reviews have covered general aspects of neurochem-ical collection with microdialysis sampling (143–146),microchemical analysis (147,148), and controversialaspects of neurotransmitter collection (84,149–151)
Neuropeptides. With successful sampling of hydrophi-lic neurotransmitters with microdialysis sampling, thenext logical analyte class to target was neuropeptides. Likeneurotransmitters, the quantitation of neuropeptides ischallenging with microdialysis sampling due to their lowconcentrations. Furthermore, their lower diffusion coeffi-cients cause their Ed values to be low. Temporal resolutioncan also be an issue since quite often immunoassays thatrequire 50–100 mL are often used for detection. Despitethese limitations, many neuropeptides have been sampledusing microdialysis sampling and have been reviewed > 15years ago (152,153). With the increased use of mass spec-trometry for neuropeptide detection of dialysates (154,155)coupled with additional bead-based immunoassays, theapplication space for microdialysis sampling of neuropep-tides should increase tremendously.
Pharmacokinetics
Microdialysis sampling has been applied for pharmacoki-netic studies in animals and humans. The great advantagehere is that microdialysis sampling tremendouslydecreases the overall number of animals used for a phar-macokinetics study. Typical pharmacokinetic studies inrodents require the animal to be sacrificed at each timepoint used for the analysis. Microdialysis sampling allowsfor collection throughout the time course of the experimentbecause it can be easily inserted into the jugular vein.Again, because of the highly flexible nature of liquid chro-matographic analysis for drug studies, the microdialysissampling technique can be rapidly applied to new drugsand their metabolites.
Microdialysis sampling applications in pharmacoki-netics have been extensively reviewed. In addition to gen-eral reviews of the subject (156–158), there have beenreviews focused on data analysis (159,160) and calibration(161,162). One of the more important points to consider
412 MICRODIALYSIS SAMPLING
0 1 2 3 4 50.0
0.1
0.2
0.3
0.4
0.5
0.6
0.7
0.8
0.9
1.0
0 1 2 3 4 5 6
0.03
0.04
0.05
0.06
0.07
0.08
0.09
0.10
0.11
0.12
Sim
ulat
ed M
ass
Rec
over
y N
orm
aliz
ed
Volumetric Flow Rate (µL min–1)
1 × 10⁻⁵ cm2·s–1 e.g., glucose 1 × 10⁻⁶ cm2·s–1 . e.g., neuropeptide 2.7 × 10⁻⁶ cm2·s–1 e.g., TNF-alpha
Figure 8. Modeled microdialysis sampling mass recovery fordifferent analytes with different diffusion coefficients.

when working with pharmacokinetic data obtained usingmicrodialysis sampling is that a microdialysis samplerepresents a concentration average over the collection timeperiod. This is in contrast to blood sampling that representsthe analyte concentration directly at the sample time.
Clinical Applications
Clinical applications of microdialysis sampling have growntremendously over the past decade and will continue togrow (163). At the present time, microdialysis samplingmethods in human subjects have focused on studies inperipheral tissues for glucose collection (164–167) or drugdistribution (168–170). Additional applications have beento determine gut barrier dysfunction (171). Microdialysissampling applications in tumors has spanned both phar-macokinetic investigations (172–174), as well as collectionof growth factors and cytokines (175). Microdialysis sam-pling has also been applied to human brain studies thathave focused on understanding the underlying alteredbiochemistry that occurs when head trauma to drug dis-tribution (176–180). Microdialysis sampling has been usedas a means to monitor pharmacokinetics in the humandermis and has been compared to blister suction techni-ques (181). While both sampling methods produced similardata, it was found that microdialysis sampling was mucheasier to handle for both the patient and clinician.
Monitoring different growth factors and cytokines isbecoming more important in clinical medicine since theseproteins are known to affect cell-to-cell signaling and com-munication and are therefore becoming important biomar-kers to measure. In particular, a group of proteins that areof great in vivo interest are the cytokines. Cytokines arepotent, transient, and highly localized soluble messengerproteins (�6–80 kDa) produced by T-cells and macro-phages that control nearly every aspect of the immunesystem (182). Cytokines exhibit complex interactions andtherefore it is often more important to determine theconcentration and cytokine profile after an immune chal-lenge rather than the concentration of one single cytokine.
Microdialysis sampling is an ideal technique to achievereal time in situ monitoring of these important proteinmediators and also has been recently described for proteo-mics applications (183). The application of microdialysis tothis area is now emerging as potential approach for clinical
in vivo studies in both healthy and diseased subjects torecover targeted cytokine molecules from the exact actionsites and has recently been reviewed by Clough (25).Commercially available microdialysis probes with a 100kDa MWCO membrane have been used for in vivo micro-dialysis of some cytokines (184,185). It is important to notethat microdialysis sampling provides localized samplingand thus insight into localized concentrations of cytokinesthat cannot be achieved via sampling from blood plasma.This has been recently demonstrated with the cytokine IL-6 where its interstitial fluid concentration was 100-foldhigher than that found in the plasma (186).
Cytokines have low Ed through 100 kDa membranes. Toimprove cytokine Ed larger MWCO membranes (3000 kDa)typically used for plasmaphoresis have been used (187).Others are beginning to use the 3000 kDa MWCO mem-brane for collection of IL-6 and TGF- b1 (186,188–190). Therange of in vitro recoveries for different cytokine proteins isshown in Table 4.
EVALUATION AND FUTURE USE
Microdialysis sampling has become a mature technologyfor neurotransmitter collection and pharmacokineticdeterminations in animals. Clinical microdialysis sam-pling applications provide the greatest opportunity forgrowth. Despite the extensive biomedical use of conven-tional microdialysis sampling, there are still aspects of thedevice that could be tremendously improved.
As currently practiced, microdialysis sampling in ani-mals can be cumbersome due to the tubing lines required.Work in Lunte’s group has focused on making micropumpsusing osmotic pumps as means to create line-free dialysisdevice (191,192). Reducing the microdialysis size by creat-ing it on a microchip also has some advantages given that adecreased volume flow chamber may allow rapid equilibra-tion across the device allowing Ed to approach nearly 100%(193–195).
A common problem with microdialysis sampling isthe difficulty incurred when sampling hydrophobicanalytes. This is an area with great promise with respectto either new device development or improvements toexisting microdialysis sampling technology. Albuminis commonly included in the perfusion fluid to block
MICRODIALYSIS SAMPLING 413
Table 4. Cytokine In Vitro Relative Recovery and Relevant Physicochemical Propertiesa
Cytokine Ed% 0.5 mL�min�1 Ed% 1.0 mL�min�1 MW, kDa Conformation Active Protein, kDa
IL-2 4.5 2.9 (12) 2.9 1.1 (15) 17.2 Monomer 17.2IL-4 12.06.5 (12) 7.5 2.6 (15) 13.6 Monomer 13.6IL-5 1.3 1.0 (12) 1.0 0.5 (15) 13.1 Homodimer 26.2IL-6 4.8 1.4 (6) 2.7 0.8 (6) 21.7 Monomer 21.7IL-10 Not performed 1.1 0.3 (3) 18.8 Homodimer 37.6
IL-12p70 N.D. N.D. 35 & 40 Heterodimer 75IFN-g 2.0 1.4 (18) 1.5 0.8 (21) 15.9 Homodimer 31.8MCP-1 24.54.8 (6) 13.13.9 (6) 13.1 Homodimer 26.2TNF-a 8.0 2.9 (15) 4.3 1.1 (18) 17.3 Homotrimer 51.9
aCytokine standards were either 1250 or 2500 pg�mL�1. All solutions were quiescent at room temperature. A CMA/20 10-mm 100-kDa PES membrane was used
for these studies performed in our laboratory. The numbers in parentheses after the RR values are the number of trials (n). All data are reported as meanSD.
N.D. is not detected.

nonspecific adsorption sites within the microdialysis poly-meric materials (196,197), and is still widely practiced(198). Unfortunately, this adds protein back into the dia-lysis perfusion that for small analytes causes difficultieswith CE and LC analyses. A second approach involvesusing lipids, such as Intralipid, a material used to suspendhydrophobic drugs, to coat the nonspecific adsorption siteson the dialysis membrane or tubing (196,199). It is notknown how compatible this approach is for CE or LCanalysis.
Cyclodextrins have been used as perfusion-fluid addi-tives for improving the microdialysis recovery for differentanalytes (200,201). A general scheme for the enhancementprocess is shown in Fig. 9. Cyclodextrins are well-knowncyclic oligosacharides that have the capability to forminclusion complexes with various organic molecules bythe capture of the guest molecule into a hydrophobiccentral cavity (202). Dialysate samples that contain cyclo-dextrin can be injected into an LC column without altera-tion to the chromatographic separation parameters, forexample, plate number and peak width (203). Cyclodex-trins are not selective, which for this enhancementapproach is beneficial given that they can be applied to awide variety of low molecular weight hydrophobic organicmolecules (204,205). However, a difficulty with thisapproach is that cyclodextrins can diffuse out of the dia-lysis membrane that may complicate some applications. Anadditional difficulty is that cyclodextrins can interfere withaffinity-based detection assays (immunoassays) due tocompetition between the analyte and cyclodextrin versusanalyte and an antibody.
To overcome the free diffusion of cyclodextrin out of thedialysis tubing, different type of solid supports have beenused for enhancement. Markides group has described theuse of a solid-vehicle support for improving neuropeptidemicrodialysis relative recovery coupled with LC–MS detec-tion (206,207). More specific enhancements can be
achieved using antibody-immobilized beads for flow cyto-metry (208). With the antibody-enhancement approach,increases in microdialysis sampling relative recovery of4–12-fold were achieved for different cytokines.
Microdialysis sampling is already beginning to be usedin metabolomic studies using LC–MS detection methods(209). With the creation of microcoil nuclear magneticresorance (NMR) that can measure nanoliter samples(210,211) the detection possibilities for dialysate samplesare greatly increased. This approach has been recentlyapplied to metabolomic studies with microdialysis sam-pling in brain (212).
The combination of these new discoveries for microdia-lysis sampling shows the enormous potential for solvingmany clinical biomedical problems with this device. Thefuture for microdialysis sampling and device spin-offs isquite bright. New developments in instrumentation andcollection procedures will provide much clinical benefit.
Microdialysis sampling has moved from a samplingdevice exclusively used to collect low molecular weighthydrophilic neurotransmitters to applications requiringthe collection of larger proteins. Many cellular signalingprocesses occur via small molecule (nitric oxide, norepi-nephrine, acetylcholine, eicosanoids, etc.), peptide (angio-tensin, etc.) as well as proteins (cytokines). Cytokineprofiling for different disease states has become quiteimportant. For the applications of both neuropeptide andlarger protein collection such as the cytokines, the princi-pal limitation to collecting these molecules is the diffusionproperties of these analytes through the dialysis mem-brane. Proteins are difficult to collect through dialysismembranes since they can exhibit both nonspecific adsorp-tion to the polymeric materials as well as diffusion restric-tions through the membrane pores. Despite the variety ofapplications of microdialysis sampling to medical andscientific research, there have been few new developmentswith respect to improving the overall sampling efficiencyfor difficult to dialyze samples. As clinical proteomics andbiomarker collection becomes better understood for mak-ing clinical predictions, it will be necessary to have sam-pling methods that can meet these clinical needs.
ACKNOWLEDGMENTS
Microdialysis sampling research in the Stenken laboratoryis currently funded by NIH EB001441. The support fromthe John Wiley & Sons, Inc. editorial staff is greatlyappreciated.
BIBLIOGRAPHY
1. Frangioni JV. In vivo near-infrared fluorescence imaging.Curr Opin Chem Biol 2003;7:626–634.
2. Ntziachristos V, Tung CH, Bremer C, Weissleder R. Fluores-cence molecular tomography resolves protease activity in vivo.Nature Med 2002;8:757–761.
3. Sevick-Muraca EM, et al. Near-infrared imaging with fluor-escent contrast agents. Handbook Biomed Fluoresc 2003; 445–527.
4. Myers RD, Adell A, Lankford MF. Simultaneous comparisonof cerebral dialysis and push–pull perfusion in the brain of
414 MICRODIALYSIS SAMPLING
S + A
Q, (µLmin–1) Analyte (S)
S ASample
Q
kCR
RRQ
CCD
dx
dC Li
io
LomemL2
)/ln()(2 pp –
–=
x
At x = 0, C = Co
At x = L, C = CL
Membrane
Figure 9. Schematic of microdialysis enhanced transport. Theanalyte (S) or substrate for an affinity agent (A) binds with theaffinity agent in the perfusion fluid. Affinity agents includeantibodies, cyclodextrins or other supramolecular agents. Thesymbols in the equation are as follows: Co ¼ Concentration atx¼0, CL ¼ Concentration at x¼L (membrane length), Dmem ¼membrane diffusion coefficient, k ¼ first-order rate constant forthe reaction between the analyte, S, and the affinity agent, A, Q ¼perfusion fluid flow rate and Ri, Ro ¼ inner and outer radii.

rats: a critical review. Neurosci Biobehav Rev 1998;22:371–387.
5. Ellmerer M, et al. Measurement of interstitial albumin inhuman skeletal muscle and adipose tissue by open-flow micro-perfusion. Am J Physiol 2000;278:E352–E356.
6. Haaverstad R, Romslo I, Larsen S, Myhre HO. Protein con-centration of subcutaneous interstitial fluid in the human leg.A comparison between the wick technique and the blistersuction technique. Inter J Microcirculation, Clin Exper1996;16:111–117.
7. Wiig H, Sibley L, DeCarlo M, Renkin EM. Sampling inter-stitial fluid from rat skeletal muscles by intermuscular wicks.Am J Physiol 1991;261:H155–H15.
8. Nedrebo T, et al. (2004). Differential cytokine response ininterstitial fluid in skin and serum during experimentalinflammation in rats. J Physiol 2004;556:193–202.
9. Bito LZ, et al. Concentration of free amino acids and otherelectrolytes in cerebrospinal fluid, in vivo dialyzate of brain, andblood plasma of the dog. J Neurochem 1966;13:1057–1067.
10. Delgado JM, et al. Dialytrode for long term intracerebralperfusion in awake monkeys. Arch Inter Pharmacodyn Ther1972;198:9–21.
11. Ungerstedt U, Pycock C. Functional correlates of dopamineneurotransmission. Bull Schweizerischen Akad MedizinischenWisse 1974;30:44–55.
12. Plock N, Kloft C. Microdialysis - theoretical background andrecent implementation in applied life-sciences. Eur J Pharma-ceut Sci 2005;25:1–24.
13. Davies MI, et al. Analytical considerations for microdialysissampling. Adv Drug Deliv Rev 2000;45:169–188.
14. Benveniste H, Hüttemeier C. Microdialysis-theory and appli-cation. Prog Neurobiol 1990;35:195–215.
15. de Lange ECM, de Boer AG, Breimer DD. Methodologicalissues in microdialysis sampling for pharmacokinetic studies.Ad Drug Del Rev 2000;45:125–148.
16. Borg N, Stahle L. Recovery as a function of the osmolality of theperfusion medium in microdialysis experiments. Anal ChimActa 1998;375:135–141.
17. Moghaddum B, Bunney BS. Ionic compositions of microdialysisperfusing solution alters the pharmacological responsivenessand basal outlflow of striatal dopamine. J Neurochem1989;53:652–654.
18. Davies MI. A review of microdialysis sampling for pharmaco-kinetic applicaitons. Analyt Chim Acta 1999;379:227–249.
19. De Lange CMA, De Boer AG, Breimer DD. Intracerebralmicrodialysis. Intro Blood–Brain Barrier 1998; 94–112.
20. Bourne JA (2003). Intracerebral microdialysis: 30 years as atool for the neuroscientist. Clin Exp Pharmacol Physiol2003;30:16–24.
21. North American and International Commercial Sources ofMicrodialysis Probes. Available at CMA Microdialysis Inc.www.microdialysis.se; Bioanalytical Systems Inc., www. bioa-nalytical.com; SciPro www.scipro.com .
22. De la Peña A, Liu P, Derendorf H. Microdialysis in peripheraltissues. Adv Drug Deli Rev 2000;45:189–216.
23. Boschi G, Scherrmann JM. Microdialysis in mice fordrug delivery research. Adv Drug Deliv Rev 2000;45:271–281.
24. Mulder M. Basic Principles of Membrane Technology. Dor-drecht, The Netherlands: Kluwer Academic Publishers 1991.
25. Clough G. Microdialysis sampling of large molecules. TheAAPS Journal E-Pub May 16, 2005.
26. Kendrick KM. Use of microdialysis in neuroendocrinology.Methods Enzymol 1989;168:182–205.
27. Torto N, et al. Optimal membrane choice for microdialysissampling of oligosaccharides. J Chromatog A 1998;806:265–278.
28. Kjellstrom S, et al. Microdialysis—a membrane based sam-pling technique for quantitative determination of proteins.Chromatogr 1999;50:539–546.
29. Snyder KL, et al. Diffusion and calibration properties ofmicrodialysis sampling membranes in biological media. Ana-lyst 2001;126:1261–1268.
30. Schuck VJA, Rinas I, Derendorf H. In vitro microdialysissampling of docetaxel. J Pharmaceutic Biomed Anal 2004;36:807–813.
31. Groth L, Jı́rgensen A. In vitro microdialysis of hydrophilicand lipophilic compounds. Analyt Chim Acta 1997;355:75–83.
32. Mary S, et al. Assessment of the recovery of three lipophilicpsoralens by microdialysis: An in vitro study. Inter J Phar-maceut 1998;161:7–13.
33. Patterson SL, Sluka KA, Arnold MA. A novel transversepush–pull microprobe: in vitro characterization and invivo demonstration of the enzymatic production of adeno-sine in the spinal cord dorsal horn. J Neurochem2001;76:234–246.
34. Patterson SL, Sluka KA, Arnold MA. A novel transversepush–pull microprobe: In vitro characterization and in vivodemonstration of the enzymatic production of adenosine inthe spinal cord dorsal horn. [Erratum to document cited in A].J Neurochem 2001;76:1955.
35. Ho WSW, Sikar KK, editors. Membrane Handbook NewYork; Van Nostrand Reinhold: 1992.
36. Rosdahl H, Hamrin K, Ungerstedt U, Henriksson J, A micro-dialysis method for the in situ investigation of the action oflarge peptide molecules in human skeletal muscle: Detectionof local metabolic effects of insulin. Intern J Biol Macromole2000;28:69–73.
37. Hamrin K, Rosdahl H, Ungerstedt U, Henriksson J. Micro-dialysis in human skeletal muscle: Effects of adding a colloidto the perfusate. J Appl Physiol 2002;92:385–393.
38. Smith AD, Justice JB. The effect of inhibition of synthesis,release, metabolism and uptake on the microdialysis extrac-tion fraction of dopamine. J Neurosci Methods 1994;54:75–82.
39. Haskins WE, et al. Capillary LC-MS2 at the attomole level formonitoring and discovering endogenous peptides in micro-dialysis samples collected in vivo. Analy Chem 2001;73:5005–5014.
40. Freed AL, Cooper JD, Davies MI, Lunte SM. Investigation ofthe metabolism of substance P in rat striatum by microdia-lysis sampling and capillary electrophoresis with laser-induced fluorescence detection. J Neurosc Methods2001;109:23–29.
41. Ste-Mari L, Boismenu D, Vachon L, Montgomery J. Evalua-tion of sodium 4-hydroxybenzoate as an hydroxyl radical trapusing gas chromatography-mass spectrometry and high-per-formance liquid chromatography with electrochemical detec-tion. Ana Bioch 1996;241:67–74.
42. Chen R, Stenken JA. An in vitro hydroxyl radical generationassay for microdialysis sampling calibration. Anal Biochem2002;306:40–49.
43. Marklund N, Clausen F, Lewander T, Hillered L. Monitor-ing of reactive oxygen species production after traumaticbrain injury in rats with microdialysis and the 4-hydroxy-benzoic acid trapping method. J Neurotrauma 2001;18:1217–1227.
44. Scott DO, Lunte CE In vivo microdialysis sampling in thebile, blood, and liver of rats to study the disposition of phenol.Pharmaceut Res 1993;10:335–342.
MICRODIALYSIS SAMPLING 415

45. Stenken JA, Ståthle L, Lunte CE, Southard MZ. Monitoringin situ liver metabolism in rats using microdialysis. Compar-ison of a microdialysis mass-transport model predictions toexperimental metabolite generation data. J Pharmaceut Sci1998;87:311–320.
46. Kajiro T, Nakajima Y, Fukushima T, Imai K. A method toevaluate the renin-angiotensin system in rat renal cortexusing a microdialysis technique combined with HPLC-fluor-escence detection. Anal Chem 2002;74:4519–4525.
47. Steuerwald AJ, Villeneuve JD, Sun L, Stenken JA. In vitrocharacterization of an in situ, microdialysis sampling assayfor elastase activity detection. J Pharmaceut Biome Analy. Inpress.
48. Bungay PM, Morrison PF, Dedrick RL. Steady-state theoryfor quantitative microdialysis of solutes and water in vivo andin vitro. Life Sci 1990;46:105–119.
49. Bungay PM, et al. Microdialysis of dopamine interpretedwith quantitative model incorporating probe implantationtrauma. J Neurochem 2003;86:932–946.
50. Justice JB. Quantitative microdialysis of neurotransmitters.J Neurosc Methods 1993;48:263–276.
51. Clough GF, et al. Effects of blood flow on the in vivo recoveryof a small diffusible molecule by microdialysis in human skin.J Pharmacol Exp Therapeut 2002;302:681–686.
52. Nicholson C. Diffusion and related transport mechanisms inbrain tissue. Rep Prog Phys 2001;64:815–884.
53. Newton AP, Justice JB. Temporal response of microdialysisprobes to local perfusion of dopamine and cocaine followedwith one-minute sampling. Analy Chem 1994;66:1468–1472.
54. Cosford RJO, Vinson AP, Kukoyi S, Justice JBJ. Quantitativemicrodialysis of serotonin and norepinephrine: Pharmacolo-gical influences on in vivo extraction fraction. J NeurosciMethods 1996;68:39–47.
55. Vinson PN, Justice JB. Effect of neostigmine on concentra-tion and extraction fraction of acetylcholine using quantita-tive microdialysis. J Neurosci Methods 1997;73:61–67.
56. Stenken JA, Lunte CE, Southard MZ, Ståhle L. Factors thatinfluence microdialysis recovery. Comparison of experimen-tal and theoretical microdialysis recoveries in rat liver. JPharmaceut Sci 1997;86:958–966.
57. Dai H, Elmquist WF. Drug transport studies using quanti-tative microdialysis. Methods Mol Med 2003;89:249–264.
58. Stenken JA. Methods and issues in microdialysis calibration.Anal Chim Acta 1999;379:337–357.
59. Chen KC, et al. Theory relating in vitro and in vivo micro-dialysis with one or two probes. J Neurochem 2002;81:108–121.
60. Rice ME, Nicholson C. Diffusion and ion shifts in the brainextracellular microenvironment and their relevance for vol-tammetric measurements. The brain is not a beaker: In vivovs. In vitro voltammetry. In: Boulton A, Baker G, Adams RN,editors. Neuromethods, Vol. 27, Voltammetric Methods inBrain Systems, ed. New York: Humana Press Inc.; 1995. pp27–79.
61. Reach G, Wilson GS. Can continuous glucose monitoring beused for the treatment of diabetes? Analy Chem 1992;64:381A–386A.
62. Benveniste H, Hüttemeir C. Microdialysis-theory and appli-cation. Progr Neurobiol 1990;35:195–215.
63. Jacobson I, Sandberg M, Hamberger A. Mass transfer inbrain dialysis devices—a new method for the estimation ofextracellular amino acids concentration. J Neurosci Methods1985;15: 263–268.
64. Menacherry S, Hubert W, Justice JB. In vivo calibration ofmicrodialysis probes for exogenous compounds. Analyt Chem1992;64:577–583.
65. Yokel RA, Allen DD, Burgio DE. McNamara JP. Antipyrineas a dialyzable reference to correct differences in efficiencyamong and within sampling devices during in vivomicrodialysis. J Pharmacol Toxicol Methods 1992;27:135–142.
66. Strindberg L, Lonnroth P. Validation of an endogenousreference technique for the calibration of microdialysis cathe-ters. Scand J Clin Lab Investigation 2000;60:205–212.
67. Ronne-Engstrom E, et al. Intracerebral microdialysis in neu-rointensive care: The use of urea as an endogenous referencecompound. J Neurosur 2001;94:397–402.
68. Ettinger SN, et al. Urea as a recovery marker for quantitativeassessment of tumor interstitial solutes with microdialysis.Cancer Res 2001;61:7964–7970.
69. Leypoldt JK, Burkart JM. Small-solute and middle-moleculeclearances during continuous flow peritoneal dialysis. AdvPeritoneal Dialysis 2002;18:26–31.
70. Krejcie TC, et al. Modifications of blood volume alter thedisposition of markers of blood volume, extracellular fluid,and total body water. J Pharmacol Exp Therap 1999;291:1308–1316.
71. Benveniste H, Diemer NH. Cellular reactions to implantationof a microdialysis tube in the rat hippocampus. Acta Neuro-pathol 1987;74:234–238.
72. Grabb MC, et al. Neurochemical and morphological res-ponses to acutely and chronically implanted brain microdia-lysis probes. J Neurosci Methods 1998;82:25–34.
73. Anderson JM. Biological responses to materials. Ann RevMater Res 2001;31:81–110.
74. Dykstra KH, et al. Quantitative examination of tissue con-centration profiles associated with microdialysis. J Neuro-chem 1992;58:931–940.
75. Davies MI, Lunte CE. Microdialysis sampling for hepaticmetabolism studies: impact of microdialysis probe designand implantation technique on liver tissue. Drug MetabolismDisposition 1995;23:1072–1079.
76. Clapp-Lilly KL, et al. An ultrastructural analysis of tissuesurrounding a microdialysis probe. J Neurosci Methods,1999;90:129–142.
77. Planas AM, et al. Certain forms of matrix metalloproteinase-9 accumulate in the extracellular space after microdialysisprobe implantation and middle cerebral artery occlusion/reperfusion. J Cerebral Blood Flow Metabolism 2002;22:918–925.
78. Wisniewski N, et al. Analyte flux through chronicallyimplanted subcutaneous polyamide membranes differs inhumans and rats. Am J Physiol, Endocrinol Metabolism2002;282:E1316–E1323.
79. Lu Y, Peters JL, Michael AC. Direct comparison of theresponse of voltammetry and microdialysis to electricallyevoked release of striatal dopamine. J Neurochem1998;70:584–593.
80. Borland LM, Shi G, Yang H, Michael AC. Voltammetric studyof extracellular dopamine near microdialysis probes acutelyimplanted in the striatum of the anesthetized rat. J NeurosciMethods 2005;146:149–158.
81. Morgan ME, Singhal D, Anderson BD. Quantitative assess-ment of blood-brain barrier damage during microdialysis. JPharmacol Exp Therap 1996;277:1167–1176.
82. Groothuis DR, et al. Changes in blood-brain barrier perme-ability associated with insertion of brain cannulas and micro-dialysis probes. Brain Res 1998;803:218–230.
83. Chen KC. Preferentially impaired neurotransmitter releasesites not their discreteness compromise the validity ofmicrodialysis zero-net-flux method. J Neurochem 2005;92:29–45.
416 MICRODIALYSIS SAMPLING

84. Khan SA, Michael AC. Invasive consequences of using micro-electrodes and microdialysis probes in the brain. TrAC,Trends Anal Chem 2003;22:503–508.
85. Ballerstadt R, Schultz JS. Sensor methods for use withmicrodialysis and ultrafiltration. Adv Drug Del Rev 1996;21:225–238.
86. Davies MI, et al. Analytical considerations for microdialysissampling. Adv Drug Del Rev 2000;45:169–188.
87. Adell A, Artigas F. In vivo brain microdialysis: Principles andapplications. Neuromethods 1998;32:1–33.
88. Chaurasia CS. In vivo microdialysis sampling: Theory andapplications. Biomed Chromatog 1999;13:317–332.
89. Church WH, Justice Jr JB. On-line small-bore chromatogra-phy for neurochemical analysis in the brain. Adv Chromatog1989;28:165–194.
90. Davies IM, Lunte CE. Microdialysis sampling coupled on-lineto microseparation techniques. Chem Soc Rev 1997;26:215–222.
91. Horn TFW, Engelmann M. In vivo microdialysis for nonapep-tides in rat brain—a practical guide. Methods 2001;23:41–53.
92. Kennedy RT. Bioanalytical applications of fast capillary elec-trophoresis. Anal Chim Acta 1999;400:163–180.
93. Kennedy RT, et al. In vivo neurochemical monitoring bymicrodialysis and capillary separations. Curr Opin ChemBiol 2002;6:659–665.
94. Lunte CE, Scott DO, Kissinger PT. Sampling living systemsusing microdialysis probes. Anal Chem, 1991;63:773A–780A.
95. Lunte SM, Lunte CE. Microdialysis sampling for pharmaco-logical studies: HPLC and CE analysis. In: Brown PR,Grushka E, editors. Advances in Chromatography. NewYork: Marcel Dekker; 1996. pp 383–432.
96. Obrenovitch TP, Zilkha E. Microdialysis coupled to onlineenzymatic assays. Methods 2001;23:63–71.
97. Parkin MC, Hopwood SE, Boutelle MG, Strong AJ. Resolvingdynamic changes in brain metabolism using biosensorsand on-line microdialysis. TrAC, Trends Analy Chem2003;22:487–497.
98. Parrot S, et al. Microdialysis monitoring of catecholaminesand excitatory amino acids in the rat and mouse brain:Recent developments based on capillary electrophoresis withlaser-induced fluorescence detection-A mini-review. CellularMol Neurobiol 2003;23:793–804.
99. Wightman RM, Strope E, Plotsky PM, Adams RN. Monitor-ing of transmitter metabolites by voltammetry in cerebrosp-inal fluid following neural path stimulation. Nature London1976;262:145–146.
100. Adams RN. Probing brain chemistry with electroanalyticaltechniques. Anal Chem 1976;48:1126A–1138A.
101. Nagy G, Rice ME, Adams RN. A new type of enzyme electrode:The ascorbic acid eliminator electrode. Life Sci 1982; 31:2611–2616.
102. Wages SA, Church WH, Justice Jr JB. Sampling considera-tions for on-line microbore liquid chromatography of braindialysate. Analy Chem 1986;58:1649–1656.
103. Kennedy RT, German I, Thompson JE, Witowski SR. Fastanalytical-scale separations by capillary electrophoresis andliquid chromatography. Chem Rev 1999;99:3081–3131.
104. Arnett SD, Lunte CE. Investigation of the mechanism of pH-mediated stacking of anions for the analysis of physiologicalsamples by capillary electrophoresis. Electrophoresis2003;24:1745–1752.
105. Davies M, et al. Studies on animal to instrument hyphena-tion: Development of separation-based sensors for near real-time monitoring of drugs and neurotransmitters. SamplePreparation for Hyphenated Analyt Tech 2004; 191–220.
106. Rossell S, Gonzalez LE, Hernandez L. One-second timeresolution brain microdialysis in fully awake rats. Protocolfor the collection, separation and sorting of nanoliter dia-lyzate volumes. J Chromatogr B: Analy Technol Biomed LifeSci 2003;784:385–393.
107. Chen A, Lunte CE. Microdialysis sampling coupled on-lineto fast microbore chromatography. J Chromatog Analy Appl1995;691:29–35.
108. Kissinger PT, Refshauge C, Dreiling R, Adams RN. Electro-chemical detector for liquid chromatography with picogramsensitivity. Analyt Lett 1973;6:465–477.
109. Acworth IN, Bogdanov MB, McCabe DR, Beal MF. Estima-tion of hydroxyl free radical levels in vivo based on liquidchromatography with electrochemical detection. MethodsEnzymol 1999;300:297–313.
110. Acworth IN, Bailey BA, Maher TJ. The use of HPLC withelectrochemical detection to monitor reactive oxygen andnitrogen species, markers of oxidative damage and antiox-idants: application to the neurosciences. Prog HPLC-HPCE1998;7:3–56.
111. Bogdanov MB, et al. A carbon column-based liquid chroma-tography electrochemical approach to routine 8-hydroxy-2’-deoxyguanosine measurements in urine and other biologicmatrices: A one-year evaluation of methods. Free Rad BiolMed 1999;27:647–666.
112. Bogdanov MB, et al. Increased oxidative damage to DNA ina transgenic mouse model of Huntington’s disease. J Neu-rochem 2001;79:1246–1249.
113. Stenken JA, Puckett DL, Lunte SM, Lunte CE. Detection ofN-acetylcysteine, cysteine and their disulfides in urine byliquid chromatography with a dual-electrode amperometricdetector. J Pharmaceut Biomed Analysis 1990;8:85–89.
114. Lunte SM, O’Shea TJ. Pharmaceutical and biomedicalapplications of capillary electrophoresis/electrochemistry.Electrophoresis 1994;15:79–86.
115. Zackheim JA, Abercrombie ED. HPLC/EC detection andquantification of acetylcholine in dialysates. Methods MolMed 2003;79:433–441.
116. Kehr J, Dechent P, Kato T, Ogren SO. Simultaneous deter-mination of acetylcholine, choline and physostigmine inmicrodialysis samples from rat hippocampus by microboreliquid chromatography/electrochemistry on peroxidaseredox polymer coated electrodes. J Neurosci Methods1998;83:143–150.
117. Kehr J. Determination of glutamate and aspartate in micro-dialysis samples by reversed-phase column liquid chroma-tography with fluorescence and electrochemical detection. JChromatog B: Biomed Sci App 1998;708:27–38.
118. Kehr J. Determination of g-aminobutyric acid in microdia-lysis samples by microbore column liquid chromatographyand fluorescence detection. J Chromatog B: Biomed Sci App1998;708:49–54.
119. Tao L, Thompson JE, Kennedy RT. Optically gated capillaryelectrophoresis of o-phthalaldehyde/b-mercaptoethanolderivatives of amino acids for chemical monitoring. AnalyChem 1998;70:4015–4022.
120. Yamaguchi M, et al. Determination of norepinephrine inmicrodialysis samples by microbore column liquid chroma-tography with fluorescence detection following derivatiza-tion with benzylamine. Analy Biochem 1999;270: 296–302.
121. Mann M, Fenn JB. Electrospray mass spectrometry: prin-ciples and methods. Mass Spectrom 1992;1:1–35.
122. Emmett MR, Andren PE, Caprioli RM. Specific molecularmass detection of endogenously released neuropeptidesusing in vivo microdialysis/mass spectrometry. J NeurosciMethods 1995;62:141–147.
MICRODIALYSIS SAMPLING 417

123. Wilm M, Mann M. Analytical properties of the nanoelec-trospray ion source. Analy Chem 1996;68:1–8.
124. Juraschek R, Dulcks T, Karas M. Nanoelectrospray-morethan just a minimized-flow electrospray ionization source. JAm Soc Mass Spectrom 1999;10:300–308.
125. Gangl ET, Annan M, Spooner N, Vouros P. Reduction ofsignal suppression effects in ESI-MS using a nanosplittingdevice. Analy Chem 2001;73:5635–5644.
126. Haskins WE, et al. Discovery and neurochemical screening ofpeptides in brain extracellular fluid by chemical analysis of invivo microdialysis samples. Analy Chem 2004;76:5523–5533.
127. Heinemann L. Continuous glucose monitoring by meansof the microdialysis technique: Underlying fundamentalaspects. Diabetes Technol Therap 2003;5:545–561.
128. Wisniewski N, Moussy F, Reichert WM. Characterization ofimplantable biosensor membrane fouling. Fresenius JAnaly Chem 2000;366:611–621.
129. Ward WK. Subcutaneous glucose monitoring: Microdialysisvs. intracorporeal. Diabetes Care 2002;25:410–411.
130. O’Neill RD, Lowry JP, Mas M. Monitoring brain chemistryin vivo: Voltammetric techniques, sensors, and behavioralapplications. Crit Rev Neurobiol 1998;12:69–127.
131. Jones DA, et al. On-line monitoring in neurointensive careEnzyme-based electrochemical assay for simultaneous, con-tinuous monitoring of glucose and lactate from critical carepatients. J Electroanalyt Chem, 2002; 538–539, 243–252.
132. Boutelle MG, Fellows LK, Cook C. Enzyme packed bedsystem for the on-line measurement of glucose, glutamate,and lactate in brain microdialysis. Analy Chem 1992;64:1790–1794.
133. Volpe G, Moscone D, Compagnone D, Palleschi G. In vivocontinuous monitoring of ***L-lactate coupling subcuta-neous microdialysis and an electrochemical biocell. SensorsActuators B 1995; 24–25 138–141.
134. Ryan MR, Lowry JP, O’Neill RD. Biosensor for neurotrans-mitter L-glutamic acid designed for efficient use of L-glu-tamate oxidase and effective rejection of interference.Analyst 1997;122:1419–1424.
135. Cook CJ. Real-time measurement of corticosteroids in con-scious animals using an antibody-based electrode. NatureBiotechnol 1997;15:467–471.
136. Sandberg M, Weber SG. Techniques for neuropeptide deter-mination. TrAC, Trends Analy Chem 2003;22:522–527.
137. O’Connor KA, et al. A method for measuring multiplecytokines from small samples. Brain, Behavior, Immunity2004; 18:274–280.
138. Li Y, Schutte RJ, Abu-Shakra A, Reichert WM. Proteinarray method for assessing in vitro biomaterial-inducedcytokine expression. Biomaterials 2005;26:1081–1085.
139. Vignali DAA. Multiplexed particle-based flow cytometricassays. J Immunol Methods 2000;243:243–255.
140. Kellar KL, et al. Multiplexed fluorescent bead-based immu-noassays for quantitation of human cytokines in serum andculture supernatants. Cytometry 2001;45:27–36.
141. Kellar KL, Iannone MA. Multiplexed microsphere-basedflow cytometric assays. Exp Hemato 2002;30:1227–1237.
142. Xie R, Hammarlund-Udenaes M, De Boer AG, De LangeECM. The role of P-glycoprotein in blood-brain barriertransport of morphine: Transcortical microdialysis studiesin mdr1a (�/�) and mdr1a (þ/þ) mice. Br J Pharmacol 1999;128:563–568.
143. Ungerstedt U. Introduction to intracerebral microdialysis.Tech Behav Neural Sci 1991;7:3–22.
144. Sharp T, Zetterstrom T. In vivo measurement of monoamineneurotransmitter release using brain microdialysis. Monit.Neuronal Act 1992; 147–179.
145. Westerink BHC, Timmerman W. Do neurotransmitterssampled by brain microdialysis reflect functional release?Anal Chim Acta 1999;379:263–274.
146. Salamone JD. The behavioral neurochem of motivation:methodological and conceptual issues in studies of thedynamic activity of nucleus accumbens dopamine. J Neu-rosc Methods 1996;64:137–149.
147. Justice Jr JB. Microchemical analysis in the brain. Micro-chem J 1986;34:11–14.
148. Kennedy RT, et al. In vivo neurochemical monitoring bymicrodialysis and capillary separations. Curr Opin ChemBiol 2002;6:659–665.
149. Fuxe K, Ferre S, Zoli M, Agnati LF. Integrated events incentral dopamine transmission as analyzed at multiplelevels. Evidence for intramembrane adenosine A2A/dopa-mine D2 and adenosine A1/dopamine D1 receptor interac-tions in the basal ganglia. Brain Res Rev 1998;26:258–273.
150. Del Arco A, Segovia G, Fuxe K, Mora F. Changes in dialysateconcentrations of glutamate and GABA in the brain: Anindex of volume transmission mediated actions? J Neuro-chem 2003;85:23–33.
151. Di Chiara G, Tanda G, Carboni E. Estimation of in-vivoneurotransmitter release by brain microdialysis: The issueof validity. Behav Pharmacol 1996;7:640–657.
152. Kendrick KM. Use of microdialysis in neuroendocrinology.Methods Enzymol 1989;168:182–205.
153. Kendrick KM. Microdialysis measurement of in vivo neu-ropeptide release. J Neurosc Methods 1990;34:35–46.
154. Andren PE, Lin-S. N, Caprioli RM. Microdialysis/massspectrometry. Mass Spectrom 1994;2:237–254.
155. Andren PE, Farmer TB, Klintenberg R. Endogenous releaseand metabolism of neuropeptides utilizing in vivo micro-dialysis microelectrospray mass spectrometry. Mass Spec-trom Hyphenated Tech Neuropeptide Res 2002; 193–213.
156. Ståhle L, Microdialysis in pharmacokinetics. Eur J DrugMetabol Pharmacokine 1993;18:89–96.
157. de Lange ECM, Danhof M, de Boer AG. Breimer DD.Methodological considerations of intracerebral microdialy-sis in pharmacokinetic studies on drug transport across theblood-brain barrier. Brain Res Rev 1997;25:27–49.
158. Hansen DK, et al. Pharmacokinetic and metabolism studiesusing microdialysis sampling. J Pharmaceut Sci 1999;88:14–27.
159. Ståhle L. Pharmacokinetic estimations from microdialysisdata. Eur J Clin Pharmacol 1992;43:289–294.
160. Ståhle L. Zero and first moment area estimation frommicrodialysis data. Eur J Clin Pharmacol 1993;45:477–481.
161. Hammarlund-Udenaes M, Paalzow LK. de Lange ECM.Drug equilibration across the blood-brain barrier—pharma-cokinetic considerations based on the microdialysis method.Pharmaceut Res 1997;14:128–134.
162. Bungay PM, Dedrick RL, Fox E, Balis FM. Probe calibrationin transient microdialysis in vivo. Pharmaceut Res 2001;18:361–366.
163. Muller M. Science, medicine, and the future: Microdialysis.Br Med J 2000;324:588–591.
164. De Boer J, Korf J, Plijter-Groendijk H. In vivo monitoring oflactate and glucose with microdialysis and enzyme reactorsin intensive care medicine. Inter J Artif Organs1994;17:163–170.
165. Weintjes KJ, et al. Microdialysis of glucose in subcutaneousadipose tissue up to 3 weeks in healthy volunteers. DiabetesCare 1998;21:1481–1488.
166. Gudbjoernsdottir S, et al. Direct measurements of the per-meability surface area for insulin and glucose in human
418 MICRODIALYSIS SAMPLING

skeletal muscle. J Clin Endocrino Metab 2003;88:4559–4564.
167. Lonnroth P. Microdialysis in adipose tissue and skeletalmuscle. Hormone Metabol Res 1997;29:344–346.
168. Blochl-Daum B, et al. Measurement of extracellular fluidcarboplatin kinetics in melanoma metastases with micro-dialysis. Br J Cancer 1996;73:920–924.
169. Muller M, et al. In vivo drug-response measurements intarget tissues by microdialysis. Clin Pharmacol Therapeut1997;62:165–170.
170. Lindberger M, Tomson T. Ståhle L. Validation of microdia-lysis sampling for subcutaneous extracellular valproic acid inhumans. Therapeut Drug Monitoring 1998;20:358–362.
171. Solligård E, et al. Gut barrier dysfunction as detected byintestinal luminal microdialysis. Int Care Med 2004;30:1188–1194.
172. Chu J, Gallo JM. Application of microdialysis to character-ize drug disposition in tumors. Adv Drug Del Rev2000;15:243–253.
173. Mader RM, et al. Penetration of capecitabine and its meta-bolites into malignant and healthy tissues of patients withadvanced breast cancer. Br J Cancer 2003;88:782–787.
174. Johansen MJ, Thapar N, Newman RA, Madden T. Use ofmicrodialysis to study platinum anticancer agent pharma-cokinetics in preclinical models. J Expe Therap Oncol 2002;2:163–173.
175. Dabrosin C. Microdialysis — an in vivo technique for studiesof growth factors in breast cancer. Frontiers Biosci 2005;10:1329–1335.
176. Hamani C, Luer MS, Dujovny M. Microdialysis in thehuman brain: review of its applications. Neurolog Res1997;19:281–288.
177. Vespa P, et al. Increase in extracellular glutamate caused byreduced cerebral perfusion pressure and seizures afterhuman traumatic brain injury: A microdialysis study. JNeurosur 1998;89:971–982.
178. Sherwin AL. Neuroactive amino acids in focally epileptichuman brain: A review. Neurochem Res 1999;24:1385–1395.
179. Bradberry CW. Applications of microdialysis methodologyin nonhuman primates: Practice and rationale. Crit RevNeurobiol 2000;14:143–163.
180. Laruelle M. Imaging synaptic neurotransmission with invivo binding competition techniques: A critical review. JCerebral Blood Flow Metab 2000;20:423–451.
181. Benfeldt E, Serup J, Menne T. Microdialysis vs. suctionblister technique for in vivo sampling of pharmacokineticsin the human dermis. Acta Dermato-Venereolog 1999;79:338–342.
182. Lefkowitz DL, Lefkowitz SS. (2001) Macrophage-neutrophilinteraction: A paradigm for chronic inflammation revisited.Immunol Cell Biol 2001;79:502–506.
183. Maurer MH, et al. The proteome of human brain micro-dialysate. Proteome Sci 2003;1:7–15.
184. Sjögren F, Svensson C, Anderson C. Technical prerequisitesfor in vivo microdialysis determination of interleukin-6 inhuman dermis. Br J Dermatol 2002;146:375–382.
185. Ao X, Rotundo RF, Loegering DJ, Stenken JA. In vivomicrodialysis sampling of cytokines produced in mice givenbacterial lipopolysaccharide. J Microbiol Methods2005;62:327–336.
186. Sopasakis VR, et al. High local concentrations and effects ondifferentiation implicate interleukin-6 as a paracrine reg-ulator. Obesity Res 2004;12:454–460.
187. Winter CD, et al. A microdialysis method for the recovery ofIL-1beta, IL-6 and nerve growth factor from human brain invivo. J Neurosc Methods 2002;119:45–50.
188. Rosendal L, et al. Increase in interstitial interleukin-6 ofhuman skeletal muscle with repetitive low-force exercise. JAppl Physiol 2005;98:477–481.
189. Heinemeier K, Langberg H, Olesen JL, Kjaer M. Role ofTGF-beta1 in relation to exercise-induced type I collagensynthesis in human tendinous tissue. J Appl Physiol2003;95:2390–2397.
190. Langberg H, Olesen JL, Gemmer C, Kjaer M. Substantialelevation of interleukin-6 concentration in peritendinoustissue, in contrast to muscle, following prolonged exercisein humans. J Physiol 2002;542:985–990.
191. Lin Y-C, Hesketh PJ, Lunte SM, Wilson GS. A microma-chined diaphragm micropump. Proc—Electrochem Soci1995; 95–27. 67–72.
192. Hesketh PJ, et al. Biosensors and microfluidic systems.Tribology Issues and Opportunities in MEMS, Proceedingsof the NSF/AFOSR/ASME Workshop on Tribiology Issuesand Opportunities in MEMS, Columbus, Ohio, Nov. 9–11,1997, 1998; pp 85–94.
193. Zahn JD, Trebotich D, Liepmann D. Microfabricated micro-dialysis microneedles for continuous medical monitoring.Proceedings of the 1st Annual International IEEE/EMBSSpecial Topics Conference on Microtechnologies in Medicine& Biology. October 12–14, 2000, Lyon, France; 2000 pp 375–380.
194. Talbot D, Liepmann D, Pisano AP. Microfabricated poly-silicon microneedles for minimally invasive biomedicaldevices. Biomed Microdevices 2000;2:295–303.
195. Bergveld P, et al. Microdialysis based lab-on-a chip, apply-ing a generic MEMS technology. Comprehen Analy Chem2003;39:625–663.
196. Carneheim C, Ståhle L. Microdialysis of lipophilic com-pounds: a methodological study. Pharmacol Toxicol 1991;69:378–380.
197. Mueller M, et al. In vivo characterization of transdermaldrug transport by microdialysis. J Controlled Release1995;37: 49–57.
198. Trickler WJ, Miller DW. Use of osmotic agents in micro-dialysis studies to improve the recovery of macromolecules.J Pharmaceut Sci 2003;92:1419–1427.
199. Kurosaki Y, Nakamura S, Shiojiri Y, Kawasaki H. Lipo-microdialysis: a new microdialysis method for studying thepharmacokinetics of lipophilic substances. Biolog Pharma-ceut Bull. 1998;21:194–196.
200. Khramov AN, Stenken JA. Enhanced microdialysis extrac-tion efficiency of ibuprofen in vitro by facilitated transportwith b-cyclodextrin. Analy Chem 1999;71:1257–1264.
201. Kjellstrom S, et al. Online coupling of microdialysis sam-pling with liquid chromatography for the determination ofpeptide and non-peptide leukotrienes. J Chromatog A1998;823:489–496.
202. Rekharsky MV, Inoue Y. Complexation thermodynamics ofcyclodextrins. Chem Rev 1998;98:1875–1917.
203. Stenken JA, Chen R, Yuan X. Influence of geometry andequilibrium chemistry on relative recovery during enhancedmicrodialysis. Anal Chim Acta 2001;436:21–29.
204. Khramov AN, Stenken JA. Enhanced microdialysis recov-ery of some tricyclic antidepressants and structurallyrelated drugs by cyclodextrin-mediated transport. Analyst1999; 124:1027–1033.
205. Ward KW, et al. Enhancement of in vitro and in vivomicrodialysis recovery of SB-265123 using intralipid andencapsin as perfusates. Biopharmaceut Drug Disposition2003;24:17–25.
206. Pettersson A, Markides K, Bergquist J. Enhanced micro-dialysis of neuropeptides. Acta Biochim Polon 2001;48:1117–1120.
MICRODIALYSIS SAMPLING 419

207. Pettersson A, et al. A feasibility study of solid supportedenhanced microdialysis. Analy Chem 2004;76:1678–1682.
208. Ao X, Sellati TJ, Stenken JA. Enhanced microdialysis rela-tive recovery of inflammatory cytokines using antibody-coated microspheres analyzed by flow cytometry. AnalChem 2004;76:3777–3784.
209. Kissinger CB, Kissinger PT. Can preclinical ADMET-PKnow be done more efficiently and effectively? Preclinica2004;2: 319–323.
210. Olson DL, Lacey ME, Sweedler JV. High-resolution micro-coil NMR for analysis of mass-limited, nanoliter samples.Anal Chem 1998;70:645–650.
211. Wolters AM, Jayawickrama DA, Sweedler JV. MicroscaleNMR. Curr Opin Chem Biol 2002;6:711–716.
212. Khandelwal P, et al. Studying rat brain Neurochem usingnanoprobe NMR spectroscopy: A metabonomics approach.Analy Chem 2004;76:4123–4127.
Further Reading
The most comprehensive sources for microdialysis sampling arethe book and the two separate journal issues shown below.
Robinson T, Justice JB, editors. Microdialysis in the Neuros-ciences. Amsterdam (The Nethernand): Elsevier; 1991.
Lunte CE Anal Chim Acta 1999;379:227–369.Elmquist WF, Sawchuk RJ. Microdialysis sampling in drug deliv-
ery. Adv Drug Del Res 2000;45:123–307.
See also ELECTROPHORESIS; GLUCOSE SENSORS; HYDROCEPHALUS, TOOLS
FOR DIAGNOSIS AND TREATMENT OF; PHARMACOKINETICS AND PHARMACODY-
NAMICS.
MICROFLUIDICS
GLENN M. WALKER
North Carolina State UniversityRaleigh, North Carolina
INTRODUCTION
Microfluidics is the study and application of fluids at themicroscale. The most common definition of the microscaleis that one or more device dimension be in the range of1–1000 mm. For reference, the diameter of an averagehuman head hair is � 150mm, the average thickness of ahuman fingernail is 360mm, and the diameter of a humanred blood cell is � 7mm. Miniaturization technology, ori-ginally developed by the microelectronics industry, hasbeen used to create microscale fluid components and com-plete microfluidic systems with pumps, valves, and filters,incorporated onto single microchips have been demon-strated.
By applying the analogy of the microelectronics indus-try (i.e., continuously incorporating more features intosmaller areas) a logical application of microfluidics is tocreate lab-on-a-chip (LOC) systems. Lab-on-a-chip sys-tems, also known as micro-total-analysis systems (mTAS),incorporate the functionality of biology or chemistrylaboratories onto a single microfabricated chip. Ideally, aLOC system would be able to execute all of the tasksroutinely performed in a biology or chemistry laboratory,such as sample preconditioning, mixing, reaction, separa-
tion, and analysis. Labor- and time-intensive procedureswould be reduced to instant results derived from a series ofautomated steps performed on a LOC.
Microscale fluid handling confers many advantages overtraditional lab operations (1). First, fluid quantities ran-ging from picoliters to microliters are used, thus reducingthe amount of sample required for tests. Second, theamount of time required to perform some analyses (e.g.,capillary electrophoresis) is reduced to seconds, whichmeans analyses can be conducted many times faster thanwith traditional methods. Third, devices can be manufac-tured using microfabrication technology, which translatesinto reduced cost per device; disposable LOC systems caneasily be envisioned.
In general, microfluidic devices are in early stages ofdevelopment and are most often found in academicresearch laboratories. However, the benefits of these sys-tems have been exploited to develop new medical devicesfor clinical diagnostics and point-of-care testing. Commer-cial examples of devices that make use of LOC concepts arediscussed at the end of this article.
THEORY
Fluid Mechanics
The term microfluidics encompasses both liquid and gasbehavior at the microscale, even though in most applica-tions the working fluid is a liquid. All of the conceptsdiscussed here are directed toward liquids. Other worksare available which provide information on gas behavior atthe microscale (2).
Fluid behavior at the microscale is different from thatcommonly observed in everyday experiences at the macro-scale, owing primarily to the very low Reynolds (Re) num-bers of the flow regime plus the large surface area/volume(SAV) ratios of the flow domain. As a consequence, viscousforces and surface tension effects become dominant overfluid inertia, and transport phenomena are purely diffu-sive.
Fluid flow at the microscale is typically laminar. Fluidflows are classified based on their flow regime, which can bepredicted with the Re number. The Re number is the ratioof inertial forces to viscous forces and can be calculatedwith the equation
Re ¼ rVDh
m(1)
where r is the fluid density, V is the characteristic fluidvelocity, Dh is the hydraulic diameter of the microchannel,and m is the fluid viscosity. Fully developed fluid flow in achannel of circular cross-section is considered laminar ifthe Re number is <2100. For Re numbers between 2100and 2300, the flow is considered transitional: it showssigns of both laminar and turbulent flow. A Re number>2300 indicates turbulent flow.
Laminar flow is predictable in the sense that the tra-jectories of microscopic particles suspended in it can beaccurately predicted (Fig. 1a). Particles suspended in aturbulent fluid flow behave chaotically and their positionas a function of time cannot be accurately predicted
420 MICROFLUIDICS

(Fig. 1b). Fluid flow that has a Re number <1 is also knownas viscous flow, creeping flow, boundary-layer flow, orStokes flow.
Low Re number flow is best visualized by imagininghow honey (or any viscous substance) behaves whenpoured or stirred. For example, water flowing inmicrochannels will generally have a Re number <1. Inthis case, water will behave like a very viscous liquid (i.e.,like honey). An important point to make here is that theproperties of water do not change at the microscale; ratherthe microscale dimensions involved make the waterappear more viscous than what we are accustomed to atthe macroscale. An excellent description of low Re numberenvironments has been given by Purcell (3). Very viscousfluid flows have certain characteristics: the flow is rever-sible, mixing is difficult, and flow separation does not occur(4).
Reversibility is the ability of a suspended particle in afluid to retrace its path if the flow is reversed. This is aresult of the minimal inertia (i.e., low Re number) presentin fluid flows at the microscale. Figure 2 shows the path asuspended microscopic particle might take in forward andreverse flow.
A second characteristic of microscale fluid flow is a lackof flow separation. Flow separation is commonly observedin the form of vortices, which are recirculating flows sepa-rate from the main flow. Because of the low Re numberenvironment, vortices usually will not form within micro-fluidic channels, as shown in Fig. 3a. Separation will onlyoccur in flows wherein inertial forces are significant rela-tive to viscous forces (Re > 1). Figure 3b is a qualitativesketch of flow separation in a cavity.
The third characteristic of microscale fluid flows isinefficient mixing as a result of very low Re number flow,and thus negligible inertia. Low inertia means that stir-ring is not effective and that mixing must be accomplishedby diffusion. At the macroscale, stirring minimizes thediffusion distances between two or more liquids by dis-tributing ‘‘folds’’ of the liquids throughout the volume.Microscale methods of mixing have been developed thattake advantage of the unique properties of the scale andimprove the efficiency of mixing over simple diffusion;examples include using three-dimensional (3D) channelgeometries, patterned channel surfaces, and pulsatileflow (5).
Figure 4 shows two streams flowing down a micro-channel side-by-side. Because of the low Re number envir-onment the streams will only mix by diffusion. If theflowrate is slow enough, the streams will eventuallybecome uniformly mixed across the whole microchannelwidth.
The hydraulic diameter, Dh, of a microchannel is deter-mined by its cross-sectional geometry and can be calculatedwith the equation
Dh ¼ 4A
P(2)
MICROFLUIDICS 421
Figure 1. (a) Particles suspended in a laminar flow within astraight microchannel follow straight trajectories. (b) Particlessuspended in a turbulent flow within a straight microchanneldo not follow straight trajectories unless they are very close tothe wall.
Figure 2. (a) A suspended particle in laminar flow around anobstacle in a microchannel. (b) If the flow is reversed, the particlewill retrace the same path.
Figure 3. (a) At low velocities (low Re numbers), flow separationwill not occur in microchannels. (b) At higher velocities (larger Renumbers), flow separation may become apparent.
Figure 4. Two streams flowing in a microchannel will only mix bydiffusion. Note that the concentration across the width of each halfof the main microchannel is not constant as diffusional mixingprogresses.
where A and P are the microchannel cross-sectional areaand wetted perimeter, respectively. The hydraulic dia-meter is often used to calculate important flow character-istics for noncircular microchannel cross-sections.
At microscale dimensions diffusion is an effectivemechanism for transporting molecules because of therelatively short distances involved. Particles diffuse fromareas of high concentration to areas of low concentrationand will eventually diffuse to uniform concentrationthroughout a given volume. The mean distance, d, aparticle travels in a time, t, can be predicted with theequation
d2 ¼ 2Dt (3)
where D is the diffusion coefficient of the particle.Diffusion times are proportional to the square ofdistance, which means that particles can diffuse acrossmicroscale distances within a particular medium in amatter of seconds. Table 1 lists representativemolecules of biological significance and their diffusioncoefficients.
The SAV ratios become very large at the microscale.Typical SAV ratios for macroscale containers such as Petridishes or culture flasks are �10 cm�1, while they are �800cm�1 for microfluidic channels. Increased SAV ratios allowdiffusion-limited processes, such as immunoassays tobecome much more efficient at the microscale because ofthe increased surface area available for binding. LargeSAV ratios also allow rapid heat radiation from microscalefluid volumes and efficient gas exchange with the ambientatmosphere and fluid in microchannels (assuming themicrochannel is made of a gas-permeable material).Enhanced gas transport is a critical ingredient for cellculture in microscale environments. One drawback oflarge SAV ratios is that evaporation becomes a significantproblem.
The surface tension of a liquid becomes increasinglyimportant at very small dimensions. To visualize this,think of a liquid surface as an elastic skin. If a slit weremade in that skin, a certain amount of force per unit lengthwould be required to hold the two sides of the slit together.The amount of force required to hold the two sides togetheris called the surface tension. Because the liquid surface isunder tension, liquid confined by the surface (e.g., a rain-
drop) will experience an internal pressure. This pressure iscalled the Young–LaPlace pressure. Smaller fluid volumesresult in larger SAV ratios, thus increasing the internalpressure. The pressure within a drop of liquid can becalculated with the formula
DP ¼ 2g
R(4)
where g is the liquid surface energy and R is the radius ofthe drop. At microscale dimensions, significant pressurescan be created by surface tension. A common result of thepressure difference of an air/liquid interface is the capil-lary effect: a pressure difference across the interfacepropels liquid through a small diameter capillary ormicrochannel.
The capillary effect also depends on the contact angle ofthe microchannel surface. Hydrophobic surfaces (e.g., poly-mers) have contact angles >908 and hydrophilic surfaces(e.g., glass) have contact angles <908. Microfluidic deviceswith hydrophilic surfaces can be filled via capillary action.The pressure difference at an air–liquid interface within amicrochannel with square cross-sectional area can be cal-culated with the formula
DP ¼ 2gcosðucÞ
Wþ cosðucÞ
H
� �(5)
where W and H are the microchannel width and height,respectively, and uc is the contact angle of the liquid on theinternal microchannel walls. Conversely, equation 5 givesthe pressure required to force water into a hydrophobicmicrochannel of rectangular cross-section.
Microfluidic Modeling
Microscale fluid flow can be modeled from either a macro-scopic or microscopic vantage point. Macroscopic modelingtreats the fluid as a well-mixed volume while the micro-scopic view looks at how particles suspended in the fluidwould behave under different flow conditions.
Macroscopic modeling, also called lumped modeling,uses conservation of mass to predict microfluidic systembehavior. A pressure drop, DP, applied across a microchan-nel (or other conduit) with fluidic resistance Z, will induce avolumetric flow rate Q:
DP ¼ QZ (6)
All microchannels have a fluidic resistance associatedwith them that depends on the geometry of the micro-channel and the viscosity of the fluid. The fluidic resis-tance of a microchannel with a circular cross-section isgiven by
Z ¼ 8mL
pR4(7)
where m is the fluid viscosity, L is the microchannellength, and R is the microchannel radius. The fluidicresistance of a microchannel with a rectangular cross-section is given by
Z ¼ 4mL
ab3f
a
b
� ��1(8)
422 MICROFLUIDICS
Table 1. Diffusion Coefficients for Biologically ImportantMolecules in Watera
Molecule T, 8C D, cm2 � s�1 Diffusion time, s
Cl� 25 2.03�10�5 0.02O2 18 2 � 10�5 0.03Kþ 25 1.96 � 10�5 0.03Naþ 25 1.33 � 10�5 0.04Glucose 20 6� 10�6 0.08Lactose 20 4.3� 10�6 0.12Insulin 20 1.5 � 10�6 0.33Hemoglobin 20 6.3 � 10�7 0.79Urease 20 3.4 � 10�7 1.47
aAll values are from Ref. 6. The time for each particle to diffuse 10 mm is
shown for comparison.

where f(a/b) is calculated with the formula
fa
b
� �¼ 16
3� 1024b
ap5
X1n¼0
tanh ma
ð2n þ 1Þ5(9)
When calculating the resistance of microchannelswith rectangular cross-section, m is the fluid viscosity, Lis the microchannel length, 2a and 2b are the micro-channel width and height, respectively, and m iscalculated with
m ¼ pð2n þ 1Þ2b
(10)
If the aspect ratio of the microchannel is very small (i.e.,2b 2a) then the simplified formula
Z ¼ 3mL
4ab3(11)
can be used. The general rule of thumb is that equation 11should be used for microchannels with b/a <0.1.The resistance of other geometries can be found else-where (7).
In predicting microfluidic system behavior, the analo-gies to Kirchhoff’s laws are used. The sum of pressure dropsin a fluidic loop must be equal to zero; the total volumetricflowrate entering a node must be equal to the total volu-metric flowrate leaving a node.
In contrast to the macroscopic view, microscopicmodeling allows fluid behavior to be predicted. Specifi-cally, the microscopic view allows the velocity profiles of afluid flow to be calculated. Velocity profiles are plots thatshow the relative velocities of different portions of a fluidwithin a microchannel. Figure 1a is an example of avelocity profile.
The velocity of flow in a microchannel with circularcross-section varies radially and can be predicted withthe formula
vðrÞ ¼ R2DP
4mL1 � r2
R2
� �(12)
where m is the fluid viscosity, L is the microchannel length,DP is the pressure drop, and R is the microchannel radius.The velocity profile of flow in a microchannel with rectan-gular cross-section varies along the height and width axesand can be predicted with the formula
vðx; yÞ ¼ DP
2mLb2 � y2 � 4
b
X1n¼0
ð�1Þn 1
m3
cos my cosh mx
cosh ma
!
(13)
where m is the fluid viscosity, L is the microchannellength, DP is the pressure drop, m is calculated fromequation 10, and 2a and 2b are the microchannel widthand height, respectively.
Microscopic modeling is performed when precise mod-eling of fluid behavior is needed. For example, cellsattached to the wall of a microchannel might affect flow;modeling at the microscopic level would reveal any per-turbations of the flow caused by the cell. In contrast,macroscopic modeling is performed when the behaviorof the entire microfluidic system is needed. For example,fluid flow in many parallel microchannels might berequired. Macroscopic modeling would reveal the relativeflowrates through each microchannel and provide themicrochannel dimensions needed to guarantee equal flowthrough each.
PUMPING FLUIDS
Fluids are pumped through microfluidic channels by creat-ing gradients; the two most common types being pressureand electrical. Other types of gradients and their applica-tions are discussed elsewhere (8).
Pressure gradients are the most common method usedto pump fluid. Pressure is applied to one end of a micro-channel which causes the fluid to flow down the pressuregradient. Common methods for creating a pressure gradi-ent include pumps or gravity. Most methods for creatingpressure-driven flow use macroscale pumps attached to themicrofluidic device via tubing. Ideally, pumps should beincorporated on-chip to realize the ultimate vision for LOCdevices. Many types of microfluidic pumps have beendemonstrated and they presently constitute an active areaof research (9).
Pressure-driven flow is attractive for use in microflui-dics because it is easy to set up and model. Some drawbacksfor using pressure-driven flow are sensitivity to bubbles,sensitivity to motion (via the tubing connecting pumps tothe microfluidic device), and parabolic flow profiles. Shearstress is proportional to the pressure drop across a micro-channel, which should be taken into account when manip-ulating cells.
The other common way to pump fluids is to use electricalgradients. This method of pumping fluid is only practical atthe microscale level because of the large electric fields andSAV ratios required. Pumping via electric fields is calledelectrokinetic flow and is based on two phenomena: elec-trophoresis and electroosmosis. Electrophoresis operateson the principle that charged particles in an electric fieldwill feel a force proportional to the field strength and theircharge. The particles will move through the electric fieldtoward the pole of opposite charge. Larger particles moveslower than smaller particles because of the drag producedby moving through a fluid. Figure 5a shows an example ofelectrophoretic flow.
A charged particle in an electric field of strength E willtravel with a velocity equal to
v ¼ mepE (14)
where mep is the electrophoretic mobility. Electrophoreticvelocities are typically much smaller than the velocitiescaused by electroosmosis.
Electroosmosis will only function in the presence ofan electric double layer at the surface of the microchannel.
MICROFLUIDICS 423

An electric double layer forms at a charged surfacewhen oppositely charged particles from an electricallyneutral liquid gather at the surface. The thickness ofthe electric double layer is known as the Debyelength; the concentration of charged particles at asurface falls off rapidly as a function of distance and isshown in Fig. 5c. When an electric field is applied acrossthe length of the microchannel, the ions gathered at themicrochannel surface begin to slide toward the oppositelycharged pole, as shown in Fig. 5b. As the ions slide, theydrag their neighbors within the bulk liquid, toward themiddle of the microchannel. The friction between subse-quent sliding layers of ions causes the bulk fluid to beginmoving.
If the Debye length is much less than the characteristicdimensions of the microchannel, then the bulk fluid velo-city can be predicted with the equation
v ¼ meoE (15)
where E is the electric field strength and meo is calculatedwith
meo ¼ ez4pm
(16)
where e is the dielectric constant of the fluid, z is the zetapotential of the surface, and m is the fluid viscosity.
Electrokinetic flow is attractive because it only requiresthe integration of electrodes in a microfluidic device, whichis straightforward by microfabrication standards. Electro-kinetic flow is therefore amenable to interfacing withelectronic control circuitry. Electrokinetic flow alsoresults in a blunt flow profile, which reduces the distortionof transported samples. Lastly, electrokinetic flow has
very rapid response times, since the electrodes are inte-grated on chip, and are generally insensitive tomovement off chip. Drawbacks to electrokinetic flowinclude fouling of the electrodes, which reduces electricfield strength and therefore flowrate. Also, protein adsorp-tion to microchannel surfaces affects the Debye layer, andin turn flow. Unintended side effects from electric fields onbiological cells within the microfluidic device may alsoexist. Figure 6 shows the difference between the parabolicflow profile of pressure-driven flow and the blunt profile ofelectrokinetic flow.
Other methods of fluid flow based on surface tension,heat, and evaporation, have also been demonstrated. How-ever, these methods have yet to be widely adopted and it is
424 MICROFLUIDICS
Figure 5. (a) Electrophoresis. Chargedparticles will move toward oppositelycharged poles in an elec- tric field. (b)Electroosmosis. Charges lining amicrochannel sur- face will movewith an applied electric field, thusinducing bulk flow via momentumtransfer within the liquid. (c) Anelectric double layer forms atcharged microchannel surfaces; thelayer thickness is called the Debyelength.
Figure 6. (a) Pressure-driven flow is parabolic; the middle of thestream moves faster than regions near the wall. (b) Electrokineticflow is blunt; all parts of the stream move at equal velocity. Notethat residual pressures can cause the profile to become slightlyparabolic in the direction of the negative pressure gradient.

unclear if they will prove more attractive than pressure-driven or electrokinetic flow.
FABRICATION
Fabricating microfluidic channels in traditional microfab-rication materials, such as silicon and glass, can beachieved in two different ways. In the first, material isselectively removed, or etched, from a bulk substrate. Theetched substrate is then bonded to another material (e.g.,glass or silicon), which may have access holes or otherfeatures embedded in it. The result is an enclosed channelstructure, as shown in Fig. 7a. The second method is toselectively add material to a substrate, and then bondanother substrate to it. This method will also form enclosedchannel structures as shown in Fig. 7b.
Photolithography is a fundamental part of allmicrofabrication (Fig. 8). Light is used to project patternsonto a photosensitive chemical, called a photoresist. Thephotoresist can be either positive or negative. Lightchemically alters positive photoresist and makes it solublein a developer. Negative photoresist is cross-linked bylight, which makes it insoluble in developer. The pat-terned photoresist can be used as an etch mask for sub-strates, producing microchannels like those shown inFig. 7a. Patterned photoresist can also be used in subse-quent steps to direct the patterning of other materials that
cannot be directly patterned with light. In-depth treat-ments of microfabrication techniques can be found else-where (10,11).
Polymers have recently become popular alternatives totraditional (e.g., silicon or glass) microfabrication materi-als. Polymers can be used to make microchannels by usingthe same methods mentioned previously for silicon andglass. Polymers also have the advantage that they can bemolded that makes them a cheaper alternative (relative tosilicon or glass) for mass production.
Polymer microfluidic devices can be created by molding,hot embossing, injection molding, photopolymerization,and laser ablation or laser cutting. An attractive methodfor fabricating polymer microfluidic devices is to use aprocess known as micromolding (12). In this process, photo-lithography is used to make a pattern of the microchannels(called a master). The photoresist provides a positive relieffrom which a polymer mold can be cast. The polymer ispoured over the master and allowed to cure. The polymermold is then peeled from the master and either placed on asubstrate or incorporated into a multilayer device. The twoadvantages of this microfabrication method are (1) nospecial microfabrication equipment is required, and (2)many inexpensive copies of a microfluidic device can berapidly manufactured.
Drawbacks to using polymers include leaching of mate-rial into microfluidic channels, solvent incompatibility,
MICROFLUIDICS 425
Figure 7. (a) Material is etchedfrom a substrate and an enclosedstructure is formed by bonding theetched substrate to a glass lid. (b)Walls of microchannels are built ontop of a substrate and a glass lid isplaced on top of the photoresist toform an enclosed structure.
Figure 8. Photolithography re-quires an ultraviolet (UV) lightsource, a mask, and a photo-sensitive layer of material (i.e.,photoresist). The photoresist ispatterned with the UV light via amask.

and the ability of some substances to diffuse into thepolymer. Also, surface treatments are occasionallyrequired to make polymers compatible with electrokineticflow; silicon or glass have an inherent surfacecharge that allows them to be used in electrokinetic flowapplications.
BIOMEDICAL APPLICATIONS OF MICROFLUIDICS
Microfluidic concepts have already been incorporated in avariety of biomedical devices (13). One example of a micro-fluidic device now found in many biomedical labs isAgilent’s Bioanalyzer. The Bioanalyzer system uses dis-posable chips etched in glass. The samples to be separatedand reagents for the separation are loaded onto the chip viareservoirs. The chip is then placed in a reader, whereelectrokinetic flow is used to manipulate the samples inthe reservoirs (Fig. 9).
Microfluidic capillary electrophoresis systems arebecoming commonplace in laboratories. By usingvery small volumes for separation, joule heating fromelectrophoresis is rapidly radiated away from the gel.
Efficient heat radiation allows larger voltages to be usedwhich translates into faster separations. The shorterseparation distances used also contribute to reduced ana-lysis times. Microfluidic capillary electrophoresis systemsallow DNA to be rapidly analyzed, and have highly repro-ducible results since the entire process is automated.Lastly, contamination is minimized because the devicesare disposable.
Because of their small size, another attractiveaspect of capillary electrophoresis (CE) systems is thatthey can be incorporated into LOC devices and madepart of a complete system. An example that has beendemonstrated in several research labs is a system thattakes cells as inputs, lyses them, performs all necessarypreprocessing, DNA amplification, and so on, and thenperforms the DNA separations, all with no human inter-vention (14).
Microfluidics are also being used in clinical devices;devices for hematology and disposable assays for point-of-care diagnostics are among those now being researchedand brought to market. A handheld point-of-care devicemade by i-STAT is an example of a clinical microfluidicdevice (Fig. 10). The handheld device quantifies analytes in
426 MICROFLUIDICS
Figure 9. (a) The Bioanalyzer usesmicrofluidic chips etched from glass.(Images courtesy of Agilent Techno-logies). (b) The etched glass chips areencased in a plastic assembly thatfacilitates handling and limitscontamination. Images courtesy ofAgilent Technologies. (c) Samplesare loaded onto the chip and thechip is loaded into the Bioanalyzer.(Images courtesy of AgilentTechnologies). (d) The Bioanalyzerthen performs an analysis on thesamples. (Images courtesy ofAgilent Technologies.)

blood samples that have been deposited on a disposablechip. The general procedure for operation is givenbelow (15).
A patient’s blood sample is deposited in a well on thedisposable chip and then the well gasket is snapped shut(Fig. 10a). The microfluidic chip is then inserted into ahandheld reader that performs an automated analysis ofthe blood sample, as shown in Fig. 10b. On-chip biosensorsare automatically calibrated and checked for accuracywith an on-chip packet of calibrated solution. Oncetheir accuracy has been determined, the calibration solu-tion is flowed to the waste compartment. The bloodsample is then flowed over the biosensors and the concen-trations of different analytes are displayed on the hand-held device screen within a few minutes. Diaphragmpumps are used to move the fluid. A variety of chips areavailable for different assays, including electrolytes andblood gases.
CONCLUSION
Microfluidics is the study and application of fluids atthe microscale. Techniques used by the microelectronicsindustry have been adapted to facilitate the creation ofmicron-size channels capable of carrying fluid. Thephysical behavior of fluid at the microscale differs frombehavior observed at the macroscale in everyday experi-ence. The miniaturization of fluid handling has allowedLOC devices to be created in which all of the procedures of atraditional chemistry or biology lab are performed auto-matically in a single microfabricated chip. Lab-on-a-chipdevices will allow new clinical and research tools to bedeveloped.
BIBLIOGRAPHY
1. Brody JP, et al. Biotechnology at low Reynolds numbers.Biophys J 1996;71(6):3430–3441.
2. Karniadakis GE, Beskok A. Micro Flows. 2nd ed. New York:Springer-Verlag; 2001. p 360.
3. Purcell EM. Life at low Reynolds number. Am J Phys1977;45(1):3–11.
4. Meldrum DR, Holl MR. Tech.Sight. Microfluidics. Microscalebioanalytical systems. Science 2002;297(5584):1197–1198.
5. Nguyen NT, Wu ZG. Micromixers—a review. J MicromechMicroeng 2005;15(2):R1–R16.
6. Stein WD. Channels, Carriers, and Pumps: An Introductionto Membrane Transport. San Diego: Academic; 1990.
7. Shah RK, London AL. Laminar Flow Forced Convection inDucts. New York: Academic; 1978.
8. Stone HA, Stroock AD, Ajdari A. Engineering flows in smalldevices: Microfluidics toward a lab-on-a-chip. Ann Rev FluidMech 2004;36:381–411.
9. Laser DJ, Santiago JG. A review of micropumps. J MicromechMicroeng 2004;14(6):R35–R64.
10. Kovacs G. Micromachined Transducers Sourcebook. Boston:WCB McGraw-Hill; 1998.
11. Madou M. Fundamentals of Microfabrication. 2nd ed BocaRaton(FL): CRC Press; 2002.
12. McDonald J, et al. Fabrication of microfluidic systems inpoly(dimethylsiloxane). Electrophoresis 2000;21(1):27–40.
13. Beebe DJ, Mensing GA, Walker GM. Physics and applica-tions of microfluidics in biology. Ann Rev Biomed Eng2002;4:261–286.
14. Waters L, et al. Microchip device for cell lysis, multiplex PCR,amplification, and electrophoretic sizing. Anal Chem 1998;70(1):158–162.
15. Lauks IR. Microfabricated biosensors and microanalyticalsystems for blood analysis. Acc Chem Res 1998;31(5):317–324.
See also DRUG DELIVERY SYSTEMS; NANOPARTICLES
MICROFLUIDICS 427
Figure 10. (a) The handheld point-of-care device manufactured by i-STAT performs analyses on bloodsamples contained in a disposablecartridge. Reprinted with per-mission from ACS (from Ref 15).Copyright 1998 American Chemi-cal Sa. (b) Microfluidic cartridgesare loaded with a sample and thenplugged into the i-STAT handhelddevice. Image courtesy of AbbottPoint-of-Care. The cartridge con-tains all necessary microfluidiccontrol and sensing componentsthat are then actuated by thehandheld device.
(a) (b)
Cartridge label
Cartridge cover
Cartridge base
Air bladder
Fluid channel
Sample entrywell gasket
Tape gasket
Biosensor chips
Calibrant pouch
Puncturing barb
Sample entry well
Cartridge

MICROPOWER FOR MEDICAL APPLICATIONS
JI YOON KANG
Korea Institute of Science andTechnologySeoul, Korea
INTRODUCTION
Generally, micropower is the local generation of electricityby small-scale generators, which locates the end point.As the recent development of the microelectromechanicalsystem (MEMS), as well as CMOS electronics technology,has been reducing the size and cost of biomedical devices,the research of micropower became important for implan-table biomedical devices since they require internal self-sustained power sources.
As for biomedical devices, micropower is an internal orexternal power source to supply energy for active devices,which replaces an organ’s function or treats diseases. Theexamples of active implantable devices that consume energyare cardiac pacemakers, cardiac defibrillators, muscle sti-mulators, neurological stimulators, cochlear implants, anddrug pumps (1). Hence, in this article the term micropowerdescribes rather tiny power supplying devices for miniatur-ized sensors, actuators, and electric devices, whose size is> or < 1 cm3.
The low power electrical actuator, such as a pacemakeror neuronal stimulator, requires tens of microwatts inter-mittently and their power source is usually a lithium iodinebattery that lasts from 5–8 years. Usually, the stand-bycurrent of a pacemaker is �1 mA in waiting mode and itspulse current is � 6 mA. One example of a specification fora pacemaker pulse is in the range of 25 mJ (�11 mA at 2.2 Vwith a 1 ms discharge) and the capacity of the battery is 2Ah at typical rating (2). The volume of a pacemaker is�20 mL and the volume occupied by the battery is aboutone-half of the total volume, 10 mL. Hence, the energydensity (energy/volume) and reliability are important fac-tors in the lifetime of the device.
An internal battery that is hermetically sealed in thesedevices can operate them with low power consumption;however, other implantable devices have radically differ-ent power requirements. Implantable cardioverter defibril-lators demand the energy of 15–40 J providing six orders ofmagnitude larger than that of a pacemaker even thoughthe pulses are less frequent. The current from a lithiumsilver vanadium battery is charged in an internal capacitorand the pulse of 1–2 A of current is fired. Electromechanicalactuator like drug pumps demand more current than alithium ion battery can deliver since it needs to overcomethe high pressure in the chamber. The examples of drugpumps are insulin pumps, pain reliever, and an cerebro-spinal fluid pump. A high current implantable batteryshould have low source impedance, such as lithium thionylchloride, lithium carbon monofluoride, or lithium silvervanadium oxide.
Other future application are in wireless sensors, inclu-ding physiological, chemical, or physical sensors embeddedin an encapsulated environment. Miniaturized sensor
consumes < 100 mW and a radio frequency (rf) transmitterconsumed �10 mW intermittently. Since most of the poweris used for communication, some research groups aredeveloping several low power wireless transmission proto-cols (3,4). Hence, less power will be necessary for a sensortransmitter as technology evolves.
Some groups investigated more efficient and reliablebatteries. To enhance their efficiency and lifetime, poten-tial alternatives of the conventional batteries studied, suchas a microfabricated battery, microfabricated fuel cell, andbiofuel cell. Microelectrical system technology reduces thesize of the primary battery and microfluidic galvanic cell(5), water activated microbatteries (6), and Li-ion micro-batteries were demonstrated. The fuel cell attracts muchattention since it has a high efficiency, high power, and lowpollution rate. Research on fuel cells focus on high powerapplications,suchastheautomobileandportableelectronics,like laptop computers and cellular phones (7). Recently,micromachining technologies employed as a method to fab-ricate miniature fuel cells (8–11) and their size becamesmaller than a button cell battery (12) with high power.Enzyme-based glucose/O2 biofuel cells were reported byseveral groups (13) and a miniaturized all (14) was reportedthat is < 1 mm3, with although a power of 4.3mW. Sinceglucose is available in all tissues and organs, it is advanta-geous in implanted medical sensortransmitters.
Although a primary battery as well as a rechargeablebattery is an important tool that supplies reliable power toimplant devices, the continuous power of the batterydecreases with time, and after 5 years they will not supplyenough power (15). Power delivery with an rf transmissioncan extend the lifetime and continuously deliver high power.In the case of a cochlear implant, an external device providespower and data through electromagnetic field coupling;however, it needs accurate positioning of the external deviceand may cause rf interference and heating of the tissue.
Therefore, many research groups are paying attention tomicrofabricated power scavenging devices as an auxiliarypower source to recharge the battery with no external power.Ambient energy sources are body heat or movement of thehuman body. Piezoelectric material (16–18), capacitancechange (19–24), and inductive coil (25–27) convert vibrationor human motion into electrical energy. The generation byhigh frequency vibration is not suitable for implant devicessince vibration of the human body is in the range of tens ofhertz. Hence, energy conversion using vibration of low fre-quency can be integrated with implant devices.
Thermoelectric generators that convert temperature dif-ferences of the human body or combustion engine to elec-tricity were reported (28,29). Another conversion method isthe thermophotovoltaic power generator (30,31), which com-bines the combustion engine and solar cell. However, inte-grating a power generation device into an implant devicehas some limitations due to biocompatibility. Power genera-tion with a high temperature like the combustion engine orthermovoltaic metoid, cannot be implemented in the insideof the human body due to the heating of tissues. Thermo-electric generation using body heat is promising for theimplantable device. However, this article includes thereview on the other portable power sources like the micro-
428 MICROPOWER FOR MEDICAL APPLICATIONS
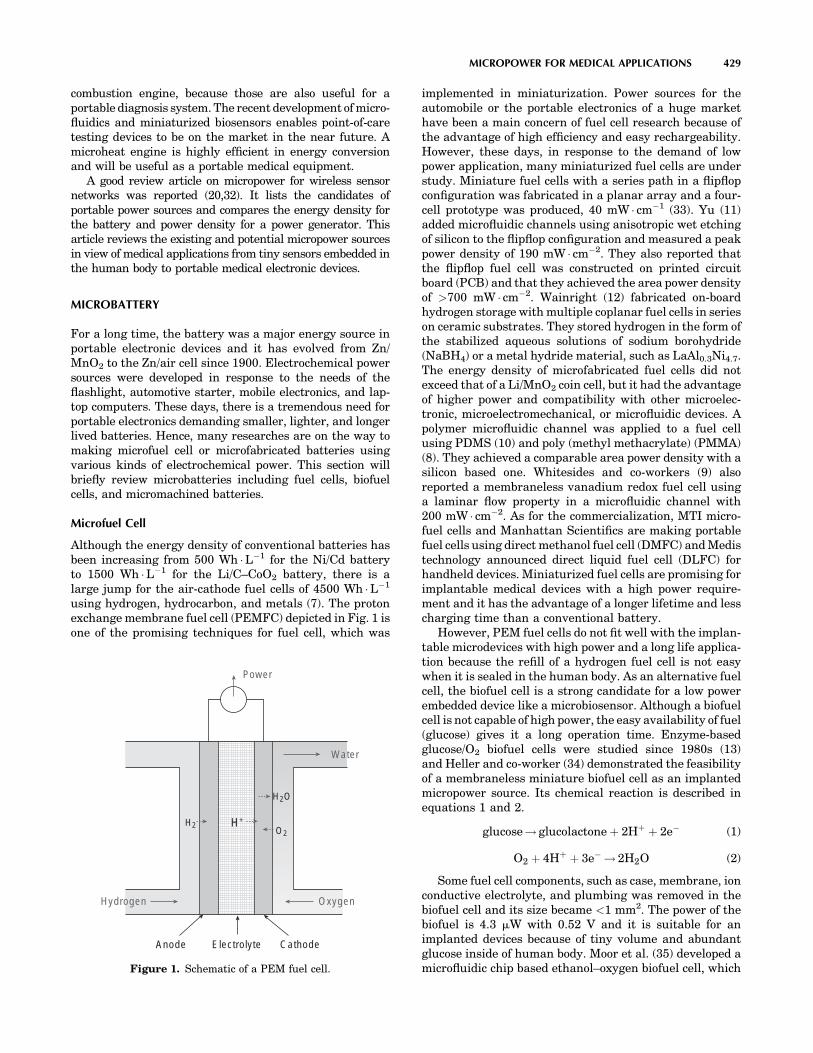
combustion engine, because those are also useful for aportable diagnosis system. The recent development of micro-fluidics and miniaturized biosensors enables point-of-caretesting devices to be on the market in the near future. Amicroheat engine is highly efficient in energy conversionand will be useful as a portable medical equipment.
A good review article on micropower for wireless sensornetworks was reported (20,32). It lists the candidates ofportable power sources and compares the energy density forthe battery and power density for a power generator. Thisarticle reviews the existing and potential micropower sourcesin view of medical applications from tiny sensors embedded inthe human body to portable medical electronic devices.
MICROBATTERY
For a long time, the battery was a major energy source inportable electronic devices and it has evolved from Zn/MnO2 to the Zn/air cell since 1900. Electrochemical powersources were developed in response to the needs of theflashlight, automotive starter, mobile electronics, and lap-top computers. These days, there is a tremendous need forportable electronics demanding smaller, lighter, and longerlived batteries. Hence, many researches are on the way tomaking microfuel cell or microfabricated batteries usingvarious kinds of electrochemical power. This section willbriefly review microbatteries including fuel cells, biofuelcells, and micromachined batteries.
Microfuel Cell
Although the energy density of conventional batteries hasbeen increasing from 500 Wh �L�1 for the Ni/Cd batteryto 1500 Wh �L�1 for the Li/C–CoO2 battery, there is alarge jump for the air-cathode fuel cells of 4500 Wh �L�1
using hydrogen, hydrocarbon, and metals (7). The protonexchange membrane fuel cell (PEMFC) depicted in Fig. 1 isone of the promising techniques for fuel cell, which was
implemented in miniaturization. Power sources for theautomobile or the portable electronics of a huge markethave been a main concern of fuel cell research because ofthe advantage of high efficiency and easy rechargeability.However, these days, in response to the demand of lowpower application, many miniaturized fuel cells are understudy. Miniature fuel cells with a series path in a flipflopconfiguration was fabricated in a planar array and a four-cell prototype was produced, 40 mW � cm�1 (33). Yu (11)added microfluidic channels using anisotropic wet etchingof silicon to the flipflop configuration and measured a peakpower density of 190 mW � cm�2. They also reported thatthe flipflop fuel cell was constructed on printed circuitboard (PCB) and that they achieved the area power densityof >700 mW � cm�2. Wainright (12) fabricated on-boardhydrogen storage with multiple coplanar fuel cells in serieson ceramic substrates. They stored hydrogen in the form ofthe stabilized aqueous solutions of sodium borohydride(NaBH4) or a metal hydride material, such as LaAl0.3Ni4.7.The energy density of microfabricated fuel cells did notexceed that of a Li/MnO2 coin cell, but it had the advantageof higher power and compatibility with other microelec-tronic, microelectromechanical, or microfluidic devices. Apolymer microfluidic channel was applied to a fuel cellusing PDMS (10) and poly (methyl methacrylate) (PMMA)(8). They achieved a comparable area power density with asilicon based one. Whitesides and co-workers (9) alsoreported a membraneless vanadium redox fuel cell usinga laminar flow property in a microfluidic channel with200 mW � cm�2. As for the commercialization, MTI micro-fuel cells and Manhattan Scientifics are making portablefuel cells using direct methanol fuel cell (DMFC) and Medistechnology announced direct liquid fuel cell (DLFC) forhandheld devices. Miniaturized fuel cells are promising forimplantable medical devices with a high power require-ment and it has the advantage of a longer lifetime and lesscharging time than a conventional battery.
However, PEM fuel cells do not fit well with the implan-table microdevices with high power and a long life applica-tion because the refill of a hydrogen fuel cell is not easywhen it is sealed in the human body. As an alternative fuelcell, the biofuel cell is a strong candidate for a low powerembedded device like a microbiosensor. Although a biofuelcell is not capable of high power, the easy availability of fuel(glucose) gives it a long operation time. Enzyme-basedglucose/O2 biofuel cells were studied since 1980s (13)and Heller and co-worker (34) demonstrated the feasibilityof a membraneless miniature biofuel cell as an implantedmicropower source. Its chemical reaction is described inequations 1 and 2.
glucose! glucolactone þ 2Hþ þ 2e� (1)
O2 þ 4Hþ þ 3e� ! 2H2O (2)
Some fuel cell components, such as case, membrane, ionconductive electrolyte, and plumbing was removed in thebiofuel cell and its size became <1 mm2. The power of thebiofuel is 4.3 mW with 0.52 V and it is suitable for animplanted devices because of tiny volume and abundantglucose inside of human body. Moor et al. (35) developed amicrofluidic chip based ethanol–oxygen biofuel cell, which
MICROPOWER FOR MEDICAL APPLICATIONS 429
H2 H+
H2O
O2
Water
Power
OxygenHydrogen
Anode CathodeElectrolyte
Figure 1. Schematic of a PEM fuel cell.
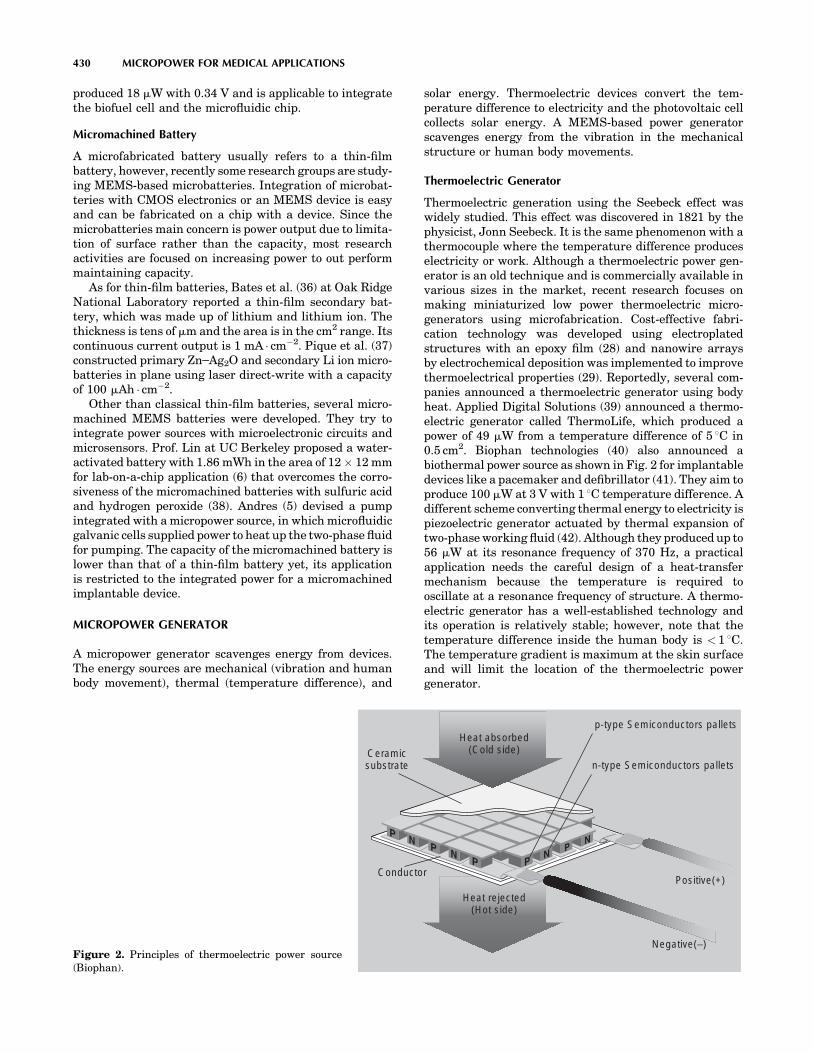
produced 18 mW with 0.34 V and is applicable to integratethe biofuel cell and the microfluidic chip.
Micromachined Battery
A microfabricated battery usually refers to a thin-filmbattery, however, recently some research groups are study-ing MEMS-based microbatteries. Integration of microbat-teries with CMOS electronics or an MEMS device is easyand can be fabricated on a chip with a device. Since themicrobatteries main concern is power output due to limita-tion of surface rather than the capacity, most researchactivities are focused on increasing power to out performmaintaining capacity.
As for thin-film batteries, Bates et al. (36) at Oak RidgeNational Laboratory reported a thin-film secondary bat-tery, which was made up of lithium and lithium ion. Thethickness is tens of mm and the area is in the cm2 range. Itscontinuous current output is 1 mA � cm�2. Pique et al. (37)constructed primary Zn–Ag2O and secondary Li ion micro-batteries in plane using laser direct-write with a capacityof 100 mAh � cm�2.
Other than classical thin-film batteries, several micro-machined MEMS batteries were developed. They try tointegrate power sources with microelectronic circuits andmicrosensors. Prof. Lin at UC Berkeley proposed a water-activated battery with 1.86 mWh in the area of 12 � 12 mmfor lab-on-a-chip application (6) that overcomes the corro-siveness of the micromachined batteries with sulfuric acidand hydrogen peroxide (38). Andres (5) devised a pumpintegrated with a micropower source, in which microfluidicgalvanic cells supplied power to heat up the two-phase fluidfor pumping. The capacity of the micromachined battery islower than that of a thin-film battery yet, its applicationis restricted to the integrated power for a micromachinedimplantable device.
MICROPOWER GENERATOR
A micropower generator scavenges energy from devices.The energy sources are mechanical (vibration and humanbody movement), thermal (temperature difference), and
solar energy. Thermoelectric devices convert the tem-perature difference to electricity and the photovoltaic cellcollects solar energy. A MEMS-based power generatorscavenges energy from the vibration in the mechanicalstructure or human body movements.
Thermoelectric Generator
Thermoelectric generation using the Seebeck effect waswidely studied. This effect was discovered in 1821 by thephysicist, Jonn Seebeck. It is the same phenomenon with athermocouple where the temperature difference produceselectricity or work. Although a thermoelectric power gen-erator is an old technique and is commercially available invarious sizes in the market, recent research focuses onmaking miniaturized low power thermoelectric micro-generators using microfabrication. Cost-effective fabri-cation technology was developed using electroplatedstructures with an epoxy film (28) and nanowire arraysby electrochemical deposition was implemented to improvethermoelectrical properties (29). Reportedly, several com-panies announced a thermoelectric generator using bodyheat. Applied Digital Solutions (39) announced a thermo-electric generator called ThermoLife, which produced apower of 49 mW from a temperature difference of 5 8C in0.5 cm2. Biophan technologies (40) also announced abiothermal power source as shown in Fig. 2 for implantabledevices like a pacemaker and defibrillator (41). They aim toproduce 100 mW at 3 V with 1 8C temperature difference. Adifferent scheme converting thermal energy to electricity ispiezoelectric generator actuated by thermal expansion oftwo-phase working fluid (42). Although they produced up to56 mW at its resonance frequency of 370 Hz, a practicalapplication needs the careful design of a heat-transfermechanism because the temperature is required tooscillate at a resonance frequency of structure. A thermo-electric generator has a well-established technology andits operation is relatively stable; however, note that thetemperature difference inside the human body is < 1 8C.The temperature gradient is maximum at the skin surfaceand will limit the location of the thermoelectric powergenerator.
430 MICROPOWER FOR MEDICAL APPLICATIONS
Figure 2. Principles of thermoelectric power source(Biophan).
Heat absorbed(Cold side)
Heat rejected(Hot side)
p-type Semiconductors pallets
n-type Semiconductors pallets
Conductor
Ceramicsubstrate
Positive(+)
Negative(−)

Power Generation with Ambient Vibration
Conversion of a mechanical vibration to electric power hasbeen studied from the mid 1990s (43) using MEMS, whilethermal and solar energy were exploited to generate elec-tricity long ago. They changed vibration to electricalenergy using piezoelectric, electromagnetic, and electro-static generations.
The frequency of vibration in an ambient environmentranges from 60 to 400 Hz and for the microwave oven theacceleration was 2.25 m � s�2 at a resonance frequency of120 Hz (15). Shad (21) suggested a graph comparing thepower density of power scavenging and batteries as afunction of time (Fig. 3). Power density in the vibrationof machining center or microwave oven becomes largerthan conventional batteries after 3 or 4 years, which meansthe waste vibration energy is not negligible. Williams andYates (43) presented a general model in equation 3 for thepower of external vibration as depicted in Fig. 4, when amass is moved at a resonant frequency of vn.
P ¼ ztmY2o v
3n
4ðzt þ zoÞ2z (3)
where m is mass, and Yo is the maximum extent that themass can move, zt and zo denote a damping factor both
in the transducer structure and in the environment(e.g., air).
Electromagnet Conversion. Motion between the induc-tor and the permanent magnet induces an electromagneticcurrent in the inductor coil, as shown in Fig. 5 (25). Theinduced voltage, V, in the coil is given by equation 4.
V ¼ NBlvn
2z(4)
where N is the number of turns in the coil, B is thestrength of the magnetic field, l is the length of coil,and z is the displacement of the magnet in the coil. Thistype of generator was fabricated with laser micromachin-ing by Ching et al. (27) in 1 cm3 volume and generated a4.4 V peak-to-peak with a maximum rms power of 830 mW.Glynne-Jones et al. (44) at the University of Southamp-ton, derived 157 mW on average new car engine. Perpe-tuum Ltd., a spin-off company from the University ofSouthampton, produced an electromechanical microge-nerator. That generated up to 4 mW and its operationfrequency was 30–350 Hz. The vibration amplitude was200 mm with 60–110 Hz and demonstrated a wireless tem-perature sensor transmitter system. This result showedelectromagnetic conversion is feasible in low frequencyvibration and is promising if it is compatible with siliconmicromachining.
MICROPOWER FOR MEDICAL APPLICATIONS 431
Continuous Power / cm3 vs. Life Several Energy Source
0
1
10
100
1000
0 0.5 1 1.5 2 2.5 3 3.5 4 4.5 5Years
mic
roW
atts
Lithium
Alkaline
Lithium rechargeableZinc air
NiMH
Solar
Vibrations
Figure 3. Comparison of power densityfrom vibrations, solar and batteries (21).
y
b
mz
k
Figure 4. Schematic analysis for mechanical movement of apower generator with external vibration.
y
b
mz
k
+
− Permanentmagnet
Figure 5. Schematic of an electromagnetic conversion device.

Piezoelectric Conversion. The piezoelectric effect statesthat the deformation in the material produces an electricalcharge due to the separation of charge within crystalstructures. The most widely used piezoelectric materialis PZT (lead zirconate titanate) in ceramic materials andPVDF [poly (vinylidene fluoride)] in polymers. Severalgroups are studying the piezoelectric cantilever withseismic mass (Fig. 6). The constitutive equations ofpiezoelectric materials are expressed in equation 5.
s ¼ Yðd� d31EÞ D ¼ d31s þ eE (5)
where s is the mechanical stress, d is the mechanicalstrain, Y is Young’s modulus, d31 is the piezoelectric straincoefficient, D is the charge density, E is the electric field,and e is the dielectric constant of the piezoelectric mate-rial. The piezoelectric coefficient links the mechanicalstress–strain to the electrical charge equation. If thecircuit is open (D¼ 0), the voltage across the piezoelectriclayer is described in equation 6.
V ¼ �d31s
etpiezo (6)
where tpiezo is the thickness of the piezoelectric layer. Thecharge collected on the electrode is integrated on the areaof the surface with no load condition as in equation 7
Q ¼Z
D dA ¼Z
d31s dA (7)
When the impedance in the load circuit is pure resistance,the time-averaged power can be derived in Ref. 17 withthe geometry of a cantilever. White and co-workers (16)presented a thick-film PZT generator, and the maximumpower is � 2 mW. According to the analysis of Lu et al. (17),a 5 mm long PZT cantilever can generate >100 mW withthe amplitude of >20 mm at � 3 kHz resonance. Roundy(15) demonstrated a piezoelectric converter of 1 cm3 involume, that is 1.75 cm in length. It generated 200 mW andis driven with vibrations of 2.25 m � s�2 at 120 Hz. Amicrofabricated PZT cantilever generator driven by abubble was studied by Kang et al. (44), and a few picowattwas generated with one tiny cantilever at 30 Hz and tensof mW is expected on a 1 cm2 surface (46). If the design,material, and fabrication are optimized, piezoelectricpowergeneration will produce hundreds of microwattswith a volume of 1 cm3.
Electrostatic Conversion. The electrical energy in acapacitor is given in equation 8.
E ¼ 1
2QV ¼ 1
2CvV2 ¼ 1
2
Q2
Cv(8)
When the charge, Q, is constant, if the variable capaci-tance, Cv, is decreased the total energy E in the capacitorwill increase. The MEMS structure can change the capa-citance Cv with an external vibration, and stored energy inthe capacitor transfers to energy storage. In the beginning,the external power source Vin initiates the charging pro-cess as in Fig. 7 (15). When Cv is maximum, SW1 is closedand the variable capacitance Cv is charged. While vibrationchanges capacitance Cv, all switched are open. When Cv
reaches a minimum, SW2 is turned on and the energy in Cv
is transferred to a storage capacitance Cstor. The disadvan-tage of electrostatic conversion is that it needs an externalvoltage source and switching circuit. The voltage across thestoring capacitance is given in equation 9.
Estor ¼1
2ðCmax � CminÞVmaxVin ðRef : 47Þ (9)
where Vmax is the maximum voltage across the capacitorCv. Switching the circuit is realized using a diode and fieldeffect transistor (FET) switch. Meninger et al. (47) made acomb-type variable capacitance with an in-plane overlaptype with a 7 mm gap and a 500 mm depth using the 0.6 mmCMOS process. They produced a power of 8 mW with anultralow power delay locked loop (DLL)-based system. Miaoet al. (23) reported an out-of-plane variable capacitor with agap closing type that varies from 100 pF to 1 pF. A periodicvoltage output of 2.3 kV (10 Hz) was generated when thecharging voltage was 26 V, which implies that a power of 24mW (2.4 mJ � cycle�1) can be produced. Mitchenson et al.analyzed architectures for vibration-driven micropowergenerators (26) and they fabricated a prototype of an elec-trostatic power generator producing 250 V � cycle�1 thatcorresponds to 0.3 mJ � cycle�1 (22). Other studies demon-strated polymer capacitor (24) and a liquid rotor powergenerator with a variable permittivity producing 10mW(19). Recent developments in electrostatic generators
432 MICROPOWER FOR MEDICAL APPLICATIONS
Silicon layer
PZT layer
Mass
Anchor
Figure 6. Structure of a piezoelectric cantilever for powergeneration.
SW1 SW2
VinCv Cpar Cstar+
−
Figure 7. Circuit representation for an electrostatic converter(15).
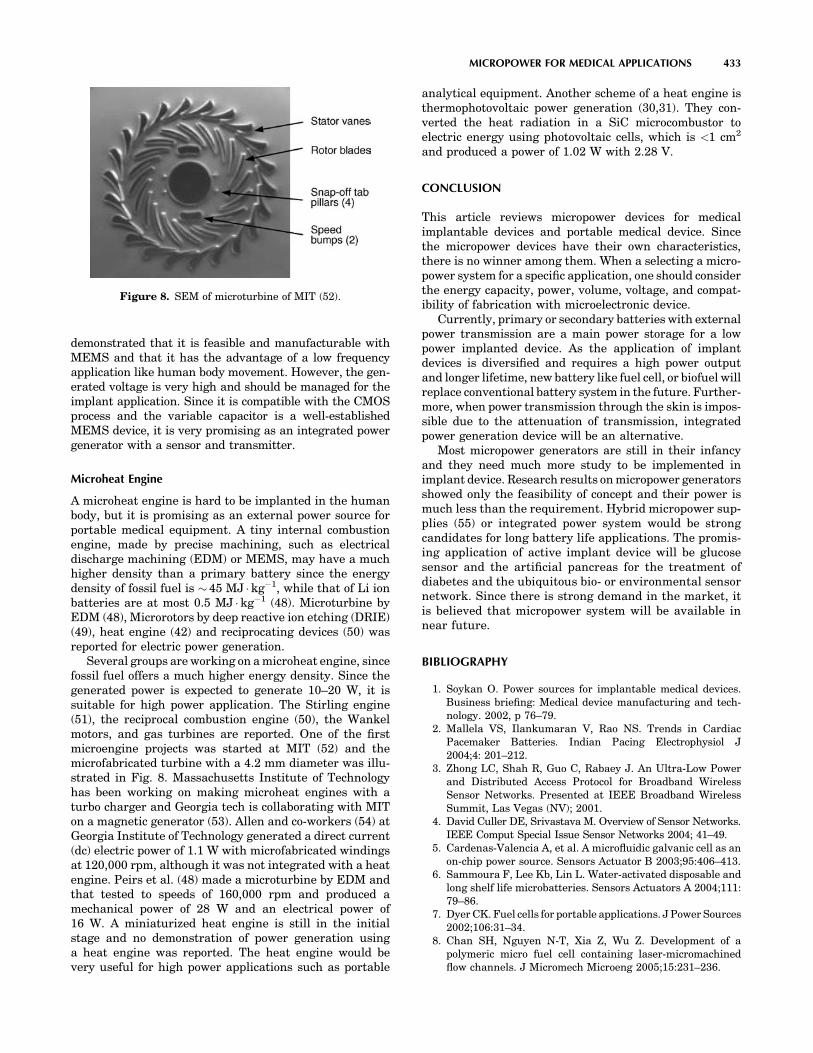
demonstrated that it is feasible and manufacturable withMEMS and that it has the advantage of a low frequencyapplication like human body movement. However, the gen-erated voltage is very high and should be managed for theimplant application. Since it is compatible with the CMOSprocess and the variable capacitor is a well-establishedMEMS device, it is very promising as an integrated powergenerator with a sensor and transmitter.
Microheat Engine
A microheat engine is hard to be implanted in the humanbody, but it is promising as an external power source forportable medical equipment. A tiny internal combustionengine, made by precise machining, such as electricaldischarge machining (EDM) or MEMS, may have a muchhigher density than a primary battery since the energydensity of fossil fuel is � 45 MJ �kg�1, while that of Li ionbatteries are at most 0.5 MJ �kg�1 (48). Microturbine byEDM (48), Microrotors by deep reactive ion etching (DRIE)(49), heat engine (42) and reciprocating devices (50) wasreported for electric power generation.
Several groups are working on a microheat engine, sincefossil fuel offers a much higher energy density. Since thegenerated power is expected to generate 10–20 W, it issuitable for high power application. The Stirling engine(51), the reciprocal combustion engine (50), the Wankelmotors, and gas turbines are reported. One of the firstmicroengine projects was started at MIT (52) and themicrofabricated turbine with a 4.2 mm diameter was illu-strated in Fig. 8. Massachusetts Institute of Technologyhas been working on making microheat engines with aturbo charger and Georgia tech is collaborating with MITon a magnetic generator (53). Allen and co-workers (54) atGeorgia Institute of Technology generated a direct current(dc) electric power of 1.1 W with microfabricated windingsat 120,000 rpm, although it was not integrated with a heatengine. Peirs et al. (48) made a microturbine by EDM andthat tested to speeds of 160,000 rpm and produced amechanical power of 28 W and an electrical power of16 W. A miniaturized heat engine is still in the initialstage and no demonstration of power generation usinga heat engine was reported. The heat engine would bevery useful for high power applications such as portable
analytical equipment. Another scheme of a heat engine isthermophotovoltaic power generation (30,31). They con-verted the heat radiation in a SiC microcombustor toelectric energy using photovoltaic cells, which is <1 cm2
and produced a power of 1.02 W with 2.28 V.
CONCLUSION
This article reviews micropower devices for medicalimplantable devices and portable medical device. Sincethe micropower devices have their own characteristics,there is no winner among them. When a selecting a micro-power system for a specific application, one should considerthe energy capacity, power, volume, voltage, and compat-ibility of fabrication with microelectronic device.
Currently, primary or secondary batteries with externalpower transmission are a main power storage for a lowpower implanted device. As the application of implantdevices is diversified and requires a high power outputand longer lifetime, new battery like fuel cell, or biofuel willreplace conventional battery system in the future. Further-more, when power transmission through the skin is impos-sible due to the attenuation of transmission, integratedpower generation device will be an alternative.
Most micropower generators are still in their infancyand they need much more study to be implemented inimplant device. Research results on micropower generatorsshowed only the feasibility of concept and their power ismuch less than the requirement. Hybrid micropower sup-plies (55) or integrated power system would be strongcandidates for long battery life applications. The promis-ing application of active implant device will be glucosesensor and the artificial pancreas for the treatment ofdiabetes and the ubiquitous bio- or environmental sensornetwork. Since there is strong demand in the market, itis believed that micropower system will be available innear future.
BIBLIOGRAPHY
1. Soykan O. Power sources for implantable medical devices.Business briefing: Medical device manufacturing and tech-nology. 2002, p 76–79.
2. Mallela VS, Ilankumaran V, Rao NS. Trends in CardiacPacemaker Batteries. Indian Pacing Electrophysiol J2004;4: 201–212.
3. Zhong LC, Shah R, Guo C, Rabaey J. An Ultra-Low Powerand Distributed Access Protocol for Broadband WirelessSensor Networks. Presented at IEEE Broadband WirelessSummit, Las Vegas (NV); 2001.
4. David Culler DE, Srivastava M. Overview of Sensor Networks.IEEE Comput Special Issue Sensor Networks 2004; 41–49.
5. Cardenas-Valencia A, et al. A microfluidic galvanic cell as anon-chip power source. Sensors Actuator B 2003;95:406–413.
6. Sammoura F, Lee Kb, Lin L. Water-activated disposable andlong shelf life microbatteries. Sensors Actuators A 2004;111:79–86.
7. Dyer CK. Fuel cells for portable applications. J Power Sources2002;106:31–34.
8. Chan SH, Nguyen N-T, Xia Z, Wu Z. Development of apolymeric micro fuel cell containing laser-micromachinedflow channels. J Micromech Microeng 2005;15:231–236.
MICROPOWER FOR MEDICAL APPLICATIONS 433
Figure 8. SEM of microturbine of MIT (52).

9. Ferrigno R, et al. Membraneless Vanadium Redox FuelCell uisng Laminar Flow. J Am Chem Soc 2002;124:12930–12931.
10. Shah K, Shin WC, Besser RS. Novel microfabricationapproaches for directly patterning PEM fuel cell membranes.J Power Sources 2003;123:172–181.
11. Yu J, Cheng P, Maa Z, Yi B. Fabrication of a miniaturetwin-fuel-cell on silicon wafer. Electrochim Acta 2003;48:1537–1541.
12. Wainright JS, Saniell RF, Liu CC, Lit M. Microfabricated fuelcells. Electrochem Acta 2003;48:2869–2877.
13. Barton SC, Gallaway J, Atanassov P. Enzymatic Biofuel Cellsfor Implantable and Microscale Devices. Chem Rev 2004;104:4867–4886.
14. Heller A. Miniature biofuel cells. Phys Chem Chem Phys2004;6:209–216.
15. Roundy SJ. Energy Scavenging for Wireless Sensor Nodeswith a Focus on Vibration to Electricity Conversion. Mechan-ical Engineering. Berkeley: The University of California;2003 p 287.
16. Glynne-Jones P, Beeby SP, White NM. Towards a piezo-electric vibration-powred microgenerator. IRR Proc-Sci MeasTechnol 2001;148:68–72.
17. Lu F, Lee HP, Lim SP. Modeling and analysis of micropiezoelectric power generators for micro-electromechanical-systems applications. Smart Mat and Structure 2004;13: 57–63.
18. Shenck N, Paradiso JA. Energy Scavenging with Shoe-mounted piezoelectronics. IEEE Micro 2001;21:30–42.
19. Boland JS, Messenger JDM, Lo HW, Tai YC. Arrayed liquidrotor electret power generation. Presented at IEEE MEMS2005, Miami(FL) 2005.
20. Roundy S, Steingart D, et al. Power Sources for Wireless Net-works. Presented at Proc. 1st European Workshop on WirelessSensor Networks (EWSN’04), Berlin(Germany). 2004.
21. Roundy S, Wright PK, Rabaey J. A study of low level vibra-tions as a power source for wireless sensor nodes. CompCommun 2003;26:1131–1144.
22. Mitcheson PD, et al. MEMS electrostatic micropower gen-erator for low frequency operation. Sensors and Actuator A2004;115:523–529.
23. Miao P, Holmes AS, Yeatman EM, Green TC. Micro-Machined Variable Capacitors for Power Generaton. Pre-sented at Electrostatics’03, Edinburgh(UK). 2003.
24. Arakawa Y, Suzuki Y, Kasagi N. Micro seismic power gen-erator using electret polymer film. Presented at The FourthInternational workshop on Micro and Nanotechnology forpower generation and energy conversion applications PowerMEMS 2004, Kyoto(Japan). 2004.
25. Li WJ, et al. A micromachined vibration-induced power gen-erator for low power sensors of robotic systems. Presented atWorld Automation Congress: 8th International Symposiumon Robotics with Applications, Hawaii 2000.
26. Mitcheson PD, Green TC, Yeatman EM, Holmes AS. Archi-tectures for Vibration-Driven MicropowerGenerators. J Micro-electomech Systems 2004;13:429–440.
27. Ching NNH, et al. A laser-micromachined multi-modal reso-nating power transducer for wireless sensing systems. Sen-sors Actuator A 2002;97:685–690.
28. Qu W, Plotner M, Fischer W-J. Microfabrication of thermo-electric generators on flexible foil substrates as a powersource for autonomous microsystems. J Micromechan Micro-eng 2001; 11:146–152.
29. Wang W, Jia F, Huang Q, Zhang J. A new type of low powerthermoelectric micro-generator fabricated by nanowire arraythermoelectric material. Proc 22nd Int Conf Thermoelectrics2003;682–684.
30. Wenming Y, et al. Effect of wall thickness of micro-combustoron the performance of micro-thermophotovoltaic power gen-erators. Sensors Actuator A; in press, 2005.
31. Yang WM, et al. A prototype microthermophotovoltaic powergenerator. Appl Phys Lett 2004;84:3864–3866.
32. Pescovitz D. The power of small tech. Smalltimes 2002; 2.33. Lee SJ, et al. Design and fabrication of a micro fuel cell
array with flip-flop interconnection. J Power Sources2002;112: 410–418.
34. Chen T, et al. A Miniature Biofuel Cell. J Am Chem Soc2001;123:8630–8631.
35. Moore CM, Minteer SD, Martin RS. Microchip-based ethanol/oxygen biofuel cell. Lab Chip 2005;5:218–225.
36. Bates JB, et al. Thin-film lithium and lithium-ion batteries.Solid State Ionics 2000;135:33–45.
37. Pique A, et al. Rapid prototyping of micropower sources by laserdirect write. Appl Phys A Mat Sci Proc 2004;79:783–786.
38. Lee KB, Lin L. Electrolyte based on-demand disposable micro-battery. Presented at IEEE MEMS 2002, Las Vega. 2002.
39. Applied Digital solutions, www.adsl.com.40. Biophan technologies. Available at www.biophan.com/
biothermal.php.41. MacDonald SG, Biothermal power source for implantable
devices. US Patent 6,640,137, 2003.42. Whalen S, et al. Design, Fabrication and testing of the P3
micro heat engine. Sensors Actuator A 2003;104:290–298.43. Williams CB, Yates RB. Analysis of a micro-electric generator
for microsystems. Sensors Actuator A 1996;52:8–11.44. Glynne-Jones P, et al. An electromagnetic, vibration-powered
generator for intelligent sensor systems. Sensors Actuators A2004;110:344–349.
45. Kang J-Y, Kim H-J, Kim J-S, Kim T-S. Optimal design ofpiezoelectric cantilever for a micro power generator withmicrobubble. Presented at Microtechnologies in Medicine& Biology 2nd Annual International IEEE-EMB SpecialTopic Conference, Madison (WI). 2002.
46. Kang JY, Kim JS, Kim HY, Kim TS. Micro Power Generatorwith Piezoelectric Cantilever Driven By Micro Bubble. Sen-sors Actuator A submitted, 2005.
47. Meninger S, et al. Vibration-to-Electric Energy Conversion.IEEE Trans VLSI Systems 2001;9:64–76.
48. Peirs J, Reynaerts D, Verplaetsen F. A microturbine for electricpower generation. Sensors Actuator A 2004;113: 86–93.
49. Miki N, Teo CJ, Ho LC, Zhang X. Enhancement of rotordy-namic performance of high-speed micro-rotors for powerMEMS applications by precision deep reactive ion etching.Sensors Actuator A 2003;104:263–267.
50. Lee DH, et al. Fabrication and test of a MEMS combustor andreciprocating device. J Micromech 2002;12:26–34.
51. Backhaus S, Swift GW. A thermoacustic Stirling heat engine.Nature (London) 1999;399:335–338.
52. Frechette LG, et al. Demonstration of a microfabricated high-speed turbine supported on gas bearings. Presented atSolid-state sensors and actuator workshop, Hilton headisland, (SC). 2000.
53. Jacobson SA, et al. Progress toward a icrofabricated gasturbine generator for soldier portable power applications.Presented at 24th Army Science Conference, Orlando (FL).2004.
54. Das S, et al. Multi-Watt electric power from a microfabricatedpermanent magnet generator. Presented at IEEE MEMS2005, Miami(FL). 2005.
55. Harb J, LaFollete R, Selfridge R, Howell L. Microbatteries forself-sustained hybrid micropower supplies. J Power Sources2002;104:46–51.
See also BIOTELEMETRY; COMMUNICATION DEVICES; MICROFLUIDICS.
434 MICROPOWER FOR MEDICAL APPLICATIONS

MICROSCOPY AND SPECTROSCOPY,NEAR-FIELD
MIODRAG MICIC
MP Biomedicals LLCIrvine, California
INTRODUCTION
The explosion of knowledge in life sciences is enabled by theability to visualize beyond the capability of the human eyeand by the capability to identify chemical compositions andthe structure of matter. This was enabled by Levenhook’sdiscovery of the new device for looking at the world of thesmall: the microscope. He found that by combining twolenses, it was possible to see much smaller objects than bythe naked eye alone. This led to his subsequent discovery ofthe cell, which has spurred an explosion of knowledge inlife science and medicine that continues at a dramatic rateof growth even today. Even 400 years after the Levenhookdiscovery, one of the first tools of choice for the visualiza-tion of small objects is the optical microscopy. What isknown to a lesser extent is that the microscopic histochem-ical studies (i.e., staining of the tissues) with tissues andorganelle-specific dyes in the late 1800s, initiated themodern pharmaceutical industry, when chemists and his-tologists alike envisioned an opportunity to selectivelyinhibit or kill pathogens by organic molecules in the sameway organic dyes selectively label certain types of tissues,cells, and organelles. While the optical microscopy methodswere able to uncover morphology and the structure andnature of the cells, they were faced with the ultimatephysical limit of magnification, which is dictated by thespatial resolution limited by the diffraction limit. This limitwas approximately the size of half of the wavelength oflight used to perform the imaging.
The breakthrough in imaging small structures andfurther understanding the machinery of life and cell biol-ogy comes with the application of the deBroglie’s postulateof particle-wave equality in order to use the electron beamwith a shorter associated wavelength as an investigativeimaging probe. Ruska’s development of the first transmis-sion electron microscope in late 1930s and the developmentof scanning electronic microscopies in the 1950s, openedthe door to detailed investigations of the organization ofsubcellular assemblies, viruses, and even imaging of theindividual biomolecules, at a resolution far beyond thediffraction limit of visible light. The rapid advances inthe tools and techniques of ultramicroscopy, especially ofscanning probe microscopies, which for the first timeenabled routine molecular imaging, greatly contribute toenabling completely new multidisciplines, like nanoscienceand nanotechnology, as well as an opening a door for anentirely new way of looking into the machinery of life.
While scanning probe microscopy in the 1990s allowedimaging at the unprecedented resolution of the unalteredsamples; in general, it lacked the ability to uniquelyidentify the chemical composition of samples or unveiltheir physicochemical properties. For the investigation ofchemical structures and fingerprinting the material com-position, the tool of choice is optical spectroscopy. However,
the problem with classical optical spectroscopic techniquesis that it provides average, bulk results with no specificinformation linking certain morphological features withspectra. This can ultimately identify chemical compositionand/or physicochemical properties. The ability of doingmolecular fingerprinting and, in a raster pattern, subse-quent molecular specific imaging at the nanoscale with thespatial resolution of modern ultramicroscopy techniques isthe holy grail for many aspects of today’s life sciencesdisciplines.
This goal is partially fulfilled with electron microscopycombined with energy-dispersive X-ray analysis (EDX),wherein semiquantitatively, it is possible to associate topo-graphical structures with elemental composition. How-ever, for most of the problems in life and materialssciences, simple knowledge of elemental composition isnot sufficient, as it is necessary to identify molecularstructure. Plus, the electron microscopy is, in most cases,a destructive method of analysis, since the sample needs tobe prepared to be vacuum compatible, and be either elec-trically conductive, in the case of scanning electron micro-scopy, or have contrasts with heavier metals, in the case oftransmission or scanning transmission electron micro-scopy. Furthermore, the physics of generating character-istic X rays (i.e., the minimum size of the excitation volumefrom which the signal is emerging) is in the tens of micro-meters, thereby limiting elemental compositional analysiswith spatial resolution only for the large structure in thetens-of-microns-sized range. The ideal technique will beone that will allow imaging of the unaltered sample, in away similar to the way atomic force microscopy (AFM)allows, while at the same time providing a way for spectro-scopic identification of the chemical structure.
There are several techniques currently in their infancythat promise spectroscopic probing with electromagneticspectroscopic information carrier signals imposed overtopography. They are near-field scanning optical micro-scopy, microthermal analysis, scanning nuclear magneticresonance (NMR) microscopy, and scanning electron para-magnetic resonance (EPR) microscopy.
However, for solving any of the practical problems, itwill be of great benefit that the ultrastructure’s informa-tion probes are photons of visible, and near-infrared (IR)and ultraviolet (UV) light, as a great deal of both morpho-logical (based on the photon’s position and intensity/count)and compositional (based on adsorption, fluorescence,Raman shift, etc.) information can be simultaneouslyobtained as optical microscopy relies on light as an infor-mation carrier. This is due to the fact that the samephotons, which are in standard imaging configurationsused to generate images, carry much more informationon composition and the various physical and chemicalproperties of the observed spot on the sample that canbe extracted through different spectroscopic methods.
The technique that has evolved over the last decade andpromises to fulfill the above-goals at the nanoscale level, isnear-field scanning optical microscopy (NSOM or SNOM),which effectively breaks the physical limits imposed bythe optical-diffraction-limited resolution by using thenear-field evanescent waves and scanning mechanismssimilar to those in the scanning probe microscopies.
MICROSCOPY AND SPECTROSCOPY, NEAR-FIELD 435

THEORETICAL PRINCIPLES OF NSOM MICROSCOPY
Abbe’s equation (Eq. 1) describes the resolution of theclassical, far-field optics, (i.e., the minimum separationsbetween two points that can be distinguished) (1). From thisequation it is easy to conclude that the maximum attainableresolution in the far field is � 1
2 of the applied wavelength,which means that the best optical microscope cannot beused to visualize details smaller than 200–400 nm.
pmin ¼ l
2n sina0 ð1Þ
In Abbe’s equation, n is the diffraction of the imagingindex and a0 is the aperture angle in the medium. WhileAbbe’s equation describes the limiting resolution in the worldof conventional optics, the Fourier optics approach can pro-vide us with the same conclusion. Following Abbe’s principle,Rayleigh (2) derived that the objects in a lens system in thefar optical field are resolved only when the maximum of onepattern coincides with the first minimum of the neighboringfeatures. What resulted was the discovery that the resolutioncriteria that describe the maximum resolution of the opticalsystem based on the size of the numeric aperture was
d ¼ 0:61 l=NA ð2Þ
wherein l is the applied wavelength and NA is the numericalaperture of the lens, again bringing the maximum theoreticalresolution to � 200 nm.
A similar observation can be derived from the Fourierformalism in optics. In Fourier optics, the information con-tent embedded in the spatial frequency f, in the case when f ishigher then 1/l, decays rapidly toward zero from the objectand thereby, no data on the subwavelength features can beefficiently collected with standard far-field optics. However, itis well known that it is possible to receive an electromagneticsignal with antenna that is smaller in size than the wave-length. The solution of the Maxwellian equations that governthe behavior of electromagnetic radiation differs in the dis-tance smaller than the wavelength than in the distance,much larger than the considered wavelengths. When thewaves propagate within the distance much smaller thanits wavelength, such situation is called the near field. Thepragmatic definition of near-field optics will be a division ofoptics that deal with the elements of the subwavelengthfeatures scales, which are intended for passing the lightthrough, from or near, to another element with subwave-length features positioned within the subwavelength dis-tances. The spatial resolution in near-field optics dependson the feature’s size and is limited to about one-half of theaperture size. Furthermore, the near-field system must beconsidered as a complete system consisting of two features(probeandsampleinthecaseofmicroscopy)andtheresolutionof the system will be dependent on both sample and probe.Thus, it is impossible to speak of the unique or standard near-field resolution, as is done with a far-field instrument.
NEAR-FIELD IMAGING EQUIPMENT
The near-field scanning optical microscopy or scanningnear-field optical microscopy (NSOM or SNOM) is a tech-
nique that enables users to work with standard opticaltools that are integrated with scanning probe microscope(SPM) technology to obtain the optical image at a resolu-tion in the range of tens of nanometers. This is quitecomparable with the resolution of scanning electron orSPM. The integration of scanning probe and optical meth-ods allows for the collection of optical information at reso-lutions well below the optical diffraction limit, whichoverlap real topography information obtained by scanningprobe feedback. For spectroscopy applications, NSOMoffers the potential for characterizing the spectroscopicsignature of material on a submicron-to-nanometer scale,thereby affording new insights into nanoscopic structureand composition.
The principles of NSOM microscopy were theoreticallyfounded by Synge in 1929 (2), and in his subsequent paperhe described an imaginary device that closely resemblestoday’s NSOM setup (3), including the use of piezoactua-tors. Due to technical difficulties at the time to implementsuch a device, the idea was forgotten until theoreticianO’Keefe rediscovered the idea in 1956 (4). The first prac-tical demonstration of the imaging of a structure smallerthan the one-sixtieth of the applied wavelength was done in1971 using the microwave in near-field scanning over thegrid (5). The basic idea behind this method was to createevanescence, a standing wave, by light diffraction throughan aperture that was much smaller than the wavelength,and then to use this evanescent light source to scan asample in a raster-scan pattern in close proximity, andcollect transmitted or reflected signal in the far field. Thefirst demonstration of near-field optical imaging was imple-mented independently by Pohl (6) in 1982 and Lewisgroups (7) in 1983, and described as an optical stethoscopy,in what is now considered the beginning of NSOM micro-scopy. The method grew rapidly during the 1990s and thetrend is continuing to this day, as described in recentreviews (8–12). Furthermore, several companies are offer-ing commercial instruments (13–16) that enable ordinaryusers, who are not inclined toward the instrumentationdevelopment, to apply NSOM in solving their researchproblems.
There are two fundamentally different ways to achievenear-field optical imaging. They are apertured-base andapertureless NSOMs with their principles of operationdepicted in Fig. 1a and b (17). In the case of the aperturedNSOM (Fig. 1a), the light passes through an aperture thatis much smaller than the wavelength of applied light, andultimately the resolution is defined by the size of theaperture. In the case of the apertureless NSOM (Fig. 1b),a sharp metallic tip is irradiated by a laser perpendicular(or as close as possible) to the tip along the axis. Theirradiation excites the plasmons on the metallic surface ofthe tip and the field is concentrated by combining antennaand plasmonic effects at the top of the tip. The resolutionof apertureless NSOM is thus defined by the size of thenear-field excitation formed at the apex of the metallictip, and is determined by tip sharpness, tip materials, andreal and imaginary parts of the refraction index of theused metal.
The practical advantage of apertured NSOM is in its easyimplementation. While the advantage of the apertureless
436 MICROSCOPY AND SPECTROSCOPY, NEAR-FIELD
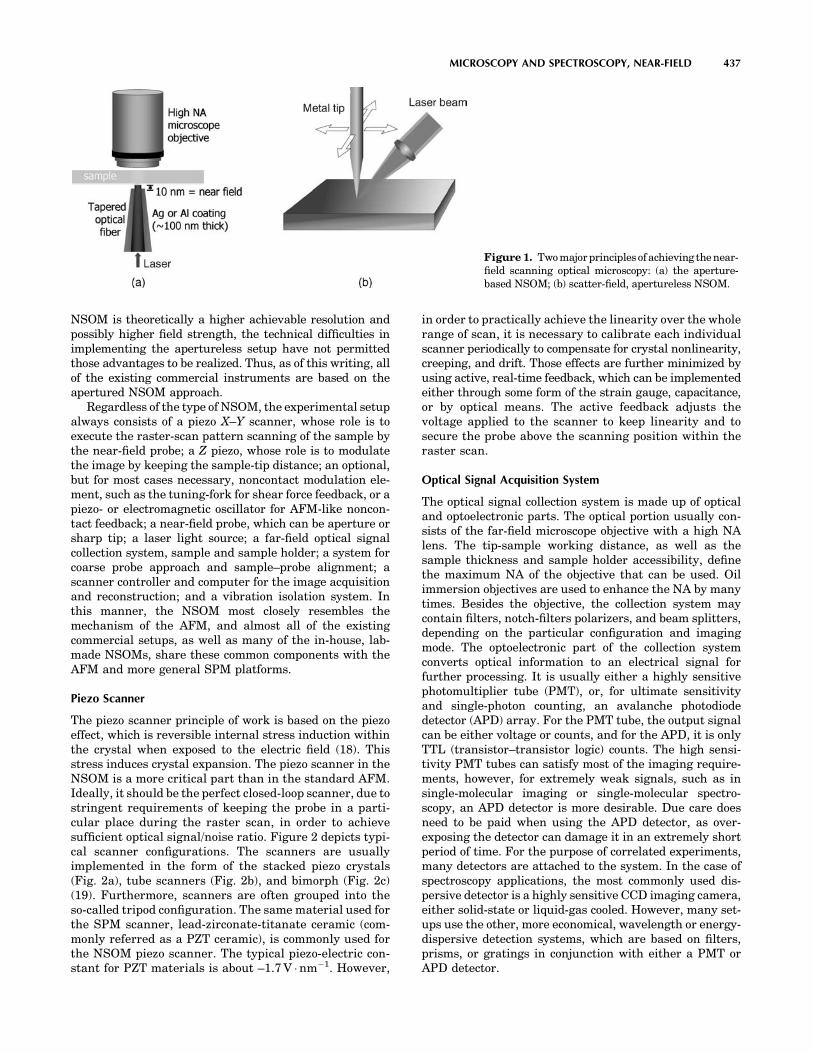
NSOM is theoretically a higher achievable resolution andpossibly higher field strength, the technical difficulties inimplementing the apertureless setup have not permittedthose advantages to be realized. Thus, as of this writing, allof the existing commercial instruments are based on theapertured NSOM approach.
Regardless of the type of NSOM, the experimental setupalways consists of a piezo X–Y scanner, whose role is toexecute the raster-scan pattern scanning of the sample bythe near-field probe; a Z piezo, whose role is to modulatethe image by keeping the sample-tip distance; an optional,but for most cases necessary, noncontact modulation ele-ment, such as the tuning-fork for shear force feedback, or apiezo- or electromagnetic oscillator for AFM-like noncon-tact feedback; a near-field probe, which can be aperture orsharp tip; a laser light source; a far-field optical signalcollection system, sample and sample holder; a system forcoarse probe approach and sample–probe alignment; ascanner controller and computer for the image acquisitionand reconstruction; and a vibration isolation system. Inthis manner, the NSOM most closely resembles themechanism of the AFM, and almost all of the existingcommercial setups, as well as many of the in-house, lab-made NSOMs, share these common components with theAFM and more general SPM platforms.
Piezo Scanner
The piezo scanner principle of work is based on the piezoeffect, which is reversible internal stress induction withinthe crystal when exposed to the electric field (18). Thisstress induces crystal expansion. The piezo scanner in theNSOM is a more critical part than in the standard AFM.Ideally, it should be the perfect closed-loop scanner, due tostringent requirements of keeping the probe in a parti-cular place during the raster scan, in order to achievesufficient optical signal/noise ratio. Figure 2 depicts typi-cal scanner configurations. The scanners are usuallyimplemented in the form of the stacked piezo crystals(Fig. 2a), tube scanners (Fig. 2b), and bimorph (Fig. 2c)(19). Furthermore, scanners are often grouped into theso-called tripod configuration. The same material used forthe SPM scanner, lead-zirconate-titanate ceramic (com-monly referred as a PZT ceramic), is commonly used forthe NSOM piezo scanner. The typical piezo-electric con-stant for PZT materials is about –1.7 V �nm�1. However,
in order to practically achieve the linearity over the wholerange of scan, it is necessary to calibrate each individualscanner periodically to compensate for crystal nonlinearity,creeping, and drift. Those effects are further minimized byusing active, real-time feedback, which can be implementedeither through some form of the strain gauge, capacitance,or by optical means. The active feedback adjusts thevoltage applied to the scanner to keep linearity and tosecure the probe above the scanning position within theraster scan.
Optical Signal Acquisition System
The optical signal collection system is made up of opticaland optoelectronic parts. The optical portion usually con-sists of the far-field microscope objective with a high NAlens. The tip-sample working distance, as well as thesample thickness and sample holder accessibility, definethe maximum NA of the objective that can be used. Oilimmersion objectives are used to enhance the NA by manytimes. Besides the objective, the collection system maycontain filters, notch-filters polarizers, and beam splitters,depending on the particular configuration and imagingmode. The optoelectronic part of the collection systemconverts optical information to an electrical signal forfurther processing. It is usually either a highly sensitivephotomultiplier tube (PMT), or, for ultimate sensitivityand single-photon counting, an avalanche photodiodedetector (APD) array. For the PMT tube, the output signalcan be either voltage or counts, and for the APD, it is onlyTTL (transistor–transistor logic) counts. The high sensi-tivity PMT tubes can satisfy most of the imaging require-ments, however, for extremely weak signals, such as insingle-molecular imaging or single-molecular spectro-scopy, an APD detector is more desirable. Due care doesneed to be paid when using the APD detector, as over-exposing the detector can damage it in an extremely shortperiod of time. For the purpose of correlated experiments,many detectors are attached to the system. In the case ofspectroscopy applications, the most commonly used dis-persive detector is a highly sensitive CCD imaging camera,either solid-state or liquid-gas cooled. However, many set-ups use the other, more economical, wavelength or energy-dispersive detection systems, which are based on filters,prisms, or gratings in conjunction with either a PMT orAPD detector.
MICROSCOPY AND SPECTROSCOPY, NEAR-FIELD 437
Figure 1. Two major principles of achieving the near-field scanning optical microscopy: (a) the aperture-based NSOM; (b) scatter-field, apertureless NSOM.

Light Sources for Near-Field Imaging and Spectroscopy
Illumination sources for near-field microscopy are alwayslasers. Selection criteria for the laser depends on thedesired wavelength(s). The most economical are thesolid-state lasers, followed by ion lasers, such as the Arlaser, which can selectively produce multiple wavelengthsof light from 450 to 514 nm (17). Besides the two mostcommon types, many setups use liquid lasers as well asoptical parametric oscillators to produce specific wave-lengths that are not available with a standard laser. Thetransduction path can consist of mirrors or single-modeoptical fibers. The mirror-based path has better through-put, however, it is more complex to adjust and requiresperiodic readjustment. The optical-fiber-based transduc-tion path has some higher attenuation then the mirror-based path, but it is very convenient for use, especially if itis implemented with the standard FC or similar connectors.
Microscope Head
The NSOM head usually consists of a probe holder, one ormore piezo scanners, a system for coarse probe approach, anda case. The head is positioned at the top of the sample holder.The probe holder is directly attached to the Z direction piezo.A video system, which shows the image of the approachingtip and substrate, and a software- controlled stepper motorwith micrometric screws provide coarse approach of the probeto the sample surface. When the probe tip is brought to closeproximity to the sample, the fine approach mechanism isengaged. The fine approach mechanism is essentially astepped mechanism wherein the probe is brought in a smallpiezo steps in the vertical direction to close the gap betweenthe tip of the probe and sample substrate. The contact isachieved when the signal indicates the deflection of the probe
in AFM-like setups, or, in shear-force mode, when its inter-action with the sample reaches the user-prescribed ‘‘setpoint’’ voltage or current level. The determination of theappropriate set point varies for different samples and sys-tems, and is more a result of art or tacit knowledge than anexact science. If the Z piezo is completely extended andcontact has not been achieved, the piezo constricts to itsneutral position and the stepper motor is activated to bringthe probe to the approximate max extension distance of thepiezo, and the process is repeated. Besides the Z piezo,sometimes the X–Y scanners can be positioned in the head.
Sample Holder/Stage
The sample holding stage can contain the X–Y piezo scan-ner, if it is not in the head. Its moving frame consists ofmicrometric screw positioners that push the sample holderin the X–Y direction under the probe, thus allowing sample‘‘pan’’ operation. These screws can be manually or stepper-motor operated. The sample stage can be stand-alone, or itcan be positioned at the top of an inverted, epi-fluorescencemicroscope. There are many advantages to having theNSOM sitting at the top of the standard inverted micro-scope. This configuration is able to combine far- and near-field microscopy, exploit the operation familiarity of theinverted fluorescence microscope, and deliver superiorimages to those acquired via a dedicated, stand-aloneNSOM stage. However, a drawback of such a configurationis a larger mechanical circuit with a higher level of vibra-tional noise than in a dedicated system.
Controller
Controllers for NSOM are usually derived from the AFM/SPM controllers. In all of today’s setups, they are digital.
438 MICROSCOPY AND SPECTROSCOPY, NEAR-FIELD
Figure 2. Schematics representa-tion of the piezo actuators: (a)stacked piezo; (b) tube scanner; (c)bimorph scanner. [Courtesy PI(Physik Instru-mente) LP, www.pi.ws.

The controller’s role is to generate the high voltage signalsnecessary to feed the piezo scanner and move the probein the raster scan pattern. It also controls the vertical,Z position of the probe via the PID control-loop modelmechanism (proportional-integral-differential), and thustopographically modulates the signal; it maintainsthe non–contact feedback; it controls the coarse probeapproach, and in some instances coarse sample positioning;and it acquires the signals coming from the probe (bothoptical and topographical) and forwards them to the com-puter for further processing. The controller usually con-sists of a series of analog-to-digital and digital-to-analogconverters, precision operational amplifiers, and highvoltage amplifiers. Due to the complexity of the tasks, oftenthe controller is designed using high end digital signalprocessors and other high end embedded systems.
The role of the control software is to control the con-troller, acquire the image, and store it in some of editableand exportable format. Furthermore, the control softwarealmost always possesses image processing capabilities,such as different image filters, Fourier transform, 3Drepresentations and rendering, and so on. All of the com-mercially available NSOMs share the same software withtheir AFM/SPM ‘‘cousins’’. Many of the homemade sys-tems, on the other hand, have software modified fromexisting commercial SPM/AFM controller software, or soft-ware that is independently written, as in cases where theusers have designed the whole control electronics by them-selves. Many times, the results are processed in third partysoftware. For example, for image processing a very popularsolution is to use shareware NIH Image software or its PCcousin, Scion Image, and for advanced applications, to usescripts written for IgroPro, LabView, MathLab, or forspectroscopy experiments, WinSpec. Use of higher levelsoftware like Igor Pro dramatically reduces developmenttime of applications, as compared to the time required towrite the script in C or Cþþ code.
Apertured NSOM
The principle of the apertured NSOM is to use the apertureas a scanning probe. This is the first (5,6) and up-to-todaymost commonly implemented NSOM setup. In basic prin-ciple, the instrument consists of the XYZ piezo scanner(s)that moves the apertured probe over the raster scan pat-tern at the controlled aperture-sample height, and a non-contact feedback mechanism, the best-suited being theshear-force based one (20). An aperture in the tens ofnanometer size can be formed by the tapering, heating,and pooling process borrowed from biophysics labs, whereit is utilized for creating micropipettes (21) or for etchingoptical fibers (22). Additionally, as an aperture, it is pos-sible to use the hollow cantilever (23).
Schematic representation of the instrument implemen-tation, for both imaging and spectroscopy–hyperspectralimaging, is presented in Fig. 3a, configured for the mostcommon, transmission mode (looking through the sample)operation. The laser light is coming from the optical fiber.Optical fiber is mounted on the tuning fork assembly,which is held onto the Z-piezo scanner and is constrictedat the end to a tens of nanometer size range (see insert) and
the evanescent field is formed at its aperture, as repre-sented in the figure insert. The light is passing through thesample, interacting with sample matter, and is collectedunder the sample in the far-field with the high numericalaperture microscopy objective. Such a signal is furthersubjected to collection and processing. For the hyperspectralimaging or for the spectroscopy or spectral imaging purposes,the signal is first passed through the holographic notchfilter, which eliminates excitation light and through thebeam splitter is directed to the wavelength-dispersive detector,such as a CCD spectrometer, and to the summary, imagingdetector, such as a PMT, or avalanche photodiode detector(APD). In the simplified setup, if the apparatus is used justfor the optical imaging, the light is passed directly from theobjective into the imaging detector, (i.e. APD or PMT).
Figure 3b schematically represents a typical aperturedprobe, mounted on the tuning fork. Micrographies at
MICROSCOPY AND SPECTROSCOPY, NEAR-FIELD 439
Figure 3. Example of the aperture-based, straight-fiber NSOM:(a) schematics representation of the scanning probe and collection;(b) schematics representation of the tapered fiber NSOM probe,attached to the tuning fork; (c) photography of the probe glued tothe tuning fork; (d) SEM image of the end of the tapered,aluminum-coated fiber optic based NSOM probe. (Courtesy ofVeeco Instruments Inc., Santa Barbara, CA.)

Fig. 3c and d represent the frontal and lateral view of themetallic-coated, laser-pulled, tapered, fiber-based tip. Anevanescent, standing wave is formed at the end of theaperture, and the size of the aperture approximatelydefines the optical resolution. Light is either broughtthrough the aperture, as in transmission and reflectionimaging mode, or collected through the aperture, as in thecollection mode. The tip is scanned across the sample in araster-scan pattern, and for imaging purposes; the signal iscollected in the far field, either by sensitive photomultipliertube, or by sensitive avalanche photo-diode counter.
The three distinctive different modes of operations ofthe aperture-based NSOM are illustrated in Fig. 4, whichalso graphically depicts the different kinds of informationthat can be extracted from the optical signal emanatingfrom the sample. The origin of the optical contrast, asdepicted in Fig. 4, can be due to topographic differences(different path length change the adsorption), materialbirefringence, reflectivity, sample extinction coefficientsfor the particular excitation wavelength, index of refrac-tion, fluorescence emission properties, nonlinear spectro-scopical properties of materials, and mechanical andmagnetic stress in the sample. However, at the momentof this writing, for life sciences and biomedical applica-tions, only transmitivitty, reflectivity and fluorescenceproperties are of significance. The mode that is the mostuseful for biological applications is the transmission modeor the ‘‘looking through’’ mode, and is most similar toclassical biological microscopy In this case, as describedabove, light is brought through the fiber-based tip, the nearfield interacts with the sample, and the signal is collectedin the far field as it passes through the sample. In thismode, it is possible to do transmission imaging, as well asfluorescence or other wavelength-resolved imaging, byapplication of adequate filters or wavelength-selective ele-ments. In a reflection mode, which can be described as‘‘looking on the surface mode’’, the near field interrogates
the surface of the sample, and the scattered signal iscollected in the far field. This mode allows imaging andspectroscopy of the nontransparent samples; however, theimaging efficiency is much lower than with transmissionmode. In a collection mode, the light is passed eitherthrough the sample, or illuminated on the sample, andthe signal is collected through the fiber in the near field.This mode is very burdensome to use, has low signalcollection efficiency, and is used mainly in photonicsresearch.
Besides these three modes, there are more exotic modesof operation, such as combined collection and illumination,where both sample illumination and resulting signal arepassed and collected through the same probe; dark fieldimaging, where the probe tip is in close proximity to asample that is illuminated from underneath with totalinternal reflection from the substrate, and wherein theprobe acts as a second, tunneling prism. Besides pureoptical operation modes, there are also a combined opto-magnetic NSOM, which explores Kerr’s effect (24); nano-mass spectroscopy (25), where near field is used for abla-tion; and optoelectrochemical NSOM (26). The later twomodes have a lot of potential applications in physiologywith their ability to simultaneously image and recordpotential at subwavelength resolution.
To secure the probe in a near field, the aperture must bekept in close proximity to the sample with a distance muchsmaller than the applied wavelength. The fiber is kept atthe nanometer-range distance from the sample by means ofnoncontact feedback. There are several ways of achievingfeedback, mainly shear force, AFM-like normal force con-tact, and noncontact force feedback. The shear-force feed-back provides gentler, lateral touching of the sample,thereby reducing the possibility of aperture contaminationor tip–aperture mechanical failure.
In shear-force feedback (20), the fiber tip is oscillatedlaterally to the sample surface. The NSOM tip is rigidlypremounted on a quartz tuning fork (Fig. 3b and c), whichis a few millimeters in size. The tuning fork is mechanicallyvibrated at resonance frequency, usually in tens to hun-dreds of kilohertz, resulting in a few nanometers of lateralmotion at the distal end of the NSOM tip. When the tip is ina close lateral proximity to the sample, the resonancefrequency of the tip-tuning fork system is disturbed dueto electrostatic, van der Waals, hydrogen bonding, andother kinds of attractive and/or repulsive interactionsbetween the tip and the sample. This disturbance is readas an electrical signal that is processed, and the tip ismoved accordingly in the vertical direction to achieve itspreset resonance frequency, thus keeping the same dis-tance from the sample.
Optical resolution, which is typically achieved by fiber-based apertured NSOM, is in the range of 50 nm, withmaximum resolution being in the range of 20 nm. Theimprovement in tip fabrication procedures and in the con-trol of the tip-sample separation distance will ultimatelylead to better resolution. For apertured NSOM, fiberopticor pipette-based tips are fabricated by constricting the coreof the optical fiber to a 50–20 nm diameter. This is achievedby a heating–pulling method (21), wherein the fiber istransversally irradiated by CO2 laser and simultaneously
440 MICROSCOPY AND SPECTROSCOPY, NEAR-FIELD
Figure 4. Typical apertured NSOM configuration: (a) illustrationof information that is carried and can be extracted from the opticalsignal; (b) transmission and reflection mode NSOM; (c) collectionmode NSOM; (d) total internal reflection or dark field mode.(Figure 3b–d adapted from Ref. 17.)

stretched on the pipette puller until the fiber is broken, orby chemical etching (22) at the phase boundaries using theHF solution with oil on the top. To enhance the efficiency ofthe light transmission and to avoid the light leakagethrough the fiber shell, the probes are usually coated witheither aluminum or silver. The coating is done by vacuumevaporation, and its role is to prevent light leaking out ofthe probe. The metallic coating is especially beneficial inthe near-field surface-enhanced Raman spectroscopy.
Another way of performing apertured NSOM is bybending the fiber or pipette. In this case, the force feedbackcan be achieved either by shear force, or by AFM-likenormal force in both contact or noncontact mode. Thedisadvantage of this approach is that such bended fibersare more vulnerable to mechanical failure, and if used forspectroscopy purposes, there may be problems with Ramanscattering lines coming from the fiber shell materials.
The other way of achieving apertured NSOM imaging isby using the hollow AFM cantilevers (23). In this kind ofsetup, the light from the excitation laser is focused on thetop aperture on the center of the hollow AFM tip, and thenear field is formed at its bottom. The feedback mechanismused therein is the same as in noncontact AFM. Presently,the resolution (in the range of 100 nm) of such hollow-cantilevered-based apertured NSOMs is inferior to thatof pulled-fiber-based NSOMs. Another disadvantage of theAFM-like force-feedback setup in NSOM applications is inthat the AFM uses a laser beam to follow the bending of thecantilever. In NSOM, when many applications are count-ing the individual photons, the optical noise introduced bythe AFM-like laser-based feedback may be several foldsstronger than the signal. Considerable improvement is tobe expected with piezo-actuated hollow cantilevers, whichwill avoid using laser feedback.
Apertureless NSOM
In the apertureless NSOM (Figs. 1b and 5), a sharp metallictip is irradiated by the laser light orthogonally to the long tipaxis, and the near-field excitation is scattered from the
tip (27,28). The light scattering from the feature is muchsmaller than the applied wavelength, which also generatesthe strong evanescent field. The best strength of the scat-tering field is achieved if the excitation laser frequencycorresponds to the surface-plasmon resonance of the metalfrom which the tip is made. Incoming beam scatteringproduces the evanescent field at the tip; however, thephysics of the process is a combination of the near-fieldantenna effects and surface plasmon resonance. The laserinduces the plasmons in the tip, which oscillates in parallelto the tip axis and amplifies the evanescent standing waveat the tip apex. The standing wave interacts with thesample and the signal is collected either in transmissionor reflection mode in the far field. The tip is scanned acrossthe sample in the same raster-pattern manner as withapertured NSOM. Feedback is provided in either thenoncontact AFM manner, preferably with a tuning forkor some other nonlaser based Z-deflection feedback, andthe signal collection is modulated by oscillating the probein a vertical direction in order to avoid static and scatteringartifacts. Furthermore, in modulated apertureless NSOM,the signal from the photodetector is also modulated with thesame modulation signal source as a tip, in exactly thesame frequency and phase (with possibilities of higherharmonics modulation. This is done in order to avoidinbound laser light nonnear-field induced scattering;static-scattering artifacts from sample features and to achieveoptical signal acquisition always in a same sample-tipseparation distance position.
In order to distinguish between the near-field scatteringand inbound laser light, most of the apertureless NSOMsare used mainly for fluorescence, Raman, or for differentnonlinear optical phenomena applications. Furthermore,because of the rapid decoy of the scattered field, modulationof the scanning probe, and control of the sample-tip separa-tion distance in the apertureless configuration is muchmore critical than in the aperture-based NSOM.
Figure 5 is a schematic representation of a typical,homemade, apertureless NSOM setup; in this particularcase used for fluorescence and fluorescence-lifetime (FLIM)
MICROSCOPY AND SPECTROSCOPY, NEAR-FIELD 441
APD
MicroscopeObjective
Filters
BeamSplitter
Las
er
Filter
X-Y PiezoStage Scanner
Controller Computer
AFM head
ComputerNanoscopeController
ComputerSPC730
Coated AFM tip
Figure 5. Schematic representation of the exampleof the apertureless NSOM. (Adapted from Ref. 29.)

near field imaging. It consists of a commercially availableAFM head, mounted on the top of the inverted epi-fluorescence microscope, positioned at the optical table.The lateral irradiation of the tip, which is necessary in orderto achieve the high intensity evanescent field generation, isproduced by offsetting the position of the AFM tip inrelationship to the high numerical apex microscope objec-tive. In this particular case, the fluorescence imagingmeasurements were conducted in an inverted fluorescence-imaging microscope (Nikon Diaphot 300), the excitationlight from a mode-locked YAG laser (Coherent Antares)at 532 nm wavelength, 10 ps pulse width, and 76 MHzrepetition rate was focused on a diffraction-limited spotthrough an objective (Nikon 60X NA 1.4), and the emissionfrom the sample was collected by the same objective, inthe epi-fluorescence manner. The emission band-passfilters were HQ565/25 and D570/20 (Chroma Technology)to ensure that the excitation light and the feedbacklaser of AFM (650 nm) were both blocked. The emissionwas detected by an avalanche photodiode (APD) (PerkinElmer, SPCM-AQR-15). The background photon countswith AFM feedback on were �150 Hz. The sample coverslip was mounted on a closed-loop two-dimensional (2D)piezoelectric scanner (Polytec PI, P-731). The AFM (VeecoInstruments Inc, D3100) head and inverted microscopewere coupled at an over–under position. The AFM tapping-mode tips used in this work are commercially available Sitips (Digital Instrument, OTESP7) coated with Au and Ag,by sputter coating. Image density of 128� 128 pixels andscan rate of 1 Hz. As the quenching effect is highly distancedependent, the tip oscillation amplitude was reduced byreducing the driving voltage to the tip as much as possiblewithout sacrificing image quality. Based on the force cali-bration curve, the tip oscillation amplitude during theimaging was estimated at � 30 nm.
The sample-scanning confocal fluorescence image wasrecorded by a home-built computer control interface thatcounted the APD signal and raster-scanned the piezo-electric scanner. The fluorescence decay traces wererecorded by a time-correlated single photon counting(TCSPC) module (Becker & Hickl SPC730, Germany).The start signal was from the APD and the stop signalwas from synchronization of the YAG laser at one-half ofthe laser repetition rate. For the lifetime imaging mode,the TCSPC module reads the line-synchronization signalof the Digital Instrument Nanoscope IIIa controller toachieve a synchronized recording of the AFM signalsand fluorescence signals.
Figure 6 depicts the FEM simulation (30) of near-fieldenhancement around a metallic tip positioned in closeproximity to the sample and irradiated with a laser beam.Figure 6 shows the rapid dependence of the near-fieldexcitation on the sample-tip separation, and emphasizesnecessity of accurate, sub nanometer sample-tip separa-tion control mechanism for any widespread, commercialapplications. This is even more important for the Ramanspectroscopy or hyperspectral imaging (or in this sense forany other, nonlinear optical applications), as the strengthof the Raman emission is proportional to the fourth powerof the strength of the electric field of applied light the smallchanges in the strength of the local near-field enhancement
can produce the dramatic fluctuation in the strength of theoptical signal.
Besides all of the difficulties in implementation, theadvantage of the apertureless mode is in theoreticallybetter resolution than the apertured mode, and in thehigher surface-enhanced Raman signal, due to plasmoncoupling, which makes this method, theoretically, an idealmolecular Raman nanoprobe, a ‘‘holy grail’’ for life scien-tists (31,32). The hyperspectral subwavelength Ramanimaging is extremely important for further studies insystem biology, proteomics, and metabolomics, as it isexpected it will for the first time allow identification andspatial positioning of biomolecules within a cell, withoutthe introduction of fluorescence labels. Aside from Ramanimaging, this approach is expected to be better for thepurpose of fluorescence lifetime imaging (FLIM) (29).The apertureless approach also has significant advantagesbecause the surface plasmon enhancement is driven by themetallic tip and a higher local intensity of the scatteredfield.
However, to date, there is no commercial instrumentavailable based on the apertureless NSOM principle,because of many technical problems, a significantly smallerphoton flux, a low signal/noise ratio, and extreme signaldependance on the tip-sample separation distance. It isexpected that with improvements in the control mechanism
442 MICROSCOPY AND SPECTROSCOPY, NEAR-FIELD
Figure 6. Finite-element methods (FEM) simulation of theelectromagnetic field scattering and near field enhancement atthe apex of the tip of the apertureless NSOM, and its behavior withchange in tip-sample separation distance. (Adapted from Ref. 30.)
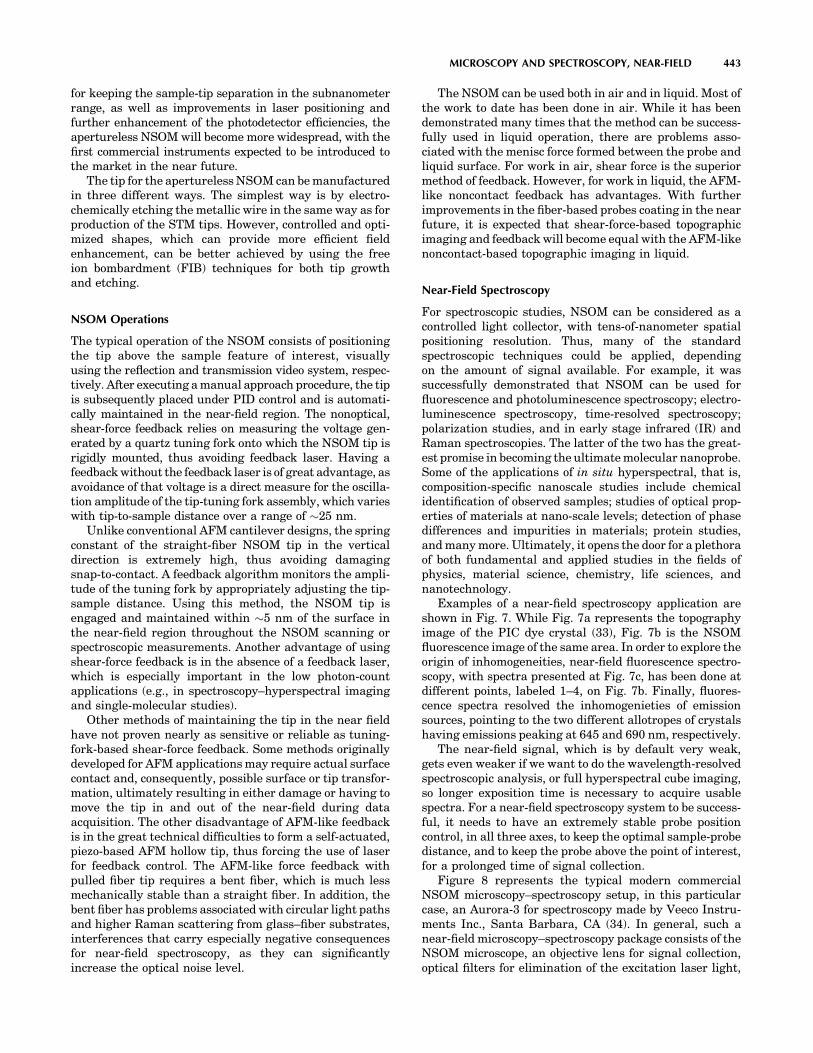
for keeping the sample-tip separation in the subnanometerrange, as well as improvements in laser positioning andfurther enhancement of the photodetector efficiencies, theapertureless NSOM will become more widespread, with thefirst commercial instruments expected to be introduced tothe market in the near future.
The tip for the apertureless NSOM can be manufacturedin three different ways. The simplest way is by electro-chemically etching the metallic wire in the same way as forproduction of the STM tips. However, controlled and opti-mized shapes, which can provide more efficient fieldenhancement, can be better achieved by using the freeion bombardment (FIB) techniques for both tip growthand etching.
NSOM Operations
The typical operation of the NSOM consists of positioningthe tip above the sample feature of interest, visuallyusing the reflection and transmission video system, respec-tively. After executing a manual approach procedure, the tipis subsequently placed under PID control and is automati-cally maintained in the near-field region. The nonoptical,shear-force feedback relies on measuring the voltage gen-erated by a quartz tuning fork onto which the NSOM tip isrigidly mounted, thus avoiding feedback laser. Having afeedback without the feedback laser is of great advantage, asavoidance of that voltage is a direct measure for the oscilla-tion amplitude of the tip-tuning fork assembly, which varieswith tip-to-sample distance over a range of �25 nm.
Unlike conventional AFM cantilever designs, the springconstant of the straight-fiber NSOM tip in the verticaldirection is extremely high, thus avoiding damagingsnap-to-contact. A feedback algorithm monitors the ampli-tude of the tuning fork by appropriately adjusting the tip-sample distance. Using this method, the NSOM tip isengaged and maintained within �5 nm of the surface inthe near-field region throughout the NSOM scanning orspectroscopic measurements. Another advantage of usingshear-force feedback is in the absence of a feedback laser,which is especially important in the low photon-countapplications (e.g., in spectroscopy–hyperspectral imagingand single-molecular studies).
Other methods of maintaining the tip in the near fieldhave not proven nearly as sensitive or reliable as tuning-fork-based shear-force feedback. Some methods originallydeveloped for AFM applications may require actual surfacecontact and, consequently, possible surface or tip transfor-mation, ultimately resulting in either damage or having tomove the tip in and out of the near-field during dataacquisition. The other disadvantage of AFM-like feedbackis in the great technical difficulties to form a self-actuated,piezo-based AFM hollow tip, thus forcing the use of laserfor feedback control. The AFM-like force feedback withpulled fiber tip requires a bent fiber, which is much lessmechanically stable than a straight fiber. In addition, thebent fiber has problems associated with circular light pathsand higher Raman scattering from glass–fiber substrates,interferences that carry especially negative consequencesfor near-field spectroscopy, as they can significantlyincrease the optical noise level.
The NSOM can be used both in air and in liquid. Most ofthe work to date has been done in air. While it has beendemonstrated many times that the method can be success-fully used in liquid operation, there are problems asso-ciated with the menisc force formed between the probe andliquid surface. For work in air, shear force is the superiormethod of feedback. However, for work in liquid, the AFM-like noncontact feedback has advantages. With furtherimprovements in the fiber-based probes coating in the nearfuture, it is expected that shear-force-based topographicimaging and feedback will become equal with the AFM-likenoncontact-based topographic imaging in liquid.
Near-Field Spectroscopy
For spectroscopic studies, NSOM can be considered as acontrolled light collector, with tens-of-nanometer spatialpositioning resolution. Thus, many of the standardspectroscopic techniques could be applied, dependingon the amount of signal available. For example, it wassuccessfully demonstrated that NSOM can be used forfluorescence and photoluminescence spectroscopy; electro-luminescence spectroscopy, time-resolved spectroscopy;polarization studies, and in early stage infrared (IR) andRaman spectroscopies. The latter of the two has the great-est promise in becoming the ultimate molecular nanoprobe.Some of the applications of in situ hyperspectral, that is,composition-specific nanoscale studies include chemicalidentification of observed samples; studies of optical prop-erties of materials at nano-scale levels; detection of phasedifferences and impurities in materials; protein studies,and many more. Ultimately, it opens the door for a plethoraof both fundamental and applied studies in the fields ofphysics, material science, chemistry, life sciences, andnanotechnology.
Examples of a near-field spectroscopy application areshown in Fig. 7. While Fig. 7a represents the topographyimage of the PIC dye crystal (33), Fig. 7b is the NSOMfluorescence image of the same area. In order to explore theorigin of inhomogeneities, near-field fluorescence spectro-scopy, with spectra presented at Fig. 7c, has been done atdifferent points, labeled 1–4, on Fig. 7b. Finally, fluores-cence spectra resolved the inhomogenieties of emissionsources, pointing to the two different allotropes of crystalshaving emissions peaking at 645 and 690 nm, respectively.
The near-field signal, which is by default very weak,gets even weaker if we want to do the wavelength-resolvedspectroscopic analysis, or full hyperspectral cube imaging,so longer exposition time is necessary to acquire usablespectra. For a near-field spectroscopy system to be success-ful, it needs to have an extremely stable probe positioncontrol, in all three axes, to keep the optimal sample-probedistance, and to keep the probe above the point of interest,for a prolonged time of signal collection.
Figure 8 represents the typical modern commercialNSOM microscopy–spectroscopy setup, in this particularcase, an Aurora-3 for spectroscopy made by Veeco Instru-ments Inc., Santa Barbara, CA (34). In general, such anear-field microscopy–spectroscopy package consists of theNSOM microscope, an objective lens for signal collection,optical filters for elimination of the excitation laser light,
MICROSCOPY AND SPECTROSCOPY, NEAR-FIELD 443

an optical pathway for signal transduction to the detector,and a wavelength dispersive detector. As the signal isgenerally very weak, the spectrometer needs to have avery sensitive detection system, in the best case, single-photon sensitivity. With today’s solid-state detectors tech-nology, the best detector to use is the CCD camera with alarger stack of sensitive pixels coupled to the imagingspectrometer. Depending on applications, either a Peltiercooled camera will be satisfactory (for most bright fluores-cence samples) or a liquid-nitrogen-cooled camera for ulti-mate sensitivity, such as in single-molecular experimentsand near-field Raman spectroscopy. Furthermore, interfa-cing and communication between spectrometer and NSOMscanning probe control software needs to be established.
Today, many spectrometers have semiopen control soft-ware, thus allowing triggering of the spectral acquisitionwith the TTL handshake signal, which can be producedby the NSOM microscope controller. In this way, themicroscope controller initiates spectral acquisition andthe system can be used with many different commercialspectrometers, allowing customization of the microprobe.Filtering out excitation photons is of extreme importance toincrease the signal/noise ratio, and the best filters avail-able today are notch, interferometric filters. Another con-sideration when designing the NSOM spectroscopypackage is that not one formula will fit all of the require-ments. Furthermore, virtually any application will requiresome special design consideration, so building the system
444 MICROSCOPY AND SPECTROSCOPY, NEAR-FIELD
Figure 7. Example of fluorescence-based hyperspectral near-fieldimaging. (a) Shear-force topography image; (b) NSOM fluorescenceimage; (c) spatially resolved fluorescence spectra, numbers 1–4corresponds to the different position on the crystal, demonstratingchemically specific imaging and material inhomogenities at thenanoscale. (Courtesy of David Vanden Bout and Paul Barbara,University of Minnesota, Minneapolis, MI.)
Figure 8. Typical, third generation commercially available NSOM setup, for imaging andspectroscopy: (a) photo of the NSOM head and sample holder; (b) complete system withattached spectrometer; (c) optical path schematics. (Courtesy of Veeco Instruments Inc., SantaBarbara, CA.)

as versatile and modular as possible is of the utmostimportance. The ability to incorporate additional standardoptical components and easy system reconfigurationshould be first in the designer’s mind. At the same time,once a system is set up for operation, it should allow foreasy, straightforward, simple operation, and robustness,which are sometimes contradictory requirements. Thedesign of the NSOM head, when having the spectroscopypackage in mind, must incorporate extremely accurateclosed-loop scan linearization. While shear-force feedbackkeeps superb control of sample-tip distance, the closed-loopX–Y scanning is necessary in order to keep the probe at theselected spatial position during sample collection.
The near-field spectroscopy package is an even morepromising breakthrough technology for life sciences thanfor NSOM imaging alone. For the first time, it will allowqualitative identification of the composition of an observedsample, via optical spectroscopies, at the spatial resolutionof scanning probe microscopy. The current commercialsystems can distinguish differences in chemical composi-tion of the samples, at the spatial resolution of 50 nm orbetter. For combined near-field spectroscopy and imaging,the signal may be split into the dual-beam path, whereinone path is used for the imaging detector and anotherone for spectroscopy. Such dual-beam solution minimizesremoval, replacement, and realignment of componentswhen a different mode is desired. The benefit is the easeof use and robust, reliable operation for separate or simul-taneous transmission and reflection measurements.
In the example of the Aurora-3 optical path system, thelight from both objectives is redirected out the side ports bytwo front-surface mirrors, which are reflection-coated foroptimal visible/near-IR (NIR) operation. The near-fieldtransmission and reflection light is collected in the far fieldby precisely aligned microscope objectives to provide highquality collimated (parallel) beams, with a nominal 7 mmdiameter. This system design allows for NSOM spectro-scopic operation with standard one-half in. diameter optics,though for ease of alignment and handling, 1 in. diameteroptics is generally recommended. Furthermore, the reflec-tion path is carefully aligned to match the transmissionpath. Such integrated solutions minimize removal, repla-cement, and realignment of components when a differentmode is desired. The integrated reflection path is alwaysavailable for use with any sample and never requiresremoval or realignment in the microscope with normaluse. As there are many variations in the spectroscopysetup, it is important for an NSOM system that isintended for spectroscopic use to be capable of utilizingthe standard optical element, so users can customize thesystem using standard optical poles and optical benchmounting systems.
Evaluation
While the first NSOM was invented just 2 years after theAFM, its widespread use has just started to pick up in thelast several years. The reasons for this lag are severalfold:the first NSOM images were hard to interpret, and as theywere achieved without topography modulation, the con-trast in the images was not intuitive; there were no com-
mercial instruments available until the mid-1990s, thus allusers needed to build their own systems; the use of thehome-built and first commercial instrument and its align-ment procedures were cumbersome and complicated forany user who was not skilled in optoelectronics develop-ment; and the resolution of the systems depended on eachindividual sample. However, the field is changing rapidly,and with introduction of the latest, third generation ofcommercial systems (13–16), such as the Aurora-3 fromVeeco Instruments Inc., MultiView 400 from NanonicsImaging Ltd, Smena from NT-MDT, and AlphaSNOM fromWiTec GmbH, the ease of use is comparable with thestandard scanning probe microscope and is within the skillset of average life sciences user. Furthermore, withimprovement in the serial production of the probes andquality control in recent years, the resolution of the NSOMsystem is becoming more uniform, and resolution expecta-tions can be met with most samples.
The way to evaluate and measure resolution of theNSOM instrument is by utilizing Fisher’s projection masks(35). It is virtually accepted as a standard for evaluatingNSOM resolution and quality of image topographic mod-ulation, the latter one by comparing the topographic withthe optical image. The Fisher project mask is a regularhexagonal array of metallic spikes (Fig. 9). It is produced byhaving the monolayer of the monodispersed polymerspheres coated with metallic coating, and the spheressubsequently dissolved with organic solvents. What is leftis the regular, closed-packed hexagonal matrix of metallicspikes. In transmission mode, the spike is seen as a darkspot on the optical micrography, while in reflection mode,the spike is a bright spot, and the void space is dark.
The near-field optical imaging obviously provides twogreat advantages over other types of imaging: its ability tosimultaneously acquire topography, in a scanning-forcemanner, and an optical image. The optical image carriesa plethora of different information that can be furthermoreextracted. The most important advantage is that there aremany different ways to extract direct or indirect informa-tion on spatial distribution of chemical composition of theobserved sample, even on the single molecular level.Furthermore, at current state-of-the-art commercialNSOM instrumentation, the near-field imaging and spec-troscopy can be performed at a resolution at least fourtimes as high as the resolution of the best optical confocalmicroscopes. The obvious applications in the biomedicalfield are all of the applications for which the standardconfocal and inverted fluorescence microscope is usedtoday, but at the same time, done at much higher resolu-tion (36–40). Examples of life sciences and biomedicalapplications involve optical ultramicroscopy of cells; opticalimaging of cell organelles; imaging and spectroscopy ofindividual molecules and macromolecules; in vivo trackingof molecular events and endocytosis; and high resolutionchromosome labeling [i.e., high resolution fluorescencein situ hybridization (FISH) (39) applications]. Some of theseapplications, like molecular tracking, and high resolutionFISH are unachievable with other methods.
The molecular tracking applications are based on fluor-escence, and in the future, Raman SERS applications willrevolutionize our way of understanding how cellular
MICROSCOPY AND SPECTROSCOPY, NEAR-FIELD 445
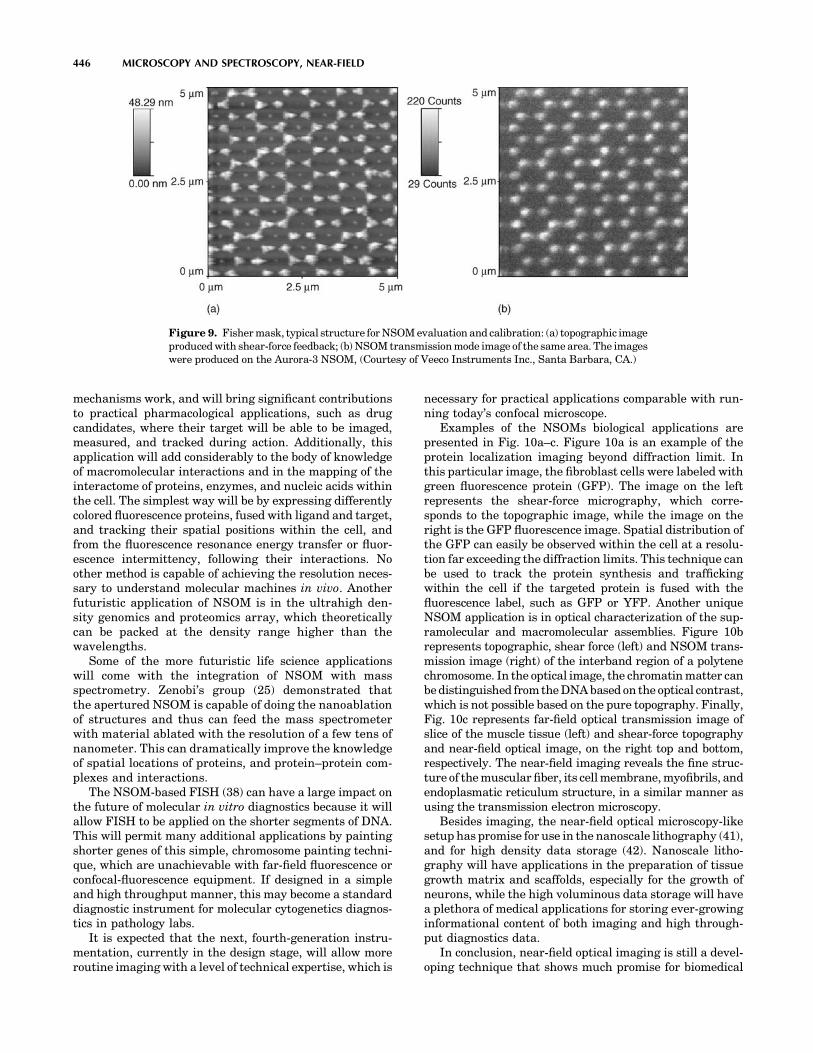
mechanisms work, and will bring significant contributionsto practical pharmacological applications, such as drugcandidates, where their target will be able to be imaged,measured, and tracked during action. Additionally, thisapplication will add considerably to the body of knowledgeof macromolecular interactions and in the mapping of theinteractome of proteins, enzymes, and nucleic acids withinthe cell. The simplest way will be by expressing differentlycolored fluorescence proteins, fused with ligand and target,and tracking their spatial positions within the cell, andfrom the fluorescence resonance energy transfer or fluor-escence intermittency, following their interactions. Noother method is capable of achieving the resolution neces-sary to understand molecular machines in vivo. Anotherfuturistic application of NSOM is in the ultrahigh den-sity genomics and proteomics array, which theoreticallycan be packed at the density range higher than thewavelengths.
Some of the more futuristic life science applicationswill come with the integration of NSOM with massspectrometry. Zenobi’s group (25) demonstrated thatthe apertured NSOM is capable of doing the nanoablationof structures and thus can feed the mass spectrometerwith material ablated with the resolution of a few tens ofnanometer. This can dramatically improve the knowledgeof spatial locations of proteins, and protein–protein com-plexes and interactions.
The NSOM-based FISH (38) can have a large impact onthe future of molecular in vitro diagnostics because it willallow FISH to be applied on the shorter segments of DNA.This will permit many additional applications by paintingshorter genes of this simple, chromosome painting techni-que, which are unachievable with far-field fluorescence orconfocal-fluorescence equipment. If designed in a simpleand high throughput manner, this may become a standarddiagnostic instrument for molecular cytogenetics diagnos-tics in pathology labs.
It is expected that the next, fourth-generation instru-mentation, currently in the design stage, will allow moreroutine imaging with a level of technical expertise, which is
necessary for practical applications comparable with run-ning today’s confocal microscope.
Examples of the NSOMs biological applications arepresented in Fig. 10a–c. Figure 10a is an example of theprotein localization imaging beyond diffraction limit. Inthis particular image, the fibroblast cells were labeled withgreen fluorescence protein (GFP). The image on the leftrepresents the shear-force micrography, which corre-sponds to the topographic image, while the image on theright is the GFP fluorescence image. Spatial distribution ofthe GFP can easily be observed within the cell at a resolu-tion far exceeding the diffraction limits. This technique canbe used to track the protein synthesis and traffickingwithin the cell if the targeted protein is fused with thefluorescence label, such as GFP or YFP. Another uniqueNSOM application is in optical characterization of the sup-ramolecular and macromolecular assemblies. Figure 10brepresents topographic, shear force (left) and NSOM trans-mission image (right) of the interband region of a polytenechromosome. In the optical image, the chromatin matter canbe distinguished from the DNA based on the optical contrast,which is not possible based on the pure topography. Finally,Fig. 10c represents far-field optical transmission image ofslice of the muscle tissue (left) and shear-force topographyand near-field optical image, on the right top and bottom,respectively. The near-field imaging reveals the fine struc-ture of the muscular fiber, its cell membrane, myofibrils, andendoplasmatic reticulum structure, in a similar manner asusing the transmission electron microscopy.
Besides imaging, the near-field optical microscopy-likesetup has promise for use in the nanoscale lithography (41),and for high density data storage (42). Nanoscale litho-graphy will have applications in the preparation of tissuegrowth matrix and scaffolds, especially for the growth ofneurons, while the high voluminous data storage will havea plethora of medical applications for storing ever-growinginformational content of both imaging and high through-put diagnostics data.
In conclusion, near-field optical imaging is still a devel-oping technique that shows much promise for biomedical
446 MICROSCOPY AND SPECTROSCOPY, NEAR-FIELD
Figure 9. Fisher mask, typical structure for NSOM evaluation and calibration: (a) topographic imageproduced with shear-force feedback; (b) NSOM transmission mode image of the same area. The imageswere produced on the Aurora-3 NSOM, (Courtesy of Veeco Instruments Inc., Santa Barbara, CA.)

MICROSCOPY AND SPECTROSCOPY, NEAR-FIELD 447
Figure 10. Examples of biomedicaland life-sciences applications of NSOMimaging: (a)Shear-forcetopographyandnear-field fluorescence from GFP-labeled fibroblast cells. Images of thefibrorblast cells are prepared bygrowing them directly on glass coverslides and subsequent labeling. Theyare imaged in air at a scan speed of 1Hz, no photodegradation was observedthroughout the measurement.(Courtesy of Renato Zenobi, ETH,Zurich, # Renato Zenobi and ETHZurich, Switzerland). (b) Shear forceand NSOM image of the interbandregion of a polytene chromosome.(Courtesy of Sid Ragona and PhilHaydon, Laboratory of CellularSignaling, Dept. of Zoology andGenetics, Iowa State University, Ames,IA, and Veeco Instruments Inc.). (c) Far-field, differential contrast opticalmicroscopy of the muscle tissue, anddetails of the muscle cell by shear forceandNSOM.(CourtesyofSidRagonaandPhil Haydon, Laboratory of CellularSignaling, Department of Zoology andGenetics, Iowa State University, Ames,IA and Veeco Instruments Inc.)

applications. This review presents the state-of-the-art NSOMtechnology up to the second quarter of 2005. It is certain thatby the time of the next edition of this Encyclopedia, therewill be many other technological and advancements in thefield of biomedical applications of near-field optics.
BIBLIOGRAPHY
1. Abbe E. Beitrsge zur theorie des mikroskops und mikrosko-pichen wahrnehmung. Arch Mikroskop Anat 1873;9:413.
2. Synge EH. A suggested method for extending the microscopicresolution into the ultramicroscopic region. Phil Mag 1928;6:356–362.
3. Synge EH. An application of piezoelectricity to microscopy.Phil Mag 1932;13:297–300.
4. O’Keefe JA. Resolving power of visible light. J Opt Soc Am1956;46:359–362.
5. Ash A, Nichols G. Super-resolution aperture scanning micro-scope. Nature London 1972;237:510–511.
6. Pohl DW, Denk W, Lanz M. Optical stethoscopy—Image record-ing with resolution lambda/20. Appl Phys Lett 1984;44: 651–653.
7. Lewis A, Isaacson M, Harootunian A, Murray A. Develop-ment of 500A spatial-resolution light-microscope. 1. Light isefficiently transmitted through gamma-16 diameter aper-tures. Ultramicroscopy 1984;13:227–231.
8. Rasmussen A, Deckert V. New dimension in nano-imaging:breaking through the diffraction limit with scanning near-fieldoptical microscopy. Anal Bioanal Chem 2005;381:165–172.
9. Edidin M. Near-field scanning optical microscopy, a siren callto biology. Traffic 2001;2:797–803.
10. Dunn RC. Near-field scanning optical microscopy. Chem Rev1999;99:2891–2899.
11. Micic M. Near-field scanning optical microscopy and spectro-scopy advance. Photonics Spectra 2005;38:124–125.
12. De Serio M, Zenobi R, Deckert V. Looking at the nanoscale:scanning near-field optical microscopy. TRAC-Trends AnalChem 2003;22:70–77.
13. Product info: Aurora-3 NSOM , Veeco Instruments Inc.,Santa Barbara, CA. Available at http://www.veeco.com.
14. Product info: Multiview Series, Nanonics Imaging Ltd., Jer-usalem, Israel. Available at http://www.nanonics.co.il.
15. Product info: Alpha SNOM, Witec Wissenschaftliche Instru-mente und Technologie. Available at GmbH GmbH,Ulm,Germany, http://www.witec.de.
16. Product info: Solver SNOM, NT-MDT Co, Zelenogorod, Rus-sia. Available at http://www.ntmdt.ru.
17. Paesler MA, Moyer P. Near-Field Optics Theory, Instrumenta-tion and Applications. New York: John Wiley & Sons; 1996.
18. Curie P, Curie J. Developement, par pression de l’electricitepolaire dans les cristaux hemiedres a faces inclinees. CompRen 1880;91:291–295.
19. Spanner K. Micro Positioning, Nano Positioning, Nano Auto-mation: Solution for Cutting Edge Technologies (productcatalog), Karslruhe, Physik Instrumente (PI) GmbH & CoKG. Available at http://www.pi.ws. Accessed 2005.
20. Betzig E, Finn PL, Weiner JS. Combined shear force andnear-field scanning optical microscope. Appl Phys Lett1992;60: 2484–2486.
21. Garcia-Parajo M, Tate T, Chen Y. Gold-coated parabolictapers for scanning near-field optical microscopy: Fabricationand optimisation. Ultramicroscopy 1995;61:155–163.
22. Pangaribuan T, et al. Reproducible fabrication technique ofnanometric tip diameter fiber probe for photon scanningtunneling microscope. Jpn J Appl Phys 1992;31:L1302–L1304.
23. Radojewski R, Grabijec P. Combined SNOM/AFM microscopywith micromachined nanoapertures. Mater Sci–Poland2003;21:321–332.
24. Takahashi S, Dickson W, Pollard R, Zaytas A. Near-fieldmagneto-optical analysis in reflection mode SNOM. Ultra-microscopy 2004;100(3–4):443–447.
25. Stockle R, et al. Nanoscale atmospheric pressure laser abla-tion mass spectrometry. Anal Chem 2001;73:139–1402.
26. Chovin A, Garrigue P, Servant L, Sojic N. Electrochemical modula-tion of remote fluorescence imaging at an ordered opto-electroche-mical nanoaperture array. Chemphyschem 2004;5:1125–1132.
27. Inoye Y, Kawata S. Near-field scanning optical microscopewith a metallic probe tip. Opt Lett 1994;19:159–161.
28. Keilmann F, Hillenbrand R. Near-field microscopy by elasticlight scattering from a tip. Philas Trans R Soc Sci A2004;362:787–805.
29. Hu DH, et al. Correlated topographic and spectroscopic ima-ging beyond diffraction limit by atomic force microscopymetallic tip enhanced near-field fluorescence lifetime micro-scopy. Rev Sci Instr 2003;74:3347–3355.
30. Micic M, Klymyshin N, Suh YD, Lu HP. Finite elementmethod simulation of the field distribution for AFM tipenhanced surface enhanced Raman scanning microscopy. JPhys Chem B 2003;107:1574–1584.
31. Sun WX, Shen ZX. Near-field scanning Raman microscopy usingapertureless probes. J Raman Spectrosc 2003;34:668–676.
32. Richards D. Near-field microscopy: Throwing light on thenanoworld Philas Trans R Soc Sci A 2003;361:2843–2857.
33. Vanden Bout DA, Kerimo J, Higgins DA, Barbara PF. Spa-tially Resolved Spectral Inhomogeneities in Small MolecularCrystals Studied by Near Field Scanning. Opt Microsc J PhysChem 1996;100:11843–11850.
34. Puestow R. Configuring Aurora-3 for Spectroscopy, applica-tion note, Veeco Instruments Inc, Santa Barbara, CA, 2003.
35. Fischer UC, et al. Latex bead projection nanopatterns. SurfInterface Anal 2002;33:75–80.
36. de Lange F, et al. Cell biology beyond the diffraction limit: Near-field scanning optical microscopy. J Cell Sci 2001;114: 4153–4160.
37. Subramaniam V, Kirsch AK, Jovin TM. Cell biological appli-cations of scanning near-field optical microscopy (SNOM).Cell Molec Biol 1998;44:689–700.
38. Lewis A, et al. Near-field scanning optical microscopy in cellbiology. Trends Cell Biol 1999;9:70–73.
39. Fukushi D, et al. Scanning near-field optical/atomic force micro-scopy detection of fluorescence in situ hybridization signalsbeyond the optical limit. Exp Cell Res 2003;289:237–244.
40. Krishnan RV, Varma R, Mayor S. Fluorescence methods toprobe nanometer-scale organization of molecules in living cellmembranes. J Fluoresc 2001;11:211–226.
41. Dryakhulshin VF, Klimov AY, Rogov VV, Vostkov NV. Near-field optical lithography method for fabrication of nanodi-mensional objects. Appl Surf Sci 2005;248:200–203.
42. Ferri V, et al. Near-field optical addressing of luminescentphotoswitchable supramolecular system embedded in inertpolymer matrices. Nano Lett 2004;4:835–859.
Further Reading
Prasad PN. Nanophotonics. New York: John Wiley & Sons; 2004.Courion D. Near Field Microscopy and Near Field Optics. London:
Imperial College Press; 2003.Paul DW, Courion D. Near Field Optics. Arc-et Senans: Kulwer
Academic Publisher; 1993.Taatjes DJ, Brooke MT. Cell Imaging Techniques: Methods and
Protocolos. Totowa: Humana Press; 2005.
See also MICROSCOPY, CONFOCAL; MICROARRAYS; NANOPARTICLES.
448 MICROSCOPY AND SPECTROSCOPY, NEAR-FIELD
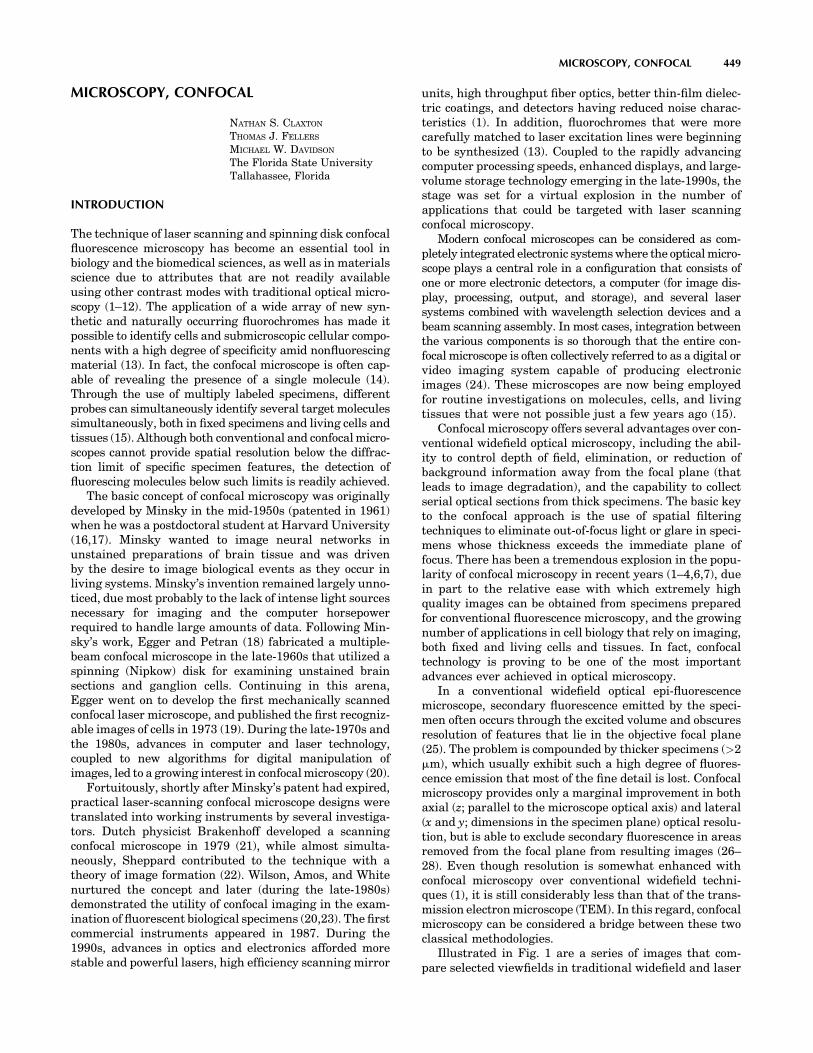
MICROSCOPY, CONFOCAL
NATHAN S. CLAXTON
THOMAS J. FELLERS
MICHAEL W. DAVIDSON
The Florida State UniversityTallahassee, Florida
INTRODUCTION
The technique of laser scanning and spinning disk confocalfluorescence microscopy has become an essential tool inbiology and the biomedical sciences, as well as in materialsscience due to attributes that are not readily availableusing other contrast modes with traditional optical micro-scopy (1–12). The application of a wide array of new syn-thetic and naturally occurring fluorochromes has made itpossible to identify cells and submicroscopic cellular compo-nents with a high degree of specificity amid nonfluorescingmaterial (13). In fact, the confocal microscope is often cap-able of revealing the presence of a single molecule (14).Through the use of multiply labeled specimens, differentprobes can simultaneously identify several target moleculessimultaneously, both in fixed specimens and living cells andtissues (15). Although both conventional and confocal micro-scopes cannot provide spatial resolution below the diffrac-tion limit of specific specimen features, the detection offluorescing molecules below such limits is readily achieved.
The basic concept of confocal microscopy was originallydeveloped by Minsky in the mid-1950s (patented in 1961)when he was a postdoctoral student at Harvard University(16,17). Minsky wanted to image neural networks inunstained preparations of brain tissue and was drivenby the desire to image biological events as they occur inliving systems. Minsky’s invention remained largely unno-ticed, due most probably to the lack of intense light sourcesnecessary for imaging and the computer horsepowerrequired to handle large amounts of data. Following Min-sky’s work, Egger and Petran (18) fabricated a multiple-beam confocal microscope in the late-1960s that utilized aspinning (Nipkow) disk for examining unstained brainsections and ganglion cells. Continuing in this arena,Egger went on to develop the first mechanically scannedconfocal laser microscope, and published the first recogniz-able images of cells in 1973 (19). During the late-1970s andthe 1980s, advances in computer and laser technology,coupled to new algorithms for digital manipulation ofimages, led to a growing interest in confocal microscopy (20).
Fortuitously, shortly after Minsky’s patent had expired,practical laser-scanning confocal microscope designs weretranslated into working instruments by several investiga-tors. Dutch physicist Brakenhoff developed a scanningconfocal microscope in 1979 (21), while almost simulta-neously, Sheppard contributed to the technique with atheory of image formation (22). Wilson, Amos, and Whitenurtured the concept and later (during the late-1980s)demonstrated the utility of confocal imaging in the exam-ination of fluorescent biological specimens (20,23). The firstcommercial instruments appeared in 1987. During the1990s, advances in optics and electronics afforded morestable and powerful lasers, high efficiency scanning mirror
units, high throughput fiber optics, better thin-film dielec-tric coatings, and detectors having reduced noise charac-teristics (1). In addition, fluorochromes that were morecarefully matched to laser excitation lines were beginningto be synthesized (13). Coupled to the rapidly advancingcomputer processing speeds, enhanced displays, and large-volume storage technology emerging in the late-1990s, thestage was set for a virtual explosion in the number ofapplications that could be targeted with laser scanningconfocal microscopy.
Modern confocal microscopes can be considered as com-pletely integrated electronic systems where the optical micro-scope plays a central role in a configuration that consists ofone or more electronic detectors, a computer (for image dis-play, processing, output, and storage), and several lasersystems combined with wavelength selection devices and abeam scanning assembly. In most cases, integration betweenthe various components is so thorough that the entire con-focal microscope is often collectively referred to as a digital orvideo imaging system capable of producing electronicimages (24). These microscopes are now being employedfor routine investigations on molecules, cells, and livingtissues that were not possible just a few years ago (15).
Confocal microscopy offers several advantages over con-ventional widefield optical microscopy, including the abil-ity to control depth of field, elimination, or reduction ofbackground information away from the focal plane (thatleads to image degradation), and the capability to collectserial optical sections from thick specimens. The basic keyto the confocal approach is the use of spatial filteringtechniques to eliminate out-of-focus light or glare in speci-mens whose thickness exceeds the immediate plane offocus. There has been a tremendous explosion in the popu-larity of confocal microscopy in recent years (1–4,6,7), duein part to the relative ease with which extremely highquality images can be obtained from specimens preparedfor conventional fluorescence microscopy, and the growingnumber of applications in cell biology that rely on imaging,both fixed and living cells and tissues. In fact, confocaltechnology is proving to be one of the most importantadvances ever achieved in optical microscopy.
In a conventional widefield optical epi-fluorescencemicroscope, secondary fluorescence emitted by the speci-men often occurs through the excited volume and obscuresresolution of features that lie in the objective focal plane(25). The problem is compounded by thicker specimens (>2mm), which usually exhibit such a high degree of fluores-cence emission that most of the fine detail is lost. Confocalmicroscopy provides only a marginal improvement in bothaxial (z; parallel to the microscope optical axis) and lateral(x and y; dimensions in the specimen plane) optical resolu-tion, but is able to exclude secondary fluorescence in areasremoved from the focal plane from resulting images (26–28). Even though resolution is somewhat enhanced withconfocal microscopy over conventional widefield techni-ques (1), it is still considerably less than that of the trans-mission electron microscope (TEM). In this regard, confocalmicroscopy can be considered a bridge between these twoclassical methodologies.
Illustrated in Fig. 1 are a series of images that com-pare selected viewfields in traditional widefield and laser
MICROSCOPY, CONFOCAL 449

scanning confocal fluorescence microscopy. A thick (16mm) section of fluorescently stained mouse hippocampusin widefield fluorescence exhibits a large amount of glarefrom fluorescent structures located above and below thefocal plane (Fig. 1a). When imaged with a laser scanningconfocal microscope (Fig. 1b), the brain thick sectionreveals a significant degree of structural detail. Likewise,widefield fluorescence imaging of rat smooth muscle fibersstained with a combination of Alexa Fluor dyes produceblurred images (Fig. 1c) lacking in detail, while the samespecimen field (Fig. 1d) reveals a highly striated topogra-phy when viewed as an optical section with confocalmicroscopy. Autofluorescence in a sunflower (Helianthusannuus) pollen grain tetrad produces a similar indistinctoutline of the basic external morphology (Fig. 1e), butyields no indication of the internal structure in widefieldmode. In contrast, a thin optical section of the same grain(Fig. 1f) acquired with confocal techniques displays adramatic difference between the particle core and thesurrounding envelope. Collectively, the image comparisonsin Fig. 1 dramatically depict the advantages of achievingvery thin optical sections in confocal microscopy. The abilityof this technique to eliminate fluorescence emission fromregions removed from the focal plane offsets it from tradi-tional forms of fluorescence microscopy.
PRINCIPLES OF CONFOCAL MICROSCOPY
The confocal principle in epi-fluorescence laser scanningmicroscope is diagrammatically presented in Fig. 2. Coher-ent light emitted by the laser system (excitation source)passes through a pinhole aperture that is situated in aconjugate plane (confocal) with a scanning point on thespecimen and a second pinhole aperture positioned in frontof the detector (a photomultiplier tube). As the laser isreflected by a dichromatic mirror, and scanned across thespecimen in a defined focal plane, secondary fluorescenceemitted from points on the specimen (in the same focalplane) pass back through the dichromatic mirror, and arefocused as a confocal point at the detector pinhole aperture.
The significant amount of fluorescence emission thatoccurs at points above and below the objective focal plane isnot confocal with the pinhole (termed out-of-focus lightrays in Fig. 2) and forms extended Airy disks in theaperture plane (29). Because only a small fraction of theout-of-focus fluorescence emission is delivered throughthe pinhole aperture, most of this extraneous light is notdetected by the photomultiplier and does not contribute tothe resulting image. The dichromatic mirror, barrier filter,and excitation filter perform similar functions to identicalcomponents in a widefield epi-fluorescence microscope (30).
450 MICROSCOPY, CONFOCAL
Figure 1. Comparison of widefield (upper row) and laser scanning confocal fluorescence microscopyimages (lower row). Note the significant amount of signal in the widefield images from fluorescentstructures located outside of the focal plane. (a) and (b) Mouse brain hippocampus thick sectiontreated with primary antibodies to glial fibrillary acidic protein (GFAP; red), neurofilaments H(green), and counterstained with Hoechst 33342 (blue) to highlight nuclei. (c) and (d) Thick section ofrat smooth muscle stained with phalloidin conjugated to Alexa Fluor 568 (targeting actin; red),wheat germ agglutinin conjugated to Oregon Green 488 (glycoproteins; green), and counterstainedwith DRAQ5 (nuclei; blue). (e) and (f) Sunflower pollen grain tetrad autofluorescence.
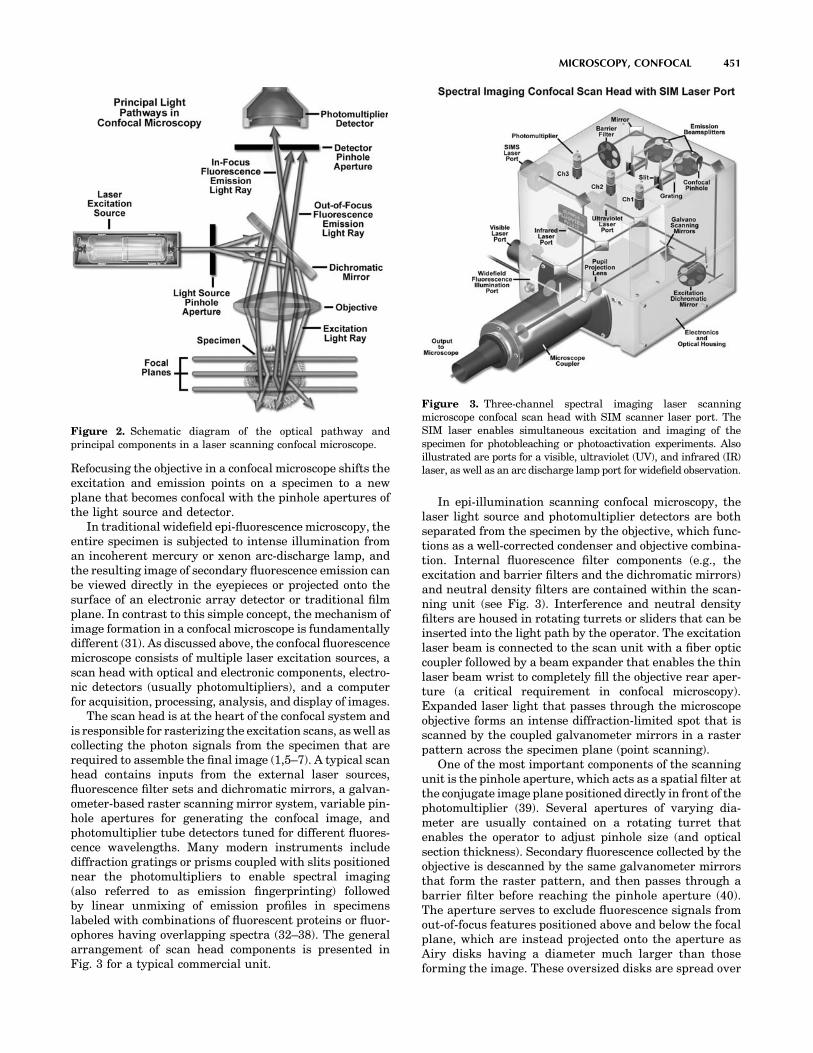
Refocusing the objective in a confocal microscope shifts theexcitation and emission points on a specimen to a newplane that becomes confocal with the pinhole apertures ofthe light source and detector.
In traditional widefield epi-fluorescence microscopy, theentire specimen is subjected to intense illumination froman incoherent mercury or xenon arc-discharge lamp, andthe resulting image of secondary fluorescence emission canbe viewed directly in the eyepieces or projected onto thesurface of an electronic array detector or traditional filmplane. In contrast to this simple concept, the mechanism ofimage formation in a confocal microscope is fundamentallydifferent (31). As discussed above, the confocal fluorescencemicroscope consists of multiple laser excitation sources, ascan head with optical and electronic components, electro-nic detectors (usually photomultipliers), and a computerfor acquisition, processing, analysis, and display of images.
The scan head is at the heart of the confocal system andis responsible for rasterizing the excitation scans, as well ascollecting the photon signals from the specimen that arerequired to assemble the final image (1,5–7). A typical scanhead contains inputs from the external laser sources,fluorescence filter sets and dichromatic mirrors, a galvan-ometer-based raster scanning mirror system, variable pin-hole apertures for generating the confocal image, andphotomultiplier tube detectors tuned for different fluores-cence wavelengths. Many modern instruments includediffraction gratings or prisms coupled with slits positionednear the photomultipliers to enable spectral imaging(also referred to as emission fingerprinting) followedby linear unmixing of emission profiles in specimenslabeled with combinations of fluorescent proteins or fluor-ophores having overlapping spectra (32–38). The generalarrangement of scan head components is presented inFig. 3 for a typical commercial unit.
In epi-illumination scanning confocal microscopy, thelaser light source and photomultiplier detectors are bothseparated from the specimen by the objective, which func-tions as a well-corrected condenser and objective combina-tion. Internal fluorescence filter components (e.g., theexcitation and barrier filters and the dichromatic mirrors)and neutral density filters are contained within the scan-ning unit (see Fig. 3). Interference and neutral densityfilters are housed in rotating turrets or sliders that can beinserted into the light path by the operator. The excitationlaser beam is connected to the scan unit with a fiber opticcoupler followed by a beam expander that enables the thinlaser beam wrist to completely fill the objective rear aper-ture (a critical requirement in confocal microscopy).Expanded laser light that passes through the microscopeobjective forms an intense diffraction-limited spot that isscanned by the coupled galvanometer mirrors in a rasterpattern across the specimen plane (point scanning).
One of the most important components of the scanningunit is the pinhole aperture, which acts as a spatial filter atthe conjugate image plane positioned directly in front of thephotomultiplier (39). Several apertures of varying dia-meter are usually contained on a rotating turret thatenables the operator to adjust pinhole size (and opticalsection thickness). Secondary fluorescence collected by theobjective is descanned by the same galvanometer mirrorsthat form the raster pattern, and then passes through abarrier filter before reaching the pinhole aperture (40).The aperture serves to exclude fluorescence signals fromout-of-focus features positioned above and below the focalplane, which are instead projected onto the aperture asAiry disks having a diameter much larger than thoseforming the image. These oversized disks are spread over
MICROSCOPY, CONFOCAL 451
Figure 2. Schematic diagram of the optical pathway andprincipal components in a laser scanning confocal microscope.
Figure 3. Three-channel spectral imaging laser scanningmicroscope confocal scan head with SIM scanner laser port. TheSIM laser enables simultaneous excitation and imaging of thespecimen for photobleaching or photoactivation experiments. Alsoillustrated are ports for a visible, ultraviolet (UV), and infrared (IR)laser, as well as an arc discharge lamp port for widefield observation.

a comparatively large area so that only a small fraction oflight originating in planes away from the focal point passesthrough the aperture. The pinhole aperture also serves toeliminate much of the stray light passing through the opticalsystem. Coupling of aperture-limited point scanning to apinhole spatial filter at the conjugate image plane is anessential feature of the confocal microscope.
When contrasting the similarities and differencesbetween widefield and confocal microscopes, it is oftenuseful to compare the character and geometry of specimenillumination utilized for each of the techniques. Traditionalwidefield epi-fluorescence microscope objectives focusa wide cone of illumination over a large volume of thespecimen (41), which is uniformly and simultaneouslyilluminated (as illustrated in Fig. 4a). A majority of thefluorescence emission directed back toward the microscopeis gathered by the objective (depending on the numericalaperture) and projected into the eyepieces or detector. Theresult is a significant amount of signal due to emittedbackground light and autofluorescence originating fromareas above and below the focal plane, which seriouslyreduces resolution and image contrast.
The laser illumination source in confocal microscopy isfirst expanded to fill the objective rear aperture, and thenfocused by the lens system to a very small spot at the focalplane (Fig. 4b). The size of the illumination point rangesfrom �0.25 to 0.8 mm in diameter (depending on theobjective numerical aperture) and 0.5 to 1.5 mm deep atthe brightest intensity. Confocal spot size is determined bythe microscope design, wavelength of incident laser light,objective characteristics, scanning unit settings, and thespecimen (41). Figure 4 presents a comparison between thetypical illumination cones of a widefield (Fig. 4a) and pointscanning confocal (Fig. 4b) microscope at the same numer-ical aperture. The entire depth of the specimen over a widearea is illuminated by the widefield microscope, while thesample is scanned with a finely focused spot of illuminationthat is centered in the focal plane in the confocal microscope.
In laser scanning confocal microscopy, the image of anextended specimen is generated by scanning the focusedbeam across a defined area in a raster pattern controlled bytwo high speed oscillating mirrors driven with galvan-ometer motors. One of the mirrors moves the beam fromleft to right along the x lateral axis, while the othertranslates the beam in the y direction. After each singlescan along the x axis, the beam is rapidly transported backto the starting point and shifted along the y axis to begin anew scan in a process termed flyback (42). During theflyback operation, image information is not collected. In
this manner, the area of interest on the specimen in asingle focal plane is excited by laser illumination from thescanning unit.
As each scan line passes along the specimen in the lateralfocal plane, fluorescence emission is collected by the objec-tive and passed back through the confocal optical system.The speed of the scanning mirrors is very slow relative to thespeed of light, so the secondary emission follows a light pathalong the optical axis that is identical to the original excita-tion beam. Return of fluorescence emission through thegalvanometer mirror system is referred to as descanning(40,42). After leaving the scanning mirrors, the fluorescenceemission passes directly through the dichromatic mirrorand is focused at the detector pinhole aperture. Unlikethe raster scanning pattern of excitation light passing overthe specimen, fluorescence emission remains in a steadyposition at the pinhole aperture, but fluctuates with respectto intensity over time as the illumination spot traverses thespecimen producing variations in excitation.
Fluorescence emission that is passed through the pin-hole aperture is converted into an analog electrical signalhaving a continuously varying voltage (corresponding tointensity) by the photomultiplier. The analog signal isperiodically sampled and converted into pixels by ananalog-to-digital (A/D) converter housed in the scanningunit or the accompanying electronics cabinet. The imageinformation is temporarily stored in an image frame buffercard in the computer and displayed on the monitor. Notethat the confocal image of a specimen is reconstructed,point by point, from emission photon signals by the photo-multiplier and accompanying electronics, yet never existsas a real image that can be observed through the micro-scope eyepieces.
LASER SCANNING CONFOCAL MICROSCOPECONFIGURATION
Basic microscope optical system characteristics haveremained fundamentally unchanged for many decadesdue to engineering restrictions on objective design, thestatic properties of most specimens, and the fact thatresolution is governed by the wavelength of light (1–10).However, fluorescent probes that are employed to addcontrast to biological specimens and, and other technolo-gies associated with optical microscopy techniques, haveimproved significantly. The explosive growth and develop-ment of the confocal approach is a direct result of a renais-sance in optical microscopy that has been largely fueled byadvances in modern optical and electronics technology.Among these are stable multiwavelength laser systemsthat provide better coverage of the uv, visible, and near-IR spectral regions, improved interference filters (includ-ing dichromatic mirrors, barrier, and excitation filters),sensitive low noise wide-band detectors, and far morepowerful computers. The latter are now available withrelatively low cost memory arrays, image analysis softwarepackages, high resolution video displays, and high qualitydigital image printers. The flow of information through amodern confocal microscope is presented diagrammati-cally in Fig. 5 (2).
452 MICROSCOPY, CONFOCAL
Figure 4. Widefield versus confocal microscopy illuminationvolumes, demonstrating the difference in size between pointscanning and widefield excitation light beams.

Although many of these technologies have been devel-oped independently for a variety of specifically targetedapplications, they have been incorporated gradually intomainstream commercial confocal microscopy systems. Incurrent microscope systems, classification of designs isbased on the technology utilized to scan specimens (7).Scanning can be accomplished either by translating thestage in the x, y, and z directions while the laser illumina-tion spot is held in a fixed position, or the beam itself canbe raster-scanned across the specimen. Because three-dimensional (3D) translation of the stage is cumbersomeand prone to vibration, most modern instruments employsome type of beam-scanning mechanism.
In modern confocal microscopes, two fundamentallydifferent techniques for beam scanning have been devel-oped. Single-beam scanning, one of the more popularmethods employed in a majority of the commercial laserscanning microscopes (43), uses a pair of computer-con-trolled galvanometer mirrors to scan the specimen in araster pattern at a rate of approximately one frame persecond. Faster scanning rates (to near video speed) can beachieved using acoustooptic devices or oscillating mirrors.In contrast, multiple-beam scanning confocal microscopesare equipped with a spinning Nipkow disk containing anarray of pinholes and microlenses (44–46). These instru-ments often use arc-discharge lamps for illuminationinstead of lasers to reduce specimen damage and enhancethe detection of low fluorescence levels during real-timeimage collection. Another important feature of the multiple-beam microscopes is their ability to readily capture imageswith an array detector, such as a charge-coupled device(CCD) camera system (47).
All modern laser scanning confocal microscope designsare centered on a conventional upright or invertedresearch level optical microscope. However, instead ofthe standard tungsten–halogen or mercury (xenon) arc-discharge lamp, one or more laser systems are used as alight source to excite fluorophores in the specimen. Imageinformation is gathered point by point with a specializeddetector, such as a photomultiplier tube or avalanchephotodiode, and then digitized for processing by the host
computer, which also controls the scanning mirrors and/orother devices to facilitate the collection and display ofimages. After a series of images (usually serial opticalsections) has been acquired and stored on digital media,analysis can be conducted utilizing numerous image pro-cessing software packages available on the host or a sec-ondary computer.
ADVANTAGES AND DISADVANTAGES OF CONFOCALMICROSCOPY
The primary advantage of laser scanning confocal micro-scopy is the ability to serially produce thin (0.5–1.5 mm)optical sections through fluorescent specimens that have athickness ranging up to 50 mm or more (48). The imageseries is collected by coordinating incremental changes inthe microscope fine focus mechanism (using a steppermotor) with sequential image acquisition at each step.Image information is restricted to a well-defined plane,rather than being complicated by signals arising fromremote locations in the specimen. Contrast and definitionare dramatically improved over widefield techniques due tothe reduction in background fluorescence and improvedsignal to noise (48). Furthermore, optical sectioning elim-inates artifacts that occur during physical sectioning andfluorescent staining of tissue specimens for traditionalforms of microscopy. The noninvasive confocal optical sec-tioning technique enables the examination of both livingand fixed specimens under a variety of conditions withenhanced clarity.
With most confocal microscopy software packages, opti-cal sections are not restricted to the perpendicular lateral(x–y) plane, but can also be collected and displayed intransverse planes (1,5–8,49). Vertical sections in the x–zand y–z planes (parallel to the microscope optical axis) canbe readily generated by most confocal software programs.Thus, the specimen appears as if it had been sectioned in aplane that is perpendicular to the lateral axis. In practice,vertical sections are obtained by combining a series of x–yscans taken along the z axis with the software, and thenprojecting a view of fluorescence intensity as it wouldappear should the microscope hardware have been capableof physically performing a vertical section.
A typical stack of optical sections (often termed a zseries) through a Lodgepole Pine tree pollen grain reveal-ing internal variations in autofluorescence emission wave-lengths is illustrated in Fig. 6. Optical sections weregathered in 1.0 mm steps perpendicular to the z axis(microscope optical axis) using a laser combiner featuringan argon ion (488 nm; green fluorescence), a green helium–neon (543 nm; red fluorescence), and a red helium–neon(633 nm; fluorescence pseudocolored blue) laser system.Pollen grains from this and many other species rangebetween 10 and 40 mm in diameter and often yield blurredimages in wide-field fluorescence microscopy (see Fig. 1c),which lack information about internal structural details.Although only 12 of the >36 images collected through thisseries are presented in the figure, they represent indivi-dual focal planes separated by a distance of �3 mm andprovide a good indication of the internal grain structure.
MICROSCOPY, CONFOCAL 453
Figure 5. Confocal microscope configuration and informationflow schematic diagram.

In specimens more complex than a pollen grain, complexinterconnected structural elements can be difficult to dis-cern from a large series of optical sections sequentiallyacquired through the volume of a specimen with a laserscanning confocal microscope. However, once an adequateseries of optical sections has been gathered, it can be furtherprocessed into a 3D representation of the specimen usingvolume-rendering computational techniques (50–53). Thisapproach is now in common use to help elucidate thenumerous interrelationships between structure and func-tion of cells and tissues in biological investigations (54). Inorder to ensure that adequate data is collected to produce arepresentative volume image, the optical sections should berecorded at the appropriate axial (z step) intervals so thatthe actual depth of the specimen is reflected in the image.
Most of the software packages accompanying commer-cial confocal instruments are capable of generating com-posite and multidimensional views of optical section dataacquired from z-series image stacks. The 3D softwarepackages can be employed to create either a single 3Drepresentation of the specimen (Fig. 7) or a video (movie)sequence compiled from different views of the specimenvolume. These sequences often mimic the effect of rotationor similar spatial transformation that enhances the appre-ciation of the specimen’s 3D character. In addition, manysoftware packages enable investigators to conduct measure-ments of length, volume, and depth, and specific parametersof the images, such as opacity, can be interactively altered toreveal internal structures of interest at differing levelswithin the specimen (54).
Typical 3D representations of several specimens exam-ined by serial optical sectioning are presented in Fig. 7. Aseries of sunflower pollen grain optical sections was com-bined to produce a realistic view of the exterior surface(Fig. 7a) as it might appear if being examined by a scanningelectron microscope (SEM). The algorithm utilized toconstruct the 3D model enables the user to rotate the
pollen grain through 3608 for examination. Similarly, thicksections (16mm) of lung tissue and rat brain are presented inFig. 7b and 7c, respectively. These specimens were eachlabeled with several fluorophores (blue, green, and redfluorescence) and created from a stack of 30–45 opticalsections. Autofluorescence in plant tissue was utilized toproduce the model illustrated in Fig. 7d of a fern root section.
In many cases, a composite or projection view pro-duced from a series of optical sections provides importantinformation about a 3D specimen than a multidimensionalview (54). For example, a fluorescently labeled neuronhaving numerous thin, extended processes in a tissuesection is difficult (if not impossible) to image usingwide-field techniques due to out-of-focus blur. Confocalthin sections of the same neuron each reveal portions ofseveral extensions, but these usually appear as fragmentedstreaks and dots and lack continuity (53). Composite viewscreated by flattening a series of optical sections from theneuron will reveal all of the extended processes in sharpfocus with well-defined continuity. Structural and func-tional analysis of other cell and tissue sections also benefitsfrom composite views as opposed to, or coupled with, 3Dvolume rendering techniques.
Advances in confocal microscopy have made possiblemultidimensional views (54) of living cells and tissues thatinclude image information in the x, y, and z dimensions asa function of time and presented in multiple colors (usingtwo or more fluorophores). After volume processing ofindividual image stacks, the resulting data can be dis-played as 3D multicolor video sequences in real time. Notethat unlike conventional widefield microscopy, all fluoro-chromes in multiply labeled specimens appear in register
454 MICROSCOPY, CONFOCAL
Figure 6. Lodgepole pine (Pinus contorta) pollen grain opticalsections. Bulk pollen was mounted in CytoSeal 60 and imaged witha 100� oil immersion objective (no zoom) in 1mm axial steps. Eachimage in the sequence (1–12) represents the view obtained fromsteps of 3mm.
Figure 7. Three-dimensional volume renders from confocalmicroscopy optical sections. (a) Autofluorescence in a series ofsunflower pollen grain optical sections was combined to producea realistic view of the exterior surface. (b) Mouse lung tissue thick(16mm)section. (c)Ratbrainthicksection.Thesespecimenswereeachlabeled with several fluorophores (blue, green, and red fluorescence)and the volume renders were created from a stack of 30–45 opticalsections. (d) Autofluorescence in a thin section of fern root.

using the confocal microscope. Temporal data can be col-lected either from time-lapse experiments conducted overextended periods or through real-time image acquisition insmaller frames for short periods of time. The potential forusing multidimensional confocal microscopy as a powerfultool in cellular biology is continuing to grow as new lasersystems are developed to limit cell damage and computerprocessing speeds and storage capacity improves.
Additional advantages of scanning confocal microscopyinclude the ability to adjust magnification electronically byvarying the area scanned by the laser without having tochange objectives. This feature is termed the zoom factor,and is usually employed to adjust the image spatial resolu-tion by altering the scanning laser sampling period(1,2,8,40,55). Increasing the zoom factor reduces the speci-men area scanned and simultaneously reduces the scanningrate. The result is an increased number of samples along acomparable length (55), which increases both the imagespatial resolution and display magnification on the hostcomputer monitor. Confocal zoom is typically employed tomatch digital image resolution (8,40,55) with the opticalresolution of the microscope when low numerical apertureand magnification objectives are being used to collect data.
Digitization of the sequential analog image data col-lected by the confocal microscope photomultiplier (or similardetector) facilitates computer image processing algorithmsby transforming the continuous voltage stream into discretedigital increments that correspond to variations in lightintensity. In addition to the benefits and speed that accruefrom processing digital data, images can be readily preparedfor print output or publication. In carefully controlledexperiments, quantitative measurements of spatial fluores-cence intensity (either statically or as a function of time) canalso be obtained from the digital data.
Disadvantages of confocal microscopy are limited pri-marily to the limited number of excitation wavelengthsavailable with common lasers (referred to as laser lines),which occur over very narrow bands and are expensive toproduce in the UV region (56). In contrast, conventionalwidefield microscopes use mercury- or xenon-based arc-discharge lamps to provide a full range of excitation wave-lengths in the UV, visible, and near-IR spectral regions.Another downside is the harmful nature (57) of highintensity laser irradiation to living cells and tissues, anissue that has recently been addressed by multiphoton andNipkow disk confocal imaging. Finally, the high cost ofpurchasing and operating multiuser confocal microscopesystems (58), which can range up to an order of magnitudehigher than comparable widefield microscopes, often limitstheir implementation in smaller laboratories. This problemcan be easily overcome by cost-shared microscope systemsthat service one or more departments in a core facility. Therecent introduction of personal confocal systems has com-petitively driven down the price of low end confocal micro-scopes and increased the number of individual users.
CONFOCAL MICROSCOPE LIGHT DETECTORS
In modern widefield fluorescence and laser scanning con-focal optical microscopy, the collection and measurement of
secondary emission gathered by the objective can be accom-plished by several classes of photosensitive detectors (59),including photomultipliers, photodiodes, and solid-stateCCDs. In confocal microscopy, fluorescence emission isdirected through a pinhole aperture positioned near theimage plane to exclude light from fluorescent structureslocated away from the objective focal plane, thus reducingthe amount of light available for image formation, asdiscussed above. As a result, the exceedingly low lightlevels most often encountered in confocal microscopy neces-sitate the use of highly sensitive photon detectors that donot require spatial discrimination, but instead respondvery quickly with a high level of sensitivity to a continuousflux of varying light intensity.
Photomultipliers, which contain a photosensitive sur-face that captures incident photons and produces a streamof photoelectrons to generate an amplified electric charge,are the popular detector choice in many commercial con-focal microscopes (59–61). These detectors contain a criti-cal element, termed a photocathode, capable of emittingelectrons through the photoelectric effect (the energy of anabsorbed photon is transferred to an electron) whenexposed to a photon flux. The general anatomy of a photo-multiplier consists of a classical vacuum tube in which aglass or quartz window encases the photocathode and achain of electron multipliers, known as dynodes, followedby an anode to complete the electrical circuit (62). Whenthe photomultiplier is operating, current flowing betweenthe anode and ground (zero potential) is directly propor-tional to the photoelectron flux generated by the photo-cathode when it is exposed to incident photon radiation.
In a majority of commercial confocal microscopes, thephotomultiplier is located within the scan head or anexternal housing, and the gain, offset, and dynode voltageare controlled by the computer software interface to thedetector power supply and supporting electronics (7). Thevoltage setting is used to regulate the overall sensitivity ofthe photomultiplier, and can be adjusted independently ofthe gain and offset values. The latter two controls areutilized to adjust the image intensity values to ensure thatthe maximum number of gray levels is included in theoutput signal of the photomultiplier. Offset adds a positiveor negative voltage to the output signal, and should beadjusted so that the lowest signals are near the photomul-tiplier detection threshold (40). The gain circuit multipliesthe output voltage by a constant factor so that the max-imum signal values can be stretched to a point just belowsaturation. In practice, offset should be applied first beforeadjusting the photomultiplier gain (8,40). After the signalhas been processed by the analog-to-digital converter, it isstored in a frame buffer and ultimately displayed on themonitor in a series of gray levels ranging from black (nosignal) to white (saturation). Photomultipliers with adynamic range of 10 or 12 bits are capable of displaying1024 or 4096 gray levels, respectively. Accompanyingimage files also have the same number of gray levels.However, the photomultipliers used in a majority of thecommercial confocal microscopes have a dynamic rangelimited to 8 bits or 256 gray levels, which in most cases,is adequate for handling the typical number of photonsscanned per pixel (63).
MICROSCOPY, CONFOCAL 455
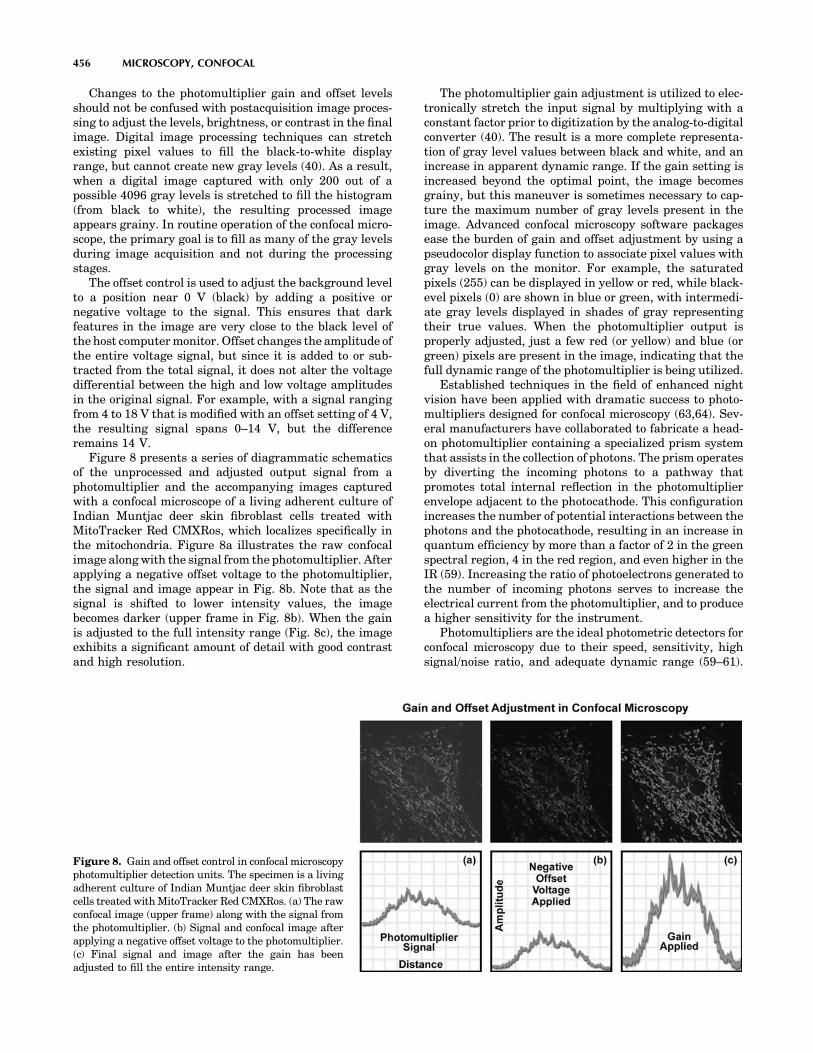
Changes to the photomultiplier gain and offset levelsshould not be confused with postacquisition image proces-sing to adjust the levels, brightness, or contrast in the finalimage. Digital image processing techniques can stretchexisting pixel values to fill the black-to-white displayrange, but cannot create new gray levels (40). As a result,when a digital image captured with only 200 out of apossible 4096 gray levels is stretched to fill the histogram(from black to white), the resulting processed imageappears grainy. In routine operation of the confocal micro-scope, the primary goal is to fill as many of the gray levelsduring image acquisition and not during the processingstages.
The offset control is used to adjust the background levelto a position near 0 V (black) by adding a positive ornegative voltage to the signal. This ensures that darkfeatures in the image are very close to the black level ofthe host computer monitor. Offset changes the amplitude ofthe entire voltage signal, but since it is added to or sub-tracted from the total signal, it does not alter the voltagedifferential between the high and low voltage amplitudesin the original signal. For example, with a signal rangingfrom 4 to 18 V that is modified with an offset setting of 4 V,the resulting signal spans 0–14 V, but the differenceremains 14 V.
Figure 8 presents a series of diagrammatic schematicsof the unprocessed and adjusted output signal from aphotomultiplier and the accompanying images capturedwith a confocal microscope of a living adherent culture ofIndian Muntjac deer skin fibroblast cells treated withMitoTracker Red CMXRos, which localizes specifically inthe mitochondria. Figure 8a illustrates the raw confocalimage along with the signal from the photomultiplier. Afterapplying a negative offset voltage to the photomultiplier,the signal and image appear in Fig. 8b. Note that as thesignal is shifted to lower intensity values, the imagebecomes darker (upper frame in Fig. 8b). When the gainis adjusted to the full intensity range (Fig. 8c), the imageexhibits a significant amount of detail with good contrastand high resolution.
The photomultiplier gain adjustment is utilized to elec-tronically stretch the input signal by multiplying with aconstant factor prior to digitization by the analog-to-digitalconverter (40). The result is a more complete representa-tion of gray level values between black and white, and anincrease in apparent dynamic range. If the gain setting isincreased beyond the optimal point, the image becomesgrainy, but this maneuver is sometimes necessary to cap-ture the maximum number of gray levels present in theimage. Advanced confocal microscopy software packagesease the burden of gain and offset adjustment by using apseudocolor display function to associate pixel values withgray levels on the monitor. For example, the saturatedpixels (255) can be displayed in yellow or red, while black-evel pixels (0) are shown in blue or green, with intermedi-ate gray levels displayed in shades of gray representingtheir true values. When the photomultiplier output isproperly adjusted, just a few red (or yellow) and blue (orgreen) pixels are present in the image, indicating that thefull dynamic range of the photomultiplier is being utilized.
Established techniques in the field of enhanced nightvision have been applied with dramatic success to photo-multipliers designed for confocal microscopy (63,64). Sev-eral manufacturers have collaborated to fabricate a head-on photomultiplier containing a specialized prism systemthat assists in the collection of photons. The prism operatesby diverting the incoming photons to a pathway thatpromotes total internal reflection in the photomultiplierenvelope adjacent to the photocathode. This configurationincreases the number of potential interactions between thephotons and the photocathode, resulting in an increase inquantum efficiency by more than a factor of 2 in the greenspectral region, 4 in the red region, and even higher in theIR (59). Increasing the ratio of photoelectrons generated tothe number of incoming photons serves to increase theelectrical current from the photomultiplier, and to producea higher sensitivity for the instrument.
Photomultipliers are the ideal photometric detectors forconfocal microscopy due to their speed, sensitivity, highsignal/noise ratio, and adequate dynamic range (59–61).
456 MICROSCOPY, CONFOCAL
Figure 8. Gain and offset control in confocal microscopyphotomultiplier detection units. The specimen is a livingadherent culture of Indian Muntjac deer skin fibroblastcells treated with MitoTracker Red CMXRos. (a) The rawconfocal image (upper frame) along with the signal fromthe photomultiplier. (b) Signal and confocal image afterapplying a negative offset voltage to the photomultiplier.(c) Final signal and image after the gain has beenadjusted to fill the entire intensity range.
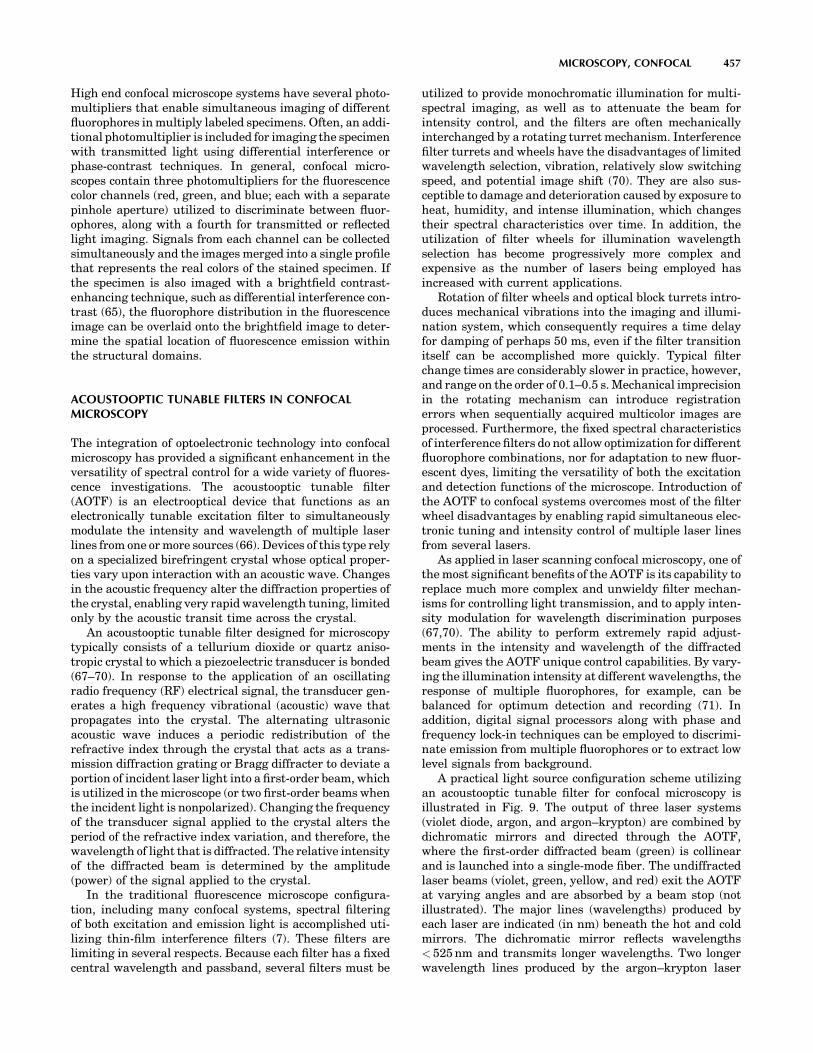
High end confocal microscope systems have several photo-multipliers that enable simultaneous imaging of differentfluorophores in multiply labeled specimens. Often, an addi-tional photomultiplier is included for imaging the specimenwith transmitted light using differential interference orphase-contrast techniques. In general, confocal micro-scopes contain three photomultipliers for the fluorescencecolor channels (red, green, and blue; each with a separatepinhole aperture) utilized to discriminate between fluor-ophores, along with a fourth for transmitted or reflectedlight imaging. Signals from each channel can be collectedsimultaneously and the images merged into a single profilethat represents the real colors of the stained specimen. Ifthe specimen is also imaged with a brightfield contrast-enhancing technique, such as differential interference con-trast (65), the fluorophore distribution in the fluorescenceimage can be overlaid onto the brightfield image to deter-mine the spatial location of fluorescence emission withinthe structural domains.
ACOUSTOOPTIC TUNABLE FILTERS IN CONFOCALMICROSCOPY
The integration of optoelectronic technology into confocalmicroscopy has provided a significant enhancement in theversatility of spectral control for a wide variety of fluores-cence investigations. The acoustooptic tunable filter(AOTF) is an electrooptical device that functions as anelectronically tunable excitation filter to simultaneouslymodulate the intensity and wavelength of multiple laserlines from one or more sources (66). Devices of this type relyon a specialized birefringent crystal whose optical proper-ties vary upon interaction with an acoustic wave. Changesin the acoustic frequency alter the diffraction properties ofthe crystal, enabling very rapid wavelength tuning, limitedonly by the acoustic transit time across the crystal.
An acoustooptic tunable filter designed for microscopytypically consists of a tellurium dioxide or quartz aniso-tropic crystal to which a piezoelectric transducer is bonded(67–70). In response to the application of an oscillatingradio frequency (RF) electrical signal, the transducer gen-erates a high frequency vibrational (acoustic) wave thatpropagates into the crystal. The alternating ultrasonicacoustic wave induces a periodic redistribution of therefractive index through the crystal that acts as a trans-mission diffraction grating or Bragg diffracter to deviate aportion of incident laser light into a first-order beam, whichis utilized in the microscope (or two first-order beams whenthe incident light is nonpolarized). Changing the frequencyof the transducer signal applied to the crystal alters theperiod of the refractive index variation, and therefore, thewavelength of light that is diffracted. The relative intensityof the diffracted beam is determined by the amplitude(power) of the signal applied to the crystal.
In the traditional fluorescence microscope configura-tion, including many confocal systems, spectral filteringof both excitation and emission light is accomplished uti-lizing thin-film interference filters (7). These filters arelimiting in several respects. Because each filter has a fixedcentral wavelength and passband, several filters must be
utilized to provide monochromatic illumination for multi-spectral imaging, as well as to attenuate the beam forintensity control, and the filters are often mechanicallyinterchanged by a rotating turret mechanism. Interferencefilter turrets and wheels have the disadvantages of limitedwavelength selection, vibration, relatively slow switchingspeed, and potential image shift (70). They are also sus-ceptible to damage and deterioration caused by exposure toheat, humidity, and intense illumination, which changestheir spectral characteristics over time. In addition, theutilization of filter wheels for illumination wavelengthselection has become progressively more complex andexpensive as the number of lasers being employed hasincreased with current applications.
Rotation of filter wheels and optical block turrets intro-duces mechanical vibrations into the imaging and illumi-nation system, which consequently requires a time delayfor damping of perhaps 50 ms, even if the filter transitionitself can be accomplished more quickly. Typical filterchange times are considerably slower in practice, however,and range on the order of 0.1–0.5 s. Mechanical imprecisionin the rotating mechanism can introduce registrationerrors when sequentially acquired multicolor images areprocessed. Furthermore, the fixed spectral characteristicsof interference filters do not allow optimization for differentfluorophore combinations, nor for adaptation to new fluor-escent dyes, limiting the versatility of both the excitationand detection functions of the microscope. Introduction ofthe AOTF to confocal systems overcomes most of the filterwheel disadvantages by enabling rapid simultaneous elec-tronic tuning and intensity control of multiple laser linesfrom several lasers.
As applied in laser scanning confocal microscopy, one ofthe most significant benefits of the AOTF is its capability toreplace much more complex and unwieldy filter mechan-isms for controlling light transmission, and to apply inten-sity modulation for wavelength discrimination purposes(67,70). The ability to perform extremely rapid adjust-ments in the intensity and wavelength of the diffractedbeam gives the AOTF unique control capabilities. By vary-ing the illumination intensity at different wavelengths, theresponse of multiple fluorophores, for example, can bebalanced for optimum detection and recording (71). Inaddition, digital signal processors along with phase andfrequency lock-in techniques can be employed to discrimi-nate emission from multiple fluorophores or to extract lowlevel signals from background.
A practical light source configuration scheme utilizingan acoustooptic tunable filter for confocal microscopy isillustrated in Fig. 9. The output of three laser systems(violet diode, argon, and argon–krypton) are combined bydichromatic mirrors and directed through the AOTF,where the first-order diffracted beam (green) is collinearand is launched into a single-mode fiber. The undiffractedlaser beams (violet, green, yellow, and red) exit the AOTFat varying angles and are absorbed by a beam stop (notillustrated). The major lines (wavelengths) produced byeach laser are indicated (in nm) beneath the hot and coldmirrors. The dichromatic mirror reflects wavelengths< 525 nm and transmits longer wavelengths. Two longerwavelength lines produced by the argon–krypton laser
MICROSCOPY, CONFOCAL 457

(568 and 648 nm) are reflected by the hot mirror, while theoutput of the argon laser (458, 476, 488, and 514 nm) isreflected by the dichromatic mirror and combined with thetransmitted light from the argon–krypton laser. Outputfrom the violet diode laser (405 nm) is reflected by the coldmirror and combined with the longer wavelengths fromthe other two lasers, which are transmitted through themirror.
Because of the rapid optical response from the AOTFcrystal to the acoustic transducer, the acoustooptic inter-action is subject to abrupt transitions resembling a rec-tangular rather than sinusoidal waveform (66). Thisresults in the occurrence of sidelobes in the AOTFpassband on either side of the central transmission peak.Under ideal acoustooptic conditions, these sidelobes shouldbe symmetrical about the central peak, with the first lobehaving 4.7% of the central peak’s intensity. In practice, thesidelobes are commonly asymmetrical and exhibit otherdeviations from predicted structure caused by variations inthe acoustooptic interaction, among other factors. In orderto reduce the sidelobes in the passband to insignificantlevels, several types of amplitude apodization of the acousticwave are employed (66,67), including various window func-tions, which have been found to suppress the highest side-lobe by 30–40 dB. One method that can be used in reductionof sidelobe level with noncollinear AOTFs is to apply spatialapodization by means of weighted excitation of the trans-ducer. In the collinear AOTF, a different approach has beenemployed, which introduces an acoustic pulse, apodized intime, into the filter crystal.
The effective linear aperture of an AOTF is limited bythe acoustic beam height in one dimension (ID) and by theacoustic attenuation across the optical aperture (the acous-tic transit distance) in the other dimension (67). The heightof the acoustic beam generated within the AOTF crystal isdetermined by the performance and physical properties ofthe acoustic transducer. Acoustic attenuation in crystallinematerials, such as tellurium dioxide, is proportional tothe square of acoustic frequency, and is therefore a moreproblematic limitation to linear aperture size in the shorterwavelength visible light range, which requires higher RFfrequencies for tuning. Near-IR and IR radiation produces
less restrictive limitations because of the lower acousticfrequencies associated with diffraction of these longerwavelengths.
The maximum size of an individual acoustic transduceris constrained by performance and power requirements inaddition to the geometric limitations of the instrumentconfiguration, and AOTF designers may use an array oftransducers bonded to the crystal in order to increase theeffective lateral dimensions of the propagating acousticbeam, and to enlarge the area of acoustooptic interaction(66,67,70). The required drive power is one of the mostimportant variables in acoustooptic design, and generallyincreases with optical aperture and for longer wave-lengths. In contrast to acoustic attenuation, which isreduced in the IR spectral range, the higher power requiredto drive transducers for infrared AOTFs is one of thegreatest limitations in these devices. High drive powerlevels result in heating of the crystal, which can causethermal drift and instability in the filter performance (66).This is particularly a problem when acoustic power andfrequency are being varied rapidly over a large range, andthe crystal temperature does not have time to stabilize,producing transient variations in refractive index. If anapplication requires wavelength and intensity stabilityand repeatability, the AOTF should be maintained at aconstant temperature. One approach taken by equipmentmanufacturers to minimize this problem is to heat thecrystal above ambient temperature, to a level at which itis relatively unaffected by the additional thermal input ofthe transducer drive power. An alternative solution is tohouse the AOTF in a thermoelectrically cooled housingthat provides precise temperature regulation. Continuingdevelopmental efforts promise to lead to new materialsthat can provide relatively large apertures combined witheffective separation of the filtered and unfiltered beamswithout use of polarizers, while requiring a fraction of thetypical device drive power.
In a noncollinear AOTF, which spatially separates theincident and diffracted light paths, the deflection angle (theangle separating diffracted and undiffracted light beamsexiting the crystal) is an additional factor limiting theeffective aperture of the device (67). As discussed pre-viously, the deflection angle is greater for crystals havinggreater birefringence, and determines in part the propaga-tion distance required for adequate separation of the dif-fracted and undiffracted beams to occur after exiting thecrystal. The required distance is increased for largerentrance apertures, and this imposes a practical limit onmaximum aperture size because of constraints on thephysical dimensions of components that can be incorpo-rated into a microscope system. The angular aperture isrelated to the total light collecting power of the AOTF, animportant factor in imaging systems, although in order torealize the full angular aperture without the use of polar-izers in the noncollinear AOTF, its value must be smallerthan the deflection angle. Because the acoustooptic tunablefilter is not an image-forming component of the microscopesystem (it is typically employed for source filtering), thereis no specific means of evaluating the spatial resolutionfor this type of device (70). However, the AOTF may restrictthe attainable spatial resolution of the imaging system
458 MICROSCOPY, CONFOCAL
Figure 9. Configuration scheme utilizing an AOTF for laserintensity control and wavelength selection in confocal microscopy.

because of its limited linear aperture size and acceptanceangle, in the same manner as other optical components.Based on the Rayleigh criterion and the angular and linearapertures of the AOTF, the maximum number of resolvableimage elements may be calculated for a given wavelength,utilizing different expressions for the polar and azimuthalplanes. Although diffraction limited resolution can beattained in the azimuthal plane, dispersion in the AOTFlimits the resolution in the polar plane, and measures mustbe taken to suppress this factor for optimum performance.The dependence of deflection angle on wavelength canproduce one form of dispersion, which is typically negligi-ble when tuning is performed within a relatively narrowbandwidth, but significant in applications involving opera-tion over a broad spectral range. Changes in deflectionangle with wavelength can result in image shifts duringtuning, producing errors in techniques, such as ratio ima-ging of fluorophores excited at different wavelengths, andin other multispectral applications. When the image shiftobeys a known relationship to wavelength, corrections canbe applied through digital processing techniques (1,7).Other effects of dispersion, including reduced angularresolution, may result in image degradation, such as blur-ring, that requires more elaborate measures to suppress.
SUMMARY OF AOTF BENEFITS IN CONFOCALMICROSCOPY
Considering the underlying principles of operation andperformance factors that relate to the application of AOTFsin imaging systems, a number of virtues from such devicesfor light control in fluorescence confocal microscopy areapparent. Several benefits of the AOTF combine to greatly
enhance the versatility of the latest generation of confocalinstruments, and these devices are becoming increasingpopular for control of excitation wavelength ranges andintensity. The primary characteristic that facilitatesnearly every advantage of the AOTF is its capability toallow the microscopist control of the intensity and/or illu-mination wavelength on a pixel-by-pixel basis while main-taining a high scan rate (7). This single feature translatesinto a wide variety of useful analytical microscopy tools,which are even further enhanced in flexibility when laserillumination is employed.
One of the most useful AOTF functions allows theselection of small user-defined specimen areas (commonlytermed regions of interest; ROI) that can be illuminatedwith either greater or lesser intensity, and at differentwavelengths, for precise control in photobleaching techni-ques, excitation ratio studies, resonance energy-transferinvestigations, or spectroscopic measurements (see Fig. 10).The illumination intensity can not only be increased inselected regions for controlled photobleaching experiments(71–73), but can be attenuated in desired areas in order tominimize unnecessary photobleaching. When the illumina-tion area is under AOTF control, the laser exposure isrestricted to the scanned area by default, and the extremelyrapid response of the device can be utilized to provide beamblanking during the flyback interval of the galvanometerscanning mirror cycle, further limiting unnecessary speci-men exposure. In practice, the regions of excitation aretypically defined by freehand drawing or using tools toproduce defined geometrical shapes in an overlay planeon the computer monitor image. Some systems allow anynumber of specimen areas to be defined for laser exposure,and the laser intensity to be set to different levels for eacharea, in intensity increments as small as 0.1%. When the
MICROSCOPY, CONFOCAL 459
Figure 10. AOTF selection of specific regions for excitation inconfocal microscopy. (a) Region of Interest (ROI) selected forfluorescence recovery after photobleaching (FRAP) experi-ments. (b) Freehand ROIs for selective excitation. (c) ROI forfluorescence resonance energy-transfer (FRET) analysis. (d) ROIfor photoactivation and photoconversion of fluorescent proteins.
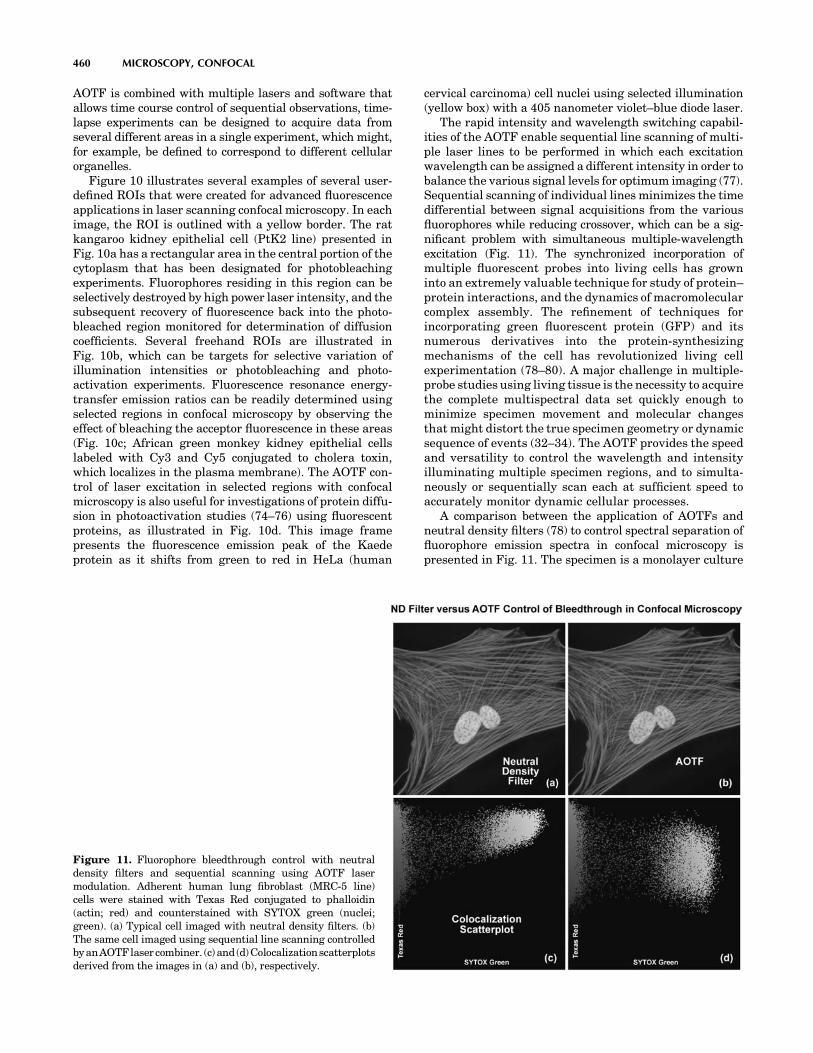
AOTF is combined with multiple lasers and software thatallows time course control of sequential observations, time-lapse experiments can be designed to acquire data fromseveral different areas in a single experiment, which might,for example, be defined to correspond to different cellularorganelles.
Figure 10 illustrates several examples of several user-defined ROIs that were created for advanced fluorescenceapplications in laser scanning confocal microscopy. In eachimage, the ROI is outlined with a yellow border. The ratkangaroo kidney epithelial cell (PtK2 line) presented inFig. 10a has a rectangular area in the central portion of thecytoplasm that has been designated for photobleachingexperiments. Fluorophores residing in this region can beselectively destroyed by high power laser intensity, and thesubsequent recovery of fluorescence back into the photo-bleached region monitored for determination of diffusioncoefficients. Several freehand ROIs are illustrated inFig. 10b, which can be targets for selective variation ofillumination intensities or photobleaching and photo-activation experiments. Fluorescence resonance energy-transfer emission ratios can be readily determined usingselected regions in confocal microscopy by observing theeffect of bleaching the acceptor fluorescence in these areas(Fig. 10c; African green monkey kidney epithelial cellslabeled with Cy3 and Cy5 conjugated to cholera toxin,which localizes in the plasma membrane). The AOTF con-trol of laser excitation in selected regions with confocalmicroscopy is also useful for investigations of protein diffu-sion in photoactivation studies (74–76) using fluorescentproteins, as illustrated in Fig. 10d. This image framepresents the fluorescence emission peak of the Kaedeprotein as it shifts from green to red in HeLa (human
cervical carcinoma) cell nuclei using selected illumination(yellow box) with a 405 nanometer violet–blue diode laser.
The rapid intensity and wavelength switching capabil-ities of the AOTF enable sequential line scanning of multi-ple laser lines to be performed in which each excitationwavelength can be assigned a different intensity in order tobalance the various signal levels for optimum imaging (77).Sequential scanning of individual lines minimizes the timedifferential between signal acquisitions from the variousfluorophores while reducing crossover, which can be a sig-nificant problem with simultaneous multiple-wavelengthexcitation (Fig. 11). The synchronized incorporation ofmultiple fluorescent probes into living cells has growninto an extremely valuable technique for study of protein–protein interactions, and the dynamics of macromolecularcomplex assembly. The refinement of techniques forincorporating green fluorescent protein (GFP) and itsnumerous derivatives into the protein-synthesizingmechanisms of the cell has revolutionized living cellexperimentation (78–80). A major challenge in multiple-probe studies using living tissue is the necessity to acquirethe complete multispectral data set quickly enough tominimize specimen movement and molecular changesthat might distort the true specimen geometry or dynamicsequence of events (32–34). The AOTF provides the speedand versatility to control the wavelength and intensityilluminating multiple specimen regions, and to simulta-neously or sequentially scan each at sufficient speed toaccurately monitor dynamic cellular processes.
A comparison between the application of AOTFs andneutral density filters (78) to control spectral separation offluorophore emission spectra in confocal microscopy ispresented in Fig. 11. The specimen is a monolayer culture
460 MICROSCOPY, CONFOCAL
Figure 11. Fluorophore bleedthrough control with neutraldensity filters and sequential scanning using AOTF lasermodulation. Adherent human lung fibroblast (MRC-5 line)cells were stained with Texas Red conjugated to phalloidin(actin; red) and counterstained with SYTOX green (nuclei;green). (a) Typical cell imaged with neutral density filters. (b)The same cell imaged using sequential line scanning controlledbyanAOTFlasercombiner. (c)and(d)Colocalizationscatterplotsderived from the images in (a) and (b), respectively.

of adherent human lung fibroblast (MRC-5 line) cellsstained with Texas Red conjugated to phalloidin (targetingthe filamentous actin network) and SYTOX Green (stain-ing DNA in the nucleus). A neutral density filter thatproduces the high excitation signals necessary for bothfluorophores leads to a significant amount of bleedthroughof the SYTOX Green emission into the Texas Red channel(Fig. 11a; note the yellow nuclei). The high degree ofapparent colocalization between SYTOX Green and TexasRed is clearly illustrated by the scatterplot in Fig. 11b. Thetwo axes in the scatterplot represent the SYTOX Green(abscissa) and the Texas Red (ordinate) channels. In orderto balance the excitation power levels necessary to selec-tively illuminate each fluorophore with greater control ofemission intensity, an AOTF was utilized to selectivelyreduce the SYTOX Green excitation power (Argon-ion laserline at 488 nm). Note the subsequent reduction in bleed-through as manifested by green color in the cellular nucleiin Fig. 11c. The corresponding scatterplot (Fig. 11d) indi-cates a dramatically reduced level of bleed-through (andapparent colocalization) of SYTOX Green into the TexasRed channel.
The development of the AOTF has provided substantialadditional versatility to techniques, such as fluorescencerecovery after photobleaching (FRAP; 81,82), fluorescenceloss in photobleaching (FLIP; 83), as well as in localizedphotoactivated fluorescence (uncaging; 84) studies(Fig. 10). The FRAP technique (81,82) was originally con-ceived to measure diffusion rates of fluorescently taggedproteins in organelles and cell membranes. In the conven-tional FRAP procedure, a small spot on the specimen iscontinuously illuminated at a low light flux level and theemitted fluorescence is measured. The illumination level isthen increased to a very high level for a brief time todestroy the fluorescent molecules in the illuminated regionby rapid bleaching. After the light intensity is returned tothe original low level, the fluorescence is monitored todetermine the rate at which new unbleached fluorescentmolecules diffuse into the depleted region. The technique,as typically employed, has been limited by the fixed geo-metry of the bleached region, which is often a diffraction-limited spot, and by having to mechanically adjust theillumination intensity (using shutters or galvanometer-driven components). The AOTF not only allows near-instantaneous switching of light intensity, but also can beutilized to selectively bleach randomly specified regions ofirregular shape, lines, or specific cellular organelles, and todetermine the dynamics of molecular transfer into the region.
By enabling precise control of illuminating beam geo-metry and rapid switching of wavelength and intensity,the AOTF is a significant enhancement to application ofthe FLIP technique in measuring the diffusional mobilityof certain cellular proteins (83). This technique monitorsthe loss of fluorescence from continuously illuminatedlocalized regions and the redistribution of fluorophorefrom distant locations into the sites of depletion. The dataobtained can aid in the determination of the dynamicinterrelationships between intracellular and intercellularcomponents in living tissue, and such fluorescence lossstudies are greatly facilitated by the capabilities of theAOTF in controlling the microscope illumination.
The method of utilizing photoactivated fluorescence hasbeen very useful in studies, such as those examining therole of calcium ion concentration in cellular processes, buthas been limited in its sensitivity to localized regionaleffects in small organelles or in close proximity to cellmembranes. Typically, fluorescent species that are inacti-vated by being bound to a photosensitive species (referredto as being caged) are activated by intense illuminationthat frees them from the caging compound and allows themto be tracked by the sudden appearance of fluorescence(84). The use of the AOTF has facilitated the refinement ofsuch studies to assess highly localized processes such ascalcium ion mobilization near membranes, made possiblebecause of the precise and rapid control of the illuminationtriggering the activation (uncaging) of the fluorescentmolecule of interest.
Because the AOTF functions, without use of movingmechanical components, to electronically control the wave-length and intensity of multiple lasers, great versatility isprovided for external control and synchronization of laserillumination with other aspects of microscopy experiments.When the confocal instrument is equipped with a controllermodule having input and output trigger terminals, laserintensity levels can be continuously monitored andrecorded, and the operation of all laser functions can becontrolled to coordinate with other experimental specimenmeasurements, automated microscope stage movements,sequential time-lapse recording, and any number of otheroperations.
RESOLUTION AND CONTRAST IN CONFOCALMICROSCOPY
All optical microscopes, including conventional widefield,confocal, and two-photon instruments are limited in theresolution that they can achieve by a series of fundamentalphysical factors (1,3,5–7,24,85–89). In a perfect opticalsystem, resolution is restricted by the numerical apertureof optical components and by the wavelength of light, bothincident (excitation) and detected (emission). The conceptof resolution is inseparable from contrast, and is defined asthe minimum separation between two points that results ina certain level of contrast between them (24). In a typicalfluorescence microscope, contrast is determined by the num-ber of photons collected from the specimen, the dynamicrange of the signal, optical aberrations of the imagingsystem, and the number of picture elements (pixels) perunit area in the final image (66,86–88).
The influence of noise on the image of two closely spacedsmall objects is further interconnected with the relatedfactors mentioned above, and can readily affect the qualityof resulting images (29). While the effects of many instru-mental and experimental variables on image contrast, andconsequently on resolution, are familiar and rather obvious,the limitation on effective resolution resulting from thedivision of the image into a finite number of picture elements(pixels) may be unfamiliar to those new to digital micro-scopy. Because all digital confocal images employing laserscanners and/or camera systems are recorded and processedin terms of measurements made within discrete pixels (66),
MICROSCOPY, CONFOCAL 461

some discussion of the concepts of sampling theory isrequired. This is appropriate to the subject of contrastand resolution because it has a direct bearing on the abilityto record two closely spaced objects as being distinct.
In addition to the straightforward theoretical aspects ofresolution, regardless of how it is defined, the reciprocalrelationship between contrast and resolution has practicalsignificance because the matter of interest to most micro-scopists is not resolution, but visibility. The ability torecognize two closely spaced features as being separaterelies on advanced functions of the human visual system tointerpret intensity patterns, and is a much more subjectiveconcept than the calculation of resolution values based ondiffraction theory (24). Experimental limitations and theproperties of the specimen itself, which vary widely, dictatethat imaging cannot be performed at the theoretical max-imum resolution of the microscope.
The relationship between contrast and resolution withregard to the ability to distinguish two closely spacedspecimen features implies that resolution cannot bedefined without reference to contrast, and it is this inter-dependence that has led to considerable ambiguity invol-ving the term resolution and the factors that influence it inmicroscopy (29). As discussed above, recent advances influorescent protein technology have led to an enormousincrease in studies of dynamic processes in living cells andtissues (71–76,78–83). Such specimens are optically thickand inhomogeneous, resulting in a far-from-ideal imagingsituation in the microscope. Other factors, such as cellviability and sensitivity to thermal damage and photo-bleaching, place limits on the light intensity and durationof exposure, consequently limiting the attainable resolu-tion. Given that the available timescale may be dictated bythese factors and by the necessity to record rapid dynamicevents in living cells, it must be accepted that the quality ofimages will not be as high as those obtained from fixed andstained specimens. The most reasonable resolution goal forimaging in a given experimental situation is that themicroscope provides the best resolution possible withinthe constraints imposed by the experiment.
THE AIRY DISK AND LATERAL RESOLUTION
Imaging a point-like light source in the microscope pro-duces an electromagnetic field in the image plane whoseamplitude fluctuations can be regarded as a manifestationof the response of the optical system to the specimen. Thisfield is commonly represented through the amplitudepoint spread function, and allows evaluation of theoptical transfer properties of the combined system compo-nents (29,86–88). Although variations in field amplitudeare not directly observable, the visible image of the pointsource formed in the microscope and recorded by itsimaging system is the intensity point spread function,which describes the system response in real space. Actualspecimens are not point sources, but can be regarded as asuperposition of an infinite number of objects havingdimensions below the resolution of the system. The proper-ties of the intensity point spread function (PSF; see Fig. 12)in the image plane as well as in the axial direction aremajor factors in determining the resolution of a microscope(1,24,29,40,85–89).
It is possible to experimentally measure the intensitypoint spread function in the microscope by recording theimage of a subresolution spherical bead as it is scannedthrough focus (a number of examples may be found in theliterature). Because of the technical difficulty posed indirect measurement of the intensity point spread function,calculated point spread functions are commonly utilized toevaluate the resolution performance of different opticalsystems, as well as the optical-sectioning capabilities ofconfocal, two-photon, and conventional widefield micro-scopes. Although the intensity point spread functionextends in all three dimensions, with regard to the rela-tionship between resolution and contrast, it is useful toconsider only the lateral components of the intensity dis-tribution, with reference to the familiar Airy disk (24).
The intensity distribution of the point-spread functionin the plane of focus is described by the rotationally sym-metric Airy pattern. Because of the cylindrical symmetryof the microscope lenses, the two lateral components
462 MICROSCOPY, CONFOCAL
Figure 12. Schematic diagram of an Airy disk diffractionpattern and the corresponding three-dimensional point spreadfunctions for image formation in confocal microscopy. Intensityprofiles of a single Airy disk, as well as the first and higher ordermaxima are illustrated in the graphs.

(x and y) of the Airy pattern are equivalent, and thepattern represents the lateral intensity distribution asa function of distance from the optical axis (24). Thelateral distance is normalized by the numerical apertureof the system and the wavelength of light, and therefore isdimensionless. Figure 12 (Airy disk and intensity func-tion) illustrates diagrammatically the formation andcharacteristics of the Airy disk, the related 3D pointspread function, and Airy patterns in the fluorescencemicroscope. Following the excitation of fluorophores in apoint-like specimen region, fluorescence emission occursin all directions, a small fraction of which is selected andfocused by the optical components into an image planewhere it forms an Airy disk surrounded by concentricrings of successively decreasing maximum and minimumintensity (the Airy pattern). The Airy pattern intensitydistribution is the result of Fraunhofer diffraction of lightpassing through a circular aperture, and in a perfectoptical system exhibits a central intensity maximumand higher order maxima separated by regions of zerointensity (85). The distance of the zero crossings from theoptical axis, when the distance is normalized by thenumerical aperture and wavelength, occur periodically(Fig. 12). When the intensity on the optical axis is normal-ized to one (100%), the proportional heights of the firstfour higher order maxima are 1.7%, 0.4%, 0.2%, and0.08%, respectively.
A useful approach to the concept of resolution is basedon consideration of an image formed by two point-likeobjects (specimen features), under the assumption thatthe image-forming process is incoherent, and that theinteraction of the separate object images can be describedusing intensity point spread functions. The resulting imageis then composed of the sum of two Airy disks, the char-acteristics of which depend on the separation distancebetween the two points (24,86). When sufficiently sepa-rated, the intensity change in the area between the objectsis the maximum possible, cycling from the peak intensity(at the first point) to zero and returning to the maximumvalue at the center of the second point. At decreaseddistance in object space, the intensity distribution func-tions of the two points, in the image plane, begin to overlapand the resulting image may appear to be that of a singlelarger or brighter object or feature rather than beingrecognizable as two objects. If resolution is defined, ingeneral terms, as the minimum separation distance atwhich the two objects can be sufficiently distinguished,it is obvious that this property is related to the width of theintensity peaks (the point spread function). Microscoperesolution is directly related, therefore, to the full-widthat half maximum (fwhm) of the instrument’s intensity pointspread function in the component directions (29,86,87).
Some ambiguity in use of the term resolution resultsfrom the variability in defining the degree of separationbetween features and their point spread functions that issufficient to allow them to be distinguished as two objectsrather than one. In general, minute features of interest inmicroscopy specimens produce point images that overlap tosome extent, displaying two peaks separated by a gap(1,24,29,40,86). The greater the depth of the gap betweenthe peaks, the easier it is to distinguish, or resolve, the two
objects. By specifying the depth of the dip in intensitybetween two overlapping point spread functions, the ambi-guity in evaluating resolution can be removed, and aquantitative aspect introduced.
In order to quantify resolution, the concept of contrastis employed, which is defined for two objects of equalintensity as the difference between their maximum inten-sity and the minimum intensity occurring in the spacebetween them (55,86,89). Because the maximum intensityof the Airy disk is normalized to one, the highest achievablecontrast is also one, and occurs only when the spacingbetween the two objects is relatively large, with sufficientseparation to allow the first zero crossing to occur in theircombined intensity distribution. At decreased distance, asthe two point spread functions begin to overlap, the dip inintensity between the two maxima (and the contrast) isincreasingly reduced. The distance at which two peakmaxima are no longer discernible, and the contrastbecomes zero, is referred to as the contrast cut-off distance(24,40). The variation of contrast with distance allowsresolution, in terms of the separation of two points, to bedefined as a function of contrast.
The relationship between contrast and separation dis-tance for two point-like objects is referred to as the con-trast/distance function or contrast transfer function(31,90). Resolution can be defined as the separation dis-tance at which two objects are imaged with a certaincontrast value. It is obvious that when zero contrast exists,the points are not resolved; the so-called Sparrow criter-ion defines the resolution of an optical system as beingequivalent to the contrast cut-off distance (24). It is com-mon, however, to specify that greater contrast is necessaryto adequately distinguish two closely spaced pointsvisually, and the well-known Rayleigh criterion (24) forresolution states that two points are resolved when thefirst minimum (zero crossing) of one Airy disk is alignedwith the central maximum of the second Airy disk. Underoptimum imaging conditions, the Rayleigh criterionseparation distance corresponds to a contrast value of26.4%. Although any contrast value >0 can be specifiedin defining resolution, the 26% contrast of the Rayleighcriterion is considered reasonable in typical fluorescencemicroscopy applications, and is the basis for the commonexpression defining lateral resolution according to thefollowing equation (24), in which the point separation (r)in the image plane is the distance between the centralmaximum and the first minimum in the Airy disk:
rlateral ¼ 1:22 l=ð2�NAÞ ¼ 0:6l=NA
where l is the emitted light wavelength and NA is thenumerical aperture of the objective.
Resolution in the microscope is directly related to thefwhm dimensions of the microscope’s point spread function,and it is common to measure this value experimentally inorder to avoid the difficulty in attempting to identify inten-sity maxima in the Airy disk. Measurements of resolutionutilizing the fwhm values of the point spread function aresomewhat smaller than those calculated employing theRayleigh criterion. Furthermore, in confocal fluorescenceconfigurations, single-point illumination scanning and
MICROSCOPY, CONFOCAL 463

single-point detection are employed, so that only thefluorophores in the shared volume of the illuminationand detection point spread functions are able to bedetected. The intensity point spread function in the con-focal case is, therefore, the product of the independentillumination intensity and detection intensity pointspread functions. For confocal fluorescence, the lateral(and axial) extent of the point spread function is reducedby �30% compared to that in the wide-field microscope.Because of the narrower intensity point spread function,the separation of points required to produce acceptablecontrast in the confocal microscope (29,31) is reduced to adistance approximated by
rlateral ¼ 0:4l=NA
If the illumination and fluorescence emission wave-lengths are approximately the same, the confocal fluor-escence microscope Airy disk size is the square of thewide-field microscope Airy disk. Consequently, the con-trast cut-off distance is reduced in the confocal arrange-ment, and equivalent contrast can be achieved at a shorterdistance compared to the widefield illumination config-uration. Regardless of the instrument configuration, thelateral resolution displays a proportional relationship towavelength, and is inversely proportional to the objectivelens numerical aperture.
As noted previously, lateral resolution is of primaryinterest in discussing resolution and contrast, althoughthe axial extent of the microscope intensity point spreadfunction is similarly reduced in the confocal arrangementas compared to the widefield fluorescence configuration(86,89). Reasonable contrast between point-like objectslying on the optical axis occurs when they are separatedby the distance between the central maximum and the firstminimum of the axial point spread function component.
Figure 13 presents the axial intensity distributions (89)for a typical widefield (Fig. 13a) and confocal (Fig. 13b)fluorescence microscope. Note the dramatic reduction inintensity of the wings in the confocal distribution as afunction of distance from the central maximum.
A variety of equations are presented in the literaturethat pertains to different models for calculating axialresolution for various microscope configurations. The ones
most applicable to fluorescence emission are similar inform to the expressions evaluating depth of field, anddemonstrate that axial resolution is proportional to thewavelength, and refractive index of the specimen medium,and inversely proportional to the square of the numericalaperture. Consequently, the NA of the microscope objectivehas a much greater effect on axial resolution than does theemission wavelength. One equation (89) commonly used todescribe axial resolution for the confocal configuration isgiven below, with h representing the index of refraction,and the other variables as specified previously:
raxial ¼ 1:4 l�h=NA2
Although the confocal microscope configuration exhibitsonly a modest improvement in measured axial resolutionover that of the widefield microscope, the true advantage ofthe confocal approach is in the optical sectioning capabilityin thick specimens, which results in a dramatic improve-ment in effective axial resolution over conventional tech-niques. The optical sectioning properties of the confocalmicroscope result from the characteristics of the integratedintensity point spread function, which has a maximum inthe focal plane when evaluated as a function of depth. Theequivalent integral of intensity point spread function for theconventional widefield microscope is constant as a functionof depth, producing no optical sectioning capabilities.
FLUOROPHORES FOR CONFOCAL MICROSCOPY
Biological laser scanning confocal microscopy relies heavilyon fluorescence as an imaging mode, primarily due to thehigh degree of sensitivity afforded by the technique coupledwith the ability to specifically target structural componentsand dynamic processes in chemically fixed as well as livingcells and tissues. Many fluorescent probes are constructedaround synthetic aromatic organic chemicals designedto bind with a biological macromolecule (e.g., a proteinor nucleic acid) or to localize within a specific structuralregion, such as the cytoskeleton, mitochondria, Golgi appa-ratus, endoplasmic reticulum, and nucleus (90). Otherprobes are employed to monitor dynamic processes andlocalized environmental variables, including concentra-tions of inorganic metallic ions, pH, reactive oxygen spe-cies, and membrane potential (91). Fluorescent dyes arealso useful in monitoring cellular integrity (live versusdead and apoptosis), endocytosis, exocytosis, membranefluidity, protein trafficking, signal transduction, and enzy-matic activity (92). In addition, fluorescent probes havebeen widely applied to genetic mapping and chromosomeanalysis in the field of molecular genetics.
The history of synthetic fluorescent probes dates backover a century to the late-1800s when many of the corner-stone dyes for modern histology were developed. Amongthese were pararosaniline, methyl violet, malachite green,safranin O, methylene blue, and numerous azo (nitrogen)dyes, such as Bismarck brown (93). Although these dyeswere highly colored and capable of absorbing selectedbands of visible light, most were only weakly fluorescentand would not be useful for the fluorescence microscopesthat would be developed several decades later. However,
464 MICROSCOPY, CONFOCAL
Figure 13. Comparison of axial (x–z) point spread functions forwidefield (left) and confocal (right) microscopy.

several synthetic dye classes synthesized during this period,based on the xanthene and acridine heterocyclic ring sys-tems, proved to be highly fluorescent and provided a foun-dation for the development of modern synthetic fluorescentprobes. Most notable among these early fluorescent dyeswere the substituted xanthenes, fluorescein and rhodamineB, and the biaminated acridine derivative, acridine orange.
Fluorochromes were introduced to fluorescence micro-scopy in the early twentieth century as vital stains forbacteria, protozoa, and trypanosomes, but did not seewidespread use until the 1920s when fluorescence micro-scopy was first used to study dye binding in fixed tissuesand living cells (7,93). However, it was not until the early1940s that Coons developed a technique for labeling anti-bodies with fluorescent dyes, thus giving birth to the field ofimmunofluorescence (94). Over the past 60 years, advancesin immunology and molecular biology have produced a widespectrum of secondary antibodies and provided insight intothe molecular design of fluorescent probes targeted at spe-cific regions within macromolecular complexes.
Fluorescent probe technology and cell biology weredramatically altered by the discovery of the GFP fromjellyfish and the development of mutant spectral variants,which have opened the door to noninvasive fluorescencemulticolor investigations of subcellular protein localiza-tion, intermolecular interactions, and trafficking usingliving cell cultures (79,80,95). More recently, the develop-ment of nanometer-sized fluorescent semiconductor quan-tum dots has provided a new avenue for research inconfocal and widefield fluorescence microscopy (96).Despite the numerous advances made in fluorescent dyesynthesis during the past few decades, there is very littlesolid evidence about molecular design rules for developingnew fluorochromes, particularly with regard to matchingabsorption spectra to available confocal laser excitationwavelengths. As a result, the number of fluorophores thathave found widespread use in confocal microscopy is alimited subset of the many thousands that have beendiscovered.
BASIC CHARACTERISTICS OF FLUOROPHORES
Fluorophores are catalogued and described according totheir absorption and fluorescence properties, including thespectral profiles, wavelengths of maximum absorbance andemission, and the fluorescence intensity of the emittedlight (92). One of the most useful quantitative parametersfor characterizing absorption spectra is the molar extinc-tion coefficient (denoted with the Greek symbole, seeFig. 14a), which is a direct measure of the ability of amolecule to absorb light. The extinction coefficient is usefulfor converting units of absorbance into units of molarconcentration, and is determined by measuring the absor-bance at a reference wavelength (usually the maximum,characteristic of the absorbing species) for a molar concen-tration in a defined optical path length. The quantum yieldof a fluorochrome or fluorophore represents a quantitativemeasure of fluorescence emission efficiency, and is expressedas the ratio of the number of photons emitted to thenumber of photons absorbed. In other words, the quantum
yield represents the probability that a given excited fluor-ochrome will produce an emitted (fluorescence) photon.Quantum yields typically range between a value of 0 and 1and fluorescent molecules commonly employed as probesin microscopy have quantum yields ranging from very low(0.05 or less) to almost unity. In general, a high quantumyield is desirable in most imaging applications. The quan-tum yield of a given fluorophore varies, sometimes to largeextremes, with environmental factors, such as metallicion concentration, pH, and solvent polarity (92).
In most cases, the molar extinction coefficient for photonabsorption is quantitatively measured and expressed at aspecific wavelength, whereas the quantum efficiency is anassessment of the total integrated photon emission over theentire spectral band of the fluorophore (Fig. 14b). Asopposed to traditional arc-discharge lamps used with theshortest range (10–20 nm) bandpass interference filters inwide-field fluorescence microscopy, the laser systems usedfor fluorophore excitation in scanning confocal microscopyrestrict excitation to specific laser spectral lines thatencompass only a few nanometers (1,7). The fluorescenceemission spectrum for both techniques, however, is con-trolled by similar bandpass or longpass filters that cancover tens to hundreds of nanometers (7). Below saturationlevels, fluorescence intensity is proportional to the productof the molar extinction coefficient and the quantum yield ofthe fluorophore, a relationship that can be utilized to judgethe effectiveness of emission as a function of excitationwavelength(s). These parameters display an approximate20-fold range in variation for the popular fluorophorescommonly employed for investigations in confocal micro-scopy with quantum yields ranging from 0.05 to 1.0, andextinction coefficients ranging from 10,000 to 0.25 million(L �mol�1). In general, the absorption spectrum of a fluor-ophore is far less dependent on environmental conditionsthan the fluorescence emission characteristics (spectralwavelength profile and quantum yield; 92).
Fluorophores chosen for confocal applications mustexhibit a brightness level and signal persistence sufficientfor the instrument to obtain image data that does not sufferfrom excessive photobleaching artifacts and low signal/noise ratios. In widefield fluorescence microscopy, excita-tion illumination levels are easily controlled with neutral
MICROSCOPY, CONFOCAL 465
Figure 14. Fluorescent spectral profiles, plotted as normalizedabsorption or emission as a function of wavelength, for popularsynthetic fluorophores emitting in the blue, green, and red regionsof the visible spectrum. Each profile is identified with a coloredbullet in (a), which illustrates excitation spectra. (b) The emissionspectra for the fluorophores according to the legend in (a).

density filters (40), and the intensity can be reduced(coupled with longer emission signal collection periods)to avoid saturation and curtail irreversible loss of fluores-cence. Excitation conditions in confocal microscopy areseveral orders of magnitude more severe, however, andrestrictions imposed by characteristics of the fluorophoresand efficiency of the microscope optical system become thedominating factor in determining excitation rate and emis-sion collection strategies (1,7,92).
Because of the narrow and wavelength-restricted laserspectral lines employed to excite fluorophores in confocalmicroscopy (Table 1), fluorescence emission intensity canbe seriously restricted due to poor overlap of the excitationwavelengths with the fluorophore absorption band. Inaddition, the confocal pinhole aperture, which is criticalin obtaining thin optical sections at high signal/noiseratios, is responsible for a 25–50% loss of emission inten-sity, regardless of how much effort has been expended onfine-tuning and alignment of the microscope optical system(7). Photomultiplier tubes are the most common detectorsin confocal microscopy, but suffer from a quantum effi-ciency that varies as a function of wavelength (especially inthe red and IR regions), further contributing to a wave-length-dependent loss of signal across the emission spec-trum (59–62). Collectively, the light losses in confocalmicroscopy can result in a reduction of intensity exceeding50 times of the level typically observed in widefield fluor-escence instruments. It should be clear from the precedingargument that fluorophore selection is one of the mostcritical aspects of confocal microscopy, and instrumentalefficiency must be carefully considered, as well, in order toproduce high quality images.
In confocal microscopy, irradiation of the fluorophoreswith a focused laser beam at high power densities increasesthe emission intensity up to the point of dye saturation, acondition whose parameters are dictated by the excitedstate lifetime (97). In the excited state, fluorophores areunable to absorb another incident photon until they emit alower energy photon through the fluorescence process.When the rate of fluorophore excitation exceeds the rateof emission decay, the molecules become saturated and theground state population decreases. As a result, a majorityof the laser energy passes through the specimen undimin-ished and does not contribute to fluorophore excitation.Balancing fluorophore saturation with laser light intensity
levels is, therefore, a critical condition for achieving the opti-mal signal/noise ratio in confocal experiments (1,7,92,97). Thenumber of fluorescent probes currently available for con-focal microscopy runs in the hundreds (90,93), with manydyes having absorption maxima closely associated withcommon laser spectral lines (90). An exact match betweena particular laser line and the absorption maximum of aspecific probe is not always possible, but the excitationefficiency of lines near the maximum is usually sufficientto produce a level of fluorescence emission that can bereadily detected.
Instrumentally, fluorescence emission collection can beoptimized by careful selection of objectives, detector aper-ture dimensions, dichromatic and barrier filters, as well asmaintaining the optical train in precise alignment (63). Inmost cases, low magnification objectives with a highnumerical aperture should be chosen for the most demand-ing imaging conditions because light collection intensityincreases as the fourth power of the numerical aperture,but only decreases as the square of the magnification.However, the most important limitations in light collectionefficiency in confocal microscopy arise from restrictionsimposed by the physical properties of the fluorophoresthemselves. As previously discussed, fluorescent probedevelopment is limited by a lack of knowledge of the specificmolecular properties responsible for producing optimumfluorescence characteristics, and the design rules are insuf-ficiently understood to be helpful as a guide to the devel-opment of more efficient fluorophores. The current successin development of new fluorescent probes capable of satis-factory performance in confocal microscopy is a testamentto the progress made through use of empirical data andassumptions about molecular structure extrapolated fromthe properties of existing dyes, many of which were firstsynthesized over a hundred years ago.
TRADITIONAL FLUORESCENT DYES
The choice of fluorescent probes for confocal microscopymust address the specific capabilities of the instrument toexcite and detect fluorescence emission in the wavelengthregions made available by the laser systems and detectors.Although the current lasers used in confocal microscopy(Table 1) produce discrete lines in the UV, visible, and
466 MICROSCOPY, CONFOCAL
Table 1. Laser and Arc-Discharge Spectral Lines in Widefield and Confocal Microscopy
Laser Type Ultraviolet Violet Blue Green Yellow Orange Red
Argon-ion 351, 364 457, 477, 488 514Blue diode 405, 440Diode-pumped solid state 355 430, 442 457, 473 532 561Helium–cadmium 322, 354 442Krypton–argon 488 568 647Green helium–neon 543Yellow helium–neon 594Orange helium–neon 612Red helium-neon 633Red diode 635, 650Mercury arc 365 405, 436 546 579Xenon arc 467

near-IR portions of the spectrum, the location of thesespectral lines does not always coincide with absorptionmaxima of popular fluorophores. In fact, it is not necessaryfor the laser spectral line to correspond exactly with thefluorophore wavelength of maximum absorption, but theintensity of fluorescence emission is regulated by the fluor-ophore extinction coefficient at the excitation wavelength(as discussed above). The most popular lasers for confocalmicroscopy are air-cooled argon and krypton–argon ionlasers, the new blue diode lasers, and a variety of helium–neon systems (7,40). Collectively, these lasers are capable ofproviding excitation at 10–12 specific wavelengths between400 and 650 nm.
Many of the classical fluorescent probes that have beensuccessfully utilized for many years in widefield fluores-cence (92,93), including fluorescein isothiocyanate, Lissa-mine rhodamine, and Texas red, are also useful in confocalmicroscopy. Fluorescein is one of the most popular fluor-ochromes ever designed, and has enjoyed extensive appli-cation in immunofluorescence labeling. This xanthene dyehas an absorption maximum at 495 nm, which coincidesquite well with the 488 nm (blue) spectral line produced byargon-ion and krypton–argon lasers, as well as the 436 and467 principal lines of the mercury and xenon arc-dischargelamps, respectively. In addition, the quantum yield offluorescein is very high and a significant amount of infor-mation has been gathered on the characteristics of this dyewith respect to the physical and chemical properties (98).On the negative side, the fluorescence emission intensity offluorescein is heavily influenced by environmental factors(e.g., pH), and the relatively broad emission spectrum oftenoverlaps with those of other fluorophores in dual and triplelabeling experiments (92,98,99).
Tetramethyl rhodamine (TMR) and the isothiocyanatederivative (TRITC) are frequently employed in multiplelabeling investigations in widefield microscopy due to theirefficient excitation by the 546 nm spectral line from mer-cury arc-discharge lamps. The fluorochromes, which havesignificant emission spectral overlap with fluorescein,can be excited very effectively by the 543 nm line fromhelium–neon lasers, but not by the 514 or 568 nanometerlines from argon-ion and krypton–argon lasers (99). Whenusing krypton-based laser systems, Lissamine rhodamineis a far better choice in this fluorochrome class due to theabsorption maximum at 575 nm and its spectral separationfrom fluorescein. Also, the fluorescence emission intensityof rhodamine derivatives is not as dependent upon strictenvironmental conditions as that of fluorescein.
Several of the acridine dyes, first isolated in the nine-teenth century, are useful as fluorescent probes in confocalmicroscopy (93). The most widely utilized, acridine orange,consists of the basic acridine nucleus with dimethylaminosubstituents located at the 3 and 6 positions of the tri-nuclear ring system. In physiological pH ranges, the mole-cule is protonated at the heterocyclic nitrogen and existspredominantly as a cationic species in solution. Acridineorange binds strongly to DNA by intercalation of theacridine nucleus between successive base pairs, and exhi-bits green fluorescence with a maximum wavelength of530 nm (92,93,100). The probe also binds strongly to ribo-nucleic acid (RNA) or single-stranded deoxyribonucleic
acid (DNA), but has a longer wavelength fluorescencemaximum (� 640 nm; red) when bound to these macromo-lecules. In living cells, acridine orange diffuses across thecell membrane (by virtue of the association constant forprotonation) and accumulates in the lysosomes and otheracidic vesicles. Similar to most acridines and related poly-nuclear nitrogen heterocycles, acridine orange has a rela-tively broad absorption spectrum, which enables the probe tobe used with several wavelengths from the argon-ion laser.
Another popular traditional probe that is useful inconfocal microscopy is the phenanthridine derivative, pro-pidium iodide, first synthesized as an antitrypanosomalagent along with the closely related ethidium bromide).Propidium iodide binds to DNA in a manner similar to theacridines (via intercalation) to produce orange-red fluor-escence centered at 617 nm (101,102). The positivelycharged fluorophore also has a high affinity for double-stranded RNA. Propidium has an absorption maximum at536 nm, and can be excited by the 488 or 514-nm spectrallines of an argon-ion (or krypton–argon) laser, or the543 nm line from a green helium–neon laser. The dye isoften employed as a counterstain to highlight cell nucleiduring double or triple labeling of multiple intracellularstructures. Environmental factors can affect the fluores-cence spectrum of propidium, especially when the dye isused with mounting media containing glycerol. The struc-turally similar ethidium bromide, which also binds to DNAby intercalation (102), produces more background staining,and is therefore not as effective as propidium.
The DNA and chromatin can also be stained with dyesthat bind externally to the double helix. The most popularfluorochromes in this category are 40,6-diamidino-2-pheny-lindole (DAPI) and the bis (benzimide) Hoechst dyes thatare designated by the numbers 33258, 33342, and 34580(103–106). These probes are quite water soluble and bindexternally to AT-rich base pair clusters in the minor grooveof double-stranded DNA with a dramatic increase in fluor-escence intensity. Both dye classes can be stimulated bythe 351 nm spectral line of high power argon-ion lasers orthe 354 nm line from a helium–cadmium laser. Similar tothe acridines and phenanthridines, these fluorescentprobes are popular choices as a nuclear counterstain foruse in multicolor fluorescent labeling protocols. The vividblue fluorescence emission produces dramatic contrastwhen coupled to green, yellow, and red probes in adjacentcellular structures.
ALEXA FLUOR DYES
The dramatic advances in modern fluorophore technologyare exemplified by the Alexa Fluor dyes (90,107,108) intro-duced by Molecular Probes (Alexa Fluor is a registeredtrademark of Molecular Probes). These sulfonated rhoda-mine derivatives exhibit higher quantum yields for moreintense fluorescence emission than spectrally similarprobes, and have several additional improved features,including enhanced photostability, absorption spectramatched to common laser lines, pH insensitivity, and ahigh degree of water solubility. In fact, the resistance tophotobleaching of Alexa Fluor dyes is so dramatic (108)
MICROSCOPY, CONFOCAL 467

that even when subjected to irradiation by high intensitylaser sources, fluorescence intensity remains stable forrelatively long periods of time in the absence of antifadereagents. This feature enables the water soluble AlexaFluor probes to be readily utilized for both live-cell andtissue section investigations, as well as in traditional fixedpreparations.
Alexa Fluor dyes are available in a broad range offluorescence excitation and emission wavelength maxima,ranging from the UV and deep blue to the near-IR regions(90). Alphanumeric names of the individual dyes are asso-ciated with the specific excitation laser or arc-dischargelamp spectral lines for which the probes are intended. Forexample, Alexa Fluor 488 is designed for excitation by theblue 488 nm line of the argon or krypton–argon ion lasers,while Alexa Fluor 568 is matched to the 568 nm spectralline of the krypton–argon laser. Several of the Alexa Fluordyes are specifically designed for excitation by either theblue diode laser (405 nm), the orange/yellow helium–neonlaser (594 nm), or the red helium–neon laser (633 nm).Other Alexa Fluor dyes are intended for excitation withtraditional mercury arc-discharge lamps in the visible(Alexa Fluor 546) or UV (Alexa Fluor 350, also useful withhigh power argon-ion lasers), and solid-state red diodelasers (Alexa Fluor 680). Because of the large number ofavailable excitation and emission wavelengths in the AlexaFluor series, multiple labeling experiments can often beconducted exclusively with these dyes.
Alexa Fluor dyes are commercially available as reactiveintermediates in the form of maleimides, succinimidylesters, and hydrazides, as well as prepared cytoskeletalprobes (conjugated to phalloidin, G-actin, and rabbit ske-letal muscle actin) and conjugates to lectin, dextrin, strep-tavidin, avidin, biocytin, and a wide variety of secondaryantibodies (90). In the latter forms, the Alexa Fluor fluor-ophores provide a broad palette of tools for investigations inimmunocytochemistry, neuroscience, and cellular biology.The family of probes has also been extended into a series ofdyes having overlapping fluorescence emission maximatargeted at sophisticated confocal microscopy detectionsystems with spectral imaging and linear unmixing cap-abilities. For example, Alexa Fluor 488, Alexa Fluor 500,and Alexa Fluor 514 are visually similar in color withbright green fluorescence, but have spectrally distinctemission profiles. In addition, the three fluorochromescan be excited with the 488 or 514 nm spectral line froman argon-ion laser and are easily detected with traditionalfluorescein filter combinations. In multispectral (x–y–l;referred to as a lambda stack) confocal imaging experi-ments, optical separation software can be employed todifferentiate between the similar signals (32–35). The over-lapping emission spectra of Alexa Fluor 488, 500, and 514are segregated into separate channels and differentiatedusing pseudocolor techniques when the three fluorophoresare simultaneously combined in a triple label investigation.
CYANINE DYES
The popular family of cyanine dyes, Cy2, Cy3, Cy5, Cy7,and their derivatives, are based on the partially saturated
indole nitrogen heterocyclic nucleus with two aromaticunits being connected via a polyalkene bridge of varyingcarbon number (92,109). These probes exhibit fluorescenceexcitation and emission profiles that are similar to many ofthe traditional dyes, such as fluorescein and tetramethylr-hodamine, but with enhanced water solubility, photostabil-ity, and higher quantum yields. Most of the cyanine dyesare more environmentally stable than their traditionalcounterparts, rendering their fluorescence emission inten-sity less sensitive to pH and organic mounting media.In a manner similar to the Alexa Fluors, the excitationwavelengths of the Cy series of synthetic dyes are tunedspecifically for use with common laser and arc-dischargesources, and the fluorescence emission can be detected withtraditional filter combinations.
Marketed by a number of distributors, the cyanine dyesare readily available as reactive dyes or fluorophorescoupled to a wide variety of secondary antibodies, dextrin,streptavidin, and eggwhite avidin (110). The cyanine dyesgenerally have broader absorption spectral regions thanmembers of the Alexa Fluor family, making them some-what more versatile in the choice of laser excitation sourcesfor confocal microscopy (7). For example, using the 547 nmspectral line from an argon-ion laser, Cy2 is about twice asefficient in fluorescence emission as Alexa Fluor 488. In ananalogous manner, the 514 nm argon-ion laser line excitesCy3 with a much higher efficiency than Alexa Fluor 546, aspectrally similar probe. Emission profiles of the cyaninedyes are comparable in spectral width to the Alexa Fluorseries.
Included in the cyanine dye series are the long-wave-length Cy5 derivatives, which are excited in the red region(650 nm) and emit in the far-red (680 nm) wavelengths. TheCy5 fluorophore is very efficiently excited by the 647 nmspectral line of the krypton–argon laser, the 633 nm line ofthe red helium–neon laser, or the 650 nm line of the reddiode laser, providing versatility in laser choice. Becausethe emission spectral profile is significantly removed fromtraditional fluorophores excited by UV and blue illumina-tion, Cy5 is often utilized as a third fluorophore in triplelabeling experiments. However, similar to other probeswith fluorescence emission in the far-red spectral region,Cy5 is not visible to the human eye and can only bedetected electronically (using a specialized CCD camerasystem or photomultiplier). Therefore, the probe is seldomused in conventional widefield fluorescence experiments.
FLUORESCENT ENVIRONMENTAL PROBES
Fluorophores designed to probe the internal environmentof living cells have been widely examined by a number ofinvestigators, and many hundreds have been developed tomonitor such effects as localized concentrations of alkaliand alkaline earth metals, heavy metals (employed bio-chemically as enzyme cofactors), inorganic ions, thiols, andsulfides, nitrite, as well as pH, solvent polarity, and mem-brane potential (7,90–93,111,112). Originally, the experi-ments in this arena were focused on changes in thewavelength and/or intensity of absorption and emissionspectra exhibited by fluorophores upon binding calcium
468 MICROSCOPY, CONFOCAL

ions in order to measure intracellular flux densities. Theseprobes bind to the target ion with a high degree of speci-ficity to produce the measured response and are oftenreferred to as spectrally sensitive indicators. Ionic concen-tration changes are determined by the application ofoptical ratio signal analysis to monitor the associationequilibrium between the ion and its host. The concen-tration values derived from this technique are largelyindependent of instrumental variations and probe concen-tration fluctuations due to photobleaching, loading para-meters, and cell retention. In the past few years, a numberof new agents have been developed that bind specific ions orrespond with measurable features to other environmentalconditions (7,90).
Calcium is a metabolically important ion that plays avital role in cellular response to many forms of externalstimuli (113). Because transient fluctuations in calcium ionconcentration are typically involved when cells undergo aresponse, fluorophores must be designed to measure notonly localized concentrations within segregated compart-ments, but should also produce quantitative changes whenflux density waves progress throughout the entire cyto-plasm. Many of the synthetic molecules designed to mea-sure calcium levels are based on the nonfluorescentchelation agents EGTA and BAPTA, which have been usedfor years to sequester calcium ions in buffer solutions(7,114,115). Two of the most common calcium probes arethe ratiometric indicators fura-2 and indo-1, but thesefluorophores are not particularly useful in confocal micro-scopy (7,116). The dyes are excited by UV light and exhibita shift in the excitation or emission spectrum with theformation of isosbestic points when binding calcium. How-ever, the optical aberrations associated with UV imaging,limited specimen penetration depths, and the expense ofultraviolet lasers have limited the utility of these probes inconfocal microscopy.
Fluorophores that respond in the visible range to cal-cium ion fluxes are, unfortunately, not ratiometric indica-tors and do not exhibit a wavelength shift (typical of fura-2and indo-1) upon binding, although they do undergo anincrease or decrease in fluorescence intensity. The bestexample is fluo-3, a complex xanthene derivative, whichundergoes a dramatic increase in fluorescence emission at525 nm (green) when excited by the 488 nm spectral line ofan argon-ion or krypton–argon laser (7,117). Because iso-sbestic points are not present to assure the absence of con-centration fluctuations, it is impossible to determine whetherspectral changes are due to complex formation or a variationin concentration with fluo-3 and similar fluorophores.
To overcome the problems associated with using visiblelight probes lacking wavelength shifts (and isosbesticpoints), several of these dyes are often utilized in combina-tion for calcium measurements in confocal microscopy(118). Fura red, a multinuclear imidazole and benzofuranheterocycle, exhibits a decrease in fluorescence at 650 nmwhen binding calcium. A ratiometric response to calciumion fluxes can be obtained when a mixture of fluo-3 and furared is excited at 488 nm and fluorescence is measured at theemission maxima (525 and 650 nm, respectively) of the twoprobes. Because the emission intensity of fluo-3 increasesmonotonically while that of fura red simultaneously
decreases, an isosbestic point is obtained when the dyeconcentrations are constant within the localized areabeing investigated. Another benefit of using these probestogether is the ability to measure fluorescence intensityfluctuations with a standard FITC/Texas red interferencefilter combination.
Quantitative measurements of ions other than calcium,such as magnesium, sodium, potassium, and zinc, areconducted in an analogous manner using similar fluoro-phores (7,90,92). One of the most popular probes for mag-nesium, mag-fura-2 (structurally similar to fura red), isalso excited in the ultraviolet range and presents the sameproblems in confocal microscopy as fura-2 and indo-1.Fluorophores excited in the visible light region are becom-ing available for the analysis of many monovalent anddivalent cations that exist at varying concentrations inthe cellular matrix. Several synthetic organic probes havealso been developed for monitoring the concentration ofsimple and complex anions.
Important fluorescence monitors for intracellular pHinclude a pyrene derivative known as HPTS or pyranine,the fluorescein derivative, BCECF, and another substi-tuted xanthene termed carboxy SNARF-1 (90,119–122).Because many common fluorophores are sensitive to pHin the surrounding medium, changes in fluorescence inten-sity that are often attributed to biological interactions mayactually occur as a result of protonation. In the physiologicalpH range (pH 6.8–7.4), the probes mentioned above areuseful for dual-wavelength ratiometric measurements anddiffer only in dye loading parameters. Simultaneous mea-surements of calcium ion concentration and pH can often beaccomplished by combining a pH indicator, such as SNARF-1, with a calcium ion indicator (e.g., fura-2). Other probeshave been developed for pH measurements in subcellularcompartments, such as the lysosomes, as described below.
ORGANELLE PROBES
Fluorophores targeted at specific intracellular organelles,such as the mitochondria, lysosomes, Golgi apparatus, andendoplasmic reticulum, are useful for monitoring a varietyof biological processes in living cells using confocal micro-scopy (7,90,92). In general, organelle probes consist of afluorochrome nucleus attached to a target-specific moietythat assists in localizing the fluorophore through covalent,electrostatic, hydrophobic, or similar types of bonds. Manyof the fluorescent probes designed for selecting organellesare able to permeate or sequester within the cell membrane(and therefore, are useful in living cells), while others mustbe installed using monoclonal antibodies with traditionalimmunocytochemistry techniques. In living cells, organelleprobes are useful for investigating transport, respiration,mitosis, apoptosis, protein degradation, acidic compart-ments, and membrane phenomena. Cell impermeant fluor-ophore applications include nuclear functions, cytoskeletalstructure, organelle detection, and probes for membraneintegrity. In many cases, living cells that have been labeledwith permeant probes can subsequently be fixed and coun-terstained with additional fluorophores in multicolor label-ing experiments.
MICROSCOPY, CONFOCAL 469

Mitochondrial probes are among the most useful fluor-ophores for investigating cellular respiration and are oftenemployed along with other dyes in multiple labeling inves-tigations. The traditional probes, rhodamine 123 and tet-ramethylrosamine, are rapidly lost when cells are fixedand have largely been supplanted by newer, more specific,fluorophores developed by Molecular Probes (90,123,124).These include the popular MitoTracker and MitoFluorseries of structurally diverse xanthene, benzoxazole,indole, and benzimidazole heterocycles that are availablein a variety of excitation and emission spectral profiles. Themechanism of action varies for each of the probes in thisseries, ranging from covalent attachment to oxidationwithin respiring mitochondrial membranes.
MitoTracker dyes are retained quite well after cellfixation in formaldehyde and can often withstand lipophilicpermeabilizing agents (123). In contrast, the MitoFluorprobes are designed specifically for actively respiring cellsand are not suitable for fixation and counterstaining pro-cedures (90). Another popular mitochondrial probe,entitled JC-1, is useful as an indicator of membrane poten-tial and in multiple staining experiments with fixed cells(125). This carbocyanine dye exhibits green fluorescence atlow concentrations, but can undergo intramolecular asso-ciation within active mitochondria to produce a shift inemission to longer (red) wavelengths. The change in emis-sion wavelength is useful in determining the ratio of activeto nonactive mitochondria in living cells.
In general, weakly basic amines that are able topass through membranes are the ideal candidates forinvestigating biosynthesis and pathogenesis in lysosomes(90–92,112). Traditional lysosomal probes include the non-specific phenazine and acridine derivatives neutral red andacridine orange, which are accumulated in the acidic vesi-cles upon being protonated (92,93). Fluorescently labeledlatex beads and macromolecules, such as dextran, can alsobe accumulated in lysosomes by endocytosis for a variety ofexperiments. However, the most useful tools for investi-gating lysosomal properties with confocal microscopy arethe LysoTracker and LysoSensor dyes developed by Mole-cular Probes (90,92,126). These structurally diverse agentscontain heterocyclic and aliphatic nitrogen moieties thatmodulate transport of the dyes into the lysosomes of livingcells for both short- and long-term studies. The LysoTrackerprobes, which are available in a variety of excitation andemission wavelengths (91), have high selectivity for acidicorganelles and are capable of labeling cells at nanomolarconcentrations. Several of the dyes are retained quite wellafter fixing and permeabilization of cells. In contrast, theLysoSensor fluorophores are designed for studying dynamicaspects of lysosome function in living cells. Fluorescenceintensity dramatically increases in the LysoSensor seriesupon protonation, making these dyes useful as pH indica-tors (91). A variety of Golgi apparatus specific monoclonalantibodies have also been developed for use in immunocy-tochemistry assays (90,127–129).
Proteins and lipids are sorted and processed in the Golgiapparatus, which is typically stained with fluorescentderivatives of ceramides and sphingolipids (130). Theseagents are highly lipophilic, and are therefore useful asmarkers for the study of lipid transport and metabolism in
live cells. Several of the most useful fluorophores for Golgiapparatus contain the complex heterocyclic BODIPYnucleus developed by Molecular Probes (90,92,131). Whencoupled to sphingolipids, the BODIPY fluorophore is highlyselective and exhibits a tolerance for photobleaching that isfar superior to many other dyes. In addition, the emissionspectrum is dependent upon concentration (shifting fromgreen to red at higher concentrations), making the probesuseful for locating and identifying intracellular structuresthat accumulate large quantities of lipids. During live-cellexperiments, fluorescent lipid probes can undergo meta-bolism to derivatives that may bind to other subcellularfeatures, a factor that can often complicate the analysis ofexperimental data.
The most popular traditional probes for endoplasmicreticulum fluorescence analysis are the carbocyanine andxanthene dyes, DiOC (6) and several rhodamine deriva-tives, respectively (90,92). These dyes must be used withcaution, however, because they can also accumulate in themitochondria, Golgi apparatus, and other intracellularlipophilic regions. Newer, more photostable, probes havebeen developed for selective staining of the endoplasmicreticulum by several manufacturers. In particular, oxazolemembers of the Dapoxyl family produced by MolecularProbes are excellent agents for selective labeling of theendoplasmic reticulum in living cells, either alone or incombination with other dyes (90). These probes areretained after fixation with formaldehyde, but can be lostwith permeabilizing detergents. Another useful probe isBrefeldin A (131), a stereochemically complex fungal meta-bolite that serves as an inhibitor of protein trafficking outof the endoplasmic reticulum. Finally, similar to otherorganelles, monoclonal antibodies (127–129) have beendeveloped that target the endoplasmic reticulum in fixedcells for immunocytochemistry investigations.
QUANTUM DOTS
Nanometer-sized crystals of purified semiconductorsknown as quantum dots are emerging as a potentiallyuseful fluorescent labeling agent for living and fixed cellsin both traditional widefield and laser scanning confocalfluorescence microscopy (132–136). Recently introducedtechniques enable the purified tiny semiconductor crystalsto be coated with a hydrophilic polymer shell and conju-gated to antibodies or other biologically active peptides andcarbohydrates for application in many of the classicalimmunocytochemistry protocols (Fig. 15). These probeshave significant benefits over organic dyes and fluorescentproteins, including long-term photostability, high fluores-cence intensity levels, and multiple colors with single-wavelength excitation for all emission profiles (136).
Quantum dots produce illumination in a manner similarto the well-known semiconductor light emitting diodes, butare activated by absorption of a photon rather than anelectrical stimulus. The absorbed photon creates an elec-tron-hole pair that quickly recombines with the concurrentemission of a photon having lower energy. The most usefulsemiconductor discovered thus far for producing biologicalquantum dots is cadmium selenide (CdSe), a material in
470 MICROSCOPY, CONFOCAL
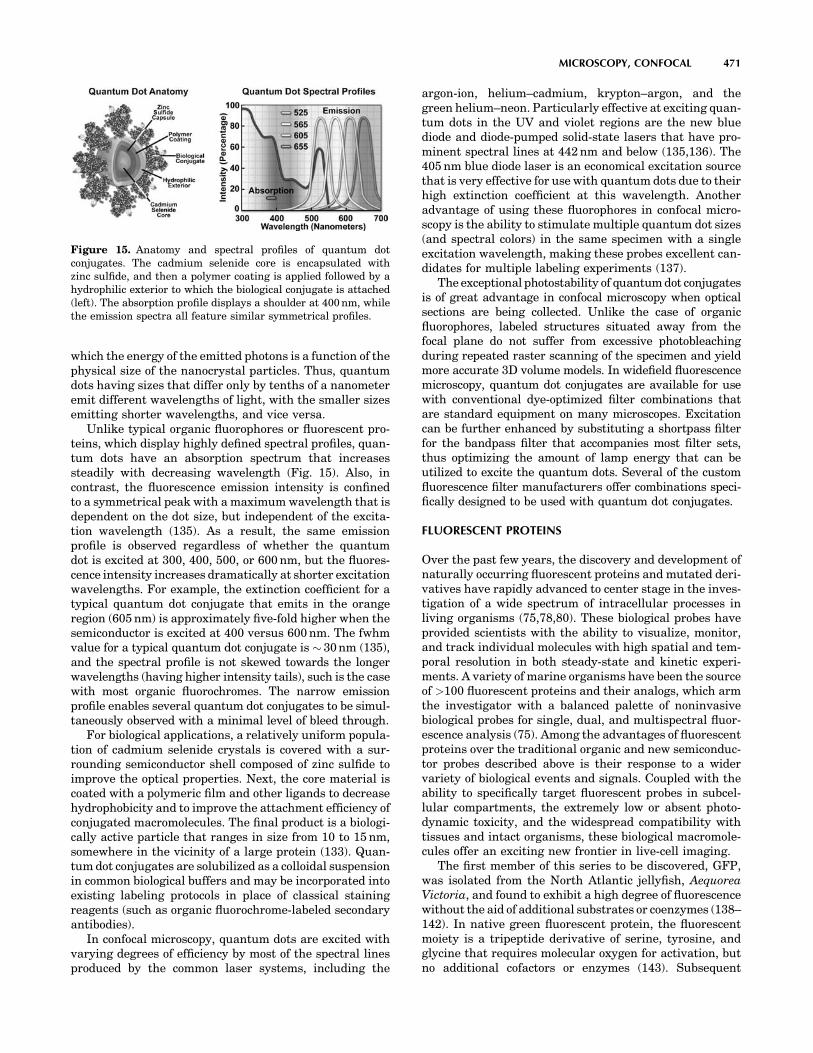
which the energy of the emitted photons is a function of thephysical size of the nanocrystal particles. Thus, quantumdots having sizes that differ only by tenths of a nanometeremit different wavelengths of light, with the smaller sizesemitting shorter wavelengths, and vice versa.
Unlike typical organic fluorophores or fluorescent pro-teins, which display highly defined spectral profiles, quan-tum dots have an absorption spectrum that increasessteadily with decreasing wavelength (Fig. 15). Also, incontrast, the fluorescence emission intensity is confinedto a symmetrical peak with a maximum wavelength that isdependent on the dot size, but independent of the excita-tion wavelength (135). As a result, the same emissionprofile is observed regardless of whether the quantumdot is excited at 300, 400, 500, or 600 nm, but the fluores-cence intensity increases dramatically at shorter excitationwavelengths. For example, the extinction coefficient for atypical quantum dot conjugate that emits in the orangeregion (605 nm) is approximately five-fold higher when thesemiconductor is excited at 400 versus 600 nm. The fwhmvalue for a typical quantum dot conjugate is � 30 nm (135),and the spectral profile is not skewed towards the longerwavelengths (having higher intensity tails), such is the casewith most organic fluorochromes. The narrow emissionprofile enables several quantum dot conjugates to be simul-taneously observed with a minimal level of bleed through.
For biological applications, a relatively uniform popula-tion of cadmium selenide crystals is covered with a sur-rounding semiconductor shell composed of zinc sulfide toimprove the optical properties. Next, the core material iscoated with a polymeric film and other ligands to decreasehydrophobicity and to improve the attachment efficiency ofconjugated macromolecules. The final product is a biologi-cally active particle that ranges in size from 10 to 15 nm,somewhere in the vicinity of a large protein (133). Quan-tum dot conjugates are solubilized as a colloidal suspensionin common biological buffers and may be incorporated intoexisting labeling protocols in place of classical stainingreagents (such as organic fluorochrome-labeled secondaryantibodies).
In confocal microscopy, quantum dots are excited withvarying degrees of efficiency by most of the spectral linesproduced by the common laser systems, including the
argon-ion, helium–cadmium, krypton–argon, and thegreen helium–neon. Particularly effective at exciting quan-tum dots in the UV and violet regions are the new bluediode and diode-pumped solid-state lasers that have pro-minent spectral lines at 442 nm and below (135,136). The405 nm blue diode laser is an economical excitation sourcethat is very effective for use with quantum dots due to theirhigh extinction coefficient at this wavelength. Anotheradvantage of using these fluorophores in confocal micro-scopy is the ability to stimulate multiple quantum dot sizes(and spectral colors) in the same specimen with a singleexcitation wavelength, making these probes excellent can-didates for multiple labeling experiments (137).
The exceptional photostability of quantum dot conjugatesis of great advantage in confocal microscopy when opticalsections are being collected. Unlike the case of organicfluorophores, labeled structures situated away from thefocal plane do not suffer from excessive photobleachingduring repeated raster scanning of the specimen and yieldmore accurate 3D volume models. In widefield fluorescencemicroscopy, quantum dot conjugates are available for usewith conventional dye-optimized filter combinations thatare standard equipment on many microscopes. Excitationcan be further enhanced by substituting a shortpass filterfor the bandpass filter that accompanies most filter sets,thus optimizing the amount of lamp energy that can beutilized to excite the quantum dots. Several of the customfluorescence filter manufacturers offer combinations speci-fically designed to be used with quantum dot conjugates.
FLUORESCENT PROTEINS
Over the past few years, the discovery and development ofnaturally occurring fluorescent proteins and mutated deri-vatives have rapidly advanced to center stage in the inves-tigation of a wide spectrum of intracellular processes inliving organisms (75,78,80). These biological probes haveprovided scientists with the ability to visualize, monitor,and track individual molecules with high spatial and tem-poral resolution in both steady-state and kinetic experi-ments. A variety of marine organisms have been the sourceof >100 fluorescent proteins and their analogs, which armthe investigator with a balanced palette of noninvasivebiological probes for single, dual, and multispectral fluor-escence analysis (75). Among the advantages of fluorescentproteins over the traditional organic and new semiconduc-tor probes described above is their response to a widervariety of biological events and signals. Coupled with theability to specifically target fluorescent probes in subcel-lular compartments, the extremely low or absent photo-dynamic toxicity, and the widespread compatibility withtissues and intact organisms, these biological macromole-cules offer an exciting new frontier in live-cell imaging.
The first member of this series to be discovered, GFP,was isolated from the North Atlantic jellyfish, AequoreaVictoria, and found to exhibit a high degree of fluorescencewithout the aid of additional substrates or coenzymes (138–142). In native green fluorescent protein, the fluorescentmoiety is a tripeptide derivative of serine, tyrosine, andglycine that requires molecular oxygen for activation, butno additional cofactors or enzymes (143). Subsequent
MICROSCOPY, CONFOCAL 471
Figure 15. Anatomy and spectral profiles of quantum dotconjugates. The cadmium selenide core is encapsulated withzinc sulfide, and then a polymer coating is applied followed by ahydrophilic exterior to which the biological conjugate is attached(left). The absorption profile displays a shoulder at 400 nm, whilethe emission spectra all feature similar symmetrical profiles.

investigations revealed that the GFP gene could beexpressed in other organisms, including mammals, to yieldfully functional analogs that display no adverse biologicaleffects (144). In fact, fluorescent proteins can be fused tovirtually any protein in living cells using recombinantcomplementary DNA cloning technology, and the resultingfusion protein gene product expressed in cell lines adaptedto standard tissue culture methodology. Lack of a need forcell-specific activation cofactors renders the fluorescentproteins much more useful as generalized probes thanother biological macromolecules, such as the phycobilipro-teins, which require insertion of accessory pigments inorder to produce fluorescence.
Mutagenesis experiments with green fluorescent pro-tein have produced a large number of variants withimproved folding and expression characteristics, whichhave eliminated wild-type dimerization artifacts and finetuned the absorption and fluorescence properties. One ofthe earliest variants, known as enhanced green fluores-cence protein (EGFP), contains codon substitutions (com-monly referred to as the S65T mutation) that alleviates thetemperature sensitivity and increases the efficiency of GFPexpression in mammalian cells (145). Proteins fused withEGFP can be observed at low light intensities for long timeperiods with minimal photobleaching. Enhanced greenfluorescent protein fusion products are optimally excitedby the 488 nm spectral line from argon and krypton–argonion lasers in confocal microscopy. This provides an excel-lent biological probe and instrument combination for exam-ining intracellular protein pathways along with thestructural dynamics of organelles and the cytoskeleton.
Additional mutation studies have uncovered GFP var-iants that exhibit a variety of absorption and emissioncharacteristics across the entire visible spectral region,which have enabled researchers to develop probe combina-tions for simultaneous observation of two or more distinctfluorescent proteins in a single organism (see the spectralprofiles in Fig. 16). Early investigations yielded the bluefluorescent protein (BFP) and cyan fluorescent protein(CFP) mutants from simple amino acid substitutions thatshifted the absorption and emission spectral profiles ofwild-type GFP to lower wavelength regions (146–148).Used in combination with GFP, these derivatives are use-ful in resonance energy transfer (FRET) experiments andother investigations that rely on multicolor fluorescenceimaging (73). Blue fluorescent protein can be efficientlyexcited with the 354 nm line from a high power argon laser,while the more useful cyan derivative is excited by anumber of violet and blue laser lines, including the
405 nm blue diode, the 442 nm helium–cadmium spectralline, and the 457 nm line from the standard argon-ion laser.
Another popular fluorescent protein derivative, the yel-low fluorescent protein (YFP), was designed on the basis ofthe GFP crystalline structural analysis to red-shift theabsorption and emission spectra (148). Yellow fluorescentprotein is optimally excited by the 514 nm spectral line ofthe argon-ion laser, and provides more intense emissionthan enhanced green fluorescent protein, but is moresensitive to low pH and high halogen ion concentrations.The enhanced yellow fluorescent protein derivative(EYFP) is useful with the 514 argon-ion laser line, butcan also be excited with relatively high efficiency by the488 nm line from argon and krypton–argon lasers. Both ofthese fluorescent protein derivatives have been widelyapplied to protein–protein FRET investigations in combi-nation with CFP, and in addition, have proven useful instudies involving multiprotein trafficking.
Attempts to shift the absorption and emission spectra ofAequorea Victoria fluorescent proteins to wavelengths inthe orange and red regions of the spectrum have met withlittle success. However, fluorescent proteins from othermarine species have enabled investigators to extend theavailable spectral regions to well within the red wave-length range. The DsRed fluorescent protein and itsderivatives, originally isolated from the sea anemoneDiscosoma striata, are currently the most popular analogsfor fluorescence analysis in the 575–650 nm region (149).Another protein, HcRed from the Heteractis crispa purpleanemone, is also a promising candidate for investigationsin the longer wavelengths of the visible spectrum (150).Newly developed photoactivation fluorescent proteins,including photoactivatable green fluorescent protein(PA-GFP;74), Kaede (76), and kindling fluorescent protein1 (KFP1; 151), exhibit dramatic improvements over GFP(up to several 1000-fold) in fluorescence intensity whenstimulated by violet laser illumination. These probesshould prove useful in fluorescence confocal studies invol-ving selective irradiation of specific target regions and thesubsequent kinetic analysis of diffusional mobility andcompartmental residency time of fusion proteins.
QUENCHING AND PHOTOBLEACHING
The consequences of quenching and photobleaching aresuffered in practically all forms of fluorescence micro-scopy, and result in an effective reduction in the levelsof emission (152,153). These artifacts should be of primary
472 MICROSCOPY, CONFOCAL
Figure 16. Fluorescent spectral profiles, plotted as normalizedabsorption or emission as a function of wavelength, for fluores-cent proteins emitting in the blue to orange-red regions of thevisiblespectrum. Each profile is identified witha colored bullet in(a), which illustrates excitation spectra. (b) The emission spectrafor the proteins according to the legend in (a).

consideration when designing and executing fluorescenceinvestigations. The two phenomena are distinct in thatquenching is often reversible whereas photobleaching isnot (154). Quenching arises from a variety of competingprocesses that induce nonradiative relaxation (withoutphoton emission) of excited-state electrons to the groundstate, which may be either intramolecular or intermole-cular in nature. Because nonradiative transition path-ways compete with the fluorescence relaxation, theyusually dramatically lower or, in some cases, completelyeliminate emission. Most quenching processes act toreduce the excited state lifetime and the quantum yieldof the affected fluorophore.
A common example of quenching is observed with thecollision of an excited state fluorophore and another (non-fluorescent) molecule in solution, resulting in deactivation ofthe fluorophore and return to the ground state. In mostcases, neither of the molecules is chemically altered in thecollisional quenching process. A wide variety of simpleelements and compounds behave as collisional quenchingagents, including oxygen, halogens, amines, and many elec-tron-deficient organic molecules (154). Collisional quench-ing can reveal the presence of localized quencher moleculesor moieties, which via diffusion or conformational change,may collide with the fluorophore during the excited statelifetime. The mechanisms for collisional quenching includeelectron transfer, spin–orbit coupling, and intersystemcrossing to the excited triplet state (154,155). Other termsthat are often utilized interchangeably with collisionalquenching are internal conversion and dynamic quenching.
A second type of quenching mechanism, termed staticor complex quenching, arises from nonfluorescent com-plexes formed between the quencher and fluorophore thatserve to limit absorption by reducing the population ofactive, excitable molecules (154,156). This effect occurswhen the fluorescent species forms a reversible complexwith the quencher molecule in the ground state, and doesnot rely on diffusion or molecular collisions. In staticquenching, fluorescence emission is reduced without alter-ing the excited state lifetime. A fluorophore in the excitedstate can also be quenched by a dipolar resonance energytransfer mechanism when in close proximity with anacceptor molecule to which the excited-state energy canbe transferred nonradiatively. In some cases, quenchingcan occur through non molecular mechanisms, such asattenuation of incident light by an absorbing species(including the chromophore itself).
In contrast to quenching, photobleaching (alsotermed fading) occurs when a fluorophore permanentlyloses the ability to fluoresce due to photon-induced chemi-cal damage and covalent modification (153–156). Upontransition from an excited singlet state to the excitedtriplet state, fluorophores may interact with another mole-cule to produce irreversible covalent modifications. Thetriplet state is relatively long lived with respect to thesinglet state, thus allowing excited molecules a muchlonger timeframe to undergo chemical reactions with com-ponents in the environment (155). The average number ofexcitation and emission cycles that occur for a particularfluorophore before photobleaching is dependent on themolecular structure and the local environment (154,156).
Some fluorophores bleach quickly after emitting only a fewphotons, while others that are more robust can undergothousands or even millions of cycles before bleaching.
Figure 17 presents a typical example of photobleaching(fading) observed in a series of digital images captured atdifferent time points for a multiply stained culture ofnormal Tahr ovary (HJ1.Ov line) fibroblast cells. Thenuclei were stained with DAPI (blue fluorescence), whilethe mitochondria and actin cytoskeleton were stained withMitoTracker Red CMXRos (red fluorescence) and an AlexaFluor phalloidin derivative (Alexa Fluor 488; green fluor-escence), respectively. Time points were taken in 2 minintervals using a fluorescence filter combination withbandwidths tuned to excite the three fluorophores simul-taneously while also recording the combined emissionsignals. Note that all three fluorophores have a relativelyhigh intensity in Fig. 17a, but the DAPI (blue) intensitystarts to drop rapidly at two min and is almost completelygone at six min (Fig. 17f). The mitochondrial and actinstains are more resistant to photobleaching, but the inten-sity of both drops dramatically over the course of the timedsequence (10 min).
An important class of photobleaching events is repre-sented by events that are photodynamic, meaning theyinvolve the interaction of the fluorophore with a combina-tion of light and oxygen (157–161). Reactions betweenfluorophores and molecular oxygen permanently destroyfluorescence and yield a free-radical singlet oxygen speciesthat can chemically modify other molecules in living cells.The amount of photobleaching due to photodynamic eventsis a function of the molecular oxygen concentration andthe proximal distance between the fluorophore, oxygenmolecules, and other cellular components. Photobleachingcan be reduced by limiting the exposure time of
MICROSCOPY, CONFOCAL 473
Figure 17. Photobleaching in multiply stained specimens. NormalTahr ovary fibroblast cells were stained with MitoTracker RedCMXRos (mitochondria; red fluorescence), Alexa Fluor 488conjugated to phalloidin (actin; green fluorescence), andsubsequently counterstained with DAPI (nuclei; blue fluore-scence). Time points were taken in two-minute intervals over a10 min period using a fluorescence filter combination withbandwidths tuned to excite the three fluorophores simultaneouslywhile also recording the combinedemissionsignals. (a–f) Time¼0,2,4, 6, 8, 10 min, respectively.
fluorophores to illumination or by lowering the excitationenergy. However, these techniques also reduce the mea-surable fluorescence signal. In many cases, solutions offluorophores or cell suspensions can be deoxygenated, butthis is not feasible for living cells and tissues. Perhaps thebest protection against photobleaching is to limit exposureof the fluorochrome to intense illumination (using neutraldensity filters) coupled with the judicious use of commer-cially available antifade reagents that can be added to themounting solution or cell culture medium (153).
Under certain circumstances, the photobleaching effectcan also be utilized to obtain specific information thatwould not otherwise be available. For example, in FRAPexperiments, fluorophores within a target region are inten-tionally bleached with excessive levels of irradiation (82).As new fluorophore molecules diffuse into the bleachedregion of the specimen (recovery), the fluorescence emis-sion intensity is monitored to determine the lateral diffu-sion rates of the target fluorophore. In this manner, thetranslational mobility of fluorescently labeled moleculescan be ascertained within a very small (2–5mm) region of asingle cell or section of living tissue.
Although the subset of fluorophores that are advanta-geous in confocal microscopy is rapidly growing, many ofthe traditional probes that have been useful for years inwidefield applications are still of little utility when con-strained by fixed-wavelength laser spectral lines. Many ofthe limitations surrounding the use of fluorophores excitedin the ultraviolet region will be eliminated with the intro-duction of advanced objectives designed to reduce aberra-tion coupled to the gradual introduction of low cost, highpower diode laser systems with spectral lines in theseshorter wavelengths. The 405 nm blue diode laser is arather cheap alternative to more expensive ion and Noblegas based ultraviolet lasers, and is rapidly becomingavailable for most confocal microscope systems. Helium–neon lasers with spectral lines in the yellow and orangeregion have rendered some fluorophores useful that werepreviously limited to widefield applications. In addition,new diode-pumped solid-state lasers are being introducedwith emission wavelengths in the UV, violet, and blueregions.
Continued advances in fluorophore design, dual-laserscanning, multispectral imaging, endoscopic instruments,and spinning disk applications will also be important in thecoming years. The persistent problem of emission crossoverdue to spectral overlap, which occurs with many syntheticprobes and fluorescent proteins in multicolor investiga-tions, benefits significantly from spectral analysis anddeconvolution of lambda stacks. Combined, these advancesand will dramatically improve the collection and analysis ofdata obtained from complex fluorescence experiments inlive-cell imaging.
BIBLIOGRAPHY
1. Pawley JB, editor. Handbook of Biological Confocal Micro-scopy. New York: Plenum Press; 1995.
2. Paddock SW, editor. Confocal Microscopy: Methods and Pro-tocols. Totowa (NJ): Humana Press; 1999.
3. Diaspro A, editor. Confocal and Two-Photon Microscopy:Foundations, Applications, and Advances. New York:Wiley-Liss; 2002.
4. Matsumoto B, editor. Cell Biological Applications of ConfocalMicroscopy. Methods in Cell Biology, Vol. 70. New York:Academic Press; 2002.
5. Sheppard CJR, Shotton DM. Confocal Laser Scanning Micro-scopy. Oxford (UK): BIOS Scientific Publishers; 1997.
6. Müller M. Introduction to Confocal Fluorescence Microscopy.Maastricht, The Netherlands: Shaker; 2002.
7. Hibbs AR. Confocal Microscopy for Biologists. New York:Kluwer Academic; 2004.
8. Conn PM. Confocal Microscopy. Methods in Enzymology, Vol.307. New York: Academic Press; 1999.
9. Corle TR, Kino GS. Confocal Scanning Optical Microscopy andRelated Imaging Systems. New York: Academic Press; 1996.
10. Wilson T, editor. Confocal Microscopy. New York: AcademicPress; 1990.
11. Gu M. Principles of Three-Dimensional Imaging in ConfocalMicroscopes. New Jersey: World Scientific; 1996.
12. Masters BR, editor. Selected Papers on Confocal Microscopy.SPIE Milestone Series, Vol. MS 131. Bellingham (WA): SPIEOptical Engineering Press; 1996.
13. Mason WT. Fluorescent and Luminescent Probes for Biolo-gical Activity. New York: Academic Press; 1999.
14. Peterman EJG, Sosa H, Moerner WE. Single-Molecule Fluor-escence Spectroscopy and Microscopy of BiomolecularMotors. Ann Rev Phys Chem 2004;55:79–96.
15. Goldman RD, Spector DL. Live Cell Imaging: A LaboratoryManual. New York: Cold Spring Harbor Press; 2005.
16. Minsky M. Microscopy Apparatus. US Patent 3,013,467. 1961.17. Minsky M. Memoir on Inventing the Confocal Scanning
Microscopy. Scanning 1988;10:128–138.18. Egger MD, Petran M. New Reflected-Light Microscope for
Viewing Unstained Brain and Ganglion Cells. Science1967;157:305–307.
19. Davidovits P, Egger MD. Photomicrography of CornealEndothelial Cells in vivo. Nature (London) 1973;244:366–367.
20. Amos WB, White JG. How the Confocal Laser Scanning Micro-scope entered Biological Research. Biol Cell 2003;95:335–342.
21. Brakenhoff GJ, Blom P, Barends P. Confocal Scanning LightMicroscopy with High Aperture Immersion Lenses. J Micros1979;117:219–232.
22. Sheppard CJR, Wilson T. Effect of Spherical Aberration onthe Imaging Properties of Scanning Optical Microscopes.Appl Opt 1979;18:1058.
23. Hamilton DK, Wilson T. Scanning Optical Microscopy byObjective Lens Scanning. J Phys E: Sci Instr 1986;19:52–54.
24. Spring KR, Inoué S. Video Microscopy: The Fundamentals.New York: Plenum Press; 1997.
25. Wilson T. Optical Sectioning in Confocal Fluorescence Micro-scopes. J Micros 1989;154:143–156.
26. Lichtmann JW. Confocal Microscopy. Sci Am Aug. 1994; 40–45.27. White JG, Amos WB, Fordham M. An Evaluation of Confocal
versus Conventional Imaging of Biological Structures byFluorescence Light Microscopy. J Cell Biol 1987;105:41–48.
28. Swedlow JR, et al. Measuring Tubulin Content in Toxo-plasma gondii: A Comparison of Laser-Scanning Confocaland Wide-Field Fluorescence Microscopy. Proc Natl AcadSci USA 2002;99:2014–2019.
29. Stelzer EHK. Practical Limits to Resolution in FluorescenceLight Microscopy. In: Yuste R, Lanni F, Konnerth A, editors.Imaging Neurons: A Laboratory Manual. New York: ColdSpring Harbor Press; 2000. pp 12.1–12.9.
30. Rost FWD. Fluorescence Microscopy. Vol. 1. New York: Cam-bridge University Press; 1992.
474 MICROSCOPY, CONFOCAL

31. Murray J. Confocal Microscopy, Deconvolution, and Struc-tured Illumination Methods. In: Goldman RD, Spector DL,editors. Live Cell Imaging: A Laboratory Manual. New York:Cold Spring Harbor Press; 2005. pp 239–280.
32. Dickinson ME, et al. Multi-Spectral Imaging and LinearUnmixing Add a Whole New Dimension to Laser ScanningFluorescence Microscopy. Biotechniques 2001;31:1272–1278.
33. Zimmermann T, Rietdorf J, Pepperkok R. Spectral Imagingand its Applications in Live Cell Microscopy. FEBS Lett2003;546:87–92.
34. Lansford R, Bearman G, Fraser SE. Resolution of MultipleGreen Fluorescent Protein Variants and Dyes using Two-Photon Microscopy and Imaging Spectroscopy. J Biomed Opt2001;6:311–318.
35. Hiraoka Y, Shimi T, Haraguchi T. Multispectral ImagingFluorescence Microscopy for Living Cells. Cell Struct Funct2002;27:367–374.
36. Gu Y, Di WL, Kelsell DP, Zicha D. Quantitative FluorescenceEnergy Transfer (FRET) Measurement with Acceptor Photo-bleaching and Spectral Unmixing. J Microsc 2004;215:162–173.
37. Ford BK, et al. Computed Tomography-Based Spectral Ima-ging for Fluorescence Microscopy. Biophys J 2001;80:986–993.
38. Bach H, Renn A, Wild UP. Spectral Imaging of Single Mole-cules. Single Mol 2000;1:73–77.
39. Wilson T, Carlini AR. Three-Dimensional Imaging in Con-focal Imaging Systems with Finite Sized Detectors. J Microsc1988;149:51–66.
40. Murphy DB. Fundamentals of Light Microscopy and Electro-nic Imaging. New York: Wiley-Liss; 2001.
41. Wright SJ, Wright DJ. Introduction to Confocal Microscopy.In: Matsumoto B, editor. Cell Biological Applications of Con-focal Microscopy. Methods in Cell Biology, Vol. 70. New York:Academic Press; 2002. pp 1–85.
42. Webb RH. Confocal Optical Microscopy. Rep Prog Phys1996;59:427–471.
43. Wilhelm S, Gröbler B, Gluch M, Hartmut H. Confocal LaserScanning Microscopy: Optical Image Formation and Electro-nic Signal Processing. Jena, Germany: Carl Zeiss AdvancedImaging Microscopy; 2003.
44. Ichihara A, et al. High-Speed Confocal Fluorescence Micro-scopy using a Nipkow Scanner with Microlenses for 3-DImaging of Fluorescent Molecules in Real-Time. Bioimages1996;4:57–62.
45. Inoué S, Inoué T. Direct-View High-Speed Confocal Scan-ner—The CSU-10. In: Matsumoto B, editor. Cell BiologicalApplications of Confocal Microscopy. Methods in Cell Biology,Vol. 70. New York: Academic Press; 2002. p 88–128.
46. Nakano A. Spinning-Disk Confocal Microscopy —A Cutting-Edge Tool for Imaging of Membrane Traffic. Cell Struct Funct2002;27:349–355.
47. Chong FK, et al. Optimization of Spinning Disk ConfocalMicroscopy: Synchronization with the Ultra-SensitiveEMCCD. In: Conchello JA, Cogswell CJ, Wilson T, editors.Three-Dimensional and Multidimensional Microscopy: ImageAcquisition and Processing XI. Proc. SPIE. 2004; 5324: 65–76.
48. Sandison D, Webb W. Background Rejection and Signal-to-Noise Optimization in the Confocal and Alternative Fluor-escence Microscopes. Appl Op 1994;33:603–610.
49. Centonze VE, White JG. Multiphoton Excitation ProvidesOptical Sections from Deeper within Scattering Specimensthan Confocal Imaging. Biophys J 1998;75:2015.
50. Boccacci P, Bertero M. Image-Restoration Methods: Basicsand Algorithms. In: Diaspro A, editor. Confocal and Two-Photon Microscopy: Foundations, Applications, and Advances.New York: Wiley-Liss; 2002. pp 253–269.
51. Verveer PJ, Gemkow MJ, Jovin TM. A Comparison of ImageRestoration Approaches Applied to Three-Dimensional Con-focal and Wide-Field Fluorescence Microscopy. J Micros1998;193:50–61.
52. Conchello JA, Hansen EW. Enhanced 3-D Reconstructionfrom Confocal Scanning Microscope Images. 1: Deterministicand Maximum Likelihood Reconstructions. Appl Op 1990;29:3795–3804.
53. Al-Kofahi O, et al. Algorithms for Accurate 3D Registration ofNeuronal Images Acquired by Confocal Scanning LaserMicroscopy. J Micros 2003;211:8–18.
54. Conchello JA, et al., editors. Three-Dimensional and Multi-dimensional Microscopy: Image Acquisition and Processing.Vol. I–XII, Bellingham (WA): SPIE International Society forOptical Engineering; 1994–2005.
55. Centonze V, Pawley J. Tutorial on Practical Confocal Micro-scopy and use of the Confocal Test Specimen. In: Pawley JB,editor. Handbook of Biological Confocal Microscopy. NewYork: Plenum Press; 1995. p 549–570.
56. Gratton E, vandeVen MJ. Laser Sources for ConfocalMicroscopy. In: Pawley JB, editor. Handbook of BiologicalConfocal Microscopy. New York: Plenum Press; 1995. p 69–98.
57. Ashkin A, Dziedzic JM, Yamane T. Optical Trapping andManipulation of Single Cells using Infrared Laser Beams.London 1987;330:769–771.
58. DeMaggio S. Running and Setting Up a Confocal MicroscopeCore Facility. In: Matsumoto B, editor. Cell Biological Appli-cations of Confocal Microscopy. Methods in Cell Biology, Vol.70. New York: Academic Press; 2002. p 475–486.
59. Spring KR. Detectors for Fluorescence Microscopy. In: Peri-asamy A, editor. Methods in Cellular Imaging. New York:Oxford University Press; 2001. p 40–52.
60. Art J. Photon Detectors for Confocal Microscopy. In: PawleyJB, editor. Handbook of Biological Confocal Microscopy. NewYork: Plenum Press; 1995. p 183–196.
61. Amos WB. Instruments for Fluorescence Imaging. In: AllanVJ, editor. Protein Localization by Fluorescence Microscopy: APractical Approach. New York: Oxford University Press; 2000.pp 67–108.
62. Hergert E. Detectors: Guideposts on the Road to Selection.Photonics Design and Applications Handbook. 2001. ppH110–H113.
63. Piston DW, Patterson GH, Knobel SM. Quantitative Imagingof the Green Fluorescent Protein (GFP). In: Sullivan KF, KaySA, editors. Green Fluorescent Proteins, Methods in CellBiology, Vol. 58. New York: Academic Press; 1999. pp 31–47.
64. Carter DR. Photomultiplier Handbook: Theory, Design,Application. Lancaster (PA): Burle Industries, Inc.; 1980.
65. Cody SH, et al. A Simple Method Allowing DIC Imaging inConjunction with Confocal Microscopy. J Microsc 2005;217:265–274.
66. Chang IC. Acousto-Optic Devices and Applications. In: BassM, Van Stryland EW, Williams DR, Wolfe WL, editors. OpticsII: Fundamentals, Techniques, and Design. New York:McGraw-Hill; 1995. pp 12.1–12.54.
67. Wachman ES. Acousto-Optic Tunable Filters for Microscopy.In: Yuste R, Lanni F, Konnerth A, editors. Imaging Neurons:A Laboratory Manual. New York: Cold Spring Harbor Press;2000. p 4.1–4.8.
68. Shonat RD, et al. Near-Simultaneous Hemoglobin Saturationand Oxygen Tension Maps in Mouse Brain using an AOTFMicroscope. Biophy J 1997;73:1223–1231.
69. Wachman ES, Niu W, Farkas DL. Imaging Acousto-OpticTunable Filter with 0.35-Micrometer Spatial Resolution. AppOpt 1996;35:5220–5226.
70. Wachman ES. AOTF Microscope for Imaging with IncreasedSpeed and Spectral Versatility. Biophys J 1997;73:1215–1222.
MICROSCOPY, CONFOCAL 475

71. Chen Y, Mills JD, Periasamy A. Protein Localization inLiving Cells and tissues using FRET and FLIM. Differentia-tion 2003;71:528–541.
72. Wallrabe H, Periasamy A. Imaging Protein Molecules usingFRET and FLIM Microscopy. Curr Opin Biotech 2005;16: 19–27.
73. Day RN, Periasamy A, Schaufele F. Fluorescence ResonanceEnergy Transfer Microscopy of Localized Protein Interac-tions in the Living Cell Nucleus. Methods 2001;25:4–18.
74. Patterson GH, Lippincott-Schwartz J. A PhotoactivatableGFP for Selective Photolabeling of Proteins and Cells.Science 2002;297:1873–1877.
75. Verkhusha VV, Lukyanov KA. The Molecular Properties andApplications of Anthozoa Fluorescent Proteins and Chromo-proteins. Nature Biotechnol 2004;22:289–296.
76. Ando R, et al. An Optical Marker Based on the UV-InducedGreen-to-Red Photoconversion of a Fluorescent Protein. ProcNatl Acad Sci USA 2002;99:12651–12656.
77. Sharma D. The Use of an AOTF to Achieve High QualitySimultaneous Multiple Label Imaging. Bio-Rad TechnicalNotes. San Francisco: Bio-Rad, Note 4; 2001.
78. Miyawaki A, Sawano A, Kogure T. Lighting up Cells: LabelingProteins with Fluorophores. Nature Cell Biol 2003;5:S1–S7.
79. Zhang J, Campbell RE, Ting AY, Tsien RY. Creating NewFluorescent Probes for Cell Biology. Nature Rev Mol Cell Bio2002;3:906–918.
80. Lippincott-Schwartz J, Patterson G. Development and Use ofFluorescent Protein Markers in Living Cells. Science2003;300:87–91.
81. Klonis N, et al. Fluorescence Photobleaching Analysis for theStudy of Cellular Dynamics. Eur Biophys J 2002;31:36–51.
82. Lippincott-Schwartz J, Altan-Bonnet N, Patterson GH.Photobleaching and Photoactivation: Following ProteinDynamics in Living Cells. Nature Cell Biol 2003;5:S7–S14.
83. Phair RD, Misteli T. Kinetic Modelling Approaches to in vivoImaging. Nature Rev Mol Cell Bio 2002;2:898–907.
84. Politz JC. Use of Caged Fluorophores to Track MacromolecularMovement in Living Cells. Trends Cell Biol 1999;9:284–287.
85. Born M, Wolf E. Principles of Optics. New York: CambridgeUniversity Press; 1999.
86. Stelzer EHK. Contrast, Resolution, Pixelation, Dynamic range,and Signal-to-Noise Ratio: Fundamental Limits to Resolution inFluorescence Light Microscopy. J Microsc 1997;189:15–24.
87. Pawley J. Fundamental Limits in Confocal Microscopy. In:Pawley JB, editor. Handbook of Biological Confocal Micro-scopy. New York: Plenum Press; 1995. p 19–37.
88. Webb RH, Dorey CK. The Pixelated Image. In: Pawley JB,editor. Handbook of Biological Confocal Microscopy. NewYork: Plenum Press; 1995. p 55–67.
89. Jonkman JEN, Stelzer EHK. Resolution and Contrast inConfocal and Two-Photon Microscopy. In: Diaspro A, editor.Confocal and Two-Photon Microscopy: Foundations, Applica-tions, and Advances. New York: Wiley-Liss; 2002. p 101–125.
90. Haugland RP. The Handbook: A Guide to Fluorescent Probesand Labeling Technologies. Chicago: Invitrogen MolecularProbes; 2005.
91. Lemasters JJ, et al. Confocal Imaging of Ca2þ, pH, ElectricalPotential and Membrane Permeability in Single Living Cells.Methods Enzymol 1999;302:341–358.
92. Johnson I. Fluorescent Probes for Living Cells. Histochem J1998;30:123–140.
93. Kasten FH. Introduction to Fluorescent Probes: Properties,History, and Applications. In: Mason WT, editor. Fluorescentand Luminescent Probes for Biological Activity. New York:Academic Press; 1999. p 17–39.
94. Coons AH, Creech HJ, Jones RN, Berliner E. Demonstrationof Pneumococcal Antigen in Tissues by use of FluorescentAntibody. J Immunol 1942;45:159–170.
95. Tsien RY. Building and Breeding Molecules to Spy on Cellsand Tumors. FEBS Lett 2005;579:927–932.
96. Bruchez Jr M, et al. Semiconductor Nanocrystals as fluor-escent Biological Labels. Science 1998;218:2013–2016.
97. Tsien RY, Waggoner A. Fluorophores for Confocal Micro-scopy. In: Pawley JB, editor. Handbook of Biological ConfocalMicroscopy. New York: Plenum Press; 1995. p 267–280.
98. Wessendorf MW, Brelje TC. Which Fluorophore is Brightest?A Comparison of the Staining Obtained Using Fluorescein,Tetramethylrhodamine, Lissamine Rhodamine, Texas Redand Cyanine 3.18. Histochemistry 1992;98:81–85.
99. Entwistle A, Noble M. The use of Lucifer Yellow, BODIPY,FITC, TRITC, RITC and Texas Red for Dual Immunofluor-escence Visualized with a Confocal Scanning Laser Micro-scope. J Microsc 1992;168:219–238.
100. Darzynkiewicz Z. Differential Staining of DNA and RNA inIntact Cells and Isolated Cell Nuclei with Acridine Orange.Methods Cell Biol 1990;33:285–298.
101. Waring MJ. Complex Formation Between Ethidium Bromideand Nucleic Acids. J Mol Biol 1965;13:269–282.
102. Arndt-Jovin DJ, Jovin TM. Fluorescence Labeling and Micro-scopy of DNA. Fluores Microsc Living Cells Culture Part BMethods Cell Biol 1989;30:417–448.
103. Kubista M, Akerman B, Norden B. Characterization of Inter-action between DNA and 40,6-Diamidino-2-phenylindole byOptical Spectroscopy. Biochemistry 1987;26:4545–4553.
104. Loewe H, Urbanietz J. Basic Substituted 2,6-Bisbenzimida-zole Derivatives: A Novel Series of Substances with Che-motherapeutic Activity. Arzneim-Forsch 1974;24:1927–1933.
105. Arndt-Jovin DJ, Jovin TM. Analysis and Sorting of LivingCells According to Deoxyribonucleic Acid Content. J Histo-chem Cytochem 1977;25:585–589.
106. Durand RE, Olive PL. Cytotoxicity, Mutagenicity and DNADamage by Hoechst 33342. J HistochemCytochem 1982; 30:111–116.
107. Panchuk-Voloshina N, et al. Alexa Dyes, A Series of NewFluorescent Dyes that Yield Exceptionally bright, PhotostableConjugates. J Histochem Cytochem 1999;47:1179–1188.
108. Berlier JE, et al. Quantitative Comparison of Long-WavelengthAlexa Fluor Dyes to Cy Dyes: Fluorescence of the Dyes andtheirConjugates.JHistochemCytochem2003;51:1699–1712.
109. Mujumdar RB, et al. Cyanine Dye Labeling Reagents: Sulfoindo-cyanine Succinimidyl Esters. Bioconjugate Chem 1993;4:105–111.
110. Ballou B, et al. Tumor Labeling in vivo using Cyanine-Conjugated Monoclonal Antibodies. Cancer Immunol Immun-other 1995;41:257–263.
111. Zorov DB, Kobrinsky E, Juhaszova M, Sollott SJ. ExaminingIntracellular Organelle Function Using Fluorescent Probes.Circul Res 2004;95:239–252.
112. Stephens DG, Pepperkok R. The Many Ways to Cross the PlasmaMembrane. Proc Natl Acad Sci USA 2001;98:4295–4298.
113. Rudolf R, Mongillo M, Rizzuto R, Pozzan T. Looking Forward toSeeing Calcium. Nature Rev Mol Cell Biol 2003;4:579–586.
114. Martin H, Bell MG, Ellis-Davies GC, Barsotti RJ. ActivationKinetics of Skinned Cardiac Muscle by Laser Photolysis ofNitrophenyl-EGTA. Biophys J 2004;86:978–990.
115. White C, McGeown G. Imaging of Changes in Sarcoplasmic Reti-culum [Ca2þ] using Oregon Green BAPTA 5N and Confocal LaserScanning Microscopy. Cell Calcium 2002;31:151–159.
116. Helm PJ, Patwardhan A, Manders EM. A Study of the Pre-cision of Confocal, Ratiometric, Fura-2-Based [Ca2þ] Mea-surements. Cell Calcium 1997;22:287–298.
117. Rijkers GT, Justement LB, Griffioen AW, Cambier JC.Improved Method for Measuring Intracellular Caþþ withFluo-3. Cytometry 1990;11:923–927.
476 MICROSCOPY, CONFOCAL

118. Schild D, Jung A, Schultens HA. Localization of Calcium Entrythrough Calcium Channels in Olfactory Receptor Neuronsusing a Laser Scanning Microscope and the Calcium IndicatorDyes Fluo-3 and Fura-Red. Cell Calcium 1994;15: 341–348.
119. Willoughby D, Thomas RC, Schwiening CJ. Comparison ofSimultaneous pH Measurements made with 8-Hydroxypyr-ene-1,3,6-trisulphonic acid (HPTS) and pH-Sensitive Micro-electrodes in Snail Neurons. Pflugers Arch 1998;436:615–622.
120. Ozkan P, Mutharasan R. A Rapid Method for MeasuringIntracellular pH using BCECF-AM. Biochim Biophys Acta2002;1572:143.
121. Cody SH, et al. Intracellular pH Mapping with SNARF-1and Confocal Microscopy. I: A Quantitative Technique forLiving Tissue and Isolated Cells. Micron 1993;24:573–580.
122. Dubbin PN, Cody SH, Williams DA. Intracellular pH Mappingwith SNARF-1 and Confocal Microscopy. II: pH Gradientswithin Single Cultured Cells. Micron 1993;24:581–586.
123. Poot M, et al. Analysis of Mitochondrial Morphology andFunction with Novel Fixable Fluorescent Stains. J Histo-chem Cytochem 1996;44:1363–1372.
124. Keij JF, Bell-Prince C, Steinkamp JA. Staining of MitochondrialMembranes with 10-Nonyl Acridine Orange, MitoFluor Green,and MitoTracker Green is Affected by Mitochondrial MembranePotential Altering Drugs. Cytometry 2000;39: 203–210.
125. Reers M. et al. Mitochondrial Membrane Potential Moni-tored by JC-1 Dye. Methods Enzymol 1995;260:406–417.
126. Price OT, Lau C, Zucker RM. Quantitative Fluorescence of 5-FU-Treated Fetal Rat Limbs using Confocal Laser ScanningMicroscopy and LysoTracker Red. Cytometry 2003;53A:9–21.
127. Kumar RK, Chapple CC, Hunter N. Improved DoubleImmunofluorescence for Confocal Laser Scanning Micro-scopy. J Histochem Cytochem 1999;47:1213–1217.
128. Suzuki T, Fujikura K, Higashiyama T, Takata K. DNAStaining for Fluorescence and Laser Confocal Microscopy.J Histochem Cytochem 1997;45:49–53.
129. Haugland RP. Coupling of Monoclonal Antibodies withFluorophores. In: Davis WC, editor. Monoclonal AnibodyProtocols, Methods in Molecular Biology. Vol. 45. Totowa,(NJ): Humana Press; 1995. p 205–221.
130. Pagano RE, Martin OC. Use of Fluorescent Analogs ofCeramide to Study the Golgi Apparatus of Animal Cells.In: Celis JE, editor. Cell Biology: A Laboratory Handbook.Vol. 2, 1998. p 507–512.
131. Cole L, Davies D, Hyde GJ, Ashford AE. ER-Tracker Dye andBODIPY-Brefeldin A Differentiate the Endoplasmic Reticulumand Golgi Bodies from the Tubular-Vacuole System in LivingHyphae of Pisolithus tinctorius. J Microsc 2000;197:239–249.
132. Jaiswal JK, Mattoussi H, Mauro JM, Simon SM. Long-TermMultiple Color Imaging of Live Cells using Quantum DotBioconjugates. Nature Biotechnol 2003;21:47–52.
133. Larson DR, et al. Water Soluble Quantum Dots for MultiphotonFluorescence Imaging in vivo. Science 2003;300: 1434–1436.
134. Watson A, Wu X, Bruchez M. Lighting up Cells with Quan-tum Dots. Biotechniques 2003;34:296–303.
135. Michalet X, et al. Quantum Dots for Live Cells, in vivoImaging, and Diagnostics. Science 2005;307:538–544.
136. Gao X, et al. In vivo Molecular and Cellular Imaging withQuantum Dots. Curr Opin Biotech 2005;16:63–72.
137. Lacoste TD, et al. Ultrahigh-Resolution Multicolor Coloca-lization of Single Fluorescent Probes. Proc Natl Acad SciUSA 2000;97:9461–9466.
138. Tsien RY. The Green Fluorescent Protein. Ann Rev Biochem1998;67:509–544.
139. Sullivan KF, Kay SA, editors. Green Fluorescent Proteins, Meth-ods in Cell Biology. Vol. 58. New York: Academic Press; 1999.
140. Conn PM, editor. Green Fluorescent Protein, Methods inEnzymology. Vol. 302. New York: Academic Press; 1999.
141. Hicks BW, editor. Green Fluorescent Protein, Methods inMolecular Biology. Vol. 183. Totowa (NJ): Humana Press; 2002.
142. Chalfie M, Kain S, editors. Green Fluorescent Protein: Proper-ties, Applications, and Protocols. New York: Wiley-Liss; 1998.
143. Zimmer M. Green Fluorescent Protein: Applications, Struc-ture, and Related Photophysical Behavior. Chem Rev2002;102:759–781.
144. Chalfie M, et al. Green Fluorescent Protein as a Marker forGene Expression. Science 1994;263:802–805.
145. Heim R, Cubitt AB, Tsien RY. Improved Green Fluores-cence. Nature (London) 1995;373:664–665.
146. Heim R, Prasher DC, Tsien RY. Wavelength Mutations andPosttranslational Autoxidation of Green Fluorescent Pro-tein. Proc Natl Acad Sci USA 1994;91:12501–12504.
147. Heim R, Tsien RY. Engineering Green Fluorescent Proteinfor Improved Brightness, Longer Wavelengths, and Fluor-escence Resonance Energy Transfer. Curr Biol 1996;6:178–182.
148. Wachter RM, et al. Structural Basis of Spectral Shifts in theYellow-Emission Variants of Green Fluorescent Protein.Structure 1998;6:1267–1277.
149. Matz MV, et al. Fluorescent Proteins from Nonbiolumines-cent Anthozoa Species. Nature Biotechnol 1999;17:969–973.
150. Matz MV, Lukyanov KA, Lukyanov SA. Family of the GreenFluorescent Protein: Journey to the End of the Rainbow.BioEssays 2002;24:953–959.
151. Natural Animal Coloration can be Determined by a Non-fluorescent Green Fluorescent Protein Homolog. J BiolChem 2000;275:25879–25882.
152. Song L, Hennink EJ, Young IT, Tanke HJ. PhotobleachingKinetics of Fluorescein in Quantitative Fluorescence Micro-scopy. Biophys J 1995;68:2588–2600.
153. Berrios M, Conlon KA, Colflesh DE. Antifading Agents forConfocal Fluorescence Microscopy. Methods Enzymol 1999;307:55–79.
154. Lakowicz JR. Principles of Fluorescence Spectroscopy. NewYork: Kluwer Academic/Plenum Publishers; 1999.
155. Song L, Varma CA, Verhoeven JW, Tanke HJ. Influence ofthe Triplet Excited State on the Photobleaching Kinetics ofFluorescein in Microscopy. Biophys J 1996;70:2959–2968.
156. Herman B. Fluorescence Microscopy. New York: BIOSScientific Publishers; 1998.
157. Bunting JR. A Test of the Singlet Oxygen Mechanism ofCationic Dye Photosensitization of Mitochondrial Damage.Photochem Photobiol 1992;55:81–87.
158. Byers GW, Gross S, Henrichs PM. Direct and SensitizedPhotooxidation of Cyanine Dyes. Photochem Photobiol 1976;23:37–43.
159. Dittrich PS, Schwille P. Photobleaching and Stabilization ofFluorophores used for Single Molecule Analysis with One-and Two-Photon Excitation. Appl Phys B 2001;73:829–837.
160. Gandin E, Lion Y, Van de Vorst A. Quantum Yield of SingletOxygen Production by Xanthene Derivatives. PhotochemPhotobiol 1983;37:271–278.
161. Kanofsky JR, Sima PD. Structural and EnvironmentalRequirements for Quenching of Singlet Oxygen by CyanineDyes. Photochem Photobiol 2000;71:361–368.
Further Reading
Willison JR. Signal Detection and Analysis, In: Bass, M. VanStryland, E. W. Williams DR, Wolfe WL. Optics I: Fundamentals,Techniques, and Design. New York: McGraw-Hill; pp 1995. 18.1–18.16.
See also CELLULAR IMAGING; FLUORESCENCE MEASUREMENTS;ION-SENSITIVE FIELD EFFECT TRANSISTORS.
MICROSCOPY, CONFOCAL 477
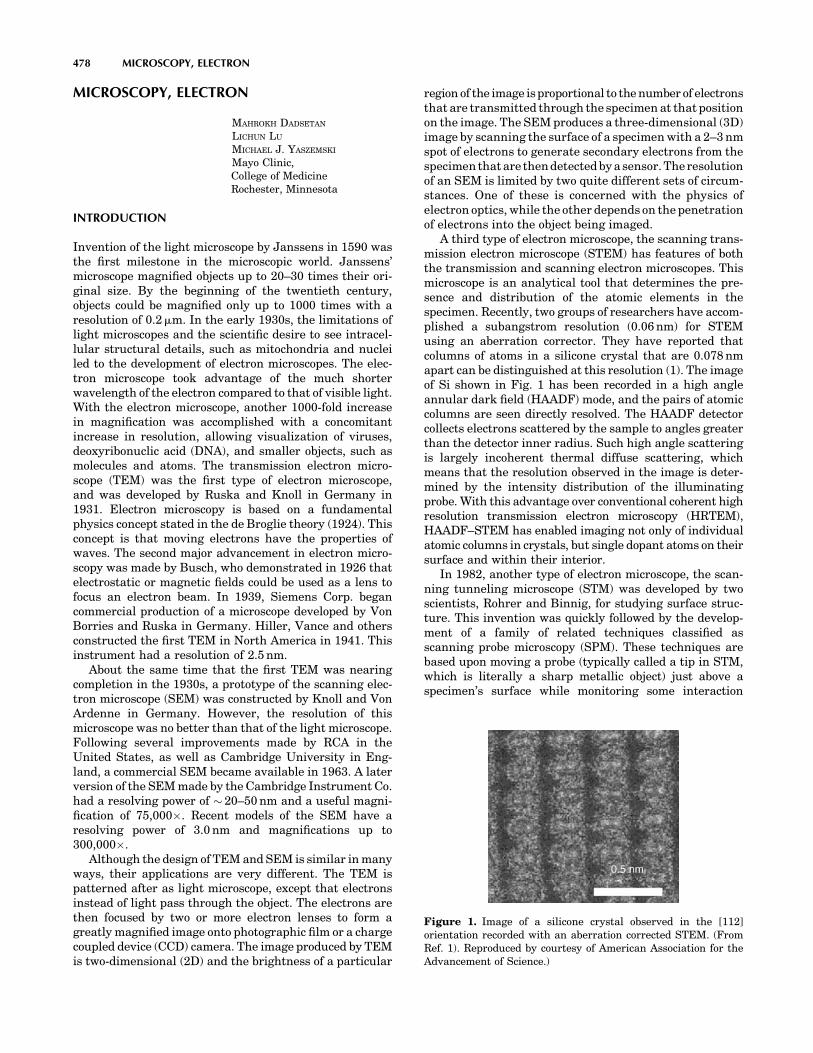
MICROSCOPY, ELECTRON
MAHROKH DADSETAN
LICHUN LU
MICHAEL J. YASZEMSKI
Mayo Clinic,College of MedicineRochester, Minnesota
INTRODUCTION
Invention of the light microscope by Janssens in 1590 wasthe first milestone in the microscopic world. Janssens’microscope magnified objects up to 20–30 times their ori-ginal size. By the beginning of the twentieth century,objects could be magnified only up to 1000 times with aresolution of 0.2mm. In the early 1930s, the limitations oflight microscopes and the scientific desire to see intracel-lular structural details, such as mitochondria and nucleiled to the development of electron microscopes. The elec-tron microscope took advantage of the much shorterwavelength of the electron compared to that of visible light.With the electron microscope, another 1000-fold increasein magnification was accomplished with a concomitantincrease in resolution, allowing visualization of viruses,deoxyribonuclic acid (DNA), and smaller objects, such asmolecules and atoms. The transmission electron micro-scope (TEM) was the first type of electron microscope,and was developed by Ruska and Knoll in Germany in1931. Electron microscopy is based on a fundamentalphysics concept stated in the de Broglie theory (1924). Thisconcept is that moving electrons have the properties ofwaves. The second major advancement in electron micro-scopy was made by Busch, who demonstrated in 1926 thatelectrostatic or magnetic fields could be used as a lens tofocus an electron beam. In 1939, Siemens Corp. begancommercial production of a microscope developed by VonBorries and Ruska in Germany. Hiller, Vance and othersconstructed the first TEM in North America in 1941. Thisinstrument had a resolution of 2.5 nm.
About the same time that the first TEM was nearingcompletion in the 1930s, a prototype of the scanning elec-tron microscope (SEM) was constructed by Knoll and VonArdenne in Germany. However, the resolution of thismicroscope was no better than that of the light microscope.Following several improvements made by RCA in theUnited States, as well as Cambridge University in Eng-land, a commercial SEM became available in 1963. A laterversion of the SEM made by the Cambridge Instrument Co.had a resolving power of � 20–50 nm and a useful magni-fication of 75,000�. Recent models of the SEM have aresolving power of 3.0 nm and magnifications up to300,000�.
Although the design of TEM and SEM is similar in manyways, their applications are very different. The TEM ispatterned after as light microscope, except that electronsinstead of light pass through the object. The electrons arethen focused by two or more electron lenses to form agreatly magnified image onto photographic film or a chargecoupled device (CCD) camera. The image produced by TEMis two-dimensional (2D) and the brightness of a particular
region of the image is proportional to the number of electronsthat are transmitted through the specimen at that positionon the image. The SEM produces a three-dimensional (3D)image by scanning the surface of a specimen with a 2–3 nmspot of electrons to generate secondary electrons from thespecimen that are then detected by a sensor. The resolutionof an SEM is limited by two quite different sets of circum-stances. One of these is concerned with the physics ofelectron optics, while the other depends on the penetrationof electrons into the object being imaged.
A third type of electron microscope, the scanning trans-mission electron microscope (STEM) has features of boththe transmission and scanning electron microscopes. Thismicroscope is an analytical tool that determines the pre-sence and distribution of the atomic elements in thespecimen. Recently, two groups of researchers have accom-plished a subangstrom resolution (0.06 nm) for STEMusing an aberration corrector. They have reported thatcolumns of atoms in a silicone crystal that are 0.078 nmapart can be distinguished at this resolution (1). The imageof Si shown in Fig. 1 has been recorded in a high angleannular dark field (HAADF) mode, and the pairs of atomiccolumns are seen directly resolved. The HAADF detectorcollects electrons scattered by the sample to angles greaterthan the detector inner radius. Such high angle scatteringis largely incoherent thermal diffuse scattering, whichmeans that the resolution observed in the image is deter-mined by the intensity distribution of the illuminatingprobe. With this advantage over conventional coherent highresolution transmission electron microscopy (HRTEM),HAADF–STEM has enabled imaging not only of individualatomic columns in crystals, but single dopant atoms on theirsurface and within their interior.
In 1982, another type of electron microscope, the scan-ning tunneling microscope (STM) was developed by twoscientists, Rohrer and Binnig, for studying surface struc-ture. This invention was quickly followed by the develop-ment of a family of related techniques classified asscanning probe microscopy (SPM). These techniques arebased upon moving a probe (typically called a tip in STM,which is literally a sharp metallic object) just above aspecimen’s surface while monitoring some interaction
478 MICROSCOPY, ELECTRON
Figure 1. Image of a silicone crystal observed in the [112]orientation recorded with an aberration corrected STEM. (FromRef. 1). Reproduced by courtesy of American Association for theAdvancement of Science.)

between the probe and the surface. Atomic force micro-scopy (AFM) is another important technique of this kindbut is not categorized as electron microscopy. Bennig andRohrer were awarded one-half of the 1986 Nobel Prize inphysics for invention of the STM, while Ernst Ruska wasawarded the other one-half of that same Nobel Prize for his1931 invention of the electron microscope. In STM, elec-trons are speeded up in a vacuum until their wavelength isextremely short, only one hundred-thousandth that ofwhite light. Beams of these fast-moving electrons arefocused on a cell sample and are absorbed or scatteredby the cell’s parts so as to form an image on an electron-sensitive photographic plate. The STM is widely used inboth industrial and academic research to obtain atomicscale images of metal surfaces. It provides a 3D profile ofthe surface, which is useful in characterizing surfaceroughness and determining the size and conformation ofsurface molecules. (2) Invention of electron microscopy hadan enormous impact in the field of biology, specifically incell and tissue analysis. Almost 15 years after the inventionof the first electron microscope by Ruska, many efforts weremade to apply this technique to biological problems. Usingthe electron microscope, cell organelles and cell inclusionswere discovered or resolved in finer details. Electron micro-scopy, specifically TEM, is now among the most importanttools in cell biology and diagnostic pathology.
The latest advancement in electron microscopy is 3Dreconstruction of cellular components at a resolution thatis on the order of magnitude of atomic structures defined byX-ray crystallography. The method for reconstruction of 3Dimages of single, transparent objects recorded by TEM iscalled electron tomography (ET). In order to generate 3Dimages of individual molecules, one needs to obtain asmany tilt images as possible, covering the widest possibleangular range. The representative images of particlesobtained from different orientations is then analyzedand combined by a software program to reconstruct themolecule in 3D. With improvements in instrumentation,data collection methods and techniques for computation,ET may become a preferred method for imaging isolatedorganelles and small cells. So far, the electron tomographymethod covers the resolution range of 2.5–5.0 nm. Dataobtained via electron tomography furnish a rich source ofquantitative information about the structural compositionand organization of cellular components. It offers theopportunity to obtain 3D information on structural cellulararrangements with a significantly higher resolution thanthat provided by any other method currently available(e.g., confocal laser microscopy) (3).
THEORY OF ELECTRON MICROSCOPY
According to electromagnetic theory, a light source initi-ates a vibrational motion that transmits energy in thedirection of propagation. The wave motion of light is ana-logous to that produced by a stone thrown into a pool ofwater. When the waves generated from throwing a stonestrike an object that has an opening or aperture, anotherseries of waves is generated from the edge of the object. Theresult is a new source of waves that emerges with the
original waves. This bending or spreading phenomenonis known as diffraction. Diffracted waves interfere with theinitial waves, and the result is an image of the edge of theobject. The edge appears to have a series of bands or fringescalled Fresnel fringes running parallel to the edge (Fig. 2).Thus, if a strong beam of light illuminates a pinhole in ascreen and thus a pinhole serves as a point source and thelight passing through is focused by an apertured ‘‘perfect’’lens on a second screen, the image obtained is not apinpoint of light, but rather a bright central disk sur-rounded by a diffuse ring of light. Even if monochromaticlight was used to illuminate the point source and was topass through a perfect lens, the image will not be a sharpone, but rather a diffuse disk composed of concentric rings.This type of image is known as an Airy disk after Sir GeorgeAiry, who first described this pattern during the nine-teenth century (Fig. 3) (4). To determine resolving power(RP), it is important to know the radius of the Airy disk.The radius of the Airy disk as measured to the first darkring (r) is expressed by following equation:
r ¼ 0:612l
nðsinaÞ ð1Þ
In Eq. 1, l¼wavelength of illumination; n¼ refractiveindex of the medium between the point source and the lens,relative to free space; a¼half the angle of the cone of lightfrom the specimen plane accepted by the front lens ofobjective
MICROSCOPY, ELECTRON 479
Lightfrom
distantsource
Pinholeaperture
Circularlimiting aperture
Biconcavelens
Viewingscreen
Figure 2. Diffraction of light waves.
Figure 3. Airy disks generated by viewing three pinholes in alight microscope. Magnification of micrograph is 1000�. (FromRef. 4. Reproduced by courtesy of Jones and Bartlett Publishers.)
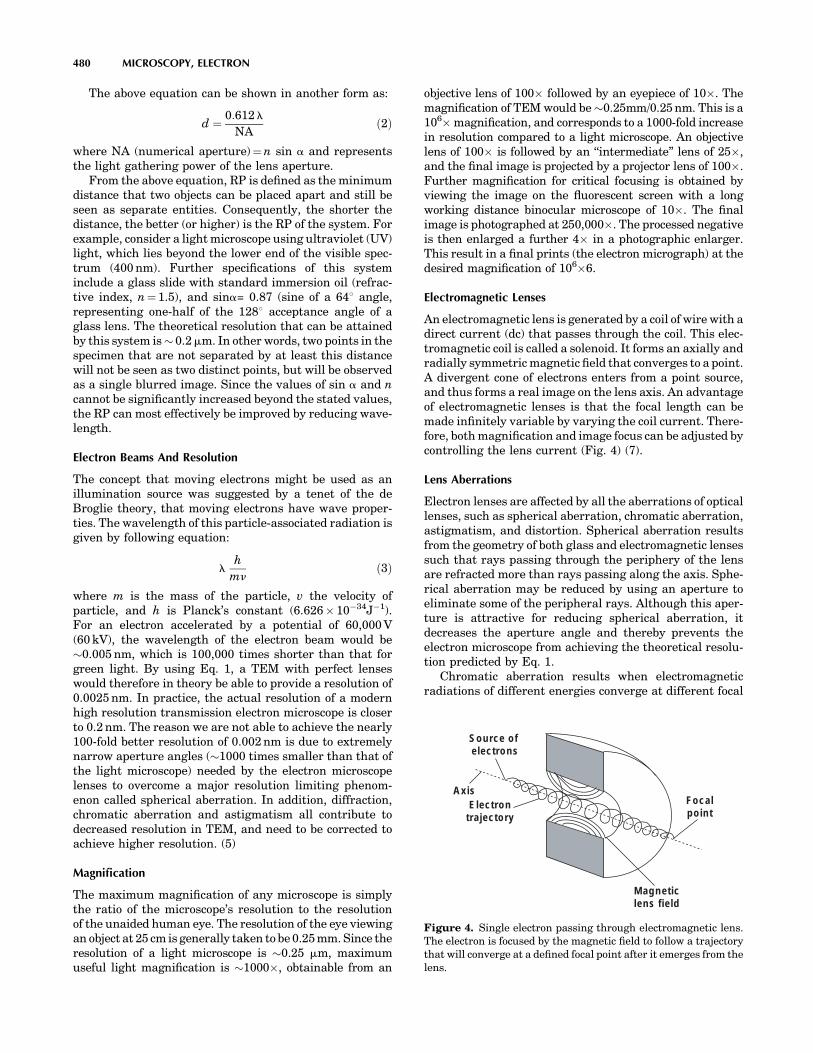
The above equation can be shown in another form as:
d ¼ 0:612 l
NAð2Þ
where NA (numerical aperture)¼n sin a and representsthe light gathering power of the lens aperture.
From the above equation, RP is defined as the minimumdistance that two objects can be placed apart and still beseen as separate entities. Consequently, the shorter thedistance, the better (or higher) is the RP of the system. Forexample, consider a light microscope using ultraviolet (UV)light, which lies beyond the lower end of the visible spec-trum (400 nm). Further specifications of this systeminclude a glass slide with standard immersion oil (refrac-tive index, n¼ 1.5), and sina= 0.87 (sine of a 648 angle,representing one-half of the 1288 acceptance angle of aglass lens. The theoretical resolution that can be attainedby this system is � 0.2mm. In other words, two points in thespecimen that are not separated by at least this distancewill not be seen as two distinct points, but will be observedas a single blurred image. Since the values of sin a and ncannot be significantly increased beyond the stated values,the RP can most effectively be improved by reducing wave-length.
Electron Beams And Resolution
The concept that moving electrons might be used as anillumination source was suggested by a tenet of the deBroglie theory, that moving electrons have wave proper-ties. The wavelength of this particle-associated radiation isgiven by following equation:
lh
mnð3Þ
where m is the mass of the particle, v the velocity ofparticle, and h is Planck’s constant (6.626� 10�34J�1).For an electron accelerated by a potential of 60,000 V(60 kV), the wavelength of the electron beam would be�0.005 nm, which is 100,000 times shorter than that forgreen light. By using Eq. 1, a TEM with perfect lenseswould therefore in theory be able to provide a resolution of0.0025 nm. In practice, the actual resolution of a modernhigh resolution transmission electron microscope is closerto 0.2 nm. The reason we are not able to achieve the nearly100-fold better resolution of 0.002 nm is due to extremelynarrow aperture angles (�1000 times smaller than that ofthe light microscope) needed by the electron microscopelenses to overcome a major resolution limiting phenom-enon called spherical aberration. In addition, diffraction,chromatic aberration and astigmatism all contribute todecreased resolution in TEM, and need to be corrected toachieve higher resolution. (5)
Magnification
The maximum magnification of any microscope is simplythe ratio of the microscope’s resolution to the resolutionof the unaided human eye. The resolution of the eye viewingan object at 25 cm is generally taken to be 0.25 mm. Since theresolution of a light microscope is �0.25 mm, maximumuseful light magnification is �1000�, obtainable from an
objective lens of 100� followed by an eyepiece of 10�. Themagnification of TEM would be �0.25mm/0.25 nm. This is a106� magnification, and corresponds to a 1000-fold increasein resolution compared to a light microscope. An objectivelens of 100� is followed by an ‘‘intermediate’’ lens of 25�,and the final image is projected by a projector lens of 100�.Further magnification for critical focusing is obtained byviewing the image on the fluorescent screen with a longworking distance binocular microscope of 10�. The finalimage is photographed at 250,000�. The processed negativeis then enlarged a further 4� in a photographic enlarger.This result in a final prints (the electron micrograph) at thedesired magnification of 106�6.
Electromagnetic Lenses
An electromagnetic lens is generated by a coil of wire with adirect current (dc) that passes through the coil. This elec-tromagnetic coil is called a solenoid. It forms an axially andradially symmetric magnetic field that converges to a point.A divergent cone of electrons enters from a point source,and thus forms a real image on the lens axis. An advantageof electromagnetic lenses is that the focal length can bemade infinitely variable by varying the coil current. There-fore, both magnification and image focus can be adjusted bycontrolling the lens current (Fig. 4) (7).
Lens Aberrations
Electron lenses are affected by all the aberrations of opticallenses, such as spherical aberration, chromatic aberration,astigmatism, and distortion. Spherical aberration resultsfrom the geometry of both glass and electromagnetic lensessuch that rays passing through the periphery of the lensare refracted more than rays passing along the axis. Sphe-rical aberration may be reduced by using an aperture toeliminate some of the peripheral rays. Although this aper-ture is attractive for reducing spherical aberration, itdecreases the aperture angle and thereby prevents theelectron microscope from achieving the theoretical resolu-tion predicted by Eq. 1.
Chromatic aberration results when electromagneticradiations of different energies converge at different focal
480 MICROSCOPY, ELECTRON
Source of electrons
AxisElectrontrajectory
Magneticlens field
Focalpoint
Figure 4. Single electron passing through electromagnetic lens.The electron is focused by the magnetic field to follow a trajectorythat will converge at a defined focal point after it emerges from thelens.
planes. Chromatic aberration results in the enlargement ofa focal point with a consequential loss of resolution. It canbe corrected by using a monochromatic source of electro-magnetic radiation. This entails stabilizing the accelerat-ing voltage to generate the electrons with same levels ofenergy, and having a good vacuum to minimize the energyloss of the electrons during their passage through thetransmission specimen. This effect can also be reducedby decreasing the aperture of the objective lens. (6)
Astigmatism is caused by radial asymmetry in a lens,giving rise to a focal length in one plane that is differentfrom that in another plane. The fabrication and mainte-nance of a lens that has a perfectly symmetric lens field isnot feasible in practice. Thus, it is necessary to correctastigmatism by applying a radial symmetry compensatordevice called a stigmator. This consists of an adjustableelectric or magnetic field that can be applied across the lensin any chosen direction, thus compensating for astigma-tism. Image distortion, due to magnification changingacross the field from the value at the center, may bepositive (called barrel distortion) or negative (called pin-cushion distortion). These effects can be compensated byoperating two lenses in series, arranging for barrel distor-tion in one to be compensated by pincushion distortion in theother. The lens system in modern electron microscopes isdesigned to automatically counterbalance the various typesof distortions throughout a wide magnification range. (4)
DESIGN OF THE TRANSMISSION ELECTRECTRONMICROSCOPE
Both the light and electron microscopes are similar so faras the arrangement and function of their components areconcerned. Thus, both microscopes, when used for photo-graphic purposes, can be conveniently divided into thefollowing component systems.
Illuminating System
This system serves to produce the required radiation and todirect it onto the specimen. It consists of source and con-denser lenses.
Source Lens. The source of electrons, or cathode, is ahairpin of fine tungsten wire about 2 mm long, maintainedat �2500 K by �2 W of alternting current (ac) or dc power.Electrons boil off the white-hot tungsten surface, and areshaped into a conical beam by an electrode system calledthe gun. Two further electrodes, the shield and the anode,combine to form an electrostatic collimating lens and accel-erator. A suitable accelerating voltage (20–100 kV) is cho-sen for the specimen under examination, and is applied tothe cathode as a negative potential so that the anode mayremain at earth potential. The cathode and shield aretherefore carried on an insulator. The filament-shield vol-tage (cathode bias) is made variable to adjust the totalcurrent drawn from the filament, which in turn varies thebrightness of the final image (4).
The energy of the electrons in the TEM determines therelative degree of penetration of electrons into a specificsample, or alternatively, influences the thickness of mate-
rial from which useful information may be obtained. Thus,a high energy TEM (400 kV) not only provides the highestresolution but also allows for the observation of relativelythick samples (e.g., �0.2mm) when compared with themore conventional 100 kV or 200 kV instruments. Becauseof the high spatial resolution obtained, TEMs are oftenemployed to determine the detailed crystallography of fine-grained, or rare, materials (6,8).
Condenser Lens. The condenser lens regulates theconvergence (and thus the intensity) of the illuminatingbeam on the specimen. The divergent electron beam emer-ging from the anode aperture can, in simple instruments,be used to illuminate the specimen directly. However,sufficient image brightness for high magnification is diffi-cult to obtain. As in the light microscope, a condensersystem is almost invariably interposed between the gunand specimen to concentrate the beam on the region of thespecimen under examination. A single condenser lens suf-fices for electronoptical work up to 50,000�. However, forhigh resolution work a double condenser system is alwaysused, which will concentrate the beam into an area as smallas 1m diameter.
Specimen Manipulation System
The pierced metal grid carrying the specimen proper isclamped at its periphery to a suitable holder designed toconduct heat rapidly away. The specimen temperature in aTEM may rise to 200 8C. The holder, including its attachedspecimen grid is introduced into the evacuated specimenchamber through an airlock by means of an insertion tool.This tool is then generally withdrawn after the holder hasbeen placed on the translation stage. The holder is thenfree to move with the stage, which is driven from outsidethe column through airlocks, by means of levers and micro-meter screws. Two mutually perpendicular stage move-ments, each of about �1 mm, allow any part of the gridarea to be brought to the microscope axis and viewed at thehighest magnification. Most instruments provide a scanmagnification so that the whole grid area may be viewed at�100�. Suitable specimen areas are then chosen, andcentered for study at higher magnifications.
Imaging System
This part of the microscope includes the objective, inter-mediate, and projector lenses. It is involved in the genera-tion of the image and the magnification and projection ofthe final image onto a viewing screen or camera system.Electrons transmitted by the specimen enter the objectivelens. Those passing through the physical aperture areimaged at �100� in the intermediate lens object plane,10–20 cm below the specimen. The position of this primaryimage plane is controlled by the objective lens current(focus control). A second image, which may be magnifiedor diminished, is formed by the intermediate lens, thecurrent through which controls overall magnification(magnification control). This secondary image, formed inthe objective plane of the projector lens, is then furthermagnified, and the overall magnification is determined bythe position of the fluorescent screen or film.
MICROSCOPY, ELECTRON 481

Image Recording System
The final image is projected onto a viewing screen coatedwith a phosphorescent zinc-activated cadmium sulfidepowder. This powder is attached to the screen with abinder, such as cellulose nitrate. Most electron microscopesprovide for an inclination of the viewing screen so that theimage may be conveniently examined either with the unaidedeye or through a stereomicroscope (the binoculars). Althoughthe stereomicroscope image may appear to be rough due tothe 100mm sized phosphorescent particles that make up thescreen, it is necessary to view a magnified image in order tofocus accurately. Some microscopes may provide a second,smaller screen that is brought into position for focusing. Inthis case, the main screen remains horizontal, except duringexposure of the film. All viewing screens will have areasmarked to indicate where to position the image so that it willbe properly situated on the film. Preevacuated films areplaced into an air lock (camera chamber) under the viewingscreen and the chamber evacuated to high vacuum. Thechamber is then opened to the column to permit exposureof the film. In modern electron microscopes (Fig. 5), exposureis controlled by an electrically operated shutter placed belowthe projector lens. As one begins to raise the viewing screen,the shutter blocks the beam until the screen is in the appro-priate position for exposure. The shutter is then opened forthe proper interval, after which the beam is again blockeduntil the screen is repositioned.
DESIGN OF THE SCANNING ELECTRON MICROSCOPE
The SEM is made up of two basic systems, and the speci-men is at their boundary. The first system is the electronoptical column that provides the beam of illumination thatis directed to the specimen. The second system consists ofthe electron collection, signal amplification, and imagedisplay units, which converts the electrons emitted fromthe specimen into a visible image of the specimen.
Electron Optical Column
The electron gun and electron lenses are present in theelectron optical column of the SEM in an analogous fashionto their presence in the TEM.
1. Electron Gun: The electron source is most commonlythe hairpin tungsten filament located in a triodeelectron gun. The electrons are emitted by the fila-ment (also called the cathode), and accelerated by afield produced by the anode. The anode is usually at apositive potential on the order of 15 kV with respectto the cathode. A third electrode, the shield, liesbetween the anode and cathode and is negative withrespect to the cathode. After leaving the bias shieldand forming an initial focused spot of electrons of� 50 mm in diameter, a series of two to three con-denser lenses are used to successively demagnify thisspot sometimes down to � 2 nm. These small spotsizes are essential for the resolutions required athigh magnifications. A heated tungsten filament isthe conventional electron source for most SEMs;other special sources are lanthanum hexaboride(LaB6) and the field emission guns (FEG). Both ofthese latter sources produce bright beams of smalldiameter and have much longer lifetimes thanheated tungsten filaments. Schottky emission haslargely replaced earlier source technologies basedon either tungsten and LaB6 emission or cold-fieldemission in today’s focused electron beam equipmentincluding SEM, TEM, Auger systems, and semicon-ductor inspection tools. Schottky and cold-field emis-sion are superior to thermionic sources in terms ofsource size, brightness and lifetime. Both are up to1000 times smaller and up to 100 times brighter thanthermionic emitters.
2. Electron Lenses: Most SEMs have three magneticlenses in their column: the first, second, and finalcondenser lenses. The first condenser lens begins thedemagnification of the 50mm focused spot of elec-trons formed in the region of the electron gun. As theamount of current running through the first conden-ser lens is increased, the focal length of the lensbecomes progressively shorter and the focused spotof electrons becomes smaller. In our earlier discus-sion of electron lenses, it was noted that focusingtakes place by varying the focal length. This isaccomplished by changing the intensity of the lenscoil current, which in turn alters the intensity of themagnetic field that is generated by the lens. As thelens current increases, the lens strength increases
482 MICROSCOPY, ELECTRON
Figure 5. Image of a 300 kV TEM (FEI-Tecnai G2 Polara) forcryoapplications at liquid nitrogen and liquid helium temperatures.(Reproduced by courtesy of FEI Company.)

and the focal length decreases. A short focal lengthlens consequently causes such a wide divergence ofthe electrons leaving the lens that many electrons arenot able to enter the next condenser lens. The overalleffect of increasing the strength of first condenserlens is to decrease the spot size, but with a loss ofelectrons. An aperture is positioned in the lenses todecrease the spot size and reduce spherical aberra-tion by excluding the more peripheral electrons. Eachof the condenser lenses behaves in a similar mannerand possesses apertures.
In designing the final condenser lens, several per-formance characteristics must be considered:
(a) Aberrations. Since the intermediate images of thecrossover produced by the condenser lenses havesignificantly larger diameters than the final spotsize, the effect of aberrations on these lenses arerelatively small. It is thus the effects of sphericaland chromatic aberration as well as the astigma-tism of the final condenser lens that are critical inthe design and performance of the objective lensof SEM.
(b) Magnetic Field. As a result of electron bombard-ment, secondary electrons in the SEM areemitted over a wide solid angle. These have ener-gies of only few electron volts, yet they must beable to reach the detector to produce the neces-sary signal. As a result, the magnetic field at thespecimen must be designed so that it will notrestrict effective secondary electron collection.
(c) Focal Length. The extent of lens aberrations isdependent upon the focal length. Thus, it is desir-able to keep the latter as short as possible in orderto help minimize the effects of aberrations.
The final lens usually has externally adjustableapertures. Normally, final apertures on the orderof 50–70mm are used to generate smaller, less elec-tron dense spots for secondary electron generationand imaging. Larger apertures, for example, 200mm,are used to generate larger spots with greater num-bers of electrons. These large spots contain a greatdeal of energy and may damage fragile specimens.They are used primarily to generate X rays for ele-mental analysis rather than for imaging purposes.
Specimen Manipulation System
The specimen is normally secured to a metal stub and isgrounded to prevent the build up of static high voltagecharges when the beam electrons strike the specimen.In order to orient the specimen precisely, relative to theelectron beam and electron detectors, all SEMs have con-trols for rotating and traversing the specimen in x, y, andz directions. It is also possible to tilt the specimen in orderto enhance the collection of electrons by a particulardetector. These movements have a large effect on magni-fication, contrast, resolution and depth of field. Someimprovement can be made in imaging by reorientationof the specimen.
Interaction Of Electron Beam With Specimen
Three basic possibilities exist as to the nature of the beam–specimen interaction used to generate the image:
1. Some primary electrons, depending on the accelerat-ing voltage, penetrate the solid to depths as much as10mm. The electrons scatter randomly throughoutthe specimen until their energy is dissipated byinteraction with atoms of the specimen.
2. Some primary electrons collide with or pass close tothe nucleus of an atom of the specimen such thatthere is a change in the electron’s momentum. Thisresults in electron scatter through a large angle andelectron reflection from the specimen. Such elasti-cally reflected primary electrons are known as back-scattered electrons.
3. Some primary electrons interact with the host atomsso that as a result of collisions, a cascade of secondaryelectrons is formed along the penetration path. Sec-ondary electrons have energy ranges of 0–50 eV andare the electrons most commonly used to generatethe 3D image. The mean path length of secondaryelectrons in many materials is �1 nm. Thus,although electrons are generated throughout theregion excited by the incident beam, only those elec-trons that originate <1 nm deep in the sample escapeto be detected as secondary. The shallow depth ofproduction of detected secondary electrons makesthem very sensitive to topography.
In addition to producing backscattered and secondaryelectrons, specimen–beam interactions also producephotons, specimen currents, Auger electrons and X raysthat are characteristic of the probed specimen. Theseemanations can be detected by X ray or electron spectro-scopy for elemental analysis of the specimen surface. How-ever, it is rarely used for biological specimens.
Signal Versus Noise
The signals generated as a result of the electron beamstriking a specimen are used to convey different types ofinformation about the specimen. In the usual SEM imagingmode, signals consist of the secondary electrons generatedfrom the spot struck by the electron beam and noise con-sists of secondary electrons originating at locations awayfrom where the beam struck the specimen. The imagequality is eventually expressed by the signal-to-noise(S/N) ratio. In a poor quality image the signal to noiseratio is low. One may achieve a better image by eitherreducing the noise or raising the signal. Since it is moredifficult to reduce the noise level, the signal is usuallyraised by increasing the electron emissions from thegun. Several methods to accomplish increased electronemissions include: altering the bias settings, decreasingthe distance between the anode and the filament, decreas-ing the distance between the filament and the shieldaperture, and using either a lanthanum hexaboride fila-ment or a cold-field emissions gun. A second method toincrease the signal is to use slower scan rates on the
MICROSCOPY, ELECTRON 483
specimen. Longer dwell times of the beam on the specimenwill generate more secondary electrons from the spot wherethe beam strikes the specimen. This increase in current,however, carries with it an increased risk of damage tosensitive specimens (9).
Secondary Electron Detection
To collect the secondary electrons, a suitable electrode isheld at a positive potential and serves to attract them andproduce an emission current. The strength of this signal isproportional to the number of electrons striking the col-lector. This signal is used, after amplification; to modulatethe intensity of the cathode-ray tube (CRT) beam as itmoves across the tube face, synchronously with the path ofthe electron probe across the specimen surface.
Typically, the secondary electron collector is based onthe original 1960 scintillator-photomultiplier design ofEverhart and Thoronley. In this system, the secondaryelectrons are accelerated towards the scintillator by apotential difference of a few hundred to a few thousandsvolts. Upon hitting the scintillator, each electron producesmany photons that are guided by the light pipe to thephotomultiplier. Each photoelectron triggers a release oftwo or more secondary electrons at the first electrode(dynode) and process cascades, yielding from 100,000 to50 million additional electrons. Thus, the photomultiplierreconverts the light to an electron current and provides ahigh degree of amplification that can be controlled byvariation of the voltage applied to the dynodes (8).
Image Recording System
The final magnified image in the SEM is formed on a CRTor monitor. Unlike TEM, in which the electrons interactdirectly with the photographic medium, SEM images aremost often photographed directly from the monitor throughthe lens of either a 35 mm roll film camera or a larger4 in.�5 in. (10.6 cm� 12.7 cm) sheet film camera. The cam-era shutter remains open as the electron beam slowly scansacross the specimen. A valuable addition to most SEMs isthe automatic data display that permits the generation ofinformational data on the viewing and recording monitors.With this accessory, experiment numbers, dates, acceler-ating voltages and magnifications may be displayed.
DIAGOSTIC ELECTRON MICROSCOPY
Electron microscopy excels as a diagnostic tool withrespect to the detection and identification of both abnor-mal tissue anatomy and the pathogens responsible for thedisease. The value of electron microscopy in difficult diag-nostic situations has been demonstrated repeatedly, par-ticularly when there is close coordination between thepathologist and the attending clinician. Ultrastructuralstudy may be applied to a variety of substances includingbiological materials. By examination of specially preparedtissue sections, changes not perceived by light microscopycan be identified, leading to improved diagnostic interpreta-tions. For example, in certain kidney diseases, such asnephrotic syndrome and Nil disease, the correct diagnosiscan be made only by these means, and this in turn affects the
selection of therapy. Similarly, certain neoplasms can beidentified definitively only through ultrstructural studies,with obvious implications for treatment and prognosis.Another area of growing importance is the identification ofviral particles in biological material. In some instances,ultrastructural study is the only way to establish the pre-sence of a viral infection, and in other instances a diagnosismay be made earlier than by serological methods. The costsof diagnostic electron microscopy are relatively small in lightof the benefits to patient care. The following are exampleshighlighting the use of electron microscopy in the diagnosisof certain diseases.
Neoplasms
Many neoplasms appear undifferentiated by light micro-scopy, but most show differentiation along one cell line oranother at the ultrastructural level. However, it is note-worthy that not all of the ultrastructureal criteria for iden-tifying the cell type may be present in every neoplasm. Asexpected, the more differentiated the neoplasm, the morelikely will its cells contain a broad complement of diagnosticmorphologic features. Usually, the ultrastructural findingsdo allow the pathologist to make a definitive diagnosis wheninterpreted in conjunction with the light microscopic pic-ture, and in some cases with the histochemical and immu-nohistochemical results. The example that follows willhighlight the use of diagnostic electron microscopy in theidentification of carcinomas. Various types of carcinomashave a number of distinguishing features, but one commoncharacteristic of all carcinomas is the presence of intracel-lular junctions, usually desmosomes and/or intermediatejunctions. The presence of lumens, microvilli, tight junc-tions, junctional complexes, basal lamina, secretory gran-ules, prominent Golgi apparatus, and moderatelyprominent rough endoplasmic reticulum are all suggestiveof adenocarcinoma in the differential diagnosis of a neo-plasm (10). Figure 6 shows a pancreatic carcinoma, whichmay arise from acinar cells, centrocinar cells, intercalatedduct cells, interlobular duct cells, interlobular duct cells andmain pancreatic duct cells. Adenocarcinomas arising frommain and interlobular ducts (mucinous cystadenocarcino-mas) have cells similar to those of bile ducts and intestinalepithelium; that is, the cytoplasm contains mucin granules,and the free surface has microvilli filled with thin filamentsthat anchor into the subjacent cytoplasm (11–13).
Infectious Diseases
Bacteria. Diagnostic criteria for bacterial rods and cocciare (1) the presence of an outer-cell wall, (2) the presenceflagella or pili (fimbria) on the outer surface of the cell, (3)the presence of an inner-cell membrane, (4) a centralnuclear region (nucleoid), without a limiting membrane,(5) dense cytoplasm composed mostly of ribosomes, and (6)a varying number of vesicles formed from the inner-cellmembrane (mesosomes), storage vacuoles and endospores(14). Figure 7 shows the bacteria in Whipple disease. Therods are present both free and within macrophages.
Viruses. The distinct morphology of members of differ-ent viral families usually allows an agent to be assigned to
484 MICROSCOPY, ELECTRON

a particular family. This morpho-diagnosis, combined withclinical information is often sufficient to permit a provi-sional diagnosis and to initiate treatment and containmentprotocols while waiting for other test results. Diagnosticcriteria that apply to viruses in general are (1) the presenceof intracellular and/or extracellular elliptical, stand-like,round or polygonal structures measuring 20–300 nm indiameter; and (2) the identification of viral morphology,consisting of a central, electron dense core (DNA-containingnucleoid) and an outer shell (capsid), which may have morethan one layer (Fig. 8) (15).
Fungi. The electron microscopic diagnostic criteria forfungi include the identification of mononucleated ovalyeast forms measuring 2–4 mm in diameter, with a thincell wall and no true capsule. These can be located eitherextracellularly or intracellularly (16). A representativefungus, Histoplasma capsulatum, is shown in Fig. 9. Theorganisms have a clear halo between their visible cyto-plasm and their thin cell wall.
Skeletal Muscle Diseases
The skeletal muscle responses to injury that are visiblewith the electron microscope can be categorized as follows:(1) alterations in the sarcolemma (e.g., discontinuities of
the plasma membrane or the basement membrane); (2)alterations in myofilaments; (3) Z-band alterations (e.g.,streaming and nemaline bodies); (4) nuclear changes (e.g.,abnormal location of the nucleus within the muscle fiberand nuclear inclusions); (5) abnormalities of the sarcoplas-mic reticulum and the T-system (e.g., tubular aggregates),(6) abnormal accumulations of metabolites (e.g., glycogenand lipids); (7) abnormal cytoplasmic structures (e.g.,vacuoles, cytoplasmic bodies, concentric laminated bodies,fingerprint bodies, curvilinear bodies). In general, many ofthese ultrastructural abnormalities are not specific for asingle disease. Electron microscopy can be a valuableadjunct to help the pathologist arrive at the proper inter-pretation of a muscle biopsy when taken together with allother available clinical, electrophysiologic, and histopatho-logical data. In addition to the pathologic changes thatmight involve the muscle fibers themselves, many diseasesof muscle also simultaneously affect adjoining connectivetissue components, blood vessels and intramuscularnerves. It is therefore important to pay particular attentionto these structures when examining muscle with the lightand electron microscope (10). The light micrograph shownin Fig. 10 demonstrates centrally placed nuclei in themajority of the muscle fibers. The central nuclei oftenare surrounded by a clear area that is devoid of adenosinetriphosphatase (ATPase) activity. Ultrastructural featuresof the paranuclear clear zone in Fig. 11 include (1) the
MICROSCOPY, ELECTRON 485
Figure 6. Ductal, mucinous cystadenocarcinoma (pancreas). Inthis field, the neoplastic cells form a cystic lumen (L) lined byinnumerable microvilli. An intracytoplasmic lumen (IL), withoutjunctional com- plexes, is present in one cell. Some of the cellslining the lumen have a rich collection of mucinous granules (M)in their apical cytoplasm. Lateral cell borders show a switch-backingpattern of interdigitation (arrows). (6800�) (From Ref. 10.Reproduced by courtesy of Springer-Verlag GmbH.)
Figure 7. Whippl’s disease. The lamina propria of the jejunalmucosa contained numerous Whipple’s type macrophages [M¼macrophage nucleus) and bacteria rods (B)]. Most of the intactbacilli are extracellular, whereas those in the macrophage arein various stages of degeneration, including the end-stage ofserpiginous membrane (�). (16,500 �) (From Ref. 10. Reproducedby courtesy of Springer-Verlag GmbH.)

absence of myofilaments, (2) numerous mitochondria, (3)glycogen accumulation. In some patients, especiallyinfants, the central clear zone may be more evident thanthe nuclei within that zone when examining the tissue incross-section (10).
Peripheral Nerve Diseases
Wallerian Degeneration. Ultrastructural changesdetected in peripheral nerve specimens include either thegeneral pathologic responses of the peripheral nerve toeither the injury or the specific disease entity that afflictsthe patient. The general pathologic processes involvingperipheral nerve can be divided into two broad categories:those that indicate a process primarily affecting the axonand those that indicate a process primarily affecting themyelin sheath. Examination of peripheral nerve biopsies byelectron microscopy therefore must include evaluation of theaxons, the interstitium, and the myelin and Schwann cells.
The sequence of structural changes following nerveinjury that are collectively called Wallerian degenerationis shown in Fig. 12. Wallerian degeneration specificallyrefers to degeneration of the distal segments of a peripheralnerve after severance of the axons from their cell bodies(17). When the nerve injury is a contusion, the basementmembrane of the Schwann cell is preserved, allowingregeneration within the endoneurial tube. In contrast,when the nerve injury is a transection, the endoneurialtube (composed of denervated Schawnn cells and extra-cellular matrix) may not be appropriately aligned with theregenerating axons. Axonal regeneration is therefore lessefficient after nerve degeneration that follows a transectioninjury compared to that following a crush injury (10,17).
PROSPECTS OF ELECTRON MICROSCOPY
In the 1980s, electron microscopy lost much of its formerrole in the life sciences due to the introduction of modern,highly effective molecular analytical techniques, such asimmunohistochemistry, chip technology, and confocallaser scan microscopy. In recent years, however, substan-tial technical improvements were made in specimen pre-paration, instrumentation and software, allowing the
486 MICROSCOPY, ELECTRON
Figure 8. Herpes simplex encephalitis (cerebrum). Virions (V)have a central dense nucleoid and an outer three-layered capsid.(63,800�) (From Ref. 10. Reproduced by courtesy of Springer-Verlag GmbH.)
Figure 9. Histoplasma capsulatum (supra-clavicular lymph node). High magnificationof parasitic yeast forms illustrates detailsof their internal structure. N¼nucleus;*¼ clear, peripheral, cytoplasmic halo;arrows¼parasitic cell membrane. (20,000�)(From Ref. 10. Reproduced by courtesy ofSpringer-Verlag GmbH.)
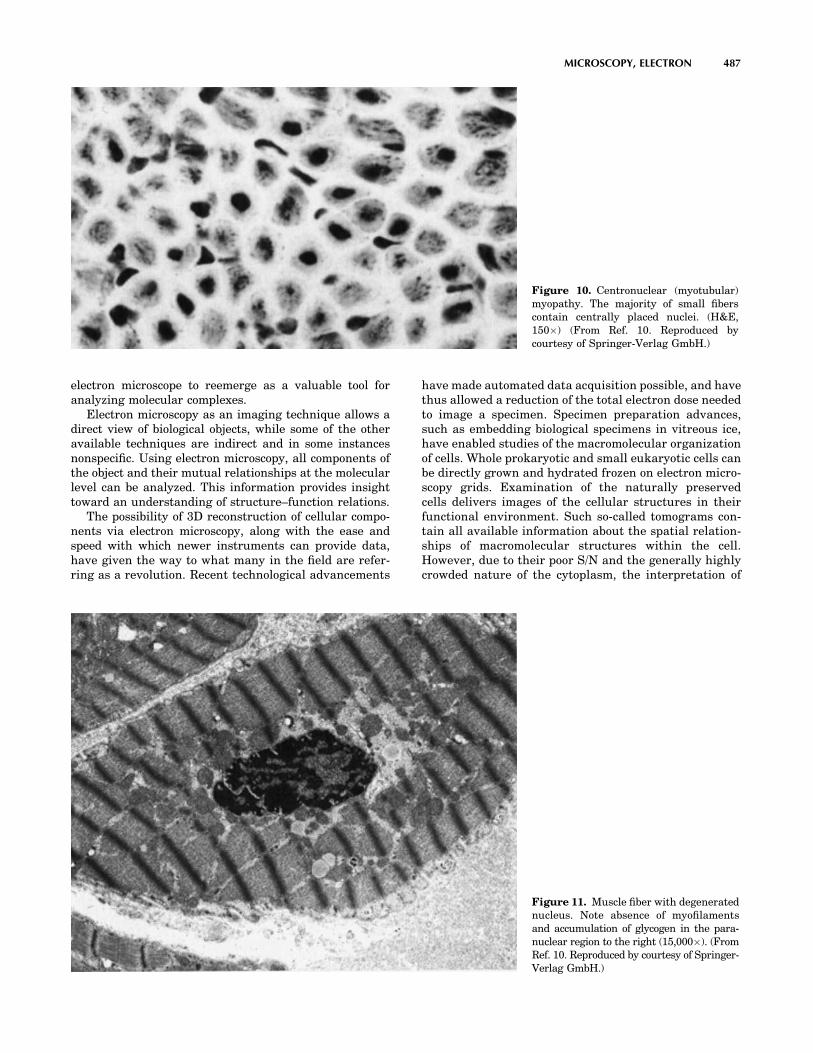
electron microscope to reemerge as a valuable tool foranalyzing molecular complexes.
Electron microscopy as an imaging technique allows adirect view of biological objects, while some of the otheravailable techniques are indirect and in some instancesnonspecific. Using electron microscopy, all components ofthe object and their mutual relationships at the molecularlevel can be analyzed. This information provides insighttoward an understanding of structure–function relations.
The possibility of 3D reconstruction of cellular compo-nents via electron microscopy, along with the ease andspeed with which newer instruments can provide data,have given the way to what many in the field are refer-ring as a revolution. Recent technological advancements
have made automated data acquisition possible, and havethus allowed a reduction of the total electron dose neededto image a specimen. Specimen preparation advances,such as embedding biological specimens in vitreous ice,have enabled studies of the macromolecular organizationof cells. Whole prokaryotic and small eukaryotic cells canbe directly grown and hydrated frozen on electron micro-scopy grids. Examination of the naturally preservedcells delivers images of the cellular structures in theirfunctional environment. Such so-called tomograms con-tain all available information about the spatial relation-ships of macromolecular structures within the cell.However, due to their poor S/N and the generally highlycrowded nature of the cytoplasm, the interpretation of
MICROSCOPY, ELECTRON 487
Figure 10. Centronuclear (myotubular)myopathy. The majority of small fiberscontain centrally placed nuclei. (H&E,150�) (From Ref. 10. Reproduced bycourtesy of Springer-Verlag GmbH.)
Figure 11. Muscle fiber with degeneratednucleus. Note absence of myofilamentsand accumulation of glycogen in the para-nuclear region to the right (15,000�). (FromRef. 10. Reproduced by courtesy of Springer-Verlag GmbH.)

these tomograms remains difficult. To get significantinformation about specific structures in the cell, theimages have to be evaluated using advanced patternrecognition methods. Existing structural models of cellu-lar constituents at lower resolutions can guide the sys-tematic evaluation of the tomograms. The aim is tovisualize the complete 3D organization of the cell atmolecular resolution. Structural evaluation by single par-ticle analysis, electron crystallography and electron tomo-graphy is slow compared to other structure determinationtechnologies, in particular X-ray crystallography. Proces-sing time for the electronic technique is typically in therange of several months per solved structure, dependingon the resolution achieved. The same task can be accom-plished in the range of hours or days for X-ray crystal-lography, once suitable crystals are available. Continuedjoint efforts between the research community and man-ufacturers to develop user-friendly, universal interfacesbetween electron crystallography, single-particle analysisand electron tomography would improve this situation, andfurther expand the usefulness of of these electronic tech-nologies.
BIBLIOGRAPHY
1. Nellist PD, et al Direct sub-angstrom imaging of a crystallattice. Science 2004;305(5691):1741.
2. Freeman MR. Time -resolved scanning tunneling microscopythrough tunnel distance modulation. Appl Phys Lett1993;68(19):2633–2635.
3. Bonetta L. Zooming in on electron tomography. Nature Meth-ods 2005;2(2):139–44.
4. Bozzola JJ, Russell LD. Electron Microscopy: Principals andtechniques for biologists. Sudbury (MA): Jones and BartlettPublishers; 1998.
5. Hayat MA. Principels and techniques of electron microscopy:Biological application. New York: Van Nostrand ReinholdCompany; 1973.
6. Wischnitzer S. Introduction to electron microscopy. NewYork: Pergamon Press; 1981.
7. Meek GA. Practical electron microscopy for biologists. NewYork: John Wiley & Sons inc; 1976.
8. Joy DC. Beam interactions, contrast and resolution in theSEM. J Microsc 1984;136:241–58.
9. Haine M. The electron microscope: The present state of theArt. London: Spon; 1961.
10. Dickersin GR. Diagnostic Electron Microscopy: A text/ atlas.New York: Springer-Verlag; 1999.
11. Franchina M, Del Borrello E, Caruso A, Altavilla G. Seroustumors of the ovary: Ultrastructural observations. Eur JGynaecol Oncol 1992;13(3):268–76.
12. Wolf HK, Garcia JA, Bossen EH. Oncocytic differentiation inintrahepatic biliary cystadenocarcinoma. Modern Pathol1992;5(6):665–866.
13. Kobayashi TK, et al. Effects of Taxol on ascites cytology from apatient with fallopian tube carcinoma: Report of a case withultrastructural studies. Diagn Cytopathol 2002;27(2):132–134.
14. Yogi T, et al Whipple’s disease: The first Japanese casediagnosed by electron microscopy and polymerase chain reac-tion. Intern Med 2004;43(7):566–570.
15. Jensen HL, Norrild B. Herpes simplex virus-cell interactionsstudied by immunogold cryosection electron microscopy.Methods Mol Biol 2005;292:143–160.
16. Garrison RG, Boyd KS. Electron microscopy of yeastlike celldevelopment from the microconidium of Histoplasma capsu-latum. J Bacteriol 1978;133(1):345–353.
17. Narciso MS, Hokoc JN, Martinez AM. Watery and dark axonsin Wallerian degeneration of the opossum’s optic nerve:Different patterns of cytoskeletal breakdown? An Acad BrasCienc 2001;73(2):231–243.
See also ANALYTICAL METHODS, AUTOMATED; CELLULAR IMAGING; CYTOLOGY,AUTOMATED.
MICROSCOPY, FLUORESCENCE
SERGE PELET
MICHAEL PREVITE
PETER T. C. SO
Massachusetts Institute ofTechnologyCambridge, Massachusetts
INTRODUCTION
Fluorescence microscopy quantifies the distribution offluorophores and their biochemical environment on the
488 MICROSCOPY, FLUORESCENCE
Figure 12. Ultrathin sections of opossum’s optic nerve fibers 24 hafter crash. Normal fibers (n) are seen among some altered fibers,which exhibit watery degeneration (star) and myelin sheathbreakdown (thick arrow). Note demyelinated fibers (thin arrows)with an apparently intact axoplasmic cytoskeleton. Asterisk, astro-cytic processes. (From Ref. 17. Reproduced by courtesy of Anais daAcademia Brasileira de Ciencias.)

micron length scale and allows In vivo measurement ofbiological structures and functions (1–3). Heimstädt devel-oped one of the earliest fluorescence microscopes in 1911.Some of the first biochemical applications of this techniqueinclude the study of living cells by the protozoologist Pro-vazek in 1914.
Fluorescence microscopy is one of the most ubiquitoustools in biomedical laboratories. Fluorescence microscopyhas three unique strengths. First, the fluorescence micro-scope has high biological specificity. Based on endogenousfluorophores or exogenous probes, fluorescence microscopyallows the association of a fluorescence signal with a speci-men structural and biochemical state. While fluorescencemicroscopy has comparable resolution to white light micro-scopes, their range of applications in biomedicine is muchbroader.
Second fluorescence microscopy is highly sensitive inthe imaging of cells and tissues. The high sensitivity offluorescence microscopy originates from two factors. Onefactor is the significant separation between the fluoro-phores’ excitation and emission spectra. This separationallows the fluorescence signal to be detected by efficientlyrejecting the excitation radiation background using band-pass filters. The fluorescence microscope has the sensitivityto image even a single fluorophore. The other factor is theweak endogenous fluorescence background in typical bio-logical systems. Since there is minimal background fluor-escence, weak fluorescence signal from even a fewfluorescent exogenous labels can be readily observed.
Third, fluorescence microscopy is a minimally invasiveimaging technique. In vivo labeling and imaging proce-dures are well developed. While photodamage may stillresult from prolonged exposure of shorter excitation radia-tion, long-term observation of biological processes is pos-sible. Today, a single neuron in the brain of a small animalcan be imaged repeatedly over a period of months with nonotable damage.
SPECTROSCOPIC PRINCIPLES OF FLUORESCENCEMICROSCOPY
Fluorescence Spectroscopy
An understanding of spectroscopic principles is essential tomaster fluorescence microscopy (4–6). Fluorescence is aphoton emission process that occurs during molecularrelaxation from electronic excited states. Historically,Brewster first witnessed the phenomenon of fluorescencein 1838 and Stokes coined the term fluorescence in 1852.These photonic processes involve transitions between elec-tronic and vibrational states of polyatomic fluorescentmolecules (fluorophores) by the absorption of either oneor more photons. Electronic states are typically separatedby energies on the order of 10,000 cm�1 and vibrationalsublevels are separated by � 102–103 cm�1. In a one-photonexcitation process, photons with energies in the ultraviolet(UV) to the blue–green region of the spectrum are needed totrigger an electronic transition, whereas photons in theinfrared (IR) spectral range are required for two-photonexcitation. The molecules from the lowest vibrational levelof the electronic ground state are excited to an accessible
vibrational level in an electronic excited state. The mole-cule is quickly relaxed to the lowest vibrational level of theexcited electronic state after excitation on the time scale offemtoseconds to picoseconds via vibrational processes. Theenergy loss in the vibrational relaxation process is the originof the Stoke shift where fluorescence photons have longerwavelengths than the excitation radiation. The coupling ofthe ground and excited – state both for the absorption andemission process is governed by the Franck–Condon prin-ciple, which states that the probability of transition isproportional to the overlap of the initial and final vibra-tional wave function. Since the vibrational level structuresof the excited and ground states are similar, the fluores-cence emission spectrum is a mirror image of the absorp-tion spectrum, but shifted to lower wavelengths. The shiftbetween the maxima of the absorption and emission spec-tra is referred to as the Stokes’ shift. The residence time of afluorophore in the excited electronic state before returningto the ground state is called the fluorescence lifetime. Thefluorescence lifetime is typically on the order of nanose-conds. The Jablonski diagram represents fluorescence exci-tation and deexcitation processes (Fig. 1).
Fluorescence deexcitation processes can occur via radia-tive and nonradiative pathways. Radiative decay describesmolecular deexcitation processes accompanied by photonemission. Molecules in the excited electronic states can alsorelax by nonradiative processes where excitation energy isnot converted into photons, but are dissipated by thermalprocesses, such as vibrational relaxation and collisionalquenching. Let G and k be the radiative and nonradiativedecay rates, respectively, and N be the number of fluor-ophore in the excited state. The temporal evolution of theexcited state can be described by
dN
dt¼ �ðGþ kÞN (1)
N ¼ N0e�ðGþkÞt ¼ N0e�t=t (2)
MICROSCOPY, FLUORESCENCE 489
S0
S1
T1
1p2p
P
FIS
IC
VL
Figure 1. A Jablonski diagram describing fluorescence (F) andphosphorescence (P) emission and excitation processes based onone-photon (1p) and two-photon (2p) absorption. The parametersS0, S1, and T1 are the electronic singlet ground state, singletexcited state, and triplet excited state, respectively. Here VLdenotes vibrational levels, IC denotes internal conversion, andIS denotes intersystem crossing.

The fluorescence lifetime, t, of the fluorophore isthe combined rate of the radiative and nonradiativepathways:
t ¼ 1
Gþ k(3)
One can define the intrinsic lifetime of the fluorophore inthe absence of nonradiative decay processes as, t0:
t0 ¼ 1
G(4)
The efficiency of the fluorophore can then be quantified bythe fluorescence quantum yield, Q, which measures thefraction of excited fluorophore relaxing via the radiativepathway:
Q ¼ G
Gþ k¼ t
t0(5)
Environmental Effect on Fluorescence
A number of factors contributes to the nonradiative decaypathways of the fluorophores and reduces fluorescenceintensity. In general, the nonradiative decay processescan be classified as
k ¼ kic þ kec þ ket þ kis (6)
where kic is the rate of internal conversion, kec is the rateof external conversion, ket is the rate of energy transfer,and kis is the rate of intersystem crossing.
Internal conversion describes the process where theelectronic energy is converted to thermal energy via avibrational process. The more interesting process is exter-nal conversion, where fluorophores lose electronic energyin collision process with other solutes. Several importantsolute molecules, such as oxygen, are efficient fluorescencequenchers. The external conversion process provides aconvenient mean to measure the concentration of thesemolecules in the microenvironment of the fluorophore. Thefluorophore is deexcited nonradiatively upon collision. Thecollisional quenching rate can be expressed as
kec ¼ k0½Q� (7)
where [Q] is the concentration of the quencher and k0 isrelated to the diffusivity and the hydrodynamics radii ofthe reactants.
When collisional quenching is the dominant non-radiative process, equation 1 predicts that fluorescencelifetime decreases with quencher concentration.
t0
t¼ ð1 þ k0t0½Q�Þ (8)
Collision quenching also reduces the steady-state fluores-cence intensity, F, relative to the fluorescence intensity inthe absence of quencher, F0. The Stern–Volmer equationdescribes this effect:
F0
F¼ 1 þ k0t0½Q� (9)
A related process is steady-state quenching, where fluor-escence signal reduction is due to ground-state processes. A
fluorophore can be chemically bound to a quencher to forma dark complex, a product that does not fluoresce. In thiscase, steady-state fluorescence intensity also decreaseswith quencher concentration as
F0
F¼ 1 þ Ks½Q� (10)
where Ks is the association constant of the quencher andthe fluorophore. However, since steady-state quenching isa ground-state process that only reduces the fraction offluorophores available for excitation, fluorescence lifetimeis not affected.
Resonance energy-transfer rate, ket, becomes significantwhen two fluorophores are in close proximity within �5–10 nm as during molecular binding. The energy of anexcited donor can be transferred to the accepted moleculevia an induced dipole–induced dipole interaction. Let Drepresents the donor and A, the acceptor. Under illumina-tion at the donor excitation wavelength, the number ofexcited donors and acceptors are ND, NA, respectively.Further, define the donor and acceptor deexcitation ratesas kD and kA. The excited-state population dynamics of thedonor and acceptor can be described as
dND
dt¼ �ðkD þ ketÞND (11)
dNA
dt¼ �kANA þ ketN
D (12)
Solving these equations provides the dynamics of donorand acceptor fluorescence:
ND ¼ ND0 exp½ð�kD � ketÞt� (13)
NA ¼ ND0
ket
kA�kD�ket½expð�kDt � kettÞ � expð�kAtÞ� (14)
The donor decay is a shortened single exponential, but theacceptor dynamics is more complex with two competingexponential processes.
The intersystem crossing rate, kis, describes transitionsbetween electronic excited states with wave functions ofdifferent symmetries. The normal ground state is a singletstate with an antisymmetric wave function. Excitation ofthe ground-state molecule via photon absorption results inthe promotion of the molecule to an excited state with anantisymmetric wavefunction, another singlet state. Due tospin–orbit coupling, the excited molecule can transit into atriplet sate via intersystem crossing. The subsequentphoton emission from the triplet state is called phosphor-escence. Since the decay of the triplet state to the singletground state is forbidden radiatively, the triplet excitedstate has a very long lifetime on the order of microsecondsto milliseconds.
FLUORESCENCE MICROSCOPE DESIGNS
The components common to most fluorescence microscopesare the light sources, the optical components, and thedetection electronics. These components can be configuredto create microscope designs with unique capabilities.
490 MICROSCOPY, FLUORESCENCE

Fluorescence Excitation Light Sources
Fluorescence excitation light sources need to producephotons with sufficient energy and flux level. The abilityto collimate the emitted rays from a light source furtherdetermines its applicability in high resolution imaging.Other less critical factors, such as wavelength selectivity,ease of use, and cost of operation, should also be considered.
Mercury arc lamps are one of the most commonly usedlight sources in fluorescence microscopy. The operation of amercury arc lamp is based on the photoemission frommercury gas under electric discharge. The photoemissionfrom a mercury arc consists of a broad background punc-tuated by strong emission lines. A mercury lamp can beconsidered as a quasimonochromatic light source by utiliz-ing one of these strong emission lines. Since mercury lampshave emission lines throughout the near-UV and visiblespectrum, the use of a mercury lamp allows easy matchingof the excitation light spectrum with a given fluorophore byusing an appropriate bandpass filter. Mercury arc lampsare also low cost and easy to use. However, since theemission of mercury lamps are difficult to collimate, theyare rarely used in high resolution techniques, such asconfocal microscopy. The advent of high power, energyefficient, light-emitting diodes (LEDs) with a long opera-tion life allows the design of new light sources that arereplacing arc lamps in some microscopy applications.
Laser light sources are commonly used in high resolu-tion fluorescence microscopes. Laser light sources have anumber of advantages including monochromatcity, highradiance, and low divergence. Due to basic laser physics,the laser emission is almost completely monochromatic.For fluorescence excitation, a monochromatic light sourceallows very easy separation of the excitation light from theemission signal. While the total energy emission from anarc lamp may be higher than some lasers, the energywithin the excitation band is typically a small fraction ofthe total energy. In contrast, lasers have high radiance: theenergy of a laser is focused within a single narrow spectralband. Therefore, the laser emission can be more efficientlyused to trigger fluorescence excitation. Furthermore, laseremission has very low divergence and can be readily col-limated to form a tight focus at the specimen permittinghigh resolution imaging. Gas lasers, such as the argon–ionlaser and helium–neon lasers, are commonly used in fluor-escence microscopy. Nowadays, they tend to be replaced bysolid-state diode lasers that are more robust and fluctuateless. Lasers can further be characterized as continuouswave and pulsed. While continuous wave lasers are suffi-cient for most applications, pulsed lasers are used in two-photon microscopes where high intensity radiation isrequired for efficient induction of nonlinear optical effects.
Microscope Optical Components
The optical principle underlying fluorescence microscopescan be understood using basic ray tracing (7,8). The raytracing of light through an ideal lens can be formulated intofour rules: (1) A light ray originated from the focal point of alens will emerge parallel to the optical axis after the lens.(2) A light ray propagating parallel to the optical axis willpass through the focal point after the lens. (3) Light rays
originated from the focal plane of a lens will emergecollimated. (4) Collimated light rays incident upon a lenswill focus at its focal plane (Fig. 2). From these rules, onecan see that a simple microscope can be formed using twolenses with different focal lengths (Fig. 3). The lens, L1,with focal length, f1, images the sample plane and is calledthe objective. The lens, L2, with focal length, f2, projectsthe image onto the detector plane and is called the tubelens. From simple geometry, two points P1 and P2separated by x in the sample plane will be separated byx(f2/f1) at the detector plane, where the ratio M¼ f2/f1 iscalled the magnification. One can see that the image in thesample plane is enlarged by the magnification factor at thedetector.
By using the common wide-field fluorescence microscopeas an example, we can further examine the components of a
MICROSCOPY, FLUORESCENCE 491
(1)
(2)
(3)
(4)
AP
a
Figure 2. Four basic rules of optical ray tracing. (1) Lightemerging from the focal point will become collimated parallel tothe optical axis after the lens. And inversely (2) a collimated beamparallel to the optical axis will be focused at the focal plane of thelens. (3) A light source in the focal plane of the lens will becomecollimated after passing through the lens with an oblique angledetermined by the distance from the optical axis and inversely (4)An oblique collimated beam will be focused in the focal plane by thelens. The numerical aperture of an imaging system is a function ofthe maximum convergence angle, a, as defined in rule 2. Themaximum convergence angle is a function of the lens propertyand its aperture (AP) size.
L1 L2
S D
P1
P2P1′
P2′
X
f 2f 2f 1f 1
Figure 3. The detection path of a microscope. Lenses L1 and L2are the objective and the tube lens, respectively. L1 has focallength f1 and L2 has focal length f2. For two points, P1 and P2with separation, x, on the sample plane (S), these points areprojected to points P1’ and P2’ on the detector plane (D).

complete fluorescence microscope system (Fig. 4a) (9). Inaddition to the detection optical path, fluorescence micro-scope requires an excitation light source. The excitationlight source is typically placed in the focal point of a thirdlens, L3. The lens collimates the excitation light and pro-jects it uniformly on the specimen (Koehler illumination).The lens, L3, is called the condenser. Since the excitationlight is typically much stronger than the fluorescenceemission, a bandpass filter is needed to block the excitationlight. In this trans-illumination configuration, it is oftendifficult to select a bandpass filter with sufficient blockingpower without also losing a significant portion of thefluorescence signal. To overcome this problem, an alter-native geometry, epi-illumination, is commonly used(Fig. 4b). In this geometry, lens L1 functions both as theimaging objective and the condenser for the excitationlight. A couple of relay lenses (L4, L4’) are used to focusthe excitation light at the back aperture plane of theobjective via a dichroic filter that reflects the excitationlight but transmits the fluorescence signal. The excitationlight is collimated by L1 and uniformly illuminates thesample plane. The fluorescence signal from the sample iscollected by the objective and projected onto the detectorvia the tube lens L2. Since the excitation light is notdirected at the detector, the task of rejecting excess excita-tion radiation at the detector is significantly easier. Abarrier filter is still needed to eliminate stray excitationradiation from the optical surfaces.
From Fig. 2, one may assume that arbitrarily smallobjects can be imaged by increasing the magnificationratio. However, this is erroneous as the interference oflight imposes a resolution limit on an optical system (10).The smallest scale features that can be resolved usingfluorescence microscopy are prescribed by the Abbe limit.
For an infinitely small emitter at the sample plane, theimage at the detector, the point spread function (PSF), isnot a single point. Instead, the intensity is distributedaccording to an Airy function with a diameter, d:
d ¼ M1:22lNA
(15)
where M is the magnification of the system, l is the emis-sion wavelength, and NA is the numerical aperture of theobjective, which is defined as (Fig. 2):
NA ¼ n sina (16)
where a is the half-convergence angle of the light and n isthe index of refraction of the material between the lens andthe sample. Therefore, the images of two objects on thesample plane will overlap if their separation is <1.22l/NA.Since NA is always on the order of 1, an optical system canonly resolve two separate objects if their separation is onthe order of the wavelength of light.
Fluorescence Detectors and Signal Processing
Since the fluorescence signal is relatively weak, sensitivedetectors are crucial in the design of a high performancefluorescence microscope. For a wide field microscope, themost commonly used detectors are charged couple device(CCD) cameras, which are area detectors that contain arectilinear array of pixels. Each pixel is a silicon semicon-ductor photosensor called a photodiode. When light isincident upon an individual photodiode, electrons are gen-erated in the semiconductor matrix. Electrodes are orga-nized in the CCD camera such that the charges generatedby optical photons can be stored capacitatively during thedata acquisition. After data acquisition, manipulatingthe voltages of the electrodes on the CCD chip allowsthe charges stored in each pixel to be extracted from thedetector sequentially and read out by the signal condition-ing circuit. These cameras are very efficient devices with aquantum efficiency up to �80% (i.e., they can detect up to 8out of 10 incident photons). Furthermore, CCD camerascan be made very low noise such that even four to fivephotons stored in a given pixel can be detected abovethe inherent electronic noise background of the readoutelectronics.
While CCDs are the detector of choice for wide-fieldmicroscopy imaging, there are other microscope configura-tions (discussed below) where an array detector is notnecessary and significantly lower cost single element detec-tors can be used. Two commonly used single elementdetectors are avalanche photodiodes (APDs) and photo-multiplier tubes (PMTs).
Avalanche photodiodes and photomultiplier tubes havebeen used in confocal and multiphoton microscopes. Ava-lanche photodiodes are similar to the photodiode elementin a CCD chip. By placing a high voltage across the device,the photoelectron generated by the photon is acceleratedacross the active area of the semiconductor and collide withother electrons. Some of these electrons gain sufficientmobility from the collision and are accelerated towardthe anode of the device themselves. This results in anavalanche effect with a total electron gain on the order
492 MICROSCOPY, FLUORESCENCE
L1
L3
S
D
LS
LS
L1
L2L2
S
D
BR
BR
DC
L4 L4′
(a) (b)
Figure 4. Two configurations of fluorescence microscopy (a)trans-illumination and (b) epi-illumination. The objective anddetection tube lenses are L1 and L2. The condenser is L3. Theexcitation relay lenses are L4 and L40. The sample and detectorplanes are S and D respectively. The light source is LS. Thedichroic filter and the barrier filter are DC and BR.
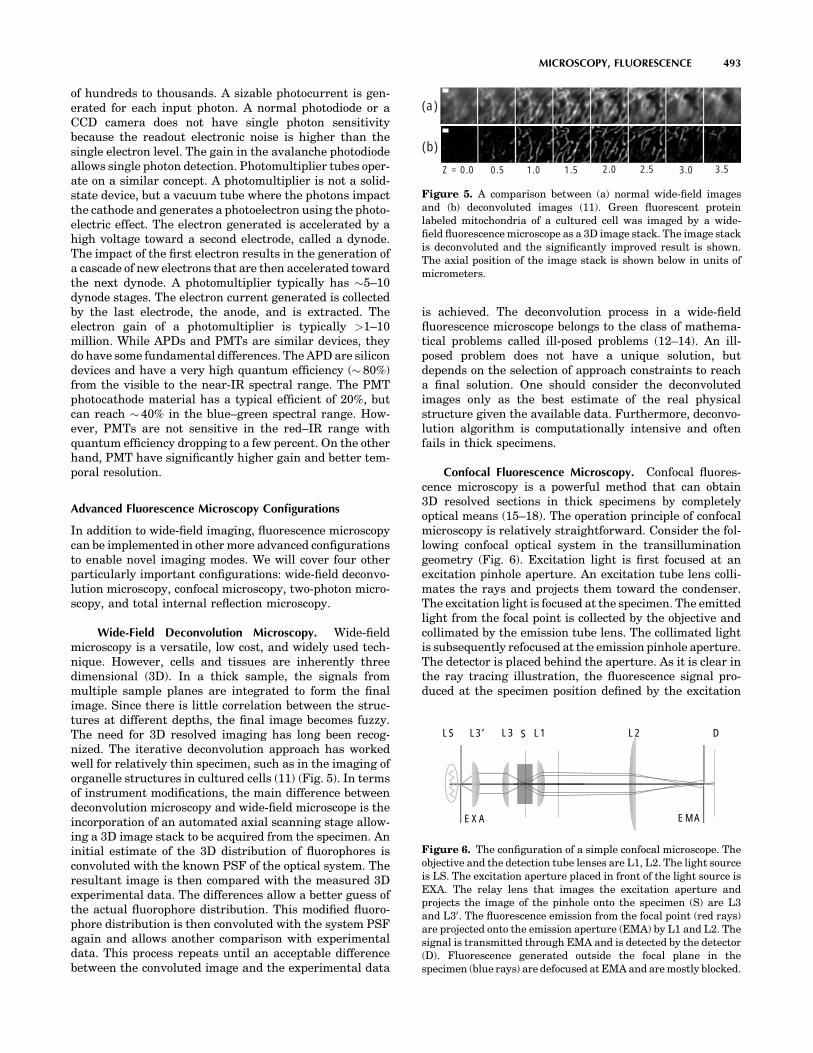
of hundreds to thousands. A sizable photocurrent is gen-erated for each input photon. A normal photodiode or aCCD camera does not have single photon sensitivitybecause the readout electronic noise is higher than thesingle electron level. The gain in the avalanche photodiodeallows single photon detection. Photomultiplier tubes oper-ate on a similar concept. A photomultiplier is not a solid-state device, but a vacuum tube where the photons impactthe cathode and generates a photoelectron using the photo-electric effect. The electron generated is accelerated by ahigh voltage toward a second electrode, called a dynode.The impact of the first electron results in the generation ofa cascade of new electrons that are then accelerated towardthe next dynode. A photomultiplier typically has �5–10dynode stages. The electron current generated is collectedby the last electrode, the anode, and is extracted. Theelectron gain of a photomultiplier is typically >1–10million. While APDs and PMTs are similar devices, theydo have some fundamental differences. The APD are silicondevices and have a very high quantum efficiency (� 80%)from the visible to the near-IR spectral range. The PMTphotocathode material has a typical efficient of 20%, butcan reach � 40% in the blue–green spectral range. How-ever, PMTs are not sensitive in the red–IR range withquantum efficiency dropping to a few percent. On the otherhand, PMT have significantly higher gain and better tem-poral resolution.
Advanced Fluorescence Microscopy Configurations
In addition to wide-field imaging, fluorescence microscopycan be implemented in other more advanced configurationsto enable novel imaging modes. We will cover four otherparticularly important configurations: wide-field deconvo-lution microscopy, confocal microscopy, two-photon micro-scopy, and total internal reflection microscopy.
Wide-Field Deconvolution Microscopy. Wide-fieldmicroscopy is a versatile, low cost, and widely used tech-nique. However, cells and tissues are inherently threedimensional (3D). In a thick sample, the signals frommultiple sample planes are integrated to form the finalimage. Since there is little correlation between the struc-tures at different depths, the final image becomes fuzzy.The need for 3D resolved imaging has long been recog-nized. The iterative deconvolution approach has workedwell for relatively thin specimen, such as in the imaging oforganelle structures in cultured cells (11) (Fig. 5). In termsof instrument modifications, the main difference betweendeconvolution microscopy and wide-field microscope is theincorporation of an automated axial scanning stage allow-ing a 3D image stack to be acquired from the specimen. Aninitial estimate of the 3D distribution of fluorophores isconvoluted with the known PSF of the optical system. Theresultant image is then compared with the measured 3Dexperimental data. The differences allow a better guess ofthe actual fluorophore distribution. This modified fluoro-phore distribution is then convoluted with the system PSFagain and allows another comparison with experimentaldata. This process repeats until an acceptable differencebetween the convoluted image and the experimental data
is achieved. The deconvolution process in a wide-fieldfluorescence microscope belongs to the class of mathema-tical problems called ill-posed problems (12–14). An ill-posed problem does not have a unique solution, butdepends on the selection of approach constraints to reacha final solution. One should consider the deconvolutedimages only as the best estimate of the real physicalstructure given the available data. Furthermore, deconvo-lution algorithm is computationally intensive and oftenfails in thick specimens.
Confocal Fluorescence Microscopy. Confocal fluores-cence microscopy is a powerful method that can obtain3D resolved sections in thick specimens by completelyoptical means (15–18). The operation principle of confocalmicroscopy is relatively straightforward. Consider the fol-lowing confocal optical system in the transilluminationgeometry (Fig. 6). Excitation light is first focused at anexcitation pinhole aperture. An excitation tube lens colli-mates the rays and projects them toward the condenser.The excitation light is focused at the specimen. The emittedlight from the focal point is collected by the objective andcollimated by the emission tube lens. The collimated lightis subsequently refocused at the emission pinhole aperture.The detector is placed behind the aperture. As it is clear inthe ray tracing illustration, the fluorescence signal pro-duced at the specimen position defined by the excitation
MICROSCOPY, FLUORESCENCE 493
Z = 0.0 0.5 1.0 1.5 2.0 2.5 3.0 3.5
(a)
(b)
Figure 5. A comparison between (a) normal wide-field imagesand (b) deconvoluted images (11). Green fluorescent proteinlabeled mitochondria of a cultured cell was imaged by a wide-field fluorescence microscope as a 3D image stack. The image stackis deconvoluted and the significantly improved result is shown.The axial position of the image stack is shown below in units ofmicrometers.
L1L3 SLS L2 DL3′
EXA EMA
Figure 6. The configuration of a simple confocal microscope. Theobjective and the detection tube lenses are L1, L2. The light sourceis LS. The excitation aperture placed in front of the light source isEXA. The relay lens that images the excitation aperture andprojects the image of the pinhole onto the specimen (S) are L3and L30. The fluorescence emission from the focal point (red rays)are projected onto the emission aperture (EMA) by L1 and L2. Thesignal is transmitted through EMA and is detected by the detector(D). Fluorescence generated outside the focal plane in thespecimen (blue rays) are defocused at EMA and are mostly blocked.

pinhole aperture is exactly transmitted through the con-jugate pinhole in the emission light path. However, for afluorescence signal generated above or below the focalplane, the light is defocused at the emission pinhole aper-ture and is largely rejected. Hence, a pair of conjugatepinholes allows the selection of a 3D defined volume. Onecan show that a confocal microscope can image structuresin 3D with a volume resolution of 0.1 fl. This systemachieves 3D resolution, at the cost of obtaining fluorescencesignal from only a single point in the specimen. It isnecessary to raster scan the excitation focus to cover a3D volume. Confocal microscopy has been used extensivelyto investigate microstructures in cells and in the imaging oftissues (19) (Fig. 7).
Two-Photon Fluorescence Microscopy. A two-photonmicroscope is an alternative to confocal microscopy forthe 3D imaging of thick specimens. Denk, Webb, and co-workers in 1990 introduced two-photon excitation micro-scopy (18,20). Fluorophores can be excited by the simulta-neous absorption of two photons each having one-half of theenergy needed for the excitation transition. Since the two-photon excitation probability is significantly less than theone-photon probability, two-photon excitation occurs onlyat appreciable rates in regions of high temporal and spatialphoton concentration. The high spatial concentration ofphotons can be achieved by focusing the laser beam with ahigh numerical aperture objective to a diffraction-limitedspot. The high temporal concentration of photons is madepossible by the availability of high peak power pulsedlasers (Fig. 8). Depth discrimination is the most importantfeature of multiphoton microscopy. In the two-photon case,>80% of the total fluorescence intensity comes from a 1 mmthick region about the focal point for objectives withnumerical aperture of 1.25. For a 1.25 NA objective usingexcitation wavelength of 960 nm, the typical point spreadfunction has a fwhm of 0.3mm in the radial direction and0.9mm in the axial direction (Fig. 8). Two-photon micro-scopy has a number of advantages compared with confocalimaging: (1) Since a two-photon microscope obtains 3Dresolution by limitation the region of excitation insteadof the region of detection as in a confocal system, photo-damage of biological specimens is restricted to the focalpoint. Since out-of-plane chromophores are not excited,
they are not subject to photobleaching. (2) Two-photonexcitation wavelengths are typically redshifted to abouttwice the one-photon excitation wavelengths in the IRspectral range. The absorption and scattering of the exci-tation light in thick biological specimens are reduced.(3) The wide separation between the excitation and emis-sion spectra ensures that the excitation light and Ramanscattering can be rejected without filtering out any of thefluorescence photons. An excellent demonstration of theability of two-photon imaging for deep tissue imaging is inthe neurobiology area (21) (Fig. 9).
Total internal reflection microscopy. Confocal and two-photon microscopy can obtain 3D resolved images fromspecimens up to a few hundred micrometers in thickness.However, both types of microscopy are technically challen-ging, require expensive instrumentation, and only canacquire data sequentially from single points. Total internalreflection microscopy (TIRM) is an interesting alternativeif 3D-resolved information is only required at the bottomsurface of the specimen, such as the basal membrane of acell (22–24). Total internal reflection occurs at an interfacebetween materials with distinct indices of refraction(Fig. 10). If light ray is incident from a high index prism,n2, toward the lower index region, n1, at an angle u, thelight will be completely reflected at the interface if u is >uc,the critical angle.
sin uc ¼n1
n2(17)
While the light is completely reflected at the interface, theelectric field intensity right above the interface is nonzero,but decays exponentially into the low index medium. Thedecay length of the electric field is on the order of tens tohundreds of nanometers. Compared with other forms of 3Dresolved microscopy, TIRM allows the selection of thethinnest optical section, but only at the lower surface ofthe sample. While prism launch TIRM as described issimpler to construct, the bulky prism complicates theroutine use of TIRM for cell biology studies. Instead,ultrahigh numerical aperture objectives have been pro-duced (1.45–1.6 N). Light rays focus at the back apertureplane of the objective that are sufficiently off axis willemerge collimated, but at an oblique angle. If a specimengrown on a high index coverglass is placed upon theobjective, total internal reflection can occur at the speci-men-coverglass interface if the oblique angle is sufficientlylarge. This approach has been described as the objectivelaunch TIRM and has been very successful in the study ofexocytosis processes (23) (Fig. 11).
FLUORESCENT PROBES
Fluorescence microscopy has found many applications inbiomedicine. This wide acceptance is a direct result of theavailability of an ever growing set of fluorescence probesdesigned to measure cell and tissue structure, metabolism,signaling processes, gene expression, and protein distribu-tion (25,26). The synthesis of fluorescent probes dates backto 1856, when William Perkin made the first synthetic
494 MICROSCOPY, FLUORESCENCE
Figure 7. A comparison between confocal (a) and wide field (b)imaging of a plasmacytoma cell labeled with fluorescentantiendoplasmin that binds mainly to the endoplasmic reticulum.In the wide-field image, it is not possible to determine whether thecentral nucleic region contains endoplasmin end the structure of thecisternae are unclear (19).

probe from coal tar dye. Thereafter, many more syntheticdyes became available: pararosaniline, methyl violet,malachite green, safranin O, methylene blue, and numer-ous azo dyes. While most of these early dyes are weakly fluo-rescent, more fluorescent ones based on the xanthene andacridine heterocyclic ring systems soon became available.
Optical Factors in the Selection of Fluorescent Probes
Before providing a survey of the wide variety of fluorescentprobes, it is important to first discuss the optical propertiesof fluorescent probes that are important for microscopicimaging: extinction coefficient, quantum yield, fluorescentlifetime, photobleaching rate, and spectral characteristics.
One of the most important characteristic of a fluorescentprobe is its extinction coefficient. Extinction coefficient, e,measures the absorption probability of the excitation lightby the fluorophore. Consider excitation light is transmittedthrough a solution containing fluorophore at concentrationc with a path length l. The light intensities before and afterthe solution are I0 and I. The extinction coefficient can then
be defined by Beer’s law:
log10I0
I¼ ecl (18)
Fluorescent probes with high extinction coefficients canbe excited by lower incident light intensity allowing the useof lowest cost light sources and reducing the backgroundnoise of the images originated from scattered excitationlight.
Quantum yield, Q, measures the relative contributionsof the radiative versus nonradiative decay pathways. Highquantum efficiency maximizes the fluorescent signal foreach photon absorbed. The combination of probe extinctioncoefficient and quantum efficiency quantifies the totalconversion efficiency of excitation light into fluorescentsignal.
While e and Q determines excitation light conversionefficiency, the maximum rate of fluorescent photon gen-eration also depends on the lifetime, t, of the probe. Since amolecule that has been excited cannot be reexcited until itreturns to the ground state, fluorescent lifetime
MICROSCOPY, FLUORESCENCE 495
Figure 8. Two-photon microscopy optically sections and produces a fluorescent signal originatingonly from the focal point (a) the geometry of two-photon fluorescence. In traditional one-photonexcitation, fluorescence is generated throughout the double inverted cones (blue arrow). Two-photonexcitation generates fluorescence only at the focal point (red arrow). (b) The submicron PSF of two-photon excitation at 960 nm: The full-widths at half maximum (fwhm) are 0.3 mm radially and 0.9mm axially. (c) An experimental visualization of the small excitation volume of two-photonfluorescence. One- and two-photon excitation beams are focused by two objectives (equalnumerical aperture) onto a fluorescein solution. Fluorescence is generated all along the path inthe one-photon excitation case (blue arrow), whereas fluorescence is generated only in a 3D confinedfocal spot for two-photon excitation (red arrow) The reduced excitation volume is thought to lead toless photodamage. (Please see online version for color figure)

determines the rate at which a single probe molecule can berecycled. In general, for fluorescent probes with equal e andQ, fluorescent photon production rate is an inverse func-tion of probe lifetime. Further intersystem cross-rate alsoplays a role in determining photon generation rate. Sincethe triplet state has a very long lifetime, probes with highintersystem cross-rates are trapped in the triplet state witha relatively lower photon generation rate.
Photobleaching rate measures the probability that aprobe will undergo an excited-state chemical reactionand become nonfluorescent irreversibly. Therefore, thephotobleaching rate of a probe limits the maximum num-ber of fluorescence photons that can be produced by a singlefluorophore. Photobleaching rates of fluorophores varygreatly. For example, rhodamine can survive up to100,000 excitation, fluorescein a few thousand, and tryp-tophan can only sustain a few excitation events. Photo-bleaching can be caused by a variety of processes.Generally, it is the result of a photochemical reaction inthe excited state of the probe. For example, a commonbleaching pathway is the generation of a triplet state thatreacts with oxygen dissolved in solution to generate singletoxygen and an oxidized molecule incapable of undergoingthe same electronic transition as before.
Spectral properties are also important in probe selectionfor a number of reasons. First, selecting fluorescent probeswith well-separated excitation and emission spectra allowmore efficient separation of the fluorescence signal fromthe excitation light background. Second, fluorescent probesshould be selected to match the detector used in the micro-scope that may have very different sensitivity across the
496 MICROSCOPY, FLUORESCENCE
Figure 9. Fluorescein dextran labeled blood vessels in theprimary vibrissa cortex of a living rat brain imaged using two-photon microscope down to a depth of >500mm, whichdemonstrates the ability of this technique to image deep intotissue (21).
L1
L2
D
BR
ΘP
Figure 10. The configuration of a total internal reflectionfluorescence microscope. L1 and L2 are objective and tube lens,respectively. The barrier filter is BR and the detector is D. Theprism is P. The excitation light (green) is incident up the prism atangle, u, greater than the critical angle. The excitation light istotally internally reflected from the surface. A magnified view isshown on the left. The evanescence electric field induced by theexcitation light above the prism surface decays exponentially andonly induces strong fluorescence signal for probes close to thesurface of the prism. Please see online version for color figure.
Figure 11. Epi-illuminated wide field (EPI) and total internalreflection (TIR) microscopy of bovine chromaffin cells containingsecretory granules marked with GFP atrial naturetic protein (23).Only the lower plane of the cells contributes to the fluorescencesignal in TIR set-up.

spectral range. For example, most PMTs have maximumefficiency in the green spectral range, but very low effi-ciency in the red. Therefore, green emitting probes areoften better matches for microscopes using PMTs as detec-tors. Third, probes with narrow emission spectra allow aspecimen to be simultaneously labeled with different colorsproviding a method to analyze multiple biochemical com-ponents simultaneously in the specimen.
Classification of Fluorescent Probes
There is no completely concise and definitive way to classifythe great variety of fluorescent probes. A classification canbe made based on how the fluorophores are deployed inbiomedical microscopy: intrinsic probes, extrinsic probes,and genetic expressible probes.
Intrinsic Probes. Intrinsic probes refer to the class ofendogenous fluorophores found in cells and tissues. Manybiological components, deoxyribonuclic acid such as (DNA),proteins, and lipid membrane are weakly fluorescent. Forexample, protein fluorescence is due to the presence ofamino acids: tryptophan, tyrosine, and phenylalanine.Among them, tryptophan is the only member with mar-ginal quantum yield for microscopic imaging. However,fluorescent imaging based on tryptophan provides verylimited information due to the prevalence of this aminoacid in many proteins distributed throughout cellular sys-tems and provides no specificity or contrast. The mostuseful intrinsic probes for microscopy imaging are a num-ber of enzymes and proteins, such as reduced pyridinenucleotides [NAD(P)H], flavoproteins, and protoporphyrinIX. Both NAD(P)H and favoproteins are present in thecellular redox pathway. The NAD(P)H becomes highlyfluorescent when reduced, whereas flavoprotein becomesfluorescent when oxidized, while their redox counterpartsare nonfluorescent. These enzymes thus provide a powerfulmethod to monitor cell and tissue metabolism. Protopor-phyrin IX (PPIX) is a natural byproduct in the hemeproduction pathway that is highly fluorescent. Certaincancer cells have been shown to have upregulate PPIXproduction relative to normal tissue and may be useful inthe optical detection of cancer. Another class of importantintrinsic fluorophores includes elastin and collagen, whichresides in the extracellular matrix allowing structuralimaging of tissues. Finally, natural pigment molecules,such as lipofuscin and melanin, are also fluorescent andhave been used in assaying aging in the ocular system andmalignancy in the dermal system respectively.
Extrinsic Probes. Many extrinsic fluorescent probeshave been created over the last century. A majority ofthese extrinsic fluorophores are small aromatic organicmolecules (25–28). Many probe families, such asxanthenes, canines, Alexas, coumarines, and acrinideshave been created. These probes are designed to spanthe emission spectrum from near UV to the near-IR rangewith optimized optical properties. Since these moleculeshave no intrinsic biological activity, they must be conju-gated to biological molecules of interest, which may beproteins or structure components, such as lipid molecules.
Most common linkages are through reactions to amine andthiol residues. Reactions to amine are based on acylatingreactions to form carboxamides, sulfonamides, or thiour-eas. Targeting thiol residue in the cysteines of proteins canbe accomplished via iodoacetamides or maleimides. Otherapproaches to conjugate fluorophores to biological compo-nents may be based on general purpose linker molecules,such as biotin-avidin pairs or based on photoactivablelinkers. A particularly important class of fluorophoresconjugated proteins is fluorescent antibodies that allowbiologically specific labeling.
In addition to maximizing the fluorescent signal, thegreater challenge in the design of small molecular probes isto provide environmental sensitivity. An important class ofenvironmentally sensitive probes distinguishes the hydro-philic versus hydrophobic environment and results in asignificant quantum yield change or spectral shift based onsolvent interaction. This class of probes includes DAPI,laurdan, and ANS, which have been used to specificallylabel DNA, measure membrane fluidity, and sense proteinfolding states, respectively. Another important class ofenvironmentally sensitive probes senses intracellular ionconcentrations, such as pH, Ca2þ, Mg2þ, Zn2þ. The mostimportant members of this class of probes are calciumconcentration sensitive because of the importance of cal-cium as a secondary messenger. Changes in intracellularcalcium levels have been measured by using probes thateither show an intensity or a spectral response upon cal-cium binding. These probes are predominantly analoguesof calcium chelators. Members of the Fluo-3 series andRhod-2 series allow fast measurement of the calcium levelbased upon intensity changes. More quantitative measure-ment can be based on the Fura-1 and Indo-1 series that areratiometric. These probes exhibit a shift in the excitation oremission spectrum with the formation of isosbestic pointsupon calcium binding. The intensity ratio between theemission maxima and the isosbestic point allows a quanti-tative measurement of calcium concentration withoutinfluence from the differential partitioning of the dyesinto cells.
Quantum dots belong to a new group of extrinsic probesthat are rapidly gaining acceptance for biomedical imagingdue to a number of their very unique characteristics (29–31). Quantum dots are semiconductor nanoparticles in thesize range of 2–6 nm. Photon absorption in the semicon-ductor results in the formation of an exciton (an electron-hole pair). Semiconductor nanoparticles with diametersbelow the Bohr radius exhibit strong quantum confinementeffect, which results in the quantization of their electronicenergy level. The quantization level is related to particlesize where smaller particles have a larger energy gap. Theradiative recombination of the exciton results in the emis-sion of a fluorescence photon with energy corresponding tothe exciton’s quantized energy levels. The lifetime for therecombination of the exciton is long, typically on the orderof a few tens of nanoseconds. Quantum dots have beenfabricated from II–VI (e.g., as CdSe, CdTe, CdS, and ZnSe)and III–V (e.g., InP and InAs) semiconductors. Due to thecompounds involved in the formation of these fluorescentlabels, toxicity studies have to be realized prior to anyexperiments. Recent research works have been devoted
MICROSCOPY, FLUORESCENCE 497

to the better manufacture of these semiconductor crystalsincluding methods to form a uniform crystalline core and toproduce a surface capping layer that enhances the bio-compability of these compounds, prevents their aggrega-tion, and can maximize their quantum efficiency.Furthermore, coating the surface of quantum dots withconvenient functional groups, including common linkages,such as silane or biotin, has been accomplished to facilitatelinkage to the biological molecules. Quantum dots areunique in their broad absorption spectra, very narrow(�15 nm) emission spectrum, and extraordinary photo-stability. In fact, quantum dots have been shown to havephotobleaching rates orders of magnitude below that oforganic dyes. Quantum dots also have excellent extinctioncoefficients and quantum yield. While there are significantadvantages in using quantum dots, they also have a num-ber of limitations including their relative larger size com-pared with organic dyes and their lower fluorescence fluxdue to their long lifetime. Quantum dots have been appliedfor single receptor tracking on cell surface and for thevisualization of tissue structures, such as blood vessels.
Genetic Expressible Probes. The development of geneti-cally expressible probes has been rapid over the last decade(32). The most notable of these genetic probes is greenfluorescent protein, GFP (33). The GFP was isolated andpurified from the bioluminescent jellyfish AequoreaVictoria. Fusion proteins can be created by insertingGFP genes into an expression vector that carries a genecoding for a protein of interest. This provides a completelynoninvasive procedure and perfectly molecular specificapproach to track the expression, distribution, and traf-ficking of specific proteins in cells and tissues. In order tobetter understand protein signaling processes and protein–protein interactions, fluorescent proteins of different colorshave been created based on random mutation processes.Today, fluorescent proteins with emission spanning thespectral range from blue to red are readily available.Expressible fluorescent proteins that are sensitive to cel-lular biochemical environment, such as pH and calcium,have also been developed. Novel fluorescent proteins withoptically controllable fluorescent properties, such as photo-activatable fluorescent proteins, PA-GFP, photoswitchableCFP, and pKindling red have been created and may be usedin tracing cell movement or protein transport. Finally,protein–protein interactions have been detected based ona novel fluorescent protein approach in which each of theinteracting protein pairs carries one-half of a fluorescentprotein structure that is not fluorescent. Upon binding ofthe protein pairs, the two halves of the fluorescent proteinalso recombine, which results in a fluorescent signal.
ADVANCED FUNCTIONAL IMAGING MODALITIES ANDTHEIR APPLICATIONS
A number of functional imaging modalities based on fluor-escent microscopy have been developed. These techniquesare extremely versatile and have found applications ran-ging from single molecular studies to tissue level experi-ments. The implementation of the most common imaging
modalities will be discussed with representative examplesfrom the literature.
Intensity Measurements
The most basic application of fluorescence microscopy con-sists in mapping fluorophore distribution based on theiremission intensity as a function of position. However, thismap is not static. Measuring intensity distribution as afunction of time allows one to follow the evolution ofbiological processes. The fastest wide-field detectors canhave a frame rate in the tens of kilohertz range, unfortu-nately at the expense of sensitivity and spatial resolution.They are used to study extremely fast dynamics, such asmembrane potential imaging in neurons. For 3D imaging,point scanning techniques are typically slower than wide-field imaging, but can reach video rate speed using multi-foci illumination.
Dynamic intensity imaging has been used at the tissuelevel to follow cancer cells as they flow through bloodvessels and extravasate to form metastases, or in embryosto track the expression of a regulatory protein at differentdevelopmental stages. One commonly used technique tofollow the movements of protein in cellular systems isfluorescent recovery after photobleaching (FRAP). InFRAP studies, a small area of a cell expressing a fluores-cently labeled protein is subjected to an intense illumina-tion that photobleaches the dye and leads to a drastic dropin fluorescence intensity. The rate at which the intensityrecovers provides a measure of the mobility of the protein ofinterest.
An important aspect of the fluorescent microscopy tech-nique lies also in the image analysis. Particle trackingexperiments are an excellent example. Zuhang and co-workers (34) studied the infection pathway of the influenzavirus labeled with a lipophilic dye in CHO cells. Each frameof the movie recorded was analyzed to extract the positionof the virus particles with 40 nm accuracy. Three differentstages of transport after endocytosis of the virus particlewere separated, each involving different transportmechanisms transduced by a different protein as shownon Fig. 12. The first stage is dependant on actin and resultsin an average transport distance of 2 mm from the initialsite of binding at the cell periphery. The second stage ischaracterized by a sudden directed displacement thatbrings the virus close to the nucleus with a speed of 1–4mm s�1 that is consistent with the velocity of dynein motorson microtublues. The last stage consists of back and forthmotion in the perinuclear region. This is followed by thefusion of the endosome with the virus and the liberation ofthe genetic material. This event is identified by a suddenincrease in the fluorescence intensity due to the dequench-ing of the fluorescent tags on the virus.
Spectral Measurements
An extremely important feature of fluorescent microscopyis the ability to image many different fluorescent speciesbased on their distinct emission spectra. Dichroic bandpassfilters optimized for the dyes used in the experiment candiscriminate efficiently between up to four or five differentfluorophores.
498 MICROSCOPY, FLUORESCENCE

In a study of connexin trafficking, Ellisman and co-workers (35) used a dual labeling scheme to highlightthe dynamics of these proteins. Using a recombinant pro-tein fused to a tetracystein receptor domain, the connexinwas stably labeled with a biarsenical derivate of fluoresceinor resorufin (a red fluorophore). The cells expressing thesemodified proteins were first stained with the green fluor-ophore and incubated 4–8 h. The proteins produced duringthis incubation period are fluorescently tagged in a secondstaining step with the red fluorophore. The two-colorimages highlight the dynamics of the connexin refurbish-ing at the gap junction. As shown on Fig. 13, the olderproteins are found in the center and are surrounded by thenewer proteins.
For wide-field fluorescence imaging using a CCD cam-era, spectral information is collected sequentially whileposition information is collected at once. Bandpass filterscan be inserted to select the emission wavelength inbetween image frames. This procedure is relatively slowand can result in image misregistration due to the slightmisalignment of the filters. This problem can be overcomeby the use of electronically tunable filter. Two types ofelectronically tunable filters are available based either onliquid-crystal technology or on electrooptical crystals.Liquid-crystal tunable filters are made of stacks of bire-fringent liquid-crystal layers sandwiched between polariz-ing filters. Polarized light is incident upon the device. Theapplication of a voltage on the liquid-crystal layer producesa wavelength dependent rotation of the polarization of lightas the light is transmitted through the liquid-crystallayers. After cumulative rotations through the multiplelayers, only the light at a specific spectral range is at thecorrect polarization to pass through the final polarizerwithout attenuation. The second type is acoustooptics tun-able filters (AOTFs). An AOTF works by setting acousticvibration at radio frequency (rf) through an electroopticalcrystal to create a diffraction grating that singles out theappropriate wavelength with a few nanometer bandwidth.The main advantage of AOTF is that the wavelengthselection is realized by tuning the acoustic wave frequency,which can be done in a fraction of a millisecond while theliquid-crystal tunable filters operate with a time constantof hundreds of milliseconds. The latter, however, have alarger clear aperture and selectable bandwidth ranging
from a fraction of a nanometer up to tens of a nanometer.Liquid-crystal filters are more often used for emissionfiltering while the acoustooptic filters are more commonlyused for excitation wavelength selection.
Typical emission spectra from molecular fluorophoreshave a sharp edge at the blue end of the spectrum, but havea long tail extending far into the red due to electronicrelaxation from the excited state into a vibrationallyexcited ground state. When imaging with a few colorchannels, where each channel represents a single chromo-phore, one has to be careful to take into account thespectral bleedthrough of each dye into the neighboringchannels. Collecting signal in a larger number of channelsallows the use of a linear unmixing technique to account forthe real shape of the emission spectra of each dye andaccounts more precisely for their contributions in eachpixel of the image. This technique can be implementedusing tunable filters with a narrow bandwidth and CCDcamera detectors. It has also been shown that an inter-ferometer can be used to encode the spectral information inthe image on the CCD camera. An image is then recordedfor each step of the interferometer and a Fourier transformanalysis allows the recovery of the spectral information.Although it requires more advanced postprocessing of theimage data, this approach offers a large spectral range anda variable spectral resolution unmatched by the tunablefilters.
MICROSCOPY, FLUORESCENCE 499
Figure 12. Particle tracking of virusinfecting a cell. (a) Trajectory of thevirus. The color of the trajectory codestime from 0 s (black) to 500 s (yellow).The star indicates the fusion site of thevirus membrane with the vesicle. (b)Time trajectories of the velocity(black) and fluorescence (blue) of thevirus particle (34). Please see onlineversion for color figure.
Figure 13. Connexin trafficking at gap junction. The newlyproduced proteins are labeled in red after 4 h (a and b) or 8 h (cand d) hours after the first staining step with green. The olderproteins occupy the periphery of the gap junction, while the newones are localized in its center (35). Please see online version forcolor figure.
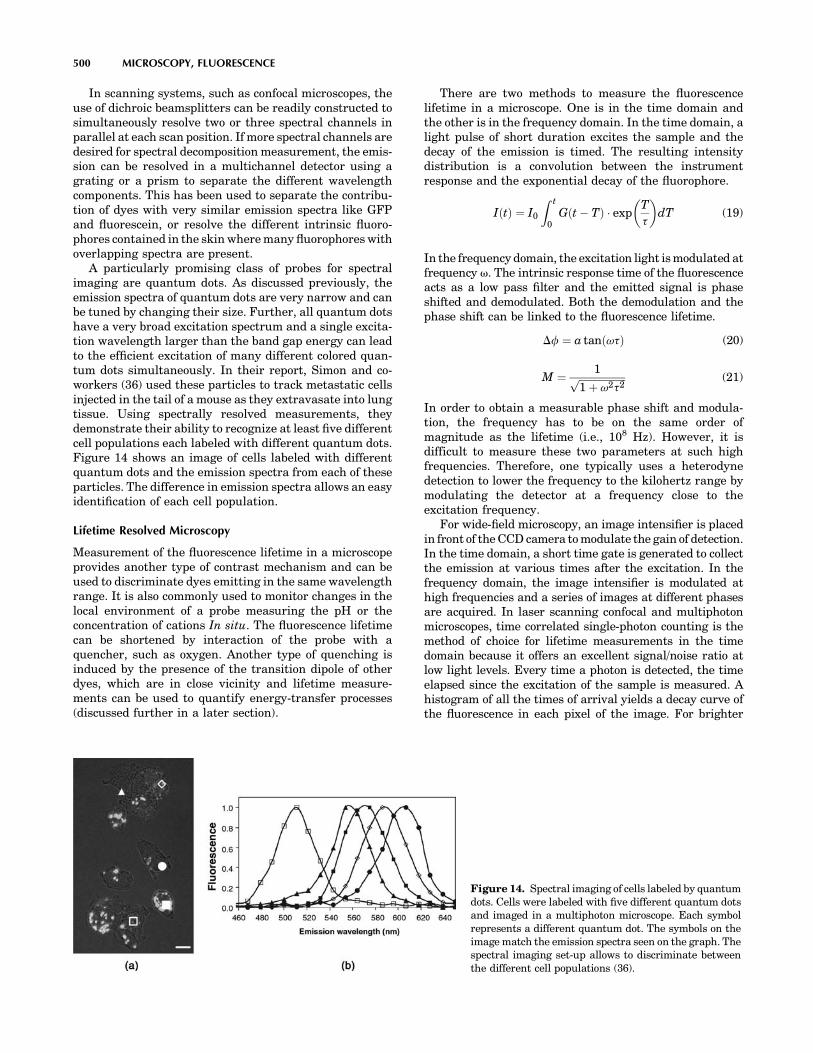
In scanning systems, such as confocal microscopes, theuse of dichroic beamsplitters can be readily constructed tosimultaneously resolve two or three spectral channels inparallel at each scan position. If more spectral channels aredesired for spectral decomposition measurement, the emis-sion can be resolved in a multichannel detector using agrating or a prism to separate the different wavelengthcomponents. This has been used to separate the contribu-tion of dyes with very similar emission spectra like GFPand fluorescein, or resolve the different intrinsic fluoro-phores contained in the skin where many fluorophores withoverlapping spectra are present.
A particularly promising class of probes for spectralimaging are quantum dots. As discussed previously, theemission spectra of quantum dots are very narrow and canbe tuned by changing their size. Further, all quantum dotshave a very broad excitation spectrum and a single excita-tion wavelength larger than the band gap energy can leadto the efficient excitation of many different colored quan-tum dots simultaneously. In their report, Simon and co-workers (36) used these particles to track metastatic cellsinjected in the tail of a mouse as they extravasate into lungtissue. Using spectrally resolved measurements, theydemonstrate their ability to recognize at least five differentcell populations each labeled with different quantum dots.Figure 14 shows an image of cells labeled with differentquantum dots and the emission spectra from each of theseparticles. The difference in emission spectra allows an easyidentification of each cell population.
Lifetime Resolved Microscopy
Measurement of the fluorescence lifetime in a microscopeprovides another type of contrast mechanism and can beused to discriminate dyes emitting in the same wavelengthrange. It is also commonly used to monitor changes in thelocal environment of a probe measuring the pH or theconcentration of cations In situ. The fluorescence lifetimecan be shortened by interaction of the probe with aquencher, such as oxygen. Another type of quenching isinduced by the presence of the transition dipole of otherdyes, which are in close vicinity and lifetime measure-ments can be used to quantify energy-transfer processes(discussed further in a later section).
There are two methods to measure the fluorescencelifetime in a microscope. One is in the time domain andthe other is in the frequency domain. In the time domain, alight pulse of short duration excites the sample and thedecay of the emission is timed. The resulting intensitydistribution is a convolution between the instrumentresponse and the exponential decay of the fluorophore.
IðtÞ ¼ I0
Z t
0Gðt � TÞ exp
T
t
� �dT (19)
In the frequency domain, the excitation light is modulated atfrequency v. The intrinsic response time of the fluorescenceacts as a low pass filter and the emitted signal is phaseshifted and demodulated. Both the demodulation and thephase shift can be linked to the fluorescence lifetime.
Df ¼ a tanðvtÞ (20)
M ¼ 1ffiffiffiffiffiffiffiffiffiffiffiffiffiffiffiffiffiffiffi1 þ v2t2
p (21)
In order to obtain a measurable phase shift and modula-tion, the frequency has to be on the same order ofmagnitude as the lifetime (i.e., 108 Hz). However, it isdifficult to measure these two parameters at such highfrequencies. Therefore, one typically uses a heterodynedetection to lower the frequency to the kilohertz range bymodulating the detector at a frequency close to theexcitation frequency.
For wide-field microscopy, an image intensifier is placedin front of the CCD camera to modulate the gain of detection.In the time domain, a short time gate is generated to collectthe emission at various times after the excitation. In thefrequency domain, the image intensifier is modulated athigh frequencies and a series of images at different phasesare acquired. In laser scanning confocal and multiphotonmicroscopes, time correlated single-photon counting is themethod of choice for lifetime measurements in the timedomain because it offers an excellent signal/noise ratio atlow light levels. Every time a photon is detected, the timeelapsed since the excitation of the sample is measured. Ahistogram of all the times of arrival yields a decay curve ofthe fluorescence in each pixel of the image. For brighter
500 MICROSCOPY, FLUORESCENCE
Figure 14. Spectral imaging of cells labeled by quantumdots. Cells were labeled with five different quantum dotsand imaged in a multiphoton microscope. Each symbolrepresents a different quantum dot. The symbols on theimage match the emission spectra seen on the graph. Thespectral imaging set-up allows to discriminate betweenthe different cell populations (36).

samples, a frequency domain approach using modulateddetectors can also be used to measure the lifetime.
To measure the pH in the skin of a mouse, Clegg and co-workers (37) used a modified fluorescein probe whose life-time varies from 2.75 ns at pH 4.5 to 3.9 ns at pH 8.5. Asthey image deeper in the skin, they observe that theaverage pH increases from 6.4 at the surface up to >7 at15 mm depth. The extracellular space is mostly acidic (pH6), while the intracellular space is at neutral pH. Typically,pH is measured in solution by correlating fluorescenceintensities with specific pH levels. This approach is notsuitable for tissues, as in the skin, since the dye is unevenlydistributed throughout the tissue (Fig. 15) due to differ-ential partitioning. A measurement of pH based on fluor-escence lifetime is not dependent on probe concentrationand thus the pH can be measured in the intra and extra-cellular space at various depths in the skin.
Polarization Microscopy
Polarization microscopy is a technique that provides infor-mation about the orientation or the rotation of fluoro-phores. Linearly polarized excitation light results inpreferential excitation of molecules with their transitiondipole aligned along the polarization. If the molecule is in arigid environment, the emitted fluorescence will mostlyretain a polarization parallel to the excitation light. How-ever, if the molecule has time to rotate before it emits aphoton, this will randomize the emission polarization. Theanisotropy r is a ratio calculated from the intensity parallelIk and perpendicular I? to the incident polarization and is ameasure of the ability of the molecule to rotate.
r ¼Ik � I?Ik þ 2I?
(22)
This ratio is mostly governed by two factors, which arethe fluorescence lifetime t and the rotational correlationtime u.
r ¼ r0
1 þ ðt=uÞ (23)
where r0 is the fundamental anisotropy. Molecules with ashort fluorescence lifetime and a long rotational correla-tion time (t < u) will have a high anisotropy. In theopposite case, where molecules can freely rotate duringthe time they reside in the excited state, the anisotropywill be low. An approximate measurement of the mobilityof a molecule can be obtained by exciting the sample atdifferent polarization angles. A proper measurement ofthe anisotropy requires both a linearly polarized excita-tion light source and the detection of the parallel andperpendicular component of the fluorescence light using apolarizer. This technique has been used to measureviscosity and membrane fluidity In vivo. It has beenapplied to quantify enzyme kinetics, relying on the factthat the cleavage of a fluorescently labeled substrate leadsto a faster tumbling and thus a decrease in anisotropy.
Goldstein and co-workers (38) used polarization micro-scopy at the single-molecule level to study the orientation ofthe kinesin motor on a microtubule. A thiol reactive rhoda-mine dye was attached to cysteines on the motor protein.Microtubules decorated with the modified kinesin wereimaged under a different polarization angle. In the presenceof adenosine monophosphate (AMP)–(PNP) [a nonhydroly-able analogue of adenonine triphosphats (ATP)], the fluor-escence intensity depends strongly on the angle ofpolarization of the excitation light (Fig. 16) proving thatthe kinesin maintains a fixed orientation. In the presence ofadenonine5–diphosphate (ADP), however, the anisotropy islower (no dependence on excitation polarization angle),
MICROSCOPY, FLUORESCENCE 501
Figure 15. Quantification of the pHof the skin by lifetime imaging. (a)Intensity, (b) modulation, (c) lifetime,and (d) pH maps of a mouse skin atdifferent depth. The lifetimemeasurements allow a determinationof the pH independently of theintensity changes recorded betweendifferent imaging depth (37).

leading to the conclusion that the kinesin is very mobile,while still attached to the microtubule.
Fluorescence Resonance Energy Transfer
Förster resonance energy transfer (FRET) is a techniqueused to monitor interaction between two fluorophores onthe nanometer scale. When a dye is promoted to its excitedstate, it can transfer this electronic excitation by dipole–dipole interaction to a nearby molecule. Due to the natureof this interaction, Förster predicted a dependence of theFRET efficiency on the sixth power of distance that wasdemonstrated experimentally by Stryer with a linear poly-peptide of varying length (39). The efficiency E of theprocess varies as function of the distance, R, betweenthe two molecules as
E ¼R6
0
R60 þ R6
(24)
Where R0 is called the Förster distance, which depends onAvogadro’s number NA, the index of refraction of themedium n, the quantum yield of the donor molecule QD,the orientation factor k, and the overlap integral J.
R60 ¼ 9000 lnð10Þk2QD
128p5NA n4J (25)
k represents the relative orientation of the transition dipoleof the donor and acceptor molecules. In most cases, arandom interaction is presumed and this factor is set totwo-thirds. The overlap integral J represents the energyoverlap between the emission of the donor and the absorp-tion of the acceptor. For well-matched fluorophore pairs, R0
is on the order of 4–7 nm.
Most FRET experiments are based on the measurementof the intensity of the donor and of the acceptor because thepresence of FRET in a system is characterized by adecrease in the emission of the donor and an increase inthe acceptor signal. Thus, in principle, a two color channelmicroscope is sufficient to follow these changes. However,experimental artifacts, such as concentration fluctuationand spectral bleed, complicate the analysis of these imagesand many different correction algorithms have beendeveloped.
FRET measurements have been used in molecular stu-dies to measure distances and observe dynamic conforma-tional changes in proteins and ribonuclic acid (RNA). Incellular studies, FRET is often used to map protein inter-actions. By labeling one protein with a donor dye and itsligand with an acceptor dye, energy transfer will occur onlywhen the two proteins are bound such that the dyes come inclose proximity of each other.
The addition of fluorescence lifetime imaging providesthe additional capability of retrieving the proportion offluorophore undergoing FRET in each pixel of an imageindependently of concentration variations. This is possiblebecause the fluorescence lifetime of a FRET construct isshorter than the natural decay of the dye. Thus if one has amixture of interacting and free protein, fitting a doubleexponential to the fluorescence decay allows us to retrievethe proportion of interacting protein. This has been appliedby Bastiaens and co-workers (40) to the study the phos-phorylation of the EGF receptor ErB1. The transmem-brane receptor is fused with a GFP protein. Thephosphrylation of the protein is sensed by an antibodylabeled with a red dye (Cy3). When the Erb1 is phosphory-lated, the antibody binds to the protein and FRET occursdue to the short distance between the antibody and theGFP. The ErB1 receptors can be stimulated by EGF coatedbeads leading to phosphorylation and FRET. The timecourse of the stimulation is followed and for each celland the fraction of phosphorylated receptors at varioustime interval is shown in Fig. 17. After 30 s, the FRETevents are localized at discrete locations. But after 1 min,the whole periphery of the cell displays high FRET, demon-strating the lateral signaling of the receptor after activa-tion at discrete location by EGF coated beads.
502 MICROSCOPY, FLUORESCENCE
Figure 16. Mobility of single kinesin motors on microtubulesprobed by polarization microscopy. (a) Image of microtubulessparsely decorated with kinesin motors in presence of AMP–PNP and ADP. (b) Time course of the fluorescent intensityrecorded from single molecule excited with linearly polarizedlight at four different angles. The large fluctuations of thefluorescence intensity as function of the excitation polarizationin the AMP–PNP case demonstrate the rigidity of the kinesinmotor on the microtubule (38).
Figure 17. Time course of the phosphorylation of EGF receptorsERB1 after stimulation by EGF coated beads observed by FRETbetween a GFP modified EGF receptor and a phosphorylationantibody labeled with Cy3. While the GFP intensity is remainsrelatively constant, the concentration of the Cy3 tagged antibodyclearly increases after the stimulation. This leads to an increaseFRET signal as function of time (40).

CONCLUSION
The utility of fluorescence microscopy lies in its ability tostudy biological structure and function In vivo. The exqui-site sensitivity and image contrast of fluorescence micro-scopy allow biological structures to be imaged on thesubmicron length scale. The greatest power of fluorescencemicroscopy lies in its ability to determine biochemicalfunctions using assays based on fluorescence spectroscopy.With the availability of more versatile instruments, morefluorophores unit greater molecular and environmentalspecificity, the impact of fluorescence microscopy technol-ogy on biomedical science will only increase.
BIBLIOGRAPHY
1. Wang XF, Herman B. Fluorescence Imaging Spectroscopyand Microscopy. New York: Wiley; 1996.
2. Inoué S, Spring KR. Video Microscopy: the Fundamentals.New York: Plenum Press; 1997.
3. Herman B. Fluorescence Microscopy. Oxford: Bios ScientificPublishers / Springer in Association with the Royal Micro-scopy Society; 1998.
4. Cantor CR, Schimmel PR. Biophysical Chemistry. San Fran-cisco: Freeman; 1980.
5. Valeur B. Molecular Fluorescence: Principles and Applica-tions. Weinheim; New York: Wiley-VCH; 2002.
6. Lakowicz JR. NetLibrary Inc. Topics in Fluorescence Spectro-scopy. Kluwer Academic; 2002.
7. Klein MV, Furtak TE. Optics. New York: Wiley; 1986.8. Hecht E. Optics. Reading, (MA): Addison-Wesley; 2002.9. Gu M. Advanced Optical Imaging Theory. Berlin: New York:
Springer; 2000.10. Born M,Wolf E. Principles of Optics: Electromagnetic Theory
of Propagation, Interference and Diffraction of Light. Cam-bridge: New York: Cambridge University Press; 1999.
11. Rizzuto R, Carrington W, Tuft RA. Digital imaging micro-scopy of living cells. Trends Cell Biol 1998;8:288–292.
12. Agard DA, Hiraoka Y, Shaw P, Sedat JW. Fluorescence micro-scopy in three dimensions. Methods Cell Biol 1989;30:353–377.
13. Carrington WA, et al. Superresolution three-dimensionalimages of fluorescence in cells with minimal light exposure.Science 1995;268:1483–1487.
14. Krishnamurthi V, Liu YH, Bhattacharyya S, Turner JN,Holmes TJ. Blind Deconvolution Of Fluorescence Micro-graphs By Maximum-Likelihood-Estimation. Appl Opt1995;34:6633–6647.
15. Wilson T, Sheppard CJR. Theory and Practice of ScanningOptical Microscopy. New York: Academic; 1984.
16. Pawley JB. Handbook of Confocal Microscopy. New York:Plenum; 1995.
17. Gu M. Principles of Three-Dimensional Imaging in ConfocalMicroscopy. Singapore: World Scientific; 1996.
18. MastersBR. Selected Papers on Multiphoton Excitation Micro-scopy. Bellingham: SPIE Optical Engineering Press; 2003.
19. Amos WB, White JG. How the confocal laser scanning micro-scope entered biological research. Biol Cell 2003;95:335–342.
20. Denk W, Strickler JH, Webb WW. Two-photon laser scanningfluorescence microscopy. Science 1990;248:73–76.
21. Kleinfeld D, Mitra PP, Helmchen F, Denk W. Fluctuationsand stimulusinduced changes in blood flow observed in indi-vidual capillaries in layers 2 through 4 of rat neocortex. ProcNatl Acad Sci U. S. A. 1998;95:15741–15746.
22. Axelrod D. Total internal reflection fluorescence. Ann RevBiophys Bioeng 1984;13:247–268.
23. Axelrod D. Total internal reflection fluorescence microscopyin cell biology. Traffic 2001;2:764–774.
24. Axelrod D. Selective imaging of surface fluorescence withvery high aperture microscope objectives. J Biomed Opt2001;6:6–13.
25. Mason WT. Fluorescent and Luminescent Probes for Biolo-gical Activity: a Practical Guide to Technology for Quantita-tive Real-time Analysis. San Diego: Academic; 1999.
26. Slavic J. Fluorescence Microscopy and Fluorescent Probes.New York: Plenum Press; 1996.
27. Tsien RY. Fluorescent probes of cell signaling. Annu RevNeurosci 1989;12:227–253.
28. Tsien RY. Fluorescent indicators of ion concentrations. Meth-ods Cell Biol 1989;30:127–156.
29. Bruchez Jr M, Moronne M, Gin P, Weiss S, Alivisatos AP.Semiconductor nanocrystals as fluorescent biological labels.Science 1998;281:2013–2016.
30. Chan WC, et al. Luminescent quantum dots for multiplexedbiological detection and imaging. Curr Opin Biotechnol2002;13:40–46.
31. Michalet X, et al. Quantum dots for live cells, in vivo imaging,and diagnostics. Science 2005;307:538–544.
32. Zhang J, Campbell RE, Ting AY, Tsien RY. Creating newfluorescent probes for cell biology. Nat Rev Mol Cell Biol2002;3:906–918.
33. Chalfie M, et al. Green Fluorescent Protein as a Marker forGene Expression. Science 1994;263:802–805.
34. Lakadamyali M, Rust MJ, Babcock HP, Zhuang X. Visualiz-ing infection of individual influenza viruses. Proc Natl AcadSci U. S. A. 2003;100:9280–9285.
35. Gaietta G, et al. Multicolor and electron microscopic imagingof connexin trafficking. Science 2002;296:503–507.
36. Voura EB, Jaiswal JK, Mattoussi H, Simon SM. Trackingmetastatic tumor cell extravasation with quantum dot nano-crystals and fluorescence emissionscanning microscopy. NatMed 2004;10:993–998.
37. Hanson KM, et al. Two-photon fluorescence lifetime imagingof the skin stratum corneum pH gradient. Biophys J2002;83:1682–1690.
38. Sosa H, Peterman EJ, Moerner WE, Goldstein LS. ADP-induced rocking of the kinesin motor domain revealed bysingle-molecule fluorescence polarization microscopy. NatStruct Biol 2001;8:540–544.
39. Stryer L, Haugland RP. Energy Transfer: a spectroscopicruler. Proc Natl Acad Sci U. S. A. 1967;58:712–726.
40. Verveer PJ, Wouters FS, Reynolds AR, Bastiaens PIH. Quan-titative imaging of lateral ErbB1 receptor signal propagationin the plasma membrane. Science 2000;290:1567–1570.
See also FLUORESCENCE MEASUREMENTS; MICROSCOPY, CONFOCAL
MICROSCOPY, SCANNING FORCE
EWA P. WOJCIKIEWICZ
KWANJ JOO KWAK
VINCENT T. MOY
University of MiamiMiami, Florida
INTRODUCTION
Recent advances in technology have allowed us to study ourworld at molecular, even subatomic, resolution. One of thedevices in the forefront of such studies is the atomic forcemicroscope (AFM), which is a relatively complex device
MICROSCOPY, SCANNING FORCE 503
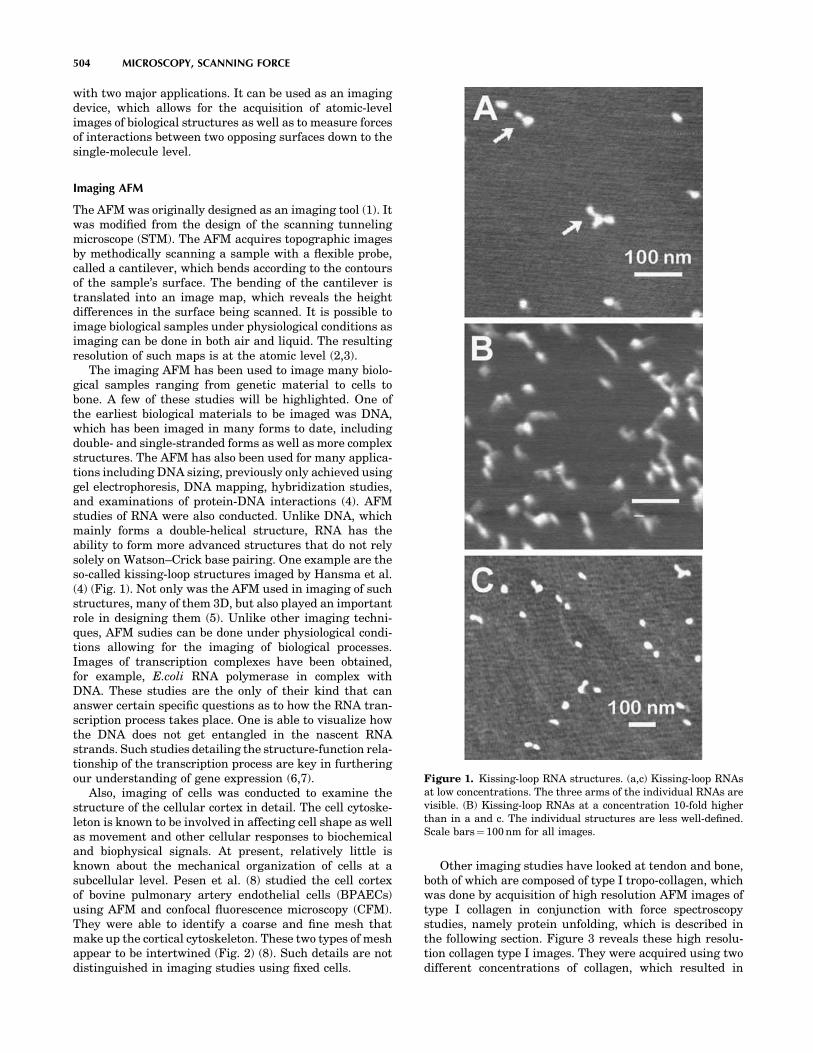
with two major applications. It can be used as an imagingdevice, which allows for the acquisition of atomic-levelimages of biological structures as well as to measure forcesof interactions between two opposing surfaces down to thesingle-molecule level.
Imaging AFM
The AFM was originally designed as an imaging tool (1). Itwas modified from the design of the scanning tunnelingmicroscope (STM). The AFM acquires topographic imagesby methodically scanning a sample with a flexible probe,called a cantilever, which bends according to the contoursof the sample’s surface. The bending of the cantilever istranslated into an image map, which reveals the heightdifferences in the surface being scanned. It is possible toimage biological samples under physiological conditions asimaging can be done in both air and liquid. The resultingresolution of such maps is at the atomic level (2,3).
The imaging AFM has been used to image many biolo-gical samples ranging from genetic material to cells tobone. A few of these studies will be highlighted. One ofthe earliest biological materials to be imaged was DNA,which has been imaged in many forms to date, includingdouble- and single-stranded forms as well as more complexstructures. The AFM has also been used for many applica-tions including DNA sizing, previously only achieved usinggel electrophoresis, DNA mapping, hybridization studies,and examinations of protein-DNA interactions (4). AFMstudies of RNA were also conducted. Unlike DNA, whichmainly forms a double-helical structure, RNA has theability to form more advanced structures that do not relysolely on Watson–Crick base pairing. One example are theso-called kissing-loop structures imaged by Hansma et al.(4) (Fig. 1). Not only was the AFM used in imaging of suchstructures, many of them 3D, but also played an importantrole in designing them (5). Unlike other imaging techni-ques, AFM sudies can be done under physiological condi-tions allowing for the imaging of biological processes.Images of transcription complexes have been obtained,for example, E.coli RNA polymerase in complex withDNA. These studies are the only of their kind that cananswer certain specific questions as to how the RNA tran-scription process takes place. One is able to visualize howthe DNA does not get entangled in the nascent RNAstrands. Such studies detailing the structure-function rela-tionship of the transcription process are key in furtheringour understanding of gene expression (6,7).
Also, imaging of cells was conducted to examine thestructure of the cellular cortex in detail. The cell cytoske-leton is known to be involved in affecting cell shape as wellas movement and other cellular responses to biochemicaland biophysical signals. At present, relatively little isknown about the mechanical organization of cells at asubcellular level. Pesen et al. (8) studied the cell cortexof bovine pulmonary artery endothelial cells (BPAECs)using AFM and confocal fluorescence microscopy (CFM).They were able to identify a coarse and fine mesh thatmake up the cortical cytoskeleton. These two types of meshappear to be intertwined (Fig. 2) (8). Such details are notdistinguished in imaging studies using fixed cells.
Other imaging studies have looked at tendon and bone,both of which are composed of type I tropo-collagen, whichwas done by acquisition of high resolution AFM images oftype I collagen in conjunction with force spectroscopystudies, namely protein unfolding, which is described inthe following section. Figure 3 reveals these high resolu-tion collagen type I images. They were acquired using twodifferent concentrations of collagen, which resulted in
504 MICROSCOPY, SCANNING FORCE
Figure 1. Kissing-loop RNA structures. (a,c) Kissing-loop RNAsat low concentrations. The three arms of the individual RNAs arevisible. (B) Kissing-loop RNAs at a concentration 10-fold higherthan in a and c. The individual structures are less well-defined.Scale bars¼ 100 nm for all images.

slightly different orientations of collagen: random at thelower concentration (Fig. 3a) and oriented unidirectionallyin the higher concentration (Fig. 3b). In these studies, theAFM was used to investigate the mechanical properties ofthis collagenous tissue, which are altered in diseases suchas osteoporosis. Being familiar with such properties isimportant for gaining further understanding as well aspreventing and curing bone diseases (9).
Force Spectroscopy
The AFM can also be operated in the force scan mode,which allows for the measurement of adhesion forces
between receptors and their corresponding binding part-ners, or ligands. In studies of ligand-receptor forces, thereceptor is immobilized on the surface of a flexible AFMcantilever whereas the ligand is attached to a suitablesubstrate. The deflection of the cantilever during theapproach and withdrawal of the cantilever from the sub-strate allow for the force of the interaction to be measured.These type of experiments provide information simulatingthe influence of internal and external forces that thesereceptors would experience in the body, for example, theshear stress experienced by a blood cell attached to theendothelium while blood rushes past it. Such informationwas previously unavailable when receptor-ligand interac-tions were examined using more traditional biochemicaltechniques. AFM has made it possible to acquire measure-ments that reveal the mechanical properties of biomole-cules under applied force. Measurements of the unbindingforce of a single ligand-receptor interaction can now beacquired with the AFM (10–12).
The AFM can also be used in adhesion studies involvingwhole cells (13,14). In these studies, the interactionbetween a cell expressing a particular receptor of interestand its ligand protein or another cell expressing the ligandis measured. The cell adhesion experiments allow for theacquisition of both single-molecule measurements, like inthe above-mentioned studies, as well as multiple-bondinteractions. The advantage of using the AFM in celladhesion studies is the high specificity and wealth ofinformation that is obtained. The AFM force scans provideinformation about the individual bond strengths as well asthe force and work that is required to separate the entirecomplex. Combining single-molecule and multiple-bonddata allows us to describe the thermodynamic model ofthe separation of a particular complex in addition to themechanism of its action on the cellular scale (15,16).
The AFM can also serve as a microindenter that probessoft samples, including cells revealing information abouttheir mechanical properties. The mechanical properties ofcells play an important role in such essential physiologicalprocesses such as cell migration and cell division. Under-standing these properties can later help scientists to iden-tify when certain processes may be taking place. Themechanical properties of cells are chiefly determined bytheir actin cytoskleleton, which is the cell’s ‘‘backbone.’’This type of information, which cannot be obtained usingstandard cell biology methods, allows for the estimation ofthe Young’s modulus of living cells (16). The Young’smodulus is a calculated value, which provides informationregarding the compliance or elasticity of a cell. Suchexperiments may be done with either the imaging AFMor using force spectroscopy. Manfred Radmacher’s grouphas conducted such measurements with an imaging AFMin force mapping mode. The advantage of such measure-ments is the wealth of information that they provide. Theseexperiments reveal not only the elastic properties of thecells being examined but also topographical information.They can also be performed in conjunction with videomicroscopy to further confirm what one is visualizingand that cells are not undergoing damage (17,18). In forcespectroscopy experiments, the Young’s modulus isobtained by poking the cell cantilever tip. This type of
MICROSCOPY, SCANNING FORCE 505
Figure 2. AFM Images of the cortical mesh of bovine pulmonaryartery endothelial cells (BPAEC). (a–d) High magnificationdeflection AFM images of the cortical mesh of living BPAECs ina physiological saline. The filamentous mesh appears to beorganized on two length scales, with coarse mesh (arrowheads)and fine mesh filaments (arrows). The two meshes are likely to beintertwined, although it is possible that the fine mesh is layeredover the coarse mesh. Lateral resolution in these images is�125 nm.
Figure 3. Topographical images (height; tapping mode in air) oftype I collagen monomers on a mica substrate. (a) low (1mg/ml)concentration of collagen, (b) high (10mg/ml) concentration ofcollagen.

information can be correlated with adhesion data to deter-mine whether elasticity changes in response to drugs orother stimulation have an effect on the strength of celladhesion (19).
Another application allows scientists to study proteinfolding. Proteins are composed of amino acid chains, whichconstitute the primary protein structure. These amino acidchains have to undergo folding into tertiary and secondary,3D structures, which is essential for the proper functioningof these proteins. Recently, advances in AFM have made itpossible to study this fascinating biological process andbring new insight into the energy landscapes of proteinfolding. Proteins involved in mechanical functions arecomposed of multiple domains, which fold individually.One of these domains is fibronectin. The most commonform of fibronectin is fibronectin type III (FN-III), which isfound in an estimated 2% of all animal proteins and hasthus been studied extensively. FN-III domains are found inthe muscle protein titin, which is responsible for the pas-sive elasticity of muscle. These domains have been found tounravel during forced extension. Understanding the forcesrequired in unfolding events as well as the time it takes forunfolding to happen can be critical for the physiologicalfunctions of mechanical proteins such as titin (9,20–22).
Now that a brief overview of the potential applications ofthe AFM has been provided, it is important to understandthe principles behind its operation. The following sectionfocuses on the theory of data acquisition using AFM as wellas descriptions of the equipment itself. The last section ofthis article provides a more in-depth evaluation of thetechnique in addition to discussing the most recentadvances in the field.
THEORY AND EXPERIMENTAL APPROACH
This section focuses on the theory and experimentalapproaches of AFM. The section begins with a descriptionof the imaging AFM as well as its different modes ofoperation, which allow for its applications in variousexperimental protocols. Later, force spectroscopy isdescribed. Focus is placed on the force apparatus usedin our laboratory, which relies on the same basic principalsas the commercially available AFMs. In addition to adescription of its operation, this section also discussesthe different applications of the force apparatus.
Imaging AFM
Optical Beam Deflection. An AFM has a force sensorcalled a cantilever to measure the forces between a sharptip and the surface (23). Unlike the optical microscope thatrelies on 2D images, the images acquired with the AFM areobtained in three dimensions: the horizontal xy-plane andthe vertical z-direction. As shown in Fig. 4, the tip at theend of the cantilever is brought in close proximity to thesample mounted on a piezoelectric element. The AFM canbe compared with a record player such as an old stylus-based instrument (1). It combines the principles of a scan-ning tunneling microscope (STM) and the stylus profiler.However, the probe forces in the AFM are much smallerthan those (� 104 N) achieved with a stylus profiler.
The AFM belongs to the family of scanning probe micro-scopes (SPMs). Like all other SPMs, the AFM uses anextremely sharp tip that moves over the sample surfacewith a raster scan (like the movement of the electron beamon the TV screen). In the first AFM, the bending of thecantilever was detected using an STM, but now a sensitiveand simple optical method is used in most AFMs (24). Asshown in Fig. 4, a laser beam is reflected off the cantileveronto a two-panel photodiode. As the cantilever bends, theposition of the reflected laser light changes. Measurementsare obtained as a result of the differences in the signalbetween the two segments of this photo-detector.
Feedback Operation. The AFM uses a piezoelectricelement to position and scan the sample with high resolu-tion. A tube-shaped piezoelectric ceramic that has a highstability is used in most SPMs. Application of voltageresults in the stretching or bending of the piezoelectrictube, allowing it to move in all three dimensions and toposition the cantilever probe with very high precision. Forexample, by applying a voltage to one of the two electrodes(xy-axis) the tube scanner expands and tilts away from acenter position (xy-origin). A corresponding negative vol-tage applied to the same electrode causes the tube scannercontract, resulting in movements on the xy-plane relative tothe origin. The magnitude of the movement depends on thetype of piezoelectric ceramic, the shape of the element, andthe applied voltage.
Feedback control is used for many common applications,such as thermostats, which are used to maintain a parti-cular temperature in buildings, and autopilot, commonlyused in airplanes. In the AFM, a feedback loop is used to
506 MICROSCOPY, SCANNING FORCE
LaserPhotodiode
Piezoelectrictube scanner
Bimorphactuator
Preamp A/DConverter
SPM controller
Computer & Interface
X, Y, Z signals
Cantilever & Tip Sample
Figure 4. Schematic illustration of an AFM. A force sensorconsists of a flexible cantilever with an extremely sharp tip atits end. A ceramic (Si3N4) or semiconductor (Si) tip on thecantilever can be brought into close proximity to a samplesurface. As the tip is close to the sample surface, it eithercontinuously touches or periodically vibrates on the surface, andbends or changes in its vibration amplitude and frequency. A laserspot is reflected off the top of the cantilever. When the cantileverbends, the laser light is deflected onto a two-panel photodiode. Thedetected signals are amplified and transformed by electroniccircuits and sent to an SPM controller. The SPM controller, thecomputer, and their interfaces generate an image.

keep the force acting on the tip in a fixed relationship withthe surface while a scan is performed. The feedback loopconsists of the piezoelectric tube scanner, the cantileverand tip, the sample, and the feedback circuit. The feedbackcircuit consists of proportional and integral gain controlsand provides an immediate response to scanning para-meter changes. A computer program acts as a compensa-tion network that monitors the cantilever deflection andattempts to keep it at a constant level.
Contact Mode (Static Mode). The AFM operates bymeasuring the intermolecular forces between the tip andsample. The most common method used in imaging AFM iscontact mode, where the piezoelectric element slightlytouches the tip to the sample. The experimental setup isshown in Fig. 4. As a result of the close contact, the tip andsample remain in the repulsive regime of the tip-sampleinteraction shown in Fig. 5. Thus, the AFM measuresrepulsive force between the tip and sample. As the rasterscan moves the tip along the sample, the two-panel photo-diode measures the vertical deflection of the cantilever,which reveals the local sample height. Each contour of the
surface results in a movement of the tip in the xyz-direction,resulting in a change in the deflection angle of the laserbeam. This change is measured through the photodiodeand translated finally to an image.
Tip-sample Interaction: The cantilever in the AFM is acritical component (1). The force produced by a springalways tends to restore the spring to its equilibrium posi-tion. When the spring is pushed upward by a distance z, ithas to be pulled downward. This restoring force is given byHooke’s Law as:
FðzÞ ¼ �k � ðz � z0Þ ()
where k is a spring constant and depends on the materialand dimensions of the cantilever, z is the vertical position ofthe cantilever, and z0 is the equilibrium position. As acantilever with a spring constant of 0.1 newton/meter (N/m) is moved by 1 nm, the resulting force is 0.1 nanonewton(nN). The first tip used by the inventors of the AFM wasmade from diamond glued to a lever of gold foil (1). Micro-fabricated cantilever tips are now commercially used.
Electromagnetic forces determine the properties ofsolids, liquids, and gases; the behavior of particles insolution; and the organization of biological structures(25). These forces are also the source of all intermolecularinteractions including covalent bonds, Coulomb forces,ionic forces, ion-dipole interaction, and dipole-dipole inter-action. In the AFM, the intermolecular interactionsbetween the tip and the sample surface include van derWaals forces, electrostatic forces, water capillary force, andmaterial properties including elasticity. The most commonforce in the tip-sample interaction is the van der Waalsforce. The force is calculated using the Lennard–Jonespotential, which combines the attractive van derWaals and the repulsive atomic potentials (25). The forcedepends on the distance between the tip and the sample, asshown in Fig. 5. This calculated force is an estimate of thevan der Waals forces and is usually a few nanonewtons inmagnitude.
Force-distance Curve: Since the invention of the AFM,many researchers have used it to measure the tip-sampleinteraction force on the atomic scale. The AFM records theforce as the tip is brought in close proximity to the samplesurface, even indented into the surface, and then pulled off.The measured force curve is a plot of cantilever deflectionversus the extension of the z-piezoelectric scanner(z-piezo). A force-distance curve is a kind of interpretationof the force measurements. It needs a simple relationshipbetween the cantilever deflection and the tip-sample dis-tance. Thus, the force-distance curve describes the tip-sample interaction force as a function of the tip-sampledistance rather than as a function of the z-piezo position. Itis difficult to measure the quantitative forces with thistechnique because the spring constant of the cantilever andthe shape of the tip are not accurately known. However,this technique has been used to study adhesion, elasticity,bond rupture length, and even thickness of adsorbedlayers. These studies of the fundamental interactionsbetween the sample surfaces have extended across basic
MICROSCOPY, SCANNING FORCE 507
Force
Tip-sample distance
Repulsiveregion
Attractiveregion
Contact mode
Intermittent contact
Non-contact
Figure 5. Relationship between the operating modes of AFM andthe force regions. The x-axis of the graph is the tip-sample distanceand the y-axis is the force or potential. The graph shows the force orpotential, as a function of the distance, simply calculated by theLennard–Jones potential and the DMT approximation. In contactmode AFM, the tip-sample interaction lies in the repulsive regionof the curve above the x-axis. As the cantilever is pushed upward, aresulting restoring force occurs, which can be given by Hooke’sLaw. The difference between this graph and the measured force-distance curve occurs when the force measurement is not static butdynamic and is quickly affected by the capillary force in the thinsurface water layer. In intermittent contact mode, the cantilever isoperated by a vibration of an amplitude of 10 to 100 nm. The tip isstill in contact with the surface, but it just contacts or ‘‘taps’’ on thesurface for a very small fraction of its oscillation period. In thisoperation mode, the tip-sample interaction is broad, ranging fromthe repulsive region of the curve to the attractive region due to thelong-range van der Waals force. The tip-sample interaction innoncontact mode is much weaker than the one in contact andintermittent contact mode. The force between the tip and sample isseveral orders of magnitude weaker than in the contact regime. Asthe cantilever in noncontact mode is vibrated near its resonancefrequency with an amplitude less than 10 nm, the spacing betweenthe tip and sample is on the order of several to tens of nanometers.
science, chemistry, biology, and even material science. Theinteraction force between tip and sample is typically on theorder of tens of pN for biomolecular interactions. Forcemeasurements in solution have the advantages of the AFMdue to the lower tip-sample interaction.
Constant Force and Constant Height: In contact mode, thetip is scanned across the surface in contact either at aconstant force or at a constant height above the sample.Constant force mode is achieved by use of a z-feedback loopfrom the deflection signal. The feedback circuits serve tomaintain a constant force between the tip and the samplewhile the tip follows the contours of the surface. Thepiezoelectric tube can respond to any changes in the canti-lever deflection. A computer program acts to keep thecantilever deflection at a constant level. Then, the tip-sample interaction can be kept at a predetermined restor-ing force. This technique is used to observe the precisetopography of the sample surface. If the z-feedback loop isswitched off, then the z-direction of the piezoelectric tube iskept constant, and an image is generated based on thecantilever deflection. Using constant height can be usefulfor imaging very flat samples.
Lateral Force Microscopy: Lateral force microscopy(LFM) is an extension of contact mode, where an additionaldetected parameter is the torsion of the cantilever, whichchanges according to the friction force (26). This lateralforce induces a torsion of the cantilever, which, in turn,causes the reflected laser beam to undergo a change in aperpendicular direction to that resulting from the surfacecorrugation. The LFM uses a photodiode with four seg-ments to measure the torsion of the cantilever. When thecantilever is scanned across the surface in contact, differ-ences in friction between tip and sample cause the tip tostick-slip on the surface. This stick-slip behavior creates acharacteristic saw-tooth waveform of atomic level in thefriction image (27). The LFM can provide material-sensi-tive contrast because different components of a compositematerial exert different friction forces. Researchers oftencall this operation mode friction force microscopy (27,28).Increasing wear with decreasing sliding velocity on thenanometer scale has been observed with this technique. Ithas been demonstrated with LFM that, on the atomic scale,frictional properties are sensitive to changes in surfaceproperties on chemical modification. The LFM can also beapplied to chemical force microscopy (CFM) by a modifiedtip with chemical functionality (29). It has been demon-strated with CFM that mapping the spatial arrangement ofchemical functional groups and their interactions is ofsignificant importance to problems ranging from lubrica-tion and adhesion to recognition in biological systems.
Capillary Force: The thin surface water layer that existson the sample surface will form a small capillary bridgebetween the tip and the sample. The capillary force isimportant when the AFM is operated in air. Examinethe effect of surface tension on AFM measurements. Atthe moment of tip contact with a liquid film on a flatsurface, the film surface reshapes producing a ring aroundthe tip. The water layer wets the tip surface because the
water-tip contact (if it is hydrophilic) is energeticallyadvantageous as compared with the water-air contact. Ifthe tip radius is 10 nm and the contact angle is small (i.e.,hydrophilic), a capillary force of about 10 nN can result.Thus, the capillary force is the same order of magnitude asthe van der Waals interaction. An AFM tip has been used towrite alkanethiols with a 30 nm line-width resolution on agold thin film in a manner analogous to that of a dip pen(30). Recently, this dip-pen nanolithography has also beenapplied to direct nanoscale patterning of biological materi-als such as DNA, peptides, and proteins on glass sub-strates.
Vibration Mode (Dynamic Mode). In dynamic mode, thecantilever is oscillated close to its resonance frequency.This vibration mode operates at a frequency-modulation(FM) mode or the more common amplitude-modulation(AM) mode, which are basically the same as the frequenciesused in radio communication. In the FM mode, a z-feedbackloop keeps a constant force between the tip and the samplewhile the tip follows the contours of the surface by main-taining the resonance frequency. In the AM mode, the z-feedback loop keeps the constant tip-sample interaction bymaintaining the amplitude of oscillation.
Intermittent Contact Mode: The cantilever in dynamicmode can easily be vibrated by a piezoelectric ceramiccalled a bimorph actuator. In air, the cantilever is oscil-lated close to its resonance frequency and positioned abovea sample surface. When the vibrating cantilever comesclose to the surface, its oscillation amplitude may changeand can be used as the control signal. In this AM mode, thetip is still in contact with the surface, but it just contacts or‘‘taps’’ on the surface for a very small fraction of its oscilla-tion period. This operation mode is best known as tappingmode in commercial AFMs and, more generally, as inter-mittent contact mode.
As a raster scan moves the tip on the sample, the four-segment photodiode measures the vibration signal of thecantilever. The detected signal can be changed to root mean-square values by an analog-to-digital converter. In constantforce mode, the z-feedback loop adjusts so that the averagedamplitude of the cantilever remains nearly constant. Eachcontour of the surface causes a movement of the tip in thexyz-direction, resulting in a change of the oscillation ampli-tude of the cantilever. This change is measured through aphotodiode and finally translated to an image. In air, frictionforces due to the surface water layer are dramaticallyreduced as the tip scans over the surface. Tapping modemay be a far better choice than contact mode for imaging ofbiological structures due to their inherent softness. In tap-ping mode, the cantilever can be vibrated at an amplitude ofless than 100 nm. Additionally, changes in the phase ofoscillation under tapping mode can be used to discriminatebetween different types of materials on the surface.
Tip-Sample Interaction: The mechanical resonance ofthe cantilever plays a major role in the response of thesystem for an interaction between a tip mounted on avibrating cantilever and a non-homogeneous external force(23). Although basic equations governing the operation of a
508 MICROSCOPY, SCANNING FORCE

bimorph actuator used to vibrate the cantilever are notintroduced here, the position of the bimorph is given by:
u ¼ u0 þ Aex cosðvtþÞ
where u0 is the equilibrium position and the excitation isdone with amplitude Aex, a frequency v, and a phase shiftf. The fundamental resonance frequency of the cantilevercan be approximately calculated from equating its strainenergy at the maximum deflection to the kinetic energy atthe point of zero deformation. A more accurate method,which takes into consideration all the resonance frequen-cies of the cantilever together with the modes of vibration,can be obtained by solving the equation of motion subject tothe boundary conditions (23). A basic equation to describethe motion of the cantilever is briefly introduced. If the tip-sample interaction is uniform and includes dissipativeforce in Newton’s second law, the vibration system includ-ing the cantilever can be described as follows:
FðzÞ ¼ kðz � uÞ þ yðdz=dtÞ þ mðd2z=dt2Þ ()
where F(z) is the tip-sample interaction force, k is a springconstant of the cantilever, z is the vertical position of thecantilever, u is the motion of the bimorph, g is the dissipa-tion term (i.e., the friction coefficient of the material or theenvironment), and m is the effective mass of the cantilever.For the constant amplitude mode, we assume that thefrictional force g (dz/dt) is compensated for by the drivingforce Fex¼ k Aex cos(vtþf). Then, the equation of motion isreduced to F(z)¼ k zþm(d2z/dt2). If a strong tip-sampleinteraction occurs only at the point of contact, the motionof the cantilever tip can be almost perfect harmonic oscilla-tion, z¼ zoþA sinvt.
Resolution and Tip Effects: The resolution obtained byan AFM depends greatly on the sharpness of the cantilevertip. Broadening effects usually develop when imaging bio-logical structures having extremely small surface featureslike a DNA strand (4). If a tip with a radius of curvature ofabout 20 nm is used to image DNA on a substrate surface,the observed width is about 20 nm, which is considerablygreater than the expected value of 2.4 nm deduced from thevan der Waals radii of DNA. When the tip radius iscomparable with the size of the feature being imaged, itis important to evaluate the radius of the tip end. As such,the development of sharper tips is currently a major con-cern for commercial vendors, which is also of interest forbiologists whose work would greatly benefit from muchfaster scanning. Recently, improvement of the scanningspeed in AFM is one of the most important topics. The tip-sample interaction also tends to distort biological struc-tures because they are relatively soft (31).
Phase Imaging: Phase imaging is an extension of tap-ping mode based on the measurement of the cantileverphase lag (32). The dependence of phase angles in tappingmode AFM on the magnitude of tip-sample interactions hasbeen demonstrated. The phase images of several hard andsoft samples have been recorded as a function of the freeamplitude and the reference of the tapping amplitude. It isthought that the elastic deformation associated with the
tip-sample repulsive force can be estimated by the repul-sive contact interaction. In many cases, phase imagingcomplements the LFM and force modulation techniques,often providing additional information along with a topo-graphic image. Phase imaging like LFM can also be appliedto CFM by using a modified tip with chemical functionality.
Pulsed Force Mode: Pulsed force mode (PFM) is a non-resonant and intermittent contact mode used in AFMimaging (33). It is similar to tapping mode in that thelateral shear forces between the tip and the sample arealso reduced. In contrast to tapping mode, the maximumforce applied to the sample surface can be controlled, and itis possible to measure more defined surface propertiestogether with topography. This mode is similar to the forcemodulation techniques of CFM in that a chemically mod-ified tip is used. A series of pseudo force-distance curvescan be achieved at a normal scanning speed and with muchlower expenditure in data storage. A differential signal canbe amplified for imaging of charged surfaces in terms of anelectrical double-layer force.
Noncontact Mode: A reconstructed silicon surface hasbeen imaged in a noncontact mode by AFM with trueatomic resolution (34). The operation of the AFM is basedon bringing the tip in close proximity to the surface andscanning while controlling the tip-sample distance for theconstant interaction force. The tip-sample interactionforces in noncontact mode are much weaker than thosein contact mode, as shown in Fig. 5. The cantilever must beoscillated above the sample surface at such a distance as isincluded in the attractive regime of the intermolecularforce. Most surfaces are covered with a layer of water,hydrocarbons, or other contaminants when exposed toair, which makes it very difficult to operate in ambientconditions with noncontact mode. Under ultrahighvacuum, clean surfaces tend to stick together, especiallywhen the materials are identical. The FM mode used innoncontact mode can keep the constant tip-sample inter-action by maintaining the resonance frequency of oscilla-tion through the z-feedback loop. Nearly ten yearsfollowing the invention of the AFM, a few groups achievedtrue atomic resolution with a noncontact mode (35). Afterthat, several groups succeeded in obtaining true atom-iclevel resolution with noncontact mode on various sur-faces. Many important yet unresolved problems, such asdetermining the tip-sample distance where atomic-levelresolution can be achieved, still remain. Experimentally,atomic-level resolution can be achieved only between 0 and0.4 nm. A stiff cantilever vibrates near resonance fre-quency (300–400 kHz) with amplitude of less than 10 nm.
In covalently bound materials, the charge distributionof surface atoms reflects their bonding to neighboringatoms (36). These charge distributions have been imagedby noncontact mode with a light-atom probe such as agraphite atom. This process revealed features with a lat-eral distance of only 77 picometers (pm). However, all of theatomic-scale images have been generated in ultrahighvacuum, which has limited applications in biology.Recently, several groups have reported obtainingatomic-scale images with FM mode in ambient conditions
MICROSCOPY, SCANNING FORCE 509

and liquid environments. In the near future, true atomic-level imaging by AFM will be commercially available invarious environments.
Force Spectroscopy
EquipmentAFM Instrumentation. The AFM that is used in the
author’s laboratory is a homemade modification of thestandard AFM design that is used for imaging and is shownin Fig. 5 (19). It operates on the same basic principles as acommercial AFM. In the author’s design, improvement ofthe signal quality by reducing mechanical and electricalnoise and improvement of the instrument’s sensitivity byuncoupling the mechanisms for lateral and vertical scanswas achieved. The cantilever is moved vertically up anddown using a piezoelectric translator (Physik Instrumente,model P-821.10) that expands or contracts in response toapplied voltage. The vertical range of the piezo is 0–15mm.A dish coated with substrate is placed below the cantilever,and the cantilever with a cell or protein attached can belowered onto that dish using the piezo allowing for thereceptor-ligand interaction to take place. During the acqui-sition of a force scan, the cantilever is bent (Fig. 6) causingthe beam of a 3 mW diode laser (Oz Optics; em. 680 nm)that is focused on top of the cantilever to be deflected. Atwo-segment photodiode (UDT Sensors; model SPOT-2D)monitors these deflections of the laser beam. An 18 bitoptically isolated analog-to-digital converter (InstrutechCorp., Port Washington, NY) then digitizes the signal fromthe photodiode. Custom software is used to control thepiezoelectric translator and to time the measurements.The AFM is shielded inside of an acoustic/vibration isola-tion chamber in order to reduce vibration and aid in keep-ing a stable temperature. The detection limit of the AFMsystem is in the range of 20 pN.
Cantilever Calibration. It is necessary to determine thespring constant of the cantilever kC (i.e., F¼ kCx) in order totranslate the deflection of the cantilever x to units of forceF. Calibrating the cantilever can be achieved throughtheoretical techniques that provide an approximation ofkC (37) or through empirical methods. Using empiricalmethods to determine kC involves taking measurementsof cantilever deflection with application of a constantknown force (38) or measuring the cantilever’s resonantfrequency (39). The method the author’s use for calibratingcantilevers is based on Hutter and Bechhoefer (39). The
author’s use triangleshaped unsharpened gold-coated sili-con-nitride cantilever tips that have spring constants ran-ging from 10 mN/m to 50 mN/m for ligand-receptor forcemeasurements (TM Microscopes, Sunnyvale, CA). Thecantilever tip can be treated as a simple harmonic oscillatorwhose power spectrum of thermal fluctuation can be usedto derive the spring constant, which can be achieved byraising the cantilever a few microns from the surface of theexperimental dish and monitoring its natural vibrationalfrequency for 2–3 s. Each vibration mode of the cantileverreceives the thermal energy commensurated to one degreeof freedom, kB T/2. The measured variance of the deflectionhxi2, can then be used to calculate the spring constant (i.e.,kBT¼ kChxi2, where kB and T are Boltzmann’s constant andtemperature, respectively). To separate deflections belong-ing to the basic (and predominant) mode of vibration fromother deflections or noise in the recording system, thepower spectral density of the temperature-induced deflec-tion is determined. The spring constant is estimated usingonly the spectral component corresponding to the basalmode of vibration. The spring constant can be calibrated ineither air or solution using this approach. The calculatedspring constant kC can then be used to calculate ruptureforce F by F¼ kCCD V. DV is the change in voltage detectedby the photodiode just prior to and immediately after therupture event. C is a calibration constant that relatesdeflection and photodiode voltage and is determinedfrom the deflection of the cantilever when it is pressedagainst a rigid surface, such as the bottom of a plastic petridish (19).
ApplicationsReceptor-Ligand Adhesion Measurements. Bell Model:
AFM force measurements (Fig. 7) of ligand-receptor inter-actions can be used to determine the dynamic strength of acomplex and characterize the changes in free energy thatthe particular complex undergoes (i.e., energy landscape)during its breakage. The Bell model can be used to inter-pret these measurements (40). The Bell model is based onthe assumption that the application of an external mechan-ical force to a receptor-ligand interaction bond will reducethe activation energy that needs to be overcome in order tobreak this bond. This unbinding force should increase withthe logarithm of the rate at which an external mechanicalforce is applied toward the unbinding of adhesioncomplexes (i.e., loading rate), which was confirmed by anumber of studies. For example, studies using the biomem-brane force probe (BFP) (40) and the AFM have shown thatincreases in loading rate cause an increase in rupture forcebetween individual complexes of streptavidin/biotin(12,15,41).
AFM Measurements of Adhesive Forces: In order to carryout force measurements, a cell is first attached to a canti-lever tip and another cell or substrate proteins are platedon a dish. The method employed to attach cells to thecantilever tip works best on nonadherent items. A cell isattached to the AFM cantilever via concanavalin A (con A)-mediated linkages (15). Most cells have receptors for con Aon their surface and will attach to the tip. To prepare thecon A-functionalized cantilever, the cantilevers are soaked
510 MICROSCOPY, SCANNING FORCE
Figure 6. AFM experimental set-up. (a) Schematic diagram of theAFM. (b) Photograph of the author’s AFM setup. The CCD camerais not in view.

in acetone for 5 min, UV irradiated for 30 min, and incu-bated in biotinamidocaproyl-labeled bovine serum albumin(biotin-BSA, 0.5 mg/ml in 100 mM NaHCO3, pH 8.6; Sigma)overnight. The cantilevers are then rinsed three times withphosphate-buffered saline (PBS, 10 mM PO4
3�, 150 mMNaCl, pH 7.3) and incubated in streptavidin (0.5 mg/mlin PBS; Pierce, Rockford, IL) for 10 min at room tempera-ture. Following the removal of unbound streptavidin, thecantilevers are incubated in biotinylated Con A (0.2 mg/mlin PBS; Sigma) and then rinsed with PBS.
The actual process of attaching a cell to a cantilever tipis reminiscent of fishing. A cantilever tip is positionedabove the center of the cell. The largest triangular canti-lever (320mm long and 22mm wide) with a spring constantof 0.017 N/m on the cantilever chip is usually used in ourmeasurements. The cell is brought into focus, with thecantilever slightly out of focus. Then, the tip is loweredonto the center of the cell and held there motionless forapproximately 1 s. When attached, the cell is positionedright behind the AFM cantilever tip. The force required todislodge the cell from the tip is greater than 2 nN, which ismuch greater than the forces measured in the receptor-ligand studies that were, at most, 300 pN (15).
A piezoelectric translator is used during measurementacquisition to lower the cantilever with an attached cell ontothe sample. The interaction between the attached cell andthe sample is given by the deflection of the cantilever. Thisdeflection is measured by reflecting a laser beam off thecantilever into a position sensitive two-segment photodiodedetector, as described in the instrumentation section above.
As a result of this process, a force scan is obtained. Thestudies shown in Fig. 8 (42,43) were conducted on cellsexpressing the adhesion receptor LFA-1 (leukocyte func-tion-associated antigen-1), an integrin expressed on thesurface of T-cells, and its ligand ICAM-1 (intercellularadhesion molecule-1), expressed on the surface of APCs.In these experiments, LFA-1-expressing cells and ICAM-1protein were used. An example of a few force scans frommultiple bond cell adhesion studies can be seen in Fig. 8a.The red trace is the approach trace and the black is theretract trace. As the cantilever is lowered and contact ismade between the cell and substrate, an initial increase inforce occurs. As the cantilever is retracted back up, theforce returns to zero and becomes negative as bonds arestretched and begin to break. The jumps in the force scan,which are pointed out by the arrows, represent bondsbreaking. Two parameters can be used in such measure-ments to assess the level of cell adhesion. One is thedetachment force, which is the maximum force requiredto dislodge the cell. Another is the work of deadhesion,which is the amount of work required to pull and stretch
MICROSCOPY, SCANNING FORCE 511
Approach
Retract
Separation
Contact
AFM cantilever
3A9
Immobilized ICAM-1
Figure 7. Steps in the acquisition of an AFM force measurement.The first step is the approach of the cantilever with a cell bound tothe substrate, followed by contact between the cell and substrateand retraction of the cantilever, which results in the separation ofthe cell from the substrate. The cantilever is bent during thisprocess. The arrows indicate the direction of cantilever movement.
Figure 8. AFM force versus displacement traces of theinteraction between cells expressing LFA-1 and immobilizedICAM-1. (a) Multiple-bond measurements acquired with acompression force of 200 pN, 5 s contact, and a cantileverretraction speed of 2mm/s. The measurements were carried outwith a resting, untreated cell (1st trace), a Mg2þ-treated cell (2ndtrace), and a PMA-stimulated cell (3rd trace). The 4th tracecorresponds to a measurement acquired from a PMA-stimulatedcell in the presence of LFA-1 (20mg/ml FD441.8) and ICAM-1(20mg/ml BE29G1) function-blocking monoclonal antibodies(mAbs). Arrows point to breakage of LFA-1/ICAM-1 bond(s). fde
is the detachment force, and the shaded area estimates the work ofde-adhesion. (b) Single-molecule measurements of LFA-1/ICAM-1unbinding forces. Traces 2 and 5 show adhesion. Measurementswere obtained under conditions that minimized contact betweenthe LFA-1-expressing cell and the ICAM-1-coated surface. Thecompression force was reduced to � 60 pN and the contact time to50 ms. An adhesion frequency of less than 30% in the forcemeasurements ensured that a >85% probability exists that theadhesion event is mediated by a single LFA-1/ICAM-1 complex(42,43). The frequency of adhesion in test and control experimentswas examined to confirm the specificity of the interaction. Theaddition of monoclonal antibodies against either LFA-1 or ICAM-1significantly lowered the frequency of adhesion of both resting cellsand activated cells under identical experimental conditions.

the cell and for the bonds to break. It is derived by inte-grating the adhesive force over the distance traveled by thecantilever. In this example, Mg2þ and PMA are used, whichenhance the adhesion of the cells studied through variousmechanisms. It is easily observed that a very pronouncedincrease occurs in the area under the curve as well as thenumber of bonds that were broken following the applica-tion of these adhesion stimulators (16).
FM Force Measurements of Individual Receptor/LigandComplexes: A different set of information can be derivedfrom single-molecule adhesion measurements. These typeof studies offer insight into the dissociation pathway of areceptor-ligand interaction and the changes in free energythat are associated with this process, which is achieved bymeasuring single-bond interactions between a receptorand ligand at increasing loading rates (20 pN/s–50,000 pN/s). In the author’s setup, it translates to usingrates of retraction of the cantilever from 0.1 to 15mm/s.
In order to obtain unbinding forces between a singlereceptor-ligand pair, the experiments have to be carriedout in conditions that minimize contact between the canti-lever tip and substrate. A > 85% probability exists that theadhesion event is mediated by a single bond if the fre-quency of adhesion is maintained below 30% (15,42). Anexample of such measurements can be seen in Fig. 8b.
Depending on the speed at which the cantilever isretracted during the measurements, the collected datausually needs to be corrected for hydrodynamic drag,which is due to the hydrodynamic force that acts in theopposite direction of cantilever movement, and its mag-nitude is proportional to the cantilever movement speeds.The hydrodynamic force may be determined based on themethod used by Tees et al. and Evans et al. (42,43). Insingle-bond AFM studies, it is found that the dataobtained with cantilever retraction speeds higher than1mm/s needed to be corrected by adding the hydrodynamicforce.
The damping coefficient can be determined by plottingthe hydrodynamic force versus the speed of cantilevermovement. The damping coefficient is the slope of thelinear fit and was found to be about 2 pN &s/mm in theauthor’s work (15).
AFM Measurements of Cell Elasticity. The AFM can alsobe used as a microindenter that probes the mechanicalproperties of the cell. In these measurements, which enableassesment of cell elasticity, a bare AFM tip is lowered ontothe center of the cell surface at a set rate, typically 2mm/s.Following contact, the AFM tip exerts a force against thecell that is proportional to the deflection of the cantilever.The indentation force used is below 1 nN (� 600 pN) inorder to prevent damage to the cell. The deflection of thecantilever is recorded as a function of the piezoelectrictranslator position during the approach and withdrawalof the AFM tip. The force-indentation curves of the cells arederived from these records using the surface of the tissueculture dish to calibrate the deflection of the cantilever.Then, one can estimate the Young’s modulus, which is ameasure of elasticity. Estimates of Young’s modulus aremade on the assumptions that the cell is an isotropic elastic
solid and the AFM tip is a rigid cone (44–46). Accordingto this model, initially proposed by Hertz, the force (F)indentation (a) relation is a function of Young’s modulus ofthe cell, K, and the angle formed by the indenter and theplane of the surface, u, as follows:
F ¼ K
2ð1 � v2Þ4
p tan ua2 ð1Þ
Young’s modulus are obtained in the author’s laboratory byleast square analysis of the forceindentation curve usingroutines in the Igor Pro (WaveMetrics, Inc., Lake Oswego,OR) software package. The indenter angle u and Poissonratio n are assumed to be 558 and 0.5, respectively.
In order to determine the cell’s elasticity, the forceversus indentation measurements are fitted to the curvesof the Hertz model. Figure 9 (44–46) illustrates an exampleof such measurements acquired on cells of varying elasti-city. Cells with the greatest degree of indentation at aparticular applied force will have the lowest Young’s mod-ulus values and will therefore be the ‘‘softest.’’
Protein Folding/Unfolding. The AFM can also be used tostudy protein unfolding. A cantilever tip is used to pick upproteins attached to a surface, which is followed by retrac-
512 MICROSCOPY, SCANNING FORCE
B
Force (pN)
300
1.0
0.5
00 200
Inde
ntat
ion
(µm
)
100
Mg2+/EGTA
PMA
Resting
A
3A9 cell
α
θ
AFM tip
Figure 9. Acquisition of cell compliance measurements. (a) Tip ofthe AFM cantilever indenting a 3A9 cell. The cell compliancemeasurements were based on the assumption that the cell is anisotropic elastic solid and the AFM tip is a rigid cone (44–46).According to this model, initially proposed by Love and Hertz, theforce (F)-indentation (a) relation (shown) is a function of Young’smodulus of the cell, K, and the angle formed by the indenter andthe plane of the surface, u, as in equation (1). The indenter angle, u,is assumed formed by the AFM tip and the 3A9 cell to be 558 andthe Poisson ratio n to be 0.5. (b) Force versus indentation traces ofresting, PMA-stimulated and Mg2þ-treated 3A9 cells.

tion of the cantilever, which results in protein unfolding.The length of the unfolded protein can be over ten times itsfolded length, depending on the protein being studied (9).
This forced protein unfolding generates an opposingforce due to the sudden drop in entropy as the protein isunfolded. Although a lower force is required to beginunfolding the protein, the force required to continue theunfolding is increased rapidly as the protein approaches itsfull, unfolded length. This phenomenon has been describedby the worm-like chain model (WLC) of elasticity. The WLCmodel is based on two parameters, the total or contourlength of the polymer being stretched and the persistencelength. The persistence length reflects the polymer flex-ibility and is the length attained when a polymer is bent. Asmaller persistence length is an indication of higherentropy and a polymer that is more difficult to unfold(47). When a multidomain protein is extended using theAFM, the first domain is unfolded at a certain pulling force,followed by a return of the cantilever to zero. Furtherunfolding meets with resistance once again, resulting ina characteristic saw-tooth profile of the unfolding, witheach domain that was unfolded being represented by apeak. Figure 10 from Andreas F. Oberhauser illustratesthis process. It is the unfolding of a titin polyprotein, whichis composed of FNIII domains (22). The protein can also berefolded following unfolding, which is done by bringing thecantilever back down to the substrate and once againretracting it. If force curves representative of unfoldingare observed once again, then refolding most likely tookplace. It is a much slower process (on the order of seconds)than the forced unfolding (48).
EVALUATION
Imaging AFM
The AFM is an exciting novel technology that enables thestudy of biological structures under physiological condi-tions. The AFM is probably the only technique of its kind
that enables image dynamic processes taking place in realtime. A number of other techniques are currently avail-able in the biological sciences for imaging studies, how-ever, most result in modifications to the biological sample.One such technique is electron microscopy (EM), which,until recently, provided images of the highest resolutions.In recent years, a number of modifications to the AFMhave brought the resolution up to par and even surpassedthose of EM.
In recent years, many advances have been made in the fieldof AFM. Significant improvements in resolution have beengained through cantilever tip modification. The currentlyavailable cantilevers are relatively ‘‘soft’’ and flexible withspring constants of 0.01–0.5N/m. Tip deformation is oneaspect that limits resolution. Recently, stiffer cantilevers havebeen designed improving resolution. One example are quartzcantilevers with spring constants on the order of 1kN/mallowing for possibly subatomic-level resolution (34). Smallercantilevers have been designed that increase the possiblescanning speed of the AFM. Images of 100 100 pixels(240nm scan size) have been achieved in 80ms. A sharper,finer tip can also improve resolution, which has been achievedthrough the use of carbonanotubes, probably the greatestprobe improvement to date, which are seamless cylinderscomposed of sp2-bonded Carbon (49).
Several characteristics exist that make Carbon nano-tubes improved AFM tip materials, including small dia-meter, a high aspect ratio, large Young’s modulus, andmechanical robustness. They are able to elastically buckleunder large loads. All these properties translate intohigher sample resolution. Chemical vapor deposition hasmade it easier to grow Carbon nanaotubes on cantileversurfaces, a process that replaces previously more laboriousand time-consuming attachment techniques (4,50).
A few techniques also exist worth mentioning that haveimproved AFM imaging. One such method is cryoAFM.This method addresses the previously mentioned problemof tip and sample flexibility. In this case, samples areimaged at extremely cold temperatures in their cryogenicstates, which provides a rigid surface that exhibits a highYoung’s modulus, thus reducing cantilever deformationand increasing resolution. CryoAFM images match andsurpass EM images. Other improvements address theproblem resulting from the vibration induced by the com-monly used piezoelectric translator. This vibration is trans-lated to the cantilever holder and the liquid containing thesample being imaged. Magnetic mode (MAC) eliminatesthe cantilever holder entirely and replaces it with a mag-netic cantilever. The cantilever is manipulated via a mag-netic field. Photothermal mode (PMOD) uses a bimetalliccantilever that is oscillated via a pulsed diode laser (50,51).
Advances have also been made in single-moleculemanipulation with a nanomanipulator. This method relieson a force feedback pen that actually allows the user totouch and manipulate the sample being studied. For exam-ple, one can dissect DNA from a chromosome. The inter-action forces involved during manipulation of samples canalso be studied through oscillating mode imaging. Thenanomanipulator can now measure forces in the pN–mNrange. For excellent reviews on this technique, see Yanget al. (50) Fotiadis et al. (52).
MICROSCOPY, SCANNING FORCE 513
Figure 10. Consecutive unfolding peaks of a titin polyprotein,composed of FNIII domains. The inset demonstrates thecorresponding steps of the unfolding process in correlation tothe AFM data.

Progress has also been made in imaging of membraneproteins, which are not ideal candidates for X-ray crystal-lography, as they do not readily form 3D crystals. Atomic-level resolution images have been obtained of membraneproteins complexed with lipids using EM. However, AFMimages of these proteins offer an improvement in that theycan be carried out in near physiological conditions andallow for the acquisition of functional and structural infor-mation (50,52).
The continued improvements leading to the enhancedimaging capabilities of AFM are reflected in the mostrecent work being done in the field. We would like tohighlight one area where a great deal of progress has beenmade, which is the filed of DNA and RNA assembly ofnanostructures in which the imaging AFM plays a pivotalrole. Some of the earlier successes in this area included theconstruction of 2D DNA arrays, which were assembled in apredictable manner (53). Much progress has also beenmade with RNA in an attempt to design self-assemblingbuilding blocks. The goal of such studies is to generatemolecular materials, the geometry of which can be deter-mined for applications in nanobiotechnology (54–56).Chworos et al. were able to form stable RNA structurestermed ‘‘tectosquares’’ from RNA helices without the pre-sence of proteins (5). ‘‘TectoRNAs’’ can be thought of asRNA Lego blocks that can be used for the formation ofsupramolecular structures. In order for these structures tobe assembled, the right conditions have to be met in termsof divalent ion concentrations, temperature, as well as thestrength, length, and orientation of the RNA. The AFM isan essential tool used in this process as it allows theresearcher to obtain detailed images of the assembledtectosquares providing the opportunity to compare pre-dicted structures with those that actually formed. Thestructures formed by Chworos et al. were in good agree-ment with the predicted structures. Figure 11 demon-
strates the amazing predictability of assembly of thesestructures, where nine different types of RNA patternswere created (5). Such DNA and RNA structures mayhave applications in nanotechnology and the materialsciences as they could be used to generate nanochips,nanocircuits, and nanocrystals (57). For an excellent recentreview of DNA nanomechanical devices, please seeSeeman (58).
Force Spectroscopy
Force spectroscopy allows us to measure interaction forcesbetween receptors and their respective ligands. Thesestudies can be carried out with purified proteins or cells,or a combination of both. Traditionally, adhesion measure-ments have been conducted using adhesion assays, whichinvolve the attachment of cells to dishes coated with sub-strate. The cells are later dislodged manually or using acentrifuge, which are older yet still viable techniques thatprovide basic kinetic information about the interaction of areceptor-ligand pair. More advanced techniques for con-ducting force measurements include the use of micronee-dles, optical tweezers, magnetic beads, and thebiomembrane force probe. These techniques, much likethe AFM, provide more advanced information from whichenergy landscapes of an interacting receptor-ligand pairmay be determined (11).
The AFM is also a powerful tool for determining themechanical properties of cells, which was traditionallydone using micropipettes or the cell poker, which offeredmuch less precision than the AFM. More recently, methodssuch as the scanning acoustic microscope, optical tweezers,and magnetic tweezers have also been used in addition tothe AFM (59).
An important advantage of the AFM over other methodsis that it can be used in conjunction with other techniquesthrough relatively simple modifications. Recently, it hasbeen combined with the patch clamp technique to study themechanically activated ion channels of sensory cells of theinner ear. This strategy allowed the researchers to use theAFM tip to stimulate the mechanosensory hair bundles byexerting force on them and measure the electrical output ofthe patch clamp simultaneously (9,60). Another example iscombining an AFM with a confocal microscope, which couldallow one to monitor cellular responses to AFM measure-ments using fluorescent reporter systems. One could moni-tor calcium levels, expression of caspases, and so on (61,62).The AFM could also be combined with RICM microsopy aswell as FRET.
Other recent advances involve modifications that wouldallow for more efficient and effective receptor-ligand stu-dies, including the use of more than one cantilever on thesame chip simultaneously. In this case, multiple proteinscould be attached and their interaction with their ligandcould be measured. So far, this approach has been donewith two cantilevers, which involves the use of two laserbeams. Further modifications could allow for measure-ments with even more proteins. Improvements can alsobe mad in plating of the ligands proteins. In the idealscenario, different proteins could be plated so that inter-action between different receptor-ligand pairs cools be
514 MICROSCOPY, SCANNING FORCE
Figure 11. Diagram and AFM images of tectosquarenanopatterns generated from 22 tectosquares. One micrometersquare scale AFM images obtained in solution (clockwise from theupper leftmost image) for the ladder pattern, fish net pattern,striped velvet pattern, basket weave pattern, cross pattern, tartanpattern, polka dot pattern, lace pattern, and diamond pattern.Scale bar, 20 nm.

carried out simultaneously. Current improvements alsoinvolve finding better ways to attach cells and proteinsto the cantilever that would result in covalent attachmentto the tip. Another area that requires improvement is dataanalysis. The currently available analysis programinvolves days of rather tedious computer time. Automatinganalysis would greatly reduce the time required to study aparticular interaction. Also, some improvements can bemade in data acquisition, where still frequent adjustmentsof cantilever retraction speed and contact time are requiredthroughout the course of the experiment. Automating dataacquisition would allow experiments to be carried outduring the night, when noise levels are also minimal.
The applications of AFM technology are vast and toonumerous to describe in one review article. The author’shave attempted to summarize the technology that wasdeemed to be of great importance in the developing fieldof AFM. AFM technology is still limited to a relatively smallnumber of laboratories, which is most likely due to the lackof familiarity with the field, limited expertise in operation,as well as the expense involved in acquiring an AFM.However, it is changing as more and more people are dis-covering the possibilities that become open to them if theyacquire and familiarize themselves with this technology.
BIBLIOGRAPHY
1. Binnig G, Quate CF, Gerber C. Atomic force microscope. PhysRev Lett 1986;56:930–933.
2. Heinz WF, Hoh JH. Spatially resolved force spectroscopy ofbiological surfaces using the atomic force microscope. TrendsBiotechnol 1999;17(4):143–150.
3. Engel A, Lyubchenko Y, Muller D. Atomic force microscopy: Apowerful tool to observe biomolecules at work. Trends CellBiol 1999;9(2):77–80.
4. Hansma HG. Surface biology of DNA by atomic force micro-scopy. Annu Rev Phys Chem 2001;52:71–92.
5. Chworos A, et al. Building programmable jigsaw puzzles withRNA. Science 2004;306(5704):2068–2072.
6. Kasas S, et al. Escherichia coli RNA polymerase activityobserved using atomic force microscopy. Biochemistry1997; 36(3):461–468.
7. Rivetti C, et al. Visualizing RNA extrusion and DNA wrappingin transcription elongation complexes of bacterial and eukar-yotic RNA polymerases. J Mol Biol 2003;326(5):1413–1426.
8. Pesen D, Hoh JH. Modes of remodeling in the cortical cytos-keleton of vascular endothelial cells. FEBS Lett 2005;579(2):473–476.
9. Horber JKH. Local probe techniques. Methods Cell Biol2002;68:1–32.
10. Lee GU, Kidwell DA, Colton RJ. Sensing discrete streptavidin-biotin interactions with AFM. Langmuir 1994;10(2):354–361.
11. Zhang X, Chen A, Wojcikiewicz E, Moy VT. Probing ligand-receptor interactions with atomic force microscopy. In:Protein-Protein Interactions: A Molecular Cloning Manual.Cold Spring Harbor, NY: Cold Spring Harbor LaboratoryPress; 2002. p 241–254.
12. Yuan C, et al. Energy landscape of streptavidin-biotin com-plexes measured by atomic force microscopy. Biochemistry2000;39(33):10219–10223.
13. Benoit M, et al. Discrete interactions in cell adhesion mea-sured by single molecule force spectroscopy. Nat Cell Biol2000;2(6):313–317.
14. Benoit M. Cell adhesion measured by force spectroscopy onliving cells. Methods Cell Biol 2002;68:91–114.
15. Zhang X, Wojcikiewicz E, Moy VT. Force spectroscopy ofthe leukocyte function-associated antigen-1/intercellularadhesion molecule-1 interaction. Biophys J 2002;83(4):2270–2279.
16. Wojcikiewicz EP, et al. Contributions of molecular bindingevents and cellular compliance to the modulation of leukocyteadhesion. J Cell Sci 2003;116(12):2531–2539.
17. Matzke R, Jacobson K, Radmacher M. Direct, high-resolutionmeasurement of furrow stiffening during division of adherentcells. Nat Cell Biol 2001;3(6):607–610.
18. Hassan AE, et al. Relative microelastic mapping of livingcells by atomic force microscopy. Biophys J 1998;74(3):1564–1578.
19. Wojcikiewicz EP, Zhang X, Moy VT. Force and compliancemeasurements on living cells using atomic force microscopy(AFM). Biol Proced Online 2004;6:1–9.
20. Rief M, et al. Reversible unfolding of individual titin immu-noglobulin domains by AFM [see comments]. Science1997;276(5315):1109–1112.
21. Oesterhelt F, et al. Unfolding pathways of individual bacter-iorhodopsins [see comments]. Science 2000;288(5463):143–146.
22. Li H, et al. Reverse engineering of the giant muscle proteintitin. Nature 2002;418(6901):998–1002.
23. Sarid D. Scanning Force Microscopy. New York: OxfordUniversity Press; 1991.
24. Meyer G, Amer NM. Novel optical approach to AFM. ApplPhys Lett 1988;53:1045–1047.
25. Israelachvili JN. Intermolecular and Surface Forces. 2nd ed.London: Academic Press; 1992.
26. Meyer G, Amer NM. Simultaneous measurement of lateraland normal forces with an optical-beam-deflection AFM. ApplPhys Lett 1990;57(20):2089–2091.
27. Mate CM, et al. Atomic-scale friction of a tungsten tip on agraphite surface. Phys Rev Lett 1987;59(17):1942–1945.
28. Overney RM, et al. Friction measurements on phasesegre-gated thin films with a modified atomic force microscope.Nature 1992;359:133–135.
29. Frisbie CD, et al. Functional group imaging by chemical forcemicroscopy. Science 1994;265:2071–2074.
30. Piner RD, et al. ‘‘Dip-Pen’’ nanolithography. Science 1999;283(5402):661–663.
31. Kwak KJ, et al. Topographic effects on adhesive force map-ping of stretched DNA molecules by pulsed-force-modeatomic force microscopy. Ultramicroscopy 2004;100(3–4):179–186.
32. Magonov SN, EV, Whango MH. Phase imaging and stiffnessin tapping mode AFM. Surf Sci 1997;375:L385–L391.
33. Miyatani T, Horii M, Rosa A, Fujihira M, Marti O. Mapping ofelectrical double-layer force between tip and sample surfacesin water with pulsed- forcemode atomic force microscopy.Appl Phys Lett 1997;71:2632–2634.
34. Giessibl FJ, et al. Subatomic features on the silicon (111)-(7 7) surface observed by atomic force microscopy. science2000;289(5478):422–426.
35. Morita SR, Wiesendanger R, Meyer E. Noncontact AFM. NewYork: Springer; 2002.
36. Hembacher S, Giessibl FJ, MJ. Force microscopy with light-atom probes. Science 2004;305(5682):380–383.
37. Sader JE. Parallel beam approximation for V-shaped atomicforce micrscope cantilevers. Rev Sci Instrum 1995;66:4583–4587.
38. Senden TJ, Ducker WA. Experimental determination ofspring constants in atomic force microscopy. Langmuir1994;10: 1003–1004.
MICROSCOPY, SCANNING FORCE 515

39. Hutter JL, Bechhoefer J. Calibration of atomic-forcemicroscope tips. Rev Sci Instrum 1993;64(7):1868–1873.
40. Bell GI. Models for the specific adhesion of cells to cells.Science 1978;200:618–627.
41. Merkel R, et al. Energy landscapes of receptor-ligand bondsexplored with dynamic force spectroscopy [see comments].Nature 1999;397(6714):50–53.
42. Tees DFJ, Woodward JT, Hammer DA. Reliability theory forreceptorligand bond dissociation. J Chem Phys 2001;114:7483–7496.
43. Evans E. Probing the relation between force—lifetime—andchemistry in single molecular bonds. Ann Rev Biophys Bio-molec Struc 2001;30:105–128.
44. Hoh JH, Schoenenberger CA. Surface morphology andmechanical properties of MDCK monolayers by atomic forcemicroscopy. J Cell Sci 1994;107:1105–1114.
45. Radmacher M, et al. Measuring the viscoelastic properties ofhuman platelets with the atomic force microscope. BiophysJ 1996;70(1):556–567.
46. Wu HW, Kuhn T, Moy VT. Mechanical properties ofL929 cells measured by atomic force microscopy: Effects ofanticytoskeletal drugs and membrane crosslinking. Scanning1998;20(5): 389–397.
47. Fisher TE, et al. The study of protein mechanics with theatomic force microscope. Trends Biochem Sci1999;24(10):379–384.
48. Altmann SM, Lenne P-F. Forced unfolding of single proteins.Methods Cell Biol 2002;68:312–336.
49. Hafner JH, et al. Structural and functional imaging withcarbon nanotube AFM probes. Prog Biophys Molec Biol2001;77(1):73–110.
50. Yang Y, Wang H, Erie DA. Quantitative characterization ofbiomolecular assemblies and interactions using atomic forcemicroscopy. Methods 2003;29(2):175–187.
51. Sheng S, Zhifeng S. Cryo-atomic force microscopy. MethodsCell Biol 2002;68:243–256.
52. Fotiadis D, et al. Imaging and manipulation of biologicalstructures with the AFM. Micron 2002;33(4):385–397.
53. Winfree E, et al. Design and self-assembly of two-dimensionalDNA crystals. Nature 1998;394(6693):539–544.
54. Hansma HG, Kasuya K, Oroudjev E. Atomic force microscopyimaging and pulling of nucleic acids. Curr Opin Struct Biol2004;14(3):380–385.
55. Jaeger L, Westhof E, Leontis NB. TectoRNA: Modular assem-bly units for the construction of RNA nano-objects. Nucl AcidsRes 2001;29:455–463.
56. Seeman NC. DNA in a material world. Nature 2003;421:427–431.
57. Yan H, et al. DNA-templated self-assembly of protein arraysand highly conductive nanowires. Science 2003;301(5641):1882–1884.
58. Seeman NC. From genes to machines: DNA nanomechanicaldevices. Trends Biochem Sci 2005;30(3):119–125.
59. Radmacher M. Measuring the elastic properties of living cellsby AFM. Methods Cell Biol 2002;68:67–90.
60. Langer MG, Koitschev A. The biophysics of sensory cells ofthe inner ear examined by AFM and patch clamp. MethodsCell Biol 2002;68:142–171.
61. Charras GT, Lehenkari P, Horton M. Biotechnological appli-cations of AFM. Methods Cell Biol 2002; 68.
62. Charras GT, Horton MA. Single cell mechanotransductionand its modulation analyzed by atomic force microscopeindentation. Biophys J 2002;82(6):2970–2981.
See also BIOMAGNETISM; NANOPARTICLES.
MICROSCOPY, SCANNING TUNNELING
VIRGINIA M. AYRES
Michigan State UniversityEast Lansing, Michigan
INTRODUCTION
Four years after its invention in 1982 (1), the scanningtunneling microscope (STM) was awarded the 1986 NobelPrize for physics, one of only four such prestigious awardsgiven for a truly significant contribution to scientificinstrumentation. Since then, the family of scanning probemicroscopy (SPM) techniques, which includes scanningtunneling microscopy, atomic force microscopy (2–4), mag-netic force microscopy (5), near-field optical microscopy (6),scanning thermal microscopy (7), and others, has revolu-tionized studies of semiconductors, polymers, and biologi-cal systems. The key capability of SPM is that, through acontrolled combination of feedback loops and detectorswith the raster motion of piezoelectric actuator, it enablesdirect investigations of atomic-to-nanometer scale phe-nomena.
Scanning probe microscopy is based on a piezoelectric-actuated relative motion of a tip versus sample surface,while both are held in a near-field relationship with eachother. In standard SPM imaging, some type of tip-sampleinteraction (e.g., tunneling current, Coulombic forces, mag-netic field strength) is held constant in z through the use offeedback loops, while the tip relative to the sample under-goes an x–y raster motion, thereby creating a surface mapof the interaction. The scan rate of the x–y raster motionper line is on the order of seconds while the tip-sampleinteraction is on the order of nanoseconds or less. The SPMis inherently cable of producing surface maps with atomicscale resolution, although convolution of tip and sampleartifacts must be considered.
Scanning tunneling microscopy is based on a tunnelingcurrent from filled to empty electronic states. The selectiv-ity induced by conservation of energy and momentumrequirements results in a self-selective interaction thatgives STM the highest resolution of all scanning probetechniques. Even with artifacts, STM routinely producesatomic scale (angstrom) resolution.
With such resolution possible, it would be highly desir-able to apply STM to investigations of molecular biologyand medicine. Key issues in biology and medicine revolvearound regulatory signaling cascades that are triggeredthrough the interaction of specific macromolecules withspecific surface sites. These are well within the inherentresolution range of STM.
The difficulty when considering the application of STMto molecular biology is that biological samples are non-conductive. It may be more accurate to describe biologicalsamples as having both local and varying conductivities.These two issues will addressed in this article, andexamples of conditions for the successful use of STM forbiomedical imaging will be discussed. We begin with anoverview of successful applications of STM in biology andmedicine.
516 MICROSCOPY, SCANNING TUNNELING
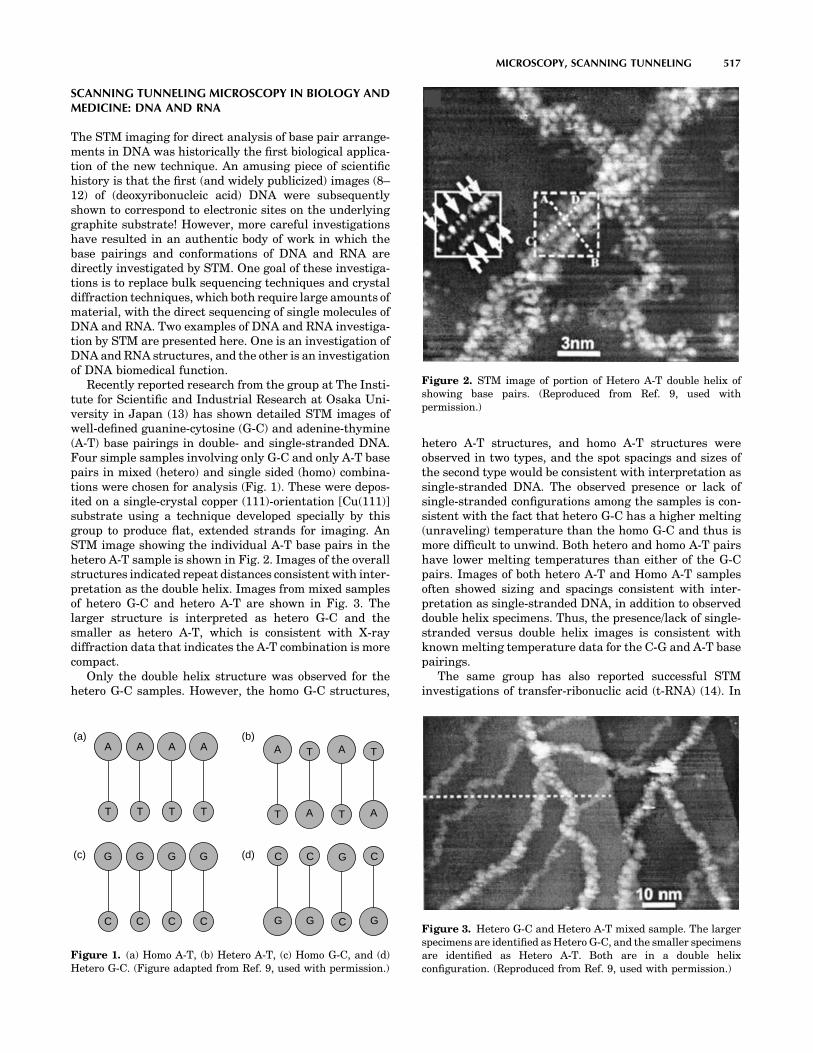
SCANNING TUNNELING MICROSCOPY IN BIOLOGY ANDMEDICINE: DNA AND RNA
The STM imaging for direct analysis of base pair arrange-ments in DNA was historically the first biological applica-tion of the new technique. An amusing piece of scientifichistory is that the first (and widely publicized) images (8–12) of (deoxyribonucleic acid) DNA were subsequentlyshown to correspond to electronic sites on the underlyinggraphite substrate! However, more careful investigationshave resulted in an authentic body of work in which thebase pairings and conformations of DNA and RNA aredirectly investigated by STM. One goal of these investiga-tions is to replace bulk sequencing techniques and crystaldiffraction techniques, which both require large amounts ofmaterial, with the direct sequencing of single molecules ofDNA and RNA. Two examples of DNA and RNA investiga-tion by STM are presented here. One is an investigation ofDNA and RNA structures, and the other is an investigationof DNA biomedical function.
Recently reported research from the group at The Insti-tute for Scientific and Industrial Research at Osaka Uni-versity in Japan (13) has shown detailed STM images ofwell-defined guanine-cytosine (G-C) and adenine-thymine(A-T) base pairings in double- and single-stranded DNA.Four simple samples involving only G-C and only A-T basepairs in mixed (hetero) and single sided (homo) combina-tions were chosen for analysis (Fig. 1). These were depos-ited on a single-crystal copper (111)-orientation [Cu(111)]substrate using a technique developed specially by thisgroup to produce flat, extended strands for imaging. AnSTM image showing the individual A-T base pairs in thehetero A-T sample is shown in Fig. 2. Images of the overallstructures indicated repeat distances consistent with inter-pretation as the double helix. Images from mixed samplesof hetero G-C and hetero A-T are shown in Fig. 3. Thelarger structure is interpreted as hetero G-C and thesmaller as hetero A-T, which is consistent with X-raydiffraction data that indicates the A-T combination is morecompact.
Only the double helix structure was observed for thehetero G-C samples. However, the homo G-C structures,
hetero A-T structures, and homo A-T structures wereobserved in two types, and the spot spacings and sizes ofthe second type would be consistent with interpretation assingle-stranded DNA. The observed presence or lack ofsingle-stranded configurations among the samples is con-sistent with the fact that hetero G-C has a higher melting(unraveling) temperature than the homo G-C and thus ismore difficult to unwind. Both hetero and homo A-T pairshave lower melting temperatures than either of the G-Cpairs. Images of both hetero A-T and Homo A-T samplesoften showed sizing and spacings consistent with inter-pretation as single-stranded DNA, in addition to observeddouble helix specimens. Thus, the presence/lack of single-stranded versus double helix images is consistent withknown melting temperature data for the C-G and A-T basepairings.
The same group has also reported successful STMinvestigations of transfer-ribonuclic acid (t-RNA) (14). In
MICROSCOPY, SCANNING TUNNELING 517
A
T
A
T
A
T
A
T
G
C
G
C
G
C
G
C
A
T A
TA
T A
T
G
C G
C
G
C
G
C
(a) (b)
(c) (d)
Figure 1. (a) Homo A-T, (b) Hetero A-T, (c) Homo G-C, and (d)Hetero G-C. (Figure adapted from Ref. 9, used with permission.)
Figure 2. STM image of portion of Hetero A-T double helix ofshowing base pairs. (Reproduced from Ref. 9, used withpermission.)
Figure 3. Hetero G-C and Hetero A-T mixed sample. The largerspecimens are identified as Hetero G-C, and the smaller specimensare identified as Hetero A-T. Both are in a double helixconfiguration. (Reproduced from Ref. 9, used with permission.)

RNA, the base pairing is adenine-uracil (A-U) instead ofadenine-thymine (A-T). Also the backbone sugars areribose rather than deoxyribose, but are still linked byphosphate groups. The RNA is very difficult to synthesizeas a single crystal and consequently there is a very limitedamount of X-ray diffraction data available for RNA. Littleis known about its variations, and therefore direct inves-tigations of single molecule RNA would add much to ourknowledge.
Transfer RNA is a small RNA chain of � 74–93 nucleo-tides that transfers a specific amino acid to a growingpolypeptide chain at the ribosomal site of protein synthesisduring translation (15). It has sites for amino acid attach-ment, and an anticodon region for codon recognition thatbinds to a specific sequence on the messenger RNA (m-RNA) chain. It has a partial double-helix structure eventhough it has only one chain, because the single RNA chainfolds back, and loops back, on itself, as shown in Fig. 4a.
X-ray diffraction studies (16) have indicated that thet-RNA structure may often assume an L-shaped conforma-tion with a long and a short arm. A model of the EscherichiaColi lysine t-RNA macromolecule used by the group for itsSTM studies is shown in Fig. 4a and b. It shows both theL conformation and the underlying loop and base pairchemistry.
Using STM, the group was able to directly image the Lconformation as shown in Fig. 4c. In addition to the firstdirect statistical data on the lengths of the long and shortarms, obtained from analysis of several STM images, ananalysis of the influence of pH on conformation was alsocarried out. Current investigations are focusing on biofunc-tion research issues in addition to structural researchissues, using STM to directly image the coupling of theimportant amino acid molecules at specific t-RNA sites.
The STM investigations of nanobiomedical rather thanstructural issues are an important emerging research area.One example is the recently reported research from theUniversity of Sydney group in which the local binding ofretinoic acid, a potent gene regulatory molecule, to plasmidp-GEM-T easy (596 base pair Promega) DNA fragments ona single-crystal graphite substrate, was directly imagedand reported (17). Retinoic acid has been documented asresponsible for a number of profound effects in cell differ-entiation and proliferation, and is known to accomplish itsfunctions through selective site binding during the tran-scription process. The STM images of retinoic acid by itself
on a single-crystal graphite substrate were investigatedfirst. These showed sizes consistent with the retinoic acidmolecular structure, and a bright head area with a darkertail area. A molecular model of retinoic acid, also shown inFig. 5a, shows its aliphatic carbon ring head and polymerictail. For reasons further discussed below, the aliphatic ringhead may be expected to have a higher tunneling currentassociated with it than the polymeric tail, and therefore theobserved bright and dark areas are consistent with theexpected structure.
At low concentrations, retinoic acid was observed to bindselectively at minor groove sites along the DNA, with someclustering of retinoic acid molecules observed, as shown inFig. 5b. High resolution STM imaging provided directevidence for alignment of the retinoic acid moleculeshead-to-tail structure edge-on with the minor groove andalso in steric alignment with each other. From STM heightstudies, it could also be inferred that the aliphatic ringhead was attached to a ring partner along the minor groovesurface, but that the tail was not attached. This maysuggest a loosely bound on–off functional mechanism. Athigh concentrations, retinoic acid was observed to bindalong the whole length of the DNA double helix, but againselecting the minor grooves. These first direct studies ofselective site binding of retinoic acid with the minor grooveof DNA should serve as a template for further directinvestigations of other known minor groove binders,thereby opening up the direct investigation of an entire
518 MICROSCOPY, SCANNING TUNNELING
TΨC arm
(a) (b) (c)
TΨC arm
D armD arm
anticodon armextra loop
anticodon arm
accepter stem accepter stem
6 nm
UU
U
A
A5′
3′
CG
AG
G
GC
G
U
A
C
G
G
C
U
UU
U
UUA
A AC
C G
GG
GC
CG
C
G
G
C
19.5 nm
C
ACC
GCG
CGGCAU
A
A
A
UU
AUAU
U
UU UU
AAA
UG
C
C
G
Figure 4. (a) Model of t-RNA L-shapedconformation. (b) Model base pair arrangementin L-shaped conformation. (c) STM image of L-shaped conformation at physiological pH.(Reproduced from Ref. 10, used with permission.)
Figure 5. (a) STM image of retinoic acid on a graphite substratecompared with its molecular model showing the aliphatic ringhead and polymeric tail. (b) STM image of retinoic acid binding tot-RNA with molecular model overlay. (Reproduced from Ref. 13,used with permission.)

class of regulatory molecule–DNA interactions. The inter-actions of related structures that are candidate therapeuticdrug molecules could be receive similar direct investiga-tion.
Note that both of the above groups have also madeimportant contributions to sample preparation techniquesfor successful STM analysis of DNA and RNA. Thesesample preparation techniques will be discussed belowin the context of the basic physics of the STM interaction,and the basic chemistry and conductivity of DNA and RNAsamples.
BASIC PHYSICS OF THE STM INTERACTION
The STM is based on tip–sample interaction via a tunnelingcurrent between filled electronic states of the sample (or tip)into the empty electronic states of the tip (or sample), inresponse to an applied bias, as shown in Fig. 6. The bias maybe positive or negative, and different and valuable informa-tion may often be obtained by investigation of the how thesample behaves in accepting, as well as in giving up, elec-trons. In STM imaging, it is important to recognize that thefeature map or apparent topography of the acquired image isreally a map of the local density of electronic states. Brightdoes not correspond to a raised topography; it corresponds toa region with a high density of electronic states. Therefore,in STM imaging of biological samples, an important con-sideration is that a differential conductivity will be observedfrom regions, such as rings (usually high) versus regions,such as alkane backbones (usually low). As in all SPMtechniques, a z-direction feedback loop maintains someaspect of the tip samples interaction constant (Fig. 6).The readily available choices on commercial machines areto hold either the tunneling distance d constant (constantheight mode) or the magnitude of the tunneling currentcontent (constant current mode).
The current in question is a tunneling current, which isa quantum mechanical phenomenon. It is well documentedthat all electrons within the atomic planes of any materialare in fact in such tight quarters that they display thecharacteristics of a wave in a waveguide, in addition to
their particle-likeness. An electron at the surface of amaterial faces a wall (barrier) created by the dissimilarmaterial (e.g., air, vacuum, or a liquid). While a particlewould run into a wall and bounce back, a wave can pene-trate into and indeed through a wall (as light goes throughglass). This is illustrated in Fig. 7. Additionally, all mate-rials have precise energy levels within them, and therefore,electrons will move by going from one energy level atlocation 0 to another at location d, meeting conservationof energy requirements.
In STM, a tip with empty electronic states is broughtphysically close to a sample surface. The electrons aregiven a direction through the application of the bias (posi-tive in this example). Because they are wavelike, whenthey reach the sample surface, they can tunnel through thebarrier created by the 0-to-d gap and reach the emptystates of the tip, where they are recorded as a currentproceeding from sample to tip. A tunneling current has theknown mathematical form: I � V exp�cd, where I is thetunneling current, V is the bias voltage between the sampleand the tip, c is a constant and d is the tip-sample separa-tion distance. The tunneling current depends sensitivelyon the size of the 0-to-d gap distance. To observe a tunnel-ing current, the gap must be on the order of tens ofnanometers. This is the case in any commercial STMsystem. It is remarkable, that with the addition of a simplefeedback loop, a tip can be easily maintained within nan-ometers of a sample surface without touching it. TypicalSTM tunneling currents are on the order of 10�9–10�12 A.With special preamplifiers, currents on the order of 10�14 Acan be detected.
Because STM is a current-based technique, some situa-tions that can interfere with its current will be brieflydiscussed. Very common in STM imaging of biologicalsamples is for the tip to acquire a layer of biologicalmaterial, possibly by going too close to the sample surfacewhile passing over an insulating region where the feedbackloop has little to work on. This usually just introducesimage artifacts, discussed below, but it can sometimesinsulate the tip from the sample, thus terminating thetip–sample interaction. The problem can be minimizedthrough careful consideration of the expected chemistryand local conductivity of the biological specimen to beinvestigated.
CHEMISTRY, CONFORMATION, AND CONDUCTIVITYOF BIOLOGICAL SAMPLES
Consideration of the basic chemistry involved in a biologi-cal sample can help to determine its appropriateness forSTM imaging. The building blocks for DNA and RNA are
MICROSCOPY, SCANNING TUNNELING 519
Feedback loop
Pie
zoel
ectr
ic s
cann
er
V
A d
Tip
Z
X, Y
Controllerelectronics
I ~ V exp–c d
Figure 6. Important features of an STM system.
Electronenergy is lessthan barrierenergy
Tunneling Current
I ~ V exp–c d
0 d
Figure 7. A particle penetrating into and through a wall.

shown Fig. 8. The sugar-phosphate backbone containsnegatively charged phosphate groups for both DNA andRNA. The bases adenine, thymine, uracil, guanine, andcytosine are all nitrogenous ring systems. Thymine, cyto-sine, and uracil are six-member ring pyrimidine systems,and adenine and guanine are purines, the fusion of a six-member pyrimidine ring to a five-member imidazole ring.Successful STM imaging of monolayers of the individualbases has been reported (18,19). Examples of the highresolution STM imaging that is possible for monolayersof the individual bases are shown in Figs. 9 and 10.
The nitrogenous ring systems, like the classic benzenering system, which has also been imaged (20), contain p-orbital electrons above and below the ring structure plane,which create a conductive electron cloud. Hence, the suc-cessful STM imaging of the DNA and RNA systems by theOsaka University and University of Sydney groups mightbe expected from the charged phosphate groups in thebackbones and the ring systems in the base pairs.
However, there are also very difficult issues to resolve inmaking the local conductivity of, especially, the signatureDNA and RNA base pairs available to the STM tip. Theseare enclosed within the sugar-phosphate backbones, andonly partially exposed by the twisting of the helix, as shownin Fig. 11a and b (21,22). Also, the choice of substrate willpowerfully influence the molecular structure deposited onit, especially if it is small. An example of this is shown inFig. 12, taken from Ref. 16. The behaviors of pyridine (a
single-nitrogen close relation to pyrimidine) and benzeneon a single crystal (001) orientation copper, Cu(001), sub-strate were investigated. The pyrimidine monolayers (thy-mine, cytosine, and uracil) in Figs. 9 and 10 had ringsoriented parallel to the substrate surface, but individualpyridine molecules on Cu(001) had rings perpendicular tothe surface, due to the strong nitrogen-copper atom inter-action, as shown in Fig. 12a. Also, if a single hydrogen atomwas dissociated from the pyridine molecule, as can happenduring routine scanning, the molecule would shift its posi-tion on the copper substrate (Fig. 12b). The STM imaging ofan individual benzene molecule indicated a ring systemparallel to the copper substrate (Fig. 12c), but hydrogendissociation would cause the benzene molecule to becomeperpendicular to the substrate surface (Fig. 12d). There-fore both the substrate choice and interactions with theimaging tip can influence the conformation of the biomo-lecule and whether its locally conductive portions arepositioned to produce a tunneling current.
Now consider the situation of a molecule with a differ-ence in local conductivity, like retinoic acid. The aliphaticring head would similarly be expected to have a high localconductivity, and separate investigations of just retinoicacid by the University of Sydney group confirmed that thisis the case (Fig. 5a). The polymeric tail is basically analkane system without any p-type orbitals. Its conductivityis therefore expected to be less than the ring system andthis is experimentally observed. However, results such asthose shown in Fig. 13 from a group at California Instituteof Technology, demonstrate that high resolution STMimaging even of low conductivity alkane systems is possible(23–26). Therefore, one aspect of STM biomolecular ima-ging is that there may be large differences in the conduc-tivities of two closely adjacent regions. It then becomes anissue of whether the STM feedback loop will be able tosufficiently respond to the differences to maintain the tip-sample tunneling current interaction throughout theinvestigation. Prior consideration of the imaging para-meters necessary for successful STM imaging of the leastconductive part of the bio molecule can help.
520 MICROSCOPY, SCANNING TUNNELING
NH
NHCH3
O
O
THYMINE
NH
N
NH2
O
CYTOSINE
NH
NH
O
O
URACIL
N
N
NH2
ADENINE
N
NH
N
NH
O
GUANINE
N
NH
NH2
OCH2
H
H
O
H
H
Base
H
O
OCH2
H
H
O
H
H
Base
H
PO
O
O
OCH2
H
H
O
H
H
Base
H
PO
O
O
PO
O
O
(a) (b)
Figure 8. (a) The deoxyribose (ribose) sugar/phosphate backbone for DNA (RNA) isnegatively charged due to phosphate groups.(b) DNA and RNA bases are nitrogenous ringsystems.
Figure 9. STM images of (a) guanine, (b) cytosine, and (c) adeninemonolayers on a single crystal (111)-orientation gold substrate.(Reproduced from Ref. 14, used with permission.)
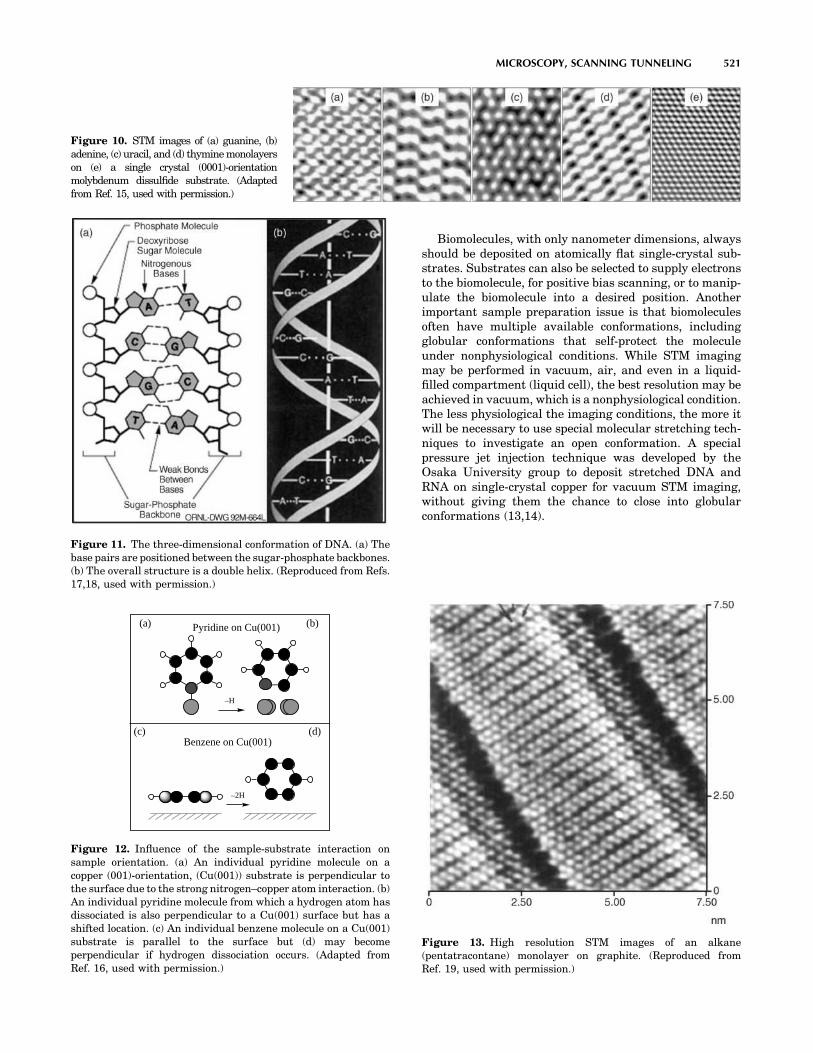
Biomolecules, with only nanometer dimensions, alwaysshould be deposited on atomically flat single-crystal sub-strates. Substrates can also be selected to supply electronsto the biomolecule, for positive bias scanning, or to manip-ulate the biomolecule into a desired position. Anotherimportant sample preparation issue is that biomoleculesoften have multiple available conformations, includingglobular conformations that self-protect the moleculeunder nonphysiological conditions. While STM imagingmay be performed in vacuum, air, and even in a liquid-filled compartment (liquid cell), the best resolution may beachieved in vacuum, which is a nonphysiological condition.The less physiological the imaging conditions, the more itwill be necessary to use special molecular stretching tech-niques to investigate an open conformation. A specialpressure jet injection technique was developed by theOsaka University group to deposit stretched DNA andRNA on single-crystal copper for vacuum STM imaging,without giving them the chance to close into globularconformations (13,14).
MICROSCOPY, SCANNING TUNNELING 521
Figure 10. STM images of (a) guanine, (b)adenine, (c) uracil, and (d) thymine monolayerson (e) a single crystal (0001)-orientationmolybdenum dissulfide substrate. (Adaptedfrom Ref. 15, used with permission.)
Figure 11. The three-dimensional conformation of DNA. (a) Thebase pairs are positioned between the sugar-phosphate backbones.(b) The overall structure is a double helix. (Reproduced from Refs.17,18, used with permission.)
Pyridine on Cu(001)
–H
(a)
Benzene on Cu(001)
–2H
(c)
(b)
(d)
Figure 12. Influence of the sample-substrate interaction onsample orientation. (a) An individual pyridine molecule on acopper (001)-orientation, (Cu(001)) substrate is perpendicular tothe surface due to the strong nitrogen–copper atom interaction. (b)An individual pyridine molecule from which a hydrogen atom hasdissociated is also perpendicular to a Cu(001) surface but has ashifted location. (c) An individual benzene molecule on a Cu(001)substrate is parallel to the surface but (d) may becomeperpendicular if hydrogen dissociation occurs. (Adapted fromRef. 16, used with permission.)
Figure 13. High resolution STM images of an alkane(pentatracontane) monolayer on graphite. (Reproduced fromRef. 19, used with permission.)

IMAGING ARTIFACTS AND DATA RESTORATIONUSING DECONVOLUTION
Examination of Fig. 5a shows the ring head of retinoic acidas a large blurred bright spot. Greater resolution of detailwould clearly be desirable. As in all SPM imaging systems,tip artifacts versus the surface features will limit theresolution of the experiments performed. This is often citedas an ultimate barrier in STM studies of macromolecularstructures and in scanning probe microscopy in general(27). It is therefore necessary to develop techniques fordeconvolution of STM tip artifacts for enhancing the reso-lution of measured STM image data.
A commonly used approach for data restoration oreliminating the smearing effect of tip sample interactionis to assume that the observed signal is a convolution of thetrue image and the probe response function (PRF). Thefollowing equation gives a general degradation model dueto the convolution of tip artifacts with true data resulting inthe measurement g(x,y). Neglecting the presence of theadditive noise, the data can be modeled as
gðx; yÞ ¼ f ðx; yÞ � hðx; yÞ ¼Xn;m
f ðn;mÞhðx � n; y � mÞ
where g(x, y), f(x, y), and h(x,y) are the observed or rawsignal, true image, and PRF, respectively. One can thenuse deconvolution methods to extract the true image fromthe knowledge of measured data and probe PRF.
Theoretically, the probe response function is derivedfrom the underlying physics of the tip sample interactionprocess. Hence, there is a need for a theoretical model forthe tip sample interaction. Recent advances in formulationand modeling of tip sample interactions allow developmentof accurate compensation algorithms for deconvolving theeffect of tip-induced artifacts.
Figure 14 shows an example of applying a deconvolutionalgorithm on synthetic degraded images. The degradedimage in Fig. 14c is generated from a synthetic image inFig. 14a blurred by a Gaussian PRF in Fig. 14b. Figure 14dshows the enhanced result obtained using deconvolution.Although the theoretical treatment of STM and relatedSPM techniques provide major challenges because theatomic structures of the tip and sample have to be modeledappropriately, its potential is clear and this is a stronglydeveloping research area at the present time.
CONCLUSIONS
The STM imaging has the highest resolution of all SPMimaging techniques. As such, it would be highly desirableto apply STM to investigations of molecular biology andmedicine. An often described difficulty when consideringthe application of STM to molecular biology is that biolo-gical samples are nonconductive. It would be more accurateto describe biological samples as having both local andvarying conductivities. Design of STM experiments inwhich ring systems are exploited, and/or imaging para-meters are set for the least conductive portion of thebiomolecules may help produce successful imaging results.New research in applications of powerful deconvolution
techniques to STM imaging will also open up the field ofdirect STM investigations of the structure and function ofimportant biomolecules.
BIBLIOGRAPHY
1. Binning G, Rohrer H. Helv Phys Acta 1982;55:726–735.2. Hansma HG, Oroudjev E, Baudrey S, Jaeger L. TectoRNA and
kissing loops: Atomic force microscopy of RNA structures. JMicrosc 2003;212:273–279; Sitko JC, Mateescu EM, HansmaHG. Sequence-dependent DNA condensation and the electro-static zipper. Biophys J 2003;84:419–431; Hansma HG,Vesenka J, Siegerist C, Kelderman G, Morrett H, SinsherimerRL, Bustanmante C, Elings V, Hansma PK. Reproducibleimaging and dissection of plasmid DNA under liquid withthe atomic force microscope. Science 1992;256:1180.
3. Hartmann U. Magnetic force microscopy. Annu Rev MaterSci 1999;29:53–87.
4. Paesler MA, Moyer PJ. Near-Field Optics: Theory, Instru-mentation, and Applications. New York: Wiley-Interscience; 1996.
5. Majumdar A. Scanning thermal microscopy. Annu Rev MaterSci 1999;29:505–585.
6. Beebe TP, Jr., et al. Science 1989;243:370–371.7. Lee G, Arscott PG, Bloomfiled VA, Evans DF. Science
1989;244:475–478.8. Driscoll RJ, Youngquist MG, Baldescwieler JD. Atomic scale
imaging of DNA using scanning tunnelling microscopy.Nature (London) 1990;346:294–296.
9. Tanaka H, Kawai T. Visualization of detailed structureswithin DNA. Surface Sci Lett 2003;539:L531–L536.
10. Nishimura M, Tanaka H, Kawai T. High resolution scanningtunneling microscopy imaging of Escherichia coli lysine trans-fer ribonucleic acid. J Vac Sci Technol B 2003;21:1265–1267.
11. Wikipedia, The free encyclopedia. Available at http://en.wi-kipedia.org/wiki/RNA.
522 MICROSCOPY, SCANNING TUNNELING
Figure 14. Clockwise from upper left: (a) synthetic true image(b) Gaussian PRF, (c) degraded measurement, and (d) restoredimage.

12. Giege R, Puglisi JD, Floentz C. In: Cohn WE, Moldave K, eds.,Progressin Nucleic Acid Research and Molecular Biology,Vol. 45. Amsterdam: Elsevier; 1993.
13. Hadi Zareie M, Lukins PB. Atomic-resolution STM structureof DNA and localization of the retinoic acid binding site.Biochem Biophy Res Commun 2003;303:153–159.
14. Otero R, et al. Proceedings of the 5th Trends In Nanotech-nology (TNT04) CMP Cientifica; 2004. Available at http://www.phantomsnet.net/files/abstracts/TNT2004/AbstractKeynoteBesenbacherF.pdf.
15. Available at http://biochem.otago.ac.nz/staff/sowerby/period-icmonolayers.htm. Multiple references listed.
16. Lauhon LJ, Ho W. Single molecule chemistry and vibrationalspectroscopy: Pyridine and benzene on Cu(001). J Phys ChemA 2000;104:2463–2467.
17. Image credit in Fig. 11(a): U.S. Department of EnergyHuman Genome Program, Available at http://www.ornl.-gov/hgmis. This image originally appeared in the 1992U.S. DOE Primer on Molecular Genetics.
18. Image credit in Fig. 11(b): Mathematical Association of Amer-ica, Available at http://www.maa.org/devlin/devlin0403.html.
19. Claypool CL, et al. Source of image contrast in STM images offunctionalized alkanes on graphite: A systematic functionalgroup approach. J Phys Chem B 1997;101:5978–5995.
20. Faglioni F, Claypool CL, Lewis NS, Goddard WA III. Theo-retical description of the STM images of alkanes and sub-stituted alkanes adsorbed on graphite. J Phys Chem B1997;101:5996–6020.
21. Claypool CL, et al. Effects of molecular geometry on the STMimage contrast of methyl- and bromo-substituted alkanesand alkanols on graphite. J Phys Chem B 1999;103:9690–9699.
22. Claypool CL, Faglioni F, Goddard WA III, Lewis NS. Tunnel-ing mechanism implications from an STM study ofH3C(CH2)15HC¼C¼CH(CH2)15CH3 on graphite andC14H29OH on MoS2. J Phys Chem B 1999;103:7077–7080.
23. Villarubia JS. Algorithms for scanned probe microscopeimage simulation, surface reconstruction and tipestimation. J Res Nat Inst Standards Technol 1997;102:425–454.
See also BIOSURFACE ENGINEERING; MICROSCOPY, ELECTRON.
MICROSENSORS FOR BIOMEDICALAPPLICATIONS. See CAPACITIVE MICROSENSORS FOR
BIOMEDICAL APPLICATIONS.
MICROSURGERY
KEITH J. REBELLO
The Johns Hopkins UniversityApplied Physics LabLaurel, Maryland
INTRODUCTION
Microsurgery is a specialized surgical technique whereby amicroscope is used to operate on tiny structures within thebody. Fine precision microinstruments are used to manip-ulate tissue with or without robotic or computer control.
This technique has allowed for significant advances insurgery especially for operations involving the inner ear,eye, brain, nerves, and small blood vessels.
HISTORY OF THE SURGICAL MICROSCOPE
The compound microscope is generally agreed upon to havebeen invented in the 1590s by the two Dutch opticiansHans and Zacharias Janssen. Their device consisted of asliding tube with two aligned lenses. In 1624 GalileoGalilei, the famous astronomer and mathematician,demonstrated an inverted telescope to his colleagues ofthe Lincean Academy. One of them, Giovanni Faber,named it a microscope from the Greek words micro, mean-ing small, and scope, meaning to aim or shoot. Microscopelenses were improved in the seventeenth century byAntonie van Leeuwenhoek, a Dutch linen draper whooriginally was interested in counting the number ofthreads per square inch in his reams of cloth. How heconstructed his spherical lenses still remains a mysteryto this day. In the eighteen century, fine and course adjust-ments as well as tube inclination were added by RobertHooke, who first discovered the cell. The microscope wasfurther improved by Joseph Jackson Lister a British winemerchant, school visitor, and histologist, the father of LordJoseph Lister whom is credited as stating the era of modernsurgery. His innovations included the developed achro-matic objective lens corrected for chromatic and sphericalaberrations and stands designed to reduce vibrations. Hisjointly published work with Dr. Joseph Hodgkins in 1827,redefined the understanding at the time of arteries, mus-cles, nerves, and the brain.
In 1848 Carl Zeiss, a German machinist opened a micro-scope workshop. Ernst Abbé, a physicist working withZeiss, derived new mathematical formulas and theoriesthat allowed the optical properties to be mathematicallypredicted for the first time. Prior lenses had always beenmade by craftsmen who learned their trade by trial anderror. Abbé’s advancements enabled Zeiss to become thefirst mass producer of high quality microscopes.
USE IN SURGERY
Edwin Theodor Saemisch, a German ophthamologist, usedloupes in surgery in 1876, but although the microscope wasbeing used in the laboratory medical research environmentit was not used the operating room. Zeiss manufactured abinocular microscope specifically designed for dissectingwhich was used for ophthalmological examinations of thecornea and anterior chamber of the eye. It was not until1921 that Carl Olof Nylen, a Swedish, otologist and tennisolympian, used his homebuilt monocular microscope forthe first time in ear surgery on a case of chronic otis media,a type of ear infection. His monocular microscope wasquickly replaced in 1922 by a binocular microscope devel-oped by adding a light source to a Zeiss dissecting micro-scope by his chief surgeon, Gunnar Holmgren. He used it totreat diseases otosclerosis, the abnormal growth of tem-poral bone in the middle ear.
MICROSURGERY 523

Despite these early successes the surgical microscopewas seldom used due to its limited field of vision, very shortfocal distance, poor light quality, and instability. It was notuntil the 1950s that the surgical microscope started tobecome more widely adopted. In 1953, Zeis released theZeiss OpMi 1(Zeiss Operating Microscope Number One),which was specially designed for otological procedures. Itssuperior coaxial lighting, stability, and ease of operationenabled the advent of tympanoplasty operations to repairruptured ear drums as well as widespread use in temporalbone surgery.
The success the microscope was having in otology soonspread to other disciplines as well. In the early 1950s, JoséIgnacio Barraquer adapted a slip lamp to the Zeiss otolo-gical surgical microscope for ocular microsurgery. By the1960s, J. I. Barraquer, Joaquı́n Barraquer, and Hans Litt-man of Zeiss, had further modified the surgical microscopeand refined microsurgical techniques to make ocular man-euvers in glaucoma microsurgery easier to perform. Duringthis same time frame, Richard Troutman also had Zeissmake a special microscope for his ophthalmic procedures.He made many advances and is credited as adding electricand hydraulic control to surgical microscopes, but possiblyhis greatest innovation was the first variable magnifica-tion, or zoom, surgical microscope.
Around this time neurosurgeons also began using thesurgical microscope in the operating room. In 1957, Theo-dore Kurze removed a neuriloma tumor from the seventhcranial nerve, and then later anastomized it to the hypo-glossal nerve. He also developed techniques to use thesurgical microscope for aneurysm surgeries. Recognizingthat sterilization was a major problem, he developed theuse of ethylene oxide gas to sterilize his surgical micro-scopes for use in the operating room. Dr. R. M. PeardonDonaghy established the first microsurgical training lab atthe University of Vermont, where many surgeons weretrained. He collaborated with the vascular surgeon JuliusJacobson to remove occlusions from cerebral arteries.Jacobson and his colleague Ernesto Suarez, were respon-sible for developing small vessel anastomoses techniques.Their procedures required another surgeon’s assistance.To meet this need Jacobson invented the diploscope thatallowed two surgeons to view the same operative field.Later he and his colleagues worked with Hans Littmanof Zeiss to develop a commercial surgical microscope with abeamsplitter enabling two surgeons to operate at the sametime. A modern day version of the Zeiss dual head micro-scope is shown in Fig. 1.
Inspired by the work of the neuroscientists plastic sur-geon also started using the surgical microscope. HaroldBuncke was one of the first plastic surgeons to use themicroscope for digit/limb replantation and free-flap autop-lantation. Buncke also developed many of the tools micro-surgeons use by borrowing technology from the jewelry,watchmaking, and microassembly industries (Fig. 2.)
The 1960s saw the techniques applied to neurosurgery.Breakthroughs in microneurosurgery included the repairof peripheral nerve injuries, intracranial aneurysm sur-geries, embolectomies of middle cerebral arteries, middlecerebral artery bypasses. One on the visionaries of thistime was M. G. Yasargil a Turkish neurosurgeon from
Switzerland. Trained in Donaghy’s training lab he furtherrefined and improved the surgical techniques.
The next advancements came with the development ofminimally invasive surgical techniques. Traditional surgi-cal techniques used relatively large incisions to allow thesurgeon full access to the surgical area. This type of opera-tion, called open surgery, enables the surgeon’s hands andinstruments to come into direct contact with organs andtissue, allowing them to be manipulated freely. Theseoperations are classified as first generation surgical tech-niques and most surgeons are trained in this manner.While the large incision gives the surgeon a wide rangeof motion to do very fine controlled procedures, it alsocauses substantial trauma to the patient. In fact, themajority of trauma is caused by the incisions the surgeonuses to get access to the surgical site instead of the actual
524 MICROSURGERY
Figure 1. Zeiss OpMi Vario S8 surgical microscope. (Courtesy ofCarl Zeiss.)
Figure 2. Modern day microsurgical tools. (Courtesy of WPI Inc.)

surgical procedure itself. For example, in a conventionalopen-heart cardiac operation, the rib cage must be crackedand split exposing the heart muscle. This trauma not onlyincreases pain to the patient, but adds to recovery timesincreasing hospital stays, in turn increasing costs.
In 1985, Muhe performed the first laparoscopic chole-cystectomy, or gallbladder removal surgery with a fiber-optic scope. The technique he performed is commonlycalled minimally invasive surgery but also goes by othernames, such as micro, keyhole, microscopic, telescopic, lessinvasive, and minimal access surgery. This microsurgicaltechnique is based on learnings from gynecological pelvis-copies and arthroscopic orthopedic operations along withthe previous advances made in otology, opthamology, neu-rosurgery, and reconstructive microsurgeries. It has sub-sequently been applied to many other surgical areas, suchas general surgery, urology, thoracic surgery, plastic sur-gery, and cardiac surgery. These procedures are classifiedas second generation surgeries as trauma to the patient isdrastically reduced by the reducing or eliminating inci-sions. The shorter hospital stays and faster recovery timesfor the patient reduce the cost of a minimally invasiveprocedure 35% compared to its open surgery counterpart.
In a minimally invasive cardiac operation a few smallholes, access points, or ports are punctured into the patientand trocars are inserted. A trocar consists of a guidingcannula or tube with a valve–seal system to allow the bodyto be inflated with carbon dioxide. This is done so that thesurgeon has enough room to manipulate his instruments atthe surgical site. An endoscope is inserted into one of thetrocar ports to allow the surgeon a view the surgical site.Various other surgical instruments, such as clippers, scis-sors, graspers, shears, cauterizers, dissectors, and irriga-tors were miniaturized and mounted on long poles so thatthey can be inserted and removed from the other trocarports to allow the surgeon to perform the necessary tasks athand.
While minimally invasive surgery has many advantagesto the patient, such as reduced postoperative pain, shorterhospital stays, quicker recoveries, less scarring, and bettercosmetic results, there are a number of new problems forthe surgeon. The surgeon’s view is now restricted and doesnot allow him to see the entire surgical area with his eyes.While the operation is being performed he must look at avideo image on a monitor rather than at his hands. This isnot very intuitive and disrupts the natural hand–eye coor-dination we all have been accustomed to since childhood.The video image on the monitor is also only two dimen-sional (2D) and results in a loss of our binocular visioneliminating the surgeon’s depth perception. While per-forming the procedure the surgeon does not have directcontrol of his own field of view. A surgical assistant holdsand maneuvers the endoscopic camera. The surgeon has todevelop his own language to command the assistantto position the scope appropriately, which often leads toorientation errors and unstable camera handling, espe-cially during prolonged procedures. Since the images fromthe camera are magnified, small motions, such as thetremor in a surgical assistant’s hand or even their heart-beat can cause the surgical team to experience motioninduced nausea. To combat the endoscopic problems, some
surgeons choose to manipulate the endoscope themselves.This restricts them to using only one hand for delicatesurgical procedures and makes procedures even morecomplicated.
The surgeon also loses the freedom of movement he hasin open surgery. The trocar ports are fixed to the patient’sbody walls by pressure and friction forces. This constrainsthe instrument’s motion in two directions and limits themotion of the tip of the instrument to four degrees offreedom (in–out, left–right, up–down, and rotation). Thetrocars also act as pivot points and cause the surgicalinstruments to move in the opposite direction to the sur-geon’s hands. When the surgeon is moving left, the imageon the monitor is moving to the right. The amount of thisopposite movement also depends on the depth of the intro-duction of the instrument. Again because of the pivot pointthe deeper an instrument is inserted into the body the morethe surgeon’s movement is amplified. Even a small move-ment made by the surgeon on the outside of the patient cantranslate to a very large movement on the inside of thepatient. The seals and valves in the trocars also impedemovements which hinders the smoothness of motions intoand out of the patient and greatly reduces the alreadylimited tactile feedback the surgeon experiences. Thesemovement behaviors and lack of tactile feedback are coun-ter to what the surgeon is used to in open surgery andrequire long training to develop the technical skills toperform these operations.
Performing a minimally invasive procedure has beenlikened to writing your name holding the end of an 18 in.(45.72 cm) pencil (1). The surgeon loses three-dimensional(3D) vision, dexterity, and the sense of touch. The instru-ments are awkward, counterintuitive, and restricted inmovement. The lack of tactile feedback prevents the sur-geon from knowing how hard he or she is pulling, cutting,twisting, suturing, and so on. These factors cause a numberof adjustments to be made by the surgeon, which requiressignificant retraining on how to do the procedures in aminimally invasive manner. These difficulties encounteredby the surgeon cause degradation in surgical performancecompared to open surgery which limits surgeons to per-forming only simpler surgical procedures.
In an attempt to address some of these shortcomingsand allow the surgeon more control during operations athird generation of surgical procedures, robotic surgerywas developed. Although these types of procedures arecommonly referred to as robotic surgery, the operationsthemselves are not completely automated and are stillcarried out by a surgeon. For this reason, robotic surgeryis also referred to as computer aided or computer assistedsurgery.
The robotic technology was originally developed fortelerobotic applications in the late 1980s for the DefenseAdvanced Research Project Administration (DARPA) byresearchers at SRI International. The surgeon of the futurewould allow surgeons from remote command centers tooperate on injured soldiers in the battlefield. In 1995, thistechnology was spun off into a new company named Intui-tive Surgical to commercialize the technology for use in thehospital environment. Near the same time Dr. Yulan Wangwas developing robotic technology for NASA to allow
MICROSURGERY 525
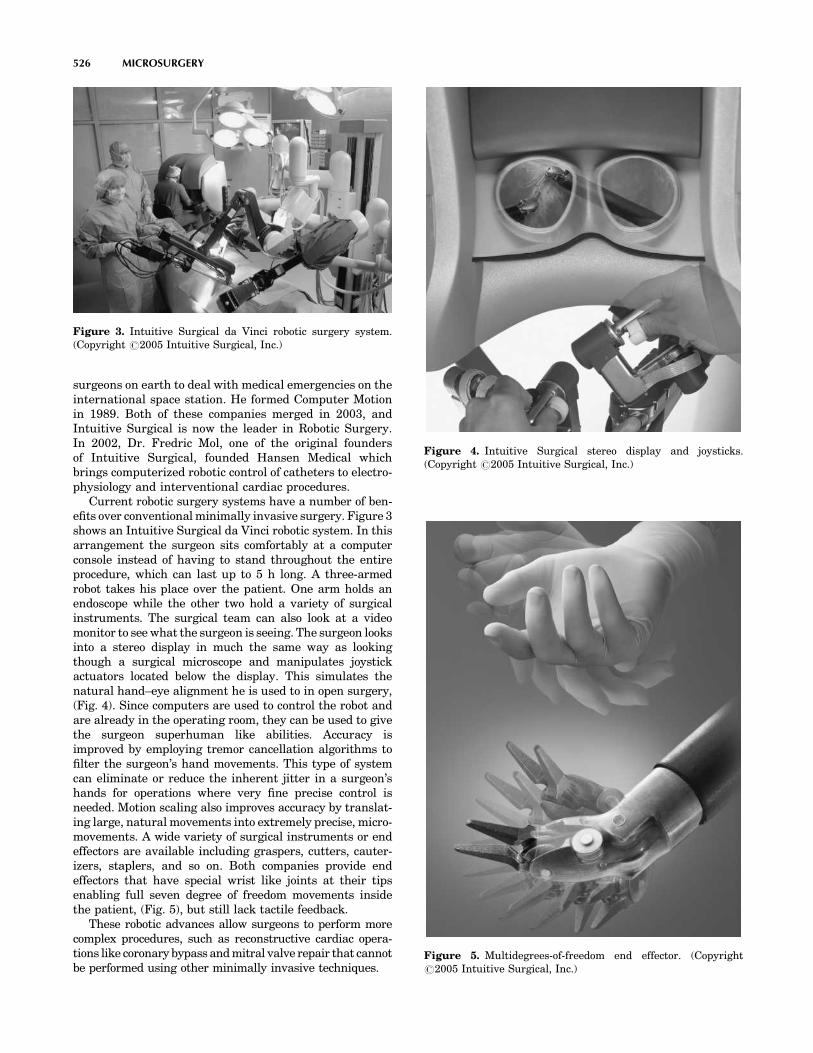
surgeons on earth to deal with medical emergencies on theinternational space station. He formed Computer Motionin 1989. Both of these companies merged in 2003, andIntuitive Surgical is now the leader in Robotic Surgery.In 2002, Dr. Fredric Mol, one of the original foundersof Intuitive Surgical, founded Hansen Medical whichbrings computerized robotic control of catheters to electro-physiology and interventional cardiac procedures.
Current robotic surgery systems have a number of ben-efits over conventional minimally invasive surgery. Figure 3shows an Intuitive Surgical da Vinci robotic system. In thisarrangement the surgeon sits comfortably at a computerconsole instead of having to stand throughout the entireprocedure, which can last up to 5 h long. A three-armedrobot takes his place over the patient. One arm holds anendoscope while the other two hold a variety of surgicalinstruments. The surgical team can also look at a videomonitor to see what the surgeon is seeing. The surgeon looksinto a stereo display in much the same way as lookingthough a surgical microscope and manipulates joystickactuators located below the display. This simulates thenatural hand–eye alignment he is used to in open surgery,(Fig. 4). Since computers are used to control the robot andare already in the operating room, they can be used to givethe surgeon superhuman like abilities. Accuracy isimproved by employing tremor cancellation algorithms tofilter the surgeon’s hand movements. This type of systemcan eliminate or reduce the inherent jitter in a surgeon’shands for operations where very fine precise control isneeded. Motion scaling also improves accuracy by translat-ing large, natural movements into extremely precise, micro-movements. A wide variety of surgical instruments or endeffectors are available including graspers, cutters, cauter-izers, staplers, and so on. Both companies provide endeffectors that have special wrist like joints at their tipsenabling full seven degree of freedom movements insidethe patient, (Fig. 5), but still lack tactile feedback.
These robotic advances allow surgeons to perform morecomplex procedures, such as reconstructive cardiac opera-tions like coronary bypass and mitral valve repair that cannotbe performed using other minimally invasive techniques.
526 MICROSURGERY
Figure 3. Intuitive Surgical da Vinci robotic surgery system.(Copyright #2005 Intuitive Surgical, Inc.)
Figure 4. Intuitive Surgical stereo display and joysticks.(Copyright #2005 Intuitive Surgical, Inc.)
Figure 5. Multidegrees-of-freedom end effector. (Copyright#2005 Intuitive Surgical, Inc.)

MEMS
Around the same time that minimally invasive surgery wasbeing developed, there was a turning point in microelec-tromechanical systems (MEMS). This a technology wasdeveloped from the integrated circuit industry to createminiature sensors and actuators. Originally, these semi-conductor processes and materials were used to buildelectrical and mechanical systems, but have now expandedto include biological, optical, fluidic, magnetic, and othersystems as well. The term MEMS originated in the UnitedStates and typically contain a moving or deformable object.In Europe, this technology goes by the name microsystemstechnology or microstructures technology (MST) and alsoencompasses the method of making these devices, which isreferred to as micromachining. In Japan and Asia MEMSare called micromachines when mechanisms and motionare involved. The MEMS devices first were used in medicalapplications in the early 1970s with the advent of thesilicon micromachined disposable blood pressure sensor(2), but it was not until the mid-1980s when more compli-cated mechanical structures, such as gears and motors,were able to be fabricated.
FABRICATION TECHNOLOGIES
The fabrication of MEMS devices is based on the merger ofsemiconductor microfabrication processes and microma-chining techniques to create the desired microstructuralcomponents. There are four major processes that are usedto fabricate MEMS devices: bulk micromachining, surfacemicromachining, LIGA, and precision machining. Combi-nations of these technologies are what allow MEMS to behighly miniaturized and integratable with microelectro-nics. These processes are very sensitive to impurities andenvironmental conditions such as temperature, humidity,and air quality. Typically, these fabrication steps are per-formed inside a cleanroom (Fig. 6). Bulk micromachining,surface micromachining, and LIGA have the added advan-tage of being able to be batch fabricated. This allows manydevices to be made in parallel at the same time greatlyreducing device cost.
Bulk micromachining utilizes wet- or dry-etch processesto form 3D structures out of the substrate. These subtrac-tive processes produce isotropic or anisotropic etch profilesin material substrates, which are typically but not limitedto silicon wafers. Bulk micromachining can create largeMEMS structures on the micrometers (mm) to millimeters(mm) scale (tens of mm-to-mm thick). Commercial applica-tions of bulk micromachining have been available since the1970s. These applications include pressure sensors, iner-tial sensors such as accelerometers and gyros, and micro-fluidic channels and needles for drug delivery.
In surface micromachining, MEMS are formed on thesurface of the substrate using alternating layers of struc-tural and sacrificial materials. These film materials arerepeatedly deposited, patterned, and etched to form struc-tures that can then be released by removing sacrificiallayers. The release process allows for the fabrication ofcomplex movable structures that are already assembled,
such as motors, switches, resonators, cantilevers, and soon. Surface micromachined structures are typically limitedto thicknesses of 2–6 mm and because they use much of thesame technology as is used in the integrated circuit indus-try are readily integrated with electronics. Because somuch technology is shared with the IC industry siliconwafers are typical substrates with thousands of devicesbeing able to be fabricated at once (Fig. 7).
Lithographie, Galvanik, Abformung (LIGA) is a Germanacronym that means lithography, electroforming, andmolding. The technology was originally developed inthe late-1970s to fabricate separation nozzles for uraniumenrichment. This technology uses X rays to fabricatedevices with very high aspect ratios. A synchrotron radia-tion source is used to define small critical dimensions in apoly(methyl methyacrylate) (PMMA), mold that can thenbe electroplated to form high aspect ratio metallic struc-tures. Many parts can be batch fabricated in this manner,but assembly is usually still a serial process.
Precision machining technology, such as micro-EDM(microelectro discharge machining), laser micromachining,and micro stereo lithography, is also used to form complexstructures out of metal, plastic, and ceramics that theprevious fabrication technologies may be incapable of.Precision machining is typically a serial process, but is
MICROSURGERY 527
Figure 6. Cleanroom fabrication facility. (Courtesy of Intel Corp.)

often better able to deal with the varied shapes and sub-strates of microsurgical instruments.
Micro EDM is a form of spark machining used to shapeconductive materials, such as silicon and metals. AnEDM erodes material by creating a controlled electricdischarge between an electrode and the substrate. It isa noncontact process and there is no direct mechanicalcutting force applied to the substrate. Dielectric fluid isused to remove the erosion particles, as well as to keepthe substrate material from oxidizing. Micro-EDMs can beused to make holes, channels gears, shafts, molds, dies,stents, as well as more complex 3D parts such as accel-erometers, motors, and propellers (3).
Lasers can be used to both deposit and remove material.Laser ablation vaporizes material through the thermalnoncontact interaction of a laser beam with the substrate.It allows for the micromachining of silicon and metals, aswell as materials that are difficult to machine using othertechniques such as diamond, glass, soft polymers, andceramics. Laser direct writing and sintering is a masklessprocess where a laser beam is used to directly transfermetal materials onto a substrate. This can be used to formmetal traces on nonplaner surfaces, which reduces theneed for wires on surgical tools (4).
Micro stereo lithography processes generate 3D struc-tures made out of ultraviolet (UV) cured polymers. It is anadditive process where complex 3D structures are madefrom stacks of thin 2D polymer slices that have beenhardened from a liquid bath. Conventional systems werelimited in that they were a serial process where only onepart could be made at a time. MicroTEC has developed abatch fabricated wafer level process called rapid materialproduct development (RMPD), which is capable of con-structing structures out of 100 different materials includ-ing plastics, sol–gels, and ceramics (5).
APPLICATIONS
The inclusion of MEMS technology in microsurgery, willallow for smaller more miniaturized surgical tools that not
only overcome many of the limitations of microsurgicalprocedures, but allow for new more advanced operationsto be performed. MEMS are just now being incorporatedinto microsurgical tools and coming on the market. Mostare still at the research level, but the industry is moving inthis direction as the need for smaller smarter toolsincreases.
HAPTIC FEEDBACK
One of the key areas for improvement in microsurgery istactile feedback. The lack of tactile sensing limits theeffectiveness these procedures. Recent work in roboticfeedback for minimally invasive surgery has concentratedon force feedback techniques using motors and positionencoders to provide tactile clues to the surgeon. In theseapproaches, the sense element is far removed from thesense area. Verimetra, Inc. has developed strain gaugeforce sensor fabrication technology which uses the surgicaltools themselves as a substrate (6). Prior efforts havefocused on fabrication of sensors on silicon, polyimide, orsome other substrate followed by subsequent attachmentonto a surgical tool with epoxy, tape, or some other gluelayer. Attaching a sensor in this manner limits perfor-mance, introduces sources of error, limits the sensor’s size,and further constrains where the sensor can be placed. Byeliminating glue and adhesion layers improved sensitivityand reduces errors due to creep. Figure 8 shows straingauges fabricated on surgical sharps. Figure 9 is a cut awaySEM image of a strain gauge and temperature sensorembedded inside of a robotic microforcep. While this micro-fabrication technology is an improvement in sensor tech-nology, wires are still used to connect the sensor to theoutside world. Reliability and the added complexity ofadding wires to surgical end effectors with high degrees
528 MICROSURGERY
Figure 7. Silicon wafer in the fabrication process. (Courtesy ofIntel Corp.)
Figure 8. Strain gauges fabricated on surgical sharps. (Courtesyof Verimetra, Inc.)
Figure 9. Strain gauges and temperature sensor embedded inrobotic microgripper. (Courtesy of Verimetra, Inc.)

of freedom limit the effectiveness of the technology. Short-range wireless technology compatible with the operatingroom environment need to be developed to overcome theselimitations.
Recently tactile feedback has been shown to be able to beadded to noncontact lasers. Based on optical distancemeasurements, the systems synthesize haptic feedbackthrough a robotic arm held by the surgeon when the focalpoint of the laser is coincident with a real surface. Thisgives the operator the impression of touching somethingsolid. By increasing the power of the laser such a systemcould also be used for cutting or ablation.
TISSUE SENSING
Taking haptic feedback one step further is the ability todistinguish between different types of tissue in the body.Tissue sensing is of vital importance to a surgeon. Beforemaking an incision into tissue, the surgeon must identifywhat type of tissue is being incised, such as fatty, muscular,vascular, or nerve tissue. This becomes more complicatedbecause the composition and thickness of different humantissues varies from patient to patient. Failure to properlyclassify tissue can have severe consequences. For example,if a surgeon fails to properly classify a nerve and cuts it,then the patient can suffer effects ranging from a loss offeeling to loss of motor control. If a neurosurgeon cuts into ablood vessel while extracting a tumor severe brain damagemay occur. The identification and classification of differenttypes of tissue during surgery, and more importantly dur-ing the actual cutting operation, will lead to the creation ofsmart surgical tools. If a surgical tool senses that it is tooclose to or about to cut the wrong type of tissue it can simplyturn itself off.
Verimetra, Inc. has developed a device called the dataknife, Fig. 10. It is a scalpel, which is outfitted withdifferent strain sensors along the edges of the blade tosense the amount of force being applied. The resistance ofthe tissue is one of the signals used for classifying tissue.Pressure sensors are used to measure the characteristics ofmaterial surrounding the blade. The pressure of the sur-rounding fluid can be used to help classify the type orlocation of tissue. Electrodes are used to measure theimpedance of different types of tissue, as well as beingused to identify nerves by picking up their electrical sig-nals. The tool provides the real-time feedback surgeons
have been asking for during surgery, and can also be usedto record data for later use for tracking purposes.
Sensing the density of tissue can also be used to assistthe surgeon in identifying tissue. In open cardiac bypassoperations, the surgeons insert their hands inside the bodyto palpate arteries. For cardiac bypass surgery, surgeonsselect the bypass location by feeling where the fat and fattyplaque is located in your arteries with their fingers. Thelack of tactile feedback in minimally invasive surgery,prevents them from using this technique. The MEMSdevices have been developed for the palpation of tissueusing strain gauges (7), diaphragms (8), micropositioners(9,10), and load cells (11) and have shown the ability tomeasure blood pressure, pulse, different kinds of arterialplaque, and distinguish between colon, bowel, stomach,lung, spleen, and liver tissue.
Piezoelectric transducers can also be used to measuredensity. Macroscale transducers are frequently used inimaging applications to differentiate between tumors,blood vessels, and different types of tissue. These transdu-cers both emit and receive sound waves. By vibrating at ahigh frequency sound waves are emitted in the direction ofthe object of interest. The density of the impinged objectcan then be measured based on the signal that is reflectedback by that object. Sound waves are reflected off theinterfaces between different types of tissue and returnedto the transducer. Present ultrasound systems tend to belarge and are not well suited for incorporation into micro-surgical devices. The MEMS technology is well suited forthis application and many ultrasonic MEMS sensors havebeen developed for imaging (12–16).
Microelectromechanical systems ultrasound devices fordensity measurements are shown in Fig. 11. They havebeen shown to be able to detect the location of bone in tissueand are being applied to atrial fibrillation surgeries. Atrialfibrillation is what causes irregular heartbeats and leads toone out of every six strokes. Drugs can be used to treat thiscondition, but have dangerous side effects including caus-ing a switch from atrial fibrillation to the more dangerousventricle fibrillation. Pacemakers and other electrical con-trol devices can be used, but they do not always work for allpatients. The most effective treatment is the surgical
MICROSURGERY 529
Figure 10. Data Knife smart scalpel. (Courtesy of Verimetra,Inc.)
Figure 11. Ultrasound transducers next to a dime. (Courtesy ofVerimetra, Inc.)

MAZE procedure, but it is an incredibly invasive treat-ment. The patient is put on a heart lung machine and thentheir heart is stopped. Next, the surgeon takes a scalpeland actually cuts all the way through the heart makinglesions, which physically separate the heart muscle. Theselesions break the electrical connections in the heart. Theheart is then sewn back together. Recently, there havebeen a variety of different methods used to address theproblem. Instead of physically cutting all the way throughthe heart with a scalpel, surgeons are using radio fre-quency, microwave, cryo, and laser energy to create trans-mural lesions. Transmurality means that the lesions go allthe way through the tissue, breaking the heart’s electricalconnections. One of the problems surgeons encounter is toknow how deep the ablation is or if it is transmural. If thelesions are not completely transmural or just partiallytransmural then the undesirable electrical signals maystill be transmitted to the heart muscle. The MEMS ultra-sound technology or micromachined electrodes can be usedto measure the transmurality.
Temperature can be used to detect if a surgical device isclose to a blood vessel, or if the surgical tool is in a diseasedor infected area. Temperature can also be used to monitorthe usage of a surgical device, by monitoring the time atwhich the device is at body temperature. Usage is just oneof many areas where Auto-ID technologies will benefitmicrosurgery (17). They can be used to make sure thatonly the correct surgical tool is used for a procedure and ifthat tool has been properly sterilized. Keeping track of howmany times, how long, and what was done with a surgicaltool will improve the reliability and effectiveness of surgi-cal procedures and will greatly impact the entire medicalindustry.
TRACKING SYSTEMS
Traditionally, a surgeon uses an endoscope in minimallyinvasive surgery to determine where the surgical instru-ments are located in the patient. The view the surgeon hasof the surgical area is not ideal and the position of surgicalinstruments outside of the camera view is not known.Ideally, the surgeon would like to know the position andorientation of each of his instruments. Computer-aidedsurgery has enabled the surgeon to overlay magnetic reso-nance imaging (MRI) or computed artial tomography(CAT) scan images of the patient with position and orien-tation data taken during surgery to create 3D models thatthe surgeon can use to better visualize the surgical proce-dure. Computers can be used to simulate the procedurebeforehand allowing the surgeon to practice difficult opera-tions ahead of time.
Current technology in this area is predominately opticalin nature. Markers are placed on the ends of the surgicalinstruments that are located outside of the body, as well ason specific locations on the patient’s body. A computerregisters the location of the surgical tools with the refer-ence markers on the patient so that images of the patient’sbody can be aligned with the surgical tools. This is donethrough the use of visible and infrared (IR) cameras. Thetips of the surgical tools that are located inside of the body
are then extrapolated. The markers must not interferewith the surgery in any way, and therefore should be assmall and lightweight as possible. While these systems arewireless and do not have cords that can get tangled on thesurgeon or on the surgical tools, there must be an unob-structed path from the markers to the camera systems. Thesurgeon must be careful not to block the markers themselfor with other surgical instruments. Precision is compro-mised because the location of the surgical tips is extra-polated and does not take into account bending of thesurgical tools. Markers on the outside of the body do nottake into account compression of the tissue.
MEMS based ultrasound tracking systems have beendeveloped to address these issues (18). Constellations ofultrasound sensors can also be placed on the surgical toolsthemselves to determine position thereby eliminatingerrors from extrapolation. Reference markers can now beplaced inside of the body, closer to the surgical area so thatthey are less affected by compression and movement of thepatient.
Position and orientation can also be estimated usingaccelerometers and gyroscopes. The signal outputs can beintegrated to determine or predict the distance traveled bya surgical tool. Conventional MEMS accelerometers haveaccuracies in the milligram range, which are not sufficientfor measuring accurately the relatively small displace-ments made during surgery (19). More accurate inertialsensors need to be developed before they can be integratedinto surgical tools.
Magnetic field sensors can also be used to determineposition and orientation of surgical tools (20,21). A threeaxis magnetoeffect sensor has been developed for deter-mining the location of catheters. Currently this is done bycontinually taking X rays of the patient. However X raysonly provide a 2D snapshot, a 3D image would be morehelpful for navigation.
EYE SURGERY
The leading cause of vision loss in adults > 60 are catar-acts. The word cataract comes from the Greek meaningwaterfall and was originally thought to be caused byopaque material flowing, like a waterfall, into the eye.The condition is actually caused by the clouding of theeye’s intraocular lense. In the eye, light passes throughthe lens that focuses it onto the retina. The retina convertsthe light into electrical signals that are then interpretedby the brain to give us our vision. The lens is a hardcrystalline material made mostly of water and protein.The protein is aligned in such a way to allow light to passthrough and focus on the retina. When proteins in the lensclump together, the lens begins to cloud and block lightfrom being focused on the retina. This causes vision tobecome dull and blurry, which is commonly referred to as acataract.
Much like other surgery in other parts of the body,cataract surgery has followed down the minimally invasivepath for the same benefits. Cataract surgery is one of theearliest known surgical procedures. The earliest evidenceis the written Sanskrit writings of the Hindu surgeon
530 MICROSURGERY
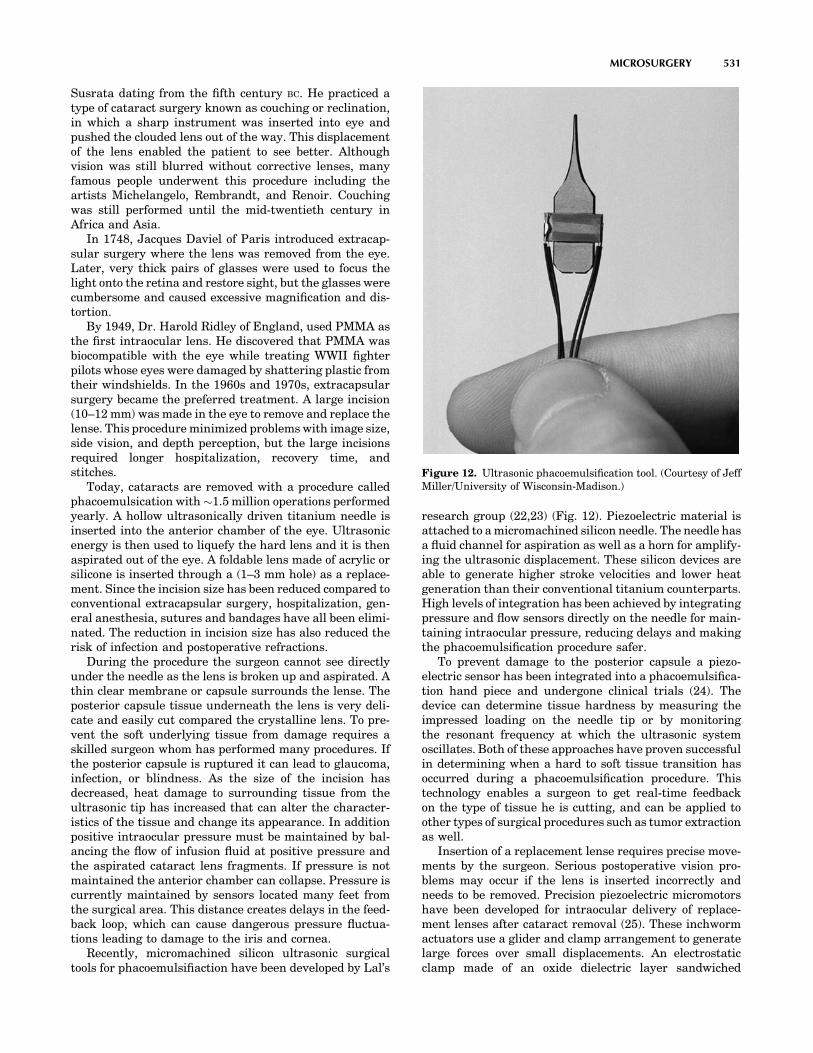
Susrata dating from the fifth century BC. He practiced atype of cataract surgery known as couching or reclination,in which a sharp instrument was inserted into eye andpushed the clouded lens out of the way. This displacementof the lens enabled the patient to see better. Althoughvision was still blurred without corrective lenses, manyfamous people underwent this procedure including theartists Michelangelo, Rembrandt, and Renoir. Couchingwas still performed until the mid-twentieth century inAfrica and Asia.
In 1748, Jacques Daviel of Paris introduced extracap-sular surgery where the lens was removed from the eye.Later, very thick pairs of glasses were used to focus thelight onto the retina and restore sight, but the glasses werecumbersome and caused excessive magnification and dis-tortion.
By 1949, Dr. Harold Ridley of England, used PMMA asthe first intraocular lens. He discovered that PMMA wasbiocompatible with the eye while treating WWII fighterpilots whose eyes were damaged by shattering plastic fromtheir windshields. In the 1960s and 1970s, extracapsularsurgery became the preferred treatment. A large incision(10–12 mm) was made in the eye to remove and replace thelense. This procedure minimized problems with image size,side vision, and depth perception, but the large incisionsrequired longer hospitalization, recovery time, andstitches.
Today, cataracts are removed with a procedure calledphacoemulsication with �1.5 million operations performedyearly. A hollow ultrasonically driven titanium needle isinserted into the anterior chamber of the eye. Ultrasonicenergy is then used to liquefy the hard lens and it is thenaspirated out of the eye. A foldable lens made of acrylic orsilicone is inserted through a (1–3 mm hole) as a replace-ment. Since the incision size has been reduced compared toconventional extracapsular surgery, hospitalization, gen-eral anesthesia, sutures and bandages have all been elimi-nated. The reduction in incision size has also reduced therisk of infection and postoperative refractions.
During the procedure the surgeon cannot see directlyunder the needle as the lens is broken up and aspirated. Athin clear membrane or capsule surrounds the lense. Theposterior capsule tissue underneath the lens is very deli-cate and easily cut compared the crystalline lens. To pre-vent the soft underlying tissue from damage requires askilled surgeon whom has performed many procedures. Ifthe posterior capsule is ruptured it can lead to glaucoma,infection, or blindness. As the size of the incision hasdecreased, heat damage to surrounding tissue from theultrasonic tip has increased that can alter the character-istics of the tissue and change its appearance. In additionpositive intraocular pressure must be maintained by bal-ancing the flow of infusion fluid at positive pressure andthe aspirated cataract lens fragments. If pressure is notmaintained the anterior chamber can collapse. Pressure iscurrently maintained by sensors located many feet fromthe surgical area. This distance creates delays in the feed-back loop, which can cause dangerous pressure fluctua-tions leading to damage to the iris and cornea.
Recently, micromachined silicon ultrasonic surgicaltools for phacoemulsifiaction have been developed by Lal’s
research group (22,23) (Fig. 12). Piezoelectric material isattached to a micromachined silicon needle. The needle hasa fluid channel for aspiration as well as a horn for amplify-ing the ultrasonic displacement. These silicon devices areable to generate higher stroke velocities and lower heatgeneration than their conventional titanium counterparts.High levels of integration has been achieved by integratingpressure and flow sensors directly on the needle for main-taining intraocular pressure, reducing delays and makingthe phacoemulsification procedure safer.
To prevent damage to the posterior capsule a piezo-electric sensor has been integrated into a phacoemulsifica-tion hand piece and undergone clinical trials (24). Thedevice can determine tissue hardness by measuring theimpressed loading on the needle tip or by monitoringthe resonant frequency at which the ultrasonic systemoscillates. Both of these approaches have proven successfulin determining when a hard to soft tissue transition hasoccurred during a phacoemulsification procedure. Thistechnology enables a surgeon to get real-time feedbackon the type of tissue he is cutting, and can be applied toother types of surgical procedures such as tumor extractionas well.
Insertion of a replacement lense requires precise move-ments by the surgeon. Serious postoperative vision pro-blems may occur if the lens is inserted incorrectly andneeds to be removed. Precision piezoelectric micromotorshave been developed for intraocular delivery of replace-ment lenses after cataract removal (25). These inchwormactuators use a glider and clamp arrangement to generatelarge forces over small displacements. An electrostaticclamp made of an oxide dielectric layer sandwiched
MICROSURGERY 531
Figure 12. Ultrasonic phacoemulsification tool. (Courtesy of JeffMiller/University of Wisconsin-Madison.)

between two silicon wafers layer locks the micromotor inplace while a PZT actuator generates the force. The inertiaof a mass is used to move the clamp. Forces of 3.0 N andstep sizes of 100 nm to 10 mm have been reported.
In eye surgery there are many times when precisioncutting is required. Highly sharpened steel, ceramic, ordiamond scalpel blades are used, but are expensive toproduce costing up to $1000 a piece. Disposable siliconmicromachined scalpels are an attractive alternative. Theycan be batch fabricated to reduce cost and sharpened to anatomic edge along their crystal planes. They are alreadybeing used in Russia at the Fyodorov Eye Care Center innonpenetrating deep sclerectomy operations for the treat-ment of glaucoma (26). BD (Bekton, Dikenson, and Com-pany) is producing Atomic Edge silicon blades for cataractsurgery (27). Soon they will be used for eye operations andeventually migrate to procedures on other parts of the body.Smaller incisions made by sharper blades result in lessbleeding and tearing. An added advantage of silicon bladesis that sensors and electronics can be directly fabricated onthem during fabrication. Integrating cauterizing electrodeson the blade itself will prevents the patient from bleeding aswell as let the surgeon more clearly see the surgical area.
CATHETERS/GUIDEWIRES/STENTS
Cardiac catheterizations can be referred to as a noninva-sive surgical procedure. Specialized tubes or catheters arethreaded up through blood vessels in the groin, arm, orneck to an area of the body which needs treatment. Theproblem is then treated from the inside of the blood vessel.The advantage of these approaches is that the proceduresrequire very small incisions, hospital stays are usually onenight or less and the discomfort and recovery times after-wards are minimal. For patients with more complicatedailments, catheter treatments can be used in combinationwith minimally invasive or open surgery to give the bestpossible results at the lowest possible risk. Catheters,guidewires, and stents currently represent the most wide-spread use of MEMS technology in surgery.
Diagnostic catheterizations, which are used to measurepressure in different parts of the body, take blood samples,and to perform detailed angiograms of the heart, can beperformed by injecting X-ray dye through the catheters.The MEMS pressure sensors are now commonly found oncatheter devices and are the most mature MEMS technol-ogy in this area. Even smaller designs are being sold forplacement on guidewires, such as those made by SilexMicrosystems, shown next to a 30 gauge needle (Fig. 13).Each sensor is but 100 mm thick, 150 mm wide, and 1300 mmlong (28). MEMS ultrasound sensors are also starting tobe used for both forward looking (16) and side lookingintravascular imaging (12,13).
To provide the doctor with more information to makebetter decisions, additional MEMS sensors are needed togather additional data for the diagnosis, monitoring ofprocedures, as well as for checking results of completedoperations. Many other types of MEMS sensors are beingresearched to measure blood flows, pressures, tempera-tures, oxygen content, and chemical concentrations forplacement on diagnostic catheters (29,30).
Heart disease continues to be the leading cause of deathin the United States. Interventional catheterization is anincreasingly more common way to treat blood vessels whichhave become occluded (blocked) or stenotic (narrowed) bycalcified artherosclerotic plaque deposits. Blood vesselsthat have become occluded or stenotic may interrupt bloodflow, which supplies oxygen and cause heart attacks orstrokes. Occluded or stenotic blood vessels may be treatedwith a number of medical procedures including angioplastyand atherectomy. Angioplasty techniques, such as percu-taneous transluminal coronary angioplasty (PTCA), alsoknown as balloon angioplasty are relatively noninvasivemethods of treating restrictions in blood vessels. A ballooncatheter is advanced over a guidewire until the balloon ispositioned in the restriction of a diseased blood vessel. Theballoon is then inflated compressing the atheroscleroticplaque. Frequently, the wall of the vessel is weakenedafter inflation and a metal stent in is expanded anddeployed against the plaque. The stent helps keep thevessel open. During an atherectomy procedure, the stenoticlesion is mechanically cut or abraded away from the bloodvessel wall using an atherectomy catheter.
Microelectrochemical systems pressure sensors can beused to measure the pressure in the balloons during infla-tion, to make sure damage due to over inflation is mini-mized. The MEMS temperature sensors can be integratedon catheters and guidewires to determine the location ofinflamed plaque. The inflammation causes artery walls inthe damaged area to have an increased temperature up to38C higher than healthy tissue. Approximately 20–50% ofall patients undergoing these therapeutic procedures toclear blocked coronary arteries will suffer restenosis(reblockage) within 6 months of the initial procedure. Drugcoated stents have significantly lowered these rates andhave been approved for use in Europe for a few years. Theyare expected to be approved in the United States later thisyear. The MEMS laser micromachining technology is usedin the fabrication of conventional stents and drug coatedstents (31). Stainless steel micromachining technology hasalso been developed at the University of Virginia for pier-cing structure drug delivery/gene therapy stents for thetreatment of restenosis (32). There is potentially a largeopportunity for MEMS in embedding sensors into stents to
532 MICROSURGERY
Figure 13. MEMS pressure sensors next to a 30-gauge needle(Courtesy of Silex Microsystems, Jarfalla, Sweden.)

create a smart stents, which would be able to alert doctorswhen restenosis occurs or other problems occur (33). TheMEMS rotary cutting devices have been fabricated foratherectomy procedures (34), but are not widely usedbecause cut up plaque particles can flow downstreamand cause strokes.
FETAL SURGERY
Fetal surgical techniques were first pioneered at the Uni-versity of California San Francisco (UCSF) in the 1980s tooperate on babies while they were still in the womb. Thesuccess rate of treating certain birth defects is higher theearlier they are addressed in fetal development. Initiallyopen surgical techniques were used with an incision throughthe mother’s abdomen to allow direct access for the sur-geon’s hands. After the surgery was complete, the womb wassutured and the mother delivered the baby weeks or monthslater. In 1981, the first fetal urinary tract obstruction pro-cedure was performed at UCSF. Lately, minimally invasivesurgical and robotic surgical techniques have been used thathave reduced the risk of complications and premature labor.Other fetal procedures have also been developed to treatcojoined twins, hernias, spina bifida, tumors, and heartdefects. One area of interest is in fetal heart.
The development of the cardiovascular system in adeveloping fetus is typically completed by the twelfth weekof gestation. At this stage primary heart defects are smalland if repaired will prevent defects from becoming moresevere as the heart changes to adapt to the normalizationblood flows and pressures in the later periods of gestation.
Fetal heart surgery can be used to treat hypoplasticheart syndrome (HHS), which was often considered fatal.This syndrome causes the heart’s left side to fail to growproperly and is caused by an obstruction which restrictsblood flow. The heart requires the mechanical stress ofblood flow to grow properly, and thus fails to developnormally. Today, three open surgeries are required to allowthe remaining single (right) ventricle to support both thepulmonary and systemic circulations. The long-term sur-vival for these patients into adulthood is significantly< 50%. Preserving both ventricles would result in the bestchances of long-term survival.
An interventional catheter can be used to treat HHS in aminimally invasive manner. The balloon catheter mustfirst penetrate in through the mother’s abdominal wall,the placenta and then the fetus’s chest into its heart. Itmust then locate the fetus’s tiny heart and expand to openthe blockage. Afterward, the surgeon needs to knowwhether the operation has succeeded enough for the babyto develop normally. Verimetra, Inc., Carnegie MellonUniversity, and Children’s Hospital of Pittsburgh haveembedded a MEMS flow sensor and a series of microma-chined bar codes on the tip of a balloon catheter. The barcodes enable the catheter to be visualized with ultrasoundallowing surgeons to know its exact position. The flowsensor is a thermistor. As blood flow increases the tem-perature measured by the thermistor decreases and in thismanner blood flow changes as the catheter progressesthrough the heart’s vessels can be monitored. This allowsfor the measurement of blood flow at or near a constriction
and then again after the procedure to open the constrictionhas been performed.
FUTURE SYSTEMS
In 1959, Richard Feynman gave his famous talk There’sPlenty of Room at the Bottom (35). In it, he talked aboutbeing able to put a surgeon in a blood vessel which would beable to look around ones heart. Initially, new microsurgicaltools will focus on measuring or detecting a specific para-meter be it pressure, blood flow, velocity, temperature, andso on. The MEMS sensor systems will continue to be refinedand improved leading to the integration of multiple sensorsystems on surgical tool followed by tools with multiplefunctions. Multifunction surgical tools will reduce thenumber of tool insertions and removals reducing patientrisks. Eventually, this will lead to highly integrated probes,which will do everything a surgeon needs, such as theconcept shown in Fig. 14 (36). These tools will fit througha standard 5-mm port and have built in 3D cameras forvisualization, biopsy samplers with microfluidic processingcapability to do tissue analysis, ultrasound transducers,and tactile sensors for feedback to the surgeon.
BIBLIOGRAPHY
1. Diamiano R. Next up: Surgery by remote control. NY Times,Apr. 4, 2000; pp. D1.
2. Blazer E, Koh W, Yon E. A miniature digital pressure trans-ducer. Proceedings of the 24th Annual Conference on Engi-neering Medicine and Biology. 1971. pp 211.
3. Peirs J, et al. A microturbine made by micro-electro-dischargemachining. Proc 16th Eur Conf Solid-State Transducers2002; 790–793.
4. Pique A, et al. Laser direct-write of embedded electroniccomponents and circuits. Presented at Photon Processing
MICROSURGERY 533
Figure 14. Highly integrated microsurgical probe. (Courtesy ofProf. Dr. M. Schurr, novineon Healthcare Technology PartnersGmbH and Prof. G. Buess, Universitätsklinikums Tbingen.)

in Microelectronics and Photonics IV, Jan 24–27 2005, SanJose, (CA); 2005.
5. Götzen R. Growing up, additive processes in MEMS fabrica-tion and packaging. Presented at Machines and Processesfor Micro-scale and Meso-scale Fabrication, Metrology andAssembly, Gainesville, FL; 2003.
6. Rebello KJ, Lebouitz K, Migliuolo M. MEMS tactile sensorsfor surgical instruments. MRS Symp. Proc.: Biomicroelectro-mech. Systems (BioMEMS). 2003;773:55–60.
7. Menciassi A, et al. Force feedback-based microinstrument formeasuring tissue properties and pulse in microsurgery. Pre-sented at 2001 IEEE International Conference on Roboticsand Automation (ICRA), May 21–26 2001, Seoul; 2001.
8. Rebello KJ, et al. MEMS based technology for endoscopicassessment of coronary arterial hardness. Presented at the5th Annual NewEra Cardiac Care Conference, Dana Point(CA); 2002.
9. Bicchi A, et al. Sensorized minimally invasive surgery tool fordetecting tissutal elastic properties. Presented at Proceedings ofthe 1996 13th IEEE International Conference on Robotics andAutomation. Pt. 1 (of 4), Apr. 22–28 1996, Minneapolis, (MN); 1996.
10. Rosen J, Hannaford B, MacFarlane MP, Sinanan MN. Forcecontrolled and teleoperated endoscopic grasper for minimallyinvasive surgery—experimental performance evaluation.IEEE Trans Biomed Eng 1999;46:1212–1221.
11. Scilingo EP, Bicchi A, De Rossi D, Iacconi P. Haptic displayable to replicate the rheological behaviour of surgical tissues.Presented at Proceedings of the 1998 20th Annual Interna-tional Conference of the IEEE Engineering in Medicine andBiology Society. Pt. 4 (of 6), Oct. 29-Nov. 1 1998, Hong Kong,China; 1998.
12. Fleischman A. et al. Miniature high frequency focused ultra-sonic transducers for minimally invasive imaging proce-dures. Sensors Actuators, A: Phys 2003;103:76–82.
13. Zara JM, Bobbio SM, Goodwin-Johansson S, Smith SW.Intracardiac ultrasound scanner using a micromachine(MEMS) actuator. IEEE Trans Ultrasonics, Ferroelectrics,and Frequency Control 2000;47:984–993.
14. Daft C, et al. Microfabricated ultrasonic transducers mono-lithically integrated with high voltage electronics. Presentedat 2004 IEEE Ultrasonics Symposium, Aug. 23–27 2004,Montreal, Queeue, Canada; 2004.
15. Chang JK, et al. Development of endovascular microtools. JMicromech Microeng 2002;12:824–831.
16. Degertekin FL, Guldiken RO, Karaman M. Micromachinedcapacitive transducer arrays for intravascular ultrasound.Presented at MOEMS Display and Imaging Systems III, Jan.24–25 2005, San Jose, (CA); 2005.
17. Brock D. Smart medicine: The application of Auto-ID technologyto healthcare. Auto-ID Center, MIT, Cambridge, (MA); 2002.
18. Tatar F, Mollinger JR, Bastemeijer J, Bossche A. Time offlight technique used for measuring position and orientationof laparoscopic surgery tools. Presented at Sensors, 2004.Proceedings of IEEE; 2004.
19. Fang C-M, Lee S-C. A research of robotic surgery techniqueby the use of MEMS accelerometer. Presented at Engineeringin Medicine and Biology, 2002. 24th Annual Conference andthe Annual Fall Meeting of the Biomedical EngineeringSociety. EMBS/BMES Conference; 2002. Proceedings of theSecond Joint, 2002.
20. Tanase D, et al. 3D position and orientation measurementswith a magnetic sensor for use in vascular interventions.Presented at Biomedical Engineering, 2003. IEEE EMBSAsian-Pacific Conference on; 2003.
21. Totsu K, Haga Y, Esashi M. Three-axis magneto-impedanceeffect sensor system for detecting position and orientation ofcatheter tip. Sensors Actuators, A: Phys 2004;111:304–309.
22. Chen X, Lal A. Integrated pressure and flow sensor in silicon-based ultrasonic surgical actuator. Presented at UltrasonicsSymposium, 2001 IEEE; 2001.
23. Son I-S, Lal A. Feedback control of high-intensity siliconultrasonic surgical actuator. Presented at Solid-State Sen-sors, Actuators and Microsystems, 2005. Digest of TechnicalPapers. TRANSDUCERS ’05. The 13th International Con-ference on; 2005.
24. Polla DL, et al. Microdevices in medicine. Annu Rev BiomedEng 2000;2:551–76.
25. Polla D, et al. Precision micromotor for surgery. Presented atMicrotechnologies in Medicine and Biology, 1st Annual Inter-national, Conference On. 2000; 2000.
26. Kozlova TV, Shaposhnikova NF, Scobeleva VB, SokolovskayaTV. Non-penetrating deep sclerectomy: Evolution of themethod and prospects for development (review). Ophthalmo-surgery 2000;3:39–54.
27. Angunawela R, Von Mohrenfels CW, Marshall J. A new age ofcataract surgery. Cataract & Refractive Surgery Today I2005; 36–38.
28. Kalvesten JE, Smith L, Tenerz L, Stemme G. First surfacemicromachined pressure sensor for cardiovascular pressuremeasurements. Presented at Proceedings of the 1998 IEEE11th Annual International Workshop on Micro Electro Mechan-ical Systems, Jan. 25–29 1998, Heidelberg, Ger; 1998.
29. Tanase D, Goosen JFL, Trimp PJ, French PJ. Multi-para-meter sensor system with intravascular navigation for cathe-ter/guide wire application. Presented at Transducers’01Eurosensors XV, Jun. 10–14 2001; Munich, 2002.
30. Haga Y, Esashi M. Biomedical microsystems for minimallyinvasive diagnosis and treatment. Proc IEEE Biomed AppMems Microfluidics 2004;92:98–114.
31. Kathuria YP. An overview on laser microfabrication of bio-compatible metallic stent for medical therapy. Presented atLaser-Assisted Micro- and Nanotechnologies 2003, Jun. 29–Jul. 3 2003, St. Petersburg, Russian Federation; 2004.
32. Reed ML. Micromechanical systems for intravascular drugand gene delivery. Presented at BioMEMS 2002 Conference,Boston; 2002.
33. Goldschmidt-Clermont P, Kandzari D, Khouri S, Ferrari M.Nanotechnology needs for cardiovascular sciences. BiomedMicrodevices 2001;3:83–88.
34. Ruzzu A, et al. A cutter with rotational-speed dependent dia-meter for interventional catheter systems. Presented at MicroElectro Mechanical Systems, 1998. MEMS 98. Proceedings.,The Eleventh Annual International Workshop on, 1998.
35. Feynman RP. There’s plenty of room at the bottom. J Micro-electromech Systs 1992;1:60–66.
36. Schurr MO, Heyn S-P, Ment W, Buess G. Endosystems—Future perspectives for endoluminal therapy. MinimallyInvasive Ther Allied Technol 1998;7:37–42.
Further Reading
Taylor RH, Lavallee S, Burdea GC, Mosges R. Computer Integra-ted Surgery: Technology and Clinical Application. Cambridge,(MA): MIT Press; 1996.
Zenati M. Robotic heart surgery. Cardiol Rev 2001;9(5):1–8.Davies B. A review of robotics in surgery. Proc Inst Mech Eng
2000;214:129–140.Madou M. Fundamentals of Microfabrication: The Science of
Miniturization. 2nd ed. Boca Raton, (FL): CRC Press; 2002.Kovacs GTA. Micromachined Transducers Sourcebook. Boston,
MA: McGraw-Hill; 2002.
See also ENDOSCOPES; FIBER OPTICS IN MEDICINE; INTRAUTERINE SURGICAL
TECHNIQUES; NANOPARTICLES; RADIOSURGERY, STEREOTACTIC.
534 MICROSURGERY

MINIMALLY INVASIVE SURGICALTECHNOLOGY
JAY R. GOLDBERG
Marquette UniversityMilwaukee, Wisconsin
INTRODUCTION
Most surgical procedures involve the invasion and disrup-tion of body tissues and structures by surgical instrumen-tation and/or implantable medical devices, resulting intrauma to the patient. Diagnostic imaging procedures,such as magnetic resonance imaging (MRI), computedtomography (CT), X ray, positron emission tomography(PET), and ultrasound do not require disruption of bodytissues, and are thus considered to be noninvasive. Extracorporeal shockwave lithotripsy (ESWL) used to disinte-grate kidney stones is an example of a noninvasive ther-apeutic procedure. As shown in Fig. 1, it focuses acousticenergy, generated outside of the patient’s body, on kidneystones. No trauma to the patient occurs during thisprocedure.
Open heart coronary artery bypass and organ trans-plantation surgery are examples of highly invasive sur-gery. These procedures require a high level of invasion anddisruption of body tissues and structures. Bones, muscletissue, and blood vessels are cut, and tissue from otherparts of the body may be grafted, resulting in a high level ofsurgical trauma to the patient.
Minimally invasive surgical procedures are less trau-matic than corresponding conventional surgical proce-dures. The use of small instruments placed throughintact natural channels, such as the esophagus, urethra,and rectum, is less invasive than conventional open surgi-cal approaches requiring large incisions, significant loss ofblood, and trauma to tissues. The use of small instruments,such as biopsy guns and angioplasty balloons placedthrough small incisions, results in minor trauma to thepatient, but is much less invasive than open surgicalprocedures used to accomplish the same goals. Proceduresusing small instruments through intact natural channelsor small incisions are classified as minimally invasive.
A minimally invasive surgical procedure can be definedas surgery that produces less patient trauma and disrup-tion of body tissues than its conventional open surgicalcounterpart. For example, conventional appendectomiesrequire a 4 cm long incision made through layers of skin,muscle, and other tissues to gain access to the appendix.Once the appendix is removed, the layers of the wound aresutured together to allow them to heal. This invasiveprocedure requires a significant level of invasion and dis-ruption of tissues and other structures. The minimallyinvasive appendectomy is performed with small surgicalinstruments placed into small incisions in the patient’sabdomen. Once the appendix is removed, the small incisionis closed with sutures. This procedure results in much lesstrauma to the patient than the open surgical approach.
Minimally invasive surgery (MIS) is performed withsmall devices inserted through intact natural orifices orchannels, or small incisions used to create an orifice. Some
procedures are performed with devices located outside thebody, and thus are noninvasive. The MIS procedures are analternative to open surgery. The benefits of MIS includereduced patient trauma, postoperative recovery time, andhealthcare costs.
INSTRUMENTATION FOR MINIMALLY INVASIVE SURGERY
Many MIS procedures involve flexible or rigid fiber opticendoscopes for imaging surgical sites and deliveringinstrumentation for diagnostic or therapeutic applications.The term ‘‘endoscope’’ is a generic term used to describetubular fiber optic devices placed into the body to allowvisualization of anatomical structures.
Endoscopes consist of a fiber optic light guide, highintensity light source, coherent fiber optic bundle, steeringmechanism, and various working channels for insertion ofendoscopic instrumentation and infusion of irrigationfluids or insufflating gases. Glass fibers comprise the fiberoptic light guide and coherent bundle and are surroundedby a flexible polyurethane sheath or rigid stainless steeltube. Figure 2 shows the components of a typical endo-scope. The light source provides light that is transmittedthrough the light guide and projected onto the anatomicalsite to create an image. The coherent fiber bundle trans-mits the image back to the focusing eyepiece and into thesurgeon’s eye. The surgeon can move the endoscope proxi-mally (toward the patient) and distally (away from thepatient) by pushing and pulling the endoscope into and outof the body, respectively. Steering is accomplished with ahandle attached to a cable that pulls and bends the tip ofthe endoscope in the desired direction. The proximal (clo-sest to the patient) end of the endoscope (shown in Fig. 3)contains lumens for the fiber optic light guide and coherentfiber bundle, and one or more working channels for passageof instruments and irrigation fluid into and out of theoperative site. Some endoscopes contain video camerasthat display endoscopic images on a video monitor in theoperating room, as shown in Fig. 4.
Specialized endoscopes have different names dependingon what part of the body they are used to image. Table 1lists the names of various endoscopes, the procedures forwhich they are used, and the anatomical location wherethey are used.
Endoscopic Procedures and Instrumentation
To perform an endoscopic procedure, the surgeon inserts asterilized endoscope into a natural channel or orifice, suchas the urethra, rectum, esophagus, bronchial tube, or nose.If there is no natural channel to provide access to theoperative site (as in abdominal surgery), then the surgeonwill create one with a small incision, and may insert ahollow trocar into the incision, as shown in Fig. 5. Thetrocar is left in the wound to provide access to the abdom-inal cavity. The endoscope is inserted into the access site(natural channel, incision, or trocar) and as it is advancedtoward the operative site the surgeon monitors the imageproduced by the endoscope, either through the objectiveeyepiece or video monitor (as shown in Fig. 4). Rigidendoscopes are typically used when access is obtained
MINIMALLY INVASIVE SURGICAL TECHNOLOGY 535
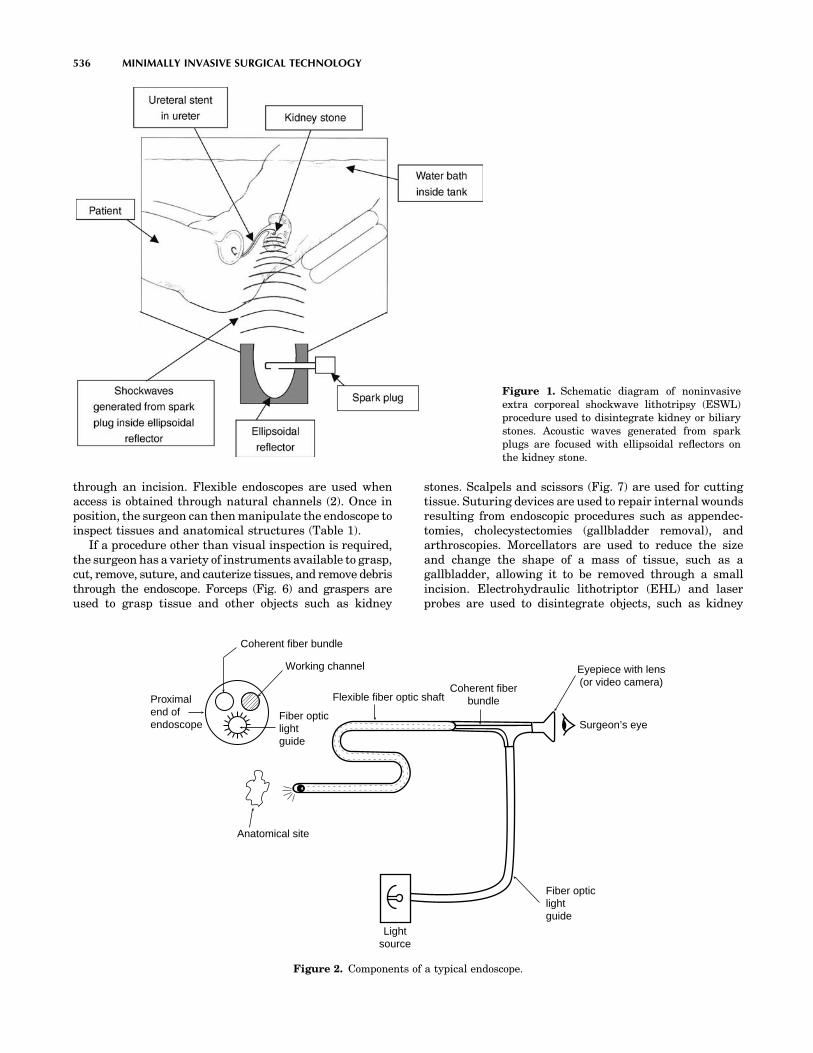
through an incision. Flexible endoscopes are used whenaccess is obtained through natural channels (2). Once inposition, the surgeon can then manipulate the endoscope toinspect tissues and anatomical structures (Table 1).
If a procedure other than visual inspection is required,the surgeon has a variety of instruments available to grasp,cut, remove, suture, and cauterize tissues, and remove debristhrough the endoscope. Forceps (Fig. 6) and graspers areused to grasp tissue and other objects such as kidney
stones. Scalpels and scissors (Fig. 7) are used for cuttingtissue. Suturing devices are used to repair internal woundsresulting from endoscopic procedures such as appendec-tomies, cholecystectomies (gallbladder removal), andarthroscopies. Morcellators are used to reduce the sizeand change the shape of a mass of tissue, such as agallbladder, allowing it to be removed through a smallincision. Electrohydraulic lithotriptor (EHL) and laserprobes are used to disintegrate objects, such as kidney
536 MINIMALLY INVASIVE SURGICAL TECHNOLOGY
Figure 1. Schematic diagram of noninvasiveextra corporeal shockwave lithotripsy (ESWL)procedure used to disintegrate kidney or biliarystones. Acoustic waves generated from sparkplugs are focused with ellipsoidal reflectors onthe kidney stone.
Flexible fiber optic shaftCoherent fiber
bundle
Eyepiece with lens(or video camera)
Surgeon’s eye
Fiber opticlightguide
Lightsource
Working channel
Fiber opticlightguide
Coherent fiber bundle
Anatomical site
Proximalend ofendoscope
Figure 2. Components of a typical endoscope.

stones, with acoustic and laser energy, respectively, allow-ing the debris to be passed through the ureter. Stonebaskets are used to trap kidney or ureteral stones forendoscopic removal, as shown in Fig. 8. These instrumentsare placed through the working channel of an endoscope ortrocar and are operated by manipulating handles andcontrols located outside the patient.
Endoscopes may contain multiple working channelsthat allow for irrigation of fluids to irrigate and flush outclots and other surgical debris. The presence of the fluidimproves visibility through the endoscope by keeping thevisual field clear and the lens clean. Laparoscopic surgeryrequires insufflation of CO2 or N2O through the workingchannel or trocar and into the abdominal cavity to causethe cavity to expand, separating organs, and enlarging theoperative site and visual field.
There are typically not enough working channels in alaparoscope to accommodate all of the instruments neededfor a particular procedure. In these cases, multiple accesssites are created with additional trocars. Typically, a cam-era is placed through one trocar and used to visualize thework being performed with instruments placed throughother trocars.
When an endoscopic procedure is completed, the endo-scope and instrumentation are removed from the patientvia the natural channel or incision. When a laparoscopicprocedure is completed, the laparoscope, camera, instru-ments, and trocars are removed from the patient. Thewounds created by the trocars are sutured and the patientbegins the recovery process. Although some of the CO2
from insufflation may escape the abdominal cavity whenall instrumentation is removed, some will be absorbed bybody tissues and eliminated via respiration. Patients typi-cally recover and are discharged from the hospital within24–48 h.
Non-Endoscopic Procedures and Instrumentation
Not all minimally invasive procedures require endoscopicdevices for imaging and placement of instruments. SomeMIS procedures (listed in Table 2), such as stereotacticradiosurgery, use lasers or gamma radiation in place ofscalpels. Others use small catheters to deliver medication,devices, or energy to specific anatomical locations. Balloonsand stents, delivered via catheters, are used to access anddilate constricted vessels and maintain patency. Cathetermounted electrodes are used to deliver thermal, micro-
MINIMALLY INVASIVE SURGICAL TECHNOLOGY 537
Figure 3. Proximal ends of typical endoscopes. Endoscopicinstruments (left:scissors, right:forceps) are shown placedthrough working channels. Two other channels contain the fiberoptic light guide and coherent fiber bundle, respectively. A fourthchannel can be used for instrumentation or delivery of irrigationfluids to operative site (1). (Reprinted from Endoscopic Surgery,Ball, K., page 62, Copyright 1997, with permission from Elsevier.)
Figure 4. Surgeon viewing laparoscopic images of gallbladder onvideo monitor in operating room. Note use of three trocars inpatient’s abdomen; one each for video camera and twoinstruments. (Courtesy ACMI, Southborough, MA.)
Figure 5. Trocar inserted into abdominal incision to provideaccess to abdominal cavity. Safety shield covers sharp end oftrocar (circled) upon insertion to prevent damage to abdominalorgans. (1) (Courtesy Ethicon Endo-Surgery Inc., Cincinnati, OH.)
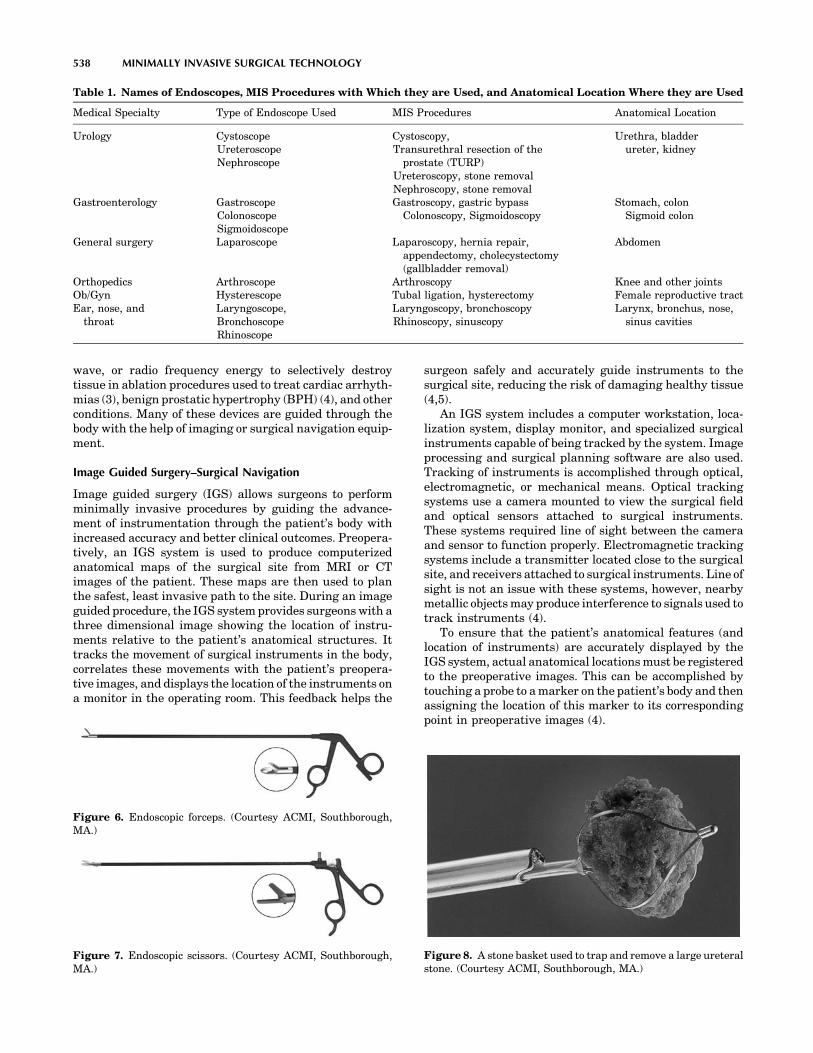
wave, or radio frequency energy to selectively destroytissue in ablation procedures used to treat cardiac arrhyth-mias (3), benign prostatic hypertrophy (BPH) (4), and otherconditions. Many of these devices are guided through thebody with the help of imaging or surgical navigation equip-ment.
Image Guided Surgery–Surgical Navigation
Image guided surgery (IGS) allows surgeons to performminimally invasive procedures by guiding the advance-ment of instrumentation through the patient’s body withincreased accuracy and better clinical outcomes. Preopera-tively, an IGS system is used to produce computerizedanatomical maps of the surgical site from MRI or CTimages of the patient. These maps are then used to planthe safest, least invasive path to the site. During an imageguided procedure, the IGS system provides surgeons with athree dimensional image showing the location of instru-ments relative to the patient’s anatomical structures. Ittracks the movement of surgical instruments in the body,correlates these movements with the patient’s preopera-tive images, and displays the location of the instruments ona monitor in the operating room. This feedback helps the
surgeon safely and accurately guide instruments to thesurgical site, reducing the risk of damaging healthy tissue(4,5).
An IGS system includes a computer workstation, loca-lization system, display monitor, and specialized surgicalinstruments capable of being tracked by the system. Imageprocessing and surgical planning software are also used.Tracking of instruments is accomplished through optical,electromagnetic, or mechanical means. Optical trackingsystems use a camera mounted to view the surgical fieldand optical sensors attached to surgical instruments.These systems required line of sight between the cameraand sensor to function properly. Electromagnetic trackingsystems include a transmitter located close to the surgicalsite, and receivers attached to surgical instruments. Line ofsight is not an issue with these systems, however, nearbymetallic objects may produce interference to signals used totrack instruments (4).
To ensure that the patient’s anatomical features (andlocation of instruments) are accurately displayed by theIGS system, actual anatomical locations must be registeredto the preoperative images. This can be accomplished bytouching a probe to a marker on the patient’s body and thenassigning the location of this marker to its correspondingpoint in preoperative images (4).
538 MINIMALLY INVASIVE SURGICAL TECHNOLOGY
Table 1. Names of Endoscopes, MIS Procedures with Which they are Used, and Anatomical Location Where they are Used
Medical Specialty Type of Endoscope Used MIS Procedures Anatomical Location
Urology CystoscopeUreteroscopeNephroscope
Cystoscopy,Transurethral resection of the
prostate (TURP)Ureteroscopy, stone removalNephroscopy, stone removal
Urethra, bladderureter, kidney
Gastroenterology GastroscopeColonoscopeSigmoidoscope
Gastroscopy, gastric bypassColonoscopy, Sigmoidoscopy
Stomach, colonSigmoid colon
General surgery Laparoscope Laparoscopy, hernia repair,appendectomy, cholecystectomy(gallbladder removal)
Abdomen
Orthopedics Arthroscope Arthroscopy Knee and other jointsOb/Gyn Hysterescope Tubal ligation, hysterectomy Female reproductive tractEar, nose, and
throatLaryngoscope,BronchoscopeRhinoscope
Laryngoscopy, bronchoscopyRhinoscopy, sinuscopy
Larynx, bronchus, nose,sinus cavities
Figure 6. Endoscopic forceps. (Courtesy ACMI, Southborough,MA.)
Figure 7. Endoscopic scissors. (Courtesy ACMI, Southborough,MA.)
Figure 8. A stone basket used to trap and remove a large ureteralstone. (Courtesy ACMI, Southborough, MA.)

Most surgical instruments must be adapted for use inimage guided surgery by mounting sensors and otherdevices to allow detection of the instrument’s position bythe IGS system. Some medical device manufacturers aredeveloping navigation-ready surgical instruments thatcontain small reflective spheres to act as reference arraysfor cameras used in image guided surgery (5).
MINIMALLY INVASIVE SURGICAL PROCEDURES
This section contains a few examples of minimally invasivesurgical procedures used in urology, orthopedics, neuro-surgery, and general and cardiovascular surgery.
Ureteroscopy
Flexible ureteroscopy is used to perform a variety of diag-nostic and therapeutic urological procedures. It involvesentry into the body via intact natural channels (urethraand ureter) and does not require an incision. Local anesthe-sia and sedation of the patient are required.
Ureteroscopy is commonly used to remove ureteral orkidney stones. Initially, a cystoscope is inserted into theurethra. Next, a guidewire is placed through a cystoscopeinto the ureter, and advanced up into the kidney. Whilemaintaining the position of the guidewire, the cystoscope isremoved, and the distal end of the guidewire is placed intoa working channel at the proximal end of the ureteroscope.The ureteroscope is then advanced along the guidewireinto the ureter or kidney, as shown in Fig. 9. Active(controlled by the cable and handle) and passive deflectionof the shaft, along with rotation of the flexible ureteroscopeallows visual inspection of the renal calices as shown inFig. 10. Ureteroscopic instruments are then placed throughthe working channel into the ureter or kidney. Figure 11shows two devices used for ureteroscopic removal of uret-eral stones. The stone grasper is used to physically grab thestone (Fig. 11). If the stone is small enough to fit into theworking channel, it is pulled out of the patient through theureteroscope. Large stones that will not fit into the working
channel are pulled out with the ureteroscope. The laserlithotripter (Fig. 11) disintegrates the stone into smallparticles that can easily be passed naturally through theureter, bladder, and urethra. Collapsed stone baskets canbe placed alongside a stone and moved proximally anddistally as they are expanded, until the stone is trappedin the basket (as shown in Fig. 8) and pulled out of theurethra.
Laparoscopy
Laparoscopy is commonly used for removal of the gallblad-der and appendix, hernia repair, and other abdominalprocedures. The basic steps involved in laparoscopy havebeen previously described. The lack of natural channelslocated in the abdomen requires the use of trocars to gainaccess to the operative site. Laparoscopic proceduresrequire insufflation of gas to separate organs and expandthe visual field. This is controlled by a separate insufflatorthat controls the pressure inside the abdomen produced bythe flow of insufflating gases (1).
MINIMALLY INVASIVE SURGICAL TECHNOLOGY 539
Table 2. Examples of Non-Endoscopic Minimally Invasive Surgical Procedures
Medical Specialty Non-Endoscopic Minimally Invasive Surgical Procedure
Cardiovascular surgery Minimally invasive direct coronary artery bypass (MIDCAB)Percutaneous transluminal coronary angioplasty (PTCA)Coronary stentingRadio frequency cardiac ablationLaser angioplastyMicrowave catheter ablation for arrhythmiasChemical ablation for ventricular tachycardia
Ophthalmology Laser photorefractive keratotomy (PRK)Laser ablation of cataractsLaser glaucoma surgery
Orthopedics Total joint arthroplasty (hips, knees, and others)Neurosurgery Stereotactic radiosurgery
Stereotactic radiotherapyLaser ablation of brain tissue, tumor tissue
Radiology Clot removalAneurism repairCerebral arterial venous malformation repairTransjugular hepatic portal systemic shunt creation
Figure 9. A surgeon views images through a ureteroscope placedthrough the urethra, bladder, ureter, and into the kidney.(Courtesy ACMI, Southborough, MA.)

Total Joint Replacement
Total hip and knee replacements are typically performedwith large incisions to expose the joint, allowing forcomplete visualization of and access to the joint and softtissues. New surgical approaches using smaller incisionsthat result in less damage to muscles and other soft tissuelimit the view of the joint. To compensate for the limitedview, fluoroscopy and IGS systems are often used. Someexisting surgical instruments have been modified to enablesurgery through smaller incisions (6).
Traditional hip arthroplasty requires a 30–46 cm longincision, which is highly disruptive to muscles and sur-rounding tissues. Two different techniques can be used forminimally invasive total hip arthroplasty. One technique
uses two 5 cm long incisions, one each for preparation andinsertion of the acetabular and femoral components,respectively. The other technique involves one 8–10 cmlong incision. Modified retractors and elevators are usedto gain access and expose the joint. Fluoroscopy and IGSsystems are used to provide the surgeon with a view ofinstruments and components (as shown in Fig. 12) andassist in positioning of instruments designed to enableaccurate component alignment and placement. Minimallyinvasive hip arthroplasty results in less disruptionof muscles and tissues, smaller and less noticeable scars,less blood loss and pain, and fewer blood clots and disloca-tions (6).
Most minimally invasive knee arthroplasties performedthrough smaller incisions involve a single compartment ofthe knee. These procedures typically use existing unicom-partmental knee implants for resurfacing the medial orlateral femoral condyle and corresponding tibial plateau.Existing instrumentation has been modified to obtain
540 MINIMALLY INVASIVE SURGICAL TECHNOLOGY
Figure 10. Flexibility and steerability of proximal end ofureteroscope allow inspection of upper, middle, and lower renalcalices. (Courtesy ACMI, Southborough, MA.)
Figure 11. Devices used for endoscopic removal of ureteralstones. (Courtesy ACMI, Southborough, MA.)
Figure 12. Acetabular component inserted with inserter throughsmall incision (top image). Fluoroscopic image of inserter andacetabular component seated in acetabulum (bottom image).Images such as these allow surgeons to ensure properplacement of instruments and implantable components withinhip joint when small incisions prevent viewing of entire device(6). (From MIS for the Hip and Knee: A Clinical Perspective, 2004,pg. 20, Minimally Invasive Total Hip Arthroplasty: The TwoIncision Approach, Berger, R.A. and Hartzband, M.A., Fig. 2.11.Copyright 2004, with kind permission of Springer Science andBusiness Media.)

access to the joint and enable accurate placement andalignment of the unicompartmental knee componentsthrough smaller incisions.
Minimally Invasive Direct Coronary Artery Bypass
Coronary arteries may become blocked due to fatty deposits(plaque), blood clots, or other causes. This reduces bloodflow to cardiac muscle, depriving it of needed oxygen andother nutrients. This condition can result in a myocardialinfarction (heart attack) that can damage cardiac muscle.
Traditional open heart coronary artery bypass graftsurgery has been used to restore normal blood flow tocardiac muscle. This procedure involves grafting a newvessel to points on both sides of the blocked coronaryartery, thereby bypassing the blockage and restoring nor-mal blood flow. It requires open access to a still heart toallow suturing of the graft to the blocked coronary artery. Asternotomy and separation of the sternum is required toprovide access to the heart. The heart is stopped and thepatient is attached to a heart–lung machine to maintaincirculation of oxygenated blood through the body duringthe surgical procedure. This procedure is highly invasive
and can result in a variety of complications, many of whichare associated with use of a heart–lung machine. Inflam-matory responses negatively affecting multiple organ sys-tems have been observed in patients who were perfusedwith a heart–lung machine during traditional open heartcoronary bypass surgery (7). These responses are due toreactions between circulating blood and material surfacespresent in the heart–lung machine.
Minimally invasive direct coronary artery bypass is analternative to open heart surgery. A small 5–10 cm incisionmade between the ribs replaces the sternotomy to gainaccess to the heart. A retractor is used to separate the ribsabove the heart to maximize access to the operative site (8).Heart positioners and stabilizers (Fig. 13) are used tominimize the motion of the heart, allowing surgeonsto perform the procedure on a beating heart, eliminatingthe need for the heart–lung machine. Some stabilizersgrasp the heart with suction cups. Others use a fork likedevice to apply pressure to the beating heart to keep itsteady for anastomosis of the graft (8). A thorascope andsmall endoscopic instruments are used to visualize thesurgical site and perform the surgical procedure. The leftinternal mammary artery is commonly used as the grafted
MINIMALLY INVASIVE SURGICAL TECHNOLOGY 541
Figure 13. Heart positioner and stabilizer used in MIDCAB procedures. The positioner attaches tothe sternal retractor and holds the heart in position using suction. It provides greater access to theblocked coronary artery. The tissue stabilizer, attached to the sternal retractor, straddles theblocked artery and holds the suturing site steady. This allows surgery on a beating heart,eliminating the need for a heart–lung machine along with its associated complications.(Courtesy of Medtronic, Inc., Minneapolis, MN.)
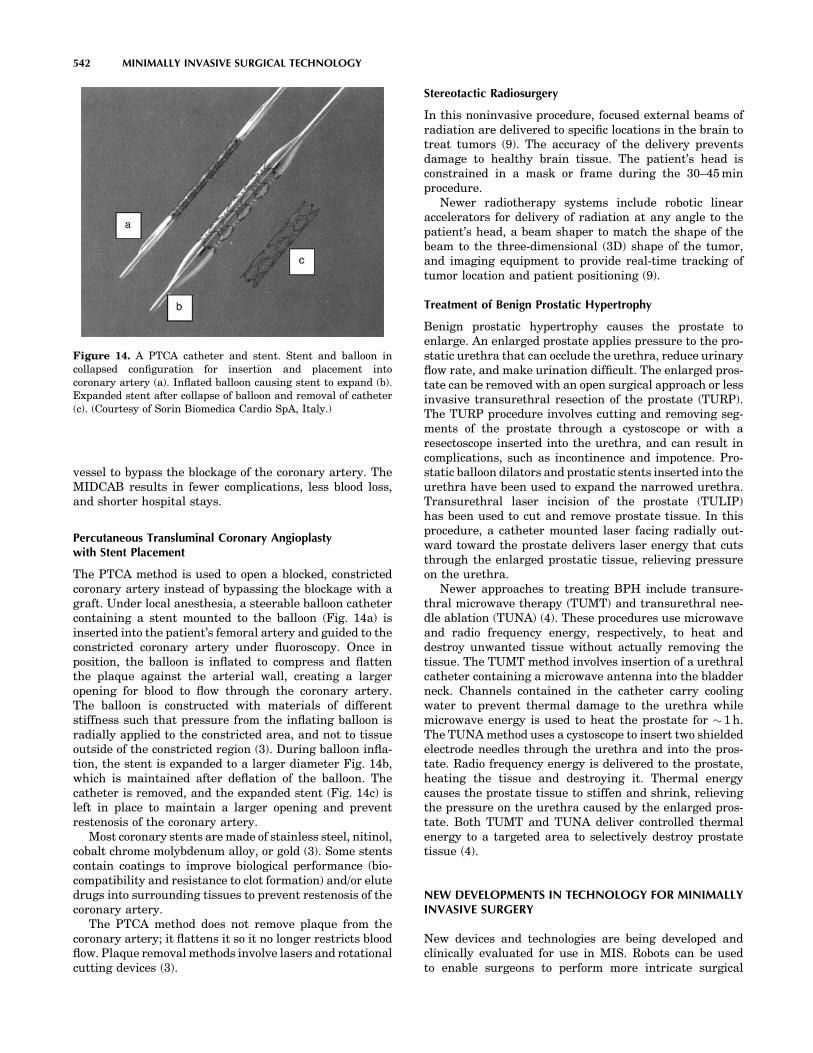
vessel to bypass the blockage of the coronary artery. TheMIDCAB results in fewer complications, less blood loss,and shorter hospital stays.
Percutaneous Transluminal Coronary Angioplastywith Stent Placement
The PTCA method is used to open a blocked, constrictedcoronary artery instead of bypassing the blockage with agraft. Under local anesthesia, a steerable balloon cathetercontaining a stent mounted to the balloon (Fig. 14a) isinserted into the patient’s femoral artery and guided to theconstricted coronary artery under fluoroscopy. Once inposition, the balloon is inflated to compress and flattenthe plaque against the arterial wall, creating a largeropening for blood to flow through the coronary artery.The balloon is constructed with materials of differentstiffness such that pressure from the inflating balloon isradially applied to the constricted area, and not to tissueoutside of the constricted region (3). During balloon infla-tion, the stent is expanded to a larger diameter Fig. 14b,which is maintained after deflation of the balloon. Thecatheter is removed, and the expanded stent (Fig. 14c) isleft in place to maintain a larger opening and preventrestenosis of the coronary artery.
Most coronary stents are made of stainless steel, nitinol,cobalt chrome molybdenum alloy, or gold (3). Some stentscontain coatings to improve biological performance (bio-compatibility and resistance to clot formation) and/or elutedrugs into surrounding tissues to prevent restenosis of thecoronary artery.
The PTCA method does not remove plaque from thecoronary artery; it flattens it so it no longer restricts bloodflow. Plaque removal methods involve lasers and rotationalcutting devices (3).
Stereotactic Radiosurgery
In this noninvasive procedure, focused external beams ofradiation are delivered to specific locations in the brain totreat tumors (9). The accuracy of the delivery preventsdamage to healthy brain tissue. The patient’s head isconstrained in a mask or frame during the 30–45 minprocedure.
Newer radiotherapy systems include robotic linearaccelerators for delivery of radiation at any angle to thepatient’s head, a beam shaper to match the shape of thebeam to the three-dimensional (3D) shape of the tumor,and imaging equipment to provide real-time tracking oftumor location and patient positioning (9).
Treatment of Benign Prostatic Hypertrophy
Benign prostatic hypertrophy causes the prostate toenlarge. An enlarged prostate applies pressure to the pro-static urethra that can occlude the urethra, reduce urinaryflow rate, and make urination difficult. The enlarged pros-tate can be removed with an open surgical approach or lessinvasive transurethral resection of the prostate (TURP).The TURP procedure involves cutting and removing seg-ments of the prostate through a cystoscope or with aresectoscope inserted into the urethra, and can result incomplications, such as incontinence and impotence. Pro-static balloon dilators and prostatic stents inserted into theurethra have been used to expand the narrowed urethra.Transurethral laser incision of the prostate (TULIP)has been used to cut and remove prostate tissue. In thisprocedure, a catheter mounted laser facing radially out-ward toward the prostate delivers laser energy that cutsthrough the enlarged prostatic tissue, relieving pressureon the urethra.
Newer approaches to treating BPH include transure-thral microwave therapy (TUMT) and transurethral nee-dle ablation (TUNA) (4). These procedures use microwaveand radio frequency energy, respectively, to heat anddestroy unwanted tissue without actually removing thetissue. The TUMT method involves insertion of a urethralcatheter containing a microwave antenna into the bladderneck. Channels contained in the catheter carry coolingwater to prevent thermal damage to the urethra whilemicrowave energy is used to heat the prostate for � 1 h.The TUNA method uses a cystoscope to insert two shieldedelectrode needles through the urethra and into the pros-tate. Radio frequency energy is delivered to the prostate,heating the tissue and destroying it. Thermal energycauses the prostate tissue to stiffen and shrink, relievingthe pressure on the urethra caused by the enlarged pros-tate. Both TUMT and TUNA deliver controlled thermalenergy to a targeted area to selectively destroy prostatetissue (4).
NEW DEVELOPMENTS IN TECHNOLOGY FOR MINIMALLYINVASIVE SURGERY
New devices and technologies are being developed andclinically evaluated for use in MIS. Robots can be usedto enable surgeons to perform more intricate surgical
542 MINIMALLY INVASIVE SURGICAL TECHNOLOGY
Figure 14. A PTCA catheter and stent. Stent and balloon incollapsed configuration for insertion and placement intocoronary artery (a). Inflated balloon causing stent to expand (b).Expanded stent after collapse of balloon and removal of catheter(c). (Courtesy of Sorin Biomedica Cardio SpA, Italy.)

procedures than can be done with endoscopic devices (10).In robot-assisted surgery, the surgeon operates a console tocontrol mechanical arms positioned over the patient. Thearms become an extension of the surgeon’s hands. Whileobserving the procedure on viewing screens (one for eacheye) that produce a 3D image, the surgeon uses hand,finger, and foot controls to move the mechanical armscontaining interchangeable surgical instruments througha small opening in the patient’s body (10).
Other new technologies for MIS include 3D video imag-ing, integrated robotic and surgical navigation systems,devices for mechanical retraction of the abdominal wall(eliminating the need for insufflation), and telerobotics (8).
OUTCOMES OF MINIMALLY INVASIVE SURGERY
Comparison of MIS to Conventional Approaches
Minimally invasive surgical procedures result in reducedpatient trauma, less postoperative pain and discomfort,and decreased complication rates. Hospital stays and post-operative recovery times are reduced, resulting in lowerhospital costs and allowing patients to return to workearlier.
Studies comparing various MIS procedures to theirtraditional open surgical counterparts have been con-ducted. One such retrospective study compared the clin-ical and economic aspects of laparoscopic andconventional cholecystectomies (11). Results of 153 con-secutive traditional procedures and 222 consecutivelaparoscopic procedures performed in a German teachinghospital were evaluated. Researchers found that althoughlaparoscopic cholecystectomies required longer operativetimes (92 vs. 62 min), they resulted in fewer complications(6 vs. 9), shorter hospital stays (3 vs. 8 days), and an 18%decrease in hospital costs, when compared to traditionalprocedures.
In a Canadian study, the direct costs of conventionalcholecystectomy, laparoscopic cholecystectomy, and biliarylithotripsy were compared (12). Researchers concludedthat laparoscopic cholecystectomy provided a small eco-nomic advantage over the other two procedures and attrib-uted this to a shorter hospital stay.
In the United States, hospital stays following laparo-scopic cholecystectomies typically ranged from 3 to 5 days.Now, many of these procedures are performed on an out-patient basis. This additional reduction in hospital stayfurther reduces hospital costs, resulting in a greater eco-nomic advantage over the conventional procedure.
A study comparing results of 125 consecutive off-pumpcoronary bypass (OPCAB) procedures to a matched, con-temporaneous control group of 625 traditional coronaryartery bypass graft (CABG) procedures was conducted (7).The OPCAB procedure is a beating heart procedure thatdoes not involve a heart–lung machine. Partial sterno-tomies were used with some patients in the OPCAB group.Researchers found that the OPCAB procedure resulted in alower mortality rate (0 vs. 1.4%), reduced hospital stays(3.3 vs. 5.5 days), 24% lower hospital costs, and a reducedtransfusion rate (29.6 vs. 56.5%), when compared to thetraditional CABG procedure. Excellent graft patency rates
and clinical outcomes were also reported with the OPCABprocedure.
In another study of 67 MIDCAB patients, it was foundthat average hospital charges for MIDCAB were $14,676compared to $22,817 for CABG and $15,000 for coronarystenting (13). The significantly lower charges for MIDCABwere attributed to shorter hospital stays, elimination ofperfusion expenses, and reduction in ICU, ventilation, andrehabilitation times.
Limitations of Minimally Invasive Surgery
There are several problems and limitations associated withMIS procedures. First, some minimally invasive surgicalprocedures can take longer to perform than their moreinvasive counterparts (10). Second, open surgical proce-dures allow the surgeon to palpate tissue and digitallyinspect for tumors, cysts, and other abnormalities. Tactilefeedback also assists in locating anatomical structures. Theinability of the surgeon to actually touch and feel tissue andstructures at the operative site limits the diagnostic abilityof some MIS procedures (10). Third, a two-dimensional(2D) image is produced by the endoscope and video moni-tor. The resulting loss of depth perception combined withrestricted mobility of instruments through a small incisionmake manipulation of endoscopic instruments challenging.Fine hand movements are difficult due to the long dis-tances between the surgeon’s hand and working ends ofthese instruments. Fourth, there is a limit to the number ofinstruments that can be used at one time through trocarsand working channels of a laparoscope. Finally, instru-mentation for MIS procedures is more expensive.
Insufflation presents a small risk not associated withopen surgical procedures (1,10). If the gas pressure insidethe abdominal cavity becomes too high or there is a smalldefect in a blood vessel, then a gas bubble can enter thebloodstream and travel to the heart or brain, causingunconsciousness or death.
Laparoscopic removal of cancer tissue carries a verysmall risk of transporting cancer cells to other parts of thebody. As tumor tissue is removed through the laparoscope,some cancer cells may remain in the body. They may bedisplaced from their original location resulting in thespread of cancer cells to other parts of the body (10).
SUMMARY
Minimally invasive surgery is made possible through theuse of specialized devices and technologies. These includeendoscopes, surgical instruments, imaging and navigationsystems, catheters, energy delivery systems, and otherdevices. The MIS procedures tend to require more time,are more difficult to perform than conventional procedures,and present some unique risks not associated with conven-tional procedures. Compared to conventional open surgicalprocedures, MIS procedures demonstrate similar clinicalefficacy and reduce trauma and disruption of body tissuesand structures. Patients experience less pain and discom-fort, fewer complications, and shorter recovery periods.Hospital stays are reduced, resulting in lower hospitalcosts.
MINIMALLY INVASIVE SURGICAL TECHNOLOGY 543
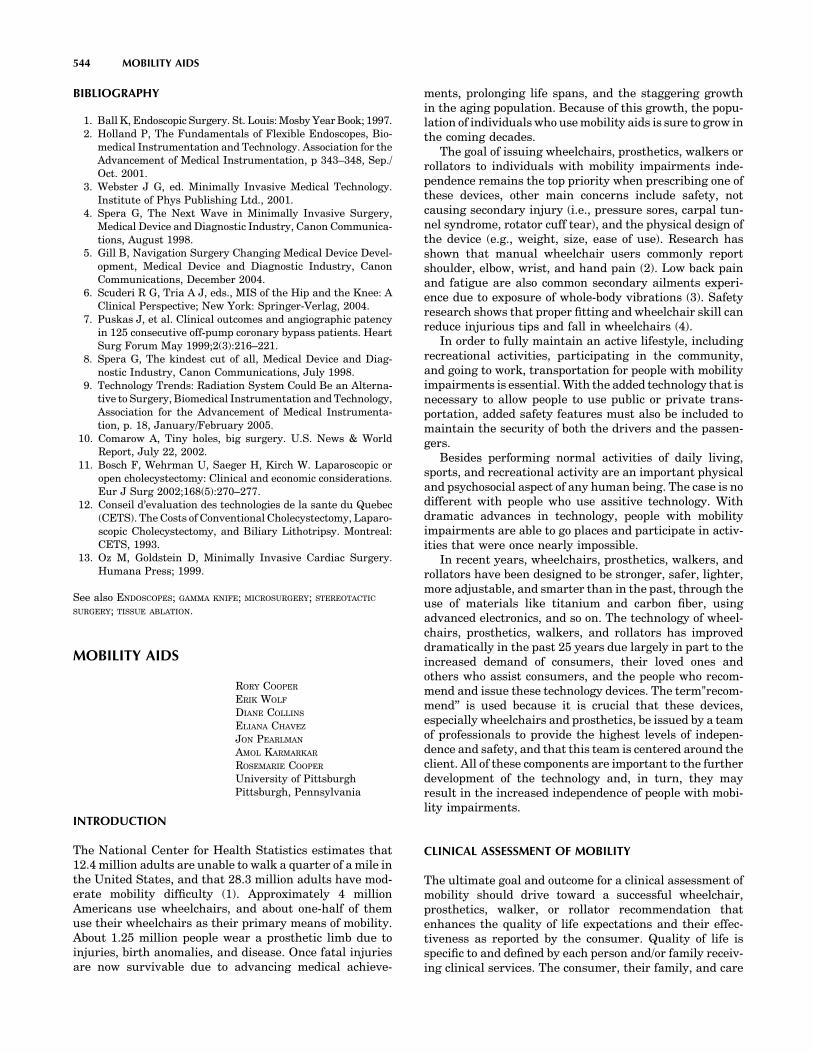
BIBLIOGRAPHY
1. Ball K, Endoscopic Surgery. St. Louis: Mosby Year Book; 1997.2. Holland P, The Fundamentals of Flexible Endoscopes, Bio-
medical Instrumentation and Technology. Association for theAdvancement of Medical Instrumentation, p 343–348, Sep./Oct. 2001.
3. Webster J G, ed. Minimally Invasive Medical Technology.Institute of Phys Publishing Ltd., 2001.
4. Spera G, The Next Wave in Minimally Invasive Surgery,Medical Device and Diagnostic Industry, Canon Communica-tions, August 1998.
5. Gill B, Navigation Surgery Changing Medical Device Devel-opment, Medical Device and Diagnostic Industry, CanonCommunications, December 2004.
6. Scuderi R G, Tria A J, eds., MIS of the Hip and the Knee: AClinical Perspective; New York: Springer-Verlag, 2004.
7. Puskas J, et al. Clinical outcomes and angiographic patencyin 125 consecutive off-pump coronary bypass patients. HeartSurg Forum May 1999;2(3):216–221.
8. Spera G, The kindest cut of all, Medical Device and Diag-nostic Industry, Canon Communications, July 1998.
9. Technology Trends: Radiation System Could Be an Alterna-tive to Surgery, Biomedical Instrumentation and Technology,Association for the Advancement of Medical Instrumenta-tion, p. 18, January/February 2005.
10. Comarow A, Tiny holes, big surgery. U.S. News & WorldReport, July 22, 2002.
11. Bosch F, Wehrman U, Saeger H, Kirch W. Laparoscopic oropen cholecystectomy: Clinical and economic considerations.Eur J Surg 2002;168(5):270–277.
12. Conseil d’evaluation des technologies de la sante du Quebec(CETS). The Costs of Conventional Cholecystectomy, Laparo-scopic Cholecystectomy, and Biliary Lithotripsy. Montreal:CETS, 1993.
13. Oz M, Goldstein D, Minimally Invasive Cardiac Surgery.Humana Press; 1999.
See also ENDOSCOPES; GAMMA KNIFE; MICROSURGERY; STEREOTACTIC
SURGERY; TISSUE ABLATION.
MOBILITY AIDS
RORY COOPER
ERIK WOLF
DIANE COLLINS
ELIANA CHAVEZ
JON PEARLMAN
AMOL KARMARKAR
ROSEMARIE COOPER
University of PittsburghPittsburgh, Pennsylvania
INTRODUCTION
The National Center for Health Statistics estimates that12.4 million adults are unable to walk a quarter of a mile inthe United States, and that 28.3 million adults have mod-erate mobility difficulty (1). Approximately 4 millionAmericans use wheelchairs, and about one-half of themuse their wheelchairs as their primary means of mobility.About 1.25 million people wear a prosthetic limb due toinjuries, birth anomalies, and disease. Once fatal injuriesare now survivable due to advancing medical achieve-
ments, prolonging life spans, and the staggering growthin the aging population. Because of this growth, the popu-lation of individuals who use mobility aids is sure to grow inthe coming decades.
The goal of issuing wheelchairs, prosthetics, walkers orrollators to individuals with mobility impairments inde-pendence remains the top priority when prescribing one ofthese devices, other main concerns include safety, notcausing secondary injury (i.e., pressure sores, carpal tun-nel syndrome, rotator cuff tear), and the physical design ofthe device (e.g., weight, size, ease of use). Research hasshown that manual wheelchair users commonly reportshoulder, elbow, wrist, and hand pain (2). Low back painand fatigue are also common secondary ailments experi-ence due to exposure of whole-body vibrations (3). Safetyresearch shows that proper fitting and wheelchair skill canreduce injurious tips and fall in wheelchairs (4).
In order to fully maintain an active lifestyle, includingrecreational activities, participating in the community,and going to work, transportation for people with mobilityimpairments is essential. With the added technology that isnecessary to allow people to use public or private trans-portation, added safety features must also be included tomaintain the security of both the drivers and the passen-gers.
Besides performing normal activities of daily living,sports, and recreational activity are an important physicaland psychosocial aspect of any human being. The case is nodifferent with people who use assitive technology. Withdramatic advances in technology, people with mobilityimpairments are able to go places and participate in activ-ities that were once nearly impossible.
In recent years, wheelchairs, prosthetics, walkers, androllators have been designed to be stronger, safer, lighter,more adjustable, and smarter than in the past, through theuse of materials like titanium and carbon fiber, usingadvanced electronics, and so on. The technology of wheel-chairs, prosthetics, walkers, and rollators has improveddramatically in the past 25 years due largely in part to theincreased demand of consumers, their loved ones andothers who assist consumers, and the people who recom-mend and issue these technology devices. The term"recom-mend’’ is used because it is crucial that these devices,especially wheelchairs and prosthetics, be issued by a teamof professionals to provide the highest levels of indepen-dence and safety, and that this team is centered around theclient. All of these components are important to the furtherdevelopment of the technology and, in turn, they mayresult in the increased independence of people with mobi-lity impairments.
CLINICAL ASSESSMENT OF MOBILITY
The ultimate goal and outcome for a clinical assessment ofmobility should drive toward a successful wheelchair,prosthetics, walker, or rollator recommendation thatenhances the quality of life expectations and their effec-tiveness as reported by the consumer. Quality of life isspecific to and defined by each person and/or family receiv-ing clinical services. The consumer, their family, and care
544 MOBILITY AIDS

givers, must be actively included in this process, as theywill be most affected by the choice of the mobility aid. Also,people chose their mobility devices based on the featuresavailable that facilitate activities or address needs (5), andthe clinician should be aware of the consumer preferencesand the features of various devices.
The complexity of some of the mobility device compo-nents combined at times with involved disease processescan make it virtually impossible for a single clinician to actindependently when recommending assistive technology.Therefore, involving an interdisciplinary team is recom-mended in the decision making process (6,7). This team,with the consumer as an involved member and a variety ofrehabilitation professionals, includes a physiatrist or simi-larly trained physician who understands the importance ofAssistive Technology, addresses medical issues and assistswith mobility decisions; the Occupational or PhysicalTherapist with RESNA (www.resna.org) certified AssistiveTechnology Practitioner (ATP) credentials, who is the pointperson for evaluation and prescription; and the Rehabilita-tion Engineering (with RE Training and RET Credential)who is a technology expert with the ability to design–modify–tune devices, and who also understands the cap-abilities and applications of various technologies. Anotherimportant team partner is the Assistive TechnologySupplier (ATS) or Certified Rehabilitation Supplier (CRTS,National Association of Rehabilitation Technology Suppliers,www.narts.org), who provides or manages demonstrationequipment, does routine home and workplace assessments,and orders, assembles, and delivers the equipment. Allteam members involved in the mobility aid selection pro-cess should have knowledge about the technology availableon the market. Peer reviewed journal articles (AssistiveTechnology, Archives of Physical Medicine and Rehabilita-tion, Journal of Rehabilitation Research and Developmentetc.), magazine articles and commercial database sourcessuch as ABLEDATA (http://www.abledata.com/), or Wheel-chairNet (www.wheelchairnet.org) are good places toresearch devices or to direct consumers who want to informand educate themselves.
Resources available to the team and its membersincludes a defined and dedicated space for demonstrationequipment, assessments, and evaluations, access to com-mon activities and tasks (e.g., ramps, curb cuts, bathroom,countertop), an electronic tracking system to follow clientsand their technology, assessment resources (e.g., pressuremapping, SMARTWheel, gait force plate, actigraph), ITResources (e.g., email, web, databases, medline, paging,cell, wireless), and the facilities–hospital commitment tocontinuing education.
A mechanism for Quality Measures for AT Clinics willprovide valuable feedback on performance quality andareas in need of improvement. An important tool to mea-sure patient satisfaction is the information gained througha satisfaction survey provided to every patient, in order tofind out whether the goals and desired outcomes have beenmet. Feedback on performance quality is provided throughtracking mechanism of primary clinician credentials (ATS,ATP, RET), dedicated staffing levels, continuing education(CEUs and CMEs), compliance with the commission onAccreditation of Rehabilitation Facilities (CARF) AT Clinic
Accreditation, as well as tracking of continuous qualityimprovement.
Assessment
The occupational or physical therapist conducts the initialassessment process and obtains critical information aboutthe consumer and their environment. This part usuallyinvolves a structured interview with the consumer andthen a physical motor assessment. Establishing a medicaldiagnosis that requires the mobility aid is vital to assure noongoing medical problems exist that are not being ade-quately addressed. To properly specify a mobility device,the intentions and abilities of the consumer must be ascer-tained (8,9). The intentions and abilities may include howpeople perform tasks, where the deficits are, and howmobility systems can compensate for the deficits to aug-ment task performance. Some outcome tools that are clini-cally used to measure the functional impact of mobility aidsare the QUEST, the FEW and the Wheelchair Skills Test(WST).
Additional necessary information includes type of insur-ance, method of transportation, and physical capabilities.Also, if the consumer has been using a chair, historicalinformation about their current chair should be addressed,including problems they are having. The mobility devicechosen should also be compatible with the public and/orprivate transportation options available to the consumer,such as a bus, car, or van. The regularity of the surface, itsfirmness and stability are important, when, for example,recommending a wheelchair in determining the tire size,drive wheel location, and wheel diameter. The performanceof a wheelchair is often dictated by the need to negotiategrades, as well as height transitions, such as thresholdsand curbs. The clearance widths in the environment willdetermine the overall dimensions of the wheelchair. Theclimates the chair will be operated in, and the need to beable to operate in snow, rain, changing humidity andtemperature levels, and other weather conditions, areimportant considerations as well.
A physical–motor assessment of strength, range ofmotion, coordination, balance, posture, tone, contractures,endurance, sitting posture, cognition, perception, andexternal orthoses is an important first step to obtain abasic understanding of an individual’s capacity to performdifferent activities. The history likely provided significantinsight related to their physical abilities. To verify this, aphysical examination should focus on aspects of the con-sumer that (1) help justify the mobility aid, (2) help deter-mine the most appropriate mobility aid, and (3) assure thatmedical issues are appropriately addressed.
Once the examination documents the need, or potentiallack of need for the mobility device the remainder of theexamination can focus on the appropriate technology. Thisis best assessed by giving the consumer the opportunity totry equipment to determine how functional and safe theymaneuver/operate the device within the clinical space.During this part of the assessment, the consumer andfamily must be informed of the positive and negativecharacteristics of devices and services. The team needsto educate the consumer or family to participate in
MOBILITY AIDS 545
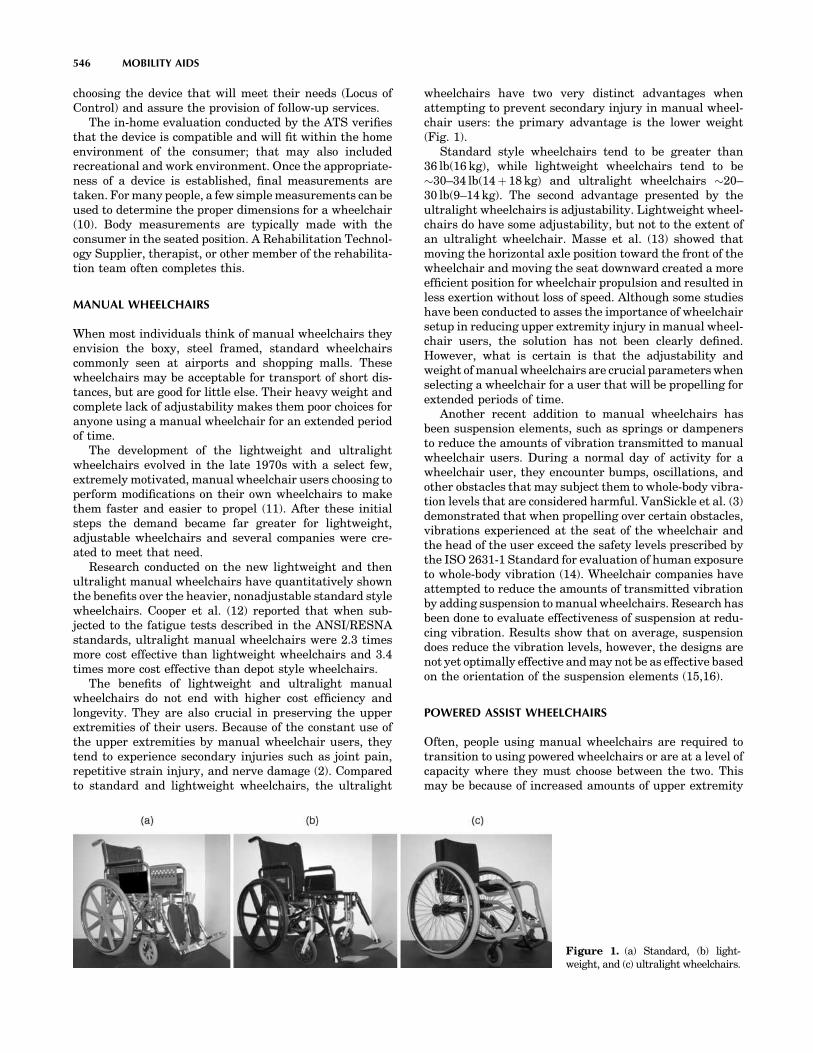
choosing the device that will meet their needs (Locus ofControl) and assure the provision of follow-up services.
The in-home evaluation conducted by the ATS verifiesthat the device is compatible and will fit within the homeenvironment of the consumer; that may also includedrecreational and work environment. Once the appropriate-ness of a device is established, final measurements aretaken. For many people, a few simple measurements can beused to determine the proper dimensions for a wheelchair(10). Body measurements are typically made with theconsumer in the seated position. A Rehabilitation Technol-ogy Supplier, therapist, or other member of the rehabilita-tion team often completes this.
MANUAL WHEELCHAIRS
When most individuals think of manual wheelchairs theyenvision the boxy, steel framed, standard wheelchairscommonly seen at airports and shopping malls. Thesewheelchairs may be acceptable for transport of short dis-tances, but are good for little else. Their heavy weight andcomplete lack of adjustability makes them poor choices foranyone using a manual wheelchair for an extended periodof time.
The development of the lightweight and ultralightwheelchairs evolved in the late 1970s with a select few,extremely motivated, manual wheelchair users choosing toperform modifications on their own wheelchairs to makethem faster and easier to propel (11). After these initialsteps the demand became far greater for lightweight,adjustable wheelchairs and several companies were cre-ated to meet that need.
Research conducted on the new lightweight and thenultralight manual wheelchairs have quantitatively shownthe benefits over the heavier, nonadjustable standard stylewheelchairs. Cooper et al. (12) reported that when sub-jected to the fatigue tests described in the ANSI/RESNAstandards, ultralight manual wheelchairs were 2.3 timesmore cost effective than lightweight wheelchairs and 3.4times more cost effective than depot style wheelchairs.
The benefits of lightweight and ultralight manualwheelchairs do not end with higher cost efficiency andlongevity. They are also crucial in preserving the upperextremities of their users. Because of the constant use ofthe upper extremities by manual wheelchair users, theytend to experience secondary injuries such as joint pain,repetitive strain injury, and nerve damage (2). Comparedto standard and lightweight wheelchairs, the ultralight
wheelchairs have two very distinct advantages whenattempting to prevent secondary injury in manual wheel-chair users: the primary advantage is the lower weight(Fig. 1).
Standard style wheelchairs tend to be greater than36 lb(16 kg), while lightweight wheelchairs tend to be�30–34 lb(14þ 18 kg) and ultralight wheelchairs �20–30 lb(9–14 kg). The second advantage presented by theultralight wheelchairs is adjustability. Lightweight wheel-chairs do have some adjustability, but not to the extent ofan ultralight wheelchair. Masse et al. (13) showed thatmoving the horizontal axle position toward the front of thewheelchair and moving the seat downward created a moreefficient position for wheelchair propulsion and resulted inless exertion without loss of speed. Although some studieshave been conducted to asses the importance of wheelchairsetup in reducing upper extremity injury in manual wheel-chair users, the solution has not been clearly defined.However, what is certain is that the adjustability andweight of manual wheelchairs are crucial parameters whenselecting a wheelchair for a user that will be propelling forextended periods of time.
Another recent addition to manual wheelchairs hasbeen suspension elements, such as springs or dampenersto reduce the amounts of vibration transmitted to manualwheelchair users. During a normal day of activity for awheelchair user, they encounter bumps, oscillations, andother obstacles that may subject them to whole-body vibra-tion levels that are considered harmful. VanSickle et al. (3)demonstrated that when propelling over certain obstacles,vibrations experienced at the seat of the wheelchair andthe head of the user exceed the safety levels prescribed bythe ISO 2631-1 Standard for evaluation of human exposureto whole-body vibration (14). Wheelchair companies haveattempted to reduce the amounts of transmitted vibrationby adding suspension to manual wheelchairs. Research hasbeen done to evaluate effectiveness of suspension at redu-cing vibration. Results show that on average, suspensiondoes reduce the vibration levels, however, the designs arenot yet optimally effective and may not be as effective basedon the orientation of the suspension elements (15,16).
POWERED ASSIST WHEELCHAIRS
Often, people using manual wheelchairs are required totransition to using powered wheelchairs or are at a level ofcapacity where they must choose between the two. Thismay be because of increased amounts of upper extremity
546 MOBILITY AIDS
Figure 1. (a) Standard, (b) light-weight, and (c) ultralight wheelchairs.
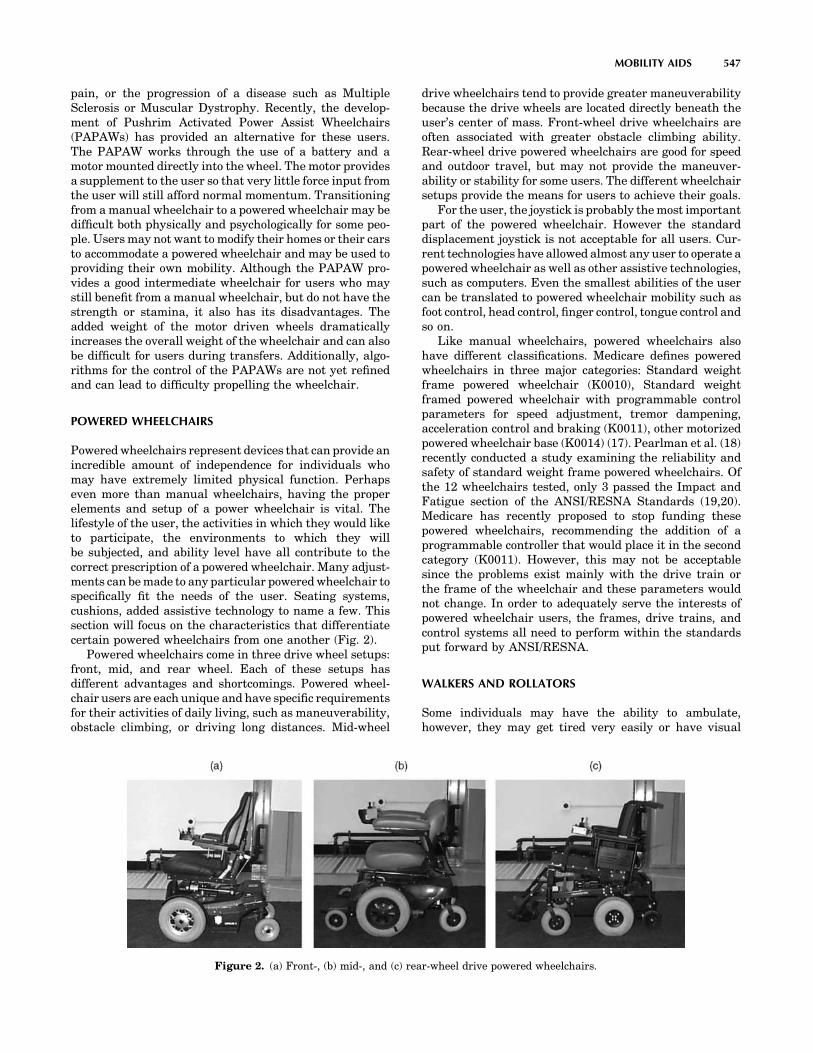
pain, or the progression of a disease such as MultipleSclerosis or Muscular Dystrophy. Recently, the develop-ment of Pushrim Activated Power Assist Wheelchairs(PAPAWs) has provided an alternative for these users.The PAPAW works through the use of a battery and amotor mounted directly into the wheel. The motor providesa supplement to the user so that very little force input fromthe user will still afford normal momentum. Transitioningfrom a manual wheelchair to a powered wheelchair may bedifficult both physically and psychologically for some peo-ple. Users may not want to modify their homes or their carsto accommodate a powered wheelchair and may be used toproviding their own mobility. Although the PAPAW pro-vides a good intermediate wheelchair for users who maystill benefit from a manual wheelchair, but do not have thestrength or stamina, it also has its disadvantages. Theadded weight of the motor driven wheels dramaticallyincreases the overall weight of the wheelchair and can alsobe difficult for users during transfers. Additionally, algo-rithms for the control of the PAPAWs are not yet refinedand can lead to difficulty propelling the wheelchair.
POWERED WHEELCHAIRS
Powered wheelchairs represent devices that can provide anincredible amount of independence for individuals whomay have extremely limited physical function. Perhapseven more than manual wheelchairs, having the properelements and setup of a power wheelchair is vital. Thelifestyle of the user, the activities in which they would liketo participate, the environments to which they willbe subjected, and ability level have all contribute to thecorrect prescription of a powered wheelchair. Many adjust-ments can be made to any particular powered wheelchair tospecifically fit the needs of the user. Seating systems,cushions, added assistive technology to name a few. Thissection will focus on the characteristics that differentiatecertain powered wheelchairs from one another (Fig. 2).
Powered wheelchairs come in three drive wheel setups:front, mid, and rear wheel. Each of these setups hasdifferent advantages and shortcomings. Powered wheel-chair users are each unique and have specific requirementsfor their activities of daily living, such as maneuverability,obstacle climbing, or driving long distances. Mid-wheel
drive wheelchairs tend to provide greater maneuverabilitybecause the drive wheels are located directly beneath theuser’s center of mass. Front-wheel drive wheelchairs areoften associated with greater obstacle climbing ability.Rear-wheel drive powered wheelchairs are good for speedand outdoor travel, but may not provide the maneuver-ability or stability for some users. The different wheelchairsetups provide the means for users to achieve their goals.
For the user, the joystick is probably the most importantpart of the powered wheelchair. However the standarddisplacement joystick is not acceptable for all users. Cur-rent technologies have allowed almost any user to operate apowered wheelchair as well as other assistive technologies,such as computers. Even the smallest abilities of the usercan be translated to powered wheelchair mobility such asfoot control, head control, finger control, tongue control andso on.
Like manual wheelchairs, powered wheelchairs alsohave different classifications. Medicare defines poweredwheelchairs in three major categories: Standard weightframe powered wheelchair (K0010), Standard weightframed powered wheelchair with programmable controlparameters for speed adjustment, tremor dampening,acceleration control and braking (K0011), other motorizedpowered wheelchair base (K0014) (17). Pearlman et al. (18)recently conducted a study examining the reliability andsafety of standard weight frame powered wheelchairs. Ofthe 12 wheelchairs tested, only 3 passed the Impact andFatigue section of the ANSI/RESNA Standards (19,20).Medicare has recently proposed to stop funding thesepowered wheelchairs, recommending the addition of aprogrammable controller that would place it in the secondcategory (K0011). However, this may not be acceptablesince the problems exist mainly with the drive train orthe frame of the wheelchair and these parameters wouldnot change. In order to adequately serve the interests ofpowered wheelchair users, the frames, drive trains, andcontrol systems all need to perform within the standardsput forward by ANSI/RESNA.
WALKERS AND ROLLATORS
Some individuals may have the ability to ambulate,however, they may get tired very easily or have visual
MOBILITY AIDS 547
Figure 2. (a) Front-, (b) mid-, and (c) rear-wheel drive powered wheelchairs.

impairment problems that may result in a fall and injury.Fuller (21) reported that 33% of community-dwellingelderly people and 60% of nursing home residents fall eachyear. Walkers and rollators represent useful assistivetechnology devices for these individuals by lending supportand weight relief during mobility. They may have zero,two, or four wheels and possibly have hand brakes. Theymay also contain a small area for sitting if the user becomesfatigued or a basket for carrying items for the user.
Some elderly persons, in addition to having mobilityimpairment, also have a visual impairment. Recent researchhas investigated a new robotic walker (Fig. 3) that throughthe use of sonar and infrared (IR) sensors can detect obstaclesas well as provide guidance along a preprogrammed path (i.e.,maneuvering around an assisted living home) (22).
SPORTS AND RECREATION DEVICES
As quality of life receives more attention, sports andrecreational activities have become more important toindividuals with disabilities. Sport and recreational activ-ity participation provides many benefits to individuals withdisabilities. Physical activity reduces or slows down thedevelopment of cardiovascular disease as well as modifiesrisk factors including high blood pressure, blood lipidlevels, insulin resistance, and obesity (23). In addition,the development of muscular strength and joint flexibilitygained through regular exercise improves the ability toperform activities of daily living (24). Regular exercise mayhelp reduce clinical depression and days spent as anin-patient in a hospital, and may improve social interac-tions and prolong life expectancy (25). With the positivebenefits of sports, exercise, and recreational activities inmind, the purpose of this section is to describe some of themore popular sports played by individual with disabilities.
Wheelchair Basketball
Wheelchair users who play basketball may have variousdiagnoses, such as paraplegia, cerebral palsy, amputa-tions, post-polio syndrome, or a disabling injury. Partici-pants are not required to use a wheelchair for their primarymeans of mobility or in their activities of daily living. Priorto the actual game, persons who want to play basketballmust have their player classification level determined by aqualified referee. To equalize the capability of each team,the classification levels of the competitors are matched(26).
Whether players play zone or person-to-person basket-ball, the basic rules apply to both. Because different playershave varying degrees of disability, rules have been devel-oped that all players need to abide by. Keep firmly seated inthe wheelchair at all times. A player may not use a func-tional leg or leg stump for physical advantage. An infrac-tion of this rule constitutes a physical advantage foul (27).
Wheelchair basketball is similar to an everyday wheel-chair, but incorporates features that enhance maneuver-ability (Fig. 4). Basketball wheelchairs are lightweight toallow for speed, acceleration and quick braking. The wheel-chair must have four wheels. Two large, rear wheels andtwo front casters. The front casters are 2 in. (50 mm) indiameter and typically made from hard plastics, similar tothe material used to make inline skate wheels. The rearwheels must be larger than or equal to 26 in. (338 mm) indiameter. The rear wheels must have handrims. Basket-ball wheelchairs use spoke guards made of high impactplastic. These guards cover the rear wheel spokes to pre-vent wheel damage and illegal ramming and picking. Thespoke guards provide several benefits: First, spoke guardscan be used to pick up the ball from the floor. Using a hand,the player pushes the ball against the spoke guard and rollsit onto their lap, Second, spoke guards protect hands andfingers from injury when reaching for the ball near anotherplayer’s rear wheel. Third, they provide space to identifyteam affiliations and sponsor names. Camber is an impor-tant feature of basketball wheelchair as well. Camberis defined as"the angle of the main wheel to the vertical’’,or as a situation in which"the spacing between the top
548 MOBILITY AIDS
Figure 3. Robotic walker for users with visual impairments.
Figure 4. Players competing in a friendly game of wheelchairbasketball.

points of the wheels may be less than the spacing betweenthe bottom points’’. Increasing camber slightly reduces theheight of the seat, while it proportionally increases thewheelbase, which corresponds to the width of the wheel-chair. In the same way, with negative camber, the center ofgravity of the occupied wheelchair moves backward. Froma practical point of view, increased wheel camber improveshand protection as chairs pass through doors and, in termsof basketball, camber makes a wheelchair more responsiveduring turns and protects players’ hands when two wheel-chairs collide from the sides, by limiting the collision to thebottom of the wheels and leaving a space at the top toprotect the hands. Basketball wheelchair seats typicallyhave a backward seat angle slope of 5–158. The angle of theseat compared to the ground is known as ‘‘seat angles’’.Guards are an exception. Guards are allowed to have lowerseat heights and greater seat angles. These modificationsmake chairs faster and more maneuverable for ball hand-ling.
Wheelchair Racing
Individuals with all levels of SCI as well as lower limbamputees can participate in competitive races. The pre-ferred racing chair among racers is the three-wheel chair(Fig. 5). The three-wheel design is constructed from highpressure tubular tires, light weight rims, precision hubs,carbon disk/spokes wheels, compensator steering, smallpush rings, ridged aluminum frame, and 2–158 of wheelcamber. The camber in a racing chair makes the chair morestable and allows the athlete to reach the bottom of thepushrim without hitting the top of the wheels or pushrim.
Hand-Cycling
Cycling has been a popular outdoor sport for several years.The adaptability of cycling to different terrains makes it afavorite for many. Adaptive equipment for bicycles consistsof a hand cycle allows individuals with limited use of theirlegs to utilize the strength of their arms (28). A handcycletypically consists of a three-wheel setup to compromise forthe balance required when riding a two-wheeled bicycle.Two-wheeled handcycles do exist but require a great deal ofskill and balance. Handcycle designs allow the user topropel, steer, break, and change gears, all with the upperextremities and trunk. Two types of handcycle designs are
readily available (1) the upright and (2) the recumbent. Inan upright handcycle, the rider remains in an uprightposition similar to the position the body takes when seatedin a touring bike. Upright handcycles use a pivot steer toturn. Only the front wheel turns while the cycle remains inan upright position. Transferring and balancing tend to beeasier on the upright cycle. In the recumbent handcycle,the rider’s torso reclines and the legs are positioned out infront of the cyclist. These cycles use a lean-to-steermechanism. The rider leans to turn, causing the cycle topivot at hinge points. Leaning to turn can be challenging ifthe rider lacks trunk stability, in which case a pivot steer-ing recumbent handcycle may be more appropriate.Recumbent handcycles are lighter and faster, making themthe choice for hand cycle racing. Relatively minimal mod-ifications are needed to accommodate individuals withtetraplegia. Some of the modifications include hand cuffsthat can be mounted to the arm crank handles and elasticabdominal binders which can be fitted around the user andthe handcycle seat to increase trunk stability.
Wheelchair Rugby
Rugby is played indoors on a large gym on a basketballcourt surface. Players use manual wheelchairs specificallydesigned for the sport. Due to the level of contact, the chairshave protective side bars on them and players are strappedin to prevent injury. Most chairs are made of titanium orsteel to handle the hits that they sustain. In addition, thelow pointers have a high camber (angle of the wheels) sothat they can turn fast, as well as ‘‘red push rim coversso they can actually stick to the other person’s chair andhold them.’’ The high pointers have armor on the front oftheir chairs resembling a cow catcher so that they can pushthrough the other players without getting stuck (Fig. 6).
To be eligible to play rugby, players must have a com-bination of upper and lower extremity impairment. Most ofthe players have sustained cervical level spinal injuriesand have some degree of tetraplegia. Like in basketball,players receive a classification number based on there levelof impairment (29). Rugby consists of two teams comprisedof four players. The object of the game is for a player to havepossession of the ball and cross the opponent’s goal line.
Rugby wheelchairs are strictly regulated to ensure fair-ness. However, chairs may vary considerably depending on
MOBILITY AIDS 549
Figure 5. Shows a racing three-wheeled wheelchair. Figure 6. Wheelchair rugby.

a player’s preferences, functional level and team role.Team roles may be assigned according to ability. Playerswith upper body limitations tend to perform the defensiveblocking and picking roles. They use chairs that haveadditional length and hardware. All rugby chairshave extreme amounts of camber, 16–208, significant buck-eting, and antitip bars. The camber provides lateral sta-bility, hand protection, and ease in turning. The bucketing(knees held high relative to rear end) helps with trunkbalance and protection of the ball.
Tennis
Tennis players compete in both singles and doubles games.Players are required to have a permanent mobility-relatedphysical disability that requires a wheelchair as the pri-mary means of mobility. Tennis is played on the traditionaltennis court using the tradition size and height tennis net.However, unlike traditional tennis, the ball is permittedtwo bounces on the court before it must be returned. Brakesare not permissible as stabilizers and the athlete must keepone buttock in contact with the seat at all times.
Tennis players use a three-wheeled chair with a largeamount of camber to maximize mobility around the court.The seat is situated at a steep backwards seat angle slope.The angle helps with balance, keeps players against theseat backs, and gives them greater control over the wheel-chair. The knees tend to be flexed with the feet on thefootrest behind the player’s knees. With the body in arelatively compact position, the combined inertia of riderand wheelchair is reduced, making the chair more man-euverable (30). Handles and straps can also be added to thechair. Many players incorporate plastic rigid handles intothe front of the seat. Players use these handles whenleaning for a shot or making quick directional changes.Straps can be used around the waist, knees and ankles, tohelp with balance (31).
Adaptive Skiing
Skis for skiers with disabilities have advanced state-of-the-art skis that offer shock absorption systems, frames moldedto body shape, and quick release safety options. Skiers withdisabilities can maintain a similar pace to that of unim-paired athletes with the development of adaptive seating,backrests, cushions, tethering ropes, roll bars and out-riggers. Outriggers, an adapted version of a forearm crutchwith a shortened ski, provide extra balance and steeringmaneuverability (32). Two types of sit-down adaptive skiesare available: Bi and Mono. Bi skis are appropriate forskiers with limited trunk stability. With Bi skis, the skierbalances on two skies and angulates and shifts to put theskis on edge. Bi skis have wider base of support, canusually be mastered quickly with few falls and are easierto control than a mono ski. The Mono Ski is the ski of choicefor individuals who want high end performance, maneu-verability and speed. With a mono ski, the skier sitsrelatively high on the seat of the ski over the snow. Theskier uses upper body, arm and head to guide their move-ment down the hill. Sit-, Mono- and Bi-skis have loadingmechanisms, usually hydraulic, that enable the individual
to raise themselves to a higher position for transferringonto a ski lift.
TRANSPORTATION SAFETY AND ADAPTIVE DRIVINGFOR WHEELCHAIR USERS
Wheelchair users, like the entire population, use severalforms of transportation to travel from place to place: Theyare passengers in public transportation systems (bus, sub-ways, and vans) and private vehicles, and are potentialdrivers of each of these types of vehicles. To ensure thesafety of all passengers and drivers, certain safety mechan-isms must be in place: drivers must be able to safely controlthe vehicle, and all seated passengers require seatssecurely fastened to the vehicle and passenger restraints(e.g., seatbelts) which can secure the passenger to the seat.The requirement of passenger restraints is relaxed forpassengers in large vehicles, like busses and subways,because of the low likelihood of high velocity crashes(33). In many cases, adaptation of a vehicle is necessarywhen the original equipment manufacturer (OEM) controland/or securement mechanism cannot provide adequatesafety for wheelchair users because either (1) sensory and/or motor impairments of the user requires adaptive drivingequipment so the vehicle can be safely controlled, or (2) theuser cannot safely or effectively use the OEM seat orpassenger restraint system in the vehicle.
Vehicle Control Systems
The complexity of the adaptive equipment required for safecontrol of the vehicle is correlated to the type and level ofimpairment of the wheelchair user. Adaptive drivingequipment can be as low tech as attaching a knob on asteering wheel, and as high tech as fly-by-wire technology,where computer-controlled actuators are added to all of thecontrols, and the drive interfaces with the computer (viavoice and/or low or no-effort sensors). Adding actuators toall of the driving and operating controls of the vehiclethrough computer controls.
An example of this range is the types of steering adapta-tions available for people with disabilities. Figure 7 demon-strates both a typical steering knob for a person with littleto no loss of hand sensory-motor function (a), and (b) a knobfor someone with loss of some sensory motor function. Bothtypes of steering knobs serve the same purpose: They allowthe driver to safely steer the vehicle with one hand while(typically) their other hand is operating a hand controlwhich actuates the fuelaccelerator and brake pedals. Whenupper-extremity sensory-motor function does not allow forsafe turning of the OEM steering system (even with aknob), actuators can be used in lieu of upper-extremityfunction. These systems are named ‘‘low-’’ or ‘‘no-effort’’steering systems, depending on the type of assistance thatthe actuators provide. Retrofitted controls for these sys-tems are used and typically require removal of the OEMequipment (e.g., the steering wheel and/or column). Con-sequently, when this level of technology is used, it usuallybecomes unsafe for an unimpaired individual to drive thevehicle (without significant training).
550 MOBILITY AIDS

Common fuelaccelerator and braking system hand con-trols are bolted to the OEM steering column, and actuateeach pedal with mechanical rods (Fig. 8). These types ofcontrols require nearly complete upper extremity functionto operate. When upper extremity function is substantiallyimpaired actuators are added to the braking and fuelacce-lerator systems and are operated through some switchingmethods. The types of switches depend on the most viablecontrol mechanism for the user: in some cases, a simplehand-operated rheostat variable resistance switch (i.e.,dimmer switch or rheostat) may be used, and in othercases, a breath-activated pressure switch (sip-and-puff)system may be used.
The above steering, fuelaccelerator, and brake adaptiveequipment are focused on the primary control systems ofthe vehicle (those which are required to drive the auto-mobile). Various adaptive equipment can control the sec-ondary control system of the vehicle also (e.g., ignitionswitch, climate control, windows). Like the primary controladaptive equipment, equipment to modify the secondarycontrols of the vehicle range from low to high tech. Forexample, users with impaired hand function may requireadditional hardware to be bolted to the ignition key so theycan insert the key and turn it to start the vehicle. Alter-natively, hardware can be added to allow a drive to startthe vehicle via a switch, either remotely or from within thecabin. Power windows and door-lock switches can be
rewired to larger switches, or in more accessible locationsfor the driver.
Both primary and secondary control systems must beplaced in locations easily accessible to the driver. In somecases, wheelchair riders will transfer out of their wheel-chair directly into the OEM seating system, allowing formost controls to remain in their OEM locations. If a wheel-chair user remains in their wheelchair and drives thevehicle the controls must be made accessible to their seatedposition and posture. In these cases, along with the case awheelchair users remaining in their wheelchair as passen-ger, provisions must be made to safely secure the wheel-chair to the vehicle, and to provide adequate passengerrestraints.
Wheelchair Tie-Down and Occupant RestraintSystems (WTORS)
For both practical and safety reasons, when a wheelchairuser remains in wheelchair while riding in a vehicle theymust be safely secured to the vehicle. An unsecured wheel-chair will move around, causing the user to be unstablewhile the vehicle is moving. Being that power wheelchairscan be in excess of 200 lb (91 kg) in weight, This instabilitycould cause harm to the wheelchair rider and/or the sur-rounding other passengers vehicle occupants. If the wheel-chair user is driving, they may lose control of the vehicle ifthey accidentally roll away from the vehicle controls.Another important concern for an unsecured wheelchairrider is in the case of an accident. An unsecured wheelchairand user can easily be ejected out of the vehicle if they arenot secured. The WTORS systems are currently governedby the ISO 7176-19 (34).
Several types of tie-down systems exist, including afour-point belt system and various latching-type mechan-isms which typically require hardware to be attached to thewheelchair. The four-point belt systems are most common,and are found on public busses, and also private vehicles.Theses systems are the most widely used tie-down systembecause they can be attached to a wide variety of wheel-chairs. In some cases, manufacturers incorporate attach-ment rings for these tie-down systems into theirwheelchair. When no points of attachment are available(most common situation), points at the front and rear of theseat or frame be used. These attachment points mustbe sufficiently strong to secure the wheelchair in the event
MOBILITY AIDS 551
Figure 7. Steering knobs.
Figure 8. Common hand controls.
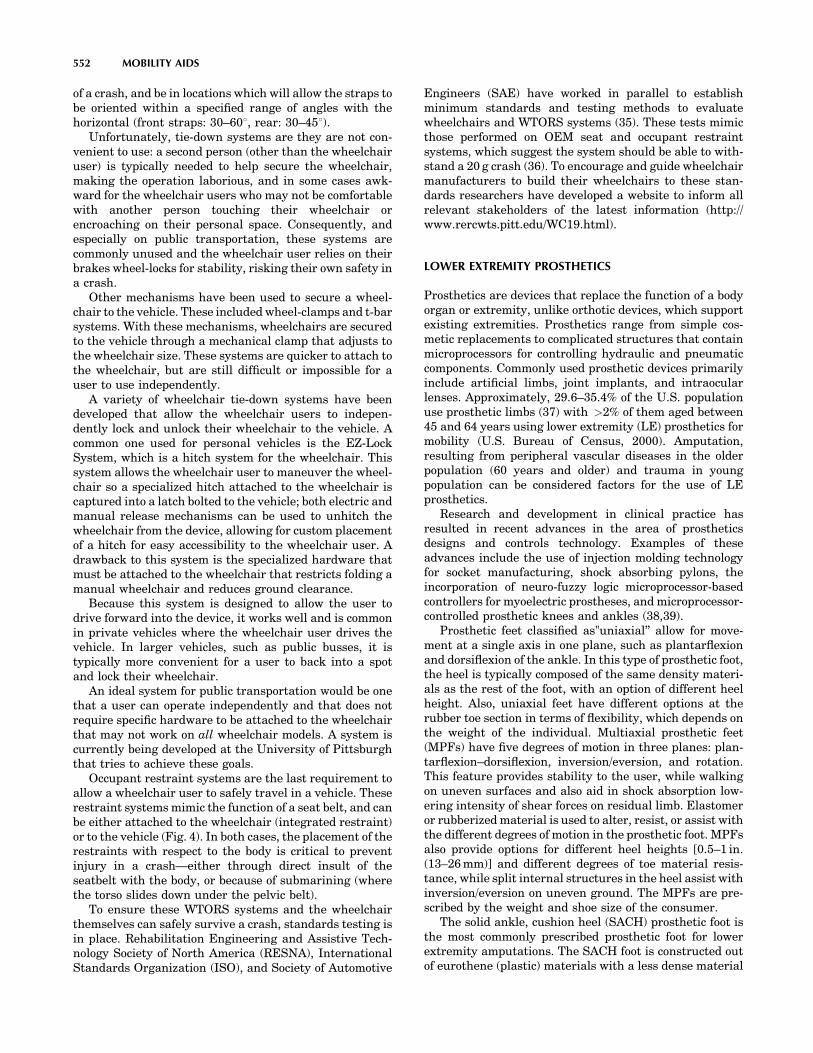
of a crash, and be in locations which will allow the straps tobe oriented within a specified range of angles with thehorizontal (front straps: 30–608, rear: 30–458).
Unfortunately, tie-down systems are they are not con-venient to use: a second person (other than the wheelchairuser) is typically needed to help secure the wheelchair,making the operation laborious, and in some cases awk-ward for the wheelchair users who may not be comfortablewith another person touching their wheelchair orencroaching on their personal space. Consequently, andespecially on public transportation, these systems arecommonly unused and the wheelchair user relies on theirbrakes wheel-locks for stability, risking their own safety ina crash.
Other mechanisms have been used to secure a wheel-chair to the vehicle. These included wheel-clamps and t-barsystems. With these mechanisms, wheelchairs are securedto the vehicle through a mechanical clamp that adjusts tothe wheelchair size. These systems are quicker to attach tothe wheelchair, but are still difficult or impossible for auser to use independently.
A variety of wheelchair tie-down systems have beendeveloped that allow the wheelchair users to indepen-dently lock and unlock their wheelchair to the vehicle. Acommon one used for personal vehicles is the EZ-LockSystem, which is a hitch system for the wheelchair. Thissystem allows the wheelchair user to maneuver the wheel-chair so a specialized hitch attached to the wheelchair iscaptured into a latch bolted to the vehicle; both electric andmanual release mechanisms can be used to unhitch thewheelchair from the device, allowing for custom placementof a hitch for easy accessibility to the wheelchair user. Adrawback to this system is the specialized hardware thatmust be attached to the wheelchair that restricts folding amanual wheelchair and reduces ground clearance.
Because this system is designed to allow the user todrive forward into the device, it works well and is commonin private vehicles where the wheelchair user drives thevehicle. In larger vehicles, such as public busses, it istypically more convenient for a user to back into a spotand lock their wheelchair.
An ideal system for public transportation would be onethat a user can operate independently and that does notrequire specific hardware to be attached to the wheelchairthat may not work on all wheelchair models. A system iscurrently being developed at the University of Pittsburghthat tries to achieve these goals.
Occupant restraint systems are the last requirement toallow a wheelchair user to safely travel in a vehicle. Theserestraint systems mimic the function of a seat belt, and canbe either attached to the wheelchair (integrated restraint)or to the vehicle (Fig. 4). In both cases, the placement of therestraints with respect to the body is critical to preventinjury in a crash—either through direct insult of theseatbelt with the body, or because of submarining (wherethe torso slides down under the pelvic belt).
To ensure these WTORS systems and the wheelchairthemselves can safely survive a crash, standards testing isin place. Rehabilitation Engineering and Assistive Tech-nology Society of North America (RESNA), InternationalStandards Organization (ISO), and Society of Automotive
Engineers (SAE) have worked in parallel to establishminimum standards and testing methods to evaluatewheelchairs and WTORS systems (35). These tests mimicthose performed on OEM seat and occupant restraintsystems, which suggest the system should be able to with-stand a 20 g crash (36). To encourage and guide wheelchairmanufacturers to build their wheelchairs to these stan-dards researchers have developed a website to inform allrelevant stakeholders of the latest information (http://www.rercwts.pitt.edu/WC19.html).
LOWER EXTREMITY PROSTHETICS
Prosthetics are devices that replace the function of a bodyorgan or extremity, unlike orthotic devices, which supportexisting extremities. Prosthetics range from simple cos-metic replacements to complicated structures that containmicroprocessors for controlling hydraulic and pneumaticcomponents. Commonly used prosthetic devices primarilyinclude artificial limbs, joint implants, and intraocularlenses. Approximately, 29.6–35.4% of the U.S. populationuse prosthetic limbs (37) with >2% of them aged between45 and 64 years using lower extremity (LE) prosthetics formobility (U.S. Bureau of Census, 2000). Amputation,resulting from peripheral vascular diseases in the olderpopulation (60 years and older) and trauma in youngpopulation can be considered factors for the use of LEprosthetics.
Research and development in clinical practice hasresulted in recent advances in the area of prostheticsdesigns and controls technology. Examples of theseadvances include the use of injection molding technologyfor socket manufacturing, shock absorbing pylons, theincorporation of neuro-fuzzy logic microprocessor-basedcontrollers for myoelectric prostheses, and microprocessor-controlled prosthetic knees and ankles (38,39).
Prosthetic feet classified as"uniaxial’’ allow for move-ment at a single axis in one plane, such as plantarflexionand dorsiflexion of the ankle. In this type of prosthetic foot,the heel is typically composed of the same density materi-als as the rest of the foot, with an option of different heelheight. Also, uniaxial feet have different options at therubber toe section in terms of flexibility, which depends onthe weight of the individual. Multiaxial prosthetic feet(MPFs) have five degrees of motion in three planes: plan-tarflexion–dorsiflexion, inversion/eversion, and rotation.This feature provides stability to the user, while walkingon uneven surfaces and also aid in shock absorption low-ering intensity of shear forces on residual limb. Elastomeror rubberized material is used to alter, resist, or assist withthe different degrees of motion in the prosthetic foot. MPFsalso provide options for different heel heights [0.5–1 in.(13–26 mm)] and different degrees of toe material resis-tance, while split internal structures in the heel assist withinversion/eversion on uneven ground. The MPFs are pre-scribed by the weight and shoe size of the consumer.
The solid ankle, cushion heel (SACH) prosthetic foot isthe most commonly prescribed prosthetic foot for lowerextremity amputations. The SACH foot is constructed outof eurothene (plastic) materials with a less dense material
552 MOBILITY AIDS

incorporated at the heel. Use of materials with differentdensities permits proper positioning while standing, assofter heels aides in enhancement of the walking efficiencyafter heel strike, by shifting center of gravity forward. Adevice known as durometer is used to measure the densityof plastics used in prosthetic devices. The weight andactivity level of the individual using the prosthesis deter-mines which heel density is selected, as heavier userrequire firmer heel cushion. The stiffness of heel, alsodetermine amount of knee flexion and shock absorption.Greater the heel stiffness more the knee flexion and lowershock absorption during heel strike and vice versa. TheSACH foot also contains a keel made out of a hard wood orcomposite material. Belting material is applied to the keel,which prevent the keel it from breaking through the euro-thene cover. During ambulation, the foot simulates plantarflexion movement and prevents the loss of anterior supportduring the push off at the toe.
Individuals who use foot prosthetic devices are assessedfor weight, potential activity levels, and type of use forwhich they anticipate using their prosthetic devices. Basedon this assessment, clients are then categorized into fourfunctional levels:
Energy Storage and Return (ESAR) prosthetic feet arefabricated to assist with the dynamic response of feet,acting as a diving board from which a person can pushoff during walking. These feet have capability to storeenergy during stance phase and return it to the user toassist in forward propulsion in late stance phase. TheESAR has flexible keels and are prescribed by the antici-pated activity level and weight of the person. Also, limitedevidence suggests use of ESAR as their use results inincreasing ambulation speed and stride length �7–13%greater than with a conventional (SACH) foot in bothtraumatic and vascular transtibial amputees (40).
Macfarlane et al. (40) compared energy expenditure ofindividuals with transfemoral amputations who walkedwith a SACH foot versus a Flex-Foot prosthetic. The SACHhas a solid ankle and cushioned heel construction, whilethe Flex-Foot prosthetic has a hydraulic knee joint. Theauthors determined that Flex-Foot walking resulted insignificantly lower exercise intensity, reduced energyexpenditure and improved gait efficiency. These findingsare significant considering the SACH foot is the mostcommonly used foot prosthetic in the U.S. today (41). Lower
energy expenditure was also reported for individuals withtrans-tibial amputation with the use of Flex-Foot as com-pared with a SCAH foot.
Higher level of limb loss results in addition of moreprosthetic components. Prostheses for transfemoral ampu-tations comprised of four basic components: the socket, theknee joint, the pylon, and the foot. Pylons are classified as:exoskeleton in which the weight of the individual is sup-ported by the external structure of the prostheses (i.e., acrustacean shank), or endoskeleton that is comprised of aninternal, weight-bearing pylon encased in moldable or softplastics (i.e., modular pylon). The knee mechanism use, aconventional damping system, where a flow of (fluid or air)is controlled by a valve and its operation is set for aparticular walking speed according to user’s preference.The system described as intelligent prosthesis (IP), where adiameter of damping controlling valve is changeableaccording to varying speed of walking (42). Romo providedguidance on the selection of prosthetic knee joints andindicated that proper alignment impacts the effectivenessof matched and adjusted knee joints for smooth and reliablegait (43). Taylor et al. (44) compared effectiveness of anintelligent prosthesis (IP), and pneumatic swing-phase,control-dampening systems while walking on a treadmillat three speeds of 1.25, 1.6, and 2 mph (2, 2.6, and3.2 km �h�1). The results indicated lower VO2 consumptionfor individuals using IP compared to controls-dampingsystem at 2 mph (3.2 km �h�1). The question often raisedby critiques concerns the cognitive demands by the highend technology on the users. The results of the study byHeller et al. (42) that investigated cognitive demand whenusing the IP compared to a conventional prosthesis indi-cated no significant differences while using these pros-theses for ambulation. Though not uncommonlyprescribed high rejection rates has been described forprostheses after hip disarticulation and hemipelvectomy.These prostheses consist of an addition of hip joint mechan-ism to other parts similar to prostheses prescribe aftertransfemoral amputation.
Modular systems were first developed in the 1960s byOtto Bock, which consisted of shock absorbing pylons thatcontained with shock absorbers. Also, a reverse-pyramidfixture at the ends of the pylon permits angular adjust-ments to the alignment of these devices with the residuallimb. Modular systems are lighter than the earlier wooden
MOBILITY AIDS 553
Table 1. Functional Level and Devices
Functional Level Type of Device
K0 No ability to ambulate or transfer safely; prosthesisdoes not enhance mobility
Cosmesis
K1 Transfers and ambulates on level surfaces;household use
SACH
K2 Able to negotiate over low level environmentalbarriers; limited community ambulation
Low level energy storage feet
K3 Prosthetic usages are beyond simple ambulation;able to traverse MOST environmental barriers andis a community ambulator
Energy storage prosthesis
K4 Able to perform prosthetic ambulation exceedingbasic skills (i.e., high impact); child, active adultand athlete
Energy storage prosthesis

systems, allow for 158 of movement gain in either thefrontal or sagittal plane, and also permit internal andexternal rotational adjustments. Modular systems canextend the life of a prosthetic device, as worn parts canbe replaced. In addition, individuals using these systemsexperienced less need for maintenance.
A significant improvement in the design procedure ofthe prosthetics considers the interaction of forces betweenprosthesis and residual limb can be found in the literature.Jia et al. (45) studied the exchange of loads and forcesbetween the residual limb and prosthetic socket in trans-tibial amputation using the Finite Element Analysis (FEA)method. Lee et al. (46) used FEA to determine contactinterface between the transtibial residual limb and pros-thetic socket. The study determined the need for samenessof shapes for both the residual limb and socket in order todecrease peak normal and shear stresses over the patellartendon, anterolateral and anteromedial tibia, and poplitealfossa. Winson et al. investigated the interaction betweensocket and residual limb during walking using a FEAmodel for transtibial prosthesis. Pylon deformities andstress distribution over the shank were problems identifiedduring walking and results indicated need for pylon flex-ibility for better optimization and need of future studiesidentifying fatigue life of these prostheses (47).
With advancement in the area of prosthetics designs anddevelopment, simultaneous factors that need to be consid-ered, use of these devices in clinical practice for targetedpopulation and cost containment. Premature abandonmentof mobility assistive devices, which might be due to poorperformance and/or changes in the need of the user, is notuncommon and adds to the expense of these devices (48).Improved quality of service delivery for LE prostheses, whichinclude identifications of reasons for successful use or non-use of LE prostheses, is needed (49). Also, incorporation ofstandardized performance testing procedure to ensure dur-ability of LE prosthetics is vital to the appropriate prescrip-tion of, and satisfaction with, prosthetic devices.
Prosthetic devices of today incorporate advancementsfrom the aerospace and engineering fields and include theuse of new materials, such silicone elastomer gel sleeves into assist in the fit of prosthetic sockets, prosthetic feet madefrom carbon-fiber composite components that are lighter inweight, and surgical implantation of titanium prostheticattachment devices directly to bones of residual limbs(50,51). Neuro- and microprocessors and sensors are nowincorporated on-board the prosthetic device to control kneejoint movement to improve the symmetry of different gaitpatterns across a variety of cadence speeds. Hydraulic orpneumatic devices are also used to dampen the swing-through phase of walking with the prostheses to assistwith walking at difference cadences (52,53). Manufac-turers are now using computer-aided design and manu-facturing techniques to improve the fit of the prostheticsockets as well as component designs (54,55).
Because of the growing population of people in need ofmobility aids, and their demand to maintain their lifestyle,whether that includes going to and from work, participat-ing in extracurricular activities, or maneuvering aroundtheir environment, continuing information must be gath-ered and disseminated to make these goals achievable.
Through technological advancements people who requiremobility aids can accomplish more of their goals than everbefore, however there are still people for whom the tech-nology is not yet developed enough or cannot obtain theproper devices to meet their needs. It is for this reason thatproblems must continually be studied and innovationsmust advance so that mobility aids will serve anyonewho requires them to meet their goals.
BIBLIOGRAPHY
1. Schiller JS, Bernadel L. Summary Health Statistics for theU.S. Population: National Health Interview Survey, NationalCenter for Health Statistics. Vital Health Stat 10(220):2004.
2. Sie IH, Waters RL, Adkins RH, Gellman H. Upper extremitypain in the postrehabilitation spinal cord injured client. ArchPhys Med Rehab 1992;73:44–48.
3. VanSickle DP, Cooper RA, Boninger ML, DiGiovine CP.Analysis of vibrations induced during wheelchair propulsion.J Rehab R&D 2001,38:409–421.
4. Calder CJ, Kirby RL. Fatal wheelchair-related accidents inthe United States. Am J Phys Med Rehab 1990;69:184–190.
5. Mills T, et al. Development and consumer validation of theFunctional Evaluation in a Wheelchair (FEW) instrument.Disabil Rehab 2002;24(1–3):38–46.
6. Chase J, Bailey DM. Evaluating potential for powered mobi-lity. Am J Occup Therapy 1990;44(12):1125–1129.
7. Cooper RA, Cooper R. Electric Powered Wheelchairs on theMove. Physical Therapy Products; July/August, 1998, p 22–24.
8. Galvin JC, Scherer MJ. Evaluating, Selecting, and UsingAppropriate Assistive Technology. Gaitherburg (MD):AspenPublishers Inc.; 1996.
9. Cooper RA. Rehabilitation Engineering Applied to Mobilityand Manipulation. Bristol (UK): Institute of Physics; 1995.
10. Grieco A. Sitting posture: An old problem and a new one.Ergonomics 1986;29:345–362.
11. Cooper RA. A perspective on the ultralight wheelchair revo-lution. Tech Disab 1996;5:383–392.
12. Cooper RA, et al. Performance of selected lightweight wheel-chairs on ANSI/RESNA tests. Arch Phys Med Rehabil1997;78:1138–1144.
13. Masse LC, Lamontagne M, O’Riain. Biomechanical analysisof wheelchair propulsion for various seating postitions. JRehab R&D 1992;29:12–28.
14. International Standards Organization, Evaluation of HumanExposure to Whole-Body Vibration—Part 1: General Require-ments. ISO 2631-1, Washington (DC): ANSI Press; 1997.
15. Wolf EJ, et al. Analysis of whole-body vibrations on manualwheelchairs using a Hybrid III test dummy. Proceedings ofthe annual RESNA conference; 2001. p 346–348.
16. Kwarciak A, Cooper RA, Wolf EJ. Effectiveness of rear sus-pension in reducing shock exposure to manual wheelchairusers during curb descents. Proceedings of the annualRESNA conference; 2002. p. 365–367.
17. Centers for Medicare and Medicade Services (CMS), http://www.cms.hhs.gov/providers/pufdownload/anhcpcdl.asp,Accessed 2005. Jan 12.
18. Pearlman J, et al. Economical (K0010) Power WheelchairsHave Poor Reliability and Important Safety Problems: AnANSI/RESNA Wheelchair Standards Comparison Study.Proceedings of the Annual RESNA Conference; 2005.
19. American National Standard for Wheelchairs, Volume 2, Addi-tional Requirements for Wheelchairs (Including Scooters) WithElectrical Systems. Virginia: Rehabilitation Engineering andAssistive Technology Society of North America; 1998.
554 MOBILITY AIDS

20. American National Standard for Wheelchairs, Volume 1,Requirements and Test Methods for Wheelchairs (IncludingScooters). Virginia: Rehabilitation Engineering and AssistiveTechnology Society of North America; 1998.
21. Fuller GF. Falls in the Elderly Am Fam Physician2000;61(7):2159–2168.
22. Rentschler AJ, et al. Intelligent walkers for the elderly:Performance and safety testing of the VA-PAMAID roboticwalker. J Rehab R&D 2003;40(5):423–432.
23. Abel T, et al. Energy Expenditure in wheelchair racing andhand biking- a basis for prevention of cardiovascular diseasesin those with disabilities. Eur J Cardio Prev Rehab2003;10(5):371–376.
24. Franklin BA, Bonsheim K, Gordon S. Resistance training incardiac rehabilitation. J Cardiopulm Rehab 1991;11:99–107.
25. Kenedy DW, Smith RW. A comparison of past and futureleisure activity participation between spinal cord injured andnon-disabled persons. Paraplegia 1990;28:130–136.
26. National wheelchair basketball association (2003–2004) offi-cial rules and case book retrieved from National WheelchairBasketball Association. http://www.mwba.org. Accessed.
27. Vanlandewijck Y, Daily C, Theisen DM. Field test evaluationof aerobic, anaerobic, and wheelchair basketball skill perfor-mances. Int J Sports Med 1999;20(8):548–554.
28. Janssen TWJ, Dallmeijer AJ, Van der Woude LHC. Physicalcapacity and race performance of handcycle users. JourRehab R&D 2001;38(1):33–40.
29. Lapolla T. International rules for the sport of wheelchairrugby. http://quadrugby.com/rules.htm. Accessed 2000.
30. Wheelchair tennis handbook. International Tennis Federa-tion. http://www.itfwheelchairtennis.com. Accessed 2004.
31. Kurtz M. Difference makers. Sports’ N Spokes 2002;28(2):10–14.32. Russell JN, et al. Trends and Differential use of Assistive
Technology Devices: United States, 1994. Adv Data 1997;292:1–9.
33. Shaw G, Gillispie B. Appropriate portection for wheelchairriders on public transit buses. J Rehab R&D 2003;40(4):309–320.
34. International Standards Organization, Wheeled mobilitydevices for use in motor vehicles. ISO 7176-19, Vol. 31. 2004.
35. Hobson D. Wheelchair transport safety - the evolving solu-tions. J Rehab R&D 2000;37(5).
36. Bertocci G, Manary M, Ha D. Wheelchair used as motorvehicle seats: Seat loading in frontal impact sled testing.Med Eng & Phys 2001;23:679–685.
37. Mak AF, Zhang M, Boone DA. State-of-the-art research inlower-limb prosthetic Biomechanics socket interface: areview. J Rehab R&D 2001;38(2):161–174.
38. Weir RF, Childress DS, Grahn EC. Development of Exter-nally-Powered Prostheses for Persons with Partial HandAmputations. Proceedings of the Chicago 2000 World Con-gress on Medical Physics and Biomedical Engineering; 2000July 23rd–28, Chicago (IL):.
39. van der Linde H. A systematic literature review of the effect ofdifferent prosthetic components on human functioning with alower-limb prosthesis. J Rehab R&D 2004;41(4):555–570.
40. Macfarlane PA, et al. Transfemoral amputee physiologicalrequirements: comparisons between SACH foot walking andflex-foot walking. J Prosthe & Ortho 1997;9(4):138–143.
41. Nielsen DH, Shurr DG, Golden JC, Meier K. Comparison ofEnergy Cost and Gait Efficiency During Ambulation inBelow-Knee Amputees Using Different Prosthetic Feet - aPreliminary Report. J Prosthet Orthotics 1989;1(1):24–31.
42. Heller BW, Datta D, Howitt J. A pilot study comparing thecognitive demand of walking for transfemoral amputeesusing the Intelligent Prosthesis with that using convention-ally damped knees. Clin Rehab 2000;14(5):518–522.
43. Romo HD. Prosthetic knee. Phys Med Rehab Clin N Am2000;11(3):595–607.
44. Taylor MB, Clark E, Offord EA, Baxter C. A comparison ofenergy expenditure by a high level trans-femoral amputeeusing the Intelligent Prosthesis and conventionally dampedprosthetic limbs. Prosthet Ortho Int 1996;8:116–121.
45. Jia X, Zhang M, Lee WC. Load Transfer Mechanics BetweenTrans-Tibial Prosthetic Socket and Residual Limb - DynamicEffects. J Biomech 2004;37(9):1371–1377.
46. Lee WC, Zhang M, Jia X, Cheung JT. Finite Element Modelingof the Contact Interface Between Trans-Tibial Residual Limband Prosthetic Socket. Med Eng Phys 2004;26(8):655–662.
47. Winson CCL, Zhang M, Boone D, Contoyannis B. Finite-Element Analysis to Determine Effect of Monolimb Flexibil-ity on Structural Strength and Interaction Between ResidualLimb and Prosthetic. J Rehab R&D 2004;41(6a):775–786.
48. Phillips B, Zhao H. Predictors of Assistive Technology Aban-donment. Assis Technol 5(1):1993; 178–184.
49. Scherer MJ. The change in emphasis from people to person:introduction to the special issue on assistive technology.Disabil Rehab 2002;24(1–3):1–4.
50. Marks LJ, Michael JW. Science, Medicine, and the Future:Artificial Limbs. BMJ 2001;323(7315):732–735.
51. Beil TL. Interface Pressures During Ambulation Using Suc-tion and Vacuum-Assisted Prosthetic Sockets. J Rehab R&D2002;39(6):693–700.
52. Michael JW. Modern Prosthetic Knee Mechanisms. ClinOrthop Relat Res 1999;361:39–47.
53. Buckley JG, Spence WD, Solomonidis SE. Energy Cost ofWalking: Comparison of"Intelligent Prosthesis’’ With Conven-tional Mechanism. Arch Phys Med Rehabil 1997;78(3):330–333.
54. Twiste M, Rithalia SV, Kenney L. A Cam-DisplacementTransducer Device for Measuring Small Two-Degree of Free-dom Inter-Component Motion in a Prosthesis. Med Eng Phys2004;26(4):335–340.
55. Lee WC, Zhang M, Jia X, Cheung JT. Finite Element Model-ing of the Contact Interface Between Trans-Tibial ResidualLimb and Prosthetic Socket. Med Eng Phys 2004;26(8):655–662.
See also BLIND AND VISUALLY IMPAIRED, ASSISTIVE TECHNOLOGY FOR;ENVIRONMENTAL CONTROL; LOCOMOTION MEASUREMENT, HUMAN; REHABI-
LITATION AND MUSCLE TESTING.
MODELING OF PHYSIOLOGICALSYSTEMS. See PHYSIOLOGICAL SYSTEMS MODELING.
MODELS, KINETIC. See TRACER KINETICS.
MONITORING IN ANESTHESIA
TARMO LIPPING
VILLE JäNTTI
ARVI YLI-HANKALA
Tampere University ofTechnologyPori, Finland
INTRODUCTION
Anesthesia is one of the most complex and mysteriousphenomena in clinical work. The main feature of anesthesia
MONITORING IN ANESTHESIA 555
is the loss of consciousness, which suggests its relatednessto sleep, epilepsy, and various kinds of brain trauma. Inthe case of anesthesia and sedation, consciousness ismanipulated deliberately to prevent the patient frombeing aware of their state and the medical procedurescarried through.
Recent decades have seen significant advancements inmapping various psychological functions to correspondingbrain areas, however, the knowledge of the formation ofhuman consciousness is still based on uncertain hypoth-esis. This complexity makes anesthesia monitoring extre-mely challenging.
This article first addresses the problem of anesthesiamonitoring from the clinical, as well as from the physiolo-gical, point of view. The main emphasis is on monitoringanesthetic depth as this is the most discussed topic inanesthesia monitoring today. It starts with clinical indi-cators of anesthetic depth, gives an overview on the meth-ods used in commercially available depth-of-anesthesiamonitors, and describes some new algorithms proposedand evaluated for anesthesia electrocardiograms (EEG)monitoring in recently published works. Finally, the fea-sibility of monitoring brain function is argued using neu-rophysiological parameters like EEG, Auditory EvokedPotentials (AEPs), and so on, in the Intensive Care Unit(ICU) and the Emergency Room (ER).
ANESTHESIA AS A PROCESS AND A PROCEDURE
Anesthesia can be seen from the clinical point of view as aprocedure, carried out according to certain protocol. Fromthe physiological point of view anesthesia is a processevolving in the nervous system as the dose of an anestheticagent increases.
Anesthesia as a Procedure
The goal of general anesthesia in the operating room (OR)is to render the patient unaware so that they do not feelpain during the surgery or recall the events afterward. It isalso important that the patient does not react to surgicalstimuli by movement. In the ICU, the goal of sedation is tokeep the patient calm and painless. Too deep anesthesiacauses prolonged awakening times after surgery in OR andlonger treatment times in the ICU. The goals of anesthesiaand sedation can be achieved by hypnotics (unconscious-ness producing drugs), analgesics (antinociceptive drugs),and neuromuscular blocking agents. The choice of drugs ismainly made based on experience and clinical signs duringthe treatment.
Although general anesthesia is considered a safe pro-cedure, various complications like postoperative nausea,vomiting, and pain are relatively frequent. The incidence ofrecall of events and awareness during anesthesia is rare(� 0.1%), however, the consequences may be traumatic forthe patient (1). Anesthesia-related mortality has decreasedsignificantly during past decades having recently beenestimated at 1 death per 200,000–300,000 cases of anes-thesia (2–4).
Anesthetic agents can be divided into inhalation anes-thetics (e.g., halothane and isoflurane) and intravenous
anesthetics (e.g., thiopental and propofol). Intravenousdrugs are becoming more popular as they are short acting,do not cause gas pollution, are easy to administer, and do notcause airway irritation. Desirable properties of anestheticagents include rapid, smooth and safe induction of andemergence from anesthesia, no accumulation in the body,minimal effects on cardiovascular functions, no irritation totissues andveins, low potential tohypersensitivityreactions.
Anesthesia as a Process
During the last decades, it has become obvious that differentanesthetic and sedative agents produce their effects withdifferent mechanisms, and therefore from the physiologicalpoint of view depth of anesthesia is a vague notion (5). It ismore meaningful to talk about components forming the statewe usually call anesthesia. These include amnesia, uncon-sciousness (hypnosis), antinociception, and neuromuscularblockade (paralysis). Different neurophysiological modal-ities should be used in order to assess these components.In the operating room, the patient is said to be anesthetizedwhile the term sedation is used in the ICU. Some drugs, likepropofol, are useful in producing both anesthesia and seda-tion at different concentrations, while some others are mostuseful as anesthetics or sedatives. There is evidence thatanesthesia and sedation can be produced via different struc-tures in the brainstem. Hypnosis and sedation cause similarchanges in the EEG signal (described in the section changesin Neurophysiological Variables During Anesthesia). As allthe available depth-of-anesthesia monitorsare either fully orpartly based on the EEG, the terms depth of hypnosis anddepth of sedation are used depending on the correspondingclinical situation and are, in the context of available mon-itoring devices, roughly equivalent.
The action of anesthetics can be studied at various levelsof neuronal function (6). The models underlying thesestudies can be divided into those operating at the molecular–cellular level and those explaining anesthetic processes athigher levels (generator models). State-of-the-art knowl-edge on the molecular and neuronal substrates for generalanesthesia has recently been reviewed in Ref. 7. The modelproposed by Flohr describes the action of anesthetics asdisruption of computational processes dependent on theNMDA receptors (8). The activation state of these receptorsin cortical neurons determines the complexity of represen-tational structures that can be built-up in the brain andthus the level of consciousness. Steyn-Ross et al. performednumerical simulations of a single-macrocolumn model ofthe cerebral cortex and found that the effects of anestheticscan be modeled by cortical phase transition (9). Theirsimulations explain several trends in the EEG caused byanesthetic actions and predict the decrease in spectralentropy of the EEG signal with deepening anesthesia. Thismodel has supported the development of the Entropy mod-ule, described in the section Recently Developed Methods,Applied in Commercial Anesthesia Monitors. Great cau-tiousness must be taken, however, in interpretation of themodels operating at molecular level, because they includeonly a small part of the neurophysiological functionsknown to be involved in consciousness and generation ofanesthesia-induced EEG patterns.
556 MONITORING IN ANESTHESIA

John et al. developed a higher level model based on acomplex neuroanatomical system described in (10). Thismodel, described and thoroughly discussed in volume 10of Ref. 11, incorporates and explains an extensive bulk ofresults obtained from EEG, evoked potential and magneticresonance imaging (MRI) image analysis, as well as labora-tory studies. Loss of consciousness is described as thefollowing cascade of events, called the Anesthetic Cascadeby the authors, involving various brain regions (Fig. 1) (6):(1) depression of the brainstem; (2) depression of mesolim-bic-dorsolateral prefrontal cortex interactions leading toblockade of memory storage; (3) inhibition of the nucleusreticularis of the thalamus, resulting in closure of thalamicgates (seen as increasing u rhythm in the EEG); (4) block-ing of thalamocortical reverberations (g loop) and per-ception; (5) uncoupling of parietal-frontal transactions(coherence in g frequency band decreases); (6) depressionof prefrontal cortex to reduce awareness (increase in fron-tal u and d rhythm).
Definitions of the EEG rhythms used in the descriptionof the Anesthetic Cascade are given in Table 1.
The model by John et al. underlies the Patient StateIndex for depth-of-anesthesia monitoring, described in thesection Recently Developed Methods, Applied in Commer-cial Anesthesia Monitory. Although the Anesthetic Cas-cade model covers a large set of neurophysiologicalfunctions, it does not explain patterns like burst suppres-sion, for example.
MONITORING ADEQUACY OF ANESTHESIA
Clinical Indicators and Measures of Anesthetic Depth
The verb monitor originally means to check systematicallyor to keep watch. Thus, monitoring actually does notnecessarily involve medical equipment, but refers also toclinical inspection. As clinical indicators of anestheticdepth are often used as a reference for automated depth-of-anesthesia monitoring methods, they are shortlydescribed here.
In the case of inhalation anesthetics, drug concentrationcan be monitored by measuring the partial pressure of theanesthetic in exhaled air (end-tidal concentration). Due tothe variation of the potency of anesthetic agents, a uni-versal unit of minimum alveolar concentration (MAC) hasbeen applied. The value 1 MAC is the partial pressure of aninhaled anesthetic at which 50% of the unparalyzed sub-jects cease to express protective movement reaction to skinincision. The primary rationale behind the development ofthe term MAC was the need to compare the potency ofdifferent volatile anesthetics, not the effort to monitor theanesthetic state of an individual patient.
For intravenous anesthetics, no such direct measure canbe derived and the effect of anesthetics can be estimatedusing pharmacokinetic models (effect-site concentration).In this case, the accuracy of the estimate depends on theadequacy of the model. If all subjects would react to anes-thetics in exactly identical ways these concentration mea-sures would provide a perfect indicator of adequacy ofanesthesia. However, there is an intersubject variabilityin the effect of anesthetics, and therefore other indicatorsare needed.
Clinical indicators of the adequacy of surgical anesthe-sia can be divided into those measuring hypnosis andthose measuring nociceptive–antinociceptive balance.The indicators measuring hypnosis include pupillary lightreflex, tested by allocating a flashlight to one eye andobserving both pupils for constriction; corneal reflex,
MONITORING IN ANESTHESIA 557
Cortico-cortical α / β / γ
Cortical-subcortical∆ α
N. Reticularis
Thalamus α
[3] Closethalamic
gates
CT-TC loopγ
Dorsal striatum
REGULATION OF MEAN FREQUENCY
[6] Depress PFC[5] Uncoupleparietal-PFCinteractions
S. NigraVentral
tegmental area
Reticularformation
[4] Block gamma
loops
Sensoryinputs
[1] Depression of ARAS
Cingulate θ
Hippocampus
[2] Block interaction with DLPFCto prevent memory transfer
Amygdala
Entorhinal CXSeptal nuclei
GENERATION OF THETA
Figure 1. The Anesthetic Cascade model(redrawn with permission from: E. R. Johnand L. S. Prichep, ‘‘The anesthetic cascade:A theory on how anesthesia suppressesconsciousness,’’ Anesthesiology, Vol. 102,Fig. 11 (p. 468), 2005).
Table 1. Definition of the EEG Rhythmsa
EEG Rhythm Frequency Range, Hz
Delta (d) < 4Theta (u) 4–8Alpha (a) 8–12Beta (b) 12–25Gamma (g) 25–50
aExact frequencies may vary slightly from source to source.

tested by applying a wisp of cotton wool to the cornea orby electrical stimulation using special electrodes (12);Eyelash reflex, tested by brushing the eyelashes with amoving object or by electrical stimulation; loss of counting,tested by letting the subject count slowly as long as they canfrom the onset of infusion–injection; syringe dropping,tested by letting the subject hold a syringe between theirthumb and forefinger as long as they can; loss of obeyingverbal commands.
The indicators measuring nociceptive–antinociceptivebalance include avoidance reaction to nociception. This ismainly a spinal reflex, however, it correlates well with theconcentration of most anesthetics; electrical tetanic stimu-lation, applied using needle electrodes or adhesive skinelectrodes to the upper or lower limb; autonomic nervoussystem—mediated reactions or motor reactions to laryngo-scopy and endotracheal intubation. This is a natural sti-mulus in many clinical situations in the operating room.
These indicators test the functioning of different neuralpathways and their applicability depends on the anestheticused. For example, ketamine leaves corneal and pupillarylight reflexes intact.
For more graded and standardized clinical assessmentof sedation and hypnosis, several scoring systems havebeen developed. Probably the most widely used such sys-tems are the Ramsay score (Table 2) and the Observer’sAssessmentofAlertnessandSedationScale (OAAS;Table3).These scoring systems are developed for use in the ICU asthey include scores for agitated states and cover mainlylighter levels of anesthesia. Therefore, they do not neces-sarily indicate the adequacy of anesthesia for surgicalprocedures. Also, the assessment obtained using thesescoring systems is subjective.
Changes in Neurophysiological Variableswith Deepening Anesthesia
All the commercial monitors of hypnosis employ the EEGsignal. Although different anesthetic agents induce specificfeatures and patterns in the EEG, certain common trendsin signal properties with deepening anesthesia can be seen.At subanesthetic levels, several agents produce oscillationsat beta frequency range, sometimes called beta buzz. Thisactivity is seen dominantly in the frontal brain areas. Withincreasing anesthetic concentrations, the activity becomesmore widespread, decreases in frequency and increases inamplitude. Around concentrations, causing the subjects tostop responding to stimuli (1 MAC for inhalation anes-thetics), the EEG activity slows further and high amplitudetheta and delta waves occur. With further increasing con-centration, the burst-suppression (BS) pattern occurs,finally turning into continuous suppression. The dynamicsof this pattern, as well as the waveforms of bursts, variesfor different anesthetic agents (Fig. 2). Several anestheticagents tend to induce epileptiform seizure activity inpatients with a prior history of seizures and even in sub-jects with no previous history of seizures (15,16).
In addition to the EEG signal, AEPs have been used foranesthesia monitoring. The latency of early corticalresponses Pa and Nb increases and the amplitudedecreases with deepening anesthesia (17). Also, late cor-tical responses to auditory stimuli, specifically the ampli-tude and latency of the N100 peak have been found toimprove the assessment of the level of consciousness in ICUpatients (18). A commercially available brain monitor, theAEP Monitor/2 by Danmeter A/S, combines AEPs withEEG parameters to calculate the cAAI index (see the nextsection).
In most commercially available monitoring devices, theEEG signal is obtained from the electrodes placed at theforehead. This makes the recording procedure easier inclinical situations. The electrodes tend to pick up frontalEMG, which is an artifact from the point of view of the EEGsignal but may be used as a valuable indicator of nocicep-tion in light anesthesia (19). The EMG component of themeasurement is either explicitly or implicitly incorporatedinto most of the available monitoring devices (see thesection Discussion).
Another neurophysiological variable proposed foranesthesia monitoring is the respiratory sinus arrhythmia(RSA) component of the heart rate (HR) signal (20).Although potentially valuable addition to the assessmentof the level of consciousness, this variable has not made itsway to anesthesia monitoring devices to date.
Short History of Brain Monitoring in Anesthesia
Since the first measurements of human electroencephalo-gram, performed by Hans Berger in 1920s, this modalityhas been applied to studying the effects of various drugs,including anesthetics. The emergence of microprocessorsand digital techniques for signal analysis opened newperspectives for anesthesia monitoring.
The first commercial brain monitoring device based ondigital signal analysis was the Cerebral Function Analyz-ing Monitor (CFAM1), developed in 1975 by Prior and
558 MONITORING IN ANESTHESIA
Table 2. Ramsay Score for Assessment of Level ofSedationa
Score Clinical Status
1 Patient anxious and/or agitated2 Patient cooperative3 Patient responds to commands only4 Brisk response5 Sluggish response6 No response to loud auditory stimulus
aSee Ref. 13.
Table 3. OAAS Score for Assessment of Level of Sedationa
Score Clinical Status
5 Responds readily to commandspoken in normal tone
4 Lethargic response to commandspoken in normal tone
3 Lethargic response to commandspoken loudly and repeatedly
2 Appropriate response to loud toneand mildly painful stimulus
1 Appropriate response to loud toneand moderately painful stimulus
0 No response
aSee Ref. 14.

Maynard (21). This device used the Motorola 6808 8-bitmicroprocessor. The display of the CFAM1 was divided intotwo sections, one showing the 10th and 90th percentile aswell as the mean of the EEG amplitude distribution whilethe other showing the percentage of weighted (prewhi-tened) EEG activity per herz in the beta, alpha, theta,and delta frequency bands (Fig. 3). In addition, muscleactivity, EEG suppression ratio, and electrode impedancewere displayed. An important feature of the CFAM1 wasthe possibility of monitoring averaged evoked potentials.Since the introduction of CFAM1, the CFAM family ofbrain monitors has been continuously developed withthe recently introduced CFAM4 being the latest memberof this product family. Comprehensive list of publicationsreferring to the CFAM family can be found at www.cfams.-com/references/a4a.htm.
In 1982 Datex-Ohmeda (Helsinki, Finland) introducedits first EEG monitor for anesthesia, the Anesthesia BrainMonitor (ABM). Like in most of the later monitoringdevices, the location of the EEG electrodes in the ABMmonitor was on the forehead. The monitor displayed theroot-mean squared (rms) value of the EMG and the RMS,as well as the zero-crossing frequency of the EEG signal.The EMG and EEG signals were obtained from the sameelectrodes–bandpass filter of 65–300 Hz was applied toobtain the EMG while frequencies 1,5–25 Hz were usedto obtain the EEG. The ABM monitor is described in (22).
At the beginning of 1990s Thomsen et al. took a differentapproach to anesthesia monitoring in their AdvancedDepth of Anesthesia Monitor (ADAM) (23). They dividedthe signal into consecutive 2 s segments, applied a pre-whitening filter, and derived 11 parameters: the rms valueand 10 correlation coefficients from each segment. Eitherthe values of the first 10 autocorrelation lags or the coeffi-cients of the 10th-order autoregressive model were sug-gested as features. To create a set of reference classes, anunsupervised repetitive hierarchical cluster analysis wasapplied to the data bank of preannotated recordings of
halothane and isoflurane anesthesia. Six clusters weredefined, corresponding to anesthetic levels from drowsi-ness to very deep anesthesia. The classification wasadjusted according to the anesthetic agent used. Burst-suppression was detected separately and the suppressionratio in 2 s segments was incorporated into classification.Anesthetic depth was displayed as the class probabilityhistogram: A plot where each line represented the clusters
MONITORING IN ANESTHESIA 559
Figure 3. Layout of the screen of the CFAM1 monitor (withpermission from D. Maynard).
28
Fz
100 µV
2 s
z
100 µV
7 s
(a)
(b)
Figure 2. Samples of BS pattern in EEG during deep propofol (a) and sevoflurane (b) anesthesia.Detection of BS suppression and calculation of BS ratio is an important part of all modern depth-of-hypnosis monitors. The pattern varies significantly among anesthetic drugs. In the case of propofolanesthesia, spindles can be observed (marked by boxes in the figure). Note that the scale of the timeaxes is different for upper and lower curves.

obtained for 10 s period of the recording. The clusters werecolor coded. In spite of its advanced approach, ADAM wasnever implemented in a commercial anesthesia monitoringdevice.
Recently Developed Methods, Applied in CommercialAnesthesia Monitors
The Bispectral Index Score (BIS), developed by AspectMedical Systems Inc. in 1997, marked a breakthrough inanesthesia monitoring. The output of the BIS monitor is asingle number between 0 and 100 achieved by combining ina nonlinear fashion from the following parameters (24):relative beta ratio calculated in spectral domain as
log P30�47P11�20
� �, where P30�47 and P11�20 denote signal power
in frequency ranges 30–47 and 11–20 Hz, respectively;SynchFastSlow measure calculated in bispectral domain
as log B0:5�47:0P40:0�47:0
� �, where B0:5�47:0 and B40:0�47:0 denote the sum
of magnitudes of the bispectrum values in the correspondingfrequency ranges; BS ratio. Bispectrum (the third-orderspectrum), is defined as the two-dimensional (2D) Fouriertransform (FT) of the third-order cumulant sequence c3(k1,k2) of the signal:
Bðv1;v2Þ FT$ c3ðk1; k2Þ ð1Þ
If the direct current (dc) component of the signal hasbeen removed (as is usually the case), c3(k1, k2) equals tothe third order moment sequence m3(k1, k2), defined as:
m3ðk1; k2Þ ¼ efsðnÞsðn þ k1Þsðn þ k2Þg ð2Þ
where e{ } denotes expected value. Overview on the esti-mation of higher order spectra can be found in (25).
The weighting of the three parameters forming the BISdepends on signal properties and is not disclosed. In lightanesthesia, relative beta ratio is dominating while Synch-FastSlow measure becomes more important with deepen-ing anesthesia. The function combining the parameterswas developed empirically, based on thousands of EEGrecords. An important part of BIS is its careful artifactrejection scheme, dealing with heartbeat artifacts, eye-blinks, wandering baseline, muscle artifacts, and so onBIS has become very popular among anesthesiologists;the bulk of literature dealing with the behavior of BIS invarious clinical situations, discussing its advantages aswell as disadvantages, incorporates more than 1000papers. Comprehensive bibliography can be found on theweb-pages of Aspect Medical Systems Inc.
At the beginning of this decade Physiometrix Inc.brought to market the PSA 4000 depth-of-hypnosis moni-tor, based on the Patient State Index (PSI) (26). The devel-opment of the PSI was based on a library of 20,000 cases ofEEG records. In addition, a library of surgical cases, alibrary of artifacts and results from volunteer studies (forcalibration), were used. In PSI, the EEG signal is measuredfrom four electrodes: Fp1, Fpz, Cz, and Pz, with the refer-ence at linked ear electrodes. Signal analysis is based onpower in standard EEG frequency bands (see Table 1) andincorporates the calculation of the following parameters:absolute power gradient between Fp1 and Cz leads in the
gamma frequency band (25–50 Hz); absolute powerchanges between Fpz and Cz leads in beta (12–25 Hz)and between Fpz and Pz; leads in alpha (8–12 Hz) fre-quency bands; total spectral power (0.5–50 Hz) at theFp1 lead; mean frequency of the total spectrum at Fpzlead; absolute power in delta frequency band (0.5–4 Hz) atCz; relative power at Pz lead in slow delta frequency band;
The calculated parameters go through a mathematicaltransformation that guarantees their Gaussian distribu-tion in order to be rescaled into the Z-score (Fig. 4). TheZ-score sets the calculated parameters into relation withthe parameter values obtained for reference populationgiving the percentage of the reference population that liesmore standard deviations away from the mean than thecalculated parameter (6). The Z-scored parameters are fedinto discriminant analysis with adaptive discriminantfunctions. EEG suppression is detected separately: Thesuppression ratio is included in the discriminant analysis.The discriminant analysis yields the PSI index: a scalarbetween 0 and 100 with higher level of hypnosis corre-sponding to lower PSI value.
The Narcotrend anesthesia monitoring system wasdeveloped by a German group and first introduced in2000 (27,28). This system has its roots in sleep analysis:A five-stage sleep scoring system was further developedinto a system of 6 stages and 14 substages for level-of-hypnosis monitoring. These stages are mapped to a scaleof 0–100 in the Narcotrend algorithm. The EEG signal isderived from one or two electrodes; the most commonelectrode location is on the forehead, however, accordingto the authors other electrode locations are possible. Thesignal is sampled at 128 Hz and prefiltered using lower andupper cutoff frequencies of 0.5 and 45 Hz, respectively. Theprincipal idea underlying the method is similar to that ofthe PSI: Several variables calculated from the EEG signalare fed todiscriminantanalysiswithseparatedetectionof BS(Fig. 5). The variables are classified as time- and frequency-domain ones and contain signal power, autoregressive coeffi-cients, relative power in standard EEG frequency bands,median frequency (the frequency dividing the signal spec-trum into two parts of equal energy), spectral edge frequency(SEF95, the frequency below which 95% of signal energy iscontained), and spectral entropy. The algorithm also con-tains plausibility check to ensure that the signal segment isactually similar to a typical EEG sample of correspondingstage and to detect patterns in the EEG signal untypical forgeneral anesthesia (e.g., epileptic activity). The detailedalgorithm of the Narcotrend index is proprietary.
Another EEG-based depth-of-anesthesia monitoringdevice is the recently introduced M-Entropy module forthe Datex-Ohmeda S/5 anesthesia monitor. As the nameindicates, the method is based on the idea that the entropyof the EEG signal decreases with deepening anesthesia.Signal entropy can be defined and calculated in manydifferent ways (see also the next section) of which spectralentropy is employed in the M-Entropy module. Spectralentropy in the frequency range f1–f2 is expressed as
Sð f1; f2Þ ¼Xf2
fi¼ f1
Pnð fiÞlog1
Pnð fiÞð3Þ
560 MONITORING IN ANESTHESIA

where Pn(fi) is the normalized power spectrum of thesignal. S(f1, f2) is again normalized by log N(f1, f2), whereN(f1, f2) is the number of frequency components in therange f1–f2, to give a value between 0 and 1. In the originalversion of the device, the analysis was performed on asingle EEG channel measured from the forehead. In thisderivation, muscle activity dominates over the EEG atfrequencies higher than �30 Hz. The algorithm of theM-Entropy module, like that of the early ABM-monitorby Datex-Ohmeda, employs these high frequency compo-nents to detect the early response of the patient to noci-ceptive stimuli. This is done by calculating spectral entropyover two frequency ranges: 0.8–32 Hz (called state entropy)and 0.8–47 Hz (called response entropy). The differencebetween these two entropies indicates the contribution ofthe EMG component to the response entropy. As in the otherdescribed monitors, BS is detected separately. The details ofthe algorithm (variable window length, obtaining the outputvalue in the case of BS, etc.) are described in (29).
The Danmeter AEP Monitor/2 (further development ofthe A-Line monitor) employs the composite AAI Index,
combining the middle latency auditory evoked potentialsin 20–80 ms latency range, calculated from the 25–65 Hzbandpass filtered signal, with spontaneous EEG. Thepurpose of combining the two modalities is to get a betterresponse to the lightening of hypnosis due to, for examplesurgical stimuli (achieved by usind AEPs) while retainingsensitivity during deep anesthesia (achieved by using theEEG). The schematic of the cAAI index calculation ispresented in Fig. 6. Using evoked potentials poses aproblem in on-line monitoring due to the long delayneeded for obtaining the averaged response. This problemhas been solved in the cAAI calculation by applying theautoregressive model with exogenous input (the ARXmodel). The ARX model enables to calculate the responseto stimuli based on the average of 18 sweeps using theaverage of 256 sweeps as a reference. The algorithm isdescribed in detail in (30) and compared with conven-tional evoked potential averaging techniques in Ref. 31.In addition to AEPs, the cAAI index incorporates loga-rithmic EEG power ratio ½logðP30�47=P10�20Þ� and the burstsuppression ratio. The EMG is extracted and monitored
MONITORING IN ANESTHESIA 561
Filter/decimation
Mainsnotch filter
Non-linearity
FP1FPZ'PZCZ
Fs = 2500 Fs = 250
44
EOGevaluation
Magnitude
Stationarity
Slew rate
Cautery
Suppression
Data editor
Frequencytransform
4
4
4
4
4
4
4
4
Suppressionratio
Artifactindex
2.5 sArtifact free EEG
QEEG measures;Power spectrum; sub-banding
QEEG measures epoch buffer
Compute mean of measures
Log transform measures
Z-Score components[mean, standard deviation]
Compute wake/sedatedDiscriminant functions based on
Z-Scored components
Compute discriminant PSIbased on ratio of
wake to wake + Sedated
Power spectrums
Arousalobserver
Discriminantobserver
Suppressionobserver
Filter & decimate
PSI
Figure 4. Schematic of the calculation of thePSI index. (Redrawn with permission fromD. R. Drover et al., ‘‘Patient State Index:Titration of delivery and recovery frompropofol, alfentanil, and nitrous oxideanesthesia,’’ Anesthesiology, Vol. 97, Fig. 3(p. 88), 2002).

separately based on the 65–85 Hz bandpass filteredsignal.
A somewhat different concept of anesthesia monitoringhasbeenused intheCerebralStateMonitor (CSM;DanmeterA/S, Odense, Denmark) and the SNAP monitor (Everest
Biomedical InstrumentsInc).Thesemonitoringdevicescomein the form of a handheld wireless PDA-type tool, convenientto use in a clinical situation. The CSM displays the CerebralState Index, calculated based on the 6–42 Hz bandpass fil-tered EEG, the EMG component calculated from the samesignal, but in 75–85 Hz frequency range, as well as the burstsuppression ratio. The algorithm of the second version of theSNAP index is described in (32). Two variables, the lowfrequency variable LF (0.1–40 Hz) and the high frequencyvariable HF (80–420 Hz) are derived from a single frontalEEG channel. The HF and LF are scaled to fit into theintervals 0.0–1.0 and 0.0–100, respectively. The SNAP indexis expressed as SI¼ 100—(HF LF); thus the index can bethought of as the reversed version of HF-modulated LF.
New Parameters Proposed for Monitoring Anesthetic Depth
In spite of the large selection of available methods, newparameters for quantifying depth of hypnosis are beingproposed continuously. This is mostly due to the followingreasons: the variety of procedures and combinations ofdrugs in surgical anesthesia is wide. No method performswell in all cases; monitoring in anesthesia is closely relatedto monitoring brain dysfunction and detection of brainischemia and hypoxia: important tasks faced in cerebralfunction monitoring in the ICU and emergency room (seethe section Monitoring Outside the Operating Theater).The available depth-of-hypnosis monitors are generally notsuitable for these applications; the neurophysiologicalbasis of consciousness is still an unsolved problem: apply-ing modern signal analysis tools to neurophysiologicalmeasurements during anesthesia can hopefully offernew insight to the problem.
Several groups have recently published studies on thebehavior of various complexity–entropy measures during
562 MONITORING IN ANESTHESIA
EEG
Filters
Artefactdetection
Time-domain analysis - amplitude measures - autoregressive parameters
Frequency-domain analysis:- fast fourier transform- spectral parameters
Suppression detection /discriminant functions
Plausibilitychecks
"Background"parameters
Narcotrend stage (A-F)
andNarcotrend index (100-0)
Figure 5. Schematic of the calculation of the Narcotrend index(with permission from B. Schultz).
A-Line Electrodes
AMP
A/DConverter
SignalOK?
No
Reject
MTA256 sweeps
MTA18 sweeps
Yes
If SNR lowsmooth signal
If SNR lowsmooth signal
ARX
MODEL
BP filterAEP
25-65 Hz
AAIcalculation
EstimateSNR
Smoothfactor
Show SNRbar/symbols
Bandpass filterEMG
65-85 Hz
EMGcalculation
Bandpass filterBurst Suppr.
1-35 Hz
EEG
LF / HF
BS %calculation
Figure 6. Schematic of the calculation of cAAI index (with permission from E. W. Jensen).
anesthesia and sedation. These measures come from dif-ferent signal analysis frameworks.
Correlation dimension is a measure for quantifying thebehavior of chaotic signals in the phase space (33). Thesignal s of finite length N is divided into N�mþ1 timeseries: sm(i)¼ {s(i), s(iþ 1), . . . , s(iþm�1)}, where m is theembedding dimension. After that, for each i the quantityCi
m(r) is calculated:
Cmi ðrÞ ¼ number of such j that d½SmðiÞ;Smð jÞ� � r
N � m þ 1ð4Þ
where the distance d between the phase space vectors sm(i)and sm(j) is defined as
d½SmðiÞ;Smð jÞ� ¼ maxk¼1;2;...;m
ðjsði þ k � 1Þ � sð j þ k � 1ÞjÞ ð5Þ
Correlation dimension D can be estimated as
D ¼ d logðCmðrÞÞd logðrÞ ð6Þ
where CmðrÞ ¼P
i Cmi ðrÞ=N � m þ 1: Although EEG can-
not be considered strictly chaotic, except in the case of someabnormal conditions, this measure has, for example, beenfound to have good correlation with the end-site concen-tration of sevoflurane (34).
Probably the most intensively studied complexity/entropy measure for the assessment of depth of hypnosisis Approximate entropy (ApEn). In general, entropy mea-sures information-richness, regularity and randomness ofa signal. The intuitive idea behind anesthesia monitoringusing signal entropy is that with deepening anesthesiaEEG becomes more regular and its entropy decreases.Approximate entropy, like correlation dimension, is calcu-lated in the phase space. First, fm(r) is defined based onCm
i(r) in Eq. 4 as
FmðrÞ ¼ 1
N � m þ 1
XN�mþ1
i¼1
logCmi ðrÞ ð7Þ
Approximate entropy is then defined as
A pEnðm; rÞ ¼ FmðrÞ �Fmþ1ðrÞ ð8Þ
Approximate entropy has been studied and comparedto other methods as an indicator of anesthetic depth in(35–37).
The classical entropy measure, introduced for informa-tion theory by Claude Shannon in 1948 (38), the Shannonentropy (ShEn), is calculated as ShEn ¼ �
Pi pi log pi,
where pi is the probability that signal amplitude obtainsthe range of values ai. In practice, ShEn can be estimatedbased on the histogram of the values of signal samples, andtherefore long signal segments are needed to achievesmooth histograms. An important property of Shannonentropy is that signal samples are considered as indepen-dent trials of some experiment, taking no notice on the timeorder of the samples. Signals having equal probability forall possible amplitude values have the highest Shannonentropy. In Ref. 39, it has been found that Shannon entropyof the EEG recorded between frontopolar electrodesincreases with increasing concentration of desflurane:A behavior opposite to other entropy measures.
Other measures of the EEG, found to correlate well withdepth of hypnosis, include Lempel–Ziv complexity andHiguchi fractal dimension (35,40). Lempel–Ziv complexityis calculated by transforming the signal into symbols andcalculating the reoccurrence rate of these symbols (41).Higuchi fractal dimension is calculated as the average rateof increase in the difference of signal amplitude values asthe separation between the samples increases in logarith-mic scales (42).
These studies demonstrate that although different mea-sures of entropy or complexity quantify different phenom-ena, many of them may correlate with concentrations ofselected anesthetics when electrode positions and signalbandwidth are selected properly.
MONITORING OUTSIDE THE OPERATING THEATER
Development of digital EEG equipment, increase in pro-cessing speed and memory capacity, and advancements intelecommunication technology have made cerebral func-tion monitoring feasible in ICU and ER. Brain monitoringin ICU and ER has much in common with monitoring inanesthesia as the changes in the EEG caused by intoxica-tion, metabolic disturbances and brain ischaemia are simi-lar to those induced by general Anesthesia. Also, in the ICUthe assessment of depth of sedation is desirable. Theadvantages offered by EEG monitoring in the ICU arebased on the following findings (43): EEG is tightly linkedto cerebral metabolism; EEG is sensitive to brain ischemiaand hypoxia; EEG detects neuronal dysfunction at a rever-sible stage; EEG detects neuronal recovery when clinicalexamination cannot; continuous EEG provides dynamicinformation; EEG provides useful information about cere-bral topography.
However, from the monitoring point of view, the situationin ICU and ER is a lot more complicated compared to that ofOR. The patients may need various medication having effecton the EEG signal and misleading automated EEG analysis,the clinical situation of the patients is often complex, and thesurrounding is hostile for interference-sensitive equipment.In ICU, recordings often need to last for several days andnights without disturbing the normal care of the patient. InER, the EEG recording equipment needs to be extremelyflexible and easy-to-use. In both situations the interpreta-tion of the recordings poses a problem as no experiencedEEG readers are usually around. The solution to the lastproblem is the usage of telecommunication protocols totransfer the data for interpretation.
Although the above described depth-of-anesthesia mon-itoring methods are sometimes applied to sedation mon-itoring and even to the detection of brain dysfunction inICU, their performance in this situation is questionable. Itis difficult to differentiate between the effects of hypoxia,ischemia and sedative drugs. The importance of having theunderlying raw EEG signal available for review to confirmthe significance of any trends and changes suggested byautomatic analysis methods, especially in complex situa-tions like ICU, has been repeatedly emphasized (44,45).A comprehensive brain monitor for ICU, especially forneuroscience ICU, should also be able to detect epileptic
MONITORING IN ANESTHESIA 563
patterns in EEG and desirably have the option for synchro-nous video recording (46). All this suggests that an adequatebrain monitor for ICU or ER should be a much more complexdevice than today’s depth-of-anesthesia monitors.
DISCUSSION
Several considerations are appropriate concerning theavailable commercial depth-of-anesthesia monitors. First,different modalities should be used to assess the differentcomponents of anesthesia (see the section Anesthesia as aProcess). Selecting EEG and AEPs as the basis for theassessment, the primary component of anesthesia consid-ered would be hypnosis.
But even in this case there still remain other physiolo-gically separate end-points like subcortically controlledreactions to nociceptive input (e.g., autonomic reactions),increased muscle tone, and movement response to surgery.Adding the fact that there are many anesthetic agents ofdifferent cell-level actions and that the interplay of hyp-notic and antinociceptive medication modulates the anes-thetic state (47), we are left with a complex situation thatmakes the comparison of the available algorithms foranesthesia monitoring a real challenge.
Another difficulty in comparing the results obtainedwith different methods is posed by the frequency bandused for the calculation. All the commercial methods oper-ate at least partly in the frequency domain although BISapplies third-order spectrum and in the Entropy module anonlinear transformation follows the calculation of thepower spectrum. For anesthesia, monitoring frequencydomain can roughly be divided into the following physio-logically meaningful areas: d (and partly u) frequencies,indicative of pre-BS deep anesthesia (� 0.5–6 Hz); a and b
frequencies; the EMG component, overlapping with theEEG and extending to > 100 Hz.
The devices differ in the usage of d frequencies and inthe way the EMG component is incorporated. While most ofthe methods employ frequency band starting from 0.1 Hz(SNAP)–0.8 Hz (Entropy), the Cerebral State Index andcAAI by Danmeter do not make use of d rhythms. Severaldevices like the A-2000 monitor by Aspect Medical SystemsInc., the AEP Monitor/2 and the Cerebral State Monitor byDanmeter as well as the PSA 4000 monitor by Physiome-trix Inc. display the EMG power separately from theircorresponding depth-of-anesthesia indices. The frequencyband the EMG component is obtained from varies fromdevice to device, falling into the range from 65 to 110 Hz.The SNAP index, the Entropy module and the Narcotrendindex incorporate the information on EMG activity intotheir depth-of anesthesia indexes in different ways. InSNAP, the high frequency band used is 80–420Hz, while theother two monitors use frequencies up to 47Hz. The variousentropy–complexity measures proposed for the assess-ment of anesthetic depth are sensitive to the prefiltersettings as well (40). Thus it can be concluded that whilecomparing the performance of various algorithms, thefollowing matters should be considered: the properties ofthe algorithm itself, the frequency band of the EEG signalit employs, and the location of the EEG electrodes.
In the future, it seems to be inevitable that brainmonitoring becomes more common in ICU and emergencyroom. There is a compromise between the simplicity of thepresentation of the output and versatility of the method.Monitoring such complex phenomenon as anesthesia by asingle number is clearly an oversimplification. On the otherhand, a device requiring sophisticated configuration anddisplaying a lot of parameters difficult to interpret getseasily rejected by clinicians. Connecting the algorithms tophysiological models would certainly help the interpreta-tion of the monitor output. Future will show if any of thenew approaches such as measures of signal complexity findtheir way into the commercial devices. Operating in thefrequency domain has the advantage of long-term experi-ence in EEG analysis by means of frequency domain meth-ods. Another advantage is the solid signal processingtheory of frequency analysis. On the other hand, the theoryof nonlinear systems is developing rapidly having madeitsway to physiological signal analysis in variousapplications.
BIBLIOGRAPHY
1. Myles PS, et al. Patient satisfaction after anesthesia andsurgery: Results of a prospective survey of 10811 patients. BrJ Anaesth 2002;84:6–10.
2. Committee on Quality of Health Care in America IoM. In:Kohn L, Corrigan J, Donaldson M, editors. To Err Is Human:Building a Safer Health System. Washington: National Acad-emy Press 1999;241.
3. Chopra V, Bovill J, Spierdijk J. Accidents, near accidents andcomplications. Br J Anaesth 1978;50(10):1041Ü6 36.
4. Lagasse RS. Anesthesia safety: Model or myth? A review ofthe published literature and analysis of current original data.Anesthesiology 2002;97:1609–1617.
5. Kissin I. General anesthetic action: An obsolete notion?Anesthol Analg 1993;76:215–218.
6. John ER, Prichep LS. The anesthetic cascade: A theory onhow anesthesia suppresses consciousness. Anesthesiology2005; 102:447–471.
7. Rudolph U, Antkowiak B. Molecular and neuronal substratesfor general anaesthetics. Nature Rev Neurosci 2004;5:709–720.
8. Flohr H, Glade U, Motzko D. The role of the NMDA synapsein general anesthesia. Toxicol Lett 1998;100-101:23–29.
9. Steyn-Ross DA, Steyn-Ross ML, Wilcocks LC, Sleigh JW.Toward a theory of the general-anesthetic-induced 24 phasetransition of the cerebral cortex. II. Numerical simulations,spectral entropy, and correlation times. Phys Rev E 2001;64:011918 (12 p).
10. Hughes JR, John ER. Conventional and quantitative electro-encephalography in psychiatry. J Neuropsychiat Clin Neu-rosci 1999;11:190–208.
11. Volume 10: Conciousness and Cognition 2001.12. Mourisse J, et al. Electromyographic assessment of blink and
corneal reflexes during midazolam administration: Usefulmethods for assessing depth of anesthesia? Acta AnaesthesiolScand 2003;47:593–600.
13. Ramsay M, Savege T, Simpson B. Controlled sedation withalphaxolene/alphadalone. Br J Med 1974;2:656–659.
14. Chernik D, et al. Validity and reliability of the observer’sassessment of alertness/sedation scale: Study with intrave-nous midazolam. J Clin Psychopharmacol 1990;10:244–251.
564 MONITORING IN ANESTHESIA

15. Yli-Hankala A, et al. Epileptiform electroencephaogram dur-ing mask induction of anesthesia with sevoflurane. Anesthe-siology 1999;91:1596–1603.
16. Vakkuri A. Effects of Sevoflurane Anesthesia on EEG Pat-terns and Hemodynamics. Ph.D. dessertation, University ofHelsinki, Finland, 2000.
17. Thornton C, et al. The auditory evoked response as anindicator of awareness. Br J Anaesthology 1989;63:113–115.
18. Yppärilä H. Depth of Sedation in Intensive Care Patients: ANeurophysiological Study. Ph. D. Dessertation, University ofKuopio, Finland, 2004.
19. Paloheimo M. Quantitative surface electromyography(qEMG): Applications in anaesthesiology and critical care,Ph. D. dissertation Acta Anaesthesiology; Scandinavian.Copenhagen. Munksgaard; 1990; Vol. 34, (Suppl. 93),.
20. Wang DY, Pomfrett CJD, Healy TEJ. Respiratory sinusarrhythmia: A new, objective sedation score. Br J Anaesthol-ogy 1993;71:354–358.
21. Maynard D. Development of the CFM: The cerebral functionanalyzing monitor (CFAM). Ann Anaesthology Francaise1979;20:253–255.
22. Edmonds HL, Paloheimo M. Computerized monitoring of theEMG and EEG during anesthesia. An evaluation of theanesthesia and brain activity monitor (ABM). Int J ClinMonit Comp 1985;1:201–210.
23. Thomsen CE, Rosenfalck A, Norregaard-Christensen K.Assessment of anaesthetic depth by clustering analysisand autoregressive modeling of electroencephalograms. Com-put Methods Progr Biomed 1991;34:125–138.
24. Rampil IJ. A primer for EEG signal processing in anesthesia.Anesthesiology 1998;89:980–1002.
25. Nikias CL, Petropulu AP. Higher Order Spectra Analysis.Englewood Cliffs (NJ): PTR Prentice Hall; 1993.
26. Drover DR, et al. Patient State Index: Titration of deliveryand recovery from propofol, alfentanil, and nitrous oxideanesthesia. Anesthesiology 2002;97:82–89.
27. Schultz B, Schultz A, Grouven U. Sleeping stage basedsystems (Narcotrend). In : Bruch HP. et al., editors. NewAspects of High Technology in Medicine 2000. Bologna: Mon-duzzi Editore; 2000:285–291.
28. Grouven U, Beger RA, Schultz B, Schultz A. Correlation ofNarcotrend Index, entropy measures, and spectral para-meters with calculated propofol effect-site concentrationsduring induction of propofol-remifentanil anesthesia. J ClinMonit Comput 2004;18:231–240.
29. Viertiö-Oja H, et al. Description of the EntropyTM algorithmas applied in the Datex–Ohmeda S/5–Entropy Module. ActaAnaesthesiol Scand 2004;48:154–161.
30. Jensen EW, Lindholm P, Henneberg SW. Autoregressivemodeling with exogenous input of middle latency auditory-evoked potentials to measure rapid changes in depth ofanesthesia. Methods Inf Med 1996;35:256–260.
31. Litvan H, et al. Comparison of conventional averaged andrapid averaged, autoregressive-based extracted auditoryevoked potentials for monitoring the hypnotic level duringpropofol induction. Anesthesiology 2002;97:351–358.
32. Wong CA, Fragen RJ, Fitzgerald PC, McCarthy RJ. The asso-ciation between propofol-induced loss of consciousness and theSNAPTM index. Anesthology Analg 2005;100:141–148.
33. Grassberger P, Procaccia I. Measuring the strangeness ofstrange attractors. Phys D 1983;9:189–208.
34. Widman G, et al. Quantifcation of depth of anesthesia bynonlinear time series analysis of brain electrical activity.Phys Rev E 2000;62:4898–4903.
35. Zhang XS, Roy RJ, Jensen EW. EEG Complexity as a mea-sure of depth of anesthesia for patients. IEEE Trans BiomedEng Dec 2001;48(12):1424–1433.
36. Bruhn J, Röpcke H, Hoeft A. Approximate entropy as anelectroencephalographic measure of anestetic drug effect dur-ing desflurane anesthesia. Anesthesiology 2000;92:715–726.
37. Bouillon TW, et al. Pharmacodynamic interaction betweenpropofol and remifentanil regarding hypnosis, tolerance oflaryngoscopy, bispectral index, and electroencephalographicapproximate entropy. Anesthesiology 2004;100:1353–1372.
38. Shannon CE. A mathematical theory of communication. BellSystem Tech J 1948;27:379–423.
39. Bruhn J, et al. Shannon entropy applied to the measurementof the electroencephalographic effects of desflurane. Anesthe-siology 2001;95:30–35.
40. Anier A, Lipping T, Melto S, Hovilehto S. Higuchi fractaldimension and spectral entropy as measures of depth ofsedation in intensive care unit. Proceedings of the 26-th IEEEEMBS Annual International Conference (EMBC’04), SanFrancisco; Sept. 2004; pp. 526–529.
41. Lempel A, Ziv J. On the complexity of finite sequences. IEEETrans Infor Theory 1976;IT–22:75–81.
42. Higuchi T. Approach to an irregular time series on the basisof the fractal theory. Phys D 1998;31:277–283.
43. Jordan KG. Continuous EEG monitoring in the neuroscienceintensive care unit and emergence department. J Clin Neu-rophysiol 1999;16:14–39.
44. Scheuer ML, Wilson SB. Data analysis for continuous EEGmonitoring in the ICU: seeing the forest and the trees. J ClinNeurophysiol 2004;21:353–378.
45. Jäntti V, Mustola S, Huotari AM, Koskinen M. The impor-tance of looking at the EEG when presenting uivariate vari-ables to describe it. Br J Anaesth 2002;88:739.
46. Hirsch LJ. Continuous EEG monitoring in the intensive careunit: an overview. J Clin Neurophysiol 2004;21:332–340.
47. Kern SE, X Gie, White JL, Egan TD. Opioid-hypnoticsynergy. Anesthesiology 2004;100:1373–1381.
48. Schultz B, et al. Der Narcotrend Monitor: Entwicklung undInterpre-tationsalgorithmus. Anaesthesist 2003;52:1143–1148.
See also ANESTHESIA MACHINES; BLOOD PRESSURE MEASUREMENT; ELEC-
TROENCEPHALOGRAPHY; OXYGEN ANALYZERS; SAFETY PROGRAM, HOSPITAL;TEMPERATURE MONITORING.
MONITORING, AMBULATORY. See AMBULATORY
MONITORING.
MONITORING, FETAL. See FETAL MONITORING.
MONITORING, HEMODYNAMIC
REED M. GARDNER
LDS Hospital and UtahUniversitySalt Lake City, Utah
INTRODUCTION
The word monitor has a variety of meanings, dependingon the context. A monitor can be any device for checking onor regulating the performance of a machine, aircraft, or apatient. A patient monitor is usually thought of as some-thing that watches, warns, or cautions if there is a life-threatening event. A more rigorous definition of patientmonitoring is Repeated or continuous observations or
MONITORING, HEMODYNAMIC 565

measurements of the patient, his or her physiologicalstatus, and the functions of life support equipment forthe purpose of guiding management decisions, includingwhen to make therapeutic interventions and assessmentof those interventions (1). As a result, a monitor shouldnot only alert physicians and nurses to potentially life-threatening events, but perhaps should also controldevices that maintain life. The primary emphasis of thissection deals with hemodynamic monitoring of the criti-cally ill patient who is in an intensive care unit (ICU), butmany of the principles apply to all hospitalized patients.
Hemodynamic monitoring relates to monitoring of theblood pressure and blood flow in the cardiovascular system.The cardiovascular system consists of the heart, lungs, andblood vessels, and has a most important function in main-taining life in complex animals, such as humans. Oxygenand fuel must be transported from their source to theindividual cells that consume them. The resulting wasteproducts of metabolism must then be disposed of. Thus, theheart and blood vessels transport nutrients to the body andremove the waste products. Clearly, if this system does notfunction properly, the organism could be compromised. Asa consequence clinically applicable methods have beendeveloped to assess the function of the cardiovascularsystem. Hemodynamic monitoring is one part of this com-plex monitoring strategy. Typical parameters measuredwhen performing hemodynamic monitoring are heart rateand rhythm, measured through analysis of the electrocar-diogram (ECG), blood pressure measurements in variouslocations in the cardiovascular system, and estimates ofblood flow usually using cardiac output as a measure.
THEORY
Hemodynamic monitoring permits minute-to-minutesurveillance of the cardiovascular system and providesphysiologic data to assist in diagnosis as well as to guidetherapy (2–5). The cardiovascular system consists of theheart, lungs, and blood vessels that supply blood to thebody and return blood from the peripheral tissue.
It is beyond the scope of this section to describe thedetailed anatomy of the cardiovascular system. However,to understand the principles of hemodynamic monitoringknowledge of the functional aspects of the cardiovascularsystem is essential.
HEART
The heart is made up of four chambers: the right atriumand the right ventricle and the left atrium and the leftventricle (see Fig. 1). The right atrium accepts blood fromthe systemic circulation (head, arms, and legs) via thesuperior and inferior vena cava. On atrial contractionthe tricuspid valve between the right atrium and rightventricle opens and blood flows into the right ventricle. Onventricular contraction the right ventricle pumps bloodthrough the pulmonic valve into the pulmonary arteryand to the lungs where oxygen is added and carbon dioxideis removed. Blood flows from the lungs to the pulmonaryveins and then into the left atrium. On atrial contraction
the blood flows into the left ventricle through the mitralvalve. On ventricular contraction the left ventricle pumpsblood through the aortic valve to the systemic circulation(aorta and the systemic vasculature).
The basic contractile element of the heart is the sarco-mere, which is composed of myofilaments, contractile pro-teins that interdigitate and slide along one another duringcontraction. Shortening of the sarcomere is the functionalunit of heart contraction. Physiologic and pharmacologicagents can change the contractile characteristics of thesarcomeres. Rate and contractility of the heart are con-trolled by sympathetic and parasympathetic innervation,as well as circulating catecholamines.
Control of Heart Performance
Mechanisms regulating cardiac (heart) output involve notonly factors controlling performance of the heart as apump, but also factors affecting the systemic vascularsystem and its resistance. Typically, the heart can increaseits output to a level of almost five times its resting value.There are two methods by which the heart regulates itscardiac output in response to stress, injury, or disease: bychanging heart rate and stroke volume.
Heart Rate Control
Heart rate can be changed rapidly and is thus one of themost effective ways for the heart to change its cardiacoutput. For a healthy person, an increase in heart ratecan more than double the cardiac output when the heartrate increases to near 180 beats min�1. However, if apatient with heart disease increases their heart rate to>120 beats min�1 they may have deleterious responsesbecause of the increased demand for oxygen by the heartmuscle. Blood flow in the heart muscle occurs primarily
566 MONITORING, HEMODYNAMIC
SP
MP
DP
ARTERIALSP = 90 to 150 mmHg SP = 20 to 30 mmHg
DP = 8 to 12 mmHgWEDGE = 6 to 12 mmHg
DP = 60 to 80 mmHgMP = 70 to 90 mmHg
PULMONARY ARTERY
LEFT ATRIUM(LA)
MP = 6 to 12 mmHgRIGHT ATRIUM
(RA)MP = 2 to 6 mmHg
LEFT VENTRICLE(LV)
SP = 90 to 50 mmHgEND DP = 6 to 12 mmHg
RIGHT VENTRICLE(RV)
SP = 20 to 30 mmHgEND DP = 2 to 6 mmHg
Figure 1. Outline drawing of the heart with its chambers andtypical pressures (expressed in mmHg) for each area of the heart.Note the pressures are systolic (SP), diastolic (DP), and mean(MP), as shown on the arterial pressure waveform.

during diastole (the relaxation phase of heart contraction).Increasing heart rate decreases the time for cardiac circu-lation during diastole. In normal subjects, decreasing theheart rate to � 50 beats min�1 may not decrease cardiacoutput because there is increased diastolic filling time thatincreases stroke volume.
Stroke Volume Changes
The stroke volume of an intact ventricle is influenced by (1)ventricular end-diastolic volume (called preload), (2) ven-tricular afterload, and (3) contractility.
Preload. Preload is the term used to define the end-diastolic stress in the wall of the ventricle. For example, zeropreload would result in the ventricle ejecting no blood. How-ever, with increased preload, ventricular ejection generallyincreases linearly until the capacity of the pump (heart) isexceeded. Since the end-diastolic volume so profoundlyinfluences themyocardialfiber length ithasa great influenceon the myocardial performance. The Frank–Starling lawdescribes this principle and is illustrated graphically inFig. 2. The most accessible measure of right ventricularpreload is the right atrial pressure. Left atrial pressure isused to estimate left ventricular preload. Since the leftventricle does most of the work of the heart, it is usuallythe first part of the heart muscle to fail. Consequently, themeasurement or estimation of the left atrial pressure isimportant in assessing a patient’s hemodynamic status.
Afterload. Afterload is a measure of the impedance(resistance) against which the right or left ventricles must
eject blood. Resistance (R) is calculated by measuring bloodflow and pressure and then using Ohm’s law {Eq. 1}.
R ¼ mean blood pressure
cardiac output(1)
Systemic Circulation
Blood flow to the periphery of the body is controlled by localautoregulation and by the autonomic nervous system.Local autoregulation of blood flow helps tissue meet itsoxygen requirements. For example, with decreased bloodflow, metabolic byproducts increase, causing local vasodi-latation that tends to increase blood flow. There are bar-oreceptors, similar to blood pressure transducers, locatedin the aortic arch and the carotid sinus which sense bloodpressure. Via the baroreceptor reflex mechanism, the bodyregulates the blood pressure. In addition, chemoreceptorsin the carotid sinus and other locations regulate respira-tion by responding to changes in CO2 and O2.
Pulmonary Circulation
The pulmonary arterial vessels differ markedly from sys-temic arterial vessels; they have thinner walls, less muscle,and have a resistance to blood flow about one-sixth that ofthe systemic circulation.
Contractility. Contractility is a measure of how ahealthy heart performs. A healthy heart pumps vigorouslyand nearly empties its ventricles with each beat and is saidto have excellent contractility. On the other hand, a com-promised heart may not be able to empty effectively.
HEMODYNAMIC MONITORING
Bedside hemodynamic monitoring makes use of data gath-ering procedures that were formerly only done in diagnos-tic cardiac catheterization laboratories. Understanding therelationship between the pressure and blood flow in thecardiovascular system is the primary reason for perform-ing hemodynamic monitoring. The cardiovascular systemresponds to many and varied stimuli and can be affected byphysical conditioning, drugs, disease, blood loss, injury,and myocardial insult such as a heart attack. Because ofthe complexity of factors controlling the body, it is neces-sary to make hemodynamic measurements on the systemto understand disease processes and provide optimumtherapy to the patient.
Electrocardiogram
Electrocardiogram (ECG) monitoring is used to determineheart rate and detect arrhythmias, pacemaker function,and myocardial ischemia (lack of blood flow to the heartmuscle). To permit optimum ECG monitoring the signalquality must be excellent (6). Since the ECG electricalsignal from the heart is only 0.5–2.0 mV at the skin’ssurface, it is best measured by properly preparing the skinand optimally placing the electrodes. Skin can be properlyprepared by removing oil from the surface and abradingthe skin to remove the dry dead outer layer (stratum
MONITORING, HEMODYNAMIC 567
HYPERDYNAMIC
NORMAL
FAILURE
CA
RD
IAC
IND
EX
PULMONARY WEDGE PRESSURE
Figure 2. Frank–Starling curve of the heart showing theventricular performance (cardiac index) plotted against the end-diastolic volume typically estimated by using pulmonary arterywedge pressure. Note to the right of these curves, there is apulmonary wedge pressure above which the heart in ineffectivein producing increased flow.

granulosum). In 90% of patients, proper skin preparationreduces electrode resistance from as high as 200 to as lowas 10 kV. Good electrode placement allows the electrodes toreceive the maximum ECG signal with minimum noise. Byplacing the electrodes over bony prominence, such as thesternum or clavicles, muscle artifact (EMG) can bereduced. Motion artifact caused by movement of electrodescan be minimized not only by proper skin preparation, butalso by taping a strain-relieving loop in the lead wires toprevent movement artifact. Shielded wire on the ECGleads helps minimizes pickup of alternating current (ac)electrical fields from 60 Hz power sources, electrosurgicalunits, and other sources like radio transmitters. The twoleads that connect the patient form a loop through whichmagnetic fields pass and can induce unwanted voltages.Pickup from magnetic fields can be minimized by decreas-ing the loop area, by keeping the lead wires close together(usually twisted pairs), and by avoiding draping the leadwires over motors, lights, or other electrically poweredinstruments.
Electrocardiogram Arrhythmia Monitoring
Early in the development of monitoring techniques, theapplication of computer technology to detect patterns of theelectrocardiogram caught the attention of those whosought to improve care of the critically ill. The computerappeared to be a logical candidate for relieving the nursingand medical staff of the tedious chore of continuouslyvisually monitoring a multichannel oscilloscope.
Arrhythmia monitoring is one of the most sophisticatedof the bedside monitor’s tasks. People-based arrhythmiamonitoring is expensive and unreliable, and those who do itfind the task to be tedious and stressful. Today virtuallyevery bedside monitor has rhythm monitoring built in.These monitors use computers and a variety of algorithmsto detect and classify ECG rhythm abnormalities. Classify-ing these rhythm abnormalities is important to hemody-namic monitoring since irregular rhythms can causedramatic inefficiencies in how the heart works as a pump.For example, Fig. 3 shows three strip recordings of theECG and the corresponding pressure waveform from threedifferent arrhythmias (ventricular tachycardia, couplet,which is two beats of abnormal electrical origin, and bige-miny where every other beat is from abnormal electricalorigin). Note that several of the abnormal beats are hardlyeffective at creating any change in the arterial pressure.Those same beats deliver small stroke volumes to thepatient’s systemic circulation. As a consequence, one can-not assume that the cardiac output remains constant orincreases just because the heart rate increases.
MEASUREMENTS
Blood Pressure Monitoring
Arterial blood pressure can be measured by both direct andindirect methods. However, central venous pressure (CVP),pulmonary artery (PA), and pulmonary capillary wedgepressure (PCWP) used to estimate left atrial pressure, atpresent, can only be measured by direct invasive methods.
Arterial Blood Pressure: Indirect Measurement; Using aCuff. Recently, the American Heart Association hasupdated its recommendations on accurate ‘‘indirect’’measures of blood pressure (7). The update reports thatthe auscultatory technique with trained observer andmercury manometer continues to be the method of choicefor measurement of a patient’s blood pressure in a physi-cian’s office. The report also suggests that hybrid devicesthat use electronic transducers rather than mercury havepromise. The report indicates that oscillometric devices canalso be used, but only after careful validation.
568 MONITORING, HEMODYNAMIC
Figure 3. Electrocardiogramandarterialpressurewaveformswiththree different abnormal rhythms. (a) Ventricular tachycardia (VT),whichoccursduringthelast twobeatsof thestrip. (b)Coupletswheretwosuccessivebeatshaveanabnormalelectricalorigin. (c) Bigeminywhere every other beat is from an abnormal electrical origin.Pressures are expressed in millimeters of mercury. For example,the patient in (a) has a systolic arterial pressure of 109 mmHg,a diastolic pressure of 53 mmHg, and a mean arterial pressure of75 mmHg.

Unfortunately, the indirect measurement of arterial pres-sure has serious limitations for patients in shock usuallysignaledby lowbloodpressure.Also, sincevirtuallyall reliableindirect pressure measurement techniques require cuff infla-tion, such measurements can only be made intermittently.
Direct Blood Pressure Measurements. The direct mea-surement of blood pressure allows for continuous andaccurate assessment of blood pressures. Direct and con-tinuous pressure monitoring allows detection of dangeroushemodynamic events and provides the information neces-sary to initiate and regulate patient therapy to preventcatastrophic events. However, monitoring of pressuresprovides valuable information only when it is obtainedin a technically satisfactory manner.
To accomplish direct blood pressure measurements, it isnecessary to inserta catheter directly into thecardiovascularsystem (8). This invasive technique has risks that must beweighted against the benefits that can be obtained. Theserisks include, infection, blood loss, insertion site damage andother factors (9,10). For many patients who are in shock orwho have cardiac disease, the benefits far outweigh the risks.Formal methods for assessing these risks have been pub-lished by the Coalition for Critical Care Excellence (11).
Blood pressure can be measured on both the pulmonary(right heart) and systemic (left heart) sides of the circulatory
system. Measurements of both pulmonary and systemicparameters yield different and important cardiovascularstatus. The CVP reflects the patient’s circulating bloodvolume or venous tone, and right atrial and ventricularpressures (right ventricular preload). To measure the rightatrial pressure accurately a catheter must be placed in amajor vein within the chest or directly in the right atrium.The CVP values fluctuate about atmospheric pressure. Thelevel of the right heart is usually taken as the zero referencepoint from which all other blood pressures are measured.The CVP gives an indication of only the function of the rightheart, and not left heart’s performance.
To measure the left atrial pressure, it is necessary to placea catheter tip through the atrial septum from the rightatrium (usually done only with fluoroscopic control in thecardiac catheterization laboratory) or estimating it by pla-cing a pulmonary artery (Swan–Ganz) catheter in thewedged position by inflating its balloon near the catheter tip.
EQUIPMENT
Components of Direct Pressure Monitoring Systems
The components of a direct blood pressure monitoringsystem for critically ill patients are shown in Fig. 4 (6,8).The components numbered 1–7 in the figure are known as
MONITORING, HEMODYNAMIC 569
Figure 4. The 10 components used to monitor direct blood pressure. The monitoring componentsare nearly independent of whether the catheter is in an artery (radial, brachial, or femoral) or in thepulmonary artery. Size of transducer and plumbing components are enlarged for illustrationpurposes. [Reproduced from Ref. 6, with permission.]
the ‘‘plumbing’’ system and must always be sterile becausethe fluid contained therein comes in direct contact with thepatient’s blood. Today virtually all of these components aredisposable or single-use items to minimize patient infec-tion. Components 8–11 in Fig. 4 are used for processing anddisplaying pressure waveforms and derived hemodynamicparameters.
1. Catheter. Arterial and pulmonary artery cathetersprovide access to the patient’s blood vessels to(a) monitor intravascular pressure and (b) providea site for samples for blood to allow determination ofblood gas and other laboratory testing parameters.These catheters are typically placed by thepercutaneous method, either by the Seldinger‘‘over-the-needle’’ technique or by introducing thecatheter through a needle (8).
2. Sampling stopcock. Stopcock 1 is used as a site forwithdrawing blood for analysis. When filling thecatheter-tubing-transducer system with fluid,precautions must be taken to be sure all centralswitching cavities of the stopcock are filled and thatentrapped air bubbles are removed. Because stop-cocks are especially vulnerable sources of patientcontamination, these devices must be handled withextreme care; ports not in active use should be cov-ered with sterile caps and medical personnel shouldnever touch open ports of the stopcocks.
3. Pressure tubing. The catheter and stopcock are nor-mally attached to a continuous flush device and trans-ducer by noncompliantpressure tubing. Tooptimize thedynamic response of the catheter-tubing-transducersystem, long lengths of tubing must be avoided.
4. Stopcock 2. This stopcock is usually put in place toallow disconnection of the flush device and transdu-cer from the patient when the patient is moved orwhen initially filling the system with fluid.
5. Continuous flush device. This device is used not onlywhen initially filling the pressure monitoring system,but also to help prevent blood from clotting in thecatheter. These devices provide a ‘‘continuouslyflush’’ of fluid at a rate of from 1 to 3 mL h�1.
6,7. Transducer dome and Pressure transducer. Todayvirtually all transducers used for monitoring arehighly reliable, standardized, disposable devices(12,13).
8. Amplifier system. The output voltage required todrive an oscilloscope or strip-chart recorder is pro-vided by an amplifier system inserted between thetransducer and display. Pressure transducer excita-tion is provided either from a direct current (dc) or acsource at a voltage of 4–8 V revolutions per second(rms). Most amplifier systems include low pass filtersthat filter out unwanted high frequency signals. Pres-sure amplifier frequency response should be flat from 0to 50 Hz to avoid pressure waveform distortion.
9. Oscilloscope. Pressure waveforms are best visualizedon a calibrated oscilloscope or other similar displaypanel.
10. Digital processing and display. Digital displaysprovide a simple method for presenting quantitativedata from the pressure waveform. They are foundon most modern pressure monitoring equipment.Systolic, diastolic, and mean pressure are typicallyderived from the pressure waveforms.
11. Strip-chart recorders. Frequently, strip-chart recor-ders are used to document dynamic response char-acteristics, respiratory variations in pulmonaryartery pressures, and aberrant rhythms and pres-sure waveforms.
STATIC CALIBRATION
Zeroing and calibrating the transducer are two importantsteps in setting up the direct pressure-monitoring system.
Zeroing the Transducer
The accuracy of blood pressure readings depends on estab-lishing an accurate reference point from which all subse-quent measurements are made. The patient’s midaxillaryline (right heart level) is the reference point most com-monly used (14). The zeroing process is used to compensatefor offset caused by hydrostatic pressure differences, offsetin the pressure transducer, amplifier, oscilloscope, recor-der, and digital displays. Zeroing is accomplished by open-ing an appropriate stopcock to the atmosphere and aligningthe resulting fluid-air interface with the midaxillary refer-ence point.
Once the system is zeroed the stopcock can be switchedto allow the patient’s waveform to be displayed. Pulmonaryartery and pulmonary artery wedge pressure are especiallysusceptible to improper zeroing and should be measuredonly after the zero point has been verified.
Sensitivity Calibration
The sensitivity of most pressure transducers is fixed at5.0 mV V�1 of excitation applied per 1 mmHg (0.13 kpa)and calibrated by the manufacturers to within �1%. Thisdegree of accuracy is adequate for clinical purposes. As aconsequence standardized transducers need only to bezeroed to obtain accurate pressure measurements (12,13).
CHECKING DYNAMIC RESPONSE
In the critical care setting, where most hemodynamicmonitoring is carried out, the catheter-tubing-transducersystems used can usually be characterized as an under-damped second-order dynamic system analogous, forexample, to a bouncing tennis ball. A second-order dynamicsystem can be expressed mathematically by a second-orderdifferential equation with characteristics determined bythree mechanical parameters: elasticity, mass, and fric-tion. These same parameters apply to a catheter-tubing-transducer system where the natural frequency (fn in Hz)and damping coefficient determine the dynamic charac-teristics for a catheter-tubing-transducer system. For anunderdamped second-order system fn and define the system’s
570 MONITORING, HEMODYNAMIC

dynamic characteristics. In the clinical setting fn and can bemeasured easily and conveniently by using the ‘‘fast-flush’’method.
Dynamic response characteristics of catheter-tubing-transducer systems have been defined by two interrelatedtechniques. The first technique specifies the frequencybandwidth and requires that the system frequencyresponse must be flat up to a given frequency so that aspecified number of harmonics usually 10 of the originalpulse wave can be reproduced without distortion (Fig. 5).
The second technique specifies fn and The plot of fn andin Fig. 6 has five areas (6,15). If the characteristics of thecatheter-tubing-transducer ‘‘plumbing’’ system fall in theadequate or optimal area of the graph, the pressure wave-forms will be adequately reproduced. If the characteristicsfall into one of the remaining three areas, there will bepressure waveform distortion. Most catheter-tubing-trans-ducer systems assembled under optimal conditions areunderdamped, but a few fall into the unacceptable areasof the chart. Methods for optimizing the catheter-tubing-transducer system components have been outlined (15–20).In the clinical setting, there are dramatic differencesbetween each patient setup; therefore it is mandatory toverify the adequacy of each pressure-monitoring system bytesting them. The testing can be done easily using the fast-flush technique.
A fast flush is produced by opening the valve of thecontinuous flush device, for example, by pulling andquickly releasing the pigtail valve on a continuous flush
device. The rapid valve closure generates a near squarewave pressure signal from which fn and of the catheter-tubing-transducer system can be measured.
Once the fast-flush test has been executed two or threetimes, the dynamic response characteristics (fn and) canquickly and easily be determined. Natural frequency fn canbe estimated by measuring the period of each full oscilla-tion on a strip-chart recorder following a fast flush (Fig. 7a)and calculating the frequency from the period. Dampingcoefficient can be determined by using the amplitudes ofany two successive peak-to-peak values measured after afast flush. The amplitude ratio is calculated by dividing themeasured height of the smaller peak-to-peak value by thatof the amplitude of the larger peak-to-peak value (Fig. 7b).The amplitude ration can then be converted to a dampingcoefficient by using the scale in the right side of Fig. 6.
Once fn and have been determined, these data can beplotted on the graph of Fig. 6 to ascertain the adequacy ofdynamic response. Some bedside monitors and recordersmay compromise the clinical user’s ability to use the fast-flush technique because the monitors have built-in low-pass filters. These filters should be expanded to at least 50Hz or be eliminated.
Several factors lead to poor dynamic responses: (1) airbubbles in the system usually caused by a poor initialcatheter-tubing-transducer system setup, (2) pressure tub-ing that is too long, too compliant, or a diameter that is toosmall, and (3) pressure transducers that are too compliant.The best way to enhance the system’s dynamics is toimprove fn.
Invasive pressure monitoring systems have patientrisks, such as a source of infection and air embolism. Inaddition, great care is required by clinical users to optimize
MONITORING, HEMODYNAMIC 571
500
450
400
350
300
250
200
150
100
50
00 2 4 6 8 10 12 14 16 18
1 2 3 4 5 6
ξ = 0.2
ξ = 0.1
ξ = 2.0
ξ = 0.5
ξ = 0.7
HARMONIC(HR = 120)
AM
PLI
TU
DE
RAT
IO %
Figure 5. Family of frequency versus amplitude ratio plots for fivedifferent damping coefficients z and natural frequencies fn ofthe plot shown is 10 Hz. When z¼ 0.1, the system is veryunderdamped, and when z¼ 2.0, it is overdamped. The dashedline shows the frequency versus amplitude characteristicthat would occur if the system had a flat frequency response.Along the frequency axis are plotted the harmonics of thepressure wave if the heart rate were 120 beats min�1 (2beats s�1). Note that by the fifth harmonic (10 Hz) if z¼ 0.1 thetrue signal would be amplified five times. If z¼ 2.0 there would bean attenuation to about one-fourth of the amplitude. In both casesthere would be a gross waveform distortion because neithersituation reflects a high fidelity system dynamic response.Fidelity of the system can be improved by increasing the fn oradjusting z to be in the range of 0.5–0.7. [Reproduced from Ref. 6,with permission.]
1.2
1.1
1
.9
.8
.7
.6
.5
.4
.3
.2
.1
00 5 10 15 20 25 30 35 40 45 50
.1
.2
.3
.4
.5
.6
.7
.8
.9
AM
PLI
TU
DE
RAT
IO
DA
MP
ING
CO
EF
FIC
IEN
T ζ
FREQUENCY (HZ)
DAMPED
OPTIMAL
ADEQUATE
UN
AC
CE
PTA
BLE
Figure 6. Plot of fn versus z illustrating the five areas into whichcatheter-tubing-transducer systems fall. Systems in the optimalarea will reproduce even the most demanding (fast heart rate andrapid systolic upstroke) arterial or pulmonary artery waveformswithout distortion. Systems in the adequate area will reproducemost typical patient waveforms with little or no distortion. Allother areas will cause serious and clinically important waveformdistortion. Note the scale on the right can be used to estimate z
from the amplitude ratio determined during fast flush testing (11).See Fig. 8 for an example of waveforms. [Reproduced from Ref. 6,with permission.]
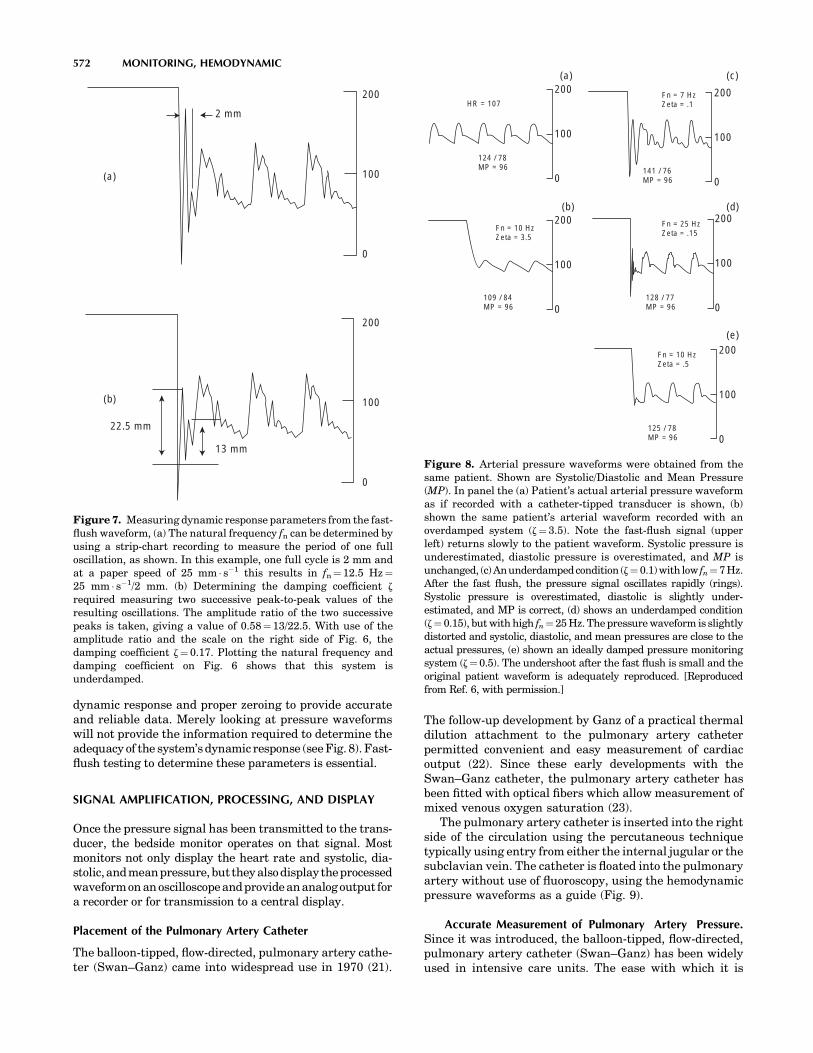
dynamic response and proper zeroing to provide accurateand reliable data. Merely looking at pressure waveformswill not provide the information required to determine theadequacy of the system’s dynamic response (see Fig. 8). Fast-flush testing to determine these parameters is essential.
SIGNAL AMPLIFICATION, PROCESSING, AND DISPLAY
Once the pressure signal has been transmitted to the trans-ducer, the bedside monitor operates on that signal. Mostmonitors not only display the heart rate and systolic, dia-stolic,andmeanpressure, but they alsodisplaytheprocessedwaveformon an oscilloscopeand provideananalog output fora recorder or for transmission to a central display.
Placement of the Pulmonary Artery Catheter
The balloon-tipped, flow-directed, pulmonary artery cathe-ter (Swan–Ganz) came into widespread use in 1970 (21).
The follow-up development by Ganz of a practical thermaldilution attachment to the pulmonary artery catheterpermitted convenient and easy measurement of cardiacoutput (22). Since these early developments with theSwan–Ganz catheter, the pulmonary artery catheter hasbeen fitted with optical fibers which allow measurement ofmixed venous oxygen saturation (23).
The pulmonary artery catheter is inserted into the rightside of the circulation using the percutaneous techniquetypically using entry from either the internal jugular or thesubclavian vein. The catheter is floated into the pulmonaryartery without use of fluoroscopy, using the hemodynamicpressure waveforms as a guide (Fig. 9).
Accurate Measurement of Pulmonary Artery Pressure.Since it was introduced, the balloon-tipped, flow-directed,pulmonary artery catheter (Swan–Ganz) has been widelyused in intensive care units. The ease with which it is
572 MONITORING, HEMODYNAMIC
200
100
0
200
100
0
(a)
(b)
2 mm
13 mm
22.5 mm
Figure 7. Measuring dynamic response parameters from the fast-flush waveform, (a) The natural frequency fn can be determined byusing a strip-chart recording to measure the period of one fulloscillation, as shown. In this example, one full cycle is 2 mm andat a paper speed of 25 mm s�1 this results in fn¼12.5 Hz¼25 mm s�1/2 mm. (b) Determining the damping coefficient z
required measuring two successive peak-to-peak values of theresulting oscillations. The amplitude ratio of the two successivepeaks is taken, giving a value of 0.58¼13/22.5. With use of theamplitude ratio and the scale on the right side of Fig. 6, thedamping coefficient z¼ 0.17. Plotting the natural frequency anddamping coefficient on Fig. 6 shows that this system isunderdamped.
200
100
0
200
100
0
200
100
0
200
100
0
200
100
0
HR = 107
124 / 78MP = 96
109 / 84MP = 96
128 / 77MP = 96
125 / 78MP = 96
141 / 76MP = 96
Fn = 7 HzZeta = .1
Fn = 25 HzZeta = .15
Fn = 10 HzZeta = .5
Fn = 10 HzZeta = 3.5
(a) (c)
(d)
(e)
(b)
Figure 8. Arterial pressure waveforms were obtained from thesame patient. Shown are Systolic/Diastolic and Mean Pressure(MP). In panel the (a) Patient’s actual arterial pressure waveformas if recorded with a catheter-tipped transducer is shown, (b)shown the same patient’s arterial waveform recorded with anoverdamped system (z¼3.5). Note the fast-flush signal (upperleft) returns slowly to the patient waveform. Systolic pressure isunderestimated, diastolic pressure is overestimated, and MP isunchanged, (c)Anunderdampedcondition (z¼ 0.1)with low fn¼7Hz.After the fast flush, the pressure signal oscillates rapidly (rings).Systolic pressure is overestimated, diastolic is slightly under-estimated, and MP is correct, (d) shows an underdamped condition(z¼ 0.15), but with high fn¼25 Hz. The pressure waveform is slightlydistorted and systolic, diastolic, and mean pressures are close to theactual pressures, (e) shown an ideally damped pressure monitoringsystem (z¼0.5). The undershoot after the fast flush is small and theoriginal patient waveform is adequately reproduced. [Reproducedfrom Ref. 6, with permission.]

usually inserted may lead one to conclude that the measure-ments of pulmonary artery and wedge pressure (PCWP) areeasily and reliably measured. However, such is not the case.
Pulmonary artery pressures can be measured accu-rately only if the following steps are taken (24–27):
1. The monitor is properly zeroed.
2. Strip-chart recordings of all PA pressures for a timeperiod covering at least three respiratory cycles areobtained. Using only the monitor’s digital displays isinsufficient.
3. Dynamic response testing (fast flush) should beobtained when the catheter is in each position (i.e.,wedge and PA). If the dynamic response is notadequate, the problems with the catheter-tubing-transducer system must be resolved before accuratepressures can be measured.
4. Pressures (i.e., systolic, diastolic, and mean pres-sures) should be assessed from a monitor’s displayor a strip-chart recording. The pressure measuresshould be made at the end expiration when thetransmural pressure is nearest zero.
CARDIAC OUTPUT DETERMINATION
Cardiac output is the volume of blood ejected by the heartevery minute. Cardiac output is a helpful measurementsince it can be used to evaluate the overall cardiac status ofthe critically ill patient, as well as help make the diagnosis
of cardiovascular disease. Ideally a cardiac outputmeasurement system would be continuous, automatic,minimally invasive, accurate, fast, inexpensive, and easyto use clinically. The most common method used to mea-sure cardiac output in critically ill patients is still theindicator dilution method. The pulmonary artery catheter(Swan–Ganz) introduced in the 1970s revolutionized theease with which cardiac output could be measured.
The thermal dilution method requires injection of coldphysiological solution, usually normal saline, into thesuperior vena cava or right atrium. Cardiac output isdetermined by measuring the area under the time–temperature curve measured in the pulmonary arterythat results from the injection of the cold solution.
The thermal dilution method for determining cardiacoutput relies on several assumptions that are not alwayscorrect. First, the exact amount of thermal indicatorinjected cannot be quantitated precisely. Second, indicatoris lost at various stages and this loss of indicator (heat loss)leads to errors.
A block diagram of the thermal dilution measuringsystem with typical thermal dilution curves and time ofinjection indicated are shown in Fig. 10. Figure 10c and dshow the transit time for the cooled blood moving from theinjection site in the right atrium to the pulmonary arterymeasurement site. Calculation of cardiac output requiresmeasuring the area under the curve. Consequently, abaseline temperature must be established before the injec-tion. In turn, the end point is usually determined byextrapolating to the baseline temperature.
MONITORING, HEMODYNAMIC 573
Figure 9. Composite illustration showing normal pressure waveforms obtained as a fiber opticballoon flotation pulmonary artery catheter (Swan-Ganz) is advanced from the right atrium to thepulmonary artery wedge position. [From Daily and Tilkian in Reading List (1986), with permission.]

To ensure that accurate thermal dilution cardiac outputresults are obtained, it is recommended that the thermaldilution curves be presented on a monitoring screen or on astrip-chart recorder. Studies have shown that synchroniz-ing the injections with the respiratory cycle improves thetechnique’s reproducibility (28). Since there is considerablevariability in cardiac output between measures, at leastthree reproducible curves are usually obtained. Averagingthe findings from these three curves gives a more repre-sentative assessment of cardiac output.
In recent times, the complexities of using the Swan–Ganz pulmonary artery catheter have result in controver-sies. Some clinicians feel that such systems should only beused only when needed and then only sparingly whileothers have a differing viewpoint (29,30). Still others havequestioned the ability of making accurate central venousand pulmonary artery occlusion pressures and whether itmatters (26,27). Many of those issues will be resolved in thefuture when there might be better methods for measuringhemodynamic parameters. Until that time, physicians andnurses caring for critically ill patients who require hemo-dynamic monitoring should be aware of several how tooriented publications (31–34).
Alarming Based on Hemodynamic Parameters. Clinicalhemodynamic monitoring is now several decades old.
What started from a simple beginning has since seenmany dramatic changes in both the development of newmedical devices and skills of the clinicians to use thosedevices. However, it is my feeling that we are not yet atoptimum hemodynamic monitoring. Some recent publi-cations on the topic are illustrative. Sander and collea-gues in Germany have recently looked at categories ofpatients with elevated heart rates who are at higher riskof cardiac complications (35). Their work resulted in aneditorial comment Vital are vital signs (36). Additionalrecent work at Vanderbilt University indicates thatvolatility in vital signs is a good predictor of death intrauma patients (37). Finally, the problem of falsealarms continues to be a huge problem with currentbedside monitors. As part of a Master of Science thesisin Medical Informatics at the University of Utah, aninvestigator found that only about one-third of the stan-dard alarms for patients in a variety of ICU care weretrue alarms. Thus about two-thirds of the alarms arefalse. However, if the alarming system used heart ratesdetermined from both the ECG and the Arterial BloodPressure, the number of alarms decreased by � 50% andthe false alarm rate was only � 25% (38). Having smar-ter and better hemodynamic monitoring with better andsmarter alarming systems will be crucial for to futuremonitoring systems.
574 MONITORING, HEMODYNAMIC
Figure 10. Schematic diagram of thethermal dilution measurement of cardiacoutput. A recorder of some type shouldalways be used to verify the quality ofthe thermal dilution curve, (a) shows thethermal dilution catheter placed into thepulmonary artery. Note the location ofinjection site and thermistor, (b) shows theconnection of the thermal dilution catheterconnected to a cardiac output processor andrecorder, (c) shows a typical temperature-time plot sensed by the thermistor near thecatheter tip after an iced saline injection.The cardiac output determined in this casewas 4.36 L min�1. (d) Shows a similartemperature–time plot for a patient withlow cardiac output (2.18 L min�1). Notethe larger area and broader dispersion ofthe waveform caused by the lower flow.[Reproduced from Ref. 9, with permission.]

COMPUTERIZED DECISION SUPPORT
Much has been learned about hemodynamic measure-ments and how to use the data to calculate derived patientparameters. These parameters can then be used todetermine patient status and augment patient therapy(39–42).
Using hemodynamic data available from bedside moni-tors and combining that data, in a structured and codedelectronic patient record allows for optimal computerizeddecision support (42–44). Morris and his colleagues havestated the value of computerized decision support well (45).Only adequately explicit protocols contain enough detail tolead different clinicians to the same decision when facedwith the same clinical scenario. Guidelines of care provideonly general guidance to patient care and require cliniciansconsiderable latitude in which care decision should bemade. Computerized protocols, on the other hand, can bepatient-specific and evidence based (46). Using computer-ized decision-support tools variation in clinical practice canbe reduced and favorable effects on improve patient out-comes can be accomplished (45,46).
FUTURE
There are still needs for improvement in hemodynamicmonitoring. Being able to make the measurements con-tinuously, less invasively, and more reliably are areaswhere progress is needed. Clearly, using computer aideddecision-support technology to help reduce false alarmsand to guide clinicians in making better patient diagnosisand more timely and more optimal and effective treatmentdecision offer ample opportunity for future research andprogress.
BIBLIOGRAPHY
1. Gravenstein JS, Paulus DA. Monitoring Practice in ClinicalAnesthesia. Philadelphia (PA): Lippincott; 1982.
2. Bruner JMR. Handbook of Blood Pressure Monitoring.Littleton (MA): PSG Publishing Co.; 1978.
3. Daily EK, Schroeder JS. Techniques in Bedside Hemody-namic Monitoring. 3rd ed. St. Louis (MO): Mosby; 1985.
4. Pinsky MF. Functional hemodynamic monitoring. IntensiveCare Med 2002;28:386–388.
5. Pinsky MF. Hemodynamic monitoring in the intensive careunit. Clin Chest Med 2003;24:549–560.
6. Gardner RM, Hollingsworth KW. Optimizing ECG and pres-sure monitoring. Crit Care Med 1986;14:651–658.
7. Pickering TG, et al. Recommendations for blood pressure mea-surement in humans and experimental animals: part 1: Bloodpressure measurement in humans: A statement for profes-sionals from the subcommittee of professional and public edu-cation of the American Heart Association council on high bloodpressure research. Circulation 2005;111:697–716.
8. Gardner RM. Hemodynamic monitoring: From catheter todisplay. Acute Care 1986;12:3–33.
9. Gardner RM, Schwartz R, Wong HC, Burke JP. Percutaneousindwelling radial-artery catheters for monitoring cardiovas-cular function (Prospective Study of the Risk of Thrombosisand Infection). N Engl J Med 1974;290:1227–1231.
10. Kline AM. Pediatric catheter-related bloodstream infections:Latest strategies to decrease risk. AACN Clin Issues 2005;16:185–198.
11. Bone RC, et al. Standards of evidence for the safety andeffectiveness of critical care monitoring devices and relatedinterventions. Coalition for critical care excellence: Consen-sus Conference on Physiological Monitoring Devices. CritCare Med 1995;23:1756–1763.
12. Kutik MH, Gardner RM. Standard for Interchangeabilityand Performance of Resistive Bridge Blood Pressure Trans-ducers, Arlington (VA): Association for the Advancement ofMedical Instrumentation (AAMI); 1986.
13. Gardner RM. Accuracy and reliability of disposable pressuretransducers coupled with modern pressure monitors. CritCare Med 1996;24:879–882.
14. McCann II UG, et al. Invasive arterial BP monitoring intrauma and critical care. Effects of variable transducer level,catheter access, and patient position. Chest 2001; 120:1322–1326.
15. Gardner RM. Direct blood pressure measurement dynamicresponse requirements. Anesthesiology 1981;54(3):227–236.
16. Gardner RM. Blood pressure monitoring. In: Webb AR,Shapiro MJ, Singer M, Suter PM, editors. Oxford Textbookof Critical Care. Oxford University Press. 1998; p 1087–1090.chapt 16.
17. Gardner RM. Fidelity of recording: Improving the signal-to-noise ratio. In: Martin J. Tobin, editors. Principles and Practiceof Intensive Care Monitoring. New York: McGraw-Hill; 1997.p. 123–132. chapt. 8.
18. Kleinman B, Powell S, Kumar P, Gardner RM. The fast flushtestmeasuresthedynamicresponseoftheentirebloodpressuremonitoring system. Anesthesiology 1992;77:1215–1220.
19. Kleinman B, Powell S, Gardner RM. Equivalence of fast flushand square wave testing of blood pressure monitoringsystems. J Clin Monit 1996;12(2):149–154.
20. Promonet C, et al. Time-dependent pressure distortion in acatheter-transducer system: Correction by fast flush.Anesthesiology 2000;92:208–218.
21. Swan HJC, et al. Catheterization of the heart in man with theuse of a flow directed balloon-tipped catheter. N Engl J Med1970;283:447–451.
22. Ganz W, et al. A new technique for measurement of cardiacoutput by thermodilution in man. Am J Cardiol 1971;27:392–396.
23. Cole J, Martin WE, Cheung PW, Johnson CC. Clinical studieswith a solid state fiberoptic oximeter. Am J Cardiol 1972;29:383–388.
24. Morris AH, Chapman RH, Gardner RM. Frequency of wedgepressure errors in the ICU. Crit Care Med 1985;13:705–708.
25. Cengiz M, Crapo RO, Gardner RM. The effect of ventilationon the accuracy of pulmonary artery and wedge pressuremeasurements. Crit Care Med 1983;11:502–507.
26. Rizvi K, et al. Effect of airway pressure display on interob-server agreement in the assessment of vascular pressure inpatients with acute lung injury and acute respiratory distresssyndrome. Crit Care Med 2005;33:98–103.
27. Liebowitz AB. More reliable determination of central venousand pulmonary artery occlusion pressures: Does it matter?Editorial Crit Care Med 2005;33:243–244.
28. Stevens JH, et al. Thermodilution cardiac output measure-ments: Effects of the respiratory cycle on its reproducibility.J Am Med Assoc 1985;253:2240–2242.
29. Pinsky MR, Vincent J-L. Lets use the pulmonary arterycatheter correctly and only when we need it. Point of view.Crit Care Med 2005;33:1119–1122.
30. Levin PD, Sprung SL. Another point of view: No Swan song forthe pulmonary artery catheter. Crit Care Med 33:1123–1124.
MONITORING, HEMODYNAMIC 575

31. Gibbs NC, Gardner RM. Dynamics of invasive pressuremonitoring systems: Clinical and laboratory evaluation.Heart Lung 1988;17:43–51.
32. Gardner RM, Hujcs M. Fundamentals of physiologic monitor-ing. AACN Clinical Issues Crit Care Nursing 1993;4(1):11–24.
33. Daily EK. Hemodynamic waveform analysis. J CardiovascNurs 2001;15(2):6–22.
34. McGhee H, Bridges EJ. Monitoring arterial blood pressure:What you may not know. Crit Care Nurse 2002;22:60–78.
35. Sander O, et al. Impact of prolonged elevated heart rate onincidence of major cardiac events in critically ill patients witha high risk of cardiac complications. Crit Care Med 2003;33:81–88.
36. Weissman C, Landesberg G. Vital are the vital signs. Com-ment/Editorial Crit Care Med 2003;33:241–242.
37. Grogan EL, et al. Volatility: A new vital sign identified usinga novel bedside monitoring strategy. J Trauma 2005;58:7–14.
38. Poon KB. Fusing Multiple Heart Rate Signals to ReduceAlarms in Adult the Intensive Care Unit. MS dissatation,University of Utah Department of Medical Informatics, SaltLake City (UT); May 2005.
39. Gardner RM. Information management hemodynamic mon-itoring. Semin Anesth 1983;2:287–299.
40. Gardner RM. Computerized management of intensive carepatients. MD Comput 1986;3(1):36–51.
41. Shabot MM, Carlton PD, Sadoff S, Nolan-Avila L. Graphicalreports and displays for complex ICU data: A new, flexibleand configurable method. Comput Methods ProgramsBiomed 1986;22:111–116.
42. Gardner RM, Huff SM. Computers in the ICU: Why? What?So what? Intl J Clin Monit Comput 1992;9:199–205.
43. Gardner RM, Sittig DF, Clemmer TP. Computer in the ICU:A match meant to be! In: Ayers SM, Grenvik A, Holbrook PR,Shoemaker WC. editors. Textbook of Critical Care Medicine.3rd ed. Philadelphia: W. B. Saunders;1995: p 1757–1770.chapt. 196.
44. Morris AH. Treatment algorithms and protocolized care.Curr Opin Crit Care 2003;9:236–240.
45. Morris AH. Clinical trial of a weaning protocol. Crit Care2004;8:207-209.
46. Bria II WF, Shabot MM. The electronic medical record, safetyand critical care. Crit Care Clin 2005;21:55–79.
Further Reading
Nichols WW, O’Rourke MF. McDonald’s Blood Flow in Arteries:Theoretical, Experimental and Clinical Principles. 5th ed. Ofspecial note is Chapter 6: Measuring principles of arterialwaves pages 132–135. Hodder Arnold; 2005.
Daily EK, Tilkian AG. Hemodynamic Monitoring. In: Tilkian AG,Daily EK, editors. Cardiovascular Procedures: DiagnosticTechniques and Therapeutic Procedures. St. Louis (MO):Mosby; 1986 chapt. 4.
Geddes LA. The Direct and Indirect Measurement of BloodPressure. Chicago: Year Book Medical Publisher; 1970.
Geddes LA. Handbook of Blood Pressure Measurement. Clifton(NJ): Humana Press; 1991.
Webster JG, editor. Design of Pulse Oximeters. Institute of Phy-sics; 1997.
Webster JG, editor. Medical Instrumentation: Application andDesign. 3rd ed. New York: John Wiley & Sons Inc.; 1998.
Tungjitkusolmun S, Heart and Circulation, In: Webster JG, editor.Bioinstrumentation. John Wiley & Sons, Inc.; 2004. Chapt. 8.
Shabot MM, Gardner RM, editors. Decision Support Systems forCritical Care. New York: Springer-Verlag Inc.; 1994.
Gardner RM, Shabot MM. Patient-monitoring systems. In: Short-liffe EH, Cimino JJ, editors. Biomedical Informatics: Computer
Applications in Health Care. 3rd ed. New York: Springer-Verlag; 2005; in press, Aug. 2005. Chapt. 17.
See also BLOOD PRESSURE MEASUREMENT; CARDIAC OUTPUT, FICK TECH-
NIQUE FOR; CARDIAC OUTPUT, INDICATOR DILUTION MEASUREMENT; CARDIAC
OUTPUT, THERMODILUTION MEASUREMENT; ELECTROCARDIOGRAPHY, COM-
PUTERS IN; HEMODYNAMICS.
MONITORING, INTRACRANIAL PRESSURE
MICHAEL L. DALEY
IAN PIPER
The University of MemphisMemphis, Tennessee
INTRODUCTION
Intracranial pressure (ICP) monitoring is a form of pres-sure monitoring used in patients with pathologies thatmight give rise to raised ICP. The definition of raised ICPdepends on the underlying pathology and, for example inadult patients who have sustained a severe head, injury isdefined as pressure greater than 20 mm Hg. Over the past50 years there has been an active and wide rangingresearch into the causes and consequences of raisedICP that, to date, has been the subject of 11 internationalsymposia embracing such diverse disciplines as neuro-surgery, anesthesia, radiology, biophysics, electrical andmechanical engineering, mathematics, and computerscience. This article reviews the underlying physiologypertinent to measurement of ICP as well as gives anoverview of some of the current technology used to mea-sure ICP. Then, a brief review follows of the clinicalliterature underlying the case for ICP measurement, withan emphasis on the main clinical condition of patientswith a head injury. The last two sections focus on the useof waveform analysis and mathematical modeling tech-niques to research into mechanisms underlying raisedICP.
PHYSIOLOGY
ICP is the pressure recorded within the tissue (parenchyma)or fluid-filled spaces and is not uniformly distributed withinthe craniospinal axis. The craniospinal axis consists of allneural tissue and contiguous fluid-filled spaces within thecranium and spinal sac. The central neural tissue is encap-sulated within bone and three-layered tissue coverings ormeninges. From outside in the meninges are the dura,arachnoid, and pia membranes. The meninges provide aphysical barrier between neural tissue and the externalenvironment but also serve both a structural and a physio-logical function as an architecture for supporting cerebralvessels and maintaining a space for flow of cerebrospinalfluid (CSF). CSF cushions the delicate neural tissues, sup-ports the weight of the brain, and acts as a transport mediafor nutrients, chemical messengers, and waste products.Except at the choroid plexus, the CSF is freely permeable
576 MONITORING, INTRACRANIAL PRESSURE

to the appendymal lining and is in chemical communicationwith the interstitial fluid and the CNS. ICP is a reflection ofthe relationship between alterations in craniospinal volumeand the ability of the craniospinal axis to accommodateadded volume. The craniospinal axis is essentially a par-tially closed box with container properties including bothviscous and elastic elements. The elastic or, its inverse, thecompliant properties of the container will determine whatadded volume can be absorbed before ICP begins to rise. Soan understanding of raised ICP encompasses an analysis ofboth intracranial volume and craniospinal compliance.
The history of the subject of ICP has been well reviewed(1,2) and starts from the doctrine named after Monro (3)and Kellie (4), which proposed that the brain and itscontained blood were incompressible, enclosed in a rigidand inextensible skull, of which the total volume remainedconstant. In its original form, the Monro–Kellie doctrinedid not take into account the CSF as a component of thecranial compartment. The concept of reciprocal volumechanges between blood and CSF was introduced in 1846by Burrows and later extended in the early twentiethcentury by Weed et al. (5,6) to allow for reciprocal changesin all craniospinal constituents. Kocher (7) in 1901 trans-lated into clinical terms the four stages of cerebral com-pression proposed almost 25 years earlier by theexperimental studies of Duret (8). Kocher described fourstages of cerebral compression related to the expansion ofintracranial brain tumours. In stage 1, the initial increasein tumor volume is compensated by a reduction in volumeof the other intracranial components, chiefly CSF andvenous blood. This spatial compensation results in nonet increase in intracranial volume or pressure and henceno clinical symptoms. In stage 2, the compensatorymechanisms are exhausted, ICP increases, and the patientbecomes drowsy with a headache. Stage 3 is characterizedby a considerable increase in ICP, an associated deteriora-tion in conscious level, and intermittent elevations of bloodpressure (BP) accompanied by bradycardia. In the fourthand final stage, the patient is unconscious, with bilateralfixed dilated pupils and falling BP usually leading to death.
Cushing (9–11), then a research worker for Kocher,described in both experimental and clinical studies theclose relationship between increases in ICP and BP andproposed that the BP rose to maintain adequate bloodsupply to the hind brain, the stimulus to this vasopressorresponse believed to be medullary ischemia (12,13). Atabout this time, a false confidence developed in the lumbarCSF pressure technique (lumbar puncture), which causedCushing’s findings to be challenged. Reports emerged(14–16) that some patients showing clinical signs of braincompression had normal lumbar CSF pressures and thatin other patients elevations in BP were found at timeswhen ICP was well below the level of BP.
Partly because of this apparent dissociation betweenICP and clinical symptoms, emphasis switched away fromICP measurement toward the relationship between cra-niospinal volume and pressure, particularly the impor-tance of the elastic properties of the craniospinal system.The relationship between ICP and intracranial volume isoften described graphically by an exponential function thatis relatively flat at low ICPs but rises rapidly as pressure
increases much above 20 mm Hg. Under normal conditions,at the low ICP end of this curve, compliance (the ratio ofadded volume to pressure) is high. When the patient’svolume–pressure status changes to move further up thecurve, compliance will fall rapidly. Measurement of cra-niospinal compliance in brain-injured patients may, there-fore, offer the potential for early detection of raised ICPbefore it rises to levels damaging to brain parenchyma. Themost commonly used methods of measuring craniospinalcompliance were developed by Marmarou (17,18) anddepend on the rapid injection of known volumes of fluidinto the CSF space with immediate measurement of theresultant increase in CSF pressure. One of these methodsis the pressure volume index (PVI); this value being thevolume that when added to the CSF space would produce atenfold rise in ICP. Miller et al. (19,20) defined a furthermeasure of the craniospinal volume–pressure relationship,the volume pressure response (VPR). The VPR, also calcu-lated from the ICP response resulting from a rapid bolusinjection of saline into the CSF space, is a direct measure ofthe inverse of compliance: elastance. Although both aremeasures of compliance, some confusion remains as towhat exactly is the difference between the VPR and thePVI. The PVI, which assumes a mono-exponential pressureversus volume relationship, is a single index that charac-terizes the patient’s entire volume–pressure relationshipand is, numerically, a measure of the slope of the logarithmof the ICP versus intracranial volume relationship. Itsstrength lies in its ability to define the whole volume–pressure status of the patient with a single index. It wasthe late J. Douglas Miller who pointed out that if therewas only a single volume–pressure curve, then no newinformation would be gained by measuring compliance orelastance, and a knowledge of absolute ICP alone wouldsuffice in determining the state of a patient’s craniospinalvolume decompensation. However, several studies (21,22)have shown that the shape of the volume–pressure rela-tionship changes under a variety of conditions bothbetween patients and within patients at different times.Under these circumstances, it is likely that the PVI willprovide the more useful information. One weakness of thePVI is that if a patient’s pressure–volume relationshipremains stable, single measurements will not detectmovement along a given pressure–volume curve and thusmay not detect slow increases in volume of a space-occupyinglesion before it causes significant increases in ICP. It is inthis situation where a continuous measure of absolutecompliance (or its inverse: elastance as measured by theVPR) provides, potentially, more useful information. It isfor this reason that, in head-injured patients, Milleret al. found that the VPR correlated better to the degreeof brain mid-line shift, as imaged on CT scan, than it didto absolute ICP alone. They subsequently demonstratedthat the VPR could serve as an indicator for surgicaldecompression, critical levels being between 3 and 5 mmHg/mL (19,23). However, in clinical practice, both circum-stances (movement along the pressure–volume curve andshift of the curve along the pressure axis) may occur withina patient at different times and thus shows the need forICP monitoring capable of both continuous compliancemeasurement and derivation of the PVI.
MONITORING, INTRACRANIAL PRESSURE 577
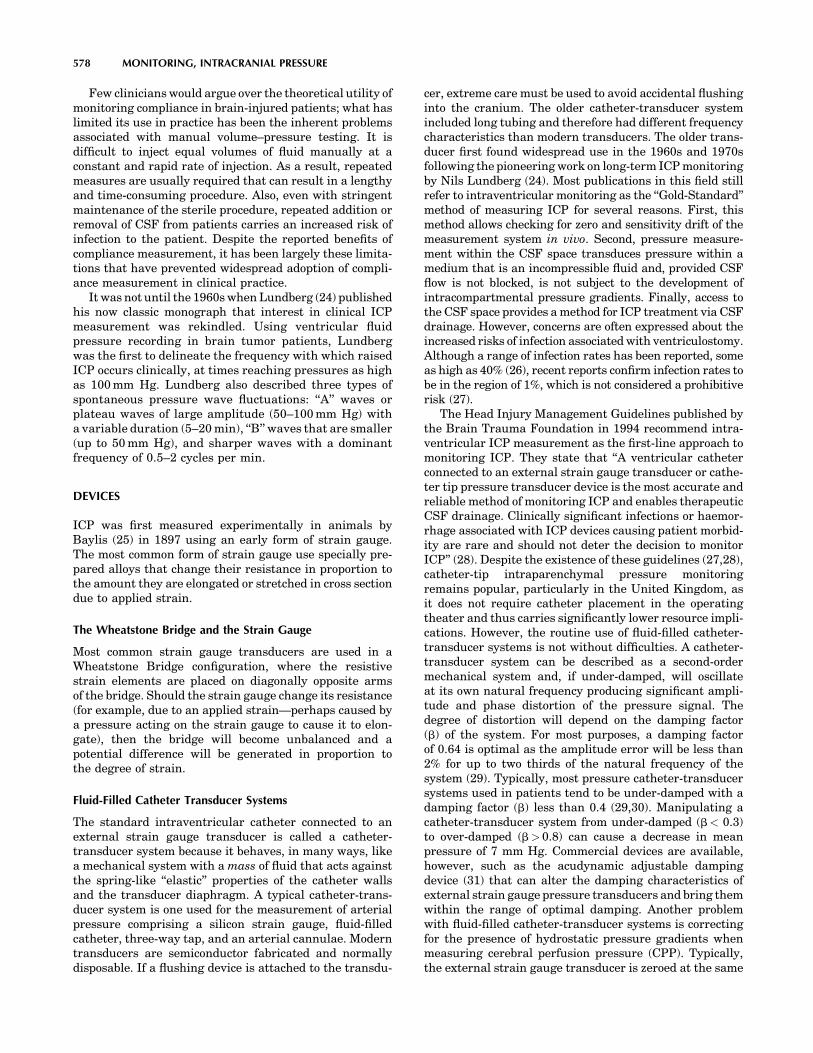
Few clinicians would argue over the theoretical utility ofmonitoring compliance in brain-injured patients; what haslimited its use in practice has been the inherent problemsassociated with manual volume–pressure testing. It isdifficult to inject equal volumes of fluid manually at aconstant and rapid rate of injection. As a result, repeatedmeasures are usually required that can result in a lengthyand time-consuming procedure. Also, even with stringentmaintenance of the sterile procedure, repeated addition orremoval of CSF from patients carries an increased risk ofinfection to the patient. Despite the reported benefits ofcompliance measurement, it has been largely these limita-tions that have prevented widespread adoption of compli-ance measurement in clinical practice.
It was not until the 1960s when Lundberg (24) publishedhis now classic monograph that interest in clinical ICPmeasurement was rekindled. Using ventricular fluidpressure recording in brain tumor patients, Lundbergwas the first to delineate the frequency with which raisedICP occurs clinically, at times reaching pressures as highas 100 mm Hg. Lundberg also described three types ofspontaneous pressure wave fluctuations: ‘‘A’’ waves orplateau waves of large amplitude (50–100 mm Hg) witha variable duration (5–20 min), ‘‘B’’ waves that are smaller(up to 50 mm Hg), and sharper waves with a dominantfrequency of 0.5–2 cycles per min.
DEVICES
ICP was first measured experimentally in animals byBaylis (25) in 1897 using an early form of strain gauge.The most common form of strain gauge use specially pre-pared alloys that change their resistance in proportion tothe amount they are elongated or stretched in cross sectiondue to applied strain.
The Wheatstone Bridge and the Strain Gauge
Most common strain gauge transducers are used in aWheatstone Bridge configuration, where the resistivestrain elements are placed on diagonally opposite armsof the bridge. Should the strain gauge change its resistance(for example, due to an applied strain—perhaps caused bya pressure acting on the strain gauge to cause it to elon-gate), then the bridge will become unbalanced and apotential difference will be generated in proportion tothe degree of strain.
Fluid-Filled Catheter Transducer Systems
The standard intraventricular catheter connected to anexternal strain gauge transducer is called a catheter-transducer system because it behaves, in many ways, likea mechanical system with a mass of fluid that acts againstthe spring-like ‘‘elastic’’ properties of the catheter wallsand the transducer diaphragm. A typical catheter-trans-ducer system is one used for the measurement of arterialpressure comprising a silicon strain gauge, fluid-filledcatheter, three-way tap, and an arterial cannulae. Moderntransducers are semiconductor fabricated and normallydisposable. If a flushing device is attached to the transdu-
cer, extreme care must be used to avoid accidental flushinginto the cranium. The older catheter-transducer systemincluded long tubing and therefore had different frequencycharacteristics than modern transducers. The older trans-ducer first found widespread use in the 1960s and 1970sfollowing the pioneering work on long-term ICP monitoringby Nils Lundberg (24). Most publications in this field stillrefer to intraventricular monitoring as the ‘‘Gold-Standard’’method of measuring ICP for several reasons. First, thismethod allows checking for zero and sensitivity drift of themeasurement system in vivo. Second, pressure measure-ment within the CSF space transduces pressure within amedium that is an incompressible fluid and, provided CSFflow is not blocked, is not subject to the development ofintracompartmental pressure gradients. Finally, access tothe CSF space provides a method for ICP treatment via CSFdrainage. However, concerns are often expressed about theincreased risks of infection associated with ventriculostomy.Although a range of infection rates has been reported, someas high as 40% (26), recent reports confirm infection rates tobe in the region of 1%, which is not considered a prohibitiverisk (27).
The Head Injury Management Guidelines published bythe Brain Trauma Foundation in 1994 recommend intra-ventricular ICP measurement as the first-line approach tomonitoring ICP. They state that ‘‘A ventricular catheterconnected to an external strain gauge transducer or cathe-ter tip pressure transducer device is the most accurate andreliable method of monitoring ICP and enables therapeuticCSF drainage. Clinically significant infections or haemor-rhage associated with ICP devices causing patient morbid-ity are rare and should not deter the decision to monitorICP’’ (28). Despite the existence of these guidelines (27,28),catheter-tip intraparenchymal pressure monitoringremains popular, particularly in the United Kingdom, asit does not require catheter placement in the operatingtheater and thus carries significantly lower resource impli-cations. However, the routine use of fluid-filled catheter-transducer systems is not without difficulties. A catheter-transducer system can be described as a second-ordermechanical system and, if under-damped, will oscillateat its own natural frequency producing significant ampli-tude and phase distortion of the pressure signal. Thedegree of distortion will depend on the damping factor(b) of the system. For most purposes, a damping factorof 0.64 is optimal as the amplitude error will be less than2% for up to two thirds of the natural frequency of thesystem (29). Typically, most pressure catheter-transducersystems used in patients tend to be under-damped with adamping factor (b) less than 0.4 (29,30). Manipulating acatheter-transducer system from under-damped (b< 0.3)to over-damped (b> 0.8) can cause a decrease in meanpressure of 7 mm Hg. Commercial devices are available,however, such as the acudynamic adjustable dampingdevice (31) that can alter the damping characteristics ofexternal strain gauge pressure transducers and bring themwithin the range of optimal damping. Another problemwith fluid-filled catheter-transducer systems is correctingfor the presence of hydrostatic pressure gradients whenmeasuring cerebral perfusion pressure (CPP). Typically,the external strain gauge transducer is zeroed at the same
578 MONITORING, INTRACRANIAL PRESSURE

level as the arterial pressure (BP) transducer, usually atthe level of the right atrium. Although the patient ismanaged in the horizontal position, there is no columnof fluid between the site of ICP and BP measurement.However, when the patient is managed with head-up tiltand if the BP transducer is not moved to the same hor-izontal level as the head, a hydrostatic fluid column will becreated. This can produce a significant error between theobserved CPP and the actual CPP, which, in the worst case,can produce an error of as much as 15 mm Hg.
The Spiegelberg ICP monitoring system (SpiegelbergKG, Homburg, Germany) largely overcomes these pro-blems. This system is a special case of a fluid-filled cathe-ter-transducer system. With this device, ICP is measuredusing a catheter with an air pouch balloon situated at thetip. By maintaining a constant known volume within theair pouch, the pressure within the air pouch balloon isequivalent to the surrounding pressure or ICP. The inter-nal air pouch balloon is transduced by an external straingauge transducer, and because the fluid used for pressuretransduction is air, the pressure error caused by an ‘‘aircolumn’’ is clinically insignificant. The design of this devicealso allows automatic in vivo zeroing of the ICP systemand, in laboratory bench tests, showed the least zero driftin comparison with standard catheter-tip ICP devices (32).This system now has versions for use in epidural, subdural,intraparenchymal, and intraventricular sites. The intra-ventricular catheter is a double lumen catheter that allowsaccess to the CSF space for drainage. The Spiegelberg sys-tem, although having many attractive features, is, as yet, arelatively little used system outside of Germany and its long-term clinical utility and robustness require evaluation.
Catheter-Tip Transducer Systems
Now several catheter-tip ICP monitoring systems areavailable, including the Camino (33–36) systems. TheGaeltec ICP/B solid-state miniature ICP transducers, foruse intheepiduralspace,arereusable,andthezeroreferencecan be checked in vivo. However, reports of measurementartifacts (37) and decay in measurement quality associatedwith repeated use (35) have limited the widespread adoptionof this technology.
The InnerSpace OPX 100 system (InnerSpace Medical,Irvine, CA) is, like the Camino system, a fiber optic system.Bench test reports on this system show it to have good zerodrift and sensitivity stability (32). However, a recent clin-ical evaluation of this system in 51 patients reported a high(17%) incidence of hematoma formation around the ICPsensor (36). The authors concluded that improved fixationof the catheter is required to minimize micro-movements.
The two catheter-tip systems most frequently used inthe management of head-injured patients are the Codmanand Camino systems. Neither allows a pressure calibrationto be performed in vivo. After these systems are ‘‘zeroed,’’relative to atmospheric pressure during a pre-insertioncalibration, their pressure output is dependent on zerodrift of the sensor. For this reason, it is critical that thesedevices exhibit good long-term zero drift characteristics.These devices provide an electrical calibration, to calibrateexternal monitors, but they cannot be corrected for inher-
ent zero drift of the catheter once placed. For the Caminosystem, the manufacturers specify the zero drift of thecatheter to be �2 mm Hg for the first day and �1 mmHg per day thereafter. Czosnyka et al. (32) have confirmedthese zero drift findings in bench tests studies althoughthey also reported that the temperature drift of the devicewas significant (0.3 mm Hg/8C). They reported that ifthe manufacturers specify the zero drift of the catheterto be �2 mm Hg for the first day and �1 mm Hg per daythereafter. In clinical practice, the reported zero drift uponremoval of the Camino device from the patient has beenreported to be greater than the manufacturer’s specifica-tions. Munch (38) assessed 136 Camino sensors in a clinicalstudy and found an average daily drift rate of 3.2 mm Hg.Chambers (39), in a comparative study of the Caminoventricular catheter with an external fluid-filled catheter-transducer system, reported that only 60% of the readingswere within 2 mm Hg of the gold-standard method. Thereare also reports of Camino probe failure because of technicalcomplications (cable kinking, probe dislocation), withreported failure rates ranging from 10% to 25% (39,40).
The Codman transducer is a micro-miniature straingauge within a titanium housing side mounted at the tipof a catheter. Similar to other transducers, bench testreports on this technology have been favorable (32,41).However, clinical evaluations have reported the presenceof inter-patient and intra-patient biases that are indepen-dent on whether the device is compared against theCamino transducer or an intraventricular catheter-trans-ducer system (42). A report by Fernades (43) found that in24% of the recordings, the Codman sensor over-read theCamino system by 5 mm Hg or more.
The Rehau System
The technology of miniaturization is allowing the develop-ment of catheter-tip pressure sensors. Catheter-tip sys-tems, due to their small diameter, are likely to causeless damage to tissue upon placement than larger fluid-filled catheters and are not affected by hydrostatic pressuredifferences. However, they are potentially more prone toproblems of robustness and in vivo zero drift. Severalsimilar technologies, although performing well in benchtest studies, have been shown to exhibit unacceptable zerodrift, fragility, or both during trials conducted underclinical conditions (38,43–45). In vivo drift is especiallyimportant in catheter-tip strain-gauge technology as it isimpossible to check if the calibration has altered after beingplaced in the patient. Until recently, to reduce the physicalsize of the catheter-tip strain gauge catheters, often only apartial Wheatstone bridge is employed at the catheter-tip.Recently, a new technology has become available, theNeurovent-P (REHAU AGþCO, REHAU, Germany), inwhich a full Wheatstone bridge is fabricated in the probetip, and this solution should, in theory, provide improvedzero drift characteristics. One potential advantage of theRehau NeuroVent system seems to be the incorporation ofa full Wheatstone bridge into the catheter-tip electronics. ThisWheatstone technological improvement should enhancethe zero drift characteristics by reducing temperaturesensitivity and the effects of non-pressure-related external
MONITORING, INTRACRANIAL PRESSURE 579

strains. Until recently, this approach was only possiblein the much physically larger external strain gauge sys-tems. Through advances in miniaturization technology, ithas now been able to incorporate this technology into itscatheter-tip systems. In the bench studies performed (46),each catheter was tested for days, from a minimum of 3 tomore than 8 days. This timeframe typically covers theperiod in which an ICP transducer is used in the clinicalsetting. The results from this bench test study confirm themanufacture’s claim that pre-insertion calibration is notrequired as the drift was within manufacture’s specifica-tions (�1 mm Hg). This advantage is very important in theclinical arena because the first pre-insertion zeroing is acrucial step conducted by the surgeons and potentially, ifincorrectly performed, could generate erroneous readingsduring the period of monitoring. Both long-term zero driftand the dynamic pressure test results also confirm thatthis system performs well in bench test studies andmeets manufacturer’s specifications. Mean zero drift, after5 days, was very small and long-term continuous recordingof a stable pressure was precise. The response to dynamictests, i.e., the changes of pressure over a wide range, wasexcellent. The average bias of the Rehau catheter com-pared with a hydrostatic pressure column is very small.Despite these promising bench test study results, furtherwork is required to determine the performance of thismeasurement device in the clinical environment. Follow-ing on from these bench tests, the next and most criticalstep will be to conduct a trial of this promising technologyunder the more demanding clinical environment. TheBrainIT group (http://www.brainit.org) as a multicentercollaborative group of neurointensive care scientists andclinicians are well placed to design and conduct such atrial (47). Should this technology demonstrate, under clin-ical conditions, the required robustness and low drift asindicated by these bench test studies, it may lead to moreprecise and reliable measurement of ICP.
CLINICAL LITERATURE
Raised ICP has been found to be associated with a pooreroutcome from injury with the higher the level of ICP,particularly the peak ICP level, which has been found tocorrelate with the expected prognosis for mortality andmorbidity (48–51). There has, however, been controversyover the usefulness of monitoring raised ICP with somegroups, with a ‘‘no ICP monitoring’’ policy, finding in theirstudies of head injury mortality and morbidity that out-come is similar to other groups that do monitor ICP (52).Reported differences in the utility of ICP monitoring couldbe due to variability both in management and in monitor-ing protocols between different neurosurgical centers. Var-iation in type of ICP pressure monitor, site of placement,treatment thresholds, patient referral characteristics, andin outcome measures can all combine to produce a largevariability both in measured ICP and in outcome irrespec-tive of whether ICP is monitored or how it is treated.Another source of variation in terms of raised ICP is theinherent variability of the head-injured population withoutcome being dependant on several other factors. For
example, mass lesions are generally accompanied by eleva-tions in ICP of greater than 40 mm Hg and are associatedwith poorer outcome, whereas diffuse injuries tend to havelower ICP levels associated with a similar poor outcome(50,53). Age is also an important factor with an age-depen-dent distribution of ICP for both type of injury and out-come. This is particularly so for pediatric cases (54–56).ICP can even be raised in the absence of overt signs ofswelling or mass lesions on CT. In a small study of severelyhead-injured patients, O’Sullivan (57) demonstrated thatsome comatose head-injured patients whose initial CT scanwas normal, with no mass lesion, midline shift, or abnor-mal basal cisterns, developed raised ICP greater than 20mm Hg that lasted longer than 5 min. This included asubset of patients showing pronounced raised ICP ofgreater than 30 mm Hg.
Data from large prospective trials carried out fromsingle centers and from well-controlled multicenter studieshave provided the most convincing evidence for a directrelationship between ICP and outcome (58–61). Narayan etal. (58) in a prospective study in 133 severely head-injuredpatients demonstrated that the outcome prediction ratewas increased when the standard clinical data such as age,Glasgow Coma Score on admission (GCS), and pupillaryresponse with extraocular and motor activity was com-bined with ICP monitoring data. Marmarou et al. (60),reporting on 428 patients’ data from the National Instituteof Health’s Traumatic Coma Data Bank, showed thatfollowing the usual clinical signs of age, admission motorscore, and abnormal pupils, the proportion of hourly ICPrecordings greater than 20 mm Hg was the next most sig-nificant predictor of outcome. Outcome was classified bythe Glasgow Outcome Score (GOS) at 6 months follow-up.They also found, using step-wise logistic regression, thatafter ICP, arterial pressure below 80 mm Hg was also asignificant predictor of outcome. Jones et al. (61) studiedprospectively 124 adult head-injured patients duringintensive care using a computerized data collection systemcapable of minute by minute monitoring of up to 14 clinicallyindicated physiological variables. They found that ICP,above 30 mm Hg, arterial pressure below 90 mm Hg, andcerebral perfusion pressure below 50 mm Hg significantlyaffected patient morbidity.
Although differing opinions remain about the contribu-tion of continuous monitoring of ICP to reduction in mor-tality and morbidity after head injury, there is nowsufficient evidence to remove doubt about the value ofICP monitoring toward improving the detection and pre-ventative management of secondary cerebral injury.
Raised Intracranial Pressure: Relationship to Primaryand Secondary Injury
Both experimental and clinical studies have clearly shownthat after traumatic brain injury, normal physiologicalmechanisms for maintaining cerebral perfusion canbecome impaired (62–65). These studies demonstrate thatbrain injury can cause impairment or loss of autoregulationdefined as the ability of the cerebral vessels to respond tochanges, in arterial gases or to arterial pressure. As aresult of these changes, there can, at times, be a decrease
580 MONITORING, INTRACRANIAL PRESSURE

in cerebrovascular resistance that can lead to raised ICP inboth adults and children (66–70). Although brain-injuredpatients are being managed in intensive care, there are,superimposed on to the primary injury, periods of reducedarterial PO2 or episodes of arterial hypotension often as aresult of other injuries or treatment by hypnotic drugs(50,53,60,61,71,72). With an impaired physiologicalmechanism unable to respond adequately to these adversechanges in physiological parameters (or ‘‘secondaryinsults’’), ischemic brain damage can occur. These second-ary, chiefly ischemic brain insults are common, withGraham et al. (74) reporting, in a series of 151 fatal casesof severe head injury, a 91% incidence of ischemic braindamage found on autopsy. A second study carried out bythe same group over 10 years later found a similar highincidence (>80%) of ischemic brain damage despite sub-sequent improvements in intensive care of head-injuredpatients (74).
There has been much interest in the relationship amongICP, CPP, and CBF. The landmark study of Miller andGaribi (75) produced some of the first experimental evi-dence confirming the concept that changes in ICP affectcerebral blood flow not directly but through changes inCPP, where CPP is defined as the difference between meanarterial pressure and ICP. Strictly speaking, the actualcerebral perfusion outflow pressure would be cerebralvenous pressure, although this pressure is, in most situa-tions, impractical to measure routinely. However, it hasbeen established that over a wide range of pressurescerebral venous pressure is well approximated (within3–4 mm Hg) by ICP (76–78). In an experimental studyof CBF as determined by the venous outflow technique indogs, Miller and Garibi (75) also demonstrated that whenMAP and ICP rise in parallel so that CPP remains constantat 60 mm Hg, CBF increases with MAP in animals found tobe non-autoregulating. It was further shown that as CPPdrops in autoregulating animals, the breakpoint at whichCBF starts to decrease is at a higher level if CPP is reducedthrough hemorrhagic arterial hypotension than throughintracranial hypertension. This work suggests that cere-bral perfusion is more sensitive to arterial hypotensionthan to intracranial hypertension.
The clinical significance of this information is that in themanagement of head injury, it is often necessary to employtherapy to lower raised ICP. Therapeutic agents for redu-cing raised ICP often do so at the expense of reduced MAP,and as a consequence, CPP may not improve. If autoregu-lation is preserved, CBF should remain unchanged despiteparallel changes in MAP and ICP. However, clinically,autoregulation is likely to be impaired in those conditionsin which ICP is increased such as head injury or subar-achnoid hemorrhage (68,69,79–82). Under these circum-stances, it is important that reduction in ICP should not beachieved at the expense of lowering CBF and provokingbrain ischemia.
This earlier work of Miller and Garibi was laterextended by Chan et al. (83) to include CPP ranges of60, 50, and 40 mm Hg. At CPP levels of 50 and 60 mmHg, when autoregulation was intact, CBF remainedunchanged. However, with loss of autoregulation, therewas a trend for CBF to increase as MAP and ICP were
increased in parallel at a CPP of 50 and 60 mm Hg.Absolute CBF levels were significantly different betweenthe autoregulating and non-autoregulating groups. At aCPP of 40 mm Hg CBF showed a linear correlation with BP.This work demonstrates that when autoregulation isimpaired, there is a functional difference between auto-regulating and non-autoregulating cerebral vessels despitesimilar MAP and CPP, and that when autoregulation isimpaired, CBF depends more on arterial driving pressurethan on cerebral perfusion pressure.
The importance of arterial pressure as the prime factorgoverning CPP-related secondary insults has been welldemonstrated by the work of Jones et al. (61), where theycarried out a prospective study over 4 years of the fre-quency and severity with which secondary insults occur tohead-injured patients while being managed in intensivecare. They developed a microcomputer-based data collec-tion system that allows the acquisition of data from up to 15monitored variables minute by minute (84). At each bedspace, data collection was under the control of a micro-computer where serial links between the patient monitorsand the microcomputer allow the controlled transfer ofmultiple channels of physiological data once per minute.The controlling software allowed medical staff to add com-ments to the current active computer file at any time,precisely annotating significant events. The software per-forms artifact detection, calculates derived data, and high-lights valid data that falls outside normal physiologicallevels. Collected data were stored to disk and could beprinted either locally or remotely. Later work by Chamberset al. (85) found that both raised ICP and lowered ABP aremajor factors in producing secondary insults.
From the valid physiological data produced, manualprocessing of data was used to identify secondary insultsthat are defined at one of three grades of severity and thatmust last for 5 min or longer to be recorded as an insult.This permits calculation of the frequency, severity, andtotal duration of insults, measured in minutes.
An analysis was made of 124 adult head-injuredpatients who were monitored during intensive care usingthe computerized data collection system. Information waslogged at 1 min intervals and scanned to identify insultswhen values fell outside threshold limits for 5 min orlonger. Three grades of insult were defined for each vari-able (Table 1). The duration of insults has been analyzed inrelation to the GOS of these patients at 12 months afterinjury. The monitored patients included 68 with severehead injury (GCS 8 or less with no eye opening), 36 withmoderate head injury (GCS 9–12), and 20 with minor headinjury (GCS 13–15 but with multiple injuries, scoring 16 ormore on the Injury Severity Scale).
Insults were found in 91% of patients at all degrees ofseverity of head injury. Overall, 10% of patients had insultsthat were only at the lowest grade 1 level, 31% had insultsat both grade 1 and grade 2 levels, and 50% of patients hadat least one insult at grade 3 level in addition to grades 1and 2 insults. Overall, the majority (77%) of all insultsdetected in the ITU were at grade 1 level, and theserepresented 85% of the total duration in minutes of insultmeasured. Differences in the duration of insult betweenoutcome groups 12 months post-injury were compared with
MONITORING, INTRACRANIAL PRESSURE 581

each grade of insult using Kruskall–Wallis one-way ana-lysis of variance and Mann–Whitney U tests. Significantdifferences in the distribution of hypotensive insults werefound between the outcome grades at all levels of severityof insult. Similar results were found for cerebral perfusionpressure insult duration. These data confirm the importantadverse effect of even moderate reductions in arterialpressure (systolic BP less than 90 mm Hg or mean BP lessthan 70 mm Hg).
Although the occurrence and clinical significance ofsevere and long-lasting secondary insults in head-injuredpatients is not disputed. The incidence, severity, and dura-tion of shorter acting ‘‘minute by minute’’ cerebral perfu-sion pressure insults, as defined by the Edinburghsecondary insult detection methodology, has not beendefined outside of the Edinburgh study population. Inaddition, the strong association between the occurrenceof specific insult types and the subsequent patient morbid-ity and mortality found by the Edinburgh study (61) needsto be reproduced in other centers. From the Edinburghgroup, Signorini et al. (86,87) developed and validated amodel for predicting survival in head-injured patientsbased on collection of simple demographic features. Whenthe minute by minute secondary insult data were added tothe baseline model, they found only ICP insults signifi-cantly improved the fit of the model.
Almost all of the evidence for a CPP management isbased on single-center cohort studies, often compared withhistorical controls. For example, Rosner and Becker (26)reported on clinical results of a CPP management protocolwhere approximately 40% of patients received vasopressorsupport. They reported a greatly improved incidence offavorable outcome in patients’ GCS� 7 compared withhistorical controls. Despite evidence from single-centerstudies as described above, a critique of the literaturefor the purposes of defining head injury managementguidelines published by the Brain Trauma Foundationin 1994 states that there is not sufficient evidence toestablish either a standard or a guideline for the manage-ment of CPP; however they indicate management of CPPgreater than 70 mm Hg as a management option (28). Sincethen, Robertson et al. (88) performed one of the firstrandomized controlled single-center trials of the CPP man-agement approach. They defined two management cohorts,one based on their normal practice of CPP managementand the other CBF, guided practice that included theaggressive management of CPP above 70 mm Hg, togetherwith restricted use of significant hyperventilation. Con-versely, their trial has shown that aggressive managementof CPP> 70 mm Hg, although reducing the incidence ofjugular venous desaturation < 50%, demonstrated no dif-ference in neurological outcome possibly due to theincreased incidence of acute respiratory distress syndromein the CBF management group. Thus, secondary insultsare common, result in mainly ischemic brain damage, andare a major contribution to disablement. Moreover Cham-bers et al. (89) has reported that the critical CPP thresholdsfor insults of pediatric patients varies with age. For bothadult and pediatric patients, insults are important becausethey are common and yet so potentially avoidable. Clearly acritical challenge facing us is to develop patient monitoring
systems and protocols that will lead to rapid detection andresolution of secondary insults. However, detection is notenough; we need also improved and clinically proven meth-ods of treating secondary insults—further evidence isrequired. In Signorini et al.’s article (87), they concludethat the questions posed by such observational studiescan only be answered definitively within the context of arandomized clinical trial. However, to design such a mul-ticenter randomized clinical trial will require improvedstandards in the monitoring and analysis of secondaryinsult data. In Europe, improved standards for high-resolution collection and analysis of multicenter data fromhead-injured data is now being addressed by the Brain-ITgroup (90). The Brain-IT group (http://www.brainit.org) isan open consortium of clinicians and basic scientistsworking toward improving the infrastructure for conduct-ing both observational and controlled trials of medicaldevices and patient management.
INTRACRANIAL PRESSURE ANALYSIS METHODS
Since the early 1990s, clinical monitoring of ICP has gen-erally become part of the intensive care management ofpatients with brain injury. Several methods of analysishave been designed to extract pathophysiological informa-tion from the ICP and the corresponding ABP recordings.As noted, one particular computation used in clinical prac-tice is the determination of mean CPP, the pressure acrossthe brain. CPP is calculated as the difference betweenmean ABP and mean ICP and is based on the assumptionthat cerebral venous pressure is approximately equal toICP. CPP is a useful parameter because it provides someinsight as to whether the blood flow though brain capil-laries is regulated. In the uninjured brain, cerebral bloodflow is regulated to match the metabolic demand of thebrain cells. Regulation of flow is primarily done by activedilation and constriction of cerebral arterioles in responseto changes of CPP and/or biochemical vasoconstrictive orvasodilator agents that interact with the vascular endothe-lium. The steady-state relationship between cerebral bloodflow and CPP is termed static pressure regulation and isillustrated by the graphical relationship between cerebralblood flow and CPP shown in Fig. 1.
In the steady state, cerebral blood flow is laminar andcomputed as the ratio of CPP to hemodynamic resistance,which is inversely proportional to the fourth power of theradius of the vessel. In the autoregulatory range, thearterial–arteriolar bed actively adjusts the resistance ofits vessels by dilating when CPP decreases and constrictingwhen CPP increases to maintain a relatively constantcerebral blood flow during changes in CPP. When CPP isbelow the lower limit of the autoregulatory range, vesselswithin the arterial–arteriolar bed tend to passively vaso-constrict. When CPP is above the upper limit of autoregu-lation, passive vasodilation occurs. One proposed intensivecare therapeutic procedure designed to prevent secondarycomplications during recovery is CPP-oriented therapy(91). This therapy requires pressure autoregulation andthe ability to manipulate CPP within the autoregulatoryrange (91). During intact pressure regulation, increases of
582 MONITORING, INTRACRANIAL PRESSURE

CPP cause constriction of the arterial-arteriolar vascularbed and lowering of ICP by a reduction in cerebral bloodvolume. In addition, the resulting decrease of pre- and post-capillary pressure lessens fluid filtration and increasesabsorption, thus reducing the effects of edema. The appli-cation of CPP-oriented therapy when autoregulation hasbeen lost may result in an imbalance of Starling forces atthe capillaries, leading to increased net filtration andfurther brain injury by increased production of vasogenicedema.
In contrast to clinical cardiology, where the physiologi-cal mechanism underlying the dynamic features of thearterial pressure recording are fairly well understood, verylittle is known about the mechanism that underlies theshape of pulsations of intracranial pressure and how theyare influenced by changes in CPP. Past studies have indi-cated that pulsations in the cerebrospinal fluid developfrom either pulsations of the choroids plexus (92,93) or thearterial vasculature (94,95). Depending on the dilatorystate of the cerebrovascular bed, ABP, ICP, and whetherthe autoregulation is intact, at times the primary compo-nent of the ICP pulse may be due to pulsations of venous orarterial origin (94–96). Although the origin of the ICPpulsation is not completely understood, possibly usefulmethodologies involving the pulsation have been devel-oped. Over two decades ago, Avezatt and van Eijnhovendeveloped a procedure for distinguishing the occurrence ofthe loss of regulation of cerebral blood flow through numer-ical analysis of the pulsation of intracranial pressure(96,97) From laboratory studies, they found that withinthe autoregulatory range, the relationship between themean amplitude of the pulsation of ICP increased linearlywith mean ICP with a high slope value. At mean ICP above30 mm Hg, the slope of this relationship decreased. They
proposed that the flattening of the slope of this relationshipwas an indication of loss of autoregulation (97). A weaknessof this technique is that it is dependent on heart rate (98).A low heart rate reflects an increase in the volume, ofpulsatile cerebral blood inflow resulting from increasedcardiac stroke volume, and the converse is likely for highheart rates. Thus, the variability in the amplitude of theICP due to heart-rate variability can complicate the ana-lysis (98). However, one modification of the analysis tech-nique is to examine the correlation value betweenamplitude-pressure and mean ICP rather than the slopeof the respective regression line (99). Positive values of thiscorrelation value, which has been called RAP, indicate theability of the vasculature to regulate cerebral blood flow,and negative values indicate poor cerebrovascular reserveand impaired cerebrovascular reactivity (99,100). Statis-tical analysis revealed that patients with a fatal outcomewere associated with a negative RAP value (99). Mostrecently, the RAP index has been used to predict theachievable reduction in intracranial pressure a patientcan obtain by the implementation of moderate hyperven-tilation (101). A modification of the mean amplitude of ICPand mean ICP characteristic has been proposed as a meansof predicting which patients with idiopathic adult hydro-cephalus will have a good outcome after shunting surgery(102). In this application, the amplitude of B-wave of ICP isused instead of the amplitude of the ICP pulsation (102).
In addition to relatively synchronous pulsations of ICPassociated with the cardiac cycle, the ICP recordingobtained during mechanical ventilation contains a low-frequency component at the rate of ventilation. Generallyduring mechanical ventilation, inhalation is produced bypositive pressure and expiration occurs during zero pres-sure. Changes in pulmonary volume produce changes inintrathoracic pressure that mechanically modulate arter-ial and venous blood flow and produce a cyclic compressionof the craniospinal sac. Evidence for this mechanical mod-ulation by intrathoracic pressure can be observed in thespectra of an ICP recording obtained during mechanicalventilation. Because the pulsation in ICP associated withthe cardiac cycle produced is quasi-periodic and the rate ofventilation is relatively constant, the spectra of the ICPpressure recording contains salient peaks at the cardiacfrequency and its higher harmonics. In addition, each ofthe spectra associated with cardiac cycle has sidebandswith a deviation at the ventilation frequency (103). Such aresult is consistent with the premise that intrathoracicpressure changes mechanical modulated arterial andvenous blood pressure and volume of the craniospinalsac (103).
Over the last few decades, several clinical and labora-tory studies of the correlative relationship between ABPand ICP have been completed. Portnoy et al. reported thatduring normal vascular tone and intact regulation of cere-bral blood flow, the ICP and ABP recordings do not looksimilar, but during maximum vasodilation of the arterial–arteriolar bed and impaired autoregulation induced bysevere hypercapnia, these pressure recordings lookremarkably similar (104–106). To numerically quantifythe correlation between ABP and ICP, this group examinedchanges in the coherence function. Specifically, they found
MONITORING, INTRACRANIAL PRESSURE 583
Figure 1. Illustration of static pressure regulation. Within theautoregulatory range, changes in arteriolar diameter, representedhere as circles at the top of the graph, are primarily responsible forthe regulation of cerebral blood flow. The arterial–arteriolar bedactively constricts with increasing CPP and dilates with decreasingCPP. Hypoperfusion occurs when CPP falls below the lower limit ofregulation. As CPP falls below this limit, the vascompression of thearterioles and resistance increases markedly. The lower limit ofregulation is not precisely known and varies with age, with 40–50mm Hg for young pediatric cases (90) and 60–70 mm Hg for an adult(61,86).

that the frequency domain coherence function approachedunity when the ICP and ABP recording became similar.Generally, their observations and the observations ofothers using a spectral analysis systems approach havesuggested that the more similar the spectral components ofthe ICP recording are to those of the ABP recording, themore likely cerebral autoregulation is impaired (106–108).The physical process describing the ABP as the input to thecraniospinal sac and the ICP as the corresponding outputhas been termed cerebrovascular pressure transmission(106). An observational clinical study determined that fourtypes of frequency descriptions of the transmission char-acteristic could be identified. Two types were associatedwith high ICP and the other two with low ICP (47).
More recent studies using time-domain correlation ana-lysis on the ICP and ABP pressure recordings have beencompleted. As correlation analysis of two signals in thetime domain is analytically equivalent to coherence ana-lysis in the frequency domain, it was not unexpected thatstudies on the normocapnic/hypercapnic piglet modelfound that as the ICP and ABP recordings became moresimilar, the maximum value of the correlation functionapproaches unity, the pial arterioles became more dilated,and cerebral blood flow increased (109,110). Consistent withclinical reports that indicate that unlike adult patients,brain-injured pediatric patients often demonstrate cere-bral hyperemia and increased ICP (82,109,111), correlationanalysis of pressure recordings obtained from pediatricpatients have been found to often approach unity, indicatingthe occurrence of inappropriate vasodilation and cerebralhyperemia (112). Most recently, Czosnyka et al. havereported the clinical use of a pressure reactivity index(PRx). This index is a moving correlation coefficient between40 consecutive samples of values for intracranial and arter-ial pressures averaged for a period of 5 s (113,114). Theyhave concluded that when slow waves in the ABP and ICPrecordings are present, the proposed clinical index providesa continuous index of cerebrovascular reactivity (114,115).In particular, the PRx was designed to evaluate the integrityof the cerebrovascular response and estimate cerebrovas-cular autoregulatory reserve reactivity (114,115). Thehypothesis is that because of the sluggish nature of thecerebrovascular system, naturally occurring slow-varyingoscillations of ABP can be used to evaluate the autoregula-tory reserve reactivity (114,115). Unlike the coherence andcorrelation indices described above, this index cannot berelated to a linear system model. By employing averagingover a 5 s interval, most of the frequency changes above0.2 Hz in the ABP and ICP recordings are filtered out. Inaddition, Nyquist’s sampling theorem dictates that the high-est frequency that can be represented by a signal sampledevery 5 s is 0.1 Hz or six oscillations per minute. As a result,aliasing occurs, and the dynamical system relationshipbetween ABP and ICP is not precisely defined by this index.Nevertheless, the PRx has been found to be a very usefultool. Clinical observations demonstrate that the PRx is highboth during the occurrence of plateau waves and duringrefractory ICP hypertension (115). In addition, the PRx hasbeen used to guide proposed therapies (116) and whilevariable seems to provide a reliable index of autoregulation(117).
Most recently, the regressive relationship betweenmean ICP and mean CPP has been used to assess whetherautoregulation of cerebral blood flow is intact. In thesestudies, ABP is pharmalogically elevated and the regres-sive relationship between ICP and CPP during the testperiod is obtained (118). If pressure regulation of cerebralblood flow is intact, then increases of CPP will causevasoconstriction, a decrease of ICP, and the regressiverelationship should have a negative slope parameter. Amarked positive slope parameter of this regressive rela-tionship is an indication of passive pressure regulation;increases of CPP cause dilation and increased ICP (119).
ANALYSIS METHODS BASED ON MODELS OF ICP
Models of ICP dynamics are based on the modified Monroe–Kellie doctrine (see the Physiology section), which assumesthat the total volume of intracranial substance, tissue,blood, and CSF, is constant. Initial mathematical modelsdescribed the relationship between the formation of CSFand absorption of CSF in equilibrium. Specifically, in thesemodels, laminar flow of CSF is assumed during steady-state conditions (120–123) and the parameters of themathematical model are presented as an electrical circuit(Fig. 2).
Using this circuit and manipulating the volume of CSFby bolus either by withdrawal, injection, or constant infu-sion, it is possible to estimate Ro, C, the volume–pressureresponse, and the PVI. The latter two parameters havebeen discussed previously in the Physiology section. Allparameters have been used to guide the management ofhydrocephalous and traumatic brain injury.
Higher order mathematical models of intracranialhydrodynamics that incorporate the arterial and venousblood volume compartments into the analog electric circuitmodel have been developed to simulate the pulsatility,which is present in the ICP recording. To account for thereciprocal relationship between cerebral blood volume andvolume of CSF, Agarwal et al. (124) constructed a modelthat connected vascular compliance to intracranial com-pliance in a series configuration. This modeling effort wasfurther developed in detail by Ursino’s proposed fourth-order analog circuit model of overall human intracranial
584 MONITORING, INTRACRANIAL PRESSURE
CSF storage
CSF formation
CSF outflowresistance
CICP
compliance
R
Dural Sinuspressure
Ps
Figure 2. Electric circuit analog model of CSF system. In thismodel, current represents flow of CSF fluid, and voltage representspressure. The capacitance C, represents intracranial compliance,and the resistance R represents resistance of CSF fluid flow intothe venous system.
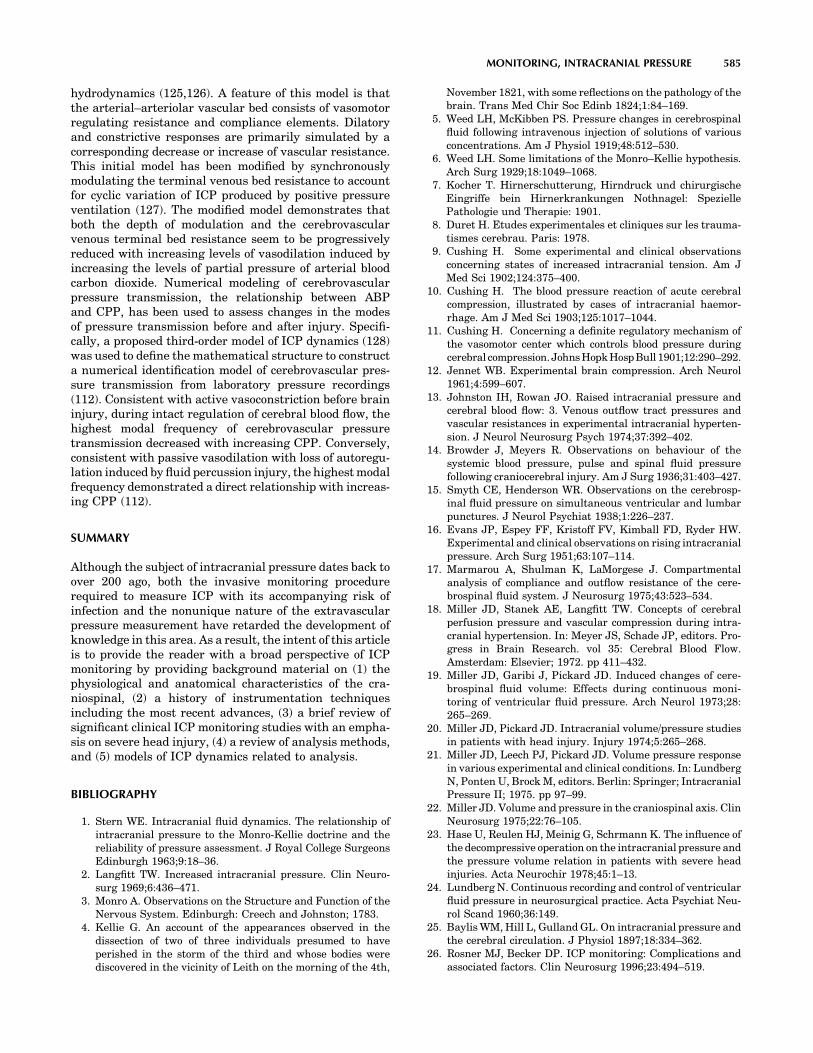
hydrodynamics (125,126). A feature of this model is thatthe arterial–arteriolar vascular bed consists of vasomotorregulating resistance and compliance elements. Dilatoryand constrictive responses are primarily simulated by acorresponding decrease or increase of vascular resistance.This initial model has been modified by synchronouslymodulating the terminal venous bed resistance to accountfor cyclic variation of ICP produced by positive pressureventilation (127). The modified model demonstrates thatboth the depth of modulation and the cerebrovascularvenous terminal bed resistance seem to be progressivelyreduced with increasing levels of vasodilation induced byincreasing the levels of partial pressure of arterial bloodcarbon dioxide. Numerical modeling of cerebrovascularpressure transmission, the relationship between ABPand CPP, has been used to assess changes in the modesof pressure transmission before and after injury. Specifi-cally, a proposed third-order model of ICP dynamics (128)was used to define the mathematical structure to constructa numerical identification model of cerebrovascular pres-sure transmission from laboratory pressure recordings(112). Consistent with active vasoconstriction before braininjury, during intact regulation of cerebral blood flow, thehighest modal frequency of cerebrovascular pressuretransmission decreased with increasing CPP. Conversely,consistent with passive vasodilation with loss of autoregu-lation induced by fluid percussion injury, the highest modalfrequency demonstrated a direct relationship with increas-ing CPP (112).
SUMMARY
Although the subject of intracranial pressure dates back toover 200 ago, both the invasive monitoring procedurerequired to measure ICP with its accompanying risk ofinfection and the nonunique nature of the extravascularpressure measurement have retarded the development ofknowledge in this area. As a result, the intent of this articleis to provide the reader with a broad perspective of ICPmonitoring by providing background material on (1) thephysiological and anatomical characteristics of the cra-niospinal, (2) a history of instrumentation techniquesincluding the most recent advances, (3) a brief review ofsignificant clinical ICP monitoring studies with an empha-sis on severe head injury, (4) a review of analysis methods,and (5) models of ICP dynamics related to analysis.
BIBLIOGRAPHY
1. Stern WE. Intracranial fluid dynamics. The relationship ofintracranial pressure to the Monro-Kellie doctrine and thereliability of pressure assessment. J Royal College SurgeonsEdinburgh 1963;9:18–36.
2. Langfitt TW. Increased intracranial pressure. Clin Neuro-surg 1969;6:436–471.
3. Monro A. Observations on the Structure and Function of theNervous System. Edinburgh: Creech and Johnston; 1783.
4. Kellie G. An account of the appearances observed in thedissection of two of three individuals presumed to haveperished in the storm of the third and whose bodies werediscovered in the vicinity of Leith on the morning of the 4th,
November 1821, with some reflections on the pathology of thebrain. Trans Med Chir Soc Edinb 1824;1:84–169.
5. Weed LH, McKibben PS. Pressure changes in cerebrospinalfluid following intravenous injection of solutions of variousconcentrations. Am J Physiol 1919;48:512–530.
6. Weed LH. Some limitations of the Monro–Kellie hypothesis.Arch Surg 1929;18:1049–1068.
7. Kocher T. Hirnerschutterung, Hirndruck und chirurgischeEingriffe bein Hirnerkrankungen Nothnagel: SpeziellePathologie und Therapie: 1901.
8. Duret H. Etudes experimentales et cliniques sur les trauma-tismes cerebrau. Paris: 1978.
9. Cushing H. Some experimental and clinical observationsconcerning states of increased intracranial tension. Am JMed Sci 1902;124:375–400.
10. Cushing H. The blood pressure reaction of acute cerebralcompression, illustrated by cases of intracranial haemor-rhage. Am J Med Sci 1903;125:1017–1044.
11. Cushing H. Concerning a definite regulatory mechanism ofthe vasomotor center which controls blood pressure duringcerebral compression. Johns Hopk Hosp Bull 1901;12:290–292.
12. Jennet WB. Experimental brain compression. Arch Neurol1961;4:599–607.
13. Johnston IH, Rowan JO. Raised intracranial pressure andcerebral blood flow: 3. Venous outflow tract pressures andvascular resistances in experimental intracranial hyperten-sion. J Neurol Neurosurg Psych 1974;37:392–402.
14. Browder J, Meyers R. Observations on behaviour of thesystemic blood pressure, pulse and spinal fluid pressurefollowing craniocerebral injury. Am J Surg 1936;31:403–427.
15. Smyth CE, Henderson WR. Observations on the cerebrosp-inal fluid pressure on simultaneous ventricular and lumbarpunctures. J Neurol Psychiat 1938;1:226–237.
16. Evans JP, Espey FF, Kristoff FV, Kimball FD, Ryder HW.Experimental and clinical observations on rising intracranialpressure. Arch Surg 1951;63:107–114.
17. Marmarou A, Shulman K, LaMorgese J. Compartmentalanalysis of compliance and outflow resistance of the cere-brospinal fluid system. J Neurosurg 1975;43:523–534.
18. Miller JD, Stanek AE, Langfitt TW. Concepts of cerebralperfusion pressure and vascular compression during intra-cranial hypertension. In: Meyer JS, Schade JP, editors. Pro-gress in Brain Research. vol 35: Cerebral Blood Flow.Amsterdam: Elsevier; 1972. pp 411–432.
19. Miller JD, Garibi J, Pickard JD. Induced changes of cere-brospinal fluid volume: Effects during continuous moni-toring of ventricular fluid pressure. Arch Neurol 1973;28:265–269.
20. Miller JD, Pickard JD. Intracranial volume/pressure studiesin patients with head injury. Injury 1974;5:265–268.
21. Miller JD, Leech PJ, Pickard JD. Volume pressure responsein various experimental and clinical conditions. In: LundbergN, Ponten U, Brock M, editors. Berlin: Springer; IntracranialPressure II; 1975. pp 97–99.
22. Miller JD. Volume and pressure in the craniospinal axis. ClinNeurosurg 1975;22:76–105.
23. Hase U, Reulen HJ, Meinig G, Schrmann K. The influence ofthe decompressive operation on the intracranial pressure andthe pressure volume relation in patients with severe headinjuries. Acta Neurochir 1978;45:1–13.
24. Lundberg N. Continuous recording and control of ventricularfluid pressure in neurosurgical practice. Acta Psychiat Neu-rol Scand 1960;36:149.
25. Baylis WM, Hill L, Gulland GL. On intracranial pressure andthe cerebral circulation. J Physiol 1897;18:334–362.
26. Rosner MJ, Becker DP. ICP monitoring: Complications andassociated factors. Clin Neurosurg 1996;23:494–519.
MONITORING, INTRACRANIAL PRESSURE 585

27. Maas A, Dearden M, Teasdale GM, Braakman R, Cohodan F,Iannotti F, Karimi A, Lapirre F, Murray G, Ohman J, PerssonL, Servadei F, Stocchetti N, Unterburg A. EBIC-Guidelines formanagement of severe head injury in adults. Acta Neurochir1997;139:286–294.
28. Naryan RK. et al. Guidelines for the management of severehead injury. J Neurotrauma 1997;13:639–734.
29. Gabe IT. Cardiovascular fluid dynamics. Acta Physiol Scand1972;19:306–322.
30. Piper IR, Dearden NM, Miller JD. Methodology of spectralanalysis of the intracranial pressure waveform in a headinjury intensive care unit. In: Hoff JT, Betz AL, editors.Intracranial Pressure VII. Berlin: Springer-Verlag; 1989.pp 668–671.
31. Allan MWB. Measurement of arterial pressure using cathe-ter–transducer systems. Br J Anaesth 1988;60:413–418.
32. Czosnyka M, Czosnyka Z, Pickard J. Laboratory testing ofthe Spiegelberg brain pressure monitor: A technical report. JNeurol Neurosurg Psych 1997;63:732–735.
33. Ostrup RC, Luerssen TG, Marshall LF. Continuous monitor-ing of intracranial pressure with a miniturized fibreopticdevice. J Neurosurg 1987;67:206–209.
34. Marmarou A, Tsuji O, Dunbar JG. Experimental evaluationof a new solid state ICP monitor. In: Nagai H, Kemiya K,Ishiii S, editors. Intracranial Pressure IX. New York:Springer-Verlag; 1994. pp 15–19.
35. Morgalla MH, Cuno M, Mettenleiter H, Will BE, Krasznai L,Skalej M, Bitzer M, Grote EH. ICP monitoring with a reu-sable transducer: experimental and clinical evaluation of theGaeltecICT/bpressureprobe.ActaNeurochir(Wien)1997;139(6):569–573.
36. Holzschuh M, Woertgen C, Metz C, Brawanski A. Clinicalevaluation of the InnerSpace fibreoptic intracranial pressuremonitoring device. Brain 1988;12:191–198.
37. Betsch HM, Aschoff A. Measurement artifacts in Gaeltecintracrnial pressure monitors due to radio waves from per-sonal beeper systems. Anaesthesiol Intensivmed NotfallmedSchmerzther 1992;27(1):51–52.
38. Munch E, Weigel R, Schmiedek P, Schurer L. The Caminointracranial pressure device in clinical practice: Reliability,handling characteristics and complications. Acta Neurochir1998;140:1113–1119.
39. Chambers IR, Kane PJ, Choksey MS, Mendelow AD. Anevaluation of the Camino ventricular bolt system in clinicalpractice. Neurosurgery 1993;33:866–868.
40. Weinstable C, Richling B, Plainer B, Czech T, Spiss CK.Comparative analysis between epidural (Gaeltec) and sub-dural (Camino) intracranial pressure probes. J Clin Monit1992;8:116–120.
41. Piper IR, Miller JD. The evaluation of the waveform analysiscapability of a new strain-gauge intracranial pressure micro-sensor. Neurosurgery 1995;36:1142–1145.
42. Signorini DF, Shad A, Piper IR, Statham PFX. A clinicalevaluation of the Codman microsensor for intracranialpressure monitoring. Br J Neurosurgery 1988;12:223–227.
43. Fernades HM, Bingham K, Chambers IR, Mendelow AD.Clinical evaluation of the Codman microsensor intracranialpressure monitoring system. Acta Neurochir Suppl (Wien)1998;71:44–66.
44. Mendelow AD, Rowan JO, Murray L, Kerr AE. A clinicalcomparison of subdural screw pressure measurements withventricular pressure. J Neurosurg 1983;58:45–50.
45. Piper IR, Barnes A, Smith DH, Dunn L. The Caminointracranial pressure sensor: Is it optimal technology?An internal audit with a review of current intracranialpressure monitoring technologies. Neurosurgery 2001;49:1158–1165.
46. Citerio G, Piper I, Cormio M, Galli D, Cazzaniga S, Enblad P,Nilsson P, Contant C, Chambers I, on behalf of the BrainITGroup, Bench test assessment of the new Raumedic.
47. Piper IR, Miller JD, Dearden NM, Leggate JR, Robertson I.Systems analysis of cerebrovascular pressure transmission:An observational study in head injured patients. J Neurosurg1993;73:871–880.
48. Becker DP, et al. The outcome from severe head injury withearly diagnosis and intensive management. J Neurosurg1977;47:491–502.
49. Marshall LF, Smith RW, Shapiro HM. The outcome withaggressive treatment in severe head injuries. Part 1: Thesignificance of intracranial pressure monitoring. J Neurosurg1979;50:20–25.
50. Miller JD, et al. Significance of intracranial hypertension insevere head injury. J Neurosurg 1977;47:503–516.
51. Pitts LH, Kaktis JV, Juster R, Heilbrun D. ICP and outcome inpatients with severe head injury. In: Shulman K, Marmarou A,Miller JD, Becker DP, Hochwald GM, Brock M, editors.Intracranial Pressure IV. Berlin: Springer; 1980. pp 5–9.
52. Stuart G, Merry G, Smith JA, Yelland JDM. Severe headinjury managed without intracranial pressure monitoring. JNeurosurg 1983;59:601–605.
53. Miller JD, et al. Further experience in the management ofsevere head injury. J Neurosurg 1981;54:289–299.
54. Alberico AM, Ward JD, Choi SC, Marmarou A, Young H.Outcome after severe head injury: Relationship to masslesions, diffuse injury and ICP course in pediatric and adultpatients. J Neurosurg 1987;67:648–656.
55. Choi SC, Muizelaar JP, Barnes TY, Marmarou A, Brooks DM,Young HF. Prediction tree for severely head injured patients.J Neurosurg 1991;75:251–255.
56. Vollmer DG, Torner JC, Jane J, et al. Age and outcomefollowing traumatic coma: Why do older patients fare worse?J Neurosurg 1991;75:s37–s49.
57. O’Sullivan MG, Statham PF, Jones PA, et al. Role of intra-cranial pressure monitoring in severely head–injuredpatients without signs of intracranial hyperension on initialcomputerised tomography. J Neurosurg 1994;80:46–50.
58. Narayan RK, Greenberg RP, Miller JD, Enas GG, Choi SC,Kishore PRS.
59. Saul TG, Ducker TB. Effect of intracranial pressure monitor-ing and aggressive treatment on mortality in severe headinjury. J Neurosurg 1982;56:498–503.
60. Marmarou A, et al. Impact of ICP instability on outcome inpatients with severe head trauma. J Neurosurg 1991;75:s59–s66.
61. Jones PA, Andrews PJD, Midgley S, Anderson SI, Piper IR,Tocher JL, Housley AM, Corrie JA, Slattery J, Dearden NM,Miller JD. Measuring the burden of secondary insults inhead–injured patients during intensive care. J NeurosurgAnaesth. 6:4–14.
62. Lewelt W, Jenkins LW, Miller JD. Autoregulation of cerebv-ral blood flow after experimental fluid percussion injury ofthe brain. J Neurosurg 1980;53:500–511.
63. Povlishock JT, Kontos HA. Continuing axonal and vascularchange following experimental brain trauma. Central Ner-vous System Trauma 1985;2:285–298.
64. Nordstrom CH, et al. Cerebral blood flow, vasoreactivity andoxygen consumption during barbiturate therapy in severetraumatic brain lesions. J Neurosurg 1988;68:424–431.
65. Miller JD, Adams JH. The pathophysiology of raised intra-cranial pressure. In: Adams JH, Duchen LW, editors. Green-field’s Neuropathology. 5th ed. London: Arnold; 1992: 69–105.
66. DeSalles AF, Muizelaar JP, Young HF. Hyperglycemia, cere-brospinal fluid lactic acidosis and cerebral blood flow in severlyhead–injured patients. Neurosurgery 1987;21:45–50.
586 MONITORING, INTRACRANIAL PRESSURE

67. Jaggi LJ, Obrist WD, Gennarelli TA, Langfitt TW. Relation-ship of early cerebral blood flow and metabolism to outcome inacute head injury. J Neurosurg 1990;72:176–182.
68. Muizelaar JP, Ward JD, Marmarou A, Newton PG, Wachi A.Cerebral blood flow and metabolism in severely head–injuredchildren. Part 2: Autoregulation. J Neurosurg 1989;71:72–76.
69. Muizelaar JP, Marmarou A, DeSalles AAF, Ward JD, Zim-merman RS, Zhongchao L, Choi SC, Young HF. Cerebralblood flow and metabolism in severely head–injured children.Part 1: Relationship with GCS score, outcome, ICP and PVI. JNeurosurg 1989;71:63–71.
70. Uzzell BP, Obrist WD, Dolinskas CA, Langfitt TW. Relation-ship of acute CBF and ICP findings to neuropsychologicaloutcome in severe head injury. J Neurosurg 1986;65:630–635.
71. Rose J, Valtonen S, Jennett B. Avoidable factors contributingto death after head injury. Brit Med J 1977;2:615–618.
72. Gentleman D, Jennett B. Hazards of interhospital transfer ofcomatose head injured patients. Lancet 1981;ii:835–855.
73. Graham DI, Hume Adams J, Doyle D. Ischemic brain damagein fatal non–missile head injuries. J Neurol Sci 1978;39:213–234.
74. Graham DI, Ford I, Adams JH, Doyle D, Teasdale GM,Lawrence AE, Mclellan DR. Ischemic brain damage is stillcommon fatal non–missile head injury. 1989.
75. Miller JD, Garibi J. Intracranial volume/pressure relation-ships during continuous monitoring of ventricular fluid pres-sure. In: Brock M, Dietz H, editors. Intracranial Pressure.Berlin: Springer; 1972. 270–274.
76. Johnston IH, Rowan JO. Raised intracranial pressure andcerebral blood flow: 3. Venous outflow tract pressures andvascular resistances in experimental intracranial hyperten-sion. J Neurol Neurosurg Psychi 1974;37:392–402.
77. Yada K, Nakagawa Y, Tsuru M. Circulatory disturbance ofthe venous system during experimental intracranial hyper-tension. J Neurosurg 1973;39:723–729.
78. Nakagawa Y, Tsura M, Yada K. Site and mechanism forcompression of the venous system during experimental intra-cranial hypertension. J Neurosurg 1974;41:427–434.
79. Harper AM. Autoregulation of cerebral blood flow: influenceof the arterial pressure on blood flow through the cerebralcortex. J Neurol Neurosurg Psych 1966;29:398–403.
80. Muizelaar JP, Becker DP. Induced hypertension for thetreatment of cerebral ischemia after subarachnoid hemor-rhage. Direct effect on cerebral blood flow. Surg Neurol1986;25:317–325.
81. Obrist WD, et al. Cerebral blood flow and metabolism incomatose patients with acute head injury. Relationship tointracranial hypertension. J Neurosurg 1984;61:241–253.
82. Bouma GJ, Muizelaar JP. Relationship between cardiac outputand cerebral blood flow in patients with intact and withimpaired autoregulation. J Neurosurg 1990;73:368–374.
83. Chan KH, Miller JD, Piper IR. Cerebral blood flow at con-stant cerebral perfusion pressure but changing arterial andintracranial pressure: Relationship to autoregulation. J Neu-rosurg Anaesth 1992;4:188–193.
84. Piper IR, Lawson A, Dearden NM, Miller JD. Computeriseddata collection: a microcomputer data collection system in headinjury intensive care. Br J Intensive Care 1991;1:73–78.
85. Chambers IR, Treadwell L, Mendelow AD. The cause andincidence of secondary insults in severely head–injuredadults and children. 2000.
86. Signorini DF, Andrews PJD, Jones PAJ, Wardlaw JM, MillerJD. Prediciting survival using simple clinical variables: A casestudy in traumatic brain injury. J Neurol Neurosurg Psych1999;66:20–25.
87. Signorini DF, Andrews PJD, Jones PAJ, Wardlaw JM, MillerJD. Adding insult to injury: The prognostic value of early
secondary insults for survival after traumatic brain injury. JNeurol Neurosurg Psychi 1999;66:26–31.
88. Robertson CS, Valadka AB, Hannay HJ, Contant CF, Gopi-nath SP, Cormio M, Uzura M, Grossman RG. Prevention ofsecondary ischemic insults after severe head injury. CritCare Med 1999;27(10):2086–2095.
89. Chambers IR, Jones PA, Lo TY, Forsyth RJ, Fulton B,Andrews PJ, Mendelow AD, Minns RA. critical thresholdof intracranial pressure and cerebral perfusion pressurerelated to age in paediatric head injury. 2005.
90. Piper I, et al. The BrainIT Group: Concept and core datasetdefinition. Acta Neurochir 2003;145:615–629.
91. Rosner MJ, Rosner SD, Johnson AH. Cerebral perfusionpressure: management protocol and clinical results. J Neu-rosurg 1995;83:949–962.
92. Bearing EA. Choroid plexus and arterial pulsation of cere-brospinal fluid. Arch Neurol Psych 1955;73:165–172.
93. Hamit HF, Beall AC, DeBakey ME. Hemodynamic influencesupon brain and cerebrospinal fluid pulsations and pressures.J Trauma 1965;5:174–184.
94. Dardenne G, Dereymaeker A, Lacheron JM. cerebrospinalfluid pressure and pulsatility. An experimental study ofcirculatory and respiratory influences in normal and hydro-cephalic dogs. 1969.
95. Hamer J, Alberti E, Hoyer S, Wiedemann K. Influence ofsystemic and cerebral vascular factors on the cerebrospinalfluid pulse waves. 1977.
96. Avezatt CJJ, van Eijndhoven JHM. Clinical observations onthe relationship between cerebrospinal fluid pulse pressureand intracranial pressure. In: Cerebrospinal Fluid PulsePressure and Cranio–spinal Dynamics: A Theoretical, Clin-ical and Experimental Study. Thesis. Erasmus Univ., Rot-terdam, 1984.
97. Avezatt CJJ, van Eijndhoven JHM. Cerebrospinal fluid pulsepressure and intracranial volume–pressure relationships. JNeurol Neurosurg Psych 1979;42:687–700.
98. Daley ML, Gallo A, Mauch W. Analysis of the intracranialpressure pulsation associated with the cardiac cycle. InnovationEt Technology En Biologie Et Medicine 1986;7:537–544.
99. Czosynka M, Guazzo E, Whitehouse M, Smielewski P, Czo-synka Z, Kirkpatric P, Piechnik S, Pickard JD. Significance ofintracranial pressure waveform analysis after head–injury.Acta Neurochir (Wien) 1996;138(5):531–541.
100. Balestreri M, Czosynka M, Steiner LA, Schmidt E, Smie-lewski P, Matta B, Pickard JD. Intracranial hypertension:What additional information can be derived from ICP wave-form after head injury? Acta Neurochir 2004;146:131–141.
101. Steiner IA, Balestreri M, Johnston AJ, Coles JP, SmielewskiP, Pickard JD, Menon DK, Czosnyka M. Predicting theresponse of intracranial pressure to moderate hyperventila-tion Acta Neurochirurgica (online) 2005.
102. Lenfeldt N, Anderson N, Agren–Wilsson A, Bergenheim AT,Koskinen LO, Eklund A, Malm J. Cerebrospinal fluid pulsepressure method: A possible substitute for the examination ofB waves. J Neurosurg 2004;101(6):944–950.
103. Daley ML, Pasley R, Connolly M, Angel J, Timmons S, StidhamG, Leffler C. Spectral characteristics of B–waves and other low–frequency activity. Acta Neurochurirgica 2002;81:147–150.
104. Chopp M, Portnoy H. System analysis of intracranial pres-sure. J Neurosurg 1980;53:516–527.
105. Portnoy HD, Chopp M. Cerebrospinal fluid pulse wave formanalysis during hypercapnia and hypoxia. Neurosurgery1981;9:14–27.
106. Portnoy HD, Chopp M, Branch C, Shannon MD. Cerebrosp-inal fluid pulse waveform as an indicator of cerebral auto-regulation. J Neurosurg 1982;56:666–678.
MONITORING, INTRACRANIAL PRESSURE 587

107. Piper IR, Chan KH, Whittle IR, Miller JD. An experimentalstudy of cerebrovascular resistance, pressure transmission,and craniospinal compliance. Neurosurgery 1993;32:805–816.
108. Nichols JS, Beel JA, Munro LG. Detection of impairedcerebral autoregulation using spectral analysis of intracra-nial pressure waves. J Neurotrauma 1996;13:439–456.
109. Bruce DA, et al. Diffuse cerebral swelling following headinjury in children: The syndrome of ‘‘malignant brainedema’’. J Neurosurg 1981;54:170–178.
110. Daley ML, Pasupathy H, Griffith M, Robertson JT, LefflerC. Evaluation of autoregulation of cerebral blood flow bycorrelation of arterial and intracranial pressure signals.IEEE Trans Biomed Eng 1995;42:420–424.
111. Bruce DA, et al. Pathophysiology, treatment and outcomefollowing severe head injury in children. Child’s Brain1979;5:174–191.
112. Daley ML, Patterson S, Marmarou A, Leffler CW, StidhamG. Pediatric traumatic brain injury: Correlation of intra-cranial and arterial pressure signals, Proc. 18th Annu. Int.Conf. IEEE Engineering in Medicine and Biology Society,Amsterdam, Netherlands, Nov. 1996.
113. Czosnyka M, Smielewski P, Kirkpatrick P, Laing R, Menon D,Pickard J. Continuous assessment of the cerebral vasomotorreactivity in head injury. Neurosurgery 1997;41:11–19.
114. Czosnyka M, Smielewski P, Kirkpatrick P, Laing R, MenonD, Pickard J. Continuous assessment of the cerebral vaso-motor reactivity in head injury. Acta Neurochirugica1998;71:74–77.
115. Czosnyka M, Smielewski P, Piechnik S, Schmidt E, Al–RawiPG, Kirkpatrick PJ, Pickard JD. Hemodynamic character-ization of intracranial pressure plateau waves in head–injured patients. J Neurosurg 1999;92:11–19.
116. Steiner LA, Czosynka M, Piechnik SK, Smielewski P,Chatfield D, Menon DK, Pickard JD. Continuous monitoringof cerebrovascular pressure reactivity allows determinationof optimal cerebral perfusion pressure in patients with trau-matic brain injury. Critical Care Med 2002;30: 733–738.
117. Steiner LA, Coles JP, Johnston AJ, Chatfield DA,Smielewske P, Fryer TD, Aigvirhio FI, Clark JC, PickardJD, Menon DK, Czosynka M. Assessment of cerebrovascu-lar autoregulation in head–injured patients. Stroke2003;34: 2404–2409.
118. Oertel M, Kelly DF, Lee JH, Glenn TC, Vespa M, MartinNA. Is CPP therapy beneficial for all patients with high ICP.Acta Neurochir 2002;81:67–68.
119. Howells T, Elf K, Jones PA, Ronne–Engstrom E, Piper I,Nilsson P, Andrews P, Enbald P. Pressure reactivity as a guidein the treatment of cerebral perfusion pressure in patients withbrain trauma. J Neurosurg 2005;102(2):311–317.
120. Marmarou A. A theoretical and experimental evaluation ofthe cerebrospinal flid system. Ph.D. Dissertation, DrexelUniversity, 1973.
121. Marmarou A, Shulman K, LaMorgese J. Compartmentalanalysis of compliance and outflow resistance of the cere-brospinal fluid system. J Neurosurg 1975;43:523–534.
122. Marmarou A, Shulman K, Rosende RM. A nonlinear ana-lysis of the cerebrospinal fluid system and intracranialpressure dynamics. J Neurosurg 1978;48(3):332–344.
123. Ekstedt J. CSF hydrodynamic studies in man. 1. Method ofconstant pressure CSF infusion. J Neurol Neurosurg Psych1977;40(2):105–119.
124. Agarwal GC, Berman BM, Stark L. A lumped parametermodel of the cerebrospinal fluid system. IEEE Trans BiomedEng 1969;16:45–53.
125. Ursino M. A mathematical study of human intracranialhydrodynamics. Part 1—the cerebrospinal fluid pulse pres-sure. Ann Biomed Eng 1988;16:379–401.
126. Ursino M. A mathematical study of human intracranialhydrodynamics. Part 2—Simulation of clinical tests. AnnBiomed Eng 1988;16:403–416.
127. Pasley RL, Leffler CW, Daley ML. Modeling modulation ofintracranial pressure by variatrion of cerebral venous resis-tance induced by ventilation. Ann Biomed Eng 2003;31:1238–1245.
128. Czosnyka M, Piechnik S, Richards HK, Kirkpatrick P,Smielewski P, Pickard JD. Contribution of mathematicalmodeling to the interpretation of bedside tests of cerebro-vascular autoregulation. J Neurol Neurosurg Psych1997;63: 721–731.
See also BIOTELEMETRY; HYDROCEPHALUS, TOOLS FOR DIAGNOSIS AND
TREATMENT OF; NEONATAL MONITORING; NEUROLOGICAL MONITORS.
MONITORING, NEONATAL. See NEONATAL
MONITORING.
MONITORING, UMBILICAL ARTERY AND VEIN
AHMAD ELSHARYDAH
HAIBO WANG
RANDALL C. CORK
Louisiana State UniversityHealth CenterDepartment of AnesthesiologyShreveport, Louisiana
INTRODUCTION
In the neonatal intensive care unit (NICU), monitoring isan integral part of patient care. The primary goal ofmonitoring is to ensure that early and appropriate inter-vention can be initiated before to the onset of complica-tions. Monitoring is also a means by which the effect ofinterventions and therapies may be recorded, evaluated,and controlled. The NICU staff have to deal with a fullrange of conditions that can arise in the preterm or criti-cally ill neonate, including hypoxemia, hypoglycemia,hypotension, acidosis, and other serious problems. Thishas led to the evolution and development of several moni-tors and different sensor-based technologies for use inNICU monitoring including umbilical vessel monitoring.These sensors may provide more accurate and reliablemonitoring of neonatal physiological and biochemicalchanges with a rapid response time. The umbilical vesselsmay be directly accessed in the first few days of life. Anumbilical artery catheter (UAC) may be used for bloodpressure monitoring, blood sampling, and fluid or druginfusion. An umbilical vein catheter (UVC) may be usedfor central venous pressure monitoring, blood sampling,and fluid or drug infusion. Different types of commerciallyavailable umbilical catheters are used for these purposes.These catheters differ in their length, size, number of ports,and their material (such as silicone and polyurethane).Blood pressure (BP) monitoring is an important part ofneonatal intensive care both for the acutely ill and theconvalescing neonate. The most accurate method of mea-suring BP is by direct intra-arterial recordings, which
588 MONITORING, UMBILICAL ARTERY AND VEIN

usually use an umbilical catheter to access the umbilicalartery. As blood gas measurement methods and monitorshave progressed in adult critical medicine, most of the newtechniques and sensors have been used in the NICU byusing umbilical artery catheterization. This articleaddresses the potential benefits of umbilical vessel cathe-ters and associated monitoring devices. It sheds light onthe catheters and monitors available on the market andexplains the complications and the risks of these catheters.Furthermore, this article looks at the direction of thistechnology in the future, and it tries to stimulate develop-ment of new technology for use in the monitoring of criti-cally ill newborn infants (1–3).
Historical Aspects
In 1946, Louis K. Diamond, a pediatrician from Boston, andF. H. Allen, Jr. developed a technique that allowed bloodtransfusion to take place through the infant’s umbilicalcord vein. Regular transfusions were difficult because ofthe small size of blood vessels in newborns, and there was afurther complication due to the use of steel needles andrubber catheters. Diamond used plastic tubing on theumbilical vein, which was larger than average andremained open for several days after birth (4). By the1960s, electronic monitors came into use and blood gasesbegan to be measured. By the 1970s, the use of umbilicalcatheters and arterial pressure transducers was routine(5). The first organized NICU opened its doors at Yale-NewHaven Hospital in 1960. The first successful use of extra-corporeal membrane oxygenation (ECMO) was in 1975.ECMO eventually reduced infant mortality from 80% to25% for the critically ill infants with acute reversiblerespiratory and cardiac failure unresponsive to conven-tional therapy (6).
Anatomical and Physiological Aspects
The umbilical cord is a cordlike structure about 56 cm long,extending from the abdominal wall of the fetus to theplacenta. Its chief function is to carry nutrients and oxygen(O2) from the placenta to the fetus and return wasteproducts and carbon dioxide (CO2) to the placenta fromthe fetus. It consists of a continuation of the membranecovering the fetus and encloses a mucoid jelly (Wharton’sjelly) with one vein and two arteries (7). Examination of theumbilical cord (after cut) normally reveals two umbilicalarteries (UA) and one umbilical vein (UV) (Fig. 1). At skinlevel, the UV is usually in the 12 o’clock position and has athinner wall and wider lumen than do the UAs (2). Beforebirth, blood from the placenta, about 80% saturated withO2, returns to the fetus by way of the UV. On approachingthe liver, most blood flows through the ductus venousdirectly into the inferior vena cava (IVC), short-circuitingthe liver. A smaller amount enters the liver sinusoids andmixes with blood from the portal circulation. After a shortcourse in the IVC, it mixes with deoxygenated blood return-ing from the lower limbs before it enters the right atrium.The blood leaves the heart to the descending aorta, where itflows toward the placenta by way of the two UAs (7). The O2
saturation in the umbilical arteries is approximately 58%.Changes in the vascular system at birth are caused by
cessation of placental blood flow and the beginning ofrespiration. These changes are summarized in closure ofthe umbilical arteries, closure of the umbilical vein andductus venous, significant reduction in the pulmonaryvascular resistance and right ventricle and right atriumpressures, and significant increase in the systemic vas-cular resistance, left ventricle, and left atrium pressures(8). After birth, the blood volume of the neonate is about300 mL, the cardiac output averages 500 mL/min, and thearterial blood pressure is about 70/50 during the first day,which increases slowly over the next several months.Arterial blood pressure of the neonate has been best cor-related with birth weight. Moreover, systolic and diastolicpressures in the neonate are significantly correlated toblood pressure levels in the mother (9).
Indications and Contra-Indications for UmbilicalArtery Catheterization
The primary indications for umbilical artery catheteriza-tion include frequent or continuous blood gas measure-ments, continuous monitoring of arterial blood pressure,and resuscitation (umbilical venous line may be the firstchoice) (10). Secondary indications include infusion ofmaintenance glucose-electrolyte solutions or medications,exchange transfusions, angiography, and a port for fre-quent blood sampling, especially in a very low-birth-weightneonate. These catheters should stay in place only as longas a primary indication exists, with the exception of thevery low-birth-weight neonate who may need it for vitalinfusions and frequent blood sampling. Contraindicationsinclude evidence of local vascular compromise in lowerlimbs or buttock areas, peritonitis, necrotizing enterocoli-tis, omphalitis, gastroischisis, and omphalocele.
Indications and Contra-Indications for UmbilicalVein Catheterization
The most frequent indications for umbilical venous cathe-terization include emergency medication administration,exchange transfusion, and partial exchange transfusion(10). This catheter is also used for frequent blood samplingand central venous pressure monitoring. Contraindica-tions for the this catheter include routine fluid infusion
MONITORING, UMBILICAL ARTERY AND VEIN 589
Umbilical vein Umbilical arteries
Figure 1. Umbilical cord after it was cut.

(relative contraindication), omphalitis, omphalocele, gas-troischisis, necrotizing enterocolitis, peritonitis, and extro-phy of the bladder.
Description of Available Catheters (Design and Material)
Catheters must be made of nontoxic materials that are theleast injurious to the vascular intima and least likely tocause thromboses and early atherosclerotic lesions (11).Commercially available umbilical catheters are usuallylatex-free, made of silicon or high-quality aliphatic poly-urethane elastomer (Tecoflex). Silicone catheters are soft,not-irritating, usually not reactive to body tissues and bodyfluids, not supportive of bacterial growth, and less proble-matic with blood clotting. Tecoflex is an advanced medicalformulation of polyurethane. Its physical characteristicsare very close to silicone; however, it is slightly stifferduring insertion, which makes it easier to insert and betterto conduct arterial pressure. Tecoflex is thermosensitive,softens at body temperature (12), and significantly reducesthe trauma to the vascular intima. These catheters have arounded tip, which makes them less likely to perforatethrough the vessel during insertion. They have depthmarkings at every centimeter for more accurate place-ment and encased radiopaque stripes to confirm placementby X ray after placement. Umbilical catheters are avail-able with single-lumen, dual-lumen, and triple-lumencatheters (13) (Fig. 2,a,b) in different sizes ranging from2.6 to 8.0 Fr. (Table 1) Umbilical artery catheter tips aredesigned in two different ways: end-hole and side-hole tips.The side-hole catheters use a special electrode to measureblood gases and biochemicals. A Cochrane review by Bar-rington (14) showed that end-hole catheters are associatedwith a much decreased risk of aortic thrombosis comparedwith side-hole catheters. Therefore, umbilical artery cathe-ters designed with a side-hole should not be used routinelyfor umbilical artery catheterization in the newborn.Furthermore, manufactures have made sterile, ready-to-go umbilical catheterization trays. These trays contain
everything needed for umbilical catheterization, includingdrapes, towels, suture, umbilical tape, skin preparationmaterials, needles, forceps, syringes, and other instru-ments.
Umbilical Vessel Catheterization Procedure
The infant must be supine and restrained (2). A fieldaround the umbilicus is sterilized and draped, and a silksuture is looped around the base of the umbilical stump.The distal end of the stump is cut off, leaving 2 cm of stump,and the vessels are occluded to prevent blood loss. For theumbilical artery catheterization (15), the stump is firmlygrasped with the gloved fingers of one hand, and one of thetwo thick-walled umbilical arteries is dilated with a curvediris forceps; then the umbilical artery catheter is insertedinto the artery. Some resistance may be encountered whenthe catheter has been advanced 3 to 5 cm into the vessel,but this resistance can usually be overcome by applyingsteady downward pressure on the catheter. If the cathetercannot advance, a second catheter can be inserted into theother artery while leaving the first catheter in place. Thismaneuver often causes one or the other vessel to relax andpermits one catheter to be advanced into the aorta.Advancement of an UAC should place the tip above theceliac axis but below the ductus arteriosis. All air should beremoved from the system. The accidental injection of smallamounts of air (<0.1 mL) may obstruct blood flow to thelegs for several hours. The catheter should be attached to apressure transducer and the arterial pressure measured.For the umbilical vein catheterization, the single, large,thin-walled umbilical vein is grasped with an iris forceps,and the air-free catheter, which is connected to a closedstopcock, is inserted 3 to 5 cm into the vessel with a twist-ing motion. The UVC tip should lie a few centimeters intothe umbilical vein or inferior vena cava. The stopcock mustbe closed to prevent aspiration of air through the cathetershould the patient take a deep breath. It is imperative thatno air be injected through venous catheter, because the airmay enter the systemic circulation through the foramenovale and occlude a coronary or cerebral artery. If it does,the neonate may die or suffer central nervous systemdamage. If the catheter ‘‘tickles’’ the atrial septum, theneonatemaysufferarrhythmias.Withdrawalof thecatheterashort distance can solve the problem. Plain radiographsshould be taken to confirm placement (Fig. 3). ‘‘High’’ place-mentoftheUACisdefinedinonemajorreviewoftheliteratureas one with ‘‘the tip in the descending aorta above the level ofthe diaphragm and below the left subclavian artery’’ and ‘‘low’’placement of the UAC as one with ‘‘the tip above the aorticbifurcation and below the renal arteries’’ (16).
Neonatal Blood Gas and Biochemical Measurement
The blood gas measurement is the most widely used clinicalmethod for assessing pulmonary function in the neonate. Itforms the basis for diagnosis and management of neonateswith cardiorespiratory disease (17). The physiology of bloodgases is discussed in other parts of this Encyclopedia. Wewill discuss in this section some issues related to theneonatal blood gas measurement. The dissociation curveof fetal hemoglobin (as compared with adult) is shifted to
590 MONITORING, UMBILICAL ARTERY AND VEIN
Figure 2. Commercially available umbilical catheters: (a) single-lumen catheter and (b) dual-lumen catheter.
Table 1. Neonate Weight and Umbilical Catheter Size
Neonate Weight (g) UAC Size (Fr) UVC Size (Fr)
<1500 g 3.5 Fr 3.5 Fr>1500 g 5.0 Fr 5.0 Fr

the left, and at any arterial O2 partial pressure (PaO2)below 100 mm Hg (13332.2 Pa) fetal blood binds more O2.This shift seems to be the result of the lower affinity of fetalhemoglobin for 2,3-diphosphoglycerate (DPG). Shunting isa common occurrence in the neonate, such as in congenitalcyanotic heart disease, persistent fetal circulation, oratelectasis. O2 supplementation does not prevent thehypoxia produced by such a shunt. Arterial carbon dioxidepartial pressure (PaCO2) is an important measure of pul-monary function in neonatal respiratory disease. Theinitiation of ventilation with the first breath after normaldelivery results in a rapid fall in PaCO2 within minutes ofbirth. PO2 rises rapidly to levels of 60 to 90 mm Hg (17).Immaturity of the kidney in the newborn affects the basalacid–base status and the response to additional acid andalkali loads (18). The blood bicarbonate (HCO3�) concen-tration is typically lower than in the adult (18–21 mEq/L).However, the blood pH (7.35 –7.43) is only marginallydecreased because of the compensatory increase in theneonatal respiratory rate. Table 2 lists the normal valuesof pH, PaCO2, and total CO2 in the adult and in pretermand term neonates (19). The transition from fetal to neo-natal life, which is associated with rapid changes in fluid
and electrolyte balance, and the neonate’s small size makethe electrolytes and glucose assessment difficult and com-plicated (20), especially in the first week of life. A physio-logic decrease in extracellular water volume, as well as atransient increase in serum potassium and transientdecreases in plasma glucose and total plasma ionizedcalcium concentrations, must be taken into account whenmonitoring neonatal electrolytes and glucose. Frequentand even continuous monitoring of physiological para-meters is indicated in some cases, including glucose andcalcium monitoring in the premature newborn (limitedhepatic glycogen storage) and in newborns of diabeticmothers (21). Before birth, fetal glucose is slightly higherthan maternal glucose. With cord clamping, neonatalplasma level plummets over the first 60–90 min of life(23), (23). Neonatal hormonal changes later leads to anincrease in endogenous glucose production and stabiliza-tion of its level.
Technical Aspects of Neonatal Blood Gasand Biochemical Measurement
Technologic innovations in the development of biosensorsand microprocessors have led to development of bedsidesmall and accurate point-of-care (POC) devices (24). POCdevices have been used widely in critical care units, includ-ing the NICU. These devices are divided into two groups:‘‘Analyzers,’’ which are not attached to the patient bloodsource and require blood sampling, and ‘‘monitors,’’ whichare continuous or near-continuous patient-attached POCmonitors (25). Neonatal biochemical measurement mayinclude several important blood parameters, such assodium, potassium, calcium, glucose, and even lactateTable 3.
Intermittent Blood Gas and Biochemical Measurement(Sampling). This is the most common technique used inthe NICU for invasive neonatal blood gas and biochemicalmeasurement. Usually a small blood sample is withdrawnfrom a blood vessel, such as an umbilical vessel through anumbilical catheter. This sample is analyzed by using abedside point-of-care analyzer or sent to a small satellitelaboratory unit in the NICU or to the central laboratory.Blood gas analyzers are discussed in other articles in thisEncyclopedia. These analyzers use the principles of Clark’selectrode for PO2 measurement and Severinghaus’selectrode for PCO2 measurement. Some blood-sample col-lecting systems are commercially available, such as theEdward VAMP Jr. system manufactured by Edward(Fig. 4), which are manufactured specifically for neonateand small children use. This system is latex-free, disposa-ble, closed, with small volume systems. Such systems aredesigned to the decrease the risks of blood loss, infection,and air bubbles (26).
Continuous Intravascular Neonatal Blood Gas andBiochemical Sensors. There are several drawbacks forusing frequent arterial blood gas (ABG) sampling in theneonate (27). This method may result in blood loss that cannecessitate blood transfusion. Moreover, in this method,rapid changes in blood gas values may be missed, especially
MONITORING, UMBILICAL ARTERY AND VEIN 591
Figure 3. Anteroposterior roentgenogram shows the position ofumbilical artery and vein catheters. Lateral roentgenogram isneeded to distinguish the umbilical artery from the umbilicalvein catheter and to determine the appropriate level ofinsertion. A¼ endotracheal tube; B¼umbilical venous catheter.C¼umbilical artery catheter passed up the aorta to T12.
Table 2. Acid–base Parameters in Neonates and Adults(mean�SD)
Preterm Term AdultpH 7.40 � 0.08 7.40 � 0.06 7.40 � 0.03PCO2 34.0 � 9.0 33.5 � 3.6 39.0 � 2.6Total CO2 21.0 � 2.0 21.0 � 1.8 25.2 � 2.8
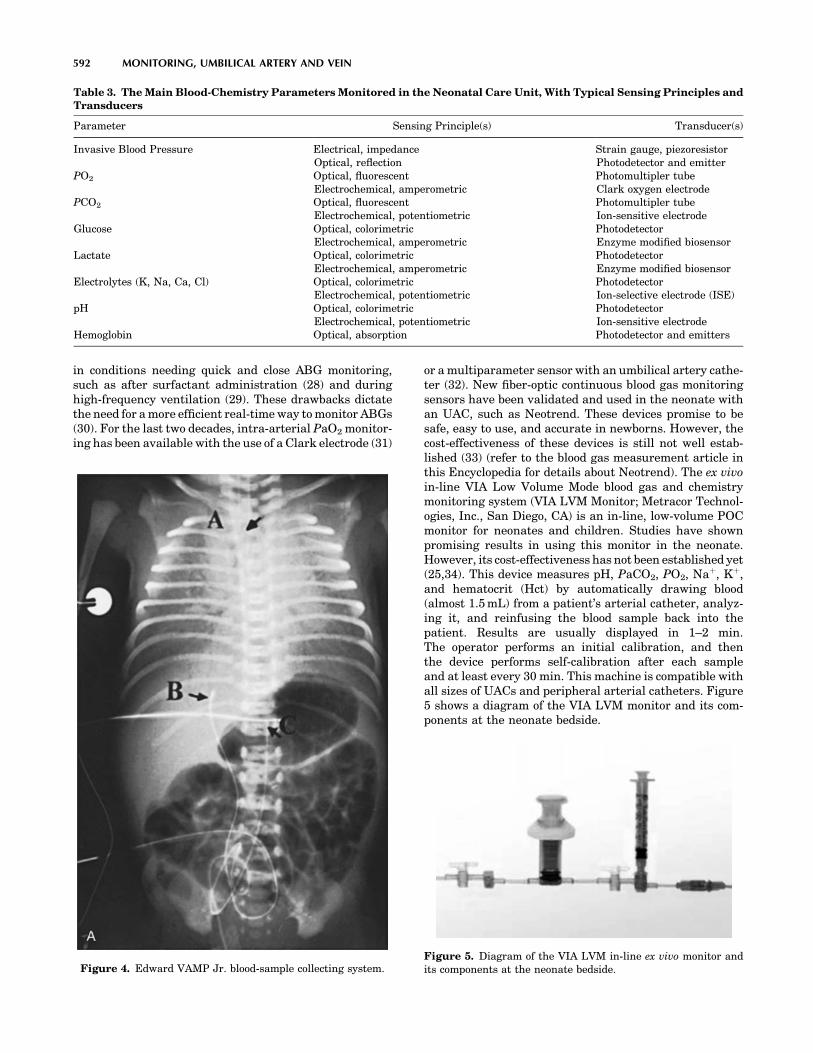
in conditions needing quick and close ABG monitoring,such as after surfactant administration (28) and duringhigh-frequency ventilation (29). These drawbacks dictatethe need for a more efficient real-time way to monitor ABGs(30). For the last two decades, intra-arterial PaO2 monitor-ing has been available with the use of a Clark electrode (31)
or a multiparameter sensor with an umbilical artery cathe-ter (32). New fiber-optic continuous blood gas monitoringsensors have been validated and used in the neonate withan UAC, such as Neotrend. These devices promise to besafe, easy to use, and accurate in newborns. However, thecost-effectiveness of these devices is still not well estab-lished (33) (refer to the blood gas measurement article inthis Encyclopedia for details about Neotrend). The ex vivoin-line VIA Low Volume Mode blood gas and chemistrymonitoring system (VIA LVM Monitor; Metracor Technol-ogies, Inc., San Diego, CA) is an in-line, low-volume POCmonitor for neonates and children. Studies have shownpromising results in using this monitor in the neonate.However, its cost-effectiveness has not been established yet(25,34). This device measures pH, PaCO2, PO2, Naþ, Kþ,and hematocrit (Hct) by automatically drawing blood(almost 1.5 mL) from a patient’s arterial catheter, analyz-ing it, and reinfusing the blood sample back into thepatient. Results are usually displayed in 1–2 min.The operator performs an initial calibration, and thenthe device performs self-calibration after each sampleand at least every 30 min. This machine is compatible withall sizes of UACs and peripheral arterial catheters. Figure5 shows a diagram of the VIA LVM monitor and its com-ponents at the neonate bedside.
592 MONITORING, UMBILICAL ARTERY AND VEIN
Table 3. The Main Blood-Chemistry Parameters Monitored in the Neonatal Care Unit, With Typical Sensing Principles andTransducers
Parameter Sensing Principle(s) Transducer(s)
Invasive Blood Pressure Electrical, impedanceOptical, reflection
Strain gauge, piezoresistorPhotodetector and emitter
PO2 Optical, fluorescentElectrochemical, amperometric
Photomultipler tubeClark oxygen electrode
PCO2 Optical, fluorescentElectrochemical, potentiometric
Photomultipler tubeIon-sensitive electrode
Glucose Optical, colorimetricElectrochemical, amperometric
PhotodetectorEnzyme modified biosensor
Lactate Optical, colorimetricElectrochemical, amperometric
PhotodetectorEnzyme modified biosensor
Electrolytes (K, Na, Ca, Cl) Optical, colorimetricElectrochemical, potentiometric
PhotodetectorIon-selective electrode (ISE)
pH Optical, colorimetricElectrochemical, potentiometric
PhotodetectorIon-sensitive electrode
Hemoglobin Optical, absorption Photodetector and emitters
Figure 4. Edward VAMP Jr. blood-sample collecting system.Figure 5. Diagram of the VIA LVM in-line ex vivo monitor andits components at the neonate bedside.

Neonatal Hemodynamic Monitoring
Direct arterial blood pressure monitoring is the most accuratetechnique for determining arterial pressure in the neonate(9). This method is best done by using umbilical arterycatheterization. It is an easy and quick procedure in compar-ison with other neonatal artery catheterizations, such asradial and femoral artery catheterization. After the umbi-lical artery catheterization is done as described above, it isconnected to a pressure transducer and a continuous flowdevice, as well as stopcock and manometer tubing.
Basic Concepts. Hemodynamic pressure monitoringrequires several basic components to accurately measurethe physiologic pressures. These components are: (1) anintravascular catheter, (2) connecting tubing and stop-cocks to connect that catheter and the patient’s bloodvessels to the monitoring system, (3) a pressure transducerto convert the mechanical impulse of a pressure wave intoan electrical signal through movement of a displaceablesensing diaphragm, (4) a continuous flush device that fillsthe pressure tubing with fluid and helps prevent blood fromclotting in the catheter, (5) an amplifier that increases thelow-voltage signal from the pressure transducer to a signalthat can be displayed on a display device, (6) an oscilloscopeto display waveforms and a digital readout to displaynumerical data, and (7) a processor or microcomputer thatis used to calculate various hemodynamic parametersbased on the measured variables.
Pressure Transducers. Pressure transducers are dividedin two groups: (1) External transducers located away fromthe intravascular catheter and connected to that cathetervia fluid-filled pressure tubing, and (2) catheter-tip trans-ducers. The external transducers use three types of sensingelements: (1) strain gauges. These consist of an electricallyconductive elastic material that responds reversibly todeformation by a change in electrical resistance. The resis-tance is converted into a voltage signal by connecting theelements to form a Wheatstone bridge circuit. The outputvoltage is proportional to the applied pressure and theexcitation voltage. Strain gauges are the most commonmethod of pressure transduction. (2) Silicon strain gauges.These are thin slices of silicon crystal bonded onto the backof a diaphragm. The movement of the diaphragm causes achange in the resistance of the crystal, which can beconverted into an output signal. Silicon strain gaugesare more sensitive than standard strain gauges, but theyare affected by temperature and are non-linear. (3) Opticalsensors: These are also diaphragms, but in this case, themovement of the diaphragm is sensed by reflecting a beamof light off the silver back of the diaphragm onto a photo-electric cell. The intensity of light sensed by the photo-electric cell changes with the diaphragm position, causinga decrease in its electrical output.
The Pressure Measurement System. The arterial wave-form can be characterized as a complex sine wave, which isthe summation of a series of simple sine waves of differentamplitude and frequencies. The fundamental frequency (orfirst harmonic) is equal to the heart rate. The first 10
harmonics of the fundamental frequency contribute tothe waveform. Any measurement system responds to arestricted range of frequencies only. Within this range,the system may respond more sensitively to some frequen-cies than to others. The response of the system plottedagainst the signal frequency is the frequency response ofthe system. However, the measurement system may pos-sess natural frequencies or resonances determined by theinertial and compliant elements in a mechanical system.These resonances can distort the output signals. Therefore,it is essential that the natural frequencies do not lie in theoperating frequency range of the instrument. Moreover,the output signal of a measurement may differ from theinput signal created by the bloodstream because of theinertial components, frictional effects of movement, viscousforces of fluids, and electrical resistance. The property thatdetermines these effects is called the damping of thesystem (35).
Technical Management of Pressure Monitoring System.These are some significant practical points in operatingthis system:
1. Removal of all air bubbles from system: Air is morecompressible than fluid, and it tends to act as a‘‘shock absorber’’ within the pressure monitoringsystem, leading to an overdamped waveform, whichmay lead to false readings of the blood pressure.Moreover, air bubbles may cause serious air embo-lism, especially in neonates and small children.
2. Zeroing the transducer: The accuracy of invasivepressure measurements is dependent on the estab-lishment of an accurate reference point (Zeroing).This is done by opening the stopcock to atmosphericpressure and zeroing the measurement system toeliminate the effect of the atmospheric pressure,and by leveling the transducer to the level of theupper portion of the right atrium (the patient’s ‘‘mid-axillary line’’ or ‘‘phlebostatic axis’’) to eliminate theeffect of the blood hydrostatic pressure.
3. Fast-flush technique: A ‘‘fast-flush’’ or ‘‘square wavetest’’ is performed by opening the valve of the con-tinuous flush device, which leads to an acute increasein the fluid flow rate through the catheter-tubingsystem from the usual 1–3 mL/h to 30 mL/h. Thisgenerates an acute rise in pressure within the systemsuch that a square wave is generated on the monitor.With closure of the valve, a sinusoidal pressure waveof a given frequency and progressively decreasingamplitude is generated. A system with appropriatedynamic response characteristics will return to thebaseline pressure waveform within one to two oscil-lations. If the fast-flush technique produces dynamicresponse characteristics that are inadequate, theclinician should troubleshoot the system (i.e., removeall air bubbles, minimize tubing length and stop-cocks, etc.) until an acceptable dynamic response isachieved. The above-explained basic concepts inhemodynamic monitoring are used in pressure mon-itoring in neonates as well as in adults. Because of
MONITORING, UMBILICAL ARTERY AND VEIN 593

the small size of a neonate (or premature newborn)and because of the different indications and expectedcomplications from adults and older children, thesemonitors have been modified to fit these require-ments. These modifications and changes include (1)using a more simple tubing system with fewer stop-cocks to reduce the risk of air embolism and infection,(2) using a smaller volume tubing system with smallsyringes to decrease blood loss and the need for bloodtransfusion, and (3) using a special constant-low-rateflush system to decrease the risk of fluid overloading.After correct placement of the umbilical artery cathe-ter, a stopcock (free of air bubbles) is connected to itsdistal end. Then a fluid-filled, well-flushed pediatric/neonatal blood pressure tubing is connected to thatstopcock (or directly to the catheter). The transduceris zeroed and leveled to the midaxillary level. Thereare several commercially available neonatal/pedia-tricpressure transducersand tubing systems.Figure6shows a disposable, latex-free neonatal/pediatricDeltran blood pressure monitoring and needlelessblood collection system (36). For central venous pres-sure (CVP) monitoring, a dual-lumen or triple-lumenumbilical vein catheter may be used. Figs. 2 and 7show some of the currently available catheters. Neo-natal/pediatric pulmonary artery catheters (PACs)have been used through the umbilical vein. However,they are difficult to place and have numerous com-plications and risks associated with their placement.Other noninvasive cardiac monitors, such as echo-cardiography, can assess cardiac output and otherphysiological cardiac parameters. Thus, use of theneonatal PAC has decreased significantly. The mostcommon indications for pediatric PACs are for car-diogenic shock, for severe distributive shock, for theuse of very high ventilator pressures to achieve ade-
quate oxygenation, and for the perioperative man-agement of patients who have undergone complexcardiac or other major surgeries (37). The smallestthermodilution catheter available is 5 Fr in size,although a single-lumen 4-Fr catheter exists and isuseful formeasuringpulmonaryarterypressure (PAP)or obtaining mixed venous saturation (MvO2). Poten-tial complications of pulmonary artery catheterizationinclude pulmonary artery erosion or infarction, dys-rhythmia, damage to the pulmonic valve, coiling in theright ventricle, and cardiac perforation (38).
Complications and Risks
Umbilical Artery Catheter. Many complications andrisks are associated with UAC placement (39). Therefore,these catheters should not be used solely for fluid andmedication administration. If an infant does not requirefrequent arterial blood sampling or continuous blood pres-sure monitoring, there is almost no justification for leavinga UAC inserted. The advantages and disadvantages of‘‘high’’ versus ‘‘low’’ UAC are still debated. Recent studies(40–43) have found that ‘‘high’’ catheters are associatedwith a decreased incidence of complications without astatistically significant increase in any adverse sequelae.Therefore, one major review of the literature has concludedthat ‘‘there appears to be no evidence to support the use oflow placed umbilical artery catheters. High cathetersshould be used exclusively’’ (40). It is clear that UACs thatare located between the ‘‘high’’ and ‘‘low’’ positions are neverappropriate. Catheters in these positions have been asso-ciated with refractory hypoglycemia (infusion into the celiacaxis), paraplegia (infusion into the artery of Adamkievicz)
594 MONITORING, UMBILICAL ARTERY AND VEIN
Figure 6. Neonatal/Pediatric Deltran pressure tubing withneedleless blood collection system.
Figure 7. Catheter.

(44), and thromboses that affect the kidneys (infusion intothe renal arteries) or the gut (infusion into the mesentericarteries). A catheter that is found in this intermediateposition should be pulled to a ‘‘low’’ position or removed.Similarly, catheters should not be placed below the level ofL5 because of the risk of gluteal skin necrosis (45) and sciaticnerve damage (45). Catheters that are placed below the levelof L5 should be removed promptly. Other complications mayinclude catheter occlusion, infection, air embolism, breaksor transection of the catheter, electrical hazards, intravas-cular knots in the catheters, bladder injury, peritonealperforation, Wharton’s jelly embolus, and others.
Umbilical Venous Catheter. Thromboembolic eventsand infections are common complications of UVC use.These complications are similar to those of other centralcatheters, although UVCs are associated with an increasedrisk of localized infections of the liver and heart. Complica-tions that are specific to UVC commonly are the result ofmalposition of the catheter. Nearly all experts recommendplacement of the catheter outside the heart in the IVC (46).Complications occur as a result of placement of the catheterin the right side of the heart or the left side (via the foramenovale). Cardiac arrhythmias are common complications,but these arrhythmias usually resolve after catheter with-drawal from the heart. Cardiac perforation with subse-quent pericardial effusion and cardiac tamponade has beenreported (47) Quick diagnosis (high index of suspicion,chest radiograph, and ultrasonography) and prompt treat-ment with pericardiocentesis decrease mortality signifi-cantly in these neonates. Placement of the catheter in theportal system can result in serious hepatic injury. Hepaticnecrosis can occur from thrombosis of the hepatic veins orinfusion of hypertonic or vasospastic solutions into the liver.Necrotizing enterocolitis and perforation of the colon alsohave been reported after positioning of the catheter in theportal system. Other complications of umbilical venouscatheters have been reported and include perforation ofthe peritoneum, electrical hazards, and digital ischemia.
Umbilical Catheter Removal and Maintenance
According to the American Academy of Pediatrics (AAP)guidelines (48), umbilical artery or venous cathetersshould be removed and not replaced if there is any signof catheter-related bloodstream infections, vascular insuf-ficiency, or thrombosis. Moreover, umbilical catheters mustbe removed as soon as possible when no longer needed orwhen any sign of vascular insufficiency to the lower extre-mities is observed. An umbilical artery catheter should notbe left in place more than 5 days. However, an umbilical
venous catheter can be used up to 14 days if managedaseptically. Umbilical venous catheters may replaced onlyif the catheter malfunctions. Table 4 lists the importanttasks for daily care of umbilical indwelling catheters.
FUTURE TRENDS IN INVASIVE NEONATAL MONITORING
Providing real-time, accurate, reliable, compact, at the bed-side, and safe neonatal monitoring devices is the future goalof researchers and manufactures involved with neonatalcritical care (3). However, the cost issue is still outstandingand is going to be a major factor in directing this industry.The market demand for integrated critical care units and theclinical demand for continuous and rapid biochemical mon-itoring at the bedside, especially in critically ill patients, willlead to a closer integration between the vital signs monitorsand POC analyzers. The monitor and POC analyzer manu-facturers have been separate companies. This will slowlychange through the formation of strategic alliances andmergers. Therefore, new devices will combine continuousvital signs, blood gases, and blood chemistry in the criticalcare units, including the NICU. The demand for continuousmonitoring of biochemical parameters is at the same timebounded by the requirement for low-blood-loss systems, espe-cially in the NICU. This is where the in-line and indwellinganalyzers can offer a major advantage over the POC analy-zers. Fortunately, technology is also moving in the rightdirection to minimize iatrogenic blood loss and decrease therisk of infection through the advances made in sampling,preparation, and handling of liquids using microfluidictechniques and closed systems (49). It is likely that in-linemonitors that interface to umbilical artery catheters willbecome more widespread and will require decreasing sam-ple-volumes. The continuing application and refinement ofestablished optical assay methods, such as absorption andfluorescence spectroscopy, onto fibre-optic cables will enablethe detection of increasing numbers of analytes by indwel-ling probes encased within the umbilical catheters (50,51).
SUMMARY
The use of umbilical vessel catheterization and associatedmonitoring techniques and devices has been advanceddramatically since Dr. Louis K. Diamond of Boston usedplastic tubing on the umbilical vein for blood transfusion in1946. Advances in invasive neonatal monitoring and neo-natal intravascular access have led to a significant reduc-tion in the incidence of complications and have increased thenumber of indications for umbilical catheters. Umbilicalvessel catheterization is now a routine and safe procedure
MONITORING, UMBILICAL ARTERY AND VEIN 595
Table 4. Care of Indwelling Umbilical Catheter
� Change all tubings and connections daily.� Secure and label all tubing, and connections should be secured and labeled appropriately.� Use only appropriate filters.� Maintain catheter, connections, and tubing free of blood to prevent clot formation, or inadvertent flushing of preexisting clots into the
neonate.� Flush catheter with 0.5 mL of flush solution each time blood sample is drawn.� Chart fluids infused in intake/output record.� Infuse heparinized parenteral solution continuously through catheter, interrupting only to obtain blood samples.

in the NICU. Moreover, with the increase in the survivalrate of low- and very low-birth-weight neonates, the need forthese catheters has increased. Sometimes these cathetersare the only intravascular access that can be established inthis new group of patients. The innovation and developmentof medical applications of silicone and polyurethane enablethe manufacturers to make soft, small catheters with ade-quate lumen size. These catheters cause minimal adversereaction to the newborn body. To decrease the risk of bloodloss and infection, new blood sampling devices have beendeveloped. These systems are closed and have small volumetubing. New technologies for continuous monitoring of bloodgases and neonatal chemistries in-line have been integratedwith the umbilical catheters by using special sensorsencased in the tip of the catheters. The future trend is touse smaller, compact, real-time, bedside monitors combinedwith pulse oximetry and other vital signs monitors. How-ever, the issue of the cost-effectiveness of these machineshas yet to be determined.
BIBLIOGRAPHY
1. Walsh-Sukys MC, Fanaroff AA. Perinatal services andresources. In: Fanaroff AA, Martin RJ, editors. Neonatal-Perinatal Medicine, Diseases of the Fetus and Infant. 6th ed.St. Louis: Mosby; 1999.
2. Stovroff M, Teague WG. Pediatric surgery for the primarycare pediatrician, Part II: Intravenous access in infants andchildren. Pediatric Clin North Am 1998;45(6).
3. Murkovı́c I, Steinberg MD, Murkovı́c B. Sensors in neonatalmonitoring: Current practice and future trends. TechnolHealth Care 2003;11:399–412.
4. Diamond LK, Allen Jr FH, Thomas Jr WO, Erythroblastosisfetalis. VII. Treatment with exchange transfusion. N Engl JMed 1951;244:39–49.
5. Klaus MH, Fanaroff AA. Care of the High-Risk Neonate, 5thed. Philadelphia: WB Saunders; 2001
6. Bartlett RH, Roloff DW, Cornell RG, Andrews AF, Dillon PW,Zwischenberger JB. Extracorporeal circulation in neonatalrespiratory failure: A prospective randomized study. Pedia-trics 1985;76:479–497.
7. Sadler TW. Langman’s Medical Embryology: CardiovascularSystem,8thed.Philadelphia:LippincottWilliams&Wilkins;2000.
8. Guyton AC, Hall JE. Textbook of Medical Physiology: Fetaland Neonatal Physiology, 10th ed. Philadelphia: W.B. Saun-ders; 2000.
9. Zahka KG. Principles of neonatal cardiovascular hemody-namics. In: Fanaroff AA, Martin RJ. editors, Neonatal-Peri-natal Medicine, Diseases of the Fetus and Infant. 6th ed. St.Louis: Mosby; 1999.
10. Grady M, Procedures. In: Gunn VL. Nechyba C, editors,Harriet Lane Handbook: A Manual for Pediatric House Offi-cers, 16th ed. St. Louis: Mosby; 2002.
11. Brown EG, Krouskop RW. Monitoring, umbilical artery andvein. In: Webster JG, editor. Encyclopedia of Medical Devicesand Instrumentation, New York: Wiley; 1988
12. Chidi CC, King DR, Boles Jr ET, An ultrastructural study ofthe intimal injury induced by an indwelling umbilical arterycatheter. J Pediatr Surg 1983;18:109–115.
13. http://www.utahmed.com/umbili-c.htm.14. Barrington KJ. Umbilical artery catheters: Catheter design
(CochraneReview).In: TheCochraneLibraryIssue4.Oxford;1997.15. Gregory GA. Resuscitation of the newborn. In: Miller RD,
editor. Miller’s Anesthesia. 6th ed. New York: Elsevier; 2005.
16. Barrington KJ. Umbilical artery catheters in the newborn:effects of position of the catheter tip. Cochrane Database SystRev CD000505, 2000.
17. Carlo WA. Assessment of pulmonary function. In: FanaroffAA, Martin RJ, editors. Neonatal-Perinatal Medicine, Dis-eases of the Fetus and Infant. 6th ed. St Louis: Mosby; 1999.
18. Stork JE, Stork EK. Acid-base physiology and disorders inthe neonate. In: Fanaroff AA, Martin RJ. editors, Neonatal-Perinatal Medicine, Diseases of the Fetus and Infant. 6th ed.St. Louis: Mosby; 1999.
19. Lorenz JM, Kleiman LI, Kotagal UR, Reller MD. Waterbalance in very low birth infants: Relationship to water andsodium intake and effect on outcome J Pediatrics 1982;101:423–432.
20. Lorenz JM. Assessing fluid and electrolyte status in thenewborn, Nat Acad of Clin Biochem. Clin Chem1997;43(1):205–210.
21. Heck LI, Erenberg A. Serum glucose values during the first48 h of life. J Pediatr 1978;110:119–122.
22. Srinivasan G, Pildes RS, Cattamanchi G, Voora S, Lillian LD.Plasma glucose values in normal neonates: A new look. JPediatr 1984;105:114–119.
23. Tsang RC, Chen IW, Freidman MA, Chen I. Neonatal para-thyroid function: role of gestational and postnatal age. JPediatr 1973;83:728–730.
24. Ehrmeyer SS, Laessig RH, Leinweber JE, Oryall JJ. Medi-care/CLIA final rules for proficiency testing: Minimum intra-laboratory performance characteristics (CV and bias) neededto pass. Clin Chem 1990;36:1736–1740.
25. Billman GF, et al. Clinical performance of an in-line, ex vivopoint-of-care monitor: A multicenter study. Clin Chem2002;48(11): 2030–2043.
26. http://www.edwards.com/Products/PressureMonitoring/Vamp Jr.htm
27. Meyers PA, Worwa C, Trusty R, Mammel MC. Clinicalvalidation of a continuous intravascular neonatal blood gassensor introduced through an umbilical artery catheter.Respir Care 2002;47(6):682–687.
28. Kresch MJ, Lin WH, Thrall RS. Surfactant replacementtherapy. Thorax 1996;51(11):1137–1154.
29. Nelle M, Zilow EP, Linderkamp O. Effects of high-frequencyoscillatoryventilationoncirculationinneonateswithpulmonaryinterstitialemphysemaofRDS.IntenCareMed1997;23(6):671–676.
30. Goddard P, et al. Use of continuously recording intravascularoxygen electrode in the newborn. Arch Dis Child 1974;49(11):853–860.
31. Weiss IK, Fink S, Harrison R, Feldman JD, Brill JE. Clinicaluse of continuous arterial blood gas monitoring in the pedia-tric intensive care unit. Pediatrics 1999;103:440–445.
32. Morgan C, et al. Continuous neonatal blood gas monitoringusing a multiparameter intra-arterial sensor. Arch Dis ChildFetal Neonatal Ed 80(2):F93–F98.
33. Rais-Bahrami K, Rivera O, Mikesell GT, Short BL. Contin-uous blood gas monitoring using in-dwelling optode method:Comparison to intermittent arterial blood gas sampling inECMO patients. J Perinatol 2002;22(6):472–474.
34. Widness JA, et al. Clinical performance of an in-line point-of-care monitor in neonates. Pediatrics 2000;106(3): 497– 504.
35. Gardner RM. Invasive pressure monitoring. In: Civetta JM,Taylor RW, Kirby RR. editors Critical Care, 3rd ed. Phila-delphia: Lippincott-Raven; 1997. pp 839–845.
36. http://www.utahmed.com/deltran.htm.37. Ewert P, Nagdyman N, Fischer T, Gortner L, Lange PE.
Continuous monitoring of cardiac output in neonates usingan intra-aortic Doppler probe. Cardiol Young 1999;9(1):42–48.
596 MONITORING, UMBILICAL ARTERY AND VEIN

38. Tsai-Goodman B, et al. Development of a system to recordcardiac output continuously in the newborn. Pediatr Res.1999;46(5):621–625.
39. Hermansen MC, Hermansen MG. Intravascular cathetercomplications in the neonatal intensive care unit. Clin Peri-natol; 2005;32(1):141–156.
40. Barrington KJ. Umbilical artery catheters in the newborn:Effects of position of the catheter tip. Cochrane Database SystRev CD000505, 2000.
41. Kempley ST, Bennett S, Loftus BG. Randomized trial ofumbilical arterial catheter position: Clinical outcome. ActaPaediatr 1993;82:173–176.
42. Mokrohisky ST, Levine RL, Blumhagen JD. Low positioningof umbilical-artery catheters increases associated complica-tions in newborn infants. N Engl J Med 1978;299:561–564.
43. Umbilical Artery Catheter Trial Study Group. Relationshipof intraventricular hemorrhage or death with the level ofumbilical artery catheter placement: A multicenter rando-mized clinical trial. Pediatrics 1992;90:881–887.
44. Haldeman S, Fowler GW, Ashwal S. Acute flaccid neonatalparaplegia: A case report. Neurology 1983;33:93–95.
45. Cumming WA, Burchfield DJ. Accidental catheterization ofinternal iliac artery branches: A serious complication of umbi-lical artery catheterization. J Perinatol 1994;14:304–309.
46. Klaus MH, Fanaroff AA. Care of the high-risk neonate, 5thed. Philadelphia: WB Saunders; 2001.
47. Nowlen TT, Rosenthal GL, Johnson GL. Pericardial effusionand tamponade in infants with central catheters. Pediatrics2002;110:137–142.
48. O’Grady NP, et al. Guidelines for the prevention of intravas-cular catheter-related infections. Pediatrics 2002;110(5):e51.
49. Tudos AJ, Besselink GAJ, Schasfoort RBM. Trends in min-iaturized total analysis systems for point-of-care testing inclinical chemistry. Lab on a Chip: 2001;1(2):83–95.
50. Wolfbeis OS. Fiber-optic chemical sensors and biosensors.Anal Chem 2001;74(12):2663–2677.
51. Zhang XC. Terahertz wave imaging: Horizons and hurdles.Proceedings of the First International Conference on Biome-dical Imaging and Sensing Applications of THz Technology,Physics in Medicine Biology 2002;47(21):3667–3677.
See also ARTERIES, ELASTIC PROPERTIES OF; BLOOD GAS MEASUREMENTS;FIBER OPTICS IN MEDICINE; NEONATAL MONITORING; STRAIN GAGE.
MONOCLONAL ANTIBODIES
BRENDA H. LASTER
JACOB GOPAS
Ben Gurion University of theNegevBeer Sheva, Israel
INTRODUCTION
This article outlines the association of antibodies withinthe human immune system, the structural and bindingcharacteristics of antibodies, and the development andproduction of monoclonal antibodies. Recent advance-ments in recombinant DNA techniques and genetic engi-neering are described, including the use of plants toincrease the production capacity of Mabs. Their usefulnessas biological and medical reagents is further elaborated ina description of the various instrumentation, techniques,
and assays employed in the diagnosis and treatment ofdiseases as well as their utility in the research laboratory.
THE IMMUNE SYSTEM AS IT APPLIES TO ANTIBODIES (1)
The immune system is normally directed at foreign mole-cules borne by pathogenic microorganisms. However, theimmune system can also be induced to respond to simplenonliving molecules. Any substance that can elicit animmune response is said to be immunogenic and is calledan immunogen. There is a clear operational distinctionbetween an immunogen and an antigen. An antigen isdefined as any substance that can bind to a specific anti-body (see below), but is not necessarily able to elicit animmune response by itself.
Immunization
The deliberate induction of an immune response is knownas immunization. To determine whether an immuneresponse has occurred and to follow its course, the immu-nized individual is usually monitored for the appearance ofantibodies directed at the specific antigen. Monitoring theantibody response usually involves the analysis of rela-tively crude preparations of sera. The serum is the fluidphase of clotted blood, which contains a variety of specificantibodies against the immunizing antigen as well as othersoluble serum proteins.
Cells Participating in an Immune Response
B lymphocytes (or simply B cells) are one of the two majortypes of lymphocytes that enable the adaptive immuneresponse. When activated, B cells differentiate into plasmacells that secrete antibodies. T lymphocytes or T cellsconsist of three main classes. One class differentiates uponactivation into cytotoxic T cells, which may kill foreigntissues, cancer cells, and cells infected with virus. Thesecond class of T lymphocytes is T helper cells that differ-entiate into cells that activate and enable the properfunction of other cells, such as B cells. The third class isthe T suppressor cells that limit the extent of the immuneresponse.
Antigen Recognition
Both T and B lymphocytes bear receptor proteins on theirsurface that allow them to recognize antigen. Collectively,these receptors are highly diverse in their antigen speci-ficity, but each individual lymphocyte is equipped withmembrane-bound receptors that will recognize only oneparticular antigen. Each lymphocyte therefore recognizes adifferent antigen. Together, the receptors of all the differ-ent lymphocytes are capable of recognizing a very widediversity of antigens, which encompass most of the differ-ent antigens an individual will meet in a lifetime. Theseinclude those antigens that are exclusively synthesized inthe laboratory. The B cells do not secrete antibody untilthey have been stimulated by specific antigen. The B-cellantigen receptor (BCR) is a membrane-bound form of thesame antibody that they will secrete when activated byantigen. Thus the antigen recognized by both the BCR and
MONOCLONAL ANTIBODIES 597

the secreted antibody present in the same B cell, areidentical.
Antibodies
Antibody molecules as a class are now generally known asimmunoglobulins (Ig), and the antigen receptor of B lym-phocytes is known as surface immunoglobulin. The T cellantigen receptor (TCR) is related to immunoglobulins, butis quite distinct from it in structure and function.
Structure and Function of Antibodies
Antibodies are the antigen-specific products (proteins)secreted by B cells. The antibody molecule has two separatefunctions: one is to bind specifically to molecules from theimmunogen (pathogen) that elicited the immune response;the other is to recruit various cells and molecules in orderto remove and destroy the pathogen once the antibody isbound to it. These functions are structurally separated inthe antibody molecule. One region of the antibody specifi-cally recognizes antigen and the other engages the effectormechanisms that will dispose of it.
The antigen-binding region varies extensively amongantibody molecules and is thus known as the variableregion or V region, labeled as VH (heavy chain) and VL(light chain). It is this variability that allows each antibodymolecule to recognize and bind a particular antigen. Thetotal repertoire of antibodies made by a single individual islarge enough to ensure that virtually any structure can bebound. The association between the antibody and theantigen depends on their steric conformation. That is,depending on the size and interatomic distance of thesereacting molecules, a tight fit between the antibody com-bining sites and the antigenic determinant can occur.
The region of the antibody molecule that engages theeffector functions of the immune system, but is not asso-ciated with antibody binding and does not vary in the sameway is known as the constant region or C region. It istypified by the IgG antibody shown in Fig. 1 and is desig-nated CL (light chain) and CH (heavy chain). It has fivemain forms, or isotypes, that are specialized for activatingthe different immune effector mechanisms.
The remarkable diversity of antibody molecules is theconsequence of a highly specialized mechanism by which
598 MONOCLONAL ANTIBODIES
Antigenbinding
COOHCOOH
NH 2 NH2
NH2NH 2
COOH
Pepsin CleavageF (ab')z fragment
lostype Determinateµ,γ,α,δ, or £
Fab fragment
Fc fragment
COOHCOOH
Car
bohy
drat
e
PapainCleavage
Antigenbinding
ss s
ss ss s
s s
VL VL
VH VH
CL CL
CH1 CH1
CH2 CH2
CH3 CH3
Heavy chain constant region.
Heavy chain variable region.
Light chain variable region.
Carbohydrate.
Antigen binding site.
Disul fide bonds.
Papain cleavage site.
Pepsin cleavage site.
Light chain constant region.
Figure 1. Basic immunoglobulin structure. [Courtesy of Sigma-Aldrich (www.sigmaaldrich.com/img/assets/8181/AntibodyExp).]

the genes that code for antibody production and that areexpressed in any given B cell are assembled by DNArearrangements that join together two or three differentsegments to form a V region gene during the developmentof the B cell. Subsequent DNA rearrangement can attachthe assembled V-region to any C-region gene and thusproduce antibodies of any of the five isotypes.
Antibodies are roughly Y-shaped molecules. All anti-bodies are constructed in the same way from paired heavyand light polypeptide chains. In Fig. 1, one can observe thatthe innermost regions of the Y-shaped molecule are theheavy chains; the light chains are the outermost regions.Within this general category, however, five classes (iso-types) of immunoglobulin -IgM, IgD, IgG, IgA, and IgE- canbe distinguished biochemically as well as functionally. Thefive classes are defined by the structure of their heavychain. Their distinctive functional properties are conferredby differences in the amino acid sequences of the carboxy-terminal part of the heavy chain (COOH in Fig. 1) in theregion that is not associated with the light chain. IgG(Fig. 1) will be used to describe the general structuralfeatures of immunoglobulin molecules.
The IgG antibodies are large molecules (�150 kDa)composed of two different polypeptide chains. One of thesepolypeptide chains, �50 kDa in size, is termed the heavy orH chain. The other, is 25 kDa in size, and is termed thelight chain or L chain. The two chains are present in anequimolar ratio, and each IgG molecule contains two heavychains and two light chains. The two heavy chains arelinked to each other by disulfide bonds and each heavychain is linked to a light chain by a disulfide bond. In anyone immunoglobulin molecule, the two heavy chains andthe two light chains are identical, enabling them to bindtwo identical antigenic determinants.
The amino-terminal sequences of both the heavy andlight chains vary greatly among different antibodies. Thevariability in sequence is limited to approximately the first110 amino acids on the chain, corresponding to the firstdomain, whereas the carboxy-terminal sequences are con-stant between immunoglobulin chains, either light orheavy, of the same isotype.
Fragmentation of Antibodies
The antibody molecule can be readily cleaved by differentproteases into functionally distinct fragments. For exam-ple, Fab fragments, each of which consists of two identicalfragments, each containing the antigen binding region.Additionally, an Fc fragment can be extracted that inter-acts with effector molecules and cells, or one F(ab0)2 frag-ment that contains both arms of the antigen bindingregion. Figure 1 shows the sites of the derivation of thesefragments. Genetic engineering techniques now permit theconstruction of designed variations of the antibody mole-cule such as a truncated Fab that comprises only the Vregion of a heavy chain linked to a V region of a light chain.This is called a single–chain Fv. A broad range of geneti-cally engineered molecules are now becoming valuabletherapeutic agents because their smaller size readily per-mits their penetration into tissue. Useful antibodies fromanimal sources have been engineered in a process referred
to as ‘‘humanization’’. This avoids their recognition asforeign, and prevents their rapid clearance from the body.The process utilizes the variable region of a mouse antibodycoupled to the Fc region from human antibodies. Antibodyfragments may also be coupled to toxins, radioactive iso-topes and protein domains that interact with effectormolecules or cells.
MONOCLONAL ANTIBODIES
Antibody Heterogeneity
The antibodies generated in a natural immune response orafter immunization in the laboratory are a mixture ofmolecules of different antigen specificities and affinities.Because of their multiple specificities they are termedpolyclonal antibodies. Some of this heterogeneity resultsfrom the production of antibodies that bind numerousdifferent antigenic determinants (epitopes) present onthe immunizing antigen. However, even antibodies direc-ted at a single antigenic determinant can be markedlyheterogeneous. Antisera (serum containing antibodiesagainst specified antigens) are valuable for many biologicalpurposes, but they have certain inherent disadvantagesthat relate to the heterogeneity of the antibodies theycontain. First, each antiserum is different from all otherantisera, even when raised in a genetically identical ani-mal while using the identical preparation of antigen andimmunization protocol. Second, antisera can be producedin only limited volumes, and thus it is impossible to use theidentical serological reagent in a long or complex series ofexperiments, or in clinical tests or therapy. Finally, evenpurified antibodies may include minor populations of anti-bodies that give unexpected cross-reactions that confoundthe analysis of experiments and can be harmful in therapy.To avoid these problems, and to harness the full potential ofantibodies, it became necessary to develop a method formaking an unlimited supply of antibody molecules ofhomogeneous structure and known specificity. This hasbeen achieved through the production of monoclonal anti-bodies from hybrid antibody forming cells or, morerecently, by genetic engineering.
Production of Monoclonal Antibodies
In 1975, using cell culture techniques, Kohler and Milstein(2) found a way to grow an immortal B-cell-like lymphocytethat continuously produced an antibody with a predeter-mined specificity. The procedure required the immuniza-tion of a mouse in order to produce a large population ofB-cells in the spleen that would secrete a specific antibody.However, in cell culture, the life span of spleen cells is onlya few days. To produce a continuous source of antibody,the B cells had to grow continuously. This was achieved byfusing the spleen cells that contained a particular gene,the hypoxanthine-guanine phosphoribosyl transferase(HGPRT) gene with immortal myeloma cells (cancerousplasma cells). In general, plasma cells are mature-antibodysecreting B cells. The myeloma cells were preselected toensure three specific properties. First, immortality in cellculture; second, that they were sufficiently altered so that
MONOCLONAL ANTIBODIES 599

they did not secrete antibody, and third, that they wouldnot flourish in a particular growth medium containinghypoxanthine, aminopterin and thymidine (HAT). TheHAT medium was previously shown to be a highly selectivemedium for those specific hybrid cells that lack the gene forthe enzyme, HGPRT. Consequently, all unfused myelomaand spleen cells would not survive in the HAT medium. TheHGPRT gene that was contributed by the spleen cell
permitted only hybrid cells to survive in the HAT medium,because only hybrid cells would be able to grow in theculture due to the conferral of immortality by the myelomacells. Therefore, the immune spleen cells conferred bothantibody specificity and the HGPRT gene to the hybrid cell,while the myeloma cell conferred immortality to the spleencell and they were able to survive indefinitely in culture.This is the method that is used today to produce individualhybridomas (the hybrid cells) that are then screened forantibody production. Single antibody-producing cells thatproduce an antibody with the desired specificity are cloned.These cloned hybridoma cells are grown in bulk culture toproduce large amounts of antibody that are used in avariety of ways. Since each hybridoma is descended froma single B cell, all cells of a particular hybridoma cell lineproduce the same hybridoma molecule. This is the mono-clonal antibody (Mab). The procedure is shown as a sche-matic outline in Fig. 2.
Recombinant Genetic Engineering
The field of antibody engineering endeavors to improve thetarget specificity and effector function of the antibodies byaltering their construction, while retaining their bindingcharacteristics. This is achieved by using new recombinantengineering technologies to redesign the molecular archi-tecture of the antibodies. Examples of this are shown inFig. 3, where in a process called genetic engineering,recombinant DNA (spliced DNA that is formed from twoor more sources and then rejoined) is produced by puttinggenes from one species into the cells of an individualorganism of another species. The foreign DNA becomes
600 MONOCLONAL ANTIBODIES
Antigen
Spleen cells
3. Clone eachpositive culture
Fusion
Myeloma cells(HGPRT-)
1.Culture inHAT medium2.Test eachsupernatant
for antibodies
4. Test eachsupernatant
for antibodies
5. Expand positive clones
propagate
or in vivo
Harvest monoclonal antibodies
in vitro
Figure 2. Schematic of hybridoma protocol. [Courtesy ofProf. John Kimball (http://users.rcn.com/jkimball.ma.ultranet/Biology Pages/M/Monoclonals.html).]
Figure 3. Antibody engineering: exa-mples of antibody-based constructsand respective routes for their genera-tion. Hybridoma technology provides away of producing mouse monoclonalantibodies. Genetic engineering hasencouraged the creation of chimeric,humanized, and human antibodies,antibody fragments (traditionallyobtained by partial digestion ofimmunoglobulins with proteases),multimeric antibody fragments, fusion(immunoadhesins and immunotoxins)and bispecific antibodies. Multimericantibody fragments (diabody, tria-body, and tetrabody) are representedas multivalent structures, althoughthey can also be engineered to bemultispecific. The minibody depictedis a dimer that can be linked to theCH3 fragment via a LD linker or aflexible linker (FlexMinibody). Bispeci-fic F(ab)2 is shown as a Fab dimerlinked noncovalently via interactionof amphipathic helices. (Courtesyof American Chemical Society andAmerican Institute of Chemical Engi-neers, Copyright # 2004.) (See Ref. 3.)
CDR-Grafted Chimeric
MouseHybridoma
TransgenicmouseHuman
F(ab')2
F(ab')2Enzymedigestion
(papain, pepsin)
Chemicalconjugation
Recombinantsystems
In vitroAb
libraries
Mouse
Fab
Fv
Diabody
Triabody Minibody
scFv2
scFv
Immunoadhesin Bispecific F(ab)2
Immunotoxin
Fab
FcpFc'

part of the host’s genome (its genetic content) and isreplicated in subsequent generations descended from thathost. An alternative technique for producing antibody-likemolecules is the Phage Display Libraries for AntibodyV-region Production (4). In this approach, gene segmentsthat encode the antigen-binding variable region of anti-bodies are fused to genes that encode the coat protein (out-side surface) of a bacteriophage (viruses that infect bacteria).In essence, mRNA from primed human B-cells is convertedto cDNA. The large variety of diverse antibody genes areexpanded by the polymerase chain reaction (PCR) to gen-erate a highly diverse library of antibody genes. Bacter-iophage containing such gene fusions are then used toinfect bacteria, resulting in phage particles that have outersurfaces that express the both antibody-like fusion protein,and the same antigen-binding domain displayed on theoutside of the bacteriophage. The collection of such recom-binant phages, each displaying a different antigen-bindingdomain on its surface, is known as a phage display library.A particular phage can be isolated from the mixture andcan be used to infect fresh bacteria. Each phage isolated inthis way produces a monoclonal antigen-binding particleanalogous to a monoclonal antibody. A complete antibodymolecule can then be produced by fusing the V region of aparticular phage with the invariant part of the immuno-globulin gene. These reconstructed antibody genes can beintroduced (transfected) into a suitable host cell line. Thesegenes will become part of the cell’s genome and will secreteantibodies akin to hybridomas.
Monoclonal Antibodies Produced in Plants, Plantibodies
After undergoing genetic engineering techniques, plantcells are capable of assembling and producing unlimitedquantities of antibodies, referred to as plantibodies (5).This trademark name for human antibodies manufacturedin plants has functionally limitless production capacity andlower costs than those associated with the yeast fermenta-tion process that is currently being used to produce massquantities of human antibodies. This fairly recent findingmight prove to be of benefit in the medical, consumer, andindustrial applications of monoclonals. For example, it hasbeen postulated that the development of plantibodies witha capability of sequestering heavy metals or radioactivecompounds might have a very positive impact on theenvironment, particularly because their production is veryinexpensive and large supplies are easily produced.Because the corn crop is so readily available worldwide,and its kernel stores natural plantibodies, these can bepurified as needed by standard milling procedures. Potatoand tomato crops are also being used. The first clinical useof the effectiveness of a plantibody was against the bacter-ium, Streptococcus mutans. This organism produces lacticacid that erodes tooth enamel. The plantibody was brushedonto human teeth for 3 weeks and tooth decay was pre-vented for up to 4 months. The action of the antibody was toprevent the bacterium from binding to the tooth surface.Plantibody-containing gels are being developed to preventgenital herpes infections and to protect newborn babiesduring delivery against transmission of the Herpes virusfrom infected mothers. Plantibodies against human immu-
nodeficiency verus (HIV) and the production of sperm arealso being developed. Concerns have been expressed aboutthe use of genetically engineered food crops because of thepotential dangers of their getting into the wrong hands, ordisturbing the ecological balance.
The aforementioned technologies have revolutionizedthe use of antibodies by providing a limitless supply ofantibodies with single and known specificity. Monoclonalantibodies are now used in most serological assays, asdiagnostic probes and as therapeutic agents.
TECHNIQUES FOR USING MONOCLONAL ANTIBODIESAS SEROLOGICAL AND DIAGNOSTIC PROBES
Monoclonal antibodies can serve as tools for diagnosingand treating disease and are valuable agents in theresearch laboratory. Their utility required the develop-ment of procedures that would permit them to be viewedat the particular region of interest. Some of the most widelyused techniques are described in the following sections (1).
Immunofluorescence
Since antibodies bind stably and specifically to their cor-responding antigen, they are invaluable as probes foridentifying a particular molecule in cells, tissues, or bio-logical fluids. Monoclonal antibody molecules (Mabs) canbe used to locate their target molecules accurately in singlecells or tissue sections by a variety of different labelingtechniques. When either the antibody itself, or the anti-Mab that is used to detect it, is labeled with a fluorescentdye the technique is known as immunofluorescence. As inall serological techniques, the antibody binds stably to itsantigen, allowing any unbound antibody to be removed bythorough washing. The fluorescent dye can be covalentlyattached directly to the specific antibody, but more com-monly, the bound antibody is detected by a secondaryfluorescent anti-immunoglobulin; that is, the first antibodybinds to the antigen and a fluorescent secondary antibody(antibody) is targeted to the primary antibody–antigencomplex. The technique is known as indirect immunofluor-escence, which is demonstrated in Fig. 4, where the bindingof the first antibody to the antigen is followed by thebinding of the antibody. The dyes chosen for immunofluor-escence are excited by light of a particular wavelength, andemit light of a different wavelength in the visible spectrum.By using selective filters that can permit only certainwavelengths of light to pass, only that light coming fromthe dye or fluorochrome used is detected in the fluorescencemicroscope. Therefore, the antibody can be located byvirtue of its emission of fluorescent light. The recentlydeveloped confocal fluorescent microscope considerablyenhances the resolution of the technique. If different dyesare attached to different antibodies, the distribution of twoor more Mabs can be determined in the same cell or tissuesection. Differentiating between the antibodies occursbecause either the dye or the fluorochrome will excite atdifferent wavelengths or because they will emit their fluor-escence at different wavelengths. An example of the immu-nofluorescence technique is shown in Fig. 4, whereby,through the use of monoclonal antibodies targeted to
MONOCLONAL ANTIBODIES 601

intracellular proteins, certain structures within the cellbecome visible. The structure shown in Fig. 5 is that of thespindle, which appears during cell division. During certainphases of cell division, the chromosomes arrange themselvesin the equatorial plane of the spindle. The spindle is madeup of microtubules that, in turn, are composed of proteins.Monoclonal antibodies that would bind to two specific pro-teins, a and g-tubulin, of the microtubule were synthesizedand labeled with two different fluorochromes. During celldivision, the cells were exposed to the fluorescent-labeledMabs that formed a complex with the proteins and per-mitted visualization of the spindle.
Immunohistochemistry
An alternative to immunofluorescence for detecting a pro-tein in tissue sections is immunohistochemistry, in whichthe specific Mab is chemically coupled to an enzyme thatconverts a colorless substrate into a colored reaction pro-
duct in situ. The Enzyme-Linked ImmunoSorbent Assay(ELISA) is a technique that detects and quantifies specificantigens from a mixture. It is widely used in proceduresthat screen blood for viral or bacterial contamination, todetect infections, toxins, illegal drugs, or allergens, and inmeasuring hormone levels, such as in pregnancy or thyroidfunction. The assay involves the binding of an antibody to asolid surface and exposing it to the antigens. A secondcomplex, consisting of the same antibody, but additionallytagged with a particular enzyme, is exposed to the initialantibody–antigen conjugate and binds. After washing thesurface to remove excess unbound antigen, a colorlesssubstrate is added that permits the antigen to be convertedinto a colored product that can be read and measured usingabsorption spectrometry. The intensity of color is pro-portional to the concentration of bound antigen. A sche-matic of the ELISA assay is shown in Fig. 6. A moredetailed description of the Elisa procedure can be foundin (Kimball’s Biology Pages http://biology-pages.info).Horseradish peroxidase and alkaline phosphatase are alsoused as enzymes in immunochemistry assays. An exampleof the utility of these enzymes for protein detection isshown in Fig. 7.
Immunoelectron Microscopy
Antibodies can be used to detect the intracellular locationof structures or particular molecules by electron micro-scopy, a technique known as immunoelectron microscopy.After labeling Mabs with gold particles and targeting themto samples, they can then be examined in the transmissionelectron microscope. Since electrons do not penetratethrough gold particles, the regions in which the antibodiesbind appear as dark dots.
602 MONOCLONAL ANTIBODIES
Figure 4. Indirect immunofluorescence. The primary antibodybinds to the antigen and the fluorescent antiantibody binds tothe primary thereby increasing the signal. [Courtesy of Prof. v.Sengbusch (http://www.biologie.uni-hamburg.de/b-online/d00/copyrig.htm).]
Figure 5. Dividing cells (mitosis: metaphase, anaphase, andtelophase) were stained with monoclonal antibodies against twointracellular proteins, a-tubulin in green, and g-tubulin in red.Because these proteins constitute the spindle, the intracellularstructure upon which chromosomes line up during mitosis, the struc-ture is visualized by virtue of the difference in the fluoro-chromes tagged to the Mabs that were bound to the proteins.Chromosomes were stained with a blue dye. (www.img.cas.cz/dbc/gallery.htm.)
Antibody
Product
Add antigen
Sol
id
Add antibody-enzyme conjugate
Enzyme
Substrate(colorless)
Add substrate
Figure 6. Schematic of ELISA assay protocol. [Courtesy of Prof.John Kimball (http://users.rcn.com/jkimball.ma.ultranet/BiologyPages/E/Elisa.html).]
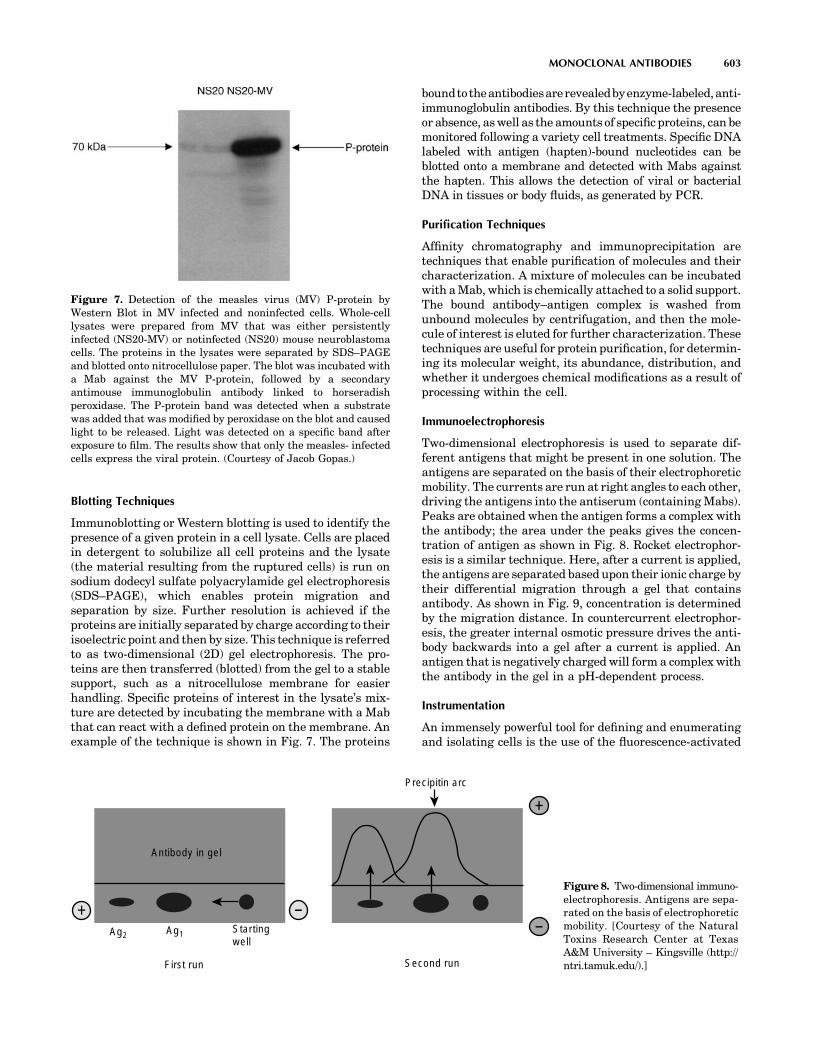
Blotting Techniques
Immunoblotting or Western blotting is used to identify thepresence of a given protein in a cell lysate. Cells are placedin detergent to solubilize all cell proteins and the lysate(the material resulting from the ruptured cells) is run onsodium dodecyl sulfate polyacrylamide gel electrophoresis(SDS–PAGE), which enables protein migration andseparation by size. Further resolution is achieved if theproteins are initially separated by charge according to theirisoelectric point and then by size. This technique is referredto as two-dimensional (2D) gel electrophoresis. The pro-teins are then transferred (blotted) from the gel to a stablesupport, such as a nitrocellulose membrane for easierhandling. Specific proteins of interest in the lysate’s mix-ture are detected by incubating the membrane with a Mabthat can react with a defined protein on the membrane. Anexample of the technique is shown in Fig. 7. The proteins
boundtotheantibodiesarerevealedbyenzyme-labeled,anti-immunoglobulin antibodies. By this technique the presenceor absence, as well as the amounts of specific proteins, can bemonitored following a variety cell treatments. Specific DNAlabeled with antigen (hapten)-bound nucleotides can beblotted onto a membrane and detected with Mabs againstthe hapten. This allows the detection of viral or bacterialDNA in tissues or body fluids, as generated by PCR.
Purification Techniques
Affinity chromatography and immunoprecipitation aretechniques that enable purification of molecules and theircharacterization. A mixture of molecules can be incubatedwith a Mab, which is chemically attached to a solid support.The bound antibody–antigen complex is washed fromunbound molecules by centrifugation, and then the mole-cule of interest is eluted for further characterization. Thesetechniques are useful for protein purification, for determin-ing its molecular weight, its abundance, distribution, andwhether it undergoes chemical modifications as a result ofprocessing within the cell.
Immunoelectrophoresis
Two-dimensional electrophoresis is used to separate dif-ferent antigens that might be present in one solution. Theantigens are separated on the basis of their electrophoreticmobility. The currents are run at right angles to each other,driving the antigens into the antiserum (containing Mabs).Peaks are obtained when the antigen forms a complex withthe antibody; the area under the peaks gives the concen-tration of antigen as shown in Fig. 8. Rocket electrophor-esis is a similar technique. Here, after a current is applied,the antigens are separated based upon their ionic charge bytheir differential migration through a gel that containsantibody. As shown in Fig. 9, concentration is determinedby the migration distance. In countercurrent electrophor-esis, the greater internal osmotic pressure drives the anti-body backwards into a gel after a current is applied. Anantigen that is negatively charged will form a complex withthe antibody in the gel in a pH-dependent process.
Instrumentation
An immensely powerful tool for defining and enumeratingand isolating cells is the use of the fluorescence-activated
MONOCLONAL ANTIBODIES 603
Figure 7. Detection of the measles virus (MV) P-protein byWestern Blot in MV infected and noninfected cells. Whole-celllysates were prepared from MV that was either persistentlyinfected (NS20-MV) or notinfected (NS20) mouse neuroblastomacells. The proteins in the lysates were separated by SDS–PAGEand blotted onto nitrocellulose paper. The blot was incubated witha Mab against the MV P-protein, followed by a secondaryantimouse immunoglobulin antibody linked to horseradishperoxidase. The P-protein band was detected when a substratewas added that was modified by peroxidase on the blot and causedlight to be released. Light was detected on a specific band afterexposure to film. The results show that only the measles- infectedcells express the viral protein. (Courtesy of Jacob Gopas.)
Antibody in gel
Precipitin arc
Ag2 Ag1 Startingwell
First run Second run
+
--
+Figure 8. Two-dimensional immuno-electrophoresis. Antigens are sepa-rated on the basis of electrophoreticmobility. [Courtesy of the NaturalToxins Research Center at TexasA&M University – Kingsville (http://ntri.tamuk.edu/).]

cell sorter (FACS). This instrument is used to study theproperties of cell subsets identified using Mabs to cellsurface proteins. Individual cells are first tagged by treat-ment with specific fluorescent Mabs. The mixture oflabeled cells is then forced with a much larger volume offluid through a nozzle, creating a fine stream of liquidcontaining cells spaced singly at intervals. As each cellpasses through a laser beam it scatters the laser light, andany dye molecules bound to the cell will be excited andfluoresce. Sensitive photomultiplier tubes detect both thescattered light, which gives information on the size andgranularity of the cell, and the fluorescence emission,provide quantification of the binding of the labeled Mabs,and on the expression of cell-surface proteins by each cell.In the cell sorter, the signals passed back to the computerare used to generate an electric charge, which is passedfrom the nozzle through the liquid stream. Droplets con-taining a charge can then be deflected from the mainstream as they pass between plates of opposite charge.In this way a specific population of cells, distinguished bythe binding of the labeled antibody and its defined elec-trical charge, can be extracted and purified from a mixedpopulation of cells. Alternatively, to deplete a population ofcells, a labeled antibody directed at marker proteinsexpressed by undesired cells will direct the cells to a wastechannel, retaining only the unlabeled cells. Several Mabslabeled with different fluorochromes can be used simulta-neously. FACS analysis can give quantitative data on thepercentage of cells bearing different molecules, and therelative abundance of the particular molecules in the cellpopulation, 10,000 cells in a typical experiment demon-strates the retrieval of data after FACS analysis. An exam-ple of data output from FACS is shown in Fig. 10.
Mabs as Molecular Probes
Mabs can also be used to determine the function of mole-cules. Some antibodies are able to act as agonists, when thebinding of the Mab to the molecule mimics the binding ofthe natural ligand (antigen) and activates its function. Forexample, antibodies to the CD3 antigen present on maturehuman T cells have been used to stimulate the T cells. This
occurs because CD3 is associated with the T-cell receptorand is responsible for signal transduction of the receptor.Conversely, Mabs can function as antagonists, inhibitingthe binding of the natural ligand and thus blocking itsfunction. For example, antibodies that block the epidermalgrowth factor receptor (a growth stimulating protein) func-tion as antagonists.
THE USE OF MONOCLONAL ANTIBODIESAS THERAPEUTIC AGENTS
Mabs against cell-surface molecules have been used toremove specific lymphocyte subsets or to inhibit cell func-tion in vitro. Cytotoxic drugs kill proliferating cells indis-criminately. In contrast, antibodies can interfere withimmune responses in a nontoxic and much more specificmanner. For example, Mabs can be used to remove unde-sirable lymphocytes from donor bone marrow cells prior totransplantation. This treatment selectively removes lym-phocytes that recognize the host tissues as ‘‘foreign’’ andinduce a potentially fatal condition known as Graft versusHost reaction (6).
604 MONOCLONAL ANTIBODIES
–
+
Increasing antigenconcentration
Antigenwells
Antibodyin agarosegel
pH 8.6
Precipitinarcs(rockets)
Figure 9. Rocket electrophoresis. Antigen is electrophoresed intogel containing antibody. The distance from the starting well to thefront of the rocket shaped arc is related to antigen concentration.[Courtesy of the Natural Toxins Research Center at Texas A&MUniversity – Kingsville (http://ntri.tamuk.edu/).]
104103102101100
100
101
102
103
104
CD
19 P
E
CD3 FITC
Figure 10. FACS analysis. Characterizing cells at differentstages of development through the use of fluorescent labeledmonoclonal antibodies against cell surface markers is one of themost common applications of flow cytometry. Changes in therelative numbers, absolute counts, or in the ratio of cell typescan provide valuable information as to the status of the immunesystem in human disorders or animal models. Different cell typescan be detected and quantified from a mixed population by the useof monoclonal antibodies labeled with different fluorescent dyesthat have nonoverlapping emission spectra. In this exampleexperiment, blood lymphocytes were incubated with twodifferent Mabs, CD19, and CD3. CD19 was labeled with thefluorochrome phycoerythrin (PE) and binds a cell membranemolecule specific for B-lymphocytes. The CD3 was labeled withfluorecein isothyocyanate (FITC) that detects a cell membraneprotein specific for T-lymphocytes. Three populations of cellswere detected in this experiment according to the antibodybound to the cells. The logarithmic x and y axis representrelative amounts of fluorescence detected on cells labeled withFITC or PE, respectively. The blue dots represent cells unstainedby either of the antibodies, the red dots represent B-lymphocytesthat were detected by CD19 and the green dots representT-lymphocytes, CD3 positive cells. No cells were detected thatbound both antibodies (top right quadrant).
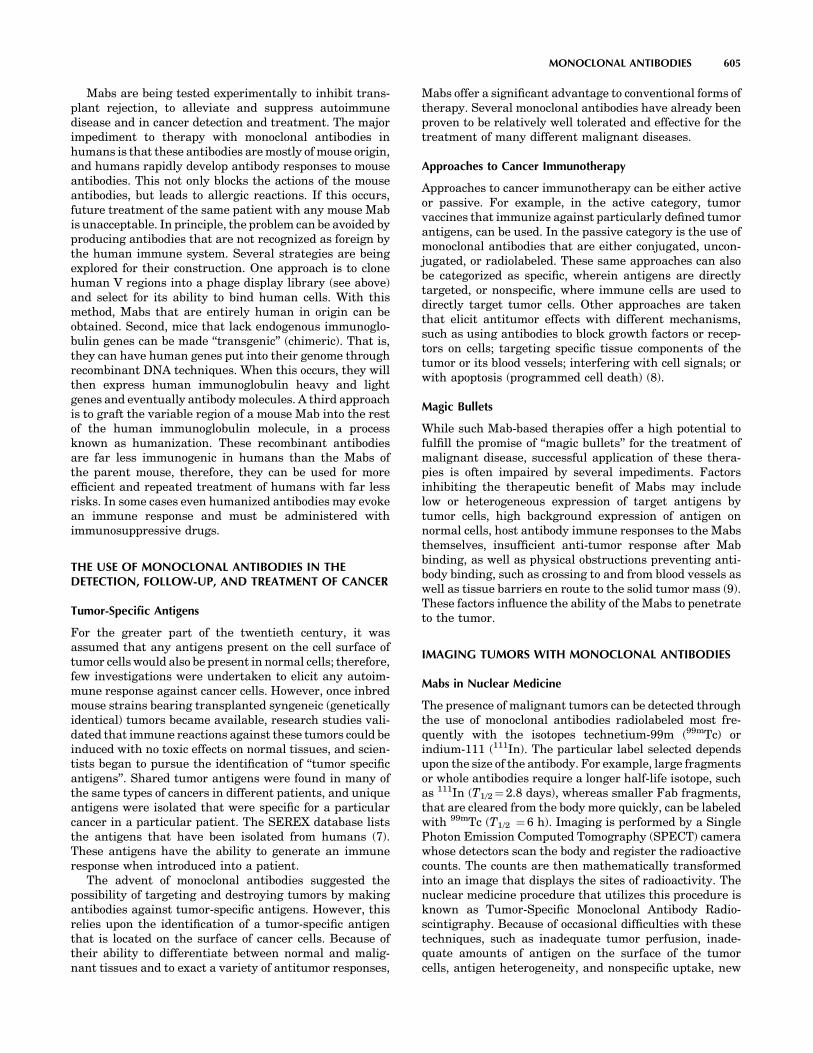
Mabs are being tested experimentally to inhibit trans-plant rejection, to alleviate and suppress autoimmunedisease and in cancer detection and treatment. The majorimpediment to therapy with monoclonal antibodies inhumans is that these antibodies are mostly of mouse origin,and humans rapidly develop antibody responses to mouseantibodies. This not only blocks the actions of the mouseantibodies, but leads to allergic reactions. If this occurs,future treatment of the same patient with any mouse Mabis unacceptable. In principle, the problem can be avoided byproducing antibodies that are not recognized as foreign bythe human immune system. Several strategies are beingexplored for their construction. One approach is to clonehuman V regions into a phage display library (see above)and select for its ability to bind human cells. With thismethod, Mabs that are entirely human in origin can beobtained. Second, mice that lack endogenous immunoglo-bulin genes can be made ‘‘transgenic’’ (chimeric). That is,they can have human genes put into their genome throughrecombinant DNA techniques. When this occurs, they willthen express human immunoglobulin heavy and lightgenes and eventually antibody molecules. A third approachis to graft the variable region of a mouse Mab into the restof the human immunoglobulin molecule, in a processknown as humanization. These recombinant antibodiesare far less immunogenic in humans than the Mabs ofthe parent mouse, therefore, they can be used for moreefficient and repeated treatment of humans with far lessrisks. In some cases even humanized antibodies may evokean immune response and must be administered withimmunosuppressive drugs.
THE USE OF MONOCLONAL ANTIBODIES IN THEDETECTION, FOLLOW-UP, AND TREATMENT OF CANCER
Tumor-Specific Antigens
For the greater part of the twentieth century, it wasassumed that any antigens present on the cell surface oftumor cells would also be present in normal cells; therefore,few investigations were undertaken to elicit any autoim-mune response against cancer cells. However, once inbredmouse strains bearing transplanted syngeneic (geneticallyidentical) tumors became available, research studies vali-dated that immune reactions against these tumors could beinduced with no toxic effects on normal tissues, and scien-tists began to pursue the identification of ‘‘tumor specificantigens’’. Shared tumor antigens were found in many ofthe same types of cancers in different patients, and uniqueantigens were isolated that were specific for a particularcancer in a particular patient. The SEREX database liststhe antigens that have been isolated from humans (7).These antigens have the ability to generate an immuneresponse when introduced into a patient.
The advent of monoclonal antibodies suggested thepossibility of targeting and destroying tumors by makingantibodies against tumor-specific antigens. However, thisrelies upon the identification of a tumor-specific antigenthat is located on the surface of cancer cells. Because oftheir ability to differentiate between normal and malig-nant tissues and to exact a variety of antitumor responses,
Mabs offer a significant advantage to conventional forms oftherapy. Several monoclonal antibodies have already beenproven to be relatively well tolerated and effective for thetreatment of many different malignant diseases.
Approaches to Cancer Immunotherapy
Approaches to cancer immunotherapy can be either activeor passive. For example, in the active category, tumorvaccines that immunize against particularly defined tumorantigens, can be used. In the passive category is the use ofmonoclonal antibodies that are either conjugated, uncon-jugated, or radiolabeled. These same approaches can alsobe categorized as specific, wherein antigens are directlytargeted, or nonspecific, where immune cells are used todirectly target tumor cells. Other approaches are takenthat elicit antitumor effects with different mechanisms,such as using antibodies to block growth factors or recep-tors on cells; targeting specific tissue components of thetumor or its blood vessels; interfering with cell signals; orwith apoptosis (programmed cell death) (8).
Magic Bullets
While such Mab-based therapies offer a high potential tofulfill the promise of ‘‘magic bullets’’ for the treatment ofmalignant disease, successful application of these thera-pies is often impaired by several impediments. Factorsinhibiting the therapeutic benefit of Mabs may includelow or heterogeneous expression of target antigens bytumor cells, high background expression of antigen onnormal cells, host antibody immune responses to the Mabsthemselves, insufficient anti-tumor response after Mabbinding, as well as physical obstructions preventing anti-body binding, such as crossing to and from blood vessels aswell as tissue barriers en route to the solid tumor mass (9).These factors influence the ability of the Mabs to penetrateto the tumor.
IMAGING TUMORS WITH MONOCLONAL ANTIBODIES
Mabs in Nuclear Medicine
The presence of malignant tumors can be detected throughthe use of monoclonal antibodies radiolabeled most fre-quently with the isotopes technetium-99m (99mTc) orindium-111 (111In). The particular label selected dependsupon the size of the antibody. For example, large fragmentsor whole antibodies require a longer half-life isotope, suchas 111In (T1/2¼ 2.8 days), whereas smaller Fab fragments,that are cleared from the body more quickly, can be labeledwith 99mTc (T1/2 ¼ 6 h). Imaging is performed by a SinglePhoton Emission Computed Tomography (SPECT) camerawhose detectors scan the body and register the radioactivecounts. The counts are then mathematically transformedinto an image that displays the sites of radioactivity. Thenuclear medicine procedure that utilizes this procedure isknown as Tumor-Specific Monoclonal Antibody Radio-scintigraphy. Because of occasional difficulties with thesetechniques, such as inadequate tumor perfusion, inade-quate amounts of antigen on the surface of the tumorcells, antigen heterogeneity, and nonspecific uptake, new
MONOCLONAL ANTIBODIES 605
approaches are being investigated. However, due to limitedclinical experience, it is too early to predict whether theywill improve imaging performance (10). Among thesemethods is the use of other imaging techniques, such asbone scans or computed tomography (CT), in conjunctionwith SPECT. In other approaches, attempts are beingmade to augment surface tumor cell antigens by presti-mulation with growth factors, such as cytokines (11).
TREATMENT OF HEMATOLOGICAL MALIGNANCIES
Blood-Cell Cancers
Surface antigens on B- and T-cell lymphocytes are alsouseful targets for the treatment of blood cell (hematopoietic)malignancies, such as leukemias and lymphomas. Theseantigens are also expressed at high levels on the surface ofvarious populations of malignant cells, but not on normaltissues. With few barriers present to impede Mab binding,hematologic malignancies are well suited to Mab-basedtherapy. In recent years, several promising Mab-basedtherapies for the treatment of hematologic malignancieshave been developed and either have already received U.S.Food and Drug Administration (FDA) approval or are inthe advanced phases of clinical testing (12). The chimericantibody, rituxan (rituximAb, Genentech, San Francisco,CA) was among the first Mabs awarded Food and DrugAdministration approval for the treatment of non-Hodg-kin’s lymphoma (13,14). This chimeric (human–mouse)antibody binds CD20, a cell surface antigen expressed onmature B lymphocytes and over 90% of non-Hodgkin’slymphoma cells, but not on hematopoetic progenitor orstem cells. Rituxan has proven to be well tolerated andeffective in the treatment of non-Hodgkin’s lymphomaeither by itself, or in combination with traditional che-motherapy, particularly in patients who are refractory toother types of therapy (15). Campath-1 (alemtuzumAb, IlexOncology, San Antonio, TX) is another antibody that hasalso received FDA approval for the treatment of patientssuffering from chronic lymphocytic leukemia. A third Mabto receive FDA approval for the treatment of hematologicmalignancies is the chimeric Mab, mylotarg (gemtuzumAbozogamicin, Wyeth-Ayerst Laboratories, Philadelphia,PA). This antibody targets the CD33 antigen expressedon myeloid (white cells) precursors and leukemic cells, andis absent from normal tissues and pluripotent hematopoe-tic (blood-cell producing) stem cells.
TREATMENT OF SOLID TUMORS
In comparison to the management of hematologic malig-nancies, successful treatment of solid tumors with Mabs hasproven more elusive; however, some significant therapeuticbenefits have been achieved. Herceptin (trastuzumAb, Gen-entech) is a humanized antibody that has received FDAapproval for the treatment of metastatic breast cancer. ThisMab recognizes an extracellular domain of the HER-2 pro-tein. Clinical trials with herceptin have shown it to be welltolerated both as a single agent for second or third linetherapy, or in combination with chemotherapeutic agents as
a first line of therapy. Combination therapy resulted in a25% improvement of overall survival in patients withtumors that overexpress HER-2, and that are refractoryto other forms of treatment (16).
The antiepithelial cellular adhesion tumors Mab mole-cule, Panorex (eclrecolomAb, GlaxoSmith-Kline, UnitedKingdom), is another Mab -based therapy that is currentlybeing used for the treatment of colorectal cancer. Panorexhas shown tangible benefit for cancer patients and hasreceived approval in Germany for the treatment ofadvanced colorectal cancer. Like other Mabs used for thetreatment of solid tumors, Panorex has proven more effi-cacious in the treatment of micrometastatic lesions andminimal residual disease in comparison to bulky tumormasses (17).
The failure of Mabs in the treatment of bulky lesions isprimarily attributable to the low level of injected Mabs thatactually reaches its target within a sizable solid-tumormass. Studies using radiolabeled Mabs suggested that onlya very small percentage of the original injected antibodydose, �0.01–0.1/g of tumor tissue, will ever reach targetantigens within a solid tumor (18). This low level of bindingis due to the series of barriers confronted by an adminis-tered Mab en route to antigens expressed on the surface oftumor cells.
ELICITING ANTITUMOR RESPONSES
After successfully negotiating the gauntlet of obstaclesobstructing access to the target cells within a tumor, atherapeutic Mab must still be capable of eliciting a potentantitumor response. Although it is often ambiguous as tothe exact mechanisms by which a particular Mab maymediate an antitumor response, both direct and indirectmechanisms can potentially be involved.
Antibodies of the IgG1 and IgG3 isotypes can supporteffector functions of both antibody-dependent cell-mediated cytotoxicity and complement-dependent cytotoxi-city. Antibody-dependent cell-mediated cytotoxicity is trig-gered by interaction between the Fc region of a cell-boundantibody and Fc receptors on immune effector cells such asneutrophils, macrophages, and natural killer cells. Thismechanism is critical for the antitumor effects of severaltherapeutic Mabs.
Many early studies showed that murine Mabs hadlimited potential to elicit a potent antitumor response,because the murine Fc regions are less efficient at recruit-ing human effector cells than their human counterparts.This problem has been largely alleviated by the use ofchimeric and humanized antibodies. Genetic engineeringtechniques have also been used to improve the immunolo-gic effects of therapeutic Mabs by altering antibody shapeand size, increasing the valency (bonds of affinity) of Mabs,and creating bifunctional antibodies with two antigenicreceptors, one to a tumor antigen and another to an effectorcell to increase efficiency of antibody-dependent cell-mediated cytotoxicity (19).
In addition to immunologic effects, Mabs can induceantitumor effects by a variety of direct mechanisms, includ-ing the induction of apoptosis (programmed cell
606 MONOCLONAL ANTIBODIES

death) (20), or the prevention of soluble growth factors frombinding their cognate receptors, such as epidermal growthfactor (EGF-R) (21) and HER-2 (22). Additionally, Mabscan also be engineered to deliver a cytotoxic agent directlyto the tumor. This offers the potential to combine thebiological effects of Mabs with the additional effect of atargeted cytotoxic response. The anti-CD33 Mabs, mylo-targ, is one such antibody. Combined with the cytotoxicagent, calichaemicin, mylotarg has been reported to berelatively well tolerated, and effective in the treatmentof chronic lymphocytic leukemia (23). Antibodies can alsobe engineered to deliver ionizing radiation directly totumor cells. Mabs have been conjugated to both a- andb-particle emitting radionuclides (24). Clinical trials inhumans also portend the promise of radiolabeled Mabsfor the treatment of cancer. In a recent phase III rando-mized study, patients with relapsed or refractory non-Hodgkin’s lymphoma were treated with yttrium-90 andiodine-131 labeled Mabs targeting the CD20 antigen (ibri-tuximomAb, tiuxetan, and tositumomAb, respectively).Patients treated with these radiolabeled Mabs showed astatistically significant increase in overall response com-pared with those treated with an unlabeled version of theMab (rituximAb) (25).
OTHER USES FOR MONOCLONAL ANTIBODIES
Proteomics
After having sequenced the entire human genome, thecurrent task is to understand the ‘‘proteome’’ by identifica-tion and quantification of all proteins in a given sample. Sofar, DNA microarrays have been employed to detect thetranscription level [production of messenger ribonucleicacid (mRNA)] of genes in cells. However, it has been foundthat there is no stringent correlation between transcriptionlevel and protein abundance. Furthermore, the status of aprotein in terms of its modification and structure cannot bedetermined by DNA microarrays. To solve this problem,antibody microarrays are envisioned to replace DNAmicroarrays in proteome research. These arrays consistof a multitude of different antibodies that are immobilizedon a solid support and allow characterization of the proteinrepertoire of a given sample. However, the production ofsuch antibody microarrays and its application require theprovision of highly specific and stable antibodies, posses-sing high affinity and showing no cross-reactivity. Proteinand antibody microarrays can be made to encompass asmany as 10,000 samples on a chip within the dimensions ofa microscope slide (26).
Monoclonal Antibodies in the Food Industry
Monoclonal antibodies are being used in the wine industry.Odors sometimes observed in spoiled food or corked winesare often the result of microbes present in the wood packa-ging materials. However, this phenomenon has also beenobserved in bottled water, suggesting that there may besecondary contaminants, such as residues of pesticidesthat can affect the quality of any packaged food or bev-erage. To further the quality assurance of products in the
wine industry, a project is being carried out to raise anti-bodies against a TCA molecule (2,4,6-trichcholoanisole)that is thought to be present in cork stoppers and isresponsible for the musty taste in wine. The ELISA assaywill be employed to detect trace amounts of the contam-inating molecule. Also an immunosensor will be used toelectrochemically detect the antibody levels present (27).Monoclonal antibodies have also been developed againstthe vegetative cells and spores of Bacillus cereus (28). Thisbacterium seems to be implicated in food poisoning and isalso responsible for food spoilage. It is impossible for thefood industry to exclude B. cereus from its products becauseB. cereus cells can survive heat processing and can grow infoods kept at refrigerated storage conditions. Two differentantibodies were developed. One was used as a specificcapture antibody to destroy the bacterium; the other asa detector antibody that would simply identify the presenceof B. cereus. The ELISA assay was used to detect andquantify the vegetative cells of this pathogenic organism.
Potato cyst nematodes are pests that destroy the potatofood crops. Monoclonal antibodies are being used to assistin the development of the plant’s resistance to the nema-tode (29). Recombinant plant monoclonal antibodies havebeen engineered to protect poultry against coccidosis infec-tions (30).
Monoclonal Antibodies and Bioterrorism
The same plant biotechnology described above is beingdeveloped to create strategic reserves of vaccines andantibodies for infectious agents that could be used inbiowarfare. Multiple genes can be engineered in plantsintended to provide prolonged immunity against newstrains of pathogens that have different mechanisms ofaction. With this technology, every plant cell will producethe signature protein of a particular biowarfare agent.That protein, in turn, will trigger an immune responsein a person who consumes the plant material in an unpro-cessed or lightly processed form, but it will not cause thedisease. These antibodies can prevent infection on surfaceareas, including nasal passages; clear infectious organismsfrom the body; identify foreign organisms for destruction;and neutralize and remove toxins. Among the disease-causing substances are several potential bioterrorismagents, such as the botulism toxin, anthrax, Ebola virus,plague, and ricin, a poisonous protein found in the seeds ofthe castor oil plant. Vaccines for anthrax (Bacillus anthra-cis) and bubonic and pneumonic plague (Yersinia pestis),two potentially deadly diseases that can be delivered as air-borne agents, are being developed. Preliminary datapredicts success in using these plant-derived vaccines (31).
CONCLUDING REMARKS
Antibodies, monoclonal antibodies and antibody deriva-tives constitute �20 % of biopharmaceutical products cur-rently in development. Antibodies represent an importantand growing class of biotherapeutics. Progress in antibodyengineering has allowed the manipulation of the basicantibody structure into its minimal essential functions,and multiple methodologies have emerged for raising
MONOCLONAL ANTIBODIES 607
and tailoring specificity and functionality. The myriad ofmonoclonal antibody structures that can be designed andobtained in different formats from various production sys-tems (bacterial, mammalian, and plants) represents achallenge for the recovery and purification of novel immu-notherapeutics (3). However, the general use in clinicalpractice of antibody therapeutics is dependent not only onthe availability of products with required efficacy but alsoon the costs of therapy. As a rule, a significant percentage(50–80%) of the total manufacturing cost of a therapeuticantibody is incurred during downstream processing. Thecritical challenges posed by the production of novel anti-body therapeutics include improving process economicsand efficiency to reduce costs, and fulfilling increasinglydemanding quality criteria for FDA approval.
BIBLIOGRAPHY
1. Janeway CA JR, Travers P, Walport M, Shlomchik M. Immu-nobiology. The Immune System in Health and Disease. 6thed. Churchill Livingstone.
2. Kohler G, Milstein C. Continuous cultures of fused cellssecreting antibody of predefined specificity. Nature (London)1975;256:495–497.
3. Roque AC, Lowe CR, Taipa MA. Antibodies and geneticallyengineered related molecules: Production and purification.Biotechnol Prog 2004;20:639–654.
4. Kretzschmar T, von Ruden T. Antibody discovery: Phagedisplay. Curr Opin Biotechnol 2002;13:598–602.
5. Fischer R, Twyman RM, Schillberg S. Production of antibodies inplants and their use for global health. Vaccine 2003; 21:820–825.
6. Chen HR. et al. Humanized anti-CD25 monoclonal antibodyfor prophylaxis of graft-vs-host disease (GVHD) in haploi-dentical bone marrow transplantation without ex vivo T-celldepletion. Exp. Hematol 2003;31:1019–1025.
7. Hartmann TB, Bazhin AV, Schadendorf D, Eichmuller SB.SEREX identification of new tumor antigens linked to mel-anoma-associated retinopathy. Int. J. Cancer 2005;10;114:88–93. http://www.licr.org/SEREX.html.
8. Davis DW. et al. Regional effects of an antivascular endothe-lial growth factor receptor monoclonal antibody on receptorphosphorylation and apoptosis in human 253J B-V bladdercancer xenografts. Cancer Res 2004;64:4601–4610.
9. Christiansen J, Rajasekaran AK. Biological impediments tomonoclonal antibody–based cancer immunotherapy. MolCancer Ther 2004;3:1493–1501.
10. Koral KF. Update on hybrid conjugate-view SPECT tumordosimetry and response in 131I-tositumomab therapy ofpreviously untreated lymphoma patients. J Nucl Med2003;44: 457–464.
11. Villa AM, Berman B. Immunomodulators for skin cancer. JDrugs Dermatol 2004;3:533–539.
12. Von Mehren M, Adams GP, Weiner LM. Monoclonal antibodytherapy for cancer. Annu Rev Med 2003;54:343–369.
13. Leget GA, Czuczman MS. Use of rituximAb, the new FDA-approved antibody. Curr Opin Oncol 1998;10:548–551.
14. McLaughlin P. et al. RituximAb chimeric anti-CD20 mono-clonal antibody therapy for relapsed indolent lymphoma:Half of patients respond to a four-dose treatment program.J Clin Oncol 1998;16:2825–2833.
15. Leyland-Jones B. TrastuzumAb: hopes and realities. LancetOncol 2002;3:137–144.
16. Riethmuller G. et al. Monoclonal antibody therapy for resectedDukes’ C colorectal cancer: Seven-year outcome of a multicenterrandomized trial. J Clin Oncol 1998;16:1788–1794.
17. Mellstedt H, et al. The therapeutic use of monoclonal antibodiesin colorectal carcinoma. Semin Oncol 1991;18:462–477.
18. Khawli LA, Miller GK, Epstein AL. Effect of seven newvasoactive immunoconjugates on the enhancement of mono-clonal antibody uptake in tumors. Cancer 1994;73:824–831.
19. Zeidler R, et al. The Fc-region of a new class of intactbispecific antibody mediates activation of accessory cellsand NK cells and induces direct phagocytosis of tumour cells.Br J Cancer 2000;83:261–266.
20. Trauth BC, et al. Monoclonal antibody-mediated tumor regres-sion by induction of apoptosis. Science 1989;245:301–305.
21. Yang XD, et al. Eradication of established tumors by a fullyhuman monoclonal antibody to the epidermal growth factorreceptor without concomitant chemotherapy. Cancer Res1999;59:1236–1243.
22. Agus DB, et al. Targeting ligand-activated ErbB2 signalinginhibits breast and prostate tumor growth. Cancer Cell2002;2:127–137.
23. Estey EH, et al. Experience with gemtuzumAb ozogamycin(‘‘mylotarg’’) and all-trans retinoic acid in untreated acutepromyelocytic leukemia. Blood 2002;99:4222–4224.
24. Bander NH, et al. Targeted systemic therapy of prostatecancer with a monoclonal antibody to prostate-specific mem-brane antigen. Semin Oncol 2003;30:667–676.
25. Witzig TE, et al. Randomized controlled trial of yttrium-90–labeled ibritumomAb tiuxetan radioimmunotherapy versusrituximAb immunotherapy for patients with relapsed orrefractory low-grade, follicular, or transformed B-cell non-Hodgkin’s lymphoma. J Clin Oncol 2002;20:2453–2463.
26. Angenendt P, et al. Seeing better through a MIST: evaluationof monoclonal recombinant antibody fragments on microar-rays. Anal Chem 2004;76:2916–2921.
27. Sanvicens N, Varela B, Marco MP. Determination of 2,4,6-trichloroanisole as the responsible agent for the musty odorin foods. 2. Immunoassay evaluation. J Agric Food Chem2003;51: 3932–3939.
28. Charni N, et al. Production and characterization of mono-clonal antibodies against vegetative cells of Bacillus cereus.Appl Environ Microbiol 2000;66:2278–2281.
29. Fioretti L, et al. Monoclonal antibodies reactive with secreted-excreted products from the amphids and the cuticle surface ofGlobodera pallida affect nematode movement and delay inva-sion of potato roots. Int J Parasitol 2002;32:1709–1718.
30. Refega S, et al. Production of a functional chicken single-chain variable fragment antibody derived from caecal tonsilsB lymphocytes against macrogamonts of Eimeria tenella. VetImmunol Immunopathol 2004;97:219–230.
31. Petrenko VA, Sorokulova IB. Detection of biological threats.A challenge for directed molecular evolution. J MicrobiolMethods 2004;58:147–168.
See also BORON NEUTRON CAPTURE THERAPY; IMMUNOTHERAPY.
MOSFET. See ION-SENSITIVE FIELD-EFFECT TRANSISTORS.
MRI. See MAGNETIC RESONANCE IMAGING.
MUSCLE ELECTRICAL ACTIVITY. SeeELECTROMYOGRAPHY.
MUSCLE TESTING, REHABILITATION AND. SeeREHABILITATION AND MUSCLE TESTING.
MUSCULOSKELETAL DISABILITIES. SeeREHABILITATION, ORTHOTICS FOR.
608 MONOCLONAL ANTIBODIES


![A V.-La Filolakia [bibliotecacatolica wordpress com]](https://static.fdokumen.com/doc/165x107/63146927c32ab5e46f0cdfc6/a-v-la-filolakia-bibliotecacatolica-wordpress-com.jpg)