The role of Ribose-5-phosphate isomerase A in the regulation ...
206
The role of Ribose-5-phosphate isomerase A in the regulation of autophagy Jacob Heintze A dissertation submitted in partial fulfillment of the requirements for the degree of Doctor of Philosophy of University College London. Laboratory of Molecular Cell Biology University College London July 22, 2016
-
Upload
khangminh22 -
Category
Documents
-
view
0 -
download
0
Transcript of The role of Ribose-5-phosphate isomerase A in the regulation ...

The role of Ribose-5-phosphateisomerase A in the regulation of
autophagy
Jacob Heintze
A dissertation submitted in partial fulfillment
of the requirements for the degree of
Doctor of Philosophy
of
University College London.
Laboratory of Molecular Cell Biology
University College London
July 22, 2016

2

3
I, Jacob Heintze, confirm that the work presented in this thesis is my own.
Where information has been derived from other sources, I confirm that this has
been indicated in the work.


Abstract
Macroautophagy (hereafter: autophagy), cell signalling and cellular metabolism are
tightly linked processes. Multiple examples of metabolites and metabolic enzymes
have recently been found to regulate signalling pathways and autophagy. Metabolic
reprogramming is one of the hallmarks of cancer and often mediated via aberrant
signalling pathways, such as receptor tyrosine kinase (RTK) signalling. Growth fac-
tor receptor-bound protein 2 (Grb2) is a key RTK signalling adaptor and is involved
in a number of downstream signalling cascades, such as mitogen-activated protein
kinase (MAPK) or phosphoinositide 3-kinase (PI3K) pathways, which in turn reg-
ulate metabolism through alterations in gene expression or by directly modifying
enzymatic activity.
This study investigates the role of ribose-5-phosphate isomerase (RPIA), a key
metabolic enzyme in the pentose phosphate pathway (PPP), in the regulation of
autophagy and Grb2-mediated signalling. RPIA expression induces Grb2 transloca-
tion from an even cytoplasmic distribution to unknown sub-cellular structures, pos-
sibly through direct protein-protein interaction. Interestingly, this effect is indepen-
dent of the catalytic activity of RPIA, suggesting a non-canonical role in signalling.
Neither RPIA over-expression, transient knockdown or deletion by CRISPR/Cas9
genome editing resulted in differences in metabolic activity or the MAPK pathway
as tested by extracellular signalregulated kinases (ERK) 1/2 phosphorylation and
MTT assay.
Furthermore, knockdown of RPIA by shRNA or genomic deletion resulted in an
increase of LC3 processing and LC3-positive autophagosomes, suggesting that en-
dogenous RPIA is an inhibitor of basal autophagy. Data from Saccharomyces cere-

6 Abstract
visiae, mass spectrometry of sugar phosphates and pharmacological treatment as-
says suggest that RPIA may inhibit autophagy through a non-canonical function.
Although the molecular mechanisms by which RPIA acts on Grb2 signalling and
how it contributes to the regulation of autophagy are currently not fully understood,
this study presents some interesting observations that may have implications in the
development of therapeutics that target cancer metabolism or aim to modulate au-
tophagy.

Acknowledgements
I would like to thank all people who have supported me for the past years in my
PhD project. First and foremost, I would like to thank Robin Ketteler for super-
vising, mentoring and supporting me throughout my thesis. He has always been
very supportive, with constructive feedback and a positive and engaging mind set.
His supervision has helped hugely to guide me through my PhD and also, he sup-
ported me in all my extracurricular activities and plans for the future. This has
been obvious on multiple occasions, such as the very quick turnaround with helpful
comments which - very much - helped me to put everything together that I have
worked on for the past few years into this PhD thesis. I will never forget the im-
mense, positive support over the years that I have received from him. Frankly, I do
not think I could have wished for a better PhD supervisor.
Next, I would like to thank the Ketteler lab members for continuous support, sug-
gestions, reagents, plasmids, protocols and in tips & tricks in general. Particular
thanks go to Joana Costa, Christin Luft, Julia Petschnigg, Alex Agrotis, Niccolo
Pengo, Melanie Weber, Janos Kriston-Vizi and Jamie Freemann. All have helped
me immensely with one or another aspect of this project. Joana and Melanie have
worked on the project once I finished in the lab, and thanks to them part of this the-
sis could be published. Christin gave fantastic support with general lab techniques
and screening equipment. Julia always shared her knowledge on RTK signalling,
whereas Alex and Niccolo gave useful advice on autophagy experiments. Janos
was my Fiji/image analysis/Opera go-to guru. Jamie always came up with great
scientific and general life advice.

8 Acknowledgements
Furthermore, the completion of this thesis would not have been possible with-
out the continuous support from my family, friends and my wonderful girlfriend
Kate. I am grateful to all of you for patiently listening to my moaning about failed
experiments and slow progression with respect to thesis completion.
Also, I would like to thank Eduard Struyss for analysing the sugar phosphates in
our HeLa CRISPR cell lines via mass spectroscopy. Furthermore, I would like to
thank Chris Stefan and Heike Omnus for reagents, plasmids, yeast strains and gen-
eral help with the budding yeast experiments.
Additionally, I would like to thank my PhD thesis committee members Buzz Baum,
Martin Raff, Dan Cutler and Paul Gissen. Big thanks goes to the LMCB student
and postdoc community, in particular to current (and past) Mole, DeBruin, Baum,
Cutler, Gissen, Henriques, Mercer, Lloyd, Saiardi, Paluch and Marsh lab members.
Also thanks to past (and current) Moss, Futter and Matter lab members at the Insti-
tute of Ophthalmology, where I did my first rotation.

Contents
Abstract 6
Acknowlegdements 8
Abbreviations used in this study 21
1 INTRODUCTION 29
1.1 Autophagy . . . . . . . . . . . . . . . . . . . . . . . . . . . . . . . 29
1.1.1 Overview . . . . . . . . . . . . . . . . . . . . . . . . . . . 29
1.1.2 Types of autophagy . . . . . . . . . . . . . . . . . . . . . . 30
1.1.2.1 Macroautophagy . . . . . . . . . . . . . . . . . . 30
1.1.2.2 Microautophagy . . . . . . . . . . . . . . . . . . 30
1.1.2.3 Chaperone-mediated autophagy (CMA) . . . . . 31
1.1.3 Autophagic core machinery . . . . . . . . . . . . . . . . . 31
1.1.4 Cellular and molecular mechanism . . . . . . . . . . . . . . 32
1.1.4.1 Induction and phagophore formation . . . . . . . 32
1.1.4.2 Elongation and autophagosome formation . . . . 34
1.1.4.3 Fusion, degradation and recycling . . . . . . . . . 36
1.1.5 Regulation of autophagy . . . . . . . . . . . . . . . . . . . 37
1.1.5.1 Autophagy and disease . . . . . . . . . . . . . . 37
1.1.5.2 The regulation of phagophore initiation . . . . . . 39
1.1.5.3 Other regulatory mechanisms . . . . . . . . . . . 42
1.2 Metabolic reprogramming in cancer . . . . . . . . . . . . . . . . . 43
1.2.1 Oxidative phosphorylation . . . . . . . . . . . . . . . . . . 44

10 Contents
1.2.2 Warburg Effect . . . . . . . . . . . . . . . . . . . . . . . . 45
1.2.3 Reactive oxygen species . . . . . . . . . . . . . . . . . . . 47
1.2.4 Glycolyis . . . . . . . . . . . . . . . . . . . . . . . . . . . 48
1.2.4.1 Hexokinase . . . . . . . . . . . . . . . . . . . . 49
1.2.4.2 Phosphofructokinase . . . . . . . . . . . . . . . . 50
1.2.4.3 Pyruvate kinase . . . . . . . . . . . . . . . . . . 51
1.2.5 TCA cycle . . . . . . . . . . . . . . . . . . . . . . . . . . 52
1.2.5.1 Pyruvate entry . . . . . . . . . . . . . . . . . . . 53
1.2.5.2 Isocitrate Dehydrogenase . . . . . . . . . . . . . 54
1.2.6 Amino acid synthesis . . . . . . . . . . . . . . . . . . . . . 54
1.2.6.1 Glutamine . . . . . . . . . . . . . . . . . . . . . 55
1.2.6.2 Arginine . . . . . . . . . . . . . . . . . . . . . . 55
1.2.6.3 Proline . . . . . . . . . . . . . . . . . . . . . . . 56
1.2.6.4 Diversion of glycolysis intermediates . . . . . . . 57
1.2.7 Fatty acid metabolism . . . . . . . . . . . . . . . . . . . . 58
1.2.8 Hypoxia response . . . . . . . . . . . . . . . . . . . . . . . 59
1.2.9 Nucleotide synthesis . . . . . . . . . . . . . . . . . . . . . 60
1.2.9.1 Purines . . . . . . . . . . . . . . . . . . . . . . . 61
1.2.9.2 Pyrimidines . . . . . . . . . . . . . . . . . . . . 62
1.2.9.3 NAD biosynthesis . . . . . . . . . . . . . . . . . 62
1.3 Pentose Phosphate pathway . . . . . . . . . . . . . . . . . . . . . . 63
1.3.1 Overview . . . . . . . . . . . . . . . . . . . . . . . . . . . 64
1.3.2 Glucose-6-phosphate dehydrogenase . . . . . . . . . . . . . 65
1.3.3 Ribose-5-phosphate isomerase A . . . . . . . . . . . . . . . 66
1.3.4 Transketolase . . . . . . . . . . . . . . . . . . . . . . . . . 68
1.4 Grb2-mediated signalling . . . . . . . . . . . . . . . . . . . . . . . 69
1.4.1 Receptor tyrosine kinases . . . . . . . . . . . . . . . . . . 69
1.4.2 Grb2 . . . . . . . . . . . . . . . . . . . . . . . . . . . . . 71
1.4.3 Grb2-Ras signalling pathway . . . . . . . . . . . . . . . . . 72
1.4.4 MAPK pathway . . . . . . . . . . . . . . . . . . . . . . . 73

Contents 11
1.4.4.1 Raf . . . . . . . . . . . . . . . . . . . . . . . . . 73
1.4.4.2 MEK . . . . . . . . . . . . . . . . . . . . . . . . 74
1.4.4.3 ERK . . . . . . . . . . . . . . . . . . . . . . . . 74
1.4.4.4 ERK targets . . . . . . . . . . . . . . . . . . . . 75
1.4.5 PI3K/Akt/mTOR pathway . . . . . . . . . . . . . . . . . . 76
1.4.5.1 PI3Ks . . . . . . . . . . . . . . . . . . . . . . . 76
1.4.5.2 Akt . . . . . . . . . . . . . . . . . . . . . . . . . 77
1.4.5.3 mTOR . . . . . . . . . . . . . . . . . . . . . . . 78
1.4.5.4 FoxO . . . . . . . . . . . . . . . . . . . . . . . . 79
1.5 Rationale for experiments . . . . . . . . . . . . . . . . . . . . . . . 81
1.5.1 RPIA - Grb2 experiments . . . . . . . . . . . . . . . . . . 81
1.5.2 RPIA in Autophagy . . . . . . . . . . . . . . . . . . . . . 81
2 MATERIALS AND METHODS 83
2.1 Cell lines . . . . . . . . . . . . . . . . . . . . . . . . . . . . . . . 83
2.2 Cell culture . . . . . . . . . . . . . . . . . . . . . . . . . . . . . . 83
2.3 Molecular biology . . . . . . . . . . . . . . . . . . . . . . . . . . . 84
2.3.1 Peak/pMOWS vectors . . . . . . . . . . . . . . . . . . . . 84
2.3.2 Gateway vectors . . . . . . . . . . . . . . . . . . . . . . . 84
2.3.3 Over-expression and knockdown plasmids . . . . . . . . . . 84
2.4 Transfection methods . . . . . . . . . . . . . . . . . . . . . . . . . 87
2.5 Lentiviral stable cell lines . . . . . . . . . . . . . . . . . . . . . . . 87
2.6 CRISPR/Cas9 genome editing . . . . . . . . . . . . . . . . . . . . 88
2.6.1 sgRNAs design . . . . . . . . . . . . . . . . . . . . . . . . 89
2.6.2 genomic primers for sgRNA validation . . . . . . . . . . . 89
2.7 Antibodies . . . . . . . . . . . . . . . . . . . . . . . . . . . . . . . 90
2.8 Protein analysis by Western Blotting . . . . . . . . . . . . . . . . . 90
2.8.1 Sample preparation . . . . . . . . . . . . . . . . . . . . . . 90
2.8.2 SDS-PAGE . . . . . . . . . . . . . . . . . . . . . . . . . . 91
2.8.3 Immunoblotting . . . . . . . . . . . . . . . . . . . . . . . 92
2.9 Immunofluorescence . . . . . . . . . . . . . . . . . . . . . . . . . 93

12 Contents
2.9.1 Sample preparation . . . . . . . . . . . . . . . . . . . . . . 93
2.9.2 Image acquisition . . . . . . . . . . . . . . . . . . . . . . . 94
2.9.3 Image analysis . . . . . . . . . . . . . . . . . . . . . . . . 94
2.9.3.1 Columbus . . . . . . . . . . . . . . . . . . . . . 94
2.9.3.2 Fiji . . . . . . . . . . . . . . . . . . . . . . . . . 96
2.10 Statistical analysis . . . . . . . . . . . . . . . . . . . . . . . . . . . 97
2.11 Metabolic activity assays . . . . . . . . . . . . . . . . . . . . . . . 97
2.12 Mass spectroscopy . . . . . . . . . . . . . . . . . . . . . . . . . . 98
2.13 Saccharomyces cerevisiae experiments . . . . . . . . . . . . . . . . 98
2.13.1 Transformation . . . . . . . . . . . . . . . . . . . . . . . . 98
2.13.2 GFP-ATG8 western blotting . . . . . . . . . . . . . . . . . 99
3 The role of RPIA in Grb2-mediated signalling 101
3.1 RPIA induces translocation of GFP-Grb2 . . . . . . . . . . . . . . 101
3.1.1 Grb2 screen . . . . . . . . . . . . . . . . . . . . . . . . . . 101
3.1.2 Expression of RPIA results in GFP-Grb2 translocation . . . 102
3.1.3 RPIA expression does not cause GFP translocation . . . . . 104
3.1.4 Catalytically inactive RPIA (D160A) can also translocate
GFP-Grb2 . . . . . . . . . . . . . . . . . . . . . . . . . . . 106
3.1.5 Flag-RPIA and GFP-Grb2 co-localise . . . . . . . . . . . . 106
3.1.6 Various GFP-Grb2 mutants also translocate upon RPIA co-
expression . . . . . . . . . . . . . . . . . . . . . . . . . . 106
3.2 Sub-cellular localisation of RPIA . . . . . . . . . . . . . . . . . . . 109
3.2.1 RPIA localises to distinct puncta . . . . . . . . . . . . . . . 109
3.2.2 RPIA does not localise to CAD puncta . . . . . . . . . . . . 109
3.3 Metabolic activity and MAPK signalling . . . . . . . . . . . . . . . 110
3.4 Altered expression levels of RPIA do not affect ERK 1/2 signalling . 112
4 The role of RPIA in the regulation of autophagy 117
4.1 shRNA-mediated knockdown of RPIA . . . . . . . . . . . . . . . . 117
4.1.1 Depletion of RPIA by shRNA increases LC3-processing . . 118

Contents 13
4.1.1.1 RT-PCR . . . . . . . . . . . . . . . . . . . . . . 118
4.1.2 Depletion of RPIA increases puncta in stably expressing
GFP-LC3 cell line . . . . . . . . . . . . . . . . . . . . . . 119
4.1.3 Depletion of RPIA increases endogenous LC3 puncta . . . . 120
4.2 Pharmacological inhibition of RPIA . . . . . . . . . . . . . . . . . 123
4.2.1 LC3-processing is not altered upon treatment with R5P or
E4P . . . . . . . . . . . . . . . . . . . . . . . . . . . . . . 123
4.2.2 ATG4B luciferase reporter is not altered upon treatment
with R5P or E4P . . . . . . . . . . . . . . . . . . . . . . . 123
4.3 The role of RKI in the regulation of autophagy in saccharomyces
cerevisiae . . . . . . . . . . . . . . . . . . . . . . . . . . . . . . . 127
4.4 Generation of CRISPR/Cas9 knockout HeLa cells . . . . . . . . . . 129
4.4.1 Choice of CRISPR method . . . . . . . . . . . . . . . . . . 129
4.4.2 Optimisation of CRISPR-mediated genome modification . . 130
4.4.2.1 Design of sgRNAs . . . . . . . . . . . . . . . . . 130
4.4.2.2 Cloning of sgRNAs into Cas9 vector . . . . . . . 133
4.4.2.3 Validation of genomic primers . . . . . . . . . . 133
4.4.2.4 SURVEYOR assay to screen for mutations . . . . 133
4.4.3 Generation & selection of CRISPR-modified cell clones . . 134
4.4.3.1 Transfection of cells . . . . . . . . . . . . . . . . 134
4.4.3.2 Selection of clones . . . . . . . . . . . . . . . . . 135
4.4.3.3 Confirmation of modifications . . . . . . . . . . . 136
4.5 Testing CRISPR cells in autophagy assays . . . . . . . . . . . . . . 139
4.5.1 LC3 processing is increased in RPIA-depleted cells . . . . . 139
4.5.2 RPIA-depleted cells display an increase in LC3 puncta . . . 139
4.5.3 Pharmacological inhibition of TKT does not alter autophagy 140
4.5.4 Mass spectrometry . . . . . . . . . . . . . . . . . . . . . . 142
4.6 Metabolic activity and MAPK signalling in CRISPR cells . . . . . . 148
5 DISCUSSION 151
5.1 RPIA induces Grb2 recruitment . . . . . . . . . . . . . . . . . . . 151

14 Contents
5.2 RPIA does not affect metabolic activity or MAPK signalling in
HeLa cells . . . . . . . . . . . . . . . . . . . . . . . . . . . . . . . 153
5.3 The role of RPIA in the regulation of autophagy . . . . . . . . . . . 154
5.3.1 Molecular mechanisms of autophagy regulation . . . . . . . 155
5.3.2 Metabolites and metabolic enzymes regulate autophagy . . . 157
5.3.3 R5P levels or non-canonical function of RPIA? . . . . . . . 159
5.3.4 Is RPIA essential? . . . . . . . . . . . . . . . . . . . . . . 160
5.3.5 Does RPIA have a non-canonical role? . . . . . . . . . . . 161
6 GENERAL CONCLUSIONS 165
6.1 RPIA in Grb2 signalling . . . . . . . . . . . . . . . . . . . . . . . 165
6.2 RPIA in autophagy regulation . . . . . . . . . . . . . . . . . . . . 166
Appendices 167
A Supporting data 167
A.1 FoxO3A experiments . . . . . . . . . . . . . . . . . . . . . . . . . 167
A.2 ATG4B reporter: Act-LC3-dN-GLuc . . . . . . . . . . . . . . . . . 167
A.3 Homozygous knockout of RPIA in mice is lethal . . . . . . . . . . 167
B Colophon 171
Bibliography 172

List of Figures
1.1 Stages of Autophagy and LC3 processing . . . . . . . . . . . . . . 33
1.2 Regulation of mTORC1 . . . . . . . . . . . . . . . . . . . . . . . . 41
1.3 Energy generation under physiological conditions . . . . . . . . . . 46
1.4 Warburg effect . . . . . . . . . . . . . . . . . . . . . . . . . . . . . 48
1.5 Glycolysis . . . . . . . . . . . . . . . . . . . . . . . . . . . . . . . 49
1.6 TCA cycle . . . . . . . . . . . . . . . . . . . . . . . . . . . . . . . 53
1.7 Hypoxia response . . . . . . . . . . . . . . . . . . . . . . . . . . . 60
1.8 Nucleotide synthesis . . . . . . . . . . . . . . . . . . . . . . . . . 61
1.9 Pentose phosphate pathway overview . . . . . . . . . . . . . . . . 65
1.10 RPIA sequence overview and species comparison . . . . . . . . . . 68
1.11 Receptor tyrosine kinase signalling . . . . . . . . . . . . . . . . . . 70
1.12 Grb2 domain overview . . . . . . . . . . . . . . . . . . . . . . . . 72
1.13 MAPK signalling cascade . . . . . . . . . . . . . . . . . . . . . . . 76
1.14 Regulation and effect of FoxO3A signalling . . . . . . . . . . . . . 80
2.1 puncta analysis using Columbus™ . . . . . . . . . . . . . . . . . . 95
3.1 Grb2 screen . . . . . . . . . . . . . . . . . . . . . . . . . . . . . . 103
3.2 RPIA changes GFP-Grb2 localisation . . . . . . . . . . . . . . . . 104
3.3 RPIA specifically changes Grb2 localisation . . . . . . . . . . . . . 105
3.4 Catalytically inactive mutant RPIA D160A also causes Grb2
translocation . . . . . . . . . . . . . . . . . . . . . . . . . . . . . . 107
3.5 Over-expressed RPIA and Grb2 co-localise . . . . . . . . . . . . . 108

16 List of Figures
3.6 Overexpression of RPIA causes various GFP-Grb2 mutants to
change localisation . . . . . . . . . . . . . . . . . . . . . . . . . . 108
3.7 RPIA localises to distinct puncta . . . . . . . . . . . . . . . . . . . 110
3.8 RPIA and CAD do not colocalise . . . . . . . . . . . . . . . . . . . 111
3.9 Expression of RPIA in HepG2 cells does not increase oxidoreduc-
tase activity . . . . . . . . . . . . . . . . . . . . . . . . . . . . . . 113
3.10 Overexpression of RPIA in HEK293T cells does not increase
metabolic activity . . . . . . . . . . . . . . . . . . . . . . . . . . . 114
3.11 RPIA does not alter phospho-ERK levels . . . . . . . . . . . . . . . 115
4.1 LC3 - processing is increased upon shRNA-mediated knockdown
of RPIA . . . . . . . . . . . . . . . . . . . . . . . . . . . . . . . . 119
4.2 Knockdown of RPIA in stable GFP-LC3 cell line increases LC3
puncta . . . . . . . . . . . . . . . . . . . . . . . . . . . . . . . . . 121
4.3 increased endogenous LC3 puncta under transient RPIA knock-
down conditions . . . . . . . . . . . . . . . . . . . . . . . . . . . . 122
4.4 pharmacological inhibition of RPIA and addition of R5P do not af-
fect LC3 processing . . . . . . . . . . . . . . . . . . . . . . . . . . 124
4.5 pharmacological inhibition of RPIA and addition of R5P do not af-
fect ATG4B activity . . . . . . . . . . . . . . . . . . . . . . . . . . 126
4.6 RKI depletion in S. cerevisiae does not regulate autophagy . . . . . 128
4.7 CRISPR/nCas9 technique . . . . . . . . . . . . . . . . . . . . . . . 130
4.8 CRISPR optimisation pipeline . . . . . . . . . . . . . . . . . . . . 131
4.9 sgRNA nicking sites in Exon 1 . . . . . . . . . . . . . . . . . . . . 132
4.10 SURVEYOR assay . . . . . . . . . . . . . . . . . . . . . . . . . . 134
4.11 CRISPR clonal selection . . . . . . . . . . . . . . . . . . . . . . . 135
4.12 CRISPR sequencing . . . . . . . . . . . . . . . . . . . . . . . . . . 137
4.13 CRISPR sequencing . . . . . . . . . . . . . . . . . . . . . . . . . . 138
4.14 LC3-processing in CRISPR cells . . . . . . . . . . . . . . . . . . . 140
4.15 LC3 puncta in CRISPR cells . . . . . . . . . . . . . . . . . . . . . 141
4.16 pharmacological inhibition of TKT in RPIA-depleted CRISPR cells 143

List of Figures 17
4.17 R5P and S7P levels in CRISPR cells . . . . . . . . . . . . . . . . . 145
4.18 DHAP and E4P levels in CRISPR cells . . . . . . . . . . . . . . . . 146
4.19 G6P/F6P levels in CRISPR cells . . . . . . . . . . . . . . . . . . . 147
4.20 Metabolic activity in HeLa CRISPR cell lines is not altered . . . . . 149
4.21 p-ERK is not altered in HeLa CRISPR cells . . . . . . . . . . . . . 150
A.1 RPIA inhibits Foxo3A signalling . . . . . . . . . . . . . . . . . . . 168
A.2 increased ATG4B reporter activity under transient RPIA knock-
down conditions . . . . . . . . . . . . . . . . . . . . . . . . . . . . 169
A.3 Complete pre-weaning lethality in homozygous RPIA knock-out mice170


List of Tables
2.1 Over-expression plasmids used in this study . . . . . . . . . . . . . 85
2.2 knockdown and control plasmids used in this study . . . . . . . . . 86
2.3 shRNA sequences targeting RPIA in pLKO.1 vectors . . . . . . . . 87
2.4 sgRNA sequences targeting Exon 1 in RPIA used in this study . . . 89
2.5 genomic primers used in this study . . . . . . . . . . . . . . . . . . 89
2.6 Antibodies used in this study . . . . . . . . . . . . . . . . . . . . . 90


Abbreviations used in this study
aKG . . . . . . . . . . . . . . . . . . . . . . . . . . . . . . . . . . . . . . . . . . . . . . . . . . . . . . . a-ketoglutarate
2-PG . . . . . . . . . . . . . . . . . . . . . . . . . . . . . . . . . . . . . . . . . . . . . . . . . . . . 2-phosphoglycerate
3-PG . . . . . . . . . . . . . . . . . . . . . . . . . . . . . . . . . . . . . . . . . . . . . . . . . . . . 3-phosphoglycerate
6PGDH . . . . . . . . . . . . . . . . . . . . . . . . . . . . . . . . . . 6-phosphogluconate dehydrogenase
AA . . . . . . . . . . . . . . . . . . . . . . . . . . . . . . . . . . . . . . . . . . . . . . . . . . . . . . . . . . . . amino acids
Ac-CoA . . . . . . . . . . . . . . . . . . . . . . . . . . . . . . . . . . . . . . . . . . . . . . . . . .Acetyl-coenzme A
ACACA . . . . . . . . . . . . . . . . . . . . . . . . . . . . . . . . . . . . . . . . . . . . . . . Ac-CoA carboxylase
ACL . . . . . . . . . . . . . . . . . . . . . . . . . . . . . . . . . . . . . . . . . . . . . . . . . . . . . . ATP-citrate lyase
ADP . . . . . . . . . . . . . . . . . . . . . . . . . . . . . . . . . . . . . . . . . . . . . . . . .Adenosine diphosphate
Ambra1 . . . . . . . . . . . . . . . . . . . activating molecule in Beclin-1-regulated autophagy
AMP . . . . . . . . . . . . . . . . . . . . . . . . . . . . . . . . . . . . . . . . . . . . . adenosine monophosphate
AMPK . . . . . . . . . . . . . . . . . . . . . . . . . . . . . . . . . . . . . . . . . AMP-activated protein kinase
ARTD . . . . . . . . . . . . . . . . . . . . . . . . . . . . ADP-ribosyltransferase diphtheria toxin-like
ATG . . . . . . . . . . . . . . . . . . . . . . . . . . . . . . . . . . . . . . . . . . . . . . . . . . . Autophagy (protein)
ATP . . . . . . . . . . . . . . . . . . . . . . . . . . . . . . . . . . . . . . . . . . . . . . . . . adenosine triphosphate
Bcl-2 . . . . . . . . . . . . . . . . . . . . . . . . . . . . . . . . . . . . . . . . . . . . . . . B-cell CLL/lymphoma-2
Bif-1 . . . . . . . . . . . . . . . . . . . . . . . . . . . . . . . . . . . . . . . . . . . . . . . . Bax-interacting factor 1
BNIP3 . . . . . . . . . . . . . . . . . . . . . . . Bcl-2/adenovirus E1B protein-interacting protein
BRCA-1 . . . . . . . . . . . . . . . . . . . . . . . . . . . . . . . . . . . . . . . . . . . . . . . . . . . . . breast cancer 1
C. elegans . . . . . . . . . . . . . . . . . . . . . . . . . . . . . . . . . . . . . . . . . . . . Caenorhabditis elegans
CAD . . . . . . . . . . . . . . . . . . . . . . . . . . . . .Carbamoyl-phosphate synthetase 2, aspartate
transcarbamylase, and dihydroorotase
cADPR . . . . . . . . . . . . . . . . . . . . . . . . . . . . . . . . . . . . . . . . . . . . . . . . . . cyclic ADP-ribose

22 List of Tables
cAMP . . . . . . . . . . . . . . . . . . . . . . . . . . . . . . . . . . . . . . . . . . . . . . . . . . . . . . . . . . cyclic AMP
cGMP . . . . . . . . . . . . . . . . . . . . . . . . . . . . . . . . . . . . . . cyclic guanosine monophosphate
CMA . . . . . . . . . . . . . . . . . . . . . . . . . . . . . . . . . . . . . . . . Chaperone-mediated autophagy
Co-IP . . . . . . . . . . . . . . . . . . . . . . . . . . . . . . . . . . . . . . . . . . . . . . . co-immunoprecipitation
CRC . . . . . . . . . . . . . . . . . . . . . . . . . . . . . . . . . . . . . . . . . . . . . . . . . . . . . . colorectal cancer
CRISPR . . . . . . . . . . . . . . . clustered regularly-interspaced short palindromic repeats
DAPK . . . . . . . . . . . . . . . . . . . . . . . . . . . . . . . . . . . . . . . . death-associated protein kinase
DEPTOR . . . . . . . . . . . . . . . . . . . DEP-domain containing mTOR-interacting protein
DHAP . . . . . . . . . . . . . . . . . . . . . . . . . . . . . . . . . . . . . . . . . .Dihydroxyacetone phosphate
DMSO . . . . . . . . . . . . . . . . . . . . . . . . . . . . . . . . . . . . . . . . . . . . . . . . . . Dimethyl sulfoxide
DNA . . . . . . . . . . . . . . . . . . . . . . . . . . . . . . . . . . . . . . . . . . . . . . . . . deoxyribonucleic acid
dR5P . . . . . . . . . . . . . . . . . . . . . . . . . . . . . . . . . . . . . . . . . . . . 2-deoxy-ribose 5-phosphate
DUSPs . . . . . . . . . . . . . . . . . . . . . . . . . . . . . . . . . . . . . . . . . dual specificity phosphatases
D. melanogaster . . . . . . . . . . . . . . . . . . . . . . . . . . . . . . . . . . . . . drosophila melanogaster
E4P . . . . . . . . . . . . . . . . . . . . . . . . . . . . . . . . . . . . . . . . . . . . . . . . . . erythrose-4-phosphate
EGF . . . . . . . . . . . . . . . . . . . . . . . . . . . . . . . . . . . . . . . . . . . . . . . . epidermal growth factor
EGFR . . . . . . . . . . . . . . . . . . . . . . . . . . . . . . . . . . . . . . . epidermal growth factor receptor
EM . . . . . . . . . . . . . . . . . . . . . . . . . . . . . . . . . . . . . . . . . . . . . . . . . . . . electron microscopy
ESCRT . . . . . . . . . . . . . . . . . . . . endosomal sorting complexes required for transport
ER . . . . . . . . . . . . . . . . . . . . . . . . . . . . . . . . . . . . . . . . . . . . . . . . . . . endoplasmic reticulum
ERK . . . . . . . . . . . . . . . . . . . . . . . . . . . . . . . . . . . . . extracellular signal-regulated kinase
Ets . . . . . . . . . . . . . . . . . . . . . . . . . . . . . . . . . . . . . . . . .E twenty-six (transcription factor)
F1(2),6P . . . . . . . . . . . . . . . . . . . . . . . . . . . . . . . . . . . . . . . . fructose-1(2)-6-bisphosphate
F6P . . . . . . . . . . . . . . . . . . . . . . . . . . . . . . . . . . . . . . . . . . . . . . . . . . . . fructose-6-phosphate
FASN . . . . . . . . . . . . . . . . . . . . . . . . . . . . . . . . . . . . . . . . . . . . . . . . . . . . fatty acid synthase
FCS . . . . . . . . . . . . . . . . . . . . . . . . . . . . . . . . . . . . . . . . . . . . . . . . . . . . . . . . fetal calf serum
FGFR2 . . . . . . . . . . . . . . . . . . . . . . . . . . . . . . . . . . . . fibroblast growth factor receptor 2
FLAG . . . . . . . . . . . . . . . . . . . . . . . . . . . . . . . . . . . . amino acid sequence DYKDDDDK
G3P . . . . . . . . . . . . . . . . . . . . . . . . . . . . . . . . . . . . . . . . . . . . . glyceraldehyde-3-phosphate
G6P . . . . . . . . . . . . . . . . . . . . . . . . . . . . . . . . . . . . . . . . . . . . . . . . . . . .glucose-6-phosphate

List of Tables 23
G6PDH . . . . . . . . . . . . . . . . . . . . . . . . . . . . . . . . . . glucose-6-phosphate dehydrogenase
GABARAP . . . . . . . . . . . . . . Gamma-aminobutyric acid receptor-associated protein
GAPDH . . . . . . . . . . . . . . . . . . . . . . . . . . . glyceraldehyde-3-phosphate dehydrogenase
GDP . . . . . . . . . . . . . . . . . . . . . . . . . . . . . . . . . . . . . . . . . . . . . . . . . guanosine diphosphate
GEF . . . . . . . . . . . . . . . . . . . . . . . . . . . . . . . . . . . . . . . . . . . . . . . . GTPase exchange factor
GFP . . . . . . . . . . . . . . . . . . . . . . . . . . . . . . . . . . . . . . . . . . . . . . . . green fluorescent protein
Grb2 . . . . . . . . . . . . . . . . . . . . . . . . . . . . . . . . . . .growth factor receptor bound protein 2
GS . . . . . . . . . . . . . . . . . . . . . . . . . . . . . . . . . . . . . . . . . . . . . . . . . . . . glutamine synthetase
GSK . . . . . . . . . . . . . . . . . . . . . . . . . . . . . . . . . . . . . . . . . . . . . . . glycogen synthase kinase
GTP . . . . . . . . . . . . . . . . . . . . . . . . . . . . . . . . . . . . . . . . . . . . . . . . . guanosine triphosphate
hsc70 . . . . . . . . . . . . . . . . . . . . . . . . . . . . . . . . . . . . . .heat shock cognate 70 kDa protein
HCC . . . . . . . . . . . . . . . . . . . . . . . . . . . . . . . . . . . . . . . . human hepatocellular carcinoma
HDR . . . . . . . . . . . . . . . . . . . . . . . . . . . . . . . . . . . . . . . . . . . . . . homology-directed repair
HGFR . . . . . . . . . . . . . . . . . . . . . . . . . . . . . . . . . . . . . . hepatocyte growth factor receptor
HIF . . . . . . . . . . . . . . . . . . . . . . . . . . . . . . . . . . . . . . . . . . . . . . . . hypoxia-inducible factor
HK . . . . . . . . . . . . . . . . . . . . . . . . . . . . . . . . . . . . . . . . . . . . . . . . . . . . . . . . . . . . . hexokinase
HPLC . . . . . . . . . . . . . . . . . . . . . . . . . . . . . . . . . . . high pressure liquid chromatography
IMP . . . . . . . . . . . . . . . . . . . . . . . . . . . . . . . . . . . . . . . . . . . . . . . . . inosine monophosphate
JNK1 . . . . . . . . . . . . . . . . . . . . . . . . . . . . . . . . . . . . . . . . . . . . . . c-jun N-terminal kinase 1
kDa . . . . . . . . . . . . . . . . . . . . . . . . . . . . . . . . . . . . . . . . . . . . . . . . . . . . . . . . . . . . . kilodalton
LAMP-2A . . . . . . . . . . . . . . . . . . . . . lysosome-associated membrane protein type 2A
(MAP)LC3 . . . . . . . . . . . . . . . . . . . . . . (microtubule-associated protein) light chain 3
LDHA . . . . . . . . . . . . . . . . . . . . . . . . . . . . . . . . . . . . . . . . . . . . . . lactate dehydrogenase A
LRS . . . . . . . . . . . . . . . . . . . . . . . . . . . . . . . . . . . . . . . . . . . . . . . Leucyl-tRNA Synthetase
MAPK . . . . . . . . . . . . . . . . . . . . . . . . . . . . . . . . . . . . . . mitogen-activated protein kinase
MEFs . . . . . . . . . . . . . . . . . . . . . . . . . . . . . . . . . . . . . . . . . . .mouse embryonic fibroblasts
MEK . . . . . . . . . . . . . . . . . . . . . . . . . . . . . . . . . . . . . . . . . . . . . . . . . . . MAPK/ERK Kinase
MG-132 . . . . . . . . . . . . . . . . . . . . . . . N-(benzyloxycarbonyl)leucinylleucinylleucinal
MKK . . . . . . . . . . . . . . . . . . . . . . . . . . . . . . . . . . . . . . . . . . . . . . . . . . . . . . MAPK Kinase 1
MKPs . . . . . . . . . . . . . . . . . . . . . . . . . . . . . . . . . . . . . . . . . . . . . MAP kinase phosphatases

24 List of Tables
mRNA . . . . . . . . . . . . . . . . . . . . . . . . . . . . . . . . . . . . . . . . . . . . . . . . . . . . . messenger RNA
MS . . . . . . . . . . . . . . . . . . . . . . . . . . . . . . . . . . . . . . . . . . . . . . . . . . . . . . mass spectroscopy
mSin1 . . . . . . . . . . . mammalian stress activated protein kinase interacting protein 1
mLST8 . . . . . . . . . . . . . . . . . . . . . . . . . . . . . . . mammalian lethal with SEC13 protein 8
mTOR . . . . . . . . . . . . . . . . . . . . . . . . . . . . . . . . . . . . . . . mammalian target of rapamycin
mTORC1 . . . . . . . . . . . . . . . . . . . . . . . . . . mammalian target of rapamycin complex 1
NaAD . . . . . . . . . . . . . . . . . . . . . . . . . . . . . . . . . . . . . nicotinic acid adenine dinucleotide
NAC . . . . . . . . . . . . . . . . . . . . . . . . . . . . . . . . . . . . . . . . . . . . . . . . . . . . . . .N-acetylcysteine
NAD+ . . . . . . . . . . . . . . . . . . . . . . . . . . . . . oxidised nicotinamide adenine dinucleotide
NADH . . . . . . . . . . . . . . . . . . . . . . . . . . . . . reduced nicotinamide adenine dinucleotide
NADP(+) . . . . . . . . . . . . . . . . oxidised nicotinamide adenine dinucleotide phosphate
NADPH . . . . . . . . . . . . . . . . . . reduced nicotinamide adenine dinucleotide phosphate
NaMN . . . . . . . . . . . . . . . . . . . . . . . . . . . . . . . . . . . . . . . . .nicotinic acid mononucleotide
NH4 . . . . . . . . . . . . . . . . . . . . . . . . . . . . . . . . . . . . . . . . . . . . . . . . . . . . . . . . . . . . . Ammonia
NHEJ . . . . . . . . . . . . . . . . . . . . . . . . . . . . . . . . . . . . . . . . . . non-homologous-end-joining
P5C . . . . . . . . . . . . . . . . . . . . . . . . . . . . . . . . . . . . . . . . . . . . . . . . . pyrroline-5-carboxylate
PAM . . . . . . . . . . . . . . . . . . . . . . . . . . . . . . . . . . . . . . . . . . . . . protospacer adjacent motif
PAS . . . . . . . . . . . . . . . . . . . . . . . . . . . . . . . . . . . . . . . . . . . pre-autophagosomal structure
PBS . . . . . . . . . . . . . . . . . . . . . . . . . . . . . . . . . . . . . . . . . . . . . . . phosphate-buffered saline
PC . . . . . . . . . . . . . . . . . . . . . . . . . . . . . . . . . . . . . . . . . . . . . . . . . . . . pyruvate carboxylase
PDGFR . . . . . . . . . . . . . . . . . . . . . . . . . . . . . . . . platelet derived growth factor receptor
PDH . . . . . . . . . . . . . . . . . . . . . . . . . . . . . . . . . . . . . . . . . . . . . . . . pyruvate dehydrogenase
PDK1 . . . . . . . . . . . . . . . . . . . . . . . . . . . . . . . . . . . . . . .pyruvate dehydrogenase kinase 1
PDK-1 . . . . . . . . . . . . . . . . . . . . . . . . . . . . . . . . . . phosphoinositide-dependent kinase-1
PE . . . . . . . . . . . . . . . . . . . . . . . . . . . . . . . . . . . . . . . . . . . . . . . . phosphatidylethanolamine
PEP . . . . . . . . . . . . . . . . . . . . . . . . . . . . . . . . . . . . . . . . . . . . . . . . . . . phosphoenolpyruvate
PFK . . . . . . . . . . . . . . . . . . . . . . . . . . . . . . . . . . . . . . . . . . . . . . . . . . . phosphofructokinase
PGDH . . . . . . . . . . . . . . . . . . . . . . . . . . . . . . . . . . . . . . phosphoglycerate dehydrogenase
PHD . . . . . . . . . . . . . . . . . . . . . . . . . . . . . . . . . . . . . . . . . . . . . . . . . . . . . prolyl hydroxylase
PKC . . . . . . . . . . . . . . . . . . . . . . . . . . . . . . . . . . . . . . . . . . . . . . . . . . . . . . . protein kinase C

List of Tables 25
PI (PtdIns) . . . . . . . . . . . . . . . . . . . . . . . . . . . . . . . . . . . . . . . . . . . . . . phosphatidylinositol
PI3K . . . . . . . . . . . . . . . . . . . . . . . . . . . . . . . . . . . . . . . . . . . . . . phosphoinositide 3-kinase
POX (PRODH) . . . . . . . . . . . . . . . . . . . . . . . . . . . . . . . . . . . . . . . . proline dehydrogenase
PP2A . . . . . . . . . . . . . . . . . . . . . . . . . . . . . . . . . . . . . . . . . . . . . . . . protein phosphatase 2A
PPP . . . . . . . . . . . . . . . . . . . . . . . . . . . . . . . . . . . . . . . . . . . . . . pentose phosphate pathway
PRAS40 . . . . . . . . . . . . . . . . . . . . . . . . . . . . . . . . . . . . 40kDa Proline-rich Akt substrate
PROTOR . . . . . . . . . . . . . . . . . . . . . . . . . . . . . . . . . . . . . . . . protein observed with Rictor
PRPP . . . . . . . . . . . . . . . . . . . . . . . . . . . . . . . . . . . . . . . phosphoribosyl-5-pyrophosphate
PPAT . . . . . . . . . . . . . . . . . . . . . . . . . . phosphoribosylpyrophosphate amidotransferase
PRPS . . . . . . . . . . . . . . . . . . . . . . . . . . . . . . . phosphoribosyl-5-pyrophosphate synthase
PTB . . . . . . . . . . . . . . . . . . . . . . . . . . . . . . . . . . . . . . . . . . . . . . . . phosphotyrosine binding
PTEN . . . . . . . . . . . . phosphatase and tensin homologue deleted on chromosome 10
PYCR1 . . . . . . . . . . . . . . . . . . . . . . . . . . . . . . . . . . . . . pyrroline-5-carboxylate reductase
R5P . . . . . . . . . . . . . . . . . . . . . . . . . . . . . . . . . . . . . . . . . . . . . . . . . . . . . ribose-5-phosphate
Raf . . . . . . . . . . . . . . . . . . . . . . . . . . . . . . . . . . . . . . . . . rapidly accelerated fibrosarcoma
RAPTOR . . . . . . . . . . . . . . . . . . . . . . . . . . . . . . regulatory associated protein of mTOR
RB1CC1 (FIP200) . . . . . . . . . . . . . . . . . . . . . . . . . . .RB1-inducible coiled-coil protein
Rheb . . . . . . . . . . . . . . . . . . . . . . . . . . . . . . . . . . . . . . . . . .Ras homolog enriched in brain
Ri5P . . . . . . . . . . . . . . . . . . . . . . . . . . . . . . . . . . . . . . . . . . . . . . . . . . . ribulose-5-phosphate
RNA . . . . . . . . . . . . . . . . . . . . . . . . . . . . . . . . . . . . . . . . . . . . . . . . . . . . . . . ribonucleic acid
ROS . . . . . . . . . . . . . . . . . . . . . . . . . . . . . . . . . . . . . . . . . . . . . . . . . reactive oxygen species
RPIA . . . . . . . . . . . . . . . . . . . . . . . . . . . . . . . . . . . . . . . . ribose-5-phosphate isomerase A
rpm . . . . . . . . . . . . . . . . . . . . . . . . . . . . . . . . . . . . . . . . . . . . . . . . . . . . rotations per minute
RT . . . . . . . . . . . . . . . . . . . . . . . . . . . . . . . . . . . . . . . . . . . . . . . . . . . . . . . room temperature
RTK . . . . . . . . . . . . . . . . . . . . . . . . . . . . . . . . . . . . . . . . . . . . . . . . receptor tyrosine kinase
Rubicon . . . . . . . . . . . . . . . . . . . . . RUN domain and cysteine-rich domain containing
Beclin 1-interacting protein
S. cerevisiae . . . . . . . . . . . . . . . . . . . . . . . . . . . . . . . . . . . . . . . Saccharomyces cerevisiae
S6K1 . . . . . . . . . . . . . . . . . . . . . . . . . . . . . . . . . . . . . . . . . . . . ribosomal protein S6 kinase
S7P . . . . . . . . . . . . . . . . . . . . . . . . . . . . . . . . . . . . . . . . . . . . . . sedoheptulose-7-phosphate

26 List of Tables
SAICAR . . . . . . . . . . . . . . succinylaminoimidazolecarboxamide ribose-5-phosphate
SAPK . . . . . . . . . . . . . . . . . . . . . . . . . . . . . . . . . . . . . . . . . stress-activated protein kinase
SCD . . . . . . . . . . . . . . . . . . . . . . . . . . . . . . . . . . . . . . . . . . . . . . . . stearoyl-CoA desaturase
SD . . . . . . . . . . . . . . . . . . . . . . . . . . . . . . . . . . . . . . . . . . . . . . . . . . . . . . . standard deviation
SDS-PAGE . . . . . . . . . . . sodiumdodecyl-sulfate polyacrylamide gel-electrophoresis
SGK . . . . . . . . . . . . . . . . . . . . . . . . . . . . . . . . . . . serum/glucocorticoid-regulated kinase
sgRNA . . . . . . . . . . . . . . . . . . . . . . . . . . . . . . . . . . . . . . . . . . . . . . . . . . . single guide RNA
SH (domains) . . . . . . . . . . . . . . . . . . . . . . . . . . . . . . . . . . . . . . . . . . . . . . . . . Src homology
shRNA . . . . . . . . . . . . . . . . . . . . . . . . . . . . . . . . . . . . . . . . . . . . . . . . . . . short hairpin RNA
siRNA . . . . . . . . . . . . . . . . . . . . . . . . . . . . . . . . . . . . . . . . . . . . . . . . small interfering RNA
SIRT . . . . . . . . . . . . . . . . . . . . . . . . . . . . . . . . . . . . . . . . . . . . . . . . . . . . . . . . . . . . . . . . sirtuin
SOS . . . . . . . . . . . . . . . . . . . . . . . . . . . . . . . . . . . . . . . . . . . . . . . . . . . . . . . son-of-sevenless
STAT3 . . . . . . . . . . . . . . . . . . . . . . . . signal transducer and activator of transcription 3
TALDO . . . . . . . . . . . . . . . . . . . . . . . . . . . . . . . . . . . . . . . . . . . . . . . . . . . . . . Transaldolase
TALEN . . . . . . . . . . . . . . . . . . . . . . . . . . Transcription activator-like effector nuclease
TCA cycle . . . . . . . . . . . . . . . . . . . . . . . . . . . . . . . . . . . . . . . . . . . tricarboxylic acid cycle
TFs . . . . . . . . . . . . . . . . . . . . . . . . . . . . . . . . . . . . . . . . . . . . . . . . . . . . . transcription factors
TKT . . . . . . . . . . . . . . . . . . . . . . . . . . . . . . . . . . . . . . . . . . . . . . . . . . . . . . . . . . transketolase
TKTL1/2 . . . . . . . . . . . . . . . . . . . . . . . . . . . . . . . . . . . . . . . . . . . . . . transketolase-like 1/2
TSC1/2 . . . . . . . . . . . . . . . . . . . . . . . . . . . . . . . . . . . . . . . tuberous sclerosis complex 1/2
UBL . . . . . . . . . . . . . . . . . . . . . . . . . . . . . . . . . . . . . . . . . . . . . . . . . . . . . . . . . ubiquitin-like
ULK 1/2 . . . . . . . . . . . . . . . . . . . . . . . . . . . . unc-51 like autophagy activating kinase 1
UMP . . . . . . . . . . . . . . . . . . . . . . . . . . . . . . . . . . . . . . . . . . . . . . . . uridine monophosphate
UVRAG . . . . . . . . . . . . . . . . . . . Ultra-Violet irradiation Resistance-Associated Gene
VDAC . . . . . . . . . . . . . . . . . . . . . . . . . . . . . . . . voltage-gated anion-dependent channel
VHL . . . . . . . . . . . . . . . . . . . . . . . . . . . . . . . . . . . . . . . . . . . von Hippel-Lindau E3 ligase
VPS . . . . . . . . . . . . . . . . . . . . . . . . . . . . . . . . . . . . . . . . . . . . . . . . .vacuolar protein sorting
X5P . . . . . . . . . . . . . . . . . . . . . . . . . . . . . . . . . . . . . . . . . . . . . . . . . . xylulose- 5-phosphate
YPD . . . . . . . . . . . . . . . . . . . . . . . . . . . . . . . . . . . . . . . . . . yeast extract peptone dextrose
ZFN . . . . . . . . . . . . . . . . . . . . . . . . . . . . . . . . . . . . . . . . . . . . . . . . . . . zinc-finger nucleases

List of Tables 27


Chapter 1
INTRODUCTION
1.1 Autophagy
1.1.1 Overview
Autophagy is a highly conserved process by which certain cellular components are
degraded inside the cell through fusion with lysosomes1. The term autophagy is
derived from ancient greek and means eating of self. Engulfed material is broken
down into basic components and released into the cytosol for metabolic use, includ-
ing for energy production and biosynthesis pathways. The key role of autophagy
in cells is to maintain cellular nutrient and energy homeostasis under various con-
ditions2. Approximately 1-1.5% of cellular proteins are degraded by autophagy
per hour at basal rates, even under nutrient-rich conditions in the liver3. Several
human diseases, including cancer, neurodegenerative disorders and increased sus-
ceptibility to infectious diseases have been linked to autophagy4 (see section 1.1.5).
Moreover, genetic knockout studies of core autophagy components in mice lead to
death after birth, partly due to lack of sufficient energy reserves between placental
metabolism and breast feeding5. In contrast to the proteasomal degradation system,
autophagy is not just restricted to degradation of proteins but can also break down
lipids, DNA and RNA6,7. Furthermore, the ubiquitin-proteasomal system consumes
energy in form of ATP in the process of degradation, whereas autophagy can gen-
erate ATP through breakdown of macromolecules7. Autophagy is a very dynamic
process which occurs at low levels, under basal conditions in all cells8. Multiple

30 Chapter 1. INTRODUCTION
signalling inputs regulate autophagy (looked at in detail in section 1.1.5), including
many metabolites and a number of metabolic enzymes. The process is tightly reg-
ulated - basal levels play an important role in cellular homeostasis and fine tuning
allows cells to adapt and survive in response to multiple stress conditions9.
1.1.2 Types of autophagy
Currently, three defined types of autophagy in mammalian cells have been char-
acterised. All have in common that contents are subject to lysosomal proteolytic
degradation10. Once the engulfed cargo is exposed to resident proteases and lipases
inside a lysosome, macromolecules are broken down to liberate free amino and fatty
acids11 (see section 1.1.4).
1.1.2.1 Macroautophagy
Macroautophagy, the most studied type of autophagy, is the process in which cellu-
lar contents are delivered and degraded by lysosomes (mammalian cells) or vacuoles
(budding yeast) and recycled12. This is achieved by formation of double membrane-
bound vesicles, referred to as an autophagosomes. They enclose various types of
cellular material, including large structures prior to fusion with lysosomes (see fig-
ure 1.1). This process occurs via selective or non-selective mechanisms13. Dam-
aged organelles, for example, are removed by organelle-specific macroautophagy
processes such as mitophagy (degradation of mitochondria), pexophagy (degra-
dation of peroxisomes) and ribophagy (degradation of ribosomes). This is gen-
erally achieved by cargo receptors that recognise cargo targeted for degradation,
such as p62. Non-selective (cytoplasmic) macroautophagy (hereafter referred to as
autophagy, unless otherwise stated) occurs at a basal level stimulated by different
types of starvation (see section 1.1.5).
1.1.2.2 Microautophagy
Microautophagy, by contrast, is characterised by direct engulfment of cytoplasmic
cargo into the lysosome (mammalian cells) or vacuole (budding yeast) through in-
vagination of the lysosomal membrane. Microautophagy is important in the main-
tenance of organellar size, membrane homeostasis and cell survival under nitrogen

1.1. Autophagy 31
restriction14. Large structures can also be engulfed through microautophagy, and
the process occurs via selective or non-selective mechanisms, such as micropex-
ophagy or micromitophagy10,13,14. There is significant overlap in the autophagic
core machinery and regulation with the other autophagy types, but this subject has
been thoroughly reviewed elsewhere (see14,15).
1.1.2.3 Chaperone-mediated autophagy (CMA)
Chaperone-mediated autophagy (CMA) is a specialised form of autophagy that in-
volves the direct translocation of unfolded, cytoplasmic proteins across the lysoso-
mal membrane. This is mediated by a complex of chaperone proteins, including
heat shock cognate 70 kDa protein (hsc70)3. Since membrane reorganisation is not
involved, large structures, such as organelles can not be degraded via CMA3 and
the process is always selective13. Protein complexes are recognized by the lysoso-
mal membrane receptor LAMP-2A (lysosomal-associated membrane protein 2A),
resulting in their unfolding and degradation6.
1.1.3 Autophagic core machinery
The core autophagy machinery is highly conserved from yeast to mammalian cells.
In fact, key cellular components were first discovered in Saccharomyces cerevisiae
(named in order of discovery, e.g. ATG1) and mammalian homologs have been
identified. Whereas in budding yeast there is only one isoform for each gene in
the pathway (e.g. ATG8), multiple isoforms exist in humans (e.g. LC3 family, see
1.1.4.2). In yeast, phagophore membrane formation is formed at a specialised com-
partment known as the pre-autophagosomal structure (PAS), a structure not found
in mammals8. Yeast also don’t have lysosomes, but instead one large vacuole16.
To date, there are at least 36 genes involved in autophagic processes, all playing
various roles in the molecular mechanism12,17. Out of those, 17 are considered
essential to the core machinery for all types of autophagy4,18. In the literature, au-
tophagy proteins are often divided into different functional groups, according to
their involvement:
(1) ULK1 complex (or known as Atg1-ULK1 complex)

32 Chapter 1. INTRODUCTION
(2) VPS34 kinase complex (or known as PI3K or Beclin-1 complex)
(3) ATG12-ATG5-ATG16L complex
(4) LC3 conjugation system
In the following sections we will review how these complexes contribute to the
process of autophagy.
1.1.4 Cellular and molecular mechanism
Autophagy involves the formation of vesicles (autophagosomes) that enclose por-
tions of the cytoplasm. The process consists of a number of stages, (see figure 1.1).
Autophagosome formation is controlled by a complex network and interplay of ac-
tivating and/or inhibitory proteins (also see section 1.1.5). In this section, various
stages of mammalian autophagy at looked at in more detail.
1.1.4.1 Induction and phagophore formation
In mammals, autophagy induction (also referred to as nucleation) is characterised by
the formation of a flat double membrane (also known as phagophores). Currently,
it is not completely clear as to where exactly in the cell the initiation of phagophore
formation takes place and this topic is highly controversial in the field20. There is
evidence that the membrane is likely to be derived primarily from the endoplasmic
reticulum (ER) and possibly from the trans-Golgi and/or endosomes21–23. Other
sources of phagophore membrane have been reported, such as plasma membrane
and nuclear envelope24,25, suggesting that there probably is not a requirement for
a unique source of membrane. However, de novo membrane formation can not be
excluded as a possibility due to a lack of suitable transmembrane proteins markers
in autophagosomal membranes10. Two major protein complexes are involved in the
regulation of phagophore formation:
ULK1 complex
The first complex is composed of the serine/threonine kinase Unc-51-like kinase 1
(ULK1), ATG13, ATG101, and RB1-inducible coiled-coil protein 1 (RB1CC1 also
known as FIP200)26,27. ULK1 and ULK2 are orthologs of yeast ATG128. The acti-
vation of ULK1/2 kinase leads to activation of ATG13 and FIP20029. The fully ac-

1.1. Autophagy 33
Adapted from J. Da Costa, J. Heintze & R. Ketteler (2015)
(immature autophagosome)
autophagosome
lysosome
autophagolysosome
Recycling
phagophore
Induction and phagophore formation
Phagophore elongation and autophagosome formation
lysosomal fusion, degradation and recycling
LC3- I LC3- IIpro-LC3
LC3 processingATG3/7
ATG4B ATG4B
B
A
ATG13
ULK 1/2
Beclin-1
ULK1complex
ATG101
RB1CC1 / FIP200
VPS34 (class 3 PI3K)
VPS15 (p150)
ATG14L
LC3
VPS34complex Legend:
1 2 3
Figure 1.1: A) Stages of autophagy biogenesis. In the process of autophagosome forma-tion, the molecular marker LC3 in its lipidated form gets incorporated into thematuring autophagosome. The phagophore induction is regulated by ULK1and VPS34 kinase complexes. Autophagosomes fuse with lysosomes in orderto degrade macromolecules and organelles. These are recycled and used forbiosynthesis or energy generation. B) LC3 processing. Pro-LC3 gets prote-olytically cleaved by ATG4B to LC3-I, which gets lipidated by addition of aPE-anchor via AGT3/7 to LC3-II. ATG4B also delipidates LC3-II to LC3-I.Figures are adapted from J. Da Costa, J. Heintze & R. Ketteler (2015)19

34 Chapter 1. INTRODUCTION
tivated complex is required to activate Beclin-1 (mammalian homologue of ATG6)
by phosphorylation, which is a core part of the VPS34 kinase complex. Together
with ATG2 and ATG18, the ULK1 complex regulates the cycling of ATG9 to and
from the site of autophagosome formation.
VPS34 complex
The class III PI3K plays a positive role (compared to class I PI3K, see section
1.4.5.1) in the regulation of autophagy. The activated VPS34 complex gener-
ates PI(3)P, essential for phagophore nucleation. VPS34 is the catalytic subunit
and aside from autophagy, is also involved in various membrane-sorting activi-
ties. Other proteins in the complex are Beclin-1, VPS15 (also known as p150)
and Atg14L. Furthermore, a number of additional regulatory subunits that either
promote or inhibit phagophore formation associate with the complex. These in-
clude the coiled-coil protein Ultra-Violet irradiation Resistance-Associated Gene
(UVRAG), B-cell CLL/lymphoma-2 (Bcl-2), Bax-interacting factor 1 (Bif-1), Acti-
vating Molecule in Beclin-1-Regulated Autophagy (Ambra1),30–32. Rubicon (RUN
domain and cysteine-rich domain containing beclin 1-interacting protein) and Bcl-
2 negatively regulate autophagy via the VPS34 complex, whereas UVRAG, Bif-
1, ATG14L and Ambra1 promote autophagy. These studies indicate that multiple
complexes can exist within the cell and that they can tune the level of autophagy as
needed33. Activated ULK1 and VPS34 complexes localize to the site of phagophore
initiation, where they in turn activate downstream autophagy components.
1.1.4.2 Elongation and autophagosome formation
Sequestration and engulfment of cellular material proceeds as the phagophore mem-
brane elongates. The phagophore elongation eventually leads to the formation of an
autophagosome, which can be seen by electron microscopy as a double-membraned
closed organelle.
ubiquitin-like (UBL) conjugation systems
Two crucial protein complexes involved in this stage of autophagy have been de-
scribed to be ubiquitin-like (UBL) conjugation systems. Ubiquitin conjugation sys-
tems are composed of ubiquitin-activating enzymes (E1), ubiquitin-conjugating en-

1.1. Autophagy 35
zymes (E2), ubiquitin ligases (E3) and UBL proteins. As for canonical ubiquitin
conjugation systems, these occur in multi-step processes in autophagosome forma-
tion. For both systems, ATG7 is the activating E134. It transfers two UBLs, ATG8
and ATG12, to each cognate E2 enzyme (ATG3 and ATG10, respectively)3. ATG12
is then conjugated to ATG5 by formation of a covalent bond. ATG5-ATG12 forms
a non-covalent complex with multiple copies of the coiled-coil protein ATG16L.
This ATG16L complex localises to the site of the forming autophagosome and is
essential for the elongation of the nascent phagophore33.
LC3 family
The ATG5ATG12-Atg16L complex on the phagophore is the E3 for ATG835. This
conjugation system is fairly unique, since the lipid phosphatidylethanolamine (PE)
is ligated to ATG8, rather than a protein. In mammalian cells, six ATG8 homo-
logues exist, known as the microtubule-associated protein 1 light chain 3/gamma-
aminobutyric acid receptor-associated protein (MAP1LC3/GABARAPs or short
LC3s and GABARAPs) that form the LC3 family. Amongst those, there are LC3A,
LC3B, LC3B2 and LC3C in the LC3 sub-family; and GABARAP, GABARAPL1
and GABARAPL2 in the GABARAP family19,36. The predominant and most char-
acterised form of LC3 for the study of autophagy is LC3B (hereafter abbreviated to
LC3). The nascent peptide of LC3 (known as pro-LC3) is proteolytically cleaved
by the cysteine protease ATG4 family, of which ATG4B is the most prevalent and
catalytically active37. This cleavage of pro-LC3 to LC3-I is required for autophagy,
but can be bypassed by a recombinant LC3-G120 mutant38. LC3-II is found on
both the inner and the outer surfaces of the autophagosome16 (see figure 1.1). Dur-
ing autophagy, the synthesis and processing of LC3 is increased and it is used as
a marker to monitor levels of autophagy in cells12. Recently, 67 interactions with
other cellular proteins were reported in a large-scale proteomic study for the mam-
malian LC3 family39.
LC3 family members also play an important role in selective autophagy: A num-
ber of ubiquitin-binding proteins, including p62 (also known as sequestosome 1 or
SQSTM1)40, Optineurin (OPTN)41, NDP5242 and NBR143 were found to be cargo

36 Chapter 1. INTRODUCTION
receptors for autophagy substrates44. Some of them play key roles in immunity,
such as OPTN and NDP52. They interact with LC3 via a LIR (LC3-interacting
region) motif that enables specific targeting to autophagosomes. To insure that
proteins targeted for degradation are sequestered, many of the cargo receptors can
recognise different ubiquitin chain linkages and thereby confer selectivity45.
1.1.4.3 Fusion, degradation and recycling
The LC3 family proteins are thought to be involved in membrane tethering, hemifu-
sion and possibly in the fusion of the phagophore membrane ends to form a closed
autophagosome46. Many of the fundamental questions in the late stages of au-
tophagy still remain unknown47, but it is thought that the fusion event is mediated
by the same machinery that is involved in homotypic vacuole membrane fusion.
After the autophagosome has formed and is fully maturated, it fuses with an endo-
some or a lysosome48. This process is achieved via dynein-mediated transport along
microtubules49. Fusion requires a number of proteins, including the VPS family,
RAB7, endosomal sorting complexes required for transport proteins (ESCRTs) and
SNAREs50. Most of those proteins are also involved in other cellular events, such as
ER-golgi trafficking. Vesicular cargo is degraded by a series of lysosomal/vacuolar
acid hydrolases10.
The building blocks from the degradation of the macromolecules, in particular
amino acids, are available for ATP-generating pathways and for maintenance of
cellular functions like protein, DNA and RNA synthesis4. Lysosomal fusion is the
final step in autophagy, and complete autophagic flux requires full lysosome func-
tion4. Therefore, lysosomotrophic agents such as ammonium chloride or vacuolar-
type H+-ATPase inhibitors such as bafilomycin A1 are employed to experimentally
inhibit autophagy12. They alter the pH of the lysosome and thereby impair au-
tophagolysosome formation and flux33. Interestingly, the reduction of cytosolic pH
(acidification) has recently been been shown to induce mitophagy and autophagy
in SHSY5Y neuroblastoma cells51. Furthermore, ATG9, ATG2, ATG18 (WIPI-1 in
mammals) and ATG21 have also been described to participate in transfer and recy-
cling of components from the autophagosome membrane4,48,52. Taken together, the

1.1. Autophagy 37
formation of autophagosomes is a complex cellular process which can be regulated
at multiple steps, by multiple mechanisms.
1.1.5 Regulation of autophagy
The regulation of autophagy is finely balanced by integration of multiple signals,
including metabolites, ROS (see section 1.2.3), growth factors and other cellular
cues. The regulatory network is very complex, since there are basal levels of au-
tophagy in most cell types, and cells need the ability to respond to stimuli and
conditions in a variety of scenarios and intensities. Regulation can occur via (fast)
post-translational modifications and via (slow) transcriptional/translational repro-
gramming2. This section of the thesis will primarily focus on the regulation within
individual cells. However, one should note that autophagy regulation is also crucial
on a whole-organism level, manifested by roles in physiological processes such as
development, aging and exercise.
1.1.5.1 Autophagy and disease
Misregulation of autophagic pathways have been widely implicated in many patho-
physiological processes such as metabolic and neurodegenerative disorders, cardio-
vascular and pulmonary diseases and cancer53,54. For instance, accumulation of
toxic or mutant proteins in brain tissue is found in many neurodegenerative con-
ditions and autophagy promotes cell survival by their removal55. Disruption of
autophagy-specific genes in neuronal cells (such as ATG5 and ATG7) lead to neu-
rodegeneration in mice56,57. Deficiencies in autophagy have also been associated
with a variety of cardiac pathologies, since the process is essential for general main-
tenance, repair, and adaptation of the heart tissue58. Furthermore, autophagy plays
an important role in immune defence against invading bacteria and other pathogens.
Upon cellular infection, autophagy is involved in the regulation of inflammation,
antigen presentation, engulfment of microorganisms and degradation59. For in-
stance, a mutation in the Atg16L gene that causes the inhibition of autophagy has
been linked to Crohn’s disease, which is a type of inflammatory bowel disease60.
It is widely accepted that autophagy plays a key role in cancer, as it can both to

38 Chapter 1. INTRODUCTION
promote and inhibit tumorigenesis53. As outlined in chapter 1.2, reprogramming of
metabolism is highly beneficial to cancer cells. On a cellular level, there need to be
mechanisms to cope with the high demand of nutrients in order to support prolifer-
ation, growth and to deal with metabolic stress10. On a tissue level, there may be a
lack of adequate nutrients before angiogenesis inside the tumor has occurred suffi-
ciently61. Basal autophagy maintains intracellular organelle homeostasis by elim-
inating damaged organelles and proteins, thereby reducing genome instability and
ROS (e.g. by eliminating damaged mitochondria, (see section 1.2.3))62. However,
tumour cells may exploit the autophagic mechanism to facilitate tumour growth
and to overcome nutrient-limiting conditions. The tumor microenvironment can be
modulated via autophagy by supplying nutrients, promoting angiogenesis and by
modulating the inflammatory response63. For instance, upregulation of autophagy
via oncogenic Ras (see section 1.4.3) results in an increase in cell viability and tu-
morigenic potential by facilitating glycolysis and mitochondrial metabolism64–66,
leading to autophagy addiction for those cells2. Deletion of RB1CC1, a promoting
factor of the UKL1 complex, inhibits mammary tumorigenesis in mice67. Further-
more, deletion of ATG7 in mice leads to Ras-mediated tumor supression in non-
small- cell lung cancer (NSCLC)62.
On the other hand, supressing autophagy or limiting autophagic flux can also pro-
mote tumorigenesis. A number of tumor supressor genes are part of the core au-
tophagic machinery. Beclin-1 has been found to be mono-allelically deleted in
human breast, ovarian and prostate cancer53. However, the role of Beclin-1 as a
tumor supressor is still somewhat controversial, since a recent study suggested that
the loss of the neighbouring gene breast cancer 1 (BRCA-1) is actually the pri-
mary factor for tumorigenesis68. Another tumor suppressor is UVRAG, which is
mono-allelically deleted in colorectal cancer (CRC),10. Other known tumor su-
pressors, such as p53, Bcl-2 and PTEN, have also implications in the regulation of
autophagy69. As can be seen, the relationship of cancer and autophagy is relatively
complex and depends on the mutational background. Hence, one should carefully
consider the context-dependent role for the design of autophagy-based cancer thera-

1.1. Autophagy 39
peutics61. Taken together, understanding the regulation of autophagic pathways has
implications for treatment of diseases, including cancer.
1.1.5.2 The regulation of phagophore initiation
The best studied regulators of starvation-induced autophagy are mTORC1 (see
section 1.4.5.3), which forms part of the PI3K/Akt/mTOR axis (see section 1.4.5)
and Adenosine monophosphate-activated protein kinase (AMPK). Both play im-
portant roles in the dynamic regulation of anabolic and catabolic processes through
monitoring cellular nutrient levels and the cellular energy status (see figure 1.2).
In consequence, autophagy is likely to be upregulated if metabolic enzymes or
metabolite levels are decreased without compensatory mechanisms. High AMP lev-
els, hypoxia and glucose starvation activate AMPK, which then inhibits mTORC1
and thereby induces autophagy. There are also several cellular mechanisms that
monitor amino acid availability and influence the regulation of mTORC1 activ-
ity2. Much of the mechanistic insights of amino acid levels regulating mTORC1
activity originates from the past decade. For many years, it was known that they
are essential in mTORC1 activation, but the exact mechanism(s) remained to be
elucidated70. A key component in the activation is the regulation of its subcellular
localisation and of associated proteins. Under nutrient-rich conditions, mTORC1
is diffused throughout the cytoplasm, but under amino acid starvation it localised
rapidly to puncta, which were reported to be late endosomes/lysosomes71. Initial
research efforts focussed on the mTORC1 activator Ras homolog enriched in brain
(Rheb) and its negative regulator tuberous sclerosis complex (TSC)1/2 complex, see
section 1.4.5.3)72. Rheb is located on late endosomal/lysosomal membranes, and
multiple signal inputs such as Akt and ERK1/2 (see sections 1.4.4.3, 1.4.5.2 and
1.4.5.3 and figure 1.2) mediate TSC1/2 inhibition. mTORC1 can only be activated
by binding to Rheb when the complex is recruited to these compartments. However,
the activation through Rheb is not enough, as shown in TSC2-/- double knockout
mouse embryonic fibroblasts (MEFs) under amino acid starvation conditions73.
mTORC1 recruitment to late endosomes/lysosomes is mediated by cytosolic Rag
(small) GTPases, which bind to raptor (mTORC1 subunit) in their active state and

40 Chapter 1. INTRODUCTION
thereby promote mTORC1 activity74. The family is composed of RagA-D which
form heterodimers and bind to GDP or GTP. Rag GTPase activity is controlled by
guanine exchange factors (GEFs) and GTPase-activating proteins (GAPs). One of
the identified amino acid sensors is Leucyl-tRNA Synthetase (LRS), the enzyme
that loads leucine onto its cognate tRNA for protein translation75. LRS acts as
a GAP for the RagDGTP/RagBGDP complex and thereby promotes mTORC sig-
nalling75 in a non-canonical (i.e. not related to protein translation) function of this
metabolic enzyme.
Another promoting factor is the pentameric protein complex named ragulator (also
referred to as LAMTOR), which has been shown to play an important role in the
recruitment of mTORC1 via monitoring amino acid levels76. Ragulator is com-
posed of p18, p14, MP1, HBXIP, and C7orf59, which act in concert to bind to
and tether Rags to the lysosomal membrane. Very recently, member 9 of the so-
lute carrier 38 family (SLC38A9) was identified as a dynamic component of the
Rag-Ragulator complex, depending on amino acid levels and the nucleotide bind-
ing state77,78. SLC38A9 was shown to transport arginine in vitro, over-expression
disrupts amino acid sensitivity of mTORC1 signalling, whereas loss of SLC38A9
represses mTORC1 activation, particularly by arginine78. Once mTORC1 is ac-
tivated, it inhibits phagophore initiation by phosphorylation of ULK1 and ATG9.
ULK1 and ATG13 have multiple phosphorylation sites and their status depends on
multiple signalling inputs4. ULK1 is also phosphorylated by AMPK directly under
starvation conditions79.
The regulation of autophagy is also tightly linked to the regulation of apop-
tosis. As discussed in section 1.1.4, the VPS34 complex is only functional in au-
tophagy when interacting with Beclin-1. Thus, any modifications that disrupt or
increase the interaction between Beclin-1 and its inhibitory binding partners can
stimulate or inhibit autophagy. Under nutrient-rich conditions, Beclin-1 forms a
complex with the apoptotic protein Bcl-22. This interaction can be disrupted by
death-associated protein kinase (DAPK)-mediated phosphorylation of Beclin-1 and

1.1. Autophagy 41
GROWTH FACTORS
O2AMPKTSC1/2
ULK1
S6K1
4E-BP1
ERK1/2
Rag
LYSOSOMESAMINO ACIDS
ATP
GLUCOSE
LATEENDOSOMES/
GROWTHPROTEIN & LIPID
SYNTHESIS
AUTOPHAGY
AKT
RaptormTORC1
DEPTOR p18
“LAMTOR 1-3”
RagulatormTORC1
p14
SLC38A9
MP1 HBXIP C7orf59mLST8
Raptor
RagulatorLRS
PRAS40
Rheb
mTOR
Figure 1.2: Regulation of mTORC1 signalling Growth factors, intracellular ATP con-centrations, O2 availability and endosomal/lysomal amino acid levels regulateautophagy via AMPK and the mTORC1 complex (mTOR, DEPTOR, mLST8,PRAS40 and raptor). Akt, ERK1/2 and AMPK inhibit TSC1/2-mediated inacti-vation of RhebGTP. Rheb is located on late endosomes/lysosomes and activatesmTORC1 if bound to GTP. Rag GTPases, also postive regulators of mTORC1signalling, are activated by the ragulator complex (composed of p18, p14, MP1,HBXIP, and C7orf59). This complex and associated proteins (LRS, SLC38A9)thether the Rag GTPases to the membrane and thereby contribute to the activa-tion of mTORC1. Once active, mTORC1 phosphorylates downstream targetssuch as 4E-BP1 and S6K1, thereby increasing growth, lipid and protein biosyn-thesis. It also phosphorylates and thereby inactivates the ULK1 complex, whichdecreases phagophore initiation.

42 Chapter 1. INTRODUCTION
JNK1 (also known as MAPK8)-mediated phosphorylation of Bcl-280,81. On the
other hand, serine/threonine kinase 4 (STK4) inhibits autophagy by phosphoryla-
tion of Beclin-1 to enhance its interaction with BCL282. Akt inhibition (see section
1.4.5.2) can also lead to an increase of autophagy, as the kinase phosphorylates
and inhibits Beclin-183,84. Under nutrient rich conditions, AMPK phosphorylation
inhibits the non-autophagic function of VPS34; whereas under glucose starvation,
ATG14 promotes AMPK-mediated phosphorylation of Beclin-1, thereby stimulat-
ing autophagy48. Furthermore, the metabolite trehalose was shown to reduce the
p62/Beclin-1 ratio and thereby increases autophagy in the mouse brain frontal cor-
tex85.
1.1.5.3 Other regulatory mechanisms
Interestingly, several metabolites from different pathways have also been reported
to regulate autophagosome formation independently from mTORC1. Ammonia
(NH4), the byproduct of glutamine degradation (glutaminolysis), stimulates au-
tophagy via an ATG5-dependent mechanism, but not via mTORC1 or ULK186.
This is interesting from a metabolomic perspective, since glutaminolysis replen-
ishes TCA cycle intermediates oxaloacetate or a-ketoglutarate (see 1.2.5), but com-
petes with other nitrogen-dependent biosynthetic pathways, such as nucleotide syn-
thesis87. However, recently glutaminolysis was also shown to be required for nor-
moxic accumulation of HIF1a88 (see section 1.2.8). Furthermore, high NH4 levels
are toxic, so autophagy stimulation may act as a survival mechanism in this in-
stance.
Leucine depletion can also induce autophagy in an mTORC1-independent fashion,
at least in mouse C2C12 myotubes89. Further studies in skeletal muscle revealed
that LC3 and Bcl-2/adenovirus E1B protein-interacting protein (BNIP3) transcrip-
tion is controlled via FoxO-dependent transcription90 (see section 1.4.5.4). FoxO
signalling is dependent on Akt activity, but not on mTORC1 (see 1.14).
ROS molecules (see section 1.2.3) are essential in low concentration as signalling
molecules for autophagy induction91. However, they have also been shown to mod-
ulate ATG4B activity92,93. It remains unclear which ROS, whether it may be H2O2,

1.2. Metabolic reprogramming in cancer 43
superoxide or another ROS, is the predominant regulator or whether different ROS
play different roles in autophagy93,94.
Interestingly, Acetyl-coenzyme A (Ac-CoA), the cofactor for multiple metabolic
reactions and acetyl group donor for post-translational modifications (such as his-
tones), was found to be involved in the regulation of autophagy in S. cerevisiae as
well95. Fluctuations in Ac-CoA levels that effectively modulate autophagy were
also confirmed in human cells (HCT-116) and a mouse model96. Inhibition of the
Ac-CoA synthesis pathway induces autophagy, whilst high Ac-CoA levels have
an inhibitory effect. It is thought that this may in part be achieved by acetyla-
tion of ATG3 or ATG795. A number of compounds have been reported to induce
autophagy in an mTORC1-independent fashion, although their mode of action re-
mains illusive, suggesting additional mechanisms on a molecular level to regulate
autophagy97. Taken together, numerous cellular enzymes and metabolites can affect
the autophagic pathway. Considering that research efforts in cancer metabolism and
autophagy have only taken off in the past few years, it is likely that various regula-
tory mechanisms still remain unknown.
1.2 Metabolic reprogramming in cancer
Cancer is a cumulative name for a number of devastating human illnesses, contribut-
ing to millions of mortalities each year worldwide98. >1.5 million invasive cancers
were reported in 2012 in the US alone98. In the UK, >350,000 cases were diag-
nosed in 2013, which on average means 960 cases per day or one every two minutes
(source: Cancer Research UK99). Amongst the most common types are mammary
(breast), prostate, lung and bowel cancer, accounting 53% of all new cases in the
UK in 2013. The 10-year survival rate is roughly 50%, since >160,000 deaths were
caused by tumors in 2012. In the past decades, there has been great progress in
diagnostic and therapeutic efforts in order to reduce incidence and mortality rates,
especially for some types (e.g. stomach and bladder). Nonetheless, the incidence
of diagnosis in Great Britain has increased by 30% compared to the late 1970s. Di-
agnosis for some tumor types (e.g. thyroid, liver, oral, and kidney) have increased

44 Chapter 1. INTRODUCTION
markedly, others have very poor diagnosis (e.g. pancreas) and high mortality (e.g.
lung, bowel, breast and prostate).
The persistence and severity of this global health problem can be partially ex-
plained by the vast genetic heterogeneity of aberrant cells within and between tu-
mors100. Large-scale DNA analyses of tumours, enabled through recent advantages
in genome sequencing, showed an abundant and heterogeneous mutation load in
cancer cells101. Within the tumor environment, there is a huge selection pressure
for survival and proliferative capacity. This is why different tumors can acquire a
vast array of mutations that cause malignance, metastasis and/or confer to drug re-
sistance.
Over the past decades of research, several hallmarks of tumorigenesis have been
identified. These include the upregulation of proliferative signalling, uncontrolled
proliferation, avoidance of immune system responses, induction of angiogenesis,
cell death resistance and alterations in metabolism102. Despite genetic heterogene-
ity within and between tumors, it is becoming evident that a number of metabolic
alterations are required for malignant cancer cells103. Metabolic reprogramming is
characterised by alterations in intracellular and extracellular metabolites that have
profound effects on gene expression, cellular differentiation, and the tumor mi-
croenvironment. A number of metabolites play a crucial role in cancer metabolism -
either their cellular levels as metabolic intermediates for biosynthesis, or as regula-
tory molecules. Glucose and glutamine are regarded as the two main substrates for
proliferating cells, providing ATP, carbon and nitrogen sources for macromolecu-
lar synthesis104,105. Recent studies suggest that cellular metabolic reprogramming is
accomplished by altered expression levels, isoform specificity and post-translational
modifications, all fine-tuning individual enzymatic activity11,102,106–108. In this sec-
tion, I will present key metabolic pathways in the cell and also specifically review
the recent findings regarding metabolic reprogramming of cancer cells.
1.2.1 Oxidative phosphorylation
A universal metabolic requirement for any (physiological or tumor) cell is to gen-
erate energy in form of ATP. Under physiological conditions, ATP is produced via

1.2. Metabolic reprogramming in cancer 45
oxidative phosphorylation (see figure 1.3 A) . Glucose is converted to pyruvate via
glycolysis (see section 1.2.4), where it enters the TCA cycle (see section 1.2.5).
Coenzyme nicotinamide adenine dinucleotide (NADH), which is generated by de-
hydrogenases in the process, acts as a donor in the electron transport chain (com-
plexes I-IV), with oxygen (O2) acting as an electron acceptor. This chain of reaction
creates a gradient across the mitochondrial inner membrane, enabling movement of
protons through ATP synthases. One molecule of glucose generates a net gain of
two ATPs via glycolysis, but a net gain of 36 ATPs via oxidative phosphorylation.
Therefore, it is more energy-efficient to utilise oxidative phosphorylation in order
to generate ATP. However, this pathway requires adequate supply of O2 (normoxic
conditions), highlighting the importance of respiratory and cardiovascular systems
across the animal kingdom. When O2 supply is limited (hypoxic conditions), cells
compensate ATP production by increasing the rate of glycolysis via the hypoxia
response pathway (see figure 1.3 B and section 1.2.8). The increased consumption
of glucose has a metabolic side effect: During glycolysis, NAD+ is required, which
is usually achieved by reduction of NADH via complex I in the electron transport
chain. Therefore, pyruvate is reduced to lactate by lactate dehydrogenase (LDH),
which is then excreted to the extracellular environment. This reaction also oxidises
NADH, regenerating the cellular pool of NAD+. ATP production via the glucose -
lactate route is also known as glucose fermentation.
1.2.2 Warburg Effect
Interestingly, most likely all cancer cells have adopted a different metabolic strategy
whereby they seem to depend on glycolysis for ATP production (also referred to as
aerobic glycolysis)109. Both under normoxic and hypoxic conditions, cancer cells
have very high consumption of glucose, high lactate excretion, a lower activity in
the TCA cycle and lower rates of mitochondrial oxidative phosphorylation. This is
quite remarkable, considering that cancer cells have such a high demand for energy
in order to proliferate rapidly. Furthermore, it may seem counter-intuitive, since
glycolysis is much less efficient for ATP production, and glucose fermentation in-
creases acidity in the tissue. The abnormal ratio of glucose consumption/aerobic

46 Chapter 1. INTRODUCTION
GLYCOLYSIS
TCA cycleElectron transport chain
OXIDATIVE PHOSPHORYLATION
TCA cycleElectron transport chain
OXIDATIVE PHOSPHORYLATION
pyruvate
PEP
ATP(cellular energy)
glucose
glucose
1 glucose = 36 ATP
PHYSIOLOGICAL ENERGY GENERATION (NORMOXIC)
GLYCOLYSIS
pyruvate
lactate
lactate
PEP
ATP(cellular energy)
glucose
O2
1 glucose = 2 ATP
glucose
O2
PHYSIOLOGICAL ENERGY GENERATION (HYPOXIC)
A
B
Figure 1.3: A) ATP production under normoxic conditions. Most the the ATP in the cellis generated via the electron transport chain in mitochondria, which is utilisingreducing power that is generated by the TCA cycle. B) ATP production underhypoxic conditions. Under oxygen depletion, glycolysis is the main pathwayto generate ATP. Excess pyruvate is converted to lactate and excreted from thecell. PEP - phosphoenolpyruvate.

1.2. Metabolic reprogramming in cancer 47
respiration was first observed almost a century ago by Otto Warburg110 and is also
referred to as the Warburg effect. For decades, the Warburg effect was acknowl-
edged, but almost nothing was known as to how and why cancer cells behave in
such a fashion. Some of the cellular and molecular mechanisms have emerged only
in the past few years, so we are only beginning to understand the complex network
of dynamic metabolic regulation. However, it should be noted that aerobic gly-
colysis is not an exclusive feature of cancer cells, but also found under normoxic
conditions in rapidly dividing physiological cells111. Growth factor or cytokine -
activated macrophages and T-cells, for example, heavily rely on aerobic glycolysis,
which is controlled via PI3K/Akt signalling (see section 1.4.5)112. Recent mod-
elling data suggests that aerobic glycolysis is in fact more energy-efficient when
cellular glucose uptake is high, due to limited solvent capacity of mitochondria
versus glycolytic enzymes109.However, cancer cells require much more than just
ATP for proliferation. It is becoming clear that the heavy glucose uptake is also
required for matching the metabolic needs of biosynthesis pathways (see sections
1.2.4, 1.2.5, 1.2.6, 1.2.9 and 1.3).
1.2.3 Reactive oxygen species
Another key requirement for cancer cells is protection against excessive levels of
reactive oxygen species (ROS), also referred to as oxidative stress. ROS are a group
of temporarily existing oxygen molecules that carry unpaired electrons, making
them highly reactive with other molecules. They have been described as a double-
edged sword in cancer biology113, due to their dual role. On one hand, they are
important physiological intra- and intercellular signalling molecules, regulating es-
sential processes such as cell cycle progression114 and autophagy115 (see section
1.1.5). However, excessive levels block cell cycle progression and trigger apopto-
sis11. Increased ROS levels are usually concomitant with nutrient (glucose, amino
acid) starvation and hypoxia2 (see section 1.2.8). The cell predominantly eliminates
ROS by non-enzymatic reactions with reduced glutathione, which is produced by
NADPH-dependent reductases103. Excessive ROS levels are mainly caused by high
metabolic activity, damaged mitochondria (including defective oxidative phospho-

48 Chapter 1. INTRODUCTION
Warburg effect
TCA cycleElectron transport chain
OXIDATIVE PHOSPHORYLATION
BIOSYNTHETICPATHWAYS
GLYCOLYSIS
pyruvate
lactate
lactate
PEP
ATP(cellular energy)
glucose
O2glucose
ENERGY GENERATION IN CANCER CELLS (NORMOXIC + HYPOXIC)
Figure 1.4: Warburg effect. Cancer cells predominantely have low rates of oxidative phos-phorylation and higher glucose consumption, irrespective of the presence orabsence of oxygen. It has become clear in the recent years that cancer cellssupress parts of the TCA cycle and thereby oxidative phosphorylation. Instead,there is an increased demand of glucose due to high metabolic needs for biosyn-thesis pathways.
rylation) and hypoxic conditions, which are all features commonly found in tu-
mors. NADPH, they key component for maintaining reduced glutathione, is pre-
dominantly produced via the oxidative phase of the Pentose Phosphate Pathway
(PPP) (see section 1.3). In the following sections I will re-visit the key metabolic
cellular pathways and discuss currently known molecular mechanisms by which
cancer cells achieve metabolic reprogramming.
1.2.4 GlycolyisGlycolysis describes 10 cytosolic reactions, mediating the catabolic breakdown of
glucose (see figure 1.5). In the process, 1 molecule of glucose gets converted to 2x
pyruvate, with a net production of 2x ATP and 2x NADH. Various metabolites of
glycolysis are precursors to other metabolic pathways, and those can also feed into

1.2. Metabolic reprogramming in cancer 49
GLYCOLYSIS
SERINE BIOSYNTHESIS
DNA/RNABIOSYNTHESIS
HEXOSAMINEBIOSYNTHESIS
PENTOSEPHOSPHATE
PATHWAY
TCACYCLE
GLUCOSE
PYRUVATE
NADPH
LACTATE
Ribose 5 isomerase A
Enolase
LIPIDBIOSYNTHESIS
3- GLYCERATEP
1,2-B GLYCERATEP
GLYCERALDEHYDE-3 P GLYCEROL-3 P
2- GLYCERATEP
ENOLPYRUVATEP
FRUCTOSE-1,6 PRIBOSE-5 P
FRUCTOSE-2,6 P
FRUCTOSE-6 P
GLUCOSE-6 PG6 P DH
P
P
Lactate DH
Glyceraldehyde P DH
P
Hexokinase
fructokinase
glycerate mutaseP
P glycerate kinase
PFKFB3
Pyruvate Kinase
Figure 1.5: Overview of metabolites and enzymes in glycolysis and precursors of di-verging pathways. Glucose metabolism generates a number of precursors forother anabolic pathways, such as nucleotide, lipid and amino acid metabolism.DH - Dehydrogenase, encircled Ps indicate ”phosphate”
different stages of glycolysis. Metabolic reprogramming, in order to increase syn-
thesis of anabolic pathways, is achieved by some key enzymes and metabolite levels
in this pathway. In particular, three enzymes have been found to play a substantial
role: Hexokinase (HK), Phosphofructokinase (PFK) and Pyruvate kinase (PK).
1.2.4.1 Hexokinase
Hexokinases catalyse the first step of glycolysis, by converting glucose to glucose-
6-phosphate (G6P). Apart from glycolysis, G6P is also utilised in a variety of other
pathways, including, glycogenesis, the PPP, (see section 1.3) and the hexosamine
biosynthetic pathway. G6P also directly regulates HK activity by in a negative
feedback loop. There are four mammalian isoforms of HK (I-IV), of which HK-
I and HK-II have a higher affinity for glucose and an N-terminal mitochondrial
binding motif. HK-II has been identified to be involved in tumor development,

50 Chapter 1. INTRODUCTION
manifested by induced gene expression of HK-II and downregulation of HK-IV in
tissues that don’t normally express HK-II116. Furthermore, HK-II can interact with
the voltage-gated anion channel (VDAC) in outer membrane of mitochondria117,118.
This interaction gives HK-II preferential access to ATP (permeates the channel) and
prevents binding of the pro-apoptotic factor Bax to the channel that would otherwise
cause cytochrome c release and thereby trigger apoptosis118,119. The upregulation of
HK-II expression is likely to be mediated via the Akt-mTORC1-HIF-1a signalling
cascade120 (see sections 1.2.8 and 1.4.5)
1.2.4.2 Phosphofructokinase
Phosphofructokinases convert fructose-6-phosphate (F6P) to fructose-bisphosphates
(F1,6P and F2,6P). The reaction of F6P to F1,6P is the third step of glycolysis, it is
essentially an irreversible reaction catalysed by PFK-1 and plays a crucial role in
cellular metabolism121,122. Prior to this conversion in glycolysis, G6P and F6P may
be used as a precursor for the ribonucleoside family via the PPP (see sections 1.2.9
and 1.3). Many different metabolites, enzymes and signalling pathways have been
identified to modulate PFK-1 activity123. Those factors control its catalytic activity
and consequently affect a number of processes, such as carbon flux, oxidative stress
and tumor formation. High AMP levels increase its activity, but the most potent ac-
tivator of PFK-1 is F2,6P. This regulation of PFK-1 activity is mediated by PFK-2.
F6P to F2,6P conversion is reversible and most PFK-2 isoforms have both kinase
and phosphatase activity. The expression of different PFK-2 isoforms that vary in
activity is a powerful mechanism for metabolic reprogramming.
Interestingly, the PFKFB3 isoform of PFK-2 is reported to have almost no phos-
phatase activity and is expressed in a number of cancer cells. PFKFB3 kinase ac-
tivity is regulated by a number of factors, including Ras (see section 1.4.4), AMPK
(see section 1.4.5.3), the oncogenic transcription factor MYC and certain metabo-
lite levels122. In T-cells from rheumatoid arthritis patients, glucose metabolism,
redox balance and autophagy (see section 1.1) were reported to be impaired be-
cause of insufficient PFKFB3 activity and those phenotypes could be reverted by
over-expression124,125. Another study in HCT-116 colon adenocarcinoma cells re-

1.2. Metabolic reprogramming in cancer 51
ported that knockdown or pharmacological inhibition of PFKFB3 also leads to an
increase of basal autophagy126. Furthermore, knockdown of the isoform PFKFB4
was found to increase non-selective and p62-dependent autophagy in a GFP-p62
based shRNA high-content screen, and also reported PFKB3 as a hit127.
PFK-1 activity is negatively regulated by a number of key cellular metabolites.
These include ATP, lactate, downstream glycolysis intermediate phosphoenolpyru-
vate (PEP, see section 1.2.4.3) and the TCA cycle metabolite citrate (see sec-
tion 1.2.5), thereby all contributing factors of diverting carbon flux from gly-
colysis. PFK-1 activity has also been shown to be reduced by O-linked b -N-
acetylglucosamine glycosylation.123,128. This post-translational modification was
found to specifically occur in multiple tumors (lung, breast, prostate, liver, colon
and cervical cancers), especially in late stages of malignancy128.
1.2.4.3 Pyruvate kinase
Pyruvate kinases convert PEP to pyruvate, mediating the last step of glycolysis be-
fore the TCA cycle129. As outlined in section 1.2.4.2, high PEP levels reduce up-
stream glycolysis via inhibition of PFK-1. Furthermore, the product pyruvate can
be converted to lactate and then excreted. 4 isoforms of PK exist in humans and
are expressed in different cell types: PKM1, PKM2, a liver (L) and an erythrocyte
isoform (R)103,130. In most cells, PKM1 is preferentially expressed and is most ac-
tive as a tetramer. PKM2, however, is expressed in the majority of cells undergoing
proliferation, including essentially all cancer cells131. It exists in a tetrameric or a
dimeric complex, but is much less catalytically active compared to the other iso-
forms. Overall, preferential PKM2 expression slows TCA cycle entry and thereby
is a key mediator of the Warburg effect and metabolic reprogramming131.
Furthermore, PKM2 plays many key roles independent of its direct metabolic func-
tion132 it regulates protein phosphorylation, transcription, and cell signal transduc-
tion. The isoform is involved in a positive regulatory feedback loop by binding HIF-
1a in a complex with prolyl hydroxylase 3 (PHD3)132,133. It phosphorylates the TF
signal transducer and activator of transcription 3 (STAT3) at Y705 and thereby acti-
vates transcription of MAP kinase kinase 5 (MEK5) in the MAP kinase pathway134.

52 Chapter 1. INTRODUCTION
PKM2 also directly binds to and phosphorylates histone H3 at T11 upon epidermal
growth factor receptor (EGFR) activation. PKM2-dependent H3 modifications are
key for expression of cyclin D1 and c-Myc, leading to tumor cell proliferation, cell-
cycle progression, and brain tumorigenesis134,135.
Furthermore, PKM2 binds directly and selectively to tyrosine-phosphorylated pep-
tides that result in release of the allosteric activator F1,6P, leading to inhibition of
PKM2 enzymatic activity136. Recently, it has also been reported that PKM2 binds
to transglutaminase type 2 (TG2) and that the interplay has a role in autophagy regu-
lation137. This study is in accordance with data suggesting ammonia as a metabolite
regulating autophagy86 (see section 1.1.5). Therefore, enzymes and/or metabolites
from major metabolic pathways can control autophagic flux.
Cumulatively, those findings show that PKM2 plays an important role in the
growth and metabolic reprogramming of cancer cells.131. Furthermore, PKM2 was
amongst the first metabolic enzymes to be implicated in exerting non-canonical
functions that affect other cellular pathways.
1.2.5 TCA cycle
As outlined in section 1.2.1, the TCA cycle (see figure 1.2.5) plays an important
role for oxidative phosphorylation by generating the reducing agents that feed into
the electron transport chain. The complete cycle consists of 10 chemical reactions
in the mitochondrial lumen, carried out by 7 enzymes. For one molecule of pyru-
vate is consumed, the net gain for the cycle is 3 NADH + 1 GTP + 2 CO2 and
QH2. TCA cycle intermediates are also precursors for other biosynthetic pathways
(see sections 1.2.6, 1.2.7 and 1.2.9). Therefore, some activity of the TCA cycle
is required, even if oxidative phosphorylation is suppressed. Many of the TCA
cycle (and affiliated) enzymes and their metabolites play an important role in can-
cer metabolism. In fact, tumor cells depend on intact mitochondria for some key
biosynthetic reactions (see figure 1.6).

1.2. Metabolic reprogramming in cancer 53
Succinyl-CoA synthetase
Isocitrate DH
Fumarase
Succinate DH
Malate DH
Pyruvate carboxylase
Pyruvate DH
SUCCINATE
SUCCINYL-CoA
ACETYL-CoA
ACETYL-CoA
GLUTAMATE
GLUTAMINE
PYRUVATE
ISOCITRATE
CITRATE
ROS
FUMARATE
MALATEOXALOACETATE
Citratesynthase
α-ketoglutarate DH
Aconitase
α-KETOGLUTARATE
LIPID BIOSYNTHESISGLYCOLYSIS
AMINO ACIDBIOSYNTHESIS
NUCLEOTIDEBIOSYNTHESIS
NADHGTPQH2
Figure 1.6: Overview of metabolites and enzymes in the TCA cycle. The TCA cycletakes place in the mitochondrial lumen. Apart from generating NADH, it alsoserves a key role for biosynthetic pathways. High TCA cycle activity con-tributes to the generation of ROS. DH - Dehydrogenase
1.2.5.1 Pyruvate entry
The carbon source of the TCA cycle is primarily glycolytic pyruvate. As outlined
in 1.2.1 and 1.2.4, cancer cells have adopted various strategies to reduce pyruvate
entry into the TCA cycle for ATP production, but it is required for biosynthetic
pathways. Pyruvate is utilised by two enzymes: Pyruvate dehydrogenase (PDH)
and Pyruvate carboxylase (PC).
PDH is a mitochondrial multimeric protein complex that catalyses the formation of
Acetyl-Coenzyme A (Ac-CoA) from pyruvate and oxaloacetate. This conversion is
the link of glycolysis to the TCA cyle. Acetyl-CoA is an important cellular cofac-
tor that is required for multiple biochemical reactions, but its main function in the
TCA cycle is as a carbon source for oxaloacetate (4 carbons) to citrate (6 carbons)
conversion by citrate synthase. Interestingly, Ac-CoA was recently reported to be
involved in starvation-induced autophagy96 (see section 1.1.5). One of the key reg-
ulators of PDH is pyruvate dehydrogenase kinase 1 (PDK1)103. Downregulation of
PDH activity via PDK1-mediated phosphorylation uncouples glycolysis from TCA

54 Chapter 1. INTRODUCTION
cycle entry. PDK-1 expression is regulated by a number of oncogenic signalling
pathways, for example via the oncogene myc11
PC replenishes the pool of TCA cycle intermediates by converting pyruvate to ox-
aloacetate. This step is important, especially when TCA cycle intermediates are
used for other biosynthetic pathways. Recently, PC was found to be over-expressed
in human breast cancer tissue and PC activity was essential in highly metastatic cells
in culture (MDA-MB-231 cells)138. Another study in human non-small-cell lung
cancer (NSCLC) reported that PC over-expression enhances growth and knockdown
decreases cell proliferation and colony formation139. Growth was also reduced in a
mouse xenograft model. Furthermore, lipid and nucleotide biosynthesis was inhib-
ited and altered ROS levels were observed.
1.2.5.2 Isocitrate Dehydrogenase
Isocitrate dehydrogenase 1 (IDH1) and IDH2 catalyze the oxidative decarboxyla-
tion of isocitrate to a-ketoglutarate (a-KG or known as 2-oxoglutarate). a-KG can
also be converted into glutamate (and glutamine) (see section 1.2.6). Furthermore, it
is the substrate of several dioxygenase enzymes. (see section 1.2.8). Interestingly, a
number of cancer studies have reported a gain-of-function mutations in both IDH1
and IDH2, resulting in production of the oncometabolite 2-hydroxyglutarate (2-
HG), which is chemically similar to a-KG103. It is thought that elevated levels of
2-HG competitively inhibit several dioxygenase enzymes that use a-KG as a sub-
strate. This includes PHD2, the enzyme that destabilizes and thereby accelerates
degradation of HIF-1a (see section 1.2.8).
1.2.6 Amino acid synthesis
There are 20 different L-type amino acids used for protein synthesis in all cells.
Out of those, 9 are essential for humans to be taken up by diet as there are no
biosynthetic pathways to generate those. As seen in this section cells have the ability
to shift metabolic pathways for synthesis of non-essential amino acids according to
the biosynthetic requirements.

1.2. Metabolic reprogramming in cancer 55
1.2.6.1 Glutamine
It was first observed in 1950 by Harry Eagle that HeLa cells require 10- to 100-fold
molar excess of glutamine compared to other amino acids140. The key role of glu-
tamine in cancer cell metabolism has since been confirmed in multiple cell lines
and in vivo tumors141. Besides glucose, glutamine is likely to be the second main
contributor to de novo biosynthesis many cellular molecules as it is the source of
reduced nitrogen. Glutamine is also crucial for purine and pyrimidine biosynthesis
(see section 1.2.9). The uptake of glutamine is primarily mediated by the plasma
membrane transporter solute carrier family 1 A5 (SLC1A5). Interestingly, loss of
SLC1A5 was recently shown to inhibit cellular growth and induce autophagy142.
Furthermore, glutamine contributes to the uptake of essential and non-essential
amino acids: L-type amino acid transporter 1 (LAT1, or also known as SLC7A5)
is a neutral amino acid antiporter that can exchange intracellular glutamine for
leucine, isoleucine, valine, methionine and aromatic amino acids (phenylalanine,
tyrosine and tryptophan)11,143. LAT1 is an obligate exchanger and requires an ef-
flux substrate such as glutamine143,144. Together, these findings suggest a 2-step
process by which glutamine levels effectively control proliferation via mTORC1
activity142 (see sections 1.1.5 and 1.4.5.3). When glutamine is plentiful, essential
amino acids (including leucine) are imported into the cell and activate mTORC1. In
the absence of glutamine, intracellular leucine levels are low, mTORC1 is inhibited
and autophagy is activated. Glutamine synthetase (GS) can also generate glutamine
from a-ketoglutarate (a TCA-cycle intermediate) or vice versa, thereby feeding into
the TCA cycle (see section 1.2.5) in a glycolysis-independent fashion. The enzyme
has been reported to be over-expressed in Hepatocellular carcinoma (HCC)145, but
its regulation remains poorly understood11.
1.2.6.2 Arginine
Arginine is a non-essential amino acid and also derived from glutamine. However,
under certain metabolic conditions it can become essential. Arginine is composed
of four nitrogen atoms, therefore serving as a precursor for many pathways, includ-

56 Chapter 1. INTRODUCTION
ing polyamine, creatine, agmatine, and pyrroline-5-carboxylate (P5C) and proline
biosynthesis. Polyamine levels are elevated in proliferating cells and have been
shown to promote tumor growth and inhibit apoptosis146. De novo biosynthesis of
arginine forms part of the urea cycle. Two enzymes in the pathway, argininosuc-
cinate lyase (ASL) and argininosuccinate synthase (ASS1) have been reported to
be epigenetically silenced in an number of cancers, including HCC and renal cell
carcinoma11,147. This silencing is associated with resistance to chemotherapy and
poor prognosis11,148. It is quite striking that cancer cells would metabolically prefer
to rely on exogenous arginine, rather than producing it themselves. Possible expla-
nations for this so far have been that by downregulating ASL and ASS1, aspartate
and ornithine accumulate and be can used for nucleotide and polyamine synthesis,
respectively11.
1.2.6.3 Proline
Proline biosynthesis is also closely linked to other metabolic pathways such as the
TCA cycle (see section 1.2.5) , urea cycle, and the PPP (see section 1.3) via the
pentose shunt. The amino acid is produced via P5C, which derives either from
glutamate or ornithine. Interestingly, high cellular P5C concentrations stimulate
5-phosphoribosylpyrophosphate (PRPP) levels, which is a precursor for nucleotide
synthesis149 (see section 1.2.9). P5C is a substrate for pyrroline-5-carboxylate re-
ductase (PYCR1), which is upregulated by the oncogenic transcription factor c-
myc150. Furthermore, it was recently identified as one of the genes most com-
monly over-expressed in tumors151. There is some evidence that PYCR1 plays
a role in replenishing the cellular pool of NADP+ and thereby contributes to the
oxidative phase of the PPP (see section 1.3), resulting in an increase in pyrimidine
synthesis152 (see section 1.2.9). The antagonist for PYCR1, the enzyme proline oxi-
dase (POX) (also referred to as proline dehydrogenase (PRODH)), mediates proline
degradation in the mitochondria153. In the process, electrons are fed via FADH2
generation into the electron transport chain (see section 1.2.1), thereby increasing
production of ATP150. This pathway is glycolysis-independent and therefore pro-
vides an alternative mechanism to generate ATP and promote survival when glucose

1.2. Metabolic reprogramming in cancer 57
levels are low. However, the process also increases cellular ROS levels154 (see sec-
tion 1.2.3). Overexpression of POX was reported to induce apoptosis, trigger cell
cycle arrest in vitro and to suppress tumor formation in a mouse xenograft model150.
These events are likely to be mediated via ROS signalling153 and suggest that POX
is a tumor supressor. POX expression is upregulated via the energy level sensor
AMPK and downregulated by the oncogenic transcription factor c-myc. Interest-
ingly, recent findings suggest a more complex role for POX than previously antici-
pated, depending on conditions of the microtumor environment: Under low glucose
conditions, POX main function is to generate ATP, but under hypoxic conditions,
the key role is to induce basal autophagy via ROS150 (see sections 1.1.5 and 1.2.3).
Therefore, POX can act as a pro-survival or pro-apoptotic factor, depending on the
context. Overall, the role of altered proline synthesis and degradation pathways in
cancer cells is still not very well understood11.
1.2.6.4 Diversion of glycolysis intermediates
For a number of non-essential amino acids, glucose is usually the supplier of the car-
bon source. Synthesis of aromatic amino acids for instance, require PEP and E4P
(see sections 1.2.4.3 and 1.3) as precursors. Serine, glycine and cysteine biosyn-
thesis originates from 3-phosphoglycerate (3-PG), a metabolite of glycolysis (see
section 1.2.4). The enzyme that mediates the first step of this pathway is phospho-
glycerate dehydrogenase (PGDH). Interestingly, the gene for the enzyme was either
found to be amplified or upregulated in melanoma and breast cancer155. Metabolic
isotope labelling showed that diversion of glycolytic flux to anabolic pathways can
be beneficial to tumor development. Interestingly, the glycolytic enzyme phospho-
glycerate mutase 1 (PGAM1), which converts 3-PG, to 2-phosphoglycerate (2-PG),
was found to play a key role in metabolic reprogramming. 3-PG directly inhibits 6-
phosphogluconate dehydrogenase (6PGDH) in the oxidative phase of the PPP (see
section 1.3), whilst 2-PG activates PGDH to converge 3-PG into the first step of ser-
ine biosynthesis pathway156,157. Therefore, nucleotide and amino acid biosynthesis
are directly affected by modulating the catalytic activity of this glycolytic enzyme.

58 Chapter 1. INTRODUCTION
1.2.7 Fatty acid metabolism
Fatty acid metabolism is associated with various cellular events, including energy
generation, lipid synthesis, and post-translational modifications. Whilst the de novo
synthesis is low in most cells, tumorigenic tissues have a dramatically increased
demand for lipids in order to facilitate growth and to alter membrane composition
for protection against oxidative stress158,159. A number of lipogenic enzymes, in-
cluding ATP-citrate lyase (ACL)160, Ac-CoA carboxylase (ACACA)161, fatty acid
synthase (FASN)162 and stearoyl-CoA desaturase (SCD)163 have been reported to
be over-expressed in many types of cancers.
The biosynthesis and modification of fatty acid chains is tightly linked to the coen-
zyme and substrate Ac-CoA. One of the main sources of Ac-CoA in the cell is via
the TCA cycle (see section 1.2.5), which is generated in the mitochondria. Ac-CoA
can not be transported directly to the cytoplasm, but citrate can be exported and
cleaved to oxaloacetate and Ac-CoA by ACL160. Oxaloacetate is reimported into
the mitochondria via malate conversion, in order to maintain the pool of TCA cycle
intermediates11. Cytosolic Ac-CoA is the substrate for various pathways, includ-
ing fatty acid and cholesterol synthesis, as well as protein acetylation and prenyla-
tion160. The rewiring of Ac-CoA for biosynthesis, rather than for TCA cycle use,
is controlled via the PI3K/Akt signalling pathway164 (see section 1.4.5). Akt phos-
phorylates ACL, and thereby expands the cytosolic pool of Ac-CoA. The fatty acid
synthesis pathway commences with the carboxylation of Ac-CoA to malonyl-CoA,
which is synthesised by ACACA. The next steps are sequential synthesis reactions
to form the 16-carbon fatty acid chain palmitate. These condensation reactions are
catalysed by FASN, which is a large (250 kDa) multifunctional, homodimeric com-
plex. Interestingly, a recent study in ovarian cancer cells showed that pharmacolog-
ical inhibition or shRNA mediated knockdown of FASN induces basal autophagy
and lysosomal degradation of PI3K signaling proteins165. In summary, fatty acid
synthesis is tightly linked to other biosynthetic pathways and controlled by cellular
signalling pathways.

1.2. Metabolic reprogramming in cancer 59
1.2.8 Hypoxia response
Low O2 concentrations (hypoxia) are a common feature in a tumor microenviron-
ment. When O2 is limited, ATP production predominantely via the TCA cycle in
the mitochondria will lead to oxidative stress (see section 1.2.3). The consequences
of low O2 availability are counteracted by tumor cells via regulation of TFs such as
hypoxia-inducible factor (HIF) complexes. The HIF-1 (hypoxia inducible factor 1)
signaling pathway plays a key role in the regulation of cellular metabolism. Under
normoxic conditions, the HIF-1a subunits are hydroxylated by the prolyl hydroxy-
lase 2 (PHD2) enzyme, resulting in their recognition by the E3 ubiquitin ligase von
Hippel-Lindau tumor suppressor (VHL) and subsequent degradation166. This hy-
droxylation reaction is O2-dependent and also requires the TCA cycle intermediate
a-KG (see section 1.2.5). Under hypoxic conditions, prolyl hydroxylation is sup-
pressed due to lack of O2, allowing HIF-1a to escape VHL-mediated degradation.
HIF-1 then accumulates and leads to an increased expression of many HIF-1 target
genes. These include glucose transporters and several key enzymes of glycolysis,
such as HK-II, PFK-1 and PKM2129,167. This transcriptional regulation increases
ATP generation in the cytosol by conversion of glucose to pyruvate168. HIF-1 also
promotes lactic acid production by upregulating lactate dehydrogenase A (LDHA).
This facilitates a sufficiently high cytoplasmic NAD+:NADH, crucial for glycolytic
flux through the NADH-dependent enzyme glyceraldehyde-3-phosphate dehydro-
genase (GAPDH). Furthermore, it promotes expression of PDK1169, reducing TCA
cycle activity (see section 1.2.5). It also limits glucose flow into certain biosynthetic
pathways that are dependent on TCA cycle intermediates. This includes citrate167,
an inhibitor of PFK-1 (see section 1.2.4.2), thereby shifting glucose metabolism to
the PPP (see section 1.3). Certain metabolites, including succinate, fumarate and
ROS are inhibitors of PHD2 activity, therefore stabilising HIF-1a and mediating the
hypoxia response105. HIF-1a mRNA levels are also increased via the Akt/mTORC1
signalling cascade70 (see section 1.4.5). Overall, HIF-1a stabilisation impacts the
flux of multiple metabolic pathways103.

60 Chapter 1. INTRODUCTION
MITOGENIC SIGNALLING
AKT
VHL
mTORC1PHD2
OH
PROTEASOMAL DEGRADATION
HYPOXIARESPONSE
METABOLICREPROGRAMMING
SUCCINATE
ROS(2-HG)
FUMARATE
HK-IIPFK-1 PKM2LDH-APDK-1
Ub
HIF-1α
HIF-1β
HIF-1α
HIF-1α
OHHIF-1α
O2α-KETOGLUTARATE
Figure 1.7: Hypoxia response. The hypoxia response is mediated via the HIF-1a subunitand regulates a number of metabolic enzymes. Under normoxic conditions, theHIF-1a subunits are hydroxylated PHD2, which targets them for degradation.However, the hydroxylation reaction can be modulated by various inputs. Un-der hypoxic conditions, the hydroxylation reaction is suppressed and HIF-1ato escapes VHL-mediated degradation.
1.2.9 Nucleotide synthesis
A universal feature of almost all cells is the generation of nucleotides (see figure
1.8). These are utilised for multiple cellular purposes, including:
(1) as precursors for DNA, RNA and NAD(P)+ synthesis
(2) as energy carriers (ATP, GTP)
(2) as secondary messengers (cAMP, cGMP, di-cAMP-cGMP)
(4) as cofactors for anabolic synthesis pathways (ATP, GTP)
(5) as regulators in metabolic and signalling pathways (AMP)
All nucleotides are composed of a base (guanine, adenine, thymine, cytidine
or uracil) and a 5-carbon pentose, either ribose 5-phosphate (R5P) or 2-deoxyribose

1.2. Metabolic reprogramming in cancer 61
PYRIMIDINE SALVAGE
PURINE DE NOVO
SYNTHESIS
PYRIMIDINE DE NOVO
SYNTHESIS
PURINESALVAGE
P PM
HGPRT
Transketolase
UMP
OROTATE
DHO
UTPURACIL
THIMIDINE
CYTIDINEADENINEGUANINE
dTTP dCTP
CTPATP
dTTP dCTP
GTP
SAICAR
IMP
GLUTAMINEGLUTAMINE
RIBOSE 5- P
RIBOSE 1- P
CAD
RIBOSYL-PYRO PP
RIBOSYL-AMINEP
Ribose 5 isomerase A
P
P RPS1PATP
UPMS
PENTOSE PHOSPHATE
PATHWAY
Figure 1.8: Nucleotide synthesis pathways: Four pathways (purine and pyrimidine denovo and salvage) contribute to the generation of nucleotides in the cell.All require phosphoribosylpyrophosphate (PRPP), which is generated fromribose-5-phosphate via the pentose phosphate pathway, either through ribose-5-phosphate A isomerase or transketolase (see figure 1.9). PRPP is producedby enzymes in the PRPS family.
5-phosphate (dR5P). Bases are either produced through de novo synthesis or ac-
quired by nutrient uptake (if available to the cell). De novo nucleotide synthesis
takes place via pyrimidine (thymine, cytidine and uridine) and purine (guanine and
adenine) biosynthesis. Importantly, 5-phosphoribosyl-1-pyrophosphate (PRPP) is
required as a precursor for all four pathways that contribute to nucleotide synthesis
(purine/pyrimidine de novo/salvage pathways) (see figure 1.8). So far, three differ-
ent enzymes that have PRPP synthetase activity were identified: PRPS1, PRPS2,
and PRPS1L1 (PRPS1-like 1)170. PRPS1L1 is expressed only in a few tissues. In-
terestingly, shRNA-mediated PRPS1L1 knockdown increased autophagic flux in a
GFP-p62 based high content screen in prostate cancer (Beclin1+/- stable EGFP-p62
iBMK) cells127 (see section 1.1.4.2).
1.2.9.1 Purines
The nucleotides (d)ATP and (d)GTP are generated via a common precursor ino-
sine monophosphate (IMP) in the purine synthesis pathway. This pathway is com-
posed of 10 enzymatic steps, mediated by 6 enzymes. The first and rate-limiting
step is catalysed by phosphoribosylpyrophosphate amidotransferase (PPAT), which

62 Chapter 1. INTRODUCTION
requires glutamine and PRPP to generate 5-phosphoribosyl-1-amine. Interest-
ingly, the downstream intermediate succinylaminoimidazolecarboxamide ribose-5-
phosphate (SAICAR) was recently reported to specifically bind to PKM2 (but not
PKM1), thereby stimulating enzymatic activity and promoting tumor survival106
(see section 1.2.4.3). The authors found that increased SAICAR concentrations in
human lung cancer (A549) cells consequently increased cellular energy levels, glu-
cose uptake, and lactate production.106.
1.2.9.2 Pyrimidines
On the other hand, uridine monophosphate (UMP) is the common precursor for
dTTP, UTP and (d)CTP in the pyrimidine synthesis pathway. This pathway con-
sists of 6 intermediates and all reactions are catalysed by 3 enzymes. The purine
and pyrimidine salvage pathways are an important part of nucleotide metabolism,
as the de novo synthesis pathways are very energy consuming: 5 ATP are required
for 1 molecule of IMP. Interestingly, one of the major enzymes of the pathway,
Carbamoyl-phosphate synthetase 2, aspartate transcarbamylase, and dihydroorotase
(CAD), was recently shown to form distinct puncta upon stimulation of amino acids
in an mTORC1-dependent manner171,172. These findings support the notion of lo-
calised sub-cytoplasmic structures/complexes that are involved in biosynthesis.
1.2.9.3 NAD biosynthesis
The de novo biosynthesis of molecules in the NAD family is closely linked to
nucleotide synthesis. The common precursor nicotinic acid adenine dinucleotide
(NaAD) contains two phosphoribosyl nucleotide moieties, one of which is ATP and
one which is a nicotinic acid mononucleotide (NaMN). The latter is produced via
tryptophan in a de novo synthesis pathway,173, but other precursors include nico-
tinic acid, nicotinamide or nicotinamide riboside in salvage pathways174. The NAD
family of molecules is, like nucleotides, used for multiple cellular processes174. As
outlined in sections 1.2.1 and 1.2.3, NAD(P)H is an important electron donor for
the electron transport chain, gluthathione reduction and a co-factor for enzymatic
reactions. More recently, the NAD family has also been found to be involved in
non-redox reactions: these molecules can be substrates of ADP-ribosyl cyclases in

1.3. Pentose Phosphate pathway 63
order to generate cyclic ADP-ribose (cADPR), a second messenger which plays a
role in Ca2+ signalling175. Furthermore, NAD is used by ADP-ribosyltransferases
for post-translational modification purposes of various proteins. As with ubiquiti-
nation, there are multiple types of ADP-ribosylation (e.g. poly- or mono-) and so
far they have been linked to processes like DNA repair, transcription control, sig-
nal transduction, and ER stress pathways176. Interestingly, several members of the
ADP-ribosyltransferase diphtheria toxin-like (ARTDs or also referred to as PARPs)
or the sirtuin (SIRT) family have been associated with the regulation of metabolism
and autophagy176. ARTD10 for instance, was found to colocalise with p62 in HeLa
cells177. The NAD-dependent deacetylase SIRT1 was reported to be a positive reg-
ulator for H2O2-induced autophagy178. On the other hand, pharmacological inhibi-
tion of SIRT1 in MCF-7 human breast cancer cells was found to increase autophagic
cell death179. Furthermore, SIRT1-mediated deacetylation has been described to
fine-tune FoxO signalling (see section 1.4.5.4) by directing the TF to selective tar-
gets. SIRT3 has been associated with the regulation of mitochondrial complexes
(see section 1.2.1), it increases IDH activity (see section 1.2.5), it also increases
fatty acid catabolism and it may play a role in amino acid metabolism180.
Conclusively, the current evidence suggests that NAD levels, the NAD+:NADH ra-
tio and NADPH availability all have a profound effect on cellular metabolism and
autophagy.
1.3 Pentose Phosphate pathway
Most metabolic cancer studies to this point have focused on glucose and glu-
tamine alterations, but cancer cells utilize a great variety of other nutrients11.
Their contribution to tumorigenesis remains largely understudied. One of those is
Ribose-5-phosphate (R5P) a, precursor of de novo synthesis of all molecules in the
ribonucleoside family (including DNA, RNA and NAD(P)H)181 (see figure 1.8).
Due to high proliferation rates and strong metabolic requirements, nucleotide syn-
thesis is essential to cancer cells182. In fact, aberrant signalling, for instance when
mediated by oncogenic Ras (see section 1.4.3), can divert glycolytic flux to biosyn-

64 Chapter 1. INTRODUCTION
thetic pathways such as the Pentose Phosphate Pathway (PPP)108,183. The PPP is
an essential pathway for a number of cellular processes. Depending on the tissue
and conditions, between 5-30% of glucose is diverted into the PPP181. De novo
R5P synthesis is a key outcome of the PPP. The second key metabolite generated
by the PPP is NADPH from NADP+. In its reduced form, it is a key component for
protection against excessive intracellular ROS (see section 1.2.3)184–187.
1.3.1 Overview
The PPP is composed of an oxidative and a non-oxidative phase (see figure 1.9 for
an overview). The oxidative phase of the PPP produces two molecules of NADPH
per molecule of G6P, in three irreversible enzymatic reactions. First, Glucose-
6-phosphate dehydrogenase (G6PDH) converts G6P to 6-phospho-gluconolactone
and generates one molecule of NAPDH. Second, phosphogluconolactonase con-
verts 6-phosphogluconolactone to 6-phosphogluconate. Third, 6-phosphogluconate
dehydrogenase (6PGDH) converts 6-phosphogluconate to ribulose-5-phosphate
(Ri5P) and NAPDH.
Ri5P then is the starting point of the non-oxidative phase of the PPP. All enzymatic
reactions in the non-oxidative phase of the PPP are reversible, allowing cells to
adapt to the dynamic metabolic demands. Ri5P is converted to R5P and xylulose-
5-phosphate (X5P) by ribose-5-phosphate isomerase (RPIA, see chapter 1.3.3) and
pentose epimerase, respectively. The enzymes in the TKT family transfer two car-
bon groups from X5P to R5P to generate sedoheptulose-7-phosphate (S7P) and
glyceraldehyde-3-phosphate (G3P). Transaldolase (TALDO) transfers three-carbon
groups from S7P to G3P to generate erythrose-4-phosphate (E4P) and fructose-6-
phosphate (F6P). Finally, TKT transfers two-carbon groups from X5P to E4P to
generate G3P and F6P. A number of the metabolites in the non-oxidative phase can
re-enter glycolysis, showing a tight link between both pathways.

1.3. Pentose Phosphate pathway 65
NON-OXIDATIVE PHASEOXIDATIVE PHASEDNA/RNA & NADH/NADPH BIOSYNTHESIS
NADPH
GLYCERALDEHYDE 3- P
SEDOHEPTULOSE 7- P
GLYCERALDEHYDE 3- P
FRUCTOSE-1,6 P
FRUCTOSE-1,6 PRIBOSE 5- P
ERYTHROSE 4- PXYLULOSE 5- P
RIBULOSE 5- P
GLUCOSE 6- P G6 P DH
6 P G DH
Ribose 5 isomerase A
P TransaldolaseTransketolase
Transketolase
6- P GLUCONOLACTONE
6- P GLUCONATE
P Pentose Epimerase
PLactonase
ROS
Figure 1.9: Pentose phosphate pathway overview. When glucose is channeled throughthe oxidative phase (essentially irreversible), NADPH is generated in the pro-cess. RPIA forms part of the non-oxidative arm of pentose phosphate pathwayand generates R5P, which is a precursor for all ribonucleoside molecules (seefigure 1.8). Molecules in blue are also part of the glycolytic pathway. Viajoint action of TKT and TALDO, R5P can be also be generated from glycolysisintermediates.
1.3.2 Glucose-6-phosphate dehydrogenase
A number of enzymes from the PPP have been found to play a role in cancer
metabolism. Glucose-6-phosphate dehydrogenase (G6PDH) and enzymes in the
TKT family (transketolase-like 1 (TKTL1) and TKTL2), for instance, were reported
to be significanlty up-regulated in cervical, lung, gastric, colorectal, and endome-
trial cancers181,188,189. G6PDH is the rate-limiting enzyme in the PPP and plays
key roles in cell survival and cellular redox homeostasis. Interestingly, G6PDH
dimerisation is required for enzymatic activity, and then enzyme has been reported
to be present in higher-order complexes as well. G6PDH activity and expression
levels are regulated by several signaling pathways through post-translational mod-
ifications and changes in gene expression. For instance, epidermal growth factor
(EGF) stimulation triggers the release of bound G6PDH (from currently unknown
structures) to the soluble fraction, which increases the activity190. Furthermore,
the NADP+/NADPH ratio is another known modulator for G6PDH activity. Whilst
NADP+ is essential for function, the product NADPH is a negative regulator of
G6PDH. However, G6PDH activity is continuously kept higher in cancer cells com-
pared to normal tissue, since they have a very high rate of NADPH consumption191.
Furthermore, the tumor supressor p53 inhibits glucose entry intro the oxidative
phase of the PPP through direct binding to G6PDH192.

66 Chapter 1. INTRODUCTION
1.3.3 Ribose-5-phosphate isomerase A
Ribose-5-phosphate isomerase A (RPIA, alternatively: Phosphoriboisomerase; ri-
bose 5-phosphate epimerase; ribose 5-phosphate isomerase A) is a 30kDa (311
residues) enzyme that catalyses the isomerase reaction of Ri5P to R5P193, thereby
playing a key role in the PPP. R5P can be converted to other phosphorylated sug-
ars (see figure 1.8) via the enzyme Phosphoribosylpyrophosphate (PRPP) synthase,
a conversion that is the first step in purine, pyrimidine, histidine and NAD family
biosynthesis. Ribose-5 phosphate isomerases are conserved from bacteria to mam-
mals, due to the key role in metabolism (see figure 1.10). Interestingly, there is an
additional N-terminal stretch of 74 amino acids that is only found in mammals, but
not in insects( e.g. D. melanogaster), budding yeast (e.g. S. cerevisiae) or bacteria
(e.g. E.coli). The aspartate (D) residue at position 160 is crucial for the catalytic
function in humans194–196. Furthermore, scansite analysis revealed a potential Grb2
- SH3 binding motif (P19) (see section 1.4.3) in this amino acid stretch, as well as
predicted Akt (see section 1.4.5.2), AMPK kinase and ERK (see section 1.4.4.3)
binding motifs197.
There is a human RPIB gene, but it is thought to be a pseudo-gene and expression
or function has yet to be determined194. Comparatively little knowledge of RPIA
has been accumulated over the years, and most of the work done on the enzyme has
been in bacteria or lower eukaryotes.
The results that have been published, however, are very interesting indeed. In a D.
melanogaster study (Wang et al198) in 2012, the authors generated and studied a
strain with low RPI levels in neuronal cells (RPIA homolog, see figure 1.10). They
reported enhanced lifespan, increased resistance to oxidative stress and higher lev-
els of NADPH. Interestingly, this effect was due to specific neuronal promoters, but
was not observed when RPI was depleted in the entire organism. There were also
no significant phenotypes regarding life span when RPI was over-expressed. The
paper did not describe a molecular mechanism for the observed increase in life span,
but they speculated TOR signalling (see 1.4.5.3) may be involved. Another group
of scientists discovered a single patient with RPIA deficiency199. The phenotype

1.3. Pentose Phosphate pathway 67
was characterised as leukoencephalopathy and peripheral neuropathy in humans,
due to a point mutation and a truncation in the other allele. Intriguingly, one of the
reported mutations in the patient (deletion of a G nucleotide a position 540) does
not match the RPIA sequence deposited on publicly available nucleic acid database
repositories (such as the International Nucleotide Sequence Database Collabora-
tion), however, the residue in question is likely to be in position 762. The authors
probably assumed that the expression of RPIA starts at a putative second start codon
(see figure 1.10), but they do not show any western blot or proteomic data confirm-
ing this assumption. Other findings in metabolic diseases, such as transaldolase
(TALDO) deficiency200 indicate that defects in pentose and polyol metabolism may
form a new area of inborn metabolic disorders201.
The ”aging” group that studied RPI in fruit flies198 published another paper in 2014,
on this occasion studying RPIA in human hepatocellular carcinoma (HCC) patients
and transformed liver cancer cell lines (Ciou et al202). They identified RPIA as an
oncogene, with increased proliferation upon over-expression, mediated via MAPK
(ERK) signalling. Their cellular findings on increased proliferation upon RPIA
over-expression were backed up with a mouse xenograft model. Recently, Xu et
al185 also confirmed that RPIA expression is upregulated almost two-fold in HCC
tumors. Another study in human colorectal cancer (CRC) cells showed that down-
regulation of microRNA 124, which occurs frequently in CRC patients, increased
transcription of RPIA and PRPS1 mRNAs, thereby re-wiring glucose metabolism
to nucleotide synthesis191. However, another study in breast cancer found that the
locus of RPIA is hypermethylated (i.e. inactivated) via STAT1-mediated signalling.
Cumulatively, this indicates that the role of RPIA in cancer may depend on tissue
type. In conclusion from the current literature, there are some interesting findings
that link RPIA to signalling, cancer and neurodegeneration. Therefore, studying
RPIA further was of particular interest given the dependence of cancer cells on
metabolic signalling and autophagy107,131,203 (see sections 1.2 and 1.1).

68 Chapter 1. INTRODUCTION
Homo sapiens MQRPGPFSTLYGRVLAPLPGRAGGAASGGGGNSWDLPGSHVRLPGRAQSGTRGGAGNTSTSCGDSNSICPAPSTMSKAEEAKKLAGRAAVENHVRNN-QV
mus musculus MQRPGPFSTLYGRVLAPLPGRAGGAASGGGGNNWGLSGSHVQLPGRAHSETRGDKGGSSAGG-------PAPSTMSKAEEAKKLASHTAVENHVKNN-QV
Drosophila melanogaster ------------------------------------------------------------------------MDDIALDAAKKTAARTAVDQWVTEDTKI
saccharomyces cerevisiae -----------------------------------------------------------MAAGVPKIDALESLGNPLEDAKRAAAYRAVDENLKFDDHKI
: : * ::. :: :: ::
Homo sapiens LGIGSGSTIVHAVQRIAERVKQ---EN--LNLVCIPTSFQARQLILQYGLTLSDLDRHPEIDLAIDGADEVDADLNLIKGGGGCLTQEKIVAGYASRFIV
mus musculus LGIGSGSTIVHAVQRIAERVKQ---EN--LDLICIPTSFQARQLILQYGLTLSDLDQHPEIDLAIDGADEVDAELNLIKGGGGCLTQEKIVAGYASRFIV
Drosophila melanogaster LGIGSGSTVVYAVQRIAERVWK---EGELTDLICVPSSYQARHLILDYNLNLGDLDRNPNIDVAIDGADEVDRHMVLIKGGGGCLLQEKVVASCAKHFIV
saccharomyces cerevisiae IGIGSGSTVVYVAERIGQYLHDPKFYEVASKFICIPTGFQSRNLILDNKLQLGSIEQYPRIDIAFDGADEVDENLQLIKGGGACLFQEKLVSTSAKTFIV
:*******:*:..:**.: : . .::*:*:.:*:*:***: * *..::: *.**:*:******* .: ******.** ***:*: *. ***
Homo sapiens IADFRKDS-KNLGDQWHKGIPIEVIPMAYVPVSRAVSQKFGGVVELR--MAVNKAGPVVTDNGNFILDWKFDR--VHKWSEVNTAIKMIPGVVDTGLFIN
mus musculus IADFRKDS-KNLGDRWHKGIPIEVIPMAYVPVSRAVAQKFGGEVELR--MAVNKAGPVVTDNGNFILDWKFDR--VHKWSEVNTAIKMTPGVVDTGLFIN
Drosophila melanogaster VADYTKNS-IRLGEQWCRGVPIEVAPMAYVPIKLHIEALFGGEASLR--MAKVKAGPIVTDNGNFLLDWKFIANREYDWDEVNRAITLIPGVLETGLFVN
saccharomyces cerevisiae VADSRKKSPKHLGKNWRQGVPIEIVPSSYVRVKNDLLEQLHAEKVDIRQGGSAKAGPVVTDNNNFIIDADFG--EISDPRKLHREIKLLVGVVETGLFID
:** *.* .**..* :*:***: * :** :. : : . . ****:****.**::* .* . ::: *.: **::****::
Homo sapiens MAERVYFGMQDGSVNMREKPFC
mus musculus MAERVYFGMQDGSVNVREKPF-
Drosophila melanogaster MAHKCYYGMANGSVKVQNK---
saccharomyces cerevisiae NASKAYFGNSDGSVEVTEK---
* : *:* :***:: :*
P19*
Grb2 SH3 domain motif
S49*
Akt kinase motif
T145*
D160
L157* V217*AMP kinase motif
catalytic activitysecond start codon
Erk-D Domainmotif
ATG
Isomerase domain
B
A
Figure 1.10: RPIA DNA and protein sequence A) RPIA has a putative second start codonand its catalytic activity depends on residue D160. A number of potentialresidues in RPIA could be modulated by signalling factors. Prediction fromprotein sequence was performed wirth Scansite 3. B) Protein sequence com-parison of RPIA in human (Homo sapiens), mouse (Mus musculus), fruitfly (Drosophila melanogaster) and budding yeast (S. cerevisiae) reveals thatthe mammalian peptide has an additional 74 residues at its N-terminal com-pared to other homologs. Sequences were obtained from the InternationalNucleotide Sequence Database Collaboration (GenBank) and sequence align-ment was performed using ClustalW.
1.3.4 Transketolase
Transketolase (TKT) is part of the non-oxidative arm of the PPP and catalyses the
reaction of G3P and F6P to X5P and E4P, and vice versa (see figure 1.9). The
compound oxythiamine was identified as a potent inhibitor of TKT, since the en-
zymatic function is thiamine pyrophosphate-dependent204. Since the enzymatic re-
actions are reversible, the direction of metabolic flux in the PPP can be regulated
depending on different conditions (such as oxidative stress) in the cell. If NADPH
demands exceed those of R5P, it can be produced through the oxidative arm via
conversion of R5P back to G6P (mediated by TKT, TALDO and phosphoglucoiso-
merase)205. On the other hand, if R5P is in high demand for biosynthesis, TKT
and TALDO reverse the reactions and channel glycolysis intermediates G3P and

1.4. Grb2-mediated signalling 69
F6P into the non-oxidative phase103,205. Interestingly, the non-oxidative arm of the
PPP for nucleotide synthesis is used up to 80% by some cancer cells, as radio-
labelled 13C-glucose experiments indicate204. Mechanistically, it has been shown
that TKT binds to and is regulated by Akt (see section 1.4.5.2)206. Phosphoryla-
tion enhances TKT enzymatic activity and thereby increases carbon flow through
the non-oxidative phase of the PPP. Upstream regulation of Akt was shown to be
mTORC2 (see section 1.4.5.3) and lysine dependent.
Therefore, elevated expression of non-oxidative PPP enzymes are often upregulated
in cancers184–187, and some cancer cells even induce the expression of TKT-like
genes207. However, whether they have TKT enzymatic activity, is still currently
controversial in the field208. The role of TALDO in cancer is currently still unclear.
Although TALDO expression has been shown to be increased in cancerous liver
cells205, genomic deletion of TALDO in mice increases the prevalence to develop
HCC209. This may have to do with disturbing the redox balance permanently and
therefore generating excessive ROS, ultimately causing mutations and cancer.
Another study recently linked the PPP to autophagy in Dictyostelium discoideum:
the serine/threonine kinase Atg1 (see section 1.1.3) was identified to interact with
TKT210. The authors report that the activity of endogenous TKT is affected by
changes in expression levels of ATG1. In HEK293T cells, they found that ULK1
positively regulates TKT, and this regulation is ULK1 kinase activity dependent.
Taken together, the data suggest crosstalk between the PI3K/Akt/mTOR pathway,
the PPP and autophagy.
1.4 Grb2-mediated signalling
1.4.1 Receptor tyrosine kinases
Regulation of autophagy and metabolism (see sections 1.1 and 1.2) is mediated by
a number of signalling pathways. In this section, receptor tyrosine kinases (RTKs)
and some of their downstream signalling cascades will be introduced. RTKs are
a major class of molecules mediating the transmission of information from extra-
cellular signalling factors to the inner of the cell. They are key regulators of many

70 Chapter 1. INTRODUCTION
P
P P
P
P
P
P
P
P
P
PPP
P
P
P
P PP
P
tyrosine kinase (TK) domain
cytoplasmic domain(s) with tyrosines
phospho-tyrosine Ras proteins
signalling cascade
Effectors, e.g.Phospholipase C
SH2-domain containing
proteins
Grb2
SOS
Extracellular ligand-binding domain
ligand
Transmembrane (TM) domain
Legend:
1 2 3 4 5
Figure 1.11: Receptor tyrosine kinase signalling cascade 1) Dimerisation and ligandbinding 2) first phase transphosphorylation, increasing catalytic activity by50-200 fold. 3) second phase transphosphorylation. 4) recruitment of dockingand adapter proteins (e.g. Grb2) that bind phosphorylated tyrosine residues onthe receptor. 5) Phosphorylation of recruited adapter proteins and recruitmentof downstream signalling molecules (e.g. PLC or Ras) leading to recruitmentof other proteins (e.g. kinases) that amplify and diversify the signalling net-work.
cellular processes, including proliferation, migration and differentiation211. The
mechanism of activation, the overall structure and key components of signalling
pathways are largely conserved from C.elegans to humans212. Aberrant signalling
has been shown to cause a variety of diseases, including inflammation, diabetes, var-
ious cancers, severe bone disorders, arteriosclerosis and angiogenesis211,213. Those
result from genetic changes that affect the abundance, activity, sub-cellular local-
ization or the regulation of RTKs. So far, 58 RTKs have been identified in humans,
and they are classified into 20 subfamilies211,212. In cancer cells, two important
subfamilies are class I (EGFR family) and class II (insulin receptor family)213.
All RTKs have three characteristic structural domains in common:
(1) extracellular ligand-binding domain (N-terminal)
(2) a transmembrane domain (single transmembrane-spanning helix)

1.4. Grb2-mediated signalling 71
(3) cytoplasmic tyrosine kinase domain(s) (C-terminal)
The general view for the mechanism of action for RTKs is that upon ligand bind-
ing on the extracellular side, the receptors undergo conformational changes that
lead to dimerisation and transautophosphorylation of tyrosine residues on the C-
terminal intracellular domain, creating a docking site for adaptor proteins that me-
diate downstream signalling211. Ligand binding is usually associated with receptor
homo- or heterodimerisation, although some RTKs, such as the insulin receptor, are
composed of constitutive, disulphide bond-linked dimers. The C-terminal domain
is composed of a protein tyrosine kinase domain and can contain juxtamembrane
regulatory regions. Prior to ligand activation, each receptor is autoinhibited and
inactive214. The exact mechanism of autoinhibition is variable across RTK subfam-
ilies. Whereas the insulin receptor family is activated via trans-phosphorylation,
the EGFR family monomers dimerise such that an activator lobe of one monomer
binds to a receiver lobe on the other, leading to the required conformational change
for activation. Once active, it proceeds to sequential tyrosine trans-phosphorylation
events.
1.4.2 Grb2
At that point, the signalling pathways are amplified and diversified. Further recep-
tor phosphorylation may be aided by binding of adaptor proteins, which can also be
phosphorylated themselves by the receptor. Adaptors often contain Src homology 2
(SH2) and phosphotyrosine binding (PTB) domains, which allow association with
activated receptors, as well as domains that enable interactions with downstream
signalling effectors. One of the key adaptors is growth factor receptor bound pro-
tein 2 (Grb2), which binds to phosphorylated tyrosine motifs via the SH2 domain.
Grb2 plays an important role as a crucial regulator of mitogenic signalling100,215.
A number of RTKs are able to recruit Grb2 via the SH2 domain. Amongst those
are epidermal growth factor receptor (EGFR),platelet derived growth factor recep-
tor(PDGFR) and hepatocyte growth factor receptor (HGFR)100,216.
Grb2 is ubiquitously expressed in all tissues during development217 and knockout
causes embryonic lethality in mice218. The protein is mainly known to promote
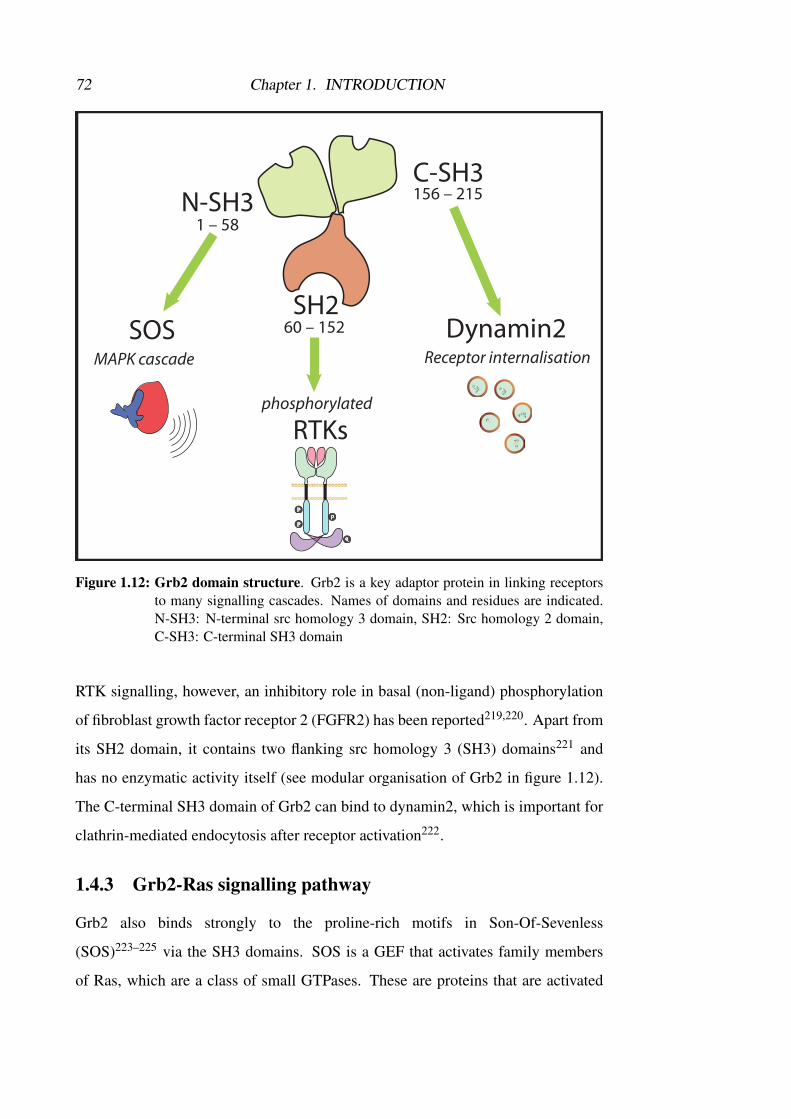
72 Chapter 1. INTRODUCTION
N-SH31 – 58
SH2
C-SH3
SOS
RTKs
MAPK cascade
phosphorylated
Dynamin2Receptor internalisation
60 – 152
156 – 215
P
P
P
P
Ligand
GFP
P
P
P
Liga
nd
GFP
P
P
P
Ligand
GFP
P
P
P
Ligand
GFP
P
P
P
Ligand
GFP
Figure 1.12: Grb2 domain structure. Grb2 is a key adaptor protein in linking receptorsto many signalling cascades. Names of domains and residues are indicated.N-SH3: N-terminal src homology 3 domain, SH2: Src homology 2 domain,C-SH3: C-terminal SH3 domain
RTK signalling, however, an inhibitory role in basal (non-ligand) phosphorylation
of fibroblast growth factor receptor 2 (FGFR2) has been reported219,220. Apart from
its SH2 domain, it contains two flanking src homology 3 (SH3) domains221 and
has no enzymatic activity itself (see modular organisation of Grb2 in figure 1.12).
The C-terminal SH3 domain of Grb2 can bind to dynamin2, which is important for
clathrin-mediated endocytosis after receptor activation222.
1.4.3 Grb2-Ras signalling pathway
Grb2 also binds strongly to the proline-rich motifs in Son-Of-Sevenless
(SOS)223–225 via the SH3 domains. SOS is a GEF that activates family members
of Ras, which are a class of small GTPases. These are proteins that are activated

1.4. Grb2-mediated signalling 73
when bound to GTP, and inactive when bound to GDP. In humans, there are four
highly homologous Ras proteins of approximately 21 kDa size: H-Ras, N-Ras,
K-Ras4A and K-Ras4B, whereby the latter two are different splice variants226.
Binding of prenylated (membrane bound) Ras proteins to EGFR via adaptors leads
to increased clustering at certain membrane locations, where Ras is tethered and
activated227. Ras activation can subsequently lead toMAPK and PI3K signalling
cascade activation (see section 1.4.4), thereby serving as key players to couple cell
surface receptors to intracellular signalling pathways226,228. Ras itself and asso-
ciated proteins are frequently mutated in cancers53,183,229,230. The most common
mutations in Ras are disturbing the binding of GTPase-activating proteins (GAPs),
hence constitutively rendering Ras in its active form226,230. Interestingly, an onco-
genic, constitutively active variant of Ras (K-RasG12D) was recently shown to divert
glucose flux into the PPP in order to increase precursors for various biosynthesis
pathways108,183.
1.4.4 MAPK pathway
Ras activation initiates a number of signalling cascades in different compartments
of the cell, leading to amplification and diversification of signals231. For most of
the downstream effectors, alternatively spliced isoforms have been identified231.
However, their abundance and activity are usually specific for a cell type or condi-
tion, giving certain isoforms unique signalling properties that divert from the main
MAPK pathway and hence won’t be further discussed here.
1.4.4.1 Raf
In the MAPK pathway, Ras activates Raf family members (A-Raf, B-Raf and C-Raf
in humans), which are cytoplasmic serine/threonine kinase proteins232 ranging from
70 - 100 kDa in size233 and are also referred to as MAP3K- or MAPKKK-acting
kinases in the literature. Whereas C-Raf (or referred to as Raf-1) is ubiquitously
expressed, A-Raf has been detected in multiple tissues, such as heart, intestine,
spleen, cartilage, thymus and cerebellum234. B-Raf is present in multiple isoforms
and is strongly expressed in the fetal brain and adult cerebrum235. The current

74 Chapter 1. INTRODUCTION
understanding from mouse knockout studies is, that C-Raf is essential and the other
two main isoforms play more specialised roles232,233. Raf activity is regulated by a
number of kinases and phosphatases, including Akt isoforms (or known as protein
kinase B, PKB)236 (see section 1.4.5.2), Protein Phosphatases 1 and 2a (PP1 and
PP2A)237 and the Raf downstream effector extracellular signal-regulated kinase 1
(ERK1)238 (see section 1.4.4.3) in a negative feedback loop.
1.4.4.2 MEK
Rafs activate other (MAP2K) serine/threonine kinases, namely MAPK/ERK Kinase
1 (MEK1) and MEK2, also sometimes referred to as MAPK Kinase 1 (MKK1)
and MKK2239. Both MEKs are conserved in eukaryotes, ubiquitously expressed,
share aproximately 80% sequence identity and have a molecular weight of 45
kDa240. They are composed of a large, regulatory N-terminal domain, followed
by a catalytic domain and a shorter C- terminal region231 and have been reported
as dual-specificity kinases, due to their ability to phosphorylate tyrosine and ser-
ine/threonine residues241. While Raf isoforms are expressed at relatively low levels,
high MEK expression levels ensure amplification of the signaling cascade240,242.
For activation, MEKs are phosphorylated on two serine residues (S218 and S222
in MEK1, S222 and S226 in MEK2)231,241,242. Both MEKs have been found to
be important for cell survival in vitro243. MEK1 has been shown to inhibit MEK2-
dependent ERK signaling244 and ERK can also inhibit MEKs in a negative feedback
loop241. Interestingly, in a constitutively active K-RasG12D mouse model, expres-
sion levels of several glycolytic genes and RPIA, are significantly decreased by
pharmacological inhibition of MEK183.
1.4.4.3 ERK
MEKs in turn phosphorylate MAPK proteins. This group includes the ERK fam-
ily (ERK1/2 and ERK5), the p38 kinase family and the c-Jun N-terminal kinase
(JNK) family (also referred to as stress-activated protein kinase (SAPK))245,246.
ERK1/ERK2, also known as p44/p42 MAP kinases, phosphorylate a large variety
of nuclear and cytoplasmic substrates involved in many cellular responses, such
as cell proliferation, differentiation, survival and motility243,247. These various cell

1.4. Grb2-mediated signalling 75
fate decisions are achieved by differences in the duration and magnitude of ERK ac-
tivity, and by subcellular compartmentalisation248,249. The latter is accomplished by
scaffolding proteins with varying compositions that restrict ERK signaling cascades
to different subcellular compartments228. ERK1 and ERK2 are 44- and 42-kDa ser-
ine/threonine hydrophilic non-receptor kinases, respectively, with 90% sequence
identity in mammalian cells246,247. Although there are some indications regarding
specific roles250,251, data from knock-out mice show that they functionally largely
compensate each other246. Both ERK1 and ERK2 are expressed in most tissues in
mammals, with ERK2 expression levels generally higher than those of ERK1231.
MEKs activate ERK1 and ERK2 on threonine and tyrosine residues (T202/Y204
in ERK1)239,240. ERK activity is highly regulated by MAP kinase phosphatases
(MKPs), including serine/threonine, tyrosine, and dual-specificity phosphatases
(DUSPs), all playing a key role in fine-tuning the magnitude and duration of ki-
nase activation231,246. In humans, at least 10 MKPs have been identified231,249, for
some of those, their expression is induced and regulated by MAPK signalling252.
ERK activity is also regulated by scaffolding proteins that co-localize signalling
components and direct the pathways to specific targets253,254.
1.4.4.4 ERK targets
Once activated, ERKs directly (or indirectly) phosphorylate serine/threonine
residues on hundreds of target proteins, predominantly in the nucleus, but also
in the cytoplasm, mitochondria, Golgi and ER245. Amongst those are cytosolic,
growth factor responsive proteins including upstream MAPK components such
as EGFR255, SOS256 and several MKPs246,252 that function as negative feedback
loops. Nuclear targets generally involve TFs that regulate gene expression, tran-
scriptional repression and chromatin remodeling245,254. These include c-Fos and
the E twenty-six (Ets) family, amongst which the most studied are Elk-1 and Ets-
1245,246.

76 Chapter 1. INTRODUCTION
P
P
EGF
EGFR
Ras
SOSGrb2
MITOGENIC SIGNALLING
MAP(3)K
MAP(2)K
MAPK
e.g. EGF - EGFR
MKPs
DUSPs
METABOLICREPROGRAMMING
PROLIFERATION
DIFFERENTIATION
SURVIVAL
MOTILITY
Raf
MEK 1/2
ERK1/2
Figure 1.13: MAPK signalling cascade. Upon stimulation with mitogens, Ras activateMAP3Ks (e.g. Raf), which in turn activate MAP2Ks (such as MEK1/2).These in turn activate MAPKs (e.g. ERK 1/2) which promote processes suchas metabolic reprogramming, survival, differentiation, proliferation and motil-ity. ERK 1/2 inhibits upstream signalling and is regulated by dual specificityphosphatases (DUSPs) and MAPK phosphatases (MKPs).
1.4.5 PI3K/Akt/mTOR pathway
The phosphoinositide 3-kinase (PI3K)/Akt/mTOR pathway (see figure 1.14) is ac-
tivated by a number of RTKs and Ras signalling. In general, this pathway and its
components play a key role in promoting cellular growth, proliferation, metabolism,
transcription, translation, apoptosis, cell cycle progression and survival229,257,258.
Disturbed activation of the pathway has been associated with a number of human
malignancies259.
1.4.5.1 PI3Ks
There are four classes of PI3K (class I-IV) in humans258. Differences in classes
are manifested in substrate specificity, though a common function is to phosphory-
late the inositol ring 3’-OH group of a phosphatidylinositol molecule (commonly
abbreviated to PtdIns or PI)229. PI molecules are amphiphilic, membrane-bound
phospholipids that play versatile cellular signalling roles, depending on the phos-
phorylation states of the inositol ring moiety260. They can interact directly with

1.4. Grb2-mediated signalling 77
intracellular proteins and influence their subcellular location and/or activity and
serve as substrates for phospholipases to generate second messengers260. In hu-
mans, three -OH groups (3’, 4’, 5’-OH) can be independently (de-)phosphorylated,
creating a large variety of cellular compounds ranging from 0-3 phosphates attached
(commonly labelled PI to PI(3,4,5)P3)260.
Class I PI3Ks are heterodimers composed of a catalytic subunit and an adap-
tor/regulatory subunit (p110 and p85, respectively)259. PI3K class I proteins
that are recruited by activated RTKs are PI3Ka , PI3Kb and PI3Kd , via recep-
tor/adaptor/SH2 domain interactions of p85 proteins229,258. The p110 subunits can
also be activated by Ras258. PI3K class I can transiently convert PI(4)P to PI(3,4)P2
and PI(4,5)P2 to PI(3,4,5)P3 on the inner leaflet of the plasma membrane229.
1.4.5.2 Akt
Phosphorylated PIs recruit PH (pleckstrin homology) domain-containing effectors
to the membrane. The most studied effector is the 56kDa serine/threonine ki-
nase Akt (alternatively known as PKB)261,262. Other PH-domain proteins recruited
by PI(3,4,5)P3 to the plasma membrane are serum/glucocorticoid-regulated kinase
(SGK), and phosphoinositide-dependent kinase-1 (PDK-1, not to be confused with
the metabolic regulator pyruvate dehydrogenase kinase 1 (PDK1)), whereby the lat-
ter is required for Akt activation on the threonine 308 residue261. A second, final
activation step of Akt occurs upon phosphorylation of serine 473 by the mTOR-
rictor complex mTORC2 (see section 1.4.5.3). In humans, there are three isoforms
of Akt261. Akt1(PKBa) has been found to be widely expressed in different tis-
sues, whereas Akt2 (PKBb ) and Akt3 (PKBg) are tissue-specific. However, mouse
knockout studies suggest there is functional redundancy amongst the isoforms263.
Akt itself regulates multiple biological processes including cell survival, prolifera-
tion, growth, and glycogen metabolism262. Similarly to ERK1/2, Akt has hundreds
of cellular downstream targets, some of which have been thoroughly tested and con-
firmed261. Its role in metabolism is manifested by phosphorylation of targets such
as glycogen synthase kinase 3b (GSK3b ). Akt regulation is achieved by a vari-
ety of mechanisms, including inhibition of membrane recruitment. For instance,

78 Chapter 1. INTRODUCTION
the phosphatases ”phosphatase and tensin homologue deleted on chromosome 10”
(PTEN) and SH2 domain-containing inositol 5-phosphatase type 2 (SHIP2) can
convert PI(3,4,5)P3 to PI(4,5)P2264, thereby abolishing Akt recruitment. PTEN has
been established to be a tumour suppressor257.
1.4.5.3 mTOR
The mechanistic (originally: mammalian) target of rapamycin (mTOR) is one of
the best studied regulators to multiple cellular responses, including growth, prolif-
eration and autophagy. The mTOR serine/threonine kinase phosphorylates a broad
range of cellular targets, has multiple regulators and effectors, is conserved from S.
cerevisiae to mammals and is related to the PI3K family.70,265. A thorough review
of mTOR signalling can be found here: Lapante et al266. It was originally identi-
fied due to its sensitivity to rapamycin267, however, mTOR signalling is comprised
of two different complexes (mTORC1 and mTORC2) with very different targets
and functions265,266. mTORC2 is not inhibited by rapamycin. Subunit composi-
tion can vary depending on function and subcellular localisation, but both com-
plexes contain mTOR, DEP-domain containing mTOR-interacting protein (DEP-
TOR) and mammalian lethal with SEC13 protein 8 (mLST8, or alternatively called
GbL)265,268–271. mTORC2 is additionally composed of Rictor, protein observed
with Rictor (PROTOR) 1/2, and mammalian stress activated protein kinase inter-
acting protein 1 (mSin1)266,269,272. The mTORC1 complex specifically contains
regulatory associated protein of mTOR (Raptor) and 40kDa Proline-rich Akt sub-
strate (PRAS40, or called AKT1S1)273.
mTOR targets
Major cellular processes, such as protein and lipid synthesis and autophagy, are
controlled by mTORC1 (see section 1.1.5). In particular, mTORC1 promotes ribo-
some biosynthesis and mRNA translation through its well-characterised substrates
S6 kinase 1 (S6K1) and eukaryotic translation initiation factor 4E (eIF4E)-binding
protein 1 (4E-BP1)70,274,275 (see figure 1.2). Targets of mTORC2 include SGK
and PKC (protein kinase C). mTORC2 also activates Akt276, whilst Akt can in-
directly activate mTORC1 via TSC2 and Rheb266. Activated Akt phosphorylates

1.4. Grb2-mediated signalling 79
TSC270,277, which is a GAP for Rheb when in complex with TSC1. RhebGTP en-
hances mTORC1 activity. Therefore, Akt-mediated phosphorylation of TSC2 in-
hibits TSC1-TSC2 complex formation, leading to prolonged activivities of Rheb
and mTORC1278. ERK1/2 (see section 1.4.4.3) also inhibits TSC2 via phosphory-
lation, highlighting one of many links between different signalling cascades.
mTOR regulation
Upstream regulation of mTORC2 is not fully understood, possibly it is activated
via growth factors/Ras266. Much more is known about mTORC1 than mTORC2.
Following intracellular and extracellular inputs signal via mTORC1:
(1) growth factors
(2) amino acids
(3) energy status
(4) oxygen
Growth factors, through the RTK-PI3KAkt pathway, positively regulate mTORC1.
Amino acids (particularly leucine and arginine) also strongly regulate mTORC1
activity (see section 1.1.5). Cellular energy levels (e.g. glucose concentration)
are regulated via AMPK112, which affects mTORC1 activity directly or indi-
rectly. In response to hypoxia (see section 1.2.8) or a low energy state in form
of a high AMP/ATP ratio, AMPK phosphorylates TSC2 (like mTORC2) and in-
creases its GAP activity toward Rheb279. AMPK also communicates directly with
mTORC1 via phosphorylation of raptor, leading to inhibition of mTORC1. Aber-
rant PI3K/Akt signalling leads to excessive mTOR signalling as is the case in vari-
ous cancers280. In general, regulation of mTOR activity itself is achieved by disso-
ciation of inhibitory subunits (e.g. PRAS40, DEPTOR) and/or scaffolding proteins
(e.g. raptor, rictor, mSin1) by changes in sub-cellular localisation266. For instance,
PRAS40 is a negative regulator of mTOR, but it is itself inhibited by Akt-mediated
phosphorylation261,281
1.4.5.4 FoxO
Forkhead box (FoxO) transcription factors form part of a superfamily consisting of
19 subclasses of genes (FoxA - FoxS) that share a highly conserved DNA-binding

80 Chapter 1. INTRODUCTION
PTEN
mTORC1
PI3KAMPK
AUTOPHAGYNUCLEOCYTOPLASMICSHUTTLING
PROTEIN & LIPIDSYNTHESIS
MITOGENIC SIGNALLING
AKT
LC3BECLIN 1ULK1/2VPS34ATG4ATG12BNIP3 GABARAPL1
FOXO3A
FOXO3AP
P
PIP3PIP2
RTKs
Figure 1.14: Autophagy regulation via FoxO3A. Phosphorylation renders FoxO3A cyto-plasmic and therefore not transcriptionally active. In the nucleus, FoxO3Apromotes the expression of various genes involved in autophagy. Growth fac-tor signalling increases PI(4,5)P2 to PI(3,4,5)P3 conversion, thereby activatingAkt. PTEN inhibits Akt signalling by counteracting PI3K. Akt also regulatesautophagy via mTORC1. The complex promotes protein and lipid biosynthe-sis and inhibits autophagy.
Fox domain282. Many members of the superfamily are expressed under specific spa-
tial and temporal circumstances and some are ubiquitously expressed283. There are
four members in mammals (FoxO1, 3a (or FoxO3), 4, 6)284. FoxO1, FoxO3a and
FoxO4 are ubiquitously expressed in mammalian cells and their loss of activity has
been observed in multiple tumors283. The FoxO transcription factors are involved in
the regulation of metabolism, stress, growth, survival, tumor suppression, differen-
tiation and cell cycle pathways285. FoxOs, in particular FOXO3a, have been shown
to regulate transcription of a number of autophagyrelated genes including LC3,
Beclin 1, ULK1/2, VPS34, ATG4, ATG12, BNIP3 and GABARAPL148,90,286,287
(see sections 1.1.3 and 1.1.5). Furthermore, FoxO3a localises to the nucleus under
nutrient-starvation conditions48 and also upregulates FoxO1-mediated transcription,
whose targets include ATG7 and other autophagy-related genes285,286. FoxO activ-

1.5. Rationale for experiments 81
ity is highly regulated through post-translational modifications that influence their
nucleocytoplasmic shuttling285. Target genes are activated or repressed through the
FoxO domain in the nucleus288. One of the key regulators of the FoxO family is
Akt (see section 1.4.5.2), promoting nuclear export of FOXO by phosphorylation,
which results in inhibition of FOXO-dependent transcription276,289.
1.5 Rationale for experimentsWhen first discovered, metabolic enzymes were thought to catalyse reactions in
metabolism. However, there is a growing amount of evidence for metabolic en-
zymes and metabolites to play additional roles in a variety of cellular activities, in-
cluding signalling, transcription and autophagy. Furthermore, it is becoming clear
that those enzymes and metabolites can act on ”distant” pathways. However, most
of these findings were published only in the last decade, so there is good reason to
believe that other metabolic enzymes have additional roles, but they have yet to be
characterised.
1.5.1 RPIA - Grb2 experimentsBefore I joined the lab, RPIA was identified as a hit in a GFP-tagged Grb2 transloca-
tion screen (J. Petschnigg, R. Ketteler, et al, submitted). This screen is described in
more detail in chapter 3. Interestingly, out of the 20,000 cDNAs that were screened,
RPIA was the only metabolic enzyme that caused a change in localisation (out of
154 hits). Due to its key role in the PPP and its possible involvement in Grb2-
mediated signalling, RPIA appeared to be a very interesting enzyme to study. As
outlined in chapter 1.2, many metabolic pathways are altered in cancer cells, in-
cluding glycolysis (section 1.2.4), TCA cycle (section 1.2.5), amino acid synthesis
(section 1.2.6) and nucleotide synthesis (section 1.2.9). The growing evidence of
enzymes involved in signalling raises questions to what extend PPP enzymes play
a role as well (section 1.3).
1.5.2 RPIA in AutophagyA review of the current literature shows a tight link and many overlaps between
metabolism and autophagy (see section 1.1.4). In fact, a number of metabolic en-

82 Chapter 1. INTRODUCTION
zymes, have been associated with the regulation of autophagy. As with biosyn-
thetic regulatory feedback loops, there is good reason to assume some crosstalk of
metabolic enzymes and the autophagy machinery. Furthermore, RPIA was identi-
fied as an inhibitor of FoxO3A in a cDNA over-expression screen (Ketteler, Na and
Seed, unpublished). FoxO signalling has been associated with autophagy, as many
genes in the autophagy pathway (such as ATG4B) are regulated via FoxO through
transcriptional control (see section 1.4.5.4). Additionally, the Ketteler lab has many
tools and expertise to study autophagy in detail, which are readily available in the
lab.

Chapter 2
MATERIALS AND METHODS
2.1 Cell lines
HeLa and human embryonic kidney (HEK293T) cells originated from the American
Type Culture Collection (ATCC). HepG2 cells were obtained as a kind gift from
the Saiardi lab (UCL, LMCB, UK). Other cells lines (stably transduced cell lines,
CRISPR cells) were generated from plain cells and described in more detail below.
All cell lines were frequently mycoplasma-tested.
2.2 Cell culture
All cell lines were cultured in Dulbecco’s modified Eagle’s medium (DMEM),
+high glucose (25mM), +GlutaMAX™(ThermoFisher Scientific®, 61965-026) and
supplemented with 1mM sodium pyruvate (ThermoFisher Scientific®, 11360-070),
100 U/ml Penicillin-Streptomycin (ThermoFisher Scientific®,15140-122) and 10%
Fetal Calf Serum (Sigma, 12133C), unless otherwise stated. In this study, this
standard culture medium is referred to as full medium/media. All live cells were
incubated at 37°C and 5% CO2. For the stable cell lines, indicated amounts of
puromycin was added to full medium. For part of the growth assays performed in
figure 4.20, I used DMEM +low glucose (5.6mM), +GlutaMAX™(ThermoFisher
Scientific®, 10567-014), supplemented with 100 U/ml Penicillin-Streptomycin and
10% Fetal Calf Serum.

84 Chapter 2. MATERIALS AND METHODS
2.3 Molecular biology
2.3.1 Peak/pMOWS vectorsThe peak and pMOWS backbone/control vectors originated from Ketteler
et al290. The shRNA sequence in pLKO.1 shRPIA #4 was cloned into
pMOWS 5.2 vectors (containing puromycin N-acetyl-transferase or GFP) im-
mediately upstream of the H1 promoter using EcoRI and BamHI restriction
site cloning. RPIA was sub-cloned using the EcoRI and NotI restriction sites
in peak 14. The catalytic inactive D160A mutant was generated using over-
lap extension PCR, with 5’-CCTTGCCATCGCTGGTGCTGATG-3’ and 5’-
CATCAGCACCAGCGATGGCAAGG-3’ primers and RPIA WT as template. The
resulting mutagenized PCR fragment was subcloned into peak 14 using EcoRI and
NotI restriction sites.
2.3.2 Gateway vectorsGateway® pDONR™221 vectors (entry clones) were obtained from Thermo Sci-
entific, namely RPIA and Firefly luciferase. pDONR vectors were used to clone
relevant sequences into a mammalian destination vector containing a 3x Flag se-
quence upstream, modified originally from a pLenti6.3/TO/V5-DEST (#A11144,
ThermoFisher Scientific®, in table 2.1 annotated as pDEST vector). The cloning
reactions were performed by using LR2 clonase according to the manufacturer’s
instructions. pDEST RPIA D160A was obtained by creating a pDONR construct
using AttB PCR arms and peak 14 D160A as a template, followed by subsequent
cloning into a pDEST donor template.
2.3.3 Over-expression and knockdown plasmidsA summary of all plasmids used in over-expression and knockdown experiments in
this study can be found in tables 2.1 and 2.2. Furthermore, Table 2.3 shows the oligo
sequences of the pLKO.1 vectors mentioned in table 2.2. The plasmids pMOWS 5.2
shRPIA puro and pMOWS 5.2 shRPIA contain the same target sequence as pLKO.1
shRPIA #4.

2.3.M
olecularbiology85
Name of plasmid gene(s) tags, mutations, comments in figures:pMOWS 4.0 N/A N/A 3.2, 3.3, 3.4, 3.5, 3.11pMOS GFP GFP N/A 3.2, 3.3, 3.4, 3.6, A.2peak 14 N/A N/A - also called ”vector” 3.2, 3.3, 3.4peak 14 RPIA RPIA Flag 3.2, 3.3, 3.5, 3.6, 3.11, A.2, A.1peak 14 D160A RPIA Flag + D160A mutation 3.2, 3.4, 3.11pMOS GFP-Grb2 (WT) Grb2 GFP 3.1, 3.2, 3.4, 3.5, 3.6, A.1GFP-Grb2 (SH2) Grb2 GFP + R86K mutation 3.6GFP-Grb2 (NSH3) Grb2 GFP + L49P mutation 3.6GFP-Grb2 (CSH3) Grb2 GFP + G203R mutation 3.6GFP-Grb2 (NCSH3) Grb2 GFP + L49P + G203R mutation 3.6peak 12 GFP-RPIA RPIA GFP 3.7, 3.8pDEST Luc Firefly Luciferase 3x Flag 3.9, 3.10pDEST RPIA RPIA 3x Flag 3.9, 3.10pDEST D160A RPIA 3x Flag + D160A mutation 3.9, 3.10peak 14 ATG4B ATG4B Flag A.2pMOS GFP-FoxO3A FoxO3A GFP A.1peak 14 AKT Akt Flag A.1peak 14 AKT KD Akt Flag + T308A mutation A.1peak 14 PTEN PTEN Flag A.1
Table 2.1: Over-expression plasmids over-expression plasmids used in experiments as indicated. They were either purchased (pDONR from Ther-moFisher Scientific®) or generated by cloning sequences into peak or pMO(W)s vectors

86C
hapter2.M
ATERIA
LSA
ND
METH
OD
S
Name of plasmid target gene(s) tags, markers, comments in figures:pLKO.1 N/A N/A 4.1pLKO.1 shRPIA #1 RPIA N/A 4.1pLKO.1 shRPIA #2 RPIA N/A 4.1pLKO.1 shRPIA #3 RPIA N/A 4.1pLKO.1 shRPIA #4 RPIA N/A 4.1pMOWS 5.2 puro N/A puromycin N-acetyl-transferase 4.2, A.2, A.1pMOWS 5.2 shRPIA puro RPIA puromycin N-acetyl-transferase 4.2, A.2, A.1pMOWS 5.2 GFP N/A GFP 4.3pMOWS 5.2 shRPIA RPIA GFP 4.3pMOWS 5.2 Grb2 Grb2 puromycin N-acetyl-transferase A.1pMOWS 5.2 shRPIA RPIAres RPIA shRPIA resistance 3.11pMOWS 5.2 shRPIA D160Ares RPIA shRPIA resistance + D160A mutation 3.11
Table 2.2: knockdown plasmids plasmids used in all short hairpin-mediated knockdown experiments. These were either purchased (pLKO.1 fromSigma) or generated by cloning appropriate oligo sequences into pMOWS vectors. This list does not include the sgRNA vectors used for thegeneration of CRISPR cell lines, please see 2.4

2.4. Transfection methods 87
designation forward oligo shRNA sequence Clone IDshRPIA #1 CCGGCGGGTACACAAATGGAGTGAACTCGAGTTCACTCCATTTGTGTACCCGTTTTTG TRCN0000049408shRPIA #2 CCGGGCTGATGAAGTAGATGCTGATCTCGAGATCAGCATCTACTTCATCAGCTTTTTG TRCN0000049409shRPIA #3 CCGGGAATTGGAAGTGGTTCTACAACTCGAGTTGTAGAACCACTTCCAATTCTTTTTG TRCN0000049410shRPIA #4 CCGGGAAGTGAATACAGCTATCAAACTCGAGTTTGATAGCTGTATTCACTTCTTTTTG TRCN0000049411
Table 2.3: shRNA sequences used in pLKO.1 vectors and pMOWS 5.2 targetting RPIAshRNA vectors were purchased from Sigma. The sequence of shRPIA #4 wascloned into pMOWS 5.2 as described in 2.3.1.
2.4 Transfection methodsVarious transfection protocols were used and optimised, depending on cell line,
downstream technique and cell seeding format. In general, for experiments in 6-
well and 12-well plates (western blotting, virus packaging cell lines, confocal mi-
croscopy), 2-5*105 cells were seeded one day prior to transfection when CaCl2
precipitation and XtremeGene 9 (Sigma, 06365779001) were used as a transfection
method. DMEM was supplemented with chloroquine (25µM) and drops of 1-2.5µg
of plasmid DNA mixed with a 5mM final concentration of CaCl2 in HEPES buffer
(10mM HEPES, 150mM NaCl, 3mM EDTA, 0.005% Tween-20) were added after
30 minute incubation at room temperature (RT) for CaCl2-mediated transfection.
Cells were washed 2x with PBS and incubated with full medium after 6 hours of
incubation of the DNA/ CaCl2 complexes on the cells. For XtremeGene 9-mediated
transfection, 3µl were mixed with 1-2.5µg of plasmid DNA in serum-reduced opti-
MEM (ThermoFisher Scientific®, 31985-088) for 30 minutes at RT and cells were
then incubated for 16 hours.
For experiments in 96-well or 384-well plates (high throughput imaging, luciferase
assays), 0.5-1*105 cells were seeded and transfected with lipofectamine® 2000
(ThermoFisher Scientific®, 12566-014). In this transfection method, 0.1-0.2µg of
plasmid DNA was mixed with 0.2-0.3µl lipofectamine in optiMEM , incubated for
30 minutes at RT and applied to cells for 16 hours.
2.5 Lentiviral stable cell linesHEK293T cells were used as a packaging cell line for producing viral particles
for stable induction. 5*105 cells were seeded in 6 well plates and co-transfected
the next day with 100ng pMD2.G (contains VSV-G Env), 900ng psPAX2 (contains

88 Chapter 2. MATERIALS AND METHODS
Gag, Pol, Rev, and Tat) (#12259, #12260, both Addgene) and 1µg of lentiviral over-
expression or shRNA construct as indicated, using XtremeGene 9 (as described
above). In brief, 100 µl Opti-MEM® (ThermoFisher Scientific®, 31985-070) were
mixed with 6 µl XtremeGene 9 and left for 5 minutes at RT. DNA, as indicated
above, was added and left at RT for another 30 minutes. Mixture was added drop-
wise to cells and left for incubation 16-20 hours at 37°C and 5% CO2. Cell culture
medium was replaced with 2ml filtered full medium + 1.1% BSA (Bovine Serum
Albumin). Virus particles were harvested after 24 hours and again after 48 hours.
The virus-containing media from both harvest rounds were mixed, filtered through
a 0.22 µm PDVF filter (GVWP04700, Millipore™) and then either used directly or
stored at -80°C by snap-freezing in liquid nitrogen.
Next, target cells were seeded at 3-6*104 cells in 12 or 24 well plates and transduced
with virus-containing medium + full medium without antibiotics the next day. For
cell lines that proved difficult to transduce (e.g. HepG2 cells), 0.5 µl of 8mg/µl
hexadimethrine bromide (107689, Sigma) was added to the media. On the follow-
ing day, selection and expansion of transduced cells with full medium containing
1µg/ml puromycin was performed for a total of 7 days, with selection medium be-
ing replaced every 2-3 days. Various dilutions of virus-containing medium (ranging
from 10 µl - 300 µl) were tested and compared to each other under puromycin se-
lection, and cells with good survival (compared to non-infected control) but most
diluted (wells infected with least virus-containing particles) were chosen for further
experiments.
2.6 CRISPR/Cas9 genome editing
For genomic modification at the RPIA locus on chromosome 2p11.2 in HeLa cells,
the CRISPR/Cas9 double nicking strategy as described in detail in Ran et al291 was
used. In brief, RPIA specific sgRNAs vectors targeting exon 1 were designed and
generated according to the protocol. Oligo sequences for sgRNA generation (see
table 2.4) were used to clone into pX335 (containing nCas9). 6.5*104 cells were
seeded in 24 well plates and co-transfected the next day with 200ng of each sgRNA

2.6. CRISPR/Cas9 genome editing 89
vector (and 400ng pX335 with no sgRNA sequence for control, labelled CR-WT)
+ 100ng pBabe mCherry-puro (empty pMOWS for selection control) using lipofec-
tamine (also, for overall strategy and vectors see figure 4.8). After 48 hours, cells
were selected with culture medium containing puromycin (Sigma, P8833) at 1.0
µg/ml. Fresh selection medium was provided every 2-3 days. Cells were selected
and expanded for a total of 18 days, with selection control cells completely dead af-
ter 7 days. After 10 days, individual clonal colonies were picked using 3mm trypsin-
soaked clonal discs and further expanded in 24 well, 6 well and ultimately in 10 cm
petri dishes. Genomic DNA was obtained using QuickExtract™DNA Extraction
Solution (Cambio, QE09050) and genomic PCR was performed using primers in-
dicated in table 2.5 with Phusion polymerase (NEB). Genomic PCR products were
purified using the PCR cleanup kit (Quiagen®) and run on a 2% Agarose gel, or di-
rectly sequenced (Source BioScience’s Sanger sequencing service), or first cloned
into pGEM-T easy (Promega®) vectors prior to sequencing in order to identify the
allelic variations on both chromosomes.
2.6.1 sgRNAs design
Primer ID designation forward oligo sgRNA sequence nicking at nucleotidereverse-strand guide #1292175 g9 CACCGTTGTGTTGCCAGCACCGCCA 155reverse-strand guide #1292177 g24 CACCGGTCCCAGACTGTGCACGCCC 132reverse-strand guide #1292179 g6 CACCGACGCCCCGGCAGCCGCACGT 118reverse-strand guide #1292182 g14 CACCGGCCGCACGTGGGAACCCGGG 107forward-strand guide #1292160 g33 CACCGCAACACAAGCACCAGCTGCG 187forward-strand guide #1292157 g18 CACCGTCTGGGACCCGTGGCGGTGC 164forward-strand guide #1292154 g4 CACCGTGCCGGGGCGTGCACAGTCT 147forward-strand guide #1292152 g19 CACCGGTTCCCACGTGCGGCTGCCG 132
Table 2.4: Overview of sgRNA oligos that were used for cloning into pX335 for modifica-tion of RPIA. Sequences that were used for the generation of the stable CRISPRcell lines in this study are highlighted in bold.
2.6.2 genomic primers for sgRNA validation
designation primer sequence amplifies with regard to start codonE1-forward 5-GCGAATCCAGATAGGGGTTCCTCGAAGC-3 -122E1-reverse 5-GCAAGCTTAGCAGGGAAGAGGGGTCTAA-3 +432
Table 2.5: genomic primers primers were purchased from Eurofins.

90 Chapter 2. MATERIALS AND METHODS
2.7 AntibodiesAll antibodies used in this study, including their dilution factor, are listed in table
2.6.
antibody/stain Company + Product ID Dilution used in Figures:Hoechst TFS #33342 1:10 000 3.2, 3.3, 3.4, 3.5, 3.7, 3.8, 4.15Flag SA F9291 1:500 (IF&WB) 3.5, 3.9, 3.10, 4.20CAD BL IHC-00280 1:500 3.8Actin SA A2228 1:2000 3.9, 3.10, 4.4, 4.14, 4.16, 4.20GFP CST #2555 1:1000 3.11pERK CST #4370 1:1000 3.11, 4.21ERK CST #9272 1:1000 3.11, 4.21LC3 SA L7543 1:1000 (WB) 1:400 (IF) 4.1, 4.3, 4.4, 4.14, 4.15, 4.16Vinculin Abcam ab129002 1:10000 4.1COX IV CST #4850 1:1000 4.21RPIA-A1 Abcam ab67080 various dilutions tested N/ARPIA-A2 AO - ABIN406525 various dilutions tested N/ARPIA-A3 AO - ABIN1537971 various dilutions tested N/ARPIA-A4 ”home-made” various dilutions tested N/A
Table 2.6: All Antibodies used in this study for Western Blotting and Immunofluores-cence Antibodies were purchased from companies and diluted as indicated inthis table. AO - Antibodies online, BL - Bethyl Laboratories®, CST - Cell Sig-nalling Technologies®, SA - Sigma-Aldrich®, TFS - ThermoFisher Scientific®
2.8 Protein analysis by Western Blotting
2.8.1 Sample preparationThe existing media on the cells was aspirated and they were washed with 1x PBS.
Cells were harvested by either trypsinisation/vigorous resuspension or direct lysis.
For the former, trypsinised/resuspended cells were collected via centrifugation at
1000 rpm for 3 minutes and then lysed. For the latter, cells were directly lysed
with lysis buffer on a shaker at low speed and 4°C for 10 min. In either scenarios,
successful detachment of cells from cell culture plates was confirmed using bright-
field microscopy. Nonidet P-40 (NP-40) lysis buffer (50 mM Tris-HCl pH 7.4, 200
mM NaCl, 0.1 mM EDTA, 10% Glycerol, 0.5% NP-40) including inhibitors was
used to lyse cells. We prepared the lysis buffer with cOmplete (EDTA-free) pro-
tease inhibitors (11873580001, Roche®) and PhosSTOP™easypack (4906837001,
Roche®) phosphatase inhibitors, according to the manufacturer’s instructions.
Lysates were transferred to an eppendorf and samples were centrifuged at 13800

2.8. Protein analysis by Western Blotting 91
rpm for 15 min. The pellet was discarded and the supernatant was transferred to
a new tube and stored at -80°C or used immediately. Protein concentration was
determined in technical triplicates using the BCA assay kit (Thermo Scientific,
#23228) with BSA being used to obtain a standard curve. One µl of lysate was
incubated with 100 µl of the reagent for 20-60 minutes at 37°C. The kit functions
as a colorimetric 96 well plate-based assay and results were obtained using a Ver-
saMax™ELISA Microplate Reader (Molecular Devices®, USA)
2.8.2 SDS-PAGE
In this study, western blotting was used as a technique to investigate protein ex-
pression levels. In brief, proteins from whole cell lysates were separated using
SDS- PAGE (sodium dodecyl sulphate-polyacrylamide gel electrophoresis) and
then transferred to PVDF membranes for immunoblotting.
SDS-PAGE gels consist of a lower resolving gel and upper stacking gel. In
this study I used 7.5% and 4-20% resolving gels (BIO RAD Mini-PROTEAN®
TGX™Precast Protein Gels), with the latter being particularly important for sep-
aration of LC3 isoforms. To prepare the samples, 15-25 µg of whole cell extract
was mixed with an equal volume of 2x SDS loading buffer (125 mM Tris-HCl,
pH 6.8, 4% SDS, 5% 2-Mercaptoethanol, 20% glycerol, 0.01% bromophenol blue),
and then incubated at 95°C for 5 minutes. Samples were loaded into the wells of
the stacking gel after centrifugation for 10s at 10 000 rpm. The BIO RAD Mini-
PROTEAN® tetra system was used (BIO RAD, Hemel Hempstead, UK). SDS-
PAGE gels were run using standard SDS-PAGE running buffer (25 mM Tris base,
250 mM glycine, 0.1 % SDS) at 20 V for 20 minutes for penetration of the stacking
gel and then at 100V until the bromophenol blue dye front had run off.
The gels were removed from the tank and assembled for transfer to a PVDF mem-
brane (Immobilion® - FL #IPFL00010) using the BIO RAD Mini Trans-Blot® Elec-
trophoretic Transfer Cell system, following the manufacturer’s instructions. Tanks
were filled with transfer buffer (25 mM Tris, 250 mM glycine and 20 % methanol)
plus an ice block to prevent over-heating, and were run at 100 V for 60 min at RT
or at 4°C overnight.

92 Chapter 2. MATERIALS AND METHODS
2.8.3 Immunoblotting
After removal of membranes from the transfer tank, ponceau S (Sigma, P3504) was
used to confirm transfer of proteins and gave a good indication whether equal load-
ing between samples had been achieved. Membranes were then blocked in blocking
solution (5% skimmed milk powder (Oxoid, LP0031)) dissolved in PBS-T (20 mM
Tris pH 7.6, 136 mM NaCl, 0.05 % Tween)) for 1 hour at RT. Primary and sec-
ondary antibodies were also diluted in blocking solution and stored at -20 °C and
4°C between uses, respectively.
After blocking, membranes were incubated with primary antibody (see table 2.6
for antibody dilutions and sources) for 16-20 hours at 4°C. Membranes were then
washed four times with PBS-T for 5 min on a shaker at low speed. In most
cases, secondary fluorescently-labelled antibodies (IR-Dye® 800CW goat anti-
rabbit, 926-32211 and IR-Dye® 680RD goat anti-mouse, 926-68070) were used
for visualisation and quantification of protein bands.
Secondary antibodies were diluted to 1:10 000 in blocking solution. For the goat
anti-mouse antibody, SDS was added to a final concentration of 0.02%. Membranes
were incubated in secondary antibody for one hour at RT on a low speed shaker and
washed four times in PBS-T for 5 min each. Protein bands were visualised using
an LI-COR Odyssey® infrared imaging system. Fluorescent detection is more ac-
curate for quantification than enzyme-based visualisation techniques, because the
relationship of signal and the amount of target protein is linear, not exponential.
In a few occasions (stated in figure captions), secondary horseradish peroxidase-
conjugated antibodies were used and equally diluted in blocking solution. Mem-
branes were incubated in secondary antibody for one hour at RT. Protein bands were
visualised using enhanced chemiluminescence (ECL) solutions (Perkin Elmer, Seer
Green, UK), with Amersham Hyperfilm ECL (GE Healthcare).
Quantification of blots was performed using the densitometry tool from ImageJ
(NIH, Bethesda, MD, USA).

2.9. Immunofluorescence 93
2.9 Immunofluorescence
2.9.1 Sample preparation
Cells were seeded, depending on downstream imaging conditions. For low-
throughput, cells were seeded at concentration of 1-1.5*105 cells per well in 12 well
plates on glass coverslips. For high-throughput, cells were seeded at concentration
of 5-15*103 cells per well in 96 well plates. On the following day, cells were tran-
siently transfected with over-expression and knockdown constructs (for plain cells)
or not transfected, if cells were modified already (CRISPR cells, stably transduced
cells), as stated in the figure legends. The following day (or after appropriate knock-
down, as indicated), after treatment whereever indicated, cells were washed 1x with
PBS, fixed and with 4%PFA for 15 minutes at RT. For LC3 immunofluorescence,
cells were fixed from 15 minutes in 100% cold methanol at -20°C and washed 3x
with PBS. If no antibody staining was necessary, cells were stained for nuclei with
Hoechst 33342 (ThermoFisher Scientific®,H1399) for 5-15 minutes at a 1:10 000
dilution directly after fixation, followed by 1x wash with PBS. Whenever antibody
staining was performed, nuclear staining was performed at the end of staining.
The following steps were all performed at RT. After washing 1x with PBS, cells
were quenched with 50mM NH4Cl for 20 minutes and washed 1x with PBS, fol-
lowed by permeabilisation with 0.1% TX-100 (Roche, 10743119103) for 10 min-
utes and washed 1x. Blocking was performed by using 3% goat serum in PBS
(blocking solution) for 30 minutes and incubated with primary antibodies in block-
ing solution as indicated in the figures. Antibody dilutions are summarised in
2.6 and staining duration varied between 1-3 hours, as recommended by the sup-
plier. After washing 3x with PBS, cells were incubated with Alexa Fluor® se-
ries of secondary antibodies at 1:400 dilution, including goat mouse/rabbit Alexa®
488/568/647, (all ThermoFisher Scientific®, A-11001, A-11034, A-11004, A-
21090, A-21443, A-21235) using the appropriate antibody for 1 hour. For low-
throughput, cells were then washed 2x with PBS and mounted on microscope slides
using prolong gold (ThermoFisher Scientific®, P36934). For reporter cell lines,
such as GFP-LC3 (figure 4.2), permeabilisation and antibody staining was omitted.

94 Chapter 2. MATERIALS AND METHODS
2.9.2 Image acquisition
Images in this study were acquired on two microscopes: An Opera LX® (Perkin
Elmer, Waltham, MA, USA) High Content Screening confocal microscope or an
inverted confocal microscope (Leica TCS SPE, Leica®, Newcastle Upon Tyne, UK)
using various objectives (20x, 40x, 63x) and digital zoom (1.0 to 3.0) as stated in the
figure legends. Scale bars were added and contrast was enhanced by 0.05% using
Fiji on images acquired on the SPE, unless otherwise stated.
2.9.3 Image analysis
2.9.3.1 Columbus
One big advantage of the Opera is that it can acquire a large number of images
easily, which is very useful for high throughput screening. Additionally, I found that
many image-based experiments can also be performed on this microscope, hence
the number of biological replicates and images per well is usually large in this study.
Images acquired using the Opera were analysed using Columbus™ software. Figure
2.1 gives an overview of the image analysis protocol to identify puncta that was used
for most imaging experiments.
(1) Nuclei in images were identified using the nuclear (405nm emission) channel
and method C, with a common (intensity) threshold of >0.4 and an area of
>50 µm2. Other optimisation parameters, such as split factor, individual
threshold and contrast were optimised based on experimental conditions.
(2) Cells in images were identified using the 488nm or 562nm (when 488nm sig-
nal was not available) emission channels and method A of ”find cytoplasm”,
with an individual (intensity) threshold of >0.25. Other optimisation param-
eters, such as split factor, individual threshold and contrast were optimised
based on experimental conditions.
(3 + 4) Cell selection was refined by measuring intensity and morphology proper-
ties. Based on these parameters, cells could be selected based on rela-
tive differences to background intensities, therefore too large or small back-
ground features could be excluded from the analysis. Chosen parameters

2.9. Immunofluorescence 95
input images:
nuclei cells puncta merge
find nuclei
find puncta
refine puncta
calculate puncta
intensity
number/cell number
area/cell area
selectpuncta
find cytoplasm
refinecytoplasm
select cytoplasm
1
4
7 8
5 6
2 3
Figure 2.1: Workflow of puncta analysis. Most images in this study were analysed usingColumbus™ software.

96 Chapter 2. MATERIALS AND METHODS
were verified for each experiment by cross-comparing images from different
wells&conditions.
(5) Puncta in images were identified using the 488nm or 562nm emission chan-
nel and spot detection method A, which is based on relative spot inten-
sity compared to the immediately surrounding pixels. The exact settings
for relative spot intensity were optimised for different experiments and kept
constant for repeats and almost identical experiments. The chosen value
was verified for each experiment by cross-comparing images from differ-
ent wells&conditions. Splitting coefficient optimisation parameter was set
to <0.865.
(6 + 7) Puncta selection was refined by measuring intensity and morphology proper-
ties. Based on parameters such as spot roundness, spot area and spot inten-
sity, puncta selection could be further refined by could be excluding oddly
shaped or sized false positives from the analysis. Wherever possible, puncta
selection was restricted to previously selected cytoplasm. Chosen parameters
were verified for each experiment by cross-comparing images from different
wells&conditions.
(8) Calculations of selected puncta were performed based on multiple parameters
to ensure accurate findings. Usually, I measured puncta number and divided
that by cell number and cell area. We also compared puncta area to cell area
and looked at puncta intensity wherever appropriate.
2.9.3.2 Fiji
Whenever images were acquired with the Leica® TCS SPE, images were anal-
ysed in Fiji, rather than Columbus. Cells numbers were obtained by identifying
and counting nuclei in the 405nm channel, using a median filter to create a ho-
mogeneous nuclear intensity and the ”find maxima” function. For puncta analysis
(488nm channel), we also used ”find maxima” function with noise settings =50,
followed by output=point selection.

2.10. Statistical analysis 97
2.10 Statistical analysis
Puncta measurements and western blot densitometric data were obtained as de-
scribed above. The mean of data points were analysed for statistic significance on
the null-hypothesis, as commonly assessed by a parametric, two-tailed (unpaired,
independent) student’s t-test. The p-values <0.05 (indicated in this study as ”*”)
have a confidence interval of 95%, in other words there is a 95% likelihood that the
data points are not randomly obtained. Equally, ”**”=p<0.01, ”***”= p<0.001 and
”****” p<0.0001. Furthermore, unpaired analysis assures that treatments, knock-
down & overexpression effects may be different to the control in both directions. In
other words, there is no statistical bias as to whether there may be an increase or
decrease compared to the control.
2.11 Metabolic activity assays
In general, I used the protocol as described in202 and followed the manufacturers in-
structions from the 3-(4,5-dimethylthiazol-2-yl)22,5-diphenyltetra-zolium bromide
(MTT) assay (Millipore™, CT02). The MTT assay measures NAD(P)H-dependent
cellular oxidoreductase activity. In this study it was used as a proxy to examine cell
proliferation. For RPIA over-expression, stable cell lines expressing either Flag-
RPIA, Flag-D160A or Flag-Firefly-Luciferase were used (see sections 2.1 and 2.1).
The cells were seeded at a density of 2-3* 103 cells per well in a 96-well plate
and incubated in a 37°C and 5% CO2 incubator. After 1, 3 and 5 days (24, 72
and 120 hours +/- 30 minutes), the medium was removed and replaced with 100
µl of 10% MTT-containing medium onto the cells followed by 4 hours of incuba-
tion at 37°C and 5% CO2. The MTT-containing medium was discarded and 100
µl of DMSO was added into each well, followed by thorough resuspension using a
multi-channel pipette. Then the resultant colour density of each well was detected
by a VersaMax™ELISA Microplate Reader at OD565 as output and OD630 as a
reference.

98 Chapter 2. MATERIALS AND METHODS
2.12 Mass spectroscopyIndicated cell lines were seeded and grown in 10cm petri dishes until confluent.
Cells were trypsinised, pelleted and sent off for measurements of phosphorylated
sugars. Liquid chromatography and mass spectroscopy (MS) were carried out by
Eduard Struys at the Metabolic Unit in the Clinical Chemistry department, Medi-
cal Center, De Boelelaan 1117, 1081 HV Amsterdam, The Netherlands. The ex-
perimental procedure and analysis were performed as described in Huck et al292.
Briefly, cells were lysed and sugar phosphates were separated by high pressure liq-
uid chromatography (HPLC). Detection was performed using an API-3000 tandem
MS (PE-Sciex) containing an electrospray source that operates in the negative-ion
mode (Turbo Ion Spray). The settings were individually optimised for each sugar-P
measured. The procedure can identify sugar phosphate profiles with clearly dis-
tinctive signals for Dihydroxyacetone phosphate (DHAP), R5P and S7P, as well
as Ri5P/X5P and F6P/G6P, although the latter two pairs have the same mass and
cannot be distinguished.
2.13 Saccharomyces cerevisiae experiments
2.13.1 Transformation
The GFP-ATG8 plasmid was generated by Sac1/Xho1 double restriction enzyme
digestion cloning. The sequence was cloned from a pRS306 vector into a pRS315
vector. This vector is compatible with the S. cerevisiae strain R1158 (originated
from BY4741 strain), lacking a gene for methionine synthesis and containing the
doxycycline-inducible system that enables targeted knockout. Plasmids and yeast
strains were a kind gift from the Stefan lab (LMCB, UCL, UK). WT (R1158) and
tetRKI strains were transformed with pRS315 (empty) or pRS315 (GFP-ATG8) as
follows: 5ml of yeast extract peptone dextrose (YPD) medium was inoculated with
frozen yeast strains. After 48 hours, 1ml of culture was spun down in a bench-top
microcentrifuge at 12,000 rotations per minute for 2 minutes at RT. The pellet was
resuspended and washed in 1ml of 0.1M lithium acetate in Tris-EDTA (LiAc/TE)
solution. After spinning down again, the cell pellet was resuspended in 300µl of

2.13. Saccharomyces cerevisiae experiments 99
40% Polyethylene glycol in LiAc/TE solution. Approximately 1µg DNA (indicated
plasmids) were added with 10µl of salmon sperm DNA (Sigma, pre-boiled) and
vortexed. After 6-8 hours, the DNA/cell mixture was heat-shocked for 10 minutes at
42°C, plated and incubated for 3 days in YPD medium lacking methionine at 26°C.
Next, different clones were isolated and grown up on another YPD (-methionine)
plate.
2.13.2 GFP-ATG8 western blottingDifferent transformed yeast strains were cultured in YPD medium lacking methio-
nine for 8 hours. Cells were incubated for 16 hours with or without 20µg/ml doxy-
cycline, followed by incubation with or without 1µg/ml rapamycin for 4 hours. All
live cell incubation steps were performed at 26°C. Next, cell numbers were nor-
malised by measuring the OD600. Volumes representing equivalents of 2.5 ODs
were pooled and prepared for western blotting as described in Omnus et al293.
Briefly, cells were precipitated with 100% Trichloroacetic acid and lysed by sonica-
tion. Lysates were loaded and analysed by western blotting as described in section
2.8.


Chapter 3
The role of RPIA in Grb2-mediated
signalling
3.1 RPIA induces translocation of GFP-Grb2
3.1.1 Grb2 screen
Growth factor receptor-mediated signal transduction is essential for proliferation
and differentiation of cells. These pathways control a number of cellular fates,
which include the regulation of metabolism and autophagy. As seen by frequently
occurring mutations in multiple cancers, signalling complexes require a tight level
of control213. A great amount of research in the past decades has helped to un-
derstand the underlying principles for most major signaling pathways. However,
receptors are often mutated in cancer and have been shown to be able to interact
with altered signalling complexes and thereby promote tumorigenesis294. This is
likely to occur via altered affinities for downstream signalling components. Cur-
rently, traditional in vitro approaches of discovering anti-cancer therapeutics that
target RTK signalling pathways have had only limited success294. Therefore the
identification of cellular proteins involved in growth factor receptor-mediated sig-
nalling is still highly relevant.
In order to identify further proteins involved in signal transduction, a high-
troughput, microscopy-based GFP-tagged Grb2 translocation assay was developed
in the lab prior to this PhD project. This screening approach was based on the

102 Chapter 3. The role of RPIA in Grb2-mediated signalling
development of biosensors, which are used for better identification of novel drug
targets compared to traditional in vitro screening methods295. A library of 21.000
unique single cDNA expression vectors were screened for the ability to translocate
cytoplasmic GFP-Grb2 to the membrane and other sub-cellular compartments (see
figure 3.1). This change in localisation can be mediated either by direct binding to
Grb2 or through indirect induction of translocation. Under basal conditions, Grb2
localises to the cytoplasm69 (see 3.1 A middle panel). When stimulated with EGF,
the protein localises to the membrane following RTK phosphorylation (see 3.1 A
left panel). The screen identified a number of proteins known to interact with Grb2,
e.g. EGFR221, ERBB2225, GAB1100 and dynamin2296, thus partially validating the
approach taken to identify Grb2 regulators. A wide variety of phenotypes for GFP-
Grb2 localisation could be observed. Through the screen, a large number of novel
proteins that either directly influence the sub-cellular localisation of Grb2 or result
from cellular morphological changes were identified. Among the list of hits were a
number of proteins with yet unassigned functions and others that had not been asso-
ciated with signalling before. One of those was the metabolic enzyme RPIA, which
became the focus of this study. Metabolic enzymes involved in signalling path-
ways have sparked a lot of interest recently, since the discovery of signalling factors
binding directly and selectively to PKM2136 and thereby achieving metabolic re-
programming.
3.1.2 Expression of RPIA results in GFP-Grb2 translocation
Seeing as RPIA expression caused translocation of Grb2, a key adaptor in
the EGFR-MAPK signalling cascade, it is possible that RPIA either binds to
Grb2/EGFR or indirectly has an effect on the EGFR signaling pathway. In or-
der to test this, I first wanted to replicate the findings of the screen in HeLa cells
by co-expressing GFP-Grb2 and RPIA. There is an even distribution of GFP-Grb2
in the cytoplasm, as observed in the HEK293T cells that were used in the screen,
(see figure 3.2 top panel) under basal conditions (cells were incubated with DMEM
+ 10% FCS, i.e. full medium). However, when co-expressed with RPIA, bright
GFP-Grb2 positive puncta can be observed, varying in size and numbers within the

3.1. RPIA induces translocation of GFP-Grb2 103
Grb2
cytoplasm endosomesplasmamembrane
GFP
e.g. EGFRe.g. EGF
GFPGrb2
+EGFR
GFPGrb2 GFPGrb2
+ 10 min EGF
P
P
Grb2
GFP
A
Grb2
GFP
+ cDNA library
punctamembraneImage
analysisHigh-throughput
screening ringsetc
adapted from Freeman et al, JoVE (2012)
B
Figure 3.1: Grb2 reporter and high-throughput screen workflow A) The GFP-Grb2 re-porter can be localised to different sub-cellular domains. When cells are stim-ulated with a mitogen such as EGF, GFP-Grb2 localises to the membrane bybinding to RTKs such as EGFR (left panel). If cells are unstimulated (mid-dle panel), GFP-Grb2 is located to the cytoplasm. If EGFR is over-expressed(right panel), GFP-Grb2 localises to endosomes. All images are representativeimages of the screen performed in COS cells (Ketteler & Seed, unpublished).B) Overview of approach taken for the cDNA screen.

104 Chapter 3. The role of RPIA in Grb2-mediated signalling
vector
Hoechst MergeGFP-Grb2
Flag-RPIA
Figure 3.2: RPIA-WT induces translocation of GFP-Grb2 HeLa cells in 6-well plateswere co-transfected with a total of 1µg plasmids: pMOS GFP-Grb2 andpMOWS 4.0 or peak14 Flag-RPIA (see table 2.1). After 24hrs, cells were fixed,stained with Hoechst and images were acquired using a Leica SPE3 confocalmicroscope with a 63x objective. Scale bar: 10µm
cells (see figure 3.2 bottom panel).
3.1.3 RPIA expression does not cause GFP translocation
Next, I investigated whether the translocation phenotype was specific for Grb2, or
whether RPIA actually was affecting the localisation of GFP (e.g. forming cyto-
plasmic aggregates). To address this systematically, I tested co-expression of GFP
and GFP-Grb2 with or without RPIA and analysed between 300 and 2000 cells per
condition using the Opera LX high-content screening microscope for image acqui-
sition. As previously, RPIA expression resulted in GFP-positive puncta in the Grb2
construct, but it did not significantly increase the number of puncta in GFP express-
ing cells (see figure 3.3). Furthermore, image analysis showed that the GFP-Grb2
positive puncta are significantly brighter in comparison to the cytoplasmic signal
(see figure 3.3 C). The size, intensity or number of GFP-positive puncta that were
picked up by the segmentation algorithm were RPIA-independent. Taken together,
GFP-Grb2 translocation mediated by RPIA does not depend on the GFP moiety.

3.1. RPIA induces translocation of GFP-Grb2 105
GFP + vector
GFP- Grb2 + vector GFP- Grb2 + RPIA
GFP + RPIA
BA
DC
3500cells analysed: 1578
163 153
n.s. **
****
n.s. *
n.s. *
GFP GFP - Grb20.0
0.2
0.4
0.6
Spot
num
ber/a
vera
ge
cell
num
ber p
er w
ell
vector RPIA
GFP GFP - Grb2-0.0005
0.0000
0.0005
0.0010
0.0015
0.0020
Rel
ativ
e sp
ot in
tens
ity/
aver
age
cell
inte
nsity
vector RPIA
GFP GFP - Grb20.000
0.002
0.004
0.006
0.008
spot
are
a/ c
ell a
rea
vector RPIA
Figure 3.3: Overexpression of RPIA does not affect GFP localisation HeLa cells weretransfected with plasmids pMOS GFP, pMOS GFP-Grb2, pMOWS 4.0 andpeak14 RPIA (see table 2.1) in 5 replicates on a 96 well plate. After 24hrs,30 images per well were acquired on an Opera LX microscope and spot imageanalysis (averaged on all 30 images per well) was performed using Columbusas described in section 2.9.3. A) representative images, scale bar = 10µm B)Box-and-whisker plot indicating B) spot number per average cell number andC) spot area per cell area. D) Scatter plot of relative spot intensity per av-erage cytoplasmic intensity. Data represent median (B,C) and mean (D) SDfrom two independent experiments. Brackets indicate t-test p-values, n.s.=nonsignificant, *=p<0.05, **=p<0.01, ****=p<0.0001

106 Chapter 3. The role of RPIA in Grb2-mediated signalling
3.1.4 Catalytically inactive RPIA (D160A) can also translocate
GFP-Grb2
Since RPIA is a protein with enzymatic function, the change in localisation of GFP-
Grb2 could be mediated either by metabolic effects (R5P levels) or by protein-
protein interaction in a non-canonical fashion (unrelated to metabolic activity). In
order to investigate this further, I generated a construct in which the catalytic residue
of RPIA (aspartic acid) is mutated to alanine (referred to as RPIA-D160A). This
residue was previously reported to be essential for the catalytic activity of RPIA194.
The validity of this construct was independently confirmed in the lab in an in-vitro
RPIA activity assay (see appendix figure A.1 D). Next, I tested whether RPIA-
D160A may also induce the translocation of GFP-Grb2. Indeed, expression of the
catalytically inactive mutant also resulted accumulated GFP-Grb2 puncta (see fig-
ure 3.4). Therefore, Grb2 translocation mediated by RPIA does not require RPIA
isomerase activity.
3.1.5 Flag-RPIA and GFP-Grb2 co-localise
The observed translocation phenotype could somehow be caused by binding of
RPIA to Grb2-related signalling complexes. This raised the question of whether
RPIA itself may also localise to the GFP-Grb2 positive puncta. In order to address
this, I stained the cells with Flag-antibody following co-expression of GFP-Grb2
and Flag-tagged RPIA. Indeed, I found that Flag-RPIA localises to GFP-Grb2 en-
riched puncta and there was only minimal background staining in cells that were
not expressing a Flag-RPIA (see 3.5).
3.1.6 Various GFP-Grb2 mutants also translocate upon RPIA
co-expression
In order to better understand potential protein-protein interactions of Grb2 and
RPIA, I next tested whether RPIA has the ability to translocate a number of Grb2
constructs that contain point mutations. Grb2 is a modular protein that is composed
of three major domains (see figure 1.12). It could be that through mutations in those
domains, the translocation phenotype may be abrogated. The mutations in the con-

3.1. RPIA induces translocation of GFP-Grb2 107
vector
Hoechst MergeGFP-Grb2
Flag-RPIA
Flag-RPIA D160A
Figure 3.4: RPIA D160A also causes Grb2 translocation. HeLa cells were seeded oncoverslips and co-transfected on the following day in a 6 well plate with 2.5µgof plasmids: pMOS GFP-Grb2 and pMOWS 4.0, peak 14 Flag-RPIA or peak14 Flag-D160A. After 24 hours, cells were fixed and images were acquiredusing a Leica SPE3 confocal microscope with a 63x objective. scale bar: 10µm
structs used in this experiment were in the N-terminal and C-terminal SH3 domains
(L49P, G203R) and the central SH2 domain (R86K). Surprisingly, all GFP-Grb2
mutants, even a double SH3 domain point mutant construct, could be enriched in
puncta upon RPIA co-expression (see figure 3.6). This was quite unexpected, since
the hypothesis at the time was that the phenotype may be caused by direct interac-
tion of Grb2 via one of the modular domains. How this could be studied further is
discussed in chapter 5.1.

108 Chapter 3. The role of RPIA in Grb2-mediated signalling
Hoechst Flag MergeGFP-Grb2
Flag-RPIA
vector
Figure 3.5: RPIA and Grb2 localise to the same spots HeLa cells were co-transfectedwith a total of 1µg plasmids: pMOS GFP-Grb2 and pMOWS 4.0 (top panel)or p14 Flag-RPIA (bottom panel). Cells were fixed 24 hours after transfection.After fixation, cells were permeabilised and stained with Flag antibody andHoechst as described in methods. Images were acquired using a Leica SPE3confocal microscope with a 63x objective. scale bar: 10µm
GFP-Grb2 NSH3 GFP-Grb2 NCSH3GFP-Grb2 CSH3
GFP-Grb2 WT GFP-Grb2 SH2GFP
Figure 3.6: Overexpression of RPIA causes various GFP-Grb2 mutants to translocate.HEK293T cells were co-transfected in a 12 well plate with 0.5µg of plasmids:p14 Flag-RPIA + pMOS GFP or indicated GFP-Grb2 plasmids (see table 2.2).After 24hrs, live cell images were acquired with a Leica 2 microscope with a20x objective. scale bar: 20µm

3.2. Sub-cellular localisation of RPIA 109
3.2 Sub-cellular localisation of RPIAOther metabolic enzymes (such as G6PDH, HK or CAD) had previously been
shown to localise to sub-cellular structures or compartments under certain condi-
tions (e.g. mTORC1-dependent). The sub-cellular localisation of proteins can play
an important role for their function within the cell, so I wanted to investigate RPIA
in this context further. Interestingly, core metabolic reactions such as PPP activ-
ity or nucleotide synthesis take place in the cytoplasm297, but some enzymes have
been shown to form clusters within the cytoplasm171. To date, PPP enzymes that
localise to distinct compartments such as peroxisomes have only been reported in
plants and parasitic protozoa (e.g. Trypanosoma brucei)298. Therefore, RPIA was
expected to be localising to the cytoplasm, but sub-cellular localisation studies of
RPIA in mammalian systems have not been reported in the literature.
3.2.1 RPIA localises to distinct puncta
Two approaches were taken to determine the subcellular localisation of RPIA. First,
I investigated endogenous RPIA localisation by staining HeLa cells with a number
of RPIA antibodies that are commercially available (see table 2.6). Under the ex-
perimental conditions I tested, no endogenous RPIA could be detected and only
background fluorescent signal was observed. It is possible that RPIA is expressed
at low levels299 and/or that the antibodies may not be suitable for immunofluores-
cence300. Using an alternative approach, I transiently over-expressed RPIA with an
N-terminal GFP fusion peptide in both HeLa and HEK cells (see figure 3.7). In-
terestingly, GFP-RPIA localisation is not evenly distributed within the cytoplasm.
Instead, distinct puncta that are varying in size and intensity can be observed.
Amongst highly transfected GFP-RPIA positive cells there are large, overlapping
structures in strongly expressing cells but distinct, smaller puncta are seen in trans-
fected cells with lower expression levels (figure 3.7 upper panel).
3.2.2 RPIA does not localise to CAD puncta
Since other enzymes in the nucleotide biosynthesis pathway have been reported to
be in protein complexes that are distinguishable as discrete puncta in cells171, I

110 Chapter 3. The role of RPIA in Grb2-mediated signalling
Hoechst Merge
lower RPIA
expression
higherRPIA
expression
GFP-RPIA
Figure 3.7: RPIA localises to distinct puncta. HeLa cells were transfected with 1µg ofp12 GFP-RPIA in 6 well plates. After 24hrs, cells were fixed and stained forhoechst. Images were acquired using a Leica SPE3 confocal microscope witha 63x objective. scale bar: 10µm
tested whether RPIA may also localise to CAD-positive puncta. CAD is a multi-
protein complex that synthesises the first step of pyrimidine synthesis (see chapter
1.2.9). Interestingly, the formation of CAD oligomers were recently shown to be
controlled via amino acid-mTORC1-S6K signalling and sensitive to rapamycin172.
This raised the question of whether the observed GFP-RPIA puncta (see figure 3.7)
are also controlled via mTORC1. To test this, I starved GFP-RPIA expressing cells
by incubation with medium that did not contain amino acids (+/- the mTORC1
inhibitor rapamycin) and performed immunostaining for CAD (see figure 3.8). In-
terestingly, RPIA did not co-localise with CAD puncta. Furthermore, the distinct
RPIA puncta did not appear to be sensitive to starvation or rapamycin as had been
reported for CAD171.
3.3 Metabolic activity and MAPK signallingGiven that Grb2 and MAPK signalling pathways are known to promote cellular
growth, it raised the question of whether RPIA expression may have an effect on
proliferation, and whether this effect was due to its catalytic activity. The MTT
assay is often used as a proxy for proliferation, for instance in Ciou et al202. In
order to test this hypothesis, I stably transduced HepG2 cells with 3x Flag-tagged

3.3. Metabolic activity and MAPK signalling 111
+FCS + AA
+FCS + AA + rap
starved
Hoechst CAD MergeGFP-RPIA
Figure 3.8: RPIA and CAD do not colocalise HeLa cells in 12 well plates were trans-fected with 500ng p12 GFP-RPIA (see table 2.1) on glass slides. After 24hrs,cells were incubated with DMEM lacking FCS (starved) for 16 hrs, then incu-bated for 15 min in 1x PBS. Next, cells were then stimulated with full medium(containing 10% FCS and 2 AA) for 1 hr with or without 100nM rapamycin asindicated. Afterwards, cells were fixed, permeabilised and stained for Hoechstand endogenous CAD (see table 2.6). Images were acquired using a LeicaSPE3 confocal microscope with a 63x objective. scale bar: 10µm.
WT-RPIA and the catalytic inactive mutant D160A. A firefly luciferase (Luc) con-
struct and non-infected HepG2 cells (control) with identical passage numbers were
used as controls. Recombinant cells were selected using puromycin treatment for
96 hours - 100% cell death of a non-infected control population was observed, so I
could be confident that the cells were transduced successfully. The expression of the
recombinant proteins were confirmed by western blot (see figure 3.9 A). Recombi-
nant Luciferase could be detected at approximately 70kDa and the RPIA constructs
at 40kDa, equivalent to the estimated molecular weight of Flag-RPIA.
Interestingly, when metabolic activity of oxidoreductases was assessed using an
MTT assay, no differences between the cell lines were observed (see figure 3.9 B).

112 Chapter 3. The role of RPIA in Grb2-mediated signalling
Although I could detect recombinant protein expression in HepG2 cells, expression
levels appeared relatively low, potentially due to the fact that those cells are more
challenging to transduct and select at high efficiency. However, there could be a
dosis-dependent effect of gene expression that affects the metabolic activity and
proliferation rates. To address this better, I stably transduced HEK293T cells using
the same experimental procedure and observed very strong over-expression of the
recombinant proteins (figure 3.10 A). When proliferation was assessed again, there
were no apparent differences in growth between the cells either (figure 3.10 B).
3.4 Altered expression levels of RPIA do not affect
ERK 1/2 signallingNext, I wanted to test whether RPIA expression levels have any effect on MAPK
signalling pathway, because it is one of the best studied downstream signalling
cascades of Grb2-mediated signalling (see chapter 1.4.3). It could be that RPIA-
induced translocation of Grb2 has consequences on the signalling output of the
MAP kinase pathway. To test this, I investigated whether a change in RPIA ex-
pression levels may affect the phosphorylation status of ERK1/2 . After transient
transfection with RPIA knockdown and over-expression constructs (see tables 2.1
and 2.2) cells were starved of growth factors (DMEM + 0.1% FCS) for 16 hours,
the MAPK signalling cascade was stimulated with EGF. Next, cell lysates were
tested for p-ERK levels and compared to total ERK levels. Interestingly, there
were no significant changes in p-ERK1/2 levels (see figure 3.11) upon shRNA-
mediated knockdown, over-expression of WT-RPIA (RPIAres) or the catalytically
inactive mutant (D160Ares). Comparison between non-treated and EGF-treated
cells showed a functional MAP kinase signalling cascade, as indicated by pERK
1/2 levels. Furthermore, the transfection was successful, since the construct with
the shRNA or control sequence also contain GFP, which can be detected by western
blotting (fig. 3.11 A - GFP antibody). A similar experiment that confirmed those
findings was performed with the genomically altered CRISPR/Cas9 RPIA knock-
out cells (see chapter 4.6 and figure 4.21). In conclusion, when RPIA levels are

3.4. Altered expression levels of RPIA do not affect ERK 1/2 signalling 113
FLAG
Actin
70
kDa
55
35
Luc RPIA D160A control
0 1 2 3 4 5 6 7 8
0
200
400
600
800
1000
Time (days)
% g
row
th (o
f day
1) Luciferase
RPIAD160A
control
A
B
Figure 3.9: Overexpression of RPIA in HepG2 cells does not increase metabolic ac-tivity (A) HepG2 cells were stably infected with over-expression constructs(see table 2.1) and presence of recombinant proteins was confirmed by westernblot (see table 2.6). (B) MTT assay was used to investigate the effect of over-expression on metabolic activity. HepG2 cells were seeded in six replicates ina 96 well plate at 1000 cells/well. Results are expressed as mean and SD of twoindependent experiments compared to respective values at 24 hrs.

114 Chapter 3. The role of RPIA in Grb2-mediated signalling
A
B
FLAG
Actin
kDa Luc RPIA D160A
70
55
0 2 4 6 8
0200400600800
1000120014001600
Time (days)
% g
row
th (o
f day
1)
LuciferaseRPIAD160A
Figure 3.10: Overexpression of RPIA in HEK293T cells does not increase metabolicactivity (A) HEK293T cells were stably infected with over-expression con-structs (see table 2.1). After 72hrs of puromycin selection, cells were har-vested and the presence of recombinant proteins was tested by western blot(see table 2.6). (B) MTT assay was used to investigate the effect of over-expression on metabolic activity. HepG2 cells were seeded in six replicatesin a 96 well plate at 1000 cells/well. Results are expressed as mean and SDcompared to respective values at 24 hrs.

3.4. Altered expression levels of RPIA do not affect ERK 1/2 signalling 115
A
B
pMOWSplainHeLa shRPIA
shRPIA +RPIAres
shRPIA +RPIAres
shRPIA +D160Ares
shRPIA+D160Ares
Knockdown Overexpression
pERK 1/2
ERK 1/2
GFP
EGF ++ -- ++ -- +-
0.0
0.5
1.0
1.5
2.0
pERK/ERK
plain HeLa pMOWS shRPIA
EGF ++ -- ++ -- +-
Figure 3.11: RPIA expression does not alter phospho-ERK levels. HeLa cells weremock-transfected or transfected with pMOS GFP, pMOS shRPIA (#4 + GFP).After 48 hrs, cells were washed 2x with PBS and incubated with medium con-taining low serum (DMEM + 0.1% FCS instead of 10% FCS) for 16 hours.Cells were then stimulated for 5 minutes with starvation medium +/- 100ngEGF as indicated. Cell lysates were separated on 7.5% SDS-PAGE gels andtested with p-ERK, ERK and GFP antibodies for immunoblot analysis. B)Quantification of A) using the densiometric analysis tool from Fiji. Pooleddata from analysis from 2 independent experiments.
reduced or elevated in HeLa cells, the p-ERK/ERK ratio is not affected. How these
results fit in with what is currently known in the field and how it could be studied
further is discussed in chapter 5.2.


Chapter 4
The role of RPIA in the regulation of
autophagy
4.1 shRNA-mediated knockdown of RPIA
The recent evidence in metabolic enzymes and metabolites associated with the regu-
lation of autophagy raised an interesting question of whether RPIA may be involved
as well. For instance, pharmacological inhibition and shRNA-mediated knockdown
of the glycolysis regulator PFKFB3 increased LC3 processing126. Considering the
importance of R5P synthesis and the ability of metabolites to alter autophagy in the
cell, we hypothesised that perturbing RPIA levels may have an effect on autophagy.
Parts of this chapter of the PhD thesis have been submitted for publication. At
the time of submission for examination, the manuscript ”Ribose 5-phosphate Iso-
merase A inhibits LC3 processing and basal autophagy” (J. Heintze, J.R. Costa,
M. Weber and R. Ketteler, 2016) was at the stage of addressing the comments of the
reviewers. Since then, the manuscript has been accepted in Cellular Signalling (see
Heintze et al312) and can be accessed via DOI: 10.1016/j.cellsig.2016.06.015. In
this section, results are presented regarding the effect of shRNA-mediated knock-
down of RPIA on autophagy in HeLa cells.
As outlined in chapter 1.1.4.2, LC3 is a well-established marker protein for inves-
tigating the regulation of autophagy12,301 that can be measured by western blotting
and fluorescence. Cellular LC3 localisation changes from an even cytoplasmic

118 Chapter 4. The role of RPIA in the regulation of autophagy
distribution to distinct puncta formation upon activation of autophagy, localising
to various stages of autophagy-related organelles (see figure 1.1). This enables
measurement of autophagosome formation via microscopy, by measuring either
GFP-LC3 puncta or endogenous LC3 puncta (figures 4.2 and 4.3). Furthermore,
LC3-I is modified post-translationally by lipidation during the autophagy process to
LC3-II (see section 1.1.4.2). The two cellular LC3 isoforms LC3-I and LC3-II can
be separated and quantified by western blot due to differential migration patterns on
gradient (4-20%) SDS-polyacrylamide gels (figure 4.1). Interestingly, the isoform
with the increased molecular weight (LC3-II) migrates faster, possibly as a conse-
quence of increased hydrophobicity12. Increased LC3-II levels have been reported
to be correlated with induction of autophagy, when normalised to a non-autophagy
related control like actin or vinculin12.
4.1.1 Depletion of RPIA by shRNA increases LC3-processing
In order to study the functional relation of RPIA to autophagy, four different
shRNAs sequences targeting human RPIA (pLKO.1 vectors, see table 2.2) were
transfected into HeLa cells and western blot analysis of LC3 isoforms from cell
lysates was performed after a 72-hour knockdown period. The results show a sig-
nificant 2.5-3.6 fold increase in LC3-II over LC3-I, thus suggesting an increase in
basal autophagy (Figure 4.1 A), with all four sequences being equally effective to
cause an increase in LC3-II/LC3-I and loading control (vinculin) ratios. I could
also observe a 1.5-2.1 fold increase of LC3-II/Vinculin and a 1.2 fold increase in
LC3-II/total LC3 (figure 4.1 B - C).
4.1.1.1 RT-PCR
Similar to the immunofluorescence experiments in chapter 3.2.1, the antibodies
against endogenous RPIA used in this study (see 2.6) did not detect RPIA suffi-
ciently to verify successful knockdown (data not shown). Therefore, knockdown
efficiency of all shRNAs targeting RPIA was measured by RT-PCR (Figure 4.1 D).
Indeed, there was a reduction of expression levels of RPIA by 10-50% compared

4.1. shRNA-mediated knockdown of RPIA 119
Vinculin
A
LC3-II
LC3-I
pLKO.1 sh-1 sh-2 sh-3 sh-4 B
pLKO.1
sh-1
sh-2
sh-3
sh-4
0.0
0.5
1.0
1.5
2.0
2.5
LC
3-I
I/vin
cu
lin
C
pLKO.1
sh-1
sh-2
sh-3
sh-4
0
1
2
3
4
LC
3-I
I/L
C3-I
D
sh-1
sh-2
sh-3
sh-4
pLKO.1
0
50
100
150
200
RP
IA/G
AP
DH
mR
NA
Figure 4.1: LC3 - processing is increased upon shRNA-mediated knockdown of RPIA.A) Immunoblot of LC3-processing in HeLa cells at 72 hour post-transfectionwith control (pLKO.1) vector or shRNA vectors against RPIA (sh1-4), imagedon the LI-COR Odyssey. B, C) Densitometry analysis of LC-II/Vinculin andLC3-II/LC3-I levels using Fiji. Data represent mean SD, n=2. D) Expressionlevels of RPIA at 72 hour post-transfection in HeLa cells using qPCR, normal-ized to GAPDH. Data represent mean SD, n=3
to the control. Next, the #4 shRPIA sequence was cloned into retroviral pMOWS-
H1 expression vectors (see chapter 2.3.1), previously found to express transcripts
at very high levels in a wide variety of cell types290. This enabled experiments us-
ing GFP as a transfection marker and a puromycin resistance casette for cellular
selection (see table 2.2).
4.1.2 Depletion of RPIA increases puncta in stably expressing
GFP-LC3 cell line
In order to establish a potential role of RPIA in the regulation of autophagy, au-
tophagosome formation was tested in HeLa cells that stably express GFP-LC3. Un-
der basal conditions, GFP-LC3 distributes evenly across the cytoplasm, only form-

120 Chapter 4. The role of RPIA in the regulation of autophagy
ing a few LC3-enriched puncta per cell (figure 4.2 A, left panel). Upon induction
of autophagy by amino acid starvation and blockage of autophagosomal-lysosomal
fusion, enrichment of GFP-LC3 in cells can be observed (figure 4.2 A, right panel).
There was a small increase in GFP-LC3 puncta when RPIA levels was depleted un-
der basal conditions, which was very apparent when lysosomal fusion was blocked
(figure 4.2 B): compared to control cells, there was a 1.6-fold increase in GFP-LC3
positive puncta in shRPIA cells.
4.1.3 Depletion of RPIA increases endogenous LC3 punctaIn order to further test the findings of increased GFP-LC3 puncta (figure 4.2) and an
increase in LC3 processing (figure 4.1), I measured endogenous LC3 puncta under
RPIA knockdown conditions. The shRNA pMOWS construct that also expresses
GFP (see table 2.2) was used in order to enable better identification of transfected
cells. There was an approximately 2-fold increase of LC3-positive puncta compared
to control cells under basal conditions (figure 4.3 A), further indicating that RPIA
suppresses basal autophagy. This was more evident upon quantification of puncta
per cell, puncta per cell area and puncta area per cell area (figure 4.3 B-D) in over
10 000 cells, indicating that this is a robust and quantifiable phenotype.

4.1. shRNA-mediated knockdown of RPIA 121
A
B***
+ Baf
GFP-LC3
pMOWS
shRPIA
+ Baf
pM
OW
S
shRPIA
pM
OW
S
shRPIA
0
10
20
30
40
50
GF
P-L
C3
pu
ncta
pe
r ce
ll a
rea
Figure 4.2: Knockdown of RPIA in stably exprssing GFP-LC3 cells increases LC3puncta A) Stable GFP-LC3 expressing HeLa cells transiently transfected withshRPIA and control vector were incubated with EBSS and with or without 10nM Bafilomycin for two hours at 37°C and 5% CO2. Cells were fixed and im-aged using an inverted Leica® TCS SPE microscope with a 63x objective, scalebar = 10µm B) Quantification of A) using Fiji for image analysis. Pooled datafrom analysis of over 500 cells per condition from 2 independent experiments.Bracket indicates t-test p-value; ***=p<0.001

122 Chapter 4. The role of RPIA in the regulation of autophagy
A
B
shRPIA
0
1
2
3
4
LC
3 p
un
cta
per
cell
pM
OW
S
shRPIA
C
0.000
0.005
0.010
0.015
0.020
LC
3 p
un
cta
are
a
per
cell a
rea
pM
OW
S
shRPIA
D
0.000
0.005
0.010
0.015
0.020
LC
3 p
un
cta
pe
r c
ell a
rea
**** **** ****
pMOWS
GFP LC3
shRPIA
PM
OW
S
Figure 4.3: Increased endogenous LC3 puncta in RPIA knockdown cells. HeLa cells in96 well plates were transiently transfected with pMOWS 5.2 GFP shRPIA andcontrol vector (5.2 GFP, see table 2.2) and then incubated for 72 hours at 37°Cand 5% CO2. Cells were fixed and stained with LC3 (Sigma) and imaged usingan Opera LX microscope. A) Endogenous LC3 puncta in transfected cells after72 hours knockdown. Images were acquired on an Opera LX microscope, scalebar = 20 µm. B-D) Image analysis using columbus. Data represent mean SDof 5 000-10 000 cells from 2 independent experiments. Brackets indicate t-testp-values, ****=p<0.0001.

4.2. Pharmacological inhibition of RPIA 123
4.2 Pharmacological inhibition of RPIA
4.2.1 LC3-processing is not altered upon treatment with R5P or
E4P
Next, I wanted to test whether pharmacological inhibition of RPIA or addition of
the product R5P also causes a modulation of LC3 processing. The related sugar
E4P has been reported to inhibit RPIA activity195,302 in some experimental systems.
Cells were incubated with 10µM of the compounds for 16 hours. Negative control
cells were treated with 1% DMSO for 16 hours, whereas bafilomycin treatment
(two hours) was used as a positive control for LC3-II accumulation. The data in
figure 4.4 indicate that there was no difference in LC3 processing upon treatment
of cells with 10 µM concentrations of E4P and R5P, although cells were indeed
capable of LC3 processing as they were responding to bafilomycin treatment (lane
7&8, positive control).
4.2.2 ATG4B luciferase reporter is not altered upon treatment
with R5P or E4P
Another autophagy reporter assay has been developed in the lab that measures
the cellular activity of ATG4B-mediated proteolytic cleavage of pro-LC3 to LC3-
I12,303,304. The reporter is based on gaussia luciferase (GLuc) release to the ex-
tracellular medium, which can be quantified, for instance by using the chemilu-
minescent substrate coelenterazine (see figure 4.5 A). GLuc is a reporter enzyme
which originates from the marine copepod Gaussia princeps that is normally se-
creted from cells by conventional secretion through an N-terminal signal peptide.
Interestingly, GLuc lacking the N-terminus (dN-GLuc) is also rapidly secreted by
a non-conventional secretion pathway303. In the context of this study, it is impor-
tant to note that secretion of dN-GLuc is not stress-induced and does not require
autophagy305. When dN-GLuc is linked to a cytoplasmic protein such as actin, it
remains in the cytoplasm. By inserting a protease-susceptible peptide between actin
and dN-GLuc, luciferase secretion depends on the protease activity. Therefore, by

124 Chapter 4. The role of RPIA in the regulation of autophagy
B
A
C
Actin
LC3-IILC3-I
bafilomycinErythrose-4-PDMSO Ribose-5-P
DMSO Erythrose-4P Ribose-5P Bafilomycin
0.0
0.5
1.0
1.5
2.0
2.5
LC
3- II/A
ctin
NON-OXIDATIVE PHASEOXIDATIVE PHASE NUCLEOTIDE BIOSYNTHESIS
NADPH
GLYCERALDEHYDE 3- P
SEDOHEPTULOSE 7- P
GLYCERALDEHYDE 3- P
FRUCTOSE-1,6 P
FRUCTOSE-1,6 PRIBOSE 5- P
E4- PERYTHROSE 4- PXYLULOSE 5- P
RIBULOSE 5- P
GLUCOSE 6- P G6 P DH
6 P G DH
Ribose 5 isomerase A
P TransaldolaseTransketolase
Transketolase
6- P GLUCONOLACTONE
6- P GLUCONATE
P Pentose Epimerase
Lactonase
ROS
Figure 4.4: Treatment with R5P or E4P does not affect LC3 processing. A) Overview ofPPP with indicated position of Riboe-5P and Erythrose-4P (E4P) target RPIA.B) Immunoblot of LC3 processing in HeLa cells (12 well plates) treated withDMSO (1%), E4P, R5P (10µM each) for 16hrs or bafilomycin (10nM) for 2hrsat 37°C (in duplicates). C) Quantification of B), densiometric analysis of LC3-II/actin ratio.

4.2. Pharmacological inhibition of RPIA 125
inserting the full-length sequence of pro-LC3, LC3 cleavage via ATG4B can be
measured in the supernatant of live cells. This assay is much more compatible for
high-content screening approaches than other techniques for measuring autophagy
(such as electron microscopy or western blotting). In fact, this approach has been
successfully used for high-throughput over-expression and knockdown screens in
order to identify novel regulators of ATG4B (Pengo et al, submitted). Some exper-
iments using this reporter were performed prior to the start of this PhD project (see
appendix figure A.2) and the results in the context of this study will be discussed in
chapter 5.3. Interestingly, shRNA-mediated knockdown of RPIA increased ATG4B
reporter activity (Act-LC3-dN-GLuc), but did not affect a control reporter (Act-dN-
GLuc).
Next, I wanted to test whether the compounds that did not show any differences in
LC3 processing have an effect on ATG4B activity. Recently, it was shown that ROS
levels regulate ATG4B115, so it raised an interesting question of whether the PPP
metabolites may affect ATG4B activity. I tested various concentrations of E4P and
R5P at a micromolar range in stably expressing Act-LC3-dN-GLuc cells (see figure
4.5), the same reporter cell line used in appendix figure A.2. As a positive control
I used a compound (A3) that had previously been shown to strongly induce au-
tophagy (Ketteler lab, unpublished). Doubling the concentration of A3 from 3µM
to 6µM caused a 42-fold induction of the reporter (see figure A.2 B), however, no
differences in luciferase activity were observed at concentrations up to 100µM for
E4P and R5P compared to the negative control DMSO. In summary, the addition of
sugar pentoses R5P and E4P to the culture medium does not affect LC3 processing
or ATG4B reporter activity.

126 Chapter 4. The role of RPIA in the regulation of autophagy
B C
1 10 100
0
50000
100000
150000
200000
250000
300000
molar concentration in M
Lum
ines
cenc
e (A
.U.)
DMSO R5P E4PA3
1 10 100
0
2000
4000
6000
8000
10000
molar concentration in M
Lum
ines
cenc
e (A
.U.)
DMSO R5P E4P
chemiluminescent detection in supernatant
cellular secretion
Actin LC3
ATG4B cleavage site
Actin(control reporter)
(ATG4B activity reporter)Act-LC3-dN-GLuc
Act-dN-GLuc
ATG4B
N gaussia Luciferase
N gaussia Luciferase
N gaussia Luciferase
A
Figure 4.5: Pharmacological inhibition of RPIA or addition of R5P do not modulateATG4B activity A) Schematic overview of the ATG4B-mediated luciferase re-lease assay. Luciferase is secreted from the cells, depending on the catalytic ac-tivity of endogenous ATG4B. The chemiluminescent signal in the supernatantcan be measured and correlates to cellular ATG4B activity. B) chemilumines-cent signal in supernatant of stably expressing Act-LC3-dN-GLuc cells thatwere treated with DMSO, E4P, R5P for 16 hours at 37°C in 6 replicates withconcentrations as indicated. 10µl of supernatant were used in the Gaussia lu-ciferase release assay and chemiluminescence was measured immediatedly af-ter addition of coelenterazine as described in Luft et al305. C) Same data andmethodology as in B), excluding positive control A3. Data points are displayedin two graphs, due to the differences in luminescence signal detected. A.U. -arbitrary units.

4.3. The role of RKI in the regulation of autophagy in saccharomyces cerevisiae127
4.3 The role of RKI in the regulation of autophagy in
saccharomyces cerevisiae
The data up to this point suggested that RPIA may have a another function apart
from the enzymatic reaction, i.e. a non-canonical role in the regulation of au-
tophagy. In order to test this further, I investigated the potential involvement of
RPIA in S. cerevisiae. Mammalian versions of the RPIA gene have an additional
N-terminal stretch of 74 amino acids compared to E. coli, S. cerevisiae and D.
melanogaster (see figure 1.10). RPIA depletion may not have an effect on au-
tophagy if this N-terminus is not present. To test this, I used a S. cerevisiae strain
with a doxycycline-inducible tetOFF system for RKI (tetRKI), the ortholog of RPIA
in S. cerevisiae (see chapter 1.3.3 and figure 4.6 A). Upon addition of doxycycline,
transcription of the mRNA is inhibited and protein levels consequently decrease.
The strain was then transformed with GFP-ATG8 (equivalent of GFP-LC3 in mam-
mals, see chapter 1.1.4.2). First, I confirmed that the GFP-ATG8 construct in this
strain behaves in response to rapamycin as reported previously16 (see figure 4.6
B). Indeed, free GFP accumulates in the vacuole and is indicative of increased au-
tophagic flux, validating the use of the GFP-ATG8 reporter in this strain. Next, I
compared free GFP and GFP-ATG8 from wild-type and tetRKI strains in the pres-
ence or absence of rapamycin and doxycycline (see figure 4.6 C). There was no
notable difference in free GFP between the strains, indicating that autophagic flux
was not affected. Taken together, the data suggest that RKI levels in S. cerevisiae
may not play a role in regulating basal or TOR-dependent autophagy, unlike in
mammalian cells (see chapter 4.1).

128 Chapter 4. The role of RPIA in the regulation of autophagy
35
55GFP-ATG8
GFP
RapamycinDoxycycline
+-- - - - - -
- - -+ + - +
GFP-ATG8 + +- - ++
WT (R1158) tetRKI WT WT tetRKI tetRKI
+ + + + ++ + +- -
- - - --+ + ++ + +
W2
Jack_Ketteler > 2YG3 - opti for GFP-ATG8 > 2014-11-28 16:48:46 > Well:D11 · Field:1 Jack_Ketteler > 2YG3 - opti for GFP-ATG8 > 2014-11-28 16:48:46 > Well:C13 · Field:1
GFP-ATG8
WT
GFP-ATG8
+Rapamycin
+Rapamycin
-Rapamycin
PAS
vacuole
cytoplasm
A
C
GFP-ATG8 GFP
+Doxycycline
RKItTA tTA RKI
B
Figure 4.6: RKI depletion in S. cerevisiae does not upregulate autophagy. A) Schematicoverview of tetOFF system (top panel): the tetracycline transactivator (tTA)protein does not activate transcription in the presence of doxycycline, a sta-ble analog of tetracycline. Schematic overview of GFP-ATG8 in buddingyeast (bottom panel): GFP-ATG8 is predominantly cytoplasmic under basalautophagy conditions. When autophagy is induced with rapamycin by in-hibition of TOR, the GFP moiety accumulates in the vacuole. PAS - pre-autophagosomal initiation site. B) R1158 WT (wild-type) cells are accumu-lating GFP in the vacuole upon treatment of 1µg/ml rapamycin for 4 hours. C)analysis of GFP and GFP-ATG8 by western blotting upon treatment of absenceor presence of 20µg/ml doxy for 20 hours and 1µg/ml rapamycin for 4 hoursas indicated. Lane 6 is the protein molecular weight marker lane

4.4. Generation of CRISPR/Cas9 knockout HeLa cells 129
4.4 Generation of CRISPR/Cas9 knockout HeLa
cells
Upon prolonged culturing of RPIA-deficient cells with the aid of shRNA mediated
knockdown, I observed a weaker phenotype over time, which is an effect that has
been observed for other enzymes as well188. In order to further validate the shRNA-
mediated findings that indicate a role of human RPIA in the regulation of autophagy,
I modified the RPIA locus in HeLa cells using CRISPR/Cas9 genome editing tech-
nology. How the CRISPR cells were generated, validated and subsequently tested
in some of the previously described autophagy assays is presented in this and the
next section of the study.
4.4.1 Choice of CRISPR method
CRISPR/Cas9 technology has made modifications to a specific genomic sequence
much easier and faster than any other technology available. TALENs and ZFNs that
target DNA at a specific locus take a long time to be generated. CRISPR offers a
much simpler way of modifying specific regions in the DNA (see figure 4.7). The
Streptococcus pyogenes Cas9 (Cas9) nuclease can be targeted to any 20 nucleotide
DNA sequence followed by a 5-NGG or 5-NAG protospacer adjacent motif (PAM)
in the genome. The system is based on three components: The Cas9 protein is a
nuclease that cleaves both strands of DNA. The crRNA binds to a specific region
of interest in the genome that contains a 5-NGG or 5-NAG PAM sequence. Finally,
the tracrRNA element links the nuclease to the site-specific RNA component. The
crRNA and tracrRNA component also exist as a single guide (sgRNA). The Cas9
component has been engineered to achieve alternative functions. In this study, I
used the mutant D10A (nCas9), a modification that leads to cleavage of one strand
only, instead of a double stranded break (DSB). Previously, it had been shown that
more specificity, i.e. less off-target cleavage, can be achieved by using an sgRNA
pair in combination with nCas9291.

130 Chapter 4. The role of RPIA in the regulation of autophagy
5’
3’ 5’3’
distance between nicks
genomic DNA
target sequence + PAM
nCas9
nicking sites/tracrRNA
crRNA
Legend:
sgRNA
Figure 4.7: CRISPR/nCas9 technique. Two plasmids that contain a sgRNA constructeach and Cas9D10A, a modified version of wild-type Cas9 that cleaves oneDNA strand. By using two sgRNAs with a suitable distance between nicks,localised instability can be generated that leads to the generation of a double-stranded break (DSB) in any region of interest in the genome, without com-promising specificity and reducing off-target effects. DSBs are repaired byNon-homologous-end-joining (NHEJ), but this generates insertions/deletions(Indels) that can disrupt gene function.
4.4.2 Optimisation of CRISPR-mediated genome modification
4.4.2.1 Design of sgRNAs
I used the tool http://crispr.mit.edu/ to identify sgRNA target sites of RPIA in hu-
mans. It identifies all Cas9 target sites within a 23-500bp DNA sequence of inter-
est, based on a specificity analysis algorithm306. For our sgRNA design, I chose
to generate sgRNAs to a number of suitable sites on exon 1 (figure 4.9). In total,
I generated four ”+” and ”-” strand sgRNA oligos each, based on top hits from the
tool over the first 1000 bp of RPIA exon 1. The list of sgRNA oligos that were then
cloned into plasmids can be found in table 2.4.

4.4. Generation of CRISPR/Cas9 knockout HeLa cells 131
sgRNA design
clone sgRNAs into
vector(s) of choice
transfect cells with
CRISPR vectors
choose CRISPR
method
design & validate
genomic primers extract genomic DNA and
amplify region of interest
Perform SURVEYOR assay to test
for modifications at genetic locus
choose sgRNA pair and
make stable cell line
RPIA modified clones (CR1-3)
U6sgRNA 1
(fwd)
+
+sgRNA 2
(rev)
U6
ψ mCherry puromycin acetyltransferase
wild-type control clones (CR-WT)
+U6no sgRNA
nCas9 nCas9 nCas9
nCas9
ψ mCherry puromycin acetyltransferase
selection control clones
+U6no sgRNA
empty vectorψ
A
B
Figure 4.8: CRISPR optimisation pipeline A) Overview of optimisation/setup steps per-formed in order to generate the stable CRISPR cell line B) plasmid combina-tions used in the generation of RPIA CRISPR cell lines. Control clones weregenerated by transfection of empty pX335 vector and a mCherry/puromycinvector. Puromycin was used as a selection marker and mCherry for monitoringsuccessful transfection. An additional control was the selection control group,which also had the pX335 plasmid, but no selection marker. Instead, emptypMOWS 5.2 was used. RPIA modified clones were generated with pX335 vec-tors that contained sgRNA sequences as indicated in table 2.4. purple boxesindicate promoters in plasmids.

132C
hapter4.The
roleofR
PIAin
theregulation
ofautophagy
Legend:
g33
g19
RPIA exon 1 other sgRNA nicking sites testedsgRNA nicking sites used for cell line generation
g6g14
g9g24
g18g4
E1 - forward
E1 - reverse
A GAT AGG GGT TCC TCG AAG CCA CAG AAC TAC ATT TCC CAG CAA GAC CCG CGC AGC AGG GCA CGC AGA CTG TGT GCG TAA GCG ACC AGA TTT CCG GGG GAG CCG GGG GCG GGA CTT CAG CGG AGG CCG GAG
a
CGA GGC GTC GGG ATG CAG CGC CCC GGG CCC TTC AGC ACC CTC TAC GGG CGG GTC TTG GCC CCG CTG CCC GGG AGG GCC GGG GGC GCG GCC TCC GGC GGA GGA GGG AAC AGC TGG GAC CTC CCG GGT TCC C
M Q R P G P F S T L Y G R V L A P L P G R A G G A A S G G G G N S W D L P G S
AC GTG CGG CTG CCG GGG CGT GCA CAG TCT GGG ACC CGT GGC GGT GCT GGC AAC ACA AGC ACC AGC TGC GGG GAC TCC AAC AGC ATC TGC CCG GCC CCC TCC ACG ATG TCC AAG GCC GAG GAG GCC AAG AA
H V R L P G R A Q S G T R G G A G N T S T S C G D S N S I C P A P S T M S K A E E A K K
G CTG GCG GGC CGC GCG GCT GTG GAG AAC CAC GTG AGG GTG AGC ACT TCG AAA CGT GGG GCG CGG GGC GCA TGT CCT TGG CGT GAT GGG CTA CTG TTG CGC GTT GTG GGT GCT GCC GGG GCG CGC CTA GCT
L A G R A A V E N H V R
CCT GGC AGG GCG GGA GCT GAG TGA GAG GGT AGA GGG TGT GCA CTT TAC CCG AGT TTA GAC CCC TCT TCC CTG CT
Figure 4.9: Genomic region of RPIA Exon 1 RPIA locus on chromosome 2p11.2, exon 1 is highlighted in a green box. All sgRNA nicking sites usedin this study are indicated, as well as genomic primers for validation of modification at the desired locus. Oligo sequences for sgRNAs canbe found in table 2.4. Red arrows indicate the nicking sites of sgRNAs that were eventually used for CR1-3 cell line generation.

4.4. Generation of CRISPR/Cas9 knockout HeLa cells 133
4.4.2.2 Cloning of sgRNAs into Cas9 vector
Oligos were assembled and cloned into pX335 as described in Ran et al (2013)291.
In summary, oligos were cloned via Bbs1 digestion followed by ligation into px335.
The restriction site is lost upon ligation into the vector, ensuring the correct insertion
upstream of the tracrRNA, the element of the sgRNA that binds to Cas9 and conse-
quently links sequence specificity to nuclease activity. All sequence insertions were
verified using Sanger Sequencing and compared to plasmid & genomic sequence
using Serial Cloner 2.5.
4.4.2.3 Validation of genomic primers
Next, specific genomic primers that only generate one band from genomic PCR
were required to confirm successful modification of RPIA exon 1. These were
designed to bind upstream and downstream of Exon 1 and to yield a band of 594bp
(as indicated in figure 4.9).
4.4.2.4 SURVEYOR assay to screen for mutations
All cloned sgRNA-containing vectors were used in all logical combinations (only
pairs that will generate 5’ overhangs, as described in Ran et al291) in order to achieve
highest modification rates within a cell population. Initially, I intended to use the
SURVEYOR assay to quantify the cleavage rates of all possible sgRNA pairs. The
SURVEYOR assay is based on nuclease-mediated cleavage of DNA mismatches. In
brief, DNA fragments are denatured at 95°C and re-annealed slowly, then incubated
with the nuclease, followed by detection of bands after agarose gel electrophoresis.
Assuming that at least one locus is modified through non-homologous-end-joining
(NHEJ) upon double nicking, one would expect different DNA populations within
a single cell and at a cell population level at the modified locus. In the experimental
setup, I could qualitatively detect cleavage products when DNA fragments had mis-
matches, but it was not possible to quantitatively measure different cleavage rates
of sgRNA pairs due to strong background bands (figure 4.10). The nuclease ac-
tivity was confirmed by observing cleavage of amplified, mixed control plasmids
(figure 4.10 A lane 3), but not in pure plasmid populations (figure 4.10 A lane 4-

134 Chapter 4. The role of RPIA in the regulation of autophagy
cont
rol
hybr
id G
C
cont
rol
C
100
bp la
dder
500
700
sg6 +sg4 sg14
+ sg
4
12µl 18µl
cont
rol
G
12µl 18µl
A
sg14
+ sg
4
inve
rse
Enha
nced
Con
tras
t
B
Figure 4.10: Genomic sequence of RPIA in HeLa cells can successfully be modified A)SURVEYOR nuclease assay on amplified PCR products, separated on a 2%agarose gel. Lane 1: 100bp DNA ladder. Lane 2-4: amplified control plas-mids that contain a single nucleotide change as described in the manufacturersinstructions. Lane 5-7: examples of sgRNA pairs. B) sgRNA pair sg4 + sg14(from subfigure A) showed a cleavage product. Due to background noise, thisis highlighted by colour inversion of the image and enhancing the contrastusing Fiji.
5).There was a cleavage product in amplified genomic PCR using sgRNAs sg4 and
sg14 (figure 4.10 A lane 7 and B). The distance between the nicks in this pair is 40
nucleotides and their exact location nicking is indicated with red arrows in figure
4.9. Having confirmed that this sgRNA pair is suitable for genome editing of the
RPIA locus, I then used those constructs in order to generate a RPIA-modified cell
line.
4.4.3 Generation & selection of CRISPR-modified cell clones
4.4.3.1 Transfection of cells
HeLa cells were chosen as target cells, because large-scale mapping of the HeLa
cell genome has recently shown that most strains have 2 copy numbers or less for
the majority of chromosome 2307. Furthermore, HeLa cells were used in previous
experiments and they are easy to transfect, select and to isolate individual clones
from. RPIA-modified cell lines (in this study referred to as CR1-3) were gener-
ated by co-transfection with 2x pX335 (containing sgRNA + nCas9) and a pBABE-
mCherry/puromycin containing vector. To control for background nCas9 nuclease
activity, I transfected a set of cells with nCas9 and no sgRNA vectors (referred to

4.4. Generation of CRISPR/Cas9 knockout HeLa cells 135
500
100
bpD
NA
ladd
er
CR-1CR-W
T
CR-2CR-4
CR-5
500
100
bpD
NA
ladd
er
CR-WT
CR-1CR-2
CR-3
no g
enom
ic
DN
AA B
Figure 4.11: Modification of E1 at the RPIA loci in HeLa CRISPR cells. Deletionsin CRISPR-RPIA clones can be observed by genomic amplification A) DNAfrom modified CRISPR HeLa cells was purified and amplified with genomicprimers (for sequences see table 2.5 by PCR. Amplification products ofCRISPR-RPIA clones (CR1-3) and control (CR-WT) were separated on a 2%agarose gels and labelled with ethidium bromide for visualisation. B) SUR-VEYOR nuclease assay on amplified PCR products from indicated clones,separated on a 2% agarose gel.
as CR-WT). To control for negative selection, we also transfected a set of cells with
empty pX335 and empty pMOWS 5.2 (figure 4.8).
4.4.3.2 Selection of clones
Cells were transfected as described in chapter 2 in more detail. Successful transfec-
tion could be observed after 24 hours since a large proportion ( 40%) of cells was
mCherry positive. 48 hours after transfection, cells were selected with puromycin
and fresh medium was provided every 2-3 days. The selection and expansion period
lasted for a total of 18 days post-transfection, with selection control cells (trans-
fected with empty pX335 and empty pMOWS 5.2) completely dead after 7 days.
After 10 days of selection, individual clonal colonies were detached, isolated and
expanded. This was done by removing the media, soaking clonal discs in trypsin
and transferring them to an empty well in a new place. After clonal expansion, I
screened eight clones for modification and tested two control clones (no sgRNA
sequence) in the transfected vectors. Out of the RPIA-modified clones, three clones
resulted in a differential migration pattern in the amplified genomic PCR products
on 2% agarose gels compared to CR-WT (see figure 4.11).

136 Chapter 4. The role of RPIA in the regulation of autophagy
4.4.3.3 Confirmation of modifications
In order to further confirm and validate successful modification at the desired locus,
I purified the PCR products of the three clones that showed a differential migration
pattern and then sent off the samples for Sanger sequencing. In all three clones
(CR1-3), only mixed sequence traces were observed at the expected location but not
in the control (CR-WT), indicating modification of the genomic sequence (figure
4.12). However, it could also be the case that only one allele was modified. As this
particular CRISPR technology randomly adds or deletes a few base pairs and HeLa
cells are diploid for the RPIA locus, if indeed both alleles are mutated, I would
expect to recover two different mutations compared to the WT sequence within
the genome edited region. In order to identify the exact genomic modifications
on both chromosomes at this locus, I sub-cloned the genomic PCR products and
re-sequenced individual bacterial clones (figure 4.13 B). Indeed, for all three RPIA-
modified clones, I obtained 2 modified genome sequences and did not recover any
wild-type sequence. For clone CR-1, all sequenced clones showed out-of-frame
mutations, whereas both clones CR-2 and CR-3 showed one in-frame mutation in
addition to one out-of-frame mutation each. For clone CR-2, one sequence with a 6
bp insertion was recovered, whereas for CR-3, a 12 bp deletion was identified. For
all three clones, only 2 different sequences were recovered, whereas for CR-WT,
only the predicted WT sequence was found. Therefore, 2 differentially modified
alleles were found in all three clones. Overall, any RPIA mRNA transcripts from
both chromosomes in CR-1 are expected to produce missense products that are
deficient in translating full-length WT RPIA.

4.4.G
enerationofC
RISPR
/Cas9
knockoutHeLa
cells137
CR-1
CR-2
CR-3
CR-WT
Figure 4.12: Wild-type sequence is altered in CR1-3 clones. Genomic DNA from CRISPR-RPIA clones was purified and DNA region of Exon 1 wasamplified by PCR (for primer sequences see table 2.5). Sanger sequencing reaction results of CR-WT and CR1-3 clones for the locus ofinterest were obtained as indicated. Red arrows show start of mixed base pair reads, indicating a modified sequence on at least one allele.

138C
hapter4.The
roleofR
PIAin
theregulation
ofautophagy
AGGCGTCGGGATGCAGCGCCCCGGGCCCTTCAGCACCCTCTACGGGCGGGTCTTGGCCCCAGGCGTCGGGATGCAGCGCCCCGGGCCCTTCAGCACCCTCTACGGGCGGGTCTTGGCCCCAGGCGTCGGGATGCAGCGCCCCGGGCCCTTCAGCACCCACTACGGGCGGGTCTTGGCCCCAGGCGTCGGGATGCAGCGCCCCGGGCCCTTCAGCACCCTCTACGGGCGGGTCTTGGCCCCAGGCGTCGGGATGCAGCGCCCCGGGCCCTTCAGCACCCTCTACGGGCGGGTCTTGGCCCC************************************** *********************
GCTGCCCGGGAGGGCCGGGGGCGCGGCCTCCGGCGGAGGAGGGAACAGCTGGGACCTCCCGCTGCCCGGGAGGGCCGGGGGCGCGGCCTCCGGCGGAGGAGGGAACAGCTGGGACCTCCCGCTGCCCGGGAGGGCCGGGGGCGCGGCCTCCGGCGGAGGAGGGAACAG------------GCTGCCCGGGAGGGCCGGGGGCGCGGCCTCCGGCGGAGGAGGGAACAGCTGGGACCTCCCGCTGCCCGGGAGGGCCGGGGGCGCGGCCTCCGGCGGAGGAGGGAACAG------------************************************************
G------GGTTCCCACGTGCGGCTGCCGGGGCGTGCAGGG-TGGGGTTCCCACGTGCGGCTGCCGGGGCGTGCA-------------------------------------GGGTTCGGGTTCCCACGTGCGGCTGCCGGGGCGTGCA-------------------------------------
CR-WT CR-1.1 CR-1.2 CR-2.1 CR-2.2
TGGCAACACAAGCACCAGCTGCGGGGACTCCAACAGCATCTGCCCGGCCCCCTCCACGATTGGCAACACAAGCACCAGCTGCGGGGACTCCAACAGCATCTGCCCGGCCCCCTCCACGATTGGCAACACAAGCACCAGCTGCGGGGACTCCAGCAGCATCTGCCCGGCCCCCTCCACGATTGGCAACACAAGCACCAGCTGCGGGGACTCCAACAGCATCTGCCCGGCCCCCTCCACGATTGGCAGCACAAGCACCAGCTGCGGGGACTCCAACAGCATCTGCCCGGCCCCCTCCACGAT***** ************************** ***************************
CAGTCTGGGACCCGTGGCGGTGCCAGTCTGGGACCCGTGGCGGTGC----------CTGGGAGCGGTGCCAGTCTGGGACCCGTGGCGGTGC----------CTGGGAGCGGTGC * * *******
GTCCAAGGCCGAGGAGGCCAAGAAGCTGGCGGGCCGCGCGGCTGTGGAGAACCACGTGAGGTCCAAGGCCGAGGAGGCCAAGAAGCTGGCGGGCCGCGCGGCTGTGGAGAATCACGTGAGGTCCAAGGCCGAGGAGGCCAAGAAGCTGGCGGGCCGCGCGGCGGTGGAGAACCACGTGGGGTCCAAGGCCGAGGAGGCCAAGAAGCTGGCGGGCCGCGCGGCTGTGGAGAACCACATGAGGTCCAAGGCCGAGGAGGCCAAGAAGCTGGCGGGCCGCGCGGCTGTGGAGAACCACGTGAG****************************************** ******** *** ** *
GGTGAGCACTTGGTGAGCACTTGGTGAGCACTTGGTGAGCACTTGGTGAGCACTT***********
CR-WT CR-1.1 CR-1.2 CR-2.1 CR-2.2
Figure 4.13: Allelic variants of RPIA exon 1 in CR-1 and CR-2 clones. Identification of the genomic sequence from both alleles of CR-1 and CR-2.Purified PCR products were sub-cloned into sequencing vectors and isolated from individual bacterial clones. Sequences of CR-WT andCR clones were aligned using ClustalW. Green box indicates nucleotides within exon 1. The red arrow shows the start codon of full-lengthRPIA

4.5. Testing CRISPR cells in autophagy assays 139
4.5 Testing CRISPR cells in autophagy assaysAfter the cell model was validated to contain genomic modifications at the RPIA
locus (figure 4.13), I wanted to perform experiments that confirm the findings of
the knockdown data (see section 4.1). To do this, I assessed the effect of genomic
perturbations on LC3 processing and LC3-positive puncta formation in the clones
CR-1 and CR-2 compared to them to CR-WT.
4.5.1 LC3 processing is increased in RPIA-depleted cells
Indeed, there is an increase in the ratio of LC3-II over the loading control (actin)
under basal conditions as detected by western-blotting (figure 4.14 A, lanes 1-3).
When autophagosome fusion with lysosomes was blocked using Bafilomycin A
(an inhibitor of lysosome acidification), there is also an expected increase of LC3-
II levels compared to mock-treated, but the difference compared to CR-WT cells
(figure 4.14 A, lanes 4-6) in not as apparent. Conclusively, the CRISPR-modified
RPIA cells have increased LC3-II levels compared to CR-WT control under basal
conditions, which was found in five independent experiments (figure 4.14 B).
4.5.2 RPIA-depleted cells display an increase in LC3 puncta
Next, I tested whether the increase in autophagosome formation under RPIA knock-
down conditions could also be observed in the RPIA depleted CRISPR clones, as
measured by LC3-positive puncta. I expected to observe an increase in LC3 punta
when cells were incubated in full medium. Indeed, both clones CR-1 and CR-2
showed a remarkable increase in LC3-positive puncta when compared to CR-WT
cells (figure 4.15). Upon treatment with bafilomycin, a further increase in LC3-
positive puncta was observed for all three cell lines, but the differences of CR-1 and
CR-2 compared to CR-WT were not as apparent (figure 4.15), which is consistent
with the findings of LC3-II levels in figure 4.14.
These results were observed in three independent experiments, in the process
analysing 10,000-28,000 cells per condition. From this, it can be concluded that
LC3-positive puncta are increased in CR-1 and CR-2 clones compared to control
cells under basal conditions. However, after keeping cells in culture for a prolonged

140 Chapter 4. The role of RPIA in the regulation of autophagy
A CR-WT CR-1 CR-2 CR-WT CR-1 CR-2
Baf
LC3-II
Actin
LC3-I--- + + +
Baf --- + + +
B*
*
CR-WT
CR-1
CR-2
CR-WT
CR-1
CR-2
0
2
4
6
8
LC3-II/Actin
Figure 4.14: LC3 processing is upregulated in RPIA depleted CRISPR cells. Im-munoblot showing LC3-processing in CR-1, CR-2 and control cells (CR-WT).Indicated lanes were treated with 10nM bafilomycin for two hours prior to celllysis. B) Densitometry analysis of relative LC-II/Actin levels using Fiji. Datarepresent mean SD, n=5. Brackets indicate t-test p-values; *=p<0.05
time (above passage number 7), the differences in increased LC3 puncta compared
to control were less apparent. This could be due to an established phenomenon that
metabolically altered cells adapt to gene deficiencies over time188.
4.5.3 Pharmacological inhibition of TKT does not alter au-
tophagy
Cumulatively, the data so far suggests that the RPIA protein itself, but not R5P
levels, may play role in the regulation of autophagy. In order to address this further
and separate potential effects of R5P levels and a non-canonical function of RPIA,
I measured LC3 processing as previously, but in the presence of a pharmacological
inhibitor of TKT204. TKT is the other enzyme in the PPP that can generate R5P
(see chapter 1.3) and can be inhibited with the compound oxythiamine. It would
be interesting to see whether further reduction of R5P levels in RPIA-depleted cells

4.5. Testing CRISPR cells in autophagy assays 141
Baf --- + + +
Baf --- + + +
B
***
***
n.s.
A
LC3 MergeHoechst LC3 MergeHoechst
CR-WT
CR-1
CR-2
CR-WT
CR-1
CR-2
Figure 4.15: LC3 puncta are increased under basal conditions in RPIA-depleted cells.A) Endogenous LC3 punctae in fixed CR-WT, CR-1 and CR-2 that weretreated with 10nM bafilomycin for two hours. Images were acquired onan Opera LX microscope, scale bar = 20m. B) Quantification of A) usingColumbus image analysis software. 10 000-28 000 cells per condition wereanalysed in 3 independent experiments. Brackets indicate t-test p-values;***=p<0.001; n.s.= non significant

142 Chapter 4. The role of RPIA in the regulation of autophagy
have a synergistic effect on the regulation of autophagy. On the other hand, if the
supression of autophagy via RPIA were non-canonical, there should be no increase
in LC3 processing compared to mock-treated cells. Indeed, between oxythiamine-
treated and mock-treated cells there was no increase in LC3 processing (see figure
4.16), but an increase in RPIA-depleted cells compared to CR-WT as observed
previously (see figure 4.14).
4.5.4 Mass spectrometry
Next, I wondered if RPIA depletion in the CRISPR cells results in metabolite
changes in the PPP. In order to investigate this further, I started a collabora-
tion with the group who first identified and reported the patient with RPIA defi-
ciency199,201. The group specialises in measuring cellular metabolites of the PPP
using metabolomic mass spectrometry (MS). I prepared equal cell numbers of RPIA
depleted and CR-WT cells and sent the samples off for measurements. There, the
cells were lysed, phosphate sugars were extracted and enriched in the samples as de-
scribed previously199,292. Samples were then analysed using high performance liq-
uid chromatography (HPLC) coupled with tandem mass spectrometry (electrospray
ionisation on an API-3000 MS/MS). One should note that distinguishing between
alterations of cellular sugar levels that have very similar molecular masses is quite
challenging. In addition to that, the PPP metabolites R5P, Ri5P and X5P actually
have exactly the same molecular weight (see molecular composition in figure 4.17).
However, due to the chromatography conditions, retention times in the column are
improved, which effectively increases the signal intensities to above the lower de-
tection limit. This also allows to distinguish between Ri5P/X5P and R5P (see two
elution peaks in figure 4.17). However, this technique cannot distinguish between
Ri5P/X5P or between G6P/F6P199. Furthermore, E4P has a very high threshold
of detection, so cellular levels cannot be quantified easily with this technique (see
4.18). The assay also includes an internal reference which allows to compare quan-
tities between samples, in this case ”heavy” glucose 6-P (C13-G6P).
Indeed, various phosphorylated sugar metabolites could be measured simultane-
ously in HeLa cells (see figures 4.17, 4.18 and 4.19). For technical reasons, this

4.5. Testing CRISPR cells in autophagy assays 143
Actin
LC3-IILC3-I
untreated bafilomycinoxythiamine torinB
A
C
untreated oxythiamine bafilomycin Torin0.0
0.2
0.4
0.6
0.8
1.0
LC3-
II/A
ctin
CR-WT
CR-WT
CR-1
CR-1CR-2
CR-WT
CR-1CR-2
CR-WT
CR-1CR-2
CR-WT
CR-1CR-2
CR-2
NON-OXIDATIVE PHASEOXIDATIVE PHASE NUCLEOTIDE BIOSYNTHESIS
NADPH
GLYCERALDEHYDE 3- P
SEDOHEPTULOSE 7- P
GLYCERALDEHYDE 3- P
FRUCTOSE-1,6 P
FRUCTOSE-1,6 PRIBOSE 5- P
OT ERYTHROSE 4- PXYLULOSE 5- P
RIBULOSE 5- P
GLUCOSE 6- P G6 P DH
6 P G DH
Ribose 5 isomerase A
P TransaldolaseTransketolase
Transketolase
6- P GLUCONOLACTONE
6- P GLUCONATE
P Pentose Epimerase
Lactonase
ROS
Figure 4.16: Pharmacological inhibition of TKT does not increase LC3 processing. A)Transketolase enzymatic activity is inhibited by oxythiamine (OT) B) HeLaCRISPR control (CR-WT) and clones (CR1, CR2) were treated with OT(10M), bafilomycin (10nM) or torin (250nM) for 2hrs at 37*C. Protein levelswere tested by western blotting with the indicated antibodies (for dilutionsand origin see table 2.6). C) quantification of B) showing relative LC-II/Actinlevels. Densiometric analysis was performed using Fiji, n=1.

144 Chapter 4. The role of RPIA in the regulation of autophagy
assay was only performed on one round of samples so far, but the results were
promising. The preliminary data show that in CR-1, the clone that has two frame-
shift mutations, there appears to be a reduction in the R5P over X5P/Ri5P ratio
(see figure 4.17). There was also a reduction in S7P levels, one of the substrates
of the other R5P-generating enzyme TKT. The was no or little differences in R5P
levels between CR-2 (clone with only one allele that had a frame-shift mutation)
and CR-WT.

4.5. Testing CRISPR cells in autophagy assays 145
CR-WT
CR-1
CR-2
CR-WT
CR-1
CR-2
HO
OH
OPO H23
O OH
xylulose-5-P
O
OH
OPO H23
OH OH
ribose-5-P
HO
OH
OPO H3 2
O OH
ribulose-5-P
HOO
OH OH
OPO H23
OH OHseduheptulose-7-P
Figure 4.17: R5P and S7P levels in CRISPR cells. CR-WT, CR-1 and CR-2 cells froma 90% confluent 10 cm cell culture dish were sent off for metabolomic massspectrometry analysis. Phosphate sugars from samples were extracted andenriched using HPLC, followed by electrospray ionisation on an API-3000MS/MS as described in Huck et al292. Plots show intensity (counts per second)and elution time (minutes) of Xylulose-5P (X5P)/ Ribulose-5P (Ri5P) (onepeak), Ribose-5P (R5P) and seduheptulose-7P (S7P).

146 Chapter 4. The role of RPIA in the regulation of autophagy
CR-WT
CR-1
CR-2
CR-WT
CR-1
CR-2
OOH
OHerythrose-4-P
OPO H23
HO OPO H23
O
DHAP
Figure 4.18: DHAP and E4P levels in CRISPR cells. CR-WT, CR-1 and CR-2 cells froma 90% confluent 10 cm cell culture dish were sent off for metabolomic massspectrometry analysis. Phosphate sugars from samples were extracted andenriched using HPLC, followed by electrospray ionisation on an API-3000MS/MS as described in Huck et al292. Plots show intensity (counts per second)and elution time (minutes) of di-hydroxyacetone-P (DHAP) and Erythrose-4P(E4P), although the latter could not be quantified due to a high lower detectionlimit.

4.5. Testing CRISPR cells in autophagy assays 147
CR-WT
CR-1
CR-2
CR-WT
CR-1
CR-2
OOH OH
OPO H23
OH OH
glucose-6-P
HOO OH
OPO H23
OH OH
fructose-6-P
OH OHO
OPO H23
OH OH
glucose13-6-P
Figure 4.19: G6P/F6P levels in CRISPR cells. CR-WT, CR-1 and CR-2 cells from a90% confluent 10 cm cell culture dish were sent off for metabolomic massspectrometry analysis. Phosphate sugars from samples were extracted andenriched using HPLC, followed by electrospray ionisation on an API-3000MS/MS as described in Huck et al292. Plots show intensity (counts per second)and elution time (minutes) of glucose-6P (G6P) and the internal reference”heavy” C13 glucose-6P.

148 Chapter 4. The role of RPIA in the regulation of autophagy
4.6 Metabolic activity and MAPK signalling in
CRISPR cellsApart from studying the regulation of autophagy in the CRISPR cells, I also wanted
to test whether genomic depletion of RPIA has an effect on metabolic activity and
MAPK signalling (see experiments in chapters 3.3 and 3.4). For this, I measured
oxidoreductase activity in CR-WT, CR-1 and CR-2 cells using an MTT assay, as
performed with in the stably transduced HEK293T and HepG2 cells (see figures
3.9 and 3.10). Interestingly, there is also no apparent difference in proliferation
between RPIA-depleted and control cells.
In another study that used an inducible murine K-RASG12D model to study prolif-
eration, it was reported that the difference in proliferation under RPIA knockdown
conditions is more apparent under lower glucose concentration. In order to test
whether the effect on growth difference is masked by the high glucose concen-
tration (25mM) in standard DMEM medium, the experiment was repeated with
low (5.6mM) glucose medium. Interestingly, no difference in proliferation rates
between the clones and the control could be observed (see figure 4.20).
Next, I investigated whether there are any changes in the MAPK signalling
cascade in the RPIA-depleted cells, as tested in the shRNA-mediated knockdown
experiment (see figure 3.11). In agreement with the previous data, there was no
difference in p-ERK/ERK or pERK/COX IV ratio (see figure 4.21).
Concluding from the growth assays and the ERK activation experiments, RPIA does
not seem to promote growth or affect the MAPK signalling cascade, at least in HeLa
cells.

4.6. Metabolic activity and MAPK signalling in CRISPR cells 149
A
B0 2 4 6 8
0
500
1000
1500
2000
% g
row
th (o
f day
1) CR-WT
CR-1CR-2
Time (days)
0 2 4 6 80
2000
4000
6000
8000
10000
Time (days)
% g
row
th (o
f day
1)
CR-WTCR-1CR-2
Figure 4.20: Metabolic activity in HeLa CRISPR cell lines is not altered A) HeLaCRISPR control (CR-WT) and clones (CR-1, CR-2) were seeded in six repli-cates in a 96 well plate at 1000 cells/well. MTT assay was used to investigatedifferences in metabolic activity rates in full medium containing (A) 25mMglucose or (B) 5.6mM glucose. Results from two independent experimentsare expressed as mean and SD compared to respective values at 24 hours.

150 Chapter 4. The role of RPIA in the regulation of autophagy
A
B C
pERK 1/2
ERK 1/2
COX IV
EGF --- + + +CR-W
T
CR-1
CR-2
EGF --- + + + EGF --- + + +CR-W
T
CR-1
CR-2
0.0
0.5
1.0
1.5
pE
RK
/CO
X IV
CR-W
T
CR-1
CR-2
0.0
0.5
1.0
1.5
pE
RK
/ER
K
Figure 4.21: RPIA-depletion in HeLa CRISPR cells does not modulate p-ERK sig-nalling. A) CR-WT, CR-1 and CR-2 HeLa cells were washed 2x with PBSand incubated with medium containing low serum (same as full medium butwith 0.1% FCS instead of 10% FCS) for 16 hours. Cells were then stimu-lated for 5 minutes with low serum medium +/- 100ng EGF as indicated. Celllysates were separated on 7.5% SDS-PAGE gels and tested with p-ERK, ERKand COXIV antibodies for immunoblot analysis. B) Quantification of p-ERKand total ERK levels using the densiometric analysis tool from Fiji from 2 in-dependent experiments (normalised to CR-WT +EGF =1). C) Quantificationof p-ERK and COXIV levels from one experiment (normalised to CR-WT+EGF =1)

Chapter 5
DISCUSSION
5.1 RPIA induces Grb2 recruitment
Further findings of interest in this study are the localisation patterns of GFP-Grb2
upon RPIA overexpression and the GFP-RPIA puncta in HeLa cells (see figures
3.2, 3.3, 3.4, 3.5, 3.6). The data indicate that the Grb2 translocation mediated by
RPIA does not seem to depend on enzymatic activity or on the classical SH2 and
SH3 domains of Grb2. Additionally, RPIA and Grb2 co-localise in a distinct part
of the cell, at least partially. Exogenous RPIA expression on its own also results
in distinct puncta rather than even cytoplasmic distribution. Intriguingly, the bio-
chemical reactions in the pentose phosphate pathway have been reported to take
place in the cytoplasm181, but the enzymes G6PD, 6GPD and transaldolase in the
pathway were shown to aggregate in complexes near glucose transporters in hu-
man neutrophils308. Interestingly, Scansite 3 analysis of RPIA reveals a number of
residues in putative binding motifs, including for an SH3 domain, ERK-D-domain,
as well as Akt and AMPK phosphorylation sites (see figure 1.10). It is too soon
to draw definite conclusions, but it raises a number of interesting questions that
remain to be addressed. Does RPIA bind to MAPK or PI3K signalling compo-
nents? Is RPIA binding somehow regulating those signalling complexes or vice
versa? Is RPIA a phosphorylation target of Akt or AMPK? With high-affinity an-
tibodies against endogenous proteins, one could perform Co-Immunoprecipitation
(Co-IP) western blot experiments or pull-down coupled with mass spectrometry to

152 Chapter 5. DISCUSSION
further study the interactions of RPIA with Grb2 and other proteins. Furthermore,
truncation and other point mutant constructs of both RPIA and Grb2 could be of aid
to probe which amino acids in the peptide chains are important for this interaction.
Perhaps surprisingly, point mutations in the Grb2 constructs did not disrupt RPIA-
induced translocation (see figure 3.6). It remains to be studied further whether point
mutations on any of the predicted RPIA sites or truncation constructs would abro-
gate the translocation phenotype. It is possible that those structures are cytoplasmic
complexes or that RPIA is (directly or indirectly) tethered to a sub-cellular compart-
ment. Does RPIA localise to trafficking related membrane-bound organelles, such
as endosomes, lysosomes and/or autophagosomes? Does it localise to biosynthetic
oligomers, such as PPP enzymatic aggregates? One could further investigate the
sub-cellular localisation by immunostaining for common organelle markers, such
as LC3, EEA-1 or LAMP-1, as well as testing for co-localisation with other en-
zymes, such as G6PD or 6GPD. Ideally, this would be done without the need of
over-expression, for instance with a good antibody against endogenous RPIA or
in a fluorescently tagged knock-in RPIA cell line in co-localisation experiments.
One could carefully measure and analyse endogenous RPIA sub-cellular localisa-
tion under different conditions. The localisation of RPIA may change according
to the cell cycle phase, binding to other proteins, post-translational modifications
or based on enzymatic activity. There have been rapid advances of CRISPR/Cas9
technology in the past year which could be of great aid to study RPIA further for its
role in protein-protein interactions and enzymatic function. Similar strategies which
have been notoriously difficult and time-consuming (such as using ZFNs) are now
largely being replaced by highly effective CRISPR/Cas9 mediated approaches. For
instance, the use of customised donor templates in homology directed repair (HDR),
as opposed to NHEJ, enables much quicker generation of endogenous (optionally
inducible or tagged) knock-outs and knock-ins cell lines which would be of aid to
address some of the raised questions.

5.2. RPIA does not affect metabolic activity or MAPK signalling in HeLa cells153
5.2 RPIA does not affect metabolic activity or MAPK
signalling in HeLa cellsInterestingly, a role for RPIA in oncogenic signalling via PP2A/ERK has been de-
scribed recently. Ciou et al202 reported in 2014 that RPIA mRNA expression levels
are elevated in HCC patients, especially in late-stage, highly malignant tumors. Fur-
ther investigation showed that there was reduced metabolic activity (MTT assay, in-
terpreted as cell proliferation rates) in Hep3B and PLC5 liver cancer cell lines upon
siRNA-mediated knockdown of RPIA. Metabolic activity measurements from MTT
assays are often used as a proxy to measure proliferation rates of cells. However, it
may be inadequate to use this assay due to RPIA potentially playing a role in PPP
flux and direction, thereby modulating redox signalling. On the other hand, the pa-
per also showed that cells over-expressing RPIA displayed an increase in metabolic
activity and enhanced colony formation, with those results being backed up by a
tumor growth xenograft mouse model. The liver, one of the most metabolically
active tissues, is a key organ for metabolic homoeostasis. Hence, sufficient PPP
activity is likely a key determinant for cell and tissue function, and its regulation
of high importance. Interestingly, it was reported that metabolic flux is diverted
from glycolysis to the PPP in order to increase precursors for biosynthesis in an in-
ducible murine pancreatic ductal adenocarcinoma K-RasG12D (constitutively active
Ras signalling) model108,183. However, RPIA may also have an inhibitory role in
some cancers, seeing as there is an increase in hyper-methylation at the RPIA locus
in breast cancer309. The data in this PhD thesis suggest that metabolic activity (see
figures 3.9, 3.10 and 4.20), as well as MAPK signalling via ERK1/2 (see figures
3.11 and 4.21), is not altered, at least not in the experiments with HeLa cells (lung
cancer cell line). However, it is possible that RPIA expression levels, which lead to
altered proliferation rates, may depend on certain mutations in other oncogenes or
tumor suppressors, as well as being cell type dependent. Further experiments that
alter RPIA expression levels in different (transformed and non-transformed) cells
may help to further differentiate the role of RPIA in proliferation. Additionally, it
could be tested whether RPIA affects other downstream effectors of Ras, such as

154 Chapter 5. DISCUSSION
PI3K, p38 and JNK. It would also be interesting to measure other metabolic param-
eters, such as O2 and glucose consumption, as well as acidification of the medium,
which is indicative of lactate production. These experiments would further inves-
tigate whether RPIA plays a role in metabolic reprogramming. Many crosstalks
between signalling and metabolic pathways exist, including glycolysis, TCA cycle
and the pentose phosphate pathway, and their regulation is especially important for
proliferating cells310. Therefore, promising drug targets are amongst the enzymes
in those central metabolic pathways, especially if they are common between cancer
types and are expressed/regulated differentially compared to physiological cells. In
the prospect of developing therapeutic strategies to combat cancer metabolism, the
role of RPIA in cancer is an interesting topic for further investigation.
5.3 The role of RPIA in the regulation of autophagy
This study identified the metabolic enzyme RPIA, a key component of the PPP
to regulate basal autophagy. Upon transient knockdown or genetic perturbation in
HeLa cells, autophagosome formation and LC3 processing is upregulated. How ex-
actly this metabolic perturbation is linked to the regulation of autophagy is currently
unknown. One hypothesis is that the cell somehow senses and responds to altered
R5P levels, and in consequence regulates autophagy as a compensatory mechanism.
Another hypothesis is that the protein RPIA itself has a non-canonical role in the
regulation of autophagy. There are several examples of enzymes and metabolites
acting in a fashion that would support either hypothesis. In the context of what has
been reported elsewhere about RPIA and the regulation of autophagy via enzymes
and their metabolites, the results of this study will be further discussed here.
RPIA has been described to play a role in several diseases, including a metabolic
disorder and as an oncogene in cancer (see section 5.2). The rare metabolic condi-
tion was named ribose-5-phosphate isomerase deficiency and there are mutations in
both alleles, with one being a truncation that may result in some residual activity199.
Currently, one patient has been reported with severe neurological symptoms, includ-
ing seizures, mental retardation, leukoencephalopathy and peripheral neuropathy.

5.3. The role of RPIA in the regulation of autophagy 155
The molecular cause for this is currently not very well understood, especially in
the context of which metabolite is causing which effect. It is thought that that the
neurological symptoms may have to do with reduced NADPH levels and polyol
(e.g. ribitol and D-arabitol) accumulation201, thereby increasing oxidative stress.
However, the effect of polyols on oxidative stress is still controversial. There is
in vitro data from rat prefrontal cortex lysates showing that polyols actually have
an anti-oxidant effect311. Also, knockdown of RPI in D. melanogaster neurons
actually increased NADPH levels198. The authors suggested that modulating RPIA
levels may serve as therapeutic strategy for neurodegenerative disorders and aging.
Both of those fields, as well as autophagy, have been heavily linked to mTOR regu-
lation, so it would be interesting to further investigate any potential role of RPIA in
mTOR signalling pathways. Taken together, the role of RPIA is neurodegeneration,
aging and autophagy require further investigation.
5.3.1 Molecular mechanisms of autophagy regulation
The metabolic state of cells in the context of regulating autophagy is an emerg-
ing field of research (see chapter 1). Absence of growth factors and energy-rich
metabolites (glucose, amino acids, Ac-CoA, NAD) as well as certain cellular con-
ditions (hypoxia, high AMP:ATP ratio) have been shown to be strong inducers
of autophagy. Although much progress has been made in the past decade with
regards to decipher the molecular mechanisms, the interplay between autophagy,
metabolism and signalling is still not very well understood. Mechanistic insights
of intracellular amino acid sensing75,77,78, for instance, were only discovered in the
past few years.
Several of the contributing factors act through low mTORC1 activity and high
AMPK activity (see figure 1.2) in order to induce autophagy. However, other mech-
anisms exist that are mTORC1 and AMPK independent, such as ROS-mediated
regulation of ATG4B activity92,93 and PI3K/Akt/FoxO signalling90 (see chapter
1.1.5). There is some preliminary evidence (see appendices) from the lab that RPIA
may act via FoxO3A signalling. FoxO3A is a key regulatory transcription factor

156 Chapter 5. DISCUSSION
in promoting autophagy and its nucleocytoplasmic shuttling status is a key regula-
tory mechanism of FoxO-dependent transcription (see chapters 1.1.5 and 1.4.5.4).
Akt is an inhibitor for FoxoO3A (see 1.4.5.2), whilst the PIP3 phosphatase PTEN
negatively regulates Akt. GFP-FoxO3A localisation is predominantly cytoplasmic
when co-expressed with Akt (see figure A.1 A). Similarly, when PTEN is co-
overexpressed, GFP-FoxO3A predominantly localises to the nucleus. When RPIA
is depleted, GFP-FoxO3A also localises mainly to the nucleus. RPIA overexpres-
sion, on the other hand, results in an Akt-like phenotype. When the transcriptional
activity of FoxO3A signalling is measured using a luciferase reporter, knockdown
of RPIA led to a 2.5-fold increase in activity (figure A.1 B), whilst overexpression
of RPIA completely reduced reporter activity to similar values of Akt (figure A.1
C). Furthermore, catalytically inactive Akt did not show a decrease in signalling,
but catalytically inactive RPIA also repressed FoxO3A signalling (figure A.1 C).
The RPIA overexpression constructs used in figure A.1 C were validated for pres-
ence or lack of catalytic activity as described in Apel et al194 (figure A.1 D).
There are several experiments that would further elucidate the mechanism of RPIA
in the regulation of autophagy. Do RPIA levels, or the enzymatic activity, affect
the function of known signalling complexes such as AMPK and mTORC1? Does
RPIA downregulation result in an increase in ROS levels, which in turn upregulates
autophagy? One could investigate mTORC1 and AMPK activity by performing
western blot analysis of their phosphorylation status. The experiments could also
be performed in the context of pharmacological treatments (e.g. with PI3K in-
hibitor wortmannin and mTORC1 inhibitor torin) or knockout of regulators (such
as TSC2-/- double knockout MEFs) to explore if and where RPIA acts on the PI3K
signalling cascade.
Furthermore, there is some other preliminary evidence (see appendix figure A.2)
from the lab that links RPIA to the regulation of the core autophagy machinery. It
has been shown elsewhere92,93,115 that ROS can regulate autophagy via ATG4B.
Data from the ATG4B-mediated luciferase release assay (Act-LC3-dN-GLuc), the
same that was used to measure the effect of PPP metabolites on autophagy regu-

5.3. The role of RPIA in the regulation of autophagy 157
lation (see figure 4.4), currently support both hypotheses of metabolite levels or
a non-canonical role for RPIA in the regulation of autophagy. In HEK293T cells
stably expressing the ATG4B activity reporter, there was a 4-fold increase in lu-
ciferase activity upon shRNA-mediated knockdown of RPIA compared to control
cells (figure A.2 B, C). The increase in luciferase release was not observed in cells
expressing a control Act-dN-GLuc construct that does not contain the LC3 cleavage
motif (figure A.2 C), indicating that shRPIA specifically enhances cleavage of LC3.
These results were confirmed in MCF7 cells (figure A.2 D) and fetal liver cells
(FLC), which express high levels of RPIA (figure A.2 E)
Therefore, it is possible that knockdown of RPIA alters ROS levels, which regulate
ATG4B activity. In order to further establish this, ROS levels could be measured
in the CR-1 and CR-2 cells, as well as under transient knockdown conditions. Fur-
thermore, it would be interesting to see whether the increase LC3 processing and
autophagosome formation upon RPIA depletion can be reverted using the soluble
antioxidant N-acetylcysteine (NAC). In fact, data from the lab indicate that ROS
levels are indeed important, as treatment with NAC reversed the increase in LC3
processing and ATG4B reporter activity (see Heintze et al)312. In addition, it would
also be interesting to study if RPIA plays any particular role in selective autophagy
pathways, such as mitophagy.
5.3.2 Metabolites and metabolic enzymes regulate autophagy
In the past decade, multiple enzymes from various metabolic pathways have been
associated with the regulation of autophagy. Those regulators (enzymes and
metabolites) with a non-canonical role promoting or supressing autophagy were
identified from numerous pathways, including protein synthesis (see 1.1.5), glycol-
ysis (see 1.2.4), TCA cycle (see 1.2.5), nucleotide and NAD synthesis (see 1.2.9),
fatty acid metabolism (see 1.2.7) and the pentose phosphate pathway (see 1.3).
Amongst the enzymes are fatty acid synthase (FASN)165, phosphofructokinase
(PFKFB3)125,126, transketolase (TKT)210 and acetyl-Coenzyme A synthase96.
Interestingly, the molecular mechanisms of regulating autophagy for these enzymes

158 Chapter 5. DISCUSSION
(or associated metabolites) is quite variable and some mechanistic aspects remain
to be elucidated. For instance, pharmacological inhibition of PFKFB3 in HCT116
cells was reported to decrease ATP levels and S6K phosphorylation, as well as cause
an accumulation of ROS126. All those cellular events can independently stimulate
autophagy, so currently it is unclear whether any one of those in particular, or all
of them acting synergistically, are crucial for PFKPFB3-mediated inhibition of au-
tophagy.
FASN was shown to inhibit autophagolysosomal degradation of the PI3K sig-
nalling components Akt, mTOR, S6K and 4EBP1165, but does not affect pERK1/2
dependent-MAPK signalling. However, the molecular mechanisms of this specific
degradation in the absence of FASN remain unclear. It is unknown whether FASN
binds to any of the PI3K signalling proteins or whether there is an indirect regula-
tory mechanism.
Ac-CoA levels are known to regulate autophagy, but the exact mechanism(s) are
not fully elucidated either. It is possible that the acetyltransferase EP300, which
has been shown to interfere with ATG5, ATG7 and ATG12 protein activity through
acetylation313, acts as a key sensor of Ac-CoA levels. However, it is also possible
that Ac-CoA indirectly regulates mTORC1 activity96, since Ac-CoA levels nega-
tively correlated with S6K phosphorylation.
The involvement of the PPP enzyme TKT in autophagy is still relatively unclear.
It has been suggested that ULK1/2 regulates TKT activity, thereby regulating PPP
activity210. TKT is the most upregulated enzyme from the PPP in HCC cells
and its expression tightly regulated by the Nuclear Factor, Erythroid 2-Like 2
(NRF2)/Kelch-Like ECH-Associated Protein 1 (KEAP1)/BTB and CNC Homolog
1 (BACH1) pathway185. This is a key pathway to counteract oxidative stress in
cancer cells and TKT expression was shown to be important for the generation of
NADPH. Interestingly, that study also confirmed a 2-fold upregulation of RPIA in
HCC patients compared to healthy individuals. The study highlighted the impor-
tance of PPP activity for cancer proliferation and survival, but did not investigate
whether the modulation of ROS levels affected autophagy as well. In contrast,

5.3. The role of RPIA in the regulation of autophagy 159
pharmacological inhibition of TKT with oxythiamine in a proteomic study in MIA
PaCa-2 cells changed the expression of multiple proteins, but did not mediate
changes in expression levels of any proteins in the autophagic machinery314. In
this thesis, I also did not observe any differences in basal autophagy upon treat-
ment of oxythiamine (see figure 4.16). Knockdown or knock-out experiments in
mammalian systems that prove TKT involvement in autophagy have not been per-
formed by any group as of yet. Considering the major role of autophagy in cellular
nutrient homoeostasis, it may not be a surprise to continuously discover additional
metabolic enzymes involved in fine-tuning autophagy. As seen in certain cancer
cells addicted to autophagy, a certain level of autophagy-mediated degradation is
essential for survival and can promote tumorigenesis. Altogether, these findings
suggest that additional metabolic pathways and enzymes operate to fine-tune au-
tophagy.
5.3.3 R5P levels or non-canonical function of RPIA?
In this study, we postulate that RPIA levels, or its enzymatic function, can mod-
ulate the regulation of basal autophagy. Cells can generate de novo R5P by two
mechanisms: Either by conversion of Ri5P to R5P (mediated by RPIA), or by con-
version of S7P and G3P to R5P and X5P (see figure 1.9). R5P is a crucial precursor
for a number of molecules (see chapters 1.2.9 and 1.3): It is also part of histidine,
pyrimidine, NAD and cADPR synthesis pathways and is a structural component
in all nucleotides. Other related metabolites have been shown to be involved in
complex cross-talk networks, so it is plausible that R5P has a signalling role in
metabolism and/or autophagy. X5P, for instance, upregulates glycolytic flux in hep-
atocytes via activation of protein phosphatase 2A (PP2A), which inhibits PFK-2
phosphatase activity315. PP2A activity also increases the transcription of lipogene-
sis genes. Therefore, X5P levels indirectly influence glucose and lipid metabolism.
Interestingly, PP2A was also found to be a key regulator of autophagy and ATG4B
in the previously mentioned Act-LC3-dN-GLuc screen (Pengo et al. submitted).
SAICAR, a purine synthesis intermediate, was also shown to regulate glycolysis

160 Chapter 5. DISCUSSION
via PKM2. Interestingly, a protective microRNA (miRNA-124) that reduces nu-
cleotide synthesis by targeting RPIA and PRPS1, was found to be downregulated in
human colorectal cancer cells191. PRPS1 generates PRPP from R5P, which is is the
first step for most of the biosynthetic pathways. Indeed, many diseases have been
linked to PRPS1/2, including cancer.
5.3.4 Is RPIA essential?
Undoubtely, R5P de novo synthesis is essential, but whether RPIA activity is abso-
lutely essential in all cells and organisms is not quite clear. Metabolically, R5P
can be generated via transketolase, so there may be compensatory mechanisms
In S. cerevisiae, the gene RKI (homolog of RPIA) has been reported to be the
only metabolic enzyme in the PPP to be essential316. I generated a GFP-ATG8
expressing, tet-inducible knock out strain of RKI (see figure 4.6) and observed
slower growth, but not a lack of viability. For other eukaryotes, it is still unclear
whether RPIA is essential or not on an organism level. Interestingly, reduced ex-
pression of RPI in neurons of in D. melanogaster actually increased the lifespan198.
Knockdown of the enzyme in the whole organism did not seem to have any ef-
fect. On the other hand, data from the international mouse phenotyping consortium
(www.mousephenotype.org) indicate that homozygous RPIA knockout strains have
a complete pre-weaning lethality phenotype (see appendix figure A.3). Heterozy-
gous strains, on the other hand, are viable indeed. They appear to have defects in
Ca2+ levels in the blood stream and a decrease in regulatory T-cell numbers. The
Ca2+ defects may be due to impaired synthesis of the calcium signalling molecule
cADPR175, but this remains to be investigated.
Interestingly, RPIA has a putative second start codon that would generate a shorter,
237 residue peptide (see figure 1.10). It raises the question whether the data I ob-
serve can partially be explained due to expression of a short RPIA that resembles
the isomerase protein homologs in all eukaryotes (except mammals) and bacteria. It
seems unlikely in the autophagy experiments using transient knockdown conditions
(see figure 4.1), since all different shRNAs that were used would target both full-
length and the putative truncated mRNA. In the CRISPR cell lines (see section 4.4),

5.3. The role of RPIA in the regulation of autophagy 161
I specifically targeted exon 1 of the full-length peptide, since at the time it was com-
mon practice and wisdom to generate mutations in exon 1. Thorough sequencing
showed that in both clones, the wild-type sequence in exon 1 was successfully al-
tered in both alleles (see figure 4.13). However, it currently can not be excluded that
this putative short peptide is expressed in those cells. It may be possible though that
transcription still occurs, and that translation occurs from the second start codon.
If the short peptide were expressed, the catalytic role of Ri5P to R5P conversion
could still be fulfilled, but full length wild-type RPIA (containing the N-terminal 74
amino acid stretch) is likely not to be present in those cells. If full-length RPIA had
any additional, non-enzymatic interactions that affected autophagy, those would be
disrupted in the CRISPR cells. This can be further investigated, for instance by per-
forming qPCR with primers specific for full length and for both peptides. Towards
the end of the PhD, our lab also intended to order RPIA knock out Hap1 cell lines
from Horizon™targeting the catalytic domain in exon 5, so some of the data could
be validated in a haploid cell line. In the end, the company reported back to us that
their knockout strain is not viable. Altogether, RPIA may be essential in mammals
on a whole-organism level and in some isolated cell types.
5.3.5 Does RPIA have a non-canonical role?
There is some preliminary evidence that points to a non-canonical function of RPIA
in this study. Upon addition of R5P to the medium, no increase in LC3 processing
or ATG4B activity could be observed. Nor was there an increase of LC3 processing
upon addition of the RPIA inhibitor E4P (see figures 4.4 and 4.16). Furthermore,
although the R5P levels (compared to X5P/Ri5P) are decreased in at least one of the
CRISPR clones, there is still an increase in basal autophagy (see figures 4.14, 4.15
and 4.17). Also, preliminary results from the S. cerevisiae experiments (see figure
4.6) indicate that the RPIA protein may have acquired additional functionality in
mammals. Further experiments are needed to address some outstanding questions
and help to test these hypotheses. It would be interesting to see if any of the phe-
notypes in the autophagy assays can be reverted by rescue experiments, and also, if
the catalytically inactive mutant D160A would rescue autophagy inhibition as well.

162 Chapter 5. DISCUSSION
It would be further evidence for the notion of a non-canonical function, if it does
rescue indeed.
A current limitation is given by the time scale of experiments: Efficient shRNA-
mediated knockdown takes multiple days, and the generation and isolation of the
CRISPR cell clones took weeks. However, metabolic reprogramming through tran-
scriptional changes can occur within hours and post-translational modifications
within seconds. Therefore, those studies in mammalian cells would ideally be per-
formed in an inducible knockout model. This would enable measurements of au-
tophagosome formation (for instance, using GFP-LC3) in live cells at multiple time
points. By using radiolabelled (heavy) glucose, one could also measure the impact
of shRNA-mediated transient knockdown of RPIA and/or in the generated CRISPR
cell lines. Also, systematic knockdown or CRISPR knockout of each PPP gene,
coupled with measurements of autophagosome formation and PPP flux would help
to test the two hypotheses.
Although the lack of effect on LC3 processing and ATG4B activity by pharmaco-
logical inhibition of RPIA (figures 4.4 and A.2) indicate a non-canonical role, this
hypothesis can be tested in more detail. It is unclear whether the cell has transport
mechanisms for internalising phosphorylated sugars (such as E4P, R5P) from the
extracellular space. Glucose, for instance, is phosphorylated as soon as it enters in
order to keep it in the cytosol. However, large or other charged molecules are taken
up by cells, sometimes via unknown mechanisms317–319. One option of ruling out
those concerns would be to use liposomes as a delivery method, which could also
contain a fluorescent marker in order to visualise uptake of E4P and R5P. Addition-
ally, in-vitro enzymatic activity of RPIA could be measured with those compounds.
The HPLC-MS/MS analysis of sugar phosphate levels in the CRISPR cells show
that this methodology allows at least some differentiation of PPP intermediate lev-
els (see figures 4.17, 4.18 and 4.19). The data agree with the predicted outcomes of
the genomically altered cells. The sequences of the alleles in CR-1 (see figure 4.13)
should not allow translation of full-length RPIA, which would explain reduced R5P
levels. S7P levels may also be reduced because R5P is predominantly synthesised

5.3. The role of RPIA in the regulation of autophagy 163
by TKT, which utilises S7P and G3P for this conversion. The locus of RPIA in one
of the CR-2 alleles may allow for translation of a peptide that has two additional
residues inserted and it currently can not be ruled out that this peptide has RPIA
enzymatic activity. Further experiments using the CRISPR cell lines would help to
test this hypothesis, for instance measurements of sugar phosphates after pharma-
cological treatments. It would be interesting to see if R5P levels in the cells are
altered upon TKT inhibition. Equally, one could investigate the effect on PPP in-
termediates upon induction or inhibition of autophagy. Hopefully, techniques will
be developed that allow simultaneous quantification of related metabolites, such as
X5P/Ri5P and G6P/F6P.
When those and other novel research tools become available, some interesting ex-
periments could be performed from a systems biology perspective. Currently, we
cannot perturb metabolic pathways and directly measure enzymatic activity of mul-
tiple enzymes within a cell. Many metabolic enzymes (e.g. G6PDH, HK, PFK1,
PKM2) are regulated through numerous inputs from different metabolic and sig-
nalling pathways, hence it is difficult to decipher direct and indirect effects of pertur-
bation in a spacial and temporal manner. For instance, addition of the TKT inhibitor
oxythiamine had profound proteomic changes that changed considerably over time
of treatment314. This suggests that there are short-term and long-term changes
through metabolic perturbation, which can have opposite effects. Equally, the
pyrimidine biosynthesis enzyme CAD forms oligomers (puncta) upon amino acid
stimulation via mTORC1 signalling, but does not localise to activated mTORC1171.
However, elucidation of the molecular mechanisms of complex formation often rely
on purified, overexpressed proteins in vitro. It is an interesting notion that cytoplas-
mic enzymes, which are still often considered ”diffused” in the cytoplasm, actually
form clusters of localised biosynthesis which are regulated by signalling cascades.
Similarly, cytoplasmic enzymes can localise to specific sub-cellular localisations
for non-canonical functions, such as HK-II binding to VDAC to inhibit apopto-
sis320. Therefore, it would be interesting to further study the sub-cellular localisa-
tion of RPIA in living cells under conditions that disturb metabolic and signalling

164 Chapter 5. DISCUSSION
pathways. CAD activity was also shown to be important for cell cycle progression,
which is consistent with its key role in de novo pyrimidine synthesis. It would be
interesting to study the potential involvement of RPIA in cell cycle progression,
considering that it also plays a major role in the de novo synthesis of the precursor
PRPP.
Taken together, RPIA plays a key role for cellular metabolism and may exert
specific functions in under certain cellular conditions, such as the regulation of
metabolism, signalling and autophagy, in a tissue-specific context. In this study,
I propose a role for RPIA in the regulation of autophagy, which is of importance
for the development of anti-cancer therapeutics that may target this novel mode of
regulation.

Chapter 6
GENERAL CONCLUSIONS
6.1 RPIA in Grb2 signalling
Metabolism and signalling are highly linked, there is a complex regulatory network
and many examples of crosstalk between distant pathways. This study investigated
a potential role of ribose-5-phosphate isomerase A (RPIA), a metabolic enzyme in
the pentose phosphate pathway (PPP), in growth factor receptor bound protein 2
(Grb2)-mediated signalling. RPIA plays a key role in the synthesis of ribose-5-
phosphate (R5P), which is a precursor to all nucleotides and related metabolites.
Grb2 is an adaptor protein that binds to a number of activated Receptor tyrosine
kinases (RTK) upon stimulation with growth factors. Here, I report that RPIA in-
duced Grb2 translocation to a currently unknown subcellular compartment in HeLa
cells. Interestingly, Grb2 translocation mediated by RPIA did not depend on en-
zymatic activity and was not mediated via the classical Src homology 2 (SH2) and
SH3 domains of Grb2. These findings suggest a non-canonical role for RPIA in
signalling. RPIA localisation was enriched in the distinct Grb2 puncta. Expres-
sion of RPIA on its own also resulted in distinct puncta which were insensitive to
amino acid starvation or mechanistic target of rapamycin complex 1 (mTORC1) in-
hibition, unlike other metabolic enzymes such as CAD. Furthermore, alterations in
RPIA expression levels did not affect the activation status of RTK downstream ef-
fectors extracellular signalregulated kinases (ERK) 1/2. Additionally, there was no
effect on proliferation upon knockdown or overexpression of RPIA. Taken together,

166 Chapter 6. GENERAL CONCLUSIONS
these findings are interesting in the context of cancer and the regulation of the PPP.
6.2 RPIA in autophagy regulationAutophagy plays a key role in cells buy maintaining cellular nutrient and energy
homeostasis in response to various conditions, including metabolic stress. Data
presented in this study suggest that human RPIA plays a role in the regulation of au-
tophagy, potentially in a non-canonical fashion. RPIA depletion, either transiently
by shRNA or in CRISPR RPIA knockout cells, results in an upregulation of au-
tophagosome formation (as shown by a number of assays) through a currently un-
known mechanism. Pharmacological inhibition of transketolase, the other enzyme
that synthesises R5P, did not affect the regulation of autophagy. Addition of an
RPIA inhibitor or the product R5P also did not affect the regulation of autophagy.
Mass spectrometry analysis of a clone (CR-1) with two out-of-frame mutations in
the RPIA gene had reduced R5P levels, but still displayed an increase in LC3 pro-
cessing. Furthermore, RKI (RPIA homolog) depletion in S. cerevisiae does not
upregulate autophagy, which indicates a potentially unique level of regulation in
mammals. Overall, this study suggests a role for RPIA in the regulation of au-
tophagy, which is important in the context of cancer, neurodegeneration and aging
and is of relevance for development of therapeutics.

Appendix A
Supporting data
A.1 FoxO3A experiments
A.2 ATG4B reporter: Act-LC3-dN-GLuc
A.3 Homozygous knockout of RPIA in mice is lethal

168 Appendix A. Supporting data
ctrl
shGrb
2
shRPIA
0
100000
200000
300000
400000
Lu
min
es
ce
nc
e (A
.U.)
ctrl
AKT
AKT K
D
Fla
g-R
PIA
(W
T)
Fla
g-R
PIA
(D160A)
0
200000
400000
600000
800000
Lu
min
es
ce
nc
e (A
.U.)
0.5
lysis
buffer
spin
ach R
PIA
mock
Fla
g-R
PIA
(W
T)
Fla
g-R
PIA
(D160A)
0.0
0.1
0.2
0.3
0.4
RP
IA a
ctiv
ity
as
sa
y (A
.U.)
A B
C D
GFP-FOXO3A +AKT1 +PTEN
+shRPIA+RPIA
Experiments performed by S. Na and R. Ketteler
Figure A.1: RPIA inhibits Foxo3A signalling A) HEK293ET cells were co-transfectedwith GFP-FOXO3A and the indicated cDNA or shRNA expression vectors.Images were acquired using a Zeiss Axiovert 100 microscope. Scale bar =10m. B) 293ET cells were co-transfected with a FOXO3A-luciferase reporterconstruct and the indicated shRNA vectors targeting RPIA or Grb2 as con-trol. Empty pMOWS vector was used as an additional control. Cells werecultured for 48 hours and cell lysates were analyzed for luciferase expression.C) 293ET cells were transfected as in B) in the presence of FOXO3A and lu-ciferase expression was monitored. D) Catalytic activity of purified Flag-RPIAand Flag-RPIA D160A were measured using a colorimetric assay as describedin194. A.U. arbitrary units.

A.3. Homozygous knockout of RPIA in mice is lethal 169
shRPIA
GFP
ATG4BRPIA
0
2 106
4 106
6 106
8 106
Lum
ines
cenc
e (A
.U.)
+ Act-LC3-dN-GLuc
chemiluminescent detection in supernatant
cellular secretion
Actin LC3
ATG4B cleavage site
Actin(control reporter)
(ATG4B activity reporter)Act-LC3-dN-GLuc
Act-dN-GLuc
ATG4B
N gaussia Luciferase
N gaussia Luciferase
N gaussia Luciferase
A
B
D E
C 2000000
+ Act-dN-GLuc
+ Act-LC3-dN-GLuc
plain MCF7 + Act-dN-GLuc
+ Act-LC3-dN-GLuc
plain HEK293T
+ Act-dN-GLuc
+ Act-LC3-dN-GLucplain FLC
Experiments performed by R. Ketteler
pMOWS
pMOWS
pMOWS
pMOWS
shRPIA
shRPIA
shRPIA
pMOWS
pMOWS
pMOWS
shRPIA
shRPIA
shRPIA
pMOWS
pMOWS
pMOWS
shRPIA
shRPIA
shRPIA
0
500000
1000000
1500000
Lum
ines
cenc
e (A
.U.)
0
50000
100000
150000
Lum
ines
cenc
e (A
.U.)
0
2000
4000
6000
8000
10000
Lum
ines
cenc
e (A
.U.)
Figure A.2: Knockdown of RPIA increases ATG4B reporter activity A) Schematicoverview of the ATG4B-mediated luciferase release assay. Luciferase is se-creted from the cells and a chemiluminescent signal in the supernatant canbe measured. B) Luciferase release assay 24 hours post-transfection with theindicated plasmids in 293ET cells transduced with the indicated reporter con-structs. Data represent mean SD, n=3. C) Luciferase activity of supernatantcollected 96 hours post-transduction with control (pMOWS) and shRPIA in293ET cells as indicated. Data represent mean SD, n=3. D, E) Luciferase ac-tivity of supernatants in transduced MCF7 (E) and primary murine fetal livercells

170 Appendix A. Supporting data
on www.mousephenotype.org/data/Home » Search » Statistics » RPIAlast accessed on 23rd May 2016
Figure A.3: Complete pre-weaning lethality in homozygous RPIA knock-out mice.For mice with C57BL/6N background, no homozygous RPIA knock-outmice survived before the pre-weaning stage. Data was obtained fromwww.mousephenotype.org/data.

Appendix B
Colophon
This document was set in the Times Roman typeface using LATEX and BibTEX, and
compiled with TexStudio 2.10. All figures were generated in Adobe Illustrator CS6.
All graphs were generated using GraphPad Prism 6. All great tools that help to draft,
write and compile a thesis!


Bibliography
[1] D J Klionsky and S D Emr. “Autophagy as a regulated pathway of cellular
degradation.” In: Science (New York, NY) 290.5497 (Dec. 2000), pp. 1717–
1721.
[2] Lorenzo Galluzzi et al. “Metabolic Control of Autophagy”. In: Cell 159.6
(Dec. 2014), pp. 1263–1276.
[3] Noboru Mizushima and Masaaki Komatsu. “Autophagy: renovation of cells
and tissues.” In: Cell 147.4 (Nov. 2011), pp. 728–741.
[4] Claudine Kraft and Sascha Martens. “Mechanisms and regulation of au-
tophagosome formation.” In: Current opinion in cell biology 24.4 (Aug.
2012), pp. 496–501.
[5] Akiko Kuma et al. “The role of autophagy during the early neonatal starva-
tion period.” In: Nature 432.7020 (Dec. 2004), pp. 1032–1036.
[6] Ellen Wirawan et al. “Autophagy: for better or for worse.” In: Cell research
22.1 (Jan. 2012), pp. 43–61.
[7] Ryan C Russell, Hai-Xin Yuan, and Kun-Liang Guan. “Autophagy regula-
tion by nutrient signaling.” In: Cell research 24.1 (Jan. 2014), pp. 42–57.
[8] Daniel J Klionsky. “Autophagy: from phenomenology to molecular under-
standing in less than a decade.” In: Nature reviews Molecular cell biology
8.11 (Nov. 2007), pp. 931–937.
[9] Noboru Mizushima, Tamotsu Yoshimori, and Beth Levine. “Methods in
mammalian autophagy research.” In: Cell 140.3 (Feb. 2010), pp. 313–326.

174 BIBLIOGRAPHY
[10] Danielle Glick, Sandra Barth, and Kay F Macleod. “Autophagy: cellular and
molecular mechanisms.” In: The Journal of pathology 221.1 (May 2010),
pp. 3–12.
[11] Natalya N Pavlova and Craig B Thompson. “The Emerging Hallmarks of
Cancer Metabolism.” In: Cell metabolism 23.1 (Jan. 2016), pp. 27–47.
[12] Daniel J Klionsky et al. “Guidelines for the use and interpretation of assays
for monitoring autophagy (3rd edition).” In: Autophagy 12.1 (Jan. 2016),
pp. 1–222.
[13] Noboru Mizushima et al. “Autophagy fights disease through cellular self-
digestion.” In: Nature 451.7182 (Feb. 2008), pp. 1069–1075.
[14] Wen-wen Li, Jian Li, and Jin-ku Bao. “Microautophagy: lesser-known self-
eating.” In: Cellular and molecular life sciences : CMLS 69.7 (Apr. 2012),
pp. 1125–1136.
[15] Dalibor Mijaljica, Mark Prescott, and Rodney J Devenish. “Microautophagy
in mammalian cells: revisiting a 40-year-old conundrum.” In: Autophagy
7.7 (Oct. 2014), pp. 673–682.
[16] Daniel J Klionsky. “For the last time, it is GFP-Atg8, not Atg8-GFP (and
the same goes for LC3).” In: Autophagy 7.10 (Oct. 2011), pp. 1093–1094.
[17] Zhiping Xie and Daniel J Klionsky. “Autophagosome formation: core
machinery and adaptations.” In: Nature cell biology 9.10 (Oct. 2007),
pp. 1102–1109.
[18] Lukas A Huber and David Teis. “Lysosomal signaling in control of degra-
dation pathways.” In: Current opinion in cell biology 39 (Jan. 2016), pp. 8–
14.
[19] Joana R Costa, Jacob Heintze, and Robin Ketteler. “LC3 – Autophagy’s
achilles’ heel?” In: Drug Target Review 2.1 (), pp. 18–21.
[20] Muriel Mari, Sharon A Tooze, and Fulvio Reggiori. “The puzzling origin of
the autophagosomal membrane.” In: F1000 biology reports 3 (2011), p. 25.

BIBLIOGRAPHY 175
[21] Elizabeth L Axe et al. “Autophagosome formation from membrane com-
partments enriched in phosphatidylinositol 3-phosphate and dynamically
connected to the endoplasmic reticulum.” In: The Journal of cell biology
182.4 (Aug. 2008), pp. 685–701.
[22] Paivi Yla-Anttila et al. “3D tomography reveals connections between the
phagophore and endoplasmic reticulum.” In: Autophagy 5.8 (Nov. 2009),
pp. 1180–1185.
[23] Noboru Mizushima and Daniel J Klionsky. “Protein turnover via autophagy:
implications for metabolism.” In: Annual review of nutrition 27 (2007),
pp. 19–40.
[24] Kevin Moreau and David C Rubinsztein. “The plasma membrane as a con-
trol center for autophagy.” In: Autophagy 8.5 (May 2012), pp. 861–863.
[25] Luc English et al. “Autophagy enhances the presentation of endogenous vi-
ral antigens on MHC class I molecules during HSV-1 infection.” In: Nature
immunology 10.5 (May 2009), pp. 480–487.
[26] Ian G Ganley et al. “ULK1.ATG13.FIP200 complex mediates mTOR sig-
naling and is essential for autophagy.” In: The Journal of biological chem-
istry 284.18 (May 2009), pp. 12297–12305.
[27] Taichi Hara et al. “FIP200, a ULK-interacting protein, is required for au-
tophagosome formation in mammalian cells.” In: The Journal of cell biol-
ogy 181.3 (May 2008), pp. 497–510.
[28] J Yan et al. “Identification of mouse ULK1, a novel protein kinase struc-
turally related to C. elegans UNC-51.” In: Biochemical and biophysical re-
search communications 246.1 (May 1998), pp. 222–227.
[29] Chang Hwa Jung et al. “ULK-Atg13-FIP200 complexes mediate mTOR
signaling to the autophagy machinery.” In: Molecular biology of the cell
20.7 (Apr. 2009), pp. 1992–2003.

176 BIBLIOGRAPHY
[30] Chengyu Liang et al. “Autophagic and tumour suppressor activity of a novel
Beclin1-binding protein UVRAG.” In: Nature cell biology 8.7 (July 2006),
pp. 688–699.
[31] Kohichi Matsunaga et al. “Two Beclin 1-binding proteins, Atg14L and Ru-
bicon, reciprocally regulate autophagy at different stages.” In: Nature cell
biology 11.4 (Apr. 2009), pp. 385–396.
[32] Gian Maria Fimia et al. “Ambra1 regulates autophagy and development of
the nervous system.” In: Nature 447.7148 (June 2007), pp. 1121–1125.
[33] Juliet Goldsmith, Beth Levine, and Jayanta Debnath. “Autophagy and can-
cer metabolism.” In: Methods in enzymology 542 (2014), pp. 25–57.
[34] Asad M Taherbhoy et al. “Atg8 transfer from Atg7 to Atg3: a distinctive E1-
E2 architecture and mechanism in the autophagy pathway.” In: Molecular
cell 44.3 (Nov. 2011), pp. 451–461.
[35] Zoltan Metlagel et al. “Structural insights into E2-E3 interaction for LC3
lipidation.” In: Autophagy 10.3 (Mar. 2014), pp. 522–523.
[36] Y Kabeya et al. “LC3, a mammalian homologue of yeast Apg8p, is local-
ized in autophagosome membranes after processing.” In: The EMBO jour-
nal 19.21 (Nov. 2000), pp. 5720–5728.
[37] Kenji Sugawara et al. “Structural basis for the specificity and catalysis of
human Atg4B responsible for mammalian autophagy.” In: The Journal of
biological chemistry 280.48 (Dec. 2005), pp. 40058–40065.
[38] Wei Wang et al. “The carboxyl-terminal amino acids render pro-human
LC3B migration similar to lipidated LC3B in SDS-PAGE.” In: PloS one
8.9 (2013), e74222.
[39] Christian Behrends et al. “Network organization of the human autophagy
system”. In: Nature 466.7302 (Jan. 2010), pp. 68–76.

BIBLIOGRAPHY 177
[40] Geir Bjørkøy et al. “p62/SQSTM1 forms protein aggregates degraded by
autophagy and has a protective effect on huntingtin-induced cell death.” In:
The Journal of cell biology 171.4 (Nov. 2005), pp. 603–614.
[41] Philipp Wild et al. “Phosphorylation of the autophagy receptor optineurin
restricts Salmonella growth.” In: Science (New York, NY) 333.6039 (July
2011), pp. 228–233.
[42] Teresa L M Thurston et al. “The TBK1 adaptor and autophagy receptor
NDP52 restricts the proliferation of ubiquitin-coated bacteria.” In: Nature
immunology 10.11 (Nov. 2009), pp. 1215–1221.
[43] Vladimir Kirkin et al. “NBR1 cooperates with p62 in selective autophagy
of ubiquitinated targets.” In: Autophagy 5.5 (July 2009), pp. 732–733.
[44] Trond Lamark et al. “NBR1 and p62 as cargo receptors for selective au-
tophagy of ubiquitinated targets.” In: Cell cycle (Georgetown, Tex) 8.13
(July 2009), pp. 1986–1990.
[45] Philipp Wild, David G McEwan, and Ivan Dikic. “The LC3 interactome at
a glance.” In: Journal of cell science 127.Pt 1 (Jan. 2014), pp. 3–9.
[46] Hilla Weidberg et al. “LC3 and GATE-16 N termini mediate membrane fu-
sion processes required for autophagosome biogenesis.” In: Developmental
cell 20.4 (Apr. 2011), pp. 444–454.
[47] T Noda, N Fujita, and T Yoshimori. “The late stages of autophagy: how
does the end begin?” In: Cell death and differentiation 16.7 (July 2009),
pp. 984–990.
[48] Yuchen Feng, Zhiyuan Yao, and Daniel J Klionsky. “How to control self-
digestion: transcriptional, post-transcriptional, and post-translational regu-
lation of autophagy.” In: Trends in Cell Biology 25.6 (June 2015), pp. 354–
363.

178 BIBLIOGRAPHY
[49] Yi Yang, Lin-Qing Feng, and Xiao-Xiang Zheng. “Microtubule and
kinesin/dynein-dependent, bi-directional transport of autolysosomes in neu-
rites of PC12 cells.” In: The international journal of biochemistry & cell
biology 43.8 (Aug. 2011), pp. 1147–1156.
[50] Eisuke Itakura, Chieko Kishi-Itakura, and Noboru Mizushima. “The
hairpin-type tail-anchored SNARE syntaxin 17 targets to autophago-
somes for fusion with endosomes/lysosomes.” In: Cell 151.6 (Dec. 2012),
pp. 1256–1269.
[51] Alexey V Berezhnov et al. “Intracellular pH modulates autophagy and mi-
tophagy.” In: The Journal of biological chemistry (Feb. 2016).
[52] Nobuo N Noda and Fuyuhiko Inagaki. “Mechanisms of Autophagy.” In:
Annual review of biophysics 44 (2015), pp. 101–122.
[53] Fred Lozy and Vassiliki Karantza. “Autophagy and cancer cell metabolism.”
In: Seminars in cell & developmental biology 23.4 (June 2012), pp. 395–
401.
[54] Emma Y Liu and Kevin M Ryan. “Autophagy and cancer–issues we need to
digest.” In: Journal of cell science 125.Pt 10 (May 2012), pp. 2349–2358.
[55] Brinda Ravikumar and David C Rubinsztein. “Can autophagy protect
against neurodegeneration caused by aggregate-prone proteins?” In: Neu-
roreport 15.16 (Nov. 2004), pp. 2443–2445.
[56] Masaaki Komatsu et al. “Loss of autophagy in the central nervous sys-
tem causes neurodegeneration in mice.” In: Nature 441.7095 (June 2006),
pp. 880–884.
[57] Taichi Hara et al. “Suppression of basal autophagy in neural cells causes
neurodegenerative disease in mice.” In: Nature 441.7095 (June 2006),
pp. 885–889.
[58] Ana Maria Cuervo. “Autophagy: in sickness and in health.” In: Trends in
Cell Biology 14.2 (Feb. 2004), pp. 70–77.

BIBLIOGRAPHY 179
[59] Beth Levine, Noboru Mizushima, and Herbert W Virgin. “Autophagy in
immunity and inflammation.” In: Nature 469.7330 (Jan. 2011), pp. 323–
335.
[60] Saleh A Naser et al. “Role of ATG16L, NOD2 and IL23R in Crohn’s dis-
ease pathogenesis.” In: World journal of gastroenterology 18.5 (Feb. 2012),
pp. 412–424.
[61] Heesun Cheong et al. “Therapeutic targets in cancer cell metabolism and
autophagy.” In: Nature biotechnology 30.7 (July 2012), pp. 671–678.
[62] J Y Guo et al. “Autophagy suppresses progression of K-ras-induced lung
tumors to oncocytomas and maintains lipid homeostasis”. In: Genes & de-
velopment 27.13 (July 2013), pp. 1447–1461.
[63] Jing-Wen Yang et al. “Autophagy in SDF-1a-mediated DPSC migration
and pulp regeneration.” In: Biomaterials 44 (Mar. 2015), pp. 11–23.
[64] Jessie Yanxiang Guo et al. “Activated Ras requires autophagy to maintain
oxidative metabolism and tumorigenesis.” In: Genes & development 25.5
(Mar. 2011), pp. 460–470.
[65] Rebecca Lock et al. “Autophagy facilitates glycolysis during Ras-mediated
oncogenic transformation.” In: Molecular biology of the cell 22.2 (Jan.
2011), pp. 165–178.
[66] Min-Jung Kim et al. “Involvement of autophagy in oncogenic K-Ras-
induced malignant cell transformation.” In: The Journal of biological chem-
istry 286.15 (Apr. 2011), pp. 12924–12932.
[67] Huijun Wei et al. “Suppression of autophagy by FIP200 deletion inhibits
mammary tumorigenesis.” In: Genes & development 25.14 (July 2011),
pp. 1510–1527.
[68] Saurabh V Laddha et al. “Mutational landscape of the essential autophagy
gene BECN1 in human cancers.” In: Molecular cancer research : MCR 12.4
(Apr. 2014), pp. 485–490.

180 BIBLIOGRAPHY
[69] Robert D Leone and Ravi K Amaravadi. “Autophagy: a targetable linchpin
of cancer cell metabolism.” In: Trends in endocrinology and metabolism:
TEM 24.4 (Apr. 2013), pp. 209–217.
[70] Roberto Zoncu, Alejo Efeyan, and David M Sabatini. “mTOR: from growth
signal integration to cancer, diabetes and ageing.” In: Nature reviews Molec-
ular cell biology 12.1 (Jan. 2011), pp. 21–35.
[71] Liron Bar-Peled and David M Sabatini. “Regulation of mTORC1 by amino
acids.” In: Trends in Cell Biology 24.7 (July 2014), pp. 400–406.
[72] Joungmok Kim and Eunjung Kim. “Rag GTPase in amino acid signaling.”
In: Amino acids 48.4 (Apr. 2016), pp. 915–928.
[73] Ewan M Smith et al. “The tuberous sclerosis protein TSC2 is not required
for the regulation of the mammalian target of rapamycin by amino acids and
certain cellular stresses.” In: The Journal of biological chemistry 280.19
(May 2005), pp. 18717–18727.
[74] Eunjung Kim et al. “Regulation of TORC1 by Rag GTPases in nutrient
response.” In: Nature cell biology 10.8 (Aug. 2008), pp. 935–945.
[75] Jung Min Han et al. “Leucyl-tRNA synthetase is an intracellular leucine
sensor for the mTORC1-signaling pathway.” In: Cell 149.2 (Apr. 2012),
pp. 410–424.
[76] Yasemin Sancak et al. “Ragulator-Rag complex targets mTORC1 to the
lysosomal surface and is necessary for its activation by amino acids.” In:
Cell 141.2 (Apr. 2010), pp. 290–303.
[77] Jennifer Jung, Heide Marika Genau, and Christian Behrends. “Amino
Acid-Dependent mTORC1 Regulation by the Lysosomal Membrane Pro-
tein SLC38A9.” In: Molecular and cellular biology 35.14 (July 2015),
pp. 2479–2494.
[78] Shuyu Wang et al. “Metabolism. Lysosomal amino acid transporter
SLC38A9 signals arginine sufficiency to mTORC1.” In: Science (New
York, NY) 347.6218 (Jan. 2015), pp. 188–194.

BIBLIOGRAPHY 181
[79] Dan Egan et al. “The autophagy initiating kinase ULK1 is regulated via
opposing phosphorylation by AMPK and mTOR.” In: Autophagy 7.6 (June
2011), pp. 643–644.
[80] Ping Xu et al. “JNK regulates FoxO-dependent autophagy in neurons.” In:
Genes & development 25.4 (Feb. 2011), pp. 310–322.
[81] Einat Zalckvar et al. “DAP-kinase-mediated phosphorylation on the BH3
domain of beclin 1 promotes dissociation of beclin 1 from Bcl-XL and in-
duction of autophagy.” In: EMBO reports 10.3 (Mar. 2009), pp. 285–292.
[82] Yasuhiro Maejima et al. “Mst1 inhibits autophagy by promoting the inter-
action between Beclin1 and Bcl-2.” In: Nature medicine 19.11 (Nov. 2013),
pp. 1478–1488.
[83] Richard C Wang et al. “Akt-mediated regulation of autophagy and tumori-
genesis through Beclin 1 phosphorylation.” In: Science (New York, NY)
338.6109 (Nov. 2012), pp. 956–959.
[84] Michael Degtyarev et al. “Akt inhibition promotes autophagy and sensitizes
PTEN-null tumors to lysosomotropic agents.” In: The Journal of cell biol-
ogy 183.1 (Oct. 2008), pp. 101–116.
[85] N Z Kara et al. “Trehalose induced antidepressant-like effects and au-
tophagy enhancement in mice.” In: Psychopharmacology 229.2 (Sept.
2013), pp. 367–375.
[86] Christina H Eng and Robert T Abraham. “Glutaminolysis yields a metabolic
by-product that stimulates autophagy.” In: Autophagy 6.7 (Oct. 2010),
pp. 968–970.
[87] Andrew N Lane and Teresa W M Fan. “Regulation of mammalian nu-
cleotide metabolism and biosynthesis.” In: Nucleic acids research 43.4
(Feb. 2015), pp. 2466–2485.
[88] Matthias Kappler et al. “Normoxic accumulation of HIF1a is associated
with glutaminolysis.” In: Clinical oral investigations (Mar. 2016).

182 BIBLIOGRAPHY
[89] S Mordier et al. “Leucine limitation induces autophagy and activation of
lysosome-dependent proteolysis in C2C12 myotubes through a mammalian
target of rapamycin-independent signaling pathway.” In: The Journal of bi-
ological chemistry 275.38 (Sept. 2000), pp. 29900–29906.
[90] Cristina Mammucari et al. “FoxO3 controls autophagy in skeletal muscle in
vivo.” In: Cell metabolism 6.6 (Dec. 2007), pp. 458–471.
[91] Ralph J DeBerardinis et al. “The biology of cancer: metabolic reprogram-
ming fuels cell growth and proliferation.” In: Cell metabolism 7.1 (Jan.
2008), pp. 11–20.
[92] Ruth Scherz-Shouval et al. “Reactive oxygen species are essential for au-
tophagy and specifically regulate the activity of Atg4.” In: The EMBO jour-
nal 26.7 (Apr. 2007), pp. 1749–1760.
[93] Y Chen, M B Azad, and S B Gibson. “Superoxide is the major reactive oxy-
gen species regulating autophagy.” In: Cell death and differentiation 16.7
(July 2009), pp. 1040–1052.
[94] Xin Wen et al. “Deconvoluting the role of reactive oxygen species and au-
tophagy in human diseases.” In: Free radical biology & medicine 65 (Dec.
2013), pp. 402–410.
[95] Tobias Eisenberg et al. “Nucleocytosolic depletion of the energy metabolite
acetyl-coenzyme a stimulates autophagy and prolongs lifespan.” In: Cell
metabolism 19.3 (Mar. 2014), pp. 431–444.
[96] Guillermo Marino et al. “Regulation of autophagy by cytosolic acetyl-
coenzyme A.” In: Molecular cell 53.5 (Mar. 2014), pp. 710–725.
[97] Tao Xie et al. “Untangling knots between autophagic targets and candidate
drugs, in cancer therapy.” In: Cell proliferation 48.2 (Apr. 2015), pp. 119–
139.
[98] S Jane Henley et al. “Invasive Cancer Incidence and Survival - United
States, 2012.” In: MMWR. Morbidity and mortality weekly report 64.49
(2015), pp. 1353–1358.

BIBLIOGRAPHY 183
[99] Cancer Research. “http://www.cancerresearchuk.org/health-professional/cancer-
statistics/incidence”. In: Cancer Research UK (May 2016).
[100] Alessio Giubellino, Terrence R Burke, and Donald P Bottaro. “Grb2 signal-
ing in cell motility and cancer.” In: Expert opinion on therapeutic targets
12.8 (Aug. 2008), pp. 1021–1033.
[101] International Cancer Genome Consortium et al. “International network of
cancer genome projects.” In: Nature 464.7291 (Apr. 2010), pp. 993–998.
[102] Frank Weinberg et al. “Mitochondrial metabolism and ROS generation are
essential for Kras-mediated tumorigenicity.” In: Proceedings of the Na-
tional Academy of Sciences of the United States of America 107.19 (May
2010), pp. 8788–8793.
[103] Tomoyoshi Soga. “Cancer metabolism: Key players in metabolic repro-
gramming.” In: Cancer science 104.3 (Mar. 2013), pp. 275–281.
[104] Chi V Dang. “Links between metabolism and cancer.” In: Genes & devel-
opment 26.9 (May 2012), pp. 877–890.
[105] Patrick S Ward and Craig B Thompson. “Metabolic reprogramming: a can-
cer hallmark even warburg did not anticipate.” In: Cancer cell 21.3 (Mar.
2012), pp. 297–308.
[106] Kirstie E Keller, Irene S Tan, and Young-Sam Lee. “SAICAR stimulates
pyruvate kinase isoform M2 and promotes cancer cell survival in glucose-
limited conditions.” In: Science (New York, NY) 338.6110 (Nov. 2012),
pp. 1069–1072.
[107] Beverly A Teicher, W Marston Linehan, and Lee J Helman. “Targeting can-
cer metabolism.” In: Clinical cancer research : an official journal of the
American Association for Cancer Research 18.20 (Oct. 2012), pp. 5537–
5545.
[108] Kirsten L Bryant et al. “KRAS: feeding pancreatic cancer proliferation.” In:
Trends in biochemical sciences 39.2 (Feb. 2014), pp. 91–100.

184 BIBLIOGRAPHY
[109] Alexei Vazquez et al. “Catabolic efficiency of aerobic glycolysis: the War-
burg effect revisited.” In: BMC systems biology 4 (2010), p. 58.
[110] O Warburg, F Wind, and E Negelein. “THE METABOLISM OF TUMORS
IN THE BODY.” In: The Journal of general physiology 8.6 (Mar. 1927),
pp. 519–530.
[111] Xin Lin Zu and Michael Guppy. “Cancer metabolism: facts, fantasy, and
fiction.” In: Biochemical and biophysical research communications 313.3
(Jan. 2004), pp. 459–465.
[112] Luke A J O’Neill and D Grahame Hardie. “Metabolism of inflammation
limited by AMPK and pseudo-starvation.” In: Nature 493.7432 (Jan. 2013),
pp. 346–355.
[113] Imoh S Okon and Ming-Hui Zou. “Mitochondrial ROS and cancer drug re-
sistance: Implications for therapy.” In: Pharmacological research 100 (Oct.
2015), pp. 170–174.
[114] K Irani et al. “Mitogenic signaling mediated by oxidants in Ras-transformed
fibroblasts.” In: Science (New York, NY) 275.5306 (Mar. 1997), pp. 1649–
1652.
[115] Shuxi Qiao et al. “A REDD1/TXNIP pro-oxidant complex regulates
ATG4B activity to control stress-induced autophagy and sustain exercise
capacity.” In: Nature communications 6 (2015), p. 7014.
[116] D J Roberts and S Miyamoto. “Hexokinase II integrates energy metabolism
and cellular protection: Akting on mitochondria and TORCing to au-
tophagy.” In: Cell death and differentiation (Oct. 2014).
[117] R A Nakashima et al. “Hexokinase receptor complex in hepatoma mito-
chondria: evidence from N,N’-dicyclohexylcarbodiimide-labeling studies
for the involvement of the pore-forming protein VDAC.” In: Biochemistry
25.5 (Mar. 1986), pp. 1015–1021.

BIBLIOGRAPHY 185
[118] Paolo E Porporato et al. “Anticancer targets in the glycolytic metabolism of
tumors: a comprehensive review.” In: Frontiers in pharmacology 2 (2011),
p. 49.
[119] John G Pastorino, Nataly Shulga, and Jan B Hoek. “Mitochondrial binding
of hexokinase II inhibits Bax-induced cytochrome c release and apoptosis.”
In: The Journal of biological chemistry 277.9 (Mar. 2002), pp. 7610–7618.
[120] Prashanth T Bhaskar et al. “mTORC1 hyperactivity inhibits serum
deprivation-induced apoptosis via increased hexokinase II and GLUT1
expression, sustained Mcl-1 expression, and glycogen synthase kinase
3beta inhibition.” In: Molecular and cellular biology 29.18 (Sept. 2009),
pp. 5136–5147.
[121] G Weber. “Enzymology of cancer cells (second of two parts).” In: The New
England journal of medicine 296.10 (Mar. 1977), pp. 541–551.
[122] Abdullah Yalcin et al. “Regulation of glucose metabolism by 6-
phosphofructo-2-kinase/fructose-2,6-bisphosphatases in cancer.” In: Ex-
perimental and molecular pathology 86.3 (June 2009), pp. 174–179.
[123] Katherine R Mattaini and Matthew G Vander Heiden. “Cancer. Glycosyla-
tion to adapt to stress.” In: Science (New York, NY) 337.6097 (Aug. 2012),
pp. 925–926.
[124] Zhen Yang et al. “Phosphofructokinase deficiency impairs ATP generation,
autophagy, and redox balance in rheumatoid arthritis T cells.” In: The Jour-
nal of experimental medicine 210.10 (Sept. 2013), pp. 2119–2134.
[125] Zhen Yang, Jorg J Goronzy, and Cornelia M Weyand. “The glycolytic en-
zyme PFKFB3/phosphofructokinase regulates autophagy.” In: Autophagy
10.2 (Feb. 2014), pp. 382–383.
[126] Alden C Klarer et al. “Inhibition of 6-phosphofructo-2-kinase (PFKFB3)
induces autophagy as a survival mechanism.” In: Cancer & metabolism 2.1
(2014), p. 2.

186 BIBLIOGRAPHY
[127] A M Strohecker et al. “Identification of 6-phosphofructo-2-kinase/fructose-
2,6-bisphosphatase as a novel autophagy regulator by high content shRNA
screening.” In: Oncogene 34.45 (Nov. 2015), pp. 5662–5676.
[128] Wen Yi et al. “Phosphofructokinase 1 glycosylation regulates cell growth
and metabolism.” In: Science (New York, NY) 337.6097 (Aug. 2012),
pp. 975–980.
[129] Philippe Icard and Hubert Lincet. “A global view of the biochemical path-
ways involved in the regulation of the metabolism of cancer cells.” In:
Biochimica et biophysica acta 1826.12 (Dec. 2012), pp. 423–433.
[130] Nana-Maria Gruning and Markus Ralser. “Cancer: Sacrifice for survival.”
In: Nature 480.7376 (Dec. 2011), pp. 190–191.
[131] Heather R Christofk et al. “The M2 splice isoform of pyruvate kinase is
important for cancer metabolism and tumour growth.” In: Nature 452.7184
(Mar. 2008), pp. 230–233.
[132] Gaochuan Zhang et al. “Unraveling the mystery of cancer metabolism in the
genesis of tumor-initiating cells and development of cancer.” In: Biochimica
et biophysica acta 1836.1 (Aug. 2013), pp. 49–59.
[133] Weibo Luo et al. “Pyruvate kinase M2 is a PHD3-stimulated coactivator for
hypoxia-inducible factor 1.” In: Cell 145.5 (May 2011), pp. 732–744.
[134] Xueliang Gao et al. “Pyruvate kinase M2 regulates gene transcription by
acting as a protein kinase.” In: Molecular cell 45.5 (Mar. 2012), pp. 598–
609.
[135] Weiwei Yang et al. “PKM2 phosphorylates histone H3 and promotes gene
transcription and tumorigenesis.” In: Cell 150.4 (Aug. 2012), pp. 685–696.
[136] Heather R Christofk et al. “Pyruvate kinase M2 is a phosphotyrosine-
binding protein.” In: Nature 452.7184 (Mar. 2008), pp. 181–186.
[137] Sara Altuntas et al. “The transglutaminase type 2 and pyruvate kinase isoen-
zyme M2 interplay in autophagy regulation.” In: Oncotarget (Dec. 2015).

BIBLIOGRAPHY 187
[138] Phatchariya Phannasil et al. “Pyruvate Carboxylase Is Up-Regulated in
Breast Cancer and Essential to Support Growth and Invasion of MDA-MB-
231 Cells.” In: PloS one 10.6 (2015), e0129848.
[139] Katherine Sellers et al. “Pyruvate carboxylase is critical for non-small-cell
lung cancer proliferation.” In: The Journal of clinical investigation 125.2
(Feb. 2015), pp. 687–698.
[140] H EAGLE. “Nutrition needs of mammalian cells in tissue culture.” In: Sci-
ence (New York, NY) 122.3168 (Sept. 1955), pp. 501–514.
[141] Mariia O Yuneva et al. “The metabolic profile of tumors depends on both
the responsible genetic lesion and tissue type.” In: Cell metabolism 15.2
(Feb. 2012), pp. 157–170.
[142] Paul Nicklin et al. “Bidirectional transport of amino acids regulates mTOR
and autophagy.” In: Cell 136.3 (Feb. 2009), pp. 521–534.
[143] O Yanagida et al. “Human L-type amino acid transporter 1 (LAT1): charac-
terization of function and expression in tumor cell lines.” In: Biochimica et
biophysica acta 1514.2 (Oct. 2001), pp. 291–302.
[144] Christian Meier et al. “Activation of system L heterodimeric amino acid
exchangers by intracellular substrates.” In: The EMBO journal 21.4 (Feb.
2002), pp. 580–589.
[145] T Osada et al. “Prognostic significance of glutamine synthetase expression
in unifocal advanced hepatocellular carcinoma.” In: Journal of hepatology
33.2 (Aug. 2000), pp. 247–253.
[146] Robert A Casero and Laurence J Marton. “Targeting polyamine metabolism
and function in cancer and other hyperproliferative diseases.” In: Nature
reviews. Drug discovery 6.5 (May 2007), pp. 373–390.
[147] Tawnya L Bowles et al. “Pancreatic cancer cell lines deficient in argini-
nosuccinate synthetase are sensitive to arginine deprivation by arginine
deiminase.” In: International journal of cancer. Journal international du
cancer 123.8 (Oct. 2008), pp. 1950–1955.

188 BIBLIOGRAPHY
[148] Jennifer A McAlpine et al. “Down-regulation of argininosuccinate syn-
thetase is associated with cisplatin resistance in hepatocellular carcinoma
cell lines: implications for PEGylated arginine deiminase combination ther-
apy.” In: BMC cancer 14 (2014), p. 621.
[149] G C Yeh and J M Phang. “Stimulation of phosphoribosyl pyrophosphate
and purine nucleotide production by pyrroline 5-carboxylate in human ery-
throcytes.” In: The Journal of biological chemistry 263.26 (Sept. 1988),
pp. 13083–13089.
[150] Wei Liu and James M Phang. “Proline dehydrogenase (oxidase), a mito-
chondrial tumor suppressor, and autophagy under the hypoxia microenvi-
ronment.” In: Autophagy 8.9 (Sept. 2012), pp. 1407–1409.
[151] Roland Nilsson et al. “Metabolic enzyme expression highlights a key role
for MTHFD2 and the mitochondrial folate pathway in cancer.” In: Nature
communications 5 (2014), p. 3128.
[152] Wei Liu et al. “Proline biosynthesis augments tumor cell growth and aero-
bic glycolysis: involvement of pyridine nucleotides.” In: Scientific reports 5
(2015), p. 17206.
[153] Ilona Zareba and Jerzy Palka. “Prolidase-proline dehydrogenase/proline
oxidase-collagen biosynthesis axis as a potential interface of apopto-
sis/autophagy.” In: BioFactors (Oxford, England) (Apr. 2016).
[154] S P Donald et al. “Proline oxidase, encoded by p53-induced gene-6, cat-
alyzes the generation of proline-dependent reactive oxygen species.” In:
Cancer Research 61.5 (Mar. 2001), pp. 1810–1815.
[155] Jason W Locasale et al. “Phosphoglycerate dehydrogenase diverts gly-
colytic flux and contributes to oncogenesis.” In: Nature Genetics 43.9 (Sept.
2011), pp. 869–874.
[156] Taro Hitosugi et al. “Phosphoglycerate mutase 1 coordinates glycolysis and
biosynthesis to promote tumor growth.” In: Cancer cell 22.5 (Nov. 2012),
pp. 585–600.

BIBLIOGRAPHY 189
[157] Taro Hitosugi et al. “Tyr26 phosphorylation of PGAM1 provides a
metabolic advantage to tumours by stabilizing the active conformation.”
In: Nature communications 4 (2013), p. 1790.
[158] Junjie Li and Ji-Xin Cheng. “Direct visualization of de novo lipogenesis in
single living cells.” In: Scientific reports 4 (2014), p. 6807.
[159] Evelien Rysman et al. “De novo lipogenesis protects cancer cells from free
radicals and chemotherapeutics by promoting membrane lipid saturation.”
In: Cancer Research 70.20 (Oct. 2010), pp. 8117–8126.
[160] Nousheen Zaidi, Johannes V Swinnen, and Karine Smans. “ATP-citrate
lyase: a key player in cancer metabolism.” In: Cancer Research 72.15 (Aug.
2012), pp. 3709–3714.
[161] L Tong. “Acetyl-coenzyme A carboxylase: crucial metabolic enzyme and
attractive target for drug discovery.” In: Cellular and molecular life sciences
: CMLS 62.16 (Aug. 2005), pp. 1784–1803.
[162] Javier A Menendez and Ruth Lupu. “Fatty acid synthase and the lipogenic
phenotype in cancer pathogenesis.” In: Nature reviews. Cancer 7.10 (Oct.
2007), pp. 763–777.
[163] R Ariel Igal. “Stearoyl-CoA desaturase-1: a novel key player in the mech-
anisms of cell proliferation, programmed cell death and transformation to
cancer.” In: Carcinogenesis 31.9 (Sept. 2010), pp. 1509–1515.
[164] Daniel C Berwick et al. “The identification of ATP-citrate lyase as a protein
kinase B (Akt) substrate in primary adipocytes.” In: The Journal of biolog-
ical chemistry 277.37 (Sept. 2002), pp. 33895–33900.
[165] Katharina Tomek et al. “Blockade of fatty acid synthase induces ubiquiti-
nation and degradation of phosphoinositide-3-kinase signaling proteins in
ovarian cancer.” In: Molecular cancer research : MCR 9.12 (Dec. 2011),
pp. 1767–1779.

190 BIBLIOGRAPHY
[166] Olga Aprelikova et al. “Regulation of HIF prolyl hydroxylases by hypoxia-
inducible factors.” In: Journal of cellular biochemistry 92.3 (June 2004),
pp. 491–501.
[167] Julian J Lum et al. “The transcription factor HIF-1alpha plays a critical role
in the growth factor-dependent regulation of both aerobic and anaerobic
glycolysis.” In: Genes & development 21.9 (May 2007), pp. 1037–1049.
[168] G L Semenza et al. “Transcriptional regulation of genes encoding gly-
colytic enzymes by hypoxia-inducible factor 1.” In: The Journal of bio-
logical chemistry 269.38 (Sept. 1994), pp. 23757–23763.
[169] Jung-whan Kim et al. “HIF-1-mediated expression of pyruvate dehydroge-
nase kinase: a metabolic switch required for cellular adaptation to hypoxia.”
In: Cell metabolism 3.3 (Mar. 2006), pp. 177–185.
[170] M Tatibana et al. “Mammalian phosphoribosyl-pyrophosphate synthetase.”
In: Advances in enzyme regulation 35 (1995), pp. 229–249.
[171] A M Robitaille et al. “Quantitative Phosphoproteomics Reveal mTORC1
Activates de Novo Pyrimidine Synthesis”. In: Science (New York, NY)
339.6125 (Mar. 2013), pp. 1320–1323.
[172] I Ben-Sahra et al. “Stimulation of de Novo Pyrimidine Synthesis by Growth
Signaling Through mTOR and S6K1”. In: Science (New York, NY) 339.6125
(Mar. 2013), pp. 1323–1328.
[173] Javier R Revollo, Andrew A Grimm, and Shin-ichiro Imai. “The regulation
of nicotinamide adenine dinucleotide biosynthesis by Nampt/PBEF/visfatin
in mammals.” In: Current opinion in gastroenterology 23.2 (Mar. 2007),
pp. 164–170.
[174] Robert W Sobol. “Preface. NAD metabolism and signaling: Critical path-
ways in bacteria, yeast and mammals influencing genome stability, cell sur-
vival and disease.” In: DNA repair 23 (Nov. 2014), pp. 1–3.

BIBLIOGRAPHY 191
[175] Andreas H Guse. “Regulation of calcium signaling by the second mes-
senger cyclic adenosine diphosphoribose (cADPR).” In: Current molecular
medicine 4.3 (May 2004), pp. 239–248.
[176] Mareike Butepage et al. “Intracellular Mono-ADP-Ribosylation in Signal-
ing and Disease.” In: Cells 4.4 (2015), pp. 569–595.
[177] Henning Kleine et al. “Dynamic subcellular localization of the mono-
ADP-ribosyltransferase ARTD10 and interaction with the ubiquitin receptor
p62.” In: Cell communication and signaling : CCS 10.1 (2012), p. 28.
[178] Xuan Ou et al. “SIRT1 positively regulates autophagy and mitochondria
function in embryonic stem cells under oxidative stress.” In: Stem cells
(Dayton, Ohio) 32.5 (May 2014), pp. 1183–1194.
[179] Jing Wang et al. “Sirtinol, a class III HDAC inhibitor, induces apoptotic and
autophagic cell death in MCF-7 human breast cancer cells.” In: Interna-
tional journal of oncology 41.3 (Sept. 2012), pp. 1101–1109.
[180] Riekelt H Houtkooper, Eija Pirinen, and Johan Auwerx. “Sirtuins as reg-
ulators of metabolism and healthspan.” In: Nature reviews Molecular cell
biology 13.4 (Apr. 2012), pp. 225–238.
[181] Chiara Riganti et al. “The pentose phosphate pathway: an antioxidant de-
fense and a crossroad in tumor cell fate.” In: Free radical biology &
medicine 53.3 (Aug. 2012), pp. 421–436.
[182] Matthew G Vander Heiden, Lewis C Cantley, and Craig B Thompson. “Un-
derstanding the Warburg effect: the metabolic requirements of cell prolifer-
ation.” In: Science (New York, NY) 324.5930 (May 2009), pp. 1029–1033.
[183] Haoqiang Ying et al. “Oncogenic Kras maintains pancreatic tumors through
regulation of anabolic glucose metabolism.” In: Cell 149.3 (Apr. 2012),
pp. 656–670.
[184] M Krockenberger et al. “Expression of transketolase-like 1 protein
(TKTL1) in human endometrial cancer.” In: Anticancer research 30.5 (May
2010), pp. 1653–1659.

192 BIBLIOGRAPHY
[185] Iris Ming-Jing Xu et al. “Transketolase counteracts oxidative stress to drive
cancer development.” In: Proceedings of the National Academy of Sciences
of the United States of America 113.6 (Feb. 2016), E725–34.
[186] Hui Chen et al. “Overexpression of transketolase-like gene 1 is associated
with cell proliferation in uterine cervix cancer.” In: Journal of experimental
& clinical cancer research : CR 28 (2009), p. 43.
[187] Santiago Diaz-Moralli et al. “Transketolase-like 1 expression is modulated
during colorectal cancer progression and metastasis formation.” In: PloS
one 6.9 (2011), e25323.
[188] Alfonso Martın-Bernabe et al. “Quantitative proteomic approach to under-
stand metabolic adaptation in non-small cell lung cancer.” In: Journal of
proteome research 13.11 (Nov. 2014), pp. 4695–4704.
[189] E Tsouko et al. “Regulation of the pentose phosphate pathway by an an-
drogen receptor-mTOR-mediated mechanism and its role in prostate cancer
cell growth.” In: Oncogenesis 3 (2014), e103.
[190] R C Stanton et al. “Rapid release of bound glucose-6-phosphate dehydroge-
nase by growth factors. Correlation with increased enzymatic activity.” In:
The Journal of biological chemistry 266.19 (July 1991), pp. 12442–12448.
[191] Zhaoping Qiu et al. “MicroRNA-124 Reduces the Pentose Phosphate Path-
way and Proliferation by Targeting PRPS1 and RPIA mRNAs in Human
Colorectal Cancer Cells.” In: Gastroenterology (Aug. 2015).
[192] Peng Jiang et al. “p53 regulates biosynthesis through direct inactivation of
glucose-6-phosphate dehydrogenase.” In: Nature cell biology 13.3 (Mar.
2011), pp. 310–316.
[193] B Hove-Jensen and M Maigaard. “Escherichia coli rpiA gene encoding ri-
bose phosphate isomerase A.” In: Journal of bacteriology 175.17 (Sept.
1993), pp. 5628–5635.

BIBLIOGRAPHY 193
[194] T W Apel et al. “The ribose 5-phosphate isomerase-encoding gene is lo-
cated immediately downstream from that encoding murine immunoglobulin
kappa.” In: Gene 156.2 (Apr. 1995), pp. 191–197.
[195] Rong guang Zhang et al. “Structure of Escherichia coli ribose-5-phosphate
isomerase: a ubiquitous enzyme of the pentose phosphate pathway and the
Calvin cycle.” In: Structure (London, England : 1993) 11.1 (Jan. 2003),
pp. 31–42.
[196] Preet Kamal Kaur et al. “Mutational and Structural Analysis of Conserved
Residues in Ribose-5-Phosphate Isomerase B from Leishmania donovani:
Role in Substrate Recognition and Conformational Stability.” In: PloS one
11.3 (2016), e0150764.
[197] John C Obenauer, Lewis C Cantley, and Michael B Yaffe. “Scansite 2.0:
Proteome-wide prediction of cell signaling interactions using short se-
quence motifs.” In: Nucleic acids research 31.13 (July 2003), pp. 3635–
3641.
[198] Ching-Tzu Wang et al. “Reduced neuronal expression of ribose-5-
phosphate isomerase enhances tolerance to oxidative stress, extends lifes-
pan, and attenuates polyglutamine toxicity in Drosophila.” In: Aging cell
11.1 (Feb. 2012), pp. 93–103.
[199] Jojanneke H J Huck et al. “Ribose-5-phosphate isomerase deficiency: new
inborn error in the pentose phosphate pathway associated with a slowly
progressive leukoencephalopathy.” In: American journal of human genet-
ics 74.4 (Apr. 2004), pp. 745–751.
[200] Vassili Valayannopoulos et al. “Transaldolase deficiency: a new cause of
hydrops fetalis and neonatal multi-organ disease.” In: The Journal of pedi-
atrics 149.5 (Nov. 2006), pp. 713–717.
[201] M M C Wamelink, E A Struys, and C Jakobs. “The biochemistry,
metabolism and inherited defects of the pentose phosphate pathway: a re-

194 BIBLIOGRAPHY
view.” In: Journal of inherited metabolic disease 31.6 (Dec. 2008), pp. 703–
717.
[202] Shih-Ci Ciou et al. “Ribose-5-phosphate isomerase a regulates hepatocar-
cinogenesis via PP2A and ERK signaling.” In: International journal of can-
cer. Journal international du cancer (Nov. 2014), n–a–n–a.
[203] Ralph J DeBerardinis and Craig B Thompson. “Cellular metabolism and
disease: what do metabolic outliers teach us?” In: Cell 148.6 (Mar. 2012),
pp. 1132–1144.
[204] L G Boros et al. “Oxythiamine and dehydroepiandrosterone inhibit the
nonoxidative synthesis of ribose and tumor cell proliferation.” In: Cancer
Research 57.19 (Oct. 1997), pp. 4242–4248.
[205] Krushna C Patra and Nissim Hay. “The pentose phosphate pathway and
cancer.” In: Trends in biochemical sciences 39.8 (Aug. 2014), pp. 347–354.
[206] Arindam Saha et al. “Akt phosphorylation and regulation of transketolase
is a nodal point for amino acid control of purine synthesis.” In: Molecular
cell 55.2 (July 2014), pp. 264–276.
[207] S Langbein et al. “Expression of transketolase TKTL1 predicts colon and
urothelial cancer patient survival: Warburg effect reinterpreted.” In: British
journal of cancer 94.4 (Feb. 2006), pp. 578–585.
[208] Ludmilla E Meshalkina et al. “Is transketolase-like protein, TKTL1, trans-
ketolase?” In: Biochimica et biophysica acta 1832.3 (Mar. 2013), pp. 387–
390.
[209] Robert Hanczko et al. “Prevention of hepatocarcinogenesis and increased
susceptibility to acetaminophen-induced liver failure in transaldolase-
deficient mice by N-acetylcysteine.” In: The Journal of clinical investi-
gation 119.6 (June 2009), pp. 1546–1557.
[210] Ana Mesquita et al. “Dissecting the function of Atg1 complex in Dic-
tyostelium autophagy reveals a connection with the pentose phosphate path-
way enzyme transketolase.” In: Open biology 5.8 (Aug. 2015).

BIBLIOGRAPHY 195
[211] Joseph Schlessinger. “Receptor tyrosine kinases: legacy of the first two
decades.” In: Cold Spring Harbor perspectives in biology 6.3 (Mar. 2014).
[212] Mark A Lemmon and Joseph Schlessinger. “Cell signaling by receptor ty-
rosine kinases.” In: Cell 141.7 (June 2010), pp. 1117–1134.
[213] Bert Vogelstein and Kenneth W Kinzler. “Cancer genes and the pathways
they control.” In: Nature medicine 10.8 (Aug. 2004), pp. 789–799.
[214] Shai Gavi et al. “G-protein-coupled receptors and tyrosine kinases: cross-
roads in cell signaling and regulation.” In: Trends in endocrinology and
metabolism: TEM 17.2 (Mar. 2006), pp. 48–54.
[215] B Gay et al. “Selective GRB2 SH2 inhibitors as anti-Ras therapy.” In: In-
ternational journal of cancer. Journal international du cancer 83.2 (Oct.
1999), pp. 235–241.
[216] Helen Morrison et al. “Merlin/neurofibromatosis type 2 suppresses growth
by inhibiting the activation of Ras and Rac.” In: Cancer Research 67.2 (Jan.
2007), pp. 520–527.
[217] Ihn Kyung Jang, Jinping Zhang, and Hua Gu. “Grb2, a simple adapter with
complex roles in lymphocyte development, function, and signaling.” In: Im-
munological reviews 232.1 (Nov. 2009), pp. 150–159.
[218] A M Cheng et al. “Mammalian Grb2 regulates multiple steps in embry-
onic development and malignant transformation.” In: Cell 95.6 (Dec. 1998),
pp. 793–803.
[219] Chi-Chuan Lin et al. “Inhibition of Basal FGF Receptor Signaling by
Dimeric Grb2”. In: Cell 149.7 (June 2012), pp. 1514–1524.
[220] Artur A Belov and Moosa Mohammadi. “Grb2, a double-edged sword of re-
ceptor tyrosine kinase signaling.” In: Science signaling 5.249 (2012), pe49.
[221] E J Lowenstein et al. “The SH2 and SH3 domain-containing protein GRB2
links receptor tyrosine kinases to ras signaling.” In: Cell 70.3 (Aug. 1992),
pp. 431–442.

196 BIBLIOGRAPHY
[222] Xuejun Jiang et al. “Grb2 regulates internalization of EGF receptors through
clathrin-coated pits.” In: Molecular biology of the cell 14.3 (Mar. 2003),
pp. 858–870.
[223] Jochen A Ackermann et al. “Grb2 regulates B-cell maturation, B-cell mem-
ory responses and inhibits B-cell Ca2+ signalling.” In: The EMBO journal
30.8 (Apr. 2011), pp. 1621–1633.
[224] Caleb B McDonald et al. “Multivalent binding and facilitated diffusion ac-
count for the formation of the Grb2-Sos1 signaling complex in a cooperative
manner.” In: Biochemistry 51.10 (Mar. 2012), pp. 2122–2135.
[225] Jon C D Houtman et al. “Oligomerization of signaling complexes by the
multipoint binding of GRB2 to both LAT and SOS1.” In: Nature structural
& molecular biology 13.9 (Sept. 2006), pp. 798–805.
[226] Yuliya Pylayeva-Gupta, Elda Grabocka, and Dafna Bar-Sagi. “RAS onco-
genes: weaving a tumorigenic web.” In: Nature reviews. Cancer 11.11 (Nov.
2011), pp. 761–774.
[227] Norbert Berndt, Andrew D Hamilton, and Saıd M Sebti. “Targeting protein
prenylation for cancer therapy.” In: Nature reviews. Cancer 11.11 (Nov.
2011), pp. 775–791.
[228] Jasminka Omerovic and Ian A Prior. “Compartmentalized signalling: Ras
proteins and signalling nanoclusters.” In: The FEBS journal 276.7 (Apr.
2009), pp. 1817–1825.
[229] Vivek Asati, Debarshi Kar Mahapatra, and Sanjay Kumar Bharti.
“PI3K/Akt/mTOR and Ras/Raf/MEK/ERK signaling pathways inhibitors
as anticancer agents: Structural and pharmacological perspectives.” In: Eu-
ropean journal of medicinal chemistry 109 (Feb. 2016), pp. 314–341.
[230] Michelle C Mendoza, E Emrah Er, and John Blenis. “The Ras-ERK and
PI3K-mTOR pathways: cross-talk and compensation.” In: Trends in bio-
chemical sciences 36.6 (June 2011), pp. 320–328.

BIBLIOGRAPHY 197
[231] Inbal Wortzel and Rony Seger. “The ERK Cascade: Distinct Functions
within Various Subcellular Organelles.” In: Genes & cancer 2.3 (Mar.
2011), pp. 195–209.
[232] Claudia Wellbrock, Maria Karasarides, and Richard Marais. “The RAF pro-
teins take centre stage.” In: Nature reviews Molecular cell biology 5.11
(Nov. 2004), pp. 875–885.
[233] Huira Chong, Haris G Vikis, and Kun-Liang Guan. “Mechanisms of reg-
ulating the Raf kinase family.” In: Cellular signalling 15.5 (May 2003),
pp. 463–469.
[234] U R Rapp et al. “Structure and biological activity of v-raf, a unique onco-
gene transduced by a retrovirus.” In: Proceedings of the National Academy
of Sciences of the United States of America 80.14 (July 1983), pp. 4218–
4222.
[235] J C Luckett et al. “Expression of the A-raf proto-oncogene in the normal
adult and embryonic mouse.” In: Cell growth & differentiation : the molec-
ular biology journal of the American Association for Cancer Research 11.3
(Mar. 2000), pp. 163–171.
[236] S Zimmermann and K Moelling. “Phosphorylation and regulation of Raf by
Akt (protein kinase B).” In: Science (New York, NY) 286.5445 (Nov. 1999),
pp. 1741–1744.
[237] M Jaumot and J F Hancock. “Protein phosphatases 1 and 2A promote Raf-
1 activation by regulating 14-3-3 interactions.” In: Oncogene 20.30 (July
2001), pp. 3949–3958.
[238] Shujie Han and Kathryn E Meier. “Integrated modulation of phorbol ester-
induced Raf activation in EL4 lymphoma cells.” In: Cellular signalling 21.5
(May 2009), pp. 793–800.
[239] C F Zheng and K L Guan. “Properties of MEKs, the kinases that phosphory-
late and activate the extracellular signal-regulated kinases.” In: The Journal
of biological chemistry 268.32 (Nov. 1993), pp. 23933–23939.

198 BIBLIOGRAPHY
[240] Christophe Fremin and Sylvain Meloche. “From basic research to clini-
cal development of MEK1/2 inhibitors for cancer therapy.” In: Journal of
hematology & oncology 3 (2010), p. 8.
[241] Robert Roskoski. “MEK1/2 dual-specificity protein kinases: structure and
regulation.” In: Biochemical and biophysical research communications
417.1 (Jan. 2012), pp. 5–10.
[242] A Alessandrini et al. “Mek1 phosphorylation site mutants activate Raf-1 in
NIH 3T3 cells.” In: The Journal of biological chemistry 271.49 (Dec. 1996),
pp. 31612–31618.
[243] Seunghee Yoon and Rony Seger. “The extracellular signal-regulated kinase:
multiple substrates regulate diverse cellular functions.” In: Growth factors
(Chur, Switzerland) 24.1 (Mar. 2006), pp. 21–44.
[244] Xiaoqi Liu et al. “The MAP kinase pathway is required for entry into mitosis
and cell survival.” In: Oncogene 23.3 (Jan. 2004), pp. 763–776.
[245] Alexander Plotnikov et al. “The MAPK cascades: signaling components,
nuclear roles and mechanisms of nuclear translocation.” In: Biochimica et
biophysica acta 1813.9 (Sept. 2011), pp. 1619–1633.
[246] Robert Roskoski. “ERK1/2 MAP kinases: structure, function, and regula-
tion.” In: Pharmacological research 66.2 (Aug. 2012), pp. 105–143.
[247] D J Robbins et al. “MAP kinases ERK1 and ERK2: pleiotropic enzymes in
a ubiquitous signaling network.” In: Advances in cancer research 63 (1994),
pp. 93–116.
[248] Miki Ebisuya, Kunio Kondoh, and Eisuke Nishida. “The duration, magni-
tude and compartmentalization of ERK MAP kinase activity: mechanisms
for providing signaling specificity.” In: Journal of cell science 118.Pt 14
(July 2005), pp. 2997–3002.
[249] Christopher J Caunt and Craig A McArdle. “ERK phosphorylation and nu-
clear accumulation: insights from single-cell imaging.” In: Biochemical So-
ciety transactions 40.1 (Feb. 2012), pp. 224–229.

BIBLIOGRAPHY 199
[250] Chiara Vantaggiato et al. “ERK1 and ERK2 mitogen-activated protein ki-
nases affect Ras-dependent cell signaling differentially.” In: Journal of bi-
ology 5.5 (2006), p. 14.
[251] G Pages et al. “Defective thymocyte maturation in p44 MAP kinase (Erk
1) knockout mice.” In: Science (New York, NY) 286.5443 (Nov. 1999),
pp. 1374–1377.
[252] Dong-Jun Peng, Jun-Ying Zhou, and Gen Sheng Wu. “Post-translational
regulation of mitogen-activated protein kinase phosphatase-2 (MKP-2) by
ERK.” In: Cell cycle (Georgetown, Tex) 9.23 (Dec. 2010), pp. 4650–4655.
[253] Deborah K Morrison and Roger J Davis. “Regulation of MAP kinase sig-
naling modules by scaffold proteins in mammals.” In: Annual review of cell
and developmental biology 19 (2003), pp. 91–118.
[254] Alan J Whitmarsh. “Regulation of gene transcription by mitogen-activated
protein kinase signaling pathways.” In: Biochimica et biophysica acta
1773.8 (Aug. 2007), pp. 1285–1298.
[255] Xin Li et al. “ERK-dependent threonine phosphorylation of EGF receptor
modulates receptor downregulation and signaling.” In: Cellular signalling
20.11 (Nov. 2008), pp. 2145–2155.
[256] Yuji Kamioka et al. “Multiple decisive phosphorylation sites for the nega-
tive feedback regulation of SOS1 via ERK.” In: The Journal of biological
chemistry 285.43 (Oct. 2010), pp. 33540–33548.
[257] Siyuan Zhang and Dihua Yu. “PI(3)king apart PTEN’s role in cancer.” In:
Clinical cancer research : an official journal of the American Association
for Cancer Research 16.17 (Sept. 2010), pp. 4325–4330.
[258] Ingrid A Mayer and Carlos L Arteaga. “The PI3K/AKT Pathway as a Tar-
get for Cancer Treatment.” In: Annual review of medicine 67 (Jan. 2016),
pp. 11–28.

200 BIBLIOGRAPHY
[259] Camillo Porta and Robert A Figlin. “Phosphatidylinositol-3-kinase/Akt
signaling pathway and kidney cancer, and the therapeutic potential of
phosphatidylinositol-3-kinase/Akt inhibitors.” In: The Journal of urology
182.6 (Dec. 2009), pp. 2569–2577.
[260] D A Fruman, R E Meyers, and L C Cantley. “Phosphoinositide kinases.”
In: Annual review of biochemistry 67 (1998), pp. 481–507.
[261] Brendan D Manning and Lewis C Cantley. “AKT/PKB signaling: navigat-
ing downstream.” In: Cell 129.7 (June 2007), pp. 1261–1274.
[262] Ingeborg Hers, Emma E Vincent, and Jeremy M Tavare. “Akt signalling in
health and disease.” In: Cellular signalling 23.10 (Oct. 2011), pp. 1515–
1527.
[263] Thomas F Franke et al. “PI3K/Akt and apoptosis: size matters.” In: Onco-
gene 22.56 (Dec. 2003), pp. 8983–8998.
[264] P T Hawkins et al. “Signalling through Class I PI3Ks in mammalian cells.”
In: Biochemical Society transactions 34.Pt 5 (Nov. 2006), pp. 647–662.
[265] Reuben J Shaw and Lewis C Cantley. “Ras, PI(3)K and mTOR signalling
controls tumour cell growth.” In: Nature 441.7092 (May 2006), pp. 424–
430.
[266] Mathieu Laplante and David M Sabatini. “mTOR signaling in growth con-
trol and disease.” In: Cell 149.2 (Apr. 2012), pp. 274–293.
[267] R Cafferkey et al. “Dominant missense mutations in a novel yeast protein
related to mammalian phosphatidylinositol 3-kinase and VPS34 abrogate
rapamycin cytotoxicity.” In: Molecular and cellular biology 13.10 (Oct.
1993), pp. 6012–6023.
[268] Timothy R Peterson et al. “DEPTOR is an mTOR inhibitor frequently over-
expressed in multiple myeloma cells and required for their survival.” In:
Cell 137.5 (May 2009), pp. 873–886.

BIBLIOGRAPHY 201
[269] Anya Alayev and Marina K Holz. “mTOR signaling for biological con-
trol and cancer.” In: Journal of cellular physiology 228.8 (Aug. 2013),
pp. 1658–1664.
[270] Esther J Chen and Chris A Kaiser. “LST8 negatively regulates amino acid
biosynthesis as a component of the TOR pathway.” In: The Journal of cell
biology 161.2 (Apr. 2003), pp. 333–347.
[271] Haijuan Yang et al. “mTOR kinase structure, mechanism and regulation.”
In: Nature 497.7448 (May 2013), pp. 217–223.
[272] D D Sarbassov et al. “Rictor, a novel binding partner of mTOR, defines
a rapamycin-insensitive and raptor-independent pathway that regulates the
cytoskeleton.” In: Current biology : CB 14.14 (July 2004), pp. 1296–1302.
[273] Kenta Hara et al. “Raptor, a binding partner of target of rapamycin (TOR),
mediates TOR action.” In: Cell 110.2 (July 2002), pp. 177–189.
[274] Xiaoju Max Ma and John Blenis. “Molecular mechanisms of mTOR-
mediated translational control.” In: Nature reviews Molecular cell biology
10.5 (May 2009), pp. 307–318.
[275] Do-Hyung Kim et al. “mTOR interacts with raptor to form a nutrient-
sensitive complex that signals to the cell growth machinery.” In: Cell 110.2
(July 2002), pp. 163–175.
[276] Jonathan R Hart and Peter K Vogt. “Phosphorylation of AKT: a mutational
analysis.” In: Oncotarget 2.6 (June 2011), pp. 467–476.
[277] Jeremiah N Winter, Leonard S Jefferson, and Scot R Kimball. “ERK and
Akt signaling pathways function through parallel mechanisms to promote
mTORC1 signaling.” In: American journal of physiology. Cell physiology
300.5 (May 2011), pp. C1172–80.
[278] Ken Inoki et al. “TSC2 is phosphorylated and inhibited by Akt and
suppresses mTOR signalling.” In: Nature cell biology 4.9 (Sept. 2002),
pp. 648–657.

202 BIBLIOGRAPHY
[279] Ken Inoki, Tianqing Zhu, and Kun-Liang Guan. “TSC2 mediates cellular
energy response to control cell growth and survival.” In: Cell 115.5 (Nov.
2003), pp. 577–590.
[280] James J Gibbons, Robert T Abraham, and Ker Yu. “Mammalian target of
rapamycin: discovery of rapamycin reveals a signaling pathway important
for normal and cancer cell growth.” In: Seminars in oncology 36 Suppl 3
(Dec. 2009), S3–S17.
[281] Haitao Wang et al. “Proline-rich Akt substrate of 40kDa (PRAS40): a novel
downstream target of PI3k/Akt signaling pathway.” In: Cellular signalling
24.1 (Jan. 2012), pp. 17–24.
[282] Geetu Tuteja and Klaus H Kaestner. “Forkhead transcription factors II.” In:
Cell 131.1 (Oct. 2007), p. 192.
[283] Xinbo Zhang et al. “Akt, FoxO and regulation of apoptosis.” In: Biochimica
et biophysica acta 1813.11 (Nov. 2011), pp. 1978–1986.
[284] Geetu Tuteja and Klaus H Kaestner. “SnapShot: forkhead transcription fac-
tors I.” In: Cell 130.6 (Sept. 2007), p. 1160.
[285] Astrid Eijkelenboom and Boudewijn M T Burgering. “FOXOs: signalling
integrators for homeostasis maintenance.” In: Nature reviews Molecular cell
biology 14.2 (Feb. 2013), pp. 83–97.
[286] Jinghui Zhao et al. “FoxO3 coordinately activates protein degradation by
the autophagic/lysosomal and proteasomal pathways in atrophying muscle
cells.” In: Cell metabolism 6.6 (Dec. 2007), pp. 472–483.
[287] Arunima Sengupta, Jeffery D Molkentin, and Katherine E Yutzey. “FoxO
transcription factors promote autophagy in cardiomyocytes.” In: The Jour-
nal of biological chemistry 284.41 (Oct. 2009), pp. 28319–28331.
[288] Arnold J Kahn. “FOXO3 and Related Transcription Factors in Develop-
ment, Aging, and Exceptional Longevity.” In: The journals of gerontology.
Series A, Biological sciences and medical sciences (Apr. 2014).

BIBLIOGRAPHY 203
[289] Hien Tran et al. “The many forks in FOXO’s road.” In: Science’s STKE :
signal transduction knowledge environment 2003.172 (Mar. 2003), RE5.
[290] R Ketteler et al. “Enhanced transgene expression in primitive hematopoietic
progenitor cells and embryonic stem cells efficiently transduced by opti-
mized retroviral hybrid vectors.” In: Gene therapy 9.8 (Apr. 2002), pp. 477–
487.
[291] F Ann Ran et al. “Double nicking by RNA-guided CRISPR Cas9 for en-
hanced genome editing specificity.” In: Cell 154.6 (Sept. 2013), pp. 1380–
1389.
[292] Jojanneke H J Huck et al. “Profiling of pentose phosphate pathway interme-
diates in blood spots by tandem mass spectrometry: application to transal-
dolase deficiency.” In: Clinical chemistry 49.8 (Aug. 2003), pp. 1375–1380.
[293] Deike J Omnus et al. “Phosphoinositide kinase signaling controls ER-PM
cross-talk.” In: Molecular biology of the cell 27.7 (Apr. 2016), pp. 1170–
1180.
[294] Carlos L Arteaga and Jeffrey A Engelman. “ERBB receptors: from onco-
gene discovery to basic science to mechanism-based cancer therapeutics.”
In: Cancer cell 25.3 (Mar. 2014), pp. 282–303.
[295] Christophe Antczak et al. “Domain-based biosensor assay to screen for epi-
dermal growth factor receptor modulators in live cells.” In: Assay and drug
development technologies 10.1 (Feb. 2012), pp. 24–36.
[296] S Y Yoon et al. “Dynamin II associates with Grb2 SH3 domain in Ras trans-
formed NIH3T3 cells.” In: Biochemical and biophysical research commu-
nications 234.3 (May 1997), pp. 539–543.
[297] Anna Stincone et al. “The return of metabolism: biochemistry and physiol-
ogy of the pentose phosphate pathway.” In: Biological reviews of the Cam-
bridge Philosophical Society (Sept. 2014).

204 BIBLIOGRAPHY
[298] Veronique Hannaert et al. “Plant-like traits associated with metabolism of
Trypanosoma parasites.” In: Proceedings of the National Academy of Sci-
ences of the United States of America 100.3 (Feb. 2003), pp. 1067–1071.
[299] Maria G Tozzi et al. “Pentose phosphates in nucleoside interconversion and
catabolism.” In: The FEBS journal 273.6 (Mar. 2006), pp. 1089–1101.
[300] Jennifer Bordeaux et al. “Antibody validation.” In: BioTechniques 48.3
(Mar. 2010), pp. 197–209.
[301] Daniel J Klionsky. “Coming soon to a journal near you — the updated
guidelines for the use and interpretation of assays for monitoring au-
tophagy.” In: Autophagy 10.10 (Oct. 2014), p. 1691.
[302] Annette K Roos et al. “Mycobacterium tuberculosis ribose-5-phosphate iso-
merase has a known fold, but a novel active site.” In: Journal of molecular
biology 335.3 (Jan. 2004), pp. 799–809.
[303] Robin Ketteler et al. “A pathway sensor for genome-wide screens of intra-
cellular proteolytic cleavage.” In: Genome biology 9.4 (2008), R64.
[304] Robin Ketteler and Brian Seed. “Quantitation of autophagy by luciferase
release assay.” In: Autophagy 4.6 (Aug. 2008), pp. 801–806.
[305] Christin Luft et al. “Application of Gaussia luciferase in bicistronic and
non-conventional secretion reporter constructs.” In: BMC biochemistry 15
(2014), p. 14.
[306] Patrick D Hsu et al. “DNA targeting specificity of rNA-guided Cas9 nucle-
ases”. In: Nature biotechnology (June 2013), pp. 1–8.
[307] Andrew Adey et al. “The haplotype-resolved genome and epigenome of
the aneuploid HeLa cancer cell line.” In: Nature 500.7461 (Aug. 2013),
pp. 207–211.

BIBLIOGRAPHY 205
[308] Ji-Biao Huang et al. “Transaldolase is part of a supramolecular complex
containing glucose-6-phosphate dehydrogenase in human neutrophils that
undergoes retrograde trafficking during pregnancy.” In: Metabolism: clini-
cal and experimental 54.8 (Aug. 2005), pp. 1027–1033.
[309] Ju Hee Kim et al. “Differential methylation hybridization profiling identi-
fies involvement of STAT1-mediated pathways in breast cancer.” In: Inter-
national journal of oncology 39.4 (June 2011), pp. 955–963.
[310] Matthew G Vander Heiden et al. “Evidence for an alternative glycolytic
pathway in rapidly proliferating cells.” In: Science (New York, NY) 329.5998
(Sept. 2010), pp. 1492–1499.
[311] V Stone et al. “International Journal of Developmental Neuroscience”.
In: International Journal of Developmental Neuroscience 37 (Oct. 2014),
pp. 21–25.
[312] Jacob Heintze et al. “Ribose 5-phosphate isomerase inhibits LC3 processing
and basal autophagy.” In: Cellular signalling 28.9 (June 2016), pp. 1380–
1388.
[313] In Hye Lee and Toren Finkel. “Regulation of autophagy by the p300 acetyl-
transferase.” In: The Journal of biological chemistry 284.10 (Mar. 2009),
pp. 6322–6328.
[314] Jiarui Wang et al. “Inhibition of transketolase by oxythiamine altered dy-
namics of protein signals in pancreatic cancer cells.” In: Experimental
hematology & oncology 2 (2013), p. 18.
[315] M Nishimura and K Uyeda. “Purification and characterization of a novel
xylulose 5-phosphate-activated protein phosphatase catalyzing dephospho-
rylation of fructose-6-phosphate,2-kinase:fructose-2,6-bisphosphatase.” In:
The Journal of biological chemistry 270.44 (Nov. 1995), pp. 26341–26346.
[316] Bertram O Fraser-Reid, Kuniaki Tatsuta, and Joachim Thiem. Glyco-
science: Chemistry and Chemical Biology I–III. Springer Science & Busi-
ness Media, Dec. 2012.

206 BIBLIOGRAPHY
[317] E Vives et al. “TAT Peptide Internalization: Seeking the Mechanism of En-
try”. In: Current Protein & Peptide Science 4.2 (Apr. 2003), pp. 125–132.
[318] D Raafat, K Von Bargen, and A Haas. “Insights into the mode of action of
chitosan as an antibacterial compound”. In: Applied and . . . (2008).
[319] John F Ryley. Chemotherapy of Fungal Diseases. Springer Science & Busi-
ness Media, Dec. 2012.
[320] George S Krasnov et al. “Targeting VDAC-bound hexokinase II: a promis-
ing approach for concomitant anti-cancer therapy.” In: Expert opinion on
therapeutic targets 17.10 (Oct. 2013), pp. 1221–1233.