Assessment of Magnesium Potassium Phosphate Cement ...
266
Assessment of Magnesium Potassium Phosphate Cement Systems for Radioactive Waste Encapsulation Laura Jane Gardner A thesis submitted in partial fulfilment for the degree of Doctor of Philosophy Immobilisation Science Laboratory Department of Materials Science and Engineering The University of Sheffield September 2016
-
Upload
khangminh22 -
Category
Documents
-
view
2 -
download
0
Transcript of Assessment of Magnesium Potassium Phosphate Cement ...

Assessment of Magnesium Potassium
Phosphate Cement Systems for Radioactive
Waste Encapsulation
Laura Jane Gardner
A thesis submitted in partial fulfilment for the degree of Doctor of Philosophy
Immobilisation Science Laboratory
Department of Materials Science and Engineering
The University of Sheffield
September 2016


i
Abstract
In the UK, the current stabilisation/solidification technique for intermediate level
waste (ILW) is for encapsulation in a Portland cement (PC) composite, which have
desirable physical and chemical interactions with ILWs. However, niche waste
streams such as reactive metals are known to corrode in the high pH and high free
water environment of PCs. Corrosion can lead to the formation of expansive products
and the generation of hydrogen. Consequently, there is a growing demand for
tailored encapsulant grouts that can be chosen based on the chemical compatibility
with the waste streams. Magnesium potassium phosphate cements (MKPCs) formed
via an acid-base reaction, with a near-neutral pH and low water demand are one of
the alternative encapsulants under consideration for such niche wastes.
The aim of this project was to assess MKPCs for deployment in the nuclear industry
with particular focus on: formulation optimisation, chemical stability with wastes,
radiation tolerance and performance in accident scenarios, i.e. thermal incident.
Uranium corrosion trials revealed a reduced gas generation compared to the
standard industry grout. It was also demonstrated that the inclusion of
supplementary cementitious materials in MKPCs (to form FA/MKPC and GBFS/MKPC)
can lead to the formation of secondary reaction products, likely to be potassium
aluminosilicates. The high temperature behaviour (i.e. thermal incident) and the
radiation tolerance of blended MKPC binders were chosen to demonstrate the
suitability of these binders for the UK nuclear industry. The high temperature
performance indicated substantial phase assemblage changes occurred up to 1200
°C, however no cracking or spalling of the pellets exposed to high temperatures was
observed, which is an important physical property and could to avoid/limit the
radioactivity release in a fire scenario. Whilst, the irradiation experiments (up to 10
MGy) revealed that blended MKPC binders exhibit considerable gamma radiation
tolerance (regardless of dose rate). The work demonstrated in this thesis indicates
that MKPC binders could be a suitable encapsulant for use in the UK but further work
involving scaled up experiments are still needed to provide an in-depth safety case.

ii

iii
Acknowledgments
First of all, I would like to express my gratitude to Prof. Neil Hyatt and Dr. Claire
Corkhill for their continued support, patience and encouragement throughout the
entirety of this research project. A special thanks to Prof. John Provis and Dr. Susan
Bernal-López, who became unofficial supervisors (willingly…I hope) and were always
available to offer their support, time and knowledge. I feel very luckily to have had
this team of supervisors throughout my Ph.D., again thank you very much!
A special thanks to Prof. Simon Pimblott and Ruth Edge based at the Dalton Cumbrian
Facility, University of Manchester, who undertook the role of irradiating the MKPC
samples in the Co-60 irradiator. I would like to express my appreciation to my family
and friends who have shown their constant love, encouragement and moral support
over the last few years.
I want to say a big thank you to Dr. Claire Corkhill, Dr. Samuel Walling, Ruth Bradley
and Valentin Lejeune who looked after my two-year uranium corrosion experiments
at times when I was absent from the university. I would also like to thank the
Immobilisation Science Laboratory group (ISL) for making it an exciting and dynamic
place to complete this research project, particularly Dr. Martin Stennett, Dr. Nik
Reeves, Dr. Oday Hussain and Andrew Mould for all your help.
Finally, I would like to thank the Nuclear Decommissioning Authority for funding this
studentship and giving me the opportunity to further my academic career.

iv

v
Publications
The author has contributed to the following peer-reviewed publications during this
body of research:
1. L.J. Gardner, V. Lejeune, C.L. Corkhill, S.A. Bernal, J.L. Provis, M.C. Stennett,
N.C. Hyatt, Evolution of the phase assemblage in magnesium potassium
phosphate cement binders at 200 and 1000 °C, Advances in Applied Ceramics
(invited response), 2015, vol. 114, pp. 386-392.
2. L.J. Gardner, S.A. Bernal, S.A. Walling, C.L. Corkhill, J.L. Provis, N.C. Hyatt,
Characterisation of magnesium potassium phosphate cements blended with
fly ash and blast furnace slag, Cement and Concrete Research, 2015, vol. 74,
pp. 78-87.
3. C.L. Corkhill, J.W. Bridge, P. Hillel, L.J. Gardner, S.A. Banwart, N.C. Hyatt,
Technetium-99m Transport and Immobilisation in Porous Media:
Development of a Novel Nuclear Imaging Technique, MRS Online Proceedings
Library, 2013, vol. 1518, pp. 123-129.
Oral Presentations
1. L.J. Gardner, V. Lejeune, C.L. Corkhill, S.A. Bernal, S.A. Walling, J.L. Provis, N.C.
Hyatt, High temperature study of FA/MKPC binders for nuclear waste
encapsulation, 34th Cement and Concrete Science Conference and Workshop
of Waste Cementation; Sheffield, UK, Sept 14-17, 2014, printed proceedings,
pp. 381-385.
2. L.J. Gardner, C.L. Corkhill, S.A. Bernal, N.C. Collier, J.L. Provis, N.C. Hyatt,
Assessment of magnesium potassium phosphate cement as an encapsulant
for radioactive waste: 1, immobilisation of 99Tc, 33rd Cement and Concrete
Science Conference; Portsmouth, UK, Sept 2-3, 2013, printed proceedings, pp.
74-78.

vi
Poster Presentations
1. L.J. Gardner, V. Lejeune, C.L. Corkhill, S.A. Bernal, S.A. Walling, J.L. Provis, N.C.
Hyatt, High resolution multi-nuclear NMR characterisation of a novel
GBFS/MKPC binder for nuclear waste encapsulation, 34th Cement and
Concrete Science Conference and Workshop of Waste Cementation; Sheffield,
UK, Sept 14-17; 2014, printed proceedings, pp. 499-502.
2. L.J. Gardner, C.L. Corkhill, S.A. Bernal, S.A. Walling, V. Lejeune, J.L. Provis, S.M.
Pimblott, N.C. Hyatt, Development of blended MKPC binders for radioactive
waste encapsulation applications, Nuclear Decommissioning Authority PhD
seminar; Manchester, UK, Jan 29th, 2013.
3. L.J. Gardner, C.L. Corkhill, S.A. Bernal, N.C. Collier, J.L. Provis, N.C. Hyatt,
Assessment of magnesium potassium phosphate cement as an encapsulant
for radioactive waste: 1, radiation tolerance, 33rd Cement and Concrete
Science Conference; Portsmouth, UK, Sept 2-3, 2013, printed proceedings, pp.
306-310.
4. L.J. Gardner, S.M. Pimblott, N.C. Hyatt, Defining the formulation envelope of
magnesium potassium phosphate composites for waste encapsulation, 32nd
Cement and Concrete Science Conference; Belfast, UK, Sept 17-18, 2012,
printed proceedings, pp. 174-179.
Industry Events
1. L.J. Gardner, C.L. Corkhill, S.A. Bernal, S.A. Walling, V. Lejeune, J.L. Provis, S.M.
Pimblott, N.C. Hyatt, Assessment of blended MKPC binders for radioactive
waste encapsulation applications, 3rd Nuclear Decommissioning Authority
PhD seminar; Manchester, UK, Jan 14th, 2015 (poster).
2. L.J. Gardner, C.L. Corkhill, S.A. Bernal, S.A. Walling, V. Lejeune, J.L. Provis, S.M.
Pimblott, N.C. Hyatt, Understanding the chemical, mechanical and radiation
stability of a magnesium potassium phosphate cement composite, 1st Nuclear
Decommissioning Authority PhD seminar; Manchester, UK, Jan 29th, 2013
(abstract).

vii
List of Abbreviations
ANL Argonne National Laboratory
BET Braunauer-Emmett-Teller
CAC Calcium aluminate cement
CAP Calcium aluminate phosphate cement
C-(A)-S-H Al-substituted calcium silicate hydrate
CBC Chemically bonded ceramic
CBPC Chemically bonded phosphate ceramic
CP Cross polarisation
CS Compressive strength
CSA Calcium sulphoaluminate cement
C-S-H Calcium silicate hydrate
DBM Dead burnt magnesia
DTA Differential thermal analysis
DTG Differential thermogravimetry
EDX Energy dispersive X-ray spectroscopy
FA Fly ash
GBFS Ground granulated blast furnace slag
GDF Geological disposal facility
HLW High level waste
HTXRD High temperature X-ray diffraction
IAEA Internal Atomic Energy Agency
ICDD International centre for diffraction data
IC Isothermal calorimetry
ILW Intermediate level waste
KDP Potassium dihydrogen phosphate
LLW Low level waste
LLWR Low level waste repository
MAS Magic angle spinning
MAP Magnesium ammonium phosphate
MEP Magnox encapsulation plant

viii
Mg/P Magnesium to phosphate molar ratio
MKPC Magnesium potassium phosphate cement
MPC Magnesium phosphate cement
MSSS Magnox swarf storage silo
NDA Nuclear Decommissioning Authority
NIST National Institute of Standards and Technology
NMR Nuclear magnetic resonance
NSLS National synchrotron light source
PC Portland cement
PSD Particle size distribution
RWM Radioactive Waste Management Ltd
SCM Supplementary cementitious materials
SEM Scanning electron microscope
SNF Spent nuclear fuel
SRM Standard reference material
SSC Supersulphated cement
SXRD Synchrotron X-ray diffraction
TGA Thermogravimetric analysis
w/s Water-to-solids ratio
XRD X-ray diffraction
XRF X-ray fluorescence

ix
List of Equations
Mg (s) + 2H2O (l) Mg(OH)2 (s) + H2 (g) Eq. 1
2Al (s) + 6H2O (l) 2Al(OH)3 (s) + 3H2 (g) Eq. 2
U (s) + 2H2O (l) UO2 (s) + 2H2 (g) Eq. 3
MgO (s) + KH2PO4 (s) + 5H2O (l) MgKPO4·6H2O (s) Eq. 4
KH2PO4 (s) H2PO4-
(aq) + K+ (aq) Eq. 5
MgO (s) + H2O (l) MgOH+ (aq) + OH- (aq) Eq. 6
MgOH+ (aq) + 6H2O (l) [Mg(H2O)6]2+ (aq) + OH-
(aq) Eq. 7
MgKPO4·6H2O (s) MgKPO4 (s) + 6H2O (g) Eq. 8
MgO (s) + NH4H2PO4 (s) + 5H2O (l) MgNH4PO4·6H2O (s) Eq. 9

x

xi
Contents
Abstract i
Acknowledgments iii
Publications v
List of Abbreviations vii
List of Equations ix
1 Introduction .................................................................................................. 1
1.1 UK nuclear waste ........................................................................................... 1
1.1.1 Magnox swarf ................................................................................................... 2
1.2 Geological disposal facility.............................................................................. 4
1.3 Project aims ................................................................................................... 6
2 Literature review .......................................................................................... 7
2.1 Portland cement ............................................................................................ 7
2.2 Alternative encapsulation grouts .................................................................. 10
2.3 Magnesium potassium phosphate cement .................................................... 11
2.3.1 Nomenclature history .................................................................................... 11
2.3.2 Acid-base reaction ......................................................................................... 12
2.3.3 The effect of MgO calcination ........................................................................ 13
2.3.4 The retardation mechanism ........................................................................... 14
2.3.5 Applications of MKPCs ................................................................................... 16
2.4 Summary ..................................................................................................... 19
3 Materials and methods ............................................................................... 21
3.1 Materials ..................................................................................................... 21
3.2 Mix design ................................................................................................... 22
3.2.1 Formulation calculations ................................................................................ 23
3.3 Analytical methods ...................................................................................... 24
3.3.1 Compressive strength .................................................................................... 24

xii
3.3.2 Fourier-transform infrared spectroscopy ...................................................... 25
3.3.2.1 Experimental parameters ............................................................................. 27
3.3.3 Isothermal calorimetry................................................................................... 27
3.3.4 Miniature slump ............................................................................................. 27
3.3.5 Mössbauer spectroscopy ............................................................................... 28
3.3.5.1 Experimental parameters ............................................................................. 29
3.3.6 Scanning electron microscopy ....................................................................... 29
3.3.6.1 Energy dispersive X-ray spectroscopy ........................................................... 30
3.3.6.2 Experimental parameters ............................................................................. 31
3.3.7 Solid-state nuclear magnetic resonance (NMR) spectroscopy ...................... 31
3.3.7.1 Principle ......................................................................................................... 31
3.3.7.2 Magic angle spinning (MAS) ......................................................................... 32
3.3.7.3 Cross polarisation (CP) .................................................................................. 33
3.3.7.4 Experimental parameters ............................................................................. 33
3.3.8 Thermal analysis............................................................................................. 35
3.3.8.1 Experimental parameters ............................................................................. 36
3.3.9 Vicat ............................................................................................................... 36
3.3.10 X-ray diffraction ............................................................................................. 36
3.3.10.1 Experimental parameters ........................................................................... 37
3.3.10.1.1 Powder X-ray diffraction (XRD) ........................................................ 37
3.3.10.1.2 High temperature XRD (HTXRD) ....................................................... 38
3.3.10.1.3 Synchrotron X-ray diffraction (SXRD) ............................................... 38
4 Formulation optimisation of blended MKPC binders .....................................41
4.1 Introduction ................................................................................................ 41
4.2 Results and Discussion ................................................................................. 42
4.2.1 Miniature-slump ............................................................................................ 42
4.2.2 Powder X-ray diffraction ................................................................................ 45
4.2.3 Thermal analysis............................................................................................. 47
4.2.4 Compressive strength .................................................................................... 49
4.2.5 Early age hydration behaviour ....................................................................... 51
4.2.5.1 MKPC-only ..................................................................................................... 51
4.2.5.2 FA/MKPC ....................................................................................................... 53
4.2.5.2.1 Isothermal calorimetry .......................................................................... 53
4.2.5.2.1 Synchrotron X-ray diffraction (SXRD) .................................................... 55

xiii
4.2.5.3 GBFS/MKPC ................................................................................................... 57
4.2.5.3.1 Isothermal calorimetry .......................................................................... 57
4.2.5.3.2 Synchrotron X-ray diffraction (SXRD) .................................................... 60
4.2.6 Uranium encapsulation in blended MKPC binders ........................................ 62
4.2.6.1 Experiment set-up ......................................................................................... 62
4.2.6.2 Corrosion results ........................................................................................... 67
4.2.6.3 Scanning electron microscopy ....................................................................... 73
4.3 Conclusions and Future work ........................................................................ 77
5 Synthesis and characterisation of pure struvite-K, MgKPO4·6H2O ................. 79
5.1 Introduction ................................................................................................. 79
5.2 Materials and Methods ................................................................................ 81
5.3 Results and Discussion ................................................................................. 82
5.3.1 In situ high temperature X-ray diffraction (HTXRD) ....................................... 82
5.3.2 Thermal analysis............................................................................................. 84
5.3.3 Nuclear magnetic resonance spectroscopy ................................................... 86
5.4 Conclusions and Future work ........................................................................ 89
6 Characterisation of blended MKPC binders .................................................. 91
6.1 Introduction ................................................................................................. 91
6.2 Results and Discussion ................................................................................. 93
6.2.1 Compressive strength .................................................................................... 93
6.2.2 X-ray diffraction ............................................................................................. 94
6.2.3 Scanning electron microscopy ....................................................................... 95
6.2.3.1 Elemental mapping - GBFS/MKPC ................................................................ 96
6.2.3.2 Elemental mapping - FA/MKPC ..................................................................... 98
6.2.4 Nuclear magnetic resonance spectroscopy ................................................. 100
6.2.4.1 27Al MAS NMR ............................................................................................. 100
6.2.4.2 31P MAS NMR .............................................................................................. 103
6.2.4.3 29Si MAS NMR .............................................................................................. 105
6.2.4.4 25Mg MAS NMR ........................................................................................... 107
6.2.4.5 39K MAS NMR .............................................................................................. 109
6.3 Conclusions and Future work ...................................................................... 112

xiv
7 High temperature stability of MKPC binders ............................................... 113
7.1 Introduction .............................................................................................. 113
7.1.1 Thermal test procedure ............................................................................... 115
7.2 Results and Discussion ............................................................................... 116
7.2.1 Physical properties ....................................................................................... 116
7.2.2 Thermal analysis........................................................................................... 120
7.2.3 Powder X-ray diffraction .............................................................................. 121
7.2.3.1 FA/MKPC ..................................................................................................... 121
7.2.3.2 GBFS/MKPC ................................................................................................. 124
7.2.4 Nuclear magnetic resonance spectroscopy ................................................. 126
7.2.4.1 27Al MAS NMR ............................................................................................. 126
7.2.4.2 29Si MAS NMR .............................................................................................. 128
7.2.5 Scanning electron microscopy ..................................................................... 134
7.2.5.1 Elemental mapping - FA/MKPC ................................................................... 135
7.2.5.2 Elemental mapping - GBFS/MKPC .............................................................. 138
7.2.6 Mössbauer spectroscopy ............................................................................. 141
7.3 Conclusions and Future work ..................................................................... 143
8 Radiation stability of blended MKPC binders .............................................. 145
8.1 Introduction .............................................................................................. 145
8.1.1 Generation of gamma radiation .................................................................. 146
8.1.2 Interaction of gamma radiation with materials ........................................... 147
8.1.3 Interaction of gamma irradiation with ILW encapsulant grouts .................. 148
8.2 Scoping irradiation trial using Cesium-137 .................................................. 151
8.2.1 Experimental set-up ..................................................................................... 151
8.2.2 Results and discussion ................................................................................. 153
8.2.2.1 X-ray diffraction .......................................................................................... 153
8.2.2.2 Fourier-transform infra-red spectroscopy ................................................... 155
8.2.2.3 Thermal analysis ......................................................................................... 158
8.2.3 Summary ...................................................................................................... 160
8.3 The effect of Cobalt-60 irradiation on blended MKPC binders ...................... 161
8.3.1 Experimental set-up ..................................................................................... 161
8.3.2 Results and discussion ................................................................................. 167
8.3.2.1 Powder X-ray diffraction ............................................................................. 167
8.3.2.2 Fourier-transform infra-red......................................................................... 170

xv
8.3.2.3 Thermal analysis ......................................................................................... 173
8.3.2.4 Nuclear magnetic resonance spectroscopy................................................. 176
8.3.2.5 Scanning electron microscopy ..................................................................... 180
8.3.2.5.1 Elemental mapping - FA/MKPC ........................................................... 180
8.3.2.5.2 Elemental mapping - GBFS/MKPC ....................................................... 186
8.4 Conclusions and Future work ...................................................................... 192
9 Conclusion ................................................................................................ 195
10 References ................................................................................................ 199
Appendix A: List of Figures ............................................................................... 217
Appendix B: List of Tables ................................................................................ 225
Appendix C: Formulation optimisation of MKPC binders .................................. 227
Appendix D: Synthesis of struvite-K ................................................................. 229
Appendix E: High temperature stability of MKPC binders ................................. 231
Appendix F: Co-60 radiation tolerance of MKPC binders ................................... 233

xvi

1
1 Introduction
1.1 UK nuclear waste
A substantial volume and breadth of radioactive materials has been created in the
UK resulting from more than 60 years of nuclear fuel operations. Each waste stream
is categorised (according to radioactivity and heat generation) into three main
classifications, which are: low level waste (LLW), intermediate level waste (ILW), and
high level waste (HLW) [1]. In LLW, the radioactivity must not exceed <4 GBq/t of
alpha (α) activity or <12 GBq/t of beta (β)/gamma (γ) activity [1]. Typical LLW waste
streams include: disposed paper, metal and protective clothing from nuclear
operations and medical research facilities [2]. The bulk of LLW will be consigned to
shallow ground storage in large steel containers at the low level waste repository
(LLWR) [2] or treated to make very low level wastes that are not deemed radioactive
and can be disposed under ordinary conditions or recycled [3].
In ILWs, the activity levels are above the upper threshold for LLWs but have a lower
heat generation than HLW and as such, do not require active management during
storage or final disposal [1]. ILWs are usually comprised of: steel, graphite, concrete,
fuel cladding, reactor components and sludges [2]. Whilst HLWs include spent
nuclear fuel (SNF) and reprocessed SNF (i.e. acidic liquors containing fission products)
that constitute substantial radioactivity/heat generation associated with radioactive
decay [3] that require substantial radiation shielding and remote handling [1]. The
total estimate of current waste and the future arising of HLW is 1,770 m3 (3,400 t)
and for ILW is 286,000 m3 (310,000 t), the latter accounts for 99.4% by volume of the
total higher activity waste according to the 2013 UK radioactive waste inventory [3].
To reduce the inherent risks (e.g. environment contamination, radiological release)
associated with nuclear waste, stabilisation and solidification techniques are often
used [4]. The latter is associated with the physical containment of the waste, e.g.
encapsulation in a cement grout, which is the treatment method for ILWs, whilst the
former chemically changes the HLW in order to reduce the mobility/toxicity, e.g.
immobilisation of highly active liquor into a glass matrix (vitrification) [4]. The

2
stabilisation and solidification enable storage of ILW and HLW in a passively safe
manner, which are subsequently referred to as conditioned waste packages [3].
The integration of ILW into suitable and stable wasteforms is a diverse and intricate
challenge due to the high degree of variability in the physical/chemical composition
and the waste condition (i.e. stored under water, inert gas, or open to air). The
current baseline option for ILW encapsulation involves cementation using a
composite Portland cement (PC) binder that consist of hydraulic PC and
supplementary cementitious materials (SCMs) (e.g. fly ash and ground granulated
blast furnace slag) [4, 5]. However, within the ILW inventory there are niche waste
streams (e.g. reactive metals: Al, Mg and U) that require tailored solutions to ensure
that both the durability and longevity of the conditioned wasteforms can be achieved
in typical storage scenarios, due to waste-binder interactions.
1.1.1 Magnox swarf
Particularly problematic waste streams within the UK are legacy wastes arising from
the reprocessing of Magnox reactor fuel. In Magnox nuclear reactors (CO2 cooled,
graphite moderated), the natural uranium fuel elements (Fig. 2.1A) are contained
within Magnox cladding, which is a magnesium alloy (99 % Mg and 1 % Al). After
defueling the reactor, the fuel elements are initially cooled (under water) prior to
transport to the Sellafield Ltd site, where the Magnox cladding is mechanically
decanned to form Magnox swarf (Fig. 1.1B) [6]. Two examples of Magnox swarf
inventories identified from the 2010 UK nuclear waste inventory are waste streams
2D22 and 2D24 (referred to as Magnox cladding and miscellaneous solid waste), the
compositions associated with these wastes are listed below.
Waste stream 2D22 (1040 m3): 21.0 wt. % Magnox swarf, 25.1 wt. %
magnesium hydroxide, 8.0 wt. % natural uranium fuel, 43.8 wt. % water and
2.1 wt. % other [7]
Waste stream 2D24 (1370 m3): 25.3 wt. % Magnox swarf, 17.3 wt. %
magnesium hydroxide, 12.6 wt. % natural uranium fuel, 44.1 wt. % water and
0.7 wt. % other [8]

3
Fig. 1.1. (A) Magnox fuel elements [9], (B) Magnox swarf [10] and (C) In-drum
encapsulated Magnox swarf [10]
Historically after decanning, Magnox swarf was stored in the Magnox swarf storage
silo (MSSS) under water to inhibit the pyrophoric reaction of uranium hydride that
reacts in air [11]. The uranium content within Magnox swarf wastes can arise from
residual fuel pieces from the decanning process, this is highlighted in waste stream
2D24 where there is significant uranium content (12.6 wt. %). Since 1992, Magnox
swarf is diverted to the Magnox encapsulation plant (MEP), were it is encapsulated
in 500 L stainless steel drums using a PC composite grout (Fig. 2.1C) [12]. However,
there is a growing concern that PC encapsulants can promote the corrosion of
encapsulated reactive metals, including aluminium, magnesium [13] and uranium
[14], consequently alternative encapsulants are under investigation (Chapter 2).

4
1.2 Geological disposal facility
In the UK, a geological disposal facility (GDF) will be designed to house the
conditioned HLW and ILW inventories (Fig. 1.2A) for long term storage/final disposal
[3]. The general concept for a GDF is based on a multi-barrier approach (Fig. 1.2B) at
depths between 200-1000 metres [2]. Each barrier is designed for radionuclide
isolation and containment, allowing for substantial radioactive decay to occur prior
to reaching the environment [10]. The engineered barriers should include: a
wasteform (e.g. waste encapsulated in a cement grout), which is the physical
containment of the waste; a waste container (e.g. stainless steel overpack) that
provides the primary structural and mechanical barrier; a buffer/backfill surrounding
the packaged wasteforms, which should impede the movement of any radionuclides
released by the wasteform. The final barrier is the host rock itself, where the
important containment properties are stability against ground movements and a
slow moving hydrogeology in order to minimise radioactivity progression towards
the surface [2].
The generic safety functions for the wasteform and waste container as described by
the Nuclear Decommissioning Authority (NDA) for transport and storage/disposal
operations are as follows [10]: a wasteform/container should contain radionuclides
during normal operations and accident scenarios (impact or fire), provide external
radiation shielding, minimise the risk of criticality, prevent the build-up of internal
gas pressure (for example, H2 gas generated from metal corrosion) by gas ventilation,
withstand loads for other waste containers and last but not least, provide safe
handling of the conditioned waste [10]. The cement grout used for encapsulation
also has several desirable properties: to physically immobilise the radioactivity, be
chemically compatible with the waste, be radiation tolerant, have sufficient strength
and stability, suitable flow properties to allow for complete infiltration of complex
waste, and be cost effective [10]. In current surface stores, the timescale that a
wasteform/waste container needs to maintain these safety functions can be up to
100 years prior to transferal into the GDF, where there is currently a 500 year safety
function target [10].

5
Fig. 1.2. (A) General GDF design [10] and (B) a schematic of the multi-barrier concept for
the disposal of nuclear waste in the UK [2]

6
1.3 Project aims
In the UK, current treatment for Intermediate level wastes (ILWs) involves
cementation in stainless steel drums or boxes. The typical cement used is based on
Portland cement (PC) and blended with supplementary cementitious materials; fly
ash (FA) and ground granulated blast furnace slag (GBFS) [4, 5]. These matrices have
many advantages (e.g. inexpensive, easy to use, low technology [15]) and are suitable
for a wide range of nuclear wastes. However, there are certain waste streams within
the UK inventory that are unsuitable for PC encapsulation[16-18]. For example, the
high pH and significant free water content of PCs can lead to the corrosion of reactive
metals (uranium, Magnox swarf from Magnox fuel cladding and aluminium) [19].
Corrosion products are expansive (e.g. Mg Mg(OH)2) and generate hydrogen gas
(flammability hazard) [20] and consequently, can affect the durability of the
cemented wasteforms. In line with the safety functions of wasteforms for storage
and final disposal in the UK, magnesium potassium phosphate cement (MKPC)
blended with FA or GBFS have been investigated as a possible alternative encapsulant
for intermediate level waste streams. MKPC binders are an acid-base cement system
with a near-neutral pH, low water demand, rapid setting and high early compressive
strength [21]. Water is chemically bound within the struvite-K crystal structure [22],
which is expected to minimise the corrosion of reactive metals.
For these reasons, this thesis will present the results of four main aims:
1. Design and optimise an MKPC formulation using FA and GBFS
2. Determine the chemistry of the optimised formulation
3. Assess the accident performance (fire) of the MKPC formulation
4. Assess the radiation tolerance of the MKPC formulation

7
2 Literature review
Note to reader: This thesis has been organised into chapters with respect to
published papers or manuscripts in preparation, as such there may be some
repetition within the chapter discussions. It is hoped that presenting the data in this
way provides distinct results. The literature review will provide a simple introduction
to magnesium potassium phosphate cements (MKPCs), whilst each chapter will
provide more detailed literature within the chapter introduction.
2.1 Portland cement
Portland cement clinker is produced in a rotary kiln using limestone (calcite, CaCO3)
and clay (or shale). At temperatures ≤ 1300 °C, calcination of the calcite to lime (CaO)
occurs alongside the disintegration of the clay minerals. The resulting reaction leads
to the formation of: belite (Ca2SiO4), tricalcium aluminate (Ca3Al2O) and ferrite
(Ca2AlFeO5)[23]. Upon further heating (between 1300 – 1450 °C), 20-30 % of the
clinker matrix melts, this is mainly from the tricalcium aluminate and ferrite phases
present [23]. A reaction between CaO, belite and the melt lead to the formation of
alite (Ca3SiO5) and agglomeration (i.e. clinkering) of the phases. Subsequent rapid
cooling of the clinker matrix leads to glass formation and crystallisation of the clinker
phases: alite (50-70 %), belite (15-30 %), tricalcium aluminate (5-10 %) and ferrite (5-
15 %), where the bracketed values refer to the typical composition range within PC
clinker [23]. This high temperature transformation of limestone and clay to the PC
clinker is shown Fig. 2.1. Upon quenching, belite undergoes a polymorph transition
to the beta phase, β-Ca2SiO4, which is most commonly found in PCs [24]. The clinker
is mixed with gypsum and finely ground using a ball mill to create the final product,
Portland cement [23]. Gypsum (CaSO4·2H2O) is included in the PC clinker as a setting-
regulator that modifies the hydration of tricalcium aluminate, preventing flash
setting [23]. A typical PC clinker used in the UK consists of: alite (60 %), belite (β-
Ca2SiO4, 15 %), tricalcium aluminate (8 %), ferrite (8%) and gypsum (5 %) [15].

8
Fig. 2.1. Formation of Portland cement clinker [23]
The reaction of alite is important for the early strength development and setting
properties of PC. It reacts with water to form a poorly crystalline calcium silicate
hydrate (C-S-H) phase and portlandite (CaOH2) [23, 24], which maintains a high
alkalinity (≈ pH 13 [25]). β-belite undergoes the similar reactions, although at a much
slower hydration rate, which has the benefit of enhancing the long term strength
properties of PC [24]. The tricalcium aluminate and ferrite clinker phases react with
gypsum to form calcium aluminate hydrated phases: ettringite
(Ca6Al2(SO4)3(OH)12·26H2O) and monosulphoaluminate (Ca4Al2(SO4)(OH)12·6H2O),
which are dependent upon the supply of sulphate within the pore solution [24].
Portland cements form composite grouts when blended with supplementary
cementitious materials (SCMs) such as, fly ash (FA) and ground granulated blast
furnace slag (GBFS). The inclusion of SCMs in PCs has several advantages, it utilises
industrial wastes (FA, from coal power stations) and industrial by-products (GBFS,
from the steel-making process), decreases the high energy requirements of PC
associated with clinker production (i.e. less clinker is required), reduces the reaction
rate and exothermic output of the PC clinker and improves durability [23].

9
Furthermore, SCMs also have cementitious properties leading to the formation
secondary C-S-H products. For example, GBFS (calcium aluminosilicate glass) is a
latently hydraulic material that will react with water to form C-S-H [26]. Whilst FA
(aluminosilicate glass) behaves like a pozzolanic material and will react with lime
(CaO) in the presence of water to form C-S-H or C-A-S-H type phases [23, 27]
It is current practice in ILW encapsulation for the utilisation of PC blended with either
FA or GBFS, to form FA/PC and GBFS/PC grouts (at up to 35 wt. % and 90 wt. %
replacements, respectively) [4, 5]. The advantage of blended PCs are readily
available whilst being inexpensive and durable, grout preparation is straightforward
in remote operations and the cement matrix imposes a high pH environment, which
can assist in the immobilisation of radionuclides (particularly actinides) through the
formation of less soluble hydroxide species [15, 17]. Despite these properties, there
is an increasing awareness that PC based encapsulants may not be suitable for the
immobilisation/encapsulation of all ILW waste types present in the ILW inventory
[16-18]. PC composites can promote the corrosion of encapsulated reactive metals,
including aluminium, magnesium [13] and uranium [14]. The high pH of blended PC
promotes the corrosion of Al whilst Mg and U are known to corrode in a wet
environment [19]. Corrosion of reactive metals (Eq. 1-3) is considered to be
problematic on two grounds: (1) the formation of expansive corrosion products (e.g.
Mg(OH)2) that can cause a volumetric change within the wasteform leading to the
formation of stress-induced fractures and (2) formation of hydrogen gas, which
presents a flammability hazard (during interim storage and disposal) and can result
in pressurisation and potential distortion of the waste container [20]. Consequently,
the durability of the monolithic wasteform and its ability to retain radioactivity can
be deleteriously affected.
Mg (s) + 2H2O (l) Mg(OH)2 (s) + H2 (g) Eq. 1
2Al (s) + 6H2O (l) 2Al(OH)3 (s) + 3H2 (g) Eq. 2
U (s) + 2H2O (l) UO2 (s) + 2H2 (g) Eq. 3

10
2.2 Alternative encapsulation grouts
In the UK, the generic waste package design for ILW cast in 500 L stainless steel
drums) are subject to strict flammable gas generation limits (the hydrogen gas limit
is 0.43 litres per day) compared to the total gas generation limit of 71 litres per day
[28]. It is therefore essential that the corrosion rate of encapsulated reactive metals
is minimised to ensure that the waste packages remain within regulatory tolerance.
Therefore, there is a need to develop tailored encapsulation compatible with niche
waste streams and conceptual disposal concepts. The alternative cement binders
under investigation for potential encapsulation of reactive metals include: calcium
aluminate cement (CAC), calcium sulphoaluminate (CSA), supersulphated cement
(SSC) and magnesium potassium phosphate cement (MKPC) [17]. For reactive metal
encapsulation, the principal purpose of alternative encapsulants is to decrease the
pH and/or the free water availability of the system compared to PC based
encapsulants in order to reduce the rate of corrosion of reactive metals and
therefore, extend the longevity of the wasteform packages.
These cements also offer other useful properties, for example:
CACs successfully maintain a high compressive strength and a low porosity at
a lower pH than PC based encapsulants. Typically CACs are blended with SCMs
(mainly GBFS) to reduce the negative volume changes associated with the
formation of the thermodynamically favoured phases [15, 17]. Recent
research has extended the scope of CACs to include phosphate modifications
(calcium aluminate phosphate (CAP) cement), which resulted in a further
reduction of the pH and facilitated control of the setting and mechanical
properties [29].
The major reaction product of CSAs and SSCs is ettringite
(Ca6Al2(SO4)3(OH)12·26H2O), which limits the amount of water available for
corrosion as it is bound within the crystal structure. The formation of

11
ettringite is beneficial for stabilisation of waste materials as it can incorporate
a large range of ions within its structure [15, 17, 19, 30].
MKPC binders are relatively less well-understood binders, their
advantageous properties include: near-neutral pH, low water demand, low
drying shrinkage, rapid setting and high early compressive strength [21].
Similarly to CSA/SSC systems, the water is chemically bound within the
struvite-K crystal structure [22], preventing it from enhancing corrosion of
any reactive metal surface present.
Although these encapsulants are passed conceptual design not all of them are
currently suitable for encapsulation of radioactive wastes. The rapid setting of CACs
produces a substantial exotherm, which may cause temperature problems in large
scale wasteforms [17], whilst CSA is constituted of niche products primarily produced
outside the UK (mainly China [17]), which has potential to produce supply continuity
issues. Further data is needed on all of the alternative cementitious binders to
validate their suitability for waste encapsulation in the UK and other countries. This
body of work will continue to assess the suitability of MKPC binders for nuclear waste
encapsulation.
2.3 Magnesium potassium phosphate cement
2.3.1 Nomenclature history
MKPCs of today emerged from early investigations by Kingery [31, 32] who
developed cold setting phosphate bonds between phosphates and oxides. It was
found that the reactivity of the oxide must be controlled to allow time for the
formation of an organised, cohesive cement-like product. As such, weakly basic or
amphoteric oxides (e.g. MgO) were favoured as they reacted slowly with phosphoric
acid [32]. The term chemically bonded ceramics (CBCs) was coined by Roy [33] in

12
relation to these new cold-setting cements that exhibited properties improved by
ten-fold when compared to conventional Portland cement. It was proposed that
these properties are more affiliated with those of a ceramic than a cement except
that the bonding was the result of low temperature chemical reactions rather than
fusion at high temperatures [33]. This term has since been further expanded to be
chemically bonded phosphate ceramic (CBPC) [34]. The terms ceramic and cement
are interchangeable within the literature based on magnesium phosphate systems
for ease they will be referred to as cements within this body of work.
2.3.2 Acid-base reaction
MKPC binders are produced via an acid-base reaction between magnesium oxide
(MgO), potassium dihydrogen phosphate (KDP; KH2PO4) and water, according to Eq.
4. The reaction product is struvite-K (MgKPO4·6H2O), an analogue of struvite
(NH4MgPO4·6H2O) [22], which is referred to as magnesium ammonium phosphate
(MAP) cement. Struvite is naturally cementitious and often found in guano and
kidney stones [35].1 The acid-base reaction is based on a dissolution-precipitation
mechanism where, the dissolution of KH2PO4 (Eq. 5) releases H2PO4- and K+ ions into
solution creating an acidic environment that promotes the hydration of MgO (Eq. 6)
to its hydrated magnesium complex, [Mg(H2O)6]2+ (Eq. 7) [36, 37].
MgO (s) + KH2PO4 (s) + 5H2O (l) MgKPO4·6H2O (s) Eq. 4
KH2PO4 (s) H2PO4-
(aq) + K+ (aq) Eq. 5
MgO (s) + H2O (l) MgOH+ (aq) + OH- (aq) Eq. 6
MgOH+ (aq) + 6H2O (l) [Mg(H2O)6]2+ (aq) + OH-
(aq) Eq. 7
1The discussions throughout this body of work often cite magnesium ammonium phosphate (MAP) cements, where struvite is the main binding phase. As only minor differences were observed in the crystal structures of struvite and struvite-K, these references were used to support MKPC binders.

13
The precipitation mechanism can be described to occur via either a “through
solution” and or “topochemical” route. The through-solution mechanism postulates
that as further Mg2+ ions are released into solution, the magnesium species,
[Mg(H2O)6]2+ react with aqueous PO43- and K+ ions resulting in the formation of a
struvite-K cementitious gel that permeates through the solution. As the gel
saturation level increases (and thus, connectivity), the gel thickens and sets around
unreacted MgO particles [38, 39]. The topochemical mechanism considers the
precipitation of struvite-K to occur via the adsorption of [Mg(H2O)6]2+ species onto
the surface of unreacted MgO particles. This process prevents the adsorption of
water molecules on to the MgO surface and thus, inhibits dissolution. Additional
[Mg(H2O)6]2+ species are adsorbed onto the MgO surface until the particle is
completely covered, at the same time available aqueous PO43- and K+ ions in solution
react with the [Mg(H2O)6]2+ species to form a struvite-K network around an unreacted
MgO particle [37, 40].
2.3.3 The effect of MgO calcination
The two precipitation mechanisms discussed above infer unreacted MgO particles
act as nucleation sites for the formation of struvite-K. It is reported that slow setting
leads to better mechanical properties of MKPCs, as such it is important to control the
reactivity of MgO [41]. MKPC formulations regularly utilise dead-burnt magnesia
(DBM) sources, calcined to ≈ 1500 °C, which have an increased particle size, lower
porosity and reactivity (due to a smaller surface area) compared to MgO calcined at
lower temperatures [42]. This was highlighted by Kingery [32] who observed the
formation of a set magnesium phosphate phase when MgO (calcined at 1280 °C)
reacted with phosphoric acid. In contrast, the use of reactive MgO resulted in a
violent reaction and no set magnesium phosphate phase [32]. The latent reactivity
of DBM allows for a slow but constant dissolution rate [38], which is important in
MKPC binders as this slow reaction rate ensures the formation of large crystallites in
the magnesium phosphate binder [32]. Within MPC/MKPC systems, DBM is often
used in conjunction with a set retarder (e.g. boric acid and borax) to further delay the
setting reaction and enhance product workability [18, 40, 43].

14
2.3.4 The retardation mechanism
The retardation mechanism initially proposed for the utilisation of borax
(Na2B4O7·10H2O) and boric acid (H3BO3) in MAP (magnesium ammonium phosphate)
cements described the early formation of a metastable poorly crystalline magnesium
borate phase around unreacted MgO particle [40, 44], that slowly releases the Mg2+
ions in to solution allowing the formation of a uniform layer of struvite around the
MgO particle [40]. This mechanism was further developed by Wagh et al. [38] who
proposed that the precipitated phase was crystalline lϋnebergite,
Mg3(H2O)6[B2(OH)6(PO4)2], which formed around the MgO particles [38]. This phase
reduced contact between the K+/H2PO4- ions in solution and the MgO particles.
The formation of lϋnebergite was founded on observations of a newberyite-rich
(MgHPO4·3H2O) magnesium phosphate cement (MPC), where 15 wt. % H3BO3 was
added to calcined MgO (1300 °C) and 50 % H3PO4 [45]. The phases identified in the
X-ray diffraction pattern (Fig. 2.3A) for this system were: newberyite, unreacted MgO
and lϋnebergite. The latter phase was also observed in the DTA data (Fig. 2.2A) with
a distinct shoulder at ≈220 °C. This feature is in agreement with the TGA/DTA
behaviour of a natural lϋnebergite specimen described by Sen Gupta et al. [46]. From
these findings, it is frequently stated that within magnesium phosphate cements,
boric acid retards the setting of the cement via the formation of lϋnebergite, even in
low-boron systems and with differing phosphates sources [14, 47-49].
The reason for this ambiguity is that the data first published by Wagh et al. [45] has
been repeatedly published for conflicting formulations. Firstly, the H3BO3 additions
were found to decrease from 15 wt. % [45] to 4 wt. % [50] and then 1 wt. % [38],
whilst the DTA plots (Fig. 2.2B-C) remained the same, with the shoulder at ≈220 °C
assigned to lϋnebergite. From these references, it would be possible to conclude that
a decreasing boron content (from 15 – 1 wt. %) results in the same DTA response,
which is unlikely to be the case. Secondly, the phosphate source was changed from
H3PO4 to KH2PO4 in [36]. Potassium dihydrogen phosphate is used in the formation
of magnesium potassium phosphate cements MKPC) were struvite-K (MgKPO4·6H2O)
is formed. In Fig. 2.3B, Wagh [36] reported the reaction products to be newberyite

15
and lϋnebergite, which is incorrect for MKPC binders. From Fig. 2.2D and Fig. 2.3B, it
is evident that the data for the MKPC system is exactly the same as published for the
newberyite-rich system [45]. These disparities in results call into to question the
validity of the formation of lϋnebergite within lower wt. % boric acid systems and
within MKPC binders. Further investigation should be conducted to identify the boric
acid retardation mechanism.
Fig. 2.2. DTA thermographs published in support of the formation of lϋnebergite in
magnesium phosphate ceramics, which were extracted from: initially (A) Wagh et al.,
1995 [45] and later produced in (B) Singh et al., 1999 [50], (C) Wagh and Jeong, 2003 [38]
and (D) Wagh, 2004 [36]

16
Fig. 2.3. X-ray diffraction patterns published in support of the formation of lϋnebergite in
magnesium phosphate ceramics, which were extracted from: initially (A) Wagh et al.,
1995 [45] and later produced in (B) Wagh, 2004 [36]
Hall et al. [43] reported that crystalline magnesium borate phases were unlikely to
form in the initially acidic environment of MPCs. The retardation mechanism was
instead thought to be associated with the adsorption of borate complexes on to the
MgO particles [46] rather than the precipitation of lϋnebergite (or alternative
magnesium borate phases) around unreacted MgO particles.. A recent study by
Sasaki [51] examining MgO – boric acid interactions reinforced the likelihood of this
theory. As precipated magneisum borate phases (Mg7B4O13·7H2O and
MgB3O3(OH)2·5H2O) were only observed in high borate conditions (>67.9 mM borate
solution) under varying conditions via an intermiedate complex, [MgB(OH)4]+ [51].
2.3.5 Applications of MKPCs
Interest in magnesium phosphate cements first developed in the 1970s where the
rapid setting and high early strength properties of MAP cements achieved
commercial application as an emergency repair material for roads, runways, bridges,
pavements [52-55]. MAP cements reduced the closure time and disturbance to high
trafficked roads (e.g. motorways, runways), which could incur high costs when
traditional patch repair materials are used [54]. Using traditional cementitious

17
materials would result in a long delay in repairs, to allow for a good bonding
capability to the old concrete. However, the liberation of ammonia gas during mixing
and setting was an undesirable characteristic of MAP cements [39]. However, in
potassium-based magnesium phosphate cement (MKPC) there is no loss during
setting, which can be advantageous in waste applications (i.e. reduce gas
generation). MKPC binders are often blended (up to 50 wt. % replacement) with
supplementary cementitious materials (SCMs), for example, FA or GBFS to reduce
the exothermic output of the acid-base reaction and reduce material costs.
In the USA, MKPC binders have been extensively researched and developed at the
Argonne National Laboratory (ANL), for the management of hazardous and
radioactive wastes, since the mid-1990s [56-62]. The work by ANL has resulted in
commercialisation of the MKPC binder under the trademark name Ceramicrete™
[36]. ANL postulated that MKPC binders have the potential to stabilise hazardous and
nuclear waste using three mechanisms: (1) chemical conversion to a less soluble
phosphate product, (2) microencapsulation within the struvite-K phase and (3)
macroencapsulation as part of a dense, insoluble monolith wasteform [36]. MKPC
binders represent a simple and low cost technology that has been shown by ANL to
stabilize a wide range of hazardous, radioactive and mixed-waste streams:
Encapsulation of heavy metals such as Pb bricks, Pb-lined gloves, Hg
contaminated light bulbs from mixed low-level waste streams. The FA/MKPC
binders were found to produce dense, strong and impermeable monoliths.
The microstructure identified continuous MKPC adhesion to the waste, free
of air pockets, which suggest complete encapsulation of the waste materials
[56].
Stabilisation of the Hanford tank waste supernates (Cr, Pb, Ag and Cs) and
sludges (Cd, Cr, Ag, Ni, Ba, Cs and Tc) separately, at respective waste loadings
of 39.8 wt. % and 32 wt. % [62].
Effective reduction of problematic long-lived radionuclide Tc-99 (half-life of
2.13x10⁵ years) as a result of the addition of 2-3 wt. % SnCl2, which acts as a

18
reducing agent in the binder [59]. The redox conditions (+225 mV, pH 6.5) of
FA/MKPC/SnCl2 binders indicated favourable conditions to reduce and
stabilise the highly mobile pertechnetate Tc(VII) species as the insoluble
Tc(IV) state. This suggests that Tc-99 was chemically stabilised within the
MKPC/SnCl2 binder, which could potentially lead to higher waste loadings
[59].
MKPC binders have been lengthily identified by ANL to have wide-reaching
applications, however, in the UK, research has mainly focussed on utilising MKPC
binders for the encapsulation of reactive metals (Al, U and Magnox swarf) [15, 17-
19]. Corrosion trials conducted by Covill et al. [14] found that using natural uranium
pucks in FA/MKPC binders (0.26 w/s and 0.28 w/s) have shown corrosion and gas
generation rates notably lower than FA/PC grout (3:1, 0.42 w/s). After 90 days, the
average hydrogen production of MKPC binders was just 5.9 vol. % of the total
hydrogen production from the FA/PC grout [14]. These trial samples have indicated
that there is very little chemical interaction between FA/MKPC binder and the
uranium puck. Whilst work undertaken by the National Nuclear Laboratory (formerly
Nexia Solutions) observed that corrosion of encapsulated aluminium was substantial
reduced for FA/MKPC binders (0.31 w/s and 0.32 w/s) when compared to a GBFS/PC
grout (9:1, 0.33 w/s). This suggests that the near-neutral pH of MKPC binders can
assist the passivation of aluminium corrosion [19]. These trials suggest that MKPC
binders appear to be suitable for encapsulation of niche intermediate level waste
streams.

19
2.4 Summary
The current literature for MKPC binders has indicated confident results for the
successful encapsulation of reactive metal waste streams. However, the UK
standards for ILW wasteforms highlight that the functions of an encapsulant should
include: immobilisation of radioactivity, be chemically compatible, be radiation
tolerant, maintain physical integrity over the wasteform lifetime and for a range of
environment conditions, have adequate strength and flow properties, and be cost
effective [10]. Further research and development is needed on MKPC binders, at
both the laboratory and plant scales, to provide a depth of understanding and to
improve the technology readiness in order to be employed as an encapsulant. In
addition to the wasteform requirements, more technical information is required to
support the long-term performance of MKPC binders for example: fire performance,
radionuclide retention, long-term chemical and mechanical stability, to understand
the cement/waste interactions.

20

21
3 Materials and methods
3.1 Materials
The cement binder precursors were: MgO (RBH Ltd, 89 % purity) in the form of dead
burnt magnesia (DBM), KH2PO4 (Prayon, >99 %) available as Food Grade E340 MKP,
and granular H3BO3 (Fisher Scientific, >99.5 %). Fly ash (FA) was supplied by CEMEX
as PFA BS EN 450-1 S [63]. Ground granulated blast furnace slag (GBFS) was supplied
by Hanson Cements in accordance with established Sellafield Limited specifications
for the UK nuclear industry, and is a blend of fine and coarse ground materials. The
characterisation and chemical compositions of MgO, FA and GBFS presented in
Tables 3.1 and 3.2 were determined using: a Malvern Mastersizer 3000 for the
particle size distribution (PSD), powder fineness was measured using Controls 62-
L0041/A Blaine fineness apparatus calibrated using NIST SRM material 114q, all
samples were prepared according to BS EN 196-9:2010 [64]. Braunauer-Emmett-
Teller (BET) surface area measurements were carried out using a Coulter SA 3100
instrument, density was measured using a Micromeritics AccuPyc II 1340 instrument,
and the oxide compositions were determined using X-ray fluorescence (XRF) analysis.
The XRF analysis was externally performed by AMG Superalloys UK (formally London
& Scandinavian Metallurgical Co. Ltd) using the fuse-bead method.
Table 3.1. Characterisation of raw materials using PSD, Blaine fineness, BET surface area
and density measurements
d10
(µm)
d50
(µm)
d90
(µm)
Blaine fineness
(m2/kg)
BET
(m2/kg)
Density
(kg/m3)
MgO 3.2 ± 0.1 24.4 ± 0.3 63.8 ± 0.6 329 ± 16 563 ± 72 3471 ± 1
FA 2.7 ± 0.1 14.0 ± 0.3 66.1 ± 3.5 560 ± 10 2258 ± 10 2329 ± 5
GBFS 1.6 ± 0.1 16.0 ± 0.1 1465 ± 15 497 ± 17 993 ± 72 2885 ± 5

22
Table 3.2. Composition of raw materials determined by XRF oxide analysis (precision ±
0.1 wt. %)
Compound (wt. %) MgO FA GBFS
Na2O <0.1 1.1 0.4
MgO 88.9 1.7 7.9
Al2O3 1.7 25.2 12.0
SiO2 4.3 50.2 36.6
P2O5 <0.1 0.3 <0.1
K2O 0.1 3.6 0.7
CaO 2.1 2.4 40.2
Fe2O3 1.5 9.3 0.4
Total 98.8 93.8 98.3
3.2 Mix design
For compressive strength, X-ray diffraction and thermal analysis investigation, the
precursors (MgO, KH2PO4, H2O, SCM (referring to either FA or GBFS) and H3BO3) were
mixed initially for 10 minutes in a Kenwood mixer at speed 1. Afterwards, the paste
was transferred to a high shear Silverson mixer operating at 4000 rpm for 10 minutes
to ensure a homogenous paste was achieved. The cement paste was cast into steel
cube moulds or centrifuge tubes (and then sealed) and cured in an environmental
chamber at 20 °C and 95 % relative humidity until testing. For miniature-slump and
calorimetry analysis, small cement batches (<100 g) were prepared by hand, each
paste was mixed for 5 minutes (mini-slump) or 2 minutes (calorimetry) prior to
analysis. The formulations used throughout this study involve the addition of boric
acid as a setting retarder to ensure that a workable paste is formed. The addition of
dead-burnt MgO (low reactivity) and supplementary cementitious materials (FA or
GBFS, which act as diluents) have also been reported to further extend the setting
time of the acid-base reaction [18, 41].

23
3.2.1 Formulation calculations
The formulations used to produce the blended MKPC pastes are shown in Table 3.3.
These formulations were derived from a previous study that investigated FA/MKPC
binders (0.26 and 0.28 water-to-solids (w/s) ratio) for ILW waste encapsulation of
reactive metal (uranium) [14]. In the present work, it was decided to expand the w/s
ratio study with the aim of further reducing the water content. In addition to varying
w/s ratio, the inclusion of GBFS was explored as it is frequently used with the UK
nuclear industry, however is not commonly studied within MKPC binders.
The molar ratio of magnesium to phosphorous (Mg/P) was calculated to be 1.7: 1
ratio (based on previous research [18]) with the addition of 50 wt. % SCM and 2 wt.
% H3BO3 (the wt. % calculations are based on the sum of MgO, KH2PO4 and H2O). It
was found that at SCM additions other than 50 wt. % (i.e. 40 and 60 wt. %), severe
cracking occurs during the first three days of curing (Appendix C). The water-to-solid
(w/s) ratio is calculated by H2O (g) divided by the sum of MgO (g), KH2PO4 (g) and
SCM (g), which relates to w/s = H2O / (MgO + KH2PO4 + SCM).
Table 3.3. FA/MKPC and GBFS/MKPC formulations based on three water-to-solids (w/s)
ratios: 0.22, 0.24 and 0.26 w/s to ± 0.1 g precision
w/s MgO (g) KH2PO4 (g) H2O (g) SCM (g) H2BO3 (g)
0.22 160 318 180 329 13
0.24 156 309 192 329 13
0.26 149 303 206 329 13

24
Table 3.4. Formulation of MKPC pastes based on a 0.24 water/solids ratio, using a 500 g
batch size to ± 0.1 g precision
3.3 Analytical methods
3.3.1 Compressive strength
Samples for compressive strength (CS) were prepared in triplicate using 50 x 50 x 50
mm (± 0.5 mm) stainless steel moulds, each mould was individually coated in a plastic
film (cling film) in order to prevent the MKPC binder bonding to steel [65] as shown
in Fig. 3.1. As soon as the samples were cast, they were repeatedly tapped on a hard
surface to remove any entrained air bubbles. The cast mould was placed inside a
plastic sample bag and cured in an environment chamber at 20 °C and 95 % relative
humidity. After two days, the MKPC cubes were demoulded and returned to the
chamber. Compressive strength was determined at 3, 7 and 28 days curing ages,
using a Controls Automax 5.0 testing machine at a load rate of 0.25 MPa/s. The values
reported correspond to an average of three measurements, the calculated error bars
are equivalent to ± 1 standard deviation. The compressive strength method was
based to the British/European Standard (BS EN 12390-3:2009). The compressive
strength method involved placing the cube specimens on clean, dry platens loaded
perpendicular to the casting face [66]. The load rate chosen throughout these
experiments was lower than the recommended load rate 0.6 ± 0.2 MPa/s. After
compression, the failure mode was assessed to determine if the specimen passed or
failed. To pass, the cube specimen should exhibit shearing of all four sides, the reader
is referred to BS EN 12390-3:2009 [62] for depictions of failed compression modes.
Blend MgO (g) KH2PO4 (g) H2O (g) SCM (g) H3BO3 (g)
MKPC 132.3 262.8 96.0 - 9.8
FA/MKPC 77.8 154.6 96.0 165.0 6.5
GBFS/MKPC 77.8 154.6 96.0 165.0 6.5

25
Fig. 3.1. FA/MKPC cubes at day 2 curing from: (A) stainless steel moulds and (B) plastic
lined stainless steel moulds
3.3.2 Fourier-transform infrared spectroscopy
Fourier-transform infrared spectroscopy is a useful analytical technique used to
identify the structure of a compound, as no compound will have exactly the same FT-
IR spectrum [67]. IR radiation (mid-IR between 4000 – 500 cm-1 [68]) creates a
vibrational response (above the natural bond vibration) in a molecule when the IR
radiation is at the correct frequency and can be absorbed, it results in the stretching
or bending of covalent bonds [67]. A molecule will only absorb a particular frequency,
which means that FT-IR spectroscopy can detect similar bonds in a wide range of
compounds, for example C = O bonds absorb the IR radiation in the range of 1800 –
1650 cm-1 [67]. However, only bonds that are IR active (i.e. have a dipole moment
that varies with the vibration) can be detected [69].

26
Fig. 3.2. Schematic of a Michelson interferometer extracted from [67]
The principle of FT-IR spectroscopy (Fig. 3.2) involves an IR source being passed
through a beam splitter, which is a mirror angled at 45° to the IR source. The beam
splitter creates two perpendicular beams (i.e. at 90° to each other) [70]. The
deflected beam is sent to a fixed mirror, where it is returned to the beam splitter.
The undeflected beam continues to the moving mirror and is also returned to the
beam splitter, however the moving mirror creates different wavelengths within the
undeflected beam [67]. As the two beams return to the beam splitter they recombine
to a form single beam that contains both constructive and deconstructive
interferences as a result of the moving mirror [70]. This beam is referred to as the
interferogram and contains all of the incident IR radiation but with a wide range of
wavelengths. The interferogram then passes through the sample, which immediately
absorbs wavelengths corresponding to the frequencies within the sample [67]. As the
transmitted interferogram reaches the detector it contains the information of the
absorbed frequencies from within the sample, the signal is processed and absorbed
frequencies extracted using Fourier-transform, which creates an FT-IR spectrum.
Prior to sample collection, a background sample is collected in order to detect the
presence of CO2 and water vapour, which can then be automatically extracted from
the FT-IR spectrum of the sample [67]. The units of the spectrum are recorded in
wavenumbers (number of cycles per centimetre) and the % transmittance, which is
the measure of IR radiation transmitted by the sample [68].

27
3.3.2.1 Experimental parameters
In Chapter 8, Fourier-transform infrared spectroscopy (FT-IR) was carried out using a
Perkin Elmer 2000 FTIR spectrometer recording % transmittance against the
wavenumber (cm-1) between 4000 - 500 cm-1. Samples were prepared according to
the KBr pellet method [68, 70], at 1 wt. % loading where 2 mg of a sample is ground
into 200 mg KBr.
3.3.3 Isothermal calorimetry
The principle of isothermal calorimetry (IC) is to measure the heat of a reaction in a
non-invasive and non-destructive environment at a constant temperature (i.e. in a
heat sink) [71]. It is compared to a reference sample, so that any external heat can
be subtracted and records power (watts) against time by a direct measurement of
the temperature changes. The data can be used to determine the kinetic and
thermodynamic behaviour of a reaction [71].
Chapter 4: IC was performed on the MKPC-only and blended MKPC binders using an
isothermal calorimeter (TAM Air, TA Instruments) at 20 °C. Each sample (≈ 15 g) was
externally mixed for two minutes, weighed into a plastic ampoule and placed into the
instrument for 7 days, using a H2O reference calculated to match the total H2O
content of each formulation.
3.3.4 Miniature slump
The miniature-slump (or mini-slump) technique is based on the work of Kantro [72]
and is ideal for small sample sizes. It requires a sheet of poly(methyl methacrylate)
marked with 2x2 cm grid squares and a poly(tetrafluoroethylene) cone based on a
scaled-down Abrams cone: (h = 57 mm, ø (top) = 19 mm and ø (bottom) = 38 mm)

28
[72]. After mixing the samples by hand for 5 minutes, the sample was poured into
the cone (in the centre of the calibration grid). The cone was quickly lifted in a smooth
motion and the paste was left for 30 seconds to equilibrate. A photograph was taken
of the final mini-slump from directly above the sample, the slump area was then
calculated using ImageJ software [73] calibrated to the grid squares (Fig. 3.2). The
flow areas reported in Chapter 4 are based on the average of nine measurements,
the calculated error bars are equivalent to ± 1 standard deviation.
-
Fig. 3.3. Mini-slump calculation using ImageJ software [73]: calibrate using the 2x2 cm
grid (A) and then measure the flow area (B)
3.3.5 Mössbauer spectroscopy
Mössbauer spectroscopy uses gamma radiation (from the decay of Co-57) to
determine the oxidation state and co-ordination number of compounds commonly
containing iron or tin as the gamma ray will only be absorbed if the sample contains
a similar atom [69]. The sample is located in a fixed position and the gamma ray is
moved at a constant velocity either towards the sample or away from the sample
stage. This process creates an energy spectrum of gamma rays that can be absorbed
by the sample [69]. In quadrupolar samples, the absorbed peak of the Mössbauer
spectrum splits (quadrupole splitting), which is sensitive to the local structure and
oxidation state, whilst in paramagnetic samples hyperfine Zeeman splitting occurs
that results in six peaks (sextet) [69].

29
3.3.5.1 Experimental parameters
Chapter 7: Mössbauer spectroscopy was performed on the high temperature
FA/MKPC samples to determine the Fe oxidation states using a Wissel spectrometer
(50 Ci 57Co(Rh) source) using 512 channels. Fe oxidation sites were assigned by fitting
Lorentzian doublets and sextets using the Recoil software [74].
3.3.6 Scanning electron microscopy
To study the microstructure and composition of blended MKPC binders scanning
electron microscopy (SEM) was used. In this technique, electrons generated from an
electron gun (usually a tungsten filament) are accelerated between 1 - 30 keV in an
electron beam onto the sample surface [75]. During the interaction between the
incident beam and the sample, several signals are produced: secondary electrons,
backscattered electrons and X-rays (Fig. 3.4). The volume of sample that the incident
beam has contact with is referred to as the interaction volume [75].
Secondary electrons (SE) are emitted from the K-shell of the sample atoms by
inelastic scattering interactions with the incident beam and have a low energy (10 to
50 eV) and consequently can only be detected in a few nanometres of the sample.
Secondary electrons have the smallest sampling volume, which leads to a higher
spatial resolution [75]. The secondary electrons are detected using a scintillator-
photomultiplier system, the electrons are accelerated through a charged metal grid
(at 10 keV), which improves the efficiency of detection as it attracts the secondary
electrons. After passing through the metal grid, the electrons interact with the
scintillator, which emits light. The light is transferred though a light pipe (or guide) to
the scintillator where the photons are converted into pulses of electrons that can be
amplified [75]. Backscattered electrons (BSE) are associated with elastic scattering (>
90°) of the incident beam and have a high energy (50 to 90 % of the incident beam)
[76]. These electrons are used for imaging, diffraction and chemical identification.

30
The latter can be obtained through an atomic number contrast, where the high
diffraction of the electrons is directly proportional to the atomic number squared
[76]. Thus, heavy elements (i.e. Fe) appear much brighter than lighter elements.
Backscattered electrons can be detected using the scintillator if a negative charge is
applied to repel the secondary electrons. The signal can be weak because only the X-
rays on a direct path can be detected [76] so longer collection times are required.
Fig. 3.4. The interaction volume of an incident beam and the regions where the signals:
secondary electron, backscattered electron, and X-rays originate
3.3.6.1 Energy dispersive X-ray spectroscopy
Energy dispersive X-ray spectroscopy (EDX) is used in conjunction with the BSE mode,
to provide detailed elemental analysis of the sample, the resulting spectra can be
obtained as: elemental maps, EDX point or linescans. The incident electron beam
ionises an electron from the inner electron shell, which is promptly replaced by a
higher energy electron to fill the electron vacancy [77]. This leads to the emission of
an X-ray with a characteristic energy that is detected by the energy dispersive
spectrometer and can be associated with the element that is was produced from
[75]. For this analytical technique the volume of material contributing to X-rays (i.e.
sampling volume) is the same order of the interaction volume [76].

31
3.3.6.2 Experimental parameters
Samples were sectioned using an Isomet saw, encapsulated in resin and left to
harden for 24 hours. The resin was then ground using grit paper ascending through
grit sizes 240, 600, 800 and 1200 until the cement surface had been exposed. The
sample was then polished using Isopropyl alcohol (IPA) and diamond pastes
decreasing from 6, 3, 1 and 0.25 µm. Once the sample was polished, it was carbon
coated and the sides coated with conductive paint to reduce the charge build-up on
the sample.
Chapter 6: Micrographs were collected using a Jeol JSM 6400 SEM at a 20 kV
accelerating voltage and a working distance of 15 mm. Elemental maps were
collected using a Link ISIS EDX (energy dispersive X-ray spectrometer) detector and
analysed using INCA software.
Chapters 4, 7 and 8: Micrographs were collected using a low vacuum Hitachi TM3030
analytical benchtop SEM with an integrated Bruker EDX system (Quantax 70) at 15
kV and a 7.0 mm working distance.
3.3.7 Solid-state nuclear magnetic resonance (NMR) spectroscopy
3.3.7.1 Principle
Solid-state nuclear magnetic resonance (NMR) spectroscopy is a technique that can
provide detailed structural information about the atomic environments present
within both crystalline and disordered phases [78]. The principle of NMR
spectroscopy is to utilise the magnetic moment of nuclei with a quantum spin
number greater than zero. When a nucleus is exposed to a strong magnetic field, the
ground energy state is split into various energy levels that are either parallel or
against the applied magnetic field (Zeeman splitting) [78]. When exposed to a pulse
of plane-polarised radiofrequency radiation, the lower energy states (those parallel)
absorb energy and become excited to the higher energy state but when the
radiofrequency pulse is removed, the excited energy states return to the lower

32
energy states (i.e. relaxation) and in the process emit radiofrequency radiation [79].
This induces a voltage in the spectrometer coil and is recorded as a function of time,
referred to as the free induction decay (FID). The resonance frequency can then be
extracted by Fourier-transform calculations [78].
The frequency of the detected resonance is dependent upon the local chemical
environment and the nearest-neighbours of a nucleus. Small differences in the
detected resonance frequency are related to the electron shielding of the local
environment. This variation in the frequency is referred to as the chemical shift,
which is reported in NMR spectra relative to an external standard reference nucleus
[78, 79]. This makes NMR highly sensitive to the local environment making it useful
for studying poorly crystalline materials.
3.3.7.2 Magic angle spinning (MAS)
Magic angle spinning (MAS) is a technique frequently used within solid-state NMR
experiments. In the solid-state, nuclei experience resonance broadening due to:
dipole-dipole interactions, chemical shift anisotropy and quadrupolar interactions
[78, 79]. These interactions can be reduced or eliminated by spinning the sample
rapidly (10-15 kHz) at an angle of 54.74° to the applied magnetic field [78]. Nuclei
that have spins greater than ½ experience quadrupole moments as a result of the
non-spherical charge distribution interacting with the electric field gradient [80]. This
quadrupolar interaction typically affects the line broadening of the NMR spectra
through first and second-order interactions. MAS NMR experiments can remove the
first-order interactions but not those of the second-order interactions [78, 80]. The
resulting spectrum is resolved into single resonances with numerous spinning side
bands, the latter a side-effect of sample spinning, which complicates spectra analysis.
To improve the second-order interactions spinning at multiple angles, either
simultaneously in double rotation spinning or sequentially in double angle spinning
[78]. Another way to improve the resolution of half-integer quadrupolar nuclei (by
averaging out quadrupole effects) is to employ multiple-quantum magic angle
spinning (MQMAS), which is a simple method that uses the probe to generate a 2D

33
spectrum [80]. The requirements for this experiment are: firstly, rotating the sample
around the magic angle (54.74° [78]), which removes dipolar interactions and the
chemical shift anisotropy. Secondly, to correlate the multiple quantum transitions to
the central transition (I = 1/2, -1/2) in order to remove the second-order interactions.
[80].
3.3.7.3 Cross polarisation (CP)
Cross polarisation (CP) involves the transfer of the magnetisation from one nucleus
(usually abundant 1H) to another nucleus, which usually has a spin ½ and a lower
abundancy (e.g. 31P) [78]. One advantage of the CP experiment is that the signal to
noise ratio of the spectra can be enhanced as 1H nuclei have a short relaxation time,
which means that a more rapid radiofrequency pulse can be used [78]. This means
that more scans can be achieved in a given time compared to the direct excitement
(standard) method, which improves to the signal to noise ratio [79]. The 1H nucleus
magnetisation is transferred to local 31P environments, which means that only
structures associated with hydrogen (i.e. hydrated phosphates), can be detected
during CP NMR experiments. This could lead to more detailed information about the
materials structure.
3.3.7.4 Experimental parameters
All 27Al (spin, I = 5/2), 29Si (I = 1/2) and 31P (I = 1/2) MAS NMR spectra were collected
at the EPSRC National Solid-state NMR Service on a Varian VNMRS 400 (9.4 T)
spectrometer using o.d. zirconia rotors with either a 4 mm probe (27Al, 31P) or 6 mm
probe for (29Si). The chemical shifts of the 27Al, 29Si and 31P spectra were referenced
to external samples of 1.0 M aqueous Al(NO3)3, tetramethylsilane (TMS), and 85 %
H3PO4, respectively.
Chapters 5, 6 and 8: 27Al MAS NMR spectra were collected at 104.198 MHz and a
spinning speed of 14 kHz, employing a pulse width of 1 µs (25 °), a relaxation delay

34
of 0.2 s, and with a minimum of 7000 scans. 29Si MAS NMR spectra were collected at
79.435 MHz at a spinning speed of 6.8 kHz and employed a pulse duration of 4.7 µs
(90 °) and a relaxation delay of 1.0-5.0 s, with a minimum of 1200 scans. 31P MAS
NMR spectra were collected at 161.874 MHz at a spinning speed of 10.0 kHz with a
pulse duration of 4.4 µs (90 °) and relaxation times of 10 and 300 s, with a minimum
of 110 and 4 scans, respectively. 31P[1H] CP/MAS NMR spectra were collected at
161.874 MHz at a spinning speed of 10 kHz with a pulse duration of 4.4 µs, acquisition
time of 30.0 ms at a recycle time of 1.0 s, and a minimum of 120 scans.
Chapter 7: 27Al MAS NMR spectra were collected at 104.198 MHz and a spinning
speed of 14 kHz, employing a pulse width of 1 µs (25 °), a relaxation delay of 0.2 s,
with 1500 - 7000 scans. The 29Si MAS NMR spectra were collected at 79.435 MHz at
a spinning speed of 6.8 kHz, and employed a pulse duration of 6.2 µs (90 °) and a
relaxation delay of 1.0 - 5.0 s, with 1660 - 54160 scans.
High field solid-state MAS NMR spectra for 25Mg (I = 5/2) and 39K (I = 3/2) nuclei were
collected at The UK 850 MHz solid-state NMR Facility, The University of Warwick.
These experiments were carried out using magnesium and potassium sources of
natural abundance, where the NMR active isotopes, 25Mg and 39K, were present at
10.1 % [81] and 93.1 % [78], respectively.
Chapters 5 and 6: Solid-state NMR spectra for 25Mg and 39K nuclei were collected on
a Bruker Advance III 850 (19.96 T) spectrometer using 4 mm o.d. zirconia rotors. 25Mg
MAS NMR spectra were collected at 52.05 MHz at a spinning speed of 10.0 kHz with
a pulse duration of 5.0 µs (90 °) and recycle time of 2.0 s for 5800 scans. 25Mg MAS
NMR chemical shifts were referenced to an external sample of MgO; the chemical
shift of MgO (26 ppm) is defined with respect to the hydrated Mg2+ ion at δ = 0 ppm
as a primary reference [78]. 39K MAS NMR spectra were collected using an echo
sequence at 39.7 MHz, spectra were collected at a spinning speed of 15.0 kHz, a pulse
duration of 15.0 µs (90 °) and a recycle time of 2.0 s for 29900 scans. 39K MAS NMR
chemical shifts were referenced to solid KBr, which has a chemical shift of 0 ppm with
respect to the hydrated K+ ion [82]. 25Mg and 39K simulations were performed using

35
Bruker TopSpin 3.2 software [83] considering the second-order quadrupolar
interaction for the central transition only.
3.3.8 Thermal analysis
Several thermal analysis techniques were used to determine the thermal
dehydration/contraction behaviour of MKPC binders and the polymorphic events
associated with the dehydration of struvite-K, which were: thermogravimetric
analysis, differential thermogravimetric analysis, differential thermal analysis and
dilatometry (also referred to as thermomechanical analysis) [69].
Thermogravimetric analysis (TGA) is an analytical technique used to measure the
mass loss of a sample as a function of a controlled heating programme under a
controlled atmosphere (usually N2). Only thermal events associated will mass loss are
detected i.e. dehydration, which are usually observed over a distinct temperature
range [84]. Differential thermogravimetric analysis (DTG) is the derivative of the TGA,
where extra information can be extracted from the TGA data in order to further
distinguish the thermal events, e.g. the separation of overlapping thermal events
[84]. Differential thermal analysis (DTA) is a technique that measures the thermal
response from a sample compared to that of an inert reference during a controlled
heating or cooling programme [85]. The sample temperature will be equal to the
inert reference until the occurrence of a thermal event (exothermic or endothermic),
whereupon the temperature difference is recorded [69]. One advantage of using the
DTA technique is the additional detection of thermal events with no associated mass
loss, e.g. polymorphic transitions [69].
Dilatometry is a technique that measures linear changes in a sample during a
controlled heating/cooling temperature programme that can detect contraction and
expansion (i.e. volume changes) [69]. The linear changes of a sample is calibrated to
an internal micrometer, whilst the temperature is calibrated to a standard material
that was exposed to the same experimental conditions [86].

36
3.3.8.1 Experimental parameters
Chapters 4 and 7: Thermal analysis data were collected using Pyris 1 TGA in alumina
crucibles under a N2 atmosphere at 10 °C/min, up to 1000 °C. In Chapter 7,
dilatometry data was collected using a NETZSCH DIL 402 C dilatometer between 20 -
1200 °C at 10 °C/min under a constant 50 mN load in air, using cylindrical specimens
of ø = 8.5 ± 0.1 mm and l = 5.7 ± 0.2 mm.
Chapter 5: Thermal analysis data of pure struvite-K were collected using Pyris 1 TGA
and Perkin Elmer DTA 7 instruments, in alumina crucibles under a N2 atmosphere at
10 °C/min, up to 1000 °C.
Chapter 8: Thermal analysis data were collected using a Perkin Elmer TGA 4000
instrument in alumina crucibles under a N2 atmosphere at 10 °C/min, up to 500 °C.
Prior to the experiment run, the samples were held at 30 °C for 30 minutes to remove
any free water.
3.3.9 Vicat
A Mastrad E040 automatic vicat apparatus was used to determine the initial and final
set of each cement batch. At time = 0 hrs, the wet cement slurry was poured into a
70 mm diameter mould placed on a Perspex plate. A 1.13 mm diameter needle set in
free fall mode was used for penetrating the cement every 15 minutes over a total of
41 penetrations. The depth of penetration was automatically recorded onto paper.
3.3.10 X-ray diffraction
X-ray diffraction (XRD) is an analytical technique that provides structural information
allowing identification of the component crystalline phases of a material. X-rays
(referred to as monochromatic X-rays) are generated via contact between an
electron beam and a metal target (e.g. Cu or Mo). In the Cu target, the incident
electron beam excites an inner shell electron (1s), immediately afterwards an

37
electron from higher atomic shell (2p) is demoted to the inner shell. The energy
difference is balanced by the emission of characteristic X-rays, which for Cu is a
combination of Kα1 and Kα2, producing an average wavelength of 1.5418 Å [69]. The
Kα2 contributions can be removed from the diffraction pattern by utilising a
monochromator (e.g. Ge(111)), which produces a pure Kα1 X-ray of 1.5406 Å. When
a sample is exposed to X-rays, the incident X-ray interacts with atoms of a crystal
structure in lattice planes (described by Miller indices, hkl) that act as a semi-
transparent mirror. The interplanar difference between the lattice planes is referred
to as the d spacing [69]. When an incident X-ray is diffracted off a lattice plane, the
angle of the diffracted X-ray is equal to the incident X-ray (θ). In order to satisfy
Bragg’s Law (nλ = 2d sinθ, Fig. 3.5), diffracted X-rays are only in phase and interfere
constructively when the distance between two incident X-rays (on different lattice
planes) is a whole integer (n) [65]. A diffraction pattern is generated by detecting the
intense diffracted X-ray, which is plotted against the diffraction angle (2θ).
Fig. 3.5. Derivation of Bragg’s Law, nλ = 2d sinθ
3.3.10.1 Experimental parameters
3.3.10.1.1 Powder X-ray diffraction (XRD)
Hardened paste samples cured for 28 days were crushed and subsequently ground
using an agate mortar and passed through a 63 µm brass sieve prior to powder XRD

38
analysis. All diffraction patterns were analysed using the STOE WinXPOW 2.1
software using the PDF2 database from the International Centre for Diffraction Data
(ICDD) [87].
Chapters 4, 6 and 8: Powder X-ray diffraction (XRD) patterns were collected between
10° < 2θ < 50° using a STOE STADI P diffractometer with an image plate detector in
transmission mode. The diffractometer uses a Ge(111) monochromator (and
produces a high purity Cu Kα1 (1.5406 Å) source.
Chapter 7: Powder X-ray diffraction patterns were collected between 10° < 2θ < 50°
using a Bruker D2 PHASER diffractometer with a LYNXEYE detector and a Cu Kα(1+2)
(1.5418 Å) source using a step size of 0.02° 2θ and a count time of 1 s per step, the
Cu Kα2 reflections were stripped using Bruker software, DIFFRAC.EVA.
3.3.10.1.2 High temperature XRD (HTXRD)
Chapter 5: In situ high temperature X-ray diffraction (HTXRD) patterns were collected
of pure struvite-K between 10° < 2θ < 50° in reflection mode using a Siemens D5000
diffractometer with no primary monochromator to strip the Cu contributions, as such
the X-ray source was an average Cu Kα(1+2) wavelength of 1.5418 Å. source The
diffraction pattern was collected at a step size of 0.02° 2θ, and a count time of 3 s
per step, with the Cu Kα2 reflections removed by DIFFRAC Plus software. The sample
was mounted onto a platinum platform. HTXRD data were collected at temperatures:
20, 400, 800, 1000 and 1200 °C, the sample was held at the desired temperature
during analysis and then ramped at 10 °C/min until the next analysis temperature
was reached.
3.3.10.1.3 Synchrotron X-ray diffraction (SXRD)
Synchrotron X-ray diffraction (SXRD) operates on the same principle of powder XRD
but provides high resolution diffraction patterns using synchrotron radiation, which
is very intense. The electrons are generated in an electron gun and accelerated up to

39
high speeds by the linear accelerator (known as the linac) and the booster
synchrotron into the large storage ring, where the path of the electrons are directed
by the straight and bending magnets [88]. Synchrotron radiation is produced when
the path of the electrons in the storage ring is changed and the electrons lose energy,
similar to bremsstrahlung radiation in an X-ray tube, which is channelled into
beamlines. The straight sections contain insertion devices that have alternating
magnetic fields, this causes the electrons to oscillate and produces more synchrotron
radiation (through braking radiation). Two important insertion devices are the
undulators and wigglers, whose magnetic field is in the vertical, which deflects the
high energy electrons horizontally creating synchrotron radiation that is linearly
polarised [88].
Fig. 3.6. Synchrotron X-ray diffraction, Beam I11 at Diamond Light Source, UK: (A) XRD
instrument and (B) the X-ray beam
Chapter 4: Time-resolved SXRD (λ = 0.825700 Å) was conducted on beamline I11 at
the Diamond Light Source (DLS) using the position sensitive detector on fresh
FA/MKPC and GBFS/MKPC pastes (w/s = 0.24), each scan time was typically ≈ 2 min.
In a disposable container, H3BO3 was added to H2O and stirred for 1 min after which,
the dry precursors (MgO, KH2PO4 and FA/GBFS) were added and mixed for an
additional 2 minutes. Using capillary action, the cement paste was drawn into
Kapton® polyimide tubes (ø = 0.8 µm) and was flamed sealed in a borosilicate
capillary tube (ø = 1 mm

40
41
4 Formulation optimisation of blended MKPC binders
4.1 Introduction
In the UK, Portland cement (PC) blended with either fly ash (FA, up to 35 wt. %) or
ground granulated blast furnace slag (GBFS, up to 90 wt. %) are used for the
encapsulation of intermediate level waste streams [4, 5]. However, the high pH of PC
based encapsulants (≈ pH 13) can promote the corrosion of Al, whilst Mg and U can
corrode in the high free water environment of PCs [13, 19, 89]. Corrosion of these
reactive metals leads to the formation of expansive corrosion products and hydrogen
gas, which increases the internal stress of the conditioned wasteform and ultimately
can affect the long term stability of the waste package. The near-neutral pH, low
water demand and high early strength properties [21] of magnesium potassium
phosphate cement (MKPC) binders have established them as possible alternative
encapsulant in the UK for niche waste streams, e.g. for reactive metals (Al, Mg and
U) with the potential to reduce corrosion within the conditioned wasteforms [15, 17-
19].
Initial studies have optimised the FA/MKPC system in order to identify a workable
formulation envelope for UK requirements and to accommodate for scale-up and
provide the optimal plant operation allowances [18, 19]. It is reported that the micro-
structure and mechanical properties of MKPC binders are sensitive to the water-to-
solids (w/s) ratio. In low w/s binders, residual KH2PO4 can react by the formation of
amorphous magnesium phosphate phase with a lower bound water content [90].
This phase is reported to seal pores, forming a continuous and uninterrupted
cementitious matrix [91]. Whilst in high w/s ratio binders, a highly crystalline matrix
is formed with an excess of unreacted water that gradually evaporates during aging.
This can result in a porous structure that has a detrimental effect on the mechanical
properties of the cement [90, 92]. The theoretical paste saturation was calculated by
Covill et al. to be a 0.26 w/s ratio [18], which allows the acid-base reaction to proceed
until completion. This formulation produced compressive strength values (≈ 25 MPa
at day 28 curing) that exceed the recommended minimum for a typical nuclear waste
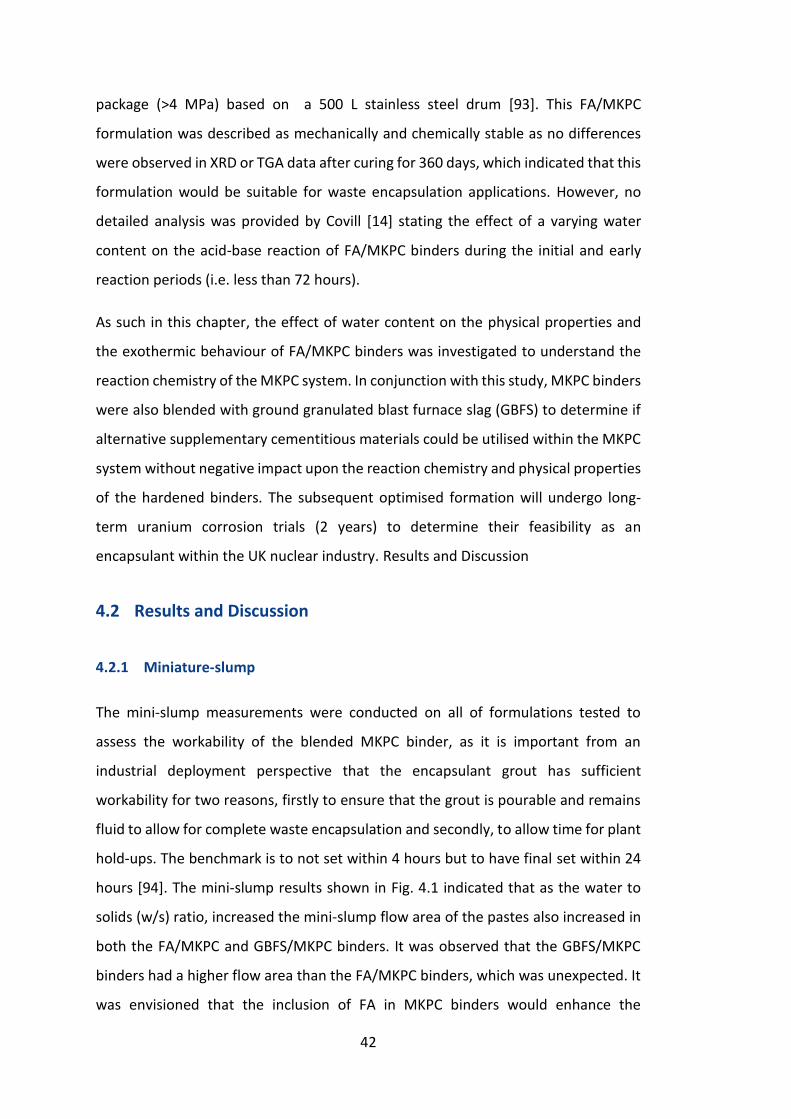
42
package (>4 MPa) based on a 500 L stainless steel drum [93]. This FA/MKPC
formulation was described as mechanically and chemically stable as no differences
were observed in XRD or TGA data after curing for 360 days, which indicated that this
formulation would be suitable for waste encapsulation applications. However, no
detailed analysis was provided by Covill [14] stating the effect of a varying water
content on the acid-base reaction of FA/MKPC binders during the initial and early
reaction periods (i.e. less than 72 hours).
As such in this chapter, the effect of water content on the physical properties and
the exothermic behaviour of FA/MKPC binders was investigated to understand the
reaction chemistry of the MKPC system. In conjunction with this study, MKPC binders
were also blended with ground granulated blast furnace slag (GBFS) to determine if
alternative supplementary cementitious materials could be utilised within the MKPC
system without negative impact upon the reaction chemistry and physical properties
of the hardened binders. The subsequent optimised formation will undergo long-
term uranium corrosion trials (2 years) to determine their feasibility as an
encapsulant within the UK nuclear industry. Results and Discussion
4.2 Results and Discussion
4.2.1 Miniature-slump
The mini-slump measurements were conducted on all of formulations tested to
assess the workability of the blended MKPC binder, as it is important from an
industrial deployment perspective that the encapsulant grout has sufficient
workability for two reasons, firstly to ensure that the grout is pourable and remains
fluid to allow for complete waste encapsulation and secondly, to allow time for plant
hold-ups. The benchmark is to not set within 4 hours but to have final set within 24
hours [94]. The mini-slump results shown in Fig. 4.1 indicated that as the water to
solids (w/s) ratio, increased the mini-slump flow area of the pastes also increased in
both the FA/MKPC and GBFS/MKPC binders. It was observed that the GBFS/MKPC
binders had a higher flow area than the FA/MKPC binders, which was unexpected. It
was envisioned that the inclusion of FA in MKPC binders would enhance the

43
workability (i.e. fluidity) more than the angular GBFS particles as a result of the “ball-
bearing effect” of the spherical FA particles [18, 54, 95, 96]. The characteristics of
the raw materials in part explain the differences observed in mini-slump
measurements of the FA/MKPC and GBFS/MKPC binders. The FA used in this study
has a finer particle size (resulting in a higher powder surface area) compared to the
GBFS (as shown in Table 3.1), which is a special coarse material preferred for nuclear
applications in the UK. Consequently, the FA absorbed more water than the GBFS,
which reduced the overall fluidity of the FA/MKPC paste.
Fig. 4.1. Mini-slump flow areas of fresh FA/MKPC and GBFS/MKPC pastes at 0.22, 0.24
and 0.26 w/s ratios compared to a BFS/PC grout (0.35 w/s) represented by the dashed
line
Only minor differences were observed in the flow areas of the 0.24 and 0.26 w/s
ratios in both the FA/MKPC and GBFS/MKPC binders, at 5 cm2 and 3 cm2, respectively.
This indicated that utilising the 0.24 w/s ratio would generate an 8 % reduction in the
water content without having a negative impact upon the workability and therefore
deployment of the cement in industrial applications. Additionally, any reduction in
the water content of the cement encapsulant is expected to reduce the rates of
reactive metal corrosion, due to less water being available to take part in the

44
corrosion reactions [19]. For reference, an MKPC-only system (for a 0.24 w/s [97],
represented by the dotted red line) was found to achieve a flow area of 118.7 ±
7.4 cm2. This implies that the inclusion of SCMs into MKPC binders resulted in an
increased water demand, and consequently reduced the fluidity, however, more
suitable working times were achieved (Table 4.1). The final setting time of MKPC-only
binders was found to occur at 1.25 hours and the sample was hot to the touch,
whereas in blended binders the initial set is delayed up to 5 hours and the final set
extended to 7.5 hours (Table 4.1). The FA/MKPC and GBFS/MKPC mini-slump results
were also compared to a standard Portland cement (PC) composite grout (3:1
GBFS/PC, 0.35 w/s) that is typically used in the UK nuclear industry. This PC based
encapsulant achieved a mini-slump flow area of 91.3 ± 1.7 cm2, depicted by the
dashed black line in Fig. 4.1. The MKPC formulations achieved an equivalent (or
greater) flow area that the industry standard grout with the exception of the 0.22
w/s FA/MKPC formulation, and as such it can be concluded that the workability of
these binders would be suitable for industrial applications.
Table 4.1. Setting time of FA/MKPC and GBFS/MKPC determined using vicat
measurements
Sample w/s pH
(0 hrs.)
pH
(4 hrs.)
Initial set
(hrs.) ± 0.3
Final set
(hrs.) ± 0.3
FA/MKPC 0.22 5.2 6.2 2.0 6.0
FA/MKPC 0.24 5.2 6.2 4.5 7.0
FA/MKPC 0.26 5.5 6.3 5.0 7.5
GBFS/MKPC 0.22 5.5 6.2 1.0 4.5
GBFS/MKPC 0.24 5.4 6.2 2.0 6.0
GBFS/MKPC 0.26 5.4 6.1 3.5 7.0

45
4.2.2 Powder X-ray diffraction
The X-ray diffraction patterns of the hardened FA/MKPC and GBFS/MKPC binders are
shown in Fig. 4.2 and Fig. 4.3. Diffuse scattering was identified in the FA/MKPC binder
between 15° < 2θ <25° and in the GBFS/MKPC binder between 25° < 2θ < 35°, which
is associated with the glassy fractions present in the FA (aluminosilicate) and the
GBFS (calcium aluminosilicate) precursors. Struvite-K (MgKPO4·6H2O, powder
diffraction file (PDF) #75-1076) was observed to be the main crystalline phase, with
traces of periclase (MgO, PDF #45-0946) identified in all formulations investigated.
Unreacted MgO was observed in the diffraction patterns for FA/MKPC and
GBFS/MKPC due to the MgO being added in excess into the cement binders. This was
for two reasons, firstly, to ensure that the phosphate source (KH2PO4) was fully
consumed in the acid-base reaction and secondly, to provide nucleation sites (around
unreacted MgO particles) for the formation of struvite-K [37-39].
In the FA/MKPC w/s ratio binders, quartz (SiO2, PDF #11-0252), mullite (3Al2O3.2SiO2,
PDF #15-0776) and hematite (Fe2O3, PDF #87-1164) were identified, whilst
åkermanite (Ca2MgSi2O7, PDF #76-0841) reflections were observed in the
GBFS/MKPC w/s ratio binders, which are typical crystalline phases present in these
materials. The phase assemblage in the FA/MKPC and GBFS/MKPC binders in Fig. 4.2-
4.3 did not appear to change with a varying w/s ratio, however the relative intensity
of the struvite-K reflections increased with an increasing water content when
compared to the relative intensity of the main periclase reflection at 42.9° = 2θ. Hall
et al. [90] describes this observation to be the result of increased formation of the
cementitious phase, struvite-K. The inclusion of FA and GBFS did not affect the
crystalline properties of blended MKPC binders, as no additional crystalline phases
were detected nor the crystallisation of struvite-K affected. The results presented
suggest that blended MKPC binders are chemically stable to small alterations in the
water content and the SCMs used, which concurs with previous work performed by
Covill et al. [18].

46
Fig. 4.2. X-ray diffraction patterns of FA/MKPC pastes at various w/s ratio after 7 days
curing
Fig. 4.3. X-ray diffractogram of GBFS/MKPC pastes at various w/s ratio after 7 days curing

47
4.2.3 Thermal analysis
The dehydration behaviour of the FA/MKPC and GBFS/MKPC binders, shown in Fig.
4.4- Fig. 4.5, was found to be comparable to pure struvite-K systems [98]. A large
mass loss occurred between 50 and 150 °C, which was associated with the one-step
dehydration of MgKPO4·6H2O to MgKPO4 (Eq. 8). The TGA data highlighted that no
secondary mass loss events occurred in the two binders. The effect of varying the
water content on the TGA of the hardened FA/MKPC and GBFS/MKPC binders was
found to result in minor changes in the total mass loss from the dehydration of
struvite-K, which is in agreement with the XRD data, as the w/s ratio increased in the
blended MKPC binders so does the struvite-K formation.
MgKPO4·6H2O (s) MgKPO4 (s) + 6H2O (g) Eq. 5
Fig. 4.4. TGA (A) and DTG (B) traces of hardened FA/MKPC pastes after 28 days curing, at
various w/s ratios

48
Fig. 4.5. TGA (A) and DTG (B) traces of hardened GBFS/MKPC pastes after 28 days curing,
at various w/s ratios
The differential thermogravimetry (DTG) data for the formulations, shown in Fig. 4.4-
Fig. 4.5, highlight that the maximum mass loss due to dehydration of struvite-K
occurred at ≈ 100 °C. The DTG plots suggest that the temperature for maximum mass
loss slightly increases with the increasing w/s ratio. This could result from longer
dehydration times due to the presence of more water. The maximum mass loss was
greatest for the 0.24 w/s ratio in both FA/MKPC and GBFS/MKPC binders, however,
the 0.26 w/s and 0.24 w/s ratios are likely to be within statistical error. This suggests
that in these w/s ratios a similar quantity of struvite-K was formed. However, there
was large a difference between the former w/s ratios and the 0.22 w/s sample for
both the FA/MKPC and GBFS/MKPC systems. The varied DTG dehydration behaviour
of the FA/MKPC binders below 80 °C is due to the presence of free water in the
samples. To eliminate free water TGA samples should be held at room temperature
for 30 minutes under a N2 gas flow.

49
4.2.4 Compressive strength
The compressive strength (CS) of blended MKPC binders was found to vary as a
function of both the supplementary cementitious material used and the water
content, as shown in Fig. 4.6. The CS values for FA/MKPC binders reached between
20 to 25 MPa (for all w/s ratios studied at day 28 curing), which is comparable to
literature based on similar systems [18, 89]. However, the GBFS/MKPC binders were
observed to have superior mechanical properties compared to the FA/MKPC binders
with the CS values ranged between 25 to 36 MPa for the w/s ratios at day 28 curing.
The most noteworthy difference between the two blended systems occurred in the
0.22 w/s formulation (at day 28 curing), where the FA/MKPC binder achieved a CS
value of 16.4 MPa ± 0.3 MPa and the GBFS/MKPC binder achieved a CS value of 35.6
MPa ± 1.4 MPa. It is postulated that the difference in mechanical properties can be
explained by the powder properties of FA and GBFS, as reported in Table 3.1. Firstly,
the FA has a much narrower particle size distribution and larger surface area (2258
m2/kg) than the GBFS (993 m2/kg). This results in FA having a greater water demand,
which could be detriment to struvite-K formation in the FA/MKPC binder. Secondly,
the difference could be due to the particle packing capabilities of FA (spherical
particles) and GBFS (angular particle), where the latter has a better physical
interlocking in the MKPC binder than FA [99]. However, these properties cannot be
solely attributed to the mechanical performance differences observed between the
FA/MKPC and GBFS/MKPC binders in the 0.22 w/s (≈ 15 MPa) and 0.24 w/s (≈ 10
MPa) formulations.

50
Fig. 4.6. Compressive strength of FA/MKPC and GBFS/MKPC hardened pastes cured for up
to 28 days, as a function of the w/s ratio
Despite the differences in CS values, all of the FA/MKPC and GBFS/MKPC w/s
formulations exceeded the minimum required compressive strength for a typical UK
nuclear waste package of >4 MPa (based on a 500 L stainless steel drum) [93]. The
effect of varying the w/s ratio in the MKPC binders appeared to be variable
depending upon the supplementary cementitious material. For the FA/MKPC
binders, the 0.24 and 0.26 w/s formulations achieved similar CS results, with the
lowest strength attributed to the water deficient 0.22 w/s sample, which could be
the result of a high FA water demand. Whilst in the GBFS/MKPC samples, the highest
strength was achieved by the 0.22 and 0.24 w/s formulations. This was consistent
with the literature [63, 65] that high water content samples have lower mechanical
properties due to an increased porosity. The findings of this study indicate that the
0.24 w/s formulation would form a suitable encapsulant and should undergo further
investigations, as it is not practical to study all six formulations. As such, the
remainder of this work will focus on FA/MPKC and GBFS/MKPC binder at a 0.24 w/s
ratio.

51
4.2.5 Early age hydration behaviour
To determine the effect of water content on the hydration characteristics of fresh
FA/MKPC and GBFS/MKPC pastes, isothermal calorimetry (IC) was conducted on the
0.22, 0.24 and 0.26 w/s formulations. Whilst time-resolved synchrotron XRD was
undertaken on the preferred w/s formulation (0.24 w/s) in order to elucidate the role
of SCMs (i.e. inert filler or chemical participants) independent of the water content
within the MKPC system. This was performed in conjunction with the IC of an MKPC-
only (0.24 w/s) binder, which was used as a reference.
4.2.5.1 MKPC-only
In the calorimetric traces (heat flow and cumulative) of the MKPC-only binder (Fig.
4.7), a rapid exothermic peak was observed where the maximum heat flow achieved
around ≈ 1 hr, a second exothermic event occurred between 10 to 50 hrs Fig. 4.7,
which was associated with a low heat flow. The shape of the calorimetric trace of the
MKPC-only sample is similar to those reported in the literature for magnesium
phosphate cements (with no SCMs) [43, 100, 101]. The first exothermic peak is
reported by Qiao et al. [101] to be associated with the acid-base reaction of the
magnesium phosphate cement, i.e. dissolution of MgO and KH2PO4 leading to
formation of struvite-K (Eq. 5-7), whilst the second exothermic peak relates to setting
of the MKPC binder [101] through the formation of a continuous network [102].

52
Fig. 4.7. Normalised calorimetric traces for MKPC-only at 0.24 w/s
A disparity exists between the calorimeter data presented for the MKPC-only binder
(Fig. 4.7) and that in the literature, with respect to the duration of the acid-base
reaction. In the literature, the cumulative heat evolution of the MKPC-only binder
(and thus, acid-base reaction) was concluded after <6 hours [101], which is
considerably shorter than the 50 hours cumulative heat evolution exhibited in Fig.
4.7. One possible explanation for the extension of the heat evolution could be the
inclusion of 2 wt. % boric acid in the MKPC-only binder as a set retarder. This theory
is supported by MAP cements (with no SCMs), where an extension of the setting time
by 20 minutes was successfully achieved with the addition of 20 % borax
(Na2B4O7·10H2O, by phosphate weight) [44], whilst Hall et al. [43] further delayed the
setting time of similar systems up to 80 minutes with the addition of 12.5 g of boric
acid (based on a 1.5 kg batch).

53
4.2.5.2 FA/MKPC
4.2.5.2.1 Isothermal calorimetry
The calorimetric traces for FA/MKPC binders at w/s ratios: 0.22, 0.24 and 0.26 are
presented in Fig. 4.8. The hydration behaviour of the FA/MKPC binders appeared to
be comparable to the MKPC-only binder (Fig. 4.7), with two exothermic peaks
detected, the first (sharp and short) corresponded to the dissolution-precipitation of
struvite-K, whilst the second (broad and long) related to the extended hydration
through the formation of an interconnected cement paste [100]. This signifies that
the inclusion of FA did not affect the typical two-step hydration behaviour of MKPCs
as observed in this study and reported in the literature [100, 101].
Differences were observed between the heat flow/duration of MKPC-only and the
FA/MKPC binders, which were further amplified as the water content was increased.
One fundamental explanation for this is quite simply that the FA/MKPC binders are
diluted with 50 wt. % FA, meaning there are fewer reactants per gram of the IC
sample compared to the MKPC-only binder and thus, resulted in a lower exothermic
output. This dilution effect was further extended between the three w/s ratios,
where the reactants were more diluted in the higher water content FA/MKPC
sample, resulting in a lower maximum heat flow and longer reaction duration (Fig.
4.8). The maximum heat flow associated with the dissolution-precipitation of
struvite-K (Fig. 4.8) around ≈ 2 hrs appeared to substantially decrease in the
FA/MKPC binders with higher w/s ratios. This indicated that the 0.22 w/s FA/MKPC
binder was initially the most reactive with the reaction reaching completion by 65
hours whilst the 0.26 w/s FA/MKPC binder was the least reactive and did not reach
completion until 80 hours. These results indicate that there is an optimum reaction
period to allow for sufficient strength forming to occur as shown in Fig. 4.6, where
the lowest compressive strength (19.9 MPa at day 28) was associated with the 0.22
w/s binder, which also had the shortest cumulative heat evolution period (Fig. 4.8)
of 65 hours. Using strength-forming and cumulative reaction time as an indicator for
the ideal w/s formulation, the optimum FA/MKPC binders would be the 0.24 w/s
ratio.

54
Fig. 4.8. Normalised calorimetric traces for fresh FA/MKPC pastes at (A) 0.22 w/s, (B) 0.24
w/s and (C) 0.26 w/s

55
4.2.5.2.1 Synchrotron X-ray diffraction (SXRD)
The hydration behaviour of the FA/MKPC binder (0.24 w/s) was observed from 0.5 to
≈ 60 hours using synchrotron X-ray diffraction (SXRD, Fig. 4.9). In the initial diffraction
patterns (0.5 – 1.5 hours), only reflections associated with unreacted periclase (MgO,
PDF #45-0946, [103]) and the crystalline phases present in the FA, mullite (PDF #15-
0776, [104]), quartz (SiO2, PDF #11-0252, [105]) and hematite (Fe2O3, PDF #87-1164,
[106]) were observed. The crystalline FA phases were still evident at the latest time
point (58.8 hrs), which indicated that the FA did not react within in this
system/timescale. The emergence of struvite-K (MgKPO4·6H2O, PDF #75-1076, [22])
reflections was observed at 2 hours, after which the relative intensity of struvite-K
reflections increased with time (up to ≈ 60 hours), commensurate with periclase
consumption.
Prior to the crystallisation of struvite-K at 2 hours, neither the phosphate reagent
(KDP) nor intermediate phosphate phases were identified in the FA/MKPC diffraction
patterns. To highlight this, the KDP (potassium dihydrogen phosphate, KH2PO4)
powder diffraction file (#35-0807, [107]) was included in Fig. 4.9. This indicated that
the complete dissolution of KDP occurred between the sample preparation and prior
to the first diffraction pattern collected at 30 minutes. Due to the narrow Kapton
tubes (ø = 0.8 mm) used, the KDP was ground slightly using a pestle and mortar to
reduce the particle size, which may have increased the reactivity of the KDP
compared to the calorimetry FA/MKPC sample. Although the early hydration
behaviour of the FA/MKPC binder is similar to magnesium ammonium phosphate
(MAP) binders, where the phosphate reagent (NH4H2PO4) completely dissolved
within 20 minutes of mixing and distinctive struvite reflections appeared after 1 hour
[108]. Neiman [39] further proposes the formation of a poorly crystalline magnesium
phosphate gel occurs prior to the crystallisation of struvite [39, 109], which is
associated with the through-solution precipitation mechanism.

56
Fig. 4.9. Time resolved synchrotron X-ray diffraction of 0.24 w/s FA/MKPC binder,
diffraction labels indicate the time (hrs) lapsed between sample preparation and data
collection

57
The SXRD data (Fig. 4.9) supports the precipitation of struvite-K during the first
exothermic peak in the calorimetry trace for the FA/MKPC (0.24 w/s) binder (Fig. 4.8).
The relative intensity of the struvite-K reflections increased up to 13 hours, which
was indicative of a continuing crystallisation process. During this time, the final set of
the FA/MKPC binder was observed in the vicat measurements (Table 4.1). The second
exothermic peak in Fig 4.8 occurred between 12 to ≈ 60 hours, as such this event
could be attributed to the formation of an interconnected struvite-K network as part
of the strength forming phase of the MKPC binder.
4.2.5.3 GBFS/MKPC
4.2.5.3.1 Isothermal calorimetry
The calorimetric traces of the GBFS/MKPC binders at 0.22, 0.24 and 0.26 w/s ratios
(Fig. 4.10) clearly demonstrate a considerable difference in the hydration behaviour
compared to the MKPC-only and FA/MKPC binders, where a sharp heat flow it
observed for the first ≈ 6 hours followed by a slower rate of reaction. The addition of
GBFS changed the reaction kinetics of the MKPC systems, although the pH of the
GBFS/MKPC binders is comparable to FA/MKPC binders (Table 3.1). All GBFS/MKPC
binders exhibited a substantial increase in the duration of the induction period
compared to the equivalent FA/MKPC binders. Varying the water content in the
GBFS/MKPC resulted in reaction delay, with time taken for the reaction to reach
completion being 67, 83 and 100 hours for 0.22, 0.24 and 0.26 w/s ratios respectively.
This suggests that one effect of increasing the water content in GBFS/MKPC binders
is slower reaction kinetics. The compressive strength data presented in Fig. 4.6
follows a similar pattern to the calorimetry data of the GBFS/MKPC binders. The
highest compressive strength (36.6 MPa at day 28) was attained for the 0.22 w/s
binder, which also had the shortest reaction period. This indicates that for
GBFS/MKPC binders, the optimum w/s ratio would be the 0.22 w/s formulation
however, the fluidity of this binder (102.3 ± 2.6 cm2) was significantly below that of
the 0.24 w/s binder (115.1 ± 2.4 cm2) as shown in Fig. 4.1. As such, the optimum
GBFS/MKPC binder was concluded to be the 0.24 w/s formulation, which provided a

58
balance between compressive strength, reaction duration and fluidity (i.e. the
workability).
Varying the water content produced notable changes in the heat flow of MKPCs
blended with GBFS, whereas those blended with FA showed subtler changes. In both
systems, the rate of heat evolution was most rapid at lower w/s ratios. The heat
evolution of the FA/MKPC binders was similar to the MKPC-only system and
ammonium-based phosphate cements (MAP cements). The duration of the heat
evolution (i.e. cumulative flow) for MAP cements with borax additions was typically
only extended up to 80 hours [43], whereas the cumulative heat evolution for all of
the FA/MKPC and GBFS/MKPC formulations extended passed 95 hours. This is
postulated to be the effect of retarding the system with 2 wt. % boric acid and
diluting the reactants (MgO, KH2PO4, and H2O) with 50 wt. % addition of
supplementary cementitious materials (FA and GBFS).
The calorimetric traces in Fig. 4.10 appear to have three distinct exothermic events,
which could be associated with the dissolution/precipitation processes and the
development of the set cementitious binder. It is postulated that GBFS is acting as a
chemical participant rather than being inert filler, which could lead to the formation
of secondary reaction products highly intermixed within the MKPC binder. There is
no calorimetry data on GBFS/MKPC formulations available in the open literature to
support these results, but the distinct calorimetric response of GBFS/MKPC binders
was reproducible at all w/s ratios investigated (Appendix C). The SXRD is important
to understand the crystalline behaviour of these binders, as only the 0.24 w/s was
studied the hydration behaviour of the 0.22 and 0.26 w/s binders will be inferred.

59
Fig. 4.10. Normalised calorimetric traces for fresh GBFS/MKPC pastes at (A) 0.22 w/s, (B)
0.24 w/s and (C) 0.26 w/s

60
4.2.5.3.2 Synchrotron X-ray diffraction (SXRD)
The time-resolved SXRD patterns of the GBFS/MKPC binder supported the
occurrence of a delayed reaction mechanism, in-line with the calorimetry data Fig.
4.10. In the first two hours, reflections associated with MgO and KDP were detected
in contrast to the FA/MKPC binder at a similar time point, this indicated that the KDP
did not undergo dissolution and as such, no poorly crystalline struvite-K could have
formed in this system. Reflections associated with a minor contamination were found
in Fig. 4.12, identified as Portland cement (alite, PDF #85-1378, [110]) and calcite
(CaCO3, PDF #05-0586, [111]). The reflections were evident at the latest time point
(57.7 hours), which suggests that the PC did not react to C-S-H or interfere with the
acid-base reaction of this binder. However, it is possible that these contaminants may
have increased the pH of the GBFS/MKPC binder to higher than normal (Table 4.1).
The dissolution of KDP was observed in Fig. 4.12 to commence at 13.9 hours, noted
by the decreasing relative intensity of the KDP reflection, whilst reflections
associated with struvite-K began to emerge with the relative intensity increasing until
all of the KDP was consumed in the diffraction pattern at 57.7 hours. Over the first
few hours, the relative intensity of the periclase reflection was observed to decrease
suggesting that dissolution of this phase had begun. The calorimetric trace of the
GBFS/MKPC (0.24 w/s) binder highlighted three exothermic events centred at 28 hrs,
40 hrs and 59 hours. It appears that all of these events were associated with the
dissolution of the reactants and the precipitation of crystalline struvite-K.

61
Fig. 4.11. Time resolved synchrotron X-ray diffraction of 0.24 w/s GBFS/MKPC binder,
diffraction labels indicate the time (hrs) lapsed between sample preparation and data
collection

62
Fig. 4.12. Key time resolved synchrotron X-ray diffraction of GBFS/MKPC binder extracted
from Fig. 4.11
4.2.6 Uranium encapsulation in blended MKPC binders
4.2.6.1 Experiment set-up
To validate the optimised blended MKPC described earlier in this Chapter, long-term
(700 days) corrosion studies were conducted using natural uranium foil in small scale
trials based on measuring water displacement. Natural uranium foil (Goodfellows,
0.178 mm) was cut into strips (w = 10 mm, l = 29 mm) using a scalpel (Table 4.2), the
surface areas were calculated in triplicate using ImageJ software [73]. Each U foil strip
was cleaned using a 50:50 solution of nitric acid/water to remove the oxide layer
(UO2). The black oxide layer is evident on all but one of the U foil samples in Fig. 4.14,
where the latter had already been cleaned.
To remove any trace of the oxide layer and nitric acid, the foil strips were then
washed several times using deionised water. The cement pastes were mixed
according to Table 4.3; each paste was mixed by hand for 5 minutes after which it

63
was poured to fill a 15 mL centrifuge tube that contained the U foil strip. The samples
were lightly tapped on the laboratory bench to remove any entrained air bubbles
from the mixing process. Within 10 minutes of mixing the samples, the experiment
was set-up to the according to the schematic and photographs shown in
Figs. 4.13-14.
Table 4.2. Sample data for natural uranium foil samples
Sample Binder Mass (mg) ± 0.1
Surface area
(mm2) ± 1.0
1 FA/MKPC 673.2 557.62
2 FA/MKPC 692.9 565.96
3 FA/MKPC 697.3 570.56
4 GBFS/MKPC 744.3 630.70
5 GBFS/MKPC 725.0 611.20
6 GBFS/MKPC 721.4 608.09
7 GBFS/PC 702.2 598.36
8 GBFS/PC 737.8 619.24
Table 4.3. Cement formulations for uranium corrosion trials to ± 0.1 g precision
Blend MgO (g) KH2PO4 (g) H2O (g) SCM (g) H3BO3 (g) w/s
FA/MKPC 77.8 154.6 96.0 165.0 6.5 0.24
GBFS/MKPC 77.8 154.6 96.0 165.0 6.5 0.24
Blend PC (g) GBFS (g) H2O (g) - - w/s
GBFS/PC 55.6 166.7 77.8 - - 0.35

64
Fig. 4.13. Schematic of the water displacement experiment
Fig. 4.14. Uranium corrosion experiments, (A) uranium foil, (B) a single completed set-up
and (C) the full set-up

65
Gas volume measurements were taken every hour for the first 8 hours, and then once
a day for the first month. After which measurements were taken every 2-3 days up
to 6 months period, between 6-24 months measurements were taken weekly. The
measuring cylinders were refilled as and when the gas volume was nearing capacity,
which was 15 mL for the blended MKPC binders and 30 mL for the GBFS/PC samples.
Biannually the water was treated with virkon S, which is a disinfectant. The water
was completely replaced once a year. For analysis purposes the gas volume data was
binned into 50-day collection periods, in which the volume observed includes the
preceding 49 days of measurements. The temperature of the laboratory (which had
a low foot fall, no windows and air conditioning) was recorded for the duration of the
experiments at 1 hour intervals (Fig. 4.15) using an Omega-63 data logger. The
temperature range was frequently between 20 to 25 °C but did experience occasions
where it decreased to 15 °C or was extended up 30 °C. Figs. 15B-15C highlights the
variance in a one month and one-week period (Feb to March 2013).

66
Fig. 4.15. The temperature data for the uranium corrosion trials: (A) Jan 2013 – Jan 2015,
where data was extracted from the highlighted (blue) region to show the temperature
variance in (B) 1 month and (C) 1 week

67
4.2.6.2 Corrosion results
The cumulative gas volume for the FA/MKPC, GBFS/MKPC and GBFS/PC binders are
presented in Fig. 4.16. The total gas volume generated for the FA/MKPC, GBFS/MKPC
and GBFS/PC samples were recorded to be: 64.7, 70.4 and 143.5 mL, respectively
after 700 days (Tables 4.4-4.6), which is a significantly longer corrosion study than
usually undertaken. The results indicated that the employment of blended MKPC
binders in the encapsulation of uranium could reduce reactive metal corrosion by
half compared to the UK nuclear industry standard grout, GBFS/PC.
After 100 days of uranium/grout interactions, Fig. 4.16 indicates that 10.8 ± 2.8 mL
(FA/MKPC) and 13.0 ± 2.8 mL (GBFS/MKPC) of gas was evolved. These results appear
comparable to a corrosion trial undertaken using FA/MKPC binders at 0.26 and 0.28
w/s ratios, where an average gas evolution of 11.2 ± 0.1 mL (0.26 w/s) and 13.7 ± 7.5
mL (0.28 w/s) was observed after 90 days [14]. However, this similarity can be
discarded when taking into account the gas evolution to surface area ratio. The
current study utilised natural uranium foil sections (l = ≈ 29 mm, w = ≈ 10 mm,
d = 0.178 mm), whilst Covill [14] used natural uranium cylinders, referred to as pucks,
(ø = 28 mm, h = ≈ 8.5 mm) sectioned from a Magnox fuel rod [14]. The average gas
evolution to surface area ratios are:
FA/MKPC (0.26 w/s) binder was 0.56 mL/cm2, calculated from [14]
FA/MKPC (0.24 w/s) binder was 1.93 mL/cm2
GBFS/MKPC (0.24 w/s) binder was 1.49 mL/cm2
The calculated gas evolution to surface area ratios suggest that the blended MKPC
binders used in this study performed worse than expected. One possible explanation
for this difference could be associated with the uranium preparation. As discussed in
section 4.2.6.1, the uranium foil was cleaned with nitric acid to remove the protective
passivation layer (UO2), whilst the uranium pucks were only cleaned with
cyclohexane [14]. This indicates that careful consideration should be taken with
regards to the uranium preparation, specimen size and data collection for corrosion
trials.

68
The gas volume generation of the blended MKPC binders appeared to peak at 200
days with a steady decrease in the volume generated over time (Fig. 4.17). The
GBFS/PC appeared to follow a similar pattern to the blended MKPC binders, albeit at
a greater rate. Fig. 4.16 highlights the importance of conducting long-term corrosion
studies as above 100 days the difference between the binders significantly increased.
Small scale corrosion studies using BFS/PC and FA/PC grouts (at varying replacement
ratios) were found to have high early corrosion rates that was attributed the free
water in the PC grouts reacting with Magnox swarf, however, as the PC hydrated to
form C-S-H products, the corrosion rate decreased [11]. A similar trend was observed
in Fig. 4.17, where the gas volume generated substantially decreased as curing age
increased.
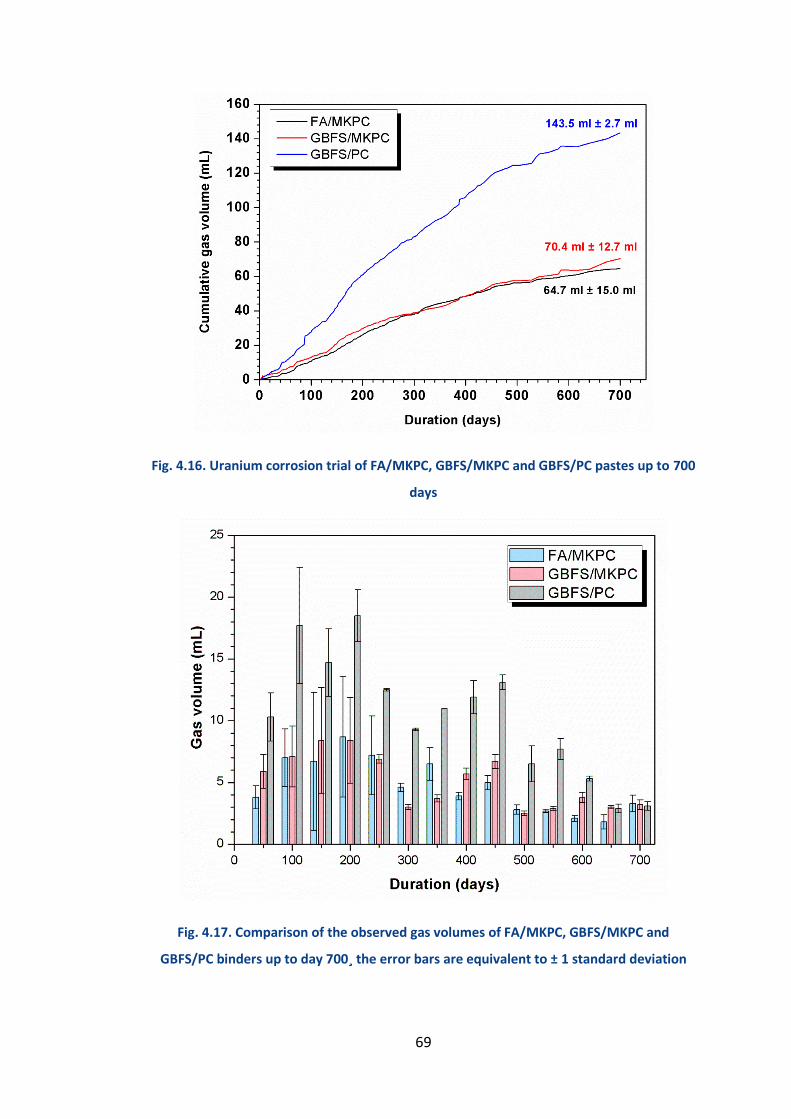
69
Fig. 4.16. Uranium corrosion trial of FA/MKPC, GBFS/MKPC and GBFS/PC pastes up to 700
days
Fig. 4.17. Comparison of the observed gas volumes of FA/MKPC, GBFS/MKPC and
GBFS/PC binders up to day 700¸ the error bars are equivalent to ± 1 standard deviation

70
Table 4.4. Gas volume generation of FA/MKPC (0.24 w/s) containing natural uranium up
to 700 days
Gas volume (mL) ± 0.1 mL
Duration
(days)
Sample 1 Sample 2 Sample 3 Average
Obs. Total Obs. Total Obs. Total Obs. Total S.D
50 3.0 3.0 5.1 5.1 3.3 3.3 3.8 3.8 0.9
100 3.9 6.9 7.6 12.7 9.5 12.8 7.0 10.8 2.8
150 1.9 8.8 3.6 16.3 14.5 27.3 6.7 17.5 7.6
200 4.0 12.8 6.7 23.0 15.4 42.7 8.7 26.2 12.4
250 6.1 18.9 13.9 30.2 9.5 52.2 7.2 33.4 13.8
300 3.9 22.8 4.7 34.9 4.3 56.5 4.6 38.0 13.9
350 5.0 27.8 8.2 43.1 6.1 62.6 6.5 44.5 14.2
400 4.1 31.9 3.4 46.5 4.0 66.7 3.9 48.4 14.3
450 5.8 37.7 4.9 51.4 4.4 71.1 5.0 53.4 13.7
500 3.2 40.9 2.3 53.7 3.0 74.1 2.8 56.2 13.7
550 2.8 43.7 2.5 56.2 2.6 76.7 2.7 58.9 13.6
600 1.9 45.6 2.1 58.3 2.5 79.2 2.2 61.1 13.9
650 1.0 46.6 2.0 60.3 2.4 81.6 1.8 62.9 14.4
700 0.9 47.5 2.0 62.3 2.5 84.1 1.8 64.7 15.0

71
Table 4.5. Gas volume generation of GBFS/MKPC (0.24 w/s) containing natural uranium
up to 700 days
Gas volume (mL) ± 0.1 mL
Duration
(days)
Sample 1 Sample 2 Sample 3 Average
Obs. Total Obs. Total Obs. Total Obs. Total S.D
50 5.1 5.1 7.8 7.8 4.7 4.7 5.9 5.9 1.4
100 5.7 10.8 10.6 18.4 5.1 9.8 7.1 13.0 2.8
150 7.5 18.3 14.1 32.5 3.7 13.5 8.4 21.4 7.6
200 7.1 25.4 13.1 45.6 4.9 18.4 8.4 29.8 11.5
250 5.8 31.2 6.6 52.2 6.0 24.4 6.9 35.9 11.8
300 3.2 34.4 3.0 55.2 2.7 27.1 3.0 38.9 11.9
350 3.8 38.2 3.3 58.5 4.0 31.1 3.7 42.6 11.6
400 6.1 44.3 6.0 64.5 5.1 36.2 5.7 48.3 11.9
450 6.2 50.5 7.5 72.0 6.4 42.6 6.7 55.0 12.4
500 2.2 52.7 2.6 74.6 2.6 45.2 2.5 57.5 12.5
550 3.0 55.7 3.1 77.7 2.7 47.9 2.9 60.4 12.6
600 3.0 59.6 3.5 81.2 4.0 51.9 3.8 64.2 12.4
650 3.0 62.6 3.1 84.3 2.8 54.7 3.0 67.2 12.5
700 2.8 65.1 3.7 88.0 3.5 58.2 3.2 70.4 12.7

72
Table 4.6. Gas volume generation of GBFS/PC (0.35 w/s) containing natural uranium up to
700 days
Gas volume (mL) ± 0.1 mL
Duration
(days)
Sample 1 Sample 2 Average
Obs. Total Obs. Total Obs. Total S.D
50 8.3 8.3 12.2 12.2 10.3 10.3 2.0
100 13.0 21.3 22.4 34.6 17.7 28.0 6.7
150 17.4 38.7 11.9 46.5 14.7 42.6 3.9
200 20.6 59.3 16.4 62.9 18.5 61.1 1.8
250 12.4 71.7 12.6 75.5 12.5 73.6 1.9
300 9.4 81.1 9.2 84.7 9.3 82.9 1.8
350 11.0 92.1 11.0 95.7 11.0 93.9 1.8
400 10.5 102.6 13.2 108.9 11.9 105.8 3.2
450 12.5 115.1 13.7 122.6 13.1 118.9 3.8
500 7.1 122.2 4.2 126.8 6.5 124.5 2.3
550 6.8 129.0 8.5 135.3 7.7 132.2 3.2
600 5.1 134.1 5.5 140.8 5.3 137.5 3.4
650 3.3 137.4 2.6 143.4 2.9 140.4 3.0
700 3.4 140.8 2.7 146.1 3.1 143.5 2.7

73
4.2.6.3 Scanning electron microscopy
The backscattered electron images of the FA/MKPC and GBFS/MKPC binders
encapsulated with uranium foil were typical for these systems (albeit without
uranium). The GBFS/PC was unable to be analysed due to the sample breaking during
sectioning. In the FA/MKPC binder (Fig. 4.18), large struvite-K crystallites, unreacted
periclase and the spherical particles associated with fly ash were clearly evident. A
good adhesion with the uranium foil is observed at 18 months with no evidence that
the uranium has corroded. The elemental maps suggest that K and Ca (Fig. 4.18: K
and Ca) were associated with the uranium foil, however this is due to an overlapping
of the characteristic X-rays detected by EDX analysis. For K, the Kα1 X-ray (3.314)
coincided with the Mβ X-ray of U at 3.336 keV, whilst the Ca Kα1 and Kα2 X-rays
(3.692 and 3.689 keV, respectively) slightly overlaid the M2N1 X-ray of U at 3.724
keV. The SEM/EDX analysis in this study indicated that the FA/MKPC (0.24 w/s) is a
suitable for the encapsulation of corrosion with no detrimental effect on the typical
microstructure. It is reported that uranium pucks encapsulated within FA/MKPC
binders will undergo oxidation (observed as a black surface using optical microscopy)
when in direct contact with the MKPC binder [14] however, no evidence for this
uniform oxidation later was found in Figs. 4.18-4.19. The summary of uranium
corrosion trials conducted by Covill revealed that even after 360 days, no uranyl
phosphate compounds or other corrosion products were identified up to 360 days
[14], which supports the SEM/EDX of the FA/MKPC binder aged for 18 months in
Fig. 4.18.
In the GBFS/MKPC binder (Fig. 4.19), a continuous struvite-K matrix was observed
with embedded angular GBFS particles. The condition of the encapsulated uranium
foil was substantially different compared to the FA/MKPC binder. A corrosion layer
can be distinguished from the pristine uranium foil, which is evident all around the
boundary of the U foil. In between the corrosion layer and the U foil, an interstitial
space was created devoid of the elements displayed in Fig. 4.19. This indicated that
no corrosion products, other than UO2, were formed. The interstitial space was
created by the expansion of the UO2 corrosion layer into the GBFS/MKPC binder. The
densities of U metal and UO2 can be used to explain why this mechanism occurs. In

74
order to have the same U content, UO2 (being less dense at 10.97 g/cm3) will need to
occupy a larger volume than the denser U metal (18.95 g/cm3) and as such, the
delaminated corrosion layer is formed via expansion. A slight chemical difference was
observed in the bottom section of the U foil (labelled in Fig. 4.19), where a Si-rich
region (Fig. 4.19: Si) was present in the interstitial space. It is postulated that this
could be associated with sample preparation for example, if the U foil was not
perfectly perpendicular to the resin, the sample would not be fully exposed during
grinding/polishing. Additional sample preparation and SEM/EDX analysis at higher
magnifications could determine (or deny) the existence of the Si-rich region within
the GBFS/MKPC binder.
The GBFS/MKPC corrosion microstructure is similar to that of an GBFS/PC sample
encapsulated with aluminium, in which a transition zone consisting of a porous layer
between the grout and metal [13]. This feature was described to be formed by
hydrogen generated during the initial corrosion of aluminium [13]. The similar overall
gas volume generation of the FA/MKPC and GBFS/MKPC binders at 64.7 and 70.4 mL,
respectively cannot justify the difference observed in the microstructure, as such it
is postulated that the two binders undergo different corrosion mechanisms. This
could be associated with the redox potential of GBFS, which is slightly reducing due
to the sulphate content [30], further work is needed to understand this in detail.

75
Fig. 4.18. FA/MKPC (0.24 w/s) with encapsulated uranium foil at 18 months

76
Fig. 4.19. GBFS/MKPC (0.24 w/s) with encapsulated uranium foil at 18 months

77
4.3 Conclusions and Future work
Investigation of various w/s ratios have reduced the water content successfully by 8
% (based on the 0.24 w/s ratio) from previous literature formulations [18] whilst still
retaining mechanical and chemical integrity of the hardened blended MKPC
monoliths. The reduction in water content could reduce the amount of water
available to support corrosion of encapsulated ILW reactive metals. There appeared
to be no differences in the XRD phase assemblage or thermal analysis between the
two binders studied: FA/MKPC and GBFS/MKPC. The compressive strength of the
GBFS/MKPC system was notably higher than that of the FA/MKPC system.
Calorimetry data for the GBFS/MKPC binders made at different water-to-solids ratios
suggests that although there is little difference identified in XRD/TGA analysis, the
heat of reaction behaviour and heat flow varied considerably compared to the
FA/MKPC formulations. This characteristic is advantageous for industrial applications
as the output and setting time can be controlled by modifying the SCM included in
the MKPC binder. The calorimetry and compressive strength data both suggest there
is potential for secondary reaction products to form within the GBFS/MKPC binders,
which would be expected fill any pores. The optimised blended MKPC binders were
found to reduce the corrosion of uranium by half compared to the industry standard
and as such, could be an alternative encapsulant for the legacy ILW reactive metal
inventory. However, significant differences were observed in the microstructural
properties of these binders at 18 months, which needs further investigation.
Note: From this point onwards, all of the MKPC, FA/MKPC and GBFS/MKPC
formulations are all based on the 0.24 water to solids ratio.

78
Further work should be undertaken in the following areas:
In-depth analysis of the encapsulated uranium samples to elucidate the
corrosion products (if any) for each binder including: X-ray absorption
spectroscopy (for phosphorous) and analysis of µ-X-ray computed
tomography data collected at Central Laboratory, National Nuclear
Laboratory.
Large scale corrosion trials using uranium and Magnox swarf simulant of the
blended MKPC binders to determine the reproducibility of the small scale
trials in this study, including direct hydrogen measurements.

79
5 Synthesis and characterisation of pure struvite-K,
MgKPO4·6H2O
This short chapter was included to introduce the basic characterisation of pure
struvite-K prior to:
Chapter 6 - where it was used as a reference for the solid-state 25Mg and 39K
MAS NMR experiments
Chapter 7 - where it was the baseline for the high temperature stability
experiments
Chapter 8 - where it was used during scoping gamma (Cs-137) irradiation
experiments
5.1 Introduction
The mineral struvite (MgNH4PO4·6H2O) was first identified in 1845 within the grounds
of St. Nicholas church, Hamburg by Ulex [112], who postulated that struvite was
formed over many years as a result of urine filtration through soil laden with
putrefied vegetation. A number of years later (in 1887), struvite was also discovered
in moist bat guano under investigation from the Skipton caves in Victoria, Australia,
amongst other newly discovered magnesium phosphate minerals (hannayite and
newberyite) [113, 114]. Several studies have since detailed the structure of struvite
(orthorhombic, space group Pmn21) and its common analogues, MgMPO4·6H2O,
where M+ is one of Rb+, Cs+, TI+ or K+ [22, 35, 115]. These cation substitutions within
the struvite structure have shown not to distort the orthorhombic symmetry with
the exception of Cs+, which formed a hexagonal structure (space group P63mc) due
to its larger ionic radius [22, 35, 115]. The work discussed here will focus only the
properties of struvite-K, MgKPO4·6H2O. Mathew and Schroeder [22] reported that
only minor structural differences were observed in the struvite-K crystal structure
when compared to that of struvite. This was due to the weak interactions between
NH4 or K and the oxygen atoms in the water molecules within the crystal structure.

80
As such, the unit cell parameters of struvite and struvite-K are reported to be: a =
6.941 ± 0.002, b = 6.137 ± 0.002, c = 11.199 ± 0.004 Å [115] and a = 6.873 ± 0.002, b =
6.160 ± 0.002, c = 11.087 ± 0.003 Å [22], respectively. Struvite-K has long been
reported to be isostructural with the naturally cementitious struvite, however, it was
only classified as a natural mineral in 2003 by the Commission of New Mineral and
Mineral Names, International Mineralogical Association after it was discovered in
two locations: Binntal in Switzerland and the Styria region of Austria [116].
Fig. 5.1. The (A) unit cell and (B) crystal structure of struvite-K based on data obtained
from Mathew and Schroeder [22] produced using VESTA [117]
The utilisation of struvite as the main binding phase in inorganic magnesium
phosphate cements (acid-base cements, Eq. 9) has received considerable attention
since the 1970s due to their quick setting time and high early strength properties
[21]. The application of these alternative magnesium phosphate cements became
prevalent in niche rapid infrastructure repairs (e.g. roads, bridges [21] and runways
[118]) in place of traditional Portland cement binders.
Eq. 6 MgO (s) + NH4H2PO4 (s) + 5H2O (l) MgNH4PO4·6H2O (s)

81
However, it was found that ammonia was liberated from these struvite-based
cements during both the mixing and setting processes [39]. This resulted in a move
towards utilising struvite-K based cements (Eq. 4), which are referred to as
magnesium potassium phosphates cements (MKPCs) and are currently favoured in
waste management applications, in particular for nuclear waste
immobilisation/encapsulation [18, 61, 119]. Due to the increased interest in struvite-
K based cements at present, it is important to investigate and characterise the
chemical environments present in this mineral.
5.2 Materials and Methods
The struvite-K precursors were: KH2PO4 (>99 % purity, Prayon), available as Food
Grade E340 MKP, MgCl2 (anhydrous, ≥98 % purity, Sigma Aldrich), KOH solution
(45 wt. % in H2O, Sigma Aldrich) and deionised H2O.
A solution with 25 g KH2PO4, 5 g MgCl2 and 100 mL of deionised H2O was prepared in
a conical flask, which was transferred to a clamp stand and positioned in an angled
position. After this, KOH (20 mL) was added dropwise to the solution until a pH of 7.5
was achieved as determined using a digital pH meter. A 3-point calibration (at pH =
4, 7 and 10) was undertaken prior to the pH measurements using pH buffer solutions.
The solution was held static for 7 days at room temperature, the resulting white
precipitate was suction filtered and washed multiple times with deionised H2O
followed by a final acetone wash. Following this, the product was transferred to a
vacuum desiccator to dry for 2 days prior to characterisation (Appendix D).

82
5.3 Results and Discussion
5.3.1 In situ high temperature X-ray diffraction (HTXRD)
The diffraction pattern of struvite-K (Fig. 5.2, 20 °C) synthesised in this study revealed
that only reflections corresponding to struvite-K (MgKPO4·6H2O, PDF #75-1076),
were identified, which indicated a pure sample was prepared using the Mathew and
Schroeder method [22]. In situ HTXRD of struvite-K was conducted to determine the
high temperature behaviour as a baseline for Chapter 7.
Fig. 5.2. HTXRD patterns of struvite-K powder up to 1000 °C
After exposure to 400 °C, it was found that the struvite-K reflections disappeared
following dehydration between 50 – 150 °C (Fig. 5.3) The dehydration product was
described by Wallez et al. [120] to exist as either the α, β or γ-MgKPO4 phase, each
can be identified by distinctive X-ray diffraction patterns. The reflections at 400 °C,

83
were characteristic of the β-MgKPO4 phase (PDF #50-0149, Pna21) whilst before 800
°C, a β to γ phase transition occurred resulting in the γ-MgKPO4 phase (PDF #50-0151,
Pnma) to be present at 800 °C. These assignments are in agreement with Wallez et
al. [120], who reported two endothermic transitions, α to β and β to γ at 362 °C and
422 °C, respectively. The β-MgKPO4 and γ-MgKPO4 phase transitions resulted in the
formation of a stabilised stuffed tridymite structure (AIBIIPO4), where the Mg atoms
are all tetrahedrally coordinated [120]. However, the structure of the α-MgKPO4
phase is reported to be comprised of two Mg co-ordination sites (tetrahedral and
pentahedral), this causes a distortion of the typical stuffed tridymite framework
[120], which can be observed by the reported lattice parameters in Table 5.1. As a
consequence of the α to β-MgKPO4 phase transition taking place at 362 °C, below the
temperature of the first in situ HTXRD scan, the α-MgKPO4 phase (P21/c) was not
detected in the pure struvite-K. Platinum (PDF #04-0802) reflections were also
detected in both the 400 and 800 °C diffraction patterns, which is an artefact from
the sample holder.
Table 5.1. Reported lattice parameters for heated MgKPO4 [120]
Lattice Parameters
Compound
Space
group a (Å) b (Å) c (Å) β (deg)
α-MgKPO4 P21/c 8.549 5.078 18.996 91.68
β-MgKPO4 Pna21 8.586 9.254 5.296
γ-MgKPO4 Pnma 8.645 5.279 9.335

84
In isostructural struvite (NH4MgPO4·6H2O) systems [22, 116] poorly crystalline phases
(e.g. MgHPO4) were observed between 200 - 700 °C [39, 121-123] whilst above 700
°C, only magnesium phosphate phases were identified, which was attributed to
ammonia liberation [121, 123]. In contrast, it was found that struvite-K retained both
its crystalline nature and the K+ ion after high temperature exposure, as evidenced
by the continued presence of γ-MgKPO4 reflections at 1000 °C. This indicates that
struvite-K is more withstanding of exposure to high temperatures than struvite.
5.3.2 Thermal analysis
Thermal analysis of synthetic struvite-K (Fig. 5.3) revealed a single, yet notable, mass
loss (40 %) between 40 - 200 °C. This event corresponds to the one-step dehydration
of struvite-K (Eq. 8) reported in the literature for both synthetic struvite-K [98] and
MKPCs [119]. The differential thermal analysis (DTA) supported the occurrence of the
endothermic dehydration of struvite-K, which was observed around 130 °C in Fig. 5.4.
Additionally, the DTA thermograph revealed the presence of an exothermic event
(with no mass loss) between 390 - 445 °C (with the maximum at 405 °C), which is
postulated to be associated with both the α to β-MgKPO4 and β to γ-MgKPO4 phase
transitions. These transitions were observed by DSC measurements to occur at 362
°C and 422 °C, respectively [120]. It may be possible that the two transitions overlap
in this study due to the relatively high heating rate (10 °C/min) of the DTA
experiment. Another possible explanation for this could the different starting
materials. Wallez et al. [120] synthesised pure α-MgKPO4 (with an XRD pattern
reported for this phase at 20 °C) whilst in this study, MgKPO4 was only formed during
the dehydration of struvite-K. This process occurs between 50 - 200 °C and initially
results in the formation of a poorly crystalline material (Fig. 5.3). The long-range
order of the struvite-K dehydration product (MgKPO4) was only re-established at
400 °C, which is above the reported (and observed) α to β to γ -MgKPO4 phase
transition temperature [120] and consequently, the α-MgKPO4 phase was not
observed in the struvite-K system.

85
Fig. 5.3. Thermogravimetric analysis of synthetic struvite-K
Fig. 5.4. Differential thermal analysis of synthetic struvite-K

86
5.3.3 Nuclear magnetic resonance spectroscopy
The local chemical environments present within pure struvite-K were determined
using 31P, 25Mg and 39K MAS NMR spectroscopy (Figs. 5.5-5.7) at room temperature.
The 31P MAS NMR spectrum (Fig. 5.5) exhibited a single sharp resonance centred at
6.2 ppm in the orthophosphate region, which was associated with crystalline
struvite-K and was in agreement with published 31P MAS NMR data for isostructural
struvite, where a single resonance was observed at 6.1 ppm [124-126]. Alongside the
31P MAS NMR data, cross-polarisation (CP) NMR was used to examine the 31P-1H
nuclei interactions. Typically, CP/MAS experiments are performed to observe
hydrated phases within a system. In this study, cross polarisation was utilised to study
the hydrated phosphate phases present in synthetic struvite-K. In Fig. 5.5, the
CP/MAS spectrum clearly shows a single resonance (at 6.2 ppm), which indicated that
all of the P-H interactions within this specimen were associated with the struvite-K
phase.
Fig. 5.5. 31P MAS and 31P-1H CP/MAS NMR spectra (9.4 T, 10 kHz) for struvite-K at
relaxation times 10 s and 1 s, respectively

87
The 25Mg and 39K MAS NMR nuclei have quadrupole moments as a result of the non-
spherical charge distribution (spins 5/2 and 3/2, respectively) interacting with the
electric field gradient [80]. This quadrupolar interaction typically affects the NMR
spectra by: resonance broadening, chemical shift anisotropy and dipolar coupling, all
but the resonance broadening can be removed by using MAS experiments [80]. These
nuclei are also often difficult to observe due the low natural abundancy of 25Mg and
the low sensitivity of 39K nuclei [82]. In order to off-set these effects and enhance
sensitivity, high-field (19.96 T) solid state MAS NMR spectra of struvite-K were
collected. However, the distinct resonance shapes observed in Figs. 5.6-5.7 clearly
indicated that the 25Mg and 39K environments in struvite-K underwent broadening
due to the second-order quadrupolar interactions [81]. An empirical fitting method
was used in Topspin 3.2 [83] to simulate the experimental spectrum for the observed
nuclei and to determine the quadrupolar parameters (Table 5.2): isotropic chemical
shift (δiso), quadrupolar coupling constant (CQ) and asymmetry (ɳQ). The calculated
25Mg quadrupolar parameters of struvite-K were found to be comparable to those
for struvite and are reported to be 1.0 ppm (δiso), 3.56 MHz (CQ) and 0.34 (ɳQ) [81]. It
is therefore assumed that the quadrupolar parameters calculated for 39K MAS NMR
(Table 5.2, Fig. 5.7) are likely to be representative of struvite-K.
Table 5.2. NMR quadrupolar parameters for sites calculated in synthetic struvite-K using
high-field 25Mg and 39K MAS NMR nuclei experiments
Experimental NMR
Site δiso (ppm)
(± 0.1)
CQ (MHz)
(± 0.1)
ɳQ
(± 0.02)
Mg -1.0 3.8 0.33
K -73.1 2.2 0.14

88
Fig. 5.6. 25Mg MAS NMR spectrum (19.96 T, 10.0 kHz) of struvite-K, simulation was
performed considering the second-order quadrupolar interaction for the central
transition only
Fig. 5.7. 39K MAS NMR spectra (19.96 T, 15.0 kHz) of struvite-K, simulation was performed
considering the second-order quadrupolar interaction for the central transition only

89
The 25Mg MAS NMR spectrum of pure struvite-K (Fig. 5.6) identified a single
resonance, which was centred at δiso = -1.0 ppm, and associated with struvite-K
where Mg is observed to octahedrally coordinated as Mg(H2O)62+ species in the
crystal structure (Fig. 5.1). Similarly, the 39K MAS NMR spectrum (Fig. 5.7) also
exhibited a single resonance, which was centred at δiso = -73.1 ppm and was assigned
to struvite-K. The K+ ion was bonded five O atoms, one from a PO43- unit and the
remaining to H2O molecules [22] as displayed in Fig. 5.1. In conjunction with the
experimental data, the simulations for both 25Mg and 39K nuclei supported the
existence of a single Mg and K environment present in the struvite-K crystal structure.
5.4 Conclusions and Future work
In this study, it was found that pure struvite-K undergoes a single step dehydration
<120 °C leading to formation of the dehydration product, MgKPO4, which is poorly
crystalline up to 400 °C where it undergoes a phase transition to the β-MgKPO4 phase
and then secondly, to theγ-MgKPO4 phase upon further heating. This was dissimilar
to the dehydration behaviour of struvite, were the simultaneous loss of ammonia
and water is observed, resulting in the formation of a poorly crystalline MgHPO4
phase [123]. High field solid state 25Mg and 39K MAS NMR spectra and their
corresponding quadrupolar parameters were presented for synthetic struvite-K for
the first time. It has been shown experimentally and theoretically that both the Mg
and K environments exist as single sites, which is in agreement with the reported
crystal structure and existing 25Mg MAS NMR data for isostructural struvite.

90
Further work should be undertaken in the following areas:
Rietveld refinement of the XRD data to confirm the lattice parameters and
crystal structure of pure struvite-K.
High field (19.96 T) 39K MAS NMR of struvite (MgNH4PO4·6H2O) and its
analogues to support the NMR data presented for struvite-K, including
calculation of the NMR parameters using TopSpin 3.0 [83] (based on
experimental data) and QuadFit [127] from the refined crystal structures.
XRD and DTA experiments to collect both heating and cooling data to further
investigate the phase transitions associated with the struvite-K dehydration
product, α-MgKPO4. Including using a slower heating/cooling rate (2 °C/min)
to separate the phase transitions into distinct regions.

91
6 Characterisation of blended MKPC binders
This chapter is based on the following published manuscript:
Gardner et al. Characterisation of magnesium potassium phosphate cements blended
with fly ash and blast furnace slag, Cement and Concrete Research, 2015, vol. 74, pp.
78-87.
6.1 Introduction
Magnesium potassium phosphate cement is a clinker-free acid-base cement, in
which the development of, and therefore mechanical strength, is a direct result of
the rapid formation of cementitious hydrogel type products [102]. The chemical
reaction resulting in the formation of MKPCs (Eq. 4) is based on the dissolution of
MgO and KH2PO4 reacting in solution to form struvite-K (MgKPO4·6H2O). When
compared to conventional Portland cements, MKPCs have different properties
including near-neutral pH, low water demand, low drying shrinkage and high early
compressive strength [36]. These properties make MKPCs remarkably versatile, and
this cementing system has been used for rapid repair of damaged roads, bridges and
runways [21], in conditioning various nuclear waste streams containing reactive
metals [18, 61] and in dental castings with antibacterial properties [128].
In practical application, MKPC binders are frequently blended (up to 50 wt. %
replacement) with fly ash (FA) to reduce water demand of the paste, and lower the
exothermic output of the acid-base reaction, which avoids cracking of the hardened
paste. The inclusion of FA in MKPC enhances the workability of the binder via the
“ball-bearing effect” of the spherical particles [18, 54, 95, 96]. Several studies [18,
39, 129] based on FA/MKPC blended binders have suggested that FA simply acts as a
diluent or inert filler, that modifies the aesthetics of MKPC to be compatible to
traditional Portland cement, which has been deemed important for rapid-repair
applications [54]. Conversely, others hypothesise that FA replacement promotes high
mechanical strength in FA/MKPC binders, as a consequence of the formation of a

92
secondary amorphous phase containing silicon-phosphate bonds [129, 130]. This is
commensurate with the work of Wilson and Nicholson [102], who suggested that
aluminosilicate glass can react with phosphoric acid to form a strong phosphate
bonded cement. It is conceivable that the glassy aluminosilicate fraction of the FA
reacts in the initially acidic environment of the MKPC, forming a secondary phase
intermixed with struvite-K. If this occurs, it could result in a matrix of higher density
that would be more impermeable to water, have a higher mechanical strength [131,
132] and provide additional sites for sorption of radionuclides, which would be of
importance for application in the encapsulation of radioactive wastes. However,
previous studies have not identified additional crystalline or amorphous reaction
products, for example by powder X-ray diffraction or Fourier transform infrared
spectroscopy, although the compressive strength and setting characteristics were
altered in MKPC with the inclusion of FA [133].
Ground granulated blast furnace slag (GBFS) is a FA alternative that could be used as
a diluent within MKPC binders. GBFS/MKPC blended binders are novel and little open
literature is available concerning their properties. However, it should be noted that
crystalline and amorphous blast furnace slags have been previously employed as
filter/sorbent materials to remove phosphates from wastewater systems such as
constructed wetlands and soil infiltration systems [134-136]. As such, it is
conceivable that slag-phosphate interactions could occur within this system and
potentially lead to the formation secondary reaction products.
The reaction of supplementary cementitious materials (SCMs), FA and GBFS, at the
pH and chemical speciation conditions reached within MKPC binders, are largely
unclear, detailed chemical or microstructural characterisation of secondary
cementitious phases forming in FA/MKPC or GBFS/MKPC binders has not yet been
reported, and there is a lack of evidence regarding whether or not the dissolution of
FA or GBFS particles occurs (and to what extent) within MKPC-based binders. It is
therefore imperative to develop an in-depth mechanistic understanding of the role
of FA and GBFS within the phase assemblage of MKPC binders.

93
In this chapter, FA/MKPC and GBFS/MKPC binders were investigated via mechanical
testing (compressive strength), XRD, SEM, 25Mg MAS NMR, 27Al MAS NMR, 29Si MAS
NMR, 31P MAS NMR, 31P[1H] CP/MAS NMR and 39K MAS NMR spectroscopy
techniques, with the aim of providing the detailed characterisation of these systems.
6.2 Results and Discussion
6.2.1 Compressive strength
The compressive strength of blended MKPC binders (0.24 w/s) varied depending on
the supplementary cementitious material added, as shown in Fig. 6.1. The
compressive strength values of the FA/MKPC binder were comparable with data
available for similar systems [18, 89]. The GBFS/MKPC was observed to have superior
mechanical properties compared to the FA/MKPC binder at all curing ages
investigated. At day 28, there was a notable (10 MPa) difference between the
FA/MKPC (24 MPa) and GBFS/MKPC (34 MPa) binders. This difference can in part be
explained by the powder properties (Table 3.1) of the raw FA and GBFS. Firstly, the
particle size distribution (d90 = 66.1 and 1465.0 µm, respectively) and the BET surface
area (2258 and 993 m2/kg, respectively) indicate that the FA has a much narrower
and larger surface area that the GBFS. This results in the FA having a greater water
demand and can reduce the formation of struvite-K, which is the strength-forming
phase within these blended MKPC binders. Secondly, the shape of the FA/GBFS
particles can affect the compressive strength values due to particle packing effects
described by Provis et al. [99], where the angular GBFS particles can interlock much
better than the spherical FA particles and would result in a fewer voids voidage within
the GBFS/MKPC binder. However, these differences in the powder properties is
unlikely to be the sole cause of a 10 MPa variation in the mechanical performance.
The FA/MKPC binder achieved comparable compressive strength values to the
MKPC-only binder (Fig. 6.1) whereas the GBFS/MKPC binder was notably stronger.
During testing, it was observed that the failure mode of the MKPC-only was via

94
viscoelastic deformation, rather than brittle fracture as in the FA/MKPC and
GBFS/MKPC binders. This suggested a possible chemical interaction between GBFS,
FA and MKPC influenced the cementitious properties of the binder.
Fig. 6.1. Compressive strength of MKPC, GBFS/MKPC and FA/MKPC, as a function of
curing time, the error bars are equivalent to ± 1 standard deviation
6.2.2 X-ray diffraction
The diffraction patterns of the anhydrous GBFS and FA, along with the hardened
GBFS/MKPC and FA/MKPC binders cured for 28 days, are shown in Fig. 6.2. In the
anhydrous GBFS, traces of åkermanite (Ca2MgSi2O7, PDF #76-841) were observed,
while in unreacted FA, quartz (SiO2, PDF #11-0252) and mullite (3Al2O3.2SiO2, PDF
#15-0776) were identified. Diffuse scattering was identified, in FA between 15° < 2θ <
25°, and in GBFS between 25° < 2θ < 35°, which is associated with the X-ray
amorphous aluminosilicate (FA) and calcium aluminosilicate (GBFS) glassy fractions
that constitute the bulk material. Struvite-K (MgKPO4·6H2O, PDF #75-1076) was
found to be the main crystalline product forming in MKPC binders.

95
Traces of periclase (MgO, PDF #45-0946) were also identified in the MKPC binders,
as MgO was added in excess (1.7:1 Mg/P molar ratio) of the stoichiometric
proportions to ensure the conversion of all phosphate to struvite-K. In the MKPC-only
system, the use of a stoichiometric ratio of MgO to KH2PO4 has been found to give
complete reaction with no residual MgO visible in XRD [98, 137]. Crystalline
secondary products were not observable in the MKPC blended either with FA or
GBFS, and the degree of crystallinity of the struvite-K was found to be high.
Fig. 6.2. X-ray diffraction patterns of GBFS/MKPC and FA/MKPC pastes after 28 days of
curing
6.2.3 Scanning electron microscopy
Backscattered electron images of FA/MKPC and GBFS/MKPC binders are shown in
Fig. 6.3, where the formation of a continuous struvite-K phase embedded with large
struvite-K crystallites can be seen in both systems. The embedded particles of
struvite-K, with a laminar habit, appeared to be highly cracked in polished sections,
probably due to dehydration under vacuum for analysis. Angular light grey particles

96
correspond to unreacted GBFS (Fig. 6.3A), while spherical particles of varying size
(Fig. 6.3B) are FA particles. A similar microstructure has previously been reported for
FA/MKPC [18], however, there are no reports of the microstructure of GBFS/MKPC
binders in the open literature. The large struvite-K crystals are known mainly to occur
in systems prepared using boric acid to retard the setting reaction [43], which
therefore allows time for the large ordered crystalline structure to form within the
adhesive binder [102].
Fig. 6.3. Backscattered electron micrographs of (A) GBFS/MKPC and (B) FA/MKPC
hardened pastes after 28 days of curing
6.2.3.1 Elemental mapping - GBFS/MKPC
In the GBFS/MKPC binder, a homogeneous distribution of Mg and P throughout the
sample was observed in EDX maps (Fig. 6.4), consistent with the formation of
crystalline struvite-K as the main binding phase of the system. Embedded unreacted

97
MgO (Fig. 6.4: Mg) particles were identified, consistent with XRD data in Fig. 6.2.
Angular particles of various sizes rich in Ca, Al and Si (Fig. 6.4) correspond to the
unreacted calcium aluminosilicate glassy fraction present in GBFS particles. The Al
and Si EDX maps (Fig. 6.4: Al and Si) show incorporation of these elements in the
binding matrix, indicating that dissolution of GBFS had occurred. GBFS dissolution
and subsequent reaction to form a secondary phase would explain the enhanced
strength development of the binder [96] as a result of filling pores in the matrix. The
“area of interest” in Fig. 6.5 shows an embedded GBFS particle immediately
neighbouring a region rich in Al, Si and P, which may be a secondary reaction product.
Fig. 6.4. Backscattered electron image and elemental maps of hardened GBFS/MKPC
paste after 28 days of curing
Slags have previously been utilised as sorbents for phosphate removal from
wastewater systems, and the mechanism for this process is controlled by the pH: at
pH ≤ 6, the mechanism is phosphate adsorption onto the surface of the slag particles
[135] whereas at pH ≥ 8, the phosphate precipitates as calcium phosphates [136]. In

98
the GBFS/MKPC binder, the majority of the Ca (Fig. 6.4: Ca) appeared to be retained
within the unreacted GBFS particles with no evidence presented for the formation of
calcium phosphates. The feature labelled as “A” in Fig. 6.4 has been highlighted to
demonstrate the impurities found in the MgO used in this study, feature “A” indicates
that the MgO particles are ingrained with calcium silicate phase impurities present
at 2.1 (Ca) and 4.3 (Si) wt. %, as determined by bulk XRF analysis (Table 3.2).
6.2.3.2 Elemental mapping - FA/MKPC
In the production of FA there is a negligible exchange of mass between particles, due
to the nature of the coal combustion process. Therefore, FA particles have a wide
variance in local composition, mineralogy and particle size, and this leads to a
variable rate of reaction between particles [138]. The separation of Fe-rich and Al-Si-
rich phases within fly ash particles can resulting in the formation of insoluble Fe-rich
dendritic particles [139], such particles were observed in Fig. 6.3, labelled as
“dendritic particle”. The backscattered micrograph of a FA particle (Fig. 6.5)
highlights the variability within a FA particle, which is observed to be a plerosphere
(contains smaller FA particles) with dendritic regions (Fe rich) [138]. In this particle,
the dendritic phase must have formed during the cooling of the raw FA due to the
perfect alignment of the dendritic phase with the circumference of the particle rather
than through the separation of Fe-rich and Al-Si-rich phases within FA particles.
Phase separation is reported to occur as a result in different glass dissolution rates
under alkaline conditions leading to etching of the Al-Si rich matrix to form insoluble
Fe-rich dendritic particles [139].
In addition to these FA characteristics, it was observed that the complete dissolution
of the particle wall was observed in the FA particle (feature labelled “A” in Fig. 6.5).
It is postulated that this dissolution occurred during the acid-base reaction of the
FA/MKPC binder because the struvite-K matrix was observed within the particle wall
opening. As a result of dissolution there is potential for the formation of secondary
reaction products, which could be based on an Al and/or Si phase. Whilst the

99
identification of the Fe-rich phases present in FA particles (e.g. hematite) [140]
suggest they do not take part in any secondary reactions.
Fig. 6.5. Backscattered electron micrograph of a single FA particle showing prominent Al
and Si dissolution resulting in phase separation leaving dendritic Fe-rich phases
A highly dense microstructure was identified in FA/MKPC binders (Fig. 6.6), large
struvite-K crystals were found to be surrounded by FA cenospheres. Similarly, to
GBFS/MKPC, unreacted MgO grains were evident throughout the matrix, the distinct
radial growth pattern of the large struvite-K crystallite in Fig. 6.6 appeared to be
centred around a Mg-rich region (Fig. 6.6: Mg). This indicated that the MgO particle
acted as nucleation site for struvite-K formation within this sample. A transition zone
between the large struvite-K crystallite and the matrix was also observed, where
small FA cenospheres agglomerated in the boundary of the struvite-K. The Ca present
in the FA/MKPC matrix (Fig. 6.6.Ca) appeared to be associated with Ca impurities
within unreacted MgO grains (2.1 wt. % by XRF analysis of MgO, Table 3.2) rather
than from the siliceous fly ash, which has a Ca content of 2.4 wt. % by XRF analysis of
FA, Table 3.2. The unreacted MgO grains were also found to be associated with silicon

100
impurities (4.3 wt. % by XRF analysis of MgO, Table 3.2), potentially a calcium silicate
impurity. The main binding matrix was observed to be notably enriched in Al and Si
(Fig. 6.6),resulting from the dissolution of the aluminosilicate FA particles within this
system, leading to the formation of a secondary product, further examination using
NMR analysis was conducted on these system to elucidate; (1) if there was a
secondary reaction product and (2) the chemical formula of the additional phase.
Fig. 6.6. Backscattered electron micrograph and elemental maps of hardened FA/MKPC
paste after 28 days of curing
6.2.4 Nuclear magnetic resonance spectroscopy
6.2.4.1 27Al MAS NMR
27Al MAS NMR spectra are known to clearly show three distinct Al coordination
environments (AlIV, AlV and AlVI), which for cements are located at chemical shifts
between 52 to 80 ppm, 30 to 40 ppm and -10 to 15 ppm, respectively [78]. Two Al
environments were identified in the 27Al MAS NMR spectrum of unreacted GBFS, as
shown in Fig. 6.7A. The first, and dominant site represents a broad AlIV environment
centred at 56 ppm, assigned to the aluminosilicate glassy fraction of the slag [141].

101
The second Al environment can be assigned to a minor band in the AlVI region centred
at 11 ppm, which may be attributed to a minor octahedral Al environment in the slag
glass. In comparison, the GBFS/MKPC binder (Fig. 6.7A) has a narrower and slightly
more deshielded AlIV region than the unreacted slag, with a resonance centred at 54
ppm. The minor AlVI environment in the GBFS/MKPC binder appeared to be more
prominent than the unreacted GBFS. This may simply be because of a reduction in
the intensity of the underlying resonance in this region during reaction.
The change in the AlIV region in the GBFS/MKPC binder can be assigned to the
remaining unreacted slag, which can undergo selective dissolution at the pH
conditions reached in these binders (and thus display an apparent shift in its
resonance position as one or more of the multiple Al environments present are
selectively removed). The potential formation of a highly cross-linked secondary
phase, more likely an aluminosilicate type product, can also be indicated by such a
shift, where the Al selectively leached from the slag remains in tetrahedral
coordination but shows a more ordered nature than in the unreacted slag glass. In
blended Portland cement and alkali-activated slag systems, the AlIV region usually
sharpens upon reaction due to the formation of an Al-substituted calcium silicate
hydrate (C-(A)-S-H) [142] type gel. In non-cross-linked C-A-S-H type phases, the
chemical shift of tetrahedrally coordinated Al occurred at 74 ppm [143-146], when
27Al MAS NMR spectra were collected at the magnetic field used in the present study.
The fact that the reaction product peak here is located far from 74 ppm indicated
that formation of a C-A-S-H product did not occur in the GBFS/MKPC binder.
In the AlVI region (-10 to 15 ppm), the most obvious difference between the
GBFS/MKPC and GBFS 27Al MAS NMR spectra was the presence of a high intensity
band centred at -9.5 ppm in the reacted material that was not present in the
unreacted GBFS. This resonance can be assigned to the secondary reaction product
forming in the GBFS/MKPC binder, which must be present at a very substantial
concentration to display such a clear NMR signal. The resonance is more shielded
(more negative chemical shift) than the resonances which have been assigned to AlVI
in the literature for condensed and intermediate alumina, aluminium hydroxide
polymorphs and aluminosilicates [141, 147, 148], and Al-rich hydrous reaction

102
products forming in GBFS-blended Portland cement [149], which are all usually
identified between 0-13 ppm. An aluminium phosphate phase may potentially be
formed as a result of chemical interactions between the GBFS and MKPC
components. Aluminium-phosphate bonds are typically observed in 27Al NMR spectra
between 45 ppm and – 25 ppm, with three main phosphate environments: Al(OP)4
centred at ~40 ppm, Al(OP)5 centred at ~10 ppm, and Al(OP)6 centred at ~ -20 ppm
[78]. Accordingly, the additional signal at -9.5 ppm in the GBFS/MKPC binder could
possibly be attributed to an Al(OP)6-containing phase, however, the 31P NMR spectra
in Fig. 6.7A call such an interpretation into question, as will be discussed in the
following section.
Fig. 6.7. 27Al MAS NMR spectra (9.4 T, 14 kHz) for (A) unreacted GBFS and GBFS/MKPC
hardened paste, and (B) unreacted FA and FA/MKPC hardened paste
Fig. 6.7B shows the 27Al MAS NMR spectra for the unreacted FA and the FA/MKPC
binder. The unreacted FA was found to have two main Al environments, AlIV and AlVI,
centred at 47 ppm and -5 ppm, respectively. The band at -5 ppm can be assigned to
mullite [150, 151], as identified by XRD (Fig. 6.2), while the broad band centred at 47
ppm can be assigned to the tetrahedral resonance of mullite (reported to be at 46

103
ppm [151]) and mullite-like glassy phases present in the FA [143]. In the FA/MKPC
binders, the AlIV band is slightly deshielded compared to the unreacted FA, with a
chemical shift centred at 50 ppm.
In alkali-activated fly ash systems, the AlIV region has been observed to sharpen due
to the formation of a sodium aluminosilicate hydrate (N-A-S-H) type gel [143] but
major differences were not observed in the lineshape of the spectrum in this region
(Fig. 6.7B) suggesting that in the current study, the formation of typical alkali-
activated fly ash phases did not occur. Formation of a new, low intensity band in the
AlVI region (centred at 14 ppm), and a slight increase in the intensity of the main AlVI,
centred at -5 ppm, are observed. These changes may be assigned to the secondary
reaction product forming in the FA/MKPC binder, however, the paramagnetic
relaxation of the NMR signal associated with the high Fe content of the fly ash limits
the resolution achievable. Similarly to the GBFS/MKPC binder (Fig. Fig. 6.7B), the
chemical shift changes do not correspond to the formation of aluminium hydroxide
polymorphs and aluminosilicates [148], as they have not been identified in these
binders, neither through XRD (Fig. 6.2) nor through thermogravimetry (Fig. 4.4Fig.
4.5). The 27Al MAS NMR spectra (Fig. 6.7) have conclusively identified that minor
chemical changes occurred in the octahedral and tetrahedral aluminium
environments present within raw FA and GBFS, resulting from a direct interaction
with the MKPC binder. It is likely that secondary reaction products were formed
however, more in-depth analysis is required to determine the composition of the
additional phase.
6.2.4.2 31P MAS NMR
Cross-polarisation (CP) NMR can be applied to examine the 31P[1H] interactions
within a sample, in conjunction with information from 31P MAS spectra. For
GBFS/MKPC the CP/MAS NMR (Fig. 6.8A) shows a sharp resonance at 6.2 ppm in the
orthophosphate region, which is associated with struvite-K. The low intensity broad
signal centred at 3.6 ppm corresponds to KH2PO4 (spectrum not shown), in
agreement with previously reported values [152]. KH2PO4 was used as a precursor to
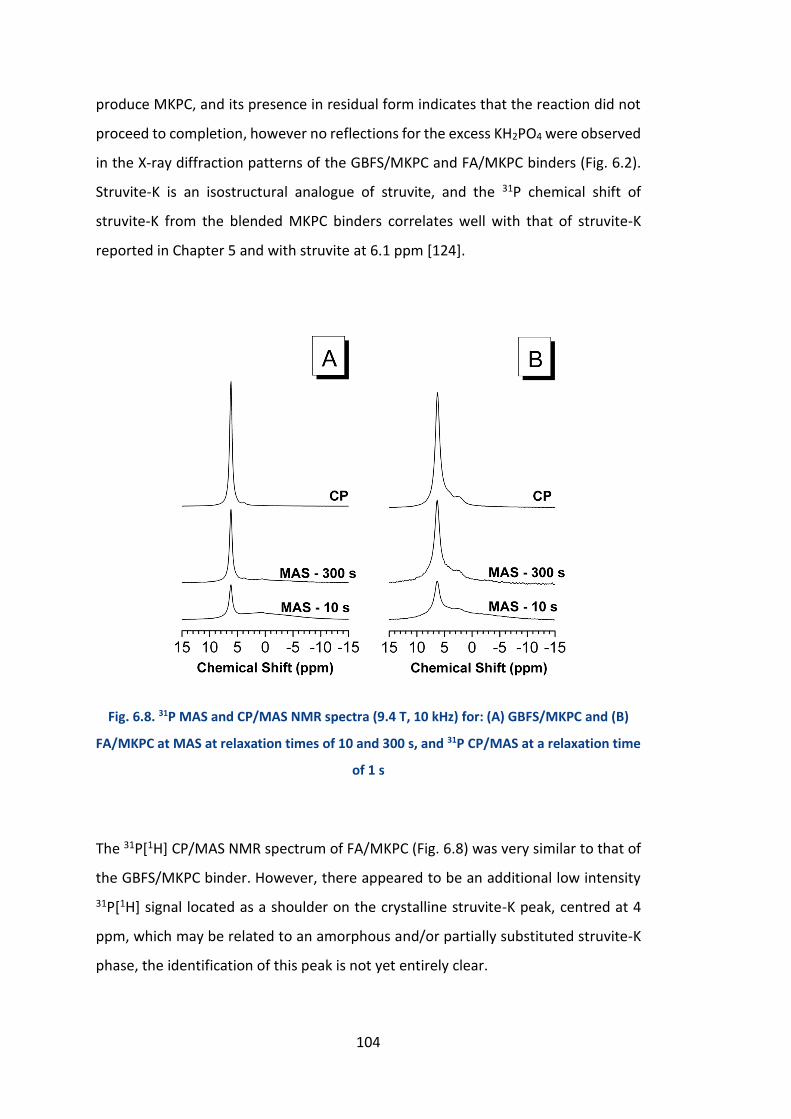
104
produce MKPC, and its presence in residual form indicates that the reaction did not
proceed to completion, however no reflections for the excess KH2PO4 were observed
in the X-ray diffraction patterns of the GBFS/MKPC and FA/MKPC binders (Fig. 6.2).
Struvite-K is an isostructural analogue of struvite, and the 31P chemical shift of
struvite-K from the blended MKPC binders correlates well with that of struvite-K
reported in Chapter 5 and with struvite at 6.1 ppm [124].
Fig. 6.8. 31P MAS and CP/MAS NMR spectra (9.4 T, 10 kHz) for: (A) GBFS/MKPC and (B)
FA/MKPC at MAS at relaxation times of 10 and 300 s, and 31P CP/MAS at a relaxation time
of 1 s
The 31P[1H] CP/MAS NMR spectrum of FA/MKPC (Fig. 6.8) was very similar to that of
the GBFS/MKPC binder. However, there appeared to be an additional low intensity
31P[1H] signal located as a shoulder on the crystalline struvite-K peak, centred at 4
ppm, which may be related to an amorphous and/or partially substituted struvite-K
phase, the identification of this peak is not yet entirely clear.

105
31P MAS NMR experiments conducted at different relaxation times (10 and 300 s)
enabled identification of low intensity phosphorus environments that have no 31P[1H]
interactions, and thus do not appear in the CP/MAS spectra. In Fig. 6.8, the
appearance of a broad signal between 4 to -4 ppm was observed for both the
GBFS/MKPC and FA/MKPC binders. This is indicative of an amorphous phosphorus
environment within these systems, and the feature appeared to be slightly more
intense in the FA/MKPC binder than the GBFS/MKPC binder. The fact that this does
not appear in the 31P[1H] CP spectra indicates that it is related to a phosphorus
environment that has no intimate interaction with hydrogen, and therefore cannot
be attributed to struvite-K.
Based on the chemistry of the binder, it is a logical progression to postulate that the
changes observed in the 31P spectra correspond with the additional octahedral Al
signal observed in the 27Al spectra (Fig. 6.7). However, the 31P MAS NMR spectra (Fig.
6.8) for both the FA/MKPC and GBFS/MKPC binders, do not exhibit resonances
necessary to satisfy a Al-P relationship within these systems, which would be in the
range of -15 to -35 ppm [78]. Furthermore, multinuclear experiments intended to
analyse Al-P interactions in these systems did not show any identifiable signals. It is
therefore only possible to state that an amorphous orthophosphate environment
exists in both binders without measurable aluminium interactions.
6.2.4.3 29Si MAS NMR
In the 29Si MAS NMR spectrum of the unreacted GBFS shown in Fig. 6.9A, a broad
resonance centred at -75 ppm was observed, consistent with the glassy fraction and
the minor åkermanite present in the slag [141]. The spectrum of the GBFS/MKPC
binder (Fig. 6.9A) has a similar lineshape to that of the unreacted slag, however, the
formation of an additional broad band between -90 to -112 ppm was observed.
Chemical shifts in this range of values are known to correspond to highly cross-linked
Q4 type sites [153] . This secondary band indicates that during the partial dissolution
of GBFS, the Si reacted to form a highly cross-linked Si-rich type phase due to the

106
presence of the observed [Q4] chemical shift in the 29Si MAS NMR spectrum for the
GBFS/MKPC binder.
Fig. 6.9. 29Si MAS NMR spectra (9.4 T, 6.8 kHz) of (A) unreacted GBFS and GBFS/MKPC
hardened paste, and (B) unreacted FA and FA/MKPC hardened paste
The broad asymmetric 29Si resonance observed between -76 and -122 ppm, centred
at -102 ppm, for the FA sample (Fig. 6.9B) is consistent with the wide variety of Si
environments present in the amorphous and crystalline phases in FA: a combination
of quartz (~ -107 ppm) [154], mullite (~ -86 ppm) [151], and the vitreous fraction
[155]. The FA/MKPC sample also displayed a broad resonance, between -80 and -
124 ppm, centred at -103 ppm, unlike the GBFS/MKPC binder no sizeable 29Si MAS
NNR resonances were observed outside of the main broad resonance associated with
unreacted FA. However, the presence of a defined peak (at -111 ppm) within the
broad resonance could indicate the occurrence of a minor change in the Si
environments within the FA/MKPC binder. There are two possible explanations for
this: (1) variation in the NMR experiment conditions resulted in a more defined

107
spectrum for the FA/MKPC binder, which was measured for 4900 repetitions,
compared to 3600 repetitions for the unreacted FA or (2) due to the formation of
secondary reaction products.
6.2.4.4 25Mg MAS NMR
High-field MAS NMR experiments for 25Mg and 39K nuclei were conducted on the
GBFS/MKPC binder to explore any transformation in the chemical environments of
these elements and are shown in Fig. 6.10 and Fig. 6.11, respectively. Unfortunately,
it was not possible to study these nuclei in the FA/MKPC binder due to the relatively
high iron content of the fly ash (9.34 % by XRF oxide analysis, Table 3.2). Table 6.1
defines the quadrupolar parameters: isotropic chemical shift (δiso), quadrupolar
coupling constant (CQ) and asymmetry (ɳQ) used to simulate the spectra for the
GBFS/MKPC binder as shown in Fig. 6.10-6.11) identifies two 25Mg MAS NMR
environments within the GBFS/MKPC, which are related to struvite-K (M2) and
excess MgO (M1) respectively. The isotropic chemical shift, δiso, of MgO was
calculated to be 26.4 ppm, which is consistent with data reported in the literature
[156]. MgO is octahedrally coordinated and highly symmetrical, and therefore does
not experience strong quadrupolar effects. The GBFS/MKPC binder showed a similar
25Mg MAS NMR spectrum to pure synthetic struvite-K, MgKPO4·6H2O (reported in
Chapter 5), where the Mg was represented by a single resonance. Using the empirical
fitting method in TopSpin 3.2 [83] and the experimental data for pure struvite-K, the
isotropic chemical shift for the Mg present in the GBFS/MKPC binder was calculated
to be δiso = -1.0 ppm. The Mg is octahedrally coordinated within the crystal structure,
as Mg(OH2)6 [22]. The quadrupolar parameters determined for struvite-K are
comparable to those reported for struvite in the literature [81] but currently there is
no published 25Mg MAS NMR data to support the spectrum observed for struvite-K
Åkermanite (Ca2MgSi2O7), identified as the only identifiable crystalline phase in GBFS
(Fig. 6.2) should have a single resonance at a chemical shift of 47 ppm [156], however,
this region overlaps with the much stronger signal of struvite-K. Due to the low

108
content of åkermanite in the binder it was not possible to distinguish this resonance
in Fig. 6.10. The 25Mg MAS NMR resonances observed in the GBFS/MKPC spectrum
can be fully assigned to a combination of MgO and struvite-K, at δiso = 26.4 and -1.0
ppm, respectively. This indicates that the magnesium present in the system does not
form any secondary reaction products within the GBFS/MKPC binder.
Table 6.1. NMR quadrupolar parameters for sites calculated using high-field 25Mg and 39K
MAS NMR nuclei experiments
*Struvite-K data also reported in Table 5.2, **The nuclei site number denoted for each
nucleus (e.g. 25Mg1) represents an arbitrarily assigned number for identification purposes,
not the atomic position in the crystal structure.
Experimental NMR
Compound Nuclei
site**
δiso (ppm)
(± 0.1)
CQ (MHz)
(± 0.1)
ɳQ
(± 0.02)
MgO 25Mg1 26.4 0.0 [156] N/A
Struvite-K* 25Mg2 -1.0 3.8 0.33
GBFS/MKPC 25Mg1 26.4 0.0 N/A
GBFS/MKPC 25Mg2 -1.0 3.8 0.33
Struvite-K* 39K1 -73.1 2.2 0.14
GBFS/MKPC 39K1 -73.1 2.2 0.14
GBFS/MKPC 39K2 -107.7 0.1 0.10

109
Fig. 6.10. 25Mg NMR spectrum (19.96 T, 10.0 kHz) of GBFS/MKPC, simulations were
performed considering the second-order quadrupolar interaction for the central
transition only
6.2.4.5 39K MAS NMR
The 39K MAS NMR spectrum of the GBFS/MKPC binder (Fig. 6.11) was found to exhibit
a dominant resonance assigned to struvite-K, where the potassium environment
undergoes a quadrupolar distortion in the peak shape, similar to that of the 25Mg/39K
MAS NMR resonance shape of pure struvite-K (Figs. 5.6 and 5.7). Using Topspin 3.2
[83] via an empirical fitting method the quadrupolar parameters (isotropic shift,
asymmetry and line broadening) for the 39K MAS NMR spectrum of GBFS/MKPC can
be determined. Whilst the experimental data from the pure struvite-K sample
(Table 5.1) was used a reference standard for the GBFS/MKPC binder as there is no
published 39K NMR data for struvite-K or struvite. Using this method, the simulated
spectrum indicated that there are two 39K sites present in the GBFS/MKPC binder.
The first and most dominant (K1) is the resonance associated with struvite-K, which

110
has an isotropic chemical shift of δiso = -73 ppm (K1) and was comparable to that
reported for struvite-K system (Chapter 5).
The simulation in Fig. 6.11, suggests the presence of a secondary K environment (K2)
downfield of the main struvite-K resonance. The K2 phase has been estimated to
have an isotropic chemical shift of δiso = -107.7 ppm (Fig. 6.11), it is possible to
confidently conclude that the K2 phase was not associated with free hydrated K+
ions, which would have a resonance at 0 ppm [82]. Attempts to fit the lineshape with
dispersions in quadrupole coupling parameters, consistent solely with a disordered
K environment, were unsuccessful. Also, a direct comparison between the 39K MAS
NMR spectra of GBFS/MKPC and pure struvite-K (Fig. 6.12) clearly demonstrates the
presence of the low intensity resonance, which is labelled as K2. This resonance
cannot be replicated using the struvite-K quadrupolar parameters, even when
extensively varied. Therefore, it is suggested that the K2 environment must be
incorporated within a secondary phase in the GBFS/MKPC binder. Certain potassium
feldspars (KAlSi3O8) exhibit 39K MAS NMR resonances within the region of the K2
environment [157-159], whilst their 27Al and 29Si signals at 50 to 65 ppm and -86 to -
107 ppm respectively, are consistent with the spectra reported here. Given the
aluminosilicate-rich nature of the SCMs and the large quantity of potassium added
to these systems as KH2PO4, there could be the potential for poorly crystalline
assemblages of this nature. Further work is thus required to fully understand the
formation of K-Al-Si secondary phases in these blended MKPC binders.
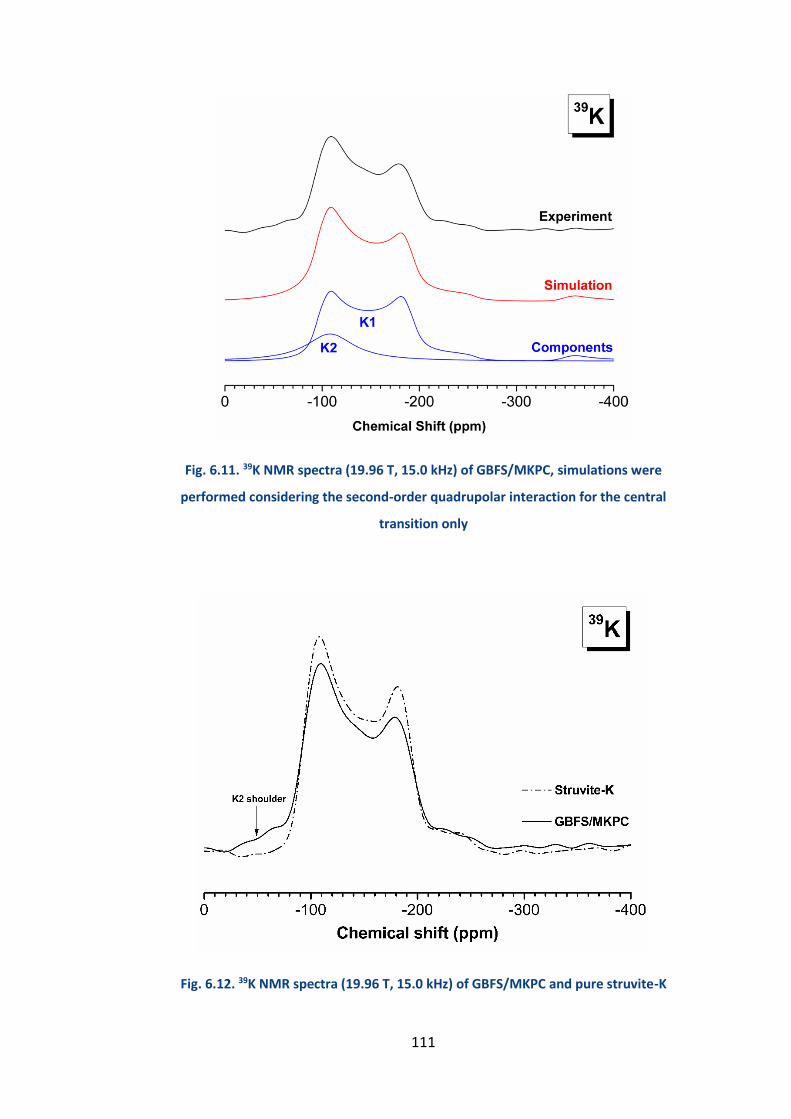
111
Fig. 6.11. 39K NMR spectra (19.96 T, 15.0 kHz) of GBFS/MKPC, simulations were
performed considering the second-order quadrupolar interaction for the central
transition only
Fig. 6.12. 39K NMR spectra (19.96 T, 15.0 kHz) of GBFS/MKPC and pure struvite-K

112
6.3 Conclusions and Future work
The principal role of FA and GBFS in blended MKPC binders is as a filler and diluent.
However, microstructural characterisation and multinuclear NMR spectra indicated
dissolution of the aluminosilicate glassy fractions of both FA and GBFS under the
near-neutral pH conditions prevailing within MKPC binders. This has been
unambiguously demonstrated for the first time in this contribution. The 27Al and 29Si
MAS NMR do not show the formation of C-(A)-S-H gels, as reported in the literature,
which is a clear difference between the behaviour of these SCMs under near-neutral
pH conditions compared to the reaction products formed through their hydration at
high pH. This suggests that the latent hydraulic nature of the slag and pozzolanic
nature of the fly ash are not being activated within the near-neutral pH conditions of
MKPC binders. Therefore, the chemical changes identified through SEM and NMR
investigations are the result of dissolution of the Al and Si from the GBFS and FA
particles, induced by the phosphate species present in the MKPC formulations. The
secondary products forming in MKPC blended with FA and GBFS are highly enriched
in Al and Si, which could potentially lead to the formation of a potassium
aluminosilicate phase. The additional phases formed through these interactions may
enhance overall densification and potentially increase the durability of MKPC
binders. NMR spectra were provided for the first time to reporting the true isotropic
chemical shift and quadrupolar parameters for the 25Mg and 39K nuclei present in
GBFS/MKPC binders.
Further work should be undertaken in the following areas:
Clarification of the existence of both the potassium aluminosilicate phase and
an amorphous orthophosphate phase, as proposed from the NMR spectra
reported in this chapter, 27Al MQMAS NMR experiments will be used to
elucidate the K-Al-Si relationships within the GFBS/MKPC binder.

113
7 High temperature stability of MKPC binders
This chapter is partially based on the following published manuscript:
Gardner et al. Evolution of phase assemblage of blended magnesium potassium
phosphate cements binders at 200 and 1000 °C, Advances in Applied Ceramics, 2015,
vol. 114, pp. 386-392.
7.1 Introduction
Cementitious binders based on the magnesium potassium phosphate (MKPC)
bonding are in general, near-neutral pH systems formed from the acid-base reaction
of KH2PO4 and dead burnt MgO [160]. These properties have led to their
consideration as encapsulants for certain nuclear wastes (especially reactive metals,
such as Al, Mg and U) that may otherwise corrode in the high pH conditions or with
the high availability of free water within conventional Portland cement (PC) based
encapsulants [15, 17-19].
The acceptance of a conditioned wasteform/waste package is contingent on
meeting strict safety requirements, laid out in waste package specifications and
acceptance criteria. In the UK, these conditions pertain to the mechanical, thermal
and immersion properties of the wasteforms and waste packages [28, 161]. The
thermal properties of waste packages are especially important for understanding and
assessing the potential impact of accident scenarios, such as fires, which might occur
during transportation, or after emplacement of a waste package into an engineered
repository (either for temporary, or final storage). It is imperative that waste
packages minimise the release of radioactive material under such fire conditions,
which may burn hotter, and for longer due to limited access, especially if deep
underground in a geological repository [161]. This is especially pertinent in light of
the recent fires and subsequent radionuclide release at the Waste Isolation Pilot
Plant (WIPP) in the USA [162], which highlight the importance of understanding how
waste packages might evolve and behave at elevated temperatures.

114
Cementitious materials typically undergo dehydration and breakdown of the
principal binding phases upon heating, which leads to the evaporation of water and
the build-up of pressure within the pores [163, 164]. As a consequence of the internal
stresses generated by differential thermal expansion and shrinkage, in addition to
the water evaporation, severe loss of mechanical performance is typically
experienced, for example a GBFS/PC (1:1) mortar exposed to 900 °C for 4 hours lost
≈ 84 % of its initial strength of 30 MPa at 20 °C [163]. Thus, external fires may have a
deleterious effect upon the performance of conventional Portland cement based
wasteforms, which might ultimately result in the release of radionuclides to the
immediate or wider environment, depending upon the scale and location of a fire.
Magnesium phosphate compounds have historically found uses as refractory
materials for furnaces [31, 165-167], therefore it is anticipated that MKPCs may be
capable of withstanding a wide range of temperature conditions. Most of the
literature regarding the thermal properties of magnesium phosphate cements
describes magnesium ammonium phosphate cements (MgNH4PO4·6H2O, struvite)
rather than MKPC binders. In ammonium-containing systems, various phase
transitions were noted upon heating, resulting in intermediate poorly crystalline
phosphate assemblages [39, 168] and ultimately sintering of the phosphate materials
to form a ceramic-like phase at 1300 °C [168].
In practical cementitious applications, MKPC binders are often blended (up to
50 wt. % replacement) with supplementary cementitious materials (SCMs) to
minimise cracking due to the exothermic output of the acid-base reaction, to reduce
material costs and to ensure sufficient workability. A recent study on MKPCs blended
with up to 40 wt. % fly ash [169] reported the conversion of struvite-K
(MgKPO4·6H2O) to MgKPO4 via a dehydration process, when exposed to 1000 °C for
3 hours, with retention of around ≈ 25 % of the original compressive strength, but
without the presentation of detailed characterisation data. Preliminary studies of
MKPC binders blended with 50 wt. % fly ash (FA/MKPC) and ground granulated blast
furnace slag (GBFS/MKPC) showed that a disordered MgKPO4 phase was formed
upon heating to 200 °C, followed by crystallisation at temperatures below 1000 °C.

115
In this study, FA/MKPC and GBFS/MKPC cements were exposed to temperatures
between 20 to 1200 °C, and the resulting products characterised using dilatometry,
X-ray diffraction (XRD), scanning electron microscopy (SEM), solid state magic angle
spinning (MAS) nuclear magnetic resonance (NMR) techniques (27Al and 29Si) and
Mössbauer spectroscopy. We discuss the microstructural stability of these MKPC
materials under exposure to high temperatures to elucidate the possible failure
mechanisms in potential fire scenarios related to storage in a geological disposal
facility.
7.1.1 Thermal test procedure
Blended MKPC samples (0.24 w/s) were cut into cylinders (h 10 ± 0.1 mm, 14 ± 0.5
mm) using a Buehler Isomet low speed saw. Using a zirconia tile, the samples were
placed into a pre-heated furnace (Elite, model 15/5) at 200, 400, 800, 1000 and 1200
°C ± 10 °C, respectively. After allowing time for the furnace to stabilise (<5 minutes)
and a 30 minute thermal exposure, the samples were removed and quenched to
room temperature, as illustrated in Fig. 7.1. Sample dimensions were measured
using digital callipers and weighed before and after high temperature exposure to
allow changes in physical properties to be determined.
Fig. 7.1. Fire performance thermal treatment programme

116
The thermal test methodology used in this study was complementary to both the
IAEA transport regulations [170] and the Radioactive Waste Management Limited
(RWM) requirements for a geological disposal facility (GDF) in the UK [161]. The
former requires samples to be fully engulfed at an average temperature of 800 °C for
a 30 minute period [170], whereas the RWM parameters increased both the average
temperature and exposure time to 1000 °C and 1 hour, respectively [161]. The
enhanced RWM parameters are intended to take into account the higher potential
risk factor associated with fire incidents in a geological disposal because (1) any
below-ground fire may reach higher temperatures due to heat reflected off tunnel
features, and (2) the restricted access (compared to an above-ground fire) would
increase the response time and therefore there is potential for the fire to burn for
longer [161]. For blended MKPC formulations to be used in waste encapsulation and
long-term storage in a GDF, it is essential that the waste packages can withstand
higher temperatures whilst retaining their structural integrity and minimising
radiological release. As a compromise to the two set of regulations described above,
the samples in this study were exposed for 30 minutes to temperatures of 1200 °C,
which surpasses the current IAEA transport regulations. The duration required for
the enhanced RWM parameters (1 hour) was based on full-scale waste packages but
as relatively small sample sizes were used in this study, an exposure time of 30
minutes was deemed acceptable.
7.2 Results and Discussion
7.2.1 Physical properties
In FA/MKPC and GBFS/MKPC binders, the principal mass loss event occurred below
200 °C, which resulted in a mass change of ≈ -20.7 % at 200 °C (Table 7.1) for both
binders, consistent with the dehydration of struvite-K (to be discussed further in
section 7.2.2). The mass decrease from 20 °C was associated volumetric contractions
of 6.1 % for FA/MKPC and 8.8 % for GBFS/MKPC, respectively. For each
measurement, the volumetric and mass differences were calculated relative to a

117
specimen not exposed to heat (i.e. kept at room temperature) and measured ex-situ
therefore, the changes do not represent incremental volume/mass changes from
in-situ heating. Similar volumetric and mass changes were observed in the samples
exposed to 400 and 800 °C. However, at 1000 °C, the relative volumetric change (%)
for both the FA/MKPC and GBFS/MKPC samples (compared to the 20 °C specimen)
appeared to decrease, as shown in Table 7.1. This is postulated to be associated with
phase assemblage changes in the blended MKPC binders resulting from the FA or
GBFS reacting with the dehydration product, MgKPO4.
Table 7.1. The volumetric (± 0.4 %) and mass changes (± 0.3 %) of FA/MKPC and
GBFS/MKPC binders exposed to high temperatures*
Temperature
(°C)
% change after heating (compared to a 20 °C sample)
FA/MKPC GBFS/MKPC
Volume Mass Volume Mass
200 -6.1 -20.7 -8.8 -20.8
400 -6.3 -23.2 -8.6 -23.5
800 -8.4 -26.3 -8.7 -24.0
1000 -4.2 -26.4 -3.4 -23.7
1200 -1.2 -29.2 -8.9 -28.2
*The quoted errors are derived from calculated standard deviations from the 800 °C experiment,
which was performed in triplicate.
At 1200 °C, the volume change of the GBFS/MKPC binder appeared to significantly
increase to - 8.9 % of the original volume (at 20 °C), whereas the FA/MKPC continued
to reduce in volume compared to the 20 °C specimen. In Fig. 7.2, the photographs of
the FA/MKPC and GBFS/MKPC binders indicate that no macroscopically visible
spalling or cracking occurred as a result of physical changes caused by exposure to

118
high temperatures. In the FA/MKPC binder (Fig. 7.2A), a progressive colour change
(from dark grey via reddish brown to a final dark brown) was observed between the
20 °C and 1200 °C samples, which is postulated to be associated with iron oxidation
in the fly ash. In the GBFS/MKPC binder (Fig. 7.2B), a more subtle colour change (from
grey to light grey) was observed, and the greenish tinge observed at low temperature
exposure (200 °C) was attributed to polysulfide species released by the GBFS [26]
faded with increasing temperature to be indistinguishable at 1200 °C.
Fig. 7.2. Photographs of (A) FA/MKPC and (B) GBFS/MKPC hardened pastes exposed to
temperatures between 20 and 1200 °C. The samples are 14 mm diameter (± 0.6 mm) and
10 mm height (± 0.5 mm)
The dilatometric traces of the FA/MKPC and GBFS/MKPC binders are presented in
Fig. 7.3. Both samples experienced a shrinkage event between 30 - 200 °C, which was
associated with the dehydration of struvite-K and was followed by a second shrinkage
event between 500 - 700 °C. The dilatometry data closely matches the measurements
reported in Table 7.1 (up to 800 °C) even though the latter were taken using digital
micrometer after each sample was quenched in air to room temperature (rather
than in situ at high temperature as for the dilatometry samples).

119
However, a thermal expansion was noted in the dilatometric samples of both binders
from 700 to 1200 °C (Fig.7.3), which was dissimilar to the volumetric changes
reported in Table 7.1 for the GBFS/MKPC binder exposed to 1200 °C. This dissimilarity
is postulated to be associated with the formation of additional crystalline phases via
the reaction of the supplementary cementitious materials (FA, GBFS) and the
dehydrated struvite-K product (MgKPO4). To support this theory, evidence for new
crystalline phases were identified in the XRD analysis for both blended binders at
>800 °C (to be discussed in section 7.2.3). The dilatometric samples experienced a
total shrinkage of ≈ 4 %, the impact of this shrinkage on the physical properties did
not result in cracking on spalling, which was encouraging from a fire performance
aspect as both the FA/MKPC and GBFS/MKPC binders can physically withstand
exposure to high temperatures.
Fig. 7.3. Dilatometric traces of the (A) FA/MKPC and (B) GBFS/MKPC up to 1200 °C

120
7.2.2 Thermal analysis
The dehydration behaviour of FA/MKPC and GBFS/MKPC binders as measured using
TGA and differential thermogravimetric (DTG) analysis, shown in Fig. 7.4, was found
to be comparable to that of pure struvite-K systems [98]. A large mass change
occurred between 50 °C and 150 °C, which were calculated to be -18 % and -20 % for
the two blends respectively. This was assigned to the single-step dehydration of
MgKPO4·6H2O, leading to the formation of the dehydration product, MgKPO4 (Eq. 8).
Fig. 7.4. TGA/DTG of (A) FA/MKPC and (B) GBFS/MKPC pastes after 7 days curing
There was a 2 % point difference in TG data between FA/MKPC and GBFS/MKPC,
which indicated that in a 20 mg TGA sample that there is more of the cementitious
struvite-K phase was present in the GBFS/MKPC sample. This could potentially be
explained by the surface area values reported for FA and GBFS, where the BET values
(Table 3.1) are reported to be: 2258 m2/g and 993 m2/g, respectively. The FA has a
significantly larger surface area than the GBFS and therefore a higher water demand,
which would result in less water being available for the formation of struvite-K in the

121
FA/MKPC binder. The DTG analysis shown in Fig. 7.4B further emphasises that only
one mass loss event occurred, suggesting that the inclusion of FA and GBFS within
MKPC binders does not have an effect on the dehydration behaviour.
7.2.3 Powder X-ray diffraction
7.2.3.1 FA/MKPC
At 20 °C struvite-K was identified as the main crystalline product formed in the
FA/MKPC binder (Fig. 7.5). Traces of unreacted periclase (MgO, PDF #45-0946) from
the excess dead burnt magnesia, along with crystalline quartz (SiO2, PDF #78-2315)
and mullite (3Al2O3.2SiO2, PDF #15-0776) from the unreacted FA were also identified.
After exposing the FA/MKPC binder to 200 °C, the reflections for periclase, quartz
and mullite remained unchanged, whereas the struvite-K reflections disappeared
due to dehydration. No reflections associated with newly formed magnesium
phosphate phases were observed, which suggests that the struvite-K collapsed to a
non-crystalline phase upon exposure to 200 °C. This is in agreement with the thermal
investigations of struvite (NH4MgPO4.6H2O), it was established that no reflections for
the equivalent dehydration product were identified between 200 – 700 °C for the
struvite system [39, 121, 122]. Neiman and Sarma [39] postulated that this was due
to the formation of a non-crystalline polymeric phase, whereas Sarkar [121]
suggested that MgHPO4 was formed due to liberation of both the crystal-bound H2O
and NH4, that occurred because struvite is unstable above 50 °C
The long-range order partially returned at 400 °C, evidenced by the appearance of α-
MgKPO4 (PDF #50-0146, P21/c) reflections amongst the reflections assigned to the FA
crystalline phases (quartz and mullite) and excess periclase. The identification of the
α-MgKPO4 phase at 400 °C was contradictory to the in situ HTXTD observations for
pure struvite-K (Fig. 5.2), where the β-MgKPO4 phase was detected at 400 °C. The
likely explanation for this difference is associated with the experimental conditions
(i.e. in situ for struvite-K vs. ex situ for the blended MKPC binders). We postulate that
the β-MgKPO4 phase in the FA/MKPC binder underwent a reverse phase transition

122
upon quenching to the α-MgKPO4 phase prior to data collection. In accordance with
the ex situ behaviour of the FA/MKPC binder, any reference to the dehydration
product herein will refer to the α-MgKPO4 phase.
Fig. 7.5. Ex situ X-ray diffractogram of hardened FA/MKPC binders heated up to 1200 °C
After exposure at 800 °C, new crystalline reflections emerged in the FA/MKPC
specimen, which were associated with a potassium aluminosilicate phase (KAlSiO4,
PDF #31-0965). The main reflections at 27.9° and 28.6° 2θ overlap those previously
assigned to the α-MgKPO4 phase at 400 °C. It is postulated that at 800 °C, both phases
are present due to the irregular shape of the main reflections and through the
existence of several reflections associated with the KAlSiO4 phase. Rietveld
refinement conducted on this diffraction pattern would assist in elucidated the
correct phase assemblage (to be included in future work). The emergence of KAlSiO4

123
could be attributed to the crystallisation of amorphous potassium aluminosilicate
previously identified within FA/MKPC binders at room temperature (discussed in
Chapter 6). Alternatively, it could be the result of a reaction between potassium
being extracted from the main Mg-P rich phase to interact and with the FA particles,
which are rich in Al and Si, to form phases such as KAlSiO4 observed at 800 °C, and
leucite (KAlSi2O6, PDF #38-1423) observed above 1000 °C. Further phase assemblage
changes occurred as a result of FA and MgKPO4 reactions in the FA/MKPC binder at
1000 °C (Fig. 7.5), this was represented by the increased number of reflections
associated with leucite, K3P3O9 (PDF #70-0048), Mg2P2O7 (PDF #32-0626) and
hematite (Fe2O3, PDF #33-0664). The phase assemblage transformation of the
FA/MKPC binder, struvite-K to leucite (KAlSi2O6) at 1200 °C combined with the
physical properties observed (no specimens displayed macro-cracks) suggests that
the changes are stable and don’t result in negative impacts on the materials.
A similar transition was observed in FA-derived geopolymers, where leucite was
identified as the main crystalline product formed in a K-aluminosilicate binder upon
exposure to 1200 °C [171]. Comparatively, in a potassium geopolymer (derived from
kaolinite, Si/Al ratio = 1), it was found that both KAlSiO4 and leucite phases were
stable between 1000 - 1400 °C [157]. In the current study, the Si/Al ratio in the
FA/MKPC binder was approximately 2 (Table 3.2), which resulted in the presence of
both KAlSiO4 and leucite at 1000 °C leading to the preference for leucite at 1200 °C.
It is postulated that the interaction between FA and potassium in the FA/MKPC
binder was similar to geopolymer systems [157], although taking place under much
less alkaline conditions
The Mg2P2O7 phase identified in Fig. 7.5 was also found in struvite-based
(NH4MgPO4·6H2O) dental investments heated between 750 – 1100 °C, which implies
that the two systems behaved comparably when exposed to high temperatures [39,
168]. After exposure at 1200 °C, the relative intensities of the KAlSiO4 and SiO2
reflections appeared to decrease whilst the relative intensities of leucite reflections
increased. This indicated that further reactions were taking place at 1200 °C, which
was reinforced by the formation of an iron-magnesium aluminate spinel phase
similar to Mg1Al0.8Fe1.2O4 (PDF #71-1235) and loss of Mg or P-containing phases (e.g.

124
K3P3O9 and Mg2P2O7). The observed phase assemblage alludes to a chemical
reorganisation at 1200 °C, leading to Mg and P incorporation into non-crystalline
phases (i.e. glass fractions).
7.2.3.2 GBFS/MKPC
At 20 °C, the diffraction pattern of the GBFS/MKPC binder (Fig. 7.6) was similar to
previous results where struvite-K was identified as the main crystalline phase, in
addition to the reflections associated with unreacted periclase and åkermanite
(Ca2MgSiO7, PDF #76-0841) from the raw GBFS. After exposure at 200 °C, the long-
range order of the dehydration product disintegrated in a similar fashion to the
FA/MKPC binder (as discussed above) and thus, to struvite systems. The phase
assemblage at 200 °C was mainly represented by diffuse scattering was observed
between 25° < 2θ < 35° assigned to the GBFS glassy fraction and the poorly crystalline
dehydration product. The glassy phase could not be clearly identified at 20 °C due to
the struvite-K reflections, which are very crystalline. The diffuse scattering presented
in Chapter 6 (Fig. 6.2) for raw GBFS is similar to that observed in the GBFS/MKPC
binder at 200 °C (Fig. 7.6). It was also observed that quartz (SiO2, PDF #78-2315)
contamination from the cleaning media (sand) was present in the 200 °C diffraction
pattern.
At 400 °C, low intensity reflections associated with α-MgKPO4 (PDF #50-0146)
emerged, signifying that the long-range order of this phase increased at 400 °C in the
GBFS/MKPC binder. Similarly to the FA/MKPC binder, it is postulated that the
MgKPO4 α to β phase transition reversed upon cooling, as the diffraction pattern was
comparable to the α-MgKPO4 phase reported by Wallez et al. [120]. After exposure
at 800 °C, additional reflections corresponding to α-MgKPO4 emerged alongside a
calcium magnesium potassium phosphate phase (Ca9MgK(PO4)7, PDF #88-0798). In
the 1000 °C diffraction pattern (Fig. 7.6) reflections due to forsterite (Mg2SiO4, PDF
#34-0189) reflections emerged, whilst the relative intensity of the Ca9MgK(PO4)7
reflections increased suggesting more of this phase had formed than at 800 °C.

125
Fig. 7.6. Ex situ X-ray diffractogram of hardened GBFS/MKPC binders heated up to
1200 °C
A phase reorganisation was observed in the 1200 °C diffraction pattern (Fig. 7.6) with
the emergence of prominent phases: forsterite, kalsilite (KAlSiO4, PDF #33-0989) and
protoenstatite (MgSiO3, PDF #75-1334). Additionally, the relative intensity of the
forsterite reflections appeared more intense than in the 1000 °C diffraction pattern.
These combined changes signified that the GBFS had begun a solid state reaction
with the dehydration product within the GBFS/MKPC binder. It is also expected that
in the GBFS/MKPC binder a poorly crystalline CaO-MgO-SiO2-P2O5 glass component
was formed after exposure to high temperatures, in similar behaviour to bioactive
glasses (CaO-MgO-SiO2-P2O5), which are formed after calcination at 700 °C in air for
3 hrs [172]. This explanation could account for the lack of Ca or P rich phases
observed in the XRD data at 1200 °C.
126
7.2.4 Nuclear magnetic resonance spectroscopy
7.2.4.1 27Al MAS NMR
The 27Al MAS NMR spectra for the FA/MKPC and GBFS/MKPC binders exposed to
temperatures between 20 and 1200 °C are shown in Fig. 7.7. The unreacted FA (Fig.
7.7A) has two main Al environments, AlIV and AlVI centred at 50 ppm and -6 ppm,
respectively. The resonance at -6 ppm corresponds to the AlVI sites in mullite [150,
151] whilst the broad resonance centred at 50 ppm was associated with a
combination of the highly cross-linked aluminosilicate glassy fraction present in FA
and the tetrahedral mullite resonance reported to occur at 46 ppm [151]. Compared
to the raw FA spectrum, the intensity of the AlIV resonance at 50 ppm appeared to
increase in the FA/MKPC binder at 20 °C, whilst the AlVI resonance at -6 ppm intensity
was reduced. There were no major changes in the aluminium environments within
the FA/MKPC binder exposed to 400 °C, concurrent with the XRD data Fig. 7.5.
However, the resonance at -6 ppm associated with AlVI mullite environments [24, 25]
disappeared in the sample exposed 800 °C, whilst the intensity of the AlIV resonance
(centred at 50 ppm) increased. These spectral differences indicated that a FA
reaction contributed to the altered phase assemblage observed at 800 °C (Fig. 7.5).
This is because the AlIV environment associated with the glassy FA fraction sharpened
(i.e. had a higher crystallinity) whilst the mullite contributions appeared diminished.
Upon exposure to 1000 °C, the AlVI resonance was almost entirely eliminated, and
the AlIV resonance presented an asymmetric shape, comprised of three distinct, but
overlapping AlIV environments positioned at 68, 59, and 46 ppm, respectively. The
latter is associated with a remnant FA environment and demonstrates that the FA
had not fully transformed at this temperature. The resonances centred at 68 and
59 ppm are indicative of leucite formation [173, 174] and are consistent with the XRD
phase assignments (Fig. 7.5). In the sample exposed to 1200 °C, the leucite resonance
sharpened whilst a decreased contribution from the remnant FA was observed,
indicative of a continuing FA reaction.

127
Fig. 7.7. Normalised 27Al MAS NMR spectra of hardened (A) FA/MKPC and (B) GBFS/MKPC
pastes heated between 20 - 1200 °C
In Fig. 7.7B two Al environments were observed in the 27Al MAS NMR spectrum of
unreacted GBFS. The dominant site was represented by a broad AlIV environment
centred at 56 ppm assigned to the calcium aluminosilicate glass, which constitutes
the majority of the slag [141]. The second Al site was a small resonance in the AlVI
region centred at 9 ppm, associated with a minor octahedral Al environment present
in the unreacted slag glass. In the GBFS/MKPC binder at 20 °C, the main AlIV
resonance was narrower, slightly more intense and shifted upfield (to be centred at
53 ppm) compared to raw GBFS. This is associated with the secondary reaction
product discussed in Chapter 6, which is likely to be a potassium aluminosilicate
phase, however the exact composition of this phase is not currently know. Between
the samples exposed ay 400 and 1000 °C, a gradual downfield shift in the broad AlIV
resonance from 55 ppm to 59 ppm was observed, along with increased asymmetry
in the resonance shape, which was most notable after exposure to 1000 °C. In
samples treated at 1200 °C, a sharp resonance associated with the [Q4(4Si)] units of
an ordered kalsilite structure was observed at 59.1 ppm in 27Al MAS NMR (Fig. 7.7B)

128
[175, 176], which validated the presence of a single Al-containing phase within the
XRD analysis (Fig. 7.6) and signalled that a solid state reaction with the dehydration
product had taken place within the GBFS/MKPC binder.
7.2.4.2 29Si MAS NMR
The 29Si MAS NMR spectra of the FA/MKPC and GBFS/MKPC binders exposed to
temperatures between 20 °C and 1200 °C are shown Fig. 7.8. The unreacted FA had
a broad resonance between -76 and -122 ppm, which was centred at -102 ppm (Fig.
7.8A). This was assigned to the crystalline and glassy aluminosilicate phases present
within FA, which are a combination of quartz (≈ -107 ppm) [154], mullite (≈ -86 ppm)
[151], and the vitreous fraction [155]. In the FA/MKPC specimen at 20 °C, the
chemical shift range of this broad resonance was observed with a slight upfield shift,
centred at -105 ppm. After exposure at 400 oC, the resonance lineshape was similar
to the FA/MKPC spectrum at 20 °C whereas in the sample exposed to 1000 °C, the
resonance shapes and chemical shifts of the partially resolved component peaks
varied considerably. These component peaks were identified in the sample exposed
to 1000 °C at -86, -92 and -96 ppm with additional resonances at -82 and -106 ppm
for the sample exposed to 1200 °C, which are consistent with the presence of a
fraction of the Si in the samples as leucite (KAlSi2O6) [177], as identified by XRD (Fig.
7.5). Although KAlSiO4 was identified in the XRD analysis it was difficult to distinguish
this phase within the 29Si MAS NMR spectra, for the samples exposed to 1000 and
1200 °C, as the typical KAlSiO4 resonances are located at –89 ppm [175] and as such,
were overlapped by the distinctive leucite environments.

129
Fig. 7.8. Normalised 29Si MAS NMR spectra of hardened (A) FA/MKPC and (B) GBFS/MKPC
pastes heated between 20 - 1200 °C
In Fig. 7.8B, the unreacted GBFS exhibited a broad resonance centred at -74 ppm,
consistent with the glassy fraction and the minor åkermanite present in the slag
[178]. The GBFS/MKPC binders exposed to 20 °C, 400 °C and 1000 °C all had a similar
resonance centred at -75 ppm with a minor resonance at -62 ppm. In the 29Si MAS
NMR spectrum (Fig. 7.8B), no differences were observed in the Si environments when
compared to the 20 °C specimen, which concurred with the XRD analysis. However,
in the GBFS/MKPC binder exposed to 1200 °C, the intensity of the unreacted GBFS
resonance at -73 ppm decreased in concurrence with the emergence of additional,
sharp and intense resonances centred at -61.6, -86.2 and -88.8 ppm. Several new Si
environments were identified in the XRD analysis (forsterite, kalsilite and
protoenstatite), the spectral changes observed in the 29Si MAS NMR spectra for the
GBFS/MKPC binder (Fig. 7.8B) reinforce the likelihood of a GBFS – α-MgKPO4
reaction. However, the low intensity resonance centred at -73 ppm (associated with
residual GBFS glass fraction) indicated that the reaction was incomplete after

130
exposure to 1200 °C, even though no GBFS particles were identified in the
microstructure Fig. 7.12C.
The resonance reported at -61.6 ppm corresponded to forsterite (Mg2SiO4) [179,
180], whilst the resonance at -88.8 ppm was associated with an ordered kalsilite
structure [175, 176]. It is postulated that the resonance at -86.2 ppm could also be
associated with kalsilite, the difference being that it has undergone a transformation
to its orthorhombic structure at 897 °C. Once quenched to room temperature this
phase is denoted as O1-KAlSiO4 [181, 182]. The reported spectrum for this phase has
two partially overlapping resonances at -85.5 and -88.5 ppm and is similar in
resonance shape to that observed in the 1200 °C 29Si MAS NMR spectrum [181]. As
such, we hypothesise that a combination of the ordered kalsilite and O1-KAlSiO4
could be present after exposure to 1200 °C. Protoenstatite, identified at high
temperature in the current study (Fig. 7.6), is the orthorhombic polymorph of
enstatite and is reported to be the stable form of MgSiO3 present between 1000 and
1300 °C [183]. The contribution of protoenstatite in the 29Si MAS NMR spectrum (Fig.
7.8B) is expected to appear as a single resonance positioned at -84.2 ppm related to
the Si Q2 environment [184, 185], however, it could not be confidently assigned in
this study as this region was overwhelmed by the kalsilite resonance at -88 ppm.

131
Fig. 7.9. Deconvoluted 29Si MAS NMR spectra at 1200 °C (A) FA/MKPC with remnant fly
ash (B) FA/MKPC fully reacted and (C) GBFS/MKPC with remnant slag

132
In order to resolve the 29Si MAS NMR spectra, deconvolutions were performed in
Microsoft Excel using the minimum combination of Gaussian lines (using a similar
methodology to Bernal et al. [143]) to accurately describe the spectra for the
FA/MKPC and GBFS/MKPC binders exposed to 1200 °C (Fig. 7.9). The numerical
values for the deconvolutions are shown in Tables. 7.2-7.4.
Brown et al. [177] reported that the 29Si MAS NMR spectra for natural and synthetic
leucite is represented by a broad resonance comprised of several Si environments,
centred at: -81, -85.5, -88, -92, -97 and -101 ppm. These chemical shift values were
used to constrain the deconvolutions (± 1 ppm) for the FA/MKPC spectra shown in
Fig. 7.9A and 7.9B. In the leucite structure, there are only three tetrahedral sites (SiIV)
however, there are 15 possible assignments because each SiIV site can be associated
with up to four coordinated Al atoms [177]. As such, it was not possible to assign the
specific [Q] species for each environment described in Tables 4.2 and 4.3. The reason
for including two deconvolutions of the 29Si MAS NMR spectrum for FA/MKPC at 1200
°C was to determine if there could be any contributions associated with remnant fly
ash (centred at –100.8 ppm) within the broad leucite resonance. The postulated
remnant FA contribution is represented by the light grey Gaussian peak in Fig, 7.9A
however, the deconvolution shown in Fig. 7.9B demonstrates that the FA/MKPC
spectrum (at 1200 °C) can accurately be fitted without a FA contribution. Further
investigations by SEM/EDX analysis and Mössbauer spectroscopy revealed that the
FA in the FA/MKPC binder fully reacted by 1200 °C (to be discussed in sections 7.2.5
and 7.2.6) consequently, the deconvolution presented in Fig. 7.9B is likely to be
correct.
For the 29Si MAS NMR spectrum of the GBFS/MKPC binder, only one deconvolution
was performed because it was clear from the distinctive remnant GBFS resonance
centred at -73 ppm (highlighted in grey shading within Fig. 7.9C) that the GBFS was
still present at 1200 °C. This chemical shift value concurs with the reported value for
glassy silicate structures often found in blast furnace slag [186]. The remainder of the
deconvolution was simulated using known chemical shifts of kalsilite and forsterite
constrained to ± 1 ppm of the literature values. Forsterite is reported to have a single
resonance at -61.9 ppm, which is related to a [Q0] Si species [180] whilst, kalsilite has

133
several possible resonances centred at: -84.9, -88.5 and -93.9 ppm, which are likely
to be assigned to [Q4(4Al)] and [Q4(3Al)] species [181].
Using these assignments for GBFS, forsterite and kalsilite, it was not possible to
perfectly simulate the 29Si MAS NMR spectrum for the GBFS/MKPC binder at 1200 °C.
However, the addition of a Gaussian peak (centred at -83.6 ppm) enabled the
deconvolution to be accurately described. It is possible that the phase assignment
could be associated with protoenstatite, which is reported to have single resonance
at -84 ppm [185] and was previously identified in the XRD analysis (Fig. 7.6: 1200 °C).
From these deconvolutions, it is clear that remnant GBFS was still present in the
GBFS/MKPC binder at 1200 °C, however it is likely that the FA within the FA/MKPC
binder had fully reacted.
Table 7.2. 29Si MAS NMR chemical shifts calculated by deconvolution of the FA/MKPC
spectrum (Fig. 7.9A)
Position (ppm) FHWM (ppm)
Leucite (1) -77.7 4.0
Leucite (2) -81.5 2.0
Leucite (3) -85.1 3.7
Leucite (4) -88.7 4.2
Leucite (5) -92.5 4.2
Leucite (6) -97.3 5.1
Leucite (7) -102.4 4.2
Leucite (8) -108.0 4.7
FA (9) -100.8 22.0
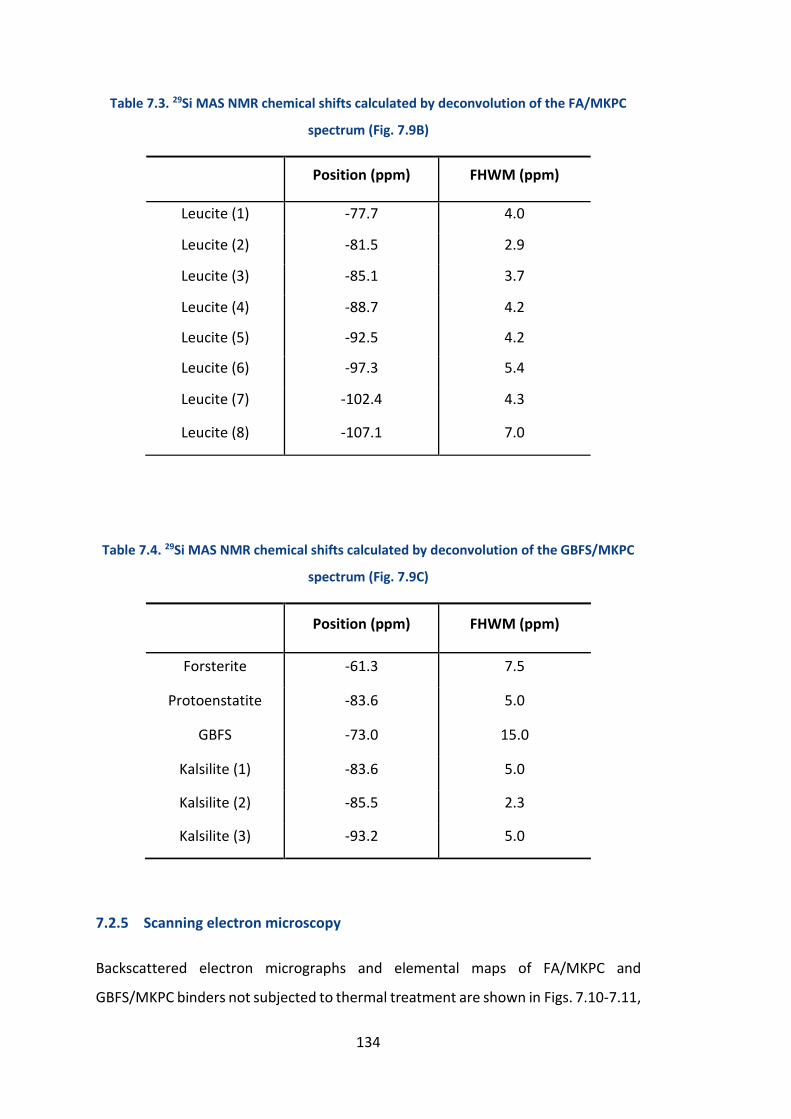
134
Table 7.3. 29Si MAS NMR chemical shifts calculated by deconvolution of the FA/MKPC
spectrum (Fig. 7.9B)
Position (ppm) FHWM (ppm)
Leucite (1) -77.7 4.0
Leucite (2) -81.5 2.9
Leucite (3) -85.1 3.7
Leucite (4) -88.7 4.2
Leucite (5) -92.5 4.2
Leucite (6) -97.3 5.4
Leucite (7) -102.4 4.3
Leucite (8) -107.1 7.0
Table 7.4. 29Si MAS NMR chemical shifts calculated by deconvolution of the GBFS/MKPC
spectrum (Fig. 7.9C)
Position (ppm) FHWM (ppm)
Forsterite -61.3 7.5
Protoenstatite -83.6 5.0
GBFS -73.0 15.0
Kalsilite (1) -83.6 5.0
Kalsilite (2) -85.5 2.3
Kalsilite (3) -93.2 5.0
7.2.5 Scanning electron microscopy
Backscattered electron micrographs and elemental maps of FA/MKPC and
GBFS/MKPC binders not subjected to thermal treatment are shown in Figs. 7.10-7.11,

135
respectively. The formation of a continuous struvite-K binder was observed, with
larger struvite-K crystallites of this phase embedded in the continuous (and
apparently microcrystalline) binder in both systems. Spherical particles of varying
sizes and with high-contrast Fe-rich inclusions correspond to unreacted FA particles,
whilst angular light grey particles correspond to unreacted GBFS. The dark grey
angular particles present in both Figs. 7.10-7.11 correspond to unreacted MgO. The
following section describes the morphology and chemical distribution of phases in
each MKPC binder after exposure at 1000 and 1200 °C.
7.2.5.1 Elemental mapping - FA/MKPC
The FA/MKPC binder underwent transformation at 1000 °C to a smooth, but porous
microstructure rather than being comprised of the distinct struvite-K and FA features
(Fig. 7.10A). However, the shape of the remnant FA particles in the Al and Si EDX
maps (Fig. 7.10B: Al and Si) were still clearly visible at 1000 °C. It is postulated that
the FA could continue to react at longer durations and/or exposure to higher
temperatures, which is supported by the microstructure of the FA/MKPC binder
exposed to 1200 °C (discussed below). It is important to note, that the aim of this
study was to observe the fire performance of the FA/MKPC binder (with respect to
IAEA and RWM fire performance parameters), not to fully react the FA. The
microstructure of the FA/MKPC binder at 1000 °C indicated that this system can
withstand fire conditions, resulting in the formation of a “ceramic-like”
microstructure.
A homogenous distribution of Mg, P and K was observed in the elemental maps,
however, Bragg reflections indicative of the dehydrated α-MgKPO4 phase were
absent from the XRD data at 1000 °C. As the melting point of MgKPO4 (1404 °C) [120]
was not exceeded in this study, a poorly crystalline α-MgKPO4 phase must be present.
The distinct correlations observed in the FA/MKPC microstructure between the Mg,
K and P elements (Fig. 7.10C: Mg, K and P) suggest that this may be the case. The Fe
EDX map in Fig. 7.10B indicated that this element was distributed into rims around
the excess MgO particles and as discrete particles within the voids of the cement,
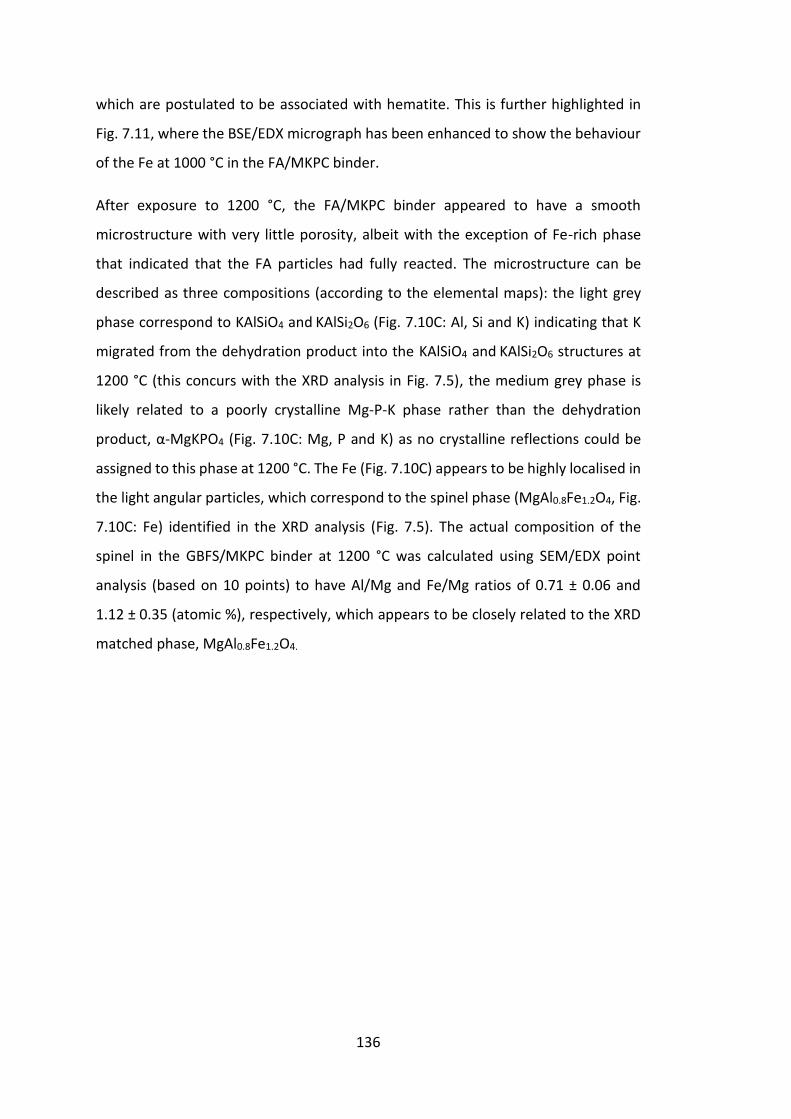
136
which are postulated to be associated with hematite. This is further highlighted in
Fig. 7.11, where the BSE/EDX micrograph has been enhanced to show the behaviour
of the Fe at 1000 °C in the FA/MKPC binder.
After exposure to 1200 °C, the FA/MKPC binder appeared to have a smooth
microstructure with very little porosity, albeit with the exception of Fe-rich phase
that indicated that the FA particles had fully reacted. The microstructure can be
described as three compositions (according to the elemental maps): the light grey
phase correspond to KAlSiO4 and KAlSi2O6 (Fig. 7.10C: Al, Si and K) indicating that K
migrated from the dehydration product into the KAlSiO4 and KAlSi2O6 structures at
1200 °C (this concurs with the XRD analysis in Fig. 7.5), the medium grey phase is
likely related to a poorly crystalline Mg-P-K phase rather than the dehydration
product, α-MgKPO4 (Fig. 7.10C: Mg, P and K) as no crystalline reflections could be
assigned to this phase at 1200 °C. The Fe (Fig. 7.10C) appears to be highly localised in
the light angular particles, which correspond to the spinel phase (MgAl0.8Fe1.2O4, Fig.
7.10C: Fe) identified in the XRD analysis (Fig. 7.5). The actual composition of the
spinel in the GBFS/MKPC binder at 1200 °C was calculated using SEM/EDX point
analysis (based on 10 points) to have Al/Mg and Fe/Mg ratios of 0.71 ± 0.06 and
1.12 ± 0.35 (atomic %), respectively, which appears to be closely related to the XRD
matched phase, MgAl0.8Fe1.2O4.

137
Fig. 7.10. Backscattered electron micrographs and elemental maps of FA/MKPC after
exposure to temperatures of (A) 20 °C, (B) 1000 °C and (C) 1200 °C

138
Fig. 7.11. Backscattered electron micrograph, Mg and Fe EDX map for FA/MKPC binder
exposed to 1000 °C, extracted from Fig. 7.10B
7.2.5.2 Elemental mapping - GBFS/MKPC
Differences in the microstructure were observed in the GBFS/MKPC binder exposed
to 1000 °C (Fig. 7.12B) when compared to 20 °C sample. A continuous phase with a
chemical composition consistent with the dehydration product, α-MgKPO4, was
identified in the SEM/EDX (Fig. 7.12B: Mg, K and P) interspersed with unreacted MgO,
GBFS particles and large areas of porosity (Fig. 7.12B). This was dissimilar to the
FA/MKPC binder, where evidence of K migration into the KAlSiO4 and KAlSi2O6
structures was observed, this highlights that the SCMs behave differently at 1000 °C.
Consequently, the Al, Si and the majority of the Ca present in the GBFS/MKPC binder
(Fig. 7.12B) remained associated with the remnant GBFS particles. A rim rich in Ca,
Mg, K and P (Fig. 7.12B) was found on the larger GBFS particles, which is hypothesised
to be associated with the Ca9MgK(PO4)7 phase identified in the phase assemblage
(Fig. 7.6). Upon exposure to 1200 °C (Fig. 7.12C) a smooth and continuous
morphology, with very little porosity was evident in the GBFS/MKPC microstructure.
This supports the occurrence of a GBFS – α-MgKPO4 reaction as no remnant GBFS
particles were detected in the microstructure (Fig. 7.12C), unlike at 1000 °C. A strong
relationship was evident between Ca, K, and P (Fig. 7.12C) indicative of a calcium
potassium phosphate phase. It is possible to conclude that this calcium potassium

139
phosphate phase must be poorly crystalline because no reflection were identified in
the XRD analysis (Fig. 7.6), in fact there were very few P-containing phases identified,
suggesting that the formation of “glass-like” phases occurred in the GBFS/MKPC
binder at 1200 °C. Interestingly, Mg was no longer associated with P in the
GBFS/MKPC specimen, but rather with forsterite and protoenstatite, which was
indicative of Ca/Mg competition at this temperature. As a result of these changes,
the microstructure can be described to contain two compositions (based on the
elemental maps), where the light grey phase is rich in Ca, K, and P (Fig. 7.12C) and
likely to be associated with a calcium potassium phosphate phase of unknown
composition. The dark grey phase is rich in Al, Si and Mg (Fig. 7.12) represents a
combination of kalsilite, forsterite and protoenstatite.

140
Fig. 7.12. Backscattered electron micrographs and elemental maps of GBFS/MKPC binders
after exposure to temperatures of (A) 20 °C, (B) 1000 °C and (C) 1200 °C

141
7.2.6 Mössbauer spectroscopy
Mössbauer spectroscopy was utilised to investigate Fe speciation in FA/MKPC
binders exposed to high temperatures, data are shown for raw FA and FA/MKPC
binders treated at 20, 800, 1000 and 1200 °C in Fig. 7.13. Analysis of raw FA (Fig.
7.13A) indicated that both magnetic and non-magnetic fractions, in the form of
hematite, magnetite and mullite (described as 3Al2O3.2SiO2 but with Fe substitution
for some of the Al when present in fly ash [187]) were observed. Two doublets with
isotropic shifts centred at 0.39 ± 0.02 and 0.78 ± 0.06 mm/s were associated with
mullite, whilst the three sextets were associated with magnetic Fe species identified
as hematite and magnetite. With increasing temperature (up to 1000 °C) preferential
Fe oxidation, from Fe2+ to Fe3+, was observed, as indicated by increased hematite and
reduced mullite contributions. This was consistent with the observed colour change
(grey to red/brown) observed at 1000 °C (Fig. 7.2A). At 1200 °C, notable changes in
the Mössbauer spectrum where a single signal was observed rather than the
sextuplets previously discussed to be associated with magnetite and hematite, (Fig.
7.13E) confirmed the presence of a spinel phase, similar to MgAl0.8Fe1.2O4 identified
by XRD and SEM/EDX analysis.

142
Fig. 7.13. Mössbauer spectroscopy of (A) raw FA, FA/MKPC at (B) 20 °C, (C) 800 °C, (D)
1000 °C and (E) 1200 °C. The data are represented by the black dashed lines, while the
simulations are represented by the solid (blue and red) lines

143
7.3 Conclusions and Future work
The exposure of FA/MKPC and GBFS/MKPC binders to 200 °C resulted in the
dehydration of MgKPO4·6H2O and consequent formation of the dehydration product,
α-MgKPO4, which had no long-range order between under 400 °C. At and above
800 °C, the formation of additional phases indicated that a reaction between the
dehydration product and the FA or GBFS (above 1000 °C) had taken place. This
resulted in the formation of leucite (FA/MKPC) and kalsilite (GBFS/MKPC) amongst
other crystalline phases (for example: hematite, spinel, forsterite, protoenstatite). As
a result of this phase assemblage restructure, considerable changes were observed
in the microstructures of FA/MKPC and GBFS/MKPC binders compared to the
blended binders at 20 °C. Although the FA/MKPC and GBFS/MKPC binders were
considerably altered at high temperatures, they formed well-understood stable
products whilst retaining dimensional stability. This suggests that these systems
could be expected to meet the fire performance requirements for UK ILW associated
with transport (withstanding exposure to a hydrocarbon fire at 800 °C for 30 minutes)
[170] and geological disposal (withstanding exposure to a fire at 1000 °C for 60
minutes) [161] of specified types of nuclear waste.
Further work should be undertaken in the following areas:
The high temperature stability criteria should be implemented over a range
of specimen sizes (up to and including full inactive wasteforms) to determine
the reproducibility of the results reported in this chapter, and to provide
confidence in the performance of blended MKPC binders under accident
conditions for nuclear waste applications.
Synthesis of α-MgKPO4 using the solid state procedure described by Wallez et
al. [120] followed by in situ HTXRD and TGA/DSC to determine the transition
behaviour of MgKPO4 up to 1200 °C, which would directly support the current
study.

144
In situ HTXRD data of the FA/MKPC and GBFS/MKPC binders to support the
occurrence of α to β to γ MgKPO4 transitions in these systems. This
investigation should include collection of HTXRD and TGA/DSC cooling data,
to confirm the β-MgKPO4 phase transition reversed upon quenching.
Ex situ thermal treatment of the pure struvite-K (up to 1200 °C) with
subsequent 31P MAS NMR analysis to understand the migration of P from
crystalline to poorly crystalline phases, in order to confidently interpret the
31P MAS NMR spectra of the blended MKPC binders (Appendix E).
Rietveld refinements of the ex situ high temperature diffraction patterns to
enable confident phase assignments.
145
8 Radiation stability of blended MKPC binders
8.1 Introduction
For employment in nuclear waste encapsulation applications, cementitious grouts
are required to have suitable properties, as discussed on Chapter 7. Encapsulants
should have a satisfactory accident performance (i.e. thermal incident) during
storage or final disposal scenarios and they should also provide radiation shielding of
the waste, as such they should be tolerant to substantial levels of radiation. The most
penetrating form of radiation is gamma radiation, which can affect a conditioned
wasteform from the encapsulated waste and from neighbouring packages [10]. As
the conditioned wasteform needs to contain the radioactive waste in a safe manner
and prevent release, it is necessary that the encapsulant grout and 500 L stainless
steel container are tolerant to gamma irradiation. The Nuclear Decommissioning
Authority report that for ILW conditioned waste packages, which equates to an
absorbed gamma dose of 0.56 Gy/hr and is predicted to decrease to 1.9 x 10⁻³ Gy/hr
after 300 years [188]. Accordingly, the maximum life-time (300 years) gamma dose
of an ILW 500 L drum waste package is estimated to be 10 MGy [188]. The significant
contribution to the radiogenic heat in ILW mainly arises from radionuclides: Co-60,
Sr-90, Cs-137, Pu-239 and Am-241 [189], with gamma irradiation largely from the
decay of Co-60, Cs-137 and Am-241 [190]. In the reactive metal waste streams
discussed in Chapter 2, these radionuclides are present in the following quantities
(reported as TBq/m3):
2D22 - 1.92 x10⁻¹ (Co-60), 1.93 x 101 (Sr-90), 2.79 x 101 (Cs-137), 5.53 x 101
(Pu-239) and 1.48 (Am-241) [7]
2D24 – 2.12 x10⁻¹ (Co-60), 2.48 x 101 (Sr-90), 4.10 x 101 (Cs-137), 7.14 x 10⁻¹
(Pu-239) and 1.93 (Am-241) [8]

146
8.1.1 Generation of gamma radiation
Gamma radiation is the product of radioactive decay, where an unstable nuclide
transforms to a stable nuclide by the emission of electromagnetic radiation (i.e. a
photon). In gamma decay, there is no change in the number of protons or neutrons,
it is only associated with the release of energy [191], as gamma rays photons with
energy in the keV to tens of MeV range, but typically around 1 MeV [77]. The energy
emitted equates to the energy difference between the initial and final states
involved, as demonstrated for the decay chains of Cs-137 and Co-60 in Figs. 8.1 and
8.2.
Fig. 8.1. Cs-137 decay chain, the data was extracted from [190]
Fig. 8.2. Co-60 decay chain, the data was extracted from [190]

147
8.1.2 Interaction of gamma radiation with materials
Gamma radiation can interact with materials in three ways: Compton scattering, pair
production, and the photoelectric effect (Fig. 8.3). The photoelectric effect is
associated with the complete conversion of the gamma energy via the expulsion of
an electron from the inner shell of an atom. The excited atom has two options for
de-excitation: (1) release an electron, known as an Auger electron; or (2) transfer an
electron from a higher atomic shell to the inner shell, which results in the emission
of an X-ray that has a characteristic energy and it is the basis of X-ray fluorescence
spectroscopy [77]. Compton scattering occurs when the incident gamma ray
interacts with a loosely bound electron resulting in a scattered electron (i.e. recoil)
and gamma ray of a lower energy (i.e. minus the energy absorbed by the electron).
This interaction is dominant when the energy of the gamma ray exceeds the binding
energy of inner electrons (Fig. 8.4) [191]. Pair production only occurs when the
energy of the incident gamma ray exceeds 1.022 MeV, which is the rest mass of two
electrons [77]. Unlike Compton scattering, all of the energy is converted into an
electron-positron pair. The positron will capture an electron as it loses energy (i.e. it
slows down) and undergo annihilation, resulting the formation of two gamma rays
that move in opposite directions to conserve [77].
Fig. 8.3. Schematic of gamma ray interactions with matter: (A) photoelectric, (B) Compton
scattering and (C) pair production extracted from [191]

148
Fig. 8.4. Schematic of the dominant mechanism for gamma ray interactions with matter,
extracted from [191]
As demonstrated in Figs. 8.1-8.2, the emitted gamma ray energy from nuclear decay
was 0.662 MeV for Cs-137, and 1.173 plus 1.333 MeV for Co-60. According to Fig. 8.4,
the dominant effect in matter (i.e. MKPCs) using gamma radiation sources will be the
Compton scattering (or effect), whilst, secondary interactions with matter occur via
the photoelectric effect [191]. The dominant interaction with matter is described by
the curves in Fig. 8.4, which represent the intersect for the atomic number
(Z)/photon energy plane where Compton scattering (σ) is equal to the photoelectric
effect (τ, left curve) and pair production (κ, right curve) [191].
8.1.3 Interaction of gamma irradiation with ILW encapsulant grouts
The majority of the cement irradiation studies have chiefly focussed on gamma
irradiation of Portland cements blended with FA or GBFS. Kontani et al. [192]
described gamma irradiation of PC pastes to result in the decomposition of the
hydrated PC phases (e.g. C-S-H, portlandite, ettringite [24]) via radiolysis. This leads
to the formation of hydrogen and hydrogen peroxide species that further degrade
into water and oxygen [169]. Radiolysis can also cause internal overpressure resulting
in stress-induced cracking of the wasteforms and the accumulation of explosive
hydrogen gas [193], which is undesirable during storage or within in a geological

149
repository. The typical effects of radiolysis occuring in PC grouts include: reduced
compressive and tensile strength, amorphisation of crystalline cement hydrated
phases, and/or densification and decomposition of hydrated phases [194, 195].
These effects could potentially be detrimental to the continued ability of the cement
to encapsulate the radioactive waste. Another impact of gamma radiation on PC
pastes is the dehydration of the hydrated PC phases through radiogenic heating
[169].
The mechanical properties of irradiated PC concretes were investigated by Soo and
Milan [195], who reported that the compressive strength of PC concretes was
dependent upon the irradiation exposure time rather than the total accumulated
dose. For example, at low a gamma dose rate (0.031 kGy/hr) a drop in compressive
strength was observed at just 0.1 MGy, whilst at a high gamma dose rate
(380 kGy/hr), the compressive strength was found to decrease after the absorption
of 10 MGy [195]. The mechanism for strength loss in these samples was attributed
to radiolysis of hydrated cement phases (e.g. C-S-H, portlandite, ettringite 17]).
However, in PC composite grouts irradiated in a Harwell spent fuel pond at a dose
rate of 10 kGy/hr, no differences were observed in the mechanical properties of
GBFS/PC and FA/PC grouts as a results of exposure to radiation doses of 9-12 MGy
[196], albeit occasional cracking of the samples was detected associated with
hydrogen generation from the radiolysis of water within the sample [196]. In a
GBFS/PC sample, exposed to a total of 87 MGy, no obvious changes were identified
in the microstructural properties of this grout apart from the formation of additional
ettringite, which was thought to be the result of accelerated oxidation of the sulphur
species present in GBFS [5]. The literature of PC based encapsulants indicated that
they have a significant radiation tolerance to gamma irradiation, and as such are
suited to application in intermediate level encapsulation [4, 5].
At present there is very little scientific data available regarding the radiation stability
of blended MKPC binders, as such more technical information is required to ensure
that they have a high degree of radiation tolerance prior to deployment as an
encapsulant of ILWs in the UK. In this chapter, initial scoping investigations were

150
conducted using Cs-137 gamma radiation at low dose rates/total doses. Whilst Co-60
gamma irradiation experiments to determine the effect of the absorbed dose (kGy)
and the applied dose rate (kGy/hr) using XRD, FTIR, TGA/DTG, SEM/EDX and solid-
state NMR techniques. This work aims to define the radiation tolerance boundaries
for these materials, supporting their potential use as nuclear waste encapsulants.
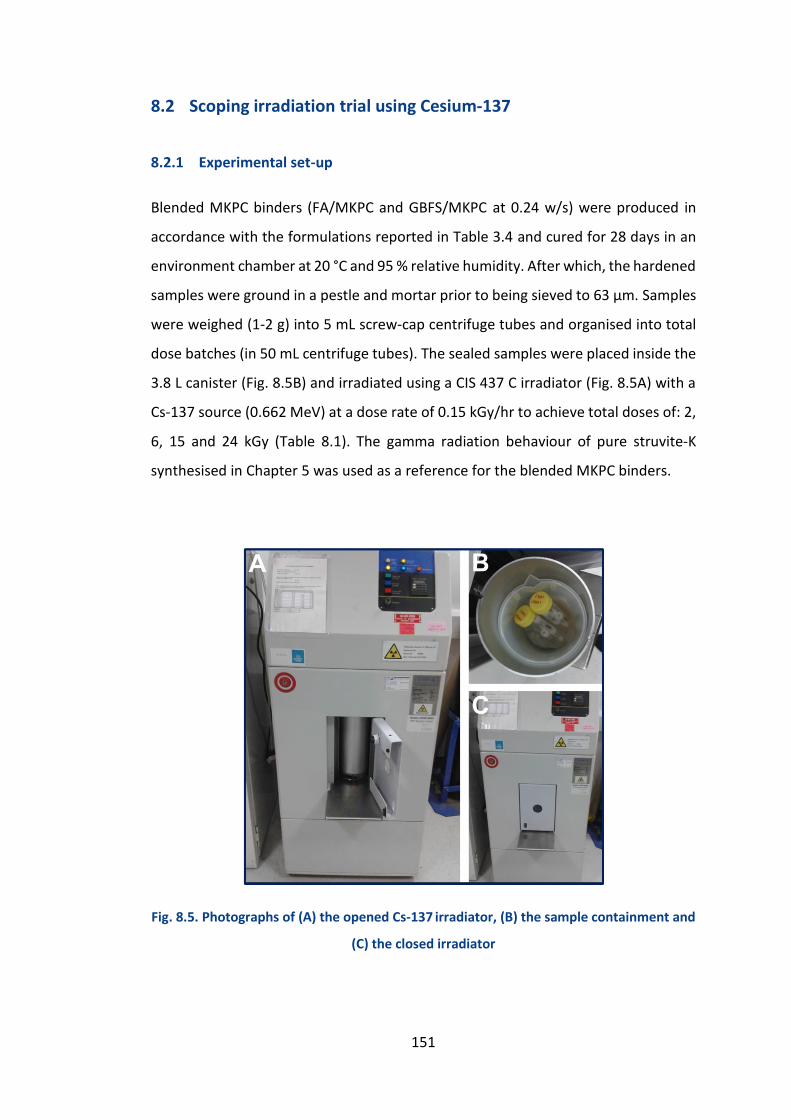
151
8.2 Scoping irradiation trial using Cesium-137
8.2.1 Experimental set-up
Blended MKPC binders (FA/MKPC and GBFS/MKPC at 0.24 w/s) were produced in
accordance with the formulations reported in Table 3.4 and cured for 28 days in an
environment chamber at 20 °C and 95 % relative humidity. After which, the hardened
samples were ground in a pestle and mortar prior to being sieved to 63 µm. Samples
were weighed (1-2 g) into 5 mL screw-cap centrifuge tubes and organised into total
dose batches (in 50 mL centrifuge tubes). The sealed samples were placed inside the
3.8 L canister (Fig. 8.5B) and irradiated using a CIS 437 C irradiator (Fig. 8.5A) with a
Cs-137 source (0.662 MeV) at a dose rate of 0.15 kGy/hr to achieve total doses of: 2,
6, 15 and 24 kGy (Table 8.1). The gamma radiation behaviour of pure struvite-K
synthesised in Chapter 5 was used as a reference for the blended MKPC binders.
Fig. 8.5. Photographs of (A) the opened Cs-137 irradiator, (B) the sample containment and
(C) the closed irradiator

152
Table 8.1. Scoping trial information for the Cs-137 irradiated specimens
Sample
No. Sample Time (hr) Dose Rate (kGy/hr) Dose (kGy)
1 Struvite-K 0.0 0.00 0.0
2 Struvite-K 2.0 0.15 0.3
3 Struvite-K 6.0 0.15 0.9
4 Struvite-K 15.0 0.15 2.3
5 Struvite-K 24.0 0.15 3.6
7 FA/MKPC 0.0 0.0 0.0
8 FA/MKPC 2.0 0.15 0.3
9 FA/MKPC 6.0 0.15 0.9
10 FA/MKPC 15.0 0.15 2.3
11 FA/MKPC 24.0 0.15 3.6
12 GBFS/MKPC 0.0 0.0 0.0
13 GBFS/MKPC 2.0 0.15 0.3
14 GBFS/MKPC 6.0 0.15 0.9
15 GBFS/MKPC 15.0 0.15 2.3
16 GBFS/MKPC 24.0 0.15 3.6
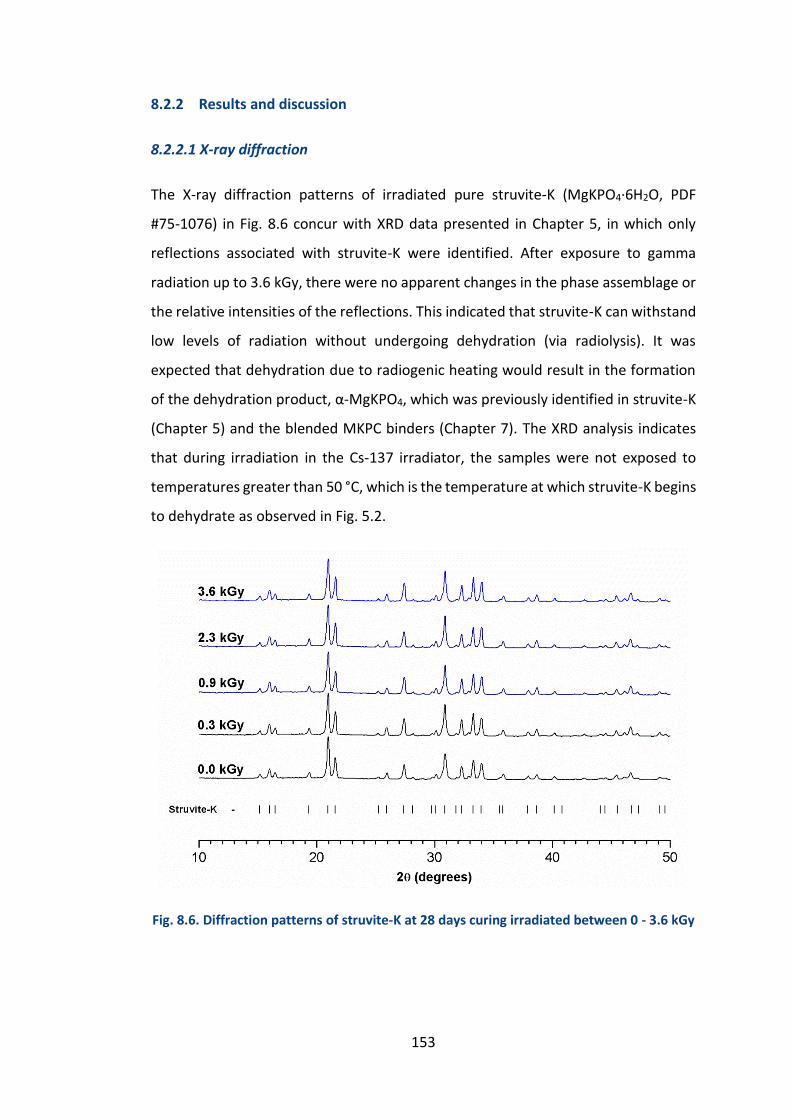
153
8.2.2 Results and discussion
8.2.2.1 X-ray diffraction
The X-ray diffraction patterns of irradiated pure struvite-K (MgKPO4·6H2O, PDF
#75-1076) in Fig. 8.6 concur with XRD data presented in Chapter 5, in which only
reflections associated with struvite-K were identified. After exposure to gamma
radiation up to 3.6 kGy, there were no apparent changes in the phase assemblage or
the relative intensities of the reflections. This indicated that struvite-K can withstand
low levels of radiation without undergoing dehydration (via radiolysis). It was
expected that dehydration due to radiogenic heating would result in the formation
of the dehydration product, α-MgKPO4, which was previously identified in struvite-K
(Chapter 5) and the blended MKPC binders (Chapter 7). The XRD analysis indicates
that during irradiation in the Cs-137 irradiator, the samples were not exposed to
temperatures greater than 50 °C, which is the temperature at which struvite-K begins
to dehydrate as observed in Fig. 5.2.
Fig. 8.6. Diffraction patterns of struvite-K at 28 days curing irradiated between 0 - 3.6 kGy
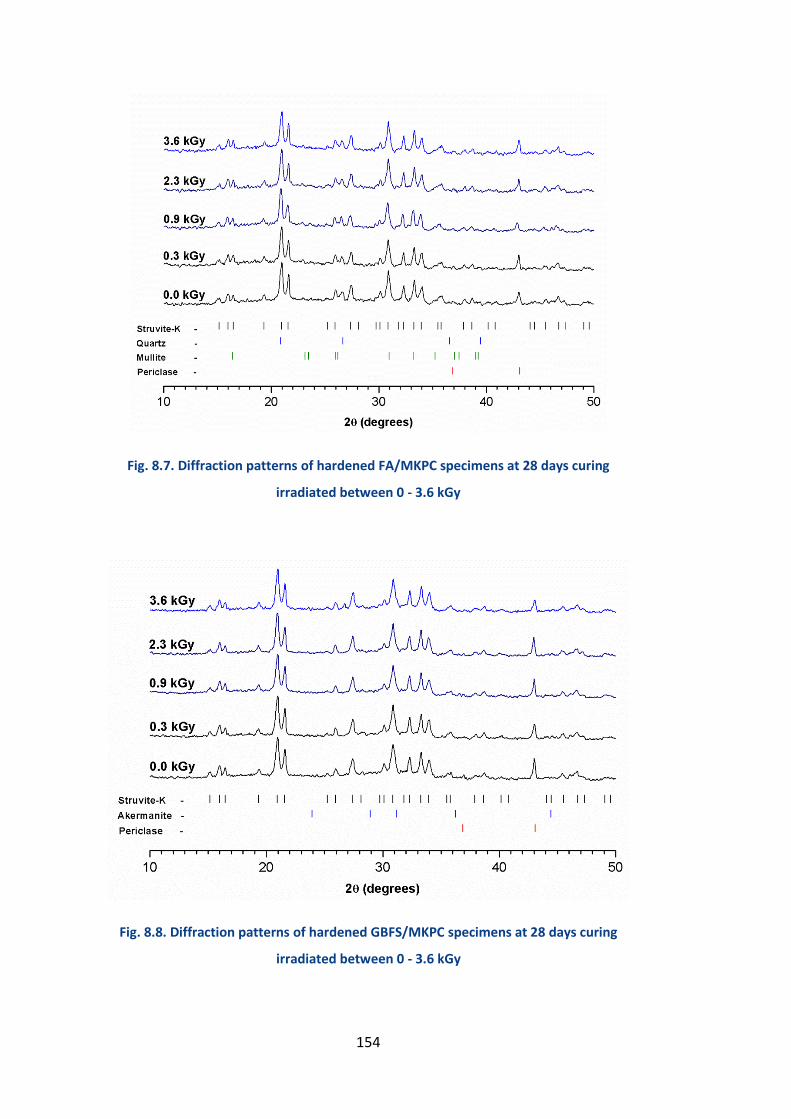
154
Fig. 8.7. Diffraction patterns of hardened FA/MKPC specimens at 28 days curing
irradiated between 0 - 3.6 kGy
Fig. 8.8. Diffraction patterns of hardened GBFS/MKPC specimens at 28 days curing
irradiated between 0 - 3.6 kGy

155
In the FA/MKPC binder (Fig. 8.7) and the GBFS/MKPC binder (Fig. 8.8) reflections
associated with struvite-K constituted the majority of reflections observed.
Additional crystalline phases identified include: unreacted periclase (MgO, PDF #45-
0946); quartz (SiO2, PDF #11-0252) and mullite (3Al2O3.2SiO2, PDF #15-0776) in the
FA/MKPC samples; and åkermanite in the GBFS/MKPC samples, where the main
reflection was at 2θ = 31°. After exposure up to 3.6 kGy (equivalent to 24-hour
irradiation at dose rate 0.15 kGy/hr), no differences were observed in the phase
assemblage of the blended MKPC binders, which was concurrent with the XRD
analysis of pure struvite-K in Fig. 8.6. It has been shown that low absorbed radiation
doses have no impact upon the crystalline nature of blended MKPC binders and its
cementitious phase, struvite-K.
8.2.2.2 Fourier-transform infra-red spectroscopy
The FTIR spectra shown in Fig. 8.9 are typical of those described in the literature for
pure struvite-K systems [35, 98, 137]. The broad, asymmetric band between ≈ 3600
- 2500 cm-1 is associated with overlapping bands relating to H-O-H stretching
vibrations of crystalline water, more specifically with the ν1 (symmetric) and ν3
(asymmetric) vibrations [35]. The weak band located at 2360 cm-1 was assigned to P-
O-H vibrations, whilst the double split band at 1678 and 1616 cm-1 is associated with
H-O-H ν2 (asymmetric) bending vibrations of crystalline water, the band at 798 cm-1
is associated with H2O – H2O hydrogen bond vibrations [35, 137]. There are four
vibration modes of the PO43- unit, of these: only ν3 (asymmetric stretching) and ν4
(asymmetric bending) are IR active [197], which were observed as strong bands at
1018 cm-1 and 573cm-1, respectively [197].The band at 744 cm-1 is assigned to
vibrations of the Mg – O bond [98].

156
Fig. 8.9. FTIR spectra of struvite-K at 28 days curing irradiated between 0 - 3.6 kGy
The intensity of the broad band between 3600 - 2500 cm-1 and the double split band
at ≈ 1670 cm-1 (associated with the crystalline H2O stretching and bending vibrations)
was observed to decrease between the control (0.0 kGy) the struvite-K sample
irradiated to 0.3 kGy (Fig. 8.9). At the higher total irradiation doses, no additional
changes associated with these regions were observed. It is postulated that the
apparent reduction in the H2O content between 0.0 and 0.3 MGy could be associated
with the loss of free water/pore water from within the sample. However, due to clear
differences in the intensity of the PO43- unit vibrations and the Mg-O bond, is it also
possible that the observed differences could be the result of sample preparation, e.g.
enforced errors whilst preparing/pressing the 2 wt. % specimen in KBr.
The FTIR spectra for blended MKPC binders, FA/MKPC (Fig. 8.10) and GBFS/MKPC
(Fig. 8.11) were observed to exhibit a similar sample preparation artefact. An
additional shoulder was observed in the FA/MKPC binder at 1114 cm-1, which is
associated Si-O stretching vibration of quartz present in the raw FA [198]. No
additional bands were observed in the unirradiated GBFS/MKPC sample or in the
irradiated samples indicative of radiation stability.

157
Fig. 8.10. FTIR spectra of hardened FA/MKPC specimens at 28 days curing irradiated
between 0 - 3.6 kGy
Fig. 8.11. FTIR spectra of hardened GBFS/MKPC specimens at 28 days curing irradiated
between 0 - 3.6 kGy

158
In magnesium phosphate cements (with no filler), it is reported that symmetry or
asymmetry of the band at 1018 cm-1 can be used as a proxy to indicate the hydration
product formed [108]. For example, the hexahydrate phase (i.e. struvite or struvite-
K) exhibits a symmetric band, whilst an asymmetric band (or a shoulder) is indicative
of more than one hydration product (i.e. hexahydrate and monohydrate phases)
[108]. In this study, the FTIR spectra for struvite-K, FA/MKPC and GBFS/MKPC indicate
that only the hexahydrate product was formed, as identified by the symmetric band
at 1018 cm-1 in Figs. 8.9-8.1 consistent with the XRD analysis (Figs. 8.6-8.8).
8.2.2.3 Thermal analysis
In Fig. 8.12, a one-step dehydration of struvite-K to MgKPO4 (Eq. 8) occurs between
40 - 200 °C, as discussed in Chapter 5 and concurs with Zhang et al. [98]. After
exposing the pure struvite-K samples to gamma irradiation up to 3.6 kGy, no distinct
differences in the dehydration behaviour can be ascertained. The sample irradiated
to 0.9 kGy was found to dehydrate at a slower rate compared to the other struvite-K
samples (unirradiated and irradiated), this was further emphasised in the DTG plot
(Fig. 8.12B). However, no differences were observed in the overall mass loss (around
≈ 40 wt. %) for each sample, which concurs with the dehydration of struvite-K in
Chapter 5 and supports the FTIR analysis. This indicates that the highlighted
difference in the 0.9 kGy struvite-K sample was within the expected range for the
dehydration behaviour of struvite-K rather than an effect from exposure to gamma
irradiation.
The thermal behaviour of the FA/MKPC (Fig. 8.13) and GBFS/MKPC (Fig. 8.14) binders
exposed to gamma irradiation were very similar to that of struvite-K, as a single
dehydration event was identified between 50 - 150 °C. The mass loss was found to
be around 18 and 20 wt. %, respectively concurrent with the thermal analysis results
in Chapter 7. The DTG plots (Fig. 8.13B and Fig. 8.14B) highlight that the dehydration
of struvite-K in MKPC binder reaches a maximum at 100 °C, in agreement with [18]
and [98]. There appeared to be no significant effect of Cs-137 radiation on the
FA/MKPC and GBFS/MKPC binders under low dose rate conditions.

159
Fig. 8.12. TGA (A) and DTG (B) traces of struvite-K irradiated between 0 - 3.6 kGy
Fig. 8.13. TGA (A) and DTG (B) traces of hardened FA/MKPC specimens at 28 days curing
irradiated between 0 - 3.6 kGy

160
Fig. 8.14. TGA (A) and DTG (B) traces hardened GBFS/MKPC specimens at 28 days curing
irradiated between 0 - 3.6 kGy
8.2.3 Summary
At the radiation doses investigated in the scoping study (0 - 3.6 kGy) the results
indicated that there was no alteration of the typical phase assemblage of pure
struvite-K and the blended MKPC binders or the dehydration behaviour. It is
postulated that the blended MKPC binders and pure struvite-K exhibit a degree of
radiation tolerance but further work is needed to determine the extent of this
tolerance. As such, the results in this scoping study validate the continuation of
gamma irradiation studies on blended MKPC binders. The effect of high gamma dose
rate/total dose on the chemical and microstructural properties of MKPC binders will
be discussed in the following section.

161
8.3 The effect of Cobalt-60 irradiation on blended MKPC binders
8.3.1 Experimental set-up
Blended MKPC binders (FA/MKPC and GBFS/MKPC) were produced in accordance
with the formulations reported in Table 3.4. To prepare the samples for the
irradiation experiments, the samples were cured for an initial 28 days in an
environmental chamber at 20 °C and 95 % relative humidity. After this curing period,
the FA/MKPC and GBFS/MKPC specimens) were then ground in a ball-mill and sieved
to 63 µm using a brass sieve. For SEM analysis, the blended MKPC samples were
sectioned into pucks (ø = 14 mm, h = 2-3 mm) and then split into two equal segments
using an Isomet slow saw. The powdered samples were weighed (5 g) into 20 mL
glass vials and the SEM section added. A rubber stopper was placed into the glass vial
prior to an aluminium-lid being crimp sealed onto the vial under an argon
atmosphere (using a glove bag) in order to achieve a tight seal. The sealed samples
were transferred to the Dalton Cumbrian Facility (DCF) at the University of
Manchester for irradiation in the self-shielded Co-60 irradiator (Fig. 8.15), the
specification of which is listed below:
Specification of the Co-60 gamma irradiator [199]:
Model 812 self-contained irradiation facility (Foss Therapy Services, Inc.)
Sample chamber: w = 20.3, d = 25.4 and h = 30.5 cm
Sample chamber volume: > 9.0 L
Dual rod assembly assemblies (total of 6 sources)
Activity: 535.4 TBq
The average dose rates and total doses of the FA/MKPC and GBFS/MKPC samples are
detailed in Tables 8.2-8.3, for brevity the FTIR, XRD, TGA and SEM/EDX results for the
radiation dose rates ≈5.0 kGy/hr and ≈3.0 kGy/hr are located in Appendix F, where
the actual dose rates for all of the samples in this study are also located. The actual

162
dose rate varied depending on when the sample was irradiated due to the decay of
the Co-60 source. To ensure that the FA/MKPC and GBFS/MKPC binders were
exposed to similar dose rates, the positions of the samples where fixed to the left
(FA/MKPC) and right side (GBFS/MKPC) of the sample holder (Fig. 8.16). Due to the
number of hours required to achieve the total doses required (Tables. 8.2-8.3), a
stop/start method was adopted. The blended MKPC samples were irradiated during
the evening sessions (i.e. after 6 pm) and removed from the irradiator in the morning.
This process was continued until the desired final total dose for each sample was
attained. During a continuous operation, the temperature within the irradiator
stabilised around 45 °C at 6 hours (Fig. 8.17) but due to the stop/start nature of these
experiments, the control samples were only stored at room temperature.
The duration of the irradiation experiments varied depending upon the final dose,
position and availability in the Co-60 irradiator (as discussed above) however, this
resulted in different final curing ages for the FA/MKPC and GBFS/MKPC samples at
the point of XRD, FTIR, TGA and SEM analysis. The last samples to be analysed in this
study were aged for one year, albeit they had been stored in glass vials (under argon)
after the initial 28-day curing period in a controlled environment. Covill [18] studied
similar FA/MKPC binders up to 360 days and observed no differences in the phase
assemblage as a result of curing age. Thus, it was decided that all samples should be
batched from one FA/MKPC and one GBFS/MPKC mix, in order to eliminate any batch
to batch variations that could occur.

163
Fig. 8.15. Photographs of the a) closed Co-60 irradiator and b) the opened Co-60
irradiator [199]
Fig. 8.16. Schematic of the (A) specimen tray and (B) the irradiation positions, Co-60 rods
are labelled A-C

164
Fig. 8.17. Temperature variance during irradiation up to 6 hours continuous operation,
data provided by R. Edge at the Dalton Cumbrian Facility, University of Manchester

165
Table 8.2. Average dose summary of the Co-60 irradiated FA/MKPC binders
Sample No. Av. Dose Rate (kGy/hr) Dose (MGy)
1 0.0 0.0
2
16.6 ± 0.7
1.0
3 2.4
4 4.7
5 7.0
6 9.6
7
10.1 ± 0.3
1.0
8 2.3
9 4.9
10 7.9
11 9.4
12
4.9 ± 0.3
0.5
13 1.0
14 1.5
15 2.4
16 4.8
17
2.8 ± 0.1
0.5
18 1.0
19 1.5
20 2.5

166
Table 8.3. Average dose summary of the Co-60 irradiated GBFS/MKPC binders
Sample No. Av. Dose Rate (kGy/hr) Dose (MGy)
1 0.0 0.0
2
17.7 ± 0.4
1.1
3 2.6
4 5.1
5 7.6
6 10.0
7
10.7 ± 0.5
1.1
8 2.5
9 5.0
10 8.0
11 10.3
12
5.0 ± 0.3
0.5
13 1.0
14 1.5
15 2.5
16 5.0
17
2.9 ± 0.1
0.5
18 1.0
19 1.5
20 2.6

167
8.3.2 Results and discussion
8.3.2.1 Powder X-ray diffraction
The phase assemblage of the FA/MKPC binders was previously discussed within
section 8.2.2.1. The main crystalline phases identified in Figs. 8.18-8.19 were:
struvite-K, unreacted periclase, quartz and mullite from the unreacted FA. This was
in agreement with all of the FA/MKPC XRD data reported in this body of work.
FA/MKPC samples irradiated in the Co-60 irradiator are shown in Fig. 8.18, up to a
total dose of 9.6 MGy, the samples were irradiated at an average dose rate of 16.6
kGy/hr.
Fig. 8.18. Diffraction patterns of FA/MKPC exposed to: 0.0, 1.0, 2.4, 4.7, 7.0 and 9.6 MGy
at 16.6 kGy/hr
In Fig. 8.18 it was found that the dominant crystalline reflections remained
associated with struvite-K, the main binding phase within FA/MKPC binders. This
indicated that these binders are stable to high levels of gamma radiation, up to
approximately 10 MGy. The relative intensities of struvite-K, periclase and quartz
reflections appeared to remain constant, which suggested that there was no change
in the composition or distribution of these phases via radiolysis or dehydration due
to radiogenic heat. At the dose rate, av. 10.1 kGy/hr, the results were comparable

168
to the diffraction patterns of the av. dose rate 16.6 kGy/hr obtained up to total dose
of 9.4 MGy (Fig. 8.19).
Fig. 8.19. Diffraction patterns of FA/MKPC exposed to: 0.0, 1.0, 2.3, 4.9, 7.9 and 9.4 MGy
at 10.1 kGy/hr
The phase assemblage of the GBFS/MKPC binders was previously discussed within
section 8.2.2.1. After irradiation with a Co-60 source, it was found that the main
crystalline phases in Figs. 8.20-8.21 were: struvite-K, unreacted periclase, and
åkermanite from the unreacted concurrent with previous data. The unirradiated and
irradiated GBFS/MKPC binders are shown in Fig. 8.20. The irradiated samples were
obtained at an average dose rate of 17.7 kGy/hr in the Co-60 irradiator up to a total
dose of approximately 10.0 MGy. No differences in the relative intensities of the
crystalline reflections were identified or the formation of additional phases was
observed. Concurrent behaviour was exhibited in the GBFS/MKPC binders irradiated
at the av. dose rate of 10.7 kGy/hr (Fig. 8.21). The diffraction patterns for blended
MKPC binders indicate the existence of a high level of radiation tolerance up to
approximately 10 MGy, which is significant for waste encapsulation applications as
the gamma irradiation dose (from internal waste and neighbouring waste packages)
to the conditioned wasteform is predicted to be 10 MGy after 300 years
emplacement in a geological repository [188].

169
Fig. 8.20. Diffraction patterns of GBFS/MKPC exposed to: 0.0, 1.1, 2.6, 5.1, 7.6 and 10.0
MGy at 17.7 kGy/hr
Fig. 8.21. Diffraction patterns of GBFS/MKPC exposed to: 0.0, 1.1, 2.5, 5.0, 8.0 and 10.3
MGy at 10.7 kGy/hr

170
8.3.2.2 Fourier-transform infra-red
The FTIR spectra for the FA/MKPC and GBFS/MKPC binders are shown in Figs. 8.22-
8.25. It is immediately apparent that there was no change in the characteristic
vibration bands for these samples. The FA/MKPC samples displayed in Fig. 8.22 were
irradiated at the highest dose rate (av. 16.6 kGy/hr) up to 9.6 MGy, however, in the
FTIR spectra, the intensity of the H-O-H stretching and bending vibrations associated
with crystalline water between 3600-2500 cm-1 (comprised of multiple overlapping
bands) and between 1678-1616 cm-1 [35, 137] did not change compared to the
unirradiated sample (0.0 MGy). Along with the observations that no intensity
changes of the PO43- unit at 1018 cm-1 and 573cm-1 [197] and the Mg-O band at 744
cm-1 [98] indicated that the hydrated cement product (struvite-K) was still the
dominant phase in this system. Comparable FTIR spectra were obtained for the
FA/MKPC binders irradiated at the av. dose rate of 10.7 kGy/hr (Fig. 8.23). This
supports the continued presence of crystalline water and indicated that the radiolysis
is not a dominant radiation effect within these systems.
Fig. 8.22. Spectra of FA/MKPC specimens exposed to: 1.0, 2.4, 4.7, 7.0 and 9.6 MGy at
16.6 kGy/hr

171
Fig. 8.23. Spectra of FA/MKPC specimens exposed to: 1.0, 2.3, 4.9, 7.9 and 9.4 MGy at
10.1 kGy/hr
In Fig. 8.24, In the FTIR spectra of the GBFS/MKPC binders irradiated at the av. 17.7
kGy/hr dose rate, the intensity of the overlapping H–O–H band between
3600-2500 cm-1 appeared to remain the same (observed by directly overlapping the
spectra) for the unirradiated control sample and the specimens exposed to gamma
irradiation, up to ≈ 10 MGy in Figs. 8.24-8.25. This is supported by the GBFS/MKPC
binders exposed to the av. dose rate of 10.7 kGy/hr (Fig. 8.25), which did not exhibit
any reduced intensities for the crystalline water environments nor any other changes
at up to a total dose 10.3 MGy. As in the FA/MKPC binders, no changes occurred in
either Fig. 8.24 or Fig. 8.25 associated with the phosphate group of the metal –
oxygen bond, signifying that struvite-K present in both blended binders is tolerant to
gamma radiation doses up to 10 MGy with no dose rate dependencies observed.

172
Fig. 8.24. Spectra of GBFS/MKPC specimens exposed to: 1.1, 2.6, 5.1, 7.6 and 10.0 MGy at
17.7 kGy/hr
Fig. 8.25. Spectra of GBFS/MKPC specimens exposed to: 1.1, 2.5, 5.0, 8.0 and 10.3 MGy at
10.7 kGy/hr

173
8.3.2.3 Thermal analysis
The thermal behaviour of the FA/MKPC (Figs. 8.26-8.27) and GBFS/MKPC (Fig. 8.28-
8.29) binders exposed to gamma irradiation were very similar to that of struvite-K
(Chapters 5 and 8) and blended MKPC binders (Chapters 4, 7 and 8). A single
dehydration event was identified between 50 - 150 °C. In the FA/MKPC binders
irradiated at the av. dose rate 16.6 kGy/hr (Fig. 8.26), the mass loss was found to be
20 wt. % (measured at 150 °C) up to a total accumulated dose of 9.6 MGy.
Concurrently, in the FA/MKPC samples irradiated at the av. dose rate 10.1 kGy/hr (up
to 9.4 MGy), the mass loss was also observed to be 20 wt. % at 150 °C. These results
are in agreement with the thermal analysis of unirradiated samples and the Cs-137
irradiated samples discussed in section 8.2.2.2. This indicates that these systems do
not undergo the radiation dehydration described for PC grouts [169] and do not have
a dose rate dependancy.
Fig. 8.26. TGA (A) and DTG (B) traces of FA/MKPC specimens exposed to: 1.0, 2.4, 4.7, 7.0
and 9.6 MGy at 16.6 kGy/hr

174
Fig. 8.27. TGA (A) and DTG (B) traces of FA/MKPC specimens exposed to: 1.0, 2.3, 4.9, 7.9
and 9.4 MGy at 10.1 kGy/hr
When compared to the thermal behaviour of the FA/MKPC binders, the irradiated
GBFS/MKPC binders (at av. dose rates of 17.7 and 10.7 kGy/hr) appeared to have
more variation in the mass loss associated with the dehydration of struvite-K (Figs.
8.28-8.29), however there is no clear pattern to this variation, which implies that
there is no dose rate dependency in these systems. A single dehydration event (50 -
150 °C) was still identified however, the mass loss from the GBFS/MKPC binders
varied from 22 to 18 wt. %, measured at 150 °C. In Fig. 8.28, the samples with the
lowest mass loss (18 wt. %) were assigned to the 0.0 and 10.0 MGy samples, whilst
in Fig. 8.29, an18 wt. % mass loss occurred in all samples, except those irradiated at
1.1 and 2.5 MGy. It is postulated that these differences are within statistical error of
each other because there is no distinguishable pattern to varying mass loss.
Therefore, this data indicated that gamma irradiation has little impact upon on the
dehydration behaviour of GBFS/MKPC binders, which concurs with the FA/MKPC
system.

175
Fig. 8.28. TGA (A) and DTG (B) traces of GBFS/MKPC specimens exposed to: 1.1, 2.6, 5.1,
7.6 and 10.0 MGy at 17.7 kGy/hr
Fig. 8.29. TGA (A) and DTG (B) traces of GBFS/MKPC specimens exposed to: 1.1, 2.5, 5.0,
8.0 and 10.3 MGy at 10.7 kGy/hr

176
8.3.2.4 Nuclear magnetic resonance spectroscopy
The 27Al MAS NMR spectra (Fig. 8.30A) of the FA/MKPC binders exposed to the av.
dose rate 16.6 kGy/hr indicated the presence of two Al environments: AlIV (47 ppm)
and AlVI (-3 ppm). The latter is assigned to mullite [150, 151] and the broad band
centred at 47 ppm is associated with the tetrahedral resonance of mullite (reported
to be at 46 ppm [151]) and the aluminosilicate glassy fraction present in the FA. At
irradiation doses: 2.4, 4.7 and 9.0 MGy, no differences in the aluminium
environments were identified, suggesting that these binders are tolerant to
substantial levels of gamma irradiation. However, in the 27Al MAS NMR spectrum (Fig.
8.30A) at 7.0 MGy and unexpected changes was observed in the AlVI region. The
resonance intensity significantly increased and the chemical shift was centred at 2
ppm, i.e. it became more shielded than in the other FA/MKPC spectra. It is postulated
that this could be the artefact of sample contamination as no other changes were
observed in the XRD, FTIR or SEM samples (discussed below), as such this analysis
should be repeated in order to elucidate the cause of the difference observed.
Fig. 8.30. Normalised 27Al MAS NMR spectra of (A) FA/MKPC and (B) GBFS/MKPC
specimens exposed to radiation at 16.6 and 17.7 kGy/hr, respectively

177
In the unreacted GBFS 27Al MAS NMR spectrum (Fig. 8.30B), the broad AlIV resonance
centred at 56 ppm was assigned to the calcium aluminosilicate glassy fraction of the
GBFS [141], whilst the minor band in the AlVI region centred at 11 ppm is attributed
to a minor octahedral Al environment in the GBFS glass. A third environment centred
at -6 ppm in the AlVI region (-10 to 15 ppm) region (discussed in Chapter 6) is thought
to be associated with the formation of secondary reaction products, which are likely
to be based on a potassium aluminate silicate phase and must be present at a
substantial concentration to display such a clear NMR resonance. During gamma
irradiation of the GBFS/MKPC binders at the av. dose rate of 17.7 kGy/hr, no
differences were observed in the resonance intensity of the aluminium environments
up to 7.6 MGy. However, in the 10.0 MGy 27Al MAS NMR spectrum, the resonance
associated with the glassy fraction broadened and the intensity of the resonance
(secondary reaction product) appeared to decrease. This could suggest that a
chemical change had begun to occur in the GBFS/MKPC as a result of radiation
exposure.
Fig. 8.31. Normalised 29Si MAS NMR spectra of (A) FA/MKPC and (B) GBFS/MKPC
specimens exposed to radiation at 16.6 and 17.7 kGy/hr, respectively

178
In Fig. 8.31A, the 29Si MAS NMR spectrum of the unirradiated FA/MKPC binder (0.0
MGy) was typical of these systems (Chapter 6 and 7), where the broad asymmetric
29Si MAS NMR resonance observed between -80 and -125 ppm (centred at -102 ppm)
relates to the crystalline and poorly crystalline Si environments present in FA: a
combination of quartz (107 ppm) [154], mullite (-86 ppm) [151], and the glassy
fraction [155]. Comparable Si environments were observed in the 29Si MAS NMR
spectrum of the FA/MKPC binder irradiated at the av. dose rate 16.6 kGy/hr (Fig.
8.31A). In the 29Si MAS NMR spectrum of the unirradiated GBFS/MKPC binder (Fig.
8.31B), a broad resonance centred at -75 ppm was observed, this is consistent with
the glassy fraction and the minor åkermanite present in GBFS [141]. The resonance
lineshape of the GBFS/MKPC binder exposed to 10.1 MGy at the av. dose rate
17.7kGy/hr was similar to that of the unirradiated control sample. The 29Si MAS NMR
spectra indicate that no chemical changes were identified in the Si environments as
a result of exposure to gamma irradiation.
Fig. 8.32. 31P MAS and 31P[1H] CP/MAS NMR spectra for (A) unirradiated FA/MKPC and (B)
FA/MKPC specimen exposed to 9.6 MGy at 16.6 kGy/hr

179
Fig. 8.33. 31P MAS and 31P[1H] CP/MAS NMR spectra for (A) unirradiated GBFS/MKPC and
(B) GBFS/MKPC specimen exposed to 9.6 MGy at 17.7 kGy/hr
The 31P MAS NMR and 31P[1H] cross-polarisation (CP) MAS NMR of the FA/MKPC and
GBFS/MKPC binders at 0.0 MGy (i.e. the control) and irradiated to ≈ 10.0 MGy at the
av. dose rates 16.6 and 17.7 kGy/hr, respectively are shown in Figs. 8.32-8.33. A single
sharp resonance at 6.2 ppm in the orthophosphate region was identified in both
blended binders, which was associated with the main cementitious phase, struvite-K
and concurred with data reported for struvite at 6.1 ppm [124]. The 31P[1H] CP MAS
NMR enhanced the signal to noise ratio of the 31P spectra, where it was found that
all of the P-H interactions were related to the presence of struvite-K, in agreement
with Chapter 4 and 6. Different relaxation times (10 s and 300 s) were utilised to
investigate the present of any poorly crystalline phosphate phases, however, no
evidence of these phases were identified in the control sample for either blended
binder or the irradiated samples. The 31P MAS NMR data conclusively show that there
is no change in the phosphate environments resulting from exposure to gamma
irradiation, which is a positive result for the application of blended MKPC binders in
the encapsulation of ILW and storage/disposal in a geological repository setting.

180
8.3.2.5 Scanning electron microscopy
8.3.2.5.1 Elemental mapping - FA/MKPC
Backscattered electron micrographs and elemental maps of FA/MKPC binders
subjected to gamma irradiation at the av. dose rates 16.6 and 10.1 kGy/hr are shown
in Figs 8.34-8.44, with the Fig. 8.34 being the unirradiated control. The
microstructure of the control sample is typical of FA/MKPC binders described in
Chapter 6 and 7, where there is a continuous struvite-K matrix intermixed with large
struvite-K crystalline and spherical particles of varying sizes and composition (Al/Si-
rich and Fe-rich) associated with the unreacted FA. The grey angular particles relate
to unreacted periclase, whilst the black spots are from the carbon coating process.
The BSE/EDX maps highlight the association of Mg, K and P with the struvite-K matrix,
whilst the spherical particles are associated with the aluminosilicate component of
FA. The Fe-rich areas (Fig. 8.34.Fe) are ascribed to the Fe-rich phases present in FA
particles (e.g. hematite) [140]. No microstructural differences were observed in the
FA/MKPC binder (Figs. 8.35-8.44) as a result of exposure to gamma irradiation at the
av. dose rates 16.6 and 10.1 kGy/hr, up to a total of ≈ 10.0 MGy.
Fig. 8.34. Backscattered electron micrograph and elemental maps of an unirradiated
FA/MKPC specimen

181
Fig. 8.35. Backscattered electron micrograph and elemental maps of a FA/MKPC
specimen exposed to 1.0 MGy at 16.6 kGy/hr
Fig. 8.36. Backscattered electron micrograph and elemental maps of a FA/MKPC
specimen exposed to 2.4 MGy at 16.6 kGy/hr

182
Fig. 8.37. Backscattered electron micrograph and elemental maps of a FA/MKPC
specimen exposed to 4.7 MGy at 16.6 kGy/hr
Fig. 8.38. Backscattered electron micrograph and elemental maps of a FA/MKPC
specimen exposed to 7.0 MGy at 16.6 kGy/hr

183
Fig. 8.39. Backscattered electron micrograph and elemental maps of a FA/MKPC
specimen exposed to 9.6 MGy at 16.6 kGy/hr
Fig. 8.40. Backscattered electron micrograph and elemental maps of a FA/MKPC
specimen exposed to 1.0 MGy at 10.1 kGy/hr
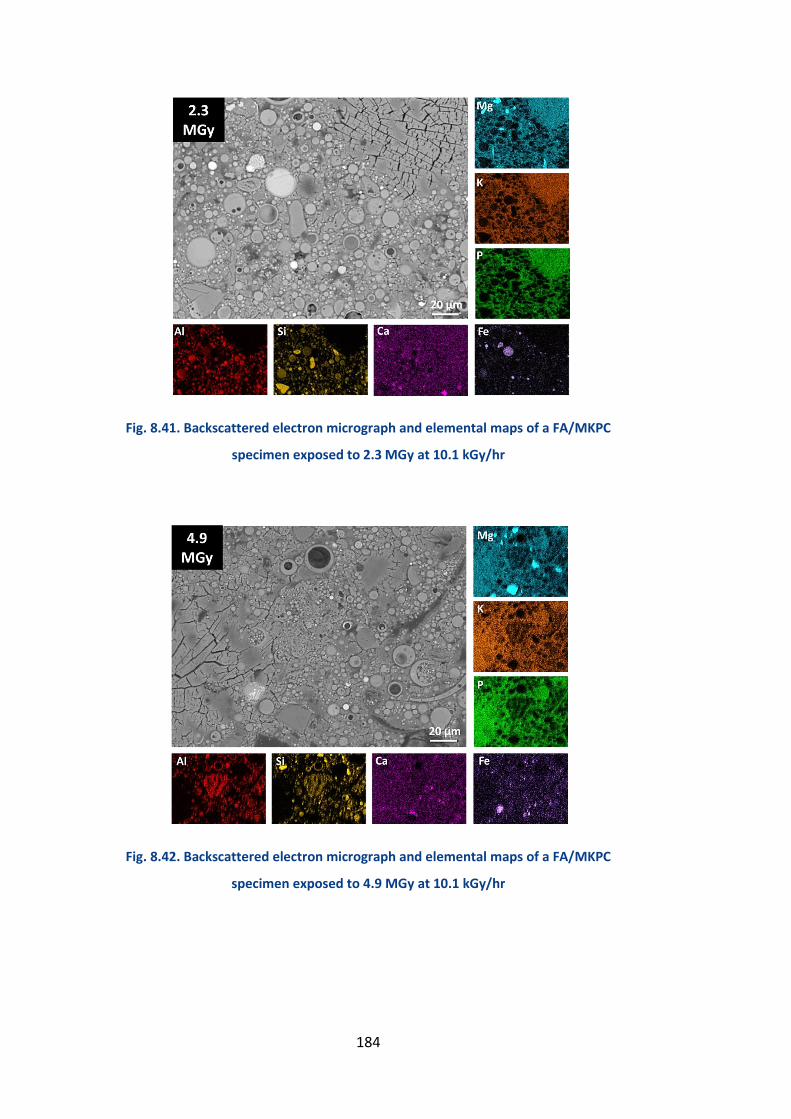
184
Fig. 8.41. Backscattered electron micrograph and elemental maps of a FA/MKPC
specimen exposed to 2.3 MGy at 10.1 kGy/hr
Fig. 8.42. Backscattered electron micrograph and elemental maps of a FA/MKPC
specimen exposed to 4.9 MGy at 10.1 kGy/hr

185
Fig. 8.43. Backscattered electron micrograph and elemental maps of a FA/MKPC
specimen exposed to 7.9 MGy at 10.1 kGy/hr
Fig. 8.44. Backscattered electron micrograph and elemental maps of a FA/MKPC
specimen exposed to 9.4 MGy at 10.1 kGy/hr

186
8.3.2.5.2 Elemental mapping - GBFS/MKPC
Backscattered electron micrographs and elemental maps of GBFS/MKPC binders
subjected to gamma irradiation at the av. dose rates 17.7 and 10.7 kGy/hr are shown
in Figs. 8.45-8.55, with the Fig. 8.45 being the unirradiated control. The
microstructure of the control sample is typical of GBFS/MKPC binders (shown in
Chapter 6 and 7). The cementitious matrix consists of struvite-K usually with large
crystallites intermixed with the matrix. The light grey angular particles are associated
with the GBFS particles and are composed of a calcium aluminosilicate glassy
fraction. The GBFS is a blend of fine and coarse ground materials (as observed in Fig.
8.45), which is designed for the UK nuclear industry. The grey angular particles relate
to unreacted periclase, whilst the black spots are from the carbon coating process.
The EDX maps in Fig. 8.45 clearly indicate the distinct relationship between Mg, K and
P (struvite-K) with the Ca, Al and Si solely associated with the unreacted GBFS
particles. In similar behaviour to the FA/MKPC binders, no microstructural
differences were observed in GBFS/MKPC binders (Figs. 8.46-8.55) due to the effect
of gamma irradiation. These results indicate that both blended MKPC binders are
tolerant to the estimated 300 year gamma radiation exposure of 10.0 MGy [188],
independent of the dose rate.
Fig. 8.45. Backscattered electron micrograph and elemental maps of an unirradiated
GBFS/MKPC specimen

187
Fig. 8.46. Backscattered electron micrograph and elemental maps of a GBFS/MKPC
specimen exposed to 1.1 MGy at 17.7 kGy/hr
Fig. 8.47. Backscattered electron micrograph and elemental maps of a GBFS/MKPC
specimen exposed to 2.6 MGy at 17.7 kGy/hr

188
Fig. 8.48. Backscattered electron micrograph and elemental maps of a GBFS/MKPC
specimen exposed to 5.1 MGy at 17.7 kGy/hr
Fig. 8.49. Backscattered electron micrograph and elemental maps of a GBFS/MKPC
specimen exposed to 7.6 MGy at 17.7 kGy/hr

189
Fig. 8.50. Backscattered electron micrograph and elemental maps of a GBFS/MKPC
specimen exposed to 10.0 MGy at 17.7 kGy/hr
Fig. 8.51. Backscattered electron micrograph and elemental maps of a GBFS/MKPC
specimen exposed to 1.1 MGy at 10.7 kGy/hr

190
Fig. 8.52. Backscattered electron micrograph and elemental maps of a GBFS/MKPC
specimen exposed to 2.5 MGy at 10.7 kGy/hr
Fig. 8.53. Backscattered electron micrograph and elemental maps of a GBFS/MKPC
specimen exposed to 5.0 MGy at 10.7 kGy/hr

191
Fig. 8.54. Backscattered electron micrograph and elemental maps of a GBFS/MKPC
specimen exposed to 8.0 MGy at 10.7 kGy/hr
Fig. 8.55. Backscattered electron micrograph and elemental maps of a GBFS/MKPC
specimen exposed to 10.3 MGy at 10.7 kGy/hr

192
8.4 Conclusions and Future work
Through the irradiation of FA/MKPC and GBFS/MKPC binders using Co-60, it was
determined that no measurable effects of gamma irradiation could be detected using
the experimental techniques used in this study. The typical radiation effects of PC
encapsulants, for example, amorphisation of crystalline cement hydrated phases,
and/or densification and decomposition of hydrated phases [194, 195] could not be
distinguished within this study. An important distinction between PC grouts and
blended MKPC binders are that the former undergo radiogenic dehydration of the
hydrated phases [169]. This radiation effect was not exhibited in the blended MKPC
binders within this study. Through the employment of four Co-60 dose rates
(averaged) of 16.6, 10.7, 4.9 and 2.8 MGy/hr at total accumulated doses of: ≈ 0.5,
1.0, 2.5, 5.0, 7.5 and 10.0 MGy it has demonstrated that the chemical structure
(through XRD, FTIR and NMR analysis) and microstructure (through SEM/EDX
analysis) of blended MKPC binders show considerate radiation resistance up to ≈ 10.0
MGy. It should be noted that in the GBFS/MKPC spectrum at 10.0 MGy minor
differences were observed in the 27Al MAS NMR. However, these changes could not
be substantiated with any other analyses. It is postulated that the differences could
be the result post-data collection baseline corrections due to normalisation of the
data. It is suggested that further work employing 27Al MQMAS NMR experiments
would help elucidate if any chemical changes as a result of gamma irradiation. In
summary, the data presented in this study supports the employment of these
alternative encapsulants for the use of nuclear waste immobilisation as no
detrimental effects were observed up to the 300 year expected absorbed gamma
dose of 10 MGy [188].
Further work should be undertaken in the following areas:
Determine the physical properties of blended MKPC binders under gamma
irradiation conditions.

193
Determine the effect of alpha radiation using ion implantation and transmission
electron microscopy (TEM) to monitor simulated alpha decay within the
conditioned wasteforms. Alpha decay could arise from waste inventory for
Magnox cladding, for example: Pu-238 and Pu-239 radionuclides [7, 8].
Repeat the solid state MAS NMR experiments to elucidate the difference
observed at 7.5 MGy in the FA/MKPC binder, including 27Al MQMAS NMR
experiments.

194
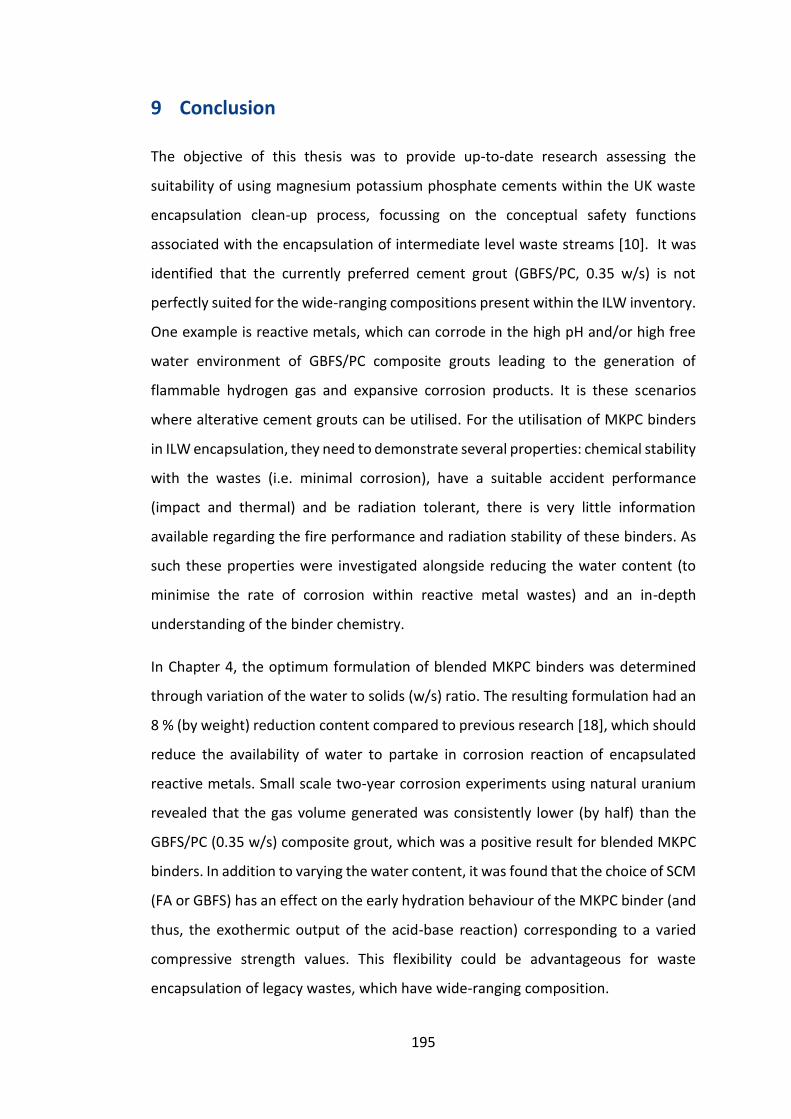
195
9 Conclusion
The objective of this thesis was to provide up-to-date research assessing the
suitability of using magnesium potassium phosphate cements within the UK waste
encapsulation clean-up process, focussing on the conceptual safety functions
associated with the encapsulation of intermediate level waste streams [10]. It was
identified that the currently preferred cement grout (GBFS/PC, 0.35 w/s) is not
perfectly suited for the wide-ranging compositions present within the ILW inventory.
One example is reactive metals, which can corrode in the high pH and/or high free
water environment of GBFS/PC composite grouts leading to the generation of
flammable hydrogen gas and expansive corrosion products. It is these scenarios
where alterative cement grouts can be utilised. For the utilisation of MKPC binders
in ILW encapsulation, they need to demonstrate several properties: chemical stability
with the wastes (i.e. minimal corrosion), have a suitable accident performance
(impact and thermal) and be radiation tolerant, there is very little information
available regarding the fire performance and radiation stability of these binders. As
such these properties were investigated alongside reducing the water content (to
minimise the rate of corrosion within reactive metal wastes) and an in-depth
understanding of the binder chemistry.
In Chapter 4, the optimum formulation of blended MKPC binders was determined
through variation of the water to solids (w/s) ratio. The resulting formulation had an
8 % (by weight) reduction content compared to previous research [18], which should
reduce the availability of water to partake in corrosion reaction of encapsulated
reactive metals. Small scale two-year corrosion experiments using natural uranium
revealed that the gas volume generated was consistently lower (by half) than the
GBFS/PC (0.35 w/s) composite grout, which was a positive result for blended MKPC
binders. In addition to varying the water content, it was found that the choice of SCM
(FA or GBFS) has an effect on the early hydration behaviour of the MKPC binder (and
thus, the exothermic output of the acid-base reaction) corresponding to a varied
compressive strength values. This flexibility could be advantageous for waste
encapsulation of legacy wastes, which have wide-ranging composition.

196
In Chapter 5, struvite-K was synthesised and the chemical environments investigated
using high field solid-state 25Mg and 39K MAS NMR for the first time. The experimental
NMR spectra were presented alongside their calculated quadrupolar parameters and
simulated NMR spectra, in combination with X-ray diffraction and thermal analysis
data.
In Chapter 6, the chemistry of struvite-K and blended MKPCs were assessed using a
range of analytical techniques (compressive strength, XRD, SEM, NMR) to provide the
first definitive evidence that dissolution of the glassy aluminosilicate phases of both
FA and GBFS occurred under the pH conditions of MKPC. The principal role of FA and
GBFS in blended MKPC binders is as a filler and diluent however, high-field solid-state
NMR analysis indicated that in the GBFS/MKPC binder, the secondary reaction
formed as a result of GBFS dissolution was likely to be a potassium-aluminosilicate
phase.
In Chapter 7, the fire performance of blended MKPC binders was assessed up to 1200
°C, after high temperature exposure, it was found that the main binding phase in
these cements, struvite-K, underwent dehydration to a poorly-crystalline α-MgKPO4
phase, upon further heating the long-range order was re-established commensurate
with polymorph transitions to the β and γ-MgKPO4 phases. Between 1000 - 1200 °C,
the formation of potassium aluminosilicate phases: leucite and kalsilite (feldspathoid
minerals), were observed along with other magnesium silicates and calcium
phosphate phases. This was the direct result of high temperature reactions between
α-MgKPO4 and the FA or GBFS, which supply the necessary Ca, Al and Si. The results
indicate that the blended MKPC binders performed satisfactorily under the fire
performance criteria, the struvite-K matrix was transformed into a combination of
well-known stable mineral phases but without the loss of the structural integrity.
In Chapter 8, initial scoping irradiation experiments using Cs-137 revealed that the
blended MKPC binders were stable up to 3.6 kGy gamma irradiation. After which, a
compete irradiation programme was undertaken at the Dalton Cumbrian Facility
(University of Manchester), where a matrix of samples was irradiated in order to
elucidate the presence of any dose rate or total dose dependencies. It was found that

197
the blended MKPC binders were radiation tolerant up to a total dose of 10 MGy,
which is considered to be the 300 year dose of ILW conditioned waste packages in a
GDF [188]. There were no apparent changes in the crystal structure or the
microstructural properties of these binders, as such no dose rate dependencies exist,
this suggest that blended MKPC binders are suitable encapsulants for the UK nuclear
industry.
Areas of interest for the future research of MKPCs would be to improve the safety
case for industrial deployment in nuclear waste encapsulation by: investigating the
durability (leaching, radionuclide sorption) of these binders, the impact accident
performance, large scale corrosion and fire accident performance trials. Investigation
into the use of different filler materials (for example: sand, which is widely available)
should be conducted as the FA/GBFS supply security cannot be guaranteed in the UK
industry due to coal power plant closures and variable iron ores [12].

198
199
10 References
[1] M.I. Ojovan, W.E. Lee, An introduction to nuclear waste immobilisation, Elsevier, Oxford, UK, 2005.
[2] Department of Energy and Climate Change, Implementing geological disposal, a framework for the long-term management of higher activity radioactive waste, 2014.
[3] Pöyry Energy Limited, Amec plc, 2013 UK radioactive waste inventory: waste quantities from all sources, NDA/ST/STY(14)0010, Prepared for Department of Energy and Climate Change and the Nuclear Decomissioning Authority, 2013.
[4] B. Batchelor, Overview of waste stabilization with cement, Waste Management, 2006, vol. 26, pp. 689-698.
[5] C.R. Wilding, The performance of cement based systems, Cement and Concrete Research, 1992, vol. 22, pp. 299-310.
[6] Nuclear decommissioning Authority, The Magnox operating programme (MOP 9), NDA, 2012.
[7] Nuclear Decommissioning Authority, Waste stream 2D22: Magnox cladding and miscellaneous solid waste, NDA, 2014.
[8] Nuclear Decommissioning Authority, Waste stream 2D24: Magnox cladding and miscellaneous solid waste, NDA, 2014.
[9] Sellafield Ltd. Magnox reprocessing. www.sellafieldsites.com/solution/spent-fuel-management/magnox-reprocessing/ (accessed 18/03/2013), n.d.).
[10] NDA, Geological Disposal Package evolution status report 2010, NDA Report no. NDA/RWMD/031, 2010.
[11] G.A. Fairhall, J.D. Palmer, The encapsulation of Magnox Swarf in cement in the United Kingdom, Cement and Concrete Research, 1992, vol. 22, pp. 293-298.
[12] M.J. Angus, I.H. Godfrey, M. Hayes, S. Foster, Managing change in the supply of cement powders for radioactive waste encapsulation, Waste Management; AZ, USA, 2010.

200
[13] A. Setiadi, N.B. Milestone, J. Hill, M. Hayes, Corrosion of aluminium and magnesium in BFS composite cements, Advances in Applied Ceramics, 2006, vol. 105, pp. 191-196.
[14] A. Covill, Novel encapsulants for intermediate level waste in the UK nuclear industry, Unpublished thesis, Department of Materials Science and Engineering, University of Sheffield, 2010.
[15] J.H. Sharp, N.B. Milestone, J. Hill, E.W. Miller, Cementitious systems for encapsulation of intermediate level waste, The 9th International Conference on Radioactive Waste Management and Environmental Remediation; Oxford, UK, Sept 21-25; 2003, On-line/CD ROM proceedings.
[16] Pöyry Energy Limited, The 2010 UK Radioactive Waste Inventory: Main Report NDA/ST/STY (11)0004, Prepared for Department of Energy and Climate Change and the Nuclear Decomissioning Authority, 2011.
[17] N.B. Milestone, Reactions in cement encapsulated nuclear wastes: need for toolbox of different cement types, Advances in Applied Ceramics, 2006, vol. 105, pp. 13-20.
[18] A. Covill, N.C. Hyatt, J. Hill, N.C. Collier, Development of magnesium phosphate cements for encapsulation of radioactive waste, Advances in Applied Ceramics, 2011, vol. 110, pp. 151-156.
[19] M. Hayes, I.H. Godfrey, Development of the use of alternative cements for the treatment of intermediate level waste, Waste Management Conference; AZ, USA, Feb 25 - Mar 1; 2007, On-line/CD ROM proceedings.
[20] Nuclear Decommissioning Authority, Geological disposal: Gas status report NDA/RWMD/037, 2010.
[21] F. Qiao, C.K. Chau, Z. Li, Property evaluation of magnesium phosphate cement mortar as patch repair material, Construction and Building Materials, 2010, vol. 24, pp. 695-700.
[22] M. Mathew, L.W. Schroeder, Crystal structure of a struvite analogue,
MgKPO4·6HO, Acta Crystallographica: Section B Structural Crystallography and Crystal Chemistry, 1979, vol. 35, pp. 11-13.
[23] H.F.W. Taylor, Cement Chemistry, Second ed., Thomas Telford, London, UK, 1997.

201
[24] E.M. Gartner, J.F. Young, D.A. Damidot, I. Jawad, Hydration of Portland cement, in: J. Bensted, P. Barnes (Eds.), Structure and Performance of Cements, Spon Press, London, UK, 2002, pp. 57-114.
[25] F.P. Glasser, Progress in the immobilization of radioactive wastes in cement, Cement and Concrete Research, 1992, vol. 22, pp. 201-216.
[26] E. Lang, Blastfurnace cements in: J. Bensted, P. Barnes (Eds.), Structure and Performance of Cements, Spon Press, London, UK, 2002, pp. 310-325.
[27] K. Luke, Pulverized fuel ash as a cement extender, in: J. Bensted, P. Barnes (Eds.), Structure and Performance of Cements, Spon Press, London, UK, 2002, pp. 353-369.
[28] Nuclear Decommissioning Authority, Waste package specification and guidance documentation; WPS/300/02, specification for 500 litre drum waste package, 2008.
[29] P. Swift, H. Kinoshita, N.C. Collier, C.A. Utton, Phosphate modified calcium aluminate cement for radioactive waste encapsulation, Advances in Applied Ceramics, 2013, vol. 112, pp. 1-8.
[30] Y. Bai, N.C. Collier, N.B. Milestone, C.H. Yang, Review: The potential of using slags activated with near neutral salts as immobilisation matrices for nuclear wastes containing reactive metals, Journal of Nuclear Materials, 2011, vol. 413, pp. 183-192.
[31] W.D. Kingery, Fundamental study of phosphate bonding in refractories: I, literature review, Journal of the American Ceramic Society, 1950, vol. 33, pp. 239-241.
[32] W.D. Kingery, Fundamental study of phosphate bonding in refractories: II, cold-setting properties, Journal of the American Ceramic Society, 1950, vol. 33, pp. 242-246.
[33] D.M. Roy, New strong cement materials: chemically bonded ceramics, Science Magazine, 1987, vol. 235, pp. 629-697.
[34] A.S. Wagh, Ceramicrete: An alternative radioactive waste form, in: R.D. Spence, C. Shi (Eds.), Stabilization and Solidification of Hazardous, Radioactive and Mixed Wastes, CRC Press, Boca Raton, FL, USA, 2004, pp. 112-121.
[35] E. Banks, R. Chianelli, R. Korenstein, Crystal chemistry of struvite analogs of the type MgMPO4·6H2O (M+ = K+, Rb+, Cs+, TI+, NH4
+), Inorganic Chemistry, 1975, vol. 14, pp. 1634-1639.
202
[36] A.S. Wagh, Chemically Bonded Phosphate Ceramics – 21st Century Material with Diverse Applications, 1st ed., Elsevier Ltd, Oxford, UK, 2004.
[37] E. Soudée, J. Péra, Mechanism of setting reaction in magnesia-phosphate cements, Cement and Concrete Research, 2000, vol. 30, pp. 315-321.
[38] A.S. Wagh, S.Y. Jeong, Chemically bonded phosphate ceramics: I, a dissolution model of formation, Journal of the American Ceramic Society, 2003, vol. 86, pp. 1838-1844.
[39] R. Neiman, A.C. Sarma, Setting and thermal reactions of phosphate investments, Journal of Dental Research, 1980, vol. 59, pp. 1478-1485.
[40] A.K. Sarkar, Investigation of reaction/bonding mechanisms in regular and retarded magnesium ammonium phosphate cement systems, Ceramic Transactions, 1993, vol. 40, pp. 281-288.
[41] E. Soudée, J. Péra, Influence of magnesia surface on the setting time of magnesia–phosphate cement, Cement and Concrete Research, 2002, vol. 32, pp. 153-157.
[42] W.R. Eubank, Calcination studies of magnesium oxides, Journal of the American Ceramic Society, 1951, vol. 34, pp. 225-229.
[43] D.A. Hall, R. Stevens, B. El-Jazairi, The effect of retarders on the microstructure and mechanical properties of magnesia–phosphate cement mortar, Cement and Concrete Research, 2001, vol. 31, pp. 455-465.
[44] T. Sugama, L.E. Kukacka, Characteristics of magnesium polyphosphate cements derived from ammonium polyphosphate solutions, Cement and Concrete Research, 1983, vol. 13, pp. 499-506.
[45] A.S. Wagh, D. Singh, S.-Y. Jeong, Stabilization of hazardous asg waste with newberyite-rich chemically binded magnesium phosphate ceramic, in: A.N.L. Energy Technology Division (Ed.) Argonne, IL, USA, 1995.
[46] P.K.S. Gupta, G.H. Swihart, R. Dimitrijevic, The crystal structure of lϋnebergite, Mg3(H2O)6[B2(OH)6(PO4)2], American Mineralogist, 1991, vol. 76, pp. 1400-1407.
[47] J. Formosa, J.M. Chimenos, A.M. Lacasta, M. Niubó, Interaction between low-grade magnesium oxide and boric acid in chemically bonded phosphate ceramics formulation, Ceramics International, 2011, vol. 38, pp. 2483-2493.

203
[48] D.V. Ribeiro, M.R. Morelli, Influence of the addition of grinding dust to a magnesium phosphate cement matrix, Construction and Building Materials, 2009, vol. 23, pp. 3094-3102.
[49] J.H. Cho, Y. Eom, T.G. Lee, Stabilization/solidification of mercury-contaminated waste ash using calcium sodium phosphate (CNP) and magnesium potassium phosphate (MKP) processes, Journal of Hazardous Materials, 2014, vol. 278, pp. 474-482.
[50] D. Singh, M. Tlustochowicz, A.S. Wagh, Development of Zirconium/Magnesium Phosphate Composites for Immobilization of Fission Products, Journal of the American Ceramic Society, 1999, vol. 82, pp. 43-49.
[51] K. Sasaki, S. Moriyama, Effect of calcination temperature for magnesite on interaction of MgO-rich phases with boric acid, Ceramics International, 2014, vol. 40, pp. 1651-1660.
[52] B.E.I. Abdelrazig, J.H. Sharp, B. El-Jazairi, The chemical composition of mortars made from magnesia-phosphate cement, Cement and Concrete Research, 1988, vol. 18, pp. 415-425.
[53] S.S. Seehra, S. Gupta, S. Kumar, Rapid setting magnesium phosphate cement for quick repair of concrete pavements — characterisation and durability aspects, Cement and Concrete Research, 1993, vol. 23, pp. 254-266.
[54] Q. Yang, X. Wu, Factors influencing properties of phosphate cement-based binder for rapid repair of concrete, Cement and Concrete Research, 1999, vol. 29, pp. 389-396.
[55] Q. Yang, B. Zhu, S. Zhang, X. Wu, Properties and applications of magnesia–phosphate cement mortar for rapid repair of concrete, Cement and Concrete Research, 2000, vol. 30, pp. 1807-1813.
[56] D. Singh, A.S. Wagh, J.C. Cunnane, J.L. Mayberry, Chemically bonded phosphate ceramics for low-level mixed-waste stabilization, Journal of Environmental Science and Health Part A: Environmental Science and Engineering and Toxicology, 1997, vol. 32, pp. 527-541.
[57] D. Singh, A.S. Wagh, M. Tlustochowicz, S.Y. Jeong, Phosphate ceramic process for macroencapsulation and stabilization of low-level debris wastes, Waste Management, 1998, vol. 18, pp. 135-143.
[58] D. Singh, S.Y. Jeong, K. Dwyer, Ceramicrete: a novel ceramic packaging system for spent-fuel transport and storage, Waste Management; AZ, USA, 2000.

204
[59] D. Singh, V.R. Mandalika, S.J. Parulekar, A.S. Wagh, Magnesium potassium phosphate ceramic for 99Tc immobilization, Journal of Nuclear Materials, 2006, vol. 348, pp. 272-282.
[60] A.S. Wagh, S.-Y. Jeong, D. Singh, Mercury stabilization in chemically bonded phosphate ceramics, American Ceramic Society San Antonio, TX, USA, 1997.
[61] A.S. Wagh, R. Strain, S.Y. Jeong, D. Reed, T. Krause, D. Singh, Stabilization of Rocky Flats Pu-contaminated ash within chemically bonded phosphate ceramics, Journal of Nuclear Materials, 1999, vol. 265, pp. 295-307.
[62] A.S. Wagh, M.D. Maloney, G.H. Thomson, A. Antink, Investigations in ceramicrete stabilization of hanford tank wastes, Waste Management; AZ, USA, 2003.
[63] British Standard, Fly ash for concrete, in: Part 1: Definition, specifications and conformity criteria, BS EN 450-1, 2012.
[64] British Standard, Methods of testing cement, in: Part 6: determination of fineness, BS EN 196-6, 2010.
[65] S.E. Mouring, P.H. Miller, V.L. Burns, Investigation into the mechanical behaviour of ceramicrete, Proceedings of 13th International Offshore and Polar Engineering Conference; Honolulu, Hawaii, USA, 2003.
[66] British Standard, Testing hardened concrete, in: Part 2: compressive strength of test specimens, BS EN 12390-3, 2009.
[67] D.L. Pavia, G.M. Lampman, G.S. Kriz, J.R. Vyvyan, Introduction to Spectroscopy, Fourth ed., Brookes/Coele, CA, USA, 2009.
[68] B.C. Smith, Fundamentals of Fourier Transform Infrared Spectroscopy, Second ed., CRC Press, FL, USA, 2011.
[69] A.R. West, Basic Solid State Chemistry, Second ed., John Wiley & Sons, Ltd, Chichester, UK, 1999.
[70] P.R. Griffiths, Fourier Transform Infrared Spectroscopy, Second ed., John Wiley & Sons, Inc., NJ, USA, 2007.
[71] R.J. Wilson, Calorimetry in: P.J. Haines (Ed.) Principles of Thermal Analysis and Calorimetry, The Royal Society of Chemistry, Cambridge, UK, 2002, pp. 129-161.

205
[72] D.L. Kantro, Influence of water-reducing admixtures on properties of cement paste - a miniature slump test, Cement, Concrete and Aggregates, 1980, vol. 2, pp. 95-102.
[73] W.S. Rasband. ImageJ, U.S. National Institute of Health: Bethesda, Maryland, USA, 1997-2012.
[74] K. Lagarec, D.G. Rancourt, Recoil - Mössbauer spectral analysis software for Windows, version 1.02, Department of Physics, University of Ottawa, Ottawa, 1998, vol.
[75] P.J. Goodhew, J. Humphreys, R. Beanland, Electron Microscopy and Analysis, Third ed., Taylor & Francis, London, UK, 2001.
[76] R.F. Egerton, Physical Principles of Electron Microscopy: An Introduction to TEM, SEM and AEM, Springer Science+Buisness Media, Inc., NY, USA, 2005.
[77] J. Lilley, Nuclear Physics: Principles and Applications, John Wiley & Sons, Ltd., Chichester, UK, 2001.
[78] K.J.D. MacKenzie, M.E. Smith, Multinuclear Solid-State NMR of Inorganic Materials, Elsevier Science Ltd, Oxford, UK, 2002.
[79] D.C. Apperley, R.K. Harris, P. Hodgkinson, Solid-State NMR: Basic Principles & Practice, Momentum Press, LLC, NY, USA, 2012.
[80] S.E. Ashbrook, S. Sneddon, New methods and applications in solid-state NMR spectroscopy of quadrupolar nuclei, Journal of the American Chemical Society, 2014, vol. 136, pp. 15440-15456.
[81] D. Laurencin, C. Gervais, H. Stork, S. Krämer, D. Massiot, F. Fayon, 25Mg solid-state NMR of magnesium phosphates: high magnetic field experiments and density functional theory calculations, The Journal of Physical Chemistry C, 2012, vol. 116, pp. 19984-19995.
[82] P. Duxson, J.L. Provis, G.C. Lukey, J.S.J. van Deventer, F. Separovic, Z.H. Gan, 39K NMR of free potassium in geopolymers, Industrial & Engineering Chemistry Research, 2006, vol. 45, pp. 9208-9210.
[83] Bruker. TopSpin 3.2, 2013.
[84] G.R. Heal, Thermogravimetry and derivative thermogravitmetry in: P.J. Haines (Ed.) Principles of Thermal Analysis and Calorimetry, The Royal Society of Chemistry, Cambridge, UK, 2002.

206
[85] P.G. Laye, Differential thermal analysis and differential scanning calorimetry in: P.J. Haines (Ed.) Principles of Thermal Analysis and Calorimetry, The Royal Society of Chemistry, Cambridge, UK, 2002, pp. 55-92.
[86] M.E. Brown, Introduction to Thermal Analysis: Techniques and Applications, Chapan and Hall Ltd, London, UK, 1988.
[87] STOE and Cie GmbH. STOE WinXPOW, 2.10; Darmstadt, Germany, 2004.
[88] R.E. Dinnebier, S.J.L. Billinge, Principles of powder diffraction, in: R.E. Dinnebier, S.J.L. Billinge (Eds.), Powder Diffraction: Theory and Practice, The Royal Society of Chemistry Cambridge, UK, 2008.
[89] A. Covill, Cementing change in nuclear waste, Materials World Magazine, 2010, vol. 18, pp. 23-25.
[90] D.A. Hall, R. Stevens, B.E. Jazairi, Effect of water content on the structure and mechanical properties of magnesia-phosphate cement mortar, Journal of the American Ceramic Society, 1998, vol. 81, pp. 1550-1556.
[91] Z. Ding, B. Dong, F. Xing, N. Han, Z. Li, Cementing mechanism of potassium phosphate based magnesium phosphate cement, Ceramics International, 2012, vol. 38, pp. 6281-6288.
[92] H. Ma, B. Xu, J. Liu, H. Pei, Z. Li, Effects of water content, magnesia-to-phosphate molar ratio and age on pore structure, strength and permeability of magnesium potassium phosphate cement paste, Materials & Design, 2014, vol. 64, pp. 497-502.
[93] Nuclear Decommissioning Authority, Waste package specification and guidance documentation: WPS/700 500 litre drum waste package specification: explantory material and design guidelines, 2008.
[94] P.D. Swift, The development of calcium aluminate phosphate cement for radioactive waste encapsulationw, Unpublished thesis, Department of Materials Science and Engineering, University of Sheffield, 2013.
[95] Q. Yang, B. Zhu, X. Wu, Characteristics and durability test of magnesium phosphate cement-based material for rapid repair of concrete, Materials and Structures, 2000, vol. 33, pp. 229-234.
[96] Z. Liu, G. Qian, J. Zhou, C. Li, Y. Xu, Z. Qin, Improvement of ground granulated blast furnace slag on stabilization/solidification of simulated mercury-doped wastes in chemically bonded phosphate ceramics, Journal of Hazardous Materials, 2008, vol. 157, pp. 146-153.

207
[97] L.J. Gardner, S.A. Bernal, S.A. Walling, C.L. Corkhill, J.L. Provis, N.C. Hyatt, Characterisation of magnesium potassium phosphate cements blended with fly ash and blast furnace slag, Cement and Concrete Research, 2015, vol. 74, pp. 78-87.
[98] S. Zhang, H. Shi, S. Huang, P. Zhang, Dehydration characteristics of struvite-K pertaining to magnesium potassium phosphate cement system in non-isothermal condition, Journal of Thermal Analysis and Calorimetry, 2013, vol. 111, pp. 35-40.
[99] J.L. Provis, P. Duxson, J.S.J. van Deventer, The role of particle technology in developing sustainable construction materials, Advanced Powder Technology, 2010, vol. 21, pp. 2-7.
[100] N.E. Hipedinger, A.N. Scian, E.F. Aglietti, Magnesia–phosphate bond for cold-setting cordierite-based refractories, Cement and Concrete Research, 2002, vol. 32, pp. 675-682.
[101] F. Qiao, C. Chau, Z. Li, Calorimetric study of magnesium potassium phosphate cement, Materials and Structures, 2012, vol. 45, pp. 447-456.
[102] A.D. Wilson, J.W. Nicholson, Acid-base Cements: Their Biomedical and Industrial Applications, Cambridge University Press, 1993.
[103] R.M. Hazen, Effects of temperature and pressure on the cell dimension and X-ray temperature factors of periclase, American Mineralogist, 1976, vol. 61, pp. 266-271.
[104] R.J. Angel, C.T. Prewitt, Crsytal structure of mullite: a re-examination of the average structure, American Mineralogist, 1986, vol. 71.
[105] S.M. Antao, I. Hassan, J. Wang, P.L. Lee, B.H. Toby, State-of-the-art high resolution powder X-ray diffraction (HRPXRD) illustrated with Rietveld structure refinement of quartz, sodalite, tremolite, and meionite, The Canadian Mineralogist, 2008, vol. 46, pp. 1501-1509.
[106] R.L. Blake, R.E. Hessevick, T. Zoltai, L.W. Finger, Refinement of the hematite structure, American Mineralogist, 1966, vol. 51, pp. 123-129.
[107] J. west, A quantitative X-ray analysis of the structure of potassium dihydrogen phosphate (KH2PO4), Zeitschrift fur Kristallographie, 1930, vol. 74, pp. 306-335.
[108] S. Popovics, N. Rajendran, M. Penko, Rapid hardening cements for repair of concrete, Materials Journal, 1987, vol. 84, pp. 65-73.

208
[109] B.E.I. Abdelrazig, J.H. Sharp, B. El-Jazairi, The microstructure and mechanical properties of mortars made from magnesia-phosphate cement, Cement and Concrete Research, 1989, vol. 19, pp. 247-258.
[110] A.G.d.l. Torre, R.N.d. Vera, A.J.M. Cuberos, M.A.G. Aranda, Crystal structure of low magnesiu-content alite: application to Rietveld quantitative phase analysis, Cement and Concrete Research, 2008, vol. 38, pp. 1261-1269.
[111] E.N. Maslan, V.A. Streltsov, N.R. Streltsova, X-ray study of the electron density in calcite, CaCO3, Acta Crystallographica B49, 1993, vol. pp. 636-641.
[112] G.L. Ulex, CLXIII. On struvite, a new mineral, Memoirs and Proceedings of the Chemical Society, 1845, vol. 3, pp. 106-110.
[113] R.W.E. MacIvor, On Australian bag guano and some minerals occuring therein, The Chemical News, 1887, vol. 55, pp. 215-216.
[114] R.W.E. MacIvor, On minerals occuring in Australian bat guano, The Chemical News, 1902, vol. 85, pp. 181-182.
[115] A. Whitaker, J.W. Jeffery, The crystal structure of struvite, MgNH4PO4·6H2O, Acta Crystallographica: Section B Structural Crystallography and Crystal Chemistry, 1970, vol. 26, pp. 1429-1440.
[116] S. Graeser, W. Postl, H.-P. Bojar, P. Berlepsch, T. Armbruster, T. Raber, K. Ettinger, F. Walter, Struvite-(K), KMgPO4·6H2O, the potassium equivalent of struvite – a new mineral, European Journal of Mineralogy, 2008, vol. 20, pp. 629-633.
[117] K. Momma, F. Izumi, VESTA 3 for three-dimensional visualization of crystal, volumetric and morphology data, Journal of Applied Crystallography, 2011, vol. 44, pp. 1272-1276.
[118] G.B. Sinclair, F.G. Barton, L.J. Kennedy, Military engineering in the Falkland Islands 1982-83, Proceedings of Instiution of Civil Engineers, part 1, 1984, vol. 76, pp. 269-277.
[119] L.J. Gardner, V. Lejeune, C.L. Corkhill, S.A. Bernal, J.L. Provis, M.C. Stennett, N.C. Hyatt, Evolution of the phase assemblage in magnesium potassium phosphate cement binders at 200 and 1000 °C, Advances in Applied Ceramics, 2015, vol. 114, pp. 386-392.
[120] G. Wallez, C. Colbeau-Justin, T. Le Mercier, M. Quarton, F. Robert, Crystal chemistry and polymorphism of potassium–magnesium monophosphate, Journal of Solid State Chemistry, 1998, vol. 136, pp. 175-180.

209
[121] A.K. Sarkar, Hydration/dehydration characteristics of struvite and dittmarite pertaining to magnesium ammonium phosphate cement systems, Journal of Materials Science, 1991, vol. 26, pp. 2514-2518.
[122] B.E.I. Abdelrazig, J.H. Sharp, Phase changes on heating ammonium magnesium phosphate hydrates, Thermochimica Acta, 1988, vol. 129, pp. 197-215.
[123] M.I.H. Bhuiyan, D.S. Mavinic, F.A. Koch, Thermal decomposition of struvite and its phase transition, Chemosphere, 2008, vol. 70, pp. 1347-1356.
[124] S.N. Scrimgeour, J.A. Chudek, G.A. Cowper, C.H. Lloyd, 31P solid-state MAS-NMR spectroscopy of the compounds that form in phosphate-bonded dental casting investment materials during setting, Dental Materials, 2007, vol. 23, pp. 934-943.
[125] N. Ma, A.A. Rouff, B.L. Phillips, A 31P NMR and TG/DSC-FTIR investigation of the influence of initial pH on phosphorus recovery as struvite, ACS Sustainable Chemistry & Engineering, 2014, vol. 2, pp. 816-822.
[126] M.C. Connaway-Wagner, W.G. Klemperer, J.F. Young, A comparative study of magnesia-orthophosphate and magnesia-tripoyphosphate cements, in: S. Mindess (Ed.) Advances in Cementitious Materials, The American Ceramic Society. Ceramic Transactions, Westerville, OH, 1991.
[127] T.F. Kemp, M.E. Smith, QuadFit—A new cross-platform computer program for simulation of NMR line shapes from solids with distributions of interaction parameters, Solid State Nuclear Magnetic Resonance, 2009, vol. 35, pp. 243-252.
[128] G. Mestres, M.P. Ginebra, Novel magnesium phosphate cements with high early strength and antibacterial properties, Acta Biomaterialia, 2011, vol. 7, pp. 1853-1861.
[129] A.S. Wagh, S.Y. Jeong, D. Singh, High strength phosphate cement using industrial byproduct ashes, in: Proceedings of 1st International Conference on High Strength Concrete, United Engineering Foundation, Inc, HI, USA, 1997, pp. 542-553.
[130] Y. Li, B. Chen, Factors that affect the properties of magnesium phosphate cement, Construction and Building Materials, 2013, vol. 47, pp. 977-983.
[131] Z. Ding, Z. Li, Effect of aggregates and water contents on the properties of magnesium phospho-silicate cement, Cement and Concrete Composites, 2005, vol. 27, pp. 11-18.
[132] F. Xing, Z. Ding, Z. Li, Study of potassium-based magnesium phosphate cement, Advances in Cement Research, 2011, vol. 23, pp. 81-87.

210
[133] F. Xing, Z. Ding, Z. Li, Effect of additives on properties of magnesium phosphosilicate cement, Advances in Cement Research, 2011, vol. 23, pp. 69-74.
[134] L. Johansson, J.P. Gustafsson, Phosphate removal using blast furnace slags and opoka-mechanisms, Water Research, 2000, vol. 34, pp. 259-265.
[135] N.M. Agyei, C.A. Strydom, J.H. Potgieter, The removal of phosphate ions from aqueous solution by fly ash, slag, ordinary Portland cement and related blends, Cement and Concrete Research, 2002, vol. 32, pp. 1889-1897.
[136] S. Lu, S. Bai, H. Shan, Mechanisms of phosphate removal from aqueous solution by blast furnace slag and steel furnace slag, Journal of Zhejiang University - Science A, 2008, vol. 9, pp. 125-132.
[137] C.K. Chauhan, P.M. Vyas, M.J. Joshi, Growth and characterization of struvite-K crystals, Crystal Research and Technology, 2011, vol. 46, pp. 187-194.
[138] S. Diamond, Particle morphologies in fly ash, Cement and Concrete Research, 1986, vol. 16, pp. 569-579.
[139] R.R. Lloyd, J.L. Provis, Microscopy and microanalyis of inorganic polymer cements. 1: remnant fly ash particles, Journal of Materials Science, 2009, vol. 44, pp. 608-619.
[140] B.G. Kutchko, A.G. Kim, Fly ash characterization by SEM–EDS, Fuel, 2006, vol. 85, pp. 2537-2544.
[141] R.J. Kirkpatrick, MAS NMR Spectroscopy of Minerals and Glasses in: F.C. Hawthorne (Ed.) Spectroscopic Methods in Mineralogy and Geology, The Society, 1988, pp. 341-403.
[142] R.J. Myers, S.A. Bernal, R. San Nicolas, J.L. Provis, Generalized Structural Description of Calcium–Sodium Aluminosilicate Hydrate Gels: The Cross-Linked Substituted Tobermorite Model, Langmuir, 2013, vol. 29, pp. 5294-5306.
[143] S.A. Bernal, J.L. Provis, B. Walkley, R. San Nicolas, J.D. Gehman, D.G. Brice, A.R. Kilcullen, P. Duxson, J.S.J. van Deventer, Gel nanostructure in alkali-activated binders based on slag and fly ash, and effects of accelerated carbonation, Cement and Concrete Research, 2013, vol. 53, pp. 127-144.
[144] J. Schneider, M.A. Cincotto, H. Panepucci, 29Si and 27Al high-resolution NMR characterization of calcium silicate hydrate phases in activated blast-furnace slag pastes, Cement and Concrete Research, 2001, vol. 31, pp. 993-1001.

211
[145] S. Wang, K.L. Scrivener, 29Si and 27Al NMR study of alkali-activated slag, Cement and Concrete Research, 2003, vol. 33, pp. 769-774.
[146] S. Murgier, H. Zanni, D. Gouvenot, Blast furnace slag cement: a 29Si and 27Al NMR study, Comptes Rendus Chimie, 2004, vol. 7, pp. 389-394.
[147] J. McManus, S.E. Ashbrook, K.J.D. MacKenzie, S. Wimperis, 27Al multiple-quantum MAS and 27Al{1H} CPMAS NMR study of amorphous aluminosilicates, Journal of Non-Crystalline Solids, 2001, vol. 282, pp. 278-290.
[148] E. Lippmaa, A. Samoson, M. Mägi, High-resolution 27Al NMR of aluminosilicates, Journal of the American Chemical Society, 1986, vol. 108, pp. 1730-1735.
[149] J. Skibsted, E. Henderson, H.J. Jakobsen, Characterization of calcium aluminate phases in cements by 27Al MAS NMR spectroscopy, Inorganic Chemistry, 1993, vol. 32, pp. 1013-1027.
[150] H. He, J. Guo, J. Zhu, P. Yuan, C. Hu, 29Si and 27Al MAS NMR spectra of mullites from different kaolinites, Spectrochimica Acta Part A: Molecular and Biomolecular Spectroscopy, 2004, vol. 60, pp. 1061-1064.
[151] L.H. Merwin, A. Sebald, H. Rager, H. Schneider, 29Si and 27Al MAS NMR spectroscopy of mullite, Physics and Chemistry of Minerals, 1991, vol. 18, pp. 47-52.
[152] T. Georgelin, M. Jaber, T. Onfroy, A.-A. Hargrove, F. Costa-Torro, J.-F. Lambert, Inorganic Phosphate and Nucleotides on Silica Surface: Condensation, Dismutation, and Phosphorylation, The Journal of Physical Chemistry C, 2013, vol. 117, pp. 12579-12590.
[153] G. Engelhardt, D. Michel, High-resolution solid-state NMR of silicates and zeolites, John Wiley & Sons, Chichester, 1987.
[154] E. Lippmaa, M. Mägi, A. Samoson, G. Engelhardt, A.R. Grimmer, Structural studies of silicates by solid-state high-resolution 29Si NMR, Journal of the American Chemical Society, 1980, vol. 102, pp. 4889-4893.
[155] Á. Palomo, S. Alonso, A. Fernandez-Jiménez, I. Sobrados, J. Sanz, Alkaline activation of fly ashes: NMR study of the reaction products, Journal of the American Ceramic Society, 2004, vol. 87, pp. 1141-1145.
[156] P.J. Pallister, I.L. Moudrakovski, J.A. Ripmeester, Mg-25 ultra-high field solid state NMR spectroscopy and first principles calculations of magnesium compounds, Physical Chemistry Chemical Physics, 2009, vol. 11, pp. 11487-11500.

212
[157] V.F.F. Barbosa, K.J.D. MacKenzie, Synthesis and thermal behaviour of potassium sialate geopolymers, Materials Letters, 2003, vol. 57, pp. 1477-1482.
[158] J.F. Stebbins, L.-S. Du, S. Kroeker, P. Neuhoff, D. Rice, J. Frye, H.J. Jakobsen, New opportunities for high-resolution solid-state NMR spectroscopy of oxide materials at 21.1- and 18.8-T fields, Solid State Nuclear Magnetic Resonance, 2002, vol. 21, pp. 105-115.
[159] L. Sánchez-Muñoz, J. Sanz, I. Sobrados, Z. Gan, Medium-range order in disordered K-feldspars by multinuclear NMR, American Mineralogist, 2013, vol. 98, pp. 2115-2131.
[160] S.A. Walling, J.L. Provis, Magnesia based cements – a journey of 150 years, and cements for the future?, Chemical Reviews, 2016, vol. Accepted.
[161] Nuclear Decommissioning Authority, Geological Disposal: Waste package accident performance status report, NDA/RWMD/032, 2010.
[162] U.S Department of Energy, Waste isolation pilot plant recovery plan, revision 0, 2014.
[163] F. Delhomme, J. Ambroise, A. Limam, Effects of high temperatures on mortar specimens containing Portland cement and GGBFS, Materials and Structures, 2012, vol. 45, pp. 1685-1692.
[164] D. Matesová, D. Bonen, S. Shah, Factors affecting the resistance of cementitious materials at high temperatures and medium heating rates, Materials and Structures, 2006, vol. 39, pp. 455-469.
[165] R.W. Limes, D. Ponzani. Basic refractory compositions for intermediate temperature zones, U.S. Patent 3285758, 1966.
[166] R.W. Limes, R.O. Russell. Process for preparing fast-setting aggregate compositions and products for low porosity produced therewith, U.S. Patent 3879209, 1975.
[167] N.E. Hipedinger, A.N. Scian, E.F. Aglietti, Magnesia–ammonium phosphate-bonded cordierite refractory castables: phase evolution on heating and mechanical properties, Cement and Concrete Research, 2004, vol. 34, pp. 157-164.
[168] T. Sugama, L.E. Kukacka, Magnesium monophosphate cements derived from diammonium phosphate solutions, Cement and Concrete Research, 1983, vol. 13, pp. 407-416.

213
[169] Y. Li, T. Shi, B. Chen, Y. Li, Performance of magnesium phosphate cement at elevated temperatures, Construction and Building Materials, 2015, vol. 91, pp. 126-132.
[170] International Atomic Energy Agency, Advisory material for the IAEA regulations for the safe transport of radioactive material; 2012 edition, specific safety guide No. SSG-26, Vienna, 2014.
[171] T. Bakharev, Thermal behaviour of geopolymers prepared using class F fly ash and elevated temperature curing, Cement and Concrete Research, 2006, vol. 36, pp. 1134-1147.
[172] X. Li, X. Wang, D. He, J. Shi, Synthesis and characterization of mesoporous CaO-MO-SiO2-P2O5 (M = Mg, Zn, Cu) bioactive glasses/composites, Journal of Materials Chemistry, 2008, vol. 18, pp. 4103-4109.
[173] B.L. Phillips, R.J. Kirkpatrick, Short-range Si-Al order in leucite and analcime: determination of the configurational entropy from 27Al and variable-temperature 29Si NMR spectroscopy of leucite, its Cs and Rb-exchanged derivatives, and analcime, American Mineralogist, 1994, vol. 79, pp. 1025-1031.
[174] B.L. Phillips, R.J. Kirkpatrick, A. Putnis, Si,Al ordering in leucite by high-resolution 27Al MAS NMR spectroscopy, Physics and Chemistry of Minerals, 1989, vol. 16, pp. 591-598.
[175] A.I. Becerro, M. Mantovani, A. Escudero, Hydrothermal synthesis of kalsilite: a simple and economical method, Journal of the American Ceramic Society, 2009, vol. 92, pp. 2204-2206.
[176] G.L. Hovis, D.R. Spearing, J.F. Stebbins, J. Roux, A. Clare, X-ray powder diffraction and 23Na, 27Al, and 29Si MAS-NMR investigation of nepheline-kalsilite crystalline solutions, American Mineralogist, 1992, vol. 77, pp. 19-29.
[177] I.W.M. Brown, C.M. Cardile, K.J.D. MacKenzie, M.J. Ryan, R.H. Meinhold, Natural and synthetic leucites studied by solid state 29-Si and 27-Al NMR and 57-Fe Mossbauer spectroscopy, Physics and Chemistry of Minerals, 1987, vol. 15, pp. 78-83.
[178] L.H. Merwin, A. Sebald, F. Seifert, The incommensurate-commensurate phase transition in akermanite, Ca2MgSi2O7, observed by in-situ 29Si MAS NMR spectroscopy, Physics and Chemistry of Minerals, 1989, vol. 16, pp. 752-756.
[179] J.A. Tangeman, B.L. Phillips, A. Navrotsky, J.K.R. Weber, A.D. Hixson, T.S. Key, Vitreous forsterite (Mg2SiO4): synthesis, structure, and thermochemistry, Geophysical Research Letters, 2001, vol. 28, pp. 2517-2520.
214
[180] M. Mägi, E. Lippmaa, A. Samoson, G. Engelhardt, A.R. Grimmer, Solid-state high-resolution silicon-29 chemical shifts in silicates, The Journal of Physical Chemistry, 1984, vol. 88, pp. 1518-1522.
[181] J.F. Stebbins, J.B. Murdoch, I.S.E. Carmichael, A. Pines, Defects and short-range order in nepheline group minerals: a silicon-29 nuclear magnetic resonance study, Physics and Chemistry of Minerals, 1986, vol. 13, pp. 371-381.
[182] J.V. Smith, O.F. Tuttle, The nepheline-kalsilite system; Part I, X-ray data for the crystalline phases, American Journal of Science, 1957, vol. 255, pp. 282-305.
[183] J.R. Smyth, Experimental study on the polymorphism of enstatite, American Mineralogist, 1974, vol. 59, pp. 345-352.
[184] S.E. Ashbrook, A.J. Berry, D.J. Frost, A. Gregorovic, C.J. Pickard, J.E. Readman, S. Wimperis, 17O and 29Si NMR parameters of MgSiO3 phases from high-resolution solid-state NMR spectroscopy and first-principles calculations, Journal of the American Chemical Society, 2007, vol. 129, pp. 13213-13224.
[185] S.A. Jones, J.M. Burlitch, J.C. Duchamp, T.M. Duncan, Sol-gel synthesis of protoenstatite and a study of the factors that affect crystallisation, Journal of Sol-Gel Science and Technology, 1999, vol. 15, pp. 201-209.
[186] P.J. Schilling, L.G. Butler, A. Roy, H.C. Eaton, 29Si and 27Al MAS-NMR of NaOH-activated blast furnace slag, Journal of American Ceramic Society, 1994, vol. 77, pp. 2363-2368.
[187] S. Gomes, M. François, M. Abdelmoula, P. Refait, C. Pellissier, O. Evrard, Characterization of magnetite in silico-aluminous fly ash by SEM, TEM, XRD, magnetic susceptibility, and Mössbauer spectroscopy, Cement and Concrete Research, 1999, vol. 29, pp. 1705-1711.
[188] Nuclear Decommissiong Authority, WPS/800: wasteform specification for 500 litre drum waste package - explantory material and design guidelines, NDA, 2008.
[189] Nirex, Generic repository studies: generic waste package specification: volume 2 - justification UK Nirex Ltd, Oxford, UK, 2007.
[190] D. Delacroix, J.P. Guerre, P. Leblanc, C. Hickman, Radionuclide and Radiation Protection Data Handbook, Second ed., Nuclear Technology Publishing, Kent, UK, 2002.
[191] W.D. Loveland, D.J. Morrissey, G.T. Seaborg, Modern Nuclear Chemistry, John Wiley & Sons, Inc., NJ, USA, 2006.
215
[192] O. Kontani, Y. Ichikawa, A. Ishizawa, M. Takizawa, O. Sato, Irradiation effects on concrete structure, 4th International Symposium on the Ageing Management & Maintenance of Nuclear Power Plants; Tokyo, Japan, 2010.
[193] P. Bouniol, A. Aspart, Disappearance of oxygen in concrete under irradiation: the role of peroxides in radiolysis, Cement and Concrete Research, 1998, vol. 28, pp. 1669-1681.
[194] A. Lowinska-Kluge, P. Piszora, Effect of gamma irradiation on cement composites observed with XRD and SEM methods in the range of radiation dose 0-1409 MGy, 7th National Meeting og Synchrotron Radiation Users; Poznan, Poland, 2007.
[195] P. Soo, L.M. Milian, The effect of gamma radiation on the strength of portland cement mortars, Journal of Materials Science Letters, 2001, vol. 20, pp. 1345-1348.
[196] C.R. Wilding, D.C. Phillips, C.E. Lyon, S.G. Burnay, J.A. Winter, W.E. Spindler, The effects of radiation on intermediate-level waste forms, Commission of the Europeon Communities, Luxembourg, 1991.
[197] V. Stefov, B. Šoptrajanov, F. Spirovski, I. Kuzmanovski, H.D. Lutz, B. Engelen, Infrared and Raman spectra of magnesium ammonium phosphate hexahydrate (struvite) and its isomorphous analogues. I. spectra of protiated and partially deuterated magnesium potassium phosphate hexahydrate, Journal of Molecular Structure, 2004, vol. 689, pp. 1-10.
[198] E.R. Lippincott, A.V. Valkenburg, C.E. Weir, E.N. Bunting, Infrared studies on polymorphs of silicon dioxide and germanium dioxide, Journal of Research of the National Bureau of Standards, 1958, vol. 61, pp. 61-70.
[199] University of Manchester. Dalton Cumbrian Facility - Co-60 irradiator. www.dalton.manchester.ac.uk/discover/daltoncumbrianfacility/discover/facilities/co-60irradiator/ (accessed 01/09/2014), n.d.).

216

217
Appendix A: List of Figures
Fig. 1.1. (A) Magnox fuel elements [9], (B) Magnox swarf [10] and (C) In-drum encapsulated Magnox swarf [10] ................................................................................. 3
Fig. 1.2. (A) General GDF design [10] and (B) a schematic of the multi-barrier concept for the disposal of nuclear waste in the UK [2]............................................................ 5
Fig. 2.1. Formation of Portland cement clinker [23] .................................................... 8
Fig. 2.2. DTA thermographs published in support of the formation of lϋnebergite in magnesium phosphate ceramics, which were extracted from: initially (A) Wagh et al., 1995 [45] and later produced in (B) Singh et al., 1999 [50], (C) Wagh and Jeong, 2003 [38] and (D) Wagh, 2004 [36] ..................................................................................... 15
Fig. 2.3. X-ray diffraction patterns published in support of the formation of lϋnebergite in magnesium phosphate ceramics, which were extracted from: initially (A) Wagh et al., 1995 [45] and later produced in (B) Wagh, 2004 [36] ..................... 16
Fig. 3.1. FA/MKPC cubes at day 2 curing from: (A) stainless steel moulds and (B) plastic lined stainless steel moulds ....................................................................................... 25
Fig. 3.2. Schematic of a Michelson interferometer extracted from [67] ................... 26
Fig. 3.3. Mini-slump calculation using ImageJ software [73]: calibrate using the 2x2 cm grid (A) and then measure the flow area (B) ....................................................... 28
Fig. 3.4. The interaction volume of an incident beam and the regions where the signals: secondary electron, backscattered electron, and X-rays originate .............. 30
Fig. 3.5. Derivation of Bragg’s Law, nλ = 2d sinθ........................................................ 37
Fig. 3.6. Synchrotron X-ray diffraction, Beam I11 at Diamond Light Source, UK: (A) XRD instrument and (B) the X-ray beam .................................................................... 39
Fig. 4.1. Mini-slump flow areas of fresh FA/MKPC and GBFS/MKPC pastes at 0.22, 0.24 and 0.26 w/s ratios compared to a BFS/PC grout (0.35 w/s) represented by the dashed line ................................................................................................................. 43
Fig. 4.2. X-ray diffraction patterns of FA/MKPC pastes at various w/s ratio after 7 days curing .......................................................................................................................... 46
Fig. 4.3. X-ray diffractograms of GBFS/MKPC pastes at various w/s ratio after 7 days curing .......................................................................................................................... 46
Fig. 4.4. TGA (A) and DTG (B) traces of hardened FA/MKPC pastes after 28 days curing, at various w/s ratios ................................................................................................... 47

218
Fig. 4.5. TGA (A) and DTG (B) traces of hardened GBFS/MKPC pastes after 28 days curing, at various w/s ratios....................................................................................... 48
Fig. 4.6. Compressive strength of FA/MKPC and GBFS/MKPC hardened pastes cured for up to 28 days, as a function of the w/s ratio ....................................................... 50
Fig. 4.7. Normalised calorimetric traces for MKPC-only at 0.24 w/s ......................... 52
Fig. 4.8. Normalised calorimetric traces for fresh FA/MKPC pastes at (A) 0.22 w/s, (B) 0.24 w/s and (C) 0.26 w/s .......................................................................................... 54
Fig. 4.9. Time resolved synchrotron X-ray diffraction of 0.24 w/s FA/MKPC binder, diffraction labels indicate the time (hrs) lapsed between sample preparation and data collection .................................................................................................................... 56
Fig. 4.10. Normalised calorimetric traces for fresh GBFS/MKPC pastes at (A) 0.22 w/s, (B) 0.24 w/s and (C) 0.26 w/s ..................................................................................... 59
Fig. 4.11. Time resolved synchrotron X-ray diffraction of 0.24 w/s GBFS/MKPC binder, diffraction labels indicate the time (hrs) lapsed between sample preparation and data collection .................................................................................................................... 61
Fig. 4.12. Key time resolved synchrotron X-ray diffraction of GBFS/MKPC binder extracted from Fig. 4.11 ............................................................................................. 62
Fig. 4.13. Schematic of the water displacement experiment .................................... 64
Fig. 4.14. Uranium corrosion experiments, (A) uranium foil, (B) a single completed set-up and (C) the full set-up ..................................................................................... 64
Fig. 4.15. The temperature data for the uranium corrosion trials: (A) Jan 2013 – Jan 2015, where data was extracted from the highlighted (blue) region to show the temperature variance in (B) 1 month and (C) 1 week ............................................... 66
Fig. 4.16. Uranium corrosion trial of FA/MKPC, GBFS/MKPC and GBFS/PC pastes up to 700 days ................................................................................................................. 69
Fig. 4.17. Comparison of the observed gas volumes of FA/MKPC, GBFS/MKPC and GBFS/PC binders up to day 700¸ the error bars are equivalent to ± 1 standard deviation .................................................................................................................... 69
Fig. 4.18. FA/MKPC (0.24 w/s) with encapsulated uranium foil at 18 months ......... 75
Fig. 4.19. GBFS/MKPC (0.24 w/s) with encapsulated uranium foil at 18 months ..... 76
Fig. 5.1. The (A) unit cell and (B) crystal structure of struvite-K based on data obtained from Mathew and Schroeder [22] produced using VESTA [117] .............................. 80
Fig. 5.2. HTXRD patterns of struvite-K powder up to 1000 °C ................................... 82

219
Fig. 5.3. Thermogravimetric analysis of synthetic struvite-K ..................................... 85
Fig. 5.4. Differential thermal analysis of synthetic struvite-K .................................... 85
Fig. 5.5. 31P MAS and 31P-1H CP/MAS NMR spectra (9.4 T, 10 kHz) for struvite-K at relaxation times 10 s and 1 s, respectively ................................................................ 86
Fig. 5.6. 25Mg MAS NMR spectrum (19.96 T, 10.0 kHz) of struvite-K, simulation was performed considering the second-order quadrupolar interaction for the central transition only ............................................................................................................ 88
Fig. 5.7. 39K MAS NMR spectra (19.96 T, 15.0 kHz) of struvite-K, simulation was performed considering the second-order quadrupolar interaction for the central transition only ............................................................................................................ 88
Fig. 6.1. Compressive strength of MKPC, GBFS/MKPC and FA/MKPC, as a function of curing time, the error bars are equivalent to ± 1 standard deviation ....................... 94
Fig. 6.2. X-ray diffraction patterns of GBFS/MKPC and FA/MKPC pastes after 28 days of curing ..................................................................................................................... 95
Fig. 6.3. Backscattered electron micrographs of (A) GBFS/MKPC and (B) FA/MKPC hardened pastes after 28 days of curing ................................................................... 96
Fig. 6.4. Backscattered electron image and elemental maps of hardened GBFS/MKPC paste after 28 days of curing ...................................................................................... 97
Fig. 6.5. Backscattered electron micrograph of a single FA particle showing prominent Al and Si dissolution resulting in phase separation leaving dendritic Fe-rich phases99
Fig. 6.6. Backscattered electron micrograph and elemental maps of hardened FA/MKPC paste after 28 days of curing ................................................................... 100
Fig. 6.7. 27Al MAS NMR spectra (9.4 T, 14 kHz) for (A) unreacted GBFS and GBFS/MKPC hardened paste, and (B) unreacted FA and FA/MKPC hardened paste .................. 102
Fig. 6.8. 31P MAS and CP/MAS NMR spectra (9.4 T, 10 kHz) for: (A) GBFS/MKPC and (B) FA/MKPC at MAS at relaxation times of 10 and 300 s, and 31P CP/MAS at a relaxation time of 1 s ............................................................................................... 104
Fig. 6.9. 29Si MAS NMR spectra (9.4 T, 6.8 kHz) of (A) unreacted GBFS and GBFS/MKPC hardened paste, and (B) unreacted FA and FA/MKPC hardened paste .................. 106
Fig. 6.10. 25Mg NMR spectrum (19.96 T, 10.0 kHz) of GBFS/MKPC, simulations were performed considering the second-order quadrupolar interaction for the central transition only .......................................................................................................... 109
Fig. 6.11. 39K NMR spectra (19.96 T, 15.0 kHz) of GBFS/MKPC, simulations were performed considering the second-order quadrupolar interaction for the central transition only .......................................................................................................... 111

220
Fig. 6.12. 39K NMR spectra (19.96 T, 15.0 kHz) of GBFS/MKPC and pure struvite-K 111
Fig. 7.1. Fire performance thermal treatment programme..................................... 115
Fig. 7.2. Photographs of (A) FA/MKPC and (B) GBFS/MKPC hardened pastes exposed to temperatures between 20 and 1200 °C. The samples are 14 mm diameter (± 0.6 mm) and 10 mm height (± 0.5 mm) ......................................................................... 118
Fig. 7.3. Dilatometric traces of the (A) FA/MKPC and (B) GBFS/MKPC up to 1200 °C.................................................................................................................................. 119
Fig. 7.4. TGA/DTG of (A) FA/MKPC and (B) GBFS/MKPC pastes after 7 days curing120
Fig. 7.5. Ex situ X-ray diffractograms of hardened FA/MKPC binders heated up to 1200 °C .............................................................................................................................. 122
Fig. 7.6. Ex situ X-ray diffractograms of hardened GBFS/MKPC binders heated up to 1200 °C ..................................................................................................................... 125
Fig. 7.7. Normalised 27Al MAS NMR spectra of hardened (A) FA/MKPC and (B) GBFS/MKPC pastes heated between 20 - 1200 °C .................................................. 127
Fig. 7.8. Normalised 29Si MAS NMR spectra of hardened (A) FA/MKPC and (B) GBFS/MKPC pastes heated between 20 - 1200 °C .................................................. 129
Fig. 7.9. Deconvoluted 29Si MAS NMR spectra at 1200 °C (A) FA/MKPC with remnant fly ash (B) FA/MKPC fully reacted and (C) GBFS/MKPC with remnant slag ............. 131
Fig. 7.10. Backscattered electron micrographs and elemental maps of FA/MKPC after exposure to temperatures of (A) 20 °C, (B) 1000 °C and (C) 1200 °C ...................... 137
Fig. 7.11. Backscattered electron micrograph, Mg and Fe EDX map for FA/MKPC binder exposed to 1000 °C, extracted from Fig. 7.10B ............................................ 138
Fig. 7.12. Backscattered electron micrographs and elemental maps of GBFS/MKPC binders after exposure to temperatures of (A) 20 °C, (B) 1000 °C and (C) 1200 °C 140
Fig. 7.13. Mössbauer spectroscopy of (A) raw FA, FA/MKPC at (B) 20 °C, (C) 800 °C, (D) 1000 °C and (E) 1200 °C. The data are represented by the black dashed lines, while the simulations are represented by the solid (blue and red) lines ................ 142
Fig. 8.1. Cs-137 decay chain, the data was extracted from [190]............................ 146
Fig. 8.2. Co-60 decay chain, the data was extracted from [190] ............................. 146
Fig. 8.3. Schematic of gamma ray interactions with matter: (A) photoelectric, (B) Compton scattering and (C) pair production extracted from [191] ........................ 147
Fig. 8.4. Schematic of the dominant mechanism for gamma ray interactions with matter, extracted from [191] ................................................................................... 148

221
Fig. 8.5. Photographs of (A) the opened Cs-137 irradiator, (B) the sample containment and (C) the closed irradiator .................................................................................... 151
Fig. 8.6. Diffraction patterns of struvite-K at 28 days curing irradiated between 0 - 3.6 kGy ............................................................................................................................ 153
Fig. 8.7. Diffraction patterns of hardened FA/MKPC specimens at 28 days curing irradiated between 0 - 3.6 kGy ................................................................................ 154
Fig. 8.8. Diffraction patterns of hardened GBFS/MKPC specimens at 28 days curing irradiated between 0 - 3.6 kGy ................................................................................ 154
Fig. 8.9. FTIR spectra of struvite-K at 28 days curing irradiated between 0 - 3.6 kGy .................................................................................................................................. 156
Fig. 8.10. FTIR spectra of hardened FA/MKPC specimens at 28 days curing irradiated between 0 - 3.6 kGy ................................................................................................. 157
Fig. 8.11. FTIR spectra of hardened GBFS/MKPC specimens at 28 days curing irradiated between 0 - 3.6 kGy ................................................................................ 157
Fig. 8.12. TGA (A) and DTG (B) traces of struvite-K irradiated between 0 - 3.6 kGy 159
Fig. 8.13. TGA (A) and DTG (B) traces of hardened FA/MKPC specimens at 28 days curing irradiated between 0 - 3.6 kGy ..................................................................... 159
Fig. 8.14. TGA (A) and DTG (B) traces hardened GBFS/MKPC specimens at 28 days curing irradiated between 0 - 3.6 kGy ..................................................................... 160
Fig. 8.15. Photographs of the a) closed Co-60 irradiator and b) the opened Co-60 irradiator [199] ......................................................................................................... 163
Fig. 8.16. Schematic of the (A) specimen tray and (B) the irradiation positions, Co-60 rods are labelled A-C ................................................................................................ 163
Fig. 8.17. Temperature variance during irradiation up to 6 hours continuous operation, data provided by R. Edge at the Dalton Cumbrian Facility, University of Manchester .............................................................................................................. 164
Fig. 8.18. Diffraction patterns of FA/MKPC exposed to: 0.0, 1.0, 2.4, 4.7, 7.0 and 9.6 MGy at 16.6 kGy/hr .................................................................................................. 167
Fig. 8.19. Diffraction patterns of FA/MKPC exposed to: 0.0, 1.0, 2.3, 4.9, 7.9 and 9.4 MGy at 10.1 kGy/hr .................................................................................................. 168
Fig. 8.20. Diffraction patterns of GBFS/MKPC exposed to: 0.0, 1.1, 2.6, 5.1, 7.6 and 10.0 MGy at 17.7 kGy/hr .......................................................................................... 169
Fig. 8.21. Diffraction patterns of GBFS/MKPC exposed to: 0.0, 1.1, 2.5, 5.0, 8.0 and 10.3 MGy at 10.7 kGy/hr .......................................................................................... 169

222
Fig. 8.22. Spectra of FA/MKPC specimens exposed to: 1.0, 2.4, 4.7, 7.0 and 9.6 MGy at 16.6 kGy/hr .......................................................................................................... 170
Fig. 8.23. Spectra of FA/MKPC specimens exposed to: 1.0, 2.3, 4.9, 7.9 and 9.4 MGy at 10.1 kGy/hr .......................................................................................................... 171
Fig. 8.24. Spectra of GBFS/MKPC specimens exposed to: 1.1, 2.6, 5.1, 7.6 and 10.0 MGy at 17.7 kGy/hr.................................................................................................. 172
Fig. 8.25. Spectra of GBFS/MKPC specimens exposed to: 1.1, 2.5, 5.0, 8.0 and 10.3 MGy at 10.7 kGy/hr.................................................................................................. 172
Fig. 8.26. TGA (A) and DTG (B) traces of FA/MKPC specimens exposed to: 1.0, 2.4, 4.7, 7.0 and 9.6 MGy at 16.6 kGy/hr ............................................................................... 173
Fig. 8.27. TGA (A) and DTG (B) traces of FA/MKPC specimens exposed to: 1.0, 2.3, 4.9, 7.9 and 9.4 MGy at 10.1 kGy/hr ............................................................................... 174
Fig. 8.28. TGA (A) and DTG (B) traces of GBFS/MKPC specimens exposed to: 1.1, 2.6, 5.1, 7.6 and 10.0 MGy at 17.7 kGy/hr ...................................................................... 175
Fig. 8.29. TGA (A) and DTG (B) traces of GBFS/MKPC specimens exposed to: 1.1, 2.5, 5.0, 8.0 and 10.3 MGy at 10.7 kGy/hr ...................................................................... 175
Fig. 8.30. Normalised 27Al MAS NMR spectra of (A) FA/MKPC and (B) GBFS/MKPC specimens exposed to radiation at 16.6 and 17.7 kGy/hr, respectively ................. 176
Fig. 8.31. Normalised 29Si MAS NMR spectra of (A) FA/MKPC and (B) GBFS/MKPC specimens exposed to radiation at 16.6 and 17.7 kGy/hr, respectively ................. 177
Fig. 8.32. 31P MAS and 31P[1H] CP/MAS NMR spectra for (A) unirradiated FA/MKPC and (B) FA/MKPC specimen exposed to 9.6 MGy at 16.6 kGy/hr ........................... 178
Fig. 8.33. 31P MAS and 31P[1H] CP/MAS NMR spectra for (A) unirradiated GBFS/MKPC and (B) GBFS/MKPC specimen exposed to 9.6 MGy at 17.7 kGy/hr ....................... 179
Fig. 8.34. Backscattered electron micrograph and elemental maps of an unirradiated FA/MKPC specimen .................................................................................................. 180
Fig. 8.35. Backscattered electron micrograph and elemental maps of a FA/MKPC specimen exposed to 1.0 MGy at 16.6 kGy/hr ........................................................ 181
Fig. 8.36. Backscattered electron micrograph and elemental maps of a FA/MKPC specimen exposed to 2.4 MGy at 16.6 kGy/hr ........................................................ 181
Fig. 8.37. Backscattered electron micrograph and elemental maps of a FA/MKPC specimen exposed to 4.7 MGy at 16.6 kGy/hr ........................................................ 182
Fig. 8.38. Backscattered electron micrograph and elemental maps of a FA/MKPC specimen exposed to 7.0 MGy at 16.6 kGy/hr ........................................................ 182

223
Fig. 8.39. Backscattered electron micrograph and elemental maps of a FA/MKPC specimen exposed to 9.6 MGy at 16.6 kGy/hr ........................................................ 183
Fig. 8.40. Backscattered electron micrograph and elemental maps of a FA/MKPC specimen exposed to 1.0 MGy at 10.1 kGy/hr ........................................................ 183
Fig. 8.41. Backscattered electron micrograph and elemental maps of a FA/MKPC specimen exposed to 2.3 MGy at 10.1 kGy/hr ........................................................ 184
Fig. 8.42. Backscattered electron micrograph and elemental maps of a FA/MKPC specimen exposed to 4.9 MGy at 10.1 kGy/hr ........................................................ 184
Fig. 8.43. Backscattered electron micrograph and elemental maps of a FA/MKPC specimen exposed to 7.9 MGy at 10.1 kGy/hr ........................................................ 185
Fig. 8.44. Backscattered electron micrograph and elemental maps of a FA/MKPC specimen exposed to 9.4 MGy at 10.1 kGy/hr ........................................................ 185
Fig. 8.45. Backscattered electron micrograph and elemental maps of an unirradiated GBFS/MKPC specimen .............................................................................................. 186
Fig. 8.46. Backscattered electron micrograph and elemental maps of a GBFS/MKPC specimen exposed to 1.1 MGy at 17.7 kGy/hr ........................................................ 187
Fig. 8.47. Backscattered electron micrograph and elemental maps of a GBFS/MKPC specimen exposed to 2.6 MGy at 17.7 kGy/hr ........................................................ 187
Fig. 8.48. Backscattered electron micrograph and elemental maps of a GBFS/MKPC specimen exposed to 5.1 MGy at 17.7 kGy/hr ........................................................ 188
Fig. 8.49. Backscattered electron micrograph and elemental maps of a GBFS/MKPC specimen exposed to 7.6 MGy at 17.7 kGy/hr ........................................................ 188
Fig. 8.50. Backscattered electron micrograph and elemental maps of a GBFS/MKPC specimen exposed to 10.0 MGy at 17.7 kGy/hr ...................................................... 189
Fig. 8.51. Backscattered electron micrograph and elemental maps of a GBFS/MKPC specimen exposed to 1.1 MGy at 10.7 kGy/hr ........................................................ 189
Fig. 8.52. Backscattered electron micrograph and elemental maps of a GBFS/MKPC specimen exposed to 2.5 MGy at 10.7 kGy/hr ........................................................ 190
Fig. 8.53. Backscattered electron micrograph and elemental maps of a GBFS/MKPC specimen exposed to 5.0 MGy at 10.7 kGy/hr ........................................................ 190
Fig. 8.54. Backscattered electron micrograph and elemental maps of a GBFS/MKPC specimen exposed to 8.0 MGy at 10.7 kGy/hr ........................................................ 191
Fig. 8.55. Backscattered electron micrograph and elemental maps of a GBFS/MKPC specimen exposed to 10.3 MGy at 10.7 kGy/hr ...................................................... 191

224

225
Appendix B: List of Tables
Table 3.1. Characterisation of raw materials using PSD, Blaine fineness, BET surface area and density measurements ............................................................................... 21
Table 3.2. Composition of raw materials determined by XRF oxide analysis (precision ± 0.1 wt. %) ................................................................................................................. 22
Table 3.3. FA/MKPC and GBFS/MKPC formulations based on three water-to-solids (w/s) ratios: 0.22, 0.24 and 0.26 w/s to ± 0.1 g precision.......................................... 23
Table 3.4. Formulation of MKPC pastes based on a 0.24 water/solids ratio, using a 500 g batch size to ± 0.1 g precision .......................................................................... 24
Table 4.1. Setting time of FA/MKPC and GBFS/MKPC determined using vicat measurements ........................................................................................................... 44
Table 4.2. Sample data for natural uranium foil samples .......................................... 63
Table 4.3. Cement formulations for uranium corrosion trials to ± 0.1 g precision ... 63
Table 4.4. Gas volume generation of FA/MKPC (0.24 w/s) containing natural uranium up to 700 days ............................................................................................................ 70
Table 4.5. Gas volume generation of GBFS/MKPC (0.24 w/s) containing natural uranium up to 700 days ............................................................................................. 71
Table 4.6. Gas volume generation of GBFS/PC (0.35 w/s) containing natural uranium up to 700 days ............................................................................................................ 72
Table 5.1. Reported lattice parameters for heated MgKPO4 [120] .......................... 83
Table 5.2. NMR quadrupolar parameters for sites calculated in synthetic struvite-K using high-field 25Mg and 39K MAS NMR nuclei experiments .................................... 87
Table 6.1. NMR quadrupolar parameters for sites calculated using high-field 25Mg and 39K MAS NMR nuclei experiments ............................................................................ 108
Table 7.1. The volumetric (± 0.4 %) and mass changes (± 0.3 %) of FA/MKPC and GBFS/MKPC binders exposed to high temperatures* ............................................. 117
Table 7.2. 29Si MAS NMR chemical shifts calculated by deconvolution of the FA/MKPC spectrum (Fig. 7.9A) ................................................................................................. 133
Table 7.3. 29Si MAS NMR chemical shifts calculated by deconvolution of the FA/MKPC spectrum (Fig. 7.9B) ................................................................................................. 134
Table 7.4. 29Si MAS NMR chemical shifts calculated by deconvolution of the GBFS/MKPC spectrum (Fig. 7.9C) ............................................................................. 134

226
Table 8.1. Scoping trial information for the Cs-137 irradiated specimens .............. 152
Table 8.2. Average dose summary of the Co-60 irradiated FA/MKPC binders ....... 165
Table 8.3. Average dose summary of the Co-60 irradiated GBFS/MKPC binders ... 166

227
Appendix C: Formulation optimisation of MKPC binders
Fig. C1. Examples of compressive strength cubes that significantly cracked by curing day
3: (A) FA/MKPC (0.26 w/s) with 40 wt. % FA, (B) FA/MKPC (0.26 w/s) with 40 wt. % FA
and (C) GBFS/MKPC 0.24 w/s

228
Fig. C2. Two sets of calorimetry data for GBFS/MKPC binders with w/s ratios 0.22, 0.24
and 0.26 to highlight the reproducibility of this characteristic hydration behaviour
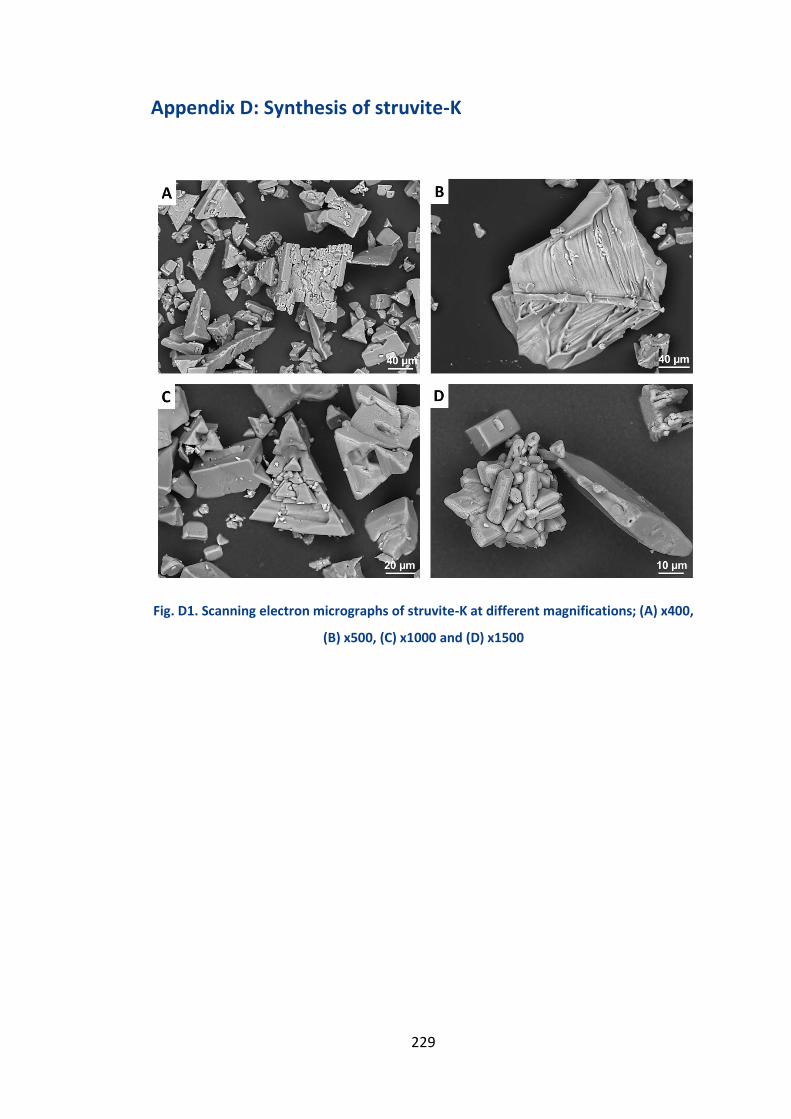
229
Appendix D: Synthesis of struvite-K
Fig. D1. Scanning electron micrographs of struvite-K at different magnifications; (A) x400,
(B) x500, (C) x1000 and (D) x1500

230

231
Appendix E: High temperature stability of MKPC binders
Fig. E1. Normalised 31P MAS NMR spectra and 31P-1H CP MAS NMR spectra of hardened
FA/MKPC (A) and GBFS/MKPC (B) binders heated between 20 - 1200 °C

232

233
Appendix F: Co-60 radiation tolerance of MKPC binders
Fig. F1. Schematic of the Co-60 irradiation positions, Co-60 rods are labelled A-C

234
Table. F1. Dose summary of the Co-60 irradiated FA/MKPC binders
Sample No. Co-60
Position
Time
(hr)
Dose Rate
(kGy/hr)
Dose
(MGy)
1 Control 0.0 0.0 0.0
2 D1 57.0 17.7 1.0
3 D1 146.0 16.2 2.4
4 D1 291.0 16.1 4.7
5 D1 438.0 16.0 7.0
6 D1 559.5 17.2 9.6
7 D2 96.0 10.6 1.0
8 D2 238.0 9.8 2.3
9 D2 495.0 9.9 4.9
10 D2 775.0 10.2 7.9
11 D2 921.0 10.2 9.4
12 D4 94.0 5.2 0.5
13 D4 221.0 4.5 1.0
14 D4 323.0 4.5 1.5
15 D4 467.5 5.1 2.4
16 D4 969.0 5.0 4.8
17 D6 172.0 2.9 0.5
18 D6 348.0 2.8 1.0
19 D6 539.0 2.7 1.5
20 D6 914.0 2.7 2.5

235
Table. F2. Dose summary of the Co-60 irradiated GBFS/MKPC binders
Sample No. Co-60 Position Time
(hr)
Dose Rate
(kGy/hr)
Dose
(MGy)
1 Control 0.0 0.0 0.0
2 D1 57.0 18.5 1.1
3 D1 146.0 17.6 2.6
4 D1 291.0 17.4 5.1
5 D1 438.0 17.3 7.6
6 D1 559.5 17.9 10.0
7 D2 96.0 11.5 1.1
8 D2 238.0 10.6 2.5
9 D2 495.0 10.1 5.0
10 D2 775.0 10.3 8.0
11 D2 921.0 11.2 10.3
12 D4 94.0 5.3 0.5
13 D4 221.0 4.6 1.0
14 D4 323.0 4.6 1.5
15 D4 467.5 5.3 2.5
16 D4 969.0 5.2 5.0
17 D6 172.0 2.9 0.5
18 D6 348.0 3.0 1.0
19 D6 539.0 2.8 1.5
20 D6 914.0 2.8 2.6

236
Fig. F2. Diffraction patterns of FA/MKPC exposed to: 0.0, 0.5, 1.0, 2.5 and 5.0 MGy at 4.9
kGy/hr
Fig. F3. Diffraction patterns of FA/MKPC exposed to: 0.0, 1.0, 1.5 and 2.5 MGy at 2.8
kGy/hr

237
Fig. F4. Diffraction patterns of GBFS/MKPC exposed to: 0.0, 0.5, 1.0, 2.5 and 5.0 MGy at
5.0 kGy/hr
Fig. F5. Diffraction patterns of GBFS/MKPC exposed to: 0.0, 1.0, 1.5 and 2.5 MGy at 2.9
kGy/hr

238
Fig. F6. Spectra of FA/MKPC specimens exposed to: 0.5, 1.0, 1.5, 2.5 and 4.8 MGy at 4.9
kGy/hr
Fig. F7. Spectra of FA/MKPC specimens exposed to: 0.5, 1.0, 1.5 and 2.5 MGy at 2.8
kGy/hr

239
Fig. F8. Spectra of GBFS/MKPC specimens exposed to: 0.5, 1.0, 1.5, 2.4 and 5.0 MGy at 5.0
kGy/hr
Fig. F9. Spectra of GBFS/MKPC specimens exposed to: 0.5, 1.0, 1.5 and 2.6 MGy at 2.9
kGy/hr

240
Fig. F10. TGA (A) and DTG (B) traces of FA/MKPC specimens exposed to: 0.5, 2.4 and 4.8
MGy at 4.9 kGy/hr
Fig. F11. TGA (A) and DTG (B) traces of FA/MKPC specimens exposed to: 0.5, 1.0 and 2.5
MGy at 2.8 kGy/hr

241
Fig. F12. TGA (A) and DTG (B) traces of GBFS/MKPC specimens exposed to: 0.5, 2.5 and
5.0 MGy at 5.0 kGy/hr
Fig. F13. TGA (A) and DTG (B) traces of GBFS/MKPC specimens exposed to: 0.5, 1.0 and
2.5 MGy at 2.9 kGy/hr

242
Fig. F14. Backscattered electron micrograph and elemental maps of a FA/MKPC specimen
exposed to 0.5 MGy at 4.9 kGy/hr
Fig. F15. Backscattered electron micrograph and elemental maps of a FA/MKPC specimen
exposed to 1.0 MGy at 4.9 kGy/hr

243
Fig. F16. Backscattered electron micrograph and elemental maps of a FA/MKPC specimen
exposed to 2.4 MGy at 4.9 kGy/hr
Fig. F17. Backscattered electron micrograph and elemental maps of a FA/MKPC specimen
exposed to 4.8 MGy at 4.9 kGy/hr

244
Fig. F18. Backscattered electron micrograph and elemental maps of a FA/MKPC specimen
exposed to 0.5 MGy at 2.8 kGy/hr
Fig. F19. Backscattered electron micrograph and elemental maps of a FA/MKPC specimen
exposed to 1.0 MGy at 2.8 kGy/hr

245
Fig. F20. Backscattered electron micrograph and elemental maps of a FA/MKPC specimen
exposed to 2.5 MGy at 2.8kGy/hr
Fig. F21. Backscattered electron micrograph and elemental maps of a GBFS/MKPC
specimen exposed to 0.5 MGy at 5.0 kGy/hr
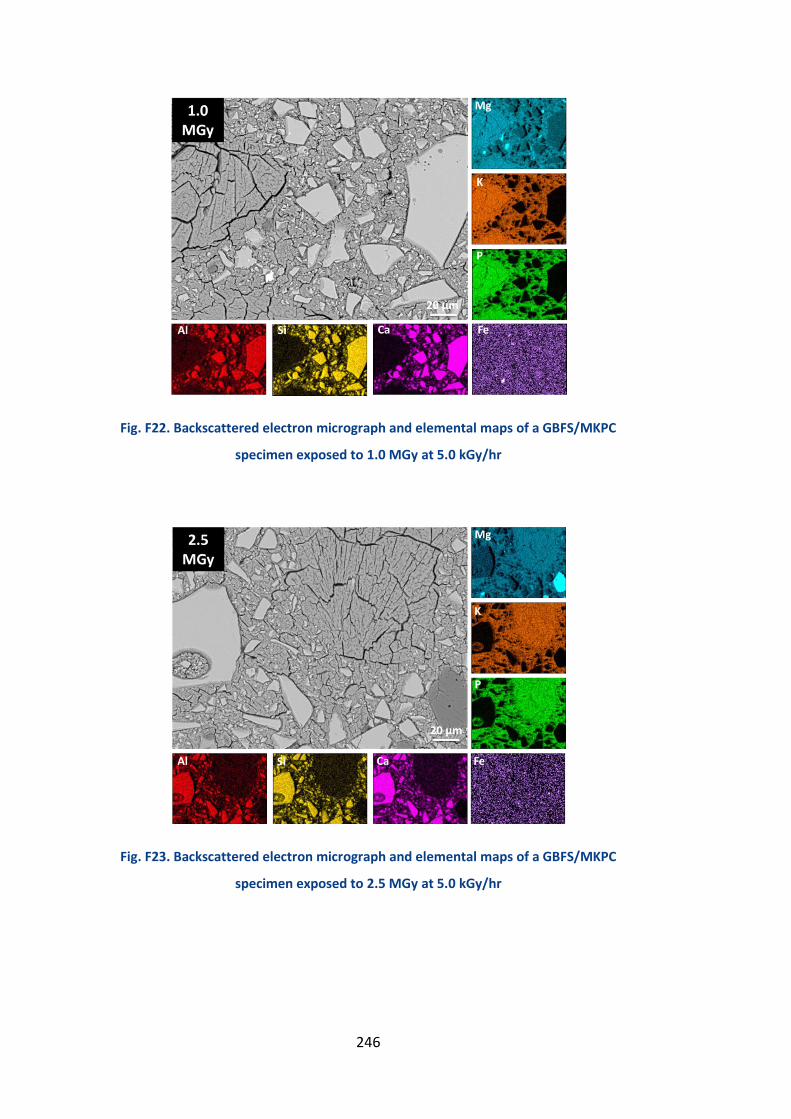
246
Fig. F22. Backscattered electron micrograph and elemental maps of a GBFS/MKPC
specimen exposed to 1.0 MGy at 5.0 kGy/hr
Fig. F23. Backscattered electron micrograph and elemental maps of a GBFS/MKPC
specimen exposed to 2.5 MGy at 5.0 kGy/hr

247
Fig. F24. Backscattered electron micrograph and elemental maps of a GBFS/MKPC
specimen exposed to 5.0 MGy at 5.0 kGy/hr
Fig. F25. Backscattered electron micrograph and elemental maps of a GBFS/MKPC
specimen exposed to 0.5 MGy at 2.9 kGy/hr

248
Fig. F26. Backscattered electron micrograph and elemental maps of a GBFS/MKPC
specimen exposed to 1.0 MGy at 2.9 kGy/hr
Fig. F27. Backscattered electron micrograph and elemental maps of a GBFS/MKPC
specimen exposed to 2.6 MGy at 2.9 kGy/hr