doors as a manifestation 0f y0 culture traditional and modern ...
Upload
khangminh22Category
view
9download
0
بسم اللة الرحمن الرحيم
Analysis 0f Chloroquine Phosphate by
Derivative UV -Spectrophotometry
Submitted by: Siham Abdoun Mohammed Abdel Alla
Supervised by: Kamal Eldin Eltayeb Ibrahium
Department of Pharmaceutical Chemistry University of Khartoum
Faculty of Pharmacy
April 2004

Acknowledgments
I would like to express my great thanks to professor Kamal Eldin
Eltayeb, head department of pharmaceutical chemistry, Faculty of
Pharmacy, University of Khartoum for great help in doing this work and
for providing the breadth and depth of his knowledge and experience and
for his careful supervision.
Also my thanks to professor Mohammed Alzein Haga, Faculty of
Pharmacy, Omdurman Islamic University for his great assistance and for
his helpful advice and guidance .
My great thanks extended to Balsam Pharmaceutical Company and to
Marrwa Pharmaceutical factory for the allowance to use their quality
control laboratories to do this work and to all the staff of these
laboratories for their great assistance. My great thank also to the Drug
Quality Control and Research Directorate and to Ministry of Health for
the financial support of this work.
I would also like to send my great thanks to all my entire colleagues and
friends for their assistance and support.
First and before all I thank God.

Contents
V List of Figures
IX List of Tables
XV Abstract English
XVIII Abstract Arabic
XXI Acknowledgement
Introduction 1
1 Malaria 1.1.
2 Chemotherapy of malaria 1.1.1.
7 Prophylaxis and suppression of malaria 1.1.2.
9 Resistance 1.1.3.
10 Treatment of malaria 1.1.4.
12 Chloroquine 1.1.5.
13 Origin 1.1.5.1.
13 Physical Properties 1.1.5.2.
13 pH 1.1.5.3.
14 Solubility 1.1.5.4.
14 Preparations of Chloroquine Salts 1.1.5.5.
15 Uses and Administration 1.1.5.6.
17 Absorption and Fate 1.1.5.7.
18 Toxicity 1.1.5.8.
19 Objectives of analysis 1.2.
20 Spectrophotometry 1.2.1.
21 Quantitative spectrophotometric assay of medicinal
substances
1.2.1.1.
23 Assay of single components 1.2.1.1.1.
24 Assay of multi-component samples 1.2.1.1.2.

24 Assay-using absorbance corrected for interference 1.2.1.1.3.
25 Assay after solvent extraction of the sample 1.2.1.1.4.
25 Method for determining concentration 1.2.1.2.
25 Simultaneous equation method 1.2.1.2.1.
25 Absorbance ratio method 1.2.1.2.2.
26 Geometric Correlation Method 1.2.1.2.3.
26 Orthogonal Polynomial Method 1.2.1.2.4.
27 Difference spectrophotometry 1.2.1.2.5.
30 Colorimetric Measurements: 1.2.1.2.6.
31 Derivative Spectrophotometry 1.2.1.2.7.
35 chemical Derivatisation 1.2.1.2.8.
36 Chromatographic techniques 1.2.2.
37 High Performance Liquid Chromatography (HPLC) 1.2.2.1.
38 Analysis of chloroquine 1.3.
Objectives 2
Methodology 3
41 Instrumentation .3.1
41 Reagents 3.2.
41 Formulations selected to be analyzed 3.3.
43 Stock Solutions of chloroquine standard 3.4.
43 Stock solutions of excipent 3.4.2.
45
45
Stock solutions pharmaceutical preparations (samples)
Stock solutions of chloroquine phosphate tablets
3.5.
3.5.1.
45 Stock solutions of chloroquine phosphate injection 3.5.2.
45 Stock solutions of chloroquine phosphate syrup 3.5.3.
45
45
45
Procedure
Spectrophotometric method
Calibration curve
3.6.
3.6.1.
3.6.1.1.

46 Assay of chloroquine phosphate in presence of
excipent
3.6.1.2.
47 Assay of chloroquine phosphate in pharmaceutical
dosage form
3.6.1.3.
47 High Performance Liquid Chromatography Method 3.6.2.
47 Phosphate buffer pH 3 3.6.2.1.
48 Calibration curve 3.6.2.2.
48 Assay of chloroquine phosphate in present of excipent 3.6.2.3.
49 Assay of chloroquine phosphate in pharmaceutical
dosage forms
3.6.2.4.
49 Non –Aqueous Titration Method 3.6.3.
49 Assay of chloroquine phosphate tablets 3.6.3.1
50 Assay of chloroquine phosphate injection 3.6.3.2.
50 Assay of chloroquine phosphate syrup 3.6.3.3.
51 Application of derivative spectroscopy in analysis of
chloroquine phosphate in biological fluids
3.7.
51 Calibration curve 3.7.1.
51 Assay of chloroquine phosphate in pure plasma 3.7.2.
Results of analysis 4.
53 Calibration curves 4.1.
54 Derivative spectrophotometry 4.1.1.
60 Absorbance spectrophotometry 4.1.2.
66 HPLC 4.1.3.
68 Analysis of Chloroquine Phosphate in presence of
pharmaceutical excipent
4.2.
93 Excipent Used In Chloroquine Phosphate Formulation 4.3.
101 Analysis of chloroquine phosphate in pharmaceutical
dosage form
4.4.

Discussion and Recommendation 5.
112 Discussion 5.1.
113 Derivative spectrophotometry calibration curves 5.1.1.
114 Absorbance spectrophotometry calibration curves 5.1.2.
117 Analysis of chloroquine phosphate in presence of
excipent
5.1.3.
120 Analysis of chloroquine phosphate in pharmaceutical
dosage forms
5.1.4.
123 Application of spectrophotometric derivative method
in the in vitro analysis of chloroquine phosphate in
biological fluids
5.1.5.
127 Recommendation 5.2.
128 Reference
134 Appendix

List of figure Figure 1. Calibration graphs for derivative spectrophotometry analysis
of chloroquine phosphate standard in water at wavelengths
(225 nm, 239 nm, 260 nm, 333 nm and 349 nm)
55
Figure 2. Calibration graphs for derivative spectrophotometry analysis
of chloroquine phosphate standard in 0.01M HCl at
wavelengths (225 nm, 239 nm, 260 nm, 333 nm and 349 nm)
57
Figure 3. Calibration graphs for derivative spectrophotometry analysis
of chloroquine phosphate standard in plasma at wavelengths
(333 nm and 349 nm)
59
Figure 4. Calibration graphs for absorbance spectrophotometry analysis
of chloroquine phosphate standard in water at wavelengths
(221 nm, 236 nm, 256 nm, 331 nm and 343 nm)
61
Figure 5. Calibration graphs for absorbance spectrophotometry analysis
of chloroquine phosphate standard in 0.01 M HCl at
wavelengths (221 nm, 236 nm, 256 nm, 331 nm and 343 nm)
63
Figure 6. Calibration graphs for absorbance spectrophotometry analysis
of chloroquine phosphate standard in plasma at wavelengths
(331 nm and 343 nm)
65
Figure 7. Calibration graphs for high performance liquid
chromatography analysis of chloroquine phosphate standard
solutions
67
Figure 8. Results of analysis of chloroquine phosphate in presence of
starch by the three methods
70
Figure 9. Results of analysis of chloroquine phosphate in presence of
aerosil by the three methods 71
Figure 10. Results of analysis of chloroquine phosphate in presence of
avicel by the three methods 72

Figure 11 . Results of analysis of chloroquine phosphate in presence of
Mg sterate by the three methods 73
Figure 12. Results of analysis of chloroquine phosphate in presence of
lactose by the three methods 74
Figure 13. Results of analysis of chloroquine phosphate in presence of
talc by the three methods 75
Figure 14. Results of analysis of chloroquine phosphate in presence of
acacia by the three methods 76
Figure 15. Results of analysis of chloroquine phosphate in presence of
methylparaben by the three methods 77
Figure 16. Results of analysis of chloroquine phosphate in presence of
propylparaben by the three methods
78
Figure 17. Results of analysis of chloroquine phosphate in presence of
dicalcium phosphate by the three methods 79
Figure 18. Results of analysis of chloroquine phosphate in presence of
titanium dioxide by the three methods 80
Figure 19. Results of analysis of chloroquine phosphate in presence of
opadry by the three methods 81
Figure 20. Results of analysis of chloroquine phosphate in presence of
propylene glycol by the three methods 82
Figure 21. Results of analysis of chloroquine phosphate in presence of
glycerin by the three methods 83
Figure 22. Results of analysis of chloroquine phosphate in presence of
sucrose by the three methods 84
Figure 23. Results of analysis of chloroquine phosphate in presence of
saccharin sodium by the three methods 85
Figure 24. Results of analysis of chloroquine phosphate in presence of
sodium citrate by the three methods 86

Figure 25. Results of analysis of chloroquine phosphate in presence of
citric acid by the three methods 87
Figure 26. Results of analysis of chloroquine phosphate in presence of
sorbitol by the three methods 88
Figure 27. Results of analysis of chloroquine phosphate in presence of
xanthan gum by the three methods 89
Figure 28. Results of analysis of chloroquine phosphate in presence of
tween 80 by the three methods 90
Figure 29. Results of analysis of chloroquine phosphate in presence of
gelatin by the three methods 91
Figure 30. Results of analysis of chloroquine phosphate in presence of
phosphoric acid by the three methods 92
Figure 31. Comparison of the results of analysis of chloroquine
phosphate in presence of disintegrant by the three methods 94
Figure 32. Comparison of the results of analysis of chloroquine
phosphate in presence of lubricant by the three methods 95
Figure 33. Comparison of the results of analysis of chloroquine
phosphate in presence of diluents by the three methods 96
Figure 34. Comparison of the results of analysis of chloroquine
phosphate in presence of coloring agents by the three methods 97
Figure 35. Comparison of the results of analysis of chloroquine
phosphate in presence of pH adjustment excipent by the three
methods
98
Figure 36. Comparison of the results of analysis of chloroquine
phosphate in presence of anti-microbial agents by the three
methods
99
Figure 37. Comparison of the results of analysis of chloroquine
phosphate in presence of emulsifying agents by the three
100

methods
Figure 38. Results of analysis of chloroquine phosphate injection by the
four methods
102
Figure 39. Results of analysis of balsaquine injection by the four
methods
103
Figure 40. Results of analysis of efroquine tablets by the four methods 104
Figure 41. Results of analysis of chloroquine phosphate tablets by the
four methods
105
Figure 42. Results of analysis of amiquine tablets by the four methods 106
Figure 43. Results of analysis of lariago tablets by the four methods 107
Figure 44. Results of analysis of chloroquine syrup (JPM) by the four
methods
108
Figure 45. Results of analysis of lariago syrup by the four methods 109
Figure 46. Results of analysis of chloroquine phosphate in pure plasma
by
the first derivative and zero order absorption spectroscopy
111

List of Tables Table 1. Exciepent used in chloroquine phosphate formulations 44
Table 2. Derivative spectrophotometry results for analysis of
chloroquine phosphate standard in water
54
Table 3. Derivative spectrophotometry results for analysis of
chloroquine standard phosphate in 0.01 M HCl
56
Table 4. Derivative spectrophotometry results for analysis of
chloroquine phosphate standard in plasma
58
Table 5. Absorbance spectrophotometry results for analysis of
chloroquine phosphate standard in water
60
Table 6. Absorbance spectrophotometry results for analysis of
chloroquine phosphate standard in 0.01 M HCl
62
Table 7. Absorbance spectrophotometry results for analysis of
chloroquine phosphate standard in plasma
64
Table 8. High performance liquid chromatography results for analysis of
chloroquine phosphate standard
66
Table 9. Statistical analysis of the calibration graphs of chloroquine
phosphate using first derivative spectrophotometry
114
Table
10.
Statistical analysis of the calibration graphs of chloroquine
phosphate using zero order absorbance spectrophotometry
115
Table
11.
Statistical analysis of the calibration graphs of chloroquine
phosphate using first derivative, zero order absorbance
spectrophotometry and HPLC methods
116
Table
12.
Statistical analysis of the calibration graphs of chloroquine
phosphate standard in plasma using first derivative
124

Appendix Table
13.
Results of analysis of chloroquine phosphate in presence of
starch by the three methods
i
Table
14.
Statistical analysis of the results of chloroquine phosphate in
presence of starch analyzed by the three methods
i
Table
15.
Results of analysis of chloroquine phosphate in presence of
aerosil by the three methods
ii
Table
16.
Statistical analysis of the results of chloroquine phosphate in
presence of aerosil analyzed by the three methods
ii
Table
17.
Results of analysis of chloroquine phosphate in presence of
avicel by the three methods
iii
Table
18.
Statistical analysis of the results of chloroquine phosphate in
presence of avicel analyzed by the three methods
iِii
Table
19.
Results of analysis of chloroquine phosphate in presence of Mg
sterate by the three methods
iv
Table
20.
Statistical analysis of the results of chloroquine phosphate in
presence of Mg sterate analyzed by the three methods
iv
Table
21.
Results of analysis of chloroquine phosphate in presence of
lactose by the three methods
v
Table
22.
Statistical analysis of the results of chloroquine phosphate in
presence of lactose analyzed by the three methods
v
Table
23.
Results of analysis of chloroquine phosphate in presence of talc
by the three methods
vi
Table
24.
Statistical analysis of the results of chloroquine phosphate in
presence of talc analyzed by the three methods
vi
Table
25.
Results of analysis of chloroquine phosphate in presence of
accacia by the three methods
vii

Table
26.
Statistical analysis of the results of chloroquine phosphate in
presence of accacia analyzed by the three methods
vii
Table
27.
Results of analysis of chloroquine phosphate in presence of
methyl paraben by the three methods
viii
Table
28.
Statistical analysis of the results of chloroquine phosphate in
presence of methyl paraben analyzed by the three methods
viii
Table
29.
Results of analysis of chloroquine phosphate in presence of
propyl paraben by the three methods
ix
Table
30.
Statistical analysis of the results of chloroquine phosphate in
presence of propyl paraben analyzed by the three methods
ix
Table
31.
Results of analysis of chloroquine phosphate in presence of
dicalcium phosphate by the three methods
x
Table
32.
Statistical analysis of the results of chloroquine phosphate in
presence of dicalcium phosphate analyzed by the three
methods
x
Table
33.
Results of analysis of chloroquine phosphate in presence of
titanium dioxide by the three methods
xi
Table
34.
Statistical analysis of the results of chloroquine phosphate in
presence of titanium dioxide analyzed by the three methods
xi
Table
35.
Results of analysis of chloroquine phosphate in presence of
opadry by the three methods
xii
Table
36.
Statistical analysis of the results of chloroquine phosphate in
presence of opadry analyzed by the three methods
xii
Table
37.
Results of analysis of chloroquine phosphate in presence of
propylene glycol by the three methods
xiii
Table
38.
Statistical analysis of the results of chloroquine phosphate in
presence of propylene glycol analyzed by the three methods
xiii
Table Results of analysis of chloroquine phosphate in presence of xiv

39. glycerin by the three methods
Table
40.
Statistical analysis of the results of chloroquine phosphate in
presence of glycerin analyzed by the three methods
xiv
Table
41.
Results of analysis of chloroquine phosphate in presence of
sucrose by the three methods
xv
Table
42.
Statistical analysis of the results of chloroquine phosphate in
presence of sucrose analyzed by the three methods
xv
Table
43.
Results of analysis of chloroquine phosphate in presence of
saccharin sodium by the three methods
xvi
Table
44.
Statistical analysis of the results of chloroquine phosphate in
presence of saccharin sodium analyzed by the three methods
xvi
Table
45.
Results of analysis of chloroquine phosphate in presence of
sodium citrate by the three methods
xvii
Table
46.
Statistical analysis of the results of chloroquine phosphate in
presence of sodium citrate analyzed by the three methods
xvii
Table
47.
Results of analysis of chloroquine phosphate in presence of
citric acid by the three methods
xviii
Table
48.
Statistical analysis of the results of chloroquine phosphate in
presence of citric acid analyzed by the three methods
xviii
Table
49.
Results of analysis of chloroquine phosphate in presence of
sorbitol by the three methods
xix
Table
50.
Statistical analysis of the results of chloroquine phosphate in
presence of sorbitol analyzed by the three methods
xix
Table
51.
Results of analysis of chloroquine phosphate in presence of
xanthan gum by the three methods
xx
Table
52.
Statistical analysis of the results of chloroquine phosphate in
presence of xanthan gum analyzed by the three methods
xx
Table Results of analysis of chloroquine phosphate in presence of xxi
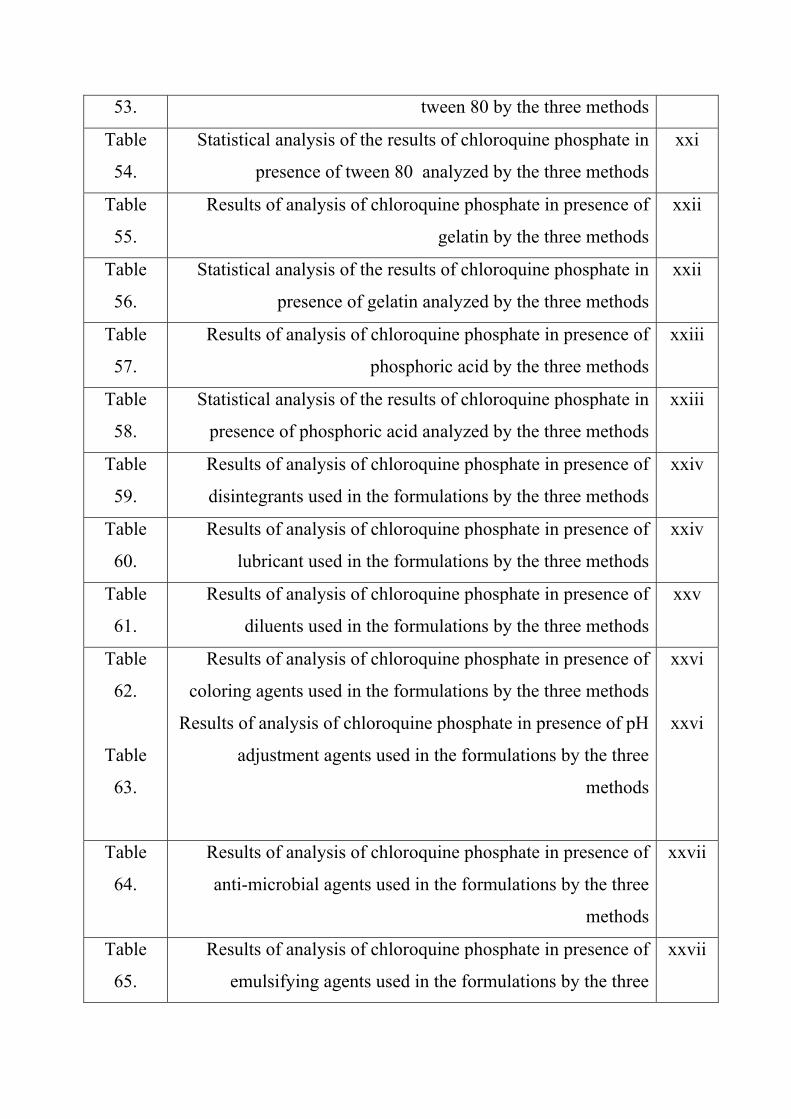
53. tween 80 by the three methods
Table
54.
Statistical analysis of the results of chloroquine phosphate in
presence of tween 80 analyzed by the three methods
xxi
Table
55.
Results of analysis of chloroquine phosphate in presence of
gelatin by the three methods
xxii
Table
56.
Statistical analysis of the results of chloroquine phosphate in
presence of gelatin analyzed by the three methods
xxii
Table
57.
Results of analysis of chloroquine phosphate in presence of
phosphoric acid by the three methods
xxiii
Table
58.
Statistical analysis of the results of chloroquine phosphate in
presence of phosphoric acid analyzed by the three methods
xxiii
Table
59.
Results of analysis of chloroquine phosphate in presence of
disintegrants used in the formulations by the three methods
xxiv
Table
60.
Results of analysis of chloroquine phosphate in presence of
lubricant used in the formulations by the three methods
xxiv
Table
61.
Results of analysis of chloroquine phosphate in presence of
diluents used in the formulations by the three methods
xxv
Table
62.
Table
63.
Results of analysis of chloroquine phosphate in presence of
coloring agents used in the formulations by the three methods
Results of analysis of chloroquine phosphate in presence of pH
adjustment agents used in the formulations by the three
methods
xxvi
xxvi
Table
64.
Results of analysis of chloroquine phosphate in presence of
anti-microbial agents used in the formulations by the three
methods
xxvii
Table
65.
Results of analysis of chloroquine phosphate in presence of
emulsifying agents used in the formulations by the three
xxvii

methods
Table
66.
Results of analysis of chloroquine phosphate injection by the
four methods
xxviii
Table
67.
Statistical analysis of the results of chloroquine phosphate
injection analyzed by the four methods
xxix
Table
68.
Results of analysis of basaquine injection by the four methods xxx
Table 69 Statistical analysis of the results of basaquine injection
analyzed by the four methods
xxx
Table
70.
Results of analysis of efroquine tablets by the four methods xxxi
Table
71.
Statistical analysis of the results of efroquine tablets analyzed
by the four methods
xxxi
Table
72.
Results of analysis of chloroquine phosphate tablets by the four
methods
xxxii
Table
73.
Statistical analysis of the results of chloroquine phosphate
tablets analyzed by the four methods
xxxii
Table
74.
Results of analysis of amiquine tablets by the four methods xxxiii
Table
75.
Statistical analysis of the results of amiquine tablets analyzed
by the four methods
xxxiii
Table
76.
Results of analysis of lariago tablets by the four methods xxxiv
Table
77.
Statistical analysis of the results of lariago tablets analyzed by
the four methods
xxxiv
Table
78.
Results of analysis of chloroquine syrup (JPM) by the four
methods
xxxv

Table
79.
Statistical analysis of the results of chloroquine syrup (JPM)
analyzed by the four methods
xxxv
Table
80.
Results of analysis of lariago syrup by the four methods xxxvi
Table
81.
Statistical analysis of the results of lariago syrup analyzed by
the four methods
xxxvi
Table
82.
Results of analysis of Chloroquine Phosphate standard in
plasma
by the first derivative and zero absorption spectroscopy
xxxvii

1.1. Malaria:
Malaria is one of the most serious protozoal infectious diseases in
man. It is caused infection by the four species of Plasmodium. P.
falciprum causes falciprum (malignant tertian or sub tertian) malaria
which is the most serious form and can be fatal in non immune
individuals if not treated promptly. P. vivax causes vivax (benign
tertian) malaria which is widespread but rarely fatal, although
symptoms during the primary attack can be severe. P. malaria
causes quartan malaria which is generally mild but causes fatal
nephrosis. P. ovale causes ovale (ovale tertian ) malaria which is the
least common type, and produces clinical features similar to P. vivax
(James et al, 1989).
Malaria is a major threat to health and blocks the path to economic
development for individuals, communities and nations.
Almost half the world’s populations are at risk from this disease. It
causes one hundred million clinical cases and over one million
deaths each year. While over 80% of malaria cases and deaths occur
in Africa, malaria is a problem in every region of the world affecting
both young and old.

Children are particularly at risk, malaria being one of the childhood
killers in tropical Africa. It takes the lives of 1 out of 20 children
before the age of five. The disease causes anemia in children and
pregnant women. It affects the poor and under privileged most
severely.
Social, political and economical changes contribute much to the
worsening malaria problem, particularly through large scale
uncontrolled population movements and ecological disturbances
(James et al, 1989).
Construction and environmental changes brought about by
development are creating environment favorable for malaria
transmission. This greatly enhance exacerbating existing problems
opening the way for devastating epidemics in areas which are
previously malaria-free, leading to many deaths and impoverishment
of communities (Bruce-Chwatts et al, 1989).
In Sudan, malaria is an endemic disease all over the country with varying
degrees from holodemisty in the South to hypodemisty in the North. It
is the most serious public health hazard causing high morbidity and
mortality which adversely affects the socio-economic development. The

disease in Sudan is mostly due to infection with P. falciprum (Roll I.M,
1986).
1.1.1. Chemotherapy of malaria:
Antimalarial drugs are classified according to the stage of parasitic
life cycle, which they affect.
Blood schizotocides act on the erythrocytic stages of the parasite,
which are directly responsible for the clinical symptoms of the
disease. They produce clinical cure or suppression of infection by
susceptible strains of all the four species of malaria parasite.
However, since they have no effect on exoerythrocytic forms, they
do not produce a radical cure of relapsing forms of ovale or vivax
malarias.
Tissue schizotocides act on exoerythrocytic stages of the parasite
and have been used for prophylaxis to prevent invasion of the blood
cells, or as anti relapse drugs to produce radical cure of vivax and
ovale malaria.
Gametocyticides destroy the sexual forms of the parasite to interrupt
transmission of the infection to the mosquito vector.
Sporonticides have no direct effect on the gametocytes in the human
host but prevent sporogony in the mosquito.

The antimalarial drugs are principally classified by chemical
structure (Susan Budavari et al, 1996) into:
1.1.1.1. quinine salts, which are rapidly acting, blood schizontocides
with some gametocidal activity. They have the chemical structure:
N
OC3
O
H
H H
H
H C2
N
(8 α , 9 R) – 6 – Methoxycinchonan – 9 – ol (C20H24N2O2)
Qinine is available as the following salt:
1.Quinine bisulfate heptahydrate (C20H24N2O2 .H2SO4.7 H2O).
2. Quinine dihydrochloride (C20H24N2O2.2HCl).
3. Quinine hydrochloride dihydrate (C20H24N2O2.HCl.2H2O).
4. Quinine sulfate dihydrate (C20H24N2O2)2 H2SO4.2H2O.
1.1.1.2. The Quinoline: Has the chemical strucure:
N
benzo [6] pyridine (C9H7N)
Derivatives of the Quinoline, which has antimalarial activities, are:
1.1.1.2.1. 8-aminoquinolines: they are tissue schizontocides mainly
used to prevent relapse of ovale and vivax malaria, and have

gametocytcidal activity. They also have some activity at other stages
of the parasites life cycle. Example is primaquine and quinocide.
The quinocide has the chemical structure:
NH
HN
NH
H CO3
3
2
C
8 – [(4 – amino – methyl butyl) amino] – 6 – methoxy
quinoline(C15H21N3O)
It is available as:
1. Quinocide diphosphate (C15H27N3O9P2).
2. Quinocide hydrochloride (C15H21N3O.HCl).
3. Quinocide dihydrochloride (C15H21N3O.2 HCl).
The chemical structure of primaquine is:
HC 3
H C3 3NHN
N
2O
H. P2 O 4H
( ± ) –8–[(4–Amino–1– methyl butyl) amino] –6–methoxy quinoline
phosphate (1:2) (C15H21N3O .2H3PO4)
1.1.1.2.2. 4-aminoquinolines: they are rapidly acting blood
schizontocides with some gametocidal activity. Examples are
amodiaquine and chloroquine, which has the chemical structure:

N
H
Cl
C
NHN
33C H
3C H
7 – chloro – 4 –(4– diethyl amino–1–methyl butyl amino)quinoline
(C18H26Cl N3)
1.1.1.3. 9-aminoacridines such as mepacrine, which is a blood
schizontocide with some gametocidal activity. It has the following
structure:
NH
N
2
C13H10N2
It is available as hydrochloride (C13H10N2.HCl)
1.1.1.4. biguanides, such as proguanil, having dihyrofolate reductase
inhibitor activity. They are tissue schizontocides used mainly for
prophylaxis of falciprum malaria. They also have some activity
against blood schizonts. It is chemical structure:
H2N H
N
NH
N 2H
NH
Amino guanidine (C2H7N5)

1.1.1.5. diaminopyrimidines such as pyrimethamine, have an action
similar to that of the biguanides. The chemical structure of the
pyrimethamine is
NH3C
Cl
N
NH2
2NH
2,4 – diamino –5–(p– chlorophenyl) – 6 – ethylpyrimidine
(C12H13ClN4)
1.1.1.6.The sesquiterpine lactones such as artemisin and artemether,
which act mainly as blood schizontocides. The artemether has the
chemical structure:
H
OH3C
C 3H
C 3HOO H3C
HHH
H
O O
O
Dihydro artemisinin methyl ether (C16H26O5 )
While the artemisin has the structure:
H
C
O
OO
H
H
3
3HC
3HC
H
6α 8α –dihydroxy–3 – oxoeudesma–1,4–dien 12–oic acid 12, 6–
lactone
C15H18O4

Other drugs with anti malarial activity include the sulphonamides,
mefloquine, dapsone and some antibiotics such as tetracycline and
erythromycin (James et, al 1989).
1.1.2. Prophylaxis and suppression of malaria:
The increasing prevalence of drug resistant strains particularly of P.
falciprum has made recommendations for malaria prophylaxis
difficult. The WHO believes that the widespread use of
chemoprophylaxis in immune or semi-immune population is no
longer recommended. Chemoprophylaxis as malaria control strategy
should aim at lowering morbidity levels in groups that are at high
risk from sever and complicated malaria, notably pregnant women
and non- immune visitors. Since the prophylaxis afforded by many
chemoprophylactic regimens is not absolute, travelers should be
advised on methods of avoiding mosquito’s bites.
Chemoprophylaxis may be (causal prophylaxis) referring to absolute
prevention of infection or (clinical prophylaxis) i.e. suppression of
parasitaemia and it is symptoms. Causal prophylaxis is provided by
tissue schizontocides, which destroy the erythrocytic form of the
parasite. Blood schizontocides produce suppression or clinical

prophylaxis, which if continued until all erythrocytic parasites are
destroyed, will ultimately produce a suppressive cure.
Recommendation on chemoprophylaxis must be based on the basis
of the occurrence and susceptibility of malaria strains in the
particular geographical area. Local variations due to altitude, rainfall
and seasonal differences in temperature, further complicate the
matter. The toxicity of some chemoprophylaxis regimens has further
worsened the situation since the incident of toxic reaction can
approach or exceed the danger of contracting malaria.
In general, amodiaquine should not be used for prophylaxis. Further
more many experts, including the WHO, also agree that a
combination of pyrimethamine with sulphadoxine (fansidar) should
not be used for prophylaxis.
In areas of little or no chloroquine resistance, chloroquine may still
be used. However some experts suggest proguanil as an alternative.
In areas of low-grade chloroquine resistance, chloroquine may still
alleviate the infection. In areas with high –grade chloroquine
resistance a combination of chloroquine and fansidar were used to be
recommended in the past. This is now considered to be too toxic and
in any case multidrug- resistant strains of malaria are increasingly

widespread. Chloroquine plus pyrimethamine-dapsone is a possible
alternative but the potential high toxicity is once again a problem.
Less toxic regimens should be considered even if they are less
effective. Mefloquine may be useful, if available, but there is
concern that indiscriminate prophylactic use may induce resistance
to mefloquine (James et al 1989).
1.1.3. Resistance:
Resistance of P. falciprum to most of the current anti malarial drugs
has stemmed as a main technical problem in malaria control. Drug
resistance has being defined as the ability of parasite strains to
multiply and or to survive in the presence of concentrations of a drug
that normally destroys parasite of the same species or prevent their
multiplication. Although drug resistance has also been observed in
other plasmodium species, it is the resistance of p. falciprum and in
particular to chloroquine, which has drawn most attention. The
WHO has developed an arbitrary grading system to describe the

relative degree of resistance of strains of P. falciprum to
chloroquine.
Sensitivity is described as the clearance of asexual parasitaemia within 7
days of initiation of treatment, without subsequent recrudescence.
Chloroquine resistance developed at almost the same time in
Southern Asia and in South America at the end of the 1950s.
Resistance now affects most of Asia and the Western Pacific Islands
with evidence of westward spread. It is well established in South and
Central America. Major and alarming changes in susceptibility have
occurred in Africa, south of Sahara and there is now evidence of
chloroquine resistance in West Africa.
A knowledge of the extent of resistance in terms of geographical
distribution and degree of resistance is important for the selection of
appropriate control measures and for development of policies for
rational use of antimalarial drugs. The use of sub curative doses o f
drugs contributes to resistance. Radical curative treatment is
probably the most reliable way of avoiding selective parasite
survival. Mass drug administration for suppression should therefore
be avoided.
The use of combination of drugs of similar half –life may also delay
the emergence of resistant strains (James et al, 1989).
1.1.4. Treatment of malaria :
Early and proper diagnosis and prompt treatment is the most
important component of the Global Malaria Control Strategy.
Effective treatment should be made to all persons at risk, and also
forms the basis of malaria control interventions.
Severe malaria is a medical emergency requiring immediate
administration of rapidly effective anti malaria drugs. When
possible, drug should be given intravenously, but studies suggest
adequate absorption of quinine, artesunate, and chloroquine after
intramuscular injections, which are acceptable alternatives.
Parentral artemether is given only by intramuscular injection.
Suppositories of chloroquine, artemisin, and artesunate are available
in some countries but more pharmacokinetic data are needed for
these drugs. Quinine and Quinimax should be administered
intrarectally. Parentral treatment is needed in acute stages but oral
treatment should be substituted as soon as the patient is able to take
fluids by mouth.

In cases, where it is not possible to give parentral treatment,
administration by mouth or via nasogatric tube should be started
immediately as drug absorption is believed to be adequate even in
sever malaria.
Chloroquine is still the drug of choice for treatment of
uncomplicated malaria in Sudan. It is safe, of affordable price and
has been used over a long time for treatment of malaria. It is noted,
however, that many patients do not respond to the treatment with
chloroquine (Mahmoud et. al, 1988). This lead to consider that the
parasite has developed resistance against chloroquine in certain
regions in Sudan (Bayoumi et. al, 1988). The increasing number of
patients showing resistance to therapeutic treatment with
chloroquine led to questioning the drug efficacy, before deciding to
change the drug policy on the first –line anti- malarial drug. The
extent and nature of true drug –resistance should be clarified
whether due to substandard drug or to other reasons.
The supply and availability of drugs in the country have been
increased substantially over the last ten years. Many product-
formulations of chloroquine from different sources have been
introduced into the market.

However, the detection of substandard and counterfeit drugs within
distribution channels in some developing countries, has led to great
concern about the quality of the drugs. In addition, the tropical
climatic conditions i.e. high temperature and humidity may affect the
quality and stability of the drug and thus may lead to physical
deterioration or chemical decomposition resulting in reduced
activity.
The stability of the drug depends largely upon its formulation, thus
its expiry date should be determined on the basis of stability studies.
Thus it is significant to determine the expiry date on the label of the
product.
Toward the end of this study the ministry of health introduce in the market new regimens for treating malaria (artesunate and fansidar) and (artesunate and lumfantrene). Chloroquine will be withdrawn gradually and replaced
by these
regimens in chloroquine resistance regions. 1.1.5. Chloroquine: Chloroquine, (British approved name, 4- aminoquinoline derivative),
has the chemical structure shown in 1.1.1.2.2.
It is available as the following salts:
1. Chloroquine hydrochloride (BANM) C18H26ClN3, 2HCl

2. Chloroquine phosphate C18H26ClN3, 2H3PO4
3. Chloroquine sulphate C18H26ClN3, H2SO4, H2O
It is official in the British pharmacopoeia as Chloroquine sulphate
and Chloroquine phosphate.
In the United State Pharmacopoeia it is found as Chloroquine and
Chloroquine phosphate.
1.1.5.1. Origin:
Chloroquine was originally synthesized in 1934 by Bayer in Germany
(Resochin); it is prepared by the condensation of 4-7-dichloro quinolone
with 1-diethylamino-4-amino pentane.
1.1.5.2. Physical Properties:
Chloroquine base is a white or slightly yellow, odorless, crystalline
powder with a bitter taste, with a melting range of 870 C - 920C.
Chloroquine phosphate is a white or almost white, odorless,
crystalline powder with a bitter taste and it is hygroscopic. It is
exists in two polymorphic forms, one form melt in the range of 1930
C - 1950C and the other in the range of 2100 C - 2180C.
Chloroquine sulphate is a white or almost white, odorless, crystalline
powder, melting in the range 2050 C - 2100C.

1.1.5.3. pH:
10%w/v solution of chloroquine phosphate has a pH of 3.8 to 4.3.
8%w/v solution of chloroquine sulphate has a pH of 4 to 5.
1% w/v solution of chloroquine phosphate has a pH of about 4.5.
1.1.5.4. Solubility:
Chloroquine is very slightly soluble in water, soluble in chloroform,
in ether and dilute acids.
Chloroquine phosphate is freely soluble (1 in 4) in water, although
solubility is reduced at alkaline or neutral pH. It is practically
insoluble in ethanol and benzene, very slightly soluble in
chloroform, ether and methanol.
Chloroquine sulphate is soluble (1 in 3) in water and very slightly
soluble in ethanol, freely soluble in methanol, practically insoluble
in acetone, chloroform and ether (Walter Lund, 1994) (15).
1.1.5.5. Preparations of Chloroquine Salts:

1. Chloroquine hydrochloride injection (U.S.P.)
A sterile solution of chloroquine in water for injection prepared with aid
of hydrochloric acid; it contains 47.5 to 52.5 mg ml-1of C18H26ClN3,
2HCl, equivalent to approximately 38.7 to 42.8 mg of chloroquine base,
pH 5.5 to 6.5.
2. Chloroquine phosphate injection (B.P.)
It is potency is expressed in terms of the equivalent amount of
chloroquine base.
3. Chloroquine sulphate injection (B.P.): It is potency is expressed in
terms of equivalent amount of chloroquine base, pH 4.0 - 5.5.
4. Chloroquine phosphate tablets (B.P.)
5. Chloroquine phosphate tablets (U.S. P.)
6. Chloroquine sulphate tablets (B.P.)
1.1.5.6. Uses and Administration:
Chloroquine is used for the suppression and clinical cure of malaria
due to susceptible strains of P. falciprum, P. ovale, P. vivax, and P.
malaria. It is a rapidly acting blood schizontocide with some
gametocyticidal activity against P. ovale, P. vivax, and P. malaria
and immature gametocytes of P. falciprum. Chloroquine does not
produce a radical cure of vivax or ovale malarias since it has no

activity against exoerythrocytic forms. The mechanism of action of
chloroquine against blood schizonts is still not clear but it appears to
act by influencing hemoglobin digestion by the malaria parasite. It
also interferes with synthesis of nucleoproteins by the parasite
(James et. al, 1989).
In addition to it is antimalarial action, chloroquine has been used in
the treatment of amoebic hepatitis in conjunction with emetine or
dehydroemetine but it has no effect on intestinal amoebiasis.
Chloroquine has also been used in rheumatoid arthritis.
However this is limited by it is toxicity particularly when it
is administered for a long period.
Chloroquine is given as phosphate, sulphate or hydrochloride. Doses
are normally expressed in terms of chloroquine base 300 mg, which
is approximately equivalent to 500 mg of chloroquine phosphate or
400 mg of chloroquine sulphate. 40 mg chloroquine base is
approximately equivalent to 50 mg of chloroquine hydrochloride.
For the treatment of acute attack of malaria the usual oral dose is 600
mg chloroquine base initially, then 300 mg after 6 hours, then 300
mg daily on each of the two following days giving a total dose of
approximately 25 mg per kg body- weight.

Traditionally a single dose of 10 mg per kg has been used to treat
malaria in semi-immune subjects. The WHO now recommends that
all patients be given the full course of 25 mg per kg over 3 days in
attempts to slow spread of the drug resistance. A recommended dose
for treatment in children is 10 mg per kg, followed by 5 mg per kg
after 6 hours, then 5 mg per kg daily for 2 days. In sever and
complicated malaria, when the patient is unable to take oral
medication, parenteral chloroquine may be used. However, many
authorities now recommend the use of quinine instead of
chloroquine in view of the serious toxicity, which may occur
following parentral administration of chloroquine.
There is also some dispute about the most appropriate route for
chloroquine injection: some favour intramuscular injection at a dose
of 3 mg of base per kg every 6 to 8 hours to a maximum of 1 g over
24 hours. Others prefer to give chloroquine by slow intravenous
infusion of 5 mg of base per kg in 10 ml of infusion fluid per kg
given over 4 hours and repeated at 12-hourly intervals. The sever
toxicity which is encountered after parentral administration is
probably due to the very high blood concentrations which follow
both intravenous and intramuscular administration, but

administration as an infusion over 4 hours may help to minimize
this. Parentral administration of chloroquine should only be
undertaken while the blood pressure is carefully monitored and
should be replaced by oral administration as soon as possible. The
situation in parentral administration is even more difficult in
children since there is evidence that they are particularly susceptible
to the adverse cardiovascular effects of chloroquine.
In many countries where chloroquine is freely available, it may be
difficult to discover whether chloroquine has been taken recently and
therefore unexpected toxicity can result during subsequent parentral
administration (James et. al, 1989).
1.1.5.7. Absorption and Fate:
Chloroquine is readily absorbed from the gastro-intestinal tract and
about 55% in the circulation is bound to plasma proteins. It
accumulates in high concentrations in some tissues such as the
kidneys, liver, lung and spleen. It is strongly bound in melanin –
containing cells such as those in eyes and skin. Chloroquine is
eliminated very slowly from the body and it may persist in tissues
for a prolonged period.

The drug is excreted mainly in the urine, with 70% as unchanged
drug and about 25% as the desethyl metabolite. The rate of urinary
excretion of chloroquine is increased at low pH values.
Intramuscular and subcutaneous routes of administration of
chloroquine give almost identical plasma or whole blood
concentration profiles. Absorption is very rapid and relatively
complete even in sever infections. Chloroquine administered as
rectal suppositories has a bioavailability of approximately 30 % -50
%, and rate of absorption similar to that of oral chloroquine in
healthy volunteers.
1.1.5.8. Toxicity:
Chloroquine is one of the most widely used drugs in the world. It still
accounts for over 90% by weight of the global antimalarial drugs
consumption. It has undoubtedly saved the lives of many patients with
sever malaria.
Oral chloroquine is usually well tolerated. Nausea, headache, and
dysphoria are relatively common but seldom serious. Patients may vomit
and may complain of blurred vision. Postural hypotension associated
with malaria may be exacerbated and pruritus can be severe especially in
dark-skinned patients.

There are several reports of sudden death following administration of
intramuscular chloroquine to children with sever malaria. These
probably resulted from cardiovascular toxicity. Fatal hypotension would
be most likely if severely ill, febrile, dehydrated children were
inadvertently given a large intramuscular dose without allowing for
weight or surface area or if the injection was given intravenously by
mistake and the child was then nursed upright. This potentially lethal
toxicity is circumvented by giving continuous constant –rate intravenous
infusion, or smaller, more frequent intramuscular or subcutaneous doses
than previously recommended.
Chloroquine overdose is manifested by coma, convulsions,
dysrhythmias and hypotension.
Administration of more than 100 g of chloroquine (i.e. weekly
prophylactic use for more than 5 years) to adults is associated with
an increased risk of retinopathy. This appears to be associated
mainly with the higher doses used in collagen –vascular diseases.
All subjects on long- term chloroquine prophylaxis should have
regular ophthalmological examinations.
Skeletal and cardiac myopathy may occur in patients receiving high-
dose chloroquine maintance therapy for rheumatoid arthritis.

1.2. Objectives of analysis in quality control:
Analytical chemistry is concerned with the chemical characterization
of matter. It plays an important role in all aspects of chemistry e.g.
agricultural, clinical, forensic, environmental, manufacturing and
pharmaceutical chemistry.
The quality of manufactured products depends on the proper
chemical proportions, and measurement of constituents is thus a
necessary part of quality control.
The field of analytical chemistry consists of qualitative analysis and
quantitative analysis. The former deals with identification while the
later deals with determination of how much of one or more
constituents are present.
Qualitative tests may be performed by selective chemical reactions
or with the use of instrumentation like gas chromatography and mass
spectrometry. In case of quantitative analysis a history of the sample
composition should be known or the analyst must first do qualitative
tests.
There are three phases in analysis, which are the fast screen phase,
the identification phase, and the possible quantification. Many

techniques are used in the fast screen phase including gas
chromatography, liquid chromatography, and immunoassay.
There are many quantitative techniques including spectrophotometry
(ultraviolet, visible and infrared), fluorimetry, atomic spectroscopy
(absorption and emission), mass spectrometry, nuclear magnetic
resonance spectrometry (NMR), X-ray spectroscopy (absorption,
fluorescence), electro analytical techniques (potentiometry,
voltametry and electrolysis), chromatography techniques (liquid and
gas), gravimetry, titrimetry, and radiochemistry. Different
techniques possess varying degrees of selectivity, sensitivity,
precision, accuracy, cost and speed (Gray Christian, 1998).
1.2.1. Spectrophotometry:
The technique of ultra violet-visible spectrophotometry is one of the
most commonly used techniques in pharmaceutical and biomedical
analysis. It is employed in quantitative purposes and with certain
limitations for characterization of drugs, impurities, metabolites and
related substances. The technique basically involves the
measurement of the amount of ultraviolet (190-380 nm) or visible
(380-800 nm) radiation absorbed by a substance in solution.

Absorption of light in both the UV and visible region of the
electromagnetic spectrum occurs when the energy of the light
matches the energy required to induce an electronic transition and it
is associated vibration and rotational transsion in the molecule.
Spectral selectivity can be induced and/or enhanced by a number of
chemicals or by instrumental technique such as difference, higher-
derivative and dual wavelength spectrophotometry.
Spectral interference can often arise from what is known as
“irrelevant” nonspecific absorption, and also from absorption by
other materials and impurities, which may be present.
When interference is due to spectral overlap of two or more well-
defined components, a number of methods are adopted to measure
the individual concentrations. These methods include the vierordt
multiwavelength technique, least squares deconvolution and second
or higher derivative spectrophotometry (Moffat et. al, 1986).
1.2.1.1. Quantitative spectrophotometic assay of medicinal
substances:
The assay of an absorbing substance is carried out by making a
solution of the substance in a transparent solvent and measuring its
absorbance at a suitable wavelength. The wavelength normally

selected is a wavelength of maximum absorption (λ max) where small
errors in the settings of the wavelength scale will have little effects
on the measured absorbance.
Ideally, the concentration should be adjusted to give an absorbance
reading of approximately 0.9, around which the accuracy and
precision of measurement are optimal. It is often preferred to read
the absorbance from the instrument display under non-scanning
conditions, i.e. with the monochromator set at the analytical
wavelength. Alternatively, the absorbance can be read from a
recorded spectrum of the substance obtained by using a recording
double-beam spectrophotometer. The later procedure is of particular
usefulness for qualitative purposes and in certain assays in which
absorbance at more than one wavelength are required. The
concentration of the absorbing substance can be calculated from the
measured absorbance using one of three principal procedures.
1. Use of standard absorbtivity value
This procedure is adopted by official compendia, e.g. British
Pharmacopoeia for stable substance.
2. Use of calibration graphs

In this procedure the absorbances of a number of standard solutions
(4-6) of reference substance at concentrations encompassing the
sample concentration are measured and a calibration graph is
constructed. Concentration of analyte can then be read from the
resultant graph.
3. Single-or double point standardization
The single point procedure involves the measurement of the
absorbance of a sample solution and of a standard solution of the
reference substance. The standard and sample solutions are prepared
in a similar manner; final concentration of the sample solution
should be close to that of the standard solution.
The concentration of the substance in the sample can be calculated
from proportional relationship that exists between absorbance and
concentration
Ctest = std
stdtest
AXCA
Where;
Ctest is the concentration of test substance; Atest is absorbance of test
substance.
Cstd is the concentration of standard; Astd is absorbance of standard.

Pharmacopoeial applications include assays for single and mixtures
of drugs analysis involving color reactions (colorimetric methods),
test for tablet dissolution, limit test for impurities, and assays of bulk
drugs. Further applications are for physicochemical measurements,
such as pKa or velocity constants in enzymatic reactions .The scope
of such applications has been significantly extended by methods,
which can confer additional specificity, namely difference
spectrophotometry, derivative spectophotometry, simultaneous
equation method, absorbance ratio method, geometric correction
method and orthogonal method.
1.2.1.1.1. Assay of single components:
When only one component in the sample absorbs significantly, the
wavelength is chosen to coincide with the center of a broad
maximum in the spectrum in order to minimize errors due to
wavelength –setting. In cases where the spectrum has no suitable
maximum, a flat absorption minimum can be used, provided that the
expected consequent loss of sensitivity is acceptable. Wavelengths
near the limits of the ultraviolet and visible ranges must be avoided,
because of the possibilities of stray-light errors.

The concentration of a component in a sample, which in addition
contains other absorbing substances, may be determined by a simple
spectrophotometric measurement. This is possible only if the other
components have a small absorbance at the wavelength of
measurement. This condition will be met if the concentration of the
interfering substances, their absorbtivity or the path length of the
solution is sufficiently small that their product can be ignored. An
example of this method is the assay of paracetamol in paediatric
paracetamol elixir (Beckett A. H and Stenlake J. B., 1997).
1.2.1.1.2. Assay of multi-component samples:
The spectrophotometric assay of drugs often involves the
measurement of absorbance of samples containing more than one
absorbing component.
A number of modifications to the simple spectrophotometric
procedure have been introduced, which may eliminate certain
sources of interference and permit the accurate determination of one
or all of the absorbing components.
Each modification of the basic procedure may be applied if certain
criteria are fulfilled. The basis of all the spectrophotometric

techniques for multi-component analysis of samples is the property
that at all wavelengths, the following facts are observed:
1. The absorbance of solution is the sum of the absorbencies of the
individual components.
2. The measured absorbance is the difference between the total
absorbance of the solution in the sample cell and that of the solution
in the reference cell (blank).
1.2.1.1.3. Assay using absorbance corrected for interference:
If the nature, concentration and absorptivity of the absorbing
interferents are known, it will be possible to calculate their
contribution to the total absorbance of a mixture. The concentration
of the absorbing component of interest can then be calculated from
the corrected absorbance (total absorbance minus the absorbance of
interfering substances).
1.2.1.1.4. Assay after solvent extraction of the sample:
If interference resulting from other absorbing substances is very
large or if its contribution to the total absorbance cannot be
calculated, it may be required, if possible, to separate the absorbing
interferents from the analyte by solvent extraction procedures. These
procedures are appropriate especially for acidic or basic drugs where
the state of ionization determines their solvent partitioning behavior.
Such an example is the assay of caffeine in aspirin and caffeine
tablets (B.P.).
1.2.1.2. Methods for determining concentration:
1.2.1.2.1. Simultaneous equation method:
If a sample contains two absorbing drugs each of which absorbs at
the maxλ of the other, it may be possible to determine both drugs by
applying the technique of simultaneous equations (Vireod’s method)
provided that certain criteria are fullfield. An example of such assay
is described in the B.P. for the assay of quinine related alkaloids and
for cinchona-related alkaloids in Cinchona Bark.
1.2.1.2.2. ABSORBANCE RATIO METHOD
The method of absorbance ratio is a modification of the
simultaneous equation procedure. It depends on the property that, for
a substance, which obeys Beers Law at all wavelengths, the ratio of
absorbance at any two wavelengths is a constant value independent
of concentration or path length. In the quantitative assay of two
components in admixture by the absorbance ratio method,
measurement of absorbance are made at two wavelengths one being

the maxλ of one of the components ( 2λ ) and the other one being a
wavelength of equal absorbtivity of the two components ( 1λ ), i.e., an
iso-absorptive point. This method is applied for the assay of
trimethoprim and sulphmethoxazole in co-trimoxazole tablets
(Beckett A. H and Stenlake J. B., 1997).
1.2.1.2.3. GEOMETRIC CORRECTION METHOD
Mathematical correction procedures have been developed to reduce
or eliminate the background irrelevant absorption that may be
present in samples of biological nature. The simplest of these
procedures is the three –point geometric procedure, which is
applicable if the irrelevant absorption is linear at the three
wavelength selected. The assay of vitamin A in fish liver oils
furnishes an example for the geometric correction method (Beckett
A. H and Stenlake J. B., 1997).
1.2.1.2.4. Orthogonal polynomial method
The technique of orthogonal polynomials is another mathematical
correction procedure, which involves more complex calculations
than the three –point correction procedure. The basis of the method
is that an absorption spectrum may be represented in term of
orthogonal function as follows:
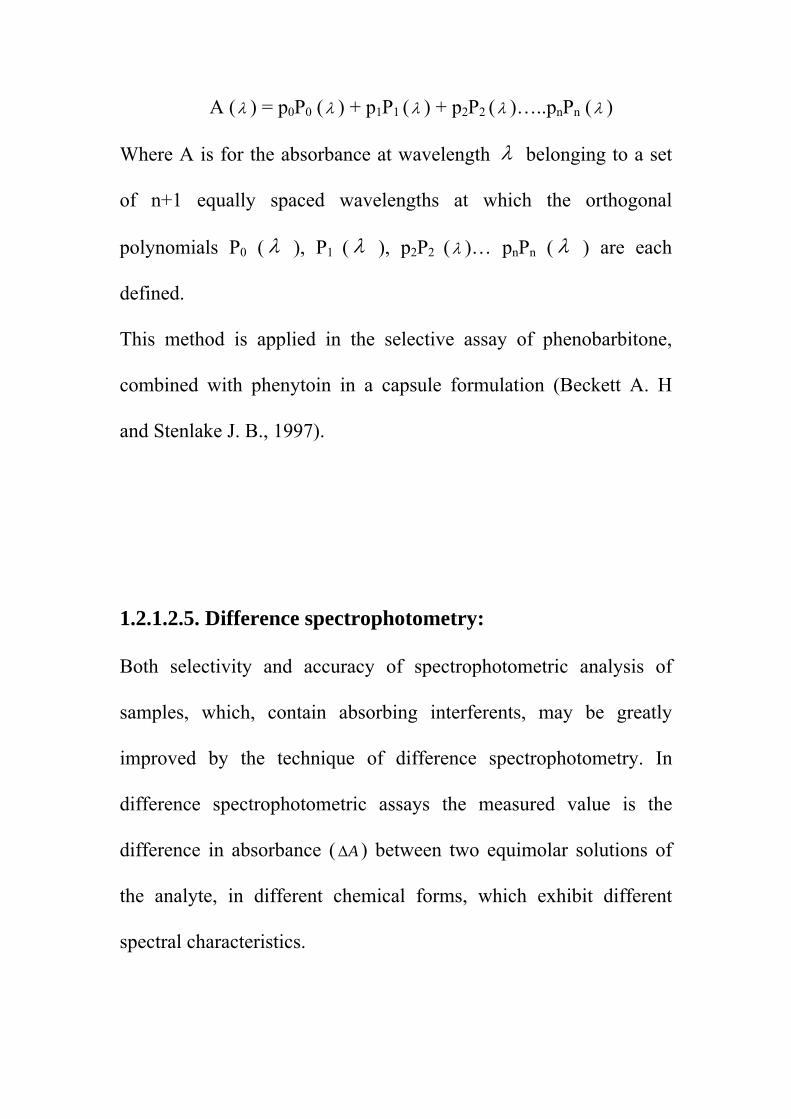
A (λ ) = p0P0 ( λ ) + p1P1 (λ ) + p2P2 ( λ )…..pnPn ( λ )
Where A is for the absorbance at wavelength λ belonging to a set
of n+1 equally spaced wavelengths at which the orthogonal
polynomials P0 ( λ ), P1 ( λ ), p2P2 ( λ )… pnPn ( λ ) are each
defined.
This method is applied in the selective assay of phenobarbitone,
combined with phenytoin in a capsule formulation (Beckett A. H
and Stenlake J. B., 1997).
1.2.1.2.5. Difference spectrophotometry:
Both selectivity and accuracy of spectrophotometric analysis of
samples, which, contain absorbing interferents, may be greatly
improved by the technique of difference spectrophotometry. In
difference spectrophotometric assays the measured value is the
difference in absorbance ( A∆ ) between two equimolar solutions of
the analyte, in different chemical forms, which exhibit different
spectral characteristics.

Difference spectrophotometry is a technique of compensating for the
extraneous materials present in a sample, which might interfere with
the spectrum of the drug being determined. It involves the
measurement of difference in the absorbance, at a defined
wavelength, between two samples in one of which a physical or
chemical property of the drug has been changed. It is assumed that
the spectrum of the drug can be changed without affecting the
spectrum of the interfering material. Alternatively, the absorbance
difference between the sample and an equivalent solution without
the drug may be measured. Difference spectrophotometry is
sometimes referred to as 'differential spectrophotometry', but this is
not recommended since it might be confused with derivative
spectrophotometry.
Certain criteria are required for applying difference
spectrophotometry for the analysis of a substance in the presence of
other absorbing substances:
1. Reproducible changes are induced in the spectrum of the analyte
by the addition of one or more reagents.
2. The absorbance of the interfering substances has not been altered
by the addition of such reagents.

The simplest and most commonly used technique for altering the
spectral properties of the analyte is the adjustment of the pH of the
solution by means of aqueous solution of acids, alkalis or buffers.
A substance whose spectrum is not affected by changes in pH can
also be determined by a difference spectrophotometric procedure.
This can be done by quantitatively converting it, using a suitable
reagent, to a chemical species that has different spectral properties
from the uncreated parent substance. The A∆ between equimolar
solutions of the uncreated substance and the corresponding
derivative is free of interference if the irrelevant absorption is
unaffected by the reagent.
If: ε∆=∆A bc
Where: ε = molar absorptivity (liter/mole/cm),
b = cell path-length (cm),
c = concentration (mol/liter). Then the difference absorbance can be related to concentration by
the relation:
∆Atest/∆Astandard = Ctest/Cstandard
It should, however, be established that ∆A is a liner function of
concentration C

Difference spectrophotometry can be used for quality control if the
interfering material is well –defined. In such a case an appropriate
dilution of a suitable reference solution can be used in the reference
cell. The technique of difference absorbance is subject to systematic
error when there is uncertainty about the concentration of interfering
materials in the samples to be assayed. This error increases in
proportion to the ratio of the molar absorptivity of the interferent to
that of the analysed drug.
A further technique to correct for absorptive interferences by
difference measurement is based on dual –wavelength
spectrophotometry. In this method, two monochromatic beams at
different wavelengths are passed through the same sample. One
wavelength (λ1) is generally characteristic of the drug, while the
other (λ2) is carefully selected so that the absorbance is equivalent to
the level of absorptive interference (Aλ1m) anticipated at the
analytical wavelength (λ1). The second radiation beam will thus be
analogous to the reference cell employed in conventional difference
spectrophotometry. The difference in absorbance at the two
wavelengths ( ∆ A) represents the absorption of drug (A 1λn ) corrected
for interference

A 1λ=A 1λ
n + A 1λm
And since
A 2λ = A 1λm
Then ∆ A = A 1λ- A 2λ = A 1λ
n
An application of this method is represented by the correction of
Raleigh scatter in samples of biological origin. An example of this
method is the selective assay of chlordiazepoxide and it is major
hydrolysis product, demoxepam, in degraded formulations of
chlordiazepoxide (Beckett A. H and Stenlake J. B., 1997).
1.2.1.2.6. Colorimetric Measurements:
In colorimetric methods we can selectively transform a drug, its
impurity, or a metabolite so that the spectrum of the product is
shifted to the visible region. This will minimize interference caused
by another drug, formulation components or biological substances,
thereby conferring a further degree of specificity. Moreover, a drug
with little or no useful absorption can be more highly – absorptive
chromophore.
There are several parameters, which require careful and critical
consideration in colormetry. Firstly, the colour reagent should be

selective for the drug molecule itself, discriminating against
degradation products, impurities, and formulation excipent which
might be present. Secondly, the effect and control of any parameters,
which is likely to affect the color reaction, should be established, i.e.
solvent, pH, temperature, reagent excess, order of mixing reagents,
and other related factors.
Moreover, the time required to establish the chromophore
generated, should be carefully monitored and assessed. Finally, the
analytical performance should be assessed in terms of recovery,
precision, sensitivity, linear range, and robust behavior.
1.2.1.2.7. DERIVATIVE SPECTROPHOTOMETRY
IN DERIVATIVE SPECTROPHOTOMETRY THE
ABSORBANCE (A) OF A SAMPLE IS DIFFERENTIATED WITH
RESPECT TO WAVELENGTH ( λ ) TO GENERATE THE FIRST,
SECOND, OR HIGHER ORDER DERIVATIVES (14). IN THE
CONTEXT OF DERIVATIVE SPECTROPHOTOMETRY, THE
NORMAL ABSORPTION SPECTRUM IS REFERRED TO AS
THE FUNDAMENTAL, ZERO ORDER OR 0D SPECTRUM
A= f ( λ ) λddA = f ' ( λ ) 22 λdAd = f " ( λ ), etc.

Zero order first derivative second derivatives
THE FIRST DERIVATIVE (1D) SPECTRUM IS A PLOT OF THE
RATE OF CHANGE OF ABSORBANCE WITH WAVELENGTH
AGAINST WAVELENGTH, I.E. A PLOT OF THE SLOPE OF
THE FUNDAMENTAL SPECTRUM AGAINST WAVELENGTH
OR A PLOT OF
λddA VS. λ .
The second derivative (2D) spectrum is a plot of the curvature of the
0D spectrum against wavelength or a plot of 22 λdAd vs. λ .
Spectra are seen as distinctive bipolar feature; the even order
derivatives are bipolar functions of alternating sign at the centroid,
whose position coincides with that of the original peak maximum
(Moffat et. al,1986 ).
The first derivative spectrum of an absorption band is characterized
by a maximum, a minimum, and a crossover point at the λ max of the
absorption band.
The second derivative spectrum is characterized by two satellite
maxima and an inverted band of which the minimum corresponds to
the λ max of the fundamental band

A derivative spectrum therefore gives a better resolution of
overlapping bands than the corresponding fundamental spectrum and
may permit the accurate determination of the λ max of the individual
bands. Secondly, derivative spectrophotometry discriminates in
favor of substances of narrow spectral bandwidth against those with
broad bandwidth. The derivative amplitude (D), i.e. the distance
from a maximum to a minimum, is inversely proportional to the
fundamental spectral bandwidth (W) raised to the power (n) of the
derivative order. Thus,
D ( )nW1α
And consequently, substances with narrow spectral bandwidth
display larger derivative amplitudes than those with broad
bandwidth.
These advantages of enhanced resolution and bandwidth
discrimination found in derivative spectrophotometry permit the
selective determination of certain absorbing substances in samples in
which non-specific interference may limit the application of simple
spectrophotometric methods. Ephedrine hydrochloride in ephedrine
hydrochloride elixir is assayed by second derivative

spectrophotometry, which eliminates the broadband absorption of
the excipent (Beckett A. H and Stenlake J. B., 1997).
The enhanced resolution and bandwidth discrimination increases
with increasing order of derivative spectrophotometry. However, it
should be noted that the concomitant increase in electronic noise
inherent in the generation of the higher order spectra, and the
consequent reduction of the signal-to-noise ratio, would confer
practical limitations on the higher order spectra.
An important property of the derivative process is that broad bands
are suppressed relative to sharp ones. This effect increases with
increasing order of the derivative. This property leads to selective
rejection of broad, additive, spectral interferences such as Rayleigh
scattering (Moffat et. al, 1986).
-Instrumentation:
Derivative spectra can be obtained by any of three techniques. The
firstderivative spectra were obtained by modification of the optical
system. Spectrophotometers with dual monochromators set at small
wavelength intervals ( λ∆ , about 1-3 nm) apart or with the facility to
oscillate the wavelength over a small range, are required. In either
case the photo detector generates a signal, which has amplitude

proportional to the slope of the spectrum over the wavelength
interval.
The second technique employed to generate derivative spectra
comprise electronic differentiation of the spectrophotometer analog
signal. Resistance-capacitance (RC) modules may be incorporated
in the series between spectrophotometer and recorder to provide
differentiation of the absorbance, with respect to time and not
wavelength, thereby producing the signal d λ /dt. If the wavelength
scan rate is constant (d λ /dt = C), the derivative with respect to
wavelength is given by:
λddA = (dA/dt) (d λ /dt)= (dA/dt)(1/C)
Where:
λddA = Change of absorbance with respect to wavelength.
DA/DT = CHANGE OF ABSORBANCE WITH RESPECT TO
TIME.
d λ /dt = Change of wavelength with respect to time.
C = Concentration (mol/liter). Derivative spectra obtained with
RC modules are highly dependent on instrumental parameters, such
as the scan speed and the time constant. It is important therefore to
use a standard solution of the analyte to calibrate the measured value

under the instrumental conditions selected. The third technique is
based upon microcomputer differentiation. Microcomputers
incorporated into or interfaced with the spectrophotometer may be
programmed to provide derivative spectra during or after the scan of
the spectrum of the sample.
For quantitative purposes, the amplitude of a derivative peak can be
measured in a number of ways including peak- to -peak, peak-to-
satellite at short wavelength, peak-to-derivative zero, peak-to-
satellite at long wavelength and satellite peak-to- derivative zero.
If Beer-Lamber law is obeyed,
i.e.
A =ε bc
Then
λd
dA = λε
dd . B.C
2
2
λdAd = 2
2
λε
dd . B.C
AND SO ON FOR A HIGHER DERIVATIVES.
Derivative spectrophotometry has found significant application in
clinical, forensic, and biomedical analysis (Moffat et. al, 1986 ).

1.2.1.2.8. CHEMICAL DERIVATISATION:
Derivatisations in direct spectrophotometric assays are based on the
conversion of the analyte by a chemical reagent to a derivative that
has different spectral characteristics.
When an excess of the reagent is used, in order to ensure complete
conversion, the absorbance of the derivative is usually proportional
to the concentration of the analyte. The majority of indirect
spectrophotometric procedures involve the conversion of the analyte
to a derivative, which will have a longer λ max and/or a higher
absorptiviy than the parent compound. Chemical derivatisation
procedures are adopted for any of several reasons:
1. IF THE ANALYTE ABSORBS WEAKLY IN THE
ULTRAVIOLET REGION
2. If the interference from irrelevant absorption is avoided by the
conversion of the analyte to a derivative, which absorbs in the
visible region, where irrelevant absorption is negligible.
3. To improve the selectivity of the assay of an ultraviolet-absorbing
substance in a sample that contains other ultraviolet-absorbing
components.

4. If the adoption of a visible spectophotometric procedure, instead
of an ultraviolet procedure is based on cost considerations.
1.2.2. CHROMATOGRAPHIC TECHNIQUES:
Chromatography was first discovered and named in 1906 by
Michael Tswett. It refers to separations of components of a sample
by distribution of the components between two phases: one, which is
stationary, and the other that moves, usually in a column (Gary and
James, 1986).
There are many types of chromatography. Size exclusion
chromatography is the one in which molecules are separated based on
their size by passage through a porous structure stationary phase. In ion
exchange and ion chromatography, ions are separated based on their
charge. In gas chromatography, gaseous substances are separated
according to their adsorption on or solubility in the stationary phase.
High performance liquid chromatography is a modern technique based
on the above principles but using micrometer size particles for the
stationary phase. Other types of chromatography include thin-layer
chromatography, paper chromatography, and electrophoresis in which
the stationary phase is in the form of a sheet or other flat surface and an

electrical gradient is applied across the sheet to cause molecules to
migrate according to the sign and magnitude of their charge.
All chromatographic techniques are principally based on establishment
of equilibrium between a stationary phase and a mobile phase. The
mechanism of retention however, differs for various type of
chromatography (Grayd Christian, 1998).
1.2.2.1. High Performance Liquid Chromatography
(HPLC):
Is a relatively modern analytical technique and it is preferred for the
rapid separation of non -volatile or thermally unstable samples. Its basic
mechanism is the same as liquid chromatography but it has the
advantage of high speed, good resolution, high sensitivity and its
convenience for quantitative analysis.
The difference between normal liquid chromatography (LC) and HPLC
is that for classical LC large porous particles are packed into columns
while in HPLC columns are packed with pellicular or micro particulate
packaging particles.
An increase in column efficiency with decrease porous particles
result from development of pellicular packing and micro particulate
which lead to use of short columns with smaller internal diameter.

The detector used in HPLC can either be selective e.g. it detects ultraviolet absorbing or fluorescence compound or it can be universal to detect all types of components. The spectrophotometric and titration methods of assay are now
largely replaced by HPLC methods. This technique is preferred
because it allows the analysis of the drug faster and reasonably
without interference from excipent.
1.3. Analysis of chloroquine:
Choroquine phosphate tablets and injections are pharmacopeial
drugs available in both the British Pharmacopoeia and the United
State Pharmacopoeia. Chloroquine syrup is not a pharmacopeial
drug.
The method of analysis of tablets and injections in both pharmacopoeias
is non-aqueous titration. A high performance liquid chromatographic
(HPLC) method, which is not pharmacopeial, but a validated one is also
available (WHO, 1990).
A lot of work has been done concerning the analysis of chloroquine
phosphate. Of these, is work done by Nsimba SE,et,al, 2001. which
involved an HPLC analysis of sugar –coated chloroquine preparations
marketed in Tanzania versus an ordinary brand for an invivo and an in
vitro comparative study. Another HPLC method was done by Sjolin-

Forsberg G, et, al 1993. involving a long term follow up of chloroquine
phosphate concentration in skin suction fluid and plasma. The
concentration of chloroquine in plasma and whole blood was done by
an HPLC method in the work done by Neuvonen PJ, et al,1992. for the
study of prevention of chloroquine absorption by activated charcoal. A
bioavailability study of oral sugar-coated and plain formulation of
chloroquine phosphate marketed in Tanzania was done by Rimoy GH,
et, al, 2002, using an HPLC method. Allen LV Jr and Erichson MA,
1998, studied the stability of alprazolam, chloroquine phosphate,
cisapride, enalapril maleate and hydrazine hydrochloride in
extemporaneously compounded oral liquids by an HPLC method.
Hassan SS and Ahmed MA, 1991, did the determination of chloroquine
phosphate in various pharmaceutical preparations by polyvinyl chloride
(PVC) matrix membrane electrodes. Dwivedi AK, et, al, 2003, has
developed an HPLC and HPTLC method for assays of a new
antimalaria agent consisting of chloroquine phosphate, primaquine and
bulaquine. A conductmetric and indirect atomic absorption spectral
methods have been developed by Amin AS and Issa YM, 2003, for the
determinations of the antimalarials, amodiaquine hydrochloride,
chloroquine phosphate and primaquine phosphate. A first derivative
spectrophotometeric and HPLC determination of cinchocaine

hydrochloride in presence of it is acid degradation product was
developed by El-Gindy A, et, al, 1998.
In the presence work, a new derivative spectroscopic method has been
established for the analysis of chloroquine phosphate.
Objectives of the present work are:
2.1. Development and optimization of a derivative
spectrophotometric method for the analysis and quantitative
measurement of chloroquine phosphate.
2.2. Assessment of the selectivity, sensitivity and accuracy of the
developed method.
2.3. Employing the developed method for analysis of chloroquine
phosphate in pharmaceutical dosage forms.
2.4. Assessment of the selectivity of the method in presence of
pharmaceutical excipent.
2.5. Comparison between the developed method and the official
methods for analysis of chloroquine phosphate.
2.6. Application of the method in analysis of chloroquine
phosphate in biological fluids.

3.1. Instrumentation
3.1.1. A double-beam UV-VIS. Spectrophotometer, Unicam Heyios
α , model UVA 082017 with software and Epson printer/Germany,
was used in the quantitative analysis of different samples of
chloroquine phosphate.The spectral bandwidth was 2 nm and the
wavelength scanning speed was 1200 nm min-1.
The absorption spectra of test and reference solutions were recorded in
1- cm quartz cells over the range 200-400 nm. The zero order
absorption and the first derivative of the measured spectra were
obtained using accompanied software.
3.1.2. High Performance Liquid Chromatograph used was Syknm
connected to a UV/Visible dector S3200, Laboratory Computing

Integrator and S1121 pump /Japan. The separations were performed on
a Supelcosil LC-18, 15X4.6 mm at room temperature. The samples were
introduced through a bracket injector valve with 50 lµ sample loop.
3.1.3. Memotitrator was used for non-aqueous titrations.
3.2. Reagents:
All reagents used were of analytical grade (perchloric acid, phosphoric
acid, sodium hydroxide, anhydrous acetic acid and chloroform).
Acetonitrile (HPLC grade) was used for preparation of mobile phase.
3.3. Formulations selected to be analyzed:
3.3.1. Amiquine tablets (Amipharma Laboratories, Ltd. Khartoum,
Sudan, batch no. t 0077, manufactured date Oct.2002, and expiry date
Oct.2005) labeled to contain 250 mg of chloroquine phosphate per
tablet, in addition to starch, talc, magnesium stearate and aerosol which
were used as exciepent.
3.3.2. Efroquine tablets (Efroze Chemical Industries (private) LTD.
Karachi Pakistan, batch no. B-42, manufactured date Jan/2000, and
expiry date Dec/2003) labeled to contain 250 mg of chloroquine
phosphate per tablet, in addition to acacia, aerosil, magnesium stearate,
starch, talc and titanium dioxide which were used as exciepent.

3.3.3. Lariago tablets (Ipcca Laboratories Ltd. India, batch
no.0013DQR, manufactured date 11/2000, and expiry date 10/2003)
labeled to contain 250 mg of chloroquine phosphate per tablet, in
addition to calcium stearate, starch, talc, acacia, gelatin, methyl paraben
and propyl paraben as exciepent.
3.3.4. Chloroquine phosphate tablets (Remidica Ltd. Cyprus-Europe,
batch no.16860, manufactured date 9/2001, and expiry date 9/2006)
labeled to contain 250 mg of chloroquine phosphate per tablet, in
addition to magnesium sterate, starch, talc, titanium dioxide, gelatin,
avicel and sucrose as exciepent.
3.3.5. Chloroquine phosphate injection (Bioluz Lab France, batch
no.22573, manufactured date 6/2002, and expiry date 6/2005) labeled to
contain 200 mg of chloroquine base per 5ml, in addition to phosphoric
acid.
3.3.6. Balsaquine injection (Balsam Pharmaceutical Company
Khartoum Sudan, manufactured date July/2001, and expiry date
July/2005) labeled to contain 200 mg of chloroquine base per 5 ml.
3.3.7. Chloroquine phosphate syrup (The Jordan Pharmaceutical
Manufacturing Co Ltd Jordan, batch no. 000839, manufactured date
8/2000, and expiry date 8/2003) labeled to contain 75 mg of

chloroquine base per 5ml, in addition to glycerin, propylene glycol,
sucrose, methyl paraben, propyl paraben, saccharin sodium and sodium
citrate as exciepent.
3.3.8. Lariago syrup (Ipcca Laboratories Ltd. India, batch no. DM
1001R, manufactured date Jun/2001, and expiry date Jun/2004) labeled
to contain 160 mg of chloroquine phosphate per 10 ml of syrup
equivalent to 100 mg of chloroquine base, in addition to raspberry
syrup, methyl paraben and propyl paraben as exciepent.
3.4. Stock Solutions of chloroquine standard:
3.4.1. Stock solutions of chloroquine phosphate standard:
An accurate weight (250 mg) of chloroquine phosphate standard was
transferred into a 250-ml volumetric flask, dissolved and diluted to
volume with water.
3.4.2. Stock solutions of excipent:
An accurate weight (Table 1) of each excipent was transferred into a
100-ml volumetric flask dissolved and diluted to volume with water
(Michael and Irene, 1995).

Table 1: Excipent used in chloroquine phosphate
formulations:
No. Name of excipent Weight/100ml
1 Aerosil 20 mg
2 Avicel 40 mg
3 Starch 48 mg
4 Magnesium stearate 82 mg
5 Lactose 24 mg
6 Talc 20 mg
7 Acacia 20 mg
8 Methyl paraben 20 mg
9 Propyl paraben 20 mg
10 Dicalcium phosphate 46 mg
11 Titanium dioxide 20 mg
12 Opadry 20 mg
13 Propylene glycol 500 mg
14 Glycerin 50 mg
15 Sucrose 1180 mg
16 Saccharin sodium 20 mg
17 Sodium citrate 50 mg

18 Citric acid 20 mg
19 Sorbitol 520 mg
20 Xanthan gum 20 mg
21 Tween 80 20 mg
22 Gelatin 20 mg
23 Phosphoric acid 455 mg
3.5. Solutions of pharmaceutical preparations (samples):
3.5.1. Stock solutions of chloroquine phosphate tablets:
Twenty tablets were accurately weighed, transferred to a mortar and
powdered. A mass containing 100 mg of chloroquine phosphate was
accurately weighed and transferred into a 100-ml volumetric flask,
dissolved in water, sonicated for 10 min and the volume completed to
100-ml with water. The solution was filtered through Whatman no. 40
filter paper.
3.5.2. Stock solutions of chloroquine phosphate injection:
2 ml of chloroquine phosphate injection was accurately measured using
a volumetric pipette and transferred to a 100-ml volumetric flask, and
the volume completed with water.

3.5.3. Stock solutions of chloroquine phosphate syrup:
A bottle of chloroquine phosphate syrup was transferred to a 100-ml
volumetric flask and the volume completed with water. 5 ml of the
solution was transferred to a 100 ml volumetric flask and the volume
completed to 100 with water.
3.6. Procedure:

3.6.1. Spectrophotometric method:
3.6.1.1. Calibration curve:
Serial dilutions were made from the stock standard solution to obtain
sets of concentrations of 2.5 gµ ml-1, 10 gµ ml-1, 20 gµ ml-1, 30 gµ ml-1,
40 gµ ml-1, and 50 gµ ml-1 with water.
Using water as blank, the zero order absorption and the first derivative
spectra of these solutions were recorded over the range 200-400 nm,
with a speed of 1200 nm/min, bandwidth 2 nm and medium smoothing
to the curve. The absorbance values at 221 nm (A221), 236 nm (A236), 256
nm (A256 ), 331 nm (A331), 343 nm (A343) were measured and the value of
first derivative at wavelengths 225 nm ( 1D225), 239 nm( 1D239), 260 nm (
1D260), 333 nm ( 1D333 ) and 349 nm ( 1D349 ) were measured (amplitude)
for each concentration. The regression, intercept and slope were
calculated for each wavelength.
The same procedure was followed for the construction of a calibration
curve for analysis of chloroquine phosphate standard dissolved in 0.01M
HCl.
3.6.1.2. Assay of chloroquine phosphate in presence of
excipent:

5 ml of the stock solution of each excipent were pipetted and
transferred to a 100 ml volumetric flask. To each, 5 ml of the stock
chloroquine phosphate standard solution were added and the volume
completed to 100 ml with water. 5 ml of the stock chloroquine
phosphate standard solution were diluted to 100 ml with water. Using
water as blank, the zero order absorption and the first derivative spectra
of these solutions were recorded over the range 200-400 nm, with a
speed of 1200 nm/min, bandwidth 2 nm and medium smoothing to the
curve. The absorbance values at ( A221), ( A236), ( A256), (A331), and ( A343)
were measured and the value of first derivative (1D225), (1D239), (1D260),
(1D333) and (1D349) were measured (amplitude) for each excipent and
standard solution. The concentration of chloroquine phosphate in each
sample was then calculated.
3.6.1.3. Assay of chloroquine phosphate in pharmaceutical
dosage form:
5 ml of the stock solution of each of chloroquine phosphate tablet,
injection and syrup were diluted to 100 ml with water. Using water as
blank the zero order absorption and the first derivative spectra of these
solutions were recorded over the range 200-400 nm, with a speed of
1200 nm/min, bandwidth 2 nm and medium smoothing to the curve.

The absorbance values (A221), (A236), (A256), (A331) and (A343) were
measured and the value of first derivative (1D225), (1D239), (1D260), (1D333)
and (1D349) were measured (amplitude) for each of the chloroquine
phosphate tablet solution, injection and syrup. The concentration in
each dosage form was calculated from regression equation for each
wavelength.
3.6.2. High Performance Liquid Chromatography Method:
The chromatographic procedure was carried out using, a mobile phase
consisting of a mixture of phosphate buffer (pH 3) and acetonitrile in
the ratio (3:2). The mobile phase was filtered and degassed before use
(Amal N. Abdelrahman et, al, 1994).
3.6.2.1. Phosphate buffer pH 3:
This was prepared by adding 7 ml of phosphoric acid (85%w/w) to
100 ml of water; 700 ml of water were then added, pH adjusted to 3
using 10 M NaOH and the volume completed to 1000 ml with water.
The separation was carried out using a C18 column with a flow rate of
1.5 ml/min, at wavelength 349 nm. The retention time was 3 min.
3.6.2.2. Calibration curve

From the stock standard solution, serial dilutions were made to obtain
sets of concentration of 2.5 gµ ml-1, 10 gµ ml-1, 20 gµ ml-1, 30 gµ ml-1,
40 gµ ml-1, and 50 gµ ml-1.
Triplicate injections (50 lµ of each concentration) were made and the
average peak heights of the three readings were calculated. The
regression, slope and intercept of the curve were calculated.
3.6.2.3. Assay of chloroquine phosphate in presence of
excipent:
5 ml of the stock solution of each excipent were accurately measured
using a volumetric pipette and transferred to a 100 ml volumetric flask.
To each solution, 5 ml of the stock chloroquine phosphate standard
solution were added and the volume completed to 100 ml with water.
5 ml of the stock chloroquine phosphate standard solution was diluted
to 100 ml with water.
50 lµ of the chloroquine phosphate standard solution were injected
(three times) then 50 lµ of each excipent solution were injected (three
times).
After the injection of the third sample of each excipent solution,
50 lµ of the standard chloroquine phosphate solution were again injected

(three times). The injection of the standard chloroquine phosphate
solution was repeated after each three samples solution (bracketing).
The average of the area under the curve (AUC) was calculated, and then
the concentration of chloroquine phosphate in each sample was
calculated.
3.6.2.4. Assay of chloroquine phosphate in pharmaceutical
dosage forms:
5 ml of the stock solution of each of chloroquine phosphate tablet,
injection and syrup were diluted to 100 ml with water. 50 lµ of the
standard chloroquine phosphate solution were injected (three times)
followed by triplicate injection (50 lµ each) of each sample solution.
After the injection of three samples, 50 lµ of standard solution were
again injected (three times) and the injection of standard was repeated
after each three-sample solution (bracketing).
The average of area under the curve (AUC) was calculated and then the
concentration of chloroquine phosphate in each sample was worked out.
3.6.3. Non Aqueous Titration Method:
3.6.3.1. Assay of chloroquine phosphate tablets:

Twenty tablets were weighed and powdered. A mass containing 0.5 gm
of chloroquine phosphate was accurately weighed and transferred into a
separatory funnel, dissolved in 20 ml of 1.0 M sodium hydroxide and
extracted with 25 ml of chloroform (four times). Combined chloroform
extracts were evaporated to a volume of about 10 ml. 40 ml of
anhydrous acetic acid were added plus crystal violet (indicator). The
solution was titrated with 0.1M perchloric acid VS to color change of
indicator.
Each ml of 0.1M perchloric acid VS is equivalent to 25.79 mg of
chloroquine phosphate.
3.6.3.2. Assay of chloroquine phosphate injection:
A volume containing the equivalent of 0.4 gm of chloroquine base was
accurately measured and transferred into a separatory funnel, dissolved
in 20 ml of 1M sodium hydroxide and extracted with 25 ml of
chloroform (four times). Combined chloroform extracts were
evaporated to a volume of about 10 ml. 40 ml of anhydrous acetic acid
were added plus crystal violet (indicator). This was titrated with 0.1M
perchloric acid VS to color change of the indicator.
Each ml of 0.1M perchloric acid VS is equivalent to 15.99 mg of
chloroquine base (BP).

3.6.3.3. Assay of chloroquine phosphate syrup:
(Non-official method, as BP tablet assay).
25 ml of chloroquine phosphate syrup were transferred to a separatory
funnel, dissolved in 20 ml of 1.0 M sodium hydroxide solution and
extracted with 25ml of chloroform (10 times). Combined chloroform
extracts were evaporated to a volume of about 10 ml. 40 ml of
anhydrous acetic acid was added plus crystal violet (indicator). This was
then titrated with 0.1M perchloric acid VS to color change of the
indicator.
Each ml of 0.1M perchloric acid VS is equivalent to 25.79 mg of
chloroquine phosphate.
3.7. Application of derivative spectroscopy in analysis of
chloroquine phosphate in biological fluids:
Trials for analysis of chloroquine phosphate in plasma by first derivative
spectroscopy were conducted. Following the validation of the method
of first derivative spectroscopy for analysis of chloroquine phosphate in
water, the method was applied for the analysis of chloroquine phosphate

dissolved in plasma and the results obtained were compared with the
absorbance spectroscopy results.
3.7.1. Calibration curve:
Prepared solutions of chloroquine phosphate standard in plasma in the
concentration range of (2.5µg ml-1 – 50 µg ml-1) were assayed by first
derivative spectroscopy. From the results obtained calibration curves
were constructed.
3.7.2. Assay of chloroquine phosphate in pure plasma:
50 mg of chloroquine phosphate standard was accurately weighed and
dissolved in 50 ml of pure plasma (stock solution). 5 ml of this solution
were pipetted and transferred to a 100 ml volumetric flask and
completed to volume with water. 5 ml of pure plasma was diluted to 100
ml with water and used as a blank. 5 ml of the stock chloroquine
phosphate standard solution were diluted to 100 ml with water. The
zero order absorption and the first derivative spectra of these solutions

were recorded over the range 200-400 nm, with a speed of 1200
nm/min, bandwidth 2 nm and medium smoothing to the curve. The
absorbance values at 331 nm (A331) and 343 nm (A343) were measured
and the value of first order derivative at wavelengths 333 nm (1D333) and
349 nm (1D349) were measured (amplitude). No significant absorbance
bands were detected at wavelengths 221 nm, 236 nm and 256 nm for
zero order absorption and at 225 nm, 239 nm, and 260 nm for first
derivative. The concentration of chloroquine phosphate in each sample
was then calculated. The assay was repeated three times.

4.1. Calibration curves
Calibration curves for analysis of chloroquine phosphate standard by
different methods were done, these methods are:
Derivative spectrophotometry.
Absorbance spectrophotometry.
HPLC.
Standard stock solutions of chloroquine phosphate (1.0 mg ml-1)
were prepared by dissolving the compound in
(1) Water (2) 0.01M HCl (3) plasma Standard solutions of chloroquine phosphate in the range 2.5-50 gµ ml-
1 were prepared by the addition of the appropriate amount of the stock
standard solutions of the compounds to water or 0.01M HCl or pure
plasma. Measurements were made on three different days.
4.1.1. Derivative spectrophotometry:
A calibration curve was constructed by assaying standard solutions
of chloroquine phosphate in the range 2.5-50 1−gmlµ in water, 0.01M
HCl and plasma.
The first derivative spectra of these solutions were recorded over the
range 200-400 nm against a blank of water, 0.01M HCl and plasma
respectively using UNICAM spectrophotometry.

The derivative value at 225 nm (1D225), 239 nm (1D239), 260 nm
(1D260), 333 nm (1D333) and 349 nm (1D349) were measured for
determination of chloroquine phosphate.
Table 2: Derivative spectrophotometry results for analysis
of chloroquine phosphate standard in H2O:
Concentration
gµ ml-1
1D225
1D239
1D260
1D333
1D349
50 -0.75 -0.34 -0.34 -0.15 -0.86
40 -0.65 -0.27 -0.27 -0.13 -0.68
30 -0.56 -0.20 -0.21 -0.09 -0.52
20 -0.37 -0.14 -0.14 -0.06 -0.35
10 -0.19 -0.07 -0.07 -0.03 -0.18
2.5 -0.04 -0.01 -0.02 -0.01 -0.04
Regression 0.988 0.999 0.999 0.997 1.000
Intercept 1.5*10-2 5*10-4 -2*10-3 -7*10-4 -4.1*10-3
Slope 1.5*10-2 -6.8*10-3 -6.8*10-3 -3.1*10-3 -1.71*10-2

Fig 1. First derivative spectrum of chloroquine phosphate
standard in water recorded over the range 200-400 nm

Fig.2. Calibration graphs for derivative spectrophotometry
analysis of chloroquine phosphate
standard in H2O at wavelengths 225 nm, 239 nm, 260 nm,
333 nm, 349 nm.
1D 225 1D239
Concentration
6050403020100
D1
0.0
-.2
-.4
-.6
-.8
-1.0
Observed
Linear
Concentration
6050403020100
D1
0.0
-.1
-.2
-.3
-.4
Observed
Linear
Concentration gµml-1
Concentration gµml-1

1D260 1D333
Concentration
6050403020100
D1
0.00
-.02
-.04
-.06
-.08
-.10
-.12
-.14
-.16
Observe
Linear
Concentration
6050403020100
D1
0.0
-.1
-.2
-.3
-.4
Observe
Linear
1D349
Concentration gµml-1
Concentration gµml-1

Concentration
6050403020100
D1
0.0
-.2
-.4
-.6
-.8
-1.0
Observed
Linear
Table.3. Derivative spectrophotometry results for analysis of
chloroquine phosphate standard in 0.01M HCl:
Concentration gµ ml-1
1D225
1D239
1D260
1D333
1D349
50 -0.79 -0.34 -0.34 -0.15 -0.86
40 -0.67 -0.27 -0.27 -0.13 -0.7
30 -0.56 -0.21 -0.21 -0.09 -0.54
20 -0.37 -0.14 -0.14 -0.06 -0.36
10 -0.19 -0.07 -0.07 -0.03 -0.18
2.5 -0.04 -0.01 -0.01 -0.01 -0.04
Regression 0.987 0.999 0.999 0.995 0.999
Intercept -4.5*10-2 1.2*10-3 1.2*10-3 -7*10-4 -7.3*10-3
Slope 1.6*10-2 -6.9*10-3 -6.9*10-3 -3.1*10-3 -1.73*10-2
Concentration gµml-1
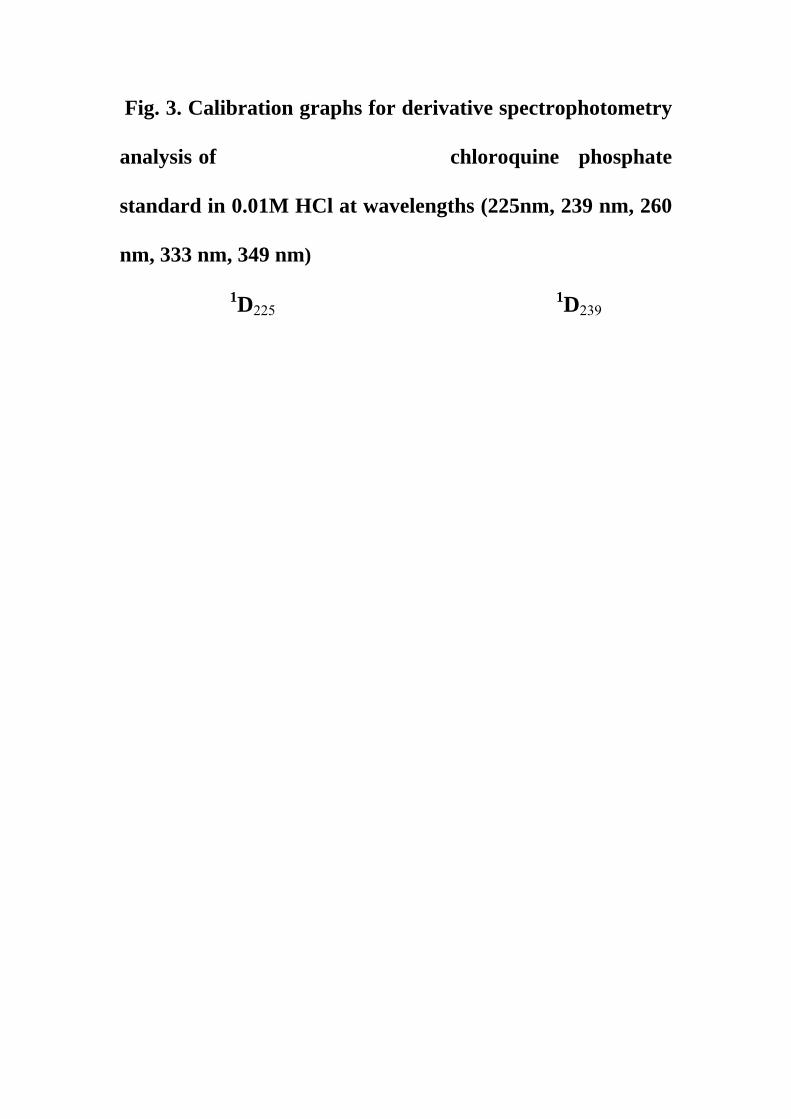
Fig. 3. Calibration graphs for derivative spectrophotometry
analysis of chloroquine phosphate
standard in 0.01M HCl at wavelengths (225nm, 239 nm, 260
nm, 333 nm, 349 nm)
1D225 1D239

Concentration
6050403020100
D1
0.0
-.1
-.2
-.3
-.4
Observe
Linear
Concentration
6050403020100
D1
0.0
-.2
-.4
-.6
-.8
-1.0
Observe
Linear
1D260 1D333
Concentration gµml-1
Concentration gµml-1

Concentration
6050403020100
D1
0.0
-.1
-.2
-.3
-.4
Observe
Linear
Concentration
6050403020100
D1
0.00
-.02
-.04
-.06
-.08
-.10
-.12
-.14
-.16
Observed
Linear
1D349
Concentration gµml-1
Concentration gµml-1

Concentration
6050403020100
D1
0.0
-.2
-.4
-.6
-.8
-1.0
Observed
Linear
Table 4. Derivative spectrophotometry results for the
analysis of chloroquine phosphate standard in plasma
Concentration
gµ ml-1
1D333
1D349
50 -0.16 -0.7 8
40 -0.14 -0.63
30 -0.10 -0.47
20 -0.06 -0.32
10 -0.3 -0.16
2.5 -0.01 -0.05
Regression 0.993 1.000
Intercept 1.1*10-3 -9.2*10-3
Slope -3.3*10-3 -1.5*10-2
Concentration gµml-1

Fig. 4. Calibration graphs for derivative spectrophotometry
analysis of chloroquine phosphate
standard in plasma at wavelengths (333 nm, 349 nm)
1D333
Concentration
6050403020100
D1
0.00
-.02
-.04
-.06
-.08
-.10
-.12
-.14
-.16
-.18
Observed
Linear
Concentration gµml-1

1D349
Concentration
6050403020100
D1
0.0
-.2
-.4
-.6
-.8
Observed
Linear
4.1.2.Absorbance spectrophotometry:
A calibration curve was constructed by assaying standard solutions
of chloroquine phosphate in the range 2.5-50 gµ ml-1 in water, in
0.01M HCl and plasma.
The zero order absorbance spectra of these solutions were recorded
over the range 200-400 nm against a blank of water, 0.01M HCl and
plasma respectively using UNICAM spectrophotometry.
Concentration gµml-1

The absorbance value at 221 nm A221, 236 nm A236, 256 nm A256,
331 nm A331 and 343 nm A349 were measured for determination of
chloroquine phosphate.
Table 5: Absorbance spectrophotometry results for analysis
of chloroquine phosphate standard in water
Fig 1. Zero absorbance spectrum of chloroquine phosphate
standard in water recorded over the range 200-400 nm
Concentration gµ ml-1
A221 A239 A256 A331 A343
50 2.65 1.72 1.5 1.58 1.66
40 2.18 1.34 1.15 1.25 1.32
30 1.71 1.01 0.87 0.95 1.01
20 1.15 0.67 0.58 0.63 0.67
10 0.57 0.33 0.28 0.32 0.34
2.5 0.13 0.06 0.06 0.07 0.08
Regression 0.997 1.000 1.000 1.000 1.000
Intercept 4.3*10-2 -2.29*10-2 -1.40*10-2 -5.90*10-3 3.16*10-2
Slope 5.33*10-2 3.45*10-2 2.93*10- 4.20*10-3 3.31*10-2

Fig.6. Calibration graphs for absorbance spectrophotometry
analysis of chloroquine phosphate standard in water at
wavelengths (221 nm, 236 nm, 256 nm, 2331 nm, 343 nm)
A221 A236

Concentration
6050403020100
Abs
orba
nce
3.0
2.5
2.0
1.5
1.0
.5
0.0
Observed
Linear
Concentration
6050403020100
Abso
rban
ce
2.0
1.5
1.0
.5
0.0
Observed
Linear
A256 A333
Concentration gµml-1
Concentration gµml-1

Concentration
6050403020100
Abs
orba
nce
1.6
1.4
1.2
1.0
.8
.6
.4
.2
0.0
Observe
Linear
Concentration
6050403020100
Abs
orba
nce
1.6
1.4
1.2
1.0
.8
.6
.4
.2
0.0
Observed
Linear
A343
Concentration gµml-1
Concentration gµml-1

Concentration
6050403020100
Abs
orba
nce
2.0
1.5
1.0
.5
0.0
Observed
Linear
Table 6: Absorbance spectrophotometry results for analysis of
chloroquine phosphate standard in 0 .01M HCl
Concentration
gµ ml-1 A221 A239 A256 A331 A343
50 2.79 1.72 1.46 1.58 1.66
40 2.247 1.34 1.15 1.25 1.36
30 1.71 1.06 0.87 0.95 1.049
20 1.15 0.67 0.58 0.63 0.69
10 0.57 0.33 0.28 0.32 0.34
2.5 0.135 0.06 0.06 0.07 0.08
Regression 1.000 0.999 1.000 1.000 0.999
Intercept 1.1*10-2 -1.90*10-2 -1.22*10-2 -2.50*10-3 1.13*10-2
Slope 5.59*10-2 3.47*10-2 2.93*10- 6.16*10-2 3.35*10-2
Concentration gµml-1

Fig. 7.Calibration graphs for absorbance spectrophotometry
analysis of chloroquine phosphate standard in 0.01M HCl
at wavelengths (221 nm, 236 nm, 256 nm, 2331 nm, 343 nm)
A221 A236
Concentration
6050403020100
Abs
orba
nce
3.0
2.5
2.0
1.5
1.0
.5
0.0
Observed
Linear
Concentration
6050403020100
Abs
orba
nce
2.0
1.5
1.0
.5
0.0
Observed
Linear
A256 A331
Concentration gµml-1
Concentration gµml-1

Concentration
6050403020100
Abs
orba
nce
1.6
1.4
1.2
1.0
.8
.6
.4
.2
0.0
Observe
Linear
Concentration
6050403020100
Abs
orba
nce
1.6
1.4
1.2
1.0
.8
.6
.4
.2
0.0
Observe
Linear
A343
Concentration gµml-1
Concentration gµml-1

Concentration
6050403020100
Abs
orba
nce
2.0
1.5
1.0
.5
0.0
Observed
Linear
Table 7: Absorbance spectrophotometry results for analysis
of chloroquine phosphate standard in plasma
Concentration gµ ml-1
A331 A343
50 2.21 2.19
40 1.82 1.77
30 1.41 1.38
20 1.08 1.06
10 0.52 0.51
2.5 0.23 0.23
Regression (r) 0.996 0.996
Intercept 0.1484 0.1438
Slope 4.18*10-2 4.12*10-2
Concentration gµml-1

Fig. 8.Calibration graphs for absorbance spectrophotometry
analysis of chloroquine phosphate standard in plasma at
wavelengths (331 nm, 343 nm)
A331
Concentration
6050403020100
Abs
orba
nce
2.5
2.0
1.5
1.0
.5
0.0
Observed
Linear
A343
Concentration gµml-1

Concentration
6050403020100
Abs
orba
nce
2.5
2.0
1.5
1.0
.5
0.0
Observed
Linear
4.1.3.HPLC:
A calibration curve was constructed by assaying standard solutions
of chloroquine phosphate in the range 2.5-50 gµ ml-1 in water. The
chromatograms of these solutions were recorded using SYKNM
instrument with UV/VS dectores at wavelength 349 nm and
acetonitrile: buffer pH 3 (3:2) as mobile phase with a flow rate at 1
ml min-1, retention time 3 min. The AUC was plotted against
concentration.
Table 14: High performance liquid chromatography results
for analysis of chloroquine phosphate standard
Concentration gµml-1

Concentration gµ ml-1 AUC
50 10.68
40 8.74
30 6.51
20 4.35
10 2.03
2.5 0.62
Regression (r) 0.999
Intercept 1.76*10-2
Slope 2.59*10-1
Fig .9. High performance liquid chromatography
chromatogram for analysis of cloroquine phosphate
standard in water
Tim
e

Fig.10. Calibration graphs for high performance liquid
chromatography analysis of chloroquine phosphate
standard:
Tim
e
Tim
e

Concentration
6050403020100
peak
hei
ght
12
10
8
6
4
2
0
Observed
Linear
The HPLC method is more sensitive than both the zero absorption
and first derivative methods as both method can not detect
concentrations below 2.5 gµ ml-1 as the absorbance’s at these
concentration is almost zero while the HPLC method can detects ten
folds below 2.5 gµ ml-1
Concentration gµml-1

4.2. Analysis of Chloroquine Phosphate in presence of pharmaceutical excipent: There are about 23 different excipent used in chloroquine phosphate formulations (tablet, syrup and injection) (Walter Lund, 1994). The possibility of interference of these excipent on the analysis of
chloroquine phosphate was investigated. This was carried out by adding
each excipent, in the concentration used in the formulation, to a
standard chloroquine phosphate solution; the resultant mixture was
analyzed by three methods:
a) Absorbance spectrophotometry (zero order absorbance).
b) Derivative spectrophotometry (First order, proposed method).
c) HPLC (non-official validated method).
The concentration of chloroquine phosphate standard used was 1mg
ml-1 dissolved in distilled water. The weighed amount of excipent
(Table 1) was added to chloroquine phosphate standard solutions
and diluted to obtain a final concentration of 50 1−gmlµ of the standard
chloroquine phosphate using distilled water.
The results of the first derivative spectrophotometry were compared
to that of absorbance spectrophotometry (the zero order absorption)
at different wavelengths of 221nm, 236 nm, 256 nm, 331 nm and

343 nm. It was also compared to the results of HPLC. The mean of
the results of each method in the three different days were plotted
against wavelengths.
The precision and accuracy of the first derivative was compared to
HPLC and zero order absorbance results, using F-test and t-test.
The F-test and t-test results were compared to tabulated values
(Grayd Christian, 1998), which are:
The theoretical F at 95% confidence level and degree of freedom Ø1
= 2
Ø2 = 2 for first derivative method, zero order absorbance method
and HPLC method were found to be 19.0 (theoretical).
(If experimental F did not exceed theoretical value at selected
confidence level, then there is no significant difference between the
two methods and the proposed method is precise)
The theoretical t at the 95% confidence level and degree of freedom
Ø1 = 2
Ø2 = 2 for first derivative method, zero order absorbance method
and HPLC method were found to be 4.303 (theoretical).

(If experimental t did not exceed theoretical value at selected
confidence level, then there is no significant difference between the
two methods and the proposed method is accurate)
4.2. Analysis of Chloroquine Phosphate in presence of pharmaceutical excipent: There are about 23 different excipent used in chloroquine phosphate formulations (tablet, syrup and injection) (Walter Lund, 1994) (15),
The possibility of interference of these excipent on the analysis of
chloroquine phosphate was investigated. This was carried out by adding each
excipent in the concentration used in the formulation to a standard
chloroquine phosphate solution, the resultant mixture was analyzed by three
methods:
a) Absorbance spectrophotometry (zero order absorbance).
b) Derivative spectrophotometry (First order, proposed method).
c) HPLC (non-official validated method).
The concentration of chloroquine phosphate standard used was 1mg ml-1
dissolved in distilled water. The weighed amount of excipent (Table 1)
was added to chloroquine phosphate standard solutions and diluted to
obtain a final concentration of 50 1−gmlµ of the standard chloroquine
phosphate using distilled water.
The results of the first derivative spectrophotometry were compared to
that of absorbance spectrophotometry (the zero order absorption) at

different wavelengths of 221nm, 236 nm, 256 nm, 331 nm and 343 nm. It
was also compared to the results of HPLC. The mean of the results of
each method in the three different days were plotted against wavelengths.
The precision and accuracy of the first derivative was compared to HPLC
and zero order absorbance results, using F-test and t-test.
The F-test and t-test results were compared to tabulated (Grayd Christian)
(16), which are:
F at 95% confidence level and degree of freedom 2 for first derivative
method, zero order absorbance method and HPLC method was found to
be 19.0
(If calculated F did not exceed tabulated value at selected confidence
level then there is no significant difference between the two methods and
the proposed method is precise)
t at the 95% confidence level and degree of freedom 2 for first derivative
method, zero order absorbance method and HPLC method was found to
be 4.303
(If calculated t did not exceed tabulated value at selected confidence level
then there is no significant difference between the two methods and the
proposed method is accurate)

4.3. Excipent used in Chloroquine Phosphate formulations:
There are many excipent used in Chloroquine Phosphate formulations
(Table1). The effect of these excipent on the analysis of chloroquine
phosphate was studied using:
a) Absorbance spectrophotometry.
b) Derivative spectrophotometry.
c) HPLC.
The excipent were classified according to the pharmaceutical uses
(Michael and Irene Ash,1995) (20), the effect of each group on the
analysis of chloroquine phosphate by the different methods was studied
and the results were compared.
1. Disintegrants:
The disintegrants used in chloroquine phosphate formulations are:
1) Starch 2) Aerosil 3) Avicel

Fig.11. Results of analysis of chloroquine phosphate in presence of starch
95
97
99
101
103
105
225nm 239nm 260nm 333nm 349nm
Absorbance
Derivative
HPLC
perc
enta
ge w
/w o
f ch
loro
quin
e ph
osph
ate
wave length

Fig.12. Results of analysis of chloroquine phosphate in presence of aerosil
95
97
99
101
103
105
225nm 239nm 260nm 333nm 349nm
Absorbance
Derivative
HPLC
wave length
perc
enta
ge w
/w o
f ch
loro
quin
e ph
osph
ate

Fig.13. Results of analysis of chloroquine phosphate in presence of avicel
95
97
99
101
103
105
225nm 239nm 260nm 333nm 349nm
Absorbance
Derivative
HPLC
wave length
per
cent
age
w/w
0f
ch
loro
quin
eph
osph
ate

Fig.14. Results of analysis of chloroquine phosphate in presence of magnesium stearate
95
97
99
101
103
105
225nm 239nm 260nm 333nm 349nm
Absorbance
Derivative
HPLC
wave length
perc
enta
ge w
/w o
f ch
loro
quin
e ph
osph
ate

Fig.15. Results of analysis of chloroquine phosphate in presence of lactose
95
97
99
101
103
105
225nm 239nm 260nm 333nm 349nm
Absorbance
Derivative
HPLC
wave length
perc
enta
ge w
/w o
f ch
loro
quin
e ph
osph
ate

Fig.16. Results of analysis of chloroquine phosphate
in presence of talc
95
97
99
101
103
105
225nm 239nm 260nm 333nm 349nm
Absorbance
Derivative
HPLC
wave length
perc
enta
ge w
/w o
f ch
loro
quin
e ph
osph
ate

Fig.17. Results of analysis of chloroquine phosphate in presence of accacia
95
97
99
101
103
105
225nm 239nm 260nm 333nm 349nm
Absorbance
Derivative
HPLC
wave length
perc
enta
ge w
/w o
f ch
loro
quin
e ph
osph
ate

Fig.18. Results of analysis of chloroquine phosphate in presence of meyl paraben
0
20
40
60
80
100
120
140
160
180
225nm 239nm 260nm 333nm 349nm
Absorbance
Derivative
HPLC
wave length
perc
enta
ge w
/w o
f ch
loro
quin
e ph
osph
ate

Fig.19. Results of analysis of chloroquine phosphate in presence of propyl paraben
0
20
40
60
80
100
120
140
160
225nm 239nm 260nm 333nm 349nm
Absorbance
Derivative
HPLC
wave length
perc
enta
ge w
/w o
f ch
loro
quin
e ph
osph
ate

Fig.20. Results of analysis of chloroquine phosphate in presence of dicalcium phosphate
95
97
99
101
103
105
225nm 239nm 260nm 333nm 349nm
Absorbance
Derivative
HPLC
wave l ength
perc
enta
ge w
/w o
f ch
loro
quin
e ph
osph
ate

Fig.21. Results of analysis of chloroquine phosphate in presence of titanium dioxide
95
97
99
101
103
105
225nm 239nm 260nm 333nm 349nm
Absorbance
Derivative
HPLC
wave length
perc
enta
ge w
/w o
f ch
loro
quin
e ph
osph
ate
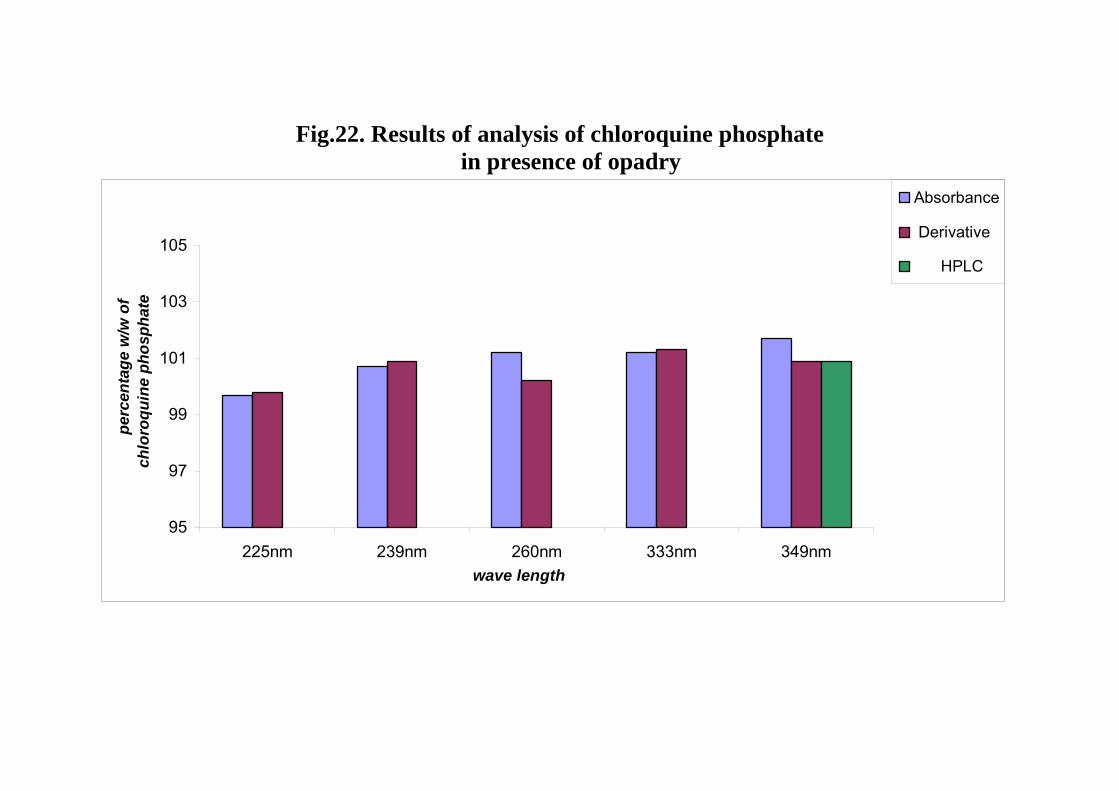
Fig.22. Results of analysis of chloroquine phosphate in presence of opadry
95
97
99
101
103
105
225nm 239nm 260nm 333nm 349nm
Absorbance
Derivative
HPLC
wave length
perc
enta
ge w
/w o
f ch
loro
quin
e ph
osph
ate

Fig.23. Results of analysis of chloroquine phosphate in presence of propylene glycol
95
97
99
101
103
105
225nm 239nm 260nm 333nm 349nm
Absorbance
Derivative
HPLC
wave length
perc
enta
ge w
/w o
f ch
loro
quin
e ph
osph
ate

Fig.24. Results of analysis of chloroquine phosphate in presence of glycerin
95
97
99
101
103
105
225nm 239nm 260nm 333nm 349nm
Absorbance
Derivative
HPLC
wave length
perc
enta
ge w
/w o
f ch
loro
quin
e ph
osph
ate

Fig.25. Results of analysis of chloroquine phosphate in presence of sucrose
95
97
99
101
103
105
225nm 239nm 260nm 333nm 349nm
Absorbance
Derivative
HPLC
wave length
perc
enta
ge w
/w o
f ch
loro
quin
e ph
osph
ate

Fig.26. Results of analysis of chloroquine phosphate in presence of saccharin sodium
0
50
100
150
200
250
225nm 239nm 260nm 333nm 349nm
Absorbance
Derivative
HPLC
wave length
perc
enta
ge w
/w o
f ch
loro
quin
e ph
osph
ate

Fig.27. Results of analysis of chloroquine phosphate in presence of sodium citrate
95
97
99
101
103
105
225nm 239nm 260nm 333nm 349nm
Absorbance
Derivative
HPLC
wave length
perc
enta
ge w
/w o
f ch
loro
quin
e ph
osph
ate

Fig.28. Results of analysis of chloroquine phosphate in presence of citric acid
95
97
99
101
103
105
225nm 239nm 260nm 333nm 349nm
Absorbance
Derivative
HPLC
wave length
perc
enta
ge w
/w o
f ch
loro
quin
e ph
osph
ate

Fig.29. Results of analysis of chloroquine phosphate in presence of sorbitol
95
97
99
101
103
105
225nm 239nm 260nm 333nm 349nm
Absorbance
Derivative
HPLC
wave length
perc
enta
gew
/w
ofch
loro
quin
e ph
osph
ate

Fig.30. Results of analysis of chloroquine phosphate in presence of xanthan gum
95
97
99
101
103
105
225nm 239nm 260nm 333nm 349nm
Absorbance
Derivative
HPLC
wave length
perc
enta
ge w
/w o
f ch
loro
quin
e h
ht

Fig.31. Results of analysis of chloroquine phosphate in presence of tween 80
95
97
99
101
103
105
225nm 239nm 260nm 333nm 349nm
Absorbance
Derivative
HPLC
wave length
perc
enta
ge w
/w o
f ch
loro
quin
e ph
osph
ate

Fig.32. Results of analysis of chloroquine phosphate in presence of gelatin
95
97
99
101
103
105
225nm 239nm 260nm 333nm 349nm
Absorbance
Derivative
HPLC
wave length
perc
enta
ge w
/w o
f ch
loro
quin
e ph
osph
ate

Fig.33. Results of analysis of chloroquine phosphate in presence of phosphoric acid
95
97
99
101
103
105
225nm 239nm 260nm 333nm 349nm
Absorbance
Derivative
HPLC
wave length
perc
enta
ge w
/w o
f ch
loro
quin
e ph
osph
ate

4.3.1. Disintegrants: The disntegrants used in chloroquine phosphate formulations are: 1) Starch 2) aerosol 3) avicel
Fig.34. Comparison of the results of analysis of chloroquine phosphate in presence of disintegrants
a. Absorbance b. Derivative c. HPLC
95
97
99
101
103
105
221n
m23
6nm
256n
m33
1nm
343n
m
starchaerosil
avicel
wave length
perc
enta
ge w
/w o
f ch
loro
quin
e ph
osph
ate
95
97
99
101
103
105
225n
m23
9nm
260n
m33
3nm
349n
m
starchaerosilavicel
wave length
perc
enta
ge w
/w o
f ch
loro
quin
e ph
osph
ate
95
97
99
101
103
105
starch aerosil avicel
starch
aerosil
avicel
perc
enta
ge w
/w o
f ch
oroq
uine
pho
spha
te

4.3.2. Lubricant: The lubricants used in chloroquine phosphate formulations are: 1) Mg Stearate 2) Talc
Fig.35. Comparison of the results of analysis of chloroquine phosphate in presence of lubricant
a. Absorbance b. Derivative c. HPLC
95
97
99
101
103
105
221n
m23
6nm
256n
m33
1nm
343n
m
Mg Sterate
Talc
wave length
perc
enta
ge w
/w o
f ch
loro
quin
e ph
osph
ate
95
97
99
101
103
105
225n
m23
9nm
260n
m33
3nm
349n
m
Mg Sterate
Talc
wave length
perc
enta
ge w
/w o
f ch
loro
quin
e ph
osph
ate
95
97
99
101
103
105
Mg Sterate Talc
Mg Sterate
Talc
perc
enta
ge w
/w o
f ch
loro
quin
e ph
osph
ate

4.3.3. Diluents: The diluents used chloroquine phosphate formulations are: 1) Lactose 2) Dicalcium phosphate 3) Sucrose
Fig.36. Comparison of the results of analysis of chloroquine phosphate in presence of diluents
a. Absorbance b. Derivative c. HPLC
95
97
99
101
103
105
221n
m23
6nm
256n
m33
1nm
343n
m
Lactose
DiCal Phos.
Sucrose
wavelength
perc
enta
ge w
/w o
f ch
loro
quin
e ph
osph
ate
95
97
99
101
103
105
225n
m23
9nm
260n
m33
3nm
349n
m
Lactose
DiCal Phos.
Sucrose
wave length
perc
enta
ge w
/w o
f ch
loro
quin
e ph
osph
ate
95
97
99
101
103
105
Lactose
DiCal
Phos.Sucro
se
Lactose
DiCal Phos.
Sucrose
perc
enta
ge w
/w o
f ch
loro
quin
e ph
osph
ate

4.3.4. Coloring Agent: The coloring agents used in chloroquine phosphate formulations are: 1) Titanium dioxide 2) Opadry
Fig37. Comparison of the results of analysis of chloroquine phosphate in presence of coloring agents
a. Absorbance b. Derivative c. HPLC
95
97
99
101
103
105
221n
m23
6nm
256n
m33
1nm
343n
m
Titnium dioxide
Opadry
wave length
perc
enta
ge w
/w o
f ch
loro
quin
e ph
osph
ate
95
97
99
101
103
105
225n
m23
9nm
260n
m33
3nm
349n
m
Titnium dioxideOpadry
wave length
perc
enta
ge w
/w o
f ch
loro
quin
e ph
osph
ate
95
97
99
101
103
105
Titniumdioxide
Opadry
Titnium dioxide
Opadry
perc
enta
ge w
/w o
f ch
loro
quin
e ph
osph
ate

4.3.5. pH Adjustment excipent: The pH adjustment excipent used in chloroquine phosphate formulations are: 1) Sodium citrate 2) citric acid 3) phosphoric acid
Fig.38 Comparison of the results of analysis of chloroquine phosphate in presence of pH adjustment agents by the three methods
a. Absorbance b. Derivative c. HPLC

95
97
99
101
103
105
221n
m23
6nm
256n
m33
1nm
343n
m
Sodium Citrate
Citric Acid
Phosphoric Acid
wave length
perc
enta
ge w
/w o
f ch
loro
quin
e ph
osph
ate
95
97
99
101
103
105
225n
m29
nm26
0nm
333n
m34
9nm
Sodium Citrate
Citric Acid
Phosphoric Acid
wave length
perc
enta
ge w
/w o
f ch
loro
quin
e ph
osph
ate
95
97
99
101
103
105
Sod
ium
Citr
ate
Citr
ic A
cid
Pho
spho
ricA
cid
Sodium Citrate
Citric Acid
Phosphoric Acid
perc
enta
ge w
/w o
f ch
loro
quin
e ph
osph
ate
4.3.6. Anti-microbial agents: The Anti-microbial excipent used in chloroquine phosphate formulations are: 1) Methyl paraben 2) propyl paraben 3) propylene glycol 4) Saccharin sodium 5) saccharin sodium

Fig.39. Comparison of the results of analysis of chloroquine phosphate in presence of anti-microbial agents
a. Absorbance b. Derivative c. HPLC
0
50
100
150
200
250
221n
m23
6nm
256n
m33
1nm
343n
m
methyl parabenpropyl parabenpropylene glcolglycerinsaccharin sodium
wave length
perc
enta
ge w
/w o
f ch
loro
quin
e ph
osph
ate
020406080
100120140160180
225n
m23
9nm
260n
m33
3nm
349n
m
methyl parabenpropyl parabenpropylene glcolglycerinsaccharin sodium
wave length
perc
enta
ge w
/w o
f ch
loro
quin
e ph
osph
ate
95
97
99
101
103
105
methyl
parab
en
propy
l para
ben
propy
lene g
lcol
glyce
rin
sacc
harin
sodiu
m
methyl parabenpropyl parabenpropylene glcolglycerinsaccharin sodium
perc
enta
ge w
/w o
f ch
loro
quin
e ph
osph
ate
4.3.7. Emulsifying agent: The emulsifying excipent used in chloroquine phosphate formulations are:
1) Acacia 2) Gelatin 3) Sorbitol 4) Xanthan Gum 5) Tween 80

Fig.40. Comparison of the results of analysis of chloroquine phosphate in presence of emulsifing agents by the three methods
a. Absorbance b. Derivative c. HPLC
95
97
99
101
103
105
221n
m23
6nm
256n
m33
1nm
343n
m
accaciagelatinsorbitolxanthan gumtween 80
wave length
perc
enta
ge w
/w o
f ch
loro
quin
eph
osph
ate
95
97
99
101
103
105
225n
m23
9nm
260n
m33
3nm
349n
m
AccaciaGelatinSorbitolXanthan gumTween 80
wave length
perc
enta
ge w
/w o
f ch
loro
quin
e ph
osph
ate
95
97
99
101
103
105
Accac
iaGela
tinSorb
itol
Xantha
n gum
Tween 8
0
AccaciaGelatinSorbitolXanthan gumTween 80
perc
enta
ge w
/w o
f ch
loro
quin
e ph
osph
ate


Fig.41. Results of analysis of chloroquine phosphate injection

Non Aqueous Titration
95
97
99
101
103
105
225 nm 239 nm 260 nm 333 nm 349 nm
Absorbance
Derivative
HPLCNon Aqueous Titration
wave length
perc
enta
ge w
/w o
f ch
loro
quin
e ph
osph
ate

Fig.42. Results of analysis of Balsaquine injection
Non AqueousTitration
95
97
99
101
103
105
225 nm 239 nm 260 nm 333 nm 349 nm
Absorbance DerivativeHPLCNon AqueousTitration
wave length
perc
enta
ge w
/w o
f ch
loro
quin
e ph
osph
ate

Fig.43. Results of analysis of Efroquine tablets

Non Aqueous Titration
95
97
99
101
103
105
225 nm 239 nm 260 nm 333 nm 349 nm
Absorbance
Derivative
HPLC
Non Aqueous Titration
wave length
perc
enta
ge w
/w o
f chl
oroq
uine
ph
osph
ate

Fig.44. Results of analysis of chloroquine phosphate tablets

Non AqueousTitration
95
97
99
101
103
105
107
225 nm 239 nm 260 nm 333 nm 349 nm
Absorbance
Derivative
HPLC
Non AqueousTitration
wave length
perc
enta
ge w
/w o
f ch
loro
quin
e ph
osph
ate

Fig.45. Results of analysis of Amiquine tablets by the four methods:

Non Aqueous Titration
95
97
99
101
103
105
225 nm 239 nm 260 nm 333 nm 349 nm
Absorbance
Derivative
HPLC
Non Aqueous Titration
wave length
perc
enta
ge w
/w o
f ch
loro
quin
e ph
osph
ate

Fig.46. Results of analysis of Lariago tablet by the four methods:

NonAqueousTitration
95
97
99
101
103
105
107
225 nm 239 nm 260 nm 333 nm 349 nm
Absorbance
Derivative
HPLC
NonAqueousTitration
wave length
perc
enta
ge w
/w o
f ch
loro
quin
e ph
osph
ate

Fig.47. Results of analysis of chloroquine syrup (JPM)

Non Aqueous Titration
0
50
100
150
200
250
225 nm 239 nm 260 nm 333 nm 349 nm
Absorbance
Derivative
HPLC
Non Aqueous Titration
wave length
perc
enta
ge w
/w o
f ch
loro
quin
e ph
osph
ate

Fig.48. Results of analysis of Lariago syrup

Non Aqueous Titration
0
20
40
60
80
100
120
140
160
180
225 nm 239 nm 260 nm 333 nm 349 nm
Absorbance DerivativeHPLCNon Aqueous Titration
wave length
perc
enta
ge w
/w o
f ch
loro
quin
e ph
osph
ate


Fig.49. Results of analysis of chloroquine phosphate in pure plasma by
the first derivative and zero order absorption spectroscopy

0
20
40
60
80
100
120
140
160
333 nm 349 nm
absorption
derivative
wave length
perc
enta
ge w
/w o
f ch
loro
quin
e ph
osph
ate

4.4. Analysis of chloroquine phosphate in pharmaceutical dosage
forms:
Samples of different dosage forms of chloroquine phosphate locally manufactured and imported that covered the 23 excipent used in
chloroquine phosphate formulation analyzed by:-
1) Absorbance spectrophotometry (Zero order absorbance)
2) Derivative spectrophotometry (First order, proposed method)
3) HPLC (non-official validated method)
4) Non -Aqueous Titration (official method, BP)
The pharmaceutical formulations used included both branded and generic
products. Four tablet dosage forms were used (Amiquine tablets,
Efroquine tablets, Lariago tablets and Chloroquine Phosphate tablets).
Two syrup dosage form (Lariago syrup and Chloroquine Phosphate
syrup) and two injectable (Balsaquine injections and Chloroquine
Phosphate injections) were used. The results of the analysis of
chloroquine phosphate in the different brands of the different dosage
forms by first derivative spectrophotometer compared with results
obtained by the other three methods. F and t-tests used to compare
precision and accuracy of first derivative spectrophotometry method to
the other three methods.

5.1. Discussion
The aim of the present work is to propose a new analytical method for the
assay of chloroquine phosphate in pharmaceutical dosage forms such as
tablet, syrup and injection. The official method for the assay of
chloroquine phosphate tablets and chloroquine phosphate injections (BP
and USP) is non-aqueous titration. This titremetric method is a sensitive
one. However, since it depends on the extraction of chloroquine,
phosphate from it is formulation; there may be some variation in
extraction from one analyst to another. Moreover, chloroform is rather
expensive. In addition, the method is not suitable for analysis of
chloroquine syrup as its extraction is difficult (due to emulsion
formation). There is also the need for large amounts of chloroform and
long period to extract the drug from its formulation. Hence, the sensitivity
of this method is questioned.
Another method for analysis of chloroquine phosphate dosage form is an
HPLC method, which is non –official (WHO method). It is a validated
method for analysis of all chloroquine phosphate dosage forms. It is a
sensitive method but it is time consuming and expensive.
As chloroquine is an important drug of high use and consumption in
Sudan its analysis has attracted great attention.

In the present work, a spectrophotometric method of assay of chloroquine
was developed and optimized.
The results of analysis of chloroquine in different pharmaceutical dosage
forms obtained by this method were compared to the results obtained by
the official titremetric BP method and the HPLC method (W H O).
Comparisons were made with regard to developing and adopting the new
method based on speed, simplicity, sensitivity, selectivity, accuracy,
precession, reproducibility, cost and ability to employ in routine analysis
of the drug.
5.1. 1. Derivative spectrophotometry calibration curves:
Calibration curves were constructed from the results of assaying standard
solutions of chloroquine phosphate in water and in 0.01M HCl.
The first derivative spectra of these solutions were recorded over the range
200- 400 nm (fig.1).
Under the described experimental conditions, the calibration curves
obtained by plotting 1D values versus concentrations at the wavelengths
225 nm (1D225), 239 nm (1D239), 260 nm (1D260), 333 nm (1D333) and 349
nm (1D349), showed linear relationships in the concentration range 2.5-
50 gµ ml-1.
The calibration curves were in agreement with the Beers law.

Comparison was made between the results obtained using water and 0.01
M HCl as solvents.
Table 9: Statistical analysis of the calibration graphs of chloroquine
phosphate using first-derivative spectrophotometry:
Wave length (nm)
Solvent Intercept Slope Regression coefficients (r)
Water1.5*10-2 1.5*10-2 0.988
225 0.01M HCl -4.5*10-2 1.6*10-2 0.987
Water5*10-4 -6.8*10-3 0.999
239 0.01M HCl 1.2*10-3 -6.9*10-3 0.999
Water-2*10-3 -6.8*10-3 0.999
260 0.01M HCl 1.2*10-3 -6.9*10-3 0.999
Water-7*10-4 -3.1*10-3 0.997
333 0.01M HCl -7*10-4 -3.1*10-3 0.995
Water-4.1*10-3 -1.71*10-2 1.000
349 0.01M HCl -7.3*10-3 -1.73*10-2 0.999
From the above results, it is evident that there is no significant difference
in linearity of chloroquine calibration curve in water and in 0.01M HCl. It
was therefore decided to use water as the solvent in the analysis carried
out in this work.

The chloroquine calibration curves were linear in all selected
wavelengths. However, the best linearity was observed at wavelength 349
nm.
5.1.2. Absorbance spectrophotometry calibration curves:
Calibration curves were constructed from the results obtained by assaying
standard solutions of chloroquine phosphate in the range 2.5-50 gµ ml-1 in
water and in 0.01M HCl.
The zero order absorbance spectra of these solutions were recorded over
the range 200-400 nm (fig. 5).
Under these experimental conditions the calibration curves, obtained by
plotting absorbencies values versus concentration at the wavelengths 221
nm (A221), 236 nm (A236), 256 nm (A256), 331 nm (A331) and 343 nm
(A343), showed linear relationships in the concentration range 2.5-50
gµ ml-1
The calibration curves were in agreement with the Beers law.
The results obtained using water and 0.01M HCl as solvents were
compared.
Table 10: Statistical analysis of the calibration graphs of chloroquine
phosphate using zero-order absorbance spectrophotometry:
Wavelength (nm)
Solvent Intercept Slope Regression coefficients (r)

Water5.33*10-2 4.3*10-2 0.997
221 0.01M HCl 1.1*10-2 5.59*10-2 1.000
Water-2.29*10-2 3.45*10-2 1.000
236 0.01M HCl -1.9 *10-2 3.47*10-2 0.999
Water-1.40*10-2 2.93*10-2 1.000
256 0.01M HCl -1.22*10-2 2.93*10-2 1.000
Water-5.90*10-3 3.16*10-2 1.000
331 0.01M HCl -2.50*10-3 3.16*10-2 1.000
Water4.20*10-3 3.31*10-2 1.000
346 0.01M HCl 1.13*10-2 3.35*10-2 0.999
It is seen from the above results that there is no significant difference in
the result when either water or 0.01M HCl were used.
It was therefore decided to use water as the solvent.
Table 11: Statistical analysis of the calibration graphs of chloroquine
phosphate using first derivative, zero-order absorbance
spectrophotometry and HPLC methods:
Method Wavelength Intercept Slope Regression
coefficients (r)

Absorbance 221nm5.33*10-2 4.3*10-2 0.997
Derivative 225nm1.5*10-2 1.5*10-2 0.988
Absorbance 236nm-2.29*10-2 3.45*10-2 1.000
Derivative 239nm5*10-4 -6.8*10-3 0.999
Absorbance 256nm-1.40*10-2 2.93*10-2 1.000
Derivative 260nm-2*10-3 -6.8*10-3 0.999
Absorbance 331nm-5.90*10-3 3.16*10-2 1.000
Derivative 333nm-7*10-4 -3.1*10-3 0.997
Absorbance 346nm4.20*10-3 3.31*10-2 1.000
Derivative 349nm-4.1*10-3 -1.71*10-2 1.000
HPLC 349nm1.76*10-2 2.59*10-1 0.999
It can be seen that linear relationships were obtained in the concentration
range of 2.5-50 gµ ml-1 for all three analytical methods.
The linearity of the calibration graphs and the adherence of the systems to
Beers law were validated by the values of correlation coefficient of the
regression equation, which were 0.99 to 1.000 for all methods.
The values of intercept were close to zero in all methods.
5.1.3. Analysis of chloroquine phosphate in presence of excipent:
Twenty-three different excipent known to be used in chloroquine
phosphate formulations (tablets, syrup and injection) (Table 1) were used.
The possible interference of these excipent with the result of analysis of
chloroquine phosphate was investigated. This done by adding each excipent,

in the concentration used in the formulation, to a standard solution of
chloroquine phosphate, which was then analyzed by the three analytical
methods
a) Absorbance spectrophotometry (Zero Absorbance)
b) Derivative spectrophotometry (First order; proposed method)
c) HPLC (non-official validated method)
The analysis was carried out by pipetting 5 ml of stock solution of each
excipent into a 100 ml volumetric flask. To each of these, 5 ml of stock
standard chloroquine phosphate solution were added and the volume
completed to 100 ml with water to obtain a final concentration of 50 gµ ml-1
of chloroquine phosphate standard. Each solution was then analyzed by the
three different methods and the analysis was carried out three times in three
different days.
The zero order absorption and the first derivative spectra of these solutions
were recorded over the range 200-400 nm, with a speed of 1200 nm/min,
bandwidth 2 nm and medium smoothing to the curve. The HPLC method
was carried out using a mobile phase of a mixture of phosphate buffer pH3 :
acetonitrile (3:2).
The was separation carried out using a C18 column with a flow rate of 1.5
ml/min, at wavelength 349 nm. The retention time was 3 min (fig.9).

The results obtained by the first derivative spectrophotometry were
compared to those obtained by the absorbance spectrophotometry at the
selected wavelengths and compared to the result obtained by the HPLC
(as in tables).
The precision and accuracy of derivative method were compared to those
of HPLC and Zero order absorbance by calculating F- and t, which has
been compared to theoretical ones.
The theoretical F at the 95% confidence level and degree of freedom Ø1 =
2 Ø2 =2
(19.0)
While the theoretical t at the 95% confidence level and degree of freedom
Ø1 = 2
Ø2 =2 (4.303).
analysis of chloroquine phosphate standard solutions each containing,
separately, each of the excipent (starch, magnesium sterate, lactose, talc,
acacia, dicalcium phosphate, titanium dioxide, Opadry, propylene glycol,
glycerin, sucrose, sodium citrate, citric acid, sorbitol, xanthan gum, tween
80, gelatin, phosphoric acid) by the three methods showed no variation in
the results. This reveals that there was no interference with the analysis of
chloroquine phosphate resulting from any of these exciepent. There were
no significant differences between the results obtained by first derivative

spectrophotometry method, HPLC and zero order absorption methods (as
shown in tables).
Experimental F and t values were smaller than the theoretical theoretical
value.
The first derivative spectrophotometry method was thus found to be
precise and accurate, being more so at wavelength 349 nm compared to
zero absorption and HPLC methods. The results were almost identical at
this wavelength.
The proposed derivative spectrophotometry method thus proved suitable
for assay of the drug in presence of pharmaceutical exciepent.
Result of analysis of chloroquine phosphate standard solutions containing
aerosil showed a significant difference at wavelength 225 nm, between
derivative and HPLC methods and at 260 nm between derivative and
absorbance methods (Table17). It is concluded that derivative
spectroscopic analysis of chloroquine phosphate was not accurate and
precise at these wavelength for the analysis of chloroquine phosphate
containing aerosil. This may be due to low selectivity at small
wavelength.
The results of analysis of standard chloroquine phosphate solution
containing avicel showed significant differences at wavelength 239 nm,
between derivative and HPLC methods (Table17). The derivative method
is therefore not recommended at this wavelength for the analysis of

chloroquine phosphate containing avicel as selectivity decreased with
decreased wavelength.
Analysis of standard chloroquine phosphate solution containing methyl
paraben or propyl paraben, or saccharin sodium showed that there were
significant differences at all wavelengths except 333 nm and 349 nm,
between the first derivative and HPLC methods, the first derivative, and
zero order absorption methods (see remark on tables 29, 31 and
44respectively).
It can be concluded from these results that the first derivative and zero
order absorption methods were not suitable at these wavelengths with
regard to analysis of chloroquine phosphate containing methyl paraben,
propyl paraben or saccharin sodium, while the HPLC method is very
suitable and superior to the two spectrophotometric methods as it is
highly selective.
Methyl paraben, propyl paraben and saccharin sodium appear to interfere
in the analysis of chloroquine phosphate at all wavelengths except at
wavelength 333 nm and 349 nm in the zero order absorption method and
the first derivative method (fig.50).
This is understandable since one would except higher selectivity with
increased wavelength of absorption and therefore absence of interference
of these exciepent at 333 nm and 349 nm.

Fig. 50. Zero order absorbance and first derivative spectra for
analysis of chloroquine phosphate standard solutions in presence of
saccharin sodium

5.1.4. Analysis of chloroquine phosphate in pharmaceutical dosage forms:
Samples of different brands of different dosage forms of chloroquine
phosphate both locally manufactured and imported that covered the 23
excipent used in chloroquine phosphate formulations were analyzed by the
three methods mentioned above in addition to the official non -aqueous
titration method.
The samples included both branded and generic products.
These were: (A) four-tablet dosage forms; Amiquine tablets, (Amipharma
Laboratories, Ltd. Khartoum, Sudan), Efroquine tablet (Efroze Chemical
Industries (private) LTD. Karachi, Pakistan), Lariago tablet (Ipca Laboratories
Ltd, India) and chloroquine phosphate tablet (Remidica Ltd. Cyprus-Europe).

(B) two syrup dosage forms; Lariago syrup (Efroze Chemical Industries
(private) LTD. Karachi, Pakistan) and Chloroquine phosphate syrup (The
Jordan Pharmaceutical Manufacturing Co Ltd, Jordan).
(C) Two injectables, Balsaquine injection (Balsam Pharmaceutical Ltd,
Khartoum, Sudan) and Chloroquine phosphate injection (Bioluz Lab,
France).
The analysis of chloroquine phosphate in dosage forms was conducted by
diluting 5 ml of stock solution of chloroquine phosphate from tablets,
injections and syrups to 100 ml with water. Using water as blank, the zero
order absorption and the first derivative spectra of these solutions were
recorded over the range 200-400 nm, with speed 1200 nm/min,
bandwidth 2 nm and medium smoothing to the curve. The HPLC method
was carried out using a mobile phase of a mixture of phosphate buffer
(pH 3): acetonitrile (3:2).
The separation was carried out using a C18 column with a flow rate of 1.5
ml/min, at a wavelength of 349 nm; the retention time was 3 min (fig.9).
The non-aqueous titration method carried out after extraction of the
samples with chloroform and evaporation of the chloroform to dryness.
The residue was dissolved in anhydrous acetic acid and then titrated with
0.1M perchloric acid using crystal violet as indicator.

The results of assay of the different dosage forms of chloroquine
phosphate by first derivative spectrophotometry were compared with the
results obtained from the three other methods. F and t-tests were used to
compare precision and accuracy of first derivative spectrophotometry
method with the other three methods.
The experimental F-value and t-value were compared to the theoretical
ones.
The results of assay of chloroquine phosphate injection dosage forms
showed no significant differences when carried out by either of the first
derivative spectrophotometry, HPLC, zero order absorption
spectrophotometry and non-aqueous titration methods.
The experimental F and t values were smaller than the theoretical ones
(see tables 68 and 70). It was therefore concluded that first derivative
spectrophotometry was precise and accurate at all wavelengths; result
being almost identical (as F-value and t-value were almost zero).
Similar results were obtained in the analysis of chloroquine phosphate in
tablet dosage forms. There were no significant differences between first
derivative spectrophotometry, HPLC, zero order absorption and non-
aqueous titration methods of analysis.
The experimental F and t values were smaller than the theoretical ones
(see tables 72, 74, 76 and 77). The first derivative spectrophotometry
was thus considered precise and accurate at all wavelengths. It was noted

that this is particularly so at wavelength 349 nm as results were almost
identical (F-value and t-value were almost zero).
Statistical analysis of the results obtained for chloroquine phosphate in
syrup dosage forms showed that there were significant differences
between first derivative spectrophotometry, zero order absorption and
non-aqueous titration methods of assay at all wavelengths except at
wavelength 333 nm and 349 nm (see tables 79and 81). The experimental
F and t values were greater than the theoretical ones.
However, comparison of the results obtained by the first derivative
method and the HPLC method revealed no significant differences when
analysis was conducted at wavelength 260 nm, 333 nm, and 349 nm for
chloroquine phosphate syrup.
It is evident from the results that the first derivative spectrophotometry is
precise and accurate at these wavelengths. It is suggested that the first
derivative method of analysis could be used for assay of chloroquine
phosphate in syrup dosage form using wavelength 260 nm, 333 nm or
349 nm.
5.1.5. Application of the spectrophotometric derivative method in the
in vitro analysis of chloroquine phosphate in biological fluids:
The first derivative spectrophotometric method was employed to analyze
chloroquine phosphate in biological fluids (pure plasma).100 mg of
chloroquine phosphate were dissolved in 100 ml of plasma and serial

dilutions made by distilled water to obtain a set of concentration in the
range of 2.5-50 gµ ml-1. From the results of analysis, a calibration curves
was constructed.
The first order derivative spectra of these solutions were recorded over
the range 200-400 nm against blank plasma diluted with water.
The derivative values at 333 nm (1D333), 349 nm and (1D349) were
measured for determination of chloroquine phosphate.
Linear relationships were obtained in the concentration range 2.5-
50 gµ ml-1. On the other hand, determination of chloroquine phosphate, in
plasma using zero order absorption values at 331 nm (A333) and 343 nm
(A343), was not feasible.
This is attributed to possible interference from plasma components. The
zero order absorption method clearly lacks selectivity in biological fluids.
Application of first order derivative spectrophotometry was found to
correct for plasma interference and to enhance selectivity. By measuring
the values of the 1D amplitudes at 333 nm and 349 nm, the concentration
can directly be calculated since the first derivative measurement cancels
the irrelevant absorbance due to plasma components at these
wavelengths.
Table 12: Statistical analysis of the calibration graphs of chloroquine
phosphate in plasma using first-derivative spectrophotometry:

Method Wavelength Intercept Slope Regression (r)
Derivative 333nm1.1*10-3 -3.3*10-3 0.993
Derivative 349nm-9.2*10-3 -1.5*10-2 1.000
Fig. 51. Zero order absorbance and first derivative spectra for
analysis of chloroquine phosphate standard solutions in plasma

Derivative spectroscopy has been widely applied in the analysis of
different pharmaceutical dosage forms. It solves the problems of analysis
associated with drug combinations, stability studies of drugs and
degradation products, drug impurities, interference of excipent in drugs,
topical preparations analysis like creams and ointments and it also solves
the problem of analysis of drugs in biological fluids.
A lot of work was reported for the application of derivative methods for
solving these problems. Nevin Erk, 2001, reported the analysis of binary
mixtures of lostran potassium and hydrochlorothiazide. The assay of
ephedrine hydrochloride and theophylline in pharmaceutical formulations
and the quantitative analysis of chloropheniramine maleate and
phenylephrine hydrochloride in nasal drops also reported by Nevin
Erk,2000.
Determination of hydrochlorothiazide and amiloride hydrochloride was
reported by Murat Katal and Nevin Erk, 1999. It has also been reported
that the determination of benazepril hydrochloride and
hydrochlorothiazide can be achieved using second derivative ( Alaa El-
Gindy et. Al, 2001). Second derivative spectrophotometry has been

applied for the simultaneous determination of vitamin C and dipyrone (T.
Aburajai et. Al,2000). Derivative spectroscopy has also been employed
for the determination of enoxacin and nalidixic acid in tablets (H.
Hopkala and D. Kowalczuk, 2000). The determination of Amlodipine-
Enalapril Maleate and Amlodipine –Lisinopril in tablets has also been
accomplished by derivative spectroscopy (C. V. N. Prasad, et, al,1999).
The application of derivative spectroscopy as a stability indicating
method for the study of degradation and decomposition of drugs during
stability studies has been reported by D. Castro et, al, 1999, for the
determination of omeprazole tablet in aqueous solution. Analysis of
Acebutolol HCl in presence of it is acid- induced degradation products,
has been reported by Alaa El-Gindy et, al. Similar work has been reported
for the determination of Benoxinate hydrochloride and its degradation
product by first derivative spectrophotometry (Alaa El-Gindy).
Derivative spectroscopy has been applied in the determination of drugs in
pharmaceutical dosage form such as creams and ointments. It has
reported that Micanazole in pharmaceutical creams can determined by
derivative spectroscopy without prior extraction of active ingredient
(Nilgun Gunden Goger and Lerzan Gokcen).
Derivative spectroscopy has reported for the analysis of drugs in
biological fluids (Alaa El-Gindy et. al). The determination of cefuroxime

and cefadroxil in urine is an example of such application of derivative
spectroscopic analysis.
The technique has also been reported (E. M. Hassan et. al) for the
determination of cisapride in pharmaceutical preparations.
Application of second derivative spectrometric has also been employed
in the determination of simvastatin in tablet dosage form ( Lei Wang and
Mandana Asgharnejad). Durisehvar Ozer and Hulya Senel have applied
derivative spectrophotometry for the determination of lisinopril in
pharmaceutical preparations.
In the present work, a derivative spectroscopy method has been
established for analysis of chloroquine phosphate. The method has been
found to be precise accurate and selective. It was employed for analysis
of chloroquine phosphate in different pharmaceutical dosage forms. The
results obtained showed that the developed method is similar in
selectivity to the HPLC method and superior to the zero order and the
official non-aqueous titration methods. While it has, advantage over the
HPLC method being less time consuming and less expensive.
The derivative method found to be suitable for assay of chloroquine
phosphate in plasma. This will likely make further future biological work
with chloroquine phosphate to be meaningful.

5.2. Recommendation: 5.2.1. The present method is suitable as a routine analytical procedure for
analysis of chloroquine phosphate in different pharmaceutical dosage
forms.
5.2.2. The method can further employed for analysis of chloroquine
phosphate in presence of its metabolite i.e. in biological fluids.

5.2.3. Further work recommended for employing this method as a
stability indicating method for the study of chloroquine phosphate in
presence of its decomposition and degradation products.
5.2.4. Work should been extended for studying drug combinations.
5.2.5. The method should been applied in determination of drugs in other
pharmaceutical dosage form such as creams and ointments without prior
extraction of active ingredients.
5.2.6. The derivative spectroscopic method should been applied in the
assay of different pharmaceutical preparations, as it is simple, rapid,
precise and accurate, less coasty and less time consuming than either the
official non-aqueous titremetric method or the HPLC method.

References
1. Aburjai T., Anro B.I., Aiedeh K., Aburirjeie M. and Al-Khalil S., second
derivative ultraviolet spectrophotometry and HPLC for the simultaneous
determination of vitamin C and dipyrone. pharmazine, (10), (751-754), 1999.
2. Alaa El-Gindy, First derivative spectrophotometric and LC determination of
benoxinate hydrochloride and its degradation products, J. Pharm. Biomed.
Anal: (22), (215- 234), 2000.
3. Alaa El-Gindy, Abdel-Fattah M. El Walily and Mohamed E. Bedair, first
derivative spectrophotometric and LC determination of cefuroxime and
cefadroxil in urine, J. Pharm. Biomed. Anal: (23), (341-352), 2000.
4. Alaa El-Gindy, Ahmed Ashour, Laila Abdel- Fattah and Marwan M. Shabana,
First derivative spectrophotometric, TLC- densitometric, and HPLC
determination of acebutolol HCL in prescence of its acid-induced degradation
product, J. Pharm. Biomed. Anal: (24) (527-534), 2001.
5. Allen LV Jr and Erickson MA, stability of alprazolam, chloroquine phosphate,
cisapride, enalapril maleate, andhydralazine hydrochloride in
extemporaneously compounded oral liquids, Am J. Health Syst. Pharm: (18),
(1915- 1920), 1998.
6. Amal N. Abdelrahman, Elfatih I.A. Karium and Kamal E. E. analysis of
chloroquine decomposition products in various brands of different dosage

forms by liquid chromatography, J. Pharm. Biomed. Anal. (12), (205-208),
1994.
7. Amin AS and Issa YM, conductimetric and indirect AAS determination of
antimalarials, J. Pharm. Biomed. Anal: (26), (785-794), 2003.
8. Beakett A. H and Stenlake J. B. Practical Pharmaceutical Chemistry, CBS
publisher and distributors, India , (278-307), 1997.
9. Bayoumi R.A., Babiker H.A., Ibrahim S.M., Ghalib H.W., Saeed B.O., Khidir
S., Elwasila M. and Elkarim E. A., Conference of Sudan Association of
physician Khartoum, 11th 1988.
10. Castro D., Moreo M.A., Torrado S. and Lastres J.L., comparison of
derivative spectrophotometric and liquid chromatographic methods for the
determination of omeprazole in aqueous solutions during stabilities studies, J.
Pharm. Biomed. Anal. (21), (291-298), 1999.
11. El-Gindy A, Korany MA and Bedair MF,first derivative spectrophotometric
and high- performance liquid chromatographic determination of cinchocaine
hydrochloride in prescemnce of its acid degradation product. J. Pharm.
Biomed. Anal. (17), (1357- 1370) 1998.
12. Gary D. Christian and James O, Reilly, Instrumental Analysis, 2nd ed. Allyn and
Bacon, Inc. Boston London Sydney Toronto, (658-665), 1986.
13. Grayd Christian, Analytical Chemistry, 5th ed.1998. 14. Hassan E.M., Hagga M.E.M. and Al Johar H.I. determination of cisapride in

pharmaceutical preparations using derivative spectrophotometry, J. Pharm.
Biomed. Anal. (24), (659- 665), 2001.
15. Hassan SS and Ahmed MA, polyvinyl chloride matrix membrane electrodes
for manual and flow injection analysis of chloroquine in pharmaceutical
preparations. J. Asso. Off. Anal. Chem. (74), (900 -905), 1991.
16. Herbert M. Gilles and David A. Warrell, Bruce-Chwatts essential
malariology,3rd ed. 1989.
17. Hopkala H. and Kowalczuk D. application of derivative UV spectrophotometry
for the determination of enoxacin and nalidixic acid in tablets, Pharmazine 55,
(6), (432- 435), 2000.
18. James E. F. Renold, Kathleen Parfitt ,Anne V. Parsous and Sean C. Sweetman,
Martin Dale, published by direction of the Council of Royal Pharmaceutical
Society of Great Britain, 29th. ed.1989.
19. Lei Wang and Mandana Asgharnjead, second derivative UV spectrometric
determination of simavastatin in its tablet dosage form, J. Pharm. Biomed.
Anal: (21), (1243- 1248),2000.
20. Mahmoud B.M., Ali H.A., Homeida M. and Bannett J. Conference of Sudan
Association of physician Khartoum, 11th 1988.
21. Michael and Irene Ash, Handbook of Pharmaceutical Additives, Gower
publishing limited , Gower House , Croft Road, England, 1995.

22. Moffat A.C., J.V. Jackson, M.S. Moss, B .Widdop And E.S. Greenfield,
Clarcks, Isolation and Identification of Drugs, (227-233), 1986.
23. Murat Kartal and Nevin Erk, simultaneous determination of
hydrochlorothiazide and amiloride hydrochloride by ratio spectra derivative
spectrophotometry and high- performance liquid chromatography. J. Pharm.
Biomed. Anal. (19), (477- 485), 1999.
24. Neuvonen PJ, Kivisto KT, Laine K and Pyykko K, prevention of chloroquine
absorption by activated charcoal. Hum Exp Toxicol.(2),(117-120),1992.
25. Nevin Erk, analysis of binary mixtures of losartan potassium and
hydrochlorothiazide by using high performance liquid chromatography, ratio
derivative spectrophotometric and compensation technique, J. Pharm. Biomed.
Anal. (24), (603- 611), 2001.
26. Nevin Erk, assay of ephedrine hydrochloride and theophylline in
pharmaceutical formulations by differential-derivative spectroscopy, J. Pharm.
Biomed. Anal. (23), (25- 261), 2000.
27. Nevin Erk, quantitative analysis of chlorpheniramine maleate and
phenylephrine hydrochloride in nasal drops by differential- derivative
spectrophotometric, zero-crossing first derivative UV spectrophotometric and
absorbance ratio methods, J. Pharm. Biomed. Anal. (23), (1023-1031), 2000.

28. Nilgun Guiden Goger and Lezan Gokkcen, quantitative determination of
micnazole in creams by second derivative spectrophotometry, Anal. Letters,
(32), (2595- 2602), 1999.
29. Nsimba SE, Aden-Abdi Y, Rimoy G, Massele AY, Ericsson O and Gstafsson
LL. Comparative in vitro and in vivo study of a sugarcoated chloroquine
preparation marketed in Tanzania versus an ordinary brand, J. Clin. Pharm.
Ther. (26), (43-48) 2001.
30. Prasad C.V.N., Saha R.N. and Parimoo P., Simultaneous Determination of
Amlodipine- Enalapril Maleate and Amlodipine-Lisinopril in Combined
Tablets Preprations by Derivative Spectrophotometry, J. Pharm. Pharmacol.
Commun. (5), (383-388), 1999.
31. Rimoy GH, Moshi MJ and Massele AY, comparative bioavailability of oral
sugarcoated and plain formulation of chloroquine phosphate marketed in
Tanzania. J. Trop. Doct. (32), (15- 17), 2002.
32. Rollo I.M. Goodman and Gilman the pharmacological basis of Therapeutics, 6th
ed. MacMillan, New York, (1038-1059), 1986.
33. Sjolin-Forsberg G, Berne B, Blixt C, Johansson M and Lindstrom B,
cloroquine phosphate: a long-term follow-up of drug concentrations in skin
suction blister fluid and plasma. J. Acta Derm Venereol. (73), (426- 429), 1993.

34. Susan Budavari, Maryadele J. Onail, Ann Smith, Patrica E. heckleman and
Joanne F. Kinneary, The Merck Index, 12th ed. published by Merck Research
Laboratories,1996.
35. The British Pharmacopoeia, Published by the stationery office under license
from The Controller Of Her Majesty’s Stationary Office, (1807-1809),2000.
36. The United State Pharmacopoeia, United States Pharmacopoeial Convention,
(388,389), 2000.
37. Walter Lund, The Pharmaceutical Codex, 12th ed. published by the direction of
the council of the Royal Pharmaceutical Society's of Great Britain, (794-
797),1994.
38. WHO Tech. Rep. Ser. no. 680, Malaria control and national health goals, 1982.
39. WHO Tech. Rep. Ser. no. 711, Advances in malaria chemotherapy, 1984.
40. WHO technical report series No. 790, 1990.
41. WHO technical report series No. 568, 1994.
42. WHO Communicable Diseases Cluster, Royal Society of Tropical Medicinal
and Hygiene, Severe Falciprum Malaria, 3rd ed. Volume 94, 2000.

Appendix

Table 13: Results of analysis of Chloroquine Phosphate (%w/w) in presence of Starch:
No Abs. 221nm
Drv. 225 nm
Abs. 236 nm
Drv. 239nm
Abs. 256nm
Drv. 260nm
Abs. 331nm
Drv. 333nm
Abs. 343nm
Drv. 349nm HPLC
1 100.9 104.1 99.5 97.1 99.6 97.1 99.7 100 100.8 97.7 100.5 2 104 105.3 104 100 104.2 103 103.7 97.1 103.4 104.9 103.3 3 103.2 103.5 102.5 101.9 103.2 102.3 102.7 101.8 102.2 102.9 101.8

Table14: Statistical analysis of the results of Chloroquine Phosphate
(%w/w) in presence of starch:
t-test (experimental)
F-test (experimental)
Pair 1 Drv.225nm –Abs.221nm 1.994 3.5392 Pair 2 Drv.225nm – HPLC 4.126 17.0256 Pair 3 Drv.239nm–Abs. 236nm 2.376 5.6452 Pair 4 Drv.239nm – HPLC -1.912 3.6574 Pair 5 Drv.260nm–Abs.256nm 3.123 9.7512 Pair 6 Drv.260nm – HPLC 0.897 0.8044 Pair 7 Drv.333nm–Abs.331nm 1.128 1.2715 Pair 8 Drv.333nm – HPLC 1.123 1.2613 Pair 9 Drv.349nm–Abs.343nm 0.211 0.0447 Pair 10 Drv.349nm – HPLC 0.024 0.0006
The theoretical F at the 95% confidence level and degree of freedom Ø1 = 2 Ø2 =2 (19.0)
While the theoretical t at the 95% confidence level and degree of freedom Ø1 = 2 Ø2 =2 (4.303).

Table 15: Results of analysis of Chloroquine Phosphate (%w/w) in presence aerosil
No Abs. 221nm
Drv. 225nm
Abs. 236nm
Drv. 239nm
Abs. 256nm
Drv. 260nm
Abs. 331nm
Drv. 333nm
Abs. 343nm
Drv. 349nm HPLC
1 101.3 103.4 99.7 100 99.8 97.1 100.3 100 101.7 98.8 99.9 2 101.3 102.9 101.4 97.1 101.6 100 102.3 100 102 101.7 100.2 3 102.9 101.9 99.7 99.5 100.5 98.5 101 99.5 101.2 100.5 99.5
Table16: Statistical analysis of the results of Chloroquine Phosphate (%w/w) in presence of Aerosil:
t-test
(experimental) F-test
(experimental))
Pair 1 Drv.225nm –Abs.221nm -0.937 0.8773 Pair 2 Drv.225nm – HPLC 8.665* 75.088* Pair 3 Drv.239nm–Abs. 236nm 0.961 0.9231 Pair 4 Drv.239nm – HPLC -0.952 0.9069 Pair 5 Drv.260nm–Abs.256nm 6.533 42.677 Pair 6 Drv.260nm – HPLC -1.754 3.0768 Pair 7 Drv.333nm–Abs.331nm 2.352 5.5296 Pair 8 Drv.333nm – HPLC -0.423 0.1791 Pair 9 Drv.349nm–Abs.343nm 1.608 2.5867 Pair 10 Drv.349nm – HPLC -0.937 0.3372
*significant difference

Table 17: Results of analysis of Chloroquine Phosphate (%w/w) in presence of Avicel
No Abs. 221nm
Drv. 225nm
Abs. 236nm
Drv. 239nm
Abs. 256nm
Drv. 260nm
Abs. 331nm
Drv. 333nm
Abs. 343nm
Drv. 349nm HPLC
1 101.1 100 101.3 97.1 101.4 100 99.7 100 103 102.5 103.2 2 101.5 101.6 101.6 100 101.9 103 103.5 102.7 102.8 103.7 102.8 3 100.9 101.5 101.9 98.6 101.5 101.5 101.7 101.3 102.5 103.1 103.3
Table18: Statistical analysis of the results of Chloroquine Phosphate
(%w/w) in presence of Avicel:
t-test (experimental)
F-test (experimental)
Pair 1 Drv.225nm –Abs.221nm 0.300 0.090 Pair 2 Drv.225nm – HPLC 2.000 4.000 Pair 3 Drv.239nm–Abs. 236nm 3.979 15.834 Pair 4 Drv.239nm – HPLC 4.741 22.474 Pair 5 Drv.260nm–Abs.256nm 0.138 0.019 Pair 6 Drv.260nm – HPLC 1.622 2.630 Pair 7 Drv.333nm–Abs.331nm 0.933 0.871 Pair 8 Drv.333nm – HPLC 1.958 3.832 Pair 9 Drv.349nm–Abs.343nm 0.543 0.295 Pair 10 Drv.349nm – HPLC 0.127 0.016

Table 19: Results of analysis of Chloroquine Phosphate (%w/w) in presence of Mg Sterate
No Abs. 221nm
Drv. 225nm
Abs. 236nm
Drv. 239nm
Abs. 256nm
Drv. 260nm
Abs. 331nm
Drv. 333nm
Abs. 343nm
Drv. 349nm HPLC
1 104.10 102.20 102.90 101.50 101.5 100.0 101.60 100.90 101.60 101.90 99.90 2 103.30 102.30 102.30 102.90 102.1 99.50 102.40 100.30 102.10 101.20 101.2 3 104.50 103.90 103.50 101.20 100.1 101.5 101.90 101.90 101.90 100.10 100.9
Table20: Statistical analysis of the results of Chloroquine Phosphate
(%w/w) in presence of Mg Sterate:
t-test (experimental)
F-test (experimental
Pair 1 Drv.225nm –Abs.221nm 3.035 9.211 Pair 2 Drv.225nm – HPLC 3.845 14.787 Pair 3 Drv.239nm–Abs. 236nm 1.206 1.454 Pair 4 Drv.239nm – HPLC 2.661 2.082 Pair 5 Drv.260nm–Abs.256nm 0.754 0.569 Pair 6 Drv.260nm – HPLC 0.477 0.228 Pair 7 Drv.333nm–Abs.331nm 1.512 2.286 Pair 8 Drv.333nm – HPLC 0.579 0.335 Pair 9 Drv.349nm–Abs.343nm 1.315 1.730 Pair 10 Drv.349nm – HPLC 0.480 0.231

Table 21: Results of analysis of Chloroquine Phosphate (%w/w) in presence of Lactose
No Abs. 221nm
Drv. 225nm
Abs. 236nm
Drv. 239nm
Abs. 256nm
Drv. 260nm
Abs. 331nm
Drv. 333nm
Abs. 343nm
Drv. 349nm HPLC
1 101.60 100.00 102.50 100.00 102.30 103.0 102.20 100.90 102.10 100.00 101.2 2 101.20 102.20 99.70 100.50 100.90 100.5 100.80 100.50 101.70 102.90 100.5 3 101.50 101.50 101.50 101.50 101.20 101.9 103.20 99.30 101.50 101.50 101.5
Table22: Statistical analysis of the results of Chloroquine Phosphate
(%w/w) in presence of Lactose:
t-test (experimental)
F-test (experimental)
Pair 1 Drv.225nm –Abs.221nm 0.264 0.070 Pair 2 Drv.225nm – HPLC 0.198 0.039 Pair 3 Drv.239nm–Abs. 236nm 0.570 0.325 Pair 4 Drv.239nm – HPLC 1.000 1.000 Pair 5 Drv.260nm–Abs.256nm 0.909 0.826 Pair 6 Drv.260nm – HPLC 1.344 1.806 Pair 7 Drv.333nm–Abs.331nm 1.709 2.920 Pair 8 Drv.333nm – HPLC 1.210 1.464 Pair 9 Drv.349nm–Abs.343nm 0.311 0.097 Pair 10 Drv.349nm – HPLC 0.378 0.143

Table 23: Results of analysis of Chloroquine Phosphate (%w/w) in presence of Talc
No Abs. 221nm
Drv. 225nm
Abs. 236nm
Drv. 239nm
Abs. 256nm
Drv. 260nm
Abs. 331nm
Drv. 333nm
Abs. 343nm
Drv. 349nm HPLC
1 99.70 102.60 98.90 100.00 99.10 97.90 99.40 100.00 101.40 102.50 102.2 2 103.10 102.70 103.10 97.10 103.30 103.0 104.10 98.50 103.40 97.70 98.80 3 101.40 101.80 101.50 102.90 101.20 101.8 101.70 103.20 102.20 103.20 103.1
Table24: Statistical analysis of the results of Chloroquine Phosphate
(%w/w) in presence of Talc:
t-test (experimental)
F-test (experimental)
Pair 1 Drv.225nm –Abs.221nm 0.973 0.946 Pair 2 Drv.225nm – HPLC 0653 0.427 Pair 3 Drv.239nm–Abs. 236nm 0.482 0.233 Pair 4 Drv.239nm – HPLC 2.274 5.172 Pair 5 Drv.260nm–Abs.256nm 0.577 0.333 Pair 6 Drv.260nm – HPLC 0.188 0.035 Pair 7 Drv.333nm–Abs.331nm 0.523 0.273 Pair 8 Drv.333nm – HPLC 1.128 1.272 Pair 9 Drv.349nm–Abs.343nm 0.533 0.284 Pair 10 Drv.349nm – HPLC 0.534 0.285

Table 25: Results of analysis of Chloroquine Phosphate (%w/w) in presence of Acacia
No Abs. 221nm
Drv. 225nm
Abs. 236nm
Drv. 239nm
Abs. 256nm
Drv. 260nm
Abs. 331nm
Drv. 333nm
Abs. 343nm
Drv. 349nm HPLC
1 99.80 97.80 99.10 97.10 99.30 97.10 100.50 100.50 100.10 100.00 98.90 2 98.60 100.20 100.50 102.90 100.90 100.0 100.30 99.80 101.30 98.80 100.2 3 99.50 99.20 99.80 101.10 100.10 99.80 100.40 101.20 100.70 102.20 100.9
Table 26: Statistical analysis of the results of Chloroquine Phosphate
(% w/w) in presence of Acacia:
t-test (experimental)
F-test (experimental)
Pair 1 Drv.225nm –Abs.221nm 0.224 0.050 Pair 2 Drv.225nm – HPLC 1.875 3.516 Pair 3 Drv.239nm–Abs. 236nm 0.429 0.184 Pair 4 Drv.239nm – HPLC 0.282 0.079 Pair 5 Drv.260nm–Abs.256nm 2.021 4.085 Pair 6 Drv.260nm – HPLC 2.231 4.979
Pair 7 Drv.333nm–Abs.331nm 0.264 0.070
Pair 8 Drv.333nm – HPLC 0.853 0.728 Pair 9 Drv.349nm–Abs.343nm 0.315 0.100 Pair 10 Drv.349nm – HPLC 0.384 0.147

Table 27: Results of analysis of Chloroquine Phosphate (%w/w) in presence of Methyl paraben
No Abs. 221nm
Drv. 225nm
Abs. 236nm
Drv. 239nm
Abs. 256nm
Drv. 260nm
Abs. 331nm
Drv. 333nm
Abs. 343nm
Drv. 349nm HPLC
1 109.90 99.70 122.70 47.10 162.00 124.2 101.70 103.30 102.20 100.00 98.90 2 109.90 102.70 122.40 50.00 164.50 120.9 98.90 102.60 101.10 99.80 99.50 3 108.70 101.50 121.50 48.90 163.90 122.8 102.10 99.10 99.50 99.30 100.3
Table28: Statistical analysis of the results of Chloroquine Phosphate
(%w/w) in presence of Methyl paraben
t-test (experimental)
F-test (experimental
Pair 1 Drv.225nm –Abs.221nm 8.200 67.24 Pair 2 Drv.225nm – HPLC 2.335 5.452 Pair 3 Drv.239nm–Abs. 236nm 71.050 5048.2 Pair 4 Drv.239nm – HPLC 71.75 5147.3 Pair 5 Drv.260nm–Abs.256nm 24.311 591.03 Pair 6 Drv.260nm – HPLC 19.869 394.78 Pair 7 Drv.333nm–Abs.331nm 0.387 0.154 Pair 8 Drv.333nm – HPLC 1.241 1.540 Pair 9 Drv.349nm–Abs.343nm 2.133 4.548 Pair 10 Drv.349nm – HPLC 0.218 0.0475

Table 29: Results of analysis of Chloroquine Phosphate (%w/w) in presence of Propyl paraben
No Abs. 221nm
Drv. 225nm
Abs. 236nm
Drv. 239nm
Abs. 256nm
Drv. 260nm
Abs. 331nm
Drv. 333nm
Abs. 343nm
Drv. 349nm HPLC
1 106.40 102.70 113.70 61.80 143.50 114.3 98.90 97.50 97.50 96.70 97.40 2 107.20 99.10 112.50 60.50 141.20 113.0 99.50 98.20 99.20 98.90 99.20 3 106.10 101.90 112.00 62.20 139.50 114.5 97.90 99.50 98.20 97.50 98.50
Table30: Statistical analysis of the results of Chloroquine Phosphate
(%w/w) in presence of Propyl paraben
t-test (experimental)
F-test (experimental
Pair 1 Drv.225nm –Abs.221nm 3.835 14.704 Pair 2 Drv.225nm – HPLC 1.813 3.286 Pair 3 Drv.239nm–Abs. 236nm 71.430 5102.31 Pair 4 Drv.239nm – HPLC 39.28 1542.205 Pair 5 Drv.260nm–Abs.256nm 21.684 470.205 Pair 6 Drv.260nm – HPLC 16.907 285.8 Pair 7 Drv.333nm–Abs.331nm 0.373 0.139 Pair 8 Drv.333nm – HPLC 0.058 0.0033 Pair 9 Drv.349nm–Abs.343nm 3.928 15.427 Pair 10 Drv.349nm – HPLC 3.288 10.811

Table 31:Results of analysis of Chloroquine Phosphate (%w/w) in presence of Dicalcium phosphate
No Abs. 221nm
Drv. 225nm
Abs. 236nm
Drv. 239nm
Abs. 256nm
Drv. 260nm
Abs. 331nm
Drv. 333nm
Abs. 343nm
Drv. 349nm HPLC
1 101.70 101.40 100.70 97.10 102.80 103.0 99.80 100.20 100.60 102.50 101.5 2 102.90 103.90 102.10 97.80 102.00 100.0 101.90 97.40 100.40 97.70 98.50 3 99.10 98.60 98.50 101.90 99.20 98.60 98.90 101.20 99.80 100.90 100.8
Table32: Statistical analysis of the results of Chloroquine Phosphate
(%w/w) in presence of Dicalcium phosphate
t-test (experimental)
F-test (experimental)
Pair 1 Drv.225nm –Abs.221nm 0.142 0.020 Pair 2 Drv.225nm – HPLC 0.456 0.208 Pair 3 Drv.239nm–Abs. 236nm 0.610 0.372 Pair 4 Drv.239nm – HPLC 0.824 0.678 Pair 5 Drv.260nm–Abs.256nm 1.244 1.548 Pair 6 Drv.260nm – HPLC 0.216 0.047 Pair 7 Drv.333nm–Abs.331nm 0.296 0.088 Pair 8 Drv.333nm – HPLC 1.243 1.544 Pair 9 Drv.349nm–Abs.343nm 0.070 0.005 Pair 10 Drv.349nm – HPLC 0.192 0.037

Table 33: Results of analysis of Chloroquine Phosphate (%w/w) in presence of Titanium Dioxide
No Abs. 221nm
Drv. 225nm
Abs. 236nm
Drv. 239nm
Abs. 256nm
Drv. 260nm
Abs. 331nm
Drv. 333nm
Abs. 343nm
Drv. 349nm HPLC
1 102.70 102.80 103.00 100.00 106.87 106.3 106.70 101.50 106.90 105.80 101.3 2 104.60 103.80 105.80 102.50 106.70 103.0 105.60 104.90 105.00 104.90 104.1 3 101.90 102.20 102.50 106.10 103.10 105.9 102.90 105.50 103.00 102.90 103.3
Table34: Statistical analysis of the results of Chloroquine Phosphate (%w/w) in presence of Titanium Dioxide
t-test (experimental)
F-test (experimental)
Pair 1 Drv.225nm –Abs.221nm 0.394 0.155 Pair 2 Drv.225nm – HPLC 0.043 0.002 Pair 3 Drv.239nm–Abs. 236nm 0.400 0.160 Pair 4 Drv.239nm – HPLC 0.023 0.001 Pair 5 Drv.260nm–Abs.256nm 0.261 0.068 Pair 6 Drv.260nm – HPLC 1.221 1.491 Pair 7 Drv.333nm–Abs.331nm 0.487 0.237 Pair 8 Drv.333nm – HPLC 1.800 3.241 Pair 9 Drv.349nm–Abs.343nm 1.300 1.690 Pair 10 Drv.349nm – HPLC 1.108 1.227

Table 35: Results of analysis of Chloroquine Phosphate (%w/w) in presence of Opadry
No Abs. 221nm
Drv. 225nm
Abs. 236nm
Drv. 239nm
Abs. 256nm
Drv. 260nm
Abs. 331nm
Drv. 333nm
Abs. 343nm
Drv. 349nm HPLC
1 99.50 98.60 102.50 102.90 103.10 100.00 100.10 103.70 104.90 100.00 101.7 2 98.50 101.50 100.50 99.50 101.90 102.80 104.90 98.90 100.60 102.90 101.2 3 101.20 99.30 99.20 100.20 98.70 97.80 98.50 101.20 99.50 99.80 99.90
Table36: Statistical analysis of the results of Chloroquine Phosphate
(%w/w) in presence of Opadry
t-test (experimental)
F-test (experimental)
Pair 1 Drv.225nm –Abs.221nm 0.045 0.002 Pair 2 Drv.225nm – HPLC 1.114 1.242 Pair 3 Drv.239nm–Abs. 236nm 0.225 0.051 Pair 4 Drv.239nm – HPLC 0.078 0.006 Pair 5 Drv.260nm–Abs.256nm 0.893 0.798 Pair 6 Drv.260nm – HPLC 0.626 0.391 Pair 7 Drv.333nm–Abs.331nm 0.033 0.001 Pair 8 Drv.333nm – HPLC 0.250 0.063 Pair 9 Drv.349nm–Abs.343nm 0.357 0.128 Pair 10 Drv.349nm – HPLC 0.034 0.001

Table 37: Results of analysis of Chloroquine Phosphate (%w/w) in presence of Propylene Glycol
No Abs. 221nm
Drv. 225nm
Abs. 236nm
Drv. 239nm
Abs. 256nm
Drv. 260nm
Abs. 331nm
Drv. 333nm
Abs. 343nm
Drv. 349nm HPLC
1 100.50 100.90 99.70 100.00 100.10 97.10 99.70 98.50 100.70 97.70 101.1 2 101.20 102.80 101.50 101.20 101.30 101.5 101.90 101.20 99.50 100.90 99.50 3 99.50 99.10 100.90 98.90 99.30 100.2 100.80 97.90 101.50 101.50 100.3
Table38: Statistical analysis of the Percentage results of Chloroquine Phosphate
(%w/w) in presence of Propylene Glycol
t-test (experimental)
F-test (experimental)
Pair 1 Drv.225nm –Abs.221nm 0.918 0.842 Pair 2 Drv.225nm – HPLC 0.464 0.216 Pair 3 Drv.239nm–Abs. 236nm 0.968 0.937 Pair 4 Drv.239nm – HPLC 0.270 0.073 Pair 5 Drv.260nm–Abs.256nm 0.528 0.278 Pair 6 Drv.260nm – HPLC 0.398 0.159 Pair 7 Drv.333nm–Abs.331nm 2.403 5.774 Pair 8 Drv.333nm – HPLC 0.785 0.616 Pair 9 Drv.349nm–Abs.343nm 0.411 0.169 Pair 10 Drv.349nm – HPLC 0.170 0.029

Table 39: Results of analysis of Chloroquine Phosphate (%w/w) in presence of Glycerin
No Abs. 221nm
Drv. 225nm
Abs. 236nm
Drv. 239nm
Abs. 256nm
Drv. 260nm
Abs. 331nm
Drv. 333nm
Abs. 343nm
Drv. 349nm HPLC
1 99.20 100.00 100.40 97.10 101.70 97.10 104.60 103.40 101.70 98.80 99.20 2 101.60 102.60 99.00 100.00 100.90 103.0 102.50 97.80 101.90 101.20 101.6 3 100.20 99.30 101.40 101.00 99.50 100.5 99.11 101.20 99.20 100.90 100.2
Table40: Statistical analysis of the results of Chloroquine Phosphate
(%w/w) in presence of Glycerin
t-test (experimental)
F-test (experimental
Pair 1 Drv.225nm –Abs.221nm 0.498 0.248 Pair 2 Drv.225nm – HPLC 0.684 0.467 Pair 3 Drv.239nm–Abs. 236nm 0.711 0.505 Pair 4 Drv.239nm – HPLC 0.608 0.37 Pair 5 Drv.260nm–Abs.256nm 0.241 0.058 Pair 6 Drv.260nm – HPLC 0.041 0.002 Pair 7 Drv.333nm–Abs.331nm 0.648 0.42 Pair 8 Drv.333nm – HPLC 0.268 0.072 Pair 9 Drv.349nm–Abs.343nm 0.477 0.227 Pair 10 Drv.349nm – HPLC 0.035 0.001

Table 41: Results of analysis of Chloroquine Phosphate (%w/w) in presence of Sucrose
No Abs. 221nm
Drv. 225nm
Abs. 236nm
Drv. 239nm
Abs. 256nm
Drv. 260nm
Abs. 331nm
Drv. 333nm
Abs. 343nm
Drv. 349nm HPLC
1 99.10 97.50 101.70 100.00 99.70 97.10 102.20 103.20 101.00 102.50 99.10 2 101.20 102.60 99.10 100.00 102.10 103.0 99.20 101.50 101.90 97.70 101.2 3 100.50 100.20 100.20 101.20 100.10 100.2 100.50 97.10 99.50 100.20 100.5
Table 42: Statistical analysis of the results of Chloroquine Phosphate
(%w/w) in presence of Sucrose
t-test (experimental)
F-test (experimental
Pair 1 Drv.225nm –Abs.221nm 0.192 0.037 Pair 2 Drv.225nm – HPLC 0.104 0.011 Pair 3 Drv.239nm–Abs. 236nm 0.075 0.006 Pair 4 Drv.239nm – HPLC 0.172 0.030 Pair 5 Drv.260nm–Abs.256nm 0.504 0.254 Pair 6 Drv.260nm – HPLC 0.089 0.008 Pair 7 Drv.333nm–Abs.331nm 0.019 0.0004 Pair 8 Drv.333nm – HPLC 0.249 0.062 Pair 9 Drv.349nm–Abs.343nm 0.374 0.14 Pair 10 Drv.349nm – HPLC 0.056 0.003

Table 43: Results of analysis of Chloroquine Phosphate (%w/w) in presence of Saccharin Na
No Abs. 221nm
Drv. 225nm
Abs. 236nm
Drv. 239nm
Abs. 256nm
Drv. 260nm
Abs. 331nm
Drv. 333nm
Abs. 343nm
Drv. 349nm HPLC
1 161.80 159.50 205.10 147.50 106.30 97.80 102.80 101.50 103.60 102.50 103.2 2 158.50 160.10 207.00 150.00 104.60 99.80 103.50 103.90 102.70 103.10 101.5 3 160.20 161.20 205.60 148.90 105.20 101.2 102.50 102.40 101.50 101.90 102.4
Table 44: Statistical analysis of the results of Chloroquine Phosphate
(%w/w) in presence of Saccharin Na
t-test (experimental)
F-test (experimental
Pair 1 Drv.225nm –Abs.221nm 0.082 0.007 Pair 2 Drv.225nm – HPLC 72.187 5211 Pair 3 Drv.239nm–Abs. 236nm 215.818 46577 Pair 4 Drv.239nm – HPLC 38.283 1465 Pair 5 Drv.260nm–Abs.256nm 4.161 17.13 Pair 6 Drv.260nm – HPLC 2.089 4.363 Pair 7 Drv.333nm–Abs.331nm 0.661 0.437 Pair 8 Drv.333nm – HPLC 0.196 0.039 Pair 9 Drv.349nm–Abs.343nm 0.200 0.040 Pair 10 Drv.349nm – HPLC 0.181 0.033

Table 45: Results of analysis of Chloroquine Phosphate (%w/w) in presence of Sodium Citrate
No Abs. 221nm
Drv. 225nm
Abs. 236nm
Drv. 239nm
Abs. 256nm
Drv. 260nm
Abs. 331nm
Drv. 333nm
Abs. 343nm
Drv. 349nm HPLC
1 102.60 103.90 102.60 100.00 102.30 103.0 102.10 104.50 101.10 101.50 101.9 2 103.30 99.20 102.20 98.50 102.60 100.2 104.00 101.50 102.50 98.80 99.90 3 99.80 104.20 99.80 101.90 100.20 99.50 98.50 99.60 99.50 102.52 102.4
Table 46: Statistical analysis of the results of Chloroquine Phosphate
(%w/w) in presence of Sodium Citrate
t-test (experimental)
F-test (experimental)
Pair 1 Drv.225nm –Abs.221nm 0.215 0.046 Pair 2 Drv.225nm – HPLC 1.190 1.415 Pair 3 Drv.239nm–Abs. 236nm 0.787 0.620 Pair 4 Drv.239nm – HPLC 3.092 9.563 Pair 5 Drv.260nm–Abs.256nm 0.893 0.797 Pair 6 Drv.260nm – HPLC 0.409 0.167 Pair 7 Drv.333nm–Abs.331nm 0.227 0.052 Pair 8 Drv.333nm – HPLC 0.281 0.079 Pair 9 Drv.349nm–Abs.343nm 0.048 0.002 Pair 10 Drv.349nm – HPLC 1.301 1.694

Table 47: Results of analysis of Chloroquine Phosphate (%w/w) in presence of Citric Acid
No Abs. 221nm
Drv. 225nm
Abs. 236nm
Drv. 239nm
Abs. 256nm
Drv. 260nm
Abs. 331nm
Drv. 333nm
Abs. 343nm
Drv. 349nm HPLC
1 99.90 97.40 102.20 100.00 102.50 103.0 103.60 101.90 103.60 104.20 100.6 2 100.20 101.20 100.50 101.20 101.30 101.4 101.30 100.50 99.20 99.50 101.2 3 98.90 100.30 99.50 99.80 98.90 98.50 99.20 99.50 100.50 100.10 99.90
Table 48: Statistical analysis of the results of Chloroquine Phosphate
(%w/w) in presence of Citric Acid
t-test (experimental)
F-test (experimental
Pair 1 Drv.225nm –Abs.221nm 0.027 0.007 Pair 2 Drv.225nm – HPLC 0.819 0.671 Pair 3 Drv.239nm–Abs. 236nm 0.441 0.194 Pair 4 Drv.239nm – HPLC 1.257 1.581 Pair 5 Drv.260nm–Abs.256nm 0.256 0.066 Pair 6 Drv.260nm – HPLC 0.363 0.132 Pair 7 Drv.333nm–Abs.331nm 1.268 1.608 Pair 8 Drv.333nm – HPLC 0.107 0.012 Pair 9 Drv.349nm–Abs.343nm 0.563 0.317 Pair 10 Drv.349nm – HPLC 0.452 0.204

Table 49: Results of analysis of Chloroquine Phosphate (%w/w) in presence of Sorbitol
No Abs. 221nm
Drv. 225nm
Abs. 236nm
Drv. 239nm
Abs. 256nm
Drv. 260nm
Abs. 331nm
Drv. 333nm
Abs. 343nm
Drv. 349nm HPLC
1 102.30 100.00 103.50 102.90 99.50 103.0 99.90 102.70 101.60 103.70 101.9 2 98.90 101.90 99.30 99.50 103.80 97.10 105.30 100.00 102.60 100.00 99.50 3 100.20 100.00 100.50 100.00 100.90 100.2 100.10 99.50 100.50 99.80 100.9
Table 50: Statistical analysis of the results of Chloroquine Phosphate
(%w/w) in presence of Sorbitol
t-test (experimental)
F-test (experimental)
Pair 1 Drv.225nm –Abs.221nm 0.108 0.012 Pair 2 Drv.225nm – HPLC 0.103 0.011 Pair 3 Drv.239nm–Abs. 236nm 1.192 1.421 Pair 4 Drv.239nm – HPLC 0.061 0.004 Pair 5 Drv.260nm–Abs.256nm 0.439 0.193 Pair 6 Drv.260nm – HPLC 0.660 0.435 Pair 7 Drv.333nm–Abs.331nm 0.440 0.194 Pair 8 Drv.333nm – HPLC 0.048 0.002 Pair 9 Drv.349nm–Abs.343nm 0.293 0.086 Pair 10 Drv.349nm – HPLC 0.477 0.228

Table 51: Results of analysis of Chloroquine Phosphate (%w/w) in presence of Xanthan Gum
No Abs. 221nm
Drv. 225nm
Abs. 236nm
Drv. 239nm
Abs. 256nm
Drv. 260nm
Abs. 331nm
Drv. 333nm
Abs. 343nm
Drv. 349nm HPLC
1 97.10 97.10 98.70 100.00 102.20 97.10 99.40 104.10 100.60 102.50 102.6 2 99.80 101.40 102.10 97.10 99.10 100.0 99.00 100.00 104.40 99.90 101.6 3 100.50 100.44 100.20 101.10 100.40 101.5 104.10 99.50 98.50 101.40 99.80
Table 52: Statistical analysis of the results of Chloroquine Phosphate
(%w/w) in presence of Xanthan Gum
t-test (experimental)
F-test (experimental
Pair 1 Drv.225nm –Abs.221nm 0.944 0.892 Pair 2 Drv.225nm – HPLC 0.878 0.770 Pair 3 Drv.239nm–Abs. 236nm 0.458 0.210 Pair 4 Drv.239nm – HPLC 1.132 1.283 Pair 5 Drv.260nm–Abs.256nm 0.508 0.258 Pair 6 Drv.260nm – HPLC 0.865 0.748 Pair 7 Drv.333nm–Abs.331nm 0.136 0.018 Pair 8 Drv.333nm – HPLC 0.148 0.022 Pair 9 Drv.349nm–Abs.343nm 0.043 0.002 Pair 10 Drv.349nm – HPLC 0.070 0.005

Table 53: Results of analysis of Chloroquine Phosphate (%w/w) in presence of Tween 80
No Abs. 221nm
Drv. 225nm
Abs. 236nm
Drv. 239nm
Abs. 256nm
Drv. 260nm
Abs. 331nm
Drv. 333nm
Abs. 343nm
Drv. 349nm HPLC
1 100.10 101.80 102.80 102.50 103.50 100.0 103.20 100.10 104.40 101.80 103.2 2 100.10 103.20 100.40 102.10 100.70 104.1 101.90 104.10 101.90 100.00 101.2 3 102.50 100.00 101.20 99.50 99.50 98.60 99.50 98.50 98.80 104.90 98.50
Table 54: Statistical analysis of the results of Chloroquine Phosphate
(%w/w) in presence of Tween 80
t-test (experimental)
F-test (experimental
Pair 1 Drv.225nm –Abs.221nm 0.456 0.208 Pair 2 Drv.225nm – HPLC 0.660 0.436 Pair 3 Drv.239nm–Abs. 236nm 0.101 0.010 Pair 4 Drv.239nm – HPLC 0.726 0.528 Pair 5 Drv.260nm–Abs.256nm 0.166 0.027 Pair 6 Drv.260nm – HPLC 0.038 0.001 Pair 7 Drv.333nm–Abs.331nm 0.411 0.169 Pair 8 Drv.333nm – HPLC 0.038 0.002 Pair 9 Drv.349nm–Abs.343nm 0.191 0.037 Pair 10 Drv.349nm – HPLC 0.456 0.243

Table 55: Results of analysis of Chloroquine Phosphate (%w/w) in presence of Gelatin
No Abs. 221nm
Drv. 225nm
Abs. 236nm
Drv. 239nm
Abs. 256nm
Drv. 260nm
Abs. 331nm
Drv. 333nm
Abs. 343nm
Drv. 349nm HPLC
1 101.30 100.00 102.80 102.00 103.50 103.1 103.90 100.00 101.40 97.70 99.30 2 100.10 103.90 100.40 102.90 100.60 100.3 100.20 101.50 102.50 104.90 102.6 3 102.20 99.80 99.50 98.90 99.30 100.0 99.10 102.50 98.90 100.50 101.9
Table 56: Statistical analysis of the results of Chloroquine Phosphate
(%w/w) in presence of Gelatin
t-test (experimental)
F-test (experimental
Pair 1 Drv.225nm –Abs.221nm 0.017 0.0003 Pair 2 Drv.225nm – HPLC 0.032 0.001 Pair 3 Drv.239nm–Abs. 236nm 0.343 0.118 Pair 4 Drv.239nm – HPLC 0.000 0.000 Pair 5 Drv.260nm–Abs.256nm 0.000 0.000 Pair 6 Drv.260nm – HPLC 0.068 0.005 Pair 7 Drv.333nm–Abs.331nm 0.123 0.015 Pair 8 Drv.333nm – HPLC 0.114 0.013 Pair 9 Drv.349nm–Abs.343nm 0.052 0.003 Pair 10 Drv.349nm – HPLC 0.184 0.034

Table 57: Results of analysis of Chloroquine Phosphate (%w/w) in presence of Phosphoric Acid
No Abs. 221nm
Drv. 225nm
Abs. 236nm
Drv. 239nm
Abs. 256nm
Drv. 260nm
Abs. 331nm
Drv. 333nm
Abs. 343nm
Drv. 349nm HPLC
1 101.50 101.30 99.90 102.90 102.40 103.0 103.70 100.00 103.40 103.10 100.1 2 98.50 100.00 101.90 100.00 100.30 97.10 101.10 103.20 102.50 100.00 101.9 3 100.20 99.20 100.20 98.50 99.50 101.2 98.90 99.20 98.50 99.50 100.5
Table 58: Statistical analysis of the results of Chloroquine Phosphate
(%w/w) in presence of Phosphoric Acid
t-test (experimental)
F-test (experimental)
Pair 1 Drv.225nm –Abs.221nm 0.136 0.018 Pair 2 Drv.225nm – HPLC 0.702 0.493 Pair 3 Drv.239nm–Abs. 236nm 0.125 0.016 Pair 4 Drv.239nm – HPLC 0.232 0.054 Pair 5 Drv.260nm–Abs.256nm 0.202 0.041 Pair 6 Drv.260nm – HPLC 0.175 0.031 Pair 7 Drv.333nm–Abs.331nm 0.253 0.064 Pair 8 Drv.333nm – HPLC 0.044 0.002 Pair 9 Drv.349nm–Abs.343nm 0.587 0.345 Pair 10 Drv.349nm – HPLC 0.022 0.001
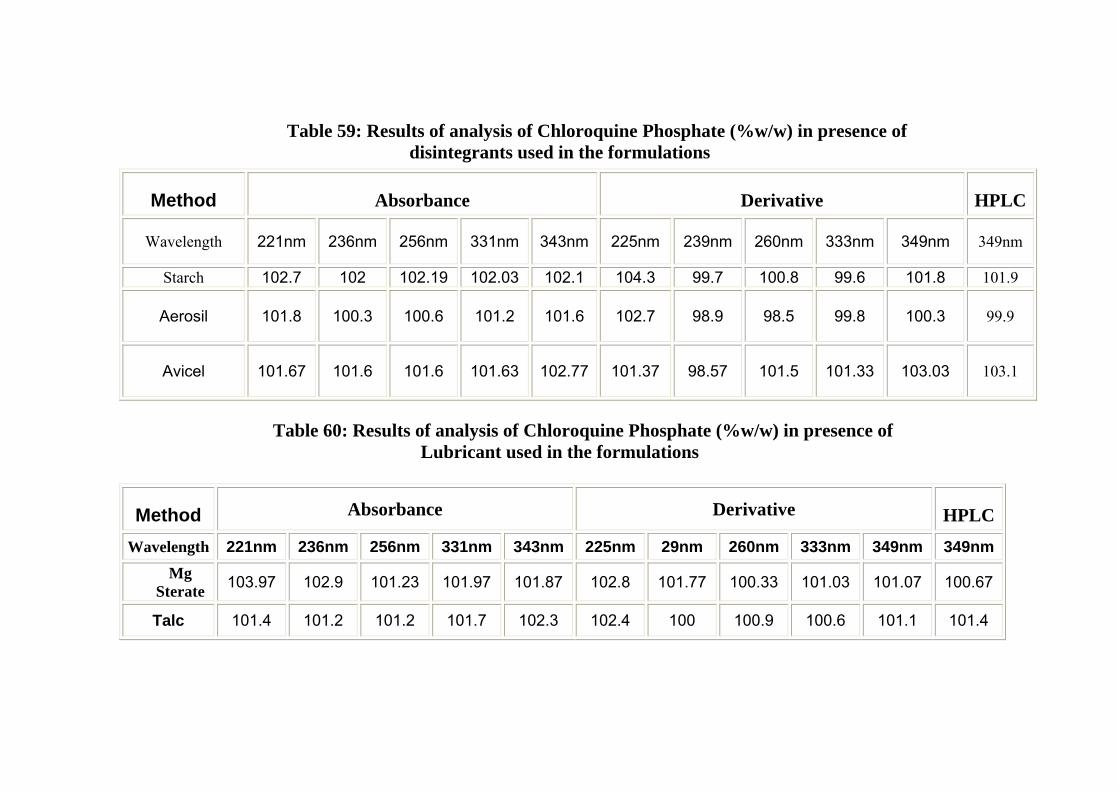
Table 59: Results of analysis of Chloroquine Phosphate (%w/w) in presence of disintegrants used in the formulations
Method Absorbance Derivative HPLC
Wavelength 221nm 236nm 256nm 331nm 343nm 225nm 239nm 260nm 333nm 349nm 349nm
Starch 102.7 102 102.19 102.03 102.1 104.3 99.7 100.8 99.6 101.8 101.9
Aerosil 101.8 100.3 100.6 101.2 101.6 102.7 98.9 98.5 99.8 100.3 99.9
Avicel 101.67 101.6 101.6 101.63 102.77 101.37 98.57 101.5 101.33 103.03 103.1
Table 60: Results of analysis of Chloroquine Phosphate (%w/w) in presence of
Lubricant used in the formulations
Method Absorbance Derivative HPLC
Wavelength 221nm 236nm 256nm 331nm 343nm 225nm 29nm 260nm 333nm 349nm 349nm Mg
Sterate 103.97 102.9 101.23 101.97 101.87 102.8 101.77 100.33 101.03 101.07 100.67
Talc 101.4 101.2 101.2 101.7 102.3 102.4 100 100.9 100.6 101.1 101.4

Table 61: Results of analysis of Chloroquine Phosphate (%w/w) in presence of Diluents used in the formulations
Method Absorbance Derivative HPLC
Wavelength 221nm 236nm 256nm 331nm 343nm 225nm 29nm 260nm 333nm 349nm 349nm
Lactose 101.43 101.23 101.47 102.07 101.77 101.23 100.67 101.8 100.2 101.47 101.07
Dical. Phos. 101.2 100.4 101.3 100.2 100.3 101.3 98.9 100.5 99.6 100.4 100.77
Sucrose 100.3 100.3 100.6 100.6 100.8 100.1 100.4 100.1 100.6 100.1 100.61
Table 62: Results of analysis of Chloroquine Phosphate (%w/w) in presence of Coloring agent used in the Formulations
Method Absorbance Derivative HPLC
Wave length 221nm 236nm 256nm 331nm 343nm 225nm 29nm 260nm 333nm 349nm 349nm
Titanium dioxide 103.1 103.8 105.6 105.1 105 102.9 102.9 105.1 104 104.5 102.9
Opadry 99.7 100.7 101.2 101.2 101.7 99.8 100.9 100.2 101.3 100.9 101.8

Table 63: Results of analysis of Chloroquine Phosphate (%w/w) in presence of pH adjustment excipent used in the Formulations
Method Absorbance Derivative HPLC
Wavelength 221nm 236nm 256nm 331nm 343nm 225nm 29nm 260nm 333nm 349nm 349nm
Sodium Citrate 101.9 101.5 101.7 100.5 101 102.4 100.1 100.9 101.9 100.9 101.75
Citric Acid 99.7 100.7 100.9 101.4 101.1 99.6 100.3 101 100.6 101.3 100.6
Phosphoric Acid 100.1 100.7 100.7 101.2 101.5 100.2 100.5 100.4 100.8 100.9 101.4
Table 64: Results of analysis of Chloroquine Phosphate (%w/w) in presence of
Anti-microbial agents used in the Formulations
Method Absorbance Derivative HPLC
Wavelength 221nm 236nm 256nm 331nm 343nm 225nm 29nm 260nm 333nm 349nm 349nmMethyl paraben 109.5 122.2 163.5 100.9 100.9 109.5 122.2 163.5 100.9 100.9 99.6
Propyl paraben 106.6 112.7 141.4 98.8 98.3 100.9 100 99.6 99.2 100 98.4
Propylene glycol 100.4 100.7 100.2 100.8 100.6 100.9 100 99.6 99.2 100 100.3
Glycerin 100.3 100.3 100.7 102.1 100.9 100.6 99.4 100.2 100.8 100.32 100.3
Saccharin sodium 160.2 205.9 105.4 102 102.6 160.3 148.8 99.6 102.6 102.5 102.4

Table 65: Results of analysis of Chloroquine Phosphate (%w/w) in presence of Emulsifying agent used in the Formulations
Method Absorbance Derivative HPLC
Wavelength 221nm 236nm 256nm 331nm 343nm 225nm 239nm 260nm 333nm 349nm 349nm
Acacia 99.3 99.8 100.1 100.4 100.7 99.1 100.4 99 100.5 100.3 100
Gelatin 101.2 100.9 101.3 101.1 100.9 101.2 101.3 101.1 101.3 101 101.3
Sorbitol 100.5 101.1 101.4 101.8 101.6 100.6 100.8 100.1 100.7 101.2 100.8
Xanthan gum 99.1 100.3 100.6 100.8 101.2 99.6 99.4 99.5 101.2 101.3 101.3
Tween 80 100.9 101.5 101.2 101.5 101.7 101.7 101.4 100.9 100.9 102.2 101
Table 66: Results of analysis of Chloroquine Phosphate injection (%w/w)
No. Abs. 221nm
Drv. 225nm
Abs. 236nm
Drv. 239nm
Abs. 256nm
Drv. 260nm
Abs. 331nm
Drv. 333nm
Abs. 343nm
Drv. 349nm HPLC Non Aqueous
Titration 1 101.6 101.1 101.9 102.60 102.40 102.80 103.70 101.9 102.3 101.7 101.6 102.2 2 101.5 101.8 101.5 102.10 101.90 100.90 102.90 102.5 101.9 102.2 100.9 101.6 3 101.2 101.5 101.7 101.50 101.60 101.90 103.20 101.7 102.1 101.5 101.8 102.6

Table 67: Statistical analysis of the results of Chloroquine Phosphate injection (%w/w)
t-test (experimental)
F-test (experimental)
Pair 1 Drv.225nm –Abs.221nm 0.125 0.016
Pair 2 Drv.225nm – HPLC 0.076 0.006
Pair 3 Drv.225 nm- Non-Aqueous Titration 1.538 2.367
Pair 4 Drv.239 nm –Abs236 nm 1.287 1.658
Pair 5 Drv.239 nm – HPLC 1.347 1.814
Pair 6 Drv.239 nm – Non-Aqueous Titration 0.129 0.017
Pair 7 Drv.260 nm–Abs256 nm 0.222 0.049
Pair 8 Drv.260 nm – HPLC 1.127 1.271
Pair 9 Drv.260 nm – Non -Aqueous Titration 0.615 0.379
Pair 10 Drv.333 nm–Abs331 nm 2.898 8.399
Pair 11 Drv.333 nm – HPLC 1.169 1.367
Pair 12 Drv.333 nm – Non -Aqueous Titration 0.189 0.036
Pair 13 Drv.343 nm–Abs349 nm 1.000 1.000
Pair 14 Drv.349 nm – HPLC 0.763 0.582
Pair 15 Drv.349 nm – Non -Aqueous Titration 0.670 0.448

Table 68: Results of analysis of Balsaquine injection (%w/w)
No. Abs. 221nm
Drv. 225nm
Abs. 236nm
Drv. 239nm
Abs. 256nm
Drv. 260n
m
Abs. 331nm
Drv. 333nm
Abs. 343nm
Drv. 349nm HPLC Non Aqueous
Titration
1 101.7 101.5 100.9 101.90 101.5 99.70 101.50 102.10 101.80 102.50 102.2 100.6 2 99.80 100.9 99.50 100.20 100.3 101.90 99.90 100.50 102.10 100.90 101.9 101.9 3 100.3 101.8 100.5 100.90 100.6 100.50 100.80 99.50 101.50 102.30 101.4 101.5

Table 69: Statistical analysis of the results of Balsaquine injection (%w/w)
t-test (experimental)
F-test (experimental)
Pair 1 Drv.225nm –Abs.221nm 1.559 2.430 Pair 2 Drv.225nm – HPLC 1.018 1.037 Pair 3 Drv.225 nm & Non-Aqueous Titration 0.189 0.036 Pair 4 Drv.239 nm –Abs236 nm 4.041 16.333 Pair 5 Drv.239 nm – HPLC 1.906 3.634 Pair 6 Drv.239 nm – Non-Aqueous Titration 0.353 0.124 Pair 7 Drv.260 nm–Abs256 nm 0.102 .010 Pair 8 Drv.260 nm – HPLC 1.550 2.403 Pair 9 Drv.260 nm – Non -Aqueous Titration 1.708 2.919 Pair 10 Drv.333 nm–Abs331 nm 0.053 0.003 Pair 11 Drv.333 nm – HPLC 2.113 4.463 Pair 12 Drv.333 nm – Non -Aqueous Titration 0.561 0.315 Pair 13 Drv.343 nm–Abs349 nm 0.154 0.024 Pair 14 Drv.349 nm – HPLC 0.119 0.014 Pair 15 Drv.349 nm – Non -Aqueous Titration 0.737 0.543
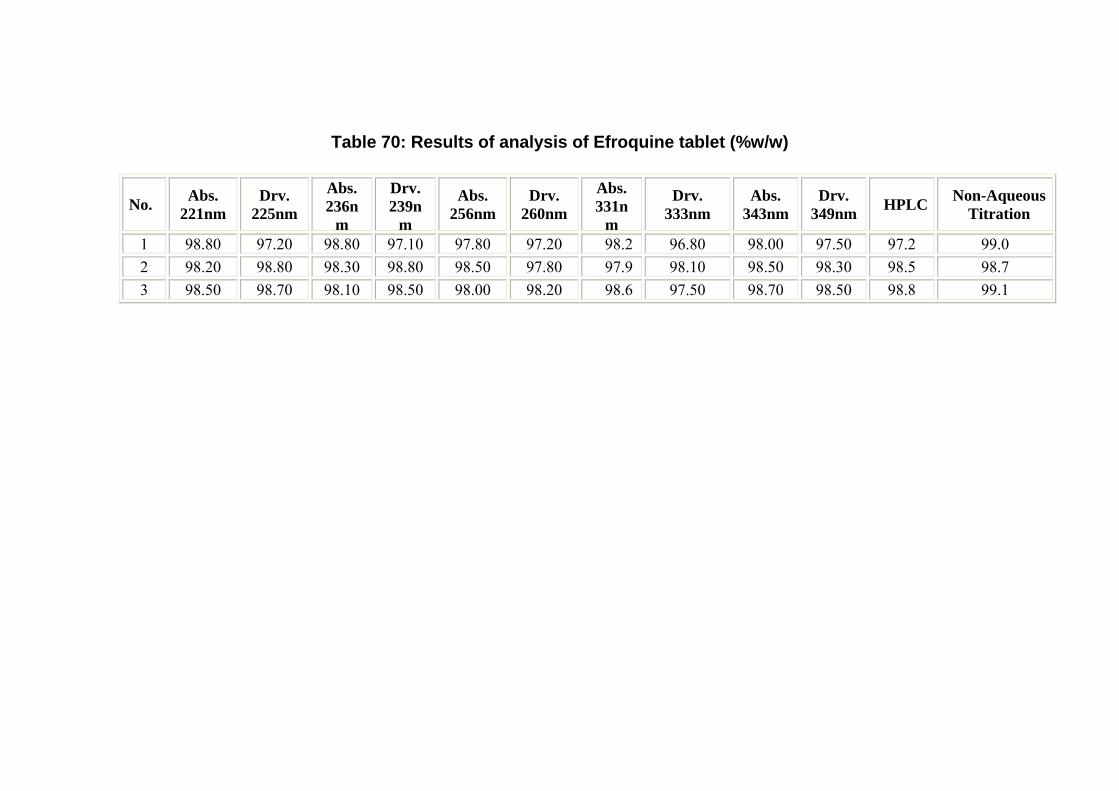
Table 70: Results of analysis of Efroquine tablet (%w/w)
No. Abs. 221nm
Drv. 225nm
Abs. 236n
m
Drv. 239n
m
Abs. 256nm
Drv. 260nm
Abs. 331n
m
Drv. 333nm
Abs. 343nm
Drv. 349nm HPLC Non-Aqueous
Titration
1 98.80 97.20 98.80 97.10 97.80 97.20 98.2 96.80 98.00 97.50 97.2 99.0 2 98.20 98.80 98.30 98.80 98.50 97.80 97.9 98.10 98.50 98.30 98.5 98.7 3 98.50 98.70 98.10 98.50 98.00 98.20 98.6 97.50 98.70 98.50 98.8 99.1

Table 71: Statistical analysis of the results of Efroquine tablet analyzed (%w/w)
t-test (experimental)
F-test (experimental
Pair 1 Drv.225nm –Abs.221nm 0.394 0.155Pair 2 Drv.225nm – HPLC 0.555 0.308Pair 3 Drv.225 nm & Non-Aqueous Titration 1.231 1.516Pair 4 Drv.239 nm –Abs236 nm 0.372 0.138Pair 5 Drv.239 nm – HPLC 0.189 0.036Pair 6 Drv.239 nm – Non-Aqueous Titration 1.365 1.864Pair 7 Drv.260 nm–Abs256 nm 1.287 1.658Pair 8 Drv.260 nm – HPLC 1.982 3.930Pair 9 Drv.260 nm – Non -Aqueous Titration 4.000 16.000Pair 10 Drv.333 nm–Abs331 nm 1.561 2.438Pair 11 Drv.333 nm – HPLC 2.333 5.444Pair 12 Drv.333 nm – Non -Aqueous Titration 3.143 9.878
Pair 13 Drv.343 nm–Abs349 nm 3.000 9.000
Pair 14 Drv.349 nm – HPLC 0.359 0.129Pair 15 Drv.349 nm – Non -Aqueous Titration 2.463 6.068

Table 72: Results of analysis of Chloroquine Phosphate tablet (%w/w)
No. Abs. 221nm
Drv. 225nm
Abs. 236nm
Drv. 239nm
Abs. 256nm
Drv. 260nm
Abs. 331nm
Drv. 333nm
Abs. 343nm
Drv. 349nm HPLC Non-Aqueous
Titration
1 106.40 103.90 104.10 105.90 104.20 103.90 106.40 103.90 104.10 105.90 104.20 103.90 2 105.80 104.50 105.90 104.20 106.20 105.90 105.80 104.50 105.90 104.20 106.20 105.90 3 104.90 104.10 106.50 105.80 105.80 105.70 104.90 104.10 106.50 105.80 105.80 105.70

Table 73: Statistical analysis of the results of Chloroquine Phosphate table analyzed (%w/w)
t-test (experimental)
F-test (experimental)
Pair 1 Drv.225nm –Abs.221nm 3.040 9.240Pair 2 Drv.225nm – HPLC 0.693 0.481Pair 3 Drv.225 nm & Non-Aqueous Titration 1.571 2.469Pair 4 Drv.239 nm –Abs236 nm 0.192 0.037Pair 5 Drv.239 nm – HPLC 3.179 10.105Pair 6 Drv.239 nm – Non-Aqueous Titration 2.253 5.075Pair 7 Drv.260 nm–Abs256 nm 3.500 12.250Pair 8 Drv.260 nm – HPLC 0.756 0.571Pair 9 Drv.260 nm – Non -Aqueous Titration 3.337 11.133Pair 10 Drv.333 nm–Abs331 nm 0.854 0.730Pair 11 Drv.333 nm – HPLC 3.478 12.094Pair 12 Drv.333 nm – Non -Aqueous Titration 3.377 11.407Pair 13 Drv.343 nm–Abs349 nm 2.897 8.395Pair 14 Drv.349 nm – HPLC 1.000 1.000Pair 15 Drv.349 nm – Non -Aqueous Titration 1.290 1.664

Table 74: Results of analysis of Amiquine tablet (%w/w)
No. Abs. 221nm
Drv. 225nm
Abs. 236nm
Drv. 239nm
Abs. 256nm
Drv. 260nm
Abs. 331nm
Drv. 333nm
Abs. 343nm
Drv. 349nm HPLC Non-Aqueous
Titration 1 98.70 97.30 98.50 100.00 101.60 100.00 104.10 104.30 101.90 102.30 100.10 100.20 2 102.30 101.90 104.00 102.90 104.70 103.00 104.00 104.20 103.80 101.90 103.10 102.50 3 100.50 100.90 99.50 101.90 98.20 99.80 98.00 97.80 98.20 99.50 99.40 100.50

Table 75: Statistical analysis of the results of Amiquine tablets (%w/w)
t-test
(experimental) F-test
(experimental
Pair 1 Drv.225nm –Abs.221nm 0.896 0.803Pair 2 Drv.225nm – HPLC 0.664 0.441Pair 3 Drv.225 nm & Non-Aqueous Titration 1.058 1.119Pair 4 Drv.239 nm –Abs236 nm 0.889 0.791Pair 5 Drv.239 nm – HPLC 0.830 0.689Pair 6 Drv.239 nm – Non-Aqueous Titration 1.143 1.306Pair 7 Drv.260 nm–Abs256 nm 0.523 0.273Pair 8 Drv.260 nm – HPLC 0.400 0.160Pair 9 Drv.260 nm – Non -Aqueous Titration 0.383 0.147Pair 10 Drv.333 nm–Abs331 nm 0.500 0.25Pair 11 Drv.333 nm – HPLC 0.736 0.542Pair 12 Drv.333 nm – Non -Aqueous Titration 0.519 0.269Pair 13 Drv.343 nm–Abs349 nm 0.070 0.005Pair 14 Drv.349 nm – HPLC 0.370 0.137Pair 15 Drv.349 nm – Non -Aqueous Titration 0.171 0.029

Table 76: Results of analysis of Lariago tablet (%w/w)
No. Abs. 221n
Drv. 225nm
Abs. 236nm
Drv. 239n
Abs. 256n
Drv. 260nm
Abs. 331nm
Drv. 333nm
Abs. 343nm
Drv. 349nm HPLC
Non-Aqueous
1 105.6 104.9 106.2 105.9 106.9 106 105.1 103.8 105 104.9 102.9 99.9 2 103.4 103.5 104.5 102.9 104.9 102.9 103.3 105.4 104.2 103.8 102.5 99.6 3 104.7 104.5 105.2 106.5 105.3 105.2 104.8 102.5 103.9 105.1 101.5 99.7

Table 77: Statistical analysis of the results of Lariago tablet (%w/w)
t-test (experimental)
F-test (experimental)
Pair 1 Drv.225nm –Abs.221nm 1.143 1.306 Pair 2 Drv.225nm – HPLC 3.464 12.000 Pair 3 Drv.225 nm - Non-Aqueous Titration 0.854 0.73 Pair 4 Drv.239 nm –Abs236 nm 0.238 0.057 Pair 5 Drv.239 nm – HPLC 2.103 4.421 Pair 6 Drv.239 nm – Non-Aqueous Titration 0.814 0.662 Pair 7 Drv.260 nm–Abs256 nm 1.816 3.297 Pair 8 Drv.260 nm – HPLC 2.365 5.592 Pair 9 Drv.260 nm – Non -Aqueous Titration 0.830 0.689 Pair 10 Drv.333 nm–Abs331 nm 0.375 0.141 Pair 11 Drv.333 nm – HPLC 2.459 6.047 Pair 12 Drv.333 nm – Non -Aqueous Titration 0.897 0.805 Pair 13 Drv.343 nm–Abs349 nm 0.475 0.226 Pair 14 Drv.349 nm – HPLC 3.379 11.417 Pair 15 Drv.349 nm – Non -Aqueous Titration 0.846 0.715

Table 78: Results of analysis of Chloroquine syrup (JPM) (%w/w)
No. Abs. 221nm
Drv. 225nm
Abs. 236nm
Drv. 239nm
Abs. 256nm
Drv. 260nm
Abs. 331nm
Drv. 333nm
Abs. 343nm
Drv. 349nm HPLC Non-Aqueous
Titration 1 200.90 202.50 110.70 102.20 116.3 99.90 105.80 99.90 103.40 100.50 97.90 99.50 2 198.50 199.50 109.50 101.90 115.40 99.20 105.50 100.50 104.20 99.90 100.20 98.20 3 210.10 208.00 111.40 99.20 113.50 100.50 104.20 101.90 102.90 98.50 99.10 98.9

Table 79: Statistical analysis of the results of Chloroquine syrup (JPM) analyzed (%w/w)
t-test
(experimental) F-test
(experimental)
Pair 1 Drv.225nm –Abs.221nm -0.145 0.021 Pair 2 Drv.225nm – HPLC 37.556* 1410.5*Pair 3 Drv.225 nm & Non-Aqueous Titration 44.115* 1946.1*Pair 4 Drv.239 nm –Abs236 nm 6.702* 44.92*Pair 5 Drv.239 nm – HPLC 1.661 2.760 Pair 6 Drv.239 nm – Non-Aqueous Titration 2.214 4.900 Pair 7 Drv.260 nm–Abs256 nm 13.799* 190.418*Pair 8 Drv.260 nm – HPLC 0.873 0.762 Pair 9 Drv.260 nm – Non -Aqueous Titration 2.887 8.333 Pair 10 Drv.333 nm–Abs331 nm 4.068 16.547 Pair 11 Drv.333 nm – HPLC 2.306 5.319 Pair 12 Drv.333 nm – Non -Aqueous Titration 2.446 5.983 Pair 13 Drv.343 nm–Abs349 nm 7.986* 63.773*Pair 14 Drv.349 nm – HPLC 0.555 0.308 Pair 15 Drv.349 nm – Non -Aqueous Titration 1.242 1.542
* Significant difference

Table 80: Results of analysis of Lariago syrup (%w/w)
No. Abs. 221nm
Drv. 225nm
Abs. 236nm
Drv. 239nm
Abs. 256nm
Drv. 260nm
Abs. 331nm
Drv. 333nm
Abs. 343nm
Drv. 349nm HPLC Non-Aqueous
Titration 1 142.10 34.30 . 136.90 156.50 106.20 104.40 104.20 105.40 104.70 105.6 98.50 2 136.50 42.10 . 126.50 160.10 104.20 104.80 103.90 102.90 103.90 102.9 97.90 3 139.20 39.50 . 130.50 158.50 102.90 102.20 101.90 103.50 102.50 103.2 100.20

Table 81: Statistical analysis of the results of Lariago syrup analyzed (%w/w)
t-test (experimental)
F-test (experimental)
Pair 1 Drv.225nm –Abs.221nm 25.828* 667.08*
Pair 2 Drv.225nm – HPLC 20.847* 434.618*
Pair 3 Drv.225 nm & Non-Aqueous Titration 22.313* 497.887*
Pair 4 Drv.239 nm –Abs236 nm - - Pair 5 Drv.239 nm – HPLC 12.324* 151.887*
Pair 6 Drv.239 nm – Non-Aqueous Titration 11.911* 141.865*
Pair 7 Drv.260 nm–Abs256 nm 29.654* 879.383*
Pair 8 Drv.260 nm – HPLC 1.152 1.326 Pair 9 Drv.260 nm – Non -Aqueous Titration 4.115 16.929 Pair 10 Drv.333 nm–Abs331 nm 2.135 4.558 Pair 11 Drv.333 nm – HPLC -0.723 0.523 Pair 12 Drv.333 nm – Non -Aqueous Titration 3.246 10.539
Pair 13 Drv.343 nm–Abs349 nm 0.375 0.140
Pair 14 Drv.349 nm – HPLC -0.332 0.110
Pair 15 Drv.349 nm – Non -Aqueous Titration 4.004 16.029
• Significant difference

Table 82: Results of analysis of Chloroquine Phosphate standard (%w/w) in plasma by the first derivative and zero absorption spectroscopy
No. Abs. 331nm
Drv. 333nm
Abs. 343nm
Drv. 349nm
1 147.5 99.2 127.9 98.9 2 148.9 100.9 130.2 99.5 3 152.2 99.5 129.5 98.5
Copyright © 2022 FDOKUMEN


![l;len a}+s lnld6]8sf] - bzf}+jflif{s ;fwf/0f - Civil Bank](https://static.fdokumen.com/doc/165x107/631a70635d5809cabd0f66f8/llen-as-lnld68sf-bzfjflifs-fwf0f-civil-bank.jpg)