Cluster crystals in confinement
17
Cluster Crystals in Confinement Sven van Teeffelen, 1, * Angel J. Moreno, 2 and Christos N. Likos 1, 3 1 Institut f¨ ur Theoretische Physik II: Weiche Materie, Heinrich-Heine-Universit¨ at D¨ usseldorf, Universit¨ atsstraße 1, D-40225 D¨ usseldorf, Germany 2 Centro de F´ ısica de Materiales (CSIC-UPV/EHU), Apartado 1072, 20080 San Sebasti´an, Spain 3 The Erwin Schr¨ odinger International Institute for Mathematical Physics (ESI), Boltzmanngasse 9, A-1090 Vienna, Austria (Dated: August 9, 2008) A large class of fluids of particles interacting via ultrasoft, repulsive pair potentials crystallize into cluster crystals. Here, we employ density functional theory and computer simulations to study the behavior of a system of particles that repel each other with a exp(-r 8 )-potential [A. J. Moreno and C. N. Likos, Phys. Rev. Lett., 2007, 99, 107801] under planar confinement. We compare the behavior for purely repulsive to that for attractive slit walls. In particular, we present the phase diagram and we show that for repulsive walls the system freezes from the middle, whereas for attractive ones crystallization sets in at the walls and proceeds to the middle. For large wall- wall-separations we find continuous growth of a fluid or crystalline layer on the wall, depending on the wall-particle interaction, which is interrupted by capillary melting or freezing close to the bulk crystallization transition. An asymptotic scaling analysis of the width of the liquid or crystalline films growing at the walls indicate complete wetting in both cases. PACS numbers: 64.70.Dv, 82.30.Nr, 61.20.Ja, 82.70.Dd I. INTRODUCTION The influence of slit pore confinement and of single planar walls on freezing and melting has been studied for many different atomic and colloidal systems [1, 2, 3, 4] by means of computer simulation [5, 6, 7, 8, 9, 10, 11], theory [12, 13, 14], and experiment [3, 15, 16]. In general, two limiting cases of planar confinement are to be distinguished in terms of the pore size: In nar- row pores of the width of one or few particle diame- ters, crystallization of the quasi-2D system is strongly influenced by the wall-particle interaction and by pack- ing effects [8, 17, 18, 19]. For monolayers or even a few hard-sphere layers in planar confinement, the otherwise first-order Kosterlitz-Thouless phase transition becomes continuous [20, 21]. On the other hand, for large con- finement widths, freezing and melting is dominated by the 3D bulk phase behavior and by single-wall proper- ties, i.e., crystal/fluid wetting [6, 7, 9]. For large confine- ment widths, two possible scenarios are observed upon approaching the bulk liquid-solid transition, depending on the different interactions between the wall, the liquid, and the crystal: In the first scenario, the walls induce melting, which becomes manifest in a fluid layer grow- ing on the walls, already under conditions in which the crystal is stable in the bulk, a situation referred to as premelting [12, 13, 14, 15]. In the second scenario, the walls induce freezing, which is due to the presence of a crystalline slab under conditions in which the fluid is stable in the bulk, denoted as prefreezing [5, 6, 7, 8, 9]. The former mechanism is responsible for surface melting, which prevents the persistence of overheated crystalline * teeff[email protected] states [15]. On the other hand, the latter mechanism prevents undercooling of the fluid state; after a quench from a high to a low temperature it is responsible for heterogeneous nucleation on the walls [22] which is often much more likely than homogeneous nucleation deep in the (bulk) fluid state. Despite a host of literature on experiments, simulation studies, and phenomenological theories, there have been only few attempts to study confinement-induced freez- ing or melting by means of microscopic theories [1], in which the only input should be the particle-particle and the wall-particle interaction potentials. The method of choice is, evidently, classical density functional theory (DFT) [4, 23, 24, 25, 26]. DFT is an exact reformula- tion of the statistical mechanics of many-body systems, uniform and nonuniform alike, based on the equilibrium one-particle density ρ eq (r) of the system. As such, it treats fluids (ρ eq (r)= ρ, a prescribed constant) and crys- tals (ρ eq (r) is a periodically modulated space field) on equal footing. In fact, several of the commonly used liquid-state theories can be derived from a DFT for- mulation [27], whereas the DFT-treatment of crystals can be traced back to the pioneering work of Ramakr- ishnan and Yussouff [28]. Concomitantly, DFT offers also a tool to study bulk phase coexistence, a prereq- uisite for the subsequent investigations of fluid-solid in- terfaces [29]. There have been DFT calculations for sur- face melting of Lennard-Jones particles [12, 13], for hard spheres on hard walls [13], for hard spheres in very thin slit pores [30], and also for hard spheres sedimenting onto hard walls [31]. Hard spheres in slit pores have been examined by means of macroscopic, thermodynamically- inspired arguments [32] as well as by computer simula- tions in a system similar to the one that is the subject of this work, in the sense that it also forms clusters, albeit of a different nature than the ones we consider here [33]. arXiv:0808.1363v1 [cond-mat.soft] 9 Aug 2008
-
Upload
independent -
Category
Documents
-
view
2 -
download
0
Transcript of Cluster crystals in confinement
Cluster Crystals in Confinement
Sven van Teeffelen,1, ∗ Angel J. Moreno,2 and Christos N. Likos1, 31Institut fur Theoretische Physik II: Weiche Materie,
Heinrich-Heine-Universitat Dusseldorf, Universitatsstraße 1, D-40225 Dusseldorf, Germany2Centro de Fısica de Materiales (CSIC-UPV/EHU), Apartado 1072, 20080 San Sebastian, Spain
3The Erwin Schrodinger International Institute for Mathematical Physics (ESI), Boltzmanngasse 9, A-1090 Vienna, Austria(Dated: August 9, 2008)
A large class of fluids of particles interacting via ultrasoft, repulsive pair potentials crystallizeinto cluster crystals. Here, we employ density functional theory and computer simulations to studythe behavior of a system of particles that repel each other with a exp(−r8)-potential [A. J. Morenoand C. N. Likos, Phys. Rev. Lett., 2007, 99, 107801] under planar confinement. We comparethe behavior for purely repulsive to that for attractive slit walls. In particular, we present thephase diagram and we show that for repulsive walls the system freezes from the middle, whereasfor attractive ones crystallization sets in at the walls and proceeds to the middle. For large wall-wall-separations we find continuous growth of a fluid or crystalline layer on the wall, depending onthe wall-particle interaction, which is interrupted by capillary melting or freezing close to the bulkcrystallization transition. An asymptotic scaling analysis of the width of the liquid or crystallinefilms growing at the walls indicate complete wetting in both cases.
PACS numbers: 64.70.Dv, 82.30.Nr, 61.20.Ja, 82.70.Dd
I. INTRODUCTION
The influence of slit pore confinement and of singleplanar walls on freezing and melting has been studied formany different atomic and colloidal systems [1, 2, 3, 4]by means of computer simulation [5, 6, 7, 8, 9, 10, 11],theory [12, 13, 14], and experiment [3, 15, 16]. Ingeneral, two limiting cases of planar confinement areto be distinguished in terms of the pore size: In nar-row pores of the width of one or few particle diame-ters, crystallization of the quasi-2D system is stronglyinfluenced by the wall-particle interaction and by pack-ing effects [8, 17, 18, 19]. For monolayers or even a fewhard-sphere layers in planar confinement, the otherwisefirst-order Kosterlitz-Thouless phase transition becomescontinuous [20, 21]. On the other hand, for large con-finement widths, freezing and melting is dominated bythe 3D bulk phase behavior and by single-wall proper-ties, i.e., crystal/fluid wetting [6, 7, 9]. For large confine-ment widths, two possible scenarios are observed uponapproaching the bulk liquid-solid transition, dependingon the different interactions between the wall, the liquid,and the crystal: In the first scenario, the walls inducemelting, which becomes manifest in a fluid layer grow-ing on the walls, already under conditions in which thecrystal is stable in the bulk, a situation referred to aspremelting [12, 13, 14, 15]. In the second scenario, thewalls induce freezing, which is due to the presence ofa crystalline slab under conditions in which the fluid isstable in the bulk, denoted as prefreezing [5, 6, 7, 8, 9].The former mechanism is responsible for surface melting,which prevents the persistence of overheated crystalline
states [15]. On the other hand, the latter mechanismprevents undercooling of the fluid state; after a quenchfrom a high to a low temperature it is responsible forheterogeneous nucleation on the walls [22] which is oftenmuch more likely than homogeneous nucleation deep inthe (bulk) fluid state.
Despite a host of literature on experiments, simulationstudies, and phenomenological theories, there have beenonly few attempts to study confinement-induced freez-ing or melting by means of microscopic theories [1], inwhich the only input should be the particle-particle andthe wall-particle interaction potentials. The method ofchoice is, evidently, classical density functional theory(DFT) [4, 23, 24, 25, 26]. DFT is an exact reformula-tion of the statistical mechanics of many-body systems,uniform and nonuniform alike, based on the equilibriumone-particle density ρeq(r) of the system. As such, ittreats fluids (ρeq(r) = ρ, a prescribed constant) and crys-tals (ρeq(r) is a periodically modulated space field) onequal footing. In fact, several of the commonly usedliquid-state theories can be derived from a DFT for-mulation [27], whereas the DFT-treatment of crystalscan be traced back to the pioneering work of Ramakr-ishnan and Yussouff [28]. Concomitantly, DFT offersalso a tool to study bulk phase coexistence, a prereq-uisite for the subsequent investigations of fluid-solid in-terfaces [29]. There have been DFT calculations for sur-face melting of Lennard-Jones particles [12, 13], for hardspheres on hard walls [13], for hard spheres in very thinslit pores [30], and also for hard spheres sedimenting ontohard walls [31]. Hard spheres in slit pores have beenexamined by means of macroscopic, thermodynamically-inspired arguments [32] as well as by computer simula-tions in a system similar to the one that is the subject ofthis work, in the sense that it also forms clusters, albeitof a different nature than the ones we consider here [33].
arX
iv:0
808.
1363
v1 [
cond
-mat
.sof
t] 9
Aug
200
8

2
Quite a bit of theoretical work and simulation studieshave been carried out for liquid-gas separation and wet-ting phenomena of fluids in confinement [24, 34]. How-ever, to the best of our knowledge, the effect of varyingconfinement-width on crystallization has not been sys-tematically studied by means of DFT to-date.
In this work, we study the influence of planar confine-ment on a special class of colloidal particles, which inter-act via bounded and purely repulsive pairwise additivepotentials. In particular, these pair potentials do not di-verge at zero particle distance. These so called ultrasoft,repulsive particles are realized in nature and experimentby a large class of complex molecules, such as branched ornon-branched polymers that possess a vast number of in-ternal degrees of freedom, a property which allows themto share their (center-of-mass) position with another par-ticle or even several other particles of their kind [35].The effective interaction of such complex molecules ishighly tunable by choosing different architectures andsolvabilities of the respective polymer monomers, modelamphiphilic dendrimers being a concrete example [36].Recent interest in such potentials has grown not only onthe basis of their physical relevance but also due to somebeautiful mathematical properties they possess, allowingfor the determination of exact ground states [37, 38] andthe application of generalized duality relations to suchsystems [39].
The rest of this work is organized as follows: In Sec-tion II we introduce the model interaction and brieflyreview its properties. In Section III we give a short de-scription of the DFT, whereas in Section IV we describethe numerical simulation technique used. The bulk phasebehavior is discussed in Section V. The system confinedbetween repulsive walls is studied in Section VI, whilstthe attractive walls are studied in Section VII. Finally,in Section VIII we summarize and draw our conclusions.
II. THE MODEL: ULTRASOFT, REPULSIVEPARTICLES
The particles considered here interact by means ofa non-negative and bounded pair interaction potential,0 ≤ φ(r) <∞, that is integrable and possesses a Fouriertransform φ(k), and are termed ultrasoft, repulsive par-ticles. Such interactions have been divided into two cat-egories, the so called Q±- and the Q+-class [40]. Theformer classifies potentials for which φ(k) has an oscil-latory decay about zero, while interaction potentials insystems of the latter kind fulfill the condition φ(k) ≥ 0.The drosophila of bounded pair potentials is the gener-alized exponential model of index n (GEM-n), which isdefined by
φ(r) = ε exp[−(r/σ)n] , (1)
where r is the particle distance, σ is the interaction range(typically a measure of the particle’s size), and ε is theinteraction strength. In the following, we will set ε = 1,
σ = 1 as well as kB = 1, the latter being Boltzmann’sconstant. It has been shown [41] that φ(r) of eq. (1) be-longs to the Q+-class for n ≤ 2 and to the Q±-class forn > 2. Moreover, it has been established [40] that thedistinction of Q±- and Q+-particles goes along with twodifferent principle features of the topologies of the respec-tive bulk phase diagrams: Systems of the Q±-kind dis-play freezing for arbitrarily high temperatures and den-sities into so called cluster crystals [36, 41, 42, 43] whilesystems of the Q+-kind are characterized by reentrant-melting and a maximum freezing temperature [44]. Inthis paper, we concentrate on the class of Q±-particlesand their behavior in confinement.
Cluster crystallization is highly distinct from crystal-lization of “conventional/ordinary” colloids: It impliesthat at high densities several particles share the samelattice site of a periodic crystal. In fact, it has beenshown for the GEM-4 model that upon increasing thedensity, the lattice constant of the stable fcc crystal,a =
√2d, where d is the nearest-neighbor distance, ap-
proaches a density- and temperature-independent con-stant [36]. The above implies that the average numberof particles sharing a lattice site, nc, grows linearly withdensity. In this work, we investigate the phase behav-ior of GEM-8-particles, i.e., representative ones of theQ±-species, which show a tendency to cluster at a lowerdensity than the GEM-4-particles do, due to a deeperminimum of the respective Fourier-transformed pair po-tential [41]. Freezing is studied with the help of meanfield density functional theory (MFA-DFT) and with sim-ulation for different wall-particle interactions and for dif-ferent wall-wall separation Lz. MFA-DFT has proved tobe highly accurate to reproduce the bulk phase behav-ior of the GEM-4 model [43], and will be shown here toaccurately predict the equilibrium phase diagram of theGEM-8 in the bulk and in confinement.
The main focus of this work is in the behavior of theGEM-8 model in slit pores. Two kinds of planar confine-ment are considered: In a first setup we study the effectof purely repulsive Yukawa-walls on the structure andphase diagram of the system while in a second setup theinfluence of attractive Lennard-Jones walls is examined.The Yukawa potential has been shown to model the inter-action of dendrimers with hard walls [45, 46]. In orderto model attractive walls we introduce a 9-3-Lennard-Jones potential. The latter interaction is not based onmicroscopic grounds but is introduced to model the in-fluence of attractive wall potentials in general. However,recent simulation results [46] have shown that dendrimerson walls with core-monomer-wall attractions show verysimilar effective interaction potentials. We demonstratethat the first setup leads to premelting: the system ismolten at the walls and crystallizes at the center, whilefor the second setup the opposite happens, i.e., there thewalls induce prefreezing [1, 2]. Furthermore, we arguethat both setups display complete wetting [47] which isdeduced from a continuous, logarithmic growth of thefluid/crystalline wetting layer down/up to the point of

3
capillary melting/freezing.A salient property that distinguishes the behavior of
clustering particles from non-clustering ones in confine-ment, is the ability to locally adjust the average occupa-tion number of the clusters, nc, without distorting thecrystal structure through point defects such as vacan-cies or interstitials. Remarkably, although there is inces-sant hopping of particles from one site to the other, ren-dering these crystals ergodic and endowing them with anon-vanishing long-time diffusivity, the underlying crys-tal structure remains intact. In fact, this happens notdespite the hopping mechanism but because of it. Fordetails, see Ref. [48, 49].
III. DENSITY FUNCTIONAL THEORY
Density functional theory is based on a variationalgrand canonical functional Ω[ρ(r)], a unique functional ofthe static one-particle density ρ(r) =
⟨∑Ni=1 δ(r− ri)
⟩of the system, where ri, i = 1 . . . N are the particle coor-dinates and 〈. . . 〉 denotes the according grand canonicalaverage [23]. The functional Ω[ρ(r)] is minimized by theequilibrium one-particle density ρeq(r), where it takes thevalue of the system’s grand potential, Ω[ρ(r)]. The den-sity functional is typically split into the ideal gas, anexcess, and an external part,
Ω[ρ(r)] = Fid [ρ(r)] + Fex [ρ(r)]
+∫
drρ(r) (V (r)− µ) ,(2)
where V (r) is the external potential and µ is the chemicalpotential. The integral runs over the system volume. Theideal part reads as
Fid [ρ(r)] = β−1
∫drρ(r) [ln ρ(r)− 1] + 3 〈N〉β−1 ln Λ ,
(3)with β−1 = T , 〈N〉 =
∫drρ(r) being the average particle
number and Λ the thermal de Broglie wavelength. Thelast term in eq. (3) above is thermodynamically irrelevantand will be ignored henceforth. The excess part is givenvery accurately for sufficiently high temperatures and/ordensities by the mean-field expression [41]
Fex [ρ(r)] =12
∫∫dr dr′ρ(r)ρ(r′)φ(r− r′) . (4)
It is pertinent, at this point, to shortly comment on theaccuracy of the expression (4) above. In Ref. [41], it hasbeen shown that this functional form rests on the validityof the approximation c(r) = −βφ(r) for the direct corre-lation function c(r) of the fluid (uniform) phase. Withinthe framework of linear response theory and employingthe Percus identity, it can be shown that the relationc(r) = −βφ(r) holds asymptotically in regions of spacefor which the potential φ(r) caused by a test particle
held fixed at the origin is much weaker than the othertwo energy scales of the problem: the thermal energy Tand/or the average potential energy per particle causedby all other particles in a fluid of density ρ [27]. Fordiverging potentials, this relationship must break downat sufficiently small r-values [50]. However, for ultrasoft,bounded potentials, it can and it indeed does hold ap-proximately true for all separations r provided T and/orρ are sufficiently high, so that the thermal and/or thepotential energy per particle dominate over φ(r). In pre-vious work [40, 41] it was demonstrated that the condi-tions T & 1 and/or ρ & 1 are sufficient for the relation-ship c(r) = −βv(r) to be fulfilled to a satisfactory degreeof approximation.
Minimization of Ω[ρ(r)] is pursued by demanding itsfunctional derivative with respect to density to vanish.This amounts to numerically solving the self-consistentequation
ρeq(r) = expβµ− βV (r)−
∫dr′βφ(|r− r′|)ρeq(r′)
,
(5)for ρeq(r) in an iterative fashion, on a periodic rectangu-lar grid of Nx × Ny × Nz grid points, where the convo-lution integral is evaluated with the help of fast Fouriertransform. We chose a grid of Nα ≈ 16Lα, α = x, y, zwhich is fine enough to reach numerical convergence forall state points under study. For the study of crystallinestates the x- and y-dimensions of the box are chosen tobe commensurable with the expected lattice spacings inplane with the confining walls (see Section V). The latticespacing of crystalline GEMs in the bulk is well known tobe relatively insensitive towards density/chemical poten-tial and temperature. This is also found for the GEM-8in confinement, as will be shown below.
IV. SIMULATION
We simulated a system of several thousand parti-cles, N , interacting through a GEM-8 potential φ(r) =exp(−r8). For the case of confinement, they also expe-rience an external wall potential V (z) presented in Sec-tions VI and VII. Simulation results presented here areobtained by means of Brownian dynamics. The equationof motion for the position vector ri of a particle i is givenby:
ri(t) = −Γ∇ri
V (ri) +∑j 6=i
φ(|ri − rj |)
+ wi(t) , (6)
where Γ is a mobility constant (we set Γ = 1) and wi(t)is a stochastic Gaussian noise term. The latter repre-sents the random collisions with the much faster solventmolecules, which are not explicitly included in the model.The noise fulfills the statistical properties [51]
〈wi(t)〉 = 0 , 〈wαi (t)wβj (t′)〉 = 2β−1δαβδijδ(t− t′) ,(7)

4
where α, β are the Cartesian x, y, z-components.We implemented periodic boundary conditions for the
simulation cell of volume Vc = Lx×Ly ×Lz. Periodicitywas applied in the x, y-directions in all cases, and also inthe z-direction for the bulk case. We employed a cubiccell of size Lx = Ly = Lz = 18.57 for the bulk system. Inthe confined system, we set Lx = Ly = 20.43 for slits ofthickness Lz ≤ 8. We also carried out simulations on theconfined system for thickness Lz = 24, with Lx = Ly =9.285.
The Brownian dynamics simulations were performedat constant N , Vc, and T , and the equations of motion(6) were integrated via the Ermak’s algorithm [51, 52],with a timestep ∆τ = 10−4τB . Here, τB = β is theBrownian time scale. The system was prepared by ran-domly placing the particles in the simulation cell. Inthis way, crystallization occurs spontaneously at suffi-ciently high density. An equilibration run of typically106 timesteps was performed before the production runof typically 3 × 10⁶ timesteps. During the productionrun, configurations were periodically saved for computa-tion of observables. Density profiles and radial distribu-tion functions (see below) were averaged over typically 30configurations, the interval between two consecutive con-figurations of the latter being 100 000 timesteps. In thistime scale, the particle mean displacement is of at leastone molecular diameter for all the investigated systems,guaranteeing that the former configurations are uncorre-lated. At high densities, a few independent runs were alsoperformed for some fixed state points (ρ, T , Lz), startingfrom different configurations of the particles, in order tocheck that the final values of the former observables areindependent of the initial conditions.
V. THE BULK PHASE DIAGRAM
The phase behavior in confinement is determined bytwo factors, the interaction of the particles with the wallsand the behavior in the bulk; in particular, the location ofthe considered thermodynamic point (µ, T ) with respectto bulk phase boundaries plays a decisive role in influenc-ing the density profiles in confinement and related surfacephase transitions. Before presenting the phase diagramof the system in confinement we therefore provide thebulk phase behavior, as obtained from the DFT, whichserves as a reference point.
Solving eq. (5) within the minimum rectangular unitcell of the body centered cubic (bcc), the face centeredcubic (fcc) and the hexagonal close packed (hcp) latticesof variable lattice spacing, we find that for temperatures0.5 ≤ T ≤ 4 the system undergoes two subsequent first-order transitions upon increasing the chemical potentialµ, first from the liquid to a hcp cluster crystal at µf , andat higher µ, a subsequent structural phase change from ahcp to a fcc cluster crystal. This scenario is in contrast toother GEM-n models with smaller n where at first a post-freezing bcc cluster phase is found, preceding a bcc→ fcc
transformation at higher values of ρ (or µ) [42, 43]. Wehave not carried out a search of other non-Bravais latticesthan the hcp-one. Thus it cannot be ruled out that thereare other stable phases of non-Bravais lattices at freezingor at higher µ. However, we can clearly state that withinthe DFT the post-freezing lattice is not a Bravais lattice.
For T = 1, which is the temperature for all confine-ment studies throughout this work, we locate the freezingtransition in the bulk at a chemical potential µf = 12.09.Here, a fluid of density ρf = 2.96 coexists with the hcpcluster crystal of density ρs = 3.48. The latter crystalconsists of polydisperse clusters that contain on averagenc ∼= 6.02 particles each, corresponding to an equilibriumnearest neighbor distance of d = 21/6(nc/ρs)1/3 ∼= 1.347.The second transition towards the fcc crystal takes placeat a chemical potential µ = 20.03. Here, already deepin the crystalline phase, an hcp lattice of average den-sity ρ = 7.80, average occupation number nc = 11.96,and nearest neighbor distance d = 1.295 coexists with afcc lattice of average density ρ = 7.82, occupation num-ber nc = 11.85, and nearest-neighbor distance d = 1.289implying a lattice constant of a =
√2d = 1.823. We
anticipate that, similar to the GEM-4-model, there is atriple point at which liquid, hcp crystal and fcc crystalcoexist.
The detailed investigation of the bulk phase behaviorof the GEM-8-model is not the purpose of this work, yeta few comments are of order. First, the stability of thehcp lattice with respect to the fcc comes as a surprise,since the latter features a larger distance to the third-nearest neighbors of a given particle than the first. Onenergetic grounds, one would thus expect the fcc to win,and it indeed does so at T = 0. But very much likethe bcc-lattice is the post-freezing structure above thetriple point of the GEM-4-model on entropy grounds, thehcp achieves a lower free energy than the fcc due to anentropically more favorable arrangement of the densityprofiles around the crystal sites [53]. As density grows,however, so does also the cluster population nc. Theinter-site interaction energy, which scales as n2
c , becomesincreasingly important, energy takes over and fcc winsover hcp. There are indications from the simulations inconfinement that at post-freezing densities the orderedstate indeed has the propensity to undertake a hcp-likeordering, i.e., an ABAB . . . stacking of hexagonal arrays,as opposed to the ABCABC . . . stacking of the fcc, asshown in fig. 1. However, in bulk simulations the sys-tem spontaneously forms a bcc lattice at freezing. Thedetermination of accurate phase boundaries and crystalphases could be pursued by means of the novel simulationtechnique of Mladek, et al. [36]. This task goes beyondthe scope of this work and will be the subject of furtherinvestigations.
For the rest of this paper, we sidestep thus the issue ofthe stability of the hcp-lattice and the associated ques-tion of the possible existence of other non-Bravais lat-tices and restrict our theoretical studies to Bravais crys-tals only. The reasons for doing this are twofold: first,

5
FIG. 1: Left panel: simulation snapshot of the four crystalline layers of a confined GEM-8-model at temperature T = 1 anddensity ρ = 4.2, view of one quarter of the xy-periodic box from the bottom (lower wall). The two repulsive walls have aseparation Lz = 5.2 and are lying parallel to the page. The layers of clusters are color-coded, from bottom to top: green, blue,orange, and gray. An ABAB . . . stacking of the hexagonal layers can be seen. Right panel: same as the left but now from theside view.
as mentioned above, because it is not clear which othernon-Bravais lattices might be competitive. Second, weexpect that our results are generic, since the physics isdictated by the tendency of the model to form clustercrystals and is not dependent on the detailed spatial ar-rangement of the same on a specific lattice. Therefore, wefocus on the bulk results for the phase boundary betweena liquid and a fcc crystal, ignoring any other candidateperiodic arrangement; among all Bravais lattices, the fcclattice is the most stable one. The bulk freezing transi-tion for the same temperature T = 1 within the DFT isfound at a slightly higher chemical potential than for theliquid-hcp transition, namely µf = 12.13. Here, a fluidof density ρf = 2.97 coexists with the fcc cluster crystalof density ρs = 3.50. The fcc crystal consists of polydis-perse clusters that contain on average nc ∼= 6.04 particleseach, corresponding to an equilibrium lattice constant ofa = (4nc/ρs)1/3 ∼= 1.905. The equilibrium lattice con-stant exceeds the value
a∗ = 2√
3π/k∗ = 1.859 , (8)
where k∗ = 5.855 is the wavenumber for which φ(k) at-tains its minimum, negative value, by a factor 1.025. Thelattice constant a∗ corresponds to a nearest-neighbor dis-tance d∗ = 2−1/2a∗ = 1.314 and to a distance of ad-jacent layers of hexagonally crystalline particles in the111-direction of the fcc crystal c∗ = a∗/
√3 = 1.073 [54].
The result of eq. (8) stems from a simplified version ofthe MFA-DFT, which takes only the first reciprocal lat-tice vector (RLV) of the fcc lattice into account and re-sults into the outcome that the length of the first shellof RLVs of the fcc crystal should coincide with k∗ at alldensities [41]. The equilibrium lattice constant of the
0.92
0.94
0.96
0.98
1
1.02
1.04
10 20 30 40 50 60 70 80 90 100
a/a*
µ
FIG. 2: The equilibrium lattice constant for the fcc crystal inthe bulk as a function of chemical potential for T = 1.
fcc crystal resulting from the full DFT-minimization isrelatively insensitive towards temperature changes. Fur-thermore, as is known for the GEM-4 as well, it is almostindependent of µ. In particular, for T = 1, a decays asa function of µ towards a plateau of a = 0.94a∗ which itreaches at µ ∼ 50, as can be seen in fig. 2.
In view of the aforementioned insensitivity of a withrespect to the state point in the phase diagram, we cansimplify the calculation by fixing it to a constant valuea = a∗ for all state points (µ, T ) and recalculate the bulkphase diagram under this constraint. Thereby, a slightlyhigher chemical potential at freezing is obtained: For T =1, the value µf = 12.25, with coexistence densities of

6
0.5
1
1.5
2
2.5
3
3.5
4
2 4 6 8 10 12 14
T
ρ
fluid
FCC
10 20 30 40 50
µ
fluid
FCC
FIG. 3: The (constrained) bulk phase diagram for fixed latticeconstant a∗ and for the fixed fcc-lattice. Left panel: Thephase diagram at the (ρ, T )-representation. The lines are theloci of the coexisting liquid- and fcc-densities and the gap in-between denotes the coexistence region. Right panel: sameas the left one but at the (µ, T )-representation.
ρf = 3.00 and ρs = 3.58, and average cluster occupancync ∼= 5.74 results. The chemical potential µf and thedensities of coexistence are plotted versus temperaturein fig. 3 [55].
Another constraint to the lattice geometry, which be-comes important for the confinement studies, is the fol-lowing: The distance of neighboring layers of hexago-nally crystalline particles in the 111-direction of the fcccrystal c is free to vary whereas the nearest-neighbor dis-tance of particles within each plane is fixed to d = d∗.If we minimize the grand potential in this partially con-strained fashion (d = d∗ only in the xy-plane of confine-ment), we obtain yet a third value for the bulk freezingchemical potential, µf = 12.19, which lies in-between thetwo bulk values µf = 12.13 (free lattice constant a) andµf = 12.25 (fixed lattice constant a = a∗). The optimaldistance of neighboring layers was then found to be givenby c = 1.113 which exceeds the corresponding distancec∗ in an isotropic fcc-crystal with lattice constant a∗ bya factor 1.038. The bulk freezing parameters obtainedby DFT under the various constraint conditions on theminimization procedure are summarized in table I.
VI. REPULSIVE SLIT PORES
In the first setup we study the effect of the repulsiveconfining walls. The latter are characterized by the ex-ternal potential
VY(r) = 10[e−z
z+e−(Lz−z)
Lz − z
], 0 < z < Lz , (9)
where z is the component of the particle coordinate r per-pendicular to the wall, measured with the origin on one
of the walls. The Yukawa form is motivated on the ba-sis of results for the interactions of athermal dendrimers(GEM-2-particles) with model planar walls [45] and isconfirmed by recent results of Lenz, et al. [46]. The pref-actor 10 in eq. (9) is so far arbitrary but should roughlyscale linearly with the number of monomers of a den-drimer.
In the DFT, the xyz-periodic box for the density fieldhas the dimensions of Lx × Ly × (Lz + 1), where neigh-boring slits in the z-direction are separated by a largeadditional barrier of width 1, which is wide enough toobviate any mutual particle interactions across the wall.The system volume itself is only of size Lx×Ly×Lz, ex-cluding the barrier. The dimensions parallel to the walls,Lx and Ly, are chosen to be commensurate with the fcc-lattice of lattice constant a∗ either at the 100- or the 111-direction perpendicular to the walls (100: Lx = Ly = a∗,111: Lx = 2−1/2a∗, Ly =
√3/2a∗). The 110-orientation
is unfavorable due to inefficient packing and is thereforenot considered. As already mentioned in the determi-nation of the bulk phase diagram, we did not vary thenearest neighbor distance in the x- and y-direction in theslit pore geometry. However, we left the system freedomin adjusting its lattice constant in the z-direction, i.e.,perpendicularly to the walls.
In confinement, freezing is defined at the point in whicha fully modulated density field ρ(r) yields a grand poten-tial lower than that of the z-modulated fluid with den-sity ρ(z): Ω[ρ(r);Lz] < Ω[ρ(z);Lz] [56] and it occurs ata corresponding freezing chemical potential in confine-ment, µf (Lz). It will be shortly demonstrated that due tothe repulsive nature of the Yukawa walls, the bulk freez-ing chemical potential µf can be independently obtainedas µf = µf (Lz → ∞) by an appropriate extrapolationprocedure. Since we minimize the grand potential in apartially constrained fashion (fixed d = d∗ only in thexy-plane, which will turn out to be perpendicular to the111-direction of the equilibrium fcc-crystal in slit poresof large widths), the asymptotic value of µf (Lz → ∞)should coincide with the bulk freezing chemical poten-tial µf = 12.19 as obtained by applying the partiallyconstrained minimization procedure in Section V (cf. ta-ble I, line 4). The coincidence of the results obtainedby two independent routes for the determination of µfserves as a confirmation of the validity of the extrapola-tion procedure to be employed.
In DFT, symmetry does not break spontaneously. Toavoid getting trapped in metastable minima of the freeenergy landscape in our search for the true equilibriumconfiguration, we iteratively solve eq. (5) starting fromdifferent initial density fields. In particular, we start bothfrom a purely z-modulated density field, which alwaysleads to a stable or metastable fluid state and from highlymodulated fields, which possess the symmetry of the fcccrystal everywhere but very close to the confining walls,trying different orientation and offsets. To be precise, westart from 111- and 100-oriented crystals (with respectto the walls), which have either a particle layer centered

7
TABLE I: Freezing parameters for the liquid-solid transition in the bulk obtained within mean field density functional theoryfor different constraints to the lattice types of the crystalline phase (hcp, fcc, distorted fcc) and for different unit cell dimensions(fixed vs variable spacing of neighboring hexagonal layers c and fixed vs variable nearest-neighbor distance within each planed). The freezing parameters are the chemical potential µf , the densities of the coexisting liquid (ρf ) and solid (ρs), the in-planenearest neighbor distance d, the distance of neighboring planes c, and the average occupancy nc.
lattice minimization µf ρf ρs d/d∗ c/c∗ nc
hcp free 12.09 2.96 3.48 1.025 1.025 6.02
fcc free 12.13 2.97 3.50 1.025 1.025 6.04
fcc constraineda 12.25 3.00 3.58 1 1 5.74
distorted fcc constrainedb 12.19 2.98 3.54 1 1.038 5.89
aThe (isotropic) lattice constant is held fixed (a = a∗).bThe nearest-neighbor distance within a plane of hexagonally
crystalline particles is held fixed (d = d∗) but the inter-plane dis-tance c is allowed to relax freely (cf. text).
about the middle of the box (z = Lz/2) or a particle layershifted by half an inter-plane distance from z = Lz/2.The 111-oriented fcc crystal always leads to a stacking ofhexagonally ordered clusters in the ABCABC-fashion.The ABAB-stacking resulting from an hcp-crystal is nottested within the theory (see the above discussion of thebulk phase behavior).
Due to the slow exponential decay of the wall-particlepotential, the clusters in the layers closest to the wallsare less populated and blurred compared to the middleof the slit. This can be seen from the plots of the x- andy-averaged density field ρxy(z) ≡ (LxLy)−1
∫∫dx dy ρ(r)
for different average densities ρ = L−1z
∫dz ρxy(z) in
fig. 4(a), as obtained from the DFT. We therefore intro-duce the notion that the crystal freezes from the middleunder the influence of the repulsive, Yukawa walls. Forcomparison, we present in fig. 4(b) results from BD com-puter simulations for the same parameters as in the DFT,which show the same quantitative behavior for ρ = 2 andthe same qualitative behavior for ρ = 4. For ρ = 3, theDFT predicts a crystalline state whereas the system re-mains fluid in the simulation. The difference in the den-sity profiles for the states at ρ = 3, 4 is associated witha difference in the bulk liquid/solid coexistence densitieswhich has already been observed for the GEM-4 modelwhen applying the compressibility route to the Helmholtzfree energy [57].
The pronounced crystallinity in the central region ofthe simulation box can be observed not only in the den-sity profiles but is also confirmed by measurements of therestricted pair-distribution function [1] in the xy-plane,
g(k)2D (r‖) ≡
VkN2k
⟨ ∑i,j(i6=j)
′δ(r‖ −
∣∣ri‖ − rj‖∣∣)⟩ . (10)
Here, r‖ denotes the lateral projection (onto the slitplane), i.e., r‖ ≡ r−(r · ez)ez, where ez is the unit vectorin the z-direction. The double sum in eq. (10) runs overall Nk particles i and j lying in the kth layer from the
wall (this restriction being denoted by the prime) withvolume Vk. Particles belong to the same layer if their po-sition lies between the same two consecutive minima ofthe respective laterally-averaged density profile ρxy(z).We show g
(k)2D (r‖) for the first three layers from either
wall, k = 1, 2, 3, in fig. 5. Peaks and minima of the pairdistribution function clearly become more pronounced forincreasing distance of the layer from the wall. Also, theappearance of a shoulder at the third peak of g(2)
2D and g(3)2D
indicates the strong crystallinity of the clusters within therespective layers.
It is important to note that the ability of the particlesto form clusters has two profound consequences for theinterpretation of the density field ρ(r), qualitatively dis-tinguishing them from ordinary colloidal crystals: First,the decreased sharpness of the density peaks close to thewalls as compared to the central region of the slit is notonly to be interpreted as a fluctuation of the clusters’center-of-mass position but also and rather as an increaseof the cluster radii, i.e., an increase of the mean distanceof the particles from their cluster’s center of mass. Sec-ond, as was already mentioned in the introduction, thedifferent average numbers of particles occupying the clus-ter peaks indicated by the numbers in fig. 4, do not goalong with distortions of the lattice structure. In contrastto freezing of usual colloidal systems in confinement, evenfor the smallest average densities above freezing the av-erage number of particles occupying a cluster is substan-tially larger than 1. In fact, it is these features whichmake the system very amenable to a mean field DFT-treatment.
For all confinement lengths 2 ≤ Lz ≤ 48 studied,the freezing chemical potential in confinement is higherthan in the bulk, µf (Lz) > µf , see fig. 6; freezing ishindered by the confining Yukawa walls. On the otherhand, the fluid and the fcc solid average densities ρf (Lz)and ρs(Lz) at coexistence are smaller than the respec-tive bulk values for Lz & 1, as can be seen in fig. 7.The reason lies in the decreased probability density to

8
0
5
10
15
20
0 1 2 3 4 5 6 7
ρ xy(
z)
z
a) DFT
5.9(4.3)
7.4(5.5)
7.6(5.9)
ρ=4ρ=3ρ=2
0
5
10
15
20
0 1 2 3 4 5 6 7
ρ xy(
z)
z
b) simulationρ=4ρ=3ρ=2
FIG. 4: Yukawa walls: Laterally-averaged density profilesρxy(z) for different average densities (ρ = 4, 3, 2 from topto bottom) for Lz = 7 as obtained from the DFT, (a), andthe simulation, (b). (a) The fcc crystal in the DFT has the100-orientation. The numbers over the peaks denote the av-erage number of particles, nc, occupying a cluster, for ρ = 4(top value) and ρ = 3 (bracketed, lower value) from the DFT.(b) The lateral dimensions of the periodic simulation box areLx = Ly = 20.43.
find a particle close to the walls. Both freezing chemi-cal potential and fluid/solid densities at coexistence dis-play pronounced oscillations while approaching the re-spective bulk values with increasing Lz. This effect isclearly more pronounced for small wall-wall separations.After each spike of µf (Lz) in fig. 6, a new layer of crys-talline clusters is introduced into the box. The local min-ima of µf (Lz) correspond to crystalline states with op-timal layer spacing in the z-direction. Concomitantly,the wavelength of the oscillations equals the bulk valueof the distance of the crystalline particle layers in the111-direction, c = 1.04c∗ = 1.113 (cf. table I, line 4).This finding is qualitatively validated by the computersimulations (see fig. 7). Here, a simple criterion to sepa-rate crystalline from non-crystalline states was based onthe value of the first minimum of the laterally averaged
0
1
2
3
4
5
6
7
8
9
10
0 0.5 1 1.5 2 2.5 3 3.5 4 4.5
g 2D(k) (
r )
r
k=1k=2k=3
FIG. 5: Yukawa walls: The lateral pair distribution function
g(k)2D (r‖) for the first three layers of clusters on either of the
wall (k is counted from the wall) for the same confinement asin fig. 4 at average density ρ = 4 (for the definition of layerssee main text).
10
15
20
25
30
35
40
1 10
µ f(L
z)
Lz
confinement 100confinement 111
bulk
FIG. 6: Yukawa walls: Freezing chemical potential µf (Lz) asa function of the confinement width Lz for the 111-orientation(red/solid) and the 100-orientation (green/dashed). The(blue) stars mark those points where the 100-orientation isstable versus the 111-orientation. The horizontal line displaysthe respective freezing value of the bulk system, µf = 12.19.
pair distribution functions g(k)2D (r‖) of the most central
layer k, which always freezes first among all layers. Thesimulation points in fig. 7 display the states of constantminimum g
(k)2D (rmin) = 0.15.
The confining walls have a profound influence on thegrand potential of the system, especially for small val-ues of Lz. Despite the lower average density withinthe slit pores, the grand potential density ω(µ;Lz) ≡Ω[ρeq(r;µ,Lz)]/V , plotted as a function of µ for differentconfinement lengths Lz in fig. 8, is higher in confinementthan in the bulk. In fig. 8, ω(µ;Lz) is represented both

9
1.5
2
2.5
3
3.5
4
1 10
ρ
Lz
ρs, DFTρf, DFT
ρf, bulk DFTρs, bulk DFT
simulation
FIG. 7: Yukawa walls: Fluid and solid densities ρf (Lz),ρs(Lz) at coexistence. The open circles display the crys-talline states which possess a 100-orientation with respect tothe walls. Shown are also the respective bulk values. TheDFT-results for the confined case are compared against the
locus of constant g(k)2D (rmin) = 0.15 from the simulation, where
k refers to the most central layer (see main text).
-30
-25
-20
-15
-10
-5
0
10 12 14 16 18 20
ω(µ
)
µ
Lz=3.5, fluidLz=3.5, solid
Lz=7, fluidLz=7, solidbulk, fluidbulk, solid
FIG. 8: Yukawa walls: Grand potential density ω(µ) in thefluid (solid lines) and the solid state (dashed lines) as a func-tion of chemical potential for T = 1 for different confinementlengths Lz = 3.5, 7 and for the bulk (from top to bottom).
for the solid and the fluid state, the fluid being stable forµ < µf (Lz) and metastable for µ > µf (Lz).
For the case of small confinement lengths, Lz . 7,the favorite orientation of the compressed/expanded fcccrystal is, except within some tiny Lz-intervals, the 111-orientation. As a consequence, the chemical potential atfreezing for the 100-crystal which is metastable withinthe DFT, is almost always equal or higher than for the111-crystal (cf. fig. 6), within the accuracy of the DFTcalculation. This signifies that the system favors to havea layer of hexagonally crystalline clusters close to the
0
10
20
30
40
50
0 2 4 6 8 10
ρ xy(
z)
z
FIG. 9: Yukawa walls: Laterally-averaged density profilesρxy(z) close to the left wall for Lz = 48 for different chemicalpotentials µ = 16, 13, 12.5, 12.24 (from top to bottom).
walls, this layer being clearly visible in the simulationsnapshots in fig. 1. We note exemplary for Lz = 7, forwhich we find a stable 100-oriented crystal, that underconsideration of the non-Bravais hcp lattice, the latter isthermodynamically stable in comparison to the fcc one,albeit with a small difference in grand potential, leadingagain to a hexagonal cluster arrangement on the walls.The stability of the hcp versus the 100-oriented fcc lat-tice is also most likely to be found for the other confine-ment lengths but we did not check this in our study. Forvery large Lz, the difference in grand potential densitybetween the 100- and the 111-orientations is decreasingand we focus on the 111-orientation for Lz ≥ 24.
For large wall-wall separations, Lz 1, as the bulkfreezing chemical potential is approached from above(µ > µf = 12.19), the blurred clusters on the wallsmelt and a fluid layer grows on each wall. The wallsenforce the growth of a liquid film, a property referredto as premelting. The number of molten layers Nm oneach wall increases continuously with decreasing differ-ence in chemical potential ∆µ ≡ µ − µf , as can be seenfrom the xy-averaged density profiles in fig. 9 for theconfinement length of Lz = 48. In fig. 10, we show thenumber of molten layers on the walls as a function of∆µ for two different confinement lengths, Lz = 24 andLz = 48. Here, a layer of what used to be crystallineclusters, is defined to be molten once the density withinit exceeds the threshold value of ρ(r) > 0.15 for all x andy. This criterion has been used for the absence of knowl-edge about the pair-correlations, which was the basis forthe simulation-results above. The z-position of a layer isdefined by the z-position of the respective maximum ofthe x- and y-averaged density field. After growing up toa maximum finite number of molten layers on each wall,N cm(Lz), the system turns completely fluid due to cap-
illary melting at µf (Lz), as is also visualized in fig. 10by the black vertical bars. At the melting transition, the

10
0
1
2
3
4
5
6
7
0.001 0.01 0.1 1 10
Nm
(∆µ)
∆µ
Lz=48Lz=24
0 2 4 6 8
0.01 0.1 1
λ(∆µ
)
∆µ
FIG. 10: Yukawa walls: The number of molten layersNm(∆µ)on either Yukawa-wall as a function of the difference in chem-ical potential ∆µ. The black bars indicate the points of cap-illary melting, µf (Lz). The points to the left of the bars cor-respond to metastable crystalline states with the minimumgrand potential among all possible crystalline states. Wedid display Nm only for those chemical potentials for whichat least one other still crystalline state with a higher num-ber of molten layers was found to be metastable (see maintext). Inset: The corresponding width λ(∆µ) of the fluid sys-tem close to the wall for Lz = 48, evaluated at the kinks ofNm(∆µ). The dashed line is the least-square logarithmic fit−ξf ln(∆µ) + const.
number of molten layers at each wall is still substantiallysmaller than the number of crystalline layers in the cen-tral region of the slit. In particular, we find for the max-imum wall-wall-separation under study, Lz = 48, thatN cm(Lz = 48) = 4 which is still microscopic. For Lz = 24
we find N cm(Lz = 24) = 2.
The occurrence of capillary filling when a system closeto its bulk phase transition is confined between two par-allel walls is a well-known phenomenon in the the contextof liquid-gas phase coexistence of ordinary fluids [24, 47].Here, we establish the existence of capillary melting fromthe walls for a system that forms crystalline layers inthe middle of the slit pore. For the liquid-gas coexis-tence, capillary condensation precludes the wetting tran-sition that takes place between two semi-infinite bulkphases [24]. Wetting can be studied within DFT ifone employs a semi-infinite system with the appropri-ate boundary condition at a distance z → ∞ from thewall and it is straightforward to implement for the caseof uniform phases [58]. In our case, however, this wouldcorrespond to fixing a periodic crystal at z →∞, whilstthe chemical potential µ is lowered towards its bulk valueµf from above. This renders the DFT-calculation verycomplicated, therefore we will resort to a different ap-proach in arguing that in the limit of infinite wall-wallseparation, the fluid completely wets the Yukawa wall asµ → µ+
f . The approach is based on general, thermo-dynamic considerations that lead to scaling laws for the
width of the wetting layer, which diverges at the bulkphase transition. Thus, the walls drive the system to themolten state.
In the limit of large wall-wall separation and for macro-scopically thick fluid films of width 1 λ(∆µ) Lz oneither wall, the grand potential per unit surface area Aof the short-range interacting system can be written as[47, 59]
Ω(∆µ)A
= 2 (γfw + γfs) + ω(µf )Lz + 2ε1 exp[− λ
ξf
]− [(Lz − 2λ)ρs + 2λρf ] ∆µ+ O(∆µ2) ,
(11)
where γfw is the fluid-wall surface tension, γfs is thefluid-solid surface tension, and ε1 is the prefactor ofthe interaction between the fluid-wall and the fluid-solidinterfaces, which decays exponentially on the range ofthe correlation length of the fluid that wets the wall[47, 59]. As thermodynamic quantities on the right-hand side are evaluated at phase coexistence, use hasbeen made of the identity ∂ωf,s/∂µ = −ρf,s, whereωf,s are the grand potential densities of the fluid andthe crystal at coexistence, respectively. The correla-tion length ξf of the fluid is obtained as the inverseof the smallest imaginary part of the pole of the staticstructure factor S(k) = [1 − ρf φ(k)]−1 closest to thereal axis, i.e., ξf = [Im(k)]−1 = 1.20, where k fulfills1−ρf φ(k) = 0 [58]. In the case of complete wetting, i.e.,for
γsw > γfw + γfs , (12)
where γsw is the wall-solid surface tension, two scaling be-haviors follow from this ansatz. At first, upon approach-ing µf from above, the width of the fluid film λ(∆µ)grows logarithmically as a function of ∆µ:
λ(∆µ) ' −ξf ln(∆µ) + const , (13)
as long as λ Lz holds, i.e., as long as both walls be-have each as single walls in contact with a semi-infinitecrystal. Growth is indeed observed in our results but it isinterrupted at the freezing transition µf (Lz) by capillarymelting, which leads us to the second scaling relation: atthe point of capillary melting, the net contribution of thefluid region in the middle of the slit pore to the grandpotential per unit area, (ωf − ωs)(Lz − 2λ) equals twicethe liquid-solid surface tension γfs, which yields the fol-lowing relation:
Lz − 2λ (µf (Lz)) '2γfs
(ρs − ρf ) (µf (Lz)− µf ). (14)
For the maximum confinement-width studied (Lz = 48),we found N c
m = 4 at µ = µf (Lz) ∼= 12.24 correspondingto λ ∼= 4.1, which is too small to accurately be fittedto a logarithmic function and to extract µf (Lz). Never-theless, within the DFT it is possible to avoid the tran-sition to the stable, capillary-molten phase, and remain
11
instead in a partly crystalline setup also for µ < µf (Lz)by iterating eq. (5) with an appropriate initial densityfield ρ(r), which already has a given number of moltenlayers. For a single wall, in which case capillary melt-ing is absent, the system will choose the crystalline statewith the lowest value of Ω[ρ(r)]. Accordingly, we focuson the state that fulfills the same condition, among allmetastable crystalline states, in the presence of two walls.However, we do consider only those chemical potentialsfor which at least one other state, which is still crys-talline and has a higher number of molten layers, wasfound to be metastable, i.e., non-collapsed to a fluid. Inthis way, further growth of the fluid layer is observed upto a point where the crystalline slab in the middle of theslit becomes unstable towards collapse (see fig. 10). Byperforming a least-square fit of the whole growth (be-tween Nm = 1 and Nm = 6) to the logarithmic growth ofeq. (13), we obtain the bulk freezing chemical potentialµf = 12.19 independently of the already known valuefrom Section V (see inset of fig. 10). In fact, the widthλ(∆µ) was taken to be the distance of the most distantmolten layer from the wall. As expected, for large num-bers of molten layers we find λ(∆µ) ' cNm(∆µ), withthe layer separation c = 1.04c∗ = 1.113, as discussedabove. The independently obtained freezing chemicalpotential µf = 12.19 agrees perfectly with the freezingchemical potential obtained from the partly constrainedbulk measurement in Section V. This finding constitutesa strong confirmation of the validity of the complete wet-ting scenario.
The second scaling relation, eq. (14), serves as a check,again for the largest confinement length Lz = 48. The in-gredient we are still missing is the surface tension γfs atcoexistence. The latter quantity can be obtained withinDFT by comparing the grand potential Ω of a bulk sys-tem at µ = µf with that of a system that contains stripesof equally sized liquid and crystalline parts that form twoplanar liquid-solid interfaces within the periodic ’box’ ofsize Lx × Ly × Lz. We have performed this calculationusing a box with the same x- and y-dimensions as in theconfining case and a longer z-length, Lz = 96; clearly,there is no external potential in this case. In this way,we obtain γfs ∼= 0.49, where the crystal is oriented in the111-direction at the interface. Insertion of γfs, togetherwith ρs − ρf = 0.56 and µf (Lz = 48) − µf = 0.05 intoeq. (14), yields Lz − 2λ ∼= 35.3, which agrees reasonablywell with Lz−2λ ∼= 39.9 from the direct comparison of thegrand potential densities of the capillary-molten or crys-talline states in confinement. It must be noted that wedisregarded widths of the interfaces in our crude, ‘sharp-kink’ treatment of the interfaces that led to eq. (14). Inreality, the widths of the fluid-wall and of the fluid-solidinterfaces are of the order of ∼ 2σ, which helps in ex-plaining the discrepancy.
Capillary melting is a first-order phase transition,which comprises the possibility of non-equilibrium statesclose to or at the transition remaining metastable. Inthe DFT calculations, the metastability of non-molten
0
2
4
6
8
10
12
3.5 3.6 3.7 3.8 3.9 4 4.1 4.2 4.3 4.4 4.5
Nm
(ρ)
ρ
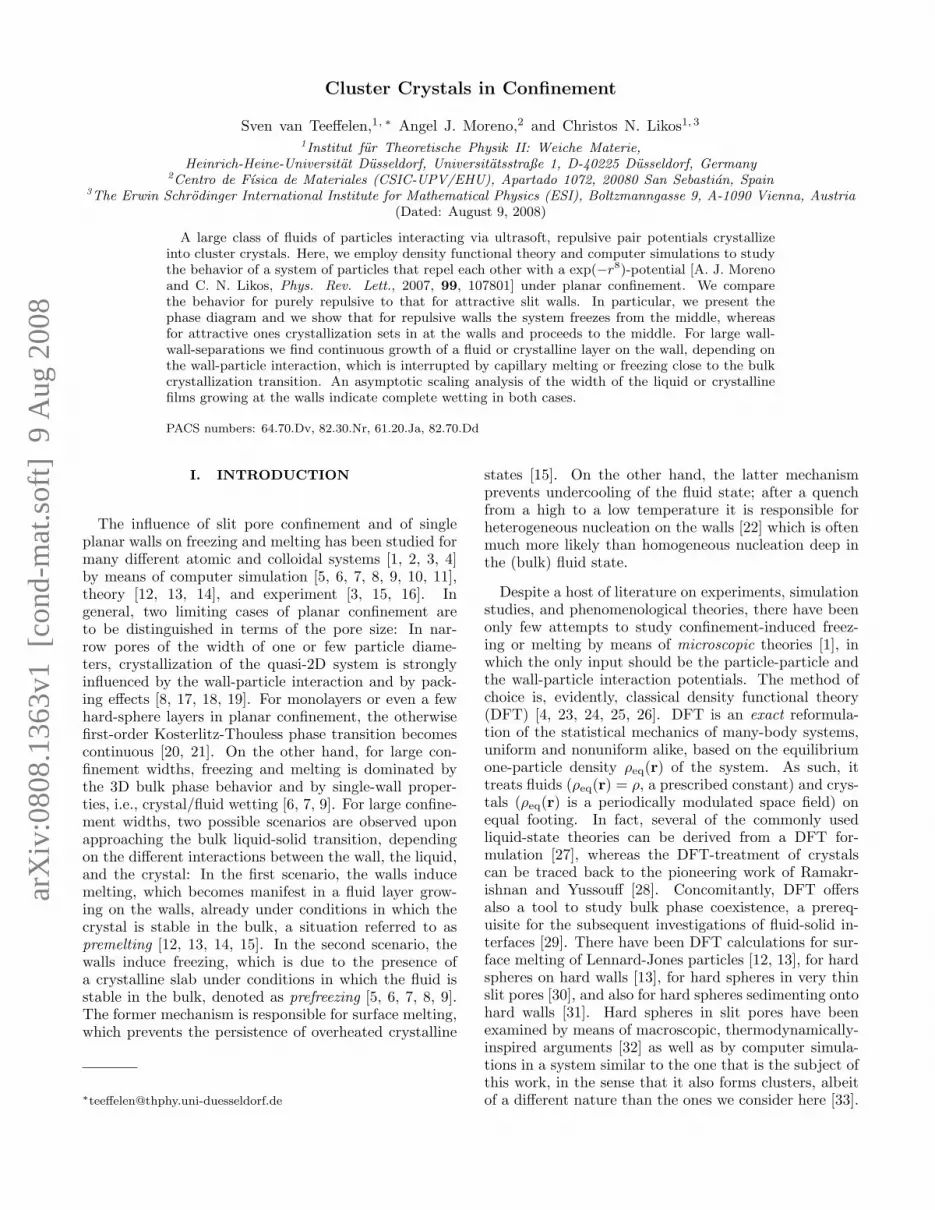
FIG. 11: Yukawa-walls: The average number of molten layerson each wall for the same confinement as in fig. 12 as a func-tion of average density ρ, and as obtained from the computersimulations. The averages are performed over the left and theright wall.
states beyond equilibrium capillary melting has alreadybeen exploited for extracting the logarithmic growth ofthe wetting layer [see fig. 10 and eq. (13)]. In computersimulations of systems in the NV T -ensemble, metastablestates may persist in small periodic simulation boxes andfor average densities lying within two coexisting densitiesof a first-order phase transition. Here, free energy contri-butions of phase-separating interfaces are comparable orlarger than bulk contributions [60]. This behavior is alsoobserved in computer simulations of the GEM-8 model ina relatively large planar confinement of Lz = 24, wherethe lateral dimensions of the xy-periodic simulation boxLx = Ly = 9.29 are comparatively small. Consequently,by continuously varying the density of the system a con-tinuous growth of a liquid layer on each Yukawa wall upto complete filling of the box is observed (see fig. 11).Snapshots of the simulation are exemplarily shown forthree different average densities ρ = 3.5, 3.7, 4.0 in fig. 12.
The average number of molten layers on each wall,Nm(ρ) in fig. 11, has been determined by analyzingthe lateral pair distribution function g2D(r‖) (not shownhere) for a total of 22 crystalline layers in parallel to thewalls, occurring for large densities. As for the narrowconfinement of Lz = 7 above, the range of each layer inthe z-direction is determined by two consecutive minimaof the respective density profile ρxy(z) (also not shownhere). A layer is defined to be molten/crystalline oncethe first minimum of g2D(r‖) is larger/smaller than 0.15.Clearly, the system separates along the z-axis and doesnot show an indication of capillary melting. However,and as already argued above, we have strong evidencethat the observation of states with a large number ofmolten layers is a finite-size effect in the simulations.

12
FIG. 12: Yukawa walls: Simulation snapshots for Lz = 24and average densities of ρ = 3.5, 3.7, 4.0 (from top to bottom).The boundaries of the box (Lx = Ly = 9.29) are indicatedby thin lines. The Yukawa-walls are situated at the left andat the right boundaries, respectively. The simulation boxesare oriented differently for better visibility of the crystallineregion in the middle of the box.
VII. ATTRACTIVE WALLS
In the second setup, we study the effect of attractiveLennard-Jones walls. The corresponding external poten-tial is taken to have the form
VLJ(r) = 10[
1z9− 1z3
+1
(Lz − z)9− 1
(Lz − z)3
],
0 < z < Lz .
(15)
0
5
10
15
20
25
0 1 2 3 4 5 6 7
ρ xy(
z)
z
a)DFT
7.8(5.3)
5.4(3.4) 5.1
(3.6)
ρ=3ρ=2ρ=1
0
5
10
15
20
25
0 1 2 3 4 5 6 7
ρ xy(
z)
z
b) simulation ρ=3ρ=2ρ=1
FIG. 13: Lennard-Jones walls: Laterally-averaged densityprofiles ρxy(z) for three different densities above (ρ = 2, 3)and below (ρ = 1) the freezing transition for Lz = 7 as ob-tained from the DFT, (a), and the simulation, (b). The num-bers over the peaks denote the average number of particles,nc, occupying a cluster, for ρ = 3 (top value) and ρ = 2 (inparentheses, lower value). (b) The lateral dimensions of theperiodic simulation box are Lx = Ly = 20.43.
Recent numerical simulations by Lenz et al [46] have in-deed shown that amphiphilic dendrimers of the secondgeneration, demonstrated to be GEM-particles of theQ±-class in ref. [36], together with an attractive corewall-particle interaction lead to very similar effective in-teraction potentials. The precise shape of the wall po-tential depends, of course, on the different molecular in-teraction parameters. However, a range of the attractionof the order of σ and a depth of the order of few kBTis certainly a reasonable assumption. Here, the mini-mum value of the Lennard-Jones potential for large Lz isVLJ(zmin
∼= 1.2) ∼= −3.85.In contrast to the setup with repulsive, Yukawa walls
of Section VI, the system now freezes at the walls be-fore freezing in the middle region of the confinement, ascan be seen for Lz = 7 in fig. 13. Note the big differ-ence of cluster population close to the wall and in the

13
0
1
2
3
4
5
6
7
0 0.5 1 1.5 2 2.5 3 3.5 4 4.5
g 2D(k) (
r )
r
k=1k=2k=3
FIG. 14: Lennard-Jones walls: The lateral pair distribution
function g(k)2D (r‖) for the first three layers of clusters on either
of the wall (k is counted from the wall) for the same confine-ment as in fig. 13 at average density ρ = 3 (for the definitionof layers see main text).
middle of the slit by more than 2 particles per cluster.As for the Yukawa setup, we present in fig. 13(b) re-sults from BD computer simulations for the same param-eters as in the DFT, which show the same quantitativebehavior for ρ = 1 and the same qualitative behaviorfor ρ = 2, 3. The reversal of the dependence of crys-tallinity on the layer-distance from the walls is confirmedby measurements of the restricted pair-distribution func-tion, g(k)
2D (r‖), eq. (10), shown for the first three layersfrom either wall in fig. 14. Peaks and minima of the pairdistribution function clearly become less pronounced forincreasing distance of the layer from the wall.
Freezing in terms of breaking the xy-symmetry of thesystem is now mainly a single-wall effect, which is slightlydisturbed by the interaction of the two crystalline layerson either wall with each other. This is at odds withfreezing at the Yukawa setup, which is a bulk-dominatedphenomenon disturbed by the walls. On these grounds,we denote the surface freezing chemical potential for theLennard-Jones setup as µsf (Lz), in order to distinguish itfrom the respective capillary freezing chemical potentialµf (Lz) (see below). The bulk phase diagram only entersthe stage once the bulk freezing chemical potential, µf , isapproached from below. Interactions between crystallinelayers on either wall are subdominant for wall separa-tions as small as Lz ≈ 5. This can be ascertained fromthe dependence of the surface-freezing chemical potentialµsf (Lz) on Lz, fig. 15, which monotonically approaches aplateau value of µsf ≡ µsf (Lz →∞) already from Lz = 5on. By extrapolating the phase diagram of fig. 15 toLz → ∞ we find µsf
∼= 7.7 which corresponds to a bulkfluid density of ρ ∼= 1.90. This value, of course, dependson the depth of the external potential.
Contrary to Yukawa walls, this setup shows capillary
7.1
7.2
7.3
7.4
7.5
7.6
7.7
7.8
4 4.5 5 5.5 6
µ fs (Lz)
Lz
FIG. 15: Lennard-Jones walls: Surface freezing chemical po-tential µs
f (Lz) as a function of the confinement width Lz forthe attractive Lennard-Jones walls.
freezing from the walls. Whereas at µsf (Lz) surface-induced freezing sets in, capillary freezing occurs at asignificantly higher value µf (Lz), which now approachesµf from below as Lz grows, i.e., µf (Lz →∞) = µf . Wenote also that freezing on the walls is not only observedfor the prefactor 10 in eq. (15) but for any prefactor,i.e., for a vanishing attractive part of VLJ(r), implyingthat surface-induced freezing is an intricate effect whichsensitively depends on the nature of the wall-particle in-teraction. In particular, for the system under study thequestion whether surface-induced freezing or melting isobserved, seems to be mostly a matter of the range orsoftness of the wall-particle potential. Our results sug-gest that there is surface-induced freezing for a hard wall(as for the Lennard-Jones walls) whereas there is surface-induced melting for a soft wall (as for the Yukawa-walls).
For small values of Lz, the two minima of the externalpotential merge and the system behaves qualitatively thesame as for the repulsive Yukawa walls. We therefore re-strict our analysis to Lz ≥ 4. Due to the relatively strongattraction of the walls, the system favors a hexagonal pat-tern of clusters on the planar surfaces. The equilibriumorientation of the (distorted) fcc lattice in confinementis therefore always the 111-orientation. As the chemi-cal potential is increased beyond µsf (Lz) and as the bulkfreezing chemical potential µf is approached from below,the number of crystalline layers on either wall grows con-tinuously, as can be seen from the density profiles forLz = 24 in fig. 16.
Upon approaching µf from below, we find for theLennard-Jones walls that the number of crystalline lay-ers on the walls, Nc(µ), grows continuously and nearlylogarithmically with |∆µ| = |µ − µf | (cf. fig. 17 forLz = 24, 48). This growth is eventually interrupted bycapillary freezing, which occurs at a chemical potentialµf (Lz). The surface- and bulk-freezing chemical po-tentials for attractive walls order as µsf (Lz) . µsf

14
0
5
10
15
20
25
30
35
40
45
50
0 2 4 6 8 10 12
ρ xy(
z)
z
12.12512.1
1211
7.75
FIG. 16: Lennard-Jones walls: Laterally-averaged densityprofiles ρxy(z) close to the left wall for Lz = 48 for differentchemical potentials µ = 12.125, 12.1, 12, 11, 7.75 (from top tobottom).
0
2
4
6
8
10
0.01 0.1 1 10
Nc(
∆µ)
|∆µ|
Lz=48Lz=24
-4 0 4 8
12
0.01 0.1 1 10
γ(∆µ
)
|∆µ|
FIG. 17: Lennard-Jones walls: The number of crystalline lay-ers on the walls, Nc(µ), as a function of the difference betweenthe bulk freezing chemical potential, ∆µ and for two differ-ent confinement widths. Note that µf > µ here. Inset: theadsorption of a crystal layer γ, eq. (16), as a function of |∆µ|.
µf (Lz) . µf .As for the case of the Yukawa walls, we studied two
large confinement lengths Lz = 24 and Lz = 48. Wefound µf (Lz = 24) = 12.12 and µf (Lz = 48) = 12.16. Inthe limit of large Lz and large crystalline film thickness λ,still substantially smaller than Lz/2, the (local) densityof the fluid in the middle of the confining region is veryclose to the fluid density of a semi-infinite fluid reservoiron a single Lennard-Jones wall at infinity, which allowsus to define the adsorption as
γ =∫ Lz/2
0
dz [ρxy(z)− ρxy(Lz/2)] , (16)
which is plotted as a function of |∆µ| in the inset offig. 17.
Following the same reasoning as for the Yukawa walls,the slopes of the logarithmic growths of Nc and γ are nowgiven by the correlation length of the (bulk) solid phaseξc that wets the wall:
Nc ' −ξcc
ln (|∆µ|) + const , (17)
γ ' −(ρc − ρf )ξc ln (|∆µ|) + const , (18)
where c = 1.113 is the distance of neighboring layersof the constrained bulk fcc crystal, again. By fittinga logarithmic curve to the Nc-data at intermediate Ncwe roughly obtain ξc ∼= 2, roughly twice as large as thefluid correlation length ξf . As for the specular case ofthe Yukawa-walls, we cannot rule out the possibility of anon-continuous growth of the crystalline layer in a single-wall setup. However, our results for the two confinementwidths of Lz = 24, 48 suggest that the crystal completelywets the Lennard-Jones walls and that the growth of thecrystalline film is only interrupted by capillary freezing.
We present snapshots of BD-computer simulations ofthe system in planar Lennard-Jones confinement of Lz =24 for different average densities in fig. 18. For the small-est density of ρ = 2.5 the system is only crystalline onthe walls. For intermediate density, ρ = 4.0, the sys-tem displays two equally large crystalline layers on bothwalls, and for ρ = 5.0 the system turns completely crys-talline. This behavior is again quantified through theanalysis of g(k)
2D (r‖) for all crystalline/fluid layers paral-lel to the confining walls, as in Section VI. The resultingaverage number of crystalline layers on each wall, Nc(ρ),is plotted as a function of average density in fig. 19.
VIII. CONCLUSIONS
In conclusion, we studied the effect of repulsive andattractive slit-pore confinement on freezing and meltingof cluster-forming, ultrasoft, repulsive particles of theGEM-8-class. For repulsive Yukawa-walls we found thatthe system freezes from the middle of the slit whereasfor attractive Lennard-Jones walls it freezes at the wallsbefore freezing in the middle. For small confinement-widths the respective freezing chemical potentials andliquid-solid coexistence densities display strong oscilla-tions with varying slit width—the wavelength being equalto the distance of crystal layers in the bulk. However,whereas the oscillations are very pronounced for Lz . 15in the case of the Yukawa-walls, they are damped al-ready for Lz ≈ 5 in the case of the Lennard-Jones walls.In the case of large confinement-widths we could findstrong indications that upon approaching the bulk freez-ing chemical potential from above the Yukawa-walls arecompletely wetted by fluid whereas upon approaching thebulk freezing chemical potential from below the Lennard-Jones walls are completely wetted by the crystal.

15
FIG. 18: Lennard-Jones walls: Simulation snapshots forLz = 24 and average densities ρ = 2.5, 4.0, 5.0 (from top tobottom). The boundaries of the box (Lx = Ly = 9.29) areindicated by thin lines. The Lennard-Jones walls are situatedat the left and at the right boundaries, respectively. The sim-ulation boxes are oriented differently for better visibility ofthe crystalline region in the middle of the box.
Different modifications to the slit-pore geometry andto the particle-wall interactions are of interest: Whereasin this work both confining walls were of the same kind,it would be interesting to study the influence of “com-peting walls” [34]. Further, the crystal arrangement atthe walls is very sensitive towards structured/patternedsubstrates [61, 62, 63, 64]. Moreover, slit pore confine-ment is a reference model for more complicated geome-tries such as porous media [65]. Confinement has alsointriguing implications for the diffusive dynamics in andout of equilibrium. For equilibrium fluids in planar con-finement, it has been recently demonstrated that bothlateral and perpendicular diffusivities, D‖ and D⊥, areenhanced at z-positions of higher average one-particledensity ρxy(z) as compared to the regions of lower den-
1
2
3
4
5
6
7
8
9
10
11
2.5 3 3.5 4 4.5 5
Nc(
ρ)
ρ
FIG. 19: Lennard-Jones-walls: The average number of crys-talline layers on each wall for the same confinement as infig. 18, as a function of average density ρ, and as obtainedfrom the computer simulations. The averages are performedover the left and the right wall.
sity [66, 67]. For cluster-forming, GEM-n particles, dif-fusive dynamics features novel characteristics, since evencrystals now display nonzero long-time diffusivities, dueto the presence of activated hopping processes [48, 49]. Itwould be interesting to examine the behavior of D‖ andD⊥ in confinement, calculated separately for each layer,for the case at hand. Bulk studies [48, 49] have revealedan essentially Arrhenius-type behavior, D ∼ exp(−βEA),of the long-time diffusivity, with an activation energy EAproportional to ρ. It is interesting to find out to whatextent this law holds also locally for each layer formed inslit-pore confinement. Recently, the relaxation dynamicsof a fluid of Gaussian particles in a temporally oscillat-ing, spherical, harmonic trap has been studied using com-puter simulations and dynamical density functional the-ory [68]. The latter method is an extension of the DFTto overdamped non-equilibrium dynamics [69, 70, 71],which has recently also been used to study crystal growthin 2D [72]. It would be interesting to employ dynamicaldensity functional theory to study the relaxation of clus-ter crystals upon sudden or temporally periodic changesof the slit-pore confinement.
Acknowledgments
The authors would like to thank Hartmut Lowen andBianca Mladek for helpful discussions. This work hasbeen supported by the DFG within the SFB TR6, projectsection C3 and by the EU Network of Excellence “Soft-comp”. CNL wishes to thank the Erwin Schrodinger In-ternational Institute for Mathematical Physics (ESI, Vi-enna), where parts of this work have been carried out, fora Senior Research Fellowship and for its hospitality. AJMacknowledges support from 2007-60I201 (CSIC, Spain).

16
[1] C. Alba-Simionesco, B. Coasne, G. Dosseh, G. Dudziak,K. Gubbins, R. Radhakrishnan, and M. Sliwinska-Bartkowiak, J. Phys.: Condens. Matter, 2006, 18, R15.
[2] L. D. Gelb, K. E. Gubbins, R. Radhakrishnan, andM. Sliwinska-Bartkowiak, Rep. Prog. Phys., 1999, 61,1573.
[3] H. K. Christenson, J. Phys.: Condens. Matter, 2001, 13,R95.
[4] H. Lowen, Phys. Rep., 1994, 237, 249.[5] J. E. Hug, F. van Swol, and C. F. Zukoski, Langmuir,
1995, 11, 111.[6] D. J. Courtemanche and F. van Swol, Phys. Rev. Lett.,
1992, 69, 2078.[7] D. J. Courtemanche, T. A. Pasmore, and F. van Swol,
Mol. Phys., 1993, 80, 861.[8] A. Fortini and M. Dijkstra, J. Phys.: Condens. Matter,
2006, 18, L371.[9] M. Dijkstra, Phys. Rev. Lett., 2004, 93, 108303.
[10] Y. Hamada, K. Koga, and H. Tanaka, J. Chem. Phys.,2007, 127, 084908.
[11] E. M. Grzelak and J. R. Errington, J. Phys. C., 2008,128, 014710.
[12] R. Ohnesorge, H. Lowen, and H. Wagner, Phys. Rev. A,1991, 43, 2870.
[13] R. Ohnesorge, H. Lowen, and H. Wagner, Phys. Rev. E,1994, 50, 4801.
[14] A. De Col, G. I. Menon, V. B. Geshkenbein, and B. G,Phys. Rev. Lett., 2006, 96, 177001.
[15] J. W. M. Frenken and J. F. van der Veen,Phys. Rev. Lett., 1985, 54, 134.
[16] A. van Blaaderen, MRS Bulletin, 2004, 29, 85.[17] N. Osterman, D. Babic, I. Poberaj, J. Dobnikar, and
P. Ziherl, Phys. Rev. Lett., 2007, 99, 248301.[18] L. Salamacha, A. Patrikiejew, S. Sokolowski, and
K. Binder, Eur. Phys. J. E, 2004, 13, 261.[19] L. Salamacha, A. Patrikiejew, S. Sokolowski, and
K. Binder, J. Chem. Phys., 2004, 120, 1017.[20] R. Radhakrishnan, K. E. Gubbins, and M. Sliwinska-
Bartkowiak, Phys. Rev. Lett., 2002, 89, 076101.[21] X. Xu and S. Rice, Phys. Rev. E, 2008, 78, 011602.[22] S. Auer and D. Frenkel, Phys. Rev. Lett., 2003, 91,
015703.[23] R. Evans, Adv. Phys., 1979, 28, 143.[24] R. Evans, J. Phys.: Condens. Matter, 1990, 2, 8989.[25] D. W. Oxtoby, Nature, 1990, 347, 725.[26] Y. Singh, Phys. Rep., 1991, 207, 351.[27] J.-P. Hansen and I. R. McDonald, Theory of simple liq-
uids, Academic Press, London, 2nd ed., 1986.[28] T. V. Ramakrishnan and M. Yussouff, Phys. Rev. B,
1979, 19, 2775.[29] D. W. Marr and A. P. Gast, Phys. Rev. E, 1993, 47,
1212.[30] M. Schmidt and H. Lowen, Phys. Rev. E, 1997, 55, 7228.[31] L. Mingqing, A. B. Michael, and M. F. David,
J. Chem. Phys., 2007, 127, 164709.[32] W. K. Kegel, J. Chem. Phys., 2001, 115, 6538.[33] A. Imperio and L. Reatto, Phys. Rev. E, 2007, 76,
040402(R).[34] K. Binder, J. Horbach, R. Vink, and A. De Virgiliis, Soft
Matter, 2008, 4, 1555.[35] C. N. Likos, Phys. Rep., 2001, 348, 267–349.
[36] B. M. Mladek, G. Kahl, and C. N. Likos, Phys. Rev. Lett.,2008, 100, 028301.
[37] A. Suto, Phys. Rev. Lett., 2005, 95, 265501.[38] A. Suto, Phys. Rev. B, 2006, 74, 104117.[39] S. Torquato and F. H. Stillinger, Phys. Rev. Lett., 2008,
100, 020602.[40] C. N. Likos, A. Lang, M. Watzlawek, and H. Lowen,
Phys. Rev. E, 2001, 63, 031206.[41] C. N. Likos, B. M. Mladek, D. Gottwald, and G. Kahl,
J. Chem. Phys., 2007, 126, 224502.[42] B. M. Mladek, D. Gottwald, G. Kahl, M. Neumann, ,
and C. N. Likos, Phys. Rev. Lett., 2006, 96, 045701.[43] B. M. Mladek, P. Charbonneau, and D. Frenkel,
Phys. Rev. Lett., 2007, 99, 235702.[44] A. Lang, C. N. Likos, M. Watzlawek, and H. Lowen,
J. Phys.: Condens. Matter, 2000, 12, 5087.[45] I. O. Gotze, A. J. Archer, and C. N. Likos,
J. Chem. Phys., 2006, 124, 084901.[46] D. Lenz, R. Blaak, and C. N. Likos, unpublished.[47] S. Dietrich in Phase Transitions and Critical Phenomena,
ed. C. Domb and J. Lebowitz, Vol. 12; Academic Press,London, 1988; p. 1.
[48] A. J. Moreno and C. N. Likos, Phys. Rev. Lett., 2007,99, 107801.
[49] C. N. Likos, B. M. Mladek, A. J. Moreno, D. Gottwald,and G. Kahl, Computer Physics Communications, 2008,179, 71.
[50] In fact, exact diagrammatic expansions show that c(r)remains finite for all r, whereas diverging potentials donot at r = 0. Thus, c(r) = −βφ(r) must break down insuch case.
[51] M. P. Allen and D. J. Tildesley, Computer Simulation ofLiquids, Clarendon Press, Oxford, 1987.
[52] D. L. Ermak, J. Chem. Phys., 1975, 62, 4189.[53] S. van Teeffelen, unpublished.[54] N. W. Ashcroft and N. D. Mermin, Solid State Physics,
Holt, Rinehart and Winston, New York, 1976.[55] By fixing the lattice constant to a∗ there is actually a sta-
ble bcc-phase intervening between the liquid-fcc-crystalphase transition, which is not persistent when relaxingthe constrained of fixed lattice constant. We thereforeignore this subtlety here.
[56] Here and in the following, we denote the local minima of
Ω[ρ(r)] with respect to the density field ρ(r) by Ω[ρ(r)],although the grand potential is, of course, given by theminimum value of all local minima.
[57] B. M. Mladek, D. Gottwald, G. Kahl, M. Neumann, andC. N. Likos, J. Phys. Chem. B, 2007, 111, 12799.
[58] A. J. Archer, C. N. Likos, and R. Evans, J. Phys.: Con-dens. Matter, 2002, 14, 12031.
[59] T. Aukrust and E. Hauge, Physica A, 1987, 141, 427.[60] Strictly speaking, these states are in equilibrium due to
the (small) finite size but only for larger sizes they wouldbe metastable.
[61] L. Harnau, F. Penna, and S. Dietrich, Phys. Rev. E, 2004,70, 021505.
[62] H. Bohlen and M. Schoen, J. Chem. Phys., 2005, 123,124714.
[63] M. Heni and H. Lowen, Phys. Rev. Lett., 2000, 85, 3668.[64] M. Heni and H. Lowen, Phys. Rev. E, 2001, 13, 4675.[65] A. Khokhlov, R. Valiullin, J. Karger, F. Steinbach, and

17
A. Feldhoff, New J. Phys., 2007, 9, 272.[66] J. Mittal, T. M. Truskett, J. R. Errington, and G. Hum-
mer, Phys. Rev. Lett., 2008, 100, 145901.[67] G. Goel, W. P. Krekelberg, J. R. Errington, and T. M.
Truskett, Phys. Rev. Lett., 2008, 100, 106001.[68] M. Rex, C. N. Likos, H. Lowen, and J. Dzubiella,
Mol. Phys., 2006, 104, 527.[69] U. M. B. Marconi and P. Tarazona, J. Chem. Phys., 1999,
110, 8032.[70] J. Dzubiella and C. N. Likos, J. Phys.: Condens. Matter,
2003, 15, L147.[71] A. J. Archer and R. Evans, J. Chem. Phys., 2004, 121,
4246.[72] S. van Teeffelen, C. N. Likos, and H. Lowen,
Phys. Rev. Lett., 2008, 100, 108302.