cross-cluster flow analysis
349
Page | 0 Finance Division Hospital Authority Year 2015/16 CROSS-CLUSTER FLOW ANALYSIS FROM THE PERSPECTIVE OF LOCAL COMMUNITIES
-
Upload
khangminh22 -
Category
Documents
-
view
1 -
download
0
Transcript of cross-cluster flow analysis
Page | 0
Finance Division
Hospital Authority
Year 2015/16
CROSS-CLUSTER FLOW ANALYSIS FROM THE PERSPECTIVE OF LOCAL COMMUNITIES

Cross-cluster Flow Analysis from the Perspective of Local Communities (Year 2015/16)
Healthcare Financing and Projection, Finance Division, Hospital Authority
November 2017
Page | 1
Table of Contents
Preface ........................................................................................................................... 7
Executive Summary ........................................................................................................ 9
1. Introduction ............................................................................................................. 13
HA Review and the Refined Population-based Model ........................................... 13
Clustering in HA ...................................................................................................... 15
Hong Kong’s Unique Situation ............................................................................... 17
Previous Study in June 2016 .................................................................................. 18
Analytical Refinements........................................................................................... 20
2. Analytical Framework .............................................................................................. 23
Service Categories .................................................................................................. 23
Carving out Designated Services ............................................................................ 23
Refining the Spatial Unit......................................................................................... 25
Data Source ............................................................................................................ 29
3. Cluster Concordance Analysis .................................................................................. 31
Methodology .......................................................................................................... 31
Results .................................................................................................................... 31
4. Locality-based Travel Time Analysis ........................................................................ 45
Methodology .......................................................................................................... 45
Results .................................................................................................................... 48
5. Potential Accessibility Analysis based on Capacity and Population ........................ 67
Methodology .......................................................................................................... 67
Results .................................................................................................................... 70
6. Discussion ................................................................................................................. 85
Summary of Results ................................................................................................ 85
Limitation and Potential Extensions....................................................................... 86
References ................................................................................................................... 89
Appendix I: Accessibility Statistics by Locality ............................................................. 93
Appendix II: Utilisation within Certain Travel Times by Cluster Catchment.............. 309
Page | 2
Appendix III: Utilisation within Certain Travel Times by TPU Group ......................... 319
Appendix IV: Utilisation within Threshold Travel Time by TPU Group ...................... 331
Annex I: TPU Maps by Planning Department ............................................................ 339
List of Abbreviations .................................................................................................. 345
Page | 3
Table of Figures
Figure 1 – Cluster catchment and 209 TPU Groups ..................................................... 28
Figure 2 – Concordance for KCC catchment: before vs. after re-clustering ................ 34
Figure 3 – Concordance for KWC catchment: before vs. after re-clustering............... 34
Figure 4 – Concordance for HA overall: before vs. after re-clustering ........................ 35
Figure 5 – Acute IP concordance by Cluster catchment: with vs. carved out DS ........ 35
Figure 6 – Non-acute IP concordance by Cluster catchment: with vs. carved out DS 36
Figure 7 – SOP concordance by Cluster catchment: with vs. carved out DS ............... 36
Figure 8 – AHOP concordance by Cluster catchment: with vs. carved out DS ............ 37
Figure 9 – HA overall concordance by core service: 3 scenarios ................................. 39
Figure 10 – Concordance by core service: HKEC catchment vs. HA overall ................ 40
Figure 11 – Concordance by core service: HKWC catchment vs. HA overall ............... 40
Figure 12 – Concordance by core service: KCC catchment vs. HA overall ................... 41
Figure 13 – Concordance by core service: KEC catchment vs. HA overall ................... 41
Figure 14 – Concordance by core service: KWC catchment vs. HA overall ................. 42
Figure 15 – Concordance by core service: NTEC catchment vs. HA overall ................ 42
Figure 16 – Concordance by core service: NTWC catchment vs. HA overall ............... 43
Figure 17 – Percentage of utilisation within various travel times by core service ...... 49
Figure 18 – Acute IP: percentage of utilisation sought < 10 mins by TPU Group ........ 52
Figure 19 – Acute IP: percentage of utilisation sought < 20 mins by TPU Group ........ 52
Figure 20 – Acute IP: percentage of utilisation sought < 30 mins by TPU Group ........ 53
Figure 21 – Acute IP: percentage of utilisation sought < 40 mins by TPU Group ........ 53
Figure 22 – Acute IP: percentage of utilisation sought < 25 mins by TPU Group ........ 55
Figure 23 – Non-acute IP: percentage of utilisation sought < 25 mins by TPU Group 56
Figure 24 – SOP: percentage of utilisation sought < 25 mins by TPU Group .............. 56
Figure 25 – PHC: percentage of utilisation sought < 20 mins by TPU Group .............. 57
Figure 26 – A&E: percentage of utilisation sought < 20 mins by TPU Group .............. 57
Figure 27 – AHOP: percentage of utilisation sought < 25 mins by TPU Group ........... 58
Figure 28 – Acute IP vs. SOP: utilisation sought within threshold time ...................... 59
Figure 29 – Acute IP vs. PHC: utilisation sought within threshold time ...................... 60
Page | 4
Figure 30 – k-means clustering: classification of TPU Groups into three clusters ...... 61
Figure 31 – Number of acute beds within 20 minutes of travel time ......................... 71
Figure 32 – Average travel time to nearest three facilities by TPU Group .................. 72
Figure 33 – Illustration of 2-step FCA Method ............................................................ 74
Figure 34 – Accessibility score by 2-step FCA Method (20 min) for Acute IP .............. 76
Figure 35 – Accessibility score by 2-step FCA Method (40 min) for Acute IP .............. 76
Figure 36 – Accessibility score by Gravity Model (β = 0.4) for Acute IP ...................... 78
Figure 37 – Accessibility score by Gravity Model (β = 0.8) for Acute IP ...................... 79
Figure 38 – Accessibility score by Gravity Model (β = 1.2) for Acute IP ...................... 79
Figure 39 – Accessibility scores by 2-step FCA Method and Gravity Model ............... 80
Appendix II: Figure 1 – HKEC catchment: utilisation < travel time by core service ... 310
Appendix II: Figure 2 – HKWC catchment: utilisation < travel time by core service . 311
Appendix II: Figure 3 – KCC catchment: utilisation < travel time by core service ..... 312
Appendix II: Figure 4 – KEC catchment: utilisation < travel time by core service ..... 313
Appendix II: Figure 5 – KWC catchment: utilisation < travel time by core service.... 314
Appendix II: Figure 6 – NTEC catchment: utilisation < travel time by core service ... 315
Appendix II: Figure 7 – NTWC catchment: utilisation < travel time by core service . 316
Appendix III: Figure 1 – Acute IP: utilisation sought < 10 mins by TPU Group .......... 319
Appendix III: Figure 2 – Acute IP: utilisation sought < 20 mins by TPU Group .......... 319
Appendix III: Figure 3 – Acute IP: utilisation sought < 30 mins by TPU Group ......... 320
Appendix III: Figure 4 – Acute IP: utilisation sought < 40 mins by TPU Group ......... 320
Appendix III: Figure 5 – Non-acute IP: utilisation sought < 10 mins by TPU Group . 321
Appendix III: Figure 6 – Non-acute IP: utilisation sought < 20 mins by TPU Group . 321
Appendix III: Figure 7 – Non-acute IP: utilisation sought < 30 mins by TPU Group . 322
Appendix III: Figure 8 – Non-acute IP: utilisation sought < 40 mins by TPU Group . 322
Appendix III: Figure 9 – SOP: utilisation sought < 10 mins by TPU Group ................ 323
Appendix III: Figure 10 – SOP: utilisation sought < 20 mins by TPU Group .............. 323
Appendix III: Figure 11 – SOP: utilisation sought < 30 mins by TPU Group .............. 324
Appendix III: Figure 12 – SOP: utilisation sought < 40 mins by TPU Group .............. 324

Page | 5
Appendix III: Figure 13 – PHC: utilisation sought < 10 mins by TPU Group .............. 325
Appendix III: Figure 14 – PHC: utilisation sought < 20 mins by TPU Group .............. 325
Appendix III: Figure 15 – PHC: utilisation sought < 30 mins by TPU Group .............. 326
Appendix III: Figure 16 – PHC: utilisation sought < 40 mins by TPU Group .............. 326
Appendix III: Figure 17 – A&E: utilisation sought < 10 mins by TPU Group ............. 327
Appendix III: Figure 18 – A&E: utilisation sought < 20 mins by TPU Group ............. 327
Appendix III: Figure 19 – A&E: utilisation sought < 30 mins by TPU Group ............. 328
Appendix III: Figure 20 – A&E: utilisation sought < 40 mins by TPU Group ............. 328
Appendix III: Figure 21 – AHOP: utilisation sought < 10 mins by TPU Group ........... 329
Appendix III: Figure 22 – AHOP: utilisation sought < 20 mins by TPU Group ........... 329
Appendix III: Figure 23 – AHOP: utilisation sought < 30 mins by TPU Group ........... 330
Appendix III: Figure 24 – AHOP: utilisation sought < 40 mins by TPU Group ........... 330
Page | 6
Table of Tables
Table 1 – Districts of residence and corresponding Clusters....................................... 16
Table 2 – Initial list of Designated Services .................................................................. 25
Table 5 – Cluster catchment, district and TPU Group mapping in the analysis .......... 27
Table 3 – Concordance for six services by Cluster catchment in 2015/16 .................. 33
Table 4 – Concordance after re-clustering and craving out DS in 2015/16 ................. 38
Table 6 – 90th of travel time by core service for Hong Kong Overall .......................... 50
Table 7 – Threshold travel time set for each core service ........................................... 55
Table 8 – k-means clustering: cluster means ............................................................... 61
Table 9 – TPU Groups with < 50% of utilisation within 25 minutes for Acute IP ........ 63
Table 10 – Population in TPU Groups with < 50% utilisation within threshold time .. 64
Table 11 – Various approaches in quantifying potential spatial accessibility ............. 70
Table 12 – Number of scheduled acute beds by Cluster catchment ........................... 70
Table 13 – TPU Groups with lower Gravity score with larger population size ............ 82
Appendix II: Table 1 – Districts of residence and corresponding Clusters ................ 309
Appendix II: Table 2 – 90th percentile of travel time by core service by Cluster ....... 317
Appendix IV: Table 1 – Percentage of utilisation by TPU Group in HKEC .................. 331
Appendix IV: Table 2 – Percentage of utilisation by TPU Group in HKWC ................ 332
Appendix IV: Table 3 – Percentage of utilisation by TPU Group in KCC .................... 333
Appendix IV: Table 4 – Percentage of utilisation by TPU Group in KEC .................... 334
Appendix IV: Table 5 – Percentage of utilisation by TPU Group in KWC ................... 335
Appendix IV: Table 6 – Percentage of utilisation by TPU Group in NTEC .................. 336
Appendix IV: Table 7 – Percentage of utilisation by TPU Group in NTWC ................ 337
Preface Page | 7
Preface
The Steering Committee (SC) on Review of Hospital Authority (HA) was set up by the
Government in August 2013 to conduct an overall review of the HA to examine its
operation in response to the changes in society such as an expected aging population.
The HA Review covered major areas with impact on HA’s operation and service
provision. Resource management was one of them, where HA was recommended to
develop a Refined Population-based Model to inform resource allocation in the SC’s
report published in July 2015. Cross-cluster movement of patients was one of the
specific considerations that the SC would like HA to take into account in model
development.
Despite being an administrative arrangement and not a registration system, HA’s
Cluster structure draws public’s attention to scrutinise HA from the locality
perspective. As groundwork for the development of the Refined Population-based
Model, an analysis on hospital service utilisation in 2014/15 by patient residence
down to local communities was conducted in 2016, to not only facilitate
understanding on the magnitude of cross-cluster flow, but also to investigate the
patterns of flow by residential location, age and time of day, so as to generate insight
and provide scenarios for assessing how Cluster boundary refinement would impact
the concordance of healthcare utilisation, and corresponding implication on resource
management. The report “Cross-cluster Flow Analysis from the Perspective of Local
Communities – Groundwork for Refined Population-based Resource Allocation
Model Development” was published in June 2016.
The Jockey Club School of Public Health and Primary Care of The Chinese University
of Hong Kong was commissioned as the external consultant to help HA in developing
the Refined Population-based Model, and their Final Report was submitted and
approved by the HA Board in September 2017. While the Refined Model has taken
into account cross-cluster movement of patients, the consultant also recommended
HA to further study the phenomenon with its important influence on Cluster
utilisation. As such, the aforementioned cross-cluster flow analysis was updated
using 2015/16 data and extended with a series of important analytical refinements.
In particular, as proximity of facilities from patients’ places of residence was found to
be among the most influential factors affecting health-seeking behaviour during the
development of the Refined Population-based Model, cross-cluster flow, and more
generally spatial accessibility of HA services, were further analysed with respect to
patients’ travel time in seeking services. In addition, a more refined spatial unit in

Preface Page | 8
Tertiary Planning Unit was employed to enhance the granularity of analysis. This
analysis aims to generate business intelligence and inform planning in short and
longer terms. This report serves to present the methodology, findings, and
limitations of this study, as part of the analytical work under the population-based
paradigm in service planning and resource management.

Executive Summary Page | 9
Executive Summary
Introduction (Chapter 1)
In response to Recommendation 3 of the Hospital Authority (HA) Review, HA has
commissioned the Jockey Club School of Public Health and Primary Care of the
Chinese University of Hong Kong as consultancy and developed a Refined
Population-based Model to inform resource allocation. Extending from the cross-
cluster flow analysis published in June 2016, which was conducted as groundwork for
model development, more in-depth analyses were conducted to provide information
on service accessibility from the perspective of local communities.
Despite being an administrative arrangement only, the Cluster structure draws
public’s attention to scrutinise HA from the perspective of local communities. This
creates some challenges though, as the Cluster structure is not a registration system
to link specific districts and enrollees, and boundaries are largely inferred from
election district boundaries. It is not unreasonable for people living near such
perceived boundaries to consult nearby hospitals that are under the network of a
neighbour Cluster. Classifying such activities as cross-cluster traffic invariably gives a
negative connotation, and will be misleading unless there are ways to reliably
differentiate the nature of cross-cluster patient movement. In addition, while HA
encourages patients to seek medical treatment from hospitals in the Cluster of their
residence to facilitate follow-up of their chronic conditions and the provision of
community support, individual patients may have other considerations when they
choose a medical facility for medical treatment. Notwithstanding the above
limitations, the Cluster concept is well accepted and has been evolving towards
providing services to meet the healthcare needs of the population in its vicinity.
Cross-cluster flow also depends on the level and scope of services, facilities and
expertise available in the hospitals of patient resides. This is because the portfolio of
hospitals was not originally planned on a Cluster basis and not all Clusters started at
the same level. In addition, some services are only provided in designated
institutions (known as Designated Services (DS)) due to (i) the unique skill /
technology / expertise required (e.g. liver transplantation), or (ii) economy of scale
or operational requirements (e.g. Blood Transfusion Service). Thus, these services
are serving beyond their Cluster boundaries and cross-cluster movement of patients
will result. Therefore, a more thorough analysis on cross-cluster flow is warranted to

Executive Summary Page | 10
gain understanding on the variation of accessibility across different localities in Hong
Kong.
Analytical Framework (Chapter 2)
Major analytical refinements over last year’s study include (1) delineation of
Designated Services to assure like-with-like comparison of core hospital service
accessibility across local communities, (2) enhanced granularity of analysis through
evaluation by major service types, namely Acute Inpatient (Acute IP), Non-acute
Inpatient (Non-acute IP), Specialist Outpatient (SOP), Primary Care (PHC) , Accident
and Emergency (A&E), Allied Health Outpatient (AHOP), and (3) adoption of a more
refined spatial unit in Tertiary Planning Unit.
HA service utilisation data for the aforementioned six core services from 1 April 2015
to 31 March 2016 was collected via the Statistics and Workforce Planning (S&WP)
team in the Strategy and Planning (S&P) Division in HA. The utilisation data was
divided into two sets, one for Acute IP and Non-acute IP with the activity measure
being BDO, and the other one for SOP, PHC, A&E and AHOP where the activity
measure is the number of attendance. Population data in 2015 was also utilised in
various parts of this study. The data was collected from the “Projections of
Population Distribution 2015-2024” report, completed in December 2015 by the
Working Group on Population Distribution Projections and published by the
Government’s Planning Department.
Cluster Concordance Analysis (Chapter 3)
As demonstrated in last year’s analysis using 2014/15 data, cross-cluster flow from
the perspective of population could be evaluated by analysing the “Cluster
concordance rate”, which quantifies the level of service being provided in patient’s
own Cluster.
After delineating the effect of Designated Services so as to assure a like-with-like
comparison across localities in Hong Kong, and simulating the current re-clustered
setting, concordance rates are generally higher in Hong Kong and the New Territories,
illustrating that they are relatively confined geographically. This study also shows
how the re-delineation of Cluster boundary increased the concordance of the KCC
and KWC catchments. The concordance rates of the KEC catchment are relatively
lower (e.g. at 74.5% for Acute IP). This can be partly explained by the unavailability of
certain core service (e.g. Oncology services, although planning of the service in KEC is
Executive Summary Page | 11
already underway) where residents in the KEC catchment need to patronise other
Clusters, namely KCC, instead.
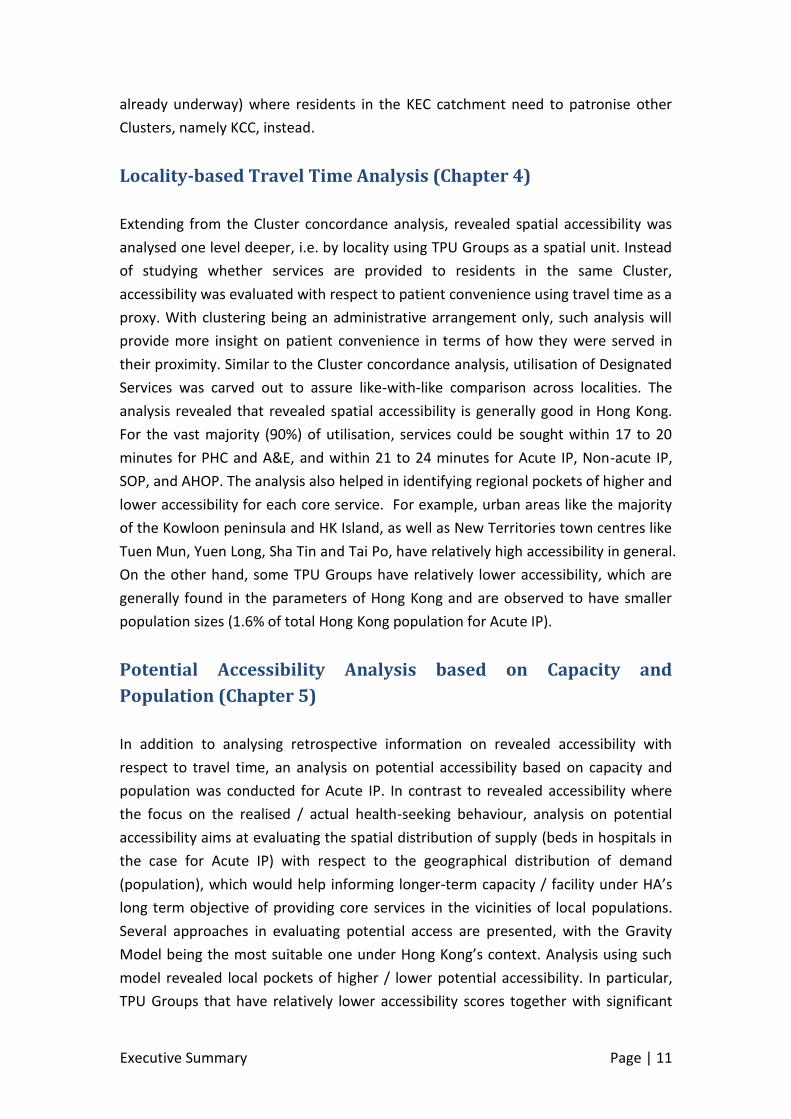
Locality-based Travel Time Analysis (Chapter 4)
Extending from the Cluster concordance analysis, revealed spatial accessibility was
analysed one level deeper, i.e. by locality using TPU Groups as a spatial unit. Instead
of studying whether services are provided to residents in the same Cluster,
accessibility was evaluated with respect to patient convenience using travel time as a
proxy. With clustering being an administrative arrangement only, such analysis will
provide more insight on patient convenience in terms of how they were served in
their proximity. Similar to the Cluster concordance analysis, utilisation of Designated
Services was carved out to assure like-with-like comparison across localities. The
analysis revealed that revealed spatial accessibility is generally good in Hong Kong.
For the vast majority (90%) of utilisation, services could be sought within 17 to 20
minutes for PHC and A&E, and within 21 to 24 minutes for Acute IP, Non-acute IP,
SOP, and AHOP. The analysis also helped in identifying regional pockets of higher and
lower accessibility for each core service. For example, urban areas like the majority
of the Kowloon peninsula and HK Island, as well as New Territories town centres like
Tuen Mun, Yuen Long, Sha Tin and Tai Po, have relatively high accessibility in general.
On the other hand, some TPU Groups have relatively lower accessibility, which are
generally found in the parameters of Hong Kong and are observed to have smaller
population sizes (1.6% of total Hong Kong population for Acute IP).
Potential Accessibility Analysis based on Capacity and
Population (Chapter 5)
In addition to analysing retrospective information on revealed accessibility with
respect to travel time, an analysis on potential accessibility based on capacity and
population was conducted for Acute IP. In contrast to revealed accessibility where
the focus on the realised / actual health-seeking behaviour, analysis on potential
accessibility aims at evaluating the spatial distribution of supply (beds in hospitals in
the case for Acute IP) with respect to the geographical distribution of demand
(population), which would help informing longer-term capacity / facility under HA’s
long term objective of providing core services in the vicinities of local populations.
Several approaches in evaluating potential access are presented, with the Gravity
Model being the most suitable one under Hong Kong’s context. Analysis using such
model revealed local pockets of higher / lower potential accessibility. In particular,
TPU Groups that have relatively lower accessibility scores together with significant
Executive Summary Page | 12
population sizes (i.e. higher than the average TPU Group population of 34,916) were
identified and they are mainly found within the catchment of KEC, NTEC, and NTWC.
Such information would inform longer-term service, facility and capacity planning, so
as to facilitate HA to move forward in enhancing local access to care.
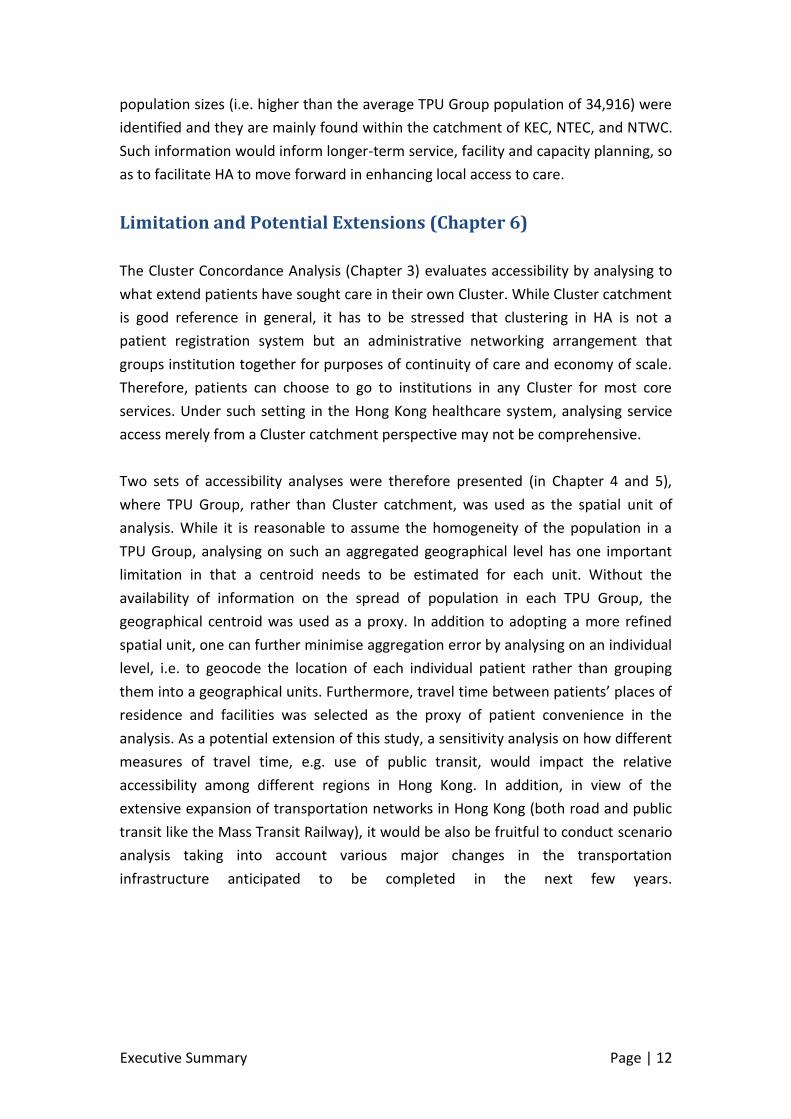
Limitation and Potential Extensions (Chapter 6)
The Cluster Concordance Analysis (Chapter 3) evaluates accessibility by analysing to
what extend patients have sought care in their own Cluster. While Cluster catchment
is good reference in general, it has to be stressed that clustering in HA is not a
patient registration system but an administrative networking arrangement that
groups institution together for purposes of continuity of care and economy of scale.
Therefore, patients can choose to go to institutions in any Cluster for most core
services. Under such setting in the Hong Kong healthcare system, analysing service
access merely from a Cluster catchment perspective may not be comprehensive.
Two sets of accessibility analyses were therefore presented (in Chapter 4 and 5),
where TPU Group, rather than Cluster catchment, was used as the spatial unit of
analysis. While it is reasonable to assume the homogeneity of the population in a
TPU Group, analysing on such an aggregated geographical level has one important
limitation in that a centroid needs to be estimated for each unit. Without the
availability of information on the spread of population in each TPU Group, the
geographical centroid was used as a proxy. In addition to adopting a more refined
spatial unit, one can further minimise aggregation error by analysing on an individual
level, i.e. to geocode the location of each individual patient rather than grouping
them into a geographical units. Furthermore, travel time between patients’ places of
residence and facilities was selected as the proxy of patient convenience in the
analysis. As a potential extension of this study, a sensitivity analysis on how different
measures of travel time, e.g. use of public transit, would impact the relative
accessibility among different regions in Hong Kong. In addition, in view of the
extensive expansion of transportation networks in Hong Kong (both road and public
transit like the Mass Transit Railway), it would be also be fruitful to conduct scenario
analysis taking into account various major changes in the transportation
infrastructure anticipated to be completed in the next few years.
1. Introduction Page | 13
1. Introduction
The Hospital Authority (HA) is a statutory body incorporated in Hong Kong on 1
December 1990 under the Hospital Authority Ordinance. The objective of HA is to
manage and develop Hong Kong’s public hospital system to provide quality public
healthcare services to the people of Hong Kong.
HA Review and the Refined Population-based Model
In August 2013, the Government announced the setting up of a Steering Committee
(SC) “to conduct an overall review of the Hospital Authority to examine its operation
in response to the changes in society such as an expected ageing population”. The
SC Report1 was published in July 2015, where a total of ten recommendations were
made, one of which (Recommendation 3) addressed the subject of equity in resource
management within the HA. In particular, HA was recommended to develop a
Refined Population-based Model to inform resource allocation.
1 The report of the Steering Committee can be found on the website of the Food and Health Bureau
at http://www.fhb.gov.hk/en/committees/harsc/report.html
(a) HA should adopt a refined population-based resource allocation model by
reviewing the present approach and taking into consideration the
demographics of the local and territory-wide population. The refined
population-based model should take into account the organisation of the
provision and development of tertiary and quaternary services, and hence
the additional resources required by selected hospitals or clusters, as well as
the demand generated from cross-cluster movement of patients; and
(b) HA should develop the refined population-based resource allocation model
and implement through its service planning and budget allocation process
within a reasonable timeframe. To avoid unintentional and undesirable
impact on the existing baseline services of individual clusters, HA should
consider appropriate ways to address the funding need of clusters identified
with additional resources requirement under the new model, while
maintaining the baseline funding to other clusters.
1. Introduction Page | 14
Unlike some overseas healthcare jurisdictions where funding is tied to defined
territories with explicit boundaries and/or target communities (i.e., directly traceable
and linked to defined populations), the Clustering arrangement in HA is an
administrative one based on the way healthcare facilities are being networked.
There are inferred catchment areas but no strict boundaries between Clusters or
restriction forbidding people to seek care from distance Clusters. Under this context,
the SC has specifically recommended HA to take into account cross-cluster
movement of patients in the development of the Refined Population-based Model.
In response to Recommendation 3, HA committed to developing a Refined
Population-based Model to inform resource allocation, as part of the Action Plan2
formulated by the HA Board and submitted to the Government on 22 October 2015
in response to the HA Review recommendations. As groundwork for model
development, an analysis on hospital service utilisation by patient residence down
to local communities was conducted in 2016, to not only facilitate understanding on
the magnitude of cross-cluster flow, but also to investigate the patterns of flow by
residential location, age and time of day, so as to generate insight and provide
scenarios for assessing how Cluster boundary refinement would impact the
concordance of healthcare utilisation, and corresponding implication on resource
allocation. The report “Cross-cluster Flow Analysis from the Perspective of Local
Communities – Groundwork for Refined Population-based Resource Allocation
Model Development” was published in June 2016.
HA commissioned an external consultancy (the Jockey Club School of Public Health
and Primary Care of the Chinese University of Hong Kong) in April 2016 to help
develop the Refined Population-based model. The Refined Population-based Model
has taken into account 13 Designated Services and cross-cluster flow of patients, so
as to assure like-with-like comparison of Cluster resources. While it is not a direct
funding formula as infrastructure and capacity take time to develop and existing
services must not be disrupted, the Refined Population-based Model is a scientific
tool to analyse and model population healthcare needs objectively, and a starting
point to facilitate understanding through transparent information. The consultant’s
Final Report3 was submitted and approved by the HA Board at its Administrative and
Operational Meeting in September 2017.
2
The Action Plan can be accessed at http://www.ha.org.hk/haho/ho/cc/HA_Review_Action_Plan_Final_en.pdf
3 The Final Report on the development of the Refined Population-based Model is available on the HA
internet website at http://www.ha.org.hk/haho/ho/fdd/report1_en.pdf
1. Introduction Page | 15
While the Refined Population-based has already taken into account the cross-cluster
flow of patients, the consultant recommended in the Final Report that populations’
health-seeking behaviour and cross-cluster flow should be further studied with their
important influence on Cluster utilisation.
This report discusses the extension of the study published in June 2016, which looks
into the different yet related concepts of cross-cluster flow, proximity to care,
service accessibility etc. to gain more understanding on the current situation and to
further debunk myths surrounding the topics. In addition to updating the study
period from 2014/15 to 2015/16, several other important refinements were made
which will be discussed in the following subsections. Before going over the various
refinements made, it would be worthwhile to further look into the clustering
arrangement in HA.
Clustering in HA
A Cluster is a network of medical facilities and services grouped together to help HA
ensure that patients would receive a continuum of care within the same
geographical setting and throughout their episode of illness – from its acute phase to
convalescence and rehabilitation, and community after-care. This is achieved by
rationalising the operations of the hospitals within each Cluster so that they are
capable of providing a comprehensive and complementary range of services to their
local population. HA Board formally adopted the current seven hospital Clusters in
2001, following evolution of the early clustering formation in 1994 and the piloting
of a new Cluster management approach.
To facilitate capital and service planning, each Cluster has designated catchment
districts demarcated based on the location of the hospitals (primarily the acute
hospitals). Medical facilities and services in the Clusters are planned and reorganised
taking into account the services provided by and the respective roles of the existing
hospitals in the Cluster, the geographical and demographic considerations of the
catchment districts, and service utilisation patterns at that time. Through this
process of clustering which involves service rationalisation and reorganisation,
continuity of care for each episode of illness is provided to the local population in the
Cluster.
In response to the HA Review, a re-delineation of administrative arrangements
between Kowloon West Cluster (KWC) and Kowloon Central Cluster (KCC) was
implemented, which included the re-grouping of Wong Tai Sin district and Mong Kok
1. Introduction Page | 16
area, involving Kwong Wah Hospital (KWH), TWGHs Wong Tai Sin Hospital (WTSH)
and Our Lady of Maryknoll Hospital (OLMH) from KWC to KCC. Such implementation
further enhanced the integration of services as well as reducing cross-cluster
consultations and strengthening the continuity of care for patients. Changes related
to Cluster identity, transfer of functions as well as transfer of accountability were
made on 1 December 2016, while cut-over from KWC to KCC with regard to non-
clinical services (e.g. human resources, business support services, etc.) took place on
1 April 2017.
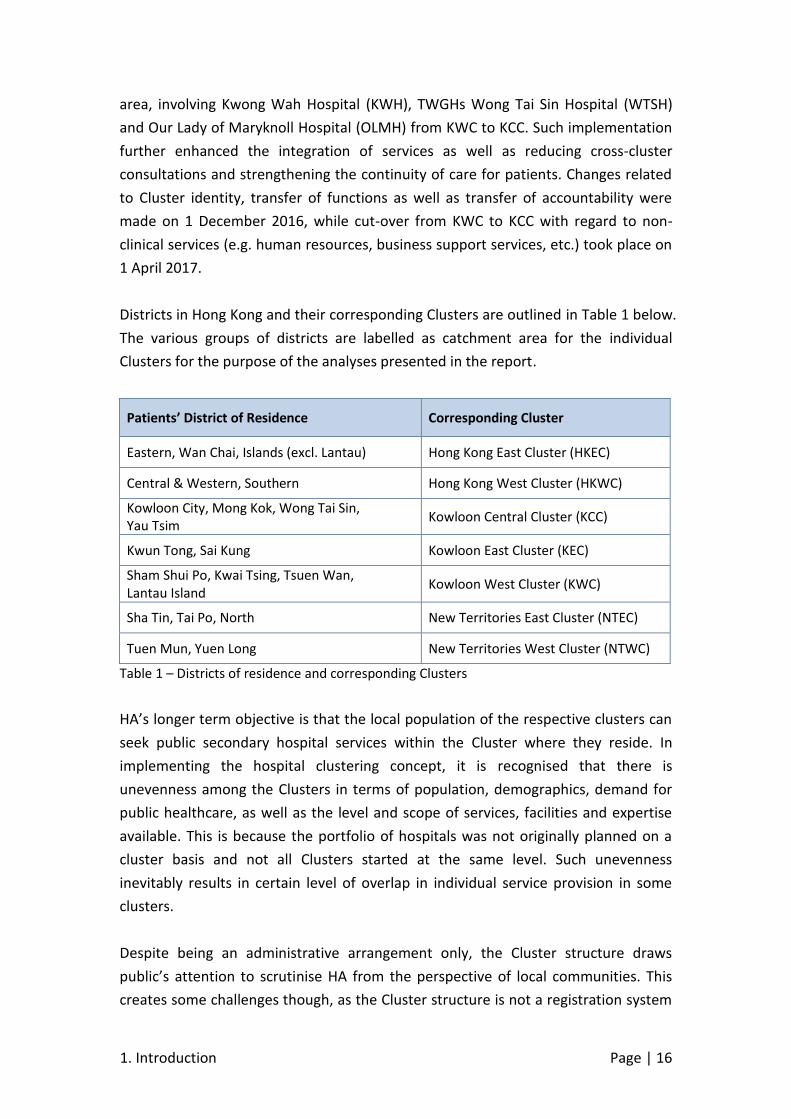
Districts in Hong Kong and their corresponding Clusters are outlined in Table 1 below.
The various groups of districts are labelled as catchment area for the individual
Clusters for the purpose of the analyses presented in the report.
Patients’ District of Residence Corresponding Cluster
Eastern, Wan Chai, Islands (excl. Lantau) Hong Kong East Cluster (HKEC)
Central & Western, Southern Hong Kong West Cluster (HKWC)
Kowloon City, Mong Kok, Wong Tai Sin, Yau Tsim
Kowloon Central Cluster (KCC)
Kwun Tong, Sai Kung Kowloon East Cluster (KEC)
Sham Shui Po, Kwai Tsing, Tsuen Wan, Lantau Island
Kowloon West Cluster (KWC)
Sha Tin, Tai Po, North New Territories East Cluster (NTEC)
Tuen Mun, Yuen Long New Territories West Cluster (NTWC)
Table 1 – Districts of residence and corresponding Clusters
HA’s longer term objective is that the local population of the respective clusters can
seek public secondary hospital services within the Cluster where they reside. In
implementing the hospital clustering concept, it is recognised that there is
unevenness among the Clusters in terms of population, demographics, demand for
public healthcare, as well as the level and scope of services, facilities and expertise
available. This is because the portfolio of hospitals was not originally planned on a
cluster basis and not all Clusters started at the same level. Such unevenness
inevitably results in certain level of overlap in individual service provision in some
clusters.
Despite being an administrative arrangement only, the Cluster structure draws
public’s attention to scrutinise HA from the perspective of local communities. This
creates some challenges though, as the Cluster structure is not a registration system
1. Introduction Page | 17
to link specific districts and enrollees, and boundaries are largely inferred from
election district boundaries. As such, there are bound to be margins of error in
estimating the size of population served by individual Clusters.
It is not unreasonable for people living near such perceived boundaries to consult
nearby hospitals that are under the network of a neighbour Cluster. Classifying such
activities as cross-cluster traffic invariably gives a negative connotation, and will be
misleading unless there are ways to reliably differentiate the nature of cross-cluster
patient movement. In addition, while HA encourages patients to seek medical
treatment from hospitals in the Cluster of their residence to facilitate follow-up of
their chronic conditions and the provision of community support, individual patients
may have other considerations when they choose a medical facility for medical
treatment. For example, some may choose to stick with the hospital they have been
following up despite moving to a new residence, or prefer a particular hospital due
to relationship with other family members, or as a result of their daytime activities.
Notwithstanding the above limitations, the Cluster concept is well accepted and has
been evolving towards providing services to meet the healthcare needs of the
population in its vicinity.
Hong Kong’s Unique Situation
As discussed above, HA has organised its facilities in Clusters to facilitate synergy and
continuum of care. In addition, for administrative and planning purposes, each
hospital Cluster is associated with catchment districts based on locations of the
hospitals. However, in contrast to some other jurisdictions around the world (e.g. the
National Health Services has divided England into 221 geographical regions named
Clinical Commissioning Groups (CCGs), and their respective population would be the
registered lists of all member General Practitioner practices of the CCGs), clustering
is not a patient registration system in Hong Kong and thus patients are free to visit
the hospitals or clinics that are deemed to be the most desirable/ convenient for
them.
Moreover, unlike other jurisdictions where residents of different regions are
geographically segregated, Hong Kong covers a small land mass (1,104km2) and
residents are highly mobile within the city with its highly developed transportation
network. This convenience in travelling within the territory contributes greatly to the
cross-cluster movement of patients, especially during daytime, where younger /
working population may have travelled outside of the resident district for work,
school, or leisure activities, etc.
1. Introduction Page | 18
In addition, cross-cluster flow also depends on the level and scope of services,
facilities and expertise available in the hospitals of patient resides. This is because
the portfolio of hospitals was not originally planned on a Cluster basis and not all
Clusters started at the same level. Hospitals may not have sufficient capacity for the
demand of patients lived in their catchment area. In addition, some services are only
provided in designated institutions due to (i) the unique skill / technology / expertise
required (e.g. liver transplantation), or (ii) economy of scale or operational
requirements (e.g. Blood Transfusion Service). Thus, these services are serving
beyond their Cluster boundaries and cross-cluster movement of patients will result.
Thus, a more thorough analysis on cross-cluster flow is warranted to gain
understanding on the variation of accessibility across different localities in Hong
Kong.
Previous Study in June 2016
As groundwork for the development of the Refined Population-based Model, a
report was published in June 20164, outlining the data analysis conducted on public
healthcare utilisation of local communities, down to small districts level, so as to
identify unusual patterns of cross-cluster flow, explore possible explanation for the
observation and assessing impact of refining the current Cluster boundaries.
Major Findings
In general, the concept of Cluster catchment was to be a useful reference. In
analysing the concordance rate – as defined by the percentage of activity of a
district’s residents being treated in their own Cluster – of different services in
different Cluster catchments, it was found that Clusters in both Hong Kong Island
(HKEC and HKWC) and New Territories (NTEC and NTWC) are relatively
geographically confined. Taking inpatient activities (in terms of bed days) as an
example, the analysis revealed that the concordance of the residents in the three
Clusters in Kowloon was considerably lower than those in New Territories and Hong
Kong Island. However, scenario analysis envisaged better concordance rates for both
KWC and KCC if Wong Tai Sin and Mong Kok were re-grouped from KWC to KCC. This
laid an objective basis in refining the boundary of KWC and KCC, which was in
progress under HA’s Action Plan in response to Recommendation 1 of the HA Review. 4 The report “Cross-cluster Flow Analysis from the Perspective of Local Communities – Groundwork
for Refined Population-based Resource Allocation Model Development” is accessible at http://www.ha.org.hk/haho/ho/fdd/Report4_en.pdf
1. Introduction Page | 19
In addition, daytime mobility in relation to commuter flow was estimated for Hong
Kong using Census 2011 data. The general pattern is that commuters from New
Territories would travel to the central commutable business districts in southern
Kowloon and northern Hong Kong Island. Patient age was found to be a significant
factor in cross-cluster flow, where patients aged 20 to 64 are more likely to seek
healthcare service other than their own Cluster when compared to the other age
groups.
Limitations
As mentioned in last year’s report, the above observations highlight that health-
seeking behaviour is complex. Further analysis is warranted to address the following
limitations of the last round of analysis:
1. Overall service utilisation data in HA was utilised, without dissecting out the
utilisation of highly-specialised services that are only available in certain
designated institutions. Including such utilisation data may skew the analysis
that aimed to evaluate relative accessibility among local communities.
2. The analysis had Acute and Non-acute Inpatient services lumped together.
With major differences in the nature of these two services, the health-
seeking behaviour for these services is expected to differ as well. Moreover,
in addition to inpatient services, only Specialist Outpatient and Accident and
Emergency services were included in last year’s analysis.
3. The spatial unit of the analysis was the 152 districts in Hong Kong as defined
by the HA data repository. They lack compatibility with spatial units utilised in
other government department/agencies.
4. The analysis focused on analysing the Cluster concordance rate, i.e. the
percentage of activity sought within residents’ own Cluster. However, the
notion of cross-cluster flow may not be the sole indicator for accessibility to
care, as clustering is merely an administrative arrangement in Hong Kong and
no rigid boundary exists.
5. Patient’s actual utilisation pattern was analysed to gain understanding on
health-seeking behaviour. Other important factors, such as the geographical
1. Introduction Page | 20
distribution of facilities and population, are also worth building in so as to
enrich the analysis.
Analytical Refinements
In view of the implementation of the re-delineation of Cluster boundary between
KCC and KEC, as well as the need to further analyse the cross-cluster flow
phenomenon, this study attempts to build on top of the last analysis to provide more
in-depth information on service accessibility from the perspective of local
communities. The next chapter (Chapter 2) discusses the overall analytical
framework which was refined over the previous study, namely:
1. To carve out the utilisation of high-specialised services provided in specific
Clusters, known as Designated Services (DS), to assure like-with-like
comparison of core service accessibility across local communities
2. To analyse accessibility by major service types to enhance granularity of
analysis, e.g. to break down service utilisation into six core services including
Acute and Non-acute Inpatient, Specialist Outpatient, Primary Healthcare,
Accident and Emergency, and Allied Health Outpatient services.
3. To adopt a more refined spatial unit in Tertiary Planning Unit (TPU) Groups,
which is demarcated by the Government’s Planning Department and also
utilised by the Census and Statistics Department (C&SD) for statistics
reporting
After the overall analytical framework is outlined in the next chapter, three different
sets of analyses are presented in Chapter 3 to 5:
Cluster Concordance Analysis (Chapter 3)
An update on last year’s analysis that evaluates concordance rate of residents
in the catchment areas of different Clusters using 2015/16 data (with DS
carved out)
Provides retrospective information on whether patients sought care in their
own Cluster
1. Introduction Page | 21
Locality-based Travel Time Analysis (Chapter 4)
Analyses spatial accessibility with respect to travel time between patients’
places of residence and institutions
Provides retrospective information on whether and to what extend patients
sought care in the proximity of their places of residence
Potential Accessibility Analysis based on Capacity and Population (Chapter 5)
Evaluates spatial accessibility by taking into account the geographical
distribution of service capacity and population in Hong Kong
Identifies local pockets of higher / lower accessibility so as to provides
business intelligence to inform longer-term facility and capacity planning

2. Analytical Framework Page | 23
2. Analytical Framework
As this analysis forms part of the development for the Refined Population-based
Model, the analytical components of this study were aligned with those of the
Refined Population-based Model as best as possible. Namely, the choice of service
categories to be analysed, definition of highly-specialised service, etc. are largely
identical to those in the development of the Refined Population-based Model.
Service Categories
There are a variety of healthcare services provided by HA. By considering the
structure of service provision, availability of utilisation data of different healthcare
activities, eight core service categories were identified as the basis of the analysis,
namely Acute Inpatient (Acute IP), Non-acute Inpatient (Non-acute IP), Specialist
Outpatient (SOP), Primary Care (PHC) , Accident and Emergency (A&E), Allied Health
Outpatient (AHOP), Day Hospital, and Community Care. Such granular analysis would
facilitate inter-community comparison down to core services. However, due to the
heterogeneity of service delivery model among Clusters as well as the lack of
comprehensive electronic data for modelling for Day hospital and Community Care
services, these two core services are not included the analysis.
With regard to the measure of utilisation, bed days occupied (BDO), number of
patients, and number of episodes could be used for inpatient services As variations
in terms of BDO could imply significant differences in quantifying related resources,
it is proposed that BDO would be a more relevant measure for the analysis. On the
other hand, the number of attendance will be used for other services, i.e. SOP, PHC,
A&E, and AHOP.
Carving out Designated Services
It is common for public healthcare systems to organise highly specialised services
and operations in designated locations so as to benefit from concentration of
expertise (not only of healthcare professionals but also technology setup and facility
design, etc.) and economies of scale. This is particularly relevant in Hong Kong in
view of the size of its population and territory.

2. Analytical Framework Page | 24
As the subject of the analysis is to assess the relative accessibility to service by local
communities, it would be most relevant to compare using utilisation of core hospital
services that are common across Clusters, i.e. to compare like against like. Therefore,
utilisation of these services (labelled as Designated Services (DS) for the purpose of
this project) are carved out from the analysis such that the remaining core hospital
and clinic services are more comparable in terms of scope, nature, and the target
population intended to serve, which in turn would minimise any potential bias on
different localities’ relative accessibility that may result from the varying provision of
DS in different Clusters.
Through discussing with frontline and deliberating at the Internal Resource
Allocation Model Development Steering Committee (IRAMD SC), the following
definition for DS was formulated.
Designated Services mainly follow corporate direction when setting out
corresponding service delivery models, and are:
(a) highly complex in nature with respect to skill, technology and/or expertise
that are only adequately available in specific Cluster(s) to serve populations
beyond its Cluster boundary, or
(b) being centralised at specific Cluster(s) to serve populations beyond its Cluster
boundary on operational reasons or economy of scale.
An identification and vetting mechanism based on materiality and data availability
was set up by the IRAMD SC. Two rounds of DS proposals were called from Clusters
and an initial list of 13 DS was shortlisted. On very rough estimation, these DS
roughly constitute to around 4% of HA’s total operating expenditure.
For more information on the detailed definition of DS, the vetting and prioritisation
mechanism, as well as the costing methodologies and results, please refer to the
“Report on Costing of Designated Services Year 2012/13 to 2015/16”5.
5 The “Report on Costing of Designated Services Year 2012/13 to 2015/16” is available on the HA
internet website at http://www.ha.org.hk/haho/ho/fdd/Report3_en.pdf
2. Analytical Framework Page | 25
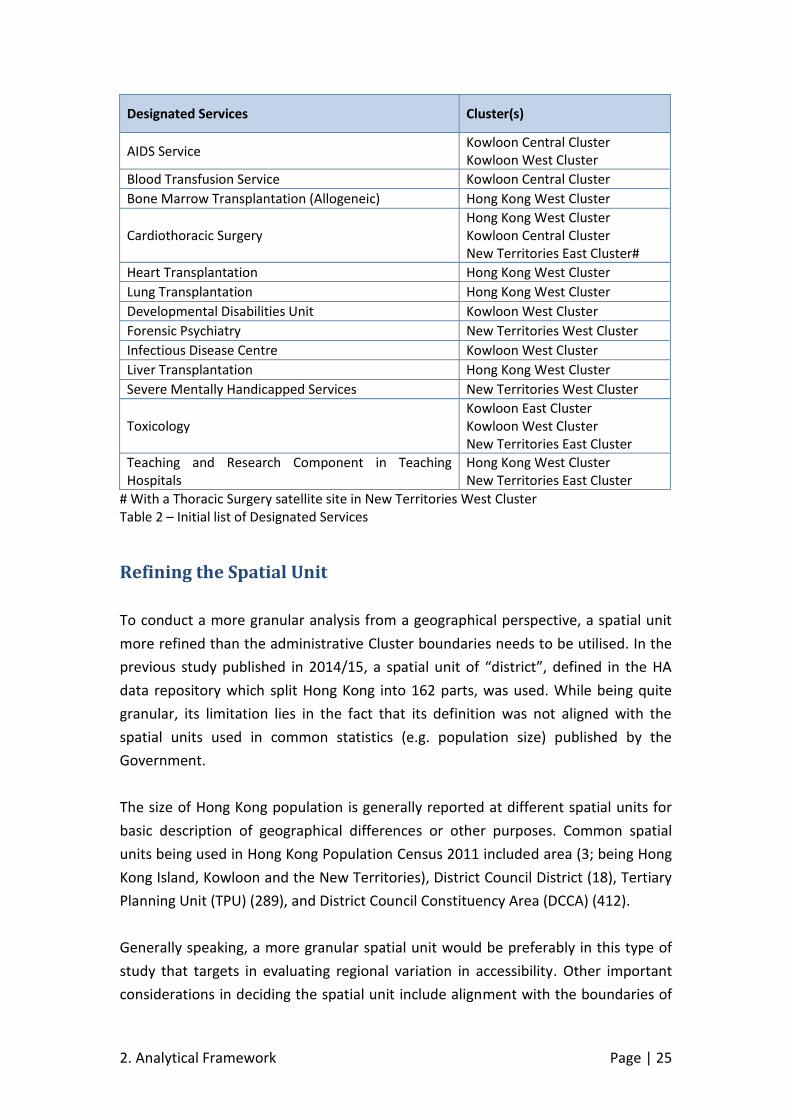
Designated Services Cluster(s)
AIDS Service Kowloon Central Cluster Kowloon West Cluster
Blood Transfusion Service Kowloon Central Cluster
Bone Marrow Transplantation (Allogeneic) Hong Kong West Cluster
Cardiothoracic Surgery Hong Kong West Cluster Kowloon Central Cluster New Territories East Cluster#
Heart Transplantation Hong Kong West Cluster
Lung Transplantation Hong Kong West Cluster
Developmental Disabilities Unit Kowloon West Cluster
Forensic Psychiatry New Territories West Cluster
Infectious Disease Centre Kowloon West Cluster
Liver Transplantation Hong Kong West Cluster
Severe Mentally Handicapped Services New Territories West Cluster
Toxicology Kowloon East Cluster Kowloon West Cluster New Territories East Cluster
Teaching and Research Component in Teaching Hospitals
Hong Kong West Cluster New Territories East Cluster
# With a Thoracic Surgery satellite site in New Territories West Cluster Table 2 – Initial list of Designated Services
Refining the Spatial Unit
To conduct a more granular analysis from a geographical perspective, a spatial unit
more refined than the administrative Cluster boundaries needs to be utilised. In the
previous study published in 2014/15, a spatial unit of “district”, defined in the HA
data repository which split Hong Kong into 162 parts, was used. While being quite
granular, its limitation lies in the fact that its definition was not aligned with the
spatial units used in common statistics (e.g. population size) published by the
Government.
The size of Hong Kong population is generally reported at different spatial units for
basic description of geographical differences or other purposes. Common spatial
units being used in Hong Kong Population Census 2011 included area (3; being Hong
Kong Island, Kowloon and the New Territories), District Council District (18), Tertiary
Planning Unit (TPU) (289), and District Council Constituency Area (DCCA) (412).
Generally speaking, a more granular spatial unit would be preferably in this type of
study that targets in evaluating regional variation in accessibility. Other important
considerations in deciding the spatial unit include alignment with the boundaries of
2. Analytical Framework Page | 26
HA Cluster catchment areas, as well as consistency of the boundaries of the spatial
unit over time. For example, while a simple split of Hong Kong into Hong Kong Island,
Kowloon, and New Territories would be consistent over time, this spatial unit lacks
the necessary granularity in evaluating geographical accessibility. On the other hand,
DCCA offers finer granularity, it is defined for election purposes and its boundaries
are subject to amendment according to the election schedule. In addition, their
boundaries do not quite match with the boundaries of HA Cluster catchment areas.
For example, in the New Territories, the Islands District is split into the catchment
areas HKEC and KWC. As such, the recommended choice goes to TPU, where it does
not only offer the necessary spatial granularity, but it also matches quite well with
the boundaries of Cluster catchment areas in HA. More information on the TPU
system is presented below.
Tertiary Planning Unit
TPU is a geographic reference system demarcated by the Planning Department for
town planning purposes. The whole territory of Hong Kong is divided into 289 TPUs,
which are aggregated under 52 Secondary Planning Units and in turn under nine
Primary Planning Units (as of 2011). The TPU boundaries are mainly delineated by
the nature of the geographic features of the area such as roads, railway lines, zoning
boundaries of town plans, etc. They also provide a common geographic system for
the compilation of statistical data. In particular, statistical data from the population
census/by-census are produced using this basic system.
Each of the TPU is identified by a unique three-digit number. The first digit of a TPU
number identifies the Primary Planning Unit code while the first and second digits
together correspond to the Secondary Planning Unit code. While the Planning
Department does not name the TPU (only the three digit code would be used),
names that identify the TPUs approximate location would be given in this report just
to facilitate reader’s understanding when references are made to specific TPUs.
According to the C&SD, having regard to data precision and protection of data
privacy of individual respondents, a TPU with less than 1,000 persons is merged with
adjacent TPU(s) for the release of statistics. The resultant 209 TPU Groups are
employed in the analysis. These TPU Groups and how they are mapped to Cluster
catchments (for presentation purposes only – according to the current re-clustered
setting) and districts (as defined internally by HA6) are presented in Table 3 below.
6 There are 20 districts defined in HA. The definition is the same as the 18 District Council Districts in
Hong Kong, with exemptions being (1) the split of Yau Tsim Mong district into Yau Tsim and Mong Kok; and (2) the split of the Islands district into Lantau Island and Islands (excluding Lantau Island).

2. Analytical Framework Page | 27
Cluster Catchment
District Tertiary Planning Unit Groups
HKEC Eastern 148; 151; 152; 153; 154; 155; 157; 161; 162; 163; 166; 167; 156 & 158; 164 & 165
Islands (excl. Lantau)
920; 963; 976; 911 - 913
Wan Chai 131; 132; 133; 134; 135; 140; 144; 145; 149; 146 & 147; 183 & 184
HKWC Central & Western
111; 112; 113; 114; 115; 116; 141; 142; 143; 121 & 122; 123 & 124; 181 & 182
Southern 171; 172; 173; 174; 191; 196; 197; 175 & 176; 190, 192 & 194; 193, 195 & 198
KCC# Kowloon City 231; 232; 233; 234; 235; 236; 237; 241; 242; 243; 244; 245; 246; 247; 271; 272; 285; 213 & 215 - 216
Mong Kok 220; 221; 222; 227; 228; 229; 253; 254
Wong Tai Sin 281; 282; 283; 284; 287; 288 & 289
Yau Tsim 211; 212; 214; 217; 225; 226; 251, 252 & 256
KEC Kwun Tong 290; 291; 292; 297; 298; 280 & 286; 293 & 296; 294 & 295
Sai Kung 821; 822; 823; 825; 827; 829; 831; 833; 835; 836; 837; 838; 839; 811 - 815; 820 & 824; 826 & 828; 832 & 834
KWC# Kwai Tsing 326; 327; 328; 350; 351
Lantau Island 944; 931 & 933; 932 & 934; 941-943; 950 & 951; 961 & 962; 971 - 974
Sham Shui Po 260; 261; 262; 263; 264; 265; 266; 267; 268; 255 & 269
Tsuen Wan 310; 321; 322; 323; 325; 335; 975; 320, 324 & 329; 331 - 334, 336 & 340
NTEC North 623; 625; 626; 627; 628; 634; 641; 642; 545 & 546; 610 & 621; 620 & 622; 624 & 629; 651 - 653
Sha Tin 755; 757; 758; 759; 731, 733 & 754; 732, 751 & 753; 756 & 761 – 762
Tai Po 720; 723; 724; 725; 726; 729; 631 - 633; 711 - 712, 721 & 728; 722 & 727; 741 - 744
NTWC Tuen Mun 424; 425; 426; 441; 442; 411 - 416 & 427; 421 & 422; 423 & 428; 431 - 434
Yuen Long 510; 511; 512; 513; 514; 516; 518; 519; 521; 522; 523; 524; 527; 528; 529; 531; 532; 533; 541; 542; 543; 544; 515 & 517; 525 & 526
Note: A small number of TPU Groups span across two Cluster catchments. They include TPU
Group 190, 192 & 194 (HKEC / HKWC), 280 & 286 (KCC / KEC), 610 & 621 (NTEC / NTWC) and
731, 733 & 754 (NTEC / NTWC). These TPU Groups were assigned to the Cluster catchment
with a bigger share of their population size.
# After re-clustering
Table 3 – Cluster catchment, district and TPU Group mapping in the analysis
2. Analytical Framework Page | 28
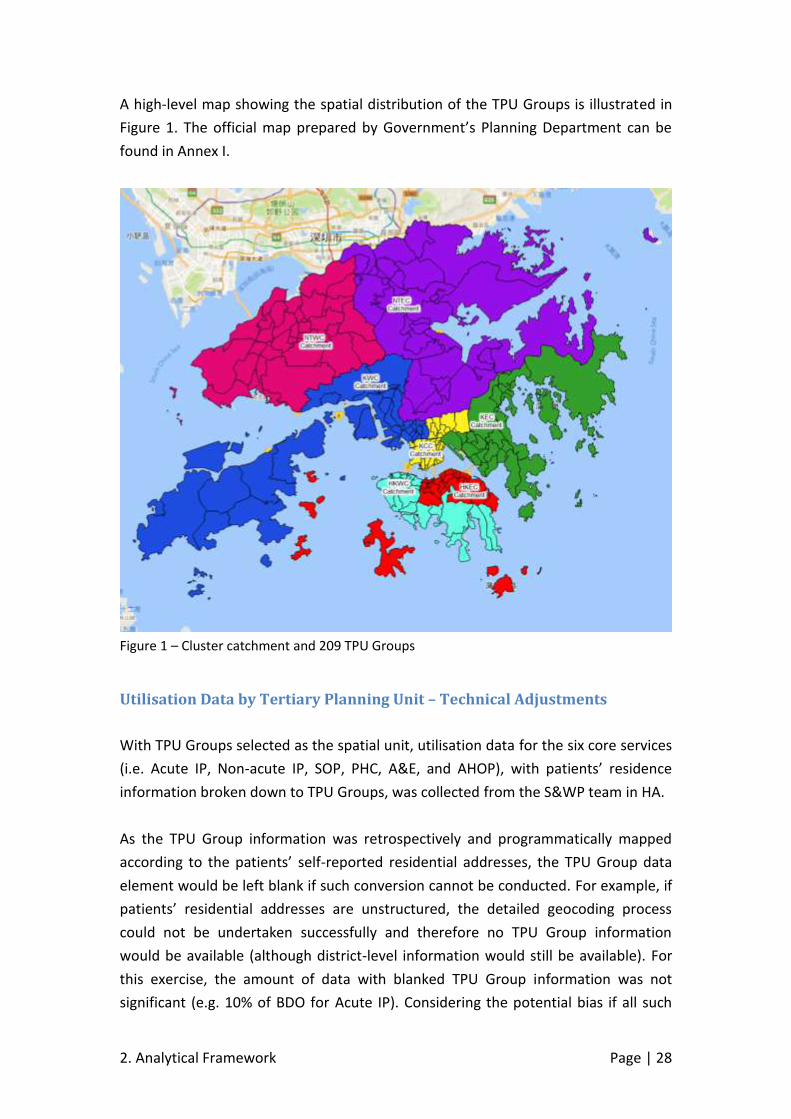
A high-level map showing the spatial distribution of the TPU Groups is illustrated in
Figure 1. The official map prepared by Government’s Planning Department can be
found in Annex I.
Figure 1 – Cluster catchment and 209 TPU Groups
Utilisation Data by Tertiary Planning Unit – Technical Adjustments
With TPU Groups selected as the spatial unit, utilisation data for the six core services
(i.e. Acute IP, Non-acute IP, SOP, PHC, A&E, and AHOP), with patients’ residence
information broken down to TPU Groups, was collected from the S&WP team in HA.
As the TPU Group information was retrospectively and programmatically mapped
according to the patients’ self-reported residential addresses, the TPU Group data
element would be left blank if such conversion cannot be conducted. For example, if
patients’ residential addresses are unstructured, the detailed geocoding process
could not be undertaken successfully and therefore no TPU Group information
would be available (although district-level information would still be available). For
this exercise, the amount of data with blanked TPU Group information was not
significant (e.g. 10% of BDO for Acute IP). Considering the potential bias if all such
2. Analytical Framework Page | 29
data was removed from the analysis (i.e. it is safe to assume that patients’ residing in
rural area would be more likely to self-report an unstructured addresses), it was
decided that keeping these records and imputing the missing values would be more
appropriate. In the imputation process, the distribution of utilisation in each
individual district would be computed and such proportion would be applied to the
total amount of utilisation that had no TPU Group information in each district. Such
mechanism assumes that the proportion of utilisation among TPU Groups in each
district is the same for those with and without TPU Group information.
Data Source
HA service utilisation data for the aforementioned six core services from 1 April 2015
to 31 March 2016 was collected via the Statistics and Workforce Planning (S&WP)
team in the Strategy and Planning (S&P) Division in HA. The utilisation data was
divided into two sets, one for Acute IP and Non-acute IP with the activity measure
being BDO, and the other one for SOP, PHC, A&E and AHOP where the activity
measure is the number of attendance.
In each set of data, utilisation figures were broken down by various key fields of
information, with the most important ones being the core service type, institution,
and patients’ residence (in both TPU Group and District Council Districts).
Population data in 2015 was also utilised in various parts of this study. Population
refers to the Hong Kong resident population, covering both usual residents and
mobile residents, in each TPU Group. The data was collected from the “Projections
of Population Distribution 2015-2024” report, completed in December 2015 by the
Working Group on Population Distribution Projections and published by the
Government’s Planning Department.

3. Cluster Concordance Analysis Page | 31
3. Cluster Concordance Analysis
As demonstrated in last year’s analysis using 2014/15 data, cross-cluster flow from
the perspective of population could be evaluated by analysing the “Cluster
concordance rate”, which quantifies the level of service being provided in patient’s
own Cluster.
Methodology
The notion of concordance, or self-sufficiency as often described in the literature,
measures how well a local community is providing service to its residents, and is
often used for evaluating population’s access to public services such as public
healthcare services (Messina et al., 2012), education (McClelland & Gandy, 2012),
and correctional services (Gurrieri, 2008).
Mathematically, the concordance rates could be derived by letting R be the activity
of residents in region r being treated by their local Cluster institutions, E be the
level of activity treated by other Clusters, and the concordance rate for region r (Cr)
is given by:
𝐶𝑟 = 𝑅
𝑅 + 𝐸× 100
The care type-specific concordance rates are defined as:
Acute IP and Non-acute IP: percentage of BDO of a region’s residents being
treated in their own Cluster
SOP, PHC, A&E and AHOP : percentage of attendances of a region’s residents
being treated in their own Cluster
Results
The concordance rates for each Cluster catchment for the six core services in
2015/16 are presented in Table 4 below. For inpatient, SOP and A&E where
3. Cluster Concordance Analysis Page | 32
concordance rates for 2014/15 were worked out in last year’s analysis, the results
this year using 2015/16 are found to be comparable7.
Similar to the observation last year, concordances are found to be generally higher in
the New Territories, moderate in Hong Kong Island, and lowest in the Kowloon Area.
In general, the concordance rates are:
highest in the New Territories (NTEC and NTWC): > 80%
moderate in Hong Kong Island (HKEC and HKWC): ~70 - 80%
lowest in Kowloon (KCC, KEC, and KWC): ~60 - 80%
As one may expect, the concordance for PHC and A&E are generally higher than
those for the other four core services. Namely, their overall concordance rates in
2015/16 were found to be 87.8% and 84.5% respectively, compared to the other
four (Acute IP, Non-Acute IP, SOP and AHOP) which are hovering around the 70% -
80% range.
As discussed in Chapter 1, a re-delineation of administrative arrangements between
KWC and KCC was implemented per recommendation of the HA Review, which
included the re-grouping of Wong Tai Sin district and Mong Kok area, involving KWH,
WTSH and OLMH from KWC to KCC. As the study period was 2015/16, which is prior
to the actual implementation of the new Cluster boundary in April 2017, the above
calculation was made using the old Cluster arrangement.
7 The definition of core services is aligned with the one used for building the Refined Population-
based Model. For inpatient services, both inpatient and daypatient BDOs are included for 2015/16, while only inpatient BDO was used in 2014/15. A&E total attendances, which included 1
st and
follow-up attendance, were used in this exercise, while only 1st
attendance was used in 2014/15.
Cluster concordance rates are generally higher in the New Territories,
moderate in Hong Kong Island, and lowest in the Kowloon Area.
3. Cluster Concordance Analysis Page | 33
2015/16 Concordance Rate
Cluster Catchment
Districts * Acute
IP Non-
Acute IP SOP PHC A&E AHOP
HKEC Eastern, Islands (excl. Lantau), Wan Chai
82.0% 83.2% 79.8% 93.4% 89.3% 82.6%
HKWC Central & Western, Southern
89.2% 52.9% 89.0% 87.7% 79.1% 73.8%
KCC Kowloon City, Yau Tsim
73.9% 70.3% 74.0% 82.5% 68.9% 72.9%
KEC Kwun Tong, Sai Kung
73.0% 45.3% 66.9% 85.8% 82.4% 72.8%
KWC
Kwai Tsing, Lantau Island, Mong Kok, Sham Shui Po, Tsuen Wan, Wong Tai Sin
70.2% 65.4% 69.6% 84.2% 79.5% 66.2%
NTEC North, Sha Tin, Tai Po
89.5% 84.0% 84.8% 90.3% 89.8% 81.5%
NTWC Tuen Mun, Yuen Long
85.7% 90.5% 84.9% 93.0% 88.5% 87.7%
HA Overall
79.1% 71.2% 76.8% 87.8% 83.5% 75.6%
* Before re-clustering as the study period was 2015/16
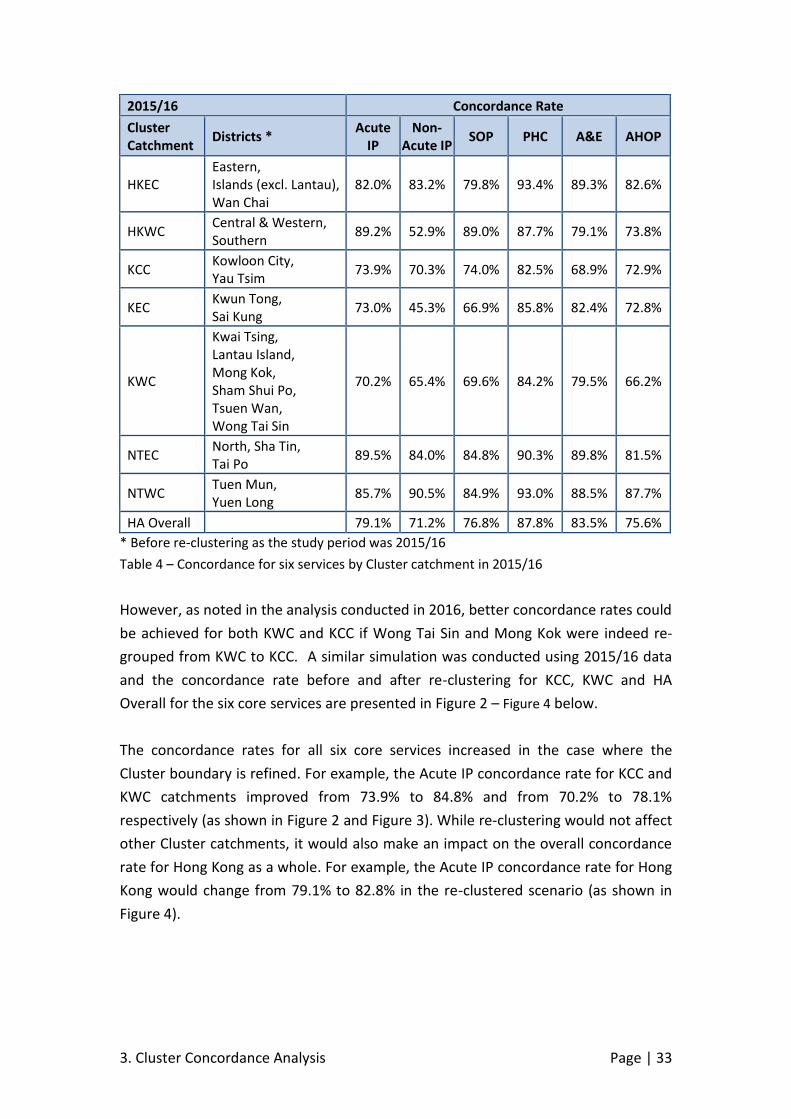
Table 4 – Concordance for six services by Cluster catchment in 2015/16
However, as noted in the analysis conducted in 2016, better concordance rates could
be achieved for both KWC and KCC if Wong Tai Sin and Mong Kok were indeed re-
grouped from KWC to KCC. A similar simulation was conducted using 2015/16 data
and the concordance rate before and after re-clustering for KCC, KWC and HA
Overall for the six core services are presented in Figure 2 – Figure 4 below.
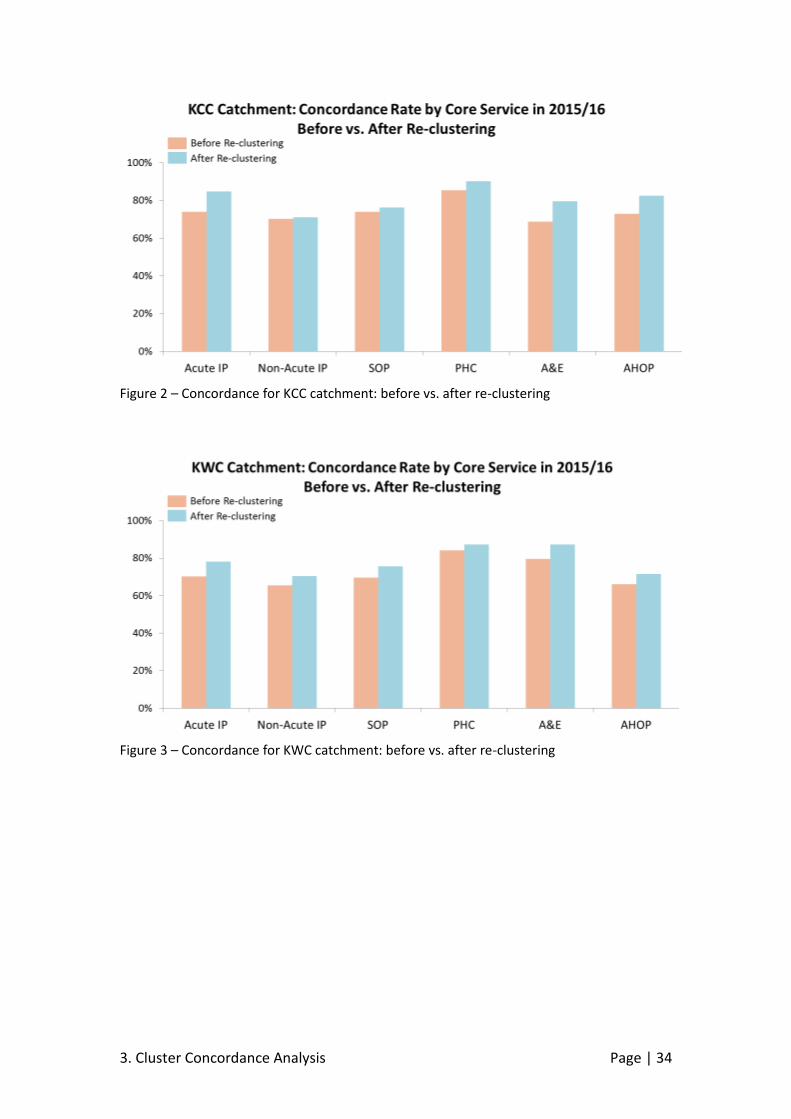
The concordance rates for all six core services increased in the case where the
Cluster boundary is refined. For example, the Acute IP concordance rate for KCC and
KWC catchments improved from 73.9% to 84.8% and from 70.2% to 78.1%
respectively (as shown in Figure 2 and Figure 3). While re-clustering would not affect
other Cluster catchments, it would also make an impact on the overall concordance
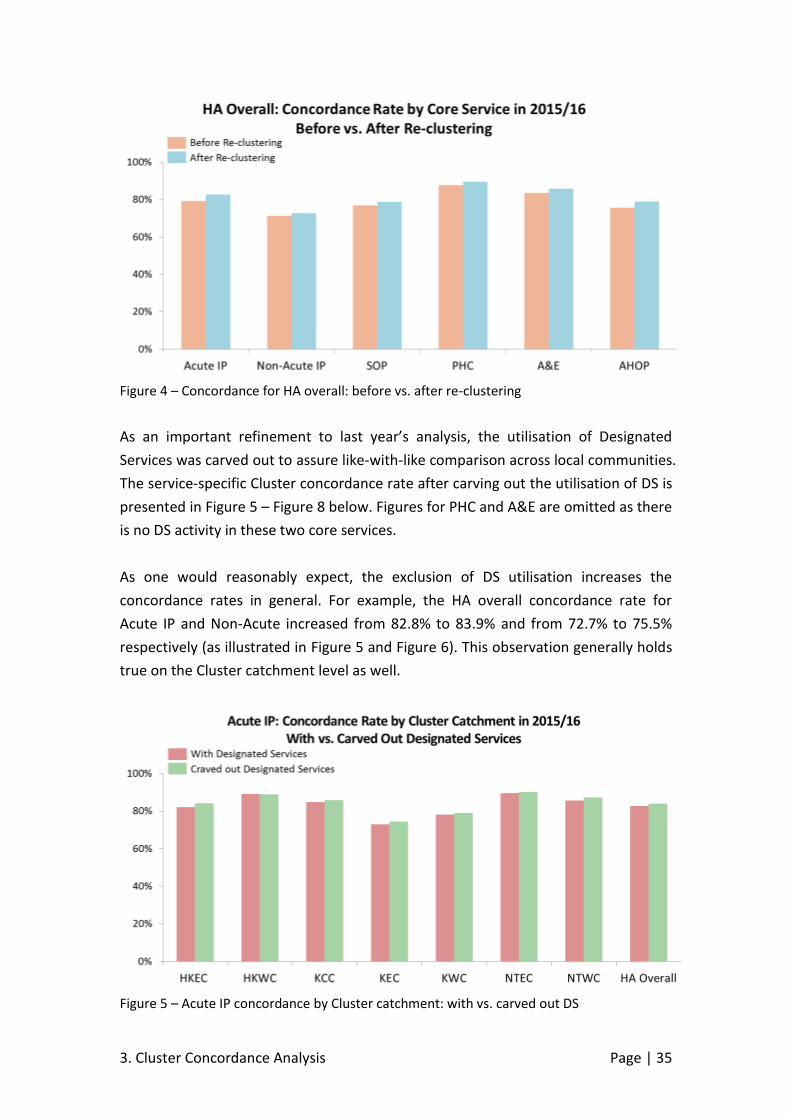
rate for Hong Kong as a whole. For example, the Acute IP concordance rate for Hong
Kong would change from 79.1% to 82.8% in the re-clustered scenario (as shown in
Figure 4).
3. Cluster Concordance Analysis Page | 34
Figure 2 – Concordance for KCC catchment: before vs. after re-clustering
Figure 3 – Concordance for KWC catchment: before vs. after re-clustering
3. Cluster Concordance Analysis Page | 35
Figure 4 – Concordance for HA overall: before vs. after re-clustering
As an important refinement to last year’s analysis, the utilisation of Designated
Services was carved out to assure like-with-like comparison across local communities.
The service-specific Cluster concordance rate after carving out the utilisation of DS is
presented in Figure 5 – Figure 8 below. Figures for PHC and A&E are omitted as there
is no DS activity in these two core services.
As one would reasonably expect, the exclusion of DS utilisation increases the
concordance rates in general. For example, the HA overall concordance rate for
Acute IP and Non-Acute increased from 82.8% to 83.9% and from 72.7% to 75.5%
respectively (as illustrated in Figure 5 and Figure 6). This observation generally holds
true on the Cluster catchment level as well.
Figure 5 – Acute IP concordance by Cluster catchment: with vs. carved out DS
3. Cluster Concordance Analysis Page | 36
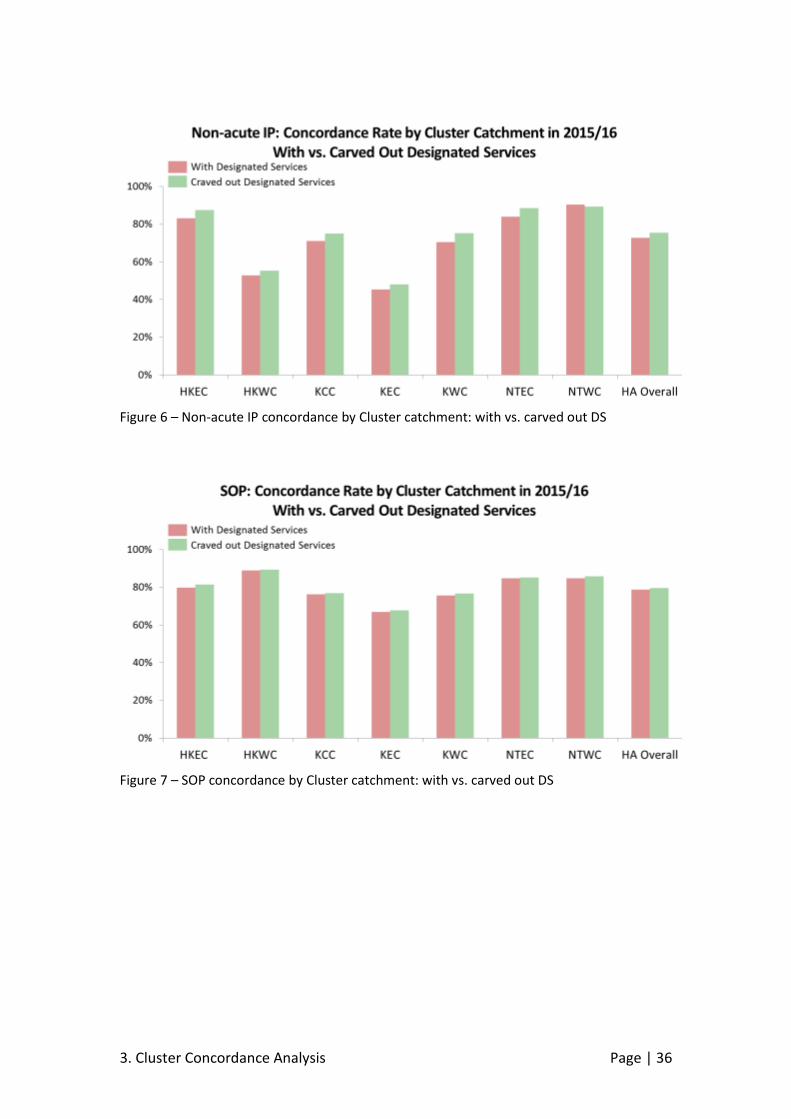
Figure 6 – Non-acute IP concordance by Cluster catchment: with vs. carved out DS
Figure 7 – SOP concordance by Cluster catchment: with vs. carved out DS
3. Cluster Concordance Analysis Page | 37
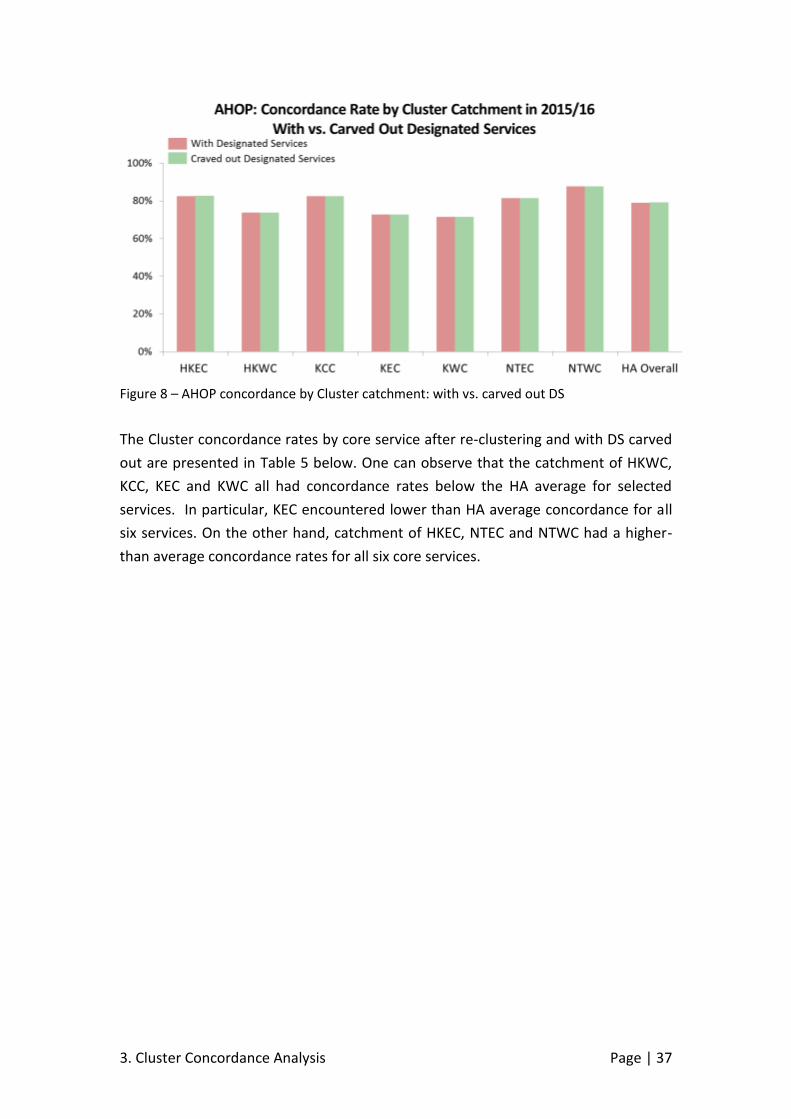
Figure 8 – AHOP concordance by Cluster catchment: with vs. carved out DS
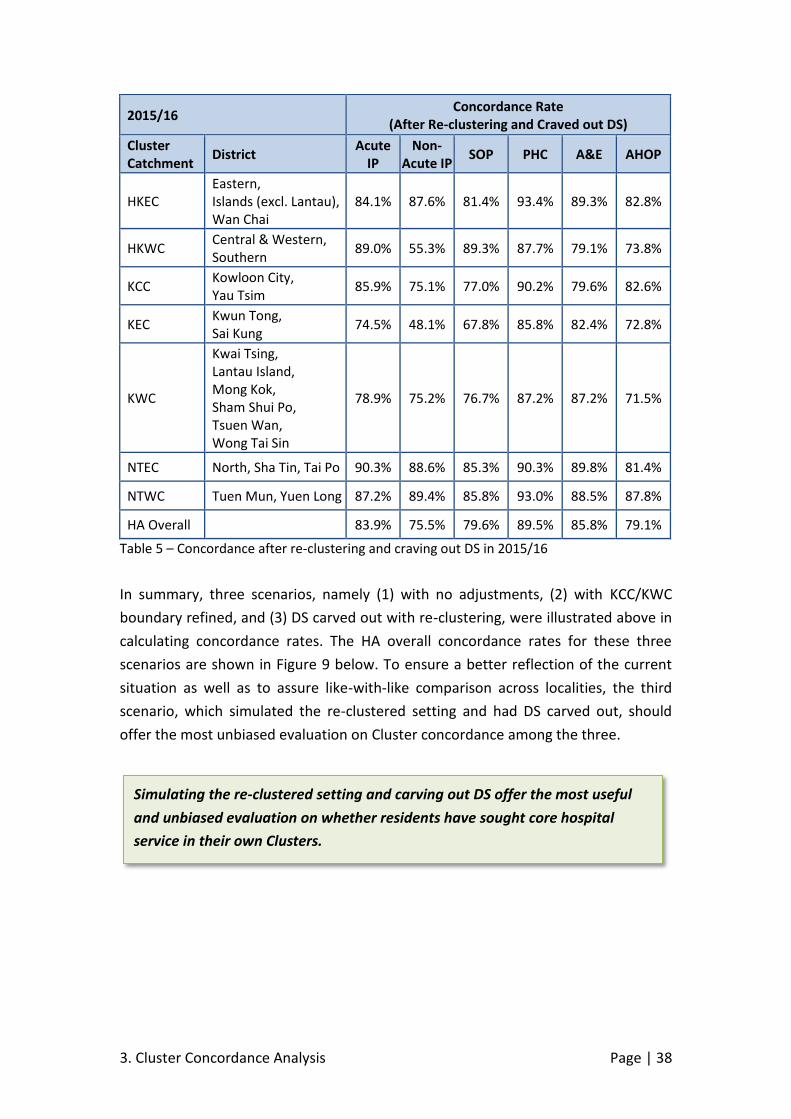
The Cluster concordance rates by core service after re-clustering and with DS carved
out are presented in Table 5 below. One can observe that the catchment of HKWC,
KCC, KEC and KWC all had concordance rates below the HA average for selected
services. In particular, KEC encountered lower than HA average concordance for all
six services. On the other hand, catchment of HKEC, NTEC and NTWC had a higher-
than average concordance rates for all six core services.
3. Cluster Concordance Analysis Page | 38
2015/16 Concordance Rate
(After Re-clustering and Craved out DS)
Cluster Catchment
District Acute
IP Non-
Acute IP SOP PHC A&E AHOP
HKEC Eastern, Islands (excl. Lantau), Wan Chai
84.1% 87.6% 81.4% 93.4% 89.3% 82.8%
HKWC Central & Western, Southern
89.0% 55.3% 89.3% 87.7% 79.1% 73.8%
KCC Kowloon City, Yau Tsim
85.9% 75.1% 77.0% 90.2% 79.6% 82.6%
KEC Kwun Tong, Sai Kung
74.5% 48.1% 67.8% 85.8% 82.4% 72.8%
KWC
Kwai Tsing, Lantau Island, Mong Kok, Sham Shui Po, Tsuen Wan, Wong Tai Sin
78.9% 75.2% 76.7% 87.2% 87.2% 71.5%
NTEC North, Sha Tin, Tai Po 90.3% 88.6% 85.3% 90.3% 89.8% 81.4%
NTWC Tuen Mun, Yuen Long 87.2% 89.4% 85.8% 93.0% 88.5% 87.8%
HA Overall
83.9% 75.5% 79.6% 89.5% 85.8% 79.1%
Table 5 – Concordance after re-clustering and craving out DS in 2015/16
In summary, three scenarios, namely (1) with no adjustments, (2) with KCC/KWC
boundary refined, and (3) DS carved out with re-clustering, were illustrated above in
calculating concordance rates. The HA overall concordance rates for these three
scenarios are shown in Figure 9 below. To ensure a better reflection of the current
situation as well as to assure like-with-like comparison across localities, the third
scenario, which simulated the re-clustered setting and had DS carved out, should
offer the most unbiased evaluation on Cluster concordance among the three.
Simulating the re-clustered setting and carving out DS offer the most useful
and unbiased evaluation on whether residents have sought core hospital
service in their own Clusters.
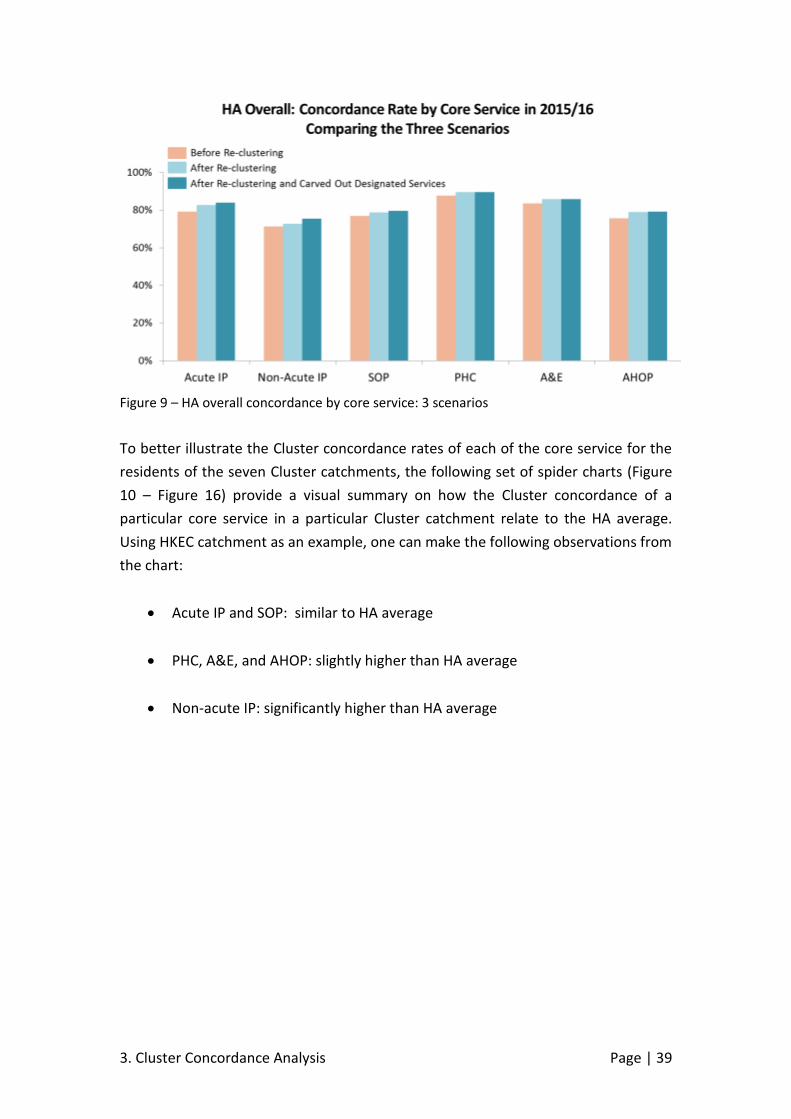
3. Cluster Concordance Analysis Page | 39
Figure 9 – HA overall concordance by core service: 3 scenarios
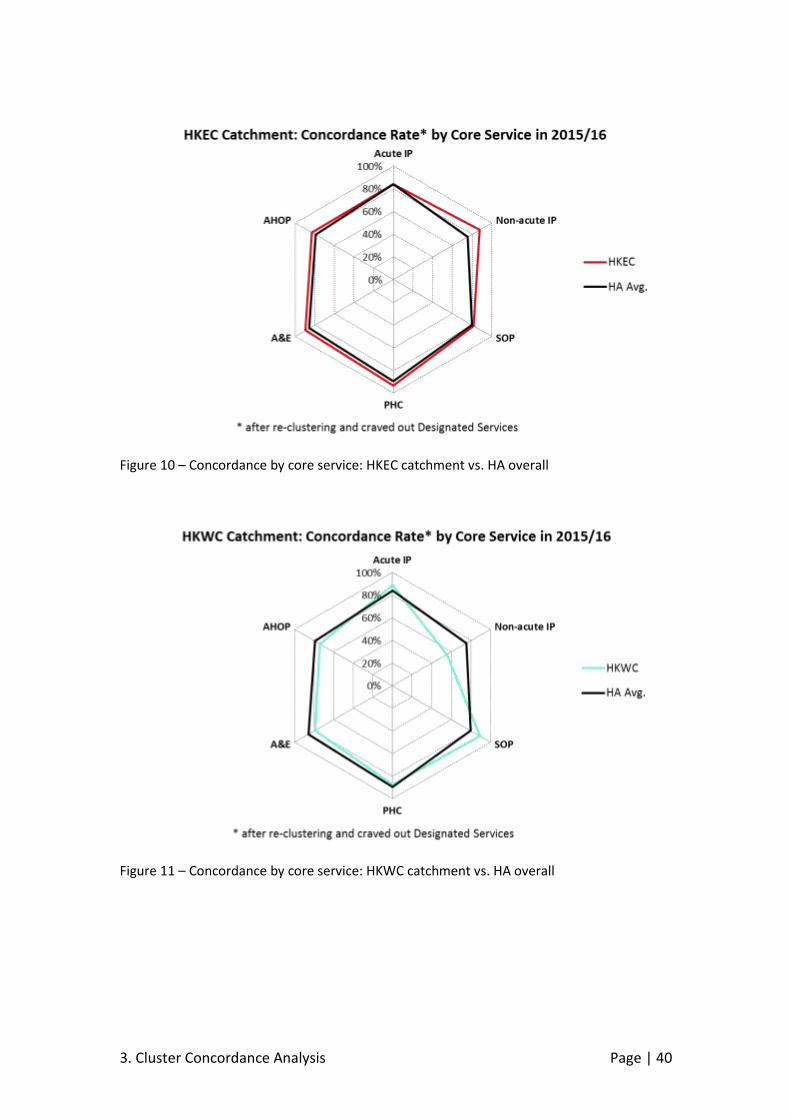
To better illustrate the Cluster concordance rates of each of the core service for the
residents of the seven Cluster catchments, the following set of spider charts (Figure
10 – Figure 16) provide a visual summary on how the Cluster concordance of a
particular core service in a particular Cluster catchment relate to the HA average.
Using HKEC catchment as an example, one can make the following observations from
the chart:
Acute IP and SOP: similar to HA average
PHC, A&E, and AHOP: slightly higher than HA average
Non-acute IP: significantly higher than HA average
3. Cluster Concordance Analysis Page | 40
Figure 10 – Concordance by core service: HKEC catchment vs. HA overall
Figure 11 – Concordance by core service: HKWC catchment vs. HA overall
3. Cluster Concordance Analysis Page | 41
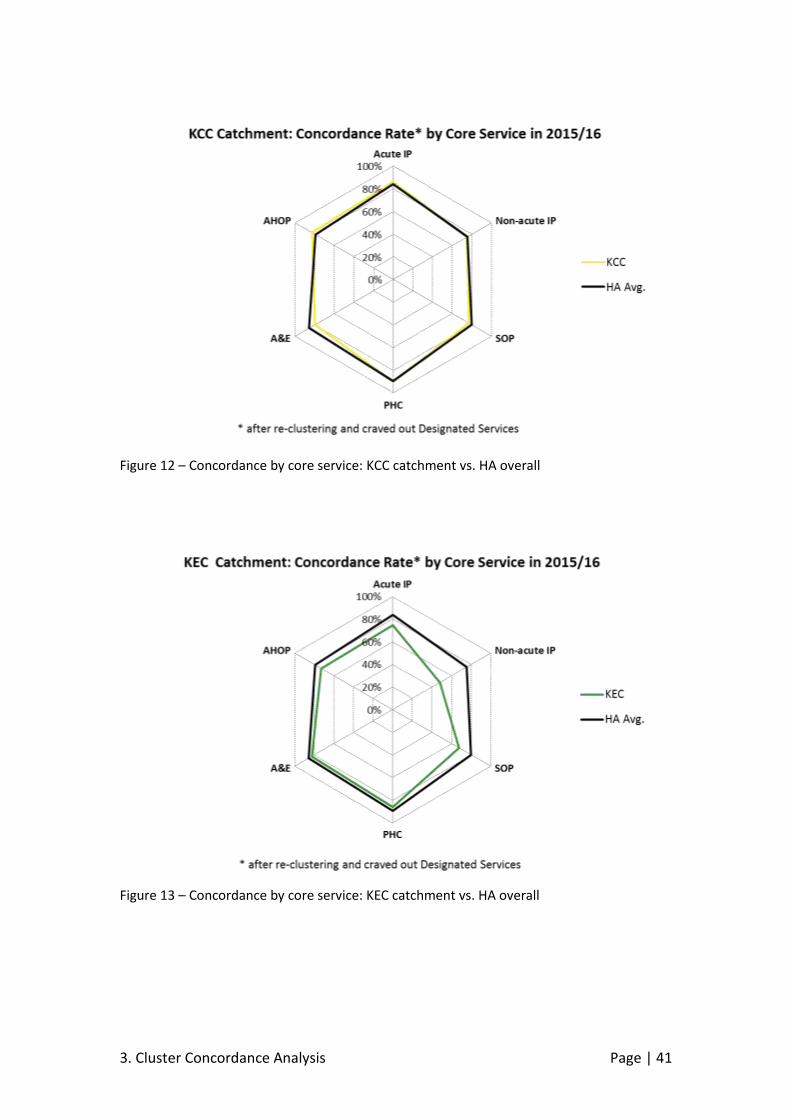
Figure 12 – Concordance by core service: KCC catchment vs. HA overall
Figure 13 – Concordance by core service: KEC catchment vs. HA overall
3. Cluster Concordance Analysis Page | 42
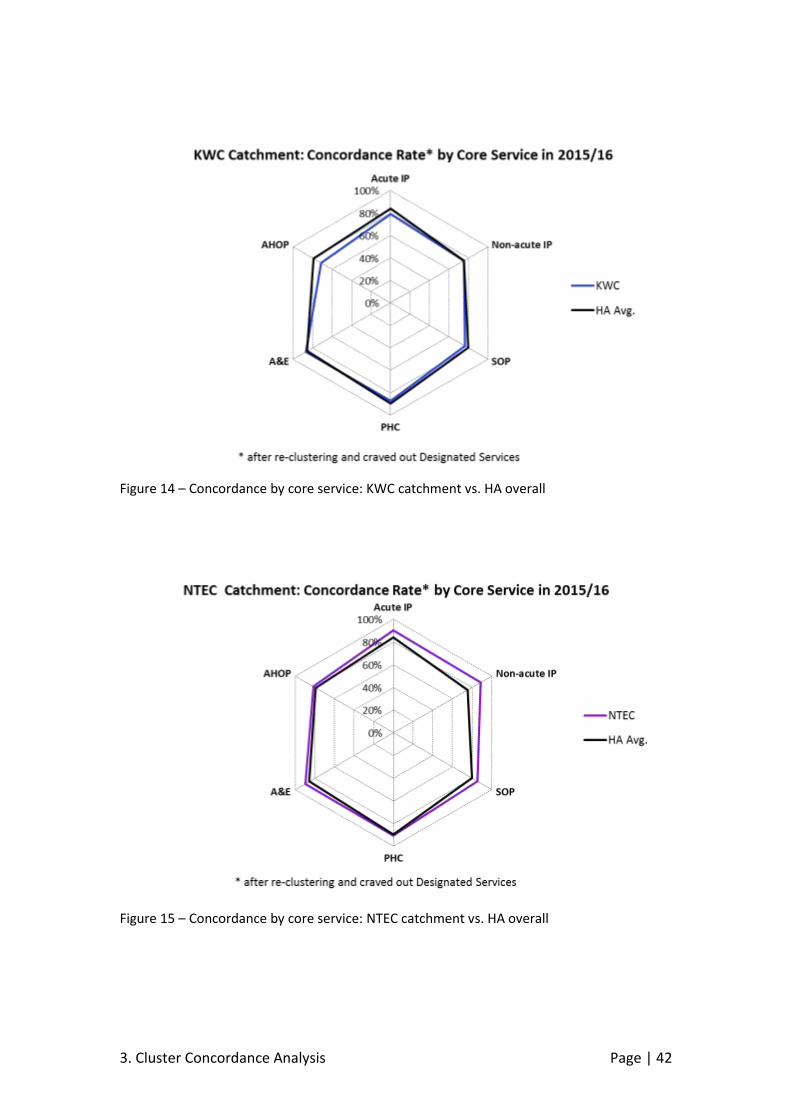
Figure 14 – Concordance by core service: KWC catchment vs. HA overall
Figure 15 – Concordance by core service: NTEC catchment vs. HA overall

3. Cluster Concordance Analysis Page | 43
Figure 16 – Concordance by core service: NTWC catchment vs. HA overall
To facilitate in-depth understanding on the patronage pattern by TPU Group under
each Cluster catchment, the percentage of utilisation by Cluster for each core service
for each TPU Group is presented in Appendix I. The percentage of utilisation in the
TPU Group’s own Cluster is bolded to highlight the Cluster concordance rate for each
core service for that TPU Group.
Similar to the observations made in last year’s study, the concept of Cluster
catchment is a useful reference. Concordance rates are generally higher in Hong
Kong and the New Territories, illustrating that they are relatively confined
geographically. This study also shows how the re-delineation of Cluster boundary
increased the concordance of the KCC and KWC catchments. The concordance rates
of the KEC catchment are relatively lower (e.g. at 74.5% for Acute IP). This can be
partly explained by the unavailability of certain core service (e.g. Oncology services)
where residents in the KEC catchment need to patronise other Clusters, namely KCC,
instead.
Spider charts offer an effective visual tool in comparing each Cluster’s
concordance rates with the HA overall average.
3. Cluster Concordance Analysis Page | 44
While the Cluster concordance analysis generated valuable insights as to how
services are provided to residents on a Cluster level, the underlying principle of
analysing whether residents are served within their own Cluster catchment have
limitations of its own. Namely, with clustering being an administrative rather than a
registration arrangement, analysing health-seeking behaviour from a Cluster
catchment perspective may not be comprehensive.
Therefore, building on top of the Cluster concordance analysis, accessibility was
analysed with respect to travel time from the TPUs’ perspective. The methodology
and results are presented in the next chapter.
4. Locality-based Travel Time Analysis Page | 45
4. Locality-based Travel Time Analysis
The previous chapter outlines an analysis that evaluates spatial accessibility on the
Cluster catchment level. Via the computation of a Cluster concordance rate, defined
as the percentage of utilisation sought within patient’s own Cluster, it generated
high-level information on whether patients have sought care in their own Cluster.
However, while such methodology is simple and intuitive, analysing service access
merely from a Cluster catchment perspective may not be comprehensive, as
evaluating whether the patients were served within a set of arbitrary Cluster
boundaries would neglect one important factor affecting health-seeking behaviour:
patient convenience. This is particularly relevant in the Hong Kong setting, with its
relatively small land mass and efficient transportation network. Rather than focusing
on whether patients are seeking healthcare service in facilities within their own
catchment, a more important metric in analysing accessibility would be to evaluate
whether they could be served in the proximity of their places of residence.
In fact, the development of the Refined Population-based Model, where 16 factors
that would influence health-seeking behaviour were identified and modelled,
revealed that (1) distance between a patient’s residence to facilities as well as (2) the
amount of capacity in each facility were found to be the most influential factors
among those analysed8. Therefore, service accessibility was analysed with respect to
whether patients sought care near their places of residence, rather than whether
they were served within / outside an administrative boundary. Such analysis using
retrospective utilisation data in analysing accessibility (like the Cluster concordance
analysis presented in the previous chapter) is often referred as “revealed
accessibility analysis” in the literature.
Methodology
Scope of Analysis
Extending from the Cluster concordance analysis presented in the previous chapter,
a more granular spatial accessibility analysis based on proximity to care was
conducted. Similar to the Cluster concordance analysis, utilisation of Designated
Services was carved out to assure like-with-like comparison across localities, and the
8 The Final Report on the development of the Refined Population-based Model is available on the HA
internet website at http://www.ha.org.hk/haho/ho/fdd/report1_en.pdf
4. Locality-based Travel Time Analysis Page | 46
six core services were separately analysed so as to give a more detailed picture to
the potentially varying accessibility in different settings.
Travel Time as Measure of Patient Convenience / Proximity
In the literature, different measures of “proximity” are used in evaluating spatial
accessibility of healthcare services. Euclidean or straight-line distance is often used
(Haynes et al., 1999, Hewko et al., 2002), partly due to it being the least intensive
computationally. However, it does not capture the varying distances travelled
between the differential road network structures often seen in urban vs. suburban
areas. According to Apparicio et al. (2008) and Bliss et al. (2012), while the use of
Euclidean distance does not introduce significant error in urban areas, the use of
such in suburban areas may lead to substantial error.
Travel distance (or technically, network distance) is another popular proxy used to
evaluate the proximity of facilities from residential locations (Fotheringham &
Brunsdon, 2000; Witten et al., 2003). While it is more sophisticated than simple
straight-line distance, it is limited with its lack of handling of the varying availability
high-speed roadways in different parts of a region (Apparicio et al., 2008).
Travel time, on the hand, captures the time spent on travelling from patients’ places
of residence to facilities. One use of travel time is illustrated by Luo and Wang (2003),
where travel time was used to measure the spatial barrier between residents and
physicians. Such measurement takes into account local variation in distances, which
are most notably observed in suburban areas, and therefore was selected as the
measure for proximity for this analysis. Use of travel time has an additional strength,
in that the general public can easily gauge proximity using travel time, but not using
travel distance (e.g. most people has a sense of proximity / convenience when asked
about travelling for 5, 10, or 15 minutes, but not for 5, 10 or 20km). With the help of
modern Geographic Information System (GIS) technologies, measuring travel time
between a large set of origins and destinations is no longer an impossible task.
Use of Geographic Information System
GIS has been used extensively in this area of research. In fact, GIS has been used in
the health sector for more than three decades (Higgs & Gould, 2001), ranging from
analysing spatial patterns of disease to examining spatial patterns of healthcare
capacity to inform planning of new facilities (Gatrell & Senior, 1999). These studies
would make use of standard functionality of GIS, such as buffering (e.g. generating
4. Locality-based Travel Time Analysis Page | 47
catchments at travel distance/ time away from supply points), overlay analysis (e.g.
examining location of patients in relation to such areas), and network analysis (e.g.
using travel time to assess how long it takes patients to access a facility) (Higgs,
2005).
Measuring Travel Time
As the spatial unit of this analysis was set at the TPU level, pairwise travel time
between each of the centroid of the 209 TPU Groups and each of the 120 institutions
were obtained using the Google Maps Distance Matrix API. Travel time was
estimated based on a recommended route with the shortest travel time. Travel time
based on the use of the existing road network via a private vehicle was chosen over
the use of public transport, so as to assure a like-with-like comparison on
accessibility across different regions (especially urban vs. rural) in Hong Kong. Travel
time was estimated using historical traffic pattern. For island TPUs, which are
inaccessible by the road network, travel time to various institutions was estimated
based on the summation of (1) average waiting time for ferry, (2) the ferry travel
time, and (3) the travel time between the location of disembarkation and the
facilities.
With the lack of population distribution information inside each TPU Group, the
geographical centroid was used in the travel time estimation. However, to better
reflect reality, for those TPUs having their geographical centroids fall at an
inaccessible location by road, their centroids would be moved to their nearest
accessible point (e.g. the geographical centroid of TPU Groups 141 – Mid-level West
(latitude 22.27967o and longitude 114.13697o) was inaccessible by road in the
middle of the Lung Fu Shan Country Park, and thus its centroid was moved slightly to
the nearby Kotewall Road (latitude 22.28109o and longitude 114.13946o).
In total, 25,080 data points on travel time between the centroids of the 209 TPU
Groups and 120 facility locations were collected and fed into the analysis.
Quantifying Spatial Accessibility
Extending from the Cluster concordance concept as illustrated in the previous
chapter, the percentages of activity sought within different threshold travel times
were computed on the TPU Group level (expressed mathematically below). Such
analysis enables one to evaluate accessibility from the perspective of patient
convenience, rather than using the rigid yet arbitrary Cluster boundaries.
4. Locality-based Travel Time Analysis Page | 48
For each locality (TPU Group) 𝑖, compute the proportion of utilisation U that are
sought in the set of facilities 𝑗 which are within a threshold travel time 𝑑0 from
locality 𝑖
𝐴𝑖 =∑ 𝑈𝑖𝑘𝑘∈{𝑑𝑖𝑘≤𝑑0}
∑ 𝑈𝑖𝑗𝑗
The numerator sums up the utilisation of residents in locality 𝑖 at the set of facilities
𝑘 that fall within the threshold travel time (𝑑𝑖𝑘 ≤ 𝑑0). The denominator, on the
other hand, sums up the total utilisation for residents in locality 𝑖.
When applicable, the results of the analysis would be plotted on a map to facilitate
readers’ understanding on the geographical variation in accessibility. Spatial
visualisation was achieved through the use of the open-source desktop geographic
information system application QGIS (version 2.16.2).
Results
The above methodology was applied to analyse the revealed spatial accessibility of
the six core services in 2015/16, with the results presented in this section.
Analysis for Hong Kong as a Whole
Before stepping down to the TPU Group level, the percentage of utilisation sought
within a threshold travel time of 10 to 30 minutes (in 10 minute increments) for
Hong Kong as whole was analysed and shown in Figure 17 below. Similar to the
analysis in the previous chapter, the six core services were separately shown to
enhance granularity of analysis. Using Non-acute IP as an example, 30%, 67% and
85% of total BDO in Hong Kong were sought within 10, 20 and 30 minutes
respectively. On the other hand, accessibility for PHC is considerably higher, with
68%, 88%, and 94% of attendance sought care within 10, 20 and 30 minutes
respectively. In general, accessibility for PHC and A&E are the highest, which is
similar to the observation made in the previous chapter when Cluster concordance
was analysed. Acute IP, SOP, and AHOP have similar levels of accessibility, which is
sensible given their inter-related nature operationally (SOP / AHOP appointments of
the same Cluster would usually be given after an Acute IP episode in the Cluster).
Partly due to its subacute nature, Non-acute IP was found to have the lowest
accessibility among the six core services.
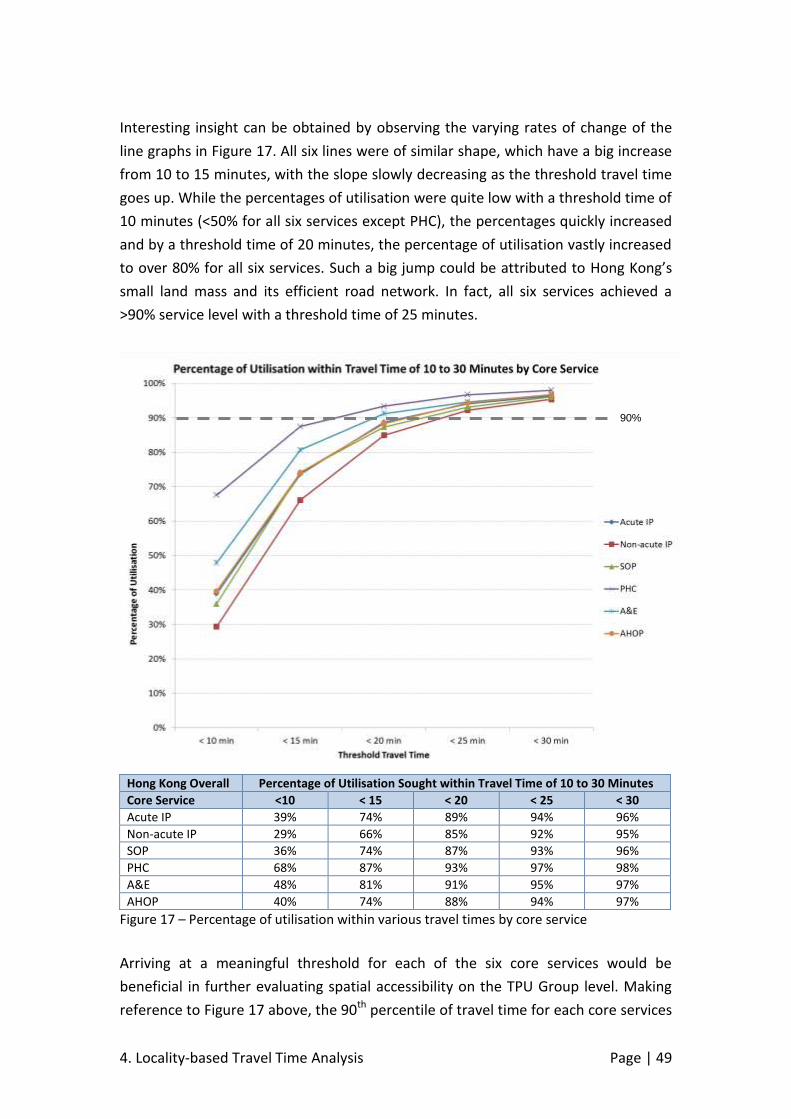
4. Locality-based Travel Time Analysis Page | 49
Interesting insight can be obtained by observing the varying rates of change of the
line graphs in Figure 17. All six lines were of similar shape, which have a big increase
from 10 to 15 minutes, with the slope slowly decreasing as the threshold travel time
goes up. While the percentages of utilisation were quite low with a threshold time of
10 minutes (<50% for all six services except PHC), the percentages quickly increased
and by a threshold time of 20 minutes, the percentage of utilisation vastly increased
to over 80% for all six services. Such a big jump could be attributed to Hong Kong’s
small land mass and its efficient road network. In fact, all six services achieved a
>90% service level with a threshold time of 25 minutes.
Hong Kong Overall Percentage of Utilisation Sought within Travel Time of 10 to 30 Minutes
Core Service <10 < 15 < 20 < 25 < 30
Acute IP 39% 74% 89% 94% 96%
Non-acute IP 29% 66% 85% 92% 95%
SOP 36% 74% 87% 93% 96%
PHC 68% 87% 93% 97% 98%
A&E 48% 81% 91% 95% 97%
AHOP 40% 74% 88% 94% 97%
Figure 17 – Percentage of utilisation within various travel times by core service
Arriving at a meaningful threshold for each of the six core services would be
beneficial in further evaluating spatial accessibility on the TPU Group level. Making
reference to Figure 17 above, the 90th percentile of travel time for each core services
90%

4. Locality-based Travel Time Analysis Page | 50
was extrapolated as shown in Table 6. The same set of information, broken down by
Cluster catchment, can be found in Appendix II.
Core Service 90th Percentile of Travel Time
Acute IP 21.2
Non-acute IP 23.5
SOP 22.3
PHC 17.2
A&E 19.4
AHOP 21.4
Table 6 – 90th of travel time by core service for Hong Kong Overall
Analysis on TPU Group Level – Illustration
The previous section illustrated the spatial accessibility for the six core services for
Hong Kong as a whole. Valuable insight could be obtained if one extends the analysis
to the locality level, i.e. to analyse accessibility by TPU groups. By studying how far /
close patients residing in each TPU group sought services, regional pockets of lower /
higher spatial accessibility could be identified.
Taking Acute IP as an example, the percentage of utilisation (BDO) that sought care
within 10, 20, 30 and 40 minutes are presented in Figure 18, Figure 19, Figure 20 and
Figure 21 respectively. To facilitate visualisation on a map, the percentages are
shown using five shades of blue, with the darkest shade having the highest values.
The classification to five shades was made using the “equal interval” method, where
a set of values is arranged into groups that contain an equal range of values. While
this method has limitations on classifying groups that are not close in size, “equal
interval” is selected for its simplicity and how it enables cross-sectional analysis (in
this case, comparison across maps for different core services and different threshold
times), as compared to other classification methods such as using quantile and Jenks
Natural Breaks. The red dots, on the other hand, provide the audience a reference
Through studying travel time, spatial accessibility is found to be generally
good in Hong Kong. For the majority (90%) of utilisation, services could be
sought within 17 to 20 minutes for PHC and A&E, and within 21 to 24 minutes
for Acute IP, Non-acute IP, SOP, and AHOP.
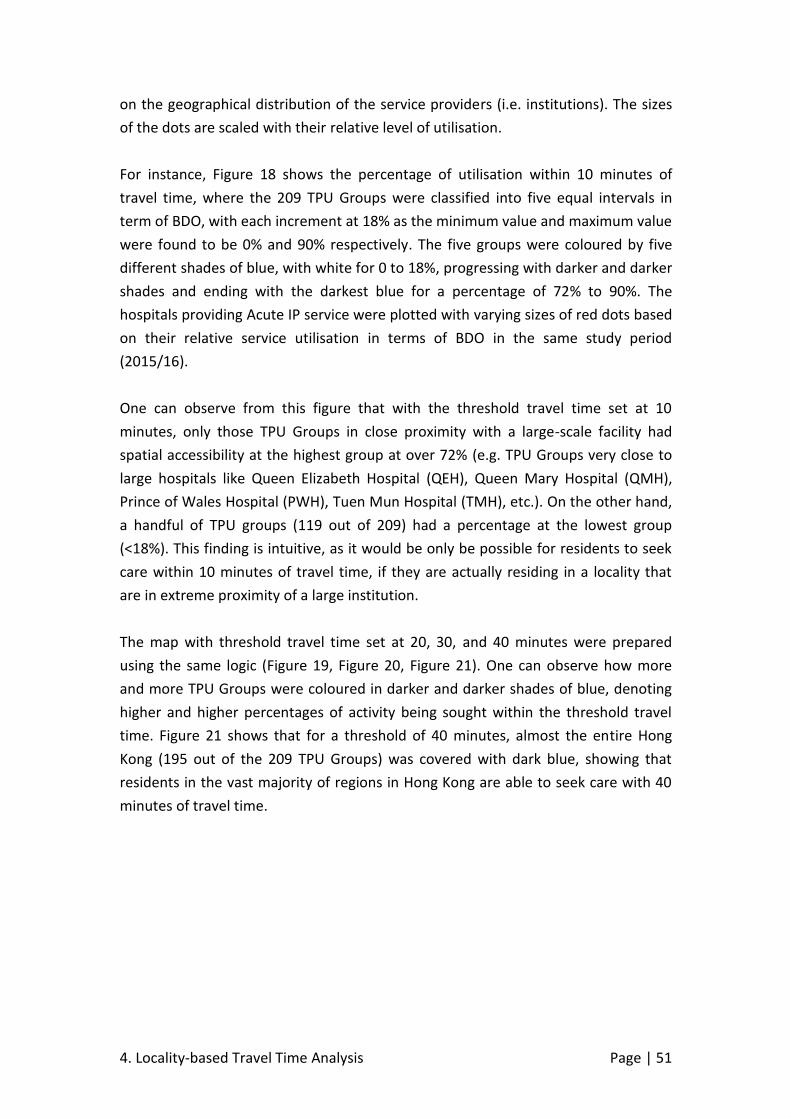
4. Locality-based Travel Time Analysis Page | 51
on the geographical distribution of the service providers (i.e. institutions). The sizes
of the dots are scaled with their relative level of utilisation.
For instance, Figure 18 shows the percentage of utilisation within 10 minutes of
travel time, where the 209 TPU Groups were classified into five equal intervals in
term of BDO, with each increment at 18% as the minimum value and maximum value
were found to be 0% and 90% respectively. The five groups were coloured by five
different shades of blue, with white for 0 to 18%, progressing with darker and darker
shades and ending with the darkest blue for a percentage of 72% to 90%. The
hospitals providing Acute IP service were plotted with varying sizes of red dots based
on their relative service utilisation in terms of BDO in the same study period
(2015/16).
One can observe from this figure that with the threshold travel time set at 10
minutes, only those TPU Groups in close proximity with a large-scale facility had
spatial accessibility at the highest group at over 72% (e.g. TPU Groups very close to
large hospitals like Queen Elizabeth Hospital (QEH), Queen Mary Hospital (QMH),
Prince of Wales Hospital (PWH), Tuen Mun Hospital (TMH), etc.). On the other hand,
a handful of TPU groups (119 out of 209) had a percentage at the lowest group
(<18%). This finding is intuitive, as it would be only be possible for residents to seek
care within 10 minutes of travel time, if they are actually residing in a locality that
are in extreme proximity of a large institution.
The map with threshold travel time set at 20, 30, and 40 minutes were prepared
using the same logic (Figure 19, Figure 20, Figure 21). One can observe how more
and more TPU Groups were coloured in darker and darker shades of blue, denoting
higher and higher percentages of activity being sought within the threshold travel
time. Figure 21 shows that for a threshold of 40 minutes, almost the entire Hong
Kong (195 out of the 209 TPU Groups) was covered with dark blue, showing that
residents in the vast majority of regions in Hong Kong are able to seek care with 40
minutes of travel time.
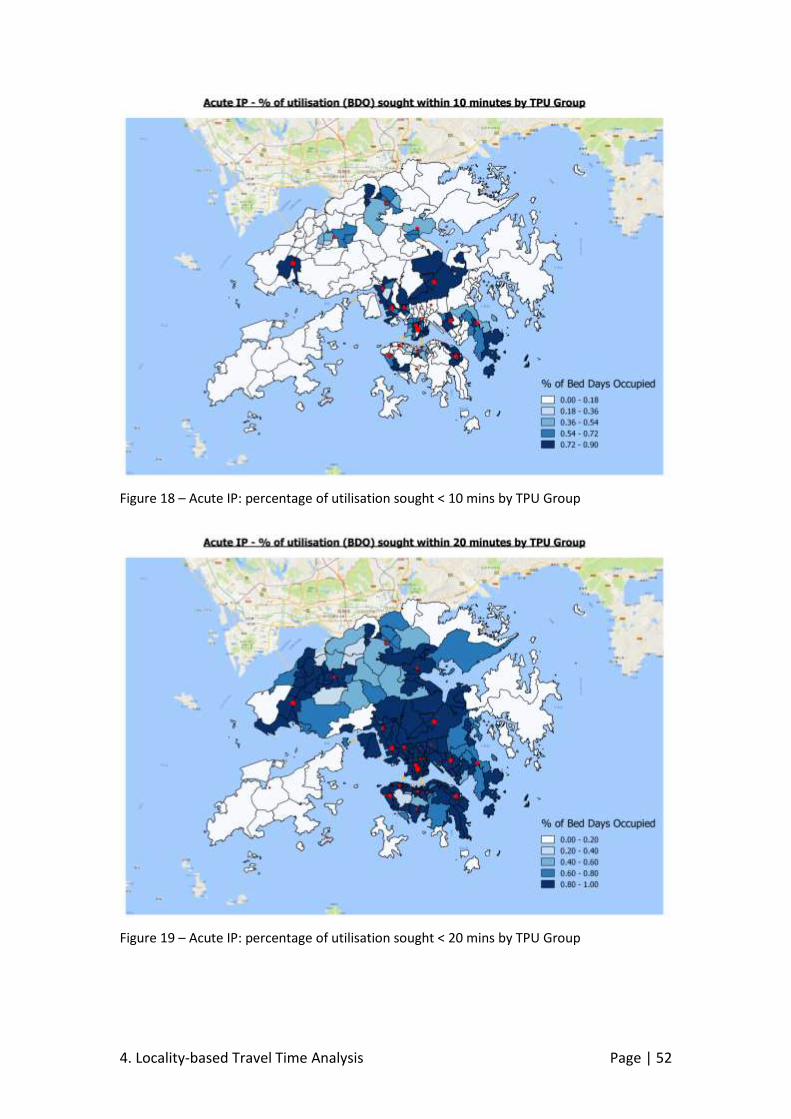
4. Locality-based Travel Time Analysis Page | 52
Figure 18 – Acute IP: percentage of utilisation sought < 10 mins by TPU Group
Figure 19 – Acute IP: percentage of utilisation sought < 20 mins by TPU Group
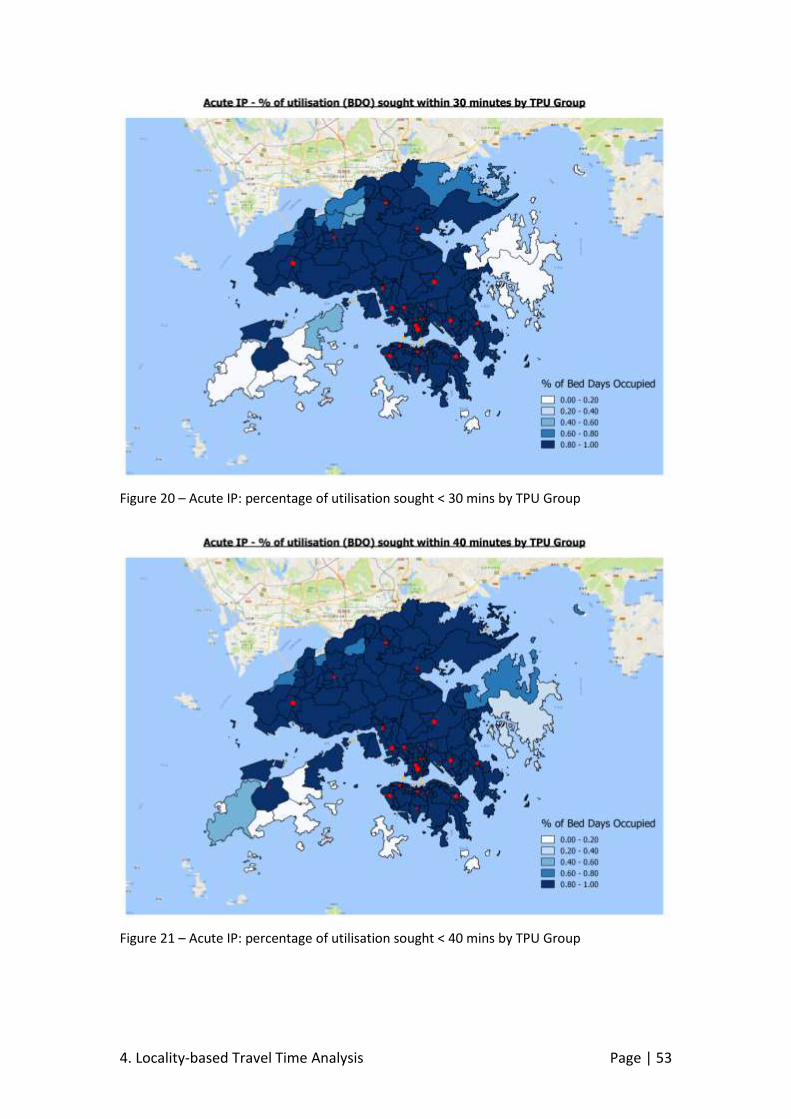
4. Locality-based Travel Time Analysis Page | 53
Figure 20 – Acute IP: percentage of utilisation sought < 30 mins by TPU Group
Figure 21 – Acute IP: percentage of utilisation sought < 40 mins by TPU Group

4. Locality-based Travel Time Analysis Page | 54
One can identify local pockets of higher / lower accessibility by referring to these
maps. Taking 30 minutes as an example threshold (Figure 20), the TPU Groups in Sha
Tau Kok , Mai Po, Lau Fau Shan, Sai Kung East, Sai Kung West, Kau Sai Chau, Tiu
Chung Chau, the Islands (including Po Toi Island and Lamma Island) and Lantau Island
(except Tung Chung and Chek Lap Kok) are of lower accessibility while the entire
Kowloon, Hong Kong Island, Kwai Tsing, Tsuen Wan, Shai Tin, Tai Po, Tuen Mun and
Yuen Long in New Territories are of higher accessibility for Acute IP.
Interested readers can refer to Appendix III for similar maps (illustrating the
percentage of utilisation sought within 10 to 40 minutes) replicated for the other five
core services.
Analysis by Core Service
To facilitate the visualisation of regional accessibility for each core service, a
threshold travel time was set for each, making reference to the results shown in
Table 6 above (the 90th percentile of travel time for each core service) while
rounding them up to their nearest 5-minute interval. This ensures that the service
level plotted would be strictly over 90%. The following figures show the percentage
of utilisation sought within 20 minutes for PHC (Figure 25) and A&E (Figure 26), and
within 25 minutes for Acute IP (Figure 22), Non-acute IP (Figure 23), SOP (Figure 24),
and AHOP (Figure 27).
Spatial accessibility by locality can easily be visualised on a map by shading
TPU Groups using various colours, representing different percentages of
utilisation sought within a specific travel time.
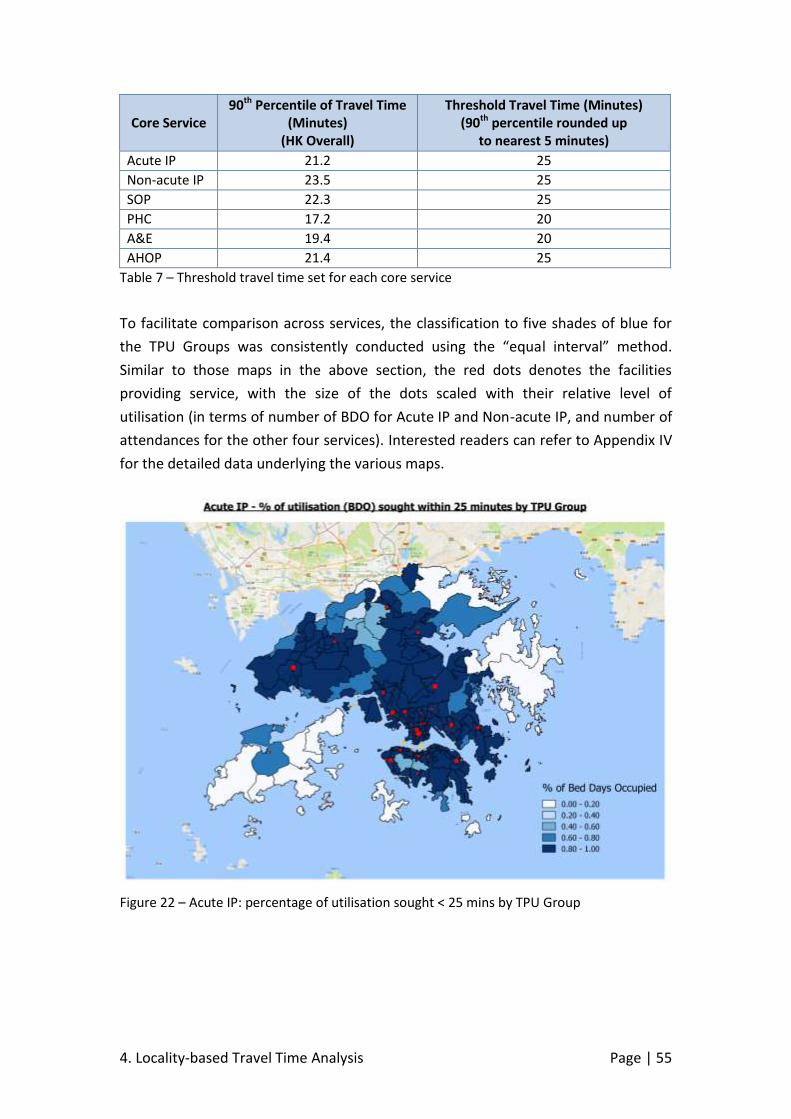
4. Locality-based Travel Time Analysis Page | 55
Core Service 90th Percentile of Travel Time
(Minutes) (HK Overall)
Threshold Travel Time (Minutes) (90th percentile rounded up
to nearest 5 minutes)
Acute IP 21.2 25
Non-acute IP 23.5 25
SOP 22.3 25
PHC 17.2 20
A&E 19.4 20
AHOP 21.4 25
Table 7 – Threshold travel time set for each core service
To facilitate comparison across services, the classification to five shades of blue for
the TPU Groups was consistently conducted using the “equal interval” method.
Similar to those maps in the above section, the red dots denotes the facilities
providing service, with the size of the dots scaled with their relative level of
utilisation (in terms of number of BDO for Acute IP and Non-acute IP, and number of
attendances for the other four services). Interested readers can refer to Appendix IV
for the detailed data underlying the various maps.
Figure 22 – Acute IP: percentage of utilisation sought < 25 mins by TPU Group
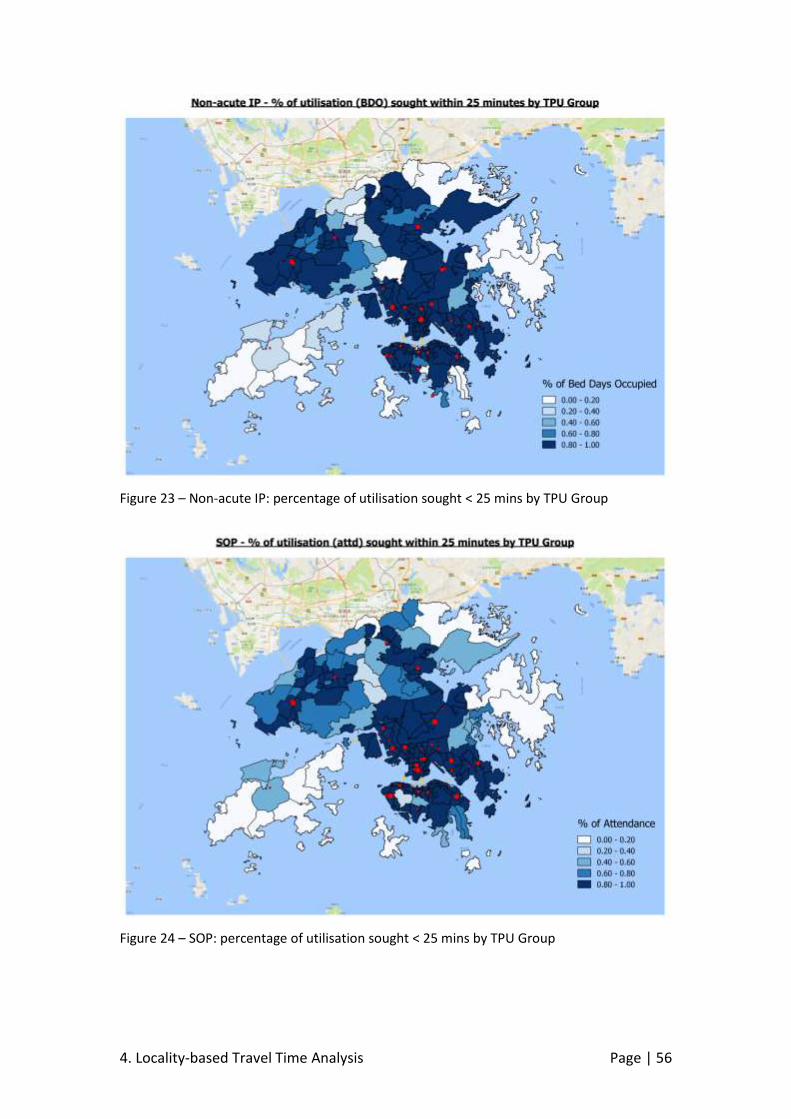
4. Locality-based Travel Time Analysis Page | 56
Figure 23 – Non-acute IP: percentage of utilisation sought < 25 mins by TPU Group
Figure 24 – SOP: percentage of utilisation sought < 25 mins by TPU Group
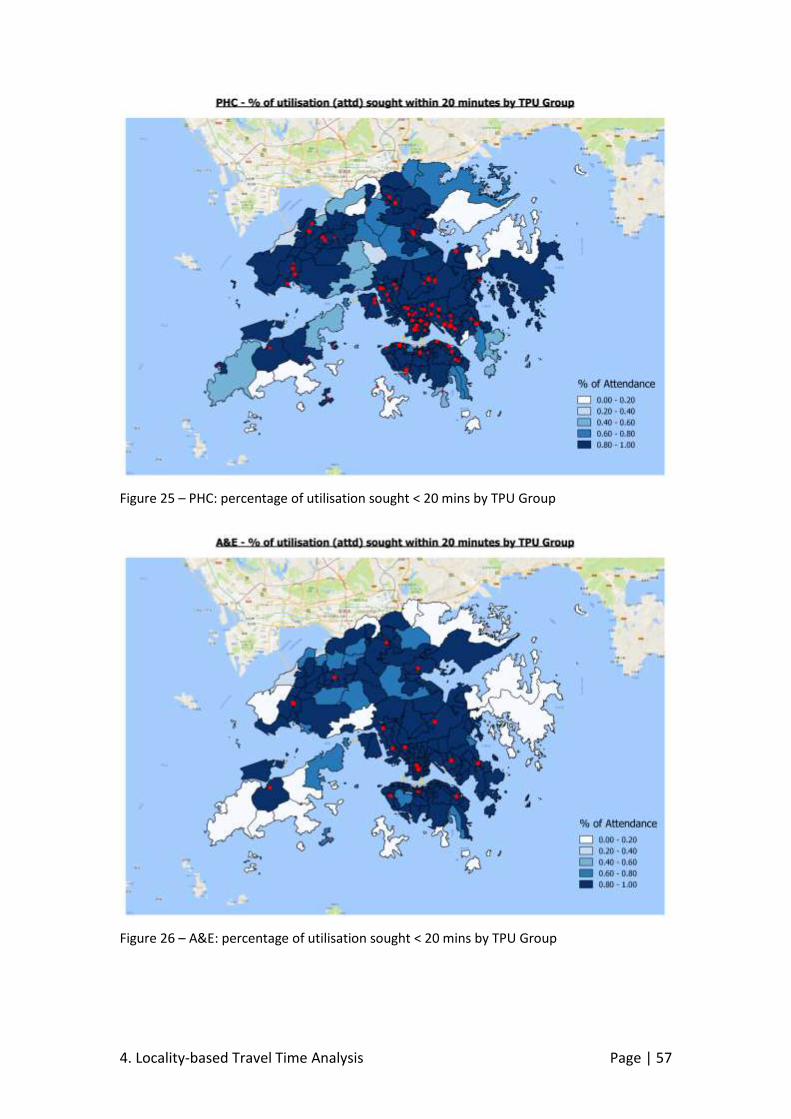
4. Locality-based Travel Time Analysis Page | 57
Figure 25 – PHC: percentage of utilisation sought < 20 mins by TPU Group
Figure 26 – A&E: percentage of utilisation sought < 20 mins by TPU Group
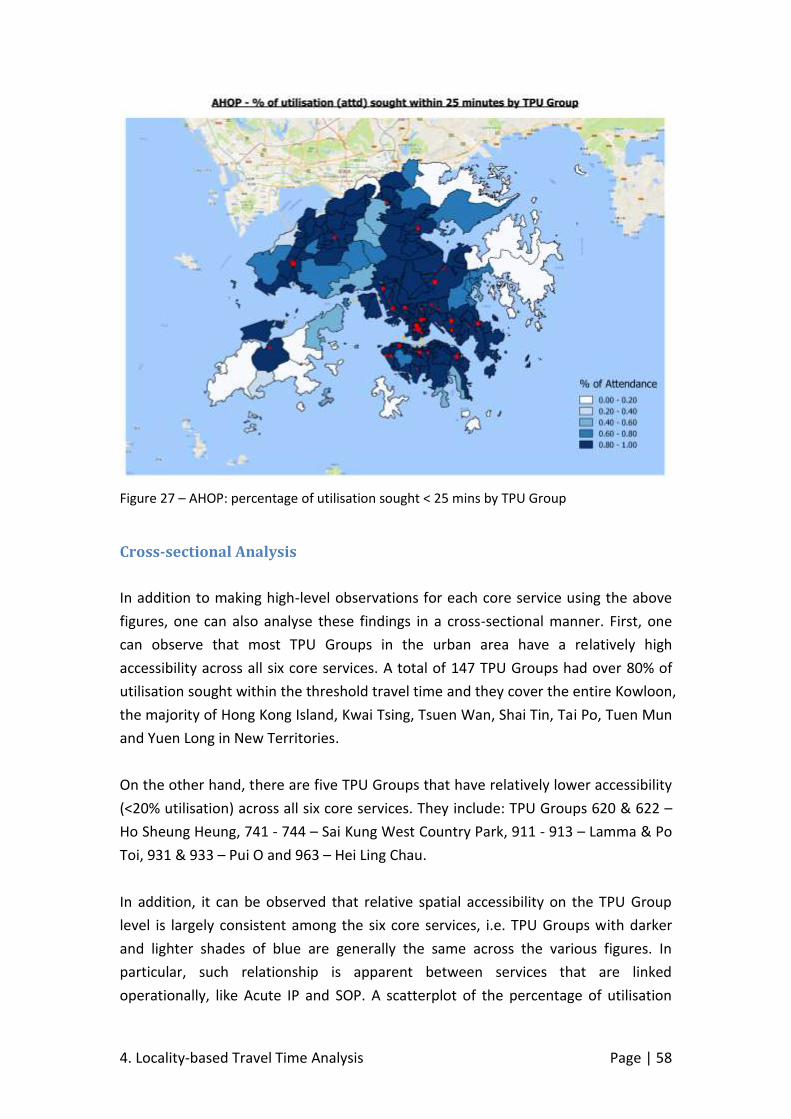
4. Locality-based Travel Time Analysis Page | 58
Figure 27 – AHOP: percentage of utilisation sought < 25 mins by TPU Group
Cross-sectional Analysis
In addition to making high-level observations for each core service using the above
figures, one can also analyse these findings in a cross-sectional manner. First, one
can observe that most TPU Groups in the urban area have a relatively high
accessibility across all six core services. A total of 147 TPU Groups had over 80% of
utilisation sought within the threshold travel time and they cover the entire Kowloon,
the majority of Hong Kong Island, Kwai Tsing, Tsuen Wan, Shai Tin, Tai Po, Tuen Mun
and Yuen Long in New Territories.
On the other hand, there are five TPU Groups that have relatively lower accessibility
(<20% utilisation) across all six core services. They include: TPU Groups 620 & 622 –
Ho Sheung Heung, 741 - 744 – Sai Kung West Country Park, 911 - 913 – Lamma & Po
Toi, 931 & 933 – Pui O and 963 – Hei Ling Chau.
In addition, it can be observed that relative spatial accessibility on the TPU Group
level is largely consistent among the six core services, i.e. TPU Groups with darker
and lighter shades of blue are generally the same across the various figures. In
particular, such relationship is apparent between services that are linked
operationally, like Acute IP and SOP. A scatterplot of the percentage of utilisation
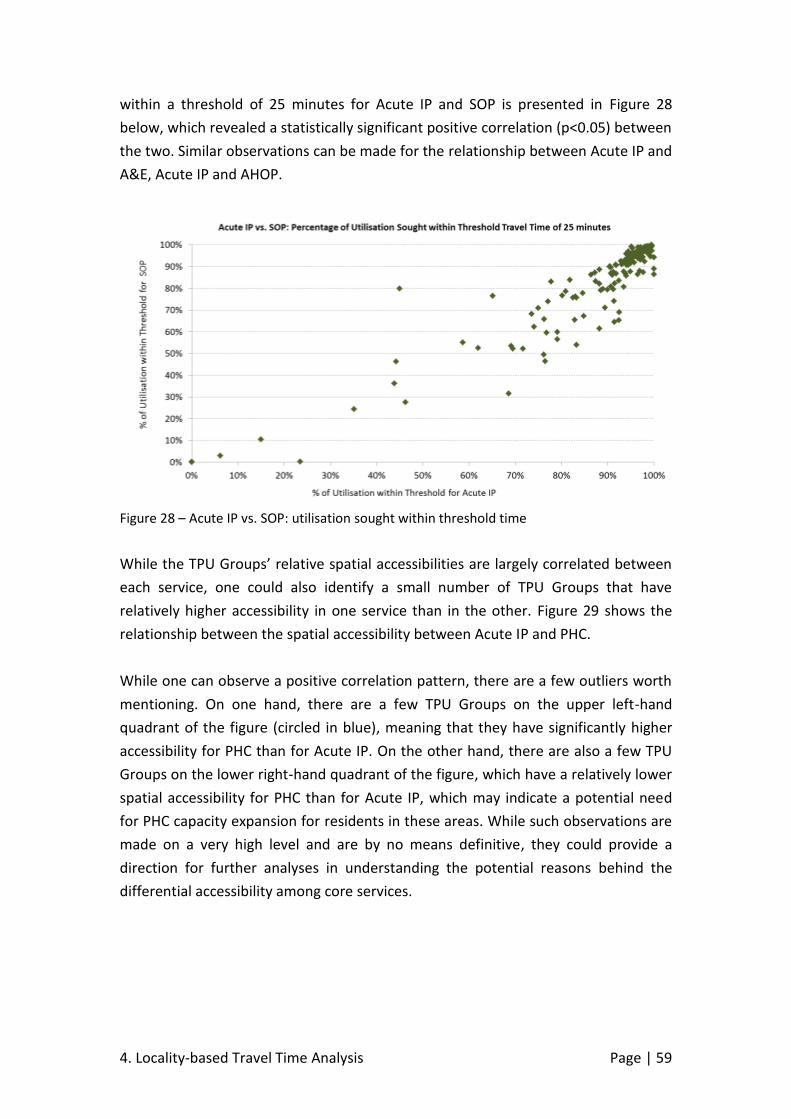
4. Locality-based Travel Time Analysis Page | 59
within a threshold of 25 minutes for Acute IP and SOP is presented in Figure 28
below, which revealed a statistically significant positive correlation (p<0.05) between
the two. Similar observations can be made for the relationship between Acute IP and
A&E, Acute IP and AHOP.
Figure 28 – Acute IP vs. SOP: utilisation sought within threshold time
While the TPU Groups’ relative spatial accessibilities are largely correlated between
each service, one could also identify a small number of TPU Groups that have
relatively higher accessibility in one service than in the other. Figure 29 shows the
relationship between the spatial accessibility between Acute IP and PHC.
While one can observe a positive correlation pattern, there are a few outliers worth
mentioning. On one hand, there are a few TPU Groups on the upper left-hand
quadrant of the figure (circled in blue), meaning that they have significantly higher
accessibility for PHC than for Acute IP. On the other hand, there are also a few TPU
Groups on the lower right-hand quadrant of the figure, which have a relatively lower
spatial accessibility for PHC than for Acute IP, which may indicate a potential need
for PHC capacity expansion for residents in these areas. While such observations are
made on a very high level and are by no means definitive, they could provide a
direction for further analyses in understanding the potential reasons behind the
differential accessibility among core services.
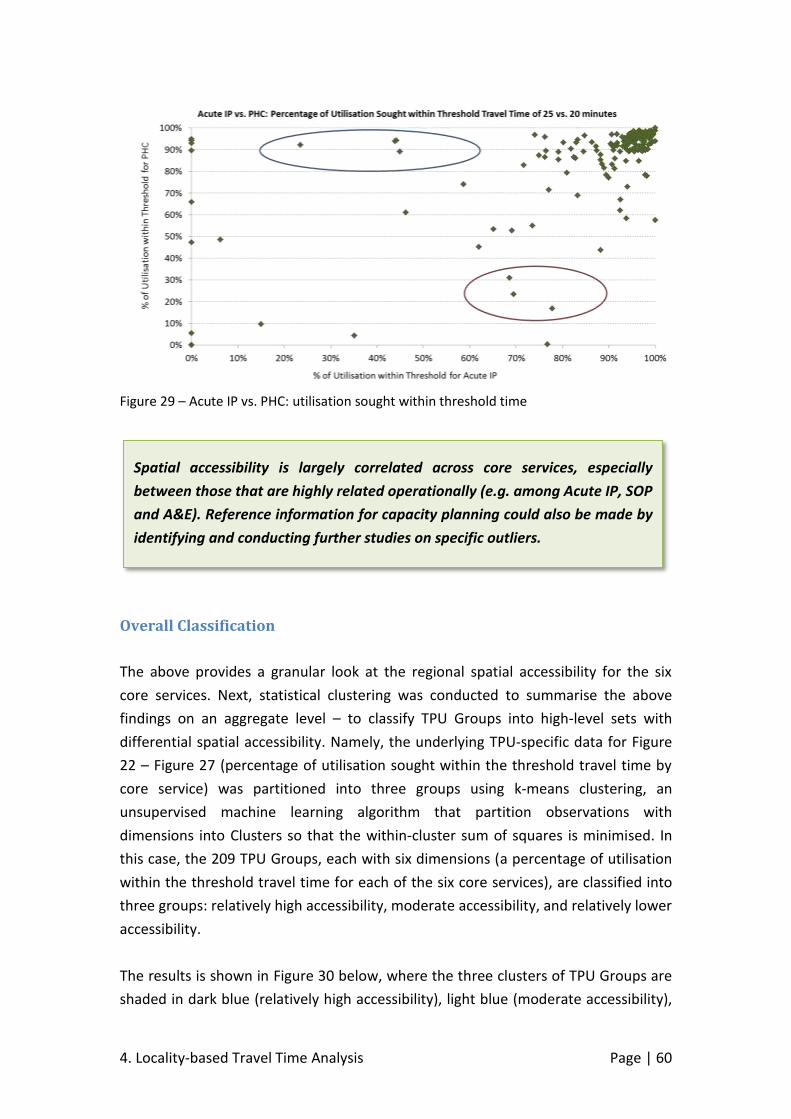
4. Locality-based Travel Time Analysis Page | 60
Figure 29 – Acute IP vs. PHC: utilisation sought within threshold time
Overall Classification
The above provides a granular look at the regional spatial accessibility for the six
core services. Next, statistical clustering was conducted to summarise the above
findings on an aggregate level – to classify TPU Groups into high-level sets with
differential spatial accessibility. Namely, the underlying TPU-specific data for Figure
22 – Figure 27 (percentage of utilisation sought within the threshold travel time by
core service) was partitioned into three groups using k-means clustering, an
unsupervised machine learning algorithm that partition observations with
dimensions into Clusters so that the within-cluster sum of squares is minimised. In
this case, the 209 TPU Groups, each with six dimensions (a percentage of utilisation
within the threshold travel time for each of the six core services), are classified into
three groups: relatively high accessibility, moderate accessibility, and relatively lower
accessibility.
The results is shown in Figure 30 below, where the three clusters of TPU Groups are
shaded in dark blue (relatively high accessibility), light blue (moderate accessibility),
Spatial accessibility is largely correlated across core services, especially
between those that are highly related operationally (e.g. among Acute IP, SOP
and A&E). Reference information for capacity planning could also be made by
identifying and conducting further studies on specific outliers.
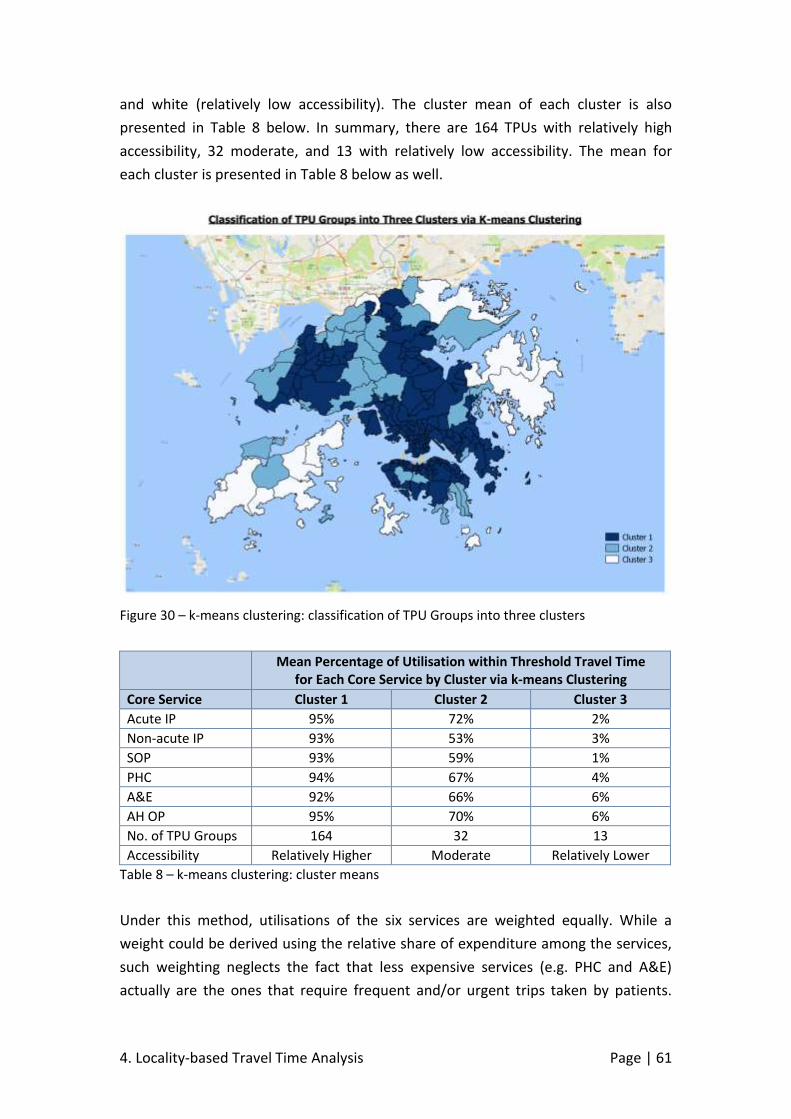
4. Locality-based Travel Time Analysis Page | 61
and white (relatively low accessibility). The cluster mean of each cluster is also
presented in Table 8 below. In summary, there are 164 TPUs with relatively high
accessibility, 32 moderate, and 13 with relatively low accessibility. The mean for
each cluster is presented in Table 8 below as well.
Figure 30 – k-means clustering: classification of TPU Groups into three clusters
Mean Percentage of Utilisation within Threshold Travel Time
for Each Core Service by Cluster via k-means Clustering
Core Service Cluster 1 Cluster 2 Cluster 3
Acute IP 95% 72% 2%
Non-acute IP 93% 53% 3%
SOP 93% 59% 1%
PHC 94% 67% 4%
A&E 92% 66% 6%
AH OP 95% 70% 6%
No. of TPU Groups 164 32 13
Accessibility Relatively Higher Moderate Relatively Lower
Table 8 – k-means clustering: cluster means
Under this method, utilisations of the six services are weighted equally. While a
weight could be derived using the relative share of expenditure among the services,
such weighting neglects the fact that less expensive services (e.g. PHC and A&E)
actually are the ones that require frequent and/or urgent trips taken by patients.
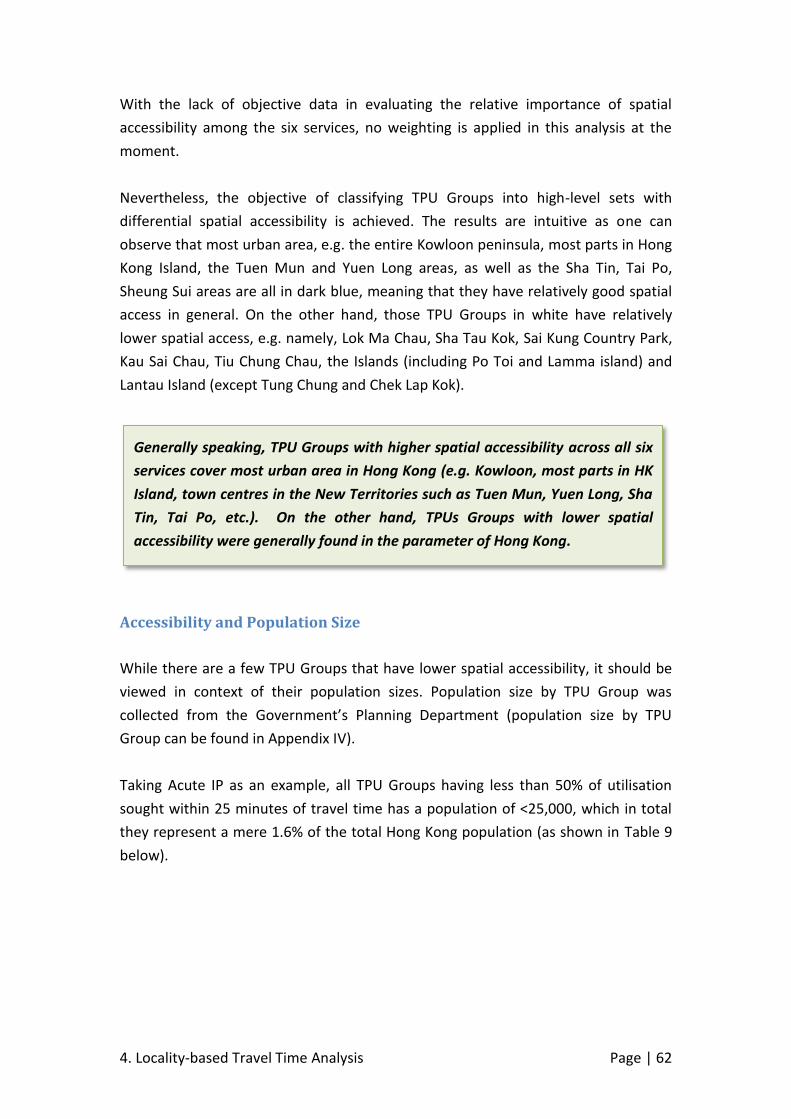
4. Locality-based Travel Time Analysis Page | 62
With the lack of objective data in evaluating the relative importance of spatial
accessibility among the six services, no weighting is applied in this analysis at the
moment.
Nevertheless, the objective of classifying TPU Groups into high-level sets with
differential spatial accessibility is achieved. The results are intuitive as one can
observe that most urban area, e.g. the entire Kowloon peninsula, most parts in Hong
Kong Island, the Tuen Mun and Yuen Long areas, as well as the Sha Tin, Tai Po,
Sheung Sui areas are all in dark blue, meaning that they have relatively good spatial
access in general. On the other hand, those TPU Groups in white have relatively
lower spatial access, e.g. namely, Lok Ma Chau, Sha Tau Kok, Sai Kung Country Park,
Kau Sai Chau, Tiu Chung Chau, the Islands (including Po Toi and Lamma island) and
Lantau Island (except Tung Chung and Chek Lap Kok).
Accessibility and Population Size
While there are a few TPU Groups that have lower spatial accessibility, it should be
viewed in context of their population sizes. Population size by TPU Group was
collected from the Government’s Planning Department (population size by TPU
Group can be found in Appendix IV).
Taking Acute IP as an example, all TPU Groups having less than 50% of utilisation
sought within 25 minutes of travel time has a population of <25,000, which in total
they represent a mere 1.6% of the total Hong Kong population (as shown in Table 9
below).
Generally speaking, TPU Groups with higher spatial accessibility across all six
services cover most urban area in Hong Kong (e.g. Kowloon, most parts in HK
Island, town centres in the New Territories such as Tuen Mun, Yuen Long, Sha
Tin, Tai Po, etc.). On the other hand, TPUs Groups with lower spatial
accessibility were generally found in the parameter of Hong Kong.
4. Locality-based Travel Time Analysis Page | 63
TPU Group % of
Utilisation < 25 minutes
Population Size (2015)
Share of Total HK
Population
181 & 182 – Peak 44% 4,600 0.1%
183 & 184 – Stubbs Road 44% 4,100 0.1%
532 – Pat Heung 46% 10,700 0.1%
543 – Shek Wu Wai San Tsuen 35% 3,100 0.0%
544 – San Wai Tsuen 45% 4,200 0.1%
620 & 622 – Ho Sheung Heung 0% 3,000 0.0%
651 - 653 – Sha Tau Kok, North-eastern islands, e.g. Kat O / Crooked Island
0% 8,000 0.1%
741 - 744 – Sai Kung West Country Park 0% 8,300 0.1%
811 - 815 – Sai Kung East Country Park & Kau Sai Chau
0% 2,400 0.0%
911 - 913 – Lamma & Po Toi 0% 6,300 0.1%
920 – Cheung Chau 23% 22,500 0.3%
931 & 933 – Pui O 0% 4,100 0.1%
932 & 934 – Lantau Island Shui Hau Tsuen 15% 2,200 0.0%
941 - 943 – Ngong Ping 0% 1,100 0.0%
944 – Tai O 0% 2,900 0.0%
961 & 962 – Mui Wo 0% 6,000 0.1%
963 – Hei Ling Chau 0% 1,000 0.0%
971 - 974 – Discovery Bay 6% 13,100 0.2%
976 – Peng Chau 0% 6,500 0.1%
Total 114,100 1.6%
Table 9 – TPU Groups with < 50% of utilisation within 25 minutes for Acute IP
The same observation holds true for all three other core services, namely SOP, A&E
and AHOP, where no TPU Group with < 50% of utilisation sought within the
threshold travel time have a population over 25,000. For Acute IP and PHC, only one
outlier TPU Group was found for each9. Table 10 illustrates that the share of total
Hong Kong population for those TPU Groups with < 50% of utilisation sought within
the threshold time ranges from 1.1% to 3.1% depending on the core service under
study.
9 TPU Group 950 - 951 – Tung Chung and Chek Lap Kok with population of 83,100 (Non-acute IP) and
TPU Group 833 – Tiu Keng Leng with population 67,000 (PHC)
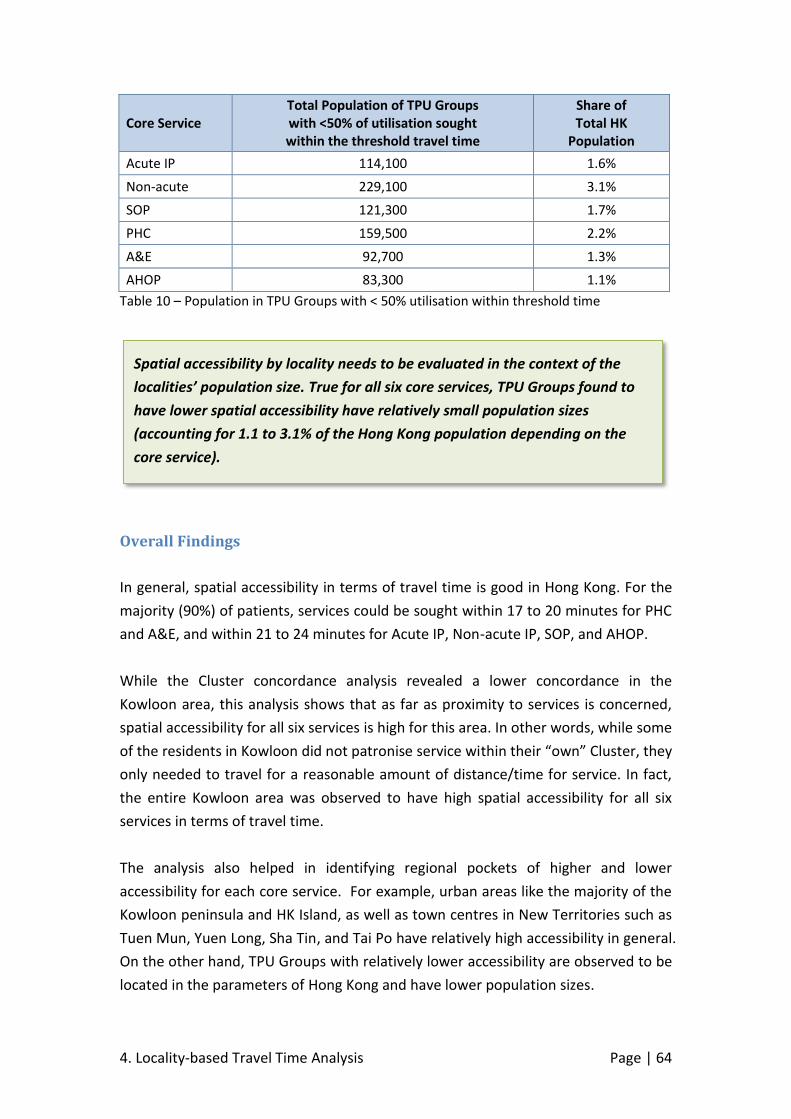
4. Locality-based Travel Time Analysis Page | 64
Core Service Total Population of TPU Groups with <50% of utilisation sought within the threshold travel time
Share of Total HK
Population
Acute IP 114,100 1.6%
Non-acute 229,100 3.1%
SOP 121,300 1.7%
PHC 159,500 2.2%
A&E 92,700 1.3%
AHOP 83,300 1.1%
Table 10 – Population in TPU Groups with < 50% utilisation within threshold time
Overall Findings
In general, spatial accessibility in terms of travel time is good in Hong Kong. For the
majority (90%) of patients, services could be sought within 17 to 20 minutes for PHC
and A&E, and within 21 to 24 minutes for Acute IP, Non-acute IP, SOP, and AHOP.
While the Cluster concordance analysis revealed a lower concordance in the
Kowloon area, this analysis shows that as far as proximity to services is concerned,
spatial accessibility for all six services is high for this area. In other words, while some
of the residents in Kowloon did not patronise service within their “own” Cluster, they
only needed to travel for a reasonable amount of distance/time for service. In fact,
the entire Kowloon area was observed to have high spatial accessibility for all six
services in terms of travel time.
The analysis also helped in identifying regional pockets of higher and lower
accessibility for each core service. For example, urban areas like the majority of the
Kowloon peninsula and HK Island, as well as town centres in New Territories such as
Tuen Mun, Yuen Long, Sha Tin, and Tai Po have relatively high accessibility in general.
On the other hand, TPU Groups with relatively lower accessibility are observed to be
located in the parameters of Hong Kong and have lower population sizes.
Spatial accessibility by locality needs to be evaluated in the context of the
localities’ population size. True for all six core services, TPU Groups found to
have lower spatial accessibility have relatively small population sizes
(accounting for 1.1 to 3.1% of the Hong Kong population depending on the
core service).
4. Locality-based Travel Time Analysis Page | 65
While this section summarises the results of the travel time-based accessibility
analysis on a high-level, detailed results broken down by TPU Groups, namely the
patronage pattern of their residents as well as the percentage of utilisation within
various travel time thresholds for each core service, are presented in Appendix I.

5. Potential Accessibility Analysis Page | 67
5. Potential Accessibility Analysis based on
Capacity and Population
The above analysis provides retrospective information on where patients actually
patronised services in 2015/16. In the literature, this is called “revealed access”,
where actual and retrospective utilisation by locality and institution would be
analysed to gain insight on the utilisation of services given then barriers and
facilitators of both the service system and the potential users (Khan, 1992). On the
other hand, “potential access” is the other useful perspective in analysing
geographical access of healthcare services, where it assesses the nature and pattern
over space of physical access to service facilities (Joseph & Phillips, 1984). The term
“potential” is used here as no actual interaction between supply and demand is
analysed; instead, it takes into account the distribution of both population and
capacity in evaluating accessibility.
While analysing revealed access would enrich one’s understanding on the current
state, analysis on potential access provides insight on the relative distribution of
capacity with respect to locality populations, and would therefore inform longer
term capacity and facility planning with respect to population development. An
illustration using Acute IP, which accounts for the largest share of resources in HA
among the six, is presented in this chapter.
Methodology
Access to health care may be classified according to two dichotomous dimensions
(potential versus revealed, and spatial versus aspatial) into four categories, such as
potential spatial access, potential aspatial access, revealed spatial access, and
revealed aspatial access (Khan, 1992). Spatial access emphasises the importance of
the spatial/distance variable (as a barrier or a facilitator), whereas the aspatial access
stresses nongeographic barriers or facilitators, such as social class, income, ethnicity,
age, sex, etc. (Joseph & Phillips, 1984; Khan, 1992).
Revealed vs. Potential Spatial Accessibility
This report focuses on spatial accessibility. In particular, the previous sections
illustrated two sets of analysis on revealed accessibility (in Chapter 3 and 4
respectively), where focus was made on actual use of health care services. On the

5. Potential Accessibility Analysis Page | 68
other hand, potential accessibility signifies the probable entry into the health care
system, but does not ensure the automatic utilisation of the offered services (Khan,
1992).
In analysing potential spatial accessibility (which is the focus of this chapter), each
facility is assumed to be providing service that is only limited by its capacity, and that
every member of the population is a potential user of the service. As such, the
pattern of accessibility will only depend on the relative location of the population
and service facilities (Joseph & Bantock, 1982). Potential accessibility is often
measured by travel time, road or map distance (Higgs, 2005).
Use of Geographic Information System
Similar to analysing revealed access to service, GIS has been widely used in
evaluating potential accessibility. For example, many studies have used spatially
disaggregated data sets to calculate accessibility based on patients’ address / postal
codes to examine travelling distance / time to their nearby healthcare facilities
(Charlton et al., 2001; Brabyn & Skelly, 2002; Slack et al., 2002; Brabyn & Gower,
2003; Rosero-Bixby, 2004).
Proxy for Capacity
Unlike analysing revealed accessibility, service capacity information would need to
be taken into account when evaluating potential accessibility. However, unlike
measures of utilisation which are relatively straight-forward (e.g. BDO for Acute IP),
the measurement of service capacity could be multi-dimensional and a suitable
supply factor should be chosen for each service category to be the proxy of capacity.
As the most straight-forward and internationally-recognised proxy for capacity of
inpatient services in hospitals, the number of acute beds was chosen as the
surrogate for capacity for Acute IP. In particular, the number of “scheduled beds”,
defined as beds with manpower and other necessary resources allocated to them for
service provision, was chosen over the “bed complement” (HA’s official planned bed
capacity as presented on the Controlling Officer’s Report) as the number of
“scheduled beds” would better reflect the true capacity of hospitals. With the study
period being 2015/16, the number of scheduled acute beds as of 31 March 2016,
broken down by institution, was collected from the S&WP team in the S&P Division.
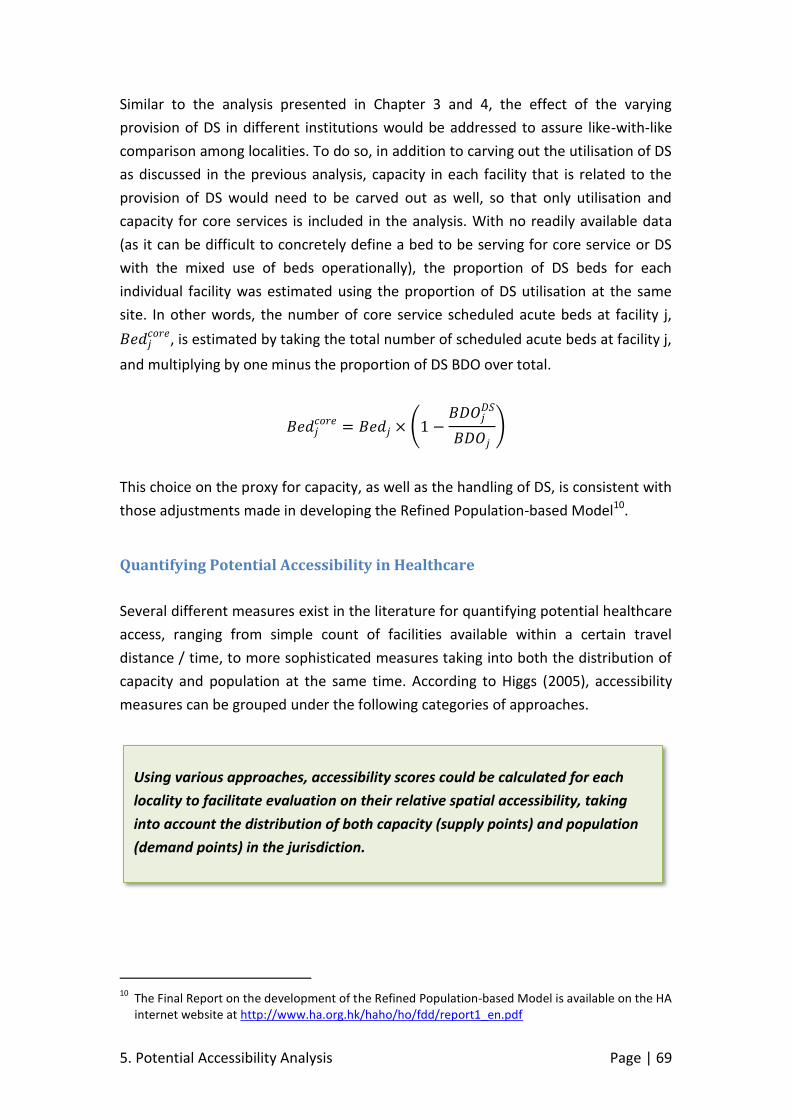
5. Potential Accessibility Analysis Page | 69
Similar to the analysis presented in Chapter 3 and 4, the effect of the varying
provision of DS in different institutions would be addressed to assure like-with-like
comparison among localities. To do so, in addition to carving out the utilisation of DS
as discussed in the previous analysis, capacity in each facility that is related to the
provision of DS would need to be carved out as well, so that only utilisation and
capacity for core services is included in the analysis. With no readily available data
(as it can be difficult to concretely define a bed to be serving for core service or DS
with the mixed use of beds operationally), the proportion of DS beds for each
individual facility was estimated using the proportion of DS utilisation at the same
site. In other words, the number of core service scheduled acute beds at facility j,
𝐵𝑒𝑑𝑗𝑐𝑜𝑟𝑒, is estimated by taking the total number of scheduled acute beds at facility j,
and multiplying by one minus the proportion of DS BDO over total.
𝐵𝑒𝑑𝑗𝑐𝑜𝑟𝑒 = 𝐵𝑒𝑑𝑗 × (1 −
𝐵𝐷𝑂𝑗𝐷𝑆
𝐵𝐷𝑂𝑗
)
This choice on the proxy for capacity, as well as the handling of DS, is consistent with
those adjustments made in developing the Refined Population-based Model10.
Quantifying Potential Accessibility in Healthcare
Several different measures exist in the literature for quantifying potential healthcare
access, ranging from simple count of facilities available within a certain travel
distance / time, to more sophisticated measures taking into both the distribution of
capacity and population at the same time. According to Higgs (2005), accessibility
measures can be grouped under the following categories of approaches.
10
The Final Report on the development of the Refined Population-based Model is available on the HA internet website at http://www.ha.org.hk/haho/ho/fdd/report1_en.pdf
Using various approaches, accessibility scores could be calculated for each
locality to facilitate evaluation on their relative spatial accessibility, taking
into account the distribution of both capacity (supply points) and population
(demand points) in the jurisdiction.

5. Potential Accessibility Analysis Page | 70
Approach Definition
Container Capacity within a given spatial unit (e.g. an administrative district)
Coverage Capacity within a given distance / travel time from a point of origin
Minimum distance Distance / travel time between a point of origin and the nearest facility
Travel cost Average distance / travel time between a point of origin and a set of nearby facilities
Floating Catchment Area / Gravity
Score / index in which the sum of capacity in all facilities is divided by the “frictional effect” of distance / travel time
Table 11 – Various approaches in quantifying potential spatial accessibility
Results
Employing data for Acute IP in 2015/16 (with DS carved out), the potential
accessibility measures as discussed above were computed with results presented in
this section.
Container Approach
The container approach, which counts the number of facilities / amount of capacity
in each administrative region, is the most basic form of an accessibility measure. For
example, the number of scheduled acute beds (after craving out DS) within each
Cluster catchment is shown in Table 12 below.
Cluster Catchment Number of Scheduled Acute Beds (Designated Services Carved Out)
HKEC 1,656
HKWC 1,992
KCC 3,259
KEC 1,835
KWC 2,511
NTEC 2,693
NTWC 1,914
Table 12 – Number of scheduled acute beds by Cluster catchment
While it is simple to compute, the resulting accessibility measure is limited and
biased with its underlying assumption of zero cross-boundary flow. Such assumption
is rather unrealistic in most regional healthcare jurisdictions, and the sensitivity of
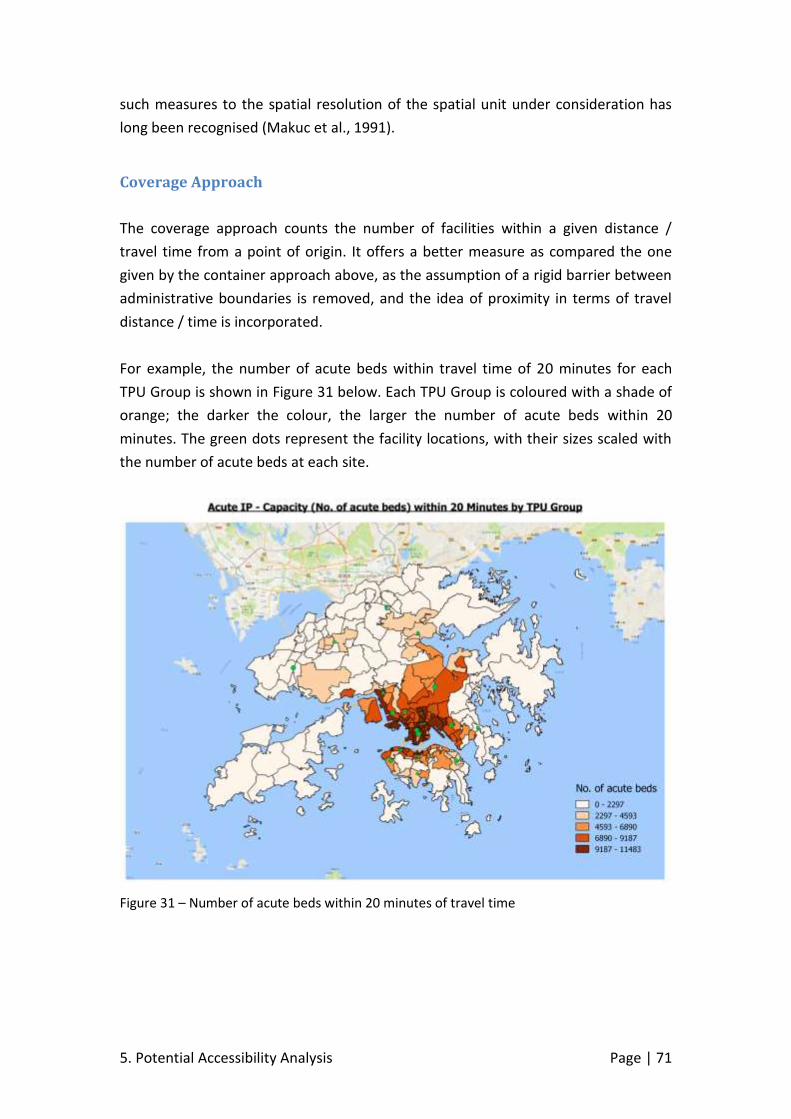
5. Potential Accessibility Analysis Page | 71
such measures to the spatial resolution of the spatial unit under consideration has
long been recognised (Makuc et al., 1991).
Coverage Approach
The coverage approach counts the number of facilities within a given distance /
travel time from a point of origin. It offers a better measure as compared the one
given by the container approach above, as the assumption of a rigid barrier between
administrative boundaries is removed, and the idea of proximity in terms of travel
distance / time is incorporated.
For example, the number of acute beds within travel time of 20 minutes for each
TPU Group is shown in Figure 31 below. Each TPU Group is coloured with a shade of
orange; the darker the colour, the larger the number of acute beds within 20
minutes. The green dots represent the facility locations, with their sizes scaled with
the number of acute beds at each site.
Figure 31 – Number of acute beds within 20 minutes of travel time
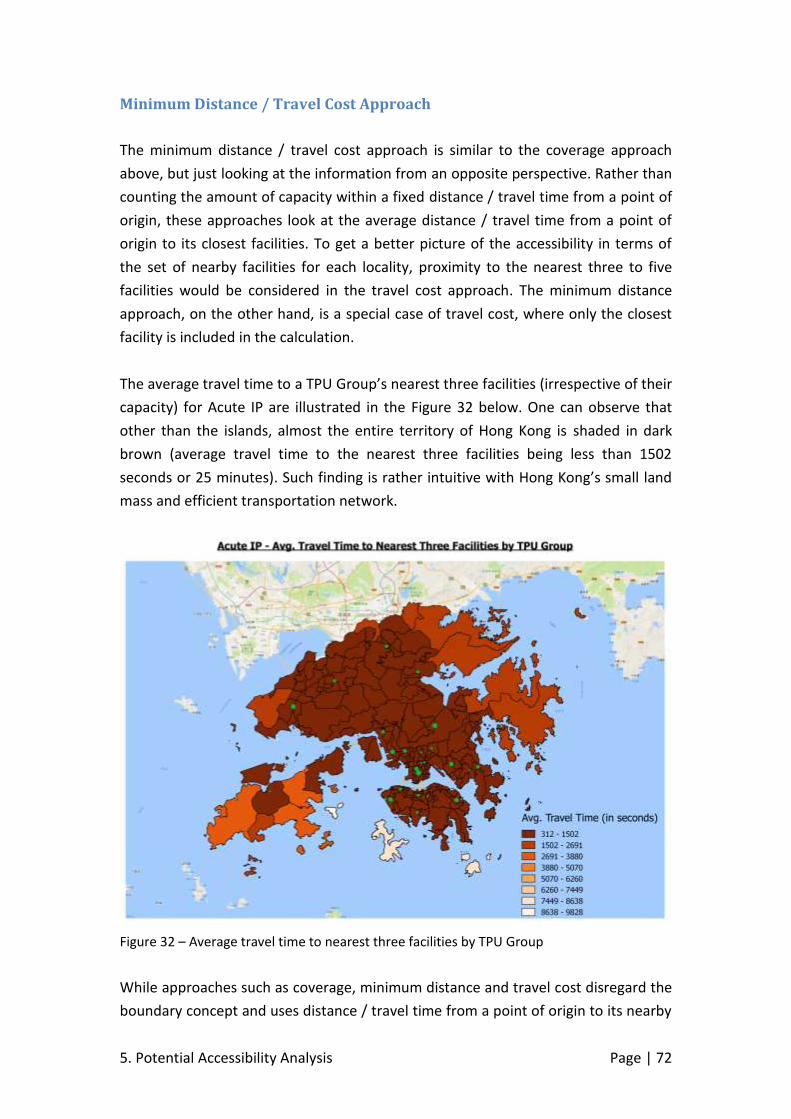
5. Potential Accessibility Analysis Page | 72
Minimum Distance / Travel Cost Approach
The minimum distance / travel cost approach is similar to the coverage approach
above, but just looking at the information from an opposite perspective. Rather than
counting the amount of capacity within a fixed distance / travel time from a point of
origin, these approaches look at the average distance / travel time from a point of
origin to its closest facilities. To get a better picture of the accessibility in terms of
the set of nearby facilities for each locality, proximity to the nearest three to five
facilities would be considered in the travel cost approach. The minimum distance
approach, on the other hand, is a special case of travel cost, where only the closest
facility is included in the calculation.
The average travel time to a TPU Group’s nearest three facilities (irrespective of their
capacity) for Acute IP are illustrated in the Figure 32 below. One can observe that
other than the islands, almost the entire territory of Hong Kong is shaded in dark
brown (average travel time to the nearest three facilities being less than 1502
seconds or 25 minutes). Such finding is rather intuitive with Hong Kong’s small land
mass and efficient transportation network.
Figure 32 – Average travel time to nearest three facilities by TPU Group
While approaches such as coverage, minimum distance and travel cost disregard the
boundary concept and uses distance / travel time from a point of origin to its nearby

5. Potential Accessibility Analysis Page | 73
facilities in computing an accessibility measure, they lack an important consideration
in the geographical distribution of population in the study area. For example, it is
intuitive that regions in close proximity to facility locations would have better
coverage scores, and vice versa. However, these resultant relative accessibility score
may be misleading as the availability of facilities / supply was not analysed with
respect to the distribution of population among each locality.
2-Step Floating Catchment Area Method
While simple area-based capacity-to-population ratios could be used to address the
above lack of consideration on regional population size, the concept of rigid
boundaries would need to be introduced again, which is severely limited with the
assumption of zero cross-boundary flow. The Floating Catchment Area (FCA)
method was developed to overcome such limitation. According to Luo and Wang
(2003), the FCA Method was first used in assessing job accessibility, and resembles
kernel estimation where a “window” defined by distance / travel time is moved
across a study area, and the density of events within the window is used to
represent the density at the centre of the window. The underlying assumption is that
services fall within the catchment area will be fully available to residents within that
catchment area, which may not hold true in some cases. To address this limitation
for measuring access to social services, Radke and Mu (2000) refined the FCA
Method such that the supplier to resident ratio for each location centred at
individual suppliers would be calculated, and as a next step the ratios for residents
living in areas where different providers’ service overlap would be summed up. Such
spatial decomposition method is named the 2-step FCA Method, and it is a major
enhancement to the FCA Method in the sense that it accounts for the interactions
between patients and service capacity by evaluating accessibility as the ratio
between supply and demand, both of which determined by distance / travel time
catchments.
An illustration of the 2-step FCA Method inspired by Luo and Wang (2003) is given
below. Figure 33 shows a jurisdiction with 12 localities (denoted by numbers 1 – 12)
and two hospitals (A and B). For simplicity, assume that each locality has 100 people
residing at its centroid (marked by dots within each locality), and 100 beds are
available in each hospital. First looking from the facilities’ perspective, the dotted
line represents the travel time catchment of the two hospitals. The catchment area
for Hospital A has 100 beds and 500 residents, translating to a beds-to-population
ratio of 1/5. On the other hand, the beds-to-population ratio for Hospital B is 1/6.
Locality 2, 4, and 5 have access to Hospital A only and their accessibility score is thus
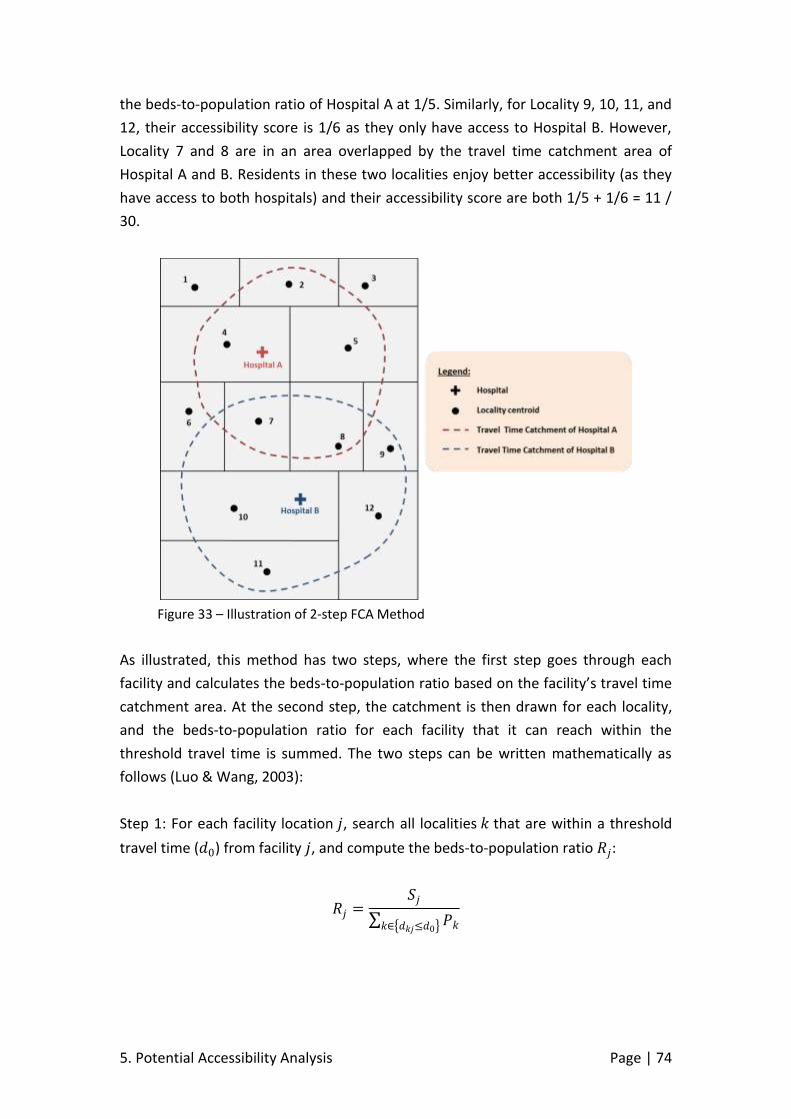
5. Potential Accessibility Analysis Page | 74
the beds-to-population ratio of Hospital A at 1/5. Similarly, for Locality 9, 10, 11, and
12, their accessibility score is 1/6 as they only have access to Hospital B. However,
Locality 7 and 8 are in an area overlapped by the travel time catchment area of
Hospital A and B. Residents in these two localities enjoy better accessibility (as they
have access to both hospitals) and their accessibility score are both 1/5 + 1/6 = 11 /
30.
Figure 33 – Illustration of 2-step FCA Method
As illustrated, this method has two steps, where the first step goes through each
facility and calculates the beds-to-population ratio based on the facility’s travel time
catchment area. At the second step, the catchment is then drawn for each locality,
and the beds-to-population ratio for each facility that it can reach within the
threshold travel time is summed. The two steps can be written mathematically as
follows (Luo & Wang, 2003):
Step 1: For each facility location 𝑗, search all localities 𝑘 that are within a threshold
travel time (𝑑0) from facility 𝑗, and compute the beds-to-population ratio 𝑅𝑗:
𝑅𝑗 =𝑆𝑗
∑ 𝑃𝑘𝑘∈{𝑑𝑘𝑗≤𝑑0}
5. Potential Accessibility Analysis Page | 75
where the denominator sums up the population of the set of localities 𝑘 that fall
within the threshold travel time (𝑑𝑘𝑗 ≤ 𝑑0), and the numerator 𝑆𝑗 denotes the
number of beds at facility location j.
Step 2: For each population location 𝑖, search all facility locations 𝑗 that are within
the threshold travel time from location 𝑖, and sum up the beds-to-population ratios
𝑅𝑗 at these locations:
𝐴𝑖𝐹 = ∑ 𝑅𝑗
𝑗∈{𝑑𝑖𝑗≤𝑑0}
= ∑𝑆𝑗
∑ 𝑃𝑘𝑘∈{𝑑𝑘𝑗≤𝑑0}𝑗∈{𝑑𝑖𝑗≤𝑑0}
Here 𝐴𝑖𝐹 represents the accessibility score at resident location 𝑖, where a higher
value indicates a better accessibility. In essence, it evaluates the ratio of capacity to
demand, with selected facilities and resident locations based on the threshold travel
time (irrespective of any administrative borders).
The 2-step FCA Method was utilised to analyse the potential accessibility for Acute IP.
Similar to the above approaches, the number of acute beds at each facility was used
as a proxy for capacity and each TPU Group represents one resident location.
Maps showing the accessibility score 𝐴𝑖𝐹 for each TPU using threshold travel time of
20 and 40 minutes are shown in Figure 34 and Figure 35. One can observe that as the
threshold increases, so is the spatial smoothing effect. It is indeed intuitive to see
that a larger threshold travel time would reduce variability of accessibility across
TPUs, as residents are less and less discouraged by travelling.
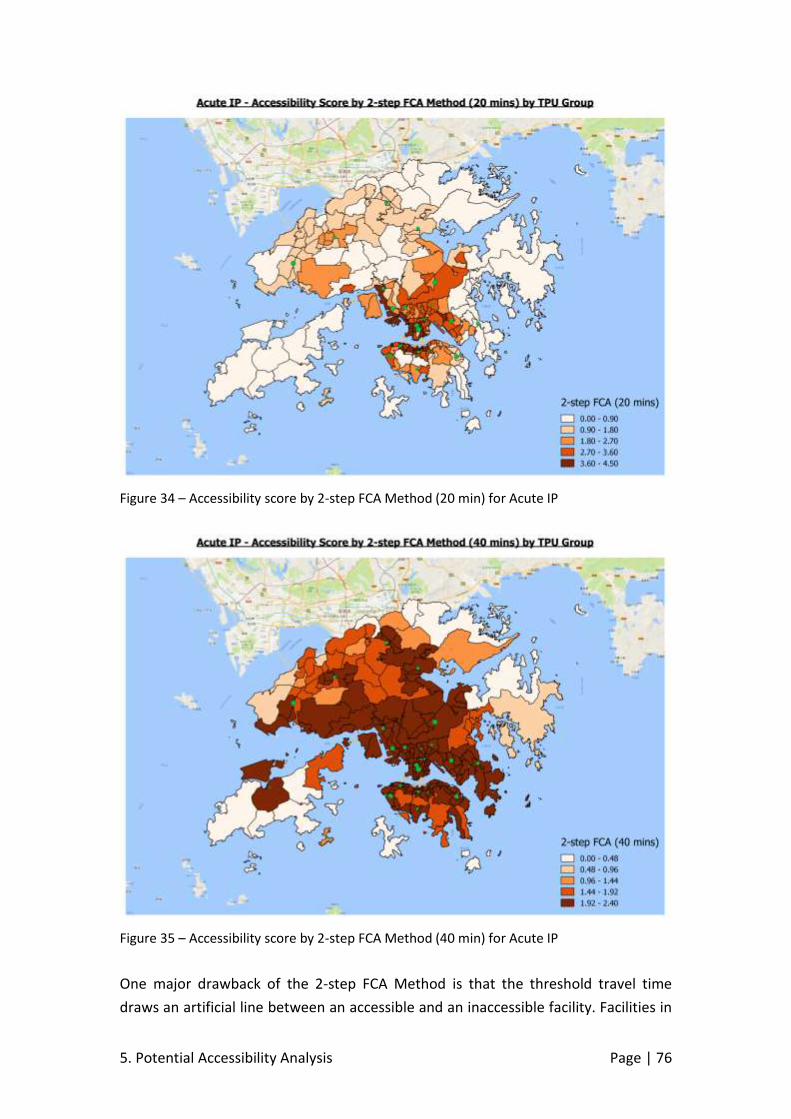
5. Potential Accessibility Analysis Page | 76
Figure 34 – Accessibility score by 2-step FCA Method (20 min) for Acute IP
Figure 35 – Accessibility score by 2-step FCA Method (40 min) for Acute IP
One major drawback of the 2-step FCA Method is that the threshold travel time
draws an artificial line between an accessible and an inaccessible facility. Facilities in
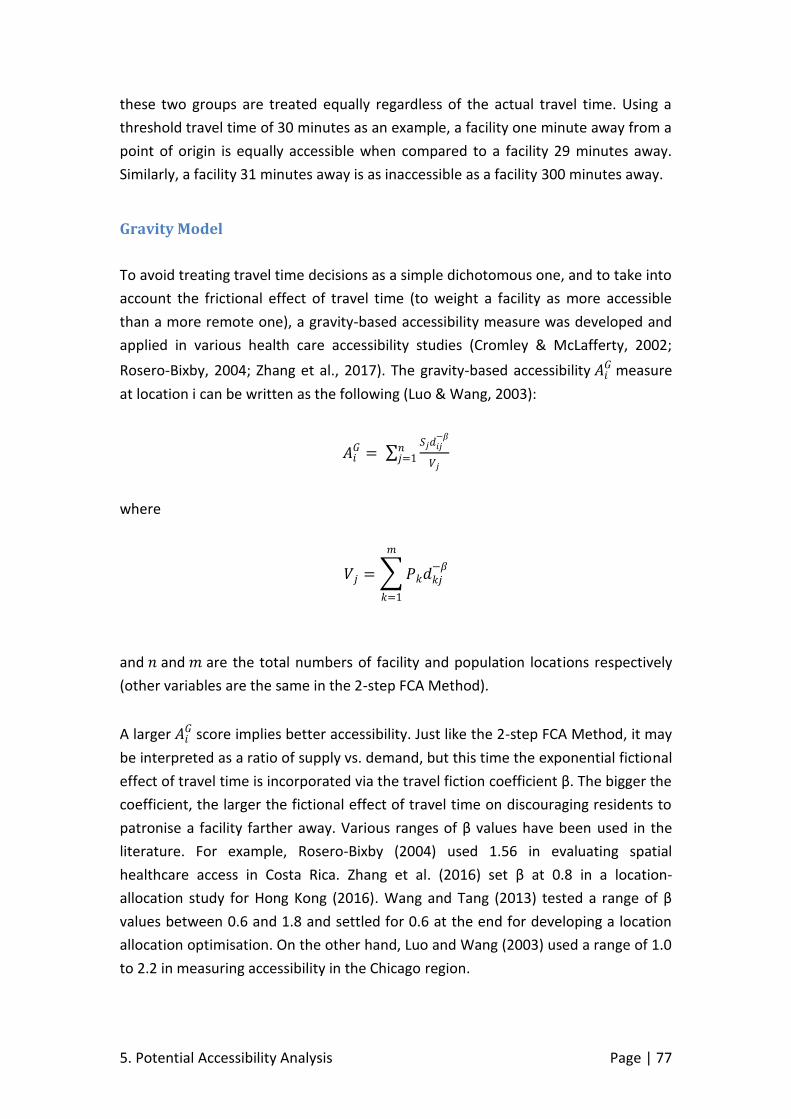
5. Potential Accessibility Analysis Page | 77
these two groups are treated equally regardless of the actual travel time. Using a
threshold travel time of 30 minutes as an example, a facility one minute away from a
point of origin is equally accessible when compared to a facility 29 minutes away.
Similarly, a facility 31 minutes away is as inaccessible as a facility 300 minutes away.
Gravity Model
To avoid treating travel time decisions as a simple dichotomous one, and to take into
account the frictional effect of travel time (to weight a facility as more accessible
than a more remote one), a gravity-based accessibility measure was developed and
applied in various health care accessibility studies (Cromley & McLafferty, 2002;
Rosero-Bixby, 2004; Zhang et al., 2017). The gravity-based accessibility 𝐴𝑖𝐺 measure
at location i can be written as the following (Luo & Wang, 2003):
𝐴𝑖𝐺 = ∑
𝑆𝑗𝑑𝑖𝑗−𝛽
𝑉𝑗
𝑛𝑗=1
where
𝑉𝑗 = ∑ 𝑃𝑘𝑑𝑘𝑗−𝛽
𝑚
𝑘=1
and 𝑛 and 𝑚 are the total numbers of facility and population locations respectively
(other variables are the same in the 2-step FCA Method).
A larger 𝐴𝑖𝐺 score implies better accessibility. Just like the 2-step FCA Method, it may
be interpreted as a ratio of supply vs. demand, but this time the exponential fictional
effect of travel time is incorporated via the travel fiction coefficient β. The bigger the
coefficient, the larger the fictional effect of travel time on discouraging residents to
patronise a facility farther away. Various ranges of β values have been used in the
literature. For example, Rosero-Bixby (2004) used 1.56 in evaluating spatial
healthcare access in Costa Rica. Zhang et al. (2016) set β at 0.8 in a location-
allocation study for Hong Kong (2016). Wang and Tang (2013) tested a range of β
values between 0.6 and 1.8 and settled for 0.6 at the end for developing a location
allocation optimisation. On the other hand, Luo and Wang (2003) used a range of 1.0
to 2.2 in measuring accessibility in the Chicago region.

5. Potential Accessibility Analysis Page | 78
With the travel friction coefficient β being a scaling constant without any straight-
forward physical meaning (in contrast with the threshold travel time used in the 2-
step FCA Method), a sensitivity analysis using β values ranging from 0.4 to 2.2 was be
conducted for Acute IP in HA. To illustrate, the accessibility score 𝐴𝑖𝐺 for each TPU
under the Gravity Model with β values of 0.4, 0.8, and 1.2 are shown in Figure 36,
Figure 37, and Figure 38 below.
Figure 36 – Accessibility score by Gravity Model (β = 0.4) for Acute IP
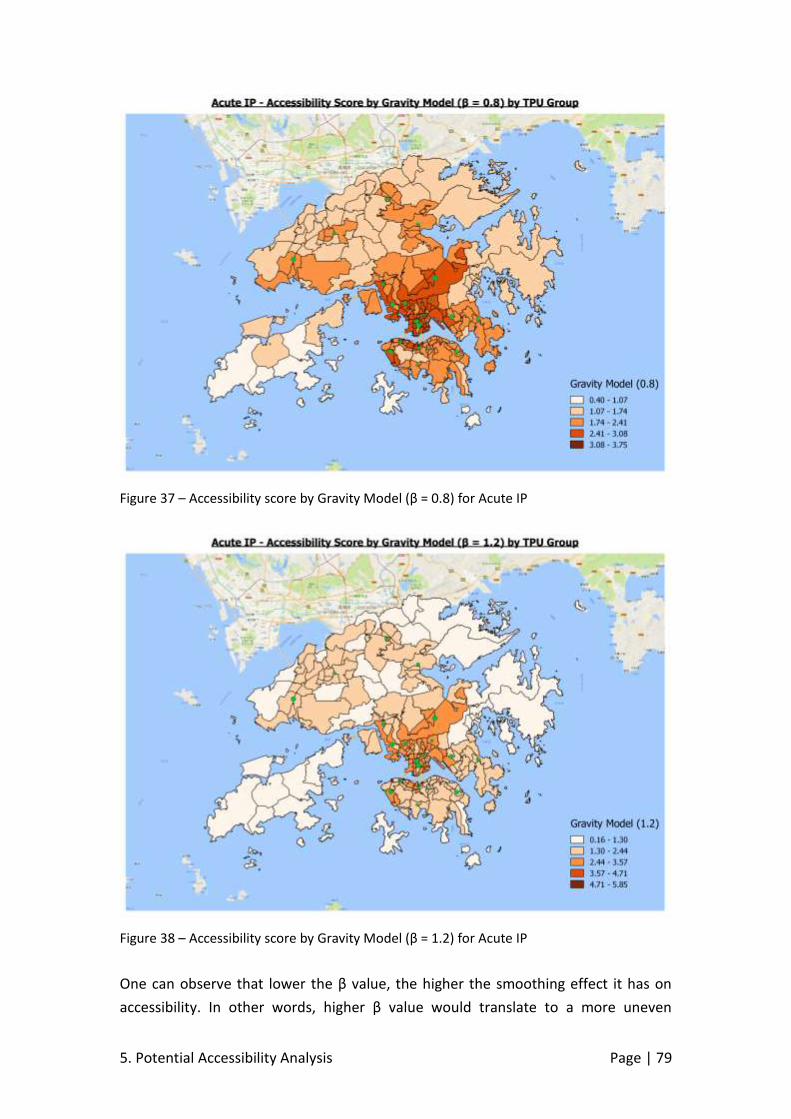
5. Potential Accessibility Analysis Page | 79
Figure 37 – Accessibility score by Gravity Model (β = 0.8) for Acute IP
Figure 38 – Accessibility score by Gravity Model (β = 1.2) for Acute IP
One can observe that lower the β value, the higher the smoothing effect it has on
accessibility. In other words, higher β value would translate to a more uneven
5. Potential Accessibility Analysis Page | 80
accessibility score, as a higher travel fiction coefficient assumes that people are more
discouraged by travelling. Comparing the results of the accessibility measures
generated by the 2-step FCA Method and the Gravity model, it is intuitive to see that
a larger threshold travel time for the 2-step FCA Method corresponds to a smaller
travel fiction coefficient for the Gravity model, in that both assume residents would
be less discouraged to travel longer to patronise service.
Taking a closer look at the individual TPU’s accessibility score computed by both
methods provide interesting insight. For example, the TPUs’ accessibility score
computed using the 2-step FCA Method (threshold travel time of 30 min) was
plotted against those computed using the Gravity model (β =0.8) in Figure 39 below:
Figure 39 – Accessibility scores by 2-step FCA Method and Gravity Model
While the two sets of accessibility scores are largely positively correlated, two main
groups of outliers can be identified. The first group (circled in red), with a relatively
higher score computed by the Gravity Model when compared to the one by the 2-
step FCA Method, comprises TPU Group 220 – Southeast Mong Kok and TPU Group
226 – King’s Park. Their extreme Gravity-based scores are due to their close
proximity with two large-scale facilities (i.e. KWH and QEH respectively), where their
scores would get significantly magnified due to the exponential nature of the travel
time decay function embedded in the Gravity Model. On the other hand, the second
group of outliers (circled in blue) have a relatively higher 2-Step FCA score when
compared to their Gravity-based one. These TPU Groups are all at the western part
of Kowloon (i.e. Tai Kok Tsui, Sham Shui Po, Ma Wan, Tsing Yi, Tsuen Wan), where
residents in these areas can reach multiple facilities within the threshold time of 30
minutes, including Castle Peak Hospital (CPH), Northern District Hospital (NDH),
North Lantau Hospital (NLTH), and Tuen Mun Hospital (TMH). In contrast,
5. Potential Accessibility Analysis Page | 81
surprisingly, the aforementioned two TPU Groups with the highest Gravity-based
score cannot reach any of these sites within 30 minutes.
This highlights the key difference between the two methods for evaluating
accessibility. The 2-step FCA Method assumes a discrete and dichotomous decision,
while the Gravity Model assumes a continuous decay function with respect to the
effect of travel time on patients’ health-seeking behaviour. There are diverging views
on whether one method is superior to the other. On one hand, the Gravity Model
can be viewed as a refined version of the 2-step FCA Method, in that it addresses the
latter’s major limitation in its dichotomous approach that defines a facility inside a
catchment as accessible and one outside as inaccessible (Wang, 2012). On the other
hand, Luo & Wang (2003) prefers the 2-step FCA Method, as the Gravity Model is not
only more computation intensive and harder to explain (especially on travel fiction
coefficient β), it could also conceal particular TPUs with relatively poorer accessibility,
as all facilities, no matter how far away, are theoretically accessible under the
Gravity Model.
After reviewing both sets of results for Acute IP, the Gravity Model seems to offer a
better reflection under the Hong Kong context, where basically the entirety of Hong
Kong is accessible within a reasonable amount of travel time. This special feature of
Hong Kong, being a small city with efficient transportation network, calls for a
continuous definition for “accessibility”, rather than a dichotomous one. For
example, with TPU Group 226 – King’s Park being in the centre of Hong Kong, the
fact that it is 30.1 and 35.9 minutes away (just over the threshold of 30 minutes)
from NDH and TMH respectively should not make them totally inaccessible as the 2-
step FCA Method would assume.
Accessibility score computed by the Gravity Model (β=0.8) is shown above in Figure
39. High accessibility is observed for the most parts of Hong Kong Island and
Kowloon, and selected New Territories town centres like Sha Tin, which is largely
similar to the observations made from the revealed accessibility analyses as
presented in Chapter 3 and 4.
There are various methods in evaluating potential spatial accessibility taking
into account both capacity and population. Under Hong Kong’s context, the
Gravity Model is useful in generating insights on how well locality populations
are served in their proximity.
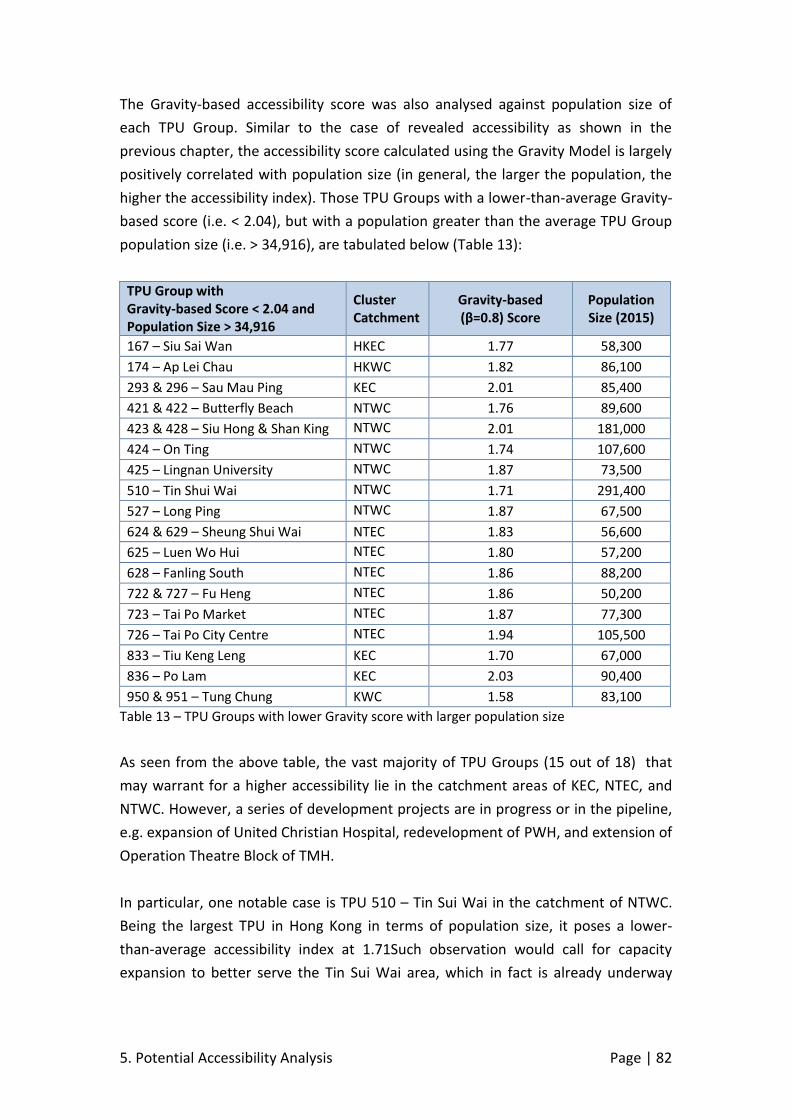
5. Potential Accessibility Analysis Page | 82
The Gravity-based accessibility score was also analysed against population size of
each TPU Group. Similar to the case of revealed accessibility as shown in the
previous chapter, the accessibility score calculated using the Gravity Model is largely
positively correlated with population size (in general, the larger the population, the
higher the accessibility index). Those TPU Groups with a lower-than-average Gravity-
based score (i.e. < 2.04), but with a population greater than the average TPU Group
population size (i.e. > 34,916), are tabulated below (Table 13):
TPU Group with Gravity-based Score < 2.04 and Population Size > 34,916
Cluster Catchment
Gravity-based (β=0.8) Score
Population Size (2015)
167 – Siu Sai Wan HKEC 1.77 58,300
174 – Ap Lei Chau HKWC 1.82 86,100
293 & 296 – Sau Mau Ping KEC 2.01 85,400
421 & 422 – Butterfly Beach NTWC 1.76 89,600
423 & 428 – Siu Hong & Shan King NTWC 2.01 181,000
424 – On Ting NTWC 1.74 107,600
425 – Lingnan University NTWC 1.87 73,500
510 – Tin Shui Wai NTWC 1.71 291,400
527 – Long Ping NTWC 1.87 67,500
624 & 629 – Sheung Shui Wai NTEC 1.83 56,600
625 – Luen Wo Hui NTEC 1.80 57,200
628 – Fanling South NTEC 1.86 88,200
722 & 727 – Fu Heng NTEC 1.86 50,200
723 – Tai Po Market NTEC 1.87 77,300
726 – Tai Po City Centre NTEC 1.94 105,500
833 – Tiu Keng Leng KEC 1.70 67,000
836 – Po Lam KEC 2.03 90,400
950 & 951 – Tung Chung KWC 1.58 83,100
Table 13 – TPU Groups with lower Gravity score with larger population size
As seen from the above table, the vast majority of TPU Groups (15 out of 18) that
may warrant for a higher accessibility lie in the catchment areas of KEC, NTEC, and
NTWC. However, a series of development projects are in progress or in the pipeline,
e.g. expansion of United Christian Hospital, redevelopment of PWH, and extension of
Operation Theatre Block of TMH.
In particular, one notable case is TPU 510 – Tin Sui Wai in the catchment of NTWC.
Being the largest TPU in Hong Kong in terms of population size, it poses a lower-
than-average accessibility index at 1.71Such observation would call for capacity
expansion to better serve the Tin Sui Wai area, which in fact is already underway

5. Potential Accessibility Analysis Page | 83
with the establishment and incremental upscaling of service in the Tin Sui Wai
Hospital (with A&E service commenced in March 2017).
Potential accessibility is found to be generally good in Hong Kong. On the
regional level, relatively high accessibility is observed for most of the areas in
Kowloon and Hong Kong Island.
TPU Groups with relatively lower accessibility and significant population sizes
(>34,916) are mainly within the catchment of KEC, NTEC, and NTWC, which
may indicate these Clusters’ need for capacity development / facility
expansion in the longer-term so as to enhance proximity to care. A series of
development projects in these areas are already underway.

6. Discussion Page | 85
6. Discussion
Summary of Results
A quantitative evaluation on spatial accessibility of healthcare services was
conducted to understand the magnitude of cross-cluster flow as well as patterns of
flow by residential location, so as to generate insight on health-seeking behaviour,
and in turn provide reference information for longer-term facility and capacity
planning in HA.
First, through analysing the Cluster concordance rates, defined as the proportion of
activity of a region’s residents being treated in their own Cluster, the concept of
Cluster catchment proves to be a useful reference. After delineating the effect of
Designated Services so as to assure a like-with-like comparison across localities in
Hong Kong, and simulating the current re-clustered setting to reflect the current
state of operation, concordance rates are generally higher in Hong Kong and the
New Territories, illustrating that they are relatively confined geographically. This
study also shows how the re-delineation of Cluster boundary increased the
concordance of the KCC and KWC catchments. The concordance rates of the KEC
catchment are relatively lower (e.g. at 74.5% for Acute IP). This can be partly
explained by the unavailability of certain core service (e.g. Oncology services) where
residents in the KEC catchment need to patronise other Clusters, namely KCC,
instead.
Extending from the Cluster concordance analysis, revealed spatial accessibility was
analysed one level deeper, i.e. by locality using TPU Groups as a spatial unit. Instead
of studying whether services are provided to residents in the same Cluster,
accessibility was evaluated with respect to patient convenience using travel time as a
proxy. With clustering being an administrative arrangement only, such analysis will
provide more insight on patient convenience in terms of how they were served in
their proximity. Similar to the Cluster concordance analysis, utilisation of Designated
Services was carved out to assure like-with-like comparison across localities. The
analysis revealed that revealed spatial accessibility is generally good in Hong Kong.
For the vast majority (90%) of utilisation, services could be sought within 17 to 20
minutes for PHC and A&E, and within 21 to 24 minutes for Acute IP, Non-acute IP,
SOP, and AHOP. The analysis also helped in identifying regional pockets of higher and
lower accessibility for each core service. For example, urban areas like the majority
of the Kowloon peninsula and HK Island, as well as New Territories town centres like
6. Discussion Page | 86
Tuen Mun, Yuen Long, Sha Tin and Tai Po, have relatively high accessibility in general.
On the other hand, some TPU Groups have relatively lower accessibility, which are
generally found in the parameters of Hong Kong and are observed to have smaller
population sizes (1.6% of total Hong Kong population for Acute IP).
In addition to analysing retrospective information on revealed accessibility with
respect to travel time, an analysis on potential accessibility based on capacity and
population was conducted for Acute IP. In contrast to revealed accessibility where
the focus on the realised / actual health-seeking behaviour, analysis on potential
accessibility aims at evaluating the spatial distribution of supply (beds in hospitals in
the case for Acute IP) with respect to the geographical distribution of demand
(population), which would help informing longer-term capacity / facility under HA’s
long term objective of providing core services in the vicinities of local populations.
Several approaches in evaluating potential access are presented, with the Gravity
Model being the most suitable one under Hong Kong’s context. Analysis using such
model revealed local pockets of higher / lower potential accessibility. In particular,
TPU Groups that have relatively lower accessibility scores together with significant
population sizes (i.e. higher than the average TPU Group population of 34,916) were
identified and they are mainly found within the catchment of KEC, NTEC, and NTWC.
Such information would inform longer-term service, facility and capacity planning, so
as to facilitate HA to move forward in enhancing local access to care.
Limitation and Potential Extensions
As in any scientific study, the observations and findings need to be viewed in the
context of the study’s limitations.
Cluster Catchment as a Spatial Unit
First and foremost, the Cluster Concordance Analysis (shown in Chapter 3) evaluates
accessibility by analysing to what extend patients have sought care in their own
Cluster. While Cluster catchment is good reference in general, it has to be stressed
that clustering in HA is not a patient registration system but an administrative
networking arrangement that groups institution together for purposes of continuity
of care and economy of scale. Therefore, patients can choose to go to institutions in
any Cluster for most core services. Imagine a patient residing near a Cluster
boundary; it may be more convenient for him / her to visit facilities of the adjacent
Cluster. Under such setting in the Hong Kong healthcare system, analysing service
access merely from a Cluster catchment perspective may not be comprehensive.
6. Discussion Page | 87
Instead, one can convincingly argue that patient’s health-seeking behaviour might be
driven other factors, such as daytime mobility, preference / prior experience with
particular institutions, and patient convenience in terms of travelling, rather than the
administrative Cluster boundaries.
Granularity of TPU Group
Two sets of accessibility analyses were therefore presented (in Chapter 4 and 5),
where TPU Group, rather than Cluster catchment, was used as the spatial unit of
analysis. As noted in Chapter 2 where the rationale of choosing TPU Groups as the
geographical unit is presented, TPU Groups were selected over Cluster Catchment
and DCCA with their granularity, and the availability of population data on the TPU
Group level. It has to be noted that other more granular spatial unit is available in
Hong Kong. Examples include “Street Block and Village Cluster”11 and “Planning Data
Zones”. Extension of this analysis using these spatial units could be conducted when
utilisation and population data broken down to such granular level is available.
Use of Geographical Centroids
While it is reasonable to assume the homogeneity of the population in a TPU Group,
analysing on such an aggregated geographical level has one important limitation in
that a centroid needs to be estimated for each unit. Without the availability of
information on the spread of population in each TPU Group, the geographical
centroid was used as a proxy. As mentioned above, one way of mitigating this
limitation is the use of a more refined spatial unit. To further minimise aggregation
error arising from the distribution of population around the centroid of spatial units,
one possible extension of this study is to analyse on an individual level, i.e. to
geocode the location of each individual patient rather than grouping them into a
geographical units. This, however, requires much more granular utilisation and
population data, and would be significantly more intensive computationally.
Travel Time based on Drive Time via Road Network
Travel time between patients’ places of residence and facilities was selected as the
proxy of patient convenience in the analysis. To facilitate a like-with-like comparison
on accessibility among different parts of Hong Kong and to arrive at more
11
Each TPU is sub-divided into a number of Street Blocks for urban areas and Village Clusters for rural areas

6. Discussion Page | 88
generalisable results, travel time estimated by means of private car using the existing
road network was utilised. As a potential extension of this study, a sensitivity
analysis on how different measures of travel time, e.g. use of public transit, would
impact the relative accessibility among different regions in Hong Kong. In addition, in
view of the extensive expansion of transportation networks in Hong Kong (both road
and public transit like the Mass Transit Railway), it would be also be fruitful to
conduct scenario analysis taking into account various major changes in the
transportation infrastructure anticipated to be completed in the next few years.
References Page | 89
References
Apparicio, P., Abdelmajid, M., Riva, M., & Shearmur, R. (2008). Comparing alternative
approaches to measuring the geographical accessibility of urban health services:
Distance types and aggregation-error issues. International journal of health
geographics, 7(1), 7.
Bliss, R. L., Katz, J. N., Wright, E. A., & Losina, E. (2012). Estimating proximity to care:
are straight line and zipcode centroid distances acceptable proxy measures?.
Medical care, 50(1), 99
Brabyn, L., & Gower, P. (2003). Mapping accessibility to general practitioners.
Geographic information systems and health applications, 289-307.
Brabyn, L., & Skelly, C. (2002). Modeling population access to New Zealand public
hospitals. International Journal of Health Geographics, 1(1), 3.
Charlton, M., Fotheringham, S., & Brunsdon, C. (2001). Analysing Access to Hospital
Facilities with GIS. In Regional science in business (pp. 283-303). Springer Berlin
Heidelberg.
Cromley, E. K., & McLafferty, S. L. (2002). GIS and public health. 2002. New York:
Guilford Press Google Scholar.
Fotheringham, A. S., Brunsdon, C., & Charlton, M. (2000). Quantitative geography:
perspectives on spatial data analysis. Sage.
Gandy, R. J. (1979). A graphical representation of the inter-relationship between
districts. The Hospital and health services review, 75(2), 50.
Gandy, R., Franci, A., Gurrieri, C., & McClelland, B. (2011). Demonstrating access to
public services diagrammatically. International Journal of Public Administration,
34(8), 516-527.
Gatrell, A., & Senior, M. (1999). Health and health care applications. Geographical
Information Systems, Wiley, New York, 19.
Gurrieri, C. (2008, October). Youth Crime in Italy: A Statistical Analysis Using Gandy’s
Diagram. In Meeting of the Italian Society of Criminology. San Marino.

References Page | 90
Haynes, R., Bentham, G., Lovett, A., & Gale, S. (1999). Effects of distances to hospital
and GP surgery on hospital inpatient episodes, controlling for needs and
provision. Social science & medicine, 49(3), 425-433.
Hewko, J., Smoyer-Tomic, K. E., & Hodgson, M. J. (2002). Measuring neighbourhood
spatial accessibility to urban amenities: does aggregation error matter?.
Environment and Planning A, 34(7), 1185-1206.
Higgs, G. (2005). A literature review of the use of GIS-based measures of access to
health care services. Health Services and Outcomes Research Methodology, 5(2),
119-139.
Higgs, G., & Gould, M. (2001). Is there a role for GIS in the ‘new NHS’?. Health &
Place, 7(3), 247-259.
Joseph, A. E., & Bantock, P. R. (1982). Measuring potential physical accessibility to
general practitioners in rural areas: a method and case study. Social science &
medicine, 16(1), 85-90.
Joseph, A. E., & Phillips, D. R. (1984). Accessibility and utilization: geographical
perspectives on health care delivery. Sage.
Khan, A. A. (1992). An integrated approach to measuring potential spatial access to
health care services. Socio-economic planning sciences, 26(4), 275-287.
Luo, W., & Wang, F. (2003). Measures of spatial accessibility to health care in a GIS
environment: synthesis and a case study in the Chicago region. Environment and
Planning B: Planning and Design, 30(6), 865-884.
M Makuc, D., Haglund, B., Ingram, D. D., Kleinman, J. C., & Feldman, J. J. (1991). The
use of health service areas for measuring provider availability. The Journal of
Rural Health, 7(4), 347-356.
McClelland, R. J., & Gandy, R. J. (2012). Undergraduate regional migration in the UK:
perspectives on local markets and trends for gender and international student
groups. Studies in Higher Education, 37(8), 901-924.
References Page | 91
McKenzie, B., Koerber, W., Fields, A., Benetsky, M., & Rapino, M. (2010). Commuter-
adjusted population estimates: ACS 2006-10. Washington, DC: Journey to Work
and Migration Statistics Branch, US Census Bureau.
Messina, G., Vigiani, N., Lispi, L., & Nante, N. (2012). Patient migration among the
Italian regions in 2003. Italian Journal of Public Health, 5(1).
Radke, J., & Mu, L. (2000). Spatial decompositions, modeling and mapping service
regions to predict access to social programs. Geographic Information Sciences,
6(2), 105-112.
Rosero-Bixby, L. (2004). Spatial access to health care in Costa Rica and its equity: a
GIS-based study. Social Science & Medicine, 58(7), 1271-1284.
Slack, A., Cumming, J., Maré, D., & Timmins, J. (2002). Variations in secondary care
utilisation and geographic access: initial analysis of 1996 data. Proceedings of
GeoHealth 2002, 105-114.
Wang, F. (2012). Measurement, optimization, and impact of health care accessibility:
a methodological review. Annals of the Association of American Geographers,
102(5), 1104-1112.
Wang, F., & Tang, Q. (2013). Planning toward equal accessibility to services: a
quadratic programming approach. Environment and planning B: Planning and
Design, 40(2), 195-212.
Witten, K., Exeter, D., & Field, A. (2003). The quality of urban environments: mapping
variation in access to community resources. Urban studies, 40(1), 161-177.
Zhang, W., Cao, K., & Liu, S. GIS-Based Accessibility Analysis of Health-Care Facilities:
A Case Study in Hong Kong.


Appendix I: Accessibility Statistics by Locality Page | 93
Appendix I: Accessibility Statistics by Locality
Appendix I presents various accessibility statistics by TPU Group for the six core
services, namely Acute Inpatient (Acute IP), Non-acute Inpatient (Non-acute IP),
Specialist Outpatient (SOP), Primary Care (PHC), Accident and Emergency (A&E),
Allied Health Outpatient (AHOP).
Cluster Catchment
District Tertiary Planning Unit Groups Page no.
HKEC Eastern 148; 151; 152; 153; 154; 155; 157; 161; 162; 163; 166; 167; 156 & 158; 164 & 165
99-112
Islands (excl. Lantau)
920; 963; 976; 911-913 113-116
Wan Chai 131; 132; 133; 134; 135; 140; 144; 145; 149; 146 & 147; 183 & 184
117-127
HKWC Central & Western
111; 112; 113; 114; 115; 116; 141; 142; 143; 121 & 122; 123 & 124; 181 & 182
128-139
Southern 171; 172; 173; 174; 191; 196; 197; 175 & 176; 190, 192 & 194; 193, 195 & 198
140-149
KCC Kowloon City 231; 232; 233; 234; 235; 236; 237; 241; 242; 243; 244; 245; 246; 247; 271; 272; 285; 213 & 215-216
150-167
Mong Kok 220; 221; 222; 227; 228; 229; 253; 254 168-175
Wong Tai Sin 281; 282; 283; 284; 287; 288 & 289 176-181
Yau Tsim 211; 212; 214; 217; 225; 226; 251, 252 & 256 182-188
KEC Kwun Tong 290; 291; 292; 297; 298; 280 & 286; 293 & 296; 294 & 295
189-196
Sai Kung 821; 822; 823; 825; 827; 829; 831; 833; 835; 836; 837; 838; 839; 811-815; 820 & 824; 826 & 828; 832 & 834
197-213
KWC Kwai Tsing 326; 327; 328; 350; 351 214-218
Lantau Island 944; 931 & 933; 932 & 934; 941-943; 950 & 951; 961 & 962; 971-974
219-225
Sham Shui Po
260; 261; 262; 263; 264; 265; 266; 267; 268; 255 & 269
226-235
Tsuen Wan 310; 321; 322; 323; 325; 335; 975; 320, 324 & 329; 331-334, 336 & 340
236-244
NTEC North 623; 625; 626; 627; 628; 634; 641; 642; 545 & 546; 610 & 621; 620 & 622; 624 & 629; 651-653
245-257
Sha Tin 755; 757; 758; 759; 731, 733 & 754; 732, 751 & 753; 756 & 761-762
258-264
Tai Po 720; 723; 724; 725; 726; 729; 631-633; 711-712, 721 & 728; 722 & 727; 741-744
265-274
NTWC Tuen Mun 424; 425; 426; 441; 442; 411-416 & 427; 421 & 422; 423 & 428; 431-434
275-283
Yuen Long 510; 511; 512; 513; 514; 516; 518; 519; 521; 522; 523; 524; 527; 528; 529; 531; 532; 533; 541; 542; 543; 544; 515 & 517; 525 & 526
284-307

Appendix I: Accessibility Statistics by Locality Page | 94
TPU Groups by Cluster Catchment
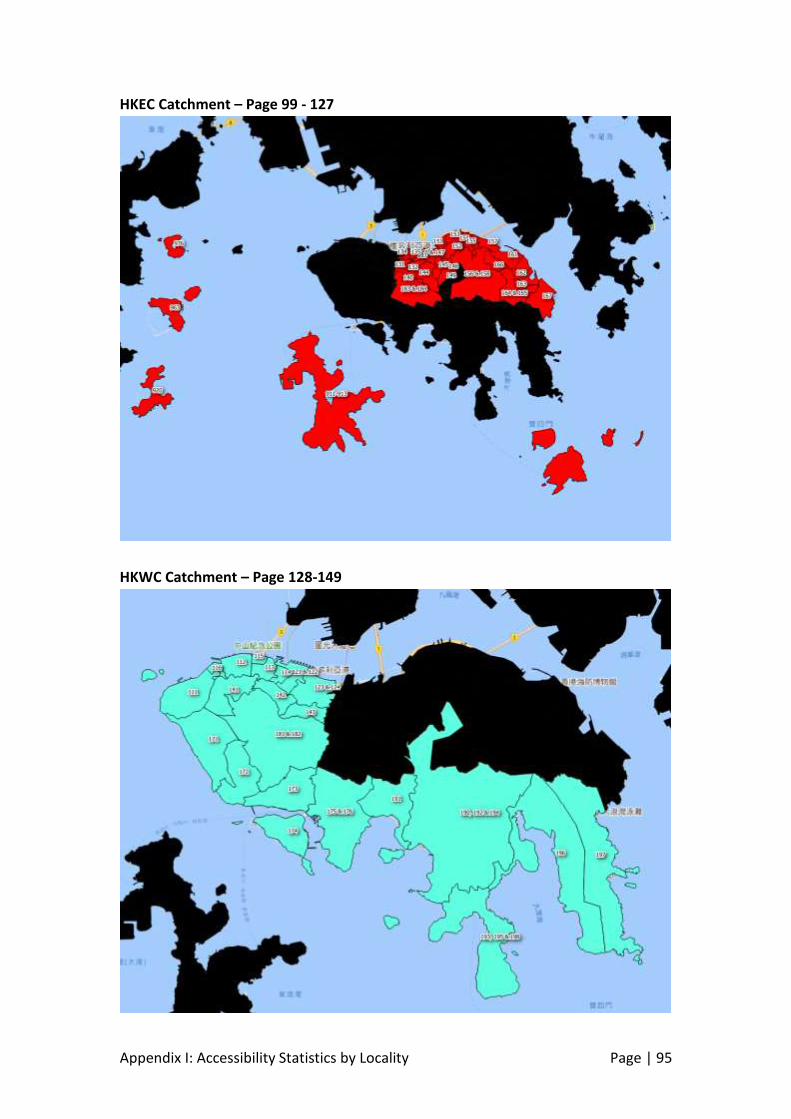
Appendix I: Accessibility Statistics by Locality Page | 95
HKEC Catchment – Page 99 - 127
HKWC Catchment – Page 128-149
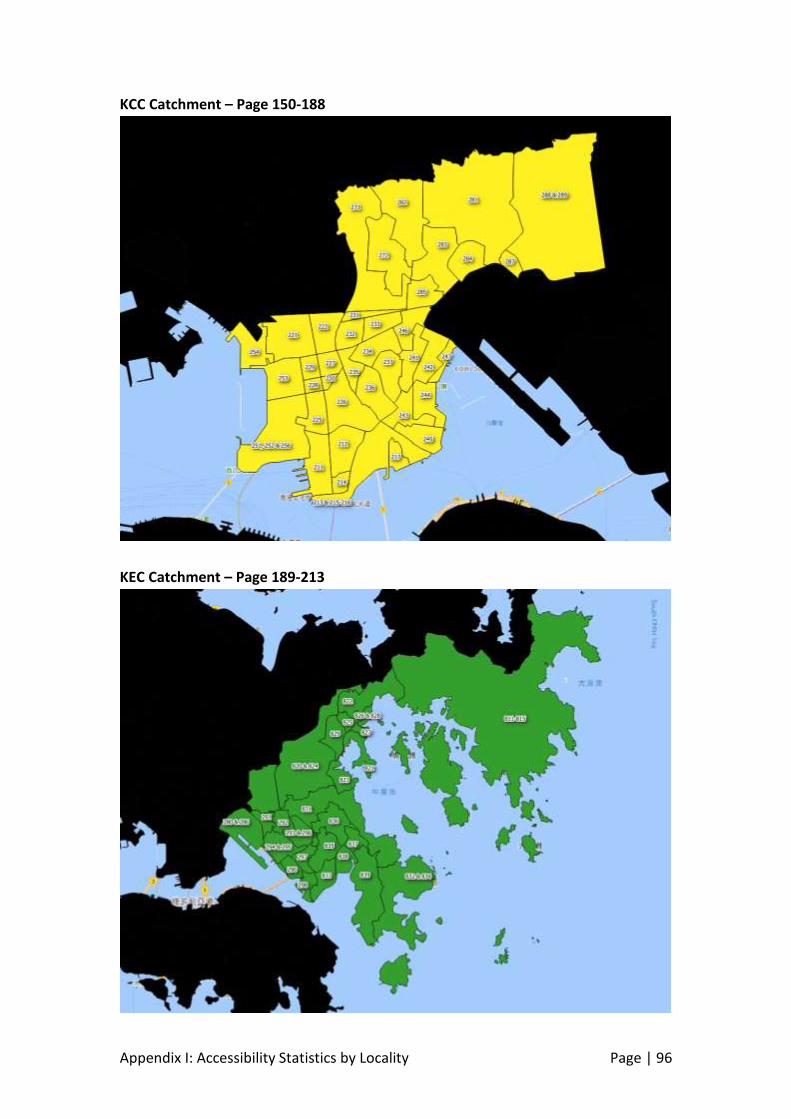
Appendix I: Accessibility Statistics by Locality Page | 96
KCC Catchment – Page 150-188
KEC Catchment – Page 189-213
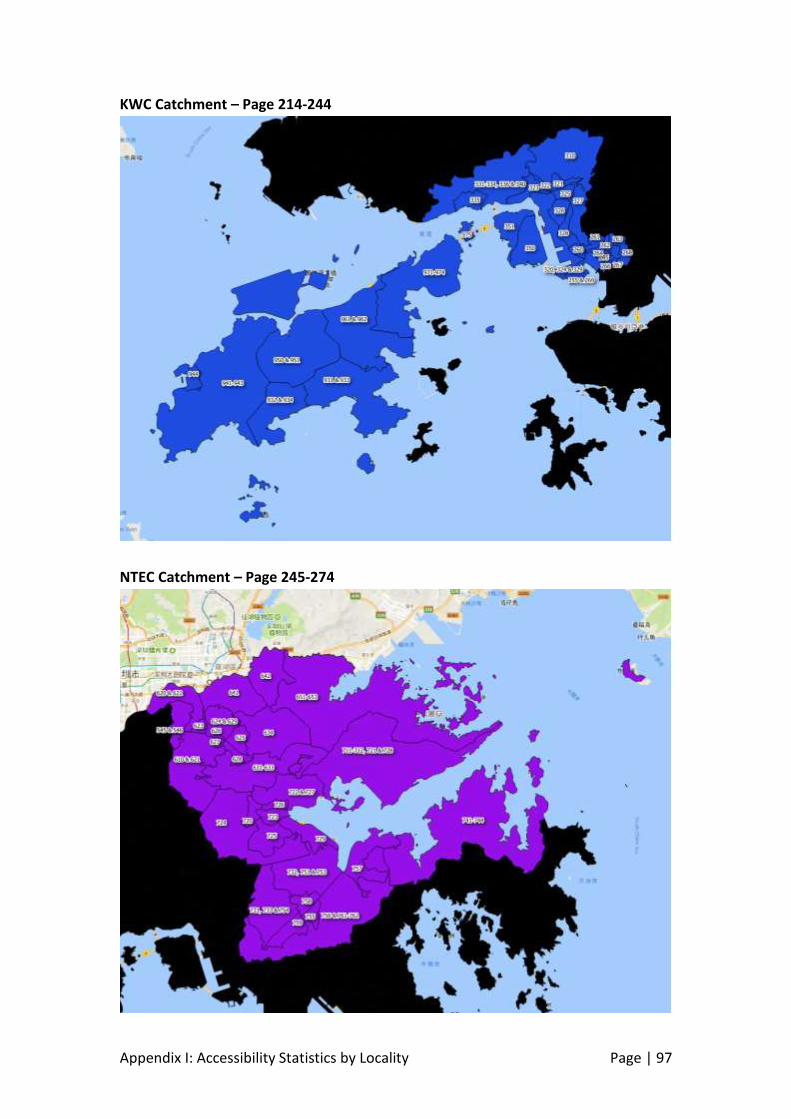
Appendix I: Accessibility Statistics by Locality Page | 97
KWC Catchment – Page 214-244
NTEC Catchment – Page 245-274
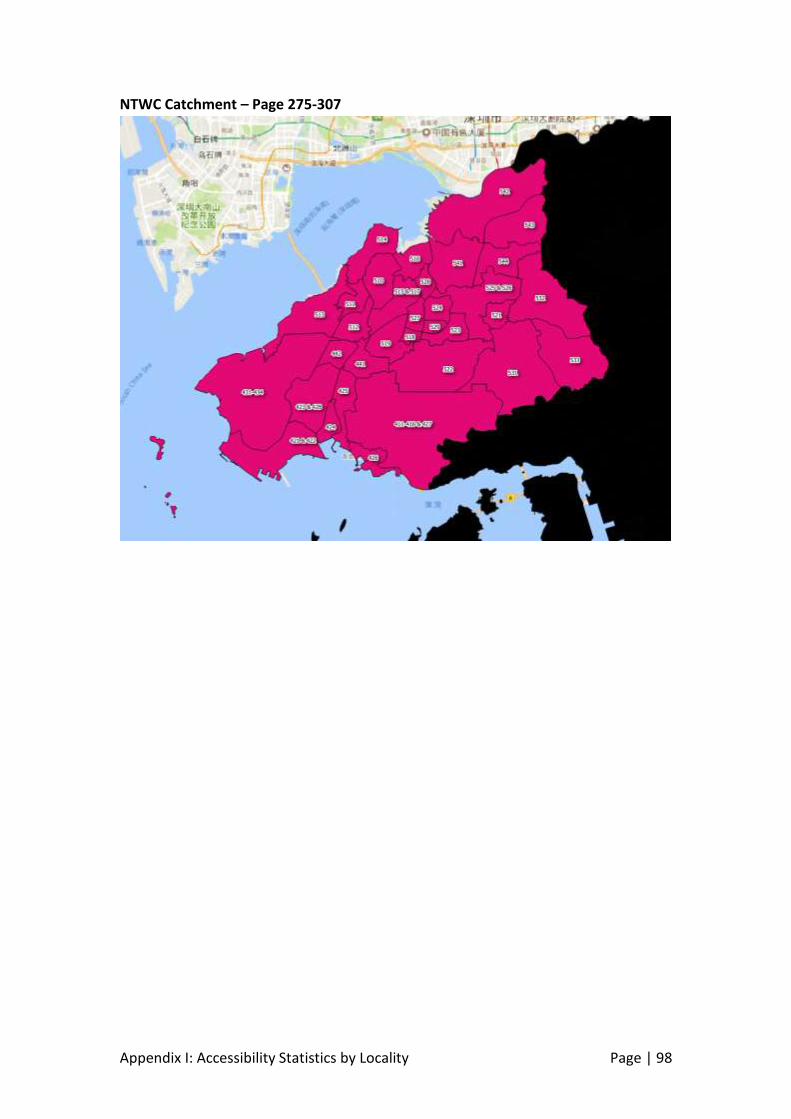
Appendix I: Accessibility Statistics by Locality Page | 98
NTWC Catchment – Page 275-307

Appendix I: Accessibility Statistics by Locality Page | 99
Cluster Concordance Analysis
The patronage pattern in 2015/16 for residents in TPU Group 148 is presented below. The Cluster
concordance rates (bolded in green) range from 73% for Acute IP to 91% for PHC.
Core Service Percentage of Utilisation* sought in Cluster# in 2015/16 Total
Utilisation HKEC HKWC KCC KEC KWC NTEC NTWC Total %
Acute IP 73% 23% - 1% 1% 1% - 100% 9,719
Non-acute IP 90% 8% - - - 1% - 100% 5,227
SOP 82% 15% 1% - 1% - - 100% 15,868
PHC 91% 6% 1% 1% 1% - - 100% 10,003
A&E 90% 5% 1% 1% 1% 1% - 100% 3,458
AHOP 87% 7% 2% 2% 2% - - 100% 4,687
Travel Time Analysis
The following table illustrates the percentages of utilisation sought within various threshold travel
times for TPU Group 148 in 2015/16. For example, the percentages of utilisation sought within 20
minutes of travel time range from 92% for Non-acute IP to 99% for PHC (bolded in green).
Core Service Percentage of Utilisation* sought within Certain Travel Time in 2015/16 Total
Utilisation <10 min < 20 min < 30 min <40 min
Acute IP 46% 95% 100% 100% 9,719
Non-acute IP 55% 92% 100% 100% 5,227
SOP 53% 98% 100% 100% 15,868
PHC 27% 99% 100% 100% 10,003
A&E 79% 97% 98% 99% 3,458
AHOP 43% 95% 100% 100% 4,687
* In terms of BDO for Acute IP and Non-acute IP, and in terms of attendances for SOP, PHC, A&E and AHOP #
Assuming the re-delineated Cluster boundary between KCC and KWC
TPU Group: 148
District: Eastern
Corresponding Cluster: Hong Kong East Cluster
Population in 2015: 9,500
TPU Group 148 (highlighted on the map) is located in
the Eastern district, with its corresponding Cluster
being the Hong Kong East Cluster.

Appendix I: Accessibility Statistics by Locality Page | 100
Cluster Concordance Analysis
The patronage pattern in 2015/16 for residents in TPU Group 151 is presented below. The Cluster
concordance rates (bolded in green) range from 77% for Acute IP to 90% for PHC.
Core Service Percentage of Utilisation* sought in Cluster# in 2015/16 Total
Utilisation HKEC HKWC KCC KEC KWC NTEC NTWC Total %
Acute IP 77% 19% 1% 1% 1% 1% - 100% 22,734
Non-acute IP 88% 9% 1% 1% 1% - - 100% 11,883
SOP 78% 16% 3% 1% 1% 1% - 100% 42,996
PHC 90% 5% 2% 1% 1% - - 100% 24,201
A&E 87% 6% 2% 2% 2% 1% 1% 100% 7,794
AHOP 77% 11% 8% 1% 1% - - 100% 13,905
Travel Time Analysis
The following table illustrates the percentages of utilisation sought within various threshold travel
times for TPU Group 151 in 2015/16. For example, the percentages of utilisation sought within 20
minutes of travel time range from 89% for Non-acute IP to 98% for PHC (bolded in green).
Core Service Percentage of Utilisation* sought within Certain Travel Time in 2015/16 Total
Utilisation <10 min < 20 min < 30 min <40 min
Acute IP 35% 97% 99% 100% 22,734
Non-acute IP 57% 89% 100% 100% 11,883
SOP 37% 96% 100% 100% 42,996
PHC 41% 98% 99% 100% 24,201
A&E 56% 95% 98% 100% 7,794
AHOP 25% 93% 100% 100% 13,905
* In terms of BDO for Acute IP and Non-acute IP, and in terms of attendances for SOP, PHC, A&E and AHOP #
Assuming the re-delineated Cluster boundary between KCC and KWC
TPU Group: 151
District: Eastern
Corresponding Cluster: Hong Kong East Cluster
Population in 2015: 46,800
TPU Group 151 (highlighted on the map) is located in
the Eastern district, with its corresponding Cluster
being the Hong Kong East Cluster.

Appendix I: Accessibility Statistics by Locality Page | 101
Cluster Concordance Analysis
The patronage pattern in 2015/16 for residents in TPU Group 152 is presented below. The Cluster
concordance rates (bolded in green) range from 70% for SOP to 88% for PHC.
Core Service Percentage of Utilisation* sought in Cluster# in 2015/16 Total
Utilisation HKEC HKWC KCC KEC KWC NTEC NTWC Total %
Acute IP 73% 21% 3% - 2% 1% - 100% 4,159
Non-acute IP 81% 19% - - 1% - - 100% 2,953
SOP 70% 21% 4% 2% 1% 1% 1% 100% 10,149
PHC 88% 5% 4% 1% 1% 1% - 100% 4,314
A&E 86% 6% 3% 1% 2% 2% 1% 100% 1,726
AHOP 78% 13% 7% 2% - - - 100% 3,494
Travel Time Analysis
The following table illustrates the percentages of utilisation sought within various threshold travel
times for TPU Group 152 in 2015/16. For example, the percentages of utilisation sought within 20
minutes of travel time range from 73% for SOP to 94% for PHC (bolded in green).
Core Service Percentage of Utilisation* sought within Certain Travel Time in 2015/16 Total
Utilisation <10 min < 20 min < 30 min <40 min
Acute IP - 77% 99% 100% 4,159
Non-acute IP - 79% 99% 100% 2,953
SOP - 73% 99% 99% 10,149
PHC 30% 94% 99% 100% 4,314
A&E - 86% 98% 99% 1,726
AHOP - 83% 100% 100% 3,494
* In terms of BDO for Acute IP and Non-acute IP, and in terms of attendances for SOP, PHC, A&E and AHOP #
Assuming the re-delineated Cluster boundary between KCC and KWC
TPU Group: 152
District: Eastern
Corresponding Cluster: Hong Kong East Cluster
Population in 2015: 18,800
TPU Group 152 (highlighted on the map) is located in
the Eastern district, with its corresponding Cluster
being the Hong Kong East Cluster.

Appendix I: Accessibility Statistics by Locality Page | 102
Cluster Concordance Analysis
The patronage pattern in 2015/16 for residents in TPU Group 153 is presented below. The Cluster
concordance rates (bolded in green) range from 84% for AHOP to 94% for PHC.
Core Service Percentage of Utilisation* sought in Cluster# in 2015/16 Total
Utilisation HKEC HKWC KCC KEC KWC NTEC NTWC Total %
Acute IP 87% 9% 2% 1% 1% 1% - 100% 50,622
Non-acute IP 89% 9% - 1% - 1% - 100% 28,932
SOP 84% 11% 2% 1% 1% 1% - 100% 69,069
PHC 94% 3% 1% 1% - - - 100% 48,952
A&E 90% 4% 2% 2% 1% 1% 1% 100% 15,587
AHOP 84% 9% 4% 1% 1% 1% - 100% 20,095
Travel Time Analysis
The following table illustrates the percentages of utilisation sought within various threshold travel
times for TPU Group 153 in 2015/16. For example, the percentages of utilisation sought within 20
minutes of travel time range from 87% for Non-acute IP to 98% for PHC (bolded in green).
Core Service Percentage of Utilisation* sought within Certain Travel Time in 2015/16 Total
Utilisation <10 min < 20 min < 30 min <40 min
Acute IP 14% 97% 99% 100% 50,622
Non-acute IP 20% 87% 99% 100% 28,932
SOP 11% 97% 100% 100% 69,069
PHC 54% 98% 99% 100% 48,952
A&E 18% 95% 98% 100% 15,587
AHOP 7% 95% 100% 100% 20,095
* In terms of BDO for Acute IP and Non-acute IP, and in terms of attendances for SOP, PHC, A&E and AHOP #
Assuming the re-delineated Cluster boundary between KCC and KWC
TPU Group: 153
District: Eastern
Corresponding Cluster: Hong Kong East Cluster
Population in 2015: 71,000
TPU Group 153 (highlighted on the map) is located in
the Eastern district, with its corresponding Cluster
being the Hong Kong East Cluster.

Appendix I: Accessibility Statistics by Locality Page | 103
Cluster Concordance Analysis
The patronage pattern in 2015/16 for residents in TPU Group 154 is presented below. The Cluster
concordance rates (bolded in green) range from 83% for AHOP to 97% for Non-acute IP.
Core Service Percentage of Utilisation* sought in Cluster# in 2015/16 Total
Utilisation HKEC HKWC KCC KEC KWC NTEC NTWC Total %
Acute IP 90% 8% 1% - 1% - - 100% 8,620
Non-acute IP 97% 2% - - - 1% - 100% 4,389
SOP 84% 12% 2% 1% 1% - - 100% 14,461
PHC 95% 3% 1% 1% 1% - - 100% 11,802
A&E 91% 4% 2% 2% 1% 1% - 100% 3,271
AHOP 83% 11% 2% 1% 2% 1% - 100% 4,228
Travel Time Analysis
The following table illustrates the percentages of utilisation sought within various threshold travel
times for TPU Group 154 in 2015/16. For example, the percentages of utilisation sought within 20
minutes of travel time range from 81% for Non-acute IP to 99% for PHC (bolded in green).
Core Service Percentage of Utilisation* sought within Certain Travel Time in 2015/16 Total
Utilisation <10 min < 20 min < 30 min <40 min
Acute IP 3% 92% 100% 100% 8,620
Non-acute IP 29% 81% 100% 100% 4,389
SOP 13% 88% 100% 100% 14,461
PHC 79% 99% 100% 100% 11,802
A&E - 93% 99% 100% 3,271
AHOP 14% 93% 100% 100% 4,228
* In terms of BDO for Acute IP and Non-acute IP, and in terms of attendances for SOP, PHC, A&E and AHOP #
Assuming the re-delineated Cluster boundary between KCC and KWC
TPU Group: 154
District: Eastern
Corresponding Cluster: Hong Kong East Cluster
Population in 2015: 11,200
TPU Group 154 (highlighted on the map) is located in
the Eastern district, with its corresponding Cluster
being the Hong Kong East Cluster.
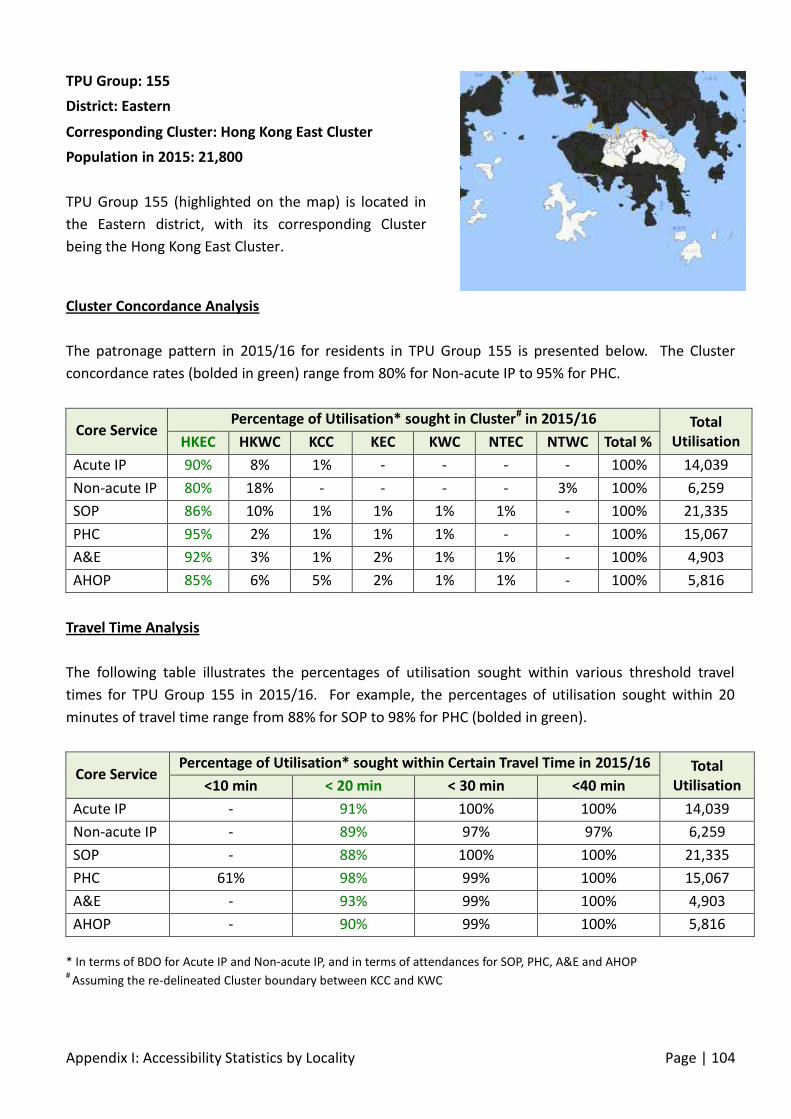
Appendix I: Accessibility Statistics by Locality Page | 104
Cluster Concordance Analysis
The patronage pattern in 2015/16 for residents in TPU Group 155 is presented below. The Cluster
concordance rates (bolded in green) range from 80% for Non-acute IP to 95% for PHC.
Core Service Percentage of Utilisation* sought in Cluster# in 2015/16 Total
Utilisation HKEC HKWC KCC KEC KWC NTEC NTWC Total %
Acute IP 90% 8% 1% - - - - 100% 14,039
Non-acute IP 80% 18% - - - - 3% 100% 6,259
SOP 86% 10% 1% 1% 1% 1% - 100% 21,335
PHC 95% 2% 1% 1% 1% - - 100% 15,067
A&E 92% 3% 1% 2% 1% 1% - 100% 4,903
AHOP 85% 6% 5% 2% 1% 1% - 100% 5,816
Travel Time Analysis
The following table illustrates the percentages of utilisation sought within various threshold travel
times for TPU Group 155 in 2015/16. For example, the percentages of utilisation sought within 20
minutes of travel time range from 88% for SOP to 98% for PHC (bolded in green).
Core Service Percentage of Utilisation* sought within Certain Travel Time in 2015/16 Total
Utilisation <10 min < 20 min < 30 min <40 min
Acute IP - 91% 100% 100% 14,039
Non-acute IP - 89% 97% 97% 6,259
SOP - 88% 100% 100% 21,335
PHC 61% 98% 99% 100% 15,067
A&E - 93% 99% 100% 4,903
AHOP - 90% 99% 100% 5,816
* In terms of BDO for Acute IP and Non-acute IP, and in terms of attendances for SOP, PHC, A&E and AHOP #
Assuming the re-delineated Cluster boundary between KCC and KWC
TPU Group: 155
District: Eastern
Corresponding Cluster: Hong Kong East Cluster
Population in 2015: 21,800
TPU Group 155 (highlighted on the map) is located in
the Eastern district, with its corresponding Cluster
being the Hong Kong East Cluster.

Appendix I: Accessibility Statistics by Locality Page | 105
Cluster Concordance Analysis
The patronage pattern in 2015/16 for residents in TPU Group 157 is presented below. The Cluster
concordance rates (bolded in green) range from 72% for Non-acute IP to 93% for PHC.
Core Service Percentage of Utilisation* sought in Cluster# in 2015/16 Total
Utilisation HKEC HKWC KCC KEC KWC NTEC NTWC Total %
Acute IP 82% 14% 2% 1% 1% 1% - 100% 23,279
Non-acute IP 72% 14% 1% - 13% - - 100% 12,025
SOP 80% 13% 4% 1% 1% 1% - 100% 46,778
PHC 93% 3% 2% 1% 1% 1% - 100% 29,359
A&E 88% 5% 2% 2% 2% 1% - 100% 8,026
AHOP 80% 9% 8% 1% 1% 1% - 100% 14,973
Travel Time Analysis
The following table illustrates the percentages of utilisation sought within various threshold travel
times for TPU Group 157 in 2015/16. For example, the percentages of utilisation sought within 20
minutes of travel time range from 71% for Non-acute IP to 97% for PHC (bolded in green).
Core Service Percentage of Utilisation* sought within Certain Travel Time in 2015/16 Total
Utilisation <10 min < 20 min < 30 min <40 min
Acute IP 75% 87% 100% 100% 23,279
Non-acute IP 27% 71% 100% 100% 12,025
SOP 65% 85% 99% 100% 46,778
PHC 68% 97% 99% 100% 29,359
A&E 81% 91% 99% 100% 8,026
AHOP 57% 89% 100% 100% 14,973
* In terms of BDO for Acute IP and Non-acute IP, and in terms of attendances for SOP, PHC, A&E and AHOP #
Assuming the re-delineated Cluster boundary between KCC and KWC
TPU Group: 157
District: Eastern
Corresponding Cluster: Hong Kong East Cluster
Population in 2015: 52,800
TPU Group 157 (highlighted on the map) is located in
the Eastern district, with its corresponding Cluster
being the Hong Kong East Cluster.

Appendix I: Accessibility Statistics by Locality Page | 106
Cluster Concordance Analysis
The patronage pattern in 2015/16 for residents in TPU Group 161 is presented below. The Cluster
concordance rates (bolded in green) range from 86% for AHOP to 94% for PHC.
Core Service Percentage of Utilisation* sought in Cluster# in 2015/16 Total
Utilisation HKEC HKWC KCC KEC KWC NTEC NTWC Total %
Acute IP 92% 6% 1% 1% 1% - - 100% 85,599
Non-acute IP 88% 9% 1% - 1% - 1% 100% 46,458
SOP 87% 9% 2% 1% 1% 1% - 100% 109,138
PHC 94% 3% 1% 1% 1% - - 100% 80,293
A&E 92% 3% 1% 1% 1% 1% - 100% 26,768
AHOP 86% 7% 4% 1% 1% 1% 1% 100% 31,435
Travel Time Analysis
The following table illustrates the percentages of utilisation sought within various threshold travel
times for TPU Group 161 in 2015/16. For example, the percentages of utilisation sought within 20
minutes of travel time range from 69% for Non-acute IP to 96% for PHC (bolded in green).
Core Service Percentage of Utilisation* sought within Certain Travel Time in 2015/16 Total
Utilisation <10 min < 20 min < 30 min <40 min
Acute IP 79% 93% 99% 100% 85,599
Non-acute IP 25% 69% 99% 99% 46,458
SOP 75% 89% 99% 100% 109,138
PHC 6% 96% 99% 100% 80,293
A&E 88% 94% 98% 99% 26,768
AHOP 66% 87% 99% 99% 31,435
* In terms of BDO for Acute IP and Non-acute IP, and in terms of attendances for SOP, PHC, A&E and AHOP #
Assuming the re-delineated Cluster boundary between KCC and KWC
TPU Group: 161
District: Eastern
Corresponding Cluster: Hong Kong East Cluster
Population in 2015: 82,800
TPU Group 161 (highlighted on the map) is located in
the Eastern district, with its corresponding Cluster
being the Hong Kong East Cluster.

Appendix I: Accessibility Statistics by Locality Page | 107
Cluster Concordance Analysis
The patronage pattern in 2015/16 for residents in TPU Group 162 is presented below. The Cluster
concordance rates (bolded in green) range from 80% for SOP to 89% for Non-acute IP.
Core Service Percentage of Utilisation* sought in Cluster# in 2015/16 Total
Utilisation HKEC HKWC KCC KEC KWC NTEC NTWC Total %
Acute IP 86% 10% 2% 1% 1% 1% - 100% 8,244
Non-acute IP 89% 9% 1% - - - - 100% 3,712
SOP 80% 12% 4% 1% 1% 1% - 100% 18,707
PHC 88% 5% 3% 1% 2% 1% - 100% 9,877
A&E 89% 4% 2% 2% 2% 1% 1% 100% 3,121
AHOP 81% 7% 8% 1% 2% 2% - 100% 6,115
Travel Time Analysis
The following table illustrates the percentages of utilisation sought within various threshold travel
times for TPU Group 162 in 2015/16. For example, the percentages of utilisation sought within 20
minutes of travel time range from 82% for Non-acute IP to 91% for PHC (bolded in green).
Core Service Percentage of Utilisation* sought within Certain Travel Time in 2015/16 Total
Utilisation <10 min < 20 min < 30 min <40 min
Acute IP 80% 88% 100% 100% 8,244
Non-acute IP 35% 82% 100% 100% 3,712
SOP 68% 82% 99% 100% 18,707
PHC 49% 91% 99% 99% 9,877
A&E 82% 91% 98% 99% 3,121
AHOP 61% 82% 99% 100% 6,115
* In terms of BDO for Acute IP and Non-acute IP, and in terms of attendances for SOP, PHC, A&E and AHOP #
Assuming the re-delineated Cluster boundary between KCC and KWC
TPU Group: 162
District: Eastern
Corresponding Cluster: Hong Kong East Cluster
Population in 2015: 19,400
TPU Group 162 (highlighted on the map) is located in
the Eastern district, with its corresponding Cluster
being the Hong Kong East Cluster.

Appendix I: Accessibility Statistics by Locality Page | 108
Cluster Concordance Analysis
The patronage pattern in 2015/16 for residents in TPU Group 163 is presented below. The Cluster
concordance rates (bolded in green) range from 89% for AHOP to 94% for PHC.
Core Service Percentage of Utilisation* sought in Cluster# in 2015/16 Total
Utilisation HKEC HKWC KCC KEC KWC NTEC NTWC Total %
Acute IP 93% 4% 1% 1% - 1% - 100% 35,748
Non-acute IP 94% 1% - - 3% 2% - 100% 18,768
SOP 89% 8% 1% 1% 1% 1% - 100% 57,669
PHC 94% 3% 1% 1% 1% 1% - 100% 40,970
A&E 93% 2% 2% 1% 1% 1% 1% 100% 14,138
AHOP 89% 6% 4% 1% 1% - - 100% 17,506
Travel Time Analysis
The following table illustrates the percentages of utilisation sought within various threshold travel
times for TPU Group 163 in 2015/16. For example, the percentages of utilisation sought within 20
minutes of travel time range from 68% for Non-acute IP to 96% for PHC (bolded in green).
Core Service Percentage of Utilisation* sought within Certain Travel Time in 2015/16 Total
Utilisation <10 min < 20 min < 30 min <40 min
Acute IP 86% 94% 99% 100% 35,748
Non-acute IP 31% 68% 100% 100% 18,768
SOP 80% 90% 100% 100% 57,669
PHC 83% 96% 99% 100% 40,970
A&E 89% 94% 98% 99% 14,138
AHOP 75% 89% 99% 99% 17,506
* In terms of BDO for Acute IP and Non-acute IP, and in terms of attendances for SOP, PHC, A&E and AHOP #
Assuming the re-delineated Cluster boundary between KCC and KWC
TPU Group: 163
District: Eastern
Corresponding Cluster: Hong Kong East Cluster
Population in 2015: 40,900
TPU Group 163 (highlighted on the map) is located in
the Eastern district, with its corresponding Cluster
being the Hong Kong East Cluster.

Appendix I: Accessibility Statistics by Locality Page | 109
Cluster Concordance Analysis
The patronage pattern in 2015/16 for residents in TPU Group 166 is presented below. The Cluster
concordance rates (bolded in green) range from 86% for AHOP to 94% for PHC.
Core Service Percentage of Utilisation* sought in Cluster# in 2015/16 Total
Utilisation HKEC HKWC KCC KEC KWC NTEC NTWC Total %
Acute IP 88% 7% 1% 1% 1% 2% - 100% 35,722
Non-acute IP 91% 3% 1% 1% 3% 1% - 100% 13,021
SOP 87% 9% 2% 1% 1% 1% - 100% 56,418
PHC 94% 3% 1% 1% - - - 100% 43,926
A&E 91% 3% 2% 2% 2% 1% 1% 100% 14,104
AHOP 86% 6% 5% 1% 1% 1% 1% 100% 17,467
Travel Time Analysis
The following table illustrates the percentages of utilisation sought within various threshold travel
times for TPU Group 166 in 2015/16. For example, the percentages of utilisation sought within 20
minutes of travel time range from 88% for Non-acute IP to 97% for PHC (bolded in green).
Core Service Percentage of Utilisation* sought within Certain Travel Time in 2015/16 Total
Utilisation <10 min < 20 min < 30 min <40 min
Acute IP - 90% 99% 100% 35,722
Non-acute IP - 88% 99% 100% 13,021
SOP - 89% 100% 100% 56,418
PHC 40% 97% 99% 99% 43,926
A&E - 92% 98% 99% 14,104
AHOP - 88% 99% 100% 17,467
* In terms of BDO for Acute IP and Non-acute IP, and in terms of attendances for SOP, PHC, A&E and AHOP #
Assuming the re-delineated Cluster boundary between KCC and KWC
TPU Group: 166
District: Eastern
Corresponding Cluster: Hong Kong East Cluster
Population in 2015: 39,600
TPU Group 166 (highlighted on the map) is located in
the Eastern district, with its corresponding Cluster
being the Hong Kong East Cluster.

Appendix I: Accessibility Statistics by Locality Page | 110
Cluster Concordance Analysis
The patronage pattern in 2015/16 for residents in TPU Group 167 is presented below. The Cluster
concordance rates (bolded in green) range from 87% for Acute IP to 94% for Non-acute IP.
Core Service Percentage of Utilisation* sought in Cluster# in 2015/16 Total
Utilisation HKEC HKWC KCC KEC KWC NTEC NTWC Total %
Acute IP 87% 9% 1% - 1% 1% - 100% 45,581
Non-acute IP 94% 2% 1% - 1% 3% - 100% 19,497
SOP 87% 9% 2% 1% 1% 1% - 100% 78,073
PHC 93% 4% 2% 1% 1% 1% - 100% 51,284
A&E 92% 2% 2% 1% 1% 1% 1% 100% 17,581
AHOP 88% 6% 3% 1% 1% 1% - 100% 23,686
Travel Time Analysis
The following table illustrates the percentages of utilisation sought within various threshold travel
times for TPU Group 167 in 2015/16. For example, the percentages of utilisation sought within 20
minutes of travel time range from 41% for Non-acute IP to 87% for A&E (bolded in green).
Core Service Percentage of Utilisation* sought within Certain Travel Time in 2015/16 Total
Utilisation <10 min < 20 min < 30 min <40 min
Acute IP - 81% 90% 99% 45,581
Non-acute IP - 41% 98% 100% 19,497
SOP - 77% 91% 100% 78,073
PHC 61% 85% 98% 99% 51,284
A&E - 87% 94% 99% 17,581
AHOP - 70% 93% 99% 23,686
* In terms of BDO for Acute IP and Non-acute IP, and in terms of attendances for SOP, PHC, A&E and AHOP #
Assuming the re-delineated Cluster boundary between KCC and KWC
TPU Group: 167
District: Eastern
Corresponding Cluster: Hong Kong East Cluster
Population in 2015: 58,300
TPU Group 167 (highlighted on the map) is located in
the Eastern district, with its corresponding Cluster
being the Hong Kong East Cluster.

Appendix I: Accessibility Statistics by Locality Page | 111
Cluster Concordance Analysis
The patronage pattern in 2015/16 for residents in TPU Group 156 & 158 is presented below. The
Cluster concordance rates (bolded in green) range from 83% for SOP to 93% for PHC.
Core Service Percentage of Utilisation* sought in Cluster# in 2015/16 Total
Utilisation HKEC HKWC KCC KEC KWC NTEC NTWC Total %
Acute IP 88% 9% 2% 1% 1% 1% - 100% 28,037
Non-acute IP 88% 8% - - - 2% 1% 100% 9,345
SOP 83% 11% 3% 1% 1% 1% - 100% 52,092
PHC 93% 3% 2% 1% 1% 1% - 100% 34,893
A&E 90% 3% 2% 2% 1% 1% 1% 100% 9,449
AHOP 85% 7% 5% 2% 1% 1% - 100% 16,124
Travel Time Analysis
The following table illustrates the percentages of utilisation sought within various threshold travel
times for TPU Group 156 & 158 in 2015/16. For example, the percentages of utilisation sought within
20 minutes of travel time range from 83% for Non-acute IP to 97% for PHC (bolded in green).
Core Service Percentage of Utilisation* sought within Certain Travel Time in 2015/16 Total
Utilisation <10 min < 20 min < 30 min <40 min
Acute IP - 91% 100% 100% 28,037
Non-acute IP - 83% 99% 99% 9,345
SOP - 87% 100% 100% 52,092
PHC 55% 97% 99% 100% 34,893
A&E - 93% 98% 100% 9,449
AHOP - 92% 100% 100% 16,124
* In terms of BDO for Acute IP and Non-acute IP, and in terms of attendances for SOP, PHC, A&E and AHOP #
Assuming the re-delineated Cluster boundary between KCC and KWC
TPU Group: 156 & 158
District: Eastern
Corresponding Cluster: Hong Kong East Cluster
Population in 2015: 50,600
TPU Group 156 & 158 (highlighted on the map) is
located in the Eastern district, with its corresponding
Cluster being the Hong Kong East Cluster.
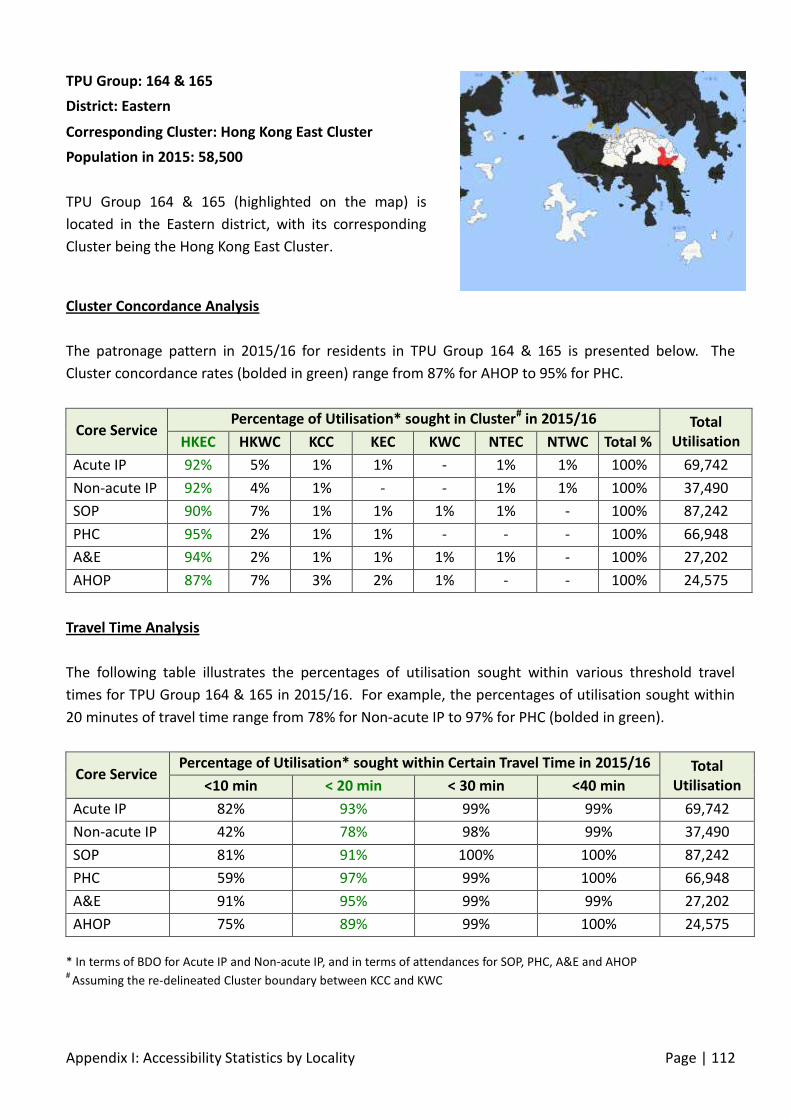
Appendix I: Accessibility Statistics by Locality Page | 112
Cluster Concordance Analysis
The patronage pattern in 2015/16 for residents in TPU Group 164 & 165 is presented below. The
Cluster concordance rates (bolded in green) range from 87% for AHOP to 95% for PHC.
Core Service Percentage of Utilisation* sought in Cluster# in 2015/16 Total
Utilisation HKEC HKWC KCC KEC KWC NTEC NTWC Total %
Acute IP 92% 5% 1% 1% - 1% 1% 100% 69,742
Non-acute IP 92% 4% 1% - - 1% 1% 100% 37,490
SOP 90% 7% 1% 1% 1% 1% - 100% 87,242
PHC 95% 2% 1% 1% - - - 100% 66,948
A&E 94% 2% 1% 1% 1% 1% - 100% 27,202
AHOP 87% 7% 3% 2% 1% - - 100% 24,575
Travel Time Analysis
The following table illustrates the percentages of utilisation sought within various threshold travel
times for TPU Group 164 & 165 in 2015/16. For example, the percentages of utilisation sought within
20 minutes of travel time range from 78% for Non-acute IP to 97% for PHC (bolded in green).
Core Service Percentage of Utilisation* sought within Certain Travel Time in 2015/16 Total
Utilisation <10 min < 20 min < 30 min <40 min
Acute IP 82% 93% 99% 99% 69,742
Non-acute IP 42% 78% 98% 99% 37,490
SOP 81% 91% 100% 100% 87,242
PHC 59% 97% 99% 100% 66,948
A&E 91% 95% 99% 99% 27,202
AHOP 75% 89% 99% 100% 24,575
* In terms of BDO for Acute IP and Non-acute IP, and in terms of attendances for SOP, PHC, A&E and AHOP #
Assuming the re-delineated Cluster boundary between KCC and KWC
TPU Group: 164 & 165
District: Eastern
Corresponding Cluster: Hong Kong East Cluster
Population in 2015: 58,500
TPU Group 164 & 165 (highlighted on the map) is
located in the Eastern district, with its corresponding
Cluster being the Hong Kong East Cluster.

Appendix I: Accessibility Statistics by Locality Page | 113
Cluster Concordance Analysis
The patronage pattern in 2015/16 for residents in TPU Group 920 is presented below. The Cluster
concordance rates (bolded in green) range from 38% for SOP to 96% for PHC.
Core Service Percentage of Utilisation* sought in Cluster# in 2015/16 Total
Utilisation HKEC HKWC KCC KEC KWC NTEC NTWC Total %
Acute IP 55% 42% 1% - 1% - - 100% 22,717
Non-acute IP 61% 28% 5% - 6% - - 100% 8,959
SOP 38% 57% 2% 1% 1% 1% - 100% 23,522
PHC 96% 3% - - 1% - - 100% 33,145
A&E 84% 12% 1% - 1% 1% 1% 100% 11,757
AHOP 71% 24% 2% 1% 1% - - 100% 9,572
Travel Time Analysis
The following table illustrates the percentages of utilisation sought within various threshold travel
times for TPU Group 920 in 2015/16. For example, the percentages of utilisation sought within 20
minutes of travel time range from 0% for SOP to 92% for PHC (bolded in green).
Core Service Percentage of Utilisation* sought within Certain Travel Time in 2015/16 Total
Utilisation <10 min < 20 min < 30 min <40 min
Acute IP 24% 24% 24% 24% 22,717
Non-acute IP 12% 12% 12% 12% 8,959
SOP - - - - 23,522
PHC 92% 92% 92% 92% 33,145
A&E 73% 73% 73% 73% 11,757
AHOP 58% 58% 58% 58% 9,572
* In terms of BDO for Acute IP and Non-acute IP, and in terms of attendances for SOP, PHC, A&E and AHOP #
Assuming the re-delineated Cluster boundary between KCC and KWC
TPU Group: 920
District: Islands (excl. Lantau)
Corresponding Cluster: Hong Kong East Cluster
Population in 2015: 22,500
TPU Group 920 (highlighted on the map) is located in
the Islands (excl. Lantau) district, with its corresponding
Cluster being the Hong Kong East Cluster.

Appendix I: Accessibility Statistics by Locality Page | 114
Cluster Concordance Analysis
The patronage pattern in 2015/16 for residents in TPU Group 963 is presented below. The Cluster
concordance rates (bolded in green) are 0% for each of the six services.
Core Service Percentage of Utilisation* sought in Cluster# in 2015/16 Total
Utilisation HKEC HKWC KCC KEC KWC NTEC NTWC Total %
Acute IP - - - - - - - - -
Non-acute IP - - - - - - - - -
SOP - - - - - - - - -
PHC - - - - - - - - -
A&E - - - 100% - - - 100% 3
AHOP - - - - - - - - -
Travel Time Analysis
The following table illustrates the percentages of utilisation sought within various threshold travel
times for TPU Group 963 in 2015/16. For example, the percentages of utilisation sought within 20
minutes of travel time are 0% for each of the six services (bolded in green).
Core Service Percentage of Utilisation* sought within Certain Travel Time in 2015/16 Total
Utilisation <10 min < 20 min < 30 min <40 min
Acute IP - - - - -
Non-acute IP - - - - -
SOP - - - - -
PHC - - - - -
A&E - - - - 3
AHOP - - - - -
* In terms of BDO for Acute IP and Non-acute IP, and in terms of attendances for SOP, PHC, A&E and AHOP #
Assuming the re-delineated Cluster boundary between KCC and KWC
TPU Group: 963
District: Islands (excl. Lantau)
Corresponding Cluster: Hong Kong East Cluster
Population in 2015: 1,000
TPU Group 963 (highlighted on the map) is located in
the Islands (excl. Lantau) district, with its corresponding
Cluster being the Hong Kong East Cluster.

Appendix I: Accessibility Statistics by Locality Page | 115
Cluster Concordance Analysis
The patronage pattern in 2015/16 for residents in TPU Group 976 is presented below. The Cluster
concordance rates (bolded in green) range from 26% for Non-acute IP to 92% for PHC.
Core Service Percentage of Utilisation* sought in Cluster# in 2015/16 Total
Utilisation HKEC HKWC KCC KEC KWC NTEC NTWC Total %
Acute IP 27% 68% 1% - 2% 1% - 100% 4,646
Non-acute IP 26% 48% - - 26% - - 100% 1,446
SOP 28% 64% 3% 1% 3% 1% - 100% 6,526
PHC 92% 5% 1% - 1% 1% - 100% 10,090
A&E 28% 55% 3% - 12% 2% - 100% 1,466
AHOP 49% 42% 4% - 5% 1% - 100% 1,427
Travel Time Analysis
The following table illustrates the percentages of utilisation sought within various threshold travel
times for TPU Group 976 in 2015/16. For example, the percentages of utilisation sought within 20
minutes of travel time are 90% for PHC and 0% for other services (bolded in green).
Core Service Percentage of Utilisation* sought within Certain Travel Time in 2015/16 Total
Utilisation <10 min < 20 min < 30 min <40 min
Acute IP - - - - 4,646
Non-acute IP - - - - 1,446
SOP - - - - 6,526
PHC 90% 90% 90% 90% 10,090
A&E - - - - 1,466
AHOP - - - - 1,427
* In terms of BDO for Acute IP and Non-acute IP, and in terms of attendances for SOP, PHC, A&E and AHOP #
Assuming the re-delineated Cluster boundary between KCC and KWC
TPU Group: 976
District: Islands (excl. Lantau)
Corresponding Cluster: Hong Kong East Cluster
Population in 2015: 6,500
TPU Group 976 (highlighted on the map) is located in
the Islands (excl. Lantau) district, with its corresponding
Cluster being the Hong Kong East Cluster.

Appendix I: Accessibility Statistics by Locality Page | 116
Cluster Concordance Analysis
The patronage pattern in 2015/16 for residents in TPU Group 911-913 is presented below. The Cluster
concordance rates (bolded in green) range from 14% for Acute IP to 97% for PHC.
Core Service Percentage of Utilisation* sought in Cluster# in 2015/16 Total
Utilisation HKEC HKWC KCC KEC KWC NTEC NTWC Total %
Acute IP 14% 80% 5% - - 1% - 100% 2,356
Non-acute IP 46% 54% - - - - - 100% 685
SOP 20% 75% 1% - 1% 1% 1% 100% 4,473
PHC 97% 2% - - - - - 100% 11,230
A&E 37% 56% 2% 2% 2% 2% - 100% 1,044
AHOP 51% 39% 5% 4% - 1% - 100% 848
Travel Time Analysis
The following table illustrates the percentages of utilisation sought within various threshold travel
times for TPU Group 911-913 in 2015/16. For example, the percentages of utilisation sought within 20
minutes of travel time are 6% for PHC and 0% for other services (bolded in green).
Core Service Percentage of Utilisation* sought within Certain Travel Time in 2015/16 Total
Utilisation <10 min < 20 min < 30 min <40 min
Acute IP - - - - 2,356
Non-acute IP - - - - 685
SOP - - - - 4,473
PHC 6% 6% 6% 6% 11,230
A&E - - - - 1,044
AHOP - - - - 848
* In terms of BDO for Acute IP and Non-acute IP, and in terms of attendances for SOP, PHC, A&E and AHOP #
Assuming the re-delineated Cluster boundary between KCC and KWC
TPU Group: 911-913
District: Islands (excl. Lantau)
Corresponding Cluster: Hong Kong East Cluster
Population in 2015: 6,300
TPU Group 911-913 (highlighted on the map) is located
in the Islands (excl. Lantau) district, with its
corresponding Cluster being the Hong Kong East
Cluster.

Appendix I: Accessibility Statistics by Locality Page | 117
Cluster Concordance Analysis
The patronage pattern in 2015/16 for residents in TPU Group 131 is presented below. The Cluster
concordance rates (bolded in green) range from 73% for SOP to 92% for PHC.
Core Service Percentage of Utilisation* sought in Cluster# in 2015/16 Total
Utilisation HKEC HKWC KCC KEC KWC NTEC NTWC Total %
Acute IP 75% 21% 1% - 1% 1% 1% 100% 19,047
Non-acute IP 83% 10% 1% - 1% 4% 1% 100% 11,666
SOP 73% 22% 2% 1% 1% 1% - 100% 30,114
PHC 92% 4% 2% 1% 1% 1% 1% 100% 18,168
A&E 86% 7% 2% 1% 2% 1% 1% 100% 9,043
AHOP 75% 15% 7% 1% 1% 1% - 100% 10,782
Travel Time Analysis
The following table illustrates the percentages of utilisation sought within various threshold travel
times for TPU Group 131 in 2015/16. For example, the percentages of utilisation sought within 20
minutes of travel time range from 95% for Non-acute IP to 98% for SOP (bolded in green).
Core Service Percentage of Utilisation* sought within Certain Travel Time in 2015/16 Total
Utilisation <10 min < 20 min < 30 min <40 min
Acute IP 51% 97% 98% 100% 19,047
Non-acute IP 56% 95% 96% 100% 11,666
SOP 42% 98% 99% 100% 30,114
PHC 86% 97% 98% 100% 18,168
A&E 82% 96% 98% 100% 9,043
AHOP 58% 98% 99% 100% 10,782
* In terms of BDO for Acute IP and Non-acute IP, and in terms of attendances for SOP, PHC, A&E and AHOP #
Assuming the re-delineated Cluster boundary between KCC and KWC
TPU Group: 131
District: Wan Chai
Corresponding Cluster: Hong Kong East Cluster
Population in 2015: 29,700
TPU Group 131 (highlighted on the map) is located in
the Wan Chai district, with its corresponding Cluster
being the Hong Kong East Cluster.

Appendix I: Accessibility Statistics by Locality Page | 118
Cluster Concordance Analysis
The patronage pattern in 2015/16 for residents in TPU Group 132 is presented below. The Cluster
concordance rates (bolded in green) range from 75% for SOP to 92% for PHC.
Core Service Percentage of Utilisation* sought in Cluster# in 2015/16 Total
Utilisation HKEC HKWC KCC KEC KWC NTEC NTWC Total %
Acute IP 79% 16% 1% 1% 1% 2% - 100% 13,362
Non-acute IP 85% 12% - - - 2% - 100% 9,951
SOP 75% 20% 2% 1% 1% 1% - 100% 19,733
PHC 92% 4% 2% 1% 1% 1% - 100% 12,934
A&E 88% 7% 2% 1% 1% 1% 1% 100% 5,947
AHOP 83% 12% 3% 1% - - - 100% 7,106
Travel Time Analysis
The following table illustrates the percentages of utilisation sought within various threshold travel
times for TPU Group 132 in 2015/16. For example, the percentages of utilisation sought within 20
minutes of travel time range from 94% for AHOP to 97% for PHC (bolded in green).
Core Service Percentage of Utilisation* sought within Certain Travel Time in 2015/16 Total
Utilisation <10 min < 20 min < 30 min <40 min
Acute IP 56% 95% 99% 100% 13,362
Non-acute IP 57% 96% 98% 100% 9,951
SOP 51% 96% 99% 100% 19,733
PHC 88% 97% 99% 99% 12,934
A&E 84% 96% 98% 100% 5,947
AHOP 72% 94% 100% 100% 7,106
* In terms of BDO for Acute IP and Non-acute IP, and in terms of attendances for SOP, PHC, A&E and AHOP #
Assuming the re-delineated Cluster boundary between KCC and KWC
TPU Group: 132
District: Wan Chai
Corresponding Cluster: Hong Kong East Cluster
Population in 2015: 19,000
TPU Group 132 (highlighted on the map) is located in
the Wan Chai district, with its corresponding Cluster
being the Hong Kong East Cluster.

Appendix I: Accessibility Statistics by Locality Page | 119
Cluster Concordance Analysis
The patronage pattern in 2015/16 for residents in TPU Group 133 is presented below. The Cluster
concordance rates (bolded in green) range from 76% for SOP to 93% for PHC.
Core Service Percentage of Utilisation* sought in Cluster# in 2015/16 Total
Utilisation HKEC HKWC KCC KEC KWC NTEC NTWC Total %
Acute IP 76% 18% 2% - 1% 3% 1% 100% 7,587
Non-acute IP 89% 4% 2% - 1% 3% 1% 100% 3,704
SOP 76% 20% 2% - 1% 1% - 100% 12,353
PHC 93% 5% 1% - - - - 100% 7,731
A&E 87% 6% 2% 1% 2% 1% 1% 100% 3,590
AHOP 80% 12% 6% - 1% 1% 1% 100% 3,921
Travel Time Analysis
The following table illustrates the percentages of utilisation sought within various threshold travel
times for TPU Group 133 in 2015/16. For example, the percentages of utilisation sought within 20
minutes of travel time range from 94% for Non-acute IP to 99% for PHC (bolded in green).
Core Service Percentage of Utilisation* sought within Certain Travel Time in 2015/16 Total
Utilisation <10 min < 20 min < 30 min <40 min
Acute IP 47% 96% 98% 100% 7,587
Non-acute IP 61% 94% 99% 100% 3,704
SOP 54% 98% 99% 100% 12,353
PHC 91% 99% 99% 100% 7,731
A&E 82% 96% 98% 100% 3,590
AHOP 69% 97% 99% 100% 3,921
* In terms of BDO for Acute IP and Non-acute IP, and in terms of attendances for SOP, PHC, A&E and AHOP #
Assuming the re-delineated Cluster boundary between KCC and KWC
TPU Group: 133
District: Wan Chai
Corresponding Cluster: Hong Kong East Cluster
Population in 2015: 11,400
TPU Group 133 (highlighted on the map) is located in
the Wan Chai district, with its corresponding Cluster
being the Hong Kong East Cluster.
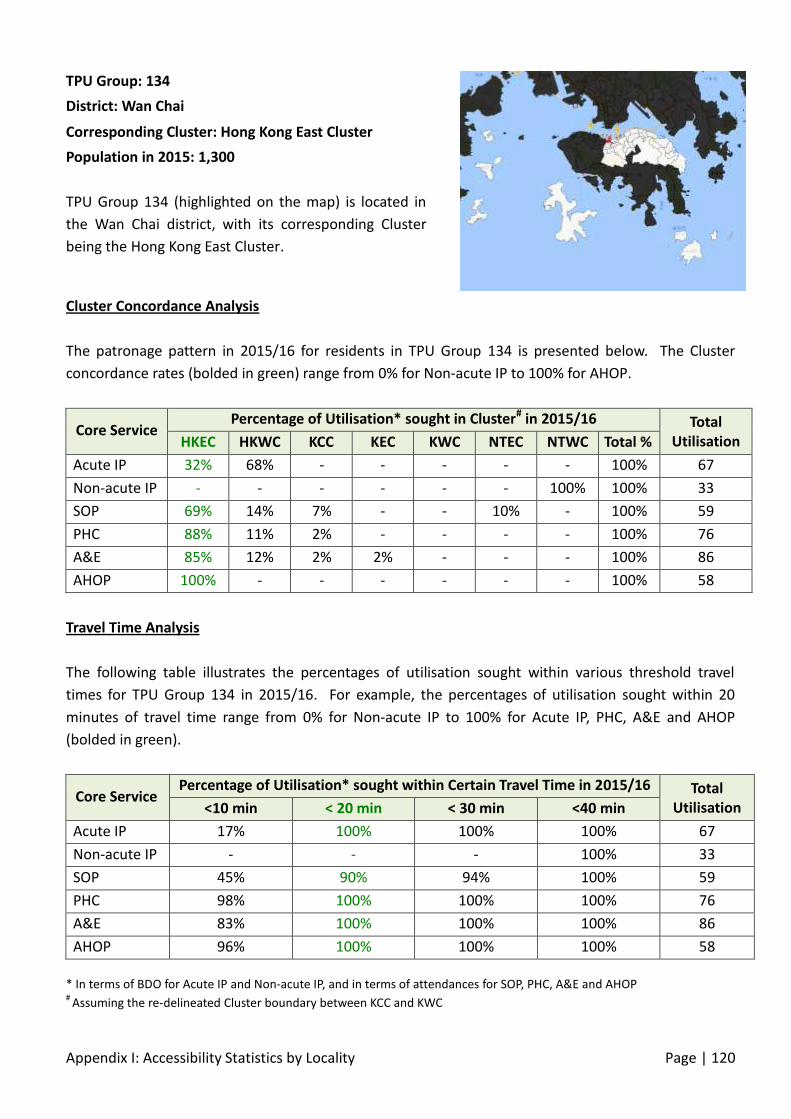
Appendix I: Accessibility Statistics by Locality Page | 120
Cluster Concordance Analysis
The patronage pattern in 2015/16 for residents in TPU Group 134 is presented below. The Cluster
concordance rates (bolded in green) range from 0% for Non-acute IP to 100% for AHOP.
Core Service Percentage of Utilisation* sought in Cluster# in 2015/16 Total
Utilisation HKEC HKWC KCC KEC KWC NTEC NTWC Total %
Acute IP 32% 68% - - - - - 100% 67
Non-acute IP - - - - - - 100% 100% 33
SOP 69% 14% 7% - - 10% - 100% 59
PHC 88% 11% 2% - - - - 100% 76
A&E 85% 12% 2% 2% - - - 100% 86
AHOP 100% - - - - - - 100% 58
Travel Time Analysis
The following table illustrates the percentages of utilisation sought within various threshold travel
times for TPU Group 134 in 2015/16. For example, the percentages of utilisation sought within 20
minutes of travel time range from 0% for Non-acute IP to 100% for Acute IP, PHC, A&E and AHOP
(bolded in green).
Core Service Percentage of Utilisation* sought within Certain Travel Time in 2015/16 Total
Utilisation <10 min < 20 min < 30 min <40 min
Acute IP 17% 100% 100% 100% 67
Non-acute IP - - - 100% 33
SOP 45% 90% 94% 100% 59
PHC 98% 100% 100% 100% 76
A&E 83% 100% 100% 100% 86
AHOP 96% 100% 100% 100% 58
* In terms of BDO for Acute IP and Non-acute IP, and in terms of attendances for SOP, PHC, A&E and AHOP #
Assuming the re-delineated Cluster boundary between KCC and KWC
TPU Group: 134
District: Wan Chai
Corresponding Cluster: Hong Kong East Cluster
Population in 2015: 1,300
TPU Group 134 (highlighted on the map) is located in
the Wan Chai district, with its corresponding Cluster
being the Hong Kong East Cluster.

Appendix I: Accessibility Statistics by Locality Page | 121
Cluster Concordance Analysis
The patronage pattern in 2015/16 for residents in TPU Group 135 is presented below. The Cluster
concordance rates (bolded in green) range from 42% for Acute IP to 90% for PHC.
Core Service Percentage of Utilisation* sought in Cluster# in 2015/16 Total
Utilisation HKEC HKWC KCC KEC KWC NTEC NTWC Total %
Acute IP 42% 49% - - 7% 1% 1% 100% 490
Non-acute IP 48% 29% - - - - 23% 100% 144
SOP 59% 33% - 1% 5% 1% - 100% 672
PHC 90% 4% 1% 2% 3% - - 100% 370
A&E 88% 8% 2% - 1% 1% - 100% 288
AHOP 82% 16% 1% 1% - - 1% 100% 228
Travel Time Analysis
The following table illustrates the percentages of utilisation sought within various threshold travel
times for TPU Group 135 in 2015/16. For example, the percentages of utilisation sought within 20
minutes of travel time range from 77% for Non-acute IP to 99% for AHOP (bolded in green).
Core Service Percentage of Utilisation* sought within Certain Travel Time in 2015/16 Total
Utilisation <10 min < 20 min < 30 min <40 min
Acute IP 34% 98% 98% 100% 490
Non-acute IP 48% 77% 77% 100% 144
SOP 48% 98% 99% 100% 672
PHC 90% 96% 100% 100% 370
A&E 87% 98% 99% 100% 288
AHOP 69% 99% 99% 100% 228
* In terms of BDO for Acute IP and Non-acute IP, and in terms of attendances for SOP, PHC, A&E and AHOP #
Assuming the re-delineated Cluster boundary between KCC and KWC
TPU Group: 135
District: Wan Chai
Corresponding Cluster: Hong Kong East Cluster
Population in 2015: 1,100
TPU Group 135 (highlighted on the map) is located in
the Wan Chai district, with its corresponding Cluster
being the Hong Kong East Cluster.

Appendix I: Accessibility Statistics by Locality Page | 122
Cluster Concordance Analysis
The patronage pattern in 2015/16 for residents in TPU Group 140 is presented below. The Cluster
concordance rates (bolded in green) range from 64% for SOP to 98% for Non-acute IP.
Core Service Percentage of Utilisation* sought in Cluster# in 2015/16 Total
Utilisation HKEC HKWC KCC KEC KWC NTEC NTWC Total %
Acute IP 87% 11% 1% - 1% 1% - 100% 4,737
Non-acute IP 98% 1% - - 1% - 1% 100% 3,871
SOP 64% 30% 4% 1% 1% 1% - 100% 4,435
PHC 88% 8% 3% 1% - 1% - 100% 1,846
A&E 89% 7% 1% - 1% 1% - 100% 1,449
AHOP 84% 11% 1% 2% 1% 1% - 100% 1,728
Travel Time Analysis
The following table illustrates the percentages of utilisation sought within various threshold travel
times for TPU Group 140 in 2015/16. For example, the percentages of utilisation sought within 20
minutes of travel time range from 91% for Non-acute IP to 98% for Acute IP (bolded in green).
Core Service Percentage of Utilisation* sought within Certain Travel Time in 2015/16 Total
Utilisation <10 min < 20 min < 30 min <40 min
Acute IP 77% 98% 99% 100% 4,737
Non-acute IP 70% 91% 99% 99% 3,871
SOP 44% 96% 100% 100% 4,435
PHC 83% 97% 100% 100% 1,846
A&E 84% 97% 99% 100% 1,449
AHOP 78% 93% 100% 100% 1,728
* In terms of BDO for Acute IP and Non-acute IP, and in terms of attendances for SOP, PHC, A&E and AHOP #
Assuming the re-delineated Cluster boundary between KCC and KWC
TPU Group: 140
District: Wan Chai
Corresponding Cluster: Hong Kong East Cluster
Population in 2015: 8,000
TPU Group 140 (highlighted on the map) is located in
the Wan Chai district, with its corresponding Cluster
being the Hong Kong East Cluster.
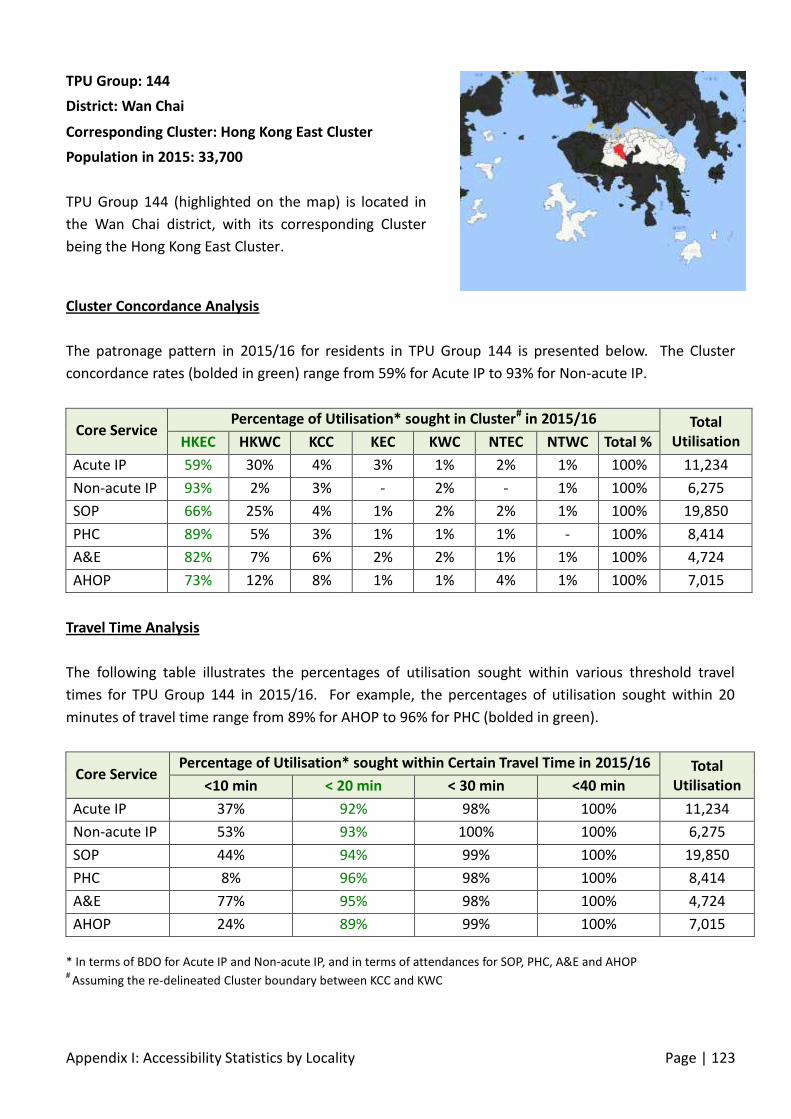
Appendix I: Accessibility Statistics by Locality Page | 123
Cluster Concordance Analysis
The patronage pattern in 2015/16 for residents in TPU Group 144 is presented below. The Cluster
concordance rates (bolded in green) range from 59% for Acute IP to 93% for Non-acute IP.
Core Service Percentage of Utilisation* sought in Cluster# in 2015/16 Total
Utilisation HKEC HKWC KCC KEC KWC NTEC NTWC Total %
Acute IP 59% 30% 4% 3% 1% 2% 1% 100% 11,234
Non-acute IP 93% 2% 3% - 2% - 1% 100% 6,275
SOP 66% 25% 4% 1% 2% 2% 1% 100% 19,850
PHC 89% 5% 3% 1% 1% 1% - 100% 8,414
A&E 82% 7% 6% 2% 2% 1% 1% 100% 4,724
AHOP 73% 12% 8% 1% 1% 4% 1% 100% 7,015
Travel Time Analysis
The following table illustrates the percentages of utilisation sought within various threshold travel
times for TPU Group 144 in 2015/16. For example, the percentages of utilisation sought within 20
minutes of travel time range from 89% for AHOP to 96% for PHC (bolded in green).
Core Service Percentage of Utilisation* sought within Certain Travel Time in 2015/16 Total
Utilisation <10 min < 20 min < 30 min <40 min
Acute IP 37% 92% 98% 100% 11,234
Non-acute IP 53% 93% 100% 100% 6,275
SOP 44% 94% 99% 100% 19,850
PHC 8% 96% 98% 100% 8,414
A&E 77% 95% 98% 100% 4,724
AHOP 24% 89% 99% 100% 7,015
* In terms of BDO for Acute IP and Non-acute IP, and in terms of attendances for SOP, PHC, A&E and AHOP #
Assuming the re-delineated Cluster boundary between KCC and KWC
TPU Group: 144
District: Wan Chai
Corresponding Cluster: Hong Kong East Cluster
Population in 2015: 33,700
TPU Group 144 (highlighted on the map) is located in
the Wan Chai district, with its corresponding Cluster
being the Hong Kong East Cluster.

Appendix I: Accessibility Statistics by Locality Page | 124
Cluster Concordance Analysis
The patronage pattern in 2015/16 for residents in TPU Group 145 is presented below. The Cluster
concordance rates (bolded in green) range from 67% for SOP to 90% for Non-acute IP.
Core Service Percentage of Utilisation* sought in Cluster# in 2015/16 Total
Utilisation HKEC HKWC KCC KEC KWC NTEC NTWC Total %
Acute IP 76% 14% 3% - 4% 2% - 100% 2,706
Non-acute IP 90% 8% - - - - 2% 100% 1,848
SOP 67% 23% 5% 1% 2% 2% 1% 100% 6,424
PHC 90% 5% 3% 1% 1% - - 100% 3,030
A&E 84% 9% 2% 1% 2% 2% 1% 100% 1,444
AHOP 71% 14% 11% 1% - 2% 1% 100% 2,367
Travel Time Analysis
The following table illustrates the percentages of utilisation sought within various threshold travel
times for TPU Group 145 in 2015/16. For example, the percentages of utilisation sought within 20
minutes of travel time range from 61% for Non-acute IP to 96% for PHC (bolded in green).
Core Service Percentage of Utilisation* sought within Certain Travel Time in 2015/16 Total
Utilisation <10 min < 20 min < 30 min <40 min
Acute IP 40% 93% 97% 99% 2,706
Non-acute IP 54% 61% 98% 98% 1,848
SOP 42% 92% 99% 99% 6,424
PHC 19% 96% 100% 100% 3,030
A&E 68% 95% 97% 99% 1,444
AHOP 26% 88% 98% 98% 2,367
* In terms of BDO for Acute IP and Non-acute IP, and in terms of attendances for SOP, PHC, A&E and AHOP #
Assuming the re-delineated Cluster boundary between KCC and KWC
TPU Group: 145
District: Wan Chai
Corresponding Cluster: Hong Kong East Cluster
Population in 2015: 12,300
TPU Group 145 (highlighted on the map) is located in
the Wan Chai district, with its corresponding Cluster
being the Hong Kong East Cluster.

Appendix I: Accessibility Statistics by Locality Page | 125
Cluster Concordance Analysis
The patronage pattern in 2015/16 for residents in TPU Group 149 is presented below. The Cluster
concordance rates (bolded in green) range from 65% for SOP to 93% for Non-acute IP.
Core Service Percentage of Utilisation* sought in Cluster# in 2015/16 Total
Utilisation HKEC HKWC KCC KEC KWC NTEC NTWC Total %
Acute IP 86% 10% 2% 1% - 1% - 100% 3,685
Non-acute IP 93% 3% 2% 1% - - 2% 100% 2,044
SOP 65% 24% 5% 2% 2% 2% 1% 100% 3,649
PHC 86% 8% 3% 1% 1% 1% - 100% 1,450
A&E 88% 7% 2% 1% 1% 1% - 100% 1,230
AHOP 70% 12% 13% 2% 2% 1% - 100% 1,323
Travel Time Analysis
The following table illustrates the percentages of utilisation sought within various threshold travel
times for TPU Group 149 in 2015/16. For example, the percentages of utilisation sought within 20
minutes of travel time range from 46% for SOP to 91% for PHC (bolded in green).
Core Service Percentage of Utilisation* sought within Certain Travel Time in 2015/16 Total
Utilisation <10 min < 20 min < 30 min <40 min
Acute IP - 76% 99% 100% 3,685
Non-acute IP 5% 91% 98% 98% 2,044
SOP 11% 46% 97% 99% 3,649
PHC 8% 91% 98% 99% 1,450
A&E - 83% 99% 100% 1,230
AHOP 11% 65% 97% 100% 1,323
* In terms of BDO for Acute IP and Non-acute IP, and in terms of attendances for SOP, PHC, A&E and AHOP #
Assuming the re-delineated Cluster boundary between KCC and KWC
TPU Group: 149
District: Wan Chai
Corresponding Cluster: Hong Kong East Cluster
Population in 2015: 8,500
TPU Group 149 (highlighted on the map) is located in
the Wan Chai district, with its corresponding Cluster
being the Hong Kong East Cluster.

Appendix I: Accessibility Statistics by Locality Page | 126
Cluster Concordance Analysis
The patronage pattern in 2015/16 for residents in TPU Group 146 & 147 is presented below. The
Cluster concordance rates (bolded in green) range from 76% for Acute IP to 93% for Non-acute IP.
Core Service Percentage of Utilisation* sought in Cluster# in 2015/16 Total
Utilisation HKEC HKWC KCC KEC KWC NTEC NTWC Total %
Acute IP 76% 20% 1% - 2% - - 100% 12,905
Non-acute IP 93% 5% - - - - 2% 100% 9,574
SOP 79% 17% 2% 1% 1% 1% 1% 100% 19,981
PHC 89% 7% 1% 1% 1% 1% 1% 100% 10,523
A&E 87% 7% 2% 1% 1% 1% 1% 100% 4,902
AHOP 81% 10% 6% 1% 1% - - 100% 6,370
Travel Time Analysis
The following table illustrates the percentages of utilisation sought within various threshold travel
times for TPU Group 146 & 147 in 2015/16. For example, the percentages of utilisation sought within
20 minutes of travel time range from 95% for AHOP to 98% for SOP (bolded in green).
Core Service Percentage of Utilisation* sought within Certain Travel Time in 2015/16 Total
Utilisation <10 min < 20 min < 30 min <40 min
Acute IP 50% 97% 99% 100% 12,905
Non-acute IP 45% 97% 98% 100% 9,574
SOP 52% 98% 99% 100% 19,981
PHC 24% 97% 99% 100% 10,523
A&E 79% 97% 98% 100% 4,902
AHOP 37% 95% 99% 100% 6,370
* In terms of BDO for Acute IP and Non-acute IP, and in terms of attendances for SOP, PHC, A&E and AHOP #
Assuming the re-delineated Cluster boundary between KCC and KWC
TPU Group: 146 & 147
District: Wan Chai
Corresponding Cluster: Hong Kong East Cluster
Population in 2015: 19,200
TPU Group 146 & 147 (highlighted on the map) is
located in the Wan Chai district, with its corresponding
Cluster being the Hong Kong East Cluster.

Appendix I: Accessibility Statistics by Locality Page | 127
Cluster Concordance Analysis
The patronage pattern in 2015/16 for residents in TPU Group 183 & 184 is presented below. The
Cluster concordance rates (bolded in green) range from 65% for SOP to 91% for PHC.
Core Service Percentage of Utilisation* sought in Cluster# in 2015/16 Total
Utilisation HKEC HKWC KCC KEC KWC NTEC NTWC Total %
Acute IP 76% 21% - - 1% 1% - 100% 539
Non-acute IP 83% 6% - - - - 11% 100% 313
SOP 65% 29% 3% 1% 2% - - 100% 1,138
PHC 91% 9% - - - - - 100% 735
A&E 90% 8% 1% - - - - 100% 388
AHOP 80% 13% 4% 1% 1% - - 100% 378
Travel Time Analysis
The following table illustrates the percentages of utilisation sought within various threshold travel
times for TPU Group 183 & 184 in 2015/16. For example, the percentages of utilisation sought within
20 minutes of travel time range from 42% for Acute IP to 94% for PHC (bolded in green).
Core Service Percentage of Utilisation* sought within Certain Travel Time in 2015/16 Total
Utilisation <10 min < 20 min < 30 min <40 min
Acute IP - 42% 99% 100% 539
Non-acute IP - 62% 89% 89% 313
SOP - 44% 98% 100% 1,138
PHC - 94% 100% 100% 735
A&E - 88% 100% 100% 388
AHOP - 76% 99% 100% 378
* In terms of BDO for Acute IP and Non-acute IP, and in terms of attendances for SOP, PHC, A&E and AHOP #
Assuming the re-delineated Cluster boundary between KCC and KWC
TPU Group: 183 & 184
District: Wan Chai
Corresponding Cluster: Hong Kong East Cluster
Population in 2015: 4,100
TPU Group 183 & 184 (highlighted on the map) is
located in the Wan Chai district, with its corresponding
Cluster being the Hong Kong East Cluster.
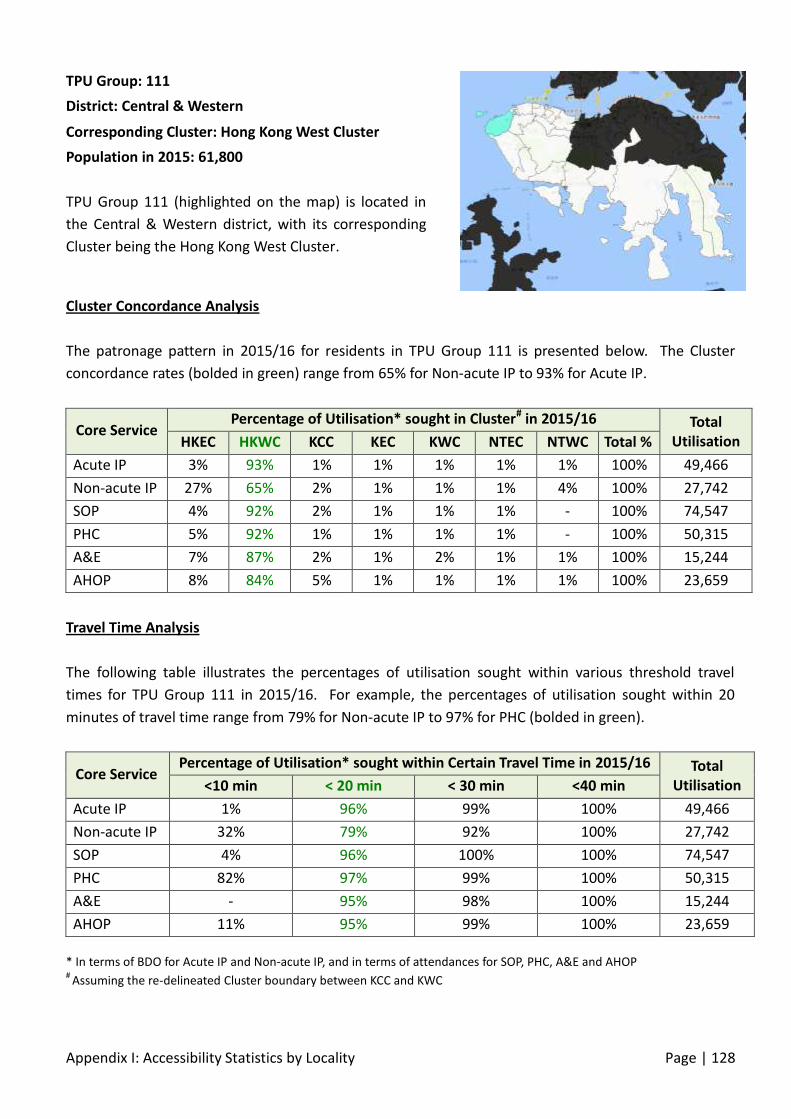
Appendix I: Accessibility Statistics by Locality Page | 128
Cluster Concordance Analysis
The patronage pattern in 2015/16 for residents in TPU Group 111 is presented below. The Cluster
concordance rates (bolded in green) range from 65% for Non-acute IP to 93% for Acute IP.
Core Service Percentage of Utilisation* sought in Cluster# in 2015/16 Total
Utilisation HKEC HKWC KCC KEC KWC NTEC NTWC Total %
Acute IP 3% 93% 1% 1% 1% 1% 1% 100% 49,466
Non-acute IP 27% 65% 2% 1% 1% 1% 4% 100% 27,742
SOP 4% 92% 2% 1% 1% 1% - 100% 74,547
PHC 5% 92% 1% 1% 1% 1% - 100% 50,315
A&E 7% 87% 2% 1% 2% 1% 1% 100% 15,244
AHOP 8% 84% 5% 1% 1% 1% 1% 100% 23,659
Travel Time Analysis
The following table illustrates the percentages of utilisation sought within various threshold travel
times for TPU Group 111 in 2015/16. For example, the percentages of utilisation sought within 20
minutes of travel time range from 79% for Non-acute IP to 97% for PHC (bolded in green).
Core Service Percentage of Utilisation* sought within Certain Travel Time in 2015/16 Total
Utilisation <10 min < 20 min < 30 min <40 min
Acute IP 1% 96% 99% 100% 49,466
Non-acute IP 32% 79% 92% 100% 27,742
SOP 4% 96% 100% 100% 74,547
PHC 82% 97% 99% 100% 50,315
A&E - 95% 98% 100% 15,244
AHOP 11% 95% 99% 100% 23,659
* In terms of BDO for Acute IP and Non-acute IP, and in terms of attendances for SOP, PHC, A&E and AHOP #
Assuming the re-delineated Cluster boundary between KCC and KWC
TPU Group: 111
District: Central & Western
Corresponding Cluster: Hong Kong West Cluster
Population in 2015: 61,800
TPU Group 111 (highlighted on the map) is located in
the Central & Western district, with its corresponding
Cluster being the Hong Kong West Cluster.

Appendix I: Accessibility Statistics by Locality Page | 129
Cluster Concordance Analysis
The patronage pattern in 2015/16 for residents in TPU Group 112 is presented below. The Cluster
concordance rates (bolded in green) range from 69% for Non-acute IP to 94% for Acute IP.
Core Service Percentage of Utilisation* sought in Cluster# in 2015/16 Total
Utilisation HKEC HKWC KCC KEC KWC NTEC NTWC Total %
Acute IP 3% 94% 1% 1% - - - 100% 45,629
Non-acute IP 29% 69% 1% - 1% - - 100% 25,306
SOP 4% 92% 1% - 1% 1% 1% 100% 59,435
PHC 4% 93% 1% 1% 1% - - 100% 44,964
A&E 8% 86% 2% 1% 2% 1% 1% 100% 13,176
AHOP 6% 89% 3% - - - - 100% 18,973
Travel Time Analysis
The following table illustrates the percentages of utilisation sought within various threshold travel
times for TPU Group 112 in 2015/16. For example, the percentages of utilisation sought within 20
minutes of travel time range from 82% for Non-acute IP to 98% for PHC (bolded in green).
Core Service Percentage of Utilisation* sought within Certain Travel Time in 2015/16 Total
Utilisation <10 min < 20 min < 30 min <40 min
Acute IP - 97% 100% 100% 45,629
Non-acute IP - 82% 100% 100% 25,306
SOP 10% 97% 99% 100% 59,435
PHC 80% 98% 99% 100% 44,964
A&E - 95% 98% 100% 13,176
AHOP 54% 97% 99% 100% 18,973
* In terms of BDO for Acute IP and Non-acute IP, and in terms of attendances for SOP, PHC, A&E and AHOP #
Assuming the re-delineated Cluster boundary between KCC and KWC
TPU Group: 112
District: Central & Western
Corresponding Cluster: Hong Kong West Cluster
Population in 2015: 53,100
TPU Group 112 (highlighted on the map) is located in
the Central & Western district, with its corresponding
Cluster being the Hong Kong West Cluster.

Appendix I: Accessibility Statistics by Locality Page | 130
Cluster Concordance Analysis
The patronage pattern in 2015/16 for residents in TPU Group 113 is presented below. The Cluster
concordance rates (bolded in green) range from 63% for Non-acute IP to 95% for PHC.
Core Service Percentage of Utilisation* sought in Cluster# in 2015/16 Total
Utilisation HKEC HKWC KCC KEC KWC NTEC NTWC Total %
Acute IP 4% 92% 1% 1% 2% 1% - 100% 23,837
Non-acute IP 24% 63% 2% - 10% 1% - 100% 15,101
SOP 5% 91% 2% 1% 1% 1% - 100% 25,331
PHC 3% 95% 1% - 1% - - 100% 22,348
A&E 10% 83% 2% 1% 2% 1% 1% 100% 6,329
AHOP 14% 79% 4% 2% 2% - 1% 100% 8,217
Travel Time Analysis
The following table illustrates the percentages of utilisation sought within various threshold travel
times for TPU Group 113 in 2015/16. For example, the percentages of utilisation sought within 20
minutes of travel time range from 82% for Non-acute IP to 98% for PHC (bolded in green).
Core Service Percentage of Utilisation* sought within Certain Travel Time in 2015/16 Total
Utilisation <10 min < 20 min < 30 min <40 min
Acute IP 25% 96% 99% 100% 23,837
Non-acute IP 15% 82% 99% 100% 15,101
SOP 22% 96% 100% 100% 25,331
PHC 93% 98% 99% 100% 22,348
A&E - 95% 98% 100% 6,329
AHOP 50% 92% 99% 100% 8,217
* In terms of BDO for Acute IP and Non-acute IP, and in terms of attendances for SOP, PHC, A&E and AHOP #
Assuming the re-delineated Cluster boundary between KCC and KWC
TPU Group: 113
District: Central & Western
Corresponding Cluster: Hong Kong West Cluster
Population in 2015: 26,400
TPU Group 113 (highlighted on the map) is located in
the Central & Western district, with its corresponding
Cluster being the Hong Kong West Cluster.

Appendix I: Accessibility Statistics by Locality Page | 131
Cluster Concordance Analysis
The patronage pattern in 2015/16 for residents in TPU Group 114 is presented below. The Cluster
concordance rates (bolded in green) range from 70% for A&E to 93% for Acute IP.
Core Service Percentage of Utilisation* sought in Cluster# in 2015/16 Total
Utilisation HKEC HKWC KCC KEC KWC NTEC NTWC Total %
Acute IP 3% 93% 1% 1% - 1% 2% 100% 3,715
Non-acute IP 3% 86% - 2% - - 8% 100% 899
SOP 6% 88% 2% 1% 1% 2% - 100% 6,927
PHC 5% 92% 1% - 1% - - 100% 5,866
A&E 18% 70% 4% 1% 3% 2% 1% 100% 1,400
AHOP 9% 82% 6% 1% 1% 1% 1% 100% 2,513
Travel Time Analysis
The following table illustrates the percentages of utilisation sought within various threshold travel
times for TPU Group 114 in 2015/16. For example, the percentages of utilisation sought within 20
minutes of travel time range from 87% for Non-acute IP to 98% for PHC (bolded in green).
Core Service Percentage of Utilisation* sought within Certain Travel Time in 2015/16 Total
Utilisation <10 min < 20 min < 30 min <40 min
Acute IP 13% 95% 98% 100% 3,715
Non-acute IP 3% 87% 92% 100% 899
SOP 19% 95% 99% 100% 6,927
PHC 91% 98% 99% 100% 5,866
A&E - 91% 95% 100% 1,400
AHOP 57% 94% 99% 100% 2,513
* In terms of BDO for Acute IP and Non-acute IP, and in terms of attendances for SOP, PHC, A&E and AHOP #
Assuming the re-delineated Cluster boundary between KCC and KWC
TPU Group: 114
District: Central & Western
Corresponding Cluster: Hong Kong West Cluster
Population in 2015: 10,100
TPU Group 114 (highlighted on the map) is located in
the Central & Western district, with its corresponding
Cluster being the Hong Kong West Cluster.

Appendix I: Accessibility Statistics by Locality Page | 132
Cluster Concordance Analysis
The patronage pattern in 2015/16 for residents in TPU Group 115 is presented below. The Cluster
concordance rates (bolded in green) range from 76% for A&E to 93% for PHC.
Core Service Percentage of Utilisation* sought in Cluster# in 2015/16 Total
Utilisation HKEC HKWC KCC KEC KWC NTEC NTWC Total %
Acute IP 4% 90% 2% - - 3% 2% 100% 1,340
Non-acute IP 7% 83% - - - 10% - 100% 337
SOP 5% 91% 1% - - 1% 2% 100% 2,259
PHC 4% 93% 1% 1% 1% - 1% 100% 2,354
A&E 17% 76% 3% - 2% 1% 1% 100% 618
AHOP 4% 89% 1% - - 5% - 100% 674
Travel Time Analysis
The following table illustrates the percentages of utilisation sought within various threshold travel
times for TPU Group 115 in 2015/16. For example, the percentages of utilisation sought within 20
minutes of travel time range from 90% for Non-acute IP to 99% for PHC (bolded in green).
Core Service Percentage of Utilisation* sought within Certain Travel Time in 2015/16 Total
Utilisation <10 min < 20 min < 30 min <40 min
Acute IP 14% 95% 96% 100% 1,340
Non-acute IP 6% 90% 90% 100% 337
SOP 27% 97% 99% 100% 2,259
PHC 93% 99% 99% 100% 2,354
A&E 15% 97% 98% 100% 618
AHOP 53% 95% 100% 100% 674
* In terms of BDO for Acute IP and Non-acute IP, and in terms of attendances for SOP, PHC, A&E and AHOP #
Assuming the re-delineated Cluster boundary between KCC and KWC
TPU Group: 115
District: Central & Western
Corresponding Cluster: Hong Kong West Cluster
Population in 2015: 2,600
TPU Group 115 (highlighted on the map) is located in
the Central & Western district, with its corresponding
Cluster being the Hong Kong West Cluster.

Appendix I: Accessibility Statistics by Locality Page | 133
Cluster Concordance Analysis
The patronage pattern in 2015/16 for residents in TPU Group 116 is presented below. The Cluster
concordance rates (bolded in green) range from 84% for AHOP to 94% for PHC.
Core Service Percentage of Utilisation* sought in Cluster# in 2015/16 Total
Utilisation HKEC HKWC KCC KEC KWC NTEC NTWC Total %
Acute IP 4% 93% 1% 1% - - 1% 100% 14,399
Non-acute IP 15% 84% - - - 1% - 100% 5,685
SOP 4% 92% 1% 1% 1% - - 100% 17,881
PHC 4% 94% 1% - 1% 1% - 100% 12,301
A&E 9% 86% 2% 1% 1% 1% 1% 100% 4,215
AHOP 10% 84% 3% 2% - 1% - 100% 4,773
Travel Time Analysis
The following table illustrates the percentages of utilisation sought within various threshold travel
times for TPU Group 116 in 2015/16. For example, the percentages of utilisation sought within 20
minutes of travel time range from 90% for Non-acute IP to 98% for PHC (bolded in green).
Core Service Percentage of Utilisation* sought within Certain Travel Time in 2015/16 Total
Utilisation <10 min < 20 min < 30 min <40 min
Acute IP - 96% 99% 100% 14,399
Non-acute IP - 90% 99% 100% 5,685
SOP 3% 97% 100% 100% 17,881
PHC 80% 98% 99% 100% 12,301
A&E - 95% 99% 100% 4,215
AHOP 2% 95% 99% 100% 4,773
* In terms of BDO for Acute IP and Non-acute IP, and in terms of attendances for SOP, PHC, A&E and AHOP #
Assuming the re-delineated Cluster boundary between KCC and KWC
TPU Group: 116
District: Central & Western
Corresponding Cluster: Hong Kong West Cluster
Population in 2015: 13,900
TPU Group 116 (highlighted on the map) is located in
the Central & Western district, with its corresponding
Cluster being the Hong Kong West Cluster.
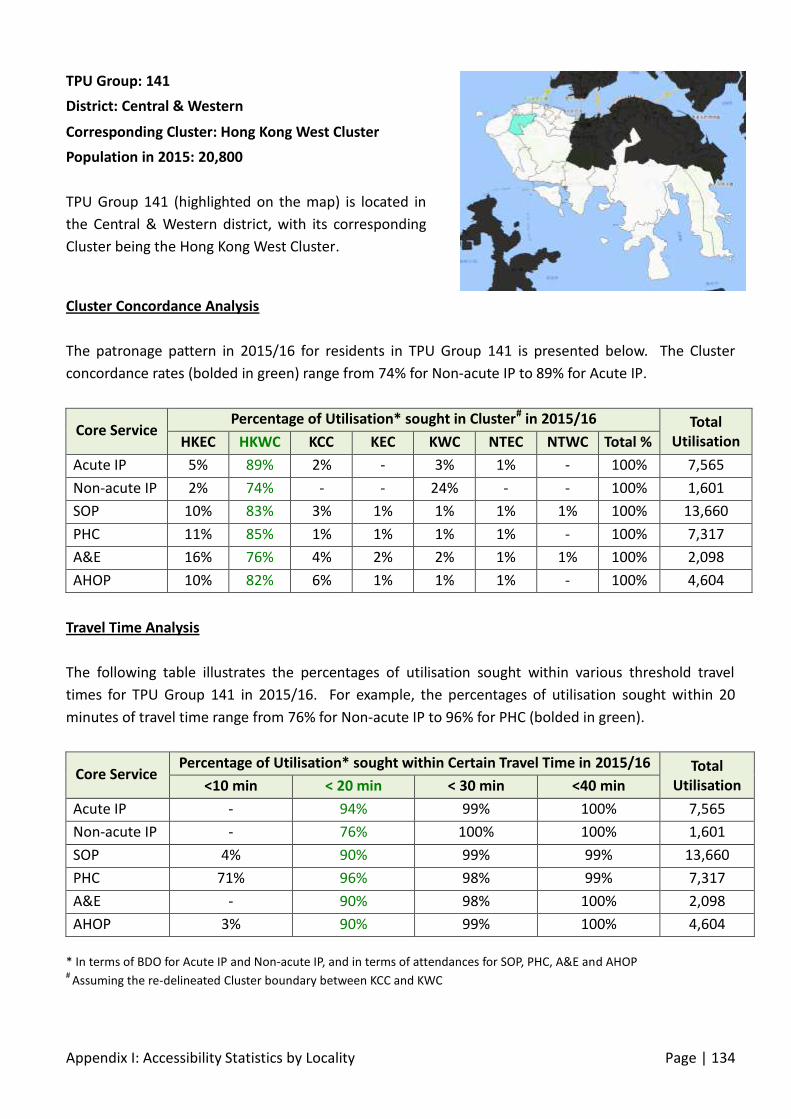
Appendix I: Accessibility Statistics by Locality Page | 134
Cluster Concordance Analysis
The patronage pattern in 2015/16 for residents in TPU Group 141 is presented below. The Cluster
concordance rates (bolded in green) range from 74% for Non-acute IP to 89% for Acute IP.
Core Service Percentage of Utilisation* sought in Cluster# in 2015/16 Total
Utilisation HKEC HKWC KCC KEC KWC NTEC NTWC Total %
Acute IP 5% 89% 2% - 3% 1% - 100% 7,565
Non-acute IP 2% 74% - - 24% - - 100% 1,601
SOP 10% 83% 3% 1% 1% 1% 1% 100% 13,660
PHC 11% 85% 1% 1% 1% 1% - 100% 7,317
A&E 16% 76% 4% 2% 2% 1% 1% 100% 2,098
AHOP 10% 82% 6% 1% 1% 1% - 100% 4,604
Travel Time Analysis
The following table illustrates the percentages of utilisation sought within various threshold travel
times for TPU Group 141 in 2015/16. For example, the percentages of utilisation sought within 20
minutes of travel time range from 76% for Non-acute IP to 96% for PHC (bolded in green).
Core Service Percentage of Utilisation* sought within Certain Travel Time in 2015/16 Total
Utilisation <10 min < 20 min < 30 min <40 min
Acute IP - 94% 99% 100% 7,565
Non-acute IP - 76% 100% 100% 1,601
SOP 4% 90% 99% 99% 13,660
PHC 71% 96% 98% 99% 7,317
A&E - 90% 98% 100% 2,098
AHOP 3% 90% 99% 100% 4,604
* In terms of BDO for Acute IP and Non-acute IP, and in terms of attendances for SOP, PHC, A&E and AHOP #
Assuming the re-delineated Cluster boundary between KCC and KWC
TPU Group: 141
District: Central & Western
Corresponding Cluster: Hong Kong West Cluster
Population in 2015: 20,800
TPU Group 141 (highlighted on the map) is located in
the Central & Western district, with its corresponding
Cluster being the Hong Kong West Cluster.

Appendix I: Accessibility Statistics by Locality Page | 135
Cluster Concordance Analysis
The patronage pattern in 2015/16 for residents in TPU Group 142 is presented below. The Cluster
concordance rates (bolded in green) range from 65% for A&E to 86% for Acute IP.
Core Service Percentage of Utilisation* sought in Cluster# in 2015/16 Total
Utilisation HKEC HKWC KCC KEC KWC NTEC NTWC Total %
Acute IP 6% 86% 6% 1% 1% 1% 1% 100% 10,288
Non-acute IP 16% 74% 8% - 2% - - 100% 3,653
SOP 9% 83% 4% 1% 2% 1% - 100% 20,112
PHC 19% 76% 2% 1% 1% 1% 1% 100% 10,268
A&E 27% 65% 3% 1% 2% 1% 1% 100% 3,674
AHOP 22% 68% 7% 1% 1% 1% 1% 100% 7,051
Travel Time Analysis
The following table illustrates the percentages of utilisation sought within various threshold travel
times for TPU Group 142 in 2015/16. For example, the percentages of utilisation sought within 20
minutes of travel time range from 96% for A&E to 100% for Non-acute IP (bolded in green).
Core Service Percentage of Utilisation* sought within Certain Travel Time in 2015/16 Total
Utilisation <10 min < 20 min < 30 min <40 min
Acute IP - 98% 99% 100% 10,288
Non-acute IP - 100% 100% 100% 3,653
SOP 4% 97% 99% 100% 20,112
PHC 67% 96% 99% 99% 10,268
A&E - 96% 98% 99% 3,674
AHOP 2% 98% 99% 100% 7,051
* In terms of BDO for Acute IP and Non-acute IP, and in terms of attendances for SOP, PHC, A&E and AHOP #
Assuming the re-delineated Cluster boundary between KCC and KWC
TPU Group: 142
District: Central & Western
Corresponding Cluster: Hong Kong West Cluster
Population in 2015: 37,400
TPU Group 142 (highlighted on the map) is located in
the Central & Western district, with its corresponding
Cluster being the Hong Kong West Cluster.

Appendix I: Accessibility Statistics by Locality Page | 136
Cluster Concordance Analysis
The patronage pattern in 2015/16 for residents in TPU Group 143 is presented below. The Cluster
concordance rates (bolded in green) range from 35% for PHC to 68% for Acute IP.
Core Service Percentage of Utilisation* sought in Cluster# in 2015/16 Total
Utilisation HKEC HKWC KCC KEC KWC NTEC NTWC Total %
Acute IP 27% 68% 3% 2% 1% - - 100% 1,632
Non-acute IP 43% 58% - - - - - 100% 699
SOP 19% 66% 9% 3% 2% 1% 1% 100% 2,712
PHC 59% 35% 2% 2% 1% 1% 1% 100% 1,435
A&E 57% 35% 2% 2% 3% 1% - 100% 960
AHOP 35% 50% 11% 3% 1% 1% - 100% 1,021
Travel Time Analysis
The following table illustrates the percentages of utilisation sought within various threshold travel
times for TPU Group 143 in 2015/16. For example, the percentages of utilisation sought within 20
minutes of travel time range from 30% for SOP to 92% for PHC (bolded in green).
Core Service Percentage of Utilisation* sought within Certain Travel Time in 2015/16 Total
Utilisation <10 min < 20 min < 30 min <40 min
Acute IP 23% 40% 100% 100% 1,632
Non-acute IP 43% 73% 100% 100% 699
SOP 14% 30% 99% 99% 2,712
PHC 56% 92% 96% 97% 1,435
A&E 55% 55% 98% 100% 960
AHOP 31% 65% 99% 99% 1,021
* In terms of BDO for Acute IP and Non-acute IP, and in terms of attendances for SOP, PHC, A&E and AHOP #
Assuming the re-delineated Cluster boundary between KCC and KWC
TPU Group: 143
District: Central & Western
Corresponding Cluster: Hong Kong West Cluster
Population in 2015: 11,000
TPU Group 143 (highlighted on the map) is located in
the Central & Western district, with its corresponding
Cluster being the Hong Kong West Cluster.

Appendix I: Accessibility Statistics by Locality Page | 137
Cluster Concordance Analysis
The patronage pattern in 2015/16 for residents in TPU Group 121 & 122 is presented below. The
Cluster concordance rates (bolded in green) range from 65% for A&E to 91% for Acute IP.
Core Service Percentage of Utilisation* sought in Cluster# in 2015/16 Total
Utilisation HKEC HKWC KCC KEC KWC NTEC NTWC Total %
Acute IP 6% 91% 1% 1% - 1% - 100% 2,829
Non-acute IP 15% 86% - - - - - 100% 1,250
SOP 7% 88% 3% 1% 1% 1% - 100% 5,468
PHC 10% 86% 2% 1% 1% - 1% 100% 4,237
A&E 27% 65% 3% 1% 1% 2% 1% 100% 1,058
AHOP 14% 76% 10% - 1% - - 100% 1,867
Travel Time Analysis
The following table illustrates the percentages of utilisation sought within various threshold travel
times for TPU Group 121 & 122 in 2015/16. For example, the percentages of utilisation sought within
20 minutes of travel time range from 93% for AHOP to 97% for Non-acute IP (bolded in green).
Core Service Percentage of Utilisation* sought within Certain Travel Time in 2015/16 Total
Utilisation <10 min < 20 min < 30 min <40 min
Acute IP 26% 96% 100% 100% 2,829
Non-acute IP 6% 97% 100% 100% 1,250
SOP 18% 95% 100% 100% 5,468
PHC 84% 97% 99% 100% 4,237
A&E - 94% 97% 100% 1,058
AHOP 53% 93% 100% 100% 1,867
* In terms of BDO for Acute IP and Non-acute IP, and in terms of attendances for SOP, PHC, A&E and AHOP #
Assuming the re-delineated Cluster boundary between KCC and KWC
TPU Group: 121 & 122
District: Central & Western
Corresponding Cluster: Hong Kong West Cluster
Population in 2015: 6,600
TPU Group 121 & 122 (highlighted on the map) is
located in the Central & Western district, with its
corresponding Cluster being the Hong Kong West
Cluster.
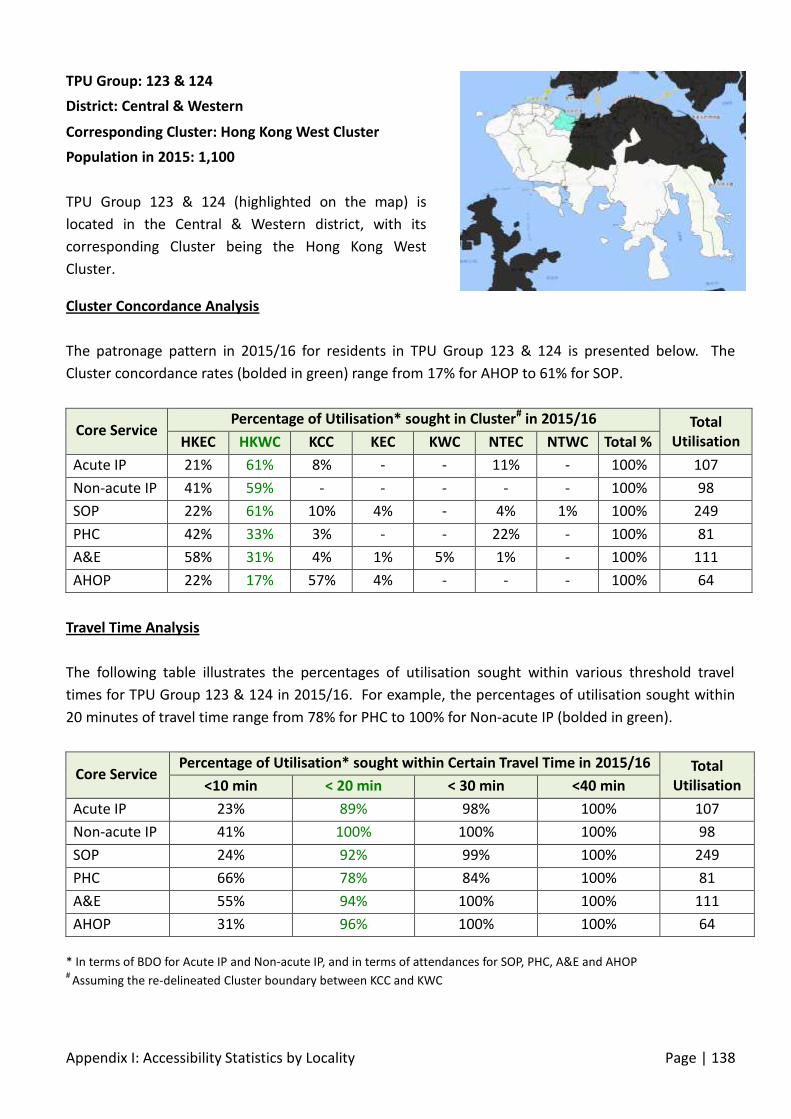
Appendix I: Accessibility Statistics by Locality Page | 138
Cluster Concordance Analysis
The patronage pattern in 2015/16 for residents in TPU Group 123 & 124 is presented below. The
Cluster concordance rates (bolded in green) range from 17% for AHOP to 61% for SOP.
Core Service Percentage of Utilisation* sought in Cluster# in 2015/16 Total
Utilisation HKEC HKWC KCC KEC KWC NTEC NTWC Total %
Acute IP 21% 61% 8% - - 11% - 100% 107
Non-acute IP 41% 59% - - - - - 100% 98
SOP 22% 61% 10% 4% - 4% 1% 100% 249
PHC 42% 33% 3% - - 22% - 100% 81
A&E 58% 31% 4% 1% 5% 1% - 100% 111
AHOP 22% 17% 57% 4% - - - 100% 64
Travel Time Analysis
The following table illustrates the percentages of utilisation sought within various threshold travel
times for TPU Group 123 & 124 in 2015/16. For example, the percentages of utilisation sought within
20 minutes of travel time range from 78% for PHC to 100% for Non-acute IP (bolded in green).
Core Service Percentage of Utilisation* sought within Certain Travel Time in 2015/16 Total
Utilisation <10 min < 20 min < 30 min <40 min
Acute IP 23% 89% 98% 100% 107
Non-acute IP 41% 100% 100% 100% 98
SOP 24% 92% 99% 100% 249
PHC 66% 78% 84% 100% 81
A&E 55% 94% 100% 100% 111
AHOP 31% 96% 100% 100% 64
* In terms of BDO for Acute IP and Non-acute IP, and in terms of attendances for SOP, PHC, A&E and AHOP #
Assuming the re-delineated Cluster boundary between KCC and KWC
TPU Group: 123 & 124
District: Central & Western
Corresponding Cluster: Hong Kong West Cluster
Population in 2015: 1,100
TPU Group 123 & 124 (highlighted on the map) is
located in the Central & Western district, with its
corresponding Cluster being the Hong Kong West
Cluster.

Appendix I: Accessibility Statistics by Locality Page | 139
Cluster Concordance Analysis
The patronage pattern in 2015/16 for residents in TPU Group 181 & 182 is presented below. The
Cluster concordance rates (bolded in green) range from 20% for PHC to 100% for Non-acute IP.
Core Service Percentage of Utilisation* sought in Cluster# in 2015/16 Total
Utilisation HKEC HKWC KCC KEC KWC NTEC NTWC Total %
Acute IP 53% 38% 8% 1% - - - 100% 240
Non-acute IP - 100% - - - - - 100% 23
SOP 23% 65% 10% 2% - 1% - 100% 699
PHC 78% 20% 2% - 1% - - 100% 361
A&E 76% 20% 3% 1% - - - 100% 199
AHOP 40% 52% 8% - 1% - - 100% 402
Travel Time Analysis
The following table illustrates the percentages of utilisation sought within various threshold travel
times for TPU Group 181 & 182 in 2015/16. For example, the percentages of utilisation sought within
20 minutes of travel time range from 19% for SOP to 100% for Non-acute IP (bolded in green).
Core Service Percentage of Utilisation* sought within Certain Travel Time in 2015/16 Total
Utilisation <10 min < 20 min < 30 min <40 min
Acute IP - 29% 99% 100% 240
Non-acute IP - 100% 100% 100% 23
SOP - 19% 97% 100% 699
PHC - 94% 100% 100% 361
A&E - 74% 99% 100% 199
AHOP - 39% 99% 100% 402
* In terms of BDO for Acute IP and Non-acute IP, and in terms of attendances for SOP, PHC, A&E and AHOP #
Assuming the re-delineated Cluster boundary between KCC and KWC
TPU Group: 181 & 182
District: Central & Western
Corresponding Cluster: Hong Kong West Cluster
Population in 2015: 4,600
TPU Group 181 & 182 (highlighted on the map) is
located in the Central & Western district, with its
corresponding Cluster being the Hong Kong West
Cluster.

Appendix I: Accessibility Statistics by Locality Page | 140
Cluster Concordance Analysis
The patronage pattern in 2015/16 for residents in TPU Group 171 is presented below. The Cluster
concordance rates (bolded in green) range from 56% for Non-acute IP to 93% for Acute IP.
Core Service Percentage of Utilisation* sought in Cluster# in 2015/16 Total
Utilisation HKEC HKWC KCC KEC KWC NTEC NTWC Total %
Acute IP 6% 93% 1% 1% 1% - - 100% 10,157
Non-acute IP 39% 56% 1% 1% 3% - - 100% 7,990
SOP 9% 85% 3% 1% 1% 1% 1% 100% 7,193
PHC 14% 82% 2% 1% 1% 1% 1% 100% 2,572
A&E 8% 89% 1% 1% 1% - - 100% 2,358
AHOP 14% 82% 2% 1% 1% - - 100% 2,209
Travel Time Analysis
The following table illustrates the percentages of utilisation sought within various threshold travel
times for TPU Group 171 in 2015/16. For example, the percentages of utilisation sought within 20
minutes of travel time range from 92% for Non-acute IP to 95% for A&E (bolded in green).
Core Service Percentage of Utilisation* sought within Certain Travel Time in 2015/16 Total
Utilisation <10 min < 20 min < 30 min <40 min
Acute IP 71% 95% 100% 100% 10,157
Non-acute IP 47% 92% 99% 100% 7,990
SOP 74% 93% 99% 100% 7,193
PHC 36% 93% 99% 100% 2,572
A&E 89% 95% 100% 100% 2,358
AHOP 43% 95% 100% 100% 2,209
* In terms of BDO for Acute IP and Non-acute IP, and in terms of attendances for SOP, PHC, A&E and AHOP #
Assuming the re-delineated Cluster boundary between KCC and KWC
TPU Group: 171
District: Southern
Corresponding Cluster: Hong Kong West Cluster
Population in 2015: 20,600
TPU Group 171 (highlighted on the map) is located in
the Southern district, with its corresponding Cluster
being the Hong Kong West Cluster.

Appendix I: Accessibility Statistics by Locality Page | 141
Cluster Concordance Analysis
The patronage pattern in 2015/16 for residents in TPU Group 172 is presented below. The Cluster
concordance rates (bolded in green) range from 59% for Non-acute IP to 94% for Acute IP.
Core Service Percentage of Utilisation* sought in Cluster# in 2015/16 Total
Utilisation HKEC HKWC KCC KEC KWC NTEC NTWC Total %
Acute IP 3% 94% 2% - 1% 1% - 100% 61,535
Non-acute IP 34% 59% - - 3% 4% - 100% 29,989
SOP 4% 93% 1% - 1% - - 100% 95,485
PHC 7% 91% 1% - 1% - - 100% 66,705
A&E 7% 88% 2% 1% 1% 1% 1% 100% 21,455
AHOP 14% 80% 3% 1% 1% 1% 1% 100% 29,425
Travel Time Analysis
The following table illustrates the percentages of utilisation sought within various threshold travel
times for TPU Group 172 in 2015/16. For example, the percentages of utilisation sought within 20
minutes of travel time range from 66% for Non-acute IP to 97% for SOP (bolded in green).
Core Service Percentage of Utilisation* sought within Certain Travel Time in 2015/16 Total
Utilisation <10 min < 20 min < 30 min <40 min
Acute IP 79% 95% 99% 100% 61,535
Non-acute IP 60% 66% 96% 100% 29,989
SOP 80% 97% 100% 100% 95,485
PHC 62% 95% 99% 99% 66,705
A&E 88% 94% 98% 99% 21,455
AHOP 35% 93% 99% 100% 29,425
* In terms of BDO for Acute IP and Non-acute IP, and in terms of attendances for SOP, PHC, A&E and AHOP #
Assuming the re-delineated Cluster boundary between KCC and KWC
TPU Group: 172
District: Southern
Corresponding Cluster: Hong Kong West Cluster
Population in 2015: 58,100
TPU Group 172 (highlighted on the map) is located in
the Southern district, with its corresponding Cluster
being the Hong Kong West Cluster.

Appendix I: Accessibility Statistics by Locality Page | 142
Cluster Concordance Analysis
The patronage pattern in 2015/16 for residents in TPU Group 173 is presented below. The Cluster
concordance rates (bolded in green) range from 51% for Non-acute IP to 95% for Acute IP.
Core Service Percentage of Utilisation* sought in Cluster# in 2015/16 Total
Utilisation HKEC HKWC KCC KEC KWC NTEC NTWC Total %
Acute IP 3% 95% 1% - - 1% - 100% 73,311
Non-acute IP 47% 51% 1% - - 1% - 100% 48,333
SOP 4% 93% 1% - 1% 1% - 100% 97,843
PHC 5% 93% 1% 1% - - - 100% 67,671
A&E 10% 85% 2% 1% 1% 1% 1% 100% 22,568
AHOP 23% 73% 3% - 1% - - 100% 29,275
Travel Time Analysis
The following table illustrates the percentages of utilisation sought within various threshold travel
times for TPU Group 173 in 2015/16. For example, the percentages of utilisation sought within 20
minutes of travel time range from 66% for Non-acute IP to 97% for Acute IP (bolded in green).
Core Service Percentage of Utilisation* sought within Certain Travel Time in 2015/16 Total
Utilisation <10 min < 20 min < 30 min <40 min
Acute IP 76% 97% 100% 100% 73,311
Non-acute IP 29% 66% 99% 100% 48,333
SOP 77% 96% 100% 100% 97,843
PHC 83% 96% 99% 99% 67,671
A&E 85% 94% 98% 99% 22,568
AHOP 28% 96% 100% 100% 29,275
* In terms of BDO for Acute IP and Non-acute IP, and in terms of attendances for SOP, PHC, A&E and AHOP #
Assuming the re-delineated Cluster boundary between KCC and KWC
TPU Group: 173
District: Southern
Corresponding Cluster: Hong Kong West Cluster
Population in 2015: 58,600
TPU Group 173 (highlighted on the map) is located in
the Southern district, with its corresponding Cluster
being the Hong Kong West Cluster.

Appendix I: Accessibility Statistics by Locality Page | 143
Cluster Concordance Analysis
The patronage pattern in 2015/16 for residents in TPU Group 174 is presented below. The Cluster
concordance rates (bolded in green) range from 58% for Non-acute IP to 94% for Acute IP.
Core Service Percentage of Utilisation* sought in Cluster# in 2015/16 Total
Utilisation HKEC HKWC KCC KEC KWC NTEC NTWC Total %
Acute IP 4% 94% 2% - 1% 1% - 100% 77,484
Non-acute IP 37% 58% 2% - 1% - 2% 100% 41,059
SOP 5% 91% 2% - 1% 1% - 100% 113,619
PHC 9% 88% 1% 1% 1% - - 100% 82,000
A&E 13% 81% 2% 1% 1% 1% 1% 100% 23,916
AHOP 29% 63% 5% 1% 1% 1% - 100% 36,932
Travel Time Analysis
The following table illustrates the percentages of utilisation sought within various threshold travel
times for TPU Group 174 in 2015/16. For example, the percentages of utilisation sought within 20
minutes of travel time range from 38% for AHOP to 91% for A&E (bolded in green).
Core Service Percentage of Utilisation* sought within Certain Travel Time in 2015/16 Total
Utilisation <10 min < 20 min < 30 min <40 min
Acute IP 13% 80% 99% 100% 77,484
Non-acute IP 9% 61% 97% 98% 41,059
SOP 5% 81% 98% 100% 113,619
PHC 78% 78% 98% 99% 82,000
A&E - 91% 96% 98% 23,916
AHOP 1% 38% 98% 99% 36,932
* In terms of BDO for Acute IP and Non-acute IP, and in terms of attendances for SOP, PHC, A&E and AHOP #
Assuming the re-delineated Cluster boundary between KCC and KWC
TPU Group: 174
District: Southern
Corresponding Cluster: Hong Kong West Cluster
Population in 2015: 86,100
TPU Group 174 (highlighted on the map) is located in
the Southern district, with its corresponding Cluster
being the Hong Kong West Cluster.

Appendix I: Accessibility Statistics by Locality Page | 144
Cluster Concordance Analysis
The patronage pattern in 2015/16 for residents in TPU Group 191 is presented below. The Cluster
concordance rates (bolded in green) range from 0% for Non-acute IP to 66% for SOP.
Core Service Percentage of Utilisation* sought in Cluster# in 2015/16 Total
Utilisation HKEC HKWC KCC KEC KWC NTEC NTWC Total %
Acute IP 52% 41% 7% - - - - 100% 206
Non-acute IP 14% - 86% - - - - 100% 34
SOP 23% 66% 5% 1% 1% 3% 1% 100% 352
PHC 58% 39% 2% - 1% - - 100% 245
A&E 60% 36% 2% 1% 1% - 1% 100% 155
AHOP 20% 62% 3% 15% - - - 100% 72
Travel Time Analysis
The following table illustrates the percentages of utilisation sought within various threshold travel
times for TPU Group 191 in 2015/16. For example, the percentages of utilisation sought within 20
minutes of travel time range from 14% for Non-acute IP to 99% for PHC (bolded in green).
Core Service Percentage of Utilisation* sought within Certain Travel Time in 2015/16 Total
Utilisation <10 min < 20 min < 30 min <40 min
Acute IP 10% 97% 100% 100% 206
Non-acute IP - 14% 100% 100% 34
SOP 6% 92% 98% 98% 352
PHC 18% 99% 100% 100% 245
A&E - 96% 99% 100% 155
AHOP - 85% 100% 100% 72
* In terms of BDO for Acute IP and Non-acute IP, and in terms of attendances for SOP, PHC, A&E and AHOP #
Assuming the re-delineated Cluster boundary between KCC and KWC
TPU Group: 191
District: Southern
Corresponding Cluster: Hong Kong West Cluster
Population in 2015: 3,900
TPU Group 191 (highlighted on the map) is located in
the Southern district, with its corresponding Cluster
being the Hong Kong West Cluster.

Appendix I: Accessibility Statistics by Locality Page | 145
Cluster Concordance Analysis
The patronage pattern in 2015/16 for residents in TPU Group 196 is presented below. The Cluster
concordance rates (bolded in green) range from 0% for Non-acute IP to 28% for AHOP.
Core Service Percentage of Utilisation* sought in Cluster# in 2015/16 Total
Utilisation HKEC HKWC KCC KEC KWC NTEC NTWC Total %
Acute IP 93% 6% 1% - - - - 100% 331
Non-acute IP - - - - - - - - -
SOP 67% 21% 6% 2% 1% 1% 3% 100% 504
PHC 93% 3% 2% - - 2% - 100% 468
A&E 86% 9% 2% 1% 1% - - 100% 299
AHOP 52% 28% 11% - 3% - 6% 100% 126
Travel Time Analysis
The following table illustrates the percentages of utilisation sought within various threshold travel
times for TPU Group 196 in 2015/16. For example, the percentages of utilisation sought within 20
minutes of travel time range from 0% for Non-acute IP to 88% for Acute IP (bolded in green).
Core Service Percentage of Utilisation* sought within Certain Travel Time in 2015/16 Total
Utilisation <10 min < 20 min < 30 min <40 min
Acute IP - 88% 93% 100% 331
Non-acute IP - - - - -
SOP - 51% 76% 97% 504
PHC - 67% 96% 100% 468
A&E - 71% 89% 99% 299
AHOP - 33% 55% 94% 126
* In terms of BDO for Acute IP and Non-acute IP, and in terms of attendances for SOP, PHC, A&E and AHOP #
Assuming the re-delineated Cluster boundary between KCC and KWC
TPU Group: 196
District: Southern
Corresponding Cluster: Hong Kong West Cluster
Population in 2015: 5,000
TPU Group 196 (highlighted on the map) is located in
the Southern district, with its corresponding Cluster
being the Hong Kong West Cluster.

Appendix I: Accessibility Statistics by Locality Page | 146
Cluster Concordance Analysis
The patronage pattern in 2015/16 for residents in TPU Group 197 is presented below. The Cluster
concordance rates (bolded in green) range from 0% for Non-acute IP, A&E and AHOP to 5% for SOP.
Core Service Percentage of Utilisation* sought in Cluster# in 2015/16 Total
Utilisation HKEC HKWC KCC KEC KWC NTEC NTWC Total %
Acute IP 99% 1% - - - - - 100% 900
Non-acute IP 100% - - - - - - 100% 150
SOP 95% 5% 1% - - - - 100% 380
PHC 100% - - - - - - 100% 270
A&E 99% - 1% - - - - 100% 86
AHOP 100% - - - - - - 100% 67
Travel Time Analysis
The following table illustrates the percentages of utilisation sought within various threshold travel
times for TPU Group 197 in 2015/16. For example, the percentages of utilisation sought within 20
minutes of travel time range from 12% for Non-acute IP to 97% for A&E (bolded in green).
Core Service Percentage of Utilisation* sought within Certain Travel Time in 2015/16 Total
Utilisation <10 min < 20 min < 30 min <40 min
Acute IP - 90% 99% 100% 900
Non-acute IP - 12% 100% 100% 150
SOP - 79% 96% 100% 380
PHC - 77% 100% 100% 270
A&E - 97% 99% 100% 86
AHOP - 86% 100% 100% 67
* In terms of BDO for Acute IP and Non-acute IP, and in terms of attendances for SOP, PHC, A&E and AHOP #
Assuming the re-delineated Cluster boundary between KCC and KWC
TPU Group: 197
District: Southern
Corresponding Cluster: Hong Kong West Cluster
Population in 2015: 3,000
TPU Group 197 (highlighted on the map) is located in
the Southern district, with its corresponding Cluster
being the Hong Kong West Cluster.

Appendix I: Accessibility Statistics by Locality Page | 147
Cluster Concordance Analysis
The patronage pattern in 2015/16 for residents in TPU Group 175 & 176 is presented below. The
Cluster concordance rates (bolded in green) range from 21% for Non-acute IP to 81% for PHC.
Core Service Percentage of Utilisation* sought in Cluster# in 2015/16 Total
Utilisation HKEC HKWC KCC KEC KWC NTEC NTWC Total %
Acute IP 55% 39% 1% 1% 3% - 1% 100% 18,420
Non-acute IP 71% 21% 2% 1% - 2% 3% 100% 17,511
SOP 17% 77% 2% 1% 1% 1% 1% 100% 17,386
PHC 14% 81% 2% 1% 1% 1% 1% 100% 11,205
A&E 63% 32% 1% 1% 1% 1% 1% 100% 4,569
AHOP 39% 56% 4% 1% 1% 1% - 100% 5,328
Travel Time Analysis
The following table illustrates the percentages of utilisation sought within various threshold travel
times for TPU Group 175 & 176 in 2015/16. For example, the percentages of utilisation sought within
20 minutes of travel time range from 79% for Non-acute IP to 95% for PHC (bolded in green).
Core Service Percentage of Utilisation* sought within Certain Travel Time in 2015/16 Total
Utilisation <10 min < 20 min < 30 min <40 min
Acute IP 4% 88% 99% 99% 18,420
Non-acute IP 21% 79% 95% 98% 17,511
SOP 7% 90% 99% 99% 17,386
PHC 69% 95% 98% 99% 11,205
A&E - 93% 98% 99% 4,569
AHOP 3% 94% 99% 100% 5,328
* In terms of BDO for Acute IP and Non-acute IP, and in terms of attendances for SOP, PHC, A&E and AHOP #
Assuming the re-delineated Cluster boundary between KCC and KWC
TPU Group: 175 & 176
District: Southern
Corresponding Cluster: Hong Kong West Cluster
Population in 2015: 13,200
TPU Group 175 & 176 (highlighted on the map) is
located in the Southern district, with its corresponding
Cluster being the Hong Kong West Cluster.

Appendix I: Accessibility Statistics by Locality Page | 148
Cluster Concordance Analysis
The patronage pattern in 2015/16 for residents in TPU Group 190, 192 & 194 is presented below. The
Cluster concordance rates (bolded in green) range from 11% for PHC to 61% for Acute IP.
Core Service Percentage of Utilisation* sought in Cluster# in 2015/16 Total
Utilisation HKEC HKWC KCC KEC KWC NTEC NTWC Total %
Acute IP 35% 61% 4% - - - - 100% 866
Non-acute IP 81% 12% 7% - - - - 100% 151
SOP 43% 45% 7% 1% 2% 2% - 100% 1,186
PHC 87% 11% 1% 1% - - - 100% 738
A&E 74% 19% 5% - 1% - - 100% 557
AHOP 64% 27% 2% - 4% 3% - 100% 282
Travel Time Analysis
The following table illustrates the percentages of utilisation sought within various threshold travel
times for TPU Group 190, 192 & 194 in 2015/16. For example, the percentages of utilisation sought
within 20 minutes of travel time range from 59% for AHOP to 94% for PHC (bolded in green).
Core Service Percentage of Utilisation* sought within Certain Travel Time in 2015/16 Total
Utilisation <10 min < 20 min < 30 min <40 min
Acute IP - 77% 100% 100% 866
Non-acute IP - 60% 100% 100% 151
SOP 2% 67% 97% 99% 1,186
PHC - 94% 100% 100% 738
A&E - 83% 98% 99% 557
AHOP 1% 59% 97% 100% 282
* In terms of BDO for Acute IP and Non-acute IP, and in terms of attendances for SOP, PHC, A&E and AHOP #
Assuming the re-delineated Cluster boundary between KCC and KWC
TPU Group: 190, 192 & 194
District: Southern
Corresponding Cluster: Hong Kong West Cluster
Population in 2015: 12,800
TPU Group 190, 192 & 194 (highlighted on the map) is
located in the Southern district, with its corresponding
Cluster being the Hong Kong West Cluster.
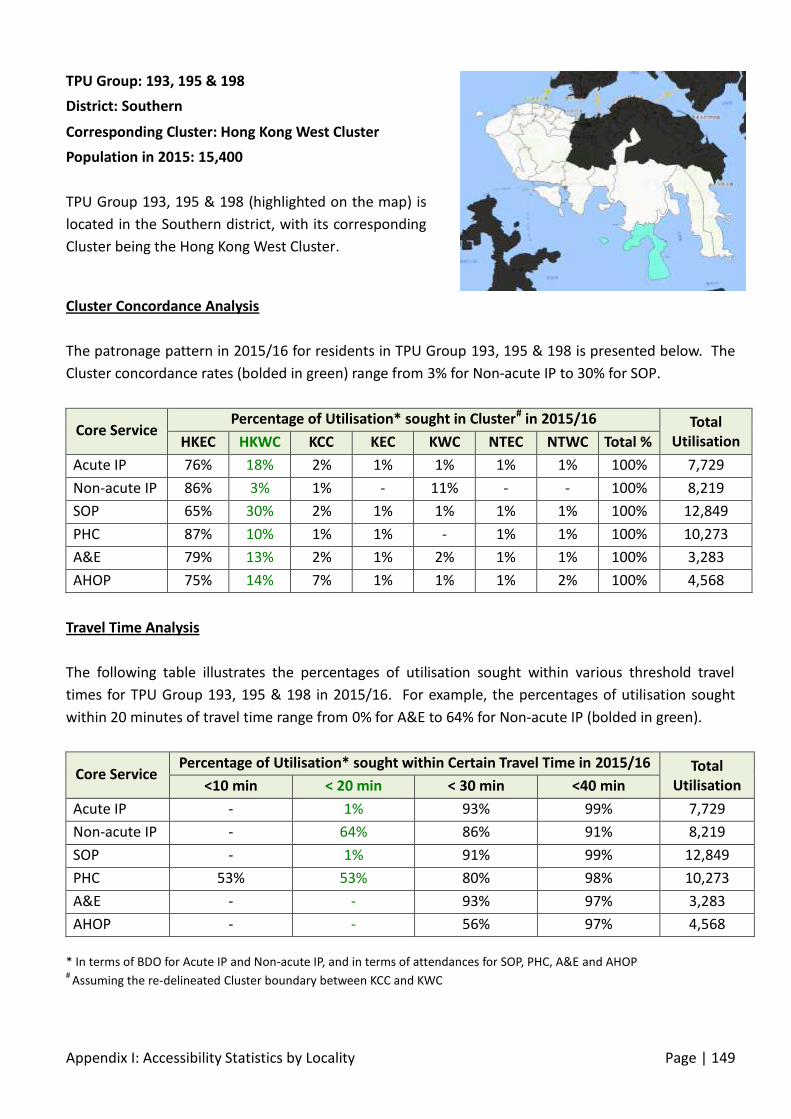
Appendix I: Accessibility Statistics by Locality Page | 149
Cluster Concordance Analysis
The patronage pattern in 2015/16 for residents in TPU Group 193, 195 & 198 is presented below. The
Cluster concordance rates (bolded in green) range from 3% for Non-acute IP to 30% for SOP.
Core Service Percentage of Utilisation* sought in Cluster# in 2015/16 Total
Utilisation HKEC HKWC KCC KEC KWC NTEC NTWC Total %
Acute IP 76% 18% 2% 1% 1% 1% 1% 100% 7,729
Non-acute IP 86% 3% 1% - 11% - - 100% 8,219
SOP 65% 30% 2% 1% 1% 1% 1% 100% 12,849
PHC 87% 10% 1% 1% - 1% 1% 100% 10,273
A&E 79% 13% 2% 1% 2% 1% 1% 100% 3,283
AHOP 75% 14% 7% 1% 1% 1% 2% 100% 4,568
Travel Time Analysis
The following table illustrates the percentages of utilisation sought within various threshold travel
times for TPU Group 193, 195 & 198 in 2015/16. For example, the percentages of utilisation sought
within 20 minutes of travel time range from 0% for A&E to 64% for Non-acute IP (bolded in green).
Core Service Percentage of Utilisation* sought within Certain Travel Time in 2015/16 Total
Utilisation <10 min < 20 min < 30 min <40 min
Acute IP - 1% 93% 99% 7,729
Non-acute IP - 64% 86% 91% 8,219
SOP - 1% 91% 99% 12,849
PHC 53% 53% 80% 98% 10,273
A&E - - 93% 97% 3,283
AHOP - - 56% 97% 4,568
* In terms of BDO for Acute IP and Non-acute IP, and in terms of attendances for SOP, PHC, A&E and AHOP #
Assuming the re-delineated Cluster boundary between KCC and KWC
TPU Group: 193, 195 & 198
District: Southern
Corresponding Cluster: Hong Kong West Cluster
Population in 2015: 15,400
TPU Group 193, 195 & 198 (highlighted on the map) is
located in the Southern district, with its corresponding
Cluster being the Hong Kong West Cluster.

Appendix I: Accessibility Statistics by Locality Page | 150
Cluster Concordance Analysis
The patronage pattern in 2015/16 for residents in TPU Group 231 is presented below. The Cluster
concordance rates (bolded in green) range from 75% for SOP to 89% for Acute IP.
Core Service Percentage of Utilisation* sought in Cluster# in 2015/16 Total
Utilisation HKEC HKWC KCC KEC KWC NTEC NTWC Total %
Acute IP - 4% 89% 5% 1% 1% - 100% 5,549
Non-acute IP - - 89% 5% 4% 3% - 100% 5,971
SOP 2% 3% 75% 6% 8% 5% 1% 100% 4,271
PHC 1% 1% 87% 3% 5% 2% 1% 100% 2,307
A&E 1% - 86% 7% 3% 1% 1% 100% 1,291
AHOP - 2% 83% 4% 6% 4% 1% 100% 2,169
Travel Time Analysis
The following table illustrates the percentages of utilisation sought within various threshold travel
times for TPU Group 231 in 2015/16. For example, the percentages of utilisation sought within 20
minutes of travel time range from 94% for SOP to 100% for Non-acute IP (bolded in green).
Core Service Percentage of Utilisation* sought within Certain Travel Time in 2015/16 Total
Utilisation <10 min < 20 min < 30 min <40 min
Acute IP 2% 96% 100% 100% 5,549
Non-acute IP 63% 100% 100% 100% 5,971
SOP 23% 94% 99% 100% 4,271
PHC 71% 97% 99% 100% 2,307
A&E - 97% 99% 100% 1,291
AHOP 46% 98% 100% 100% 2,169
* In terms of BDO for Acute IP and Non-acute IP, and in terms of attendances for SOP, PHC, A&E and AHOP #
Assuming the re-delineated Cluster boundary between KCC and KWC
TPU Group: 231
District: Kowloon City
Corresponding Cluster: Kowloon Central Cluster
Population in 2015: 7,200
TPU Group 231 (highlighted on the map) is located in
the Kowloon City district, with its corresponding Cluster
being the Kowloon Central Cluster.

Appendix I: Accessibility Statistics by Locality Page | 151
Cluster Concordance Analysis
The patronage pattern in 2015/16 for residents in TPU Group 232 is presented below. The Cluster
concordance rates (bolded in green) range from 79% for SOP to 98% for Non-acute IP.
Core Service Percentage of Utilisation* sought in Cluster# in 2015/16 Total
Utilisation HKEC HKWC KCC KEC KWC NTEC NTWC Total %
Acute IP 1% 6% 89% 1% - 1% 3% 100% 803
Non-acute IP - - 98% - 1% - - 100% 316
SOP 3% 7% 79% 3% 5% 3% 1% 100% 1,919
PHC 3% 2% 90% 3% 2% 1% - 100% 1,174
A&E 3% 3% 86% 1% 4% 2% 2% 100% 329
AHOP 2% 1% 90% 1% 4% 2% - 100% 1,114
Travel Time Analysis
The following table illustrates the percentages of utilisation sought within various threshold travel
times for TPU Group 232 in 2015/16. For example, the percentages of utilisation sought within 20
minutes of travel time range from 90% for Acute IP to 100% for Non-acute IP (bolded in green).
Core Service Percentage of Utilisation* sought within Certain Travel Time in 2015/16 Total
Utilisation <10 min < 20 min < 30 min <40 min
Acute IP 63% 90% 98% 100% 803
Non-acute IP 45% 100% 100% 100% 316
SOP 41% 91% 99% 100% 1,919
PHC 81% 98% 99% 100% 1,174
A&E 56% 93% 98% 100% 329
AHOP 67% 97% 100% 100% 1,114
* In terms of BDO for Acute IP and Non-acute IP, and in terms of attendances for SOP, PHC, A&E and AHOP #
Assuming the re-delineated Cluster boundary between KCC and KWC
TPU Group: 232
District: Kowloon City
Corresponding Cluster: Kowloon Central Cluster
Population in 2015: 4,300
TPU Group 232 (highlighted on the map) is located in
the Kowloon City district, with its corresponding Cluster
being the Kowloon Central Cluster.

Appendix I: Accessibility Statistics by Locality Page | 152
Cluster Concordance Analysis
The patronage pattern in 2015/16 for residents in TPU Group 233 is presented below. The Cluster
concordance rates (bolded in green) range from 79% for A&E to 100% for Non-acute IP.
Core Service Percentage of Utilisation* sought in Cluster# in 2015/16 Total
Utilisation HKEC HKWC KCC KEC KWC NTEC NTWC Total %
Acute IP 1% 3% 83% 1% 9% 2% 1% 100% 1,141
Non-acute IP - - 100% - - - - 100% 371
SOP 2% 6% 80% 1% 8% 3% - 100% 2,613
PHC 1% - 91% 4% 2% 1% - 100% 2,051
A&E 4% 4% 79% 2% 7% 3% 1% 100% 372
AHOP 1% 1% 91% - 5% 3% - 100% 1,553
Travel Time Analysis
The following table illustrates the percentages of utilisation sought within various threshold travel
times for TPU Group 233 in 2015/16. For example, the percentages of utilisation sought within 20
minutes of travel time range from 90% for Acute IP to 100% for Non-acute IP (bolded in green).
Core Service Percentage of Utilisation* sought within Certain Travel Time in 2015/16 Total
Utilisation <10 min < 20 min < 30 min <40 min
Acute IP 1% 90% 99% 100% 1,141
Non-acute IP 84% 100% 100% 100% 371
SOP 25% 92% 99% 100% 2,613
PHC 78% 97% 99% 100% 2,051
A&E - 92% 98% 99% 372
AHOP 60% 96% 100% 100% 1,553
* In terms of BDO for Acute IP and Non-acute IP, and in terms of attendances for SOP, PHC, A&E and AHOP #
Assuming the re-delineated Cluster boundary between KCC and KWC
TPU Group: 233
District: Kowloon City
Corresponding Cluster: Kowloon Central Cluster
Population in 2015: 4,000
TPU Group 233 (highlighted on the map) is located in
the Kowloon City district, with its corresponding Cluster
being the Kowloon Central Cluster.

Appendix I: Accessibility Statistics by Locality Page | 153
Cluster Concordance Analysis
The patronage pattern in 2015/16 for residents in TPU Group 234 is presented below. The Cluster
concordance rates (bolded in green) range from 80% for SOP to 92% for AHOP.
Core Service Percentage of Utilisation* sought in Cluster# in 2015/16 Total
Utilisation HKEC HKWC KCC KEC KWC NTEC NTWC Total %
Acute IP 1% 4% 90% 2% 2% 1% - 100% 14,619
Non-acute IP 4% - 90% 1% 3% 2% - 100% 11,290
SOP 2% 6% 80% 3% 5% 4% 1% 100% 14,117
PHC 2% 1% 92% 3% 2% 1% - 100% 9,589
A&E 2% 1% 90% 2% 3% 2% 1% 100% 3,532
AHOP 1% 2% 92% 2% 3% 1% - 100% 8,963
Travel Time Analysis
The following table illustrates the percentages of utilisation sought within various threshold travel
times for TPU Group 234 in 2015/16. For example, the percentages of utilisation sought within 20
minutes of travel time range from 92% for SOP to 98% for Non-acute IP (bolded in green).
Core Service Percentage of Utilisation* sought within Certain Travel Time in 2015/16 Total
Utilisation <10 min < 20 min < 30 min <40 min
Acute IP 89% 96% 100% 100% 14,619
Non-acute IP 77% 98% 100% 100% 11,290
SOP 76% 92% 99% 100% 14,117
PHC 81% 98% 100% 100% 9,589
A&E 90% 97% 99% 100% 3,532
AHOP 88% 98% 100% 100% 8,963
* In terms of BDO for Acute IP and Non-acute IP, and in terms of attendances for SOP, PHC, A&E and AHOP #
Assuming the re-delineated Cluster boundary between KCC and KWC
TPU Group: 234
District: Kowloon City
Corresponding Cluster: Kowloon Central Cluster
Population in 2015: 14,800
TPU Group 234 (highlighted on the map) is located in
the Kowloon City district, with its corresponding Cluster
being the Kowloon Central Cluster.

Appendix I: Accessibility Statistics by Locality Page | 154
Cluster Concordance Analysis
The patronage pattern in 2015/16 for residents in TPU Group 235 is presented below. The Cluster
concordance rates (bolded in green) range from 77% for Non-acute IP to 90% for AHOP.
Core Service Percentage of Utilisation* sought in Cluster# in 2015/16 Total
Utilisation HKEC HKWC KCC KEC KWC NTEC NTWC Total %
Acute IP 1% 4% 82% 7% 1% 4% 1% 100% 14,127
Non-acute IP 1% - 77% 3% 5% 5% 9% 100% 12,349
SOP 3% 5% 81% 2% 5% 4% 1% 100% 15,575
PHC 2% 1% 88% 3% 3% 2% 1% 100% 9,088
A&E 2% 1% 86% 3% 4% 3% 2% 100% 3,719
AHOP 1% 1% 90% 2% 4% 2% - 100% 7,564
Travel Time Analysis
The following table illustrates the percentages of utilisation sought within various threshold travel
times for TPU Group 235 in 2015/16. For example, the percentages of utilisation sought within 20
minutes of travel time range from 86% for Non-acute IP to 98% for AHOP (bolded in green).
Core Service Percentage of Utilisation* sought within Certain Travel Time in 2015/16 Total
Utilisation <10 min < 20 min < 30 min <40 min
Acute IP 82% 95% 98% 100% 14,127
Non-acute IP 32% 86% 91% 100% 12,349
SOP 81% 92% 99% 100% 15,575
PHC 82% 97% 98% 100% 9,088
A&E 86% 94% 97% 100% 3,719
AHOP 91% 98% 99% 100% 7,564
* In terms of BDO for Acute IP and Non-acute IP, and in terms of attendances for SOP, PHC, A&E and AHOP #
Assuming the re-delineated Cluster boundary between KCC and KWC
TPU Group: 235
District: Kowloon City
Corresponding Cluster: Kowloon Central Cluster
Population in 2015: 16,300
TPU Group 235 (highlighted on the map) is located in
the Kowloon City district, with its corresponding Cluster
being the Kowloon Central Cluster.

Appendix I: Accessibility Statistics by Locality Page | 155
Cluster Concordance Analysis
The patronage pattern in 2015/16 for residents in TPU Group 236 is presented below. The Cluster
concordance rates (bolded in green) range from 84% for Non-acute IP to 91% for PHC.
Core Service Percentage of Utilisation* sought in Cluster# in 2015/16 Total
Utilisation HKEC HKWC KCC KEC KWC NTEC NTWC Total %
Acute IP 1% 3% 90% 1% 2% 2% 1% 100% 23,200
Non-acute IP 2% 4% 84% - 3% 2% 5% 100% 15,270
SOP 2% 3% 88% 1% 5% 2% - 100% 40,956
PHC 1% 1% 91% 3% 2% 1% - 100% 33,329
A&E 3% 1% 86% 2% 4% 2% 2% 100% 9,701
AHOP 2% 2% 91% 1% 4% 1% 1% 100% 16,753
Travel Time Analysis
The following table illustrates the percentages of utilisation sought within various threshold travel
times for TPU Group 236 in 2015/16. For example, the percentages of utilisation sought within 20
minutes of travel time range from 90% for Non-acute IP to 98% for PHC (bolded in green).
Core Service Percentage of Utilisation* sought within Certain Travel Time in 2015/16 Total
Utilisation <10 min < 20 min < 30 min <40 min
Acute IP 70% 96% 99% 100% 23,200
Non-acute IP - 90% 95% 100% 15,270
SOP 44% 96% 99% 100% 40,956
PHC 47% 98% 99% 100% 33,329
A&E 65% 94% 97% 100% 9,701
AHOP 40% 98% 99% 100% 16,753
* In terms of BDO for Acute IP and Non-acute IP, and in terms of attendances for SOP, PHC, A&E and AHOP #
Assuming the re-delineated Cluster boundary between KCC and KWC
TPU Group: 236
District: Kowloon City
Corresponding Cluster: Kowloon Central Cluster
Population in 2015: 29,700
TPU Group 236 (highlighted on the map) is located in
the Kowloon City district, with its corresponding Cluster
being the Kowloon Central Cluster.

Appendix I: Accessibility Statistics by Locality Page | 156
Cluster Concordance Analysis
The patronage pattern in 2015/16 for residents in TPU Group 237 is presented below. The Cluster
concordance rates (bolded in green) range from 87% for A&E to 93% for Non-acute IP.
Core Service Percentage of Utilisation* sought in Cluster# in 2015/16 Total
Utilisation HKEC HKWC KCC KEC KWC NTEC NTWC Total %
Acute IP 1% 2% 92% 1% 3% 2% 1% 100% 19,512
Non-acute IP 1% 1% 93% - 4% 1% - 100% 11,501
SOP 1% 2% 88% 1% 5% 2% 1% 100% 26,754
PHC 1% 1% 92% 3% 2% 1% - 100% 24,781
A&E 2% 1% 87% 2% 4% 3% 1% 100% 7,157
AHOP 2% - 92% 2% 3% 1% 1% 100% 11,769
Travel Time Analysis
The following table illustrates the percentages of utilisation sought within various threshold travel
times for TPU Group 237 in 2015/16. For example, the percentages of utilisation sought within 20
minutes of travel time range from 94% for A&E to 98% for Non-acute IP (bolded in green).
Core Service Percentage of Utilisation* sought within Certain Travel Time in 2015/16 Total
Utilisation <10 min < 20 min < 30 min <40 min
Acute IP 71% 96% 99% 100% 19,512
Non-acute IP 61% 98% 100% 100% 11,501
SOP 68% 96% 99% 100% 26,754
PHC 56% 98% 99% 100% 24,781
A&E 56% 94% 98% 100% 7,157
AHOP 57% 97% 99% 100% 11,769
* In terms of BDO for Acute IP and Non-acute IP, and in terms of attendances for SOP, PHC, A&E and AHOP #
Assuming the re-delineated Cluster boundary between KCC and KWC
TPU Group: 237
District: Kowloon City
Corresponding Cluster: Kowloon Central Cluster
Population in 2015: 16,200
TPU Group 237 (highlighted on the map) is located in
the Kowloon City district, with its corresponding Cluster
being the Kowloon Central Cluster.

Appendix I: Accessibility Statistics by Locality Page | 157
Cluster Concordance Analysis
The patronage pattern in 2015/16 for residents in TPU Group 241 is presented below. The Cluster
concordance rates (bolded in green) range from 86% for A&E to 93% for PHC.
Core Service Percentage of Utilisation* sought in Cluster# in 2015/16 Total
Utilisation HKEC HKWC KCC KEC KWC NTEC NTWC Total %
Acute IP 1% 2% 90% 3% 2% 2% - 100% 38,008
Non-acute IP 1% - 89% 3% 2% 2% 4% 100% 25,218
SOP 2% 3% 87% 3% 3% 2% 1% 100% 47,488
PHC 1% 1% 93% 3% 1% 1% 1% 100% 44,150
A&E 3% 1% 86% 3% 3% 2% 1% 100% 11,839
AHOP 2% 1% 88% 4% 3% 1% 1% 100% 20,768
Travel Time Analysis
The following table illustrates the percentages of utilisation sought within various threshold travel
times for TPU Group 241 in 2015/16. For example, the percentages of utilisation sought within 20
minutes of travel time range from 93% for Non-acute IP to 97% for PHC (bolded in green).
Core Service Percentage of Utilisation* sought within Certain Travel Time in 2015/16 Total
Utilisation <10 min < 20 min < 30 min <40 min
Acute IP 1% 96% 100% 100% 38,008
Non-acute IP - 93% 96% 96% 25,218
SOP 14% 94% 99% 100% 47,488
PHC 19% 97% 99% 100% 44,150
A&E - 93% 98% 99% 11,839
AHOP 3% 96% 99% 100% 20,768
* In terms of BDO for Acute IP and Non-acute IP, and in terms of attendances for SOP, PHC, A&E and AHOP #
Assuming the re-delineated Cluster boundary between KCC and KWC
TPU Group: 241
District: Kowloon City
Corresponding Cluster: Kowloon Central Cluster
Population in 2015: 46,200
TPU Group 241 (highlighted on the map) is located in
the Kowloon City district, with its corresponding Cluster
being the Kowloon Central Cluster.

Appendix I: Accessibility Statistics by Locality Page | 158
Cluster Concordance Analysis
The patronage pattern in 2015/16 for residents in TPU Group 242 is presented below. The Cluster
concordance rates (bolded in green) range from 86% for AHOP to 93% for PHC.
Core Service Percentage of Utilisation* sought in Cluster# in 2015/16 Total
Utilisation HKEC HKWC KCC KEC KWC NTEC NTWC Total %
Acute IP 1% 2% 90% 4% 2% 1% 1% 100% 39,892
Non-acute IP - - 91% 3% 5% 1% - 100% 29,339
SOP 1% 3% 87% 3% 3% 2% 1% 100% 48,676
PHC 1% 1% 93% 4% 1% 1% - 100% 48,383
A&E 2% 1% 86% 4% 4% 2% 1% 100% 15,240
AHOP 1% 2% 86% 5% 4% 1% - 100% 16,804
Travel Time Analysis
The following table illustrates the percentages of utilisation sought within various threshold travel
times for TPU Group 242 in 2015/16. For example, the percentages of utilisation sought within 20
minutes of travel time range from 95% for SOP to 99% for Non-acute IP (bolded in green).
Core Service Percentage of Utilisation* sought within Certain Travel Time in 2015/16 Total
Utilisation <10 min < 20 min < 30 min <40 min
Acute IP 1% 96% 99% 100% 39,892
Non-acute IP - 99% 100% 100% 29,339
SOP 14% 95% 99% 100% 48,676
PHC 78% 97% 100% 100% 48,383
A&E - 96% 98% 100% 15,240
AHOP 4% 96% 99% 100% 16,804
* In terms of BDO for Acute IP and Non-acute IP, and in terms of attendances for SOP, PHC, A&E and AHOP #
Assuming the re-delineated Cluster boundary between KCC and KWC
TPU Group: 242
District: Kowloon City
Corresponding Cluster: Kowloon Central Cluster
Population in 2015: 49,300
TPU Group 242 (highlighted on the map) is located in
the Kowloon City district, with its corresponding Cluster
being the Kowloon Central Cluster.

Appendix I: Accessibility Statistics by Locality Page | 159
Cluster Concordance Analysis
The patronage pattern in 2015/16 for residents in TPU Group 243 is presented below. The Cluster
concordance rates (bolded in green) range from 86% for SOP to 95% for Non-acute IP.
Core Service Percentage of Utilisation* sought in Cluster# in 2015/16 Total
Utilisation HKEC HKWC KCC KEC KWC NTEC NTWC Total %
Acute IP 1% 2% 91% 3% 1% 2% 1% 100% 28,223
Non-acute IP 1% - 95% 1% 1% 1% - 100% 16,669
SOP 2% 3% 86% 2% 4% 2% 1% 100% 35,065
PHC 2% 1% 92% 3% 1% 1% - 100% 32,180
A&E 2% 1% 87% 3% 4% 2% 1% 100% 9,740
AHOP 1% 3% 88% 2% 4% 1% 1% 100% 12,068
Travel Time Analysis
The following table illustrates the percentages of utilisation sought within various threshold travel
times for TPU Group 243 in 2015/16. For example, the percentages of utilisation sought within 20
minutes of travel time range from 93% for A&E to 98% for PHC (bolded in green).
Core Service Percentage of Utilisation* sought within Certain Travel Time in 2015/16 Total
Utilisation <10 min < 20 min < 30 min <40 min
Acute IP 82% 96% 99% 100% 28,223
Non-acute IP - 98% 99% 100% 16,669
SOP 54% 94% 99% 100% 35,065
PHC 79% 98% 99% 100% 32,180
A&E 80% 93% 97% 100% 9,740
AHOP 55% 95% 98% 100% 12,068
* In terms of BDO for Acute IP and Non-acute IP, and in terms of attendances for SOP, PHC, A&E and AHOP #
Assuming the re-delineated Cluster boundary between KCC and KWC
TPU Group: 243
District: Kowloon City
Corresponding Cluster: Kowloon Central Cluster
Population in 2015: 33,800
TPU Group 243 (highlighted on the map) is located in
the Kowloon City district, with its corresponding Cluster
being the Kowloon Central Cluster.

Appendix I: Accessibility Statistics by Locality Page | 160
Cluster Concordance Analysis
The patronage pattern in 2015/16 for residents in TPU Group 244 is presented below. The Cluster
concordance rates (bolded in green) range from 74% for Non-acute IP to 91% for Acute IP.
Core Service Percentage of Utilisation* sought in Cluster# in 2015/16 Total
Utilisation HKEC HKWC KCC KEC KWC NTEC NTWC Total %
Acute IP 1% 3% 91% 1% 1% 2% 1% 100% 11,452
Non-acute IP - - 74% 3% 3% 19% 1% 100% 6,785
SOP 2% 4% 86% 2% 3% 2% 1% 100% 20,877
PHC 2% 1% 90% 4% 2% 1% - 100% 17,226
A&E 3% 2% 86% 3% 4% 3% 1% 100% 5,260
AHOP 2% 1% 87% 3% 4% 1% 1% 100% 7,853
Travel Time Analysis
The following table illustrates the percentages of utilisation sought within various threshold travel
times for TPU Group 244 in 2015/16. For example, the percentages of utilisation sought within 20
minutes of travel time range from 78% for Non-acute IP to 97% for PHC (bolded in green).
Core Service Percentage of Utilisation* sought within Certain Travel Time in 2015/16 Total
Utilisation <10 min < 20 min < 30 min <40 min
Acute IP 78% 93% 99% 100% 11,452
Non-acute IP - 78% 100% 100% 6,785
SOP 53% 90% 99% 100% 20,877
PHC 60% 97% 99% 100% 17,226
A&E 77% 91% 97% 100% 5,260
AHOP 46% 93% 99% 100% 7,853
* In terms of BDO for Acute IP and Non-acute IP, and in terms of attendances for SOP, PHC, A&E and AHOP #
Assuming the re-delineated Cluster boundary between KCC and KWC
TPU Group: 244
District: Kowloon City
Corresponding Cluster: Kowloon Central Cluster
Population in 2015: 29,000
TPU Group 244 (highlighted on the map) is located in
the Kowloon City district, with its corresponding Cluster
being the Kowloon Central Cluster.

Appendix I: Accessibility Statistics by Locality Page | 161
Cluster Concordance Analysis
The patronage pattern in 2015/16 for residents in TPU Group 245 is presented below. The Cluster
concordance rates (bolded in green) range from 86% for SOP to 92% for PHC.
Core Service Percentage of Utilisation* sought in Cluster# in 2015/16 Total
Utilisation HKEC HKWC KCC KEC KWC NTEC NTWC Total %
Acute IP 2% 5% 88% 1% 3% 2% - 100% 25,161
Non-acute IP 1% 4% 87% 1% 2% 5% - 100% 13,741
SOP 2% 4% 86% 2% 4% 3% 1% 100% 44,762
PHC 2% 1% 92% 3% 2% 1% - 100% 34,759
A&E 3% 1% 86% 2% 4% 3% 1% 100% 8,571
AHOP 2% 2% 89% 2% 4% 2% - 100% 18,016
Travel Time Analysis
The following table illustrates the percentages of utilisation sought within various threshold travel
times for TPU Group 245 in 2015/16. For example, the percentages of utilisation sought within 20
minutes of travel time range from 92% for SOP to 96% for PHC (bolded in green).
Core Service Percentage of Utilisation* sought within Certain Travel Time in 2015/16 Total
Utilisation <10 min < 20 min < 30 min <40 min
Acute IP 81% 93% 99% 100% 25,161
Non-acute IP - 94% 100% 100% 13,741
SOP 58% 92% 99% 100% 44,762
PHC 84% 96% 99% 100% 34,759
A&E 80% 92% 98% 100% 8,571
AHOP 56% 95% 100% 100% 18,016
* In terms of BDO for Acute IP and Non-acute IP, and in terms of attendances for SOP, PHC, A&E and AHOP #
Assuming the re-delineated Cluster boundary between KCC and KWC
TPU Group: 245
District: Kowloon City
Corresponding Cluster: Kowloon Central Cluster
Population in 2015: 49,700
TPU Group 245 (highlighted on the map) is located in
the Kowloon City district, with its corresponding Cluster
being the Kowloon Central Cluster.

Appendix I: Accessibility Statistics by Locality Page | 162
Cluster Concordance Analysis
The patronage pattern in 2015/16 for residents in TPU Group 246 is presented below. The Cluster
concordance rates (bolded in green) range from 84% for A&E to 93% for Non-acute IP.
Core Service Percentage of Utilisation* sought in Cluster# in 2015/16 Total
Utilisation HKEC HKWC KCC KEC KWC NTEC NTWC Total %
Acute IP 1% 3% 87% 4% 3% 3% - 100% 14,265
Non-acute IP 3% - 93% 1% 3% 1% - 100% 10,323
SOP 1% 3% 85% 3% 5% 3% 1% 100% 20,969
PHC 1% 1% 92% 4% 1% 1% 1% 100% 18,130
A&E 2% 1% 84% 4% 5% 2% 1% 100% 4,401
AHOP 2% 1% 90% 3% 3% 1% - 100% 10,137
Travel Time Analysis
The following table illustrates the percentages of utilisation sought within various threshold travel
times for TPU Group 246 in 2015/16. For example, the percentages of utilisation sought within 20
minutes of travel time range from 96% for SOP to 98% for PHC (bolded in green).
Core Service Percentage of Utilisation* sought within Certain Travel Time in 2015/16 Total
Utilisation <10 min < 20 min < 30 min <40 min
Acute IP 3% 96% 100% 100% 14,265
Non-acute IP 71% 97% 98% 100% 10,323
SOP 30% 96% 99% 100% 20,969
PHC 81% 98% 99% 100% 18,130
A&E - 96% 99% 100% 4,401
AHOP 54% 98% 100% 100% 10,137
* In terms of BDO for Acute IP and Non-acute IP, and in terms of attendances for SOP, PHC, A&E and AHOP #
Assuming the re-delineated Cluster boundary between KCC and KWC
TPU Group: 246
District: Kowloon City
Corresponding Cluster: Kowloon Central Cluster
Population in 2015: 16,900
TPU Group 246 (highlighted on the map) is located in
the Kowloon City district, with its corresponding Cluster
being the Kowloon Central Cluster.

Appendix I: Accessibility Statistics by Locality Page | 163
Cluster Concordance Analysis
The patronage pattern in 2015/16 for residents in TPU Group 247 is presented below. The Cluster
concordance rates (bolded in green) range from 81% for AHOP to 100% for Non-acute IP.
Core Service Percentage of Utilisation* sought in Cluster# in 2015/16 Total
Utilisation HKEC HKWC KCC KEC KWC NTEC NTWC Total %
Acute IP 2% 3% 91% 1% 1% 2% - 100% 2,197
Non-acute IP - - 100% - - - - 100% 573
SOP 4% 3% 84% 3% 3% 3% - 100% 4,095
PHC 3% 1% 86% 7% 1% 2% 1% 100% 3,318
A&E 4% 1% 82% 3% 6% 2% 1% 100% 1,145
AHOP 2% 1% 81% 4% 10% 2% - 100% 1,362
Travel Time Analysis
The following table illustrates the percentages of utilisation sought within various threshold travel
times for TPU Group 247 in 2015/16. For example, the percentages of utilisation sought within 20
minutes of travel time range from 93% for PHC to 100% for Non-acute IP (bolded in green).
Core Service Percentage of Utilisation* sought within Certain Travel Time in 2015/16 Total
Utilisation <10 min < 20 min < 30 min <40 min
Acute IP 1% 95% 100% 100% 2,197
Non-acute IP - 100% 100% 100% 573
SOP 11% 94% 99% 100% 4,095
PHC 51% 93% 99% 100% 3,318
A&E - 94% 98% 100% 1,145
AHOP 5% 97% 100% 100% 1,362
* In terms of BDO for Acute IP and Non-acute IP, and in terms of attendances for SOP, PHC, A&E and AHOP #
Assuming the re-delineated Cluster boundary between KCC and KWC
TPU Group: 247
District: Kowloon City
Corresponding Cluster: Kowloon Central Cluster
Population in 2015: 6,800
TPU Group 247 (highlighted on the map) is located in
the Kowloon City district, with its corresponding Cluster
being the Kowloon Central Cluster.

Appendix I: Accessibility Statistics by Locality Page | 164
Cluster Concordance Analysis
The patronage pattern in 2015/16 for residents in TPU Group 271 is presented below. The Cluster
concordance rates (bolded in green) range from 70% for SOP to 85% for Non-acute IP.
Core Service Percentage of Utilisation* sought in Cluster# in 2015/16 Total
Utilisation HKEC HKWC KCC KEC KWC NTEC NTWC Total %
Acute IP 1% 7% 81% 1% 5% 4% - 100% 7,085
Non-acute IP 1% - 85% 2% 6% 7% 1% 100% 2,673
SOP 4% 8% 70% 4% 8% 5% 1% 100% 9,668
PHC 4% 2% 81% 5% 5% 4% 1% 100% 4,957
A&E 5% 3% 73% 5% 9% 5% 1% 100% 1,804
AHOP 2% 5% 81% 1% 5% 5% - 100% 5,985
Travel Time Analysis
The following table illustrates the percentages of utilisation sought within various threshold travel
times for TPU Group 271 in 2015/16. For example, the percentages of utilisation sought within 20
minutes of travel time range from 88% for SOP to 97% for Non-acute IP (bolded in green).
Core Service Percentage of Utilisation* sought within Certain Travel Time in 2015/16 Total
Utilisation <10 min < 20 min < 30 min <40 min
Acute IP 4% 91% 100% 100% 7,085
Non-acute IP 85% 97% 100% 100% 2,673
SOP 25% 88% 99% 100% 9,668
PHC 72% 96% 99% 100% 4,957
A&E 5% 90% 100% 100% 1,804
AHOP 46% 91% 100% 100% 5,985
* In terms of BDO for Acute IP and Non-acute IP, and in terms of attendances for SOP, PHC, A&E and AHOP #
Assuming the re-delineated Cluster boundary between KCC and KWC
TPU Group: 271
District: Kowloon City
Corresponding Cluster: Kowloon Central Cluster
Population in 2015: 18,200
TPU Group 271 (highlighted on the map) is located in
the Kowloon City district, with its corresponding Cluster
being the Kowloon Central Cluster.

Appendix I: Accessibility Statistics by Locality Page | 165
Cluster Concordance Analysis
The patronage pattern in 2015/16 for residents in TPU Group 272 is presented below. The Cluster
concordance rates (bolded in green) range from 75% for SOP to 99% for Non-acute IP.
Core Service Percentage of Utilisation* sought in Cluster# in 2015/16 Total
Utilisation HKEC HKWC KCC KEC KWC NTEC NTWC Total %
Acute IP 1% 3% 87% 1% 3% 4% 1% 100% 5,947
Non-acute IP 1% - 99% - - - - 100% 3,758
SOP 2% 5% 75% 3% 7% 7% 1% 100% 6,982
PHC 2% 2% 86% 4% 3% 2% 1% 100% 4,012
A&E 3% 2% 83% 2% 5% 4% 1% 100% 1,548
AHOP 2% 1% 87% 2% 4% 3% 1% 100% 3,458
Travel Time Analysis
The following table illustrates the percentages of utilisation sought within various threshold travel
times for TPU Group 272 in 2015/16. For example, the percentages of utilisation sought within 20
minutes of travel time range from 92% for SOP to 100% for Non-acute IP (bolded in green).
Core Service Percentage of Utilisation* sought within Certain Travel Time in 2015/16 Total
Utilisation <10 min < 20 min < 30 min <40 min
Acute IP 5% 95% 100% 100% 5,947
Non-acute IP 99% 100% 100% 100% 3,758
SOP 26% 92% 99% 100% 6,982
PHC 78% 97% 99% 100% 4,012
A&E 2% 94% 99% 100% 1,548
AHOP 48% 97% 100% 100% 3,458
* In terms of BDO for Acute IP and Non-acute IP, and in terms of attendances for SOP, PHC, A&E and AHOP #
Assuming the re-delineated Cluster boundary between KCC and KWC
TPU Group: 272
District: Kowloon City
Corresponding Cluster: Kowloon Central Cluster
Population in 2015: 9,600
TPU Group 272 (highlighted on the map) is located in
the Kowloon City district, with its corresponding Cluster
being the Kowloon Central Cluster.
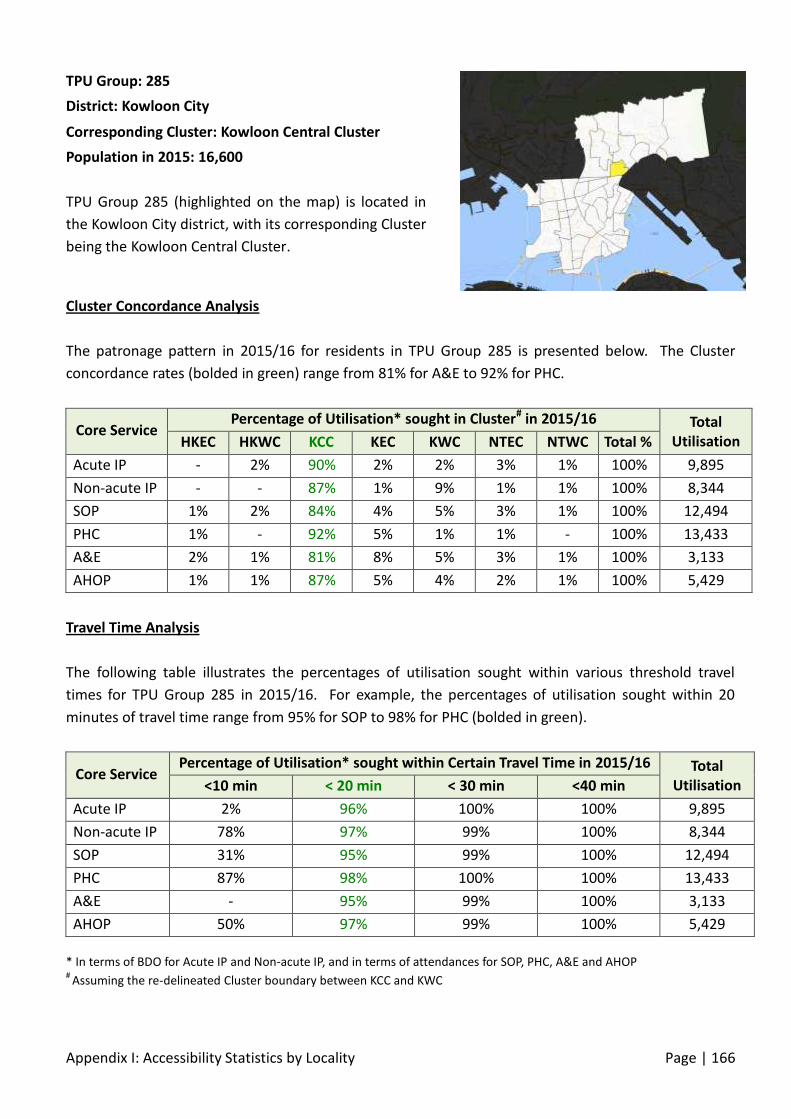
Appendix I: Accessibility Statistics by Locality Page | 166
Cluster Concordance Analysis
The patronage pattern in 2015/16 for residents in TPU Group 285 is presented below. The Cluster
concordance rates (bolded in green) range from 81% for A&E to 92% for PHC.
Core Service Percentage of Utilisation* sought in Cluster# in 2015/16 Total
Utilisation HKEC HKWC KCC KEC KWC NTEC NTWC Total %
Acute IP - 2% 90% 2% 2% 3% 1% 100% 9,895
Non-acute IP - - 87% 1% 9% 1% 1% 100% 8,344
SOP 1% 2% 84% 4% 5% 3% 1% 100% 12,494
PHC 1% - 92% 5% 1% 1% - 100% 13,433
A&E 2% 1% 81% 8% 5% 3% 1% 100% 3,133
AHOP 1% 1% 87% 5% 4% 2% 1% 100% 5,429
Travel Time Analysis
The following table illustrates the percentages of utilisation sought within various threshold travel
times for TPU Group 285 in 2015/16. For example, the percentages of utilisation sought within 20
minutes of travel time range from 95% for SOP to 98% for PHC (bolded in green).
Core Service Percentage of Utilisation* sought within Certain Travel Time in 2015/16 Total
Utilisation <10 min < 20 min < 30 min <40 min
Acute IP 2% 96% 100% 100% 9,895
Non-acute IP 78% 97% 99% 100% 8,344
SOP 31% 95% 99% 100% 12,494
PHC 87% 98% 100% 100% 13,433
A&E - 95% 99% 100% 3,133
AHOP 50% 97% 99% 100% 5,429
* In terms of BDO for Acute IP and Non-acute IP, and in terms of attendances for SOP, PHC, A&E and AHOP #
Assuming the re-delineated Cluster boundary between KCC and KWC
TPU Group: 285
District: Kowloon City
Corresponding Cluster: Kowloon Central Cluster
Population in 2015: 16,600
TPU Group 285 (highlighted on the map) is located in
the Kowloon City district, with its corresponding Cluster
being the Kowloon Central Cluster.

Appendix I: Accessibility Statistics by Locality Page | 167
Cluster Concordance Analysis
The patronage pattern in 2015/16 for residents in TPU Group 213 & 215 - 216 is presented below. The
Cluster concordance rates (bolded in green) range from 63% for Non-acute IP to 93% for Acute IP.
Core Service Percentage of Utilisation* sought in Cluster# in 2015/16 Total
Utilisation HKEC HKWC KCC KEC KWC NTEC NTWC Total %
Acute IP 1% 2% 93% - 1% 2% - 100% 1,581
Non-acute IP - - 63% - 37% - - 100% 755
SOP 5% 4% 79% 2% 4% 6% 1% 100% 2,432
PHC 4% 2% 81% 5% 3% 3% 2% 100% 1,563
A&E 4% 2% 81% 1% 4% 4% 5% 100% 763
AHOP 4% 4% 83% 3% 2% 1% 2% 100% 870
Travel Time Analysis
The following table illustrates the percentages of utilisation sought within various threshold travel
times for TPU Group 213 & 215 - 216 in 2015/16. For example, the percentages of utilisation sought
within 20 minutes of travel time range from 92% for A&E to 100% for Non-acute IP (bolded in green).
Core Service Percentage of Utilisation* sought within Certain Travel Time in 2015/16 Total
Utilisation <10 min < 20 min < 30 min <40 min
Acute IP 90% 99% 100% 100% 1,581
Non-acute IP 63% 100% 100% 100% 755
SOP 76% 94% 98% 100% 2,432
PHC 77% 97% 98% 100% 1,563
A&E 75% 92% 96% 100% 763
AHOP 79% 97% 98% 100% 870
* In terms of BDO for Acute IP and Non-acute IP, and in terms of attendances for SOP, PHC, A&E and AHOP #
Assuming the re-delineated Cluster boundary between KCC and KWC
TPU Group: 213 & 215 - 216
District: Kowloon City
Corresponding Cluster: Kowloon Central Cluster
Population in 2015: 12,400
TPU Group 213 & 215 - 216 (highlighted on the map) is
located in the Kowloon City district, with its
corresponding Cluster being the Kowloon Central
Cluster.

Appendix I: Accessibility Statistics by Locality Page | 168
Cluster Concordance Analysis
The patronage pattern in 2015/16 for residents in TPU Group 220 is presented below. The Cluster
concordance rates (bolded in green) range from 35% for Non-acute IP to 92% for AHOP.
Core Service Percentage of Utilisation* sought in Cluster# in 2015/16 Total
Utilisation HKEC HKWC KCC KEC KWC NTEC NTWC Total %
Acute IP - 2% 89% - 4% 1% 5% 100% 947
Non-acute IP - - 35% - 49% - 16% 100% 497
SOP - 5% 82% 2% 7% 4% - 100% 1,532
PHC 1% 3% 91% 2% 2% 1% 1% 100% 1,225
A&E 2% - 90% 1% 3% 3% 1% 100% 396
AHOP - 1% 92% 1% 6% 2% - 100% 533
Travel Time Analysis
The following table illustrates the percentages of utilisation sought within various threshold travel
times for TPU Group 220 in 2015/16. For example, the percentages of utilisation sought within 20
minutes of travel time range from 84% for Non-acute IP to 99% for AHOP (bolded in green).
Core Service Percentage of Utilisation* sought within Certain Travel Time in 2015/16 Total
Utilisation <10 min < 20 min < 30 min <40 min
Acute IP 87% 93% 95% 100% 947
Non-acute IP 13% 84% 84% 100% 497
SOP 83% 94% 99% 100% 1,532
PHC 90% 94% 98% 100% 1,225
A&E 90% 95% 97% 100% 396
AHOP 93% 99% 100% 100% 533
* In terms of BDO for Acute IP and Non-acute IP, and in terms of attendances for SOP, PHC, A&E and AHOP #
Assuming the re-delineated Cluster boundary between KCC and KWC
TPU Group: 220
District: Mong Kok
Corresponding Cluster: Kowloon Central Cluster #
Population in 2015: 1,200
TPU Group 220 (highlighted on the map) is located in
the Mong Kok district, with its corresponding Cluster
being the Kowloon Central Cluster#.

Appendix I: Accessibility Statistics by Locality Page | 169
Cluster Concordance Analysis
The patronage pattern in 2015/16 for residents in TPU Group 221 is presented below. The Cluster
concordance rates (bolded in green) range from 66% for Non-acute IP to 87% for PHC.
Core Service Percentage of Utilisation* sought in Cluster# in 2015/16 Total
Utilisation HKEC HKWC KCC KEC KWC NTEC NTWC Total %
Acute IP 1% 3% 86% 2% 6% 2% - 100% 74,855
Non-acute IP 3% 1% 66% 3% 21% 3% 2% 100% 51,945
SOP 1% 3% 71% 2% 21% 2% 1% 100% 77,086
PHC 1% 1% 87% 1% 8% 1% 1% 100% 62,141
A&E 2% 1% 79% 2% 13% 2% 1% 100% 26,720
AHOP 1% 2% 83% 2% 10% 1% 1% 100% 30,094
Travel Time Analysis
The following table illustrates the percentages of utilisation sought within various threshold travel
times for TPU Group 221 in 2015/16. For example, the percentages of utilisation sought within 20
minutes of travel time range from 89% for Non-acute IP to 97% for PHC (bolded in green).
Core Service Percentage of Utilisation* sought within Certain Travel Time in 2015/16 Total
Utilisation <10 min < 20 min < 30 min <40 min
Acute IP 69% 96% 99% 100% 74,855
Non-acute IP - 89% 96% 100% 51,945
SOP 46% 95% 99% 100% 77,086
PHC 79% 97% 99% 100% 62,141
A&E 68% 94% 99% 100% 26,720
AHOP 57% 95% 99% 100% 30,094
* In terms of BDO for Acute IP and Non-acute IP, and in terms of attendances for SOP, PHC, A&E and AHOP #
Assuming the re-delineated Cluster boundary between KCC and KWC
TPU Group: 221
District: Mong Kok
Corresponding Cluster: Kowloon Central Cluster #
Population in 2015: 83,400
TPU Group 221 (highlighted on the map) is located in
the Mong Kok district, with its corresponding Cluster
being the Kowloon Central Cluster#.

Appendix I: Accessibility Statistics by Locality Page | 170
Cluster Concordance Analysis
The patronage pattern in 2015/16 for residents in TPU Group 222 is presented below. The Cluster
concordance rates (bolded in green) range from 72% for Non-acute IP to 89% for AHOP.
Core Service Percentage of Utilisation* sought in Cluster# in 2015/16 Total
Utilisation HKEC HKWC KCC KEC KWC NTEC NTWC Total %
Acute IP 1% 4% 89% 1% 4% 2% - 100% 13,425
Non-acute IP 4% - 72% 1% 19% 4% - 100% 6,957
SOP 2% 3% 77% 1% 14% 3% 1% 100% 19,222
PHC 2% 1% 88% 1% 6% 2% - 100% 14,151
A&E 3% 1% 82% 2% 8% 3% 1% 100% 5,256
AHOP 2% 1% 89% 1% 5% 1% 1% 100% 7,855
Travel Time Analysis
The following table illustrates the percentages of utilisation sought within various threshold travel
times for TPU Group 222 in 2015/16. For example, the percentages of utilisation sought within 20
minutes of travel time range from 92% for Non-acute IP to 97% for PHC (bolded in green).
Core Service Percentage of Utilisation* sought within Certain Travel Time in 2015/16 Total
Utilisation <10 min < 20 min < 30 min <40 min
Acute IP 65% 94% 99% 100% 13,425
Non-acute IP 18% 92% 100% 100% 6,957
SOP 59% 95% 99% 100% 19,222
PHC 73% 97% 99% 100% 14,151
A&E 66% 93% 97% 100% 5,256
AHOP 74% 96% 99% 100% 7,855
* In terms of BDO for Acute IP and Non-acute IP, and in terms of attendances for SOP, PHC, A&E and AHOP #
Assuming the re-delineated Cluster boundary between KCC and KWC
TPU Group: 222
District: Mong Kok
Corresponding Cluster: Kowloon Central Cluster #
Population in 2015: 21,000
TPU Group 222 (highlighted on the map) is located in
the Mong Kok district, with its corresponding Cluster
being the Kowloon Central Cluster#.

Appendix I: Accessibility Statistics by Locality Page | 171
Cluster Concordance Analysis
The patronage pattern in 2015/16 for residents in TPU Group 227 is presented below. The Cluster
concordance rates (bolded in green) range from 68% for Non-acute IP to 92% for PHC.
Core Service Percentage of Utilisation* sought in Cluster# in 2015/16 Total
Utilisation HKEC HKWC KCC KEC KWC NTEC NTWC Total %
Acute IP - 3% 89% 1% 2% 3% 2% 100% 14,011
Non-acute IP 5% - 68% - 27% - - 100% 8,077
SOP 1% 3% 82% 1% 10% 2% 1% 100% 20,122
PHC 1% 1% 92% 2% 3% 1% 1% 100% 15,912
A&E 2% 1% 89% 2% 4% 3% 1% 100% 5,914
AHOP 1% 2% 90% 1% 4% 1% 1% 100% 7,253
Travel Time Analysis
The following table illustrates the percentages of utilisation sought within various threshold travel
times for TPU Group 227 in 2015/16. For example, the percentages of utilisation sought within 20
minutes of travel time range from 94% for Acute IP to 98% for PHC (bolded in green).
Core Service Percentage of Utilisation* sought within Certain Travel Time in 2015/16 Total
Utilisation <10 min < 20 min < 30 min <40 min
Acute IP 88% 94% 98% 100% 14,011
Non-acute IP 17% 95% 96% 100% 8,077
SOP 82% 95% 99% 100% 20,122
PHC 91% 98% 99% 100% 15,912
A&E 89% 95% 98% 100% 5,914
AHOP 90% 95% 99% 100% 7,253
* In terms of BDO for Acute IP and Non-acute IP, and in terms of attendances for SOP, PHC, A&E and AHOP #
Assuming the re-delineated Cluster boundary between KCC and KWC
TPU Group: 227
District: Mong Kok
Corresponding Cluster: Kowloon Central Cluster #
Population in 2015: 18,500
TPU Group 227 (highlighted on the map) is located in
the Mong Kok district, with its corresponding Cluster
being the Kowloon Central Cluster#.

Appendix I: Accessibility Statistics by Locality Page | 172
Cluster Concordance Analysis
The patronage pattern in 2015/16 for residents in TPU Group 228 is presented below. The Cluster
concordance rates (bolded in green) range from 77% for Non-acute IP to 96% for PHC.
Core Service Percentage of Utilisation* sought in Cluster# in 2015/16 Total
Utilisation HKEC HKWC KCC KEC KWC NTEC NTWC Total %
Acute IP 1% 3% 87% 2% 3% 4% 1% 100% 18,156
Non-acute IP 1% 3% 77% 3% 13% 3% 1% 100% 9,278
SOP 1% 3% 82% 1% 11% 2% 1% 100% 16,124
PHC 1% - 96% 1% 2% 1% - 100% 15,165
A&E 1% 1% 87% 1% 5% 3% 1% 100% 6,972
AHOP 1% 1% 92% 1% 3% 2% - 100% 6,680
Travel Time Analysis
The following table illustrates the percentages of utilisation sought within various threshold travel
times for TPU Group 228 in 2015/16. For example, the percentages of utilisation sought within 20
minutes of travel time range from 92% for Non-acute IP to 98% for PHC (bolded in green).
Core Service Percentage of Utilisation* sought within Certain Travel Time in 2015/16 Total
Utilisation <10 min < 20 min < 30 min <40 min
Acute IP 85% 93% 99% 100% 18,156
Non-acute IP - 92% 99% 100% 9,278
SOP 68% 96% 99% 100% 16,124
PHC 95% 98% 99% 100% 15,165
A&E 87% 94% 99% 100% 6,972
AHOP 77% 96% 100% 100% 6,680
* In terms of BDO for Acute IP and Non-acute IP, and in terms of attendances for SOP, PHC, A&E and AHOP #
Assuming the re-delineated Cluster boundary between KCC and KWC
TPU Group: 228
District: Mong Kok
Corresponding Cluster: Kowloon Central Cluster #
Population in 2015: 14,800
TPU Group 228 (highlighted on the map) is located in
the Mong Kok district, with its corresponding Cluster
being the Kowloon Central Cluster#.

Appendix I: Accessibility Statistics by Locality Page | 173
Cluster Concordance Analysis
The patronage pattern in 2015/16 for residents in TPU Group 229 is presented below. The Cluster
concordance rates (bolded in green) range from 61% for Non-acute IP to 93% for PHC.
Core Service Percentage of Utilisation* sought in Cluster# in 2015/16 Total
Utilisation HKEC HKWC KCC KEC KWC NTEC NTWC Total %
Acute IP 2% 5% 87% 1% 3% 2% 1% 100% 13,291
Non-acute IP - 1% 61% 3% 28% 2% 6% 100% 7,754
SOP 1% 3% 78% 1% 14% 2% 1% 100% 17,214
PHC 1% 1% 93% 1% 3% 1% 1% 100% 14,407
A&E 2% 1% 88% 1% 6% 2% 1% 100% 6,184
AHOP 2% 2% 89% 2% 4% 1% 1% 100% 7,173
Travel Time Analysis
The following table illustrates the percentages of utilisation sought within various threshold travel
times for TPU Group 229 in 2015/16. For example, the percentages of utilisation sought within 20
minutes of travel time range from 92% for Non-acute IP to 98% for PHC (bolded in green).
Core Service Percentage of Utilisation* sought within Certain Travel Time in 2015/16 Total
Utilisation <10 min < 20 min < 30 min <40 min
Acute IP 85% 95% 99% 100% 13,291
Non-acute IP - 92% 95% 100% 7,754
SOP 68% 97% 99% 100% 17,214
PHC 92% 98% 99% 100% 14,407
A&E 89% 96% 99% 100% 6,184
AHOP 84% 98% 100% 100% 7,173
* In terms of BDO for Acute IP and Non-acute IP, and in terms of attendances for SOP, PHC, A&E and AHOP #
Assuming the re-delineated Cluster boundary between KCC and KWC
TPU Group: 229
District: Mong Kok
Corresponding Cluster: Kowloon Central Cluster #
Population in 2015: 15,900
TPU Group 229 (highlighted on the map) is located in
the Mong Kok district, with its corresponding Cluster
being the Kowloon Central Cluster#.

Appendix I: Accessibility Statistics by Locality Page | 174
Cluster Concordance Analysis
The patronage pattern in 2015/16 for residents in TPU Group 253 is presented below. The Cluster
concordance rates (bolded in green) range from 69% for Non-acute IP to 88% for PHC.
Core Service Percentage of Utilisation* sought in Cluster# in 2015/16 Total
Utilisation HKEC HKWC KCC KEC KWC NTEC NTWC Total %
Acute IP 1% 6% 85% 1% 4% 2% 1% 100% 25,731
Non-acute IP 2% 1% 69% 1% 21% 5% 1% 100% 13,689
SOP 2% 5% 73% 1% 15% 2% 1% 100% 39,272
PHC 2% 2% 88% 1% 5% 1% 1% 100% 31,206
A&E 2% 2% 84% 2% 7% 2% 1% 100% 9,382
AHOP 2% 4% 83% 2% 8% 1% 1% 100% 16,323
Travel Time Analysis
The following table illustrates the percentages of utilisation sought within various threshold travel
times for TPU Group 253 in 2015/16. For example, the percentages of utilisation sought within 20
minutes of travel time range from 93% for Non-acute IP to 97% for PHC (bolded in green).
Core Service Percentage of Utilisation* sought within Certain Travel Time in 2015/16 Total
Utilisation <10 min < 20 min < 30 min <40 min
Acute IP 61% 97% 99% 100% 25,731
Non-acute IP - 93% 99% 100% 13,689
SOP 48% 96% 99% 100% 39,272
PHC 81% 97% 99% 100% 31,206
A&E 67% 95% 98% 100% 9,382
AHOP 53% 96% 100% 100% 16,323
* In terms of BDO for Acute IP and Non-acute IP, and in terms of attendances for SOP, PHC, A&E and AHOP #
Assuming the re-delineated Cluster boundary between KCC and KWC
TPU Group: 253
District: Mong Kok
Corresponding Cluster: Kowloon Central Cluster #
Population in 2015: 33,900
TPU Group 253 (highlighted on the map) is located in
the Mong Kok district, with its corresponding Cluster
being the Kowloon Central Cluster#.

Appendix I: Accessibility Statistics by Locality Page | 175
Cluster Concordance Analysis
The patronage pattern in 2015/16 for residents in TPU Group 254 is presented below. The Cluster
concordance rates (bolded in green) range from 65% for PHC to 77% for Acute IP.
Core Service Percentage of Utilisation* sought in Cluster# in 2015/16 Total
Utilisation HKEC HKWC KCC KEC KWC NTEC NTWC Total %
Acute IP 2% 6% 77% 1% 10% 3% 1% 100% 5,106
Non-acute IP 1% - 74% - 25% 1% - 100% 1,494
SOP 4% 9% 67% 2% 14% 3% 2% 100% 9,802
PHC 5% 4% 65% 2% 17% 5% 2% 100% 4,765
A&E 5% 3% 69% 2% 16% 3% 2% 100% 2,175
AHOP 2% 5% 76% 1% 12% 3% 1% 100% 4,001
Travel Time Analysis
The following table illustrates the percentages of utilisation sought within various threshold travel
times for TPU Group 254 in 2015/16. For example, the percentages of utilisation sought within 20
minutes of travel time range from 90% for PHC to 100% for Non-acute IP (bolded in green).
Core Service Percentage of Utilisation* sought within Certain Travel Time in 2015/16 Total
Utilisation <10 min < 20 min < 30 min <40 min
Acute IP 8% 97% 100% 100% 5,106
Non-acute IP 1% 100% 100% 100% 1,494
SOP 7% 93% 100% 100% 9,802
PHC 24% 90% 99% 100% 4,765
A&E 4% 90% 100% 100% 2,175
AHOP 9% 94% 100% 100% 4,001
* In terms of BDO for Acute IP and Non-acute IP, and in terms of attendances for SOP, PHC, A&E and AHOP #
Assuming the re-delineated Cluster boundary between KCC and KWC
TPU Group: 254
District: Mong Kok
Corresponding Cluster: Kowloon Central Cluster #
Population in 2015: 19,900
TPU Group 254 (highlighted on the map) is located in
the Mong Kok district, with its corresponding Cluster
being the Kowloon Central Cluster#.

Appendix I: Accessibility Statistics by Locality Page | 176
Cluster Concordance Analysis
The patronage pattern in 2015/16 for residents in TPU Group 281 is presented below. The Cluster
concordance rates (bolded in green) range from 70% for Non-acute IP to 92% for PHC.
Core Service Percentage of Utilisation* sought in Cluster# in 2015/16 Total
Utilisation HKEC HKWC KCC KEC KWC NTEC NTWC Total %
Acute IP 1% 2% 88% 3% 3% 3% 1% 100% 176,214
Non-acute IP 2% 1% 70% 1% 19% 2% 5% 100% 112,931
SOP 1% 3% 73% 4% 16% 3% 1% 100% 237,010
PHC 1% 1% 92% 3% 2% 1% - 100% 252,199
A&E 2% 1% 77% 8% 7% 4% 1% 100% 53,725
AHOP 1% 2% 80% 5% 9% 2% 1% 100% 88,736
Travel Time Analysis
The following table illustrates the percentages of utilisation sought within various threshold travel
times for TPU Group 281 in 2015/16. For example, the percentages of utilisation sought within 20
minutes of travel time range from 92% for Non-acute IP to 98% for PHC (bolded in green).
Core Service Percentage of Utilisation* sought within Certain Travel Time in 2015/16 Total
Utilisation <10 min < 20 min < 30 min <40 min
Acute IP 8% 95% 99% 100% 176,214
Non-acute IP 38% 92% 94% 100% 112,931
SOP 25% 95% 99% 100% 237,010
PHC 79% 98% 100% 100% 252,199
A&E - 93% 99% 100% 53,725
AHOP 29% 96% 99% 100% 88,736
* In terms of BDO for Acute IP and Non-acute IP, and in terms of attendances for SOP, PHC, A&E and AHOP #
Assuming the re-delineated Cluster boundary between KCC and KWC
TPU Group: 281
District: Wong Tai Sin
Corresponding Cluster: Kowloon Central Cluster #
Population in 2015: 206,100
TPU Group 281 (highlighted on the map) is located in
the Wong Tai Sin district, with its corresponding Cluster
being the Kowloon Central Cluster#.

Appendix I: Accessibility Statistics by Locality Page | 177
Cluster Concordance Analysis
The patronage pattern in 2015/16 for residents in TPU Group 282 is presented below. The Cluster
concordance rates (bolded in green) range from 66% for Non-acute IP to 94% for PHC.
Core Service Percentage of Utilisation* sought in Cluster# in 2015/16 Total
Utilisation HKEC HKWC KCC KEC KWC NTEC NTWC Total %
Acute IP 1% 2% 88% 2% 5% 2% 1% 100% 47,213
Non-acute IP 3% - 66% 1% 25% 4% 2% 100% 29,525
SOP 1% 3% 76% 2% 15% 3% 1% 100% 74,637
PHC 1% 1% 94% 2% 2% 1% - 100% 82,555
A&E 2% 1% 80% 5% 7% 4% 1% 100% 14,971
AHOP 1% 1% 83% 3% 9% 2% 1% 100% 31,534
Travel Time Analysis
The following table illustrates the percentages of utilisation sought within various threshold travel
times for TPU Group 282 in 2015/16. For example, the percentages of utilisation sought within 20
minutes of travel time range from 94% for A&E to 98% for PHC (bolded in green).
Core Service Percentage of Utilisation* sought within Certain Travel Time in 2015/16 Total
Utilisation <10 min < 20 min < 30 min <40 min
Acute IP 13% 96% 99% 100% 47,213
Non-acute IP 67% 96% 100% 100% 29,525
SOP 40% 96% 100% 100% 74,637
PHC 88% 98% 100% 100% 82,555
A&E 7% 94% 99% 100% 14,971
AHOP 48% 97% 100% 100% 31,534
* In terms of BDO for Acute IP and Non-acute IP, and in terms of attendances for SOP, PHC, A&E and AHOP #
Assuming the re-delineated Cluster boundary between KCC and KWC
TPU Group: 282
District: Wong Tai Sin
Corresponding Cluster: Kowloon Central Cluster #
Population in 2015: 56,700
TPU Group 282 (highlighted on the map) is located in
the Wong Tai Sin district, with its corresponding Cluster
being the Kowloon Central Cluster#.

Appendix I: Accessibility Statistics by Locality Page | 178
Cluster Concordance Analysis
The patronage pattern in 2015/16 for residents in TPU Group 283 is presented below. The Cluster
concordance rates (bolded in green) range from 66% for Non-acute IP to 93% for PHC.
Core Service Percentage of Utilisation* sought in Cluster# in 2015/16 Total
Utilisation HKEC HKWC KCC KEC KWC NTEC NTWC Total %
Acute IP 1% 3% 89% 2% 2% 3% 1% 100% 54,739
Non-acute IP - 2% 66% 1% 29% 2% - 100% 34,062
SOP 1% 2% 76% 3% 15% 2% 1% 100% 82,513
PHC 1% - 93% 3% 2% 1% - 100% 84,843
A&E 2% 1% 80% 6% 6% 3% 1% 100% 18,695
AHOP 1% 1% 83% 4% 8% 2% 1% 100% 31,770
Travel Time Analysis
The following table illustrates the percentages of utilisation sought within various threshold travel
times for TPU Group 283 in 2015/16. For example, the percentages of utilisation sought within 20
minutes of travel time range from 93% for A&E to 98% for PHC (bolded in green).
Core Service Percentage of Utilisation* sought within Certain Travel Time in 2015/16 Total
Utilisation <10 min < 20 min < 30 min <40 min
Acute IP 8% 95% 100% 100% 54,739
Non-acute IP 32% 96% 100% 100% 34,062
SOP 36% 96% 99% 100% 82,513
PHC 87% 98% 100% 100% 84,843
A&E 4% 93% 99% 100% 18,695
AHOP 26% 96% 100% 100% 31,770
* In terms of BDO for Acute IP and Non-acute IP, and in terms of attendances for SOP, PHC, A&E and AHOP #
Assuming the re-delineated Cluster boundary between KCC and KWC
TPU Group: 283
District: Wong Tai Sin
Corresponding Cluster: Kowloon Central Cluster #
Population in 2015: 65,800
TPU Group 283 (highlighted on the map) is located in
the Wong Tai Sin district, with its corresponding Cluster
being the Kowloon Central Cluster#.

Appendix I: Accessibility Statistics by Locality Page | 179
Cluster Concordance Analysis
The patronage pattern in 2015/16 for residents in TPU Group 284 is presented below. The Cluster
concordance rates (bolded in green) range from 73% for SOP to 93% for PHC.
Core Service Percentage of Utilisation* sought in Cluster# in 2015/16 Total
Utilisation HKEC HKWC KCC KEC KWC NTEC NTWC Total %
Acute IP 1% 2% 90% 4% 1% 2% - 100% 15,921
Non-acute IP 3% - 84% 4% 6% 1% 4% 100% 13,310
SOP 1% 3% 73% 5% 15% 3% 1% 100% 13,293
PHC 1% - 93% 3% 1% 1% - 100% 12,277
A&E 2% 1% 86% 7% 3% 2% 1% 100% 4,251
AHOP 1% 3% 74% 9% 11% 2% - 100% 5,438
Travel Time Analysis
The following table illustrates the percentages of utilisation sought within various threshold travel
times for TPU Group 284 in 2015/16. For example, the percentages of utilisation sought within 20
minutes of travel time range from 95% for SOP to 98% for PHC (bolded in green).
Core Service Percentage of Utilisation* sought within Certain Travel Time in 2015/16 Total
Utilisation <10 min < 20 min < 30 min <40 min
Acute IP 4% 97% 99% 100% 15,921
Non-acute IP 38% 96% 100% 100% 13,310
SOP 29% 95% 97% 100% 13,293
PHC 22% 98% 100% 100% 12,277
A&E - 96% 99% 100% 4,251
AHOP 19% 96% 98% 100% 5,438
* In terms of BDO for Acute IP and Non-acute IP, and in terms of attendances for SOP, PHC, A&E and AHOP #
Assuming the re-delineated Cluster boundary between KCC and KWC
TPU Group: 284
District: Wong Tai Sin
Corresponding Cluster: Kowloon Central Cluster #
Population in 2015: 16,500
TPU Group 284 (highlighted on the map) is located in
the Wong Tai Sin district, with its corresponding Cluster
being the Kowloon Central Cluster#.

Appendix I: Accessibility Statistics by Locality Page | 180
Cluster Concordance Analysis
The patronage pattern in 2015/16 for residents in TPU Group 287 is presented below. The Cluster
concordance rates (bolded in green) range from 64% for A&E to 81% for PHC.
Core Service Percentage of Utilisation* sought in Cluster# in 2015/16 Total
Utilisation HKEC HKWC KCC KEC KWC NTEC NTWC Total %
Acute IP 1% 5% 78% 10% 3% 3% 1% 100% 19,661
Non-acute IP 1% 4% 64% 4% 23% 5% - 100% 11,691
SOP 1% 2% 67% 9% 17% 3% 1% 100% 26,622
PHC 1% 1% 81% 14% 2% 1% - 100% 28,507
A&E 2% 1% 64% 22% 6% 4% 1% 100% 6,845
AHOP 1% 2% 68% 15% 11% 3% - 100% 10,030
Travel Time Analysis
The following table illustrates the percentages of utilisation sought within various threshold travel
times for TPU Group 287 in 2015/16. For example, the percentages of utilisation sought within 20
minutes of travel time range from 93% for Acute IP to 97% for PHC (bolded in green).
Core Service Percentage of Utilisation* sought within Certain Travel Time in 2015/16 Total
Utilisation <10 min < 20 min < 30 min <40 min
Acute IP 4% 93% 99% 100% 19,661
Non-acute IP 16% 95% 100% 100% 11,691
SOP 22% 96% 100% 100% 26,622
PHC 65% 97% 99% 100% 28,507
A&E - 96% 99% 100% 6,845
AHOP 13% 96% 100% 100% 10,030
* In terms of BDO for Acute IP and Non-acute IP, and in terms of attendances for SOP, PHC, A&E and AHOP #
Assuming the re-delineated Cluster boundary between KCC and KWC
TPU Group: 287
District: Wong Tai Sin
Corresponding Cluster: Kowloon Central Cluster #
Population in 2015: 18,500
TPU Group 287 (highlighted on the map) is located in
the Wong Tai Sin district, with its corresponding Cluster
being the Kowloon Central Cluster#.
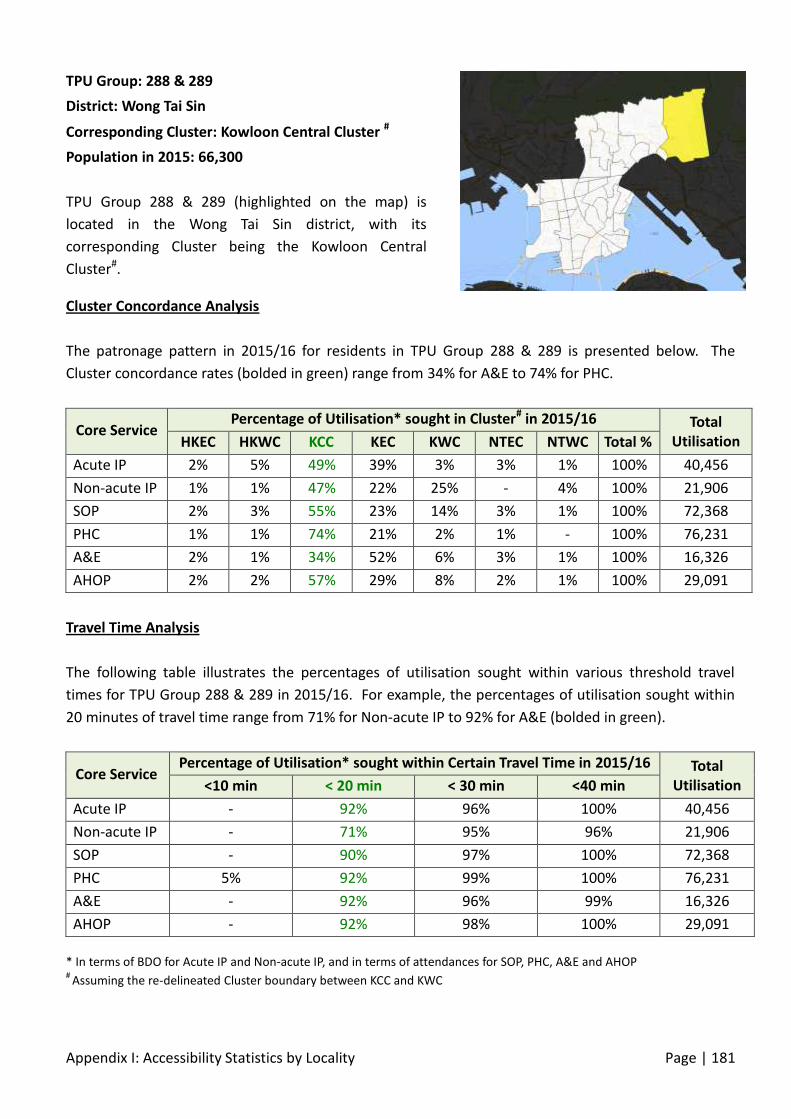
Appendix I: Accessibility Statistics by Locality Page | 181
Cluster Concordance Analysis
The patronage pattern in 2015/16 for residents in TPU Group 288 & 289 is presented below. The
Cluster concordance rates (bolded in green) range from 34% for A&E to 74% for PHC.
Core Service Percentage of Utilisation* sought in Cluster# in 2015/16 Total
Utilisation HKEC HKWC KCC KEC KWC NTEC NTWC Total %
Acute IP 2% 5% 49% 39% 3% 3% 1% 100% 40,456
Non-acute IP 1% 1% 47% 22% 25% - 4% 100% 21,906
SOP 2% 3% 55% 23% 14% 3% 1% 100% 72,368
PHC 1% 1% 74% 21% 2% 1% - 100% 76,231
A&E 2% 1% 34% 52% 6% 3% 1% 100% 16,326
AHOP 2% 2% 57% 29% 8% 2% 1% 100% 29,091
Travel Time Analysis
The following table illustrates the percentages of utilisation sought within various threshold travel
times for TPU Group 288 & 289 in 2015/16. For example, the percentages of utilisation sought within
20 minutes of travel time range from 71% for Non-acute IP to 92% for A&E (bolded in green).
Core Service Percentage of Utilisation* sought within Certain Travel Time in 2015/16 Total
Utilisation <10 min < 20 min < 30 min <40 min
Acute IP - 92% 96% 100% 40,456
Non-acute IP - 71% 95% 96% 21,906
SOP - 90% 97% 100% 72,368
PHC 5% 92% 99% 100% 76,231
A&E - 92% 96% 99% 16,326
AHOP - 92% 98% 100% 29,091
* In terms of BDO for Acute IP and Non-acute IP, and in terms of attendances for SOP, PHC, A&E and AHOP #
Assuming the re-delineated Cluster boundary between KCC and KWC
TPU Group: 288 & 289
District: Wong Tai Sin
Corresponding Cluster: Kowloon Central Cluster #
Population in 2015: 66,300
TPU Group 288 & 289 (highlighted on the map) is
located in the Wong Tai Sin district, with its
corresponding Cluster being the Kowloon Central
Cluster#.

Appendix I: Accessibility Statistics by Locality Page | 182
Cluster Concordance Analysis
The patronage pattern in 2015/16 for residents in TPU Group 211 is presented below. The Cluster
concordance rates (bolded in green) range from 87% for SOP to 95% for PHC.
Core Service Percentage of Utilisation* sought in Cluster# in 2015/16 Total
Utilisation HKEC HKWC KCC KEC KWC NTEC NTWC Total %
Acute IP 1% 9% 87% - 2% 1% - 100% 7,909
Non-acute IP - - 88% - 6% 6% - 100% 3,262
SOP 1% 4% 87% 1% 5% 2% 1% 100% 11,082
PHC 1% 1% 95% 1% 1% 1% - 100% 10,362
A&E 2% 2% 89% 1% 3% 2% 1% 100% 3,987
AHOP 1% 2% 92% 1% 3% 1% 1% 100% 3,965
Travel Time Analysis
The following table illustrates the percentages of utilisation sought within various threshold travel
times for TPU Group 211 in 2015/16. For example, the percentages of utilisation sought within 20
minutes of travel time range from 94% for Non-acute IP to 98% for PHC (bolded in green).
Core Service Percentage of Utilisation* sought within Certain Travel Time in 2015/16 Total
Utilisation <10 min < 20 min < 30 min <40 min
Acute IP 72% 95% 99% 100% 7,909
Non-acute IP - 94% 94% 100% 3,262
SOP 57% 95% 99% 100% 11,082
PHC 5% 98% 99% 100% 10,362
A&E 80% 95% 97% 100% 3,987
AHOP 61% 97% 99% 100% 3,965
* In terms of BDO for Acute IP and Non-acute IP, and in terms of attendances for SOP, PHC, A&E and AHOP #
Assuming the re-delineated Cluster boundary between KCC and KWC
TPU Group: 211
District: Yau Tsim
Corresponding Cluster: Kowloon Central Cluster
Population in 2015: 14,800
TPU Group 211 (highlighted on the map) is located in
the Yau Tsim district, with its corresponding Cluster
being the Kowloon Central Cluster.

Appendix I: Accessibility Statistics by Locality Page | 183
Cluster Concordance Analysis
The patronage pattern in 2015/16 for residents in TPU Group 212 is presented below. The Cluster
concordance rates (bolded in green) range from 86% for SOP to 92% for Non-acute IP.
Core Service Percentage of Utilisation* sought in Cluster# in 2015/16 Total
Utilisation HKEC HKWC KCC KEC KWC NTEC NTWC Total %
Acute IP 1% 3% 91% 1% 2% 2% - 100% 7,530
Non-acute IP 1% - 92% 1% 2% 4% 1% 100% 2,862
SOP 2% 4% 86% 1% 4% 2% - 100% 11,399
PHC 2% 1% 92% 2% 1% 2% - 100% 8,215
A&E 3% 1% 89% 1% 3% 3% 1% 100% 3,867
AHOP 2% 3% 88% 2% 2% 2% - 100% 4,094
Travel Time Analysis
The following table illustrates the percentages of utilisation sought within various threshold travel
times for TPU Group 212 in 2015/16. For example, the percentages of utilisation sought within 20
minutes of travel time range from 88% for SOP to 95% for PHC (bolded in green).
Core Service Percentage of Utilisation* sought within Certain Travel Time in 2015/16 Total
Utilisation <10 min < 20 min < 30 min <40 min
Acute IP - 93% 99% 100% 7,530
Non-acute IP - 93% 99% 100% 2,862
SOP 49% 88% 99% 100% 11,399
PHC 2% 95% 98% 100% 8,215
A&E - 92% 97% 100% 3,867
AHOP 1% 90% 98% 100% 4,094
* In terms of BDO for Acute IP and Non-acute IP, and in terms of attendances for SOP, PHC, A&E and AHOP #
Assuming the re-delineated Cluster boundary between KCC and KWC
TPU Group: 212
District: Yau Tsim
Corresponding Cluster: Kowloon Central Cluster
Population in 2015: 16,600
TPU Group 212 (highlighted on the map) is located in
the Yau Tsim district, with its corresponding Cluster
being the Kowloon Central Cluster.

Appendix I: Accessibility Statistics by Locality Page | 184
Cluster Concordance Analysis
The patronage pattern in 2015/16 for residents in TPU Group 214 is presented below. The Cluster
concordance rates (bolded in green) range from 87% for A&E to 95% for Non-acute IP.
Core Service Percentage of Utilisation* sought in Cluster# in 2015/16 Total
Utilisation HKEC HKWC KCC KEC KWC NTEC NTWC Total %
Acute IP 1% 2% 92% - 1% 3% - 100% 2,981
Non-acute IP 4% - 95% - 1% - - 100% 945
SOP 2% 2% 89% 1% 3% 3% 1% 100% 3,132
PHC 2% - 94% 1% 1% 2% 1% 100% 3,810
A&E 3% 1% 87% 1% 3% 3% 2% 100% 2,231
AHOP 1% 3% 90% - 2% 2% 2% 100% 1,371
Travel Time Analysis
The following table illustrates the percentages of utilisation sought within various threshold travel
times for TPU Group 214 in 2015/16. For example, the percentages of utilisation sought within 20
minutes of travel time range from 93% for A&E to 97% for PHC (bolded in green).
Core Service Percentage of Utilisation* sought within Certain Travel Time in 2015/16 Total
Utilisation <10 min < 20 min < 30 min <40 min
Acute IP 80% 95% 98% 100% 2,981
Non-acute IP - 96% 100% 100% 945
SOP 55% 96% 98% 100% 3,132
PHC 5% 97% 97% 100% 3,810
A&E 77% 93% 95% 100% 2,231
AHOP 41% 95% 98% 100% 1,371
* In terms of BDO for Acute IP and Non-acute IP, and in terms of attendances for SOP, PHC, A&E and AHOP #
Assuming the re-delineated Cluster boundary between KCC and KWC
TPU Group: 214
District: Yau Tsim
Corresponding Cluster: Kowloon Central Cluster
Population in 2015: 4,700
TPU Group 214 (highlighted on the map) is located in
the Yau Tsim district, with its corresponding Cluster
being the Kowloon Central Cluster.

Appendix I: Accessibility Statistics by Locality Page | 185
Cluster Concordance Analysis
The patronage pattern in 2015/16 for residents in TPU Group 217 is presented below. The Cluster
concordance rates (bolded in green) range from 44% for AHOP to 79% for A&E.
Core Service Percentage of Utilisation* sought in Cluster# in 2015/16 Total
Utilisation HKEC HKWC KCC KEC KWC NTEC NTWC Total %
Acute IP 9% 15% 71% 1% 4% - 1% 100% 555
Non-acute IP 3% 14% 60% - - 24% - 100% 161
SOP 6% 10% 71% 1% 4% 6% 3% 100% 635
PHC 11% 5% 70% 2% 4% 6% 2% 100% 262
A&E 4% 5% 79% 2% 3% 4% 3% 100% 192
AHOP 5% 5% 44% 14% 1% 21% 10% 100% 113
Travel Time Analysis
The following table illustrates the percentages of utilisation sought within various threshold travel
times for TPU Group 217 in 2015/16. For example, the percentages of utilisation sought within 20
minutes of travel time range from 86% for AHOP to 97% for A&E (bolded in green).
Core Service Percentage of Utilisation* sought within Certain Travel Time in 2015/16 Total
Utilisation <10 min < 20 min < 30 min <40 min
Acute IP 71% 92% 100% 100% 555
Non-acute IP 60% 86% 100% 100% 161
SOP 70% 92% 95% 100% 635
PHC 66% 93% 95% 97% 262
A&E 79% 97% 100% 100% 192
AHOP 44% 86% 98% 100% 113
* In terms of BDO for Acute IP and Non-acute IP, and in terms of attendances for SOP, PHC, A&E and AHOP #
Assuming the re-delineated Cluster boundary between KCC and KWC
TPU Group: 217
District: Yau Tsim
Corresponding Cluster: Kowloon Central Cluster
Population in 2015: 6,200
TPU Group 217 (highlighted on the map) is located in
the Yau Tsim district, with its corresponding Cluster
being the Kowloon Central Cluster.

Appendix I: Accessibility Statistics by Locality Page | 186
Cluster Concordance Analysis
The patronage pattern in 2015/16 for residents in TPU Group 225 is presented below. The Cluster
concordance rates (bolded in green) range from 79% for Non-acute IP to 96% for PHC.
Core Service Percentage of Utilisation* sought in Cluster# in 2015/16 Total
Utilisation HKEC HKWC KCC KEC KWC NTEC NTWC Total %
Acute IP 1% 4% 91% 1% 2% 2% 1% 100% 29,168
Non-acute IP 7% 1% 79% - 11% 1% 1% 100% 16,065
SOP 2% 3% 87% 1% 5% 2% 1% 100% 37,358
PHC 1% 1% 96% 1% 1% 1% - 100% 47,483
A&E 2% 1% 90% 1% 3% 1% 1% 100% 14,459
AHOP 1% 6% 86% 1% 4% 1% 1% 100% 15,588
Travel Time Analysis
The following table illustrates the percentages of utilisation sought within various threshold travel
times for TPU Group 225 in 2015/16. For example, the percentages of utilisation sought within 20
minutes of travel time range from 91% for Non-acute IP to 99% for PHC (bolded in green).
Core Service Percentage of Utilisation* sought within Certain Travel Time in 2015/16 Total
Utilisation <10 min < 20 min < 30 min <40 min
Acute IP 88% 98% 99% 100% 29,168
Non-acute IP - 91% 97% 100% 16,065
SOP 68% 97% 99% 100% 37,358
PHC 94% 99% 100% 100% 47,483
A&E 90% 95% 99% 100% 14,459
AHOP 74% 97% 99% 100% 15,588
* In terms of BDO for Acute IP and Non-acute IP, and in terms of attendances for SOP, PHC, A&E and AHOP #
Assuming the re-delineated Cluster boundary between KCC and KWC
TPU Group: 225
District: Yau Tsim
Corresponding Cluster: Kowloon Central Cluster
Population in 2015: 39,000
TPU Group 225 (highlighted on the map) is located in
the Yau Tsim district, with its corresponding Cluster
being the Kowloon Central Cluster.

Appendix I: Accessibility Statistics by Locality Page | 187
Cluster Concordance Analysis
The patronage pattern in 2015/16 for residents in TPU Group 226 is presented below. The Cluster
concordance rates (bolded in green) range from 79% for SOP to 92% for PHC.
Core Service Percentage of Utilisation* sought in Cluster# in 2015/16 Total
Utilisation HKEC HKWC KCC KEC KWC NTEC NTWC Total %
Acute IP 2% 3% 84% 3% 6% 3% 1% 100% 6,365
Non-acute IP 1% - 90% 2% 8% - - 100% 4,967
SOP 3% 5% 79% 3% 6% 3% 1% 100% 7,165
PHC 2% 1% 92% 1% 2% 2% 1% 100% 5,078
A&E 3% 1% 88% 2% 3% 2% 2% 100% 2,725
AHOP 2% 3% 87% 2% 5% 1% 1% 100% 3,323
Travel Time Analysis
The following table illustrates the percentages of utilisation sought within various threshold travel
times for TPU Group 226 in 2015/16. For example, the percentages of utilisation sought within 20
minutes of travel time range from 94% for SOP to 100% for Non-acute IP (bolded in green).
Core Service Percentage of Utilisation* sought within Certain Travel Time in 2015/16 Total
Utilisation <10 min < 20 min < 30 min <40 min
Acute IP 82% 96% 99% 100% 6,365
Non-acute IP 77% 100% 100% 100% 4,967
SOP 80% 94% 99% 100% 7,165
PHC 89% 98% 99% 100% 5,078
A&E 88% 95% 98% 100% 2,725
AHOP 87% 96% 99% 100% 3,323
* In terms of BDO for Acute IP and Non-acute IP, and in terms of attendances for SOP, PHC, A&E and AHOP #
Assuming the re-delineated Cluster boundary between KCC and KWC
TPU Group: 226
District: Yau Tsim
Corresponding Cluster: Kowloon Central Cluster
Population in 2015: 10,500
TPU Group 226 (highlighted on the map) is located in
the Yau Tsim district, with its corresponding Cluster
being the Kowloon Central Cluster.

Appendix I: Accessibility Statistics by Locality Page | 188
Cluster Concordance Analysis
The patronage pattern in 2015/16 for residents in TPU Group 251, 252 & 256 is presented below. The
Cluster concordance rates (bolded in green) range from 59% for Acute IP to 81% for Non-acute IP.
Core Service Percentage of Utilisation* sought in Cluster# in 2015/16 Total
Utilisation HKEC HKWC KCC KEC KWC NTEC NTWC Total %
Acute IP 2% 26% 59% 3% 7% 3% 1% 100% 3,607
Non-acute IP 6% 6% 81% 5% - 3% - 100% 1,022
SOP 3% 13% 67% 3% 8% 4% 3% 100% 5,439
PHC 7% 4% 76% 3% 5% 4% 2% 100% 2,369
A&E 8% 5% 76% 2% 5% 3% 1% 100% 1,606
AHOP 1% 9% 76% 1% 7% 5% 1% 100% 2,683
Travel Time Analysis
The following table illustrates the percentages of utilisation sought within various threshold travel
times for TPU Group 251, 252 & 256 in 2015/16. For example, the percentages of utilisation sought
within 20 minutes of travel time range from 92% for PHC to 98% for AHOP (bolded in green).
Core Service Percentage of Utilisation* sought within Certain Travel Time in 2015/16 Total
Utilisation <10 min < 20 min < 30 min <40 min
Acute IP 54% 95% 99% 100% 3,607
Non-acute IP - 93% 100% 100% 1,022
SOP 49% 93% 98% 100% 5,439
PHC 3% 92% 99% 100% 2,369
A&E 65% 94% 99% 100% 1,606
AHOP 50% 98% 99% 100% 2,683
* In terms of BDO for Acute IP and Non-acute IP, and in terms of attendances for SOP, PHC, A&E and AHOP #
Assuming the re-delineated Cluster boundary between KCC and KWC
TPU Group: 251, 252 & 256
District: Yau Tsim
Corresponding Cluster: Kowloon Central Cluster
Population in 2015: 20,400
TPU Group 251, 252 & 256 (highlighted on the map) is
located in the Yau Tsim district, with its corresponding
Cluster being the Kowloon Central Cluster.

Appendix I: Accessibility Statistics by Locality Page | 189
Cluster Concordance Analysis
The patronage pattern in 2015/16 for residents in TPU Group 290 is presented below. The Cluster
concordance rates (bolded in green) range from 41% for Non-acute IP to 78% for PHC.
Core Service Percentage of Utilisation* sought in Cluster# in 2015/16 Total
Utilisation HKEC HKWC KCC KEC KWC NTEC NTWC Total %
Acute IP 5% 6% 19% 62% 4% 4% 1% 100% 20,615
Non-acute IP 7% 5% 35% 41% 7% 2% 3% 100% 9,884
SOP 6% 6% 23% 58% 4% 4% 1% 100% 40,400
PHC 5% 2% 12% 78% 3% 1% - 100% 36,186
A&E 6% 2% 10% 76% 4% 2% 1% 100% 10,187
AHOP 4% 2% 23% 67% 2% 2% - 100% 19,041
Travel Time Analysis
The following table illustrates the percentages of utilisation sought within various threshold travel
times for TPU Group 290 in 2015/16. For example, the percentages of utilisation sought within 20
minutes of travel time range from 79% for Non-acute IP to 95% for AHOP (bolded in green).
Core Service Percentage of Utilisation* sought within Certain Travel Time in 2015/16 Total
Utilisation <10 min < 20 min < 30 min <40 min
Acute IP - 90% 99% 99% 20,615
Non-acute IP - 79% 90% 97% 9,884
SOP 6% 91% 99% 99% 40,400
PHC 32% 93% 99% 100% 36,186
A&E - 94% 98% 100% 10,187
AHOP 33% 95% 99% 100% 19,041
* In terms of BDO for Acute IP and Non-acute IP, and in terms of attendances for SOP, PHC, A&E and AHOP #
Assuming the re-delineated Cluster boundary between KCC and KWC
TPU Group: 290
District: Kwun Tong
Corresponding Cluster: Kowlloon East Cluster
Population in 2015: 56,200
TPU Group 290 (highlighted on the map) is located in
the Kwun Tong district, with its corresponding Cluster
being the Kowlloon East Cluster.

Appendix I: Accessibility Statistics by Locality Page | 190
Cluster Concordance Analysis
The patronage pattern in 2015/16 for residents in TPU Group 291 is presented below. The Cluster
concordance rates (bolded in green) range from 38% for Non-acute IP to 70% for A&E.
Core Service Percentage of Utilisation* sought in Cluster# in 2015/16 Total
Utilisation HKEC HKWC KCC KEC KWC NTEC NTWC Total %
Acute IP 2% 2% 23% 65% 4% 3% 1% 100% 53,239
Non-acute IP 2% 2% 52% 38% 5% 1% - 100% 32,329
SOP 3% 3% 31% 53% 6% 3% 1% 100% 85,502
PHC 2% 1% 25% 66% 4% 1% 1% 100% 86,917
A&E 3% 1% 17% 70% 6% 3% 1% 100% 24,927
AHOP 2% 2% 33% 57% 3% 2% 1% 100% 33,027
Travel Time Analysis
The following table illustrates the percentages of utilisation sought within various threshold travel
times for TPU Group 291 in 2015/16. For example, the percentages of utilisation sought within 20
minutes of travel time range from 95% for SOP to 96% for Acute IP (bolded in green).
Core Service Percentage of Utilisation* sought within Certain Travel Time in 2015/16 Total
Utilisation <10 min < 20 min < 30 min <40 min
Acute IP 63% 96% 99% 100% 53,239
Non-acute IP 57% 96% 99% 100% 32,329
SOP 54% 95% 99% 100% 85,502
PHC 80% 96% 99% 100% 86,917
A&E 65% 96% 98% 100% 24,927
AHOP 62% 95% 99% 100% 33,027
* In terms of BDO for Acute IP and Non-acute IP, and in terms of attendances for SOP, PHC, A&E and AHOP #
Assuming the re-delineated Cluster boundary between KCC and KWC
TPU Group: 291
District: Kwun Tong
Corresponding Cluster: Kowlloon East Cluster
Population in 2015: 85,600
TPU Group 291 (highlighted on the map) is located in
the Kwun Tong district, with its corresponding Cluster
being the Kowlloon East Cluster.

Appendix I: Accessibility Statistics by Locality Page | 191
Cluster Concordance Analysis
The patronage pattern in 2015/16 for residents in TPU Group 292 is presented below. The Cluster
concordance rates (bolded in green) range from 45% for Non-acute IP to 88% for PHC.
Core Service Percentage of Utilisation* sought in Cluster# in 2015/16 Total
Utilisation HKEC HKWC KCC KEC KWC NTEC NTWC Total %
Acute IP 1% 2% 14% 78% 2% 2% 1% 100% 40,462
Non-acute IP 1% 2% 48% 45% 1% 1% 3% 100% 29,746
SOP 1% 2% 21% 71% 2% 2% - 100% 62,281
PHC 1% 1% 8% 88% 1% 1% - 100% 75,328
A&E 2% 1% 9% 83% 3% 2% 1% 100% 19,280
AHOP 1% 1% 20% 74% 2% 1% - 100% 24,110
Travel Time Analysis
The following table illustrates the percentages of utilisation sought within various threshold travel
times for TPU Group 292 in 2015/16. For example, the percentages of utilisation sought within 20
minutes of travel time range from 93% for Non-acute IP to 96% for Acute IP (bolded in green).
Core Service Percentage of Utilisation* sought within Certain Travel Time in 2015/16 Total
Utilisation <10 min < 20 min < 30 min <40 min
Acute IP 75% 96% 97% 100% 40,462
Non-acute IP 15% 93% 97% 98% 29,746
SOP 62% 94% 97% 100% 62,281
PHC 81% 95% 99% 100% 75,328
A&E 80% 95% 98% 100% 19,280
AHOP 68% 95% 99% 100% 24,110
* In terms of BDO for Acute IP and Non-acute IP, and in terms of attendances for SOP, PHC, A&E and AHOP #
Assuming the re-delineated Cluster boundary between KCC and KWC
TPU Group: 292
District: Kwun Tong
Corresponding Cluster: Kowlloon East Cluster
Population in 2015: 51,000
TPU Group 292 (highlighted on the map) is located in
the Kwun Tong district, with its corresponding Cluster
being the Kowlloon East Cluster.

Appendix I: Accessibility Statistics by Locality Page | 192
Cluster Concordance Analysis
The patronage pattern in 2015/16 for residents in TPU Group 297 is presented below. The Cluster
concordance rates (bolded in green) range from 46% for Non-acute IP to 90% for PHC.
Core Service Percentage of Utilisation* sought in Cluster# in 2015/16 Total
Utilisation HKEC HKWC KCC KEC KWC NTEC NTWC Total %
Acute IP 2% 3% 15% 74% 2% 3% - 100% 68,597
Non-acute IP 2% 3% 45% 46% 2% 1% 1% 100% 43,325
SOP 3% 4% 17% 71% 2% 2% 1% 100% 113,071
PHC 2% 1% 6% 90% 1% 1% - 100% 121,424
A&E 3% 1% 8% 81% 3% 2% 1% 100% 29,418
AHOP 3% 1% 17% 76% 2% 2% 1% 100% 45,878
Travel Time Analysis
The following table illustrates the percentages of utilisation sought within various threshold travel
times for TPU Group 297 in 2015/16. For example, the percentages of utilisation sought within 20
minutes of travel time range from 92% for Non-acute IP to 97% for PHC (bolded in green).
Core Service Percentage of Utilisation* sought within Certain Travel Time in 2015/16 Total
Utilisation <10 min < 20 min < 30 min <40 min
Acute IP - 94% 99% 100% 68,597
Non-acute IP - 92% 99% 99% 43,325
SOP 6% 94% 99% 100% 113,071
PHC 65% 97% 100% 100% 121,424
A&E - 95% 98% 99% 29,418
AHOP 26% 96% 99% 100% 45,878
* In terms of BDO for Acute IP and Non-acute IP, and in terms of attendances for SOP, PHC, A&E and AHOP #
Assuming the re-delineated Cluster boundary between KCC and KWC
TPU Group: 297
District: Kwun Tong
Corresponding Cluster: Kowlloon East Cluster
Population in 2015: 103,900
TPU Group 297 (highlighted on the map) is located in
the Kwun Tong district, with its corresponding Cluster
being the Kowlloon East Cluster.

Appendix I: Accessibility Statistics by Locality Page | 193
Cluster Concordance Analysis
The patronage pattern in 2015/16 for residents in TPU Group 298 is presented below. The Cluster
concordance rates (bolded in green) range from 45% for Non-acute IP to 82% for PHC.
Core Service Percentage of Utilisation* sought in Cluster# in 2015/16 Total
Utilisation HKEC HKWC KCC KEC KWC NTEC NTWC Total %
Acute IP 3% 4% 14% 75% 2% 2% 1% 100% 30,493
Non-acute IP 6% 3% 38% 45% 1% 5% 2% 100% 20,516
SOP 5% 5% 18% 67% 3% 3% 1% 100% 50,860
PHC 3% 1% 10% 82% 2% 1% - 100% 50,931
A&E 4% 2% 9% 79% 3% 2% 1% 100% 15,053
AHOP 5% 2% 17% 72% 2% 1% 1% 100% 20,785
Travel Time Analysis
The following table illustrates the percentages of utilisation sought within various threshold travel
times for TPU Group 298 in 2015/16. For example, the percentages of utilisation sought within 20
minutes of travel time range from 83% for Non-acute IP to 90% for Acute IP (bolded in green).
Core Service Percentage of Utilisation* sought within Certain Travel Time in 2015/16 Total
Utilisation <10 min < 20 min < 30 min <40 min
Acute IP - 90% 99% 100% 30,493
Non-acute IP - 83% 98% 98% 20,516
SOP - 88% 99% 100% 50,860
PHC 21% 90% 99% 99% 50,931
A&E - 90% 98% 99% 15,053
AHOP - 88% 99% 100% 20,785
* In terms of BDO for Acute IP and Non-acute IP, and in terms of attendances for SOP, PHC, A&E and AHOP #
Assuming the re-delineated Cluster boundary between KCC and KWC
TPU Group: 298
District: Kwun Tong
Corresponding Cluster: Kowlloon East Cluster
Population in 2015: 53,900
TPU Group 298 (highlighted on the map) is located in
the Kwun Tong district, with its corresponding Cluster
being the Kowlloon East Cluster.

Appendix I: Accessibility Statistics by Locality Page | 194
Cluster Concordance Analysis
The patronage pattern in 2015/16 for residents in TPU Group 280 & 286 is presented below. The
Cluster concordance rates (bolded in green) range from 31% for Non-acute IP to 77% for PHC.
Core Service Percentage of Utilisation* sought in Cluster# in 2015/16 Total
Utilisation HKEC HKWC KCC KEC KWC NTEC NTWC Total %
Acute IP 3% 4% 42% 45% 4% 3% 1% 100% 38,880
Non-acute IP 2% 2% 57% 31% 7% 1% 1% 100% 20,629
SOP 3% 4% 41% 42% 6% 3% 1% 100% 60,924
PHC 2% 1% 16% 77% 2% 1% 1% 100% 69,023
A&E 4% 1% 36% 49% 7% 3% 1% 100% 15,964
AHOP 3% 2% 45% 42% 3% 3% 1% 100% 25,753
Travel Time Analysis
The following table illustrates the percentages of utilisation sought within various threshold travel
times for TPU Group 280 & 286 in 2015/16. For example, the percentages of utilisation sought within
20 minutes of travel time range from 94% for SOP to 97% for Non-acute IP (bolded in green).
Core Service Percentage of Utilisation* sought within Certain Travel Time in 2015/16 Total
Utilisation <10 min < 20 min < 30 min <40 min
Acute IP - 95% 99% 100% 38,880
Non-acute IP - 97% 99% 100% 20,629
SOP 4% 94% 99% 100% 60,924
PHC 74% 97% 99% 100% 69,023
A&E - 95% 98% 100% 15,964
AHOP 14% 95% 99% 100% 25,753
* In terms of BDO for Acute IP and Non-acute IP, and in terms of attendances for SOP, PHC, A&E and AHOP #
Assuming the re-delineated Cluster boundary between KCC and KWC
TPU Group: 280 & 286
District: Kwun Tong
Corresponding Cluster: Kowlloon East Cluster
Population in 2015: 71,800
TPU Group 280 & 286 (highlighted on the map) is
located in the Kwun Tong district, with its
corresponding Cluster being the Kowlloon East Cluster.
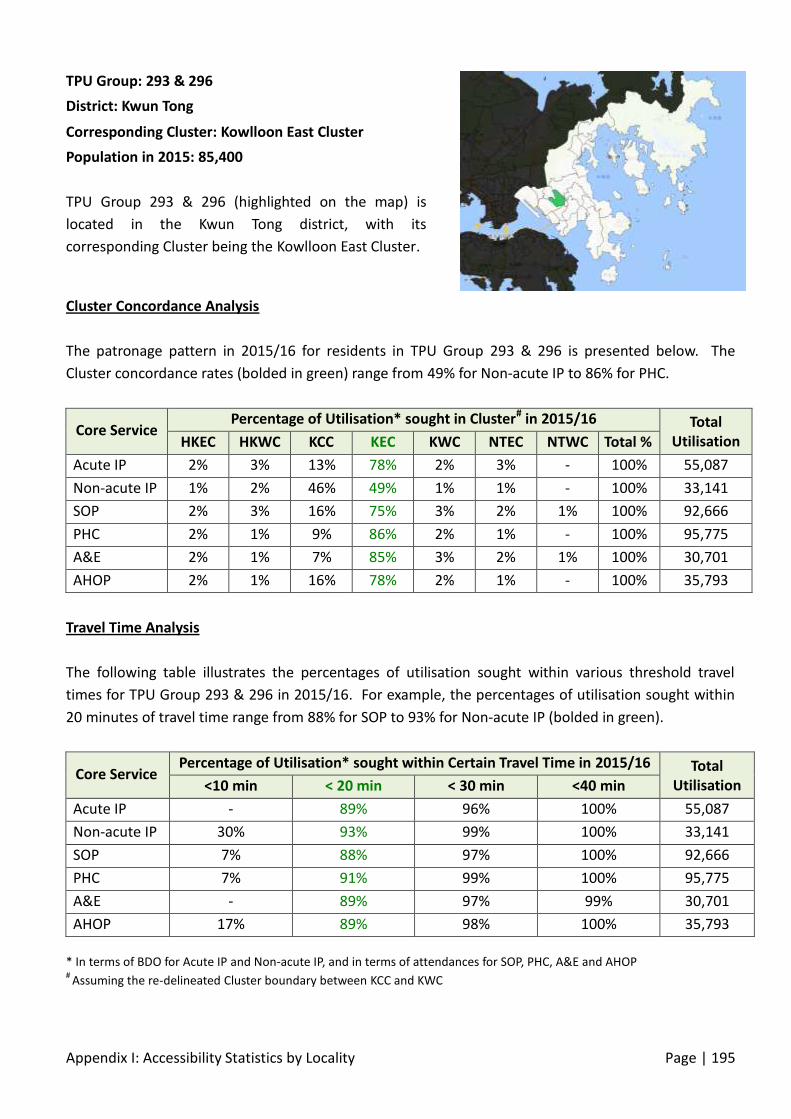
Appendix I: Accessibility Statistics by Locality Page | 195
Cluster Concordance Analysis
The patronage pattern in 2015/16 for residents in TPU Group 293 & 296 is presented below. The
Cluster concordance rates (bolded in green) range from 49% for Non-acute IP to 86% for PHC.
Core Service Percentage of Utilisation* sought in Cluster# in 2015/16 Total
Utilisation HKEC HKWC KCC KEC KWC NTEC NTWC Total %
Acute IP 2% 3% 13% 78% 2% 3% - 100% 55,087
Non-acute IP 1% 2% 46% 49% 1% 1% - 100% 33,141
SOP 2% 3% 16% 75% 3% 2% 1% 100% 92,666
PHC 2% 1% 9% 86% 2% 1% - 100% 95,775
A&E 2% 1% 7% 85% 3% 2% 1% 100% 30,701
AHOP 2% 1% 16% 78% 2% 1% - 100% 35,793
Travel Time Analysis
The following table illustrates the percentages of utilisation sought within various threshold travel
times for TPU Group 293 & 296 in 2015/16. For example, the percentages of utilisation sought within
20 minutes of travel time range from 88% for SOP to 93% for Non-acute IP (bolded in green).
Core Service Percentage of Utilisation* sought within Certain Travel Time in 2015/16 Total
Utilisation <10 min < 20 min < 30 min <40 min
Acute IP - 89% 96% 100% 55,087
Non-acute IP 30% 93% 99% 100% 33,141
SOP 7% 88% 97% 100% 92,666
PHC 7% 91% 99% 100% 95,775
A&E - 89% 97% 99% 30,701
AHOP 17% 89% 98% 100% 35,793
* In terms of BDO for Acute IP and Non-acute IP, and in terms of attendances for SOP, PHC, A&E and AHOP #
Assuming the re-delineated Cluster boundary between KCC and KWC
TPU Group: 293 & 296
District: Kwun Tong
Corresponding Cluster: Kowlloon East Cluster
Population in 2015: 85,400
TPU Group 293 & 296 (highlighted on the map) is
located in the Kwun Tong district, with its
corresponding Cluster being the Kowlloon East Cluster.
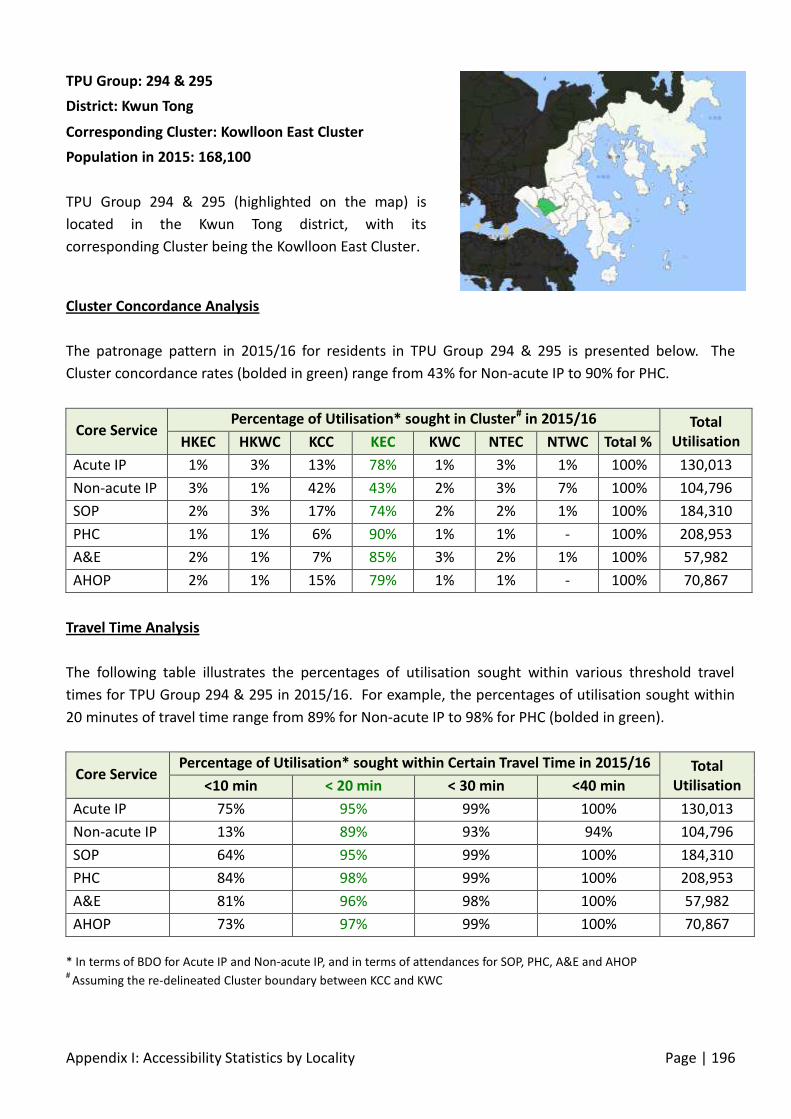
Appendix I: Accessibility Statistics by Locality Page | 196
Cluster Concordance Analysis
The patronage pattern in 2015/16 for residents in TPU Group 294 & 295 is presented below. The
Cluster concordance rates (bolded in green) range from 43% for Non-acute IP to 90% for PHC.
Core Service Percentage of Utilisation* sought in Cluster# in 2015/16 Total
Utilisation HKEC HKWC KCC KEC KWC NTEC NTWC Total %
Acute IP 1% 3% 13% 78% 1% 3% 1% 100% 130,013
Non-acute IP 3% 1% 42% 43% 2% 3% 7% 100% 104,796
SOP 2% 3% 17% 74% 2% 2% 1% 100% 184,310
PHC 1% 1% 6% 90% 1% 1% - 100% 208,953
A&E 2% 1% 7% 85% 3% 2% 1% 100% 57,982
AHOP 2% 1% 15% 79% 1% 1% - 100% 70,867
Travel Time Analysis
The following table illustrates the percentages of utilisation sought within various threshold travel
times for TPU Group 294 & 295 in 2015/16. For example, the percentages of utilisation sought within
20 minutes of travel time range from 89% for Non-acute IP to 98% for PHC (bolded in green).
Core Service Percentage of Utilisation* sought within Certain Travel Time in 2015/16 Total
Utilisation <10 min < 20 min < 30 min <40 min
Acute IP 75% 95% 99% 100% 130,013
Non-acute IP 13% 89% 93% 94% 104,796
SOP 64% 95% 99% 100% 184,310
PHC 84% 98% 99% 100% 208,953
A&E 81% 96% 98% 100% 57,982
AHOP 73% 97% 99% 100% 70,867
* In terms of BDO for Acute IP and Non-acute IP, and in terms of attendances for SOP, PHC, A&E and AHOP #
Assuming the re-delineated Cluster boundary between KCC and KWC
TPU Group: 294 & 295
District: Kwun Tong
Corresponding Cluster: Kowlloon East Cluster
Population in 2015: 168,100
TPU Group 294 & 295 (highlighted on the map) is
located in the Kwun Tong district, with its
corresponding Cluster being the Kowlloon East Cluster.

Appendix I: Accessibility Statistics by Locality Page | 197
Cluster Concordance Analysis
The patronage pattern in 2015/16 for residents in TPU Group 821 is presented below. The Cluster
concordance rates (bolded in green) range from 0% for Non-acute IP to 91% for PHC.
Core Service Percentage of Utilisation* sought in Cluster# in 2015/16 Total
Utilisation HKEC HKWC KCC KEC KWC NTEC NTWC Total %
Acute IP 3% 2% - 76% - 19% - 100% 160
Non-acute IP - - 46% - 54% - - 100% 218
SOP 4% 3% 21% 46% 2% 24% - 100% 312
PHC 2% - 6% 91% - 1% - 100% 377
A&E - - 7% 85% - 8% - 100% 70
AHOP 41% - 11% 46% - 3% - 100% 120
Travel Time Analysis
The following table illustrates the percentages of utilisation sought within various threshold travel
times for TPU Group 821 in 2015/16. For example, the percentages of utilisation sought within 20
minutes of travel time range from 0% for Non-acute IP to 89% for PHC (bolded in green).
Core Service Percentage of Utilisation* sought within Certain Travel Time in 2015/16 Total
Utilisation <10 min < 20 min < 30 min <40 min
Acute IP - 70% 96% 99% 160
Non-acute IP - - 46% 100% 218
SOP - 41% 83% 97% 312
PHC 87% 89% 97% 100% 377
A&E - 84% 88% 100% 70
AHOP - 33% 57% 100% 120
* In terms of BDO for Acute IP and Non-acute IP, and in terms of attendances for SOP, PHC, A&E and AHOP #
Assuming the re-delineated Cluster boundary between KCC and KWC
TPU Group: 821
District: Sai Kung
Corresponding Cluster: Kowlloon East Cluster
Population in 2015: 1,100
TPU Group 821 (highlighted on the map) is located in
the Sai Kung district, with its corresponding Cluster
being the Kowlloon East Cluster.

Appendix I: Accessibility Statistics by Locality Page | 198
Cluster Concordance Analysis
The patronage pattern in 2015/16 for residents in TPU Group 822 is presented below. The Cluster
concordance rates (bolded in green) range from 55% for Non-acute IP to 91% for PHC.
Core Service Percentage of Utilisation* sought in Cluster# in 2015/16 Total
Utilisation HKEC HKWC KCC KEC KWC NTEC NTWC Total %
Acute IP - 1% 3% 79% - 17% - 100% 778
Non-acute IP - - 37% 55% - 8% - 100% 257
SOP 2% 3% 23% 56% 3% 14% - 100% 966
PHC - 1% 2% 91% - 6% - 100% 2,093
A&E 2% 1% 7% 77% 1% 13% 1% 100% 336
AHOP 1% 2% 19% 69% 5% 4% - 100% 584
Travel Time Analysis
The following table illustrates the percentages of utilisation sought within various threshold travel
times for TPU Group 822 in 2015/16. For example, the percentages of utilisation sought within 20
minutes of travel time are 92% for PHC and 0% for other services (bolded in green).
Core Service Percentage of Utilisation* sought within Certain Travel Time in 2015/16 Total
Utilisation <10 min < 20 min < 30 min <40 min
Acute IP - - 95% 99% 778
Non-acute IP - - 63% 100% 257
SOP - - 72% 96% 966
PHC 88% 92% 97% 99% 2,093
A&E - - 89% 98% 336
AHOP - - 73% 97% 584
* In terms of BDO for Acute IP and Non-acute IP, and in terms of attendances for SOP, PHC, A&E and AHOP #
Assuming the re-delineated Cluster boundary between KCC and KWC
TPU Group: 822
District: Sai Kung
Corresponding Cluster: Kowlloon East Cluster
Population in 2015: 7,600
TPU Group 822 (highlighted on the map) is located in
the Sai Kung district, with its corresponding Cluster
being the Kowlloon East Cluster.

Appendix I: Accessibility Statistics by Locality Page | 199
Cluster Concordance Analysis
The patronage pattern in 2015/16 for residents in TPU Group 823 is presented below. The Cluster
concordance rates (bolded in green) range from 46% for SOP to 86% for PHC.
Core Service Percentage of Utilisation* sought in Cluster# in 2015/16 Total
Utilisation HKEC HKWC KCC KEC KWC NTEC NTWC Total %
Acute IP 3% 4% 6% 81% 2% - 4% 100% 421
Non-acute IP - - 37% 63% - - - 100% 116
SOP 5% 6% 27% 46% 8% 5% 3% 100% 687
PHC 2% 1% 2% 86% 6% - 3% 100% 938
A&E 2% - 8% 77% 6% 4% 3% 100% 290
AHOP 6% 3% 22% 60% 9% - 1% 100% 279
Travel Time Analysis
The following table illustrates the percentages of utilisation sought within various threshold travel
times for TPU Group 823 in 2015/16. For example, the percentages of utilisation sought within 20
minutes of travel time range from 46% for SOP to 86% for PHC (bolded in green).
Core Service Percentage of Utilisation* sought within Certain Travel Time in 2015/16 Total
Utilisation <10 min < 20 min < 30 min <40 min
Acute IP - 81% 90% 92% 421
Non-acute IP - 63% 100% 100% 116
SOP - 46% 87% 91% 687
PHC - 86% 93% 97% 938
A&E - 77% 93% 96% 290
AHOP - 60% 91% 96% 279
* In terms of BDO for Acute IP and Non-acute IP, and in terms of attendances for SOP, PHC, A&E and AHOP #
Assuming the re-delineated Cluster boundary between KCC and KWC
TPU Group: 823
District: Sai Kung
Corresponding Cluster: Kowlloon East Cluster
Population in 2015: 4,800
TPU Group 823 (highlighted on the map) is located in
the Sai Kung district, with its corresponding Cluster
being the Kowlloon East Cluster.

Appendix I: Accessibility Statistics by Locality Page | 200
Cluster Concordance Analysis
The patronage pattern in 2015/16 for residents in TPU Group 825 is presented below. The Cluster
concordance rates (bolded in green) range from 50% for SOP to 100% for Non-acute IP.
Core Service Percentage of Utilisation* sought in Cluster# in 2015/16 Total
Utilisation HKEC HKWC KCC KEC KWC NTEC NTWC Total %
Acute IP - 1% 12% 76% - 8% 2% 100% 732
Non-acute IP - - - 100% - - - 100% 256
SOP 3% 1% 29% 50% 4% 12% 1% 100% 1,252
PHC - - 2% 96% - 2% - 100% 2,349
A&E - 1% 3% 85% 1% 10% 1% 100% 374
AHOP - - 17% 77% 2% 4% - 100% 420
Travel Time Analysis
The following table illustrates the percentages of utilisation sought within various threshold travel
times for TPU Group 825 in 2015/16. For example, the percentages of utilisation sought within 20
minutes of travel time range from 23% for Non-acute IP to 96% for PHC (bolded in green).
Core Service Percentage of Utilisation* sought within Certain Travel Time in 2015/16 Total
Utilisation <10 min < 20 min < 30 min <40 min
Acute IP - 72% 87% 97% 732
Non-acute IP - 23% 100% 100% 256
SOP - 44% 78% 98% 1,252
PHC 91% 96% 99% 100% 2,349
A&E - 83% 94% 99% 374
AHOP - 67% 92% 100% 420
* In terms of BDO for Acute IP and Non-acute IP, and in terms of attendances for SOP, PHC, A&E and AHOP #
Assuming the re-delineated Cluster boundary between KCC and KWC
TPU Group: 825
District: Sai Kung
Corresponding Cluster: Kowlloon East Cluster
Population in 2015: 4,500
TPU Group 825 (highlighted on the map) is located in
the Sai Kung district, with its corresponding Cluster
being the Kowlloon East Cluster.

Appendix I: Accessibility Statistics by Locality Page | 201
Cluster Concordance Analysis
The patronage pattern in 2015/16 for residents in TPU Group 827 is presented below. The Cluster
concordance rates (bolded in green) range from 18% for Non-acute IP to 97% for PHC.
Core Service Percentage of Utilisation* sought in Cluster# in 2015/16 Total
Utilisation HKEC HKWC KCC KEC KWC NTEC NTWC Total %
Acute IP 8% - 11% 74% - 6% - 100% 1,815
Non-acute IP 2% - 80% 18% - - - 100% 698
SOP 3% 2% 24% 60% 2% 9% - 100% 2,423
PHC - - 1% 97% - 2% - 100% 5,437
A&E 9% - 5% 81% 2% 3% 1% 100% 728
AHOP 1% - 12% 77% 4% 6% - 100% 579
Travel Time Analysis
The following table illustrates the percentages of utilisation sought within various threshold travel
times for TPU Group 827 in 2015/16. For example, the percentages of utilisation sought within 20
minutes of travel time range from 2% for Non-acute IP to 97% for PHC (bolded in green).
Core Service Percentage of Utilisation* sought within Certain Travel Time in 2015/16 Total
Utilisation <10 min < 20 min < 30 min <40 min
Acute IP - 56% 80% 100% 1,815
Non-acute IP - 2% 98% 100% 698
SOP - 51% 85% 99% 2,423
PHC 92% 97% 98% 100% 5,437
A&E - 78% 83% 99% 728
AHOP - 68% 89% 100% 579
* In terms of BDO for Acute IP and Non-acute IP, and in terms of attendances for SOP, PHC, A&E and AHOP #
Assuming the re-delineated Cluster boundary between KCC and KWC
TPU Group: 827
District: Sai Kung
Corresponding Cluster: Kowlloon East Cluster
Population in 2015: 3,900
TPU Group 827 (highlighted on the map) is located in
the Sai Kung district, with its corresponding Cluster
being the Kowlloon East Cluster.
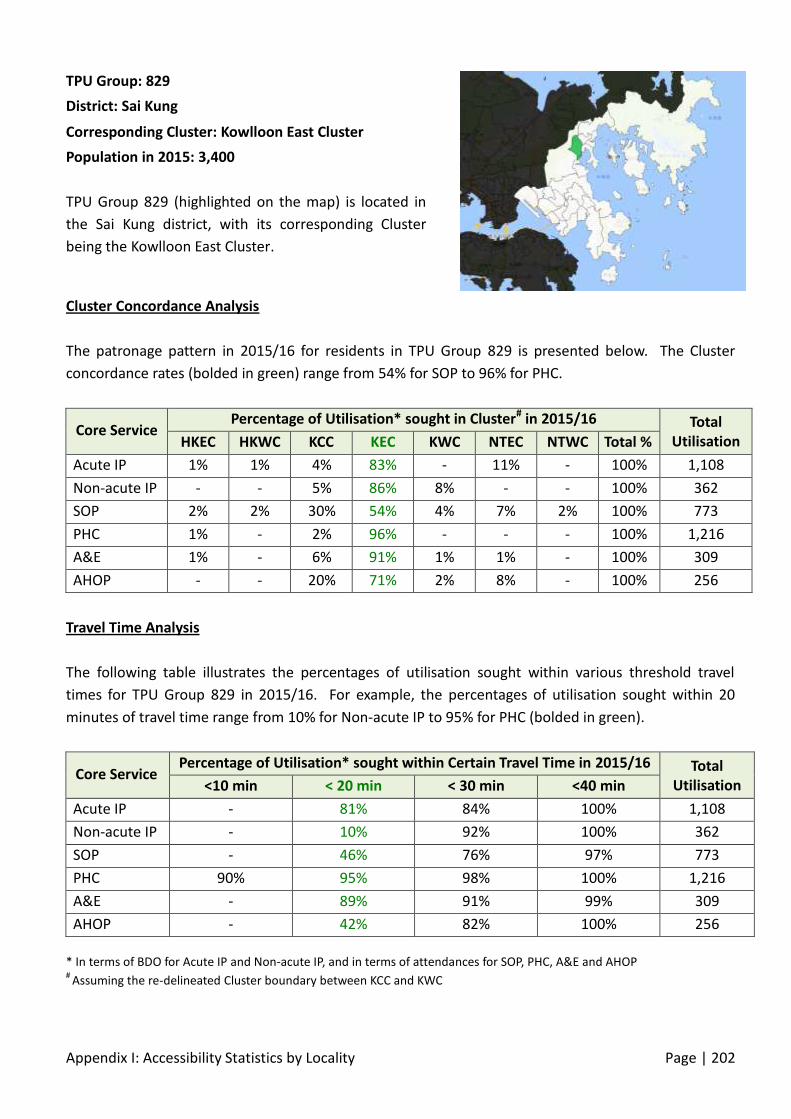
Appendix I: Accessibility Statistics by Locality Page | 202
Cluster Concordance Analysis
The patronage pattern in 2015/16 for residents in TPU Group 829 is presented below. The Cluster
concordance rates (bolded in green) range from 54% for SOP to 96% for PHC.
Core Service Percentage of Utilisation* sought in Cluster# in 2015/16 Total
Utilisation HKEC HKWC KCC KEC KWC NTEC NTWC Total %
Acute IP 1% 1% 4% 83% - 11% - 100% 1,108
Non-acute IP - - 5% 86% 8% - - 100% 362
SOP 2% 2% 30% 54% 4% 7% 2% 100% 773
PHC 1% - 2% 96% - - - 100% 1,216
A&E 1% - 6% 91% 1% 1% - 100% 309
AHOP - - 20% 71% 2% 8% - 100% 256
Travel Time Analysis
The following table illustrates the percentages of utilisation sought within various threshold travel
times for TPU Group 829 in 2015/16. For example, the percentages of utilisation sought within 20
minutes of travel time range from 10% for Non-acute IP to 95% for PHC (bolded in green).
Core Service Percentage of Utilisation* sought within Certain Travel Time in 2015/16 Total
Utilisation <10 min < 20 min < 30 min <40 min
Acute IP - 81% 84% 100% 1,108
Non-acute IP - 10% 92% 100% 362
SOP - 46% 76% 97% 773
PHC 90% 95% 98% 100% 1,216
A&E - 89% 91% 99% 309
AHOP - 42% 82% 100% 256
* In terms of BDO for Acute IP and Non-acute IP, and in terms of attendances for SOP, PHC, A&E and AHOP #
Assuming the re-delineated Cluster boundary between KCC and KWC
TPU Group: 829
District: Sai Kung
Corresponding Cluster: Kowlloon East Cluster
Population in 2015: 3,400
TPU Group 829 (highlighted on the map) is located in
the Sai Kung district, with its corresponding Cluster
being the Kowlloon East Cluster.
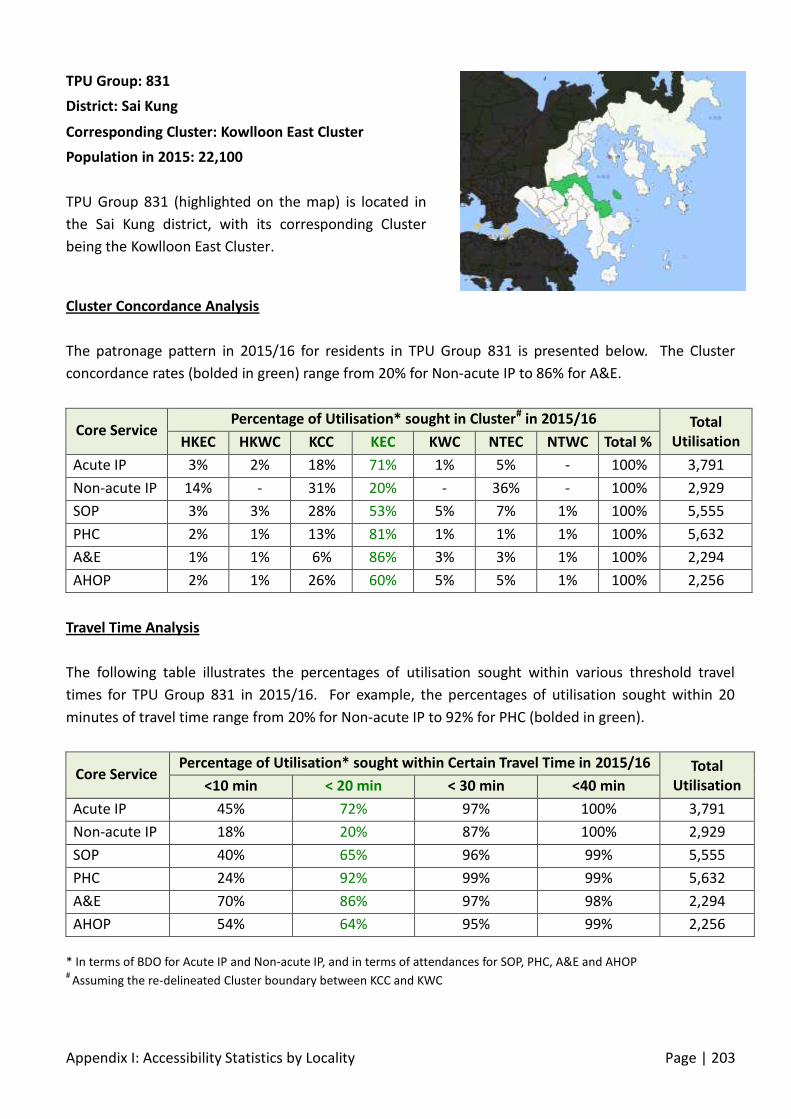
Appendix I: Accessibility Statistics by Locality Page | 203
Cluster Concordance Analysis
The patronage pattern in 2015/16 for residents in TPU Group 831 is presented below. The Cluster
concordance rates (bolded in green) range from 20% for Non-acute IP to 86% for A&E.
Core Service Percentage of Utilisation* sought in Cluster# in 2015/16 Total
Utilisation HKEC HKWC KCC KEC KWC NTEC NTWC Total %
Acute IP 3% 2% 18% 71% 1% 5% - 100% 3,791
Non-acute IP 14% - 31% 20% - 36% - 100% 2,929
SOP 3% 3% 28% 53% 5% 7% 1% 100% 5,555
PHC 2% 1% 13% 81% 1% 1% 1% 100% 5,632
A&E 1% 1% 6% 86% 3% 3% 1% 100% 2,294
AHOP 2% 1% 26% 60% 5% 5% 1% 100% 2,256
Travel Time Analysis
The following table illustrates the percentages of utilisation sought within various threshold travel
times for TPU Group 831 in 2015/16. For example, the percentages of utilisation sought within 20
minutes of travel time range from 20% for Non-acute IP to 92% for PHC (bolded in green).
Core Service Percentage of Utilisation* sought within Certain Travel Time in 2015/16 Total
Utilisation <10 min < 20 min < 30 min <40 min
Acute IP 45% 72% 97% 100% 3,791
Non-acute IP 18% 20% 87% 100% 2,929
SOP 40% 65% 96% 99% 5,555
PHC 24% 92% 99% 99% 5,632
A&E 70% 86% 97% 98% 2,294
AHOP 54% 64% 95% 99% 2,256
* In terms of BDO for Acute IP and Non-acute IP, and in terms of attendances for SOP, PHC, A&E and AHOP #
Assuming the re-delineated Cluster boundary between KCC and KWC
TPU Group: 831
District: Sai Kung
Corresponding Cluster: Kowlloon East Cluster
Population in 2015: 22,100
TPU Group 831 (highlighted on the map) is located in
the Sai Kung district, with its corresponding Cluster
being the Kowlloon East Cluster.

Appendix I: Accessibility Statistics by Locality Page | 204
Cluster Concordance Analysis
The patronage pattern in 2015/16 for residents in TPU Group 833 is presented below. The Cluster
concordance rates (bolded in green) range from 48% for Non-acute IP to 87% for A&E.
Core Service Percentage of Utilisation* sought in Cluster# in 2015/16 Total
Utilisation HKEC HKWC KCC KEC KWC NTEC NTWC Total %
Acute IP 4% 5% 12% 74% 1% 4% 1% 100% 32,428
Non-acute IP 3% 4% 34% 48% 3% 1% 6% 100% 12,139
SOP 5% 5% 16% 67% 3% 3% 1% 100% 57,284
PHC 5% 2% 8% 81% 2% 2% - 100% 43,298
A&E 3% 1% 5% 87% 2% 2% 1% 100% 22,655
AHOP 5% 3% 15% 73% 2% 3% 1% 100% 21,344
Travel Time Analysis
The following table illustrates the percentages of utilisation sought within various threshold travel
times for TPU Group 833 in 2015/16. For example, the percentages of utilisation sought within 20
minutes of travel time range from 7% for Non-acute IP to 83% for A&E (bolded in green).
Core Service Percentage of Utilisation* sought within Certain Travel Time in 2015/16 Total
Utilisation <10 min < 20 min < 30 min <40 min
Acute IP - 59% 94% 99% 32,428
Non-acute IP - 7% 89% 94% 12,139
SOP - 55% 93% 99% 57,284
PHC - 17% 90% 99% 43,298
A&E - 83% 96% 99% 22,655
AHOP - 61% 96% 99% 21,344
* In terms of BDO for Acute IP and Non-acute IP, and in terms of attendances for SOP, PHC, A&E and AHOP #
Assuming the re-delineated Cluster boundary between KCC and KWC
TPU Group: 833
District: Sai Kung
Corresponding Cluster: Kowlloon East Cluster
Population in 2015: 67,000
TPU Group 833 (highlighted on the map) is located in
the Sai Kung district, with its corresponding Cluster
being the Kowlloon East Cluster.

Appendix I: Accessibility Statistics by Locality Page | 205
Cluster Concordance Analysis
The patronage pattern in 2015/16 for residents in TPU Group 835 is presented below. The Cluster
concordance rates (bolded in green) range from 64% for Non-acute IP to 92% for PHC.
Core Service Percentage of Utilisation* sought in Cluster# in 2015/16 Total
Utilisation HKEC HKWC KCC KEC KWC NTEC NTWC Total %
Acute IP 1% 1% 8% 86% 1% 2% 1% 100% 23,516
Non-acute IP 1% - 23% 64% 3% 2% 7% 100% 11,514
SOP 2% 2% 13% 78% 1% 3% 1% 100% 29,758
PHC 1% 1% 5% 92% 1% 1% - 100% 29,198
A&E 2% 1% 5% 88% 2% 2% 1% 100% 11,160
AHOP 2% 3% 11% 82% 1% 2% - 100% 11,521
Travel Time Analysis
The following table illustrates the percentages of utilisation sought within various threshold travel
times for TPU Group 835 in 2015/16. For example, the percentages of utilisation sought within 20
minutes of travel time range from 86% for Non-acute IP to 94% for Acute IP (bolded in green).
Core Service Percentage of Utilisation* sought within Certain Travel Time in 2015/16 Total
Utilisation <10 min < 20 min < 30 min <40 min
Acute IP - 94% 98% 100% 23,516
Non-acute IP 50% 86% 92% 93% 11,514
SOP 6% 90% 97% 99% 29,758
PHC 48% 89% 99% 100% 29,198
A&E - 92% 97% 99% 11,160
AHOP 5% 91% 99% 100% 11,521
* In terms of BDO for Acute IP and Non-acute IP, and in terms of attendances for SOP, PHC, A&E and AHOP #
Assuming the re-delineated Cluster boundary between KCC and KWC
TPU Group: 835
District: Sai Kung
Corresponding Cluster: Kowlloon East Cluster
Population in 2015: 25,700
TPU Group 835 (highlighted on the map) is located in
the Sai Kung district, with its corresponding Cluster
being the Kowlloon East Cluster.

Appendix I: Accessibility Statistics by Locality Page | 206
Cluster Concordance Analysis
The patronage pattern in 2015/16 for residents in TPU Group 836 is presented below. The Cluster
concordance rates (bolded in green) range from 69% for Non-acute IP to 91% for PHC.
Core Service Percentage of Utilisation* sought in Cluster# in 2015/16 Total
Utilisation HKEC HKWC KCC KEC KWC NTEC NTWC Total %
Acute IP 2% 3% 11% 80% 1% 3% 1% 100% 67,752
Non-acute IP 2% 2% 22% 69% 1% 4% 1% 100% 27,154
SOP 4% 4% 14% 73% 2% 3% - 100% 94,942
PHC 2% 1% 4% 91% 1% 1% - 100% 82,880
A&E 3% 1% 4% 87% 2% 2% 1% 100% 29,980
AHOP 3% 2% 12% 80% 1% 2% - 100% 36,678
Travel Time Analysis
The following table illustrates the percentages of utilisation sought within various threshold travel
times for TPU Group 836 in 2015/16. For example, the percentages of utilisation sought within 20
minutes of travel time range from 69% for Non-acute IP to 89% for PHC (bolded in green).
Core Service Percentage of Utilisation* sought within Certain Travel Time in 2015/16 Total
Utilisation <10 min < 20 min < 30 min <40 min
Acute IP 66% 80% 97% 99% 67,752
Non-acute IP 63% 69% 96% 99% 27,154
SOP 61% 83% 96% 100% 94,942
PHC 83% 89% 99% 100% 82,880
A&E 83% 87% 96% 99% 29,980
AHOP 72% 81% 98% 100% 36,678
* In terms of BDO for Acute IP and Non-acute IP, and in terms of attendances for SOP, PHC, A&E and AHOP #
Assuming the re-delineated Cluster boundary between KCC and KWC
TPU Group: 836
District: Sai Kung
Corresponding Cluster: Kowlloon East Cluster
Population in 2015: 90,400
TPU Group 836 (highlighted on the map) is located in
the Sai Kung district, with its corresponding Cluster
being the Kowlloon East Cluster.

Appendix I: Accessibility Statistics by Locality Page | 207
Cluster Concordance Analysis
The patronage pattern in 2015/16 for residents in TPU Group 837 is presented below. The Cluster
concordance rates (bolded in green) range from 68% for Non-acute IP to 93% for PHC.
Core Service Percentage of Utilisation* sought in Cluster# in 2015/16 Total
Utilisation HKEC HKWC KCC KEC KWC NTEC NTWC Total %
Acute IP 2% 4% 10% 81% 1% 2% - 100% 57,381
Non-acute IP 6% 3% 21% 68% 1% 1% - 100% 21,965
SOP 3% 5% 13% 74% 2% 3% - 100% 86,867
PHC 2% 1% 3% 93% 1% 1% - 100% 82,543
A&E 2% 1% 3% 91% 2% 2% 1% 100% 30,265
AHOP 3% 2% 11% 81% 1% 1% - 100% 34,476
Travel Time Analysis
The following table illustrates the percentages of utilisation sought within various threshold travel
times for TPU Group 837 in 2015/16. For example, the percentages of utilisation sought within 20
minutes of travel time range from 68% for Non-acute IP to 91% for A&E (bolded in green).
Core Service Percentage of Utilisation* sought within Certain Travel Time in 2015/16 Total
Utilisation <10 min < 20 min < 30 min <40 min
Acute IP 73% 82% 95% 100% 57,381
Non-acute IP 65% 68% 99% 100% 21,965
SOP 65% 84% 95% 100% 86,867
PHC 85% 89% 99% 100% 82,543
A&E 88% 91% 97% 99% 30,265
AHOP 75% 82% 98% 100% 34,476
* In terms of BDO for Acute IP and Non-acute IP, and in terms of attendances for SOP, PHC, A&E and AHOP #
Assuming the re-delineated Cluster boundary between KCC and KWC
TPU Group: 837
District: Sai Kung
Corresponding Cluster: Kowlloon East Cluster
Population in 2015: 80,800
TPU Group 837 (highlighted on the map) is located in
the Sai Kung district, with its corresponding Cluster
being the Kowlloon East Cluster.

Appendix I: Accessibility Statistics by Locality Page | 208
Cluster Concordance Analysis
The patronage pattern in 2015/16 for residents in TPU Group 838 is presented below. The Cluster
concordance rates (bolded in green) range from 57% for Non-acute IP to 88% for A&E.
Core Service Percentage of Utilisation* sought in Cluster# in 2015/16 Total
Utilisation HKEC HKWC KCC KEC KWC NTEC NTWC Total %
Acute IP 3% 4% 12% 76% 1% 3% 1% 100% 58,732
Non-acute IP 4% 4% 28% 57% 2% 1% 3% 100% 25,169
SOP 4% 5% 16% 69% 2% 3% 1% 100% 91,958
PHC 3% 1% 7% 85% 2% 2% - 100% 72,021
A&E 3% 1% 4% 88% 2% 2% 1% 100% 29,832
AHOP 4% 2% 15% 75% 1% 2% - 100% 33,843
Travel Time Analysis
The following table illustrates the percentages of utilisation sought within various threshold travel
times for TPU Group 838 in 2015/16. For example, the percentages of utilisation sought within 20
minutes of travel time range from 85% for Non-acute IP to 93% for A&E (bolded in green).
Core Service Percentage of Utilisation* sought within Certain Travel Time in 2015/16 Total
Utilisation <10 min < 20 min < 30 min <40 min
Acute IP 63% 91% 95% 99% 58,732
Non-acute IP 52% 85% 92% 97% 25,169
SOP 58% 88% 95% 100% 91,958
PHC 70% 85% 99% 99% 72,021
A&E 83% 93% 97% 99% 29,832
AHOP 68% 91% 98% 100% 33,843
* In terms of BDO for Acute IP and Non-acute IP, and in terms of attendances for SOP, PHC, A&E and AHOP #
Assuming the re-delineated Cluster boundary between KCC and KWC
TPU Group: 838
District: Sai Kung
Corresponding Cluster: Kowlloon East Cluster
Population in 2015: 103,600
TPU Group 838 (highlighted on the map) is located in
the Sai Kung district, with its corresponding Cluster
being the Kowlloon East Cluster.
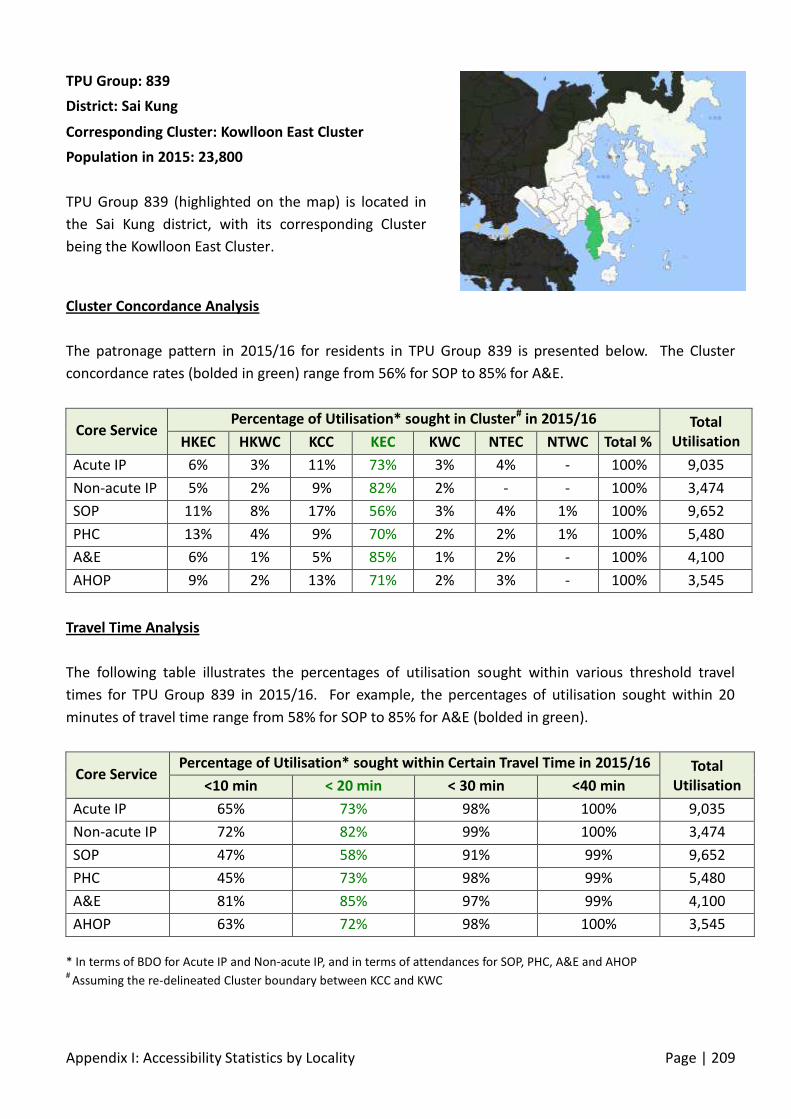
Appendix I: Accessibility Statistics by Locality Page | 209
Cluster Concordance Analysis
The patronage pattern in 2015/16 for residents in TPU Group 839 is presented below. The Cluster
concordance rates (bolded in green) range from 56% for SOP to 85% for A&E.
Core Service Percentage of Utilisation* sought in Cluster# in 2015/16 Total
Utilisation HKEC HKWC KCC KEC KWC NTEC NTWC Total %
Acute IP 6% 3% 11% 73% 3% 4% - 100% 9,035
Non-acute IP 5% 2% 9% 82% 2% - - 100% 3,474
SOP 11% 8% 17% 56% 3% 4% 1% 100% 9,652
PHC 13% 4% 9% 70% 2% 2% 1% 100% 5,480
A&E 6% 1% 5% 85% 1% 2% - 100% 4,100
AHOP 9% 2% 13% 71% 2% 3% - 100% 3,545
Travel Time Analysis
The following table illustrates the percentages of utilisation sought within various threshold travel
times for TPU Group 839 in 2015/16. For example, the percentages of utilisation sought within 20
minutes of travel time range from 58% for SOP to 85% for A&E (bolded in green).
Core Service Percentage of Utilisation* sought within Certain Travel Time in 2015/16 Total
Utilisation <10 min < 20 min < 30 min <40 min
Acute IP 65% 73% 98% 100% 9,035
Non-acute IP 72% 82% 99% 100% 3,474
SOP 47% 58% 91% 99% 9,652
PHC 45% 73% 98% 99% 5,480
A&E 81% 85% 97% 99% 4,100
AHOP 63% 72% 98% 100% 3,545
* In terms of BDO for Acute IP and Non-acute IP, and in terms of attendances for SOP, PHC, A&E and AHOP #
Assuming the re-delineated Cluster boundary between KCC and KWC
TPU Group: 839
District: Sai Kung
Corresponding Cluster: Kowlloon East Cluster
Population in 2015: 23,800
TPU Group 839 (highlighted on the map) is located in
the Sai Kung district, with its corresponding Cluster
being the Kowlloon East Cluster.
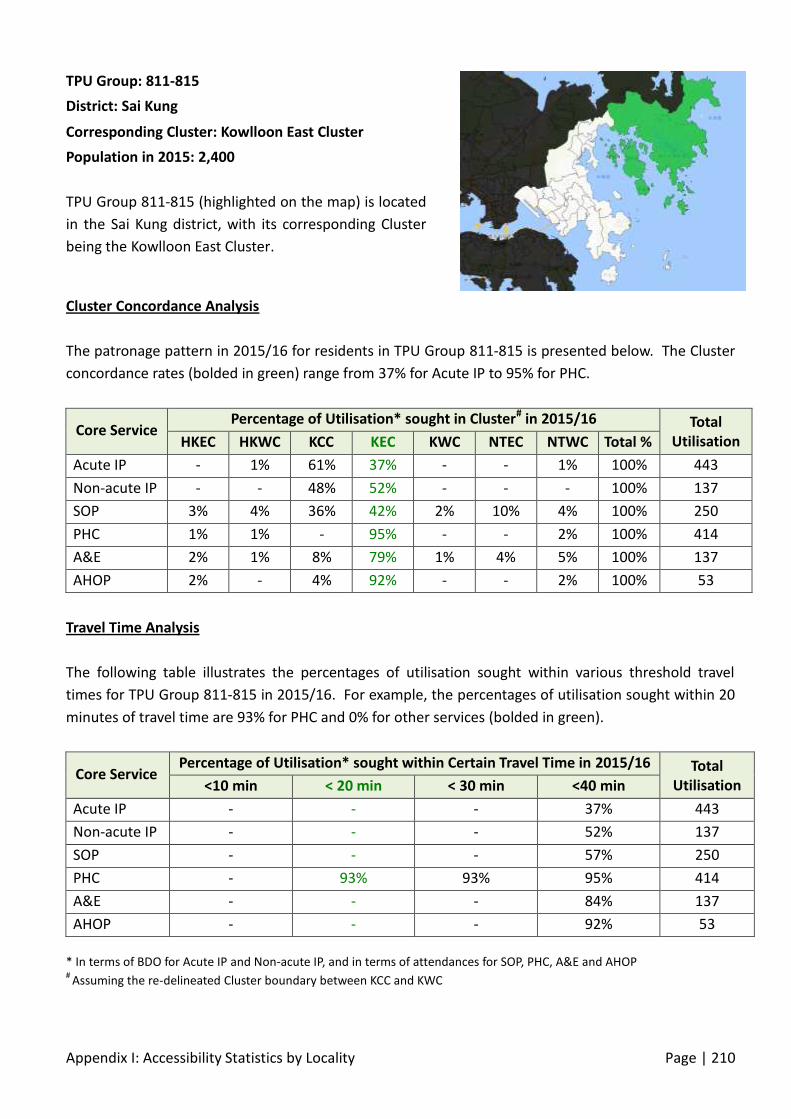
Appendix I: Accessibility Statistics by Locality Page | 210
Cluster Concordance Analysis
The patronage pattern in 2015/16 for residents in TPU Group 811-815 is presented below. The Cluster
concordance rates (bolded in green) range from 37% for Acute IP to 95% for PHC.
Core Service Percentage of Utilisation* sought in Cluster# in 2015/16 Total
Utilisation HKEC HKWC KCC KEC KWC NTEC NTWC Total %
Acute IP - 1% 61% 37% - - 1% 100% 443
Non-acute IP - - 48% 52% - - - 100% 137
SOP 3% 4% 36% 42% 2% 10% 4% 100% 250
PHC 1% 1% - 95% - - 2% 100% 414
A&E 2% 1% 8% 79% 1% 4% 5% 100% 137
AHOP 2% - 4% 92% - - 2% 100% 53
Travel Time Analysis
The following table illustrates the percentages of utilisation sought within various threshold travel
times for TPU Group 811-815 in 2015/16. For example, the percentages of utilisation sought within 20
minutes of travel time are 93% for PHC and 0% for other services (bolded in green).
Core Service Percentage of Utilisation* sought within Certain Travel Time in 2015/16 Total
Utilisation <10 min < 20 min < 30 min <40 min
Acute IP - - - 37% 443
Non-acute IP - - - 52% 137
SOP - - - 57% 250
PHC - 93% 93% 95% 414
A&E - - - 84% 137
AHOP - - - 92% 53
* In terms of BDO for Acute IP and Non-acute IP, and in terms of attendances for SOP, PHC, A&E and AHOP #
Assuming the re-delineated Cluster boundary between KCC and KWC
TPU Group: 811-815
District: Sai Kung
Corresponding Cluster: Kowlloon East Cluster
Population in 2015: 2,400
TPU Group 811-815 (highlighted on the map) is located
in the Sai Kung district, with its corresponding Cluster
being the Kowlloon East Cluster.
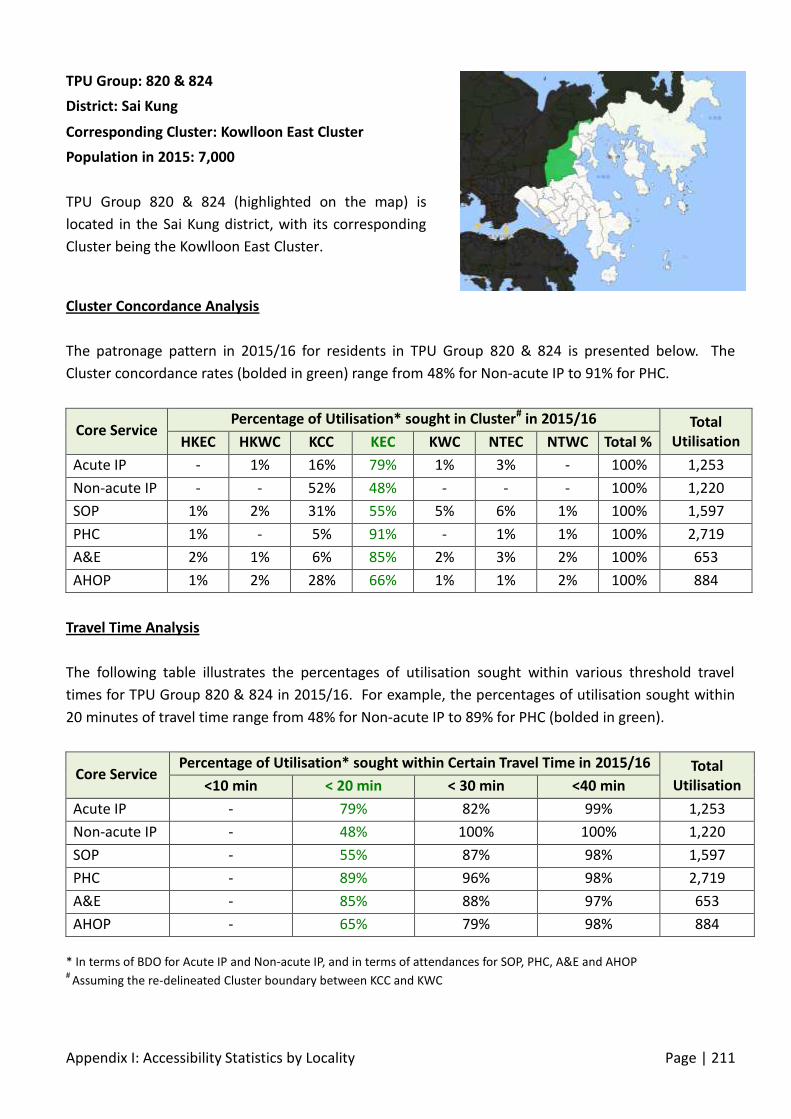
Appendix I: Accessibility Statistics by Locality Page | 211
Cluster Concordance Analysis
The patronage pattern in 2015/16 for residents in TPU Group 820 & 824 is presented below. The
Cluster concordance rates (bolded in green) range from 48% for Non-acute IP to 91% for PHC.
Core Service Percentage of Utilisation* sought in Cluster# in 2015/16 Total
Utilisation HKEC HKWC KCC KEC KWC NTEC NTWC Total %
Acute IP - 1% 16% 79% 1% 3% - 100% 1,253
Non-acute IP - - 52% 48% - - - 100% 1,220
SOP 1% 2% 31% 55% 5% 6% 1% 100% 1,597
PHC 1% - 5% 91% - 1% 1% 100% 2,719
A&E 2% 1% 6% 85% 2% 3% 2% 100% 653
AHOP 1% 2% 28% 66% 1% 1% 2% 100% 884
Travel Time Analysis
The following table illustrates the percentages of utilisation sought within various threshold travel
times for TPU Group 820 & 824 in 2015/16. For example, the percentages of utilisation sought within
20 minutes of travel time range from 48% for Non-acute IP to 89% for PHC (bolded in green).
Core Service Percentage of Utilisation* sought within Certain Travel Time in 2015/16 Total
Utilisation <10 min < 20 min < 30 min <40 min
Acute IP - 79% 82% 99% 1,253
Non-acute IP - 48% 100% 100% 1,220
SOP - 55% 87% 98% 1,597
PHC - 89% 96% 98% 2,719
A&E - 85% 88% 97% 653
AHOP - 65% 79% 98% 884
* In terms of BDO for Acute IP and Non-acute IP, and in terms of attendances for SOP, PHC, A&E and AHOP #
Assuming the re-delineated Cluster boundary between KCC and KWC
TPU Group: 820 & 824
District: Sai Kung
Corresponding Cluster: Kowlloon East Cluster
Population in 2015: 7,000
TPU Group 820 & 824 (highlighted on the map) is
located in the Sai Kung district, with its corresponding
Cluster being the Kowlloon East Cluster.

Appendix I: Accessibility Statistics by Locality Page | 212
Cluster Concordance Analysis
The patronage pattern in 2015/16 for residents in TPU Group 826 & 828 is presented below. The
Cluster concordance rates (bolded in green) range from 53% for Non-acute IP to 98% for PHC.
Core Service Percentage of Utilisation* sought in Cluster# in 2015/16 Total
Utilisation HKEC HKWC KCC KEC KWC NTEC NTWC Total %
Acute IP 1% 2% 11% 78% 1% 8% - 100% 6,367
Non-acute IP 1% - 35% 53% - 11% - 100% 2,397
SOP 1% 3% 25% 56% 2% 12% - 100% 7,189
PHC - - 1% 98% - 1% - 100% 17,254
A&E 1% - 7% 85% 2% 4% - 100% 2,089
AHOP 1% 1% 18% 69% 2% 8% 1% 100% 2,453
Travel Time Analysis
The following table illustrates the percentages of utilisation sought within various threshold travel
times for TPU Group 826 & 828 in 2015/16. For example, the percentages of utilisation sought within
20 minutes of travel time range from 12% for Non-acute IP to 97% for PHC (bolded in green).
Core Service Percentage of Utilisation* sought within Certain Travel Time in 2015/16 Total
Utilisation <10 min < 20 min < 30 min <40 min
Acute IP - 68% 86% 99% 6,367
Non-acute IP - 12% 99% 100% 2,397
SOP - 49% 82% 97% 7,189
PHC 93% 97% 99% 100% 17,254
A&E - 81% 89% 99% 2,089
AHOP - 63% 87% 98% 2,453
* In terms of BDO for Acute IP and Non-acute IP, and in terms of attendances for SOP, PHC, A&E and AHOP #
Assuming the re-delineated Cluster boundary between KCC and KWC
TPU Group: 826 & 828
District: Sai Kung
Corresponding Cluster: Kowlloon East Cluster
Population in 2015: 7,900
TPU Group 826 & 828 (highlighted on the map) is
located in the Sai Kung district, with its corresponding
Cluster being the Kowlloon East Cluster.
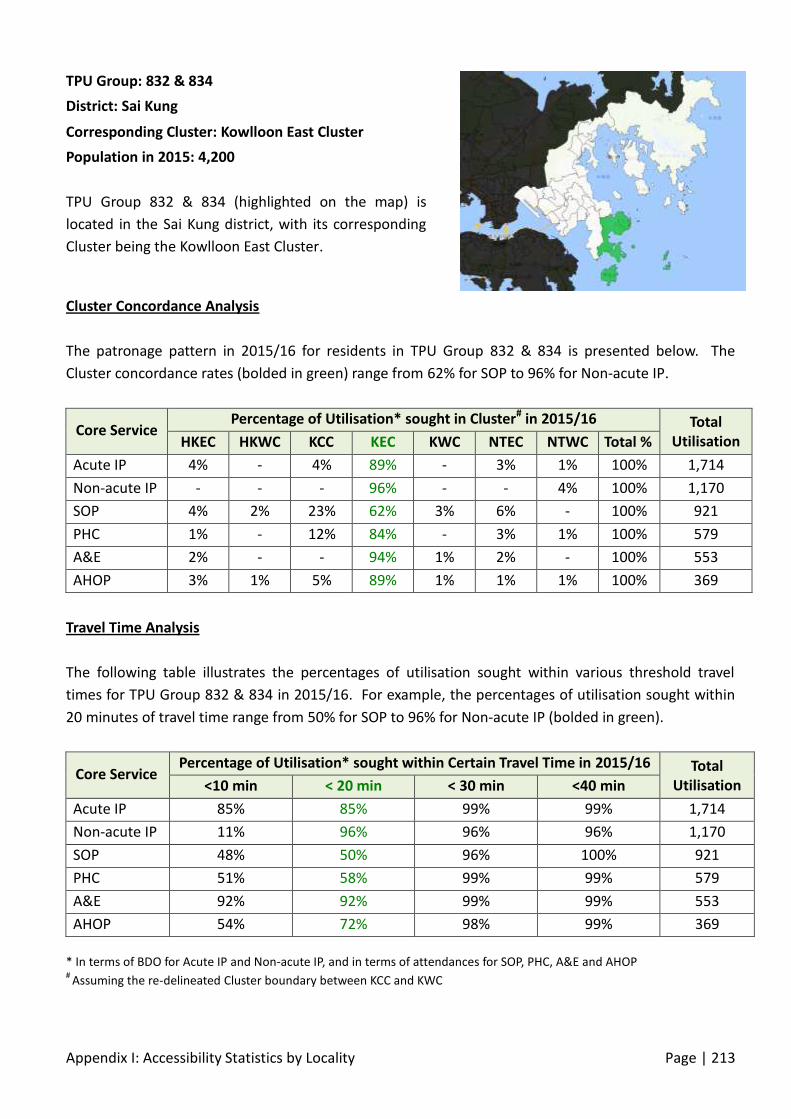
Appendix I: Accessibility Statistics by Locality Page | 213
Cluster Concordance Analysis
The patronage pattern in 2015/16 for residents in TPU Group 832 & 834 is presented below. The
Cluster concordance rates (bolded in green) range from 62% for SOP to 96% for Non-acute IP.
Core Service Percentage of Utilisation* sought in Cluster# in 2015/16 Total
Utilisation HKEC HKWC KCC KEC KWC NTEC NTWC Total %
Acute IP 4% - 4% 89% - 3% 1% 100% 1,714
Non-acute IP - - - 96% - - 4% 100% 1,170
SOP 4% 2% 23% 62% 3% 6% - 100% 921
PHC 1% - 12% 84% - 3% 1% 100% 579
A&E 2% - - 94% 1% 2% - 100% 553
AHOP 3% 1% 5% 89% 1% 1% 1% 100% 369
Travel Time Analysis
The following table illustrates the percentages of utilisation sought within various threshold travel
times for TPU Group 832 & 834 in 2015/16. For example, the percentages of utilisation sought within
20 minutes of travel time range from 50% for SOP to 96% for Non-acute IP (bolded in green).
Core Service Percentage of Utilisation* sought within Certain Travel Time in 2015/16 Total
Utilisation <10 min < 20 min < 30 min <40 min
Acute IP 85% 85% 99% 99% 1,714
Non-acute IP 11% 96% 96% 96% 1,170
SOP 48% 50% 96% 100% 921
PHC 51% 58% 99% 99% 579
A&E 92% 92% 99% 99% 553
AHOP 54% 72% 98% 99% 369
* In terms of BDO for Acute IP and Non-acute IP, and in terms of attendances for SOP, PHC, A&E and AHOP #
Assuming the re-delineated Cluster boundary between KCC and KWC
TPU Group: 832 & 834
District: Sai Kung
Corresponding Cluster: Kowlloon East Cluster
Population in 2015: 4,200
TPU Group 832 & 834 (highlighted on the map) is
located in the Sai Kung district, with its corresponding
Cluster being the Kowlloon East Cluster.

Appendix I: Accessibility Statistics by Locality Page | 214
Cluster Concordance Analysis
The patronage pattern in 2015/16 for residents in TPU Group 326 is presented below. The Cluster
concordance rates (bolded in green) range from 80% for Non-acute IP to 92% for PHC.
Core Service Percentage of Utilisation* sought in Cluster# in 2015/16 Total
Utilisation HKEC HKWC KCC KEC KWC NTEC NTWC Total %
Acute IP 1% 2% 5% 1% 88% 3% 1% 100% 142,432
Non-acute IP 1% 2% 11% 1% 80% 4% 2% 100% 70,178
SOP 1% 2% 6% 1% 87% 2% 1% 100% 184,570
PHC 1% 1% 4% 1% 92% 1% 1% 100% 152,026
A&E 1% 1% 3% 1% 91% 2% 1% 100% 65,042
AHOP 1% 2% 10% 1% 81% 2% 2% 100% 52,617
Travel Time Analysis
The following table illustrates the percentages of utilisation sought within various threshold travel
times for TPU Group 326 in 2015/16. For example, the percentages of utilisation sought within 20
minutes of travel time range from 88% for Non-acute IP to 96% for PHC (bolded in green).
Core Service Percentage of Utilisation* sought within Certain Travel Time in 2015/16 Total
Utilisation <10 min < 20 min < 30 min <40 min
Acute IP 29% 93% 99% 100% 142,432
Non-acute IP 11% 88% 100% 100% 70,178
SOP 23% 92% 99% 100% 184,570
PHC 87% 96% 99% 100% 152,026
A&E 45% 94% 99% 100% 65,042
AHOP 32% 90% 99% 100% 52,617
* In terms of BDO for Acute IP and Non-acute IP, and in terms of attendances for SOP, PHC, A&E and AHOP #
Assuming the re-delineated Cluster boundary between KCC and KWC
TPU Group: 326
District: Kwai Tsing
Corresponding Cluster: Kowloon West Cluster
Population in 2015: 160,000
TPU Group 326 (highlighted on the map) is located in
the Kwai Tsing district, with its corresponding Cluster
being the Kowloon West Cluster.

Appendix I: Accessibility Statistics by Locality Page | 215
Cluster Concordance Analysis
The patronage pattern in 2015/16 for residents in TPU Group 327 is presented below. The Cluster
concordance rates (bolded in green) range from 74% for Non-acute IP to 93% for PHC.
Core Service Percentage of Utilisation* sought in Cluster# in 2015/16 Total
Utilisation HKEC HKWC KCC KEC KWC NTEC NTWC Total %
Acute IP 1% 2% 6% 1% 87% 2% 1% 100% 102,001
Non-acute IP 3% 2% 13% - 74% 4% 4% 100% 66,116
SOP 1% 2% 7% 1% 86% 3% 1% 100% 123,670
PHC 1% 1% 4% 1% 93% 1% 1% 100% 106,186
A&E 1% 1% 4% 1% 91% 2% 1% 100% 41,117
AHOP 1% 2% 12% 1% 82% 2% 1% 100% 33,543
Travel Time Analysis
The following table illustrates the percentages of utilisation sought within various threshold travel
times for TPU Group 327 in 2015/16. For example, the percentages of utilisation sought within 20
minutes of travel time range from 82% for Non-acute IP to 96% for PHC (bolded in green).
Core Service Percentage of Utilisation* sought within Certain Travel Time in 2015/16 Total
Utilisation <10 min < 20 min < 30 min <40 min
Acute IP 11% 91% 98% 100% 102,001
Non-acute IP 3% 82% 95% 100% 66,116
SOP 18% 91% 99% 100% 123,670
PHC 78% 96% 99% 100% 106,186
A&E 31% 92% 98% 100% 41,117
AHOP 24% 86% 99% 100% 33,543
* In terms of BDO for Acute IP and Non-acute IP, and in terms of attendances for SOP, PHC, A&E and AHOP #
Assuming the re-delineated Cluster boundary between KCC and KWC
TPU Group: 327
District: Kwai Tsing
Corresponding Cluster: Kowloon West Cluster
Population in 2015: 109,600
TPU Group 327 (highlighted on the map) is located in
the Kwai Tsing district, with its corresponding Cluster
being the Kowloon West Cluster.

Appendix I: Accessibility Statistics by Locality Page | 216
Cluster Concordance Analysis
The patronage pattern in 2015/16 for residents in TPU Group 328 is presented below. The Cluster
concordance rates (bolded in green) range from 76% for Non-acute IP to 91% for A&E.
Core Service Percentage of Utilisation* sought in Cluster# in 2015/16 Total
Utilisation HKEC HKWC KCC KEC KWC NTEC NTWC Total %
Acute IP 1% 3% 7% 1% 87% 2% 1% 100% 43,043
Non-acute IP 1% 4% 13% - 76% 5% 1% 100% 20,804
SOP 1% 3% 9% 1% 84% 2% 1% 100% 66,509
PHC 1% 1% 8% 1% 88% 1% 1% 100% 59,905
A&E 1% 1% 4% 1% 91% 1% 1% 100% 20,613
AHOP 2% 2% 15% 2% 76% 2% 2% 100% 19,609
Travel Time Analysis
The following table illustrates the percentages of utilisation sought within various threshold travel
times for TPU Group 328 in 2015/16. For example, the percentages of utilisation sought within 20
minutes of travel time range from 91% for Non-acute IP to 96% for PHC (bolded in green).
Core Service Percentage of Utilisation* sought within Certain Travel Time in 2015/16 Total
Utilisation <10 min < 20 min < 30 min <40 min
Acute IP 86% 95% 100% 100% 43,043
Non-acute IP 75% 91% 100% 100% 20,804
SOP 84% 94% 100% 100% 66,509
PHC 80% 96% 99% 100% 59,905
A&E 90% 95% 100% 100% 20,613
AHOP 77% 93% 100% 100% 19,609
* In terms of BDO for Acute IP and Non-acute IP, and in terms of attendances for SOP, PHC, A&E and AHOP #
Assuming the re-delineated Cluster boundary between KCC and KWC
TPU Group: 328
District: Kwai Tsing
Corresponding Cluster: Kowloon West Cluster
Population in 2015: 55,700
TPU Group 328 (highlighted on the map) is located in
the Kwai Tsing district, with its corresponding Cluster
being the Kowloon West Cluster.
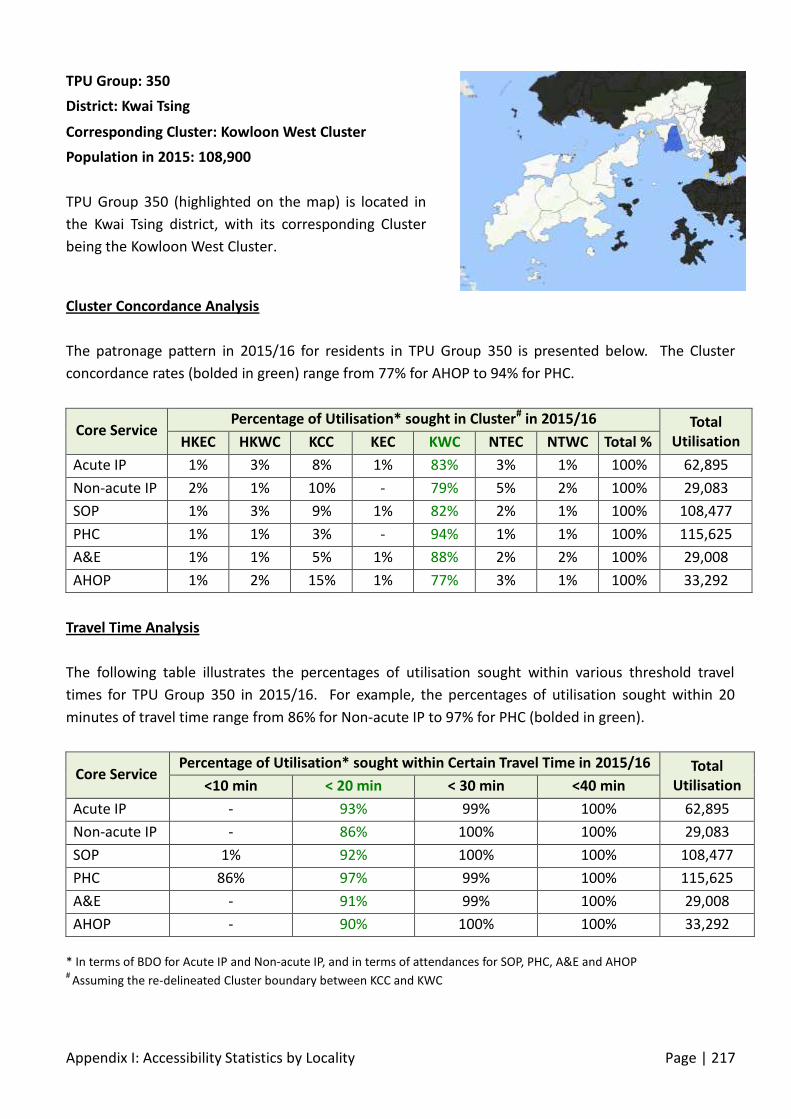
Appendix I: Accessibility Statistics by Locality Page | 217
Cluster Concordance Analysis
The patronage pattern in 2015/16 for residents in TPU Group 350 is presented below. The Cluster
concordance rates (bolded in green) range from 77% for AHOP to 94% for PHC.
Core Service Percentage of Utilisation* sought in Cluster# in 2015/16 Total
Utilisation HKEC HKWC KCC KEC KWC NTEC NTWC Total %
Acute IP 1% 3% 8% 1% 83% 3% 1% 100% 62,895
Non-acute IP 2% 1% 10% - 79% 5% 2% 100% 29,083
SOP 1% 3% 9% 1% 82% 2% 1% 100% 108,477
PHC 1% 1% 3% - 94% 1% 1% 100% 115,625
A&E 1% 1% 5% 1% 88% 2% 2% 100% 29,008
AHOP 1% 2% 15% 1% 77% 3% 1% 100% 33,292
Travel Time Analysis
The following table illustrates the percentages of utilisation sought within various threshold travel
times for TPU Group 350 in 2015/16. For example, the percentages of utilisation sought within 20
minutes of travel time range from 86% for Non-acute IP to 97% for PHC (bolded in green).
Core Service Percentage of Utilisation* sought within Certain Travel Time in 2015/16 Total
Utilisation <10 min < 20 min < 30 min <40 min
Acute IP - 93% 99% 100% 62,895
Non-acute IP - 86% 100% 100% 29,083
SOP 1% 92% 100% 100% 108,477
PHC 86% 97% 99% 100% 115,625
A&E - 91% 99% 100% 29,008
AHOP - 90% 100% 100% 33,292
* In terms of BDO for Acute IP and Non-acute IP, and in terms of attendances for SOP, PHC, A&E and AHOP #
Assuming the re-delineated Cluster boundary between KCC and KWC
TPU Group: 350
District: Kwai Tsing
Corresponding Cluster: Kowloon West Cluster
Population in 2015: 108,900
TPU Group 350 (highlighted on the map) is located in
the Kwai Tsing district, with its corresponding Cluster
being the Kowloon West Cluster.

Appendix I: Accessibility Statistics by Locality Page | 218
Cluster Concordance Analysis
The patronage pattern in 2015/16 for residents in TPU Group 351 is presented below. The Cluster
concordance rates (bolded in green) range from 78% for AHOP to 92% for PHC.
Core Service Percentage of Utilisation* sought in Cluster# in 2015/16 Total
Utilisation HKEC HKWC KCC KEC KWC NTEC NTWC Total %
Acute IP 1% 4% 6% - 84% 2% 2% 100% 49,501
Non-acute IP 2% 1% 7% - 85% 4% 1% 100% 23,671
SOP 1% 3% 8% 1% 85% 2% 1% 100% 83,489
PHC 1% 1% 5% 1% 92% 1% 1% 100% 79,748
A&E 1% 1% 5% 1% 89% 2% 2% 100% 26,500
AHOP 1% 3% 14% 1% 78% 2% 1% 100% 25,672
Travel Time Analysis
The following table illustrates the percentages of utilisation sought within various threshold travel
times for TPU Group 351 in 2015/16. For example, the percentages of utilisation sought within 20
minutes of travel time range from 88% for AHOP to 96% for PHC (bolded in green).
Core Service Percentage of Utilisation* sought within Certain Travel Time in 2015/16 Total
Utilisation <10 min < 20 min < 30 min <40 min
Acute IP 13% 90% 99% 100% 49,501
Non-acute IP 1% 89% 98% 100% 23,671
SOP 19% 91% 99% 100% 83,489
PHC 87% 96% 99% 100% 79,748
A&E 33% 91% 99% 100% 26,500
AHOP 26% 88% 99% 100% 25,672
* In terms of BDO for Acute IP and Non-acute IP, and in terms of attendances for SOP, PHC, A&E and AHOP #
Assuming the re-delineated Cluster boundary between KCC and KWC
TPU Group: 351
District: Kwai Tsing
Corresponding Cluster: Kowloon West Cluster
Population in 2015: 82,600
TPU Group 351 (highlighted on the map) is located in
the Kwai Tsing district, with its corresponding Cluster
being the Kowloon West Cluster.

Appendix I: Accessibility Statistics by Locality Page | 219
Cluster Concordance Analysis
The patronage pattern in 2015/16 for residents in TPU Group 944 is presented below. The Cluster
concordance rates (bolded in green) range from 58% for SOP to 98% for PHC.
Core Service Percentage of Utilisation* sought in Cluster# in 2015/16 Total
Utilisation HKEC HKWC KCC KEC KWC NTEC NTWC Total %
Acute IP 6% 17% 2% - 75% - - 100% 1,738
Non-acute IP 2% - 20% - 78% - - 100% 483
SOP 4% 26% 7% 1% 58% 1% 3% 100% 1,779
PHC - - 1% - 98% - - 100% 9,408
A&E 4% 6% 3% 1% 85% 1% 1% 100% 595
AHOP 2% 7% 3% 1% 80% - 8% 100% 442
Travel Time Analysis
The following table illustrates the percentages of utilisation sought within various threshold travel
times for TPU Group 944 in 2015/16. For example, the percentages of utilisation sought within 20
minutes of travel time are 95% for PHC and 0% for other services (bolded in green).
Core Service Percentage of Utilisation* sought within Certain Travel Time in 2015/16 Total
Utilisation <10 min < 20 min < 30 min <40 min
Acute IP - - - 14% 1,738
Non-acute IP - - - 46% 483
SOP - - - 10% 1,779
PHC 95% 95% 95% 97% 9,408
A&E - - - 75% 595
AHOP - - - 68% 442
* In terms of BDO for Acute IP and Non-acute IP, and in terms of attendances for SOP, PHC, A&E and AHOP #
Assuming the re-delineated Cluster boundary between KCC and KWC
TPU Group: 944
District: Lantau Island
Corresponding Cluster: Kowloon West Cluster
Population in 2015: 2,900
TPU Group 944 (highlighted on the map) is located in
the Lantau Island district, with its corresponding Cluster
being the Kowloon West Cluster.
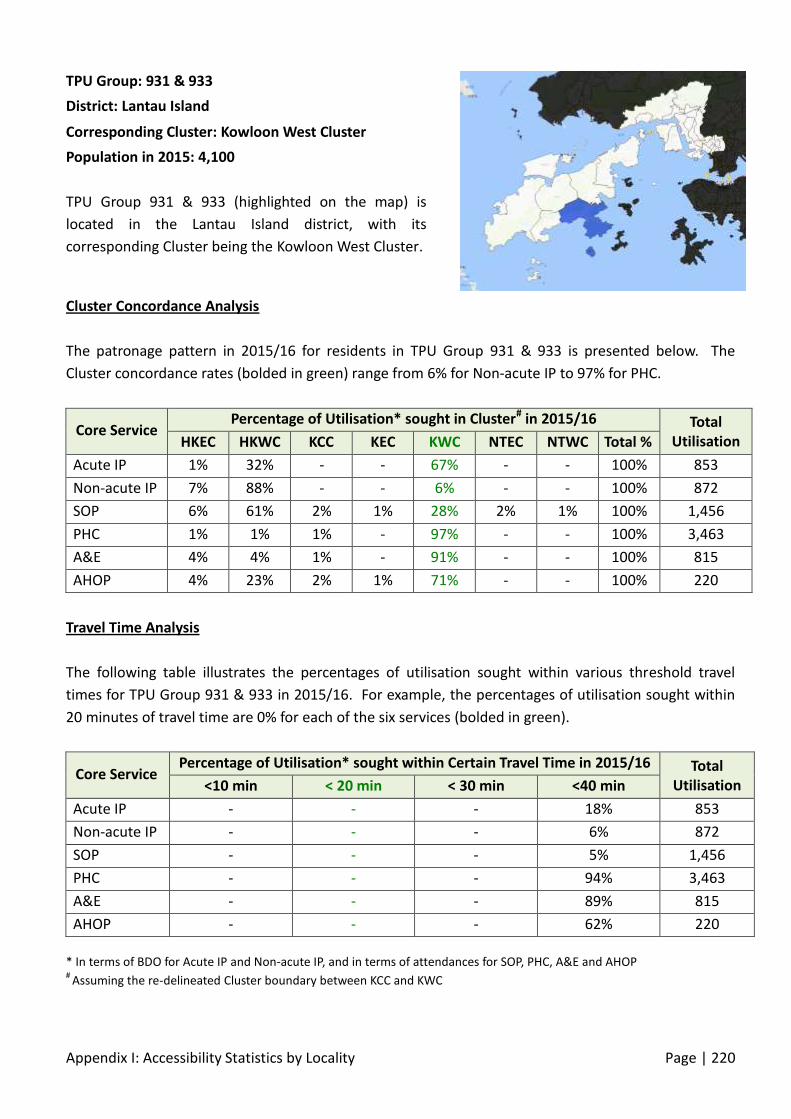
Appendix I: Accessibility Statistics by Locality Page | 220
Cluster Concordance Analysis
The patronage pattern in 2015/16 for residents in TPU Group 931 & 933 is presented below. The
Cluster concordance rates (bolded in green) range from 6% for Non-acute IP to 97% for PHC.
Core Service Percentage of Utilisation* sought in Cluster# in 2015/16 Total
Utilisation HKEC HKWC KCC KEC KWC NTEC NTWC Total %
Acute IP 1% 32% - - 67% - - 100% 853
Non-acute IP 7% 88% - - 6% - - 100% 872
SOP 6% 61% 2% 1% 28% 2% 1% 100% 1,456
PHC 1% 1% 1% - 97% - - 100% 3,463
A&E 4% 4% 1% - 91% - - 100% 815
AHOP 4% 23% 2% 1% 71% - - 100% 220
Travel Time Analysis
The following table illustrates the percentages of utilisation sought within various threshold travel
times for TPU Group 931 & 933 in 2015/16. For example, the percentages of utilisation sought within
20 minutes of travel time are 0% for each of the six services (bolded in green).
Core Service Percentage of Utilisation* sought within Certain Travel Time in 2015/16 Total
Utilisation <10 min < 20 min < 30 min <40 min
Acute IP - - - 18% 853
Non-acute IP - - - 6% 872
SOP - - - 5% 1,456
PHC - - - 94% 3,463
A&E - - - 89% 815
AHOP - - - 62% 220
* In terms of BDO for Acute IP and Non-acute IP, and in terms of attendances for SOP, PHC, A&E and AHOP #
Assuming the re-delineated Cluster boundary between KCC and KWC
TPU Group: 931 & 933
District: Lantau Island
Corresponding Cluster: Kowloon West Cluster
Population in 2015: 4,100
TPU Group 931 & 933 (highlighted on the map) is
located in the Lantau Island district, with its
corresponding Cluster being the Kowloon West Cluster.
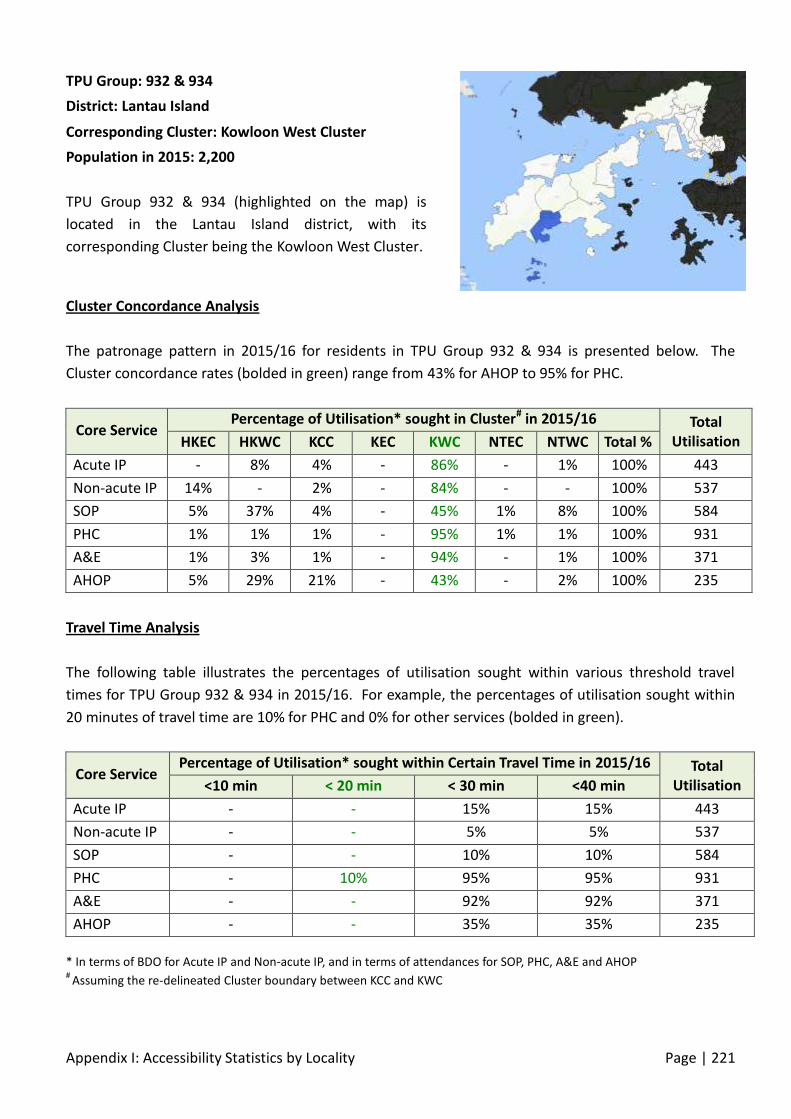
Appendix I: Accessibility Statistics by Locality Page | 221
Cluster Concordance Analysis
The patronage pattern in 2015/16 for residents in TPU Group 932 & 934 is presented below. The
Cluster concordance rates (bolded in green) range from 43% for AHOP to 95% for PHC.
Core Service Percentage of Utilisation* sought in Cluster# in 2015/16 Total
Utilisation HKEC HKWC KCC KEC KWC NTEC NTWC Total %
Acute IP - 8% 4% - 86% - 1% 100% 443
Non-acute IP 14% - 2% - 84% - - 100% 537
SOP 5% 37% 4% - 45% 1% 8% 100% 584
PHC 1% 1% 1% - 95% 1% 1% 100% 931
A&E 1% 3% 1% - 94% - 1% 100% 371
AHOP 5% 29% 21% - 43% - 2% 100% 235
Travel Time Analysis
The following table illustrates the percentages of utilisation sought within various threshold travel
times for TPU Group 932 & 934 in 2015/16. For example, the percentages of utilisation sought within
20 minutes of travel time are 10% for PHC and 0% for other services (bolded in green).
Core Service Percentage of Utilisation* sought within Certain Travel Time in 2015/16 Total
Utilisation <10 min < 20 min < 30 min <40 min
Acute IP - - 15% 15% 443
Non-acute IP - - 5% 5% 537
SOP - - 10% 10% 584
PHC - 10% 95% 95% 931
A&E - - 92% 92% 371
AHOP - - 35% 35% 235
* In terms of BDO for Acute IP and Non-acute IP, and in terms of attendances for SOP, PHC, A&E and AHOP #
Assuming the re-delineated Cluster boundary between KCC and KWC
TPU Group: 932 & 934
District: Lantau Island
Corresponding Cluster: Kowloon West Cluster
Population in 2015: 2,200
TPU Group 932 & 934 (highlighted on the map) is
located in the Lantau Island district, with its
corresponding Cluster being the Kowloon West Cluster.
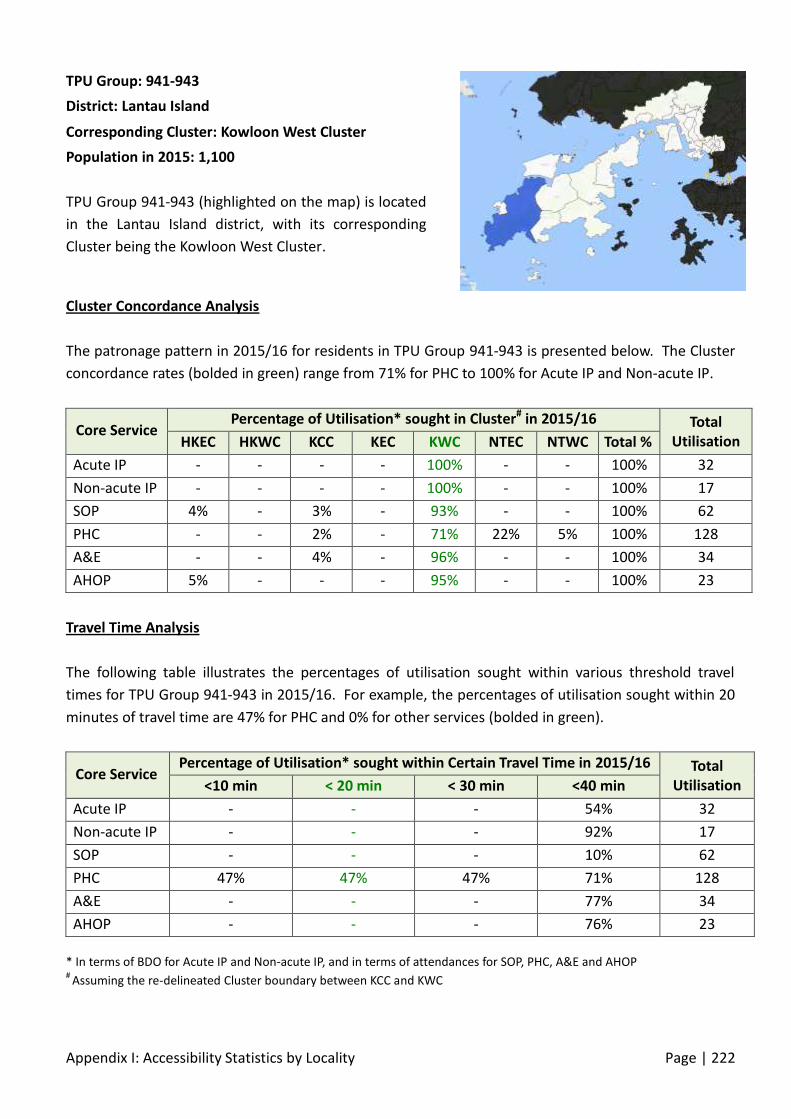
Appendix I: Accessibility Statistics by Locality Page | 222
Cluster Concordance Analysis
The patronage pattern in 2015/16 for residents in TPU Group 941-943 is presented below. The Cluster
concordance rates (bolded in green) range from 71% for PHC to 100% for Acute IP and Non-acute IP.
Core Service Percentage of Utilisation* sought in Cluster# in 2015/16 Total
Utilisation HKEC HKWC KCC KEC KWC NTEC NTWC Total %
Acute IP - - - - 100% - - 100% 32
Non-acute IP - - - - 100% - - 100% 17
SOP 4% - 3% - 93% - - 100% 62
PHC - - 2% - 71% 22% 5% 100% 128
A&E - - 4% - 96% - - 100% 34
AHOP 5% - - - 95% - - 100% 23
Travel Time Analysis
The following table illustrates the percentages of utilisation sought within various threshold travel
times for TPU Group 941-943 in 2015/16. For example, the percentages of utilisation sought within 20
minutes of travel time are 47% for PHC and 0% for other services (bolded in green).
Core Service Percentage of Utilisation* sought within Certain Travel Time in 2015/16 Total
Utilisation <10 min < 20 min < 30 min <40 min
Acute IP - - - 54% 32
Non-acute IP - - - 92% 17
SOP - - - 10% 62
PHC 47% 47% 47% 71% 128
A&E - - - 77% 34
AHOP - - - 76% 23
* In terms of BDO for Acute IP and Non-acute IP, and in terms of attendances for SOP, PHC, A&E and AHOP #
Assuming the re-delineated Cluster boundary between KCC and KWC
TPU Group: 941-943
District: Lantau Island
Corresponding Cluster: Kowloon West Cluster
Population in 2015: 1,100
TPU Group 941-943 (highlighted on the map) is located
in the Lantau Island district, with its corresponding
Cluster being the Kowloon West Cluster.

Appendix I: Accessibility Statistics by Locality Page | 223
Cluster Concordance Analysis
The patronage pattern in 2015/16 for residents in TPU Group 950 & 951 is presented below. The
Cluster concordance rates (bolded in green) range from 74% for SOP to 96% for A&E.
Core Service Percentage of Utilisation* sought in Cluster# in 2015/16 Total
Utilisation HKEC HKWC KCC KEC KWC NTEC NTWC Total %
Acute IP 1% 8% 6% 1% 81% 2% 1% 100% 46,639
Non-acute IP 5% 2% 10% - 79% 3% 2% 100% 18,039
SOP 3% 9% 8% 1% 74% 3% 2% 100% 70,270
PHC 2% 1% 3% 1% 92% 1% 1% 100% 67,396
A&E 1% 1% 1% - 96% 1% 1% 100% 75,852
AHOP 2% 3% 6% - 86% 2% 1% 100% 35,445
Travel Time Analysis
The following table illustrates the percentages of utilisation sought within various threshold travel
times for TPU Group 950 & 951 in 2015/16. For example, the percentages of utilisation sought within
20 minutes of travel time range from 11% for SOP to 93% for A&E (bolded in green).
Core Service Percentage of Utilisation* sought within Certain Travel Time in 2015/16 Total
Utilisation <10 min < 20 min < 30 min <40 min
Acute IP 12% 12% 87% 99% 46,639
Non-acute IP 19% 19% 87% 94% 18,039
SOP 11% 11% 81% 98% 70,270
PHC 85% 85% 94% 99% 67,396
A&E 93% 93% 98% 100% 75,852
AHOP 68% 68% 91% 99% 35,445
* In terms of BDO for Acute IP and Non-acute IP, and in terms of attendances for SOP, PHC, A&E and AHOP #
Assuming the re-delineated Cluster boundary between KCC and KWC
TPU Group: 950 & 951
District: Lantau Island
Corresponding Cluster: Kowloon West Cluster
Population in 2015: 83,100
TPU Group 950 & 951 (highlighted on the map) is
located in the Lantau Island district, with its
corresponding Cluster being the Kowloon West Cluster.

Appendix I: Accessibility Statistics by Locality Page | 224
Cluster Concordance Analysis
The patronage pattern in 2015/16 for residents in TPU Group 961 & 962 is presented below. The
Cluster concordance rates (bolded in green) range from 16% for SOP to 96% for PHC.
Core Service Percentage of Utilisation* sought in Cluster# in 2015/16 Total
Utilisation HKEC HKWC KCC KEC KWC NTEC NTWC Total %
Acute IP 3% 37% - - 59% 1% - 100% 3,322
Non-acute IP 37% 19% 5% - 37% 2% - 100% 1,416
SOP 7% 73% 2% 1% 16% 1% - 100% 3,917
PHC 2% 1% - - 96% - - 100% 11,479
A&E 7% 12% 1% 1% 77% 2% - 100% 1,257
AHOP 19% 38% 1% 1% 40% 1% - 100% 1,262
Travel Time Analysis
The following table illustrates the percentages of utilisation sought within various threshold travel
times for TPU Group 961 & 962 in 2015/16. For example, the percentages of utilisation sought within
20 minutes of travel time are 94% for PHC and 0% for other services (bolded in green).
Core Service Percentage of Utilisation* sought within Certain Travel Time in 2015/16 Total
Utilisation <10 min < 20 min < 30 min <40 min
Acute IP - - - 14% 3,322
Non-acute IP - - - 27% 1,416
SOP - - - 3% 3,917
PHC - 94% 94% 95% 11,479
A&E - - - 73% 1,257
AHOP - - - 33% 1,262
* In terms of BDO for Acute IP and Non-acute IP, and in terms of attendances for SOP, PHC, A&E and AHOP #
Assuming the re-delineated Cluster boundary between KCC and KWC
TPU Group: 961 & 962
District: Lantau Island
Corresponding Cluster: Kowloon West Cluster
Population in 2015: 6,000
TPU Group 961 & 962 (highlighted on the map) is
located in the Lantau Island district, with its
corresponding Cluster being the Kowloon West Cluster.
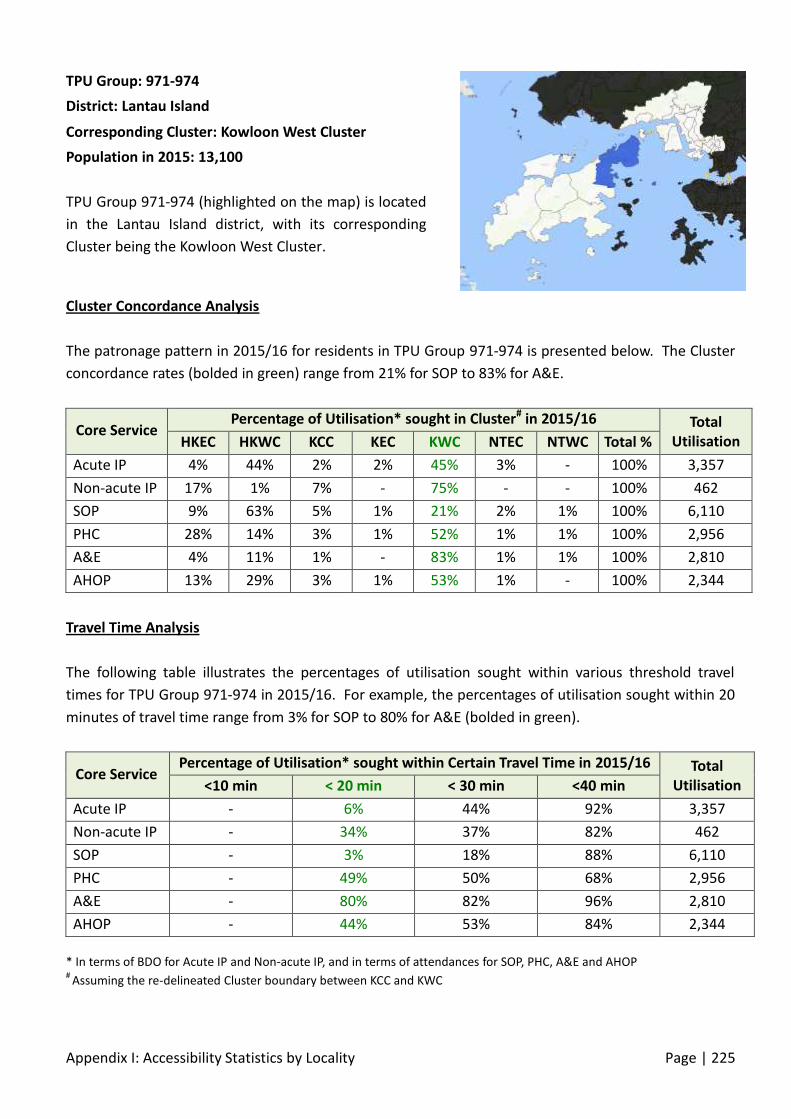
Appendix I: Accessibility Statistics by Locality Page | 225
Cluster Concordance Analysis
The patronage pattern in 2015/16 for residents in TPU Group 971-974 is presented below. The Cluster
concordance rates (bolded in green) range from 21% for SOP to 83% for A&E.
Core Service Percentage of Utilisation* sought in Cluster# in 2015/16 Total
Utilisation HKEC HKWC KCC KEC KWC NTEC NTWC Total %
Acute IP 4% 44% 2% 2% 45% 3% - 100% 3,357
Non-acute IP 17% 1% 7% - 75% - - 100% 462
SOP 9% 63% 5% 1% 21% 2% 1% 100% 6,110
PHC 28% 14% 3% 1% 52% 1% 1% 100% 2,956
A&E 4% 11% 1% - 83% 1% 1% 100% 2,810
AHOP 13% 29% 3% 1% 53% 1% - 100% 2,344
Travel Time Analysis
The following table illustrates the percentages of utilisation sought within various threshold travel
times for TPU Group 971-974 in 2015/16. For example, the percentages of utilisation sought within 20
minutes of travel time range from 3% for SOP to 80% for A&E (bolded in green).
Core Service Percentage of Utilisation* sought within Certain Travel Time in 2015/16 Total
Utilisation <10 min < 20 min < 30 min <40 min
Acute IP - 6% 44% 92% 3,357
Non-acute IP - 34% 37% 82% 462
SOP - 3% 18% 88% 6,110
PHC - 49% 50% 68% 2,956
A&E - 80% 82% 96% 2,810
AHOP - 44% 53% 84% 2,344
* In terms of BDO for Acute IP and Non-acute IP, and in terms of attendances for SOP, PHC, A&E and AHOP #
Assuming the re-delineated Cluster boundary between KCC and KWC
TPU Group: 971-974
District: Lantau Island
Corresponding Cluster: Kowloon West Cluster
Population in 2015: 13,100
TPU Group 971-974 (highlighted on the map) is located
in the Lantau Island district, with its corresponding
Cluster being the Kowloon West Cluster.

Appendix I: Accessibility Statistics by Locality Page | 226
Cluster Concordance Analysis
The patronage pattern in 2015/16 for residents in TPU Group 260 is presented below. The Cluster
concordance rates (bolded in green) range from 62% for AHOP to 85% for A&E.
Core Service Percentage of Utilisation* sought in Cluster# in 2015/16 Total
Utilisation HKEC HKWC KCC KEC KWC NTEC NTWC Total %
Acute IP 1% 5% 15% 1% 74% 4% 1% 100% 23,580
Non-acute IP 7% - 11% - 76% 6% - 100% 9,938
SOP 2% 5% 19% 1% 70% 3% 1% 100% 44,458
PHC 2% 2% 19% 2% 73% 2% 1% 100% 22,988
A&E 2% 1% 8% 1% 85% 2% 2% 100% 8,734
AHOP 2% 3% 30% 1% 62% 1% 2% 100% 13,460
Travel Time Analysis
The following table illustrates the percentages of utilisation sought within various threshold travel
times for TPU Group 260 in 2015/16. For example, the percentages of utilisation sought within 20
minutes of travel time range from 86% for Non-acute IP to 93% for PHC (bolded in green).
Core Service Percentage of Utilisation* sought within Certain Travel Time in 2015/16 Total
Utilisation <10 min < 20 min < 30 min <40 min
Acute IP 67% 92% 99% 100% 23,580
Non-acute IP 46% 86% 100% 100% 9,938
SOP 43% 88% 99% 100% 44,458
PHC - 93% 99% 100% 22,988
A&E 70% 92% 98% 100% 8,734
AHOP 40% 91% 98% 100% 13,460
* In terms of BDO for Acute IP and Non-acute IP, and in terms of attendances for SOP, PHC, A&E and AHOP #
Assuming the re-delineated Cluster boundary between KCC and KWC
TPU Group: 260
District: Sham Shui Po
Corresponding Cluster: Kowloon West Cluster
Population in 2015: 46,400
TPU Group 260 (highlighted on the map) is located in
the Sham Shui Po district, with its corresponding
Cluster being the Kowloon West Cluster.

Appendix I: Accessibility Statistics by Locality Page | 227
Cluster Concordance Analysis
The patronage pattern in 2015/16 for residents in TPU Group 261 is presented below. The Cluster
concordance rates (bolded in green) range from 64% for Non-acute IP to 90% for A&E.
Core Service Percentage of Utilisation* sought in Cluster# in 2015/16 Total
Utilisation HKEC HKWC KCC KEC KWC NTEC NTWC Total %
Acute IP 1% 4% 20% - 73% 1% - 100% 8,389
Non-acute IP 8% - 21% - 64% 5% 2% 100% 4,908
SOP 1% 3% 17% 1% 75% 2% 1% 100% 8,687
PHC 1% 1% 9% 1% 86% 1% 1% 100% 5,880
A&E 1% 1% 6% 1% 90% 1% 1% 100% 4,565
AHOP 2% 5% 20% 1% 71% 1% 1% 100% 2,837
Travel Time Analysis
The following table illustrates the percentages of utilisation sought within various threshold travel
times for TPU Group 261 in 2015/16. For example, the percentages of utilisation sought within 20
minutes of travel time range from 85% for Non-acute IP to 97% for PHC (bolded in green).
Core Service Percentage of Utilisation* sought within Certain Travel Time in 2015/16 Total
Utilisation <10 min < 20 min < 30 min <40 min
Acute IP 79% 95% 100% 100% 8,389
Non-acute IP 55% 85% 98% 100% 4,908
SOP 64% 94% 99% 100% 8,687
PHC 85% 97% 100% 100% 5,880
A&E 88% 96% 99% 100% 4,565
AHOP 63% 92% 100% 100% 2,837
* In terms of BDO for Acute IP and Non-acute IP, and in terms of attendances for SOP, PHC, A&E and AHOP #
Assuming the re-delineated Cluster boundary between KCC and KWC
TPU Group: 261
District: Sham Shui Po
Corresponding Cluster: Kowloon West Cluster
Population in 2015: 10,700
TPU Group 261 (highlighted on the map) is located in
the Sham Shui Po district, with its corresponding
Cluster being the Kowloon West Cluster.

Appendix I: Accessibility Statistics by Locality Page | 228
Cluster Concordance Analysis
The patronage pattern in 2015/16 for residents in TPU Group 262 is presented below. The Cluster
concordance rates (bolded in green) range from 69% for AHOP to 90% for PHC.
Core Service Percentage of Utilisation* sought in Cluster# in 2015/16 Total
Utilisation HKEC HKWC KCC KEC KWC NTEC NTWC Total %
Acute IP - 4% 22% - 71% 2% - 100% 17,047
Non-acute IP - - 16% - 84% - - 100% 8,046
SOP 1% 3% 18% 1% 76% 2% 1% 100% 28,187
PHC 1% - 7% 1% 90% 1% - 100% 21,256
A&E 1% 1% 9% 1% 86% 2% 1% 100% 7,510
AHOP 1% 3% 24% 1% 69% 2% 1% 100% 7,872
Travel Time Analysis
The following table illustrates the percentages of utilisation sought within various threshold travel
times for TPU Group 262 in 2015/16. For example, the percentages of utilisation sought within 20
minutes of travel time range from 95% for A&E to 100% for Non-acute IP (bolded in green).
Core Service Percentage of Utilisation* sought within Certain Travel Time in 2015/16 Total
Utilisation <10 min < 20 min < 30 min <40 min
Acute IP 71% 96% 100% 100% 17,047
Non-acute IP 84% 100% 100% 100% 8,046
SOP 76% 95% 100% 100% 28,187
PHC 14% 98% 100% 100% 21,256
A&E 85% 95% 100% 100% 7,510
AHOP 70% 96% 100% 100% 7,872
* In terms of BDO for Acute IP and Non-acute IP, and in terms of attendances for SOP, PHC, A&E and AHOP #
Assuming the re-delineated Cluster boundary between KCC and KWC
TPU Group: 262
District: Sham Shui Po
Corresponding Cluster: Kowloon West Cluster
Population in 2015: 17,400
TPU Group 262 (highlighted on the map) is located in
the Sham Shui Po district, with its corresponding
Cluster being the Kowloon West Cluster.
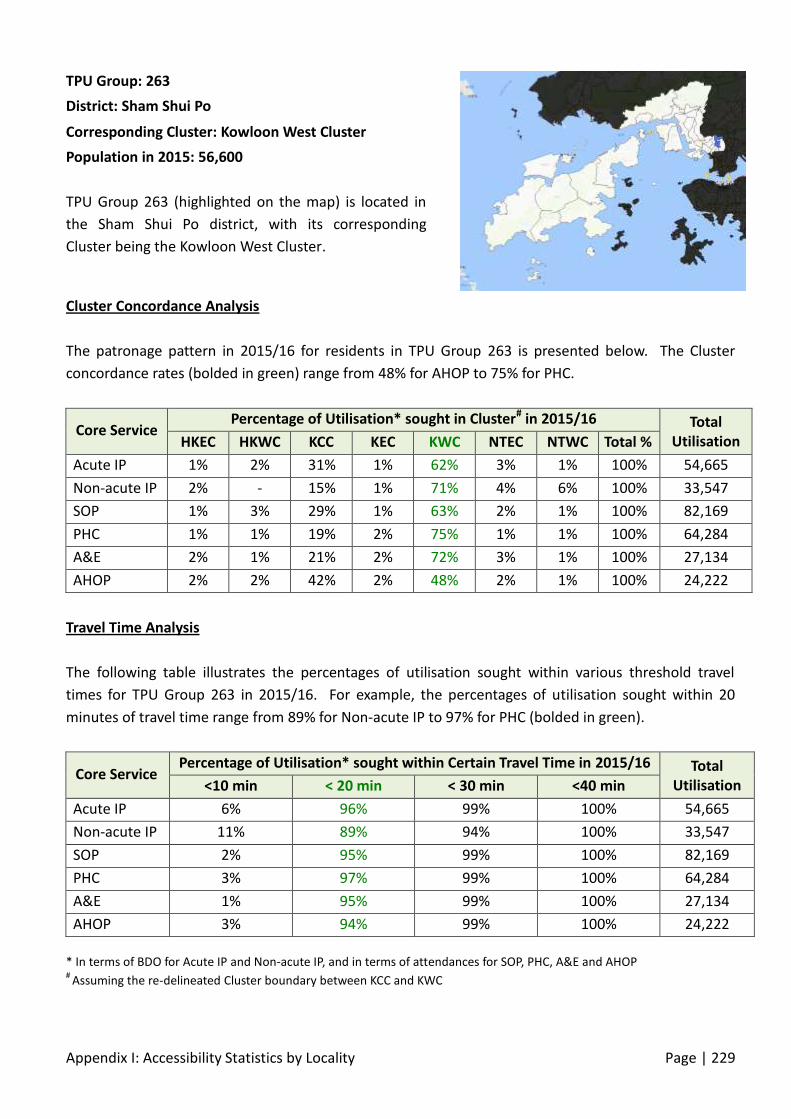
Appendix I: Accessibility Statistics by Locality Page | 229
Cluster Concordance Analysis
The patronage pattern in 2015/16 for residents in TPU Group 263 is presented below. The Cluster
concordance rates (bolded in green) range from 48% for AHOP to 75% for PHC.
Core Service Percentage of Utilisation* sought in Cluster# in 2015/16 Total
Utilisation HKEC HKWC KCC KEC KWC NTEC NTWC Total %
Acute IP 1% 2% 31% 1% 62% 3% 1% 100% 54,665
Non-acute IP 2% - 15% 1% 71% 4% 6% 100% 33,547
SOP 1% 3% 29% 1% 63% 2% 1% 100% 82,169
PHC 1% 1% 19% 2% 75% 1% 1% 100% 64,284
A&E 2% 1% 21% 2% 72% 3% 1% 100% 27,134
AHOP 2% 2% 42% 2% 48% 2% 1% 100% 24,222
Travel Time Analysis
The following table illustrates the percentages of utilisation sought within various threshold travel
times for TPU Group 263 in 2015/16. For example, the percentages of utilisation sought within 20
minutes of travel time range from 89% for Non-acute IP to 97% for PHC (bolded in green).
Core Service Percentage of Utilisation* sought within Certain Travel Time in 2015/16 Total
Utilisation <10 min < 20 min < 30 min <40 min
Acute IP 6% 96% 99% 100% 54,665
Non-acute IP 11% 89% 94% 100% 33,547
SOP 2% 95% 99% 100% 82,169
PHC 3% 97% 99% 100% 64,284
A&E 1% 95% 99% 100% 27,134
AHOP 3% 94% 99% 100% 24,222
* In terms of BDO for Acute IP and Non-acute IP, and in terms of attendances for SOP, PHC, A&E and AHOP #
Assuming the re-delineated Cluster boundary between KCC and KWC
TPU Group: 263
District: Sham Shui Po
Corresponding Cluster: Kowloon West Cluster
Population in 2015: 56,600
TPU Group 263 (highlighted on the map) is located in
the Sham Shui Po district, with its corresponding
Cluster being the Kowloon West Cluster.
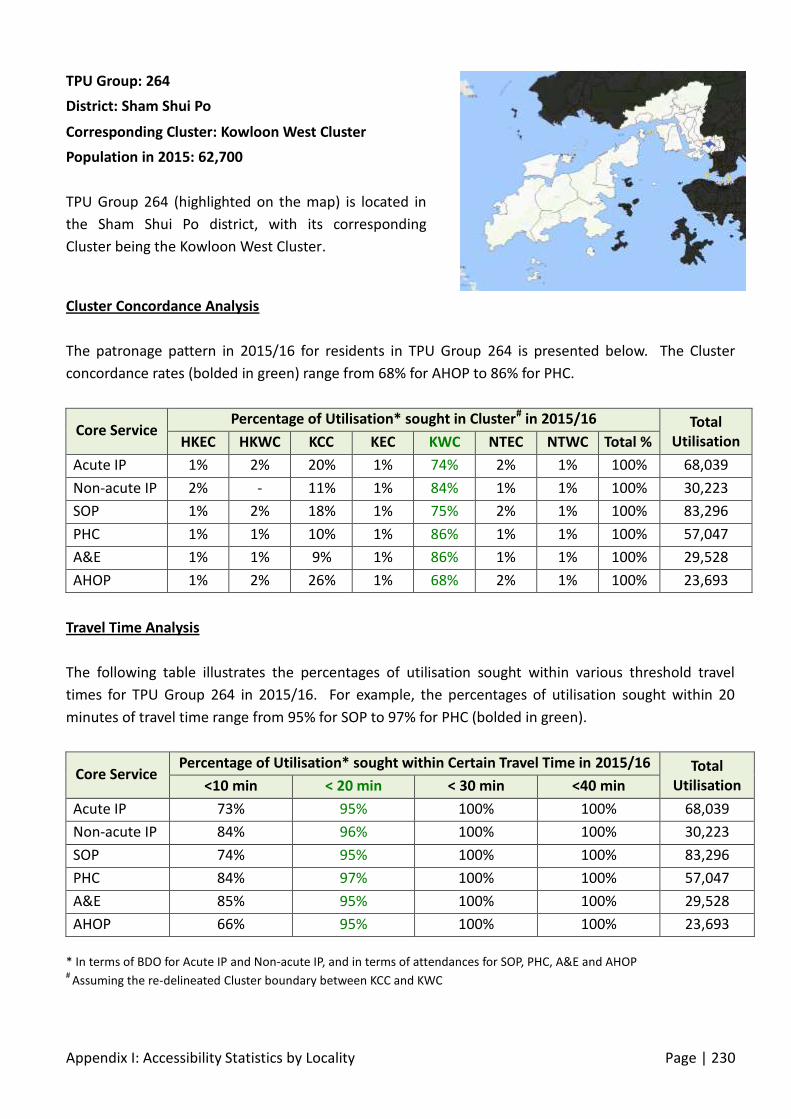
Appendix I: Accessibility Statistics by Locality Page | 230
Cluster Concordance Analysis
The patronage pattern in 2015/16 for residents in TPU Group 264 is presented below. The Cluster
concordance rates (bolded in green) range from 68% for AHOP to 86% for PHC.
Core Service Percentage of Utilisation* sought in Cluster# in 2015/16 Total
Utilisation HKEC HKWC KCC KEC KWC NTEC NTWC Total %
Acute IP 1% 2% 20% 1% 74% 2% 1% 100% 68,039
Non-acute IP 2% - 11% 1% 84% 1% 1% 100% 30,223
SOP 1% 2% 18% 1% 75% 2% 1% 100% 83,296
PHC 1% 1% 10% 1% 86% 1% 1% 100% 57,047
A&E 1% 1% 9% 1% 86% 1% 1% 100% 29,528
AHOP 1% 2% 26% 1% 68% 2% 1% 100% 23,693
Travel Time Analysis
The following table illustrates the percentages of utilisation sought within various threshold travel
times for TPU Group 264 in 2015/16. For example, the percentages of utilisation sought within 20
minutes of travel time range from 95% for SOP to 97% for PHC (bolded in green).
Core Service Percentage of Utilisation* sought within Certain Travel Time in 2015/16 Total
Utilisation <10 min < 20 min < 30 min <40 min
Acute IP 73% 95% 100% 100% 68,039
Non-acute IP 84% 96% 100% 100% 30,223
SOP 74% 95% 100% 100% 83,296
PHC 84% 97% 100% 100% 57,047
A&E 85% 95% 100% 100% 29,528
AHOP 66% 95% 100% 100% 23,693
* In terms of BDO for Acute IP and Non-acute IP, and in terms of attendances for SOP, PHC, A&E and AHOP #
Assuming the re-delineated Cluster boundary between KCC and KWC
TPU Group: 264
District: Sham Shui Po
Corresponding Cluster: Kowloon West Cluster
Population in 2015: 62,700
TPU Group 264 (highlighted on the map) is located in
the Sham Shui Po district, with its corresponding
Cluster being the Kowloon West Cluster.
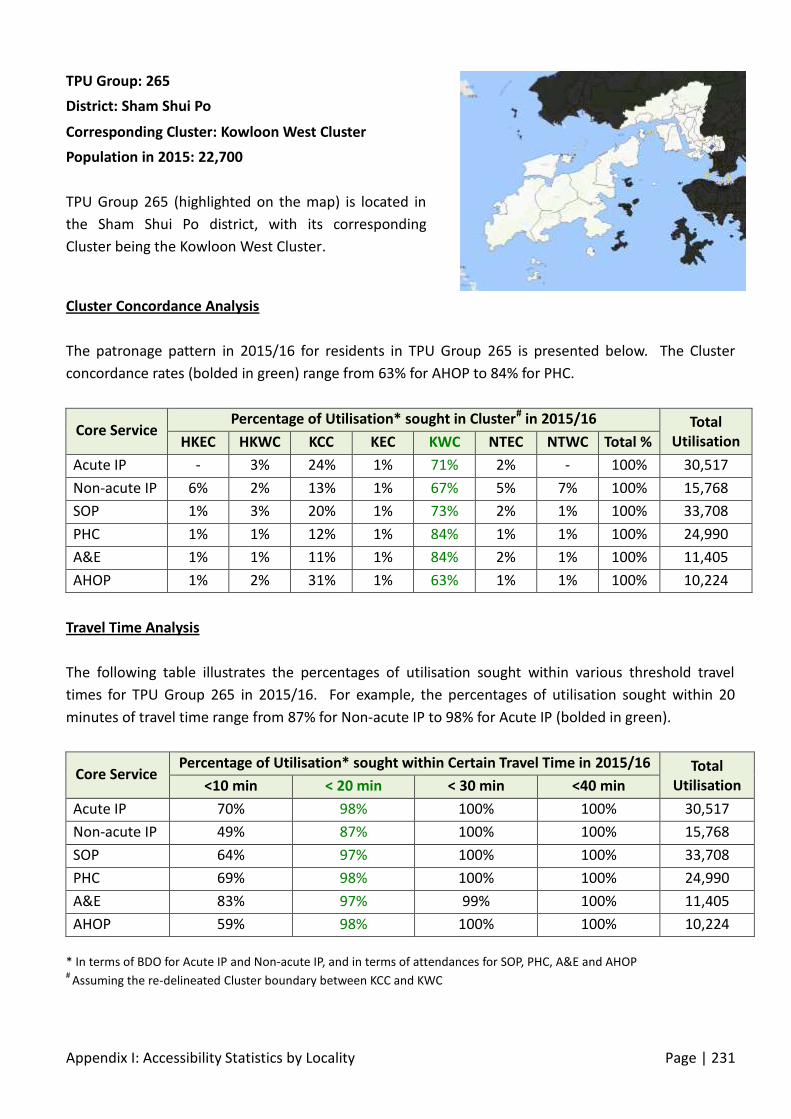
Appendix I: Accessibility Statistics by Locality Page | 231
Cluster Concordance Analysis
The patronage pattern in 2015/16 for residents in TPU Group 265 is presented below. The Cluster
concordance rates (bolded in green) range from 63% for AHOP to 84% for PHC.
Core Service Percentage of Utilisation* sought in Cluster# in 2015/16 Total
Utilisation HKEC HKWC KCC KEC KWC NTEC NTWC Total %
Acute IP - 3% 24% 1% 71% 2% - 100% 30,517
Non-acute IP 6% 2% 13% 1% 67% 5% 7% 100% 15,768
SOP 1% 3% 20% 1% 73% 2% 1% 100% 33,708
PHC 1% 1% 12% 1% 84% 1% 1% 100% 24,990
A&E 1% 1% 11% 1% 84% 2% 1% 100% 11,405
AHOP 1% 2% 31% 1% 63% 1% 1% 100% 10,224
Travel Time Analysis
The following table illustrates the percentages of utilisation sought within various threshold travel
times for TPU Group 265 in 2015/16. For example, the percentages of utilisation sought within 20
minutes of travel time range from 87% for Non-acute IP to 98% for Acute IP (bolded in green).
Core Service Percentage of Utilisation* sought within Certain Travel Time in 2015/16 Total
Utilisation <10 min < 20 min < 30 min <40 min
Acute IP 70% 98% 100% 100% 30,517
Non-acute IP 49% 87% 100% 100% 15,768
SOP 64% 97% 100% 100% 33,708
PHC 69% 98% 100% 100% 24,990
A&E 83% 97% 99% 100% 11,405
AHOP 59% 98% 100% 100% 10,224
* In terms of BDO for Acute IP and Non-acute IP, and in terms of attendances for SOP, PHC, A&E and AHOP #
Assuming the re-delineated Cluster boundary between KCC and KWC
TPU Group: 265
District: Sham Shui Po
Corresponding Cluster: Kowloon West Cluster
Population in 2015: 22,700
TPU Group 265 (highlighted on the map) is located in
the Sham Shui Po district, with its corresponding
Cluster being the Kowloon West Cluster.

Appendix I: Accessibility Statistics by Locality Page | 232
Cluster Concordance Analysis
The patronage pattern in 2015/16 for residents in TPU Group 266 is presented below. The Cluster
concordance rates (bolded in green) range from 55% for AHOP to 74% for Non-acute IP.
Core Service Percentage of Utilisation* sought in Cluster# in 2015/16 Total
Utilisation HKEC HKWC KCC KEC KWC NTEC NTWC Total %
Acute IP 1% 2% 33% 2% 60% 2% 1% 100% 35,728
Non-acute IP 3% - 17% 2% 74% 2% 2% 100% 19,430
SOP 1% 2% 31% 1% 62% 2% 1% 100% 42,353
PHC 1% 1% 22% 1% 73% 1% 1% 100% 33,876
A&E 1% 1% 21% 1% 73% 2% 1% 100% 18,697
AHOP 2% 1% 39% 1% 55% 1% 1% 100% 12,937
Travel Time Analysis
The following table illustrates the percentages of utilisation sought within various threshold travel
times for TPU Group 266 in 2015/16. For example, the percentages of utilisation sought within 20
minutes of travel time range from 91% for Non-acute IP to 96% for PHC (bolded in green).
Core Service Percentage of Utilisation* sought within Certain Travel Time in 2015/16 Total
Utilisation <10 min < 20 min < 30 min <40 min
Acute IP - 94% 99% 100% 35,728
Non-acute IP - 91% 98% 100% 19,430
SOP - 94% 99% 100% 42,353
PHC 56% 96% 99% 100% 33,876
A&E - 94% 99% 100% 18,697
AHOP - 94% 99% 100% 12,937
* In terms of BDO for Acute IP and Non-acute IP, and in terms of attendances for SOP, PHC, A&E and AHOP #
Assuming the re-delineated Cluster boundary between KCC and KWC
TPU Group: 266
District: Sham Shui Po
Corresponding Cluster: Kowloon West Cluster
Population in 2015: 51,700
TPU Group 266 (highlighted on the map) is located in
the Sham Shui Po district, with its corresponding
Cluster being the Kowloon West Cluster.
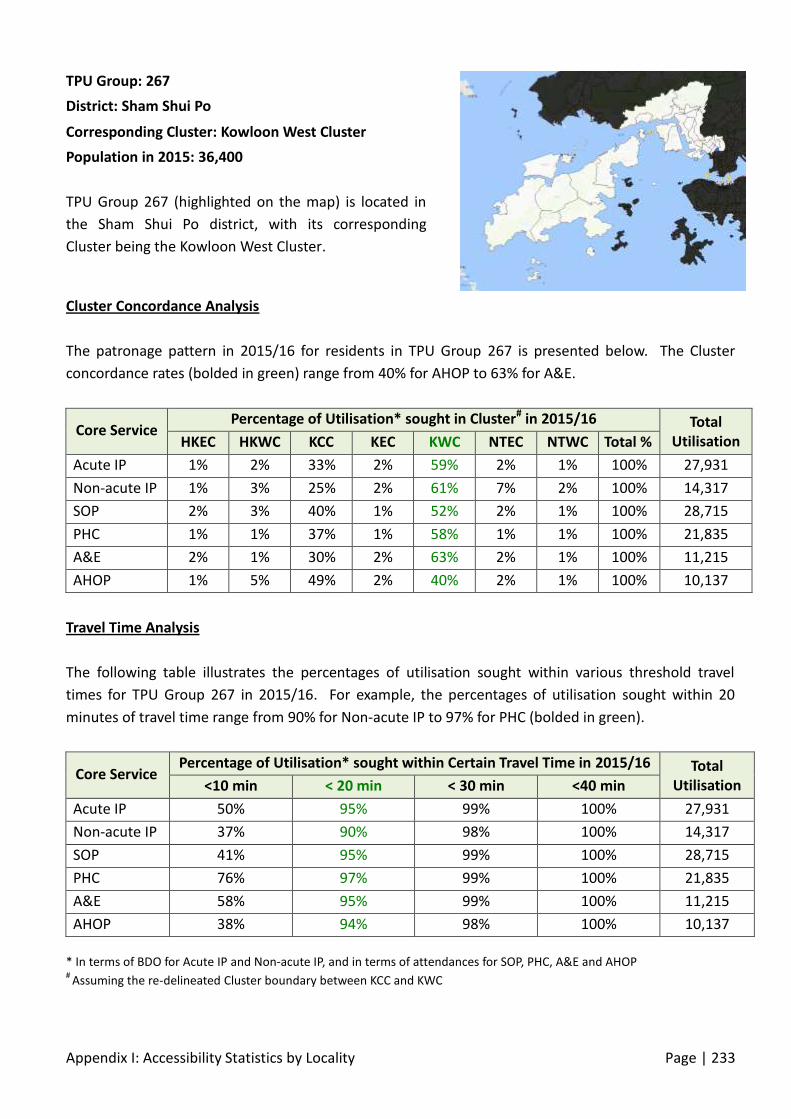
Appendix I: Accessibility Statistics by Locality Page | 233
Cluster Concordance Analysis
The patronage pattern in 2015/16 for residents in TPU Group 267 is presented below. The Cluster
concordance rates (bolded in green) range from 40% for AHOP to 63% for A&E.
Core Service Percentage of Utilisation* sought in Cluster# in 2015/16 Total
Utilisation HKEC HKWC KCC KEC KWC NTEC NTWC Total %
Acute IP 1% 2% 33% 2% 59% 2% 1% 100% 27,931
Non-acute IP 1% 3% 25% 2% 61% 7% 2% 100% 14,317
SOP 2% 3% 40% 1% 52% 2% 1% 100% 28,715
PHC 1% 1% 37% 1% 58% 1% 1% 100% 21,835
A&E 2% 1% 30% 2% 63% 2% 1% 100% 11,215
AHOP 1% 5% 49% 2% 40% 2% 1% 100% 10,137
Travel Time Analysis
The following table illustrates the percentages of utilisation sought within various threshold travel
times for TPU Group 267 in 2015/16. For example, the percentages of utilisation sought within 20
minutes of travel time range from 90% for Non-acute IP to 97% for PHC (bolded in green).
Core Service Percentage of Utilisation* sought within Certain Travel Time in 2015/16 Total
Utilisation <10 min < 20 min < 30 min <40 min
Acute IP 50% 95% 99% 100% 27,931
Non-acute IP 37% 90% 98% 100% 14,317
SOP 41% 95% 99% 100% 28,715
PHC 76% 97% 99% 100% 21,835
A&E 58% 95% 99% 100% 11,215
AHOP 38% 94% 98% 100% 10,137
* In terms of BDO for Acute IP and Non-acute IP, and in terms of attendances for SOP, PHC, A&E and AHOP #
Assuming the re-delineated Cluster boundary between KCC and KWC
TPU Group: 267
District: Sham Shui Po
Corresponding Cluster: Kowloon West Cluster
Population in 2015: 36,400
TPU Group 267 (highlighted on the map) is located in
the Sham Shui Po district, with its corresponding
Cluster being the Kowloon West Cluster.

Appendix I: Accessibility Statistics by Locality Page | 234
Cluster Concordance Analysis
The patronage pattern in 2015/16 for residents in TPU Group 268 is presented below. The Cluster
concordance rates (bolded in green) range from 32% for AHOP to 78% for Non-acute IP.
Core Service Percentage of Utilisation* sought in Cluster# in 2015/16 Total
Utilisation HKEC HKWC KCC KEC KWC NTEC NTWC Total %
Acute IP 1% 3% 33% - 59% 3% - 100% 18,977
Non-acute IP 2% - 17% - 78% 2% - 100% 9,718
SOP 1% 4% 39% 2% 51% 3% 1% 100% 27,452
PHC 1% 1% 21% 2% 75% 1% 1% 100% 21,493
A&E 1% 1% 28% 2% 65% 3% 1% 100% 8,052
AHOP 2% 3% 57% 3% 32% 3% - 100% 8,645
Travel Time Analysis
The following table illustrates the percentages of utilisation sought within various threshold travel
times for TPU Group 268 in 2015/16. For example, the percentages of utilisation sought within 20
minutes of travel time range from 93% for AHOP to 97% for PHC (bolded in green).
Core Service Percentage of Utilisation* sought within Certain Travel Time in 2015/16 Total
Utilisation <10 min < 20 min < 30 min <40 min
Acute IP 1% 94% 99% 100% 18,977
Non-acute IP 8% 95% 100% 100% 9,718
SOP 6% 94% 99% 100% 27,452
PHC 63% 97% 99% 100% 21,493
A&E - 96% 98% 100% 8,052
AHOP 18% 93% 100% 100% 8,645
* In terms of BDO for Acute IP and Non-acute IP, and in terms of attendances for SOP, PHC, A&E and AHOP #
Assuming the re-delineated Cluster boundary between KCC and KWC
TPU Group: 268
District: Sham Shui Po
Corresponding Cluster: Kowloon West Cluster
Population in 2015: 28,600
TPU Group 268 (highlighted on the map) is located in
the Sham Shui Po district, with its corresponding
Cluster being the Kowloon West Cluster.
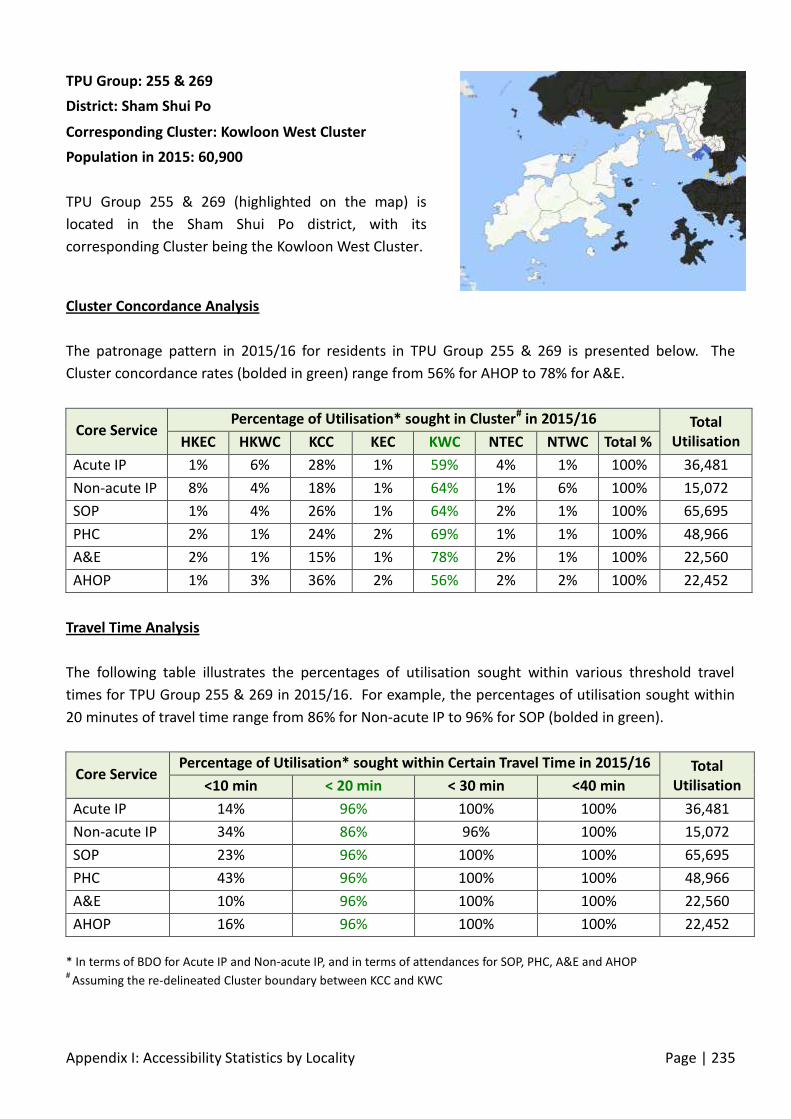
Appendix I: Accessibility Statistics by Locality Page | 235
Cluster Concordance Analysis
The patronage pattern in 2015/16 for residents in TPU Group 255 & 269 is presented below. The
Cluster concordance rates (bolded in green) range from 56% for AHOP to 78% for A&E.
Core Service Percentage of Utilisation* sought in Cluster# in 2015/16 Total
Utilisation HKEC HKWC KCC KEC KWC NTEC NTWC Total %
Acute IP 1% 6% 28% 1% 59% 4% 1% 100% 36,481
Non-acute IP 8% 4% 18% 1% 64% 1% 6% 100% 15,072
SOP 1% 4% 26% 1% 64% 2% 1% 100% 65,695
PHC 2% 1% 24% 2% 69% 1% 1% 100% 48,966
A&E 2% 1% 15% 1% 78% 2% 1% 100% 22,560
AHOP 1% 3% 36% 2% 56% 2% 2% 100% 22,452
Travel Time Analysis
The following table illustrates the percentages of utilisation sought within various threshold travel
times for TPU Group 255 & 269 in 2015/16. For example, the percentages of utilisation sought within
20 minutes of travel time range from 86% for Non-acute IP to 96% for SOP (bolded in green).
Core Service Percentage of Utilisation* sought within Certain Travel Time in 2015/16 Total
Utilisation <10 min < 20 min < 30 min <40 min
Acute IP 14% 96% 100% 100% 36,481
Non-acute IP 34% 86% 96% 100% 15,072
SOP 23% 96% 100% 100% 65,695
PHC 43% 96% 100% 100% 48,966
A&E 10% 96% 100% 100% 22,560
AHOP 16% 96% 100% 100% 22,452
* In terms of BDO for Acute IP and Non-acute IP, and in terms of attendances for SOP, PHC, A&E and AHOP #
Assuming the re-delineated Cluster boundary between KCC and KWC
TPU Group: 255 & 269
District: Sham Shui Po
Corresponding Cluster: Kowloon West Cluster
Population in 2015: 60,900
TPU Group 255 & 269 (highlighted on the map) is
located in the Sham Shui Po district, with its
corresponding Cluster being the Kowloon West Cluster.
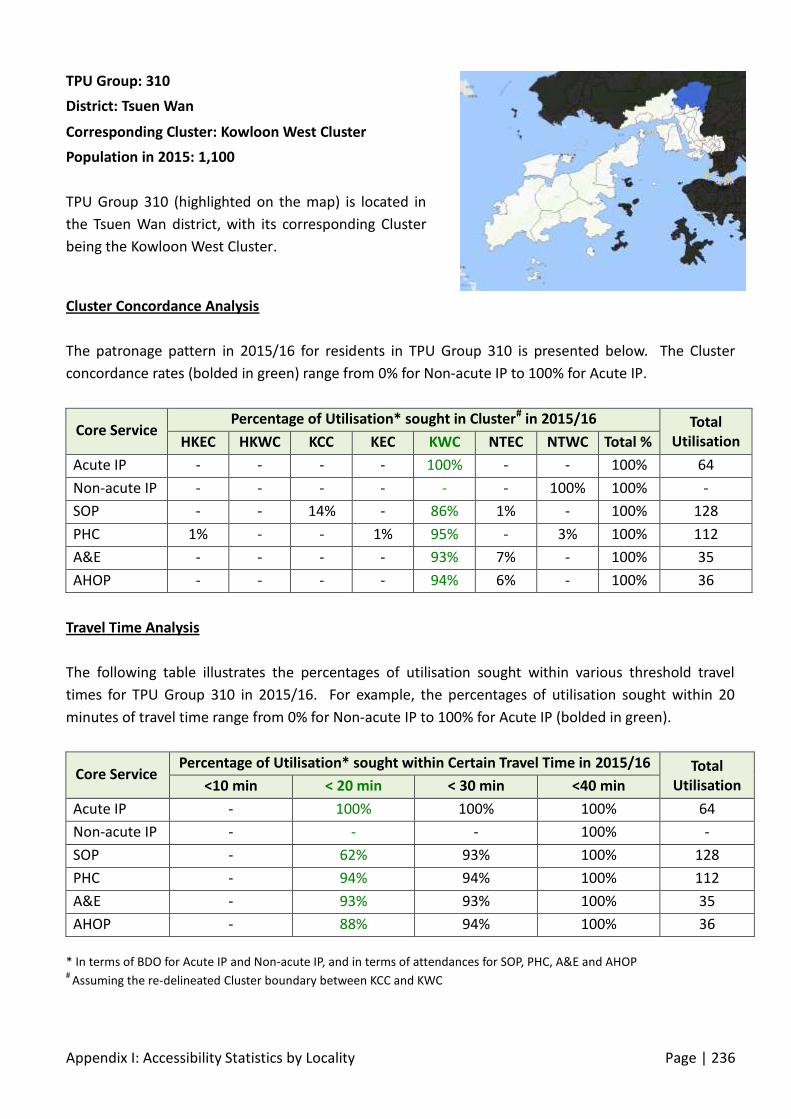
Appendix I: Accessibility Statistics by Locality Page | 236
Cluster Concordance Analysis
The patronage pattern in 2015/16 for residents in TPU Group 310 is presented below. The Cluster
concordance rates (bolded in green) range from 0% for Non-acute IP to 100% for Acute IP.
Core Service Percentage of Utilisation* sought in Cluster# in 2015/16 Total
Utilisation HKEC HKWC KCC KEC KWC NTEC NTWC Total %
Acute IP - - - - 100% - - 100% 64
Non-acute IP - - - - - - 100% 100% -
SOP - - 14% - 86% 1% - 100% 128
PHC 1% - - 1% 95% - 3% 100% 112
A&E - - - - 93% 7% - 100% 35
AHOP - - - - 94% 6% - 100% 36
Travel Time Analysis
The following table illustrates the percentages of utilisation sought within various threshold travel
times for TPU Group 310 in 2015/16. For example, the percentages of utilisation sought within 20
minutes of travel time range from 0% for Non-acute IP to 100% for Acute IP (bolded in green).
Core Service Percentage of Utilisation* sought within Certain Travel Time in 2015/16 Total
Utilisation <10 min < 20 min < 30 min <40 min
Acute IP - 100% 100% 100% 64
Non-acute IP - - - 100% -
SOP - 62% 93% 100% 128
PHC - 94% 94% 100% 112
A&E - 93% 93% 100% 35
AHOP - 88% 94% 100% 36
* In terms of BDO for Acute IP and Non-acute IP, and in terms of attendances for SOP, PHC, A&E and AHOP #
Assuming the re-delineated Cluster boundary between KCC and KWC
TPU Group: 310
District: Tsuen Wan
Corresponding Cluster: Kowloon West Cluster
Population in 2015: 1,100
TPU Group 310 (highlighted on the map) is located in
the Tsuen Wan district, with its corresponding Cluster
being the Kowloon West Cluster.

Appendix I: Accessibility Statistics by Locality Page | 237
Cluster Concordance Analysis
The patronage pattern in 2015/16 for residents in TPU Group 321 is presented below. The Cluster
concordance rates (bolded in green) range from 47% for Non-acute IP to 94% for A&E.
Core Service Percentage of Utilisation* sought in Cluster# in 2015/16 Total
Utilisation HKEC HKWC KCC KEC KWC NTEC NTWC Total %
Acute IP 1% 1% 4% - 93% 1% 1% 100% 5,052
Non-acute IP - - 35% 1% 47% 16% 1% 100% 2,072
SOP 1% 2% 8% 2% 82% 2% 2% 100% 3,772
PHC - 1% 7% 2% 87% 2% 1% 100% 2,563
A&E - - 3% 1% 94% 1% 1% 100% 1,628
AHOP 1% 2% 12% 3% 81% 1% 1% 100% 1,039
Travel Time Analysis
The following table illustrates the percentages of utilisation sought within various threshold travel
times for TPU Group 321 in 2015/16. For example, the percentages of utilisation sought within 20
minutes of travel time range from 56% for Non-acute IP to 94% for A&E (bolded in green).
Core Service Percentage of Utilisation* sought within Certain Travel Time in 2015/16 Total
Utilisation <10 min < 20 min < 30 min <40 min
Acute IP 79% 94% 100% 100% 5,052
Non-acute IP 29% 56% 100% 100% 2,072
SOP 37% 84% 99% 100% 3,772
PHC 76% 90% 99% 99% 2,563
A&E 86% 94% 100% 100% 1,628
AHOP 62% 83% 100% 100% 1,039
* In terms of BDO for Acute IP and Non-acute IP, and in terms of attendances for SOP, PHC, A&E and AHOP #
Assuming the re-delineated Cluster boundary between KCC and KWC
TPU Group: 321
District: Tsuen Wan
Corresponding Cluster: Kowloon West Cluster
Population in 2015: 7,500
TPU Group 321 (highlighted on the map) is located in
the Tsuen Wan district, with its corresponding Cluster
being the Kowloon West Cluster.

Appendix I: Accessibility Statistics by Locality Page | 238
Cluster Concordance Analysis
The patronage pattern in 2015/16 for residents in TPU Group 322 is presented below. The Cluster
concordance rates (bolded in green) range from 60% for Non-acute IP to 89% for Acute IP.
Core Service Percentage of Utilisation* sought in Cluster# in 2015/16 Total
Utilisation HKEC HKWC KCC KEC KWC NTEC NTWC Total %
Acute IP 1% 6% 3% - 89% 1% - 100% 1,426
Non-acute IP 23% - 7% - 60% 11% - 100% 777
SOP 2% 8% 11% 1% 71% 5% 3% 100% 1,643
PHC 2% 2% 9% 1% 82% 3% 3% 100% 816
A&E 1% 2% 4% 1% 89% 3% 2% 100% 499
AHOP 1% 3% 8% - 76% 10% 2% 100% 418
Travel Time Analysis
The following table illustrates the percentages of utilisation sought within various threshold travel
times for TPU Group 322 in 2015/16. For example, the percentages of utilisation sought within 20
minutes of travel time range from 28% for Non-acute IP to 78% for PHC (bolded in green).
Core Service Percentage of Utilisation* sought within Certain Travel Time in 2015/16 Total
Utilisation <10 min < 20 min < 30 min <40 min
Acute IP - 72% 93% 99% 1,426
Non-acute IP - 28% 77% 77% 777
SOP - 36% 83% 99% 1,643
PHC - 78% 92% 100% 816
A&E - 75% 93% 100% 499
AHOP - 38% 92% 100% 418
* In terms of BDO for Acute IP and Non-acute IP, and in terms of attendances for SOP, PHC, A&E and AHOP #
Assuming the re-delineated Cluster boundary between KCC and KWC
TPU Group: 322
District: Tsuen Wan
Corresponding Cluster: Kowloon West Cluster
Population in 2015: 4,100
TPU Group 322 (highlighted on the map) is located in
the Tsuen Wan district, with its corresponding Cluster
being the Kowloon West Cluster.

Appendix I: Accessibility Statistics by Locality Page | 239
Cluster Concordance Analysis
The patronage pattern in 2015/16 for residents in TPU Group 323 is presented below. The Cluster
concordance rates (bolded in green) range from 72% for Non-acute IP to 89% for A&E.
Core Service Percentage of Utilisation* sought in Cluster# in 2015/16 Total
Utilisation HKEC HKWC KCC KEC KWC NTEC NTWC Total %
Acute IP 1% 3% 6% 1% 85% 3% 1% 100% 51,458
Non-acute IP 1% 2% 11% 1% 72% 11% 3% 100% 16,286
SOP 2% 4% 11% 1% 77% 4% 2% 100% 69,938
PHC 2% 1% 6% 1% 87% 2% 2% 100% 44,811
A&E 2% 1% 4% 1% 89% 2% 1% 100% 17,756
AHOP 2% 2% 17% 1% 73% 2% 3% 100% 22,893
Travel Time Analysis
The following table illustrates the percentages of utilisation sought within various threshold travel
times for TPU Group 323 in 2015/16. For example, the percentages of utilisation sought within 20
minutes of travel time range from 73% for Non-acute IP to 92% for PHC (bolded in green).
Core Service Percentage of Utilisation* sought within Certain Travel Time in 2015/16 Total
Utilisation <10 min < 20 min < 30 min <40 min
Acute IP - 87% 99% 100% 51,458
Non-acute IP - 73% 99% 100% 16,286
SOP - 85% 99% 100% 69,938
PHC 49% 92% 99% 100% 44,811
A&E - 90% 99% 100% 17,756
AHOP - 79% 99% 100% 22,893
* In terms of BDO for Acute IP and Non-acute IP, and in terms of attendances for SOP, PHC, A&E and AHOP #
Assuming the re-delineated Cluster boundary between KCC and KWC
TPU Group: 323
District: Tsuen Wan
Corresponding Cluster: Kowloon West Cluster
Population in 2015: 82,500
TPU Group 323 (highlighted on the map) is located in
the Tsuen Wan district, with its corresponding Cluster
being the Kowloon West Cluster.

Appendix I: Accessibility Statistics by Locality Page | 240
Cluster Concordance Analysis
The patronage pattern in 2015/16 for residents in TPU Group 325 is presented below. The Cluster
concordance rates (bolded in green) range from 82% for Non-acute IP to 94% for PHC.
Core Service Percentage of Utilisation* sought in Cluster# in 2015/16 Total
Utilisation HKEC HKWC KCC KEC KWC NTEC NTWC Total %
Acute IP 1% 3% 4% 1% 88% 2% 1% 100% 50,110
Non-acute IP 4% - 10% - 82% 3% 1% 100% 22,720
SOP 1% 2% 5% 1% 87% 3% 1% 100% 69,467
PHC - 1% 3% 1% 94% 1% 1% 100% 65,295
A&E 1% 1% 3% 1% 91% 2% 1% 100% 25,449
AHOP 1% 1% 9% 1% 83% 2% 2% 100% 18,311
Travel Time Analysis
The following table illustrates the percentages of utilisation sought within various threshold travel
times for TPU Group 325 in 2015/16. For example, the percentages of utilisation sought within 20
minutes of travel time range from 87% for Non-acute IP to 97% for PHC (bolded in green).
Core Service Percentage of Utilisation* sought within Certain Travel Time in 2015/16 Total
Utilisation <10 min < 20 min < 30 min <40 min
Acute IP 56% 92% 99% 100% 50,110
Non-acute IP 32% 87% 100% 100% 22,720
SOP 36% 91% 100% 100% 69,467
PHC 91% 97% 100% 100% 65,295
A&E 69% 93% 100% 100% 25,449
AHOP 48% 90% 99% 100% 18,311
* In terms of BDO for Acute IP and Non-acute IP, and in terms of attendances for SOP, PHC, A&E and AHOP #
Assuming the re-delineated Cluster boundary between KCC and KWC
TPU Group: 325
District: Tsuen Wan
Corresponding Cluster: Kowloon West Cluster
Population in 2015: 57,100
TPU Group 325 (highlighted on the map) is located in
the Tsuen Wan district, with its corresponding Cluster
being the Kowloon West Cluster.
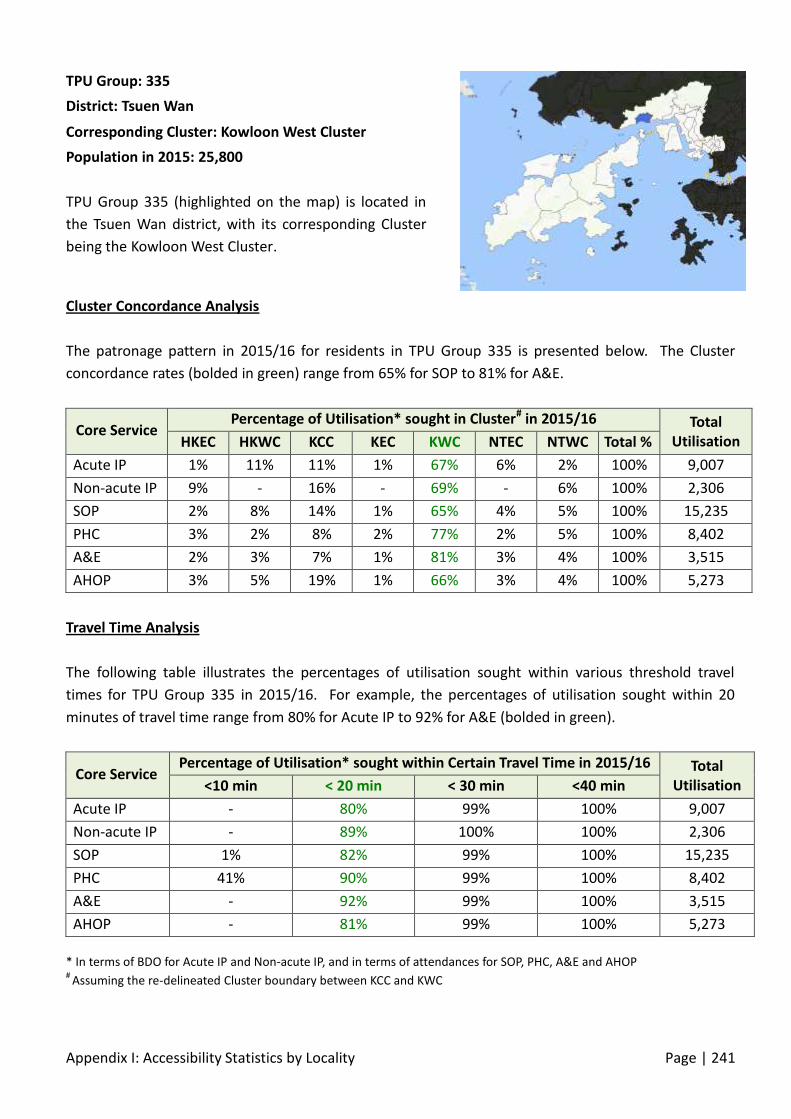
Appendix I: Accessibility Statistics by Locality Page | 241
Cluster Concordance Analysis
The patronage pattern in 2015/16 for residents in TPU Group 335 is presented below. The Cluster
concordance rates (bolded in green) range from 65% for SOP to 81% for A&E.
Core Service Percentage of Utilisation* sought in Cluster# in 2015/16 Total
Utilisation HKEC HKWC KCC KEC KWC NTEC NTWC Total %
Acute IP 1% 11% 11% 1% 67% 6% 2% 100% 9,007
Non-acute IP 9% - 16% - 69% - 6% 100% 2,306
SOP 2% 8% 14% 1% 65% 4% 5% 100% 15,235
PHC 3% 2% 8% 2% 77% 2% 5% 100% 8,402
A&E 2% 3% 7% 1% 81% 3% 4% 100% 3,515
AHOP 3% 5% 19% 1% 66% 3% 4% 100% 5,273
Travel Time Analysis
The following table illustrates the percentages of utilisation sought within various threshold travel
times for TPU Group 335 in 2015/16. For example, the percentages of utilisation sought within 20
minutes of travel time range from 80% for Acute IP to 92% for A&E (bolded in green).
Core Service Percentage of Utilisation* sought within Certain Travel Time in 2015/16 Total
Utilisation <10 min < 20 min < 30 min <40 min
Acute IP - 80% 99% 100% 9,007
Non-acute IP - 89% 100% 100% 2,306
SOP 1% 82% 99% 100% 15,235
PHC 41% 90% 99% 100% 8,402
A&E - 92% 99% 100% 3,515
AHOP - 81% 99% 100% 5,273
* In terms of BDO for Acute IP and Non-acute IP, and in terms of attendances for SOP, PHC, A&E and AHOP #
Assuming the re-delineated Cluster boundary between KCC and KWC
TPU Group: 335
District: Tsuen Wan
Corresponding Cluster: Kowloon West Cluster
Population in 2015: 25,800
TPU Group 335 (highlighted on the map) is located in
the Tsuen Wan district, with its corresponding Cluster
being the Kowloon West Cluster.
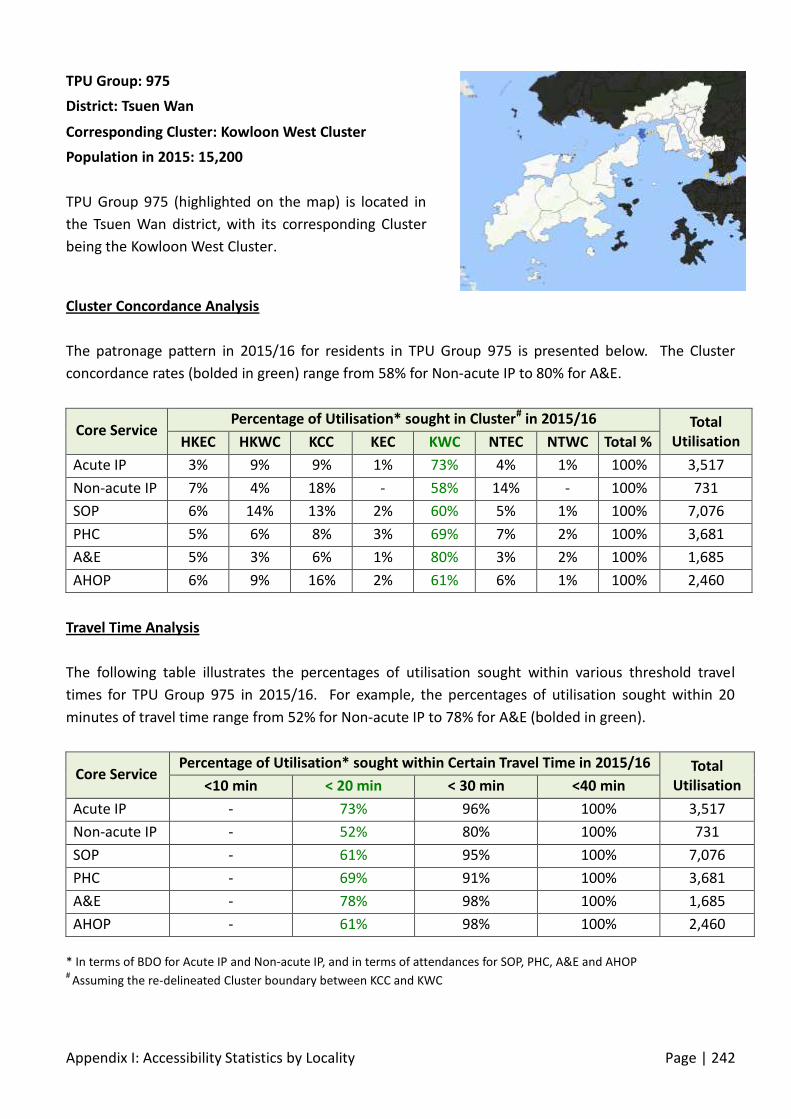
Appendix I: Accessibility Statistics by Locality Page | 242
Cluster Concordance Analysis
The patronage pattern in 2015/16 for residents in TPU Group 975 is presented below. The Cluster
concordance rates (bolded in green) range from 58% for Non-acute IP to 80% for A&E.
Core Service Percentage of Utilisation* sought in Cluster# in 2015/16 Total
Utilisation HKEC HKWC KCC KEC KWC NTEC NTWC Total %
Acute IP 3% 9% 9% 1% 73% 4% 1% 100% 3,517
Non-acute IP 7% 4% 18% - 58% 14% - 100% 731
SOP 6% 14% 13% 2% 60% 5% 1% 100% 7,076
PHC 5% 6% 8% 3% 69% 7% 2% 100% 3,681
A&E 5% 3% 6% 1% 80% 3% 2% 100% 1,685
AHOP 6% 9% 16% 2% 61% 6% 1% 100% 2,460
Travel Time Analysis
The following table illustrates the percentages of utilisation sought within various threshold travel
times for TPU Group 975 in 2015/16. For example, the percentages of utilisation sought within 20
minutes of travel time range from 52% for Non-acute IP to 78% for A&E (bolded in green).
Core Service Percentage of Utilisation* sought within Certain Travel Time in 2015/16 Total
Utilisation <10 min < 20 min < 30 min <40 min
Acute IP - 73% 96% 100% 3,517
Non-acute IP - 52% 80% 100% 731
SOP - 61% 95% 100% 7,076
PHC - 69% 91% 100% 3,681
A&E - 78% 98% 100% 1,685
AHOP - 61% 98% 100% 2,460
* In terms of BDO for Acute IP and Non-acute IP, and in terms of attendances for SOP, PHC, A&E and AHOP #
Assuming the re-delineated Cluster boundary between KCC and KWC
TPU Group: 975
District: Tsuen Wan
Corresponding Cluster: Kowloon West Cluster
Population in 2015: 15,200
TPU Group 975 (highlighted on the map) is located in
the Tsuen Wan district, with its corresponding Cluster
being the Kowloon West Cluster.
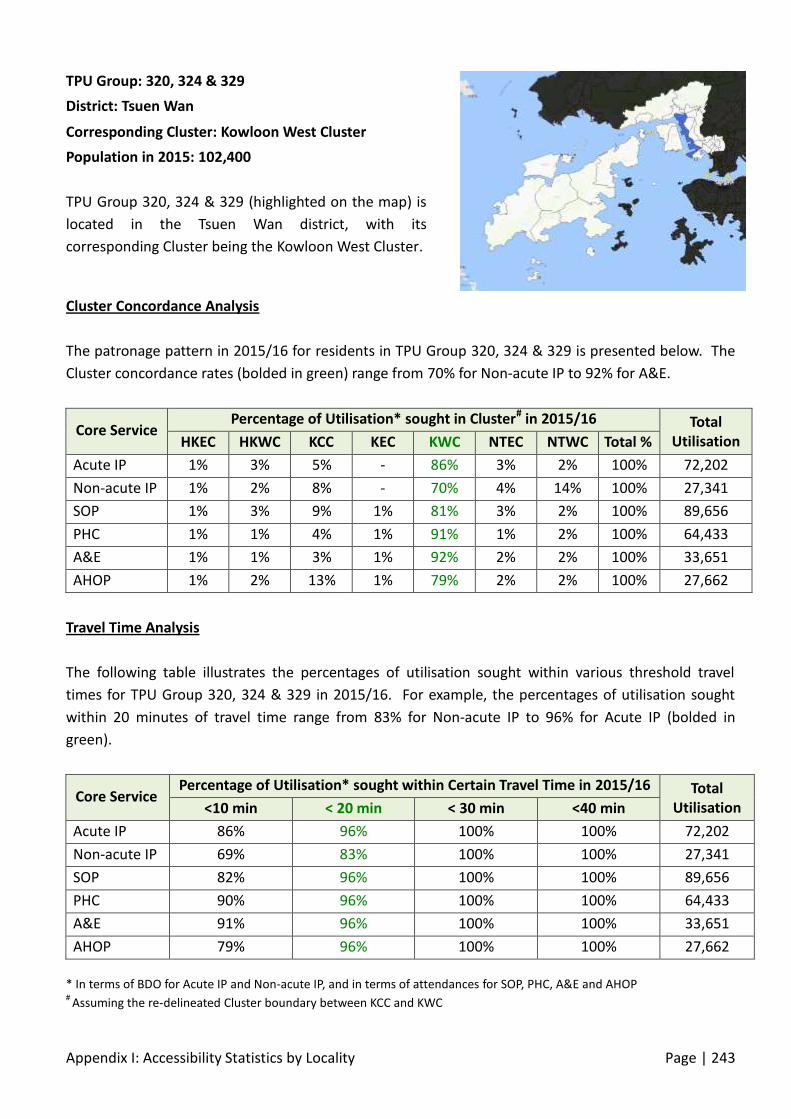
Appendix I: Accessibility Statistics by Locality Page | 243
Cluster Concordance Analysis
The patronage pattern in 2015/16 for residents in TPU Group 320, 324 & 329 is presented below. The
Cluster concordance rates (bolded in green) range from 70% for Non-acute IP to 92% for A&E.
Core Service Percentage of Utilisation* sought in Cluster# in 2015/16 Total
Utilisation HKEC HKWC KCC KEC KWC NTEC NTWC Total %
Acute IP 1% 3% 5% - 86% 3% 2% 100% 72,202
Non-acute IP 1% 2% 8% - 70% 4% 14% 100% 27,341
SOP 1% 3% 9% 1% 81% 3% 2% 100% 89,656
PHC 1% 1% 4% 1% 91% 1% 2% 100% 64,433
A&E 1% 1% 3% 1% 92% 2% 2% 100% 33,651
AHOP 1% 2% 13% 1% 79% 2% 2% 100% 27,662
Travel Time Analysis
The following table illustrates the percentages of utilisation sought within various threshold travel
times for TPU Group 320, 324 & 329 in 2015/16. For example, the percentages of utilisation sought
within 20 minutes of travel time range from 83% for Non-acute IP to 96% for Acute IP (bolded in
green).
Core Service Percentage of Utilisation* sought within Certain Travel Time in 2015/16 Total
Utilisation <10 min < 20 min < 30 min <40 min
Acute IP 86% 96% 100% 100% 72,202
Non-acute IP 69% 83% 100% 100% 27,341
SOP 82% 96% 100% 100% 89,656
PHC 90% 96% 100% 100% 64,433
A&E 91% 96% 100% 100% 33,651
AHOP 79% 96% 100% 100% 27,662
* In terms of BDO for Acute IP and Non-acute IP, and in terms of attendances for SOP, PHC, A&E and AHOP #
Assuming the re-delineated Cluster boundary between KCC and KWC
TPU Group: 320, 324 & 329
District: Tsuen Wan
Corresponding Cluster: Kowloon West Cluster
Population in 2015: 102,400
TPU Group 320, 324 & 329 (highlighted on the map) is
located in the Tsuen Wan district, with its
corresponding Cluster being the Kowloon West Cluster.
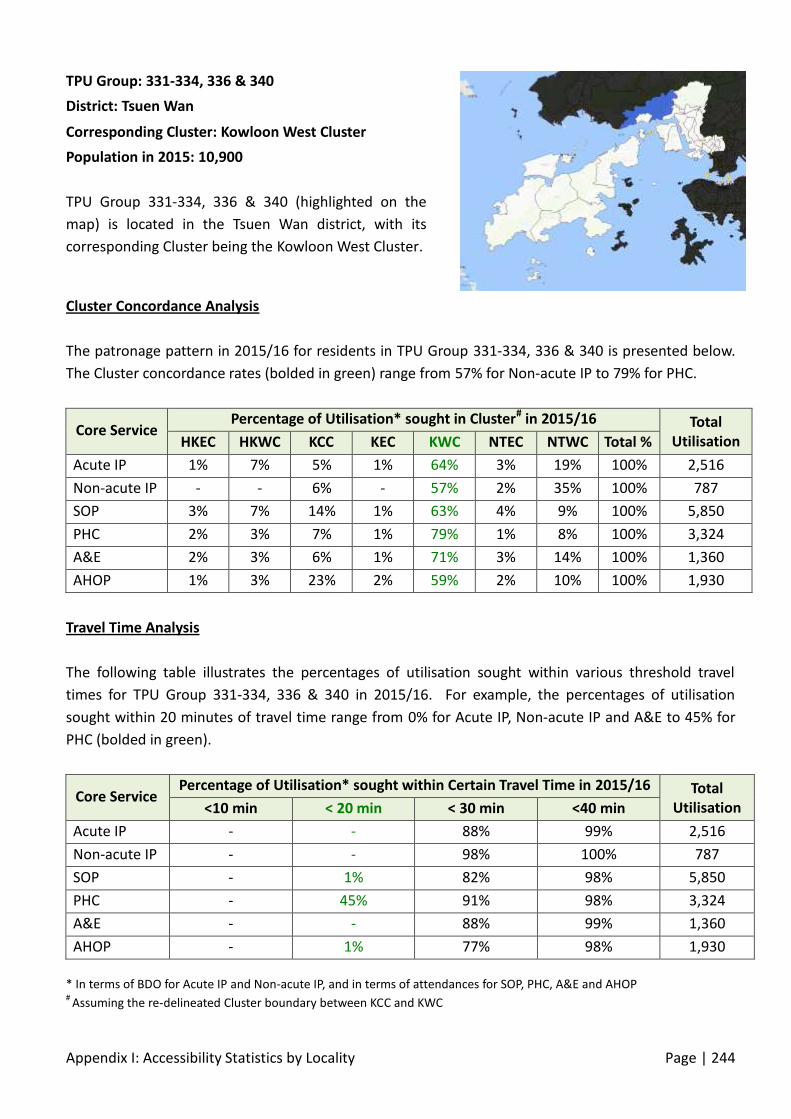
Appendix I: Accessibility Statistics by Locality Page | 244
Cluster Concordance Analysis
The patronage pattern in 2015/16 for residents in TPU Group 331-334, 336 & 340 is presented below.
The Cluster concordance rates (bolded in green) range from 57% for Non-acute IP to 79% for PHC.
Core Service Percentage of Utilisation* sought in Cluster# in 2015/16 Total
Utilisation HKEC HKWC KCC KEC KWC NTEC NTWC Total %
Acute IP 1% 7% 5% 1% 64% 3% 19% 100% 2,516
Non-acute IP - - 6% - 57% 2% 35% 100% 787
SOP 3% 7% 14% 1% 63% 4% 9% 100% 5,850
PHC 2% 3% 7% 1% 79% 1% 8% 100% 3,324
A&E 2% 3% 6% 1% 71% 3% 14% 100% 1,360
AHOP 1% 3% 23% 2% 59% 2% 10% 100% 1,930
Travel Time Analysis
The following table illustrates the percentages of utilisation sought within various threshold travel
times for TPU Group 331-334, 336 & 340 in 2015/16. For example, the percentages of utilisation
sought within 20 minutes of travel time range from 0% for Acute IP, Non-acute IP and A&E to 45% for
PHC (bolded in green).
Core Service Percentage of Utilisation* sought within Certain Travel Time in 2015/16 Total
Utilisation <10 min < 20 min < 30 min <40 min
Acute IP - - 88% 99% 2,516
Non-acute IP - - 98% 100% 787
SOP - 1% 82% 98% 5,850
PHC - 45% 91% 98% 3,324
A&E - - 88% 99% 1,360
AHOP - 1% 77% 98% 1,930
* In terms of BDO for Acute IP and Non-acute IP, and in terms of attendances for SOP, PHC, A&E and AHOP #
Assuming the re-delineated Cluster boundary between KCC and KWC
TPU Group: 331-334, 336 & 340
District: Tsuen Wan
Corresponding Cluster: Kowloon West Cluster
Population in 2015: 10,900
TPU Group 331-334, 336 & 340 (highlighted on the
map) is located in the Tsuen Wan district, with its
corresponding Cluster being the Kowloon West Cluster.
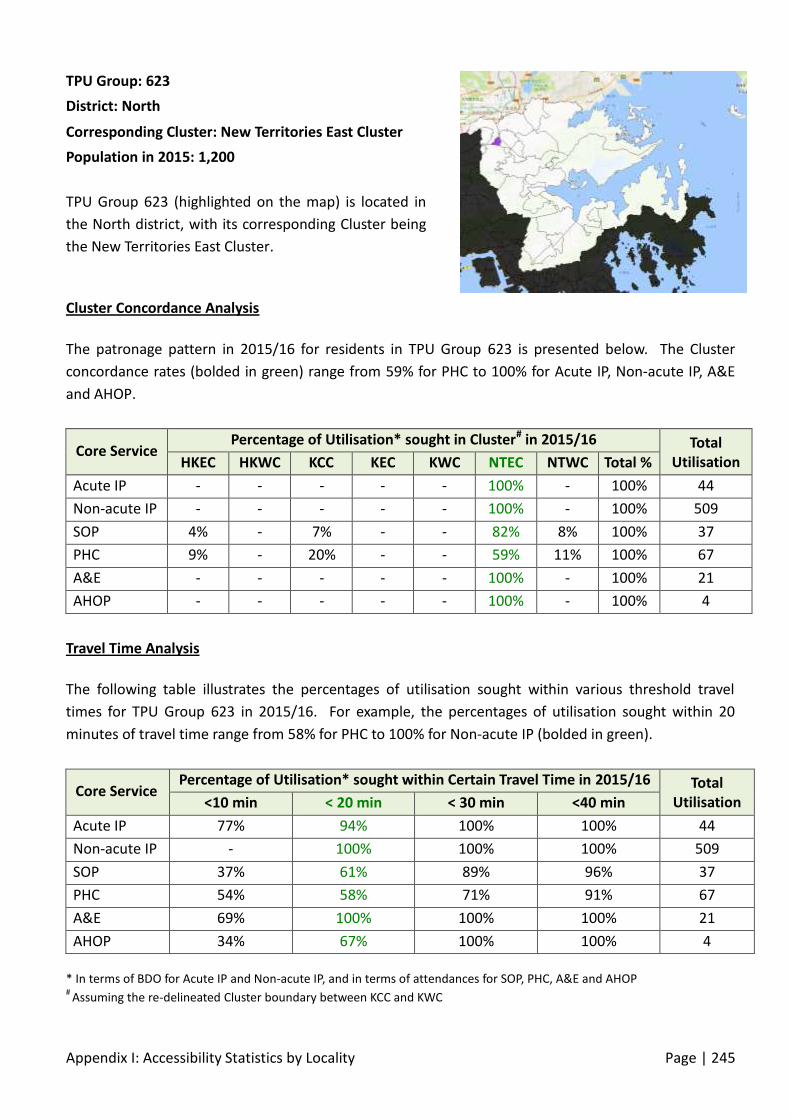
Appendix I: Accessibility Statistics by Locality Page | 245
Cluster Concordance Analysis
The patronage pattern in 2015/16 for residents in TPU Group 623 is presented below. The Cluster
concordance rates (bolded in green) range from 59% for PHC to 100% for Acute IP, Non-acute IP, A&E
and AHOP.
Core Service Percentage of Utilisation* sought in Cluster# in 2015/16 Total
Utilisation HKEC HKWC KCC KEC KWC NTEC NTWC Total %
Acute IP - - - - - 100% - 100% 44
Non-acute IP - - - - - 100% - 100% 509
SOP 4% - 7% - - 82% 8% 100% 37
PHC 9% - 20% - - 59% 11% 100% 67
A&E - - - - - 100% - 100% 21
AHOP - - - - - 100% - 100% 4
Travel Time Analysis
The following table illustrates the percentages of utilisation sought within various threshold travel
times for TPU Group 623 in 2015/16. For example, the percentages of utilisation sought within 20
minutes of travel time range from 58% for PHC to 100% for Non-acute IP (bolded in green).
Core Service Percentage of Utilisation* sought within Certain Travel Time in 2015/16 Total
Utilisation <10 min < 20 min < 30 min <40 min
Acute IP 77% 94% 100% 100% 44
Non-acute IP - 100% 100% 100% 509
SOP 37% 61% 89% 96% 37
PHC 54% 58% 71% 91% 67
A&E 69% 100% 100% 100% 21
AHOP 34% 67% 100% 100% 4
* In terms of BDO for Acute IP and Non-acute IP, and in terms of attendances for SOP, PHC, A&E and AHOP #
Assuming the re-delineated Cluster boundary between KCC and KWC
TPU Group: 623
District: North
Corresponding Cluster: New Territories East Cluster
Population in 2015: 1,200
TPU Group 623 (highlighted on the map) is located in
the North district, with its corresponding Cluster being
the New Territories East Cluster.

Appendix I: Accessibility Statistics by Locality Page | 246
Cluster Concordance Analysis
The patronage pattern in 2015/16 for residents in TPU Group 625 is presented below. The Cluster
concordance rates (bolded in green) range from 86% for AHOP to 94% for PHC.
Core Service Percentage of Utilisation* sought in Cluster# in 2015/16 Total
Utilisation HKEC HKWC KCC KEC KWC NTEC NTWC Total %
Acute IP 1% 2% 3% 1% 1% 91% 1% 100% 38,263
Non-acute IP - - 5% 1% 4% 88% 2% 100% 13,760
SOP 1% 2% 5% 1% 2% 87% 2% 100% 53,133
PHC 1% - 3% 1% 1% 94% 1% 100% 51,117
A&E 1% - 3% 1% 2% 91% 2% 100% 18,323
AHOP 1% 1% 9% 1% 1% 86% 2% 100% 18,107
Travel Time Analysis
The following table illustrates the percentages of utilisation sought within various threshold travel
times for TPU Group 625 in 2015/16. For example, the percentages of utilisation sought within 20
minutes of travel time range from 64% for SOP to 92% for PHC (bolded in green).
Core Service Percentage of Utilisation* sought within Certain Travel Time in 2015/16 Total
Utilisation <10 min < 20 min < 30 min <40 min
Acute IP 53% 65% 93% 98% 38,263
Non-acute IP - 88% 99% 100% 13,760
SOP 43% 64% 92% 98% 53,133
PHC 86% 92% 96% 100% 51,117
A&E 72% 87% 95% 100% 18,323
AHOP 56% 79% 93% 99% 18,107
* In terms of BDO for Acute IP and Non-acute IP, and in terms of attendances for SOP, PHC, A&E and AHOP #
Assuming the re-delineated Cluster boundary between KCC and KWC
TPU Group: 625
District: North
Corresponding Cluster: New Territories East Cluster
Population in 2015: 57,200
TPU Group 625 (highlighted on the map) is located in
the North district, with its corresponding Cluster being
the New Territories East Cluster.

Appendix I: Accessibility Statistics by Locality Page | 247
Cluster Concordance Analysis
The patronage pattern in 2015/16 for residents in TPU Group 626 is presented below. The Cluster
concordance rates (bolded in green) range from 87% for AHOP to 97% for Non-acute IP.
Core Service Percentage of Utilisation* sought in Cluster# in 2015/16 Total
Utilisation HKEC HKWC KCC KEC KWC NTEC NTWC Total %
Acute IP - 1% 3% 1% 1% 93% 2% 100% 22,033
Non-acute IP - 2% 1% 1% - 97% - 100% 11,157
SOP 1% 1% 4% 1% 2% 89% 2% 100% 30,848
PHC 1% - 2% 1% 1% 95% 2% 100% 30,522
A&E 1% - 2% 1% 2% 93% 2% 100% 12,104
AHOP - 1% 8% - 1% 87% 3% 100% 8,972
Travel Time Analysis
The following table illustrates the percentages of utilisation sought within various threshold travel
times for TPU Group 626 in 2015/16. For example, the percentages of utilisation sought within 20
minutes of travel time range from 71% for SOP to 97% for Non-acute IP (bolded in green).
Core Service Percentage of Utilisation* sought within Certain Travel Time in 2015/16 Total
Utilisation <10 min < 20 min < 30 min <40 min
Acute IP 66% 76% 96% 99% 22,033
Non-acute IP - 97% 98% 98% 11,157
SOP 50% 71% 94% 99% 30,848
PHC 91% 94% 97% 100% 30,522
A&E 81% 91% 96% 100% 12,104
AHOP 62% 82% 91% 99% 8,972
* In terms of BDO for Acute IP and Non-acute IP, and in terms of attendances for SOP, PHC, A&E and AHOP #
Assuming the re-delineated Cluster boundary between KCC and KWC
TPU Group: 626
District: North
Corresponding Cluster: New Territories East Cluster
Population in 2015: 24,300
TPU Group 626 (highlighted on the map) is located in
the North district, with its corresponding Cluster being
the New Territories East Cluster.

Appendix I: Accessibility Statistics by Locality Page | 248
Cluster Concordance Analysis
The patronage pattern in 2015/16 for residents in TPU Group 627 is presented below. The Cluster
concordance rates (bolded in green) range from 83% for AHOP to 95% for A&E.
Core Service Percentage of Utilisation* sought in Cluster# in 2015/16 Total
Utilisation HKEC HKWC KCC KEC KWC NTEC NTWC Total %
Acute IP - 2% 3% 1% 1% 91% 2% 100% 28,420
Non-acute IP 2% - 4% 2% 1% 88% 3% 100% 12,672
SOP 1% 2% 4% 1% 1% 89% 3% 100% 35,963
PHC 1% - 2% 1% 1% 94% 2% 100% 31,852
A&E 1% - 1% 1% 1% 95% 1% 100% 19,100
AHOP 1% 1% 12% - 1% 83% 4% 100% 11,368
Travel Time Analysis
The following table illustrates the percentages of utilisation sought within various threshold travel
times for TPU Group 627 in 2015/16. For example, the percentages of utilisation sought within 20
minutes of travel time range from 70% for SOP to 94% for PHC (bolded in green).
Core Service Percentage of Utilisation* sought within Certain Travel Time in 2015/16 Total
Utilisation <10 min < 20 min < 30 min <40 min
Acute IP 60% 71% 94% 98% 28,420
Non-acute IP - 79% 91% 98% 12,672
SOP 47% 70% 92% 98% 35,963
PHC 87% 94% 97% 100% 31,852
A&E 83% 93% 96% 99% 19,100
AHOP 58% 77% 86% 99% 11,368
* In terms of BDO for Acute IP and Non-acute IP, and in terms of attendances for SOP, PHC, A&E and AHOP #
Assuming the re-delineated Cluster boundary between KCC and KWC
TPU Group: 627
District: North
Corresponding Cluster: New Territories East Cluster
Population in 2015: 35,800
TPU Group 627 (highlighted on the map) is located in
the North district, with its corresponding Cluster being
the New Territories East Cluster.

Appendix I: Accessibility Statistics by Locality Page | 249
Cluster Concordance Analysis
The patronage pattern in 2015/16 for residents in TPU Group 628 is presented below. The Cluster
concordance rates (bolded in green) range from 85% for AHOP to 92% for PHC.
Core Service Percentage of Utilisation* sought in Cluster# in 2015/16 Total
Utilisation HKEC HKWC KCC KEC KWC NTEC NTWC Total %
Acute IP 1% 2% 3% 1% 1% 91% 2% 100% 64,999
Non-acute IP 2% 2% 1% 1% - 87% 8% 100% 33,792
SOP 1% 2% 6% 1% 2% 87% 2% 100% 92,041
PHC 1% 1% 3% 1% 1% 92% 1% 100% 86,470
A&E 1% 1% 3% 1% 2% 91% 2% 100% 33,770
AHOP 1% 1% 9% 1% 2% 85% 2% 100% 32,008
Travel Time Analysis
The following table illustrates the percentages of utilisation sought within various threshold travel
times for TPU Group 628 in 2015/16. For example, the percentages of utilisation sought within 20
minutes of travel time range from 65% for SOP to 90% for PHC (bolded in green).
Core Service Percentage of Utilisation* sought within Certain Travel Time in 2015/16 Total
Utilisation <10 min < 20 min < 30 min <40 min
Acute IP 55% 66% 94% 98% 64,999
Non-acute IP - 87% 96% 100% 33,792
SOP 44% 65% 92% 98% 92,041
PHC 84% 90% 95% 99% 86,470
A&E 70% 87% 94% 99% 33,770
AHOP 56% 77% 90% 99% 32,008
* In terms of BDO for Acute IP and Non-acute IP, and in terms of attendances for SOP, PHC, A&E and AHOP #
Assuming the re-delineated Cluster boundary between KCC and KWC
TPU Group: 628
District: North
Corresponding Cluster: New Territories East Cluster
Population in 2015: 88,200
TPU Group 628 (highlighted on the map) is located in
the North district, with its corresponding Cluster being
the New Territories East Cluster.

Appendix I: Accessibility Statistics by Locality Page | 250
Cluster Concordance Analysis
The patronage pattern in 2015/16 for residents in TPU Group 634 is presented below. The Cluster
concordance rates (bolded in green) range from 79% for SOP to 93% for Non-acute IP.
Core Service Percentage of Utilisation* sought in Cluster# in 2015/16 Total
Utilisation HKEC HKWC KCC KEC KWC NTEC NTWC Total %
Acute IP - 1% 4% 2% 2% 92% - 100% 2,384
Non-acute IP - - 6% 1% - 93% - 100% 861
SOP 5% 3% 7% 3% 3% 79% 1% 100% 2,381
PHC 1% 1% 6% 2% 1% 88% 2% 100% 2,212
A&E 1% 1% 3% 1% 2% 91% 1% 100% 1,032
AHOP 3% - 6% 1% 1% 88% 2% 100% 786
Travel Time Analysis
The following table illustrates the percentages of utilisation sought within various threshold travel
times for TPU Group 634 in 2015/16. For example, the percentages of utilisation sought within 20
minutes of travel time range from 0% for Non-acute IP to 83% for PHC (bolded in green).
Core Service Percentage of Utilisation* sought within Certain Travel Time in 2015/16 Total
Utilisation <10 min < 20 min < 30 min <40 min
Acute IP - 56% 92% 95% 2,384
Non-acute IP - - 93% 99% 861
SOP - 35% 79% 86% 2,381
PHC 3% 83% 89% 94% 2,212
A&E - 65% 92% 94% 1,032
AHOP - 53% 89% 92% 786
* In terms of BDO for Acute IP and Non-acute IP, and in terms of attendances for SOP, PHC, A&E and AHOP #
Assuming the re-delineated Cluster boundary between KCC and KWC
TPU Group: 634
District: North
Corresponding Cluster: New Territories East Cluster
Population in 2015: 16,400
TPU Group 634 (highlighted on the map) is located in
the North district, with its corresponding Cluster being
the New Territories East Cluster.
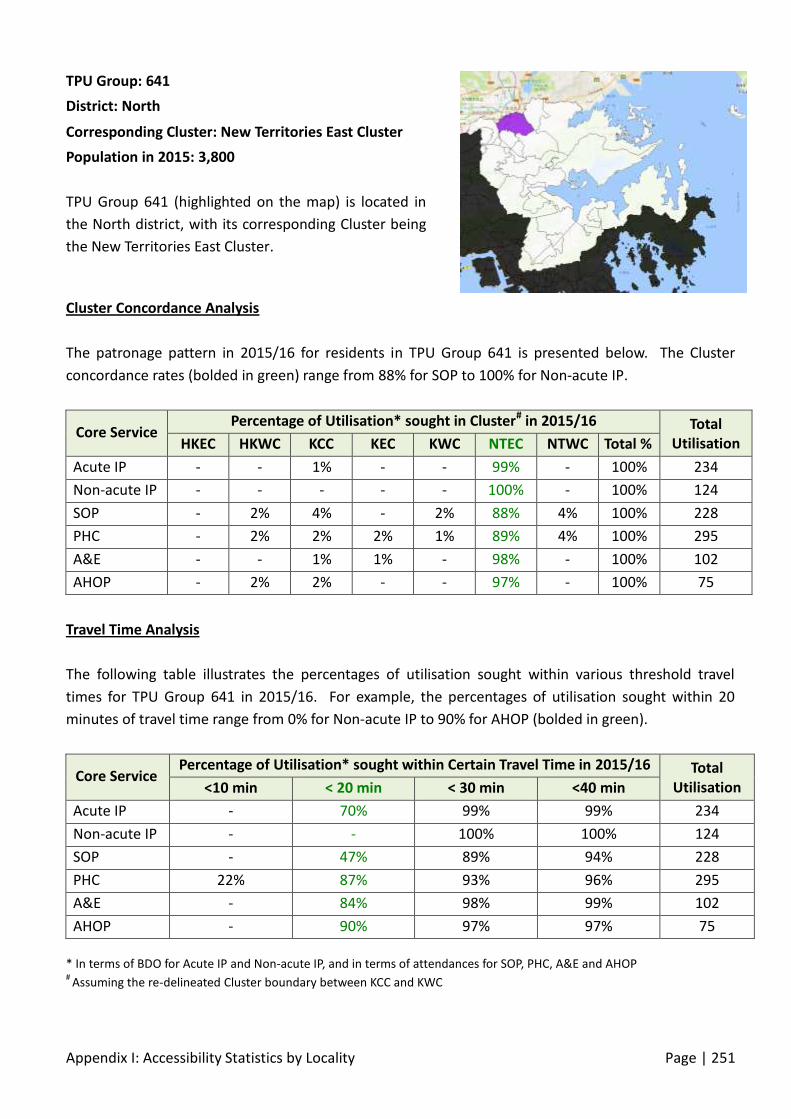
Appendix I: Accessibility Statistics by Locality Page | 251
Cluster Concordance Analysis
The patronage pattern in 2015/16 for residents in TPU Group 641 is presented below. The Cluster
concordance rates (bolded in green) range from 88% for SOP to 100% for Non-acute IP.
Core Service Percentage of Utilisation* sought in Cluster# in 2015/16 Total
Utilisation HKEC HKWC KCC KEC KWC NTEC NTWC Total %
Acute IP - - 1% - - 99% - 100% 234
Non-acute IP - - - - - 100% - 100% 124
SOP - 2% 4% - 2% 88% 4% 100% 228
PHC - 2% 2% 2% 1% 89% 4% 100% 295
A&E - - 1% 1% - 98% - 100% 102
AHOP - 2% 2% - - 97% - 100% 75
Travel Time Analysis
The following table illustrates the percentages of utilisation sought within various threshold travel
times for TPU Group 641 in 2015/16. For example, the percentages of utilisation sought within 20
minutes of travel time range from 0% for Non-acute IP to 90% for AHOP (bolded in green).
Core Service Percentage of Utilisation* sought within Certain Travel Time in 2015/16 Total
Utilisation <10 min < 20 min < 30 min <40 min
Acute IP - 70% 99% 99% 234
Non-acute IP - - 100% 100% 124
SOP - 47% 89% 94% 228
PHC 22% 87% 93% 96% 295
A&E - 84% 98% 99% 102
AHOP - 90% 97% 97% 75
* In terms of BDO for Acute IP and Non-acute IP, and in terms of attendances for SOP, PHC, A&E and AHOP #
Assuming the re-delineated Cluster boundary between KCC and KWC
TPU Group: 641
District: North
Corresponding Cluster: New Territories East Cluster
Population in 2015: 3,800
TPU Group 641 (highlighted on the map) is located in
the North district, with its corresponding Cluster being
the New Territories East Cluster.

Appendix I: Accessibility Statistics by Locality Page | 252
Cluster Concordance Analysis
The patronage pattern in 2015/16 for residents in TPU Group 642 is presented below. The Cluster
concordance rates (bolded in green) range from 86% for Non-acute IP to 97% for PHC.
Core Service Percentage of Utilisation* sought in Cluster# in 2015/16 Total
Utilisation HKEC HKWC KCC KEC KWC NTEC NTWC Total %
Acute IP - - 3% 1% - 95% 1% 100% 2,496
Non-acute IP 4% - 5% 1% 1% 86% 4% 100% 2,350
SOP 1% - 5% 1% - 91% 2% 100% 741
PHC 1% - 1% - - 97% 1% 100% 1,189
A&E 1% - 1% 1% - 96% 1% 100% 547
AHOP - - 4% 1% - 94% 1% 100% 139
Travel Time Analysis
The following table illustrates the percentages of utilisation sought within various threshold travel
times for TPU Group 642 in 2015/16. For example, the percentages of utilisation sought within 20
minutes of travel time are 62% for PHC and 0% for other services (bolded in green).
Core Service Percentage of Utilisation* sought within Certain Travel Time in 2015/16 Total
Utilisation <10 min < 20 min < 30 min <40 min
Acute IP - - 92% 95% 2,496
Non-acute IP - - - 86% 2,350
SOP - - 65% 91% 741
PHC 62% 62% 97% 98% 1,189
A&E - - 92% 96% 547
AHOP - - 71% 95% 139
* In terms of BDO for Acute IP and Non-acute IP, and in terms of attendances for SOP, PHC, A&E and AHOP #
Assuming the re-delineated Cluster boundary between KCC and KWC
TPU Group: 642
District: North
Corresponding Cluster: New Territories East Cluster
Population in 2015: 3,000
TPU Group 642 (highlighted on the map) is located in
the North district, with its corresponding Cluster being
the New Territories East Cluster.

Appendix I: Accessibility Statistics by Locality Page | 253
Cluster Concordance Analysis
The patronage pattern in 2015/16 for residents in TPU Group 545 & 546 is presented below. The
Cluster concordance rates (bolded in green) range from 88% for Non-acute IP to 98% for PHC.
Core Service Percentage of Utilisation* sought in Cluster# in 2015/16 Total
Utilisation HKEC HKWC KCC KEC KWC NTEC NTWC Total %
Acute IP - - 1% 1% - 97% 1% 100% 13,104
Non-acute IP 3% - 4% 1% - 88% 5% 100% 12,573
SOP - - 1% 1% 1% 94% 4% 100% 3,512
PHC - - 1% - - 98% 1% 100% 2,278
A&E - - 1% - - 95% 3% 100% 2,468
AHOP - - 1% 1% - 96% 2% 100% 808
Travel Time Analysis
The following table illustrates the percentages of utilisation sought within various threshold travel
times for TPU Group 545 & 546 in 2015/16. For example, the percentages of utilisation sought within
20 minutes of travel time range from 80% for Non-acute IP to 98% for PHC (bolded in green).
Core Service Percentage of Utilisation* sought within Certain Travel Time in 2015/16 Total
Utilisation <10 min < 20 min < 30 min <40 min
Acute IP 90% 94% 98% 100% 13,104
Non-acute IP - 80% 94% 97% 12,573
SOP 69% 84% 98% 100% 3,512
PHC - 98% 99% 100% 2,278
A&E 92% 94% 99% 100% 2,468
AHOP 78% 89% 99% 99% 808
* In terms of BDO for Acute IP and Non-acute IP, and in terms of attendances for SOP, PHC, A&E and AHOP #
Assuming the re-delineated Cluster boundary between KCC and KWC
TPU Group: 545 & 546
District: North
Corresponding Cluster: New Territories East Cluster
Population in 2015: 2,700
TPU Group 545 & 546 (highlighted on the map) is
located in the North district, with its corresponding
Cluster being the New Territories East Cluster.

Appendix I: Accessibility Statistics by Locality Page | 254
Cluster Concordance Analysis
The patronage pattern in 2015/16 for residents in TPU Group 610 & 621 is presented below. The
Cluster concordance rates (bolded in green) range from 66% for AHOP to 99% for Non-acute IP.
Core Service Percentage of Utilisation* sought in Cluster# in 2015/16 Total
Utilisation HKEC HKWC KCC KEC KWC NTEC NTWC Total %
Acute IP 1% 1% 3% - 3% 87% 5% 100% 882
Non-acute IP - - 1% - - 99% - 100% 202
SOP 3% 4% 9% 2% 4% 73% 5% 100% 962
PHC 7% 1% 5% 1% 4% 75% 8% 100% 675
A&E 2% 1% 7% 1% 4% 78% 8% 100% 517
AHOP 5% 2% 15% - 3% 66% 9% 100% 251
Travel Time Analysis
The following table illustrates the percentages of utilisation sought within various threshold travel
times for TPU Group 610 & 621 in 2015/16. For example, the percentages of utilisation sought within
20 minutes of travel time range from 53% for AHOP to 82% for A&E (bolded in green).
Core Service Percentage of Utilisation* sought within Certain Travel Time in 2015/16 Total
Utilisation <10 min < 20 min < 30 min <40 min
Acute IP 41% 59% 92% 98% 882
Non-acute IP - 67% 99% 100% 202
SOP 40% 55% 78% 93% 962
PHC 2% 74% 84% 97% 675
A&E 69% 82% 86% 98% 517
AHOP 33% 53% 76% 94% 251
* In terms of BDO for Acute IP and Non-acute IP, and in terms of attendances for SOP, PHC, A&E and AHOP #
Assuming the re-delineated Cluster boundary between KCC and KWC
TPU Group: 610 & 621
District: North
Corresponding Cluster: New Territories East Cluster
Population in 2015: 15,300
TPU Group 610 & 621 (highlighted on the map) is
located in the North district, with its corresponding
Cluster being the New Territories East Cluster.

Appendix I: Accessibility Statistics by Locality Page | 255
Cluster Concordance Analysis
The patronage pattern in 2015/16 for residents in TPU Group 620 & 622 is presented below. The
Cluster concordance rates (bolded in green) range from 40% for Non-acute IP to 92% for PHC.
Core Service Percentage of Utilisation* sought in Cluster# in 2015/16 Total
Utilisation HKEC HKWC KCC KEC KWC NTEC NTWC Total %
Acute IP - - 1% 2% 5% 90% 1% 100% 799
Non-acute IP - - 1% - 21% 40% 37% 100% 4,717
SOP 1% 1% 7% 2% 4% 81% 5% 100% 717
PHC - - 3% - 2% 92% 2% 100% 598
A&E 1% 1% 2% 5% 4% 87% 1% 100% 249
AHOP - - 9% 1% - 90% - 100% 138
Travel Time Analysis
The following table illustrates the percentages of utilisation sought within various threshold travel
times for TPU Group 620 & 622 in 2015/16. For example, the percentages of utilisation sought within
20 minutes of travel time are 0% for each of the six services (bolded in green).
Core Service Percentage of Utilisation* sought within Certain Travel Time in 2015/16 Total
Utilisation <10 min < 20 min < 30 min <40 min
Acute IP - - 81% 86% 799
Non-acute IP - - - 39% 4,717
SOP - - 64% 73% 717
PHC - - 87% 89% 598
A&E - - 78% 84% 249
AHOP - - 83% 87% 138
* In terms of BDO for Acute IP and Non-acute IP, and in terms of attendances for SOP, PHC, A&E and AHOP #
Assuming the re-delineated Cluster boundary between KCC and KWC
TPU Group: 620 & 622
District: North
Corresponding Cluster: New Territories East Cluster
Population in 2015: 3,000
TPU Group 620 & 622 (highlighted on the map) is
located in the North district, with its corresponding
Cluster being the New Territories East Cluster.

Appendix I: Accessibility Statistics by Locality Page | 256
Cluster Concordance Analysis
The patronage pattern in 2015/16 for residents in TPU Group 624 & 629 is presented below. The
Cluster concordance rates (bolded in green) range from 86% for Non-acute IP to 94% for PHC.
Core Service Percentage of Utilisation* sought in Cluster# in 2015/16 Total
Utilisation HKEC HKWC KCC KEC KWC NTEC NTWC Total %
Acute IP - 1% 3% - 1% 93% 2% 100% 46,467
Non-acute IP 3% 1% 4% 2% 3% 86% 1% 100% 18,550
SOP 1% 2% 5% 1% 2% 88% 3% 100% 52,011
PHC 1% - 2% 1% 1% 94% 2% 100% 52,951
A&E 1% 1% 2% 1% 2% 92% 2% 100% 20,496
AHOP 1% 1% 7% 1% 1% 87% 3% 100% 16,775
Travel Time Analysis
The following table illustrates the percentages of utilisation sought within various threshold travel
times for TPU Group 624 & 629 in 2015/16. For example, the percentages of utilisation sought within
20 minutes of travel time range from 68% for SOP to 94% for PHC (bolded in green).
Core Service Percentage of Utilisation* sought within Certain Travel Time in 2015/16 Total
Utilisation <10 min < 20 min < 30 min <40 min
Acute IP 66% 75% 95% 99% 46,467
Non-acute IP - 80% 90% 96% 18,550
SOP 49% 68% 93% 98% 52,011
PHC 91% 94% 97% 100% 52,951
A&E 80% 90% 96% 99% 20,496
AHOP 63% 81% 91% 99% 16,775
* In terms of BDO for Acute IP and Non-acute IP, and in terms of attendances for SOP, PHC, A&E and AHOP #
Assuming the re-delineated Cluster boundary between KCC and KWC
TPU Group: 624 & 629
District: North
Corresponding Cluster: New Territories East Cluster
Population in 2015: 56,600
TPU Group 624 & 629 (highlighted on the map) is
located in the North district, with its corresponding
Cluster being the New Territories East Cluster.

Appendix I: Accessibility Statistics by Locality Page | 257
Cluster Concordance Analysis
The patronage pattern in 2015/16 for residents in TPU Group 651-653 is presented below. The Cluster
concordance rates (bolded in green) range from 94% for AHOP to 100% for Non-acute IP.
Core Service Percentage of Utilisation* sought in Cluster# in 2015/16 Total
Utilisation HKEC HKWC KCC KEC KWC NTEC NTWC Total %
Acute IP - - - 1% - 99% - 100% 4,625
Non-acute IP - - - - - 100% - 100% 2,067
SOP - - 2% 1% 1% 95% 1% 100% 3,980
PHC 1% - 1% - - 98% - 100% 5,295
A&E - - 1% 1% 1% 96% 1% 100% 1,787
AHOP - - 4% 1% 1% 94% - 100% 977
Travel Time Analysis
The following table illustrates the percentages of utilisation sought within various threshold travel
times for TPU Group 651-653 in 2015/16. For example, the percentages of utilisation sought within 20
minutes of travel time are 66% for PHC and 0% for other services (bolded in green).
Core Service Percentage of Utilisation* sought within Certain Travel Time in 2015/16 Total
Utilisation <10 min < 20 min < 30 min <40 min
Acute IP - - 80% 99% 4,625
Non-acute IP - - 100% 100% 2,067
SOP - - 67% 95% 3,980
PHC 66% 66% 96% 98% 5,295
A&E - - 92% 97% 1,787
AHOP - - 84% 94% 977
* In terms of BDO for Acute IP and Non-acute IP, and in terms of attendances for SOP, PHC, A&E and AHOP #
Assuming the re-delineated Cluster boundary between KCC and KWC
TPU Group: 651-653
District: North
Corresponding Cluster: New Territories East Cluster
Population in 2015: 8,000
TPU Group 651-653 (highlighted on the map) is located
in the North district, with its corresponding Cluster
being the New Territories East Cluster.
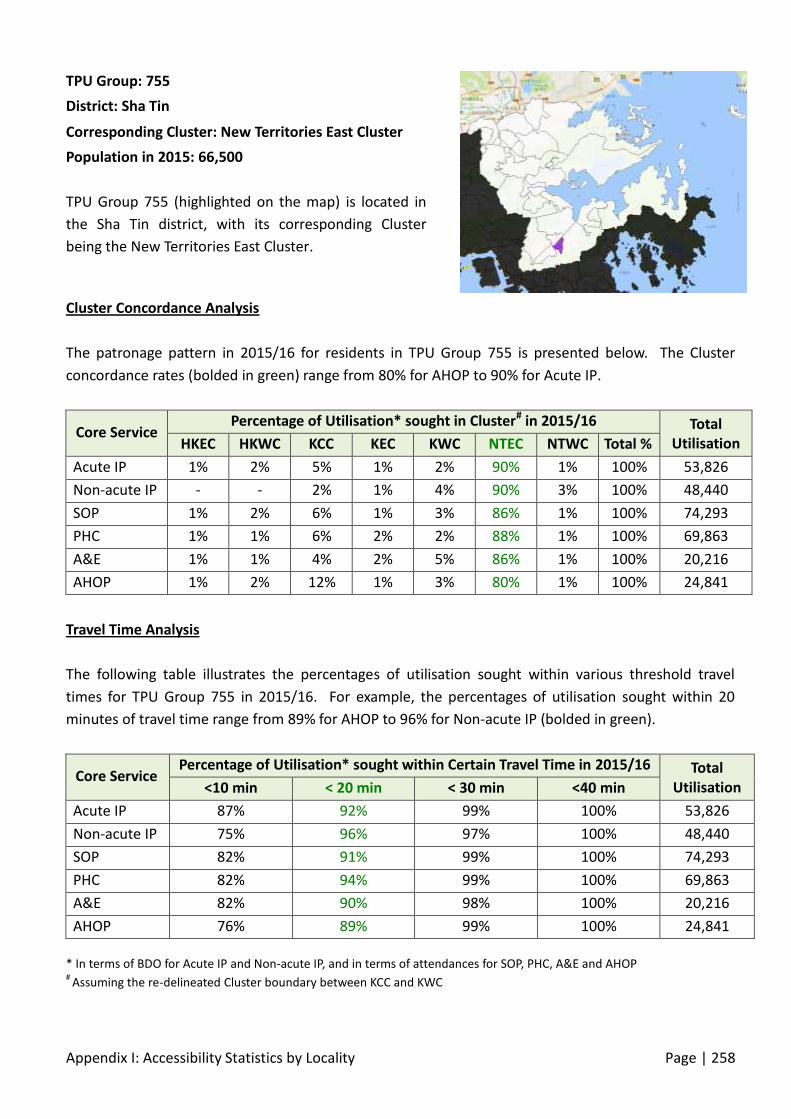
Appendix I: Accessibility Statistics by Locality Page | 258
Cluster Concordance Analysis
The patronage pattern in 2015/16 for residents in TPU Group 755 is presented below. The Cluster
concordance rates (bolded in green) range from 80% for AHOP to 90% for Acute IP.
Core Service Percentage of Utilisation* sought in Cluster# in 2015/16 Total
Utilisation HKEC HKWC KCC KEC KWC NTEC NTWC Total %
Acute IP 1% 2% 5% 1% 2% 90% 1% 100% 53,826
Non-acute IP - - 2% 1% 4% 90% 3% 100% 48,440
SOP 1% 2% 6% 1% 3% 86% 1% 100% 74,293
PHC 1% 1% 6% 2% 2% 88% 1% 100% 69,863
A&E 1% 1% 4% 2% 5% 86% 1% 100% 20,216
AHOP 1% 2% 12% 1% 3% 80% 1% 100% 24,841
Travel Time Analysis
The following table illustrates the percentages of utilisation sought within various threshold travel
times for TPU Group 755 in 2015/16. For example, the percentages of utilisation sought within 20
minutes of travel time range from 89% for AHOP to 96% for Non-acute IP (bolded in green).
Core Service Percentage of Utilisation* sought within Certain Travel Time in 2015/16 Total
Utilisation <10 min < 20 min < 30 min <40 min
Acute IP 87% 92% 99% 100% 53,826
Non-acute IP 75% 96% 97% 100% 48,440
SOP 82% 91% 99% 100% 74,293
PHC 82% 94% 99% 100% 69,863
A&E 82% 90% 98% 100% 20,216
AHOP 76% 89% 99% 100% 24,841
* In terms of BDO for Acute IP and Non-acute IP, and in terms of attendances for SOP, PHC, A&E and AHOP #
Assuming the re-delineated Cluster boundary between KCC and KWC
TPU Group: 755
District: Sha Tin
Corresponding Cluster: New Territories East Cluster
Population in 2015: 66,500
TPU Group 755 (highlighted on the map) is located in
the Sha Tin district, with its corresponding Cluster
being the New Territories East Cluster.

Appendix I: Accessibility Statistics by Locality Page | 259
Cluster Concordance Analysis
The patronage pattern in 2015/16 for residents in TPU Group 757 is presented below. The Cluster
concordance rates (bolded in green) range from 77% for AHOP to 89% for PHC.
Core Service Percentage of Utilisation* sought in Cluster# in 2015/16 Total
Utilisation HKEC HKWC KCC KEC KWC NTEC NTWC Total %
Acute IP 1% 3% 5% 1% 2% 88% 1% 100% 106,805
Non-acute IP - 1% 5% 1% 3% 83% 7% 100% 64,321
SOP 1% 3% 8% 2% 3% 82% 1% 100% 178,215
PHC 1% 1% 5% 2% 2% 89% 1% 100% 177,463
A&E 2% 1% 5% 2% 4% 84% 1% 100% 40,161
AHOP 2% 1% 14% 3% 3% 77% 1% 100% 65,149
Travel Time Analysis
The following table illustrates the percentages of utilisation sought within various threshold travel
times for TPU Group 757 in 2015/16. For example, the percentages of utilisation sought within 20
minutes of travel time range from 82% for AHOP to 92% for PHC (bolded in green).
Core Service Percentage of Utilisation* sought within Certain Travel Time in 2015/16 Total
Utilisation <10 min < 20 min < 30 min <40 min
Acute IP - 88% 97% 100% 106,805
Non-acute IP 64% 88% 92% 100% 64,321
SOP - 85% 97% 100% 178,215
PHC 74% 92% 99% 100% 177,463
A&E - 85% 98% 100% 40,161
AHOP - 82% 98% 100% 65,149
* In terms of BDO for Acute IP and Non-acute IP, and in terms of attendances for SOP, PHC, A&E and AHOP #
Assuming the re-delineated Cluster boundary between KCC and KWC
TPU Group: 757
District: Sha Tin
Corresponding Cluster: New Territories East Cluster
Population in 2015: 216,500
TPU Group 757 (highlighted on the map) is located in
the Sha Tin district, with its corresponding Cluster
being the New Territories East Cluster.

Appendix I: Accessibility Statistics by Locality Page | 260
Cluster Concordance Analysis
The patronage pattern in 2015/16 for residents in TPU Group 758 is presented below. The Cluster
concordance rates (bolded in green) range from 78% for AHOP to 93% for PHC.
Core Service Percentage of Utilisation* sought in Cluster# in 2015/16 Total
Utilisation HKEC HKWC KCC KEC KWC NTEC NTWC Total %
Acute IP 1% 2% 4% 1% 2% 90% 1% 100% 34,545
Non-acute IP - - 3% 1% 6% 89% 1% 100% 22,927
SOP 1% 2% 6% 1% 4% 86% 1% 100% 47,997
PHC 1% - 3% 1% 2% 93% - 100% 55,380
A&E 1% 1% 4% 2% 5% 86% 1% 100% 12,958
AHOP 1% 2% 11% 2% 5% 78% 1% 100% 16,871
Travel Time Analysis
The following table illustrates the percentages of utilisation sought within various threshold travel
times for TPU Group 758 in 2015/16. For example, the percentages of utilisation sought within 20
minutes of travel time range from 91% for AHOP to 98% for PHC (bolded in green).
Core Service Percentage of Utilisation* sought within Certain Travel Time in 2015/16 Total
Utilisation <10 min < 20 min < 30 min <40 min
Acute IP 87% 94% 99% 100% 34,545
Non-acute IP 67% 98% 100% 100% 22,927
SOP 82% 95% 99% 100% 47,997
PHC 90% 98% 100% 100% 55,380
A&E 81% 92% 99% 100% 12,958
AHOP 73% 91% 99% 100% 16,871
* In terms of BDO for Acute IP and Non-acute IP, and in terms of attendances for SOP, PHC, A&E and AHOP #
Assuming the re-delineated Cluster boundary between KCC and KWC
TPU Group: 758
District: Sha Tin
Corresponding Cluster: New Territories East Cluster
Population in 2015: 50,700
TPU Group 758 (highlighted on the map) is located in
the Sha Tin district, with its corresponding Cluster
being the New Territories East Cluster.

Appendix I: Accessibility Statistics by Locality Page | 261
Cluster Concordance Analysis
The patronage pattern in 2015/16 for residents in TPU Group 759 is presented below. The Cluster
concordance rates (bolded in green) range from 74% for AHOP to 93% for Non-acute IP.
Core Service Percentage of Utilisation* sought in Cluster# in 2015/16 Total
Utilisation HKEC HKWC KCC KEC KWC NTEC NTWC Total %
Acute IP 1% 2% 6% 1% 2% 88% 1% 100% 86,149
Non-acute IP 1% 1% 3% 1% 1% 93% 1% 100% 61,856
SOP 1% 2% 9% 2% 4% 82% 1% 100% 122,076
PHC 1% 1% 10% 2% 3% 83% 1% 100% 110,276
A&E 2% 1% 7% 2% 5% 83% 1% 100% 30,597
AHOP 1% 2% 16% 2% 4% 74% 1% 100% 41,972
Travel Time Analysis
The following table illustrates the percentages of utilisation sought within various threshold travel
times for TPU Group 759 in 2015/16. For example, the percentages of utilisation sought within 20
minutes of travel time range from 93% for A&E to 97% for Non-acute IP (bolded in green).
Core Service Percentage of Utilisation* sought within Certain Travel Time in 2015/16 Total
Utilisation <10 min < 20 min < 30 min <40 min
Acute IP 85% 95% 100% 100% 86,149
Non-acute IP 3% 97% 99% 100% 61,856
SOP 79% 94% 99% 100% 122,076
PHC 37% 96% 99% 100% 110,276
A&E 77% 93% 99% 100% 30,597
AHOP 70% 94% 100% 100% 41,972
* In terms of BDO for Acute IP and Non-acute IP, and in terms of attendances for SOP, PHC, A&E and AHOP #
Assuming the re-delineated Cluster boundary between KCC and KWC
TPU Group: 759
District: Sha Tin
Corresponding Cluster: New Territories East Cluster
Population in 2015: 130,700
TPU Group 759 (highlighted on the map) is located in
the Sha Tin district, with its corresponding Cluster
being the New Territories East Cluster.
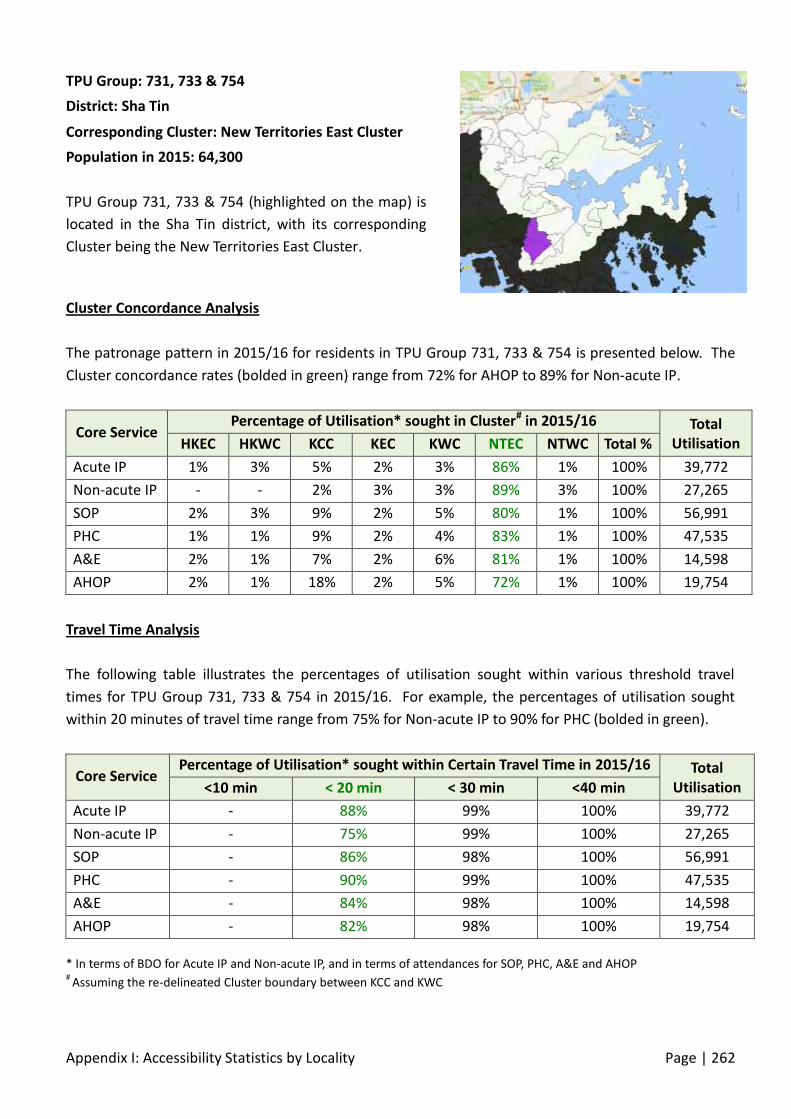
Appendix I: Accessibility Statistics by Locality Page | 262
Cluster Concordance Analysis
The patronage pattern in 2015/16 for residents in TPU Group 731, 733 & 754 is presented below. The
Cluster concordance rates (bolded in green) range from 72% for AHOP to 89% for Non-acute IP.
Core Service Percentage of Utilisation* sought in Cluster# in 2015/16 Total
Utilisation HKEC HKWC KCC KEC KWC NTEC NTWC Total %
Acute IP 1% 3% 5% 2% 3% 86% 1% 100% 39,772
Non-acute IP - - 2% 3% 3% 89% 3% 100% 27,265
SOP 2% 3% 9% 2% 5% 80% 1% 100% 56,991
PHC 1% 1% 9% 2% 4% 83% 1% 100% 47,535
A&E 2% 1% 7% 2% 6% 81% 1% 100% 14,598
AHOP 2% 1% 18% 2% 5% 72% 1% 100% 19,754
Travel Time Analysis
The following table illustrates the percentages of utilisation sought within various threshold travel
times for TPU Group 731, 733 & 754 in 2015/16. For example, the percentages of utilisation sought
within 20 minutes of travel time range from 75% for Non-acute IP to 90% for PHC (bolded in green).
Core Service Percentage of Utilisation* sought within Certain Travel Time in 2015/16 Total
Utilisation <10 min < 20 min < 30 min <40 min
Acute IP - 88% 99% 100% 39,772
Non-acute IP - 75% 99% 100% 27,265
SOP - 86% 98% 100% 56,991
PHC - 90% 99% 100% 47,535
A&E - 84% 98% 100% 14,598
AHOP - 82% 98% 100% 19,754
* In terms of BDO for Acute IP and Non-acute IP, and in terms of attendances for SOP, PHC, A&E and AHOP #
Assuming the re-delineated Cluster boundary between KCC and KWC
TPU Group: 731, 733 & 754
District: Sha Tin
Corresponding Cluster: New Territories East Cluster
Population in 2015: 64,300
TPU Group 731, 733 & 754 (highlighted on the map) is
located in the Sha Tin district, with its corresponding
Cluster being the New Territories East Cluster.

Appendix I: Accessibility Statistics by Locality Page | 263
Cluster Concordance Analysis
The patronage pattern in 2015/16 for residents in TPU Group 732, 751 & 753 is presented below. The
Cluster concordance rates (bolded in green) range from 69% for AHOP to 85% for Acute IP.
Core Service Percentage of Utilisation* sought in Cluster# in 2015/16 Total
Utilisation HKEC HKWC KCC KEC KWC NTEC NTWC Total %
Acute IP 1% 4% 7% 1% 1% 85% 1% 100% 15,188
Non-acute IP 6% 3% 2% - 4% 84% - 100% 10,673
SOP 2% 4% 10% 2% 4% 77% 1% 100% 25,760
PHC 2% 1% 8% 2% 2% 84% 1% 100% 18,438
A&E 3% 1% 6% 2% 4% 83% 1% 100% 5,302
AHOP 2% 1% 23% 2% 2% 69% 1% 100% 10,485
Travel Time Analysis
The following table illustrates the percentages of utilisation sought within various threshold travel
times for TPU Group 732, 751 & 753 in 2015/16. For example, the percentages of utilisation sought
within 20 minutes of travel time range from 84% for AHOP to 90% for Non-acute IP (bolded in green).
Core Service Percentage of Utilisation* sought within Certain Travel Time in 2015/16 Total
Utilisation <10 min < 20 min < 30 min <40 min
Acute IP 82% 86% 99% 100% 15,188
Non-acute IP - 90% 96% 100% 10,673
SOP 72% 84% 99% 100% 25,760
PHC 75% 90% 99% 100% 18,438
A&E 75% 86% 98% 100% 5,302
AHOP 63% 84% 100% 100% 10,485
* In terms of BDO for Acute IP and Non-acute IP, and in terms of attendances for SOP, PHC, A&E and AHOP #
Assuming the re-delineated Cluster boundary between KCC and KWC
TPU Group: 732, 751 & 753
District: Sha Tin
Corresponding Cluster: New Territories East Cluster
Population in 2015: 44,400
TPU Group 732, 751 & 753 (highlighted on the map) is
located in the Sha Tin district, with its corresponding
Cluster being the New Territories East Cluster.

Appendix I: Accessibility Statistics by Locality Page | 264
Cluster Concordance Analysis
The patronage pattern in 2015/16 for residents in TPU Group 756 & 761-762 is presented below. The
Cluster concordance rates (bolded in green) range from 77% for AHOP to 93% for Non-acute IP.
Core Service Percentage of Utilisation* sought in Cluster# in 2015/16 Total
Utilisation HKEC HKWC KCC KEC KWC NTEC NTWC Total %
Acute IP 1% 3% 4% 1% 2% 90% 1% 100% 60,647
Non-acute IP 1% 1% 4% 1% 1% 93% - 100% 41,560
SOP 1% 3% 8% 2% 3% 83% 1% 100% 89,157
PHC 1% 1% 6% 2% 2% 88% - 100% 76,893
A&E 1% 1% 4% 2% 3% 88% 1% 100% 21,970
AHOP 2% 1% 15% 2% 2% 77% 1% 100% 32,919
Travel Time Analysis
The following table illustrates the percentages of utilisation sought within various threshold travel
times for TPU Group 756 & 761-762 in 2015/16. For example, the percentages of utilisation sought
within 20 minutes of travel time range from 93% for SOP to 98% for Non-acute IP (bolded in green).
Core Service Percentage of Utilisation* sought within Certain Travel Time in 2015/16 Total
Utilisation <10 min < 20 min < 30 min <40 min
Acute IP 87% 94% 97% 100% 60,647
Non-acute IP 73% 98% 99% 100% 41,560
SOP 80% 93% 97% 100% 89,157
PHC 55% 95% 99% 100% 76,893
A&E 84% 94% 98% 100% 21,970
AHOP 74% 94% 99% 100% 32,919
* In terms of BDO for Acute IP and Non-acute IP, and in terms of attendances for SOP, PHC, A&E and AHOP #
Assuming the re-delineated Cluster boundary between KCC and KWC
TPU Group: 756 & 761-762
District: Sha Tin
Corresponding Cluster: New Territories East Cluster
Population in 2015: 98,500
TPU Group 756 & 761-762 (highlighted on the map) is
located in the Sha Tin district, with its corresponding
Cluster being the New Territories East Cluster.

Appendix I: Accessibility Statistics by Locality Page | 265
Cluster Concordance Analysis
The patronage pattern in 2015/16 for residents in TPU Group 720 is presented below. The Cluster
concordance rates (bolded in green) range from 75% for SOP to 88% for PHC.
Core Service Percentage of Utilisation* sought in Cluster# in 2015/16 Total
Utilisation HKEC HKWC KCC KEC KWC NTEC NTWC Total %
Acute IP 2% 3% 7% 2% 2% 83% 3% 100% 1,784
Non-acute IP - - 7% - - 85% 8% 100% 787
SOP 1% 4% 11% 4% 4% 75% 2% 100% 3,172
PHC 2% 1% 4% 3% 1% 88% 1% 100% 1,942
A&E 1% 1% 4% 3% 2% 88% 1% 100% 998
AHOP 2% - 12% 1% 1% 83% 2% 100% 1,241
Travel Time Analysis
The following table illustrates the percentages of utilisation sought within various threshold travel
times for TPU Group 720 in 2015/16. For example, the percentages of utilisation sought within 20
minutes of travel time range from 49% for SOP to 87% for PHC (bolded in green).
Core Service Percentage of Utilisation* sought within Certain Travel Time in 2015/16 Total
Utilisation <10 min < 20 min < 30 min <40 min
Acute IP - 55% 85% 100% 1,784
Non-acute IP - 85% 92% 100% 787
SOP - 49% 86% 100% 3,172
PHC - 87% 93% 98% 1,942
A&E - 81% 92% 100% 998
AHOP - 75% 91% 99% 1,241
* In terms of BDO for Acute IP and Non-acute IP, and in terms of attendances for SOP, PHC, A&E and AHOP #
Assuming the re-delineated Cluster boundary between KCC and KWC
TPU Group: 720
District: Tai Po
Corresponding Cluster: New Territories East Cluster
Population in 2015: 4,800
TPU Group 720 (highlighted on the map) is located in
the Tai Po district, with its corresponding Cluster being
the New Territories East Cluster.

Appendix I: Accessibility Statistics by Locality Page | 266
Cluster Concordance Analysis
The patronage pattern in 2015/16 for residents in TPU Group 723 is presented below. The Cluster
concordance rates (bolded in green) range from 88% for Non-acute IP to 94% for PHC.
Core Service Percentage of Utilisation* sought in Cluster# in 2015/16 Total
Utilisation HKEC HKWC KCC KEC KWC NTEC NTWC Total %
Acute IP - 1% 3% 1% 1% 94% 1% 100% 74,404
Non-acute IP 2% 1% 2% 1% 2% 88% 4% 100% 49,152
SOP 1% 2% 5% 1% 2% 90% 1% 100% 83,026
PHC 1% 1% 3% 1% 1% 94% 1% 100% 76,086
A&E 1% - 2% 1% 2% 94% 1% 100% 38,983
AHOP 1% 1% 5% 1% 2% 89% 1% 100% 33,375
Travel Time Analysis
The following table illustrates the percentages of utilisation sought within various threshold travel
times for TPU Group 723 in 2015/16. For example, the percentages of utilisation sought within 20
minutes of travel time range from 88% for Non-acute IP to 94% for A&E (bolded in green).
Core Service Percentage of Utilisation* sought within Certain Travel Time in 2015/16 Total
Utilisation <10 min < 20 min < 30 min <40 min
Acute IP 59% 94% 95% 100% 74,404
Non-acute IP 73% 88% 93% 99% 49,152
SOP 62% 90% 94% 100% 83,026
PHC 90% 94% 97% 100% 76,086
A&E 87% 94% 96% 100% 38,983
AHOP 80% 89% 94% 100% 33,375
* In terms of BDO for Acute IP and Non-acute IP, and in terms of attendances for SOP, PHC, A&E and AHOP #
Assuming the re-delineated Cluster boundary between KCC and KWC
TPU Group: 723
District: Tai Po
Corresponding Cluster: New Territories East Cluster
Population in 2015: 77,300
TPU Group 723 (highlighted on the map) is located in
the Tai Po district, with its corresponding Cluster being
the New Territories East Cluster.

Appendix I: Accessibility Statistics by Locality Page | 267
Cluster Concordance Analysis
The patronage pattern in 2015/16 for residents in TPU Group 724 is presented below. The Cluster
concordance rates (bolded in green) range from 79% for SOP to 98% for Non-acute IP.
Core Service Percentage of Utilisation* sought in Cluster# in 2015/16 Total
Utilisation HKEC HKWC KCC KEC KWC NTEC NTWC Total %
Acute IP - - 15% 2% 2% 81% - 100% 808
Non-acute IP - - - 2% - 98% - 100% 274
SOP - 2% 12% 3% 3% 79% 1% 100% 1,492
PHC - 1% 5% 1% 2% 88% 2% 100% 1,298
A&E 1% 1% 3% 1% 1% 91% 2% 100% 674
AHOP - 1% 7% 1% 1% 89% 1% 100% 546
Travel Time Analysis
The following table illustrates the percentages of utilisation sought within various threshold travel
times for TPU Group 724 in 2015/16. For example, the percentages of utilisation sought within 20
minutes of travel time range from 48% for Acute IP to 98% for Non-acute IP (bolded in green).
Core Service Percentage of Utilisation* sought within Certain Travel Time in 2015/16 Total
Utilisation <10 min < 20 min < 30 min <40 min
Acute IP - 48% 81% 100% 808
Non-acute IP - 98% 98% 100% 274
SOP - 52% 79% 96% 1,492
PHC - 79% 89% 99% 1,298
A&E - 80% 91% 98% 674
AHOP - 80% 89% 99% 546
* In terms of BDO for Acute IP and Non-acute IP, and in terms of attendances for SOP, PHC, A&E and AHOP #
Assuming the re-delineated Cluster boundary between KCC and KWC
TPU Group: 724
District: Tai Po
Corresponding Cluster: New Territories East Cluster
Population in 2015: 10,700
TPU Group 724 (highlighted on the map) is located in
the Tai Po district, with its corresponding Cluster being
the New Territories East Cluster.

Appendix I: Accessibility Statistics by Locality Page | 268
Cluster Concordance Analysis
The patronage pattern in 2015/16 for residents in TPU Group 725 is presented below. The Cluster
concordance rates (bolded in green) range from 73% for SOP to 100% for Non-acute IP.
Core Service Percentage of Utilisation* sought in Cluster# in 2015/16 Total
Utilisation HKEC HKWC KCC KEC KWC NTEC NTWC Total %
Acute IP - 3% 2% 3% 2% 89% - 100% 712
Non-acute IP - - - - - 100% - 100% 157
SOP 2% 5% 13% 3% 3% 73% 2% 100% 1,206
PHC 3% 2% 4% 4% 5% 81% - 100% 736
A&E 1% 1% 4% 3% 5% 86% - 100% 511
AHOP 2% - 13% 2% 3% 80% - 100% 350
Travel Time Analysis
The following table illustrates the percentages of utilisation sought within various threshold travel
times for TPU Group 725 in 2015/16. For example, the percentages of utilisation sought within 20
minutes of travel time range from 73% for SOP to 100% for Non-acute IP (bolded in green).
Core Service Percentage of Utilisation* sought within Certain Travel Time in 2015/16 Total
Utilisation <10 min < 20 min < 30 min <40 min
Acute IP - 89% 97% 100% 712
Non-acute IP - 100% 100% 100% 157
SOP - 73% 91% 100% 1,206
PHC - 81% 97% 100% 736
A&E - 86% 96% 98% 511
AHOP - 80% 98% 100% 350
* In terms of BDO for Acute IP and Non-acute IP, and in terms of attendances for SOP, PHC, A&E and AHOP #
Assuming the re-delineated Cluster boundary between KCC and KWC
TPU Group: 725
District: Tai Po
Corresponding Cluster: New Territories East Cluster
Population in 2015: 5,600
TPU Group 725 (highlighted on the map) is located in
the Tai Po district, with its corresponding Cluster being
the New Territories East Cluster.

Appendix I: Accessibility Statistics by Locality Page | 269
Cluster Concordance Analysis
The patronage pattern in 2015/16 for residents in TPU Group 726 is presented below. The Cluster
concordance rates (bolded in green) range from 91% for SOP to 95% for PHC.
Core Service Percentage of Utilisation* sought in Cluster# in 2015/16 Total
Utilisation HKEC HKWC KCC KEC KWC NTEC NTWC Total %
Acute IP 1% 2% 2% 1% 1% 92% 1% 100% 91,379
Non-acute IP 1% 1% 2% 1% 2% 91% 2% 100% 49,221
SOP 1% 2% 4% 1% 1% 91% 1% 100% 125,933
PHC - - 2% 1% 1% 95% 1% 100% 121,537
A&E 1% - 2% 1% 1% 94% 1% 100% 57,083
AHOP 1% 1% 5% 1% 1% 91% 1% 100% 51,156
Travel Time Analysis
The following table illustrates the percentages of utilisation sought within various threshold travel
times for TPU Group 726 in 2015/16. For example, the percentages of utilisation sought within 20
minutes of travel time range from 91% for SOP to 95% for PHC (bolded in green).
Core Service Percentage of Utilisation* sought within Certain Travel Time in 2015/16 Total
Utilisation <10 min < 20 min < 30 min <40 min
Acute IP 56% 92% 97% 100% 91,379
Non-acute IP 82% 91% 97% 99% 49,221
SOP 62% 91% 97% 100% 125,933
PHC 91% 95% 99% 100% 121,537
A&E 88% 94% 98% 100% 57,083
AHOP 83% 91% 98% 100% 51,156
* In terms of BDO for Acute IP and Non-acute IP, and in terms of attendances for SOP, PHC, A&E and AHOP #
Assuming the re-delineated Cluster boundary between KCC and KWC
TPU Group: 726
District: Tai Po
Corresponding Cluster: New Territories East Cluster
Population in 2015: 105,500
TPU Group 726 (highlighted on the map) is located in
the Tai Po district, with its corresponding Cluster being
the New Territories East Cluster.

Appendix I: Accessibility Statistics by Locality Page | 270
Cluster Concordance Analysis
The patronage pattern in 2015/16 for residents in TPU Group 729 is presented below. The Cluster
concordance rates (bolded in green) range from 69% for AHOP to 97% for Non-acute IP.
Core Service Percentage of Utilisation* sought in Cluster# in 2015/16 Total
Utilisation HKEC HKWC KCC KEC KWC NTEC NTWC Total %
Acute IP 1% 4% 5% 2% 1% 87% - 100% 2,987
Non-acute IP - - 3% - - 97% - 100% 897
SOP 3% 5% 12% 4% 4% 71% 1% 100% 4,452
PHC 5% 2% 9% 3% 3% 79% 1% 100% 2,565
A&E 2% 1% 3% 2% 3% 88% 1% 100% 1,753
AHOP 4% 2% 17% 2% 5% 69% 1% 100% 2,091
Travel Time Analysis
The following table illustrates the percentages of utilisation sought within various threshold travel
times for TPU Group 729 in 2015/16. For example, the percentages of utilisation sought within 20
minutes of travel time range from 73% for AHOP to 99% for Non-acute IP (bolded in green).
Core Service Percentage of Utilisation* sought within Certain Travel Time in 2015/16 Total
Utilisation <10 min < 20 min < 30 min <40 min
Acute IP - 88% 96% 100% 2,987
Non-acute IP - 99% 100% 100% 897
SOP - 75% 91% 100% 4,452
PHC 46% 83% 96% 100% 2,565
A&E - 90% 96% 100% 1,753
AHOP - 73% 94% 100% 2,091
* In terms of BDO for Acute IP and Non-acute IP, and in terms of attendances for SOP, PHC, A&E and AHOP #
Assuming the re-delineated Cluster boundary between KCC and KWC
TPU Group: 729
District: Tai Po
Corresponding Cluster: New Territories East Cluster
Population in 2015: 14,800
TPU Group 729 (highlighted on the map) is located in
the Tai Po district, with its corresponding Cluster being
the New Territories East Cluster.
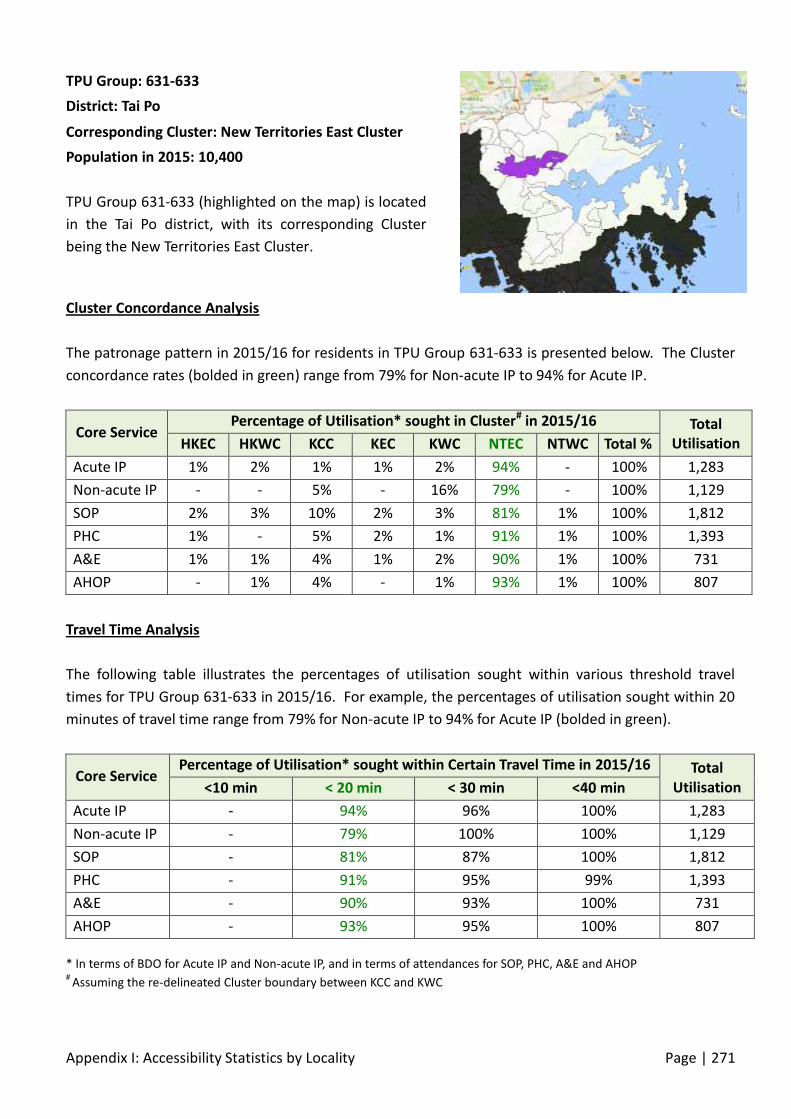
Appendix I: Accessibility Statistics by Locality Page | 271
Cluster Concordance Analysis
The patronage pattern in 2015/16 for residents in TPU Group 631-633 is presented below. The Cluster
concordance rates (bolded in green) range from 79% for Non-acute IP to 94% for Acute IP.
Core Service Percentage of Utilisation* sought in Cluster# in 2015/16 Total
Utilisation HKEC HKWC KCC KEC KWC NTEC NTWC Total %
Acute IP 1% 2% 1% 1% 2% 94% - 100% 1,283
Non-acute IP - - 5% - 16% 79% - 100% 1,129
SOP 2% 3% 10% 2% 3% 81% 1% 100% 1,812
PHC 1% - 5% 2% 1% 91% 1% 100% 1,393
A&E 1% 1% 4% 1% 2% 90% 1% 100% 731
AHOP - 1% 4% - 1% 93% 1% 100% 807
Travel Time Analysis
The following table illustrates the percentages of utilisation sought within various threshold travel
times for TPU Group 631-633 in 2015/16. For example, the percentages of utilisation sought within 20
minutes of travel time range from 79% for Non-acute IP to 94% for Acute IP (bolded in green).
Core Service Percentage of Utilisation* sought within Certain Travel Time in 2015/16 Total
Utilisation <10 min < 20 min < 30 min <40 min
Acute IP - 94% 96% 100% 1,283
Non-acute IP - 79% 100% 100% 1,129
SOP - 81% 87% 100% 1,812
PHC - 91% 95% 99% 1,393
A&E - 90% 93% 100% 731
AHOP - 93% 95% 100% 807
* In terms of BDO for Acute IP and Non-acute IP, and in terms of attendances for SOP, PHC, A&E and AHOP #
Assuming the re-delineated Cluster boundary between KCC and KWC
TPU Group: 631-633
District: Tai Po
Corresponding Cluster: New Territories East Cluster
Population in 2015: 10,400
TPU Group 631-633 (highlighted on the map) is located
in the Tai Po district, with its corresponding Cluster
being the New Territories East Cluster.
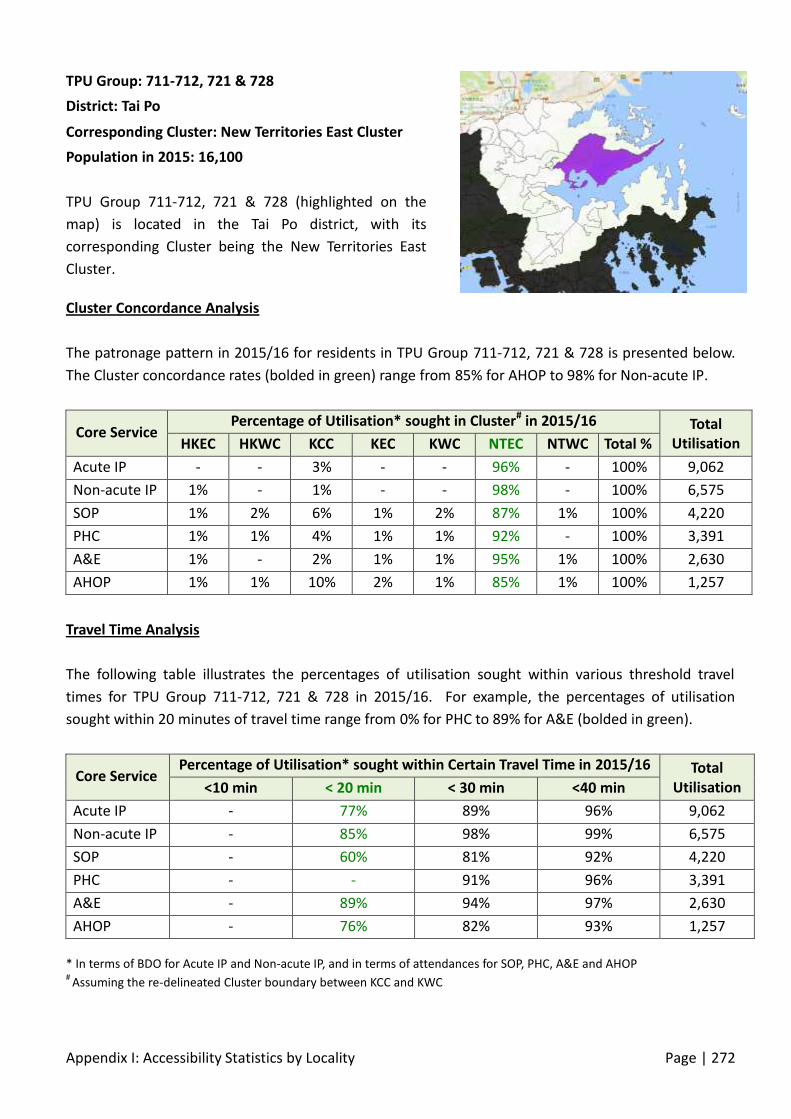
Appendix I: Accessibility Statistics by Locality Page | 272
Cluster Concordance Analysis
The patronage pattern in 2015/16 for residents in TPU Group 711-712, 721 & 728 is presented below.
The Cluster concordance rates (bolded in green) range from 85% for AHOP to 98% for Non-acute IP.
Core Service Percentage of Utilisation* sought in Cluster# in 2015/16 Total
Utilisation HKEC HKWC KCC KEC KWC NTEC NTWC Total %
Acute IP - - 3% - - 96% - 100% 9,062
Non-acute IP 1% - 1% - - 98% - 100% 6,575
SOP 1% 2% 6% 1% 2% 87% 1% 100% 4,220
PHC 1% 1% 4% 1% 1% 92% - 100% 3,391
A&E 1% - 2% 1% 1% 95% 1% 100% 2,630
AHOP 1% 1% 10% 2% 1% 85% 1% 100% 1,257
Travel Time Analysis
The following table illustrates the percentages of utilisation sought within various threshold travel
times for TPU Group 711-712, 721 & 728 in 2015/16. For example, the percentages of utilisation
sought within 20 minutes of travel time range from 0% for PHC to 89% for A&E (bolded in green).
Core Service Percentage of Utilisation* sought within Certain Travel Time in 2015/16 Total
Utilisation <10 min < 20 min < 30 min <40 min
Acute IP - 77% 89% 96% 9,062
Non-acute IP - 85% 98% 99% 6,575
SOP - 60% 81% 92% 4,220
PHC - - 91% 96% 3,391
A&E - 89% 94% 97% 2,630
AHOP - 76% 82% 93% 1,257
* In terms of BDO for Acute IP and Non-acute IP, and in terms of attendances for SOP, PHC, A&E and AHOP #
Assuming the re-delineated Cluster boundary between KCC and KWC
TPU Group: 711-712, 721 & 728
District: Tai Po
Corresponding Cluster: New Territories East Cluster
Population in 2015: 16,100
TPU Group 711-712, 721 & 728 (highlighted on the
map) is located in the Tai Po district, with its
corresponding Cluster being the New Territories East
Cluster.

Appendix I: Accessibility Statistics by Locality Page | 273
Cluster Concordance Analysis
The patronage pattern in 2015/16 for residents in TPU Group 722 & 727 is presented below. The
Cluster concordance rates (bolded in green) range from 88% for SOP to 94% for A&E.
Core Service Percentage of Utilisation* sought in Cluster# in 2015/16 Total
Utilisation HKEC HKWC KCC KEC KWC NTEC NTWC Total %
Acute IP 1% 2% 4% 1% 2% 89% 1% 100% 25,468
Non-acute IP 1% - 1% 1% 4% 91% 2% 100% 13,649
SOP 1% 2% 5% 1% 2% 88% 1% 100% 40,091
PHC 1% - 3% 1% 1% 94% 1% 100% 35,322
A&E 1% - 2% 1% 1% 94% 1% 100% 21,868
AHOP 1% 1% 6% 1% 2% 90% 1% 100% 15,555
Travel Time Analysis
The following table illustrates the percentages of utilisation sought within various threshold travel
times for TPU Group 722 & 727 in 2015/16. For example, the percentages of utilisation sought within
20 minutes of travel time range from 88% for SOP to 94% for A&E (bolded in green).
Core Service Percentage of Utilisation* sought within Certain Travel Time in 2015/16 Total
Utilisation <10 min < 20 min < 30 min <40 min
Acute IP 53% 89% 94% 100% 25,468
Non-acute IP 78% 91% 97% 100% 13,649
SOP 60% 88% 96% 100% 40,091
PHC 28% 93% 99% 100% 35,322
A&E 89% 94% 97% 100% 21,868
AHOP 81% 90% 96% 100% 15,555
* In terms of BDO for Acute IP and Non-acute IP, and in terms of attendances for SOP, PHC, A&E and AHOP #
Assuming the re-delineated Cluster boundary between KCC and KWC
TPU Group: 722 & 727
District: Tai Po
Corresponding Cluster: New Territories East Cluster
Population in 2015: 50,200
TPU Group 722 & 727 (highlighted on the map) is
located in the Tai Po district, with its corresponding
Cluster being the New Territories East Cluster.
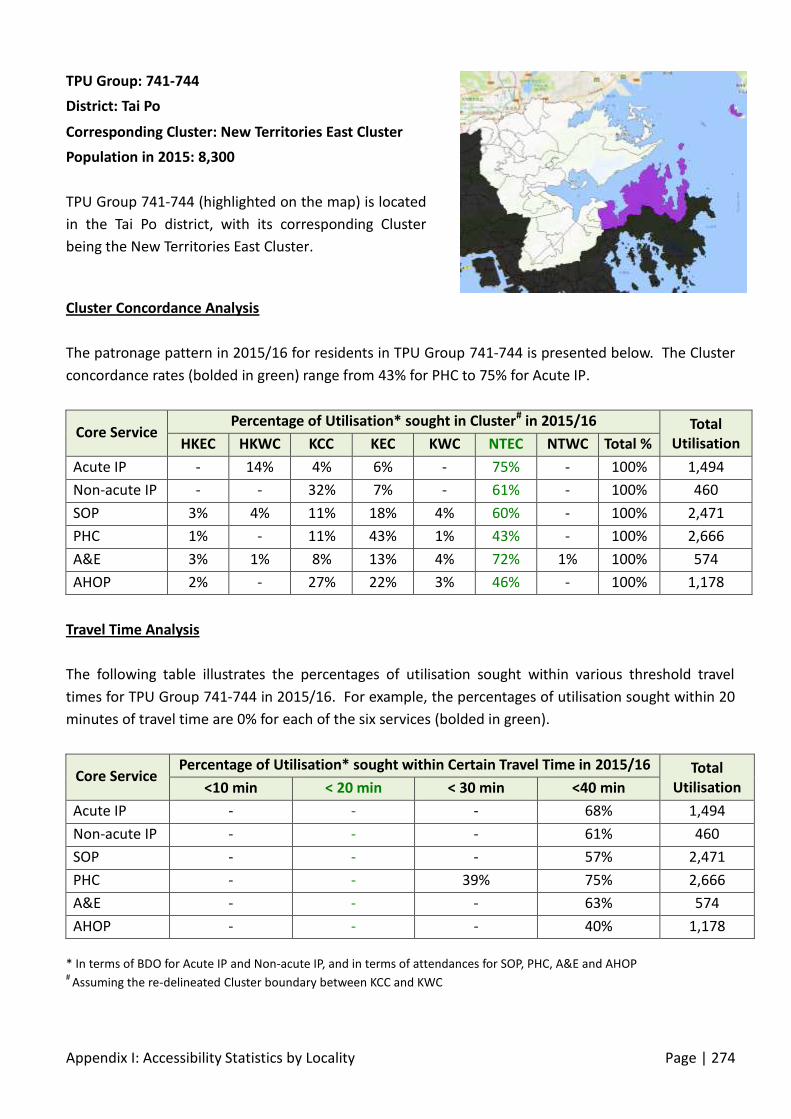
Appendix I: Accessibility Statistics by Locality Page | 274
Cluster Concordance Analysis
The patronage pattern in 2015/16 for residents in TPU Group 741-744 is presented below. The Cluster
concordance rates (bolded in green) range from 43% for PHC to 75% for Acute IP.
Core Service Percentage of Utilisation* sought in Cluster# in 2015/16 Total
Utilisation HKEC HKWC KCC KEC KWC NTEC NTWC Total %
Acute IP - 14% 4% 6% - 75% - 100% 1,494
Non-acute IP - - 32% 7% - 61% - 100% 460
SOP 3% 4% 11% 18% 4% 60% - 100% 2,471
PHC 1% - 11% 43% 1% 43% - 100% 2,666
A&E 3% 1% 8% 13% 4% 72% 1% 100% 574
AHOP 2% - 27% 22% 3% 46% - 100% 1,178
Travel Time Analysis
The following table illustrates the percentages of utilisation sought within various threshold travel
times for TPU Group 741-744 in 2015/16. For example, the percentages of utilisation sought within 20
minutes of travel time are 0% for each of the six services (bolded in green).
Core Service Percentage of Utilisation* sought within Certain Travel Time in 2015/16 Total
Utilisation <10 min < 20 min < 30 min <40 min
Acute IP - - - 68% 1,494
Non-acute IP - - - 61% 460
SOP - - - 57% 2,471
PHC - - 39% 75% 2,666
A&E - - - 63% 574
AHOP - - - 40% 1,178
* In terms of BDO for Acute IP and Non-acute IP, and in terms of attendances for SOP, PHC, A&E and AHOP #
Assuming the re-delineated Cluster boundary between KCC and KWC
TPU Group: 741-744
District: Tai Po
Corresponding Cluster: New Territories East Cluster
Population in 2015: 8,300
TPU Group 741-744 (highlighted on the map) is located
in the Tai Po district, with its corresponding Cluster
being the New Territories East Cluster.
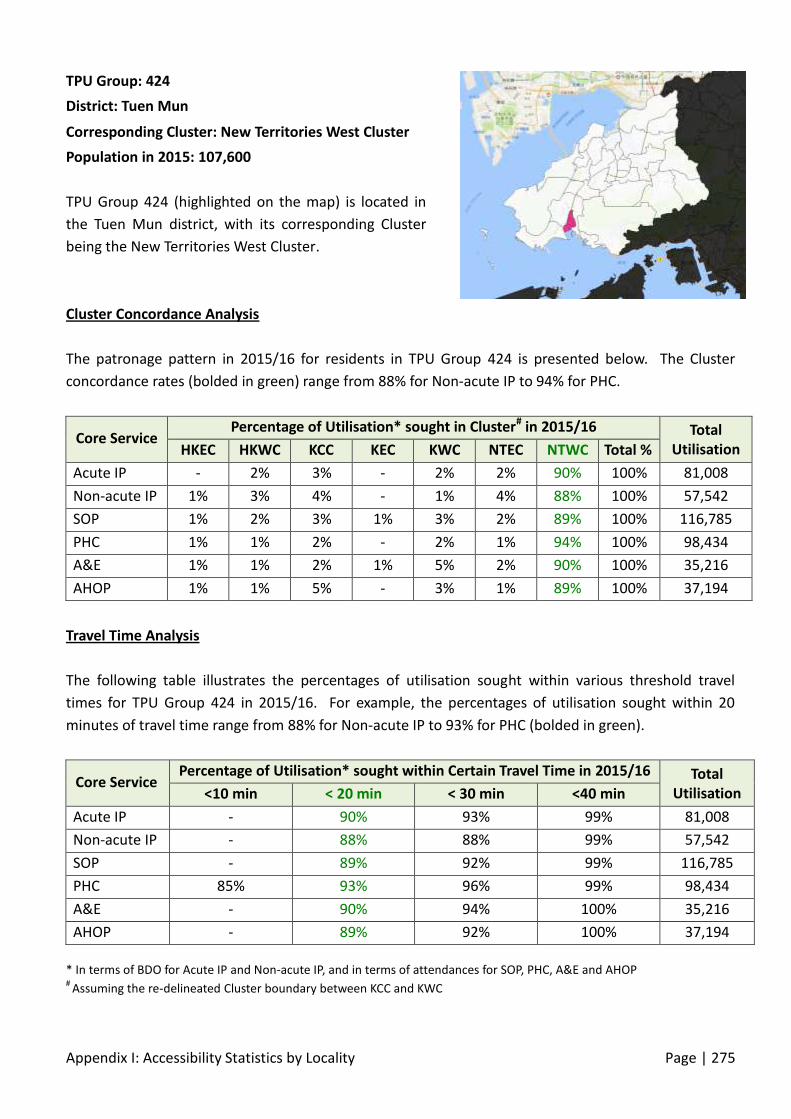
Appendix I: Accessibility Statistics by Locality Page | 275
Cluster Concordance Analysis
The patronage pattern in 2015/16 for residents in TPU Group 424 is presented below. The Cluster
concordance rates (bolded in green) range from 88% for Non-acute IP to 94% for PHC.
Core Service Percentage of Utilisation* sought in Cluster# in 2015/16 Total
Utilisation HKEC HKWC KCC KEC KWC NTEC NTWC Total %
Acute IP - 2% 3% - 2% 2% 90% 100% 81,008
Non-acute IP 1% 3% 4% - 1% 4% 88% 100% 57,542
SOP 1% 2% 3% 1% 3% 2% 89% 100% 116,785
PHC 1% 1% 2% - 2% 1% 94% 100% 98,434
A&E 1% 1% 2% 1% 5% 2% 90% 100% 35,216
AHOP 1% 1% 5% - 3% 1% 89% 100% 37,194
Travel Time Analysis
The following table illustrates the percentages of utilisation sought within various threshold travel
times for TPU Group 424 in 2015/16. For example, the percentages of utilisation sought within 20
minutes of travel time range from 88% for Non-acute IP to 93% for PHC (bolded in green).
Core Service Percentage of Utilisation* sought within Certain Travel Time in 2015/16 Total
Utilisation <10 min < 20 min < 30 min <40 min
Acute IP - 90% 93% 99% 81,008
Non-acute IP - 88% 88% 99% 57,542
SOP - 89% 92% 99% 116,785
PHC 85% 93% 96% 99% 98,434
A&E - 90% 94% 100% 35,216
AHOP - 89% 92% 100% 37,194
* In terms of BDO for Acute IP and Non-acute IP, and in terms of attendances for SOP, PHC, A&E and AHOP #
Assuming the re-delineated Cluster boundary between KCC and KWC
TPU Group: 424
District: Tuen Mun
Corresponding Cluster: New Territories West Cluster
Population in 2015: 107,600
TPU Group 424 (highlighted on the map) is located in
the Tuen Mun district, with its corresponding Cluster
being the New Territories West Cluster.
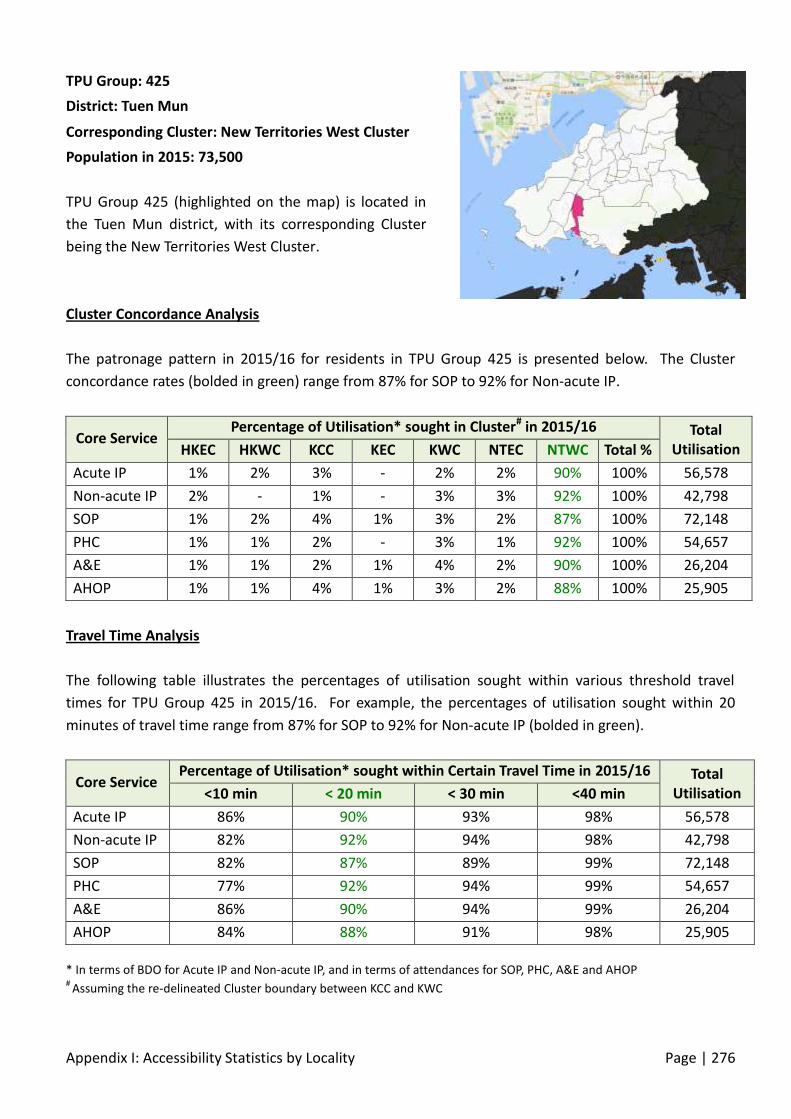
Appendix I: Accessibility Statistics by Locality Page | 276
Cluster Concordance Analysis
The patronage pattern in 2015/16 for residents in TPU Group 425 is presented below. The Cluster
concordance rates (bolded in green) range from 87% for SOP to 92% for Non-acute IP.
Core Service Percentage of Utilisation* sought in Cluster# in 2015/16 Total
Utilisation HKEC HKWC KCC KEC KWC NTEC NTWC Total %
Acute IP 1% 2% 3% - 2% 2% 90% 100% 56,578
Non-acute IP 2% - 1% - 3% 3% 92% 100% 42,798
SOP 1% 2% 4% 1% 3% 2% 87% 100% 72,148
PHC 1% 1% 2% - 3% 1% 92% 100% 54,657
A&E 1% 1% 2% 1% 4% 2% 90% 100% 26,204
AHOP 1% 1% 4% 1% 3% 2% 88% 100% 25,905
Travel Time Analysis
The following table illustrates the percentages of utilisation sought within various threshold travel
times for TPU Group 425 in 2015/16. For example, the percentages of utilisation sought within 20
minutes of travel time range from 87% for SOP to 92% for Non-acute IP (bolded in green).
Core Service Percentage of Utilisation* sought within Certain Travel Time in 2015/16 Total
Utilisation <10 min < 20 min < 30 min <40 min
Acute IP 86% 90% 93% 98% 56,578
Non-acute IP 82% 92% 94% 98% 42,798
SOP 82% 87% 89% 99% 72,148
PHC 77% 92% 94% 99% 54,657
A&E 86% 90% 94% 99% 26,204
AHOP 84% 88% 91% 98% 25,905
* In terms of BDO for Acute IP and Non-acute IP, and in terms of attendances for SOP, PHC, A&E and AHOP #
Assuming the re-delineated Cluster boundary between KCC and KWC
TPU Group: 425
District: Tuen Mun
Corresponding Cluster: New Territories West Cluster
Population in 2015: 73,500
TPU Group 425 (highlighted on the map) is located in
the Tuen Mun district, with its corresponding Cluster
being the New Territories West Cluster.
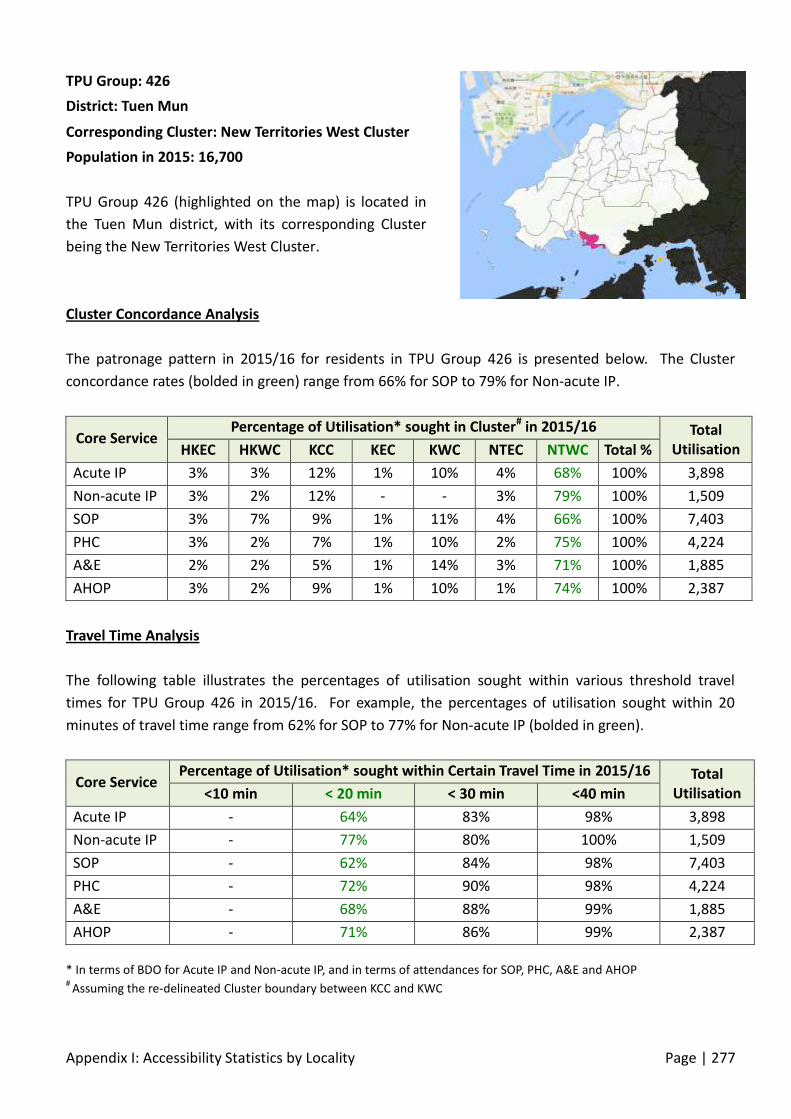
Appendix I: Accessibility Statistics by Locality Page | 277
Cluster Concordance Analysis
The patronage pattern in 2015/16 for residents in TPU Group 426 is presented below. The Cluster
concordance rates (bolded in green) range from 66% for SOP to 79% for Non-acute IP.
Core Service Percentage of Utilisation* sought in Cluster# in 2015/16 Total
Utilisation HKEC HKWC KCC KEC KWC NTEC NTWC Total %
Acute IP 3% 3% 12% 1% 10% 4% 68% 100% 3,898
Non-acute IP 3% 2% 12% - - 3% 79% 100% 1,509
SOP 3% 7% 9% 1% 11% 4% 66% 100% 7,403
PHC 3% 2% 7% 1% 10% 2% 75% 100% 4,224
A&E 2% 2% 5% 1% 14% 3% 71% 100% 1,885
AHOP 3% 2% 9% 1% 10% 1% 74% 100% 2,387
Travel Time Analysis
The following table illustrates the percentages of utilisation sought within various threshold travel
times for TPU Group 426 in 2015/16. For example, the percentages of utilisation sought within 20
minutes of travel time range from 62% for SOP to 77% for Non-acute IP (bolded in green).
Core Service Percentage of Utilisation* sought within Certain Travel Time in 2015/16 Total
Utilisation <10 min < 20 min < 30 min <40 min
Acute IP - 64% 83% 98% 3,898
Non-acute IP - 77% 80% 100% 1,509
SOP - 62% 84% 98% 7,403
PHC - 72% 90% 98% 4,224
A&E - 68% 88% 99% 1,885
AHOP - 71% 86% 99% 2,387
* In terms of BDO for Acute IP and Non-acute IP, and in terms of attendances for SOP, PHC, A&E and AHOP #
Assuming the re-delineated Cluster boundary between KCC and KWC
TPU Group: 426
District: Tuen Mun
Corresponding Cluster: New Territories West Cluster
Population in 2015: 16,700
TPU Group 426 (highlighted on the map) is located in
the Tuen Mun district, with its corresponding Cluster
being the New Territories West Cluster.

Appendix I: Accessibility Statistics by Locality Page | 278
Cluster Concordance Analysis
The patronage pattern in 2015/16 for residents in TPU Group 441 is presented below. The Cluster
concordance rates (bolded in green) range from 82% for SOP to 90% for Non-acute IP.
Core Service Percentage of Utilisation* sought in Cluster# in 2015/16 Total
Utilisation HKEC HKWC KCC KEC KWC NTEC NTWC Total %
Acute IP 1% 2% 6% - 2% 1% 88% 100% 6,827
Non-acute IP 1% - 5% - 3% 1% 90% 100% 3,466
SOP 1% 2% 7% 1% 4% 2% 82% 100% 8,309
PHC 1% 1% 4% 1% 5% 1% 88% 100% 5,386
A&E 1% 1% 3% 1% 5% 2% 88% 100% 2,595
AHOP 1% 1% 5% - 6% 1% 86% 100% 3,274
Travel Time Analysis
The following table illustrates the percentages of utilisation sought within various threshold travel
times for TPU Group 441 in 2015/16. For example, the percentages of utilisation sought within 20
minutes of travel time range from 82% for SOP to 90% for Non-acute IP (bolded in green).
Core Service Percentage of Utilisation* sought within Certain Travel Time in 2015/16 Total
Utilisation <10 min < 20 min < 30 min <40 min
Acute IP - 88% 89% 97% 6,827
Non-acute IP - 90% 91% 96% 3,466
SOP 11% 82% 84% 95% 8,309
PHC - 88% 91% 98% 5,386
A&E - 88% 90% 98% 2,595
AHOP 3% 86% 89% 98% 3,274
* In terms of BDO for Acute IP and Non-acute IP, and in terms of attendances for SOP, PHC, A&E and AHOP #
Assuming the re-delineated Cluster boundary between KCC and KWC
TPU Group: 441
District: Tuen Mun
Corresponding Cluster: New Territories West Cluster
Population in 2015: 17,800
TPU Group 441 (highlighted on the map) is located in
the Tuen Mun district, with its corresponding Cluster
being the New Territories West Cluster.

Appendix I: Accessibility Statistics by Locality Page | 279
Cluster Concordance Analysis
The patronage pattern in 2015/16 for residents in TPU Group 442 is presented below. The Cluster
concordance rates (bolded in green) range from 80% for SOP to 93% for Non-acute IP.
Core Service Percentage of Utilisation* sought in Cluster# in 2015/16 Total
Utilisation HKEC HKWC KCC KEC KWC NTEC NTWC Total %
Acute IP - 2% 3% 1% 4% 2% 89% 100% 1,902
Non-acute IP - - 5% - 1% 2% 93% 100% 1,367
SOP 1% 2% 7% 1% 6% 3% 80% 100% 1,737
PHC 1% 1% 6% 1% 2% 2% 88% 100% 1,127
A&E 1% 1% 3% 1% 6% 2% 86% 100% 674
AHOP 1% - 7% - 3% 2% 87% 100% 700
Travel Time Analysis
The following table illustrates the percentages of utilisation sought within various threshold travel
times for TPU Group 442 in 2015/16. For example, the percentages of utilisation sought within 20
minutes of travel time range from 80% for SOP to 93% for Non-acute IP (bolded in green).
Core Service Percentage of Utilisation* sought within Certain Travel Time in 2015/16 Total
Utilisation <10 min < 20 min < 30 min <40 min
Acute IP - 89% 92% 97% 1,902
Non-acute IP - 93% 94% 95% 1,367
SOP 11% 80% 81% 95% 1,737
PHC - 82% 90% 98% 1,127
A&E - 86% 88% 96% 674
AHOP 2% 87% 89% 97% 700
* In terms of BDO for Acute IP and Non-acute IP, and in terms of attendances for SOP, PHC, A&E and AHOP #
Assuming the re-delineated Cluster boundary between KCC and KWC
TPU Group: 442
District: Tuen Mun
Corresponding Cluster: New Territories West Cluster
Population in 2015: 8,000
TPU Group 442 (highlighted on the map) is located in
the Tuen Mun district, with its corresponding Cluster
being the New Territories West Cluster.
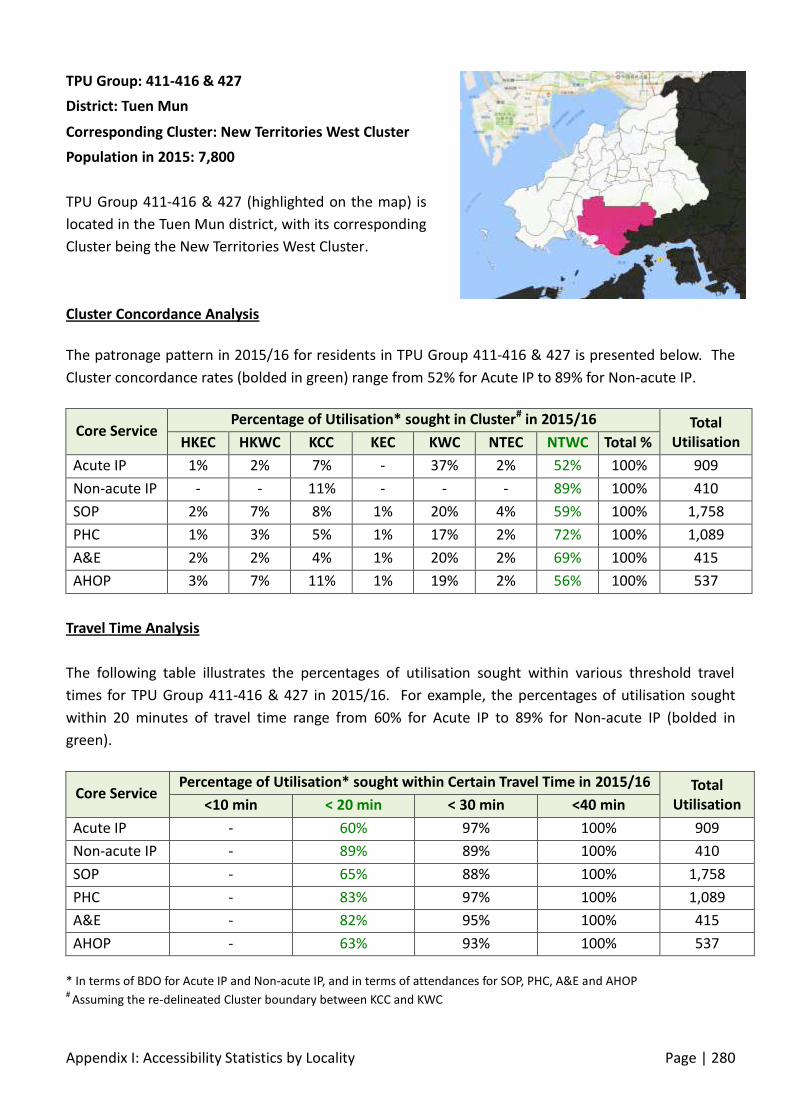
Appendix I: Accessibility Statistics by Locality Page | 280
Cluster Concordance Analysis
The patronage pattern in 2015/16 for residents in TPU Group 411-416 & 427 is presented below. The
Cluster concordance rates (bolded in green) range from 52% for Acute IP to 89% for Non-acute IP.
Core Service Percentage of Utilisation* sought in Cluster# in 2015/16 Total
Utilisation HKEC HKWC KCC KEC KWC NTEC NTWC Total %
Acute IP 1% 2% 7% - 37% 2% 52% 100% 909
Non-acute IP - - 11% - - - 89% 100% 410
SOP 2% 7% 8% 1% 20% 4% 59% 100% 1,758
PHC 1% 3% 5% 1% 17% 2% 72% 100% 1,089
A&E 2% 2% 4% 1% 20% 2% 69% 100% 415
AHOP 3% 7% 11% 1% 19% 2% 56% 100% 537
Travel Time Analysis
The following table illustrates the percentages of utilisation sought within various threshold travel
times for TPU Group 411-416 & 427 in 2015/16. For example, the percentages of utilisation sought
within 20 minutes of travel time range from 60% for Acute IP to 89% for Non-acute IP (bolded in
green).
Core Service Percentage of Utilisation* sought within Certain Travel Time in 2015/16 Total
Utilisation <10 min < 20 min < 30 min <40 min
Acute IP - 60% 97% 100% 909
Non-acute IP - 89% 89% 100% 410
SOP - 65% 88% 100% 1,758
PHC - 83% 97% 100% 1,089
A&E - 82% 95% 100% 415
AHOP - 63% 93% 100% 537
* In terms of BDO for Acute IP and Non-acute IP, and in terms of attendances for SOP, PHC, A&E and AHOP #
Assuming the re-delineated Cluster boundary between KCC and KWC
TPU Group: 411-416 & 427
District: Tuen Mun
Corresponding Cluster: New Territories West Cluster
Population in 2015: 7,800
TPU Group 411-416 & 427 (highlighted on the map) is
located in the Tuen Mun district, with its corresponding
Cluster being the New Territories West Cluster.
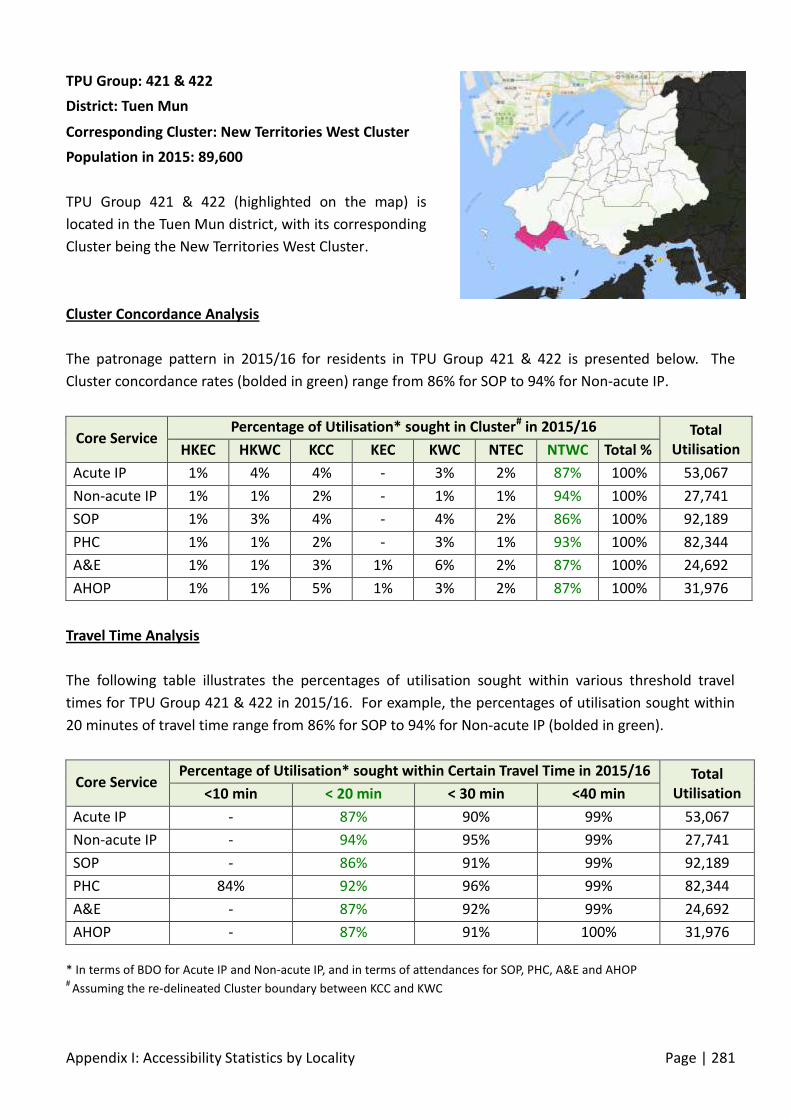
Appendix I: Accessibility Statistics by Locality Page | 281
Cluster Concordance Analysis
The patronage pattern in 2015/16 for residents in TPU Group 421 & 422 is presented below. The
Cluster concordance rates (bolded in green) range from 86% for SOP to 94% for Non-acute IP.
Core Service Percentage of Utilisation* sought in Cluster# in 2015/16 Total
Utilisation HKEC HKWC KCC KEC KWC NTEC NTWC Total %
Acute IP 1% 4% 4% - 3% 2% 87% 100% 53,067
Non-acute IP 1% 1% 2% - 1% 1% 94% 100% 27,741
SOP 1% 3% 4% - 4% 2% 86% 100% 92,189
PHC 1% 1% 2% - 3% 1% 93% 100% 82,344
A&E 1% 1% 3% 1% 6% 2% 87% 100% 24,692
AHOP 1% 1% 5% 1% 3% 2% 87% 100% 31,976
Travel Time Analysis
The following table illustrates the percentages of utilisation sought within various threshold travel
times for TPU Group 421 & 422 in 2015/16. For example, the percentages of utilisation sought within
20 minutes of travel time range from 86% for SOP to 94% for Non-acute IP (bolded in green).
Core Service Percentage of Utilisation* sought within Certain Travel Time in 2015/16 Total
Utilisation <10 min < 20 min < 30 min <40 min
Acute IP - 87% 90% 99% 53,067
Non-acute IP - 94% 95% 99% 27,741
SOP - 86% 91% 99% 92,189
PHC 84% 92% 96% 99% 82,344
A&E - 87% 92% 99% 24,692
AHOP - 87% 91% 100% 31,976
* In terms of BDO for Acute IP and Non-acute IP, and in terms of attendances for SOP, PHC, A&E and AHOP #
Assuming the re-delineated Cluster boundary between KCC and KWC
TPU Group: 421 & 422
District: Tuen Mun
Corresponding Cluster: New Territories West Cluster
Population in 2015: 89,600
TPU Group 421 & 422 (highlighted on the map) is
located in the Tuen Mun district, with its corresponding
Cluster being the New Territories West Cluster.

Appendix I: Accessibility Statistics by Locality Page | 282
Cluster Concordance Analysis
The patronage pattern in 2015/16 for residents in TPU Group 423 & 428 is presented below. The
Cluster concordance rates (bolded in green) range from 89% for SOP to 93% for PHC.
Core Service Percentage of Utilisation* sought in Cluster# in 2015/16 Total
Utilisation HKEC HKWC KCC KEC KWC NTEC NTWC Total %
Acute IP 1% 3% 2% - 2% 2% 89% 100% 125,732
Non-acute IP 1% - 2% - 3% 4% 91% 100% 93,005
SOP 1% 2% 3% 1% 3% 2% 89% 100% 203,292
PHC 1% 1% 2% 1% 2% 1% 93% 100% 161,810
A&E 1% 1% 2% 1% 4% 2% 89% 100% 67,459
AHOP 1% 1% 4% 1% 2% 1% 90% 100% 69,687
Travel Time Analysis
The following table illustrates the percentages of utilisation sought within various threshold travel
times for TPU Group 423 & 428 in 2015/16. For example, the percentages of utilisation sought within
20 minutes of travel time range from 89% for SOP to 93% for PHC (bolded in green).
Core Service Percentage of Utilisation* sought within Certain Travel Time in 2015/16 Total
Utilisation <10 min < 20 min < 30 min <40 min
Acute IP 83% 89% 92% 99% 125,732
Non-acute IP 85% 91% 93% 99% 93,005
SOP 85% 89% 92% 99% 203,292
PHC 75% 93% 95% 99% 161,810
A&E 85% 89% 94% 100% 67,459
AHOP 85% 90% 93% 99% 69,687
* In terms of BDO for Acute IP and Non-acute IP, and in terms of attendances for SOP, PHC, A&E and AHOP #
Assuming the re-delineated Cluster boundary between KCC and KWC
TPU Group: 423 & 428
District: Tuen Mun
Corresponding Cluster: New Territories West Cluster
Population in 2015: 181,000
TPU Group 423 & 428 (highlighted on the map) is
located in the Tuen Mun district, with its corresponding
Cluster being the New Territories West Cluster.
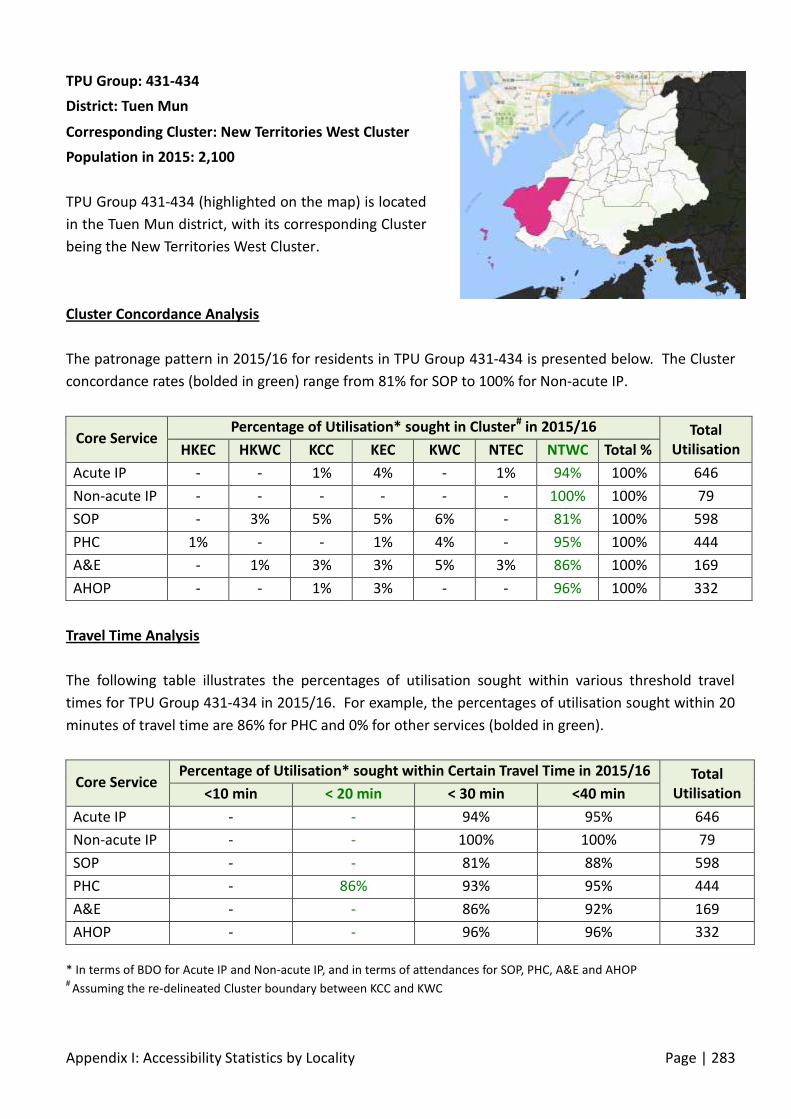
Appendix I: Accessibility Statistics by Locality Page | 283
Cluster Concordance Analysis
The patronage pattern in 2015/16 for residents in TPU Group 431-434 is presented below. The Cluster
concordance rates (bolded in green) range from 81% for SOP to 100% for Non-acute IP.
Core Service Percentage of Utilisation* sought in Cluster# in 2015/16 Total
Utilisation HKEC HKWC KCC KEC KWC NTEC NTWC Total %
Acute IP - - 1% 4% - 1% 94% 100% 646
Non-acute IP - - - - - - 100% 100% 79
SOP - 3% 5% 5% 6% - 81% 100% 598
PHC 1% - - 1% 4% - 95% 100% 444
A&E - 1% 3% 3% 5% 3% 86% 100% 169
AHOP - - 1% 3% - - 96% 100% 332
Travel Time Analysis
The following table illustrates the percentages of utilisation sought within various threshold travel
times for TPU Group 431-434 in 2015/16. For example, the percentages of utilisation sought within 20
minutes of travel time are 86% for PHC and 0% for other services (bolded in green).
Core Service Percentage of Utilisation* sought within Certain Travel Time in 2015/16 Total
Utilisation <10 min < 20 min < 30 min <40 min
Acute IP - - 94% 95% 646
Non-acute IP - - 100% 100% 79
SOP - - 81% 88% 598
PHC - 86% 93% 95% 444
A&E - - 86% 92% 169
AHOP - - 96% 96% 332
* In terms of BDO for Acute IP and Non-acute IP, and in terms of attendances for SOP, PHC, A&E and AHOP #
Assuming the re-delineated Cluster boundary between KCC and KWC
TPU Group: 431-434
District: Tuen Mun
Corresponding Cluster: New Territories West Cluster
Population in 2015: 2,100
TPU Group 431-434 (highlighted on the map) is located
in the Tuen Mun district, with its corresponding Cluster
being the New Territories West Cluster.

Appendix I: Accessibility Statistics by Locality Page | 284
Cluster Concordance Analysis
The patronage pattern in 2015/16 for residents in TPU Group 510 is presented below. The Cluster
concordance rates (bolded in green) range from 85% for Acute IP to 93% for PHC.
Core Service Percentage of Utilisation* sought in Cluster# in 2015/16 Total
Utilisation HKEC HKWC KCC KEC KWC NTEC NTWC Total %
Acute IP 1% 3% 4% 1% 3% 4% 85% 100% 198,813
Non-acute IP 1% - 1% - 2% 3% 91% 100% 104,668
SOP 1% 2% 4% 1% 3% 4% 85% 100% 330,709
PHC 1% 1% 2% - 2% 2% 93% 100% 303,144
A&E 1% 1% 2% 1% 4% 4% 87% 100% 120,252
AHOP 1% 1% 5% 1% 3% 3% 87% 100% 117,389
Travel Time Analysis
The following table illustrates the percentages of utilisation sought within various threshold travel
times for TPU Group 510 in 2015/16. For example, the percentages of utilisation sought within 20
minutes of travel time range from 85% for Acute IP to 93% for PHC (bolded in green).
Core Service Percentage of Utilisation* sought within Certain Travel Time in 2015/16 Total
Utilisation <10 min < 20 min < 30 min <40 min
Acute IP - 85% 89% 96% 198,813
Non-acute IP - 91% 92% 97% 104,668
SOP - 85% 89% 96% 330,709
PHC 79% 93% 96% 99% 303,144
A&E - 87% 92% 98% 120,252
AHOP - 87% 90% 97% 117,389
* In terms of BDO for Acute IP and Non-acute IP, and in terms of attendances for SOP, PHC, A&E and AHOP #
Assuming the re-delineated Cluster boundary between KCC and KWC
TPU Group: 510
District: Yuen Long
Corresponding Cluster: New Territories West Cluster
Population in 2015: 291,400
TPU Group 510 (highlighted on the map) is located in
the Yuen Long district, with its corresponding Cluster
being the New Territories West Cluster.

Appendix I: Accessibility Statistics by Locality Page | 285
Cluster Concordance Analysis
The patronage pattern in 2015/16 for residents in TPU Group 511 is presented below. The Cluster
concordance rates (bolded in green) range from 76% for SOP to 94% for AHOP.
Core Service Percentage of Utilisation* sought in Cluster# in 2015/16 Total
Utilisation HKEC HKWC KCC KEC KWC NTEC NTWC Total %
Acute IP 1% 8% 2% - 3% 7% 80% 100% 1,328
Non-acute IP - - - - - 7% 93% 100% 847
SOP 2% 7% 4% 3% 3% 5% 76% 100% 1,541
PHC 1% 1% 3% 1% 1% 1% 93% 100% 1,402
A&E 1% 1% 2% 1% 5% 4% 87% 100% 564
AHOP - 1% - 1% 2% 3% 94% 100% 693
Travel Time Analysis
The following table illustrates the percentages of utilisation sought within various threshold travel
times for TPU Group 511 in 2015/16. For example, the percentages of utilisation sought within 20
minutes of travel time range from 76% for SOP to 94% for AHOP (bolded in green).
Core Service Percentage of Utilisation* sought within Certain Travel Time in 2015/16 Total
Utilisation <10 min < 20 min < 30 min <40 min
Acute IP - 80% 82% 91% 1,328
Non-acute IP - 93% 93% 100% 847
SOP - 76% 78% 87% 1,541
PHC - 93% 95% 99% 1,402
A&E - 87% 92% 98% 564
AHOP - 94% 95% 98% 693
* In terms of BDO for Acute IP and Non-acute IP, and in terms of attendances for SOP, PHC, A&E and AHOP #
Assuming the re-delineated Cluster boundary between KCC and KWC
TPU Group: 511
District: Yuen Long
Corresponding Cluster: New Territories West Cluster
Population in 2015: 6,600
TPU Group 511 (highlighted on the map) is located in
the Yuen Long district, with its corresponding Cluster
being the New Territories West Cluster.

Appendix I: Accessibility Statistics by Locality Page | 286
Cluster Concordance Analysis
The patronage pattern in 2015/16 for residents in TPU Group 512 is presented below. The Cluster
concordance rates (bolded in green) range from 74% for Non-acute IP to 95% for AHOP.
Core Service Percentage of Utilisation* sought in Cluster# in 2015/16 Total
Utilisation HKEC HKWC KCC KEC KWC NTEC NTWC Total %
Acute IP 1% 3% 1% - 1% 1% 92% 100% 5,992
Non-acute IP - - 1% - - 25% 74% 100% 4,345
SOP - 4% 4% 1% 3% 4% 84% 100% 3,830
PHC 1% - 2% 1% 1% 5% 90% 100% 2,653
A&E 1% - 2% 1% 2% 2% 93% 100% 1,745
AHOP - - 1% - 2% 1% 95% 100% 1,759
Travel Time Analysis
The following table illustrates the percentages of utilisation sought within various threshold travel
times for TPU Group 512 in 2015/16. For example, the percentages of utilisation sought within 20
minutes of travel time range from 74% for Non-acute IP to 95% for AHOP (bolded in green).
Core Service Percentage of Utilisation* sought within Certain Travel Time in 2015/16 Total
Utilisation <10 min < 20 min < 30 min <40 min
Acute IP - 92% 93% 95% 5,992
Non-acute IP - 74% 74% 100% 4,345
SOP - 84% 85% 92% 3,830
PHC - 89% 91% 96% 2,653
A&E - 93% 94% 97% 1,745
AHOP - 95% 95% 99% 1,759
* In terms of BDO for Acute IP and Non-acute IP, and in terms of attendances for SOP, PHC, A&E and AHOP #
Assuming the re-delineated Cluster boundary between KCC and KWC
TPU Group: 512
District: Yuen Long
Corresponding Cluster: New Territories West Cluster
Population in 2015: 6,900
TPU Group 512 (highlighted on the map) is located in
the Yuen Long district, with its corresponding Cluster
being the New Territories West Cluster.

Appendix I: Accessibility Statistics by Locality Page | 287
Cluster Concordance Analysis
The patronage pattern in 2015/16 for residents in TPU Group 513 is presented below. The Cluster
concordance rates (bolded in green) range from 24% for AHOP to 100% for Non-acute IP.
Core Service Percentage of Utilisation* sought in Cluster# in 2015/16 Total
Utilisation HKEC HKWC KCC KEC KWC NTEC NTWC Total %
Acute IP - 1% 29% - 1% - 70% 100% 237
Non-acute IP - - - - - - 100% 100% 82
SOP - 3% 35% - 6% 4% 52% 100% 326
PHC 3% 1% 46% 1% - 1% 49% 100% 330
A&E 2% - 22% - 2% 1% 74% 100% 153
AHOP - 4% 10% - 62% - 24% 100% 175
Travel Time Analysis
The following table illustrates the percentages of utilisation sought within various threshold travel
times for TPU Group 513 in 2015/16. For example, the percentages of utilisation sought within 20
minutes of travel time range from 11% for AHOP to 65% for Acute IP (bolded in green).
Core Service Percentage of Utilisation* sought within Certain Travel Time in 2015/16 Total
Utilisation <10 min < 20 min < 30 min <40 min
Acute IP - 65% 70% 70% 237
Non-acute IP - 56% 100% 100% 82
SOP - 41% 52% 58% 326
PHC - 23% 49% 50% 330
A&E - 36% 74% 74% 153
AHOP - 11% 24% 86% 175
* In terms of BDO for Acute IP and Non-acute IP, and in terms of attendances for SOP, PHC, A&E and AHOP #
Assuming the re-delineated Cluster boundary between KCC and KWC
TPU Group: 513
District: Yuen Long
Corresponding Cluster: New Territories West Cluster
Population in 2015: 1,900
TPU Group 513 (highlighted on the map) is located in
the Yuen Long district, with its corresponding Cluster
being the New Territories West Cluster.

Appendix I: Accessibility Statistics by Locality Page | 288
Cluster Concordance Analysis
The patronage pattern in 2015/16 for residents in TPU Group 514 is presented below. The Cluster
concordance rates (bolded in green) range from 78% for A&E to 92% for AHOP.
Core Service Percentage of Utilisation* sought in Cluster# in 2015/16 Total
Utilisation HKEC HKWC KCC KEC KWC NTEC NTWC Total %
Acute IP 8% 3% 3% 1% 3% 1% 82% 100% 649
Non-acute IP 9% - - - - - 91% 100% 217
SOP 2% 2% 7% 1% 3% 2% 84% 100% 975
PHC - - 4% - - 5% 90% 100% 795
A&E 2% - 7% 1% 6% 5% 78% 100% 364
AHOP - - 7% - 1% - 92% 100% 249
Travel Time Analysis
The following table illustrates the percentages of utilisation sought within various threshold travel
times for TPU Group 514 in 2015/16. For example, the percentages of utilisation sought within 20
minutes of travel time range from 78% for A&E to 92% for AHOP (bolded in green).
Core Service Percentage of Utilisation* sought within Certain Travel Time in 2015/16 Total
Utilisation <10 min < 20 min < 30 min <40 min
Acute IP - 82% 83% 89% 649
Non-acute IP - 91% 91% 91% 217
SOP - 84% 85% 93% 975
PHC 13% 90% 93% 99% 795
A&E - 78% 85% 96% 364
AHOP - 92% 93% 100% 249
* In terms of BDO for Acute IP and Non-acute IP, and in terms of attendances for SOP, PHC, A&E and AHOP #
Assuming the re-delineated Cluster boundary between KCC and KWC
TPU Group: 514
District: Yuen Long
Corresponding Cluster: New Territories West Cluster
Population in 2015: 2,700
TPU Group 514 (highlighted on the map) is located in
the Yuen Long district, with its corresponding Cluster
being the New Territories West Cluster.

Appendix I: Accessibility Statistics by Locality Page | 289
Cluster Concordance Analysis
The patronage pattern in 2015/16 for residents in TPU Group 516 is presented below. The Cluster
concordance rates (bolded in green) range from 65% for Acute IP to 100% for Non-acute IP.
Core Service Percentage of Utilisation* sought in Cluster# in 2015/16 Total
Utilisation HKEC HKWC KCC KEC KWC NTEC NTWC Total %
Acute IP 5% 1% 2% - 1% 27% 65% 100% 567
Non-acute IP - - - - - - 100% 100% 117
SOP 2% 2% 6% - 2% 3% 85% 100% 686
PHC - - 1% 2% - 5% 91% 100% 666
A&E - 1% 1% 2% 3% 6% 88% 100% 299
AHOP - 1% 8% 5% - 2% 84% 100% 144
Travel Time Analysis
The following table illustrates the percentages of utilisation sought within various threshold travel
times for TPU Group 516 in 2015/16. For example, the percentages of utilisation sought within 20
minutes of travel time range from 14% for Non-acute IP to 76% for A&E (bolded in green).
Core Service Percentage of Utilisation* sought within Certain Travel Time in 2015/16 Total
Utilisation <10 min < 20 min < 30 min <40 min
Acute IP - 26% 75% 76% 567
Non-acute IP - 14% 100% 100% 117
SOP - 19% 86% 88% 686
PHC - 53% 95% 96% 666
A&E - 76% 93% 95% 299
AHOP - 45% 85% 85% 144
* In terms of BDO for Acute IP and Non-acute IP, and in terms of attendances for SOP, PHC, A&E and AHOP #
Assuming the re-delineated Cluster boundary between KCC and KWC
TPU Group: 516
District: Yuen Long
Corresponding Cluster: New Territories West Cluster
Population in 2015: 3,100
TPU Group 516 (highlighted on the map) is located in
the Yuen Long district, with its corresponding Cluster
being the New Territories West Cluster.

Appendix I: Accessibility Statistics by Locality Page | 290
Cluster Concordance Analysis
The patronage pattern in 2015/16 for residents in TPU Group 518 is presented below. The Cluster
concordance rates (bolded in green) range from 88% for SOP to 100% for Non-acute IP.
Core Service Percentage of Utilisation* sought in Cluster# in 2015/16 Total
Utilisation HKEC HKWC KCC KEC KWC NTEC NTWC Total %
Acute IP - 2% - - - 1% 97% 100% 775
Non-acute IP - - - - - - 100% 100% 1,128
SOP 1% 4% 1% - 2% 5% 88% 100% 832
PHC 2% - 5% - 2% 1% 90% 100% 1,213
A&E 1% - 2% - 2% 3% 92% 100% 363
AHOP - - 5% - 3% 2% 90% 100% 255
Travel Time Analysis
The following table illustrates the percentages of utilisation sought within various threshold travel
times for TPU Group 518 in 2015/16. For example, the percentages of utilisation sought within 20
minutes of travel time range from 88% for SOP to 100% for Non-acute IP (bolded in green).
Core Service Percentage of Utilisation* sought within Certain Travel Time in 2015/16 Total
Utilisation <10 min < 20 min < 30 min <40 min
Acute IP 33% 97% 97% 99% 775
Non-acute IP 11% 100% 100% 100% 1,128
SOP 22% 88% 89% 96% 832
PHC 22% 90% 92% 98% 1,213
A&E 72% 92% 95% 99% 363
AHOP 34% 90% 93% 100% 255
* In terms of BDO for Acute IP and Non-acute IP, and in terms of attendances for SOP, PHC, A&E and AHOP #
Assuming the re-delineated Cluster boundary between KCC and KWC
TPU Group: 518
District: Yuen Long
Corresponding Cluster: New Territories West Cluster
Population in 2015: 2,400
TPU Group 518 (highlighted on the map) is located in
the Yuen Long district, with its corresponding Cluster
being the New Territories West Cluster.

Appendix I: Accessibility Statistics by Locality Page | 291
Cluster Concordance Analysis
The patronage pattern in 2015/16 for residents in TPU Group 519 is presented below. The Cluster
concordance rates (bolded in green) range from 75% for Non-acute IP to 89% for PHC.
Core Service Percentage of Utilisation* sought in Cluster# in 2015/16 Total
Utilisation HKEC HKWC KCC KEC KWC NTEC NTWC Total %
Acute IP 1% 3% 7% - 2% 4% 84% 100% 3,745
Non-acute IP - - - - - 26% 75% 100% 2,645
SOP 2% 5% 8% 1% 4% 4% 77% 100% 7,120
PHC 2% - 4% 1% 3% 2% 89% 100% 6,185
A&E 1% 1% 3% 1% 5% 3% 87% 100% 2,435
AHOP 1% 2% 10% 1% 2% 9% 76% 100% 2,552
Travel Time Analysis
The following table illustrates the percentages of utilisation sought within various threshold travel
times for TPU Group 519 in 2015/16. For example, the percentages of utilisation sought within 20
minutes of travel time range from 75% for Non-acute IP to 89% for PHC (bolded in green).
Core Service Percentage of Utilisation* sought within Certain Travel Time in 2015/16 Total
Utilisation <10 min < 20 min < 30 min <40 min
Acute IP - 84% 86% 96% 3,745
Non-acute IP - 75% 75% 100% 2,645
SOP - 77% 81% 92% 7,120
PHC 42% 89% 92% 98% 6,185
A&E - 87% 91% 97% 2,435
AHOP - 76% 78% 94% 2,552
* In terms of BDO for Acute IP and Non-acute IP, and in terms of attendances for SOP, PHC, A&E and AHOP #
Assuming the re-delineated Cluster boundary between KCC and KWC
TPU Group: 519
District: Yuen Long
Corresponding Cluster: New Territories West Cluster
Population in 2015: 13,100
TPU Group 519 (highlighted on the map) is located in
the Yuen Long district, with its corresponding Cluster
being the New Territories West Cluster.

Appendix I: Accessibility Statistics by Locality Page | 292
Cluster Concordance Analysis
The patronage pattern in 2015/16 for residents in TPU Group 521 is presented below. The Cluster
concordance rates (bolded in green) range from 73% for Non-acute IP to 92% for A&E.
Core Service Percentage of Utilisation* sought in Cluster# in 2015/16 Total
Utilisation HKEC HKWC KCC KEC KWC NTEC NTWC Total %
Acute IP 1% 1% 1% - 5% 1% 92% 100% 5,953
Non-acute IP 19% - - - - 7% 73% 100% 3,722
SOP 1% 4% 4% 1% 4% 6% 82% 100% 3,093
PHC 1% - 4% 1% 2% 6% 86% 100% 2,827
A&E - - 2% 1% 2% 3% 92% 100% 1,928
AHOP 1% 1% 6% 1% 3% 3% 86% 100% 1,066
Travel Time Analysis
The following table illustrates the percentages of utilisation sought within various threshold travel
times for TPU Group 521 in 2015/16. For example, the percentages of utilisation sought within 20
minutes of travel time range from 31% for SOP to 85% for A&E (bolded in green).
Core Service Percentage of Utilisation* sought within Certain Travel Time in 2015/16 Total
Utilisation <10 min < 20 min < 30 min <40 min
Acute IP 68% 68% 97% 100% 5,953
Non-acute IP 53% 53% 73% 81% 3,722
SOP 21% 31% 89% 100% 3,093
PHC 30% 85% 93% 99% 2,827
A&E 85% 85% 95% 100% 1,928
AHOP 51% 54% 88% 100% 1,066
* In terms of BDO for Acute IP and Non-acute IP, and in terms of attendances for SOP, PHC, A&E and AHOP #
Assuming the re-delineated Cluster boundary between KCC and KWC
TPU Group: 521
District: Yuen Long
Corresponding Cluster: New Territories West Cluster
Population in 2015: 10,000
TPU Group 521 (highlighted on the map) is located in
the Yuen Long district, with its corresponding Cluster
being the New Territories West Cluster.
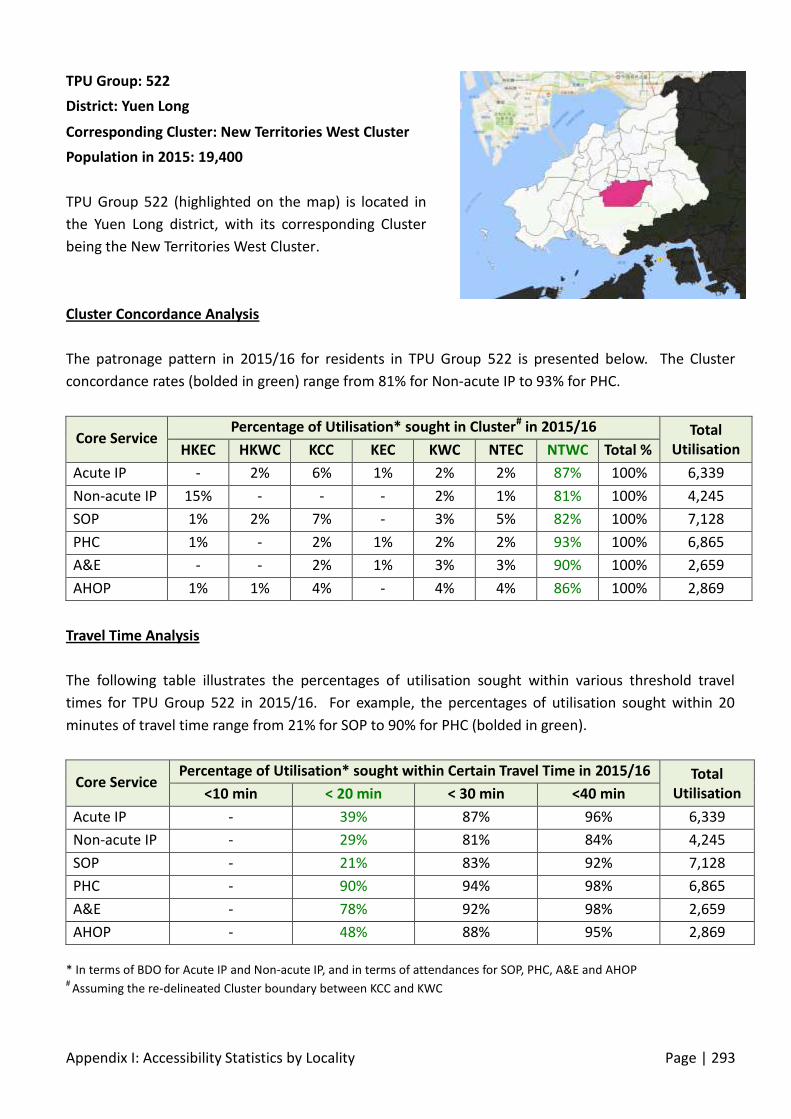
Appendix I: Accessibility Statistics by Locality Page | 293
Cluster Concordance Analysis
The patronage pattern in 2015/16 for residents in TPU Group 522 is presented below. The Cluster
concordance rates (bolded in green) range from 81% for Non-acute IP to 93% for PHC.
Core Service Percentage of Utilisation* sought in Cluster# in 2015/16 Total
Utilisation HKEC HKWC KCC KEC KWC NTEC NTWC Total %
Acute IP - 2% 6% 1% 2% 2% 87% 100% 6,339
Non-acute IP 15% - - - 2% 1% 81% 100% 4,245
SOP 1% 2% 7% - 3% 5% 82% 100% 7,128
PHC 1% - 2% 1% 2% 2% 93% 100% 6,865
A&E - - 2% 1% 3% 3% 90% 100% 2,659
AHOP 1% 1% 4% - 4% 4% 86% 100% 2,869
Travel Time Analysis
The following table illustrates the percentages of utilisation sought within various threshold travel
times for TPU Group 522 in 2015/16. For example, the percentages of utilisation sought within 20
minutes of travel time range from 21% for SOP to 90% for PHC (bolded in green).
Core Service Percentage of Utilisation* sought within Certain Travel Time in 2015/16 Total
Utilisation <10 min < 20 min < 30 min <40 min
Acute IP - 39% 87% 96% 6,339
Non-acute IP - 29% 81% 84% 4,245
SOP - 21% 83% 92% 7,128
PHC - 90% 94% 98% 6,865
A&E - 78% 92% 98% 2,659
AHOP - 48% 88% 95% 2,869
* In terms of BDO for Acute IP and Non-acute IP, and in terms of attendances for SOP, PHC, A&E and AHOP #
Assuming the re-delineated Cluster boundary between KCC and KWC
TPU Group: 522
District: Yuen Long
Corresponding Cluster: New Territories West Cluster
Population in 2015: 19,400
TPU Group 522 (highlighted on the map) is located in
the Yuen Long district, with its corresponding Cluster
being the New Territories West Cluster.

Appendix I: Accessibility Statistics by Locality Page | 294
Cluster Concordance Analysis
The patronage pattern in 2015/16 for residents in TPU Group 523 is presented below. The Cluster
concordance rates (bolded in green) range from 81% for AHOP to 99% for Non-acute IP.
Core Service Percentage of Utilisation* sought in Cluster# in 2015/16 Total
Utilisation HKEC HKWC KCC KEC KWC NTEC NTWC Total %
Acute IP - - 1% - - 1% 97% 100% 2,779
Non-acute IP - - 1% - - - 99% 100% 1,854
SOP 1% 1% 5% - 4% 2% 87% 100% 2,571
PHC - - 1% - 1% 4% 94% 100% 2,694
A&E - - 1% - 2% 3% 94% 100% 1,177
AHOP - - 5% - - 14% 81% 100% 878
Travel Time Analysis
The following table illustrates the percentages of utilisation sought within various threshold travel
times for TPU Group 523 in 2015/16. For example, the percentages of utilisation sought within 20
minutes of travel time range from 81% for AHOP to 99% for Non-acute IP (bolded in green).
Core Service Percentage of Utilisation* sought within Certain Travel Time in 2015/16 Total
Utilisation <10 min < 20 min < 30 min <40 min
Acute IP - 97% 98% 99% 2,779
Non-acute IP - 99% 99% 100% 1,854
SOP - 87% 88% 97% 2,571
PHC - 93% 95% 100% 2,694
A&E - 94% 96% 99% 1,177
AHOP - 81% 81% 98% 878
* In terms of BDO for Acute IP and Non-acute IP, and in terms of attendances for SOP, PHC, A&E and AHOP #
Assuming the re-delineated Cluster boundary between KCC and KWC
TPU Group: 523
District: Yuen Long
Corresponding Cluster: New Territories West Cluster
Population in 2015: 8,800
TPU Group 523 (highlighted on the map) is located in
the Yuen Long district, with its corresponding Cluster
being the New Territories West Cluster.

Appendix I: Accessibility Statistics by Locality Page | 295
Cluster Concordance Analysis
The patronage pattern in 2015/16 for residents in TPU Group 524 is presented below. The Cluster
concordance rates (bolded in green) range from 84% for SOP to 94% for PHC.
Core Service Percentage of Utilisation* sought in Cluster# in 2015/16 Total
Utilisation HKEC HKWC KCC KEC KWC NTEC NTWC Total %
Acute IP - 1% 3% - 1% 4% 91% 100% 67,392
Non-acute IP - - 2% 1% 2% 5% 91% 100% 37,880
SOP 1% 2% 5% 1% 3% 4% 84% 100% 57,460
PHC 1% - 2% 1% 2% 2% 94% 100% 52,625
A&E 1% - 2% - 2% 2% 93% 100% 30,405
AHOP 1% - 4% - 3% 2% 89% 100% 22,758
Travel Time Analysis
The following table illustrates the percentages of utilisation sought within various threshold travel
times for TPU Group 524 in 2015/16. For example, the percentages of utilisation sought within 20
minutes of travel time range from 85% for SOP to 95% for PHC (bolded in green).
Core Service Percentage of Utilisation* sought within Certain Travel Time in 2015/16 Total
Utilisation <10 min < 20 min < 30 min <40 min
Acute IP 50% 92% 96% 100% 67,392
Non-acute IP 46% 91% 98% 100% 37,880
SOP 23% 85% 92% 99% 57,460
PHC 35% 95% 98% 100% 52,625
A&E 82% 94% 98% 100% 30,405
AHOP 51% 90% 97% 100% 22,758
* In terms of BDO for Acute IP and Non-acute IP, and in terms of attendances for SOP, PHC, A&E and AHOP #
Assuming the re-delineated Cluster boundary between KCC and KWC
TPU Group: 524
District: Yuen Long
Corresponding Cluster: New Territories West Cluster
Population in 2015: 64,600
TPU Group 524 (highlighted on the map) is located in
the Yuen Long district, with its corresponding Cluster
being the New Territories West Cluster.

Appendix I: Accessibility Statistics by Locality Page | 296
Cluster Concordance Analysis
The patronage pattern in 2015/16 for residents in TPU Group 527 is presented below. The Cluster
concordance rates (bolded in green) range from 88% for SOP to 96% for PHC.
Core Service Percentage of Utilisation* sought in Cluster# in 2015/16 Total
Utilisation HKEC HKWC KCC KEC KWC NTEC NTWC Total %
Acute IP 1% 3% 3% 1% 1% 3% 89% 100% 53,148
Non-acute IP - 2% 2% - 1% 1% 95% 100% 26,861
SOP 1% 2% 3% 1% 2% 3% 88% 100% 69,490
PHC - - 1% - 1% 1% 96% 100% 76,886
A&E 1% - 2% 1% 2% 3% 92% 100% 32,054
AHOP - 1% 3% - 1% 2% 91% 100% 27,437
Travel Time Analysis
The following table illustrates the percentages of utilisation sought within various threshold travel
times for TPU Group 527 in 2015/16. For example, the percentages of utilisation sought within 20
minutes of travel time range from 89% for SOP to 97% for PHC (bolded in green).
Core Service Percentage of Utilisation* sought within Certain Travel Time in 2015/16 Total
Utilisation <10 min < 20 min < 30 min <40 min
Acute IP 41% 90% 92% 99% 53,148
Non-acute IP 39% 95% 96% 99% 26,861
SOP 22% 89% 92% 99% 69,490
PHC 67% 97% 98% 100% 76,886
A&E 76% 93% 96% 100% 32,054
AHOP 46% 92% 94% 100% 27,437
* In terms of BDO for Acute IP and Non-acute IP, and in terms of attendances for SOP, PHC, A&E and AHOP #
Assuming the re-delineated Cluster boundary between KCC and KWC
TPU Group: 527
District: Yuen Long
Corresponding Cluster: New Territories West Cluster
Population in 2015: 67,500
TPU Group 527 (highlighted on the map) is located in
the Yuen Long district, with its corresponding Cluster
being the New Territories West Cluster.

Appendix I: Accessibility Statistics by Locality Page | 297
Cluster Concordance Analysis
The patronage pattern in 2015/16 for residents in TPU Group 528 is presented below. The Cluster
concordance rates (bolded in green) range from 86% for SOP to 100% for Non-acute IP.
Core Service Percentage of Utilisation* sought in Cluster# in 2015/16 Total
Utilisation HKEC HKWC KCC KEC KWC NTEC NTWC Total %
Acute IP - 1% 3% - 1% 4% 91% 100% 956
Non-acute IP - - - - - - 100% 100% 229
SOP 1% 2% 5% - 2% 4% 86% 100% 1,814
PHC - - 2% 1% 3% 2% 92% 100% 1,828
A&E 1% - 3% 1% 3% 4% 89% 100% 730
AHOP - 1% 2% - 2% 2% 93% 100% 681
Travel Time Analysis
The following table illustrates the percentages of utilisation sought within various threshold travel
times for TPU Group 528 in 2015/16. For example, the percentages of utilisation sought within 20
minutes of travel time range from 86% for SOP to 100% for Non-acute IP (bolded in green).
Core Service Percentage of Utilisation* sought within Certain Travel Time in 2015/16 Total
Utilisation <10 min < 20 min < 30 min <40 min
Acute IP 35% 91% 92% 98% 956
Non-acute IP 28% 100% 100% 100% 229
SOP 22% 86% 89% 96% 1,814
PHC 59% 92% 94% 99% 1,828
A&E 70% 89% 92% 99% 730
AHOP 44% 93% 95% 99% 681
* In terms of BDO for Acute IP and Non-acute IP, and in terms of attendances for SOP, PHC, A&E and AHOP #
Assuming the re-delineated Cluster boundary between KCC and KWC
TPU Group: 528
District: Yuen Long
Corresponding Cluster: New Territories West Cluster
Population in 2015: 6,500
TPU Group 528 (highlighted on the map) is located in
the Yuen Long district, with its corresponding Cluster
being the New Territories West Cluster.

Appendix I: Accessibility Statistics by Locality Page | 298
Cluster Concordance Analysis
The patronage pattern in 2015/16 for residents in TPU Group 529 is presented below. The Cluster
concordance rates (bolded in green) range from 74% for SOP to 93% for Non-acute IP.
Core Service Percentage of Utilisation* sought in Cluster# in 2015/16 Total
Utilisation HKEC HKWC KCC KEC KWC NTEC NTWC Total %
Acute IP - 2% 8% - 3% 10% 78% 100% 6,605
Non-acute IP - 1% 3% - - 3% 93% 100% 1,865
SOP 2% 3% 9% 1% 5% 6% 74% 100% 10,697
PHC 1% 1% 2% 1% 2% 2% 92% 100% 10,613
A&E 2% 1% 3% 1% 3% 4% 87% 100% 4,187
AHOP 1% 1% 6% 1% 1% 3% 88% 100% 4,966
Travel Time Analysis
The following table illustrates the percentages of utilisation sought within various threshold travel
times for TPU Group 529 in 2015/16. For example, the percentages of utilisation sought within 20
minutes of travel time range from 75% for SOP to 93% for PHC (bolded in green).
Core Service Percentage of Utilisation* sought within Certain Travel Time in 2015/16 Total
Utilisation <10 min < 20 min < 30 min <40 min
Acute IP 35% 83% 86% 100% 6,605
Non-acute IP 42% 93% 96% 100% 1,865
SOP 21% 75% 81% 99% 10,697
PHC 70% 93% 95% 99% 10,613
A&E 74% 89% 93% 99% 4,187
AHOP 56% 88% 90% 99% 4,966
* In terms of BDO for Acute IP and Non-acute IP, and in terms of attendances for SOP, PHC, A&E and AHOP #
Assuming the re-delineated Cluster boundary between KCC and KWC
TPU Group: 529
District: Yuen Long
Corresponding Cluster: New Territories West Cluster
Population in 2015: 21,000
TPU Group 529 (highlighted on the map) is located in
the Yuen Long district, with its corresponding Cluster
being the New Territories West Cluster.

Appendix I: Accessibility Statistics by Locality Page | 299
Cluster Concordance Analysis
The patronage pattern in 2015/16 for residents in TPU Group 531 is presented below. The Cluster
concordance rates (bolded in green) range from 64% for SOP to 86% for Non-acute IP.
Core Service Percentage of Utilisation* sought in Cluster# in 2015/16 Total
Utilisation HKEC HKWC KCC KEC KWC NTEC NTWC Total %
Acute IP 1% 3% 3% - 5% 5% 83% 100% 2,816
Non-acute IP 2% - - - - 12% 86% 100% 989
SOP 2% 6% 8% 1% 6% 12% 64% 100% 4,486
PHC 1% 1% 5% 1% 3% 7% 83% 100% 4,168
A&E 1% - 4% 1% 5% 7% 83% 100% 1,896
AHOP 2% 3% 14% 1% 7% 8% 67% 100% 1,773
Travel Time Analysis
The following table illustrates the percentages of utilisation sought within various threshold travel
times for TPU Group 531 in 2015/16. For example, the percentages of utilisation sought within 20
minutes of travel time range from 19% for SOP to 76% for A&E (bolded in green).
Core Service Percentage of Utilisation* sought within Certain Travel Time in 2015/16 Total
Utilisation <10 min < 20 min < 30 min <40 min
Acute IP - 46% 94% 100% 2,816
Non-acute IP - 50% 98% 98% 989
SOP - 19% 83% 98% 4,486
PHC - 44% 96% 99% 4,168
A&E - 76% 94% 99% 1,896
AHOP - 42% 90% 99% 1,773
* In terms of BDO for Acute IP and Non-acute IP, and in terms of attendances for SOP, PHC, A&E and AHOP #
Assuming the re-delineated Cluster boundary between KCC and KWC
TPU Group: 531
District: Yuen Long
Corresponding Cluster: New Territories West Cluster
Population in 2015: 15,600
TPU Group 531 (highlighted on the map) is located in
the Yuen Long district, with its corresponding Cluster
being the New Territories West Cluster.
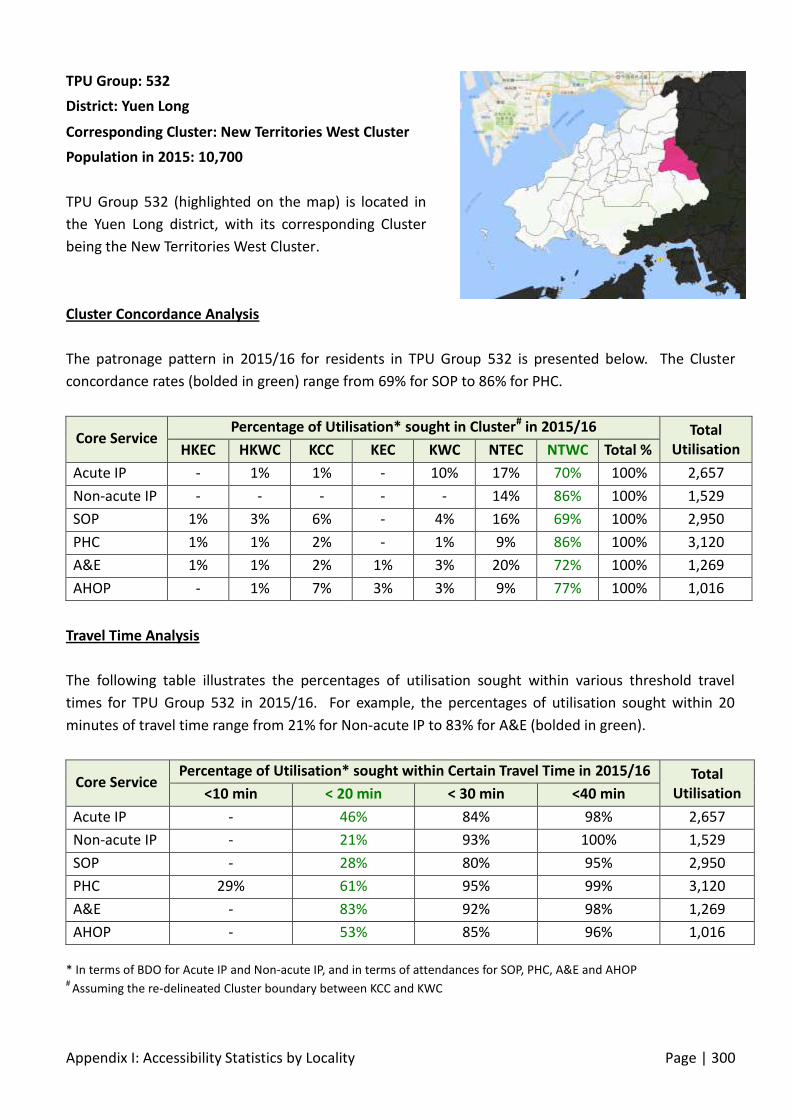
Appendix I: Accessibility Statistics by Locality Page | 300
Cluster Concordance Analysis
The patronage pattern in 2015/16 for residents in TPU Group 532 is presented below. The Cluster
concordance rates (bolded in green) range from 69% for SOP to 86% for PHC.
Core Service Percentage of Utilisation* sought in Cluster# in 2015/16 Total
Utilisation HKEC HKWC KCC KEC KWC NTEC NTWC Total %
Acute IP - 1% 1% - 10% 17% 70% 100% 2,657
Non-acute IP - - - - - 14% 86% 100% 1,529
SOP 1% 3% 6% - 4% 16% 69% 100% 2,950
PHC 1% 1% 2% - 1% 9% 86% 100% 3,120
A&E 1% 1% 2% 1% 3% 20% 72% 100% 1,269
AHOP - 1% 7% 3% 3% 9% 77% 100% 1,016
Travel Time Analysis
The following table illustrates the percentages of utilisation sought within various threshold travel
times for TPU Group 532 in 2015/16. For example, the percentages of utilisation sought within 20
minutes of travel time range from 21% for Non-acute IP to 83% for A&E (bolded in green).
Core Service Percentage of Utilisation* sought within Certain Travel Time in 2015/16 Total
Utilisation <10 min < 20 min < 30 min <40 min
Acute IP - 46% 84% 98% 2,657
Non-acute IP - 21% 93% 100% 1,529
SOP - 28% 80% 95% 2,950
PHC 29% 61% 95% 99% 3,120
A&E - 83% 92% 98% 1,269
AHOP - 53% 85% 96% 1,016
* In terms of BDO for Acute IP and Non-acute IP, and in terms of attendances for SOP, PHC, A&E and AHOP #
Assuming the re-delineated Cluster boundary between KCC and KWC
TPU Group: 532
District: Yuen Long
Corresponding Cluster: New Territories West Cluster
Population in 2015: 10,700
TPU Group 532 (highlighted on the map) is located in
the Yuen Long district, with its corresponding Cluster
being the New Territories West Cluster.

Appendix I: Accessibility Statistics by Locality Page | 301
Cluster Concordance Analysis
The patronage pattern in 2015/16 for residents in TPU Group 533 is presented below. The Cluster
concordance rates (bolded in green) range from 79% for SOP to 96% for Acute IP.
Core Service Percentage of Utilisation* sought in Cluster# in 2015/16 Total
Utilisation HKEC HKWC KCC KEC KWC NTEC NTWC Total %
Acute IP - - - 1% - 3% 96% 100% 4,885
Non-acute IP - - - 2% - 5% 93% 100% 4,164
SOP 2% 1% 4% 2% 3% 10% 79% 100% 1,861
PHC 1% - 3% 1% 2% 5% 88% 100% 1,426
A&E - - 1% 1% 1% 5% 93% 100% 1,274
AHOP - - 9% 1% - 4% 86% 100% 679
Travel Time Analysis
The following table illustrates the percentages of utilisation sought within various threshold travel
times for TPU Group 533 in 2015/16. For example, the percentages of utilisation sought within 20
minutes of travel time range from 22% for SOP to 88% for A&E (bolded in green).
Core Service Percentage of Utilisation* sought within Certain Travel Time in 2015/16 Total
Utilisation <10 min < 20 min < 30 min <40 min
Acute IP - 67% 99% 99% 4,885
Non-acute IP - 52% 98% 98% 4,164
SOP - 22% 91% 97% 1,861
PHC - 31% 94% 99% 1,426
A&E - 88% 98% 99% 1,274
AHOP - 57% 90% 99% 679
* In terms of BDO for Acute IP and Non-acute IP, and in terms of attendances for SOP, PHC, A&E and AHOP #
Assuming the re-delineated Cluster boundary between KCC and KWC
TPU Group: 533
District: Yuen Long
Corresponding Cluster: New Territories West Cluster
Population in 2015: 5,800
TPU Group 533 (highlighted on the map) is located in
the Yuen Long district, with its corresponding Cluster
being the New Territories West Cluster.

Appendix I: Accessibility Statistics by Locality Page | 302
Cluster Concordance Analysis
The patronage pattern in 2015/16 for residents in TPU Group 541 is presented below. The Cluster
concordance rates (bolded in green) range from 59% for Non-acute IP to 85% for PHC.
Core Service Percentage of Utilisation* sought in Cluster# in 2015/16 Total
Utilisation HKEC HKWC KCC KEC KWC NTEC NTWC Total %
Acute IP - 2% 4% 1% 12% 10% 71% 100% 9,900
Non-acute IP 4% - 10% 4% 4% 19% 59% 100% 8,844
SOP 2% 4% 9% 1% 6% 13% 65% 100% 9,159
PHC 1% 1% 3% 1% 3% 7% 85% 100% 6,423
A&E - 1% 2% 1% 10% 9% 78% 100% 3,143
AHOP 1% 1% 10% - 4% 5% 79% 100% 3,891
Travel Time Analysis
The following table illustrates the percentages of utilisation sought within various threshold travel
times for TPU Group 541 in 2015/16. For example, the percentages of utilisation sought within 20
minutes of travel time range from 19% for Non-acute IP to 87% for PHC (bolded in green).
Core Service Percentage of Utilisation* sought within Certain Travel Time in 2015/16 Total
Utilisation <10 min < 20 min < 30 min <40 min
Acute IP - 46% 79% 97% 9,900
Non-acute IP - 19% 64% 92% 8,844
SOP - 34% 75% 93% 9,159
PHC - 87% 91% 98% 6,423
A&E - 78% 86% 98% 3,143
AHOP - 57% 84% 99% 3,891
* In terms of BDO for Acute IP and Non-acute IP, and in terms of attendances for SOP, PHC, A&E and AHOP #
Assuming the re-delineated Cluster boundary between KCC and KWC
TPU Group: 541
District: Yuen Long
Corresponding Cluster: New Territories West Cluster
Population in 2015: 19,700
TPU Group 541 (highlighted on the map) is located in
the Yuen Long district, with its corresponding Cluster
being the New Territories West Cluster.
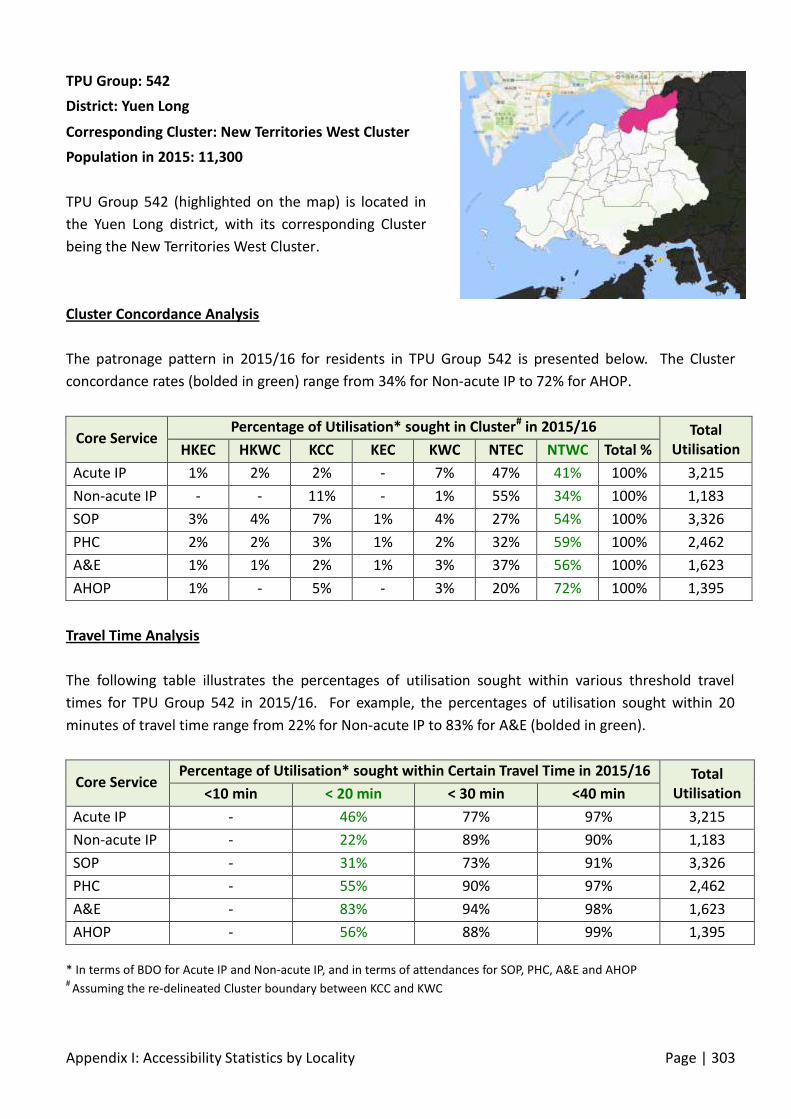
Appendix I: Accessibility Statistics by Locality Page | 303
Cluster Concordance Analysis
The patronage pattern in 2015/16 for residents in TPU Group 542 is presented below. The Cluster
concordance rates (bolded in green) range from 34% for Non-acute IP to 72% for AHOP.
Core Service Percentage of Utilisation* sought in Cluster# in 2015/16 Total
Utilisation HKEC HKWC KCC KEC KWC NTEC NTWC Total %
Acute IP 1% 2% 2% - 7% 47% 41% 100% 3,215
Non-acute IP - - 11% - 1% 55% 34% 100% 1,183
SOP 3% 4% 7% 1% 4% 27% 54% 100% 3,326
PHC 2% 2% 3% 1% 2% 32% 59% 100% 2,462
A&E 1% 1% 2% 1% 3% 37% 56% 100% 1,623
AHOP 1% - 5% - 3% 20% 72% 100% 1,395
Travel Time Analysis
The following table illustrates the percentages of utilisation sought within various threshold travel
times for TPU Group 542 in 2015/16. For example, the percentages of utilisation sought within 20
minutes of travel time range from 22% for Non-acute IP to 83% for A&E (bolded in green).
Core Service Percentage of Utilisation* sought within Certain Travel Time in 2015/16 Total
Utilisation <10 min < 20 min < 30 min <40 min
Acute IP - 46% 77% 97% 3,215
Non-acute IP - 22% 89% 90% 1,183
SOP - 31% 73% 91% 3,326
PHC - 55% 90% 97% 2,462
A&E - 83% 94% 98% 1,623
AHOP - 56% 88% 99% 1,395
* In terms of BDO for Acute IP and Non-acute IP, and in terms of attendances for SOP, PHC, A&E and AHOP #
Assuming the re-delineated Cluster boundary between KCC and KWC
TPU Group: 542
District: Yuen Long
Corresponding Cluster: New Territories West Cluster
Population in 2015: 11,300
TPU Group 542 (highlighted on the map) is located in
the Yuen Long district, with its corresponding Cluster
being the New Territories West Cluster.
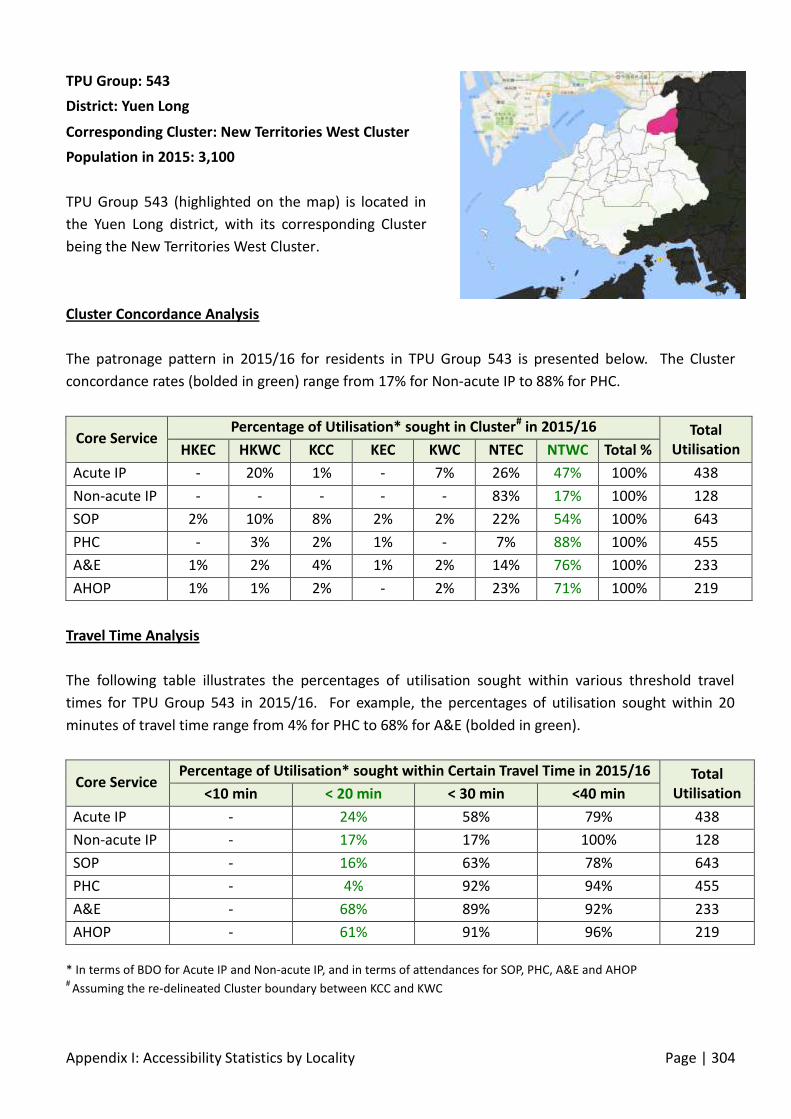
Appendix I: Accessibility Statistics by Locality Page | 304
Cluster Concordance Analysis
The patronage pattern in 2015/16 for residents in TPU Group 543 is presented below. The Cluster
concordance rates (bolded in green) range from 17% for Non-acute IP to 88% for PHC.
Core Service Percentage of Utilisation* sought in Cluster# in 2015/16 Total
Utilisation HKEC HKWC KCC KEC KWC NTEC NTWC Total %
Acute IP - 20% 1% - 7% 26% 47% 100% 438
Non-acute IP - - - - - 83% 17% 100% 128
SOP 2% 10% 8% 2% 2% 22% 54% 100% 643
PHC - 3% 2% 1% - 7% 88% 100% 455
A&E 1% 2% 4% 1% 2% 14% 76% 100% 233
AHOP 1% 1% 2% - 2% 23% 71% 100% 219
Travel Time Analysis
The following table illustrates the percentages of utilisation sought within various threshold travel
times for TPU Group 543 in 2015/16. For example, the percentages of utilisation sought within 20
minutes of travel time range from 4% for PHC to 68% for A&E (bolded in green).
Core Service Percentage of Utilisation* sought within Certain Travel Time in 2015/16 Total
Utilisation <10 min < 20 min < 30 min <40 min
Acute IP - 24% 58% 79% 438
Non-acute IP - 17% 17% 100% 128
SOP - 16% 63% 78% 643
PHC - 4% 92% 94% 455
A&E - 68% 89% 92% 233
AHOP - 61% 91% 96% 219
* In terms of BDO for Acute IP and Non-acute IP, and in terms of attendances for SOP, PHC, A&E and AHOP #
Assuming the re-delineated Cluster boundary between KCC and KWC
TPU Group: 543
District: Yuen Long
Corresponding Cluster: New Territories West Cluster
Population in 2015: 3,100
TPU Group 543 (highlighted on the map) is located in
the Yuen Long district, with its corresponding Cluster
being the New Territories West Cluster.

Appendix I: Accessibility Statistics by Locality Page | 305
Cluster Concordance Analysis
The patronage pattern in 2015/16 for residents in TPU Group 544 is presented below. The Cluster
concordance rates (bolded in green) range from 22% for Non-acute IP to 89% for PHC.
Core Service Percentage of Utilisation* sought in Cluster# in 2015/16 Total
Utilisation HKEC HKWC KCC KEC KWC NTEC NTWC Total %
Acute IP - - 3% - 3% 51% 43% 100% 1,775
Non-acute IP - - 23% - - 56% 22% 100% 1,658
SOP - - 3% 2% 2% 15% 78% 100% 956
PHC - - 1% - 1% 9% 89% 100% 656
A&E - - - - 3% 31% 65% 100% 415
AHOP - - - 1% - 17% 82% 100% 283
Travel Time Analysis
The following table illustrates the percentages of utilisation sought within various threshold travel
times for TPU Group 544 in 2015/16. For example, the percentages of utilisation sought within 20
minutes of travel time range from 12% for Non-acute IP to 89% for PHC (bolded in green).
Core Service Percentage of Utilisation* sought within Certain Travel Time in 2015/16 Total
Utilisation <10 min < 20 min < 30 min <40 min
Acute IP - 25% 48% 100% 1,775
Non-acute IP - 12% 24% 100% 1,658
SOP - 15% 82% 98% 956
PHC - 89% 92% 100% 656
A&E - 64% 70% 99% 415
AHOP - 59% 83% 100% 283
* In terms of BDO for Acute IP and Non-acute IP, and in terms of attendances for SOP, PHC, A&E and AHOP #
Assuming the re-delineated Cluster boundary between KCC and KWC
TPU Group: 544
District: Yuen Long
Corresponding Cluster: New Territories West Cluster
Population in 2015: 4,200
TPU Group 544 (highlighted on the map) is located in
the Yuen Long district, with its corresponding Cluster
being the New Territories West Cluster.

Appendix I: Accessibility Statistics by Locality Page | 306
Cluster Concordance Analysis
The patronage pattern in 2015/16 for residents in TPU Group 515 & 517 is presented below. The
Cluster concordance rates (bolded in green) range from 75% for Non-acute IP to 92% for PHC.
Core Service Percentage of Utilisation* sought in Cluster# in 2015/16 Total
Utilisation HKEC HKWC KCC KEC KWC NTEC NTWC Total %
Acute IP - 2% 3% - 2% 2% 91% 100% 6,505
Non-acute IP - - 1% 3% 5% 17% 75% 100% 4,128
SOP 1% 2% 5% 1% 5% 4% 82% 100% 5,426
PHC 1% 1% 2% 1% 2% 1% 92% 100% 4,373
A&E 1% 1% 2% 1% 2% 2% 92% 100% 2,298
AHOP 1% 1% 7% 1% 2% 2% 86% 100% 2,054
Travel Time Analysis
The following table illustrates the percentages of utilisation sought within various threshold travel
times for TPU Group 515 & 517 in 2015/16. For example, the percentages of utilisation sought within
20 minutes of travel time range from 75% for Non-acute IP to 92% for PHC (bolded in green).
Core Service Percentage of Utilisation* sought within Certain Travel Time in 2015/16 Total
Utilisation <10 min < 20 min < 30 min <40 min
Acute IP - 91% 93% 97% 6,505
Non-acute IP - 75% 79% 97% 4,128
SOP - 82% 86% 96% 5,426
PHC 56% 92% 94% 98% 4,373
A&E - 92% 94% 98% 2,298
AHOP - 86% 89% 97% 2,054
* In terms of BDO for Acute IP and Non-acute IP, and in terms of attendances for SOP, PHC, A&E and AHOP #
Assuming the re-delineated Cluster boundary between KCC and KWC
TPU Group: 515 & 517
District: Yuen Long
Corresponding Cluster: New Territories West Cluster
Population in 2015: 10,800
TPU Group 515 & 517 (highlighted on the map) is
located in the Yuen Long district, with its corresponding
Cluster being the New Territories West Cluster.
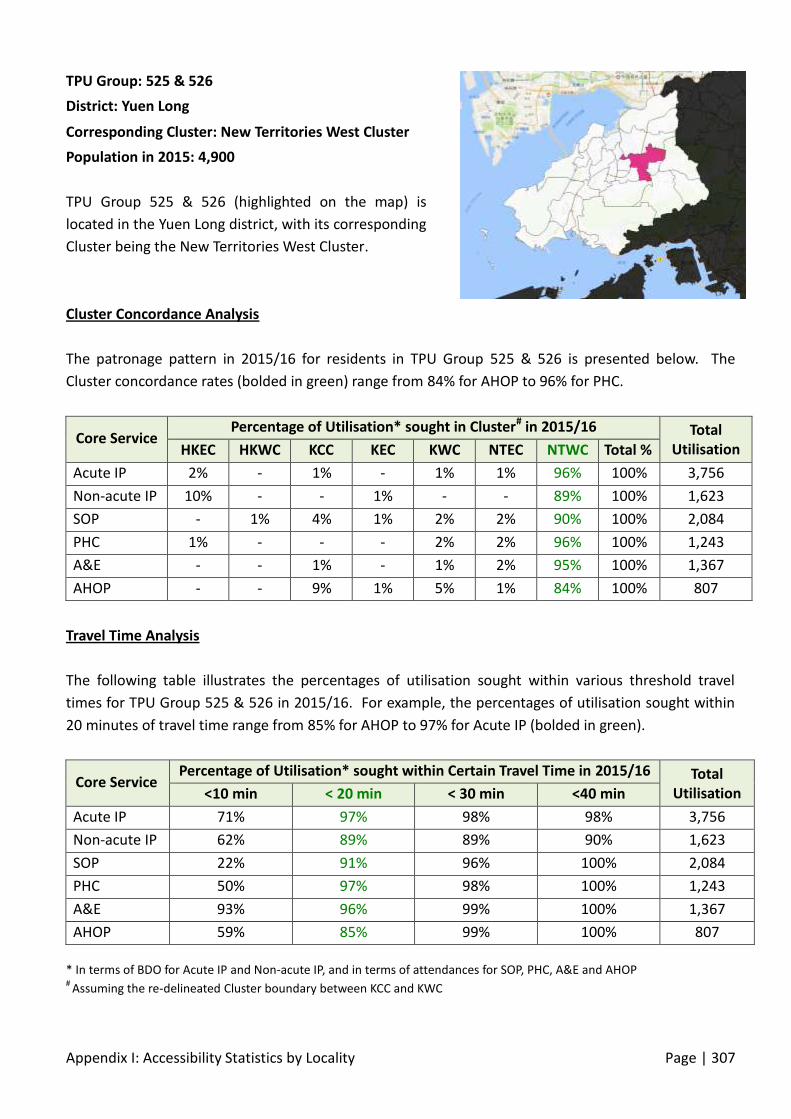
Appendix I: Accessibility Statistics by Locality Page | 307
Cluster Concordance Analysis
The patronage pattern in 2015/16 for residents in TPU Group 525 & 526 is presented below. The
Cluster concordance rates (bolded in green) range from 84% for AHOP to 96% for PHC.
Core Service Percentage of Utilisation* sought in Cluster# in 2015/16 Total
Utilisation HKEC HKWC KCC KEC KWC NTEC NTWC Total %
Acute IP 2% - 1% - 1% 1% 96% 100% 3,756
Non-acute IP 10% - - 1% - - 89% 100% 1,623
SOP - 1% 4% 1% 2% 2% 90% 100% 2,084
PHC 1% - - - 2% 2% 96% 100% 1,243
A&E - - 1% - 1% 2% 95% 100% 1,367
AHOP - - 9% 1% 5% 1% 84% 100% 807
Travel Time Analysis
The following table illustrates the percentages of utilisation sought within various threshold travel
times for TPU Group 525 & 526 in 2015/16. For example, the percentages of utilisation sought within
20 minutes of travel time range from 85% for AHOP to 97% for Acute IP (bolded in green).
Core Service Percentage of Utilisation* sought within Certain Travel Time in 2015/16 Total
Utilisation <10 min < 20 min < 30 min <40 min
Acute IP 71% 97% 98% 98% 3,756
Non-acute IP 62% 89% 89% 90% 1,623
SOP 22% 91% 96% 100% 2,084
PHC 50% 97% 98% 100% 1,243
A&E 93% 96% 99% 100% 1,367
AHOP 59% 85% 99% 100% 807
* In terms of BDO for Acute IP and Non-acute IP, and in terms of attendances for SOP, PHC, A&E and AHOP #
Assuming the re-delineated Cluster boundary between KCC and KWC
TPU Group: 525 & 526
District: Yuen Long
Corresponding Cluster: New Territories West Cluster
Population in 2015: 4,900
TPU Group 525 & 526 (highlighted on the map) is
located in the Yuen Long district, with its corresponding
Cluster being the New Territories West Cluster.

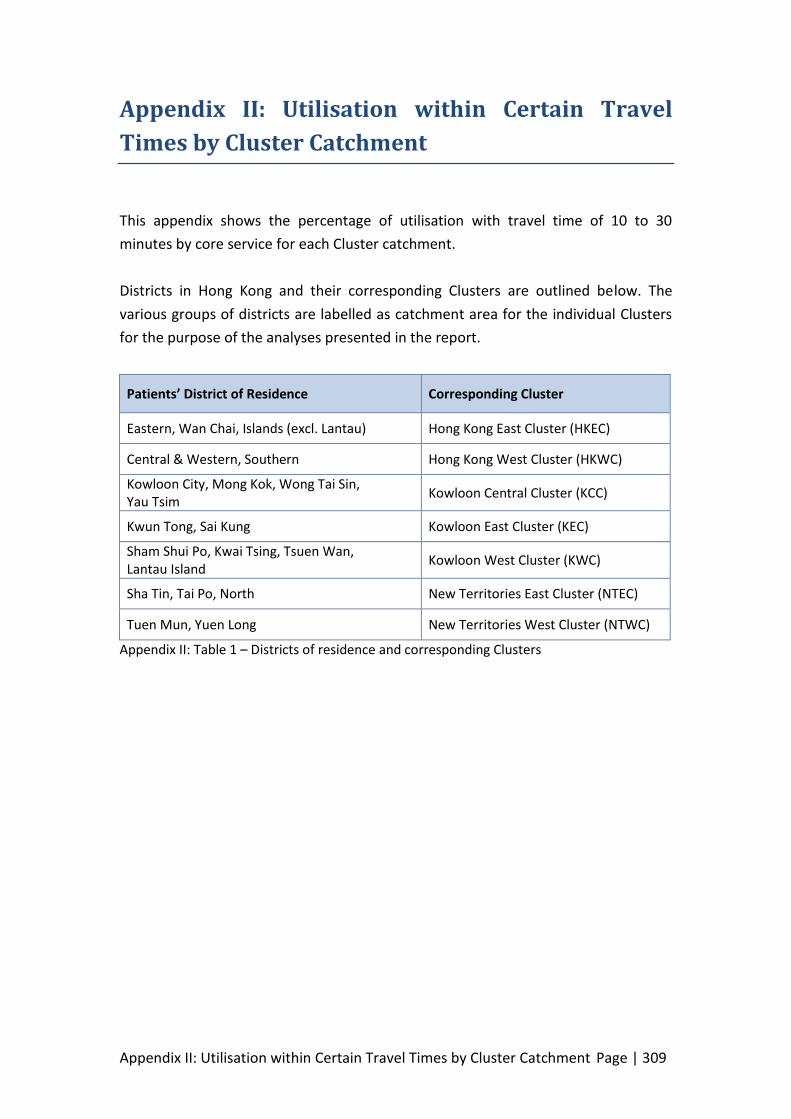
Appendix II: Utilisation within Certain Travel Times by Cluster Catchment Page | 309
Appendix II: Utilisation within Certain Travel
Times by Cluster Catchment
This appendix shows the percentage of utilisation with travel time of 10 to 30
minutes by core service for each Cluster catchment.
Districts in Hong Kong and their corresponding Clusters are outlined below. The
various groups of districts are labelled as catchment area for the individual Clusters
for the purpose of the analyses presented in the report.
Patients’ District of Residence Corresponding Cluster
Eastern, Wan Chai, Islands (excl. Lantau) Hong Kong East Cluster (HKEC)
Central & Western, Southern Hong Kong West Cluster (HKWC)
Kowloon City, Mong Kok, Wong Tai Sin, Yau Tsim
Kowloon Central Cluster (KCC)
Kwun Tong, Sai Kung Kowloon East Cluster (KEC)
Sham Shui Po, Kwai Tsing, Tsuen Wan, Lantau Island
Kowloon West Cluster (KWC)
Sha Tin, Tai Po, North New Territories East Cluster (NTEC)
Tuen Mun, Yuen Long New Territories West Cluster (NTWC)
Appendix II: Table 1 – Districts of residence and corresponding Clusters

Appendix II: Utilisation within Certain Travel Times by Cluster Catchment Page | 310
HKEC Cluster Catchment
HKEC Catchment Percentage of Utilisation Sought within Travel Time of 10 to 30 Minutes
Core Service <10 < 15 < 20 < 25 < 30
Acute IP 44% 75% 88% 91% 94%
Non-acute IP 29% 52% 76% 91% 95%
SOP 40% 72% 86% 91% 95%
PHC 52% 85% 94% 96% 97%
A&E 56% 85% 91% 94% 95%
AH OP 38% 71% 86% 93% 96%
Appendix II: Figure 1 – HKEC catchment: utilisation < travel time by core service
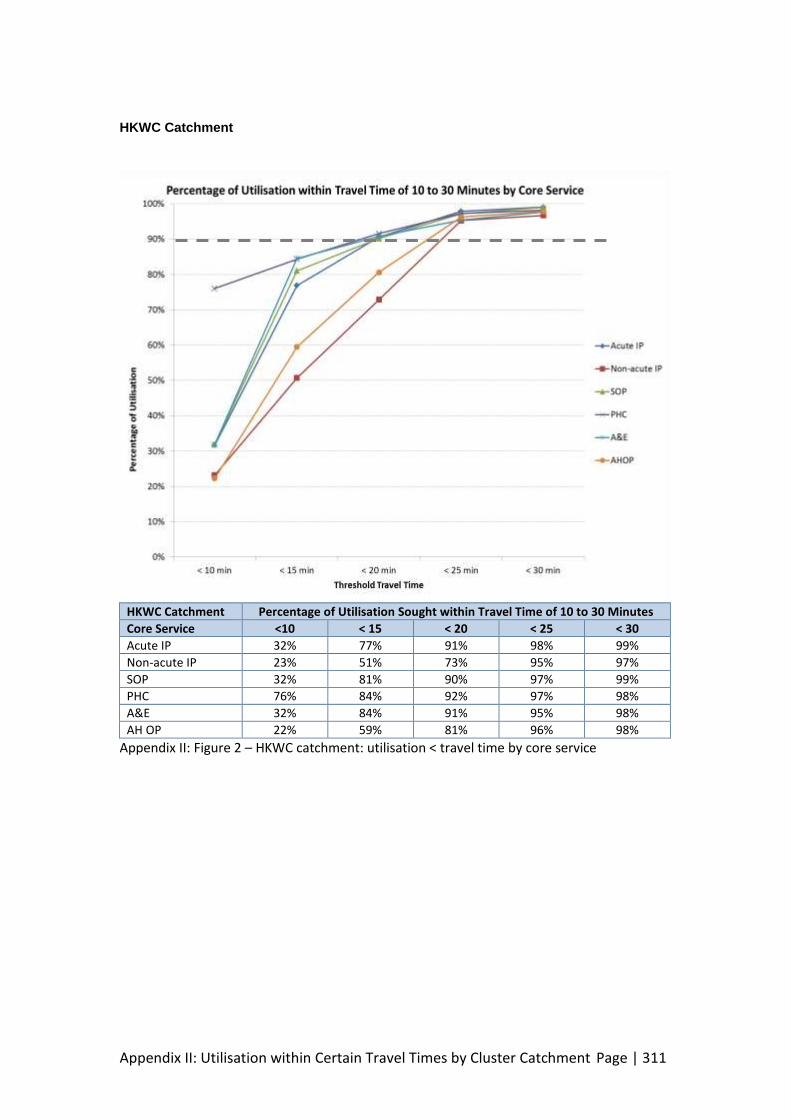
Appendix II: Utilisation within Certain Travel Times by Cluster Catchment Page | 311
HKWC Catchment
HKWC Catchment Percentage of Utilisation Sought within Travel Time of 10 to 30 Minutes
Core Service <10 < 15 < 20 < 25 < 30
Acute IP 32% 77% 91% 98% 99%
Non-acute IP 23% 51% 73% 95% 97%
SOP 32% 81% 90% 97% 99%
PHC 76% 84% 92% 97% 98%
A&E 32% 84% 91% 95% 98%
AH OP 22% 59% 81% 96% 98%
Appendix II: Figure 2 – HKWC catchment: utilisation < travel time by core service
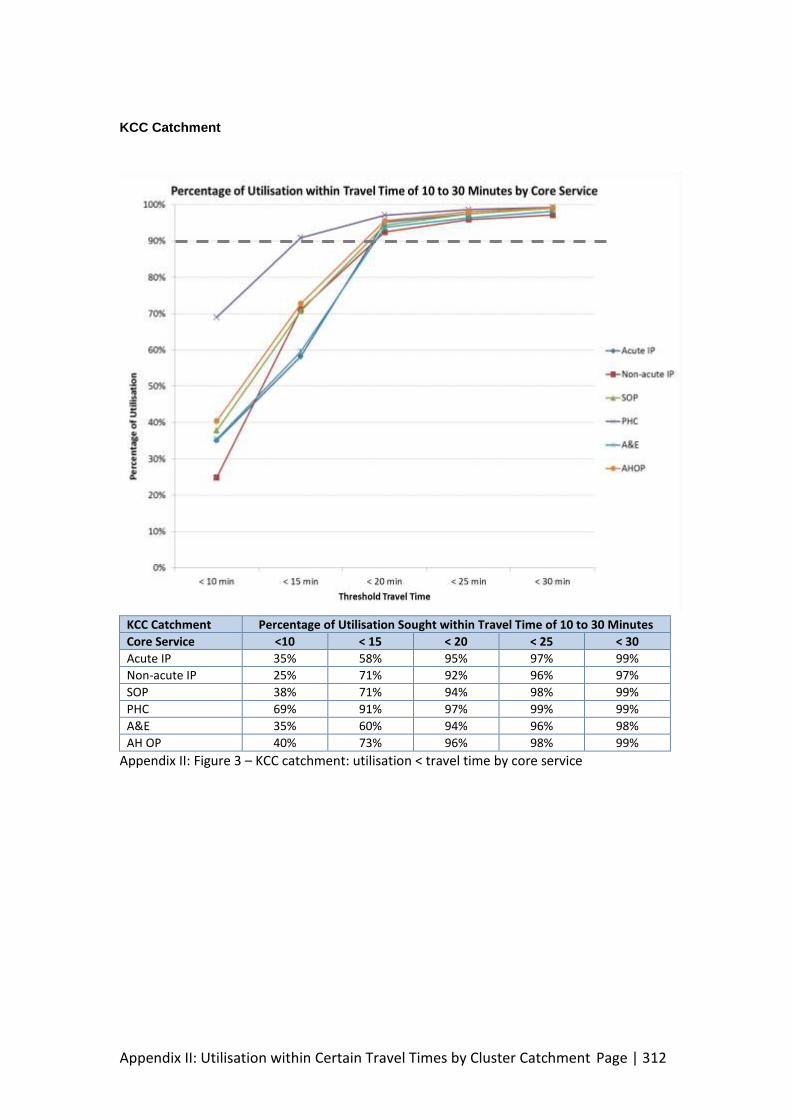
Appendix II: Utilisation within Certain Travel Times by Cluster Catchment Page | 312
KCC Catchment
KCC Catchment Percentage of Utilisation Sought within Travel Time of 10 to 30 Minutes
Core Service <10 < 15 < 20 < 25 < 30
Acute IP 35% 58% 95% 97% 99%
Non-acute IP 25% 71% 92% 96% 97%
SOP 38% 71% 94% 98% 99%
PHC 69% 91% 97% 99% 99%
A&E 35% 60% 94% 96% 98%
AH OP 40% 73% 96% 98% 99%
Appendix II: Figure 3 – KCC catchment: utilisation < travel time by core service
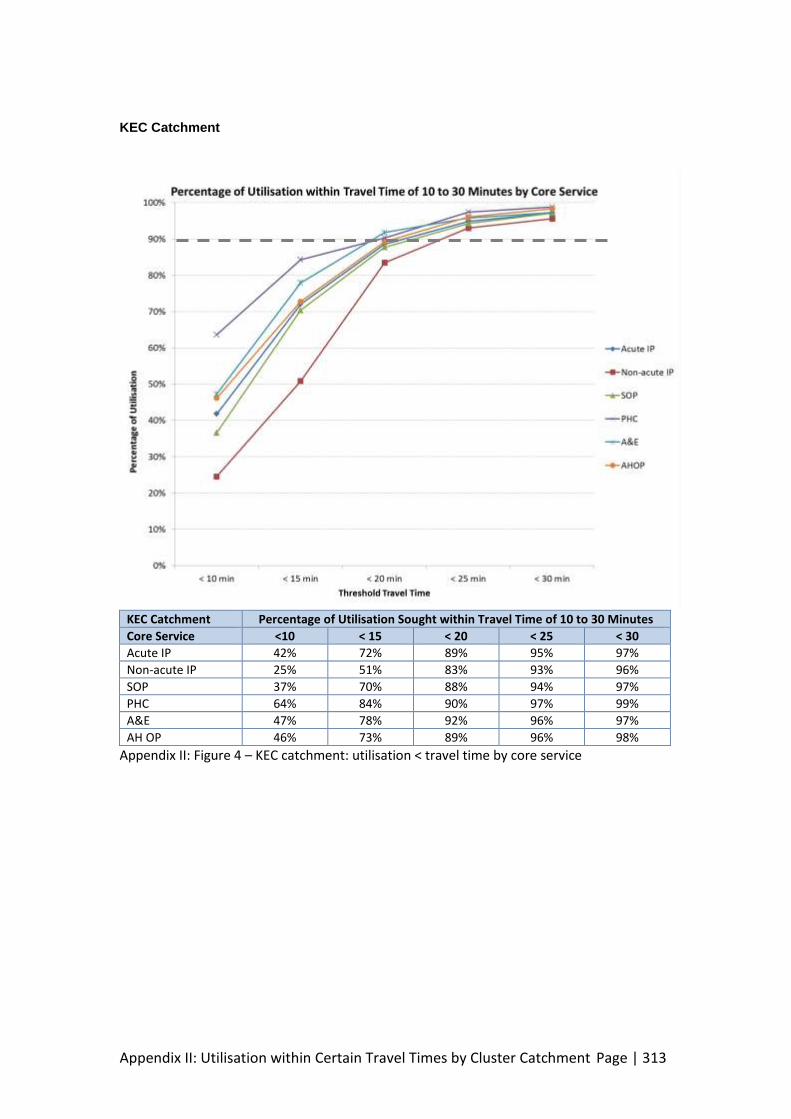
Appendix II: Utilisation within Certain Travel Times by Cluster Catchment Page | 313
KEC Catchment
KEC Catchment Percentage of Utilisation Sought within Travel Time of 10 to 30 Minutes
Core Service <10 < 15 < 20 < 25 < 30
Acute IP 42% 72% 89% 95% 97%
Non-acute IP 25% 51% 83% 93% 96%
SOP 37% 70% 88% 94% 97%
PHC 64% 84% 90% 97% 99%
A&E 47% 78% 92% 96% 97%
AH OP 46% 73% 89% 96% 98%
Appendix II: Figure 4 – KEC catchment: utilisation < travel time by core service

Appendix II: Utilisation within Certain Travel Times by Cluster Catchment Page | 314
KWC Catchment
KWC Catchment Percentage of Utilisation Sought within Travel Time of 10 to 30 Minutes
Core Service <10 < 15 < 20 < 25 < 30
Acute IP 33% 81% 88% 95% 98%
Non-acute IP 25% 76% 84% 90% 97%
SOP 30% 78% 87% 93% 97%
PHC 70% 88% 95% 97% 98%
A&E 50% 88% 93% 96% 98%
AH OP 35% 77% 88% 94% 98%
Appendix II: Figure 5 – KWC catchment: utilisation < travel time by core service
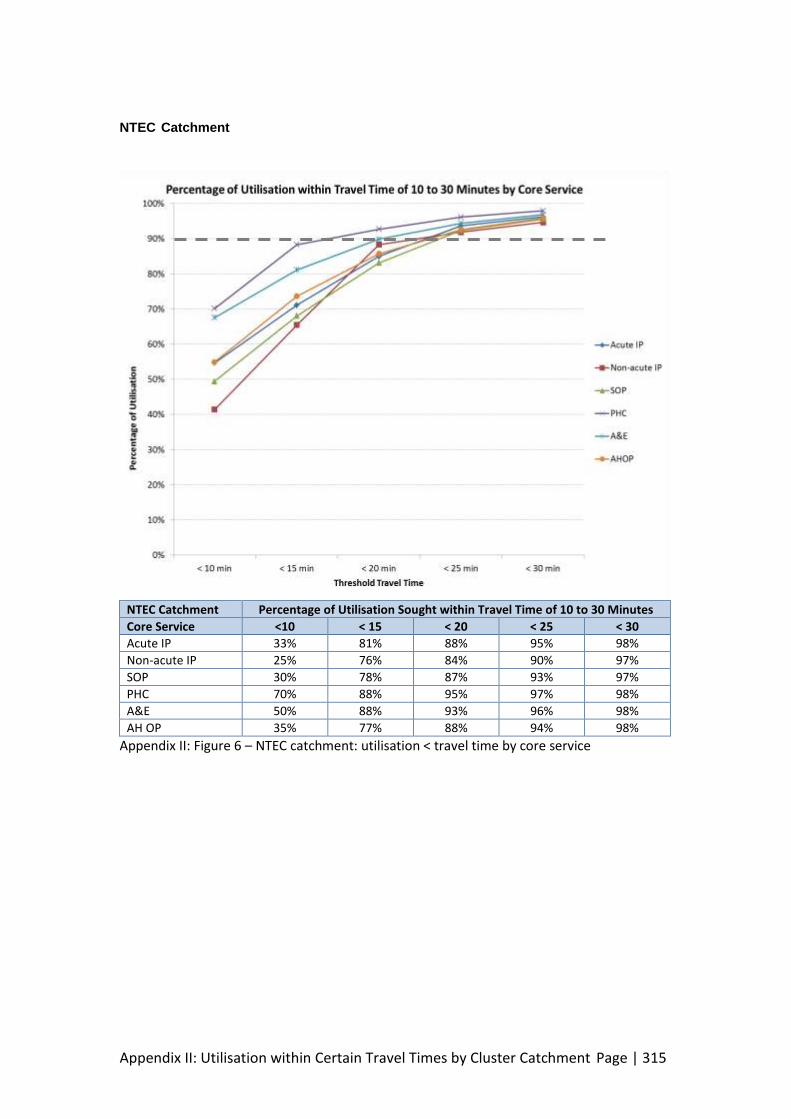
Appendix II: Utilisation within Certain Travel Times by Cluster Catchment Page | 315
NTEC Catchment
NTEC Catchment Percentage of Utilisation Sought within Travel Time of 10 to 30 Minutes
Core Service <10 < 15 < 20 < 25 < 30
Acute IP 33% 81% 88% 95% 98%
Non-acute IP 25% 76% 84% 90% 97%
SOP 30% 78% 87% 93% 97%
PHC 70% 88% 95% 97% 98%
A&E 50% 88% 93% 96% 98%
AH OP 35% 77% 88% 94% 98%
Appendix II: Figure 6 – NTEC catchment: utilisation < travel time by core service
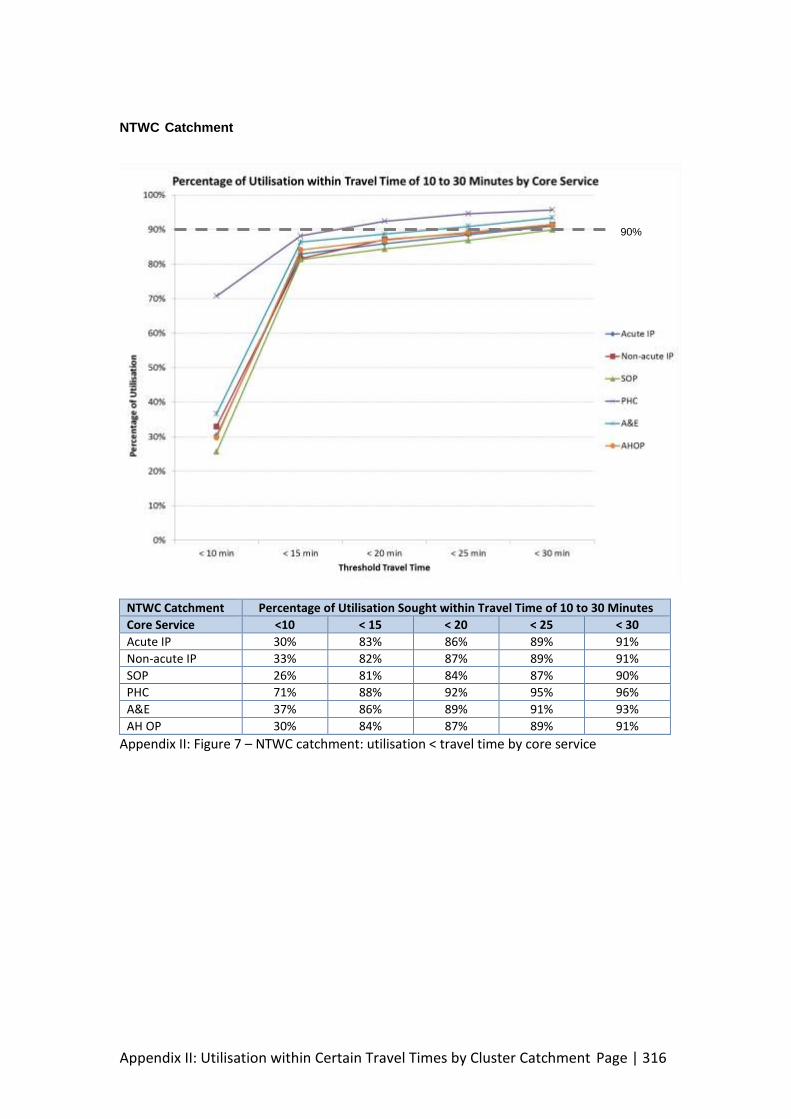
Appendix II: Utilisation within Certain Travel Times by Cluster Catchment Page | 316
NTWC Catchment
NTWC Catchment Percentage of Utilisation Sought within Travel Time of 10 to 30 Minutes
Core Service <10 < 15 < 20 < 25 < 30
Acute IP 30% 83% 86% 89% 91%
Non-acute IP 33% 82% 87% 89% 91%
SOP 26% 81% 84% 87% 90%
PHC 71% 88% 92% 95% 96%
A&E 37% 86% 89% 91% 93%
AH OP 30% 84% 87% 89% 91%
Appendix II: Figure 7 – NTWC catchment: utilisation < travel time by core service
90%

Appendix II: Utilisation within Certain Travel Times by Cluster Catchment Page | 317
Summary by Cluster Catchment
Percentage of Utilisation Sought within Travel Time of 10 to 30 Minutes
Core Service HKEC HKWC KCC KEC KWC NTEC NTWC Overall
Acute IP 23.0 19.8 19.3 21.1 21.4 22.9 28.0 21.2
Non-acute IP 24.7 23.8 19.4 23.4 25.1 22.4 27.1 23.5
SOP 24.2 19.9 19.1 21.7 22.6 23.7 30.1 22.3
PHC 17.8 18.9 14.8 19.7 16.4 16.9 17.2 17.2
A&E 19.2 19.4 19.5 19.4 17.3 20.1 23.0 19.4
AHOP 22.6 23.0 18.8 20.5 21.8 23.1 26.7 21.4
Appendix II: Table 2 – 90th percentile of travel time by core service by Cluster

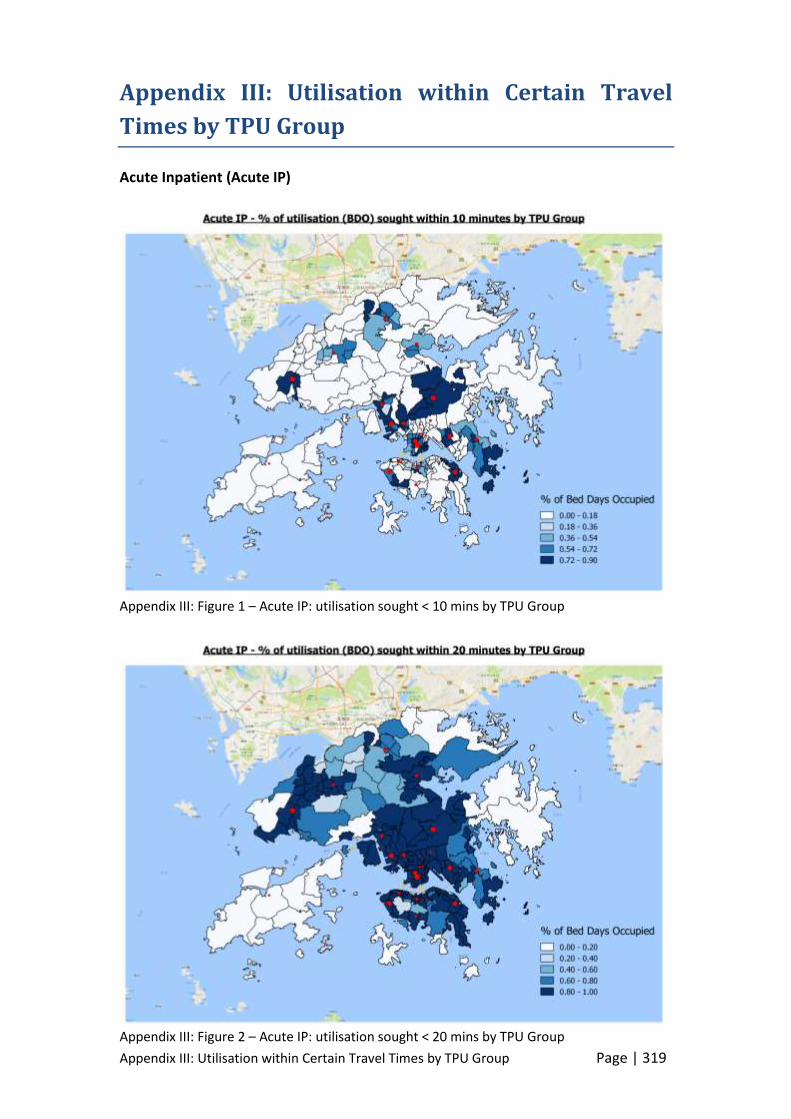
Appendix III: Utilisation within Certain Travel Times by TPU Group Page | 319
Appendix III: Utilisation within Certain Travel
Times by TPU Group Acute Inpatient (Acute IP)
Appendix III: Figure 1 – Acute IP: utilisation sought < 10 mins by TPU Group
Appendix III: Figure 2 – Acute IP: utilisation sought < 20 mins by TPU Group

Appendix III: Utilisation within Certain Travel Times by TPU Group Page | 320
Appendix III: Figure 3 – Acute IP: utilisation sought < 30 mins by TPU Group
Appendix III: Figure 4 – Acute IP: utilisation sought < 40 mins by TPU Group
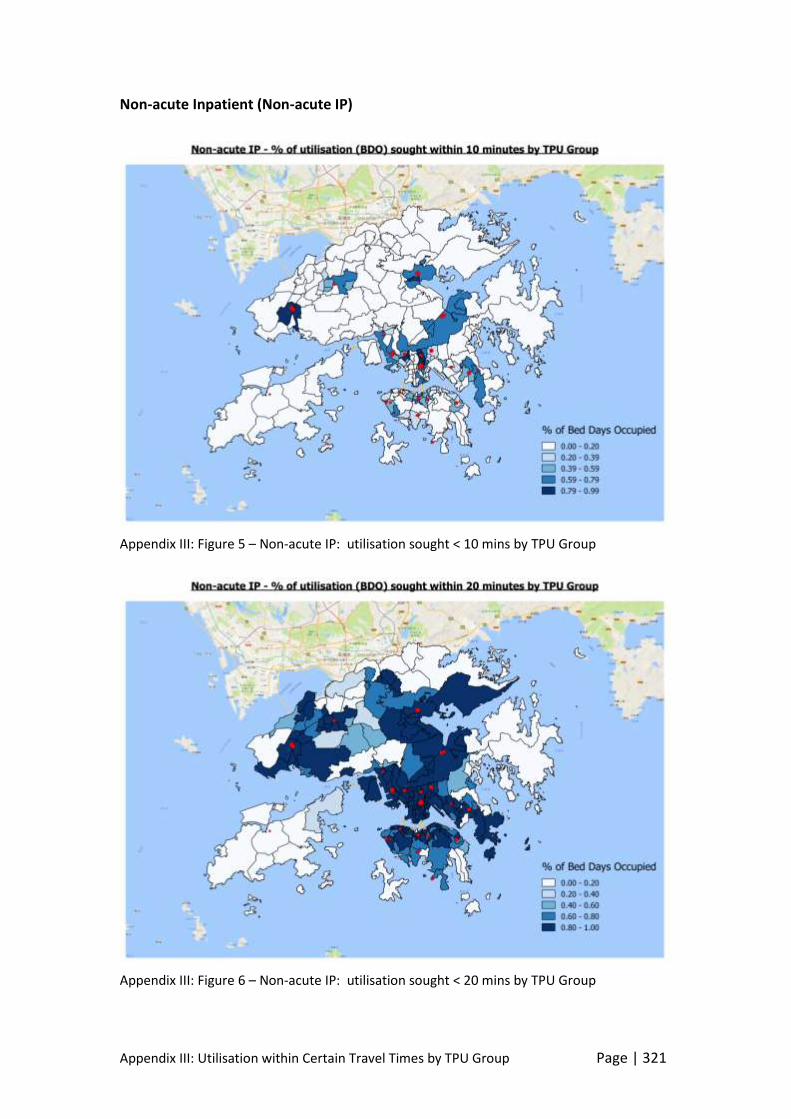
Appendix III: Utilisation within Certain Travel Times by TPU Group Page | 321
Non-acute Inpatient (Non-acute IP)
Appendix III: Figure 5 – Non-acute IP: utilisation sought < 10 mins by TPU Group
Appendix III: Figure 6 – Non-acute IP: utilisation sought < 20 mins by TPU Group
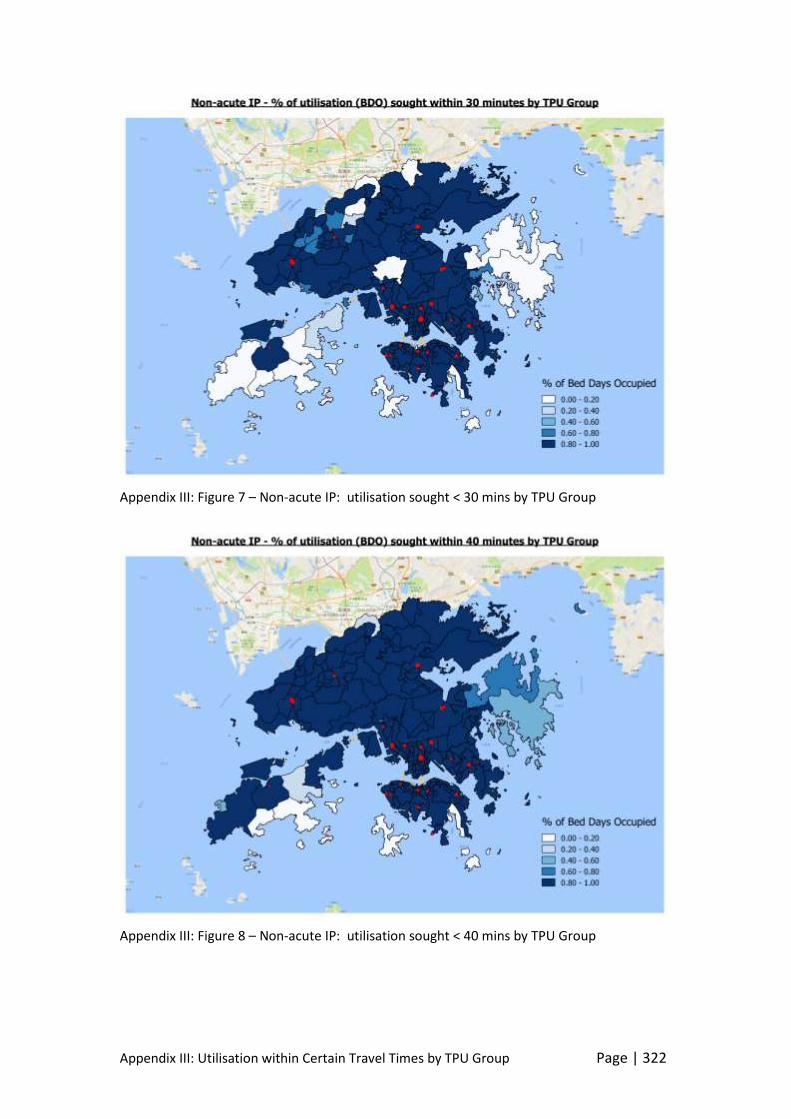
Appendix III: Utilisation within Certain Travel Times by TPU Group Page | 322
Appendix III: Figure 7 – Non-acute IP: utilisation sought < 30 mins by TPU Group
Appendix III: Figure 8 – Non-acute IP: utilisation sought < 40 mins by TPU Group

Appendix III: Utilisation within Certain Travel Times by TPU Group Page | 323
Specialist Outpatient (SOP)
Appendix III: Figure 9 – SOP: utilisation sought < 10 mins by TPU Group
Appendix III: Figure 10 – SOP: utilisation sought < 20 mins by TPU Group
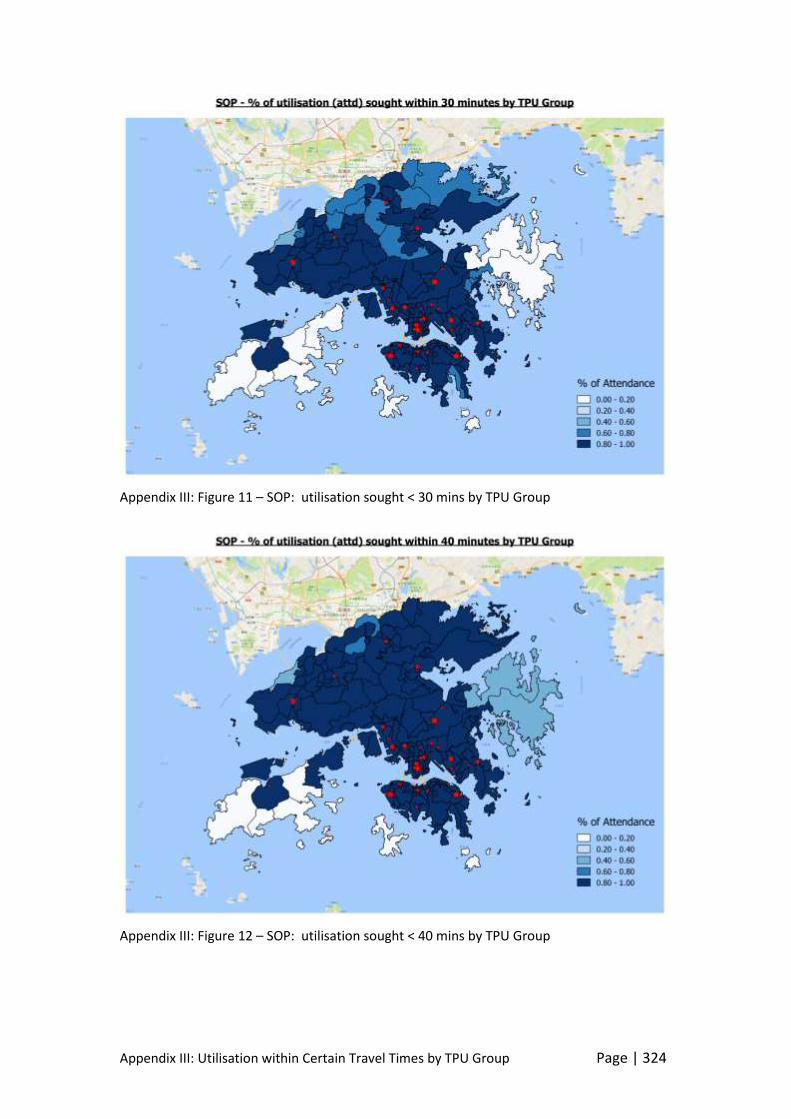
Appendix III: Utilisation within Certain Travel Times by TPU Group Page | 324
Appendix III: Figure 11 – SOP: utilisation sought < 30 mins by TPU Group
Appendix III: Figure 12 – SOP: utilisation sought < 40 mins by TPU Group
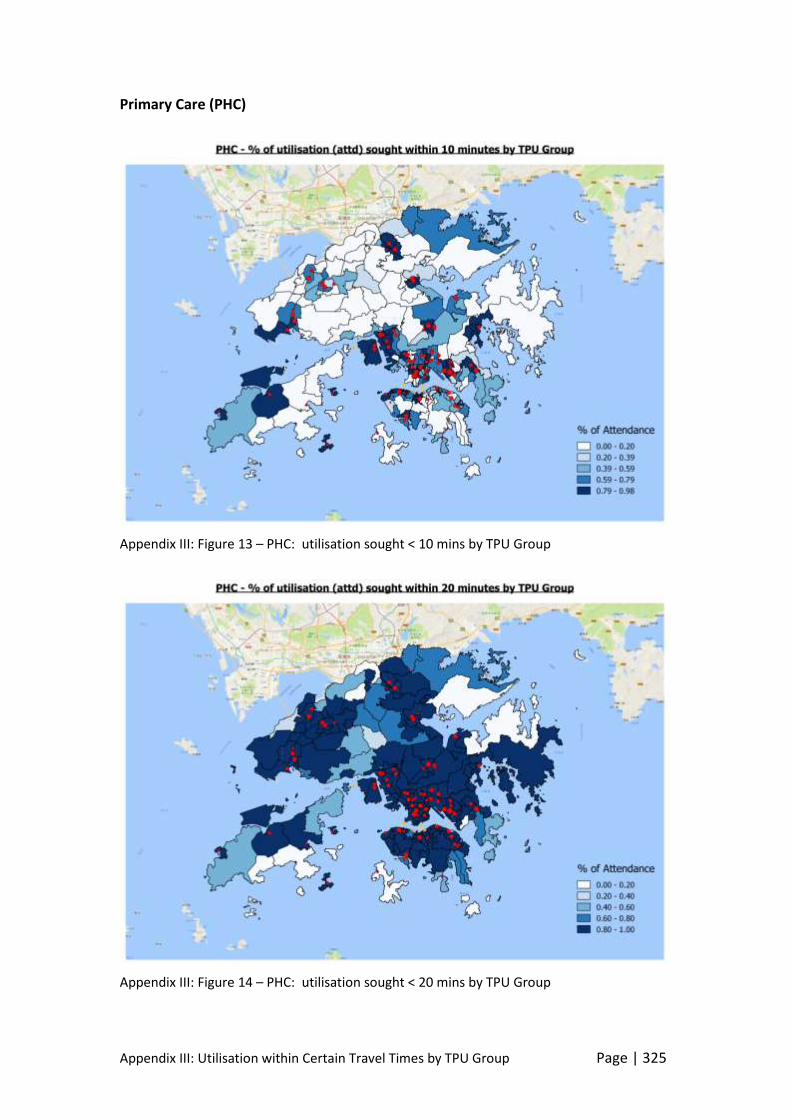
Appendix III: Utilisation within Certain Travel Times by TPU Group Page | 325
Primary Care (PHC)
Appendix III: Figure 13 – PHC: utilisation sought < 10 mins by TPU Group
Appendix III: Figure 14 – PHC: utilisation sought < 20 mins by TPU Group
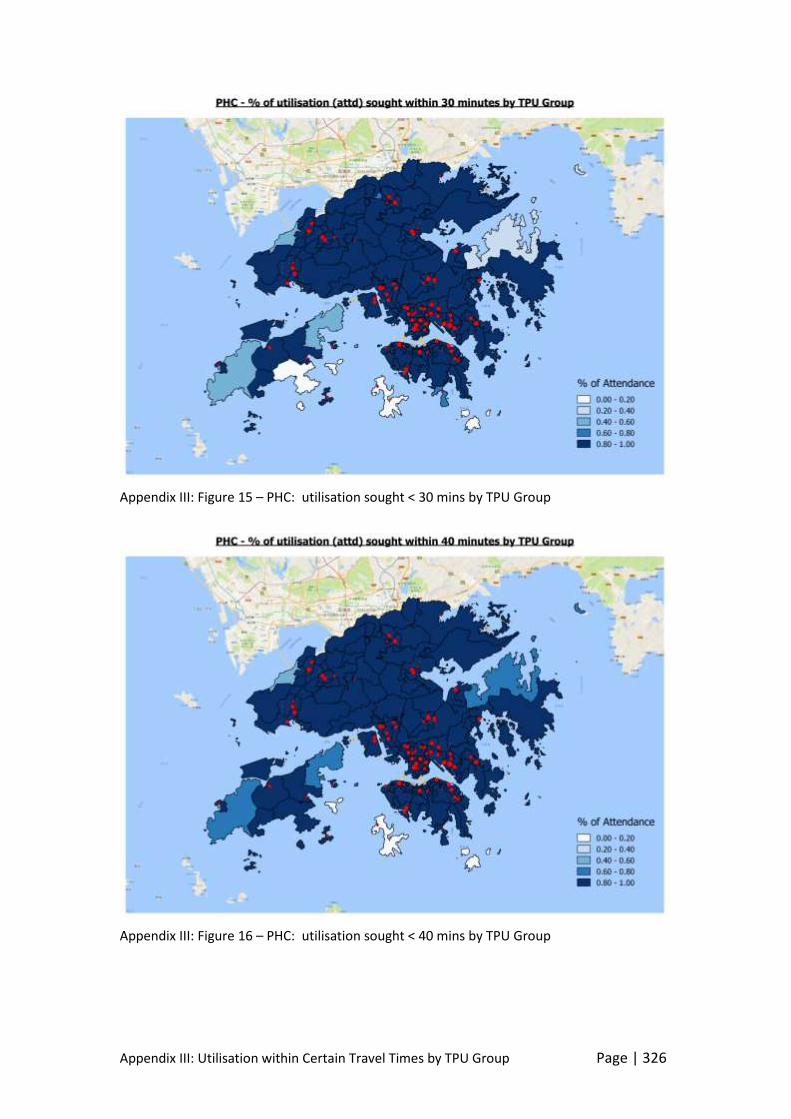
Appendix III: Utilisation within Certain Travel Times by TPU Group Page | 326
Appendix III: Figure 15 – PHC: utilisation sought < 30 mins by TPU Group
Appendix III: Figure 16 – PHC: utilisation sought < 40 mins by TPU Group

Appendix III: Utilisation within Certain Travel Times by TPU Group Page | 327
Accident and Emergency (A&E)
Appendix III: Figure 17 – A&E: utilisation sought < 10 mins by TPU Group
Appendix III: Figure 18 – A&E: utilisation sought < 20 mins by TPU Group
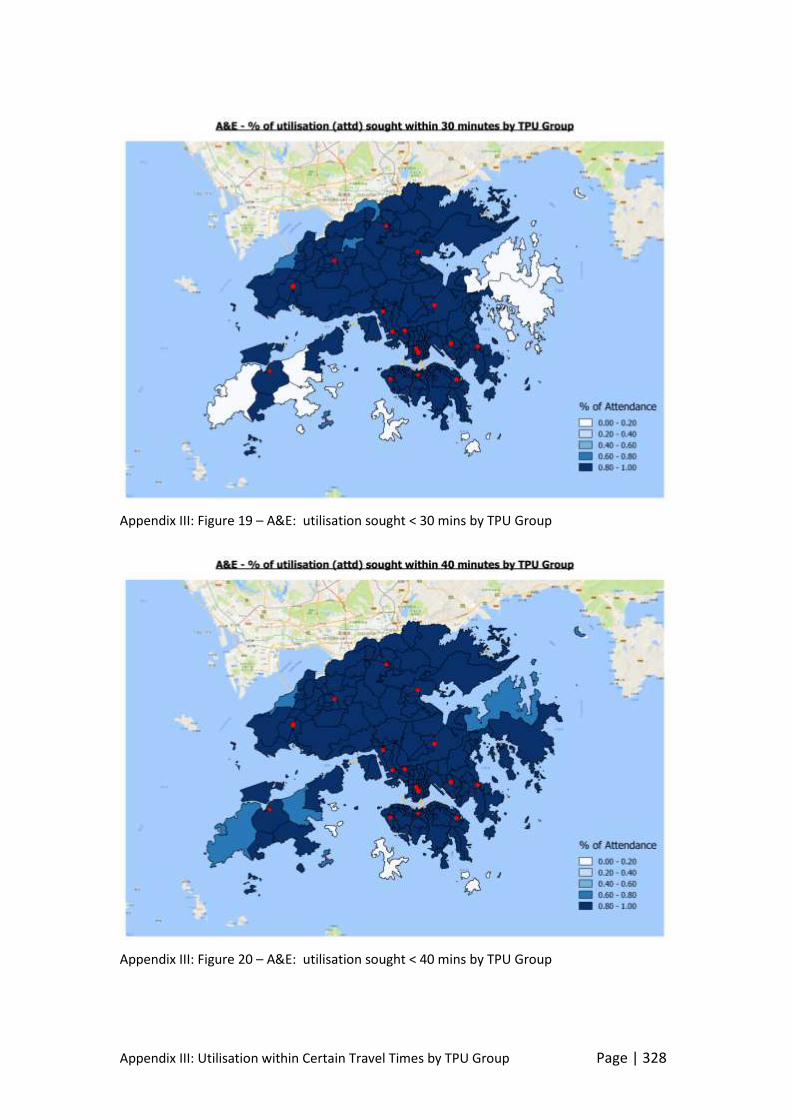
Appendix III: Utilisation within Certain Travel Times by TPU Group Page | 328
Appendix III: Figure 19 – A&E: utilisation sought < 30 mins by TPU Group
Appendix III: Figure 20 – A&E: utilisation sought < 40 mins by TPU Group
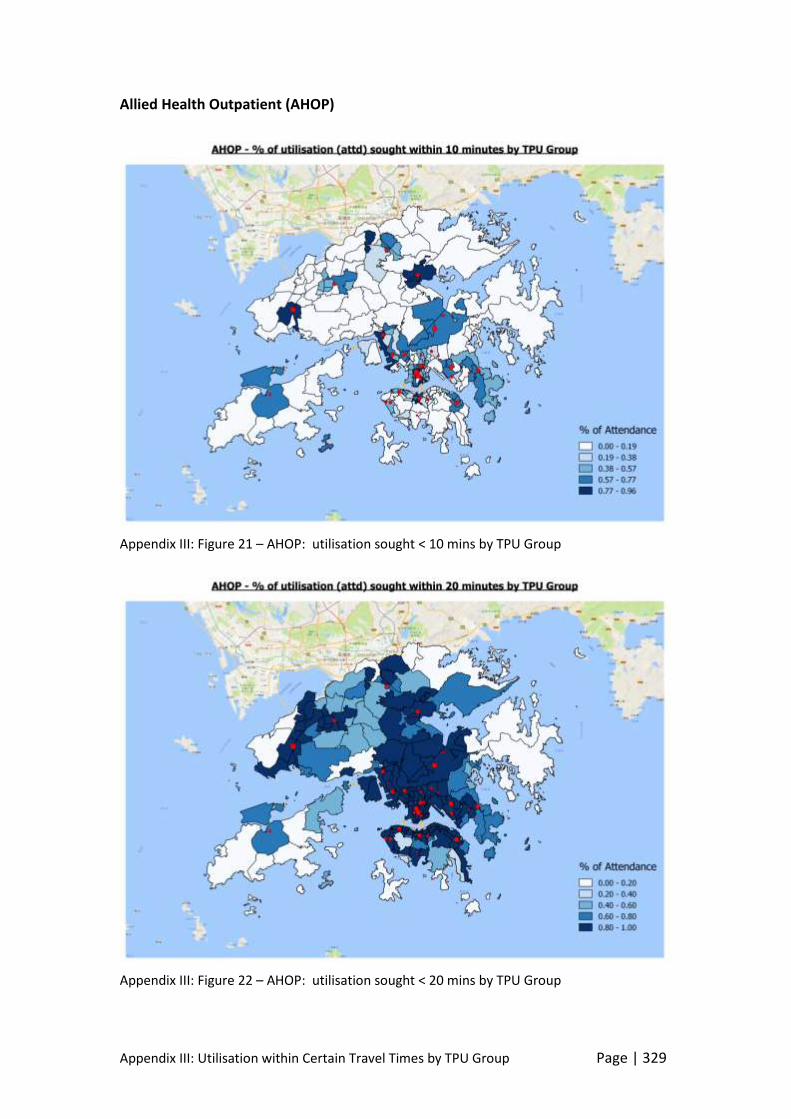
Appendix III: Utilisation within Certain Travel Times by TPU Group Page | 329
Allied Health Outpatient (AHOP)
Appendix III: Figure 21 – AHOP: utilisation sought < 10 mins by TPU Group
Appendix III: Figure 22 – AHOP: utilisation sought < 20 mins by TPU Group
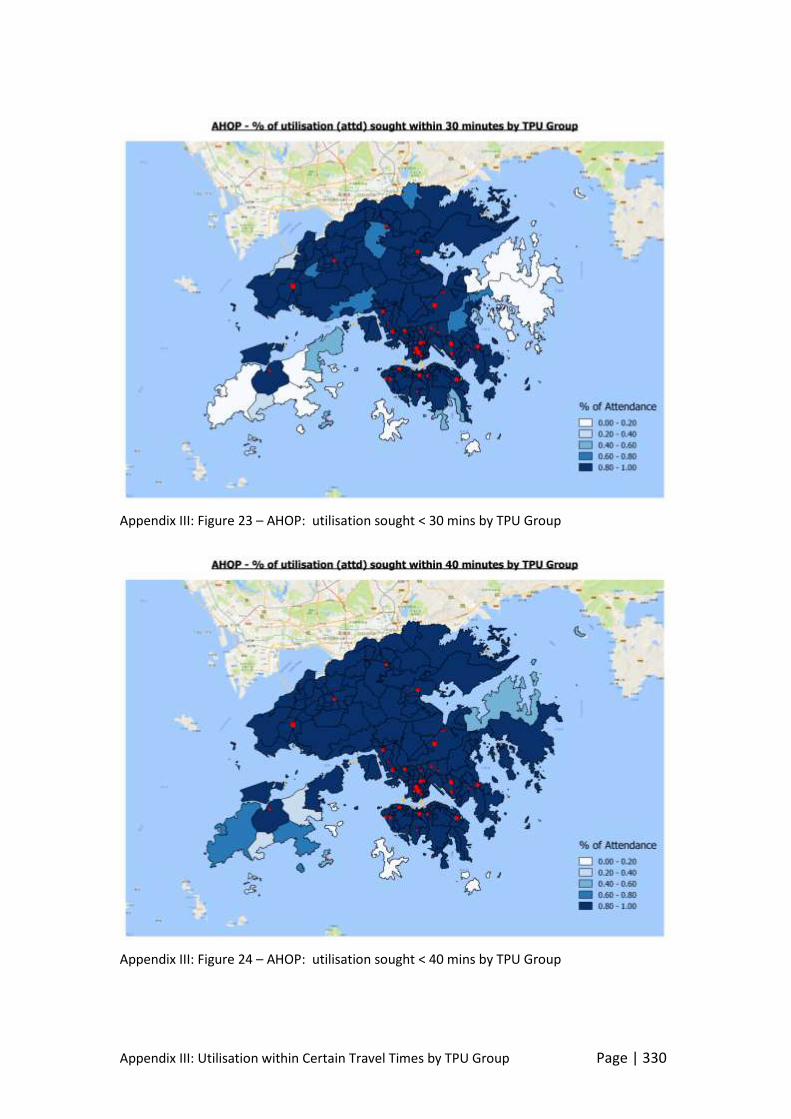
Appendix III: Utilisation within Certain Travel Times by TPU Group Page | 330
Appendix III: Figure 23 – AHOP: utilisation sought < 30 mins by TPU Group
Appendix III: Figure 24 – AHOP: utilisation sought < 40 mins by TPU Group
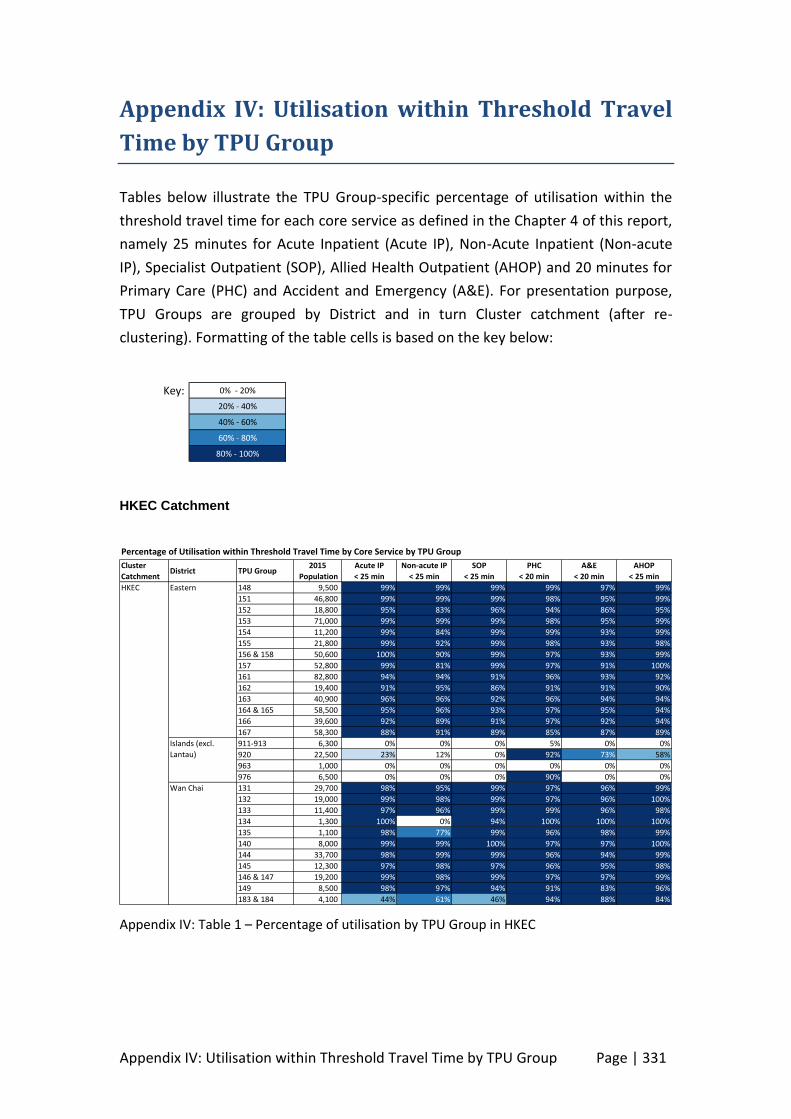
Appendix IV: Utilisation within Threshold Travel Time by TPU Group Page | 331
Appendix IV: Utilisation within Threshold Travel
Time by TPU Group
Tables below illustrate the TPU Group-specific percentage of utilisation within the
threshold travel time for each core service as defined in the Chapter 4 of this report,
namely 25 minutes for Acute Inpatient (Acute IP), Non-Acute Inpatient (Non-acute
IP), Specialist Outpatient (SOP), Allied Health Outpatient (AHOP) and 20 minutes for
Primary Care (PHC) and Accident and Emergency (A&E). For presentation purpose,
TPU Groups are grouped by District and in turn Cluster catchment (after re-
clustering). Formatting of the table cells is based on the key below:
HKEC Catchment
Appendix IV: Table 1 – Percentage of utilisation by TPU Group in HKEC
Key: 0% - 20%
20% - 40%
40% - 60%
60% - 80%
80% - 100%
Percentage of Utilisation within Threshold Travel Time by Core Service by TPU Group
Cluster
CatchmentDistrict TPU Group
2015
Population
Acute IP
< 25 min
Non-acute IP
< 25 min
SOP
< 25 min
PHC
< 20 min
A&E
< 20 min
AHOP
< 25 min
HKEC Eastern 148 9,500 99% 99% 99% 99% 97% 99%
151 46,800 99% 99% 99% 98% 95% 99%
152 18,800 95% 83% 96% 94% 86% 95%
153 71,000 99% 99% 99% 98% 95% 99%
154 11,200 99% 84% 99% 99% 93% 99%
155 21,800 99% 92% 99% 98% 93% 98%
156 & 158 50,600 100% 90% 99% 97% 93% 99%
157 52,800 99% 81% 99% 97% 91% 100%
161 82,800 94% 94% 91% 96% 93% 92%
162 19,400 91% 95% 86% 91% 91% 90%
163 40,900 96% 96% 92% 96% 94% 94%
164 & 165 58,500 95% 96% 93% 97% 95% 94%
166 39,600 92% 89% 91% 97% 92% 94%
167 58,300 88% 91% 89% 85% 87% 89%
911-913 6,300 0% 0% 0% 5% 0% 0%
920 22,500 23% 12% 0% 92% 73% 58%
963 1,000 0% 0% 0% 0% 0% 0%
976 6,500 0% 0% 0% 90% 0% 0%
Wan Chai 131 29,700 98% 95% 99% 97% 96% 99%
132 19,000 99% 98% 99% 97% 96% 100%
133 11,400 97% 96% 99% 99% 96% 98%
134 1,300 100% 0% 94% 100% 100% 100%
135 1,100 98% 77% 99% 96% 98% 99%
140 8,000 99% 99% 100% 97% 97% 100%
144 33,700 98% 99% 99% 96% 94% 99%
145 12,300 97% 98% 97% 96% 95% 98%
146 & 147 19,200 99% 98% 99% 97% 97% 99%
149 8,500 98% 97% 94% 91% 83% 96%
183 & 184 4,100 44% 61% 46% 94% 88% 84%
Islands (excl.
Lantau)
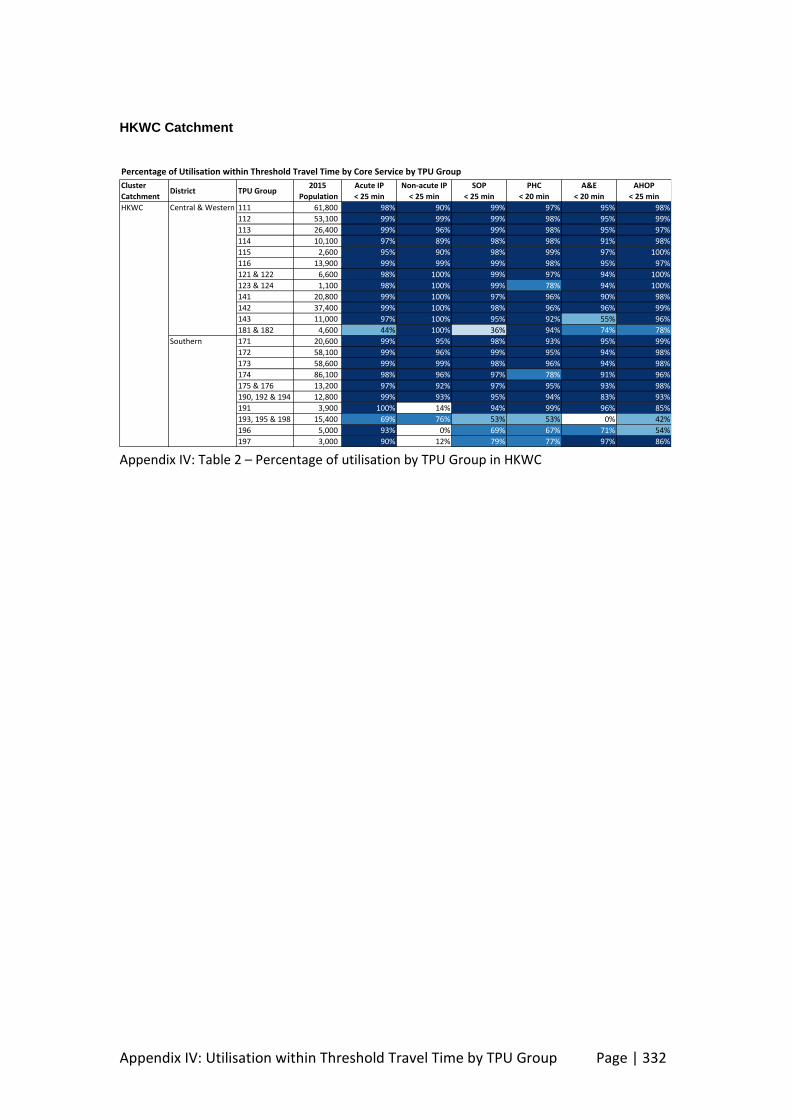
Appendix IV: Utilisation within Threshold Travel Time by TPU Group Page | 332
HKWC Catchment
Appendix IV: Table 2 – Percentage of utilisation by TPU Group in HKWC
Percentage of Utilisation within Threshold Travel Time by Core Service by TPU Group
Cluster
CatchmentDistrict TPU Group
2015
Population
Acute IP
< 25 min
Non-acute IP
< 25 min
SOP
< 25 min
PHC
< 20 min
A&E
< 20 min
AHOP
< 25 min
HKWC 111 61,800 98% 90% 99% 97% 95% 98%
112 53,100 99% 99% 99% 98% 95% 99%
113 26,400 99% 96% 99% 98% 95% 97%
114 10,100 97% 89% 98% 98% 91% 98%
115 2,600 95% 90% 98% 99% 97% 100%
116 13,900 99% 99% 99% 98% 95% 97%
121 & 122 6,600 98% 100% 99% 97% 94% 100%
123 & 124 1,100 98% 100% 99% 78% 94% 100%
141 20,800 99% 100% 97% 96% 90% 98%
142 37,400 99% 100% 98% 96% 96% 99%
143 11,000 97% 100% 95% 92% 55% 96%
181 & 182 4,600 44% 100% 36% 94% 74% 78%
Southern 171 20,600 99% 95% 98% 93% 95% 99%
172 58,100 99% 96% 99% 95% 94% 98%
173 58,600 99% 99% 98% 96% 94% 98%
174 86,100 98% 96% 97% 78% 91% 96%
175 & 176 13,200 97% 92% 97% 95% 93% 98%
190, 192 & 194 12,800 99% 93% 95% 94% 83% 93%
191 3,900 100% 14% 94% 99% 96% 85%
193, 195 & 198 15,400 69% 76% 53% 53% 0% 42%
196 5,000 93% 0% 69% 67% 71% 54%
197 3,000 90% 12% 79% 77% 97% 86%
Central & Western
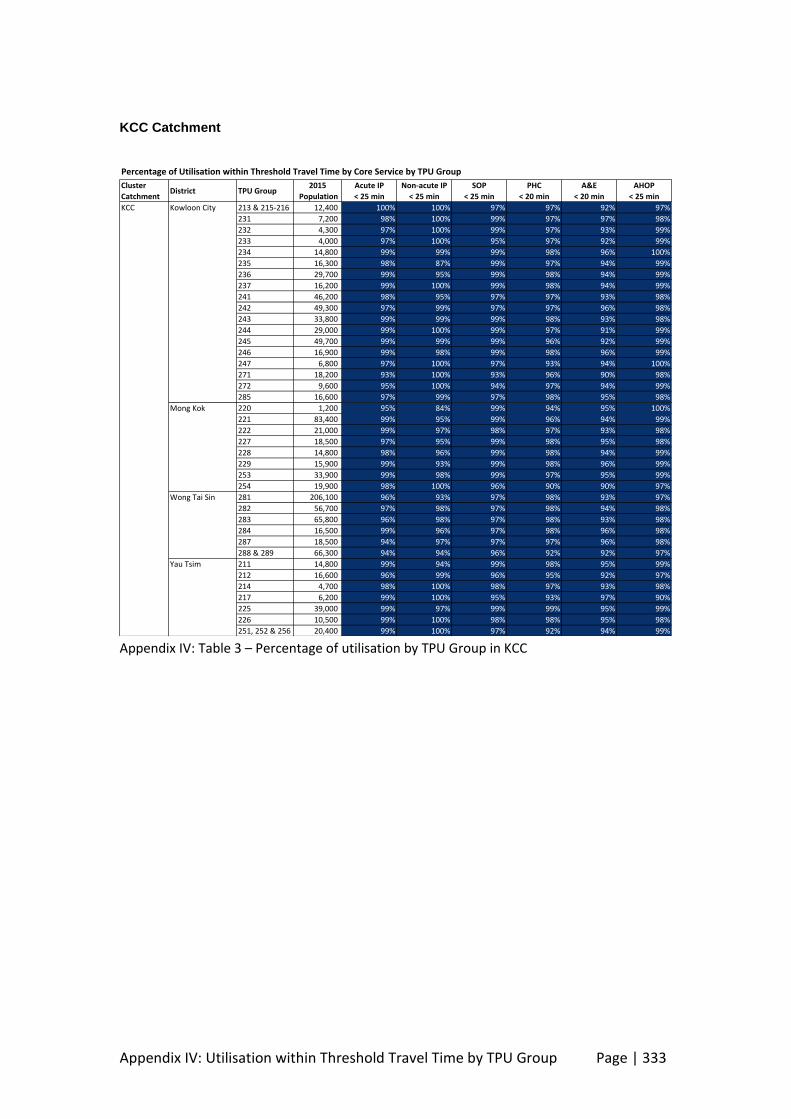
Appendix IV: Utilisation within Threshold Travel Time by TPU Group Page | 333
KCC Catchment
Appendix IV: Table 3 – Percentage of utilisation by TPU Group in KCC
Percentage of Utilisation within Threshold Travel Time by Core Service by TPU Group
Cluster
CatchmentDistrict TPU Group
2015
Population
Acute IP
< 25 min
Non-acute IP
< 25 min
SOP
< 25 min
PHC
< 20 min
A&E
< 20 min
AHOP
< 25 min
KCC Kowloon City 213 & 215-216 12,400 100% 100% 97% 97% 92% 97%
231 7,200 98% 100% 99% 97% 97% 98%
232 4,300 97% 100% 99% 97% 93% 99%
233 4,000 97% 100% 95% 97% 92% 99%
234 14,800 99% 99% 99% 98% 96% 100%
235 16,300 98% 87% 99% 97% 94% 99%
236 29,700 99% 95% 99% 98% 94% 99%
237 16,200 99% 100% 99% 98% 94% 99%
241 46,200 98% 95% 97% 97% 93% 98%
242 49,300 97% 99% 97% 97% 96% 98%
243 33,800 99% 99% 99% 98% 93% 98%
244 29,000 99% 100% 99% 97% 91% 99%
245 49,700 99% 99% 99% 96% 92% 99%
246 16,900 99% 98% 99% 98% 96% 99%
247 6,800 97% 100% 97% 93% 94% 100%
271 18,200 93% 100% 93% 96% 90% 98%
272 9,600 95% 100% 94% 97% 94% 99%
285 16,600 97% 99% 97% 98% 95% 98%
Mong Kok 220 1,200 95% 84% 99% 94% 95% 100%
221 83,400 99% 95% 99% 96% 94% 99%
222 21,000 99% 97% 98% 97% 93% 98%
227 18,500 97% 95% 99% 98% 95% 98%
228 14,800 98% 96% 99% 98% 94% 99%
229 15,900 99% 93% 99% 98% 96% 99%
253 33,900 99% 98% 99% 97% 95% 99%
254 19,900 98% 100% 96% 90% 90% 97%
Wong Tai Sin 281 206,100 96% 93% 97% 98% 93% 97%
282 56,700 97% 98% 97% 98% 94% 98%
283 65,800 96% 98% 97% 98% 93% 98%
284 16,500 99% 96% 97% 98% 96% 98%
287 18,500 94% 97% 97% 97% 96% 98%
288 & 289 66,300 94% 94% 96% 92% 92% 97%
Yau Tsim 211 14,800 99% 94% 99% 98% 95% 99%
212 16,600 96% 99% 96% 95% 92% 97%
214 4,700 98% 100% 98% 97% 93% 98%
217 6,200 99% 100% 95% 93% 97% 90%
225 39,000 99% 97% 99% 99% 95% 99%
226 10,500 99% 100% 98% 98% 95% 98%
251, 252 & 256 20,400 99% 100% 97% 92% 94% 99%
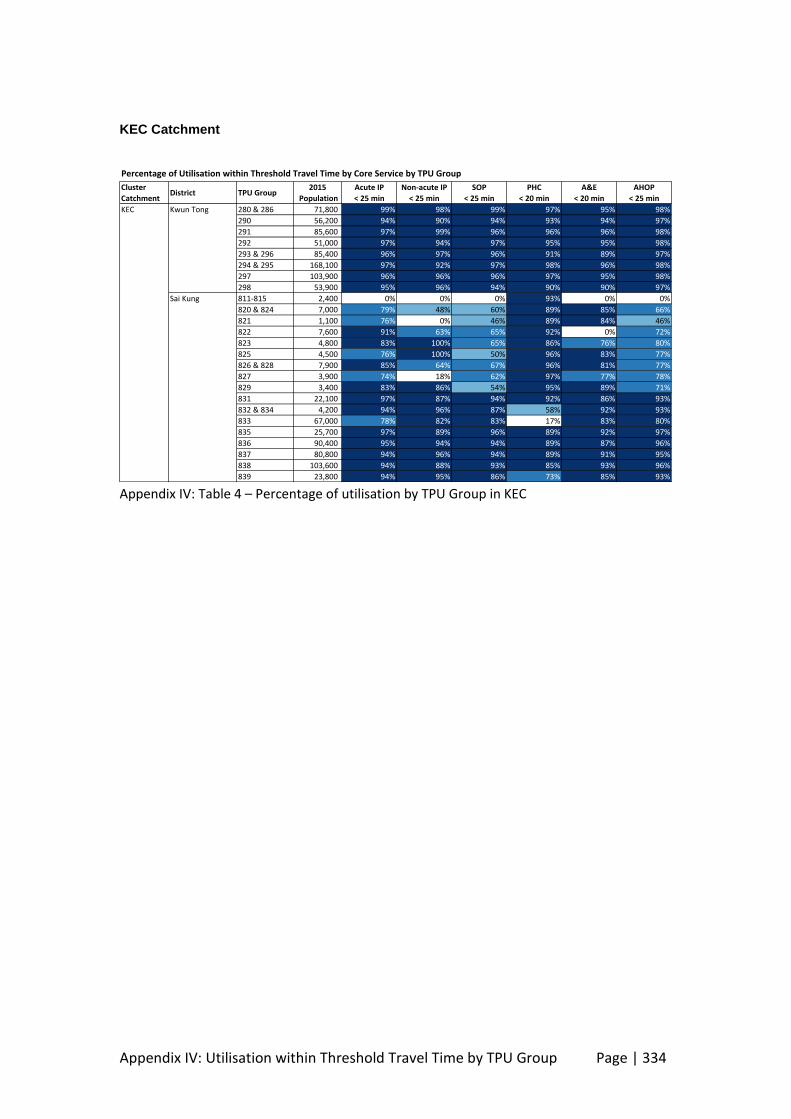
Appendix IV: Utilisation within Threshold Travel Time by TPU Group Page | 334
KEC Catchment
Appendix IV: Table 4 – Percentage of utilisation by TPU Group in KEC
Percentage of Utilisation within Threshold Travel Time by Core Service by TPU Group
Cluster
CatchmentDistrict TPU Group
2015
Population
Acute IP
< 25 min
Non-acute IP
< 25 min
SOP
< 25 min
PHC
< 20 min
A&E
< 20 min
AHOP
< 25 min
KEC Kwun Tong 280 & 286 71,800 99% 98% 99% 97% 95% 98%
290 56,200 94% 90% 94% 93% 94% 97%
291 85,600 97% 99% 96% 96% 96% 98%
292 51,000 97% 94% 97% 95% 95% 98%
293 & 296 85,400 96% 97% 96% 91% 89% 97%
294 & 295 168,100 97% 92% 97% 98% 96% 98%
297 103,900 96% 96% 96% 97% 95% 98%
298 53,900 95% 96% 94% 90% 90% 97%
Sai Kung 811-815 2,400 0% 0% 0% 93% 0% 0%
820 & 824 7,000 79% 48% 60% 89% 85% 66%
821 1,100 76% 0% 46% 89% 84% 46%
822 7,600 91% 63% 65% 92% 0% 72%
823 4,800 83% 100% 65% 86% 76% 80%
825 4,500 76% 100% 50% 96% 83% 77%
826 & 828 7,900 85% 64% 67% 96% 81% 77%
827 3,900 74% 18% 62% 97% 77% 78%
829 3,400 83% 86% 54% 95% 89% 71%
831 22,100 97% 87% 94% 92% 86% 93%
832 & 834 4,200 94% 96% 87% 58% 92% 93%
833 67,000 78% 82% 83% 17% 83% 80%
835 25,700 97% 89% 96% 89% 92% 97%
836 90,400 95% 94% 94% 89% 87% 96%
837 80,800 94% 96% 94% 89% 91% 95%
838 103,600 94% 88% 93% 85% 93% 96%
839 23,800 94% 95% 86% 73% 85% 93%
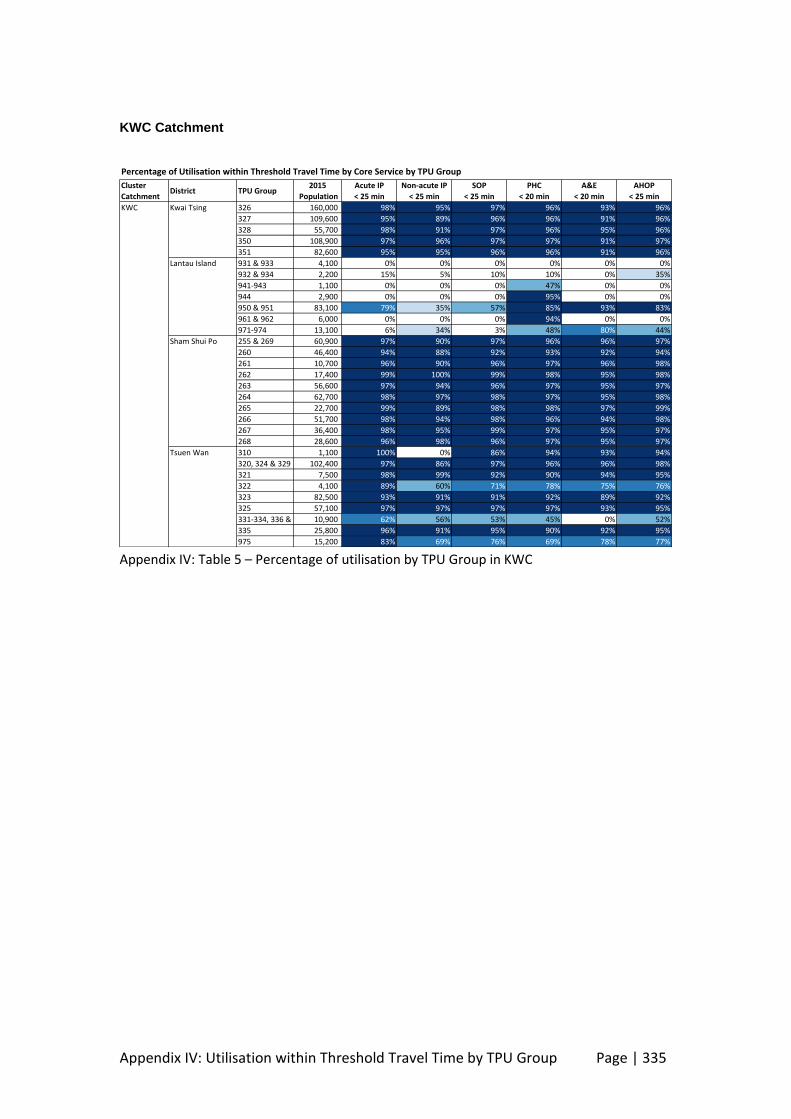
Appendix IV: Utilisation within Threshold Travel Time by TPU Group Page | 335
KWC Catchment
Appendix IV: Table 5 – Percentage of utilisation by TPU Group in KWC
Percentage of Utilisation within Threshold Travel Time by Core Service by TPU Group
Cluster
CatchmentDistrict TPU Group
2015
Population
Acute IP
< 25 min
Non-acute IP
< 25 min
SOP
< 25 min
PHC
< 20 min
A&E
< 20 min
AHOP
< 25 min
KWC Kwai Tsing 326 160,000 98% 95% 97% 96% 93% 96%
327 109,600 95% 89% 96% 96% 91% 96%
328 55,700 98% 91% 97% 96% 95% 96%
350 108,900 97% 96% 97% 97% 91% 97%
351 82,600 95% 95% 96% 96% 91% 96%
Lantau Island 931 & 933 4,100 0% 0% 0% 0% 0% 0%
932 & 934 2,200 15% 5% 10% 10% 0% 35%
941-943 1,100 0% 0% 0% 47% 0% 0%
944 2,900 0% 0% 0% 95% 0% 0%
950 & 951 83,100 79% 35% 57% 85% 93% 83%
961 & 962 6,000 0% 0% 0% 94% 0% 0%
971-974 13,100 6% 34% 3% 48% 80% 44%
Sham Shui Po 255 & 269 60,900 97% 90% 97% 96% 96% 97%
260 46,400 94% 88% 92% 93% 92% 94%
261 10,700 96% 90% 96% 97% 96% 98%
262 17,400 99% 100% 99% 98% 95% 98%
263 56,600 97% 94% 96% 97% 95% 97%
264 62,700 98% 97% 98% 97% 95% 98%
265 22,700 99% 89% 98% 98% 97% 99%
266 51,700 98% 94% 98% 96% 94% 98%
267 36,400 98% 95% 99% 97% 95% 97%
268 28,600 96% 98% 96% 97% 95% 97%
Tsuen Wan 310 1,100 100% 0% 86% 94% 93% 94%
320, 324 & 329 102,400 97% 86% 97% 96% 96% 98%
321 7,500 98% 99% 92% 90% 94% 95%
322 4,100 89% 60% 71% 78% 75% 76%
323 82,500 93% 91% 91% 92% 89% 92%
325 57,100 97% 97% 97% 97% 93% 95%
331-334, 336 & 340 10,900 62% 56% 53% 45% 0% 52%
335 25,800 96% 91% 95% 90% 92% 95%
975 15,200 83% 69% 76% 69% 78% 77%
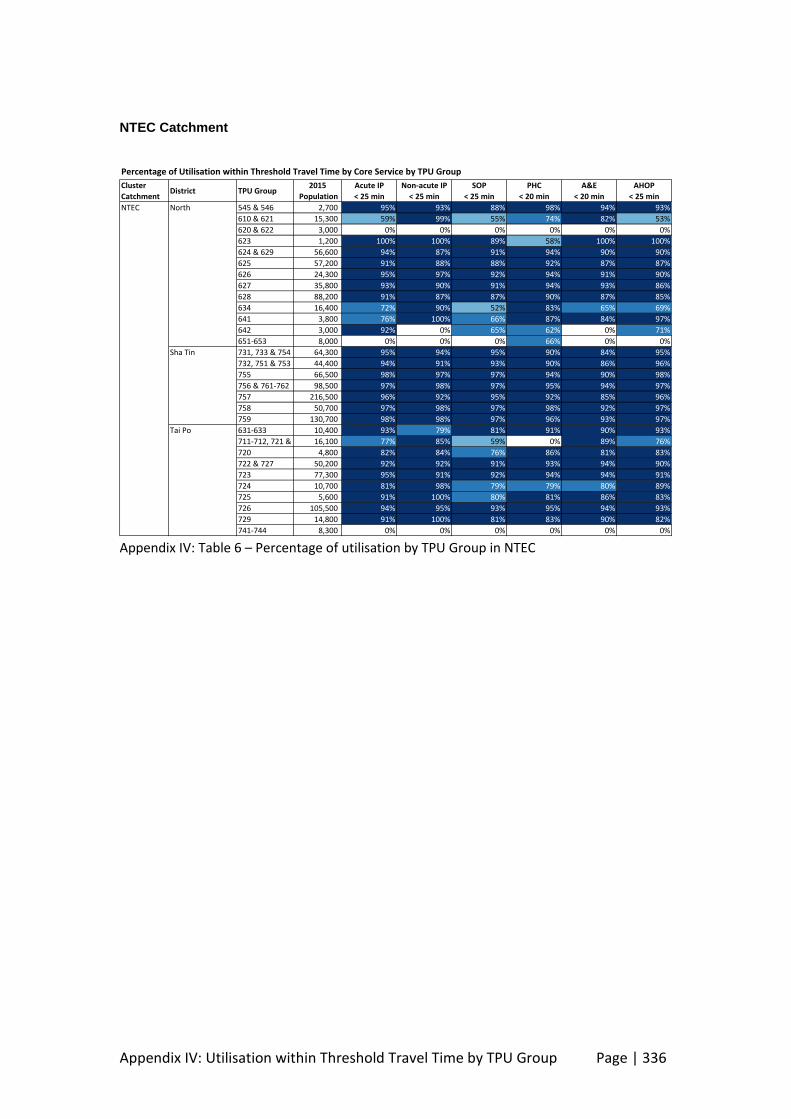
Appendix IV: Utilisation within Threshold Travel Time by TPU Group Page | 336
NTEC Catchment
Appendix IV: Table 6 – Percentage of utilisation by TPU Group in NTEC
Percentage of Utilisation within Threshold Travel Time by Core Service by TPU Group
Cluster
CatchmentDistrict TPU Group
2015
Population
Acute IP
< 25 min
Non-acute IP
< 25 min
SOP
< 25 min
PHC
< 20 min
A&E
< 20 min
AHOP
< 25 min
NTEC North 545 & 546 2,700 95% 93% 88% 98% 94% 93%
610 & 621 15,300 59% 99% 55% 74% 82% 53%
620 & 622 3,000 0% 0% 0% 0% 0% 0%
623 1,200 100% 100% 89% 58% 100% 100%
624 & 629 56,600 94% 87% 91% 94% 90% 90%
625 57,200 91% 88% 88% 92% 87% 87%
626 24,300 95% 97% 92% 94% 91% 90%
627 35,800 93% 90% 91% 94% 93% 86%
628 88,200 91% 87% 87% 90% 87% 85%
634 16,400 72% 90% 52% 83% 65% 69%
641 3,800 76% 100% 66% 87% 84% 97%
642 3,000 92% 0% 65% 62% 0% 71%
651-653 8,000 0% 0% 0% 66% 0% 0%
Sha Tin 731, 733 & 754 64,300 95% 94% 95% 90% 84% 95%
732, 751 & 753 44,400 94% 91% 93% 90% 86% 96%
755 66,500 98% 97% 97% 94% 90% 98%
756 & 761-762 98,500 97% 98% 97% 95% 94% 97%
757 216,500 96% 92% 95% 92% 85% 96%
758 50,700 97% 98% 97% 98% 92% 97%
759 130,700 98% 98% 97% 96% 93% 97%
Tai Po 631-633 10,400 93% 79% 81% 91% 90% 93%
711-712, 721 & 728 16,100 77% 85% 59% 0% 89% 76%
720 4,800 82% 84% 76% 86% 81% 83%
722 & 727 50,200 92% 92% 91% 93% 94% 90%
723 77,300 95% 91% 92% 94% 94% 91%
724 10,700 81% 98% 79% 79% 80% 89%
725 5,600 91% 100% 80% 81% 86% 83%
726 105,500 94% 95% 93% 95% 94% 93%
729 14,800 91% 100% 81% 83% 90% 82%
741-744 8,300 0% 0% 0% 0% 0% 0%
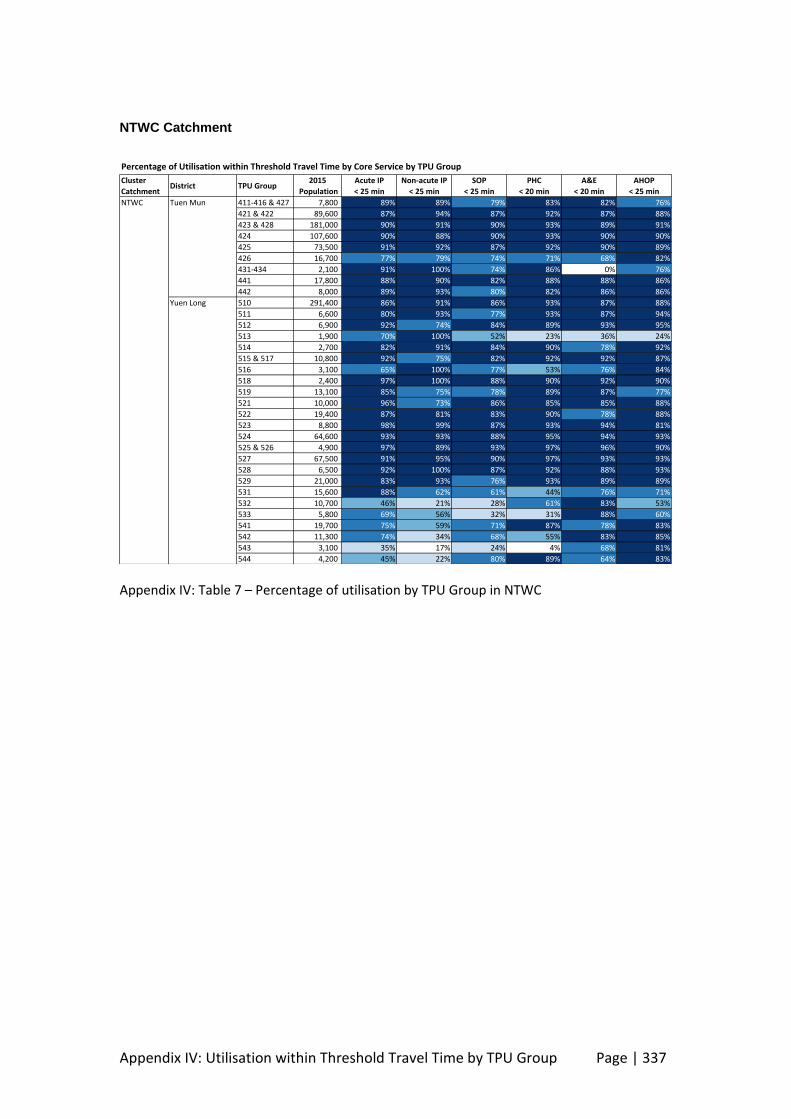
Appendix IV: Utilisation within Threshold Travel Time by TPU Group Page | 337
NTWC Catchment
Appendix IV: Table 7 – Percentage of utilisation by TPU Group in NTWC
Percentage of Utilisation within Threshold Travel Time by Core Service by TPU Group
Cluster
CatchmentDistrict TPU Group
2015
Population
Acute IP
< 25 min
Non-acute IP
< 25 min
SOP
< 25 min
PHC
< 20 min
A&E
< 20 min
AHOP
< 25 min
NTWC Tuen Mun 411-416 & 427 7,800 89% 89% 79% 83% 82% 76%
421 & 422 89,600 87% 94% 87% 92% 87% 88%
423 & 428 181,000 90% 91% 90% 93% 89% 91%
424 107,600 90% 88% 90% 93% 90% 90%
425 73,500 91% 92% 87% 92% 90% 89%
426 16,700 77% 79% 74% 71% 68% 82%
431-434 2,100 91% 100% 74% 86% 0% 76%
441 17,800 88% 90% 82% 88% 88% 86%
442 8,000 89% 93% 80% 82% 86% 86%
Yuen Long 510 291,400 86% 91% 86% 93% 87% 88%
511 6,600 80% 93% 77% 93% 87% 94%
512 6,900 92% 74% 84% 89% 93% 95%
513 1,900 70% 100% 52% 23% 36% 24%
514 2,700 82% 91% 84% 90% 78% 92%
515 & 517 10,800 92% 75% 82% 92% 92% 87%
516 3,100 65% 100% 77% 53% 76% 84%
518 2,400 97% 100% 88% 90% 92% 90%
519 13,100 85% 75% 78% 89% 87% 77%
521 10,000 96% 73% 86% 85% 85% 88%
522 19,400 87% 81% 83% 90% 78% 88%
523 8,800 98% 99% 87% 93% 94% 81%
524 64,600 93% 93% 88% 95% 94% 93%
525 & 526 4,900 97% 89% 93% 97% 96% 90%
527 67,500 91% 95% 90% 97% 93% 93%
528 6,500 92% 100% 87% 92% 88% 93%
529 21,000 83% 93% 76% 93% 89% 89%
531 15,600 88% 62% 61% 44% 76% 71%
532 10,700 46% 21% 28% 61% 83% 53%
533 5,800 69% 56% 32% 31% 88% 60%
541 19,700 75% 59% 71% 87% 78% 83%
542 11,300 74% 34% 68% 55% 83% 85%
543 3,100 35% 17% 24% 4% 68% 81%
544 4,200 45% 22% 80% 89% 64% 83%

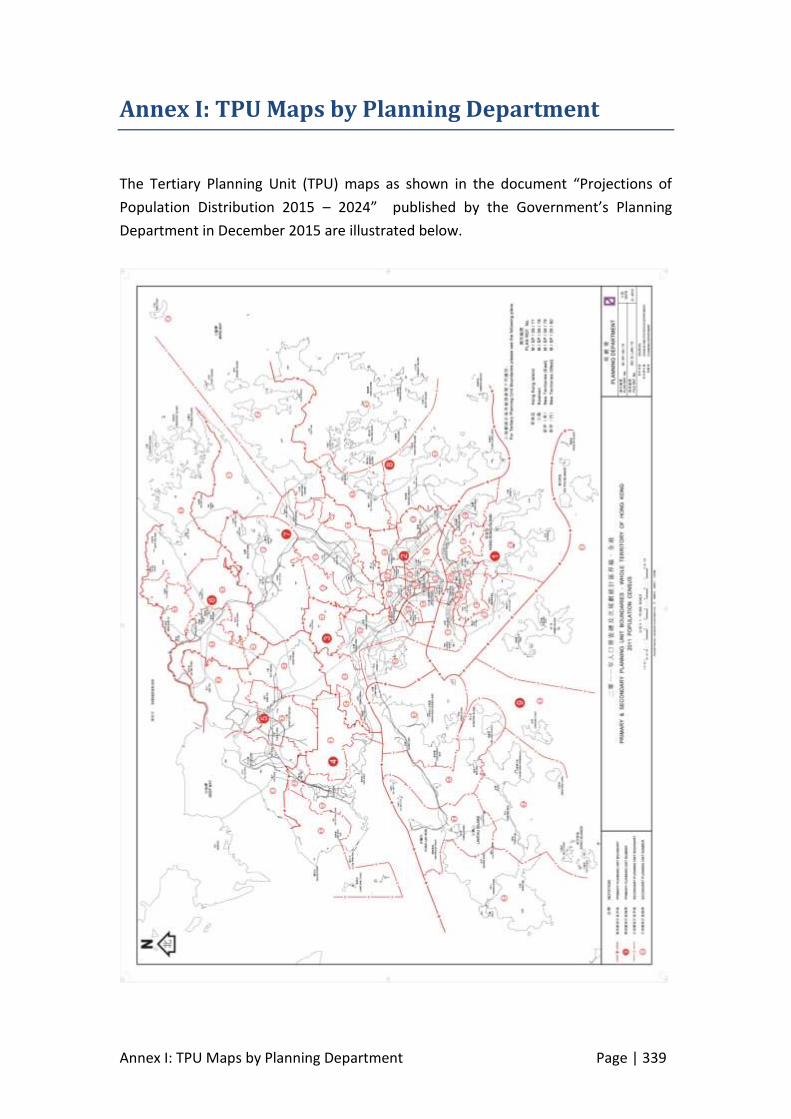
Annex I: TPU Maps by Planning Department Page | 339
Annex I: TPU Maps by Planning Department
The Tertiary Planning Unit (TPU) maps as shown in the document “Projections of
Population Distribution 2015 – 2024” published by the Government’s Planning
Department in December 2015 are illustrated below.
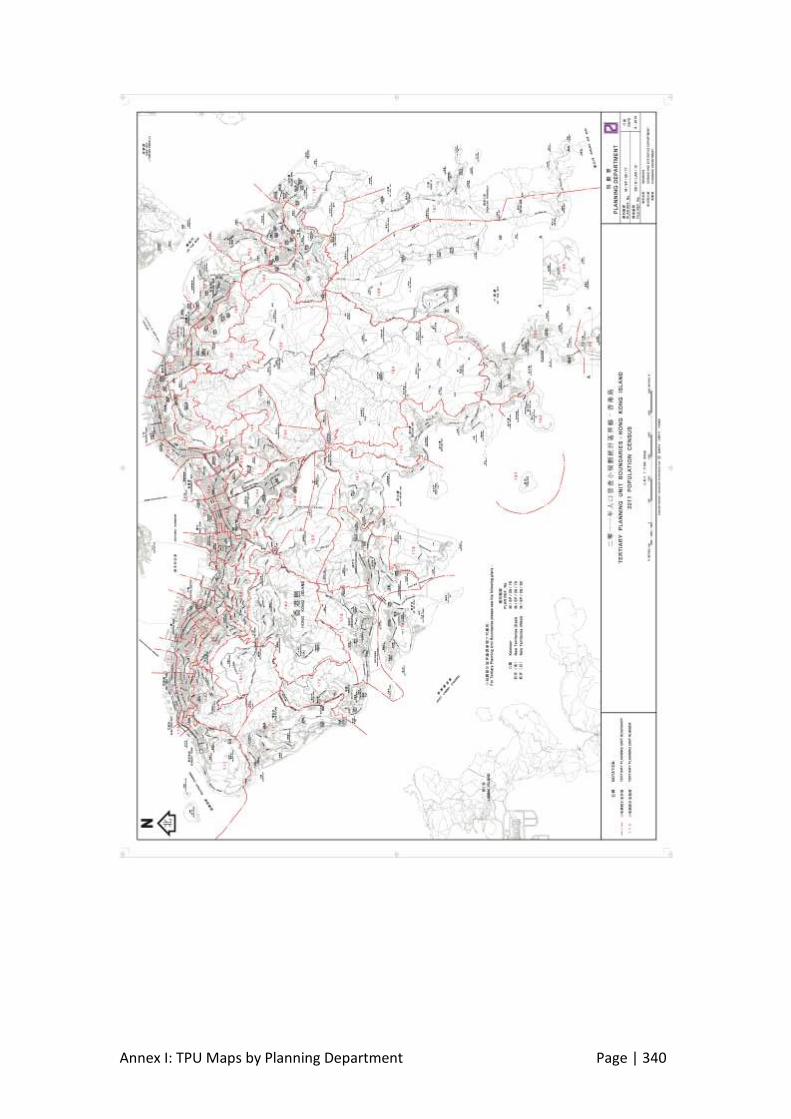
Annex I: TPU Maps by Planning Department Page | 340
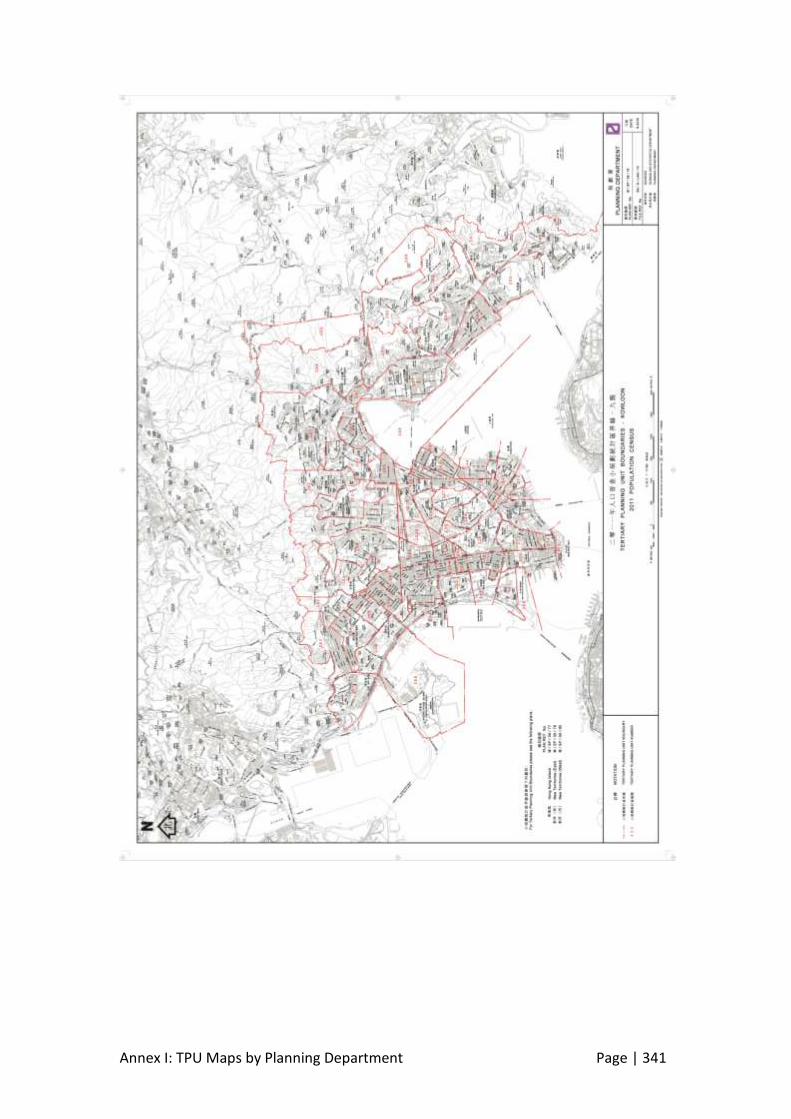
Annex I: TPU Maps by Planning Department Page | 341
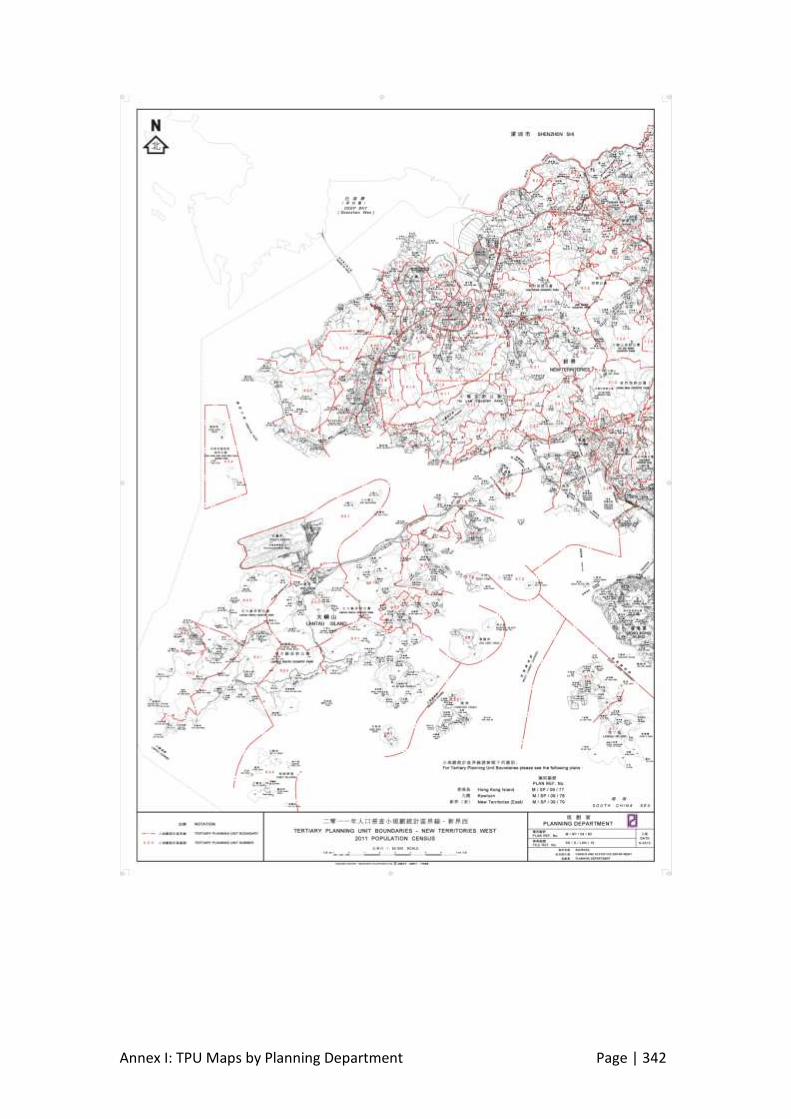
Annex I: TPU Maps by Planning Department Page | 342
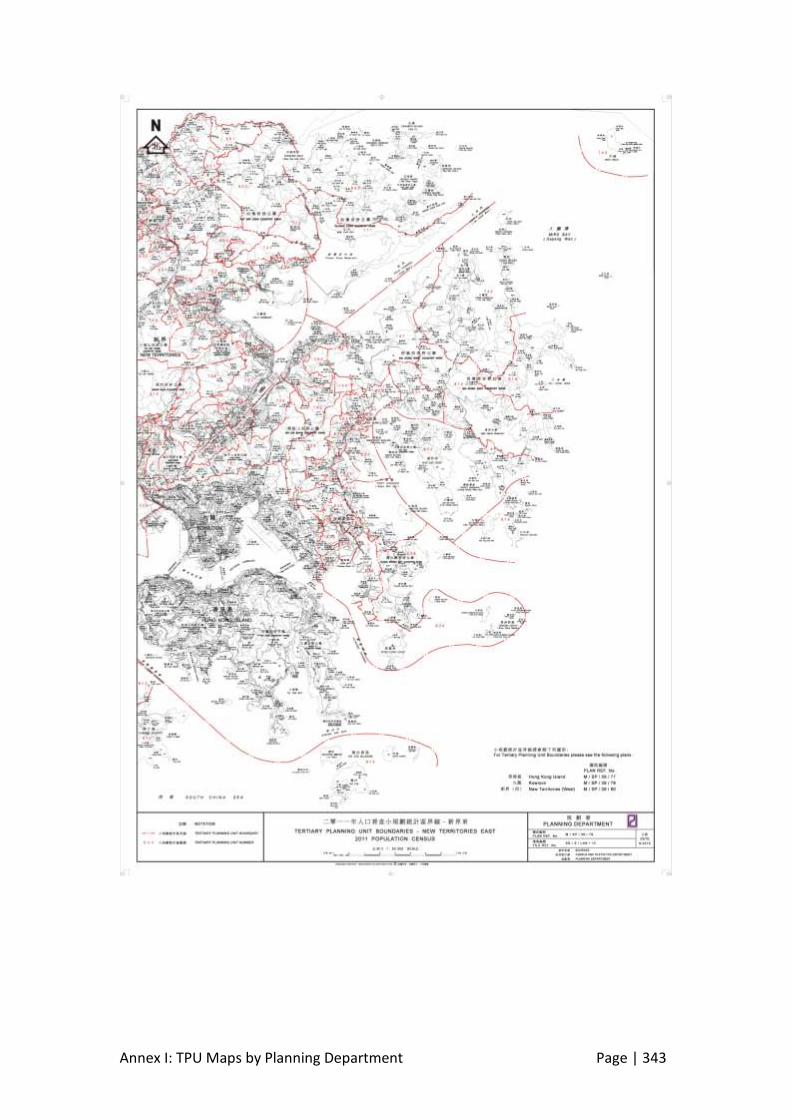
Annex I: TPU Maps by Planning Department Page | 343

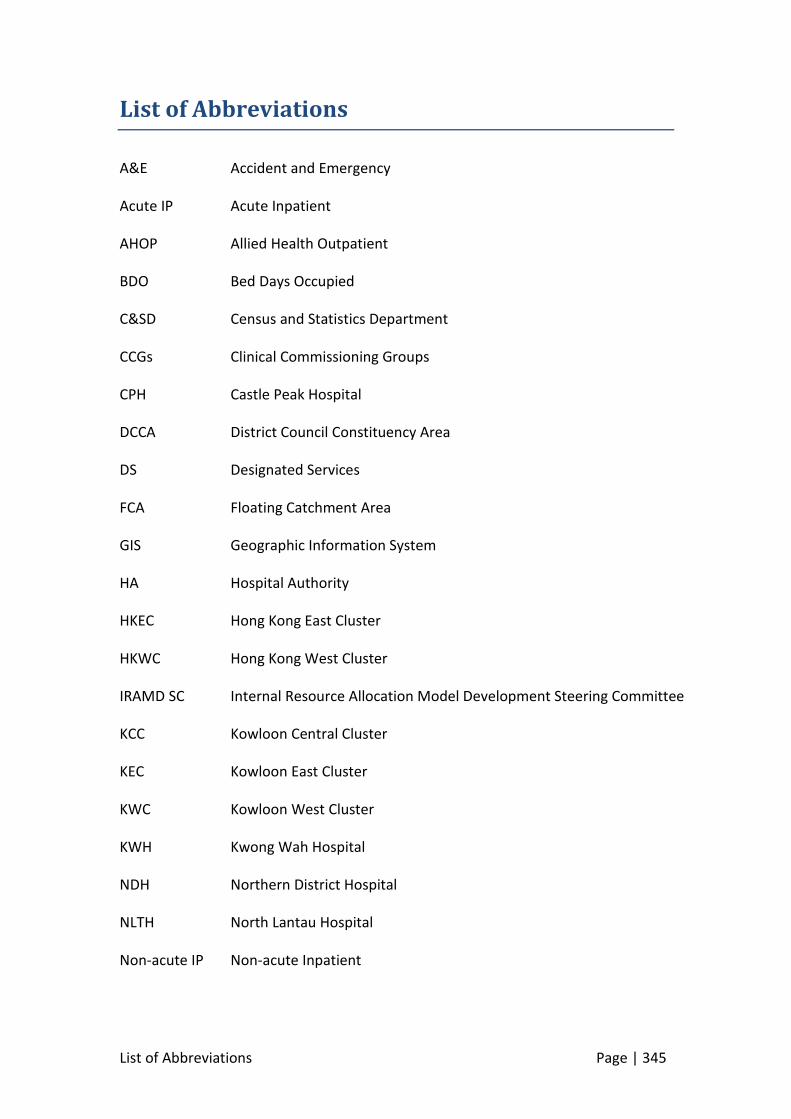
List of Abbreviations Page | 345
List of Abbreviations
A&E Accident and Emergency
Acute IP Acute Inpatient
AHOP Allied Health Outpatient
BDO Bed Days Occupied
C&SD Census and Statistics Department
CCGs Clinical Commissioning Groups
CPH Castle Peak Hospital
DCCA District Council Constituency Area
DS Designated Services
FCA Floating Catchment Area
GIS Geographic Information System
HA Hospital Authority
HKEC Hong Kong East Cluster
HKWC Hong Kong West Cluster
IRAMD SC Internal Resource Allocation Model Development Steering Committee
KCC Kowloon Central Cluster
KEC Kowloon East Cluster
KWC Kowloon West Cluster
KWH Kwong Wah Hospital
NDH Northern District Hospital
NLTH North Lantau Hospital
Non-acute IP Non-acute Inpatient
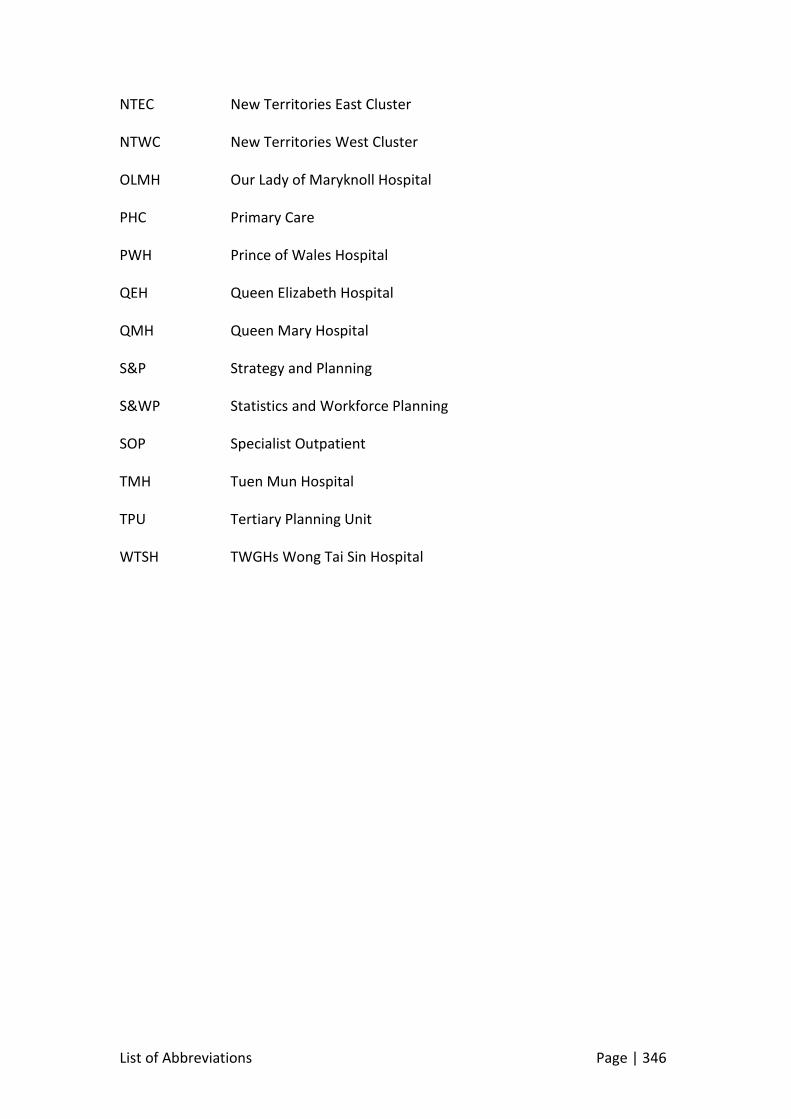
List of Abbreviations Page | 346
NTEC New Territories East Cluster
NTWC New Territories West Cluster
OLMH Our Lady of Maryknoll Hospital
PHC Primary Care
PWH Prince of Wales Hospital
QEH Queen Elizabeth Hospital
QMH Queen Mary Hospital
S&P Strategy and Planning
S&WP Statistics and Workforce Planning
SOP Specialist Outpatient
TMH Tuen Mun Hospital
TPU Tertiary Planning Unit
WTSH TWGHs Wong Tai Sin Hospital

Prepared by:
Finance Division, Hospital Authority
Hospital Authority Building, 147B, Argyle Street, Kowloon, Hong Kong
www.ha.org.hk
Copyright © 2017
All rights reserved. No part of this publication may be reproduced, stored in a
retrieval system, or transmitted in any form without the prior permission of the
copyright owner.