training manual for chemical cluster
111
TRAINING MANUAL FOR CHEMICAL CLUSTER Guidelines for Energy Professionals for preparing bankable DPRs Devki Energy Consultancy Pvt. Ltd. Vadodara, Gujarat, India www.devkienergy.com [email protected]
-
Upload
khangminh22 -
Category
Documents
-
view
1 -
download
0
Transcript of training manual for chemical cluster

TRAINING MANUAL FOR CHEMICAL CLUSTER
Guidelines for Energy Professionals for preparing bankable DPRs
Devki Energy Consultancy Pvt. Ltd. Vadodara, Gujarat, India
www.devkienergy.com

2
CONTENTS
1. INTRODUCTION ............................................................................................................................................. 6
1.1 PROJECT BACKGROUND .............................................................................................................................. 6
1.2 PROJECT ACTIVITIES .................................................................................................................................... 7
2. OVERVIEW OF ANKLESHWAR CLUSTER ............................................................................................... 8
2.1 ANKLESHWAR INDUSTRY PROFILE .............................................................................................................. 8
2.2 MSME PROFILE – ANKLESHWAR ................................................................................................................ 9
3. BARRIERS TO FINANCING ENERGY EFFICIENCY ............................................................................ 10
3.1 PERSPECTIVES OF STAKEHOLDERS ............................................................................................................ 10
3.2 POLICY & REGULATORY PERSPECTIVE ...................................................................................................... 10
3.3 EQUIPMENT/SERVICE PROVIDERS’ PERSPECTIVE ...................................................................................... 11
3.4 END USER PERSPECTIVE ............................................................................................................................ 12
3.5 FINANCIERS/LENDER PERSPECTIVE .......................................................................................................... 13
4. UNDERSTANDING FINANCIALS OF MSME UNITS ......................................................................... 15
4.1 CLASSIFICATION ........................................................................................................................................ 15
4.2 OWNERSHIP OF UNITS ............................................................................................................................... 15
4.3 BALANCE SHEET ........................................................................................................................................ 18
4.4 ASSETS........................................................................................................................................................ 18
4.5 INTANGIBLE ASSETS .................................................................................................................................. 19
4.6 CURRENT ASSETS ....................................................................................................................................... 19
4.7 LIABILITIES- CAPITAL ACCOUNT .............................................................................................................. 20
4.8 PROFIT & LOSS ACCOUNT ......................................................................................................................... 20
4.9 LOANS ........................................................................................................................................................ 20
4.10 CURRENT LIABILITIES ................................................................................................................................ 20
4.11 FINANCIAL RATIOS .................................................................................................................................... 21
4.12 CREDIT MONITORING ANALYSIS (CMA) ................................................................................................. 23
5. PREPARATION OF BANKABLE DPRS .................................................................................................... 25
5.1 INTRODUCTION .......................................................................................................................................... 25
5.2 WORKING CAPITAL ................................................................................................................................... 25
5.3 FUND BASED FACILITIES............................................................................................................................ 26
5.4 NON FUND BASED FACILITIES .................................................................................................................. 27
5.5 PREPARATION OF DPRS ............................................................................................................................ 27
5.6 BANKER’S PERSPECTIVE............................................................................................................................. 29
5.7 PREPARATION OF IGDPR .......................................................................................................................... 31
6. FUNDING SCHEMES FROM GOVERNMENT & FINANCIAL INSTITUTIONS .......................... 34
6.1 INTRODUCTION .......................................................................................................................................... 34

3
6.2 CREDIT GUARANTEE FUND TRUST FOR MICRO AND SMALL ENTERPRISES (CGTMSE) ......................... 35
6.3 CREDIT LINKED CAPITAL SUBSIDY SCHEME (CLCSS) ............................................................................. 38
6.4 SIDBI SCHEME FOR FUNDING PROJECTS THROUGH INDO JAPAN COLLABORATION ON ENERGY
SAVING IN MSME SECTORS ................................................................................................................................... 41
6.5 KFW-SIDBI SCHEME FOR FINANCING ENERGY EFFICIENCY PROJECTS IN THE MSME SECTOR............. 43
7. ENERGY AUDIT ............................................................................................................................................. 47
7.1 ENERGY MANAGEMENT ............................................................................................................................ 47
7.2 ENERGY AUDIT .......................................................................................................................................... 47
7.3 ENERGY AUDIT INSTRUMENTS .................................................................................................................. 49
7.4 ANALYTICAL TECHNIQUES ........................................................................................................................ 50
7.5 HEAT TRANSFER CALCULATIONS .............................................................................................................. 51
7.6 ESTIMATING COST OF IMPLEMENTATION .................................................................................................. 53
7.7 THE PLANT ENERGY STUDY REPORT .......................................................................................................... 53
7.8 BARRIERS TO SUCCESSFUL IMPLEMENTATION .......................................................................................... 55
8. IDENTIFYING ENERGY SAVING PROJECTS ....................................................................................... 58
8.1 INTRODUCTION .......................................................................................................................................... 58
8.2 BOILERS ...................................................................................................................................................... 58
8.2 THERMIC FLUID HEATERS .......................................................................................................................... 65
8.3 DRYERS ...................................................................................................................................................... 66
8.4 DISTILLATION PROCESS ............................................................................................................................. 77
8.5 HOT/COLD RECOVERY .............................................................................................................................. 79
8.6 ELECTRIC MOTORS .................................................................................................................................... 84
8.7 BELTS & GEARS ............................................................................................................................................ 0
8.8 PUMPS & FANS ............................................................................................................................................ 1
8.9 COOLING TOWERS ....................................................................................................................................... 8
8.10 COMPRESSED AIR ........................................................................................................................................ 8
8.11 REFRIGERATION & AIR CONDITIONING SYSTEM ...................................................................................... 13
9. ANNEXURE-1 .................................................................................................................................................. 19
9.1 BANKS IN ANKLESHWAR ........................................................................................................................... 19
10. ANNEXURE-2: SME FINANCE SCHEMES .......................................................................................... 20
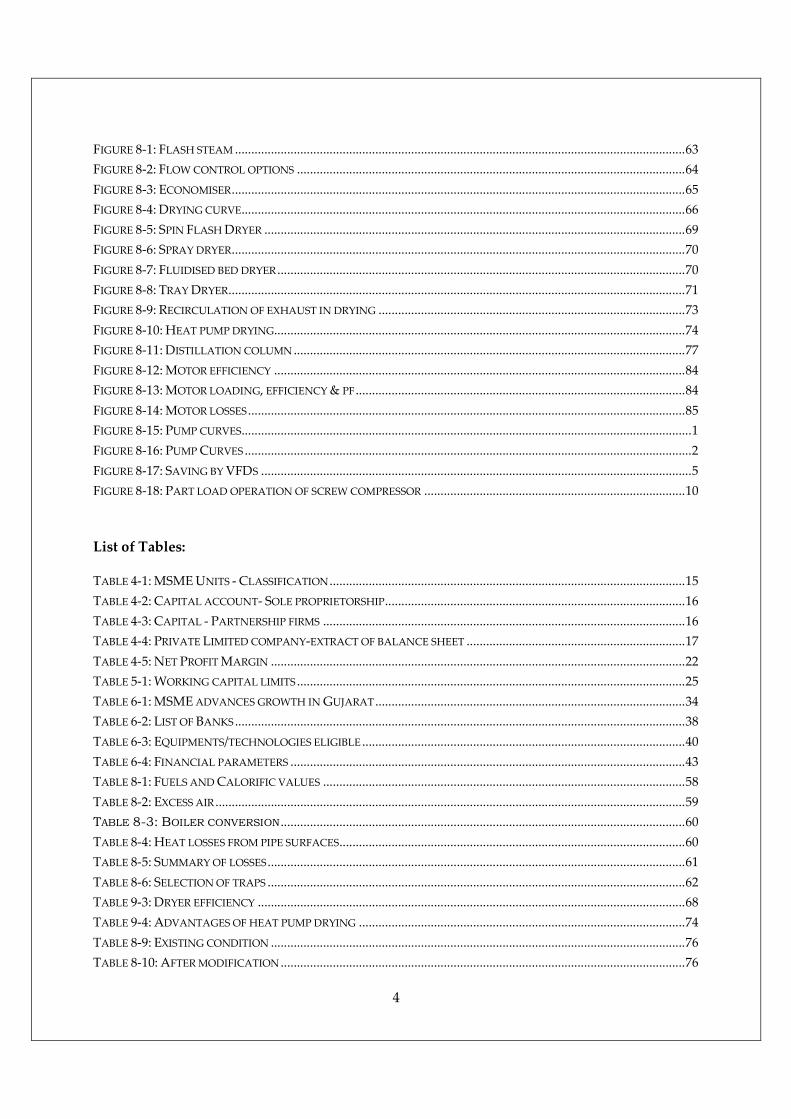
List of Figures
FIGURE 1-1: PROGRAM OVERVIEW ................................................................................................................................ 7
FIGURE 2-1: ANKLESHWAR MAP ................................................................................................................................... 8
FIGURE 2-2: MSME CHEMICAL CLUSTER .................................................................................................................... 9
FIGURE 3-1: BARRIERS TO FINANCING- SUMMARY ..................................................................................................... 14
FIGURE 6-1: MSME ADVANCES- BREAK UP ................................................................................................................ 34
4
FIGURE 8-1: FLASH STEAM .......................................................................................................................................... 63
FIGURE 8-2: FLOW CONTROL OPTIONS ....................................................................................................................... 64
FIGURE 8-3: ECONOMISER ........................................................................................................................................... 65
FIGURE 8-4: DRYING CURVE........................................................................................................................................ 66
FIGURE 8-5: SPIN FLASH DRYER ................................................................................................................................. 69
FIGURE 8-6: SPRAY DRYER ........................................................................................................................................... 70
FIGURE 8-7: FLUIDISED BED DRYER ............................................................................................................................. 70
FIGURE 8-8: TRAY DRYER ............................................................................................................................................ 71
FIGURE 8-9: RECIRCULATION OF EXHAUST IN DRYING .............................................................................................. 73
FIGURE 8-10: HEAT PUMP DRYING.............................................................................................................................. 74
FIGURE 8-11: DISTILLATION COLUMN ........................................................................................................................ 77
FIGURE 8-12: MOTOR EFFICIENCY .............................................................................................................................. 84
FIGURE 8-13: MOTOR LOADING, EFFICIENCY & PF ..................................................................................................... 84
FIGURE 8-14: MOTOR LOSSES ...................................................................................................................................... 85
FIGURE 8-15: PUMP CURVES .......................................................................................................................................... 1
FIGURE 8-16: PUMP CURVES ......................................................................................................................................... 2
FIGURE 8-17: SAVING BY VFDS .................................................................................................................................... 5
FIGURE 8-18: PART LOAD OPERATION OF SCREW COMPRESSOR ................................................................................ 10
List of Tables:
TABLE 4-1: MSME UNITS - CLASSIFICATION ............................................................................................................. 15
TABLE 4-2: CAPITAL ACCOUNT- SOLE PROPRIETORSHIP ............................................................................................ 16
TABLE 4-3: CAPITAL - PARTNERSHIP FIRMS ............................................................................................................... 16
TABLE 4-4: PRIVATE LIMITED COMPANY-EXTRACT OF BALANCE SHEET ................................................................... 17
TABLE 4-5: NET PROFIT MARGIN ............................................................................................................................... 22
TABLE 5-1: WORKING CAPITAL LIMITS ....................................................................................................................... 25
TABLE 6-1: MSME ADVANCES GROWTH IN GUJARAT ............................................................................................... 34
TABLE 6-2: LIST OF BANKS .......................................................................................................................................... 38
TABLE 6-3: EQUIPMENTS/TECHNOLOGIES ELIGIBLE ................................................................................................... 40
TABLE 6-4: FINANCIAL PARAMETERS ......................................................................................................................... 43
TABLE 8-1: FUELS AND CALORIFIC VALUES ............................................................................................................... 58
TABLE 8-2: EXCESS AIR ................................................................................................................................................ 59
TABLE 8-3: BOILER CONVERSION ............................................................................................................................ 60
TABLE 8-4: HEAT LOSSES FROM PIPE SURFACES .......................................................................................................... 60
TABLE 8-5: SUMMARY OF LOSSES ................................................................................................................................ 61
TABLE 8-6: SELECTION OF TRAPS ................................................................................................................................ 62
TABLE 9-3: DRYER EFFICIENCY ................................................................................................................................... 68
TABLE 9-4: ADVANTAGES OF HEAT PUMP DRYING .................................................................................................... 74
TABLE 8-9: EXISTING CONDITION ............................................................................................................................... 76
TABLE 8-10: AFTER MODIFICATION ............................................................................................................................ 76

5
TABLE 8-11: SAVING POTENTIAL ................................................................................................................................ 76
TABLE 9-8: HEAT PUMP ASSISTED CHLORINE EVAPORATION .................................................................................... 83
TABLE 8-13: MOTOR SIZING ........................................................................................................................................ 85
TABLE 8-14: COMPARISON OF REWINDING & REPLACEMENT.................................................................................... 86
TABLE 8-15: HIGH EFFICIENCY MOTORS ..................................................................................................................... 86
TABLE 8-16: MOTOR REPLACEMENT ............................................................................................................................. 0
TABLE 8-17: EFFICIENCY OF GEAR & BELT DRIVES........................................................................................................ 1
TABLE 8-18: SAVING BY IMPELLER TRIMMING .............................................................................................................. 6
TABLE 9-15: PNEUMATIC VS ELECTRICAL PUMPS ....................................................................................................... 11
TABLE 9-16: COMPRESSED AIR LEAKAGE .................................................................................................................... 11
TABLE 9-17: EFFECT OF HIGHER TEMPERATURE ON EFFICIENCY ............................................................................... 14
TABLE 9-18: INCREASE IN COP .................................................................................................................................. 14
TABLE 9-19: REPLACEMENT OF EVAPORATORS .......................................................................................................... 16

6
1. Introduction
1.1 Project Background
1.1.1 The Micro, Small and Medium Enterprises Sector (MSME) is a critical segment of the Indian
economy. It has a large share in employment generation and contributes significantly to
manufacturing output as well as exports of the country.
1.1.2 The potential for growth and stability of this sector is however being hampered by factors
like obsolete technology, information deficiencies, lack of financing avenues for
technological up gradation and conservative management practices. These factors are also
likely to create energy inefficiencies.
1.1.3 The Bureau of Energy Efficiency (BEE), a statutory body under the Ministry of Power, and Small Industries Development Bank of India (SIDBI) are jointly executing a Project
“Financing Energy Efficiency at MSMEs”. This project forms a part of the Global
Environment Facility (GEF) Programmatic Framework (2010-14) for promoting Energy
Efficiency in India with an objective to increase demand for energy efficiency investments in
targeted MSME clusters and to build their capacity to access commercial finance.
1.1.4 The GEF implementation agency for this project is World Bank. The project aspires to
address the current gap in the understanding between energy auditors and bank loan officers
and demonstrate a viable mechanism of synergic tie-up between MSMEs, energy auditors,
financial consultants/chartered accountants, local industrial or MSME associations and local
bankers.
1.1.5 The project has been launched at the following five MSME clusters from different industrial
sectors, namely, Ankleshwar (Chemical), Faridabad (Mixed), Kolhapur (Foundry), Pune
(Forging) and Tirunelveli (Lime kiln).
1.1.6 Devki Energy Consultancy Pvt. Ltd. is providing technical assistance to energy professionals at the
Ankleshwar Cluster, which involves capacity building of energy professionals in techno-
economic feasibility studies and development of bankable Detailed Project Reports.
1.1.7 The primary objective of the assignment is to develop a constituency of trained energy
auditors and energy professionals for the MSME Chemical clusters with specific knowledge
in:
� Production processes in various types of industries in the cluster, viz., Chemicals,
Pesticides, Dye & Dyestuffs, Petroleum Products, Rubber, Bulk Drugs, Pharmaceuticals,
Packaging, etc.

7
� Identifying potential for energy savings in equipments and processes in these industries
� Developing implementable energy saving schemes in these industries
� Preparing bankable DPRs
� Schemes available with banks/FIs for financing energy saving schemes
1.2 Project Activities
1.2.1 A brief activity chart followed by us for implementing this project is given below.
Figure 1-1: Program overview
Review of cluster information
•Identify chemical MSME units in Ankleshwar by discussions with BEE, Industry Associations & End Users
•Review & compile information on EE in the Ankleshwar cluster such as energy norms, current technologies, penetration of EE technologies, barriers, etc.
Walk through audits to validate review findings
•Identify plants for conducting walkthough audits considering scale of production, production process and technology. About 25 audits to be done in the Ankleshwar chemical cluster.
•Develop a Cluster specific template for data collection, monitoring & measurements, energy saving calculations. The Walk Through Audit Report will include process flow charts, energy & material balance, energy use information and practices, energy production norms, information gaps, case studies, etc.
Developing training modules
•Discussions with FIs to understand existing schemes and documentation requirements to prepare guidelines for training energy professionals to prepare bankable DPRs
•Modules will be developed by discussions with Associations, FIs & BEE to highlight govt /FI initiatives, technological interventions to save energy cost, M&V techniques, financial evaluation methods, etc.
Imparting Training to
Energy Professionals
•Three training programs will be conducted with number of participants 25-30 in each program.
•Candidates for training will be selected in consultation with BEE regarding qualifications and experience
•A half-day industry visit will be organised after each program to familiarise participants with the processes, practices and barriers in MSME in the cluster.
•Design, collect & disseminate feed back from programs to BEE

8
2. Overview of Ankleshwar Cluster
2.1 Ankleshwar Industry profile
2.1.1 Ankleshwar is one of the historical cities of Gujarat in Bharuch district. The city is also well
connected with the metro cities of Mumbai and Delhi by road (NH 8), rail and air
(approximately 90 kms from Vadodara and Surat airports). One of the notable attractions of
Ankleshwar is the 132 year old Golden Bridge over the river Narmada, that connects it with
Bharuch city.
2.1.2 The city is also primarily identified with the presence of Ankleshwar Industrial Estate, one of
the largest industrial townships of Asia. This estate was set up by GIDC in the mid 70s and
today there are more than 1200 Micro, Small and Medium industrial units engaged in
manufacturing, trading and providing various services. Most of the industries being from the
chemical sector, Ankleshwar is also recognised as a major chemical zone of the State.
2.1.3 Ankleshwar also provides industrial and social infrastructure to other nearby estates like
Panoli and Jhagadia as indicated in the map below.
Figure 2-1: Ankleshwar map
2.1.4 35% of the total exports of the State are from this area. Ankleshwar is contributing significantly to the growth of Gujarat State as well as the nation.

9
2.1.5 Many MNC companies and large corporates also have manufacturing facilities at GIDC
Ankleshwar; some of the well known names are Aventis Pharma, Asian Paints, Bayer
Cropscience, Cadila Healthcare, Lupin, UPL etc.
2.2 MSME profile – Ankleshwar
2.2.1 Of the 1200 units in Ankleshwar GIDC, around 450 units can be classified as chemical units
in MSME. These units can be further classified under the following industrial sector
� Chemicals
� Dyes, Pigments & Colours
� Pesticides & Fertilisers
� Packaging
� Petroleum Products
� Pharma & Bulk Drugs
� Plastics & Rubber
2.2.2 The following figure illustrates the number of units coming under various categories.
Figure 2-2: MSME Chemical Cluster
2.2.3 The majority of industries fall into Dyes & Pigments sector. General chemicals & pharma-
bulk drugs also contribute significantly in terms of numbers in this cluster.
450 MSME Chemical Units
Chemicals84
Petroleum products
10
Dyes, Pigments, Paints &
Colour 179
Plastics & Rubber 72
Pesticides & Fertilizers 4
Packaging 22
Pharma & Bulk
Drugs 79

10
3. Perspectives on Financing Energy Efficiency
3.1 Perspectives of Stakeholders
3.1.1 Big ticket Energy Efficiency projects in the MSME sector have often suffered due to non-
availability of finance. Financing Barriers are broadly segregated to understand the
perspectives of the stakeholders:
• Policy & Regulatory Perspective
• Equipment/Service providers’ Perspective
• End Users’ Perspective
• Financiers’/Lenders’ Perspective
3.2 Policy & Regulatory Perspective
3.2.1 Energy pricing structures often do not send the right signals to end users to improve their
energy efficiency.
3.2.2 One of the important financial barriers being faced by MSMEs today is the difficulty in
providing technical and financial information to banks and companies to routinely negotiate
loans for implementing energy efficiency interventions.
3.2.3 Reserve Bank of India has issued guidelines & directives to banks regarding priority sector
lending, including MSMEs. Bank lending to the Micro and Small Enterprises is reckoned as
priority sector advances; lending to Medium enterprises is not eligible to be included for the
purpose of computation of priority sector lending. The domestic commercial banks are
expected to enlarge credit to the priority sector and ensure that priority sector advances
(which include the micro and small enterprises sector) constitute 40% of Adjusted Net Bank
Credit (ANBC) or credit equivalent amount of Off-Balance Sheet Exposure, whichever is
higher. However, the priority sector also includes agriculture, housing etc. and hence there
are no separate targets for loans to MSEs alone.
3.2.4 Banks have been advised to achieve a 20 per cent year-on-year growth in credit to Micro and
Small enterprises and a 10 per cent annual growth in the number of Micro enterprise
accounts.

11
3.2.5 Serious market failures exist in most jurisdictions. The perception is that governments are
not providing a clear and compelling set of targeted policies and incentives to pursue energy
efficiency interventions across the economy at a meaningful scale. Most of the government
subsidies/incentives are generally targeting renewable energy investments like wind energy,
solar thermal and solar photovoltaic, micro hydro etc. The rapid, policy-led growth in
renewable energy investment in many countries is highlighted as a positive example that
should be emulated.
3.2.6 Market driven mechanisms such as Clean Development Mechanism (CDM) have not
penetrated the MSME sector because of high transaction costs as compared to the benefits.
The Perform, Achieve, Trade mechanism, initiated by BEE, which is targeting only
designated consumers under the Energy Conservation Act, is not available as an incentive
for MSMEs.
3.2.7 Most financial institutions lack awareness about the impact of energy efficient
equipment/processes on the bottom line and resultant environmental benefits; for example,
a loan may be granted more easily for pollution control equipment than energy efficient
equipment.
3.3 Equipment/Service Providers’ Perspective
3.3.1 Absence of sufficient information from the customers and lack of customer awareness are
often major impediments in implementation of energy efficiency projects. Company
purchase policies often encourage purchases at the lowest cost, disregarding the issue of
energy efficiency and potential energy cost savings.
3.3.2 Techno-economic feasibility analyses of any energy saving projects are typically done by
energy auditor or the vendor of the energy efficient equipment; often insufficient knowledge
of financial analyses results in a report that does not provide all information required by a
banker or financier. For example, a typical feasibility study makes assumptions for various
factors for estimating energy savings, such as energy cost, operating hours, production levels,
discount rates, inflation in costs and other factors beyond the control of unit owner.
Sensitivity analysis is required to understand the base case, best case and worst case scenarios
and build the confidence level of the industry owner and the financier; often this is not done.
For large investments, the bankers may be interested in understand the impact on CMA
data, which may require the skills of a chartered accountant; lack of access to qualified
professionals to do this type of analyses often limits further development of energy saving
interventions. The scope of such analyses is often limited by the professional charges that
the unit owner is willing to spend on such activity.

12
3.3.3 The process for loan approval for project financing also often tends to be a tedious process;
the efforts are often disproportionately high and not worth especially if the loan amount is
small. High risk projects, that can be implemented on an ESCO basis, also do not take off
at times as establishing water-tight Monitoring & Verification protocols is also difficult in
some cases. It may also be difficult to secure the rights over the Energy Efficient equipment
and/or collect payment installments in the event of dispute over performance.
3.3.4 Poor documentation and inability of the industry owner to communicate issues to the
banker may also result in non-availability of funding for potentially lucrative energy saving
projects.
3.4 End Users’ Perspective
3.4.1 Very high perceived risks of some energy efficiency projects, mistrust in unduly optimistic
projections in project reports of auditors/vendors etc. can often derail the implementation
of energy efficiency projects.
3.4.2 Lack of money , lack of time, absence of experts for designing & project planning or lack of
internal expertise for implementation are genuine problems faced by MSMEs. Many unit
owners may have good conceptual knowledge but are unable to take these forward due to
the mentioned reasons.
3.4.3 Cash flows from saving energy are not conventional revenues, so it discourages commercial
financial institutions (CFI)s' entry into this market. Energy cost savings are often not
considered as positive cash flows into the plant boundary like money from sales of products.
3.4.4 Even in cases wherein the payback periods are short and huge savings are expected, energy
efficiency projects are often not implemented because of high startup cost, especially due to
production shutdown requirements for implementation. Often high investment projects are
filtered based on simple payback periods, which considers only the savings in the first year;
use of IRR or other methods, which provide a more holistic understanding of economics
over the life time of the equipment, are often not used.
3.4.5 Additional project costs for engineering analyses & design, additional utility requirements,
disruptions to production during implementation, additional staffing & training and other
overheads are often ignored in calculation resulting overly optimistic scenarios and
misleading economics. Due to small size of projects, due diligence requirements from a
project financing perspective create relatively high transaction costs, resulting in
managements giving low priority to such projects.
13
3.5 Financiers’/Lenders’ Perspective
3.5.1 The contributions of energy savings to cash flow often cannot be differentiated from main
cash flow which may increase or decrease due to a variety of factors. Often the
contributions of energy saving projects get masked due to variations in cash flow due to
other reasons, which lead to finance persons doubting the real contribution of energy saving
projects.
3.5.2 Low collateral asset value of energy efficient equipment results in difficulties in creating
creditworthy financing structures. Collateral value is low because for most energy efficiency
projects equipment represents a small share of total project cost but may have high
engineering development and installation costs.
3.5.3 Energy efficiency projects often represent a relatively small position of business for major
banks and may be perceived as high credit risk. Unfavorable financial position indicated in
balance sheet may also demand more collateral to fund the project.
3.5.4 Energy professionals should make an attempt to transgress their limitations in understanding
of finance to ensure the Investment Grade Detailed Project Reports (IGDPR) prepared by
them
3.5.5 The following diagram shows the broad category of barriers to implementing energy
efficiency schemes.

14
Energy pricing High Project development costs
Lack of awareness of EE New technologies and contractual mechanisms
Procurement policies favor lowest cost
Limited demand for EE goods
Higher project development and upfront costs
Small sizes widely high transaction costs
Import duties on EE equipment
Diffuse/diverse markets Ability/willingness to pay incremental cost
High perceived risk as these are traditional asset based
Unclear or underdeveloped institutional framework for EE
New contractual mechanisms(ESCOs)
Low EE benefits relative to other costs
Other higher return, low risk projects are more attractive
Lack of testing facilities, poor enforcement of standards
Limited technical, business, risk management skills, Limited financing/equity
Perceived risk of new tech/systems, mixed incentives, lack of credible data
Behavioral biases
Figure 3-1: Barriers to financing- summary
Barriers to investment in energy efficiency
Policy /
Regulatory
Equipment vendors /
Service providers
End Users Banks /FIs
15
4. Understanding Financials of MSME Units
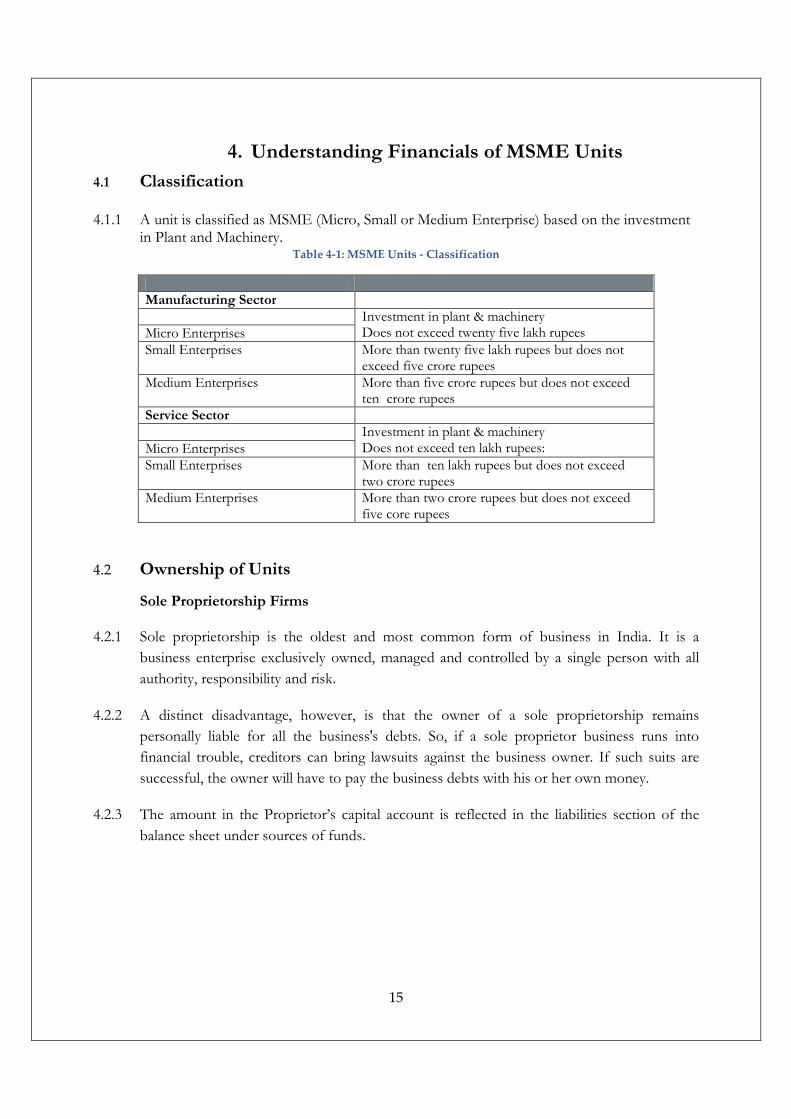
4.1 Classification
4.1.1 A unit is classified as MSME (Micro, Small or Medium Enterprise) based on the investment in Plant and Machinery.
Table 4-1: MSME Units - Classification
Manufacturing Sector Investment in plant & machinery
Does not exceed twenty five lakh rupees Micro Enterprises Small Enterprises More than twenty five lakh rupees but does not
exceed five crore rupees Medium Enterprises More than five crore rupees but does not exceed
ten crore rupees Service Sector Investment in plant & machinery
Does not exceed ten lakh rupees: Micro Enterprises Small Enterprises More than ten lakh rupees but does not exceed
two crore rupees Medium Enterprises More than two crore rupees but does not exceed
five core rupees
4.2 Ownership of Units
Sole Proprietorship Firms
4.2.1 Sole proprietorship is the oldest and most common form of business in India. It is a
business enterprise exclusively owned, managed and controlled by a single person with all
authority, responsibility and risk.
4.2.2 A distinct disadvantage, however, is that the owner of a sole proprietorship remains
personally liable for all the business's debts. So, if a sole proprietor business runs into
financial trouble, creditors can bring lawsuits against the business owner. If such suits are
successful, the owner will have to pay the business debts with his or her own money.
4.2.3 The amount in the Proprietor’s capital account is reflected in the liabilities section of the
balance sheet under sources of funds.

16
Table 4-2: Capital account- Sole proprietorship
Particular Current Year (Amount in Rs)
Previous Year (Amount in Rs)
Capital Account Opening Balance xxx xxx Add – Addition to Capital xxx xxx Interest on Capital xxx xxx Net Profit earned during the year xxx xxx Less - Withdrawals xxx xxx Closing Balance of Capital Account xxxx xxxx
Partnership Firms
4.2.4 Partnership concerns are formed when more than one person owns the business and they
have jointly signed a Partnership Deed.
4.2.5 At least two members are required to start a partnership business. But the number of
members should not exceed 10 in case of “banking business” and 20 in case of “other
business”. If the number of members exceeds this maximum limit, then that business is not
called as a partnership business legally.
4.2.6 The Partnership Firm’s capital account is reflected in the liabilities section of the balance
sheet under sources of funds as shown in table 4.3. This is the net worth of the Partnership
Firm
Table 4-3: Capital - Partnership firms
Partner Capital Account ( Mr. B)
Opening Balance xxx xxx
Add – Addition to Capital xxx xxx
Interest on Capital xxx xxx
Net Profit ( as per Profit Sharing Ratio) xxx Xxx
Remuneration
Less - Withdrawals xxx Xxx
Closing Balance of Capital Account xxxx Xxxx
Particular Current Year (Amount in Rs)
Previous Year (Amount in Rs)
Partner Capital Account ( Mr. A) Opening Balance xxx xxx Add – Addition to Capital xxx xxx Interest on Capital xxx xxx Net Profit ( as per Profit Sharing Ratio) xxx xxx
Remuneration Less - Withdrawals xxx xxx Closing Balance of Capital Account xxxx xxxx

17
Private Limited Company
4.2.7 A private limited company is a voluntary association that offers limited liability or legal
protection for its shareholders but that places certain restrictions on its ownership. These
restrictions are defined in the company's bye laws or regulations and are meant to prevent
any hostile takeover attempt.
4.2.8 The major ownership restrictions are:
� Shareholders cannot sell or transfer their shares without offering them first to other
shareholders for purchase,
� Shareholders cannot offer their shares to the general public over a stock exchange ,
� The number of shareholders should not be less than two and not more than fifty.
4.2.9 Private Limited company is a fully owned by a group of promoters. All shares of the
company are held with promoters and their relatives. Details of shareholder’s funds are
found in the liabilities section of the balance sheet of the private limited company as detailed
in table 4.4 below.
Table 4-4: Private Limited company-extract of balance sheet
Particular Current Year (Amount in Rs)
Previous Year (Amount in Rs)
Shareholder’s Funds A) Share Capital Account ( Note No -1) xxxx xxxx B) Reserve & Surplus Account ( Note No -2) xxxx xxxx
Particular Current Year (Amount in Rs)
Previous Year (Amount in Rs)
Share Capital Account Authorized Equity shares of Rs 10 each with voting rights (No Share xxx )
xxx xxx
Issued ,Subscribed & fully paid up Equity shares of Rs 10 each with voting rights (No. Share xxx)
xxx xxx
Particular Current Year (Amount in Rs)
Previous Year (Amount in Rs)
Reserve & Surplus Account
Surplus /Deficit in the statement of Profit and Loss Account
xxx xxx

18
4.3 Balance Sheet
4.3.1 A financial statement summarizes a company's assets, liabilities and Shareholders' Fund at a
specific point in time. These three balance sheet segments give investors an idea as to what
the company owns and owes, as well as the amount invested by the shareholders.
4.3.2 An audited balance sheet generally comprises of the following:
• Directors’ Report.
• Auditor’s Report
• Balance Sheet
• Profit and Loss Account
4.3.3 The first page of the balance sheet contains a summary of all the balances in the various
asset and liability accounts of the company. The total of all the assets must equal the total of
all the liabilities.
4.4 Assets
4.4.1 The Assets part of the balance sheet generally comprise of the following.
4.4.2 This section of the balance sheet contains the book value of all the fixed assets of the
firm/company i.e. summary of the cost of asset less depreciation for the year.
4.4.3 Fixed Assets are assets used within the business and not acquired for the purposes of resale.
4.4.4 Examples include:
• Land and buildings
• Plant and machinery (Eg. boilers, chillers, Reactors etc.)
• Fixtures and fittings, such as light fittings and shelves
• Motor vehicles like vans and cars.
4.4.5 Fixed assets are shown at original cost (purchase price) or valuation (including all expenses
that are incurred before it is ready for use. Depreciation* is charged on the asset at a rate
prescribed under the Income Tax Act 1961 and Companies Act 1956.
*Depreciation is the measure of wearing out of a fixed asset. Fixed assets are expected to wear
out and become less efficient. Depreciation is calculated as the estimate of this measure of
wearing out and is a charge in the Profit and loss Account.
19
No Depreciation should be charged on land while depreciation is to be charged on all other
assets.
4.5 Intangible Assets
4.5.1 An intangible asset is an identifiable non-monetary asset, without physical
substance, held for use in the production or supply of goods or services, for
rental to others, or for administrative purposes. Eg. Copyright, Patents etc
4.6 Current Assets
4.6.1 Current assets are assets which can be easily liquidated within a period of 12 months or as
per operating cycle of business concern. The following can be classified under current assets:
• Cash and Bank Balances
• Government and other deposits
• Fixed Deposits with banks
• Sundry Debtors or Receivables (domestic & export, outstanding for less than six months)
• Inventory (Stock of Raw materials)
• Stocks in process
• Finished goods
• Other consumable spares and packing
• Advances and prepaid expenses
• Advance Tax
• Others – Deposits etc

20
4.7 Liabilities- Capital Account
4.7.1 Proprietor’s capital account or Partnership Firm’s capital account or Share Capital account in
the case of Private Limited companies wherein the Paid up Capital will actually give an idea
regarding the amount of money the promoters of the company have brought into the
business.
4.7.2 The credit/ (Debit) balance in the profit and loss account is called a surplus/(Deficit) and, at
the end of an accounting period, the company may decide to transfer part of the profits to
“Reserve” head in the balance sheet; the reserve created out of profits transferred from
Profit and Loss account is called General Reserve.
4.7.3 The company can use the general reserve for various purposes including issue of bonus
shares to shareholders and payment of dividend when profits are insufficient.
4.8 Profit & Loss Account
4.8.1 Profit & loss Account is a Financial Statement summarizes the revenues, costs and expenses
incurred during a specific period of time, usually a fiscal quarter or year. These records
provide information that shows the ability of a company to generate profit by increasing
revenue and reducing costs. The P&L statement is also known as a "statement of profit and
loss", an "income statement" or an "income and expense statement".
4.9 Loans
Working Capital Loan- Current outstanding of working capital loans are mention .Example Cash Credit
Unsecured Loans- Outstanding loans from promoters, their friends and relatives, which are
not secured by any collateral.
4.10 Current Liabilities
A. From Banks
Short term borrowings from banks (including bills purchased & discounted and the excess borrowings placed on repayment basis)
B. Other Current Liabilities
• Short term borrowings (others)
• Sundry Creditors (trade)
• Advance Payments from customers/deposits from dealers, agents etc.
• Provision for taxation

21
• Dividend payable
• Other statutory liabilities
• Installments of term loans/ deferred payment credits / etc. due within one year
• Other current liabilities and provisions due within one year
4.11 Financial Ratios
Current Ratio
4.11.1 This is the most fundamental ratio in Financial Analysis. It is also known as Liquidity Ratio
and is calculated as under:
���������� = (�������������)/(�������������)
Having a current ratio of 1.33 is ideal.
4.11.2 The current ratio is a liquidity ratio which estimates the ability of a company to pay back
short-term obligations. This ratio is also known as cash asset ratio, cash ratio, and liquidity
ratio. A higher current ratio indicates the higher capability of a company to pay back its
debts.
Quick Ratio
4.11.3 The quick ratio also referred as the “acid test ratio” or the “quick assets ratio”, this ratio is a
gauge of the short term liquidity of a firm. The quick ratio is helpful in measuring a
company’s short term debts with its most liquid assets.
The formula used for computing quick ratio is:
(������������� − ���������)/(�������������)
A higher quick ratio indicates the better position of a company.
Debt Equity Ratio
4.11.4 This ratio gives an idea regarding the total debt or borrowings of the entity against the
capital or the tangible net worth of the entity.
������������ = ���/���
TOL stands for Total outside Liabilities.

22
TNW stands for Tangible Net Worth.
��� = �������ℎ − ����!���������
Debt Service Coverage Ratio (DSCR)
4.11.5 The Debt Service Coverage ratio (DSCR), also known as "debt coverage ratio" (DCR), is
the ratio of cash available for debt servicing to interest, principal and lease payments. It is a
popular benchmark used in the measurement of an entity's (person or corporation) ability to
produce enough cash to cover its debt (including lease) payments. The higher this ratio, the
easier it is to obtain a loan. This terminology is also used in commercial banking and may be
expressed as a minimum ratio that is acceptable to a lender; it may be a loan condition or
covenant.
�"�� = (#�� + ��%��&��� + ��������)/(��%�'������!���)
Net Profit Margin
The Net Profit margin is a number which indicates the efficiency of a company in cost
control. A higher net profit margin shows more efficiency of the company at converting its
revenue into actual profit. This ratio is a good way of making comparisons between
companies in the same industry, for such companies are often subject to similar business
conditions.
The formula for computing the Net Profit Margin is:(NetProfit)/(NetSales)
Table 4-5: Net Profit Margin
Acceptable Values
A ) Ratios
Current Ratio 1.33 Debt: Equity 1.5 to 2:1(preferred)
TOL/TNW Not More than 3:1
Gross Average DSCR 1.75 – 2.00 PBDIT/Interest More than 2.5
B) Promoters’ Contribution as % age to Total Cost of Project
25% to 30%

23
4.12 Credit Monitoring Analysis (CMA)
4.12.1 The financials of a company are classified in a spreadsheet in a particular format. This forms
the CMA data of the entity.
4.12.2 CMA Data means credit monitoring arrangement data. This data is provided by a company
to a bank for getting a loan from the bank. Banks analyse this data and decide whether the
loan should be sanctioned as well as set the drawing power/limits.
4.12.3 The CMA generally consists of 5 years data including 2 years Audited balance sheets and 1
year’s estimated/provisional (i.e. current year) balance sheet and the future projected balance
sheets for the remaining years. In the case of a Term Loan, CMA includes data till the
repayment of a loan and, in case of a WC, current year ‘s and following year’s projections.
4.12.4 The Fund flow statement, changes in working capital report, ratio analysis and maximum
permissible bank finance (MPBF) report.
4.12.5 Banks want to decrease risk of default of loan. Over a period of time, if any company is not
in position to repay the loan, it becomes bad debt. The reason for the default may be due to
the fact that the bank did not analyze the financial and solvency position of company. By
getting CMA data, bankers will be in the position to understand the financial position of the
company. So, every bank should demand CMA Data and analyze it in depth. CAs generally
provide the service of preparing and analyzing the CMA data on the behalf of the company
and bank.
4.12.6 With studying the balance sheet, the bank will know as to whether the financial position of
the entity is sound or not, and whether the assets are debt free or mortgaged.
4.12.7 With the fund flow statement, banks get an idea regarding the inflows and outflows of
funds. It also gives the exact picture as to whether the company is wasting their funds or
using the funds for growing the business.
4.12.8 The profit and loss account gives details of the appropriation of profits etc. to the banker. It
also helps in understanding the earning cycle which gives a further understanding of how
expenses are being met.
4.12.9 With changes in working capital report, the banker will know the changes in current assets
and current liabilities. It also gives a picture of short term solvency of the entity i.e. if the
entity has enough money to pay the current liabilities, it will be difficult to misuse its long
term resources.

24
4.12.10 With ratio analysis, banks can understand the financial position of the entity quickly.
4.12.11 Maximum permissible bank finance (MPBF) generally should not be more than 75% of the
working capital of the entity, which helps set loan limits.
4.12.12 RBI has introduced clause for inclusion of the CMA data with the aim of protecting the
customers’ deposits in bank.

25
5. Preparation of Bankable DPRs
5.1 Introduction
5.1.1 A company can be endowed with assets and profitability but requires liquidity or cash for
Expansion / Diversification / Technology up-gradation / Face competition and also meet
with its day to day operating requirements like procurement of raw materials, routine
expenses like local conveyance, salaries, rent etc. The firm/company is said to be short of
liquidity if its assets cannot readily be converted into cash.
5.2 Working Capital
5.2.1 Working capital, also known as net working capital or NWC, is a financial metric which
represents operating liquidity available to a business. Along with fixed assets such as plant
and equipment, working capital is considered a part of operating capital. If current assets are
less than current liabilities, an entity has a working capital deficiency or working capital
deficit.
���4�!�%�� = (�������������) − (�������������)
5.2.2 Positive working capital is required to ensure that a firm is able to continue its operations
and that it has sufficient funds to satisfy both maturing short term debt and upcoming
operational expenses. The management of working capital involves managing inventories,
accounts receivable & payable and cash.
5.2.3 There are two types of limits which are generally set by banks:
Table 5-1: Working capital limits
Type Fund Based Non-fund Based Meaning With Fund Based Limit, the
Company actually gets money (Cash)
With Non-fund based limit, the bank makes payment on behalf of company
Examples of fund based limits are: 1. Cash Credit 2. Term Loans 3. Demand Loan 4. Bank Overdraft etc.
Examples of Non fund based limits are: 1. Bank Guarantee 2. Letter of Credit etc.

26
5.2.4 Working capital loans are provided by banks or financial institutions and are tailored to
suit the precise requirements of the client through any of the various instruments available or
are structured as a combination of cash credit, demand loan, bill financing and non-funded
facilities.
5.3 Fund Based Facilities
Cash Credit
5.3.1 Cash Credit (CC) is a facility that has the features of a loan as well as bank account. When a
person opens a CC account with the bank, he is being provided specified CC limit for the
purpose of carrying on his business. For this purpose he is required to submit Stock
Statements each month to the bank. The bank charges interest each month for operating
the CC account. Once the CC account is opened, the person can start issuing cheques. The
bank will then debit the account holder’s account & the account holder will credit the bank
account in his books. This is exactly the opposite of the normal current account. They need
not maintain any balance, but have to pay cheques subject to the CC limit granted by the
bank.
Term Loan
5.3.2 Term loans are given to purchase fixed assets like plant and machinery, which are long term
assets. It is a loan from a bank of a specific amount with a specified repayment schedule
and a floating interest rate. Term loans usually mature between one to ten years.
Demand Loan
5.3.4 Is a loan (such as an overdraft) with or without a fixed maturity date, but which can be
recalled anytime (often on a 24-hour notice) by the lender and must be paid in full on the
date of demand. Also, the borrower can pay off a demand loan at any time without incurring
early-payment penalties. Demand loans often require collateral and are also called “call
loans”.
Overdraft Facilities
5.3.5 A loan arrangement under which a bank extends credit up to a maximum amount (called
overdraft limit) against which a current account customer can write cheques or make
withdrawals. It is one of the most common forms of business borrowing. Overdraft facility
is against a security like Bank Deposits / NSC / mortgage etc. pledged to the Bank.

27
5.4 Non Fund Based Facilities
Bank Guarantee
5.4.5 A guarantee from a lending institution ensuring that the liabilities of a debtor will be met i.e.
if the debtor fails to settle a debt, the bank will cover it. A bank guarantee enables the
customer (debtor) to acquire goods, buy equipment, or draw down loans, and thereby
expand business activity.
Letter of Credit
5.4.6 A letter from a bank guaranteeing that a buyer's payment to a seller will be received on time
and for the correct amount. In the event that the buyer is unable to make payment on the
purchase, the bank will be required to cover the full or remaining amount of the purchase.
5.4.7 Letters of credit are often used in international transactions to ensure that payment is
received. Due to the nature of international dealings including factors such as distance,
differing laws in each country and difficulty in knowing each party personally, the use of
letters of credit has become a very important aspect of international trade. The bank also
acts on behalf of the buyer (holder of letter of credit) by ensuring that the supplier will not
be paid until the bank receives a confirmation that the goods have been shipped.
5.5 Preparation of DPRs
5.5.5 In the normal course of an Energy Audit, the Energy Auditor submits his findings and
recommends retrofits or replacement of existing equipment with more energy efficient
equipment. The investment figure is given in the form of cost of equipment plus additional
costs for infrastructure adjustments. To justify the investment, usually Payback Period is
calculated, which is quite simplistic and is generally suitable only for small investments with
very fast payback periods of only few months (less than a year). Simple Payback Period
calculation does not consider the time value of money. When the investments are large, usually
Detailed Project Reports (DPRs) are made, wherein Internal Rate of Return (IRR) is
calculated, Which considers all cash inflows and out flows, including interest, depreciation
etc. while IRR is a good parameters to evaluate the project with large investment, as far as
the clients are concerned, bankers need more information than Payback Period and/or IRR
to fund the project; they insist on evaluating the financials of the company, both historical
and future projections, to satisfy themselves about the company’s ability to repay the loan
through positive cash flows.

28
5.5.6 After a brief mention of Payback Period and IRR, the bankers’ perspective is elaborated in
this section. If the DPR provides unambiguous information on the impact of the project on
the financials of the company, the chances of getting bank funds for the project improves.
Payback Period
5.5.7 The payback period i.e. the length of time required to recover the cost of an investment, is
computed based on the monetary value of expected savings divided by cost of investment.
Please note that this calculation does not consider the interest cost, annual maintenance cost
etc.
#��&4%���5 = �����"��!�/������'���
Internal Rate of Return
5.5.8 Since payback period ignores the “time value of money”, we also compute the Internal Rate
of Return (IRR) and/or Net Present Value (NPV) of the proposed investment; these are the
two most-used measures for evaluating an investment.
5.5.9 NPV is the difference between the present value of cash inflows and the present value of
cash outflows. NPV is used in capital budgeting to analyze the profitability of an investment
or project. NPV analysis is sensitive to the reliability of future cash inflows that an
investment or project will yield.
5.5.10 IRR is the rate of return on investment at which the cash inflows equal the cash out flows
i.e. NPV = 0.
NPV = 0; or
PV of future cash flows − Initial Investment = 0; or
CF1
+ CF2
+ CF3
+ ... − Initial Investment = 0 ( 1 + r )1 ( 1 + r )2 ( 1 + r )3
Where, r is the internal rate of return; CF1 is the period one net cash inflow; CF2 is the period two net cash inflow, CF3 is the period three net cash inflow, and so on ...

29
5.5.11 The following graph explains that IRR is the discount rate when NPV is zero.
Example
5.5.12 Find the IRR of an investment having initial cash outflow (investment) of Rs 213,000. The
cash inflows (cost reduction) during the first, second, third and fourth years are expected to
be Rs 65,200, Rs 96,000, Rs 73,100 and Rs 55,400 respectively.
Solution
Assume that r is 10%.
NPV at 10% discount rate = Rs18,372
Since NPV is greater than zero we have to increase discount rate, thus
NPV at 13% discount rate = Rs 4,521
But it is still greater than zero we have to further increase the discount rate, thus
NPV at 14% discount rate = Rs 204
NPV at 15% discount rate = (Rs 3,975)
Since NPV is fairly close to zero at 14% value of r, therefore
IRR ≈ 14%
5.6 Banker’s Perspective
5.6.5 A bank generally sanctions a Term Loan for such an investment; the banker conducts a
holistic evaluation of the investment which involves evaluation the existing financial position
of the company/firm for the last three years, estimating and projecting the financials for the
coming years, after factoring in the proposed loan etc.
5.6.6 The projected balance sheet can be prepared by taking into account the need of the business
to expand its activities in the future. In such cases, it has to project the required assets it
intends to purchase, the corresponding cash resources it would be able to generate and the
external sources of finance it would require after considering its internal cash resources.

30
5.6.7 Documents required by a bank/financial institution for appraising a Term Loan Proposal:
Sr. No.
Annexure
Verification
A Company
1 MOA & AOA Basic Document for Company Formation
2 PAN KYC
3 Address Proof of a Regd. Office KYC
4 Last 3 years ITRs and Audited BS Financial position
5 Bank Statements of last 6 months To see the flow of funds
B Licenses / Approvals To ensure that the proper permission and approvals. 1 Excise Registration
2 GST/CST/VAT Registration
3 Service Tax Registration
4 Industrial License – SSI Registration
C Factory Land & Building Documents
1 Ownership documents if owned and Lease Deed if leased
To ensure the ownership
2 Title Clearance Report To ensure the encumbrance of property
3 Valuation Report To ascertain the market value of the property.
D Promoters/Guarantors
1 PAN KYC
2 Address Proof KYC
3 Last 3 years Income Tax Returns Financial Position 4 Net Worth Details along with Proofs Credit facilities
5 Names & Activities of all Associate Concerns, Last 3 years Audited BS
To know the business activities
6 Saving Account Bank Statements of last 6 months To see the flow of funds. 7 If existing accounts and loans are with another
bank/FI
• Copy of sanction letter of borrowings with other banks including working capital loans
• Repayment schedules and repayment track records of above loans
• Bank statements of CC/CA/OD accounts with other banks
To know other liabilities of Business
8 Detailed project report including SWOT analysis, market trends, growth prospects.
To know industrial scenario of Business

31
� Copy of CA certified Audited Financials of the Firm/Company for last three financial years
or CA certified balance sheet and P&L account (if the financials of the firm are not audited)
� CMA data with last three audited financial data, estimates for current/following financial
years and projections for next three financial years (or more, this varies from bank to bank).
� CA certified Net Worth statements of the promoters
� Specifications of the equipment being financed including cost and other overheads
� Detailed profile of the client
� Detailed Project Report (DPR) including SWOT analysis, market trends, growth prospects,
prevailing industry scenario.
5.7 Preparation of IGDPR
5.7.5 The Investment Grade Detailed Project Report (IGDPR) should include the following:
1. Introduction of the company
• Mention company founding year and briefly describe company history, including qualifications and experience of promoters and key persons.
• Describe briefly the product types and growth in production volumes over the years.
2. Products
• Mention all products and byproducts produced by the company presently, along with annual production volumes.
3. Brief Overview of the Industry
• Describe the product and product sub-categories
• Mention typical users of the product
• Briefly describe market scenario in India & world and potential for growth in the foreseeable future
• Regulatory scenario for product quality and export & import
4. Strengths, Weakness, Opportunities & Threats (SWOT) Analysis
• Present results of SWOT analysis of the Company; Typical issues to be considered are:
� Ability to exploit market potential and increase market share � Advantages in terms of product range, quality & volumes to capture higher market
share
32
� Likely obsolescence of products or processes, especially if processes are causing environmental pollution.
� Marketing network, both national and global reach. � Financial strength for technology upgrades and expansion of production � Profit margins & ability to beat the competition in the market � Regulatory issues enforced by governments and/or local bodies; for example, in
Ankleshwar, strictures of the Gujarat Pollution Control Board often results in increased lead time for project implementation.
5. Manufacturing process in brief
• Mention and briefly describe the important steps in the manufacturing process.
• Mention the energy source and/or utilities consumed in each process step. 6. Review of Energy Consumption
• Provide quantitative information on all energy sources used on a monthly basis for at least one year.
• Provide information on monthly energy costs for all energy sources independently.
• Correlate energy consumption with production and calculate Specific Energy Consumption, if possible
7. Energy Cost Saving Measures with Analyses
• Technical basis for recommendation
• Quantifications of savings
• Specifications of new equipment, retrofits and additional infrastructure required i.e. additional utilities, civil work etc.
• Investments required for the project, including equipment, instrumentation and other associated infrastructure
• Additional maintenance requirements
• Additional manpower man power requirements
8. Detailed Financial Calculations
• Quantification of investment required
• Assumed lifetime of the project (usually 10 or 15 years)
• Quantification of annual maintenance costs over the assumed life time of the recommended equipment
• Assumption of energy costs during the life time of the project
• Calculation of IRR and DSCR
• Sensitivity analysis considering changes in assumptions related to energy and other costs
• Impact on CMA data (required only when the project investment and/or impact are large)

33
9. Plan for Capacity Building
• Training requirements to ensure correct operation of recommended equipment to maximize energy cost savings
10. Plan for Project Management
• Special expertise for project design, installation and commissioning
• Production shutdown required for implementing the project
• Time line for the project 11. Sources for Project Funding
• Contacts on prospective lending agencies
• Information of specific funding schemes for MSMEs
12. Monitoring and Verification Protocol
• Instrumentation required for monitoring energy savings.
• Unambiguous calculation methodology for measuring the energy consumption and specific energy consumption before and after implementation of the project
• Methodology for calculating net cost savings on a monthly basis.

34
6. Funding Schemes from Government & Financial Institutions
6.1 Introduction
6.1.1 The following break up of loans to MSMEs in Gujarat gives a clear picture of the major
lenders in Gujarat. The major players are State Bank of India, Bank of Baroda & Bank of
India together contributing to about 50% of the advances. A private sector bank also has
significant presence in Gujarat MSME financing. The Growth rate in lending to MSMEs in
Gujarat has exceeded the targets set by RBI & Ministry of Finance.
Figure 6-1: MSME advances- break up
Table 6-1: MSME advances growth in Gujarat

35
6.1.2 Most of the public sector banks and private sector banks have a presence in Ankleshwar city
with either with branches/extension counters in the GIDC. Some co-operative banks and
credit societies are also operating in Ankleshwar.
6.1.3 A detailed list of banks in the public sector, private sector & cooperative sector is given in
Annexure-1. Typical lending rates of these public sector banks vary from 12.5% to 16%
depending on the amount sanctioned, credit rating etc. Lending rates of private banks are
generally 2%-5% higher than PSU banks. Cooperative banks have higher interest rates than
PSU & Private sector banks.
6.2 Credit Guarantee Fund Trust for Micro and Small Enterprises
(CGTMSE)
Objective
6.2.1 Government of India launched Credit Guarantee Scheme (CGS) so as to strengthen credit
delivery system and facilitate flow of credit to the MSE sector. Ministry of Micro, Small &
Medium Enterprises (MSME, Government of India) and SIDBI have set up CGTMSE to
ensure availability of bank credit without the hassles of collaterals / third party guarantees
for setting up a Micro and Small Enterprises (MSE).
6.2.2 The lender gives importance to project viability and secure the credit facility purely on the
primary security of the assets financed. The lender, availing guarantee facility, endeavors to
give composite credit to the borrowers so that the borrowers obtain both term loan and
working capital facilities from a single agency. The CGS seeks to reassure the lender that, in
the event of a MSE unit, which availed collateral free credit facilities, fails to discharge its
liabilities to the lender, the Guarantee Trust would make good the loss incurred by the
lender up to 75 / 80/ 85 per cent of the credit facility.
Credit Guarantee
6.2.3 Any collateral / third party guarantee free credit facility (both fund as well as non- fund
based) extended by eligible institutions, to new as well as existing Micro and Small
Enterprise, including Service Enterprises, with a maximum credit cap of Rs. 100 lakh are
eligible to be covered.
6.2.4 The guarantee cover available under the scheme is to the extent of 75% / 80% of the
sanctioned amount of the credit facility, with a maximum guarantee cap of Rs.62.50 lakh /
Rs. 65 lakh. The extent of guarantee cover is 85% for micro enterprises for credit up to Rs.5
lakh.
36
6.2.5 The extent of guarantee cover is 80% (i) Micro and Small Enterprises operated and/or
owned by women; and (ii) all credits/loans in the North East Region (NER). In case of
default, the Trust settles the claim up to 75% (or 80%) of the amount in default of the credit
facility extended by the lending institution.
6.2.6 The lender should cover the eligible credit facilities as soon as they are sanctioned. In any
case, the lender should apply for guarantee cover in respect of eligible credits, sanctioned in
one calendar quarter, latest by end of subsequent calendar quarter. Guarantee will
commence from the date of payment of guarantee fee and shall run through the agreed
tenure of the term credit in case of term loans / composite loans and for a period of 5 years
where working capital facilities alone are extended to borrowers, or for such period as may
be specified by the Guarantee Trust in this behalf.
Eligible Lending Institutions
6.2.7 All scheduled commercial banks and specified Regional Rural Banks, NSIC, NEDFI,
SIDBI, which have entered into an agreement with the Trust for the purpose, are Member
Lending Institutions (MLIs) of CGTMSE.
Eligible Borrowers New as well as existing Micro and Small Enterprises.
Maximum Risk Cover
6.2.8 Of the credit facilities extended by MLIs, the Trust guarantees, in case of default by the
borrower, up to 75 per cent (85% for select category of borrowers), of the defaulted the
principal amount in respect of term credit, including interest on principal for one quarter and
/ or outstanding working capital advances (inclusive of interest), as on the date of account
becoming NPA, or as on the date of filing the suit. Other charges such as penal interest,
commitment charge, service charge, or any other levies/ expenses shall not qualify for the
guarantee cover.
Rehabilitation Assistance
6.2.9 Units, covered under CGTMSE, becoming sick due to factors beyond the control of
management, assistance for rehabilitation extended by the lender could also be covered
under the scheme provided the overall assistance is within the credit cap of Rs.100 lakh.
Non-Eligibility
6.2.10 Any facility given on the basis of collateral security or third party guarantee shall be
disqualified for coverage under the scheme. The Trust also reserves the right to reject any
application for the guarantee cover, if it deems necessary.

37
Guarantee Fee
6.2.11 For credit facility up to Rs.5 lakh, an upfront Guarantee Fee (GF) of 1% of the amount
sanctioned will have to be paid to the Trust by the MLI. For amounts sanctioned beyond
Rs.5 lakh and up to Rs.100 lakh, the GF is 1.5%; while for credit facility up to Rs. 50 lakh
for units in the North Eastern Region including Sikkim, the GF is 0.75%. The GF will have
to be paid within 30 days from the date of first disbursement of credit facility by the MLI to
a borrower.
Annual Service Fee
6.2.12 Guarantee cover extended by CGTMSE in respect of any specific borrower shall be valid,
provided the MLI concerned pays an Annual Service Fee (ASF) of 0.50% on the amount
guaranteed for credit facilities up to Rs. 5 lakh and 0.75% on the amount guaranteed for
credit facilities beyond Rs. 5 lakh and up to Rs. 100 lakh. Such ASF is to be paid by the MLI
on or before 31st May of that year. The Trust reserves the right to revise the guarantee fee /
annual service fee from time to time.
Cost To the Borrower
6.2.13 The Credit Guarantee Scheme leaves it to the discretion of the MLIs to decide about
passing on the incidence of Guarantee Fee and Annual Service Fee to the borrower or
alternatively they may decide to bear it themselves.
Interest Rate Payable by Borrower
6.2.14 The MLI shall follow the guidelines issued by RBI. However, interest rate shall not exceed 3
per cent over and above the Prime Lending Rate of the MLI, excluding the annual service
fee.
6.2.15 Details of some the schemes offered by public sector banks are given in Annexure-2 similar
such loans are being offered by private sector banks like Axis Bank, ICICI Bank etc.

38
6.3 Credit Linked Capital Subsidy Scheme (CLCSS)
6.3.1 For Technology up-gradation of the Small Scale Industries, the Ministry of Small Scale
Industries is operating a scheme for Small Scale Industries (SSI) called the Credit Linked
Capital Subsidy Scheme (CLCSS). The Scheme aims at facilitating technology up-gradation
by providing upfront capital subsidy to SSI units, including tiny, khadi, village and coir
industrial units, on institutional finance (credit) availed of by them for modernization of their
production equipment (plant and machinery) and techniques.
6.3.2 The Scheme (pre-revised) provided for 12 per cent capital subsidy to SSI units, including tiny
units, on institutional finance availed of by them for induction of well established and
improved technology in selected sub-sectors/products approved under the Scheme. The
eligible amount of subsidy calculated under the pre-revised scheme was based on the actual
loan amount not exceeding Rs. 40 lakh.
• The ceiling on loans under the Scheme has been raised from Rs. 40 lakh to Rs. 1 crore
• The admissible capital subsidy is to be calculated with reference to the purchase price of
plant and machinery, instead of the term loan disbursed to the beneficiary unit
• The practice of categorization of SSI units in different slabs on the basis of their present
investment for determining the eligible subsidy is followed .
6.3.3 The Small Industries Development Bank of India (SIDBI) and the National Bank for
Agriculture and Rural Development (NABARD) will continue to act as the Nodal Agencies
for the implementation of this scheme.
6.3.4 The following nine Public Sector Banks/ Government Agencies have also been inducted as
nodal banks/agencies for implementation and release of capital subsidy under the CLCSS:
Table 6-2: List of Banks
S. No. Name of Bank/Agencies 1. State Bank of India 2. Canara Bank 3. Bank of Baroda 4. Punjab National Bank 5. Bank of India 6. Andhra Bank 7. State Bank of Bikaner & Jaipur 8. Tamil Nadu Industrial Investment Corporation 9. The National Small Industries Corporation Ltd.

39
6.3.5 The inclusion of above-mentioned nodal banks/agencies will be in addition to the existing
nodal agencies, namely, the Small Industries Development Bank of India (SIDBI) and the
National Bank for Agriculture and Rural Development (NABARD) under the CLCSS. These
nodal banks/ agencies would consider proposals only in respect of credit approved by their
respective branches, whereas, for other Primary Lending Institutions (PLI), SIDBI and
NABARD would continue to be the nodal agencies for release of subsidy under this scheme.
Eligible Primary Lending Institutions (PLI)
6.3.6 All Scheduled Commercial Banks , Scheduled Cooperative Banks [including the urban
cooperative banks co-opted by the SIDBI under the Technological Up gradation Fund
Scheme(TUFS) of the Ministry of Textiles, Regional Rural Banks (RRBs), State Financial
Corporation’s (SFCs) and North Eastern Development Financial Institution (NEDFi) are
eligible as PLI under this scheme after they execute a General Agreement (GA) with any of
the nodal agencies, i.e., the Small Industries Development Bank of India (SIDBI) and
National Bank for Agriculture and Rural Development (NABARD).
Eligible Beneficiaries
6.3.7 The eligible beneficiaries include sole Proprietorships, Partnerships, Co-operative societies, and Private and Public limited companies in the SSI sector. Priority shall be given to Women entrepreneurs.
Types of units to be covered under the Scheme
6.3.8 Existing SSI units registered with the State Directorate of Industries, which upgrade their
existing plant and machinery with the state- of -the -art technology, with or without
expansion.
6.3.9 New SSI units which are registered with the State Directorate of Industries and which have
set up their facilities only with the appropriate eligible and proven technology duly approved
by the GTAB/TSC.
Eligibility Criteria
6.3.10 Capital subsidy at the revised rate of 15 per cent of the eligible investment in plant and
machinery under the Scheme shall be available only for such projects, where terms loans
have been sanctioned by the eligible PLI on or after September 29, 2005. Machinery
purchased under Hire Purchase Scheme of the NSIC is also eligible for subsidy under this
Scheme.

40
6.3.11 Industry graduating from small scale to medium scale on account of sanction of additional
loan under CLCSS shall be eligible for assistance.
6.3.12 Eligibility for capital subsidy under the Scheme is not linked to any refinance Scheme of the
Nodal Agencies. Hence, it is not necessary that the PLI will have to seek refinance in respect
of the term loans sanctioned by them from any of the refinancing Nodal Agencies.
Definition of Technology Up gradation
6.3.13 Technology Up gradation would ordinarily mean induction of state-of-the-art or near state-
of-the-art technology. In the varying mosaic of technology obtaining in more than 7500
products in the Indian small scale sector, technology up gradation would mean a significant
step up from the present technology level to a substantially higher one involving improved
productivity, and/or improvement in the quality of products and/or improved
environmental conditions including work environment for the unit. It would also include
installation of improved packaging techniques as well as anti-pollution measures and energy
conservation machinery. Further, the units in need of introducing facilities for in-house
testing and on-line quality control would qualify for assistance, as the same is a case of
technology up gradation.
6.3.14 Replacement of existing equipment/technology with the same equipment/technology will not qualify for subsidy under this scheme, nor would the scheme be applicable to units upgrading with second hand
machinery.
6.3.15 The scheme would cover the following technology needs / products/sub - sectors:
Table 6-3: Equipments/technologies eligible
Common Effluent Treatment Plant Drugs and Pharmaceuticals Dyes and Intermediates Industry based on Medicinal and Aromatic plants Plastic Moulded / Extruded Products and Parts/ Components Rubber Processing including Cycle/ Rickshaw Tyres Food Processing (including Ice Cream manufacturing) Paints, Varnishes, Alkyds and Alkyd products Zinc Sulphate

41
6.4 SIDBI Scheme for Funding Projects through Indo Japan Collaboration
on Energy Saving In MSME Sectors
6.4.1 The Japan International Cooperation Agency (JICA) has extended a Line of Credit to Small
Industries Development Bank of India (SIDBI) for financing Energy Saving projects in
Micro, Small and Medium Enterprises (MSMEs) Sector. The project is expected to
encourage MSME units to undertake energy saving investments in plant and machinery to
reduce energy consumption, enhance energy efficiency, reduce CO2 emissions, and improve
the profitability of the units in the long run.
6.4.2 The financial assistance to MSMEs is through SIDBI, as well as through refinance to banks
/ State Finance Corporations (SFCs) and Non-Banking Financial Companies (NBFCs). The
project also seeks to provide technical assistance to these financial institutions and MSME
units for successful implementation of this Scheme resulting in Energy Saving in MSME
Sector and thereby contributing to environmental improvement and socio-economic
development in the country and address the climate change concerns.
6.4.3 The escalating cost of energy is a cause for major concern. There are some highly energy
intensive sub-sectors where the cost of energy forms a sizeable proportion of the total
production cost and offers tremendous scope for energy efficiency improvement vis-a-vis
reduction in energy cost through technology up gradation.
6.4.4 Project Objectives
• Motivate MSMEs to undertake energy saving investments in plant and machinery geared at reduced energy consumption.
• Support the creation of a list of energy saving equipment that qualifies for the financial assistance.
• Reinforce the capability of financial institutions so as to evaluate the loan applications (likely to be received) for the energy-saving projects.
• Utilize the expertise of the financial programs that cushion the energy-saving initiatives.
• Support the financed projects to apply for the Clean Development Mechanism (CDM) specific carbon credits.
• Make the units profitable in an ultimate analysis.
6.4.5 Energy Saving Sub-Projects under This Initiative
• Acquisition (including lease and rental) of energy saving equipments/ facilities, including
newly installing, remodeling and upgrading of those existing,
• Replacement of obsolete industrial furnaces and/or boilers or burners etc. or
introduction of additional equipment which improve performance comparable to those
of replacement,

42
• Installation or improvement or adoption of such manufacturing machinery and
equipment that meet the specific requirements for energy performance standard
provided by the related energy conservation act/code in India (e.g. Top Runner
Equipment, Energy Labels etc.),
• Installation of building envelopes, equipment, heating systems, lighting and electrical
power/motors in compliance with energy performance standard provided in the Energy
Conservation Building Code (ECBC),
• Introduction of the equipment that utilize alternative energy sources which can reduce
GHG emissions such as natural gas, renewable energy, biogas etc. instead of fossil fuel
such as oil and coal etc.,
• Clean Development Mechanism (CDM) projects involving clusters level intervention by
a change in the process and technologies for the cluster as a whole duly supported by
technical consultancy will be eligible for coverage.
• The equipment list eligible for financing under this initiative is available in SIDBI offices.
The equipment list would be continuously revised and updated by the Consultants
Inspire Development Services appointed by JICA. The List shall be used for screening
the sub-projects for deciding their eligibility for coverage under the JICA Line of Credit
and the List would be the primary criteria for the sub-projects.
6.4.6 Eligibility Criteria for Units
• New / existing MSME units, as per the definition of the Micro, Small & Medium
Enterprises Development (MSMED) Act, 2006; however, units graduating out of
medium scale will not be eligible for assistance.
• Existing units should have satisfactory track record of past performance and sound
financial position.
• Energy saving projects will be screened as per the Energy Saving List, which is available
on SIDBI website.
• Units should have minimum investment grade rating of SIDBI.
• Sectors such as the arms industry, narcotics industry or any unlawful businesses are not
eligible. Similarly, such projects which may result in larger negative social and
environmental impact are also not eligible under this scheme.
• Equipment/machinery with energy saving potential less than 10% is not eligible

43
Table 6-4: Financial parameters
Application for Loan Assistance
6.4.6 The prospective borrower is required to submit the duly filled in application form along with
the supporting documents as per the prescribed format, to the nearest SIDBI branch office.
In addition to the information requested for in the application form, it may be ensured that
the prospective borrower explicitly provides details of the energy saving potential of the
project. This will be an important parameter for deciding the eligibility of the project
financing under the Line of Credit.
Disbursement
6.4.7 Disbursement would be carried out after compliance of the terms of sanction.
6.5 Kfw-SIDBI Scheme for Financing Energy Efficiency Projects in the
MSME Sector
6.5.1 Micro, Small & Medium Sized Enterprises (MSMEs) can reduce their energy consumption
by investing in equipment, technologies or process improvements, which increase the energy
efficiency of their facilities. SIDBI offers financial assistance for investments in energy
efficiency projects to existing MSMEs under a Line of Credit from KfW Development Bank
in the framework of the Indo-German Development Cooperation.
6.5.2 Energy efficiency investments may include:
� Improving insulation of e.g. heat pipes,
Parameter Norms Minimum Assistance Rs.10 lakh
Minimum promoters contribution
25% for existing units 33% for new units
Debt Equity Ratio Maximum 2.5 :1
Interest Rate As per credit rating and 1% below the normal lending rate Upfront fee Non-refundable upfront fee of 1% of sanctioned loan plus applicable
service tax Security First charge over assets acquired under the scheme; first/second charge
over existing assets and collateral security as may be deemed necessary Asset coverage Minimum Asset Coverage should be 1.4 : 1 for new units and 1.3 : 1 for
existing units Repayment period Need based. Normally, the repayment period does not extend beyond 7
years. However, longer repayment period of more than 7 years can be considered under the Line if considered necessary

44
� Energy efficient lighting,
� Installing variable speed drives,
� Upgrading or modernizing of industrial boilers,
� Heat recovery systems,
� Optimization of air pressure systems,
� Fuel switching (e.g. from electricity to Liquefied Petroleum Gas (LPG),
� Replacing existing equipment / machinery with energy efficient equipment / machinery.
6.5.3 Financial Parameters include:
Minimum Assistance: Generally not less than Rs.10 lakh
Minimum Promoter’s Contribution: 25% of project cost
Overall Debt/Equity Ratio: 2:1
Interest Rate As per credit rating and 0.75% below the normal lending rate
Asset Coverage: 1.3 for manufacturing unit and 1.75 for service sector unit
Repayment Period: Need based – normally not more than 7 years
6.5.4 Eligibility Criteria- In order to qualify for a loan an enterprise should be an existing MSME
unit (as per the definition of the MSMED Act 2006 ); Have a satisfactory track record of
past performance and sound financial position; and Score above the minimum investment
grade rating as per SIDBI’s extant Loan Policy.
6.5.5 Proposed investments for the Energy Efficiency Financing Scheme Will result in significant
energy savings and reductions of greenhouse gas emissions; Will up grade existing
installations; May include purchase of machinery and equipment, process modifications and
related civil construction ; and Taxes, import duties and other public charges shall be borne
by the enterprise.
Email Contact for SIDBI: [email protected]
6.5.6 A long list of equipment is provided on SIDB’s website (www.sidbi.in); some of the equipment that are relevant to the Chemical cluster are:
� Thermal Insulation materials � Amorphous core transformers � Energy efficient motors � Variable frequency Drives � Energy efficient blowers

45
� Energy efficient pumps � Energy efficient air compressors � Heat of compression dryers for compressed air � Synthetic flat belts � BEE Star rated appliances � High Efficacy lamps & gear (Electronic ballasts, Metal halide lamps, Sodium Vapour
lamps, LED lamps etc.) � Transformers for lighting feeders � Infra-red heaters � Energy efficient boiler (including Fluidized Bed Boilers) � Water tube boilers � Condensate recovery systems � High efficiency furnace � Improved burners (including regenerative burners) � Combustion controls & instrumentation � Heat recovery equipment (including recuperators) � Steam recompression pump � Interfuel substitution projects (including Biomass gasifiers) � Automatic temperature controllers � Energy efficient mixers (eg. Nauta mixer, Planetary mixer etc.) � High concentration filter press � Flash dryers � Rotary vacuum dryers � Dehumidification dryer � Falling film evaporator � Wiped film evaporator � Mechanical conveyors � Energy efficient refrigeration system � HVAC heat reclaim systems � Air separation plant (including Molecular sieve for nitrogen) � Renewable energy systems (solar, biomass etc.)
6.6 Gujarat Government’s Scheme for Assistance to MSMEs
In 2009, Gujarat Government announced a "Scheme for Assistance to Micro, Small and
Medium Enterprises" for the period 2009-14 for Expansion or Diversification for existing
MSME units taking up expansion or diversification with investment more than 50% in its
existing gross fixed capital investment.
Modernization/Technology Up gradation:
Existing MSME unit investing more than 25% in the cost of its existing plant and machinery
to upgrade technology by way of adopting new technology / production process and/or
improving quality of products.

46
6.6.1 Salient features of this scheme are as follows:
• Subsidy graded interest subsidy for micro, small and medium enterprises. Interest
subsidy @ 7% for micro enterprises and @ 5% for small and medium enterprises.
Maximum amount of interest subsidy will be Rs. 25 lakhs per annum, for a period of
five years. Unit availing term loan from any bank/Fl approved by RBI will be
eligible. The amount of interest subsidy will be paid to the Bank/FI with intimation
to the unit.
• Quality Certification: Assistance will be granted to the eligible MSMEs for maximum
3 quality certifications, at the rate of 50% of cost of quality certification within
overall ceiling of Rs. 6 lakhs in 5 years. The cost for certificate will include:
• Fees charged by certification agency
• Cost of testing equipments as suggested by BIS.
• Calibration charges of equipment.
• Consulting fees and training charges
• Energy and Water Conservation: 50% cost of energy/water audit conducted in a unit
by a recognized institution/ consultant subject to a limit of Rs. 25,000/- will be
reimbursed to the MSME.
• Group of units/cluster will be given priority.
• In addition, assistance of 20% of cost of equipment subject to maximum Rs. 10
lakhs per project will be considered in a period of five years.

47
7. ENERGY AUDIT
7.1 Energy Management
7.1.1 Energy Management can be defined in different ways. In the present context, Energy
Management can be defined as the judicious and efficient use of available energy resources to
increase profitability of an enterprise with minimal impact on the environment.
7.1.2 Energy Management is an integral part of cost reduction strategy to improve
competitiveness. Energy management addresses issues related to energy costs, energy
efficiency, secure energy supplies, alternative energy sources and abatement of
environmental pollution.
7.1.3 Greenhouse gases are polluting gaseous emissions that are leading to rise in the atmospheric
temperature or leading to ozone depletion in the atmosphere. The Kyoto Protocol has been
ratified most major member nations (excluding the USA) of the United Nations. It specifies
a mandatory 5.2 % reduction in Carbon emissions by the developed nations with 1990 as the
baseline year. The Clean Development Mechanism (CDM) is part of the global strategy proposed
by the Kyoto Protocol (1997) to combat atmospheric build-up of greenhouse gases. CDM is a
mechanism for trading of Carbon credits to help the developed nations buy Carbon credits
from developing nations, to achieve their carbon emission reduction targets. Another
mechanism called Emission Trading is the trading of carbon credits between developed
nations. Energy efficiency improvement and fuel switching to less polluting fuels are
acceptable methods to reduce carbon emissions. Participation in this global endeavor is now
part of the corporate policy of some organizations. In India, some organizations are
undertaking CDM projects with the objective of participating in the global trading of carbon
credits.
7.2 Energy Audit
7.2.1 Energy Audit is an important tool for energy management. Energy Audit can be defined as a
systematic exercise for collection of information on energy consumption and energy costs at
macro and micro levels, followed by its analyses in relation to production, provided utility
service and equipment operating efficiencies with the objective of improving energy
efficiency, identifying energy efficient alternatives, reducing the energy consumption per unit
of production or provided service, identifying alternative energy sources and ultimately
reducing energy costs.

48
7.2.2 Often energy audit is compared with financial audits, which is glaringly misleading. Financial
audits check for compliance with declared accounting rules and regulations. An energy audit
is not merely a check for compliance with energy norms, its main objective is to identify
measures for improving energy efficiency and reduce energy costs.
7.2.3 Energy audit goes beyond study of available information in the record books, it involves
measurements to establish operating energy efficiencies and recommendations to improve
efficiency and reduce energy costs. The information generated by an energy audit can be
used for benchmarking, target setting and developing a road map to achieve the energy
conservation targets.
7.2.4 There are three styles of conducting energy audits: Walk-thru’, Preliminary and Detailed
Energy Audits.
7.2.5 Walk thru’ energy audit involves physical observation of operation of equipments and
processes to visually identify glaring deficiencies, identify areas worthy of further study and
check compliance with previously recommended measures. No measurements are taken
during this type of energy audit. This type of energy audit is usually conducted by
consultants before preparation of a techno-commercial proposal for a preliminary or detailed
energy audit. It is also done by plant personnel (like members of energy conservation cell) to
identify obvious energy wastages and maintain surveillance on previously implemented
measures.
7.2.6 Preliminary energy audit is a precursor to a detailed energy audit wherein the consultant
conducts a quick energy audit with a few spot measurements to identify obvious energy
saving opportunities and identify areas worthy of a detailed energy audit. Such energy audits
are usually done by consultants, on the client’s insistence, if the client wants detailed study of
only those areas with significant scope for energy savings.
7.2.7 Detailed energy audit is a study involving collection of past records of energy consumption,
production data, co-relation of energy consumption with production data, spot
measurements or prolonged data logging of energy consumption and process parameters to
establish the efficiencies of various equipments and processes, followed by practical
recommendations to improve energy efficiency and reduce energy costs.
7.2.8 An extension of the detailed energy audit is the so called Investment Grade energy audit, wherein
the detailed energy audit results in a project report that can be a basis for receiving complete
commercial proposals from implementing agencies like vendors and contractors.

7.3 Energy Audit Instruments
7.3.1 The effectiveness of an energy audit depends on the identification of energy saving projects
that can be practically implemented. Realistic techno-economics of proposed projects can
only be estimated only if the existing energy consumption and process parameters are
measured with reasonable accuracy. Both installed plant instrumentation and portable
instruments have to be used to measure various parameters.
7.3.2 In the Indian industry, the plant instrumentation is usually restricted to that minimum level
that is required to maintain production, quality and safety; installed instrumentation is
generally not sufficient to estimate the energy efficiency and energy losses in the existing
system. Portable instruments are generally used by energy auditors to measure various
operating parameters like electrical power, pressure, flow, temperature, flue gas composition
etc.
7.3.3 Some of the commonly used portable instruments are:
7.3.4 Electrical power analyzer: To measure electrical parameters like voltage, current, power
factor, power, frequency, harmonics etc.
7.3.5 Flue gas analyzer: To measure flue gas composition i.e. CO2, O2, CO etc.
7.3.6 Temperature measuring devices: To measure temperature by direct contact or non-
contact method. Direct contact temperature measuring instruments use thermocouples or
RTDs with electronic indicating instruments or mercury in glass thermometers. Non-
contact temperature measuring instruments indicate the temperature by sensing the infra-red
radiation from the hot surface, which requires emissivity correction depending on the
condition and colour of the radiating surface.
7.3.7 Pressure gauges: Analog and digital pressure gauges are used to measure pressures of
liquids and compressed gases.
7.3.8 Manometers: U-tube and inclined manometers are used for measure low air pressures.
Electronic manometers are also used.

50
7.3.9 Ultrasonic flow meter: Doppler type flow meters are used to measure of velocity of liquids in
pipelines, wherein the liquid has particulate matter or air bubbles of more than 30 microns
size. Transit time ultrasonic flow meters are used to measure the velocity of clear liquids in
pipelines. Flow measurement using ultrasonic flow meters is prone to errors and is not
accepted as a standard flow measurement method. However, it is used in energy audits in
the absence of installed in-line flow measuring instruments. Similar instruments for air flow
measurement are also available in the international market; however, these are not
commonly used presently due to the prohibitively high cost of the instrument.
7.3.10 Anemometer: Turbine type and thermal anemometers are used to measure the velocity of
low pressure air.
7.3.11 Psychrometer: Measurement of relative humidity is measured by measuring the dry bulb
and wet bulb temperature of air and correlating it on a psychrometric chart. Direct relative
humidity indicating capacitance electronic instruments are also available.
7.3.12 Steam Trap Tester: This instrument is used to identify malfunctioning steam traps
7.3.13 Ultrasonic leak detector: Ultrasonic leak detectors are electronic instruments with analog
indication used to detect minor leaks in compressed air systems and refrigerant gas leaks,
which are normally not audible. This instrument only detects leaks, it cannot quantify the
leakage.
7.3.14 Energy audits also use data from installed plant instruments wherever there constraints in
using portable instruments; typical examples are measurement of flow of gaseous fluids, flow
of liquids at high temperature etc. Calibrated installed instrumentation is generally more
accurate than portable instruments.
7.4 Analytical techniques
7.4.1 A number of analytical techniques are used in energy management context to help the energy
auditing team to arrive at realistic results. The following discussions will familiarise you with
some techniques.
7.4.2 Incremental cost concept: How much energy cost is saved by saving 1 unit of energy? In a
plant that is supplied from Electricity Board Grid, this is more or less straight forward …or,
is it really so?
7.4.3 When energy auditors probe the plant managers, the usual answer is Rs 4 to 5 per kWh. This
figure is generally arrived at by dividing the total bill amount by energy consumed. How
accurate is this calculation?

51
7.4.4 We have seen that electricity billing is generally appearing in two parts. One for the demand
of electricity (kVA or kW) and the other for energy consumed (kWh). In addition to this, lot
more other cost components like time of use charges, power factor penalty/rebate etc also
are applicable. If an energy saving measure results in only energy saving (and no demand
saving), one need to consider energy cost alone, excluding demand charges.
7.4.5 In the case of a plant having a cogeneration system and drawing power from grid also, this
calculation becomes slightly involved. For example, in a Paper Mill, energy audit has shown
that there is a potential of saving 200 kW by modifications in the pumping systems. The
plant has a power plant with a coal fired boiler and a back pressure turbine. The average cost
of electricity generation is Rs 1.0/kWh. The following calculations can be made.
Annual operating time = 8000 hours. Annual energy saving = 200 X 8000 = 16,00,000 kWh
per year.
7.4.6 Now, it would be correct to state that the energy cost saving is Rs 1.0 X 16,00,000 = Rs 16.0
lakhs per year. Looking more closely at the given system operation, you may also find that in
some plants, due to the process requirement of steam remaining the same, when you reduce
generated power by 200 kW, some amount of steam need to be vented out. If this is so, your
saving may reduce to the extent of loss of steam and its cost.
7.4.7 On the other side of it, consider a grid connected system, where you have identified 200 kW
saving by replacement of Chilling plant with a new efficient plant. While evaluating potential
energy saving opportunities, you should note that chillers run most often when the weather
is hottest and/or when your plant is running at its highest capacity. Chillers contribute
greatly to the monthly demand charge on your electric bill. As a result, using an average
Rs/kWh figure to estimate operating costs yields inaccurate results. Estimating the savings
available through chiller conservation measures requires that you evaluate the effects on
energy charges and peak demand charges separately.
7.4.8 Hence, make sure that your energy cost calculations include all the possible variables. The
cost saving should be the difference in overall energy cost baseline and the total energy cost
after the implementation of measures. This is the basis of incremental cost concept.
7.5 Heat transfer calculations
7.5.1 In Chemical processes, there are mainly three types of energy involved. Sensible heat ( eg. heating water) Latent heat ( eg. condensing vapours) Heat of reaction ( eg. combustion)
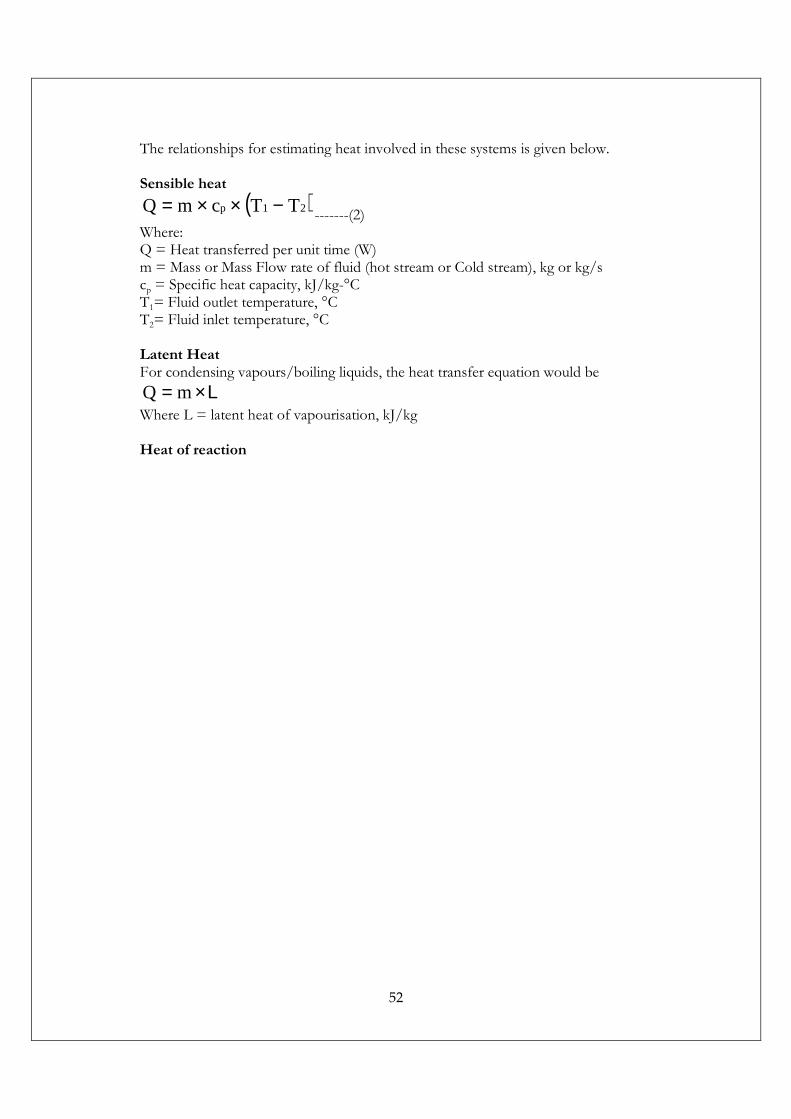
52
The relationships for estimating heat involved in these systems is given below. Sensible heat
( )21p TTcmQ −××=-------(2)
Where: Q = Heat transferred per unit time (W) m = Mass or Mass Flow rate of fluid (hot stream or Cold stream), kg or kg/s cp = Specific heat capacity, kJ/kg-°C T1= Fluid outlet temperature, °C T2= Fluid inlet temperature, °C Latent Heat For condensing vapours/boiling liquids, the heat transfer equation would be
L×= mQ
Where L = latent heat of vapourisation, kJ/kg Heat of reaction

53
7.5.2 The Heat of Reaction or Enthalpy of Formation of a substance is the energy required to
form it from its elements at 298K and 1 atmosphere. These values are negative when heat is
given out when the substance is formed and positive when heat is to be supplied to form
substance. The following relationship can be used
(Sum of heats of formation of reactants) + (Heat of reaction) = (Sum of heats of formation
of products)
7.5.3 The above relationships can be used estimate heat flow in processes.
7.6 Estimating cost of implementation
7.6.1 The cost of implementation should take into account the total cost, not only the basic
equipment cost. For example, while estimating cost of installing of capacitors for power
factor improvement, one should consider the cost of capacitors, controls, electrical panels,
cables etc. The error in investment calculation can be as high as 50% if we take only the cost
of capacitors.
7.6.2 In another case, for calculating investment for installation of heat recovery equipment, the
basic equipment cost + cost of fittings + transportation cost etc. need to be considered. If
additional auxiliary equipments are likely to be added, the energy consumption of those
auxiliaries also needs to be considered.
7.6.3 When considering new equipments, like a motor, the incremental cost concept can be used.
Here, one can estimate the payback period or rate of return on the basis of additional cost,
because a motor has to be bought anyway.
7.7 The plant energy study report
7.7.1 Energy audits don't save money and energy for companies unless the recommendations are
implemented. The goal in writing an audit report should not be the report itself; rather, it
should be to achieve implementation of the report recommendations and thus achieve
increased energy efficiency and energy cost savings for the facility.
7.7.2 Effective organization: The first thing to keep in mind when you start to write anything is
to know who your audience is and tailor your writing to that audience. When writing an
industrial audit report, your readers can range from the company president to the head of
maintenance. If recommendations affect a number of groups in the company, each group
leader may be given a copy of the report. Thus, you may have persons of varying
backgrounds and degrees of education referring the report. Not all of them may necessarily
have a technical background. The final decision maker may not be an engineer and the
person who implements the recommendations may not have a college degree.

54
7.7.3 The report may start with an executive summary which briefly describes the
recommendations and tabulates the results such as the energy and money savings and the
simple payback periods.
7.7.4 Present Information Visually: Often the concepts conveyed in an audit report are not easy
to explain in a limited number of words. Therefore, use drawings to show what you mean.
Present energy use data visually with graphs showing the annual energy and demand usage
by month. These graphs give a picture of use patterns. Any discrepancies in use show up
clearly.
7.7.5 Use Commonly Understood Units: In the report, be sure to use units that your client will
understand. Discussing energy savings in terms of BTUs is not meaningful to the average
reader. Kilowatt-hours for electricity or m3 for natural gas are better units because most
energy bills use these units.
7.7.6 Make Your Recommendations Clear: Some writers assume that their readers will
understand their recommendation even if it is not explicitly stated. Although the implied
recommendation may often be clear, the better practice is to clearly state your
recommendation so that your reader knows exactly what to do.
7.7.7 Explain Your Assumptions: A major problem with many reports is a failure to explain the
assumptions underlying the calculations. When you show your basic assumptions and
calculations, the reader can make adjustments if there is any change in parameters later.
7.7.8 Contents of Energy Audit Report: Executive Summary: The audit report should start with
an executive summary which basically lists the recommended energy conservation measures
and shows the implementation cost and savings amount. This section is intended for the
readers who only want to see the bottom line.
7.7.9 Introduction: Give a brief introduction of the facility, scope of study, the personnel
involved in the study and energy auditors’ team. The duration of the study, instruments used
etc also should come in this section.
7.7.10 Manufacturing Process /service: You can describe about the process in this section. The
process flow diagram should be presented here.
7.7.11 Analysis of Energy Consumption & Production: Energy Bill analysis, energy vs.
production analysis etc can be described in this section.

55
7.7.12 Energy Audit recommendations: Here, you can describe the measurements and analysis
of each energy consuming system followed by recommendations, financial analysis.
Equipments/systems can be grouped together based on their functions (cooling water
system, refrigeration system etc.) or they can be grouped as per individual production areas
(grinding section, core making section, melting section etc.)
7.7.13 In the calculation section, explain the methodology that you have used to arrive at your
savings estimates. Provide equations and show how the calculations are performed so that
clients can appreciate the calculations. If they want to change your assumptions
subsequently, they can, if they understand the calculations. If some of the data that has been
used is incorrect, they can replace it with the correct data and recalculate the results.
7.7.14 Energy Financing Options.: Include a short discussion of the ways that a company can
finance the implementation of the recommendations. Cover the traditional use of company
capital, loans for businesses, utility or government incentive programs and the shared savings
approach of the energy service companies.
7.7.15 Maintenance Recommendations: Do not usually make formal maintenance
recommendations in the technical supplement because the savings are not often easy to
quantify. Provide energy-savings maintenance checklists for desired equipments such as
lighting, heating/ventilation/air-conditioning, and boilers.
7.7.16 Appendix: Use an appendix for lengthy data tables, wherever required. For example, power
measurements-voltage, current, p.f., power input, frequency etc. Instead of repeating it in
each chapter, put it in the appendix. The appendix allows us to provide backup information
with out cluttering up the main body of the report.
7.8 Barriers to Successful implementation
7.8.1 While formulating ideas for energy saving, it is important to understand that many
recommendations are not implemented in plants due to various reasons.
7.8.2 Cost of energy is too small when compared to production cost: The sectors where the
energy cost is low as a percentage of production cost include pharmaceuticals, engineering
(heavy and light), value added products, assembly units, automobile units, machine shops,
fabrication units, electronic units, appliances, garments, etc. In these units the energy cost is
normally lesser than 5% of the total production cost. Though there is potential about 20%
savings in total energy cost the cost of production can be reduced by maximum 1%. This
makes the management not to venture for the energy audit

56
7.8.3 Non involvement or poor co-ordination among the inter-departments: Normally most
of the energy audits services will be coordinated by the maintenance or utility department
rather than the energy consumers (production or process personnel). Making the energy
consumers (process or production departments) are equally responsible for the energy
conservation by making the balanced team from the both sides is very important
7.8.4 Lack of minimum instrumentation, metering and monitoring: In addition to portable
instrumentation employed by the external auditor, some amount of metering and monitoring
is required on plant side to have effective field study to analyze the energy consumption
minutely. Also, metering & monitoring by the plant makes a historical trend assessment
possible which may account for factors like seasonal variations etc.
7.8.5 Plant sees only the first cost rather than life cycle cost while making the fresh
purchase: High importance should be given to life cycle cost of the equipment by
considering energy, maintenance, depreciation and other costs.
7.8.6 Failure or Poor performance of the energy saving retrofits or equipment supplied by
the vendors due to inferior quality or improper application: In many cases actual
practice the plant identifies the vendors locally who can supply the similar type equipment at
low cost. After the implementation in many cases these retrofits were failed due to many
reasons such as improper sizing, poor quality, technology adopted, location, poor attention
given, lack of expertise, etc. Hence plant will revert back to original situation.
7.8.7 New technology application: There are plenty of the new equipment or new technologies
available in the market and many of them resort to marketing gimmicks to penetrate the
market. The function of the auditor or energy manager is to evaluate these equipment
thoroughly before recommending their use.
7.8.8 Lack of Communication to downstream manpower (Operator Level) for EC
Measures: In all Industrial units, successful implementation of energy saving activities only
depends upon proper communication with internal customers (Execution area). Effect of
EC measures should be properly communicated to the operators who will actually perform
his duty after any EC measures in that area.

57
7.8.9 Absence of alternative implementation strategies: Reports resulting from an industrial
audit regularly include a number of recommendations for energy savings. The
recommendations normally calculate expected savings and evaluate the costs of
implementation. Usually, one of two forms of implementation of a new practice or
technology is recommended; either immediate implementation or incremental
implementation where the items are changed out as they fail. These two methods often fail
to consider such concerns as risk (real or perceived), comfort, the appropriate sizing and
loading of equipment, availability of product, rebuilt products, time constraints, disposal
costs, and economies of scale.
7.8.10 Presentation too theoretical – not able to convince the plant personnel during the
presentation: During the presentations of the report to the plant, the convincing skills of
the auditor will be depend up on his practical approach rather than theoretical since in actual
practice the practical skills are more important. The practical approach of the auditor is most
important and the plant personnel will get convinced if the auditor suggests the measures,
which are realistic, more practical and implementable.
7.8.11 At the same time the auditor should know about the concept behind the principle. But if you
see the most of the auditor lack the practical approach since they may have not on the job
experience to implement the measures. More over the auditor in their measures they will not
consider the human involvement in implementing the measure. We can see some of the
examples: Switching of the idle transformers during idle operation (plant personnel feel that
moisture will ingress in to the transformers and also frequent on and off of the transformer
requires human attention) Switching of the Air condition units during non-occupancy times
of the guests in the rooms. But the management feels that when the guest enters the rooms
there should be required conditions of the temperature with in the rooms
7.8.12 There are so many measures where the practical aspects should be considered very carefully
before suggesting the measures. The above measures can be implemented; but you need to
convince the operating people and gain their confidence.
7.8.13 Lack of expertise and resources during the energy audit field study: Many of the audit firms
prefer methods which just focus on the cause and not the effect during the plant studies of
the energy conservation measures. This is most often due to lack of theoretical background
and measurement resources.

58
8. Identifying Energy Saving Projects
8.1 Introduction
8.1.1 Some of the typical energy saving opportunities in common energy consuming systems are discussed below. This will help in focusing on energy conservation opportunities during the energy audit.
8.2 Boilers
Q1. What are the typical fuels used for fired equipments and their calorific values?
8.2.1 Various fuels & their calorific values of fuels are summarized below.
Table 8-1: Fuels and Calorific values
Sr Fuel Approx heating value Kcal/Kg
Dry state
A BIOMASS
1 Wood 3500
2 Cattle dung 3700
3 Bagasse 4400
4 Wheat and rice straw 2500
5 Cane trash, rice husk, leaves and vegetable
wastes
3000
6 Coconut husks, dry grass and crop
residues
3500
7 Groundnut shells 4000
8 Coffee and oil palm husks 4200
9 Cotton husks 4400
10 Peat 6500
B FOSSIL FUELS
1 Coal 4000-7000
2 Coke 6500
3 Charcoal 7000
4 Carbon 8000
5 Fuel oil 9800
6 Kerosene and diesel 10000
7 Petrol 10800
8 Paraffin 10500
9 Natural gas, kcal/Sm3 8600
10 Coal gas, kcal/Sm3 4000
11 Electrical (Kcal(KW) 860
12 Bio gas(Kcal/cu mtr) (12 kg of dung
produces 1 cu. Mtr gas)
4700-6000

59
Q2. What is excess air?
8.2.2 The quantity of air in excess of the theoretical minimum air required for complete combustion of
the solid and liquid fuels is excess air. Free oxygen in the products of combustion is an indication
of the excess air. Usually the CO2 recorder provides the indicating of excess air. For a fuel
containing only carbon, the theoretically correct combustion will yield in products of combustion
only CO2 and N2.
Excess air is estimated by the equation %789:;<
=>?%789:;<
8.2.3 Usually CO2 % varies from 10 –12% by volume in boilers with natural draught and 10-15 % by
volume in boiler with artificial draught. The boiler efficiency is maximum within small excess air.
For higher excess air, higher is the heat loss in the exhaust.
8.2.4 For natural gas boilers, 10% excess air corresponds to 2.2% oxygen in the flue gas. For coal-fired
boilers, 20% excess air corresponds to 4% oxygen. The recommended excess air for various fuels is
shown below:
Table 8-2: Excess air
FUEL Excess Air Recommended
OIL 15%
COAL 25%
NATURAL GAS 10%
DRY BAGASSE 30%
WET BAGASSE 45%
Q3. Can steam be generated from renewable fuels in place of Natural gas or oil?
8.2.5 Biomass fired boilers are an excellent choice for replacing petroleum fuels on two counts. It uses a
much cheaper fuel such as brequettes made from locally available agricultural residues. Cost saving
potential of 40-60% can be achieved by either purchasing a new biomass boiler or converting
existing Oil/Gas fired boilers to briquette firing.
8.2.6 The conversion of boiler essentially means installation of a briquette fired furnace in place of the
existing oil fired burner. The furnace will have features of fuel feeding system, draft system etc. The
existing shell and tubes will be intact. The rated capacity of the boiler would be 70% of the existing
rated capacity i.e. 2000 kg/h. However, since maximum load is expected to be about 1.5 TPH, there
will not be any issues related to availability of steam.

60
8.2.7 The economics of fuel cost saving is worked out below.
Table 8-3: Boiler conversion
Average NG consumption 1665 M3 per day
Average NCV of NG 9000 kcal/Sm3
Average boiler eff. 82.0% %
Enthalpy gain by steam 600 kcal/kg
Total steam generation 20479.5 kg per day
Cost of NG 30 Rs/M3
Cost of steam 2.44 Rs/kg of steam
Average GCV of Briquette 3800 kcal/kg
Avg efficiency of converted boiler 65.0% %
Amount of briquette required 4974.8 kg per day
Cost pf Briquette 5 Rs/kg
Cost of steam generation 1.2 Rs/kg of steam
Annual steam generation cost saving 7,522,834 Rs
8.2.8 Note that the existing steam generation cost (only fuel cost considered) is Rs 2.44/kg steam. This can be reduced to Rs 1.2/kg steam if the boiler is converted to briquette firing. The annual cost reduction is Rs 75.0 lakhs per year. Additional power consumption on 6 kW in an ID fan will have to be considered, which amounts to Rs 2.8 lakhs. Hence the net saving potential is Rs 72.2 lakhs per year.
Q4. How to estimate heat losses from hot pipe surfaces?
8.2.9 The following table can be used to estimate heat losses from surfaces.
Table 8-4: Heat losses from pipe surfaces

61
Q5. What are the typical losses in boiler & methods to reduce the same?
8.2.10 The following table summarises boiler losses and methods to minimize the same. Table 8-5: Summary of losses
LOSSES INDICATOR REASON LIMITING FACTOR
RANGE HOW TO MINIMIZE LOSS
Dry Gas Loss
High Exhaust Gas Temperature Low CO2 in Exhaust Gas
High Temperature High excess air
Dew Point (% Sulphur in Fuel) 2. Avoiding Incomplete Combustion
13 – 15 %
Cleaning Boiler Tubes, carry out feasibility for Waste Heat Recovery Opting Low Sulphur Fuel Minimize Excess Air
Wet Gas Loss
%H in Fuel %H in Fuel %H in Hydrocarbon Fuel
5 – 7 % Proper Choice of Fuel
Moisture Loss
%Water in Fuel High Relative Humidity
%Water in Fuel %Water in Air
Hygroscopic Nature of Fuel Uncontrollable
0.1 – 0.5 %
Coal-> Storage under Shed before charging; Oil->Regular Separation of Water At Storage Tank Uncontrollable
Blow down Loss
Higher number of Blow down Higher Quantity of Blow down
High TDS in Boiler Feed Water
Available Water Source with High TDS. Inadequate Treatment Capacity &/or operation
1 – 2 % Possibility of Source Changeover Proper Selection, Design and operation of Water Treatment Plant
Loss due to CO in Flue Gas
%CO in Flue Gas Incomplete Combustion
High Dry Gas Loss
0.01 – 0.05 %
Adequate Amount of Excess Air and cleaning of Blocked Air path due to Clinkers
Un-burnt Carbon Loss
%Un-burnt Carbon in Ash
Higher Coal Particle size
Non availability of proper sized Coal &/or Coal Sizing Facility
2 – 10 % Use of Proper Sized Coal
Ash Loss ((Sensible Heat)
High Ash Temperature and Quantity
High Ash content in Coal2. High Ash Temperature
Non availability of Low Ash Coal
0.1 – 1 %
Proper Choice of Coal
Radiation Loss
High Body Temperature
Improper Insulation
Insulation Thickness2. Material of Construction
0.1 -- 1 %
Proper and timely Repair of damaged Insulation
Losses due to Improper Sizing of Boiler
High Duration of Boiler Trips
Over Sizing of Boiler
Changing Steam Load 2 – 15 % Derating of Boiler
Losses due to Improper Fuel Selection
Higher Steam Cost inspite of Higher Boiler Efficiency
Fluctuation in Fuel prices and their Quality and Availability
Capital Investment2. Changing Steam Load. Availability of Fuel
2 – 10 % Conversion of Existing Boiler to Cheaper Fuel options (Along with possible Downsizing) is Possible by Retrofitting Investments

62
Q6. Does the plant have a significant number of steam traps that are malfunctioning?
8.2.11 The following table summarises application of various types of steam traps.
Table 8-6: Selection of traps
TYPE OF LINE STEAM TRAP SUITABLE Distribution Line Thermodynamic Trap Moisture Separator Thermodynamic Trap for Package Boiler
Inverted Bucket Trap for Coil type Non-IBR Boiler
Constant Load equipments beyond heat transfer area of 5 m2 like tray drier, kettle, etc.
Ball Float Trap Inverted Bucket Trap
Drum Drier Inverted Bucket Trap Evaporator beyond 20 m2 heat transfer area
Inverted Bucket Trap
Operations near 100 deg C. Ball Float Trap Dead end of Pipeline Metallic Expansion Thermostatic Air vent Main Line Headers Thermodynamic Trap
8.2.12 Steam traps are usually designed based upon a maximum back pressure rating. This rating is
determined by dividing the outlet pressure by the inlet pressure, absolute. If the back pressure of the
present system is greater than the original design pressure, the trap is not able to fully close, and can
fail in the open position. When these traps fail open, they blow steam into the return system, which
increases the back pressure on other traps in the system, causing them to fail. When the steam is
induced into the return piping, the vapour flows over the condensate, eventually causing enough
turbulence to create a mass or “slug” of condensate that fills the pipe.
8.2.13 The most reliable method to identify traps that are malfunctioning is to use ultrasonic tools.
8.2.14 Initiate a program to identify and repair traps that are malfunctioning. Consider installing
continuously discharging thermostatic steam traps.
Q7. How to calculate flash steam generation potential?
8.2.15 Use of flash steam depends on Its availability i.e. continuous or Intermittent and Its pressure .By the use of flash vessel the high-pressure condensate can be used to satisfy the need. It lowers the demand on boiler and saves the energy. Use of flash steam are:
� To heat fuel oil
� Pre-heat air
� To pre-heat feed water
� Can be used with thermo compressor.

63
8.2.16 The condensate enters the steam trap as saturated water, at a gauge pressure of 7 bar g and a
temperature of 170°C. The specific amount of heat in the condensate at this pressure is 721 kJ/kg.
After passing through the steam trap, the pressure in the condensate return line is 0 bar g. At this
pressure, the maximum amount of heat each kilogram of condensate can hold is 419 kJ and the
maximum temperature is 100°C. There is an excess of 302 kJ of heat which evaporates some of the
condensate into steam. The quantity of steam is calculated in the following text.
Figure 8-1: Flash steam
8.2.17 The heat needed to produce 1 kg of saturated steam from water at the same temperature, at 0 bar
gauge, is 2257 kJ. An amount of 302 kJ can therefore evaporate:
8.2.18 From each kilogram of condensate in this example, the proportion of flash steam generated
therefore equals 13.4% of the initial mass of condensate.. If the equipment using steam at 7 bar g
were condensing 250 kg/h, then the amount of flash steam released by the condensate at 0 bar g
would be = 0.134 x 250 kg/h of condensate = 33.5 kg/h of flash steam
8.2.19 Hot condensate will travel in the direction of high pressure to low pressure. When the feed tank is
vented to atmosphere, as the condensate enters the feed tank, it will flash to steam due to the
sudden drop in pressure and the steam escapes through the vent to atmosphere. The steam and
associated energy is lost.
8.2.20 Install properly designed steam traps to reduce the amount of steam lost through the open system
8.2.21 Install pressurized condensate return system to reduce flash steam losses.
8.2.22 Insulate Condensate Storage Tanks.

64
Q8. Does the boiler cycle frequently?
8.2.23 Boiler efficiency is reduced at partial load. Frequent cycling reduces the overall operation efficiency
and the life of a boiler. Continual cycling can be an indicator of an oversized boiler. Install multiple
smaller boilers (modular). Match steam load to the boiler output.
Q9. Is the flow rate of the induced draft and forced draft fans being controlled by throttling
methods?
8.2.24 Install VSD control on boiler induced draft and forced draft fans. From the following chart, note
that operating at lower flows with VFDs consume much less power than damper controls.
Figure 8-2: Flow control options
Q10. Are there any opportunities for heat recovery?
Install economiser on the boiler to preheat feed water
8.2.25 The existing feed water temperature is only about 40 C. This should be heated to about 80 C by
using an economiser. The economiser can use Boiler feed water from the feed water pump, which
should pump through the economiser and then to the drum. This can improve the boiler efficiency
to 87%.
8.2.26 Average feed water consumption is about 20 Tons per day. Economiser can be designed for heating
1000 kg/h water from 40 C to 80 C. the heat recovery potential is 40,000 kcal/h, equivalent to 4.4
m3 per hour of NG. This is roughly 100 m3/day saving in NG cost. i.e. Rs 90,000 per year.
8.2.27 The following is a schematic of an economiser system.

65
Figure 8-3: Economiser
8.2.28 Investment for a coil type economiser is expected to be about Rs 80,000 with a payback period of 1 year.
8.2 Thermic fluid heaters
8.2.18 In recent times, thermic fluid heaters have found wide application for indirect process heating.
Employing petroleum - based fluids as the heat transfer medium, these heaters provide constantly
maintainable temperatures for the user equipment. The combustion system comprises of a fixed
grate with mechanical draft arrangements.
8.2.19 The modern oil fired thermic fluid heater consists of a double coil, three pass construction and fitted
a with modulated pressure jet system. The thermic fluid, which acts as a heat carrier, is heated up in
the heater and circulated through the user equipment. There it transfers heat for the process through
a heat exchanger and the fluid is then returned to the heater. The flow of thermic fluid at the user
end is controlled by a pneumatically operated control valve, based on the operating temperature.
The heater operates on low or high fire depending on the return oil temperature, which varies with
the system load.
8.2.20 The overall economics of the thermic fluid heater will depend upon the specific application and
reference basis. Coal fired thermic fluid heaters with a thermal efficiency range of 55-65 percent may
compare favorably with most boilers. Incorporation of heat recovery devices in the flue gas path
enhances the thermal efficiency levels further.

66
8.2.21 The efficiency assessment is done similar to a boiler, and is very simple in Indirect method. Direct
method is not followed because of lack of measurement on the hot oil flow through the heater.
8.2.22 The following case study illustrates the economics of replacing a 5.0 lakh kcal/hr oil fired thermic
fluid heater with wood chip fired heater.
Inter-fuel Substitution: Agro Briquette Fired Heater
8.2.23 The prevailing price of natural gas is Rs 40 per scm, which implies that we are essentially purchasing
it at the rate of 207 kcal/Re. Assuming 80% efficiency for the natural gas fired thermic fluid heater,
the net energy delivered to the plant is 160 kcal/Re.
8.2.24 The prevailing price for agro briquettes is Rs 5.80 per kg, which implies that we are essentially
purchasing 620 kcal/Re. Assuming 60% efficiency for the agro briquette fired thermic fluid heater,
the net energy delivered to the plant is 372 kcal/Re.
8.2.25 The natural gas consumption is around 1400 scm/day, costing Rs. 56,000 per day. By switching to
agro briquette fired thermic fluid heaters, the energy cost is likely to be Rs. 24,000 per day i.e. a
saving of Rs. 32,000 per day.
8.2.26 The investment for the new agro briquette fired thermic fluid heaters is expected to be around Rs 75
lacs, with a payback period of 250 days
8.3 Dryers
Q1. What is drying curve?
8.3.18 Each and every product, there is a representative curve that describes the drying characteristics for
that product at specific temperature, velocity and pressure conditions. This curve is referred to as
the drying curve for a specific product. Fig 2.1 shows a typical drying curve. Variations in the curve
will occur principally in rate relative to carrier velocity and temperature.
Figure 8-4: Drying curve
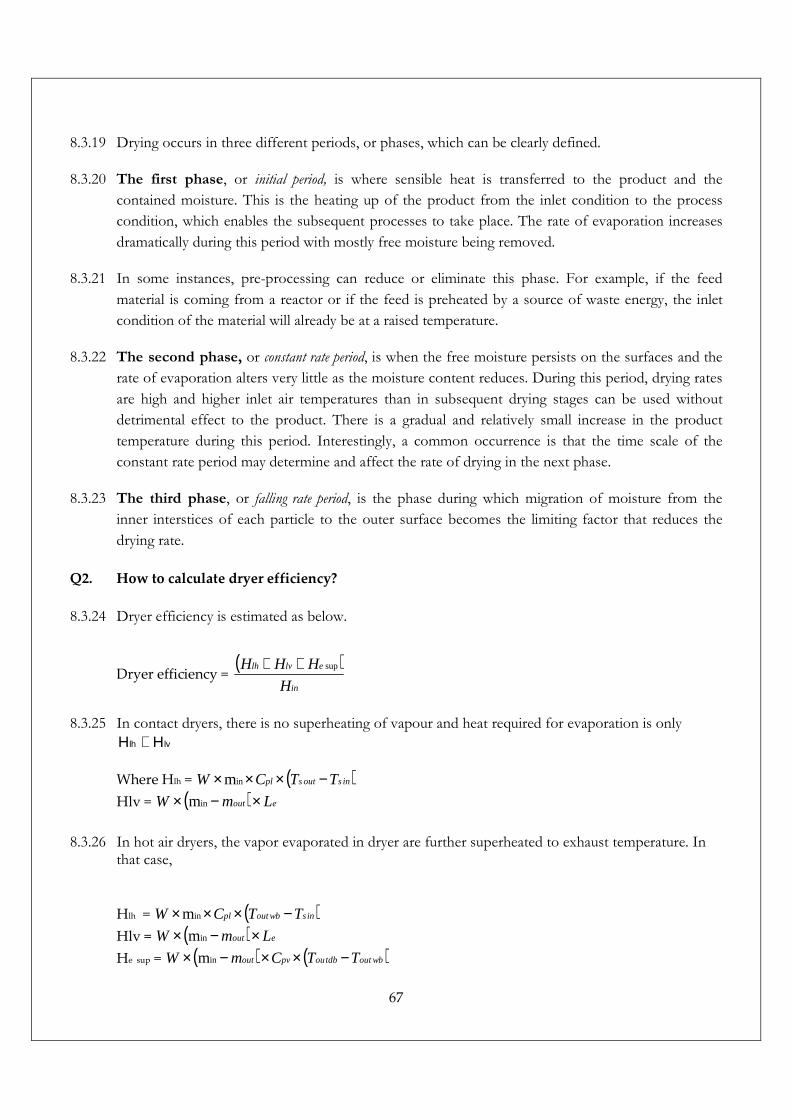
67
8.3.19 Drying occurs in three different periods, or phases, which can be clearly defined.
8.3.20 The first phase, or initial period, is where sensible heat is transferred to the product and the
contained moisture. This is the heating up of the product from the inlet condition to the process
condition, which enables the subsequent processes to take place. The rate of evaporation increases
dramatically during this period with mostly free moisture being removed.
8.3.21 In some instances, pre-processing can reduce or eliminate this phase. For example, if the feed
material is coming from a reactor or if the feed is preheated by a source of waste energy, the inlet
condition of the material will already be at a raised temperature.
8.3.22 The second phase, or constant rate period, is when the free moisture persists on the surfaces and the
rate of evaporation alters very little as the moisture content reduces. During this period, drying rates
are high and higher inlet air temperatures than in subsequent drying stages can be used without
detrimental effect to the product. There is a gradual and relatively small increase in the product
temperature during this period. Interestingly, a common occurrence is that the time scale of the
constant rate period may determine and affect the rate of drying in the next phase.
8.3.23 The third phase, or falling rate period, is the phase during which migration of moisture from the
inner interstices of each particle to the outer surface becomes the limiting factor that reduces the
drying rate.
Q2. How to calculate dryer efficiency?
8.3.24 Dryer efficiency is estimated as below.
Dryer efficiency = ( )
in
elvlh
H
HHH sup++
8.3.25 In contact dryers, there is no superheating of vapour and heat required for evaporation is only
lvlh HH +
Where Hlh = ( )insoutspl TTCW −××× inm
Hlv = ( ) eout LmW ×−× inm
8.3.26 In hot air dryers, the vapor evaporated in dryer are further superheated to exhaust temperature. In that case,
Hlh = ( )inswboutpl TTCW −××× inm
Hlv = ( ) eout LmW ×−× inm
He sup = ( ) ( )wbouttdboupvout TTCmW −××−× inm

68
8.3.27 For batch dryers, the material and energy flow rate has to be replaced with total material quantity
dried and energy consumed in the period.
Q3. What are the typical efficiencies of various types of dryers?
8.3.28 The following table summarises dryer efficiencies and source of losses
Table 8-7: Dryer efficiency
Dryer group and type Typical Heat
loss sources
Typical
specific energy consumption, MJ/kgof water
Typical
efficiency
Rotary
Indirect Rotary Surface 3.0 to 8.0 28 – 75%
Cascading Rotary Exhausts, leaks 3.5 to 12.0 19 – 64%
Band, Tray & Tunnel
Cross circulated tray/oven/band
Exhaust, surface 8.0 to 16.0 14 – 28%
Cross circulated shelf / tunnel
Exhaust, surface 6.0 to 16.0 14 – 38%
Through circulated tray /
band
Exhaust 5.0 to 12.0 19 – 45%
Vacuum tray / band / plate Surface 3.5 to 8.0 28 – 64%
Drum Surface 3.0 to 12.0 19 – 75%
Fluidised / Sprouted bed Exhaust 3.5 to 8.5 28 – 64%
Spray
Pneumatic conveying/Spray Exhaust 3.5 to 8.0 28 – 64%
Two stage Exhaust, surface
3.3 to 6.0 38 – 68%
Cylinder Surface 3.5 to 10.0 23 – 64%
Stenter Exhaust 5.0 to 12.0 19 – 45%
Q4. What are the major types of dryers in chemical industry?
Spin Flash Dryer
8.3.29 The pneumatic or ‘flash’ dryer is used with products that dry rapidly owing to the easy removal of
free moisture or where any required diffusion to the surface occurs readily. Drying takes place in a
matter of seconds. Wet material is mixed with a stream of heated air (or other gas), which conveys it
through a drying duct where high heat and mass transfer rates rapidly dry the product. Applications
include the drying of filter cakes, crystals, granules, pastes, sludges and slurries; in fact almost any
material where a powdered product is required. Salient features are as follows.

69
� Particulate matter can be dispersed, entrained and pneumatically conveyed in air. If this air is
hot, material is dried.
� Pre-forming or mixing with dried material may be needed feed the moist material
� The dried product is separated in a cyclone. This is followed by separation in further
cyclones, fabric sleeve filters or wet scrubbers.
� This is suitable for rapidly drying heat sensitive materials. Sticky, greasy material or that
which may cause attrition (dust generation) is not suitable.
Figure 8-5: Spin Flash Dryer
Spray dryers
8.3.30 Salient features of Spray dryers are as follows.
� Solutions, suspensions, slurries and pastes, which can be pumped, can be dried on spray dryers.
The advantage of spray dryer is rapid and non-contact drying.
� Much higher initial temperature of drying medium can be used. High evaporation rates and
thermal efficiencies are achieved.
� It can be quickly started and shut down.
� It is capable of handling volatile or inflammable solvents in a closed cycle.

70
Figure 8-6: Spray dryer
Fluidised bed dryers
8.3.31 Fluid bed dryers are found throughout all industries, from heavy mining through food, fine
chemicals and pharmaceuticals. They provide an effective method of drying relatively free-flowing
particles with a reasonably narrow particle size distribution. In general, fluid bed dryers operate on a
through-the-bed flow pattern with the gas passing through the product perpendicular to the
direction of travel. The dry product is discharged from the same section. Refer figure 3.5.
8.3.32 With a certain velocity of gas at the base of a bed of particles, the bed expands and particles move
within the bed.
� High rate of heat transfer is achieved with almost instant evaporation.
� Batch/continuous flow of materials is possible.
� The hot gas stream is introduced at the base of the bed through a dispersion/distribution plate.
Figure 8-7: Fluidised bed dryer

71
Tray Dryers
8.3.33 By far the most common dryer for small tonnage products, a batch tray dryer (Figure 1) consists of a
stack of trays or several stacks of trays placed in a large insulated chamber in which hot air is
circulated with appropriately designed fans and guide vanes. Often, a part of the exhausted air is
recirculated with a fan located within or outside the drying chamber. These dryers require large
amount of labor to load and unload the product. Typically, the drying times are long (10-60 hours).
The key to successful operation is the uniform air flow distribution over the trays as the slowest
drying tray decides the residence time required and hence dryer capacity.
Figure 8-8: Tray Dryer
Q3. How to calculate moisture removed in drying process?
8.3.34 If the throughput of the dryer is 60 kg of wet product per hour, drying it from 55% moisture to 10%
moisture, the heat requirement is estimated below:
60 kg of wet product contains 60 x 0.55 kg water = 33 kg moisture and 60 x (1 - 0.55) = 27 kg
bone-dry product.
As the final product contains 10% moisture, the total weight of final product is
= 27/(1-0.1) = 30 kg. Moisture content in final product is 30-27 = 3.0 kg
Total moisture removed by drying = 33 -3 = 30 kg
Latent heat of evaporation = 2257 kJ kg-1(at 100 °C so heat necessary to supply = 30 x 2257 = 6.8 x l04
kJ

72
Q5. How energy can be optimised in dryers?
8.3.35 While drying is an extremely energy intensive operation, there are techniques that can be used to
minimize the energy costs per unit output of product, including:
8.3.36 Minimizing the water content of the feed prior to feeding to the dryer: The most important of
the above is to minimize the water content of the feed by pretreatment with other techniques.
Mechanical separation processes such as settling, centrifuging, filtration, reverse osmosis, etc., are far
more energy efficient than thermal processes. When mechanical separation is not possible,
evaporation should be considered. Although evaporation is a thermal process, the thermal efficiency
of water removal is many times that of a dryer. In a large system, say 7 effect evaporator, it is
possible to evaporate 7 or 8 mass units of water for 1 mass unit of steam supply. Mechanical
recompression evaporation can be even more energy efficient. A typical dryer does not even
evaporate 1 mass unit per 1 mass unit of steam.
8.3.37 At 35% moisture content as shown at point “A” , a spray dryer could be used to dry the material to
0.1%. However, if a rotary vacuum filter can be used to reduce the water content to 14%, the energy
requirements are reduced to less than 1/3. The final drying can then be performed by a spin flash or
pneumatic dryer

73
8.3.38 Maximizing the temperature drop of the drying gas: This implies maximum inlet and minimum
outlet temperature. Unlike evaporators where the latent heat of the evaporated water can usually be
reused in effects operating at lower pressure, the steam from a dryer is not easily reused apart from
some preheating applications. The steam is usually carried in a gas stream, which reduces the thermal
potential. Hence, the dryers are usually a once-through system. Therefore, it is important to
minimize the volume of inlet gas used to input the heat and carry over the steam that is generated. If
large quantities of gas exit the dryer, an equally large quantity of heat is lost. The higher the inlet gas
temperature, the lower the quantity of gas required, and the higher the efficiency of the dryer.
Unfortunately, there are usually temperature limitations associated with the product which limit both
the inlet and outlet gas temperature. For example, with dairy products, the inlet gas temperature limit
is approximately 480°F (250°C). For ceramics, the gas inlet temperature can exceed 1200°F (650°C).
The outlet temperature is controlled by the type of product and the dryness required.
8.3.39 Employing the maximum possible recirculation of the drying gas: Any gas that leaves the
system carries heat and reduces the thermal efficiency of the dryer. It appears logical to recirculate as
much gas as possible. However, this system is limited by the relationship between the required
dryness of the product and the humidity of the outlet gas. A condenser can be used in the
recirculation loop to condense some water vapor, but the heat can only be recovered at low
temperatures.
8.3.40 Example of a flash dryer system with recirculation is given below.
Figure 8-9: Recirculation of exhaust in drying
8.3.41 Utilizing the heat in the discharge air to preheat incoming air. Heat can be saved by using the
discharge gas (air)/steam mixture to preheat the incoming air. This technique is most beneficial
when product properties restrict the gas (air) inlet temperatures, requiring large volumes of gas (air).

74
8.3.42 Reducing radiation and convection heat loss by means of efficient thermal insulation. Drying
equipment tends to be large. Also the equipment operates at quite high temperatures. As a result,
there is a large potential for high heat loss from both convection and radiation. Insulation of the
equipment is vital to ensure energy efficiency.
8.3.43 Heat Pump assisted Drying: This is relatively a new concept, and one of the most efficient forms of
drying.
Table 8-8: Advantages of heat pump drying
8.3.44 Schematic of heat pump assisted drying is given below.
Figure 8-10: Heat pump drying

75
Q6: Caste Study on energy saving in dryers
8.3.45 Retrofit of Heat Pump based Fresh Air Dehumidifier: The energy savings by retrofit of Low
Energy Heat Pump Fresh Air Dryer on existing dryers is expected for the following reasons:
� Reducing sensible heat load due fresh air now entering the dryer at 60 °C instead of at
ambient temperature.
� Since dehumidified fresh air will have absolute humidity (grams moisture per kg of dry air), it
has more capacity to pick up and hold water or solvent vapour, scope will exist for the
following measures:
� Reducing the air flow for the same production throughput in fluidized bed dryers, spray
dryers and tray dryers
� Reducing the air supply temperature for the same air flow and production throughput in tray
dryers, fluidized bed dryers, spin flash dryers and spray dryers
� Reducing batch cycle time for the same production throughput in tray dryers
� Increasing production throughput for the same air flow and air supply temperatures
A combination of all the above measures
8.3.46 The dynamics of drying will vary depending on the properties of the material being dried and type of
dryer; hence, after retrofitting the Low Energy Heat Pump Air Dryer, energy savings should be
maximized by optimizing air flow, air supply temperature and production throughput for
maintaining the same quality of output and residual moisture in the product.
8.3.47 The following case study is from a chemical industry belt dryer. Optimising airflow to the
requirement helped in reducing the useful heat carried away by the excess airflow. Drying processes
where falling rate of evaporation time is significant, reduction of airflow can be a good energy saving
option. During the falling rate period of drying, the moisture diffusion from inside the material to
the surface is predominant and this is a function of more of the material properties than external
conditions like airflow.
8.3.48 The energy inputs to the system are:
Steam for air heating : 300 kg/hr Electrical energy for FD : 8.5 kW Electrical energy for ID : 8.4 kW

76
8.3.32 Initial performance parameters were established by field measurements and the performance was
monitored for few batches. Following is summary of performance parameters at present conditions:
Table 8-9: Existing condition
1. Air flow rate : 17,000 kg/hr 2. Moisture evaporation load : 27 kg/hr 3. Effectiveness of dryer : 10.9% 4. Effectiveness of steam consumption : 9.5% 5. Efficiency of FD fan : 29.2% 6. Efficiency of ID fan : 26.2%
8.3.33 Recommendation: Start the circulating fans in each section and cut down the blower flow rate.
Replace the blower with smaller size blower. Following is summary of performance parameters at
after modifications conditions:
Table 8-10: After modification
1. Air flow rate : 5,000 kg/hr 2. Moisture evaporation load : 27 kg/hr 3. Effectiveness of dryer : 40% 4. Effectiveness of steam consumption : 38% 5. Efficiency of FD fan : 60% 6. Efficiency of ID fan : 26.2%
The energy consumption of new system
Steam for air heating : 90kg/hr
Electrical energy for FD : 2 kW
Electrical energy for FD Table 8-11: Saving potential
Steam Saving = 215 kg/hr (i.e. 72 %) Yearly fuel Saving = Rs. 3,87,000/- Electrical saving = 9 kW (i.e. 75%) Yearly electrical Saving = Rs. 3,24,000/-
8.3.34 This is a typical example where reduction in demand by modification in the end application leads to
a mammoth saving of 75%. However, note that for a spin flash dryer, reduction in airflow should be
done carefully, as the heat and mass transfer rates in SFDs are closely linked with the airflow.

77
8.4 Distillation Process
Q1. What is distillation process?
8.3.49 Distillation, sometimes referred to as fractionation or rectification, is a process for the separating of
two or more liquids. The process utilizes the difference of the vapor pressures to produce the
separation.
8.3.50 When a mixture of two or more liquids is heated and boiled, the vapor has a different composition
than the liquid. For example, if a10% mixture of ethanol in water is boiled, the vapor will contain
over 50% ethanol. The vapor can be condensed and boiled again, which will result in an even higher
concentration of ethanol. Distillation operates on this principle
8.3.51 The two classes of distillation are batch distillation and continuous distillation. In batch distillation,
the feed to the column is introduced batch-wise. The column is first charged with a ‘batch’ and then
the distillation process is carried out. When the desired task is achieved, the next batch of feed is
introduced. Batch distillation is usually preferred in the pharmaceutical industries and for the
production of seasonal products.
8.3.52 On the other hand, continuous distillation handles a continuous feed stream. No interruption occurs
during the operation of a continuous distillation column unless there is a problem with the column
or surrounding unit operations. Continuous columns are capable of handling high throughputs.
Besides, additional variations can be utilized in a continuous distillation column, such as multiple
feed points and multiple product drawing points.
Figure 8-11: Distillation column

78
Q2. What are the typical causes of inefficiencies in distillation processes?
8.3.53 Operating at the wrong pressure — Higher column pressure costs the system the ability to
separate and thus energy. Higher pressure reduces vaporization so a column must operate at higher
temperature. Therefore, more energy is added to the reboiler at higher pressure than at lower
pressure to get the same separation. To save energy, run column pressure at the lower end of the
operating range, just high enough to cool the overhead and hydraulically move products. One way to
do this is to reduce the pressure drop across the column by installing distillation trays or packing
that has little differential pressure (more efficient trays also can reduce energy requirements). This
allows to run the same overhead pressure with less reboiler work. Or reduce pressure in the entire
tower. For those in areas of the country that experience wide variation in outside temperature (and
thus have the ability to cool better in the winter), look at seasonable adjustments in tower pressure.
8.3.54 Putting the feed in the wrong location — Tower separation is typically determined by the
reboiler, condenser, and feed system. Designers sometimes concentrate on getting the two ends,
condenser and reboiler, to do the right thing but forget about the feed system itself. In some cases,
where multiple feed entrances are possible, always look at the proper tray to introduce your feed .
The feed location depends heavily on the composition and your final product spec. Introducing a
feed at the wrong location means the trays around the feed entrance will operate inefficiently and
thus require the tower to work harder, use more energy, to perform the required separation. If your
feed composition changes or if it has changed since the tower was designed, run tower simulations
to see if you can introduce your feed on a different tray to reduce energy cost.
8.3.55 Over-purifying your products — In a distillation column, the primary control protects the most
valuable product. For example, if you have a specification of less than 5% unwanted material in the
overhead liquid, you typically will set a target to achieve that. However, it’s very common for a plant
to produce 2% to 3% unwanted material in shipped product even when allowed 5%. This
commonly happens because operators are taught to respond immediately to results close to the limit
but are less likely to make changes when the results are far below the target. Although you never
want to produce off-spec material, running a distillation column far below target takes a lot more
energy then running a column to produce very near the target. With the advanced control schemes
and equipment available today, look at your column to determine if you can run a “tighter”
specification range for a lot less energy.
8.3.56 Using too much reflux — It seems to make sense that a higher reflux ratio would create better
separation, but more traffic in the tower requires energy. Many towers operate at the same reflux
rate no matter how much feed is running to the tower. Typically, a distillation tower can operate at
many different reflux rates and produce acceptable products. The key is to find the most stable low
energy rate you can. Modifying reflux rates isn’t a simple task as a tower running reduced reflux
needs more operator attention.

79
Q3. Example of Re-sizing of Methanol Distillation column
8.3.57 The diameter of the existing distillation column is 600 mm which is most probably resulting in very
high reflux quantity which in turn results in increase in heating loads and results in higher natural gas
consumption. Presently the gas consumption is 2250 scm/batch of 36 hours; two options are
available for reducing the heating demand:
For mole fraction of 65% methanol,
mole fraction of water will be about 57439
8.57
+ = 11%.
Thus, minimum reflux will be 600260
600
3000
200 ×× = 92 kg/h of methanol.
Estimation of Vapor Load
Excessive reflux of 5 times i.e. 450 kg/h will have vapor load of (600 + 450) = 1050 Kg/hr.
Volumetric flow of vapor will 4.2232
1056× = 739 m3/h.
Cross section area for 6 m/s vapor velocity will be 36006
739
×= 0.03 m2.
Accounting for packing void space by 0.6, cross-sectional area 6.0
03.0= 0.05 m2 should be
sufficient, this would be equivalent to 250 mm. Thus, 300 mm dia column should be more
than sufficient even for 5 times of the minimum reflux. The heat load accordingly will come
down to 1050 x 260 x 1.1 = 300,000 Kcal/hr or 1100 m3 of gas consumption per day.
8.3.58 We therefore recommend blanking of existing distillation column and erecting parallel 250/300 mm
dia distillation column and connecting both ends. The weight of the column will be 800 kg and
packing will weigh about 400 kg. The potential savings will be around 100,000 kcal/h; the natural
gas savings are expected to be about 350 scm/day. i.e. Rs.14000 per day.
8.4 Hot/Cold Recovery
8.4.1 Heating or cooling from processes can reduce the requirements of steam or cooling/chilled water if properly integrated. The following examples of process heat recovery explains the concept.
8.4.2 Recover heat from hot water circulation system of RK2 & RK3 to preheat fresh water . The solvent
recovery and reflux system of RK2 & RK3 are based on hot water circulation. Since these reactors
operate at elevated pressures, condensing solvent vapours and recovering back to the reactor require
hot water circulation.

80
8.4.3 The temperature requirement of hot water in tank is about 85 deg.C. There is one pump each for
each reactor for circulating hot water through the condenser and accumulating heat in a storage
tank. Fresh water supply at 25 deg.C (flow of about 10.5 m3/h) is continuously fed into the storage
tank and the same amount of hot water is drained to maintain the temperature in the tank.
8.4.4 A schematic of the existing system is given below.
8.4.5 The total amount of heat available for recovery is 10.5 x 1000x (85-25) = 630000 kcal/h for two
reactors. The above heat availability was verified by measurements on the hot water circulation side.
The hot water circulation rate is 80 m3/h for each pump and temperature rise by 4 deg.C in the
condenser. Hence total heat recovered from condenser is 2 x 80000 x 4 = 640,000 kcal/h.
8.4.6 Assuming 75% of this heat can be recovered for generating hot water by installing a heat exchanger,
energy can be saved by reduced steam demand for hot water generation. Presently hot water is
generated in a hot water tank of 15 m3 capacity located near the cooling tower in CPC plant. This is
at 60 deg.C and is used for filter press washing and preparation for slurry for transferring RVD
product to acid purification vessel.
8.4.7 The total heat requirement for hot water generation in CPC & Alpha plants is thus 675 kg/h. This
matches with the heat recovery from RK2 & RK3 condenser.With an average steam cost of Rs
0.75/kg, annual fuel cost saving achieved is Rs 35.4 Lakhs/year. This can save about 780 Tons/year
of coal consumption.

81
8.4.8 Concept of a proposed system is given below.
Heat Recovery from Thermic fluid heater exhaust
8.4.9 The existing flue gas exhaust temperature in the thermic fluid heater is at a temperature of 250 °C
which is very high for natural gas fired heater; ideally, this temperature should be in the vicinity of
130 °C to 140 °C, which is usually achieved by using combustion air preheater or other heat
exchanger for recovery of the waste heat for any process heat application.
8.4.10 The possibility of installing a waste heat hot water generator may be explored; this can heat up the
water to 90 °C which can be used in the reboiler of the methanol distillation column.
8.4.11 The energy saving expected from this is approximately 400,000 kcal/h which implies natural gas
saving of 120 scm/day i.e. Rs. 4,800 per day. The hot water generator can be a heat exchanger with
hot water tank with thermosyphon; the investment is likely to be approximately Rs 6.1 lacs for the
hot water tank, heat exchanger and piping with a payback period of around 128 days.
Cold recovery from Chlorine vaporizer using heat pump
8.4.12 The plant manufactures monochloro acetic acid. The process involved chlorination of acetic acid.
For a production of 9600 Tons/year, the chlorine consumption is about 2000 kg/h. The schematic
of production process is given below.

82
8.4.13 The process of generating vapour chlorine from liquid chlorine involves heating by steam. The
energy balance of chlorination process is given below. The steam consumption is 218 kg/h.
8.4.14 A more energy efficient option is by use of a heat pump system. A heat pump is basically a chilling
plant with generates chilled water and hot water simultaneously.

83
8.4.15 From the above schematic, note that hot water at 60 C generated by the heat pump and fed to a
chlorine vapouriser. Chilling is generated at the heat pump can offset partially the chilling
requirements which is presently met with a centralized chilling plant. Detailed calculations are given
below.
Table 8-12: Heat pump assisted Chlorine evaporation
8.4.16 Investment for a 50 TR heat pump is expected to be about Rs 30.0 lakhs, with a payback period of
10 months.
Production of monochloro acetic acid 25 Tons/day
Chlorine consumption 2 Tons/h
Liquid chlorine temperature 25 C
Liquid chlorine pressure 6 kg/cm2
Liquid chlorine enthalpy 71.05 kcal/kg
Vapour chlorine temperature 50 C
Vapour chlorine pressure 2 kg/cm2
Vapour chlorine enthalpy 132.0 kcal/kg
Enthalpy rise of chlorine 61.0 kcal/kg
Energy required for clhorine vapourisation, kcal/h 121900.0 kcal/h
TR 40.3 TR
Enthalpy of steam 559.4 kcal/kg
Equivalent steam consumption 217.9 kg/h
Steam cost 2.6 Rs/kg
Cost of steam consumption 4,079,581 Rs/year
Heat pump based chlorine vapourisation system
Heating required by heat pump to vapourise chlorine 121900.0 kcal/h
Hot water inlet temperature to condenser 60.0
Hot water out let temperature of condenser 55.0
Hot water flow required 24.4 m3/h
Expected Power consumption of condenser (hot water) pump 3.9 kW
Additional cooling available from heat pump 32.2 TR
Chilled water inlet temperature to heat pump 12 C
Chilled water outlet temperature of heat pump 7 C
Chilled water flow required 19.5 m3/h
Expected Power consumption of chilled water pump 3.7 kW
Power consumption of heat pump 32.2 kW
Total power consumption of heat pump system 39.8 kW
Power saving in chilling capacity at KC6 chiller 25.8 kW
Net power consumption of heat pump 14.0 kW
Electricity price 6.5 Rs/kWh
Cost of power consumption of heat pump 656,436 Rs/year
Overall cost saving potential 3,423,145 Rs/year

84
8.5 Electric Motors
Q1. Motor efficiency & Power factor – How does it vary with load/rating?
8.5.1 Electric motors are intrinsically very efficient. Their efficiencies vary from 85% to 95% for motors
of sizes ranging from 10 HP to 500 HP. Due to a large installed base of motors using electricity,
even a small improvement in efficiency can result in significant savings from a broader national
perspective. The following chart shows efficiency of electric motors of various sizes at different
loads. Higher the motor rating higher will be the efficiency at full load.
Figure 8-12: Motor efficiency
8.5.2 Typical variations of motor efficiency and power factor with load are shown in figure below.
Figure 8-13: Motor loading, efficiency & pf

85
8.5.3 The motor efficiency remains almost constant up to 40% load, below which the efficiency drops
significantly and becomes zero at 0% load.For a particular operating voltage and shaft load, the
motor efficiency is determined by design, it cannot be changed externally.
8.5.4 The power factor reduces with load. At no load the p.f. is in the range of 0.05 to 0.2 depending on
size of the motors Note that at 50% load, the efficiency has dropped by 3%, whereas the power
factor has dropped from 0.84 to 0.7 for the same load change. At no load, the power consumption is
only about 1 to 5%; just sufficient to supply the iron, friction and windage losses.
8.5.5 Break up of losses of a 50 HP motor is given below. Some losses are fixed; some vary with load as
can be seen from the figure.
Figure 8-14: Motor losses
Q2. How much saving can be achieved by motor replacement or proper sizing?
8.5.6 The following table explains the effect of oversizing a motor. For a duty requirement of 15 kW, if
we install a 30 kW or a 55 kW motor, the additional energy consumption is given below.
Table 8-13: Motor sizing
Description Unit Motor Rating
Motor Load Requirement KW 15 15 15
Motor Rating KW 15 30 55
Motor Efficiency % 89 89 84
Input Power KW 16.85 16.85 17.85
Input Energy (for 6000 hrs/annum)
KWH 101100 101100 107100
Input Energy Cost @ Rs.5/- Rs 505500 505500 535000
Motor Power Factor 0.89 0.75 0.50
Input KVA 18.93 22.44 35.70
Energy Difference KWH - - 6000
Investment Rs. 25000 55000 95000
Increase in Investment RS. - 30000 70000
Increased in Running Cost Rs. - - 30000

86
8.5.7 It is clear that even if we oversize by double, energy penalty is quite low.
Q3. Motor rewinding or replacement – How to decide?
8.5.8 The following table compares the efficiency, economics of rewinding vs. high efficiency motors.
Efficiency of a rewound motor can be same as original or less depending on the rewinding practices.
It does not mean that all rewound motors have poor efficiency.
Table 8-14: Comparison of rewinding & replacement
Rewound motor
Standard Motor
High efficiency Motor
Motor rating, kW 9.3 9.3 9.3
Efficiency 85% 88% 91%
Energy consumed per hour, kW 10.9 10.6 10.2
Annual electricity consumption, kWh 65647.1 63409.1 61318.7
Additional energy consumption 4328.4 2090.4
Additional energy cost, Rs/year 17313.5 8361.6
8.5.9 A new high efficiency motor will payback within one year, as compared to rewinding.
Q4. High efficiency motors – Compare with standard efficiency motors
Table 8-15: High efficiency motors
Rated kW Speed at rated output rpm
Input current at rated output Amps
Motor Efficiency, % Standard Premium
0.37 1330 1.4 66.0 73.0 0.75 1360 2.2 73.0 82.5 1.1 1370 2.9 76.2 83.8
1.5 1380 3.8 78.5 85.0 2.2 1390 5.1 81.0 86.4
3.7 1410 8.1 84.0 88.3 5.5 1420 11.4 85.7 89.2 7.5 1430 15.4 87.0 90.1
9.3 1430 18.5 87.7 90.5 11.0 1440 22.0 88.4 91.0
15.0 1440 30.0 89.4 91.8 18.5 1440 36.0 90.0 92.2
22.0 1440 43.0 90.5 92.6 30 1450 56.0 91.4 93.2
37 1450 69.0 92.0 93.6 45 1460 84.0 92.5 93.9 55 1460 99.0 93.0 94.2

Q5. Case study- motor replacement
8.5.10 A case study of replacing existing motor with a high efficiency motor is discussed below.
Table 8-16: Motor replacement
Principle
Replacement of standard efficiency motors with high efficiency motors can
give savings of about 2 to 5% depending on the ratings. The savings can be
still higher if the efficiency of existing motor is poor.
In this case a motor which is frequently rewound and very high no load
current is replaced with a high efficiency motor.
Background
A 15 kW motor was being used to drive an air-conditioning compressor.
This motor had been rewound a few times. The normal load current was
32.5 A. Since this was higher than the rated current. The no load current
(after removing the belts) was observed to be 24 A (85% of the full load
current) and the no load power loss was 2.334 kW, which is very high. The
operating efficiency of the motor was estimated to be about 76%. This motor
was replaced by a new High Efficiency Motor.
Existing Motor: Make: Bharat Bijlee, Rating: 15 kW/20hp, Voltage: 415V,
Current: 28A, Speed: 1445 rpm
New Motor: Make: Bharat Bijlee, Rating: 15 kW/20hp, Voltage: 415V,
Current: 26.1A, Speed: 1450 rpm, Efficiency: 90.8%, Power Factor: 0.88
The measured no load current was 6.6 A and the no load power was 0.873
kW. The saving in no load power itself was 1.461 kW (from 2.334 to
0.873kW). Ignoring the reduction in copper losses, the minimum saving for
about 6000 hours operation is 8766 kWh/annum i.e. Rs. 35,000/- per annum.
The investment in the new motor was Rs. 35,000/-. The pay back period was
one year.
8.6 Belts & Gears
Q1. What are the typical efficiencies of various types of mechanical power transmission systems?
8.6.1 Different types of belts & gears have different efficiencies. Energy savings can be achieved in some
applications by replacing inefficient worms gears by helical bevel gears.
8.6.2 Worm gear efficiency varies from 75 to 95%. For agitators, this is a common application. Use of a
planetary gear or helical bevel gears can save about 5 to 10% depending on the efficiency of worm
gear. For new applications, consider planetary gears.

• • •
Table 8-17: Efficiency of gear & belt drives
8.6.3 Examples of replacing inefficient belts/gears with high efficiency models are given below.
Flat Belt in Place of V Belt in Refrigeration Compressor Power consumed with 4 nos. of V belts -37 KW Power Consumed with 1 flat belt - 34.5 KW Power Saving with flat belt - 2.5 KW % Power Saving - 6.75% High Efficiency Gear in Place of Low Efficiency Gear : For a Reactor with Worm Gear Motor Rating - 7.5 KW (10 HP) Actual Motor Input - 3.75 KW With High Efficiency planetary gear Motor Rating = 5 HP Actual Motor Input = 3 KW Savings achieved = 0.75 KW
8.7 Pumps & Fans
8.8.1 Pumps and fans account for more than 60% of the industrial motive power consumption. We
will discuss the basic principles, operational aspects and energy saving potential in water
pumping systems. The approach in fans is also similar.
Type Efficiency %
Spur Gear Cast teeth 93
Cut teeth 96
Bevel gear Cast teeth 92
Cut teeth 95
Worm gear Thread angle 30° 85 - 95
Thread angle 15° 75 – 90
Planetary Gear 92 – 96
V Belts 88 – 90
Flat belts 94 - 96

• • •
Q1. What is a pump characteristic curve and how it can be used to understand performance?
8.7.2 Figures below give the typical basic characteristics for pump and fan. The important characteristics
of Head v/s Flow, Power v/s Flow and Efficiency V/S Flow are shown.
Figure 8-16: Pump Curves
8.7.3 The pump head pressure decreases with increase in flow. Blowers also have a similar characteristic,
except that the pressure increases slightly from zero flow and then decreases with increasing flow.
8.7.4 The pump/blower efficiency increases with flow, reaches a maximum and then decreases with
further increase in flow. Please note that the efficiency drops significantly on both sides of the best
efficiency point. Electric motors at 50% shaft load have almost the same efficiency as that at full
load. But in the case of pumps/blowers, at 50% flow, the efficiency can be even 20 percentage
points below the best efficiency.
8.7.5 The input power v/s flow curve is approximately a rising near linear characteristics, At shut off, the
output flow end hence output is zero, but the pump input is sizeable (40% to 45% of full load) due
to internal churning losses. This is in sharp contrast with electric motors which take very small input
at no load.
8.7.6 Efficiency v/s flow is a curve rising from zero at shut off to a very narrow (unique) region for
maximum efficiency at a certain design flow and fells by 10% to 20% on either side. Thus operation
at a flow, higher or lower than Best Efficiency Point (BEP) gives a sizeable drop in efficiency. 10%
drop in efficiency may be quite common due to OFF DUTY POINT OPERATION.

• • •
8.7.7 The following figure shows a typical performance curve for a model. Impeller diameter varies from
270 mm to 370 mm, as can be seen in the figure.
‘

• • •
Q2. How to calculate pump/fan efficiency?
8.7.8 Efficiency of pump is calculated as below.
Efficiency (Pump) = 1000××××
Pshaft
HgQ ρ in per unit
Q = Flow, cu.m/s ρ = Density, kg/cu.m g = 9.8 m/s
H = Head in metres of water column
8.7.9 Efficiency of fan/blower is calculated below
Q(CFM) x H (inches of Water Column)
Efficiency (blower) = ------------------------------------------------------ in per unit Pshaft (HP) x 6356
Q3. What are the causes of inefficiency in Fluid handling systems?
8.7.10 Ideally, pumps and fans should operate at their best efficiency points, when their valves or dampers
are in fully open position; however, such cases are rare. During energy audits, some of the causes of
poor efficiency observed are as follows:
8.7.11 The valves and dampers are fully open and the pump/fan is operating at either higher flow or lower
flow; the actual operating point being not at the best efficiency point. This results in energy wastage
as the pump or fan is not operating near its best efficiency point.
8.7.12 The actual operating point of the pump or fan is near its best efficiency point. However this
operation has been achieved by closing of valves or dampers. In such cases, the pumps/fans are
operating efficiently, only to supply large valve/damper throttling losses. Hence the overall system
efficiency is still likely to be very poor.
8.7.13 The pump/fan has a certain rated head/flow specification on its nameplate. The pump is operating
at the specified head and flow condition, but study of the pump/fan performance characteristic
reveals that the best efficiency point of that pump/fan is not at at the specified condition. This is
again very wasteful from the energy view point.
8.7.14 The pump or fan is itself of very poor efficiency. This can happen it the equipment is old or if the
equipment has been purchased from manufacturers whose models are of poorer efficiency than
their competitors.

• • •
Q4. Can water flow be optimised?
8.7.15 Optimal use of water for various applications can significantly reduce the raw water pumping energy
consumption.
8.7.16 Review of water circulation rates to optimize flow rates for process cooling can also have a
significant effect on energy consumption
Q5. Are pumps or fans installed that are not sized correctly for the task?
8.7.17 Pump or fan efficiency is very dependent upon flow and pressure, and the pump or fan’s operating
characteristics. For a given rpm there is one optimal operating point of flow and pressure. As the
pressure changes, flow changes and operating efficiency is also affected. If system conditions have
changed since the initial selection of the pump or fan, they may be operating at a higher rpm than is
required, therefore wasting energy. An oversized pump or fan often works continuously against a
throttle or damper causing even greater inefficiencies.
8.7.18 Use of Variable Speed Drives. Use of mechanical, electrical or electronic variable speed drives can
help in improving the pumping system efficiency in cases that require variable flow or in cases where
the pumps are oversized and the flow is controlled by throttling of valves.
Figure 8-17: Saving by VFDs

• • •
8.7.19 Trim or replace pump impellers. A pump’s operating characteristics can be adjusted by re-sizing
the impeller. On a given system, it may be possible to achieve greater efficiency with a different
pump impeller. An example of trimming impeller in a large chemical plant is given below:
8.7.20 The utility equipment comprising 3 nos. centrifugal chillers, 3 to 4 nos. air compressors, and 2 nos.
refrigeration dryers were cooled by 3 nos. cooling tower pumps. The cooling water piping was very
liberally designed and pipe friction losses were very low
8.7.21 During the energy audit, it was observed that the valves on the return line of each cooling tower cell
were kept about 70% closed and that the pumps were operating at about 35 m head. Detailed
pressure measurements indicated that about 70% of the pressure drop in the entire system was in
throttled valves. This implied that there was a large mismatch between the pump and the piping
system for the required operating flows. After a detailed study, it was decided to replace the existing
342 mm dia. impellers with 307 mm dia. impellers and only slightly throttled to balance the flow.
The savings are estimated to be 376800 kWh/annum i.e. Rs.15 lakhs per annum. The pay back
period on an investment of Rs. 75,000/- (for 3 nos. new impellers) was 18 days.
Pump Specifications: Head: 30m, Flow: 550 m3/hr, Speed: 1450 rpm,
(3 nos. pumps in operation) Table 8-18: Saving by impeller trimming
Impeller diameter, mm 342 307
Head,m 35.00 28.00
Flow, m3/hr (per pump) 380 380
Motor input, kW (per pump) 52.7 37
Power savings for 3 pumps, kW 47.10
Energy savings, kWh 376800
Money saved, Rs. 1507200
Investment, Rs. 75000
Payback, days 18
8.7.22 Replace fan or pump with a more energy efficient model. It may not always be possible to
achieve an acceptable efficiency in a system with a given pump or fan. New equipment may be
required and a better option.

• • •
Q6. Are pumps or fans being throttled in order to control the flow rate?
8.7.23 One of the most common and inefficient methods to control a fan or pump is to restrict its flow by
throttling. As the pressure is increases, the flow reduces. The following recommendations apply best
to systems with variable flow (such as a boiler feed-water pump or an induced draft fan.).
8.7.24 Replace throttle control on pump or fan with solid state VSD control. VSDs can provide significant
energy savings. Quick savings estimates vary greatly with conditions; however VSDs frequently pay
off in a year or two if they replace a throttle control that operates at 60-70 percent of full flow or
less most of the time. The impact on the fan or pumping system due to variations in speed should
be evaluated when considering this measure.
8.7.25 Example: Use of variable frequency drive on boiler FD fan to avoid damper control. The
boiler FD fan was rated 20 HP and the airflow was controlled by discharge damper. Use of a VFD
on fan was implemented so that electrical energy at the fan could be saved. In addition to this, there
was expectation of improving the boiler efficiency since the VFD can be used for better control of
excess air.
8.7.26 The energy consumption in the blower per Ton of Furnace oil as estimated was 44 kWh before the
retrofit. The damper postion was varied between 50% to 80%. After installing the VFD, the
frequency was kept between 31 to 45 Hz with damper fully open. The energy consumption per Ton
of furnace oild was reduced to 12 kWh/Ton of F.O. With an average 110 KL furnace oil
consumption, the energy saving was 42,000 kWh/annum. i.e Rs 170,000 per annum. Payback period
was 7 months
8.7.27 Trim or replace pump impellers and open the discharge valve. On a given system, it may be possible
to achieve greater efficiency with a different pump impeller.
8.7.28 Example: Blower Speed Reduction at a Chemical Plant by Change of Pulley Ratio. For the
SFD (Spin Flash Dryer) blower, inlet damper was 40% closed in order to control dust collection
performance. It was felt during the audit that this blower is probably oversized for the existing
requirement. Blower speed was 2350 rpm with 14’’ pulley diameter and power consumption was
about 51.3 kW. After conducting trials to ensure optimised production and quality, a 12” pulley has
been put on the motor and 8.75” pulley on the blower so that blower now operates at 2000 rpm.
This is an effective speed reduction of 15% from the initial blower speed of 2350 rpm. Now the
dampers are also kept fully open. Power input to the motor is now 45.3 kW. This is a reduction of 6
kW. For 7000 hours/annum operation, annual energy saving of 42,000 kWh is being achieved. I.e.
Rs 2.1 lakhs/annum. Investment is about Rs 5000/- with payback period of 10 days.
.

• • •
8.7.29 Replace throttle control on fan discharge with inlet vane control. Inlet vanes are a good option
for applications like dust collection systems where the air volume (cubic feet per minute (CFM) of
air flow) required changes, while the air velocity and associated pressure drop must remain relatively
constant. By pre-spinning inlet air, inert guide vanes can reduce air flow without affecting the
pressure the fan must overcome. They are not as efficient as VSDs in applications where system
pressure can be allowed to drop with reductions in airflow. At extreme reductions in airflow (less
than 30 percent) an inlet vane acts like a throttle and its efficiency drops off significantly.
Q7. Is bypass control being utilized to vary the flow out of the Pump?
8.7.30 Although less common, bypass control can be an extremely inefficient method for controlling flow.
In the best case, pump energy use is constant regardless of delivery to an end use. In the worst case,
energy use increases with reduced delivery to the end use. As less flow is required at the end use, the
excess is diverted to the bypass circuit and re-circulated. The diverted fluid does not add any value to
the finished product.
8.8 Cooling Towers
Q1. What are the saving opportunities in cooling towers
8.8.2 Install solid state VSD control on the cooling tower fans. The cooling tower fans typically operated
with single speed (50 Hz) or a two –speed motors. Depending upon the ambient weather conditions
(Wet Bulb Temperature) at the tower location and the cooling loads placed on the tower, the
installation of VSDs on the cooling tower fan motors can produce significant energy savings. During
periods when the cooling demands are at a minimum, the tower fans run at minimum speed and
consume less energy.
8.8.3 The tower fans can be turned off during periods when the ambient air conditions will sufficiently
cool the water without the aide of the fans. The energy consumption is significantly reduced to just
the cost of circulating the water through the tower.
8.8.4 Replace the tower fill material with cellular film fill to improve the heat transfer efficiency.
8.8.5 Install non-clogging, non-corroding spray nozzles to improve water distribution through the tower.
8.8.6 Install energy efficient airfoil fans.
8.9 Compressed Air
Q1. What are the saving opportunities in compressed air system?

• • •
8.9.2 Reducing Compressed Air Use: Many uses of compressed air like cleaning, material conveying,
scouring, agitation and aeration of liquids etc. are not justified at the present energy prices. For
applications like cleaning & conveying, blowers can be used. For material conveying, use of efficient
alternatives like belts, bucket elevators, screw conveyors etc. can be used. For agitation or aeration
of liquids, low-pressure Roots compressors or submersible (pump type) agitators can be used. More
efficient, portable electrical tools can replace pneumatic portable tools. In many plants,
pneumatically operated controls are being replaced by electronic and electrical controls, thus
reducing the requirement for instrumentation air. In all these cases, the potential for energy saving
is about 80% to 90%.
8.9.3 Pressure Reduction: A thorough study of the end-use pressure requirements and the compressor
discharge pressure should be done. An opportunity to reduce the discharge pressure should not be
missed as it can give significant energy savings due reduced compression power as well as reduced
air leakage. An approximate thumb rule is that 10% reduction in compressor discharge pressure
reduces energy consumption by about 5%; the savings due to leakage reduction are additional. In
cases where higher pressures are set to overcome the problem of pressure fluctuations, increase in
receiver capacity and use of newly developed pressure & flow controllers can help reduce pressure
settings.
8.9.4 Air Leakage Reduction: Compressed air leakage can vary from 5% to 70% or higher depending on
the house keeping efforts on the compressed air distribution system. At the present energy cost, all
plants should attempt to operate at compressed air leakage levels below 5%. Even a small leakage of
50 cfm is equivalent to a loss of Rs.3.0 lakhs per annum (@ Rs. 4.50 per kWh). Air leakage generally
take place from threaded pipe joints, hose connections, valve stems, buried underground lines etc.
8.9.5 Distribution System: Decentralized installation of compressors can lead to smaller distribution
systems and hence reduced pressure and leakage losses. However, whether a system should be
decentralized or centralized depends on the air utilisation patterns for various end uses in the plant.
If uses are highly variable and the equipments (with significant air consumption) are spread out over
a large area, a decentralized system may be preferred, with interconnections with isolation valves for
emergencies. A decentralized system facilitates switching off compressors when air is not required
in a particular area. Pipe sizing should be done to minimize pressure drops, say less than 0.3 bars
from the receiver at the compressor end. Isolation valves should be provided at convenient,
accessible locations to shut off air when not required in certain areas for known time periods.

• • •
Q2. Compare performance of compressor types
8.9.6 Compressors should be selected with a good understanding of the air utilisation pattern.
Reciprocating, Screw or Centrifugal or Roots compressors can be used depending on the pressure,
quantum of air required and the air demand variations.
8.9.7 All compressors have the facility for capacity control; part load efficiencies depend on the type of
compressor and the method of capacity control; prolonged operation at part loads results in higher
energy consumption. Compressors consume 10% to 50% of their rated power (depending on the
type of compressor and capacity control method) even at no load. Power vs. capacity curves of
screw compressor is given below.
Figure 8-18: Part load operation of screw compressor
8.9.8 The attempt should be to ensure that the operating compressors run close to their rated load. Automatic controls are available to detect and switch off compressors operating in unloaded condition for prolonged period.
Q3. Compare Pneumatic diaphragm pumps and electrical options
8.9.9 Air operated diaphragm pumps are not used because they are efficient. They are generally used
because they tolerate aggressive conditions relatively well and run without catastrophic damage even
if the pump is dry. There several areas to pursue to perhaps generate significant air savings.
� Is the air operated diaphragm pump the right answer? An electric pump is significantly
more power efficient. Electric motor driven diaphragm pumps are available.

• • •
� Consider the installation of electronic or ultrasonic controls to shut the pumps off
automatically when they are not needed. Remember the pump uses the most air when it is
pumping nothing.
� Are you running most of the time at the lowest possible pressure? The higher the pressure
the more air used.
Table 8-19: Pneumatic vs electrical pumps
Basic Pump Requirement
Pneumatically
driven Diaphragm pump
Equivalent
power
Likely motor
input of elect. Pump
Savings
Discharge Pressure
Head
Estimated flow
Air cons
Air Pressure
kW kW kW %
1/2" diaphragm pump
3.0 20.0 20.0 5.0 70.0 0.9 0.4 0.5 53.8
1" diaphragm pump
1.0 6.7 100.0 17.5 50.0 3.0 0.5 2.5 84.7
1-1/2" diaphragm pump
1.0 6.7 100.0 14.0 30.0 2.4 0.4 2.0 82.4
1-1/2" diaphragm pump
1.0 6.7 200.0 45.0 68.0 7.7 0.8 6.8 89.0
2" diaphragm pump
1.0 6.7 200.0 23.0 22.0 3.9 0.8 3.1 80.2
2" diaphragm pump
1.0 6.7 300.0 35.0 30.0 6.0 1.2 4.8 80.5
Q3. How much does compressed air leakage cost?
8.9.10 The following table explains the quantity of air leakage thru various sizes of openings.
Table 8-20: Compressed air leakage
Orifice Diameter Air leakage Scfm
Power wasted KW
Cost of Wastage (for 8000 hrs/year) (@ Rs. 4.50/kWh
At 3 bar (45 psig) pressure 1/32” 0.845 0.109 3924 1/16” 3.38 0.439 15804 1/8” 13.5 1.755 63180 ¼” 54.1 7.03 253080 At 4 bar (60 psig) pressure 1/32” 1.06 0.018 6487 1/16” 4.23 0.719 25887

• • •
1/8” 16.9 3.23 103428 ¼” 164.6 14.57 395352 At 5.5 bar (80 psig) pressure 1/32” 1.34 0.228 8201 1/16” 5.36 0.911 32803 1/8” 21.4 3.64 130968 ¼” 85.7 14.57 524484 At 7 bar (100 psig) pressure
1/32” 1.62 0.275 9915 1/16” 6.49 1.10 39719 1/8” 26 4.42 159120 ¼” 104 17.68 636480
Q4. Is the pressure drop across auxiliary equipment such as dryers, oil separators, or filters
excessive?
8.9.11 Some compressors display pressure drop across these devices. Pressure drop should not exceed 8 to
10 psig; for oil separators, 5 psig for a dryer, 0.5 to 1 psig for a filter.
8.9.12 Replace filters, overhaul equipment to reduce pressure drop. Clogged filters and fouled lines increase
air velocity and pressure drop.
8.9.13 Size equipment to accommodate air flow with acceptable pressure drop. Equipment such as a
refrigerated dryer causes excessive pressure drop when air flow exceeds design.
Q5. Does the facility utilize any air nozzles? Have the air nozzles been designed for maximum
efficiency?
8.9.14 Install engineered nozzles. These nozzles are typically used for blowing off parts of equipment,
cutting or cooling. Commercially available engineered nozzles use less air.
8.9.15 For applications like blowing of components, use of compressed air amplifiers, blowers or gravity-based
systems may be possible. Brushes can sweep away debris from work in progress as effectively as
high-pressure air. Blowers also can be used for this purpose. When moving air really is required for
an application, often sources other than compressed air can do the job. Many applications do not
require clean, dry, high-pressure, and expensive 90- or 100-psi compressed air-rather, only moving
air is needed to blow away debris, provide cooling, or other functions. In these cases, local air fans
or blowers may satisfy the need for moving air much economically.
8.9.16 Mechanical stirrers, conveyers, and low-pressure air many mix materials far more economically than
high-pressure compressed air.

• • •
8.10 Refrigeration & Air conditioning System
Q1. Description of terms 8.10.2 The cooling effect of refrigeration systems is generally quantified in tons of refrigeration.
1 Ton of Refrigeration (TR) = 3023 kcal/hr
= 3.51 kWthermal = 12000 Btu/hr
8.10.3 The commonly used figures of merit for comparison of refrigeration systems are Coefficient of
Performance (COP), Energy Efficiency Ratio (EER), Specific Power Consumption (kW/TR) These are defined
as follows:
8.10.4 If both refrigeration effect and the work done by the compressor (or the input power) are taken in
the same units (TR or kcal/hr or kW or Btu/hr), the ratio is
COP = Refrigeration Effect Work done
If the refrigeration effect is quantified in Btu/hr and the work done is in Watts, the ratio is EER = Refrigeration Effect (Btu/hr) Work done (Watts)
Higher COP or EER indicates better efficiency.
The other commonly used and easily understood figure of merit is
Specific Power Consumption = Power Consumption (kW) Refrigeration effect (TR) 8.10.5 A lower value of Specific Power Consumption implies that the system has better efficiency. Q2. Can we reduce the Need for Refrigeration
8.10.6 For process cooling applications, many foreign machinery suppliers specify chilled water at 10°C to
15°C as these are the normal cooling tower water temperatures in cold countries for most time of
the year.
8.10.7 The possibility of replacing chilled water with cooling water with higher flows can be considered.
Air-conditioning should be restricted to small spaces, as guided by process requirements. Comfort
air-conditioning should be provided only if necessary in small areas.

• • •
8.10.8 Use Evaporative Cooling for Comfort Cooling in Dry Areas In dry areas, reasonable comfort
temperatures can be achieved in summer by use of evaporative cooling i.e. by humidification of air
by small desert coolers or centralised humidification plants. The energy consumption is likely to be
about only about 10% to 20% of an air conditioning system.
8.10.9 Table below shows the variation of refrigeration capacity, power consumption and specific power
consumption for a particular vapour compression system with evaporator refrigerant gas
temperature.
Table 8-21: Effect of higher temperature on efficiency
Evaporator
Temperature
°°°°C
Condenser Temperatures °°°°C
+35 +40 +45 +50
+5
Capacity (TR) 151 143 135 127
Power cons. (kW) 94 102.7 110.6 117.8
Sp. Power (kW/TR) 0.62 0.72 0.82 0.93
0
Capacity (TR) 129 118 111 104
Power cons. (kW) 90 96.8 103 108.9
Sp. Power (kW/TR) 0.70 0.82 0.93 1.05
-5
Capacity (TR) 103 96 90 84
Power cons. (kW) 84.2 89.6 94.7 99.4
Sp. Power (kW/TR) 0.82 0.93 1.05 1.19
8.10.10 It may be observed that higher the temperature, higher the system capacity, higher the power input
and lower the specific power consumption (kW/TR). This clearly indicates that the cooling effect
increases in greater proportion than the power consumption, thus the system will cool faster and
shut off.
8.10.11 The approximate thumb rule is that for every 1°°°°C higher temperature in the evaporator, the
specific power consumption will decrease by about 2 to 3%. Details of saving for each type of
systems are given in table below
Table 8-22: Increase in COP
Compressor
Type Percent Increase in the COP
for each 1°F Reset for: Condenser
Temperature Evaporation
Temperature Reciprocating 1.30% 1.13% Centrifugal 0.50% 1.54% Screw 2.30% 2.08% Absorption 0.80% 0.59%

• • •
Q3. Reduction of air conditioning volume /shifting of unnecessary loads
8.10.12 Keep Unnecessary Heat Loads Out: Unnecessary heat loads may be kept outside air-conditioned
spaces. Often, laboratory ovens/furnaces are kept in air-conditioned spaces. Such practices may be
avoided. Use air-to-air heat exchangers to reduce energy requirements for heating and cooling of
outside air. Provide dedicated outside air supply to kitchens, cleaning rooms, combustion equipment
etc. to avoid excessive exhausting of conditioned air.
8.10.13 Use False Ceilings: Air-conditioning of unnecessary space wastes energy. In rooms with very high
ceiling, provision of false ceiling with return air ducts can reduce the air-conditioning load. Relocate
air diffusers to optimum heights in areas with high ceilings.
8.10.14 Use Small Power Panel Coolers :In some engineering industries, CNC machine shops are air-
conditioned. Use of small power panel coolers and hydraulic oil coolers (0.1 to 0.33 TR are
available) can make the whole centralised air-conditioning redundant and save energy.
8.10.15 Use Pre-Fabricated, Modular Cold Storage Units: Under-utilised large cold storage units can be
replaced by pre-fabricated, modular, small cold storage units. The idea is to match product volumes
and avoid unnecessary cooling of space and reduce losses.
8.10.16 Improve Air Distribution and Circulation: In some air-conditioning systems, lower temperatures
are set to overcome problems of poor air distribution; making changes in ducting may be a more
economical solution than permanently paying higher energy bills. In air-conditioned spaces, use of
circulation fans can provide apparent comfort and help raise the room temperature settings to about
26°C instead of 24°C. the reduction in energy consumption in the refrigeration machine will be
significantly more than that consumed by the circulation fans.
8.10.17 Improve air Distribution in Cold Storages: In cold storage units, replacement of centralised coil-
fan-diffuser units by ducts (for better air distribution) or frigid coil units (small expansion coils with
fans) can lead to lower temperature settings (at the compressor end) and large energy savings.
8.10.18 Reduce Heat Ingress: Vessels, pipelines and pipe fittings (like valves, flanges, bends etc.) handling
refrigerant, chilled water or brine should be well insulated. For air-conditioned spaces and cold
stores, appropriate methods like double doors, fast closing doors, air curtains and low emissivity
films (sun control) for glass windows should be incorporated. Building insulation is strongly
recommended for air-conditioned buildings, this aspect is usually neglected in India.

• • •
Q4: How does better maintenance or improved design of chillers save energy?
8.10.19 Better Heat Exchanger Design and Maintenance: Use of larger and better heat exchangers
(evaporators & condensers) can help in increasing the refrigerant temperature in the evaporator and
decreasing the temperature in the condenser for the same end use temperatures and cooling loads.
The potential for savings can be 10% to 30%. This can be ideally addressed at the time of purchase
of new equipment. The quality of circulating chilled and cooling water should be maintained within
tolerable limits to prevent scaling and ensure efficient heat transfer. Proper water treatment is
necessary for maintaining the efficiency of a refrigeration plant.
8.10.20 Case Study: Replacement of Existing Evaporator with a New Evaporator with Better Heat
Transfer Efficacy: Replacing the existing “Ammonia Evaporator Coil in Tank” with “Shell &
Tube Heat Exchanger” was implemented in a chemical plant. The comparative measurements are
given in table as follows.
Table 8-23: Replacement of evaporators
Description Qty Unit
Power consumption of the chiller before replacing evaporator = 32.3 kW
Average operating hours before replacing evaporator = 10 hours/day
Daily energy consumption = 323 kWh/day
Power consumption of the chiller after replacement = 39.9 kW
Average operating hours after replacing evaporator = 6.7 hours/day
Daily energy consumption = 267 kWh/day
Daily energy savings = 56 kWh/day
No. of days of operation/annum = 330 days/annum
Annual energy savings = 18371 kWh/annum
Annual savings(@Rs 4.5/kWh) = 82670 Rs/annum
8.10.21 Daily energy saving is 56 kWh/day i.e. 18,370 kWh/annum. This is a saving of Rs. 82,670/-
per annum. The investment in the new evaporator and primary pumping system is about Rs. 1.2
lakhs. The pay back period is about 1.5 years.
Q5. How does Thermal Energy Storage help?
8.10.22 Some electricity boards have adopted Time of Use energy pricing, which implies higher energy
prices during certain hours. By operation of compressors in off-peak hours (when energy price is
low), Cooling Effect can be stored in ice banks, some special salts etc. In addition to the advantage
of lower energy cost, this method can also help reduce the peak kW and kVA demand of the plant,
resulting in lower Maximum Demand charges. Thermal Storage implies storing the cooling effect in
the latent heat of ice banks (fig. 8) or eutectic salts (which undergo a phase change) and using it
when required. Ice banks are being used in dairies for the past many years to overcome their peak
cooling loads. The same concept can be used to reduce energy cost by operating the refrigeration

• • •
machines during off-peak hours and storing “cold” for use during peak hours. This reduces the
number of refrigeration machines that may have to run to satisfy the peak cooling load. The energy
cost savings accrue due to reduction in the registered Maximum kVA Demand and Peak-time energy
charges (if applicable); the quantum would depend on the load profile of the plant.
8.10.23 Ice banks are a proven technology. One company in India has now introduced a variety of salt
hydrates which can change from solid to liquid phase at temperatures ranging from –33° to +27°C.
The salt hydrates are enclosed in HDPE nodules; a number of such nodules are enclosed in a tank
through which chilled water or brine can be allowed to flow. Some hotels and industries are already
using this technology.
Q6. System configuration in Chilled Water Pumping System
8.10.24 The chilled water system had primary (chiller side) and secondary (process side) pumps with a hot
well and cold well arrangement. Since the chilled water requirement for the plant was reasonably
steady, it was decided to eliminate the primary pump and connect the warm chilled water from the
secondary side directly to the chiller, bypassing the hot well. In view of the increased pressure
requirement, a new, efficient pump of appropriate head requirement was recommended. The power
consumption scenario before and after this change is as follows.
Before Change Operating hours of primary pump = 10 hours Daily energy consumption of primary pump = 8.5 x 10 kWh/day = 85 kWh/day Operating hours of secondary pump = 24 hours Daily energy consumption of secondary pump = 11.3 x 24 kWh/day = 271.2 kWh/day

• • •
Total daily energy consumption = 271.2 + 85 = 356.2 kWh/day After Change Power input of new chilled water pump = 5.8 kW Operating hours = 24 hours/day Daily energy consumption = 139.2 kWh/day Daily energy saving = 356.2 – 139.2 = 217 kWh/day
8.10.25 The energy saving is about 71,610 kWh/annum i.e. Rs 3,22,000/annum. The investment in the new
pump is about Rs. 10,000/-. The pay back is 11 days.

• • •
9. ANNEXURE-1
9.1 Banks in Ankleshwar
Table 9-1: Public sector Banks
SI.No Name Of Bank
1 State Bank of India
2 Bank of Baroda
3 Bank of India
4 Dena Bank
5 Corporation Bank
6 Allahabad Bank
7 Punjab National Bank
8 Union Bank of India
9 Oriental Bank of Commerce
10 Indian Bank - Panoli
11 Bank of Maharashtra
12 Central Bank of India
13 Vijaya Bank
Table 9-2: Private Banks
Sr.No Name Of Bank
1 Axis Bank Ltd
2 HDFC Bank Ltd.
3 IDBI Bank Ltd.
4 Development Credit Bank Ltd.
5 ICICI Bank Ltd.
6 Kotak Mahindra Bank Ltd.
Table 9-3: Cooperative Banks
SI.No Name Of Bank
1 The Cosmos Co-operative Bank Ltd.
2 Prime Co-operative Bank Ltd.
3 Ankleshwar Udhyog Nagar Bank Ltd.

• • •
10.ANNEXURE-2: SME FINANCE SCHEMES
SME Collateral Free Loans (State Bank of India)
Eligibility
Micro and Small Enterprises engaged in Manufacturing and
Service sector. For Manufacturing sector, original investment in
plant & machinery should be up to Rs 5 crore and for Service
sector, original investment in equipment up toRs 2 crore.
Purpose • Working capital needs (Fund Based+ Non Fund Based).
• Term loan for construction of Building, office, acquisition of
machines / equipment including expansion and
modernization of the unit.
Facility • Cash Credit
• Term Loan
• Letter of Credit
• Bank Guarantee
Quantum of finance Total Exposure to the unit: UptoRs. 1.00 Crore (All facilities
WC, TL & NFB facilities)
Interest rate Attractive rates of interest
Service charges • Concession in processing and service charges.
• Other charges as applicable.
Credit guarantee fund trust for
micro & small enterprises
(CGTMSE) guarantee
Borrowers eligible under the scheme will be covered under
CGTMSE guarantee scheme
Eligibility
Micro and Small Enterprises engaged in Manufacturing and
Service sector. For Manufacturing sector, original investment in
plant & machinery should be up to Rs 5 crore and for Service
sector, original investment in equipment up toRs 2 crore.
Purpose • Working capital needs (Fund Based+ Non Fund Based).
• Term loan for construction of Building, office, acquisition of
machines / equipment including expansion and
modernization of the unit.
Facility • Cash Credit
• Term Loan

• • •
• Letter of Credit
• Bank Guarantee
Quantum of finance Total Exposure to the unit: UptoRs. 1.00 Crore (All facilities
WC, TL & NFB facilities)
Interest rate Attractive rates of interest
Service charges • Concession in processing and service charges.
• Other charges as applicable.
Credit guarantee fund trust for
micro & small enterprises
(CGTMSE) guarantee
Borrowers eligible under the scheme will be covered under
CGTMSE guarantee scheme
Security • Primary Security:- Assets created out of bank finance
• Existing assets of the borrower as per definition of CGTMSE
• No collateral
• No third party guarantee
Repayment period • Working Capital (WC): One year, repayable on demand.
Working capital limits will be renewed every two year.
However, performance of the unit and conduct of account
will be reviewed annually for continuation of limits.
• Term Loan: Maximum Seven Years including moratorium
period.
SME Easy Loan against Property (State Bank of India)
Facility Hassle free business loan against mortgage of property.
Target group SME Units engaged in the Trading, Manufacturing and Services
Purpose Working Capital Limits & Term Loans For stocks and build up of
inventory/current assets, fixed assets needed for business
purposes / capacity expansion/ modernization /technology up-
gradation/R&D/shoring of NWC etc.
Quantum of finance Minimum Loan Amount:
• For trade and service enterprises: Rs 10 lacs
• For manufacturing enterprise’s 1 Cr
• Maximum loan amount: Rs 20 crores
Interest rate Very attractive interest rate
Repayment period Equated Monthly Installments (EMI) or customized repayment
depending upon the cash accruals and no pre payment penalty
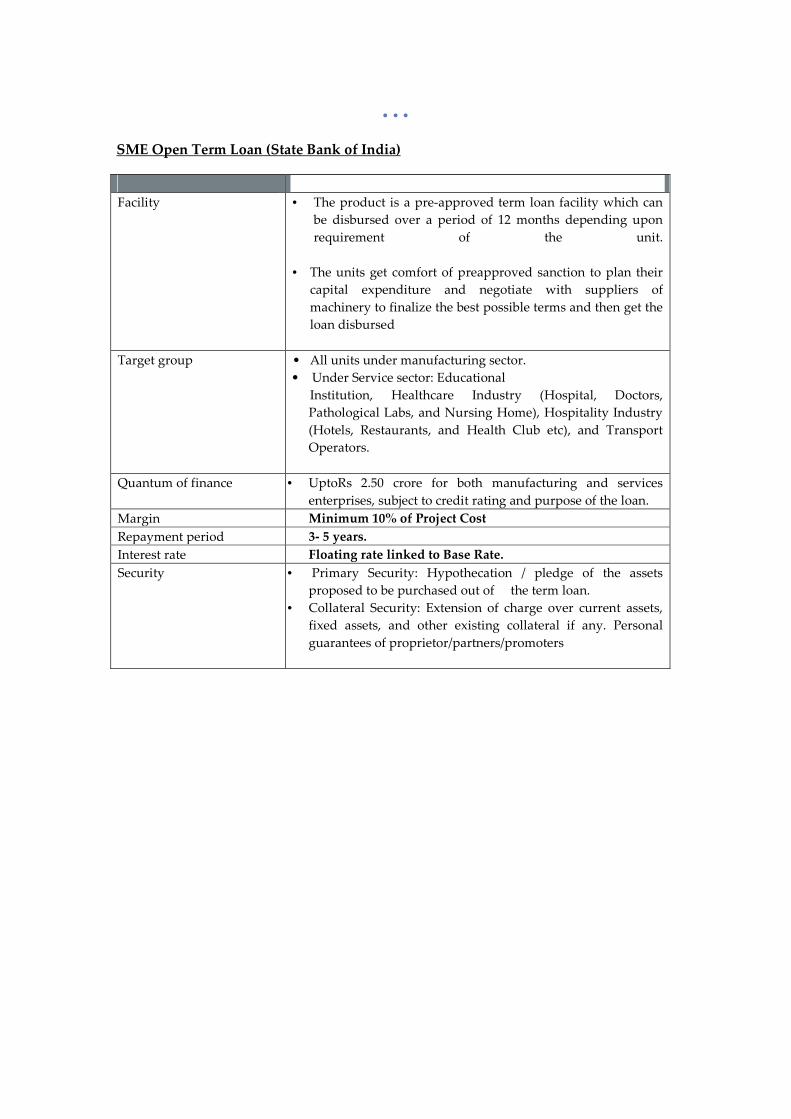
• • •
SME Open Term Loan (State Bank of India)
Facility • The product is a pre-approved term loan facility which can
be disbursed over a period of 12 months depending upon
requirement of the unit.
• The units get comfort of preapproved sanction to plan their
capital expenditure and negotiate with suppliers of
machinery to finalize the best possible terms and then get the
loan disbursed
Target group • All units under manufacturing sector.
• Under Service sector: Educational
Institution, Healthcare Industry (Hospital, Doctors,
Pathological Labs, and Nursing Home), Hospitality Industry
(Hotels, Restaurants, and Health Club etc), and Transport
Operators.
Quantum of finance • UptoRs 2.50 crore for both manufacturing and services
enterprises, subject to credit rating and purpose of the loan.
Margin Minimum 10% of Project Cost
Repayment period 3- 5 years.
Interest rate Floating rate linked to Base Rate.
Security • Primary Security: Hypothecation / pledge of the assets
proposed to be purchased out of the term loan.
• Collateral Security: Extension of charge over current assets,
fixed assets, and other existing collateral if any. Personal
guarantees of proprietor/partners/promoters

• • •
Collateral Free Loans under CGTMS(Bank of Baroda)
Purpose To provide collateral free loans UptoRs. 100/- lacs to Micro &
Small Enterprises, as defined under MSMED Act, 2006
Eligibility The coverage of the Scheme is extended to all new and existing
Micro and Small Enterprises (both in the Manufacturing Sector as
well as in the Service Sector) as defined under MSMED Act, 2006
Limit The eligible loan limit under the Scheme is Rs.100 lacs. A
borrower, who has availed certain credit facilities secured by
collaterals and/or third party guarantees and is sanctioned
distinct/separate credit facility without collateral security/third
party guarantee, can be covered under CGTMSE scheme
Security Primary security" in respect of a credit facility shall mean the
assets created out of the credit facility so extended and/or
existing unencumbered assets which are directly associated with
the project or business for which the credit facility has been
extended. This means if a borrower is sanctioned working capital
facility only, a charge can be created on the fixed assets of the
unit even though the same are not financed by the Bank and the
same will not be treated as collateral security. Similarly in case of
sanction of Term/Demand loan on standalone basis, charge taken
on current assets will not be treated as collateral security.
Margin The credit guarantee cover is available up to 75% of the amount
in default in respect of credit facilities up to Rs. 50/- lacs extended
by the Lending Institution to an eligible borrower subject to
maximum guarantee cover of Rs. 37.50 lacs and 50% for the
facilities over Rs. 50/- lacs and up to a limit of Rs. 100/-, i.e.
maximum of Rs. 62.50 lacs. In case of following categories of
borrowers, guarantee cover is available up to 80% of the amount
in default. a) Loans to Micro enterprises up to Rs. 5 lacs (85%). b)
Loans to Micro and Small enterprises operated and/ or owned by
women. c) All loans in North East Region including the State of
Sikkim.
Guarantee fee: Composite all-in Guarantee Fee as under
Credit Facility Annual Guarantee Fee (AGF) [%
p.a.]
Women, Micro Enterprises
and units in North East
Region (incl. Sikkim)
Others
Upto Rs.5 lakh 0.75 1.00
Above Rs.5 lakh and
upto Rs.100 lakh
0.85 1.00

• • •
Complete details of the scheme are available on the website of Credit Guarantee Fund
Trust for Micro and Small Enterpriseswww.cgtmse.in
Sarthak Udyami - Scheme For Financing Micro And Small Enterprises (Punjab National Bank)
Purpose of the loan For setting up new units; expansion, modernization &
renovation of existing units; purchase of land, construction of
building, machinery, equipment etc; and working capital
facilities.
Eligibility
Micro Enterprises:
Enterprises engaged in the Manufacturing or Production,
Processing or Preservation of goods with investment in plant &
machinery upto Rs. 25 lakh.
Small Enterprises:
Enterprises engaged in the Manufacturing or Production,
Processing or Preservation of goods with investment in plant &
machinery above 25 lakh upto 500 lakh.
Loan amount Need based. However Credit requirement upto 100 lakh for
Working Capital and Term loan can also be provided as
Composite loan.
Margin
Upto Rs.2,00,000/- =Nil
Above Rs.2.00 lakh upto Rs. 5 lakh = 15%
Above Rs. 5 lakh =20%
Interest Rate Floating rate linked to Base Rate.
Repayment Upto 7 years (for term loan) depending upon projected
profitability, over and above the gestation period of 6 to 12
months.
Collateral security No Collateral Security and/or Third Party Guarantee for Loans
upto Rs.100 lakh covered under Guarantee Scheme of Credit
Guarantee Fund Trust for Micro & Small Enterprises
(CGTMSE).


![[Document title] - Food Security Cluster](https://static.fdokumen.com/doc/165x107/63150bb56ebca169bd0b096c/document-title-food-security-cluster.jpg)