2013JPCB Cluster Phases
11
Cluster Phases of Decorated Micellar Solutions with Macrocyclic Ligands S. Marchetti, † E. Fratini, ‡ S. Sennato, § G. Cazzolli, ∥ B. Rossi, ∥ S. Caponi, ⊥ L. Lanzi, † M. Carla ̀ , † F. Sciortino, § G. Viliani, ∥ and C. M. C. Gambi* ,† † Department of Physics and Astronomy, University of Florence, and CNISM, Via G. Sansone 1, 50019, Sesto Fiorentino, Florence, Italy ‡ Department of Chemistry and CSGI, University of Florence, Via della Lastruccia 3, 50019, Sesto Fiorentino, Florence, Italy § Department of Physics, Sapienza University of Rome, and CNR-IPCF, Piazzale A. Moro 5, 00185, Rome, Italy ∥ Physics Department, University of Trento, 38123, Povo, Trento, Italy ⊥ Istituto di Biofisica, Consiglio Nazionale delle Ricerche, Via alla Cascata, 56/C, 38123, Trento, Italy ABSTRACT: An aqueous self-assembled micellar system (sodium dodecyl sulfate, SDS, decorated with various adhesive sites, cryptand Kryptofix 222 and crown ether 18-Crown-6 molecules) has been investigated by dynamic light scattering (DLS) and small angle x-ray scattering (SAXS) to have insights into the micellar structure, the micellar interactions, and the aggregation properties of the system. DLS demonstrates the existence of populations of aggregates in the submicrometer/micrometer range, while the Guinier analysis of the SAXS curves helps in detailing objects smaller than 30 nm. The aggregates of micelles are here named cluster phases of micelles (CPMs). Considering that SDS micelles in water do not aggregate at low concentration, it is shown that macrocyclic ligands induce the SDS micelle aggregation as a function of the concentration (i.e., investigated ligand/SDS molar ratios are 5.0, 1.5, 1.0, and 0.5) and hydrophobicity of the adhesive sites. The sizes and the percentages of the micelles and the CPMs have been monitored to test the stability and reversibility of the system. DLS results clearly show that the aggregation processes of the decorated micelles are reproducible at time intervals of the order of 1 month, while the stability may not be entirely maintained after a year. As an issue of particular relevance, the higher the ligand/surfactant molar ratio, the larger are the CPMs induced. The K222 ligand results in being more effective in promoting the micellar aggregation than 18C6 as a consequence of the different hydrophobicity. ■ INTRODUCTION Aggregation processes are an important subject of current research in liquid state physics because understanding the aggregation mechanisms makes it possible to build up new “responsive” materials and to solve important challenges in medicine/biology as well as in several industrial-manufacturing processes. Self-assembly leads to ordered structures like lipid bilayers and proteins in the biophysical field as well as to complex fluids, molecular crystals, polymers, and nanostruc- tures in the material science field. In this paper, we investigate cluster phases of micelles (CPMs) built up by sodium dodecyl sulfate (SDS) at a concentration of 8% w/w in water and decorated with the macrocyclic ligands Kryptofix 222 (K222) or 18-Crown-6 (18C6) crown ether, to understand the interactions that lead to the aggregation process of decorated micelles in solution. The 8% w/w concentration value was chosen to avoid aggregation between naked SDS micelles. The aggregation processes, we refer to, are at two different levels: the one related to the micellar structure and the other to CPMs. The ligands are neutral organic molecules that in the micellar solution are able to selectively form stable noncovalent host/ guest complexes 1 enclosing some of the sodium counterions of the Gouy−Chapman layer 2,3 and to migrate to the micellar surface reducing the charge of the micelles as reported in the literature. 4−8 The SDS micelles without ligands interact by hard-sphere and screened Coulomb repulsive interactions, whereas the SDS micelles with ligands can be considered “colloidal molecules” or “patchy colloids”, 9 i.e., particles decorated on their surface with a well-defined number of adhesive sites (the ligand molecules in our case) that can link to similar sites on other micelles, giving rise to cluster formation. The cluster phase formation has been observed in globular protein solutions in salt-free conditions as a result of the competition between a long-range screened Coulomb repulsion and a short-range attraction, 10−14 in concentrated protein solutions at different pH and salt concentrations, 11,15 and in concentrated protein solutions and colloids 16 as well as in gelation. 17 In these cases, bulk aggregation is disfavored and finite-size clusters are formed and could persist in equilibrium. In particular, equilibrium cluster phases with low volume fraction are reported in the literature. 18−21 Received: June 7, 2012 Revised: January 22, 2013 Published: January 23, 2013 Article pubs.acs.org/JPCB © 2013 American Chemical Society 3613 dx.doi.org/10.1021/jp3055813 | J. Phys. Chem. B 2013, 117, 3613−3623
-
Upload
independent -
Category
Documents
-
view
7 -
download
0
Transcript of 2013JPCB Cluster Phases

Cluster Phases of Decorated Micellar Solutions with MacrocyclicLigandsS. Marchetti,† E. Fratini,‡ S. Sennato,§ G. Cazzolli,∥ B. Rossi,∥ S. Caponi,⊥ L. Lanzi,† M. Carla,̀†
F. Sciortino,§ G. Viliani,∥ and C. M. C. Gambi*,†
†Department of Physics and Astronomy, University of Florence, and CNISM, Via G. Sansone 1, 50019, Sesto Fiorentino, Florence,Italy‡Department of Chemistry and CSGI, University of Florence, Via della Lastruccia 3, 50019, Sesto Fiorentino, Florence, Italy§Department of Physics, Sapienza University of Rome, and CNR-IPCF, Piazzale A. Moro 5, 00185, Rome, Italy∥Physics Department, University of Trento, 38123, Povo, Trento, Italy⊥Istituto di Biofisica, Consiglio Nazionale delle Ricerche, Via alla Cascata, 56/C, 38123, Trento, Italy
ABSTRACT: An aqueous self-assembled micellar system (sodium dodecyl sulfate, SDS,decorated with various adhesive sites, cryptand Kryptofix 222 and crown ether 18-Crown-6molecules) has been investigated by dynamic light scattering (DLS) and small angle x-rayscattering (SAXS) to have insights into the micellar structure, the micellar interactions, and theaggregation properties of the system. DLS demonstrates the existence of populations ofaggregates in the submicrometer/micrometer range, while the Guinier analysis of the SAXScurves helps in detailing objects smaller than 30 nm. The aggregates of micelles are here namedcluster phases of micelles (CPMs). Considering that SDS micelles in water do not aggregate atlow concentration, it is shown that macrocyclic ligands induce the SDS micelle aggregation as afunction of the concentration (i.e., investigated ligand/SDS molar ratios are 5.0, 1.5, 1.0, and 0.5) and hydrophobicity of theadhesive sites. The sizes and the percentages of the micelles and the CPMs have been monitored to test the stability andreversibility of the system. DLS results clearly show that the aggregation processes of the decorated micelles are reproducible attime intervals of the order of 1 month, while the stability may not be entirely maintained after a year. As an issue of particularrelevance, the higher the ligand/surfactant molar ratio, the larger are the CPMs induced. The K222 ligand results in being moreeffective in promoting the micellar aggregation than 18C6 as a consequence of the different hydrophobicity.
■ INTRODUCTION
Aggregation processes are an important subject of currentresearch in liquid state physics because understanding theaggregation mechanisms makes it possible to build up new“responsive” materials and to solve important challenges inmedicine/biology as well as in several industrial-manufacturingprocesses. Self-assembly leads to ordered structures like lipidbilayers and proteins in the biophysical field as well as tocomplex fluids, molecular crystals, polymers, and nanostruc-tures in the material science field.In this paper, we investigate cluster phases of micelles
(CPMs) built up by sodium dodecyl sulfate (SDS) at aconcentration of 8% w/w in water and decorated with themacrocyclic ligands Kryptofix 222 (K222) or 18-Crown-6(18C6) crown ether, to understand the interactions that lead tothe aggregation process of decorated micelles in solution. The8% w/w concentration value was chosen to avoid aggregationbetween naked SDS micelles. The aggregation processes, werefer to, are at two different levels: the one related to themicellar structure and the other to CPMs.The ligands are neutral organic molecules that in the micellar
solution are able to selectively form stable noncovalent host/guest complexes1 enclosing some of the sodium counterions ofthe Gouy−Chapman layer2,3 and to migrate to the micellar
surface reducing the charge of the micelles as reported in theliterature.4−8
The SDS micelles without ligands interact by hard-sphereand screened Coulomb repulsive interactions, whereas the SDSmicelles with ligands can be considered “colloidal molecules” or“patchy colloids”,9 i.e., particles decorated on their surface witha well-defined number of adhesive sites (the ligand molecules inour case) that can link to similar sites on other micelles, givingrise to cluster formation.The cluster phase formation has been observed in globular
protein solutions in salt-free conditions as a result of thecompetition between a long-range screened Coulomb repulsionand a short-range attraction,10−14 in concentrated proteinsolutions at different pH and salt concentrations,11,15 and inconcentrated protein solutions and colloids16 as well as ingelation.17 In these cases, bulk aggregation is disfavored andfinite-size clusters are formed and could persist in equilibrium.In particular, equilibrium cluster phases with low volumefraction are reported in the literature.18−21
Received: June 7, 2012Revised: January 22, 2013Published: January 23, 2013
Article
pubs.acs.org/JPCB
© 2013 American Chemical Society 3613 dx.doi.org/10.1021/jp3055813 | J. Phys. Chem. B 2013, 117, 3613−3623

Previous studies have shown that the ultimate driving forcethat leads to the formation of CPMs is the hydrophobicity ofK222 or 18C6 adhesive sites. In fact, the analysis ofelectrocapillary curves5 has demonstrated that K222 ligandsstrongly adsorb at the mercury−water interface even in thepresence of an intermolecular repulsive electrostatic contribu-tion due to Na+ cations trapped inside the macrocyclic cages.Since the 1980s, it has been known that SDS molecules in
conditions similar to those investigated in this work, namely, atconcentration C = 0.25 M and temperature T = 25 °C, exhibitself-assembly in uniform-size micelles of spheroidal shape withan aggregation number of the order of 100, charge 30, axialratio around 1.3, and hydrodynamic diameter of 50 Å.22,23 Dueto the partial ionization of the sulfate groups, each micelle has anegative surface charge and some SO4
− groups remainunscreened because of the migration of the Na+ ions into theGouy−Chapman diffuse layer.2 The interaction potentialbetween the micelles can be described by the combination ofboth hard-sphere and screened Coulomb repulsion.24,25
Since the 1990s, SDS micelles in water in the presence ofmacrocyclic ligands K222 or 18C6 were intensively studied bysmall angle neutron scattering (SANS). According to SANSmeasurements,4,6,7 both ligands localize at the micellar surface.It was seen that, as the K222/SDS molar ratio changes from 0.5to 1.5, the thickness of the polar head region at the SDSmicellar interface increases from 5.5 to 10 Å,26−28 while boththe micellar surface charge and the aggregation numberdecrease. Furthermore, the fraction of interfacial ligandsincreases from 40 to 65% over the total surfactant molecules.The surface charge is the same as for naked micelles, theaggregation number is 74 as for K222 with molar ratio 0.5, theinterfacial amount of ligand is lower (11%), the axial ratio is 1.4,and the diameter of the micelle is 48 Å.Lithium dodecyl sulfate (LDS) micelles were also studied4
with addition of 18C6 at the ratio 18C6/LDS = 1.0. Theresulting thickness of the polar head is 5.5 Å (the same as forSDS naked micelles), and the ligand does not penetrate into themicellar core, leading to infer that the plane of the crown-etheris tangential to the micellar surface. The crown-ether screeningeffect for the counterion is smaller than in the cryptand case.From dielectric spectroscopy measurements,29−31 three
relaxation processes have been found in SDS micellar solutionsboth with and without complexation with macrocyclic ligands,K222 and 18C6. Two relaxations are of micellar origin, at 30and 300 MHz, as a result of the radial and lateral motions of thediffuse ion cloud around the micelle; the third relaxation, closeto 20 GHz, corresponds to bulk water contribution.32 Thepresence of ligands either K222 or 18C6 is seen to deeply alterthe dielectric spectra, broadening the micellar contribution,shifting to higher frequencies both micellar relaxations andredistributing their dielectric strengths. The observed changeshave been attributed to a reorganization of the system, wherethe ligand-decorated micelles aggregate in large clusters, as aresult of the progressive reduction of both the surface chargeand thickness. These findings suggest the possibility to tune theaggregation of the decorated micelles by finely controlling theamount of complexed ligand at the micellar surface.Raman scattering experiments and numerical simulations
have been used to obtain more information on the micellaraggregation process.33 Raman spectra of SDS micellar solutionsboth pure and decorated with various adhesive sites have beencompared in order to identify specific bands sensitive to theaggregation process. The numerical simulation helped the
assignment of these bands. The comparison of the spectrashows differences in intensity and wavenumber, confirming thesensitivity of the Raman spectroscopy to the aggregationprocess and the ability of this technique to characterize theCPMs.While it is well-known that SDS micelles in water do not
aggregate, in this work, we give experimental evidence bydynamic light scattering (DLS) and small angle X-ray scattering(SAXS) that it is possible to induce aggregation by decoratingthe SDS micellar surface with macrocyclic ligands. Further-more, the aggregation can be tuned by changing the ligand/surfactant ratio and the hydrophobicity of the ligand.
■ SAMPLES PREPARATION ANDCHARACTERIZATION
Aqueous solutions of 8% w/w SDS/(SDS + water) and (SDS +ligand)/(SDS + ligand + water) were prepared at differentligand/SDS molar ratios. SDS with 99% purity was purchasedfrom Aldrich, while the ligands Kryptofix 222 and 18-Crown-6were from Merck. All the products were used as received.The SDS density is 1.01 g cm−3, and the CMC (critical
micellar concentration) in water is 8.1 mM34 at 25 °C. Thedensity of K222 and 18C6 molecules is 1.11 and 1.10 g cm−3,respectively. The SDS solutions with K222 and 18C6 at 25 °Chave, respectively, CMC = 1.622 and 7.1 mM.35
The hydrophobicity of the two ligand molecules, accordingto the common definition,36 has been determined calculatingthe log10(P), where P is the partition coefficient in n-octanol/water. log10(P) was calculated using the ChemProp module inthe ChemDraw Suite, v.11,37 which implements the fragmenta-tion approaches by Crippen38 and Broto.39 The valuesextracted using these two procedures show a lower log10(P)for the K222 ligand (−1.18 and −1.72) compared to the 18C6ligand (−0.93 and −0.49), thus evidencing a slightly higherhydrophobicity for the latter molecule. According to thereported values, both ligands show a slightly higher affinity towater than to the organic phase.SDS solutions in water and SDS solutions with ligand in
water were filtered with 0.45 μm pore size Millipore filters inorder to have dust free solutions. Millex-HV (PVDF), MillexLCR, and PTFE filters were used. One solution was centrifugedto remove dust using a Beckman J2-21 centrifuge, with 3100rpm for 2 h. The samples were the same for both methods,filters or centrifuge. The micellar solutions were prepared incylindrical light scattering cells (2.5 cm inner diameter). All thesamples were transparent, and homogeneous. We verified thatno liquid crystal structure was present in the samples.The index of refraction for K222 and 18C6 micellar solutions
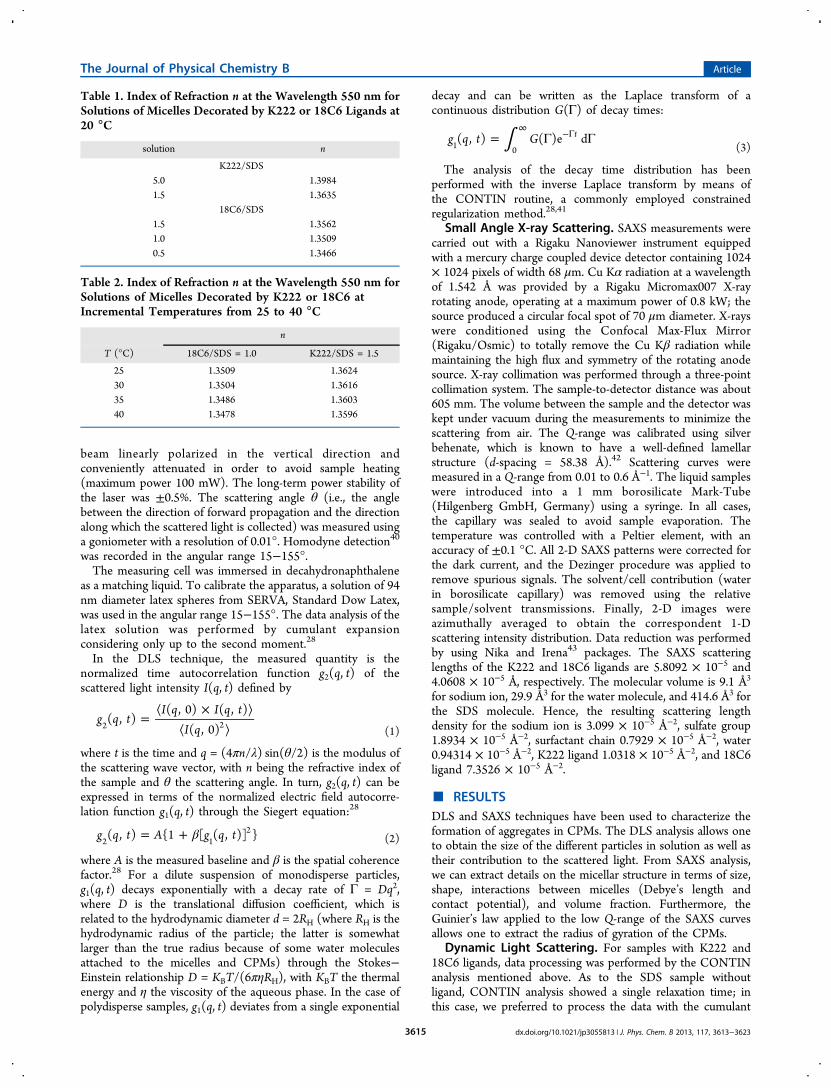
at 20 °C was measured with an Abbe refractometer (ATAGO3T) with a resolution of 0.0001 at 550 nm. Obtained values arereported in Table 1. The index of refraction for the 18C6/SDS= 1.0 and K222/SDS = 1.5 solutions for some temperatures inthe range 25−40 °C is reported in Table 2. All the sampleswere thermally stabilized by means of a thermostat with anaccuracy of ±0.2 °C.
■ METHODS
Dynamic Light Scattering. DLS experiments were carriedout on a Brookhaven Instruments apparatus (BI 9000ATcorrelator and BI 200 SM goniometer). The signal was detectedwith an EMI 9863B/350 photomultiplier. The light source wasa Coherent Verdi V2 laser at the wavelength 532 nm, with the
The Journal of Physical Chemistry B Article
dx.doi.org/10.1021/jp3055813 | J. Phys. Chem. B 2013, 117, 3613−36233614
beam linearly polarized in the vertical direction andconveniently attenuated in order to avoid sample heating(maximum power 100 mW). The long-term power stability ofthe laser was ±0.5%. The scattering angle θ (i.e., the anglebetween the direction of forward propagation and the directionalong which the scattered light is collected) was measured usinga goniometer with a resolution of 0.01°. Homodyne detection40
was recorded in the angular range 15−155°.The measuring cell was immersed in decahydronaphthalene
as a matching liquid. To calibrate the apparatus, a solution of 94nm diameter latex spheres from SERVA, Standard Dow Latex,was used in the angular range 15−155°. The data analysis of thelatex solution was performed by cumulant expansionconsidering only up to the second moment.28
In the DLS technique, the measured quantity is thenormalized time autocorrelation function g2(q, t) of thescattered light intensity I(q, t) defined by
=⟨ × ⟩
⟨ ⟩g q t
I q I q tI q
( , )( , 0) ( , )
( , 0)2 2(1)
where t is the time and q = (4πn/λ) sin(θ/2) is the modulus ofthe scattering wave vector, with n being the refractive index ofthe sample and θ the scattering angle. In turn, g2(q, t) can beexpressed in terms of the normalized electric field autocorre-lation function g1(q, t) through the Siegert equation:28
β= +g q t A g q t( , ) {1 [ ( , )] }2 12
(2)
where A is the measured baseline and β is the spatial coherencefactor.28 For a dilute suspension of monodisperse particles,g1(q, t) decays exponentially with a decay rate of Γ = Dq2,where D is the translational diffusion coefficient, which isrelated to the hydrodynamic diameter d = 2RH (where RH is thehydrodynamic radius of the particle; the latter is somewhatlarger than the true radius because of some water moleculesattached to the micelles and CPMs) through the Stokes−Einstein relationship D = KBT/(6πηRH), with KBT the thermalenergy and η the viscosity of the aqueous phase. In the case ofpolydisperse samples, g1(q, t) deviates from a single exponential
decay and can be written as the Laplace transform of acontinuous distribution G(Γ) of decay times:
∫= Γ Γ∞
−Γg q t G( , ) ( )e dt1 0 (3)
The analysis of the decay time distribution has beenperformed with the inverse Laplace transform by means ofthe CONTIN routine, a commonly employed constrainedregularization method.28,41
Small Angle X-ray Scattering. SAXS measurements werecarried out with a Rigaku Nanoviewer instrument equippedwith a mercury charge coupled device detector containing 1024× 1024 pixels of width 68 μm. Cu Kα radiation at a wavelengthof 1.542 Å was provided by a Rigaku Micromax007 X-rayrotating anode, operating at a maximum power of 0.8 kW; thesource produced a circular focal spot of 70 μm diameter. X-rayswere conditioned using the Confocal Max-Flux Mirror(Rigaku/Osmic) to totally remove the Cu Kβ radiation whilemaintaining the high flux and symmetry of the rotating anodesource. X-ray collimation was performed through a three-pointcollimation system. The sample-to-detector distance was about605 mm. The volume between the sample and the detector waskept under vacuum during the measurements to minimize thescattering from air. The Q-range was calibrated using silverbehenate, which is known to have a well-defined lamellarstructure (d-spacing = 58.38 Å).42 Scattering curves weremeasured in a Q-range from 0.01 to 0.6 Å−1. The liquid sampleswere introduced into a 1 mm borosilicate Mark-Tube(Hilgenberg GmbH, Germany) using a syringe. In all cases,the capillary was sealed to avoid sample evaporation. Thetemperature was controlled with a Peltier element, with anaccuracy of ±0.1 °C. All 2-D SAXS patterns were corrected forthe dark current, and the Dezinger procedure was applied toremove spurious signals. The solvent/cell contribution (waterin borosilicate capillary) was removed using the relativesample/solvent transmissions. Finally, 2-D images wereazimuthally averaged to obtain the correspondent 1-Dscattering intensity distribution. Data reduction was performedby using Nika and Irena43 packages. The SAXS scatteringlengths of the K222 and 18C6 ligands are 5.8092 × 10⁻⁵ and4.0608 × 10−5 Å, respectively. The molecular volume is 9.1 Å3
for sodium ion, 29.9 Å3 for the water molecule, and 414.6 Å3 forthe SDS molecule. Hence, the resulting scattering lengthdensity for the sodium ion is 3.099 × 10⁻⁵ Å−2, sulfate group1.8934 × 10−5 Å−2, surfactant chain 0.7929 × 10⁻⁵ Å−2, water0.94314 × 10−5 Å−2, K222 ligand 1.0318 × 10⁻⁵ Å−2, and 18C6ligand 7.3526 × 10⁻⁵ Å−2.
■ RESULTSDLS and SAXS techniques have been used to characterize theformation of aggregates in CPMs. The DLS analysis allows oneto obtain the size of the different particles in solution as well astheir contribution to the scattered light. From SAXS analysis,we can extract details on the micellar structure in terms of size,shape, interactions between micelles (Debye’s length andcontact potential), and volume fraction. Furthermore, theGuinier’s law applied to the low Q-range of the SAXS curvesallows one to extract the radius of gyration of the CPMs.
Dynamic Light Scattering. For samples with K222 and18C6 ligands, data processing was performed by the CONTINanalysis mentioned above. As to the SDS sample withoutligand, CONTIN analysis showed a single relaxation time; inthis case, we preferred to process the data with the cumulant
Table 1. Index of Refraction n at the Wavelength 550 nm forSolutions of Micelles Decorated by K222 or 18C6 Ligands at20 °C
solution n
K222/SDS5.0 1.39841.5 1.3635
18C6/SDS1.5 1.35621.0 1.35090.5 1.3466
Table 2. Index of Refraction n at the Wavelength 550 nm forSolutions of Micelles Decorated by K222 or 18C6 atIncremental Temperatures from 25 to 40 °C
n
T (°C) 18C6/SDS = 1.0 K222/SDS = 1.5
25 1.3509 1.362430 1.3504 1.361635 1.3486 1.360340 1.3478 1.3596
The Journal of Physical Chemistry B Article
dx.doi.org/10.1021/jp3055813 | J. Phys. Chem. B 2013, 117, 3613−36233615
analysis. The SDS micellar solution without ligand is composedof micelles with a size of 5.6 and 10% polydispersity.DLS measurements have been made at scattering angles in
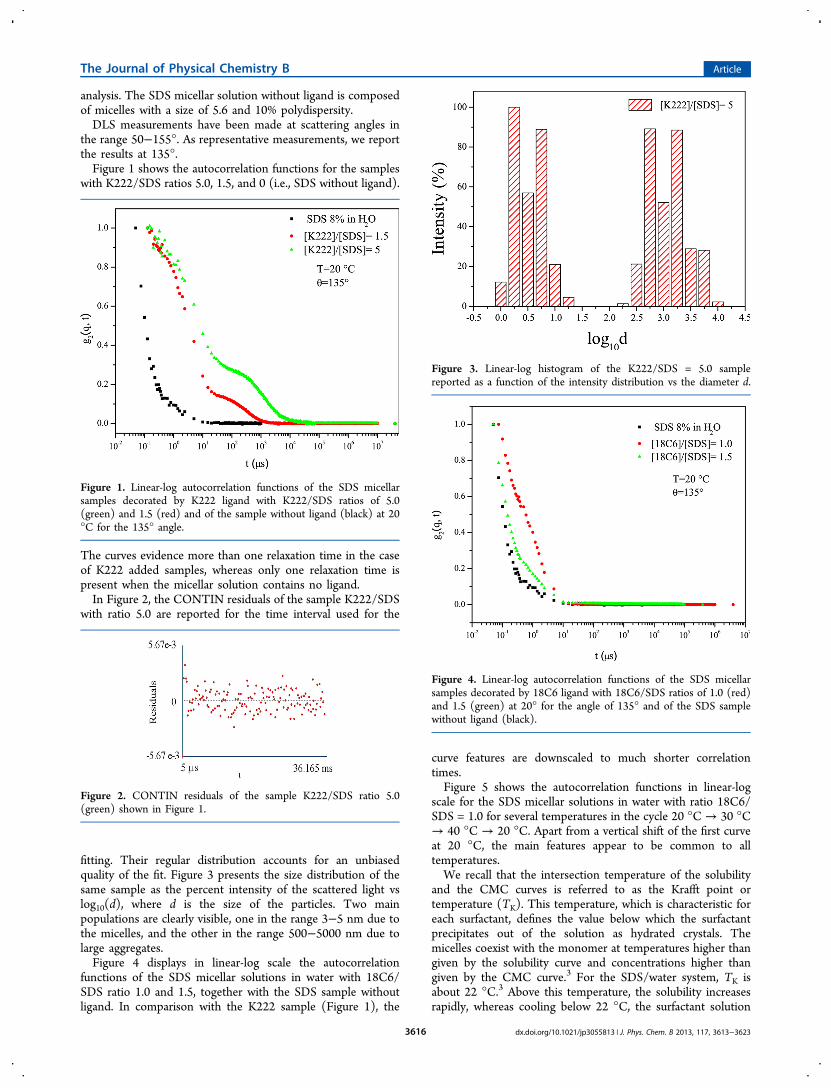
the range 50−155°. As representative measurements, we reportthe results at 135°.Figure 1 shows the autocorrelation functions for the samples
with K222/SDS ratios 5.0, 1.5, and 0 (i.e., SDS without ligand).
The curves evidence more than one relaxation time in the caseof K222 added samples, whereas only one relaxation time ispresent when the micellar solution contains no ligand.In Figure 2, the CONTIN residuals of the sample K222/SDS
with ratio 5.0 are reported for the time interval used for the
fitting. Their regular distribution accounts for an unbiasedquality of the fit. Figure 3 presents the size distribution of thesame sample as the percent intensity of the scattered light vslog10(d), where d is the size of the particles. Two mainpopulations are clearly visible, one in the range 3−5 nm due tothe micelles, and the other in the range 500−5000 nm due tolarge aggregates.Figure 4 displays in linear-log scale the autocorrelation
functions of the SDS micellar solutions in water with 18C6/SDS ratio 1.0 and 1.5, together with the SDS sample withoutligand. In comparison with the K222 sample (Figure 1), the
curve features are downscaled to much shorter correlationtimes.Figure 5 shows the autocorrelation functions in linear-log
scale for the SDS micellar solutions in water with ratio 18C6/SDS = 1.0 for several temperatures in the cycle 20 °C → 30 °C→ 40 °C → 20 °C. Apart from a vertical shift of the first curveat 20 °C, the main features appear to be common to alltemperatures.We recall that the intersection temperature of the solubility
and the CMC curves is referred to as the Krafft point ortemperature (TK). This temperature, which is characteristic foreach surfactant, defines the value below which the surfactantprecipitates out of the solution as hydrated crystals. Themicelles coexist with the monomer at temperatures higher thangiven by the solubility curve and concentrations higher thangiven by the CMC curve.3 For the SDS/water system, TK isabout 22 °C.3 Above this temperature, the solubility increasesrapidly, whereas cooling below 22 °C, the surfactant solution
Figure 1. Linear-log autocorrelation functions of the SDS micellarsamples decorated by K222 ligand with K222/SDS ratios of 5.0(green) and 1.5 (red) and of the sample without ligand (black) at 20°C for the 135° angle.
Figure 2. CONTIN residuals of the sample K222/SDS ratio 5.0(green) shown in Figure 1.
Figure 3. Linear-log histogram of the K222/SDS = 5.0 samplereported as a function of the intensity distribution vs the diameter d.
Figure 4. Linear-log autocorrelation functions of the SDS micellarsamples decorated by 18C6 ligand with 18C6/SDS ratios of 1.0 (red)and 1.5 (green) at 20° for the angle of 135° and of the SDS samplewithout ligand (black).
The Journal of Physical Chemistry B Article
dx.doi.org/10.1021/jp3055813 | J. Phys. Chem. B 2013, 117, 3613−36233616
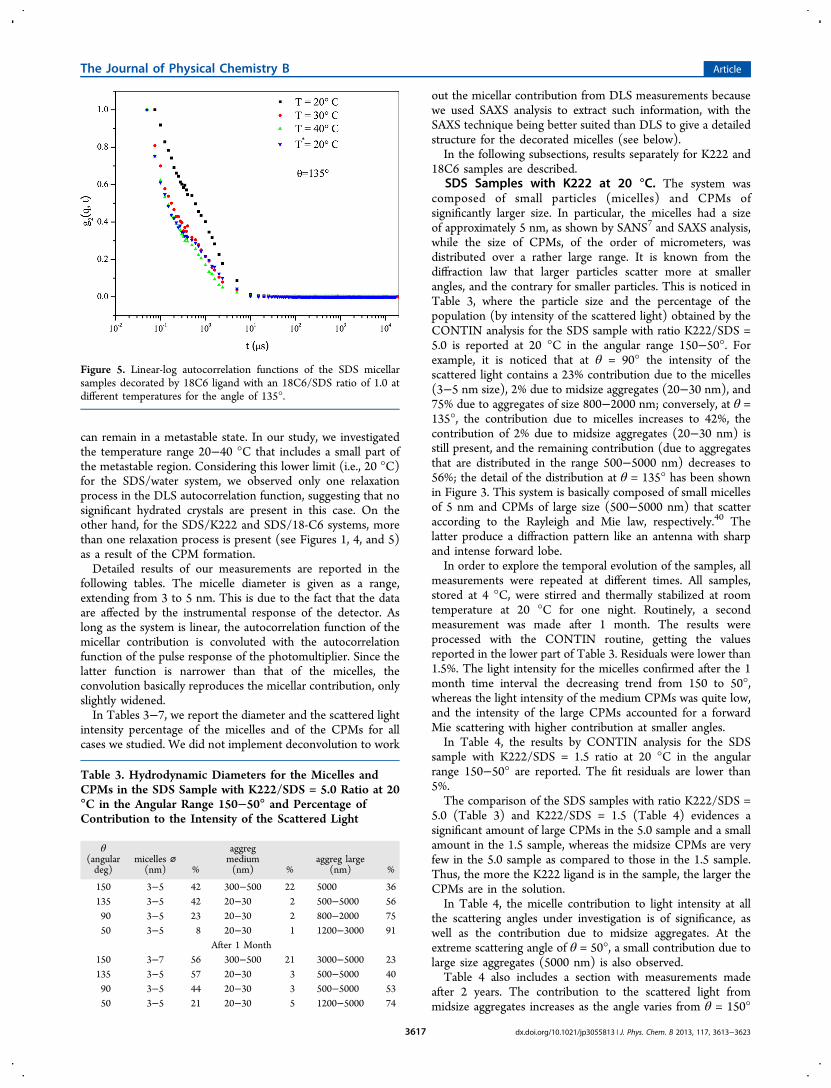
can remain in a metastable state. In our study, we investigatedthe temperature range 20−40 °C that includes a small part ofthe metastable region. Considering this lower limit (i.e., 20 °C)for the SDS/water system, we observed only one relaxationprocess in the DLS autocorrelation function, suggesting that nosignificant hydrated crystals are present in this case. On theother hand, for the SDS/K222 and SDS/18-C6 systems, morethan one relaxation process is present (see Figures 1, 4, and 5)as a result of the CPM formation.Detailed results of our measurements are reported in the
following tables. The micelle diameter is given as a range,extending from 3 to 5 nm. This is due to the fact that the dataare affected by the instrumental response of the detector. Aslong as the system is linear, the autocorrelation function of themicellar contribution is convoluted with the autocorrelationfunction of the pulse response of the photomultiplier. Since thelatter function is narrower than that of the micelles, theconvolution basically reproduces the micellar contribution, onlyslightly widened.In Tables 3−7, we report the diameter and the scattered light
intensity percentage of the micelles and of the CPMs for allcases we studied. We did not implement deconvolution to work
out the micellar contribution from DLS measurements becausewe used SAXS analysis to extract such information, with theSAXS technique being better suited than DLS to give a detailedstructure for the decorated micelles (see below).In the following subsections, results separately for K222 and
18C6 samples are described.SDS Samples with K222 at 20 °C. The system was
composed of small particles (micelles) and CPMs ofsignificantly larger size. In particular, the micelles had a sizeof approximately 5 nm, as shown by SANS7 and SAXS analysis,while the size of CPMs, of the order of micrometers, wasdistributed over a rather large range. It is known from thediffraction law that larger particles scatter more at smallerangles, and the contrary for smaller particles. This is noticed inTable 3, where the particle size and the percentage of thepopulation (by intensity of the scattered light) obtained by theCONTIN analysis for the SDS sample with ratio K222/SDS =5.0 is reported at 20 °C in the angular range 150−50°. Forexample, it is noticed that at θ = 90° the intensity of thescattered light contains a 23% contribution due to the micelles(3−5 nm size), 2% due to midsize aggregates (20−30 nm), and75% due to aggregates of size 800−2000 nm; conversely, at θ =135°, the contribution due to micelles increases to 42%, thecontribution of 2% due to midsize aggregates (20−30 nm) isstill present, and the remaining contribution (due to aggregatesthat are distributed in the range 500−5000 nm) decreases to56%; the detail of the distribution at θ = 135° has been shownin Figure 3. This system is basically composed of small micellesof 5 nm and CPMs of large size (500−5000 nm) that scatteraccording to the Rayleigh and Mie law, respectively.40 Thelatter produce a diffraction pattern like an antenna with sharpand intense forward lobe.In order to explore the temporal evolution of the samples, all
measurements were repeated at different times. All samples,stored at 4 °C, were stirred and thermally stabilized at roomtemperature at 20 °C for one night. Routinely, a secondmeasurement was made after 1 month. The results wereprocessed with the CONTIN routine, getting the valuesreported in the lower part of Table 3. Residuals were lower than1.5%. The light intensity for the micelles confirmed after the 1month time interval the decreasing trend from 150 to 50°,whereas the light intensity of the medium CPMs was quite low,and the intensity of the large CPMs accounted for a forwardMie scattering with higher contribution at smaller angles.In Table 4, the results by CONTIN analysis for the SDS
sample with K222/SDS = 1.5 ratio at 20 °C in the angularrange 150−50° are reported. The fit residuals are lower than5%.The comparison of the SDS samples with ratio K222/SDS =
5.0 (Table 3) and K222/SDS = 1.5 (Table 4) evidences asignificant amount of large CPMs in the 5.0 sample and a smallamount in the 1.5 sample, whereas the midsize CPMs are veryfew in the 5.0 sample as compared to those in the 1.5 sample.Thus, the more the K222 ligand is in the sample, the larger theCPMs are in the solution.In Table 4, the micelle contribution to light intensity at all
the scattering angles under investigation is of significance, aswell as the contribution due to midsize aggregates. At theextreme scattering angle of θ = 50°, a small contribution due tolarge size aggregates (5000 nm) is also observed.Table 4 also includes a section with measurements made
after 2 years. The contribution to the scattered light frommidsize aggregates increases as the angle varies from θ = 150°
Figure 5. Linear-log autocorrelation functions of the SDS micellarsamples decorated by 18C6 ligand with an 18C6/SDS ratio of 1.0 atdifferent temperatures for the angle of 135°.
Table 3. Hydrodynamic Diameters for the Micelles andCPMs in the SDS Sample with K222/SDS = 5.0 Ratio at 20°C in the Angular Range 150−50° and Percentage ofContribution to the Intensity of the Scattered Light
θ(angulardeg)
micelles ⌀(nm) %
aggregmedium(nm) %
aggreg large(nm) %
150 3−5 42 300−500 22 5000 36135 3−5 42 20−30 2 500−5000 5690 3−5 23 20−30 2 800−2000 7550 3−5 8 20−30 1 1200−3000 91
After 1 Month150 3−7 56 300−500 21 3000−5000 23135 3−5 57 20−30 3 500−5000 4090 3−5 44 20−30 3 500−5000 5350 3−5 21 20−30 5 1200−5000 74
The Journal of Physical Chemistry B Article
dx.doi.org/10.1021/jp3055813 | J. Phys. Chem. B 2013, 117, 3613−36233617
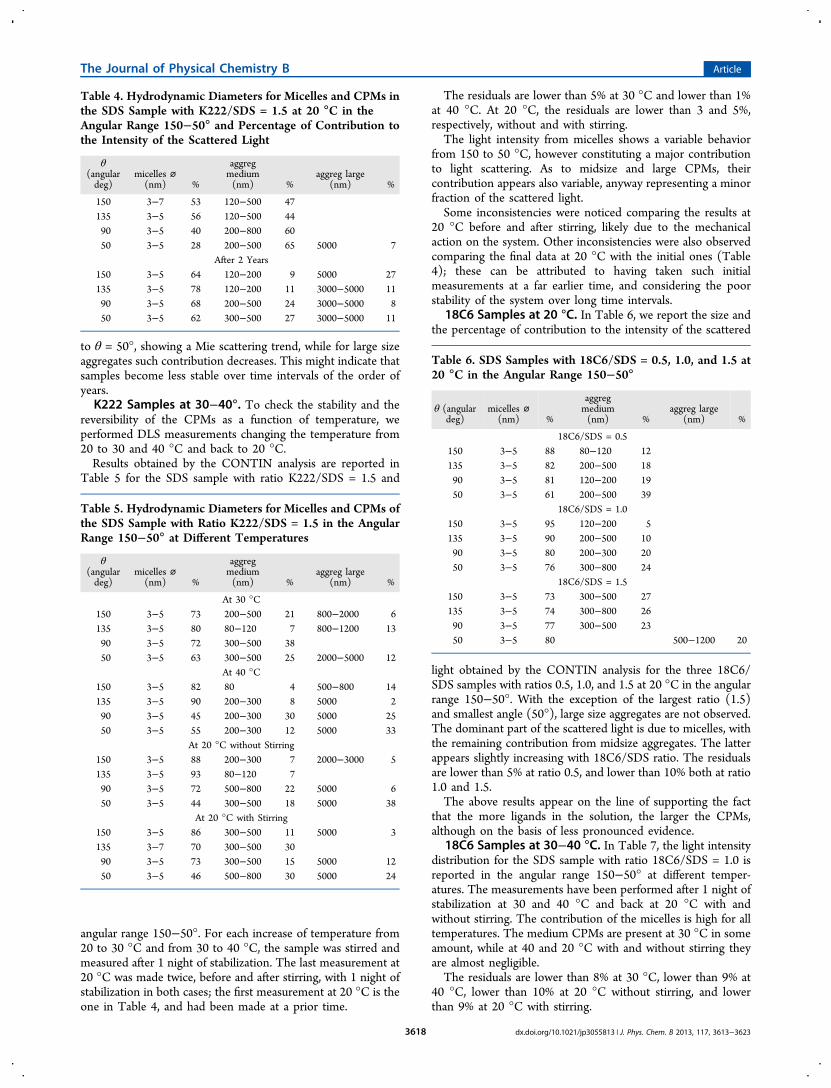
to θ = 50°, showing a Mie scattering trend, while for large sizeaggregates such contribution decreases. This might indicate thatsamples become less stable over time intervals of the order ofyears.K222 Samples at 30−40°. To check the stability and the
reversibility of the CPMs as a function of temperature, weperformed DLS measurements changing the temperature from20 to 30 and 40 °C and back to 20 °C.Results obtained by the CONTIN analysis are reported in
Table 5 for the SDS sample with ratio K222/SDS = 1.5 and
angular range 150−50°. For each increase of temperature from20 to 30 °C and from 30 to 40 °C, the sample was stirred andmeasured after 1 night of stabilization. The last measurement at20 °C was made twice, before and after stirring, with 1 night ofstabilization in both cases; the first measurement at 20 °C is theone in Table 4, and had been made at a prior time.
The residuals are lower than 5% at 30 °C and lower than 1%at 40 °C. At 20 °C, the residuals are lower than 3 and 5%,respectively, without and with stirring.The light intensity from micelles shows a variable behavior
from 150 to 50 °C, however constituting a major contributionto light scattering. As to midsize and large CPMs, theircontribution appears also variable, anyway representing a minorfraction of the scattered light.Some inconsistencies were noticed comparing the results at
20 °C before and after stirring, likely due to the mechanicalaction on the system. Other inconsistencies were also observedcomparing the final data at 20 °C with the initial ones (Table4); these can be attributed to having taken such initialmeasurements at a far earlier time, and considering the poorstability of the system over long time intervals.
18C6 Samples at 20 °C. In Table 6, we report the size andthe percentage of contribution to the intensity of the scattered
light obtained by the CONTIN analysis for the three 18C6/SDS samples with ratios 0.5, 1.0, and 1.5 at 20 °C in the angularrange 150−50°. With the exception of the largest ratio (1.5)and smallest angle (50°), large size aggregates are not observed.The dominant part of the scattered light is due to micelles, withthe remaining contribution from midsize aggregates. The latterappears slightly increasing with 18C6/SDS ratio. The residualsare lower than 5% at ratio 0.5, and lower than 10% both at ratio1.0 and 1.5.The above results appear on the line of supporting the fact
that the more ligands in the solution, the larger the CPMs,although on the basis of less pronounced evidence.
18C6 Samples at 30−40 °C. In Table 7, the light intensitydistribution for the SDS sample with ratio 18C6/SDS = 1.0 isreported in the angular range 150−50° at different temper-atures. The measurements have been performed after 1 night ofstabilization at 30 and 40 °C and back at 20 °C with andwithout stirring. The contribution of the micelles is high for alltemperatures. The medium CPMs are present at 30 °C in someamount, while at 40 and 20 °C with and without stirring theyare almost negligible.The residuals are lower than 8% at 30 °C, lower than 9% at
40 °C, lower than 10% at 20 °C without stirring, and lowerthan 9% at 20 °C with stirring.
Table 4. Hydrodynamic Diameters for Micelles and CPMs inthe SDS Sample with K222/SDS = 1.5 at 20 °C in theAngular Range 150−50° and Percentage of Contribution tothe Intensity of the Scattered Light
θ(angulardeg)
micelles ⌀(nm) %
aggregmedium(nm) %
aggreg large(nm) %
150 3−7 53 120−500 47135 3−5 56 120−500 4490 3−5 40 200−800 6050 3−5 28 200−500 65 5000 7
After 2 Years150 3−5 64 120−200 9 5000 27135 3−5 78 120−200 11 3000−5000 1190 3−5 68 200−500 24 3000−5000 850 3−5 62 300−500 27 3000−5000 11
Table 5. Hydrodynamic Diameters for Micelles and CPMs ofthe SDS Sample with Ratio K222/SDS = 1.5 in the AngularRange 150−50° at Different Temperatures
θ(angulardeg)
micelles ⌀(nm) %
aggregmedium(nm) %
aggreg large(nm) %
At 30 °C150 3−5 73 200−500 21 800−2000 6135 3−5 80 80−120 7 800−1200 1390 3−5 72 300−500 3850 3−5 63 300−500 25 2000−5000 12
At 40 °C150 3−5 82 80 4 500−800 14135 3−5 90 200−300 8 5000 290 3−5 45 200−300 30 5000 2550 3−5 55 200−300 12 5000 33
At 20 °C without Stirring150 3−5 88 200−300 7 2000−3000 5135 3−5 93 80−120 790 3−5 72 500−800 22 5000 650 3−5 44 300−500 18 5000 38
At 20 °C with Stirring150 3−5 86 300−500 11 5000 3135 3−7 70 300−500 3090 3−5 73 300−500 15 5000 1250 3−5 46 500−800 30 5000 24
Table 6. SDS Samples with 18C6/SDS = 0.5, 1.0, and 1.5 at20 °C in the Angular Range 150−50°
θ (angulardeg)
micelles ⌀(nm) %
aggregmedium(nm) %
aggreg large(nm) %
18C6/SDS = 0.5150 3−5 88 80−120 12135 3−5 82 200−500 1890 3−5 81 120−200 1950 3−5 61 200−500 39
18C6/SDS = 1.0150 3−5 95 120−200 5135 3−5 90 200−500 1090 3−5 80 200−300 2050 3−5 76 300−800 24
18C6/SDS = 1.5150 3−5 73 300−500 27135 3−5 74 300−800 2690 3−5 77 300−500 2350 3−5 80 500−1200 20
The Journal of Physical Chemistry B Article
dx.doi.org/10.1021/jp3055813 | J. Phys. Chem. B 2013, 117, 3613−36233618

Small Angle X-ray Scattering. Figure 6 reports the log−log plot of the SAXS curves at 20 °C for the SDS micellarsolutions decorated by K222 (top panel) or 18C6 (bottompanel) with ligand/SDS ratios of 1.5, 1.0, and 0.5 in the full Qrange accessed by the instrument. The present investigationextends and completes preliminary SANS studies performed onsimilar ligand−SDS micellar systems.4,6,7 The case of SDSmicellar solutions without any ligands was already reported inthe literature.7 Two regions can be clearly distinguished inFigure 6: at high Q, the curves show the presence of aninteraction peak at about Q = 0.2 Å−1 due to the repulsionexisting between the primary SDS micelles, whereas at low Qvalues the curves are dominated by the presence of CPMs asseen by the huge increase of scattered intensity.SAXS curves have been fitted in the 0.15−0.30 Å−1 range to
disclose the effect of the two ligands on the micellar structure.The CPM region has been analyzed using Guinier’s approach.The analysis of the micellar contribution to the SAXS curves
(fits in Figures 7 and 8) was performed using a model wherethe particles are made of an inner core (the surfactant tails) andan outer layer (the polar head groups of the SDS surfactant).The assumed arrangement is that of a two-shell prolateellipsoid. The normalized structure factor accounting for theshape of the micelles is the so-called form factor, P(Q). Theinterparticle structure factor S(Q) was calculated assuming ananalytical solution based on the Hayter−Penfold model24,25
considering a multicomponent ionic liquid in the meanspherical approximation. S(Q) is the result of the hard-sphererepulsion and screened Coulomb repulsion between micelles.The multicomponent system was reduced to an effective one-component macroion system under the Gillan condition.8
Figures 7 and 8 show the detail of the interaction peak forthe K222/SDS and 18C6/SDS, respectively. A small bump is
present in all cases at about Q = 0.05 Å−1 as a result of thesuperposition of the form factor P(Q) proper of the SDS
Table 7. SDS Sample with Ratio 18C6/SDS = 1.0 in theAngular Range 150−50° at Different Temperatures
θ(angulardeg)
micelles⌀ (nm) %
aggregmedium(nm) %
aggreg large(nm) %
At 30 °C150 3−5 50 800−1200 50135 3−5 58 800−1200 4290 3−5 10050 3−5 80 80 6 5000 2330 3−5 66 50−80 7 2000−5000 27
At 40 °C150 3−5 79 500−800 21135 3−5 91 5000 990 3−5 90 5000 1060 3−5 72 5000 2830 3 68 800−3000 32
At 20 °C without Stirring150 3−5 86 300 6 3000−5000 8135 3−5 97 800−1200 2 5000 190 3 10050 3−5 87 5000 1330 3 68 200−300 7 3000−5000 25
At 20 °C with Stirring150 3−5 82 300 4 3000−5000 14135 3−5 80 3000−5000 2090 3−5 88 5000 1250 3−5 86 1200−5000 1430 3 64 300−500 21 5000 15
Figure 6. Log−log representation of the SAXS intensity distributionsfor K222/SDS micellar solutions (top panel) and 18C6/SDS micellarsolutions (bottom panel) as a function of the ligand/SDS ratio.Original data have been offset for graphical purposes.
Figure 7. SAXS intensity distribution of SDS micellar solutions withK222 ratios of 0.5 (open circles), 1.0 (solid circles), and 1.5 (opensquares). The fits of the micellar region (black, red, and green) are alsoshown (solid lines). Original data and the corresponding fitting havebeen offset for graphical purposes.
The Journal of Physical Chemistry B Article
dx.doi.org/10.1021/jp3055813 | J. Phys. Chem. B 2013, 117, 3613−36233619

micelles44 (which appears as hollow spheres to X-rays) with theCPM intensity increase dominating the low Q region of theSAXS curve.The parameters characterizing the structure and interaction
of the SDS micelles are the surface charge, Z, the averageaggregation number, N, the shell thickness, th, the number ofcarbon atoms for a SDS monomer in the core, Nc, thepercentage of the interfacial ligand molecules with respect tothe total surfactant molecules, Nlig, the ellipsoidal axial ratio, a/b, the micellar diameter, d, the Debye length, Dlength, the contactpotential, V, and the volume fraction, volfract, of the surfactantpresent in the solution. The parameters extracted from thefitting were Z, N, th, Nlig, Nc, and the background. The latterquantity was estimated by the Porod analysis at high Q values.45
a/b, d, Debye’s length, V, the volume fraction, and the numberNs of water molecules for one surfactant molecule (hydrationnumber) can be derived from the fitting outputs.Table 8 lists the results obtained by the SAXS analysis of the
micellar solutions with both ligands at ligand/SDS ratios of 1.5,1.0, and 0.5. The errors on the fit parameters are reported asrelative standard deviation.In the case of the K222/SDS system increasing the ratio from
0.5 to 1.5, the parameters Z, N, Nc, diam, and V decrease whilethe parameters th, Ns, and volfract remain constant and Dlengthincreases. Nlig and a/b do not show a simple behavior. In thecase of 18C6, the behavior of the fitting parameters is in generalmore various.
Comparing the SAXS data listed in Table 8 with previousSANS results,4,6,7 it is clear that small angle scatteringexperiments are consistent in the three K222/SDS cases.Data for the 18C6/SDS sample with a ratio of 1.0 of Table 8are in agreement with previous results obtained using SANS.4,6
The main effects imposed by the decoration of SDS micelleswith adhesive sites are described in the following. On one hand,increasing the 18C6/SDS ratio, the shell thickness does notchange from the value 5.5 Å obtained by SANS in the case ofSDS micelles without ligands.32 On the other hand, the micellarcharge, Z, decreases both with respect to the “naked” case andincreasing the ligand/SDS ratio. From these results, we caninfer that the crown-ether ligands accommodate the crownparallel to the micellar surface and complex some sodium ionpresent in the Gouy−Chapman layer. The 18C6/SDS = 0.5sample is similar to the sample where “naked” SDS micelles areconsidered.22 In particular, at 0.250 M (which is close to ourSDS concentration) and 25 °C, the reported results of Z = 26.7,N = 94.5, axial ratio 1.3, and D = 49.2 Å are very close to thevalues obtained in this work for the 18C6/SDS = 0.5 case.Comparing with data obtained for hydrogenated 8 wt %/wt
SDS micelles without K222,32 we note that the effect of K222addition to SDS micellar solution is to increase the outer layerthickness from 5.5 to 10−12 Å.4 Furthermore, we observe againa decrease of the effective micellar charge from 30 to 10−20and of the average aggregation number from 90 to 55−75.As confirmed by the constant value of Nc for the three
samples of the 18C6 series, the crown-ether is less effectivethan K222 to move to the micellar interface and does not enterinto the micellar hard-core. A slight increase of Nlig is observedfor the increase of the ligand/surfactant ratio. The micellardiameters for 18C6 are smaller than for K222 samples. TheDebye length, volume fraction, and contact potential do notchange as a function of the ratio, while N increases when theratio decreases.As a result of the addition of the ligand, a huge intensity
increase is detected in the SAXS curves at low Q values,evidencing the presence of structures larger than the primarymicelles, i.e., CPMs. This low Q region, not accessed previouslyby SANS measurements, can help in characterizing theaggregates of micelles. To this aim, we analyzed the data withQ below 0.025 using the Guinier law.46 The plots of ln(I) as afunction of Q2 (i.e., Guinier’s representation) are shown inFigures 9 and 10. The error bar for the data points is ±0.02 forK222 and ±0.03 for 18C6.If QR < 1 (where R is the radius of a spherical scattering
object), the Guinier equation holds
= −I Q K( ) Vol e Q R2 2 /32g
2
(4)
Figure 8. SAXS intensity distribution of SDS micellar solutions with18C6 ratios of 10.5 (open circles), 1.0 (solid circles), and 1.5 (opensquares). The fits of the micellar region (black, red, and green) are alsoshown (solid lines). Original data and the corresponding fitting havebeen offset for graphical purposes.
Table 8. Fitting Results according to a Prolate Ellipsoidal Core-Shell Form Factor Coupled with a Repulsion Potential for theSamples K222/SDS and 18C6/SDS with Ratios 1.5, 1.0, and 0.5 at 20 °C
Z N t (Å) Nc Nlig (%) a/b Ns diam (Å) Dlength (Å) V (kBT) vol frac
K222/SDS1.5 12 ± 1 56 ± 8 11 ± 1 8.9 ± 1.8 59 ± 1 1.7 21 53 18 3.2 0.2011 15 ± 1 59 ± 15 11 ± 4 8.9 ± 2.0 68 ± 10 1.8 21 54 17 4.1 0.2110.5 21 ± 3 74 ± 13 10 ± 2 12 ± 0.4 40 ± 3 1.3 21 57 16 6.7 0.206
18C6/SDS1.5 20 ± 3 84 ± 12 5.5 ± 1.0 12 ± 0.7 15 ± 3 1.5 50 17 9.7 0.1151 27 ± 3 74 ± 5 5.5 ± 1.0 12 ± 1.1 12 ± 2 1.3 48 14 14 0.1210.5 18 ± 2 103 ± 10 5.5 ± 0.7 12 ± 1.7 10 ± 1 1.85 52 19 8.2 0.116
The Journal of Physical Chemistry B Article
dx.doi.org/10.1021/jp3055813 | J. Phys. Chem. B 2013, 117, 3613−36233620

and data have a linear trend when ln I(Q) versus Q2 is plotted;Rg is the gyration radius of the CPMs, K is a constant, and Volis the particle’s volume. Rg was then calculated from the slopeof the straight lines in Figures 9 and 10 using in all cases 20 datapoints in the Q2 region from 2.5 × 10⁻⁴ to 3.8 × 10⁻⁴ Å−2.Assuming that the CPMs are spherical, the geometric radius Ris related to the gyration radius by the equation R = Rg(5/3)
1/2.From this calculation, we extracted the average CPM radiusreported in Table 9 for all the investigated cases.As shown in Table 9, the CPM size is about 200 Å in the two
distinct series. This value is quite small compared to the
dimensions of the CPMs obtained by DLS and is below themaximum dimension achievable by the present SAXS experi-ment (i.e., about 300 Å). By using the Guinier law, we see onlythe smaller CPMs present in the samples which could beresponsible for the generation of the greater structuresevidenced by DLS in the submicrometer/micrometer range.An ultra-SAXS experiment could be performed in the nearfuture to cover a broader range of dimensions that superimposeto DLS and confirm this point.
■ DISCUSSION
The work reported in this paper was performed to investigatethe aggregation process of micelles into CPMs in a solution ofSDS micelles decorated with K222 or 18C6 ligands. CPMs oftwo main sizes were detected primarily in the submicrometer/micrometer range by DLS. Furthermore, we studied thestability and the reversibility of the system, considering thatthe nondecorated SDS micellar solutions do not aggregate.The system of decorated micelles is characterized by a low
amount of isolated micelles in solution, 8% w/w of solute(SDS), chosen with the aim to avoid aggregation between the“naked” micelles. The only perturbation imposed to the SDSmicellar aqueous solution is the addition of the ligand whichhas the primary effect to decorate the micelles with adhesivesites. The amount of added K222 or 18C6 ligand maintains thesample homogeneous from 20 to 40 °C. SAXS resultsevidenced a different hydrophobic effect of the two ligands,being 18C6 less hydrophobically effective than K222 inagreement with previous SANS investigations.In the SAXS curves, we could distinguish a micellar region at
intermediate/high Q and a CPM region at low Q. The latterwas useful to detect the smaller aggregates present in the CPMsby using the Guinier law. The maximum diameter of theobserved CPMs is approximately 200 Å for all the SDS sampleswith K222 or 18C6 ligands, meaning that they are formed byabout 50−100 micellar units. These entities can be the smallerclusters giving rise to the CPMs. An ultra-SAXS experimentcovering a lower Q range is necessary to detect aggregatesgreater than 200−300 Å and confirm this hypothesis.In Tables 3, 4, and 5, the DLS results by CONTIN analysis
are reported for the micellar solutions with K222 ligand and inTables 6 and 7 those with 18C6 ligand.The study was performed at different times to explore the
temporal evolution. Short and long time intervals were tested.The reported findings suggest that the decorated micellarsolutions are fairly stable over a time interval of the order of 1month. An experiment conducted on a sample at a time intervalof 2 years appears to indicate that the stability is not fullymaintained over such a long time.
■ CONCLUSION
Sodium dodecyl sulfate in water, decorated with variousadhesive sites (Kryptofix 222 and 18-Crown-6), has beeninvestigated by DLS and SAXS to study the micelle structureand interactions. Special attention was attracted by theformation of micelle aggregates, here named cluster phases ofmicelles, characterized by medium and large size in thesubmicrometer/micrometer range. As is well-known, the SDSmicelles in water do not aggregate at the low surfactantconcentration used in this paper; however, with respect toprevious works and literature, we demonstrate that SDSmicelles decorated with macrocyclic ligands do aggregate
Figure 9. Plots of Guinier’s region (the smaller Q region) for CPMswith K222 ligand at 20 °C and ratios of 1.5 (open circles), 1.0 (solidsquares), and 0.5 (open squares). The solid lines are the fit results.The error estimate on ln(I) is ±0.02. Original data and thecorresponding fitting have been offset for graphical purposes.
Figure 10. Plots of Guinier’s region (the smaller Q region) for CPMswith 18C6 ligand at 20 °C and ratios of 1.5 (open circles), 1.0 (solidsquares), and 0.5 (open squares). The solid lines are the fit results.The error estimate on ln(I) is ±0.03. Original data and thecorresponding fitting have been offset for graphical purposes.
Table 9. Radius of CPMs Decorated by the K222 or 18C6Ligandsa
K222/SDS R (Å) 18C6/SDS R (Å)
1.5 103 1.5 91.41.0 100 1.0 1040.5 96.2 0.5 101
aThe standard deviation on the calculated CPM size is below 10%.
The Journal of Physical Chemistry B Article
dx.doi.org/10.1021/jp3055813 | J. Phys. Chem. B 2013, 117, 3613−36233621

depending on the ligand/surfactant molar ratio. The hydro-phobicity of the adhesive sites (ligand molecules) and thecomplexation ability, greater for Kryptofix 222 than for 18-Crown-6, give rise to adhesive forces that induce the formationof CPMs. The sizes and the percentages of the micelles and theCPMs were studied at 20, 30, and 40 °C by DLS to test thestability and reversibility of the system, and at 20 °C by SAXS.DLS results evidence that the CPM formation processes are
fairly reproducible for both types of decorated micelles. At agiven temperature, the more ligand is added to the micellarsolution, the larger are the CPMs present in the samples. TheGuinier analysis was used in the low Q region of the SAXScurves to obtain the sizes of the CPMs and the number ofmicelles for a given CPM. The results indicate that smallerCPMs are present in the solutions almost independently by theligand used in this work.
■ AUTHOR INFORMATION
Corresponding Author*E-mail: [email protected].
NotesThe authors declare no competing financial interest.
■ ACKNOWLEDGMENTS
This work was supported by Italian MIUR, PRIN2005, EnteCassa di Risparmio di Firenze, INFM, and ConsorzioInteruniversitario per lo Sviluppo dei Sistemi a Grande Interfase(CSGI). S.S. and F.S. are supported by ERC-226207-PATCHYCOLLOIDS.
■ REFERENCES(1) Gokel, G. W. Crown Ethers & Cryptands; The Royal Society ofChemistry: Cambridge, U. K., 1994.(2) Hunter, R. J. Foundations of Colloid Science; Oxford SciencePublications, Clarendon Press: Oxford, U. K., 1987; Vol. 1.(3) Evans, D. F.; Wennestrom, H. The Colloidal Domain WherePhysics, Chemistry, Biology, and Technology Meet; VCH Publishers, Inc.:New York, 1994; Chapter 1, pp 8−9.(4) Baglioni, P.; Gambi, C. M. C.; Giordano, R.; Teixeira, J. The Roleof Macrocyclic Ligands on the Structure of LDS Micellar Solutions.Physica B 1995, 213 & 214, 597−599.(5) Carla,̀ M.; Gambi, C. M. C.; Baglioni, P. Adsorption Properties ofCryptand 222 at the Charged Mercury-Solution Interface. J. Phys.Chem. 1996, 100, 11067−11071.(6) Baglioni, P.; Gambi, C. M. C.; Giordano, R.; Teixeira, J.Complexation of Counterions in Micellar Solutions: A Small AngleNeutron Scattering Study. Colloids Surf., A 1997, 121, 47−52.(7) Scaffei, L.; Lanzi, L.; Gambi, C. M. C.; Giordano, R.; Baglioni, P.;Teixeira, J. Study by Small-Angle Neutron Scattering of SodiumDodecyl Sulfate Micelles with the Macrocyclic Ligand [2.2.2.]-Cryptand. J. Phys. Chem. B 2002, 106, 10771−10776.(8) Gillan, M. A Simple Model for the Classical One-ComponentPlasma. J. Phys. C 1974, 7, L1−L4.(9) Bianchi, E.; Largo, J.; Tartaglia, P.; Zaccarelli, E.; Sciortino, F.Phase Diagram of Patchy Colloids: Towards Empty Liquids. Phys. Rev.Lett. 2006, 97, 168301-1−168301-4.(10) Cardinaux, F.; Stradner, A.; Schurtenberger, P.; Sciortino, F.;Zaccarelli, E. Modeling Equilibrium Clusters in Lysozyme Solutions.EPL 2007, 77, 48004-p1−48004-p5.(11) Lonetti, B.; Fratini, E.; Chen, S.; Baglioni, P. Viscoelastic andSmall Angle Neutron Scattering Studies of Concentrated ProteinSolutions. Phys. Chem. Chem. Phys. 2004, 6, 1388−1395.(12) Liu, Y.; Fratini, E.; Baglioni, P.; Chen, W.-R.; Chen, S.-H.Effective Long-Range Attraction between Protein Molecules in
Solutions Studied by Small Angle Neutron Scattering. Phys. Rev.Lett. 2005, 95 (11), 118102-1−118102-4.(13) Porcar, L.; Falus, P.; Chen, W.-R.; Faraone, A.; Fratini, E.; Hong,K.; Baglioni, P.; Liu, Y. Formation of the Dynamic Clusters inConcentrated Lysozyme Protein Solutions. J. Phys. Chem. Lett. 2010, 1,126−129.(14) Liu, Y.; Porcar, L.; Chen, J.; Chen, W.-R.; Falus, P.; Faraone, A.;Fratini, E.; Hong, K.; Baglioni, P. Lysozyme Protein Solution with anIntermediate Range Order Structure. J. Phys. Chem. B 2011, 115,7238−7247.(15) Baglioni, P.; Fratini, E.; Lonetti, B.; Chen, S. H. Structural Arrestin Concentrated Cytochrome C Solutions: the Effect of pH and Salts.J. Phys.: Condens. Matter 2004, 16, S5003−S5022.(16) Stradner, A.; Sedgwick, H.; Cardinaux, F.; Poon, W.; Egelhaaf,S.; Schurterberger, P. Equilibrium Cluster Formation in ConcentratedProtein Solutions and Colloids. Nature 2004, 432, 492−495.(17) Campbell, A.; Anderson, V. J.; van Duijneveldt, J.; Bartlett, P.Dynamical Arrest in Attractive Colloids: the Effect of Long-RangeRepulsion. Phys. Rev. Lett. 2005, 94, 208301-1−208301-4.(18) Sciortino, F.; Mossa, S.; Zaccarelli, E.; Tartaglia, P. EquilibriumCluster Phases and Low-Density Arrested Disordered States: the Roleof Short-Range Attraction and Long-Range Repulsion. Phys. Rev. Lett.2004, 93, 055701-1−055701-4.(19) Segre,́ P.; Prasad, V.; Schofield, A.; Weitz, D. Glasslike KineticArrest at the Colloidal Gelation Transition. Phys. Rev. Lett. 2001, 86,6042−6045.(20) Dinsmore, A.; Weitz, D. Direct Imaging of Three-DimensionalStructure and Topology of Colloidal Gels. J. Phys.: Condens. Matter2002, 14, 7581−7597.(21) Sedgwick, H.; Egelhaaf, S.; Poon, W. Clusters and Gels inSystems of Sticky Particles. J. Phys.: Condens. Matter 2004, 16, S4913−S4922.(22) Payne, K.; Magid, L.; Evans, D. Structural Changes in AnionicMicelles Induced by Counterion Complexation with a MacrocyclicLigand: A Neutron Scattering Study. Prog. Colloid Polym. Sci. 1987, 73,10−17.(23) Caponetti, E.; Chillura Martino, D.; Floriano, M.; Triolo, R.Application of the Small-Angle Neutron Scattering Technique to theStudy of Solubilization Mechanisms of Organic Molecules by MicellarSystems. Mol. Struct. 1996, 383, 133−143.(24) Hayter, J.; Penfold, J. An Analytic Structure Factor for Macro-Ion Solutions. J. Mol. Phys. 1981, 42, 109−118.(25) Hayter, J. Concentrated Colloidal Dispersions Viewed as One-Component Macrofluids. Faraday Discuss. Chem. Soc. 1983, 76, 7−17.(26) Bendedouch, D.; Chen, S.-H.; Koehler, W. Structure of IonicMicelles from Small Angle Neutron Scattering. J. Phys. Chem. 1983, 87,153−159.(27) Chao, Y.; Sheu, E. Y.; Chen, S.-H. Experimental Test of aTheory of Dressed Micelles: the Case of Monovalent Counterion. J.Phys. Chem. 1985, 89 (22), 4862−4866.(28) Brown, W. Dynamic Light Scattering - The Method and someApplications; Oxford Science Publications: Oxford, U.K., 1993; p 177.(29) Lanzi, L.; Carla,̀ M.; Lanzi, L.; Gambi, C. M. C. DielectricSpectroscopy by Differential Measurements in Transmission Lines onSodium Dodecyl Sulfate Micelles in Water. J. Non-Cryst. Solids 2005,351, 2864−2867.(30) Lanzi, L.; Carla,̀ M.; Lanzi, L.; Gambi, C. M. C. A New Insighton the Dynamics of Sodium Dodecyl Sulfate Aqueous MicellarSolutions by Dielectric Spectroscopy. J. Colloid Interface Sci. 2009, 330(1), 156−162.(31) Sennato, S.; Marchetti, S.; Gambi, C. M. C.; Cametti, C.Complexation of Macrocyclic Ligands in Ionic SDS Micellar Solutions:A Dielectric Spectroscopy Investigation. J. Non-Cryst. Solids 2011, 357(2), 754−759.(32) Grosse, C. In Encyclopedia of Surface and Colloid Science;Hubbard, A. T., Ed.; Dekker: New York, 2002.(33) Cazzolli, G.; Caponi, S.; Defant, A.; Gambi, C. M. C.; Marchetti,S.; Mattarelli, M.; Montagna, M.; Rossi, B.; Rossi, F.; Viliani, G.
The Journal of Physical Chemistry B Article
dx.doi.org/10.1021/jp3055813 | J. Phys. Chem. B 2013, 117, 3613−36233622
Aggregation Processes in Micellar Solutions: a Raman Study. J. RamanSpectrosc. 2012, 43, 1877−1883.(34) Evans, D.; Ser, R.; Warr, G. Structural Changes in SodiumDodecyl Sulfate Micelles Induced by Using Counterion Complexationby Macrocyclic Ligands. J. Phys. Chem. 1986, 90, 5500−5502.(35) Evans, D.; Evans, J.; Sen, R.; Warr, G. A Comparison ofCounterion Effects in Surfactant and Classical Colloid Systems. J. Phys.Chem. 1988, 92, 784−790.(36) Selassie, C. History of Quantitative Structure-Activity Relation-ships; Wiley: New York, 2003; Vol. Burger’s Medicinal Chemistry andDrug Discovery, Chapter 1.(37) Cambridge Software, http://www.cambridgesoft.com.(38) Crippen, N. Atomic Physicochemical Parameters for Three-Dimensional-Structure-Directed Quantitative Structure-Activity Rela-tionships. 2. Modeling Dispersive and Hydrophobic Interactions. J.Chem. Inf. Comput. Sci. 1987, 27 (1), 21−35.(39) Broto, P.; Moreau, G.; Vandycke, C. Molecular Structures:Perception, Autocorrelation Descriptor and SAR Studies. Eur. J. Med.Chem. 1984, 19, 71−78.(40) Berne, B. J.; Pecora, R. Dynamic Light Scattering; Dover: NewYork, 2000.(41) Provencher, S. A Constrained Regularization Method forInverting Data Represented by Linear Algebraic or Integral Equations.Comput. Phys. Commun. 1982, 27, 213−227.(42) Blanton, T.; Huang, T.; Toraya, C., H.; Hubbard; Robie, S.;Louer, D.; Gobel, H.; Will, G.; Gilles, R.; Raftery, T. JCPDS -International Centre for Diffraction Data Round Robin Study of SilverBehenate. A Possible Low-Angle X-ray Diffraction CalibrationStandard. Powder Diffr. 1995, 10, 91−95.(43) Ilavsky, J.; Jemian, P. Irena: Tool Suite for Modeling andAnalysis of Small-Angle Scattering. J. Appl. Crystallogr. 2009, 42 (2),347−353.(44) Zemb, T.; Charpin, P. Micellar Structure from Comparison ofX-ray and Neutron Small-Angle Scattering. J. Phys. (Paris) 1985, 46,249−256.(45) Auvray, L.; Auroy, P. Neutron, X-Ray and Light Scattering; NorthHolland: Amsterdam, 1991; Chapter 3, pp 199−221.(46) Guinier, A.; Fournet, G. Small-Angle Scattering of X-rays; JohnWiley & Sons, Inc.: New York, 1955.
The Journal of Physical Chemistry B Article
dx.doi.org/10.1021/jp3055813 | J. Phys. Chem. B 2013, 117, 3613−36233623