Argon cluster evaporation dynamics
12
Argon cluster evaporation dynamics Randall S. Dumont, a) Shashi Jain, and Anthony G. Basile Department of Chemistry, McMaster University, Hamilton, Ontario L8S 4M1, Canada ~Received 11 August 1994; accepted 18 November 1994! Expansion of argon clusters in a vacuum is simulated via molecular dynamics computations. The resulting evaporation dynamics is investigated with observations of temperature and pV energy loss curves. Observed cooling curves ~T vs n ! and collapse curves ~pV / n vs n ! are found to depend on final cluster size but not the initial cluster ensemble. The evaporation mechanism consists of an initial rapid cooling-and-collapse stage of a preliquid dense-gas-like cluster, followed by ‘‘equilibrium’’evaporation, and then another cooling stage of the resulting relatively incompressible liquidlike subcluster. Elements of this dynamics evaporation mechanism are tested by examination of finite n phase diagrams constructed using Metropolis Monte Carlo simulations of the fixed T and p ensemble. © 1995 American Institute of Physics. I. INTRODUCTION It is well known, and well understood for macroscopic systems via thermodynamics, that both adiabatic expansion and evaporation of a fluid cause cooling. Recent efforts have sought a more detailed understanding of these cooling phe- nomena at a microscopic level, particularly in the case of microscopic cluster systems. For example, Klots 1 has devel- oped a simple model of evaporation kinetic energy release for water clusters based on treating the cluster as a collection of Debye oscillators and hindered rotors and accounting for evaporative increase in surface tension. 2 Stace 3 has modeled evaporative rotational cooling ~and heating! using phase space theory applied to three-dimensional cluster-and-atom separation dynamics. Other studies simulate cluster evapora- tion via molecular dynamics computations and a variety of initial activated cluster states. 4–7 A simple qualitative microscopic explanation of cooling due to adiabatic expansion or evaporation is straightforward. ~Here we actually consider spontaneous adiabatic expansion where there is no external wall on which the expanding fluid can do work, see Ref. 8.! Both processes conserve the total energy of the fluid ~or liquid plus gas, in the case of evapo- ration!, and both involve an increase in interatomic separa- tions resulting in a net increase in potential energy. 9 Adia- batic expansion and evaporation are entropy-controlled processes, favoring looser configurations where the dominant attractive potential tail is diminished. Since the kinetic en- ergy must decrease to conserve energy, the fluid is observed ~via decreasing temperature! to cool. In addition, expansion and evaporation are driven by thermal energy, so their rate decreases with cooling. We deduce from simple dynamical considerations that cooling progresses at a diminishing rate until a stable fluid is achieved or until the fluid vanishes. In this article, the simple atomic picture is elaborated specifically in the case of small cluster expansion into a vacuum. With small clusters there is the possibility of finite size effects not ordinarily described by thermodynamics— the ‘‘graininess’’ of the atomic scale is important in small cluster dynamics. In addition small clusters are amenable to a close examination of the underlying dynamics. Below, we present a detailed dynamics mechanism of isolated cluster evaporation which emerges from observations of small clus- ter evaporation simulations. An illustration of finite size effects is found in the p 50 neighborhood of Tp phase diagrams. At p 50 a bulk liquid ~or solid! can evaporate at any temperature. This is because the bulk material has essentially infinite energy, if it is mea- sured in atomic units. There is always sufficient energy to overcome the barrier to single atom evaporation no matter what the temperature. In contrast, because of its finite energy, a microscopic cluster of atoms has a non-negligible energy threshold below which evaporation cannot take place. The implication for a bulk liquid in a vacuum is that it evaporates only until it reaches microscopic proportions. In general, a bulk liquid evaporates to an equilibrium state consisting of an assortment of microscopic clusters. However, this assort- ment of clusters actually constitutes the macroscopic equilib- rium gas. 10 Thus, from a macroscopic standpoint, the evapo- ration of a bulk liquid in a vacuum proceeds to completion for any initial temperature. Correspondingly, the liquid–gas coexistence curve in a Tp phase diagram cuts the T axis at T 50. We show below that the Tp plane of a small collection of argon atoms exhibits a coexistence band ~see Sec. III! analogous to the coexistence curve of the thermodynamic- limit bulk fluid. However, due to the non-negligible evapo- ration energy threshold, the finite n coexistence band cuts the T axis between 45 and 65 K. There is, effectively, a tempera- ture threshold below which small liquidlike ~and solidlike! argon clusters can exist at zero pressure. In this study we simulate the expansion of clusters of n argon atoms into a vacuum in Sec. II, and we examine argon phase diagrams for small n ~21, 30, and 40! in Sec. III. The evaporative cooling and collapse seen in Sec. II is character- ized as ‘‘universal.’’Specifically, thermal and mechanical en- ergies ~defined below! follow certain pathways independent of the initial activated-cluster ensemble temperature and pressure. Only the final cluster size distribution depends on these initial ensemble properties. Examination of the univer- sal pathways of thermal and mechanical energy losses, and other observations, leads to construction of a detailed dy- a! National Science and Engineering Research Council of Canada University Research Fellow 1988 –present. 4227 J. Chem. Phys. 102 (10), 8 March 1995 0021-9606/95/102(10)/4227/12/$6.00 © 1995 American Institute of Physics
Transcript of Argon cluster evaporation dynamics

Argon cluster evaporation dynamicsRandall S. Dumont,a) Shashi Jain, and Anthony G. BasileDepartment of Chemistry, McMaster University, Hamilton, Ontario L8S 4M1, Canada
~Received 11 August 1994; accepted 18 November 1994!
Expansion of argon clusters in a vacuum is simulated via molecular dynamics computations. Theresulting evaporation dynamics is investigated with observations of temperature andpV energy losscurves. Observed cooling curves~T vs n! and collapse curves~pV/n vs n! are found to depend onfinal cluster size but not the initial cluster ensemble. The evaporation mechanism consists of aninitial rapid cooling-and-collapse stage of a preliquid dense-gas-like cluster, followed by‘‘equilibrium’’ evaporation, and then another cooling stage of the resulting relatively incompressibleliquidlike subcluster. Elements of this dynamics evaporation mechanism are tested by examinationof finite n phase diagrams constructed using Metropolis Monte Carlo simulations of the fixedT andp ensemble. ©1995 American Institute of Physics.
i
a
tf
to
g
s
a
r
l
nr
ac
t—
toe
sterus-
usea-totterrgy,rgyhesaofort-lib-o-nas
ic--
ra-
on
ter-n-tndoner-anddy-
r
I. INTRODUCTION
It is well known, and well understood for macroscopsystems via thermodynamics, that both adiabatic expansand evaporation of a fluid cause cooling. Recent efforts hsought a more detailed understanding of these cooling pnomena at a microscopic level, particularly in the casemicroscopic cluster systems. For example, Klots1 has devel-oped a simple model of evaporation kinetic energy releafor water clusters based on treating the cluster as a collecof Debye oscillators and hindered rotors and accountingevaporative increase in surface tension.2 Stace3 has modeledevaporative rotational cooling~and heating! using phasespace theory applied to three-dimensional cluster-and-aseparation dynamics. Other studies simulate cluster evaption via molecular dynamics computations and a varietyinitial activated cluster states.4–7
A simple qualitative microscopic explanation of coolindue to adiabatic expansion or evaporation is straightforwa~Here we actually consider spontaneous adiabatic expanwhere there is no external wall on which the expanding flucan do work, see Ref. 8.! Both processes conserve the totenergy of the fluid~or liquid plus gas, in the case of evaporation!, and both involve an increase in interatomic sepations resulting in a net increase in potential energy.9 Adia-batic expansion and evaporation are entropy-controlprocesses, favoring looser configurations where the dominattractive potential tail is diminished. Since the kinetic eergy must decrease to conserve energy, the fluid is obse~via decreasing temperature! to cool. In addition, expansionand evaporation are driven by thermal energy, so their rdecreases with cooling. We deduce from simple dynamiconsiderations that cooling progresses at a diminishing runtil a stable fluid is achieved or until the fluid vanishes.
In this article, the simple atomic picture is elaboratespecifically in the case of small cluster expansion intovacuum. With small clusters there is the possibility of finisize effects not ordinarily described by thermodynamicsthe ‘‘graininess’’ of the atomic scale is important in sma
a!National Science and Engineering Research Council of Canada UniveResearch Fellow 1988–present.
J. Chem. Phys. 102 (10), 8 March 1995 0021-9606/95/102(10)/
cionvehe-of
seionor
omra-of
rd.ionidl-a-
edant-ved
tealate
dae
ll
cluster dynamics. In addition small clusters are amenablea close examination of the underlying dynamics. Below, wpresent a detailed dynamics mechanism of isolated cluevaporation which emerges from observations of small clter evaporation simulations.
An illustration of finite size effects is found in thep50neighborhood ofT p phase diagrams. Atp50 a bulk liquid~or solid! can evaporate at any temperature. This is becathe bulk material has essentially infinite energy, if it is mesured in atomic units. There is always sufficient energyovercome the barrier to single atom evaporation no mawhat the temperature. In contrast, because of its finite enea microscopic cluster of atoms has a non-negligible enethreshold below which evaporation cannot take place. Timplication for a bulk liquid in a vacuum is that it evaporateonly until it reaches microscopic proportions. In general,bulk liquid evaporates to an equilibrium state consistingan assortment of microscopic clusters. However, this assment of clusters actually constitutes the macroscopic equirium gas.10 Thus, from a macroscopic standpoint, the evapration of a bulk liquid in a vacuum proceeds to completiofor any initial temperature. Correspondingly, the liquid–gcoexistence curve in aT p phase diagram cuts theT axis atT50. We show below that theT p plane of a small collectionof argon atoms exhibits a coexistence band~see Sec. III!analogous to the coexistence curve of the thermodynamlimit bulk fluid. However, due to the non-negligible evaporation energy threshold, the finiten coexistence band cuts theT axis between 45 and 65 K. There is, effectively, a tempeture threshold below which small liquidlike~and solidlike!argon clusters can exist at zero pressure.
In this study we simulate the expansion of clusters ofnargon atoms into a vacuum in Sec. II, and we examine argphase diagrams for smalln ~21, 30, and 40! in Sec. III. Theevaporative cooling and collapse seen in Sec. II is characized as ‘‘universal.’’ Specifically, thermal and mechanical eergies~defined below! follow certain pathways independenof the initial activated-cluster ensemble temperature apressure. Only the final cluster size distribution dependsthese initial ensemble properties. Examination of the univsal pathways of thermal and mechanical energy losses,other observations, leads to construction of a detailed
sity
42274227/12/$6.00 © 1995 American Institute of Physics

a
n-
at
l
i
oe
x
s
-
o
n
ing
of
ersns.ndrsre-e-ueesbeonn
n-the
ateruper.ndnin
-.ed.
al,
ention
4228 Dumont, Jain, and Basile: Argon cluster evaporation dynamics
namical mechanism where the observed sequence of evaration events is divided into three stages. The last two stagare in accord with the observations of equilibrium evaportion in Sec. III.
In a companion article11 the cooling~T vs n! and col-lapse~pV/n vsn! data presented here are reproduced usingstatistical model, described briefly in Sec. IV, which effectively replaces trajectory propagation by anE J ensembleMetropolis Monte Carlo process.
II. CLUSTER EXPANSION IN A VACUUM
In the absence of constraining forces a cluster can frament if it has sufficient energy to overcome fragmentatiothresholds. Fragmentation is viewed as evaporation if ofragment~or subcluster! is much larger than the others. Successive evaporation is possible if product subclusters excetheir fragmentation~or evaporation! thresholds. The underly-ing molecular dynamics of activated-cluster sequentievaporation is readily studied. The only question is howchoose the initial activated-cluster ensemble. For exampwe could consider an ideal ‘‘experiment’’ wherein a smagroup of atoms are ‘‘transported’’~Star Trek style! into avacuum from a bulk characterized by specific temperatuand pressure. In such an experiment one controls the degof compression of the cluster and its kinetic energy via thbulk temperature and pressure. This permits an investigatof the effects of such initial cluster characteristics on subsquent evaporative dynamics.
Other molecular dynamics studies of cluster evaporatiemploy a variety of different initial ensembles. For examplMarkovic and Pettersson6 produce activated ArnNem viasimulated collisions with a hard surface. In Goldberget al.7
activated charged argon cluster ions are generated by simlated ionization. Real experiments typically employ photoecitation of an inserted chromophore,12,13 or ionization14 togenerate an activated cluster ensemble. This study of argcluster evaporation employs a simple initial cluster ensembsimilar to theT p ensemble described above. But, becausea universality described in this section, our results do ndepend on the choice of initial ensemble. They are, howevlimited to the case of neutral argon evaporation. Applicatioto real experimental situations requires modified forcesaccount for an inserted chromophore or electron holes. Asociated studies are deferred to future articles.
In this work we start with small clusters of argon atom~typically with n<50! at fixed temperature,Ti , within aspherical cavity of variable volume subject to a fixed extenal pressure,pi . The cavity wall is removed instantaneouslyleaving the cluster free to expand. The selection of cluststates from this ‘‘initial ensemble’’ is simulated using a Metropolis Monte Carlo algorithm adapted for theT p ensemblewhere the fixed volume is that of a spherical cavity.15 Thecluster initial conditions generated by this Monte Carlo procedure are then propagated numerically via Hamilton’s equtions for approximately 200 ps, a long time on the scaleargon cluster dynamics yet small enough to allow the propgation of sufficiently many trajectories to get converged esemble averages. Some 1 ns runs were carried out for co
J. Chem. Phys., Vol. 102,
po-es-
a-
g-ne
ed
lole,l
rereeeone-
n,
u--
onleofoter,ntos-
r-
er
-a-fa--m-
parison. The extended time scale presented nothqualitatively different from that described below.
The many-body argon potential is modeled as a sumtwo-body 6-12 Lennard-Jones potentials~eAr5119.4 K,sAr56.425 bohr!.16,17Hamilton’s equations are solved usingthe fourth order Runge–Kutta algorithm with step size,Dt50.015 ps. Trajectories computed with these paramettypically conserve angular momentum very accurately otime scales of interest, but energy tends to drift downwardHowever, the latter effect translates into temperature apV/n errors which are much smaller than Monte Carlo erroin even the most accurately determined average values psented below. In addition, the chaos inherent in thdynamics18 is expected to render numerical trajectory ensembles roughly indistinguishable from corresponding trtrajectory ensembles; i.e., whereas individual trajectorimay not be accurate, we expect ensemble dynamics towell represented. The need for rapid trajectory computatiinfluenced our adoption of simple potential energy functioand trajectory integrator.
Evaporation events in the course of a trajectory are idetified in terms of a graph-theoretic scheme used to define‘‘cluster.’’ Specifically, we assign a ‘‘bond’’ to pairs of atomswithin a certain maximum distance,r bond525 bohr.19A clus-ter is defined as a collection of atoms which determineconnected set of bonds. Evaporation occurs when a clusbreaks into a set of smaller subclusters. Typically, breakoccurs with the loss of 1 or 2 atoms by the largest subclustWe view the largest subcluster as the evaporating cluster afocus our attention on its properties. The cluster definitioemployed here is essentially the same as that describedRef. 2.
TemperatureT and mechanical energypV are observed,as a function of cluster sizen, through sequences of evaporation processes resulting in relatively stable ‘‘final’’ clustersThe times between evaporation events are also recordClusterT andpV are defined by
kT
25^~3n28!/@E2V~r !2JTu21~r !J/2#&21 ~1!
and
pV5nkT21
3K (j, j 8P@1,n#
r j j 8v8~r j j 8!L , ~2!
wherer j j 8 is the distance between thej th and j 8th atoms,rrepresents the complete cluster configuration~i.e., the full setof atomic position vectors!, and u(r )5( j51,nmj ~r j
212r j r jT!
is the inertia matrix with respect to center of mass~super-scriptT denotes transpose, i.e.,r j r j
T is a dyad!. Use is madein Eq. ~2! of the assumed pairwise character of the potentiV(r )5( j, j 8P[1,n]v(r j j 8), i.e., V(r ) is a sum of two bodyenergies,v(r j j 8). E andJ5( j51,nr j3pj are the cluster en-ergy and angular momentum which are conserved betweevaporation events. They are not conserved at evaporaevents due to the loss of atom~s!. The brackets &, denotetime average over the lifetime of then atom cluster.
Equation~1! is specific to the fixedEJ ensemble associ-ated with a cluster ofn atoms.20 It is derived by differenti-
No. 10, 8 March 1995

si
a
t
e
o
u
r
e
t
a
s
is
s
t
is
t
l
e
inn-
a-to
l
s-he
y-e-
x-
on-
sterith
ies,
4229Dumont, Jain, and Basile: Argon cluster evaporation dynamics
ating theEJ partition function with respect to energy. Thiensemble is appropriate as it corresponds to the long tlimit of trajectory time averages.21 The expression for tem-perature used here equates~kT/2!21 to the mean reciprocalvibrational kinetic energy per effective number of vibrationdegrees of freedom, 3n28. Since there are actually 3n26vibrational degrees of freedom, the connection betweentemperature and the more physically motivated mean kineenergy per degree of freedom breaks down whenn is small.Otherwise~n.7! these different definitions of temperaturproduce qualitatively similar results.
Equation~2! is adapted from an expression derived fthe canonical ensemble.22 The original expression differsonly in that its bracket denotes canonical ensemble averaAlong with T, this expression provides an unambiguocharacterization of the state of the cluster~distinct from thatprovided byT, except in the ideal gas limit!. The pressureand volume of a cluster expanding into a vacuum astrictly, zero and infinity, respectively; therefore, by themselvesp and V do not well characterize the state of thcluster. SincepV, which does conveniently characterize thcluster state, is an extensive quantity it is generally reporbelow in the form of the intensivepV/n. Note that althoughboth terms in Eq.~2! scale withn the intensive quantity stillhas ann dependence through the scaled virial term~secondterm! whenn is small.
It is instructive to consider the microscopic interprettion of pV/n which is deduced from Eq.~2!. The limit ofwell separated atoms corresponds to the ideal gas case wpV/n equals thermal energy,kT. Compressing such atomdecreasespV/n via attractive potential tail contributions tothe virial term. Here the value ofpV/n is governed by thedecrease in the cluster volume rather than the increase inpressure~diminished by attractive internal forces!. Such acluster resembles a nonideal dense gas. At sufficiently hcompression, further compression increases the repulcontribution to the virial~associated with smallr j j 8! morethan it decreases the attractive contribution. Such a cluclearly resembles a relatively incompressible liquid wherepV/n andp are positively correlated.
pV/n is viewed as a measure of cluster ‘‘looseness’’ witwo cases to be distinguished. In the case of a ‘‘dense-glike’’ cluster, largerpV/n corresponds to looser clusters. Thtrend is reversed in the denser ‘‘liquidlike’’ clusters. With thin mind we expect a minimumpV/n value ~with respect tocompression! to correspond to the transition between the twcluster types. This is shown in Sec. III, and in this section vdynamics simulations.
In the discussion below we treatT andpV/n as effective‘‘phase space’’ variables with temperature characterizingaverage atomic momentum, andpV/n characterizing thecluster configuration as described above. In this analogy wclassical mechanics the ‘‘mechanical energy,’’pV, and the‘‘thermal energy,’’ 32nkT, are roughly identified with poten-tial and kinetic energy, respectively.
A. Evaporative cooling, T versus n
A set of data was produced by the means describabove. In Fig. 1 we show averageT vs n for initial en-
J. Chem. Phys., Vol. 102
me
l
histic
r
ge.s
e,-
eed
-
here
the
ghive
terin
has-e
oia
he
ith
ed
sembles withni530, pi560 atm andTi5115, 120, and 125K. The averaging in question is with respect to the initiaensemble. Note that sinceT andpV ~pV is not shown in thisfigure! are recorded for each trajectory as sequences of timaverages~over the range ofn values!, it is necessary toweight each time average by its associated cluster lifetimeorder to get an unbiased average with respect to initial esemble. This is justified by appealing to Liouville’stheorem23 which tells us that the invariant phase space mesure associated with a trajectory segment is in proportionits length in time.
The pi and Ti values of Fig. 1 were chosen primarilybecause they generated interesting results. LargerTi and/orsmallerpi values produce loose, relatively energetic initiaclusters which evaporate~actually fragment! rapidly. In thiscase there is little opportunity for intracluster forces and asociated dynamics to have much impact on the course of tevaporation sequence and its outcome. SmallerTi and/orlarger pi values produce clusters which are more tightlbound. They evaporate slowly and are difficult to study because long trajectories present greater computational dmands. Very smallTi and/or very largepi produces clusterswhich essentially do not evaporate.24
Figure 1 shows the expansive cooling expected. For eample, theT values forn530 ~time average temperature upto the first evaporation event! are significantly lower than theassociated initial ensemble average temperatures,Ti . Theclusters experience rapid cooling due to adiabatic expansiimmediately after the spherical cavity wall is removed, before evaporation. Forn,30 it is impossible to distinguish,
FIG. 1. Average temperature cooling curves; average temperature vs clusize during evaporation sequence associated with initial ensembles wpi560 atm and initial temperatures,Ti5115 ~asterisks!, 120 ~triangles! and125 K ~squares!. Note that initial temperature,Ti , and averageT ~up to thefirst evaporation event! both appear asn530 points.Ti.T is indicative ofcooling due to adiabatic expansion. Data withn,6 are not shown. Errorsare small compared with variation ofT along the curves. The 115, 120, and125 K ensembles are represented by 31 597, 3 094, and 3 016 trajectorrespectively.
, No. 10, 8 March 1995

io
s
ae
h
n
ai
r
e
s
tpItdr
-eo
r
du
la
eep
e
d
-
-
4230 Dumont, Jain, and Basile: Argon cluster evaporation dynamics
with the data provided, cooling due to adiabatic expansfrom that due to evaporation. This is not a problem, thougsince it is not necessary to separate the two processes—entire evaporation sequence is a single adiabatic expaninto a vacuum with evaporation events signaling specmilestones. However, in our discussion of this and other dwe term all cooling ‘‘evaporative,’’ since evaporation is thmost obvious characteristic of cluster expansion invacuum. Clusters typically expand in a vacuum only in tsense that evaporated atoms occupy a greater effectiveume. In fact, the subcluster remaining after evaporationusually relatively collapsed on a volume per atom basis.
Figure 1 exhibits evaporative cooling in two apparestages, rapid initial cooling followed by a long sequenceslowly cooling evaporation steps. We first consider the lfew evaporation steps where there seems to be a slevaporative heating~at least in the case of 125 K!. At thispoint, we note that the figure only incorporates data assoated with final clusters withnf>7 atoms. Inclusion of alltrajectories produces similar curves but with a greatly ehanced upturn in temperature for smalln values. We havetraced this ‘‘anomaly’’ to the effective number of vibrationadegrees of freedom used in Eq.~1! ~3n28 as opposed to3n26!; scaling the data to ‘‘correct’’ this number producerelatively flat cooling curves in the smalln regime. Thisobservation lead us to question the use of the formal miccanonical temperature formula, Eq.~1!, used in this work.Nevertheless, because the formula works well forn.7 andthese largern values are the focus of the results presentbelow, we retain the formula in its current form.
Each temperature datum presented in Fig. 1 is an avage over all cluster states of a given size represented inevaporating cluster ensemble. In particular, there are clustates associated with every stage of the evaporation procSome of these clusters have essentially stopped evaporawhile others are much more energetic and continue evarating until a much smaller final cluster size is attained.order to separate out the potentially different characterisexpected from such disparate cluster states, we are leaconsidernf specific cooling curves where trajectories abinned according to the value ofnf .
Figure 2 showsnf specific cooling curves wherein averaging is performed only over sets of similar clusters evolvfrom the initial ensemble—similar in that they give rise tthe same final cluster size. Thenf specific cooling curvesseen here are typical. They are all characterized by thdistinct stages of evaporation. In the first stage~i.e., at nclose toni530!, there is rapid initial cooling. The seconstage consists of slow cooling near an effective temperatplateau always in the neighborhood ofT565 K. In the final‘‘quenching’’ stage there is rapid cooling, stopping at a retively stable final cluster. It is important to note, howevethat while the cooling seen in the final stage is rapid whviewed in terms of evaporation steps, it is not rapid whviewed in real time. This distinction results because evaration time scale increases dramatically for the last few stesee Fig. 3.
Qualitative features of the evaporative cooling seenFig. 2 are of much interest, and a physical understanding
J. Chem. Phys., Vol. 102
nh,theionialta
aevol-is
tofstght
ci-
n-
l
s
o-
d
er-theteress.ing,o-nicsto
e
d
ee
re
-r,nno-ps,
inof
these features is a principal goal of this article. Perhaps thmost striking feature is the agreement ofnf specific coolingcurves irrespective of initial ensemble temperature. Differ-ences evident in Fig. 1 are removed when data is binneaccording tonf . It follows that the differences in Fig. 1 aredue almost entirely to the different final cluster size distribu-tions ~shown in the second column of Fig. 4! associated withthe three initial ensembles. Note that Fig. 1 can be constructed by summing corresponding curves in Fig. 2 withweights taken from the final cluster size distributions of Fig.
FIG. 2. nf specific cooling curves from the data of Fig. 1 forpi560 atm,andTi5115 ~solid line!, 120 ~long dashed line!, and 125 K~short dashedline!. Errors are comparable to the evident fluctuations from smooth variation along these curves. The long dashed curves with3’s are for singletrajectories taken from theTi5115 K ensemble. Note how the latter curvesstraddle the universal average pathways.
FIG. 3. nf specific average cluster lifetimes during sequential evaporationfor pi560 atm, andTi5115 K.
, No. 10, 8 March 1995

ise
s
ed
r
ssree
f
tod-s
-ce
ar-g
tra-
4231Dumont, Jain, and Basile: Argon cluster evaporation dynamics
4. We conclude that, at least for the (Ti ,pi) cases consideredso far, the cooling curve depends principally onnf , and theinitial ensemble is manifest primarily in the distribution onf , i.e., how far the evaporation process proceeds on aage. The cooling curves of Fig. 2 are therefore suggestive‘‘universal’’ cluster-state pathways which arenf specific.
The apparent universality ofnf specific cooling curves isfurther investigated in Fig. 2 by including cooling curve daassociated with individual trajectories~one for each of thechosennf values! taken at random from the (Ti ,pi)5~115 K,60 atm! initial ensemble. The temperature distributions alothe evaporation sequence have variance ranging from 10K asn ranges from 30 to 9. These variances are manifesfluctuations seen in individual trajectory cooling data. However, the averages which we have thus far focused on cleemerge as a central pathway which the individual coolicurves straddle, and this behavior is in no way exceptionavirtually all randomly chosen trajectories exhibit similar behavior. The temperature distribution variance results frofluctuations in individual trajectory cooling curves, not fromsystematic variation of cooling curve pathway from one trjectory to another. It is therefore not surprising that differeensemble averages of such cooling curves produce the s‘‘universal’’ result.
The independence ofnf specific cooling curves on initialensemble is investigated withpi510 atm initial ensembles.To produce final cluster size distributions comparablethose forpi560 atm, smallerTi were required~see Fig. 4!.Figure 5 showspi510 atm cooling curves forTi570, 80,and 84 K. The~115 K, 60 atm! data of Fig. 2 are also shownfor comparison.
At pi510 atm the initial rapid cooling stage is not apronounced as for thepi560 atm data. However, the temperature plateau at;65 K and the final quenching stage appear just as before. Moreover, the initial systematic diffe
FIG. 4. Final cluster size distributions forpi510 and 60 atm in the left andright columns, respectively.
J. Chem. Phys., Vol. 10
fver-of
ta
ngto 6t as-arlyngl—-m
a-ntame
to
s--r-
ence between the 10 atm and 60 atm cooling curvesessentially eliminated after the first evaporation event. Th(Ti ,pi!5~50 K, 1.2 atm! ensemble was also treated. In thiscase, the low initial pressure generated initial clusters of lesthan 30 atoms~16–20!—there is rapid initial fragmentation.Nevertheless, cooling curves~not shown! of the resultantevaporating subclusters follow universal pathways in ththird stage and exhibit slow cooling about 60 K in the seconstage~with large fluctuations due to poor convergence of theavailable data!. In particular, the brief initial stage of sequen-tial evaporation of a 50 K subcluster exhibits heating in ordeto attain the plateau thermal energy.
Clearly, the strongly diminished initial rapid coolingstage is expected for the lowerTi values used in Fig. 5. Theinitial stage seen in Fig. 2 seems to be a period of exceenergy dissipation until the desired evaporation temperatuof near 65 K is attained. It is also the stage where the threaveraged cooling curves differed the most. WhenTi is closeto 65 K little energy dissipation is necessary and, in fact, iTi is less than 65 K, heating is required. It is important tonote that the heating observed in the latter case is duecollapse of the initially rather loose clusters in the associateinitial ensemble and the corresponding conversion of mechanical energy into thermal energy. Had the initial clusternot been so loose~i.e., if the initial pressure were not solow!, little or no evaporation would be seen.
The universality of the cooling curves, seen in the second and third stages of evaporation, ensures that our choiof initial ensemble does not affect the interpretation of thecooling curve data. It is reasonable to surmise that the StTrek style ‘‘transporter’’ experiment described at the beginning of this section would have produced the same coolin
FIG. 5. nf specific cooling curves forpi510 atm, andTi570 ~triangles,lower right panel only!, 80 ~long dashed line!, and 84 K~short dashed line!.Sufficient data was not available fornf,16 with Ti570 K ~see Fig. 4!.(Ti ,pi!5~115 K, 60 atm! data are included~solid line! for comparison. The70, 80, and 84 K ensembles are represented by 1001, 2874, and 5042jectories, respectively.
2, No. 10, 8 March 1995

si
oar
sb
d
e
ed
-
g
e
no
isrofin
e-
4232 Dumont, Jain, and Basile: Argon cluster evaporation dynamics
curves. It would be interesting to see if a yet broader rangeinitial ensembles and forces, such as those associated wexperiments, produces the same universal behavior. Wecurrently considering such future studies.
B. Final cluster size distribution and evaporativecollapse, n f and pV /n versus n
One of the most compelling observations arising fromexperimental studies of rare gas clusters is that of ‘‘magnumber’’ cluster sizes apparent in mass spectra taken subquent to supersonic jet expansion.25 Since we expect freeevaporation processes~and the equivalent reverse processe!to play a role in the production of stable neutral clustersthe supersonic jet, it is reasonable to suppose that the simlations of the current article might provide some insight intthe dynamical mechanism of magic number cluster formtion. We are thus led to examine the final cluster size distbutions resulting from the free expansions treated in thstudy. Note that the ‘‘final clusters’’ are the only clusterstable on a sufficiently long time scale to be observedmost experiments.
Inspection of final cluster size distributions in Fig. 4 ansimilar data~not shown! associated with different initial en-sembles shows no preferential formation of magic numbclusters. Our results do provide one clue, however. The oserved correlation of initial cluster ensemble and final clustdistribution suggest that activated cluster preparation mayimportant in the generation of magic numbers. Of coursthere is also the possibility that magic numbers are only asociated with ionized clusters, as these are the only clustobserved in experiments.25 The issue is not further addressehere.
In addition to temperature we computed the mechanicenergy per atom,pV/n, during the course of cluster evaporation. Figure 6 showsnf specific collapse curves~averagepV/n vs n binned according to final cluster size! with(Ti ,pi)5~115 K, 60 atm!, and individual trajectories takenfrom the same ensemble. Collapse curves for theTi5120and 125 K ensembles~each withpi560 atm! are also shown.Like the cooling curves, collapse curves exhibit a plateaupV/n during the second stage of evaporation. However, ulike the cooling curve data, the plateau inpV/n persists intothe last stage. Also, as in the case of cooling curves, collapcurves exhibit an apparent universality; i.e., thenf specificcollapse curves are relatively independent of initial ensemble. This universality is not as evident in the individuatrajectory data, however. Individual trajectories exhibit largfluctuations with less tendency to track the ‘‘universal’’ pathways than corresponding individual trajectory coolincurves. ThepV/n distribution variance ranges from 15 to 5K over the range ofn from 30 to 9. Since the averagepV/nvalues are smaller than the corresponding average temptures, thepV/n distributions are broader on a relative scale
An important difference betweenpV/n andT data arethe nf dependence of thepV/n plateau value which rangesfrom;16 K ~Ref. 17! for nf59 to;8 K for nf516; whereasthenf dependence of the temperature plateau is weak andclearly indicated by the data. Also, beyond the initial stageevaporation the temperature is not well correlated to the fin
J. Chem. Phys., Vol. 102,
ofithare
icse-
nu-
-i-is
y
erb-rbees-rs
al
inn-
se
-le-
ra-.
otfal
cluster size. In contrast, the mechanical energy per atomalways negatively correlated with final cluster size. LargepV/n leads to smaller clusters which retain the signaturegreater mechanical energy. This last point is made clearFig. 7 which overlaysnf specific cooling and collapse curves~in the top and bottom panels, respectively! associated withthe (Ti ,pi)5~115 K, 60 atm! ensemble.
It is interesting to explore the factors which determinthe final cluster size more closely. Figure 4 shows that increasingTi or decreasingpi decreases the typical final clus-
FIG. 6. nf specific averagepV/n collapse curves forpi560 atm, andTi5115 ~solid line!, 120 ~long dashed line!, and 125~short dashed line!.Individual trajectory data chosen from theTi5115 K ensemble are alsoshown~long dashed curves with3’s!.
FIG. 7. Overlayednf specific cooling~top panel! and collapse~bottompanel! curves for (Ti ,pi)5~115 K, 60 atm!.
No. 10, 8 March 1995

a
n
t
e
t—
e
e
h-g
ned
endyhe
che---
ht-r--
-t-ly
-
-
-be-ss-
e
t
is
-,
4233Dumont, Jain, and Basile: Argon cluster evaporation dynamics
ter size. The obvious conclusion that the initially hottesand/or loosest clusters evaporate most readily, leads usinvestigate the dynamical mechanism by which the initiexcess energy~thermal or mechanical! is translated into ad-ditional evaporation. We can already address this questioncomparing the differentnf specific cooling curves shown inFig. 7. The figure clearly shows, as one might expect, thclusters with the highestT andpV/n, after the initial adia-batic expansion of then530 atom cluster, are those whichlead to the smallest final cluster size. These are the hottand/or loosest clusters of the initial ensemble. Note that wassume positive correlation betweenpV/n and cluster loose-ness amongst initial configurations, i.e., dense-gas like cofigurations@see the discussion of Eq.~2!#. Conversely, thecoldest and/or tightest clusters lead to the largest final cluters.
As one might expect from a Fick’s law standpoint,26 thehottest clusters cool the fastest in the initial rapid coolinstage. However, they cool so fast that they end up coldestthe second cooling stage. In contrast the loosest clustersmain loosest throughout the entire evaporation process. Othe mechanical energy is always correlated with the extentevaporation. This and the fact that collapse curves exhibimore gradual transition to plateau behavior than coolincurves leads us to hypothesize that excess thermal eneextends evaporation by first being stored, as mechanicalergy, during the initial rapid cooling stage. It is the mechancal energy alone which drives the evaporation process afthe first stage. In this picture evaporation proceeds, afterfirst stage, via concerted atom ejection and remainingsubcluster collapse—no excess kinetic energy is requireThis hypothesis is further investigated in terms ofpV/n vsTand pV vs T curves shown in Fig. 8. In the first stage th‘‘evaporation pathways’’ of the top panel follow a roughlyconstant slope with points bunching up as the plateau stag
FIG. 8. Evaporation pathways from data of Fig. 7;pV/n vs T ~top panel!andpV vs T ~bottom panel!. Associatednf values have the same order inboth panels.
J. Chem. Phys., Vol. 102,
ttol
by
at
este
n-
s-
ginre-lyofagrgyn-i-terhe
d.
is
entered. The second stage corresponds to a kink in thepV/nvs T pathways~especially for the smallernf values! withfixed plateau valuepV/n andT. It is here that correlation ofT and final cluster size is lost. In the last stage, these patways bend into an almost horizontal band. It is interestinthat while this band spans a range ofpV/n values correlatedwith nf , the correspondingpV values shown in the bottompanel are very nearly the same.pV values appear to con-verge to near 120 K. It is also interesting that all of thepathways end up with a final temperature of about 50 K. Ithe last stage temperature is almost completely uncorrelatwith cluster size.
The plateaupV/n andT appear in the top panel of Fig.8 as kinks in the evaporation pathways associated with thbunching up of data points. These kinks separate the first alast stages of evaporation which both appear with roughlconstant slope. We propose that the kinks be viewed as tuniquely defined~as apV/n vs T point! equilibrium state ofa liquidlike cluster evaporating at zero pressure. Thenf de-pendence of the kink locations is a finite size effect—eachnvalue effectively has its own distinctpV/n vs T thermody-namic state space. With this proposal, the first stage of eaevaporation pathway is viewed as evaporation on the densgas-like side of condensation, while the third stage corresponds to the liquidlike side of the evaporation induced condensation process.
In the above picture, dense-gas-like clusters approaccondensation in the first stage of evaporation by loosing aoms with more than their share of both mechanical and themal energy. The second stage of evaporation is an ‘‘equilibrium’’ condensation stage withpV/n andT conservation~seeSec. III!. Eventually the evaporating cluster becomes decidedly liquidlike and the second stage gives way to the lasstage wherein the relatively incompressible liquidlike clusters loose only thermal energy upon evaporation, on a rapidincreasing time scale. There is even a slight increase inpV/nduring the liquidlike cooling stage, consistent with the behavior of an incompressible liquid wherein cluster tighteningdue to evaporation corresponds to an increasingpV/n. Tight-ening of a liquidlike cluster increases the repulsive component of the virial more than the attractive contribution isdecreased, see Eq.~2!. In contrast, as we have seen, tightening a dense-gas-like cluster decreases mechanical energycause the attractive contribution to the virial dominates itresponse. This distinction between liquidlike and dense-galike clusters is substantiated in Sec. II B with equilibriumMonte Carlo computations.
The convergence of all collapse curves to constantpVseen in the bottom panel of Fig. 8 provides an important cluregarding thenf dependence of the plateaupV/n values. Thelatter plateaus are clearly approximately reciprocal tonf . Inparticular the associated constantpV value of ;120 K isconsistent with a model wherein the low temperature limipV corresponds to the dissociation energy,Edis, of ann atomcluster.Edis is weakly dependent onn because theminimumenergy required to remove a single atom from the clusteralways~given our definition of cluster! associated with con-figurations for which the evaporating atom interacts primarily with only one of the remaining cluster atoms. Therefore
No. 10, 8 March 1995

-
i
oc
l
n
mt
ee
-
r
u
l
io
ainp
,rge
nt
ce
se
a-
k
4234 Dumont, Jain, and Basile: Argon cluster evaporation dynamics
Edis is close to 119 K, the well depth of the Ar–Ar LennardJones potential used in these computations.
The (T,pV/n) location of the condensationlike transi-tion, observed here as the second stage in our simulationevaporation dynamics, agrees with a phase-transition-liphenomenon examined in Sec. III via~T,p! ensemble MonteCarlo computations. Phase-transition-like phenomena habeen observed in other molecular dynamics studies of a wrange of atomic and molecular clusters. It is typically thsolidlike liquidlike transition that is most easilycharacterized.27
III. CLUSTER ‘‘PHASE DIAGRAMS’’
A. T p phase diagram
In macroscopic systems the liquid–gas phase transitiis most conveniently studied using phase diagrams whiassign phase labels to distinct regions in thermodynamstate space. For example, evaporation of a macroscopicuid to completion is manifest in aT p phase diagram by theliquid–gas coexistence curve intersecting the origin. In cotrast, a finite sized cluster generally cannot evaporatecompletion. In this section, we consider the phase diagraof finite size clusters in order to make the finite size effecexplicit. At the same time we are able to identify the stageof evaporation seen in Sec. II with equilibrium cluster state
The sameT p equilibrium ensemble used to generatinitial conditions in Sec. II was chosen for this study. Wconsider an ensemble ofni argon atoms in a variable-sizedspherical cavity with fixed external pressure,p, and tempera-ture,T. Ensemble averages are computed using the Metroplis Monte Carlo algorithm of Sec. II. Approximate coexistence curves appear as sharp changes in thermodynaobservables such as^E& and logV& considered as functionsof T andp. Here the brackets indicateT p ensemble average.Examples of such coexistence curves, seen as dense nabands of contours, are shown in Figs. 9 and 10 forni521,30, and 40. Figure 9 contrasts theni530 phase diagram withcorresponding data for bulk argon. The bulk argon is simlated using a variation on the second order virial series eqution of state. Specifically, the repulsive part of the seconvirial term is replaced by an infinite geometric series resuing in a van der Waals equation of state. Knowing the themodynamic state of the systemp, T, V, andni ~note that weeffectively considerni representative atoms from a bulk!,one can then calculate the energyE from its correspondingsecond order virial series.28 ~No geometric resummation isneeded forE.! Finite-size clusterT p ensemble average en-ergies are computed using
^E&53
2nikT1K (
j, j 8
v~r j j 8!L . ~3!
Theni530 equilibrium ensembles used as initial condtions in Sec. II are located in the phase diagrams. The tpanel of Fig. 9 shows that thepi560 atm initial ensemblescorrespond to supercritical fluids. We expect these initiconditions to have an excess of both thermal and mechanenergy. In addition one expects finite-size-effect fluctuatioof observables sampled from such ensembles. For exam
J. Chem. Phys., Vol. 102,
ofke
vedee
nhiciq-
-tossss.
o-
mic
row
-a-dt-r-
-p
lcalsle,
liquidlike states should exhibit small density fluctuationswhile states nearer the coexistence band should have lafluctuations in all observables.29 Fluctuations expected forthe pi560 atm supercritical initial ensembles are consistewith the dynamics observations of Sec. II. Thepi510 atminitial ensembles used in Sec. II are close to the coexistenband with theTi570 K well into the liquidlike region. IfTiis increased beyond 84 K into the gaslike part of the phadiagram, evaporation~actually fragmentation! is fast andleads to a predominance of very small final clusters. Altern
FIG. 9. T p phase diagrams; contours of^E& for 30 atoms~top panel! andbulk argon ~bottom panel!. The bulk argon data corresponds to the bulenergy per atom scaled byni530 for comparison with the top panel.
FIG. 10. T p phase diagrams forni521 ~top row!, 30 ~middle row!, and 40~bottom row!; contours of E& ~left column! and logV& ~right column!. Therectangular kinks in the contours are artifacts of the limited (T,p) spaceresolution.
No. 10, 8 March 1995
--this10asv-o-
ec.
b-
de
on
eheseum
he,f assv-umas-
s-
es
um
4235Dumont, Jain, and Basile: Argon cluster evaporation dynamics
tively, decreasingTi below 70 K produces very little evaporation on a reasonable time scale. Note the dramatic shifthe final cluster size distribution~see Fig. 4! in going fromTi580 K to 70 K. Not only does the distribution shift tolarger final clusters, but it also narrows as might be expecfrom a liquidlike ensemble with small fluctuations. ThTi580 and 84 K ensembles have broader final cluster sdistributions seen in Fig. 4. These are consistent with coistent region ensembles which have large fluctuations.29 It isinteresting that the large fluctuations in these ensemblesnot affect the apparent universality of the cooling and clapse curves of Sec. II.
Remarkably, the cooling-curve plateau temperature sin Sec. II emerges here as thep50 condensation temperature for 30 atoms. Theni530 liquid–gas coexistence bandshown in Figs. 9 and 10, clearly intersects theT axis at60–65 K. Of course, the Monte Carlo computation is ncarried out atp50, since at zero pressure the (T,p) en-semble is unbounded and Monte Carlo ensemble averaare not clearly defined. The identification of the plateau teperature with a zero-pressure liquid–gas coexistence equrium state is based on extrapolation of the available data aappears in the figure. In fact, close examination of theni530phase diagrams reveals that the coexistence band splitstwo bands at small pressure. There is a correspondingondary intersection with theT axis in the neighborhood of 55K. Thus, there appear to be two condensationlike transitioat zero pressure forni530. Higher resolution data at lowpressures~not shown here! actually show only the lowertemperature band intersecting theT axis, in the 50–55 Krange.
The following picture emerges when observationsni530 phase diagrams are compared with the results of SII: ~i! The low-resolution zero-pressure coexistence tempeture of ;65 K, seen in Figs. 9~b! and 10, matches thesecond-stage plateau temperature which is identified in SII with finite-size equilibrium condensation.~ii ! The high-resolution zero-pressure coexistence temperature of;50 Kcoincides with the lowest temperature attained in the thstage of evaporation seen in Sec. II. This latter temperatcorresponds to clusters with energies approaching theirsociation threshold and evaporation time scales rapidlyproaching infinity.
Figure 10 and other computations not presented hshow that zero-pressure coexistence temperatures aretively correlated toni . This trend persists in the range oni514–100. These observations are counterintuitive asknow that the zero pressure coexistence temperature meventually tend to zero asni→`. Apparently an approach tomacroscopic behavior does not set in untilni is much larger.We do not address this question further here—it could leadan interesting future study. Instead we focus on more detaaspects of the observed condensationlike transitions,note here that surprises are quite common when one attemto extrapolate finite size system behavior ton5`.30
B. Compression curves, Šn ‹ versus pV /^n &
In Sec. II evaporating clusters are characterized by mchanical energy in addition to temperature. We wish to co
J. Chem. Phys., Vol. 10
-t in
tedeizeex-
dool-
een-,
ot
gesm-ilib-s it
intosec-
ns
ofec.ra-
ec.
irduredis-ap-
ereposi-fweust
toiledandpts
e-m-
parepV/n for the dynamically evaporating clusters with ensemble averagepV/n values associated with the zeropressure liquid–gas coexistence states observed insection. However, using the volume which appears in Fig.means determining the total mechanical energy of liquid–gmixtures, not the liquidlike subcluster. To get ensemble aerage mechanical energy of the liquidlike subcluster we prceed by analyzing theni atom configurations of the MonteCarlo process in the graph-theoretic fashion described in SII. SubclusterpV is determined using Eq.~2! with T p en-semble average instead of time average. In principle, sucluster sizen varies from 0 toni in the coexistence region.Small liquidlike subclusters are observed in the gaslike siof the coexistence region, while nearni-atom subclusterscorrespond to the liquidlike side. Because the evaporatitransition state defined byr bond525 bohr is loose,19 there aregenerally residual subclusters well into gaslike portion of thphase diagram, even at the lowest pressures. We expect tsubclusters to represent dense-gas-like drops in equilibriwith a low density gas~approaching zero density asp→0!,rather than liquidlike drops; alternatively, they represent higdensity fluctuations in an otherwise low density gas. Nothowever, that the residual subclusters may be artifacts olong Monte Carlo relaxation time due to near unboundedneof the equilibrium configuration space at low pressures. Neertheless, whether the residual subclusters are equilibrigaslike drops or Monte Carlo metastable states, they are eily identified by small^n& and qualitatively distinct charac-teristics in comparison with liquidlike properties.
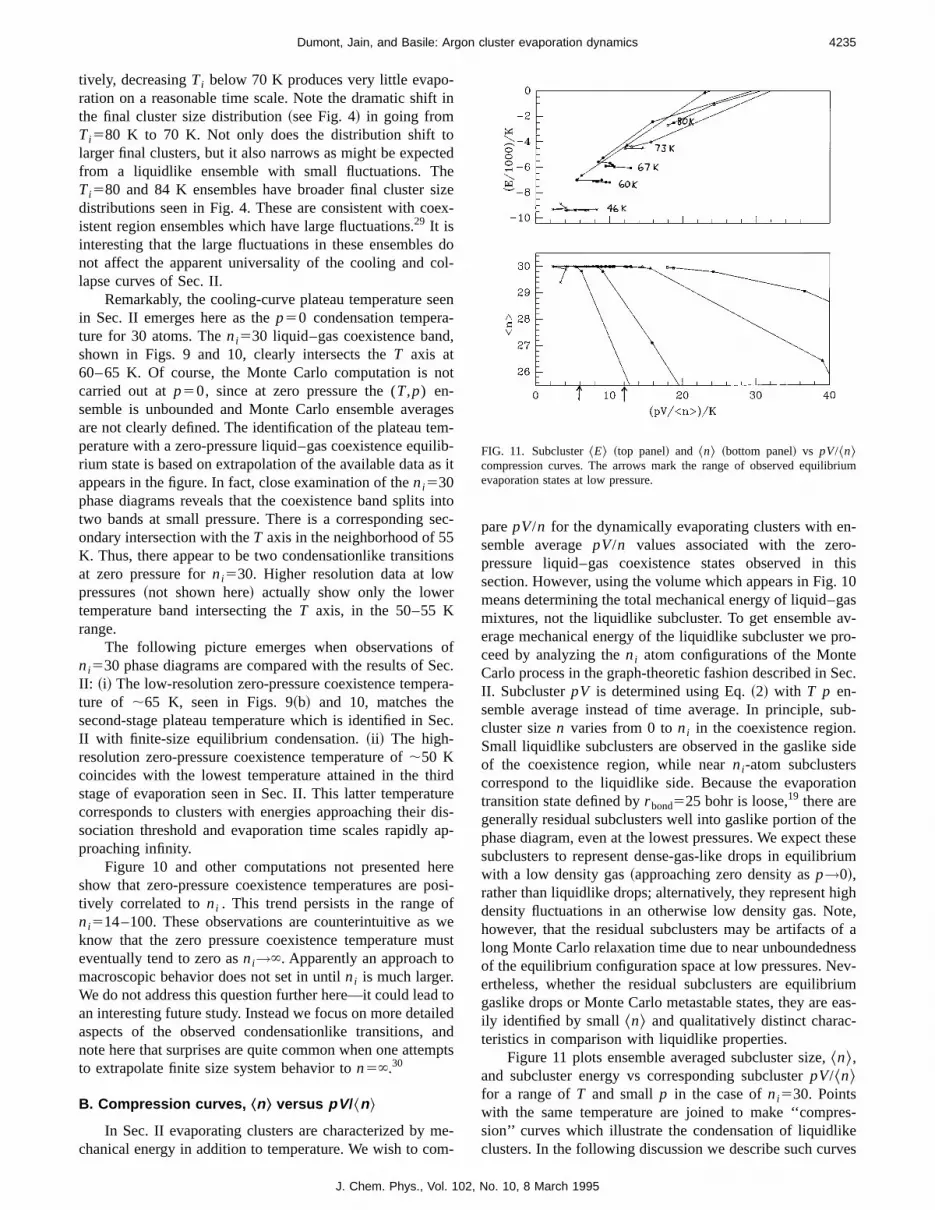
Figure 11 plots ensemble averaged subcluster size,^n&,and subcluster energy vs corresponding subclusterpV/^n&for a range ofT and smallp in the case ofni530. Pointswith the same temperature are joined to make ‘‘compresion’’ curves which illustrate the condensation of liquidlikeclusters. In the following discussion we describe such curv
FIG. 11. SubclusterE& ~top panel! and ^n& ~bottom panel! vs pV/^n&compression curves. The arrows mark the range of observed equilibrievaporation states at low pressure.
2, No. 10, 8 March 1995

he
d
e,ns
r-esctKto
of-idneal
ar
c-
e
4236 Dumont, Jain, and Basile: Argon cluster evaporation dynamics
in the sense of decompression; i.e., we imagine traversthe curves from large to smallp.
At all but the highest temperatures~,73 K! compressioncurves exhibit horizontal lines at^n&530 in the bottom panelof Fig. 11. ~The 80 K curve also has a few points near^n&530, but these are considered to be outside the neighhood of zero pressure.! Energy, in the top panel, is approximately horizontal at the same pressures. The subcluster srepresented on these lines are liquidlike. Characteristic ofincompressible liquid,pV/^n& decreases asp decreasesalong the horizontal lines. At all but the lowest temperatur~.46 K!, rapidly decreasingn&, and increasingE& andpV/^n& are observed with further decompression. Tmiddle range of temperatures show both types of behavThe turn in the compression curves signals a finite-size liqto gas phase transition; i.e., the change in response ofvirial to decompression is consistent with a transition froliquidlike to dense-gas-like clusters. The effect on the eneis more subtle.E& increases with decompression throughothe process, but at a much greater rate after the transitThe attractive contribution to the energy is dominant atpressures represented here. Negative energies are conswith an strong attractive component in Eq.~3!. However,since the liquidlike cluster configuration responds onweakly to decompression, its energy changes very little.contrast decompression of the dense-gas-like subclustesults in significant expansion and a corresponding loss ofder Waals attraction.
The equilibrium evaporation process in theT p en-semble is signaled byn& suddenly dropping away fromni .CorrespondingpV/^n& values are identified with this pro-cess. To get these values in the zero pressure limit, we nthat equilibrium evaporation pressure decreases withcreasing temperature, but only to a point. There are lowtemperatures for which equilibrium evaporation does not ocur; i.e., ^n& remains at 30. The zero-pressure equilibriuevaporation temperature is identified as the lowest tempeture for which a transition does occur. In Fig. 11 this temperature is seen to be about 46 K. If we do not insist on zpressure then the equilibrium evaporation temperaturepV/^n& have a pressure dependence. For example, forrange of pressures represented in Fig. 11, the equilibritemperatures range from 46 to 73 K~the 80 K compressioncurve shown does not have a distinct transition to a liquidliphase!. This range roughly corresponds to the zero-presscoexistence band seen in Figs. 9 and 10. Associated equrium evaporationpV/^n& is in the range of 6–12 K, in ac-cord with plateau values seen in Sec. II.
We extract equilibrium evaporationpV/^n& values, asdescribed above, for a range of temperatures~and associatedrange of pressures!. It is instructive to plot these equilibriumevaporation mechanical energies vs corresponding temptures. Such a plot is given in Fig. 12 forni517, 24, and 40.Theni dependence of the pathways is a finite-size effect wa trend consistent with that seen fornf specific pathwaysdetermined in Sec. II. Specifically, smallerni shifts the equi-librium evaporation pathways to largerpV/^n&. Figure 12also shows threeni530 dynamics evaporation pathways~theaverage, andnf59 and 15 specific pathways!. They map out
J. Chem. Phys., Vol. 10
ing
bor--tatesan
es
heior.uidthemrgyution.allistent
lyInr re-van
otede-erc-mra--
eroandtheum
keureilib-
era-
ith
a band in the thermodynamic state space which overlaps tequilibrium pathways band.
Whereas the dynamical evaporation data of Sec. II anthe phase diagrams of Sec. III A single outT>65 K as aprincipal evaporation temperature, Fig. 12 identifies a rangof evaporation temperatures. As described in Sec. II BT560–65 K is where temperature plateaus and evaporatiopathways kink. However, dynamical evaporation also occurat higher and lower temperatures~the first and third stages!,and Fig. 12 connects dynamical evaporation events with coresponding equilbrium evaporation states for all three stagof evaporation. Examination of the data used to construFig. 12 reveals that as temperature is increased above 65the associated equilibrium evaporation pressure beginsrise swiftly from about 2 atm. Equilibrium evaporation athigher temperature does not occur in the neighborhoodzero pressure. In Fig. 12, higher pressure equilibrium corresponds roughly to zero pressure evaporation of the preliqudense-gas-like clusters in the first stage of the evaporatiodynamics. Equilibrium evaporation in the zero-pressurneighborhood corresponds to stage two and three dynamicevaporation. Note, in particular, that both equilibrium anddynamical evaporation have a low temperature bound of ne50 K seen in Fig. 12.
C. p E and T E phase diagrams
Theni530 data used to construct the top panel of Fig. 9is presented here again in the form ofp E andT E phasediagrams. In Fig. 13, we plot isotherms and isobars as funtions ofp and^E& andT and^E&, respectively. The resultingphase diagrams are similar to thep V diagram traditionallyused to describe liquid–gas equilibrium. Both^E& and ^V&of coexistence states are sharply varying sinc
FIG. 12. Equilibrium evaporation pathways forni517 ~squares!, ni524~triangles!, and ni540 ~hexagons!. nf59 and nf515 specific pathways~open triangles and pentagons, respectively! and the nonspecific averagepathway~solid line! of Fig. 8 are included for comparison.
2, No. 10, 8 March 1995

thes-
can-a-s
f.in
ndareo-hiss,on-thec-er-
enrlon
-erze
reeofe
ar
y
nl
ter
athe
y-
4237Dumont, Jain, and Basile: Argon cluster evaporation dynamics
DEevap[^Egas&2^Eliq& and DVevap are positive. In the ther-modynamic limit, there is a coexistence region inp V space~also p E andT E spaces!, whereas coexistence states appear as a curve in theT p plane. Correspondingly, in Fig. 13,we seeni530 coexistence regions rather than bands. Tcoexistence regions, shown here with hash marks and bouing dashed lines, are associated with large energy jumalong isotherms and isobars. Although the relatively largfluctuations in the coexistence ensembles introduce signcant error into the average energy determinations, our intpretation stands because the liquidlike and dense-gas-isobars and isotherms are relatively smooth and easily idetified as outside the coexistence region.
Both panels of Fig. 13 show clearly that all of thepi560atm initial ensembles are supercritical fluid ensembles, whthe pi510 atm data correspond to subcritical coexisteninitial ensembles. These identifications are in accord with tdiscussion of Sec. III A.
IV. EVAPORATION SEQUENCE DYNAMICALEQUILIBRIUM
Section III describes a set of Monte Carlo computationwhich indicate a connection betweenT p ensemble equilib-rium evaporation states and the dynamical evaporation esembles studied in Sec. II. Here we consider the equilibriuquestion for the dynamical data more closely by discussithe results of a companion paper11 which presents a MonteCarlo algorithm based on assumptions of dynamical equilirium.
The statistical model of sequential decay processesveloped in Ref. 11 is applied to the argon cluster evaporati
FIG. 13. pE ~bottom panel! andT E ~top panel! phase diagrams forni530.These phase diagrams consist of points joined in isothermal and isobcurves, respectively. Coexistence regions are depicted by hash marksdashed line boundaries determined subjectively by inspection.
J. Chem. Phys., Vol. 102
-
hend-pseifi-er-liken-
ilecehe
s
n-mng
b-
de-on
process considered here. The statistical model is based onseparation of evaporation time scales from those of intracluter relaxation. It is valid if the transient ensemble ofn atomclusters which develops during the evaporation sequencebe treated as a set ofE J ensembles truncated at the evaporation transition state. This in turn depends on rapid intrcluster relaxation wherein typical evaporation trajectoriemap out~within the resolution determined by observablesTand pV/n! fixed E and J manifolds for each cluster sizeencountered in the evaporation sequence.
Model cooling and collapse curves are computed in Re11 and found to agree with the dynamical results describedSec. II.
We conclude from the agreement of the statistical adynamical data that the intracluster relaxation time scalesreasonably fast in comparison with evaporation. The evapration pathways seen in Sec. II are essentially statistical. Tis consistent with the relative universality of these pathwayas described above. It is also consistent with the correspdence of dynamically determined evaporation states toequilibrium states depicted in Sec. III. Furthermore, the sucess of the statistical model shows that the pathway univsality is understandable in terms of characteristics of fixedEandJ manifolds inn-atom phase spaces.
V. SUMMARY
The mechanism of argon cluster evaporation has beinvestigated using trajectory ensemble and Monte Catechniques. The principal conclusions of this investigatioare as follows:
~1! Dynamical cooling curves~T vs n! and collapse curves~pV/n vs n! specific to fixed final cluster size exhibitedan apparently ‘‘universality.’’ Specifically, they are independent of initial ensemble characteristics. The lattcharacteristics were manifest only in the final cluster sidistribution.
~2! The elucidated evaporation mechanism consists of thstages. First, there is rapid cooling and collapse stagea ‘‘preliquid’’ or dense-gas-like cluster. The second stagconsists of equilibriumlike evaporation at constantT andpV/n. The associated cooling curve plateaus at neT565 K for most final cluster sizes.pV/n plateau valuesexhibit an nf dependence which is well described bEdis/nf , whereEdis5119 K is the dissociation thresholdof an nf atom cluster. The third stage of evaporatioconsists of rapid~in terms of evaporation steps, not reatime! cooling of the resulting relatively incompressible‘‘liquidlike’’ subcluster. The evaporation time scale in-creases dramatically in this last stage.
~3! Metropolis Monte Carlo simulations of the fixedT andpensemble are used to determine a variety of finite clusphase diagrams. ComputedT p phase diagrams exhibit awell defined condensationlike process in the form ofcoexistence band which intersects zero pressure inneighborhood ofT>65 K for ni530. The associatedlower temperature bound on coexistence atT>50 K is inaccord with the lowest temperatures achieved in the dnamics simulations.
aricand
, No. 10, 8 March 1995

aa
g
l
se
in
.
f
ll-
he
nd
rss-
o-of
.
in
c-
es.er-tately
s.
4238 Dumont, Jain, and Basile: Argon cluster evaporation dynamics
ACKNOWLEDGMENTS
We appreciate financial support provided by the NaturSciences and Engineering Research Council of Canada,the Centers of Excellence in Molecular and Interfacial Dynamics.
1C. E. Klots, J. Phys. Chem.92, 5864 ~1988!; J. Chem. Phys.83, 5854~1985!.
2See also, C. L. Weakliem and H. Reiss, J. Chem. Phys.99, 5374 ~1993!for a similar statistical thermodynamics treatment of condensation.
3A. J. Stace, J. Chem. Phys.93, 6502~1990!.4S. Weerasinghe and F. G. Amar, J. Chem. Phys.98, 4967~1993!.5I1I~Ar!n association is studied using molecular dynamics in X. Hu and CC. Martens, J. Chem. Phys.99, 2654~1993!.
6Evaporation of ArnNem subsequent to collision~with hard surface! in-duced activation is simulated in N. Markovic and J. B. C. Pettersson,Chem. Phys.100, 3911~1994!.
7Evaporation of ionization activated cluster ions is treated in A. GoldberI. Last and T. F. George, J. Chem. Phys.100, 8277~1994!.
8The distinction between adiabatic and spontaneous~adiabatic! expansionis made, in J. H. Noggle,Physical Chemistry, 2nd ed.~Scott Foresman,Glenview, 1989!, p. 105.
9Note that the adiabatic cooling we study requires nonideality. The weknown cooling of an ideal gas undergoing adiabatic expansion dependsthe presence of a wall on which the gas does work and therefore lokinetic energy. Also, an ideal gas model of cooling in a supersonic jexpansion accounts only for a ‘‘geometric’’ cooling due to selection of onvelocity direction. See, for example, R. Kubo,Statistical Mechanics~North–Holland, Amsterdam, 1965!, p. 66.
10Recall the Mayer cluster expansion method for determining the propertof a nonideal gas by treating it as a collection of clusters. Whereas momers generally predominate, clusters of arbitrary size make some conbution to overall gas properties.
11R. S. Dumont, S. Jain, and A. G. Basile~in preparation!.12J. A. Smith, N. G. Gotts, J. F. Winkel, R. Hallett, C. A. Woodward, A. JStace, and B. J. Whitaker, J. Chem. Phys.97, 397 ~1992!.
13M. Gutmann, D. M. Willberg, and A. H. Zewail, J. Chem. Phys.97, 8048~1992!.
14See, for example, Y. Ji, M. Foltin, C. H. Liao, and T. D. Ma¨rk, J. Chem.Phys.96, 3624~1992!.
15D. W. Heermann,Computer Simulation Methods~Springer, Berlin, 1986!,Sec. 4.3.3 presents theT p ensemble Metropolis algorithm in the case oa rectangular cavity.
16Although it is well known that the Lennard-Jones potential does not acurately describe the two body argon interaction, it has served well
J. Chem. Phys., Vol. 102,
lnd-
.
J.
,
l-oneste
eso-tri-
c-in
describing argon cluster dynamics. See, for example, T. L. Beck, J. Jeinek, and R. S. Berry, J. Chem. Phys.87, 545~1987!. Also note that theseauthors claim that a Verlet~essentially time symmetric second order nu-merical integration! algorithm with step size of 0.01 ps produces backintegrable trajectories on the longest relaxation time scale relevant to tdynamical variables of interest in their study.
17We use thermal atomic units wherein the Boltzmann constant is unity aenergy has units of Kelvin.
18T. L. Beck, D. M. Leitner, and R. S. Berry, J. Chem. Phys.89, 1681~1988!.
19The evaporation transition state defined by the choice ofr bond525 bohr isloose ~see Ref. 11!. Such a choice is important to this study since ouinterpretation of the data depend on the neglect of transition state recroing which is rare in the case of a loose transition state.
20R. S. Dumont, J. Chem. Phys.96, 2203~1992!.21Application of the ergodic theorem to relate time average between evapration events toE J ensemble average is based on assumed ergodicitythe argon cluster dynamics~see Ref. 18! and a separation of intraclusterrelaxation and evaporation time scales~see Sec. IV and Ref. 11!.
22Equation~2! is a variant of the equation of state found on p. 182, in C. EHecht, Statistical Thermodynamics and Kinetic Theory~Freeman, NewYork, 1990!.
23A. I. Kinchin,Mathematical Foundations of Statistical Mechanics~Dover,New York, 1949!.
24Clusters with sufficiently large initial pressure will actually explode due totheir large repulsive potential energy. This effect requires pressure wellexcess of 103 atm however.
25See, for example, S. Sugano,Microcluster Physics~Springer, Berlin,1991!, Chap. 6, and references therein.
26Just as rate of diffusion scales with concentration gradient, heat condution is proportional to temperature gradient. See, L. E. Reichl,A ModernCourse in Statistical Physics~University of Texas, Austin, 1980!, Chap.13.
27See, for example, G. Del Mistro and A. J. Stace, J. Chem. Phys.99, 4656~1993!; 98, 3905 ~1993!; J. C. Shelley, R. J. LeRoy, and F. G. Amar,Chem. Phys. Lett.152, 14 ~1988!; T. L. Beck and R. S. Berry, J. Chem.Phys.88, 3910~1988!.
28T. L. Hill, An Introduction to Statistical Thermodynamics~Addison–Wesley, Reading, 1960!, Eq. ~15-83!, p. 284.
29States in the coexistence region correspond to a mixture of two phasSince first order phase transitions are associated with discontinuous thmodynamic state functions, the breadth of a coexistence ensemble sfunction distribution must span a discontinuity and is correspondingtypically large.
30See, for example, F. M. Beniere, A. Boutin, and J.-M. Simon, J. PhyChem.97, 10 472~1993!.
No. 10, 8 March 1995