Beam tests of the DØ uranium liquid argon end calorimeters
24
NUCLEAR INSTRUMENTS Nuclear Instruments and Methods in Physics Research A324 (1993) 53-76 &METHODS North-Holland IN PHYSICS RESEARCH Section A Beam tests of the DO uranium liquid argon end calorimeters DO Collaboration S . Abachi f, S . Ahn f, M . Abolins n, H . Aihara k , N . Amos f , Y . Antipov s, S .H . Aronson b, R . Astur n, R . Aveilaneda h , R .E . Avery q, A. R . Baden ', B . Baidin s, J . Bantly q, E . Barasch °°', J .F . Bartiett f, K. Bazizi d , T. Behnke °,2, V. Bezzubov s, P . Bhat f, G .C . Biazey `, S . Blessing q, D . Bogert f, F . Borcherding f , J . Borders `, N . Botko s, R . Brock n, A .D . Bross f, D . Buchholz q, N . Bulgakov s, V. Burtovoy s, J .M . Butler f, R . Cence ', S . Chekuiaev s, S . Cherny s, J . Chen a, J .H . Christenson f , A.R . Clark k , J . Cochran ', W .E . Cooper f, C . Cretsinger a,3, D . Cullen-Vidal `, D . Cutts c, 0 .1 . Dahi k, A. Davidenko s, K . De ', M . Demarteau v, D . Denisov s, S . Denisov s, W . Dharmaratna ', H .T . Diehi f, M . Diesburg f, R . Dixon f, P . Draper r,4, Y . Ducros °, G . Dugan f, S . Durston `, A . Dyakonenkov s, D . Eartly f, D . Edmunds n, A . Efimov s, J . Ellison d , R . Engelmann °, 0 . Eroshin s, V . Evdokimov s, S . Fahey °, M . Fatyga b, J . Featherly b, S . Feher ', T . Ferbel `, D . Finiey f, G . Finocchiaro v, H .E . Fisk f, G .E . Forden a, M . Fortner P, P . Franzini e, S . Fuess f , C .S . Gao f, T. Geld ', K. Genser f , B .G . Gibbard b, V . Glebov s, J.-F . Giicenstein °, B . Gobbi q, M . Goforth h , M .L. Good ', H .A. Gordon b , N . Graf f, P .D . Grannis v, D .R . Green f, J . Green P, H . Greenlee f , P . Grudberg k , J .A. Guida v, J .M . Guida b, W . Guryn b, N .J . Hadley ', H . Haggerty f , S . Hagopian h , R . Hall d , D . Hedin P, T. Heuring °, R . Hirosky ', J . Hoftun ', J .F . Hubbard °, T . Huehn d , R . Huson Y, S . Igarashi f, A.S . lto f, M .E . Johnson f , A.M . Jonckheere f, K. Johns a, H . Jostlein f , W . Karsh v, S . Kalm b, A. Kernan d, L. Kerth k , A. Kholodenko s, A. Kirunin s, E . Kistenev s, A . Kiatchko d , B . Klima f, B . Klochkov s, C . Klopfenstein ', V . Klyukhin s, V. Kochetkov s, W. Kononenko v, J . Kotcher °, 1 . Kotov s, J . Kourlas °, E . Kozlovsky s, S . Kunori ', S . Krzywdzinzski f, R. Lanou °, P . Laurens n, J . Lee-Franzini ', R . Li f, Q .Z . Li-Demarteau 2, J .T . Linnemann n, S .L . Linn h , R . Lipton f, F . Lobkowicz `, S.C . Loken k, S . Lökös °, P . Lucas f, R .J . Madaras k , R. Madden h , E . Malamud f, Ph . Mangeot u, B . Mansouiié u, 1 . Manning f , H.-S . Mao f, T. Marshall ', P .S . Martin f, H .J . Martin ', M . Marx ", A . Mayorov s, R . McCarthy ", J . McKinley ", X .C . Meng f , K .W . Merritt f, A. Milder a, A . Mincer °, P . Mooney °, R. Morphis P, M . Mudan °, C .T . Murphy f , F . Nang c, V .S . Narasimham ', H .A. Neal P . Nemethy °, D . Nesié °, K. Ng v, D . Norman ', L . Oesch ', E . Oltman k , N . Oshima f , D .L . Owen u,5, D .P . Owen n, R . Partridge ', M . Paterno ', A . Peryshkin f, M . Peters ', B . Pi °, H . Piekarz h, Y. Pischalnikov s, D . Pizzuto v, V . Piatonov s, A. Pluquet u, V . Podstavkov s, B .G . Pope n, H . Prosper f , S . Protopopescu b, R. Raja f , S . Rajagopalan q, L . Rasmussen v, A .L . Read f, T .M .-L . Ren', S . Repond P, V. Riadovikov s, M . Rijssenbeek ", N .A . Roe k , P . Rubinov ", R . Ruiand v, J . Rutherfoord a, R .D . Schamberger ', J . Sculli °, W . Selove r, A . Shkurenkov s, M . Shupe a, W . Smart f, D . Smith d , R .P . Smith f, G .R . Snow ', A .L . Spadafora k , R . Stephens g, M.L . Stevenson k, C . Stewart f, F . Stocker °,6, D . Stoyanova s, K . Streets ', M . Strovink k , A. Suhanov s, A . Taketani f , M . Tartaglia f, J . Teiger °, G . Theodosiou r °', J . Thompson v, S . Tisserant n, T.G . Trippe k, P.M . Tuts e, R . Van Berg r, A. Vorobiev s, H .D . Wahl h , H . Weerts n, W .A . Wenzel k , A .P . White ", J .T . White Y, S . Wiilis P, J.A . Wightman Y, S .J . Wimpenny d , Z . Wolf g,3, J . Womersiey h, Y . Xia n, P . Xie f , 0168-9002/93/$06 .00 © 1993 - Elsevier Science Publishers B .V . All rights reserved
-
Upload
www-centre-saclay -
Category
Documents
-
view
1 -
download
0
Transcript of Beam tests of the DØ uranium liquid argon end calorimeters

NUCLEARINSTRUMENTS
Nuclear Instruments and Methods in Physics Research A324 (1993) 53-76
&METHODSNorth-Holland
IN PHYSICSRESEARCH
Section A
Beam tests of the DO uranium liquid argon end calorimetersDO Collaboration
S. Abachi f, S . Ahn f, M. Abolins n, H. Aihara k, N. Amos f , Y . Antipov s, S.H . Aronson b,
R. Astur n, R. Aveilaneda h, R.E . Avery q, A.R. Baden ', B. Baidin s, J . Bantly q,E. Barasch °°', J.F . Bartiett f , K. Bazizi d , T. Behnke °,2, V. Bezzubov s, P. Bhat f ,G.C . Biazey `, S . Blessing q, D . Bogert f, F . Borcherding f , J . Borders `, N . Botko s,
R. Brock n, A.D. Bross f, D. Buchholz q, N. Bulgakov s, V. Burtovoy s, J.M . Butler f,
R. Cence ', S . Chekuiaev s, S. Cherny s, J . Chen a, J.H . Christenson f , A.R . Clark k ,J . Cochran ', W.E . Cooper f , C . Cretsinger a,3, D. Cullen-Vidal `, D. Cutts c, 0.1 . Dahi k,
A. Davidenko s, K. De ', M . Demarteau v, D . Denisov s, S . Denisov s, W. Dharmaratna ',H.T . Diehi f , M. Diesburg f, R. Dixon f, P. Draper r,4, Y. Ducros °, G. Dugan f , S . Durston `,A. Dyakonenkov s, D . Eartly f , D . Edmunds n, A. Efimov s, J . Ellison d , R . Engelmann °,0. Eroshin s, V. Evdokimov s, S . Fahey °, M. Fatyga b, J . Featherly b, S. Feher ', T . Ferbel `,D . Finiey f, G. Finocchiaro v, H.E. Fisk f , G.E. Forden a, M. Fortner P, P. Franzini e,
S. Fuess f , C.S . Gao f, T. Geld ', K. Genser f , B.G . Gibbard b, V. Glebov s, J.-F. Giicenstein °,B . Gobbi q, M. Goforth h, M.L. Good ', H.A. Gordon b , N. Graf f , P.D. Grannis v,
D.R. Green f , J . Green P, H. Greenlee f , P . Grudberg k, J.A. Guida v, J.M. Guida b,
W. Guryn b, N.J . Hadley ', H. Haggerty f , S . Hagopian h , R . Hall d , D. Hedin P, T. Heuring °,R . Hirosky ', J . Hoftun ', J.F . Hubbard °, T. Huehn d, R. Huson Y, S. Igarashi f , A.S . lto f,M.E. Johnson f , A.M. Jonckheere f , K. Johns a, H . Jostlein f , W. Karsh v, S. Kalm b,
A. Kernan d, L. Kerth k , A. Kholodenko s, A. Kirunin s, E. Kistenev s, A. Kiatchko d ,B . Klima f, B. Klochkov s, C. Klopfenstein ', V. Klyukhin s, V. Kochetkov s, W. Kononenko v,
J . Kotcher °, 1 . Kotov s, J . Kourlas °, E . Kozlovsky s, S . Kunori ', S . Krzywdzinzski f ,R. Lanou °, P . Laurens n, J . Lee-Franzini ', R . Li f, Q .Z. Li-Demarteau 2, J.T . Linnemann n,
S.L . Linn h , R . Lipton f , F . Lobkowicz `, S.C . Loken k, S. Lökös °, P . Lucas f , R.J . Madaras k,R. Madden h, E. Malamud f , Ph . Mangeot u, B. Mansouiié u, 1 . Manning f , H.-S . Mao f,
T. Marshall ', P.S . Martin f , H.J . Martin ', M. Marx ", A. Mayorov s, R. McCarthy ",J . McKinley ", X.C . Meng f , K.W. Merritt f , A. Milder a, A. Mincer °, P. Mooney °,R. Morphis P, M. Mudan °, C.T . Murphy f , F . Nang c, V.S . Narasimham ', H.A. NealP. Nemethy °, D. Nesié °, K. Ng v, D. Norman ', L . Oesch ', E. Oltman k , N. Oshima f ,D.L . Owen u,5, D.P . Owen n, R. Partridge ', M. Paterno ', A. Peryshkin f, M. Peters ', B . Pi °,H. Piekarz h, Y. Pischalnikov s, D. Pizzuto v, V. Piatonov s, A. Pluquet u, V. Podstavkov s,
B.G. Pope n, H. Prosper f , S . Protopopescu b, R. Raja f , S . Rajagopalan q, L . Rasmussen v,
A.L . Read f , T.M.-L . Ren', S . Repond P, V. Riadovikov s, M. Rijssenbeek ", N.A . Roe k ,P . Rubinov ", R. Ruiand v, J . Rutherfoord a, R.D. Schamberger ', J . Sculli °, W. Selove r,
A. Shkurenkov s, M. Shupe a, W. Smart f, D. Smith d , R.P . Smith f , G.R. Snow ',A.L . Spadafora k , R. Stephens g, M.L. Stevenson k, C. Stewart f , F . Stocker °,6, D. Stoyanova s,K. Streets ', M. Strovink k , A. Suhanov s, A. Taketani f , M. Tartaglia f, J . Teiger °,G. Theodosiou r°', J . Thompson v, S. Tisserant n, T.G. Trippe k, P.M. Tuts e, R. Van Berg r,
A. Vorobiev s, H.D. Wahl h, H. Weerts n,W.A. Wenzel k , A.P . White ", J.T . White Y,
S . Wiilis P, J.A. Wightman Y, S.J . Wimpenny d , Z . Wolf g,3, J . Womersiey h, Y. Xia n, P. Xie f ,
0168-9002/93/$06 .00 © 1993 - Elsevier Science Publishers B.V . All rights reserved

54
S Abachi et al. / Do uranium liquid argon end calorimeters
H. XU c, J. XU h , R. Yamada f, P. Yamin b, J . Yang ', MA. Yang d,a, C. Yoshikawa ',S . Youssef h , J. Yu ', R . Zeller ', Y.H. Zhoi f , Q. Zhu °, D. Zieniinska ', A . ZieniinskiA. Zotov s and A. Zylberstejn° University of Arizona, Tucson, AZ 85721, USA6 Brookhaven National Laboratory, Upton, NY 11973, USA' Brown University, Providence, RI 02912, USAd University of California, Riverside, CA 92521, USA" Columbia University, New York, NY 10027, USAf Fermi National Accelerator Laboratory, Batavia, IL 60510, USAx University of Florida, Gainesville, FL 32312, USA" Florida State University, Tallahassee, FL 32306, USA`University ofHawaii, Honolulu, HI 96822, USAJ Indiana University, Bloomington, IN 47401, USAk Lawrence Berkeley Laboratory, Berkeley, CA 94720, USAi University of Maryland, College Park, MD 20742, USAm University of Michigan, Ann Arbor, MI 48109, USA" Michigan State University, East Lansing, MI 48824, USA° New York University, New York, NY 10003, USAP Northern Illinois University, Dekalb, IL 60115, USAQ Northwestern University, Evanston, IL 60208, USAUniversity of Pennsylvania, Philadelphia, PA 19104, USA
s Institute of High Energy Physics, 142 284 Protvino, Russian Federation` University of Rochester, Rochester, NY 14627, USA" CEN-Saclay, 91191 Gif-sur-Yvette, France` State University of New York, Stony Brook, NY 11794, USA`" Tata Institute of Fundamental Research, Bombay 400 005, Indiax University of Texas, Arlington, TX 76019, USAr Texas A&M University, College Station, TX 77843, USA
Received 25 June 1992
We describe the results of beam tests of three uranium-liquid argon calorimeter modules constructed for the Do detector atthe Fermilab Tevatron collider. As part of the calibration procedure, these modules were exposed to beams of electrons, pions andmuons between 10 and 150 GeV/c before their installation in the end calorimeter of the completed DO detector. We obtain anelectromagnetic sampling resolution of 15.7%/F and constant term of 0.3% . The hadronic sampling resolution is 45%/F(degraded to 50%o/FE by the effects of upstream material) and the constant term is 4% . The calorimeter is linear to 0 .5%, and theelectromagnetic to hadronic response ratio is between 1 .02 and 1 .09 over this range of momenta . For an electron efficiency of 95%we obtain a rejection factor against pions of - 900-3000 for particles in the momentum range between 50 and 150 GeV/c . Wealso compare our results with the predictions of a detailed Monte Carlo simulation .
1. Introduction
The recently completed DO detector is a second-generation device for the study of proton-antiproton
i Now at Texas A&M University, College Station, TX, USA .Z Now at DESY, Hamburg, Germany .3 Now at Institute of High Energy Physics, Protvino, RussianFederation .
4 Now at Tata Institute of Fundamental Research, Bombay,India .
5 Now at Thinking Machines Inc ., Cambridge, MA, USA .6 Now at SSC Laboratory, Dallas, TX, USA.Now at Demokritos, Athens, Greece .
s Now at Fermi National Accelerator Laboratory, Batavia, IL,USA .
collisions at the Fermilab Tevatron collider . One of thedesign aims of DO was excellent calorimetry, to pro-vide good energy resolution for electrons, photons andjets, with good overall hermeticity . For these reasons,and for compactness, radiation hardness and uniform-ity of response, liquid argon with uranium absorberwas chosen for the calorimetry . Previous test beamstudies were performed to confirm this technical choice[1] and to test electromagnetic and prototype hadronicmodules [2] .A cutaway view of the DO calorimeters is shown in
fig . 1 . The system consists of three parts of roughlyequal size : a central calorimeter and two end calorime-ters . Each of the end calorimeters consists of a ring of16 outer hadronic (ECOH) calorimeter modules; inside

2. Description of the calorimeter modules
S . Abachi et al. / DO uranium liquid argon end calorimeters
,m
CENTRALCALORIMETER
ElectromagneticFine Hadronic
Coarse Hadronic
Fig . 1 . Isometric cutaway drawing of the calorimeters of the DO detector .
this is another ring of 16 middle hadronic (ECMH)modules ; and at the central core is a single large innerhadronic (ECIH) module . The latter weighs 32 tons,has a diameter of 1 .7 m and contains approximately5000 readout channels . In front of the ECIH, andcovering the inner part of the ECMH front faces, is afinely segmented electromagnetic calorimeter (ECEM),of 2.2 m diameter, with 7488 readout channels . Datapresented in this paper concern the ECMH, ECIH andECEM modules .A necessary part of the program of constructing this
detector was the calibration of the calorimeter . To thisend, data was taken with these three calorimeter mod-ules in a Fermilab test beam during May-August 1990,before their installation in DO . The goal was to estab-lish the absolute energy calibration of the calorimetermodules, and to transfer this calibration to DO. Thisincluded the choice of high voltage operating point,effects of possible argon contamination, understandingthe resolution of each detector, measuring the uni-formity of response over the module (especially in theregion of cracks, spacers and edges), and measure-ments of the shower shape . It also involved comparisonwith simulations to give confidence that the responseof modules not explicitly tested can be modelled accu-rately . The exercise also served to verify other aspectsof the detector system, such as the calorimeter elec-tronics and its calibration, the data acquisition, and theliquid argon purity monitors .
The basic construction of the liquid argon calorime-ters is shown in fig. 2. A stack of absorber plates
alternates with gaps filled with liquid argon . The showerdevelops in the dense absorber, and ionization is mea-sured in the argon . The basic sampling cell consists ofa depleted uranium absorber plate (4 mm thick in theECEM, 6 mm thick in the ECIH), a 2 .3 mm liquidargon gap, a NEMA G-10 signal board, and another2.3 mm argon gap . The ECEM and ECIH signal boardsare five layer printed circuit boards with copper signalpads on the outer surfaces and signal traces on theinnermost layer which bring the signals to connectorsat the outer radius of the module . Two shieldinggroundplanes reduce crosstalk to a negligible level .The boards were assembled into disks from 22.5°wedges, and then covered with face-sheet disks of 0.5mm thick G-10 that had been screen-printed with a
4.0 2.3 4.3 (mm)
1 unit cell
55
Fig . 2 . Cross section through the basic sampling cell of theECEM and ECIH calorimeters, showing uranium plates, liq-
uid argon gaps and a multilayer signal board .

56
thin layer of high resistivity carbon-loaded epoxy. Thisserves as a positive high voltage electrode; both thesignal pads and the absorber plates are at groundpotential, the face-sheet serving as a blocking capaci-tor . The normal operating voltage is 2.5 kV, corre-sponding to a drift field of 1.1 kV/mm in the gap (seesection 6 for a description of the high voltage behavior).
The ECEM electromagnetic calorimeter module [3]provides full azimuthal (0) coverage in the forwarddirection; 0 is the angle in the plane perpendicular tothe beam. The module covers the polar angle region upto 28° from the beamline (pseudorapidity, Y7 =-In tan(0/2) > 1.4) . The module is shown in fig. 3. Itcontains 18 sampling cells in depth and has a totalthickness of 238 mm (approximately 20 radiationlengths at normal incidence) . Signals are read out infour separate longitudinal layers, respectively 2, 2, 6and 8 sampling gaps in depth (0 .3, 2.6, 7.9 and 9.3radiation lengths) . Transverse segmentation is providedby readout pad electrodes on the signal boards, eachcovering (typically) an 71,(~ interval of i1?1 x AO = 0.1x 0.1 . In the third longitudinal layer, which typicallycontains 65% of the shower energy, the transversesegmentation is made finer, 0q x AO (0.05 x 0.05), toprovide better shower position resolution . The elec-trodes are arranged in a semiprojective tower geometrywhich lines up with that of the ECIH behind . Thetowers are semiprojective rather than truly projectivein that the same pad layout is used for pairs of adja-cent readout boards (and for sets of four in the lastlayer) in order to reduce costs . The between-tower
S. Abachi et al. / Do uranium liquid argon end calorimeters
w. _
Fig. 3 . Isometric view of an ECEM calorimeter module .
boundaries are therefore "staircases" rather thanplanes . In order to minimize losses due to internalcracks, the module is built as a monolithic unit . Thesignal boards and absorber plates are preassembledinto disks of approximately 1 m radius and then stackedto assemble the module .
The first two ECEM absorber plates are thin (1 .6mm) stainless steel disks in order to be sensitive toshowers initiated in the cryostat walls just upstream(whose thickness is about 2 radiation lengths) and thusto monitor the energy loss therein. The remainingabsorber plates are 4 mm thick rolled depleted ura-nium . The weight of the absorber and signal disks iscarried by an aluminum tube around the beampipe .This in turn is supported by a 2 cm thick stainless steelstrongback in the middle of the module, which isattached to the external mountings. The strongback isfollowed by a thin steel absorber disk so that theaverage fraction of energy deposited in the argon forthese two cells, as determined by Monte Carlo simula-tion for 50 GeV/c electrons, is the same as that of auranium cell .
The hadronic (ECIH and ECMH) modules eachcontain five longitudinal layers . The first four layers,which are 1.3, 1 .2, 1.2 and 1 .2 interaction lengths indepth, use fifteen 6 mm thick absorber plates made ofuranium-2% niobium alloy. The fifth layer, which con-tains an additional 3 .6 interaction lengths, uses thir-teen absorber plates of 46.5 mm stainless steel forreasons of economy. As in the ECEM, there is a dual2.3 mm argon gap with a central G-10 signal board

between each pair of absorber plates . The uraniumabsorber plates in the ECIH were made in two semicir-cles, with alternate plates having the crack between thetwo halves running horizontally and vertically . In thehadronic modules the semiprojective cells each cover0 ,r7 X A0 = 0.1 X 0.1 . In the ECIH module, multilayersignal boards are used as in the ECEM; for the smallerECMH module, surface traces are used to bring outthe signals as the distances to the edge of the moduleare much shorter .
3. Beam test layout
The calibration was carried out in the NeutrinoWest secondary beam at Fermilab . Fig . 4 shows aschematic of the beamline . The beam momentum set-tings used were between 10 and 150 GeV/c. The beampolarity was negative, and particles available were ir-,e - and w-. The electron beam was produced using a
S. Abachi et al. / DO uranium liquid argon end calorimeters
lead sheet to convert photons from neutral pion de-cays, while the muon beam used a beam dump toabsorb all secondary particles except muons. The beamwas operated in slow spill mode over a 22 s interval,with the instantaneous rate normally restricted to a fewthousand particles per second (to limit the effects ofpileup in the calorimeter). The beam at the calorimeterhad a momentum spread of 1 .1% and approximatelyGaussian profiles, with width o = 1 .5 cm horizontallyand 1 .1 cm vertically. The beamline was instrumentedwith scintillation counters to form the beam trigger .Proportional wire counters with 1 mm wire spacingwere provided for reconstruction of beam particle tra-jectory and momentum, and two threshold Cherenkovcounters were used for electron identification .
The calorimeter modules to be tested were enclosedwithin a double-walled liquid argon cryostat vessel .The cryostat was cylindrical, approximately 3 m indiameter and 5 m long . It was mounted on a motorizedtransporter system able to move the vessel through the
Fig. 4 . Schematic drawing of the Neutrino West test beam at Fermilab showing the beam line elements .
5 7
58
following ranges of motion:- 190° rotation about a vertical axis ;- ± 15° rotation about the horizontal long axis of the
cylinder;- 3.5 m horizontal translation perpendicular to thebeam;
- 0.75 m vertical translation .These motions were sufficient to allow the beam to
be directed into the modules along the trajectory thatwould be followed by particles from the DO interac-tion point, over a range of pseudorapidity, azimuthalangle, and interaction point positions within the beamcrossing . A PC-based control system was used to drivethe transporter ; the operator could enter the desiredposition in the DO coordinate system, and the re-quired motion on each of the four motors would becalculated and executed . The transporter also enabledthe cryostat to be positioned for loading of the mod-ules into the cryostat through one end. The beamentered the cryostat through a thin end window con-sisting of two 1 .6 mm steel plates .
The cryogenic system supplied the cryostat withhigh purity liquid argon and with liquid nitrogen forcooling purposes . The system maintained the tempera-ture within ± 1 K of the nominal 90 K and the pressurewithin ±0.5 psi of the nominal 20 psi(a) . Cooldown ofthe calorimeter modules took about four days and wasmonitored with approximately 70 resistive temperaturesensors mounted on the cryostat and within the mod-ules .
The arrangement of the modules within the cryostatis shown in fig. 5. It should be noted that the ECEMand ECIH modules were in the correct relationship to
S Abachi et al. / DO uranium liquid argon end calorimeters
each other, and that extra material in the form ofaluminum and steel plates was included to mock upthe material that will be present upstream of them inthe full DO detector . This consisted of a foamedplastic argon excluder, a 2.5 cm thick steel plate tosimulate the EC cryostat walls, and a 4.4 cm thickaluminum plate at small angles to simulate the vertexdetector end plates and electronics.
Behind the ECIH, an ECMH module was mountedalso on the beam axis, which is not its position in thefull DO detector . This enabled measurements to bemade of the amount of shower energy leaking from theECIH down the beam pipe, and it was also exposeddirectly to electron and pion beams passing throughthe simulated DO beam pipe . This was a 5 cm diame-ter stainless steel tube, filled with helium gas to reducethe amount of material upstream of the ECMH.
The instrumented region in the module array cov-ered approximately 60° in azimuth, together with allazimuths for the region around the beampipe . This waslarge enough for hadronic shower containment andallowed the beam to be scanned over various areas ofinterest in the modules. Approximately 1450 ECEMchannels, 2400 ECIH channels and 120 ECMH chan-nels were read out. This represents about 10% of thetotal number of calorimeter channels in the full DOdetector .
4. Monte Carlo simulation
In order to verify our understanding of thecalorimeter behavior, a comprehensive simulation of--
ARGON EXCLUDER
CRYOSTAT SHELL
Fig . 5 . Arrangement of calorimeter modules within the cryostat .
St

fort was undertaken using the CERN Monte Carloprogram GEANT [4] . This program provides a frame-work for tracking particles through the detector geom-etry and simulating physics processes of the shower.The detector geometry was modelled in considerabledetail, including individual uranium plates, argon gapsand readout boards throughout the modules, the cor-rect materials upstream of the calorimeters includingbeamline instrumentation, and the cryostat vessels .Tracking in the resulting detailed geometry is slowbecause of the many independent volumes involved ;nevertheless, for single-particle test-beam events, thetime taken (of the order of 24 min to simulate a 50GeV/c incident pion using a DEC VAXstation 3100-M76) was considered tolerable .
The GEANT geometry was created from text filesdescribing the detectors, using a DO-developed geom-etry-building program [5] . The Monte Carlo programitself was designed to share a common framework withthe full DO detector Monte Carlo, with different op-tions selected by the user at link time . This package oftools for the use of GEANT will be described in moredetail in a future paper . Version 3.14 of GEANT wasused, with the tracking carried down to 10 keV forelectromagnetically interacting particles and 100 keVfor hadronic particles . The output events were in thesame format as real data and could be read with thesame programs, facilitating analysis and comparisons .
5 . Electronics and calibration
A crucial aspect in establishing the absolute calibra-tion of the DO calorimeter is the understanding of theperformance of the calorimeter electronics .
5.1 . Detector electronics
The calorimeter signals are brought out of the cryo-stat through feedthrough ports. Inside the cryostat thesignals are ordered so that physically close towers areclose to each other on the cables . This allows signalsfrom many Y1, ¢ towers from a particular depth toappear on a single multiconductor cable . The signalsare reordered in the feedthrough ports so that all thereadout cells of a A71 x A0 = 0.2 x 0.2 semiprojectivetower exit on two adjacent multiconductor cables, facil-itating the formation of a fast trigger . Short runs ofcables connect the external side of the feedthrough tolow noise hybrid charge-sensitive amplifiers (preamps) .Two versions of preamps are used, one with a 5 pF andone with a 10 pF feedback capacitor. The 10 pFversion is used in layers 3 and 4 of the electromagneticsection of the calorimeter, where the largest signalsoccur .
S. Abachi et al. / DO uranium liquid argon end calorimeters 59
The output voltages of the preamps are fed into ashaping and sampling circuit, known as the base linesubtractor (BLS) [6] . The shaping in the front end ofthe BLS hybrid consists of a 430 ns integration and a33 Ws differentiation . In addition, there is a gain of 3 tochange the full scale from 3.3 V at the preamp outputto 10 V at the sampling stage . The shaped signals peakbetween 2 and 2.4 ws, depending on the detectorcapacitance, and have a broad maximum around 2.2Ws . Baseline subtraction from dual sampling followsthe shaping. Two analog memory cells follow the signaluntil a trigger is received from the counters in thebeam. On arrival of this trigger, one memory cellsamples the delayed calorimeter signal before it hasbegun to rise, forming the baseline sample. The secondmemory cell holds the signal 2.2 ws later, to form thepeak sample . The difference between the peak and thebaseline is sent to the ADC.
Fifteen bit dynamic range is obtained with low cost12 bit successive approximation ADCs by using preci-sion X 8-or- x 1 amplifiers, whose gains can be forcedinto either of the two values, or selected automaticallyaccording to the signal amplitude . If the differencesignal reaching these amplifiers is less than 1.25 V, it isamplified eightfold and the result digitized by the 12bit ADC circuitry . Larger signals are digitized directly,with no additional analog gain, and the resulting ADCoutput digitally shifted by 3 bits [6] .
The ADCs digitize 24 input signals simultaneouslyin about 10 ws, and repeat this cycle 16 times tocomplete digitizing all 16 X 24 channels in one ADCcard . Because of the X8-or-x 1 amplification, the dy-namic range of the measurements is 2 15 . The ADCsreside in a VME crate that reads the outputs into aVME buffer, which drives the data cable . The datacable carries the data to the dual-port memories of aset of four DEC MicroVAX-11 computers .
The ADCs can perform pedestal subtraction andzero-suppression separately for each channel, thoughin fact these functions were performed offline duringthis test-beam run . During the whole running period,pedestal and pulser runs were taken on a regular basis.The pedestals were stable to within 1 ADC count(0.4% of a typical pedestal).
5 .2. Noise
The performance of a system with a very largenumber of electronic channels can be severely affectedby the presence of noise . Consider the variance S2 ofthe signal obtained by summing N channels (to mea-sure total energy, for example) . For simplicity we canassume that each channel has the same random noise012 and that there is a cross-correlation c 2 betweenpairs of channels. Then
S2 =No- 2 +N(N- 1)c2 .

60
As N becomes large, the random noise o-2 must bekept low to obtain a reliable measurement. The secondterm, N(N- 1)c 2 grows even faster ; this is the so-called"coherent noise", in which channels tend to fluctuatetogether. The coherent and random noise become equalwhen N=Q2/C Z channels are added together, so it isnecessary to ensure that the coherent noise remainssmall or else it will dominate . The DO electronicssystem is designed to ensure that both random andcoherent noise remain manageably low.
The rms noise voltage measured by the ADC isproportional to the noise density and the bandwidth ofthe system, and is linear in the total detector cellcapacitance [7,8] . Fig. 6a shows the distribution of thestandard deviations of the pedestals, taken in the X8-mode, versus the detector cell capacitance CD, for thecase where the high voltage on the signal boards isturned off (and hence there are no signals from ura-nium radioactivity) . The linear dependence on the de-tector cell capacitance can be seen quite clearly . Thisdependence arises because the amplifier noise consistsof an (equivalent) series voltage source and a parallelcurrent source at the amplifier input. The voltagesource supplies an amount of charge proportional tothe detector cell capacitance, accounting for the linearslope, while the current source supplies a constantcharge which accounts for the offset at C,=0.Therandom noise per channel corresponds to about 150-200 wV at the preamp output . ?t should be noted that100 wV correspond to approximately one ADC count,which represents a charge of 3000 electrons at thepreamp input. Fig. 6b shows the same scatter plot withthe high voltage applied to the signal boards . Thebroadening of the distribution is due to the uraniumnoise. It is interesting to note that for some channelsthe pedestal width is the same for both cases. These
S . Abachc et al. / DO uranium liquid argon end calorimeters
channels, typically the channels with a large capaci-tance, are the readout channels of the coarse sectionsof the calorimeter modules that use stainless steelrather than uranium as absorber .
In order to understand the effect of radioactivedecays of uranium on pedestal distributions, a simpleMonte Carlo was written which simulates pileup ofminimum ionizing particles in the liquid argon gaps . Inthis study, it was assumed that all effects may besimulated using only minimum ionizing particles. Thecurrent induced in an argon gap by uranium activity iswell established at 4 pA per cm2 of uranium surface,which may be converted to a mean time betweendecays, r . This depends only on the amount of uraniumsurface area that is exposed. Using this time distribu-tion for radioactive decays, a uranium noise spectrumwas generated by assuming that the signal amplitudewas the same as that of cosmic rays, but that the timerelative to the trigger was random. The known timedependence of the calorimeter pulse after shaping wasused to derive the signal. This uranium noise signal isnon-Gaussian because the calorimeter pulse has anasymmetric time dependence . In addition to this ura-nium noise, there is a capacitance noise from theamplifiers, which is Gaussian . The convolution of thesedistributions is shown in fig. 7, superimposed upon themeasured pedestal distribution of a central tower. Theagreement is excellent.
Much effort was spent grounding and shielding thepreamplifier/BLS system to minimize coherent noisefrom oscillations, pickup and crosstalk; all detectedsources were eliminated. The level of coherent noise isconsistent with zero ; an upper limit based purely onthe measurement precision is 5-7 wV per channel. Thiscorresponds to a charge of about 150 electrons perchannel at the preamp input. These measurements
2000 4000 6000 8000 2000 4000 6000Capacitance (pF)
Capacitance (pF)8000
Fig . 6. Widths of pedestals taken in X8 mode as a function of detector cell capacitance ; the detector high voltage was off in (a),and at nominal voltage in (b) .

were repeated at the full DO detector, with a factortwo higher precision, and again most channels showedno coherent noise at the threshold of sensitivity. Thenumber of channels that can be added before thecoherent noise starts to dominate is thus at least 2000channels . A typical electron shower contains 100 cellswith signals above the zero-suppression threshold; ahadron shower, 400. The noise is low enough to permitminimum ionizing particles to be detected unambigu-ously in the calorimeter (see section 10). The signal fora minimum ionizing particle is about 10 ADC countsper centimeter of liquid argon.
5.3. Gain calibration
A precision resistor (0.1% tolerance) is connectedto the input of each preamp channel. This allowsmeasurement of the relative response of all channelsusing a pulser system [8,91, which consists of a currentsource, an attenuator box (to control the amplitude ofthe injected charge) and a coaxial switch box. During apulser calibration run the system steps through 32switch positions of the switch box, with a pattern of 144channels available at each position of the switch .
Given an input voltage V(t) at the input to thepreamp, the output voltage is given approximately (seefig. 8) by :
V°ut =
RC F
ACF+CD '
~2)
where CF is the feedback capacitance, CD is the detec-tor capacitance, R is a resistance in series with thepulser, and A is the do open-loop gain of the preamp.To ensure an equal response for all channels, R = 499W and 249 kfl: were used for the CF = 5 pF and 10
500
400
d 300w
200
100
0
fV(t) dt
ACF
Fig. 7. Simulated distribution of pedestals, in ADC counts, fora central IH tower, including the effects of uranium decaysconvoluted with capacitive noise (points) ; superimposed is a
measured pedestal distribution (solid line).
S. Abachi et al. / DO uranium liquid argon end calorimeters
Fig . 8. Schematic of the pulser input to the DO calorimeterpreamplifier .
pF channels respectively . The detector capacitance CDranges from 1.5 to 5.0 nF, and the open loop gainA = 5000. The width of the pulse from the pulser isabout 300 ns. The uniformity of the pulser distributionfor all channels has been measured to be better than0.25%, with an rms of about 0.1%. The relative timingaccuracy in the full system will be ±10 ns, with acombined error from all sources on the measured gainof < 0.2%.
The pulses are digitized and analyzed online andtwo gains are obtained for each channel, correspondingto the x 1 and x 8 amplifier settings .
The linearity of the gains was studied using pulserruns taken at a series of attenuator settings . The out-put ADC values, corrected for the detector and feed-back capacitance as given above, were fitted to straightlines for both the x 1 and x 8 amplification regions.The results for a typical channel are shown in fig . 9.Plotted here is the ADC output versus pulser ampli-tude . The pulser covers an energy range from 2.5 to 50GeV. The deviations from a straight line fit for allchannels are less than ±0.25%, and the channel-to-channel relative response for a given pulser amplitudehas an rms spread of = 2.3%.
Events from a single pulser pattern of 144 channels,were used to study gain stability. The rms gain varia-tion over time is about 0.8%. To remove temperaturedependences, a linear correction [81 was applied to the
61
Fig . 9 . Response of a single channel to different pulseramplitude settings . The pulser amplitude is in arbitrary units .

62
1 010
m
1 005rn
1 000
0 9950.990
Fig . 10 . Normalized gam of a typical channel as a function oftime (corrected for BLS and preamp temperature variations) .
gains. The BLS and preamp crate temperatures wereread out and recorded at the start of each run. Withthe BLS and preamp temperature correction, the vari-ation of the gains is reduced by about a factor of four.Fig. 10 shows the time dependence of the gain of aparticular channel, normalized to the average gain forthe 144 channels in this pulser pattern, after the tem-perature corrections.
6. High voltage behavior
0 2 4 6 8 10 12Time (days)
Argon purity was monitored using ionization cells,in which a radioactive source creates ionization in anargon gap. The complete purity monitoring system,described in detail elsewhere [11], included eight testcells, located in pairs at four different locations withinthe test cryostat . Each pair included an a test cell anda ß test cell . The a test cell has a single 2.3 mm argongap with an 241Am source electrodeposited on a con-ducting plane. The gap size is the same as that used inthe DO calorimeter . The electrons freed from theargon by the ionizing a particles are collected and theresultant signal amplified. The strength of the signaldepends on argon purity and high voltage. The argonpurity can be deduced from the shape of the responseas a function of high voltage. The ß test cell has twogaps . The first gap contains an electrodeposited Io6Ru
source, and is used to collect the electron ionizationsignal when triggered by a signal in the second gap.
The response of the test cells was monitored contin-uously during the 1990 run. Table 1 lists the percent-age change R(a) in the various a cell responses at afield of 13 kV/cm over the entire running period . Theerrors differ between the four cells because of varia-tion in the local noise characteristics of the sensor andpreamplifier. A weighted average of the four channelsshows less than 0.25% signal loss at the 95% confi-dence level.
The table also shows the percentage changes, R((3),in the ratio of ß cell response at a field of 0.8 kV/cmto the response at 10 .9 kV/cm, for three of the four (3cells (the fourth developed a problem at the start ofthe run) . Because 106Ru has a short half-life (1 .020 yr),
S. Abachi et al. / Do uranium liquid argon end calorimeters
Table 1Change in a and p-cell response over the 100 day run
the pileup rate from the source changes over thecourse of an experiment . Since pileup significantly af-fects the response, the ratio is used to minimize theeffect . A decrease of 0.9% in R(ß) was seen during therun. Test cell results with varying oxygen contamina-tions indicate that such a decrease corresponds to lessthan a 0.1% signal loss at 10 .9 kV/cm [11] . Since thecalorimeter and the R cells have similar response (seefig . 11), the loss in the calorimeter response to elec-trons is also less than 0.1%. Comparison of a and presponse to various oxygen contaminations indicatesthat a loss of 0.25% in a signal at 13 .0 kV/cm corre-sponds to less than 0.1% loss in R signal at 10.9kV/cm. This is in agreement with the loss deducedfrom the ß ratio . Direct measurements showed that thedetectors were stable to better than 0.3% at the oper-ating voltage of 10 .9 kV/cm during the duration of therun.
In later tests we have made direct comparisonsbetween the response of the monitors and the detector
roEC
0
08
06
Electrons in calorimeter' Beta argon test cell
0
1
2
3Gap voltage (kV)
Fig . 11 . Calorimeter response to electrons, and the responseof an argon p test cell, as a function of high voltage across the
2.3 mm gap (curves normalized at 3.0 kV).
Sensor R(a) [%] R(0) [%]la -0.05_+0 .112a +0.25+_0 .893a -0.31+0.13_4a -0.05+_0 .11All a -0.12+0.07
lp - -1.2±0.520 - -0.9±0.13p - -0.8±0.sAll p - -0.9±0.1

response for known argon contamination levels . Thiswill be reported in a subsequent paper.
Fig . 11 shows the calorimeter response to 100GeV/c electrons as a function of calorimeter voltage .Also shown is the response of an argon 0 test cell .Both sets of measurements have been normalized tothe response at 13.0 kV/cm. The rise to the plateaufor both curves is sharper than observed during previ-ous test beam runs . The response of the 0 test celltracks quite closely with the electron response . Theshape of the 0 response indicates that the effectiveoxygen content of the LAr is less that 1 .0 ppm [12] .
7 . Electromagnetic response and resolution
7.1. Electron response as a function of energy
A series of runs were taken with electron beams ofmomenta ranging from 10 to 150 GeV/c to study thecalorimeter linearity and energy resolution . For thisanalysis, events were required to have a beam trackreconstructed by the PWC system and to be flagged asan electron by the Cherenkov counters .
The energy of electromagnetic showers was recon-structed by summing the four longitudinal sections inthe ECEM and the first section of the ECIH for ann X n array of 0 .1 X 0.1 pseudo-projective towers . Thenumber of towers summed to contain an electromag-netic shower varies with rl, corresponding to the varia-tion of pad size with rl . At rl = 1 .95, the locationwhere the energy resolution was determined, 99.6%containment is achieved by summing an array of 5 X 5towers . Channels were required to have signals outsidea symmetric threshold around zero (± 1 X rms noise).Each channel was pedestal-subtracted and correctedfor electronic gain .
The reconstructed energy (in GeV) for event i isgiven by :
5E,=a r_ /3 lADC� +S,
1 =1
where a weight, (3 i , is given to the ADC counts of eachreadout layer . The third layer weight, /3 3 , is set equalto 1 and a is an overall scale factor. The additive term,S, is a small offset which can be attributed to energyloss before the calorimeter, and is determined from thedata . The ratios of the inverse sampling fractions foreach layer, as calculated from the dE/dx values forminimum ionizing particles (see table 2), can be usedas the first-approximation layer weights in eq . (3) . (Thesampling fraction is defined as the fraction of a parti-cle's energy that is deposited in the sensitive medium,liquid argon in our case .) An improved set of weights isobtained from the data by minimizing the deviation of
S. Abachi et al. / DO uranium liquid argon end calorimeters 6 3
Table 2The sampling fractions (SF) calculated for a minimum ioniz-ing particle, these values normalized to the third EM layer(SF(3)/SFW), and the layer weights (l3) found from theresolution/linearity minimization . The dE/dx values for thefirst readout layer (EM1) include the material upstream of themodule . The values in parentheses were not varied in the fit
the reconstructed energy from the track momentummeasured by the PWC system, i .e . minimizing :
7 Nk
2
2- 1
(P, -E,)2 '
k=11=1
where p, is the measured PWC track momentum forevent i, the first sum is over the seven runs with beammomenta ranging from 10 to 150 GeV/c, and thesecond sum is over the Nk events of any run with agiven momentum setting . An equal number of events(1000) at each momentum setting is used to obtainweights which are optimized uniformly over the mo-mentum range . The estimated measurement error, a�used in calculating the X2 , is taken from a fit to theresolution given below .
The optimized layer weights, given in the last col-umn of table 2, are consistent with the ratios calculatedfrom minimum ionizing dE/dX losses, except for thefirst layer . Although this first layer has a "low mass"construction (using 1 .6 mm steel plates in place of 4mm uranium absorber plates), its effective samplingfraction is low because of the inclusion of materialupstream of the detector, used to simulate the cryostatwalls at the collider. The optimized fit yields an overallscale factor a = (3.74 ± 0.01) X 10-3 GeV/ADC andan offset S = 0.30 +_ 0.02 GeV .
The distribution of reconstructed energy for runs ofvarious beam momenta is shown in fig. 12 . The 1 .1%spread in the beam momentum was corrected event-by-event using the momentum measured (to an accu-racy of ±0.2%) by the PWC system.
The linearity of the calorimeter's response can beseen in fig . 13a which shows the agreement of themean of a Gaussian fit to the reconstructed energywith the mean track momentum for the various beammomentum settings . Over the momentum range stud-ied, the deviations from linearity are less than +0.3% .
Layer dE/dx Fit
SF SF(3)/SF(0 ß,
EMI U49 1.83 1.47+0.030 .03EM2 0.088 1 .01 1.00+0.010 .01EM3 0.089 1 .00 (1 .0)EM4 0.081 1 .10 1.10+0.01IH1 0.053 1 .67 (1 .67)

64
a
m
wb
U
0 010
0 005
0 000
-0005
-00100 10
008
006
004
002
000
400
300
100
50
100
150Reconstructed Energy (GeV)
Fig . 12 . Energy spectra measured in the calorimeter for runswith electron beams with momentum of 10, 25, 50, 75, 100,
125, and 150 GeV/c. 1000 events are used for each run.
The fractional energy resolution, calculated as o-/E,where o- and E are the standard deviation and meanfrom the Gaussian fits, is shown in fig . 13b.We assume the energy dependence of the resolu-
tion is of the quadratic form :
o- )2
S2
N2
E
=C2+ P+ p2
where p is the beam momentum in GeV/c, C is aconstant contribution from systematic errors such asremaining channel-to-channel variation in gain, S isdue to the statistical error in sampling, and N repre-
0
50
100
150Beam Momentum (GeV/c)
Fig . 13 . Calorimeter linearity and energy resolution for elec-trons: (a) fractional deviation of the mean reconstructed en-ergy from the mean track momentum, as a function of beammomentum ; (b) fractional energy resolution as a function ofbeam momentum . The parameters of the fit are given in the
text.
S. Abachl et al. / DO uranium liquid argon end calorimeters
sents energy independent contributions to o- such aselectronic and uranium noise. The results of the fit are:C = 0.003 ± 0.003,
S=0.157±0.006( GeV)
and
N=0.29±0 .03 (GeV) .
The noise term, N, is consistent with the valueobtained from pedestal widths for an array of 5 X 5towers .
7.2. Position resolution
The transverse spread of an electromagnetic shower,which results in sharing of the energy among severaltowers, enables the centroid of the shower to be deter-mined with much better accuracy than one wouldnaively calculate on the basis of the calorimeter seg-mentation. In the ECEM, the shower position can bemost accurately determined in the third longitudinalsection (EM3), which has a transverse segmentation of0.05 X 0.05 in 71 X ¢. We have studied the positionresolution in EM3 using the entry position of theparticle as extrapolated from the PWCs in the beam-line . Several techniques are available to extract thepoint of origin of an electromagnetic shower ; we havestudied two algorithms, both of which give very satis-factory results .
In the first method, the transverse shower shape isfit to the sum of two exponentials and a ratio ofobserved energies is constructed, from which theshower impact position can be determined iteratively[3] . In the second method [13], a first estimate of theposition is made by calculating the energy weightedcenter-of-gravity, Xcoc = EX,E,/EE,, and then cor-recting it using the following algorithm:
Xccoc = Xmm +B sinh-1( (XcoG -Xm) sinh(B
.) }
In this expression, Xm is the position of the EM3tower with the largest signal, A is the pad half-widthand B characterizes the transverse shower shape as-suming a (single) exponential dependence on trans-verse distance.
The position resolution as determined by these twotechniques was very similar . In both cases, the bestresolution is obtained when the shower originates nearthe edge of a tower, and gets worse as the square ofthe distance from the tower edge . In addition, owing tothe inherently statistical nature of shower developmentwe expect the position resolution to vary approximatelyas 1/F. In fig. 14 the position resolution obtainedusing the corrected center-of-gravity technique is shown

E
c0
ON
G0
óa
Fig . 14 . Position resolution obtained in the ECEM, as afunction of energy, using the corrected center-of-gravity tech-nique . Both the resolution at the tower edge, and the resolution integrated over the tower width at 77 = 1 .95 (where the
pad size in EM3 is 2.6 cm) are shown.
as a function of energy. Both the resolution at thetower edge, and the resolution integrated over thetower width at q = 1 .95 (where the pad size in EM3 is2.6 cm) are shown . The former does vary approxi-mately as 1/~_E while the average resolution shows aslightly stronger dependence . The average resolution isapproximately 2 mm at 25 GeV/c and 1 mm at 75GeV/c .
8. Pion response and resolution
The resolution and linearity of the inner hadroniccalorimeter were evaluated using data from 10 to 150GeV/c, taken at q = 2.55, where shower containmentis maximal . All instrumented channels in the ECIHand ECEM, with signals outside a symmetric thresholdaround zero (±2 x rms noise) were included in thetotal energy sum. Each channel was pedestal-sub-tracted and corrected for electronic gain . Data werealso corrected for the spread in the beam momentumon an event by event basis .
8.1 . Pion response as a function of energy
Cuts were imposed requiring a single good beamtrack, no evidence of pileup from previous events, andno signal in the muon and halo counters . In addition,data were analyzed both with and without a cut requir-ing less than 150 ADC counts (0.51 GeV energy) in theEM1 layer . This cut was intended to remove events inwhich an interaction had occurred in the materialupstream of the calorimeter . This material was in-cluded in the test beam to simulate the material in the
S. Abachi et al. / DO uranium liquid argon end calorimeters
CNW
0 20 40 60 80 100 120Reconstructed Energy (GeV)
6 5
Fig . 15 . The sum of the ECEM+ECIH response to 100GeV/c pions, with EM1 < 0.51 GeV, and without any cut on
EM1 energy.
DO cryostat and vertex chamber . Results which in-clude the EM1 cut can be regarded as providing ameasure of the intrinsic resolution of the calorimeterwhile results without the cut are a closer approxima-tion to the performance expected at DO, though acorrection for early showering should ameliorate theresolution broadening . Fig . 15 shows the calorimeterresponse to 100 GeV/c pions both with and withoutthe EM1 cut .
Energies measured in each layer i were multipliedby the (relative) weight ,6, for that layer . The weightsfor the EM section were taken from electron studies(section 7) and, as before, 163 (for EM3) was fixed at1 .0. Weights for the hadronic layers were obtained intwo ways . The first set (dE/dx weights) was calcu-lated by assuming that the energy loss was proportionalto that of a minimum ionizing particle . The second setof weights was obtained by minimizing the resolution,subject to a constraint of linearity, over the entireenergy scan by varying three ECIH weights (IH1, IH2-4,and IH5) relative to the ECEM weights . The results ofthis study are shown in table 3 . The remainder of thisanalysis will use the final fitted weights. Results using
Table 3Layer weights determined from dE/dx and from fitting, forthe ECIH module
Layer dE/dx weight Fitted weight
IM 1.63 1 .57IH2-4 1.54 1 .55IH5 5 .72 5 .56

66
003
002
-001
-002
-003
0 20 40 60 80 100 120 140 160
Beam Momentum (GeV/c)Fig . 16 Deviations from a linear fit to the mean hadronic
pulse height, as a function of beam momentum .
the dE/dx weights have only slightly worse resolutionthan those using the fitted weights. Data at each en-ergy were fitted to a Gaussian . As fig . 15 suggests,non-Gaussian tails which would be caused by a differ-ent intrinsic response to electromagnetic and hadronicenergy deposition (i .e . a non-unity value of e/h) aresmall.
Fig. 16 shows the deviations from a linear fit to themean pion pulse height as a function of beam momen-tum. The fit gives an overall scale factor of a = (3.89 ±0.01) x 10-3 GeV/ADC and an offset S = -2.20 ±0.05 GeV. The residuals to a linear fit are in all casessmaller than 3% and are typically less than 0.5%. Theincreased offset relative to the electron data is proba-bly due to some nonlinearity at the lowest energy point
S . Abachi et al. / DO uranium liquid argon end calorimeters
óó
0 12
Lu 010mc
016
0080
Vf0ti 006
0040 20 40 60 80 100 120 140 160
Beam Momentum (GeV/c)Fig . 17. Pion resolution for ECEM+ECIH calorimeters, as afunction of beam momentum, with and without the EM1 <0.51 GeV cut . Also shown are Monte Carlo points for the case
of EM1 <0.51 GeV.
(10 GeV) apparent from the figure . This is consistentwith the observed increase in the e/-rr ratio at thisenergy (see the next section) .
The pion resolution is parameterized as before, as(o-1E ) 2 = C2 + S2/p +N 2/p2 where N, S, and C arethe noise, sampling, and constant term contributions tothe resolution and p is the measured momentum ofthe beam particle . The noise term was evaluated, usingpedestal data, to be 975 MeV. Fig. 17 shows resolu-tions for data both with and without the EMI cut. Wefind an intrinsic sampling resolution of 0.45 GeV,which degrades to 0.50 GeV if the EMI cut is re-
020
0 16
Reconstructed Energy (ADC Counts)
Data0
Data (EM1 cut)p
Monte Carlo (EMI cut)- - - - Fit to Data- --- Fit to Data (EM1 cut)
Fig . 18 . Hadronic energy response in the ECMH module, for 150 GeV/c pious, showing the low-energy tail due to interactions inupstream material .
Beam momentum (GeV/c)
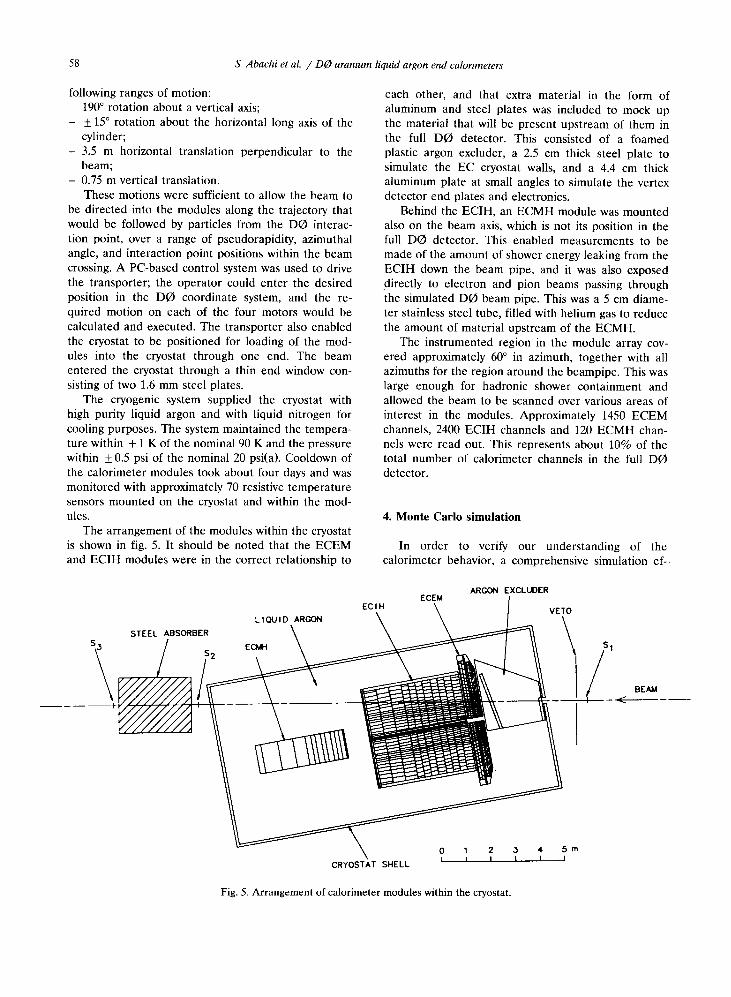
Fig . 19. Fractional hadronic and electromagnetic energy resolution as a function of beam momentum for the ECMH
module .
moved . Our measured sampling term is consistent withexpectations based on calculations by Wigmans [14] .Our resolution is also well described by a GÉANTsimulation of the calorimeter . We estimate that at most1% of the 3.5-4% constant term can be attributed toimproper gain calibration and 1% may be due to thedeparture of e/h from unity . An additional 1-2% maybe due to lack of complete containment of the showers[15].
Data from the ECMH module suffered from thepresence of additional upstream material, which causeda low energy tail in the observed energy distribution, asshown in fig . 18 . This effect was parametrized byconvoluting the usual Gaussian response of the detec-tor with an exponential term representing upstreamenergy loss . The exponential has a width .1, where .1 isthe average upstream loss in ADC counts . The ECMHpion energy response was fitted to :
N w A_Y_
(X_ Y)2
x
=
f ex
ex
dy,)
Ao, 21r o
p
p
20,2
Y,
S. Abachi et al. /DO uranium liquid argon end calorimeters
where N, and o-, extracted from the fit, are taken to bethe mean and width of the Gaussian response whichthe ECMH detector would have had in the absence ofupstream energy loss.
In fig . 19, the ECMH resolution is shown for bothelectrons and pions . For pion showers, the samplingterm of 0.41 ± 0.04 GeV compares well with thatfound in the ECIH data . For electromagnetic showers,a sampling term of 0.19 ± 0.02
GeV is consistent withthe value found in the ECEM module scaled by thesquare root of the ratio of sampling fractions . Table 4summarizes our results for the ECIH and ECMH mod-ules for the various analyses.
8.2. Electromagnetic to hadronic response ratio e /-tr
Our previous studies [2] showed that a uranium-liquid argon calorimeter can be made nearly compen-sating, i .e . the ratio of electromagnetic and hadronicresponse at any energy (e/ar) is close to unity. In orderto measure e/-rr for the present calorimeter modules,we compared the response for electrons and negativepions at 71 = 2.55, at the ECIH benchmark. To mea-sure e/ ,rr without introducing systematic errors oneneeds to make the analysis as similar as possible forelectrons and pions. We therefore sum the same chan-nels in each case, adding many more channels than isusual for electron data, and thus become sensitive topossible systematic pedestal offsets . For this analysisthe pedestals were not subtracted using the standardpedestal files, but pedestal events interspersed be-tween the beam events were used instead, so thateffects due to pileup from out of time events wouldaffect pedestals and data in the same way . The elec-tron and pion data were both summed within 15 X 15towers around the beam . The pion data were addition-ally required to have the energy in the first EM layer tobe less than some value, in order to remove eventswhere the shower started upstream of the detector . Inthe e/,ir analysis this EM1 cut was relaxed to 1 .2 GeVin order to improve the statistics . The e/ ,rr ratio isplotted in fig. 20a . The uncertainties on the data pointsinclude (and in some cases are dominated by) thestatistical uncertainty from the pedestal subtraction,because of the limited number of pedestal events . Thee/ ,rr ratio is about 1 .16 at 10 GeV/c and falls to 1 .06at 150 GeV/c . Also plotted are the predictions of twoalternative hadron shower algorithms GHEISHA [16]and NUCRIN [17], each run within the framework ofthe GÉANT 3.14 Monte Carlo . It can be seen thatGHEISHA reproduces rather well the observed trendof e/-rr, but the NUCRIN prediction is too high . TheseMonte Carlo calculations were done assuming that thecharge produced in the liquid argon is proportional tothe energy deposited therein, thus ignoring possible
Table 4Hadronic and electromagnetic energy resolutions in theECEM+ECIH and in the ECMH modules
67
Detector Weighting Samplingterm (S)
Constantterm (C)
ECIH pions dE/dx 0.546±0.008 0.041±0.001ECIH pions fitted 0.501±0.008 0.044±0.001ECIH pions,EM1 cut fitted 0.446±0.009 0.039±0.002
ECMH pions dE/dx 0.41 ±0.04 0.032±0.004ECMH
electrons dE/dx 0.19 ±0.02 0.008±0.004

68
saturation effects in charge production by any heavilyionizing particles.
In fig . 20b the data and Monte Carlo are againplotted, this time using the GEANT/GHEISHAMonte Carlo to correct the data for the energy leakingoutside the instrumented region of the calorimeter,and for the effect of the cut on the EM1 layer. Thistherefore shows the e/Tr ratio that would be expectedfor the sum of all channels in a fully instrumentedcalorimeter and no material except the cryostat up-stream . The size of the Monte Carlo corrections istypically 3-6% . The errors on the data include a sys-tematic uncertainty in these corrections from the lim-ited statistics of the Monte Carlo events . They alsoinclude a 0.5% uncertainty on the leakage correction
1.40
1.30
1.10
1.00
1.20
1.15
1.05
1.00
0 50 100 150
Beam Momentum (GeV/c)
0 50 100 150Beam Momentum (GeV/c)
Fig. 20 . (a) The electromagnetic to hadronic response ratio(e/Tr), as a function of beam momentum, for the sum of theECEM and ECIH modules, using 15 X 15 towers around thebeam and EM1 < 1.2 GeV; (b) e/Tr corrected for transverse
shower leakage and EMI cut .
S. Abachi et al. / Do uranium liquid argon end calorimeters
for energy oustide the instrumented area . This is esti-mated from the level of agreement between the dataand Monte Carlo in describing the fraction of hadronshower energy contained within a transverse windowranging from 8 X 8 to 18 X 18 towers . We have notcorrected the results for downstream leakage. Alsoplotted are results from the GEANT/GHEISHAMonte Carlo, as before ; the agreement between thedata and Monte Carlo is quite good .
We have compared these results with the predic-tions of Wigmans [14]. Using his parameterization offEM = 0.1 In E(GeV) for the electromagnetic fractionin a hadronic shower between 10 and 100 GeV, we canderive the "intrinsic e/h" of the calorimeter, that isthe ratio of its sensitivity to electromagnetic andhadronic forms of energy deposition. The result variesfrom e/h= 1 .12 at 10 GeV/c to e/h = 1.04 at 100GeV/c (ignoring the 150 GeV/c point because it isoutside the validity of the parameterization and hasleakage of the order of a few percent). This is reason-ably consistent with Wigmans' predictions, which arethat e/h = 1.10 for the 4 mm thickness of uranium inthe ECEM and 1.08 for the 6 mm uranium thickness inthe ECIH .
As an additional measure of the electromagnetic tohadronic response ratio, we selected "EM showers" inthe ECIH hadronic module by requiring events to haveover 90% of their energy in any single layer of thecalorimeter (30 radiation lengths). This selects hadronicshowers which are very electromagnetic in character .From 187 events passing the cut, one obtains a re-sponse ratio ",rr °/Tr" = 1 .094 ± 0.005 at 100 GeV/c.This was compared with the GEANT/GHEISHAMonte Carlo by inserting single Tr ° 's into the calorime-ter at the start of a hadronic layer . The Monte Carlopredicts "Tr °/,rr" = 1.117 ±0.008 at 100 GeV/c, whichis in good agreement with the data . These responseratios are a few percent higher than the direct mea-surement of e/ ,rr . This is probably due to the energylost by the average electron before reaching thecalorimeter, but may also indicate that the weightsgiven the calorimeter layers when summing the ener-gies are slightly incorrect.
8.3. Longitudinal development ofpion showers
Fig. 21 shows the energy deposited in two typicallayers of the calorimeter (the plot is for 100 GeV/cpions in the third ECEM layer and the first ECIHhadronic layer) . The dashed distributions are for theGEÀNT/GHEISHA Monte Carlo, and reproduce thedata very well .
Fig. 22 shows the mean energy deposited in eachlayer of the calorimeter for 50, 75, 100 and 150 GeV/cincident pions. Upstream interactions were minimizedby cutting on the energy in the first layer of the

electromagnetic section of the calorimeter . These dis-tributions are also well reproduced by theGEANT/GHEISHA Monte Carlo, as shown in thefigure .
The longitudinal development of pion showers wasfitted to the usual parameterization of Bock et al. [18] .The energy BE deposited in a small interval of 8sradiation lengths and bt interaction lengths, a distances radiation lengths and t interaction lengths from thestart of the shower, is given by :
BE= I,(á) w(bs)° -1 e`bós
+ 'r(c) (1 -w)(td)`- ' e -`d d8t,
(8)
where T is the gamma function, Eo the incident en-ergy, and a, b, c, d, and w are the parameters fitted .This form was fitted to 50, 75, and 100 GeV/c piondata, after introducing fluctuations in the origin of theshower and in the effective values of s and t [19] . Thefollowing were the results of the fit :a=c=0 .316+0.3611n(E),b = 0.20,d = 1 .03,w = 0.43 .
vNCw
NCNw
10 2
10
10
S. Abachi et al. / DO uranium liquid argon end calorimeters
W v, r
ii
r
20 40
n60
ECEM Layer 3 Energy (GeV)
Fig . 22 shows that the parametrization well repro-duces the distribution of energy between the calorime-ter layers .
The parameterization also provides a good descrip-tion of the lack of containment of pion showers whenthey do not pass through the full calorimeter. Theenergy response to 100 GeV/c pions for various valuesof pseudorapidity is shown in fig . 23, together with theresponse expected from the parameterization (ob-tained by integrating the form of eq . (8) up to wherethe shower exited from the detector) . The data and theparameterization compare well, considering that trans-verse shower shape has not been incorporated . (Itshould be noted that the transverse leakage does notoccur for the full DO calorimeter which has full solidangle coverage .)
8.4. Rate dependence of response
Because the energy resolution of the hadroniccalorimeter was observed to degrade at high beamintensities, a study was performed to evaluate the ratedependence of the resolution . The DO pulse shape ischaracterized by a fast rise ( - 2 ws) and a slow fall(- 50 vs), with 2.2 ws base-peak sampling . Because ofthis shape, there is a much higher probability of sam-
Solid line = data
Dashed line = Monte Carlo
Solid line = data
80 100 120
Dashed line = Monte Carlo
20ECIH Layer 1 Energy (GeV)
iL,tQ
80 100 120
69
Fig. 21 . Distributions of energy in the third ECEM layer and in the first ECIH layer for 100 GeV/c pion showers (solid line), andGEANT/GHEISHA Monte Carlo (dashed line) for comparison .

70
wva
aGW
" Data° GEANT/GHEISHA Monte Carlo+ Parametrization
Depth in Interaction lengths
c0.11
uu) 0.09a)
0.08
LL, 0.07Co
Ço 0.06Û(2 0.051L
0 .040 .0
S. Abachi et al / DO uranium liquid argon end calorimeters
Fig . 22 . Mean energy deposited per interaction length for thecalorimeter readout layers as a function of depth in thecalorimeter . Pion showers are shown together with Monte
Carlo and the shower parameterization .
pling the falling edge of a preceding pulse rather thanthe rising edge of a following pulse when there ispileup . This means that pileup noise from randomout-of-time pulses usually produces a large number ofsmall negative signals from the falling edge together
2.5X10 4 5X10 4 7.5X10 4
Rate (Beam particles per second)
4.0
Fig . 23 . Mean pulse height for 100 GeV/c pions as a functionof pseudorapidity, for data and for the shower parameteriza-
tion .
with a few large positive signals from the rising edge.This broadens the resolution .A series of ten 150 GeV/c pion runs were taken at
intensities varying from 2.8 X 10 4 to 1.62 X 10 6 parti-cles per 20 second spill. The data were obtained for afixed pseudorapidity of 2.3, with 3000 events per run.The energy resolution, obtained from a Gaussian fit tothe reconstructed energy, as a function of rate is shownin fig . 24. The results indicate a degradation of about afactor of two from lowest to highest intensity, with theresolution changing from 5.5% to 10.5%. It is alsoevident from fig . 24 that, below a rate of 5 kHz, thereis very little rate-dependence to the resolution . At the
G 150 GeV pions
7~y
Datao Simulation
105
Fig. 24 . Fractional energy resolution as a function of beam intensity for 150 GeV/c pions, showing effects of pileup as a functionof the number of beam particles incident per second .
110
v 100 + .,As__-__s-
P'
OA Np90
W
v bV 80100 GeV pions
G -- Datav 70 i 0 Parametrization
0
601 .0 2.0 3.0
11

highest intensities, distributions in the total observedenergy, as well as the pedestals taken during the spill,clearly show the broadening expected from pileup .A simple simulation was performed to reproduce
these effects . This entailed using Poisson statistics tocalculate the probability that, for a given intensity, oneor more pulses would pile up within the relevant timeinterval . The pileup pulses were distributed randomlyrelative to the trigger-time, and summed using theknown pulse shape [20] . Subsequently, the resultingvoltage response as a function of time, V(t), was calcu-lated . Using the resolution measured at lowest intensi-ties, the values obtained for V(t) were smeared out toaccount for the calorimeter sampling resolution . Thebaseline-subtracted signals were then calculated,V(peak time) - V(base time), yielding the energy re-sponse and resolution of the calorimeter. This simu-lated resolution is also shown as a function of rate infig. 24, and agrees well with the experimental results .This suggests that the observed degradation of resolu-tion at high rates is consistent with the effects expectedfrom pileup .
The occupancy rate at the Tevatron may be crudelyestimated assuming an average multiplicity of 50 parti-cles per interaction, an inelastic cross section of 50 mb,and that a hadronic shower deposits significant energyover roughly 10 towers (each with t1í7 = 0(~ = 0.1). Therate of particles entering this 10 tower region is 25 kHzat a luminosity of 5 x 1030 cm-2 s-1 , rising to 500 kHzat a luminosity of 1032 cm -2 s- ' . Of course, theaverage energy of these particles is much less than 150GeV, but we may use fig . 24 as a guide; it shows thatpileup should not broaden the resolution significantlyat the lower luminosity, which is what is foreseen forthe 1992 collider run . However, if the Tevatron lumi-nosity is upgraded significantly, pileup could become aproblem using the present calorimeter readout . Thereis therefore a plan to replace components in the elec-tronics in order to reduce the intrinsic noise andshorten the sampling time, so that the calorimeterperformance is not degraded at higher luminosities.
9. Electron-pion discrimination
The spatial development of electromagnetic andhadronic showers is quite different and so the showershapes can be exploited to differentiate between elec-trons and hadrons. To obtain the best discriminationagainst hadrons, and to maximize the efficiency ofelectron-finding, one should use both longitudinal andtransverse shower shape and also take account of cor-relations between energies in the various calorimetercells .We have used an H-matrix technique [21], which
satisfies the above objectives, to carry out electron-
S . Abachi et al. / DO uranium liquid argon end calorimeters 7 1
finding and hadron rejection . In this technique, a"training" sample of Monte Carlo generated electronshowers is used to compute the mean energy ~ E, )deposited in each detector cell i, together with itscorrelation coefficient C,, with the energy EJ de-
For each event, an effective X 2 is calculated from :
X2=F_(E, - (E,))Hti (Ej-(E,)) . (11)I ,l
A cut is then placed on the X2 to define an electronand to separate electrons from hadrons .
Electron-hadron separation is performed in twostages . First, a cut on the ratio of energy in the hadronicto electromagnetic calorimeter sections, HAD/EM, isused as an initial electron selection . We then use anH-matrix, "trained" on electrons, with 72 x 72 ele-ments, including the energies in all cells within aA?7 x A0 = 0.3 x 0.3 transverse area centered on theshower . These steps therefore take account of trans-verse as well as longitudinal shape and correlations,and can also be used to predict the particle entryposition in the calorimeter . Our approach is to param-
TUCUU
0
OUAw
C".O
UN
K
104
103
102
0 50 100 150
Particle momentum (GeV/c)Fig . 25 . Pion rejection factors for 95% electron efficiency, as afunction of pion momentum . The points shown are for a cuton the ratio of hadronic to electromagnetic energy HAD/EM< 0.02, and for HAD/EM < 0.04 used together with theH-matrix scheme . The upward arrows indicate points which
are lower limits .
M.
" HAD/E
HAD/E
< 0 02
< 0 04 & 72A72 H-matrix
posited in every other cell j :
C,J=(( E,-(E,)) ( EJ-(E,)1) . (9)
We then define the H-matrix by :
' (10)

7 2
eterize the elements of the H-matrix as a function ofreconstructed energy (5-100 GeV) and pseudorapidity,and then use the parametrization to create an H-matrixappropriate for each shower energy in the data .
This technique was applied to samples of test beamelectrons . The Xz cuts were chosen to obtain an elec-tron efficiency of 95% . The pion rejection factor wasthen determined by applying the same cuts to pion testbeam data . The rejection factors are shown in fig. 25 asa function of pion momentum, for the case of cuttingonly on HAD/EM < 0.02, and for the case of a cut onHAD/EM < 0.04 followed by the H-matrix . Both ofthese give an electron efficiency of about 95%. Theresults at high momenta (>- 100 GeV/c) are given aslower limits at 90% confidence level due to the limitedstatistics of the test beam pion data sample ( - 6500-3200 events/momentum setting). The covariance ma-trix method significantly improves the pion rejectionover the HAD/EM cut . The 1r rejection factor is
tn
W
O
Oz
wO
óz
S. Abachi et al. / Do uranium liquid argon end calorimeters
ADC Counts
900-3000 for particles in the momentum range be-tween 50 and 150 GeV/c .
10. Muon response
Using the small fraction of muons (originating frompion decay) in the pion beam, the ECEM and ECIHcalorimeter module response to muons was studiedunder the same experimental conditions as used forelectrons and pions . The arrangement of the calorime-ter modules and the moon beam counters is shown infig . 5 . Counters which were placed behind thecalorimeter, labelled SZ and S3 in fig . 5, were used intagging these muons . The total thickness of thecalorimeter modules was 9.42 interaction lengths, whichwas followed by 17.9 interaction lengths of steel to stopany punch-through hadrons ; this material sets a pass-ing muon momentum threshold of 4.8 GeV/c . Muon
ADC CountsFig . 26 . Pulse height and pedestal distributions in four calorimeter layers for 15 GeV/c muons .

data were taken using a coincidence trigger S 1 ' S 2 ' S3 ;pedestal triggers were interspersed randomly with themuon triggers during the spill . Data were taken at fourdifferent momenta : 15, 50, 100 and 150 GeV/c .
In contrast with electrons or pions, the muons de-posit only a very small fraction of their energy in thecalorimeter, and only a small fraction of that (thesampling fraction) is in the active medium and thusobservable . A 15 GeV/c muon, for example, depositsabout 2% of its energy in the electromagnetic sectionof the ECEM and only about 8% of that is in thesensitive medium . Hence, the observed signal is muchsmaller for muons than for electrons or pions . There-fore noise is particularly significant for the muon sig-nal . To minimize noise, the analysis of muon data wasperformed slightly differently from that of the pion andelectron data. First, pedestals interspersed between thedata events were used to calculate the mean and thestandard deviation of the pedestal value of each cellfor each run ; these values were then used in thepedestal subtraction and in the zero suppression whenanalyzing the data. Second, only the cells adjacent tothe projected track (obtained by extrapolating the beamtrack using the PWC information) were used in obtain-ing the signal . It was found that four projective towers(two nearest 0 and two nearest 71), were sufficient tocollect the muon signal at ?7 = 2.3 where the data weretaken .
Two properties of the calorimeter modules werestudied by using muon data, the uniformity in depthand the "W/e" ratio for ECEM. It has been knownboth experimentally [22] and theoretically [23] that,especially at high energies, the energy loss of a muon isenergy and material dependent. This is due to the factthat at higher energies additional sources of muonenergy loss, e + e - pair production, bremsstrahlung andnuclear interaction, become important . The energy de-pendence of energy loss for relativistic muons is signifi-cantly different in passive (high Z) and active (low Z)layers in a sampling calorimeter [24] . As a result, theobserved signal becomes more complicated, and a morecareful treatment is required for muons than just re-garding them as minimum ionizing particles (mips)traversing bulk material . Taking these complicationsinto account, it has been suggested by Wigmans that itis preferable to measure "W/e" ratios at a well-definedenergy or to convert the measured "w/e" ratio to"mip/e" ratio, in order to make comparison withother data meaningful .
10.1 . Uniformity in depth
At low energies, where radiative processes are notsignificant, one could use the muon signal to study theuniformity of the calorimeter modules . If it is assumedthat the energy of the 8-electrons is deposited locally
S. Abachi et al. / DO uranium liquid argon end calorimeters
in each argon layer, then one would expect the ob-served signal per unit thickness of active medium to bethe same anywhere in the calorimeter, regardless ofthe number of active/passive layers and their thick-nesses . Using this assumption, we have attempted tostudy the uniformity in depth by comparing the muonsignal on individual layers of ECEM and ECIH mod-ules, using the data at the lowest available momentum(15 GeV/c) .
The pulse height distribution measured in several ofthe ECEM and ECIH layers, with their pedestal distri-butions, are shown in figs. 26a, 26b, 26c and 26d. Thedata points are fitted with the Moyal function [25,26](an approximate analytic expression for the Landaudistribution), convoluted with a Gaussian resolutionfunction . The most probable values obtained from thefit are given in the figure . It is the mean value of thepulse height, not the most probable value, that isproportional to the thickness of the medium traversedby the muon [25] . The mean pulse heights, as calcu-lated from the fit, per unit thickness of the argon gapfor individual layers are shown in fig . 27 . The resultshows the expected uniformity of the calorimeter .
10.2 "g/ e" ratio
As discussed earlier, the muon response is expectedto be energy dependent. This can be seen in fig . 28which shows the normalized pulse height distributionsfrom muons of four different momenta (15, 50, 100 and150 GeV/c) in the ECEM, together with a fit to thefunction described above . Both the mean and the mostprobable value (both obtained from the fit), shown infig . 29, increase with energy, the latter to a lesserdegree, as expected [24] . The spectrum becomes
0
73
2
4
6
8
loCalorimeter Layer Index (EMI-IH5)
Fig . 27 . Mean pulse height for 15 GeV/c muons, per unitargon thickness, as a function of calorimeter layer .
Cv 20
C0U
15 15 GeV/c muons
vC
10fi m
c5
roCm
c0

74
broader and more asymmetrical at higher energiesowing to the contributions from radiative processes.
The above results clearly indicate that the signal inthe calorimeter for a muon is always larger than that ofa mip. By comparing the observed signal with MonteCarlo results (using GEANT), we have estimated themip signal as follows . First, the Monte Carlo resultswere obtained for muons traversing the same positionin the calorimeter with same energies as in the data .Then, the most probable value (in MeV) of the MCspectrum was obtained by fitting the Moyal function .The Monte Carlo results, converted to ADC countsusing a constant factor for all energies, agree very wellwith the data as shown in fig . 29 . These Monte Carlopoints were also used to determine the ratio of muonpulse height to mip dE/dx pulse height at each en-ergy . Then the pulse height for a mip in our data wasextracted by reducing the measured muon pulse height
VI
W
O
Oz
yw0
0z
S. Abachc et al. / DO uranium liquid argon end calorimeters
according to the above ratio . The result is included infig . 29 and is independent of energy, as expected .
In order to compare the electromagnetic-calorime-ter response to muons with the response to electrons,we consider the ratio,
w _ PH,~/EWe
PHe/Ee '(12)
where PH, and PH e are the measured pulse heightsfor muons and electrons respectively, Ee is the elec-tron beam energy and E,, is the total energy loss by amuon traversing the ECEM . All quantities except E,,are measured experimentally . If one assumes thatntuons behaves as mips then EW can be calculatedusing the known [27] dE/dx values . The "w/e" ratioobtained under such assumption is shown in fig . 30 .The energy dependence of the "W/e" is due to the
ADC Counts
ADC CountsFig. 28 . Muon pulse height spectrum in ECEM fitted with a Moyal/Gaussian convolution at 15, 50, 100 and 150 GeV/c; the most
probable value (MPV) is shown

c0U
UQ
ó
ww
100
90
80
70
60
50
-
o Data (most probable velue)
o Monte Carl, [most probable value)
-
v pate (man)
+ Deduced NIP s~gnel
0
50 100 150 200
Fig. 29 . The mean, the most probable value (MPV) for dataand Monte Carlo, and the deduced mip pulse height, as afunction of momentum for muons in the ECEM (MC results
converted to ADC counts).
energy dependence of PH,, which becomes smaller ifthe most probable value is used for PH w . By using thecorrected PH for mips (as in fig . 29) we obtained the"mip/e" ratio which is energy independent as it shouldbe .
It should be pointed out that to estimate the pulseheight for mipsfrom the experimental data one needsa reliable Monte Carlo simulation . Our study indicatesthat the best way to obtain an approximate value of the"mip/e" ratio without such a simulation is to use themost probable value of the measured muon signal atthe lowest possible energy . For the DO ECEM the bestestimate of the "mip/e" ratio is 1 .41 ± 0.05 .
Similar ratios have been observed in samplingcalorimeters in other experiments . A detailed compari-son of the data with Monte Carlo results [121 has
250
225
200
175
150
1 25
100
Muon Momentum (GeV/c)
S . Abaehi et al. / DO uranium liquid argon end calorimeters
0 50 100 150 200Muon momentum (GeV/c)
Fig. 30. W /e ratio as a function of energy . Shown are theratios obtained using the mean, the most probable value and
the mip pulse height.
75
shown that this behavior is due to the way in which lowenergy photons, which are abundantly produced in theelectromagnetic shower development, interact withmatter. Because of the strong Z-dependence of thephotoelectric effect ( a ZS), most of these photons willtransfer their energies to electrons in the high Z ab-sorber rather than the low Z sensitive medium . There-fore the observed fraction of the energy deposited bythese low energy photons is much smaller than wouldbe expected from sampling fractions based on theenergy loss for mips . This causes "mip/e" > 1, which isan important factor in making the calorimeter responseto electromagnetic and hadronic showers equal .
It may be noted that the ECEM calorimeter is justbehind a cryostat wall . This acts as an integral part ofthe calorimeter as it plays a part in the development ofelectromagnetic showers . If we include the cryostat,the mip energy deposited therein must be counted inthe calculation of the expected energy loss, loweringthe "mip/e" ratio of the cryostat-plus-ECEMcalorimeter . In this case the measured value becomes1.22+0.05 .
11 . Conclusions
Three uranium-liquid-argon calorimeter modulesconstructed for the DO detector at the Fermilab Teva-tron collider have been tested with beams of electrons,pions and muons between 10 and 150 GeV/c. Theperformance of the system, including the cryogenics,high voltage, calibration, readout and argon puritymonitoring appears excellent. Good energy resolutionhas been obtained for electrons and hadrons ; and thelinearity, compensation and electron-hadron discrimi-nation power of the detectors has been well demon-strated. The results agree well with predictions of adetailed Monte Carlo simulation .
Acknowledgements
We are grateful for the support from the Accelera-tor and Research Divisions at Fermilab . We thank K .Holly, D . Kewley and S . Libonate for their help withthese tests . This work was funded by the US Depart-ment of Energy and the National Science Foundation .
References
[11 H . Aronson et al., Nucl. Instr . and Meth . A269 (1988)492 .
[21 M. Abolins et al ., Nucl . Instr . and Meth . A280 (1989) 36 .[31 H. Aihara et al ., to be published in Nucl . Instr . and
Meth. A.

76
[4] R . Brun et al ., CERN-DD/EE/84-1 (1986).[5] H.B . Prosper, Proc . Int . Conf . on Calorimetry in High
Energy Physics, Fermilab, 1990, p . 546 .[61 R.D . Schamberger, Nucl . Phys . B (Proc . Suppl .) 23A
(1991) 191 .[7] V. Radeka and S. Rescia, Nucl. Instr. and Meth. A265
(1988) 228 .[8] M . Demarteau, Proc . Int . Conf. on Calorimetry in High
Energy Physics, Fermilab, 1990, p . 91 .[9] P . Franzini, DO note 750, Fermilab, unpublished .
[10] J . Kourlas and J . Sculli, DO note 936, Fermilab, unpub-lished;J . Kourlas, DO note 970, Fermilab, unpublished .
[11] G.C. Blazey et al ., Proc . Int . Conf. on Calorimetry inHigh Energy Physics, Fermilab, 1990, p . 101 .
[12] W . Hoffmann et al ., Nucl . Instr . and Meth . 135 (1976)151 .
[13] G.A . Akopdjanov et al., Nucl . Instr. and Meth . 140(1977) 441 ;A . DeAngelis and F. Mazzone, Nucl . Instr . and Meth .A287 (1990) 397.
[14] R . Wigmans, Nucl . Instr . and Meth . A259 (1987) 389;A265 (1988) 273 .
S. Abachi et al. / DO uranium liquid argon end calorimeters
[15] J . Womersley, Nucl . Instr. and Meth . A289 (1990) 475 .[16] H . Fesefeldt, RWTH Aachen report RWTH/PITHA
85/02 .[17] K. Hánssgen and J . Ranft, Comp . Phys . Commun . 39
(1986) 37 ; 39 (1986) 53 .[18] R.K. Bock et al ., Nucl . Instr. and Meth . 186 (1981) 533 .[19] M . De Palma et al ., Nucl . Instr . and Meth. 219 (1984) 87 .[20] P . Franzini, DO note 77, Fermilab, unpublished.[21] R. Engelmann et al., Nucl . Instr . and Meth . 216 (1983)
45 .[22] T. Akesson et al ., Nucl . Instr . and Meth . A262 (1987)
243 .[23] W . Lohmann, R. Kopp and R . Voss, CERN Report
CERN 85-03 (1985).[24] B. Anders, U . Behrens and H . Brückmann, Nucl . Instr.
and Meth . A270 (1988) 140 .[25] E . Bernardi, Dissertation, Universität Hamburg, Ham-
burg (1987).[26] J .E . Moyal, Philos . Mag . 46 (1955) 263 .[27] Review of Particle Properties, Phys . Lett . B170 (1986) 1 .