Radial oxygen and argon abundance gradients of the thin and ...
14
MNRAS 000, 1–14 (2021) Preprint 15 March 2022 Compiled using MNRAS L A T E X style file v3.0 Radial oxygen and argon abundance gradients of the thin and thicker disc of Andromeda from planetary nebulae Souradeep Bhattacharya, 1 ★ Magda Arnaboldi, 2 Nelson Caldwell, 3 Ortwin Gerhard, 4 Chiaki Kobayashi 5 Johanna Hartke, 6 Kenneth C. Freeman, 7 Alan W. McConnachie, 8 and Puragra Guhathakurta 9 1 Inter University Centre for Astronomy and Astrophysics, Ganeshkhind, Post Bag 4, Pune 411007, India 2 European Southern Observatory, Karl-Schwarzschild-Str. 2, 85748 Garching, Germany 3 Harvard-Smithsonian Center for Astrophysics, 60 Garden Street, Cambridge, MA 02138, USA 4 Max-Planck-Institut für extraterrestrische Physik, Giessenbachstraße, 85748 Garching, Germany 5 Centre for Astrophysics Research, Department of Physics, Astronomy and Mathematics, University of Hertfordshire, Hatfield, AL10 9AB, UK 6 European Southern Observatory, Alonso de Córdova 3107, Santiago de Chile, Chile 7 Research School of Astronomy and Astrophysics, Mount Stromlo Observatory, Cotter Road, ACT 2611 Weston Creek, Australia 8 NRC Herzberg, 5071 West Saanich Road, Victoria, BC V9E 2E7, Canada 9 UCO/Lick Observatory, Department of Astronomy & Astrophysics, University of California Santa Cruz, 1156 High Street, Santa Cruz, California 95064, USA Accepted XXX. Received YYY; in original form ZZZ ABSTRACT Andromeda (M 31) is the nearest giant spiral galaxy to our Milky Way (MW) and the most massive member of our Local Group. We obtain a magnitude-limited sample of M 31 disc PNe with chemical abundance measurements through the direct detection of the [OIII] 4363 Å line. This leads to 205 and 200 PNe with oxygen and argon abundance measurements respectively. We find that high- and low-extinction M 31 disc PNe have statistically distinct argon and oxygen abundance distributions. In the radial range 2 - 30 kpc, the older low-extinction disc PNe are metal-poorer on average with a slightly positive radial oxygen abundance gradient (0.006 ± 0.003 dex/kpc) and slightly negative radial argon abundance gradient (-0.005 ± 0.003 dex/kpc), while the younger high-extinction disc PNe are metal-richer on average with steeper radial abundance gradients for both oxygen (-0.013 ± 0.006 dex/kpc) and argon (-0.018 ± 0.006 dex/kpc), similar to the gradients measured for M 31 HII regions. These abundance gradients are consistent with a major merger in the M 31 disc, with the majority of the low-extinction PNe being the older pre-merger disc stars in the thicker disc, and the majority of the high-extinction PNe being younger stars in the thin disc, formed during and after the merger event. The chemical abundance of the M 31 thicker disc has been radially homogenized because of the major merger. Accounting for differences in disc-scale lengths, we find the radial oxygen abundance gradient of the M 31 thicker disc is amongst the most positive values observed till date in spiral galaxies, flatter than that of the MW thick disc which has a negative radial gradient. On the other hand, the thin discs of the MW and M 31 have remarkably similar negative oxygen abundance gradient values. Key words: Galaxies: individual (M 31) – Galaxies: evolution – Galaxies: structure – planetary nebulae: general 1 INTRODUCTION Late-type galaxies can contain multi-layered populations that are kinematically distinct, the “cold" thin disc and the “hot" thick disc, found in the Milky Way (MW; e.g. Gilmore & Reid 1983) and in nearby galaxies (Yoachim & Dalcanton 2006; Comerón et al. 2019). The MW thick disc within the solar radius is found to be chemically distinct from the MW thin disc suggesting separate evolution for the two (e.g. Bland-Hawthorn & Gerhard 2016; Kobayashi et al. 2020). Thick discs may form from accreted gas during a chaotic period of hierarchical clustering at high redshift (Brook et al. 2004) or from dynamical heating of thinner discs by secular processes (Sellwood 2014). Mergers with satellites can also dynamically heat thin discs to decrease their rotational velocity and increase their ★ E-mail: [email protected] velocity dispersion (Quinn & Goodman 1986), resulting in thickened discs (Hopkins et al. 2009). Even the stars from the merged satellite can form the thick disc (Peñarrubia et al. 2006). Since galaxies are thought to evolve by hierarchical mergers with satellite galaxies (White & Rees 1978; Bullock & Johnston 2005), late-type galaxies of varying disc thickness are expected. Observa- tional evidence of multi-layered disks in nearby spirals can be ob- tained by measuring kinematics and metallicity of their stellar pop- ulations covering a large radial range in these discs (E.g. Yoachim & Dalcanton 2008a,b). However, this requires deep spectroscopic observations of resolved stars (E.g. Guhathakurta et al. 2005) or in- tegral field spectroscopy (E.g. Saglia et al. 2018). For the nearly 12 sq. deg. on-sky coverage of the M 31 disc, such observations would be highly time consuming with current instrumentation. However, spectroscopic observations for kinematics and chemistry is possible in reasonable time with discrete tracers, such as Plane- © 2021 The Authors arXiv:2203.06428v1 [astro-ph.GA] 12 Mar 2022
-
Upload
khangminh22 -
Category
Documents
-
view
1 -
download
0
Transcript of Radial oxygen and argon abundance gradients of the thin and ...
MNRAS 000, 1–14 (2021) Preprint 15 March 2022 Compiled using MNRAS LATEX style file v3.0
Radial oxygen and argon abundance gradients of the thin and thicker discof Andromeda from planetary nebulae
Souradeep Bhattacharya,1★ Magda Arnaboldi,2 Nelson Caldwell,3 Ortwin Gerhard,4 Chiaki Kobayashi5Johanna Hartke,6 Kenneth C. Freeman,7 Alan W. McConnachie,8 and Puragra Guhathakurta91Inter University Centre for Astronomy and Astrophysics, Ganeshkhind, Post Bag 4, Pune 411007, India2European Southern Observatory, Karl-Schwarzschild-Str. 2, 85748 Garching, Germany3Harvard-Smithsonian Center for Astrophysics, 60 Garden Street, Cambridge, MA 02138, USA4Max-Planck-Institut für extraterrestrische Physik, Giessenbachstraße, 85748 Garching, Germany5Centre for Astrophysics Research, Department of Physics, Astronomy and Mathematics, University of Hertfordshire, Hatfield, AL10 9AB, UK6European Southern Observatory, Alonso de Córdova 3107, Santiago de Chile, Chile7Research School of Astronomy and Astrophysics, Mount Stromlo Observatory, Cotter Road, ACT 2611 Weston Creek, Australia8NRC Herzberg, 5071 West Saanich Road, Victoria, BC V9E 2E7, Canada9UCO/Lick Observatory, Department of Astronomy & Astrophysics, University of California Santa Cruz, 1156 High Street, Santa Cruz, California 95064, USA
Accepted XXX. Received YYY; in original form ZZZ
ABSTRACTAndromeda (M 31) is the nearest giant spiral galaxy to our Milky Way (MW) and the most massive member of our Local Group.We obtain a magnitude-limited sample of M 31 disc PNe with chemical abundance measurements through the direct detectionof the [OIII] 4363 Å line. This leads to 205 and 200 PNe with oxygen and argon abundance measurements respectively. Wefind that high- and low-extinction M 31 disc PNe have statistically distinct argon and oxygen abundance distributions. In theradial range 2 − 30 kpc, the older low-extinction disc PNe are metal-poorer on average with a slightly positive radial oxygenabundance gradient (0.006 ± 0.003 dex/kpc) and slightly negative radial argon abundance gradient (−0.005 ± 0.003 dex/kpc),while the younger high-extinction disc PNe are metal-richer on average with steeper radial abundance gradients for both oxygen(−0.013 ± 0.006 dex/kpc) and argon (−0.018 ± 0.006 dex/kpc), similar to the gradients measured for M 31 HII regions. Theseabundance gradients are consistent with a major merger in the M 31 disc, with the majority of the low-extinction PNe being theolder pre-merger disc stars in the thicker disc, and the majority of the high-extinction PNe being younger stars in the thin disc,formed during and after the merger event. The chemical abundance of the M 31 thicker disc has been radially homogenizedbecause of the major merger. Accounting for differences in disc-scale lengths, we find the radial oxygen abundance gradient ofthe M 31 thicker disc is amongst the most positive values observed till date in spiral galaxies, flatter than that of the MW thickdisc which has a negative radial gradient. On the other hand, the thin discs of the MW andM 31 have remarkably similar negativeoxygen abundance gradient values.
Key words: Galaxies: individual (M 31) – Galaxies: evolution – Galaxies: structure – planetary nebulae: general
1 INTRODUCTION
Late-type galaxies can contain multi-layered populations that arekinematically distinct, the “cold" thin disc and the “hot" thick disc,found in the Milky Way (MW; e.g. Gilmore & Reid 1983) and innearby galaxies (Yoachim & Dalcanton 2006; Comerón et al. 2019).The MW thick disc within the solar radius is found to be chemicallydistinct from the MW thin disc suggesting separate evolution forthe two (e.g. Bland-Hawthorn & Gerhard 2016; Kobayashi et al.2020). Thick discs may form from accreted gas during a chaoticperiod of hierarchical clustering at high redshift (Brook et al. 2004)or from dynamical heating of thinner discs by secular processes(Sellwood 2014). Mergers with satellites can also dynamically heatthin discs to decrease their rotational velocity and increase their
★ E-mail: [email protected]
velocity dispersion (Quinn &Goodman 1986), resulting in thickeneddiscs (Hopkins et al. 2009). Even the stars from the merged satellitecan form the thick disc (Peñarrubia et al. 2006).
Since galaxies are thought to evolve by hierarchical mergers withsatellite galaxies (White & Rees 1978; Bullock & Johnston 2005),late-type galaxies of varying disc thickness are expected. Observa-tional evidence of multi-layered disks in nearby spirals can be ob-tained by measuring kinematics and metallicity of their stellar pop-ulations covering a large radial range in these discs (E.g. Yoachim& Dalcanton 2008a,b). However, this requires deep spectroscopicobservations of resolved stars (E.g. Guhathakurta et al. 2005) or in-tegral field spectroscopy (E.g. Saglia et al. 2018). For the nearly 12sq. deg. on-sky coverage of the M 31 disc, such observations wouldbe highly time consuming with current instrumentation.
However, spectroscopic observations for kinematics and chemistryis possible in reasonable time with discrete tracers, such as Plane-
© 2021 The Authors
arX
iv:2
203.
0642
8v1
[as
tro-
ph.G
A]
12
Mar
202
2

2 S. Bhattacharya et al.
tary Nebulae (PNe). PNe are discrete tracers of stellar populationproperties and their kinematics have been measured in galaxies ofdifferent morphological types (e.g. Coccato et al. 2009; Cortesi et al.2013; Pulsoni et al. 2018; Aniyan et al. 2018; Hartke et al. 2018;Aniyan et al. 2021; Hartke et al. 2022). In particular, in Bhattacharyaet al. (2019b, , hereafter Paper II), through velocity dispersion pro-files of high- and low- extinction PNe in the M 31 disc, kinematicallydistinct dynamically colder thin and hotter thicker discs were re-spectively identified. The thin and thicker discs of M 31 were foundto have rotational velocity dispersions twice and thrice that of theMW disc population of the same age (Paper II, Collins et al. 2011;Dorman et al. 2015). While the MW disc is thought to have evolvedmainly by secular evolution (Sellwood 2014) with its most recentmerger ∼10 Gyr ago (Helmi et al. 2018; Belokurov et al. 2018), theage-velocity dispersion relation in the M 31 disc at galactocentricradial distances RGC =14–20 kpc was found to be consistent witha ∼1:5 major merger in M 31 ∼2.5–4.5 Gyr ago. A minor merger,such as that modelled for M 31 by Fardal et al. (2013), would not beable to dynamically heat the M 31 disc to the measured rotationalvelocity dispersion for the thicker disc (E.g. see models by Martiget al. 2014). Thus, while the MW is a prime laboratory for studyingeffects driven by secular evolution in discs, the M 31 disc formationis considered to be primarily driven by mergers (Paper II) also sup-ported by observational evidence of substructures in its inner halo(PAndAS – McConnachie et al. 2009).The measured rotational velocity dispersions for the M 31 thin
and thicker disc is in agreement with predictions from the mergersimulations by Hammer et al. (2018). There a gas-rich satellite wasaccreted on to M 31 with an orbit along the Giant Stream, heating theM31 disc and producing a thick disc from the pre-existing stars. Afterthe merger, the replenished cold gas would lead to the formation of athin disc through a burst of star formation. The stars in the thin andthick discs of M 31 are formed in different epochs in this scenarioand so differences may be present in the chemical composition oftheir stars. See also the N-body simulations of a merger (mass ratioincluding dark matter ∼1:5) in M 31 by Milošević et al. (2022) aswell as the suite of N-body simulations by Sadoun et al. (2014).The chemical evolution of discs of spiral galaxies is also reflected
in their radial abundance distributions. In an inside-out build-upscenario of a galaxy disc, negative radial metallicity gradients areexpected (e.g. Sánchez-Menguiano et al. 2018). Hydrodynamicalsimulations have shown that the radialmetallicity gradient in galaxiesis modified both in case of secular evolution (e.g. Gibson et al. 2013)and also in the case of galaxy mergers (e.g. Zinchenko et al. 2015;Tissera et al. 2019).Abundance distributions in galaxies can be mapped from PNe,
thereby making them tracers of chemistry in galaxies (Maciel &Koppen 1994; Kwitter & Henry 2021). PN elemental abundances,particularly oxygen and argon, shed light on the ISM conditions atthe time of formation of their parent stellar population (e.g. Bresolinet al. 2010; Hernández-Martínez et al. 2011; Stanghellini et al. 2014).When PNe ages can be identified, it becomes possible to map abun-dance variations across different epochs of star formation in galaxies.In the MW, the radial oxygen abundance gradient for both thin andthick disc PNe formed at different epochs have been obtained sepa-rately allowing for significant constraints on its chemical evolution(Stanghellini & Haywood 2018).In the case of M 31, the PN oxygen abundance gradient has pre-
viously been measured by Sanders et al. (2012) from ∼ 50 observedPNe in theM 31 disc. They found a best-fit slope of−0.0056±0.0076dex/kpcwithinRGC ∼4–24 kpc. Latermeasurements byKwitter et al.(2012) (only oxygen abundances) and Peña & Flores-Durán (2019)
Table 1.Details of MMT Hectospec observations of PNe. Brighter PNe wereprioritised for observations but PNe to m5007 = 26.4 mag were targeted.Some PNe were observed twice in the regions of overlap of adjacent fields.The fields for tag-along observations are marked with ∗.
Obs. date RA DEC Exp. time NPN,targ NPN,obs(deg) (deg) (s)
14.09.18∗ 10.4700833 41.0778389 9000 38 1915.09.18 11.2468750 39.3372003 4800 41 1306.10.18∗ 10.4700833 41.0778389 9000 65 4104.12.18 11.5407083 42.7038650 3600 202 4402.09.19 10.83 40.645 4800 148 6705.09.19 10.0681250 39.9762458 3600 119 5523.10.19 9.4446667 40.4633331 4800 175 7124.10.19 10.8910833 41.5916672 4800 226 17425.10.19 9.0818750 39.6116675 6000 79 2607.10.20∗ 10.659625 41.1844253 7920 44 2207.10.20∗ 10.15525 40.9850014 6600 53 2108.10.20∗ 10.8875833 41.4929542 8400 37 2608.10.20 11.568125 41.4599992 4800 232 6309.10.20∗ 10.15525 40.9850014 5280 88 3409.10.20∗ 11.2415417 41.8282319 7560 30 1810.10.20∗ 10.2915417 40.7175942 3000 45 1710.10.20 9.7178333 41.5566672 4800 110 2811.10.20∗ 11.2415417 41.8282319 7560 8 312.10.20∗ 11.4205 42.0603333 4500 26 1412.10.20∗ 11.4205 42.0603333 6000 27 1612.10.20 12.2790417 42.4166681 4800 166 2612.10.20 10.5755 42.3983344 6000 153 3713.10.20 8.5034167 40.7700006 4800 26 813.10.20 12.44075 43.9933319 4800 13 524.10.20 10.6455667 41.2599983 3000 228 5724.10.20 11.8477083 38.5099983 5760 30 1624.10.20∗ 10.2915417 40.7175942 4800 135 5825.10.20 13.06125 42.3266678 6000 80 1725.10.20 12.7429167 40.9850006 3600 42 825.10.20 8.919125 41.9350014 3600 23 525.10.20 9.8354167 43.3883325 6000 69 12
(both oxygen and argon abundances) out to RGC ∼ 110 kpc havealso found near-flat abundance gradients. The flat PN oxygen abun-dance gradient differs from that measured for HII regions in theM 31disc which display a much steeper best-fit slope of −0.023 ± 0.002dex/kpc (Zurita & Bresolin 2012). Since HII regions sample only ayoung (<0.3 Gyr) stellar population, while PNe sample a wider agerange, the difference in abundance gradients of the two samples mayreflect the different properties of their parent generations of stars.Elemental abundance measurements of the high- and low- extinctionPNe with distinct ages can now be measured to obtain separate abun-dance distributions of the kinematically distinct thin and thicker discin M 31 (Paper II).In this paper we obtain direct measurements of oxygen and argon
abundances for the M 31 disc PNe using a large sample size andcovering a wide 2−30 kpc radial range. Our aim is to assess whetherthe kinematically distinct thin and thicker disc of M 31 have differentabundance distribution and gradients. Our observations and sampleselection are discussed in Section 2. The radial oxygen and argonabundance gradients of the high- and low-extinction PNe respec-tively, are presented in Section 3. We assess our radial abundancegradient measurements in context of disc galaxies in Section 4. Wethen discuss constraints on the chemical evolution and formationhistory of M 31 in Section 5 and finally conclude in Section 6.
MNRAS 000, 1–14 (2021)

Radial abundance gradients of the M 31 thin and thicker discs from PNe 3
2 DATA REDUCTION AND SAMPLE SELECTION
2.1 Observations
In Bhattacharya et al. (2019a, hereafter Paper I), we identified PNcandidates in a 16 sq. deg. imaging survey of M 31 withMegaCam atthe CFHT, covering the disc and inner halo. This was later expandedto cover 54 sq. deg in M31 (Bhattacharya et al. 2021, hereafterPaper III). Spectroscopic observations of a complete subsample ofthese PN candidates were carried out with the Hectospec multifibrepositioner and spectrograph on theMultipleMirror Telescope (MMT;Fabricant et al. 2005). The Hectospec 270 gpm grating was used andprovided spectral coverage from 3650 to 9200 Å at a resolution of∼ 5 Å. Some spectra did not cover [O ii] 3726/3729 Å because ofthe design of the spectrograph (alternate fibers are shifted by 30 Å)and the small blueshift of M 31. Each Hectospec fibre subtends 1.5′′on the sky and was positioned on the PN candidates in each field.Table 1 shows details of the fields observed in this work whosepositions have been marked in Figure 1. We targeted 2222 distinctPNe candidates with fibres in 26 separate fields in M 31, some ofwhich were observed multiple times. Of these fields, seven werepart of tag-along observations (where only a few free fibres fromother observing programs covering M31 were placed on the PNcandidates). These pointings are marked with ∗ in Table 1.The initial steps for the data reduction of each Hectospec spec-
tra are similar to that described by Caldwell et al. (2009) for theirobservations of star clusters in M 31, which were also followed bySanders et al. (2012) for their PN spectra. Briefly, following the de-biasing and flat-fielding of each observed field, individual spectrawere extracted and wavelength calibrated, including a heliocentriccorrection. Standard star spectra were used for flux calibration andinstrumental response. Sky subtraction was carried out by averagingspectra from fibers placed on blank sky from the same exposures orby offsetting the telescope by a few arcseconds (see Caldwell et al.2009). The spectra of PN candidates that were observed multipletimes (in adjacent fields) have been combined, effectively coaddingthose integration times. Figure 2 shows an example of the observedPN spectra.
2.2 Emission line fluxes and line-of-sight velocity estimation
Emission-line fluxes for each PN candidate were measured using theautomated line fitting algorithm, ALFA (Wesson 2016), which hasbeen tailored for emission line sources. The line-of-sight velocity(VLOS) is measured from the strongest emission-lines accountingfor heliocentric correction, with an uncertainty of 3 km s−1. Aftersubtracting a globally-fitted continuum, ALFA derives fluxes by opti-mising the parameters of Gaussian fits to line profiles using a geneticalgorithm. Of the 2222 targeted PNe candidates, 866 have confirmeddetection of the [O iii] 4959/5007 Å emission lines. The [O iii] 5007Å emission line is detected in all these cases with a signal-to-noiseratio higher than 5. All of them have H𝛼 emission line present also.The fraction of PNe detected as a function of magnitude is shownin Figure 3. We also used ALFA to obtain the emission line fluxesfrom the archival Hectospec spectra of 449 PNe studied by Sanderset al. (2012) which had confirmed detection of the [O iii] 4959/5007Å emission lines. Of these archival PNe, 64 were re-observed inthis work. We thus have 1251 unique PNe with VLOS measurementsin M31, termed the PN_M31_LOSV sample. Their spatial positionis shown in Figure 1. Note that contaminant spatially unresolvedHII regions were removed and are not included in this sample (seeAppendix A for further details).
Figure 1. Position on sky of the PNe with VLOS measurements in M31, bothobserved in this work aswell as the archival sample fromSanders et al. (2012),overlaid on the PAndAS number density map of RGB stars(McConnachieet al. 2018). The targeted MMT fields are marked in red while those utilisedin tag-along observations are marked in blue.
2.3 Extinction measurement
For each PN, the measured emission-line fluxes are then passedto NEAT (Nebular Empirical Analysis Tool; Wesson et al. 2012),which applies an empirical scheme to calculate the extinction andelemental abundances. NEAT calculated the intrinsic c(H 𝛽) usingthe flux-weighted ratios of H𝛼/H𝛽, H𝛾/H𝛽 and H𝛿/H𝛽 (whicheverpairs are observed) and the extinction law of Cardelli et al. (1989),first assuming a nebular temperature of 10000K and an electrondensity of 1000 cm−3, and then recalculating c(H 𝛽) at the measuredtemperature and density (whenever available; see Section 2.5 fordetails). Of the 1251 PNe in the PN_M31_LOSV sample, 745 hadthe H 𝛽 line detected and their extinctions (A𝑉 ) could be determinedwith a positive value.Note that a further 380PNe showed the presenceof the H 𝛽 line but resulted in a negative (but close to zero) value ofA𝑉 , similar to that found by Sanders et al. (2012). These PNe werenot utilised further in this work to measure elemental abundances butare a part of the PN_M31_LOSV sample.
2.4 Selection of M 31 disc PNe from the position velocitydiagram
The PNe with extinction measurements are de-projected on to thegalaxy plane based on the position angle (PA = 38◦) and inclina-tion (i = 77◦) of M 31 in the planar disc approximation. PNe be-yond RGC = 30 kpc are not included further in the analysis, as asignificant fraction of them may be associated with the prominentbright substructures – G1-Clump and Northern Spur, and the dwarfgalaxy NGC 205, present at these radii. The remaining PNe within
MNRAS 000, 1–14 (2021)

4 S. Bhattacharya et al.
Figure 2. An example of the spectra observed by Hectospec for the PNe in M31. The spectra shown in grey is obtained following heliocentric correction,removal of sky-lines and flux calibration. The fitted spectra from ALFA (Wesson 2016) is shown in black. The emission lines with fluxes tabulated in Table B1are labelled in red, while other observed bright lines are marked in grey.
Figure 3. Fraction of PNe targeted with spectroscopic observations where[O iii] 4959/5007 Å emission lines (the [O iii] doublet) were detected.The uncertainty in detection fraction is the binomial proportion confidence-interval of observed PNe in any magnitude bin obtained using the Wilsonscore interval method (Wilson 1927). The blue dashed line shows the 50%detection limit of the spectroscopic follow-up.
RGC = 30 kpc are shown in Figure 4 which plots their position, XGC(de-projected major-axis distance in deg in the disc-plane), againsttheir VLOSV − Vsys (M 31 systemic velocity, Vsys = −309 kms−1; Merrett et al. 2006). While the majority of PNe in M 31 withinRGC = 30 kpc are associated with its bulge and disc, some PNe as-sociated with the extension of a luminous substructure or any fainterstellar stream co-spatial with the disc may also be present.Such PNe may present themselves as a dynamically cold compo-
nent that is offset from the disc PNe in the position-velocity plot, like
Figure 4. Position-velocity diagram of PNe within RGC = 30 kpc. Here XGCis the deprojected major-axis distance in deg (1 deg= 13.68 kpc). The dottedlines distinguish the outliers which have a non-disc angular momentum andpossibly correspond to streams or halo PNe. The PNe are coloured by their(VLOS - Vclose)/𝜎close values, where the outliers stand out in yellow. Vcloseand 𝜎close refer to the local LOSV and dispersion within a radius of 4′ centredaround each PN.
the PNe associated with the extension of the Giant Stream on the discas proposed by Merrett et al. 2003. The dotted lines in Figure 4 cor-respond to an offset from the mean value of the VLOSV − Vsys for thePNe to the maximum possible velocity dispersion of the thick disc inM 31 (160 km s−1; from Paper II). We identify the position-velocityoutliers as those PNe whose VLOSV − Vsys values are outside themaximum values for the thick disc PNe in M 31. This selection suc-cessfully identifies as outliers those PNe on the extension of the giant
MNRAS 000, 1–14 (2021)

Radial abundance gradients of the M 31 thin and thicker discs from PNe 5
Table 2. Summary of numbers of PNe observed in this work and Sanderset al. (2012) to build the total sample of M 31 disc PNe with LOSV and AVmeasurements.
No. of PNe with LOSV measurement observed in this work 866No. of Sanders et al. (2012) PNe with LOSV measurement 449Total PNe with LOSV measurement (PN_M31_LOSV) 1251Those of the above with positive AV measurement 745Those of the above in the disc (PN_M31d_Av ) 601
Figure 5. Fraction of PNe with spectroscopic observations where the [O iii]4363 Å emission line were detected and the elemental abundances could bemeasured. The uncertainty in detection fraction is the binomial proportionconfidence-interval of observed PNe in any magnitude bin obtained using theWilson score interval method (Wilson 1927). The blue dashed line shows the75% detection limit of the [O iii] 4363 Å emission line.
stream tagged previously by Merrett et al. 2003 and a few additionalPNe.A further selection of PN outliers is possible for the inner regions
of the discwith large number of PNLOSVmeasurements,where suchLOSV outliers may stand out from the LOSVs of the PNe in theirlocal spatial neighbourhood. For each PN, we obtain the mean localLOSV, Vclose, and local LOSV dispersion,𝜎close, within a radius of4′. The value of the radius was chosen such that there are at least5 PNe within such radius for each PNe out to RGC ∼ 20. ThosePNe whose LOSV is over 2𝜎close away from Vclose, are tagged asoutliers. In this way, we identify as outliers those PNe associated withthe claimed extension of the giant stream from Merrett et al. 2003 asseen in Figure 4, along with additional PNe that were not classifiedas such in previous works. We thus identify 601 PNe with extinctionmeasurements (see Section 2.3) within RGC = 30 kpc which arerobust M 31 disc members (some of these within RGC = 5 kpc mayalso belong to the M 31 bulge). This is then the M 31 disc PN sample(termed PN_M31d_Av ) and Table 2 summarises the number of PNeidentified in each aforementioned step. This is the largest sample ofPNe with extinction measurements observed in theM 31 disc, in fact,in any external galaxy. We have nearly doubled the sample size ofPNewith extinctionmeasurements from Paper II. PN disc kinematicswith the increased sample will be explored in a future paper. In thiswork, we further refine the M 31 disc PN sample in order to studyPN elemental abundances.
Figure 6. Position on sky of the PNe with oxygen abundance measure-ments in M31, overlaid on the PAndAS number density map of RGBstars(McConnachie et al. 2018). The high- and low-extinction PNe aremarkedin cyan and red respectively. The white ellipses show RGC = 10, 20, 30 kpcrespectively.
2.5 Direct determination of elemental abundances for each PN
Emission lines in the spectra of each PN of the PN_M31d_Av sampleare de-reddened using the calculated c(H 𝛽) and their temperaturesand densities are calculated using an iterative process from the rel-evant diagnostic lines using NEAT (see Wesson et al. 2012, section3.3). For our observations, NEAT utilizes the temperature-sensitive[O iii] 4363 Å line and the density-sensitive [O ii] 3726/3729 Å and[S ii] 6717/6731 Å doublets to obtain temperature and electron den-sity for each PN, whenever the [O iii] 4363 Å line is observed.Oxygen and argon ionic abundances are measured from the observedfluxes of the oxygen ([O ii] 3726/3729 Å, [O iii] 4363/4959/5007 Å)and argon ([Ar iii] 7136/7751Å, [Ar iv] 4711/4740Å, [Arv] 7005Å)lines respectively. Elemental oxygen and argon abundances are ob-tained from the ionic abundances using the ionisation correctionfactors (ICFs) from Delgado-Inglada et al. (2014). Uncertainties arepropagated through all steps of the analysis into the final values. Com-parison with archival PN abundance determinations is discussed inAppendix C. Of the 601 PNe in the PN_M31d_Av sample, 276 haveoxygen abundances measured, out of which 269 also have argonabundances.Figure 5 shows the detection fraction of the temperature-sensitive
[O iii] 4363 Å emission line, enabling the measurement of oxy-gen and argon abundances, in those PNe with spectroscopic obser-vations. The [O iii] 4363 Å emission line, relative to the [O iii]doublet, is brighter for lower metallicity PNe. Hence, we are morelikely to preferentially observe metal-poor PNe at the faint-end. Wethus restrict the analysis of the abundance distribution and gradientto those PNe where the detection fraction is higher than 75%, i.e,m5007 ≤ 21.9mag, so as not to be biased towards metal-poor PNewhile still maintaining a large sample, 205 and 200 PNe with oxygenand argon abundance measurements respectively. The magnitude-
MNRAS 000, 1–14 (2021)
6 S. Bhattacharya et al.
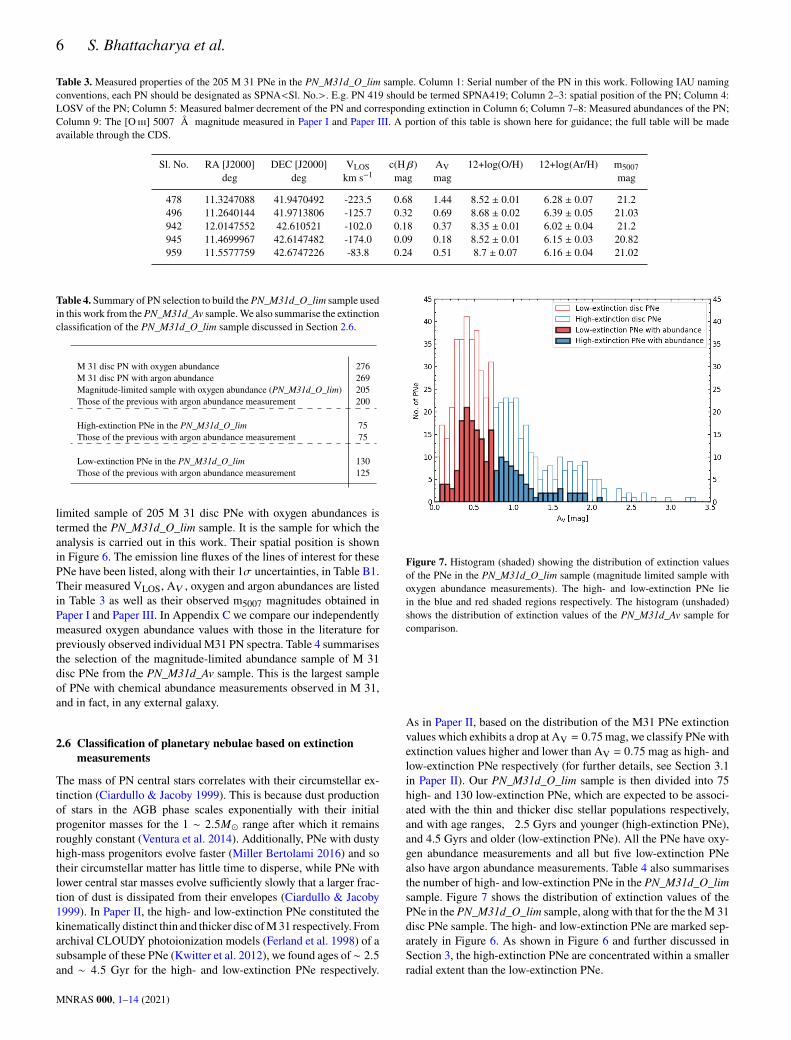
Table 3. Measured properties of the 205 M 31 PNe in the PN_M31d_O_lim sample. Column 1: Serial number of the PN in this work. Following IAU namingconventions, each PN should be designated as SPNA<Sl. No.>. E.g. PN 419 should be termed SPNA419; Column 2–3: spatial position of the PN; Column 4:LOSV of the PN; Column 5: Measured balmer decrement of the PN and corresponding extinction in Column 6; Column 7–8: Measured abundances of the PN;Column 9: The [O iii] 5007 Å magnitude measured in Paper I and Paper III. A portion of this table is shown here for guidance; the full table will be madeavailable through the CDS.
Sl. No. RA [J2000] DEC [J2000] VLOS c(H 𝛽) AV 12+log(O/H) 12+log(Ar/H) m5007deg deg km s−1 mag mag mag
478 11.3247088 41.9470492 -223.5 0.68 1.44 8.52 ± 0.01 6.28 ± 0.07 21.2496 11.2640144 41.9713806 -125.7 0.32 0.69 8.68 ± 0.02 6.39 ± 0.05 21.03942 12.0147552 42.610521 -102.0 0.18 0.37 8.35 ± 0.01 6.02 ± 0.04 21.2945 11.4699967 42.6147482 -174.0 0.09 0.18 8.52 ± 0.01 6.15 ± 0.03 20.82959 11.5577759 42.6747226 -83.8 0.24 0.51 8.7 ± 0.07 6.16 ± 0.04 21.02
Table 4. Summary of PN selection to build thePN_M31d_O_lim sample usedin this work from thePN_M31d_Av sample.We also summarise the extinctionclassification of the PN_M31d_O_lim sample discussed in Section 2.6.
M 31 disc PN with oxygen abundance 276M 31 disc PN with argon abundance 269Magnitude-limited sample with oxygen abundance (PN_M31d_O_lim) 205Those of the previous with argon abundance measurement 200
High-extinction PNe in the PN_M31d_O_lim 75Those of the previous with argon abundance measurement 75
Low-extinction PNe in the PN_M31d_O_lim 130Those of the previous with argon abundance measurement 125
limited sample of 205 M 31 disc PNe with oxygen abundances istermed the PN_M31d_O_lim sample. It is the sample for which theanalysis is carried out in this work. Their spatial position is shownin Figure 6. The emission line fluxes of the lines of interest for thesePNe have been listed, along with their 1𝜎 uncertainties, in Table B1.Their measured VLOS, A𝑉 , oxygen and argon abundances are listedin Table 3 as well as their observed m5007 magnitudes obtained inPaper I and Paper III. In Appendix C we compare our independentlymeasured oxygen abundance values with those in the literature forpreviously observed individual M31 PN spectra. Table 4 summarisesthe selection of the magnitude-limited abundance sample of M 31disc PNe from the PN_M31d_Av sample. This is the largest sampleof PNe with chemical abundance measurements observed in M 31,and in fact, in any external galaxy.
2.6 Classification of planetary nebulae based on extinctionmeasurements
The mass of PN central stars correlates with their circumstellar ex-tinction (Ciardullo & Jacoby 1999). This is because dust productionof stars in the AGB phase scales exponentially with their initialprogenitor masses for the 1 ∼ 2.5𝑀� range after which it remainsroughly constant (Ventura et al. 2014). Additionally, PNe with dustyhigh-mass progenitors evolve faster (Miller Bertolami 2016) and sotheir circumstellar matter has little time to disperse, while PNe withlower central star masses evolve sufficiently slowly that a larger frac-tion of dust is dissipated from their envelopes (Ciardullo & Jacoby1999). In Paper II, the high- and low-extinction PNe constituted thekinematically distinct thin and thicker disc ofM31 respectively. Fromarchival CLOUDY photoionization models (Ferland et al. 1998) of asubsample of these PNe (Kwitter et al. 2012), we found ages of ∼ 2.5and ∼ 4.5 Gyr for the high- and low-extinction PNe respectively.
Figure 7. Histogram (shaded) showing the distribution of extinction valuesof the PNe in the PN_M31d_O_lim sample (magnitude limited sample withoxygen abundance measurements). The high- and low-extinction PNe liein the blue and red shaded regions respectively. The histogram (unshaded)shows the distribution of extinction values of the PN_M31d_Av sample forcomparison.
As in Paper II, based on the distribution of the M31 PNe extinctionvalues which exhibits a drop at AV = 0.75mag, we classify PNe withextinction values higher and lower than AV = 0.75mag as high- andlow-extinction PNe respectively (for further details, see Section 3.1in Paper II). Our PN_M31d_O_lim sample is then divided into 75high- and 130 low-extinction PNe, which are expected to be associ-ated with the thin and thicker disc stellar populations respectively,and with age ranges, 2.5 Gyrs and younger (high-extinction PNe),and 4.5 Gyrs and older (low-extinction PNe). All the PNe have oxy-gen abundance measurements and all but five low-extinction PNealso have argon abundance measurements. Table 4 also summarisesthe number of high- and low-extinction PNe in the PN_M31d_O_limsample. Figure 7 shows the distribution of extinction values of thePNe in the PN_M31d_O_lim sample, along with that for the theM 31disc PNe sample. The high- and low-extinction PNe are marked sep-arately in Figure 6. As shown in Figure 6 and further discussed inSection 3, the high-extinction PNe are concentrated within a smallerradial extent than the low-extinction PNe.
MNRAS 000, 1–14 (2021)

Radial abundance gradients of the M 31 thin and thicker discs from PNe 7
Figure 8. Histogram showing the distribution of oxygen abundances for the[top] high- and [bottom] low-extinction PNe in the PN_M31d_O_lim sample.The bins are 0.1 dex wide and show the Poissonian errors.
3 ABUNDANCE DISTRIBUTION AND RADIALGRADIENTS IN THE M 31 DISC FROM PLANETARYNEBULAE
We separately explore the chemical abundance distribution and gra-dients of both oxygen and argon for the high- and low-extinctionPNe which trace the kinematically distinct thin and thicker discs ofM 31. We note that Delgado-Inglada et al. (2015) suggested a possi-ble dependency of PN oxygen abundance on metallicity and mass forcarbon dust rich (CRD) MW PNe. As per their study, CRDMWPNemay be oxygen enriched by up to 0.3 dex frommodification of surfaceoxygen in the Asymptotic Giant Branch (AGB) phase. However, ar-gon has been found to be invariant during the AGB phase, providingan independent probe to the ISM conditions at the time of birth of thePN parent stellar population. We, however, do not find that oxygenis enriched in CRDs in a larger MW PNe sample from Ventura et al.(2017), detailed in Appendix D. Additionally, for PNe evolving fromstars with initial mass ≥ 3M� (younger than ∼ 300Myr), hot-bottomburning (HBB) may result in an oxygen depletion of up to ∼ 0.2 dex.The M 31 high- extinction PNe have average ages ∼ 2.5Gyr with thebulk of them having likely formed in a burst of star formation ∼2 Gyrago (Paper II). This implies that a very small number of PNe withvery young massive progenitors (affected by HBB) are expected inour sample. The bulk of theM 31 PNe would thus exhibit oxygen andargon abundances unaffected by AGB evolution. Hence we proceedto use oxygen and argon abundances for high- and low-extinctionPNe in M31 as probes of the chemical abundances of the ISM atthe time of their birth for the different kinematic components of theM 31 disc.
3.1 Oxygen abundance distribution and radial gradient fromPlanetary Nebulae
Figure 8 shows the PN oxygen abundance distribution for all thehigh- and low-extinction PNe in the PN_M31d_O_lim sample of theM 31 disc. The mean value of the oxygen abundance for all thehigh-extinction PNe, < 12+ (O/H) >high−ext= 8.57±0.03, is higherthan that for all the low- extinction PNe, < 12 + (O/H) >low−ext=8.48 ± 0.02. While the high-extinction PN sample has higher oxy-gen abundance on average than the low-extinction sample, there is
Figure 9. The galactocentric radial distribution of oxygen abundances for[top] all, [middle] high- and [bottom] low-extinction PNe in M 31 in ourPN_M31d_O_lim sample. The best-fitting radial oxygen abundance gradientto the PN_M31d_O_lim sample is shown for all (green), high- (blue) andlow-extinction (red) PNe.
a considerable overlap in the distributions which is reflected in thelarge standard deviation values 𝜎(12 + (O/H))high−ext = 0.28 and𝜎(12 + (O/H))low−ext = 0.21. We can establish whether the oxy-gen abundance distributions of the two PN samples are different bystatistically comparing them. We utilize the two-sample Anderson-Darling test (AD-test; Scholz & Stephens 1987) to compare the twodistributions, which yields a significance level of 2.3%. Since thesignificance level is lower than 5%, the null hypothesis that the twosamples are drawn from the same distribution is rejected. The differ-ence in the oxygen abundance distributions of the two PN populationsstems from the distinct ISM conditions at the time of their birth.Figure 9 shows the galactocentric radial distribution of PN oxy-
gen abundances for all PNe, as well as distinctly for high- andlow-extinction PNe, in the PN_M31d_O_lim sample. We note thatthe high-extinction PNe cover a smaller radial extent than the low-extinction PNe, i.e. the thicker disc in M 31 is more radially extendedthan the thin disc. The best-fit parameters are noted in Table 5. Forthe PN_M31d_O_lim sample, we find a near-flat abundance gradientfor all PNe, (Δ(O/H)/ΔR)all = 0.001 ± 0.003 dex/kpc, a steeplynegative oxygen abundance gradient for the high-extinction PNe,(Δ(O/H)/ΔR)high−ext = −0.013 ± 0.006 dex/kpc while for the low-extinction PNewe find a slightly positive oxygen abundance gradient,(Δ(O/H)/ΔR)low−ext = 0.006 ± 0.003 dex/kpc. Zurita & Bresolin(2012) found that for HII regions the oxygen abundance gradient (de-termined indirectly for a large sample), (Δ(O/H)/ΔR)HII−regions =−0.023±0.002 dex/kpc is steeper than that observed for either of thePN populations. However, we do find a similar intercept for the high-extinction PNe (12+log(O/H)0, high−ext = 8.6 ± 0.08) and the HIIregions (12+log(O/H)0, HII−regions = 8.72 ± 0.18; Zurita & Bresolin2012). Both high extinction PNe and HII regions show the highestoxygen abundance values at RGC < 5 kpc.
MNRAS 000, 1–14 (2021)

8 S. Bhattacharya et al.
Table 5. Fitted parameters for radial gradients in the M 31 disc from thePN_M31d_O_lim sample.
PN sample X X0 ΔX/ΔRdex/kpc dex/rd
All 12+log(O/H) 8.4 ± 0.04 0.001 ± 0.003 0.006 ± 0.018High-extinction 12+log(O/H) 8.6 ± 0.08 -0.013 ± 0.006 -0.079 ± 0.036Low-extinction 12+log(O/H) 8.31 ± 0.05 0.006 ± 0.003 0.036 ± 0.018
All 12+log(Ar/H) 6.37 ± 0.04 -0.008 ± 0.002 -0.049 ± 0.012High-extinction 12+log(Ar/H) 6.51 ± 0.08 -0.018 ± 0.006 -0.109 ± 0.036Low-extinction 12+log(Ar/H) 6.3 ± 0.05 -0.005 ± 0.003 -0.03 ± 0.018
Figure 10. Histogram showing the distribution of argon abundances for the[top] high- and [bottom] low-extinction PNe. The bins are 0.1 dex wide,vertical bars indicate the Poissonian errors.
3.2 Argon abundance distribution and radial gradient fromPlanetary Nebulae
Figure 10 shows the PN argon abundance distribution for the high-and low-extinction PNe in the M 31 disc within ∼30 kpc. We utilizetheAD-test to statistically compare the two distributionswhich yieldsa significance level of 3.3%. Since the significance level is lesserthan 5%, the null hypothesis that the two samples are drawn from thesame distribution is rejected. Thus the two disc components in M31traced by the high- and low- extinction PNe have stellar populationsthat were born from ISM with distinct argon and oxygen abundancedistributions. Their parent stellar populations, forming the thin andthicker disc of M 31, are not only kinematically distinct (Paper II),but also have distinct elemental abundances and radial gradients.The mean value of the argon abundance for the high-extinction PNe,< 12 + log(Ar/H) >high−ext= 6.32± 0.03, is clearly higher than thatfor the low- extinction PNe, < 12+log(Ar/H) >low−ext= 6.25±0.02.The standard deviation values,𝜎(12+log(Ar/H))high−ext = 0.29 and𝜎(12 + log(Ar/H))low−ext = 0.2, reflect an overlap of their argonabundance distribution.Figure 11 shows the galactocentric radial distribution of PN
argon abundances for the high- and low-extinction PNe samplesin RGC =2–30 kpc radial range. Their fitted parameters are alsonoted in Table 5. We find a steeply negative argon abundancegradient for the high-extinction PNe, (Δ(Ar/H)/ΔR)high−ext =
−0.018 ± 0.006 dex/kpc while for all PNe and the low-extinctionPNe we find negative and slightly negative argon abundance gradi-
Figure 11. The galactocentric radial distribution of argon abundances for[top] all, [middle] high- and [bottom] low-extinction PNe in the M 31 discin our PN_M31d_O_lim sample. The best-fitting radial argon abundancegradient to the PN_M31d_O_lim sample is shown for all (green), high- (blue)and low-extinction (red) PNe.
ents respectively, (Δ(Ar/H)/ΔR)all = −0.008 ± 0.002 dex/kpc and(Δ(Ar/H)/ΔR)low−ext = −0.005 ± 0.003 dex/kpc.We can then compare the argon abundance gradients in PNe with
that of the oxygen abundance gradientmeasured forHII regions1. Thehigh-extinction PNe have an abundance gradient which is consistentwithin error with that of the HII regions, (Δ(O/H)/ΔR)HII−regions =−0.023±0.002 dex/kpc (Zurita & Bresolin 2012), implying that boththe parent stellar populations of these young PNe and the HII regionsoriginated from a similarly-enriched ISM. The near-flat abundancegradient of the low-extinction PNe, on the other hand, implies aparent stellar population which has a different chemical compositionand radial trend.
4 COMPARISON OF RADIAL ABUNDANCE GRADIENTFROM M 31 DISC PLANETARY NEBULAE WITHGRADIENTS IN GALAXY DISCS
4.1 Comparison with previous nebular abundance gradientmeasurements in the M 31 disc
Previous PN abundance gradient measurements in the M 31 disc(Sanders et al. 2012; Kwitter et al. 2012; Peña & Flores-Durán2019) found a flat radial oxygen abundance gradient out to largegalactocentric radii. Peña & Flores-Durán (2019) found an oxygenabundance gradient of −0.001 ± 0.001 dex/kpc within RGC ∼110kpc, including both disc and halo PNe and an argon abundancegradient of −0.002 ± 0.001 dex/kpc for the same sample. The flatoxygen abundance gradient determined in this work for all PNe(0.001 ± 0.003 dex/kpc; Table 5) is consistent with what was pre-viously measured. Our derived radial argon abundance gradient for
1 The argon abundance gradient for HII regions is not as robust becausethe argon abundance is measured only for 16 HII regions (as it requiresobservation of the faint [O iii] 4363 Å emission line; Esteban et al. 2020)over a limited radial range.
MNRAS 000, 1–14 (2021)
Radial abundance gradients of the M 31 thin and thicker discs from PNe 9
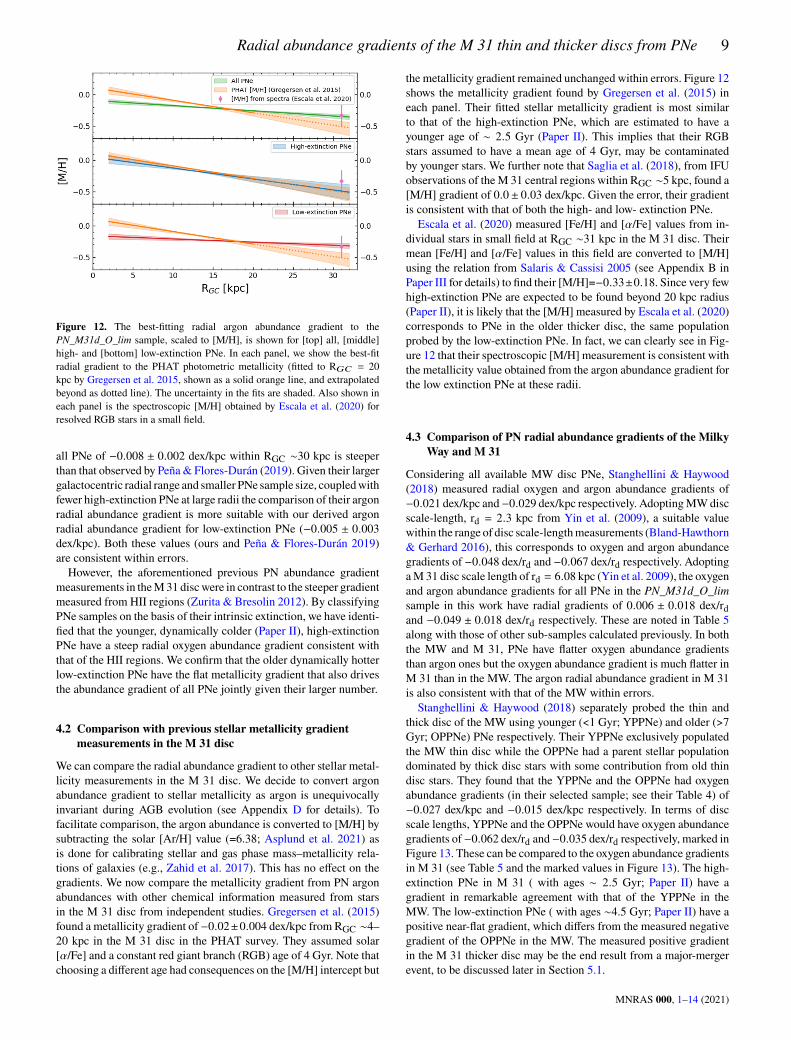
Figure 12. The best-fitting radial argon abundance gradient to thePN_M31d_O_lim sample, scaled to [M/H], is shown for [top] all, [middle]high- and [bottom] low-extinction PNe. In each panel, we show the best-fitradial gradient to the PHAT photometric metallicity (fitted to R𝐺𝐶 = 20kpc by Gregersen et al. 2015, shown as a solid orange line, and extrapolatedbeyond as dotted line). The uncertainty in the fits are shaded. Also shown ineach panel is the spectroscopic [M/H] obtained by Escala et al. (2020) forresolved RGB stars in a small field.
all PNe of −0.008 ± 0.002 dex/kpc within RGC ∼30 kpc is steeperthan that observed by Peña& Flores-Durán (2019). Given their largergalactocentric radial range and smaller PNe sample size, coupledwithfewer high-extinction PNe at large radii the comparison of their argonradial abundance gradient is more suitable with our derived argonradial abundance gradient for low-extinction PNe (−0.005 ± 0.003dex/kpc). Both these values (ours and Peña & Flores-Durán 2019)are consistent within errors.However, the aforementioned previous PN abundance gradient
measurements in theM31 discwere in contrast to the steeper gradientmeasured from HII regions (Zurita & Bresolin 2012). By classifyingPNe samples on the basis of their intrinsic extinction, we have identi-fied that the younger, dynamically colder (Paper II), high-extinctionPNe have a steep radial oxygen abundance gradient consistent withthat of the HII regions. We confirm that the older dynamically hotterlow-extinction PNe have the flat metallicity gradient that also drivesthe abundance gradient of all PNe jointly given their larger number.
4.2 Comparison with previous stellar metallicity gradientmeasurements in the M 31 disc
We can compare the radial abundance gradient to other stellar metal-licity measurements in the M 31 disc. We decide to convert argonabundance gradient to stellar metallicity as argon is unequivocallyinvariant during AGB evolution (see Appendix D for details). Tofacilitate comparison, the argon abundance is converted to [M/H] bysubtracting the solar [Ar/H] value (=6.38; Asplund et al. 2021) asis done for calibrating stellar and gas phase mass–metallicity rela-tions of galaxies (e.g., Zahid et al. 2017). This has no effect on thegradients. We now compare the metallicity gradient from PN argonabundances with other chemical information measured from starsin the M 31 disc from independent studies. Gregersen et al. (2015)found a metallicity gradient of −0.02±0.004 dex/kpc from RGC ∼4–20 kpc in the M 31 disc in the PHAT survey. They assumed solar[𝛼/Fe] and a constant red giant branch (RGB) age of 4 Gyr. Note thatchoosing a different age had consequences on the [M/H] intercept but
the metallicity gradient remained unchanged within errors. Figure 12shows the metallicity gradient found by Gregersen et al. (2015) ineach panel. Their fitted stellar metallicity gradient is most similarto that of the high-extinction PNe, which are estimated to have ayounger age of ∼ 2.5 Gyr (Paper II). This implies that their RGBstars assumed to have a mean age of 4 Gyr, may be contaminatedby younger stars. We further note that Saglia et al. (2018), from IFUobservations of the M 31 central regions within RGC ∼5 kpc, found a[M/H] gradient of 0.0± 0.03 dex/kpc. Given the error, their gradientis consistent with that of both the high- and low- extinction PNe.Escala et al. (2020) measured [Fe/H] and [𝛼/Fe] values from in-
dividual stars in small field at RGC ∼31 kpc in the M 31 disc. Theirmean [Fe/H] and [𝛼/Fe] values in this field are converted to [M/H]using the relation from Salaris & Cassisi 2005 (see Appendix B inPaper III for details) to find their [M/H]=−0.33±0.18. Since very fewhigh-extinction PNe are expected to be found beyond 20 kpc radius(Paper II), it is likely that the [M/H] measured by Escala et al. (2020)corresponds to PNe in the older thicker disc, the same populationprobed by the low-extinction PNe. In fact, we can clearly see in Fig-ure 12 that their spectroscopic [M/H] measurement is consistent withthe metallicity value obtained from the argon abundance gradient forthe low extinction PNe at these radii.
4.3 Comparison of PN radial abundance gradients of the MilkyWay and M 31
Considering all available MW disc PNe, Stanghellini & Haywood(2018) measured radial oxygen and argon abundance gradients of−0.021 dex/kpc and−0.029 dex/kpc respectively. AdoptingMWdiscscale-length, rd = 2.3 kpc from Yin et al. (2009), a suitable valuewithin the range of disc scale-lengthmeasurements (Bland-Hawthorn& Gerhard 2016), this corresponds to oxygen and argon abundancegradients of −0.048 dex/rd and −0.067 dex/rd respectively. AdoptingaM 31 disc scale length of rd = 6.08 kpc (Yin et al. 2009), the oxygenand argon abundance gradients for all PNe in the PN_M31d_O_limsample in this work have radial gradients of 0.006 ± 0.018 dex/rdand −0.049 ± 0.018 dex/rd respectively. These are noted in Table 5along with those of other sub-samples calculated previously. In boththe MW and M 31, PNe have flatter oxygen abundance gradientsthan argon ones but the oxygen abundance gradient is much flatter inM 31 than in the MW. The argon radial abundance gradient in M 31is also consistent with that of the MW within errors.Stanghellini & Haywood (2018) separately probed the thin and
thick disc of the MW using younger (<1 Gyr; YPPNe) and older (>7Gyr; OPPNe) PNe respectively. Their YPPNe exclusively populatedthe MW thin disc while the OPPNe had a parent stellar populationdominated by thick disc stars with some contribution from old thindisc stars. They found that the YPPNe and the OPPNe had oxygenabundance gradients (in their selected sample; see their Table 4) of−0.027 dex/kpc and −0.015 dex/kpc respectively. In terms of discscale lengths, YPPNe and the OPPNe would have oxygen abundancegradients of−0.062 dex/rd and−0.035 dex/rd respectively, marked inFigure 13. These can be compared to the oxygen abundance gradientsin M 31 (see Table 5 and the marked values in Figure 13). The high-extinction PNe in M 31 ( with ages ∼ 2.5 Gyr; Paper II) have agradient in remarkable agreement with that of the YPPNe in theMW. The low-extinction PNe ( with ages ∼4.5 Gyr; Paper II) have apositive near-flat gradient, which differs from the measured negativegradient of the OPPNe in the MW. The measured positive gradientin the M 31 thicker disc may be the end result from a major-mergerevent, to be discussed later in Section 5.1.
MNRAS 000, 1–14 (2021)

10 S. Bhattacharya et al.
Figure 13. The oxygen radial abundance gradients measured in terms ofdisc scale length for galaxies of different morphological types in Sánchez-Menguiano et al. (2016). The Sa-Sab (red), Sb-Sbc (green) and Sc-Sdm (darkblue) galaxies also have their mean oxygen abundance gradients plotted inblack. The oxygen abundance gradients for theMW (Stanghellini &Haywood2018) (square symbols) and M 31 (this work, larger dots) are marked. TheMW and M 31 thin disc values are marked in light blue while that for theMW thick disc and the M 31 thicker disc are marked in red.
4.4 Comparison with radial abundance gradients of othergalaxies
Sánchez-Menguiano et al. (2016) measured the oxygen abundanceprofiles in a sample of 122 face-on spiral galaxies observed by theCALIFA IFU survey(Sánchez et al. 2012) using both binned spaxelsand individually identified HII regions. Figure 13 shows the oxy-gen abundance gradients measured in terms of disc scale length forgalaxies of different morphological types in their sample. Sa–Sabtype galaxies that have the least prominent spiral arms with loweststar-formation, also show the flattest radial oxygen gradients. Othermorphological types of spiral galaxies (Sb–Sdm) in the CALIFAsample have relatively steeper abundance gradients with a mean of−0.07 dex/rd. Such individual spirals span a wide range of radial oxy-gen gradients values, with many having near-flat gradients like thoseof the MW thick disc, while several others having steeper slopes thanthat observed for the MW and M 31 thin disc. However, the thickerdisc ofM 31 has a positive radial oxygen gradient comparable only toone measurement for a Sa-type galaxy in the CALIFA sample, beingflatter than any of those measured for the Sab–Sdm type galaxies.
5 CONSTRAINTS ON THE FORMATION HISTORY OFTHE M 31 DISC
5.1 Inferences on chemical evolution of galaxies from radialabundance gradients
Simulations of chemical evolution in isolated galaxies make predic-tions on the variation of the radial abundance gradient over timedepending on the choice of physical mechanisms, particularly feed-back prescriptions, that govern the enrichment of elements into theISM (e.g. Gibson et al. 2013; Mollá et al. 2019). Such simulationsgenerally predict either an initial flat gradient that steepens over timeor an initial steep one that flattens over time (Gibson et al. 2013;Mollá et al. 2019). One can attempt to constrain such models by
comparing with radial abundance gradient measurements of starsformed at different epochs in a galaxy, as carried out using the PNe,HII regions and other stellar tracers in the MW by Stanghellini &Haywood (2018) and Mollá et al. (2019).To constrain the chemical evolution of galaxies from chemical
abundance gradients, measurements are required for at least twoepochs. The gradients for the high and low extinction PN samplesprovide measurements in M 31 for two distinct but relatively broadage ranges, ∼2.5 Gyr and ∼4.5 Gyr and older respectively. A thirdepoch for such a comparisons, the present-day epoch, is provided bythe gradient from oxygen abundance measurements in the M 31 HIIregions. The thicker disc PNe (corresponding to a redshift, z∼0.5)have a flatter abundance gradient than the thin disc PNe or the HIIregions. The chemical evolution models of isolated galaxies in Molláet al. (2019) predict a gradient of −0.0106 ± 0.0010 dex/kpc (or−0.053 ± 0.005 dex/rd) for the MW at z∼0.5 (Gibson et al. 2013predict −0.04 dex/rd for the same), much steeper than the observedpositive radial gradient (0.036 ± 0.018 dex/rd) of the M 31 thickerdisc. In fact, such a positive radial gradient is not predicted in anymodels of chemical evolution for isolated disc galaxies covering awide range of total masses (Mollá & Díaz 2005), which have theirflattest radial oxygen gradient at −0.01 dex/rd. 2
5.2 Radial migration as a driver for the flat oxygen gradient inthe M31 thicker disc
Magrini et al. (2016) noted that the radial oxygen abundance gradientof the M 31 PNe derived from the entire sample of Sanders et al.(2012) was flatter than the predictions from the chemical evolutionmodels of isolated galaxies by Mollá & Díaz (2005). Since suchmodels do not account for the dynamical effects of secular evolution,Magrini et al. (2016) attributed the flat radial oxygen abundance gra-dient in the M 31 disc to radial migration. Radial migration, possiblyinduced by bar resonances and transient spiral arms, may displacestars from their birth positions to larger radii thereby flattening theradial abundance gradient (Roškar et al. 2008; Minchev et al. 2011).Is then radial migration a possible explanation for the positive
abundance gradient of the M31 thicker disc? If we were to focus onlyon the redistribution of stars at larger radii, then indeed radial migra-tion brings about a flattening of the abundance gradient. Accordingto Sellwood (2014) such secular processes do not dynamically heatthe disc though, and thus one can not reproduce the observed highrotational velocity dispersion (𝜎𝜙 = 101 ± 13 km s−1; Paper II) ofthe thicker disc PNe, which would then be left unexplained.Since merger events do flatten the radial metallicity gradients of
pre-merger discs (Zinchenko et al. 2015) and can heat the discs(Quinn & Goodman 1986), the measured flatter (even positive foroxygen) abundance gradients of the M 31 thicker and dynamicallyhot disc, compared to that from chemical evolution models of iso-lated discs, shows the influence of the recent merger on the radialmetallicity gradient of M 31. It is further explored in the next section.
5.3 The radial elemental abundance gradient in galaxy mergersimulations and the merger scenario in M 31
N-body simulations of interacting galaxies have shown that mergersleave imprints on the metallicity gradient of a galaxy, including
2 The radial oxygen gradient of the M 31 thin disc (−0.079 ± 0.036 dex/rd)is comparable with that of chemical evolution models of MW-type isolatedgalaxies (−0.1 dex/rd; Mollá et al. 2019).
MNRAS 000, 1–14 (2021)

Radial abundance gradients of the M 31 thin and thicker discs from PNe 11
dilution of the concentration of metals in the central part of galaxiesdue to gas inflow during initial passages as well as flattening of theradial metallicity gradient during the interaction (Rupke et al. 2010;Zinchenko et al. 2015). A near-flat abundance gradient has also beenseen in EAGLE cosmological simulations of disc galaxies whichexperienced mergers with mass ratio ≥1:10 (Tissera et al. 2019).
In a minor merger scenario in M 31 as advocated by Fardal et al.(2013), a satellite galaxy (mass ratio ∼ 1:20) infalls along the giantstreamon to theM31 disc∼1Gyr ago. Such a satellite howeverwouldnot be able to produce a heated disc with the velocity dispersion of100 km s−1 as measured in Paper II for the low-extinction PNein M 31 and would additionally not form a distinct hot thin disc(Martig et al. 2014). Following the major merger scenario describedbyHammer et al. (2018), however, the pre-merger disc inM 31wouldbe perturbed by the a massive satellite (mass ratio > 1:4.5) in a highlyretrograde orbit. A prediction of this merger model is that a thin diskis rebuilt from the gas brought in by the satellite along with a burstof star formation following the dissolution of the satellite.
Zinchenko et al. (2015) quantified the effect of mergers on theradial elemental abundance profiles of MW mass galaxies usingN-body simulations (no new star formation). They found that theamount of flattening of the radial abundance gradient at large radiidepends on the mass and inclination of the in-falling satellite, withflatter gradients observed for the more massive mergers. They findthe maximum possible flattening from ∼1:20 and ∼ 1 : 6mergers are0.041 dex/rd and 0.067 dex/rd respectively which occur for progrademergers. We can check the flattening of the radial oxygen abundancegradient if we assume that the pre-merger thicker disc of M 31 had aradial oxygen abundance gradient similar to that of the MW (−0.035dex/rd), a reasonable assumption given the thin discs of the twogalaxies have similar radial gradients (see Section 4.3). Then theM 31 thicker disc gradient was flattened by 0.071 dex/rd, consistentwith a mass ratio of the merger event in M 31 of at least ∼ 1 : 6 orlarger depending on the orbital inclination of the infalling satellite.
The observed high-extinction PNe are ∼2.5 Gyr old (or younger;Paper II) and likely trace the thin disc during its formation. Thechemical evolution of an isolated thin disc after its formation hasbeen shown in other hydrodynamic models (e.g. Mollá et al. 2019)to result in a negative radial abundance gradient, consistent withthe observed negative abundance gradient for the thin disc high-extinction PNe. Furthermore, Vincenzo & Kobayashi (2020) showthat gas in-fall into a galaxy at large radii can steepen the metallicitygradient of stars formed after the in-fall. In the case ofM 31, the steepthin disc radial oxygen and argon abundance gradients are consistentwith the thin disc having formed either completely from gas broughtin by the merging satellite or from such infalling gas mixing with thatalready present in the M 31 disc. The gas from the merging satellitewas less enriched than the pre-merger M 31 disc given the measuredlow stellar metallicity (Conn et al. 2016; Cohen et al. 2018) of thegiant stream substructure, the likely infalling trail left by the satellite.In this context, see the recent results on the giant stream metallicitydistribution from N-body simulations by Milošević et al. (2022).
The elemental abundance gradient from PNe thus acts as con-straints for merger-induced chemical evolution simulations in galax-ies in general and M 31 in particular. While the fairly major mergersimulations by Hammer et al. (2018) do predict the formation of dis-tinct thin and thick discs as observed, predictions of the abundancegradients from such simulations (not explicitly predicted in Hammeret al. 2018) must be constrained in future investigations using thecurrent values measured for the ISM using PNe.
6 CONCLUSIONS
We present the largest sample of PNe in the M 31 disc with extinc-tion measurements, oxygen abundances and argon abundances. Weclassify our observed PNe on the basis of their measured extinc-tion. Oxygen and argon abundance distributions and radial gradientsare measured for the high- and low-extinction PNe separately in theM 31 disc from direct temperaturemeasurements. The high- and low-extinction PN abundance gradients trace the younger thin and olderthicker disc ofM31 respectively. Our conclusions can be summarisedas follows:
• Comparing the oxygen and argon abundances in the thin andthicker discs of M 31 reveals that the two discs have distinct abun-dance distributions. This is the first evidence of chemically distinctthin and thicker discs in M 31.
• We find a steeper radial abundance gradient for the thin disc ofM 31 (consistent with that of HII regions) and a near-flat (slightlypositive for oxygen and slightly negative for argon) abundance gra-dient for the thicker disc. This is also consistent with the findingsof previous studies whose near-flat PN abundance gradient measure-ments were dominated by the more numerous low-extinction PNe.
• The steep abundance gradient of the M 31 thin disc is consistentwith the younger thin disc having been formed following awetmergerevent. Some, if not all, of the gas would have been brought in withthe merging satellite. The thin discs of the MW and M 31 haveremarkably similar oxygen abundance gradients when difference intheir disc-scale lengths is taken into account.
• The abundance gradients for the thicker disc is flatter than ex-pected from chemical evolution models of isolated galaxies but areconsistent with the expectations of a major merger scenario (massratio ∼1:5; Paper II). The oxygen abundance gradient of the M 31thicker disc, in particular, is amongst the most positive observed tilldate in spiral galaxies, much more positive than that of the MW thickdisc. The chemical abundance of the M 31 thicker disc has been ra-dially homogenised as a consequence of the merger event. Given thatthe merger mass and orbital inclination has measurable influence onthe metallicity gradient (Zinchenko et al. 2015), the observed abun-dance gradients can provide constraints on the mass and inclinationof the merging satellite in a major-merger scenario in M 31.
ACKNOWLEDGEMENTS
SB acknowledges support from the European Southern Observatory,Garching, Germany during his PhD. A preliminary version of thiswork appears in his PhD thesis (Bhattacharya 2020). SB is funded bythe INSPIRE Faculty award (DST/INSPIRE/04/2020/002224), De-partment of Science and Technology (DST), Government of India.Based on observations obtained at the MMT Observatory, a jointfacility of the Smithsonian Institution and the University of Ari-zona. Based on observations obtained with MegaPrime/MegaCam,a joint project of CFHT and CEA/DAPNIA, at the Canada-France-Hawaii Telescope (CFHT). This research made use of Astropy– acommunity-developed core Python package for Astronomy (AstropyCollaboration et al. 2013), SciPy (Virtanen et al. 2019), NumPy(Oliphant 2015) and Matplotlib (Hunter 2007). This research alsomade use of NASA’s Astrophysics Data System (ADS3).
3 https://ui.adsabs.harvard.edu
MNRAS 000, 1–14 (2021)

12 S. Bhattacharya et al.
DATA AVAILABILITY
Tables 3 and B1 provide the required data on the kinematics andchemical abundances of the M 31 PN_M31d_O_lim PN sample andwill be made available in full through the CDS. The PN spectra canbe shared upon reasonable request to the authors.
REFERENCES
Aniyan S., et al., 2018, MNRAS, 476, 1909Aniyan S., Ponomareva A. A., Freeman K. C., Arnaboldi M., Gerhard O. E.,Coccato L., Kuijken K., Merrifield M., 2021, MNRAS, 500, 3579
Asplund M., Amarsi A. M., Grevesse N., 2021, A&A, 653, A141Astropy Collaboration et al., 2013, A&A, 558, A33Belokurov V., Erkal D., Evans N. W., Koposov S. E., Deason A. J., 2018,MNRAS, 478, 611
Bhattacharya S., 2020, Survey of planetary nebulae in Andromeda (M31).Ludwig-Maximilians-Universität München, http://nbn-resolving.de/urn:nbn:de:bvb:19-271861
Bhattacharya S., Arnaboldi M., Hartke J., Gerhard O., Comte V., Mc-Connachie A., Caldwell N., 2019a, A&A, 624, A132
Bhattacharya S., et al., 2019b, A&A, 631, A56Bhattacharya S., Arnaboldi M., Gerhard O., McConnachie A., Caldwell N.,Hartke J., Freeman K. C., 2021, A&A, 647, A130
Bland-Hawthorn J., Gerhard O., 2016, Annual Review of Astronomy andAstrophysics, 54, 529
Bresolin F., Stasińska G., Vílchez J. M., Simon J. D., Rosolowsky E., 2010,MNRAS, 404, 1679
Brook C. B., Kawata D., Gibson B. K., Freeman K. C., 2004, ApJ, 612, 894Bullock J. S., Johnston K. V., 2005, ApJ, 635, 931Caldwell N., Harding P., Morrison H., Rose J. A., Schiavon R., Kriessler J.,2009, AJ, 137, 94
Cardelli J. A., Clayton G. C., Mathis J. S., 1989, ApJ, 345, 245Ciardullo R., Jacoby G. H., 1999, ApJ, 515, 191Ciardullo R., Feldmeier J. J., Jacoby G. H., Kuzio de Naray R., LaychakM. B., Durrell P. R., 2002, ApJ, 577, 31
Coccato L., et al., 2009, MNRAS, 394, 1249Cohen R. E., et al., 2018, AJ, 156, 230Collins M. L. M., et al., 2011, MNRAS, 413, 1548Comerón S., Salo H., Knapen J. H., Peletier R. F., 2019, A&A, 623, A89Conn A. R., et al., 2016, MNRAS, 458, 3282Corradi R. L. M., Kwitter K. B., Balick B., Henry R. B. C., Hensley K., 2015,ApJ, 807, 181
Cortesi A., et al., 2013, A&A, 549, A115Dalcanton J. J., et al., 2012, The Astrophysical Journal Supplement Series,200, 18
Delgado-Inglada G., Morisset C., Stasińska G., 2014, MNRAS, 440, 536Delgado-Inglada G., Rodríguez M., Peimbert M., Stasińska G., Morisset C.,2015, MNRAS, 449, 1797
Dorman C. E., et al., 2015, ApJ, 803, 24Escala I., Gilbert K. M., Kirby E. N., Wojno J., Cunningham E. C.,Guhathakurta P., 2020, ApJ, 889, 177
Esteban C., Bresolin F., García-Rojas J., Toribio San Cipriano L., 2020,MNRAS, 491, 2137
Fabricant D., et al., 2005, Publications of the Astronomical Society of thePacific, 117, 1411
Fang X., Zhang Y., García-Benito R., Liu X. W., Yuan H. B., 2013, ApJ, 774,138
FangX., García-Benito R., GuerreroM. A., Liu X., YuanH., ZhangY., ZhangB., 2015, ApJ, 815, 69
Fang X., et al., 2018, ApJ, 853, 50Fardal M. A., et al., 2013, MNRAS, 434, 2779Ferland G. J., Korista K. T., Verner D. A., Ferguson J. W., Kingdon J. B.,Verner E. M., 1998, Publications of the Astronomical Society of thePacific, 110, 761
García-Hernández D. A., Górny S. K., 2014, A&A, 567, A12
García-Hernández D. A., Ventura P., Delgado-Inglada G., Dell’Agli F., DiCriscienzo M., Yagüe A., 2016, MNRAS, 458, L118
Gibson B. K., Pilkington K., Brook C. B., Stinson G. S., Bailin J., 2013,A&A, 554, A47
Gilmore G., Reid N., 1983, MNRAS, 202, 1025Gregersen D., et al., 2015, AJ, 150, 189Guhathakurta P., Ostheimer J. C., Gilbert K. M., Rich R. M., Majewski S. R.,Kalirai J. S., Reitzel D. B., Patterson R. J., 2005, arXiv e-prints [astro-ph/0502366]
Hammer F., Yang Y. B., Wang J. L., Ibata R., Flores H., Puech M., 2018,MNRAS, 475, 2754
Hartke J., et al., 2018, A&A, 616, A123Hartke J., et al., 2022, arXiv e-prints, p. arXiv:2201.08710Helmi A., Babusiaux C., Koppelman H. H., Massari D., Veljanoski J., BrownA. G. A., 2018, Nature, 563, 85
Hernández-Martínez L., Carigi L., Peña M., Peimbert M., 2011, A&A, 535,A118
Herrmann K. A., Ciardullo R., Feldmeier J. J., Vinciguerra M., 2008, ApJ,683, 630
Hopkins P. F., Cox T. J., Younger J. D., Hernquist L., 2009, ApJ, 691, 1168Hunter J. D., 2007, Computing In Science & Engineering, 9, 90Kobayashi C., Karakas A. I., Lugaro M., 2020, ApJ, 900, 179Kreckel K., Groves B., Bigiel F., Blanc G. A., Kruijssen J. M. D., Hughes A.,Schruba A., Schinnerer E., 2017, ApJ, 834, 174
Kwitter K. B., Henry R. B. C., 2021, arXiv e-prints, p. arXiv:2110.13993Kwitter K. B., Lehman E. M. M., Balick B., Henry R. B. C., 2012, ApJ, 753,12
Maciel W. J., Koppen J., 1994, A&A, 282, 436Magrini L., Coccato L., Stanghellini L., Casasola V., Galli D., 2016, A&A,588, A91
Martig M., Minchev I., Flynn C., 2014, MNRAS, 443, 2452McConnachie A. W., et al., 2009, Nature, 461, 66McConnachie A. W., et al., 2018, ApJ, 868, 55Merrett H. R., et al., 2003, MNRAS, 346, L62Merrett H. R., et al., 2006, MNRAS, 369, 120Miller Bertolami M. M., 2016, A&A, 588, A25Milošević S., Mićić M., Lewis G. F., 2022, MNRAS,Minchev I., Famaey B., Combes F., Di Matteo P., Mouhcine M., Wozniak H.,2011, A&A, 527, A147
Mollá M., Díaz A. I., 2005, MNRAS, 358, 521Mollá M., Díaz Á. I., Cavichia O., Gibson B. K., Maciel W. J., Costa R. D. D.,Ascasibar Y., Few C. G., 2019, MNRAS, 482, 3071
Oliphant T. E., 2015, Guide to NumPy, 2nd edn. CreateSpace IndependentPublishing Platform, USA
Peña M., Flores-Durán S. N., 2019, Rev. Mex. Astron. Astrofis., 55, 255Peñarrubia J., McConnachie A., Babul A., 2006, ApJ, 650, L33Pulsoni C., et al., 2018, A&A, 618, A94Quinn P. J., Goodman J., 1986, ApJ, 309, 472Roškar R., Debattista V. P., Quinn T. R., Stinson G. S., Wadsley J., 2008, ApJ,684, L79
Rupke D. S. N., Kewley L. J., Barnes J. E., 2010, ApJ, 710, L156Sadoun R., Mohayaee R., Colin J., 2014, MNRAS, 442, 160Saglia R. P., Opitsch M., Fabricius M. H., Bender R., Blaña M., Gerhard O.,2018, A&A, 618, A156
Salaris M., Cassisi S., 2005, Evolution of Stars and Stellar PopulationsSánchez-Menguiano L., et al., 2016, A&A, 587, A70Sánchez-Menguiano L., et al., 2018, A&A, 609, A119Sánchez S. F., et al., 2012, A&A, 538, A8Sanders N. E., Caldwell N., McDowell J., Harding P., 2012, ApJ, 758, 133Schlegel D. J., Finkbeiner D. P., Davis M., 1998, ApJ, 500, 525Scholz F. W., Stephens M. A., 1987, Journal of the American StatisticalAssociation, 82, 918
Sellwood J. A., 2014, Reviews of Modern Physics, 86, 1Stanghellini L., Haywood M., 2018, ApJ, 862, 45Stanghellini L., Magrini L., Casasola V., Villaver E., 2014, A&A, 567, A88Tissera P. B., Rosas-Guevara Y., Bower R. G., Crain R. A., del P Lagos C.,Schaller M., Schaye J., Theuns T., 2019, MNRAS, 482, 2208
MNRAS 000, 1–14 (2021)
Radial abundance gradients of the M 31 thin and thicker discs from PNe 13
Ventura P., Dell’Agli F., Schneider R., Di Criscienzo M., Rossi C., La FrancaF., Gallerani S., Valiante R., 2014, MNRAS, 439, 977
Ventura P., Stanghellini L., Dell’Agli F., García-Hernández D. A., 2017,MNRAS, 471, 4648
Vincenzo F., Kobayashi C., 2020, MNRAS, 496, 80Virtanen P., et al., 2019, arXiv e-prints, p. arXiv:1907.10121Wesson R., 2016, MNRAS, 456, 3774Wesson R., Stock D. J., Scicluna P., 2012, MNRAS, 422, 3516White S. D. M., Rees M. J., 1978, MNRAS, 183, 341Wilson E. B., 1927, Journal of the American Statistical Association, 22, 209Yin J., Hou J. L., Prantzos N., Boissier S., Chang R. X., Shen S. Y., ZhangB., 2009, A&A, 505, 497
Yoachim P., Dalcanton J. J., 2006, AJ, 131, 226Yoachim P., Dalcanton J. J., 2008a, ApJ, 682, 1004Yoachim P., Dalcanton J. J., 2008b, ApJ, 683, 707Zahid H. J., Kudritzki R.-P., Conroy C., Andrews B., Ho I. T., 2017, ApJ,847, 18
Zinchenko I. A., Berczik P., Grebel E. K., Pilyugin L. S., Just A., 2015, ApJ,806, 267
Zurita A., Bresolin F., 2012, MNRAS, 427, 1463
APPENDIX A: HII REGION CONTAMINATION
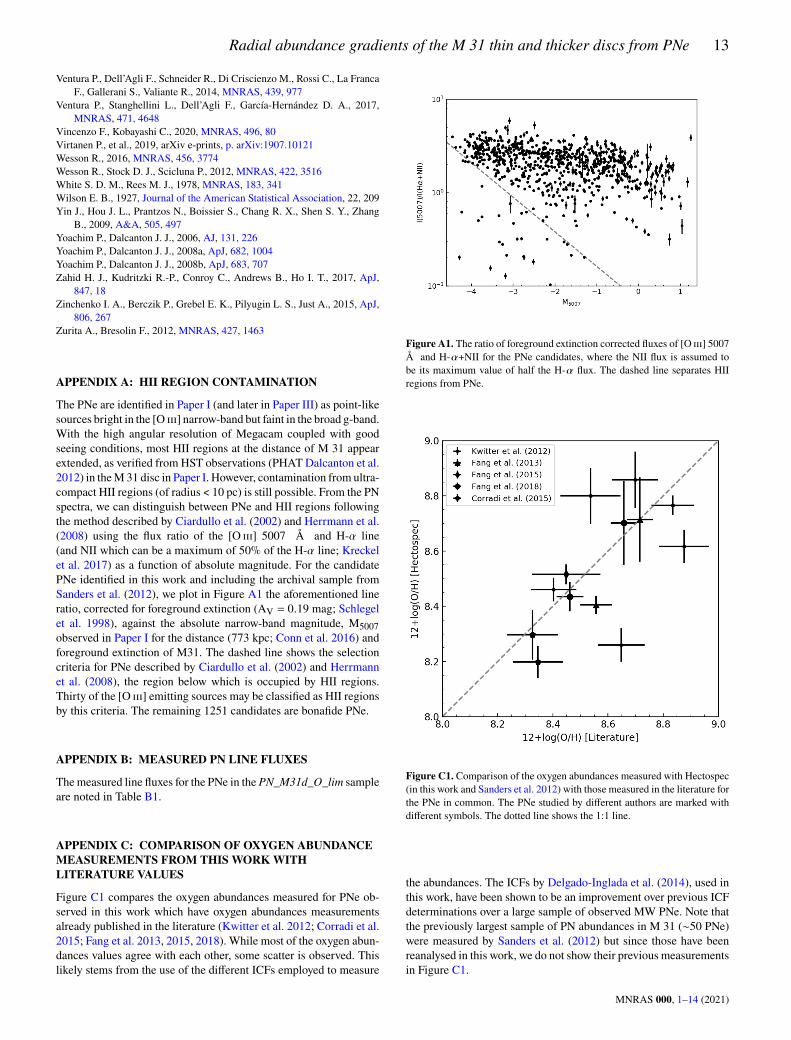
The PNe are identified in Paper I (and later in Paper III) as point-likesources bright in the [O iii] narrow-band but faint in the broad g-band.With the high angular resolution of Megacam coupled with goodseeing conditions, most HII regions at the distance of M 31 appearextended, as verified from HST observations (PHAT Dalcanton et al.2012) in theM31 disc in Paper I. However, contamination from ultra-compact HII regions (of radius < 10 pc) is still possible. From the PNspectra, we can distinguish between PNe and HII regions followingthe method described by Ciardullo et al. (2002) and Herrmann et al.(2008) using the flux ratio of the [O iii] 5007 Å and H-𝛼 line(and NII which can be a maximum of 50% of the H-𝛼 line; Kreckelet al. 2017) as a function of absolute magnitude. For the candidatePNe identified in this work and including the archival sample fromSanders et al. (2012), we plot in Figure A1 the aforementioned lineratio, corrected for foreground extinction (AV = 0.19 mag; Schlegelet al. 1998), against the absolute narrow-band magnitude, M5007observed in Paper I for the distance (773 kpc; Conn et al. 2016) andforeground extinction of M31. The dashed line shows the selectioncriteria for PNe described by Ciardullo et al. (2002) and Herrmannet al. (2008), the region below which is occupied by HII regions.Thirty of the [O iii] emitting sources may be classified as HII regionsby this criteria. The remaining 1251 candidates are bonafide PNe.
APPENDIX B: MEASURED PN LINE FLUXES
Themeasured line fluxes for the PNe in the PN_M31d_O_lim sampleare noted in Table B1.
APPENDIX C: COMPARISON OF OXYGEN ABUNDANCEMEASUREMENTS FROM THIS WORK WITHLITERATURE VALUES
Figure C1 compares the oxygen abundances measured for PNe ob-served in this work which have oxygen abundances measurementsalready published in the literature (Kwitter et al. 2012; Corradi et al.2015; Fang et al. 2013, 2015, 2018). While most of the oxygen abun-dances values agree with each other, some scatter is observed. Thislikely stems from the use of the different ICFs employed to measure
Figure A1. The ratio of foreground extinction corrected fluxes of [O iii] 5007Å and H-𝛼+NII for the PNe candidates, where the NII flux is assumed tobe its maximum value of half the H-𝛼 flux. The dashed line separates HIIregions from PNe.
Figure C1. Comparison of the oxygen abundances measured with Hectospec(in this work and Sanders et al. 2012) with those measured in the literature forthe PNe in common. The PNe studied by different authors are marked withdifferent symbols. The dotted line shows the 1:1 line.
the abundances. The ICFs by Delgado-Inglada et al. (2014), used inthis work, have been shown to be an improvement over previous ICFdeterminations over a large sample of observed MW PNe. Note thatthe previously largest sample of PN abundances in M 31 (∼50 PNe)were measured by Sanders et al. (2012) but since those have beenreanalysed in this work, we do not show their previous measurementsin Figure C1.
MNRAS 000, 1–14 (2021)

14 S. Bhattacharya et al.
Table B1.Measured line fluxes of the 205 M31 PNe in the PN_M31d_O_lim sample. Column 1 shows the Sl. No. of the PN in this work while the latter columnsrefer to the observed flux of different emission lines, relative to H 𝛽=100. Following IAU naming conventions, each PN should be designated as SPNA<Sl.No.>. E.g. PN 478 should be termed SPNA478. A portion of this table is shown here for guidance; the full table will be made available through the CDS.
Sl. No. [O ii] [O ii] H 𝛿 H 𝛾 [O iii] [Ar iv] [Ar iv] [O iii] [O iii] H 𝛼 [S ii] [S ii] [Arv] [Ar iii] [Ar iii]3726 Å 3729 Å 4102 Å 4340 Å 4363 Å 4711 Å 4740 Å 4959 Å 5007 Å 6562 Å 6717 Å 6731 Å 7005 Å 7136 Å 7751 Å
478 17.7 ± 4.9 18.8 ± 4.8 19.3 ± 2.5 17.4 ± 1.6 15.0 ± 1.2 – 5.1 ± 1.3 581.9 ± 6.6 1753.9 ± 18.0 428.0 ± 6.2 – – – 28.0 ± 1.7 16.3 ± 16.3496 36.7 ± 4.5 36.1 ± 4.6 22.7 ± 2.3 27.1 ± 1.9 17.3 ± 1.5 5.9 ± 1.4 8.1 ± 1.2 600.7 ± 7.8 1792.4 ± 21.7 331.1 ± 10.2 5.1 ± 1.1 9.2 ± 1.0 – 25.2 ± 1.4 15.1 ± 15.1942 – – 28.1 ± 1.1 25.5 ± 0.8 8.2 ± 1.0 – – 309.6 ± 3.9 963.3 ± 13.6 296.3 ± 3.7 – – – 10.5 ± 0.2 5.4 ± 5.4945 32.1 ± 2.4 21.8 ± 2.4 – 34.8 ± 1.1 8.3 ± 0.6 – 1.5 ± 0.3 366.9 ± 3.5 1105.7 ± 13.7 277.5 ± 4.4 2.1 ± 0.2 3.2 ± 0.3 – 12.8 ± 0.4 6.9 ± 6.9959 34.0 ± 2.0 19.8 ± 2.3 – 20.2 ± 0.8 8.5 ± 0.6 – – 455.7 ± 5.1 1339.6 ± 13.9 311.3 ± 5.8 1.9 ± 0.3 3.9 ± 0.4 – 14.5 ± 0.4 7.3 ± 7.3
Figure D1.Oxygen vs. argon abundance distribution of 101MWPNemarkedby their circumstellar dust types from Ventura et al. (2017). The chemicalevolution model track for the solar neighbourhood is from Kobayashi et al.(2020).
APPENDIX D: AGB EVOLUTION AND POSSIBLEDEPENDENCIES OF PN OXYGEN ABUNDANCES
While the measured argon abundances in PNe have been found to beinvariant during the AGB evolution, thus reflecting the ISM abun-dance at the time of their birth, AGB evolution effects have beensuggested to modify the oxygen abundance measured in the nebulafrom that of the progenitor star, for specific PNe (Delgado-Ingladaet al. 2015; García-Hernández et al. 2016). These effects depend onthe progenitor mass and metallicity according to AGB theoreticalevolution models such as those described in Ventura et al. (2017).For PNe evolving from stars with initial mass ≥ 3M� , hot-bottom
burning (HBB) may result in an oxygen depletion of up to ∼ 0.2 dex,while for PNe evolving from stars with initial masses of 1−2M� andZ< 0.008, third dredge-up (TDU) effects may result in an oxygenenrichment of up to ∼ 0.3 dex (e.g. García-Hernández et al. 2016;Ventura et al. 2017). In a small sample of 20 MW PNe, Delgado-Inglada et al. (2015) found that oxygen is enriched in MW PNe withCarbon-rich (circumstellar) dust (CRDs), by up to ∼ 0.3 dex forintermediate metallicities of 12+(O/H) = 8.2–8.7, while oxygen isinvariant in MW PNe with oxygen-rich (circumstellar) dust (ORDs).We therefore check whether the oxygen abundance values of a
larger sample of MW PNe depend on the PN circumstellar dustcomposition. Figure D1 shows the distribution of oxygen abundancesagainst the argon abundances of 101MW PNe whose dust propertiesand abundances were tabulated by Ventura et al. (2017, their Sample2). CRDs, ORDs as well as those PNe with featureless dust distribute
around the ISMmodel predictions tracks for the solar neighbourhood(see Kobayashi et al. 2020 for details of the models). In particular,we compare the oxygen abundance of the PNe with that of the solarneighbourhood model at their given argon abundance. We find theMW CRDs and ORDs have mean offset in oxygen abundance of0.06 dex (𝜎offset = 0.26 dex) and 0.05 dex (𝜎offset = 0.41 dex)respectively against the model. The featureless dust MW PNe havea mean offset of -0.02 dex (𝜎offset = 0.43 dex) against the model.The offsets are much lower than the mean measurement uncertainty,which is ∼0.19 dex. The errors on the measured oxygen and argonabundances of the M 31 disc PNe in the current work are comparableto those of theMWPNe sample compiled by Ventura et al. (2017), aswell as by Delgado-Inglada et al. (2015) for their statistically limitedsample. We conclude that there is no segregation of CRD/ORD (aswell as featureless) MW PNe in Figure D1.We note also in the same figure that many of the MW PNe with
mixed chemistry dust (MCDs) that are metal-rich (12 + log(Ar/H)> 6.3) preferentially have log(O/Ar) values below the model tracks,indicating lower oxygen or oxygen depletion. These MCDs have amean offset of -0.13 dex (𝜎offset = 0.21 dex) against themodel. ThesePNe have been suggested byGarcía-Hernández&Górny (2014) to bethe youngest (<300 Myr), most metal-rich PNe in the MW sample.These PNe likely evolve from the most massive progenitors thatdisplay HBB, as predicted by the AGB evolution models discussedin Ventura et al. (2017). Thus, the log(O/Ar) values of MW PNeyounger than ∼300 Myr may be reduced due to oxygen depletion(see Figure D1). The M 31 low- and high- extinction PNe haveaverage ages ∼ 4.5 Gyr and ∼ 2.5 Gyr respectively with the bulk ofthe latter having likely formed in a burst of star formation ∼2 Gyrago (Paper II). This implies that a very small number of PNe withvery young massive progenitors (affected by HBB) are expected inour sample.To summarise, we find no conclusive evidence of AGB evolution
effects with modification of the oxygen abundance in the M 31 discPNe studied in this work. Any such effect is within the measurementerrors. We thus conclude the oxygen abundance measurements forM 31 PNe reflect their birth ISM chemical abundances, within theerrors.
This paper has been typeset from a TEX/LATEX file prepared by the author.
MNRAS 000, 1–14 (2021)