The temperature profiles in an argon plasma issuing into an argon atmosphere: A comparison of...
17
Plasma Chemistry and Plasma Processing, Vol. I0, No. ~,~ 1990 The Temperature Profiles in an Argon Plasma Issuing into an Argon Atmosphere: a Comparison of Measurements and Predictions A. H. Dilawari, j'2 J. Szekely, ~J. Batdorf, 3 R. Detering, 3 and C. B. Shaw 3 Received June 15, 1988; revised August 31, 1989 Experimental measurements and computed results are reported on a nontransferred argon plasma discharging into an argon environment in a laminar regime. The experimental data provide information on the temperature profiles, particularly those close to the torch exit. The mathematical representation of the system involves the simultaneous statement of the equations of continuity, motion, and thermal energy balance for an axisymmetric system, but for.full), temperature-dependent property values. On the whole, the theoretical predictions are in very good agreement with the measurements, with the maximum discrepancy being of the order of 5-10%. This augurs well for the extension of this work to more complex systems, also including gas mixtures. KEY WORDS: Thermal plasma jets; laminar; modelling; spectroscopic tem- perature measurements; comparison. NOTATION a's curve fit parameters C v specific heat at constant pressure h enthalpy k thermal conductivity r radial coordinate R0 nozzle radius SR radiation loss per unit volume of plasma t Department of Materials Science and Engineering, Massachusetts Institute of Technology, Cambridge, Massachusetts 02139. 2 Visiting Fulbright Scholar, on leave from the Institute of Chemical Engineering and Tech- nology, Punjab University, Lahore-20, Pakistan. 3 Idaho National Materials Technology Engineering Laboratory, Idaho Falls, Idaho 83415. 321 0272-4324/90/0600-0321506.00/0 © !990 PlenumPublishing, Corporation
Transcript of The temperature profiles in an argon plasma issuing into an argon atmosphere: A comparison of...
Plasma Chemistry and Plasma Processing, Vol. I0, No. ~,~ 1990
The Temperature Profiles in an Argon Plasma Issuing
into an Argon Atmosphere: a Comparison of Measurements and Predictions
A. H. Dilawari, j'2 J. Szekely, ~ J. Batdorf, 3 R. Detering, 3 and C. B. S h a w 3
Received June 15, 1988; revised August 31, 1989
Experimental measurements and computed results are reported on a nontransferred argon plasma discharging into an argon environment in a laminar regime. The experimental data provide information on the temperature profiles, particularly those close to the torch exit. The mathematical representation of the system involves the simultaneous statement of the equations o f continuity, motion, and thermal energy balance for an axisymmetric system, but for.full), temperature-dependent property values. On the whole, the theoretical predictions are in very good agreement with the measurements, with the maximum discrepancy being of the order of 5-10%. This augurs well for the extension of this work to more complex systems, also including gas mixtures.
KEY WORDS: Thermal plasma jets; laminar; modelling; spectroscopic tem- perature measurements; comparison.
N O T A T I O N
a ' s c u r v e fit p a r a m e t e r s
C v spec i f i c h e a t a t c o n s t a n t p r e s s u r e
h e n t h a l p y
k t h e r m a l c o n d u c t i v i t y
r r a d i a l c o o r d i n a t e
R0 n o z z l e r a d i u s
SR r a d i a t i o n loss p e r u n i t v o l u m e o f p l a s m a
t Department of Materials Science and Engineering, Massachusetts Institute of Technology, Cambridge, Massachusetts 02139.
2 Visiting Fulbright Scholar, on leave from the Institute of Chemical Engineering and Tech- nology, Punjab University, Lahore-20, Pakistan.
3 Idaho National Materials Technology Engineering Laboratory, Idaho Falls, Idaho 83415.
321
0272-4324/90/0600-0321506.00/0 © !990 Plenum Publishing, Corporation

3 2 2 D i l a w a r i e t al.
7",, "/'w
[A m
t~
Z
p /x
Temperature at 1.0 mm from torch exit on the axis maximum temperature wall temperature velocity in z-direction maximum velocity velocity in r-direction axial coordinate density molecular viscosity
1. I N T R O D U C T I O N
In recent years there has been a great deal of interest in the quantitative description of nontransferred arc plasma systems. ~ ~-9~ The main motivation for this work is the widespread use of plasmas for heating, surface treatment, spraying, and synthesis in the materials industries. As a result of this work there exists a reasonably good, semiquantitative understanding of these systems. However, a fully systematic comparison of the measurements and the predictions has not yet been undertaken. Such a comparison is of particular importance in plasma systems, because uncertainties exist regard- ing both the accuracy of measurements and the appropriateness of the assumptions made in model development.
The purpose of the work described in this paper is to initiate a combined experimental-modelling effort in the nontransferred arc field, so as to perform a critical comparison of measurements and predictions in a rela- tively simple laminar plasma system, in order to obtain realistic perspectives regarding the accuracy of both measurements and predictions. In this work, particular attention will be paid to the internal consistency and sensitivity of the results to the process parameters. One has to recognize that the key objective of modelling is not to fit a "theoretical curve" to experimental data points, but to aid in the interpretation of measurements and to provide additional insights.
2. EXPERIMENTAL
2.1. Equipment
The experimental apparatus consisted o f a nontransferred plasma torch (Fig. 1) and an atmosphere control chamber (Fig. 2). The plasma torch uses a 9.5-mm-diameter thoriated tungsten cathode. This cone-shaped cathode is mounted in a water-cooled copper support. Plasma gas enters the cathode region through a gas distribution ring that provides swirl flow

Temperature Profiles in an Argon Plasma 323
I _ _ 0 . 1 5 2 4 4 m
0 . 0 3 1 C o o l i n g t |
w a t e r ~ " ~t . . . . . . . . . . . . . . ; " 1 ' o u t e t - - t . . " . ' , . : . -~? ' .1"~ '~ ~ i } ~ : . ' " " '
Cooling | ~ i:i.:::: :: :: :[i:: ':: i:;~::i: |~:?:::!:i::ii ~ w a t e r i~ii; ne --I " ~ " . . . . . . . ~ ; ~
g a s -1= , , , - I x : ~ \ . l / t "" : ~ i n l e t _ . \ ' . ~ > . : . / . ' . ; . . : ' t . : . . [ . , ~ ; "
,'"-~" anode ]
\ Tungsten c a t h o d e
Fig. 1. Cross section of nontransferred plasma torch.
for arc stabilization. The anode is a water-cooled copper cylinder with an inside diameter of 12.7 mm and an overall length of 29 mm. The body of the plasma torch (76 mm diameter) protrudes into the atmosphere control chamber as shown in Fig. 2. The atmosphere control chamber is approxi- mately cubic with inside dimensions of 0.5 m. The chamber atmosphere is continuously purged from several locations. As shown in Fig. 2, one purge
Fig. 2. Atmosphere control chamber.

324 Dilawari et al.
line supplies gas coaxially with the plasma torch from 19 holes (1.3 mm diameter) equally spaced about a 0.12-m circle. The second purge line supplies gas to distribution tubes located along four edges of the box, parallel to the torch axis. The purge gas discharges through 10 equally spaced holes (1 mm diameter) in each of the four tubes. The gas flows radially inward to the torch axis. Total purge gas flow rate to the chamber was maintained at 2.8 std. m3/h of argon for all of the runs. The exhaust duct protrudes into the chamber and provides baffling to prevent recircula- tion. View ports on the sides of the box allow visual observation of the plasma plume at right angles to the torch axis.
2.1. Temperature Measurements
Emission spectroscopy was used to analyze the plasma issuing from the nontransferred torch. A diagram of the equipment for these experiments is shown in Fig. 3. Emission spectroscopy has been widely used as a means of determining plasma temperatures. ~t°-~2) Several different emission spec- troscopy techniques can be used to determine plasma temperatures, includ- ing: absolute measurement of continuum emission or a single-line emission, relative measurement of several line emissions, line width measurements, and the Larenz method. ~t3~
Among these various methods, the measurement of the absolute intensity of the continuum radiation or a spectral line results in the lowest
Minor I
Nofmansl~rmd arc plasma torch
IBM AT < ~ for data processing
t c
I r i s~
C
: Glass plate
~> Quartz lens 1
I meter scanning monochromator
Mirror 5 II
I I Photo diode . array detector I I
OMA Ill multichannel analyzer
% Mirror 3 Mirror 2 Mirror 6 / Grating
1800 lines/ram
Fig. 3. Equipment layout for emission spectroscopy.

Temperature Profiles in an Argon Plasma 325
error. This is due to the exponential increase in emission with temperature. Large errors in measuring the emission correspond to small temperature differences. All of these techniques interpret the data via a theoretical description of the emission processes in a small isothermal volume. Emission spectroscopy cannot monitor a small isothermal volume; instead, the sum of all the emissions along a line-of-sight are observed. These observed intensities must be mathematically deconvolved to yield point emissions.
In these experiments, the absolute intensity of the neutral argon line at 430.01 nm and continuum emission at 430.80 nm were observed with a 1-meter scanning monochromator intensified silicon photodiode array detector and optical multichannel analyzer ~4j (Fig. 3). The photodiode array was calibrated using an NBS calibrated tungsten ribbon lamp. The data processing procedure involved background subtraction, correction for pixel-to-pixel response, and absolute intensity calibration. The resulting data of emission intensity vs. x-coordinate were fitted to the following equation by a least-squares procedure:
l (x ) = ( ao + a 2 ( x - xo) 2) exp ( - a 4 ( x - Xo) 2) (1)
where ao, a2, a4, Xo are curve fit parameters. The resulting equation was used to generate a 100-point data set for input to the discrete Abel inversion procedure) TM The resulting emissivities of the ArI line, as corrected for continuum contribution, are used to determine the plasma temperature via a solution of the Saha equation, the ideal gas law, and the equation describing line emission} TM
Data were obtained with the torch operating at the plasma gas flows and power levels shown in Table I. Operating efficiency was determined by monitoring the input power (current and voltage at the torch) and the torch coolant energy loss (coolant flow, inlet and outlet temperature). Spectral measurements were obtained at 2.0-mm increments from an axial position of 1.0 mm (downstream of the torch exit) to a distance of 49.0 mm.
Table I. Operating Conditions for Experimental Measurements
Label Current Plasma gas Power Efficiency T,. (A) flow (scmh) ~ (kW) (%) (K)
BES 23 250 0.59 4.79 24.64 11131 BES 18 497 0.59 10.11 29.41 12243 BES 19 497 0.71 10.09 30.40 12726 BES 28 500 0.83 9.96 29.82 12227 BES 32 750 0.83 15.33 30.92 13075
Standard conditions are 101.325 kPa and 273.15 K.

326 Dilawari et al.
2.2. Error Estimates--Temperature Measurements
Figure 4 shows sample standard deviation versus temperature as deter- mined by 30 repetitive measurements of the temperature profile of the plasma plume at an axial position 1 mm from the exit of the torch. Each of the 30 profiles was based on data from a single scan of the OMA III , with a corresponding scan of the background and noise, the latter being subtracted from the raw-intensity data. The complete procedure described above for determination of the temperature profile from integrated intensity, normally averaged over data from 500 scans, was applied to these individual scans. The thirty sets of temperature data were then treated as experimental data for purposes of statistical analysis. While the figure shows appreciable scatter, certain features are evident. Most significantly, the standard devi- ation is small, around 0.2% of the mean, in the regime (just below 12,000 K) where a plot of emission versus temperature, for the particular spectral line used to determine temperature, has high slope and the determination of temperature is correspondingly most accurate. At higher temperatures, approaching that at which the emission has its maximum and a small error in emission induces a large error in temperature, the standard deviation increases as expected, but only to about 0.6% of the mean temperature for that set of measurements. At lower temperatures, where the emission is comparable to background radiation, the sample standard deviation also increases as expected, but only to the order of 1.5% of the mean of each set of temperature measurements.
The temperature measurements reported here are seen to be highly reproducible, but not necessarily of comparable absolute accuracy, since statistical methods offer no protection against systematic error, such as may
150-
v
z
o 100- F- _
a
n ~
< 50- Q
0 6000
I O D I O O Q
O Q i I b Q
. . . . . • : , I
• : • ° • o • 0 ,
i i 0 , I , T , , I
80 0 10000 12000 14000 TEMPERATURE (K)
Fig. 4. Standard deviation vs. temperature for 30 repetitive measurements of the temperature
profile at an axial position of 1.0 ram.

Temperature Profiles in an Argon Plasma 327
be present in the published tables of emission versus temperature used in our data reduction. An idea of the possible magnitude of such errors may be obtained from Fig. 5, in which the temperature profile at the same axial position and operating condition is compared when measured by use of lines in the spectra of neutral and singly ionized argon, and by use of the argon continuum. The differences between neighboring pairs of curves in Fig. 5 are of the order of 400 K, significantly larger than the sample standard deviation of 25 K at peak temperature or 130 K at the lower temperature limit. This apparent systematic error is assumed to come from the limited accuracy of the published data relating absolute emission to temperature, or from departure of the plasma from local thermal equilibrium. Emission spectroscopy measures the population of the higher excited state of the transition. These higher states may be overpopulated relative to the kinetic temperature of the plasma, especially in the cooler regions, by radiation from the hottest region of the plasma.
Our statistical estimate of the errors in temperature measurement cannot be tightened at this time, since the distribution function type for the error process has not yet been identified. ( I f the temperature measurements had been found to be a sample from a normally distributed population, we could assert that the population mean is the sample mean, with standard deviation equal to the sample value divided by the square root of the number
16000.00
14000.00
12000.00
I0000.00
/ / ~ N \
/ \ / \
/ \
s°°°°°o.86''o14c; ' 'o126' 'o.6o'' b.~o'''o.~o'''o.~o RADIAL POSITION (mr'n)
Fig. 5. Comparison of temperature determined by absolute emission spectroscopy of Ar I, Ar I1, and continuum.

328 Dilawari et al.
of measurements.) Unfortunately, the Shapiro-Wilk statistic, applied to temperature measurements at 64 radial positions, shows that only one set of measurements supports the normality hypothesis (at about the 90% confidence level) while almost all the rest have 0.1% probability or less of being samples from a normal distribution. It is intended to apply sharper statistical analytical methods to our data in the future. For example, non- parametric methods are known to exist which give interval estimates for the population mean, with confidence level dependent only on sample size and the observed data, but they are not implemented in the statistical software package used to date.
2.3. Error E s t i m a t e s - - - N e t P o w e r
The accuracy of determining the net power to the plasma is determined by the accuracy of the measurements of the current, voltage, coolant flow, and coolant inlet and outlet temperatures. The current is measured with a calibrated shunt with an accuracy of 2.5%. The voltage was read with a digital voltmeter. The voltage varied by as much as 0.5 V or 2.5% during the course of an experiment. This results in measurement of the input power to within 3.5%. The coolant volume flow was measured with a turbine meter with an accuracy of 0.5%. The coolant temperatures were monitored with type J thermocouples and measured to within 0.2°1 =. The lowest power levels resulted in a temperature rise of 10°F or a possible error of 2%; at higher power levels, this decreased. The combined errors for mass flow, heat capacity, and temperature differential resulted in measurement of the energy loss within 5%. Thus the efficiency, the ratio of net power to input power, is determined to within 6%, resulting in a confidence limit of ±5 percentage points.
The above calculations do not include the loss of radiant energy (from the cathode and plasma column) that is emitted through the exit of the torch. Since the plasma is optically thin, this energy is not absorbed by the plasma. Depending on the location within the torch, the view factor varies from a solid angle of 12 ° at the cathode to nearly 180 ° at the exit. The magnitude of this energy loss is strongly dependent on the temperature within the column. For the operating conditions shown in Table I, this could be as large as the measured errors. A model of the plasma column temperature profile is required to obtain a better estimate of this error.
3. FORMULATION
The mathematical statement of the problem, that is, a laminar argon jet discharging into an argon atmosphere, has been presented previously;

Temperature Profiles in an Argon Plasma 329
see Refs. 6, 7, and 9 (for the more complex turbulent case); thus only the highlights will be given here.
In the present case, plasma jet emerging from a nozzle into a very large chamber (the ratio of the flow area of the chamber to that of the flow area of the torch orifice is large) amounts to the plasma jet emerging from a nozzle into an infinite argon environment.
The flow is laminar as the Reynolds number based on exit conditions was always less than 100, and the assumptions that the plasma is in local thermodynamic equilibrium and is optically thin are not likely to make significant error. One may thus readily write the equations of conservation of mass, momentum, and thermal energy, in cylindrical coordinates as
Continuity:
, a r Or (prv)+ (pu) = 0 (2)
Axial component o f momentum :
r ar (prvu)+ (PU2)=-O--z+r O~ rlZk~r ~ l J
+a~ -# ~zz-] \~rr r / (3)
Radial component o f momentum:
_ _ oe r40v < 1 O (pry2) + ( p n ~ ) = - - - + . . . . rOr Or r a r ~ r l z L 3 ~ r - 3 \ r a z / J J
r L ] r - ] k~ r r a z / d
+- - p. (4) az \Or az/d
Thermal energy:
1 0 (prvh)+ O_ 1 a ( r ~ 0 h ) + d _ ( ~ p a h ) r Or Oz (ouh) . . . . r 8r az SR (51
The boundary conditions were the following:

330 Dllawari et al.
As discussed in Ref. 6, the profiles of the temperature and of the axial velocity inside the torch, some distance from the exit, were expressed as
U=Umax 1-- (6)
This gave three adjustable parameters, viz. n, u . . . . and Tmax. These quantities were so chosen as to satisfy mass conservation, the conservation of thermal energy, and the value of the gas temperature at the axis, 1 mm from the torch exit. The radial component of the velocity is taken to be equal to zero. At solid boundaries, such as the top torch surface and the torch tip, both axial and radial velocities are zero and a constant temperature of 700 K is used.
Along the entrainment boundary, which is placed sufficiently far away from the axis of symmetry, static pressure is assumed constant. The axial velocity is assumed zero. The entrainment velocity v is computed by setting the radial gradient of pry equal to zero. The entraining argon is assigned an enthalpy value corresponding to 300 K temperature. The importance of setting the correct boundary conditions for the assessment of the entrainment has been discussed in previous publications, t6'9) In the present case the position of the entrainment boundary was established by an iterative pro- tess; the position finally selected corresponded to a surface at which further movement away from the axis produced no significant difference in the computed fields of velocities and temperature. The assumption of a zero axial velocity at the entrainment boundary may appear to be inappropriate at first sight, but this is a "s tandard" assumption in calculations of this type. The purge gas flow rate in the chamber was several times the plasma flow, yet its linear velocity, because of very large chamber flow area and low temperature of the gas, was quite small.
At the axis of symmetry, the radial velocity v and radial gradients of axial velocity and enthalpy are set to zero.
Across the exit plane, located some 20 diameters from the torch exit, the axial pressure gradient is assumed zero. The axial gradient of other variables is set to zero.
The solutions were obtained using the computer code earlier developed by Dilawari and Szekelyff '7"9) based on the algorithm of Pun and Spalding. C'61
The computational mesh used for all calculations consisted of 9 x 9 nonuniformly distributed nodes inside the torch, and 21 x 30 nodes outside the torch to cover the plume. The grid dependence tests showed that any

Temperature Profiles in an Argon Plasma 331
further refinement of the computational grid is unlikely to affect the numeri- cal accuracy of the results presented. A typical run required a cpu time of 45 min on a MicroVAX II.
The temperature-dependent property values of the argon plasma gas used are taken from tabulated data of Liu, (IT1 which entered the model as digitized tables.
4. C O M P A R I S O N OF MEASUREMENTS AND P R E D I C T I O N S
In presenting a critical comparison between the experimental measure- ments and the theoretical predictions, it has to be stressed that this is not a curve-fitting exercise with a series of adjustable parameters, but rather a means for assessing the potential accuracy of both the experimental and the modelling work.
In developing the theoretical predictions, no adjustable parameters were used. The input parameters included the system geometry, the gas flow rate, and the torch efficiency. The actual temperature and the velocity profiles at the exit nozzle were so selected as to simultaneously satisfy both the overall heat and mass balance. As a matter of fact, the actual integration was started at some point inside the plasma torch.
The specific input parameters used are given in Table I. Before present- ing the actual measured and computed profiles, it is important to note that the measurement of temperatures in plasma systems is notoriously difficult. In the present case, the reliably measured temperature range was confined between 12,500 to 9000 K.
Figure 6 shows the radial profiles for run BES 18. The agreement between measurements and predictions is not unreasonable, and indicates the type of discrepancy or scatter that one might expect for systems of this type. The relative flatness of the measured axial profile close to the torch exit is due to problems with measuring temperatures above 12,000 K using
12500
lOOOO
7500
5000
2500 Fig. 6. Predicted and experimentally . . . . I , , \ \ ~q ' -~ ' - ' ,-~ i - - - ~
measured radial prof i les o f p lasma tern- 5 lo Is . . . . zo perature at var ious axial locat ions ( run BES 18). RADIAL DISTANCE (ram)
BESt8
.... I .... I .... I'''
(I.o) Z= Irnrn
= ~ ' ~ < ' ~ \ (3,~) z=25mm "o~'x.~ (4,+) Z=37mm

332 Dilawari et al.
12500~
v 10000
7500 w
5000
2500
i i I i 5
B E S I 9
. . . . i . . . . I . . . . (I.o) Z = i m m (2.x) Z= 15mm (3.)) Z=31mm (4.+) Z=49mm
I 10 IS 20
RADIAL DISTANCE (mm)
Fig. 7. Predicted and experimentally measured radial profiles of plasma tem- perature at various axial locations (run BES 19).
the currently e m p l o y e d technique. In Fig. 6, the measured radial profile corresponding to Z -- 49 m m tends to show a very sharp decrease with radial distance, in apparent v io lat ion o f the overall energy balance. This again is attributable to the difficulties associated with measuring temperatures b e l o w about 9000 K. In order to gain a realistic perspect ive , it was thought desirable to retain these data points rather than to delete them for "cosmet ic" reasons.
Figure 7 shows a set o f results for run BES 19 which are s o m e w h a t similar to those given previously; here again the discrepancy is typical.
It should be stressed that up to this point we have made no attempt to fit the parameters or to adjust the torch etticiency to bring about a better agreement between measurements and predict ions . What can be done in this regard is i l lustrated in the fo l lowing figures.
Figures 8 and 9 show a compar i son be tween measurements and predic- t ions for run BES 23. It is seen that here again the measurements appear to be consis tent ly above the predict ions.
Figures 10 and 11 s h o w the same measurements , but with an adjustment o f the torch efficiency from the experimental 24.64% to a value o f 29.19%.
12000
IO000 v
8000
6000 w
4000
2000
B E S 2 3
~ ' " l . . . . i . . . . i . . . . i . . . . ) ~ o (1.o) Z = l m m LLt~.~., ,~o~,~° o (2,x) Z= 13mm ~ ' ~ (3.o) Z=25mm
~ (5.*) Z=49mm
2.5 5 7.5 10 12.5 15
RADIAL DISTANCE {mm)
Fig. 8. Predicted and experimentally measured radial profiles of plasma tem- perature at various axial locations (run BES 23).

Temperature Profiles in an Argon Plasma 333
Fig. 9. Predicted and experimentally measured axial decay of plasma temperature (run BES 23).
12000
100OO
8000
6000
4000
2000
0 0
BES23
. . . . [ . . . . I . . . . I . . . . I "
~°o o
- - - predict ions ~_ o m e a s u r e m e n t ~
- . . . . . I . . . . I . . . . I . . . . I , ,
20 40 60 80
AXIAL DISTANCE Z (ram)
Fig. 10. Predicted and experimentally measured radial profiles of plasma tem- perature at various locations (run BES 23).
12000
10000
8000
0ooo
4000
2000
BES23
( . ) = r a m
2.5 5 7.5 I0 1 2 5 15
RADIAL DISTANCE (mm)
It is seen that this adjustment , which is a parameter fitting, brings about an a lmost perfect agreement be tween the predicted and the measured axial and radial temperature profiles. As will be noted in the discuss ion, such a d iscrepancy is well within the total errors involved in the measurements , which will have to inc lude both the torch efficiency and the determinat ion o f the temperature.
Fig. ! i. Predicted and experimentally measured axial decay of plasma temperature (run BES 23).
12000
I0000
v 8000
6000
4000
2000
BES23
~- --- predict ions ~__ o m e a s u r e m e n t s
i . . . . I . . . . I . . . . I . . . . 1 , ,
20 40 60 80
AXIAL DISTANCE Z ( m m )

334 Dilawari et al.
12500
I0000
7500
5000
2500
BES28
- ' ' " 1 . . . . I . . . . I . . . . i . . . . I "
(1,o) Z = I m m ~ . . , ~ . , . ~ (2.X) Z = 1 3 m m
(3 .o) z = 2 5 m m . . . . . . . * *,~'-,~"~ (4.+) Z = 3 7 m m -- ~ L (5 . , ) Z = 4 9 m m
_ i \ \ ~ ~ 5 - \ ~ \ , ~ % .
, , , I . . . . I , , , ;~L, ~ ~ .
2 5
I I .
• Fig. 12. Predicted and experimentally 5 75 10 125 15 measured radial profiles of plasma tem-
RADIAL DISTANCE (ram) perature at various axial locations (run BES 28).
Examination of Figs. 8-11 is very instructive, because it gives an excellent idea of the sensitivity of the predictions to the torch efficiency assumed. This finding also provides an important guideline to experimen- ta l i s t s - that torch efficiency is a parameter that must be measured very accurately.
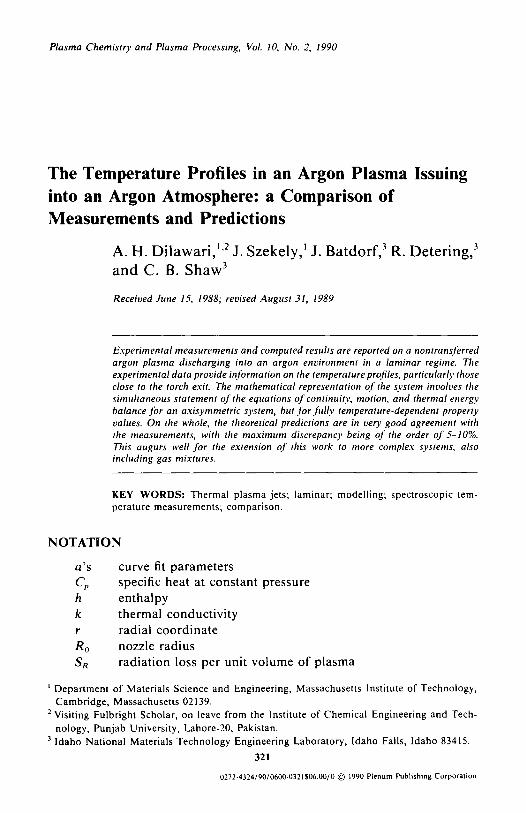
From a consideration of the previously presented results, it may appear that the mathematical model has consistently underpredicted the measure- ments. As seen in Figs. 12-14, depicting runs BES 28 and BES 32, there are cases when the predictions provide consistently higher temperatures than the measurements.
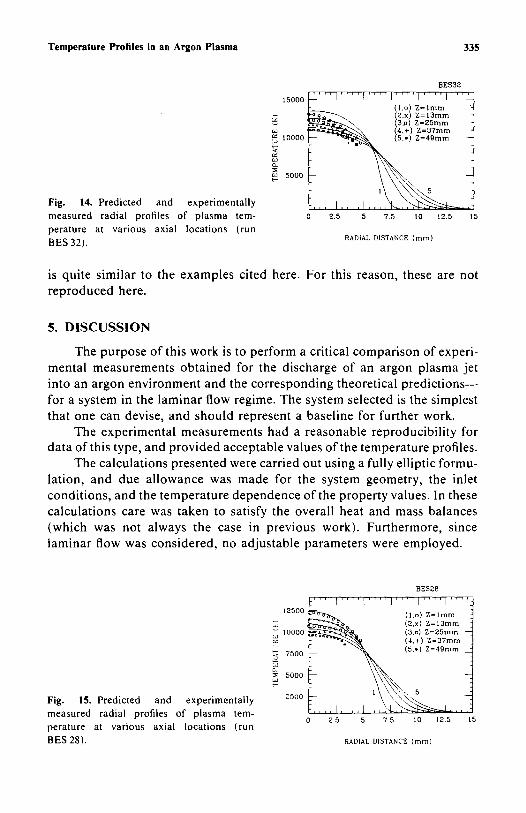
It is o f interest to note that here again, one can obtain excellent agreement between measurements and predictions by adjusting the torch efficiency, such as running BES 28 from a measured value of 29.82% to 25.74% (Fig. 15).
A much larger number of measurements and corresponding predictions have been made as part o f this investigation, but the general nature of these
BES28
~ 4 o o o : . . . . I . . . . I . . . . I . . . . I ' ' ~
12ooo -
I0000
8000 L 0re ,c.oos
0000 o m e a s u r e m e n t s
4000
mooo . . . . I . . . . I . . . . I . . . . I , , 0 20 40 60 80
AXIAL DISTANCE Z (mm)
Fig. 13. Predicted and experimentally measured axial decay of plasma temperature (run BES 28).
Temperature Profiles in an Argon Plasma 335
Fig. 14. Predicted and experimentally measured radial profiles of plasma tem- perature at various axial locations (run BES 32).
15000
1000O
5000
BES32
. . . . I . . . . t . . . . I . . . . I . . . . I . . . .
(1,o) Z= lmrn (2.X} Z= lamm
~ (3.=) Z = 2 5 r n m ~ (4.+) Z=3?rnm
1 5
i . . . . I . . . . I . . . . 2.5 5 75 10 12.5 15
RADIAL DISTANCE (ram)
is quite similar to the examples cited here. For this reason, these are not reproduced here.
5. D I S C U S S I O N
The purpose of this work is to perform a critical comparison of experi- mental measurements obtained for the discharge of an argon plasma jet into an argon environment and the corresponding theoretical predict ions-- for a system in the laminar flow regime. The system selected is the simplest that one can devise, and should represent a baseline for further work.
The experimental measurements had a reasonable reproducibility for data of this type, and provided acceptable values of the temperature profiles.
The calculations presented were carried out using a fully elliptic formu- lation, and due al lowance was made for the system geometry, the inlet conditions, and the temperature dependence of the property values. In these calculations care was taken to satisfy the overall heat and mass balances (which was not always the case in previous work). Furthermore, since laminar flow was considered, no adjustable parameters were employed.
Fig. 15. Predicted and experimentally measured radial profiles of plasma tem- perature at various axial locations (run BES 28).
12500
- - 10000
7500
5000
2500
BES28
.... I .... I .... I .... I .... I .... -
(I.o) Z= Irnm -
~ (2,x) Z: 13ram - ~ (3.0) 2=25mrn ~" . . . . ~ (4.+) Z=aTmrn i
~ i ~ (5.,) Z=49mrn ~_.
2 5 5 7 5 10 125 L5
RADIAL DISTANCE (mm)
336 Dilawari et al.
The theoretical predictions were, in general, within about 10% of the measured data, which is excellent agreement by present-day modelling standards.
It is noted that the computed results were extremely sensitive to the torch efficiency; indeed, by a "few percentage-points ' adjustment" in the torch efficiency, one could obtain excellent agreement between measure- ments and predictions. This is reasonable because the torch efficiency will govern the total thermal energy input into the system.
The work described here is one of the first systematic efforts to make a critical comparison between measurements and theoretical predictions, carried out in a fully interactive manner. The system chosen, argon plasma discharging into argon, is one of the simplest possible and should provide realistic perspectives regarding the current state of plasma modelling.
The discrepancies found cannot be readily ascribed either to the short- comings of the modelling or to the inaccuracies of the measurements. In any case, the potential experimental errors were of about the same order as the discrepancies between the measurements and the predictions. No systematic deviations were found that would suggest logical directions for upgrading the model to provide better agreement with the measured data. Indeed, the general agreement of measurements and predictions would suggest that some of the key assumptions made, such as the existence of local thermodynamic equilibrium, the optically thin plasma, and the property values used, are not inappropriate in the light of the accuracy and the internal consistency of the data available.
Clearly, there is a great deal more room for improvement, and this will require simultaneous upgrading of measurements and predictions.
From the standpoint of measurements, it would be highly desirable to obtain information simultaneously on the temperature and the velocity profiles, and preferably reliable temperature data over a broader temperature range. This would enable one to test the internal consistency of the measure- ments and provide a sound basis for upgrading the model.
Potentially needed improvements in the mathematical modelling effort include a better allowance for thermal radiation (especially in the torch exit region), an allowance for a departure from local thermodynamic equili- brium, and the representation of intermixing in the case of mult icomponent systems. Work is currently in progress in these areas.
A C K N O W L E D G M E N T S
The authors wish to thank the U.S. Department of Energy for support of this work under DE-FG02-85ER-13331 at MIT and under DE-AC07- 76ID0570 at INEL and the United States Education Foundation in Pakistan.

Temperature Profiles in an Argon Plasma 337
REFERENCES
1. J. Grey, M. P. Sherman, P. M. Williams, and D. B. Frodkin, AIAA Z 4, 986 (1966). 2. C. P. Donaldson and K. E. Gray, AIAA J. 4, 2017 (1966). 3. M. I. Boulos and W. H. Gauvin, Can..1. Chem. E 52, 355 (1974). 4. J. McKelliget, J. Szekely, M. Vardelle, and P. Fauchais, Plasma Chem. Plasma Process. 2,
317 (1982). 5. S. M. Correa, Proc. ISPC-6, Montreal, 1983, Vol. 1, p. 77. 6. A, H. Dilawari and J. Szekely, Plasma Chem. Plasma Process. 7, 317 (1987). 7. A, H. Dilawari and J. Szekely, Proc. Mater. Res. Soc. ,Syrup. 98, 3 (1987). 8. D.J. Varacalle, Jr., L. D. Reynolds, and C. B. Shaw, Jr., Proc. Mater. Res. Soc. 98, 49 (1987). 9. A. H. Dilawari, J. Szekely, J. F. Coudert, and P. Fauchais, Int. J. Heat Mass Transfer 32,
35 (1989). 10. J. F. Coudert, J. F. Baronnet, and P. Fauchais. Diagnostic on a D.C. Arc Plasma Jet Using
an Optical Multichannel Analyzer (OMA), Proc. ISPC-6, Montreal, 1983, Vol. 1, p. 102. 11. M. Vardelle, Ph.D. Thesis, No. 80-7, Universite de Limoges (1980). 12. D. Gravelle, M. Beaulieu, C. Carlone, D. lacocca, and M. I. Boulos, Proc. ISPC-8,
Montreal, 1983, Vol. 1, p. 108. 13. M. Boulos, P. Fauchais, and E. Pfender, U.S. Department of Energy, Office of Basic
Energy Sciences, Washington, D.C., DOE/ER-0270, p. 190 (1986). 14. OMA III, Model 1460V, Optical Multichannel Analyzer, EG&G Princeton Applied
Research, Princeton, New Jersey. 15. Y. Yasutoma, et aL, IEEE Trans. Plasma Sci. PS-9, 18 (1981). 16. W. M. Pun and D. B. Spalding, Rep. No. HTS/76/2, Heat Transfer Section, Imperial
College, London (1976). 17. C. H. Liu, Ph.D. Thesis, Department of Mechanical Engineering, University of Minnesota,
Minneapolis, Minnesota (1977).