Hard Times or Greatr Expectations?: Dividend Omissions and Dividend Cuts by UK Firms

Journal of Financial Economics 74 (2004) 121–148
Earnings management and the marketperformance of acquiring firms$
Henock Louis
Smeal College of Business Administration, Pennsylvania State University, University Park, PA,
16802-1912, USA
Received 22 April 2002; accepted 28 August 2003
Abstract
I examine the market’s efficiency in processing manipulated accounting reports and provide
an explanation for the post-merger underperformance anomaly. I find strong evidence
suggesting that acquiring firms overstate their earnings in the quarter preceding a stock swap
announcement. I also find evidence of a reversal of the stock price effects of the earnings
management in the days leading to the merger announcement. However, the pre-merger
reversal is only partial. I find evidence of a post-merger reversal of the stock price effects of the
pre-merger earnings management. The results suggest that the extant evidence of post-merger
underperformance by acquiring firms is partly attributable to the reversal of the price effects of
earnings management. The study also suggests that the post-merger reversal is not fully
anticipated by financial analysts in the month immediately following the merger announce-
ment. However, consistent with suggestions in the financial press that managers guide
analysts’ forecasts to ‘‘beatable’’ levels, the effect of the earnings management reversal seems
to be reflected in the consensus analysts’ forecasts by the time of the subsequent quarterly
earnings releases.
r 2004 Elsevier B.V. All rights reserved.
JEL classification: G14; G34; M41
Keywords: Merger; Earnings management; Market efficiency; Analyst forecast
ARTICLE IN PRESS
$This paper benefits from comments and suggestions by Paul Fischer, Steven Huddart, Shelley Herbein,
Alan Jagolinzer, Bin Ke, James McKeown, Merle Erickson, Andrew Sbaraglia, Andrei Shleifer, and an
anonymous referee.
Email-address: [email protected] (H. Louis).
0304-405X/$ - see front matter r 2004 Elsevier B.V. All rights reserved.
doi:10.1016/j.jfineco.2003.08.004

1. Introduction
This study examines the market’s efficiency in processing manipulated accountingreports and provides an explanation for the post-merger underperformanceanomaly. Prior studies find that acquirers experience significant losses in the yearssubsequent to a merger announcement. Jensen and Ruback (1983, p. 20), who reviewthis literature, comment that the ‘‘post-outcome negative abnormal returns areunsettling because they are inconsistent with market efficiency and suggest thatchanges in stock prices during takeovers overestimate the future efficiency gain frommergers.’’ Through an examination of the effects of earnings management on theperformance of acquiring firms, I find that the reversal of the effects of pre-mergerearnings management is a significant determinant of both the short-term and thelong-term performance of stock-for-stock acquirers.Consistent with Erickson and Wang (1999), I find strong evidence suggesting that
acquiring firms overstate their earnings reports in the quarter preceding a stockswap announcement. Erickson and Wang (1999) postulate that the marketexpects a firm to inflate its earnings prior to a stock swap and, consequently,discounts its stock price at the announcement of the stock swap whether the firmmanages earnings or not. Anticipating this market behavior, an acquirer’s bestresponse is to manage earnings. Consistent with rational market expectations,Shivakumar (2000) finds a significant negative correlation between a firm’sdiscretionary accruals and the market reaction to the announcement of a seasonedequity offering (SEO).In this study, I find no evidence that the market reaction over the three
days around a merger announcement is negatively correlated with acquirers’abnormal accruals. This apparent contradiction with Shivakumar (2000) likely stemsfrom differences in the process leading to a merger as opposed to an SEO. A mergeris the result of negotiations between an acquirer and a target, while an SEO involvesonly the issuing firm. Therefore, because of the negotiation process between themerging partners that is inherent in a merger, news leakage is more likely for mergersthan for SEOs. This is consistent with results by Schwert (1996), for instance, whoshows significant run-ups in targets’ prices as far back as one month (21 tradingdays) before a merger announcement.1 Hence, in a merger, the stock priceadjustment is likely to start weeks before the merger announcement during therumor phase of the merger. To accommodate this eventuality, I extend the eventwindow one month prior to the merger announcement. Consistent with the rationalexpectations hypothesis, the correlation between the abnormal accruals and theabnormal returns of the acquiring firms that engage in stock swaps becomessignificantly negative.
ARTICLE IN PRESS
1Schwert (1996) shows the pre-merger run-up only for target firms. Palepu (1986) suggests that investors
anticipate potential targets. However, investors are also likely to identify potential acquirers because news
of impending mergers is usually leaked into the market well before the merger announcement. The Security
Data Company’s online database of mergers and acquisitions, for instance, has a sample of merger rumors
in which both the targets and the bidders are identified.
H. Louis / Journal of Financial Economics 74 (2004) 121–148122

Shivakumar (2000) finds no significant correlation between the discretionaryaccruals and issuers’ long-term performance when performance is measured using amatched-firm control sample. He concludes that the market completely undoes theeffects of earnings management at the announcement of an SEO. However,Shivakumar’s results may not be generalizable. To completely undo the effects ofearnings management, it seems that investors would need to observe managers’actions or, at least, fully understand managers’ opportunity sets and all theintricacies of earnings management. Because managers have so many ways tomanipulate earnings, it is unlikely that the market would know exactly how muchthey have inflated their reports. Existing anecdotal evidence suggests that even themost sophisticated investors are fooled by earnings management, even whenmanagers’ incentives to mislead the market are evident.2 Furthermore, if investorscould completely undo earnings management, they would probably have enoughincentives to do so for all firms, regardless of whether the firms are issuing stocks ornot. Once investors determine the exact amount of earnings management, the signalabout the direction of the earnings management provided by the stock offeringswould be uninformative.In the case of a stock-for-stock merger, the managers of the target firms should
have enough incentives and expertise to detect earnings management by acquirers.However, Shleifer and Vishny (2003) suggest that the managers of a target firm couldagree to a stock merger even if they know that the acquirer’s stock is overvalued. Themanagers of the target will agree to merge for reasons of retirement or illiquid stockownership.3 The acquirer can also buy their agreement through the acceleration inthe exercise of stock options, by granting them generous severance pay, or bykeeping them in top positions. In addition, the target’s managers can simply beduped into accepting the acquirer’s inflated stocks. In a lawsuit against Walter A.Forbes and E. Kirk Shelton, the Securities and Exchange Commission accuses thetop two former officers of CUC International Inc. (CUC) of undertaking ‘‘aprogram of mergers and acquisitions on behalf of CUC in order to generate inflatedmerger and purchase reserve.’’ The suit contends: ‘‘To entice HFS management intoy [a] merger, Forbes and Shelton inflated CUC’s earnings and earnings projections.Soon after CUC merged with HFS to create Cendant, Forbes and Shelton explicitly
ARTICLE IN PRESS
2Following are a few examples of sophisticated investors being misled. Crazy Eddie Inc. and Crime
Control Inc. were found to have manipulated their financial statements prior to raising significant amounts
of private debt just before their collapses. A group of banks led by Citigroup and Bank of America lent
KPNQwest NV $905 million three months before KPNQwest was declared insolvent. A group of British
banks gave a three billion-euro credit to Marconi Plc only weeks before the company announced that its
earnings would fall. Because financiers are concentrated claimholders and are typically sophisticated, one
would expect them to be unlikely to be fooled by earnings management. However, the anecdotal evidence
suggests that even these sophisticated investors are susceptible to being misled by managers. The most
famous cases of Enron and WorldCom and the ensuing loss of market confidence in financial reporting are
broad examples of investors’ inability to understand the intricacies of earnings management.3Shleifer and Vishny (2003) provide the example of a family business selling to a conglomerate or an
entrepreneur selling to Intel. In these cases, it is easier to unload the shares of the acquirers because they
are more liquid. The merger allows the owners of the target to cash out more easily and to exercise less
downward price pressure than if they had to sell large blocks of the target’s shares.
H. Louis / Journal of Financial Economics 74 (2004) 121–148 123
congratulated each other on being masterful ‘financial engineers’ y [for] dupingHFS into agreeing to a merger with CUC.’’4
Shivakumar (2000, p. 340) posits that, ‘‘since issuers cannot credibly signal theabsence of earnings management, investors treat all firms announcing an offering ashaving overstated prior earnings, and consequently discount their stock prices.’’ Thisassumes that the market’s estimation of earnings management is unbiased andimplies that the announcement of a stock issuance will lead to a mean stock pricedecline as investors correct for the average earnings management. Errors in themarket’s assessment of earnings management will reverse in the subsequent yearswhen the pre-issuance earnings management reverses or the managers deflate themarket’s expectations.5 Therefore, even if the market’s assessment of earningsmanagement is unbiased, the post-merger performance of the stock-for-stockacquirers will very likely have a negative correlation with the degree of the pre-merger earnings management.To illustrate my point, assume that, through earnings management, Firm A and
Firm B inflate their values by 6% and 14%, respectively. Investors do not observethe managers’ actions. However, for the sake of argument, assume that the marketforms unbiased estimates (on average) of the firms’ earnings management anddiscounts the value of each firm by 10% (the average percentage stock priceinflation) at the merger announcement. Under this scenario, the abnormal return atthe merger announcement (AR) and the pre-merger earnings management (EM) willbe uncorrelated. There will only be a mean effect captured by the intercept of theregression of AR on EM. After the merger, when the pre-merger earningsmanagement reverses or the managers deflate the market’s expectations, everythingelse equal, the value of Firm A should increase by 4% and the value of Firm Bshould decrease by 4%, implying a negative correlation between earnings manage-ment and the post-merger performance. Hence, even under the strong assumptionthat the market’s assessment of earnings management is correct on average (whichseems unlikely given the anecdotal evidence), as long as the market does not knowexactly the extent of pre-merger earnings management by each acquirer, a negativecorrelation should be observed between earnings management and post-mergerperformance.I find that stock-for-stock acquirers fare worse than cash acquirers over the three
years subsequent to the merger announcement. More important, I find a significantnegative correlation between the abnormal accruals and the long-term stockperformance for the stock-for-stock acquirers. I also compare the acquirers’ reportedearnings with the analysts’ earnings forecasts in the year subsequent to the merger.The results suggest that the reversal of the effects of the pre-merger earnings
ARTICLE IN PRESS
4See Securities and Exchange Commission v. Walter A. Forbes and E. Kirk Shelton, Civil Action No. 01-
987(AJL) (D.N.J. Feb. 28, 2001) (Release No. AAER 1372, Lit Rel No. 16910).5To avoid reporting negative earnings surprises, managers are likely to deflate the market’ expectation
prior to the post-merger earnings releases. Comments in the financial press suggest that managers usually
guide analysts’ expectations to ensure that they beat or, at least, meet analysts’ forecasts (cf. Fox, 1997;
Wall Street Journal, 1997a, b; Business Week, 1999). Bartov et al. (2002) provide corroborating empirical
evidence.
H. Louis / Journal of Financial Economics 74 (2004) 121–148124

management by stock-for-stock acquirers is not fully anticipated by financialanalysts in the month immediately following the merger announcement. However, Ifind that by the time of the subsequent quarterly earnings releases, the effect of theearnings management reversal is reflected in the consensus analysts’ forecasts.My findings are distinct from those reported by Sloan (1996), who finds a
significant inverse relation between accruals and long-term returns. Sloan uses allfirms that have necessary data on Compustat and the Center for Research in SecurityPrices (CRSP). However, consistent with Chen and Cheng (2004), I find evidenceindicating that the accrual effect is not general; it is associated with incentives relatedto the accruals. Sloan (1996) estimates a univariate regression of raw return onaccruals and a multivariate regression where he controls for beta, log market value,earnings-to-price, and book-to-market. Using similar models, I find that thecoefficient on the accrual variable is negative for the stock-for-stock acquirers andpositive for the cash acquirers.6
The balance of the paper is organized as follows. Section 2 describes the researchdesign. The sample selection process is discussed in Section 3. The results arereported in Section 4. The study concludes in Section 5.
2. Research design
This section explains the research design. It describes the modeling of the testvariable and the testing hypotheses, explains the measurement of the variables ofinterest, and formulates the regression model.
2.1. Modeling the test variable
Once managers decide to finance an acquisition through a stock swap, they haveincentives to inflate their stock price by managing their reported earnings upward.7 Ifinvestors fail to realize that the reported earnings of a bidder are managed upward,they will overvalue the bidder’s stock price. The announcement of a stock swap maysignal the overpricing to the market, resulting in a discount of the bidder’s price. Theundoing of the effects of earnings management is one potential explanation for thedifference in the abnormal returns of bidders in pure stock swaps and bidders in purecash offers documented in the extant literature. To test this hypothesis, I model the
ARTICLE IN PRESS
6The p-values reported by Sloan (1996) are smaller than those obtained for the sample of acquirers even
though Sloan reports much smaller coefficients on his accrual variable. The differences in the p-values are
likely due to differences in sample sizes. Sloan (1996) uses a sample of 40,679 observations, while I use
samples of 125 to 219 stock-for-stock mergers to compute the correlations between accruals and long-term
returns.7Target firms face similar incentives to manage earnings. However, Erickson and Wang (1999) find that
these firms’ pre-merger discretionary accruals are positive, but insignificant. They attribute this result to
the timing of the transactions. They argue that an acquirer can identify its targets and time its acquisitions.
However, in general, by the time the acquirer initiates the bid, it is too late for the target to manage its
earnings.
H. Louis / Journal of Financial Economics 74 (2004) 121–148 125

market’s reaction to a merger announcement as follows:
ABRETi ¼X1
s¼0
ða0;s þ a1;sABCAi;sÞ þ ei; ð1Þ
where ABRET is the abnormal return of the acquirer; ABCA is abnormal currentaccruals, a proxy for the amount of earnings management by bidder i; s is a binaryvariable taking the value zero for cash purchases and one for stock swaps; a0 is anintercept term; and e is the residual.The merger announcement abnormal return is computed over the day of the
merger announcement, the preceding day, and the day after ðt ¼ ½�1; 1�Þ: The marketmodel is used to estimate return expectations for the individual firms. The marketreturn is proxied by the CRSP equally weighted return. The model is estimated overthe period from 60 days to 259 days before the merger announcement date. Schwert(1996) suggests that news about an eventual merger is usually leaked into the marketwell before the merger announcement. He finds significant run-ups in targets’ pricesas far back as 21 trading days before the merger announcement. Hence, I alsomeasure ABRET over the period from 21 days before to 1 day after theannouncement.I expect the coefficient on ABCA11 to be negative and less than the coefficient on
ABCA10: In notational terms, I hypothesize:
H1: a11o0; ð2Þ
H2: a11 � a10o0: ð3Þ
I posit that investors would be unlikely to completely undo earnings managementat the merger announcement. I expect that the reversal of the effects of the pre-merger earnings management will be completed after the merger when the pre-merger earnings management reverses or managers deflate the market’s expectations.Hence, I hypothesize a negative correlation between the acquirers’ abnormal accrualand long-term abnormal returns. I measure long-term performance as the abnormalreturn over one, two, and three years, according to the procedure proposed byBarber and Lyon (1997) and described in Section 2.2.
2.2. Measuring long-term abnormal return
Many studies report significant negative abnormal returns for acquirers over theone to three years following a merger.8 However, Barber and Lyon (1997) andKothari and Warner (1997) find that the market-adjusted and portfolio-adjustedmethods of computing long-term returns used in these studies are mis-specified.Barber and Lyon (1997, p. 342) argue that these methods are ‘‘conceptually flawedand/or lead to biased test statistics.’’ They suggest estimating the abnormal return byadjusting the buy-and-hold return by the return of a matched firm. They find thatsuch a procedure yields test statistics that are well specified.
ARTICLE IN PRESS
8See Langetieg (1978), Asquith (1983), Agrawal et al. (1992), and Rau and Vermaelen (1998).
H. Louis / Journal of Financial Economics 74 (2004) 121–148126

Following Barber and Lyon (1997), I estimate the long-run performance ofacquiring firms as the difference between the raw buy-and-hold return of anacquirer and the raw buy-and-hold return of a matched firm. The match firm ischosen from all firms with a market value of equity between 70% and 130% of themarket value of equity of the acquirer in a given calendar quarter. From thisset of firms, I match the acquirer with the firm that has the closest book-to-marketratio.
2.3. Estimating earnings management
Different measures of discretionary accruals are used in the literature to proxy forearnings management. Kothari et al. (2004) show that the existing methods ofestimating discretionary accruals are biased toward rejecting the null hypothesis ofno earnings management when the event related to the incentive is associated withperformance. They recommend adjusting the discretionary accruals by the averagediscretionary accrual of a portfolio matched on prior-year return-on-asset (ROA)and industry. They suggest that researchers who do not use performance-adjusteddiscretionary accruals ‘‘are likely to draw inferences that are unreliable at best andincorrect at worst.’’ Following Kothari et al. (2004), for each quarter and for eachindustry [two-digit Standard Industrial Classification (SIC) code], I create fiveportfolios by sorting the data into quintiles of ROA measured four quarters prior tothe quarter of the portfolio formation. The abnormal accrual for a given firm is theunexplained accrual for that firm minus the average (excluding the sample firm)unexplained accrual of the matched portfolio.Following Guenther (1994) and Teoh et al. (1998a, b), I use a discretionary
current accrual model to estimate the unexplained accrual. The choice of thediscretionary current accrual model is motivated by Healy’s (1985) argument thatlong-term accruals, like depreciation, account for little variation in total accruals. Bytheir nature, these accruals are less susceptible to manipulation. In addition, invaluing acquisition partners, investment bankers rely more on earnings beforeinterest, taxes, depreciation, and amortization (EBITDA). Therefore, an acquirer ismore likely to manage its current accruals (total accruals before depreciation andamortization). Using all firms that have the necessary data on Compustat, I estimatethe following discretionary current accrual model for each two-digit SIC codeindustry:
CAi ¼X4
j¼1
ajQj þX2000
t¼1992
btYt þ l1ðDSALESi � DARiÞ þ ei; ð4Þ
where CA is the current accrual of firm i, Q is a binary variable taking the valueone in quarter j and zero otherwise, Y is a binary variable taking the valueone in year t and zero otherwise, DSALES is the quarterly change in sales, DAR isthe quarterly change in accounts receivable, and e is the regression residual.Current accrual is defined as change in noncash current assets (change in
ARTICLE IN PRESSH. Louis / Journal of Financial Economics 74 (2004) 121–148 127

Compustat quarterly data item 40 minus change in Compustat data item 36) minuschange in current liabilities (change in Compustat quarterly data item 49) pluschange in debt in current liabilities (change in Compustat quarterly data item 45).All the variables, including the dummies, are scaled by assets at the beginningof quarter. Following Kothari et al. (2004), I delete observations in which theabsolute value of total current accruals scaled beginning total assets are greaterthan one.
2.4. Control variables
In addition to the method of payment, many other variables have been found toaffect market reactions to merger announcements. These variables include thepremium paid by the acquirer, the relative size of the merging partners, the acquirer’sbook-to-market ratio, the industry relatedness of the merging firms, the method usedto account for the transaction, the acquirer’s Chief Executive Officer (CEO)ownership, the acquirer’s board size, and the proportion of outsiders on theacquirer’s board. To control for the effects of these factors, I estimate the followingregression model:
ABRETi ¼X
s¼0
ða0;s þ a1;sABCAi;s þ a2;sPREMi;s þ a3;sRSIZEi;s þ a4;sBMi;s
þ a5;sINDRi;s þ a6;sCEOSHi;s þ a7;sBSIZEi;s
þ a8;sOUTSIDERi;sÞ þ a9;1POOLi;1 þ a10;1POOLi;1�CEOSHi;1
þ a11;1POOLi;1�BSIZEi;1 þ a12;1POOLi;1�OUTSIDERi;1 þ ei;
ð5Þ
where ABRET is the abnormal return of the acquirer; s is a binary variable takingthe value zero for cash purchases and one for stock swaps; ABCA is the estimate ofearnings management by the acquirer; PREM is the percentage difference betweenthe market capitalization of the target four weeks before the merger announcementdate and the merger price as provided by the Security Data Company (SDC); RSIZE
is the ratio of the total assets of the target to the total assets of its acquirer; BM is thebook-to-market ratio of the acquirer; INDR is a proxy for the industry relatedness ofthe merging firms which is equal to one if the two merging partners are in the sametwo-digit SIC code and zero otherwise; CEOSH is the total number of the acquirer’scommon shares controlled by the CEO of the acquirer divided by the number ofcommon shares outstanding, a proxy for the CEO stake in the company; POOL is abinary variable taking the value one if the merger is accounted for by the pooling-of-interest method and zero if it is accounted for by the purchase method; BSIZE is thetotal number of directors on the board; and OUTSIDER is the proportion ofoutsiders on the board.The premium paid over the target’s price is likely correlated with the market
reaction. Managerial actions consistent with the hubris hypothesis, the manage-rialism hypothesis, as well as the free cash flow theory tend to lead managers to
ARTICLE IN PRESSH. Louis / Journal of Financial Economics 74 (2004) 121–148128

overpay.9 If investors perceive that an acquirer has overbid, they will react morenegatively to the announcement of the merger the larger the premium paid.Prior studies find a negative correlation between the abnormal return of a bidder
and the relative size of the target (cf. Scanlon et al., 1989; Louis, 2004). There are twopotential explanations for this finding. First, a smaller target is likely to be moremanageable, increasing the ability of the acquirer to exploit its potential (Chatterjee,1986). Second, a target that is large relative to its acquirer is more likely to have adetectable effect on the acquirer’s stock return.Lang et al. (1989) and Servaes (1991) report a significant correlation between
Tobin’s q and bidders’ abnormal returns. Rau and Vermaelen (1998) argue that highbook-to-market acquirers tend to be more cautious before engaging in majortransactions and their acquisitions are less likely to be motivated by hubris. Book-to-market is also likely to be correlated with firms’ incentives to manage earnings.Because low book-to-market ratio firms are more sensitive to earnings fluctuations,they stand to benefit more from earnings management and, hence, have strongerincentives to manage earnings (cf. Skinner and Sloan, 2002). The inclusion of thebook-to-market ratio in the model is intended to ensure that the effect of thesurrogate for earnings management is distinct from the book-to-market ratio effect.Many studies have documented a positive correlation between a firm’s stock
return and the level of concentration in its lines of business.10 One explanation forthe negative performance of bidders in unrelated acquisitions is the coinsuranceeffect. As two unrelated firms merge, the total value of their options to declarebankruptcy declines (for more detail, see Lewellen, 1971; Scott, 1977). Anotherexplanation is that managers are more efficient in operating firms that focus on asingle line of business as opposed to diversified firms. While diversification reducesthe overall risk of the firm, it does not create value for investors because they canachieve their desired level of diversification on their own.The agency problems that lead managers to engage in non-value-maximizing
investments will be mitigated as the CEO’s equity ownership in the companyincreases. CEO ownership aligns the incentives of the CEO and the shareholders.Denis et al. (1997) find a negative correlation between the level of firm diversificationand management ownership. Because diversification is associated with a decrease instockholder wealth, the abnormal return of the bidders around the mergerannouncement date is likely to increase in CEO ownership. Hubbard and Palia(1995) document such a relation for a sample of industrial firms, and Louis (2004)finds corroborating evidence for a sample of bank mergers. While CEO ownership is
ARTICLE IN PRESS
9The managerialism hypothesis postulates that managers are empire builders. They want to increase the
size of their companies to increase their salaries and other perquisites (Mueller, 1969). The hubris
hypothesis advocates the view that some managers believe that they can correctly spot undervalued firms
(Roll, 1986). These managers act to exploit perceived valuation errors. The free cash flow theory predicts
that firms that have unused cash tend to undertake acquisitions instead of distributing the free cash flow to
their shareholders. Managers may prefer to invest in value-destroying projects instead of losing control of
the firm assets by distributing them to the shareholders (Jensen, 1986).10See Scanlon et al. (1989), Morck et al. (1990), Lang and Stulz (1994), Berger and Ofek (1995), John
and Ofek (1995), and Comment and Jarrell (1995).
H. Louis / Journal of Financial Economics 74 (2004) 121–148 129

positively correlated with a bidder’s return, it is likely to be negatively related tomanagement’s incentive to manage earnings.11
Smaller boards are generally considered more effective monitors than largerboards, probably because larger boards are likely to hinder the free and effectiveexchange of ideas between corporate directors (see Jensen, 1993; Yermack, 1996).Byrd and Hickman (1992) and Mart!ınez-Jerez (2003) find a significant positiveassociation between the market’s reaction to a merger announcement and theproportion of outsiders on the board. However, Subrahmanyam et al. (1997) find anegative correlation between acquirers’ return and the proportion of outsiders on theboard for the banking industry.Existing studies suggest that, on average, pooling transactions are bad investment
decisions because of managers’ focus on improving accounting earnings instead of cashflows and because they reduce management’s flexibility to sell the targets’ assets after theacquisitions (see Robinson and Shane, 1990; Lys and Vincent, 1995). Mart!ınez-Jerez(2003) finds that the method used to account for a merger is associated with the mergerannouncement return, even after controlling for the method of payment. He reports anegative price reaction for pooling mergers. I interact the pooling variable with thecorporate governance variables, namely CEO ownership, board size, and the proportionof outsiders on the board, because Mart!ınez-Jerez (2003) finds that the negative marketreaction to pooling acquisitions is particularly strong for acquirers that have poorcorporate governance. I control for the effect of pooling only for the stock-for-stockacquirers because all the cash acquirers use the purchase method.I condition on the control variables in explaining the acquirers’ performance both
around the merger announcement and in the subsequent years. However, I do nothave any hypothesis that relates the control variables with the long-run performancein a particular way.12 The sign of the correlation between long-run abnormal returnand the other control variables is not predictable. It depends on whether the marketoverprices or underprices these factors at the merger announcement.
3. Sample selection
The study covers mergers of publicly traded U.S. companies that were announcedbetween January 1992 and December 2000, inclusively. I select that period because
ARTICLE IN PRESS
11As the stake of a CEO increases in the firm, he may have an incentive to undertake less profitable
projects if they reduce the risk of his undiversified personal holding (Amihud and Lev, 1981). This may
lead to a nonlinear relationship between the CEO’s ownership and the market’s response to the merger
announcement. However, adding the square of CEO ownership as an additional control variable does not
affect the results.12Rau and Vermaelen (1998) find a positive correlation between acquirers’ long-term performance and
book-to-market ratio. However, Louis (2002) finds that the positive correlation is driven by the long-term
performance of firms in the banking industry. Bank acquirers, on average, outperform other acquirers
and, because most bank assets are booked at market value, these firms tend to have the highest book-to-
market ratios. Given that my sample does not include financial firms, I do not expect the positive
correlation between acquirers’ long-term performance and book-to-market ratio to hold.
H. Louis / Journal of Financial Economics 74 (2004) 121–148130

necessary data on CEO ownership are available on the Wharton Research Data
Services’ (WRDS) executive compensation database starting January 1992. Thesample is obtained from the Security Data Company’s online database of domesticmergers and acquisitions. A transaction is included in the sample if it satisfies thefollowing criteria:
(1) The merger was successfully completed.(2) The transaction is either a pure stock swap or a pure cash purchase.(3) The acquirer is a nonfinancial company.13
(4) The four-week premium over the market value of the target is reportedin SDC.
(5) The total assets of the target are reported in SDC.(6) The acquirer’s quarterly earnings announcement date that precedes the merger
announcement is available on Compustat.(7) The acquirer has the necessary quarterly data on Compustat to estimate the
abnormal current accrual for the earnings reports that took place within 92days prior to the merger announcement.14 To control for the effects of leakage,I also use a sample that is restricted to earnings reports that are releasedbetween 30 days and 92 days prior to the merger announcements.
(8) In addition to the required data in (6) and (7), the acquirer has quarterlyCompustat data on equity book value, price, number of shares outstanding,and total assets.
(9) The acquirer has the necessary data on CRSP to compute abnormal return.(10) The equity holding of the acquirer’s CEO is available on either the Wharton
Research Data Services’ executive compensation database or from SEC filingsthrough LexisNexis Academic.
(11) The proportion of outside board members can be determined from SEC filingsthrough LexisNexis Academic.
SDC contains, over the period 1992–2000, 894 successful mergers of nonfinancialdomestic firms that were either pure stock swaps or pure cash purchases for whichthe premium and the total assets of the targets are reported. A total of 421 of thebidders lack necessary quarterly data on Compustat. An additional 26 bidders lacknecessary stock returns on CRSP. Fifty-seven bidders do not have available data onCEO ownership. Finally, 17 bidders do not have necessary data on boardcomposition. The final sample has 373 mergers, including 236 pure stock swapsand 137 pure cash purchases.15 In Panel A of Table 1, I present the distribution of
ARTICLE IN PRESS
13Quarterly current assets (data item 40) and current liabilities (data item 49) necessary to compute the
accruals are not available on Compustat for the banking industry. In addition, because these firms are
closely regulated, they face more constraints in their ability to manage earnings.14 I use only firms that have non-negative asset, liability, and sales account balances. However, relaxing
this constraint does not change the conclusions of the paper.15The reduction in sample size is due primarily to missing quarterly data and earnings release dates on
Compustat. However, relative to other studies, the sample size in this study is large. Erickson and Wang
(1999), for instance, use a sample of 55 stock-for-stock acquirers, even though their study requires data on
fewer variables than my study.
H. Louis / Journal of Financial Economics 74 (2004) 121–148 131

the sample per industry, and in Panel B of Table 1, I present the distribution of thesample per year.
4. Results
The results of the study are presented below. They include descriptive statistics,estimates of the acquirers’ abnormal returns around and after merger announce-ments, estimates of earnings management by the acquirers prior to mergerannouncements, the association between the acquirers’ abnormal returns andearnings management, estimates of analysts’ earnings forecast errors around mergerannouncements, and some sensitivity analyses.
4.1. Descriptive statistics
Descriptive statistics for sample firms are reported in Table 2. The p-values for theWilcoxon Rank Sum tests comparing the characteristics of the bidders in stockswaps to those of the bidders in cash purchases are presented in the right-handcolumn. Cash acquirers have significantly higher asset values than stock-for-stockacquirers. However, I find no evidence that they have a larger market capitalization.Stock-for-stock acquirers have significantly lower book-to-market ratios, aresignificantly closer in size to their targets, and have significantly higher CEOownership. They have fewer board members, lower proportion of outsiders on theirboards, lower return-on-equity (ROE), and insignificantly lower ROA. I find noevidence that stock-for-stock acquirers pay higher premiums than cash acquirers.16
The significant difference in the two groups of acquirers’ book-to-market ratiossuggests that the market expects the stock-for-stock acquirers to grow faster than thecash acquirers and is indicative of the relative sensitivity of the stock-for-stockacquirers to earnings management.
4.2. Abnormal returns around and after merger announcements
Median abnormal returns around and after merger announcements are reported inTable 3. Consistent with Travlos (1987), I find a significant negative market reactionover the three days around the merger announcement for acquirers that use stock astheir method of payment and a marginally significant positive reaction for those thatuse cash. Extending the event window over 21 days before to 1 day after theannouncement, the market reaction becomes much more positive for the cashacquirers; however, it remains marginally significant. Consistent with Langetieg(1978), Asquith (1983), Agrawal et al. (1992), and Rau and Vermaelen (1998), themedian one-year, two-year, and three-year abnormal returns are negative for the
ARTICLE IN PRESS
16At first glance, one would expect stock-for-stock acquirers to pay higher premiums than cash
acquirers. However, the premium paid in cash-financed mergers is immediately taxable. Therefore, a target
is likely to require a higher premium to compensate for the tax effect.
H. Louis / Journal of Financial Economics 74 (2004) 121–148132

ARTICLE IN PRESS
Table 1
Industry and event-year distribution of a sample of 236 pure stock swaps and 137 pure cash mergers that
took place between 1992 and 2000.
Standard industrial classification Industry Stock swap Cash purchase
Panel A. Sample distribution by industry
10 Metal mining 1 0
13 Oil and gas exploration 8 2
15 General building contractors 1 0
16 Heavy construction 3 0
20 Food and kindred products 2 4
22 Textile mill products 1 1
23 Apparels 2 2
24 Lumber and wood products 1 1
25 Furniture and fixtures 0 1
26 Paper and allied products 3 2
27 Printing and publishing 1 2
28 Chemicals 16 14
30 Rubber and plastics products 1 3
32 Stone, clay, glass and concrete products 1 1
33 Primary metals 2 2
34 Fabricated metal products 1 7
35 Machinery and computer equipment 26 16
36 Electronic and electrical equipment 30 19
37 Transportation equipment 4 5
38 Measuring equipment 26 11
39 Miscellaneous manufacturing 0 3
42 Motor freight transportation 2 1
44 Water transportation 1 0
45 Transportation by air 0 1
48 Communications 14 2
49 Utility services 7 3
50 Wholesale – durable 3 1
51 Wholesale – nondurable 7 3
53 General merchandise store 0 2
54 Food stores 0 1
55 Automotive dealers and gas stations 0 1
56 Apparel and accessory 0 1
58 Eating and drinking places 2 1
59 Miscellaneous retail 4 3
70 Hotels and other lodging places 2 0
72 Personal services 1 1
73 Business services 48 18
78 Motion pictures 2 0
79 Recreation services 1 1
80 Health services 7 0
87 Engineering and management services 5 1
Total 236 137
1992 1993 1994 1995 1996 1997 1998 1999 2000 Total
Panel B. Sample distribution by year
Stock swap 3 2 7 26 32 29 33 55 49 236
Cash purchase 2 4 5 13 12 13 19 43 26 137
H. Louis / Journal of Financial Economics 74 (2004) 121–148 133

stock-for-stock acquirers and positive for the cash acquirers. The Wilcoxon RankSum statistics comparing the performance of the two groups of acquirers aresignificant over all the return horizons.
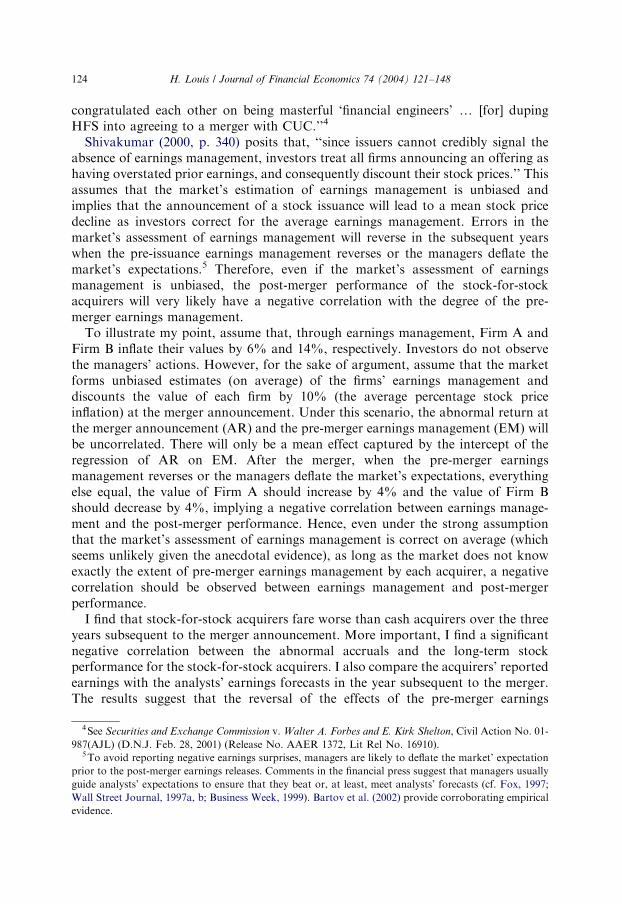
4.3. Earnings management prior to merger announcements
The median abnormal current accrual included in the earnings report releasedimmediately prior to the merger announcements is reported in Table 4. The medianabnormal current accrual is significantly positive for bidders engaging in stockswaps, whereas it is statistically insignificant for acquirers that pay with cash. TheWilcoxon Rank Sum statistic comparing the abnormal accruals of the two groups ofacquirers indicate that the stock-for-stock acquirers have significantly higherabnormal accruals than the cash acquirers. These results are consistent withErickson and Wang (1999).I also report median abnormal accruals for the eight earnings quarters
surrounding the merger announcement. The time-series pattern of the abnormalaccruals suggests that the difference in the abnormal accruals between cash andstock-for-stock acquirers observed in the quarter prior to the merger announcementsis conditional on the mergers. For the stock-for-stock acquirers, there is a jump inthe abnormal accrual in the quarter immediately prior to the merger announcement.However, I find no evidence of a reversal in abnormal accruals after the merger.17
ARTICLE IN PRESS
Table 2
Median acquirer characteristics.
Characteristics Stock swap Cash purchase Wilcoxon
two-sample test
two-tail p-value
Acquirer’s assets ð$000; 000Þ 978.14 1,641.36 0.031
Acquirer’s market value ð$000; 000Þ 2,910.27 2,712.35 0.563
Acquirer’s book-to-market ratio 0.19 0.33 0.000
Acquirer’s return-on-assets (%) 1.95 2.23 0.120
Acquirer’s return-on-equity (%) 4.10 4.75 0.012
Four-week premium over target price (%) 40.99 47.37 0.171
Shares controlled by acquirer’s chief executive
officer divided by shares outstanding (%) 0.70 0.21 0.002
Board size 8.00 9.00 0.000
Percentage of outside board members 77.78 81.82 0.001
Target size/acquirer size 0.11 0.05 0.000
Number of observations 236 137
17 I estimate the post-merger abnormal accruals. However, these measures may not be very meaningful.
A merger affects the balance sheet accounts in such a complex way that it is difficult to explain and
compare the changes in accruals. For example, the change in accruals depends on the existing relation
between the merging partners, how the acquisition is accounted for (purchase versus pooling), what point
during the reporting period the transaction is finalized, and the level of restructuring undertaken by the
new entity. The mechanical effects of a merger on a firm’s accruals are discussed in Revsine et al. (1999)
and Zach (2003).
H. Louis / Journal of Financial Economics 74 (2004) 121–148134

4.4. Association between acquirers’ stock performance and abnormal accruals
Table 5 reports the association between the acquirers’ abnormal returns andabnormal accruals. Stock-for-stock acquirers have significantly lower abnormalreturns than the cash acquirers. However, I find no evidence of a significant inverserelation between the abnormal accrual measure and the abnormal return over thethree days around the merger announcements for either group of acquirers.Schwert (1996) finds evidence suggesting that the market anticipates a merger as
early as one month (21 trading days) before the merger announcement. He findssignificant run-ups in targets’ prices as far back as 21 trading days before the merger
ARTICLE IN PRESS
Table 3
Median abnormal acquirers’ returns around and after merger announcements
The cumulative abnormal returns are computed over the day of the merger announcement, the preceding
day, and the day after ðt ¼ ½�1; 1�Þ; and over the period from 21 days before to 1 day after the
announcement ðt ¼ ½�21; 1�Þ; respectively. The market model is used to estimate return expectations for
the individual firms. The market return is proxied by the Center for Research in Security Price equally
weighted return. The model is estimated over the period from 60 days to 259 days before the merger
announcement date. The long-run abnormal returns are measured over one, two, and three years,
according to the procedure proposed by Barber and Lyon (1997). The long-run abnormal return is the
difference between the raw return of an acquirer and the raw return of a matched firm. The match firm is
chosen from all firms with a market value of equity between 70% and 130% of the market value of equity
of the acquirer in a given calendar quarter. From this set of firms, I match the acquirer with the firm that
has the closest book-to-market ratio. One-tail p-values are presented in brackets and two-tail p-values in
parentheses. They are based on the Wilcoxon signed rank test. For the stock-for-stock acquirers, the
alternative hypothesis is that the median abnormal returns are negative. The cumulative abnormal return
is hypothesized to be positive for the acquirers that pay with cash.
Abnormal return Stock Cash Wilcoxon
swap purchase two-sample test
one-tail p-value
Panel A. Acquisition return
Cumulative abnormal return �2:280 0.440 0.000
½�1; 1� (%) [0.000] [0.093]
fn ¼ 236g fn ¼ 137gCumulative abnormal return �3:210 2.300 0.001
½�21; 1� (%) [0.000] [0.080]
fn ¼ 235g fn ¼ 138g
Panel B. Post-acquisition return
Abnormal return �8:840 10.090 0.006
over one year (%) [0.041] (0.081)
fn ¼ 219g fn ¼ 134gAbnormal return �11:640 10.880 0.027
over two years (%) [0.071] (0.220)
fn ¼ 177g fn ¼ 109gAbnormal return �17:490 16.260 0.030
over three years (%) [0.138] (0.267)
fn ¼ 125g fn ¼ 67g
H. Louis / Journal of Financial Economics 74 (2004) 121–148 135
announcement. Hence, I extend the return measurement window over the periodfrom 21 days before to 1 day after the merger announcement. The sample includesacquirers that report earnings within 92 days prior to the merger announcement. Ialso present results for a sample that is restricted to acquirers that announce theirearnings between one month (30 days) and three months (92 days) prior to themerger announcements.18 This restriction is intended to ensure that the earnings
ARTICLE IN PRESS
Table 4
Median acquirers’ abnormal current accruals around the merger announcement
Earnings management is proxied by the abnormal current accrual (ABCA) expressed as a percentage of
total assets. ABCA is the difference between the unexplained current accrual (UECA) of an acquirer and
the average UECA of a portfolio matched on industry and performance four quarters prior to the
estimation quarter. UECA is the residual of the following regression:
CAi ¼X4
j¼1
ajQj þX2000
t¼1992
btYt þ l1ðDSALESi � DARiÞ þ ei;
where CA is current accrual, Q is a binary variable taking the value one in quarter j and zero otherwise, Y
is a binary variable taking the value one in year t and zero otherwise, DSALES is the quarterly change in
sales, DAR is the quarterly change in accounts receivable, and e is the regression residual. Current accrualis defined as change in non-cash current assets (change in Compustat quarterly data item 40 minus change
in Compustat data item 36) minus change in current liabilities (change in Compustat quarterly data item
49) plus change in debt in current liabilities (change in Compustat quarterly data item 45). All the
variables, including the dummies, are scaled by assets at the preceding quarter. Quartert�1 is the calendar
quarter immediately prior to the merger the merger announcement. Two-tail p-values are presented in
parentheses. They are based on the Wilcoxon signed rank test.
Unexplained current accrual Abnormal current accrual
Stock Cash Wilcoxon Stock Cash Wilcoxon
swap purchase two-sample test swap purchase two-sample test
Quarter two-tail p-value two-tail p-value
Quartert�4 0.584 0.217 0.352 �0.052 �0.520 0.342
(0.004) (0.228) (0.641) (0.087)
Quartert�3 0.485 0.229 0.244 �0.054 �0.646 0.037
(0.007) (0.346) (0.851) (0.004)
Quartert�2 0.387 0.772 0.157 �0.166 �0.003 0.435
(0.107) (0.001) (0.270) (0.911)
Quartert�1 1.267 0.419 0.009 0.740 0.055 0.016
(0.000) (0.073) (0.001) (0.595)
Quartertþ1 0.850 0.285 0.119 �0.024 �0.262 0.172
(0.000) (0.133) (0.285) (0.398)
Quartertþ2 0.910 0.882 0.528 0.560 0.048 0.430
(0.000) (0.025) (0.044) (0.614)
Quartertþ3 0.701 1.402 0.266 0.210 0.350 0.412
(0.000) (0.000) (0.667) (0.173)
Quartertþ4 0.501 0.369 0.225 0.053 �0.434 0.038
(0.001) (0.300) (0.290) (0.049)
18 I do the same for the association between abnormal accrual and abnormal return over the three days
around the merger announcement. I obtain results similar to those reported in the table.
H. Louis / Journal of Financial Economics 74 (2004) 121–148136

announcements take place before the market’s anticipation of the mergers and thatthe abnormal accrual effects be different from the earnings announcement effects. Inboth samples, consistent with the rational expectations hypothesis, I find asignificantly negative correlation between the abnormal accrual and the cumulativeabnormal return for acquirers engaging in stock swaps.19
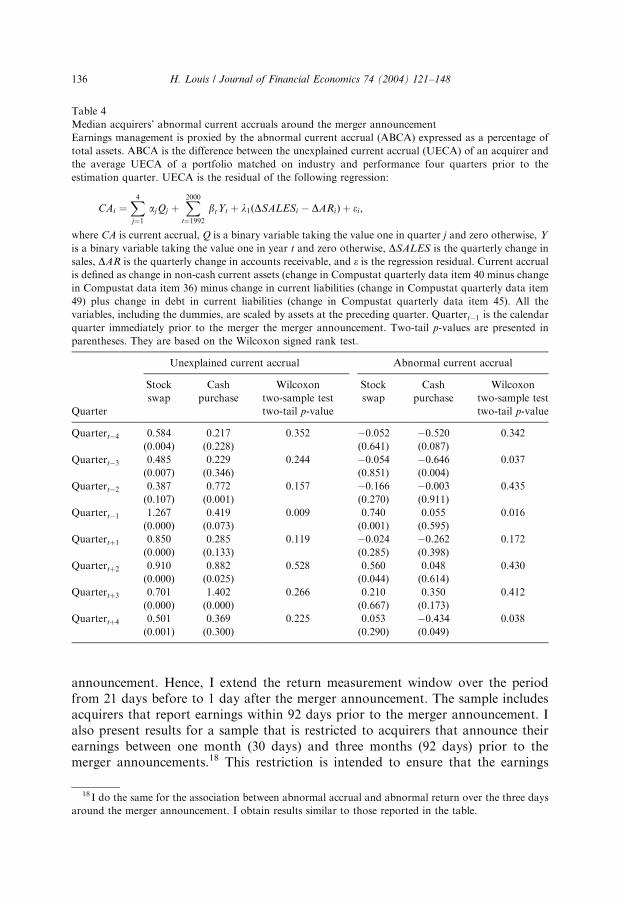
Table 5 also reports the results of the regressions of the long-term stockperformance measures on the abnormal accruals. The coefficients on abnormalaccruals are significantly negative for acquirers that engage in stock swaps andinsignificant for acquirers that pay with cash. The significantly negative correlationbetween long-term performance and abnormal accruals of the stock-for-stockacquirers strongly suggest that the reversal of prior earnings management in the daysleading to the announcement of a stock swaps is partial and that the long-termperformance of stock-for-stock acquirers is partly attributable to the reversal of theeffects of pre-merger earnings management.20
4.5. Analysts’ forecast errors around merger announcements
I analyze the quarterly analysts’ forecast errors before and after the mergerannouncements. The results are reported in Table 6. In Panel A, the forecasterrors are deflated by the absolute value of actual earnings. To ensure that theforecast errors are not distorted by incidences of negative earnings or very smallearnings, I present forecast errors deflated by prices in Panel B. The resultssuggest that, within 30 days after the merger announcement, analysts’ earningsforecasts are generally overoptimistic. This is consistent with O’Brien (1988),
ARTICLE IN PRESS
19To further ensure that the abnormal accrual effect does also reflect the effect of contemporaneous
earnings announcements, I control for the contemporaneous change in earnings over the same quarter last
year scaled by beginning of quarter market value. The inclusion of change in earnings in the model does
not qualitatively change the results. A potential nonlinear relation exits between abnormal returns and
abnormal accruals. The slope coefficient is conceivably very significant for those firms that have positive
abnormal accruals and flat for those that have negative abnormal accruals. I condition the analysis on the
sign of the abnormal accrual. I find no significant difference between the slope coefficients of the positive
and negative abnormal accrual acquirers.20 I also control for the difference in the growth in sales between the two groups of acquirers by
including the four-quarter growth in sales in the regressions as an additional control variable. Controlling
for growth in sales does not qualitatively change the results of the paper. There are two reasons for the
irrelevance of the growth variable. First, the multivariate regression model has already included book-to-
market ratio, which likely controls for growth. Second, the effect of the last quarter change in sales is
already removed from the accruals. Therefore, to the extent that the last quarter change in cash sales is
correlated with the four-quarter growth in sales, the growth in sales and the abnormal accrual variables
should be orthogonal. Stock-for-stock acquirers and cash acquirers differ on many dimensions.
Consequently, the potential exits for sample selection bias when comparing the two samples. To control
for the potential bias, I follow the two-step procedure proposed by Heckman (1979). I first model the
likelihood that an acquiring firm will pay with stock as a function of a set of predetermined variables using
a probit regression model. I use various sets of exogenous variables. Then, I use the inverse Mills’ ratio
from the probit model to control for the potential self-selection bias. The coefficient on the inverse Mills’
ratio is insignificant, and the coefficient on the abnormal accrual is statistically unaffected by the inclusion
of the inverse Mills’ ratio in the regression models.
H. Louis / Journal of Financial Economics 74 (2004) 121–148 137

ARTIC
LEIN
PRES
S
Table 5
Association between acquirer performance and pre-merger abnormal current accrual
ABRETi ¼P1
s¼0ða0;s þ a1;sABCAi;s þ a2;sPREMi;s þ a3;sRSIZEi;s þ a4;sBMi;s þ a5;sINDRi;s þ a6;sCEOSHi;s þ a7;sBSIZEi;s
þa8;sOUTSIDERi;sÞ þ a9;1POOLi;1 þ a10;1POOLi;1�CEOSHi;1 þ a11;1POOLi;1�BSIZEi;1 þ a12;1POOLi;1�OUTSIDERi;1 þ ei :
ABRET ½�1; 1� is the abnormal return cumulated over the day of the merger announcement, the preceding day, and the day after; ABRET ½�21; 1� is theabnormal returns cumulated over the period from 21 days before to 1 day after the announcement; ABRET1Y, ABRET2Y, and ABRET3Y are the long-run
abnormal returns measured, respectively, over one, two, and three years after the merger announcement; s is a binary variable taking the value zero for pure
cash purchases and one for pure stock swaps; ABCA is the acquirer’s pre-merger abnormal accruals; PREM is the percentage difference between the market
capitalization of the target four weeks before the merger announcement date and the merger price as provided by the Security Data Company; RSIZE is the
ratio of the total assets of the target to the total assets of its acquirer; BM is the book-to-market ratio of the acquirer; INDR is a proxy for the industry
relatedness of the merging firms and is equal to one if the two merging partners are in the same two-digit SIC code and zero otherwise; CEOSH is the total
number of the acquirer’s common shares controlled by the chief executive officer (CEO) of the acquirer divided by the number of common shares outstanding,
a proxy for the CEO stake in the company; POOL is a binary variable taking the value one if the merger is accounted for by the pooling-of-interest method
and zero if it is accounted for by the purchase method; BSIZE is the total number of directors on the board; and OUTSIDER is the proportion of outsiders on
the board. The sample includes acquirers that report earnings within 92 days prior to the merger announcement. The restricted sample for the ABRET ½�21; 1�model includes acquirers that announce their earnings between one month (30 days) and three months (92 days) prior to the merger announcements. Two-tail
p-values are reported in parentheses and one-tail p-values are reported in brackets.
ABRET ½�1; 1� ABRET ½�21; 1� ABRET ½�21; 1�unrestricted restricted ABRET1Y ABRET2Y ABRET3Y
Coefficient Stock Cash Stock Cash Stock Cash Stock Cash Stock Cash Stock Cash
N ¼ 236 N ¼ 137 N ¼ 236 N ¼ 137 N ¼ 174 N ¼ 91 N ¼ 219 N ¼ 134 N ¼ 177 N ¼ 109 N ¼ 125 N ¼ 67
a0 �0.032 0.008 �0.091 0.012 �0.138 0.057 �0.594 0.167 �0.630 1.024 1.100 3.448
(0.432) (0.844) (0.271) (0.883) (0.178) (0.572) (0.177) (0.687) (0.602) (0.277) (0.670) (0.022)
a1 �0.033� 0.312 �0.461�� 0.399 �0.433�� 0.401 �3.384� �0.568 �5.603��� 3.607 �4.745�� 4.282
[0.367] [0.982] [0.010] [0.905] [0.025] [0.723] [0.001] [0.359] [0.004] [0.905] [0.066] [0.837]
H.
Lo
uis
/J
ou
rna
lo
fF
ina
ncia
lE
con
om
ics7
4(
20
04
)1
21
–1
48
138
ARTIC
LEIN
PRES
Sa2 0.008 0.022 0.056 0.020 0.053 �0.024 0.093 0.478 �0.305 �0.056 �0.322 �0.566
[0.723] [0.891] [0.988] [0.703] [0.945] [0.319] (0.533) (0.012) (0.266) (0.874) (0.548) (0.355)
a3 �0.035 0.079 0.000 0.128 �0.005 0.067 �0.021 0.252 0.300 0.170 �0.074 �1.149[0.003] [0.979] [0.505] [0.951] [0.428] [0.751] (0.878) (0.536) (0.333) (0.809) (0.876) (0.312)
a4 0.043 0.044 0.136 �0.041 0.117 �0.036 0.323 �0.026 �0.021 �0.608 �1.396 �0.140[0.081] [0.043] [0.015] [0.786] [0.067] [0.724] (0.319) (0.934) (0.974) (0.323) (0.198) (0.899)
a5 �0.018 0.003 �0.015 �0.002 0.007 0.005 �0.053 �0.039 0.373 �0.030 0.202 0.846
[0.943] [0.410] [0.737] [0.533] [0.403] [0.450] (0.670) (0.792) (0.094) (0.909) (0.580) (0.070)
a6 �0.021 �0.053 0.091 �0.236 0.167 �0.189 0.551 0.258 �2.858 1.366 1.958 �1.756[0.613] [0.690] [0.270] [0.860] [0.150] [0.776] (0.487) (0.819) (0.330) (0.593) (0.824) (0.666)
a7 0.006 �0.002 0.008 �0.005 0.010 �0.007 0.459 �0.092 0.081 �0.017 �0.005 �0.075[0.978] [0.201] [0.907] [0.168] [0.906] [0.157] (0.140) (0.810) (0.269) (0.740) (0.970) (0.406)
a8 �0.066 �0.001 �0.074 0.061 �0.063 0.049 0.007 �0.025 �0.201 �0.543 �1.237 �3.154[0.987] [0.517] [0.992] [0.179] [0.832] [0.271] (0.831) (0.390) (0.898) (0.586) (0.728) (0.042)
a9 0.033 N/A 0.021 N/A 0.078 N/A 0.164 N/A �1.601 N/A �3.527 N/A
[0.741] [0.577] [0.282] (0.774) (0.238) (0.205)
a10 �0.218 N/A �0.371 N/A �0.458 N/A �2.790 N/A 5.974 N/A 2.514 N/A
[0.966] [0.938] [0.951] (0.028) (0.088) (0.792)
a11 �0.009 N/A �0.007 N/A �0.008 N/A �0.015 N/A �0.056 N/A 0.046 N/A
[0.036] [0.167] [0.208] (0.725) (0.507) (0.774)
a12 0.067 N/A 0.071 N/A 0.017 N/A 0.157 N/A 2.485 N/A 4.243 N/A
[0.109] [0.258] [0.459] (0.790) (0.166) (0.267)
Adjusted R2 16.61% 3.67% 1.76% 4.71% 2.32% 1.37%
�Coefficient for the stock acquirers is smaller than the coefficient for the cash acquirers at the 10% significant level.��Coefficient for the stock acquirers is smaller than the coefficient for the cash acquirers at the 5% significant level.���Coefficient for the stock acquirers is smaller than the coefficient for the cash acquirers at the 1% significant level.
H.
Lo
uis
/J
ou
rna
lo
fF
ina
ncia
lE
con
om
ics7
4(
20
04
)1
21
–1
48
139

Abarbanell (1991), and Richardson et al. (2004), among others. However, for thestock-for-stock acquirers, the analysts’ overoptimism is particularly pronounced forthe earnings reports made in the fourth quarter following the month after the mergerannouncement.The evidence suggests that the reversal of the effects of pre-merger earnings
management by stock-for-stock acquirers is not anticipated by financial analysts inthe month immediately following the merger announcement. The size of the forecasterrors (21% of the absolute value of actual earnings) also seems to suggest that,around merger announcements, managers of stock-for-stock acquirers misleadanalysts by depicting very rosy scenarios about their firms’ long-term prospects sothat the one-year-ahead analyst forecast is grossly inflated. However, consistent withthe suggestion that managers guide analysts’ expectations to ‘‘beatable’’ levels, aconsiderable reduction is evident in the analysts’ earnings forecast estimates by themonth immediately prior to the earnings releases allowing the stock-for-stockacquirers to meet the last consensus analysts’ forecasts.21
4.6. Sensitivity analysis
This subsection analyzes the robustness of the results to the model specificationused by Sloan (1996). It also analyzes the extent to which the results are driven bymanagers’ overoptimistic expectations.
4.6.1. Sloan’s (1996) model specification
Sloan (1996) documents a significant inverse relation between accruals and long-term returns. He estimates a univariate regression of raw return on accruals and amultivariate regression where he controls for beta, log market value, earnings-to-price ratio, and book-to-market. For the sake of comparison, I estimate similarmodels for the sample of acquirers. The results are reported in Table 7. I find that thenegative association between accruals and long-term stock returns is driven by thestock-for-stock acquisitions. The coefficient on the accrual variable is negative forthe stock-for-stock acquirers, whereas it is positive for the cash acquirers. The resultssuggest that the inverse relation between accruals and long-term stock returnsreported by Sloan (1996) is not general. This finding is consistent with Chen andCheng (2004), who find that the accrual anomaly is associated with incentives relatedto the accruals.22
ARTICLE IN PRESS
21 I analyze the market’s reaction to the earnings reports following the merger announcements. I find no
evidence that the negative post-merger performance occurs at post-merger earnings announcements. There
are many potential reasons for this result. First, managers may unwind the pre-merger earnings
management over multiple periods after the merger so that the empirical tests fail to capture the effects.
Second and more important, because managers presumably want to avoid negative earnings surprises,
they are likely to deflate the market’s expectations way before the earnings release. This is consistent with
the patterns in the analysts’ forecast errors reported above.22Zach (2003, p. 3) also finds that excluding observations associated with either mergers or divestitures
‘‘leads to a decrease of about 25%’’ in the returns of an accrual-based strategy.
H. Louis / Journal of Financial Economics 74 (2004) 121–148140

ARTIC
LEIN
PRES
STable 6
Median pre-merger and post-merger percentage earnings forecast errors
Earnings expectations are proxied by the average analysts’ forecasts as reported by Institutional Brokers Estimate System (IBES). The forecast error is the
difference between the average analysts’ earnings forecast and the actual earnings. In Panel A, the forecast error is deflated by absolute value of actual earnings
and, in Panel B, it is deflated by share price. In Column [1], Quarter 2, Quarter 3, and Quarter 4 refer, respectively, to the second, third, and fourth quarterly
earnings reports starting from the earnings forecast made during the 335–365 days preceding the merger announcement. In Column [2], Quarter 2, Quarter 3,
and Quarter 4 refer, respectively, to the second, third, and fourth quarterly earnings reports subsequent to the month after the merger announcement. In
Column [3], the forecast error is the median percentage deviation of the earnings expectations formed during the month immediately prior to the earnings
reports from the actual earnings reports in the second, third, and fourth quarters subsequent to the month after the merger announcement. I exclude the first
quarter after the merger because of overlaps between the month after the merger announcement and the earnings report dates. One-tail p-values for the
forecast errors are reported in brackets. I also compare the forecast errors in Columns [1] and [2].
Quarter Stock swap Cash purchase
[1] [2] [3] [1] [2] [3]
Forecast made Forecast made Forecast made Forecast made Forecast made Forecast made
335–365 days prior 1–30 days after 1–30 days prior to 335–365 days 1–30 days after 1–30 days prior to
to the merger the merger the post-merger prior to the merger the merger the post-merger
announcement announcement earnings reports announcement announcement earnings reports
Panel A. The forecast error is deflated by absolute value of IBES actual earnings
Quarter 2 �4.196��� 0.000 0.000 �0.690 0.000 �2.500(0.040) (0.013) (0.094) (0.699) (0.049) (0.031)
Quarter 3 �5.714��� 1.794 �1.961 0.000 0.800 �1.099(0.006) (0.000) (0.052) (0.930) (0.007) (0.380)
Quarter 4 �4.945��� 21.053 0.000 �1.587�� 0.000 �1.389(0.591) (0.000) (0.741) (0.223) (0.016) (0.241)
Panel B. The forecast error is deflated by IBES share price
Quarter 2 �0.041��� 0.000 0.000 �0.011 0.000 �0.032(0.028) (0.001) (0.391) (0.563) (0.116) (0.015)
Quarter 3 �0.065��� 0.018 �0.015 0.000 0.017 �0.018(0.006) (0.000) (0.038) (0.780) (0.020) (0.405)
Quarter 4 �0.054��� 0.161 0.000 �0.014�� 0.000 �0.022(0.324) (0.000) (0.968) (0.173) (0.038) (0.215)�
�The pre-merger forecast error (reported in column [1]) is significantly different from the post-merger forecast error (reported in column [2]) at the 10%
significance level, in a one-tail test.��The pre-merger forecast error (reported in column [1]) is significantly different from the post-merger forecast error (reported in column [2]) at the 5%
significance level, in a one-tail test.���The pre-merger forecast error (reported in column [1]) is significantly different from the post-merger forecast error (reported in column [2]) at the 1%
significance level, in a one-tail test.
H.
Lo
uis
/J
ou
rna
lo
fF
ina
ncia
lE
con
om
ics7
4(
20
04
)1
21
–1
48
141

4.6.2. The overoptimistic expectation hypothesis
The proxy for earnings management that I use is the latest refinement in thediscretionary accrual measurement process. However, the abnormal accruals couldrelate to overoptimistic expectations about the acquirers’ growth prospects. This is aconcern particularly because the evidence suggests that stock-for-stock acquirers are
ARTICLE IN PRESS
Table 7
Association between raw return and current accrual
RET is the acquirer’s raw return over the years subsequent to the merger announcement; s is a binary
variable taking the value zero for cash purchases and one for stock swaps; AC is the acquirer’s accrual
from the earnings report issued in the quarter prior to the merger announcement; BETA is the acquirers
beta estimated over the period from 60 days to 259 days before the merger announcement date; SIZE is the
log of the acquirer’s total market value prior to the merger announcement; EP is the acquirer’s earnings-
to-price ratio prior to the merger announcement; and BM is the acquirer’s book-to-market ratio of the
acquirer. Two-tail p-values are reported in parentheses and one-tail p-values are reported in brackets. One
outlier is deleted for each of the one-year and two-year horizon regressions using the Cook (1977) distance
statistic.
Coefficient One-year horizon Two-year horizon Three-year horizon
Stock Cash Stock Cash Stock Cash
ðN ¼ 219Þ ðN ¼ 134Þ ðN ¼ 177Þ ðN ¼ 109Þ ðN ¼ 125Þ ðN ¼ 67Þ
Panel A. Unconditional association
RETi ¼P1
s¼0ða0;s þ a1;sACi;sÞ þ ei
a0 0.064 0.212 0.163 0.373 0.236 0.909
(0.132) (0.000) (0.047) (0.003) (0.101) (0.000)
a1 �1.410 0.217 �2.138�� 3.286 �1.955� 3.798
[0.041] [0.575] [0.095] [0.943] [0.223] [0.854]
Adjusted R2 4.51% 5.78% 10.71%
Panel B. Conditional association
RETi ¼P1
s¼0ða0;s þ a1;sACi;s þ a2;sBETAi;s þ a3;sSIZEi;s þ a4;sEPi;s þ a5;sBMi;sÞ þ ei
a0 0.051 �0.013 0.668 0.351 0.212 0.809
(0.524) (0.971) (0.199) (0.052) (0.821) (0.506)
a1 �1.857�� 0.474 �2.919�� 3.264 �2.247� 4.219
[0.012] [0.665] [0.004] [0.944] [0.207] [0.881]
a2 �0.160 0.058 �0.086 0.162 �0.156 0.422
(0.000) (0.750) (0.233) (0.812) (0.207) (0.886)
a3 0.021 0.001 �0.032 �0.115 0.055 �0.036(0.330) (0.963) (0.492) (0.059) (0.558) (0.763)
a4 0.030 8.974 4.727 3.011 0.267 14.224
(0.935) (0.006) (0.531) (0.614) (0.796) (0.371)
a5 0.060 0.013 �0.589 �0.834 �0.552 �0.991(0.814) (0.965) (0.320) (0.145) (0.581) (0.345)
Adjusted R2 8.12% 5.58% 9.34%
�The coefficient for the stock acquirers is smaller than the coefficient for the cash acquirers at the 10%
significant level.��The coefficient for the stock acquirers is smaller than the coefficient for the cash acquirers at the 5%
significant level.
H. Louis / Journal of Financial Economics 74 (2004) 121–148142

growing faster than cash acquirers. For instance, if managers of stock-for-stockacquirers are overly optimistic, the inventory levels of the acquirers will be high,resulting in positive abnormal accruals. The accruals will then unravel and stockprices fall when the high expectations about the firms’ prospects turn out to havebeen overly optimistic, resulting in a negative association between abnormal accrualsand long-term stock performance. I refer to this explanation as the overoptimisticexpectation hypothesis.To analyze the extent to which the reported results are driven by managers’
overoptimistic expectations, I first examine the acquirers’ pattern of inventoryturnover around the merger announcements. Under the overoptimistic expectationhypothesis, inventory turnover should be low around the merger, initially because ofinventory buildups resulting from high demand expectations and subsequentlybecause of weak sales. The inventory turnover should eventually revert to normalonce the high expectations diminish.I compare the inventory turnovers of the two groups of acquirers from four
quarters prior to four quarters after the calendar quarter that follows the mergerannouncements. The results are reported in Table 8. Contrary to the overoptimisticexpectation hypothesis, I find no evidence that the stock-for-stock acquirers havelower inventory turnovers than the cash acquirers. Furthermore, I find no evidencethat the stock-for-stock acquirers’ inventory turnovers increase after the mergerannouncement. The same performance-match approach is used as in the accrualanalysis to adjust the acquirers’ inventory turnovers. The results are also reported inTable 8. I find no significant difference between the performance-adjusted inventoryturnovers of stock-for-stock, and cash acquirers. I also find no indication that theperformance-adjusted inventory turnovers increase after the merger.23 The resultssuggest that the difference in the abnormal accrual of the two groups of acquirers ismore likely associated with incentives related to the stock swaps than optimisticexpectations.I then analyze the pre-merger analysts’ earnings forecasts. In Fig. 1, I present the
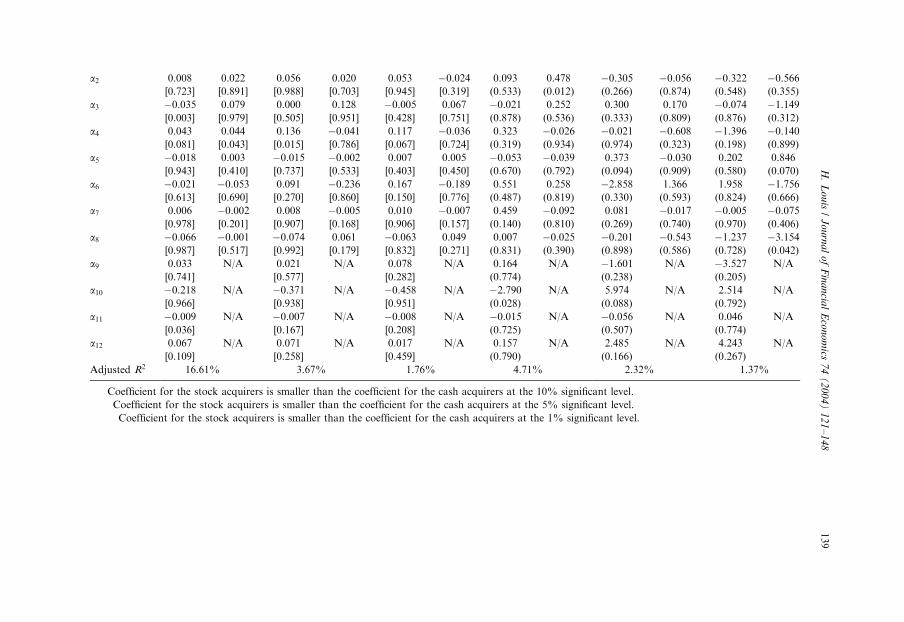
pattern of the ratio of analysts’ forecasts to the absolute value of actual earnings forthe quarter that immediately precedes the merger announcement using sample firmsthat have earnings forecasts data from the Institutional Brokers Estimate System
ARTICLE IN PRESS
23 I also compare the receivable turnovers of the two groups of acquirers and find no evidence that the
stock-for-stock acquirers have lower receivable turnovers. I then compare the growths in sales of the two
groups of acquirers. Consistent with their book-to-market ratios, their growth in sales is significantly
different. However, I find evidence suggesting that the discretionary accrual model has adequately
controlled for the acquirers’ growth. I also find no evidence that lagged inventory turnover, lagged
receivable turnover, and growth in sales are correlated with the abnormal accrual. A negative correlation
exists between the stock-for-stock acquirers’ lagged inventory turnover and the abnormal return over the
three days around the merger announcement. Otherwise, I find no significant correlations between lagged
inventory turnover, lagged receivable turnover, growth in sales, and the abnormal return measures. These
results strongly indicate that the significant correlations between the abnormal accrual and the
performance measures are not driven by the growth of the stock-for-stock acquirers or their normal
working capital turnovers.
H. Louis / Journal of Financial Economics 74 (2004) 121–148 143

(IBES).24 The results show that analysts tend to form unbiased earnings forecasts forcash acquirers 5 to 12 months prior to the merger announcement. However,consistent with comments in the financial press suggesting that managers guideanalysts’ forecasts to beatable levels (cf. Fox, 1997; Wall Street Journal, 1997a, b;Business Week, 1999), I find that, relative to the actual earnings, analysts’ forecastsfor the cash acquirers fall steadily over the five months immediately prior to themerger announcement.However, the analysts’ earnings forecasts for the stock-for-stock acquirers are
lower than the actual earnings reported immediately prior to the mergerannouncements. In addition, instead of a gradual deflation of analysts’ expectations,
ARTICLE IN PRESS
Table 8
Median inventory turnover around the merger announcement
Inventory turnover is the ratio of sales to average inventory (the sum of beginning and ending inventory
for the quarter divided by two). Performance-adjusted inventory turnover is the difference between the
inventory turnover of an acquirer and the average inventory turnover of a portfolio matched on
performance four quarters prior to the measurement quarter. Quartert�1 is the calendar quarter
immediately prior to the merger the merger announcement. Two-tail p-values, based on the signed rank
test, are presented in parentheses for the performance-adjusted inventory turnover. I do not present test
statistics comparing the inventory turnovers because, under the overoptimistic expectation hypothesis,
stock-for-stock acquirers should have lower inventory turnovers than cash acquirers. I observe the
opposite in most quarter. The inventory turnover is lower for the stock-for-stock acquirers only in
Quartertþ4 (the one-tail p-value from Wilcoxon two-sample test is 0.153).
Quarter Inventory turnover Performance-adjusted inventory turnover
Stock Cash Stock Cash Wilcoxon
swap purchase swap purchase two-sample test
one-tail p-value
Quartert�4 2.755 2.229 �0.097 �0.179 0.633
(0.117) (0.035)
Quartert�3 2.833 2.357 0.025 �0.025 0.907
(0.936) (0.145)
Quartert�2 2.838 2.300 0.082 0.059 0.745
(0.755) (0.367)
Quartert�1 2.728 2.330 0.076 �0.090 0.859
(0.820) (0.207)
Quartertþ1 2.728 2.334 0.008 0.017 0.461
(0.311) (0.380)
Quartertþ2 2.519 2.279 �0.001 0.009 0.459
(0.169) (0.320)
Quartertþ3 2.364 2.167 �0.208 �0.060 0.154
(0.024) (0.433)
Quartertþ4 2.213 2.231 �0.330 �0.040 0.097
(0.001) (0.119)
24Because of problems in computing ratios for negative earnings, I also plot the ratio of analysts’
forecasts to actual earnings and the analysts’ forecast errors scaled by price. I obtain the same patterns as
the ones reported in the paper.
H. Louis / Journal of Financial Economics 74 (2004) 121–148144

there is an increase in analysts’ expectations for the stock-for-stock acquirers’ overthe 12-month period. The stock-for-stock acquirers’ ratios of analysts’ forecasts toactual earnings are lower than the cash acquirers’ ratio of analysts’ forecasts toactual earnings over all the forecast horizons. Nontabulated Wilcoxon Rank Sumtest results show that, except for the earnings forecasts made in the last two monthsprior to the last earnings report before the merger announcement, the median ratiosof analysts’ forecasts to actual earnings are significantly lower for the stock-for-stockacquirers.25 These results indicate that, prior to the merger announcement, eitheranalysts are pessimistic about the stock-for-stock acquirers’ prospects or the actualearnings are inflated. Both explanations are inconsistent with the overoptimisticexpectation hypothesis.
ARTICLE IN PRESS
0.86
0.88
0.9
0.92
0.94
0.96
0.98
1
1.02
12 11 10 9 7 5 38 6 4 2 1Months from the earnings forecast to the last earnings report
before the merger announcement
Med
ian
rati
o of
ana
lyst
for
ecas
t to
act
ual e
arni
ngs
Cash
Stock
Fig. 1. Cash versus stock acquirers’ pre�merger earnings forecasts. This figure presents the monthly
pattern of the ratio of analysts’ forecasts to the absolute value of actual earnings for the quarter that
immediately precedes the merger announcement. Months 1–12 indicate the forecast months; they are
measured relative to the report dates of the forecasted earnings. The forecasted earnings is the earnings
released in the quarter immediately prior to the merger announcement.
25Notice that, depending on the timing of the earnings reports, the last two earnings forecasts are likely
to take place after the end of the fiscal quarter.
H. Louis / Journal of Financial Economics 74 (2004) 121–148 145

5. Summary
This study provides an explanation for the post-merger underperformanceanomaly. It shows, through an examination of the effects of earnings managementon the performance of acquiring firms, that the reversal of the effects of pre-mergerearnings management is a significant determinant of both the short-term and thelong-term performance of stock-for-stock acquirers.I find strong evidence suggesting that acquiring firms report significant positive
abnormal accruals in the quarter preceding stock swap announcements. I do not findevidence that the market reaction over the three days around a stock swapannouncement is correlated with prior earnings management. However, I find asignificantly negative correlation between the discretionary accrual and the abnormalreturn when the event window is extended over the period going from 21 tradingdays before to 1 trading day after the merger announcement.Further analyses reveal that the reversal of the effects of prior earnings
management before a stock swap is only partial. I find that stock-for-stock acquirersare largely responsible for the long-run negative performance of acquiring firms.More important, I find a significant negative correlation between the discretionaryaccrual and the stock-for-stock acquirers’ long-term performance. This entails thatthe market reactions around merger announcements do not fully capture prioreffects of earnings management.The results are important because, in an efficient market, return should not be
predictable, particularly after matching on size and book-to-market. The results areparticularly important because, in spite of extensive investigation of the post-mergerunderperformance, its causes remain a puzzle. They suggest that the long-termunderperformance of acquiring firms reported in the extant literature is partlyattributable to the reversal of the effects of prior earnings management.The study also indicates that the post-merger reversal is not fully anticipated by
financial analysts in the month immediately following the merger announcement.However, consistent with suggestions in the financial press that managers guideanalysts’ forecasts to ‘‘beatable’’ levels, the effect of the earnings managementreversal seems to be reflected in the consensus analysts’ forecasts by the time of thesubsequent quarterly earnings releases.
References
Abarbanell, J., 1991. Do analysts’ earnings forecasts incorporate information in prior stock price changes?
Journal of Accounting and Economics 14, 147–165.
Agrawal, A., Jaffe, J., Mandelker, G., 1992. The post-merger performance of acquiring firms:
a re-examination of an anomaly. Journal of Finance 47, 1605–1621.
Amihud, Y., Lev, B., 1981. Risk reduction as a managerial motive for conglomerate mergers. Bell Journal
of Economics 12, 605–617.
Asquith, P., 1983. Merger bids, uncertainty, and stockholder returns. Journal of Financial Economics 11,
51–83.
ARTICLE IN PRESSH. Louis / Journal of Financial Economics 74 (2004) 121–148146

Barber, R., Lyon, J., 1997. Detecting long-run abnormal stock returns: the empirical power and
specifications of test statistics. Journal of Financial Economics 43, 341–372.
Bartov, E., Givoly, D., Hayn, C., 2002. The rewards to meeting or beating earnings expectations. Journal
of Accounting and Economics 31, 173–204.
Berger, P., Ofek, E., 1995. Diversification’s effect on firm value. Journal of Financial Economics 37,
39–65.
Business Week, 1999. Ho-hum, another earnings surprise. M. Vickers, May 24, pp. 83, 84.
Byrd, J., Hickman, K., 1992. Do outside directors monitor managers? Evidence from tender offer bids.
Journal of Financial Economics 32, 195–221.
Chatterjee, S., 1986. Types of synergy and economic value: the impact of acquisitions on merging and rival
firms. Strategic Management Journal 7, 119–139.
Chen, X., Cheng, Q., 2004. Abnormal accrual-based anomaly and managers’ motivations to record
abnormal accruals. Unpublished working paper, University of British Columbia.
Comment, R., Jarrell, G., 1995. Corporate focus and stock returns. Journal of Financial Economics 37,
67–87.
Cook, R., 1977. Detection of influential observations in linear regression. Technometrics 19, 15–18.
Denis, D., Denis, D.K, Sarin, A., 1997. Agency problems, equity ownership, and corporate diversification.
Journal of Finance 52, 135–160.
Erickson, M., Wang, S., 1999. Earnings management by acquiring firms in stock for stock mergers.
Journal of Accounting and Economics 27, 149–176.
Fox, J., 1997. Learn to play the earnings game (and Wall Street will love you). Fortune 135, 76–81.
Guenther, D., 1994. Earnings management in response to corporate tax rate changes: evidence from the
1986 tax reform act. Accounting Review 69, 230–243.
Healy, P., 1985. The effect of bonus schemes on accounting decisions. Journal of Accounting and
Economics 7, 448–467.
Heckman, J., 1979. Sample selection bias as specification error. Econometrica 47, 153–161.
Hubbard, G., Palia, D., 1995. Benefits of control, managerial ownership, and the stock returns of
acquiring firms. Rand Journal of Economics 26, 782–792.
Jensen, M., 1986. Agency costs of free cash flow, corporate finance, and takeover. American Economic
Review 76, 323–329.
Jensen, M., 1993. AFA presidential address: the modern industrial revolution exit and the failure of
internal control systems. Journal of Finance 48, 830–881.
Jensen, M., Ruback, R., 1983. The market for corporate control: the scientific evidence. Journal of
Financial Economics 11, 5–50.
John, K., Ofek, E., 1995. Asset sales and increase in focus. Journal of Financial Economics 37, 105–126.
Kothari, S., Warner, J., 1997. Measuring long-horizon security price performance. Journal of Financial
Economics 43, 301–339.
Kothari, S., Leone, A., Wasley, C. 2004. Performance matched discretionary accrual measures. Journal of
Accounting and Economics, forthcoming.
Lang, L., Stulz, R., 1994. Tobin’s q, corporate diversification and firm performance. Journal of Political
Economy 102, 1248–1280.
Lang, L., Stulz, R., Walking, R., 1989. Managerial performance, Tobin’s q, and the gain from successful
tender offers. Journal of Financial Economics 24, 137–154.
Langetieg, T., 1978. An application of a three-factor performance index to measure stockholder gains
from merger. Journal of Financial Economics 6, 365–383.
Lewellen, W., 1971. A pure financial rational for the conglomerate merger. Journal of Finance 26,
521–537.
Louis, H., 2002. The causes of post-merger underperformance: evidence from successful and unsuccessful
bidders. Unpublished working paper, Pennsylvania State University.
Louis, H., 2004. The cost of using bank mergers as defensive mechanisms against takeover threats. Journal
of Business 77, forthcoming.
Lys, T., Vincent, L., 1995. An analysis of value destruction in AT&T’s acquisition of NCR. Journal of
Financial Economics 39, 353–378.
ARTICLE IN PRESSH. Louis / Journal of Financial Economics 74 (2004) 121–148 147

Mart!ınez-Jerez, A., 2003. Interaction between accounting and corporate governance: evidence from
business combinations. Unpublished working paper, Harvard University.
Morck, R., Shleifer, A., Vishny, R., 1990. Do managerial objectives drive bad acquisitions? Journal of
Finance 45, 31–48.
Mueller, D., 1969. A theory of conglomerate mergers. Quarterly Journal of Economics 84, 643–659.
O’Brien, P., 1988. Analysts’ forecasts as earnings expectations. Journal of Accounting and Economics 10,
53–83.
Palepu, K., 1986. Predicting takeover targets: a methodological and empirical analysis. Journal of
Accounting and Economics 8, 3–35.
Rau, P., Vermaelen, T., 1998. Glamour, value, and the post-acquisition performance of acquiring firms.
Journal of Financial Economics 49, 223–253.
Revsine, L., Collins, D., Johnson, B., 1999. Financial Reporting and Analysis. Prentice-Hall, Upper
Saddle River, NJ.
Richardson, S., Teoh, S., Wysochi, P., 2004. The walkdown to beatable analyst forecast: the roles of equity
issuance and insider trading incentives. Journal of Accounting and Economics, forthcoming.
Robinson, J., Shane, P., 1990. Acquisition accounting method and bid premia for target firms. Accounting
Review 65, 25–48.
Roll, R., 1986. The hubris hypothesis of corporate takeovers. Journal of Business 59, 197–216.
Scanlon, K., Trifts, J., Pettway, R., 1989. Impact of relative size and industrial relatedness on returns to
shareholders of acquiring firms. Journal of Financial Research 12, 103–112.
Schwert, G., 1996. Markup pricing in mergers and acquisitions. Journal of Financial Economics 41,
153–192.
Scott, J., 1977. On the theory of conglomerate mergers. Journal of Finance 32, 1235–1250.
Servaes, H., 1991. Tobin’s q and gains from takeovers. Journal of Finance 54, 547–580.
Shivakumar, L., 2000. Do firms mislead investors by overstating earnings around seasoned equity
offerings? Journal of Accounting and Economics 29, 339–371.
Shleifer, A., Vishny, R., 2003. Stock market driven acquisitions. Journal of Financial Economics 70,
295–311.
Skinner, D., Sloan, R., 2002. Earnings surprises, growth expectations, and stock returns or don’t let an
earnings torpedo sink your portfolio. Review of Accounting Studies 7, 289–312.
Sloan, R., 1996. Do stock prices fully reflect information in accruals and cash flows about future earnings?
Accounting Review 77, 289–315.
Subrahmanyam, V., Rangan, N., Rosenstein, S., 1997. The role of outside directors in bank acquisitions.
Financial Management 26, 23–36.
Teoh, S., Welch, I., Wong, T., 1998a. Earnings management and the long-run underperformance of
seasoned equity offerings. Journal of Financial Economics 50, 63–100.
Teoh, S., Welch, I., Wong, T., 1998b. Earnings management and the long-run underperformance of initial
public equity offerings. Journal of Finance 53, 1935–1974.
Travlos, N., 1987. Corporate takeover bids, method of payment, and bidding firms’ stock returns. Journal
of Finance 42, 943–963.
Wall Street Journal, 1997a. As stock market surges ahead, ‘‘predictable’’ profits are driving it. S. McGee,
May 5, C1.
Wall Street Journal, 1997b. Rise in profit guidance dilutes positive surprises, G. Ip, June 23, C1.
Yermack, D., 1996. Higher market valuation of companies with a small board of directors. Journal of
Financial Economics 40, 185–211.
Zach, T., 2003. Inside the accrual anomaly. Unpublished working paper, Washington University.
ARTICLE IN PRESSH. Louis / Journal of Financial Economics 74 (2004) 121–148148
Copyright © 2022 FDOKUMEN