Numerical predictions of the rollover phenomenon using ...
7
SYMPOSIUM SERIES NO 162 HAZARDS 27 © 2017 IChemE 1 Numerical predictions of the rollover phenomenon using computational fluid dynamics Antoine Hubert, Research Associate, Kingston University, London Siaka Dembele, Associate Professor, Kingston University, London Petr Denissenko, Associate Professor, University of Warwick , Coventry Jennifer Wen * , Professor, University of Warwick, Coventry *corresponding author: [email protected] In the past six decades over 24 rollover incidents have occurred in the Liquefied Natural Gas (LNG) industry. During rollover, because of the heat losses at the tank walls, a stratified LNG may be naturally and suddenly homogenised while releasing a large amount of energy in the form of vapour. This rapid vaporisation can be dangerous due to the high pressure produced in the tank and because of the significant amount of LNG vapour that can be potentially released into the atmosphere, leading to possible explosions. The current study is aimed at developing a predictive tool rolloverFoam, on the basis of open source Computational Fluid Dynamics (CFD) code, OpenFOAM, to reliably predict the occurrence of rollover. Such a predictive tool can be of assistance to safety study to prevent the occurrence of rollover through improved tank design, LNG handling procedures and storage. It may also be used by tank operators to monitor the conditions and take timely interventions to prevent the occurrence of rollover in some circumstances. The modelling approach is based on the three-dimensional numerical study of a mixture consisting primarily of methane and some ethane to represent the minor constituents. The evaporation rate is calculated using the Hashemi-Wesson relation. The computational domain is initialized with a stratified liquid involving two layers with different thermophysical properties. The predictions of rolloverFoam were firstly validated with experimental data obtained from small scale experiments in the literature as well as with numerical results of previous researchers. Subsequently, the code is applied to analyse the La Spezia rollover accident which happened in 1973. The rollover time, the boil-off rate, the interface motion and the evolution of the strata’ compositions and temperatures are monitored during the scenario. These predictions provided important insights into the underlying physics during LNG rollover process and the spontaneous mixing of the liquid layers. These will be discussed in detail in the full manuscript. Keywords: LNG, Rollover, CFD, Double-diffusion, Safety, Buoyancy Introduction The Liquefied Natural Gas (LNG) industry is one of the fastest growing energy sector. Indeed, its world demand is supposed to double by 2025. As a result, it is necessary to develop more storage facilities as well as to optimise them in the available infrastructures. In some storage cases where LNG from different sources are added in the same tank, a rapid mixing called "rollover" occurs while releasing a high amount of vapour. In such a scenario, this sudden release, if not handled, could damage the tank structure and potential explosion hazard. Rollover is a phenomenon known and studied since the 60s. In 1973, Sarsten [1] reported the rollover incident in La Spezia which happened after loading from below a denser liquid than the LNG initially present in the tank. Following this event, in the 70s -80s, in order to understand the rollover process, Chatterjee and Geist [2], Germeles [3] and Heestand [4] successively developed mathematical models based on a 1D approach. However, these do not take into account the spatial distribution of a rollover which is of prime interest when studying the phenomenon. Thus, the novelty of the presented work is to develop a Computational Fluid Dynamics (CFD) approach capable of predicting with good accuracy the spatial dynamics of the rollover phenomenon.. Rollover LNG is stored at -160°C at around the atmospheric pressure in heavily insulated tanks so as to keep it under its liquefied form. However, despite this insulation, the liquid is heated at the walls and because of buoyancy, it rises along the wall. Once the liquid reaches the surface, part of it evaporates and the remaining part cools down and sinks. These motions form convection cells in the tank while releasing normal amounts of boil-off gases (BOG). This case is illustrated in Figure 1a) for a homogeneous LNG. LNG is a multicomponent fluid. As illustrated in Table 1 below, its composition depends on its source of production. Different LNG from several sources often have different densities. When adding them in the same tank, it may lead to stratification especially if a denser LNG is injected at the bottom of a lighter LNG or a lighter LNG is added at the top of a denser LNG.
-
Upload
khangminh22 -
Category
Documents
-
view
3 -
download
0
Transcript of Numerical predictions of the rollover phenomenon using ...

SYMPOSIUM SERIES NO 162 HAZARDS 27 © 2017 IChemE
1
Numerical predictions of the rollover phenomenon using computational
fluid dynamics
Antoine Hubert, Research Associate, Kingston University, London
Siaka Dembele, Associate Professor, Kingston University, London
Petr Denissenko, Associate Professor, University of Warwick , Coventry
Jennifer Wen*, Professor, University of Warwick, Coventry
*corresponding author: [email protected]
In the past six decades over 24 rollover incidents have occurred in the Liquefied Natural Gas (LNG) industry. During rollover, because of the heat losses at the tank walls, a stratified LNG may be naturally and suddenly
homogenised while releasing a large amount of energy in the form of vapour. This rapid vaporisation can be
dangerous due to the high pressure produced in the tank and because of the significant amount of LNG vapour that can be potentially released into the atmosphere, leading to possible explosions.
The current study is aimed at developing a predictive tool rolloverFoam, on the basis of open source Computational Fluid Dynamics (CFD) code, OpenFOAM, to reliably predict the occurrence of rollover. Such a
predictive tool can be of assistance to safety study to prevent the occurrence of rollover through improved tank
design, LNG handling procedures and storage. It may also be used by tank operators to monitor the conditions and take timely interventions to prevent the occurrence of rollover in some circumstances.
The modelling approach is based on the three-dimensional numerical study of a mixture consisting primarily of
methane and some ethane to represent the minor constituents. The evaporation rate is calculated using the Hashemi-Wesson relation. The computational domain is initialized with a stratified liquid involving two layers
with different thermophysical properties. The predictions of rolloverFoam were firstly validated with
experimental data obtained from small scale experiments in the literature as well as with numerical results of previous researchers. Subsequently, the code is applied to analyse the La Spezia rollover accident which
happened in 1973. The rollover time, the boil-off rate, the interface motion and the evolution of the strata’
compositions and temperatures are monitored during the scenario. These predictions provided important insights into the underlying physics during LNG rollover process and the spontaneous mixing of the liquid
layers. These will be discussed in detail in the full manuscript.
Keywords: LNG, Rollover, CFD, Double-diffusion, Safety, Buoyancy
Introduction
The Liquefied Natural Gas (LNG) industry is one of the fastest growing energy sector. Indeed, its world demand is supposed
to double by 2025. As a result, it is necessary to develop more storage facilities as well as to optimise them in the available
infrastructures. In some storage cases where LNG from different sources are added in the same tank, a rapid mixing called
"rollover" occurs while releasing a high amount of vapour. In such a scenario, this sudden release, if not handled, could
damage the tank structure and potential explosion hazard.
Rollover is a phenomenon known and studied since the 60s. In 1973, Sarsten [1] reported the rollover incident in La Spezia
which happened after loading from below a denser liquid than the LNG initially present in the tank. Following this event, in
the 70s -80s, in order to understand the rollover process, Chatterjee and Geist [2], Germeles [3] and Heestand [4]
successively developed mathematical models based on a 1D approach. However, these do not take into account the spatial
distribution of a rollover which is of prime interest when studying the phenomenon. Thus, the novelty of the presented work
is to develop a Computational Fluid Dynamics (CFD) approach capable of predicting with good accuracy the spatial
dynamics of the rollover phenomenon..
Rollover
LNG is stored at -160°C at around the atmospheric pressure in heavily insulated tanks so as to keep it under its liquefied
form. However, despite this insulation, the liquid is heated at the walls and because of buoyancy, it rises along the wall.
Once the liquid reaches the surface, part of it evaporates and the remaining part cools down and sinks. These motions form
convection cells in the tank while releasing normal amounts of boil-off gases (BOG). This case is illustrated in Figure 1a) for
a homogeneous LNG. LNG is a multicomponent fluid. As illustrated in Table 1 below, its composition depends on its source
of production. Different LNG from several sources often have different densities. When adding them in the same tank, it
may lead to stratification especially if a denser LNG is injected at the bottom of a lighter LNG or a lighter LNG is added at
the top of a denser LNG.
SYMPOSIUM SERIES NO 162 HAZARDS 27 © 2017 IChemE
2
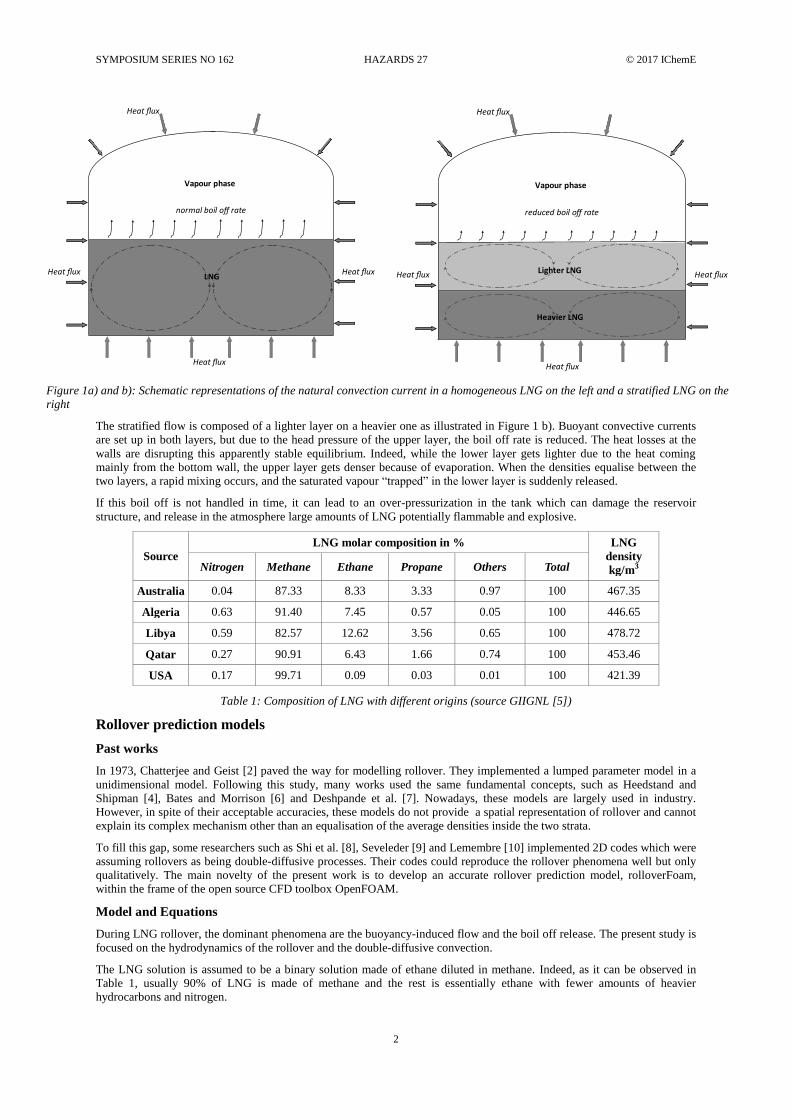
Figure 1a) and b): Schematic representations of the natural convection current in a homogeneous LNG on the left and a stratified LNG on the
right
The stratified flow is composed of a lighter layer on a heavier one as illustrated in Figure 1 b). Buoyant convective currents
are set up in both layers, but due to the head pressure of the upper layer, the boil off rate is reduced. The heat losses at the
walls are disrupting this apparently stable equilibrium. Indeed, while the lower layer gets lighter due to the heat coming
mainly from the bottom wall, the upper layer gets denser because of evaporation. When the densities equalise between the
two layers, a rapid mixing occurs, and the saturated vapour “trapped” in the lower layer is suddenly released.
If this boil off is not handled in time, it can lead to an over-pressurization in the tank which can damage the reservoir
structure, and release in the atmosphere large amounts of LNG potentially flammable and explosive.
Source
LNG molar composition in % LNG
density
kg/m3 Nitrogen Methane Ethane Propane Others Total
Australia 0.04 87.33 8.33 3.33 0.97 100 467.35
Algeria 0.63 91.40 7.45 0.57 0.05 100 446.65
Libya 0.59 82.57 12.62 3.56 0.65 100 478.72
Qatar 0.27 90.91 6.43 1.66 0.74 100 453.46
USA 0.17 99.71 0.09 0.03 0.01 100 421.39
Table 1: Composition of LNG with different origins (source GIIGNL [5])
Rollover prediction models
Past works
In 1973, Chatterjee and Geist [2] paved the way for modelling rollover. They implemented a lumped parameter model in a
unidimensional model. Following this study, many works used the same fundamental concepts, such as Heedstand and
Shipman [4], Bates and Morrison [6] and Deshpande et al. [7]. Nowadays, these models are largely used in industry.
However, in spite of their acceptable accuracies, these models do not provide a spatial representation of rollover and cannot
explain its complex mechanism other than an equalisation of the average densities inside the two strata.
To fill this gap, some researchers such as Shi et al. [8], Seveleder [9] and Lemembre [10] implemented 2D codes which were
assuming rollovers as being double-diffusive processes. Their codes could reproduce the rollover phenomena well but only
qualitatively. The main novelty of the present work is to develop an accurate rollover prediction model, rolloverFoam,
within the frame of the open source CFD toolbox OpenFOAM.
Model and Equations
During LNG rollover, the dominant phenomena are the buoyancy-induced flow and the boil off release. The present study is
focused on the hydrodynamics of the rollover and the double-diffusive convection.
The LNG solution is assumed to be a binary solution made of ethane diluted in methane. Indeed, as it can be observed in
Table 1, usually 90% of LNG is made of methane and the rest is essentially ethane with fewer amounts of heavier
hydrocarbons and nitrogen.

SYMPOSIUM SERIES NO 162 HAZARDS 27 © 2017 IChemE
3
The variation of density with dilute concentration and temperature is small compared to the density of the fluid, and the latter
is assumed to be incompressible which justifies the use of the Boussinesq approximation. The density can then be expressed
as:
(1)
with the reference density, the solutal expansion coefficient, the thermal expansion coefficient, the solute
concentration, the reference solute concentration, the temperature and the reference temperature.
The equations governing the problem are, in the order, the mass continuity, the momentum, the mass transport and the
energy transport equations and are as follows:
(2)
(3)
(4)
(5)
where stands for the velocity vector, the pressure gradient, the dynamic viscosity, the gravity vector, the solutal
diffusivity and the thermal diffusivity.
In this model, heat conduction and molecular diffusion are dominating the rollover. As a result, the transport of
concentration due to gradients of temperature (Soret effect) is neglected as well as the transport of temperature due to
gradients of concentration (Dufour effect).
An important aspect in simulating rollover is modelling the evaporation at the liquid surface in contact with the vapour of
LNG. Hashemi-Wesson’s relation [11] is commonly used when dealing with evaporation. The boil off rate is then defined
as:
Where stands for the boil off rate, is a constant equal to 0.328 defined by Hashemi and Wesson [11], is the kinematic
viscosity and is the difference in temperature between the surface and the bulk.
Evaporation has a critical role during rollover because while the liquid gets lighter at the walls due to buoyancy and rises, it
gets heavier in the vicinity of the free surface sinks and stirs the interface to some extent. This phenomenon is also
accelerated because the evaporation of methane which is lighter than ethane makes the liquid even more denser.
Results and Discussion
Simulation of an experimental scenario for model validation
Figure 2:Experimental Set up (adapted from [12])
Instead of using LNG, Nakano and Sugawara [12] in their rollover experiments used Freon because it remains liquid under
standard conditions for temperature and pressure. Besides, its saturation temperature is 22.8 0C which enabled them to
experiment the boil off during the rollover.

SYMPOSIUM SERIES NO 162 HAZARDS 27 © 2017 IChemE
4
The liquid used in this experiment was a mixture of Freon 11 and Freon 113. It is placed in an enclosure which is 490 mm
wide, 390 mm high and 200 mm deep. Stratification was then obtained after a slow injection of a denser mixture at the
bottom of a lighter one. In these experiments, the interface between the two liquids is located at around 2/3 of the liquid
height.
The stratified liquid could then be heated from the sides and the bottom as shown in Figure 2 via copper plates heated
electrically.
Table 2 shows the different parameters used in the different experiments. Numerical simulations have been carried out and
compared to the test results. During these simulations, the Reynolds number is around 2.104 but the flow is supposed to be
laminar because the Rayleigh number does not exceed 1013 which is the limit for fully turbulent flow [10]. A mesh
sensitivity study was done on this case and also 2D and 3D models were compared. The results were showing no difference
which enabled us to study for this validation test case 2D models and the mesh was made of 4000 cells.
Experiment Conditions Experimental Results CFD Simulation Results Comparison
Experiments/Simulation
Heating
Condition
Run
No
Freon 113
Concentration
[wt%]
Heat Flux
[W]
Initial Height
[mm] Time until
mixing
started
[min]
Mixing time
[min]
Time until
mixing
started [min]
Mixing time
[min]
Relative
difference in
time until
mixing
started [%]
Relative
difference in
mixing time
[%] Upper
Layer
Lower
Layer
Side
Bottom Upper
Layer
Lower
Layer
Side
Heating 6 0.3 6.6 30 0 114 216 160 55 150 50 6.25 9.09
Side and
Bottom
Heating
8 0.6 8.4 30 12 139 206 150 20 160 20 -6.6 0
14 1.1 17.4 30 30 128 216 125 5 120 5 4 0
15 0.6 22.1 30 20 131 211 176 24 174 21 1.13 14
Table 2: Experimental and numerical results
The time until mixing started obtained numerically is compared to the one obtained experimentally for different cases
(numbers 6,8,14 and 15) as depicted in Table 2. In all the four cases simulated, the time before the strata start mixing is less
than 7% different from the experimental ones and the mixing times are less than 14%.
Quantitatively, the evolutions in densities, concentrations and temperatures are compared with the ones obtained during the
test 15 and shown in Figure 3. During this test, the heat input at the bottom is around 20 W and on the sides it is around 30
W. Also, Freon 113 is 0.6% of the weight of the top layer while it represents 22.1% of the bottom one.
Figure 3: Comparison of numerical results for the evolution of temperatures,
concentrations and densities for both strata with experimental results (test 15)
Figure 4: Comparison of numerical results of the evolution of the
interface and the boil off rate during rollover with experimental
data (test 15)
SYMPOSIUM SERIES NO 162 HAZARDS 27 © 2017 IChemE
5
As shown in Figure 3, the predictions are in good agreements with the measurements. However, the results for concentration
show a difference less than 20% but this difference may be due to the fact that the collected data are averaged over the top
and bottom layers in the simulated case while in the experiment it is evaluated locally with probes but whose coordinates are
unknown. Also, while "mixing patterns after stirring the interface" have been observed by Nakano and Sugawara [12], this
was not the case in the experimental results but has been revealed in the present predictions. This explains why the averaged
concentration of the lower layer increases before the rollover while it does not according to the experimental data reported.
Also, the boil off rate and the interface position are compared on Figure 4. As shown, the interface moves downward rapidly.
Indeed, in less than 5 min time, the interface disappears and the liquid is homogenised. As far as boil off rates are concerned,
the one calculated is 3 times higher than the experimented one. The model has to be improved but the trends are similar and
it highlights the sudden evaporation of Freon 11 during the sudden mixing which happens when the interface starts moving
downwards.
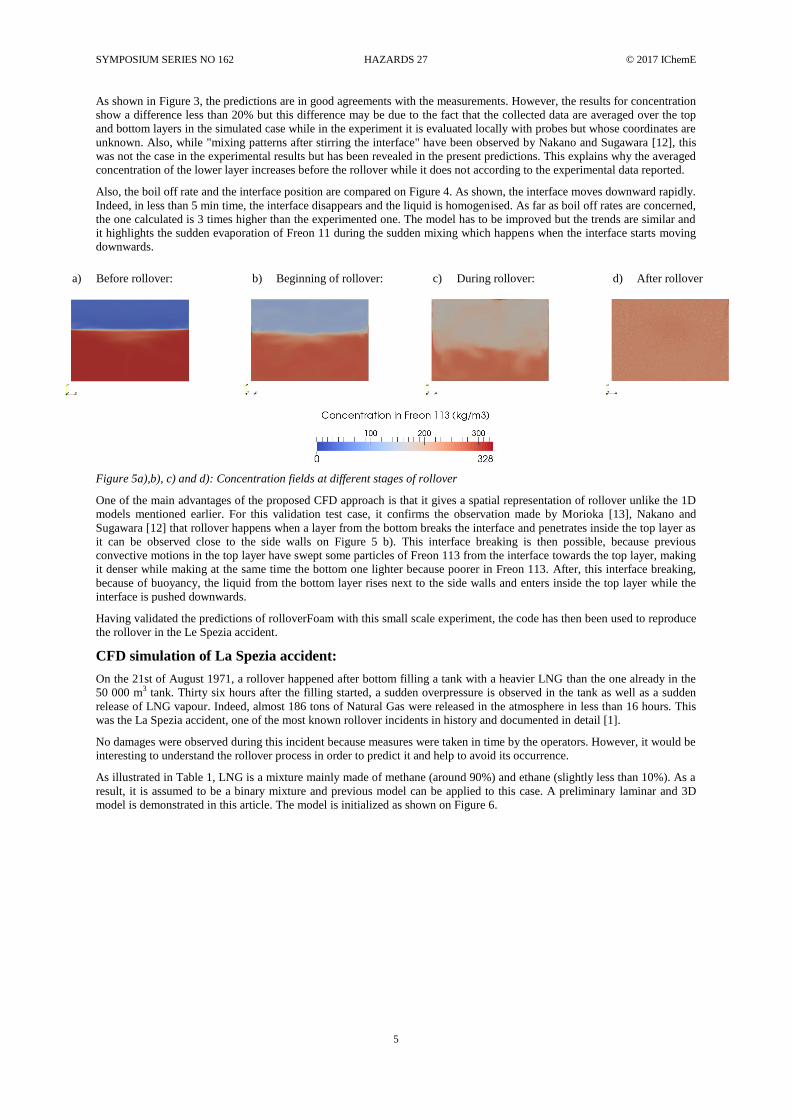
a) Before rollover: b) Beginning of rollover: c) During rollover: d) After rollover
Figure 5a),b), c) and d): Concentration fields at different stages of rollover
One of the main advantages of the proposed CFD approach is that it gives a spatial representation of rollover unlike the 1D
models mentioned earlier. For this validation test case, it confirms the observation made by Morioka [13], Nakano and
Sugawara [12] that rollover happens when a layer from the bottom breaks the interface and penetrates inside the top layer as
it can be observed close to the side walls on Figure 5 b). This interface breaking is then possible, because previous
convective motions in the top layer have swept some particles of Freon 113 from the interface towards the top layer, making
it denser while making at the same time the bottom one lighter because poorer in Freon 113. After, this interface breaking,
because of buoyancy, the liquid from the bottom layer rises next to the side walls and enters inside the top layer while the
interface is pushed downwards.
Having validated the predictions of rolloverFoam with this small scale experiment, the code has then been used to reproduce
the rollover in the Le Spezia accident.
CFD simulation of La Spezia accident:
On the 21st of August 1971, a rollover happened after bottom filling a tank with a heavier LNG than the one already in the
50 000 m3 tank. Thirty six hours after the filling started, a sudden overpressure is observed in the tank as well as a sudden
release of LNG vapour. Indeed, almost 186 tons of Natural Gas were released in the atmosphere in less than 16 hours. This
was the La Spezia accident, one of the most known rollover incidents in history and documented in detail [1].
No damages were observed during this incident because measures were taken in time by the operators. However, it would be
interesting to understand the rollover process in order to predict it and help to avoid its occurrence.
As illustrated in Table 1, LNG is a mixture mainly made of methane (around 90%) and ethane (slightly less than 10%). As a
result, it is assumed to be a binary mixture and previous model can be applied to this case. A preliminary laminar and 3D
model is demonstrated in this article. The model is initialized as shown on Figure 6.

SYMPOSIUM SERIES NO 162 HAZARDS 27 © 2017 IChemE
6
Figure 6: Initial conditions for La Spezia case
Figure 7: Evolution of densities, concentrations and
temperatures during the simulation of La Spezia accident
Figure 8: Evolution of the boil-off rate during the simulation
of La Spezia accident
Figure 7 shows the evolution of the densities, temperatures and concentrations in the upper and lower layers during the
rollover. Figure 8 compares the predicted and recorded evolution of the boil-off rate, which was the only quantified
recordings from the accidents which could be used for comparison. The predictions demonstrate similar pattern as the
experiments, showing a drastic surge around 30 hours which was the moment the rollover started. The intensities of this boil-
off peak are also similar. Some differences are found with the experimental boil off rate but these could be caused by the
neglecting of the reduced boil-off rate explained in Figure 1b). Also, while the LNG is added to the tank, during the first 16
hours, the LNG already available is stirred which generates a higher amount of LNG vapour. This latter has also been
neglected in the numerical model where the liquid is assumed to be initially stratified and at rest.
(a) (b)
Figure 9: Concentration fields and isodensity lines in half of the tank before rollover (a) and at the beginning of rollover
(b)

SYMPOSIUM SERIES NO 162 HAZARDS 27 © 2017 IChemE
7
The developed CFD tool shows a similar behaviour for the rollover than in the experimental case. Indeed, as it can be
observed in Figure 9 with the isodensity lines which rise close to the walls and to the interface, it turns out that the rollover is
also due to a layer from the bottom which penetrates inside the top layer while breaking the interface.
However, because of the lack of data more simulations are needed. Besides, the Rayleigh number is around 1018 which
means the flow is fully turbulent. As a results, the model needs to be improved in order to take into account the turbulence in
large tanks.
Conclusion
A predictive tool for rollover, rolloverFoam, has been developed with the frame of open source CFD code OpenFOAM. The
validation study with small scale experimental data has shown relatively good agreements between the predictions and
measurements. In addition, the three-dimensional results have provided good insight of the rollover phenomenon. The code
has also been applied to simulate the large case scenario in the La Spezia accident and shown promising results. Indeed, in
this case, the amount of boil-off gases when the rollover started and the mixing time are close to the ones observed during
the accident. The code can potentially be of interest to predict the occurrence of rollover and assist the understanding the
influence of boil-off rate of many parameters such as the size of the layers, the difference in concentration of ethane as well
as the difference in temperature between the layers. It could also help to optimize the use of fans to mix the layers once a
stratification is noticed and as a result save considerable amount of energy. More validation studies will, however, be
beneficial, to further demonstrate the robustness and potential applications of the code.
Acknowledgments
The work is a part of the SafeLNG project funded by the Marie Curie Action of the 7th Framework Programme of the
European Union.
References
1. Sarsten, J.S., 1972, LNG Stratification and Rollover, Pipeline and Gas Journal, 199, p. 37-42.
2. Chatterjee, N. and Geist, J. M., 1972, The Effects of Stratification on Boil-off Rate in LNG Tanks, Pipeline and
Gas Journal, 99, p. 40.
3. Germeles, A. E., 1975, A model for LNG tank Rollover, Advanced in Cryogenic Engineering, 21, 326, Plenum
Press.
4. Heestand, J. and Shipman, C. W., 1983, A Predictive Model for Rollover in Stratified LNG Tanks, AIChE Journal,
Vol. 29, No.2, Page 199.
5. Groupe International des Importateurs de Gaz Naturel Liquéfié (GIIGNL), 2016, The LNG Industry in 2015,
annual report.
6. Bates, S. and Morrison, D.S., 1997, Modelling the behaviour of stratified liquid natural gas in storage tanks: a
study of rollover phenomenon, Int. J. Heat Mass Transfer, 40 (8), p. 1875–1884
7. Deshpande, K.B., Zimmerman, W.B., Tennant, M.T., Webster, M.B. and Lukaszewski, M.W., 2011, Optimisation
methods for the real-time inverse problem posed by modelling of liquefied natural gas storage, Chemical
Engineering Journal, 170 (1), p. 44-52.
8. Shi, J.Q., Beduz, C. and Scurlock, R.G., 1993, Numerical modelling and flow visualization of mixing of stratified
layers and rollover in LNG, Cryogenics, Vol: 33, p. 1116-1124.
9. Seveleder, V., 1990, Convection naturelle doublement diffusive dans des fluides stratifiés : application au gaz
naturel liquéfié, PhD thesis, Ecole Centrale de Paris
10. Lemembre, A., 1999, Evolution par convection naturelle d'une stratification formée de deux couches liquides dans
un réservoir cylindrique, PhD thesis, Ecole Centrale de Paris
11. Hashemi, H.T. and Wesson, H.R., 1971, Cut LNG Storage Cost, Hydrocarbon Processing, p. 117-120.
12. Nakano, R., Sugawara, Y., and Yamagata, S., 1982, An experimental study on the mixing of stratified layers using
liquefied freon, Gastech Proceedings, p. 383–391.
13. Morioka ,M. and Enya ,S., 1983, Natural convection of density-stratified layers in a vessel I, Heat Transfer
Japanese Research, 12 (4): 48
14. Groupe International des Importateurs de Gaz Naturel Liquéfié (GIIGNL), 2015, Rollover in LNG storage tanks,
Summary Report.