Technology, Media, and Telecommunications Predictions 2020
136
Technology, Media, and Telecommunications Predictions 2020
-
Upload
khangminh22 -
Category
Documents
-
view
2 -
download
0
Transcript of Technology, Media, and Telecommunications Predictions 2020

Technology, Media, and Telecommunications Predictions 2020

Deloitte’s Technology, Media, and Telecommunications (TMT) group brings together one of the world’s largest pools of industry experts—respected for helping companies of all shapes and sizes thrive in a digital world. Deloitte’s TMT specialists can help companies take advantage of the ever-changing industry through a broad array of services designed to meet companies wherever they are, across the value chain and around the globe. Contact the authors for more information or read more on www.deloitte.com.

Contents
Foreword 2
Bringing AI to the device: Edge AI chips come into their own 4
Robots on the move: Professional service robots 18 set for double-digit growth
Private 5G networks: Enterprise untethered 30
High speed from low orbit: A broadband revolution 46 or a bunch of space junk?
The smartphone multiplier: Toward a trillion-dollar economy 58
My antennae are tingling: Terrestrial TV’s surprising staying power 72
Coming to a CDN near you: Videos, games, and much, much more 86
Ad-supported video: Will the United States follow Asia’s lead? 94
The ears have it: The rise of audiobooks and podcasting 106
Cycling’s technological transformation: 118 Making bicycling faster, easier, and safer
2
Technology, Media, and Telecommunications Predictions 2020
ForewordTMT Predictions 2020: The canopy effect
DELOITTE’S 2020 TMT Predictions report contains three overarching themes. First, individual technologies are no longer siloed, but are becoming ever more connected and interdependent—and their impact and value are increasing as a result. Second, most of the TMT industry’s money is coming from smartphones,
computers, TVs, enterprise data centers and software, and IoT (we call these the “Big Five”). And third, many ser-vices and products that have been “just around the corner” for years are finally turning that corner in 2020.
Think of a forest…
In prior years of TMT Predictions, we have cross-referenced chapters a handful of times. This year, however, we have done so much more frequently. Consider that edge AI chips, private 5G, and robots are all intercon-nected, while ad-supported video and antenna TV are both affected by each other as well as by low-earth-orbit broadband satellites.
Why has this cross-linking ballooned in 2020?
Think of a forest. In its youth, saplings grow meters apart from each other. Bacteria, fungi, insects, and animals coexist in a single tree, but the same organisms might not be present in the tree next to it. Each sapling is, to an extent, an island with its own ecosystem. As the forest reaches maturity, while the trunks remain meters apart at ground level, 30 meters above the branches now all touch, creating a dense canopy that may be six meters thick. This single canopy, consisting of perhaps millions of trees, is now a unified ecosystem that may span thousands of kilometers.
A parallel phenomenon is underway in the TMT industry. Only 10 years ago, for instance, each kind of AI tech-nology was its own “sapling”: Innovations in natural language processing did not lead to better visual recognition, for example. Then, new deep machine learning hardware began to accelerate all AI innovations at the same time, creating a “canopy” in which advances in one area were almost always matched by advances in the other (former) AI silos. Nor does the phenomenon stop there. Until recently, deep learning has been performed using chips that cost thousands of dollars and used thousands of watts, and that were hence largely restricted to data centers. Within just the last two years, however, new edge AI chips that cost mere dollars and require only a few watts have made it possible to perform machine learning anywhere—further expanding the canopy, to stick with our meta-phor. Thanks to this development, even more data, algorithms, information, and solutions are flowing through all parts of the ecosystem, leading to ever faster and more useful AI for consumers and enterprises.
Big money and the Big Five
Just five ecosystems are responsible for the bulk of the TMT industry’s revenue. The smartphone ecosystem alone is worth well over a trillion dollars per year. The TV ecosystem is worth more than US$600 billion; PC sales and ancillaries (consumer and enterprise) generate yearly revenues of about US$400 billion, enterprise data centers and software (combined) will make about US$660 billion in 2020, and IoT (accelerated by the rollout of 5G) will be worth half a trillion dollars by 2021.
3
Foreword
If we add up other newer devices—smart watches, consumer drones, e-readers, home 3D printers, AR glasses, VR glasses, and smart speakers—their combined ecosystems generate only a small fraction of the smallest of these Big Five.
The 10 chapters of this year’s report are largely about connecting the Big Five ecosystems, advertising on them, selling accessories for them, or providing content for them. Yes, some audiobooks and podcasts will be played on smart speakers, for example—but by the end of 2020, more than half of all audiobooks will be listened to on smartphones alone. For the foreseeable future, the big bucks will gravitate toward the Big Five, with everything else being relatively niche markets.
Better late than never
As the old tech joke goes: “X is the technology of the future … and always will be!” But that isn’t always strictly true. In 2020, we foresee an entire crop of previously perennially delayed technologies finally becoming ready for prime time. TMT Predictions’ poster child for such late-blooming technologies is the deployment of low earth orbit (LEO) satellites for low-latency broadband internet.
The first LEO megaconstellation was envisioned in 1998; the first (limited) commercial service may launch by the end of 2020, 22 years later. Other late bloomers, though not quite as delayed, are professional services robots, whose unit sales may exceed those of robot arms in 2020; bikes, particularly e-bikes, catching on in a big way for commuters around the world; and podcasts, which will have their first billion-dollar year in 2020—16 years after the first podcast was released.
This trio of trends may make predicting more predictable! An interconnected ecosystem with a limited number of significant players should allow us (and everyone) to foresee trends with greater accuracy and more confidence. Indeed, it may be time to retire the other old joke: “It’s tough to make predictions, especially about the future.”
In the near future, maybe it won’t be as tough.
Paul Sallomi Global Technology, Media & Telecommunications industry leader
Paul Lee Head of global TMT research
David Jarvis Senior research manager US TMT Center
Mark Casey Global Telecommunications Media & Entertainment sector leader
Jeff Loucks Executive director, US TMT Center
Chris Arkenberg Research manager US TMT Center
Craig Wigginton Global Telecommunications leader
Duncan Stewart Canada TMT research director

4
Technology, Media, and Telecommunications Predictions 2020
MANY PEOPLE MAY be familiar with the frustration of calling up their smartphone’s speech-to-text function to dictate an email,
only to find that it won’t work because the phone isn’t connected to the internet. Now, a new generation of edge artificial intelligence (AI) chips is set to reduce those frustrations by bringing the AI to the device.1
Bringing AI to the deviceEdge AI chips come into their own
We predict that in 2020, more than 750 million edge AI chips—chips or parts of chips that perform or acceler-ate machine learning tasks on-device, rather than in a remote data center—will be sold. This number, repre-senting a cool US$2.6 billion in revenue, is more than twice the 300 million edge AI chips Deloitte

5
Bringing AI to the device: Edge AI chips come into their own
predicted would sell in 20172—a three-year com-pound annual growth rate (CAGR) of 36 percent. Further, we predict that the edge AI chip market will continue to grow much more quickly than the overall chip market. By 2024, we expect sales of edge AI chips to exceed 1.5 billion, possibly by a great deal.3 This represents annual unit sales growth of at least 20 percent, more than double the longer-term forecast of 9 percent CAGR for the overall semiconductor industry.4
These edge AI chips will likely find their way into an increasing number of consumer devices, such as high-end smartphones, tablets, smart speakers, and wearables. They will also be used in multiple enterprise markets: robots, cameras, sensors, and other IoT (internet of things) devices in general. Both markets are important. The consumer edge AI chip market is much larger than the enterprise market, but it is likely to grow more slowly, with a CAGR of 18 percent expected between 2020 and 2024. The enterprise edge AI chip
market, while much newer—the first commercially available enterprise edge AI chip only launched in 20175—is growing much faster, with a predicted CAGR of 50 percent over the same time frame.
HERE, THERE, AND EVERYWHERE: THE MANY LOCATIONS OF AI COMPUTINGUntil recently, AI computations have almost all been performed remotely in data centers, on enterprise core appliances, or on telecom edge processors—not locally on devices. This is because AI computations are extremely processor-intensive, requiring hundreds of (traditional) chips of varying types to execute. The hardware’s size, cost, and power drain made it essentially impossible to house AI computing arrays in anything smaller than a footlocker.
Now, edge AI chips are changing all that. They are physically smaller, relatively inexpensive, use much less power, and generate much less heat, making it possible to integrate them into handheld devices such as smartphones as well as nonconsumer devices such as robots. By enabling these devices to perform processor-intensive AI computations locally, edge AI chips reduce or eliminate the need to send large amounts of data to a remote location—thereby delivering benefits in usability, speed, and data security and privacy.
Of course, not all AI computations have to take place locally. For some applications, sending data to be processed by a remote AI array may be adequate or even preferred—for instance, when there is simply too much data for a device’s edge AI chip to handle. In fact, most of the time, AI will be done in a hybrid fashion: some portion on-device, and some in the cloud. The preferred mix in any given situation will vary depending on exactly what kind of AI processing needs to be done.
By 2024, we expect sales of edge AI chips to exceed 1.5 billion, possibly by a great deal. This represents annual unit sales growth of at least 20 percent, more than double the longer-term forecast of 9 percent CAGR for the overall semiconductor industry.
6
Technology, Media, and Telecommunications Predictions 2020
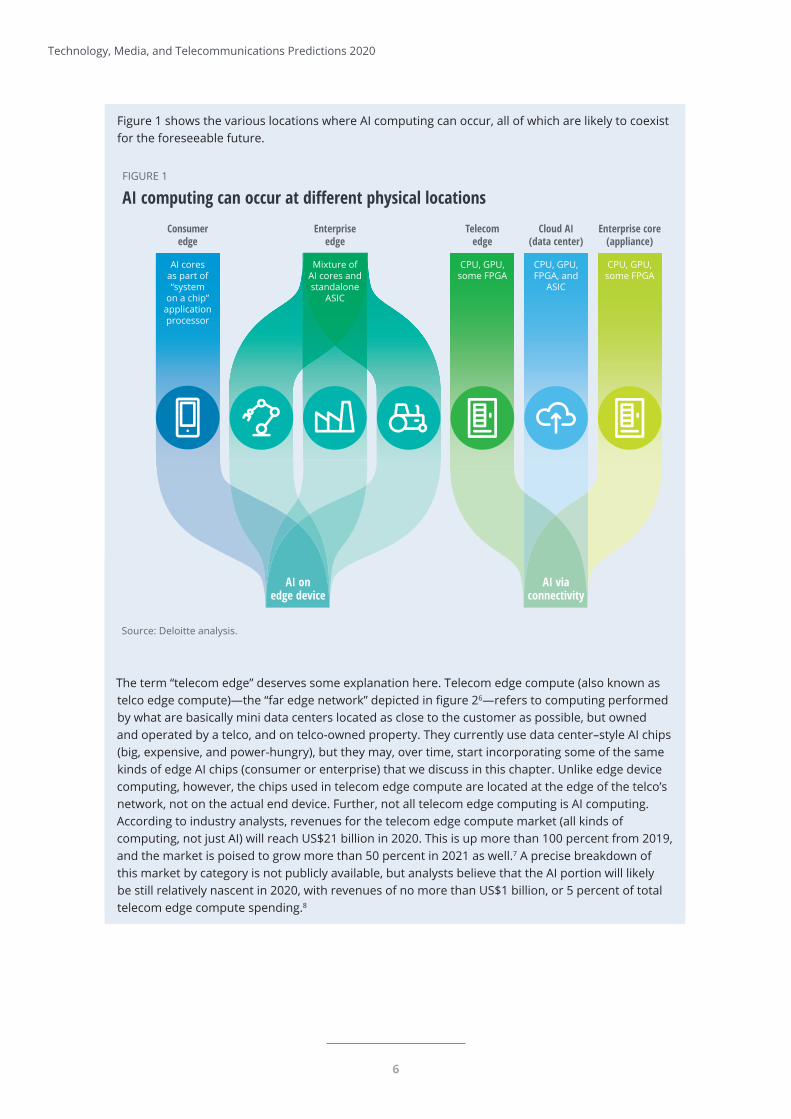
Figure 1 shows the various locations where AI computing can occur, all of which are likely to coexist for the foreseeable future.
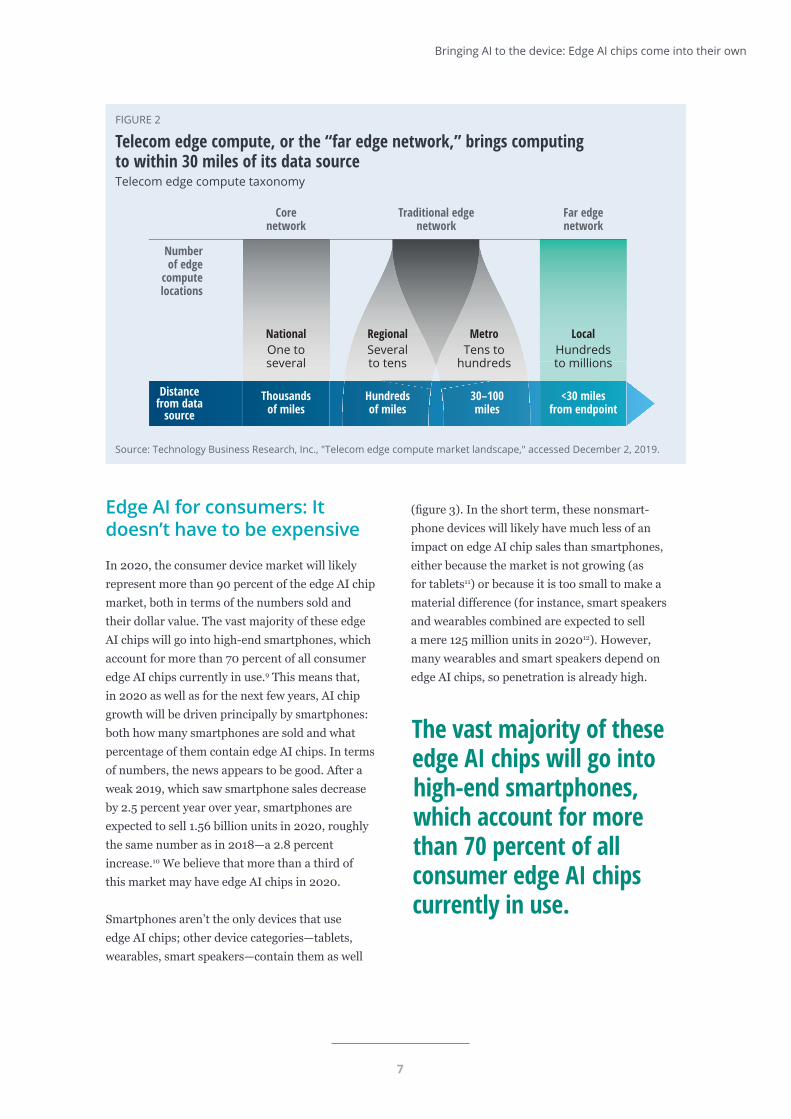
The term “telecom edge” deserves some explanation here. Telecom edge compute (also known as telco edge compute)—the “far edge network” depicted in fi gure 26—refers to computing performed by what are basically mini data centers located as close to the customer as possible, but owned and operated by a telco, and on telco-owned property. They currently use data center–style AI chips (big, expensive, and power-hungry), but they may, over time, start incorporating some of the same kinds of edge AI chips (consumer or enterprise) that we discuss in this chapter. Unlike edge device computing, however, the chips used in telecom edge compute are located at the edge of the telco’s network, not on the actual end device. Further, not all telecom edge computing is AI computing. According to industry analysts, revenues for the telecom edge compute market (all kinds of computing, not just AI) will reach US$21 billion in 2020. This is up more than 100 percent from 2019, and the market is poised to grow more than 50 percent in 2021 as well.7 A precise breakdown of this market by category is not publicly available, but analysts believe that the AI portion will likely be still relatively nascent in 2020, with revenues of no more than US$1 billion, or 5 percent of total telecom edge compute spending.8
Source: Deloitte analysis.Deloitte Insights | deloitte.com/insights
2020
2024
2012 20142013 20162015 2017 2018 2019e 2010f
FIGURE 1. THE AUDIOBOOK AND PODCAST MARKETS, WHILE RELATIVELY SMALL, ARE POISED TO GROW
2020 global media revenues by category (US$ billions).
Percent100
80
60
40
20
0
Monthly price (US$) Annual charge (%)
eSports
Audiobooks
Recorded music
Ad supported video on demand
Live music
Radio
Movies
Magazines
Streaming video on demand
Newspapers
Books
Video games
TV (pay TV and advertising)
0 200 400 600 800 1000 1200 1400 1600 1800
$1.1$1.3
500
1,000 100 150 100 250
75 75 50 50
FIGURE 1
AI computing can occur at different physical locations
Wearable Enterprise edgeSmartphone Tablet Speaker
Consumer edge
Enterprise edge
Telecomedge
Cloud AI(data center)
Enterprise core (appliance)
AI coresas part of “system
on a chip” application processor
Mixture ofAI cores and standalone
ASIC
CPU, GPU, some FPGA
CPU, GPU,FPGA, and
ASIC
CPU, GPU, some FPGA
AI onedge device
AI viaconnectivity
08
10%
7
Edge AI for consumers: It doesn’t have to be expensive
In 2020, the consumer device market will likely represent more than 90 percent of the edge AI chip market, both in terms of the numbers sold and their dollar value. The vast majority of these edge AI chips will go into high-end smartphones, which account for more than 70 percent of all consumer edge AI chips currently in use.9 This means that, in 2020 as well as for the next few years, AI chip growth will be driven principally by smartphones: both how many smartphones are sold and what percentage of them contain edge AI chips. In terms of numbers, the news appears to be good. After a weak 2019, which saw smartphone sales decrease by 2.5 percent year over year, smartphones are expected to sell 1.56 billion units in 2020, roughly the same number as in 2018—a 2.8 percent increase.10 We believe that more than a third of this market may have edge AI chips in 2020.
Smartphones aren’t the only devices that use edge AI chips; other device categories—tablets, wearables, smart speakers—contain them as well
(fi gure 3). In the short term, these nonsmart-phone devices will likely have much less of an impact on edge AI chip sales than smartphones, either because the market is not growing (as for tablets11) or because it is too small to make a material diff erence (for instance, smart speakers and wearables combined are expected to sell a mere 125 million units in 202012). However, many wearables and smart speakers depend on edge AI chips, so penetration is already high.
Bringing AI to the device: Edge AI chips come into their own
Corenetwork
Traditional edgenetwork
Far edgenetwork
Source: Technology Business Research, Inc., "Telecom edge compute market landscape," accessed December 2, 2019.Deloitte Insights | deloitte.com/insights
FIGURE 2
Telecom edge compute, or the “far edge network,” brings computingto within 30 miles of its data sourceTelecom edge compute taxonomy
NationalOne toseveral
RegionalSeveralto tens
MetroTens to
hundreds
LocalHundredsto millions
Distance from data
sourceThousands
of milesHundredsof miles
30–100miles
<30 milesfrom endpoint
Numberof edge
compute locations
The vast majority of these edge AI chips will go into high-end smartphones, which account for more than 70 percent of all consumer edge AI chips currently in use.

8
Technology, Media, and Telecommunications Predictions 2020
Sources: MarketsandMarkets, Edge AI hardware market by device (smartphones, cameras, robots, automobiles,smart speakers, wearables, and smart mirrors), processor (CPU, GPU, ASIC, and others), power consumption, process,end user industry, and region—global forecast to 2024, April 4, 2019; Deloitte analysis.
Deloitte Insights | deloitte.com/insights
2020
2024
0 200 400 600 800 1,000 1,200 1,400 1,600 1,800
500
1,000 100 150 100 250
75 75 50 50
FIGURE 3
The edge AI chip industry is poised for growthEdge AI chips by device, 2020 and 2024 (millions of units)
Wearable Enterprise edgeSmartphone Tablet Speaker
THE ECONOMICS OF EDGE AI CHIPS FOR SMARTPHONESCurrently, only the most expensive smart-phones—those in the top third of the price distribution—are likely to use edge AI chips. That said, some phones under the US$1,000 price point do contain AI as well. Several AI-equipped phones from Chinese manufacturers, such as Xiaomi’s Mi 9,13 sell for under US$500 in Western countries. Further, as we’ll see below, putting an AI chip in a smartphone doesn’t have to be price-prohibitive for the consumer.
Calculating the cost of a smartphone’s edge AI chip is a roundabout process, but it’s possible to arrive at a fairly sound estimate. The reason one must estimate instead of simply looking up the cost outright is that a smartphone’s “AI chip” is not literally a separate chip unto itself. Inside a modern smartphone, only 7 to 8 millimeters thick, there is no room for multiple discrete chips. Instead, many of the various necessary functions (processing, graphics, memory, con-nectivity, and now AI) are all contained on the same silicon die, called a system on a chip (SoC) applications processor (AP). The term “AI chip,” if a phone has one, refers to the portion of the overall silicon die that is dedicated to performing
or accelerating machine learning calculations. It is made from exactly the same materials as the rest of the chip, using the same processes and tools. It consists of hundreds of millions of standard transistors—but they are arranged in a different way (that is, they have a different architecture) than in the chip’s general processing or graphics portions. The AI portion is commonly, though not always, known as an NPU, or neural processing unit.
To date, three companies—Samsung, Apple, and Huawei—have had images taken of their phone processors that show the naked silicon die with all its features visible, which allows analysts to identify which portions of the chips are used for which functions. A die shot of the chip for Sam-sung’s Exynos 9820 shows that about 5 percent of the total chip area is dedicated to AI processors.14 Samsung’s cost for the entire SoC AP is estimated at US$70.50, which is the phone’s second-most expensive component (after the display), rep-resenting about 17 percent of the device’s total bill of materials.15 Assuming that the AI portion costs the same as the rest of the components on a die-area basis, the Exynos’s edge AI NPU represents roughly 5 percent of the chip’s total cost. This translates into about US$3.50 each.
9
Bringing AI to the device: Edge AI chips come into their own
Similarly, Apple’s A12 Bionic chip dedicates about 7 percent of the die area to machine learning.16 At an estimated US$72 for the whole processor,17 this suggests a cost of US$5.10 for the edge AI portion. The Huawei Kirin 970 chip, estimated to cost the manufacturer US$52.50,18 dedicates 2.1 percent of the die to the NPU,19 suggesting a cost of US$1.10. (Die area is not the only way to measure what percent of a chip’s total cost goes toward AI, however. According to Huawei, the Kirin 970’s NPU has 150 million transistors, representing 2.7 percent of the chip’s total of 5.5 billion transistors. This would suggest a slightly higher NPU cost of US$1.42.)20
Although this cost range is wide, it may be rea-sonable to assume that NPUs cost an average of US$3.50 per chip. Multiplied by half a billion smartphones (not to mention tablets, speakers, and wearables), that makes for a large market, despite the low price per chip. More importantly, at an average cost of US$3.50 to the manufacturer, and a probable minimum of US$1, adding a dedicated edge AI NPU to smartphone processing chips starts looking like a no-brainer. Assuming normal markup, adding US$1 to the manufacturing cost translates into only US$2 more for the end cus-tomer. This means that NPUs and their attendant benefits—a better camera, offline voice assistance,
and so on—can be put into even a US$250 smart-phone for less than a 1 percent price increase.
Companies that manufacture smartphones (and other device types) can take different approaches to obtaining edge AI chips, with the decision driven by factors including phone model and (sometimes) geography. Some buy AP/modem chips from third-party companies that specialize in making and selling them to phone makers, but do not make their own phones. Qualcomm and MediaTek are two prominent examples; combined, these two companies captured roughly 60 percent of the smartphone SoC chip market in 2018.21 Both Qualcomm and MediaTek offer a range of SoCs at various prices; while not all of them include an edge AI chip, the higher-end offerings (including Qualcomm’s Snapdragon 845 and 855 and MediaTek’s Helio P60) usually do. At the other end of the scale, Apple does not use external AP chips at all: It designs and uses its own SoC processors such as the A11, A12, and A13 Bionic chips, all of which have edge AI.22 Still, other device makers, such as Samsung and Huawei, use a hybrid strategy, buying some SoCs from merchant market silicon suppliers and using their own chips (such as Samsung’s Exynos 9820 and Huawei’s Kirin 970/980) for the rest.
WHAT DO EDGE AI CHIPS DO?Perhaps the better question is, what don’t they do? Machine learning today underlies all sorts of capabilities, including but not limited to, biometrics, facial detection and recognition, anything to do with augmented and virtual reality, fun image filters, voice recognition, language translation, voice assistance … and photos, photos, photos. From hiding our wrinkles to applying 3D effects to enabling incredibly low-light photography, edge AI hardware and software—not the lens or the sensor’s number of megapixels—are now what differentiates the best smartphone cameras from the rest.
Although all these tasks can be done on processors without an edge AI chip, or even in the cloud, they work much better, run much faster, and use less power (thereby improving battery life) when performed by an edge AI chip. Keeping the processing on the device is also better in terms of privacy and security; personal information that never leaves a phone cannot be intercepted or misused. And when the edge AI chip is on the phone, it can do all these things even when not connected to a network.
10
Technology, Media, and Telecommunications Predictions 2020
Edge AI for enterprise: A fertile field for opportunity
If the edge AI processors used in smartphones and other devices are so great, why not use them for enterprise applications too? This has, in fact, already happened for some use cases, such as for some autonomous drones. Equipped with a smartphone SoC AP, a drone is capable of performing navigation and obstacle avoid-ance in real time and completely on-device, with no network connection at all.23
However, a chip that is optimized for a smartphone or tablet is not the right choice for many enterprise or industrial applications. The situation is analogous to what chip manufacturers faced in the 1980s with central processing units (CPUs). In the 1980s, personal computers (PCs) had excellent CPUs; their high computational power and flexi-bility made them ideal for such a general-purpose tool. But it made no sense to use those same CPUs to put just a bit of intelligence into (say) a thermo-stat. Back then, CPUs were too big to fit inside a thermostat housing; they used far too much power, and at roughly US$200 per CPU, they cost too much for a device whose total cost needed to be less than US$20. To address these shortcomings, an entire industry developed to manufacture chips that had some of the functions of a computer CPU, but were smaller, cheaper, and less power-hungry.
But wait. As discussed earlier, the edge AI portion of a smartphone SoC is only about 5 percent of the total area, about US$3.50 of the total cost, and would use about 95 percent less power than the whole SoC does. What if someone built a chip that had only the edge AI portion (along with a few other required functions such as memory) that cost less, used less electricity, and was smaller?
Some already have—and more are coming. Intel and Google, for instance, are currently selling internally developed standalone edge AI chips
to developers. Nvidia, the leading manufacturer of graphics processing units (GPUs) commonly used in accelerating data center AI—which are very large, use hundreds of watts of electricity, and can cost thousands of dollars—now sells a customized AI-specific chip (that is not a GPU) suitable for edge devices that is smaller, cheaper, and less power-hungry.24 Qualcomm, the leading maker of merchant market SoCs with embedded edge AI processing cores for smartphones and other consumer devices, has released two stand-alone edge AI chips that are less powerful than its SoCs, but that are cheaper, smaller, and use less electricity.25 Huawei is doing the same.26
In all, as many as 50 different companies are said to be working on AI accelerators of various kinds.27 In addition to those working on application-specific integrated circuit (ASIC) chips, field-programmable gate array (FPGA) manufacturers now offer edge AI chip versions for use outside data centers.28
The standalone edge AI chips available in 2019 were targeted at developers, who would buy them one at a time for around US$80 each. In volumes of thousands or millions, these chips will likely cost device manufacturers much less to buy: some as little as US$1 (or possibly even less), some in the tens of dollars. We are, for now, assuming an average cost of around US$3.50, using the smartphone edge AI chip as a proxy.
In the 1980s, personal computers (PCs) had excellent CPUs; their high computational power and flexibility made them ideal for such a general-purpose tool.
11
Bringing AI to the device: Edge AI chips come into their own
Besides being relatively inexpensive, standalone edge AI processors have the advantage of being small. Some are small enough to fit on a USB stick; the largest is on a board about the size of a credit card. They are also relatively low power, drawing between 1 to 10 watts. For comparison, a data center cluster (albeit a very powerful one) of 16 GPUs and two CPUs costs US$400,000, weighs 350 pounds, and consumes 10,000 watts of power.29
With chips such as these in the works, edge AI can open many new possibilities for enterprises, particularly with regard to IoT applications. Using edge AI chips, companies can greatly increase their ability to analyze—not just collect—data from con-nected devices and convert this analysis into action, while avoiding the cost, complexity, and security challenges of sending huge amounts of data into the cloud. Issues that AI chips can help address include:
Data security and privacy. Collecting, storing, and moving data to the cloud inevitably exposes an organization to cybersecurity and privacy threats, even when companies are vigilant about data protection. This immensely important risk is becoming even more critical to address as time goes on. Regulations about personally identifiable information are emerging across jurisdictions, and consumers are becoming more cognizant of the data enterprises collect, with 80 percent of them saying that they don’t feel that companies are doing all they can to protect consumer privacy.30 Some devices, such as smart speakers, are starting to be used in settings such as hospitals,31 where patient privacy is regulated even more stringently.
By allowing large amounts of data to be processed locally, edge AI chips can reduce the risk of personal or enterprise data being intercepted or misused. Security cameras with machine learning processing, for instance, can reduce privacy risks by
analyzing the video to determine which segments of the video are relevant, and sending only those to the cloud. Machine learning chips can also recognize a broader range of voice commands, so that less audio needs to be analyzed in the cloud. More accurate speech recognition can deliver the additional bonus of helping smart speakers detect the “wake word” more accurately, preventing it from listening to unrelated conversation.
Low connectivity. A device must be connected for data to be processed in the cloud. In some cases, however, connecting the device is impractical. Take drones as an example. Maintaining con-nectivity with a drone can be difficult depending on where they operate, and both the connection itself and uploading data to the cloud can reduce battery life. In New South Wales, Australia, drones with embedded machine learning patrol beaches to keep swimmers safe. They can identify swimmers who have been taken by riptides, or warn swimmers of sharks and crocodiles before an attack, all without an internet connection.32
(Too) big data. IoT devices can generate huge amounts of data. For example, an Airbus A-350 jet has over 6,000 sensors and generates 2.5 terabytes of data each day it flies.33 Globally, security cameras create about 2,500 petabytes of data per day.34 Sending all this data to the cloud for storage and analysis is costly and complex. Putting machine learning processors on the endpoints, whether sensors or cameras, can solve this problem. Cameras, for example, could be equipped with vision processing units (VPUs), low-power SoC processors specialized for ana-lyzing or preprocessing digital images. With edge AI chips embedded, a device can analyze data in real time, transmit only what is relevant for further analysis in the cloud, and “forget” the rest, reducing the cost of storage and bandwidth.
12
Technology, Media, and Telecommunications Predictions 2020
Power constraints. Low-power machine learning chips can allow even devices with small batteries to perform AI computations without undue power drain. For instance, ARM chips are being embedded in respiratory inhalers to analyze data, such as inhalation lung capacity and the flow of medicine into the lungs. The AI analysis is performed on the inhaler, and the results are then sent to a smart-phone app, helping health care professionals to develop personalized care for asthma patients.35 In addition to the low-power edge AI NPUs currently available, tech companies are working to develop “tiny machine learning”: Deep learning on devices as small as microcontroller units (which are similar to the SoCs mentioned earlier, but smaller, less sophisticated, and much lower power, drawing only milliwatts or even microwatts). Google, for instance, is developing a version of TensorFlow Lite that can enable microcontrollers to analyze data, condensing what needs to be sent off-chip into a few bytes.36
THE DIFFERENCE BETWEEN TRAINING AND INFERENCE, AND WHAT IT COULD MEAN FOR DATA CENTER–BASED AIThe AI enabled by an edge AI chip is more properly known as deep machine learning, which has two components. The first component is training. Training involves repeatedly analyzing a large amount of historical data, detecting patterns in that data, and generating an algorithm for that kind of pattern detection. The second component is inference. In inference, the algorithm generated by training—often updated or modified over time through further training—is used to analyze new data and produce useful results.
Until recently, machine learning software used the same standard chips—a mix of CPUs, GPUs, FPGAs, and ASICs—for all their training and inference. These chips are all large, expensive, power-hungry, and produce a lot of heat; consequently, AI hardware built on these chips is always housed in a data center. In contrast, the edge AI chips discussed in this chapter perform mainly (or only) inferencing, using algorithms that were developed by training back in a data center. Although some edge AI chips do training as well, most training still occurs in data centers.
Interestingly, although data center chips have historically been used for both training and inference, we are now seeing the development of different flavors of data center chips, with some optimized for training and some for inference.38 The implications of this relatively new development are not yet clear. But it is possible that, due to the emergence of edge AI chips, data centers will see their current mix of training and inference processing shift toward more training and less inferencing over time. If this happens, these more specialized data center chips could be especially useful for flexibility, allowing a data center that sees its ratio of training to inferencing shifting to change its hardware mix accordingly.
Low latency requirements. Whether over a wired or wireless network, performing AI computations at a remote data center means a round-trip latency of at least 1–2 milliseconds in the best case, and tens or even hundreds of milliseconds in the worst case. Performing AI on-device using an edge AI chip would reduce that to nanoseconds—critical for uses where the device must collect, process, and act upon data virtually instantaneously. Autonomous vehicles, for instance, must collect and process huge amounts of data from computer vision systems to identify objects, as well as from the sensors that control the vehicle’s functions. They must then convert this data into decisions immediately—when to turn, brake, or accelerate—in order to operate safely. To do this, autonomous vehicles must process much of the data they collect in the vehicle itself. (Today’s autonomous vehicles use a variety of chips for this purpose, including standard GPUs as well as edge AI chips.) Low latency is also important for robots, and it will become more so as robots emerge from factory settings to work alongside people.37
13
Bringing AI to the device: Edge AI chips come into their own
THE BOTTOM LINEWho will benefit from the edge AI chip market’s growth? Obviously, it’s good for the companies that make edge AI chips. From essentially zero a few years ago, they will earn more than US$2.5 billion in “new” revenue in 2020, with a 20 percent growth rate for the next few years, and likely with industry-comparable margins. But that number should be placed in context. With 2020 global semiconductor industry revenue projected at US$425 billion,39 edge AI chips make up too small a fraction of that to move the needle for the industry as a whole, or even for its larger individual companies.
In truth, the bigger beneficiaries are likely those who need AI on the device. Edge AI chips can not only enormously improve the capabilities of existing devices, but also allow for entirely new kinds of devices with new abilities and markets. Over the longer term, edge AI chips’ more transformative impact will most probably come from the latter.
Will companies that make AI chips for data centers be harmed as some of the processing (mainly inferencing at first) moves from the core to the edge? The answer is uncertain. All of the companies that make data center AI chips are also making edge versions of these chips, so the shift in processing from the core to the edge may have little or no net effect. Also, demand for AI processing is growing so quickly that its rising tide may lift all boats: The AI chip industry (edge and data center combined) is expected to grow from about US$6 billion in 2018 to more than $90 billion in 2025, a 45 percent CAGR.40 A more likely potential negative is that the emergence of cheaper, smaller, lower-power edge AI chips may exert downward pressure on data center AI chip pricing, if not units. This has happened before: In the semiconductor industry’s history, the spread of edge processing chips frequently caused prices for mainframe/core processing hardware to fall faster than would have been expected based only on improvements according to Moore’s Law.
Some might also think that moving AI processing from the core to the edge will hurt cloud AI companies. This is unlikely: Recent forecasts for the cloud AI or AI-as-a-Service market predict that its revenues will grow from US$2 billion in 2018 to nearly US$12 billion by 2024, a 34 percent CAGR.41 Perhaps that growth would be even larger if edge AI chips did not exist, but it still means that cloud AI is growing twice as quickly as the overall cloud market, with a predicted CAGR of 18 percent to 2023.42
Equally, some might fear that if edge devices can perform AI inference locally, then the need to connect them will go away. Again, this likely will not happen. Those edge devices will still need to communicate with the network core—to send data for AI training, to receive updated AI algorithms for inference, and for many other reasons. For these reasons, we expect that all or almost all edge AI devices will be connected.
The nature of that connection, however, may be different than what was expected only two to three years ago. At that time, AI inference was restricted to large data centers, meaning that smart IoT devices had to be connected to access those AI inference capabilities—and not just to any old network, but one with ultra-high speeds, guaranteed quality of service, high connection densities, and the lowest possible latency. These attributes were (and still are) only to be found on 5G wireless networks. The natural assumption, therefore, was that all IoT devices that used AI would also need to use 5G, and only 5G.
That assumption no longer holds. If a device can handle a significant amount of AI processing locally, it doesn’t eliminate the need for a connection of some sort, but the connection may not always need to be through 5G. 5G will still be necessary some of the time, of course. And the 5G market is poised to grow enormously, at a 55 percent CAGR—more than US$6 billion annually—through 2025.43 But thanks to edge AI chips, the market opportunity in 5G IoT may be slightly smaller than was expected a few years ago.

14
Technology, Media, and Telecommunications Predictions 2020
The spread of edge AI chips will likely drive significant changes for consumers and enterprises alike. For consumers, edge AI chips can make possible a plethora of features—from unlocking their phone, to having a conversation with its voice assistant, to taking mind-blowing photos under extremely difficult conditions—that previously only worked with an internet connection, if at all. But in the long term, edge AI chips’ greater impact may come from their use in enterprise, where they can enable companies to take their IoT applications to a whole new level. Smart machines powered by AI chips could help expand existing markets, threaten incumbents, and shift how profits are divided in industries such as manufacturing, construction, logistics, agriculture, and energy.44 The ability to collect, interpret, and immediately act on vast amounts of data is critical for many of the data-heavy applications that futurists see as becoming widespread: video monitoring, virtual reality, autonomous drones and vehicles, and more. That future, in large part, depends on what edge AI chips make possible: Bringing the intelligence to the device.

15
Bringing AI to the device: Edge AI chips come into their own
1. Devin Coldewey, “Google’s new voice recognition system works instantly and offline (if you have a Pixel),” TechCrunch, March 12, 2019.
2. Deloitte, 2017 Technology, Media and Telecommunications Predictions, January 2017.
3. Cision PR Newswire, “The edge AI market in hardware to grow at CAGR of 20.64%,” April 15, 2019.
4. Cision PR Newswire, “The global semiconductor market at a CAGR of close to 9% during the forecast period,” June 26, 2019.
5. Nate Oh, “Intel launches Movidius neural compute stick: Deep learning and AI on a $79 USB stick,” AnandTech, July 20, 2017.
6. The “far edge” is also known as the local edge, new edge, mobile edge compute (MEC), multiaccess edge or distributed new edge. All of these characterizations refer to the same thing.
7. Technology Business Research, “Telecom edge compute market landscape,” June 11, 2019.
8. Conversation with TBR Edge Compute analyst, August 26, 2019.
9. Cision PR Newswire, “The edge AI market in hardware to grow at CAGR of 20.64%.”
10. Gartner, “Gartner Says worldwide smartphone sales will decline 2.5% in 2019,” press release, August 1, 2019.
11. Tablet sales declined 5 percent in both Q1 and Q2 2019, but were up 1.9 percent in Q3 2019. It is likely that the market for all of 2019 will be roughly flat to down. IDC, “Worldwide tablet shipments return to growth in Q3 2019, fueled by new product launches, according to IDC,” October 31, 2019.
12. Deloitte Global estimates.
13. Cherlynn Low, “The Snapdragon 855 is a 7nm CPU primed for 5G, AI and more,” Engadget, December 5, 2018.Several other Chinese smartphone manufacturers sell smartphones with this SoC in the US$500 range, including OPPO.
14. Daniel R Deakin, “Teardown of Samsung Galaxy S10 allows for detailed die shot of the Exynos 9820,” Notebook Check, March 10, 2019.
15. Michelle Alarcon et al., “Samsung Galaxy S10+ teardown,” Tech Insights, March 1, 2019.
16. AnandTech, “Tech insights: Floor plan,” accessed October 9, 2019. TMT Predictions 2020 is an independent publi-cation and has not been authorized, sponsored, or otherwise approved by Apple Inc. A12 Bionic is a trademark of Apple Inc., registered in the United States and other countries.
17. Daniel Yang & Stacy Wegner, “Apple iPhone Xs Max teardown,” Tech Insights, September 17, 2018. TMT Predic-tions 2020 is an independent publication and has not been authorized, sponsored, or otherwise approved by Apple Inc. iPhone is a trademark of Apple Inc., registered in the United States and other countries.
18. Ibid.
19. AnandTech, “Tech insights,” accessed October 9, 2019.
20. Gary Sims, “What is the Kirin 970’s NPU? – Gary explains,” Android Authority, 2017.
21. Strategy Analytics, “Q1 2018 smartphone apps processor market share: Chips with on-device artificial intelli-gence (AI) grew three fold,” press release, August 8, 2019.
Endnotes

16
Technology, Media, and Telecommunications Predictions 2020
22. TMT Predictions 2020 is an independent publication and has not been authorized, sponsored, or otherwise approved by Apple Inc. A11 Bionic, A12 Bionic, and A13 Bionic are trademarks of Apple Inc., registered in the United States and other countries.
23. April Glaser, “Qualcomm’s latest technology allows drones to learn about their environment as they fly,” Recode, January 7, 2017.
24. Nvidia, “Autonomous machines: Jetson Nano,” accessed October 9, 2019. Although based on a GPU-style architecture, Nvidia’s stand-alone AI chip is not a GPU but an AI chip meant for use in devices, not data centers.
25. Jim McGregor, “Qualcomm brings AI, vision processing to IoT,” EE Times, April 13, 2019.
26. Sally Gao, “Activating AI power with the Ascend chipset,” Huawei blog, February 5, 2019.
27. Rick Merritt, “AI flood drives chips to the edge,” EE Times, July 11, 2018.
28. Xilinx, “AI Edge platform,” accessed October 9, 2019.
29. Brian Wang, “Nvidia DGX-2 is 2 petaflop AI supercomputer for $399,000,” Next Big Future, March 27, 2018.
30. Kevin Westcott et al., Digital media trends survey, 13th edition, Deloitte Insights, 2019.
31. Tess Bennett, “Deloitte brings Amazon’s Alexa into wards to improve patient care,” Which-50, May 14, 2019.
32. Arm Blueprint, “Edge AI: From the art of the possible to the art of the tangible,” June 3, 2019.
33. Silicon Semiconductor, “Aviation depends on sensors and big data,” November 6, 2017.
34. Jessica Burton, “The facts about big data storage in smart cities applications,” Security Infowatch, August 16, 2019.
35. Arm, “From cloud to the edge: On-device artificial intelligence boosts performance,” MIT Technology Review, May 16, 2019.
36. Sally Ward-Foxton, “AI at the very, very edge,” EE Times, July 12, 2019.
37. Duncan Stewart, “Robots on the move: Professional service robots set for double-digit growth,” TMT Predictions 2020, Deloitte Insights, December 9, 2020.
38. Paul Alcorn, “10nm Ice Lake CPU meets M.2: The ‘Spring Hill’ Nervana NNP-I deep dive,” Tom’s Hardware, August 20, 2019.
39. World Semiconductor Trade Statistics, “WSTS has published the Q2 2019 semiconductor market figures,” August 27, 2019.
40. Research and Markets, “Global artificial intelligence (AI) chip market set to record a CAGR of 45.2% between 2019 & 2025 - ASIC segment anticipated to overtake the GPU type in the near future, in terms of revenue,” press release, August 28, 2019.
41. Cision PR Newswire, “Global artificial intelligence as a service market by technology, by organization size, by service type, by type of cloud, by vertical, by region, competition, forecast & opportunities, 2024,” August 27, 2019.
42. Anirban Ghoshal, “Global cloud computing to reach $624 billion by 2023: ResearchAndMarkets study,” Tech Circle, May 24, 2019.
43. Research and Markets, “Global 5G IoT market forecast to 2025: Market is forecast to grow at a CAGR of 55.4% - The state of 5G commercialization,” press release, April 19, 2019.
44. David Schatsky, Jonathan Camhi, and Aniket Dongre, Pervasive intelligence: Smart machines everywhere, Deloitte Insights, November 7, 2018.

17
Bringing AI to the device: Edge AI chips come into their own

18
Technology, Media, and Telecommunications Predictions 2020
THE IDEA OF robots picking items from ware-house shelves may still seem futuristic today. But the future may be closer than many peo-
ple think. Of the almost 1 million robots we expect to be sold for enterprise use in 2020, we predict that just over half of them will be professional ser-vice robots, generating more than US$16 billion in
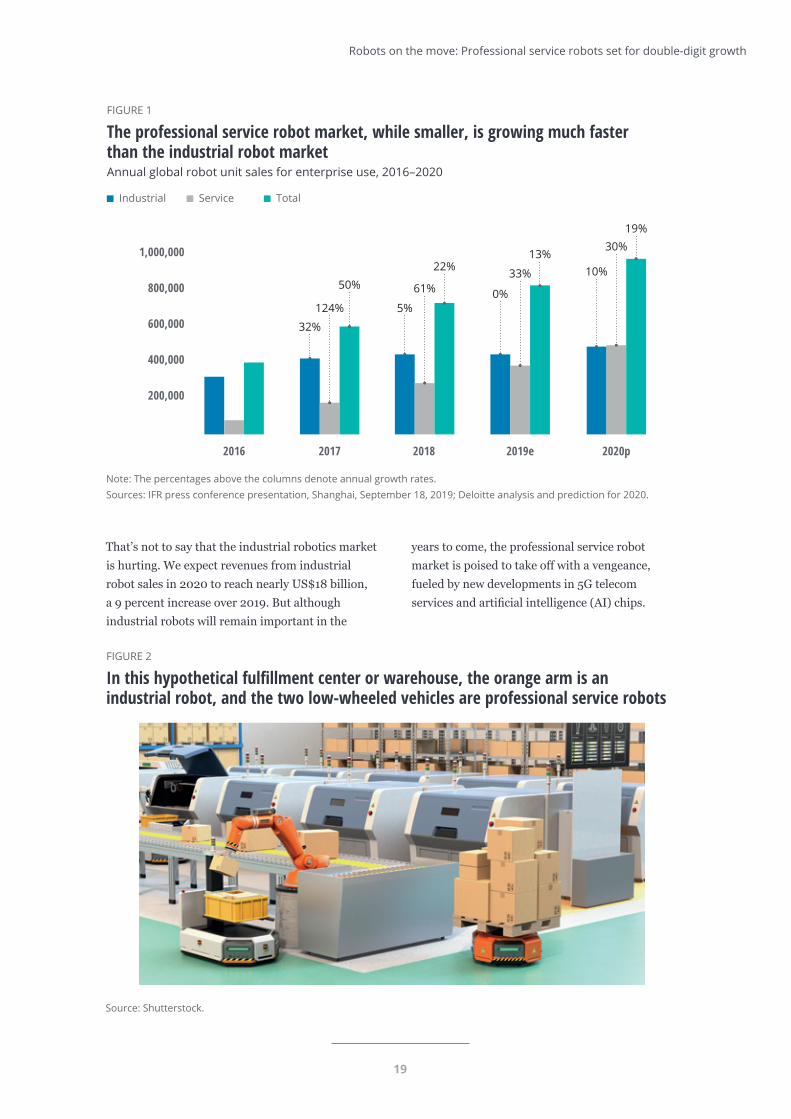
revenue—30 percent more than in 2019. What’s more, with regard to enterprise spending, the mar-ket for professional service robots is growing much faster than that for industrial robots (figure 1). If recent trends are any sign, professional service robots may pass industrial robots in terms of units in 2020 and revenue—in 2021.
Robots on the moveProfessional service robots set for double-digit growth
19
Robots on the move: Professional service robots set for double-digit growth
That’s not to say that the industrial robotics market is hurting. We expect revenues from industrial robot sales in 2020 to reach nearly US$18 billion, a 9 percent increase over 2019. But although industrial robots will remain important in the
Note: The percentages above the columns denote annual growth rates.Sources: IFR press conference presentation, Shanghai, September 18, 2019; Deloitte analysis and prediction for 2020.
Deloitte Insights | deloitte.com/insights
FIGURE 1
The professional service robot market, while smaller, is growing much faster than the industrial robot marketAnnual global robot unit sales for enterprise use, 2016–2020
Industrial Service Total
2016
1,000,000
800,000
600,000
400,000
200,000
2017
124%
32%
50%
2018
61%
5%
22%
2019e
33%
0%
13%
2020p
30%
10%
19%
years to come, the professional service robot market is poised to take off with a vengeance, fueled by new developments in 5G telecom services and artificial intelligence (AI) chips.
Source: Shutterstock.Deloitte Insights | deloitte.com/insights
FIGURE 2
In this hypothetical fulfillment center or warehouse, the orange arm is an industrial robot, and the two low-wheeled vehicles are professional service robots
Please supply high resolution image
20
Technology, Media, and Telecommunications Predictions 2020
Industrial robots: A welcome return to growth
The 10 percent growth in unit sales we predict for industrial robots in 2020 is much better than the sector fared in 2018 and 2019. In 2018, unit sales went up 5 percent, and actually declined slightly in 2019. The forecast return to higher growth in 2020 is very good news for the industrial robot industry after two years (and counting) of disruption by trade wars, tariffs, and the associated slowdown in the automo-tive and technology sectors, and in China.
Industrial robots find their greatest use in the automotive industry, where robots on assembly lines build cars, and the electrical/electronics
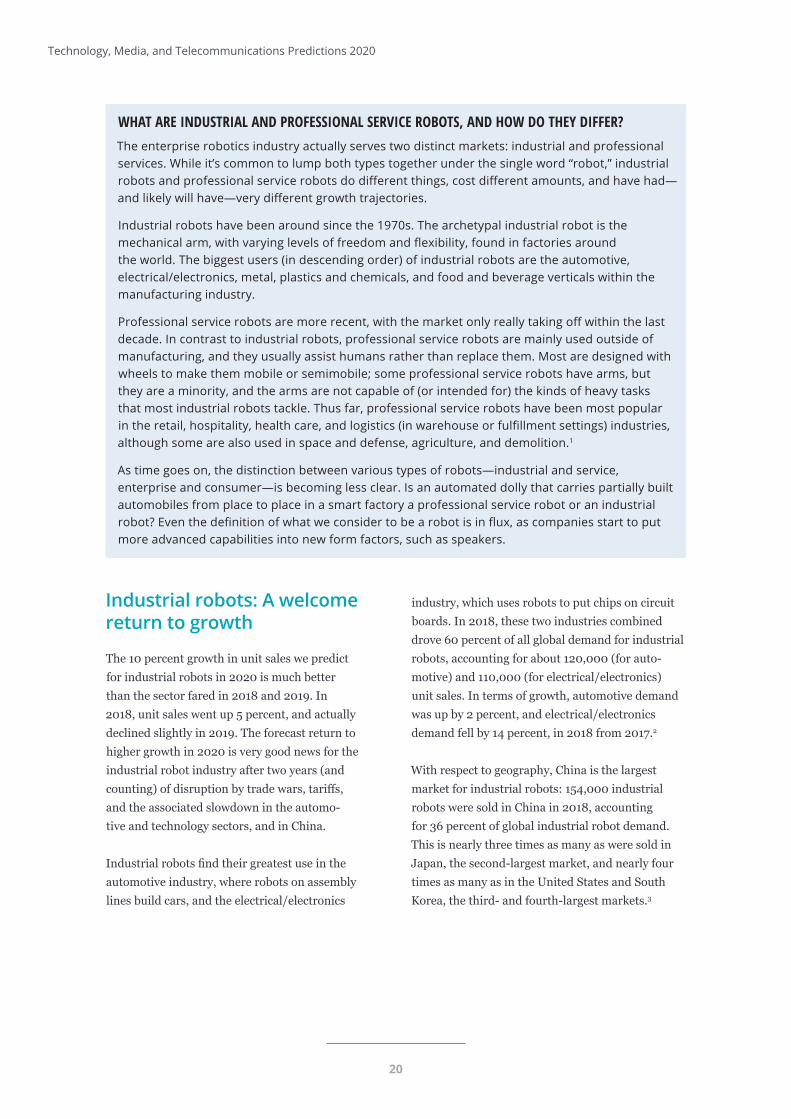
WHAT ARE INDUSTRIAL AND PROFESSIONAL SERVICE ROBOTS, AND HOW DO THEY DIFFER?The enterprise robotics industry actually serves two distinct markets: industrial and professional services. While it’s common to lump both types together under the single word “robot,” industrial robots and professional service robots do different things, cost different amounts, and have had—and likely will have—very different growth trajectories.
Industrial robots have been around since the 1970s. The archetypal industrial robot is the mechanical arm, with varying levels of freedom and flexibility, found in factories around the world. The biggest users (in descending order) of industrial robots are the automotive, electrical/electronics, metal, plastics and chemicals, and food and beverage verticals within the manufacturing industry.
Professional service robots are more recent, with the market only really taking off within the last decade. In contrast to industrial robots, professional service robots are mainly used outside of manufacturing, and they usually assist humans rather than replace them. Most are designed with wheels to make them mobile or semimobile; some professional service robots have arms, but they are a minority, and the arms are not capable of (or intended for) the kinds of heavy tasks that most industrial robots tackle. Thus far, professional service robots have been most popular in the retail, hospitality, health care, and logistics (in warehouse or fulfillment settings) industries, although some are also used in space and defense, agriculture, and demolition.1
As time goes on, the distinction between various types of robots—industrial and service, enterprise and consumer—is becoming less clear. Is an automated dolly that carries partially built automobiles from place to place in a smart factory a professional service robot or an industrial robot? Even the definition of what we consider to be a robot is in flux, as companies start to put more advanced capabilities into new form factors, such as speakers.
industry, which uses robots to put chips on circuit boards. In 2018, these two industries combined drove 60 percent of all global demand for industrial robots, accounting for about 120,000 (for auto-motive) and 110,000 (for electrical/electronics) unit sales. In terms of growth, automotive demand was up by 2 percent, and electrical/electronics demand fell by 14 percent, in 2018 from 2017.2
With respect to geography, China is the largest market for industrial robots: 154,000 industrial robots were sold in China in 2018, accounting for 36 percent of global industrial robot demand. This is nearly three times as many as were sold in Japan, the second-largest market, and nearly four times as many as in the United States and South Korea, the third- and fourth-largest markets.3
21
Robots on the move: Professional service robots set for double-digit growth
While the industrial robot market looks poised to resume healthy growth, it is still growing much more slowly than many expect. This may, however, be due to inflated expectations rather than any shortcomings in the industrial robot market. Alarmist projections—such as a 2015 forecast from the Bank of England that the United Kingdom would lose 15 million jobs to robots,4 or a 2018 Brookings study stating that one-quarter of all US jobs were at high risk of automation, or the World Bank’s 2017 estimate that robots would take over 600 million jobs globally by 20326—are widely reported, and can conjure up scenarios of robots running rampant in the near future. In reality, reports of these estimates usually select their numbers from the higher (more alarming) end, and the projections themselves encompass not only actual physical robots (both industrial and professional service) but also tools such as AI and robotic process automation. Most people, if told how fast the industrial robot industry is growing, might find the 10 percent figure for 2020 to be much lower than their expectations … or fears.
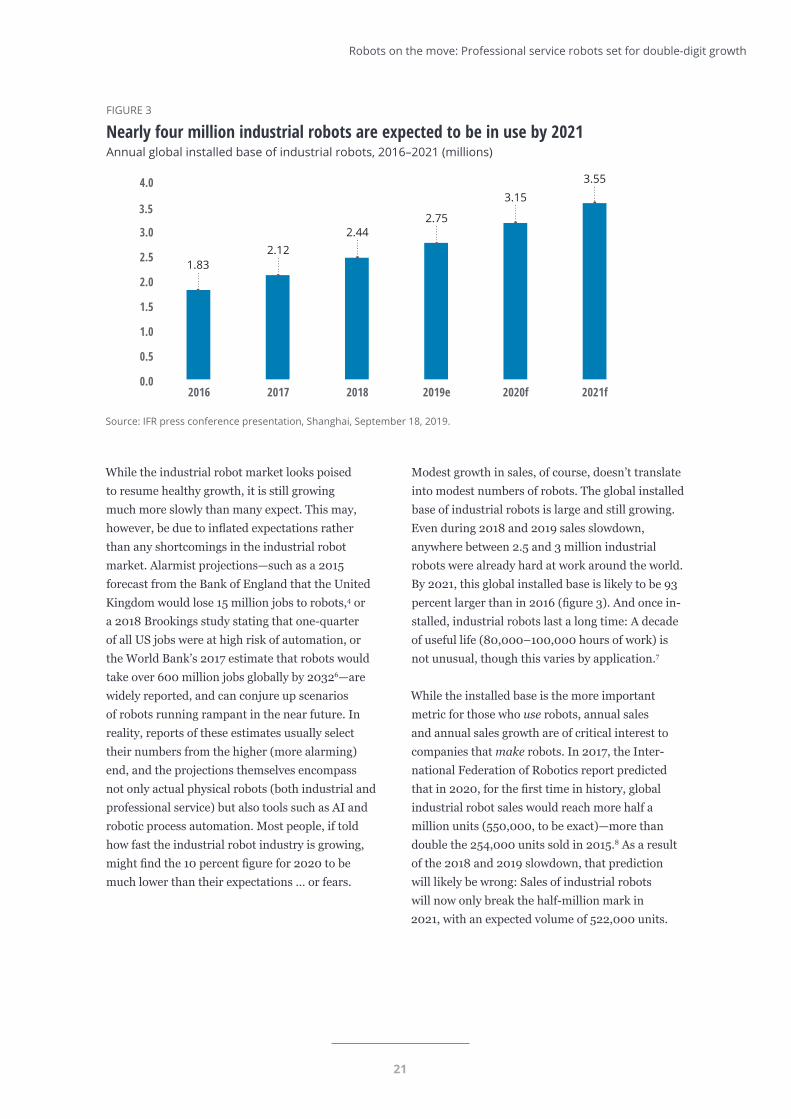
Modest growth in sales, of course, doesn’t translate into modest numbers of robots. The global installed base of industrial robots is large and still growing. Even during 2018 and 2019 sales slowdown, anywhere between 2.5 and 3 million industrial robots were already hard at work around the world. By 2021, this global installed base is likely to be 93 percent larger than in 2016 (figure 3). And once in-stalled, industrial robots last a long time: A decade of useful life (80,000–100,000 hours of work) is not unusual, though this varies by application.7
While the installed base is the more important metric for those who use robots, annual sales and annual sales growth are of critical interest to companies that make robots. In 2017, the Inter-national Federation of Robotics report predicted that in 2020, for the first time in history, global industrial robot sales would reach more half a million units (550,000, to be exact)—more than double the 254,000 units sold in 2015.8 As a result of the 2018 and 2019 slowdown, that prediction will likely be wrong: Sales of industrial robots will now only break the half-million mark in 2021, with an expected volume of 522,000 units.
Source: IFR press conference presentation, Shanghai, September 18, 2019.Deloitte Insights | deloitte.com/insights
2016 2017 2018 2019e 2020f 2021f0.0
0.5
1.0
1.5
2.0
2.5
3.0
3.5
4.0
1.832.12
2.442.75
3.15
3.55
FIGURE 3
Nearly four million industrial robots are expected to be in use by 2021Annual global installed base of industrial robots, 2016–2021 (millions)
22
Technology, Media, and Telecommunications Predictions 2020
Professional service robots: Robotics’ growth hot spot
Some might say that professional service robotics’ rapid recent growth is an artifact of the industry’s youth and small size. Only about 100,000 profes-sional service robots worldwide were probably in use as of 2015,9 and global professional service robot sales in 2016 were a mere 100,000 units. On such a small base, achieving double-digit growth from 2017 to 2019 was comparatively easy.
However, that’s not why we predict that the pro-fessional service robot industry will grow almost as quickly in 2020 and even beyond. Instead, we base this prediction on the impact of two technological advancements: the improvements in wireless connectivity made possible by 5G network tech-nology, and the falling price and rising power of edge AI chips that can perform processor-intensive AI tasks on the actual robot, rather than through the cloud. The use of 5G and edge AI chips together can solve many challenges that limit professional service robots’ practicality today, making them more useful—and more attractive—to enterprise buyers.
Connectivity is one such challenge. Maintaining reliable connectivity for professional service robots, which usually need to be mobile, is often difficult. Connecting via wire is one solution, but this constrains mobility. Wi-Fi is an inexpensive wireless option, but quality of service is not guaranteed, and handover between access points is often not reliable. 4G wireless networks can be expensive (often charging a monthly connection fee) and latency can be high, limiting a robot’s ability to react quickly. Density can also be problematic with 4G. Although one can hardwire a factory with literally thousands of industrial robots, 4G could have trouble handling that many professional service robots in the same footprint.
The use of 5G could address all of these issues. The full 5G standard provides for a 99.9999 percent (six nines) reliability rate, which means an expected downtime of just five minutes per year.10 A tech-nology known as network slicing, which allocates network performance to different tasks based on their priority, can further enhance reliability for top-priority tasks. 5G also delivers submillisecond latencies, allowing for much faster reaction times than LTE’s 40–50 milliseconds or Wi-Fi’s 100-plus milliseconds. 5G supports connection densities of up to 1 million per square kilometer; in a largish factory or warehouse of 10,000 square meters, a 5G network could connect 10,000 devices, while the 4G LPWA specification would max out at 607.11 5G service providers would still charge a monthly fee, but a company may be able to control these costs by building a private 5G network.12 And although 5G today still has trouble in environments containing a great deal of metal, its recent 3GPP Release 16, to be finalized in December 2019, is designed to address many of these shortcomings. No other mobile connectivity technology, including 4G and Wi-Fi, can function well in a metal-filled industrial environment.
Connectivity is one such challenge. Maintaining reliable connectivity for professional service robots, which usually need to be mobile, is often difficult. Connecting via wire is one solution, but this constrains mobility.

23
Robots on the move: Professional service robots set for double-digit growth
For their part, advances in edge AI chips can benefit professional service robots in terms of both perfor-mance and power consumption. Because mobile professional service robots run on batteries, power often limits what they can accomplish. Running on-the-go machine learning algorithms using traditional chips such as graphics processing units (GPUs), which consume hundreds or even thousands of watts, is impractical for a battery-powered robot. Chips designed specifically for AI computations, however, draw much less power, and fewer of them are needed for a given amount of processing, making it easier to fit the required number of chips into a pro-fessional service robot’s design. In cases when the robot’s own chips aren’t enough, 5G can connect the robot to more powerful processors elsewhere on the site, on a telecom edge server, or in the cloud.
Why shouldn’t 5G and edge AI chips boost indus-trial robot growth to the same degree? To some extent, we believe they will. Both types of robot will use these new technologies, and both types will improve their capabilities as a result. But the improvement opportunity is far greater for pro-fessional service robots than for industrial robots. Industrial robots today are usually connected to a wired factory network; they thus already have high-speed (if needed), ultra-reliable, low-latency connectivity, with minimal annual operating costs. They also have lots of space for extra chips to support machine learning, and their wired
connection makes it easy for them to cheaply and reliably access more powerful remote processors if need be. And unlike most professional service robots, industrial robots don’t run on batteries: They are plugged into the power grid, at any combination of volts, watts, and amps desired.
The edge AI chip industry appears ready for the challenge. Major manufacturers such as Intel,13 Nvidia,14 and Google15 (with more to follow) are already selling edge machine learning chips that cost less than US$100 and use less than 10 watts; most of these are smaller than a postage stamp, with the largest about the size of a credit card. These chips are less powerful than the machine learning accelerators containing hundreds of chips that may be found in data centers at the network core, but they are quite capable of the kinds of on-board AI computations that enable professional service robots to perform their tasks, even when connectivity is not available. We expect 50 million enterprise edge machine learning chips to be sold in 2020 alone, growing to 250 million chips by 2024.16
As for 5G, robotics is expected to make up a sizable fraction of the enterprise IoT market, which in turn is predicted to be one of 5G’s major beneficiaries. (“Cloud robots: The killer 5G application,” screamed one recent headline.)17 Across all applications (not just robotics), 5G IoT connections are expected to number a staggering 4.1 billion by 2024, up from 1 billion in 2018—a 27 percent compound annual growth rate.18 In terms of dollars, revenues for the total 5G IoT market (again, not just for robotics) are forecast to grow by an average of 55 percent per year for the next five years, from only US$694 million in 2020 to US$6.3 billion in 2025.19 The market for private 5G networks—many of which will almost certainly be used to connect robots—will also likely increase. Worth only a few hundred million dollars in 2020, private 5G installation spending by enterprises is expected to total billions of dollars in 2023;20 in Germany, a number of private 5G networks were already in use for profes-sional service robots on production lines in 2019.21
As for 5G, robotics is expected to make up a sizable fraction of the enterprise IoT market, which in turn is predicted to be one of 5G’s major beneficiaries.
24
Technology, Media, and Telecommunications Predictions 2020
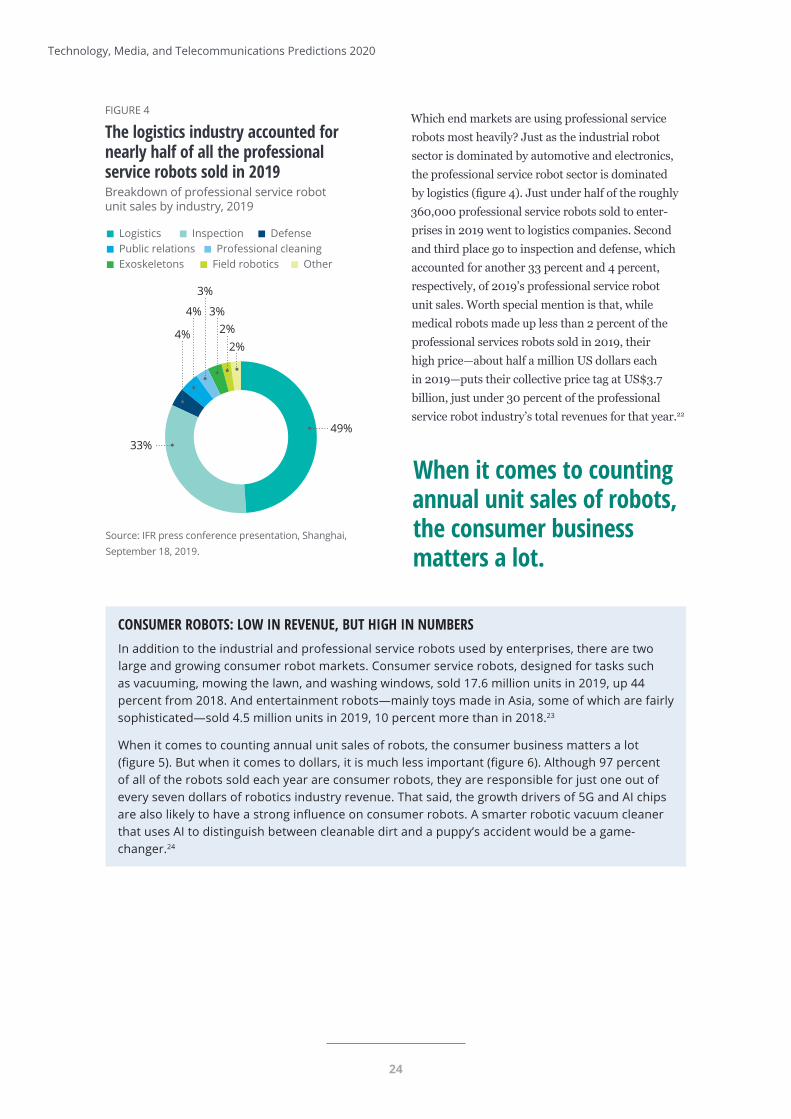
Which end markets are using professional service robots most heavily? Just as the industrial robot sector is dominated by automotive and electronics, the professional service robot sector is dominated by logistics (figure 4). Just under half of the roughly 360,000 professional service robots sold to enter-prises in 2019 went to logistics companies. Second and third place go to inspection and defense, which accounted for another 33 percent and 4 percent, respectively, of 2019’s professional service robot unit sales. Worth special mention is that, while medical robots made up less than 2 percent of the professional services robots sold in 2019, their high price—about half a million US dollars each in 2019—puts their collective price tag at US$3.7 billion, just under 30 percent of the professional service robot industry’s total revenues for that year.22
Source: IFR press conference presentation, Shanghai, September 18, 2019.
Deloitte Insights | deloitte.com/insights
FIGURE 4
The logistics industry accounted for nearly half of all the professionalservice robots sold in 2019Breakdown of professional service robotunit sales by industry, 2019
Logistics Inspection DefensePublic relations Professional cleaningExoskeletons Field robotics Other
2%2%
3%
3%
4%
4%
49%33%
CONSUMER ROBOTS: LOW IN REVENUE, BUT HIGH IN NUMBERSIn addition to the industrial and professional service robots used by enterprises, there are two large and growing consumer robot markets. Consumer service robots, designed for tasks such as vacuuming, mowing the lawn, and washing windows, sold 17.6 million units in 2019, up 44 percent from 2018. And entertainment robots—mainly toys made in Asia, some of which are fairly sophisticated—sold 4.5 million units in 2019, 10 percent more than in 2018.23
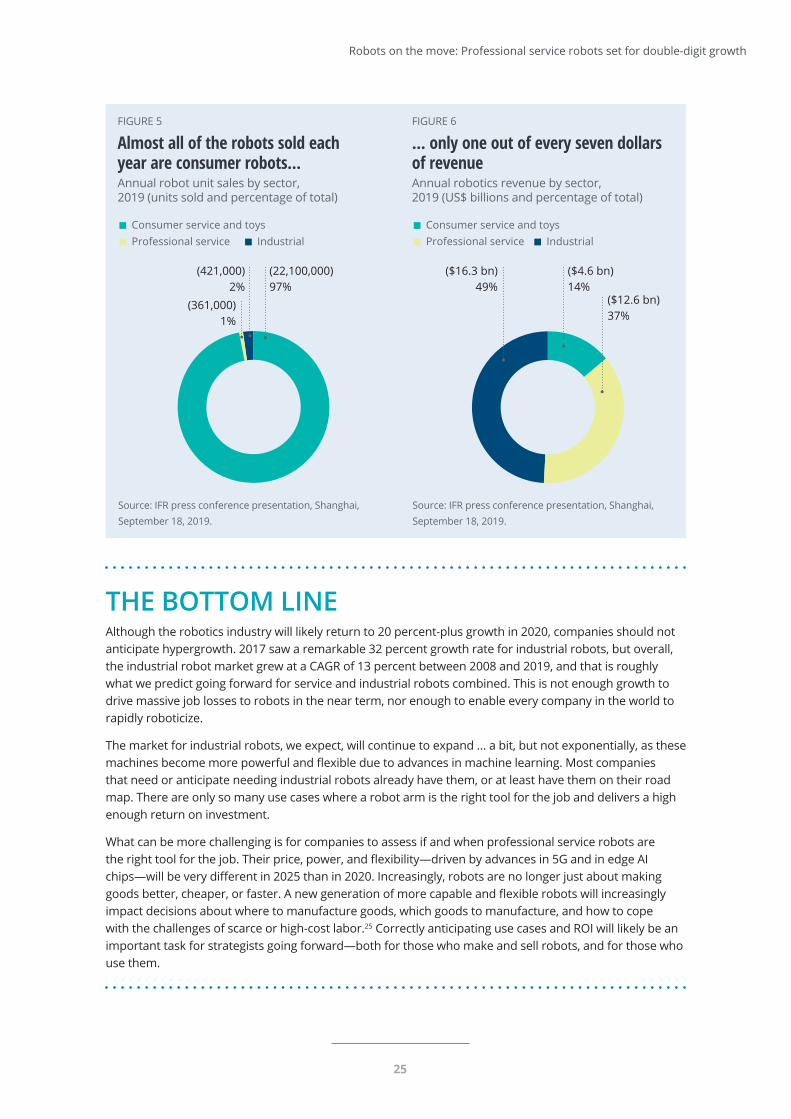
When it comes to counting annual unit sales of robots, the consumer business matters a lot (figure 5). But when it comes to dollars, it is much less important (figure 6). Although 97 percent of all of the robots sold each year are consumer robots, they are responsible for just one out of every seven dollars of robotics industry revenue. That said, the growth drivers of 5G and AI chips are also likely to have a strong influence on consumer robots. A smarter robotic vacuum cleaner that uses AI to distinguish between cleanable dirt and a puppy’s accident would be a game-changer.24
When it comes to counting annual unit sales of robots, the consumer business matters a lot.
25
Robots on the move: Professional service robots set for double-digit growth
THE BOTTOM LINEAlthough the robotics industry will likely return to 20 percent-plus growth in 2020, companies should not anticipate hypergrowth. 2017 saw a remarkable 32 percent growth rate for industrial robots, but overall, the industrial robot market grew at a CAGR of 13 percent between 2008 and 2019, and that is roughly what we predict going forward for service and industrial robots combined. This is not enough growth to drive massive job losses to robots in the near term, nor enough to enable every company in the world to rapidly roboticize.
The market for industrial robots, we expect, will continue to expand … a bit, but not exponentially, as these machines become more powerful and flexible due to advances in machine learning. Most companies that need or anticipate needing industrial robots already have them, or at least have them on their road map. There are only so many use cases where a robot arm is the right tool for the job and delivers a high enough return on investment.
What can be more challenging is for companies to assess if and when professional service robots are the right tool for the job. Their price, power, and flexibility—driven by advances in 5G and in edge AI chips—will be very different in 2025 than in 2020. Increasingly, robots are no longer just about making goods better, cheaper, or faster. A new generation of more capable and flexible robots will increasingly impact decisions about where to manufacture goods, which goods to manufacture, and how to cope with the challenges of scarce or high-cost labor.25 Correctly anticipating use cases and ROI will likely be an important task for strategists going forward—both for those who make and sell robots, and for those who use them.
Source: IFR press conference presentation, Shanghai, September 18, 2019.
Deloitte Insights | deloitte.com/insights
FIGURE 5
Almost all of the robots sold eachyear are consumer robots...Annual robot unit sales by sector,2019 (units sold and percentage of total)
Consumer service and toysProfessional service Industrial
(421,000)2%
(361,000)1%
(22,100,000)97%
Source: IFR press conference presentation, Shanghai, September 18, 2019.
Deloitte Insights | deloitte.com/insights
FIGURE 6
... only one out of every seven dollarsof revenueAnnual robotics revenue by sector,2019 (US$ billions and percentage of total)
Consumer service and toys Professional service Industrial
($16.3 bn)49%
($4.6 bn)14%
($12.6 bn)37%
WHAT EXACTLY IS A ROBOT? SHIFTING CATEGORIES AND BLURRING LINESThe United States is suffering from a nursing shortage that is likely to get even worse in the near future, as more than a million Registered Nurses retire by 2030 and the population ages.26 Several Texas hospitals are turning to robots to fill the gap. But instead of automating nursing tasks such as taking vitals or changing bedpans, the robots instead augment existing nursing staff by performing non–patient-facing work.
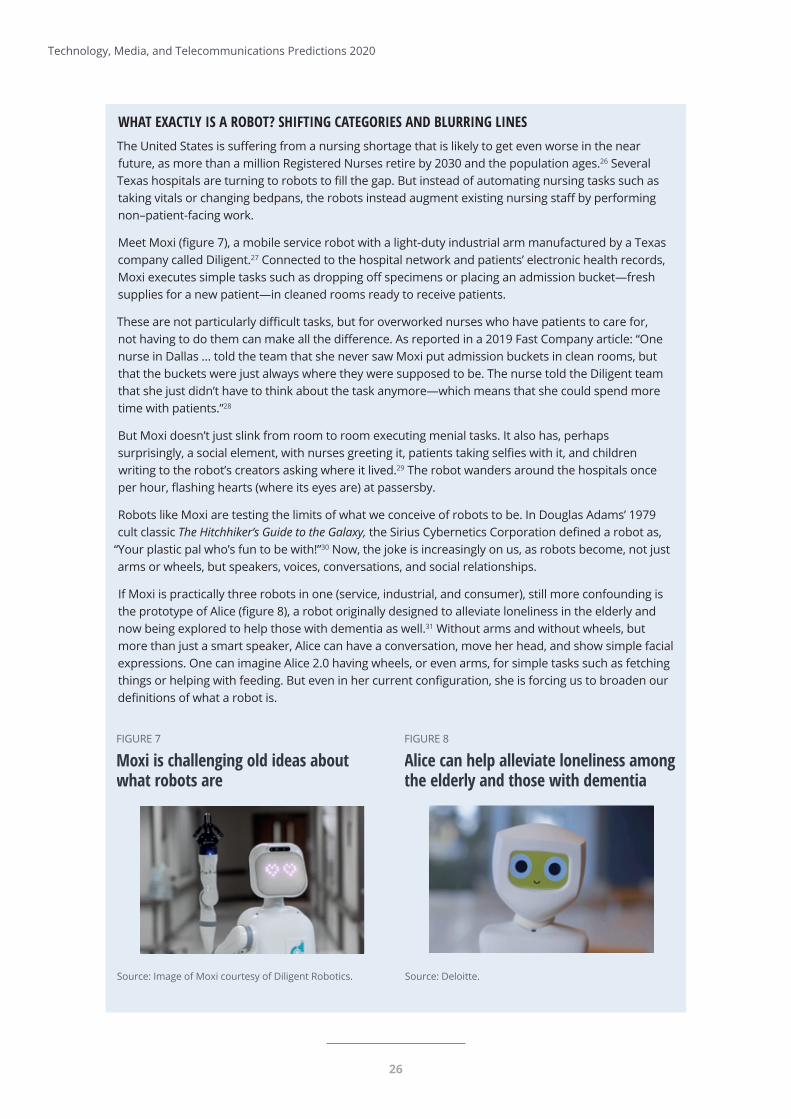
Meet Moxi (figure 7), a mobile service robot with a light-duty industrial arm manufactured by a Texas company called Diligent.27 Connected to the hospital network and patients’ electronic health records, Moxi executes simple tasks such as dropping off specimens or placing an admission bucket—fresh supplies for a new patient—in cleaned rooms ready to receive patients.
These are not particularly difficult tasks, but for overworked nurses who have patients to care for, not having to do them can make all the difference. As reported in a 2019 Fast Company article: “One nurse in Dallas … told the team that she never saw Moxi put admission buckets in clean rooms, but that the buckets were just always where they were supposed to be. The nurse told the Diligent team that she just didn’t have to think about the task anymore—which means that she could spend more time with patients.”28
But Moxi doesn’t just slink from room to room executing menial tasks. It also has, perhaps surprisingly, a social element, with nurses greeting it, patients taking selfies with it, and children writing to the robot’s creators asking where it lived.29 The robot wanders around the hospitals once per hour, flashing hearts (where its eyes are) at passersby.
Robots like Moxi are testing the limits of what we conceive of robots to be. In Douglas Adams’ 1979 cult classic The Hitchhiker’s Guide to the Galaxy, the Sirius Cybernetics Corporation defined a robot as,
“Your plastic pal who’s fun to be with!”30 Now, the joke is increasingly on us, as robots become, not just arms or wheels, but speakers, voices, conversations, and social relationships.
If Moxi is practically three robots in one (service, industrial, and consumer), still more confounding is the prototype of Alice (figure 8), a robot originally designed to alleviate loneliness in the elderly and now being explored to help those with dementia as well.31 Without arms and without wheels, but more than just a smart speaker, Alice can have a conversation, move her head, and show simple facial expressions. One can imagine Alice 2.0 having wheels, or even arms, for simple tasks such as fetching things or helping with feeding. But even in her current configuration, she is forcing us to broaden our definitions of what a robot is.
Source: Image of Moxi courtesy of Diligent Robotics.Deloitte Insights | deloitte.com/insights
FIGURE 7
Moxi is challenging old ideas aboutwhat robots are
Source: Deloitte.Deloitte Insights | deloitte.com/insights
FIGURE 8
Alice can help alleviate loneliness among the elderly and those with dementia
26
Technology, Media, and Telecommunications Predictions 2020

The need for something like Alice is pressing. The market for robots for the handicapped and elderly is estimated at only 30,000 units between 2019 and 2021, but it is expected to expand significantly over the next two decades.32 By 2050, the world will have 2.1 billion people age 65 and up, three times as many as today, with nearly half a billion those more than 80 years old.33 And loneliness is a problem among dementia sufferers too, who are almost twice as likely to experience high levels of loneliness than the general public.34
It’s convenient today to categorize robots by their primary use: industrial, service, entertainment. But robots such as Moxi and Alice show that such categories are by no means carved in stone. Perhaps the broader lesson is that it’s not what one calls a machine that’s important—it’s what the machine can do.
27
Robots on the move: Professional service robots set for double-digit growth
28
Technology, Media, and Telecommunications Predictions 2020
Endnotes
1. Robotics Online, “What are professional service robots?,” accessed September 26, 2019.
2. International Federation of Robotics (IFR), “IFR press conference, Shanghai,” presentation, September 18, 2019, p. 9.
3. Ibid, p. 8.
4. Larry Elliott, “Robots threaten 15m UK jobs, says Bank of England’s chief economist,” Guardian, November 12, 2015.
5. Annie Nova, “Automation threatening 25% of jobs in the US, especially the ‘boring and repetitive’ ones: Brookings study,” CNBC, January 25, 2019.
6. Archana Khatri Das, “World Bank predicts 600 million job losses worldwide by 2032,” Indvstrvs, June 8, 2017.
7. Motion Controls Robotics, “Robot life cycle—FAQs,” accessed September 26, 2019.
8. IFR, “IFR press conference, Tokyo,” presentation, October 18, 2018, p. 6.
9. IFR, “IFR press conference, Shanghai,” p. 9.
10. Yongbin Wei, “A new era in industrial production: How can 5G help to unlock the potential of the Industrial IoT?,” New Electronics, May 31, 2019.
11. Christian Kim, “5G and massive IoT: Legacy technologies will bridge the gap for now,” IHS Markit, February 13, 2019.
12. Please see companion prediction, Private 5G: Enterprise untethered.
13. Intel, “Intel® Movidius™ Neural Compute Stick,” accessed September 26, 2019.
14. Nvidia, “Jetson Nano: Bringing the power of modern AI to millions of devices,” accessed September 26, 2019.
15. Coral Beta, “Build intelligent ideas with our platform for local AI,” accessed September 26, 2019.
16. Duncan Stewart, “Bringing AI to the device: Edge AI chips come into their own,” TMT Predictions 2020, December 9, 2020.
17. Mobile World Live, “Cloud robots: The killer 5G application,” March 8, 2019.
18. Ericsson, IoT connections outlook, June 2019.
19. Research and Markets, “Global 5G IoT market forecast to 2025: Market is forecast to grow at a CAGR of 55.4%— The state of 5G commercialization,” Global Newswire, April 19, 2019.
20. Please see companion prediction, Private 5G: Enterprise untethered.
21. Ian Scales, “Going private: 5G will arrive early in some factories,” Telecom TV, June 20, 2019.
22. IFR, “IFR press conference, Shanghai,” p. 28.
23. Ibid, pp. 23–4.
24. Olivia Solon, “Roomba creator responds to reports of ‘poopocalypse’: ‘We see this a lot’,” Guardian, August 15, 2016.
25. For an analysis of the impact of these next-generation robots and the trends affecting them, see David Schatsky and Amanpreet Arora, Robots unchanged: How a new generation of sophisticated robots is changing business, Deloitte Insights, October 18, 2017.
26. American Association of Colleges of Nursing (AACN), “Nursing shortage,” accessed September 26, 2019.

29
Robots on the move: Professional service robots set for double-digit growth
27. Katharine Schwab, “A hospital introduced a robot to help nurses. They didn’t expect it to be so popular,” Fast Company, August 7, 2019.
28. Ibid.
29. Ibid.
30. Douglas Adams, The Hitchhiker’s Guide to the Galaxy (Pan Books, 1979).
31. Deloitte, “Hello, my name is Alice: Social robot for the well-being of the elderly,” November 28, 2018.
32. IFR, “Executive summary World Robotics 2018 service robots,” accessed September 26, 2019.
33. United Nations, “Ageing,” accessed September 26, 2019.
34. Dementia Australia, “People with dementia the loneliest people in Australia,” media release, September 1, 2016.

30
Technology, Media, and Telecommunications Predictions 2020
TO ENABLE ENTERPRISE connectivity— and not just any connectivity, but ultra-reliable, high-speed, low-latency, power-efficient,
high-density wireless connectivity—a company likely has two basic options. It can connect to a public 5G network. Or it can opt for a private 5G network, either by purchasing its own
Private 5G networksEnterprise untethered
infrastructure while contracting for operational support from a mobile operator, or by building and maintaining its own 5G network using its own spectrum. For many of the world’s largest businesses, private 5G will likely become the preferred choice, especially for industrial environments such as manufacturing plants, logistics centers, and ports.
31
Private 5G networks: Enterprise untethered
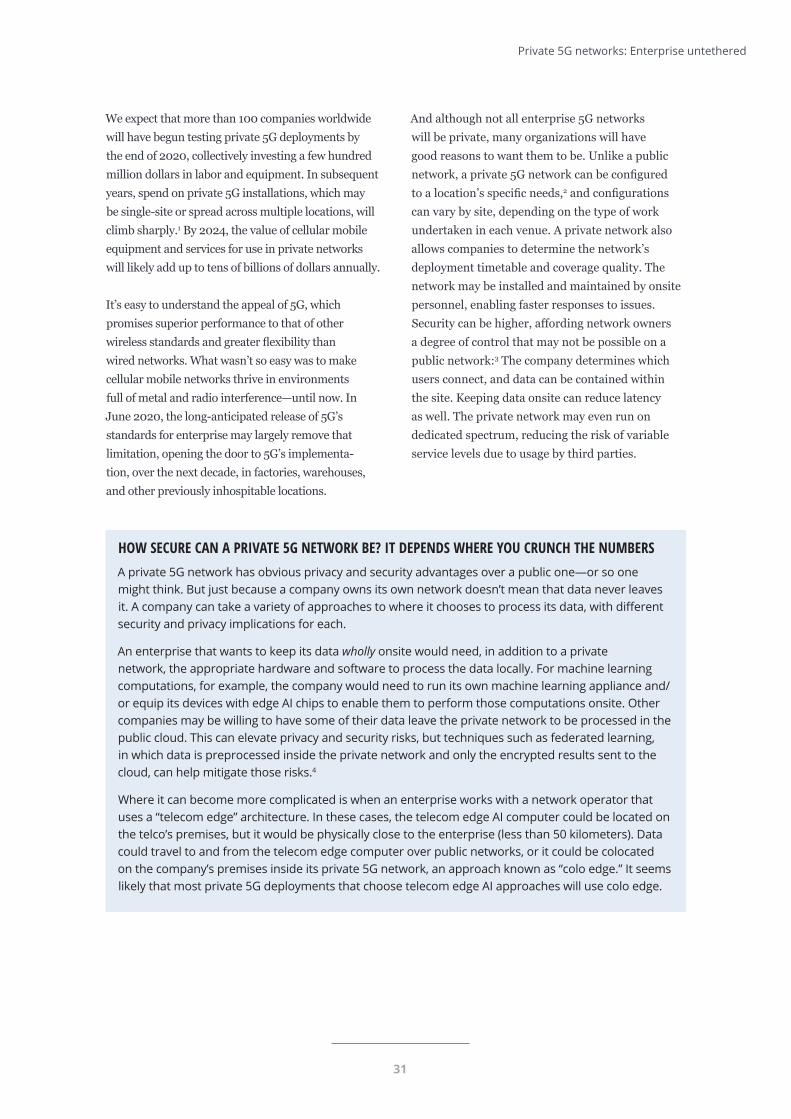
We expect that more than 100 companies worldwide will have begun testing private 5G deployments by the end of 2020, collectively investing a few hundred million dollars in labor and equipment. In subsequent years, spend on private 5G installations, which may be single-site or spread across multiple locations, will climb sharply.1 By 2024, the value of cellular mobile equipment and services for use in private networks will likely add up to tens of billions of dollars annually.
It’s easy to understand the appeal of 5G, which promises superior performance to that of other wireless standards and greater flexibility than wired networks. What wasn’t so easy was to make cellular mobile networks thrive in environments full of metal and radio interference—until now. In June 2020, the long-anticipated release of 5G’s standards for enterprise may largely remove that limitation, opening the door to 5G’s implementa-tion, over the next decade, in factories, warehouses, and other previously inhospitable locations.
And although not all enterprise 5G networks will be private, many organizations will have good reasons to want them to be. Unlike a public network, a private 5G network can be configured to a location’s specific needs,2 and configurations can vary by site, depending on the type of work undertaken in each venue. A private network also allows companies to determine the network’s deployment timetable and coverage quality. The network may be installed and maintained by onsite personnel, enabling faster responses to issues. Security can be higher, affording network owners a degree of control that may not be possible on a public network:3 The company determines which users connect, and data can be contained within the site. Keeping data onsite can reduce latency as well. The private network may even run on dedicated spectrum, reducing the risk of variable service levels due to usage by third parties.
HOW SECURE CAN A PRIVATE 5G NETWORK BE? IT DEPENDS WHERE YOU CRUNCH THE NUMBERSA private 5G network has obvious privacy and security advantages over a public one—or so one might think. But just because a company owns its own network doesn’t mean that data never leaves it. A company can take a variety of approaches to where it chooses to process its data, with different security and privacy implications for each.
An enterprise that wants to keep its data wholly onsite would need, in addition to a private network, the appropriate hardware and software to process the data locally. For machine learning computations, for example, the company would need to run its own machine learning appliance and/or equip its devices with edge AI chips to enable them to perform those computations onsite. Other companies may be willing to have some of their data leave the private network to be processed in the public cloud. This can elevate privacy and security risks, but techniques such as federated learning, in which data is preprocessed inside the private network and only the encrypted results sent to the cloud, can help mitigate those risks.4
Where it can become more complicated is when an enterprise works with a network operator that uses a “telecom edge” architecture. In these cases, the telecom edge AI computer could be located on the telco’s premises, but it would be physically close to the enterprise (less than 50 kilometers). Data could travel to and from the telecom edge computer over public networks, or it could be colocated on the company’s premises inside its private 5G network, an approach known as “colo edge.” It seems likely that most private 5G deployments that choose telecom edge AI approaches will use colo edge.
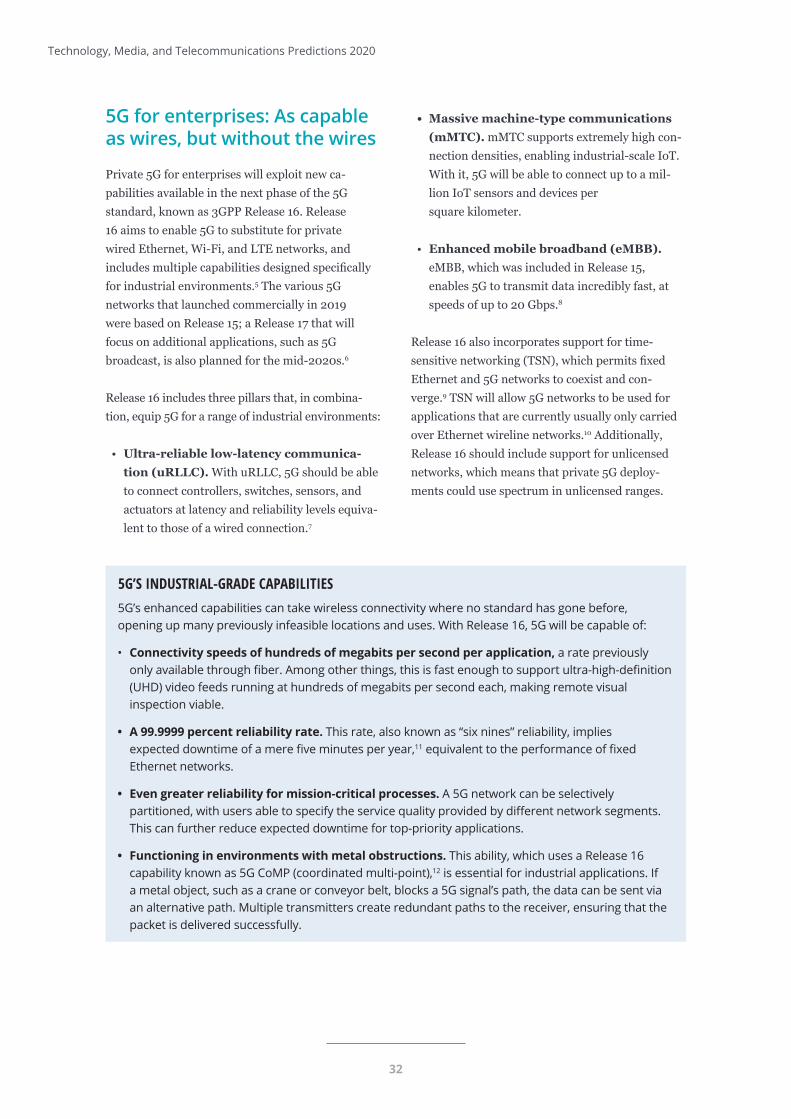
32
Technology, Media, and Telecommunications Predictions 2020
5G for enterprises: As capable as wires, but without the wires
Private 5G for enterprises will exploit new ca-pabilities available in the next phase of the 5G standard, known as 3GPP Release 16. Release 16 aims to enable 5G to substitute for private wired Ethernet, Wi-Fi, and LTE networks, and includes multiple capabilities designed specifically for industrial environments.5 The various 5G networks that launched commercially in 2019 were based on Release 15; a Release 17 that will focus on additional applications, such as 5G broadcast, is also planned for the mid-2020s.6
Release 16 includes three pillars that, in combina-tion, equip 5G for a range of industrial environments:
• Ultra-reliable low-latency communica-
tion (uRLLC). With uRLLC, 5G should be able to connect controllers, switches, sensors, and actuators at latency and reliability levels equiva-lent to those of a wired connection.7
5G’S INDUSTRIAL-GRADE CAPABILITIES5G’s enhanced capabilities can take wireless connectivity where no standard has gone before, opening up many previously infeasible locations and uses. With Release 16, 5G will be capable of:
• Connectivity speeds of hundreds of megabits per second per application, a rate previously only available through fiber. Among other things, this is fast enough to support ultra-high-definition (UHD) video feeds running at hundreds of megabits per second each, making remote visual inspection viable.
• A 99.9999 percent reliability rate. This rate, also known as “six nines” reliability, implies expected downtime of a mere five minutes per year,11 equivalent to the performance of fixed Ethernet networks.
• Even greater reliability for mission-critical processes. A 5G network can be selectively partitioned, with users able to specify the service quality provided by different network segments. This can further reduce expected downtime for top-priority applications.
• Functioning in environments with metal obstructions. This ability, which uses a Release 16 capability known as 5G CoMP (coordinated multi-point),12 is essential for industrial applications. If a metal object, such as a crane or conveyor belt, blocks a 5G signal’s path, the data can be sent via an alternative path. Multiple transmitters create redundant paths to the receiver, ensuring that the packet is delivered successfully.
• Massive machine-type communications
(mMTC). mMTC supports extremely high con-nection densities, enabling industrial-scale IoT. With it, 5G will be able to connect up to a mil-lion IoT sensors and devices per square kilometer.
• Enhanced mobile broadband (eMBB). eMBB, which was included in Release 15, enables 5G to transmit data incredibly fast, at speeds of up to 20 Gbps.8
Release 16 also incorporates support for time- sensitive networking (TSN), which permits fixed Ethernet and 5G networks to coexist and con-verge.9 TSN will allow 5G networks to be used for applications that are currently usually only carried over Ethernet wireline networks.10 Additionally, Release 16 should include support for unlicensed networks, which means that private 5G deploy-ments could use spectrum in unlicensed ranges.
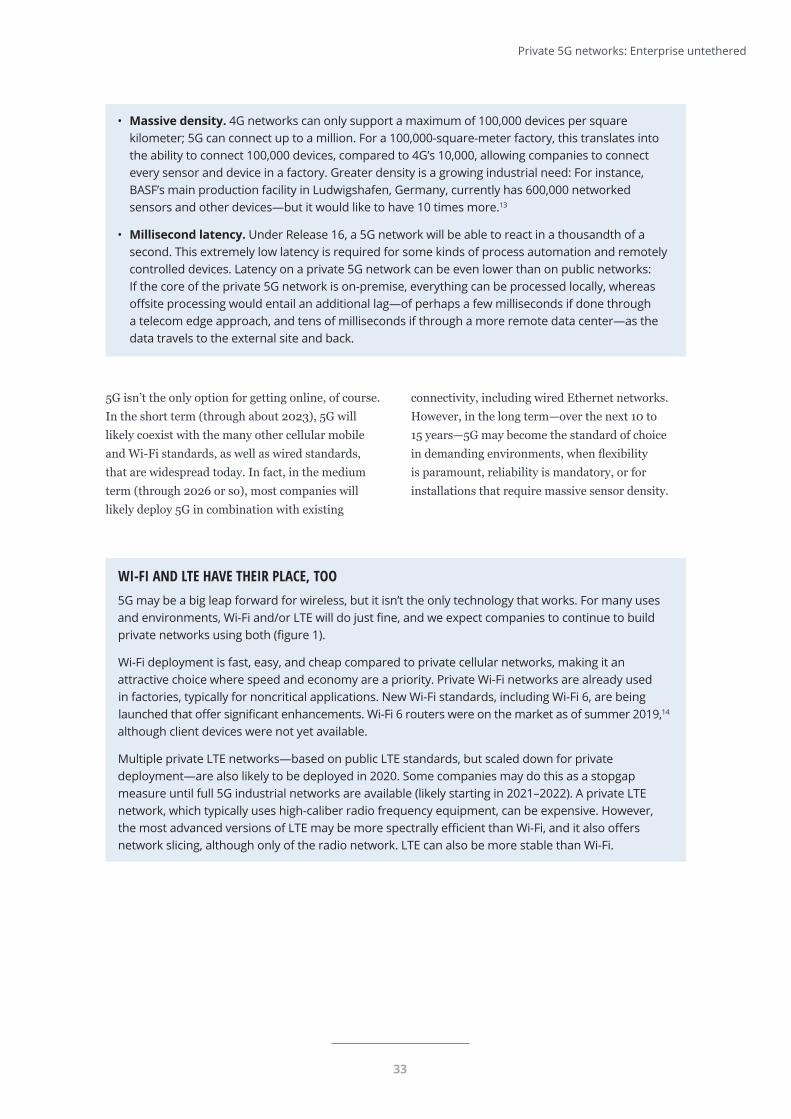
33
• Massive density. 4G networks can only support a maximum of 100,000 devices per square kilometer; 5G can connect up to a million. For a 100,000-square-meter factory, this translates into the ability to connect 100,000 devices, compared to 4G’s 10,000, allowing companies to connect every sensor and device in a factory. Greater density is a growing industrial need: For instance, BASF’s main production facility in Ludwigshafen, Germany, currently has 600,000 networked sensors and other devices—but it would like to have 10 times more.13
• Millisecond latency. Under Release 16, a 5G network will be able to react in a thousandth of a second. This extremely low latency is required for some kinds of process automation and remotely controlled devices. Latency on a private 5G network can be even lower than on public networks: If the core of the private 5G network is on-premise, everything can be processed locally, whereas offsite processing would entail an additional lag—of perhaps a few milliseconds if done through a telecom edge approach, and tens of milliseconds if through a more remote data center—as the data travels to the external site and back.
5G isn’t the only option for getting online, of course. In the short term (through about 2023), 5G will likely coexist with the many other cellular mobile and Wi-Fi standards, as well as wired standards, that are widespread today. In fact, in the medium term (through 2026 or so), most companies will likely deploy 5G in combination with existing
Private 5G networks: Enterprise untethered
connectivity, including wired Ethernet networks. However, in the long term—over the next 10 to 15 years—5G may become the standard of choice in demanding environments, when flexibility is paramount, reliability is mandatory, or for installations that require massive sensor density.
WI-FI AND LTE HAVE THEIR PLACE, TOO5G may be a big leap forward for wireless, but it isn’t the only technology that works. For many uses and environments, Wi-Fi and/or LTE will do just fine, and we expect companies to continue to build private networks using both (figure 1).
Wi-Fi deployment is fast, easy, and cheap compared to private cellular networks, making it an attractive choice where speed and economy are a priority. Private Wi-Fi networks are already used in factories, typically for noncritical applications. New Wi-Fi standards, including Wi-Fi 6, are being launched that offer significant enhancements. Wi-Fi 6 routers were on the market as of summer 2019,14 although client devices were not yet available.
Multiple private LTE networks—based on public LTE standards, but scaled down for private deployment—are also likely to be deployed in 2020. Some companies may do this as a stopgap measure until full 5G industrial networks are available (likely starting in 2021–2022). A private LTE network, which typically uses high-caliber radio frequency equipment, can be expensive. However, the most advanced versions of LTE may be more spectrally efficient than Wi-Fi, and it also offers network slicing, although only of the radio network. LTE can also be more stable than Wi-Fi.
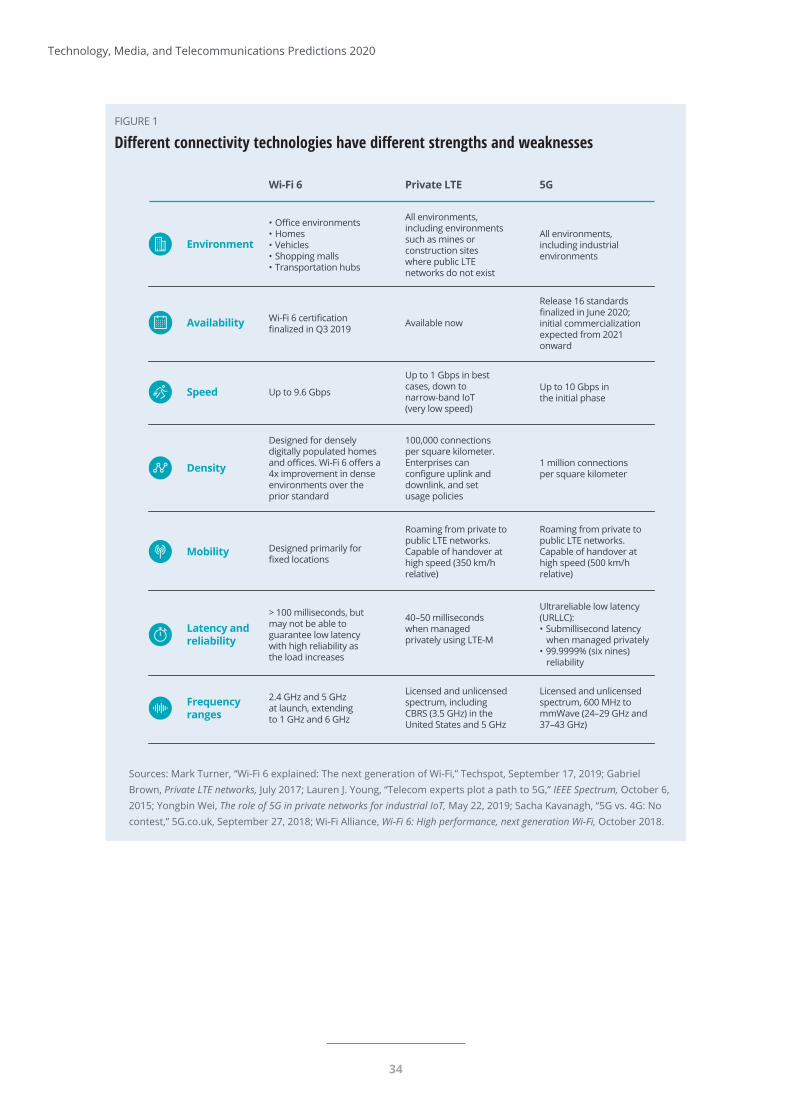
34
Technology, Media, and Telecommunications Predictions 2020
FIGURE 1
Different connectivity technologies have different strengths and weaknesses
Wi-Fi 6 Private LTE 5G
Sources: Mark Turner, “Wi-Fi 6 explained: The next generation of Wi-Fi,” Techspot, September 17, 2019; Gabriel Brown, Private LTE networks, July 2017; Lauren J. Young, “Telecom experts plot a path to 5G,” IEEE Spectrum, October 6, 2015; Yongbin Wei, The role of 5G in private networks for industrial IoT, May 22, 2019; Sacha Kavanagh, “5G vs. 4G: No contest,” 5G.co.uk, September 27, 2018; Wi-Fi Alliance, Wi-Fi 6: High performance, next generation Wi-Fi, October 2018.
Deloitte Insights | deloitte.com/insights
Frequency ranges
Speed
Environment
Density
Latency and reliability
Mobility
Availability
• Office environments• Homes• Vehicles• Shopping malls• Transportation hubs
Wi-Fi 6 certification finalized in Q3 2019
Up to 9.6 Gbps
Designed primarily for fixed locations
Designed for densely digitally populated homes and offices. Wi-Fi 6 offers a 4x improvement in dense environments over the prior standard
Roaming from private to public LTE networks. Capable of handover at high speed (350 km/h relative)
> 100 milliseconds, but may not be able to guarantee low latency with high reliability as the load increases
2.4 GHz and 5 GHz at launch, extending to 1 GHz and 6 GHz
All environments, including environments such as mines or construction sites where public LTE networks do not exist
Available now
Up to 1 Gbps in best cases, down to narrow-band IoT(very low speed)
100,000 connections per square kilometer. Enterprises can configure uplink and downlink, and set usage policies
40–50 milliseconds when managed privately using LTE-M
Licensed and unlicensed spectrum, including CBRS (3.5 GHz) in the United States and 5 GHz
Roaming from private to public LTE networks. Capable of handover at high speed (500 km/h relative)
All environments, including industrial environments
Release 16 standards finalized in June 2020; initial commercialization expected from 2021 onward
Up to 10 Gbps in the initial phase
1 million connections per square kilometer
Ultrareliable low latency (URLLC):• Submillisecond latency
when managed privately • 99.9999% (six nines)
reliability
Licensed and unlicensed spectrum, 600 MHz to mmWave (24–29 GHz and 37–43 GHz)

35
Private 5G networks: Enterprise untethered
To date, LTE has usually been the technology of choice to enable connectivity in the most demanding industrial environments. China’s Yangshan Port, for instance, uses a variant of LTE to run its fleet of automated guided vehicles (AGVs).15 The advantage of LTE for this use is its greater coverage and mobility than fixed Ethernet or Wi-Fi. When fully deployed, the port will house 130 AGVs, 26 bridge cranes, and 120 rail-mounted gantry cranes, all operating remotely or autonomously. Similarly, in the United Kingdom, Ocado has deployed a private LTE network to control 1,000 fast-moving robots in a logistics center for online grocery orders. The network allows the robots to be managed from a single base station, communicating with them up to 10 times per second.
Though potentially expensive, a private LTE network can pay off economically. For instance, Nokia has used private advanced LTE networks (4.9G) to automate one of its base station factories. The LTE network has enabled IoT analytics running on an edge cloud, a real-time digital twin of operational data and internal logistics automation via connected mobile robots. According to Nokia, the use of these networks has improved productivity by 30 percent and reduced the cost of delivering products to market by 50 percent, benefits that add up to millions of euros annually.16
36
Technology, Media, and Telecommunications Predictions 2020
The hotbeds of private 5G implementation
Thanks to the specifications in Release 16, 5G has the potential to become the world’s predominant LAN and WAN technology over the next 10 to 20 years, especially in greenfield builds. Those building a new factory, port, or campus may significantly reduce their usage of wired connections. The next five years will likely see a boom in private 5G implementations at locations that would greatly benefit from better wireless technology—in terms of speed, capacity, latency, and more—right now.
We predict that about a third of the 2020–2025 private 5G market, measured in dollars of spend, will come from ports, airports, and similar logistics hubs, which we expect to be among the first movers. It’s not hard to see why. A major seaport (for instance) has some fixed machinery and equipment that can connect to networks over cables, but it also needs to track and communicate with hundreds of forklifts and dollies—not to mention hundreds or thousands of employees—in a controlled, sensitive, and secure environment. Further, port managers need to track multiple data points for thousands or tens of thousands of containers: exactly where each container is, whether it has cleared customs, whether it is at the right temperature, whether anyone has moved or opened it, whether anything has been removed or added, and so on. Ideally, every single high-value object in every single container could be tracked—potentially a million objects. And all this must be done in an area only about one kilometer square, filled with moving metal objects and radiofrequency-emitting devices.
For operations such as these, 5G is the clear choice. 5G works in these types of environments; all other technologies, including 4G and Wi-Fi, do not. And security, flexibility, and price con-siderations will likely drive these organizations to want to control their own networks.
Another third of the total private 5G opportunity will come from factories and warehouses. Today, these facilities operate with a mix of wired and wireless technologies, but many companies are adopting new equipment that they expect to transform their business—but that won’t work with wires. Again, the “private” nature of these networks can offer better security, privacy, and flexibility; allow companies to develop proprietary, specialized solutions; and cost less than buying services from a public network.
Several of 5G’s Release 16 capabilities will be crucial in industrial settings. Paramount among them is the ability to function in an environment filled with metal, which has stymied all prior generations of wireless technology. Another critical driver of adoption will be network slicing. Instead of allocating equal network share to each device, network slicing allows network perfor-mance to be assigned by priority. Top priority might go to remotely piloted vehicles operating at speed, while sensors and tracking devices could make do with lower speed or higher latency.
We predict that about a third of the 2020–2025 private 5G market, measured in dollars of spend, will come from ports, airports, and similar logistics hubs, which we expect to be among the first movers.
37
Private 5G networks: Enterprise untethered
Still another of enterprise 5G’s important features is its ability to support an extremely high connection density. Every industrial screwdriver in an assembly plant or weighing scale in a hospital can become part of a massively expanded network, allowing the equipment to be better monitored and managed for higher productivity. Connecting everything can also greatly enhance simple asset management: knowing where the screwdriver is and how often it has been used since it was last serviced.
Using 5G to communicate with and among ma-chines, manufacturers can build flexible factories that can be reconfigured with relatively little down-time. Some factory equipment, of course, might not need to move: A traditional industrial robot arm is powerful, expensive, and may always need to be fixed in place. But companies are introducing more and more mobile elements into factories and warehouses in their efforts to improve productivity. One example is the growing use of autonomous professional service robots—machine-controlled, not driven remotely by a human operator—to take things from place to place. We predict that nearly half a million of these devices will be sold in 2020, up 30 percent from 2019; by 2025, annual sales could exceed a million units.17 These auton-omous dollies will need 5G capabilities to support activities such as precise indoor navigation and positioning (within 10 centimeters).18 As devices such as these become more important, factory floors will evolve into a blend of fixed and mobile equipment aimed at an ideal of complete flexibility.
The final third of the private 5G market will consist of greenfield installations, especially on campuses. In fact, many companies may initially choose to deploy 5G only for greenfield sites, creating islands of private 5G adoption among a heterogenous mix of connectivity technologies at legacy sites.
Historically, building a new facility or campus entailed designing, buying, installing, and op-erating a wildly heterogenous jumble of copper wires, Ethernet cables, fiber-optic cables, 3G and/or 4G cellular repeaters, and Wi-Fi equipment.
Over the next five years, however, private 5G networks will become cost-effective enough for many sites to skip wires entirely, or at least to have as few as possible. In some cases, these campuses may be temporary. For example, a private 5G network could be deployed for a few days to support a major music festival. A mobile operator may ship in a mobile network to serve the influx of 200,000 music fans, reserving a portion of capacity, with specific speed and latency requirements, for festival operations such as television broad-casting (with 5G replacing cabled connections), speaker connections, and emergency services.19
Companies can take multiple approaches to deploying a private 5G network. The very largest companies are likely to install private 5G networks using fully owned infrastructure and dedicated spectrum (in markets where this is permitted), managing these networks either through an in-house team or via an outsourced mobile operator. Medium-sized and smaller companies are more likely to lease network equipment, outsource network management, and sublease spectrum (geofenced to their location) from a public mobile operator—or, in some cases, use unlicensed spectrum.20 A mobile operator, systems integrator, or equipment vendor may manage the network and all of its attached elements.
Companies can take multiple approaches to deploying a private 5G network. The very largest companies are likely to install private 5G networks using fully owned infrastructure and dedicated spectrum.
38
Technology, Media, and Telecommunications Predictions 2020
A NICE-TO-HAVE FOR CONSUMERS, A MUST-HAVE FOR MANUFACTURERS?The first 5G launches in 2019 were aimed at consumers, in large part because the standards applicable to consumers (known as 3GPP Release 15) were available first. But first offered does not necessarily mean most useful, at least in terms of broader economic impact. Most consumers may experience only incremental benefits from 5G. It alleviates congestion in densely populated areas such as train stations, and can offer an alternative to fixed connections for home broadband, but the resulting gains in speed, convenience, and availability may be too small for many to notice.
Businesses are a different story. With the advent of Release 16 in June 2020, 5G is poised to drive massive changes in the way companies work, particularly in the manufacturing industry.
In 2020, only an estimated 10 percent of the world’s machines will have a wireless connection. (This compares to the estimated 5 billion people worldwide who will have a mobile data connection by 2025—the majority of the human population.)21 This means that most of today’s production lines are fixed and cabled, making it time-consuming and expensive to reconfigure production lines. This, in turn, constrains the flexibility of their outputs. Physical cables attached to moving machines also weaken over time. Maintaining and replacing them is expensive, not just due to parts and labor costs, but also because of the interruption to production.
Recent manufacturing history is rife with efforts, not all of them successful, to reconcile the factory floor’s inflexibility with customers’ burgeoning expectations for mass personalization.22 5G Release 16, deployed in a private environment, may be the solution.
5G for industry: From cost reduction to process reinventionEnterprises are likely to deploy 5G in stages, with initial deployments in the next couple of years largely focused on cost reduction. Some deployments may start off on public 5G networks and then be converted to private networks; the opposite may also occur.
Below are some of 5G’s applications in indus-trial contexts. All of these applications could be deployed over public networks, but companies may stand to gain greater benefits if their networks were eventually made private.
5G FOR CABLE REPLACEMENT In some cases, an organization may opt for 5G simply because it is cheaper than adding additional fixed connections. This is the rationale for Rush University Medical Hospital in Chicago, which is
installing 5G in one of its older buildings. At 100 years old, the building’s architecture was simply not designed for the computer age:23 Its false ceilings are already full, and there is no space for additional cables. Adding wires to the building would cost millions of dollars more than connecting it with 5G, which offers equivalent connectivity and greater flexibility. That’s not to say that Rush is indifferent to 5G’s potential for newer buildings—the hospital is also designing a new 11-story facility with 5G connectivity at its heart.
5G FOR REMOTE CONTROL 5G can also be used to control facilities remotely. For example, a small farm in the United Kingdom plans to use 5G to create a “hands-free hectare”— a fully automated farm.24 Remote-controlled machines, such as tractors and drones, will be used to sow, maintain, and harvest crops. Extra sensors at ground level provide additional information.
39
Private 5G networks: Enterprise untethered
Similarly, one Japanese company uses 5G to connect drivers, based in a Tokyo office building, to a mechanical digger at a construction site tens of kilometers away.25 Video streams from multiple 4K cameras relay the digger’s surroundings at 5G speeds. The driver can thus control the digger without having to sit cramped in a cab, possibly in arduous weather conditions, or having to commute to a distant site. Besides the advantages in comfort and convenience, remote-controlled machinery can allow aging or disabled individuals to remain economically active—an important benefit in countries such as Japan with aging populations.
Some ports are also looking at using cellular mobile to monitor autonomous guided vehicles or to control cranes remotely, as well as for video surveillance. In Rotterdam, Netherlands, 5G- connected ultra–high-definition cameras enable visual inspection of a 160,000-kilometer pipeline network.26 In Tianjin, China, 5G-connected drones have been used to inspect electric power lines.27
5G FOR NEW DEVICE CATEGORIES The full 5G standard may enable some relatively niche, nascent device form factors to attain their full potential. Augmented reality (AR) and virtual reality (VR) goggles are two examples. As of 2019, sales of AR goggles in both consumer and enter-prise contexts were estimated to be in the hundreds of thousands,28 as were sales of VR goggles for industrial use.29 5G’s high-speed, reliable connec-tivity could allow these devices to process images in the cloud rather than locally, greatly improving the user experience. In trials, 5G has been able to deliver images to VR goggles with a 2880-by-1600-pixel display (equivalent to between HD and 4K resolution) with a refresh rate of 75 frames per second.30 This rapid frame rate is necessary to minimize goggle-related motion sickness.31
Of their possible enterprise applications, AR and VR goggles may be especially useful for mainte-nance. Maintenance workers could don high-caliber AR goggles to access automated assistance in the field, for instance, with AR overlays guiding workers around the equipment.32 VR, too, could be used for remote maintenance, relaying images from 360-degree spherical cameras.
5G FOR PRODUCTIVITY IMPROVEMENTBy improving the efficiency of existing processes, 5G has the potential to drive huge productivity gains. One trial by Worcester Bosch in the United Kingdom found that private 5G enabled a 2 percent productivity improvement for some applications, double what was expected. To put this figure in context, 2 percent improvement is equivalent to the United Kingdom’s average productivity gain over the whole of the past decade.33
The manner in which 5G can help improve pro-cesses is constrained only by human ingenuity. At one manufacturing plant in Helsinki, for instance, a 5G-connected camera provides real-time feed-back to staff assembling low-voltage drives. The camera’s video feed is analyzed using machine vision,34 and any assembly errors trigger an instant alert. An absence of alerts reassures workers that the assembly is perfect. The machine vision application also guides workers on ergonomically correct body and hand positions for assembly.
Ericsson is using 5G to automate the maintenance of about 1,000 high-precision screwdrivers based on utilization levels. Previously, workers had to manually calibrate and lubricate the screwdrivers, using a paper-based system to track when service was needed. Adding motion sensors to quantify screwdriver usage, along with narrowband Internet of Things (NB-IoT) modules for connectivity, has enabled Ericsson to automate the process, cutting annual workload by 50 percent.35
40
Technology, Media, and Telecommunications Predictions 2020
5G FOR PROCESS REINVENTION AND NEW OPERATING MODELSPerhaps 5G’s most compelling aspect is its ability to contribute to fundamental process redesign, particularly in manufacturing. 5G technology is arriving at a time when manufacturing, in many markets, is looking to reinvent itself. For many companies, the timing could not be better.
Take the automobile industry as an example. Car buyers today expect, and will pay for, personaliza-tion in their vehicles. While vehicle manufacturers are offering an ever-widening range of car models and subcategories to meet this demand, assembly lines need to be more flexible to accommodate their manufacture. In response to this need, Mercedes has created a template for a new type of factory based on a flexible production line, called “TecLine.” Mercedes’s TecLine facility, equipped with 5G, houses a flexible assembly line composed of 300 driverless systems. Rather than moving step by step down a linear assembly line, builds in progress are carried by autono-mous transport systems to different areas of the factory, with the appropriate parts brought to each station by intelligent picking systems.36
Bosch Rexroth is taking this concept even further. It is building a factory in Xi’an, China, in which only the walls, floors, and ceiling are fixed; everything else is mobile. Assembly lines are modular, with their constituent machines—communicating with each other over 5G—autonomously moving and re-configuring themselves into new production lines.37
Other industries can reinvent processes using 5G as well. A 5G-equipped hospital, for instance, could connect many more devices than was formerly possible, and the devices would remain connected even if they were moved around. Medical instruments, from scales to blood pressure cuffs, would no longer need to stay in a fixed location to be connected,38 while doctors could access more sophisticated remote imaging and diagnosis capabilities from these devices.
Private 5G follows in the footsteps of the private branch exchange (PBX)In the early days of enterprise telephony, when the sole application was voice calls, a company that wanted each of its 10 employees to have a different phone number needed to provision and pay for 10 separate lines. If one employee wanted to make an internal call—for example, a call to a colleague five meters away—the call was routed from that employee’s phone out of the building, to the tele-communications operator’s central office switching center, and then back into the building to the col-league’s office. This was neither cheap nor efficient.
The 1970s saw the development of an alternative solution: an automated private branch exchange (PBX). A PBX is a telephone switch that resides inside the business’s premises. Each internal phone has its own extension number. With a PBX, internal calls never leave the office: It is, in effect, a private network, which connects to the public network only for external calls. A business can lease or rent a PBX from the telephone company, which maintains and services it for a monthly charge—or, from the 1990s, the business could buy and maintain its own PBX. A PBX offers various benefits and features (hold music, for example) not available on public network lines, and also offers cost savings.
In the early days of the PBX, almost every company left installing and maintaining PBXs to the telephone company. It took decades for the enter-prise-owned and -operated PBX market to take off.
By 1988, the US PBX market amounted to nearly 5 million phone lines annually.39 The launch of internet protocol PBX (IP PBX) technology in 1997 allowed enterprises to use PBXs for local and even long-distance calls as well as internal calls, enabling them to offer even more features and reduce costs even further.40 IP PBXs enable a company’s geographically dispersed sites to be part of a single nationwide, or even multinational, voice network.
41
Private 5G networks: Enterprise untethered
Like a PBX, a private 5G network is internally self-contained, but it also needs to be connected to the external network. It can work in partnership with a telco on a managed service basis, or it can be entirely run by the enterprise. It enables features as well as many benefits that are not available on public 5G, and it may offer cost savings.
We expect that in the early days of private 5G, most companies will opt to leave it to the experts: the operators who also run the public 5G networks.
THE BOTTOM LINEBusinesses have always been disrupted by successive generations of communications technology improvement. 5G’s Release 16, however, could be the most disruptive mobile technology yet. Its broader adoption for private networks has implications for many types of companies.
For mobile operators, the growth of private 5G networking can mean additional revenue. Operators supporting private 5G deployments have an opportunity to bring their network management skills to individual companies, especially small and medium businesses to establish and operate private networks. In some markets, they may be able to sublease their spectrum in specific geofenced locations. To effectively tap into these opportunities, mobile operators will need to build vertical sector capabilities or partner with companies with sector-specific knowledge: Each sector—indeed, each deployment—will likely have a custom set of needs and applications, each requiring a different combination of performance attributes such as speed, latency, and reliability.
For network equipment vendors, the private 5G prize is a much-expanded market into which to sell cellular mobile equipment. One (admittedly hyperbolic) estimate projects that private wireless networks could eventually account for up to 14 million cellular base stations, which would be more than double the 7 million base stations currently operated by the world’s public mobile operators (although the price per site for enterprise cellular is likely to be lower than for public).41 Additional revenue opportunities can come from companies’ needs for service and support to maintain their private 5G networks. Vendors will need to determine whether to sell directly to companies or to partner with mobile operators, often as part of a consortium.
Regulators should determine how much, if any, spectrum to make available to companies’ private networks. In some markets, regulators may need to decide whether to allocate spectrum directly to companies or to distribute it through mobile operators. Regulators should also consider at which frequency bands to make spectrum available.
42
Technology, Media, and Telecommunications Predictions 2020
SPECTRUM BANDS FOR PRIVATE 5GThe performance of private 5G networks will depend on the quantity and ranges of spectrum available. Mid-band spectrum (1–6 GHz) works well in indoor environments, enabling wide coverage with a relatively small number of transmission points. Millimeter-wave spectrum (24–29 GHz, 37–43.5 GHz, and 66–71 GHz) offers higher speeds and lower latency, and its signals are easier to contain within a building, thus lessening the potential for interference with macro mobile networks; however, it requires denser radio deployment than mid-band.
Many approaches to spectrum for private mobile networks are currently deployed, in trial, or under consideration. These include:
• 5G in licensed spectrum. In this approach, which has been adopted in Germany,42 spectrum may be allocated to an individual company or managed by an operator.
• LTE in licensed spectrum.
• Standalone LTE in unlicensed spectrum (MulteFire). This is the current approach in Japan, where the plan is to eventually migrate MulteFire to 5G NR.
• LTE in shared spectrum (e.g., Citizens Broadband Radio Service band [CBRS] in the United States). This operates at 3.5 GHz in the United States, where the US Federal Communications Commission has set up a three-tiered spectrum-sharing framework.
• Standalone 5G in unlicensed spectrum (MulteFire). One example is NR-U, with standalone and nonstandalone modes of operation in the 5 GHz and 6 GHz bands.
Hundreds of thousands of companies are likely to deploy private cellular networks over the next decade. Some may simply swap some or all their cables for wireless, but potentially much more rewarding—though more challenging—would be to pair private 5G deployment with process change and business model redesign. As more
and more companies undertake transformations on the back of 5G, the shape of industry itself will alter, perhaps dramatically. If and when that happens, history will likely view 5G not just as a technological marvel, but as an elemental force that reshaped the way companies do business.

43
Private 5G networks: Enterprise untethered
1. A survey by Gartner found that two-thirds of organizations planned to deploy 5G by 2020, predominantly for IoT communications and video. For more information, see: Gartner, “Gartner survey reveals two-thirds of organiza-tions intend to deploy 5G by 2020,” press release, December 18, 2018.
2. Qualcomm, “Expanding 5G NR to industrial IoT,” accessed October 3, 2019.
3. Markus Fasse and Stephan Scheuer, “Carmakers want their own 5G networks,” Handelsblatt Today, October 29, 2018.
4. Solmaz Niknam, Harpreet S. Dhillon, and Jeffery H. Reed, “Federated learning for wireless communications: Motivation, opportunities and challenges,” Cornell University, September 6, 2019.
5. 5G delivers this capability via a single standard. In contrast, there are currently multiple industrial fixed ethernet systems: Sercos, PROFINET, and EtherCAT. For more information, see: 3GPP, “3GPP SA6 initiatives to enable new vertical applications,” September 30, 2019.
6. For more information on the differences between releases 15 and 16, see: IEEE Spectrum, “3GPP release 15 overview,” accessed October 3, 2019.
7. Gabriel Brown, Ultra-reliable low-latency 5G for industrial automation, Qualcomm, accessed October 3, 2019.
8. Lauren J. Young, “Telecom experts plot a path to 5G,” IEEE Spectrum, October 6, 2015.
9. János Farkas et al., “5G-TSN integration for industrial automation,” Ericsson Technology Review, August 27, 2019.
10. Chantal Polsonetti, “Could 5G NR + TSN mean the end of industrial ethernet as we know it?,” ARC Advisory Group, June 10, 2018.
11. Yongbin Wei, “A new era in industrial production?,” New Electronics, May 31, 2019.
12. Light Reading, “How can CoMP extend 5G NR to high capacity & ultra-reliable communications?,” July 11, 2018.
13. Reuters, “Factbox: German industrial giants eye regional 5G licences,” January 24, 2019.
14. ASUS, “AX6000 dual band 802.11 ax WiFi router supporting MU-MIMO and OFDMA technology, with AiProtection network security powered by Trend Micro, built-in WTFast game accelerator and adaptive QoS,” accessed October 3, 2019.
15. Huawei, “World’s largest automated container port uses 5.8 GHz LTE,” accessed October 3, 2019.
16. Nokia, “Nokia’s digitalization of its 5G Oulu factory recognized by the World Economic Forum as an “Advanced 4th industrial revolution lighthouse,” press release, July 3, 2019.
17. Please see Deloitte TMT Prediction in the same series: Robots on the move: Professional service robots set for double-digit growth.
18. 3GPP, “Study on positioning use cases,” accessed October 3, 2019; 3GPP, “Service requirements for cyber-physi-cal control applications in vertical domains,” accessed October 3, 2019.
19. Glastonbury Festival has 200,000 attendees plus staff. For more information, see Ben Wood, “The first 5G-enabled festival,” CCS Insight, accessed October 3, 2019.
20. IEEE Spectrum, “Unlicensed spectrum may be critical to 5G,” accessed October 3, 2019.
21. GSMA, The mobile economy 2019, 2019.
22. Vicki Holt, “Five expert insights into digital manufacturing and mass customization,” IndustryWeek, July 19, 2018.
23. Mike Dano, “This hospital is installing 5G for one big reason: Getting rid of wires,” Light Reading, January 29, 2019.
Endnotes

44
Technology, Media, and Telecommunications Predictions 2020
24. Harper Adams University, “Agricultural Engineering Precision Innovation (Agri-EPI) Centre,” accessed October 3, 2019.
25. NTT Docomo, “Smart construction powered by 5G & IoT,” accessed October 3, 2019.
26. Huawei, “KPN, Shell and partners test industrial 5G applications in the port of Rotterdam,” November 6, 2018.
27. Xinhua, “China completes first 5G inspection of power lines,” May 16, 2019.
28. International Data Corporation, “Augmented reality and virtual reality headsets poised for significant growth, according to IDC,” March 28, 2019; Andrew McDonald, “CCS: VR and AR device sales to drop in 2018 despite long-term promise,” Digital TV Europe, December 3, 2018.
29. The majority of VR units sold in 2019 were likely for use in consumer contexts, principally gaming. Shanhong Liu, “Unit shipments of virtual reality (VR) devices worldwide from 2017 to 2019 (in millions), by vendor,” Statista, September 5, 2019.
30. Jeremy Horwitz, “AT&T: Our 5G network is ready for 2880×1600 VR and 5ms latency games,” VentureBeat, April 1, 2019.
31. Ibid.
32. Ericsson, “Troubleshooting made easier with augmented reality,” January 12, 2018.
33. Jayne Brooks, “UK’s first 5G industrial trial suggests new technology could increase UK productivity by 2%,” Total Telecom, June 18, 2019.
34. Juan Pedro Tomás, “ABB pilots industrial AI application using 5G,” Enterprise IoT Insights, June 7, 2019.
35. Ericsson, “The world’s first cellular IoT-based smart factory,” accessed October 3, 2019.
36. Chris Davies, “Mercedes reveals the 5G robot-filled factory for its most high-tech cars,” SlashGear, November 16, 2018.
37. Bosch Rexroth, “Bosch Rexroth invests in the factory of the future,” press release, May 8, 2019.
38. Dano, “This hospital is installing 5G for one big reason.”
39. Network World, “Intecom charts new strategy for future,” June 26, 1989.
40. Kevin Gu, “How does a business phone system work?,” GenVoice, May 10, 2019; Johnson Hur, “History of PBX,” BeBusinessed, accessed October 3, 2019.
41. Mike Dano, “Nokia CTO: Private wireless could be 2x bigger than commercial wireless,” Light Reading, May 30, 2019.
42. Bundesnetzagentur, “Electronic communications services,” accessed October 3, 2019.

45
Private 5G networks: Enterprise untethered

4646
Technology, Media, and Telecommunications Predictions 2020
IN 2020, COMPANIES’ efforts to bring internet access to the world will take off—literally. We pre-dict that by the end of 2020, there will be more
than 700 satellites in low-earth orbit (LEO) seeking to offer global broadband internet, up from roughly
High speed from low orbitA broadband revolution or a bunch of space junk?
200 at the end of 2019. Though these won’t be enough to connect all of the world’s consumers and enter-prises, they may offer partial service in late 2020 or early 2021, likely starting with higher latitudes.

4747
High speed from low orbit: A broadband revolution or a bunch of space junk?
SATELLITE BASICS: A GLOSSARY OF THIS CHAPTER’S TERMSConstellations and megaconstellations: A constellation of satellites is simply a group of similar satellites working together for a specific purpose, whether for earth observation, communications, scientific research, or global positioning. The term “megaconstellation” has begun to be used to classify constellations that may include hundreds or thousands of individual satellites—a scale being reached by a growing number of broadband internet systems.
Low-earth orbit (LEO): An orbit between 160 and 2,000 kilometers above the earth. Low-earth orbits have a short orbital period (approximately 90 to 120 minutes) and are commonly used for remote sensing, human space flight, and data communication.2 Satellites in this orbit can only communicate with a small portion of the earth’s surface at any given moment, which is why a larger number of satellites are needed for global coverage.
Medium-earth orbit (MEO): A less-popular orbit between 2,000 and 35,786 kilometers above the earth. Satellites in this orbit can see more of the earth than LEO-based satellites, and they enable lower latencies than higher satellites. This orbit is used by both positioning (such as Global Positioning System) and communications satellites.
Geosynchronous orbit (GEO): An orbit at 35,786 km above the earth’s surface. Satellites in this orbit move at the same speed that the Earth is rotating, so they stay in roughly the same place over the earth’s surface. With a much wider view of the earth, this orbit is good for imagery, communications, and weather satellites, because only a few satellites can provide global coverage. To connect with GEO satellites, ground-based antennas can remain fixed at one point in the sky rather than needing to track a moving object.
Frequency: Satellites use a specific portion of the radio frequency spectrum for communication, and each constellation of satellites has an assigned frequency band. These range from the lower-frequency L- (1–2 GHz) and S- (2–4 GHz) bands to the higher-frequency Ku- (12–18 GHz), Ka- (26–40 GHz), and V- (40–75 GHz) bands. Each frequency range has its advantages, disadvantages and specific use cases.3
Latency: Latency can be broadly defined as the time it takes a signal (data) to travel from transmitter to receiver. Latency depends on factors including distance, the type of technology used, and interference. Currently, satellite broadband services have median latencies of around 594 to 612 milliseconds. Latencies for terrestrial broadband (using technologies such as fiber, cable, or DSL) range from 12 to 37 milliseconds.4 The goal for future 5G networks is a latency as low as 1 to 2 milliseconds, although this will likely take years to achieve.5
Conjunction: Generally speaking, a conjunction is when two objects (such as satellites) pass into the same area, raising the probability of a collision. When the probability of collision passes a certain threshold, satellites typically perform collision avoidance maneuvers. This is a real threat, as evidenced by the 2009 collision between the Iridium 33 and the nonfunctioning Russian Kosmos 2251 satellite.6 This was the first time two satellites had collided in orbit.
To put this endeavor into perspective, consider that about 8,700 objects have been launched into space since the start of the Space Age, of which more than 2,000 are actively operating satellites orbiting the earth.1 These new “megaconstellations” of orbiting broadband stations will potentially add more than
16,000 individual satellites to that count over the coming years. The world may derive a historic bene-fit from their deployment—but at the same time, they might make space a much riskier and complex environment.
4848
Technology, Media, and Telecommunications Predictions 2020
Bringing the internet to the world
Ever since Sir Arthur C. Clarke predicted and popularized geostationary satellite communications in 1945, the world’s imagination has been captured by the idea of instant global communication from space.7 In the years since, multiple generations of communications satellites, starting with Telstar, Intelsat, and others in the 1960s, have made his prediction a reality. Companies today are deploying “megaconstellations” of hundreds or thousands of satellites linked to each other as well as to ground stations. Both traditional aerospace giants and newer technology companies are entering the market, funding, developing, and deploying megaconstellations with the aim of bringing affordable high-speed internet access to the world.
The profit motive is clear enough. Connecting those in currently unserved and underserved areas can create millions of new customers and enable new business models. In terms of their number, the potential market is vast: Although great strides have been made connecting the world, statistics show that many people are still unconnected or underconnected. The International Telecom-munications Union (ITU) says that only about 51 percent of the world’s population was using the internet as of the end of 2018.8 Even many developed countries do not have universal internet access, or at least access at a tolerable speed. A US Federal Communications Commission (FCC) report states that 21.3 million Americans lack access to a broadband internet connection—that is, one with a download speed of at least 25 Mbps and an upload speed of at least 3 Mbps.9 That’s a lot of people to connect, and a lot of potential revenue for companies that can connect them. Morgan Stanley estimates that the satellite broad-band market could be worth as much as US$400 billion by 2040—fully 40 percent of the estimated US$1 trillion global space industry that year.10
Organizations creating megaconstellations also point to other, nonfinancial benefits. For example, Kuiper Systems—Amazon’s foray into
space—touted three major societal benefits of its planned constellation in its application for operations to the FCC. Beyond the direct benefit of connecting broadband customers in currently unserved and underserved areas, Kuiper claims that increased access will drive general economic development as well as support government agencies, disaster relief organizations, and first responders.11 OneWeb, another new entrant to the satellite broadband business, emphasizes its vision of “internet access everywhere for everyone,” highlighting how their satellites are connecting schools that formerly lacked internet access.12
All of this has happened before … or has it?
Some might wonder how new this phenomenon really is. After all, several commercial satellite internet service providers—Viasat, Eutelsat, Hughes, Iridium, O3b Networks, and others—have been operating constellations across different orbits for years. There have also been a few famous false starts. For instance, the Iridium LEO constellation of 66 active satellites—initially deployed in the late 1990s and early 2000s to provide global voice and data services—never gained the subscriber base to make it commercially successful, although it eventually found a niche market and continues to operate today using a new generation of satel-lites (Iridium NEXT). Teledesic, which attracted significant funding from luminaries including Bill Gates and Craig McCaw, fell even further short. It planned to deploy a constellation of 288 satellites in low-earth orbit to support global broadband internet connectivity, but only ever launched one test satellite before shutting down.13
So what has changed? Today’s satellite broadband players are seeking to avoid their predecessors’ fates by offering higher speeds, lower latency, and cheaper prices to users. They are being helped in these efforts by three main enablers:
Getting into orbit has become less
expensive. Launch and satellite construction costs have decreased dramatically since the turn

4949
High speed from low orbit: A broadband revolution or a bunch of space junk?
of the century, thanks to new launch services and heavier competition. Between 1970 and 2000, the average cost of launching an object into orbit was about US$18,500 per kilogram. With the advent of new launch providers such as SpaceX and others, companies can now put a kilo into orbit for about US$2,720, or about 85 percent less. Equally im-portant to improving launch economics is the fact that today’s satellites weigh less.14 For example, the original Iridium satellites launched in the late 1990s weighed 689 kilograms each, while today’s Starlink satellites (from SpaceX) weigh only 227 kilograms.15
Satellites and their manufacturing methods
are becoming more advanced. Constellations containing hundreds or thousands of individual sat-ellites couldn’t be built in a reasonable timeframe or at a reasonable cost without mass production approaches. As part of this approach, companies are using a more modular design for these indi-vidual satellites, building them on standardized buses, and using smaller, more advanced compo-nents. Many are also using electrical propulsion systems which trade strength for reduced weight and lower cost. There are now dedicated satellite factories for many of these megaconstellations, allowing for both cost-effectiveness and speed through mass production: For example, OneWeb Satellites, a joint venture between Airbus and OneWeb, aims to produce two satellites per day.16
The demand for connectivity has in-
creased. Besides the billions of unserved and underserved individuals in the world’s remote or less-developed areas, demand is also being driven by growing expectations. Wave after wave of new technologies have made it easier and easier to say connected. As this ability has spread, consumers, companies, and governments now expect to be able to stay connected no matter where they are—in isolated and rural areas, at sea, in the air, and everywhere in between.
Major players in the internet space race
A number of companies from the United States, Canada, China, Russia, and Europe are trying to establish themselves in the satellite broadband market. As of November 2018, in the United States, the FCC had granted thirteen market access requests and nine satellite applications for broad-band internet constellations, to companies including Telesat, Kepler, LeoSat, SpaceX, OneWeb, SES (O3b), Space Norway, and others.17 More recently, in July 2019, Amazon applied for FCC approval to deploy its Kuiper satellite system.
In all of these cases, the number of companies that end up deploying their constellations—as well as the number of satellites that will eventually wind up in those constellations—remains unknown. The key question is: Which companies can prove their capabilities and grab the biggest market share the fastest? Some of the major players are:
OneWeb. In 2017, OneWeb was the first of this new class of satellite broadband internet providers to gain FCC approval to deploy and operate a constellation. The company has raised over US$3 billion in investments from SoftBank, Grupo Salinas, Qualcomm, Virgin Group, Airbus, and others.18 The FCC approval allows OneWeb to deploy 720 satellites using Ku- and Ka-band frequencies, which the company plans to operate at an altitude of 1,200 kilometers. The first six of these were launched in February 2019 on a Soyuz rocket; another 32 satellites are planned to be launched by the end of 2019, and two launches are currently scheduled for 2020.19 OneWeb plans to begin offering limited commercial service in late 2020 to Arctic regions (north of latitude 60°), with broader service available in 2021.20
5050
Technology, Media, and Telecommunications Predictions 2020
SpaceX. In March 2018, SpaceX received FCC approval to launch 4,425 satellites using Ku- and Ka-band as part of its Starlink constellation; another 7,518 Starlink satellites using V-band were approved in November 2018.21 SpaceX exerts more control over Starlink’s destiny than many other providers, as the company is using its own Falcon 9 rocket to launch the constellation. The first launch of 60 satellites occurred in May 2019; 57 of those 60 satellites are fully operational. Starlink is planning to offer service in the northern United States and Canada after it completes six launches, and expects to be able to cover the entire populated world after 24 launches.22 SpaceX is still modifying Starlink’s orbital plan, so it is difficult to determine the constellation’s final configuration.23
Amazon. Amazon’s proposal to the FCC to deploy its Kuiper System constellation is still under review. The Kuiper System will consist of 3,236 satellites using Ka-band at altitudes of 590, 610, and 630 kilometers. It is highly likely that Kuiper will use launch vehicles from Jeff Bezos’s other space initiative, Blue Origin. According to Amazon, “Service rollout will begin as soon as the first 578 satellites are launched. Coverage begins at 56˚N and 56˚S latitudes and [will quickly expand] toward the equator as more satellites are launched.”24
Kepler Communications. Kepler is taking a much more focused approach to its satellite broad-band endeavor. It plans to launch 140 satellites focused on Internet of Things (IoT) connectivity to support industrial, maritime, shipping, and logistics applications. After completing two small test launches in 2018, the company’s goal is to have the full constellation up and running in 2022.25
Satellite broadband’s anticipated services and markets The goals and business models of these satellite broadband companies are varied and still a bit opaque. In general, the plan seems to be to open new markets and compete in existing ones by im-proving the quality of service over what is currently available. Once their constellations are in orbit and operational, providers can easily and quickly add new services on top of these networks as well. Services such as high-speed trading, improved lo-gistics and fleet management, remote maintenance, and more are all potential areas of opportunity.
Some providers are targeting the direct-to- consumer market, competing against traditional telecom players providing cable or fiber-based broadband internet. Others are looking to sell dedicated broadband connectivity to enterprises. A fairly typical use case is providing infrastructure or mobile backhaul for other communications companies, including those offering 5G networks. OneWeb, for instance, is providing infrastructure services for two of its first customers, Talia and Intermatica.26 Another opportunity could be to provide better and faster internet connectivity to the transportation industry—ships, trains, and aircraft.
In general, the plan seemsto be to open new marketsand compete in existingones by improving thequality of service overwhat is currently available.
5151
High speed from low orbit: A broadband revolution or a bunch of space junk?
Many satellite broadband companies have mar-keted their ability to bring broadband internet to rural areas and other locations with poor or no service. This could enable more of the world to partake in the educational and economic gains from a more connected society. However, one uncertainty is the true size of the unserved and underserved market. For example, the GSMA estimates that as of 2018, only 750 million people are completely uncovered by mobile broadband networks, which is much smaller than the roughly 3.8 billion people in the world who don’t use the internet.27 A hotspot to watch is the world’s Arctic regions, including Alaska, Canada, the Nordics, and Russia. Due to their geographic location and the relatively small number of customers, service in this region has been slower and more expensive than in the rest of the world for years. Multiple companies are looking to specifically address this need.
Other players are pursuing more specialized applications. A major opportunity, for instance, could be to provide the backbone for networks of IoT devices—smart factories, supply chains, utilities, oil platforms, and other systems that require machine-to-machine communication. Companies could also sell satellite broadband to governments for services such as education, emergency response, and others that demand high levels of reliable, dedicated connectivity.
Looking forward, subscriptions alone may not be enough to guarantee financial success. The potential exists for some of these providers to offer a comprehensive suite of services on top of basic connectivity. Instead of selling band-width to other service providers, some may opt to create their own new applications deployed through their satellite networks. If this happens, successful satellite broadband providers could end up owning entire value chains in areas such as commerce and communication. For example, Amazon’s Kuiper System could easily offer a whole host of existing and new Amazon services directly to consumer and enterprise customers, bypassing legacy internet services providers.
It won’t be easy
Operating in space and starting a new business are both notoriously hard and offer little room for error, and many of the companies going into the satellite broadband business are attempting to do both at the same time. They face a vast number of technical and operational challenges that could delay or derail their plans, including but not limited to ground station construction and operation, potential radio frequency interference with other satellites, user terminal pricing and availability, battles over spectrum rights, and even concerns about the visual pollution from bright satellites disrupting ground-based astronomy.28 Here are a few of the most important hurdles that companies in this young industry will likely need to clear:
Meeting service expectations. Will a company’s constellation deliver the promised speeds and latency? Will it be fast enough for high-definition video, high-speed financial trading, and near real-time control over vast networks of IoT devices? It’s certainly possible—a recent operational test of OneWeb’s service demonstrated live, full high-defi-nition streaming video with latency of less than 40 milliseconds at speeds of over 400 Mbps29—but only if the technology works as expected.
Ensuring satellite reliability. The advanced satellite buses and manufacturing techniques that are making this new generation of satellites possible are also relatively new. While these techniques are necessary to meet megaconstellations’ short time-frames for construction, launch, and deployment, companies should invest enough in designing and testing the outputs to create robust, reliable systems that will work for their lifetime in orbit. If there is a problem with a satellite, companies should make sure that it can be quickly and safely de-orbited. SpaceX has already lost three Starlink satellites from its first launch of 60 (which will passively de-orbit and burn up in the atmosphere).30
Managing space debris. Many are justifiably worried that introducing thousands upon thou-sands of new objects into LEO will not only crowd
52
Technology, Media, and Telecommunications Predictions 2020
existing orbits, but create a dangerous environment with the potential for exponentially more conjunc-tions between satellites. No one wants to see a Kessler Syndrome scenario, in which a cascade of collisions ends up creating so much orbital debris that LEO becomes unusable for generations.31
Unfortunately, the prospect of collision isn’t hypothetical. On September 2, 2019, the Euro-pean Space Agency had to maneuver one of its scientific satellites to avoid potentially crashing into a Starlink satellite.32 It is general practice to do this when the probability of two satellites potentially colliding is greater than 1 in 10,000.
Different commercial and government organiza-tions are currently looking at changing the rules governing how conjunctions are handled, as well as how to safely de-orbit satellites at their end of life. They are also exploring using machine learning al-gorithms and improving tracking technologies, such as ground-based radar, to manage the problem. International collaboration around this issue is on the rise, and companies themselves are seeking to get in front of it. OneWeb has set up a framework of principles and practices called “Responsible Space” for themselves to follow and to inspire others. Says OneWeb’s founder and chairman, Greg Wyler: “On my tombstone, it should say ‘Con-nected the world,’ not ‘Created orbital debris.’”33
Addressing economic uncertainties. As Gus Grissom’s character put it in The Right
Stuff: “No bucks, no Buck Rogers.” Companies and investors have already sunk billions into satellite broadband constellations. However, little is known about what these services will actually cost consumers and businesses—for subscriptions and user terminals—and if the cost will be competitive with more traditional alternatives. Additionally, many of these satellites have a relatively short life expectancy: less than seven years. This means that companies will need to regularly launch new satellites to replenish the fleet, as well as safely de-orbit old ones—creating ongoing operational costs and a highly dynamic orbital environment.
Operating in space and starting a new business are both notoriously hard and offer little room for error, and many of the companies going into the satellite broadband business are attempting to do both at the same time.
53
High speed from low orbit: A broadband revolution or a bunch of space junk?
THE BOTTOM LINEThe biggest impact of satellite broadband constellations and megaconstellations—should they be successfully deployed and activated—can be to bring low-latency, high-speed connectivity to people who currently are not within the reach of cellular towers or connected to high-speed lines. For people like the 138 million in Nigeria with no internet access at all, or the 48 percent of the Arctic population that has no access to broadband, the effect will be revolutionary.34 Just as with the spread of mobile phones, a more tightly connected world could pay multiple societal and economic dividends, benefiting entrepreneurs as well as hospitals, schools, and governments. For businesses and others in need of fast, reliable global communication, satellite broadband could improve current service levels or allow them the advantage of new services entirely.
For satellite broadband to become a vibrant, sustainable industry, however, would-be providers—and the marketplace—will need to answer many open questions. Will satellite broadband provide the service quality needed to be a true alternative to fiber, cable, and cellular services? Will providers be able to meet schedules and satisfy regulatory requirements? Will the unconnected want to connect, and will satellite broadband service be affordable for them? Will average revenue per user be high enough for providers to make a profit? For providers, is it better to be a general-purpose provider or to focus on specific applications and market segments? Will the technology act as an enabler for other new services? If so, what? Will there be too much capacity if more than one of these constellations proves to be successful?
Not all of the current players will likely survive or achieve their original goals. Industry watchers would do well to carefully monitor their entire life cycle to see what might happen in the long and winding path from receiving regulatory approval, securing investors, constructing the satellites, selecting the launch provider, and deploying and operating the constellation. Also, there will likely be accidents, whether launch failures or satellite malfunctions. The way a provider manages these accidents may be critical to its success.
As more satellites are deployed and more is learned, regulations around deployment rate, frequency allocation, and/or orbital debris mitigation will likely be modified. There will also be disagreements and challenges among operators, as well as challenges dealing with regulatory bodies in different countries. Those companies that can better manage such disputes may gain a competitive advantage. The evolution of enabling and component technologies, such as antennas and terminals, can have a significant impact on overall progress. Companies with more advanced and reliable suppliers will likely fare better.
It is unlikely that traditional telecommunications companies and current satellite internet providers will be disrupted at first. However, in time, satellite broadband may prove transformational. Pricing and ground equipment costs are still unknown, and space is not cheap, so low-price disruption seems unlikely—certainly not in the big cities where most of humanity lives. However, Hughes and Intelsat, two traditional satellite providers, are hedging their bets by investing in OneWeb.35 Other telecoms might decide to cede rural and less-developed areas that they do not currently cover to satellite broadband players, since building infrastructure in these areas is often cost-prohibitive. In fact, satellite broadband constellations may actually help telecommunications companies by improving mobile backhaul services.
Will satellite broadband give us a communications revolution or just a bunch of space junk? The race is on, and although it faces significant challenges, this nascent industry should not be dismissed.
54
Technology, Media, and Telecommunications Predictions 2020
NAVIGATING THE REGULATORY MAZEDepending on where a satellite company originates and where it operates, it may need to deal with multiple government and international agencies responsible for managing spectrum and approving and licensing satellite services. For example, in Canada, the relevant bodies are Innovation, Science and Economic Development Canada (ISED) and the Canadian Radio-Television and Telecommunications Commission; in the Russian Federation, it is the Ministry of Digital Development, Communications, and Mass Media; in India, the Telecom Regulatory Authority of India; and in China, the Bureau of Radio Regulation.
Two particularly important regulators deserve special mention. The first is the United Nations’ International Telecommunication Union (ITU), the international regulatory body overseeing satellite communications. As the UN agency responsible for information and communication technologies, the ITU assigns global radio spectrum and satellite orbits, develops technical standards, and works to improve access, as well as providing international coordination. By working toward “connecting all the world's people – wherever they live and whatever their means,” the ITU aims to drive social and economic development through telecommunications.36
The ITU has rules regarding spectrum rights and timing for satellite deployment. After it formally files a request with the ITU, a satellite operator has seven years to fill its slot with a new or existing satellite, and it has to remain in that slot for at least ninety days. After rights are assigned, newer systems are not permitted to interfere with existing systems. This can lead to the “warehousing” of orbital slots and frequencies, however, and the ITU is currently considering altering the rules to avoid this.37
The other heavyweight regulator is the United States’ FCC, important because the United States is the largest open market for satellite broadband services. The FCC’s responsibilities cover many areas of direct interest to satellite internet providers, including enabling efficient and widely available communications service, ensuring competition and innovation, and assigning commercial spectrum licenses. In the United States, the FCC is responsible for approving plans for and granting licenses to commercial satellite services—including authorizing services that were approved in other countries.
A key FCC regulation driving satellite broadband providers’ activities is that those seeking to establish satellite systems must launch and operate at least 50 percent of their constellation within six years of authorization, or lose that authorization and forfeit their spectrum allocation. Further, the full constellation must be deployed within nine years; if it is not, the constellation must make do thereafter with the satellites it already has in orbit.38
55
High speed from low orbit: A broadband revolution or a bunch of space junk?
Endnotes1. United Nations Office for Outer Space Affairs, “Online index of objects launched into outer space,” accessed
October 9, 2019; Union of Concerned Scientists, “UCS satellite database,” accessed October 9, 2019.
2. Aerospace Security, “Popular orbits 101,” Center for Strategic and International Studies, November 30, 2017.
3. European Space Agency, “Telecommunications & integrated applications: Satellite frequency bands,” accessed October 9, 2019.
4. Federal Communications Commission, Measuring fixed broadband: Eighth report, December 14, 2018.
5. WSIP, “The ultimate 5G explainer: The untold story,” September 21, 2018.
6. Becky Iannotta, “US satellite destroyed in space collision,” SpaceNews, February 11, 2009.
7. Arthur C. Clarke, “Extra-terrestrial relays,” Wireless World, October 1945.
8. ITU News, “New ITU statistics show more than half the world is now using the internet,” December 6, 2018.
9. Federal Communications Commission, FCC 2019 broadband deployment report, May 29, 2019.
10. Morgan Stanley, “A new space economy on the edge of liftoff,” July 12, 2019.
11. Federal Communications Commission, “Application for authority to launch and operate a non-geostationary satellite orbit system in Ka-Band frequencies,” July 4, 2019.
12. OneWeb, “Our vision & values,” accessed October 9, 2019.
13. Caleb Henry, “How OneWeb plans to make sure its first satellites aren’t its last,” SpaceNews, March 18, 2019; Chris Oakes, “Teledesic launches test satellite,” Wired, February 27, 1998.
14. Harry W. Jones, “The recent large reduction in space launch cost,” 48th International Conference on Environmen-tal Systems, July 2018.
15. SpaceX, “Starlink mission: Mission overview,” May 2019.
16. Jeff Foust, “OneWeb Satellites inaugurates Florida factory,” SpaceNews, July 22, 2019.
17. Federal Communications Commission, “FCC boosts satellite broadband connectivity and competition in the United States,” November 15, 2018.
18. Michael Sheetz, “Space startup adds $1.25 billion from SoftBank and other to mass produce internet satellites,” CNBC, March 18, 2019.
19. Spaceflight Now, “Launch schedule,” accessed October 9, 2019.
20. OneWeb, “OneWeb brings fiber-like internet for the Arctic in 2020,” press release, September 4, 2019.
21. Caleb Henry, “FCC OKs lower orbit for some Starlink satellites,” SpaceNews, April 26, 2019.
22. Starlink website, accessed October 9, 2019.
23. Caleb Henry, “SpaceX says more Starlink orbits will speed service, reduce launch needs,” SpaceNews, September 7, 2019.
24. Caleb Henry, “Amazon lays out constellation service goals, deployment and deorbit plans to FCC,” SpaceNews, July 8, 2019.
25. Caleb Henry, “Kepler Communications opens launch bids for Gen-1 LEO constellation,” SpaceNews, August 29, 2018.
26. OneWeb, “OneWeb announces first two client agreements – start of commercial network commercialisation”, press release, February 27, 2019.
56
Technology, Media, and Telecommunications Predictions 2020
27. Kalvin Bahia and Stefano Suardi, “The state of mobile internet connectivity 2019,” GSMA, July 23, 2019.
28. Todd Shields, “Elon Musk’s satellites dot the heavens, leaving stargazers upset,” The Print, July 8, 2019.
29. OneWeb, “OneWeb’s satellites deliver real-time HD streaming from space,” press release, July 16, 2019.
30. Charlotte Jee, “SpaceX has lost communication with three of its 60 Starlink satellites,” MIT Technology Review, July 1, 2019.
31. NASA, “Micrometeoroids and Orbital Debris (MMOD),” June 14, 2016.
32. Charlotte Jee, “One of SpaceX’s Starlink satellites almost collided with a weather satellite,” MIT Technology Review, September 2, 2019.
33. OneWeb, “Responsible space,” accessed October 10, 2019.
34. Loren Grush, “Internet-from-space provider OneWeb says it will provide coverage to the Arctic by 2020,” Verge, September 4, 2019. Babatunde Okunoye, “Building an internet of opportunity for Africa,” Council on Foreign Relations, March 21, 2019.
35. OneWeb, “Our partners,” accessed October 10, 2019.
36. International Telecommunication Union, “About International Telecommunication Union (ITU),” accessed October 10, 2019.
37. Caleb Henry, “ITU wants megaconstellations to meet tougher launch milestones,” SpaceNews, May 9, 2019.
38. Caleb Henry, “FCC approves SpaceX, Telesat, LeoSat and Kepler internet constellations,” SpaceNews, November 15, 2018.

57
High speed from low orbit: A broadband revolution or a bunch of space junk?

58
Technology, Media, and Telecommunications Predictions 2020
SMARTPHONE SALES, TO state the obvious, are big business. But even that market may soon begin to pale next to the sums com-
manded by the sale of products and services that depend on smartphone ownership—the so-called
“smartphone multiplier.” From selfie sticks and ringtones to mobile ads and apps, smartphone mul-tiplier revenues may eclipse the revenue generated by smartphones themselves in just a few short years.
The smartphone multiplierToward a trillion-dollar economy
We predict that the smartphone multiplier will drive US$459 billion of revenue in 2020 alone.1 This rep-resents a 15 percent (US$58 billion) increase over the prior year, already greater than the US$26.6 billion (6 percent) year-over-year growth that smartphones may see in 2020.2 With smartphone sales in 2020 expected to reach US$484 billion,3 the entire smart-phone ecosystem—smartphones plus smartphone multipliers—will be worth over US$900 billion.
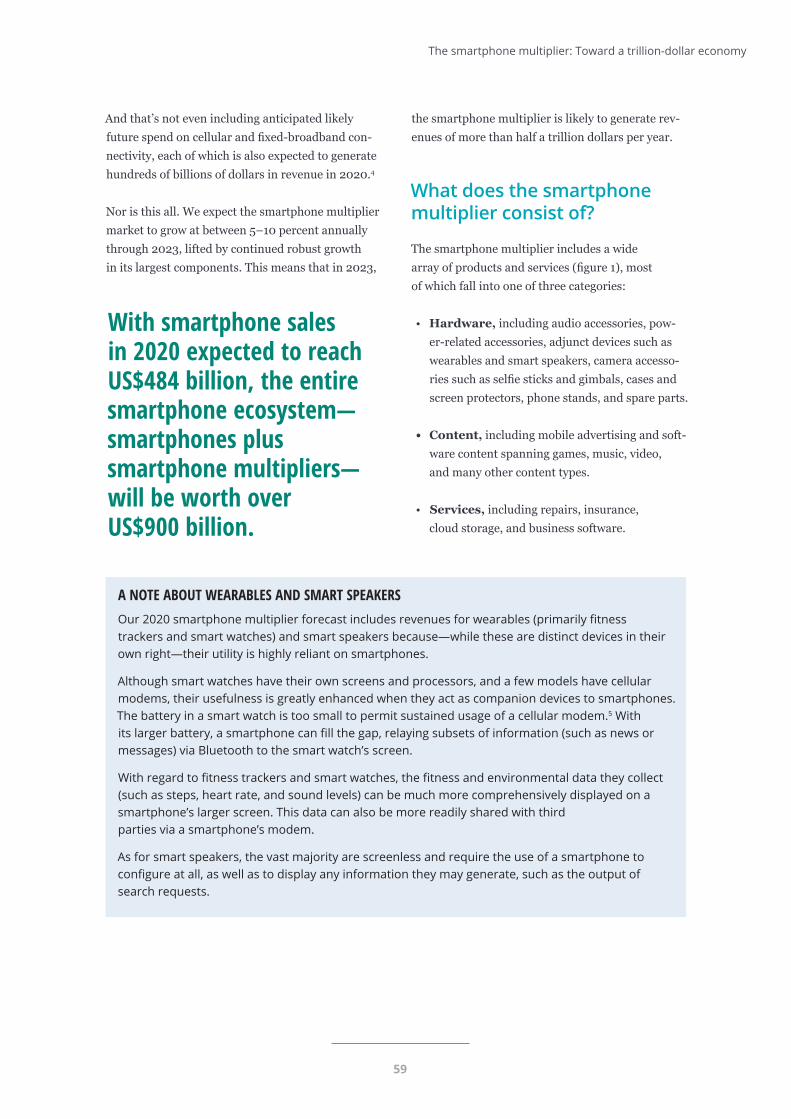
59
The smartphone multiplier: Toward a trillion-dollar economy
And that’s not even including anticipated likely future spend on cellular and fixed-broadband con-nectivity, each of which is also expected to generate hundreds of billions of dollars in revenue in 2020.4
Nor is this all. We expect the smartphone multiplier market to grow at between 5–10 percent annually through 2023, lifted by continued robust growth in its largest components. This means that in 2023,
A NOTE ABOUT WEARABLES AND SMART SPEAKERSOur 2020 smartphone multiplier forecast includes revenues for wearables (primarily fitness trackers and smart watches) and smart speakers because—while these are distinct devices in their own right—their utility is highly reliant on smartphones.
Although smart watches have their own screens and processors, and a few models have cellular modems, their usefulness is greatly enhanced when they act as companion devices to smartphones. The battery in a smart watch is too small to permit sustained usage of a cellular modem.5 With its larger battery, a smartphone can fill the gap, relaying subsets of information (such as news or messages) via Bluetooth to the smart watch’s screen.
With regard to fitness trackers and smart watches, the fitness and environmental data they collect (such as steps, heart rate, and sound levels) can be much more comprehensively displayed on a smartphone’s larger screen. This data can also be more readily shared with third parties via a smartphone’s modem.
As for smart speakers, the vast majority are screenless and require the use of a smartphone to configure at all, as well as to display any information they may generate, such as the output of search requests.
With smartphone sales in 2020 expected to reach US$484 billion, the entire smartphone ecosystem—smartphones plus smartphone multipliers—will be worth over US$900 billion.
the smartphone multiplier is likely to generate rev-enues of more than half a trillion dollars per year.
What does the smartphone multiplier consist of?
The smartphone multiplier includes a wide array of products and services (figure 1), most of which fall into one of three categories:
• Hardware, including audio accessories, pow-er-related accessories, adjunct devices such as wearables and smart speakers, camera accesso-ries such as selfie sticks and gimbals, cases and screen protectors, phone stands, and spare parts.
• Content, including mobile advertising and soft-ware content spanning games, music, video, and many other content types.
• Services, including repairs, insurance, cloud storage, and business software.
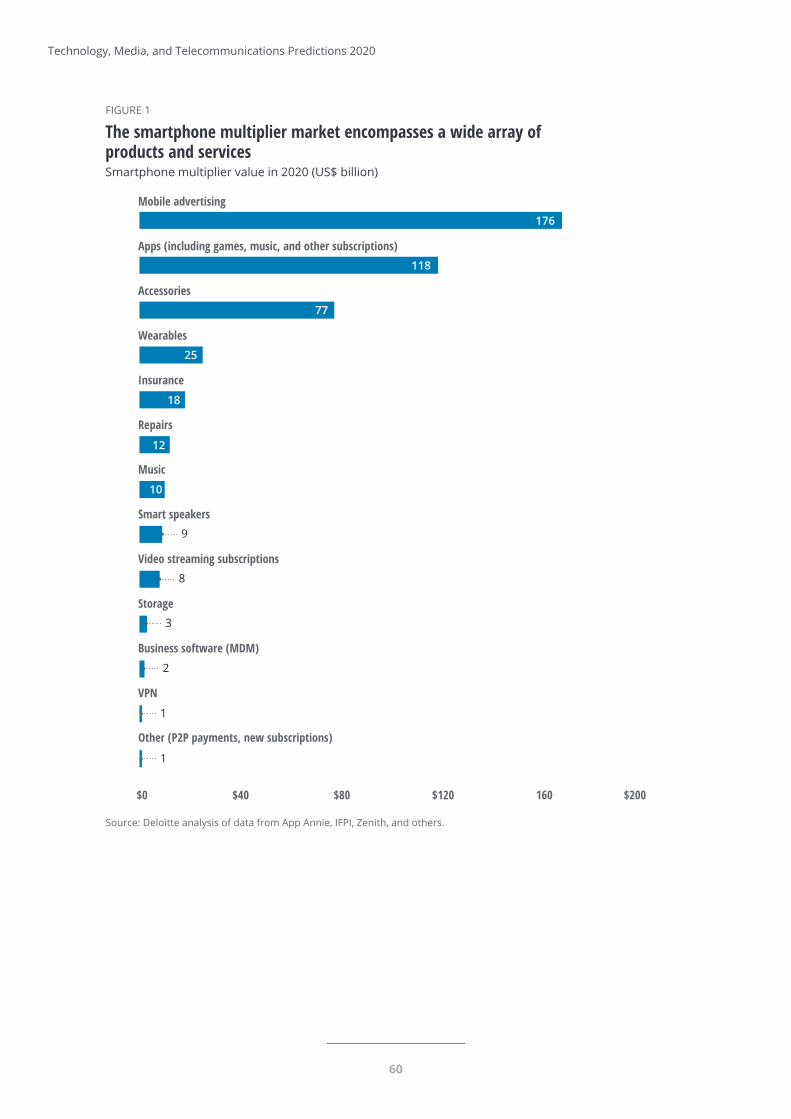
60
Technology, Media, and Telecommunications Predictions 2020
Source: Deloitte analysis of data from App Annie, IFPI, Zenith, and others.Deloitte Insights | deloitte.com/insights
Mobile advertising
Apps (including games, music, and other subscriptions)
Accessories
Wearables
Insurance
Repairs
Music
Smart speakers
Video streaming subscriptions
Storage
Business software (MDM)
VPN
Other (P2P payments, new subscriptions)
$0 $40 $80 $120 160 $200
9
8
3
2
1
1
176
118
77
25
18
12
10
FIGURE 1
The smartphone multiplier market encompasses a wide array ofproducts and servicesSmartphone multiplier value in 2020 (US$ billion)
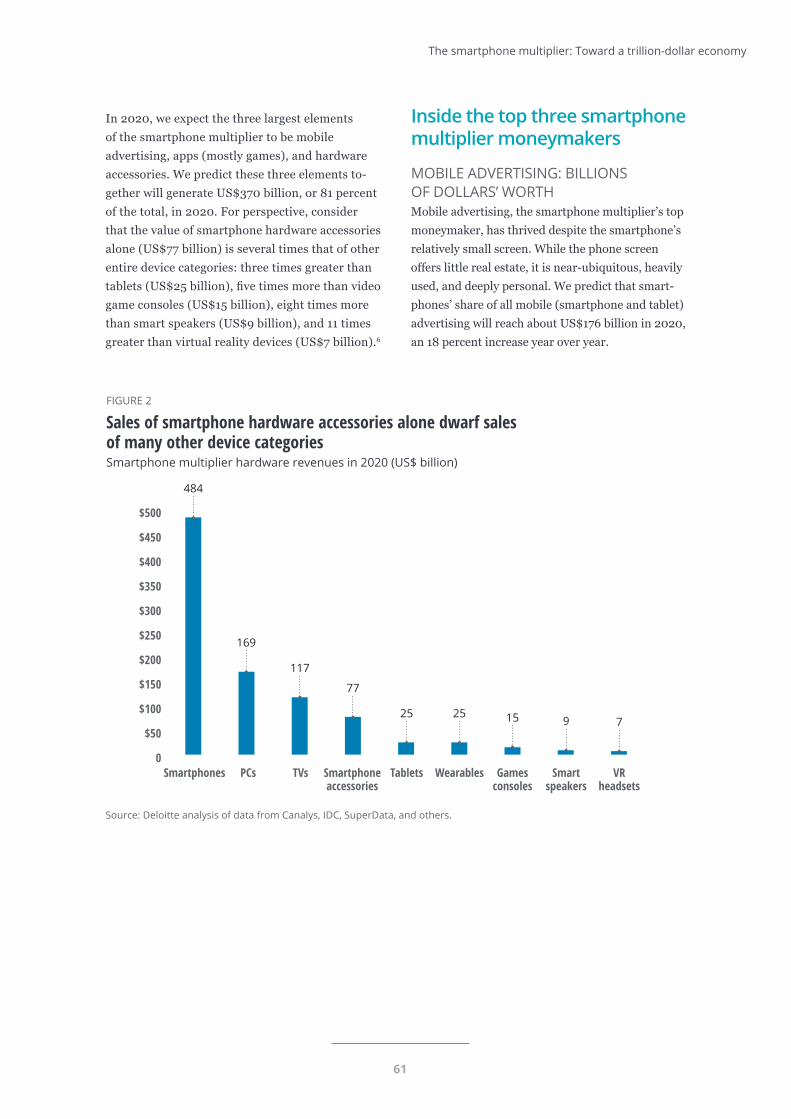
61
The smartphone multiplier: Toward a trillion-dollar economy
In 2020, we expect the three largest elements of the smartphone multiplier to be mobile advertising, apps (mostly games), and hardware accessories. We predict these three elements to-gether will generate US$370 billion, or 81 percent of the total, in 2020. For perspective, consider that the value of smartphone hardware accessories alone (US$77 billion) is several times that of other entire device categories: three times greater than tablets (US$25 billion), five times more than video game consoles (US$15 billion), eight times more than smart speakers (US$9 billion), and 11 times greater than virtual reality devices (US$7 billion).6
Source: Deloitte analysis of data from Canalys, IDC, SuperData, and others.Deloitte Insights | deloitte.com/insights
Smartphones PCs TVs Smartphoneaccessories
Tablets Wearables Gamesconsoles
Smartspeakers
VRheadsets
0
$50
$100
$150
$200
$250
$300
$350
$400
$450
$500
484
169
117
77
25 25 15 9 7
FIGURE 2
Sales of smartphone hardware accessories alone dwarf salesof many other device categoriesSmartphone multiplier hardware revenues in 2020 (US$ billion)
Inside the top three smartphone multiplier moneymakers
MOBILE ADVERTISING: BILLIONS OF DOLLARS’ WORTHMobile advertising, the smartphone multiplier’s top moneymaker, has thrived despite the smartphone’s relatively small screen. While the phone screen offers little real estate, it is near-ubiquitous, heavily used, and deeply personal. We predict that smart-phones’ share of all mobile (smartphone and tablet) advertising will reach about US$176 billion in 2020, an 18 percent increase year over year.
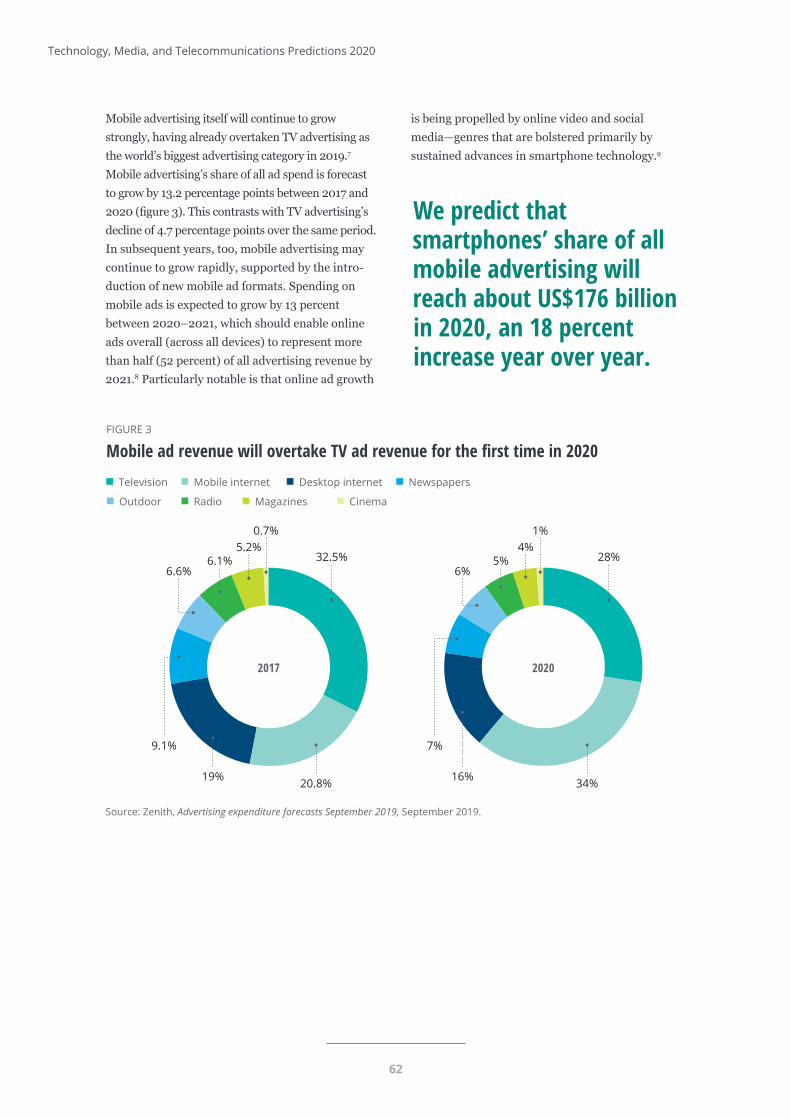
62
Technology, Media, and Telecommunications Predictions 2020
Source: Zenith, Advertising expenditure forecasts September 2019, September 2019.Deloitte Insights | deloitte.com/insights
Television Mobile internet
Magazines Cinema
Desktop internet Newspapers
Outdoor Radio
FIGURE 3
Mobile ad revenue will overtake TV ad revenue for the first time in 2020
20.8% 34%19% 16%
9.1% 7%
32.5% 28%6.1% 5%5.2% 4%
0.7% 1%
6.6% 6%
2017 2020
is being propelled by online video and social media—genres that are bolstered primarily by sustained advances in smartphone technology.9
We predict that smartphones’ share of all mobile advertising will reach about US$176 billion in 2020, an 18 percent increase year over year.
Mobile advertising itself will continue to grow strongly, having already overtaken TV advertising as the world’s biggest advertising category in 2019.7 Mobile advertising’s share of all ad spend is forecast to grow by 13.2 percentage points between 2017 and 2020 (figure 3). This contrasts with TV advertising’s decline of 4.7 percentage points over the same period.In subsequent years, too, mobile advertising may continue to grow rapidly, supported by the intro-duction of new mobile ad formats. Spending on mobile ads is expected to grow by 13 percent between 2020–2021, which should enable online ads overall (across all devices) to represent more than half (52 percent) of all advertising revenue by 2021.8 Particularly notable is that online ad growth
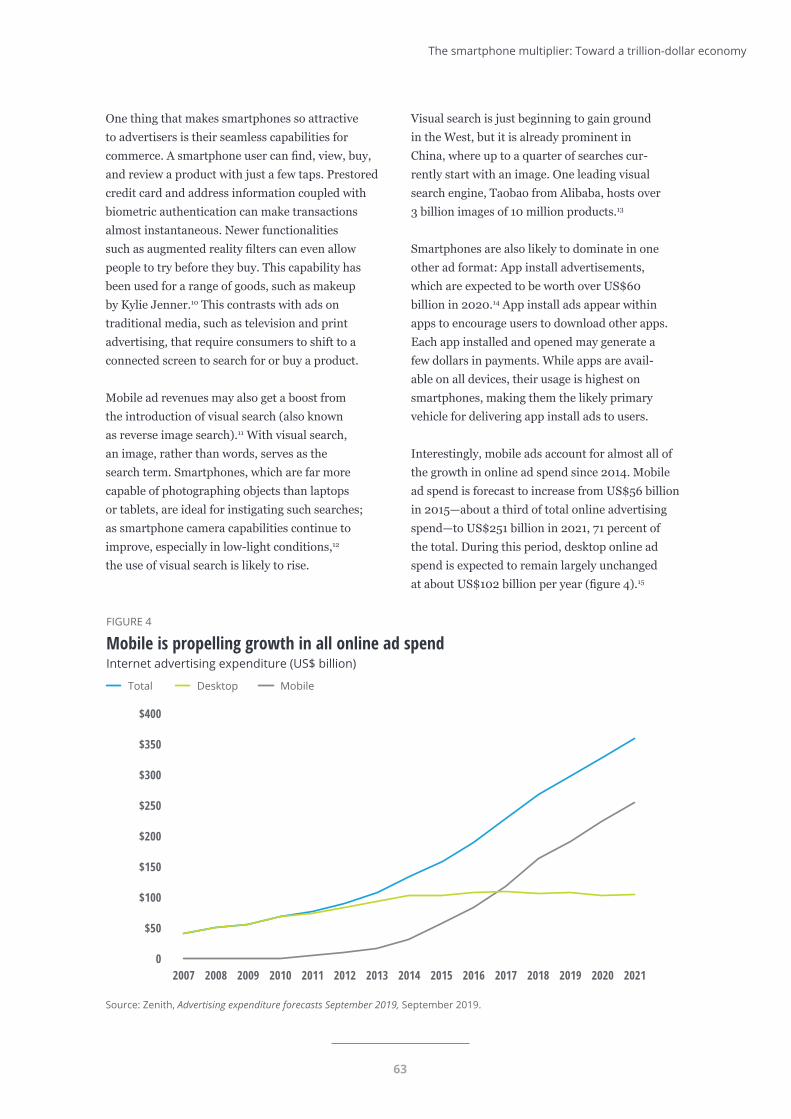
63
The smartphone multiplier: Toward a trillion-dollar economy
One thing that makes smartphones so attractive to advertisers is their seamless capabilities for commerce. A smartphone user can find, view, buy, and review a product with just a few taps. Prestored credit card and address information coupled with biometric authentication can make transactions almost instantaneous. Newer functionalities such as augmented reality filters can even allow people to try before they buy. This capability has been used for a range of goods, such as makeup by Kylie Jenner.10 This contrasts with ads on traditional media, such as television and print advertising, that require consumers to shift to a connected screen to search for or buy a product.
Mobile ad revenues may also get a boost from the introduction of visual search (also known as reverse image search).11 With visual search, an image, rather than words, serves as the search term. Smartphones, which are far more capable of photographing objects than laptops or tablets, are ideal for instigating such searches; as smartphone camera capabilities continue to improve, especially in low-light conditions,12 the use of visual search is likely to rise.
Visual search is just beginning to gain ground in the West, but it is already prominent in China, where up to a quarter of searches cur-rently start with an image. One leading visual search engine, Taobao from Alibaba, hosts over 3 billion images of 10 million products.13
Smartphones are also likely to dominate in one other ad format: App install advertisements, which are expected to be worth over US$60 billion in 2020.14 App install ads appear within apps to encourage users to download other apps. Each app installed and opened may generate a few dollars in payments. While apps are avail-able on all devices, their usage is highest on smartphones, making them the likely primary vehicle for delivering app install ads to users.
Interestingly, mobile ads account for almost all of the growth in online ad spend since 2014. Mobile ad spend is forecast to increase from US$56 billion in 2015—about a third of total online advertising spend—to US$251 billion in 2021, 71 percent of the total. During this period, desktop online ad spend is expected to remain largely unchanged at about US$102 billion per year (figure 4).15
Source: Zenith, Advertising expenditure forecasts September 2019, September 2019.Deloitte Insights | deloitte.com/insights
2007 2008 2009 2010 2011 2012 2013 2014 2015 2016 2017 2018 2019 2020 20210
$50
$100
$150
$200
$250
$300
$350
$400
FIGURE 4
Mobile is propelling growth in all online ad spendInternet advertising expenditure (US$ billion)
Total Desktop Mobile
64
Technology, Media, and Telecommunications Predictions 2020
APPS: GAMES, GAMES, AND MORE GAMES The second-largest component of the smart-phone multiplier market is apps, expected to generate US$118 billion in 2020.16 We expect the value of app stores to continue to grow in the near term, driven primarily by existing apps.
Perhaps to no one’s surprise, we predict that the top app stores by revenue in 2020 will be Google Play and Apple’s App Store.17 These two stores combined are expected to generate about three-quarters of 2020’s total app store revenues. The remainder will be distributed among hundreds of other app stores, some of which are managed by smartphone vendors such as Samsung, Huawei, and Xiaomi.18 Many are located in China, which has an estimated 300 Android app stores.
Apps exist in a smorgasbord of genres, including games, photo and video, entertainment and lifestyle, social networking, and music. In addition, app store revenues include a small proportion of subscription video on demand (SVOD) and music revenue. The largest content providers for these tend to have a direct billing relationship with subscribers.
Game apps make the most money by far. They are expected to earn around US$80 billion in revenue in 2020, up by over 10 percent from 2019.19 And while mobile phones and games have long had a close relationship—even most 2G handsets came with at least one bundled game (remember Snake?)—the smartphone, along with app stores and the freemium business model, has enabled the mobile game market to take off. According to one forecast, revenues for game apps for smartphones and tablets may surpass US$100 billion by 2022, with smartphone users representing over 80 percent of this.20 Revenues may be lifted further by the avail-ability of mobile games subscription services.
Apple launched a game subscription service, Apple Arcade, in September 2019, which offers access to more than 100 games—some exclu-sive to the platform when played on mobile devices—for a monthly payment of US$4.99 per household.21 Google launched its game subscription service, Play Pass, on September 23, 2019.22
The mobile game industry has undoubtedly benefited from smartphones’ increasing pro-cessing power, which makes gameplay more compelling. The most powerful smartphones now support 120Hz games. At 120Hz, the screen refreshes 120 times per second,23 enabling smooth motion graphics, ideal for fast-moving games. As of May 2019, more than 100 titles supported this frame rate.24
The introduction of game streaming, in which gameplay takes place in the cloud and is then streamed to a device, may further boost the market. Hatch Premium, one of the first game-streaming subscription services, offers instant, unlimited access to more than 100 high-quality, premium mobile games, including Hatch Originals. As well as freeing up device memory space, game streaming also enables massive collaborative play: Hundreds of people could collectively solve a puzzle, hunt an enemy, or run a race. The low latency available with 5G could make mobile game streaming an even more compelling experience.25
The mobile game industry has undoubtedly benefited from smartphones’ increasing processing power, which makes gameplay more compelling.
65
The smartphone multiplier: Toward a trillion-dollar economy
HARDWARE ACCESSORIES: HEADPHONES, BATTERIES, AND CASES The smartphone hardware accessories market, projected to be worth US$77 billion in 2020, consists of three principal subcategories: audio, power, and protection. Of these, audio and power are likely to experience signif-icant growth over the medium term.
Headphone sales may grow markedly over the next few years, predominantly driven by users upgrading wired headphones for wireless versions. Currently, wired headphones are the norm among smartphone owners in a range of developed countries (Belgium, Canada, Denmark, Finland, Germany, Ireland, Italy, Japan, the Netherlands, Norway, South Korea, Spain, Sweden, UK, USA). According to our 2019 mobile consumer survey for developed countries, 68 percent of smartphone owners have wired earbuds, while only 23 percent had a wireless model.26 But although they are more expensive—quality wireless earbuds typically cost between US$100–US$200, while simple wired earbuds rarely cost more than US$30—wireless sets have the advantage in ease of use: There are no cords to untangle, and the earbuds have little chance of being yanked out by a stray arm or chair armrest. Some claim that wireless earbuds also offer better audio quality. Over the next few years, we expect most owners to ditch the cable, driving wireless earbud sales up to a potential 129 million units in 2020, from 46 million in 2018.27
Further, we expect headphones to be regularly upgraded over the coming decade as new func-tionalities become available. Improvements in audio quality, noise cancellation, battery life, water and sweat resistance, and wireless charging are all possible. A minority of smartphone owners will also purchase multiple headphones, each suited to different contexts, such as office, exercise, commuting, and high-fidelity. Cur-rently, among headphone owners in the United Kingdom, 28 percent have two types, 11 percent have three, and nine percent have four.28
The demand for power-related accessories (external batteries, replacement batteries, chargers, and cables) should remain strong over the coming years. Purchases of higher-speed chargers are one likely driver of growth, especially as more smart-phones integrate USB-C technology. Currently, chargers vary widely in the rate at which they can transmit power: A standard charger works at 2.5 watts, while the fastest units for smartphones operate at 40 watts.29 USB-C chargers, however, can operate at up to 100 watts—40 times faster than the current standard—and they can support bidirectionality as well (so a device can send as well as receive power).30 The migration to USB-C is expected to take many years to complete, implying multiple years of upgrade purchases to come.
Demand for wireless charging accessories will also likely rise. Wireless chargers transmit power more slowly, but some users may find them more con-venient. While only a minority (about 20 percent) of smartphone owners in developed countries now have a wireless charger, ownership should increase over the coming years now that major smartphone vendors have agreed to adopt the Qi standard for wireless power transfer.31 The establishment of a common standard is likely to prompt third-party accessory makers to introduce a wider range of wireless chargers, which should continue to bring their cost down. (Wireless chargers today cost about US$10, and they are becoming increas-ingly more affordable.)32 A few wireless chargers are now also able to charge multiple devices simultaneously,33 a capability which will grow in attractiveness as users accumulate more peripherals that support wireless charging, such as wireless earbuds, fitness trackers, and smart watches.
Headphone sales may grow markedly over the next few years, predominantly driven by users upgrading wired headphones for wireless versions.
66
Technology, Media, and Telecommunications Predictions 2020
External, portable battery packs are likely to remain popular as well, as charging points are not always available at the point of need. The global power bank market was worth US$16.3 billion in 2017, and is expected to rise to US$19.4 billion by 2025.34 Just over half (51 percent) of smartphone owners in developed countries currently own an external battery; because these battery packs lose capacity over time, they need to be regularly replaced, driving repeat sales. On top of this, the switch to USB-C is likely to spur a slow-moving but inexorable wave of power pack upgrades by consumers hungry for more and faster power.
At the foundation: 3.6 billion smartphone users and countingEvery successful device cultivates—and in turn relies upon—an associated ecosystem. The better the device, the more vibrant the ecosystem. By this measure, the sheer number and variety of smartphone-linked accessories, devices, content, and services surely qualify smartphones as one of history’s most successful products.
Approximately 3.6 billion smartphones are in use globally today. This huge user base is the smartphone multiplier’s essential foundation, and it is still growing. Although global smart-phone unit sales appear to be nearing a ceiling of 1.4–1.6 billion units per year, the overall number of smartphone users should continue to increase at both the global and the country level. As it is, the 1.6 billion smartphones expected to sell in 2020 is multiple times the number of sales expected for any other major consumer device.
Smartphone unit sales are forecast to grow some-what in 2020, boosted by 5G.35 The next few years beyond that may see unit sales decline, albeit modestly. One sign pointing to this possibility is the stretching renewal cycle in many markets. In the five largest European markets, for instance, the average lifetime of a new handset increased from 23.4 months in 2016 to 26.2 months in 2018.36 This may be due to smartphones’ approaching an asymptotic limit of functionality. Upgrades, which are the predominant driver of sales, appear to be becoming less meaningful to mainstream consumers, who may not find the latest crop of features—such as mechanized pop-up selfie cameras, additional rear-facing lenses, or water resistance to greater depths37—worth the cost.38
The launch of 5G handsets will likely stimulate demand moderately. But unlike a decade ago when flip and feature phone users upgraded to both smartphones and 4G in one go, today’s smartphone users may have less motive to buy a 5G device at the first possible opportunity. The upgrade to 4G offered a Wi-Fi type of experience when outdoors, markedly improving the user experience; 5G may not bring a similarly striking additional benefit.
Every successful device cultivates—and in turn relies upon—an associated ecosystem. The better the device, the more vibrant the ecosystem.
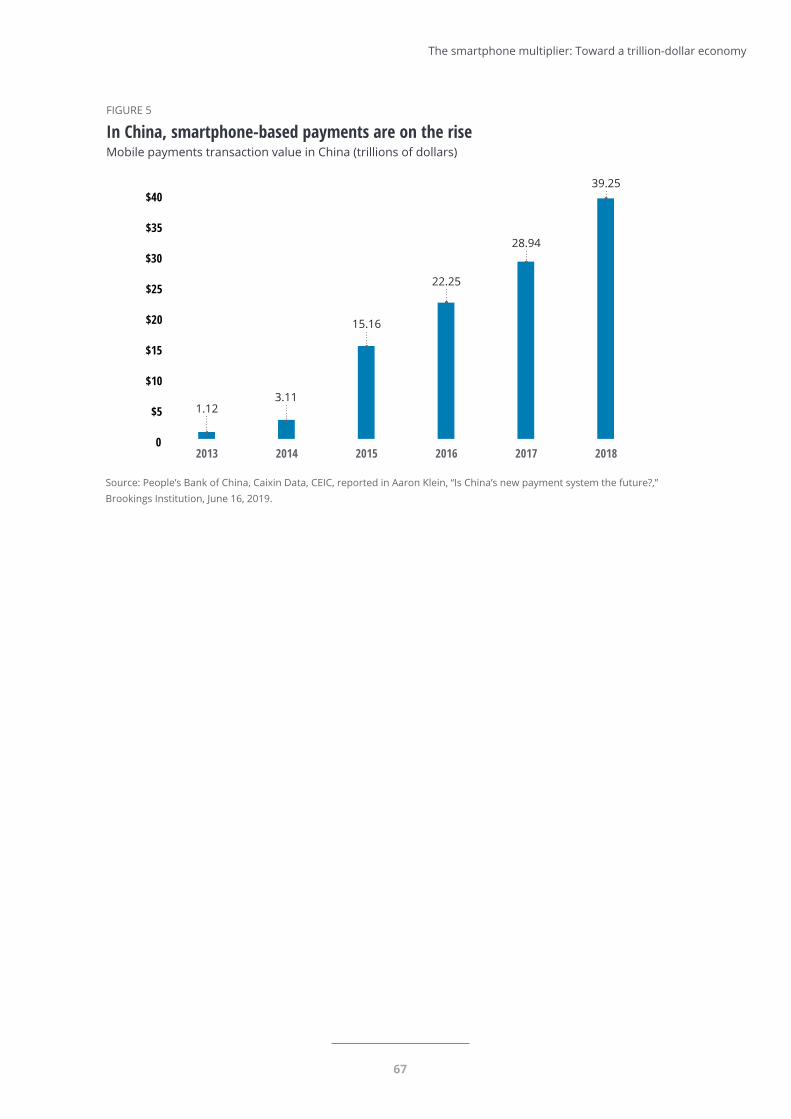
67
The smartphone multiplier: Toward a trillion-dollar economy
Source: People’s Bank of China, Caixin Data, CEIC, reported in Aaron Klein, “Is China’s new payment system the future?,” Brookings Institution, June 16, 2019.
Deloitte Insights | deloitte.com/insights
2013 2014 2015 2016 2017 20180
$5
$10
$15
$20
$25
$30
$35
$40
1.123.11
15.16
22.25
28.94
39.25
FIGURE 5
In China, smartphone-based payments are on the riseMobile payments transaction value in China (trillions of dollars)
68
Technology, Media, and Telecommunications Predictions 2020
THE BOTTOM LINEThe smartphone market is nearing its peak in terms of unit sales per year. But its power as a foundation for multiple associated revenue streams—advertising, hardware, content, and services—is growing apace. Already approaching half a trillion dollars in 2020, these ancillary revenues may exceed the value of smartphone sales within the next five years. Those looking to strike it rich in the smartphone business may find that the best opportunities lie, not in the smartphone market itself, but in the vast and growing markets the smartphone has created.
One of the largest of these could be payments at physical stores as well as online, enabled by near-field communication (NFC) technology. Payment by smartphone is already common in China, where consumers used their phones to pay for US$41 trillion worth of goods in 2018 (figure 5).39 However, the growth opportunity in Western markets could be significant. Although relatively few Western consumers today use their phone for brick-and-mortar transactions—despite several major players offering the option to do so—adoption could grow as more people come to appreciate the advantages. Smartphone-based payments are more secure than chip-and-PIN or sign-and-swipe methods, both of which remain popular in the United States. With chip-and-pin or sign-and-swipe, a stolen card could be used multiple times before fraud is detected. An individual’s signature can be faked; a personal identification number can be obtained by looking over someone’s shoulder. Smartphones, on the other hand, authenticate users on a per-transaction basis, and they can enable biometric recognition, which can be extremely secure relative to other methods. While it is possible to spoof fingerprint readers and facial imprints, it is very resource-intensive to do so. NFC-based mobile payments use a one-time token to authenticate each payment; if this token is intercepted, it cannot be used for another transaction.40 This capability could be widely deployed to not only accelerate the pace at which individual payments can be made, but also to lessen fraud.41
Another opportunity is enterprise apps, such as software used to handle work email and files securely on a user’s smartphone.42 Little business software today is created specifically for smartphones: Enterprise apps are forecast to generate a modest US$2.4 billion in direct revenue in 2020, far less than the US$118 billion expected for consumer apps in the same year.43 Established and startup companies that can successfully resize and reinvent their B2B software for mobile use—for everything from intranet access to expense processing—could be looking at a potential gold mine. We estimate that in developed markets, only about two-fifths of workers are currently using a smartphone for work tasks beyond calls and instant messaging.44
For billions of people today, it’s hard to imagine life without smartphones—or without the apps, accessories, and ancillary devices that integrate them ever more seamlessly into our lives. The booming smartphone multiplier market presents a clear opportunity for businesses that can devise even more ways to extend smartphones’ capabilities. We don’t expect that opportunity to fade anytime soon.

69
The smartphone multiplier: Toward a trillion-dollar economy
Endnotes1. Deloitte Global estimates based on various sources including 4A’s, “Zenith advertising expenditure forecasts,”
September 2019; App Annie, The state of mobile 2019, 2019; International Federation of the Phonographic Industry, IFPI global music report 2019, April 2, 2019.
2. International Data Corporation (IDC) forecasts smartphone sales to increase by 39 million units in 2020. IDC also forecasts a five-year CAGR of 2.9 percent for the smartphone ASP. Based on this CAGR, the smartphone ASP for 2019 will reach US$331 and for 2020 will reach US$341. The variation in units and ASP gives us a total market value for 2020 of US$484.1 billion, US$26.6 billion greater than that of 2019. For units, see: Anthony Scarsella and William Stofega, “Worldwide smartphone forecast update, 2019–2023,” IDC, June 2019; for ASP, see: Anthony Scarsella and William Stofega, “Worldwide smartphone forecast update, 2018–2022,” IDC, June 2018.
3. This figure is based on IDC’s units forecast of 1.42 billion smartphones expected to ship in 2020. IDC also forecasts a five-year CAGR of 2.9 percent for the smartphone ASP. Based on this CAGR, the smartphone ASP for 2020 will reach US$341, giving us a total value of US$484.1 billion. For units, see Scarsella and Stofega, “World-wide smartphone forecast update, 2019–2023”; for ASP, see Scarsella and Stofega, “Worldwide smartphone forecast update, 2018–2022.”
4. There are over one billion broadband connections globally. Average revenue per user varies, and in many developed markets the broadband connection is conditional upon the rental of a landline. In developed markets monthly broadband costs are between US$20 and US$50, equivalent to US$240 to US$600 per year. Broadband subscriber numbers are sourced from Point Topic. See also Mark Jackson, “Global fixed broadband subs total 1.047 billion as fibre dominates,” ISPreview, July 23, 2019.
5. The size of a battery in a smart watch is typically a few hundred mAh, which is considerably smaller than batteries for smartphones, which tend to be a few hundred mAh. An indication of smart watch battery sizes is at: BatteryClerk, “Samsung Gear 1 SM-V700 replacement battery,” accessed October 1, 2019.
6. Deloitte Global estimates based on various sources, including: Anthony Scarsella and William Stofega, “World-wide smartphone forecast update, 2019–2023”; Jeremy Horwitz, “Canalys: Wearables have a $200-$399 sweet spot, led by Apple Watch,” VentureBeat, August 15, 2019; Jeremy Horwitz, “SuperData: VR grew 30% in 2018 thanks to PSVR, Oculus Quest will be 2019’s hit,” VentureBeat, January 24, 2019.
7. Zenith, Advertising expenditure forecasts September 2019, September 2019.
8. Ibid.
9. David Murphy, “Zenith: Online advertising will exceed half of global ad spend in 2021,” Mobile Marketing, July 8, 2019.
10. Robert Williams, “Kylie Jenner debuts AR lipstick filter on Instagram,” Mobile Marketer, August 2, 2018.
11. Google, “Find related images with reverse image search,” accessed October 1, 2019.
12. For more information in low-light capabilities in phones see Tristan Rayner, “Google is no longer the low-light camera king,” Dgit, April 2, 2019; Yoni Heisler, “First photos taken with the iPhone 11’s new night mode look incredible,” BGR, September 12, 2019.
13. Jennifer O’Brien, “How Alibaba is using AI to power the future of business,” CMO, May 18, 2018.
14. Richard Harris, “Mobile app ad spending predicted to hit $64B by 2020,” App Developer Magazine, December 20, 2018.
15. Zenith, Advertising expenditure forecasts September 2019.
16. To arrive at the total app store revenues, Deloitte Global has considered various publicly available information, such as: Sam Cheney and Eric Thompson, “The 2017–2022 app economy forecast: 6 billion devices, $157 billion in spend & more,” App Annie, May 2, 2018.

70
Technology, Media, and Telecommunications Predictions 2020
17. TMT Predictions 2020 is an independent publication and has not been authorized, sponsored, or otherwise approved by Apple Inc. Apple App Store is a trademark of Apple Inc., registered in the United States and other countries.
18. Elad Natanson, “The ’Other’ Android app stores – a new frontier for app discovery,” Forbes, September 3, 2019.
19. To arrive at the games revenues, Deloitte Global has considered various publicly available information, such as: Sam Cheney and Eric Thompson, “The 2017–2022 app economy forecast.”
20. Tom Wijman, “The global games market will generate $152.1 billion in 2019 as the U.S. overtakes China as the biggest market,” Newzoo, June 18, 2019.
21. Apple, “Apple Arcade: Play extraordinary,” accessed September 20, 2019. TMT Predictions 2020 is an independent publication and has not been authorized, sponsored, or otherwise approved by Apple Inc. Apple Arcade is a trademark of Apple Inc., registered in the United States and other countries.
22. Ron Amadeo, “Google confirms “Play Pass” subscription service for Android apps,” Ars Technica, August 2, 2019.
23. There are multiple approaches to delivering ultra-smooth motion. One approach is a 120 Hz touch sample rate. See: Omar Sohail, “iPhone XS 120Hz touch sample rate explained: Not the same as the Razer Phone’s 120Hz refresh rate but the start of something better,” Wccftech, September 13, 2018.
24. Williams Pelegrin, “Here are all the 120Hz-enabled games you can play on the Razer Phone 2,” Android Authority, May 11, 2019.
25. Hatch, “Hatch and Samsung extend 5G cloud gaming partnership to Europe,” September 3, 2019.
26. Deloitte Global Mobile Consumer Survey, with all respondents residing in Belgium, Canada, Denmark, Finland, Germany, Ireland, Italy, Japan, the Netherlands, Norway, South Korea, Spain, Sweden, United Kingdom and United States of America. The research was conducted between May and September 2019.
27. Liz Lee, “True wireless hearables sales to climb to 129 million units globally by 2020,” press release, Counterpoint Research, March 15, 2019.
28. Deloitte Global Mobile Consumer Survey, United Kingdom cut (survey fielded in May–June 2019).
29. Robert Triggs, “How fast charging really works,” Android Authority, June 30, 2019.
30. Chris Hoffman, “USB Type-C explained: What is USB-C and why you’ll want it,” How-To Geek, June 8, 2018.
31. Wikipedia, “Qi (standard),” accessed October 1, 2019.
32. Amazon, “Wireless charger,” accessed October 1, 2019.
33. Chaim Gartenberg, “The best wireless charger to buy right now,” Verge, May 17, 2019.
34. Rahul Kumar and Divyanshi Tewari, Power bank market by battery type (lithium ion and lithium polymer), power rating (up to 3000 mAh, 3,001–8,000 mAh, 8,001–20,000 mAh, and above 20,000 mAh), distribution channel (online and offline), and price range (low, mid – range, and premium range): Global opportunity analysis and industry forecast, 2019–2025, Allied Market Research, November 2018.
35. Gartner, “Gartner says worldwide smartphone sales will decline 2.5% in 2019,” press release, August 1, 2019.
36. Abigail Ng, “Smartphone users are waiting longer before upgrading – here’s why,” CNBC, May 16, 2019.
37. For more information on the differences in water resistance certifications, see Max Parker, “IP67 v IP68: Waterproof IP ratings explained,” Trusted Reviews, February 11, 2019.

71
The smartphone multiplier: Toward a trillion-dollar economy
38. The availability of foldable screens may prompt mass upgrades, but likely not until prices have reached mass-market levels.
39. Aaron Klein, “Is China’s new payment system the future?,” Brookings Institution, June 16, 2019.
40. Apple, “Apple Pay security and privacy overview,” accessed October 1, 2019. TMT Predictions is an independent publication and has not been authorized, sponsored, or otherwise approved by Apple Inc. Apple Pay is a trademark of Apple Inc., registered in the United States and other countries; Google, “How payments work,” accessed October 1, 2019.
41. Tokenization within online payments from a smartphone could also be used to control fraud levels. For more information, see European Central Bank, “Fifth report on card fraud,” September 26, 2018.
42. BlackBerry, “BlackBerry Work,” accessed October 1, 2019.
43. Deloitte Global estimates based on various sources, including: App Annie, The state of mobile 2019; Sensor Tower, “5-year market forecast: App store and Google Play spending will grow 120% to reach $156 billion by 2023,” March 28, 2019; MarketsandMarkets, “Mobile device management (MDM) market worth 7.86 billion USD by 2023,” March 29, 2018.
44. Deloitte, “More than 10 million UK workers could be using smartphones to boost productivity,” press release, August 3, 2018.

7272
Technology, Media, and Telecommunications Predictions 2020
IN THE 1970S, TV antennas dominated skylines worldwide. In 2020, they may be about to do so again. Surprised? Hold onto your hats: We predict
that in 2020, at least 1.6 billion people worldwide, representing 450 million households, will get at least some of their TV from an antenna. And that’s the low end of the estimate: Extrapolations from verified data suggest that number may even be as high as
2 billion. Along with a predicted $32 billion in 2020 revenues from ad-supported video on demand (AVOD),1 antenna TV is helping the global TV industry keep on growing even in the face of falling TV viewing minutes and, in some markets, increasing numbers of consumers cutting the pay-TV cord.
My antennae are tinglingTerrestrial TV’s surprising staying power
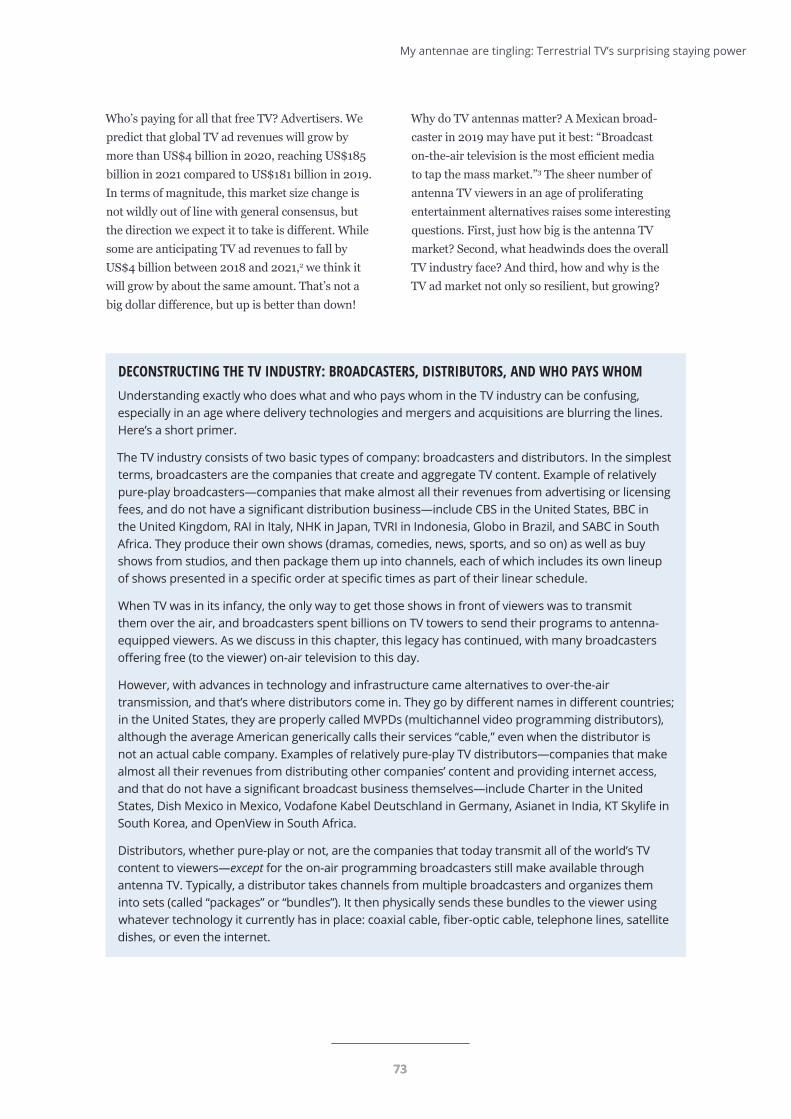
7373
My antennae are tingling: Terrestrial TV’s surprising staying power
Who’s paying for all that free TV? Advertisers. We predict that global TV ad revenues will grow by more than US$4 billion in 2020, reaching US$185 billion in 2021 compared to US$181 billion in 2019. In terms of magnitude, this market size change is not wildly out of line with general consensus, but the direction we expect it to take is different. While some are anticipating TV ad revenues to fall by US$4 billion between 2018 and 2021,2 we think it will grow by about the same amount. That’s not a big dollar difference, but up is better than down!
Why do TV antennas matter? A Mexican broad-caster in 2019 may have put it best: “Broadcast on-the-air television is the most efficient media to tap the mass market.”3 The sheer number of antenna TV viewers in an age of proliferating entertainment alternatives raises some interesting questions. First, just how big is the antenna TV market? Second, what headwinds does the overall TV industry face? And third, how and why is the TV ad market not only so resilient, but growing?
DECONSTRUCTING THE TV INDUSTRY: BROADCASTERS, DISTRIBUTORS, AND WHO PAYS WHOMUnderstanding exactly who does what and who pays whom in the TV industry can be confusing, especially in an age where delivery technologies and mergers and acquisitions are blurring the lines. Here’s a short primer.
The TV industry consists of two basic types of company: broadcasters and distributors. In the simplest terms, broadcasters are the companies that create and aggregate TV content. Example of relatively pure-play broadcasters—companies that make almost all their revenues from advertising or licensing fees, and do not have a significant distribution business—include CBS in the United States, BBC in the United Kingdom, RAI in Italy, NHK in Japan, TVRI in Indonesia, Globo in Brazil, and SABC in South Africa. They produce their own shows (dramas, comedies, news, sports, and so on) as well as buy shows from studios, and then package them up into channels, each of which includes its own lineup of shows presented in a specific order at specific times as part of their linear schedule.
When TV was in its infancy, the only way to get those shows in front of viewers was to transmit them over the air, and broadcasters spent billions on TV towers to send their programs to antenna-equipped viewers. As we discuss in this chapter, this legacy has continued, with many broadcasters offering free (to the viewer) on-air television to this day.
However, with advances in technology and infrastructure came alternatives to over-the-air transmission, and that’s where distributors come in. They go by different names in different countries; in the United States, they are properly called MVPDs (multichannel video programming distributors), although the average American generically calls their services “cable,” even when the distributor is not an actual cable company. Examples of relatively pure-play TV distributors—companies that make almost all their revenues from distributing other companies’ content and providing internet access, and that do not have a significant broadcast business themselves—include Charter in the United States, Dish Mexico in Mexico, Vodafone Kabel Deutschland in Germany, Asianet in India, KT Skylife in South Korea, and OpenView in South Africa.
Distributors, whether pure-play or not, are the companies that today transmit all of the world’s TV content to viewers—except for the on-air programming broadcasters still make available through antenna TV. Typically, a distributor takes channels from multiple broadcasters and organizes them into sets (called “packages” or “bundles”). It then physically sends these bundles to the viewer using whatever technology it currently has in place: coaxial cable, fiber-optic cable, telephone lines, satellite dishes, or even the internet.
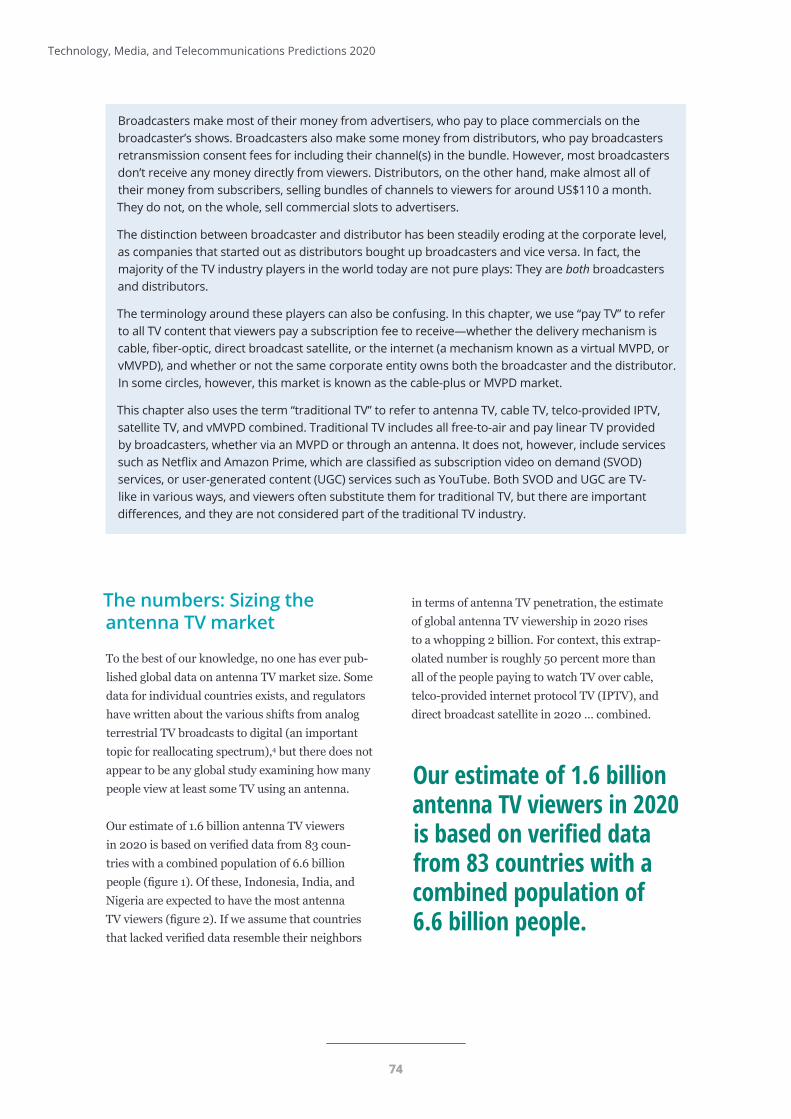
7474
Technology, Media, and Telecommunications Predictions 2020
Broadcasters make most of their money from advertisers, who pay to place commercials on the broadcaster’s shows. Broadcasters also make some money from distributors, who pay broadcasters retransmission consent fees for including their channel(s) in the bundle. However, most broadcasters don’t receive any money directly from viewers. Distributors, on the other hand, make almost all of their money from subscribers, selling bundles of channels to viewers for around US$110 a month. They do not, on the whole, sell commercial slots to advertisers.
The distinction between broadcaster and distributor has been steadily eroding at the corporate level, as companies that started out as distributors bought up broadcasters and vice versa. In fact, the majority of the TV industry players in the world today are not pure plays: They are both broadcasters and distributors.
The terminology around these players can also be confusing. In this chapter, we use “pay TV” to refer to all TV content that viewers pay a subscription fee to receive—whether the delivery mechanism is cable, fiber-optic, direct broadcast satellite, or the internet (a mechanism known as a virtual MVPD, or vMVPD), and whether or not the same corporate entity owns both the broadcaster and the distributor. In some circles, however, this market is known as the cable-plus or MVPD market.
This chapter also uses the term “traditional TV” to refer to antenna TV, cable TV, telco-provided IPTV, satellite TV, and vMVPD combined. Traditional TV includes all free-to-air and pay linear TV provided by broadcasters, whether via an MVPD or through an antenna. It does not, however, include services such as Netflix and Amazon Prime, which are classified as subscription video on demand (SVOD) services, or user-generated content (UGC) services such as YouTube. Both SVOD and UGC are TV-like in various ways, and viewers often substitute them for traditional TV, but there are important differences, and they are not considered part of the traditional TV industry.
The numbers: Sizing the antenna TV market
To the best of our knowledge, no one has ever pub-lished global data on antenna TV market size. Some data for individual countries exists, and regulators have written about the various shifts from analog terrestrial TV broadcasts to digital (an important topic for reallocating spectrum),4 but there does not appear to be any global study examining how many people view at least some TV using an antenna.
Our estimate of 1.6 billion antenna TV viewers in 2020 is based on verified data from 83 coun-tries with a combined population of 6.6 billion people (figure 1). Of these, Indonesia, India, and Nigeria are expected to have the most antenna TV viewers (figure 2). If we assume that countries that lacked verified data resemble their neighbors
in terms of antenna TV penetration, the estimate of global antenna TV viewership in 2020 rises to a whopping 2 billion. For context, this extrap-olated number is roughly 50 percent more than all of the people paying to watch TV over cable, telco-provided internet protocol TV (IPTV), and direct broadcast satellite in 2020 … combined.
Our estimate of 1.6 billion antenna TV viewers in 2020 is based on verified data from 83 countries with a combined population of 6.6 billion people.
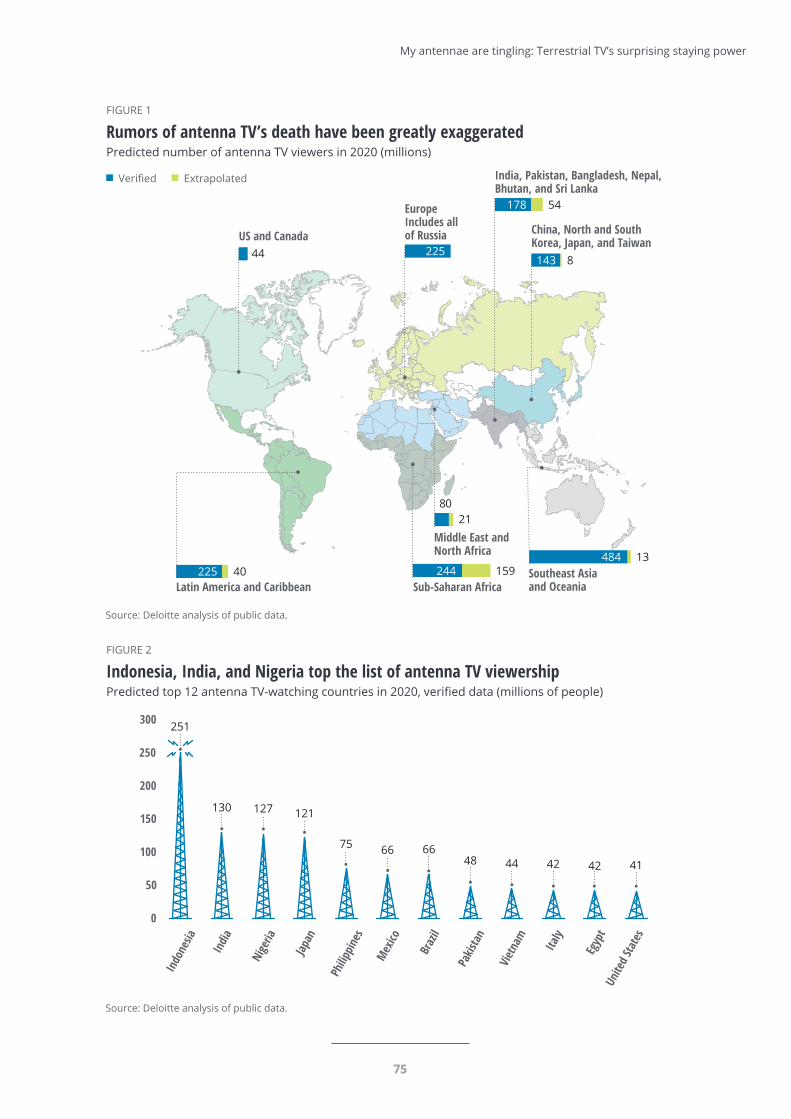
7575
My antennae are tingling: Terrestrial TV’s surprising staying power
Source: Deloitte analysis of public data.Deloitte Insights | deloitte.com/insights
225 40
8021
244 159
178 54
484 13
44 225143 8
US and Canada
Latin America and Caribbean
EuropeIncludes allof Russia
Middle East andNorth Africa
Sub-Saharan Africa
India, Pakistan, Bangladesh, Nepal,Bhutan, and Sri Lanka
Southeast Asiaand Oceania
China, North and SouthKorea, Japan, and Taiwan
FIGURE 1
Rumors of antenna TV’s death have been greatly exaggeratedPredicted number of antenna TV viewers in 2020 (millions)
Verified Extrapolated
Source: Deloitte analysis of public data.Deloitte Insights | deloitte.com/insights
Indo
nesia
India
Nige
ria
Japan
Philip
pines
Mex
ico
Braz
il
Pakis
tan
Vietn
am Italy
Egyp
tUn
ited S
tate
s
251
130 127 121
75 66 6648 44 42 42 41
FIGURE 2
Indonesia, India, and Nigeria top the list of antenna TV viewershipPredicted top 12 antenna TV-watching countries in 2020, verified data (millions of people)
0
50
100
150
200
250
300
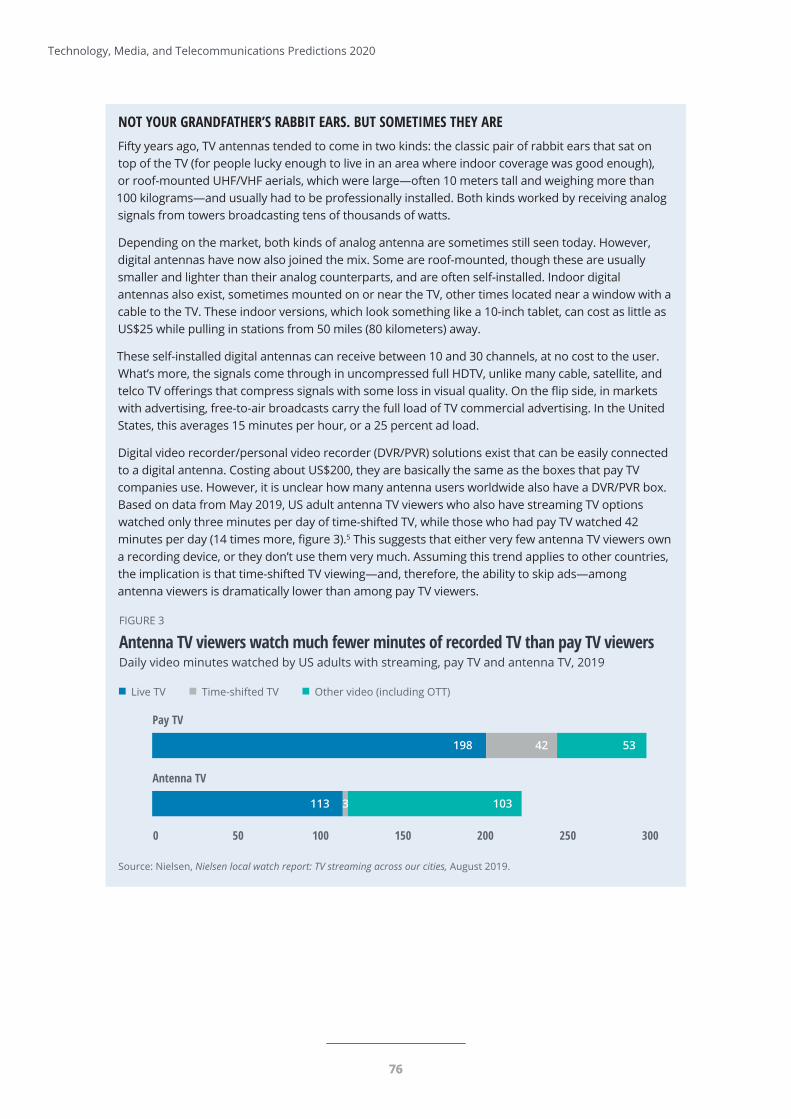
7676
Technology, Media, and Telecommunications Predictions 2020
NOT YOUR GRANDFATHER’S RABBIT EARS. BUT SOMETIMES THEY AREFifty years ago, TV antennas tended to come in two kinds: the classic pair of rabbit ears that sat on top of the TV (for people lucky enough to live in an area where indoor coverage was good enough), or roof-mounted UHF/VHF aerials, which were large—often 10 meters tall and weighing more than 100 kilograms—and usually had to be professionally installed. Both kinds worked by receiving analog signals from towers broadcasting tens of thousands of watts.
Depending on the market, both kinds of analog antenna are sometimes still seen today. However, digital antennas have now also joined the mix. Some are roof-mounted, though these are usually smaller and lighter than their analog counterparts, and are often self-installed. Indoor digital antennas also exist, sometimes mounted on or near the TV, other times located near a window with a cable to the TV. These indoor versions, which look something like a 10-inch tablet, can cost as little as US$25 while pulling in stations from 50 miles (80 kilometers) away.
These self-installed digital antennas can receive between 10 and 30 channels, at no cost to the user. What’s more, the signals come through in uncompressed full HDTV, unlike many cable, satellite, and telco TV offerings that compress signals with some loss in visual quality. On the flip side, in markets with advertising, free-to-air broadcasts carry the full load of TV commercial advertising. In the United States, this averages 15 minutes per hour, or a 25 percent ad load.
Digital video recorder/personal video recorder (DVR/PVR) solutions exist that can be easily connected to a digital antenna. Costing about US$200, they are basically the same as the boxes that pay TV companies use. However, it is unclear how many antenna users worldwide also have a DVR/PVR box. Based on data from May 2019, US adult antenna TV viewers who also have streaming TV options watched only three minutes per day of time-shifted TV, while those who had pay TV watched 42 minutes per day (14 times more, figure 3).5 This suggests that either very few antenna TV viewers own a recording device, or they don’t use them very much. Assuming this trend applies to other countries, the implication is that time-shifted TV viewing—and, therefore, the ability to skip ads—among antenna viewers is dramatically lower than among pay TV viewers.
Source: Nielsen, Nielsen local watch report: TV streaming across our cities, August 2019.Deloitte Insights | deloitte.com/insights
Pay TV
Antenna TV
198
113 3 103
42 53
FIGURE 3
Antenna TV viewers watch much fewer minutes of recorded TV than pay TV viewersDaily video minutes watched by US adults with streaming, pay TV and antenna TV, 2019
0 50 100 150 200 250 300
Live TV Time-shifted TV Other video (including OTT)
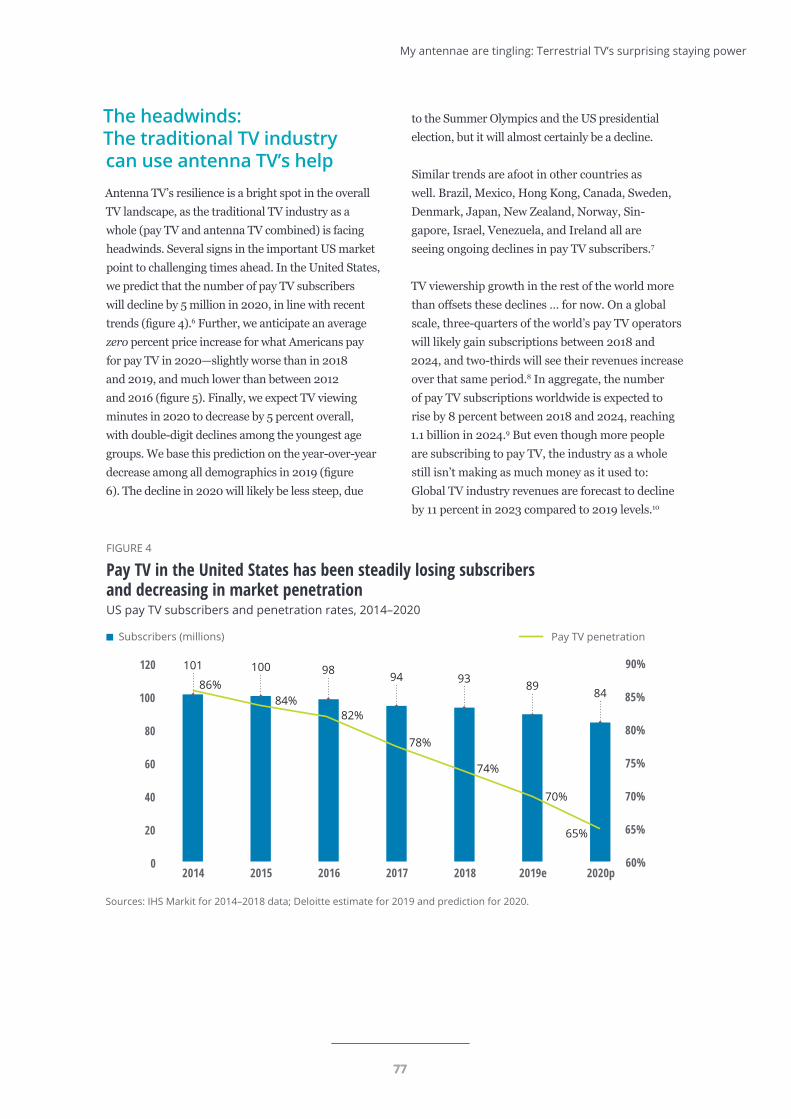
7777
My antennae are tingling: Terrestrial TV’s surprising staying power
The headwinds: The traditional TV industry can use antenna TV’s helpAntenna TV’s resilience is a bright spot in the overall TV landscape, as the traditional TV industry as a whole (pay TV and antenna TV combined) is facing headwinds. Several signs in the important US market point to challenging times ahead. In the United States, we predict that the number of pay TV subscribers will decline by 5 million in 2020, in line with recent trends (figure 4).6 Further, we anticipate an average zero percent price increase for what Americans pay for pay TV in 2020—slightly worse than in 2018 and 2019, and much lower than between 2012 and 2016 (figure 5). Finally, we expect TV viewing minutes in 2020 to decrease by 5 percent overall, with double-digit declines among the youngest age groups. We base this prediction on the year-over-year decrease among all demographics in 2019 (figure 6). The decline in 2020 will likely be less steep, due
Sources: IHS Markit for 2014–2018 data; Deloitte estimate for 2019 and prediction for 2020.Deloitte Insights | deloitte.com/insights
2014 2015 2016 2017 2018 2019e 2020p0
20
40
60
80
100
120
Subscribers (millions)
60%
65%
70%
75%
80%
85%
90%101 100 98 94 93 89 84
FIGURE 4
Pay TV in the United States has been steadily losing subscribersand decreasing in market penetrationUS pay TV subscribers and penetration rates, 2014–2020
86%84%
82%
78%
74%
70%
65%
Pay TV penetration
to the Summer Olympics and the US presidential election, but it will almost certainly be a decline.
Similar trends are afoot in other countries as well. Brazil, Mexico, Hong Kong, Canada, Sweden, Denmark, Japan, New Zealand, Norway, Sin-gapore, Israel, Venezuela, and Ireland all are seeing ongoing declines in pay TV subscribers.7
TV viewership growth in the rest of the world more than offsets these declines … for now. On a global scale, three-quarters of the world’s pay TV operators will likely gain subscriptions between 2018 and 2024, and two-thirds will see their revenues increase over that same period.8 In aggregate, the number of pay TV subscriptions worldwide is expected to rise by 8 percent between 2018 and 2024, reaching 1.1 billion in 2024.9 But even though more people are subscribing to pay TV, the industry as a whole still isn’t making as much money as it used to: Global TV industry revenues are forecast to decline by 11 percent in 2023 compared to 2019 levels.10
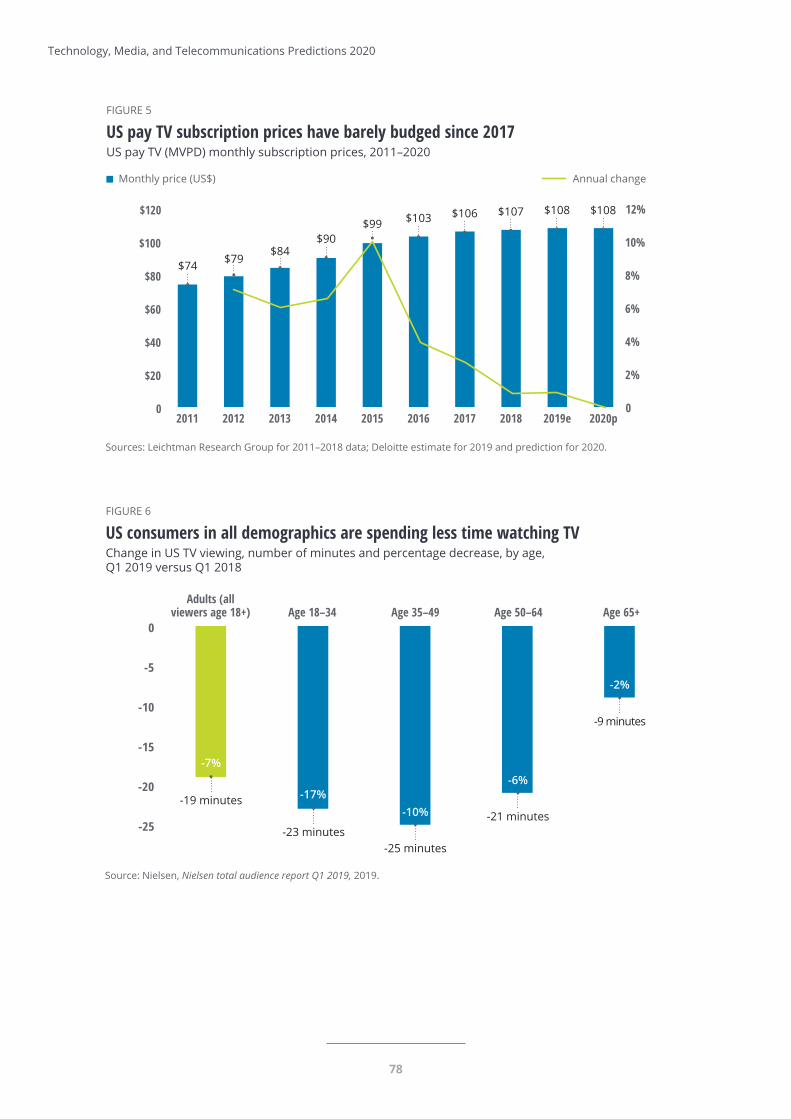
78
Technology, Media, and Telecommunications Predictions 2020
Source: Nielsen, Nielsen total audience report Q1 2019, 2019.Deloitte Insights | deloitte.com/insights
Adults (allviewers age 18+) Age 18–34 Age 35–49 Age 50–64 Age 65+
-25
-20
-15
-10
-5
0
-19 minutes
-23 minutes-25 minutes
-21 minutes
-9 minutes
FIGURE 6
US consumers in all demographics are spending less time watching TVChange in US TV viewing, number of minutes and percentage decrease, by age,Q1 2019 versus Q1 2018
-7%
-17%-10%
-6%
-2%
Sources: Leichtman Research Group for 2011–2018 data; Deloitte estimate for 2019 and prediction for 2020.Deloitte Insights | deloitte.com/insights
2011 2012 20142013 20162015 2017 2018 2019e 2020p0
$20
$40
$60
$80
$100
$120
Monthly price (US$) Annual change
0
2%
4%
6%
8%
10%
12%
$74 $79$84
$90$99 $103 $106 $107 $108 $108
FIGURE 5
US pay TV subscription prices have barely budged since 2017US pay TV (MVPD) monthly subscription prices, 2011–2020
79
My antennae are tingling: Terrestrial TV’s surprising staying power
The ads: Why are TV ad revenues still growing?
Advertisers are still showing faith in traditional TV. In the United States, average annual upfronts (the annual presales of ads for the whole year held every May, which generate about half of annual big-brand TV advertising spend) went up by 2.4 percent in 2019 year over year, and they are expected to rise by another 1.8 percent in 2020.11 And that’s just the average: Some networks even reported double-digit growth.12
Why aren’t things worse for broadcasters’ TV ad revenues, at least in markets such as the United States where viewership is falling? Here, antenna TV may well be one of the factors making the difference.
Antenna TV viewership is growing or at least stable in several large ad markets, representing tens of mil-lions of antenna TV watchers who (mostly) are not skipping ads while watching traditional TV. Antenna TV is big in the United States’ massive ad market, for instance, and it is getting bigger. More than 40 million Americans in at least 16 million homes watch antenna TV,13 up 48 percent since 2010; 10 million US homes have only antenna TV.14 In the United Kingdom, nearly 30 million people in 12 million homes watch antenna TV, up 2.3 percent since 2012, and 11 million of those homes have only free antenna TV as their source for traditional TV, although many of those also subscribe to SVOD services.15
Besides antenna TV’s growth, another reason for TV advertising’s resilience is the development of targeted or “addressable” ads. If a home has the right kind of box or TV—more than half of US homes in 2018,16 and about 40 percent of UK homes in 201917—advertisers can deliver specific ads to specific households (though not to individual viewers) at premium rates (three times that of a traditional ad, in one US instance).18 In the United Kingdom, broadcasters are working together to get more addressable ads in front of more viewers
as Channel Four uses Sky’s AdSmart technology.19 Addressable ads are likely to generate revenues of nearly US$3.4 billion in 2020 in the United States, up about one-third over the previous year, and 4.5 times more than in 2016.20 Although still only a small part of the United States’ overall US$70 billion annual spend on TV ads, these ads are helping the TV industry to offer advertisers features such as personalization and viewership measurement that previously were possible only with digital ads, as well as drive much higher prices per thousand views.
The final factor contributing to TV ad spending is that the ongoing shift to digital ads of all types isn’t a one-way street. Although digital has been growing, and is expected to continue growing, individual ad buyers are constantly reallocating their spending between digital and TV (as well as other categories); but TV and digital combined are expected to represent just under 80 percent of global ad spending by 2021.21 According to a recent UBS study, half of the surveyed ad buyers are planning on shifting advertising dollars from TV to digital … but the other half are shifting dollars from digital back to TV.22 Prominent names that have publicly announced reallocating at least some money to TV include JPMorgan,23 P&G,24 and Amazon.25
Research supports the business reasons behind that shift. One UK study found that TV ads have the highest ROI of any channel.26 A US study found that TV ads were best at building an emotional connection with a brand, and that the most effective campaigns were TV-led.27 At a high level, findings such as these suggest that the choice is not binary between TV and digital; rather, advertisers should find a mix of the two that work together. Given that some companies in recent years have gone
“all in” on digital,28 it is not surprising that some dollars—billions of them, in fact—may be coming back to TV worldwide. (To be clear, in some regions, the shift to digital is at an earlier stage than in the United States or the United Kingdom, so digital is still gaining share in the ad market globally.)
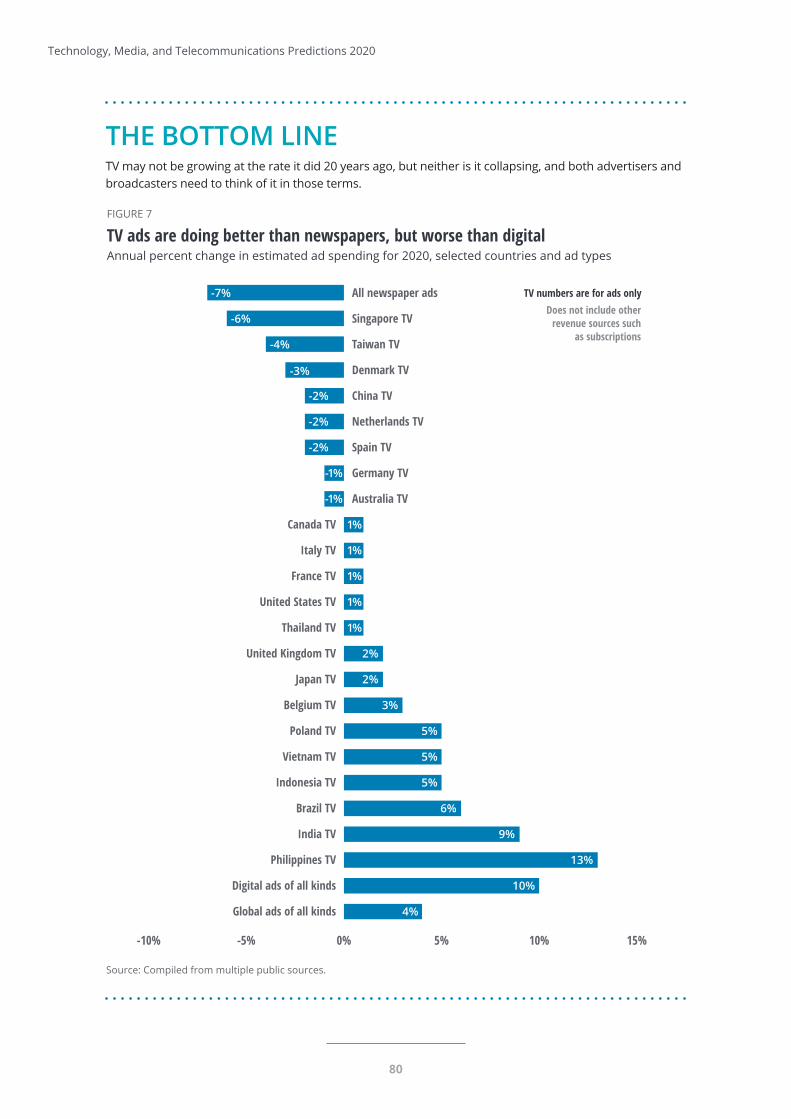
80
Technology, Media, and Telecommunications Predictions 2020
Source: Compiled from multiple public sources.Deloitte Insights | deloitte.com/insights
-10% -5% 0% 5% 10% 15%
All newspaper ads
Singapore TV
Taiwan TV
Denmark TV
China TV
Netherlands TV
Spain TV
Germany TV
Australia TV
Canada TV
Italy TV
France TV
United States TV
Thailand TV
United Kingdom TV
Japan TV
Belgium TV
Poland TV
Vietnam TV
Indonesia TV
Brazil TV
India TV
Philippines TV
Digital ads of all kinds
Global ads of all kinds
-7%
-6%
-4%
-3%
-2%
-2%
-2%
2%
2%
3%
5%
5%
5%
6%
9%
13%
10%
4%
-1%
-1%
1%
1%
1%
1%
1%
TV numbers are for ads onlyDoes not include other
revenue sources suchas subscriptions
FIGURE 7
TV ads are doing better than newspapers, but worse than digital Annual percent change in estimated ad spending for 2020, selected countries and ad types
THE BOTTOM LINETV may not be growing at the rate it did 20 years ago, but neither is it collapsing, and both advertisers and broadcasters need to think of it in those terms.
81
My antennae are tingling: Terrestrial TV’s surprising staying power
TV ads, first of all, are not following the same path as some other traditional media ads. TV ad revenue is not dealing with multiyear double-digit declines. Although our discussion has mainly focused on the large US market, TV ad spending in 2020 is also expected to grow in dollar terms (although usually losing share of the total ad market) in the Philippines,29 India,30 Brazil,31 Vietnam,32 Indonesia,33 Poland,34 Belgium,35 Japan,36 the United Kingdom,37 Thailand,38 Canada,39 France,40 and Italy.41 And although it is expected to shrink even in absolute dollar terms in some markets (Australia,42 Germany,43 Spain,44 Netherlands,45 China,46 Denmark,47 Taiwan48 and Singapore49), the annual declines are moderate rather than severe, and they are still less than the declines in ad revenues for other kinds of traditional media, such as newspapers (figure 7). Interestingly, many of the higher-growth TV ad markets are also ones where antenna TV usage rates are the highest.
It’s worth noting, however, that the future of TV advertising is by no means certain. While we can be fairly confident about its growth in 2020—Olympics plus the US presidential election make for predictable growth—the picture becomes cloudier as we peer further into the future. We believe that total TV ad spend in 2021 should still be higher than in 2019, even if slightly lower than or flat with 2020 levels. For 2022 and later, the crystal ball becomes even murkier. Although it seems probable that the current trend will continue—basically flat TV ad revenues, with uplifts once every four years—at least one study predicts a “TV tipping point” in 2022 and beyond.50 It argues that TV’s decreasing reach combined with the ongoing drop in TV viewing minutes—especially among desirable younger demographics—is reducing TV’s current ROI advantage over other forms of advertising. And as that ROI advantage erodes, the study predicts, TV ad revenue will begin to drop more sharply unless broadcasters and distributors take steps to adapt. The implications may be sobering for broadcasters in many countries: While this particular report is based on data from the United Kingdom, data from other markets shows similar trends.
Focusing on antenna TV specifically, its surprisingly strong performance holds some interesting angles for broadcasters. One might assume that broadcasters would be indifferent to whether a viewer watches TV via an antenna or a pay-TV distribution mechanism, such as cable. As long as they are watching, and the broadcaster can charge advertisers for those eyeballs, who cares how the content is delivered? In fact, since ad skipping is likely less common on antenna TV, one might think that broadcasters would be pleased by antenna TV viewership growth. The reality is more nuanced. Prior to 1992, at least in the United states, broadcasters would indeed have had reason to celebrate antenna TV’s resilience. But since then, in the United States as well as other countries, distributors have been paying broadcasters retransmission consent fees. These fees added up to an estimated US$11.7 billion in 2019 in the United States, up 11 percent from 2018.51 Thus, in countries where retransmission consent fees are material, a shift to antenna TV is better for broadcasters than losing viewers to cord-cutting entirely, but it is a mixed blessing. In countries without those fees, however, antenna TV is an absolutely good thing for broadcasters.
Antenna TV’s resilience shows that up to 2 billion viewers worldwide are willing to make a deal: They will watch some commercials (sometimes a lot of commercials) in exchange for free TV. The willingness to do this is not confined to antennas and terrestrial broadcasts. With the growth of AVOD, we expect hundreds of millions of viewers in 2020 to make the same deal, willing to watch some percentage of advertising content in exchange for free, or at least discounted, quality video entertainment.52
Are all viewers willing to make that deal? Obviously not. As we described in 2018, about 10 percent of “adlergic” North American (American and Canadian) adults block ads in four or more different ways.53 A subsequent survey in Turkey found that about 10 percent of adults there showed the same pattern, which suggests an adlergic population in the developing world as well. In all three countries, the percentage of individuals showing adlergic behavior was higher among young people, those with jobs, and those with higher incomes or more education. When it came to video sources, about half of the US study’s respondents who subscribed to SVOD services, such as Netflix, said that their ad-free nature was one of the reasons they subscribed; just under 10 percent said it was the main reason they subscribed.
82
Technology, Media, and Telecommunications Predictions 2020
Don’t start counting that second digital dividend quite yetOddly, antenna TV’s continuing popularity may have its biggest impact, not on the TV or advertising industries, but on wireless telecommunications companies, regulators, and governments. Perhaps due to the lack of a global figure for antenna TV viewers, it has been widely assumed that, although perhaps a few people still watched using antennas, the number was small and would (relatively) soon approach zero. At that point, it was thought, the frequencies used for terrestrial broadcast could be reassigned. Switzerland has already announced that it is doing so, and some articles speculate that the rest of Europe could follow in the next 10 to 15 years.54 But can the rest of the world follow suit?
It’s not a trivial question. The frequencies used for UHF TV stations in the Americas, between 470 and 890 MHz,55 have many desirable characteristics: They can travel nearly 100 kilometers (depending on power and broadcast tower height), and they pass through trees and most building materials easily, assuring good reception as long as there wasn’t a mountain in the way. These attributes are ideal for transmitting TV signals … or any other kind of radio signal, for that matter.
Digital broadcasting was an amazing win/win transition. A digital signal was better than analog,
had less interference and static, and could support high-definition images rather than standard, all using a narrower chunk of spectrum than analog. The TV industry’s conversion from analog transmis-sion to digital (and their corresponding shutdown of analog transmission) not only gave consumers better TV, but also freed up hundreds of megahertz of desirable “beachfront” spectrum. Governments were then able to reallocate this spectrum, mostly to mobile network operators, raising billions of dollars via spectrum auctions in the process. For their part, operators using these frequencies were able to improve coverage and higher data transmission speeds. These gains, which were not small, are referred to as the “digital dividend.” Among other things, the digital dividend contributed an estimated US$15 billion to the Latin American economy alone,56 while spectrum auctions raised $20 billion in the United States, $4 billion in Germany, and tens of billions more in the rest of the world.57
The potential gains for operators and governments would likely be just as large if terrestrial digital transmission goes away. But will it ever happen? It can and will in Switzerland, where only 1.9 percent of the population (about 64,000 people) still watch TV via an antenna. But with half of all TV viewers around the world watching at least some TV using an antenna, broadcasters aren’t going to want to hand over the spectrum they use for those broadcasts to governments, and then to operators, anytime soon. A second digital dividend looks anything but imminent.
Based on all this, it looks like the future of TV will contain a mix of business models. Some TV watchers—about a tenth of the population in developed countries—utterly refuse to watch ads, and will be willing to pay for the privilege. Others, who are willing to watch many ads but want to pay nothing on an ongoing basis, will watch only antenna TV. This latter group likely represents another tenth of the population in North America, but it is higher or much higher almost everywhere else. The expected number of antenna TV viewers varies considerably across regions and among countries within a region: For instance, the gap between the top and bottom antenna TV–watching countries in Europe is greater than 90 percent. And then there are the rest of us: the 80 percent of TV watchers who fall in between those two extremes, paying varying monthly fees and watching varying amounts of ads.

83
My antennae are tingling: Terrestrial TV’s surprising staying power

84
Technology, Media, and Telecommunications Predictions 2020
Endnotes1. Jeff Loucks, David Ciampa, and Shashank Srivastava, Ad-supported video: Will the United States follow Asia’s lead?—
TMT Predictions 2020, Deloitte Insights, December 9, 2019.
2. Larissa Faw, “Ad outlook downgraded again, this time it’s Zenith,” MediaPost Agency Daily, July 7, 2019.
3. TV Azteca, “La televisión del futuro comienza aquí,” May 2019.
4. International Telecommunication Union (ITU), “Status of the transition to digital terrestrial television,” accessed 1 October 2019.
5. Nielsen, The Nielsen local watch report, August 5, 2019.
6. Erik Brannon, “Early year end 2018 US pay TV reporting shows video subscriber declines,” IHS Markit, February 8, 2019.
7. Guy Daniels, “Pay TV subscriptions decline in 14 markets in 2017, but revenues hold fast,” TelecomTV, May 3, 2018.
8. Business Wire, “Global pay TV operator forecasts to 2024—3/4ths of the world’s pay-TV operators will gain subscribers between 2018–2024, Research And Markets,” June 24, 2019.
9. Broadband TV News, “Global pay-TV to add 81 million subscribers,” June 13, 2019.
10. PR Newswire, “Global pay tv revenue market 2017–2023: Revenues peaked in 2016 at $205 billion but will fall by 11% by 2023,” Research And Markets, April 19, 2018.
11. Wayne Friedman, “TV upfront projected up 2.5%, digital video will rise 20%,” Television News Daily, MediaPost, April 29, 2019.
12. Anthony Crupi, “In new SEC filing, NBCU reports $7 billion in upfront sales,” AdAge, July 25, 2019.
13. Daniel Frankel, “U.S. OTA homes up 48% in 8 years to 16M: Nielsen,” Multichannel News, January 16, 2019.
14. Nielsen, The Nielsen total audience report, 2019.
15. Ofcom, Media nations: UK, July 18, 2018.
16. Jamie Power, “Don’t believe everything you’ve heard about addressable TV advertising,” AdAge, October 24, 2018.
17. Seb Joseph, “‘The market lacks uniformity’: In the UK, targeted TV ads have their challenges,” Digiday, May 1, 2019.
18. Mike Dano, “AT&T: Addressable advertising CPMs up to $40, 3x traditional ads,” FierceVideo, August 8, 2017.
19. Channel 4, “Sky and Channel 4 broaden industry-leading partnership,” September 17, 2019.
20. Ross Benes, “Still early days for TV ad innovation,” eMarketer, February 27, 2019.
21. Zenith Media, “Advertising expenditure forecasts March 2019: Executive summary,” March 2019.
22. Paul Dughi, “Major advertisers shifting dollars from digital to TV,” Medium, June 4, 2018.
23. Jacqui Frank, Kara Chin, and Tanya Dua, “Kristin Lemkau interview: JPMorgan Chase’s CMO explains how she deals with disruption on two fronts at once, why she’s moving some ad dollars back to TV, and why it matters what your credit card feels like,” Business Insider, May 22, 2018.
24. Paul Dughi, “P&G cuts programmatic ad spend by 90% due to brand safety concerns,” Paul Dughi.com, March 6, 2018.
25. Ellen Hammett, “Amazon doubles down on TV advertising,” Marketing Week, March 21, 2019.
26. Thinkbox, “TV advertising is more effective than ever,” July 16, 2018.

85
My antennae are tingling: Terrestrial TV’s surprising staying power
27. Todd Wasserman, “TV advertising isn’t dead—it’s evolving,” CMO by Adobe, September 26, 2018.
28. Frank, Chin, and Dua, “Kristin Lemkau interview.”
29. Dentsu Aegis Network, Global ad spend forecasts, February 2019, p. 132.
30. Ibid., p. 115.
31. Ibid., p. 155.
32. Ibid., p. 148.
33. Ibid., p. 118.
34. Ibid., p. 78.
35. Ibid., p. 14
36. Ibid., p. 123.
37. Ibid., p. 56.
38. Ibid., p. 145.
39. Ibid., p. 94.
40. Ibid., p. 23.
41. Ibid., p. 35.
42. Ibid., p. 102.
43. Ibid., p. 26.
44. Ibid., p. 47.
45. Ibid., p. 38.
46. Ibid., p. 106.
47. Ibid., p. 17.
48. Ibid., p. 142.
49. Ibid., p. 135.
50. Andrew Challier, “Is TV approaching a tipping point for reach?,” Ebiquity, February 4, 2019.
51. Adam Jacobson, “Retransmission consent revenue: An 11% growth engine,” Radio+Television Business Report, July 30, 2019.
52. Loucks, Ciampa, and Srivastava, Ad-supported video.
53. Deloitte, Is there an #adlergic epidemic? Ad blocking across media, 2018.
54. Chris Morris, “Switzerland is doing away with over-the-air TV. Could the U.S. do the same?,” Fortune, September 6, 2018.
55. Wikipedia, “Pan-American television frequencies,” accessed October 1, 2019.
56. GSMA Latin America, “Allocating digital dividend spectrum for mobile broadband could contribute up to $15 billion to the Latin American economy,” September 22, 2011.
57. GSMA, “Auctions summary,” accessed October 1, 2019.

8686
Technology, Media, and Telecommunications Predictions 2020
CONTENT DELIVERY NETWORKS (CDNs) are the workhorses of the internet, designed to improve media quality, speed, and reliability
by bringing content physically closer to the user. We predict that the global CDN market will reach
Coming to a CDN near youVideos, games, and much, much more
US$14 billion in 2020, up more than 25 percent from 2019’s estimated US$11 billion. Further, the market will more than double to US$30 billion by 2025, a compound annual growth rate of more than 16 percent.1

8787
Coming to a CDN near you: Videos, games, and much, much more
This growth is being driven primarily by consumers’ ever-increasing hunger for streaming video over the internet, now amplified by the migration of more broadcast and cable TV onto direct-to-consumer over-the-top (OTT) internet delivery networks. Live video streaming and the emergence of stream-ing video games may further spur growth, as well as prompt more technical innovation. However, it’s not certain exactly who will cash in on all this growth, as bigger media, cloud, and telecom players develop or expand their own content delivery net-works. Their success may threaten profits for existing CDN providers even while increasing demand for the hardware and software capabilities necessary to deliver so much media.
Why are CDNs such a big deal?
CDNs have played a critical role in the internet’s expansion and evolution. Originally, when band-width was less available, CDNs emerged as a way to make the more data-intense parts of a website, such as images with large file sizes, load more quickly. Early CDNs like Akamai set up regional hubs that held copies (caches) of all the images on a website, bringing content closer to people browsing the internet around the world. With so many points of presence (PoPs), even though a user in San Francisco might be browsing a popular website hosted on servers in Europe, their browser could fetch the images from a nearby CDN hub holding copies of the media.
As more people accessed the internet, and as band-width availability grew, Web-based sites and services were able to become richer and more
capable, placing further demands on specialized CDNs. They evolved to support software downloads, accelerated mobile content, and richer media such as video. The build-out of these more sophisticated networks and capabilities created even greater demand for CDNs to accelerate the user experience, supporting the CDN industry’s growth. Top global CDN providers today are in a position to spend bil-lions to expand their massive infrastructure underneath the growth of the Web—and they might need to: CDNs are expected to carry 72 percent of all internet traffic by 2022, up from 56 percent in 2017.2 And it’s not just existing CDN providers that are getting into the act: A growing number of media and telecom companies are developing CDNs as well.
A typical CDN will place media storage and play-back “appliances” at the edges of its network, in internet service providers (ISPs) or internet exchange points (IXPs) in major metropolitan areas, to get closer to end users. These appliances are physical boxes with large storage capacity and soft-ware capabilities, sometimes referred to as micro data centers. Netflix, for instance, maintains thou-sands of these boxes across its global OpenConnect CDN, each holding up to 80 percent of Netflix’s entire media catalog.3 The boxes are custom-de-signed, assembled by suppliers, and delivered to regional ISPs and IXPs for installation. The Netflix core manages the transcoding of new content and regularly pushes updates to its edge appliances. The system is continuously monitored for loads and faults, and failing appliances can be quickly taken offline and capacity shifted to other redundant PoPs.4
8888
Technology, Media, and Telecommunications Predictions 2020
Video goes over the top
The largest driver of growth for the CDN market has been, and will likely continue to be, the rising demand for video over the internet. The internet, of course, isn’t the only way to watch videos; many other video delivery technologies, ranging from old-school on-air broadcasting to cable, DSL (copper phone lines), and private internet protocol televi-sion (IPTV) networks, are still in use today.5 However, to keep up with evolving consumer behavior amid an explosion of mobile devices, as well as the advertising dollars that follow large numbers of eyeballs, digital media delivery has been expanding from private IPTV networks into OTT networks that run over the internet. This expansion into OTT has at once enabled and been a response to much higher internet usage and greater broadband penetration.
According to Sandvine, OTT streaming video uses over 60 percent of global internet bandwidth.6 Netflix already uses an estimated 15 percent of global downstream internet traffic,7 and a single top streaming video service can consume up to 40 percent of downstream traffic on some regional operator networks.8 Fueling all that video traffic is continued growth in streaming video on demand services (SVOD). In 2018, global subscriptions to streaming video services overtook those for cable television for the first time, reaching over 613 mil-lion people, 27 percent more than the year before.9
With several major new SVOD services launching, global subscriptions to streaming services could grow significantly. The resulting increase in OTT video traffic, however, won’t necessarily drive greater revenues for specific CDN providers. Much of the growth in video traffic comes from the largest SVOD services, social networks, and other hyper-scale digital media companies that already operate their own CDNs.10 Furthermore, the largest media companies entering the SVOD space may eventually build their own networks or, in some cases, use the networks they already control. For example, some major telecoms that have acquired media proper-ties also have their own CDNs. This could give them greater control of delivery from cloud to consumer.
Although the current SVOD expansion is being led primarily by US-based media, some see global net-works as a path to unlock global markets.11 Analysts have predicted a rapid expansion of demand in Asia-Pacific markets; Asia-Pacific is expected to account for 51 percent of all video streaming traffic by 2024, almost twice as much as in 2018.12 Some US CDN providers offer CDN services in Asian markets, and some leading Chinese CDNs now host over 1,000 PoP nodes across the country, with additional net-works in other Asian countries.13 However, content delivery in Asian markets can be challenging due to sparse coverage and limited mobile networks. For broadcasters eyeing expansion into Asia, working with CDNs that understand these regions’ nuances can reduce some of these challenges.
IT’S HARD WORK MAKING IT EASY TO WATCH VIDEOVideo files are particularly large, and tremendous technological wizardry is needed to compress them, break them apart into distributed pieces, and then dynamically reassemble and stream them on demand to hundreds of millions of requesters, all with high resolution and minimal latency. The growing quantity and sophistication of OTT video content means more traffic, more routing, and a greater need for manage-ment, optimization, and prediction across the CDNs responsible for delivering speedy and reliable content.
From a technical standpoint, live and on-demand video streams move a lot of bits to render high-resolu-tion images. The stream travels in only one direction, and the content isn’t directly interactive, but they still contain a great deal of data. Streams need buffering and caching to avoid lags and dropouts. Legacy proto-cols such as real-time messaging protocol (RTMP), developed over a decade ago to encode video and move it across networks to clients, will likely be dis-placed by newer solutions such as secure reliable transport (SRT), designed to further decrease latency and meet the demands of live and on-demand stream-ing. CDN giant Akamai, for instance, has announced a partnership with Bitmovin to develop “next-genera-tion encoding capabilities” that include SRT.14

8989
Coming to a CDN near you: Videos, games, and much, much more
Live video streaming, in particular, can pose significant challenges for CDNs. Live video streams support real-time events like concerts and sports games, but they also include social streaming services that let anyone stream video, a global phe-nomenon that is growing quickly. After launching its social streaming platform TikTok, China’s ByteDance saw almost 1 billion downloads within the first two years.15 Many people are streaming their lives to the world, further fragmenting audi-ences and driving viewers toward free niche content. By some estimates, live video streams in 2018 accounted for 11 exabytes (EB) out of a total 58 EB of CDN video traffic; by 2024, live streaming is expected to account for as much as 238 EB out of a total of 453 EB—or half of all video streaming.16
As the audiences for live streaming services grow, so too should CDNs. CDNs delivering live stream-ing media should be able to encode video in real time, copy it out to PoPs, and manage demand for the content. Planned events like big concerts and championships can have network resources allo-cated to them ahead of time, but other events can be unexpected. Major influencers and celebrities can suddenly draw an enormous viewing audience to their streams, as can breaking news events. CDNs must be able to quickly detect such spikes in traffic and respond dynamically to support the demand, whether regional or global.
Apart from issues around timing and resource allo-cation, CDNs also have to deal with the challenges of operating across diverse and dynamic networks, carriers, devices, and audiences. To do this effec-tively requires ongoing analysis and responsiveness, and depends crucially on continuous visibility into network performance. For CDNs that are also mov-ing content across telecom carrier networks, routing intelligence is critical to ensuring high-per-formance streams. These systems can dynamically shift traffic across carriers if one is experiencing
low throughput and placing the stream at risk. Evaluating carrier performance, too, can help a CDN determine where faults may have originated. Beyond the edge of the CDN network, streams must transit last-mile networks that include wire-line and wireless carriers as well as a myriad of access points, such as home Wi-Fi. But although CDNs can see across these long tendrils of the net-work topology, they are typically unable to meaningfully manage them.
Ultimately, for media companies and CDN provid-ers in an increasingly competitive landscape, ensuring a high-quality experience for the end user is the top priority. Low-quality video and buffered streams can quickly damage a CDN operator’s reputation, making it imperative to invest in sophis-ticated monitoring and analytics capabilities. Software layers deliver status dashboards, extract and operate on data analytics, and automate net-work-scale load balancing, fault detection, and demand prediction. More sophisticated data sci-ence and machine learning solutions can predict failure rates for digital content and hardware assets before deploying them to the end user.17 Likewise, they can predict spikes in demand within specific regions, and then preallocate resources directly to those PoPs, even copying content such as a newly released movie to specific regional appliances.18
Streaming video games: The next big challenge
Even as networks expand to accommodate growth in OTT video, much richer and more dynamic con-tent may soon be vying for their infrastructure. Some of the world’s largest cloud providers have announced plans to stream multiplayer video games. Doing that, however, is quite a different challenge from streaming video.

9090
Technology, Media, and Telecommunications Predictions 2020
Rendering a game on a player’s device isn’t markedly different than rendering a movie. However, in multi-player video games, the “movie” continuously changes in response to player commands—run, turn, shoot—and every player has a different view of the game based on their position in the game world. Hence, data must flow both downstream to the play-er’s device and upstream back to the game engine, and there can be no noticeable latency between a player’s action and the game engine’s resulting response. Latencies above 50 milliseconds or so can quickly make many top video games unplayable.19 Rendering speed, which depends on bandwidth, is also a challenge. Continuously drawing and redraw-ing images on a small mobile screen is one thing, but many gamers play on large 4K screens, and some TV makers promise 8K rendering.
Considerable computational power and network messaging goes into instantaneously synchronizing actions between the game and its players, particu-larly if synchronization is required across the globe. The most popular multiplayer games today host more than a million players simultaneously, but they only manage this by partitioning users into smaller groups in separate instances of the game (for example, by creating 10,000 different “worlds” that host 100 players each). The newer streaming video game providers claim that their services will allow a single game instance to potentially support thousands of players, placing greater demands on CDNs to manage the necessary synchronization.
Google is tackling these challenges head-on with its Stadia service for streaming video games. To do so successfully will likely require infrastructure, exper-tise, and significant capital. Google’s capex grew by 80 percent in Q4 2018 to reach US$6.8 billion,
although much of this was in the opaque category of data centers and servers.20 Google has also been growing its fiber network, which has hundreds of PoPs and several thousand edge processing nodes. The company operates a mature CDN to support YouTube, leveraging its expertise in data science and machine learning to manage demand and deliv-ery; in fact, Stadia is positioned as an extension of YouTube. Google is thus likely well placed to cap-ture game traffic on its own CDN—a reminder that overall CDN revenues may accrue more to leading platform services running their own networks that support services higher up the stack.
Among the many technical and market challenges ahead for streaming video games, it’s worth noting that several leading game publishers have announced their own interest in developing cloud streaming for their top franchises. They too may look to CDN providers for the assist. With a global video game market serving over 2.5 billion players and estimated to generate US$150 billion by 2020, game publishers and content delivery networks could align to build the next generation of stream-ing media.
Some of the world’s largest cloud providers have announced plans to stream multiplayer video games. Doing that, however, is quite a different challenge from streaming video.

9191
Coming to a CDN near you: Videos, games, and much, much more
THE BOTTOM LINEPeople across the world now spend the majority of their internet time streaming video, and the internet itself is segmenting into cloud-based services and CDN edge capabilities. Growth in live streaming video and the promise of streaming video games may further impact competition and innovation. These shifts have implications for a range of players: media companies, telecoms, and CDN providers.
Media companies may view the current landscape as an incentive to move more content onto CDNs. However, this is by no means a simple decision. Broadcast and pay TV are still strong, although slowing in some major geographies.21 In addition, deconstructing IPTV networks and set-top boxes is not easy, nor is shifting an audience to potentially risky OTT services. Most media companies will likely run their OTT efforts in parallel with their broadcast and pay TV services, allowing the market to determine which will draw the most subscribers.
For many media companies adding OTT to their strategic initiatives, the question becomes: How? Should they partner with a CDN provider? Do they expand on their existing relationships with networks that they have developed for streaming pilots? Or do they commit to building their own CDN? The equation becomes more difficult when considering the potential competitive advantages media companies may find in controlling delivery and owning the value chain right down to the end consumer. Major media companies may choose to build their own networks to control the entire delivery pipeline—and to secure ownership of the data their audiences generate. However, only a few will likely have the capital to do so. The rest will probably rent capacity from CDN providers who, in turn, will pay telecoms to run traffic on their networks. The cost of renting distribution over CDNs is now very low, which can make renting an attractive option—as well as increase the pressure on CDN providers to expand margins by offering other services or applying event-based peak pricing models.22
For their part, many telecoms already operate and lease access to CDNs. However, with margins on CDN rents narrowing, leasing CDN access to content providers may become less profitable. This may provide an incentive for telecoms that have purchased media catalogs to invest more in delivery capabilities around their own content. Yet telecoms are also building out appliances on cell towers and selling edge services. Can they sell CDN and edge services and still invest in differentiating delivery for their own content? Also worth considering is that both CDN and edge services allow telecoms to offer their customers more sensing and analytics capabilities that can be translated into performance and innovation. Is there a clear path from controlling a private CDN to establishing competitive advantage around delivery and analytics?
Telecoms also control the last mile of content delivery to users. Can they parlay this last-mile control into value? Cisco predicts that, by 2022, 12 percent of mobile traffic will be over 5G, with the average 5G connection using 21GB of traffic per month. If 5G becomes widely implemented and adopted, will it shift more power to the telecoms that control last-mile delivery? Will it open up room for richer media we haven’t yet imagined?
As for CDN providers themselves, they will likely face more challenges with capacity, quality of service, load balancing, and demand prediction as more audiences shift onto streaming services. Similar to what has happened among cloud providers, competition could drive CDN rental prices down further. Top CDNs may also face greater market pressure to secure delivery of intellectual property against intrusion and theft. To address these needs, CDNs could put in place additional data analytics, machine learning, and potentially content blockchains to manage growing complexity—all of which would add to their operating costs. Computation storage and routing will likely prompt investments in hardware, while load balancing, stream optimization, demand prediction, and security may demand more software capabilities.

92
Technology, Media, and Telecommunications Predictions 2020
On the other hand, while CDNs may face growing competition and lower margins for delivery, they may also expand as more cloud services migrate to the edge. Just as telecoms are dabbling in CDNs, CDNs are spinning up edge computing services,23 not just for media, but also for IoT.24 Savvy observers should pay attention to CDN provider announcements that might give them greater competitive advantage at the edge, as this new shift reshapes the businesses of cloud providers, telecoms, and CDNs alike.
The rising demand for more and more internet video, along with new offerings such as streaming video games, should continue to shape the internet to meet users’ needs. Networks of all stripes will likely keep coevolving with hardware innovations and human behavior. In the near term, the CDN market is poised for strong growth. What this means for the CDN providers, media companies, and telecoms jockeying for position in that market remains to be seen.

93
Coming to a CDN near you: Videos, games, and much, much more
Endnotes1. Mordor Intelligence, Content delivery network (CDN) market - growth, trends, and forecast (2019 - 2024),
Research and Markets, May 2019.
2. Cisco, Cisco Visual Networking Index: Forecast and trends, 2017–2022 white paper, February 27, 2019.
3. Eric Limer, “This box can hold an entire Netflix,” Gizmodo, July 23, 2014.
4. Netflix, “Open Connect appliances,” accessed October 11, 2019.
5. Duncan Stewart, “My antennae are tingling: Terrestrial TV’s surprising staying power,” TMT Predictions 2020, Deloitte Insights, December 9, 2020.
6. Cam Cullen, “Sandvine releases 2019 global internet phenomena report,” Sandvine, September 10, 2019.
7. Cam Cullen, “Global internet phenomena report: Netflix is approximately 15 per cent of worldwide downstream traffic,” Sandvine, September 28, 2018.
8. Todd Spangler, “Netflix eats up 15% of all internet downstream traffic worldwide (study),” Variety, October 2, 2018.
9. Andrew Liptak, “The MPAA says streaming video has surpassed cable subscriptions worldwide,” Verge, March 21, 2019.
10. Dan Rayburn, “Update on CDN market trends: Latest CDN data shows pricing hitting rock bottom at $0.001 per GB, here’s what it means for the industry,” Streaming Media Blog, May 9, 2019.
11. Todd Spangler and Leo Barraclough, “Disney Plus: First global markets get launch dates, pricing,” Variety, August 19, 2019.
12. Rapid TV News, “SRT triggering video surge bigger than SVOD,” July 22, 2019.
13. Alibaba Cloud, “Alibaba Cloud CDN vs. AWS CDN and Akamai China coverage,” Medium, January 31, 2018.
14. Michelle Clancy, “Akamai integrates Bitmovin for transcoding,” Rapid TV News, April 6, 2019.
15. Eamon Barrett, “Can TikTok turn 950 million downloads into a booming business?,” Fortune, June 26, 2019.
16. Rapid TV News, “SRT triggering video surge bigger than SVOD.”
17. Nirmal Govind and Athula Balachandran (Netflix Technology Blog), “Optimizing content quality control at Netflix with predictive modeling,” Medium, December 10, 2015.
18. Andrew Berglund (Netflix Technology Blog), “How data science helps power worldwide delivery of Netflix content,” Medium, May 26, 2017.
19. Plug Things In, “What is latency?,” accessed October 11, 2019.
20. Tom Krazit, “Google boosts capital expenditures in Q4 by 80 percent to $6.8B as it chases cloud rivals,” GeekWire, February 4, 2019.
21. Duncan Stewart, “My antennae are tingling: Terrestrial TV’s surprising staying power,” TMT Predictions 2020, Deloitte Insights, December 9, 2020.
22. Rayburn, “Update on CDN market trends.”
23. Akamai, “Akamai introduces the Edge Cloud solution, designed to scale, secure and simplify IoT connected device and in-application messaging,” press release, June 12, 2019.
24. Ibid.

94
Technology, Media, and Telecommunications Predictions 2020
AMIT SHARMA (not his real name)1 admits that he watched way more of the recent Cricket World Cup2 than he planned to—
including when he should have been working for his Hyderabad-based employer. “It was so tempting to binge-watch because I had an app on my smart-phone that gave me access to every single game.
Ad-supported videoWill the United States follow Asia’s lead?
I’m a big cricket fan, so I tuned in as often as I could.” He doesn’t regret it: “It was great to see so many matches, and lots of my friends and family were watching on their smartphones too. So, it was a social experience even though I was watching on my phone. It seemed like the whole country was.”
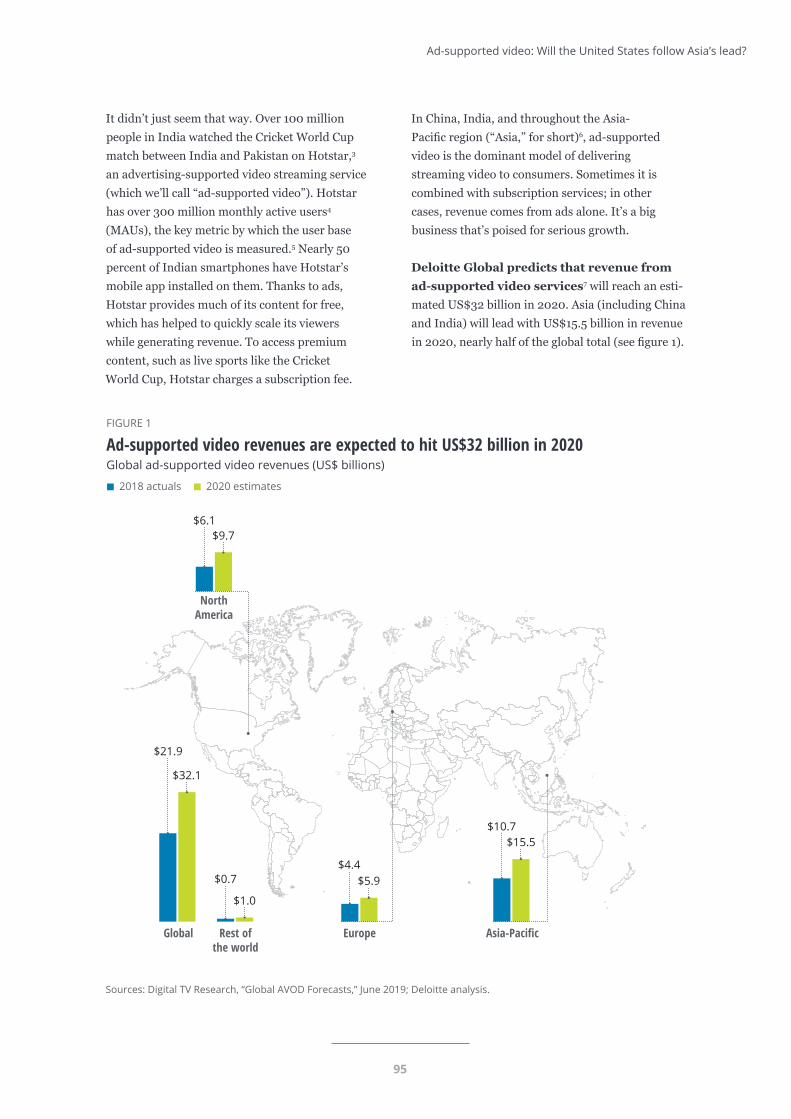
95
Ad-supported video: Will the United States follow Asia’s lead?
It didn’t just seem that way. Over 100 million people in India watched the Cricket World Cup match between India and Pakistan on Hotstar,3 an advertising-supported video streaming service (which we’ll call “ad-supported video”). Hotstar has over 300 million monthly active users4 (MAUs), the key metric by which the user base of ad-supported video is measured.5 Nearly 50 percent of Indian smartphones have Hotstar’s mobile app installed on them. Thanks to ads, Hotstar provides much of its content for free, which has helped to quickly scale its viewers while generating revenue. To access premium content, such as live sports like the Cricket World Cup, Hotstar charges a subscription fee.
In China, India, and throughout the Asia- Pacific region (“Asia,” for short)6, ad-supported video is the dominant model of delivering streaming video to consumers. Sometimes it is combined with subscription services; in other cases, revenue comes from ads alone. It’s a big business that’s poised for serious growth.
Deloitte Global predicts that revenue from
ad-supported video services7 will reach an esti-mated US$32 billion in 2020. Asia (including China and India) will lead with US$15.5 billion in revenue in 2020, nearly half of the global total (see figure 1).
2018 actuals 2020 estimates
Sources: Digital TV Research, “Global AVOD Forecasts,” June 2019; Deloitte analysis. Deloitte Insights | deloitte.com/insights
FIGURE 1
Ad-supported video revenues are expected to hit US$32 billion in 2020Global ad-supported video revenues (US$ billions)
$9.7
$5.9$4.4
$15.5$10.7
$6.1
$1.0
$0.7
$21.9
$32.1
Rest ofthe world
NorthAmerica
Global Europe Asia-Pacific
96
Technology, Media, and Telecommunications Predictions 2020
This prediction will document the rapid rise of ad-supported video services in Asia. Over a billion people in Asia watch ad-supported video services thanks to the advent of affordable 4G connectivity, low-cost smartphones, and business models that allows consumers to exchange their attention for free (or low cost) TV shows, movies, and sports.
Some Asian streaming services are using ad-sup-ported video as the foundation for broader ambitions. After building huge user bases and reliable revenue from ad-supported streaming, they are developing formidable subscription businesses that feature original content, sports, music, and gaming. The goal is to become an entertainment platform that can satisfy both those willing to “spend” only their time and those who are willing to spend money, too.
In the United States, by contrast, most direct-to-con-sumer video offerings are pursuing the ad-free subscription model that companies like Netflix have used to dominate the American market. Consumers like avoiding ads: Forty-four percent of US con-sumers say an ad-free experience is a top reason they signed up for a streaming service.8 Yet evidence of “subscription fatigue” is emerging. Americans are growing frustrated that they need to manage and pay for so many subscriptions to watch what they want.9 As more TV networks, film studios, and tech companies launch their own subscription services, the fact that US consumers have an average of three such services10—and are already frustrated—suggests that only a handful can thrive. Where does that leave the rest of the 300-plus subscription-based services competing for attention and wallet share?
Could ad-supported video provide a model that brings consumers a greater variety of content in one place, at low (or no) cost? Could it offer a solu-tion for advertisers looking for an alternative to the social networks and search engines that dominate the online ad market? Could it provide the basis for broad entertainment platforms that serve gamers, music buffs, sports fans, and everyone in between? If so, ad-supported video could be the latest successful Asian import to the United States.
Ad-supported video: The Asian model
In Asia, the number of people who watch ad-sup-ported video services is staggering: The user base of several leading services reaches nearly half a billion (see figure 2). Most of these services were launched after 2010. They have grown so big, so quickly, by making it easy for cost-conscious consumers to monetize their attention—essentially converting time spent watching ads into content they’d otherwise have to pay for. But that’s just the start. Many of the biggest ad-supported services are pursuing similar strategies to scale quickly and expand their sources of revenue.
What we might call the “Asian model” of ad-sup-ported video has the following elements:
• Ad-supported core offering: In exchange for watching ads, users can view thousands of shows and movies. Much of this content is licensed from multiple studios and networks. Ads make it possible for anyone to watch, regardless of income.
• Subscriptions for premium content: Users pay a subscription fee to access premium con-tent such as sports, foreign productions, and domestically produced original shows. Subscription revenue gives streaming services the funds to acquire broadcast rights to highly sought sports and top-tier international programming.
• Mobile-forward strategy: Asian streaming services have grown rapidly by focusing on smartphone users. In some countries, such as India and Indonesia, streaming services reach consumers who can’t access traditional pay TV. In others, such as China, pay TV is widely avail-able, but streaming services deliver shows and movies to the device that consumers can’t seem to put down.11 In both cases, it’s easy for con-sumers to download an app and start watching.
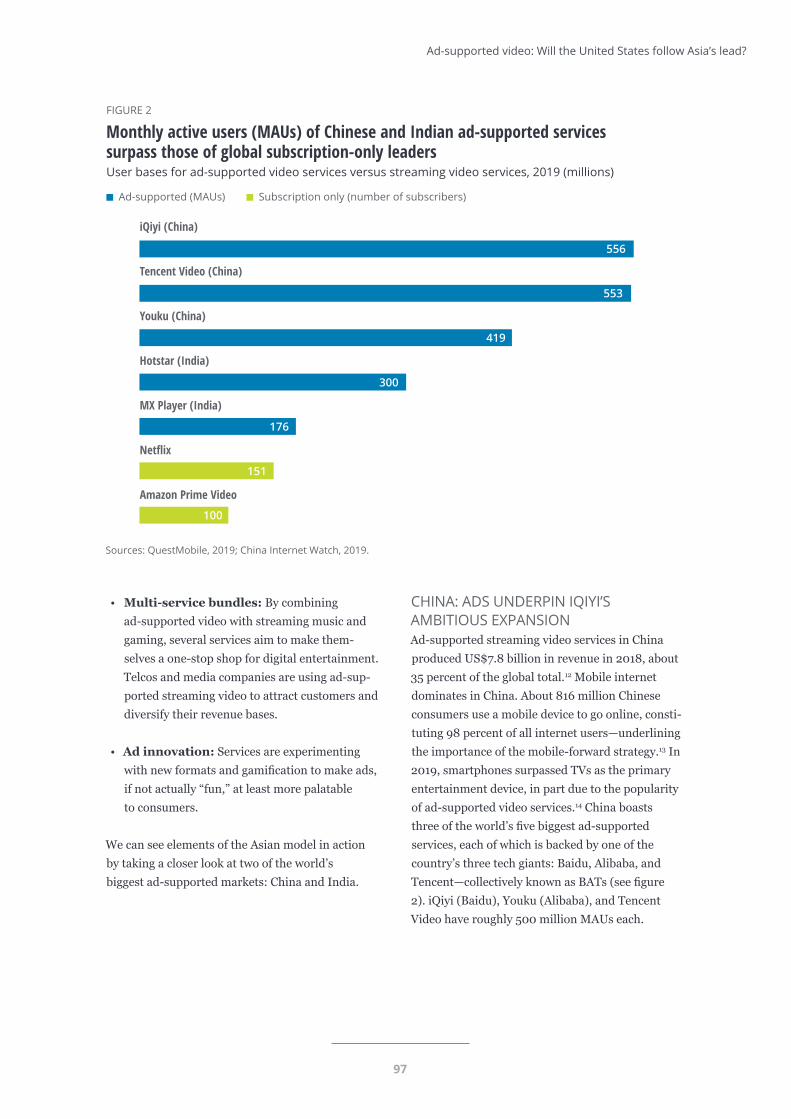
97
Ad-supported video: Will the United States follow Asia’s lead?
• Multi-service bundles: By combining ad-supported video with streaming music and gaming, several services aim to make them-selves a one-stop shop for digital entertainment. Telcos and media companies are using ad-sup-ported streaming video to attract customers and diversify their revenue bases.
• Ad innovation: Services are experimenting with new formats and gamification to make ads, if not actually “fun,” at least more palatable to consumers.
We can see elements of the Asian model in action by taking a closer look at two of the world’s biggest ad-supported markets: China and India.
Sources: QuestMobile, 2019; China Internet Watch, 2019.Deloitte Insights | deloitte.com/insights
iQiyi (China)
Tencent Video (China)
Youku (China)
Hotstar (India)
MX Player (India)
Netflix
Amazon Prime Video
Ad-supported (MAUs) Subscription only (number of subscribers)
556
553
419
300
176
151
100
FIGURE 2
Monthly active users (MAUs) of Chinese and Indian ad-supported services surpass those of global subscription-only leadersUser bases for ad-supported video services versus streaming video services, 2019 (millions)
CHINA: ADS UNDERPIN IQIYI’S AMBITIOUS EXPANSIONAd-supported streaming video services in China produced US$7.8 billion in revenue in 2018, about 35 percent of the global total.12 Mobile internet dominates in China. About 816 million Chinese consumers use a mobile device to go online, consti-tuting 98 percent of all internet users—underlining the importance of the mobile-forward strategy.13 In 2019, smartphones surpassed TVs as the primary entertainment device, in part due to the popularity of ad-supported video services.14 China boasts three of the world’s five biggest ad-supported services, each of which is backed by one of the country’s three tech giants: Baidu, Alibaba, and Tencent—collectively known as BATs (see figure 2). iQiyi (Baidu), Youku (Alibaba), and Tencent Video have roughly 500 million MAUs each.
98
Technology, Media, and Telecommunications Predictions 2020
iQiyi epitomizes several aspects of the Asian model. Launched in 2010 by China’s largest search engine, Baidu, iQiyi began as an ad-supported video aggre-gation service. In exchange for free content, users watch ad spots.15 By 2014, 212 million people were watching ads—and free video content—on iQiyi.
In the same year, iQiyi launched its own film division to produce original content and work with foreign producers as it moved to the second phase of its strategy: building a subscription business on top of its ad-supported service. In 2015–17, it produced dozens of original series and licensed high-quality foreign shows and movies, including content from Netflix.
In 2018, iQiyi launched an initial public offering as it pursued an ambitious expansion of its en-tertainment offerings. This included buying one of China’s top video game producers, Chengdu Skymoons.16 It has continued expanding its subscription offerings with exclusive live sports17 such as Spain’s top football league, La Liga, and by spending big on original dramas and movies.18
iQiyi is now the top streaming video service in the world, with over 560 million MAUs,19 100 million of whom are subscribers—up from 51 million at the end of 2017. The increase in members came at the cost of higher spending on content, which grew 65 percent between 2017 and 2018, to US$3.9 billion. As its membership base grew, the share of revenue from subscriptions increased from 38 percent in 2017 to 42 percent in 2018.20 While advertising as a percentage of total revenue declined in the same period, from 47 percent to 37 percent,21 ads have put iQiyi in a position to vie for leadership in China’s competitive entertainment market by helping it scale quickly, and by curbing losses as the company ramps up its investment in new forms of content.
However, even as it seeks to become a one-stop shop that can keep entertainment-hungry con-sumers on its platform, iQiyi is losing money.22 Although it grew revenue by 44 percent between 2017 and 2018, it lost US$1.3 billion, a 108 percent increase. iQiyi’s losses continue in 2019 as it ramps up its content investment.23
The scale of its investment is bold, but iQiyi may have little choice. It faces intense competition for consumers’ time and attention from other top streaming services; from short video service Douyin (branded as TikTok outside China), which has 480 million MAUs of its own;24 and from a robust pay-TV market.25 Moreover, iQiyi’s streaming competitors are making similar moves. Tencent Video, which is neck-and-neck with iQiyi in terms of MAUs and subscribers, recently spent US$524 million for a stake in New Classics Video, a Chinese film studio, and has partnered with the US National Basketball Association to stream games.26 Youku has spent big to secure exclusive online streaming rights to the FIFA World Cup, and to develop original hit series such as Day and Night, a crime drama that it serves up to paying subscribers.27 All three are also expanding abroad, or hatching plans to do so.
Ads have given iQiyi and other Chinese video services the scale to reach hundreds of millions of viewers —helping nudge the smartphone ahead of TV as the primary entertainment device in China and delivering billions in revenue. The free apps also allow consumers to “stack” services, watching what they like from each of the “big three,” without spending anything more than time and attention. For those who want access to sports and exclusive content, subscription options are available. Although their ambitions to create a “one-stop shop” for entertainment and to grow their subscriber bases are delaying their arrival
“in the black,” Chinese video services would be in far worse financial shape without ad revenue.
The scale of its investment is bold, but iQiyi may have little choice. It faces intense competition for consumers’ time and attention from other top streaming services …
99
Ad-supported video: Will the United States follow Asia’s lead?
INDIA: AD-SUPPORTED VIDEO PUTS TV INTO THE HANDS OF MILLIONS—MANY FOR THE FIRST TIMEPay TV in India is inexpensive, and in some states, nearly 90 percent of households have a television. But overall penetration rates remain below 70 percent.28 By focusing on mobile users, ad-supported video services have put “TV” into the hands of hundreds of millions and given some consumers their first access to video entertainment.
Indian consumers are cost-conscious, and many are willing to watch ads to access free or lower-cost video content.29 This has helped the country’s ad-supported video services to scale rapidly. So has the advent of affordable smartphones and 4G wireless with low data rates. Good phones with screen sizes exceeding six inches can be bought for around 7,000 Indian rupees, or under US$100. Affordability has put smartphones within reach of more consumers, and 400 million Indians— 38 percent of the population—now own one. Of course, you can’t use a smartphone to watch videos without a reliable, affordable wireless connection. The entry of new telecom providers into the Indian market in 2016 reduced the price of data plans and made streaming affordable.30 India now has the highest data usage per smartphone in the world, at nearly 9.8 gigabytes per month.31
All this has proven fertile ground for streaming video services. In 2012, there were just nine streaming video services. In 2019, there are more than 35, with offerings from broadcasters, telcos, international and regional players, as well as independent content companies.32 Streaming video consumption is nearly ubiquitous among smartphone owners: Eighty percent of them use at least one streaming video app.33
Hotstar is the undisputed leader in terms of MAUs, with 300 million; and half of all Indian smartphones have the app on their devices.34 It was launched in 2015 by Star, a media company that has 60 TV channels which produce content in eight languages; this reaches 90 percent of pay-TV homes in India.35 Star also happens to be wholly owned by Disney, giving the US-based media giant
an up-close view of a rapidly evolving market burgeoning with competition and innovation.
With access to one-third of Indian consumers, including young sports fans, Hotstar is convincing advertisers to shift some of their TV ad budgets to streaming video.36 Advertisers are particularly drawn to the innovative ad models that Hotstar is experimenting with, such as gamification. This includes Watch’N Play, a trivia game with a social media flavor that tests viewers’ knowledge of cricket during match play. Advertisers can target their chosen demographic as part of the game using tools such as banner ads and video. Hotstar claims that Watch’N Play users spent three times more on Hotstar than average viewers and were more engaged with ads.37 Other streaming video services in Asia are developing innovative ad strategies as well. For example, when viewers of Indonesia’s OONA TV (185 million MAUs) watch ads and spend time on the platform, they earn rewards points called “tcoins” that they can redeem for discounts.38
Hotstar is the leader in India, but competitors from TV networks, telcos, and foreign streaming services (including Netflix and Singapore-based HOOQ) are fighting for consumers’ attention. MX Player is Hotstar’s top rival, with a fully ad-sup-ported business model. Users can watch video content—including live news, original shows, and music—in 10 languages. Large Indian broadcasters are following Hotstar’s formula of ad-supported free video for “catch-up” content, with subscrip-tions required for live sports and premium shows. Meanwhile, telcos such as Airtel and Vodafone are aggregating content from multiple platforms and providing a payment interface. Over 200 million Indian consumers stream video from telcos, which could grow to 375 million by 2021.39
Over 200 million Indian consumers stream video from telcos, which could grow to 375 million by 2021.
100
Technology, Media, and Telecommunications Predictions 2020
It may play in Bangalore and Beijing, but will it play in Boston?In contrast to the Asian model, most US streaming video services take a subscription-only approach, in which users pay a monthly fee to access content ad-free. The two leaders, Netflix and Amazon Prime Video, are subscription-based, with the latter included in Prime membership. Both Disney and Apple have launched subscription-only streaming services, albeit with low monthly fees intended to make the services “no-brainers” for customers.
THE REALITY OF SUBSCRIPTION FATIGUEThe question remains: How many subscription TV services are consumers willing to maintain? Deloitte’s Digital media trends survey, 13th
edition shows that consumers have an average of three streaming video services, a number that has remained steady for two years. How many spots are there “on the podium”? Certainly, consumers love having a choice of services, and avoiding ads is a top reason that consumers sign up for streaming video. Some viewers are especially ad-resistant, while others care less about avoiding ads than about maximizing their viewing options.40
But for most consumers, the costs of having multiple video subscriptions—in both hassle and money— are adding up.41 Consumers are especially frustrated when their favorite shows “disappear” without notice, and by the reality that they must subscribe to multiple services to watch their favorite shows and movies. These factors make streaming services seem progressively less valuable to consumers: For the same (or a higher) price, they get less of what they want. The problem will get worse as media companies withdraw rights from competitors and launch their own streaming services. Finally, there are the economic costs of multiple services. For consumers who cut the cord to spend less than they would with a pay-TV bundle, three services could be the maximum.42
The costs of launching subscription-only streaming services are mounting, too. The highest costs, as in China and India, are developing original
content and obtaining rights to live sports. Netflix plans to spend US$15 billion on original content in 2019 and nearly US$18 billion in 2020, but in past years has usually ended up spending even more than it had originally planned. Apple spent a reported US$6 billion on original content for the launch of its Apple TV+ service.43 Sports rights, which Hotstar and the Chinese “big three” have brought to consumers, are also costly. Rights to broadcast National Football League games, the highest-rated sport in the United States and the key to attracting young male viewers, cost networks about US$6 billion per year, with big increases anticipated once the current contract ends in 2021.44 It is difficult to absorb these costs and make a profit from subscription fees alone.
US CONSUMERS—ESPECIALLY STREAMERS—ARE WILLING TO EXCHANGE ATTENTION FOR CONTENT While few people love watching ads, Deloitte has found that US consumers are willing to exchange their attention for content,45 much like Asian consumers. That makes ad-supported services, with or without a subscription tier, an enticing option. This is especially true for media companies that cannot fund premium content without another source of revenue.
In Deloitte’s recent report, Are ads the prescription
for subscription fatigue?, we analyzed responses from over 2,000 US consumers to understand their tolerance for ads. Consumers consider an average of eight minutes of advertising “fair,” while 16 minutes of commercials per hour is “too many” for them to watch any further. In short, after 16 minutes, they can’t take the pain and turn the program off. Interestingly, younger consumers (Generation Z, millennials, and Generation X) have a higher tolerance for ads than baby boomers and matures (consumers who are 72 and older).46 Young consumers feel an average of about 8.5 minutes is “fair” and 16.6 minutes is “too much,” compared with 6.6 and 15 minutes, respectively, for their older counterparts.
US consumers who watch live TV streaming services that feature ads, such as Sling TV,
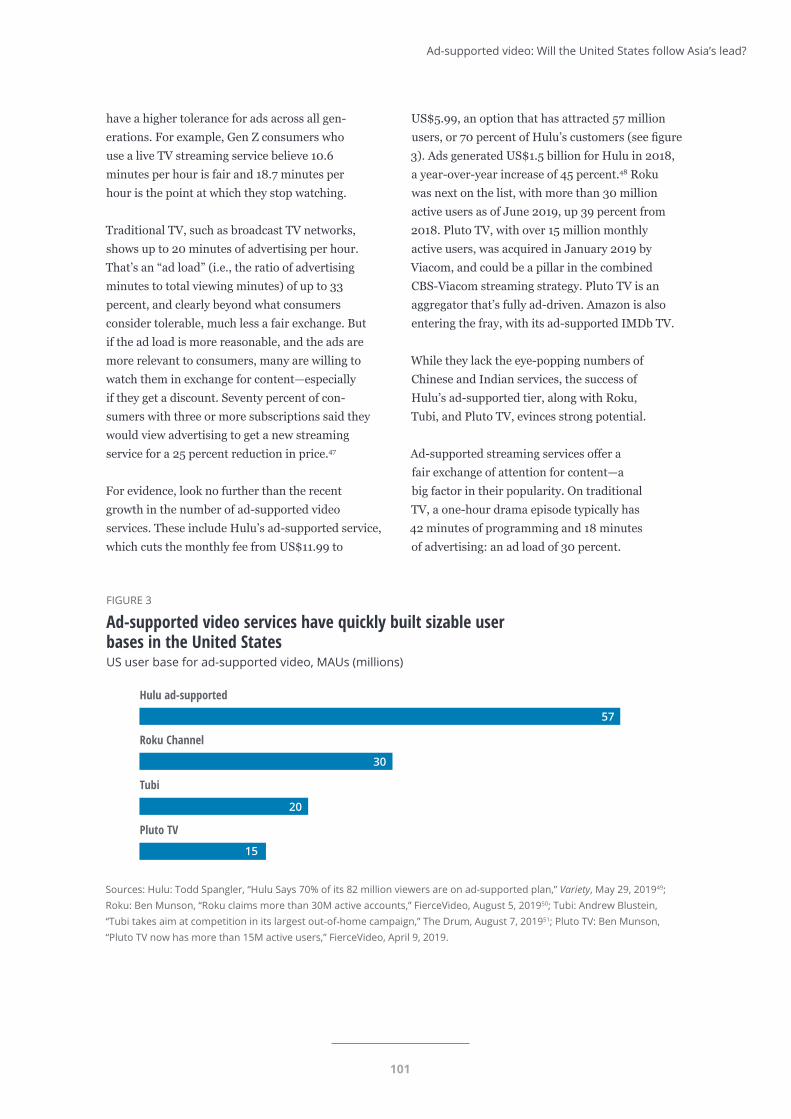
101
Ad-supported video: Will the United States follow Asia’s lead?
Sources: Hulu: Todd Spangler, “Hulu Says 70% of its 82 million viewers are on ad-supported plan,” Variety, May 29, 201949; Roku: Ben Munson, “Roku claims more than 30M active accounts,” FierceVideo, August 5, 201950; Tubi: Andrew Blustein,“Tubi takes aim at competition in its largest out-of-home campaign,” The Drum, August 7, 201951; Pluto TV: Ben Munson, “Pluto TV now has more than 15M active users,” FierceVideo, April 9, 2019.
Deloitte Insights | deloitte.com/insights
Hulu ad-supported
Roku Channel
Tubi
Pluto TV
57
30
20
15
FIGURE 3
Ad-supported video services have quickly built sizable userbases in the United StatesUS user base for ad-supported video, MAUs (millions)
have a higher tolerance for ads across all gen-erations. For example, Gen Z consumers who use a live TV streaming service believe 10.6 minutes per hour is fair and 18.7 minutes per hour is the point at which they stop watching.
Traditional TV, such as broadcast TV networks, shows up to 20 minutes of advertising per hour. That’s an “ad load” (i.e., the ratio of advertising minutes to total viewing minutes) of up to 33 percent, and clearly beyond what consumers consider tolerable, much less a fair exchange. But if the ad load is more reasonable, and the ads are more relevant to consumers, many are willing to watch them in exchange for content—especially if they get a discount. Seventy percent of con-sumers with three or more subscriptions said they would view advertising to get a new streaming service for a 25 percent reduction in price.47
For evidence, look no further than the recent growth in the number of ad-supported video services. These include Hulu’s ad-supported service, which cuts the monthly fee from US$11.99 to
US$5.99, an option that has attracted 57 million users, or 70 percent of Hulu’s customers (see figure 3). Ads generated US$1.5 billion for Hulu in 2018, a year-over-year increase of 45 percent.48 Roku was next on the list, with more than 30 million active users as of June 2019, up 39 percent from 2018. Pluto TV, with over 15 million monthly active users, was acquired in January 2019 by Viacom, and could be a pillar in the combined CBS-Viacom streaming strategy. Pluto TV is an aggregator that’s fully ad-driven. Amazon is also entering the fray, with its ad-supported IMDb TV.
While they lack the eye-popping numbers of Chinese and Indian services, the success of Hulu’s ad-supported tier, along with Roku, Tubi, and Pluto TV, evinces strong potential.
Ad-supported streaming services offer a fair exchange of attention for content—a big factor in their popularity. On traditional TV, a one-hour drama episode typically has 42 minutes of programming and 18 minutes of advertising: an ad load of 30 percent.
102
Technology, Media, and Telecommunications Predictions 2020
On a streaming service, a TV drama episode averages five minutes of advertising and thus, an ad load of less than 10 percent.
Advertisers are rooting for ad-supported video services to take hold. The predominance of the subscription-only model has left advertisers out in the cold and made the ad market for pay TV remarkably resilient52 given its accelerating subscriber attrition, which included 1.5 million losses in Q2 2019 alone.53 Digital ad spending is increasing, but 60 percent of it goes to Face-book and Google (including YouTube)54; only 3 percent of TV ad spending finds its way to streaming video services that offer professionally
produced content.55 With the emergence of ad-supported video services with millions of monthly users, advertisers will have more options.
Not only options, but superior options thanks to dynamic advertising, which allows advertisers to serve consumers who are watching the same program with individualized ads based on their profile and data. Because most streaming services are IP-based, it is easier to deliver and execute more addressable and contextualized advertising. Additionally, using a platform that combines streaming video with data-driven advertising can enable an efficient market for exchanging personal data for content.
THE BOTTOM LINEIn Asia, ad-supported services will likely remain a pillar of video streaming. Ads provide much-needed revenue for services like the Chinese “big three” that seek to expand into new areas, such as gaming and music. Subscriptions will remain part of the mix for premium content, such as sports and original programs. However, ad-supported-only services will likely remain vital for consumers with little disposable income, and for whom “catch-up TV,” including sporting events that have already taken place, is enough.
In the United States, ad-supported video services could grow rapidly. With over 300 streaming services available today and a raft of high-profile services entering the market, there simply isn’t room for them all. Consumers will likely select a handful of “must-have” subscriptions—whether that’s more than three remains to be seen. Big media companies with large libraries that don’t “make the podium” could launch their own ad-supported services, with or without a subscription tier. For other services, providers may have to decide between making them subscription-only or joining an ad-supported aggregator. Then there’s the matter of paying for the original programs and live sports that attract subscribers; ad revenue can surely help fund content development and acquisition, as it has in Asia.
Some US-based streaming giants that use a subscription-only model may opt for an ad-driven model in value-conscious markets.
In both Asia and the United States, advertisers will likely move more of their spending to ad-supported services, attracted by millions of “eyeballs,” the ability to target individual consumers, and the certainty that their brands will be attached to professionally produced shows and movies—known quantities in comparison with user-generated content.

103
Ad-supported video: Will the United States follow Asia’s lead?
Endnotes1. His identity was changed to avoid reprisals from his employer, since much of his binge-watching occurred at his
desk during business hours.
2. For Indians, the popularity of cricket is like that of American football in the United States—huge, with a pas-sionate fan base. There are approximately 1 billion cricket fans worldwide, and 90 percent of them are in India. For more information, see: PTI, “India constitutes 90 percent of one billion cricket fans: ICC research,” Economic Times, June 27, 2018.
3. Tasneem Akolawala, “Cricket World Cup 2019: Hotstar breaks record with 100 million daily active users on India vs. Pakistan match day,” Gadget 360, June 25, 2019.
4. Manish Singh, “Hotstar, Disney’s Indian streaming service, sets new global record for live viewership,” TechCrunch, May 12, 2019.
5. Monthly active users (MAUs) is the key metric employed by any digital content platform/site or internet business.
6. In this chapter, we’ll refer to these countries as “Asia-Pacific” and “Asia” interchangeably. We will focus on two countries in particular: China and India.
7. By revenue from ad-supported video, we mean online advertising in or around any professionally made TV shows or movies. This figure does not include online advertising revenue from consumer-generated content (e.g., YouTube). This could come from services that rely solely on ads for revenue, or from services that combine ad and subscription revenue. This forecast includes data from Digital TV Research, “Global AVOD forecasts,” June 2019. This data was analyzed by Deloitte Global to develop global and regional forecasts for 2020.
8. Kevin Westcott et al., Digital media trends survey, 13th edition, Deloitte Insights, March 2019.
9. Ibid.
10. Ibid.
11. William Chou, Roger Chung, and Taylor Lam, 2018 Deloitte China Mobile Consumer Survey, Deloitte, November 2018.
12. Digital TV Research, “Global AVOD forecasts,” June 2019.
13. Deloitte, Semiconductors—The next wave, April 29, 2019.
14. Chinese adults spend two hours and 39 minutes viewing their smartphones, eclipsing the time they spend watching TV by seven minutes. See Ryan Browne, “Chinese consumers forecast to spend more time on their phones than watching TV this year,” CNBC, April 19, 2018.
15. Yin Xiaosheng, Xie Hao, and Shao Meiqi, “Chinese loosen purse strings for content,” Xinhua News Agency, August 25, 2019.
16. Keith Noonan, “iQiyi just made a major move into video games,” Motley Fool, August 5, 2018.
17. PR Newswire, “iQiyi Sports strengthens sports offerings through exclusive broadcasting rights to La Liga 2019/20,” August 15, 2019.
18. Evelyn Cheng, “Chinese streaming giant iQiyi is planning out an original movie business,” CNBC, May 13, 2019.
19. China Internet Watch, “Top mobile apps, app stores in China in H1 2019,” August 20, 2019.
20. Iqiyiinc.gcs, “IQiyi announces fourth quarter and fiscal year 2018 financial results,” February 21, 2019. Figures are given for fiscal years.
21. Ibid.
22. Yue Wang, “iQiyi is no longer content with being the Netflix of China,” Forbes, May 29, 2019.

104
Technology, Media, and Telecommunications Predictions 2020
23. Iqiyiinc.gcs, “IQiyi announces fourth quarter and fiscal year 2018 financial results.” Losses have continued in 2019. See: Iqiyiinc.gcs, “iQiyi announces second quarter 2019 financial results,” August 19, 2019.
24. China Internet Watch, “Top mobile apps, app stores in China in H1 2019,” August 20, 2019.
25. Asia Video Industry Association, “Online video industry: China 2018,” 2018.
26. Verdict, “Chinese streaming platforms may unseat Netflix,” September 2, 2019.
27. Natalie Walters, “Alibaba building Youku to be the Netflix of China,” Motley Fool, April 11, 2019.
28. Gaurav Laghate, “Television remains the choice of the masses even in digital times,” Economic Times, July 23, 2018.
29. Malvika Gurung, “MX Player beats Hotstar, Amazon Prime in loyalty; 25% Indians want free Netflix access, ads no problem!,” Trak.in, June 19, 2019.
30. Ravie Lakshmanan, “China and India account for most internet users; 2019 Internet Trends Report,” TNW, June 2019.
31. PTI, “Data usage per smartphone in India set to double by 2024: Ericsson report,” Economic Times, June 21, 2019.
32. Gaurav Laghate, “Partnership is name of the game in burgeoning video streaming segment,” Economic Times, August 6, 2019.
33. Indian Express, “Hotstar, MX Player lead in OTT Entertainment apps for smartphones users in India: Study,” July 19, 2019.
34. Gurung, “MX Player beats Hotstar, Amazon Prime in loyalty; 25% Indians want free Netflix Access, ads no problem!.”
35. Rishi Iyengar, “Disney’s next 700 million viewers might be in India,” CNN Business, July 9, 2018.
36. Dolly Mahayan, “How Hotstar is upping its ad-revenue game this Cricket World Cup,” Exchange4Media, July 11, 2019.
37. WARC, “Hotstar offers targeted ads for this year’s IPL,” March 11, 2019.
38. Advanced Television, “OONA announces free home & mobile OTT TV for life,” January 9, 2019.
39. Laghate, “Partnership is name of the game in burgeoning video streaming segment.”
40. Kevin Westcott et al., Digital media segments: Looking beyond generations, Deloitte Insights, 2018.
41. Westcott et al., Digital media trends survey, 13th edition.
42. Peter Csathy, “Room for three video subscriptions only in a cord-cutting world—Here’s the math,” Forbes, August 19, 2019.
43. Chance Miller, “Apple’s original content spending hits $6 billion, Apple TV+ Launching ‘within next 2 months’,” 9to5Mac, August 19, 2019. TMT Predictions 2020 is an independent publication and has not been authorized, sponsored, or otherwise approved by Apple Inc. Apple TV+ is a trademark of Apple Inc., registered in the United States and other countries.
44. Brian Steinberg, “NFL, Networks mull Sunday-afternoon shake-up for TV football (EXCLUSIVE),” Variety, March 5, 2019.
45. This section features original research from Deloitte’s report: Kevin Westcott et al., Digital media trends: Are ads the prescription for subscription fatigue?, Deloitte Insights, September 2019.
46. For a more detailed discussion of these generations, please see Westcott et al., Digital media trends survey, 13th edition.
47. Ibid.
48. Todd Spangler, “Will Netflix cave in to the advertising opportunity? Wall Street sees potential for $1 billion yearly windfall,” Variety, June 28, 2019.

105
Ad-supported video: Will the United States follow Asia’s lead?
49. Hulu: Todd Spangler, “Hulu says 70% of its 82 million viewers are on ad-supported plan,” Variety, May 29, 2019.
50. Roku: Ben Munson, “Roku claims more than 30M active accounts,” Fierce Video, August 5, 2019; Pluto TV: Ben Munson, “Pluto TV now has more than 15M active users,” Fierce Video, April 9, 2019.
51. Tubi: Andrew Blustein, “Tubi takes aim at competition in its largest out-of-home campaign,” Drum, August 7, 2019.
52. Jon Lafayette, “National TV ad revenues post gain in May, says SMI,” Broadcasting & Cable, June 27, 2019.
53. Michael Balderston, “Pay-TV lost 1.5M subscribers in Q2 2019, says Leichtman,” TV Technology, August 12, 2019.
54. Kurt Wagner, “Digital advertising in the US is finally bigger than print and television,” Vox, February 20, 2019.
55. Sahil Patel, “The next front of the streaming wars is the battle for ad-supported programming,” Digiday, April 9, 2019.

106
Technology, Media, and Telecommunications Predictions 2020
THE NEXT TIME you settle down with a good book, will you reach for a set of headphones instead of an eReader? Audiobook publishers
are hoping so—and the market’s anticipated growth lends weight to their aspirations. In 2020, Deloitte predicts, the global audiobook market will grow by
The ears have itThe rise of audiobooks and podcasting
25 percent to US$5 billion. And audiobooks aren’t the only audio format gaining in popularity. We also predict that the global podcasting market will increase by 30 percent to reach US$1.1 billion in 2020, surpassing the US$1 billion mark for the first time.1
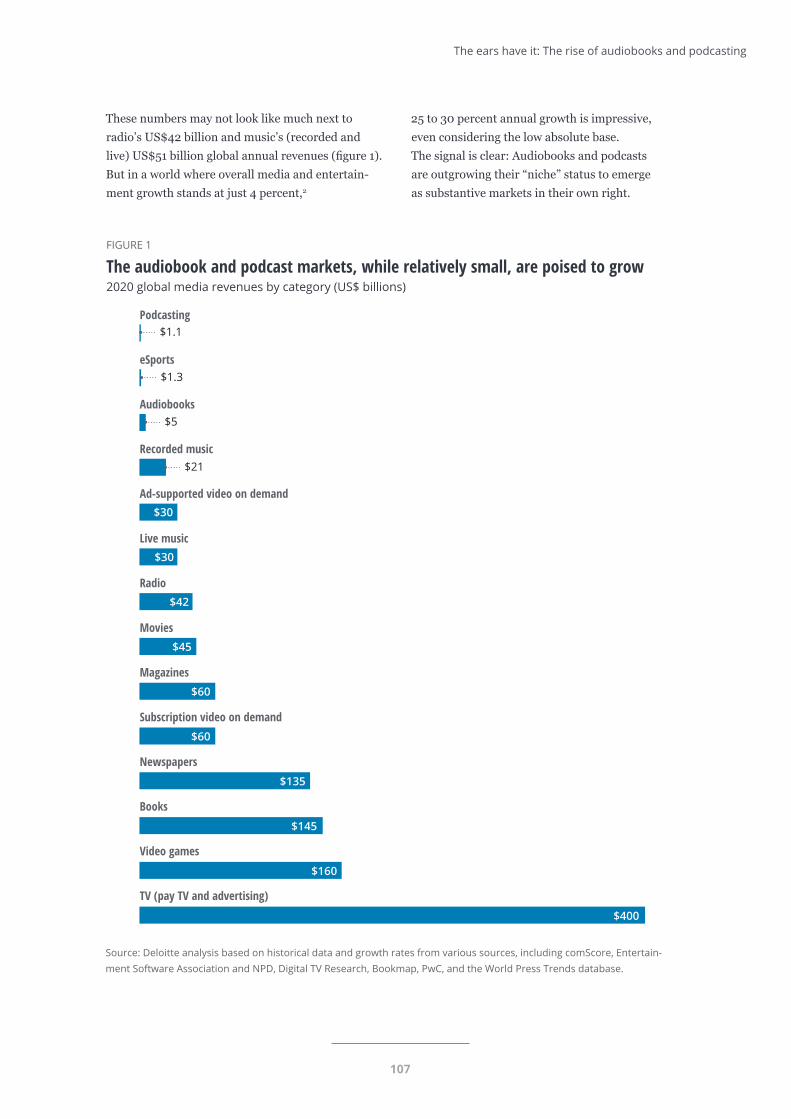
107
The ears have it: The rise of audiobooks and podcasting
These numbers may not look like much next to radio’s US$42 billion and music’s (recorded and live) US$51 billion global annual revenues (figure 1). But in a world where overall media and entertain-ment growth stands at just 4 percent,2
Source: Deloitte analysis based on historical data and growth rates from various sources, including comScore, Entertain-ment Software Association and NPD, Digital TV Research, Bookmap, PwC, and the World Press Trends database.
Deloitte Insights | deloitte.com/insights
Podcasting
eSports
Audiobooks
Recorded music
Ad-supported video on demand
Live music
Radio
Movies
Magazines
Subscription video on demand
Newspapers
Books
Video games
TV (pay TV and advertising)
$1.1
$1.3
$5
$21
$30
$30
$42
$45
$60
$60
$135
$145
$160
$400
FIGURE 1
The audiobook and podcast markets, while relatively small, are poised to grow2020 global media revenues by category (US$ billions)
25 to 30 percent annual growth is impressive, even considering the low absolute base. The signal is clear: Audiobooks and podcasts are outgrowing their “niche” status to emerge as substantive markets in their own right.
108
Technology, Media, and Telecommunications Predictions 2020
Hearing is believing
The anticipated growth in audiobooks and podcasts is part of a larger trend of better-than-you-might-think growth in audio overall. In the United States, for instance, recorded music revenues grew by 12 percent in 2018;3 vinyl record revenues went up by 8 percent, showing that even physical music media can still have consumer appeal. And although neither global radio revenues nor global concert ticket sales are increasing at the same rate, both are still growing a few percentage points faster than global TV and global (printed) book revenues, and 10 to 20 percentage points faster than global magazine and newspaper revenues (as the latter markets are contracting).4 Meanwhile, 2018 headphone sales reached US$20 billion in the United States alone, up 27 percent year over year. People use headphones for more than just podcasts or audiobooks, of course … but they do illustrate how important our hearing is.5
All this goes to show that audio is anything but dead. To paraphrase what we said about radio last year: “Audio is the voice whispering in our ear, in the background of dinner, in an office, or while driving the car. It is not pushy or prominent … but it is there.”6 Silence may be golden, but it’s not necessarily the most interesting thing to listen to while commuting, doing chores, or working out.
Audiobooks and their listeners: Ripe for continued growth
The United States’ audiobook market—predicted at US$3 billion in 2020, and growing at a seem-ingly sustainable 20 to 25 percent per year for the next few years—is the world’s largest. Coming in second is the Chinese audiobook market, expected to generate about US$1 billion in the same year, up from US$450 million in 2017.7
Outside these two well-studied markets, data is sparse and the markets themselves more nascent. Data gleaned from various sources suggests that annual audiobook revenues in the four Nordic countries are running at about US$100 million;8 the UK audiobook market was about US$85 million in 2018,9 with audiobook revenues for all of Europe (including the United Kingdom) grossing about US$500 million.10 Based on these figures, a global audiobook market of US$5 billion seems reason-able, with the United States and China making up about 75 percent of it.
The audiobook market isn’t just about dollars; it’s about listeners as well. According to a 2018 survey, 18 percent of American adults said that they listened to an audiobook in the last 12 months, up four percentage points since 2016.11 Assuming this growth rate has held steady, these figures imply that more than 73 million people listen to an audiobook at least once a year in the United States today. Likewise, data from China suggests that 22.8 percent of the population listened to at least one audiobook in 2017.12 Assuming similar growth, likely more than a quarter of the Chinese population, or another 350 million people, listens to audiobooks today. Globally, the number of current audiobook consumers almost certainly exceeds half a billion.
In the longer term, we expect double-digit growth in audiobooks to continue, even if it slows some-what from 2020’s torrid 25 percent pace. US audiobook revenues, for instance, have grown at double digits almost every year since 2013, and even accelerated to nearly 40 percent in 2018.13 The spread of smart speakers is one likely driver, as are streaming-books-on-demand (SBOD) models that offer monthly subscriptions. Glob-ally, too, growth is likely to accelerate as other countries and regions catch up to the levels seen in the United States, China, and the Nordics.
109
The ears have it: The rise of audiobooks and podcasting
Audiobook consumption will likely differ across geographies and demographics. In 2019, for example, 74 percent of audiobook listeners in the United States listened to them in their cars.14 Countries where commute times are longer may thus see higher revenues, growth rates, and opportunities for audiobooks than countries with shorter com-mutes. Children’s audiobooks, too, which already represent a substantial fraction of the total number of audiobooks sold, may also be a growth hotspot: In 2017, this category made up 40 percent of the audiobook titles sold in China, 10 percent in the United States, and 25 percent in France.15
Interestingly, while audiobooks are rapidly gaining share in both the book market and the overall media market … that share isn’t coming from print books. As an example, in the United States, revenues from sales of print books for consumers (trade books) in the first six months of 2019 rose by 2.5 percent year over year, even as revenues from downloaded audiobooks also increased by 34 percent. E-book revenues, however, went down by 4 percent in the same period (although e-books still made 77 percent more money than downloaded audiobooks).16 It appears that, while hardcore print lovers are clinging to the physical page—which is still the dominant form of consumption, accounting for 78 percent of all US trade book revenues overall—a war in the digital arena is underway between those who want to use their eyes versus those who prefer their ears. The outcome? No one knows for sure yet—but at current growth rates, audiobook revenues are on a trajectory to pass e-books by 2023 or so.
Podcasts and the monetization question
With anticipated revenues of just over US$1 billion in 2020, podcasts barely make enough money today to rate a slot on the media formats list. But if future growth remains as high as in the past few years, podcasts could be a US$3.3 billion–plus business by 2025.17 For this to happen, however, the podcast industry should further expand globally, add new listeners, and—most crucially—get better at mone-tizing (at least to some extent) its large listener base.
With all these different revenue possibilities, one might think that podcasts would have no problem monetizing their listeners. Wrong.
So let’s talk about podcast monetization, especially in contrast to audiobooks. Audiobook pricing models come in two basic forms: The consumer either purchases audiobooks outright, or streams them through a monthly subscription service such as Audible, Scribd, or Kobo. Purchasing a high-quality audiobook outright usually costs US$20–30—always more expensive than a paperback or e-book, and indeed often with a 50 to 100 percent premium over them.18 And while prices and features for the monthly services vary, US$9–15 per month (or well over US$100 per year) is about average.
Podcasts, on the other hand, have multiple revenue streams: advertising and sponsorships, subscriptions, events, merchandise, content marketing, contracts for branded podcasts, and individual listener donations.19 Of these, advertising and sponsorships are by far the largest, although exact splits by revenue stream do not seem to be publicly available.
With all these different revenue possibilities, one might think that podcasts would have no problem monetizing their listeners. Wrong. Although the United States in 2018 had 60 percent more podcast listeners than audiobook listeners (21 percent of Americans for podcasts versus 13 percent for audiobooks), podcast revenues for that year were roughly 80 percent lower than for audiobooks (US$500 million compared with US$2.5 billion). This means that each audiobook listener generates more than eight times the annual revenue of a podcast listener. And it isn’t just audiobooks that podcasts lag behind when it comes to monetiza-tion. In the United Kingdom in 2017, commercial radio generated 2.8 pence of ad spend per hour of listening, while podcasts generated just 0.5 pence.20
110
Technology, Media, and Telecommunications Predictions 2020
Is that about to change? Possibly. Although podcasts have been around since 2004,21 podcasters have only really pursued making money from them since about 2015—prompted largely by the success of 2014’s Serial, which was the first single podcast to gain a large enough audience to attract advertisers. As podcasters get more serious about revenue generation in the future, they will presumably become better at optimizing their various revenue streams. And global podcast revenues in 2013 totaled only about US$45 million, giving podcasts plenty of room for growth.22 (That said, estimates for US podcast ad revenues predict decreasing growth rates over time, slowing from more than 50 percent growth in 2018 to about 20 percent by 2021.)23
Podcasts also cost less to make than audiobooks, as a rule. Even podcasts with higher production standards and better-known hosts hardly compare with most audiobooks’ production costs. To create a 10-hour audiobook (containing about 75,000 words, equivalent to about 300 pages), a publisher typically pays between US$3,000 and US$15,000, factoring in the cost of narration, editing, recording, and mastering.24 Audiobooks narrated by celebrities (including Claire Danes, Meryl Streep, Samuel L. Jackson, Ian McKellen, and many others) can be more expensive still.
However, we believe that podcasts will have a very hard time catching up to audiobooks’ ability to monetize listeners. One of the biggest difficulties is simply the sheer number of podcasts that are available for free.
ENTERPRISE PODCASTS: ARE THEY REALLY WORTH A BILLION DOLLARS?Enterprise podcasts may seem odd to mention at all in this chapter, considering that they generate no (direct) revenue and that global corporate spending on them probably totals no more than tens of millions of dollars per year. But if we view them as vehicles for marketing, brand-building, training, and recruiting, we are looking at an industry that creates value for enterprises of all stripes, as well as for their customers and current and prospective employees. Although it’s impossible to measure that value precisely, we can make an educated guess. If millions of people are listening to enterprise podcasts, as is likely, then the value being generated for the enterprises making these podcasts could be close to US$1 billion, or about the same size as the consumer podcast market.
Because the barriers to podcasting are low, anyone can (and a great many do) make them: As of 2019, more than 700,000 podcast series encompassing 29 million episodes were active, and most were basically free for the listening.25
What’s more, many of these free podcasts are of surprisingly high quality. Broadcast radio, for instance, is an excellent source of high-quality podcasts. It’s easy for broadcasters to “podcast-ify” a radio episode after it airs (for minimal cost) and put it on their website—and if it’s a public broadcaster (such as BBC, NPR, and CBC), the podcasts are often free, with no subscription charges and no ads. The newspaper industry, too, contributes to this phenomenon. Although some newspapers charge for their podcasts, many others offer them to sub-scribers for free (though with ads) as a way to attract and retain digital subscriptions, or to encourage subscribers to pay more for a premium tier.26
Enterprise podcasting is yet another source of free podcast content. Businesses tend not to include ads in or charge subscriptions for their podcasts. They almost invariably give them away for free—but that doesn’t mean they are without value!
The upshot: So long as people can listen to thou-sands of hours of high-quality podcasts essentially for free, profit-motivated podcasters will have a hard time getting listeners to actually pay for content.

111
The ears have it: The rise of audiobooks and podcasting
As of 2019, enterprise podcasting is already mainstream. Of the 25 largest Fortune 500 companies, 17 (68 percent) hosted their own podcasts on their corporate websites.27 To be clear, these are podcasts produced and paid for by the companies themselves, not company CEOs appearing in third-party podcasts or companies sponsoring the production of an independent podcast series. The trend seems to cross all industries: Both B2B and B2C companies produce podcasts, with retail, health care, energy, telecom, financial services, manufacturing, automotive, and technology all represented. However, within any particular industry, companies’ podcasting efforts vary widely. While one major auto company might have several podcast series, another of roughly the same size may have none. The one industry where this hit-or-miss pattern does not hold is professional services. All of the world’s largest law, tax and accounting, and consulting firms have enterprise podcast series. And not just one or two: Almost all of these firms have dozens or even hundreds of series, each with multiple episodes, and each usually associated with a specific service line.
These enterprise podcasts have three main uses. First, companies produce podcasts for marketing purposes: to demonstrate their knowledge, showcase their expertise, and generally build their brand. Second, podcasts can support internal education as a way to deliver e-learning content. And finally, many businesses use podcasts as a recruitment tool.
Businesses spend substantial sums of money on all three of the above activities, which means that they certainly have the funds to produce many podcasts. Large enterprises spend more than US$1.6 trillion globally on marketing each year,28 while the global training/e-learning market and the global recruiting market each attracts US$200 billion of corporate spending annually.29 Podcasts are only ever going to be a small percentage of that overall spend, but that may still prove to be a surprisingly large amount.
The return on investment (ROI) on enterprise podcasts is likely to be quite high, especially given how inexpensive they typically are to make. Audio recording equipment and technology is typically cheap, editing is relatively easy compared to that for videos or audiobooks, and a single corporate podcast host (who likely does other tasks as well) can record hundreds of episodes firmwide each year. But what makes podcasts especially economical is that businesses have likely already invested millions of dollars in creating content and building expertise that might make for compelling podcast material. A company might spend tens or hundreds of thousands of dollars to conduct a single research study, print out tens of thousands of dollars’ worth of reports based on the study, and spend tens of thousands of dollars more on videos to promote the study. Spending an incremental US$500 on a podcast is such a low additional cost that triple-digit ROIs seem almost assured.
The catch is that measuring this ROI, as mentioned above, is essentially impossible. Besides the fact that the value they generate is mostly intangible, it’s difficult, if not impossible, to tease out podcasts’ specific role in the overall process of building an organization’s brand, enhancing its reputation as a thought leader, increasing its employees’ skills and knowledge, and getting a foot in the door with prospective clients and employees.
Still, we expect growth in enterprise podcasting to be much higher than in nonenterprise podcasting due to the overall podcast audience’s demographics. The kinds of people who often listen to podcasts—young, educated, and employed—are also the kinds of people whom companies find desirable as both prospective customers and employees. They can be an attractive audience to many advertisers as well, which explains why ad revenues for podcasts in general are expected to grow faster than for many forms of traditional media. To enterprises looking for long-term employees—not just buyers of a product—the podcast audience’s demographics may prove an even more irresistible lure.
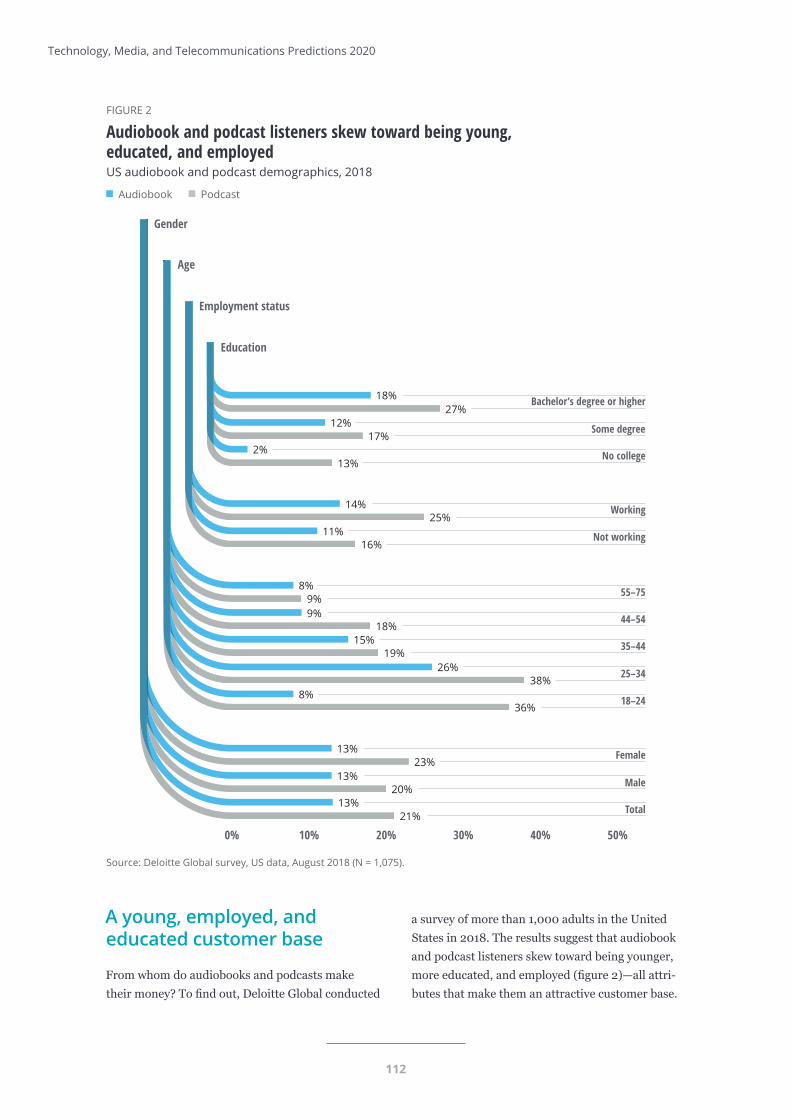
112
Technology, Media, and Telecommunications Predictions 2020
Source: Deloitte Global survey, US data, August 2018 (N = 1,075). Deloitte Insights | deloitte.com/insights
0% 10% 20% 30% 40% 50%
18%27%
Bachelor’s degree or higher
Some degree
No college
Working
Not working
55–75
44–54
35–44
25–34
18–24
Female
Male
Total
12%17%
2%13%
14%25%
11%16%
8%9%9%
18%15%
19%26%
38%8%
36%
13%23%
13%20%
13%21%
Gender
Age
Employment status
Education
FIGURE 2
Audiobook and podcast listeners skew toward being young,educated, and employedUS audiobook and podcast demographics, 2018
Audiobook Podcast
A young, employed, and educated customer base
From whom do audiobooks and podcasts make their money? To fi nd out, Deloitte Global conducted
a survey of more than 1,000 adults in the United States in 2018. The results suggest that audiobook and podcast listeners skew toward being younger, more educated, and employed (fi gure 2)—all attri-butes that make them an attractive customer base.
113
The ears have it: The rise of audiobooks and podcasting
The above generalization, of course, masks certain nuances. For instance, audiobook listenership among the youngest cohort surveyed, 18–24-year-olds, is markedly lower than among the next older cohort of 25–30-year-olds; only eight percent of US 18–24-year-olds listen to audiobooks, about the same proportion as 44–75-year-olds. One possible explanation is that many 18–24-year-olds are still in school and spend most of their reading time studying printed textbooks rather than listening to audiobooks for pleasure. Also surprising is that, although some have suggested that audiobooks would be a boon for seniors (due in part to age-related vision loss)30 and those with lower levels of literacy,31 the survey data showed that neither those aged 55–75 nor those with no postsecondary education (a group likely to overindex on illiterate or low-literacy readers) are embracing audiobooks en masse—at least not yet.
Of the 21 percent of adult Americans who listen to podcasts, most are doing so regularly. Thirty-eight percent of surveyed podcast listeners reported listening daily or almost daily, 66 percent at least once a week, and 87 percent at least monthly. These frequencies were generally consistent across gender, education, and work status … with one exception. Only about 40 percent of 55–75-year-old podcast listeners do so at least weekly, making this age group
not only the least likely to listen to podcasts at all, but the least likely to listen to them frequently.
These general patterns also hold in Canada. When the same survey polled more than 1,000 Canadians (also in 2018) about their audiobook and podcast listening habits, it found that, while the proportions of both audiobook and podcast listeners were about 2–3 percentage points lower across groups, the overall distribution was similar to that in the United States.
Of the 21 percent of adult Americans who listen to podcasts, most are doing so regularly. Thirty-eight percent of surveyed podcast listeners reported listening daily or almost daily, 66 percent at least once a week, and 87 percent at least monthly.
114
Technology, Media, and Telecommunications Predictions 2020
THE BOTTOM LINEFor audiobook publishers, the audiobook market’s growth prospects in 2020 and beyond will certainly be music to their ears. To compete effectively for listeners and dollars, however, they should determine not only which titles to release as audiobooks, but also how many and how often. If 46,000 new titles per year is reasonable for the United States, are 650 local-language titles for Spain or 95 per year for India the right numbers for those countries?32 Whatever that number turns out to be, it will probably get bigger from year to year. The cost of producing an audiobook is not negligible, but it is quite small compared to the cost of advances, promotion, and printing for traditional books, so we expect the percentage of titles that are made into audiobooks to rise over time.
As for podcasts and their monetization prospects, various structural headwinds suggest that the revenue gap with audiobooks, while it may narrow, will not close. Higher production values may help: Too many podcasts have very low-quality sound, and moving closer to the recording techniques used for audiobooks may allow for higher pricing.33 Another possible strategy is to reduce quantity while increasing quality. News UK, for instance, halved the number of podcasts it makes and saw downloads double while ad revenue tripled.34 Indeed, it seems likely that higher-profile podcast producers may start curating their podcasts more thoughtfully, resulting in fewer but higher-quality podcasts on the market overall. Signs also point to a possible decline in user-generated podcasts. Many newer podcasts are interview-style podcasts (aka “bantercasts”) that are insufficiently differentiated to compete in an already overcrowded market, and industry experts are predicting that many of these, having failed to attract audiences or advertisers, will simply stop being updated, a phenomenon known as “podfade.” 35
Both audiobooks and podcasts may receive a boost from the continuing spread of smart speakers. Smart speakers are expected to achieve more than 25 percent market penetration in the United States and urban China by 2020,36 and more growth is anticipated as the rest of the world catches up. These devices are popular with audiobook and podcast listeners, with 66 percent of smart speaker owners in the United States saying they listen to at least one audiobook or podcast on their smart speaker weekly.37
Finally, how worried should the rest of the audio industry be? That depends on where audio and podcast listeners are coming from—but the radio industry, in particular, may have reason for concern. Although radio has proven surprisingly resilient compared to other traditional media, with current revenues of US$42 billion globally and slow but steady growth expected on the back of its 90 percent-plus global weekly reach, recent data shows some worrisome signs. While the decision of what to listen to is not an all-or-nothing choice—90 percent of US podcast listeners have also listened to radio in the last week, for instance38—radio’s total listening minutes are declining. In the first quarter of 2019, average radio listening time in the United States fell by four minutes per day to 1 hour and 42 minutes, down 3.8 percent year over year. This decrease, moreover, occurred among all age groups, with the steepest declines among 18–34-year-olds and 35–49-year-olds (5.9 percent and 4.5 percent, respectively).39 Given that two-thirds of all out-of-home US radio listening occurs in cars,40 and that podcasts and audiobooks serve a function similar to radio during commutes, it’s at least plausible that radio’s decrease in listening minutes reflects a loss of listeners to audiobooks or podcasts. For radio broadcasters, these numbers may be worth watching closely as audiobooks and podcasts continue their upward climb.

115
The ears have it: The rise of audiobooks and podcasting
1. A podcast is an episodic series of digital audio files that a user can download or stream. The term “podcast” may also refer to an individual component of such a series. For more information, see: Wikipedia, “Podcast,” accessed October 10, 2019.
2. PwC, Getting personal: Putting the me in media and entertainment, accessed September 26, 2019.
3. Recording Industry Association of America, RIAA 2018 year-end music industry revenue report, February 28, 2019.
4. Deloitte analysis of various sources including comScore, RIAA, NPD, Digital TV Research, Bookmap, PwC, and the World Press Trends database.
5. Futuresource Consulting, “Headphones to generate nearly $21 billion in 2018, according to Futuresource Consulting’s latest headphone report,” audioXpress, October 22, 2018.
6. Duncan Stewart, Radio: Revenue, reach, and resilience, Deloitte Insights, December 11, 2018.
7. Xinhua, “Audiobooks, e-books lift China’s book industry,” Straits Times, August 7, 2018.
8. Ed Nawotka, “Sweden’s Storytel continues its global expansion,” Publishers Weekly, May 17, 2019.
9. Mark Sweney, “New chapter? UK print book sales fall while audiobooks surge 43%,” Guardian, June 25, 2019.
10. Porter Anderson, “Books heard ‘round the world: A new survey of international audiobook markets,” Publishing Perspectives, April 11, 2019.
11. Andrew Perrin, “One-in-five Americans now listen to audiobooks,” Pew Research, September 25, 2019.
12. Chi Dehua, “Audiobook figures on the rise in China,” GBTIMES, April 19, 2018.
13. Lily Rugo, “AAP reports e-books sales fall, audiobooks rise,” Forbes, February 20, 2019.
14. Audio Publishers Association “New survey shows 50% of Americans have listened to an audiobook,” press release, April 24, 2019.
15. Ed Nawotka, “Bologna 2019: Audiobook sales show global growth,” Publishers Weekly, April 11, 2019.
16. Association of American Publishers, “AAP StatShot: Publisher revenue at $6 billion for first six months of 2019,” press release, August 28, 2019.
17. Assuming 25 percent annual growth.
18. Piotr Kowalczyk, “Audiobook prices compared to ebooks and print books,” Ebook Friendly, July 3, 2018.
19. Wenbin Fang, “How do podcasts make money in 2019? Here are 8 intriguing ways,” Listen Notes, August 9, 2019.
20. Enders Analysis, Spotify’s podcast play, September 11, 2019.
21. Wikipedia, “Podcast.”
22. Bob Woods, “The podcasting revenue boom has started,” Strategy+business, October 18, 2018.
23. Bill Rosenblatt, “Podcast ad revenue continues to grow but growth is slowing down,” Forbes, June 9, 2019.
24. Subodh Sharma, “Why are audiobooks so expensive? 6 factors for their high price,” GladReaders, January 29, 2019.
25. MusicOomph, “Podcast statistics (2019) – [infographic],” accessed October 10, 2019.
26. Enders Analysis, Reader-first news media – from transition to transformation, June 28, 2019.
27. Deloitte analysis of the Fortune 500 list.
Endnotes

116
Technology, Media, and Telecommunications Predictions 2020
28. According to a 2016 US and UK study of enterprise CMOs, companies spend 12 percent of revenues on marketing, with larger companies (>US$5 billion in revenues) spending 13 percent and smaller companies (US$250–500 million in revenues) spending 10 percent. For more information, see: Gartner, “Gartner CMO spend survey 2016-2017 shows marketing budgets continue to climb,” press release, December 12, 2016. The 500th largest company on the Fortune 500 had revenues of US$5.4 billion in 2018 and the list has aggregate revenues of US$12.8 trillion. Thirteen percent of US$12.8 trillion is US$1.664 trillion. For more information, see: Fortune, “Fortune 500,” accessed October 10, 2019.
29. Josh Bersin, “A new paradigm for corporate training: Learning in the flow of work,” June 3, 2018; Josh Bersin, “Google for jobs: Disrupting the $200 billion recruiting market?,” May 26, 2017.
30. mmLearn.org, “The many benefits of audiobooks for seniors,” July 8, 2016.
31. Penguin Random House, “Audiobooks support literacy in America,” accessed October 10, 2019.
32. Porter Anderson, “Books heard ‘round the world.”
33. Shan Man, “The difference between a podcast and audiobook recording,” October 11, 2018.
34. Lucinda Southern, “Why News UK halved the number of podcasts it produces,” Digiday, July 23, 2019.
35. Jennifer Miller, “Have we hit peak podcast?,” New York Times, July 18, 2019.
36. Based on moderate growth from 2018 levels of 20 percent in the United States and 22 percent in Urban China. For more information, see: Paul Lee, Smart speakers: Growth at a discount, Deloitte Insights, December 11, 2018.
37. Nielsen, Q1 Nielsen total audience report, July 1, 2019, p. 13.
38. Nielsen, Audio today 2019: How America listens, June 2019.
39. Nielsen, Q1 Nielsen total audience report, p. 8.
40. Nielsen, Audio today 2019: How America listens, p. 9.

117
The ears have it: The rise of audiobooks and podcasting

118118
Technology, Media, and Telecommunications Predictions 2020
DRIVERS, CHECK YOUR rearview mirrors: More and more cyclists are taking to the roads, and they’re not going away anytime
soon. We predict that tens of billions of additional bicycle trips per year will take place in 2022 over 2019 levels. This increase in bicycling will double the number of regular bicycle users in many major
cities around the world where cycling to work is still uncommon. (In the United States and Canada, for instance, only about 1 percent of the workforce commutes by bike today).1 In total, we predict a 1 percentage point rise in the proportion of people who bike to work during the three years from 2019 to 2022.
Cycling’s technological transformationMaking bicycling faster, easier, and safer
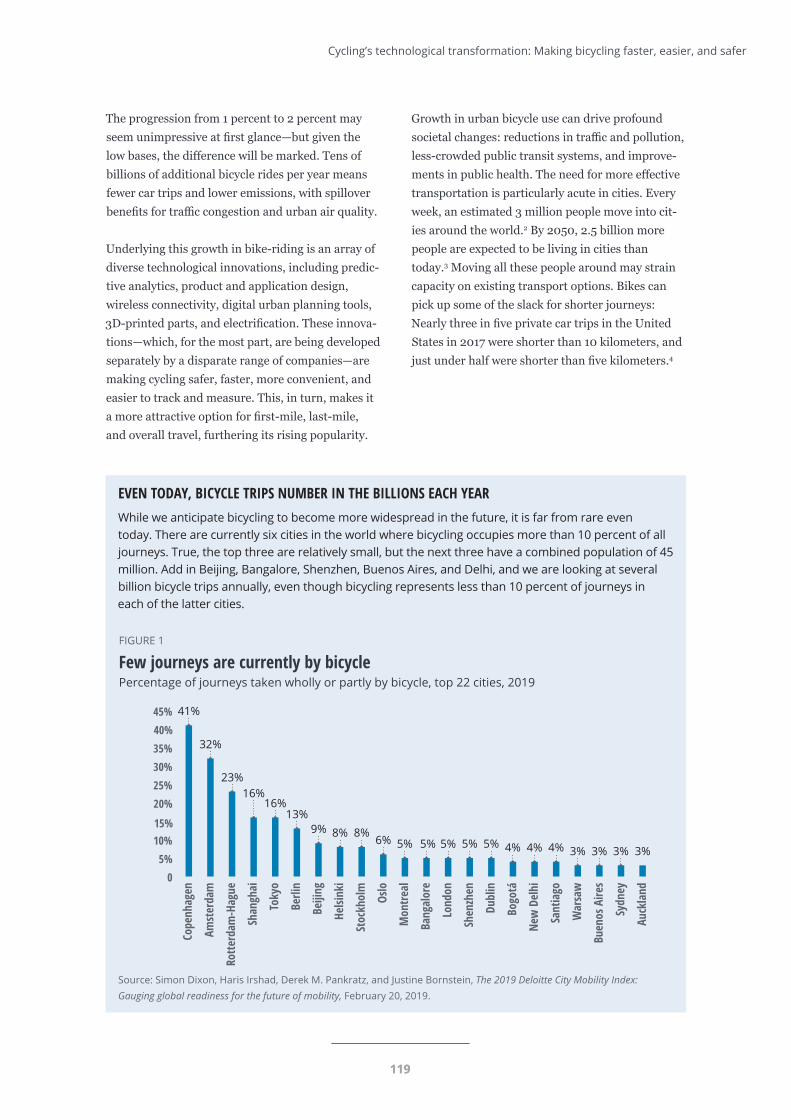
119119
Cycling’s technological transformation: Making bicycling faster, easier, and safer
EVEN TODAY, BICYCLE TRIPS NUMBER IN THE BILLIONS EACH YEARWhile we anticipate bicycling to become more widespread in the future, it is far from rare even today. There are currently six cities in the world where bicycling occupies more than 10 percent of all journeys. True, the top three are relatively small, but the next three have a combined population of 45 million. Add in Beijing, Bangalore, Shenzhen, Buenos Aires, and Delhi, and we are looking at several billion bicycle trips annually, even though bicycling represents less than 10 percent of journeys in each of the latter cities.
The progression from 1 percent to 2 percent may seem unimpressive at first glance—but given the low bases, the difference will be marked. Tens of billions of additional bicycle rides per year means fewer car trips and lower emissions, with spillover benefits for traffic congestion and urban air quality.
Underlying this growth in bike-riding is an array of diverse technological innovations, including predic-tive analytics, product and application design, wireless connectivity, digital urban planning tools, 3D-printed parts, and electrification. These innova-tions—which, for the most part, are being developed separately by a disparate range of companies—are making cycling safer, faster, more convenient, and easier to track and measure. This, in turn, makes it a more attractive option for first-mile, last-mile, and overall travel, furthering its rising popularity.
Growth in urban bicycle use can drive profound societal changes: reductions in traffic and pollution, less-crowded public transit systems, and improve-ments in public health. The need for more effective transportation is particularly acute in cities. Every week, an estimated 3 million people move into cit-ies around the world.2 By 2050, 2.5 billion more people are expected to be living in cities than today.3 Moving all these people around may strain capacity on existing transport options. Bikes can pick up some of the slack for shorter journeys: Nearly three in five private car trips in the United States in 2017 were shorter than 10 kilometers, and just under half were shorter than five kilometers.4
Source: Simon Dixon, Haris Irshad, Derek M. Pankratz, and Justine Bornstein, The 2019 Deloitte City Mobility Index:Gauging global readiness for the future of mobility, February 20, 2019.
Deloitte Insights | deloitte.com/insights
FIGURE 1
Few journeys are currently by bicyclePercentage of journeys taken wholly or partly by bicycle, top 22 cities, 2019
Source: Simon Dixon, Haris Irshad, Derek M. Pankratz, and Justine Bornstein, The 2019 Deloitte City Mobility Index:Gauging global readiness for the future of mobility, February 20, 2019.
Deloitte Insights | deloitte.com/insights
FIGURE 1
Bicycling is far from rare even todayPercentage of journeys taken wholly or partly by bicycle, top 22 cities, 2019
Copenhagen41%
Amstertam32%
Rotterdam23%
Shanghai16%
Tokyo16%
Berlin13%
Beijing9%
Helsinki8%
Stockholm8%
Oslo6%
Montreal5%
Bangalore5%
London5%
Shenzhen5%
Dublin5%
Bogotà4%
Dehli4%
Santiago4%
Warsaw3%
Buenos Aires3%
Sydney3%
Auckland3%
Cope
nhag
en
Amst
erda
m
Rotte
rdam
-Hag
ue
Shan
ghai
Toky
o
Berli
n
Beiji
ng
Helsi
nki
Stoc
khol
m
Oslo
Mon
treal
Bang
alor
e
Lond
on
Shen
zhen
Dubl
in
Bogo
tá
New
Del
hi
Sant
iago
War
saw
Buen
os A
ires
Sydn
ey
Auck
land
05%
10%15%
20%25%30%35%40%45% 41%
32%
23%16%
16%13%
9% 8% 8% 6% 5% 5% 5% 5% 5% 4% 4% 4% 3% 3% 3% 3%
120120
Technology, Media, and Telecommunications Predictions 2020
Electrification: My other car is an e-bike
Of the slew of the aforementioned bicycle-related technologies, the development and spread of e-bikes, which use batteries to assist pedaling, stands out for its potential to boost cycling’s growth.
Electrifying a bike is not a new idea: The first patent for an electrically powered bicycle dates from 1895.5 The concept, however, did not catch on like wildfire. Even earlier in this century, e-bikes remained relatively rare in most of the world. Between 2006 and 2012, for example, e-bikes represented less than 1 percent of all annual bicycle sales (standard and electric) in the United States.6 The exception was China, where 37 million e-bikes were manufac-tured and 32 million sold in 2013.7 By contrast, only 1.8 million e-bikes were sold in all of Europe that same year, while Japan recorded only 440,000 and the United States a measly 185,000.8
Now, thanks largely to recent improvements in lithium-ion battery (LIB) technology, pricing, and power, the e-bike market is seeing a surge in interest, particularly for high-end models. Between 2020 and 2023, more than 130 million e-bikes (using all battery technologies) are expected to be sold,9 and in 2023, e-bike sales are expected to top 40 million units worldwide,10 generating about US$20 billion in revenue.11 To put these numbers into context, only 12 million electric vehicles—that is, automobiles and trucks—are expected to sell in 2025; at the end of 2018, just 5.1 million electric vehicles were in circulation.12
Advances in LIBs are a strong sales driver. Al-though more than 80 percent of the e-bikes sold each year were using heavy lead-acid batteries as recently as 2016, the falling price of much lighter LIBs has shifted the market. Over the entire four-year forecast period between 2020 and 2023, we expect about two-fifths of all e-bikes sold globally to feature LIBs, with the proportion of LIB-powered e-bikes starting out at about 25 percent in 2020 and rising to more than 60 percent in 2023. LIBs are now becoming avail-able in variants for different applications, with models specifically designed for commuting (for fast acceleration at a low pedaling speed), cargo (for heavy loads), and mountain bikes (ideal for fast sprints and steep hills) now available.13
Bike makers and sellers are already seeing e-bike sales pick up the pace. One global bicycle manufac-turer’s e-bike H1 revenues for 2019 were up by more than 40 percent year over year.14 In Germany, e-bike sales in 2018 rose by 36 percent to nearly 1 million units;15 almost a million more were sold in Germany in just the first half of 2019.16 More than half of all adult bikes sold in the Netherlands in 2018 were electric,17 and e-bike sales at speciality stores in the United States surged to more than 400,000 units, a 73 percent increase.18 Spain recorded a 55 percent year-on-year increase in e-bike unit sales in 2018, selling 111,297 e-bikes for an average of 2,165 euros each.19
All those sales mean a lot of e-bikes on the streets. By 2023, the total number of e-bikes in circulation around the world—owned by both consumers and organizations—should reach about 300 million, a 50 percent increase over 2019’s 200 million.20 These 300 million e-bikes will include both pri-vately owned e-bikes and e-bikes available to share.
Electrifying a bike is not a new idea: The first patent for an electrically powered bicycle dates from 1895.

121121
Cycling’s technological transformation: Making bicycling faster, easier, and safer
What’s the appeal of e-bikes? One big plus is that battery assist makes bicycling less of a physical effort. This translates into faster speeds; easier ac-celeration after a stop, such as at a traffic light; and a power boost when going uphill, facing headwinds, carrying heavy loads, or some combination of the above.21 Once a specific speed has been attained, the assist stops. In Europe and China, battery assis-tance stops at 25 kilometers per hour;22 any faster, and the rider must power the bike on their own.
On an e-bike, a bicyclist can attain an average speed of about 22 kilometers per hour, about 50 percent faster than the average 15 kilometers per hour for a standard bike.23 This increased speed could cut journey times by two-thirds. At such speeds, an e-bike might even outpace a car, bus, or subway. Moreover, riding an e-bike requires less effort than a standard bike. An e-bike ride is more akin to a stroll than a sprint, meaning that bicycling can be done in a suit rather than spandex. One test found that e-bikers sweat two-thirds less than regular cyclists.24 This matters to commuters: Not having to pack a change of clothing or shower after a ride removes a significant disincentive to bicycling.
E-bikes open up bicycling to many who might otherwise hesitate. Because the electric motor takes over when energy levels flag, e-bikes can encourage people who feel out of shape to get back in the saddle. According to one survey, 20 percent of Londoners who don’t bicycle say that they are too old or unfit to do so.25 And the effect doesn’t end with out-of-shape able-bodied individuals. Electrifi-cation can be a game-changer for the disabled: The motorized elements of an e-bike can be integrated into a wheelchair that can then be ridden in bike lanes or on the road.26 For the disabled, this can make moving around a city far faster than traveling by bus (even with ramps) or rail (assuming station platforms have been adapted and lifts added).
Yet electrifying a bicycle does more than making it easier to pedal. E-bikes can also be secured and unlocked via a smartphone app, and the same
technology makes it possible to more easily locate an e-bike if lost or stolen. Electrification can also improve safety. Most higher-end e-bikes have very large, bright, battery-powered front and rear LED lights—not as important for daytime pleasure rides, but critical for winter rush-hour commutes, which in the northern hemisphere often occur in dusk or even complete darkness.
Yes, most or all of this can be done on mechanical bikes, too. But … it usually isn’t. Buying these capabilities integrated into an electric bike elim-inates hassle for the rider. Consider someone using battery-powered front and rear lights on a standard bike. Nonintegrated lights are easy to steal, so the rider would have to remove them after the morning commute, carry them to the office or classroom, find somewhere to store or charge them, and then bring them back and remount them for the ride home. At home, the entire process must be repeated if secure parking is not available. An e-bike’s integrated lights, on the other hand, are always there, always powered, and hard to steal, and they only run out of battery if the bike does.
Electrification enables greater experimentation in form factors as well. Bikes can be reconfigured to carry toddlers safely, transport a week’s worth of groceries, and make local deliveries—without requiring Olympian levels of fitness to operate.
Perhaps the most compelling factor favoring e-bikes’ eventual uptake is the ubiquity of the charging network. Unlike electric cars, e-bikes do not require a new network of fast chargers or the installation of spe-cialized chargers in parking lots: Recharging an e-bike merely requires plugging the battery into a standard power socket for a few hours. A modern house is likely to have more than 60 electricity sockets;27 a modern office building housing 1,000 workers may have more than 5,000. In contrast, only 150,000 public fast chargers for vehicles were available globally as of the end of 2018, of which 78 percent were in China.28 Additional e-bike batteries, which can be carried in a backpack, typically weigh only around 2.5 kilograms.29

122122
Technology, Media, and Telecommunications Predictions 2020
E-bikes may soon start to invade the niche cur-rently occupied by automobiles thanks to their convenience, utility, and relatively low cost. Even electric cargo bikes, though more expensive (at about US$8,000) than standard e-bikes, are much cheaper than most cars—and may be just as useful for running most errands. According to one survey, 28 percent of e-bike buyers bought the e-bike as a substitute for a car,30 not as an upgrade to a bike. Uber’s foray into e-bikesharing offers further suggestive data. Six months after Uber purchased e-bikesharing company Jump in January 2018, trips by new e-bikesharers on the Uber platform had gone up 15 percent while the number of car and SUV trips decreased by 10 percent, with the greatest shift happening between 8 a.m. and 6 p.m.31 Auto manufacturers themselves are getting in on the action. GM has launched a folding e-bike.32 Maserati has designed a 10,000-euro electric racing bike that won the German Design Award in 2019.33 And Volkswagen is marketing an e-cargo bike with a maximum load of 210 kilograms (including the driver).34
Electric cargo bikes, in fact, could become a pre-ferred solution for last-mile delivery in cities.35 They emit zero carbon, and occupy far less road space than cars when in use or parked. Logistics companies could use comparative data to determine when using e-cargo bikes instead of cars or vans would improve delivery times and reduce costs. One study found that e-cargo bikes could be used for 20 percent of deliveries.36 This means that e-cargo bikes could make potentially tens of billions of yearly deliveries worldwide: In the United States alone, delivery volumes are rising by 20 percent per year, with forecast of 285 billion shipments in 2021.37 In the near term, standard-sized delivery trucks could get squeezed out by e-cargo bikes. UPS, for one, is testing electric trikes that can hold up to 181 kilograms with a capacity of 2.7 cubic meters.38
The impact on take-out food delivery worldwide could be especially high. Beijing alone sees 1.8
million food deliveries every day.39 A dozen pizzas would overwhelm a mechanical bike, and could be awkward even for a moped—but they might fit perfectly on an e-cargo bike.40 In trials, Domino’s Pizza found that e-bike deliveries were not only faster than delivery by car, but also received higher customer service ratings.41
Bikesharing: Bringing bikes to where the riders are
There are billions of bikes in the world, with hundreds of millions of them under individual ownership—but only a small fraction of them are regularly used. One reason for this is because bikes are seldom around when you most need them. With the rise of bikesharing, this may be about to change.
Bikesharing makes bicycles available at the point of demand. More than 1,000 dock-based bikesharing programs exist worldwide,42 rep-resenting tens of millions of shareable bikes.43 The bikesharing market is even attracting bike manufacturers seeking to diversify; specialist folding bike manufacturer Brompton, for example, has 45 rental locations in the United Kingdom.44
Although bikesharing usage is still relatively low— in the United States, for instance, only 45 million trips were made on shared bikes in 2018,45 as opposed to the 115 million cars and trucks driven on US streets every day46—electrification should make bikesharing more appealing in the future by offsetting one of its major current drawbacks: the weight. Shared bikes are designed to be up to three times heavier than a standard bike,47 both to make them more robust and able to withstand heavy use, and to make them less attractive to would-be thieves. But heavy bikes can be harder to ride, and they may discourage the less fit from making the attempt. An electrified e-bike, on the other hand, can be both robust and easier to pedal than mechanical shared bikes.
123123
Cycling’s technological transformation: Making bicycling faster, easier, and safer
Electrified bikesharing programs, docked as well as dockless, are likely to proliferate in 2020 and beyond. Of the 192 cities in the United States with bikesharing schemes, more than 40 already include e-bikes in their fleet.48 Madison, Wis-consin, for example, converted all of the bikes in its bikeshare program to electric in June 2019.49 In trials, the Madison e-bikes had generated up to five times as many trips as standard bikes; since the move to all-electric bikes, the program’s ridership has risen by a factor of 1.5 to 4.50 Conversely, in cities where e-bikes have been withdrawn, bikesharing usage has declined.51
Besides being more user-friendly, shared electric bikes may offer better economics. Hello Bike, a Chinese shared mobility company that started offering shared electric bikes in 2017, has stated that e-bikes are its most profitable division.52 The aggregate number of Hello Bike’s e-bike and e-scooter rides, at 700 million per day, is more than twice that of standard bikes.53
Technologies beyond electrification: Improving the cycling experienceBeyond electrification, technology can offer a host of additional tools for improving the cycling experience, whether on an e-bike or a standard one.
TECHNOLOGY CAN SHOW WHEN BICYCLING IS THE SMART CHOICEIn many cities, average car speeds are getting slower and slower, and car trips are getting correspond-ingly longer and longer. This trend may make bikes, particularly e-bikes, the fastest way to get around in some areas. One 2017 analysis pegged average car speed within a mile of the center of London at 5.13
miles per hour, 19 percent slower than 2016’s 6.25 miles per hour.54 At that, London is still faster than Manhattan, where cars average 4.7 miles per hour in midtown.55 In Moscow, a study found that drivers spent an average of 210 hours in 2018 in traffic queues.56 Meanwhile, in Copenhagen—where 62 percent of residents bike to work, school, or univer-sity57—49 percent of one survey’s respondents said that their primary reason for bicycling was because it was faster,58 a greater proportion than cited health benefits, cost savings, or the environment.
Bikers seeking to plan their commutes down to the minute can draw on a range of technologies to help them do so: first, by recording bike journey times; second, by sharing this information with others; and third, by helping them plan even faster routes. The most accessible tool is the smartphone. Using an app, bikers can not only easily log and share their journey times, but also receive time estimates based on aggregated user data. Citymapper, for example, estimates bike journey times for three dif-ferent types of routes: quiet, regular, or fast. Taking this concept a step further, cyclist-specific smart mobility platforms have recently been piloted in Cologne (Germany), Porto (Portugal), and Trikala (Greece). Bikers on these platforms can upload information on road conditions, building sites, or unexpected incidents such as road accidents, which the platform then shares with other cyclists.59
Electrified bikesharing programs, docked as well as dockless, are likely to proliferate in 2020 and beyond.
124
Technology, Media, and Telecommunications Predictions 2020
Apps can quantify the cycling experience in other ways as well. They can calculate the number of calo-ries burned, as do the Strava and LimeBike apps, or measure the amount of greenhouse gas not created as a result of not driving, as do some health apps. This kind of information may not motivate everyone to bike, but for those who like their exercise with a bit of gamification, it can act as a further incentive.
Apps also exist for bikesharing. As of July 2019, Google Maps displays bikesharing stations’ lo-cations, as well as how many bikes are available at each, in 24 cities.60 Bikesharing companies’ own dedicated apps can pinpoint available bikes’ locations and their prices as measured by range. Uber, as mentioned above, now rents bikes through its app.61 And in the United States, Lyft offers Citi Bike rentals through its app—having also purchased Motivate, the United States’ largest bikeshare operator, in July 2018.62
Over the coming years, transport apps will likely include real-time information designed specifically for cyclists in the same way that Waze does for mo-torists. Indeed, these apps could consolidate data on all modes of transportation, allowing commuters to compare journey times across modes at any time.
TECHNOLOGY CAN MAKE BICYCLING SAFER A major reason that people do not ride bikes—of any type—is because of safety concerns. Here, too, technology can offer multiple solutions.
Accelerometers and gyroscopes, available on most smartphones, tablets, and action cameras, can be used to detect a crash. Some bike helmet models can use this capability to call a pre-defined number on the rider’s smartphone in the event of a collision.63 Wearable airbags are also available. Hövding’s wearable airbag, worn as a collar and charged via USB,64 measures the cyclist’s movements 200 times a second to monitor for abnormalities. In the event of an accident—signaled by an abnormal move-ment—the airbag inflates to cover the neck and head with an air-filled cushion, dramatically reducing the risk of concussion and almost com-pletely eliminating the risk of skull fracture.
Wireless technologies can also help bikers signal their turns to other road users without taking a hand off their handlebars, which some cyclists feel unsafe doing. Bluetooth-enabled indicator lights integrated into bike helmets, with switches mounted on handlebars, eliminate this difficulty; some such helmets even incorporate a brake light.65 Other helmet models feature short-range communications (up to 900 meters) via an intercom system, complete with integrated microphone and speakers. Up to four cyclists can be connected on the same network.66
Additive manufacturing (3D printing) techniques can improve helmet crash resistance, as well as create highly protective bespoke helmets. One vendor, HEXR, uses 3D scans of a client’s head to 3D-print a helmet constructed with a hexag-onal honeycomb cell inner shell. HEXR claims this helmet offers 68 percent more protection than a regular polystyrene foam helmet, as each printed cell can buckle and bend under impact.
Apps can quantify the cycling experience in other ways as well. They can calculate the number of calories burned, as do the Strava and LimeBike apps, or measure the amount of greenhouse gas not created as a result of not driving, as do some health apps.

125
Cycling’s technological transformation: Making bicycling faster, easier, and safer
Technology can help protect bikers from social dangers as well. Female cyclists, in particular, can be at risk of being physically attacked,67 and are often subjected to verbal abuse from drivers or male cyclists about their clothing, speed, body size, or even the merits of bicycling while pregnant.68 To help combat these issues, manufacturers are beginning to integrate increasingly high-quality cameras into helmets, lights, and bikes. Filming antisocial behavior does not address the root of the problem, but it may deter or dampen it. Not only can this improve safety for women riders, but it may also help increase overall bicycling participation rates, which tend to be higher in markets where women feel safe bicycling. In the Netherlands, Germany, and Denmark, for instance, there is minimal difference between male and female participation rates in cycling, and overall bicycling rates are among the highest in the world.69 On the other hand, one study of trends in the United States, the United Kingdom, Canada, and Australia found that male cyclists outnumbered female cyclists by about two to one.70 In New York and London, about three-quarters of commuter cyclists are male.71
TECHNOLOGY CAN HELP REDESIGN CITIES TO BE MORE BIKE-FRIENDLYFor the past century, cities have primarily been designed around cars. Bicycles and their needs for space and storage have usually been an afterthought, if indeed they were thought of at all. The construction of a 10-story garage would not merit a write-up in a local news-paper. The opening of a three-story bike park adjacent to a train station in Utrecht, Neth-erlands made news around the world.72
But although cars are likely to remain prevalent for decades to come, a growing number of cities are beginning to reallocate available space to accom-modate other forms of transport, including bicycles. Giving bikes more space is very likely a critical step toward making cities more hospitable to bicycle use: Many people who might otherwise embrace cycling are frightened off by the prospect of sharing a crowded road with big metal vehicles with only a helmet for protection. The good news is that there is plenty of space to reallocate. The United States has more than a billion parking spaces,73 for instance, and more than half of all of the country’s downtown space is given over to roads or parking.74
In some cities, effective road redesign has prompted notable habit changes. London has invested hun-dreds of millions of dollars in creating standalone bike lanes. Partly as a result, cycle journeys in the city grew by 5 percent in 2018, with more than 4 million kilometers traveled by bike each day.75 The deployment of a dedicated bike lane on one of London’s busiest bridges, which required the removal of a lane previously used for cars, enabled a 5 percent increase in the number of people crossing the bridge during peak usage hours.76 On the flip side, city planning that fails to consider bicyclists’ needs can drive bicycling participation rates down. For instance, the proportion of adults bicycling five times a week in Cambridge, UK fell from 32 percent in 2016 to 29 percent in 2017, a decline attributed partly to developers’ failure to incorporate bicyclists into plans for new streets, road junctions, and bicycle parking.77
Although cars are likely to remain prevalent for decades to come, a growing number of cities are beginning to reallocate available space to accommodate other forms of transport, including bicycles.
126
Technology, Media, and Telecommunications Predictions 2020
Data and analytics technologies can aid urban planners’ efforts to devise bicycle-friendly solu-tions. The amount of data available to planners is growing, while advances in analytics are making this data ever more useful. London’s transport authority is using a digital tool called Cynemon to help inform investments in the city’s bike lanes.78 This tool applies algorithms to data synthesized from multiple sources to determine what routes bikers are most likely to take along Greater London’s network of streets and urban paths. Strava, whose consumer app collects data from millions of bikers and runners around the world, aggregates and anonymizes this data through its Metro product and makes it available to departments of transportation and city planning groups to use in improving bicycle and pedestrian infrastructure.79 Depersonalized, aggregated data from mobile network operators could also be used to understand commuter journeys.80
WHAT ABOUT E-SCOOTERS?Bicycles aren’t the only two-wheeled vehicle people use to get around. The “micromobility” sector also includes e-scooters,83 which have attracted a great deal of attention in a number of locales.
E-scooters incorporate many of the technologies that are making cycling better and easier: batteries, GPS and data capabilities, app-based access, and availability through sharing platforms. However, despite their popularity—millions of e-scooters have been sold to individuals and to rideshare fleets, and tens of millions of e-scooter trips are taken per year—we have excluded e-scooters from this chapter’s analysis. The reason: We expect that e-scooters will be overwhelmingly used only for first- and last-mile travel, not for entire commutes of many kilometers that can take half an hour or more.
E-scooters’ higher injury rates may also nudge users toward e-bikes and other safer modes. A 2019 Calgary, Canada study of scooter injuries reported to hospitals found that the risk of injury per trip for scooters was 120 times higher than for motorists, and 600 times higher than for buses, compared to a study based on police reported injuries.84
New tools to analyze traffic flow can further improve data quantity and quality. Vivacity Labs has developed an AI tool that can classify road users by transport type from a video feed. Unlike older automated methods that rely on weight to trigger a response, this technology can be used to count bikes and pedestrians as well as heavier cars, buses, and trucks.81
Bicycles and bike accessories themselves can be fitted with location and motion sensors to yield useful data. In the United Kingdom, Manchester’s city council subsidized a program that equipped bikers with See.Sense lights to capture data on routes, journey times, problem spots such as potholes, and key pinch points or stoppages.82 The council used the aggregated and anonymized data to understand what routes cyclists were using and where safety concerns were highest due to factors such as lack of infrastructure, adverse road conditions, or overexposure to traffic.

127
Cycling’s technological transformation: Making bicycling faster, easier, and safer
THE BOTTOM LINEThe technology industry has a large role to play in encouraging greater bicycle use—a goal that can help society address many challenges arising from continuing global urbanization. Improving the technology itself—better data analytics to support urban planning, or faster battery recharge times, or apps that help people integrate bicycling into their commutes—is only part of the picture. The other, equally important part is to support policies and programs that promote bicycling.
The tech industry can’t do it alone, however. Many vertical sectors should be involved for cycling to make a dent in certain entrenched challenges. For example, consider public health and the related issue of health care costs. Standing at an estimated US$8.9 trillion in 2020, health care is one of the developed world’s biggest expenses.85 The adoption of healthier lifestyles could help lower these costs in some markets. To this end, instead of prescribing pills, doctors could offer programs designed to change behavior, such as encouraging exercise. This is actually already happening to a limited extent: In the United Kingdom, some doctors are referring patients to a 12-week bicycling course with the aim of making them more confident about being on a bike—and, hopefully, to make bicycling a habit.86
The health benefits of bicycling and other forms of exercise have been proven many times over. As just one example, one major study that followed 236,450 participants for five years found that bicycling to work was associated with a 41 percent lower risk of dying compared with commuting by car or public transport.87 Cyclists also had a 52 percent lower risk of succumbing to heart disease than noncyclists, and a 40 percent lower chance of dying from cancer.88 Even riding an electric bike can improve a person’s health;89 an e-bike may require less effort, but less effort does not mean effortless. One US study found that people who rode e-bikes for 40 minutes each week for a month improved in cardiovascular health, aerobic capacity, and blood sugar control, while also losing body fat.90
In association with national and local governments, health care systems could use data models to predict the long-term financial benefits of health improvements driven by behavioral modification programs. These analyses could then be fed into cost models for the redesign of cities and towns to encourage more bicycling.
Employers, too, should be involved in shaping healthier commuter habits. Many companies already invest heavily in a range of worker well-being initiatives. Businesses can encourage people to bike to work in many ways, such as converting existing car parking space to space for bikes (10 bikes can fit into a single standard car parking space).91 New buildings could plan to build in ample space for bikes from the beginning; Zurich’s AXA Winterhur office, which was designed with 1,000 bike parking spaces, is one example.92 Office entrances could include a dedicated ramp for bicyclists.93 Calendar apps can add further incentive by encouraging workers to bicycle to their next meeting rather than drive or take a cab. The app could show projected travel time for a range of options, including for mechanical and e-bikes; as observed previously, cycling in major cities is likely to be faster than driving or taking public transportation, and e-cycling faster still.
In terms of usage, bicycling still makes up only a small fraction of urban transportation modes. In terms of impact, however, bicycling can be immensely important—and the more people who bicycle, the greater the likely societal benefits. As technologies continue to improve, bicycling will most likely continue to become easier, faster, and safer. That’s good news for cities worldwide as they search for more economical and more sustainable ways to move people and things around.

128
Technology, Media, and Telecommunications Predictions 2020
Endnotes1. Richard Florida, “Mapping America’s bike commuters,” CityLab, May 19, 2017.
2. United Nations, “Around 2.5 billion more people will be living in cities by 2050, projects new UN report,” May 16, 2018.
3. Ibid.
4. National Household Travel Survey, “Explore vehicle trips data,” accessed September 30, 2019.
5. Ebike Portal, “Ogden Bolton Jr and his 1895 hub motor ebike,” February 13, 2015.
6. Nilesh Bothra, “E-bikes are changing the way we move—A glimpse into e-bike sales around the globe,” Medium, March 22, 2019.
7. International Nickel Study Group, “The global e-bike market,” September 2014.
8. Ibid.
9. It is also worth noting that as of 2020, there is an installed base of 2 billion bikes in the world, most of which are however unused. See Wikipedia, “Bicycle,” accessed September 30, 2019.
10. TJ McCue, “Global electric bike market is still moving fast—Sondors e-bike offers glimpse,” Forbes, April 12, 2018.
11. Mordor Intelligence, “Global e-bike market—growth, trends and forecast (2019–2024),” accessed September 30, 2019.
12. International Energy Agency, Global EV outlook 2019: Scaling up the transition to electric mobility, May 27, 2019.
13. Michel de Chavanon, “For MY 2020 Bosch focuses on more power at less weight,” Bike Europe, July 2, 2019.
14. Jo Beckendorff, “Giant Europe reports over 40 percent e-bike sales growth,” Bike Europe, August 15, 2019.
15. Jan-Willem van Schaik, “One million e-bikes sold in Germany in 2018: up 36 percent!,” Bike Europe, March 21, 2019.
16. Jack Oortwijn, “Are supply shortages hitting on Europe’s biggest e-bike market,” Bike Europe, September 19, 2019.
17. Carlton Reid, “When will e-bike sales overtake sales of bicycles? For the Netherlands, that’s now,” Forbes, March 2, 2019.
18. Phil Wahba, “E-bike sales are putting a charge in the fortunes of bikemakers,” Fortune, July 20, 2019.
19. Jack Oortwijn, “E-bike sales skyrockets across Europe,” Bike Europe, August 30, 2019.
20. It is also worth noting that as of 2020, there is an installed base of 2 billion bikes in the world, most of which are, however, unused.
21. Bonnie Friend, “What are the true benefits of electric bikes?,” WeLoveCycling.com, December 18, 2018.
22. Nick Busca, “Electric bikes and UK law: what you need to know,” Cycling Weekly, February 13, 2019; Ma Si, “China adjusts e-bike speed requirements,” China Daily, January 16, 2018.
23. In Copenhagen, average biking speed in 2012 (a less electrified age) was 15.5 kilometers/hour. See: Cycling Embassy of Denmark, Copenhagen city of cyclists: The bicycle account 2014, May 2015.
24. Shimano Steps, “On your marks, forget-sweat go! Study proves e-bikers sweat 2/3rds less than regular bikers,” accessed September 30, 2019.
25. Transport for London, Cycling action plan: Making London the world’s best big city for cycling, December 2018.
26. Invictus Active, “Wheelchair electric bike attachment: Fantastic addition to any manual wheelchair!,” accessed September 30, 2019; Better Mobility, “Invacare Alber e-pilot,” accessed September 30, 2019.

129
Cycling’s technological transformation: Making bicycling faster, easier, and safer
27. Electrical Safety First, “Minimum provision of electrical socket—outlets in the home,” March 2018.
28. International Energy Agency, Global EV Outlook 2019.
29. Bosch eBike Systems, “Bosch batteries,” accessed September 30, 2019.
30. Selene Yeager, “13 reasons to get stoked about e-bikes,” Bicycling, May 3, 2019.
31. Matt McFarland, “Uber’s e-bikes are cannibalizing rides from Uber’s cars,” CNN, July 19, 2018.
32. Thomas Ricker, “Test-riding GM’s Ariv Meld and folding merge e-bikes: General Motors’ first e-bikes have arrived,” The Verge, June 21, 2019.
33. John Styles, “Maserati road e-bike wins German award,” Cycling Industry News, November 9, 2018.
34. Copenhagen Bikeshow, “Volkswagen enters cargo ebike market,” accessed September 30, 2019.
35. Richard Schrubb, “How UPS sees electric cargo bikes fitting into global logistics,” Electric Bike Report, May 10, 2018.
36. Carlton Reid, “Cargobikes not drones are the future for urban deliveries,” Forbes, October 15, 2018.
37. Bill Ciervo, “18 Ecommerce order fulfillment statistics that’ll change the way you think about retail,” Conveyco, January 8, 2019.
38. Micah Toll, “UPS expands use of electric cargo bicycles for deliveries,” Electrek, October 26, 2018.
39. Gentlemen Marketing Agency, “Chinese food ordering apps: What you should know?,” February 4, 2019.
40. Micah Toll, “Domino’s to start delivering pizzas by electric bicycle after successful pilot,” Electrek, August 13, 2019.
41. Ibid.
42. Wikipedia, “List of bicycle-sharing systems,” accessed September 30, 2019.
43. Padraig Belton, “How cheap dockless hire bikes are flooding the world,” BBC, May 15, 2018.
44. Brompton Bike Hire, accessed September 30, 2019.
45. National Association of City Transportation Officials, “84 million trips taken on shared bikes and scooters across the U.S. in 2018,” April 17, 2019.
46. Adie Tomer, “America’s commuting choices: 5 major takeaways from 2016 census data,” Brookings, October 3, 2017.
47. Eillie Anzilotti, “Turns out, people really miss e-bikes when they’re taken away,” Fast Company, April 25, 2019.
48. Julissa Trevino, “E-bikes take the lead in city bikeshare programs,” U.S. News & World Report, August 12, 2019.
49. Eillie Anzilotti, “Madison is the first city to go 100% electric for its bike share,” Fast Company, June 18, 2019.
50. Trevino, “E-bikes take the lead in city bikeshare programs.”
51. Anzilotti, “Turns out, people really miss e-bikes when they’re taken away.”
52. Rita Liao, “Hellobike, survivor of China’s bike-sharing craze, goes electric,” TechCrunch, July 15, 2019.
53. Ibid.
54. Other cities in the UK, such as Manchester and Edinburgh were not as slow, but still averaged under 10 miles per hour. See Natalie Middleton, “Average driving speeds plummet in UK’s major cities,” Fleet World, 2017.
55. Nina Agrawal, “The average speed of traffic in Midtown Manhattan is 4.7 mph. New York thinks it’s found a solution,” Los Angeles Times, January 24, 2018.
56. The Moscow Times, “Moscow has the worst traffic jams in the world, study says,” February 13, 2019.

130
Technology, Media, and Telecommunications Predictions 2020
57. Wikipedia, “Cycling in Copenhagen,” accessed September 30, 2019.
58. Cycling Embassy of Denmark, Copenhagen city of cyclists.
59. Karen Rike Greiderer, “The smart city of the future—Cologne launches the ‘Smart bicycle traffic challenge’,” Urban Independence Magazine, October 10, 2018.
60. Andrew Hyatt, “Real-time bikeshare information in Google Maps rolls out to 24 cities,” The Keyword, Google, July 16, 2019.
61. Sasha Lekach, “After Uber bought Jump, people started riding bikes instead of ordering cars,” Mashable, February 8, 2019.
62. Andrew J. Hawkins, “Citi bikes can now be rented through the Lyft app,” The Verge, May 22, 2019.
63. Paul Norman, “Now specialized helmets call for help if you crash,” Cycling Weekly, November 28, 2018.
64. Hövding Sverige, “The world’s safest bicycle helmet isn’t a helmet,” September 26, 2019, YouTube video, 1: 49.
65. Caroline Dean, “Four of the best smart bike helmets with brake/indicator lights,” Kit Radar, accessed September 30, 2019.
66. Sena, “X1: First-ever Bluetooth integrated cycling helmet,” accessed September 30, 2019.
67. Anna Allatt, “What is stopping women from cycling?,” BBC, January 21, 2018.
68. Victoria Hazael, “Cycling with a bump—is it safe to ride whilst pregnant?,” Cycling UK, March 22, 2014.
69. Suzanne Motherwell, “Are we nearly there yet?” Exploring gender and active travel, Sustrans, February 2018.
70. Ibid.
71. Aaron Short, “Tally Ho! London breaks its cycling record,” Streetsblog, July 8, 2019.
72. Andrew J. Hawkins,“I can’t wrap my feeble American brain around this massive bike parking garage in the Netherlands,” The Verge, August 20, 2019; Daniel Boffey, “World’s biggest bike parking garage opens in Utrecht—but Dutch dream of more,” Guardian, August 7, 2017; Xinhua, “In pics: new parking facility in Utrecht, the Netherlands,” August 20, 2019; Darko Janjevic, “Utrecht opens ‘world’s biggest’ bicycle parking lot,” Deutsche Welle, August 21, 2018.
73. Brad Plumer, “Cars take up way too much space in cities. New technology could change that.,” Vox, accessed September 30, 2019.
74. Charlie Gardner, “We are the 25%: Looking at street area percentages and surface parking,” Old Urbanist, December 12, 2011.
75. Gwyn Topham, “London records biggest rise in cycling journeys in 2018,” Guardian, July 3, 2019.
76. Transport for London, Cycling action plan.
77. Annie Gouk and Alistair Ryder, “Cambridge is the UK’s cycling capital—but it’s on the decline,” Cambridge News, September 2, 2018.
78. Transport for London, Strategic cycling analysis: Identifying future cycling demand in London, June 2017.
79. “Strava Metro,” accessed September 30, 2019.
80. Transport for London, “Event data from mobile devices,” accessed September 30, 2019.
81. “VivacCity Labs,” accessed September 30, 2019.
82. See.Sense, “Manchester and See.Sense cycling data trial,” accessed September 30, 2019.
83. Rasheq Zarif, Derek M. Pankratz, and Ben Kelman, Small is beautiful: Making micromobility work for citizens, cities, and service providers, Deloitte Insights, April 15, 2019.

131
Cycling’s technological transformation: Making bicycling faster, easier, and safer
84. Rosa Saba, Calgary doctors push helmets as e-scooter injuries send an average of six people to hospital a day, September 18, 2019; Laurie F. Beck, Ann M. Dellinger, and Mary E. O’Neil, “Motor vehicle crash injury rates by mode of travel, United States: Using exposure-based methods to quantify differences,” American Journal of Epidemiology 166, (2007): pp. 212–8, DOI: 10.1093/aje/kwm064.
85. Global health care expenditures are expected to continue to rise. Spending is projected to increase at an annual rate of 5.4 percent between 2017–2022, from US$7.724 trillion to US$10.059 trillion. Deloitte, “2019 Global Health Care Outlook: Sharing the future,” 2019.
86. Neil Roberts, “GPs back plan to prescribe cycling lessons for patients,” GP, February 2, 2019.
87. Jason Gill and Carlos Celis-Morales, “Cycling to work: Major new study suggests health benefits are staggering,” The Conversation, April 20, 2017.
88. Ibid.
89. Michael Barnard, “Major study shows electric bikes good for health,” CleanTechnica, December 6, 2018.
90. Considerable, “The popularity of electric bikes is skyrocketing among older riders,” September 3, 2019.
91. Rupprecht Consult, “Bicycle parking in the city centre,” accessed September 30, 2019.
92. Adele Peters, “This sleek Zurich office building has public parking for 1,000 bikes,” Fast Company, September 30, 2016.
93. Alyn Griffiths, “Studio RHE converts three historic buildings into ‘London’s first cycle-in office’,” Dezeen, September 16, 2015.
132
Technology, Media, and Telecommunications Predictions 2020
About the authors
Paul Lee | [email protected]
Paul Lee is a UK partner and the global head of research for the technology, media, and telecommunications (TMT) industry at Deloitte. In addition to running the TMT research team globally, Lee manages the industry research team for Deloitte UK.
Jeff Loucks | [email protected]
Jeff Loucks is the executive director of Deloitte’s Center for Technology, Media & Telecommunications. He is especially interested in the strategies that organizations use to adapt to accelerating change, conducting research and writing on topics that help companies capitalize on technological change.
Duncan Stewart | [email protected]
Duncan Stewart is the director of research for the technology, media, and telecom-munications (TMT) industry for Deloitte Canada. He presents regularly at conferences and to companies on marketing, technology, consumer trends, and the longer-term TMT outlook.
David Jarvis | [email protected]
David Jarvis is a senior research manager with Deloitte’s Center for Technology, Media & Telecommunications. He has more than 12 years of experience in the tech-nology industry focusing on emerging business and technology issues and the potential impacts of longer-term change.
Chris Arkenberg | [email protected]
Chris Arkenberg is a research manager with Deloitte’s Center for Technology, Media & Telecommunications. He has dedicated his career to exploring how people and organizations interact with transformational technologies.

133
Technology, Media, and Telecommunications Predictions 2020
Acknowledgments
Thanks to Deloitte’s David Ciampa, Rishabh Kapoor, Shashi Kaligotla, and Shashank Srivastava for sharing their expertise.
Contacts
Industry leadership
Paul J. SallomiGlobal TMT industry leader | Partner | Deloitte Tax [email protected]
Paul Sallomi is the global technology, media, and telecommunications industry leader and US technology sector leader for Deloitte LLP. He is based in San Jose, CA.
Mark A. CaseyGlobal TM&E sector leader | Partner | Deloitte [email protected]
Mark Casey guides strategy across the global network of Deloitte’s Telecommunications, Media & Entertainment professionals. He is based in Amsterdam.
Craig WiggintonGlobal Telecommunications leader | Partner | Deloitte & Touche [email protected]
Craig Wigginton is a US vice chairman and the Technology, Media & Telecommunications Industry leader for the Americas. He is based in New York.

About Deloitte Insights
Deloitte Insights publishes original articles, reports and periodicals that provide insights for businesses, the public sector and NGOs. Our goal is to draw upon research and experience from throughout our professional services organization, and that of coauthors in academia and business, to advance the conversation on a broad spectrum of topics of interest to executives and government leaders.
Deloitte Insights is an imprint of Deloitte Development LLC.
About this publication
This publication contains general information only, and none of Deloitte Touche Tohmatsu Limited, its member firms, or its and their affiliates are, by means of this publication, rendering accounting, business, financial, investment, legal, tax, or other profes-sional advice or services. This publication is not a substitute for such professional advice or services, nor should it be used as a basis for any decision or action that may affect your finances or your business. Before making any decision or taking any action that may affect your finances or your business, you should consult a qualified professional adviser.
None of Deloitte Touche Tohmatsu Limited, its member firms, or its and their respective affiliates shall be responsible for any loss whatsoever sustained by any person who relies on this publication.
About Deloitte
Deloitte refers to one or more of Deloitte Touche Tohmatsu Limited, a UK private company limited by guarantee (“DTTL”), its network of member firms, and their related entities. DTTL and each of its member firms are legally separate and independent entities. DTTL (also referred to as “Deloitte Global”) does not provide services to clients. In the United States, Deloitte refers to one or more of the US member firms of DTTL, their related entities that operate using the “Deloitte” name in the United States and their respective affiliates. Certain services may not be available to attest clients under the rules and regulations of public accounting. Please see www.deloitte.com/about to learn more about our global network of member firms.
Copyright © 2019 Deloitte Development LLC. All rights reserved. Member of Deloitte Touche Tohmatsu Limited
Sign up for Deloitte Insights updates at www.deloitte.com/insights.
Follow @DeloitteInsight
Deloitte Insights contributorsEditorial: Junko Kaji, Blythe Hurley, Preetha Devan, Rupesh Bhat, Abrar Khan, Nairita Gangopadhyay, and Anya George TharakanCreative: Mark MilwardPromotion: Maria Martin CirujanoCover artwork: Stuart Briers