
Telecommunications - Trefis
54
ATLAS ALPHA • THOUGHT LEADERSHIP • ACCESS • SERVICE 13 January 2017 Vodafone Group plc BUY Telecommunications Trimming estimates, reiterating Buy Paul Marsch Analyst +44 20 3207 7857 [email protected] Laura Janssens Analyst +44 20 3465 2639 [email protected] Julia Thannheiser Specialist Sales +44 20 3465 2676 [email protected]
-
Upload
khangminh22 -
Category
Documents
-
view
4 -
download
0
Transcript of Telecommunications - Trefis
ATLAS ALPHA • THOUGHT LEADERSHIP • ACCESS • SERVICE
13 January 2017
Vodafone Group plc
BUY
Telecommunications
Trimming estimates,
reiterating Buy
Paul Marsch Analyst
+44 20 3207 7857 [email protected]
Laura Janssens Analyst
+44 20 3465 2639 [email protected]
Julia Thannheiser Specialist Sales
+44 20 3465 2676 [email protected]

Vodafone Group plc
Telecommunications
THE TEAM
Paul Marsch has been with Berenberg since 2009. He was previously head of telecoms
research at Morgan Stanley, where he was consistently very highly ranked. Paul has 20
years’ experience in telecoms research, as well as having worked for five years in the
telecoms industry for Cable & Wireless.
Laura Janssens joined Berenberg in September 2011 and was previously head of global
telecoms research at UBS and head of European telecoms research at Merrill Lynch. She
has also worked at telecoms consultancy Analysys, and at BT. She has 17 years of
telecommunications experience. Laura has been a top-ranked individual analyst in the Extel
survey on several occasions.
Julia Thannheiser joined the Berenberg specialist sales desk in May 2013. Prior to this, she
spent over three years as a telecoms analyst at UBS. Julia holds a BSc from the University
of Maastricht and an MSc from Cass Business School.
For our disclosures in respect of Article 20 of Regulation (EU) No. 596/2014 of the
European Parliament and of the Council of 16 April 2014 on market abuse (market abuse
regulation - MAR) and our disclaimer please see the end of this document.
Please note that the use of this research report is subject to the conditions and restrictions
set forth in the disclosures and the disclaimer at the end of this document.

Vodafone Group plc
Telecommunications
3
Table of contents
Trimming estimates, reiterating Buy 4
Investment thesis 5
Vodafone Group plc – investment thesis in pictures 6
Swings and roundabouts, but we will still own it 7
Dividend drives valuation appeal 13
Estimate changes 21
Appendix: Operating KPIs and background data 33
Financials 43

Vodafone Group plc
Telecommunications
Trimming estimates, reiterating Buy
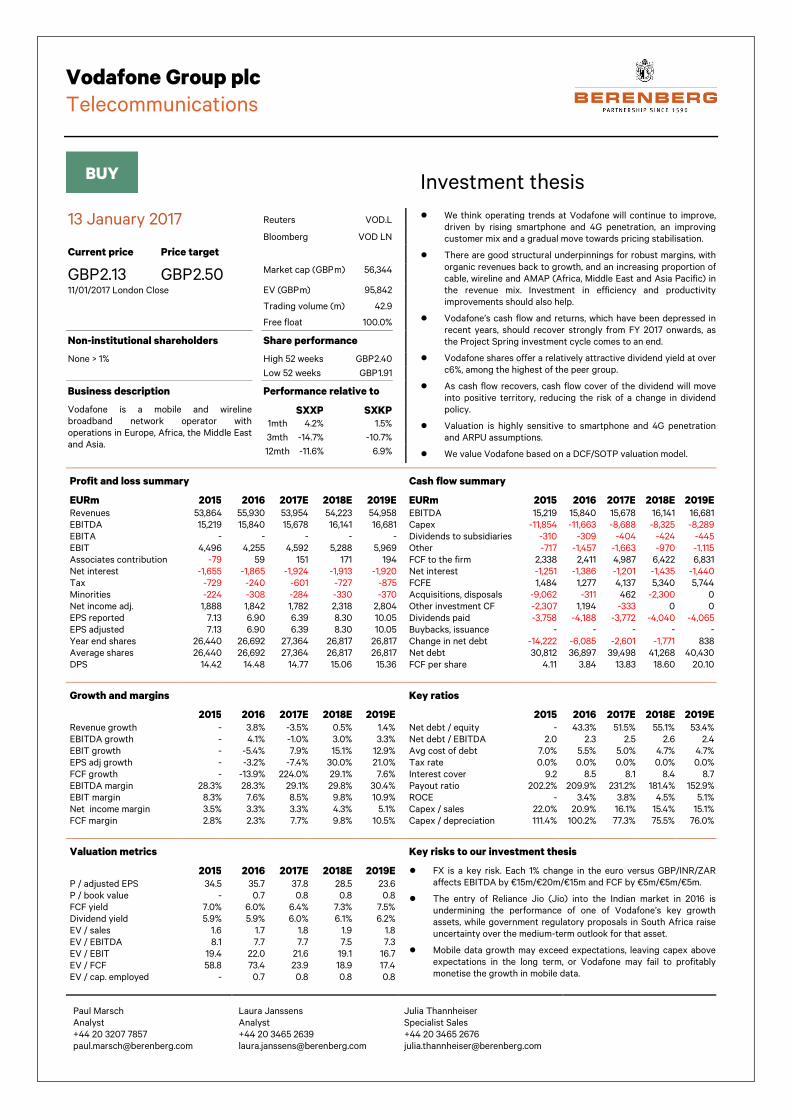
● Trimming estimates, reiterating Buy: We trim our estimates but reiterate our Buy case, as we still believe that the market will come to value Vodafone’s relatively attractive dividend yield as cash flow cover continues to rebuild. A 1% reduction to our FY 2017-19E “organic” group revenue and EBITDA estimates plus a 1-3ppt drag from adverse currency movements in Egypt and Turkey results in 2-4% reductions to our reported group revenue and EBITDA estimates. We reduce our estimates for Vodafone India on increased uncertainty (competition and demonetisation), while our Italy estimates are trimmed to reflect caution ahead of Iliad’s (ILD) entry, which we expect in H2 2017. These reductions are largely offset by higher estimates for almost all Vodafone’s other business units, reflecting strong trends in Q3, and encouraging signs in Germany and Spain into Q4 (eg competitor price increases). Our 250p price target is unchanged with reduced estimates offset by the extension of our price target date to end-March 2018.
● Dividend yield of 6.1% is 33% higher than peers: Vodafone’s dividend yield is among the most attractive of its large cap peer group. Among peers there are few we would own at present (BT Group, KPN, Telefónica Deutschland), so Vodafone, trading in line with peers on EV/EBITDA, EV/OpFCF and FCF yields, stands out with its 6.1% dividend yield, 33% above peers, with falling risk as FCF cover rebuilds after Project Spring.
● H2 revenues to slow, but medium-term growth unaffected: We expect Q3 group organic service revenue growth to slow to +1.6% yoy from +2.4% in Q2, as pressure in India builds, with a further modest slowdown to +0.8% yoy in Q4 as German cuts to mobile termination rates (MTR) bite and the “comp” gets tougher after last year’s leap year. Beyond that, we believe that Vodafone can sustain a medium-term revenue CAGR of 1.5% pa, with good structural and self-help drivers for margin expansion, against a backdrop of falling capex/sales. Hence dividend cover should rebuild to 1.5x/1.2x (pre/post-spectrum) by FY 2020E.
● Upside case to 336p: Revenue growth and margins +1ppt above our respective estimates, combined with upside from potential in-market consolidation deals in India (Vodafone + Idea), Germany and the UK (Vodafone + Liberty Global), would raise our price target to 336p per share.
● Downside case to 182p: Revenue growth and margins 1ppt below our expectations, combined with capex/sales 1ppt above our expectations would see our price target fall to 182p. The risks are skewed to the upside.
13 January 2017
BUY
Current price
Price target
GBP 2.14
GBP 2.50
12/01/2017 London Close
Market cap (GBP m) 56,674 Reuters VOD.L Bloomberg VOD LN
Changes made in this note
Rating: Buy (no change) Price target: GBP 2.50 (no change)
Estimates changes 2017E 2018E 2019E
old ∆ % old ∆ % old ∆ %
Sales 43,406 -1.8 44,289 -3.3 45,076 -3.7
Ebitda 12,629 -1.9 13,088 -2.6 13,683 -3.7
EPS 5.03 0.0 5.93 10.3 7.83 1.1 Source: Berenberg estimates
Share data
Shares outstanding (m) 27,364 Enterprise value (GBP m) 96,172 Daily trading volume 42,900,000
Interactive model click here to explore
* there may be a delay for the new estimates to be
updated on the interactive model
View all interactive models in Telecoms
Y/E 31/3., EUR m 2016 2017E 2018E 2019E 2020E 2021E
Sales 55,930 53,954 54,223 54,958 55,805 56,661 EBITDA 15,840 15,678 16,141 16,681 17,222 17,820
Operating Profit (adj.) 4,255 4,592 5,288 5,969 6,702 7,474
Net Income (adj.) 1,842 1,782 2,318 2,804 3,465 4,059 EPS (recurring) 6.90 6.39 8.30 10.05 12.41 14.54
DPS 14.48 14.77 15.06 15.36 15.67 15.98
DPS (GBPp) 11.45 12.44 13.03 13.29 13.55 13.83
Capex (accrued) 11,663 8,688 8,325 8,289 8,290 8,252
Spectrum Investment 4,057 3,095 770 841 1,500 1,500
FCF (company defined) 1,277 4,137 5,340 5,744 6,310 6,749 Net Debt 36,897 39,498 41,268 40,430 39,740 38,693
PE (Adj.) 35.9 38.0 28.7 23.7 19.2 16.4 Dividend Yield 5.8% 6.0% 6.1% 6.2% 6.3% 6.5%
EV/EBITDA (Berenberg adj.) 7.7 7.8 7.6 7.3 7.1 6.9
EV/OpFCF (Berenberg adj.) 16.2 15.9 13.9 13.2 12.7 12.0
FCFE Yield (normalised) 6.0% 6.4% 7.2% 7.5% 7.7% 8.1% FCF Yield (Berenberg adj.) 4.9% 5.1% 5.8% 6.0% 6.1% 6.4%
Capex/Sales 20.9% 16.1% 15.4% 15.1% 14.9% 14.6% Source: Company data, Berenberg
Paul Marsch
Analyst
+44 20 3207 7857
Laura Janssens
Analyst
+44 20 3465 2639
Julia Thannheiser
Specialist Sales
+44 20 3465 2676
Vodafone Group plc
Telecommunications
BUY
Investment thesis
13 January 2017 Reuters VOD.L
● We think operating trends at Vodafone will continue to improve,
driven by rising smartphone and 4G penetration, an improving
customer mix and a gradual move towards pricing stabilisation.
● There are good structural underpinnings for robust margins, with
organic revenues back to growth, and an increasing proportion of
cable, wireline and AMAP (Africa, Middle East and Asia Pacific) in
the revenue mix. Investment in efficiency and productivity
improvements should also help.
● Vodafone’s cash flow and returns, which have been depressed in
recent years, should recover strongly from FY 2017 onwards, as
the Project Spring investment cycle comes to an end.
● Vodafone shares offer a relatively attractive dividend yield at over
c6%, among the highest of the peer group.
● As cash flow recovers, cash flow cover of the dividend will move
into positive territory, reducing the risk of a change in dividend
policy.
● Valuation is highly sensitive to smartphone and 4G penetration
and ARPU assumptions.
● We value Vodafone based on a DCF/SOTP valuation model.
Bloomberg VOD LN
Current price Price target
GBP 2.13 GBP 2.50 Market cap (GBP m) 56,344
11/01/2017 London Close EV (GBP m) 95,842
Trading volume (m) 42.9
Free float 100.0%
Non-institutional shareholders Share performance
None > 1% High 52 weeks GBP 2.40
Low 52 weeks GBP 1.91
Business description Performance relative to
Vodafone is a mobile and wireline
broadband network operator with
operations in Europe, Africa, the Middle East
and Asia.
SXXP SXKP
1mth 4.2% 1.5%
3mth -14.7% -10.7%
12mth -11.6% 6.9%
Profit and loss summary
EURm 2015 2016 2017E 2018E 2019E
Revenues 53,864 55,930 53,954 54,223 54,958
EBITDA 15,219 15,840 15,678 16,141 16,681
EBITA - - - - -
EBIT 4,496 4,255 4,592 5,288 5,969
Associates contribution -79 59 151 171 194
Net interest -1,655 -1,865 -1,924 -1,913 -1,920
Tax -729 -240 -601 -727 -875
Minorities -224 -308 -284 -330 -370
Net income adj. 1,888 1,842 1,782 2,318 2,804
EPS reported 7.13 6.90 6.39 8.30 10.05
EPS adjusted 7.13 6.90 6.39 8.30 10.05
Year end shares 26,440 26,692 27,364 26,817 26,817
Average shares 26,440 26,692 27,364 26,817 26,817
DPS 14.42 14.48 14.77 15.06 15.36
Cash flow summary
EURm 2015 2016 2017E 2018E 2019E
EBITDA 15,219 15,840 15,678 16,141 16,681
Capex -11,854 -11,663 -8,688 -8,325 -8,289
Dividends to subsidiaries -310 -309 -404 -424 -445
Other -717 -1,457 -1,663 -970 -1,115
FCF to the firm 2,338 2,411 4,987 6,422 6,831
Net interest -1,251 -1,386 -1,201 -1,435 -1,440
FCFE 1,484 1,277 4,137 5,340 5,744
Acquisitions, disposals -9,062 -311 462 -2,300 0
Other investment CF -2,307 1,194 -333 0 0
Dividends paid -3,758 -4,188 -3,772 -4,040 -4,065
Buybacks, issuance - - - - -
Change in net debt -14,222 -6,085 -2,601 -1,771 838
Net debt 30,812 36,897 39,498 41,268 40,430
FCF per share 4.11 3.84 13.83 18.60 20.10
Growth and margins
2015 2016 2017E 2018E 2019E
Revenue growth - 3.8% -3.5% 0.5% 1.4%
EBITDA growth - 4.1% -1.0% 3.0% 3.3%
EBIT growth - -5.4% 7.9% 15.1% 12.9%
EPS adj growth - -3.2% -7.4% 30.0% 21.0%
FCF growth - -13.9% 224.0% 29.1% 7.6%
EBITDA margin 28.3% 28.3% 29.1% 29.8% 30.4%
EBIT margin 8.3% 7.6% 8.5% 9.8% 10.9%
Net income margin 3.5% 3.3% 3.3% 4.3% 5.1%
FCF margin 2.8% 2.3% 7.7% 9.8% 10.5%
Key ratios
2015 2016 2017E 2018E 2019E
Net debt / equity - 43.3% 51.5% 55.1% 53.4%
Net debt / EBITDA 2.0 2.3 2.5 2.6 2.4
Avg cost of debt 7.0% 5.5% 5.0% 4.7% 4.7%
Tax rate 0.0% 0.0% 0.0% 0.0% 0.0%
Interest cover 9.2 8.5 8.1 8.4 8.7
Payout ratio 202.2% 209.9% 231.2% 181.4% 152.9%
ROCE - 3.4% 3.8% 4.5% 5.1%
Capex / sales 22.0% 20.9% 16.1% 15.4% 15.1%
Capex / depreciation 111.4% 100.2% 77.3% 75.5% 76.0%
Valuation metrics
2015 2016 2017E 2018E 2019E
P / adjusted EPS 34.5 35.7 37.8 28.5 23.6
P / book value - 0.7 0.8 0.8 0.8
FCF yield 7.0% 6.0% 6.4% 7.3% 7.5%
Dividend yield 5.9% 5.9% 6.0% 6.1% 6.2%
EV / sales 1.6 1.7 1.8 1.9 1.8
EV / EBITDA 8.1 7.7 7.7 7.5 7.3
EV / EBIT 19.4 22.0 21.6 19.1 16.7
EV / FCF 58.8 73.4 23.9 18.9 17.4
EV / cap. employed - 0.7 0.8 0.8 0.8
Key risks to our investment thesis
● FX is a key risk. Each 1% change in the euro versus GBP/INR/ZAR
affects EBITDA by €15m/€20m/€15m and FCF by €5m/€5m/€5m.
● The entry of Reliance Jio (Jio) into the Indian market in 2016 is
undermining the performance of one of Vodafone’s key growth
assets, while government regulatory proposals in South Africa raise
uncertainty over the medium-term outlook for that asset.
● Mobile data growth may exceed expectations, leaving capex above
expectations in the long term, or Vodafone may fail to profitably
monetise the growth in mobile data.
Paul Marsch
Analyst
+44 20 3207 7857
Laura Janssens
Analyst
+44 20 3465 2639
Julia Thannheiser
Specialist Sales
+44 20 3465 2676

Vodafone Group plc
Telecommunications
Vodafone Group plc – investment thesis in pictures
Vodafone offers among the most attractive dividend yields;
Vodafone’s dividend yield, declared in euros, now exceeds
6.1%and is among the most attractive in the sector, we believe.
Dividend cover Dividend cover Dividend cover Dividend cover –––– we forecast it to rise we forecast it to rise we forecast it to rise we forecast it to rise furtherfurtherfurtherfurther
Dividends are covered by recurring FCF from FY17; group Dividends are covered by recurring FCF from FY17; group Dividends are covered by recurring FCF from FY17; group Dividends are covered by recurring FCF from FY17; group
dividend policy is to pay a rising dividenddividend policy is to pay a rising dividenddividend policy is to pay a rising dividenddividend policy is to pay a rising dividend
Source: Berenberg estimates. Note: * Telefónica dividend includes is based
on EUR0.40 cash
Source: Company data, Berenberg estimates
Organic financial trends have improved
Recovery in revenue trends has been followed by EBITDA and adjusted operating profit.
Source: Berenberg estimates
Capital intensity should fall further
The high capex of Project Spring is in the rear-view mirror, and
capital intensity should fall further in coming years.
Upside to GBP3.36, downside to GBP1.82
With faster revenue growth, higher margins, and deal potential
could see upside to GBP3.36. If revenues and margins are weaker,
and capex higher than we expect, downside to GBP1.82 exists.
Source: Company data Source: Berenberg estimates
0.0
%
3.0
% 3.6
%
3.7
% 4.4
%
4.4
%
4.5
%
4.5
%
4.6
%
4.8
% 5.4
%
5.5
%
5.8
%
6.1
%
6.4
% 6.9
%
0.0%
1.0%
2.0%
3.0%
4.0%
5.0%
6.0%
7.0%
8.0%
TI
(Ord
s)
TD
C
KP
N
DT
E
BT
TE
F*
OR
A
TI
(sa
vs)
Av
g.
SC
MN
TLS
N
PR
OX
TN
OR
VO
D
TE
FD
Te
le2
Dividend yield (2017E)
-2.3% -3.0% -2.8%-0.4%
1.0% 2.0% 2.3%
-2.7%
-11.0% -10.0%
-3.6%
1.9%3.6% 4.3%
2.0%
-28.2% -29.9%
-16.4%
-5.9%-1.6%
11.4%
-35.0%
-30.0%
-25.0%
-20.0%
-15.0%
-10.0%
-5.0%
0.0%
5.0%
10.0%
15.0%
H1/14 H2/14 H1/15 H2/15 H1/16 H2/16 H1/17
Vodafone group organic revenue and EBITDA trends (HY yoy %)Group service revenues Adj. EBITDA Adj. Op Profit
11854 11663
8688 8325 8289 8290 8252
22.0%20.9%
16.1%15.4% 15.1% 14.9% 14.6%
0.0%
5.0%
10.0%
15.0%
20.0%
2000
4000
6000
8000
10000
12000
14000
FY15 FY16 FY17E FY18E FY19E FY20E FY21E
Ca
pe
x/s
ale
s %
Ca
pe
x £
m
Vodafone capex (€m) and capital intensity (%)
Project Spring capex

Vodafone Group plc
Telecommunications
7
Swings and roundabouts, but we will still own it
60-second summary
We update our estimates and reiterate the buy case, citing the attractive peer group-leading dividend yield. Our estimates are revised down modestly, primarily reflecting increased uncertainty in India (Jio entry and demonetisation), our cautious medium-term view on Italy (Iliad entry), and adverse FX movements in Egypt and Turkey. The organic impact is largely compensated by increased estimates across most of Vodafone’s other business units.
Our price target is unchanged at 250p as we roll forward our price target date to March 2018. We cite an upside case of GBP3.36 in the event of better than expected revenue growth and margins, and synergies from potential deals in India (Idea), Germany and UK (both with Liberty Global). We cite a downside case to GBP1.82 in the event that revenue growth and margins fall short of our expectations, and capex/sales ends up higher than we expect.
The basic Vodafone story of low-single-digit revenue growth, expanding margins, and falling capital intensity remains intact, allowing recovery in FCF to cover the dividend. The shares trade in line with peers on most metrics, but the 6.1% dividend yield stands out at a full 33% higher than the peer group average.
Still worth owning
We think the case for owning Vodafone shares remains intact following a second half of 2016 which saw them underperform both the UK index and the SXKP peer group (once adjusted for currency). There have been some developments over that period that have marginally eroded the bull case on the shares, but on balance we think the positives for the equity case still outweigh the negatives.
When we laid out our investment case for Vodafone shares in mid-2016, we highlighted:
● the appeal and reducing risk of the Vodafone dividend;
● the appealing diversified and stabilising revenue base;
● the clear structural support for medium-term margin expansion;
● the likelihood of capital intensity declining; and
● the strong medium-term growth in FCF.
We think the investment case for Vodafone shares remains largely intact. Although there are clear challenges to some elements of the story (eg competitive tensions in India, currency devaluation in Egypt, new entrant risk in Italy), there have also been positive surprises such as the strong near-term performance in both Italy and Spain, the robust financial performance in Germany, and the strong EBITDA contributions from many of the smaller business units in both Europe (Portugal, Greece, Netherlands, Other Europe) and AMAP (Turkey, Egypt, Other AMAP).
Figure 1: Vodafone’s dividend yield is 33% above the peer group average
Source: Berenberg estimates
0.0
%
3.0
%
3.6
%
3.7
% 4.4
%
4.4
%
4.5
%
4.5
%
4.6
%
4.8
% 5.4
%
5.5
%
5.8
%
6.1
%
6.4
%
6.9
%
0.0%
1.0%
2.0%
3.0%
4.0%
5.0%
6.0%
7.0%
8.0%
TI…
TD
C
KP
N
DT
E
BT
TE
F*
OR
A TI…
Avg
.
SC
MN
TLS
N
PR
OX
TN
OR
VO
D
TE
FD
Te
le2
Dividend yield (2017E)

Vodafone Group plc
Telecommunications
8
Figure 2: Vodafone FCF dividend cover should recover to 1.5x/1.2x
(pre/post average spectrum costs) by FY 2020E
Source: Berenberg estimates
Our latest views on the above list are as follows.
● The appeal and reducing risk of the Vodafone dividend: We think this remains the case. We wonder whether the market is missing the natural currency hedge built in to Vodafone’s dividend since it switched to reporting (and declaring dividends) in euros. On FY 2018 estimates, Vodafone now offers a dividend yield of 6.1%, with at least low-single-digit growth possible. There are higher-yielding stocks in the sector, but among the liquid large caps, we would prefer to own Vodafone than alternatives. The dividend appeal itself reflects what we expect to be continued robust financial performance.
● Diversification and stabilisation of the revenue base: In local-currency terms Vodafone has been back in revenue growth territory for several quarters now. The big news of the last quarter was the return to organic service revenue growth in the Europe region, underpinned by a solid performance in Germany, strong growth in Italy and a strong bounce in Spain.
● Clear structural support for margin expansion: Our basic case on Vodafone margins was that they would benefit from: faster growth of higher-margin cable, and higher-margin AMAP revenues; the ongoing migration by Vodafone to own-network in the wireline broadband segment (transferring opex to capex and benefiting EBITDA margins in the process); falling churn (usually accompanied by better margins); Project Spring operating leverage (as Spring opex stopped growing); and investment in productivity projects. We still think this case is intact, with competitive tension in India and incremental caution on Italy partially offset by better margin trends in several other business units (eg Spain, Netherlands, Portugal, Greece, Turkey, Egypt).
● The likelihood of capital intensity declining: If anything, we have increased confidence that Vodafone Group’s capital intensity will decline in the medium term. Guidance at the half-year stage seemed to spook some observers. CFO Nick Read’s guidance for capex/sales to be in the “mid-teens” range for the next few years has typically been taken to imply something in the range 14-16%, with the near term at the higher end of that range, and the medium term towards the lower end. Given the H1/FY 2017 capex/sales of 14.7%, the market seemed spooked by the reiteration of guidance, as it implied H2 capex/sales of c17%. Management has since clarified that there is no change to capex guidance. Furthermore, CEO Vittorio Colao has been increasingly vocal on his cautious view of the near/mid-term potential of 5G, suggesting that 5G capex is some way off having an impact on Vodafone’s financials. Overall then, we remain comfortable with the idea that capital intensity at Vodafone can decline in the medium term.

Vodafone Group plc
Telecommunications
9
Figure 3: EBITDA margins expanding, EBITDA growing faster than service revenues into H1/FY 2017
Source: Berenberg estimates
Figure 4: Declining capex/sales post-Project Spring
Source: Berenberg estimates
● The strong medium-term growth in FCF: Again, we think this aspect of the Vodafone equity story remains intact, with stable low-single-digit revenue growth potential, expanding margins, and falling capital intensity, FCF, pre-spectrum, should be able to grow strongly from last year’s c€1.3bn to our estimated c€3.9bn this year, and on to €4.7bn in FY 2018E and €5.4bn in FY 2019E. That means that Vodafone’s dividend cover should progress from 0.3x in FY 2016E, to 1.03x in FY 2017E, and on to 1.35x by FY 2019E. If we incorporate spectrum on the basis of our expectations for FY 2017 and FY 2018, and our assumption that spectrum costs will average €1.5bn pa in the medium term, then Vodafone’s dividend cover reaches 1.0x by next year (FY 2018), and continues to gradually improve in the medium term.
As with most telcos in our coverage list, there are threats and risks to challenge the equity story. We would specifically highlight the following four risks.
● India – competition/regulation/demonetisation threat: Competitive tensions in the Indian mobile market continued to ratchet through the year-end, with Jio extending its aggressive offers beyond 3 December 2016 to end-March 2017, and Bharti Airtel and Vodafone responding. The TRAI, the regulator, sided with Jio, in an interconnect dispute
-2.3% -3.0% -2.8%-0.4%
1.0%2.0% 2.3%
-2.7%
-11.0% -10.0%
-3.6%
1.9%3.6% 4.3%
2.0%
-28.2%-29.9%
-16.4%
-5.9%
-1.6%
11.4%
-35.0%
-30.0%
-25.0%
-20.0%
-15.0%
-10.0%
-5.0%
0.0%
5.0%
10.0%
15.0%
H1/14 H2/14 H1/15 H2/15 H1/16 H2/16 H1/17
Vodafone group organic revenue and EBITDA trends (HY yoy %)
Group service revenues Adj. EBITDA Adj. Op Profit
11854 11663
8688 8325 8289 8290 8252
22.0%20.9%
16.1%15.4% 15.1% 14.9% 14.6%
0.0%
5.0%
10.0%
15.0%
20.0%
2000
4000
6000
8000
10000
12000
14000
FY15 FY16 FY17E FY18E FY19E FY20E FY21E
Ca
pe
x/s
ale
s %
Ca
pe
x £
m
Vodafone capex (€m) and capital intensity (%)
Project Spring capex

Vodafone Group plc
Telecommunications
10
and raised a potential fine of INR30bn against the big three incumbents, including INR10.5bn (€140m) against Vodafone. The Indian government’s demonetisation of INR500 and INR1000 notes has also created uncertainty, particularly for the pre-paid market.
Competitively, Vodafone has responded to Jio through accelerating 4G deployment, with new 4G offers, and by strengthening its voice offers. Vodafone also introduced in Mid-December its M-Pesa “Pay” service allowing merchants and retailers to receive e-payments from their customers without exchanging cash, looking to counter the effects of demonetisation.
We reduced our Vodafone India estimates back in June 2016 ahead of the launch of Jio, and in this report we further reduce our India expectations, forecasting Vodafone India (local currency) service revenue growth to slow from +5.4% yoy in Q2 to +1.5%, -1.7%, -1.9% and -1.3% yoy over the next four quarters. We had previously expected Indian service revenue growth to slow to low-single digits at the trough. Our 2022 local-currency India revenues and EBITDA are reduced by 4% and 7% respectively.
Looking forward, there could be a positive catalyst if and when Jio removes its free offers from the market (expected end-March 2017), and if we see further signs of consolidation in India (in this report, we estimate that synergies arising from a Vodafone+Idea combination could be worth at least 10p/share to Vodafone investors).
● Italy – new entrant risk: We are also lowering our medium-term expectations for Vodafone in India, in anticipation of Iliad’s entry into that market late in 2017. In our Telecom Italia report, Not the bargain it seems, dated 30 September 2016, we wrote in detail about our concerns for the long-term impact of Iliad in the Italian market. Italy is a high churning mostly pre-paid mobile market, with spend per pop broadly in line with European peer markets following two years of price increases, and clear scope for a price discounter to make an impact.
In short, we expect Iliad to gain over 10% share of the Italian mobile market in the long term, with 37% of its gains coming from 3/Wind, 29% from Vodafone and 27% from Telecom Italia. Vodafone has a partial offset through its wireline broadband agreement with Enel Open Fibre, which should enable to extend its successful broadband strategy in Italy. While we suspect Vodafone is inclined to make room for Iliad in the mobile market, we believe there is a risk that Telecom Italia might pre-empt Iliad’s entry with the launch of a second brand aimed at the low end of the market. Our 2020 Vodafone Italy revenue and EBITDA estimates are reduced by 7% and 8% to reflect our caution.
● Emerging markets – currency risk: In the last few months Vodafone has seen currency volatility in two of its second-tier markets, Egypt and Turkey. Egypt devalued its currency by two-thirds, and Turkey has seen its currency devalue by 20% since mid-2016, including a 7% weakening so far in 2017. Egypt and Turkey together account for c8% of Vodafone Group EBITDA and about 22% of Vodafone’s AMAP regional EBITDA.
Both had been delivering strong local-currency revenue growth, and Egypt in particular has shown very good margins in recent periods. Even together they are a relatively small part of the pie for Vodafone, and the effect of adverse FX movements in those markets has been partially offset by continued strengthening of the South Africa rand against the euro (ZAR up 15% since mid-2016), and modest strengthening of the Indian rupee (INR up 3.5% since mid 2016). Back in Europe, the UK pound has bounced off its lows since October 2016, and certain of Vodafone’s other trading currencies have moved favourably (HUF, QAR, KES, AUD, NZD).
● South Africa – medium-term risk from government proposals: One risk we think worth flagging now, although we need to do more work on it as the situation develops, relates to South Africa, where the government has issued a white paper containing quite radical proposals for the reform of the mobile industry. In summary, this white paper on ICT seems to suggest that: 1) the government will create a new national mobile wholesale infrastructure for access by new competitors, MVNOs, etc; and 2) there will be no more spectrum auctions or allocations to private companies – all future high-demand spectrum will be owned by the government wholesale mobile network. Although the detailed meaning of the whitepaper is unclear at this time, the CEO of Vodafone’s competitor MTN suggested that the white paper implies that operators must sell their existing spectrum back to the government for use in the wholesale mobile network. It is not clear what the white paper means for pending allocation and auction of the 700, 800 and 2600Mhz spectrum that was recently cancelled following a dispute between the regulator and the government. Vodafone’s response to the white paper came from

Vodafone Group plc
Telecommunications
11
Vodacom CEO Shameel Jossub at the Q2 results conference call, when he said the following.
“I would like to say that Vodacom is committed to the objectives of the white paper, which is to make broadband more accessible and affordable for all South Africans. The white paper as we currently understand is basically an intent of how government would like to achieve these objectives. For this to take effect, a number of laws and regulations will first need to be changed to give this a legally binding effect. The process could take anything from 18 to 24 months. As it stands, there’s currently a number of grey areas within the policy paper and these are still open for debate. As part of the process, we will have the opportunity to engage. But just to be clear on our stance, we feel that the white paper will not achieve the objectives that are set out, so we have a problem in the how it gets implemented. What we would recommend is a hybrid model and the hybrid model being basically to say let the current networks and the investment that needs to be put in continue to happen, but let's set some spectrum aside for open access so that we don't become the guinea pig for the world, but at least we can give smaller players access to spectrum whilst allowing the bigger networks to continue to flourish and to basically cover rural areas.”
This is one to watch, in our opinion.
Thoughts ahead of Q3/Q4
Group organic service revenue trends are likely to slow through Q3 and Q4. We expect Q3 service revenue growth of 1.6% yoy, and Q4 service revenue growth of 0.8% yoy. There are several factors at play.
● German MTR cuts: These will have an impact from Q4, with the 40% cumulative reduction in MTRs over two years equating to a c1.2ppt drag on German service revenues. Vodafone had guided that a 50% cut would drag on German service revenues by 1.5%. The actual cut imposed at 1 December 2016 was 36%, with a further 6% cut in December 2017. We estimate that the 2016 cut will drag by c1ppt on German service revenues, but we have to factor in that the cut only happened at the start of December, so we will see just one month’s impact in Q3, implying a drag of c33bp on German service revenues, and c7bp incremental drag on group organic service revenues. Q4 should see the full 1ppt impact in Germany, but the incremental impact versus Q3 will be only 67bp, translating into 13bp of drag at group level.
● Leap year creates tougher comp: Pre-paid markets in particular will face a tougher comp in Q4 since Q4 FY 2016 benefited from an extra leap-year day. A leap year has the potential to boost growth by c1ppt, so lapping such a boost can potentially also cause c1ppt of drag. However, the leap year would have different effects across the Vodafone revenue base, primarily affecting mostly pre-paid markets like Italy, Egypt, Portugal and Greece. If we weight the theoretical 1ppt drag by the weight of Vodafone’s pre-paid markets in the revenue pie, then the leap year could equate to an incremental drag of around 25bp.
● India slowdown: Indian service revenue growth is likely to slow to reflect continued tough competitive conditions in that market. Since the Q2 stage, there has been incremental bad news, with the extension by Jio of its free offers. While this will have only one month’s impact in Q3, we will see a full quarter’s impact in Q4. We forecast Indian service revenues to slow to 1.5% growth from 5.4% yoy in Q2. That constitutes a 47bp incremental drag on group service revenues in Q3. In Q4 we expect a further slowdown to -1.7% yoy, constituting a further 35bp drag at group level.
In aggregate then, we can identify a total 54bp of incremental service revenue drags in Q3 and a further 73bp of drags in Q4. We believe there may be a number of other small drags which together would have an impact of c30bp as we progress through the next two quarters. On the other hand, there should also be some positive factors at play to partially offset new drags.
● UK: lapping the 08XX drag, easier “comp” in UK enterprise, and in UK carrier;
● Spain: easier “comp” as “out-of-bundle” effects that dragged in recent quarters are lapped, plus the continued unwind of device leasing drag;
● Vodacom: first benefits from new government contract, plus reducing drag from new customer identification rules in Vodacom’s international markets.

Vodafone Group plc
Telecommunications
12
In aggregate then, we think Q3 service revenues could slow to 1.56% yoy, while Q4 revenues could slow to 0.8% yoy.
Slowing growth could raise concern for investors, but we think the growth trend will stabilise into next year with Vodafone capable of generating a medium-term revenue CAGR of c1.5% pa. Figure 15, in a later section of this report, details some of the factors we incorporate into our medium-term estimates.
Figure 5: We expect group organic service revenues to slow into Q3 and Q4 in the face of tougher
comps, India pressure and new regulatory drags (Germany)
Source: Berenberg estimates
-3.8%
-5.2% -5.1%
-4.0% -4.2%
-1.5%
-0.4%
0.1%
0.8%1.2% 1.4%
2.5%2.2% 2.4%
1.6%
0.8%
-6.0%
-5.0%
-4.0%
-3.0%
-2.0%
-1.0%
0.0%
1.0%
2.0%
3.0%
Q1 14 Q2 14 Q3 14 Q4 14 Q1 15 Q2 15 Q3 15 Q4 15 Q1 16 Q2 16 Q3 16 Q4 16 Q1 17 Q2 17 Q3
17E
Q4
17E
Group organic service revenue growth (% yoy)

Vodafone Group plc
Telecommunications
13
Dividend drives valuation appeal
Vodafone’s dividend stands out versus peers
The shares really stand out on the dividend, where the valuation relative to the peers has benefited due to GBPEUR currency fluctuations. Given that Vodafone is declaring the dividend in euros, yet the share price is quoted in GBP, the weakening of sterling against the euro has had a beneficial effect on the dividend yield, which has increased to over 6% (6.1% in 2017E rising to 6.4% in 2019E).
This runs counter to our mid-2016 thesis that dividend risk at Vodafone would decline as capex fell after Project Spring, and FCF recovered to cover the dividend both before and after average spectrum costs.
Of course, euro-based investors may feel that they are taking on more currency risk owning a GBP-listed stock in the aftermath of the Brexit vote, but with Vodafone, given that the majority of its earnings, and all of its dividend, are denominated in euros, there should be an inherent hedge built in to the share.
Figure 6 shows how the dividend on Vodafone shares compares with its peer group: we think Vodafone’s dividend has relative appeal compared with most of the names shown.
There are higher dividend yields available among the peer group, from Tele2, and from Telefónica Deutschland for example. We like the latter, and have a Buy rating and €4.80 price target: with its limited free float it is relatively small, but we would nevertheless own the shares. We do not like Telenor (Sell, price target NOK115), or Proximus (Hold, price target €25.0, below the current price), and Telia is also a Sell (price target SEK30). Swisscom is now a Sell, with a price target of CHF380. Telecom Italia currently pays a dividend only on its savings shares, and although this is close to the peer group average we have concerns about the challenges it faces in the medium term.
As yet we have no rating on Orange, and Telefónica SA is a Hold, trading close to our price target of €9.6. We like BT shares (Buy), believing there is significant upside to our price target of 506p, but the dividend is well below Vodafone’s, and significant regulatory uncertainty hangs over the shares for now.
Figure 6: Vodafone’s dividend yield is 33% higher than the peer average
Source: Berenberg estimates * TEF dividend based on 40c cash for 2017

Vodafone Group plc
Telecommunications
14
Deutsche Telekom has a lower dividend and less of an upside case than Vodafone, in our view. KPN shares we rate a Buy, with a price target of €3.55, offering significant upside for a relatively cheap stock, but again the dividend yield is well below that offered by Vodafone. Finally, TDC’s dividend yield is the lowest of the incumbent peers (excluding Telecom Italia ordinaries, which do not pay a dividend), and our TDC price target of DK38 is close to the current price.
So, working down the list, and ruling out the names that we either do not like, or that have limited upside, Vodafone stands out as having upside to our price target, significant upside in a “blue-sky scenario” that we discuss later, and pays one of the highest “safe” dividend yields in the sector.
VOD trades in line with peers on EBITDA, OpFCF, and FCF yields
On other valuation metrics, Vodafone trades broadly in line with its peer group on most of the metrics we use (see Figure 7).
● The 7.5x EBITDA multiple for 2017E falls to 7.1x by 2019E, with the shares at a 3-4% premium to the sector over the next three years.
● On EV/OpFCF the shares trade at a 3-5% premium to peers for 2017-19E, with the multiple falling from 13.9x to 12.6x.
● On normalised FCFF yield the shares trade at a 2-3% premium over 2017-19E, as the FCFF yield rises from 5.8% to 6.1%. by 2019E, while on normalised FCFE yield they trade at a more interesting 2.4% discount in 2017E, but this moves to 3% premium by 2019E.
● P/E makes no sense for this stock, given the high proportion of legacy spectrum amortisation and PPA in the numbers.
Price target unchanged
We have left our price target unchanged at £2.50, as illustrated in Figure 12, which sums up the following key components of the valuation:
● €119bn aggregate value of the consolidated business units;
● €6.4bn value of associates Safaricom, Indus Towers, and Vodafone Australia Holdings (note the negative equity value);
● €8.1bn value of tax assets based on the discounted value of savings to cash taxes derived from Vodafone’s tax management (note that our business unit DCFs use normalised cash taxes);
● €39.3bn of net debt adjusted for the outstanding €1.6bn convertible, the remaining €2.4bn Verizon loan note asset, and €1.2bn of minority net debt adjustments;
Figure 7: Vodafone versus peer valuation comparables
Vodafone trades broadly in line with peers on EV/EBITDA, and FCF yields, and offers a relatively attractive dividend yield
Source: Berenberg estimates. “Normalised” figures reflect the effect of cash flow “leakage” (eg spectrum expense, abnormal capex cycles,
headcount reduction costs, and unfunded pension liabilities) by adding the NPV of such leakage to EV, and excluding annual cash outflows from
FCF. In this way the numerator and denominator are consistent and reconciled.
Vodafone
Relative Valuation Comparables 2017 2018 2019 2017 2018 2019 2017 2018 2019
Vodafone 7.5 7.3 7.1 13.9 13.2 12.6 5.8% 6.0% 6.1%
Sector (average) 7.3 7.0 6.8 13.5 12.7 12.0 6.0% 6.1% 6.2%
Premium/(discount) vs simple 3.2% 4.2% 3.9% 2.9% 3.9% 5.2% 2.7% 1.7% 1.0%
Vodafone
Relative Valuation Comparables 2017 2018 2019 2017 2018 2019 2017 2018 2019
Vodafone 7.3% 7.5% 7.8% 28.5 23.6 19.1 6.1% 6.2% 6.4%
Sector (average) 7.1% 7.6% 8.0% 15.9 14.1 14.2 5.3% 5.2% 5.5%
Premium/(discount) vs simple -2.4% 1.3% 3.0% 79.3% 67.1% 34.3% -13.3% -16.6% -13.5%
Div Yield
Adjusted EV/EBITDA
Normalised FCFE Yield
Adjusted EV/OpFCF Normalised FCFF Yield
Adjusted PE

Vodafone Group plc
Telecommunications
15
DCF/SOTP valuation
Figure 8: DCP/SOTP valuation
Source: Berenberg estimates
Revenue EBITDA EV/EBITD OpFCF EV/OpFCF EV
Valuation by Segment €m Code Method FY18 FY18 Multiple FY18 Multiple €m Stake Vodafone % of AV Minority
Germany GE DCF 10,604 3,685 8.2 1,988 15.3 30,344 100.0% 30,344 22.7% 0
o/w KDG GEK DCF 2,440 1,171 11.1 683 19.1 13,028 76.0% 9,901 7.4% (3,127)
Italy IT DCF 5,992 2,172 8.0 1,273 13.6 17,381 100.0% 17,381 13.0% 0
UK UK DCF 6,787 1,357 8.9 407 29.8 12,135 100.0% 12,135 9.1% 0
Spain SP DCF 5,185 1,478 9.6 700 20.2 14,122 100.0% 14,122 10.6% 0
Netherlands NL DCF 1,783 624 7.3 365 12.4 4,545 100.0% 4,545 3.4% 0
Portugal PO DCF 998 359 8.8 210 15.1 3,159 100.0% 3,159 2.4% 0
Greece GR DCF 881 282 5.6 150 10.5 1,578 100.0% 1,578 1.2% 0
Other Europe OE DCF 3,009 903 9.3 451 18.6 8,412 100.0% 8,412 6.3% 0
India IN DCF 6,340 1,680 5.8 729 13.3 9,731 100.0% 9,731 7.3% 0
Vodacom VO DCF 5,848 2,369 8.6 1,550 13.2 20,430 65.0% 13,280 9.9% (7,151)
Turkey TK DCF 2,822 607 5.3 198 16.3 3,216 100.0% 3,216 2.4% 0
Egypt EG DCF 836 383 4.3 257 6.5 1,662 54.9% 912 0.7% (749)
Other AMAP OA DCF 1,967 492 8.3 206 19.9 4,102 100.0% 4,102 3.1% 0
Common function CF DCF 1,400 (250) 15.2 (670) 5.7 (3,796) 94.7% (3,595) (2.7%) 201
Segment totals 54,453 16,141 7.9 7,816 16.3 127,021 93.9% 119,322 96.5% (10,826)
Associates (proportionate value)
Metho
d
EBITDA
FY18 Multiple EV €m
Net (Debt)
€m
Ownershi
p %
Equity
Value
Safaricom Multiple 986 7.0 6,902 259 40.0% 2,864
Indus Towers Multiple 407 10.2 4,147 (170) 42.0% 3,977
Vodafone Australia Holdings Multiple 193 6.5 1,253 (1,660) 50.0% (407)
Total Associate Investments 6,435
Value of tax asset
BV of
DTA €m
% that
benefits
tax Years
Capitalise
at €m
Tax asset 29,121 60.0% 30 7.2% 8,096
Total proportionate asset value
Segments + associates + investments + tax assets 133,853
Adjustments For Group Net Debt and Other Liabilities €m
Group Net debt (@ p/t date) (41,268)
Add mandatory convertible (issued with a view to being covered by VZ loan note proceeds) (1,588)
Offset with Verizon loan note US$ 2,500 FX 1.05 2,376
Adjust for Minorities Share of Net Debt Net debt % Stake Value €m
KDG 3,091 76.0% 742
Vodacom 1,040 65.0% 364
Voda Egypt 0 54.9% 0
Vodafone Qatar 143 38.3% 88
Total Minorities Debt Adjustments to Group EV 4,274 27.9% 1,194
Other Obligations & Liabilities Per 20F Probability €m
Vod Esar (Hutch Cap Gain Tax) $2bn (1,295) 30.0% (389)
Vod Essar (Hutch Cap Gain - Fine) $2bn? (1,295) 30.0% (389) Include?Other 0 0.0% 0
Total Other Obligations & Liabilities (777) Y
Adjustments to EV for leakage Cashflows €m
Spectrum payments (21,587)
Other FCF not captured in segment EV 1,969
Disposals of PP&E 2,368 Include?
Total EV Adjustments (17,251) Y
Total Net Debt & other liabilities (57,313)
Equity Value €m 76,539
FX (GBPEUR =) 1.153
Equity value £m 66,383
Equity Value per share €
Number of shares 000's 27,912
Adjust for mandatory convert share repuchased £m 2,800 @price £: 2.000 Shares: 1,400 26,512
Equity Value Per Share 2.50
Proportionate adjustment
Vodafone Group plc
Telecommunications
16
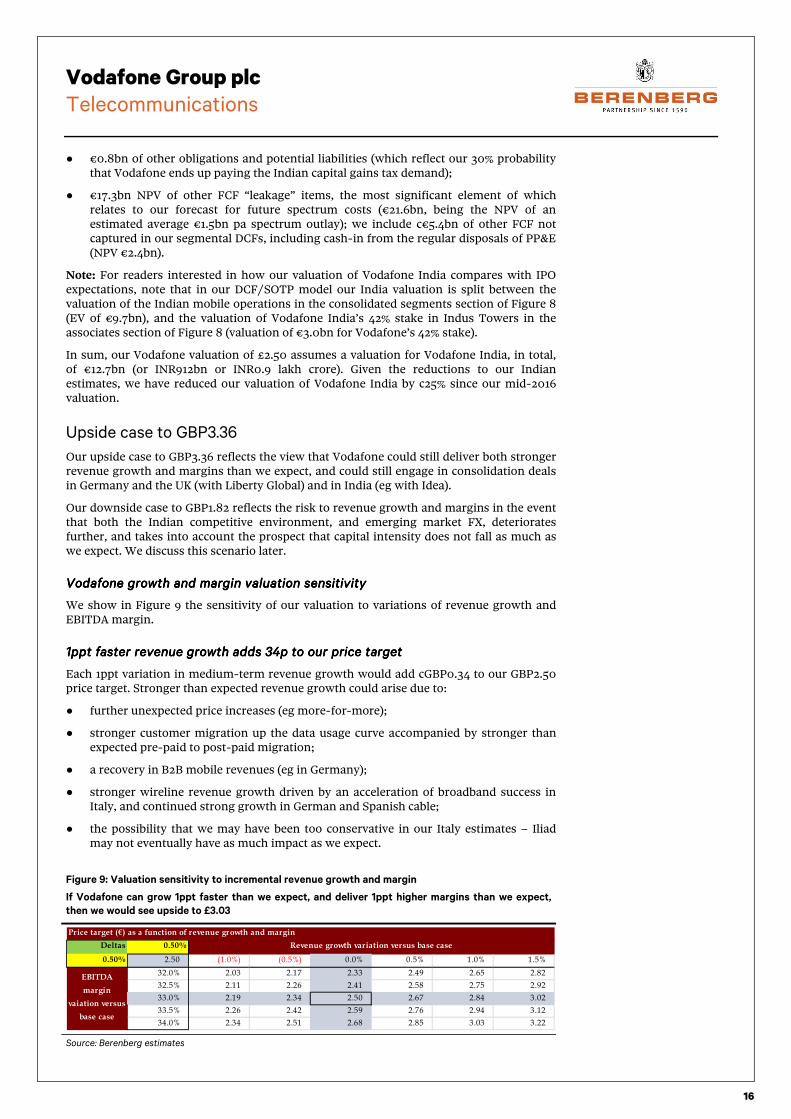
● €0.8bn of other obligations and potential liabilities (which reflect our 30% probability that Vodafone ends up paying the Indian capital gains tax demand);
● €17.3bn NPV of other FCF “leakage” items, the most significant element of which relates to our forecast for future spectrum costs (€21.6bn, being the NPV of an estimated average €1.5bn pa spectrum outlay); we include c€5.4bn of other FCF not captured in our segmental DCFs, including cash-in from the regular disposals of PP&E (NPV €2.4bn).
Note: For readers interested in how our valuation of Vodafone India compares with IPO expectations, note that in our DCF/SOTP model our India valuation is split between the valuation of the Indian mobile operations in the consolidated segments section of Figure 8 (EV of €9.7bn), and the valuation of Vodafone India’s 42% stake in Indus Towers in the associates section of Figure 8 (valuation of €3.0bn for Vodafone’s 42% stake).
In sum, our Vodafone valuation of £2.50 assumes a valuation for Vodafone India, in total, of €12.7bn (or INR912bn or INR0.9 lakh crore). Given the reductions to our Indian estimates, we have reduced our valuation of Vodafone India by c25% since our mid-2016 valuation.
Upside case to GBP3.36
Our upside case to GBP3.36 reflects the view that Vodafone could still deliver both stronger revenue growth and margins than we expect, and could still engage in consolidation deals in Germany and the UK (with Liberty Global) and in India (eg with Idea).
Our downside case to GBP1.82 reflects the risk to revenue growth and margins in the event that both the Indian competitive environment, and emerging market FX, deteriorates further, and takes into account the prospect that capital intensity does not fall as much as we expect. We discuss this scenario later.
VodafoVodafoVodafoVodafone growth and margin valuation sensitivityne growth and margin valuation sensitivityne growth and margin valuation sensitivityne growth and margin valuation sensitivity
We show in Figure 9 the sensitivity of our valuation to variations of revenue growth and EBITDA margin.
1ppt faster revenue growth adds 34p to our price target1ppt faster revenue growth adds 34p to our price target1ppt faster revenue growth adds 34p to our price target1ppt faster revenue growth adds 34p to our price target
Each 1ppt variation in medium-term revenue growth would add cGBP0.34 to our GBP2.50 price target. Stronger than expected revenue growth could arise due to:
● further unexpected price increases (eg more-for-more);
● stronger customer migration up the data usage curve accompanied by stronger than expected pre-paid to post-paid migration;
● a recovery in B2B mobile revenues (eg in Germany);
● stronger wireline revenue growth driven by an acceleration of broadband success in Italy, and continued strong growth in German and Spanish cable;
● the possibility that we may have been too conservative in our Italy estimates – Iliad may not eventually have as much impact as we expect.
Figure 9: Valuation sensitivity to incremental revenue growth and margin
If Vodafone can grow 1ppt faster than we expect, and deliver 1ppt higher margins than we expect,
then we would see upside to £3.03
Source: Berenberg estimates
Price target (€) as a function of revenue growth and margin
Deltas 0.50%
0.50% 2.50 (1.0%) (0.5%) 0.0% 0.5% 1.0% 1.5%
32.0% 2.03 2.17 2.33 2.49 2.65 2.82
32.5% 2.11 2.26 2.41 2.58 2.75 2.92
33.0% 2.19 2.34 2.50 2.67 2.84 3.02
33.5% 2.26 2.42 2.59 2.76 2.94 3.12
34.0% 2.34 2.51 2.68 2.85 3.03 3.22
Revenue growth variation versus base case
EBITDA
margin
vaiation versus
base case

Vodafone Group plc
Telecommunications
17
In our estimate changes today, we have increased our local-currency revenue estimates in Spain, Portugal, Greece, Turkey, Egypt, Other EU and Other AMAP – ie in segments accounting for one-third of Vodafone Group revenues. Where we have reduced revenues estimates, excluding India and Italy, our reductions are driven predominantly by lower equipment estimates.
1ppt higher margins would add 18p tour price target1ppt higher margins would add 18p tour price target1ppt higher margins would add 18p tour price target1ppt higher margins would add 18p tour price target
Each 1ppt variation in medium-term margin would add 18p to our price target (see Figure 10). In our estimate changes today, we have raised EBITDA expectations for Germany, Spain, Netherlands, Portugal, Greece, Turkey, Egypt, Other EU and Other AMAP (ie segments accounting for 55% of group EBITDA).
We note that Vodafone has a target to increase EBITDA margins in all of its business units in the medium term, and it is clear from the plans laid out by CFO Nick Read that it has good self-help options available to it at the business unit level to do so.
In addition, as we have noted in this report, and in prior research, there are structural factors at play that could boost margins more than we expect (eg growth in revenues, improving revenue mix due to faster AMAP and cable top-line growth, the general downward trend in churn rates, operating leverage from Project Spring).
A combination of 1ppt faster revenue growth, with 1ppt higher margin outcome in the medium term, would therefore add c53p to our valuation.
A synergistic India consolidation deal could add at least 10p to our price targetA synergistic India consolidation deal could add at least 10p to our price targetA synergistic India consolidation deal could add at least 10p to our price targetA synergistic India consolidation deal could add at least 10p to our price target
Most observers seem to agree that the Indian market now needs to see consolidation. Idea would make an ideal partner for Vodafone, and a deal on the right terms could release synergies with an NPV of GBP5.4bn, worth 10p per share for Vodafone investors if split equitably with Idea shareholders. We attach a high probability to “something” happening in the Indian market in the near-to-medium term.
Figure 10: Price target risks skewed to the upside
An upside case of 335p exits in the event of 1ppt faster revenue growth, higher margins, a synergistic
India consolidation deal, and further synergistic deals with Liberty Global. A downside case to 180p
could occur if revenue growth and margins are 1ppt lower than we expect, and capex/sales is 1ppt
higher than we expect.
Source: Berenberg estimates

Vodafone Group plc
Telecommunications
18
Further deals with Further deals with Further deals with Further deals with Liberty could release c24p per share of synergiesLiberty could release c24p per share of synergiesLiberty could release c24p per share of synergiesLiberty could release c24p per share of synergies
We continue to believe that further deals between Vodafone and Liberty Global remain possible. On our calculations (see our Vodafone report Upgrading to buy on operating momentum, dated 28 April 2015), we believe that synergies with an NPV of €12.7bn remain to be extracted across Germany and the UK business units of Vodafone and Liberty Global. Again, if split equitably between Vodafone and Liberty Global shareholders, such deals would add 24p to our Vodafone price target. While we still believe in the compelling strategic logic for further deals with Liberty Global, for now we have a higher conviction that “something” will happen in the Indian market than we do in the European arena.
Downside case to GBP1.82
1ppt lower revenue growth and margins 1ppt lower revenue growth and margins 1ppt lower revenue growth and margins 1ppt lower revenue growth and margins would reducewould reducewould reducewould reduce our price target by 47pour price target by 47pour price target by 47pour price target by 47p
What if things turn out the other way around, and revenues and margins are 1ppt lower than we expect? The impact is broadly the same in terms of pence per share, reducing our price target by a combined 47p.
In today’s report we have again reduced our estimates for India, and we have also factored in our concerns about the Italian market pending the entry of Iliad, which we expect in late 2017. Areas where our assumptions may be too optimistic include the following.
● Indian competition effect could turn out to be even worse than we expect: However, we have tried to reflect the likely prospect that Jio will, at some point, have to start charging for its currently “free” services. Not only is Jio’s offer subject to legal challenge by Bharti Airtel, which is also pressuring the regulator (TRAI) to step in and force Jio to start charging, but presumably Mukesh Ambani wants to make some money out of mobile at some point. At present Jio intends to run its free offers through to the end of March 2017.
● Visibility on the effect of demonetisation is very low: Demonetisation is the other big uncertainty in India (the removal of INR500 and INR1000 notes, accounting for c80% of all notes, from circulation, and replacement by new INR500 and INR2000 notes). We have very limited visibility on the impact on mobile consumers and their ability to recharge their mobiles.
● Adverse currency movements: Vodafone has seen two major adverse FX impacts in recent months – in Egypt and Turkey – together accounting for c8% of group revenue and EBITDA. However, the South African ZAR and Indian INR have both strengthened against the euro compared with a year ago, and that has provided a buffer to the drag from Egypt and Turkey. More currency volatility could occur, especially as US President-elect Trump starts to implement his economic policies.
● Further out, South Africa uncertainty could increase: The South African government has made some radical proposals to reform the mobile telecom market, with a white paper currently being debated in the country. The proposals seek to develop better mobile coverage of rural South Africa by creating an industry structure more suited to supporting MVNOs and smaller players. The aim is to renationalise spectrum for use by a government-owned network wholesale business, which will rent access to spectrum to mobile network operators and MVNOs. It is still early days, and the proposals have provoked considerable debate in South Africa, and may be subject to significant changes before being implemented. South Africa constitutes c6% of Vodafone Group revenues and c7% of Vodafone Group EBITDA.
1ppt higher1ppt higher1ppt higher1ppt higher capex/sales capex/sales capex/sales capex/sales would reducewould reducewould reducewould reduce our price target by 20p/shareour price target by 20p/shareour price target by 20p/shareour price target by 20p/share
For all the focus on capex across the sector, telecom valuations are not that sensitive to assumptions about capex/sales. A 1ppt increase in capex sales, which over ten years would mean Vodafone spending an additional €5.3bn cumulative, would take just 20p from our price target once discounted by our WACC of 7.2%. Note that this sensitivity does not change any of our assumptions about revenues or margins, only capex.
On the contrary, we believe that if capex does turn out materially higher than we currently expect it will be accompanied by a higher revenue trajectory than we currently expect, and the impact on value would therefore be less than in our downside case.

Vodafone Group plc
Telecommunications
19
Finally, while we have laid out our upside and downside cases in Figure 10, there is one omission that is worth thinking about. In the event that Vodafone did embark on in-market consolidation deals in India, Germany and the UK, these would be accompanied by a high probability of market repair, which would likely result in higher value for Vodafone, beyond the synergies that we include in our calculations.
The internet of things (IoT): too soon to get excited
We have received a couple of enquiries about the potential upside from the rapid development of demand for IoT applications, following publicity on IoT at the Consumer Electronics Show (CES) in Las Vegas earlier this month. We include more detail on our thoughts below, but at this stage it does not really move the needle enough for us to factor it in to our upside/downside cases.
Huge IoT SIM growth is forecast over the next four to six yearsHuge IoT SIM growth is forecast over the next four to six yearsHuge IoT SIM growth is forecast over the next four to six yearsHuge IoT SIM growth is forecast over the next four to six years
Investors may have noted the growing industry and media excitement about IoT. This year’s CES in Las Vegas was accompanied by numerous IoT product announcements (eg network connected smart hairbrushes!). Vodafone’s German business unit CEO, Hannes Ametsreiter, was recently quoted in the Süddeutsche Zeitung suggesting that global network connected devices could reach up to 500bn units in 2020 from 7bn today – representing a CAGR of 191%.
Other industry observers are certainly predicting very healthy growth for IoT connections over the next four to five years, but estimates vary very widely, and it is very difficult to find estimates on a comparable basis. To illustrate, we summarise two such forecasts in Figures 11 and 12, from Ericsson and IHS.
So why should telecom investors not get So why should telecom investors not get So why should telecom investors not get So why should telecom investors not get carried awaycarried awaycarried awaycarried away by IoT? by IoT? by IoT? by IoT?
At this stage, the revenue and profit upside, albeit large in absolute terms, does not quite move the needle in terms of the size of the global mobile market. For example, the GSMA (an industry association) estimates that global mobile operator revenues in 2015 amounted to $1.1trn.
This revenue base was generated by 7.6bn SIMs and 4.7bn unique customers. From that, we can calculate global ARPS (average revenue per SIM) of c$16.6pcm and ARPU (average revenue per unique user) of $10.25pcm. Embedded within these estimates is existing revenues derived from IoT via from what must be around 300m IoT device SIMs at the end of 2015.
Figure 11: Ericcson IoT estimates
Ericcson provides one of the few estimates we could find that actually breaks down IoT growth into
cellular and non-cellular.
(Billions of units)
ApplicationApplicationApplicationApplication 2016201620162016 2022202220222022 CAGRCAGRCAGRCAGR
Wide-area IoT* 0.4 2.1 30%
o/w cellular IoT 0.4 1.5 25%
Short-range IoT** 5.2 16.0 20%
PC/Laptop/tablet 1.6 1.7 0%
Mobile phones 7.3 8.6 3%
Fixed phones 1.4 1.3 0%
TotalTotalTotalTotal 16.016.016.016.0 29.029.029.029.0 10%10%10%10%
Source: Ericcson Mobility Report, November 2016
* Wide-area IoT relates to devices connected via cellular networks and other forms of radio network (eg LoRa, Sigfoc,
Ingenu)
** Short-range IoT relates to devices connected via non-cellular radio conenctss, (eg near-field, wifi, bluetooth)

Vodafone Group plc
Telecommunications
20
Figure 12: IHS estimates for IoT installed base growth
IHS’s estimates are very different to Ericcson’s, although they predict similarly
impressive growth in the IoT installed base. It is not clear whether IHS estimates
incorporate mobile phones, tablets, etc, or just relate to other types of IoT devices.
Source: IHS
IoTIoTIoTIoT SIM ARPUs are likely to be well below mobile phone ARPUsSIM ARPUs are likely to be well below mobile phone ARPUsSIM ARPUs are likely to be well below mobile phone ARPUsSIM ARPUs are likely to be well below mobile phone ARPUs
Looking forward to 2022, the global mobile industry revenue uplift from IoT is noticeable, but not sufficient, on its own, to materially move the needle. While we do not have any reference point for IoT SIM APRUs, what most industry commentators seem to agree on is that IoT ARPUs will be significantly below mobile phone user ARPUs. This reflects the scale economics of IoT. Industrial scale machine-to-machine (M2M) applications should account for a large proportion of IoT SIMs, while in the consumer market IoT is likely to be characterised by a wide range of applications, covering both narrowband low-speed uses (eg fridge monitoring) and high-speed broadband uses (video security systems). Overall, the expectation is that IoT ARPUs will be significantly lower than typical current mobile phone ARPUs.
IoT growth could boost global mobile industry revenues by 1.2% by 2022IoT growth could boost global mobile industry revenues by 1.2% by 2022IoT growth could boost global mobile industry revenues by 1.2% by 2022IoT growth could boost global mobile industry revenues by 1.2% by 2022
If we assume, just for the sake of illustration, that IoT SIMs generate monthly ARPUs of $1, then we can use Ericcson’s cellular IoT forecast to estimate the revenue uplift from IoT growth to 2022. Ericcson forecasts cellular IoT SIMs to grow from 0.4bn units in 2016 to 1.5bn in 2022, ie growth of 1.1bn SIMs. The revenue uplift, at $1pcm per SIM, would be $13.2bn. In the context of current global mobile industry revenues of $1.1trn (per GSMA estimates), cellular IoT would account for 1.2ppt of growth over the 2016-22 period – in other words, a tiny portion.
At this stage then, assessing the IoT opportunity is a work in progress, but worth flagging given some of the astonishing estimates industry participants are starting to make about IoT SIM growth.
15.417.7
20.423.1
26.730.7
35.8
42.6
51.1
62.1
75.4
0.0
10.0
20.0
30.0
40.0
50.0
60.0
70.0
80.0
2015 2016 2017 2018 2019 2020 2021 2022 2023 2024 2025
IoT installed base, global market, (blns)

Vodafone Group plc
Telecommunications
21
Estimate changes
● We cut local-currency revenues on lower equipment sales.
● We cut local-currency EBITDA estimates for India, Vodacom, Italy and the UK.
● We raise local-currency EBITDA estimates for most other business units.
● The net result is modest reductions for organic revenues and EBITDA estimates…
● …compounded by adverse FX in Egypt and Turkey
Changes to revenue and EBITDA estimates presented in this report reflect changes to most of Vodafone’s key business units – these are summarised in Figure 13.
On a currency-neutral basis, our group revenue and EBITDA estimates are not changing very much (see Figure 14). In fact, our revenue estimates are very modestly reduced mostly on account of lower expectations for equipment sales.
Regionally, revenues are trimmed in Europe, and unchanged in AMAP (pre-FX), while EBITDA is raised in Europe and trimmed in AMAP (pre FX), with AMAP reductions just outweighing EU increases.
At EBITDA level, our changes reflect primarily the increased FX pressure from Egypt and Turkey. Beyond FX, our changes to EBITDA reflect the expected variations across Vodafone’s diverse portfolio.
We have adopted a more cautious stance for India (revenues and EBITDA), Italy (revenues and EBITDA, reflecting medium-term caution ahead of Iliad’s entry), Vodacom (EBITDA), and the UK (revenues and EBITDA).
However, we have also adopted a more positive view of developments in most of Vodafone’s other markets, including important ones such as Spain, the Netherlands, Turkey, Egypt, and other smaller business units in both Europe and AMAP.
The net impact of changes to organic estimates is fairly minor downgrades to revenues and EBITDA, amplified by the adverse FX movements in Egypt and Turkey.
Our group FCF estimates would be looking at upgrades for FY 2017-19E were it not for adverse FX, with EBITDA pressure (India), offset by corrections to our overly cautious working capital assumptions. Our FY 2017 net debt figure reflects proceeds from the first tranche of the Verizon loan note maturity.
Figure 13: Revenue and EBITDA estimate revisions(FY 2017-19E), organic (pre-FX)
Source: Berenberg estimates
Business unit/segment
% of group Up/Down? % of group Up/down?
Germany 19.6% ���� 22.8% ����
UK 12.5% � 8.4% ����
Italy 11.1% � 13.5% ����
Spain 9.6% � 9.2% ����
Netherlands 3.3% � 3.9% ����
Other Europe 9.0% � 9.6% ����
Europe 64.8% ���� 67.3% ����
India 11.7% ���� 10.4% ����
Vodacom 10.8% � 14.7% ����
Turkey 5.2% � 3.8% ����
Egypt 1.5% � 2.4% ����
Other AMAP 3.6% � 3.0% ����
AMAP 32.8% �������� 34.3% ����
Reported Revenues 100.2% ���� 100.0% ����
Revenue estimates FY17-19 EBITDA estimates FY17-18

Vodafone Group plc
Telecommunications
22
Figure 14: Estimate changes
Changes reflect mostly adverse FX arising from Egypt and Turkey. In organic terms, we are adopting a more cautious stance on Indian,
UK and South African margins, and in the medium term on Italy. On the other hand we are more positive on EBITDA trends in
Vodafone’s other business units.
Source: Berenberg estimates
Estimate Changes FY17 FY18 FY19 Rationale
Group Revenues €mln
New €mln 53,954 54,223 54,958
Old 54,943 56,061 57,057
Change % (ex FX) (0.7%) (0.8%) (1.2%)
Change % (1.8%) (3.3%) (3.7%)
Consensus 54,206 55,202 55,821
We are above (below) consensus by.. (0.5%) (1.8%) (1.5%)
Group EBITDA €mln
New €mln 15,678 16,141 16,681
Old 15,986 16,567 17,320
Change % (ex FX) (1.1%) (0.3%) (1.4%)
Change % (1.9%) (2.6%) (3.7%)
Consensus 15,721 16,253 16,798
We are above (below) consensus by.. (0.3%) (0.7%) (0.7%)
Group Operating Profit €mln
New €mln 4,592 5,288 5,969
Old 4,680 5,257 6,124
Change % (ex FX) (1.6%) 2.4% (0.8%)
Change % (1.9%) 0.6% (2.5%)
Consensus 4,479 5,150 5,703
We are above (below) consensus by.. 2.5% 2.7% 4.7%
Group Capex €mln
New €mln 8,688 8,325 8,289
Old 8,726 8,650 8,780
Change % (0.4%) (3.8%) (5.6%)
Consensus 8,787 8,604 8,686
We are above (below) consensus by.. (1.1%) (3.2%) (4.6%)
Group FCF
New €mln 4,137 5,340 5,744
Old 3,935 5,453 5,843
Change % (ex FX) 5.6% 1.1% 1.5%
Change % 5.1% (2.1%) (1.7%)
Consensus 4,110 5,243 5,717
We are above (below) consensus by.. 0.7% 1.8% 0.5%
Group Net Debt (reported) €mln
New €mln 39,498 41,268 40,430
Old 41,455 41,011 39,965
Change % (ex FX) (4.8%) 0.2% 0.2%
Change % (4.7%) 0.6% 1.2%
Consensus 39,711 39,712 39,434
We are above (below) consensus by.. (0.5%) 3.9% 2.5%
Reductions to IT, UK, IN, SA partially offset by increases in
GE, SP, NDL, PT, GR, Other EU, TKY, EWG, Other AMAP.
EGP and TKL devalutions are partially offset by other FX
movements.
Near-term uplift in Operating Profit results from IFRS
treatment of NDL D&A as an asset held for sale. BY 2018,
the reduced EBITDA expectations drag on Operating Profit
too.
FCF revisions reflect tougher India and adverse FX, offset by
revised working capital assumptions.
Modest tweaks to capex expectations reflect lower revenues.
Capital intensity assumptions are almost unchanged.
EU revenues reduced by c2% (cuts to GE, IT, NDL, UK,
offset by increases to SP, PO, GR, Other EU). AMAP
revenues increased (SA, TK, EG, Other AMAP, offset by
reductions in IN, SA). Note that estimate reductions relate
primarily to equipment sale assumptions, except in India,
which reflects competition.
FY17 revisions reflects proceeds from Verizon loan note,
while FY18 and FY19 reflect assumption loan note proceeds
will be used to repuchase shares.

Vodafone Group plc
Telecommunications
23
Capturing the moving parts
The Vodafone modelling task these days is about capturing a whole array of moving parts. We summarise our medium-term expectations for Vodafone’s six key business units in Figure 15 below. In short, this suggests a medium-term outlook for Vodafone characterised by the following.
● A robust European performance: This should be underpinned by a solid stable outlook in Germany, revenue and profit growth in Spain, and a medium-term recovery in the UK. We note that price increases occurred over recent weeks in Germany (United Internet) and Spain (Telefónica), and Vodafone’s vigorous marketing and advertising in the UK suggests that problems with its IT systems are starting to fade (even though the financial impacts are likely to drag on numbers for some time).
● Italy challenges: Growing challenges in Italy arise from the entry of Iliad in late 2017, with the potential for pre-emptive moves by Telecom Italia ahead of that. On our Italy mobile market assumptions, Iliad should gain over 10% market share in the long term, with most of that gain sourced from 3/Wind, but with 28.9% of ILDs gain sourced from Vodafone. Vodafone management clearly have a more optimistic view of their ability to accommodate Iliad’s entry to the market, and we may well turn out to be too pessimistic in our assumptions. History is on our side though, and Telecom Italia has already made worrying comments about launching a second low-end brand ahead of Iliad’s launch, so we believe it makes sense to adopt a cautious approach. We discuss our revised expectations for Italy in more detail later in this section.
● India pressure from Jio and demonetisation: Pressure on Vodafone in India, with continued competitive actions by new entrant Jio, and the hard-to-predict effects of demonetisation, means that one of Vodafone’s key AMAP growth assets is struggling to get much above low-single-digit revenue and EBITDA growth in the medium term. We discuss developments in India in more detail later in this section. Our more cautious stance could be challenged if Jio is forced to lift its “free” offers before the end of March 2017, although we do not expect this to happen. In the medium term, our estimates may prove too conservative if we see material in-market consolidation in India, and in this respect we note the combination of Reliance Communications and Aircel, recent press comments on the prospects for Bharti Airtel to acquire Telenor’s Indian operations, and the ongoing “noise” about Vodafone and Idea combining.
● Solid Vodacom: The company is achieving low-single-digit revenue growth and mid-single-digit EBITDA growth. Drags from its international operations should start to fade in the coming quarters, lifting the contribution from those operations (Tanzania, DRC, Mozambique, Lesotho). Data use and 4G adoption should continue to support revenues and the combination of continued South African revenue growth, recovery of growth in Vodacom’s international markets, and a focus on cost efficiencies should allow EBITDA to grow faster than revenues.
● Robust local currency performance across smaller assets: Strong local-currency revenue and EBITDA trends are apparent for the main second-tier assets in Egypt, Turkey and the Netherlands. We note that at the Q2 stage many of Vodafone’s smaller assets surprised positively at either the revenue or EBITDA level, trends that we have reflected in our estimate revisions today.
Therefore, the overall picture for Vodafone’s group revenue and EBITDA outlook continues to feel robust. There are, however, a few areas where we need to be more cautious, and we discuss the two main ones, India and Italy, in more detail now.
India and Italy India and Italy India and Italy India and Italy –––– caution revisited.caution revisited.caution revisited.caution revisited.
In our revised estimates, we have tried to reflect an assessment of the threats and risks facing Vodafone, particularly with respect to two key areas:
● India – competition/regulation/demonetisation threat;
● Italy – new entrant risk.

Vodafone Group plc
Telecommunications
24
Figure 15: Key business unit assumptions
Source: Berenberg estimates
Business Unit
FY16-19
CAGR Comment/Key assumptions: We expect…:
Germany Our estimates take account of:
Service revenues 1.5% - MTR reductions from 1 December 2016 (34%), and again on 1 December 2017 (6%), amount to a cumulative drag of 1.2ppt on revenues
Mobile 0.5% - Unwind of the benefit to revenue growth arising from the reclassification of CPE into service revenues; will drag on FY18 financials
Wireline 2.9% - Likely gradual loss of MVNO revenues from UTDI as it migrates 4G service over to TEFD/E+ in the mid-term
Total revenues 1.0% - Customer mix could see more prepaid offsetting slower postpaid additions
EBITDA 2.1% + Continued more-for-more tariff traction, combined with increasing smartphone penetration and 4G adoption
OpFCF 3.8% + On-going easing of tension with DT in the B2B segment
+ Robust, albeit slowing, underlying cable growth (ex CPE reclassification effect)
+ Easing pressure on the low end mobile segment from DRI/UTDI, and gradual unwind of roaming drag
+ scope for mid-term margin improvement due to full year benefit from synergies, mix and efficiencies
Italy Our estimates take account of:
Service revenues (1.3%) - A slowing pace of recovery in mobile ARPU as the uplift from the price increases of the last two years starts to fade
Mobile (2.1%) - An expect impact from Iliad's entry from end-calendar 2017
Wireline 2.2% - Pre-emptive moves by Telecom Italia ahead of Iliad's entry, eg the introduction of a low-end brand, which may provoke a response
Total revenues (1.1%) + Continued growth in fixed broadband subscribers
EBITDA (1.6%) + A growing benefit as Enel gradually deploys its full fibre footprint to up to 9.5mln premises
OpFCF (3.6%) + Continued, albeit lessening, cost efficiencies
+ Continued benefits from migration of customers off TI wholesale broadband offers, to own sub-loop network, or Enel network
UK Our estimates take account of:
Service revenues 0.3% - A modest threat from SKY's MVNO launch
Mobile (0.2%) - Modest pressure from migration of TALK MVNO to O2 UK
Wireline 2.0% - On-going mix-shift towards sim-only contracts in the market, which impacts service revenues, but aids margin
Total revenues 0.4% + Fading roaming drag
EBITDA 5.5% + Easier 'comp' due to lapping 08XX effect
OpFCF 11.8% + Easier 'comp' in enterprise segment through rest of FY17
+ Fading headwinds from low-margin carrier voice
+ Fading IT cost drags, and on-going efficiency improvements
Spain Our estimates take account of:
Service revenues 2.6% - Modest pricing threat, with VOD to respond on front-book pricing only
Mobile 2.9% - Another rise in content costs in H2
Wireline 1.8% + Easier 'comp' into Q3 arising as out-of-bundle' factors lap
Total revenues 2.5% + Good postpaid adds and rising TV and FBB base
EBITDA 4.7% + Regained commercial momentum after April price increases
OpFCF 7.4% + Continued unwind of the drag from device financing
+ Margin benefit from rising revenues
+ Margin benefit from Ono synergies
India Our estimates take account of:
Service revenues 1.4% - Continuing R Jio pressure arising from extension of 'free' offer to end March 2017, aggressive responses from incumbents
Mobile 1.4% - Data pricing pressure, and flattening of the data user base growth for Vodafone, with incremental data demand going to R Jio
Wireline 2.2% - potential for further MTR reductions (from 14p/min) as suggested by R Jio
Total revenues 1.4% - Demonetisation impacting users ability to recharge prepaid phones with INR 500 and INR1000 notes
EBITDA 2.7% + Robust Q2 voice trends, and some signs of SIM growth recovery in to Q3
OpFCF 13.5% + Postpaid additions remained robust, and we assume prepaid additions start to recover into FY18
+ Lapping drag (2.5ppt) from change to dealer commissions as of Q1 FY17 (note this is excluded from VOD 'organic' figures anyway)
+ Improving economics from secondary circles after roaming terms were recently renegotiated
+ scale benefits to margins as revenues recover in mid-term
Vodacom Our estimates take account of:
Service revenues 3.2% + Reacceleration of subscriber growth
Mobile 3.1% + Particularly in international markets, as drag from new registration procedures eases
Wireline 4.0% + Data users and volumes continue to grow
Total revenues 2.7% + Migration from 3G to 4G drives ARPU uplift (c19%)
EBITDA 5.6% + New government contract comes in to P&L in H2 Fy17
OpFCF 10.9% + Margin uplift as International resumes good growth (only 26% margins)
+ Focus on cost efficiencies, particularly in network
- Mozambique and DRC economic weakness
- Uncertainty created by government telecom's White Paper
Others
Turkey - Growth expected to start slowing in coming quarters from mid-high teens rate in recent years
Egypt - Leap year effect will drag into H2, as will new service revenue VAT. Strong Q2 seasonality effects will also unwind
Netherlands - should see benefits from improved profitability post-divestments, and revenue and opex synergies going forward

Vodafone Group plc
Telecommunications
25
India competition/regulation/demonetisation threat
Competitive tensions in the Indian mobile market continued to ratchet through the year-end, with Jio extending its aggressive offers beyond 3 December 2016 to the end of March 2017, and incumbent operators Bharti Airtel and Vodafone responding. Jio’s offers are particularly aggressive and are detailed in Figure 16. Even more aggressive, from its full commercial launch on 5 September 2016, Jio offered a period of completely free usage through to the end of the 2016. This was known as the Jio Welcome Offer (JWO). On 1 December Jio announced its Jio Happy New year Offer (JNO) that, with some amendments, extended its offer of completely free usage through to the end of March 2017.
Jio extends free ofJio extends free ofJio extends free ofJio extends free offfffer to ender to ender to ender to end----MarchMarchMarchMarch andandandand launches other initiativeslaunches other initiativeslaunches other initiativeslaunches other initiatives
In its 1 December announcement Jio stated that it was extending the “free” promotion period by three months, despite already signing 50m new subscribers in 83 days, partly because it felt that its users had not been able to fully experience its voice service, due to inadequate interconnection services from other operators. With government and regulatory intervention, Jio said that there had been some improvement in interconnection, but it clearly still felt the need to extend the free offer period.
Figure 16: Jio tariff schedule from 5 September 2016
Source: Company data
With the 1 December update, Jio also made several other announcements.
● Throttling data usage above 1GB… per day (!): Jio announced some data usage statistics and refined its offer to impose some control on very high volume data users. Jio said that, across its 50m customers, average daily data usage was about 1GB, 25x greater than the Indian average daily data use. It also said that 80% of its base used up to 1GB of data, while 20% used well above 1GB of data per day, and that 8% of its towers were experiencing daily congestion due to abnormally high data usage. Jio believes that its network is delivering 4x more data than all the other networks in India combined. It is understandable therefore that Jio has taken the decision to throttle data speeds to 128kbs for users exceeding 1GB usage per day, in order to ensure quality of data usage for all users.
● Doubling the number of eKYC signup outlets: During the first 83 days of operation Jio signed up 50m customers: ie about 600,000 per day! It acknowledges that in the early stages there were significant waiting times for paper-based signup. However, in recent months Jio has deployed its eKYC electronic signup process (reducing the signup process to 15 minutes for customers with an Indian Aadhaar, or identification, card) with 200,000 outlets available across India as of 1 December 2016. To put that in perspective, Jio states this is almost as many outlets as bank ATMs in India. Jio also said that it would double the number of eKYC outlets to 400,000 by March 2017.
Main plan 1 2 3 4 5 6 7 8 9 10
Maximum retail price (Rs)* 19 129 149 299 499 999 1499 2499 3999 4999
Validity of benefits - prepaid (days) 1 7 28 21 28 28 28 28 28 28
Validity of benefits - postpaid (days) NA NA 1 month NA
Benefits
(i) local and STD voice calls
(ii) Local and STD video calls
(iii) 4G LTE data 100MB 750MB 300MB 2GB 4GB 10GB 20GB 35GB 60GB 75GB
(iv) 4G LTE data - night time (2am-5am) -
(v) Free WiFi data** 200MB 1.5GB - 4GB 8GB 20GB 40GB 70GB 120GB 150GB
(vi) Free local and national SMS 100pcm
(vii) Subscription to Jio apps
(viii) ISD tariffs - - - -
(viii) ISD tariffs (free minutes) - - - - - - 30 50 80 100
* For postpaid plans, MRP excludes applicable taxes
**(post expiry, Wifi data will be charged at Rs0.50/GB
*** Data used for access to Jio Apps is deducted from the data plan allowance
Discounted ISD tariffs in 61 select countries
UnlimitedUnlimited
100/day 100/day
All local and STD video calls in home and national roaming will be charged only for data usage
1 month
Free subscription to Jio Apps***
All local and STD voice calls free in home and national roaming

Vodafone Group plc
Telecommunications
26
● Interconnection not there yet: Jio criticised its incumbent competitors for not providing adequate points of interconnect for voice calls originating on the Jio network. Jio claims that since launch, over 900 crore voice calls originating from Jio customers to customers on the three largest networks were blocked. Jio notes that since the regulator intervened, the situation has improved, but is still not adequate – call block rates were said to have reduced from 90% to around 20% as of 1 December, with Jio aiming to achieve call blocked rates below 0.2%.
● Number portability now fully supported: Jio noted that in the enterprise segment customers did not want to give up their mobile number. It announced that as of 1 December number portability was fully supported for all customers.
● Home delivery of SIM: Jio also introduced home delivery of its SIMs, aiming to have this feature available in 100 cities by the end of 2016, allowing customers to avoid having to visit a Jio store to purchase the SIM. However, customers would still need to activate the SIM by visiting an outlet with eKYC capability, taking their Aadhaar identification card, with Jio suggesting that activation through its eKYC system would only take five minutes in such cases.
● Jio digital recharge and JioMoney Merchant introduced: Finally, Jio introduced the “test driving” of its digital recharging process, allowing customers to top up digitally using the JioMoney wallet. With the impact of demonetisation in mind, Jio also launched its JioMoney Merchant app, allowing merchants to receive and make payments electronically using their JioMoney accounts.
Regulator sides with Jio on interconnect,Regulator sides with Jio on interconnect,Regulator sides with Jio on interconnect,Regulator sides with Jio on interconnect, andandandand levies INR30bn fine on otherslevies INR30bn fine on otherslevies INR30bn fine on otherslevies INR30bn fine on others
The price war is being played out against the backdrop of a regulatory dispute that has seen TRAI, the regulator, siding with Jio, and raising a potential fine of INR30bn against the big three incumbents, including INR10.5bn (€140m) against Vodafone.
Demonetisation adds to the pressure in IndiaDemonetisation adds to the pressure in IndiaDemonetisation adds to the pressure in IndiaDemonetisation adds to the pressure in India
The Indian government’s surprise move to demonetise INR500 (c$7) and INR1000 (c$15) notes as of 9 November 2016 has created uncertainty, particularly for the pre-paid market.
Vodafone responds with 4G push and MVodafone responds with 4G push and MVodafone responds with 4G push and MVodafone responds with 4G push and M----PesaPesaPesaPesa
Competitively, Vodafone has responded to Jio by accelerating its 4G deployment, introducing offers to encourage 4G adoption and strengthening its voice offers. In an attempt to counter the impact of demonetisation, Vodafone also introduced in mid-December its M-Pesa “pay” service allowing merchants and retailers to receive e-payments from their customers without exchanging cash.
Looking back at the Q2 report, Vodafone management was careful not to sound too negative on the outlook in India. CEO Vittorio Colao said that he did not expect dramatic declines in ARPU, while significant declines in unit prices were to be expected. Meanwhile, CFO Nick Read stated that “We’re seeing good traction in the market” since introducing refreshed offers, and that “In terms of net add performance, […] if you look at September and […] at October, we’re trading well on customer growth […] I’d argue we’re not losing customers”. Even so, Vodafone lowered the top end of its EBITDA guidance range by €100m, suggesting that the move reflected increased caution on India. It also took a €5bn writedown on its Indian asset.
Further caution on India estimates is therefore warrantedFurther caution on India estimates is therefore warrantedFurther caution on India estimates is therefore warrantedFurther caution on India estimates is therefore warranted
News flow since then shows that Jio has extended its aggression to end-March 2017, as detailed above, and so we feel that further caution on Indian estimates is warranted.
We reduced our Vodafone FY 2017 and FY 3018 estimates in June 2016, and in this report we reduce our India expectations further, forecasting Vodafone India (local-currency) service revenue growth to slow from +5.4% yoy in Q2 to +1.5%, -1.5%, -0.5% and +0.4% yoy over the next four quarters. We had previously expected Indian service revenue growth to slow to the low single digits at the trough. In absolute terms, our Vodafone India revenue and EBITDA forecast for 2022 are reduced by c4% and 7% respectively (note that we had already reduced our India estimates one time to reflect rising concerns about Jio).

Vodafone Group plc
Telecommunications
27
Investors should note, however, that Vodafone’s definition of “organic” in India strips out the impact of a change to recognition of dealer commissions two quarters ago – a change that dragged 2.6ppt on “reported” local currency service revenue trends in India in Q2 (although it had no impact on cash flow). This means that anyone looking at the local-currency service revenues for India for Q1/FY 2017 through to Q4/FY 2017 will see a worse trend than the “organic” figures stated by Vodafone, and than the expected trends we stated above. Taking this drag into account, our estimates actually see Vodafone’s India local-currency service revenues trending -1.1%, -4.3%, -3.4% and -2.4% yoy over the next four quarters.
It remains to be seen whether this is this sufficient to take account of the impact from Jio; however, we note that just a few quarters ago Vodafone India service revenues were showing organic growth in the low double digits (see Figure 17).
Consolidation to save the day?Consolidation to save the day?Consolidation to save the day?Consolidation to save the day?
There have long been hopes that the Indian mobile industry would undergo a significant bout of consolidation, and in recent days several newspapers have carried stories suggesting that Vodafone is looking to combine with one of its competitors in the country. These stories follow Reliance Communications combination with Airtel, and what appear to be well informed press comments suggesting that market leader Bharti Airtel is interested in acquiring Telenor’s Indian mobile operation.
Figure 17: Vodafone India “organic” service revenue trends
Last year’s service revenue performance was affected by regulatory drags, and our estimates are
intended to reflect the expected drag from Jio’s entry to the market.
Source: Berenberg estimates
Note that our “organic” estimates exclude the drag from the change to treatment of dealer commissions in Q1/FY 2017, as
does Vodafone. We calculate that this drag amounted to 2.6ppt in Q2 – ie with this drag included Vodafone India service
revenue trends would have been 2.6ppt worse at c+2.8% instead of c+5.4% yoy.
Idea, the number four in the market, is the most obvious candidate suggested for Vodafone to combine with, although there has been also a recent press speculation that Vodafone could look to combine with new entrant Jio, or perhaps Jio itself combine with Idea.
Vodafone combining with Idea would make a lot of sense. While both companies operate nationwide in India, they have partially complementary geographical presence, focus and spectrum portfolios. A combined entity would therefore make for a more powerful national player, and would open the door to potentially material synergies.
● The clear number one: Vodafone and Idea together would become the number one in India with about 375m subscribers and c36% market share, well ahead of Bharti Airtel with c260m subscribers and 25% share, and Reliance Communications with c103m subscribers and 10% market share.
● Very complementary footprint: Vodafone’s strong positions in Uttar Pradesh East, Tamil Nadu and Chennai, Gujurat, Rajasthan, West Bengal, Delhi, Mumbai, Kolkata, and Assam would complement Idea’s strong positions in Maharashtra, Andhra
13.2 11.9
10.3
13.2
14.7
11.7
6.9 5.6
2.3
5.3 6.4
5.4
1.5
(1.5)(0.5)
0.4
(0.1) (0.1)
1.9 1.9 1.9 1.8
-4
-2
0
2
4
6
8
10
12
14
16
Q3
14
Q4
14
Q11
5
Q2
15
Q3
15
Q4
15
Q11
6
Q2
16
Q3
16
Q4
16
Q11
7
Q2
17
Q3
17
Q4
17
Q11
8
Q2
18
Q3
18
Q4
18
Q11
9
Q2
19
Q3
19
Q4
19India 'organic' service revenue trend (% yoy)
R Jio drags on
our estimatesRegulatory drags
(MTRs, roaming)
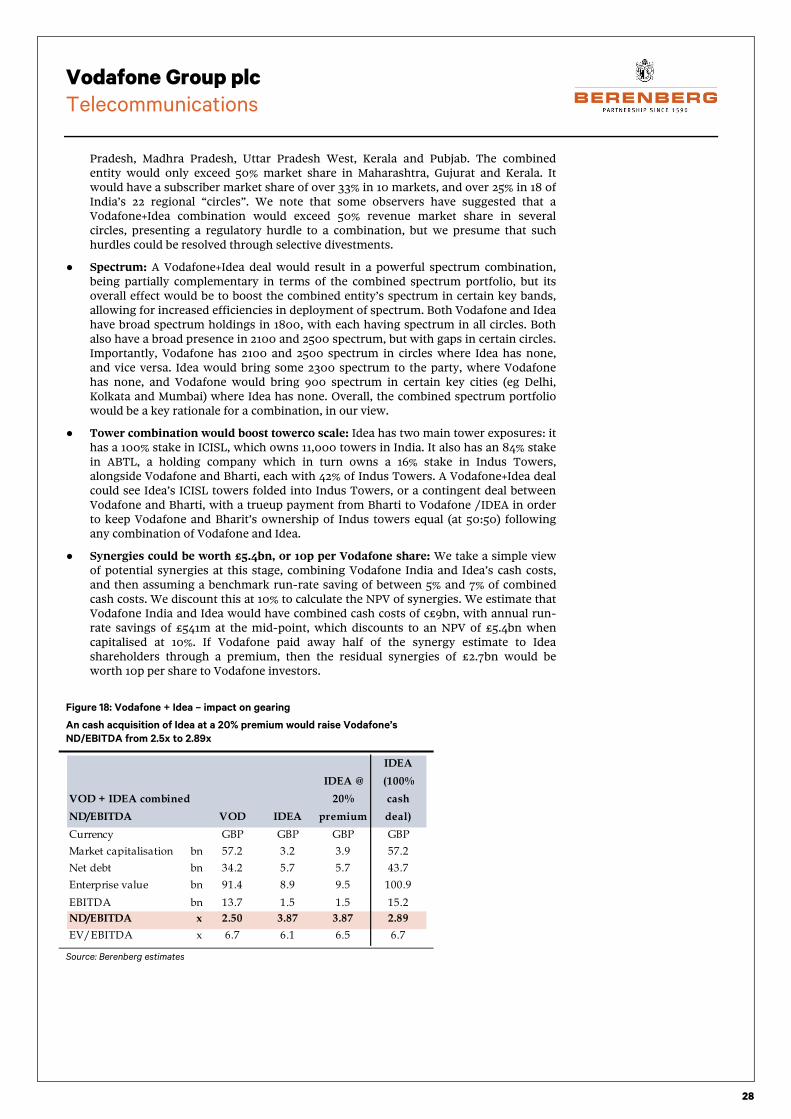
Vodafone Group plc
Telecommunications
28
Pradesh, Madhra Pradesh, Uttar Pradesh West, Kerala and Pubjab. The combined entity would only exceed 50% market share in Maharashtra, Gujurat and Kerala. It would have a subscriber market share of over 33% in 10 markets, and over 25% in 18 of India’s 22 regional “circles”. We note that some observers have suggested that a Vodafone+Idea combination would exceed 50% revenue market share in several circles, presenting a regulatory hurdle to a combination, but we presume that such hurdles could be resolved through selective divestments.
● Spectrum: A Vodafone+Idea deal would result in a powerful spectrum combination, being partially complementary in terms of the combined spectrum portfolio, but its overall effect would be to boost the combined entity’s spectrum in certain key bands, allowing for increased efficiencies in deployment of spectrum. Both Vodafone and Idea have broad spectrum holdings in 1800, with each having spectrum in all circles. Both also have a broad presence in 2100 and 2500 spectrum, but with gaps in certain circles. Importantly, Vodafone has 2100 and 2500 spectrum in circles where Idea has none, and vice versa. Idea would bring some 2300 spectrum to the party, where Vodafone has none, and Vodafone would bring 900 spectrum in certain key cities (eg Delhi, Kolkata and Mumbai) where Idea has none. Overall, the combined spectrum portfolio would be a key rationale for a combination, in our view.
● Tower combination would boost towerco scale: Idea has two main tower exposures: it has a 100% stake in ICISL, which owns 11,000 towers in India. It also has an 84% stake in ABTL, a holding company which in turn owns a 16% stake in Indus Towers, alongside Vodafone and Bharti, each with 42% of Indus Towers. A Vodafone+Idea deal could see Idea’s ICISL towers folded into Indus Towers, or a contingent deal between Vodafone and Bharti, with a trueup payment from Bharti to Vodafone /IDEA in order to keep Vodafone and Bharit’s ownership of Indus towers equal (at 50:50) following any combination of Vodafone and Idea.
● Synergies could be worth £5.4bn, or 10p per Vodafone share: We take a simple view of potential synergies at this stage, combining Vodafone India and Idea’s cash costs, and then assuming a benchmark run-rate saving of between 5% and 7% of combined cash costs. We discount this at 10% to calculate the NPV of synergies. We estimate that Vodafone India and Idea would have combined cash costs of c£9bn, with annual run-rate savings of £541m at the mid-point, which discounts to an NPV of £5.4bn when capitalised at 10%. If Vodafone paid away half of the synergy estimate to Idea shareholders through a premium, then the residual synergies of £2.7bn would be worth 10p per share to Vodafone investors.
Figure 18: Vodafone + Idea – impact on gearing
An cash acquisition of Idea at a 20% premium would raise Vodafone’s
ND/EBITDA from 2.5x to 2.89x
Source: Berenberg estimates
VOD IDEA
IDEA @
20%
premium
IDEA
(100%
cash
deal)
Currency GBP GBP GBP GBP
Market capitalisation bn 57.2 3.2 3.9 57.2
Net debt bn 34.2 5.7 5.7 43.7
Enterprise value bn 91.4 8.9 9.5 100.9
EBITDA bn 13.7 1.5 1.5 15.2
ND/EBITDA x 2.50 3.87 3.87 2.89
EV/EBITDA x 6.7 6.1 6.5 6.7
VOD + IDEA combined
ND/EBITDA

Vodafone Group plc
Telecommunications
29
A deal with Idea on the right terms would therefore be very positive for Vodafone in India. Is it doable?
● Idea is digestible: Idea has a market cap of INR269bn (£3.2bn) at its current stock price of INR75. It comes with estimated net debt of INR475bn (£5.6bn) at end-March 2017, making an EV of £8.8bn. Vodafone, by contrast, has a market cap of £57bn, forecast net debt of £34bn and an enterprise value of £9bn (see Figure 18).
● A deal would create only temporary stress on Vodafone’s gearing: We forecast Vodafone to end FY 2017 with net debt/EBITDA of 2.49x – the top of its guidance range. On current consensus estimates, that falls only marginally in FY 2018. Idea has net debt/EBITDA of 3.8x. If Vodafone paid a 20% premium for Idea, and funded it all in cash, then its net debt/EBITDA would increase to 2.9x (see Figure 18), and subsequently fall back within guidance within a few years.
● But is the current owner willing? Idea is currently listed on the Indian stock exchange but Indian conglomerate Aditya Birla (AB) appears to control c42% of the company, with Malaysian telecom investor Axiata holding a further 19.8%. In August 2016 an AB spokesperson strongly denied news reports that the company was seeking a merger deal for Idea with Vodafone India. Vodafone India remained silent. AB’s CEO has also been pressed publicly on why the company continues to own Idea when investors can themselves buy Idea shares, and when AB’s valuation apparently implies a conglomerate discount, although there is no evidence that such criticism is influencing the way Aditya Birla’s management thinks about its holding in Idea.
What does seem clear is that Idea is looking at ways to raise funds to deploy the spectrum acquired in the recent auction, with the press (Economic Times) suggesting that an $800m rights issue is being planned for early 2017, and separately suggesting that AB is looking at how to reorganise its telecom tower holdings so as to release cash to Idea. Such developments, if true, suggest that Idea is in need of funding to continue to develop its business plan if it remains under its current ownership.
Figure 19: £5.4bn of Vodafone+IDEA synergies could be worth 10p/share to Vodafone if it retains 50% of synergies for its own
shareholders
Vodafone+Idea would have c£9bn of combined cash costs (opex + capex) and we assume synergies based on run-rate savings
equivalent to 5-7% of combined cask costs, discounted at c10%, with Vodafone paying away 50% of synergies to Idea shareholders.
Source: Berenberg estimates
VOD IDEA VOD + IDEA VOD + IDEA Comment
Currency INR bn INR bn INR bn GBP (mln)
Revenues 454,118 379,974 834,092
EBITDA 126,651 121,046 247,697
Opex 327,468 258,928 586,396
Capex 81,374 80,000 161,374
Cash costs 408,842 338,928 747,770 9,027 Combined entity has £9bn of cash costs
5% of cash costs 37,388 451 In market synergies typically in the range
NPV @ 10% 373,885 4,513 5% to 7% of combined cash costs
7% of cash costs 52,344 632
NPV @ 10% 523,439 6,319
FX (GBPINR=) 82.84 Current GBPINR rate
Mid-point of synergies bn 5,416 c£5.4bn of synergies at the mid-point
Assumed paid away to Idea % 50% Assume equitable split of synergies
Retained for VOD mln 2,708 £2.7bn of synergies retained for VOD s/h
VOD share count mln 27,912
Synergy value per VOD share*GBP 0.10 Deal is worth 10p per share ot VOD share price
* Scenario excludes upside from Indian market repair
VOD + IDEA Synergy Scenario

Vodafone Group plc
Telecommunications
30
Figure 20: Vodafone India + Idea – a merger scenario leaves VOD
with c72% of a combined Indian entity
Source: Berenberg estimates
● Regulatory issues: The last time that the local press carried stories suggesting a Vodafone+Idea move, local analysts cited regulatory hurdles to a deal given that the combined entity would breech 50% revenue market share limits in some circles. We think such concerns could be addressed through selective disposals.
● A merger could make more sense: Our synergy scenario above assumed a 100% cash deal in order to look at the digestibility of a Vodafone offer for Idea. However, a merger could make for a more sensible deal, but could be dependent upon a Vodafone India IPO to create a clear valuation and acquisition currency for Vodafone India. Alternatively, Vodafone could use a Vodafone India merger with Idea to reverse into a listing. At present we do not know the capital structure of Vodafone India.
However, if we assume the unit is levered in line with the group, at 2.5x net debt/EBITDA, then a nil-premium merger on the basis of our valuation of Vodafone India (at 5.8x EBITDA, roughly similar to local Indian valuation comps) would result in Vodafone owning 72% of the merged entity, with Idea shareholders AB and Axiata diluting to 11.9% and 5.6% each, and Idea’s remaining public shareholders left with 10.8% of the final entity.
In short, Vodafone+Idea combination makes a lot of sense, but so far there has been no confirmation of talks, and it is far from a done deal.
Italy: new entrant risk
We detailed our views on the Italian telecoms market in our Telecom Italia report, Not the bargain it seems, dated 30 September 2016,. In this Vodafone report we are updating our Vodafone Italy estimates to reflect an expectation of disruption in the Italian market when Iliad makes its entry in late 2017.
Iliad can be successfulIliad can be successfulIliad can be successfulIliad can be successful
We assume that Iliad will gain at least 10% market share in the long term, by building up its share of gross additions to c13% in the short to medium term. This reflects the following ideas.
● New entrants can and do take share: They typically take between a few per cent to a low double-digit percentage over ten years. MVNO-based models tend to take less share, while network-based entry models tend to take more.
● Italy is a high-churn market: Even today, after a period of calm, the market will see c26m churners in a year. Iliad will only need to take a mid-teens share of this churn, and keep its own churn below 3.5% pcm in order to get over 10% share in ten years.
● Prices in Italy are not as low as the bulls think: ARPUs are at the long end of the spectrum compared with the European peer market, but this is distorted by the high
VOD India Idea
VOD
India +
IDEA
EV Eur m 13,708 10,222 23,930
Net debt Eur m 4,478 6,482 10,960
Equity value Eur m 9,231 3,740 12,971
Share 71.2% 28.8% 100.0%
o/w Vodafone 71.2%
o/w Aditya Birla 12.1%
o/w Axiata 5.7%
o/w Idea public s/h 11.0%
ND/EBITDA 2.50 3.69
EBITDA 1,791 1,757
VOD India + IDEA
combined EURm

Vodafone Group plc
Telecommunications
31
proportion of multi-SIM adoption in the Italian market. If we look instead at mobile spend per pop then Italy is approximately in line with the peer group average for European mobile markets, at c€17.2 pcm (the average for the UK, Germany, France, Greece, Spain and Portugal is €17.6). Furthermore, in the last two years, prices in Italy have been rising, increasing the scope for a new entrant to price aggressively. Finally, a look across the market at available offers suggests that there is scope for Iliad to make an impact in tariffing, with an approach similar to its French model of two distinct tariffs, one at €2pcm and the other at €20pcm.
Even so, challenges Even so, challenges Even so, challenges Even so, challenges exist for Iliadexist for Iliadexist for Iliadexist for Iliad
We recognise that there are challenges for Iliad in Italy, not least the fact it lacks an existing broadband customer base on which to launch its mobile offer, as it did in France. There will also be challenges relating to Italian laws on the identification of mobile users (ie the requirement to show an identity card when purchasing a mobile SIM, or migrating to a new operator).
While these are likely to present some issues for Iliad in Italy, we note the innovative solutions to the identification problem from companies such as Inventia, which licenses the technology for operators to comply with Italian terrorism ID laws through digital means, enabling the development of fully online distribution strategies. Iliad may also find a greater need for a high street presence in Italy too, and certainly former MVNO entrants to the Italian market, such as BIP, suggest that the absence of a retail strategy can cause difficulties.
Finally, Iliad’s ability to gain share will be influenced by how incumbent operators respond. If they pre-empt by cutting prices, or if they seek to counter Iliad’s entry through aggressive service bundling discounts, then Iliad will find it tougher to build a meaningful share in the long term, unless it pushes into the wireline broadband space itself (which it may well do).
Our assumptions reflect operatorsOur assumptions reflect operatorsOur assumptions reflect operatorsOur assumptions reflect operators’’’’ respective churn ratesrespective churn ratesrespective churn ratesrespective churn rates
We assume that Iliad achieves at least a double-digit market share in the long term, with its gains sourced primarily from the other three network players. However, we also recognise that Iliad’s gains are likely to reflect the respective size and churn rates of the other three players. As a result, we assume that most (c36%) of Iliad’s customer gains will be sourced from 3/Wind, which has the highest churn rate in the market (c2.55%pcm), and the largest customer base (33.6% share). We think that 3/Wind could source 36.5% of Iliad’s gross customer gains over the next ten years.
Using the same approach for Vodafone and Telecom Italia, we estimate that Vodafone could source c28.9% of Iliad’s customer gains and Telecom Italia 26.9% of Iliad’s customer gains over the next ten years. Investors should note that our expectations are based on recent churn patterns in Italian mobile. It remains possible that Iliad’s entry could raise the churn rate some way above its current, historically low level.
Vodafone Italy is partially hedged via its broadband deal with EneVodafone Italy is partially hedged via its broadband deal with EneVodafone Italy is partially hedged via its broadband deal with EneVodafone Italy is partially hedged via its broadband deal with Enellll
While we incorporate Iliad’s entry results in reduced mobile estimates for Vodafone, this impact is partially hedged by Vodafone’s agreement with Enel Open Fibre. Vodafone has agreed to be an anchor tenant on EOF’s fibre (FTTP) network, which will deploy to pass 9.5m households by 2021. Where EOF fibre is present Vodafone has an obligation to use it for its broadband customer additions.
While the EOF deployment may take some time, it offers Vodafone a meaningful economic incentive by providing it with access to cheap full fibre at a discount to the alternative, and inferior, “bitstream” product from Telecom Italia. We estimate that as Vodafone’s customers migrate to fibre, it will save somewhere in the region of €5-10 per customer per month by using the EOF fibre instead of the Telecom Italia bitstream offer.
Vodafone has been achieving good success in the Italian broadband market in recent years, being, alongside Fastweb, one of the key broadband market share gainers. We believe that this success will be underpinned by the new EOF agreement, and will partly offset the impact of Iliad’s entry into the Italian mobile market.
Vodafone Group plc
Telecommunications
32
What What What What thisthisthisthis meanmeanmeanmeanssss for our for our for our for our VodafoneVodafoneVodafoneVodafone Italy estimatesItaly estimatesItaly estimatesItaly estimates
We have lowered our Vodafone Italy 2022 revenue estimate by 6.8% and our 2022 EBITDA estimate by 8.0% to reflect our expectation that Iliad will take more than 10% of the Italian mobile market in the long term.
One of the benefits of Vodafone’s portfolio is diversification, and we would highlight that while our India and Italy estimate reductions are meaningful on a standalone basis, in the Vodafone Group context their impact is offset by increased estimates in numerous other business units, as described in Figures 13 and 14.

Vodafone Group plc
Telecommunications
33
Appendix: Operating KPIs and background data
Figure 21: Vodafone group service revenue segmentation
European mobile accounts for c50% of group service revenues in
FY16, with AMAP mobile accounting for 31%, and wireline service
revenues making up c20%
Figure 22: Vodafone service revenue segmentation by type
Alternatively, residential/consumer accounts for 66% of group
service revenues, enterprise 33.9% and other (eg MVNOs) 6%
Source: Company data, Berenberg calculations Source: Company data, Berenberg calculations
Figure 23: Service revenue contribution by market
Vodafone has good service revenue diversification, with its largest
business unit, Germany, generating about a fifth of group service
revenues.
Figure 24: EBITDA contribution by market
Vodafone has good EBITDA diversification, with its largest
business unit, Germany, generating just over a fifth of group
EBITDA.
Source: Company data, Berenberg calculations Source: Company data, Berenberg calculations
Europe
mobile,
49.4%
Europe
wireline ,
17.3%
AMAP
mobile,
30.8%
AMAP
wireline,
2.5%
Vodafone group service revenue:
Segmentatation by region (Q2/FY17)
Residential
/
consumer,
66.0%
Other
(MVNO
etc.), 6.0%
Enterprise,
33.9%
Vodafone group service revenue:
Segmentatation by customer type
(Q4/FY16)
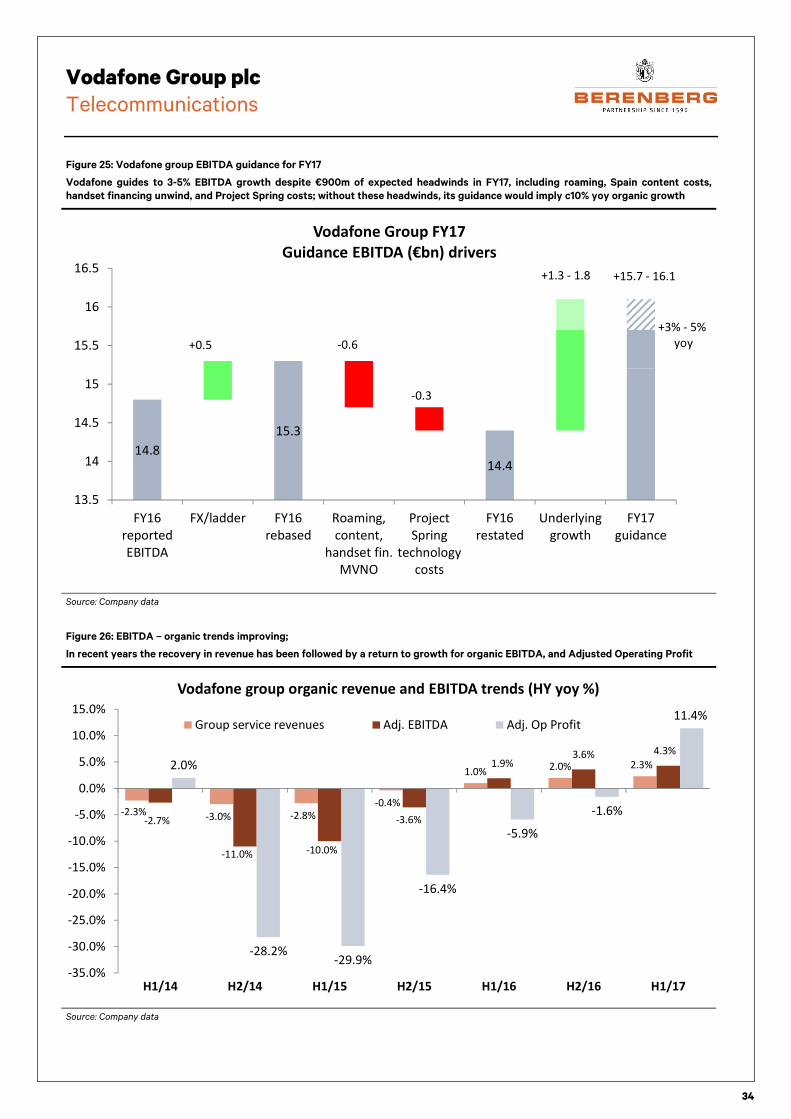
Vodafone Group plc
Telecommunications
34
Figure 25: Vodafone group EBITDA guidance for FY17
Vodafone guides to 3-5% EBITDA growth despite €900m of expected headwinds in FY17, including roaming, Spain content costs,
handset financing unwind, and Project Spring costs; without these headwinds, its guidance would imply c10% yoy organic growth
Source: Company data
Figure 26: EBITDA – organic trends improving;
In recent years the recovery in revenue has been followed by a return to growth for organic EBITDA, and Adjusted Operating Profit
Source: Company data
14.8
15.3
14.4
13.5
14
14.5
15
15.5
16
16.5
FY16
reported
EBITDA
FX/ladder FY16
rebased
Roaming,
content,
handset fin.
MVNO
Project
Spring
technology
costs
FY16
restated
Underlying
growth
FY17
guidance
Vodafone Group FY17
Guidance EBITDA (€bn) drivers
+0.5 -0.6
-0.3
+1.3 - 1.8 +15.7 - 16.1
+3% - 5%
yoy
-2.3% -3.0% -2.8%
-0.4%
1.0%2.0% 2.3%
-2.7%
-11.0% -10.0%
-3.6%
1.9%3.6% 4.3%
2.0%
-28.2%-29.9%
-16.4%
-5.9%
-1.6%
11.4%
-35.0%
-30.0%
-25.0%
-20.0%
-15.0%
-10.0%
-5.0%
0.0%
5.0%
10.0%
15.0%
H1/14 H2/14 H1/15 H2/15 H1/16 H2/16 H1/17
Vodafone group organic revenue and EBITDA trends (HY yoy %)
Group service revenues Adj. EBITDA Adj. Op Profit

Vodafone Group plc
Telecommunications
35
Figure 27: Vodafone group and European organic service revenue trends
We peel back the onion of growth, starting with group organic service revenue growth, then incrementally strip out regulatory drags
(MTRs), wireline revenues, and AMAP, to home in on European mobile service revenue trends (ex-MTRs)
Source: Company reports
-3.8%
-5.2% -5.1%
-4.0% -4.2%
-1.5%
-0.4%
0.1%0.8%
1.2% 1.4%
2.5% 2.2% 2.4%
-6.0%
-5.0%
-4.0%
-3.0%
-2.0%
-1.0%
0.0%
1.0%
2.0%
3.0%
Q1 14 Q2 14 Q3 14 Q4 14 Q1 15 Q2 15 Q3 15 Q4 15 Q1 16 Q2 16 Q3 16 Q4 16 Q1 17 Q2 17
Group organic service revenue growth (% yoy)
-0.8%
-2.4% -2.7% -2.8% -2.9%
-0.9%
0.2%0.9%
1.4%1.8% 2.1%
3.0%2.4% 2.6%
-4.0%
-3.0%
-2.0%
-1.0%
0.0%
1.0%
2.0%
3.0%
4.0%
Q1 14 Q2 14 Q3 14 Q4 14 Q1 15 Q2 15 Q3 15 Q4 15 Q1 16 Q2 16 Q3 16 Q4 16 Q1 17 Q2 17
Group (ex-MTR) service revenue growth (% yoy)
-0.6%
-2.5%-2.9% -3.0%
-3.4%
-1.1% -1.1%-0.5%
0.8%1.3%
1.9%2.8% 2.5% 2.4%
-5.0%
-4.0%-3.0%
-2.0%
-1.0%
0.0%
1.0%2.0%
3.0%
4.0%
Q1 14 Q2 14 Q3 14 Q4 14 Q1 15 Q2 15 Q3 15 Q4 15 Q1 16 Q2 16 Q3 16 Q4 16 Q1 17 Q2 17
Group mobile service revenues growth (% yoy) ex MTRs
-5.7%
-7.5% -8.0% -8.0% -7.5%
-5.2%
-3.5%-2.9%
-2.2% -2.1% -1.6%-0.8% -0.5%
0.0%
-10.0%
-8.0%
-6.0%
-4.0%
-2.0%
0.0%
Q1 14 Q2 14 Q3 14 Q4 14 Q1 15 Q2 15 Q3 15 Q4 15 Q1 16 Q2 16 Q3 16 Q4 16 Q1 17 Q2 17
Europe underlying (ex-MTR) mobile service revenue growth (% yoy)

Vodafone Group plc
Telecommunications
36
Figure 28: European mobile service revenue components
The improvement in European mobile service revenues was initially the result of an improving pace of decline in European organic
ARPU (ex-MTR average revenue per user), but in recent quarters has reflected improved subscriber base trends.
Source: Berenberg figures (calculated from company data)
-5.0%
-4.4%
-3.7%
-2.6% -2.5% -2.7%-2.5%
-3.2%-3.7%
-3.4%-3.1%
-1.6%
-0.4%-0.1%
-6.0%
-5.0%
-4.0%
-3.0%
-2.0%
-1.0%
0.0%
Q1 14 Q2 14 Q3 14 Q4 14 Q1 15 Q2 15 Q3 15 Q4 15 Q1 16 Q2 16 Q3 16 Q4 16 Q1 17 Q2 17
Europe average subscriber growth (% yoy)
Improving subscriber growth in Europe has been a driver of recent mobile
service revenue growth improvements.
-0.7%
-3.3%
-4.5%
-5.6%-5.2%
-2.6%
-1.1%
0.3%
1.5% 1.4% 1.5%0.8%
-0.1%
0.1%
-7.0%
-6.0%
-5.0%
-4.0%
-3.0%
-2.0%
-1.0%
0.0%
1.0%
2.0%
Q1 14 Q2 14 Q3 14 Q4 14 Q1 15 Q2 15 Q3 15 Q4 15 Q1 16 Q2 16 Q3 16 Q4 16 Q1 17 Q2 17
Implied Europe ARPU change (organic, ex-MTRs, % yoy)

Vodafone Group plc
Telecommunications
37
Figure 29: Vodafone Europe mobile service revenue trends improve across markets
Vodafone has seen improving mobile service revenue trends (ex-MTRs) across most of its European business units;
the UK and the Netherlands buck the trend
Source: Berenberg figures (calculated from company data)
-1.8%-3.2%
-5.7% -5.6% -5.5%-3.6%
-1.5%-3.0%
-1.9% -2.6%-1.5%
0.5%
-0.1%
1.4%
-8.0%
-6.0%
-4.0%
-2.0%
0.0%
2.0%
Q1 14 Q2 14 Q3 14 Q4 14 Q1 15 Q2 15 Q3 15 Q4 15 Q1 16 Q2 16 Q3 16 Q4 16
Germany (~12%/18%)
-10.3%-13.9%-14.4%-18.2%-17.2%-11.7% -9.6% -6.3% -3.2% -3.0%
0.1% 1.6% 1.4% 1.6%
-20.0%
0.0%
20.0%Italy (~8%/12%)
-9.6%-12.8%-11.5% -9.8%
-12.7%-11.7%-11.1% -9.3% -9.5%-6.8% -9.2%
-6.4%
0.8% 0.1%
-20.0%
-10.0%
0.0%
10.0%Spain (~6%/9%)
1.3% 1.0% 1.0%5.0%
2.0%
7.6% 9.1% 10.0%6.3%
4.5% 5.6%8.2%
4.5% 3.6%
0.0%
10.0%
20.0%Romania(~1%/2%)
-9.1% -11.7%-11.2%-6.6% -6.9% -4.5%
-1.7% -2.2%
0.3%
-0.5% -2.1% -0.4% -1.0%
2.3%
-20.0%
-10.0%
0.0%
10.0%Greece (~1%/2%)
-4.9%-10.6%-12.9%-13.8%-11.8%
-3.8% -2.3%
3.7% 1.3% 3.0% 2.7% 5.7% 3.7% 4.1%
-20.0%
0.0%
20.0%Czech Republic (~1%/2%)
-8.8% -8.3% -6.2%-11.6%
-7.9% -9.8% -10.5% -9.4% -7.3% -4.7% -3.2%
0.2%
-3.1% -2.0%
-20.0%
-10.0%
0.0%
10.0%Portugal (~2%/3%)
-1.4% -1.0% -2.1%-5.3% -3.8%
-1.3%-3.8%
-9.2%-3.2%
-1.1%
0.7% 0.7% 0.8%
-0.1%
-10.0%
0.0%
10.0% Ireland (~2%/3%)
-2.6% -2.5% -3.2%-1.4%
-0.5% -0.3%
2.0%1.1% 0.9%
-0.2% -0.7%-1.6%
-2.9%-1.4%
-5.0%
0.0%
5.0%UK (~12%/18%)
-4.2%-6.1% -6.9% -6.6%
-3.7%-0.6%
1.5% 2.5%
-0.6%
0.0%
-1.6%-5.8% -4.9% -6.8%-10.0%
0.0%
10.0%Netherlands (~3%/5%)

Vodafone Group plc
Telecommunications
38
Figure 30: Blended ARPU trends (ex-MTRs) by major market (% yoy)
Group organic blended ARPU improvement reflects improving ARPU trends in most markets, notably Italy, Spain, and
Germany
Source: Company reports
8.4% 7.0%
2.3%
-3.2% -4.5% -3.2%-1.3%
0.2%2.2% 1.5% 1.5% 1.9%
-0.1% -0.2%
-10.0%
-5.0%
0.0%
5.0%
10.0%
Q1 14 Q2 14 Q3 14 Q4 14 Q1 15 Q2 15 Q3 15 Q4 15Germany
-3.1% -3.4% -4.5% -3.9% -3.2% -2.2%
0.0% 0.0%
7.0% 5.3% 5.9% 7.2%
-1.0%
1.1%
-10.0%
-5.0%
0.0%
5.0%
10.0%
UK
-8.1%-12.2%-13.1%
-16.2%-13.2%
-4.3%
0.0%
4.8% 5.6%2.2%
5.3% 5.0% 5.1% 6.4%
-20.0%
-10.0%
0.0%
10.0% Italy
7.1%2.5% 1.4%
-0.5%-6.0% -6.7% -7.8% -9.6%
-6.1% -3.9% -6.2% -5.4%-1.9% -2.8%
-20.0%
-10.0%
0.0%
10.0%Spain
-5.3% -6.0% -4.4% -4.8%-0.9%
1.9% 2.0%4.5%
-0.4%
0.8%
-0.8%-4.1% -4.1% -5.5%-10.0%
-5.0%
0.0%
5.0%
10.0%
Netherlands
-7.0%-5.2%
-1.3%-3.3%
1.7% 0.8% 0.8% 0.9% 1.7% 1.6% 2.7% 4.0%
-1.5% -1.2%
-10.0%
-5.0%
0.0%
5.0%
Portugal
-15.5%-18.8%-20.0%
-17.1%-13.1%-10.5%
-5.6% -6.0% -7.0% -6.0%
-12.8%-12.6%-11.8%-10.6%
-30.0%
-20.0%
-10.0%
0.0%
Greece
-3.4% -5.1% -6.6%
4.4% 6.3%10.1% 11.8% 11.4%
2.2% 0.4% 0.3%3.1%
0.4% 0.8%
-10.0%
0.0%
10.0%
20.0%Romania

Vodafone Group plc
Telecommunications
39
Figure 31: Post-paid ARPU trends by major European market (% yoy)
Post-paid ARPU trends have improved in most of Vodafone’s European markets. When combined with the mix-shift from prepaid to
post-paid subscriptions, this has a beneficial effect on service revenues.
Source: Company reports
-7.3%-11.0%-11.2%
-14.7%-17.5%
-14.8%-14.3%-13.5%-13.5%-14.9%-18.0%
-15.3%-13.2%
-7.0%
-20.0%
-10.0%
0.0%Italy
-1.3% -0.9%-1.8%
-4.2%-3.1% -3.5% -3.9%
-5.6%-6.3% -7.0% -6.1%
-4.2%-3.4%
-1.5%
-8.0%
-6.0%
-4.0%
-2.0%
0.0%
Q1 14 Q2 14 Q3 14 Q4 14 Q1 15 Q2 15 Q3 15 Q4 15 Q1 16 Q2 16 Q3 16 Q4 16
Germany
-6.6% -5.7% -5.9% -5.6% -5.2%-3.5%
-0.4%
0.4%
-0.2%
-3.0%-4.4%
-2.8%-3.8%
-2.3%
-10.0%
-5.0%
0.0%
5.0% UK
-2.3%-4.3% -4.5% -5.0%
-8.8%-10.5%
-13.7%-15.0%-14.1%-11.3%-10.9%-10.0%
-3.6% -4.3%
-20.0%
-15.0%
-10.0%
-5.0%
0.0%Spain
-8.0% -8.3% -7.3% -7.7%
-4.4%-2.7% -2.1%
0.6%
-3.6%
-1.2%-2.7%
-6.8%-5.1%
-7.1%-10.0%
-5.0%
0.0%
5.0% Netherlands
-5.8%-9.0%
-7.1%
-11.8%-12.1%-15.4%-14.5%-13.8%-12.9%
-10.8%-10.9%-7.0% -7.9%
-5.3%
-20.0%
-10.0%
0.0%Portugal
-8.3%-11.2%-12.0%-10.3% -9.7%
-7.7%-4.2% -5.2% -6.2% -6.7% -7.4%
-3.0% -2.1%
0.1%
-15.0%
-10.0%
-5.0%
0.0%
5.0%Greece
2.4%0.1%
-2.1%
6.5%4.2%
8.4%11.4% 13.1%
3.6% 2.6% 1.7% 2.2% 0.9% 0.6%
-10.0%
0.0%
10.0%
20.0% Romania

Vodafone Group plc
Telecommunications
40
Figure 32: Pre-paid-to-post-paid mix shift
In the last two years the post-paid share of Vodafone’s European
base has increased by 4ppt to c50%, with a clear acceleration of
the shift through 2014 and 15, and a slowdown in 2016
Figure 33: Post-paid subscribers as percentage of total
The pre-paid-to-post-paid customer mix shift has occurred in
most of Vodafone’s European markets, underpinning blended
ARPU and mobile service revenue trends at the business unit
level
Source: Company reports Source: Company reports
Figure 34: Post-paid proportion of the mobile base
Vodafone’s European portfolio encompasses a diverse range of
markets from mostly pre-paid (eg Italy and Greece) to mostly
post-paid (eg Spain and the Netherlands)
Figure 35: Pre-paid/post-paid ARPUs versus mix shift
Markets like Germany, the UK, the Netherland, and Greece,
where post-paid ARPU is several times higher than pre-paid
ARPU, should benefit from the mix shift as long as post-paid
ARPUs do not decline too rapidly
Source: Company reports Source: Company reports
30.0%
35.0%
40.0%
45.0%
50.0%
55.0%
Q2
FY
09
Q4
FY
09
Q2
FY
10
Q4
FY
10
Q2
FY
11
Q4
FY
11
Q2
FY
12
Q4
FY
12
Q2
FY
13
Q4
FY
13
Q2
FY
14
Q4
FY
14
Q2
FY
15
Q4
FY
15
Q2
FY
16
Q4
FY
16
Q2
FY
17
The mix-shift from prepaid to postpaid
continues, albeit at a slowing pace,
-4.4%
-1.8%-1.4%
0.5%
3.5%3.9% 4.1% 4.3%
5.4%6.0% 6.0%
6.8%
8.3%
13.3%
-6.0%
-4.0%
-2.0%
0.0%
2.0%
4.0%
6.0%
8.0%
10.0%
12.0%
14.0%
16.0%
Gre
ece
Alb
an
ia
Ro
ma
nia
Ita
ly
Ne
the
rla
nd
s
Ma
lta
Sp
ain
Eu
rop
e A
vg
.
Cze
ch R
ep
ub
lic
Hu
ng
ary
Ge
rma
ny
Ire
lan
d
UK
Po
rtu
ga
l
4%
19%22%
27%
39% 41%
50% 52%55%
61%
67% 68%
77% 78%
0.0%
10.0%
20.0%
30.0%
40.0%
50.0%
60.0%
70.0%
80.0%
90.0%
Alb
an
ia
Ita
ly
Ma
lta
Gre
ece
Po
rtu
ga
l
Ro
ma
nia
Eu
rop
e A
vg.
Ire
lan
d
Ge
rma
ny
Hu
ng
ary
Cze
ch R
ep
ub
lic
UK
Ne
the
rla
nd
s
Sp
ain
0.0
1.0
2.0
3.0
4.0
5.0
6.0
7.0
8.0
9.0
-5%
-4%
-3%
-2%
-1%
0%
1%
2%
3%
4%
5%
6%
7%
8%
9%
10
%
11
%
12
%
13
%
14
%
15
%
Po
stp
aid
/Pre
pa
id A
RP
U r
ati
o
1 year change in postpaid
subscribers as % of base
European postpaid/prepaid ARPU
vs 1-year change in postpaid mix (%)
UK
GR
IT
PT
RO
GE
NL
SP

Vodafone Group plc
Telecommunications
41
Figure 36: Europe and AMAP drive strong data volume growth
Note the stabilisation of the formerly slowing EU data volume
growth trend
Figure 37: European mobile data traffic growth
Data growth continues to be strong, sustaining c60% yoy in
recent quarters
Source: Company data Source: Company data
Figure 38: Vodafone’s European smartphone take-up
Only 61% of Vodafone’s European base own a smartphone,
suggesting room for further growth
Figure 39: Individual smartphone data usage
Data usage per customer continues to show strong growth to
end FY16, with Germany standing out as the laggard
Source: Company data Source: Company data
122%
73%
61%
53%
30%
40%
50%
60%
70%
80%
90%
100%
110%
120%
130%
Q3/14 Q4/14 Q1/15 Q2/15 Q3/15 Q4/15 Q1/16 Q2/16 Q3/16 Q4/16
Vodafone group data volume growth (% yoy)
AMAP
Group
Europe
37 39 43 46 49 55 61 67 71 80 87 95108
135149
163183
221234
259
296
356
10%
20%
30%
40%
50%
60%
70%
25
75
125
175
225
275
325
375
425
475
Q1
/FY
12
Q2
/FY
12
Q3
/FY
12
Q4
/FY
12
Q1
/FY
13
Q2
/FY
13
Q3
/FY
13
Q4
/FY
13
Q1
/FY
14
Q2
/FY
14
Q3
/FY
14
Q4
/FY
14
Q1
/FY
15
Q2
/FY
15
Q3
/FY
15
Q4
/FY
15
Q1
/FY
16
Q2
/FY
16
Q3
/FY
16
Q4
/FY
16
Q1
/FY
17
Q2
/FY
17
Vodafone Europe mobile data traffic growth
Quarterly data traffic (Petabytes - lhs)
Growth yoy (rhs)
32.8% 35.4%
37.8% 39.5%
41.3% 43.1%
44.6% 46.6% 47.9%
49.9% 51.7%
53.5% 56.0% 57.0% 58.1%
60.7%
--%
10.0%
20.0%
30.0%
40.0%
50.0%
60.0%
70.0%
Q3
FY
13
Q4
FY
13
Q1
FY
14
Q2
FY
14
Q3
FY
14
Q4
FY
14
Q1
FY
15
Q2
FY
15
Q3
FY
15
Q4
FY
15
Q1
FY
16
Q2
FY
16
Q3
FY
16
Q4
FY
16
Q1
FY
17
Q2
FY
17
Vodafone smartphone adoption - Europe (%)
300
500
700
900
1100
1300
1500
Smartphone data usage (MB/pcm)
in Vodafone's big 4 European markets
Spain
Italy
UK
Germany

Vodafone Group plc
Telecommunications
42
Figure 40: Out-of-bundle revenues are an ever smaller part of the mix
OOB revenues continue to decline at a hefty rate, reducing the risk of
cannibalisation by ‘over-the-top’ services
Figure 41: OOB revenues are less important
They are so small now as a percentage of total and European
revenues that their drag has materially eased
Source: Company data Source: Company data
Figure 42: Churn is falling
Consumer post-paid and enterprise churn rates continued to fall
to end FY16
Figure 43: ‘Big four’ churn rates
Of “the big four” markets, churn trends have generally been
encouraging, with rates in Italy and Spain falling the most
Source: Company data Source: Company data
-30.0
-25.0
-20.0
-15.0
-10.0
-5.0
-
5.0
10.0
FY
14
Q3
/14
Q4
/14
Q1
/15
Q2
/15
Q3
/15
Q4
/15
Q1
/16
Q2
/16
Q3
/16
Q4
/16
Q1
/17
Q2
/17
Vodafone: in-bundle vs out-of-bundle
revenue growth % yoy
Europe in-
bundle
Europe out-
of-bundle
39.7%
29.8%
27.7%
20.8%
49.5%
14.8%
32.4%
9.7%
0.0% 20.0% 40.0% 60.0%
EU in-bundle as % of EU
service revenues
EU out-of-bundle as % of
EU service revenues
EU in bundle as % of
group service revenues
EU out of bundle as % of
Group service revenues
Q2/FY1
7
Q1/FY1
3
18.6%
17.9% 17.6%
17.0% 17.0% 16.7%
16.2% 16.4%
14.6%
16.4%
13.9%
15.4%
13.0%
14.0%
15.0%
16.0%
17.0%
18.0%
19.0%
20.0%
Q3
FY
15
Q4
FY
15
Q1
FY
16
Q2
FY
16
Q3
FY
16
Q4
FY
16
Vodafone Europe churn rates % pa
Consumer
postpaid
Enterprise
10.0%
12.0%
14.0%
16.0%
18.0%
20.0%
22.0%
24.0%
26.0%
28.0%SP postpaid
UK postpaid
IT postpaid
GE postpaid

Vodafone Group plc
Telecommunications
43
Financials
Income statement
Year-end March (EUR m) 2016 2017E 2018E 2019E 2020E 2021E
Group RevenuesGroup RevenuesGroup RevenuesGroup Revenues 55,93055,93055,93055,930 53,95453,95453,95453,954 54,22354,22354,22354,223 54,95854,95854,95854,958 55,80555,80555,80555,805 56,66156,66156,66156,661
Group EBITDAGroup EBITDAGroup EBITDAGroup EBITDA 15,84015,84015,84015,840 15,67815,67815,67815,678 16,14116,14116,14116,141 16,68116,68116,68116,681 17,22217,22217,22217,222 17,82017,82017,82017,820
EBITDA margin 28.3% 29.1% 29.8% 30.4% 30.9% 31.5%
Depreciation and Amortisation -11,644 -11,239 -11,029 -10,911 -10,730 -10,565
Associates 59 151 171 194 209 218
Group AOPGroup AOPGroup AOPGroup AOP 4,2554,2554,2554,255 4,5924,5924,5924,592 5,2885,2885,2885,288 5,9695,9695,9695,969 6,7026,7026,7026,702 7,4747,4747,4747,474
Adj. net finance expense -1,865 -1,924 -1,913 -1,920 -1,814 -1,775
Group adjusted PBT 2,390 2,668 3,374 4,049 4,888 5,699
Adjusted Tax expense -240 -601 -727 -875 -1,028 -1,220
Non-controlling interest -308 -284 -330 -370 -395 -420
Adjusted PATAdjusted PATAdjusted PATAdjusted PAT 1,8421,8421,8421,842 1,7821,7821,7821,782 2,3182,3182,3182,318 2,8042,8042,8042,804 3,4653,4653,4653,465 4,0594,0594,0594,059
Adjusted EPS (basic) 6.90 6.39 8.30 10.05 12.41 14.54
Adjusted EPS (Dil) 6.90 6.51 8.64 10.46 12.92 15.14
DPS 14.48 14.77 15.06 15.36 15.67 15.98
Shares ranking (dil.) 26,692 27,364 26,817 26,817 26,817 26,817
Source: Company data, Berenberg estimates

Vodafone Group plc
Telecommunications
44
Revenue and EBITDA by market
Year-end March 2016 2017E 2018E 2019E 2020E 2021E
Revenue by segment (EURm)Revenue by segment (EURm)Revenue by segment (EURm)Revenue by segment (EURm)
Germany 10,626 10,539 10,604 10,701 10,870 11,092
Italy 6,008 6,052 5,992 5,936 5,857 5,851
UK 8,428 7,013 6,787 6,814 6,908 6,972
Spain 4,959 5,024 5,185 5,297 5,407 5,480
Netherlands 1,890 1,802 1,783 1,789 1,799 1,807
Portugal 973 997 998 1,000 1,016 1,024
Greece 848 866 881 889 903 919
Other Europe 2,888 2,949 3,009 3,066 3,124 3,184
EUROPEEUROPEEUROPEEUROPE 36,46236,46236,46236,462 35,07835,07835,07835,078 35,11935,11935,11935,119 35,37135,37135,37135,371 35,76535,76535,76535,765 36,20836,20836,20836,208
India 6,161 6,161 6,340 6,455 6,587 6,703
Vodacom 5,325 5,299 5,848 6,018 6,173 6,322
Turkey 2,959 3,016 2,822 2,993 3,113 3,214
Egypt 1,634 1,150 836 846 856 865
Other AMAP 1,973 1,995 1,967 1,985 2,022 2,059
AMAPAMAPAMAPAMAP 18,04018,04018,04018,040 17,61117,61117,61117,611 17,80417,80417,80417,804 18,28718,28718,28718,287 18,74018,74018,74018,740 19,15319,15319,15319,153
Total RevenuesTotal RevenuesTotal RevenuesTotal Revenues 55,93055,93055,93055,930 53,95453,95453,95453,954 54,22354,22354,22354,223 54,95854,95854,95854,958 55,80555,80555,80555,805 56,66156,66156,66156,661
EBITDA by segment (EURm)EBITDA by segment (EURm)EBITDA by segment (EURm)EBITDA by segment (EURm)
Germany 3,462 3,571 3,685 3,745 3,805 3,882
Italy 2,015 2,216 2,172 2,137 2,109 2,121
UK 1,756 1,327 1,357 1,431 1,520 1,603
Spain 1,250 1,412 1,478 1,562 1,622 1,671
Netherlands 644 628 624 626 629 633
Portugal 341 350 359 370 381 384
Greece 235 264 282 284 289 294
Other EuropeOther EuropeOther EuropeOther Europe 782782782782 851851851851 903903903903 950950950950 968968968968 987987987987
EUROPEEUROPEEUROPEEUROPE 10,48510,48510,48510,485 10,62110,62110,62110,621 10,86010,86010,86010,860 11,10711,10711,10711,107 11,32311,32311,32311,323 11,57511,57511,57511,575
India 1,815 1,718 1,680 1,775 1,910 2,011
Vodacom 2,028 2,071 2,369 2,498 2,623 2,750
Turkey 553 638 607 666 716 771
Egypt 683 462 383 389 394 398
Other AMAP 442 494 492 496 505 515
AMAPAMAPAMAPAMAP 5,5215,5215,5215,521 5,3835,3835,3835,383 5,5305,5305,5305,530 5,8245,8245,8245,824 6,1496,1496,1496,149 6,4456,4456,4456,445
Total EBITDATotal EBITDATotal EBITDATotal EBITDA 15,84015,84015,84015,840 15,67815,67815,67815,678 16,14116,14116,14116,141 16,68116,68116,68116,681 17,22217,22217,22217,222 17,82017,82017,82017,820
EBITDA margins (%)EBITDA margins (%)EBITDA margins (%)EBITDA margins (%)
Germany 32.6% 33.9% 34.7% 35.0% 35.0% 35.0%
Italy 33.5% 36.6% 36.2% 36.0% 36.0% 36.3%
UK 20.8% 18.9% 20.0% 21.0% 22.0% 23.0%
Spain 25.2% 28.1% 28.5% 29.5% 30.0% 30.5%
Netherlands 34.1% 34.9% 35.0% 35.0% 35.0% 35.0%
Portugal 35.0% 35.2% 36.0% 37.0% 37.5% 37.5%
Greece 27.7% 30.5% 32.0% 32.0% 32.0% 32.0%
Other Europe 27.1% 28.9% 30.0% 31.0% 31.0% 31.0%
Europe totalEurope totalEurope totalEurope total 28.8%28.8%28.8%28.8% 30.3%30.3%30.3%30.3% 30.9%30.9%30.9%30.9% 31.4%31.4%31.4%31.4% 31.7%31.7%31.7%31.7% 32.0%32.0%32.0%32.0%
India 29.5% 27.9% 26.5% 27.5% 29.0% 30.0%
Vodacom 38.1% 39.1% 40.5% 41.5% 42.5% 43.5%
Turkey 18.7% 21.2% 21.5% 22.3% 23.0% 24.0%
Egypt 41.8% 40.2% 45.7% 46.0% 46.0% 46.0%
Other AMAP 22.4% 24.8% 25.0% 25.0% 25.0% 25.0%
AMAP totalAMAP totalAMAP totalAMAP total 30.6%30.6%30.6%30.6% 30.6%30.6%30.6%30.6% 31.1%31.1%31.1%31.1% 31.9%31.9%31.9%31.9% 32.8%32.8%32.8%32.8% 33.7%33.7%33.7%33.7%
Group totalGroup totalGroup totalGroup total 28.3%28.3%28.3%28.3% 29.1%29.1%29.1%29.1% 29.8%29.8%29.8%29.8% 30.4%30.4%30.4%30.4% 30.9%30.9%30.9%30.9% 31.5%31.5%31.5%31.5%
Source: Company data, Berenberg estimates

Vodafone Group plc
Telecommunications
45
Capex and capital intensity by market
Year ending March 2016 2017E 2018E 2019E 2020E 2021E
Capex by segment (EURm)Capex by segment (EURm)Capex by segment (EURm)Capex by segment (EURm)
Germany 2,362 1,724 1,697 1,712 1,739 1,775
Italy 1,516 779 899 861 820 819
UK 1,210 920 950 954 967 976
Spain 1,178 714 778 768 757 767
Netherlands 355 259 259 250 252 253
Portugal 350 191 150 145 142 143
Greece 127 126 132 129 131 129
Other Europe 540 456 451 445 453 446
Europe totalEurope totalEurope totalEurope total 7,6387,6387,6387,638 5,1705,1705,1705,170 5,3155,3155,3155,315 5,2645,2645,2645,264 5,2615,2615,2615,261 5,3085,3085,3085,308
India 1,102 1,108 951 936 988 1,005
Vodacom 847 835 819 842 802 759
Turkey 478 411 409 426 436 450
Egypt 405 176 125 123 120 112
Amap Other 290 261 285 278 263 268
AMAP totalAMAP totalAMAP totalAMAP total 3,1223,1223,1223,122 2,7922,7922,7922,792 2,5902,5902,5902,590 2,6062,6062,6062,606 2,6092,6092,6092,609 2,5942,5942,5942,594
Group totalGroup totalGroup totalGroup total 11,66311,66311,66311,663 8,6888,6888,6888,688 8,3258,3258,3258,325 8,2898,2898,2898,289 8,2908,2908,2908,290 8,2528,2528,2528,252
Capex/sales %Capex/sales %Capex/sales %Capex/sales %
Germany 22.2% 16.4% 16.0% 16.0% 16.0% 16.0%
Italy 25.2% 12.9% 15.0% 14.5% 14.0% 14.0%
UK 14.4% 13.1% 14.0% 14.0% 14.0% 14.0%
Spain 23.8% 14.2% 15.0% 14.5% 14.0% 14.0%
Netherlands 18.8% 14.4% 14.5% 14.0% 14.0% 14.0%
Portugal 36.0% 19.2% 15.0% 14.5% 14.0% 14.0%
Greece 15.0% 14.6% 15.0% 14.5% 14.5% 14.0%
Other Europe 18.7% 15.5% 15.0% 14.5% 14.5% 14.0%
Europe totalEurope totalEurope totalEurope total 20.9%20.9%20.9%20.9% 14.7%14.7%14.7%14.7% 15.1%15.1%15.1%15.1% 14.9%14.9%14.9%14.9% 14.7%14.7%14.7%14.7% 14.7%14.7%14.7%14.7%
India 17.9% 18.0% 15.0% 14.5% 15.0% 15.0%
Vodacom 15.9% 15.8% 14.0% 14.0% 13.0% 12.0%
Turkey 16.2% 13.6% 14.5% 14.2% 14.0% 14.0%
Egypt 24.8% 15.3% 15.0% 14.5% 14.0% 13.0%
Other AMAP 14.7% 13.1% 14.5% 14.0% 13.0% 13.0%
AMAP totalAMAP totalAMAP totalAMAP total 17.3%17.3%17.3%17.3% 15.9%15.9%15.9%15.9% 14.5%14.5%14.5%14.5% 14.2%14.2%14.2%14.2% 13.9%13.9%13.9%13.9% 13.5%13.5%13.5%13.5%
Group totalGroup totalGroup totalGroup total 20.9%20.9%20.9%20.9% 16.1%16.1%16.1%16.1% 15.4%15.4%15.4%15.4% 15.1%15.1%15.1%15.1% 14.9%14.9%14.9%14.9% 14.6%14.6%14.6%14.6%
Source: Company data, Berenberg estimates

Vodafone Group plc
Telecommunications
46
OpFCF and margin by market
Year ending March 2016 2017E 2018E 2019E 2020E 2021E
OpFCF by segment (EURm)OpFCF by segment (EURm)OpFCF by segment (EURm)OpFCF by segment (EURm)
Germany 866 1,847 1,988 2,033 2,065 2,107
Italy 496 1,437 1,273 1,276 1,289 1,302
UK 334 408 407 477 553 627
Spain -149 699 700 794 865 904
Netherlands 244 369 365 376 378 380
Portugal -40 160 210 225 239 241
Greece 130 138 150 155 158 165
Other Europe 212 395 451 506 515 541
Europe totalEurope totalEurope totalEurope total 2,0932,0932,0932,093 5,4515,4515,4515,451 5,5455,5455,5455,545 5,8435,8435,8435,843 6,0626,0626,0626,062 6,2686,2686,2686,268
India 737 610 729 839 922 1,005
Vodacom 1,071 1,235 1,550 1,655 1,821 1,991
Turkey -64 227 198 240 280 321
Egypt 367 286 257 266 274 286
Amap Other 200 233 206 218 243 247
AMAP totalAMAP totalAMAP totalAMAP total 2,3112,3112,3112,311 2,5912,5912,5912,591 2,9412,9412,9412,941 3,2193,2193,2193,219 3,5403,5403,5403,540 3,8513,8513,8513,851
Group totalGroup totalGroup totalGroup total 3,8163,8163,8163,816 6,9906,9906,9906,990 7,8167,8167,8167,816 8,3928,3928,3928,392 8,9328,9328,9328,932 9,5699,5699,5699,569
OpFCF margin %OpFCF margin %OpFCF margin %OpFCF margin %
Germany 8.1% 17.5% 18.7% 19.0% 19.0% 19.0%
Italy 8.3% 23.7% 21.2% 21.5% 22.0% 22.3%
UK 4.0% 5.8% 6.0% 7.0% 8.0% 9.0%
Spain -3.0% 13.9% 13.5% 15.0% 16.0% 16.5%
Netherlands 12.9% 20.5% 20.5% 21.0% 21.0% 21.0%
Portugal -4.1% 16.0% 21.0% 22.5% 23.5% 23.5%
Greece 15.3% 16.0% 17.0% 17.5% 17.5% 18.0%
Other Europe 7.3% 13.4% 15.0% 16.5% 16.5% 17.0%
Europe totalEurope totalEurope totalEurope total 5.7%5.7%5.7%5.7% 15.5%15.5%15.5%15.5% 15.8%15.8%15.8%15.8% 16.5%16.5%16.5%16.5% 16.9%16.9%16.9%16.9% 17.3%17.3%17.3%17.3%
India 12.0% 9.9% 11.5% 13.0% 14.0% 15.0%
Vodacom 20.1% 23.3% 26.5% 27.5% 29.5% 31.5%
Turkey -2.2% 7.5% 7.0% 8.0% 9.0% 10.0%
Egypt 22.5% 24.9% 30.7% 31.5% 32.0% 33.0%
Other Amap 10.1% 11.7% 10.5% 11.0% 12.0% 12.0%
AMAP TotalAMAP TotalAMAP TotalAMAP Total 12.8%12.8%12.8%12.8% 14.7%14.7%14.7%14.7% 16.5%16.5%16.5%16.5% 17.6%17.6%17.6%17.6% 18.9%18.9%18.9%18.9% 20.1%20.1%20.1%20.1%
Group totalGroup totalGroup totalGroup total 6.8%6.8%6.8%6.8% 13.0%13.0%13.0%13.0% 14.4%14.4%14.4%14.4% 15.3%15.3%15.3%15.3% 16.0%16.0%16.0%16.0% 16.9%16.9%16.9%16.9%
Source: Company data, Berenberg estimates

Vodafone Group plc
Telecommunications
47
Cash flow, net debt, and dividend cover
Year ending March (EURm) 2016 2017E 2018E 2019E 2020E 2021E
EBITDAEBITDAEBITDAEBITDA 15,84015,84015,84015,840 15,67815,67815,67815,678 16,14116,14116,14116,141 16,68116,68116,68116,681 17,22217,22217,22217,222 17,82017,82017,82017,820
Working capital -709 -739 0 0 0 0
Cash generated by operations 15,131 15,003 16,141 16,681 17,222 17,820
Cash capital expenditures -11,663 -8,688 -8,325 -8,289 -8,290 -8,252
Disposal of PPE 188 160 160 160 160 160
Other 160 133 133 133 133 133
Operating free cash flowOperating free cash flowOperating free cash flowOperating free cash flow 3,8163,8163,8163,816 6,6086,6086,6086,608 8,1098,1098,1098,109 8,6858,6858,6858,685 9,2259,2259,2259,225 9,8629,8629,8629,862
Taxation -936 -1,084 -1,130 -1,275 -1,300 -1,500
Dividend Income (net) 3,480 0 0 0 0 0
Dividends paid to minorities -309 -404 -424 -445 -468 -491
Net interest paid -1,386 -1,201 -1,435 -1,440 -1,366 -1,341
Free cash flowFree cash flowFree cash flowFree cash flow 1,2771,2771,2771,277 4,1374,1374,1374,137 5,3405,3405,3405,340 5,7445,7445,7445,744 6,3106,3106,3106,310 6,7496,7496,7496,749
Spectrum payments 4,057 3,095 770 841 1,500 1,500
Acquisitions and disposals -130 -1,041 0 0 0 0
Equity dividends paid -4,188 -3,772 -4,040 -4,065 -4,120 -4,202
Convertible issue 3,480 0 0 0 0 0
Foreign exchange 1,194 -333 0 0 0 0
Other -3,661 1,503 -2,300 0 0 0
Net debt decrease/(increase)Net debt decrease/(increase)Net debt decrease/(increase)Net debt decrease/(increase) ----6,0856,0856,0856,085 ----2,6012,6012,6012,601 ----1,7711,7711,7711,771 838838838838 691691691691 1,0471,0471,0471,047
Opening Net (Debt) Cash 30,812 36,897 39,498 41,268 40,430 39,740
Closing Net (Debt) Cash 36,897 39,498 41,268 40,430 39,740 38,693
Memo: debt redemptions per Bloomberg DDISMemo: debt redemptions per Bloomberg DDISMemo: debt redemptions per Bloomberg DDISMemo: debt redemptions per Bloomberg DDIS ---- 2,1702,1702,1702,170 4,6504,6504,6504,650 5,3905,3905,3905,390 1,8861,8861,8861,886 4,5634,5634,5634,563
Dividend coverDividend coverDividend coverDividend cover
Equity dividends paid 4,188 3,772 4,040 4,065 4,120 4,202
FCF (per VOD guidance, pre-spectrum) 1,277 4,137 5,340 5,744 6,310 6,749
FCF (post spectrum) -2,780 1,042 4,570 4,903 4,810 5,249
by FCF (per VOD guidance, pre-spectrum) 0.30x 1.10x 1.32x 1.41x 1.53x 1.61x
by FCF (post spectrum) -0.66x 0.28x 1.13x 1.21x 1.17x 1.25x
Source: Company data, Berenberg estimates

Vodafone Group plc
Telecommunications
48
Please note that the use of this research report is subject to the conditions and restrictions set forth in the “General invePlease note that the use of this research report is subject to the conditions and restrictions set forth in the “General invePlease note that the use of this research report is subject to the conditions and restrictions set forth in the “General invePlease note that the use of this research report is subject to the conditions and restrictions set forth in the “General investmentstmentstmentstment----related related related related disclosures” and the “Legal disclaimer” at the end of this document. disclosures” and the “Legal disclaimer” at the end of this document. disclosures” and the “Legal disclaimer” at the end of this document. disclosures” and the “Legal disclaimer” at the end of this document.
For analyst certification and remarks regardinFor analyst certification and remarks regardinFor analyst certification and remarks regardinFor analyst certification and remarks regarding foreign investors and countryg foreign investors and countryg foreign investors and countryg foreign investors and country----specific disclosures, please refer to the respective specific disclosures, please refer to the respective specific disclosures, please refer to the respective specific disclosures, please refer to the respective paragraph at the end of this document.paragraph at the end of this document.paragraph at the end of this document.paragraph at the end of this document.
Disclosures in respect of Article 20 of Regulation (EU) No. 596/2014 of the European Parliament and of the Disclosures in respect of Article 20 of Regulation (EU) No. 596/2014 of the European Parliament and of the Disclosures in respect of Article 20 of Regulation (EU) No. 596/2014 of the European Parliament and of the Disclosures in respect of Article 20 of Regulation (EU) No. 596/2014 of the European Parliament and of the
Council of 16 April 2014 Council of 16 April 2014 Council of 16 April 2014 Council of 16 April 2014 on market abuse (market abuse regulation on market abuse (market abuse regulation on market abuse (market abuse regulation on market abuse (market abuse regulation ---- MAR)MAR)MAR)MAR)
CompanyCompanyCompanyCompany DisclosuresDisclosuresDisclosuresDisclosures Vodafone Group plc no disclosures BT Group plc no disclosures Deutsche Telekom AG 5 KPN NV no disclosures Proximus plc no disclosures Swisscom AG no disclosures TDC A/S no disclosures Telefónica SA no disclosures Telefónica Deutschland Holding AG no disclosures Telenor ASA no disclosures Tele2 AB no disclosures Telia Company AB no disclosures Telecom Italia SpA no disclosures (1) Joh. Berenberg, Gossler & Co. KG (hereinafter referred to as “the Bank”) and/or its affiliate(s) was Lead Manager or Co-
Lead Manager over the previous 12 months of a public offering of this company. (2) The Bank acts as Designated Sponsor/Market Maker for this company. (3) Over the previous 12 months, the Bank and/or its affiliate(s) has effected an agreement with this company for investment
banking services or received compensation or a promise to pay from this company for investment banking services. (4) The Bank and/or its affiliate(s) holds 5% or more of the share capital of this company. (5) The Bank holds a long position in shares of this company. (6) The Bank holds a short position in shares of this company. Paul Marsch, or a connected person, has a conflict of interest in the form of a personal holding in Vodafone, BT Group, Deutsche Telekom, KPN, Telecom Italia. Production of the recommendation completed: 13.01.2017, 17:28 Historical price target and rating changes for Vodafone Group plc in the last 12 months Historical price target and rating changes for Vodafone Group plc in the last 12 months Historical price target and rating changes for Vodafone Group plc in the last 12 months Historical price target and rating changes for Vodafone Group plc in the last 12 months Date Date Date Date PricPricPricPrice target e target e target e target ---- GBPGBPGBPGBP RatingRatingRatingRating First dissemination GMTFirst dissemination GMTFirst dissemination GMTFirst dissemination GMT Initiation of coverageInitiation of coverageInitiation of coverageInitiation of coverage
25 January 10 Historical price target and rating changes for BT Group plc in the last 12 months Historical price target and rating changes for BT Group plc in the last 12 months Historical price target and rating changes for BT Group plc in the last 12 months Historical price target and rating changes for BT Group plc in the last 12 months Date Date Date Date Price target Price target Price target Price target ---- GBPGBPGBPGBP RatingRatingRatingRating First dissemination GMTFirst dissemination GMTFirst dissemination GMTFirst dissemination GMT Initiation of coverageInitiation of coverageInitiation of coverageInitiation of coverage
10 June 16 5.06 Buy 2016-06-13 07:13 25 January 10 Historical price target and rating changes for Deutsche Telekom AG in the last 12 months Historical price target and rating changes for Deutsche Telekom AG in the last 12 months Historical price target and rating changes for Deutsche Telekom AG in the last 12 months Historical price target and rating changes for Deutsche Telekom AG in the last 12 months Date Date Date Date Price target Price target Price target Price target ---- EUREUREUREUR RatingRatingRatingRating First dissemination GMTFirst dissemination GMTFirst dissemination GMTFirst dissemination GMT Initiation of coverageInitiation of coverageInitiation of coverageInitiation of coverage
08 September 16 17.40 Hold 2016-09-09 07:18 25 January 10 Historical price target and rating changes for KPN NV in the last 12 months Historical price target and rating changes for KPN NV in the last 12 months Historical price target and rating changes for KPN NV in the last 12 months Historical price target and rating changes for KPN NV in the last 12 months Date Date Date Date Price target Price target Price target Price target ---- EUREUREUREUR RatingRatingRatingRating First dissemination GMTFirst dissemination GMTFirst dissemination GMTFirst dissemination GMT Initiation of coverageInitiation of coverageInitiation of coverageInitiation of coverage
04 March 16 3.00 Hold 2016-03-04 17:37 25 January 10
15 April 16 3.90 Buy 2016-04-18 07:06
29 July 16 3.80 Buy 2016-08-01 07:00
03 October 16 3.60 Buy 2016-10-04 07:04
31 October 16 3.55 Buy 2016-11-01 07:03
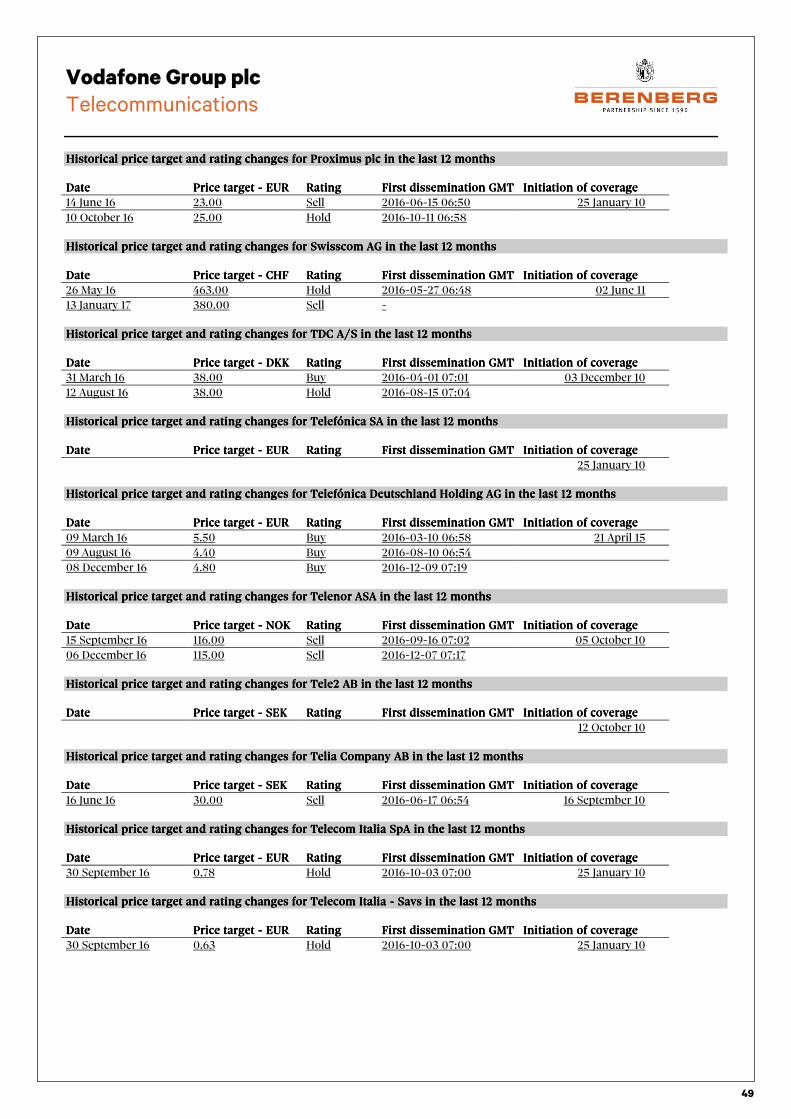
Vodafone Group plc
Telecommunications
49
Historical price target and rating changes for Proximus plc in the last 12 months Historical price target and rating changes for Proximus plc in the last 12 months Historical price target and rating changes for Proximus plc in the last 12 months Historical price target and rating changes for Proximus plc in the last 12 months Date Date Date Date Price targetPrice targetPrice targetPrice target ---- EUREUREUREUR RatingRatingRatingRating First dissemination GMTFirst dissemination GMTFirst dissemination GMTFirst dissemination GMT Initiation of coverageInitiation of coverageInitiation of coverageInitiation of coverage
14 June 16 23.00 Sell 2016-06-15 06:50 25 January 10
10 October 16 25.00 Hold 2016-10-11 06:58 Historical price target and rating changes for Swisscom AG in the last 12 months Historical price target and rating changes for Swisscom AG in the last 12 months Historical price target and rating changes for Swisscom AG in the last 12 months Historical price target and rating changes for Swisscom AG in the last 12 months Date Date Date Date Price Price Price Price target target target target ---- CHFCHFCHFCHF RatingRatingRatingRating First dissemination GMTFirst dissemination GMTFirst dissemination GMTFirst dissemination GMT Initiation of coverageInitiation of coverageInitiation of coverageInitiation of coverage
26 May 16 463.00 Hold 2016-05-27 06:48 02 June 11
13 January 17 380.00 Sell - Historical price target and rating changes for TDC A/S in the last 12 months Historical price target and rating changes for TDC A/S in the last 12 months Historical price target and rating changes for TDC A/S in the last 12 months Historical price target and rating changes for TDC A/S in the last 12 months Date Date Date Date Price target Price target Price target Price target ---- DKKDKKDKKDKK RatingRatingRatingRating First dissemination GMTFirst dissemination GMTFirst dissemination GMTFirst dissemination GMT Initiation of coverageInitiation of coverageInitiation of coverageInitiation of coverage
31 March 16 38.00 Buy 2016-04-01 07:01 03 December 10
12 August 16 38.00 Hold 2016-08-15 07:04 Historical price target and rating changes for Telefónica SA in the last 12 months Historical price target and rating changes for Telefónica SA in the last 12 months Historical price target and rating changes for Telefónica SA in the last 12 months Historical price target and rating changes for Telefónica SA in the last 12 months Date Date Date Date Price Price Price Price target target target target ---- EUREUREUREUR RatingRatingRatingRating First dissemination GMTFirst dissemination GMTFirst dissemination GMTFirst dissemination GMT Initiation of coverageInitiation of coverageInitiation of coverageInitiation of coverage
25 January 10 Historical price target and rating changes for Telefónica Deutschland Holding AG in the last 12 months Historical price target and rating changes for Telefónica Deutschland Holding AG in the last 12 months Historical price target and rating changes for Telefónica Deutschland Holding AG in the last 12 months Historical price target and rating changes for Telefónica Deutschland Holding AG in the last 12 months Date Date Date Date Price target Price target Price target Price target ---- EUREUREUREUR RatingRatingRatingRating First dissemination GMTFirst dissemination GMTFirst dissemination GMTFirst dissemination GMT Initiation of coverageInitiation of coverageInitiation of coverageInitiation of coverage
09 March 16 5.50 Buy 2016-03-10 06:58 21 April 15
09 August 16 4.40 Buy 2016-08-10 06:54
08 December 16 4.80 Buy 2016-12-09 07:19 Historical price target and rating changes for Telenor ASA in the last 12 months Historical price target and rating changes for Telenor ASA in the last 12 months Historical price target and rating changes for Telenor ASA in the last 12 months Historical price target and rating changes for Telenor ASA in the last 12 months Date Date Date Date Price Price Price Price target target target target ---- NOKNOKNOKNOK RatingRatingRatingRating First dissemination GMTFirst dissemination GMTFirst dissemination GMTFirst dissemination GMT Initiation of coverageInitiation of coverageInitiation of coverageInitiation of coverage
15 September 16 116.00 Sell 2016-09-16 07:02 05 October 10
06 December 16 115.00 Sell 2016-12-07 07:17 Historical price target and rating changes for Tele2 AB in the last 12 months Historical price target and rating changes for Tele2 AB in the last 12 months Historical price target and rating changes for Tele2 AB in the last 12 months Historical price target and rating changes for Tele2 AB in the last 12 months Date Date Date Date Price target Price target Price target Price target ---- SEKSEKSEKSEK RatingRatingRatingRating First dissemination GMTFirst dissemination GMTFirst dissemination GMTFirst dissemination GMT Initiation of coverageInitiation of coverageInitiation of coverageInitiation of coverage
12 October 10 Historical price target and rating changes for Telia Company AB in the last 12 months Historical price target and rating changes for Telia Company AB in the last 12 months Historical price target and rating changes for Telia Company AB in the last 12 months Historical price target and rating changes for Telia Company AB in the last 12 months Date Date Date Date Price target Price target Price target Price target ---- SEKSEKSEKSEK RatingRatingRatingRating First dissemination GMTFirst dissemination GMTFirst dissemination GMTFirst dissemination GMT Initiation Initiation Initiation Initiation of coverageof coverageof coverageof coverage
16 June 16 30.00 Sell 2016-06-17 06:54 16 September 10 Historical price target and rating changes for Telecom Italia SpA in the last 12 months Historical price target and rating changes for Telecom Italia SpA in the last 12 months Historical price target and rating changes for Telecom Italia SpA in the last 12 months Historical price target and rating changes for Telecom Italia SpA in the last 12 months Date Date Date Date Price target Price target Price target Price target ---- EUREUREUREUR RatingRatingRatingRating First dissemination GMTFirst dissemination GMTFirst dissemination GMTFirst dissemination GMT Initiation of coverageInitiation of coverageInitiation of coverageInitiation of coverage
30 September 16 0.78 Hold 2016-10-03 07:00 25 January 10 Historical price target and rating changes for Telecom Italia Historical price target and rating changes for Telecom Italia Historical price target and rating changes for Telecom Italia Historical price target and rating changes for Telecom Italia ---- Savs in the last 12 months Savs in the last 12 months Savs in the last 12 months Savs in the last 12 months Date Date Date Date Price target Price target Price target Price target ---- EUREUREUREUR RatingRatingRatingRating First dissemination GMTFirst dissemination GMTFirst dissemination GMTFirst dissemination GMT Initiation of coverageInitiation of coverageInitiation of coverageInitiation of coverage
30 September 16 0.63 Hold 2016-10-03 07:00 25 January 10

Vodafone Group plc
Telecommunications
50
Click here for a list of all recommendations on any financial instrument or issuer that were disseminated during the preceding 12-month period. Berenberg Equity Research ratings distribution and in proportion to investment banking services on a quarterly basis, as Berenberg Equity Research ratings distribution and in proportion to investment banking services on a quarterly basis, as Berenberg Equity Research ratings distribution and in proportion to investment banking services on a quarterly basis, as Berenberg Equity Research ratings distribution and in proportion to investment banking services on a quarterly basis, as oooof 1 January 2017f 1 January 2017f 1 January 2017f 1 January 2017 Buy 48.09 % 87.50 % Sell 13.38 % 0.00 % Hold 38.54 % 12.50 % Valuation basis/rating keyValuation basis/rating keyValuation basis/rating keyValuation basis/rating key The recommendations for companies analysed by Berenberg’s Equity Research department are made on an absolute basis for which the following three-step rating key is applicable:
Buy:Buy:Buy:Buy: Sustainable upside potential of more than 15% to the current share price within 12 months;
Sell:Sell:Sell:Sell: Sustainable downside potential of more than 15% to the current share price within 12 months;
Hold:Hold:Hold:Hold: Upside/downside potential regarding the current share price limited; no immediate catalyst visible.
NB: During periods of high market, sector, or stock volatility, or in special situations, the recommendation system criteria may be breached temporarily.
Competent Competent Competent Competent supervisory authoritysupervisory authoritysupervisory authoritysupervisory authority
Bundesanstalt für Finanzdienstleistungsaufsicht -BaFin- (Federal Financial Supervisory Authority),
Graurheindorfer Straße 108, 53117 Bonn and Marie-Curie-Str. 24-28, 60439 Frankfurt am Main, Germany.
General investmentGeneral investmentGeneral investmentGeneral investment----related disclosrelated disclosrelated disclosrelated disclosuresuresuresures Joh. Berenberg, Gossler & Co. KG (hereinafter referred to as “the Bank”) has made every effort to carefully research all information contained in this financial analysis. The information on which the financial analysis is based has been obtained from sources which we believe to be reliable such as, for example, Thomson Reuters, Bloomberg and the relevant specialised press as well as the company which is the subject of this financial analysis.
Only that part of the research note is made available to the issuer (who is the subject of this analysis) which is necessary to properly reconcile with the facts. Should this result in considerable changes a reference is made in the research note.
Opinions expressed in this financial analysis are our current opinions as of the issuing date indicated on this document. The companies covered by Berenberg are continuously followed by the analyst. Based on developments with the relevant company, the sector or the market which may have a material impact on the research views, research reports will be updated as it deems appropriate.
The functional job title of the person/s responsible for the recommendations contained in this report is “Equity Research Analyst” unless otherwise stated on the cover.
The following internet lThe following internet lThe following internet lThe following internet link provides further remarks on our financial analyses:ink provides further remarks on our financial analyses:ink provides further remarks on our financial analyses:ink provides further remarks on our financial analyses: http://www.berenberg.de/research.html?&L=1&no_cache=1http://www.berenberg.de/research.html?&L=1&no_cache=1http://www.berenberg.de/research.html?&L=1&no_cache=1http://www.berenberg.de/research.html?&L=1&no_cache=1
Legal disclaimerLegal disclaimerLegal disclaimerLegal disclaimer This document has been prepared by Joh. Berenberg, Gossler & Co. KG (hereinafter referred to as “the Bank”). This document does not claim completeness regarding all the information on the stocks, stock markets or developments referred to in it.
On no account should the document be regarded as a substitute for the recipient procuring information for himself/herself or exercising his/her own judgements.
The document has been produced for information purposes for institutional clients or market professionals.
Private customers, into whose possession this document comes, should discuss possible investment decisions with their customer service officer as differing views and opinions may exist with regard to the stocks referred to in this document.
This document is not a solicitation or an offer to buy or sell the mentioned stock.
The document may include certain descriptions, statements, estimates, and conclusions underlining potential market and company development. These reflect assumptions, which may turn out to be incorrect. The Bank and/or its employees accept no liability whatsoever for any direct or consequential loss or damages of any kind arising out of the use of this document or any part of its content.
The Bank and/or its employees may hold, buy or sell positions in any securities mentioned in this document, derivatives thereon or related financial products. The Bank and/or its employees may underwrite issues for any securities mentioned in this document, derivatives thereon or related financial products or seek to perform capital market or underwriting services.

Vodafone Group plc
Telecommunications
51
Analyst certificationAnalyst certificationAnalyst certificationAnalyst certification I, Paul Marsch, hereby certify that all of the views expressed in this report accurately reflect my personal views about any and all of the subject securities or issuers discussed herein.
In addition, I hereby certify that no part of my compensation was, is, or will be, directly or indirectly related to the specific recommendations or views expressed in this research report, nor is it tied to any specific investment banking transaction performed by the Bank or its affiliates.
I, Laura Janssens, hereby certify that all of the views expressed in this report accurately reflect my personal views about any and all of the subject securities or issuers discussed herein.
In addition, I hereby certify that no part of my compensation was, is, or will be, directly or indirectly related to the specific recommendations or views expressed in this research report, nor is it tied to any specific investment banking transaction performed by the Bank or its affiliates.
Remarks regarding foreign investorRemarks regarding foreign investorRemarks regarding foreign investorRemarks regarding foreign investorssss The preparation of this document is subject to regulation by German law. The distribution of this document in other jurisdictions may be restricted by law, and persons into whose possession this document comes should inform themselves about, and observe, any such restrictions.
United KingdomUnited KingdomUnited KingdomUnited Kingdom This document is meant exclusively for institutional investors and market professionals, but not for private customers. It is not for distribution to or the use of private investors or private customers.
United StatesUnited StatesUnited StatesUnited States of Americaof Americaof Americaof America This document has been prepared exclusively by the Bank. Although Berenberg Capital Markets LLC, an affiliate of the Bank and registered US broker-dealer, distributes this document to certain customers, Berenberg Capital Markets LLC does not provide input into its contents, nor does this document constitute research of Berenberg Capital Markets LLC. In addition, this document is meant exclusively for institutional investors and market professionals, but not for private customers. It is not for distribution to or the use of private investors or private customers.
This document is classified as objective for the purposes of FINRA rules. Please contact Berenberg Capital Markets LLC (+1 617 292 8200) if you require additional information.
ThirdThirdThirdThird----party research disclosures party research disclosures party research disclosures party research disclosures CompanyCompanyCompanyCompany DisclosuresDisclosuresDisclosuresDisclosures Vodafone Group plc no disclosures BT Group plc no disclosures Deutsche Telekom AG no disclosures KPN NV no disclosures Proximus plc no disclosures Swisscom AG no disclosures TDC A/S no disclosures Telefónica SA no disclosures Telefónica Deutschland Holding AG no disclosures Telenor ASA no disclosures Tele2 AB no disclosures Telia Company AB no disclosures Telecom Italia SpA no disclosures (1) Berenberg Capital Markets LLC owned 1% or more of the outstanding shares of any class of the subject company by the end
of the prior month.* (2) Over the previous 12 months, Berenberg Capital Markets LLC has managed or co-managed any public offering for the subject
company.* (3) Berenberg Capital Markets LLC is making a market in the subject securities at the time of the report. (4) Berenberg Capital Markets LLC received compensation for investment banking services in the past 12 months, or expects to
receive such compensation in the next 3 months.* (5) There is another potential conflict of interest of the analyst or Berenberg Capital Markets LLC, of which the analyst knows
or has reason to know at the time of publication of this research report.
* For disclosures regarding affiliates of Berenberg Capital Markets LLC please refer to the ‘Disclosures in respect of section 34b of the German Securities Trading Act (Wertpapierhandelsgesetz – WpHG)’ section above.

Vodafone Group plc
Telecommunications
52
CopyrightCopyrightCopyrightCopyright The Bank reserves all the rights in this document. No part of the document or its content may be rewritten, copied, photocopied or duplicated in any form by any means or redistributed without the Bank’s prior written consent.
© July 2016 Joh. Berenberg, Gossler & Co. KG

Contacts
53
Internet www.berenberg.com E-mail: [email protected]
AEROSPACE & DEFENCE CHEMICALS GENERAL MID CAP - UK (cont'd) REAL ESTATE
Ryan Booker +44 20 3753 3074 Sebastian Bray +44 20 3753 3011 Edward James +44 20 3207 7811 Kai Klose +44 20 3207 7888
Andrew Gollan +44 20 3207 7891 Rikin Patel +44 20 3753 3080 Benjamin May +44 20 3465 2667 Tina Munda +44 20 3465 2716
Charlotte Keyworth +44 20 3753 3013 Andrew Heap +44 20 3207 7918 Owen Shirley +44 20 3465 2731
Ross Law +44 20 3465 2692 TECHNOLOGY
CONSTRUCTION GENERAL RETAIL Jean Beaubois +44 20 3207 7835
AUTOMOTIVES Saravana Bala +44 20 3753 3043 Conrad Bartos +44 20 3753 3053 Josep Bori +44 20 3753 3058
Cristian Dirpes +44 20 3465 2721 Lush Mahendrarajah +44 20 3207 7896 Camilla Mazzolini +44 20 3753 3042 Georgios Kertsos +44 20 3465 2715
Alexander Haissl +44 20 3465 2749 Robert Muir +44 20 3207 7860 Michelle Wilson +44 20 3465 2663 Gal Munda +44 20 3465 2746
Paul Kratz +44 20 3465 2678 Olivia Peters +44 20 3465 2646 Richard Odumosu +44 20 3207 7851
Fei Teng +44 20 3753 3049 HEALTHCARE Tammy Qiu +44 20 3465 2673
ENERGY Scott Bardo +44 20 3207 7869
BANKS Yuriy Kukhtanych (EM) +44 20 3465 2675 Jakob Berry +44 20 3465 2724 TELECOMMUNICATIONS
Adam Barrass +44 20 3207 7923 Alistair Campbell +44 20 3207 7876 Ondrej Cabejsek (EM) +44 20 3753 3071
James Chappell +44 20 3207 7844 FOOD MANUFACTURING AND H&PC Klara Fernandes +44 20 3465 2718 Nicolas Didio +44 20 3753 3091
Andrew Lowe +44 20 3465 2743 Rosie Edwards +44 20 3207 7880 Tom Jones +44 20 3207 7877 Usman Ghazi +44 20 3207 7824
Andreas Markou (EM) +44 20 3753 3022 Yordana Mavrodieva +44 20 3207 7817 Joseph Lockey +44 20 3465 2730 Siyi He +44 20 3465 2697
Alex Medhurst +44 20 3753 3047 Philip Patricha +44 20 3753 3039 Laura Sutcliffe +44 20 3465 2669 Laura Janssens +44 20 3465 2639
Eoin Mullany +44 20 3207 7854 Fintan Ryan +44 20 3465 2748 Paul Marsch +44 20 3207 7857
Peter Richardson +44 20 3465 2681 James Targett +44 20 3207 7873 INSURANCE Michael Summerville +44 20 3207 7914
Jonathan Sharpe +44 20 3753 3031 Charles Bendit +44 20 3465 2729
FOOD RETAIL Trevor Moss +44 20 3207 7893 THEMATIC RESEARCH
BEVERAGES Batuhan Karabekir (EM) +44 20 3465 2631 Emanuele Musio +44 20 3207 7916 Nick Anderson +44 20 3207 7838
Javier Gonzalez Lastra +44 20 3465 2719 Iain Pearce +44 20 3465 2665 Asad Farid +44 20 3207 7932
Batuhan Karabekir (EM) +44 20 3465 2631 GENERAL MID CAP - DACH Sami Taipalus +44 20 3207 7866 Robert Lamb +44 20 3465 2623
Matt Reid +44 20 3753 3075 Gunnar Cohrs +44 20 3207 7894 James Sherborne +44 20 3753 3073
Martin Comtesse +44 20 3207 7878 LUXURY GOODS
BUSINESS SERVICES, LEISURE & TRANSPORT Charlotte Friedrichs +44 20 3753 3077 Mariana Horn +44 20 3753 3044 TOBACCO
Roberta Ciaccia +44 20 3207 7805 Gerhard Orgonas +44 20 3465 2635 Zuzanna Pusz +44 20 3207 7812 Jonathan Leinster +44 20 3465 2645
Najet El Kassir +44 20 3207 7836 Benjamin Pfannes-Varrow +44 20 3465 2620
Stuart Gordon +44 20 3207 7858 Julia Scheufler +44 20 3753 3016 MEDIA UTILITIES
Josh Puddle +44 20 3207 7881 Robert Berg +44 20 3465 2680 Oliver Brown +44 20 3207 7922
Kate Somerville +44 20 3753 3081 GENERAL MID CAP - EU core Laura Janssens +44 20 3465 2639 Andrew Fisher +44 20 3207 7937
Julia Winarso +44 20 3465 2627 Flavien Hias +44 20 3465 2693 Alastair Reid +44 20 3207 7841 Neha Saxena +44 20 3753 3048
Aymeric Lang +44 20 3753 3037 Sarah Simon +44 20 3207 7830 Lawson Steele +44 20 3207 7887
CAPITAL GOODS Anna Patrice +44 20 3207 7863
Nicholas Housden +44 20 3753 3050 Simona Sarli +44 20 3207 7834 METALS & MINING
Sebastian Kuenne +44 20 3207 7856 Alessandro Abate +44 20 3753 3029 ECONOMICSPhilippe Lorrain +44 20 3207 7823 GENERAL MID CAP - UK Fawzi Hanano +44 20 3207 7910 Florian Hense +44 20 3207 7859
Rizk Maidi +44 20 3207 7806 Robert Chantry +44 20 3207 7861 Yuriy Vlasov +44 20 3465 2674 Carsten Hesse (EM) +44 20 3753 3001
Horace Tam +44 20 3465 2726 Sam England +44 20 3465 2687 Kallum Pickering +44 20 3465 2672
Simon Toennessen +44 20 3207 7819 Ned Hammond +44 20 3753 3017 Holger Schmieding +44 20 3207 7889
SPECIALIST SALES UK SWITZERLAND, AUSTRIA & ITALY LONDON
AEROSPACE & DEFENCE, CAPITAL GOODS Alexandra Clément +44 20 3753 3018 Andrea Ferrari +41 44 283 2020 Assia Adanouj +44 20 3753 3087
Bruna Zugliani +44 20 3207 7818 Fabian De Smet +44 20 3207 7810 Carsten Kinder +41 44 283 2024 Mike Berry +44 20 3465 2755
AUTOMOTIVE & THEMATICS Karl Hancock +44 20 3207 7803 Gianni Lavigna +41 44 283 2038 Stewart Cook +44 20 3465 2752
Chris Armstrong +44 20 3207 7809 Sean Heath +44 20 3465 2742 Jamie Nettleton +41 44 283 2026 Mark Edwards +44 20 3753 3004
BANKS, DIVERSIFIED FINANCIALS & INSURANCE David Hogg +44 20 3465 2628 Benjamin Stillfried +41 44 283 2033 Tristan Hedley +44 20 3753 3006
Iro Papadopoulou +44 20 3207 7924 Gursumeet Jhaj +44 20 3753 3041 Peter King +44 20 3753 3139
Calum Marris +44 20 3753 3040 Peter Kaineder +44 20 3753 3062 CRM Christoph Kleinsasser +44 20 3753 3063
BUSINESS SERVICES, LEISURE & TRANSPORT James Matthews +44 20 3207 7807 Laura Cooper +44 20 3753 3065 Chris McKeand +44 20 3207 7938
Rebecca Langley +44 20 3207 7930 James McRae +44 20 3753 3036 Louise Hughes +44 20 3753 3066 Simon Messman +44 20 3465 2754
CONSTRUCTION,CHEMICALS, METALS & MINING David Mortlock +44 20 3207 7850 Jessica Jarmyn +44 20 3465 2696 AJ Pulleyn +44 20 3465 2756
James Williamson +44 20 3207 7842 Eleni Papoula +44 20 3465 2741 Edwina Lucas +44 20 3207 7908 Matthew Regan +44 20 3465 2750
CONSUMER STAPLES Bhavin Patel +44 20 3207 7926 Greg Swallow +44 20 3207 7833 Asbjoern Rogge +44 20 3753 3051
Rupert Trotter +44 20 3207 7815 Kushal Patel +44 20 3753 3038 Michael Schumacher +44 20 3753 3006
CONSUMER DISCRETIONARY Richard Payman +44 20 3207 7825 CORPORATE ACCESS Paul Somers +44 20 3465 2753
Victoria Maigrot +44 20 3753 3010 Clémence Peyraud +44 20 3465 2651 Lindsay Arnold +44 20 3207 7821
HEALTHCARE Christopher Pyle +44 20 3753 3076 Jennie Jiricny +44 20 3207 7886 EQUITY TRADINGAbigail James +44 20 3753 3078 Joanna Sanders +44 20 3207 7925 Stella Siggins +44 20 3465 2630
MEDIA & TELECOMMUNICATIONS Mark Sheridan +44 20 3207 7802 HAMBURG
Julia Thannheiser +44 20 3465 2676 George Smibert +44 20 3207 7911 EVENTS David Hohn +49 40 350 60 761
SPECIAL SITUATIONS Alexander Wace +44 20 3465 2670 Laura Hawes +44 20 3753 3008 Gregor Labahn +49 40 350 60 571
Jeremy Grant +44 20 3207 7890 Paul Walker +44 20 3465 2632 Suzy Khan +44 20 3207 7915 Lennart Pleus +49 40 350 60 596
Charlotte Kilby +44 20 3207 7832 Marvin Schweden +49 40 350 60 576
FRANCE Natalie Meech +44 20 3207 7831 Linus Weidner +49 40 350 60 798
SALES Thibault Bourgeat +33 1 5844 9505 Ellen Parker +44 20 3465 2684 Philipp Wiechmann +49 40 350 60 346
BENELUX Alexandre Chevassus +33 1 5844 9512 Sarah Weyman +44 20 3207 7801 Christoffer Winter +49 40 350 60 559
Miel Bakker +44 20 3207 7808 Dalila Farigoule +33 1 5844 9510
Martin de Laet +44 20 3207 7804 Benjamin Voisin +33 1 5844 9507 LONDON
SALES TRADING Edward Burlison-Rush +44 20 3753 3055
GERMANY SCANDINAVIA HAMBURG Richard Kenny +44 20 3753 3083
Michael Brauburger +49 69 91 30 90 741 Frederik Angel +44 20 3753 3055 Tim Storm +49 40 350 60 415
Nina Buechs +49 69 91 30 90 735 Marco Weiss +49 40 350 60 719 ELECTRONIC TRADINGAndré Grosskurth +49 69 91 30 90 734 PARIS
Florian Peter +49 69 91 30 90 740 Vincent Klein +33 1 58 44 95 09 Daniel Eichhorn +49 40 350 60 391
Joerg Wenzel +49 69 91 30 90 743 Antonio Scuotto +33 1 58 44 95 03 Matthias Führer +49 40 350 60 597
Member FINRA & SIPC E-mail: [email protected]
SALES (cont'd) CRM
SALES Michael Lesser +1 646 445 5575 Monika Kwok +1 646 445 4863 Christopher Kanian +1 646 445 5576
Enrico DeMatt +1 646 445 4845 Jessica London +1 646 445 7218 Lars Schwartau +1 646 445 5571
Kelleigh Faldi +1 617 292 8288 Ryan McDonnell +1 646 445 7214 CORPORATE ACCESS Brett Smith +1 646 445 4873
Isabella Fantini +1 646 445 4861 Emily Mouret +1 415 802 2525 Olivia Lee +1 646 445 7212 Bob Spillane +1 646 445 5574
Alexander Frankiewicz +1 646 445 4870 Peter Nichols +1 646 445 7204 Tiffany Smith +1 646 445 4874
Shawna Giust +1 646 445 7216 Kieran O'Sullivan +1 617 292 8292
Rich Harb +1 617 292 8228 Rodrigo Ortigao +1 646 445 7202 Mickey Levy +1 646 445 4842
Zubin Hubner +1 646 445 5572 Matt Waddell +1 646 445 5562 Roiana Reid +1 646 445 4865
ECONOMICS
BERENBERG CAPITAL MARKETS LLC
JOH. BERENBERG, GOSSLER & CO. KG
EQUITY SALES
EQUITY RESEARCH
EQUITY SALES SALES TRADING