Distinguishing DD from SLI. Language profiles of Italian ...
Upload
newcastle-auCategory
view
0download
0
Flow Measurement and Instrumentation 22 (2011) 500–506
Contents lists available at SciVerse ScienceDirect
Flow Measurement and Instrumentation
journal homepage: www.elsevier.com/locate/flowmeasinst
Distinguishing condition curve for radial gatesM. Bijankhan ∗, S. Kouchakzadeh, Esmaeel BayatUniversity of Tehran, Iran
a r t i c l e i n f o
Article history:Received 29 January 2011Received in revised form12 July 2011Accepted 1 August 2011
Keywords:Free flowSubmerged flowRadial gatesDistinguishing condition
a b s t r a c t
Identifying the free or submerged flow condition and the threshold between the two regimes is vitalfor accurate flow measurement through a gate. In this paper, analytical findings about distinguishingcondition curve of radial gates are presented. The generality of the available calibration methods ofthe radial gates has been analyzed. Then, based on the assumption of starting the transition zone rightat the interception point of the free and submerged flow relationships, a comprehensive equation isdeveloped to distinguish the flow condition through a radial gate. Using ample high quality availableexperimental data, the accuracy of the proposed distinguishing curve was verified. The results indicatedthat the proposed distinguishing curve accurately identified observed flow condition data. Finally, bydefining a suitable sensitivity index, the effects of downstream channel width, energy loss through thegate, Reynolds number, and contraction coefficient on the distinguishing condition curve have beenevaluated. Also, the results promise the application of the proposed method for situations where onlyone of some parallel radial gates is operating under the submerged flow condition.
© 2011 Elsevier Ltd. All rights reserved.
1. Introduction
Gates are widely used in irrigation networks and estimatingthe discharge through gates under free and submerged flow isconsidered as a classical problem in hydraulic engineering andof practical importance. The discharge through a gate is affectedby an upstream depth for the free flow condition while boththe upstream and downstream depths influence the submergedflow condition. Many methods exist for discharge measurementthrough a gate under free or submerged regimes; all of whichrequire identifying the flow regime prior to application.
Flowmeasurement is subject to highuncertaintywhen submer-gence takes place in practice. Identifying the free or submergedflow condition and the threshold between the two flow regimesis vitally important for accurate discharge measurement througha gate. In this regard, the distinguishing condition curve has beenfound as a very useful tool for identifying the flow condition. Freeflow condition through a gate occurs provided that a hydraulicjump takes place at a far distance from the gate. By increasing thetailwater depth, the hydraulic jump moves toward the gate untilthe upstream flow condition is affected. Beyond such condition,further increase in the tailwater depth causes flow submergence.The maximum value of the tailwater depth that permits free flowversus the corresponding value of the upstream depth representsthe distinguishing condition curve. Lin et al. [1] investigated the
∗ Corresponding author. Fax: +98 31587 77871.E-mail address: [email protected] (M. Bijankhan).
0955-5986/$ – see front matter© 2011 Elsevier Ltd. All rights reserved.doi:10.1016/j.flowmeasinst.2011.08.002
effect of contraction coefficient, δ, on the distinguishing conditioncurve by developing the following formula based on the hydraulicjump concept:
y3(t)w
=δ
2
1 +
16y21
y1δw + δ2w2− 1
(1)
in which y3(t) = transitional value of tailwater depth, w = gateopening, δ = contraction coefficient, and, y1 = upstreamflow depth. They concluded that a gate with a higher contractioncoefficient would be less susceptible to submergence. However, itseems that such relationship was previously developed by Bos [2]based on the hydraulic jump definition. Rajaratnam and Subra-manya [3] and Swamee [4] derived the distinguishing condition ofa sluice gate for constant contraction coefficients of 0.61 and 0.6,respectively.
In spite of vast investigations and ample published data onvertical sluice gates [3–10, e.g.], only a few studies for radial ortainter gates have been reported so far. Buyalski [11] performedan extensive experimental study on both free and submergedflow through a radial gate. Although the classical calibration ofradial gates available in relevant text [2] shows a relatively goodagreement with field data for the free flow condition, Clemmenset al. [12] reported an error up to 50% in the calibration of radialgates under the submerged flow condition. They proposed theenergy–momentum method (E–M) for calibrating both the freeand submerged flow conditions. Clemmens et al. [12] consideredthe effect of downstream channel width and also the energy lossesof upstream side of the gate. The E–M method also allows the

M. Bijankhan et al. / Flow Measurement and Instrumentation 22 (2011) 500–506 501
Notations
δ Contraction coefficientρ Water densityΠ Dimensionless groupθ Gate leaf angelυ Kinetic viscosityα Numerical constant1 + ξ Combined coefficientB b3/bb Gate widthb3 The downstream channel widthE(t) Transitional value of non-dimension energy correc-
tor factorE Ecorr/wFw Component of the force of water on all surfaces be-
tween downstream gate side and tailwater sectionin the direction of flow
g Acceleration due to gravityH1(F) Energy head at upstream side of the gate in the free
flow conditionp Weighing factorq∗(q2/gw3) The non-dimensional discharge per unit width
of the gateQ Discharge through the gateR Thehydraulic radius just upstream the gate, by1/(b+
2y1)Re Reynolds number, QR/(bwυ)Se Sensitivity indexSr Submergence ratiove Effective velocity in the jet (v2
e /2g = v2j /2g − Ecorr )
vj Jet flow velocityw Gate openingX Parametery1 Upstream depthY1 y1/wY2(t) Transitional value of the flow depth just after the
gatey2 Flow depth just after the gateY2 y2/wY3(t) Transitional value of the tailwater depthy3 Tailwater depthY3 y3/wyj Jet thicknessYw(t) Transitional value of the weighing depthyw A weighing depth of y2 and y3Yw yw/wΓ Area below the distinguishing condition curve
Subscripts
F Stands for the free flow conditions Stands for the submerged flow conditionsh, h, and m Are associatedwith sharp edge, hard rubber bar,
and music note seals, respectively
calibration through the transition from free to submerged flowconditions. Later,Wahl and Clemmens [13] proposed twomethodsfor obtaining the energy correction factor and concluded that arelationship having the form of Clemmens et al.’s [12] equationwould have a better fit to experimental data.
Nevertheless, it seems that some uncertainties about the en-ergy correction factor, Ecorr , still remained unsolved and additionalexperimental data is required for developing a reliable relation-ship for Ecorr . Shahrokhnia and Javan [14] proposed dimensionless
relationships for both the free and submerged flow conditions forradial gates which provide simple yet accurate discharge estima-tion. The advantage of their method was eliminating the necessityof a trial-and-error procedure required in the E–M method com-putations.
There are a few studies available on thedistinguishing conditioncurve of the radial gates. Bos [2] developed a relationship based onthe hydraulic jump concept to distinguish the flow condition of aradial gate. Considering negligible velocity head at upstream sideof the gate, the distinguishing condition curve proposed by Bos [2]takes the following form:
y3(t)w
=δ
2
1 + 16
y1δw
− 1
− 1
. (2)
Also Whal [15] used the momentum equation to predict the flowcondition. In this regard, themomentum force of free flow throughthe gate was compared with the momentum force associatedwith the measured downstream flow depth. If the momentumforce due to the downstream flow depth becomes greater thanthat of the upstream flow depth, the submerged flow conditionwill present. Otherwise, the free flow condition will prevail. It isworth mentioning that such analysis was previously employedby Buyalski [11]. However, neither Whal [15] nor Buyalski [11]proposed a relationship showing the maximum tailwater depthwhich permits free flow i.e. the distinguishing condition curve ofradial gates.
In this study by investigating the continuity (i.e. flowmeasuringcontinuously from free to submerged regimes and through thetransition zone) of the available radial gate calibrationmethods themore appropriate one was identified. Then a general equation wasdeveloped by using the E–M theory to obtain the distinguishingcondition curve for flow conditions of radial gates. By defininga suitable sensitivity index, the effects of downstream channelwidth, energy loss through the gate, Reynolds number, and gateseal angel on the distinguishing condition curve were evaluatedand reported. Using Buyalski’s [11] experimental data, the accuracyof the proposed distinguishing curve was evaluated. Also theresults promise the application of the proposed method forsituations where only one of some installed parallel radial gatesis operating under the submerged flow condition.
2. Governing equations
A brief description of the proposed methods for calibratingsubmerged radial gates is presented herein to justify the selectionof the more suitable one for determining the distinguishingcondition curve of radial gates.
2.1. E–M method
Free flowThe E–M method was originally proposed by Clemmens
et al. [12] to calibrate a radial gate for both the free and submergedflow conditions. For the free flow condition applying the energyequation between upstream and downstream sides of the gate (seeFig. 1) can be used alone to find the discharge through the gate.
H1(F) = δw + (1 + ξ)v2j(F)
2g(3)
where H1(F) = energy head at upstream side of the gate in thefree flow condition, 1 + ξ = combined coefficient which includesthe effect of velocity distribution and energy loss coefficients, vj =
jet flow velocity, g = acceleration due to gravity and the subscriptF corresponds to the free flow condition.

502 M. Bijankhan et al. / Flow Measurement and Instrumentation 22 (2011) 500–506
Fig. 1. Definition sketch for radial gate.
Considering b = gate width, Q = discharge through the gate,vj(F) = QF/(byj) jet flow velocity, yj = jet thickness (δw), andq∗ = q2/gw3 as the non-dimensional discharge per unit width ofthe gate, Eq. (3) could be normalized as follows:
q∗F = 2Y 21 δ2(Y1 − δ)
(1 + ξ)Y 21 − δ2
(4)
in which q∗F = normalized free flow discharge per unit width andY1 = y1/w.
For calculating the free flowing discharge for a given Y1, bothcontraction and combined coefficients are unknown. Based onthe Buyalski’s [11] experimental data conducted for three gateseal types, i.e. sharp edge, hard rubber bar, and music note seal,Whal [15] proposed the following empirical relationships to com-pute the contraction coefficient:
δSh = 1.001 − 0.2349θ − 0.1843θ2+ 0.1133θ3 (5)
δh = 0.0138 + 1.0209δSh (6)δm = 0.1292 + 0.7884δSh (7)
where θ = gate leaf angel (= cos−1(a − w/r)), r = radialgate radius, a = gate trunnion-pin height (shown in Fig. 1) andsubscripts sh, h, and m are associated with sharp edge, hard rub-ber bar, and music note seals, respectively.
The combined coefficient can also be calculated using thefollowing regression based formula developed by Clemmenset al. [12]:
1 + ξ = 1 + 0.15e−5×10⁻⁶Re (8)
where Re = QR/(bwυ) in which R is the hydraulic radiusjust upstream of the gate, R = by1/(b + 2y1), and υ =
kinematic viscosity of water (which was considered = 1.14 ×
10−6).Submerged flow
In the submerged condition applying the energy equation be-tween upstream and downstream sides of the gate and incorporat-ing the adjustment factor, Ecorr , as proposed by Clemmens et al. [12]yield:
H1(s) = y2(s) + (1 + ξ)v2j(s)
2g− Ecorr (9)
in which subscript s stands for the submerged flow condition. vj(s)is set to Qs/byj(s), with yj(s) remaining at the free-flow value, δw, asassumed by Clemmens et al. [12] and y2 is the flow depth just afterthe gate.
Considering Y2 = y2/w, E = Ecorr/w the normalized sub-merged flow discharge per unit width takes the following form:
q∗S = 2Y 21 δ2(Y1 − Y2 + E)
(1 + ξ)Y 21 − δ2
. (10)
Clemmens et al. [12] considered the values of δ and ξ in the sub-merged flow condition as that of free flow. They also proposed thefollowing relationship for evaluating the energy correction factor:
E = (Y2 − δ)
×
0.52 − 0.34 arctan
7.89
[Y2 − δ
δ− 0.83
]. (11)
Whal [15] also proposed the energy correction factor as an expo-nential function by considering the effect of upstream head as fol-lows:
E = (Y2 − δ)e−6.78[(y2−yj)/H1]. (12)
However, Whal and Clemmens [13] believe that a relationship inthe form of Eq. (11) which is used in the current study wouldpresent a better fit to the experimental data.
Due to drastic fluctuations of the downstream gate flow depthoccurred by a submerged hydraulic jump, it would be very difficultto measure the value of Y2 in the field accurately. Therefore, it isconsidered unknown and to calculate q∗S an additional equationis required. Consequently, the conservation of momentum shouldthen be applied fromvena contracta to tailwater section as follows:
QSve + bgy222
+Fw
ρ= QSv3 + b3g
y232
(13)
where ve = effective velocity in the jet (v2e /2g = v2
j /2g − Ecorr ),Fw = component of the force of water on all surfaces betweendownstream gate side and tailwater section in the direction offlow, ρ = water density, b3 = the downstream channel width,Fw = b3γ y2w/2 in which yw is a weighing depth of y2 and y3 with aweighing factor of p as follows [12]:
yw = py3 + (1 − p)y2. (14)
Based on the experimental investigations of Clemmens et al. [12]p = 0.643. Considering Yw = yw/w, Y3 = y3/w, B = b3/b,E = Ecorr/w, the normalized momentum equation and weighingdepth take the following forms:
q∗S
q∗S
δ2− 2E
=
0.5(BY 2
3 − Y 22 ) − 0.5
(B − 1)Y 2
w
+ q∗SB−1Y−1
3
2(15)
Yw = pY3 + (1 − p)Y2. (16)
It should bementioned that for determining the discharge of a sub-merged radial gate, Eqs. (10) and (15) should be solved simultane-ously.
2.2. Dimensionless method
A phenomenon is defined as self-similar in a given Πn dimen-sionless group when the functional relationship, Π1 = φ(Π2,Π3, . . . , Πn), is independent of Πn [16]. Self-similarity in the pa-rameter Πn would be helpful to simplify the dimensionless groupobtained by Π theorem. In such condition, the functional relation-ship would be Π1 = Πα
n φ(Π2, Π3, . . . , Πn−1) where α is a nu-merical constant. Based on this concept, the dimensionlessmethodwas initially proposed by Ferro [16] for calibrating simultaneousoverflow and underflow of a gate. Later Ansar [17] and Ferro [7]

M. Bijankhan et al. / Flow Measurement and Instrumentation 22 (2011) 500–506 503
extended the method to develop explicit equations for calibratingthe free and submerged sluice gates. Shahrokhnia and Javan [14]used the dimensionless method to develop accurate relationshipsfor calibrating the radial gate for both the submerged and free flowconditions (Eqs. (17) and (18), respectively).
qS = 1.217w√
wg(y1 − y3)0.495 (17)
qF = 0.825w√
wgy0.61 . (18)
The dimensionless form of Eqs. (17) and (18) takes the followingforms:
q∗S = 1.4815(Y1 − Y3)0.99 (19)
q∗F = 0.6815Y 1.21 . (20)
In the abovemethods, the flow conditions were categorized as freeand submerged regimes. Consequently, the proposed governingequations are supposed to determine the flow rate continuouslyfrom free to submerged conditions and within the transitionalzone. This method is called as a continuous calibration method.Swamee et al. [18] and Bijankhan and Kouchakzadeh [19] believethat for a continues gate calibration method, right at the thresholdof the free and submerged flow conditions (i.e. the starting point ofthe transition zone) both free and submerged formulations shouldyield same discharge values, i.e. the free flowing discharge valueequates with that of the submerged one. At the threshold opera-tion point any slight increase in tailwater forces the flow to be-come submerged. Consequently, in such condition the tailwaterdepth reaches its maximum value that permits the free flow con-dition. The aforementioned assumption was found as a very usefultool to find the distinguishing condition curve. Accordingly, a com-parison between the abovementioned radial gate calibrationmeth-ods would identify themore appropriate one that can compute theflow through the gate continuously andwithin the transition zone.
Considering δ = 0.6 and the method presented by Bos [2],Eq. (2), as the starting point of the transition zone, q∗ versus Y3could be determined for the given values of Y1, for both E–Mand dimensionless methods. The results are depicted in Fig. 2.The figure clearly indicates that the dimensionless method is notable to predict the discharge continuously within the transitionzone which is due to the presence of a gap between the free andsubmerged flow conditions (the gap is indicated in Fig. 2). While,the E–M method can effectively be used to calibrate a radial gatefor both the free and submerged flow regimes continuously andwithin the transition zone. Consequently, the E–M method wouldbe considered to derive the distinguishing condition curve of theradial gate.
3. Governing the distinguishing condition curve
The Salt River Project (SRP) in Arizona was done to resolvethe problem of the discontinuity of the traditional energy andmomentum method [12]. SRP suggested a straight line startingat the hydraulic jump conjugate depth to describe the transitionzone. Choosing the best transition was based on trial-and-errorand it was found that the transition zone would vary from gate togate and even with flow rate for a given gate [12]. This indicatesthat the starting point of the transition zone is also varying withdifferent parameters affecting the flow rate through a radial gate.That is, considering the conjugate depth presented by Bos [2] as thedistinguishing condition curve (Eq. (1)) which varies only with thecontraction coefficient does not provide a general definition of thedistinguishing condition curve.
The energy adjustment used in the energy equation under thesubmerged flow make the results of the E–M method accurate atlow submergence [12], i.e. using the E–M method it is possible
Fig. 2. q∗ versus Y3 computed based on E–M and dimensionless methodsconsidering given values of Y1 .
to determine the flow rate from free to submerged conditionscontinuously and within the transitional zone. Accordingly theE–M method could be considered as a useful tool to obtain thedistinguishing condition of a radial gate.
At the threshold of free and submerged flow,H1(F) equatesH1(s).By substituting H1(F) from Eq. (3) for Eq. (9), the transitional valueof the non-dimensional energy correction factor, E(t), takes theform:
E(t) = 0.0398δ. (21)
Substituting E(t) from Eq. (21) for Eq. (11), yields:
Y2(t) = 1.0398δ (22)
where, Y2(t) is the transitional value of the flow depth just after thegate.
Eq. (22) shows that by 3.98% increase in the flow jet thickness,flow through a radial gate remains free, while it was believed thatthe jet thickness should not exceed δw to prevent submergence [2].However, the validity of this phenomenon should be examinedexperimentally.
The transitional value of the weighing depth, Yw(t), could beobtained easily by substituting Y2(t) from Eq. (22) for Y2 in Eq. (14):
Yw(t) = 0.643Y3(t) + 0.371δ. (23)
Applying the assumption of equating the free and submerged dis-charges at the threshold of the free and submerged flow conditions,Eq. (15) takes the following form:
q∗F
q∗F
δ2− 2E(t)
=
0.5(BY 2
3(t) − Y 22(t)) − 0.5
(B − 1)Y 2
w(t)
+ q∗FB−1Y−1
3(t)
2. (24)
Substituting Eq. (4) for q∗F and Eq. (21) to (23) for E(t), Y2(t), Yw(t),respectively the distinguishing condition equation of a radial gateis obtained as follows:[
2δY 21 (Y1 − δ)
(1 + ξ)Y 21 − δ2
]2
=
0.5(BY 2
3(t) − 1.081δ2)
− 0.5(B − 1)(0.643Y3(t) + 0.371δ)2
+
2δ2Y 21 (Y1 − δ)
BY3(t)[(1 + ξ)Y 21 − δ2]
]2
+ 0.1592δ3 Y 21 (Y1 − δ)
(1 + ξ)Y 21 − δ2
. (25)
For a given upstream depth, the distinguishing condition equationshows the maximum non-dimensional tailwater depth, Y3(t), thatpermits the free flow condition.

504 M. Bijankhan et al. / Flow Measurement and Instrumentation 22 (2011) 500–506
Fig. 3. Downstream channel width effect on the distinguishing condition curveobtained based on Eq. (25) (to plot the figure δ and 1 + ξ were considered 0.6 and1 respectively).
Eq. (25) indicates that the distinguishing condition curveof a radial gate is affected by the relative channel width, B,the combined coefficient including the effects of energy headloss between upstream and downstream sides of the gate andvelocity distribution, 1 + ξ , and the contraction coefficient, δ.While, previous studies considered it as a function of contractioncoefficient alone [2]. It should be mentioned that for the givenvalues of Y1, δ, B, and 1 + ξ , a trial and error procedure is requiredto obtain Y3(t) from Eq. (25).
The presence of hydrostatic pressure distribution at the sectionjust after the gate, and considering the values of δ and ξ in thesubmerged flow condition as that of free flow are the assumptionsapplied by Clemmens et al. [12] to develop their calibrationmethod. Eq. (25) is also developed based on these assumptions.Also, the application limits 1.04 < 1 + ξ < 1.12, 0.6 < δ <0.8, and 4.46 × 10⁴ < Re < 2.64 × 10⁵ should be consideredbased on the experimental data ranges reported by Clemmenset al. [12]. It should be noted that Clemmens et al. [12] performedtheir experiments in a flume with B = 2.69.
By using the proposed equation (Eq. (25)) it is possibleto investigate the effect of different parameters affecting thedistinguishing condition curve theoretically. Considering Eq. (25)the distinguishing condition curve of a radial gate was plotted inFig. 3 for different values of the relative channel depth. Fig. 3 re-veals that a radial gate located in a channel having a wider down-stream sectionwould bemore susceptible to submergence. That is,for a specific tailwater depth, the associated values of the force andmomentum for awider downstreamchannel section aremore thanthe force andmomentum values for a channel having identical up-stream and downstream sections. Consequently, when B > 1, therequired sum of the force andmomentum associated with the sec-tion just after the gate should be greater to make a free hydraulicjump. In such condition the gate would be more susceptible to be-come submerge.
The advantage of the proposed distinguishing condition equa-tion over the traditional one (Eq. (2)) can be highlighted for situ-ations where multi-radial gates installed parallel but they do notoperate simultaneously. In such condition only one of some paral-lel radial gates is operating and therefore B > 1.
The effects of the combined coefficient and Reynolds numberwere then investigated. Fig. 4 shows that increasing combinedcoefficient inversely affects the maximum value of tailwater thatpermits free flowwhile increasing Re allows the presence of highertailwater for the free flow condition. It is worth mentioning thatfor laboratory models the energy loss is relatively high and thecorresponding Reynolds number is low. Consequently, a radialgate in a laboratory scale model is more susceptible to becomesubmerged rather than a prototype gate.
Fig. 4. Effects of the combined coefficient and Reynolds number on thedistinguishing condition curve obtained based on Eq. (25) (to plot the figures δ andB were considered 0.6 and 1 respectively).
Fig. 5. Effect of sharp edge gate seal angel on the distinguishing condition curve(to plot the figure B and 1 + ξ were considered unity).
For a given gate leaf angel the effect of different gate seal types,i.e. sharp edge, hard rubber bar, and music note seal on the dis-tinguishing condition curve was analyzed. Due to the small dif-ferences between the contraction coefficients of the mentionedgate seals there was an insignificant difference among the distin-guishing condition curves. However, for a specific gate seal type(e.g. sharp edge) the effect of different gate seal angels was deter-mined and illustrated in Fig. 5. The figure shows a gate seal with alarger angel is more vulnerable to become submerged.
4. Experimental verification
Buyalski [11] performed extensive experimental study on aradial gate under both the free and submerged flow conditions.He used one radial gate under nine different installation situationsby considering different trunnion-pin heights, a, settings and gateseal types as shown in Table 1. For all tests, the radial gate radiuswas 702 mm. Also, the gate width was kept at 711 mm whilethe downstream channel width was 762 mm, i.e. B = 1.07. Thedifference between gate and channel widths was due to the half-pier installed on one side of the laboratory flume.
Buyalski [11]measured upstreamand downstreamwater levelsfor different values of gate openings and seal types. He named theflow conditions as FREE, SUBMERGED, and JUMP (assumed to bethe transitional point).
In the current study, only the free and submerged flow condi-tions observed by Buyalski [11] were used to evaluate the perfor-mance of the Eq. (25) for distinguishing the flow condition. Using
M. Bijankhan et al. / Flow Measurement and Instrumentation 22 (2011) 500–506 505
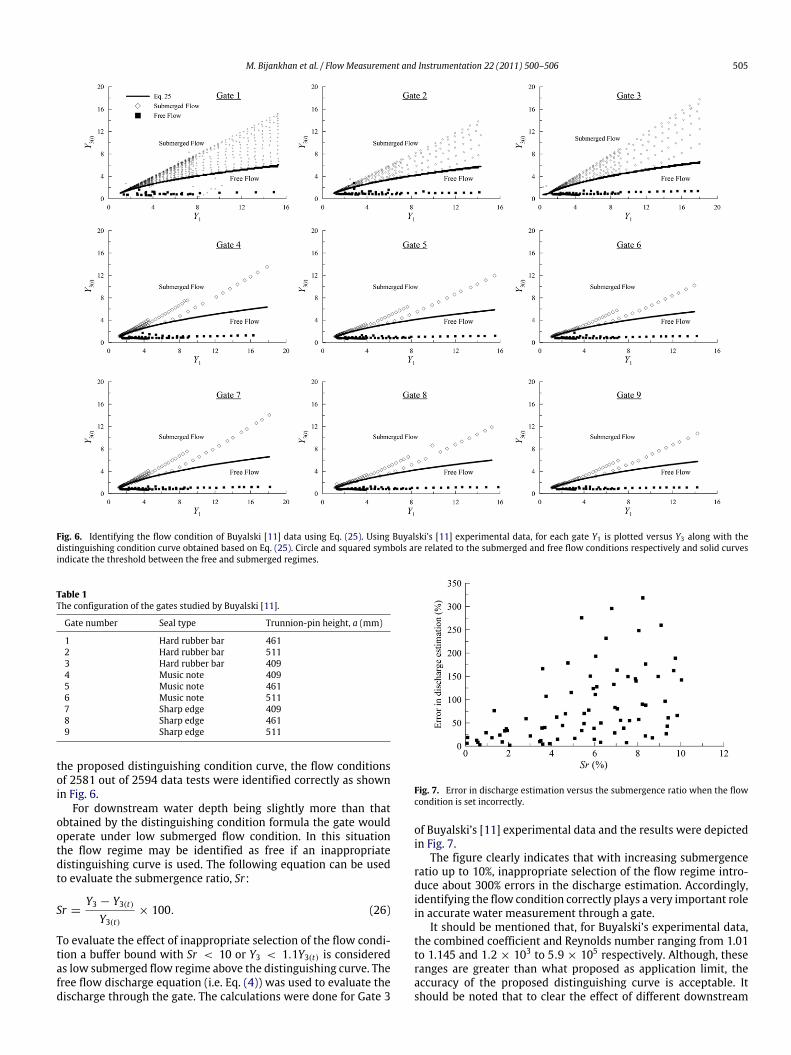
Fig. 6. Identifying the flow condition of Buyalski [11] data using Eq. (25). Using Buyalski’s [11] experimental data, for each gate Y1 is plotted versus Y3 along with thedistinguishing condition curve obtained based on Eq. (25). Circle and squared symbols are related to the submerged and free flow conditions respectively and solid curvesindicate the threshold between the free and submerged regimes.
Table 1The configuration of the gates studied by Buyalski [11].
Gate number Seal type Trunnion-pin height, a (mm)
1 Hard rubber bar 4612 Hard rubber bar 5113 Hard rubber bar 4094 Music note 4095 Music note 4616 Music note 5117 Sharp edge 4098 Sharp edge 4619 Sharp edge 511
the proposed distinguishing condition curve, the flow conditionsof 2581 out of 2594 data tests were identified correctly as shownin Fig. 6.
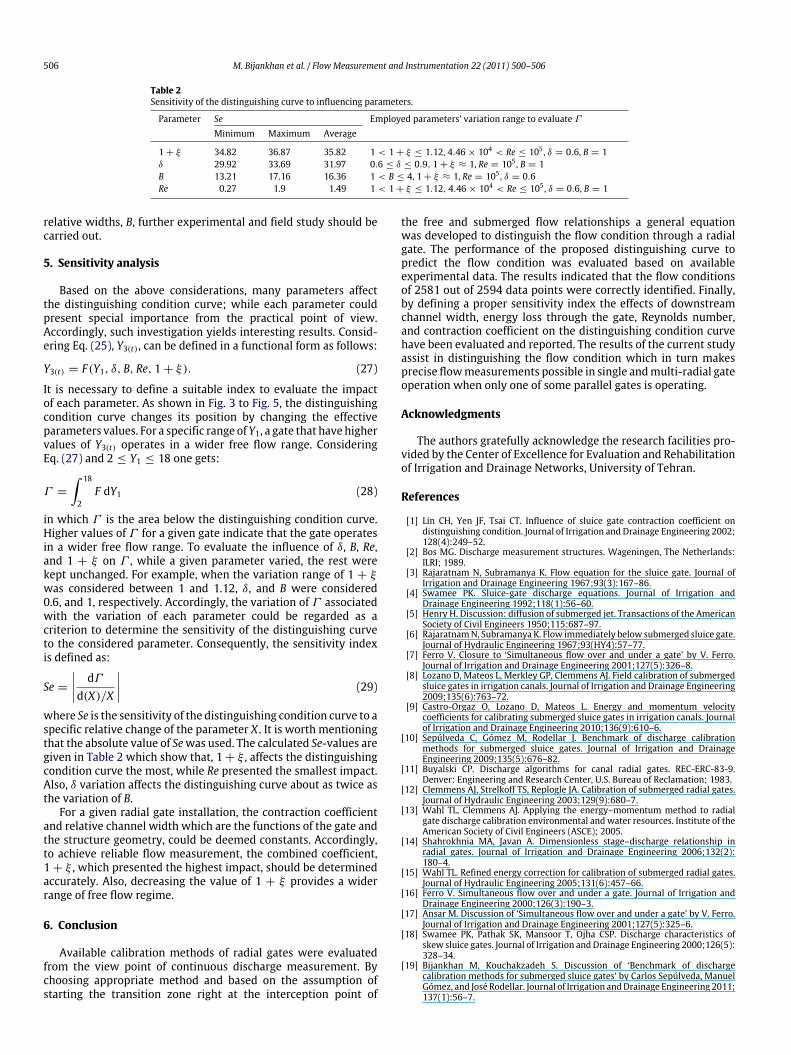
For downstream water depth being slightly more than thatobtained by the distinguishing condition formula the gate wouldoperate under low submerged flow condition. In this situationthe flow regime may be identified as free if an inappropriatedistinguishing curve is used. The following equation can be usedto evaluate the submergence ratio, Sr:
Sr =Y3 − Y3(t)
Y3(t)× 100. (26)
To evaluate the effect of inappropriate selection of the flow condi-tion a buffer bound with Sr < 10 or Y3 < 1.1Y3(t) is consideredas low submerged flow regime above the distinguishing curve. Thefree flow discharge equation (i.e. Eq. (4)) was used to evaluate thedischarge through the gate. The calculations were done for Gate 3
Fig. 7. Error in discharge estimation versus the submergence ratio when the flowcondition is set incorrectly.
of Buyalski’s [11] experimental data and the results were depictedin Fig. 7.
The figure clearly indicates that with increasing submergenceratio up to 10%, inappropriate selection of the flow regime intro-duce about 300% errors in the discharge estimation. Accordingly,identifying the flow condition correctly plays a very important rolein accurate water measurement through a gate.
It should be mentioned that, for Buyalski’s experimental data,the combined coefficient and Reynolds number ranging from 1.01to 1.145 and 1.2 × 10³ to 5.9 × 10⁵ respectively. Although, theseranges are greater than what proposed as application limit, theaccuracy of the proposed distinguishing curve is acceptable. Itshould be noted that to clear the effect of different downstream
506 M. Bijankhan et al. / Flow Measurement and Instrumentation 22 (2011) 500–506
Table 2Sensitivity of the distinguishing curve to influencing parameters.
Parameter Se Employed parameters’ variation range to evaluate Γ
Minimum Maximum Average
1 + ξ 34.82 36.87 35.82 1 < 1 + ξ ≤ 1.12, 4.46 × 10⁴ < Re ≤ 105 , δ = 0.6, B = 1δ 29.92 33.69 31.97 0.6 ≤ δ ≤ 0.9, 1 + ξ ≈ 1, Re = 105 , B = 1B 13.21 17.16 16.36 1 < B ≤ 4, 1 + ξ ≈ 1, Re = 105 , δ = 0.6Re 0.27 1.9 1.49 1 < 1 + ξ ≤ 1.12, 4.46 × 10⁴ < Re ≤ 105 , δ = 0.6, B = 1
relative widths, B, further experimental and field study should becarried out.
5. Sensitivity analysis
Based on the above considerations, many parameters affectthe distinguishing condition curve; while each parameter couldpresent special importance from the practical point of view.Accordingly, such investigation yields interesting results. Consid-ering Eq. (25), Y3(t), can be defined in a functional form as follows:
Y3(t) = F(Y1, δ, B, Re, 1 + ξ). (27)
It is necessary to define a suitable index to evaluate the impactof each parameter. As shown in Fig. 3 to Fig. 5, the distinguishingcondition curve changes its position by changing the effectiveparameters values. For a specific range of Y1, a gate that have highervalues of Y3(t) operates in a wider free flow range. ConsideringEq. (27) and 2 ≤ Y1 ≤ 18 one gets:
Γ =
∫ 18
2F dY1 (28)
in which Γ is the area below the distinguishing condition curve.Higher values of Γ for a given gate indicate that the gate operatesin a wider free flow range. To evaluate the influence of δ, B, Re,and 1 + ξ on Γ , while a given parameter varied, the rest werekept unchanged. For example, when the variation range of 1 + ξwas considered between 1 and 1.12, δ, and B were considered0.6, and 1, respectively. Accordingly, the variation of Γ associatedwith the variation of each parameter could be regarded as acriterion to determine the sensitivity of the distinguishing curveto the considered parameter. Consequently, the sensitivity indexis defined as:
Se =
dΓ
d(X)/X
(29)
where Se is the sensitivity of the distinguishing condition curve to aspecific relative change of the parameter X . It is worth mentioningthat the absolute value of Sewas used. The calculated Se-values aregiven in Table 2 which show that, 1 + ξ , affects the distinguishingcondition curve the most, while Re presented the smallest impact.Also, δ variation affects the distinguishing curve about as twice asthe variation of B.
For a given radial gate installation, the contraction coefficientand relative channel width which are the functions of the gate andthe structure geometry, could be deemed constants. Accordingly,to achieve reliable flow measurement, the combined coefficient,1 + ξ , which presented the highest impact, should be determinedaccurately. Also, decreasing the value of 1 + ξ provides a widerrange of free flow regime.
6. Conclusion
Available calibration methods of radial gates were evaluatedfrom the view point of continuous discharge measurement. Bychoosing appropriate method and based on the assumption ofstarting the transition zone right at the interception point of
the free and submerged flow relationships a general equationwas developed to distinguish the flow condition through a radialgate. The performance of the proposed distinguishing curve topredict the flow condition was evaluated based on availableexperimental data. The results indicated that the flow conditionsof 2581 out of 2594 data points were correctly identified. Finally,by defining a proper sensitivity index the effects of downstreamchannel width, energy loss through the gate, Reynolds number,and contraction coefficient on the distinguishing condition curvehave been evaluated and reported. The results of the current studyassist in distinguishing the flow condition which in turn makesprecise flowmeasurements possible in single andmulti-radial gateoperation when only one of some parallel gates is operating.
Acknowledgments
The authors gratefully acknowledge the research facilities pro-vided by the Center of Excellence for Evaluation and Rehabilitationof Irrigation and Drainage Networks, University of Tehran.
References
[1] Lin CH, Yen JF, Tsai CT. Influence of sluice gate contraction coefficient ondistinguishing condition. Journal of Irrigation and Drainage Engineering 2002;128(4):249–52.
[2] Bos MG. Discharge measurement structures. Wageningen, The Netherlands:ILRI; 1989.
[3] Rajaratnam N, Subramanya K. Flow equation for the sluice gate. Journal ofIrrigation and Drainage Engineering 1967;93(3):167–86.
[4] Swamee PK. Sluice-gate discharge equations. Journal of Irrigation andDrainage Engineering 1992;118(1):56–60.
[5] Henry H. Discussion: diffusion of submerged jet. Transactions of the AmericanSociety of Civil Engineers 1950;115:687–97.
[6] RajaratnamN, Subramanya K. Flow immediately below submerged sluice gate.Journal of Hydraulic Engineering 1967;93(HY4):57–77.
[7] Ferro V. Closure to ‘Simultaneous flow over and under a gate’ by V. Ferro.Journal of Irrigation and Drainage Engineering 2001;127(5):326–8.
[8] Lozano D, Mateos L, Merkley GP, Clemmens AJ. Field calibration of submergedsluice gates in irrigation canals. Journal of Irrigation and Drainage Engineering2009;135(6):763–72.
[9] Castro-Orgaz O, Lozano D, Mateos L. Energy and momentum velocitycoefficients for calibrating submerged sluice gates in irrigation canals. Journalof Irrigation and Drainage Engineering 2010;136(9):610–6.
[10] Sepúlveda C, Gómez M, Rodellar J. Benchmark of discharge calibrationmethods for submerged sluice gates. Journal of Irrigation and DrainageEngineering 2009;135(5):676–82.
[11] Buyalski CP. Discharge algorithms for canal radial gates. REC-ERC-83-9.Denver: Engineering and Research Center, U.S. Bureau of Reclamation; 1983.
[12] Clemmens AJ, Strelkoff TS, Replogle JA. Calibration of submerged radial gates.Journal of Hydraulic Engineering 2003;129(9):680–7.
[13] Wahl TL, Clemmens AJ. Applying the energy–momentum method to radialgate discharge calibration environmental and water resources. Institute of theAmerican Society of Civil Engineers (ASCE); 2005.
[14] Shahrokhnia MA, Javan A. Dimensionless stage–discharge relationship inradial gates. Journal of Irrigation and Drainage Engineering 2006;132(2):180–4.
[15] Wahl TL. Refined energy correction for calibration of submerged radial gates.Journal of Hydraulic Engineering 2005;131(6):457–66.
[16] Ferro V. Simultaneous flow over and under a gate. Journal of Irrigation andDrainage Engineering 2000;126(3):190–3.
[17] Ansar M. Discussion of ‘Simultaneous flow over and under a gate’ by V. Ferro.Journal of Irrigation and Drainage Engineering 2001;127(5):325–6.
[18] Swamee PK, Pathak SK, Mansoor T, Ojha CSP. Discharge characteristics ofskew sluice gates. Journal of Irrigation and Drainage Engineering 2000;126(5):328–34.
[19] Bijankhan M, Kouchakzadeh S. Discussion of ‘Benchmark of dischargecalibration methods for submerged sluice gates’ by Carlos Sepúlveda, ManuelGómez, and José Rodellar. Journal of Irrigation andDrainage Engineering 2011;137(1):56–7.
Copyright © 2022 FDOKUMEN