update on the chemical thermodynamics of uranium ...
960
UPDATE ON THE CHEMICAL THERMODYNAMICS OF URANIUM, NEPTUNIUM, PLUTONIUM, AMERICIUM AND TECHNETIUM
-
Upload
khangminh22 -
Category
Documents
-
view
2 -
download
0
Transcript of update on the chemical thermodynamics of uranium ...

UPDATE ON THECHEMICAL THERMODYNAMICS
OF URANIUM, NEPTUNIUM, PLUTONIUM,
AMERICIUM AND TECHNETIUM
OECD_5VW2 01-08-2003 13:43 Pagina 1 (Zwart/Process Black Plaat)

CHEMICAL THERMODYNAMICS
Vol. 1. Chemical Thermodynamics of Uranium (H. Wanner and I. Forest, eds.)Vol. 2. Chemical Thermodynamics of Americium (R.J. Silva et al.)
Vol. 3. Chemical Thermodynamics of Technetium (M.C.A. Sandino and E. Östhols, eds.)Vol. 4. Chemical Thermodynamics of Neptunium and
Plutonium (OECD Nuclear Energy Agency, ed.)Vol. 5. Update on the Chemical Thermodynamics of Uranium, Neptunium, Plutonium,
Americium and Technetium (OECD Nuclear Energy Agency, ed.)
OECD_5VW2 01-08-2003 13:43 Pagina 2 (Zwart/Process Black Plaat)

CHEMICAL THERMODYNAMICS 5
Update on theChemical Thermodynamics of
Uranium, Neptunium, Plutonium,Americium and Technetium
Edited byFederico J. MOMPEAN, Myriam ILLEMASSENE,Cristina DOMENECH-ORTI and Katy BEN SAID
OECD Nuclear Energy Agency, Data BankIssy-les-Moulineaux (France)
NUCLEAR ENERGY AGENCYORGANISATION FOR ECONOMIC CO-OPERATION AND DEVELOPMENT
2003
ELSEVIERAMSTERDAM • BOSTON • HEIDELBERG • LONDON • NEW YORK • OXFORD
PARIS • SAN DIEGO • SAN FRANCISCO • SINGAPORE • SYDNEY • TOKYO
Volker NECKForschungszentrum Karlsruhe
Institut für Nukleare Entsorgung (INE)Karlsruhe, Germany
Donald A. PALMEROak Ridge National Laboratory
Chemical Sciences DivisionOak Ridge, Tennessee, USA
Malcolm H. RANDWintersHill ConsultancyDry Sandford, Abingdon
United Kingdom
Robert GUILLAUMONT (Chairman)Université de Paris XI - Orsay
Laboratoire de Radiochimie - IPNOrsay, France
Thomas FANGHÄNELForschungszentrum Karlsruhe
Institut für Nukleare Entsorgung (INE)Karlsruhe, Germany
Jean FUGERInstitute of Radiochemistry
University of Liège-Sart TilmanLiège, Belgium
Ingmar GRENTHERoyal Institute of Technology
Department of ChemistryStockholm, Sweden
OECD_5VW2 01-08-2003 13:43 Pagina 3 (Zwart/Process Black Plaat)

Published byELSEVIER B.V.Sara Burgerhartstraat 25P.O. Box 211, 1000 AE Amsterdam, The Netherlands
ISBN: 0-444-51401-5
Copyright © Organisation for Economic Co-Operation and Development, 2003. All rights reserved.No part of this publication may be reproduced, stored in a retrieval, system or transmitted in any form or by any means, electronic, electrostatic,magnetic tape, mechanical, photocopying, recording or otherwise, without permission in writing from the copyright holders. Queries concerningpermission or translation rights should be addressed to: Head of Publications Service, OECD, 2 rue André Pascal, 75775 Paris Cedex 16, France
Special regulations for readers in the U.S.A. - This publication has been registered with the Copyright Clearance Center Inc. (CCC), Salem,Massachusetts. Information can be obtained from the CCC about conditions under which photocopies of parts of this publication may be made inthe U.S.A. All other copyright questions, including photocopying outside of the U.S.A., should be referred to the OECD.
No responsibility is assumed by the Publisher or by the OECD for any injury and/or damage to persons or property as a matter of products liabili-ty, negligence or otherwise, or from any use or operation of any methods, products, instructions or ideas contained in the material herein.
The opinions expressed and arguments employed in this publication are the sole responsibility of the authors and do not necessarily reflect thoseof the OECD or of the governments of its member countries. Les idées exprimées et les arguments avancés dans cette publication sont ceux desauteurs et ne reflètent pas nécessairement ceux de l’OCDE ou des gouvernments de ses pays membres.
This volume has been reproduced by the publisher from the formatted pages prepared by the editors.
The paper used in this publication meets the requirements of ANSI/NISO Z39.48-1992 (Permanenceof Paper).
Printed in The Netherlands
OECD_5VW2 01-08-2003 13:43 Pagina 4 (Zwart/Process Black Plaat)

Preface This volume is the fifth of the series "Chemical Thermodynamics" edited by the OECD Nu-clear Energy Agency (NEA). It is an update of the critical reviews published successively in 1992, as Chemical Thermodynamics of Uranium, in 1995 as Chemical Thermodynamics of Americium, in 1999 as Chemical Thermodynamics of Technetium and in 2001 as Chemical Thermodynamics of Neptunium and Plutonium. These previous volumes comprise reviews of the scientific literature in their areas of scope until 1989, 1993, 1995 and 1996, respec-tively, although later references are, in some isolated cases, also included.
This Update was initiated by the Management Board of the NEA Thermochemical Database Project Phase II (NEA TDB II). The first meeting of the U/Am/Tc/Np/Pu Update Review Group was held in October 1998 and six plenary meetings followed at NEA Head-quarters at Issy-les-Moulineaux (France) in April 1999, November 1999, March 2000, Sep-tember 2000 January 2001 and September 2001. The Executive Group of the Management Board provided scientific assistance in the implementation of the NEA TDB Project Guide-lines. Jordi Bruno participated in Review Group meetings as the designated member of the Executive Group. At the NEA Data Bank the responsibility for the overall co-ordination of the Project was placed with Eric Östhols (from its initiation in 1998 to February 2000), with Stina Lundberg (from March 2000 to September 2000) and with Federico Mompean (since September 2000). Federico Mompean was in charge of the preparation of the successive drafts, updating the NEA thermodynamic database and editing the book to its present final form, with assistance from Myriam Illemassène, Cristina Domènech-Ortí and Katy Ben Said.
The aim of the members of the Review Group was to review all of the papers pub-lished two years prior to the publication dates of the books cited above in order to assure sufficient overlap with previous reviews in collecting and analysing data. The cut-off date was set at roughly the end of 2001 for the papers. The critical selection of thermodynamic data was made with reference to the previous selections. The Review Group focused on lit-erature that contained new information, but in some instances material already analysed was re-examined in order to include all the data referring to a special problem. In all cases the arguments leading to a necessary change in previously selected values were carefully con-sidered.
All the members contributed fully to the main text and the discussions, but the workload was distributed according to the expertise of each member. Malcolm Rand and Jean Fuger reviewed gas and solid-state thermodynamics, while the other members were involved in solution thermodynamics. Volker Neck and Thomas Fanghänel carried out the
v

PREFACE vi
americium update with the help of Ingmar Grenthe, who mainly reviewed the carbonate and silicate complexes and compounds of uranium and, together with Volker Neck the carbonate complexes and compounds of neptunium and plutonium. Robert Guillaumont reviewed the hydrolysis and complexation of uranium, neptunium and plutonium with the help of Ingmar Grenthe, Volker Neck and Donald Palmer, who was also in charge of reviewing technetium.
The uranium section is the largest due to the amount of material published during the last ten years. This element has been extensively studied, principally because of its role as a nuclear fuel; in addition, it does not present any special radiological risk in laboratory-scale research and is widely present in the natural environment. In the field of solution thermodynamics the classical solubility, potentiometric and spectrophotometric methods to obtain data have been customarily used. A problem identified in all previous compilations is the assignment of uncertainties to the thermodynamic data obtained by these equilibrium analytical methods. During the past ten years scientists have implemented new statistical methods for hypothesis testing that are discussed in this review. However, there are few investigations that have used these methods; uncertainty estimates in this Update therefore follow the methods used in prior volumes. Thermodynamic data have also been obtained from new spectroscopic techniques that are applicable in systems with very low total con-centrations of metal ions. The spectral resolution of these techniques is often better than in “traditional” spectrophotometry, allowing for a more accurate peak deconvolution. It is gratifying that data obtained by these new techniques in general agrees very well with data obtained by more traditional methods. Quantum chemical methods are also emerging as tools to understand the coordination chemistry of f-elements, thereby providing a valuable tool when discussing speciation.
In general, the sections dealing with the other elements addressed in this Update are shorter (except for the section on americium) because there are fewer experimental in-vestigations to be reviewed. This situation is explained by the fact that previous reviews of these elements are more recent and fewer laboratories are currently working on them. The new experimental data concern mostly solution thermodynamics. The section on americium also contains reviews of curium data, the reason for this being the chemical similarity be-tween the two elements and the much higher accuracy of thermodynamic data on Cm(III) that are obtained by fluorescence spectroscopy.
This Update does not substantially change the main body of thermodynamic values selected previously by the NEA, but rather supplements it with an appreciable amount of new data.
Palaiseau, France, March 2003 Robert Guillaumont, Chairman

Acknowledgements
For the preparation of this book, the authors have received financial support from the NEA TDB Phase II Project. The following organisations take part in the Project:
ANSTO, Australia ONDRAF/NIRAS, Belgium RAWRA, Czech Republic POSIVA, Finland ANDRA, France IPSN (now IRSN), France FZK, Germany JNC, Japan ENRESA, Spain SKB, Sweden SKI, Sweden HSK, Switzerland NAGRA, Switzerland PSI, Switzerland BNFL, UK NIREX, UK DoE, USA
The authors would like to express their gratitude to Rod Ewing for providing pre-prints of several of his publications related to uranium minerals. Comments from the Chairmen of the TDB Phase I Reviews on Americium and Technetium, Robert J. Silva and Joseph A. Rard are also gratefully acknowledged.
Malcolm Rand would like to acknowledge valuable advice on spectroscopic pa-rameters from Rudy Konings, Federico Mompean and a Peer Reviewer, Vladimir Yungman.
At the NEA Data Bank, the bibliographical database was maintained by Linda Fu-ruäng well into 2001. Pierre Nagel and Christian Penon have provided excellent software and advice, which have eased the editorial and database work. Cynthia Picot, Solange Quarmeau and Amanda Costa from NEA Publications have provided considerable help in
vii

ACKNOWLEDGEMENTS viii
editing the present series. Their contributions and the support of many NEA staff members are highly appreciated.
The entire manuscript of this book has undergone a peer review by an independent international group of reviewers, according to the procedures in the TDB-6 Guideline, avail-able from the NEA. The peer reviewers have seen and approved the modifications made by the authors in response to their comments. The peer review comment records may be ob-tained on request from the OECD Nuclear Energy Agency. The peer reviewers were:
Prof. Sue B. Clark, Washington State University, Pullman, Washington, USA
Prof. Diego Ferri, Università Federico II di Napoli, Naples, Italy
Dr. Robert J. Lemire, Atomic Energy of Canada Ltd., Chalk River Laboratories, Ontario, Canada
Dr. Lester R. Morss, Office of Basic Energy Sciences, US Department of Energy, Washing-ton DC, USA
Dr. Dhanpat Rai, Batelle, Pacific Northwest National Laboratory, USA
Dr. Vladimir Yungman, Glushko Thermocenter, Russian Academy of Sciences, Moscow, Russia
Their contributions are gratefully acknowledged.
Note from the Chairman of the NEA TDB Project Phase II
The need to make available a comprehensive, internationally recognised and quality-assured chemical thermodynamic database that meets the modeling requirements for the safety as-sessment of radioactive waste disposal systems prompted the Radioactive Waste Manage-ment Committee (RWMC) of the OECD Nuclear Energy Agency (NEA) to launch in 1984 the Thermochemical Database Project (NEA TDB) and to foster its continuation as a semi-autonomous project known as NEA TDB Phase II in 1998.
The RWMC assigned a high priority to the critical review of relevant chemical thermodynamic data of inorganic species and compounds of the actinides uranium, neptu-nium, plutonium and americium, as well as the fission product technetium. The first four books in this series on the chemical thermodynamics of uranium, americium, neptunium and plutonium, and technetium originated from this initiative.
The organisation of Phase II of the TDB Project reflects the interest in many OECD/NEA member countries for a timely compilation of the thermochemical data that would meet the specific requirements of their developing national waste disposal pro-grammes.
The NEA TDB Phase II Review Teams, comprising internationally recognised ex-perts in the field of chemical thermodymanics, exercise their scientific judgement in an in-dependent way during the preparation of the review reports. The work of these Review Teams has also been subjected to further independent peer review.
Phase II of the TDB Project consisted of: (i) updating the existing, CODATA-compatible database for inorganic species and compounds of uranium, neptunium, pluto-nium, americium and technetium, (ii) extending it to include selected data on inorganic spe-cies and compounds of nickel, selenium and zirconium, (iii) and further adding data on or-ganic complexes of citrate, oxalate, EDTA and iso-saccharinic acid (ISA) with uranium, neptunium, plutonium, americium, technetium, nickel, selenium, zirconium and some other competing cations.
The NEA TDB Phase II objectives were formulated by the 17 participating organi-sations coming from the fields of radioactive waste management and nuclear regulation. The TDB Management Board is assisted for technical matters by an Executive Group of experts
ix

NOTE FROM THE CHAIRMAN OF THE NEA TDB PROJECT PHASE II x
in chemical thermodynamics. In this second phase of the Project, the NEA acts as coordina-tor, ensuring the application of the Project Guidelines and liaising with the Review Teams.
The present volume is the first one published within the scope of NEA TDB Phase II and contains an update of the existing databases for inorganic species and compounds of uranium, neptunium, plutonium, americium and technetium. This update was determined by the Project Management Board to be the highest priority task within the established pro-gramme of work. We trust that the efforts of the reviewers and the peer reviewers merit the same high recognition from the broader scientific community as received for previous vol-umes of this series.
Mehdi Askarieh United Kingdom Nirex limited Chairman of TDB Project Phase II Management Board On behalf of the NEA TDB Project Phase II Participating Organisations:
ANSTO, Australia ONDRAF/NIRAS, Belgium RAWRA, Czech Republic POSIVA, Finland ANDRA, France IPSN (now IRSN), France FZK, Germany JNC, Japan ENRESA, Spain SKB, Sweden SKI, Sweden HSK, Switzerland PSI, Switzerland BNFL, UK Nirex, UK DoE, USA

Editor’s note
This is the fifth volume of a series of expert reviews of the chemical thermodynamics of key chemical elements in nuclear technology and waste management. This volume is devoted to updating the four previously published reviews on U [92GRE/FUG], Am [95SIL/BID], Tc [99RAR/RAN] and Np and Pu [2001LEM/FUG]. The tables contained in Chapters 3 to 8 list the currently selected thermodynamic values within the NEA TDB Project. The database system developed at the NEA Data Bank, cf. Section 2.6, assures consistency among all the selected and auxiliary data sets.
The recommended thermodynamic data are the result of a critical assessment of published information. In many instances (where updating has not been needed) the critical reviews supporting a particular selection will not be found in the present volume, but in the preceding one of this series dealing with the particular element involved (or in the volumes dealing with uranium and technetium for auxiliary data). In order to assist the reader in find-ing earlier reviewing information, a cross-reference system has been established between the sections of this volume and those of the preceding ones where the same species or group of species has been discussed. For this purpose, the relevant sections of the preceding volumes for a given element are listed in parentheses after the current volume section headings. In this way, for example, “9.4.5.2 Solid uranium iodides (V.4.4.1.3)” refers the reader to sec-tion V.4.4.1.3 in volume 1 of the series, [92GRE/FUG] and “10.2.1.2 Neptunium (IV) hy-droxide complexes (8.1.4)” to section 8.1.4 in volume 4 of the series, [2001LEM/FUG].
xi
xii
How to contact the NEA TDB Project
Information on the NEA and the TDB Project, on-line access to selected data and computer programs, as well as many documents in electronic format are available at
www.nea.fr.
To contact the TDB project coordinator and the authors of the review reports, send comments on the TDB reviews, or to request further information, please send e-mail to [email protected]. If this is not possible, write to:
TDB project coordinator OECD Nuclear Energy Agency, Data Bank Le Seine-St. Germain 12, boulevard des Îles F-92130 Issy-les-Moulineaux FRANCE
The NEA Data Bank provides a number of services that may be useful to the reader of this book.
• The recommended data can be obtained via internet directly from the NEA Data Bank.
• The NEA Data Bank maintains a library of computer programs in various areas. This includes geochemical codes such as PHREEQE, EQ3/6, MINEQL, MINTEQ and PHRQPITZ, in which chemical thermodynamic data like those presented in this book are required as the basic input data. These computer codes can be obtained on request from the NEA Data Bank.

Contents
Preface v
Acknowledgement vii
Note from the chairman of the NEA TDB Project Phase II ix
Editor’s note xi
Part I Introductory material 1
1 INTRODUCTION 3
1.1 Background..................................................................................................................3
1.2 Focus of the review......................................................................................................4
1.3 Review procedure and results ......................................................................................5
2 STANDARDS, CONVENTIONS AND CONTENTS OF THE TABLES 9
2.1 Symbols, terminology and nomenclature ....................................................................9 2.1.1 Abbreviations .......................................................................................................9 2.1.2 Symbols and terminology...................................................................................11 2.1.3 Chemical formulae and nomenclature ................................................................13 2.1.4 Phase designators................................................................................................13 2.1.5 Processes ............................................................................................................15 2.1.6 Spectroscopic constants and statistical mechanics calculations for gaseous
species ................................................................................................................16 2.1.7 Equilibrium constants .........................................................................................17
2.1.7.1 Protonation of a ligand ................................................................................17 2.1.7.2 Formation of metal complexes ....................................................................18 2.1.7.3 Solubility constants .....................................................................................20
xiii

CONTENTS xiv
2.1.7.4 Equilibria involving the addition of a gaseous ligand .................................21 2.1.7.5 Redox equilibria ..........................................................................................21
2.1.8 pH.......................................................................................................................24 2.1.9 Order of formulae ...............................................................................................26 2.1.10 Reference codes..................................................................................................28
2.2 Units and conversion factors .....................................................................................28
2.3 Standard and reference conditions.............................................................................31 2.3.1 Standard state .....................................................................................................31 2.3.2 Standard state pressure .......................................................................................32 2.3.3 Reference temperature........................................................................................35
2.4 Fundamental physical constants ................................................................................35
2.5 Uncertainty estimates.................................................................................................36
2.6 The NEA-TDB system ..............................................................................................36
2.7 Presentation of the selected data................................................................................38
Part II Tables of selected data 41
3 SELECTED DATA FOR URANIUM 43
3.1 General considerations...............................................................................................43
3.2 Precautions to be observed in the use of the tables....................................................44
4 SELECTED DATA FOR NEPTUNIUM 79
4.1 General considerations...............................................................................................79
4.2 Precautions to be observed in the use of the tables....................................................80
5 SELECTED DATA FOR PLUTONIUM 97
5.1 General considerations...............................................................................................97
5.2 Precautions to be observed in the use of the tables....................................................98
CONTENTS xv
6 SELECTED DATA FOR AMERICIUM 113
6.1 General considerations.............................................................................................113
6.2 Precautions to be observed in the use of the tables..................................................114
7 SELECTED DATA FOR TECHNETIUM 125
7.1 General considerations.............................................................................................125
7.2 Precautions to be observed in the use of the tables..................................................126
8 SELECTED AUXILIARY DATA 133
Part III Discussion of new data selection 151
9 DISCUSSION OF NEW DATA SELECTION FOR URANIUM 157
9.1 Elemental uranium (V.1) .........................................................................................157 9.1.1 Uranium metal (V.1.1) .....................................................................................157 9.1.2 Uranium gas (V.1.2) .........................................................................................157
9.2 Simple uranium aqua ions (V.2) ..............................................................................158 9.2.1 (V.2.1) ...................................................................................................159 2+
2UO+9.2.2 (V.2.2).....................................................................................................160 2UO
9.2.3 U4+ (V.2.3) and U3+ (V.2.4) .............................................................................160
9.3 Uranium oxygen and hydrogen compounds and complexes (V.3) ..........................160 9.3.1 Gaseous uranium oxides and hydroxides .........................................................160
9.3.1.1 Gaseous uranium oxides (V.3.1) ...............................................................160 9.3.1.1.1 UO(g) .................................................................................................160 9.3.1.1.2 UO3(g) ................................................................................................161
9.3.1.2 Gaseous uranium hydroxides ....................................................................162 9.3.1.2.1 UO2(OH)2(g) ......................................................................................162
9.3.2 Aqueous uranium hydroxide complexes (V.3.2) ..............................................164

CONTENTS xvi
9.3.2.1 U(VI) hydroxide complexes (V.3.2.1).......................................................164 9.3.2.1.1 Major polymeric species at 298.15 K (V.3.2.1.1) ..............................169 9.3.2.1.2 Monomeric cationic and neutral hydrolysis species (V.3.2.1.2) ........175 9.3.2.1.3 Anionic hydrolysis species (V.3.2.1.3) ..............................................176 9.3.2.1.4 Other polymeric cationic hydrolysis species (V.3.2.1.4)....................178 9.3.2.1.5 Relevant solubility studies .................................................................178
9.3.2.1.5.1 Schoepite.....................................................................................179 9.3.2.1.5.1.1 Temperature dependence (V.3.2.1.5)...................................179
9.3.2.1.5.2 Polyuranates................................................................................180 9.3.2.1.5.2.1 CaU6O19 · 11H2O(cr)............................................................180 9.3.2.1.5.2.2 Na2U2O7 · x H2O(cr) ............................................................181 9.3.2.1.5.2.3 NaxUO(3+x/2)·H2O(cr) ............................................................182 9.3.2.1.5.2.4 K2U6O19 · 11H2O(cr)............................................................182
9.3.2.2 U(IV) hydroxide complexes (V.3.2.3).......................................................182 9.3.2.2.1 Solubility of UO2(am) (=UO2(am, hydr.)...........................................184 9.3.2.2.2 Solubility of UO2(cr)..........................................................................185 9.3.2.2.3 Comparison of the solubilities of UO2(am) and UO2(cr) ...................186 9.3.2.2.4 Selection of equilibrium constants .....................................................187
9.3.2.3 U(III) hydroxide complexes (V.3.2.4).......................................................188 9.3.3 Crystalline and amorphous uranium oxides and hydroxides (V.3.3)................188
9.3.3.1 U(VI) oxides and hydroxides (V.3.3.1).....................................................188 9.3.3.1.1 Other forms of anhydrous UO3(cr) (V.3.3.1.2) ..................................188 9.3.3.1.2 U(VI) hydrated oxides and hydroxides (V.3.3.1.5)............................188
9.3.3.1.2.1 UO3·2H2O (cr).............................................................................189 9.3.3.1.2.2 UO2(OH)2(cr) or UO3·H2O(cr) ....................................................190 9.3.3.1.2.3 UO3·xH2O ...................................................................................191
9.3.3.1.3 U(VI) peroxides (V.3.3.1.4) ...............................................................192 9.3.3.2 U(IV) oxides (V.3.3.2) ..............................................................................193
9.3.3.2.1 Crystalline UO2 (uraninite) (V.3.3.2.1) ..............................................193 9.3.3.3 Mixed valence oxides (V.3.3.3) ................................................................193
9.3.3.3.1 UO2.3333 (≡ 1/3 U3O7) (V.3.3.3.2) .......................................................193
CONTENTS xvii
9.3.3.3.2 Hydrogen insertion compounds..........................................................194 9.3.3.3.3 Other mixed valence oxides (V.3.3.3.4).............................................194
9.3.4 Uranium hydrides (V.3.4).................................................................................195
9.4 Uranium group 17 (halogen) compounds and complexes (V.4) ..............................195 9.4.1 General .............................................................................................................195
9.4.1.1 Molecular parameters of the gaseous uranium halide species ...................195 9.4.2 Fluorine compounds and complexes (V.4.1) ....................................................199
9.4.2.1 Gaseous uranium fluorides (V.4.1.1).........................................................199 9.4.2.1.1 UF(g), UF2(g) and UF3(g) (V.4.1.1.1 and V.4.1.1.2) .........................199 9.4.2.1.2 UF4(g) (V.4.1.1.3) ..............................................................................201 9.4.2.1.3 UF5(g) (V.4.1.1.4) ..............................................................................204 9.4.2.1.4 UF6(g) (V.4.1.1.5) ..............................................................................206 9.4.2.1.5 U2F10(g) and U2F11(g) (V.4.1.1.6) ......................................................206 9.4.2.1.6 UO2F2(g) (V.4.1.1.7) ..........................................................................207 9.4.2.1.7 UOF4(g) (V.4.1.1.8) ...........................................................................208
9.4.2.2 Aqueous uranium fluorides (V.4.1.2)........................................................209 9.4.2.2.1 Aqueous U(VI) fluorides (V.4.1.2.1) .................................................209
9.4.2.2.1.1 Binary complexes........................................................................209 9.4.2.2.1.2 Ternary U(VI) hydroxide-fluoride complexes ............................210
9.4.2.2.2 Aqueous U(IV) fluorides (V.4.1.2.3) .................................................210 9.4.2.3 Solid uranium fluorides (V.4.1.3)..............................................................213
9.4.2.3.1 Binary uranium fluorides and their hydrates (V.4.1.3.1)....................213 9.4.2.3.1.1 UF3(cr) and UF4(cr).....................................................................213
9.4.2.3.1.1.1 High temperature heat capacity............................................213 9.4.2.3.2 Other U(VI) fluorides (V.4.1.3.2) ......................................................213
9.4.2.3.2.1 UO2F2(cr) and its hydrates ..........................................................213 9.4.3 Chlorine compounds and complexes (V.4.2)....................................................214
9.4.3.1 Uranium chlorides (V.4.2.1)......................................................................214 9.4.3.1.1 Gaseous uranium chlorides (V.4.2.1.1) ..............................................214
9.4.3.1.1.1 UCl(g), UCl2(g) and UCl3(g) ......................................................214 9.4.3.1.1.2 UCl4(g)........................................................................................216

CONTENTS xviii
9.4.3.1.1.3 UCl5(g)........................................................................................217 9.4.3.1.1.4 UCl6(g)........................................................................................218 9.4.3.1.1.5 U2Cl8(g).......................................................................................219 9.4.3.1.1.6 U2Cl10(g) .....................................................................................219 9.4.3.1.1.7 UO2Cl2(g)....................................................................................220
9.4.3.1.2 Aqueous uranium chlorides (V.4.2.1.2.) ............................................221 9.4.3.1.2.1 Aqueous U(VI) chlorides ............................................................221 9.4.3.1.2.2 Aqueous U(IV) chlorides ............................................................221
9.4.3.1.3 Solid uranium chlorides (V.4.2.1.3) ...................................................222 9.4.3.1.3.1 UCl3(cr).......................................................................................222 9.4.3.1.3.2 UCl4(cr).......................................................................................223 9.4.3.1.3.3 UCl6(cr).......................................................................................224
9.4.3.2 Uranium hypochlorites .....................................................................................224 9.4.3.2.1 Aqueous U(VI) hypochlorites ............................................................224
9.4.4 Bromine compounds and complexes (V.4.3)....................................................224 9.4.4.1 Gaseous uranium bromides (V.4.3.1.1).....................................................224
9.4.4.1.1 UBr(g), UBr2(g) and UBr3(g) .............................................................224 9.4.4.1.2 UBr4(g)...............................................................................................226 9.4.4.1.3 UBr5(g)...............................................................................................228
9.4.4.2 Solid uranium bromides (V.4.3.1.3) ..........................................................228 9.4.4.2.1 UBr4 (cr).............................................................................................228
9.4.5 Iodides compounds and complexes (V.4.4.1)...................................................228 9.4.5.1 Gaseous uranium iodides (V.4.4.1.1) ........................................................228
9.4.5.1.1 UI(g), UI2(g) and UI3(g).....................................................................229 9.4.5.1.2 UI4(g) .................................................................................................229
9.4.5.2 Solid uranium iodides (V.4.4.1.3) .............................................................230
9.5 Uranium group 16 (chalcogens) compounds and complexes (V.5) .........................230 9.5.1 Aqueous uranium sulphate (V.5.1.3.1).............................................................230 9.5.1.1 Aqueous U(VI) sulphates .................................................................................230
9.5.1.1.1 Binary complexes...............................................................................230 9.5.1.1.2 Ternary hydroxide-sulphate complexes .............................................232

CONTENTS xix
9.5.2 Aqueous uranium selenate (V.5.2.3.1) .............................................................233 9.5.3 Tellurium compounds (V.5.3) ..........................................................................234
9.5.3.1 Uranium tellurides (V.5.3.1) .....................................................................234 9.5.3.1.1 Binary uranium tellurides (V.5.3.1.1) ................................................234
9.5.3.2 Solid uranium tellurites (V.5.3.2.2)...........................................................234 9.5.3.2.1 Uranium(VI) monotellurites...............................................................234 9.5.3.2.2 Uranium(VI) polytellurites.................................................................236
9.6 Uranium group 15 compounds and complexes (V.6) ..............................................236 9.6.1 Nitrogen compounds and complexes (V.6.1) ...................................................236
9.6.1.1 Uranium nitrides (V.6.1.1) ........................................................................236 9.6.1.1.1 UN(cr) (V.6.1.1.1)..............................................................................237 9.6.1.1.2 UN(g) .................................................................................................237
9.6.1.2 Uranium Nitrates (V.6.1.3)........................................................................239 9.6.1.2.1 Aqueous U(VI) nitrates ......................................................................239
9.6.2 Uranium sulphamate.........................................................................................239 9.6.2.1 Aqueous U(VI) sulphamate.......................................................................239
9.6.3 Uranium phosphorus compounds and complexes (V.6.2) ................................239 9.6.3.1 Aqueous uranium phosphorus species (V.6.2.1.) ......................................239
9.6.3.1.1 The uranium–phosphoric acid system (V.6.2.1.1)..............................239 9.6.3.1.1.1 Complex formation in the U(VI)–H3PO4 system ........................239 9.6.3.1.1.2 Complex formation in the U(IV)–H3PO4 system ........................241
9.6.3.2 Solid uranium phosphorus compounds (V.6.2.2) ......................................242 9.6.3.2.1 Uranium orthophosphates (V.6.2.2.5) ................................................242
9.6.3.2.1.1 U(VI) orthophosphates................................................................242 9.6.3.2.2 U(VI) phosphates and vanadates (V.6.2.2.10)....................................243 9.6.3.2.3 U(VI) fluorophosphates......................................................................243
9.6.4 U(VI) arsenates (V.6.3.2.1) ..............................................................................243 9.6.4.1 Aqueous U(VI) arsenates ..........................................................................243
9.6.5 USb(cr) (V.6.4.1)..............................................................................................244
9.7 Uranium group 14 compounds and complexes (V.7) ..............................................244 9.7.1 Uranium carbides (V.7.1.1) ..............................................................................244

CONTENTS xx
9.7.1.1 UC(cr) (V.7.1.1.1) .....................................................................................244 9.7.2 The aqueous uranium carbonate system (V.7.1.2.1).........................................244
9.7.2.1 Uranium(VI) carbonates............................................................................244 9.7.2.1.1 Binary U(VI) carbonate complexes....................................................246 9.7.2.1.2 Ternary U(VI) hydroxide carbonate complexes.................................247 9.7.2.1.3 Ternary U(VI) fluoride carbonate complexes ....................................248 9.7.2.1.4 Calcium uranium carbonate complex.................................................248
9.7.2.2 Solid U(VI) carbonates compounds ..........................................................249 9.7.2.3 Uranium(V) carbonates .............................................................................250
9.7.2.3.1 Aqueous U(V) carbonates complexes ..............................................................250 9.7.2.4 Uranium(IV) carbonates............................................................................250
9.7.2.4.1 Binary U(IV) carbonate complexes....................................................250 9.7.2.4.2 Ternary U(IV) hydroxide carbonate complexes.................................251
9.7.3 Silicon compounds and complexes (V.7.2) ......................................................252 9.7.3.1 Aqueous uranium silicates (V.7.2.1) .........................................................252 9.7.3.2 Solid uranium silicates (V.7.2.2) ...............................................................254
9.7.3.2.1 Solid U(IV) silicates...........................................................................254 9.7.3.2.2 Solid U(VI) silicates...........................................................................254 9.7.3.2.3 (UO2)2SiO4·2H2O (soddyite) (V.7.2.2.1)............................................254 9.7.3.2.4 Ca(UO2)2(SiO3OH)2·5H2O (uranophane), Na(UO2)(SiO3OH)·2H2O
(sodium boltwoodite) and Na2(UO2)2(Si2O5)3·4H2O (sodium weeksite) .....................................................................................256
9.8 Uranium actinide complexes (V.8)..........................................................................257 9.8.1 Actinides–actinides interactions (V. 8.1)..........................................................257
9.9 Uranium group 2 (alkaline-earth) compounds (V.9) ...............................................257 9.9.1 Magnesium compounds (V.9.2) .......................................................................257 9.9.2 Calcium compounds (V.9.3).............................................................................259
9.9.2.1 Calcium uranates (V.9.3.1.).......................................................................259 9.9.2.1.1 CaUO4(cr) (V.9.3.1.1) ........................................................................259 9.9.2.1.2 CaUO6O19 · 11H2O(cr) .......................................................................259 9.9.2.1.3 Other calcium uranates.......................................................................259
CONTENTS xxi
9.9.3 Strontium compounds (V.9.4) ..........................................................................259 9.9.3.1 SrUO3(cr) ..................................................................................................260 9.9.3.2 Strontium uranates (VI).............................................................................261
9.9.3.2.1 α–SrUO4 (V.9.4.1.1)...........................................................................261 9.9.3.2.2 β–SrUO4 (V.9.4.1.2)...........................................................................261 9.9.3.2.3 SrU4O13 (V.9.4.2) ...............................................................................262 9.9.3.2.4 Sr2UO5 (V.9.4.3) ................................................................................262 9.9.3.2.5 Sr2U3O11 (V.9.4.4)..............................................................................263 9.9.3.2.6 Sr3UO6 (V.9.4.5) ...............................................................................263 9.9.3.2.7 Sr3U11O36............................................................................................263 9.9.3.2.8 Sr5U3O14 .............................................................................................264 9.9.3.2.9 Sr3U2O9 ..............................................................................................264
9.9.3.3 Strontium uranates (V) ..............................................................................265 9.9.3.3.1 Sr2UO4.5..............................................................................................265
9.9.3.4 Strontium uranium tellurites......................................................................265 9.9.4 Barium compounds (V.9.5) ..............................................................................265
9.9.4.1 BaUO3(cr) (V.9.5.1.1) ...............................................................................265
9.10 Uranium group 1 (alkali) compounds (V.10) ..........................................................267 9.10.1 General .............................................................................................................267 9.10.2 Lithium compounds (V.10.1) ...........................................................................269
9.10.2.1 Other uranates ...........................................................................................269 9.10.3 Sodium compounds (V.10.2)............................................................................271
9.10.3.1 Sodium monouranates (VI) (V.10.2.1.1)...................................................271 9.10.3.2 Sodium monouranates (V) (V.10.2.1.2) ....................................................271
9.10.3.2.1 NaUO3(cr) ..........................................................................................271 9.10.3.3 Other sodium uranates...............................................................................272 9.10.3.4 Sodium polyuranates (V.10.2.2)................................................................274
9.10.3.4.1 Na2U2O7(cr) (V.10.2.2.1) ...................................................................274 9.10.3.4.2 Na6U7O24(cr) (V.10.2.2.3) ..................................................................274
9.10.4 Potassium compounds (V.10.3)........................................................................274 9.10.4.1 KUO3 (cr) (V.10.3.1).................................................................................274

CONTENTS xxii
9.10.4.2 K2U2O7(cr) (V.10.3.3) ...............................................................................275 9.10.4.3 K2U4O12(cr), K2U4O13(cr) ....................................................................275 9.10.4.4 K2U6O19 · 11H2O(cr) .................................................................................275
9.10.5 Rubidium compounds (V.10.4) ........................................................................275 9.10.5.1 RbUO3(cr) (V.10.4.1) ................................................................................275 9.10.5.2 Rb2U3O8.5(cr), Rb2U4O11(cr), Rb2U4O12(cr) and Rb2U4O13(cr) .................276 9.10.5.3 Rb2U(SO4)3(cr) ..........................................................................................277
9.10.6 Caesium compounds (V.10.5) ..........................................................................277 9.10.6.1 Caesium monouranate (V.10.5.1)..............................................................277 9.10.6.2 Caesium polyuranates (V.10.5.2) ..............................................................277
9.10.6.2.1 Cs2U2O7(cr) (V.10.5.2.1)....................................................................277 9.10.6.2.2 Cs4U5O17(cr).......................................................................................278 9.10.6.2.3 Cs2U4O12(cr) and Cs2U4O13(cr) ..........................................................278
9.11 Uranium compounds with elements from other groups...........................................279 9.11.1 Thallium compounds ........................................................................................279
9.11.1.1 Thallium uranates ......................................................................................279 9.11.2 Zinc compounds. ..............................................................................................280 9.11.3 Polyoxometallates.............................................................................................280
9.12 Uranium mineral phases ..........................................................................................282 9.12.1 Introduction ......................................................................................................282 9.12.2 Review of papers ..............................................................................................282 9.12.3 Summary of mineral information .....................................................................285
10 DISCUSSION OF NEW DATA SELECTION FOR NEPTUNIUM 293
10.1 Neptunium aqua ions (7) .........................................................................................293
10.2 Neptunium oxygen and hydrogen compounds and complexes (8) ..........................294 10.2.1 Aqueous neptunium hydroxide complexes (8.1) ..............................................294
10.2.1.1 Neptunium (VI) hydroxide complex (8.1.2)..............................................294 10.2.1.2 Neptunium(V) hydroxide complexes (8.1.3).............................................294 10.2.1.3 Neptunium(IV) hydroxide complexes (8.1.4) ...........................................294
10.2.2 Crystalline and amorphous neptunium oxides and hydroxides (8.2)................297

CONTENTS xxiii
10.2.2.1 Solubility of neptunium(V) oxides and hydroxides (8.2.4) .......................297 10.2.2.2 Neptunium(IV) oxides and hydroxides (8.2.5)..........................................297
10.2.2.2.1 Solubility of crystalline oxide NpO2(cr) (8.2.5.1) ..............................297 10.2.2.2.2 Solubility of amorphous oxide NpO2(am, hydr.) (8.2.5.2).................298
10.3 Neptunium halide compounds (9.1).........................................................................299 10.3.1 Neptunium fluoride compounds (9.1.2)............................................................299
10.3.1.1 NpF(g), NpF2(g), NpF3(g) (9.1.2.1, 9.1.2.3)..............................................299
10.4 Neptunium group 15 compounds and complexes (11) ............................................300 10.4.1 Neptunium nitrogen compounds (11.1)............................................................300
10.4.1.1 NpN(cr) (11.1.1.1).....................................................................................300 10.4.2 Neptunium antimony compounds.....................................................................301
10.4.2.1 Neptunium antimonides ............................................................................301 10.4.2.1.1 Neptunium monoantimonide..............................................................301
10.5 Neptunium chloride (9.2.2), nitrate (11.1.4.1) complexes and complexes with other actinides...................................................................................................................301
10.6 Neptunium carbon compounds and complexes (12.1).............................................301 10.6.1 Aqueous neptunium carbonate complexes (12.1.2.1).......................................301
10.6.1.1 Ternary Np(IV) hydroxide-carbonate complexes......................................302 10.6.2 Solid neptunium carbonates (12.1.2.2) .............................................................305
10.6.2.1 Solid alkali metal neptunium(V) carbonates hydrates (12.1.2.2.2) ...........305 10.6.2.1.1 Sodium neptunium(V) carbonates......................................................305 10.6.2.1.2 Potassium neptunium(V) carbonates..................................................311
11 DISCUSSION OF NEW DATA SELECTION FOR PLUTONIUM 313
11.1 Plutonium aqua ions (16.1)......................................................................................313
11.2 Plutonium oxygen and hydrogen compounds and complexes (17)..........................313 11.2.1 Aqueous hydroxide complexes (17.1) ..............................................................313
11.2.1.1 Plutonium(V) hydroxide complexes (17.1.2) ............................................313 11.2.1.2 Plutonium(IV) hydroxides complexes (17.1.3) .........................................313
11.2.2 Solid plutonium oxides and hydroxides (17.2).................................................315 11.2.2.1 Plutonium(IV) oxides and hydroxides.......................................................315

CONTENTS xxiv
11.2.2.1.1 Solubility of crystalline oxide PuO2(cr) (17.2.1.2).............................316 11.2.2.1.2 Solubility of amorphous oxide and hydroxide PuO2(am, hydr.) ........316
11.2.3 Comparison of thermodynamic data for oxides and hydroxide complexes of tet-ravalent actinides ..............................................................................................318
11.2.3.1 Solid oxides and aqueous hydroxide complexes of tetravalent actinides ..318 11.2.3.2 Crystalline and amorphous oxides.............................................................321
11.3 Plutonium group 17 complexes ...............................................................................323 11.3.1 Aqueous plutonium chloride complexes (18.2.2.1) ..........................................323
11.3.1.1 Pu(III) chloride complexes ........................................................................323 11.3.1.2 Pu(VI) chloride complexes........................................................................323 11.3.1.3 Cation-cation complexes of Pu(V) ............................................................324
11.4 Plutonium group 16 compounds and complexes (19)..............................................324 11.4.1 Plutonium selenium compounds.......................................................................324
11.4.1.1 Plutonium selenides...................................................................................324 11.4.1.1.1 Plutonium monoselenide ....................................................................324
11.4.2 Plutonium tellurium compounds ......................................................................325 11.4.2.1 Plutonium tellurides ..................................................................................325
11.4.2.1.1 Plutonium monotelluride....................................................................325
11.5 Plutonium nitrogen compounds and complexes ......................................................325 11.5.1 Plutonium nitrides ............................................................................................325
11.5.1.1 PuN(cr) ......................................................................................................325
11.6 Plutonium carbon compounds and complexes (21.1.2) ...........................................325 11.6.1 Aqueous plutonium carbonates (21.1.2.1) ........................................................325
11.6.1.1 Pu(VI) carbonate complexes (21.1.2.1.1)..................................................325 11.6.1.2 Pu(IV) carbonate complexes (21.1.2.1.3)..................................................327
11.6.2 Solid plutonium carbonate (21.1.2.2) ...............................................................331 11.6.2.1 Solid Pu(VI) carbonates (21.1.2.2.1).........................................................331
11.7 Plutonium group 2 (alkaline-earth) compounds ......................................................332 11.7.1 Plutonium-strontium compounds (22.1) ...........................................................332 11.7.2 Plutonium-barium compounds (22.1)...............................................................332
11.7.2.1 BaPuO3(cr) (22.2.2)...................................................................................332

CONTENTS xxv
12 DISCUSSION OF NEW DATA SELECTION FOR AMERICIUM 333
12.1 Introductory remarks ...............................................................................................333 12.1.1 Estimation of standard entropies (V.4.2.1.2) ....................................................333 12.1.2 Introductory remarks on the inclusion of thermodynamic data of aqueous
Cm(III) complexes in this review.....................................................................334
12.2 Elemental americium (V.1) .....................................................................................335 12.2.1 Americium ideal monatomic gas (V.1.2)..........................................................335
12.2.1.1 Heat capacity and entropy (V.1.2.1)..........................................................335 12.2.1.2 Enthalpy of formation (V.1.2.2) ................................................................336
12.3 Americium oxygen and hydrogen compounds and complexes (V.3) ......................336 12.3.1 Aqueous americium hydroxide complexes (V.3.1) ..........................................336
12.3.1.1 Aqueous Am(III) and Cm(III) hydroxide complexes (V.3.1.1).................336 12.3.1.2 Aqueous Am(V) hydroxide complexes (V.3.1.2)......................................342
12.3.2 Solid americium oxides and hydroxides (V.3.2) ..............................................343 12.3.2.1 Americium oxides .....................................................................................343 12.3.2.2 Solid Am(III) hydroxides (V.3.2.4)...........................................................343 12.3.2.3 Solid Am(V) hydroxides (V.3.2.5)............................................................352
12.4 Americium group 17 (halogen) compounds and complexes (V.4) ..........................354 12.4.1 Aqueous group 17 (halogen) complexes (V.4.1) ..............................................354
12.4.1.1 Aqueous Am(III) fluorides (V.4.1.1).........................................................354 12.4.1.2 Aqueous Am(III) chloride complexes (V.4.1.2)........................................356 12.4.1.3 Aqueous Am(III) and Cm(III) chlorides (V.4.1.2.1) .................................356
12.4.2 Americium halide compounds (V.4.2) .............................................................358 12.4.2.1 Enthalpies of formation .............................................................................358 12.4.2.2 Americium fluoride compounds (V.4.2.2) ................................................359
12.4.2.2.1 Americium trifluoride (V.4.2.2.1) ......................................................359 12.4.2.2.1.1 AmF3(cr) .....................................................................................359 12.4.2.2.1.2 AmF3(g) ......................................................................................360
12.4.2.2.2 Americium tetrafluoride (V.4.2.2.2) ..................................................361 12.4.2.3 Americium chlorides (V.4.2.3)..................................................................362
12.4.2.3.1 Americium trichloride (V.4.2.3.2)......................................................362

CONTENTS xxvi
12.4.2.3.1.1 AmCl3(cr)....................................................................................362 12.4.2.3.2 Americium oxychloride (V.4.2.3.3) ...................................................362 12.4.2.3.3 Quaternary chloride Cs2NaAmCl6(cr) (V.4.2.3.4.2)...........................363
12.4.2.4 Americium bromides (V.4.2.4) .................................................................363 12.4.2.4.1 Americium tribromide (V.4.2.4.2) .....................................................363
12.4.2.4.1.1 AmBr3(cr) ...................................................................................363 12.4.2.4.2 Americium oxybromide (V.4.2.4.3) ...................................................363
12.4.2.5 Americium iodides (V.4.2.5).....................................................................364 12.4.2.5.1 Americium triiodide (V.4.2.5.2).........................................................364
12.4.2.5.1.1 AmI3(cr) ......................................................................................364
12.5 Americium group 16 (chalcogen) compounds and complexes (V.5).......................365 12.5.1 Americium sulphates (V.5.1.2).........................................................................365
12.5.1.1 Aqueous Am(III) and Cm(III) sulphate complexes(V.5.1.2.1) .................365
12.6 Americium group 14 compounds and complexes (V.7) ..........................................369 12.6.1 Carbon compounds and complexes (V.7.1)......................................................369
12.6.1.1 Americium carbonate compounds and complexes (V.7.1.2).....................369 12.6.1.1.1 Aqueous Am(III) and Cm(III) carbonate complexes .........................369
12.6.1.1.1.1 Tetracarbonato complex..............................................................374 12.6.1.1.1.2 Am(III) and Cm(III) bicarbonate complexes ..............................375 12.6.1.1.1.3 Mixed Am(III) and Cm(III) hydroxide–carbonate complexes ....376
12.6.1.1.2 Am(V) carbonate complexes..............................................................376 12.6.1.1.3 Solid americium carbonates (V.7.1.2.2).............................................378
12.6.1.1.3.1 Americium(III) hydroxycarbonate AmOHCO3(s) ......................378 12.6.1.1.3.2 Americium(III) carbonate Am2(CO3)3(s) ....................................381 12.6.1.1.3.3 Sodium americium(III) carbonates..............................................382 12.6.1.1.3.4 Sodium dioxoamericium(V) carbonate NaAmO2CO3(s) ............384
12.6.2 Aqueous americium silicates (V.7.2.2).............................................................385
12.7 Americium group 6 compounds and complexes (V.10) ..........................................386 12.7.1 Americium(III) molybdate compounds and complexes ...................................386 12.7.2 Aqueous complexes with tungstophosphate and tungstosilicate heteropolyanions
(V.10.2) ............................................................................................................386
CONTENTS xxvii
13 DISCUSSION OF NEW DATA SELECTION FOR TECHNETIUM 389
13.1 Elemental technetium (V.1).....................................................................................389 13.1.1 Heat capacity and entropy (V.1.1.2).................................................................389
13.2 Simple technetium aqua ions of each oxidation state (V.2).....................................390 13.2.1 (V.2.1) ...................................................................................................390 4TcO−
13.3 Oxide and hydrogen compounds and complexes (V.3) ...........................................390 13.3.1 The acid/base chemistry of Tc(IV) (V.3.1.1)....................................................390 13.3.2 The protonation of 4TcO− (V.3.1.2.1)...............................................................390 13.3.3 General properties, hydration number (V.3.2.5.1)............................................391
13.4 Group 17 (halogen) compounds and complexes (V.4) ............................................391 13.4.1 Aqueous Tc(IV) halides (V.4.2.1.1) .................................................................391 13.4.2 Other aqueous halides (V.4.2.1.3) ....................................................................391
13.5 Technetium nitrido compounds (V.6.1.3.1).............................................................392
14 DISCUSSION OF NEW AUXILIARY DATA SELECTION 393
14.1 Group 16 (chalcogen) auxiliary species...................................................................393 14.1.1 Tellurium auxiliary species ..............................................................................393
14.1.1.1 TeO2(cr).....................................................................................................393
14.2 Other auxiliary species ............................................................................................393 14.2.1 Copper auxiliary species...................................................................................393
14.2.1.1 CuCl(g)......................................................................................................393
14.3 Group 2 (alkaline earth) auxiliary data ....................................................................394 14.3.1 Calcium Auxiliary data.....................................................................................394
14.3.1.1 CaF(g) .......................................................................................................394 14.3.1.2 CaCl(g) ......................................................................................................394
14.3.2 Barium Auxiliary data ......................................................................................395 14.3.2.1 Ba(g)..........................................................................................................395 14.3.2.2 BaF(g) .......................................................................................................395
14.4 Sodium auxiliary data ..............................................................................................395 14.4.1 NaNO3(cr) and NaNO3(aq)...............................................................................395

CONTENTS xxviii
Part IV Appendices 395
A Discussion of selected references 397
B Ionic strength corrections 707
B.1 The specific ion interaction equations .....................................................................709 B.1.1 Background ......................................................................................................709 B.1.2 Ionic strength corrections at temperatures other than 298.15 K .......................715 B.1.3 Estimation of ion interaction coefficients.........................................................717
B.1.3.1 Estimation from mean activity coefficient data.........................................717 B.1.3.2 Estimations based on experimental values of equilibrium constants at dif-
ferent ionic strengths ........................................................................................717 B.1.4 On the magnitude of ion interaction coefficients..............................................721
B.2 Ion interaction coefficients versus equilibrium constants for ion pairs ...................722
B.3 Tables of ion interaction coefficients.......................................................................723
C Assigned uncertainties 735
C.1 The general problem. ...............................................................................................735
C.2 Uncertainty estimates in the selected thermodynamic data. ....................................737
C.3 One source datum ....................................................................................................738
C.4 Two or more independent source data .....................................................................739 C.4.1 Discrepancies....................................................................................................741
C.5 Several data at different ionic strengths...................................................................743 C.5.1 Discrepancies or insufficient number of data points.........................................746
C.6 Procedures for data handling ...................................................................................748 C.6.1 Correction to zero ionic strength ......................................................................748 C.6.2 Propagation of errors ........................................................................................750 C.6.3 Rounding ..........................................................................................................751 C.6.4 Significant digits...............................................................................................752

CONTENTS xxix
D Some limitations encountered in the use of the ionic strength correction procedures 753
D.1 Implications of neglecting triple ion interactions and the use of constant values for ε(j,k,Im) .................................................................................................................754
D.2 Implications of neglecting anion-anion and cation-cation interactions ...................756 D.2.1 On the magnitude of anion-anion and cation-cation interactions .....................757 D.2.2 Discussion of ion interaction coefficients for the carbonate ion and the conse-
quences for selected data ..................................................................................762
Bibliography 765
List of authors 881
CONTENTS xxx
List of Figures
Figure 2-1: Standard order of arrangement of the elements and compounds based on the periodic classification of the elements ........................................................27
Figure 9-1: Vapour pressure of UF4(cr, l) included data..............................................202
Figure 9-2: Vapour pressure of UF4(cr, l) excluded data .............................................203
Figure 9-3: Vapour pressure of UCl4(cr, l)...................................................................218
Figure 9-4: Vapour pressure of UBr4(cr, l) ..................................................................227
Figure 9-5: Structure of the ternary complex 2 2 3 3(UO ) (CO )(OH)− .............................248
Figure 9-6: Heat capacity coefficient versus temperature for some uranium alkali compounds ................................................................................................268
Figure 10-1: SIT extrapolation to I = 0 for the reaction: + + 2
2 3 2 2 3 2NaNpO CO 3.5H O(s) Na +NpO +CO +3.5 H O(l)−⋅ ..................304
Figure 10-2: SIT extrapolation to I = 0 for the reaction: + + 2
2 3 2 2 3 2NaNpO CO 3.5H O(s) Na +NpO +CO +3.5 H O(l)−⋅ ................308
Figure 11-1. Solubility of PuO2(am, hydr.)....................................................................329
Figure 12-1: Application of the SIT to literature data in dilute to concentrated NaCl and 0.1 m NaClO4, for the equilibrium: An ..... 340 3+ +
2+ H O(l) An(OH) +H+
Figure 12-2: Application of the SIT to literature data in dilute to concentrated NaCl and 0.1 m NaClO4, for the equilibrium: ....341 3+ +
2 2An +2H O(l) An(OH) +2H+
Figure 12-3: Solubility measurements of crystalline Am(III) hydroxide and aged Am(OH)3(s) in 0.1 M NaClO4 and NaCl at 298.15 K ..............................346
Figure 12-4: Solubility measurements of amorphous Am(III) hydroxide in pH–adjusted dilute solutions and 0.1 M NaClO4 ..........................................................347

LIST OF FIGURES xxxi
Figure 12-5: Solubility constants of amorphous Np(V) and Am(V) hydroxides in 0.3 – 5.6 m NaCl solution .........................................................................353
Figure 12-6: Distribution of Cm species at 298.15 K as a function of the CaCl2
concentration. ............................................................................................357
Figure 12-7: Vapour Pressure of AmF3(cr) ....................................................................361
Figure 12-8: Extrapolation to I = 0 of experimental data for the formation of Am(III) and Cm(III) sulphate complexes .....................................................................367
Figure 12-9: Application of the SIT to the stepwise formation constants of Am(III) and Cm(III) carbonate complexes in dilute to concentrated NaCl solutions ...372
Figure A-1: Comparison of solubility measurements for Am(OH)3(cr) and aged Am(OH)3(s) in 0.1 M NaClO4 at 25°C. ....................................................411
Figure A-2. Solubility of NaAm(CO3)2·xH2O determined at 25°C and 22°C, respectively, in 5.6 m NaCl solution under an atmosphere of
2= 10
COp –2 bar
in argon......................................................................................................429
Figure A-3: Speciation diagram of [U4+] = 10–7 M and [ 23CO − ] = 1.5·10–3 M..............450
Figure A-4: Speciation diagram of [U4+] = 10–7 M and [ 23CO − ] = 2.1·10–1 M..............450
Figure A-5. Experimental data of [95PAL/NGU] as Z versus – log10[H+] ...................500
Figure A-6. Experimental data Z versus – log10[H+] from [95PAL/NGU] and the corre-sponding calculated values from the equilibrium constants obtained by this review using the LETAGROP least-squares program...............................502
Figure A-7: Application of the SIT to Np(V) solubility data in K2CO3 solutions ≥ 0.17 mol · kg–1, reaction: ....572 2 5
2 3 3 2 3 3KNpO (CO )(s)+2CO NpO (CO ) +K− − +
+Figure A-8: Application of the SIT to Np(V) solubility data in K2CO3 solutions ≥ 0.17
mol·kg–1, reaction: K 573 2 53 2 3 2 3 2 3 3NpO (CO ) (s)+CO NpO (CO ) 3K− − +
Figure A-9: Speciation at zero ionic strength calculated using equilibrium constants given by Meinrath. ....................................................................................599
Figure A-10: Speciation in the U(VI) hydroxide system at zero ionic strength using the equilibrium constants selected in [92GRE/FUG]. .....................................600
Figure A-11: Speciation in the U(VI) hydroxide system in 0.1 M NaClO4 using the equi-librium constants of Meinrath. ..................................................................601

LIST OF FIGURES xxxii
Figure A-12: Speciation in the U(VI) hydroxide system using the equilibrium constants from Meinrath recalculated to 3 M NaClO4. .............................................602
Figure A-13: Speciation in the U(VI) hydroxide system using the equilibrium constants from [92GRE/FUG] recalculated to 3 M NaClO4. ....................................603
Figure A-14: Speciation in the U(VI) hydroxide system using the equilibrium constants from Meinrath recalculated to 3 M NaClO4, but excluding the 7:4 species. ... ...................................................................................................................604
Figure A-15: Speciation in the U(VI) hydroxide system using the equilibrium constants from [92GRE/FUG] recalculated to 3 M NaClO4, but excluding the 7:4 spe-cies.............................................................................................................605
Figure A-16: Speciation diagram of U(VI) in alkaline solutions according to constants given in [2000NGU/PAL] where precipitation of uranyl phases has been suppressed .................................................................................................677
Figure A-17: Experimental Np(IV) solubility data measured upon freshly formed solid particles of Np(OH)4(am) as a function of the H+ or D+ concentration in 0.1 M perchlorate solution.........................................................................694
Figure A-18: Np(IV) species distribution in 0.1 M HClO4–NaClO4. .............................694
Figure A-19: Speciation diagram obtained in perchlorate media assuming that no precipi-tation occurs ..............................................................................................699
Figure A-20: Speciation diagram obtained in nitrate media (no precipitation of uranyl spe-cies is assumed).........................................................................................700
Figure B-1: Plot of log10β1 +4D versus Im for reaction (B.12), at 25°C and 1 bar.. .....719
Figure D-1: Trace activity coefficients of the H+ ion in NaCl and CsCl solution at 25°C...................................................................................................................758
Figure D-2: Trace activity coefficients of the 23CO − ion in NaCl and NaClO4 solution at
25°C...........................................................................................................761
Figure D-3: Trace activity coefficients of the 24SO − ion in NaCl and NaTcO4 solution at
25°C...........................................................................................................761

List of Tables
Table 2-1: Abbreviations for experimental methods ......................................................9
Table 2-2: Symbols and terminology............................................................................11
Table 2-3: Abbreviations used as subscripts of ∆ to denote the type of chemical process.........................................................................................................15
Table 2-4: Unit conversion factors ...............................................................................28
Table 2-5: Factors ρ for the conversion of molarity, cB, to molality, mB, of a substance B, in various media at 298.15 K .................................................................30
Table 2-6: Reference states for some elements at the reference temperature of 298.15 K and standard pressure of 0.1 MPa................................................................31
Table 2-7: Fundamental physical constants ..................................................................36
Table 3-1: Selected thermodynamic data for uranium compounds and complexes ......45
Table 3-2: Selected thermodynamic data for reaction involving uranium compounds and complexes .............................................................................................64
Table 3-3: Selected temperature coefficients for heat capacities of uranium compounds ..................................................................................................76
Table 4-1: Selected thermodynamic data for neptunium compounds and complexes ..81
Table 4-2: Selected thermodynamic data for reaction involving neptunium compounds and complexes .............................................................................................88
Table 4-3: Selected temperature coefficients for heat capacities of neptunium compounds ..................................................................................................95
Table 5-1: Selected thermodynamic data for plutonium compounds and complexes...99
xxxiii

LIST OF TABLES xxxiv
Table 5-2: Selected thermodynamic data for reaction involving plutonium compounds and complexes ...........................................................................................105
Table 5-3: Selected temperature coefficients for heat capacities of plutonium compounds ................................................................................................111
Table 6-1: Selected thermodynamic data for americium compounds and complexes ...... ...................................................................................................................115
Table 6-2: Selected thermodynamic data for reaction involving americium compounds and complexes ...........................................................................................119
Table 6-3: Selected temperature coefficients for heat capacities of americium compounds ................................................................................................123
Table 7-1: Selected thermodynamic data for technetium compounds and complexes..................................................................................................127
Table 7-2: Selected thermodynamic data for reaction involving technetium compounds and complexes ...........................................................................................129
Table 7-3: Selected temperature coefficients for heat capacities of technetium compounds ................................................................................................132
Table 8-1: Selected thermodynamic data for auxiliary compounds and complexes. ..135
Table 8-2: Selected thermodynamic data for reactions involving auxiliary compounds and complexes ...........................................................................................149
Table 9-1: Molecular parameters for UO(g) ..............................................................161
Table 9-2: Derived values of f mH ο∆ (UO2(OH)2, g, 298.15 K)...................................163
Table 9-3: Experimental equilibrium constants for the U(VI) hydroxide system for the equilibria: ..................................................................................................166
Table 9-4: Experimental equilibrium constants for the U(VI) hydroxide system.......167
Table 9-5: Literature data for the solubility product of schoepite and Na2U2O7(s).....168
Table 9-6: Selected values for U(VI) hydrolysis species at 298.15 K ........................179
Table 9-7: Equilibrium constants and solubility product [2001NEC/KIM]................187
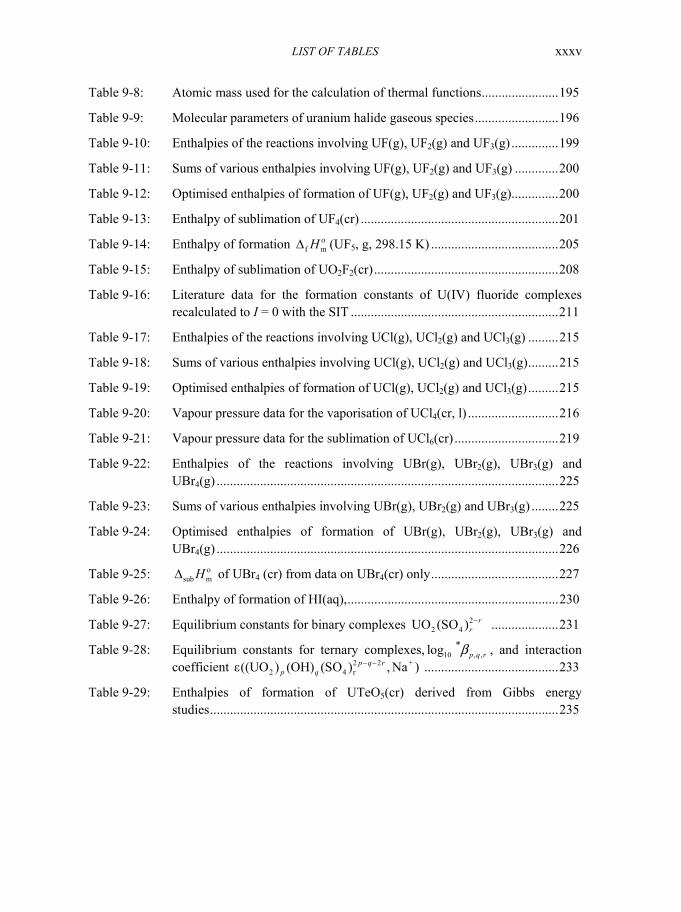
LIST OF TABLES xxxv
Table 9-8: Atomic mass used for the calculation of thermal functions.......................195
Table 9-9: Molecular parameters of uranium halide gaseous species.........................196
Table 9-10: Enthalpies of the reactions involving UF(g), UF2(g) and UF3(g) ..............199
Table 9-11: Sums of various enthalpies involving UF(g), UF2(g) and UF3(g) .............200
Table 9-12: Optimised enthalpies of formation of UF(g), UF2(g) and UF3(g)..............200
Table 9-13: Enthalpy of sublimation of UF4(cr) ...........................................................201
Table 9-14: Enthalpy of formation f mH ο∆ (UF5, g, 298.15 K) ......................................205
Table 9-15: Enthalpy of sublimation of UO2F2(cr).......................................................208
Table 9-16: Literature data for the formation constants of U(IV) fluoride complexes recalculated to I = 0 with the SIT ..............................................................211
Table 9-17: Enthalpies of the reactions involving UCl(g), UCl2(g) and UCl3(g) .........215
Table 9-18: Sums of various enthalpies involving UCl(g), UCl2(g) and UCl3(g).........215
Table 9-19: Optimised enthalpies of formation of UCl(g), UCl2(g) and UCl3(g).........215
Table 9-20: Vapour pressure data for the vaporisation of UCl4(cr, l) ...........................216
Table 9-21: Vapour pressure data for the sublimation of UCl6(cr) ...............................219
Table 9-22: Enthalpies of the reactions involving UBr(g), UBr2(g), UBr3(g) and UBr4(g) ......................................................................................................225
Table 9-23: Sums of various enthalpies involving UBr(g), UBr2(g) and UBr3(g) ........225
Table 9-24: Optimised enthalpies of formation of UBr(g), UBr2(g), UBr3(g) and UBr4(g) ......................................................................................................226
Table 9-25: sub mH ο∆ of UBr4 (cr) from data on UBr4(cr) only......................................227
Table 9-26: Enthalpy of formation of HI(aq),...............................................................230
Table 9-27: Equilibrium constants for binary complexes 22 4UO (SO ) r
r− ....................231
Table 9-28: Equilibrium constants for ternary complexes, lo 10 , ,*g p q rb , and interaction
coefficient ........................................233 2 2 +2 4 r((UO ) (OH) (SO ) , Na )p q r
p q− −ε
Table 9-29: Enthalpies of formation of UTeO5(cr) derived from Gibbs energy studies........................................................................................................235

LIST OF TABLES xxxvi
Table 9-30: Enthalpies of formation of UTe3O9(cr) derived from Gibbs energy studies........................................................................................................236
Table 9-31: Comparison of selected values from [90HAY/THO] and [92GRE/FUG].237
Table 9-32: Equilibrium constants related to the reaction: ...........................................243 2+ + 3 2 3
2 4 2UO H AsO UO H (AsO ) r qr qr q −+ + 4
+ −
Table 9-33: Equilibrium constants in the U(VI) carbonate systems .............................245
Table 9-34: Equilibrium constants of the ...252 2+ + +2 4 2 3UO Si(OH) (aq) UO SiO(OH) H+ +
Table 9-35: Enthalpies sol m f m and H H∆∆ of SrUO4-x .................................................261
Table 9-36: Derived heat capacity equations ................................................................269
Table 9-37: Derived enthalpies of reactions from stoichiometric phases .....................270
Table 9-38: Derived enthalpies of insertion reactions ..................................................270
Table 9-39: Derived enthalpies of reactions from stoichiometric phases .....................272
Table 9-40: Derived enthalpies of insertion reactions ..................................................273
Table 9-41: Conditional equilibrium constants K1 and K2 at different concentrations of [H+] .......................................................................................................281
Table 9-42: Conditional equilibrium constants of U(VI) with some polyoxometalate anions.. ......................................................................................................282
Table 9-43: Minerals of uranium and related solid phases of interest for geochemical modelling...................................................................................................286
Table 10-1: Solubility constants of NaNpO2CO3·3.5H2O(s) and Na3NpO2(CO3)2(s) at 20 – 25°C and conversion to I = 0 with the SIT ........................................307
Table 11-1: Summary of solubility and equilibrium constants for tetravalent actinides retained for discussion or selected by this review .....................................318
Table 11-2: Standard Gibbs energy of formation of tetravalent actinides ions and oxides ........................................................................................................319
Table 11-3: Comparison of equilibrium constants 10 ,0log sK ο derived from thermochemi-cal data and solubility experiments ...........................................................321

LIST OF TABLES xxxvii
Table 12-1 Summary of entropy contributions for some Am compounds...................334
Table 12-2: Literature data for Am(III) and Cm(III) hydroxide complexes used in the previous [95SIL/BID] and present reviews for the evaluation of equilibrium constants at I = 0........................................................................................338
Table 12-3: Solubility constants for Am(III) hydroxides and conversion to I = 0, with the SIT coefficients in Appendix B. ................................................................344
Table 12-4: Literature data for the solubility of Am(III) in alkaline solution (pH = 11 to 13). ........................................................................................................349
Table 12-5: Literature values of the formation constants for (3 )AnF nn
− and complexes..................................................................................................355
(3 )CmF nn
−
Table 12-6: Estimated enthalpies of formation of americium halides at 298.15 K ......359
Table 12-7: Calculations of mS ο (AnF4, cr, 298.15 K) ...................................................362
Table 12-8: Data for Am(III) and Cm(III) carbonate complexes discussed in the present and previous [95SIL/BID] reviews for the evaluation of stepwise formation constants at I = 0........................................................................................369
Table 12-9: Stepwise formation constants of aqueous Am(V) carbonate complexes from the solubility studies..................................................................................377
Table 12-10: Solubility constants reported for Am(III) hydroxycarbonate. ...................378
Table 12-11: Solubility constants reported for the reaction: 3+ 2
2 3 3 31/2 Am (CO ) (s) Am + 3/2 CO − ......................................................381
Table 12-12: Conditional formation constants of Am(III), Cm(III) and Am(IV) complexes with tungstophosphate and tungstosilicate heteropolyanions ....................386
Table A-1: Literature data for the solubility of dehydrated schoepite .........................400
Table A-2: Derived values of f mH ο∆ (UO2(OH)2, g, 298.15 K)...................................403
Table A-3: Equilibrium constants for Am(OH)3(s) and Am(III) hydroxide complexes derived from the solubility experiments of Stadler and Kim.....................410
Table A-4: Comparison of selected values from [90HAY/THO] and [92GRE/FUG].417
Table A-5. values corresponding to an ionic strength of 1.046 m HClO10log nb 4.....421
Table A-6: Equilibrium constant lo 10 ng β for 22UO + with Cl− and 3NO− ..................432

LIST OF TABLES xxxviii
Table A-7: Values of XA, YA and WA for the calculation of enthalpy and Gibbs energy from the Wilcox equation..........................................................................433
Table A-8: Values of XB, YB and WB for the calculation of enthalpy and Gibbs energy from the Wilcox equation..........................................................................433
Table A-9: Solubility product and Gibbs energy of formation of soddyite, uranophane, Na–boltwoodite and Na–weeksite:............................................................442
Table A-10: Equilibrium constants at zero ionic strength for the U(VI) hydroxide system........................................................................................................444
Table A-11: Heat capacity coefficients and standard heat capacity for Rb2U4O12(cr) Rb2U4O13(cr), Cs2U4O12(cr) and Cs2U4O13(cr) ..........................................445
Table A-12: Derived values of f mH ο∆ (UO2(OH)2, g, 298.15 K)...................................455
Table A-13: Enthalpies of solution and formation of SrUO4–x ......................................467
Table A-14: Equilibrium constants for the dissolution of NaAmO2CO3(s). ..................471
Table A-15: Experimental and calculated Gibbs energies of sodium uranate reactions 474
Table A-16: Equilibrium constants derived from the solubility of AmO2OH(am) and NpO2OH(am, aged) in 5 M NaCl at 22°C .................................................482
Table A-17: Equilibrium constants derived in [94RUN/KIM], [96RUN/NEU] from the solubility studies with NaNpO2CO3(s) and NaAmO2CO3(s) in NaCl solu-tions at 22°C..............................................................................................483
Table A-18: Equilibrium constant obtained in various experimental conditions...........490
Table A-19: Equilibrium constant at I = 0.1 m and I = 0 for (UO species .......................................................................................................499
22 ) (OH) m n
m n−
Table A-20: – log10[H+] ranges used in the various titrations........................................500
Table A-21: Tests of various chemical models and refinement of the corresponding equilibrium constants. ...............................................................................501
Table A-22: Equilibrium constants and lifetime measurements of , , and UO
2+2UO 2 4UO SO (aq)
22 4 2UO (SO ) −
2OH+ and UO2(OH)2(aq).........................................509
Table A-23: Equilibrium constants and lifetime measurements of , , and
2+2UO 2 4UO SO (aq)
22 4 2UO (SO ) − 4
2 4 3UO (SO ) − ................................................................509

LIST OF TABLES xxxix
Table A-24: Comparison between f mGο∆
f mG calculated from the sum of constituent oxide
contributions and ο∆ selected in [92GRE/FUG]..................................519
Table A-25: Comparison between f mGο∆
m
calculated from the sum of constituent oxide contribution and f G
ο∆ selected in [92GRE/FUG] ...................................535
Table A-26: Estimated and experimental Gibbs energy of formation for some uranium(VI) minerals. ...............................................................................536
Table A-27: Main characteristics of fluorescence spectra of some aqueous complexes..................................................................................................537
Table A-28: Temperature coefficients for K2U4O12(cr) and K2U4O13(cr) compounds ................................................................................................545
Table A-29: Temperature coefficient for Cs2U2O7(cr) and Cs4U5O17(cr) compounds ................................................................................................546
Table A-30: Spectroscopic data of some U(VI) complexes...........................................553
Table A-31: Standard state thermodynamic data...........................................................564
Table A-32: Standard state thermodynamic data...........................................................565
Table A-33: Np(V) carbonate solids observed in [97NOV/ALM], [98ALM/NOV]. ....570
Table A-34: Enthalpy of the hydration reaction for trivalent and tetravalent ions Mn+.....................................................................................................582
Table A-35: Comparison between the calculated molar standard entropy and selected by TDB review. ..............................................................................................582
Table A-36: Unit cell parameters for schoepite, metaschoepite and dehydrated schoepite crystals.......................................................................................................588
Table A-37: Spectroscopic characteristic of 1:1 and 2:2 species at 25°C......................594
Table A-38: Spectroscopic characterisation of 0:1, 1:1, 2:1, 3:1, 2:2, 5:3 and 7:3 species...................................................................................................................613
Table A-39: Equilibrium constants of U(VI) with polyanions LX– at pH = 4...............620
Table A-40: Emission wavelengths and lifetimes of emission of , , and UO
2+2UO +
2 2 4UO H PO2 4UO HPO (aq) 2PO4
− ...................................................................621
Table A-41: Experimental and calculated Gibbs energies of potassium uranate reactions...................................................................................................................639

LIST OF TABLES xl
Table A-42: ∆ε values used to calculate the SIT interaction coefficients and lo for , PuO
10g οb+
2PuO Cl 2Cl2(aq) and UO2Cl+, UO2Cl2(aq). ....................................653
Table A-43: Equilibrium constant lo 10 1g οb and interaction coefficient ∆ε(1) for the first chloride complexes of U(VI) and Pu(VI) ..................................................654
Table A-44: Equilibrium constant lo 10 2g οb and interaction coefficient ∆ε(2) for the sec-ond chloride complexes of U(VI) and Pu(VI) ...........................................655
Table A-45: Equilibrium constants derived from spectroscopic measurements ............656
Table A-46: Values of 10log K ο for protonation of arsenic acid at 25°C......................657
Table A-47: 10 , ,*log p q r
οb and ε(p, q, r, Na+) (kg · mol–1) ..............................................665
Table A-48: Values and units of the coefficients of equations (A.127) and (A.128).....667
Table A-49. Formation constants for (1 )3 2 3Tc(CO) (H O) X n
n n− +
− complexes ..................668
Table A-50: Values of absorption coefficient , ε, for (UO 22 ) (OH) n m
n m− species ...........674
Table A-51: Solubility constants for PuO2CO3(s) (molal scale in Bold ) and conversion to I = 0 with the SIT coefficients in Appendix B. .........................................681
Table A-52 Thermodynamic data at zero ionic strength proposed in [2001NEC/KIM]692
Table A-53: Values of for (1,1), (2,2), (4,3)¸ (5,3), (7,4) in 0.1 M KCl, NaClO
10 ,*log n mb
4 and in 1.0 M KNO3 ......................................................................697
Table A-54: values and εn,m for , (1,1), (2,2), (4,3), (5,3) and (7,4) species .......................................................................................................698
10 ,*log n m
οb 2+2UO
Table A-55: Species of U(VI) identified by Raman spectra in basic media according to [2002NGU]................................................................................................703
Table B-1: Water activities 2
for the most common ionic media at various concen-trations applying Pitzer’s ion interaction approach and the interaction pa-rameters given in [91PIT]..........................................................................712
H Oa
Table B-2: Debye–Hückel constants as a function of temperature at a pressure of 1 bar below 100°C and at the steam saturated pressure for t 100°C.. ............716 ≥
Table B-3: The preparation of the experimental equilibrium constants for the extrapola-tion to I = 0 with the specific ion interaction method at 25°C and 1 bar, ac-cording to reaction (B.12)..........................................................................718

LIST OF TABLES xli
Table B-4: Ion interaction coefficients ( , )j kε (kg·mol–1) for cations j with k = Cl–, and
4ClO−
3NO− , taken from Ciavatta [80CIA], [88CIA] unless indicated other-wise. ..........................................................................................................724
Table B-5: Ion interaction coefficients ( , )j kε (kg·mol–1) for cations j with k = Li, Na and K, taken from Ciavatta [80CIA], [88CIA] unless indicated otherwise......731
Table B-6: Ion interaction coefficients (1, , )j kε and (2, , )j kε for cations j with k = Cl–, and 4ClO−
3NO− (first part), and for anions j with k = Li+, Na+ and K+ (sec-ond part), according to the relationship ε = ε1 + ε2 log10Im. The data are taken from Ciavatta [80CIA], [88CIA]. ....................................................734
Table C-1: Details of the calculation of equilibrium constant corrected to I=0, using (C.19) ........................................................................................................748


Part I
Introductory material
1


Chapter 1
1 Introduction
1.1 Background The modelling of the behaviour of hazardous materials under environmental conditions is among the most important applications of natural and technical sciences for the pro-tection of the environment. In order to assess, for example, the safety of a waste deposit, it is essential to be able to predict the eventual dispersion of its hazardous components in the environment (geosphere, biosphere). For hazardous materials stored in the ground or in geological formations, the most probable transport medium is the aqueous phase. An important factor is therefore the quantitative prediction of the reactions that are likely to occur between hazardous waste dissolved or suspended in ground water, and the surrounding rock material, in order to estimate the quantities of waste that can be transported in the aqueous phase. It is thus essential to know the relative stabilities of the compounds and complexes that may form under the relevant conditions. This infor-mation is often provided by speciation calculations using chemical thermodynamic data. The local conditions, such as ground water and rock composition or temperature, may not be constant along the migration paths of hazardous materials, and fundamental thermodynamic data are the indispensable basis for dynamic modelling of the chemical behaviour of hazardous waste components.
In the field of radioactive waste management, the hazardous material consists to a large extent of actinides and fission products from nuclear reactors. The scientific literature on thermodynamic data, mainly on equilibrium constants and redox potentials in aqueous solution, has been contradictory in a number of cases, especially in actinide chemistry. A critical and comprehensive review of the available literature is necessary in order to establish a reliable thermochemical database that fulfils the requirements for rigorous modelling of the behaviour of the actinide and fission products in the environ-ment.
The International Atomic Energy Agency (IAEA) in Vienna published special issues with compilations of physicochemical properties of compounds and alloys of elements important in reactor technology: Pu, Nb, Ta, Be, Th, Zr, Mo, Hf and Ti be-tween 1966 and 1983. In 1976, IAEA also started the publication of the series “The Chemical Thermodynamics of Actinide Elements and Compounds”, oriented towards nuclear engineers and scientists. This international effort has resulted in the publication
3

4 1 Introduction
of several volumes, each concerning the thermodynamic properties of a given type of compounds for the entire actinide series. These reviews cover the literature approxi-mately up to 1984. The latest volume in this series appeared in 1992, under Part 12: The Actinide Aqueous Inorganic Complexes [92FUG/KHO]. Unfortunately, data of impor-tance for radioactive waste management (for example, Part 10: The Actinide Oxides) is lacking in the IAEA series.
The Radioactive Waste Management Committee (RWMC) of the OECD Nu-clear Energy Agency recognised the need for an internationally acknowledged, high-quality thermochemical database for application in the safety assessment of radioactive waste disposal, and undertook the development of the NEA Thermochemical Data Base (TDB) project [85MUL], [88WAN], [91WAN]. The RWMC assigned a high priority to the critical review of relevant chemical thermodynamic data of compounds and com-plexes for this area containing the actinides uranium, neptunium, plutonium and ameri-cium, as well as the fission product technetium. The first four books in this series on the chemical thermodynamics of uranium [92GRE/FUG], americium [95SIL/BID], techne-tium [99RAR/RAN] and neptunium and plutonium [2001LEM/FUG] originated from this initiative. Simultaneously with the NEA’s TDB project, other reviews on the physi-cal and chemical properties of actinides appeared, including the book by Cordfunke et al. [90COR/KON2], the series edited by Freeman et al. [84FRE/LAN], [85FRE/LAN], [85FRE/KEL], [86FRE/KEL], [87FRE/LAN], [91FRE/KEL], the two volumes edited by Katz et al. [86KAT/SEA], and Part 12 by Fuger et al. [92FUG/KHO] within the IAEA review series mentioned above.
In 1998, Phase II of the TDB Project (TDB-II) was started to provide for the further needs of the radioactive waste management programs by updating the existing database and applying the TDB review methodology to other elements and to simple organic complexes. In TDB-II the overall objectives are set by a Management Board, integrated by representatives of 17 organisations from the field of radioactive waste management. These participating organisations, together with the NEA, provide finan-cial support for TDB-II. The TDB-II Management Board is assisted in technical matters by a group of experts in chemical thermodynamics (the Executive Group). The NEA acts in this phase as Project Co-ordinator ensuring the implementation of the Project Guidelines and liaising with the Review Teams. The present volume, the fifth in the series, is the first one to be published within this second phase of the TDB Project.
1.2 Focus of the review This first NEA TDB Update is within the scope and the spirit of previous reviews aimed at helping model the chemical behaviour of actinides and fission products in the near and far field of a radioactive waste repository using consistent data. The present critical review deals with U, Np, Pu, Am (Cm) and Tc. The data discussed and selected in some

1.3 Review procedure and results 5
cases complement those of the previous reviews and in other cases revise them; they cover both solid compounds and soluble species of these elements.
The literature has been surveyed since the last NEA TDB reviews on U, Am, Tc and Np and Pu up to the end of 2001. This survey has revealed that many of the problems pointed out in the previous reviews have been addressed by the scientific community and in some cases have been resolved. This is to a large extent due to the use of new experimental and theoretical methods, in addition to the “traditional” ther-modynamic methods such as potentiometric titrations and solubility measurements. The net result in that new data have come available that have been analysed together with the previous data already considered in the previous specific reviews. In addition this review has also used information on the systematics of chemical properties within the actinide series, one example being analogies between Am(III) and Cm(III). The policy of the NEA TDB is concentred on experimental results but it can not be denied that pre-dictive papers present lot of interest. Some have been reviewed and quoted in the dis-cussion of new data selection. Those dealing with thermochemistry are: [92DUC/SAN] (containing [62WIL], [92HIS/BEN] (containing [89LIE/GRE])) and [97ION/MAD] (containing [85BRA/LAG], [86BRA/LAG]).
Although the focus of the review is on actinides it is necessary to use data on a number of other species during the evaluation process that lead to selected data. These auxiliary data are taken both from the publication of CODATA key values [89COX/WAG] and from the evaluation of additional auxiliary data in the series of vol-umes entitled "Chemical Thermodynamics" [92GRE/FUG], [99RAR/RAN], and their use is recommended by this review. Care has been taken that all the selected thermody-namic data at standard state and conditions (cf. section 2.3) and 298.15 K are internally consistent. For this purpose, special software within the NEA TDB database system has been used; cf. section 2.6. In order to maintain consistency in the application of the val-ues selected by this review, it is essential to use these auxiliary data when calculating equilibrium constants involving actinide compounds and complexes.
This review does not include any compounds and complexes containing or-ganic ligands.
1.3 Review procedure and results The objective of the present review is to update the database for the inorganic species of those elements that have been the object of previous NEA TDB reviews. This aim is achieved by an assessment of the new sources of thermodynamic data published since the cut-off dates for the literature searches in the earlier volumes of the series. This as-sessment is performed in order to decide on the most reliable values that can be recom-mended. Experimental measurements published in the scientific literature are the main source for the selection of recommended data. Previous reviews are not neglected, but form a valuable source of critical information on the quality of primary publications.

6 1 Introduction
When necessary, experimental source data are re-evaluated by using chemical models that are either found to be more realistic than those used by the original author, or are consistent with side-reactions discussed in another section of the review (for example, data on carbonate complex formation might need to be re-interpreted to take into ac-count consistent values for hydrolysis reactions). Re-evaluation of literature values might be also necessary to correct for known systematic errors (for example, if the junc-tion potentials are neglected in the original publication) or to make extrapolations to standard state conditions (I = 0) by using the specific ion interaction (SIT) equations (cf. Appendix B). For convenience, these SIT equations are referred to in some places in the text as “the SIT”. In order to ensure that consistent procedures are used for the evalua-tion of primary data, a number of guidelines have been developed. They have been up-dated and improved since 1987, and their most recent versions are available at the NEA [2000OST/WAN], [2000GRE/WAN], [99WAN/OST], [2000WAN/OST], [99WAN]. Some of these procedures are also outlined in this volume, cf. Chapter 2, Appendix B, and Appendix C. Parts of these sections, which were also published in earlier volumes [92GRE/FUG], [95SIL/BID], [99RAR/RAN], [2001LEM/FUG] have been revised in this review. For example, in Chapter 2, the section on “pH” has been revised. Appendix D deals with some limitations encountered in the application of the ionic strength cor-rection procedures. Once the critical review process in the NEA TDB project is com-pleted, the resulting manuscript is reviewed independently by qualified experts nomi-nated by the NEA. The independent peer review is performed according to the proce-dures outlined in the TDB-6 guideline [99WAN]. The purpose of the additional peer review is to receive an independent view of the judgements and assessments made by the primary reviewers, to verify assumptions, results and conclusions, and to check whether the relevant literature has been exhaustively considered. The independent peer review is performed by persons having technical expertise in the subject matter to be reviewed, to a degree at least equivalent to that needed for the original review. The thermodynamic data selected in the present review (see Chapters 3, 4, 5, 6, 7 and 8) refer to the reference temperature of 298.15 K and to standard conditions, cf. section 2.3. For the modelling of real systems it is, in general, necessary to recalculate the stan-dard thermodynamic data to non-standard state conditions. For aqueous species a proce-dure for the calculation of the activity factors is thus required. This review uses the ap-proximate specific ion interaction method (SIT) for the extrapolation of experimental data to the standard state in the data evaluation process, and in some cases this requires the re-evaluation of original experimental values (solubilities, emf data, etc.). For maximum consistency, this method, as described in Appendix B, should always be used in conjunction with the selected data presented in this review. The thermodynamic data selected in this review are provided with uncertainties representing the 95% confidence level. As discussed in Appendix C, there is no unique way to assign uncertainties, and the assignments made in this review are to a large extent based on the subjective choice by the reviewers, supported by their scientific and technical experience in the corre-sponding area. The quality of thermodynamic models cannot be better than the quality

1.3 Review procedure and results 7
of the data on which they are based. The quality aspect includes both the numerical val-ues of the thermodynamic data used in the model and the “completeness” of the chemi-cal model used, e.g., the inclusion of all the relevant dissolved chemical species and solid phases. For the user it is important to consider that the selected data set presented in this review (Chapters 3 to 8) is certainly not “complete” with respect to all the con-ceivable systems and conditions; there are gaps in the information. The gaps are pointed out in the various sections of Part III, and this information may be used as a basis for the assignment of research priorities.

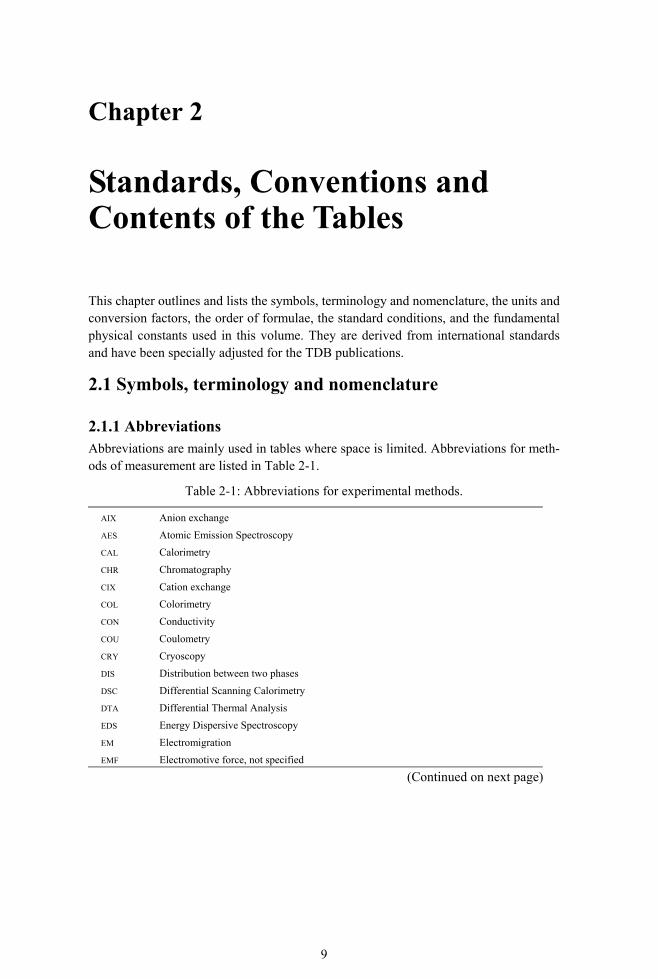
Chapter 2
2 Standards, Conventions and Contents of the Tables Equation Section 2 This chapter outlines and lists the symbols, terminology and nomenclature, the units and conversion factors, the order of formulae, the standard conditions, and the fundamental physical constants used in this volume. They are derived from international standards and have been specially adjusted for the TDB publications.
2.1 Symbols, terminology and nomenclature
2.1.1 Abbreviations Abbreviations are mainly used in tables where space is limited. Abbreviations for meth-ods of measurement are listed in Table 2-1.
Table 2-1: Abbreviations for experimental methods.
AIX Anion exchange AES Atomic Emission Spectroscopy CAL Calorimetry CHR Chromatography CIX Cation exchange COL Colorimetry CON Conductivity COU Coulometry CRY Cryoscopy DIS Distribution between two phases DSC Differential Scanning Calorimetry DTA Differential Thermal Analysis EDS Energy Dispersive Spectroscopy EM Electromigration EMF Electromotive force, not specified
(Continued on next page)
9

10 2 Standards, Conventions and Contents of the Tables
Table 2-1: (continued)
EPMA Electron Probe Micro Analysis EXAFS Extended X-ray Absorption Fine Structure FTIR Fourier Transform Infra Red IDMS Isotope Dilution Mass-Spectroscopy IR Infrared GL Glass electrode ISE-X Ion selective electrode with ion X stated IX Ion exchange KIN Rate of reaction LIBD Laser Induced Breakdown Detection MVD Mole Volume Determination NMR Nuclear Magnetic Resonance PAS Photo Acoustic Spectroscopy POL Polarography POT Potentiometry PRX Proton relaxation QH Quinhydrone electrode RED Emf with redox electrode SEM Scanning Electron Microscopy SP Spectrophotometry SOL Solubility TC Transient Conductivity TGA Thermo Gravimetric Analysis TLS Thermal Lensing Spectrophotometry TRLFS Time Resolved Laser Fluorescence Spectroscopy UV Ultraviolet VLT Voltammetry XANES X-ray Absorption Near Edge Structure XRD X-ray Diffraction ? Method unknown to the reviewers
Other abbreviations may also be used in tables, such as SHE for the standard
hydrogen electrode or SCE for the saturated calomel electrode. The abbreviation NHE has been widely used for the “normal hydrogen electrode”, which is by definition iden-tical to the SHE. It should nevertheless be noted that NHE customarily refers to a stan-dard state pressure of 1 atm, whereas SHE always refers to a standard state pressure of 0.1 MPa (1 bar) in this review.

2.1 Symbols, terminology and nomenclature 11
2.1.2 Symbols and terminology The symbols for physical and chemical quantities used in the TDB review follow the recommendations of the International Union of Pure and Applied Chemistry, IUPAC [79WHI], [88MIL/CVI]. They are summarised in Table 2-2.
Table 2-2: Symbols and terminology.
Symbols and terminology
length l
height h
radius r
diameter d
volume V
mass m
density (mass divided by volume) ρ
time t
frequency ν
wavelength λ internal transmittance (transmittance of the medium itself, disregarding boundary or container influence)
T
internal transmission density, (decadic absorbance): log10(1/T) A
molar (decadic) absorption coefficient: B/A c l ε
relaxation time τ
Avogadro constant NA
relative molecular mass of a substance(a) Mr
thermodynamic temperature, absolute temperature T
Celsius temperature t
(molar) gas constant R
Boltzmann constant k
Faraday constant F
(molar) entropy mS
(molar) heat capacity at constant pressure ,mp
C
(molar) enthalpy mH
(molar) Gibbs energy mG
chemical potential of substance B Bµ
pressure p
partial pressure of substance B: xB p pB
fugacity of substance B fB
(Continued next page)

12 2 Standards, Conventions and Contents of the Tables
Table 2-2 (continued)
Symbols and terminology
fugacity coefficient: fB/pB γf,B
amount of substance(b) n
mole fraction of substance B: xB
molarity or concentration of a solute substance B (amount of B divided by the vol-
ume of the solution) (c)
cB, [B]
molality of a solute substance B (amount of B divided by the mass of the solvent) (d) mB
mean ionic molality (e), + +(ν ν ) ν νm m− −+± += m−
a−
m±
activity of substance B aB
activity coefficient, molality basis: B B/a m γB
activity coefficient, concentration basis: B B/a cν ν
yB
mean ionic activity (e), B+ +(ν ν )a a a− −+
± += =(ν ν )
a±
mean ionic activity coefficient (e), + +ν ν− −± +γ = γ+
−γ y±
osmotic coefficient, molality basis φ
ionic strength: 2 21 1 or 2 2
i im i i c i iI m z I c z= =∑ ∑ I
SIT ion interaction coefficient between substance B1 and substance B2, stoichiomet-ric coefficient of substance B (negative for reactants, positive for products)
1 2(B ,B )ε
general equation for a chemical reaction B B0 ν B= ∑
equilibrium constant (f) K
charge number of an ion B (positive for cations, negative for anions) zB
charge number of a cell reaction n
electromotive force E
+
1
10 HpH= log /(mol kg )[ ]a −− ⋅ pH
electrolytic conductivity κ
superscript for standard state.(g) ο (a) ratio of the average mass per formula unit of a substance to 1
12 of the mass of an atom of nuclide 12C. (b) cf. sections 1.2 and 3.6 of the IUPAC manual [79WHI]. (c) This quantity is called “amount-of-substance concentration” in the IUPAC manual [79WHI].A solution
with a concentration equal to 0.1 3mol dm−⋅ is called a 0.1 molar solution or a 0.1 M solution. (d) A solution having a molality equal to 0.1 1mol kg −⋅ is called a 0.1 molal solution or a 0.1 m solution. (e) For an electrolyte which dissociates into
+ν ν
N X−
+ ν ( ν ν )± −= + ions, in an aqueous solution with concentration m, the individual cationic molality and activity coefficient are and
. A similar definition is used for the anionic symbols. Electrical neutrality requires that
+( ν )m m+ =
+ (γ /a m+ +=
+ +ν νz z− −=
)
(f) Special notations for equilibrium constants are outlined in section 2.1.6. In some cases, cK is used to indicate a concentration constant in molar units, and mK a constant in molal units.
(g) See section 2.3.1.

2.1 Symbols, terminology and nomenclature 13
2.1.3 Chemical formulae and nomenclature This review follows the recommendations made by IUPAC [71JEN], [77FER], [90LEI] on the nomenclature of inorganic compounds and complexes, except for the following items:
• The formulae of coordination compounds and complexes are not enclosed in square brackets [71JEN] (Rule 7.21). Exceptions are made in cases where square brackets are required to distinguish between coordinated and uncoordi-nated ligands.
• The prefixes “oxy–” and “hydroxy–” are retained if used in a general way, e.g., “gaseous uranium oxyfluorides”. For specific formula names, however, the IUPAC recommended citation [71JEN] (Rule 6.42) is used, e.g., “uranium(IV) difluoride oxide” for 2UF O(cr).
An IUPAC rule that is often not followed by many authors [71JEN] (Rules 2.163 and 7.21) is recalled here: the order of arranging ligands in coordination com-pounds and complexes is the following: central atom first, followed by ionic ligands and then by the neutral ligands. If there is more than one ionic or neutral ligand, the alpha-betical order of the symbols of the ligating atoms determines the sequence of the ligands. For example, 2 2 3 3(UO ) CO (OH) − is standard, is non-standard and is not used.
2 2 3 3(UO ) (OH) CO−
Abbreviations of names for organic ligands appear sometimes in formulae. Following the recommendations by IUPAC, lower case letters are used, and if neces-sary, the ligand abbreviation is enclosed within parentheses. Hydrogen atoms that can be replaced by the metal atom are shown in the abbreviation with an upper case “H”, for example: H e , Am(Hedta)(s) (where edta stands for ethylenediaminetetraacetate). 3 dta−
2.1.4 Phase designators Chemical formulae may refer to different chemical species and are often required to be specified more clearly in order to avoid ambiguities. For example, occurs as a gas, a solid, and an aqueous complex. The distinction between the different phases is made by phase designators that immediately follow the chemical formula and appear in paren-theses. The only formulae that are not provided with a phase designator are aqueous ions. They are the only charged species in this review since charged gases are not con-sidered. The use of the phase designators is described below.
4UF
• The designator (l) is used for pure liquid substances, e.g., . 2H O(l)
• The designator (aq) is used for undissociated, uncharged aqueous species, e.g., , . Since ionic gases are not considered in this re-view, all ions may be assumed to be aqueous and are not designed with (aq). If a chemical reaction refers to a medium other than H (e.g., , 90% etha-
4U(OH) (aq) 2CO (aq)
2O 2D O
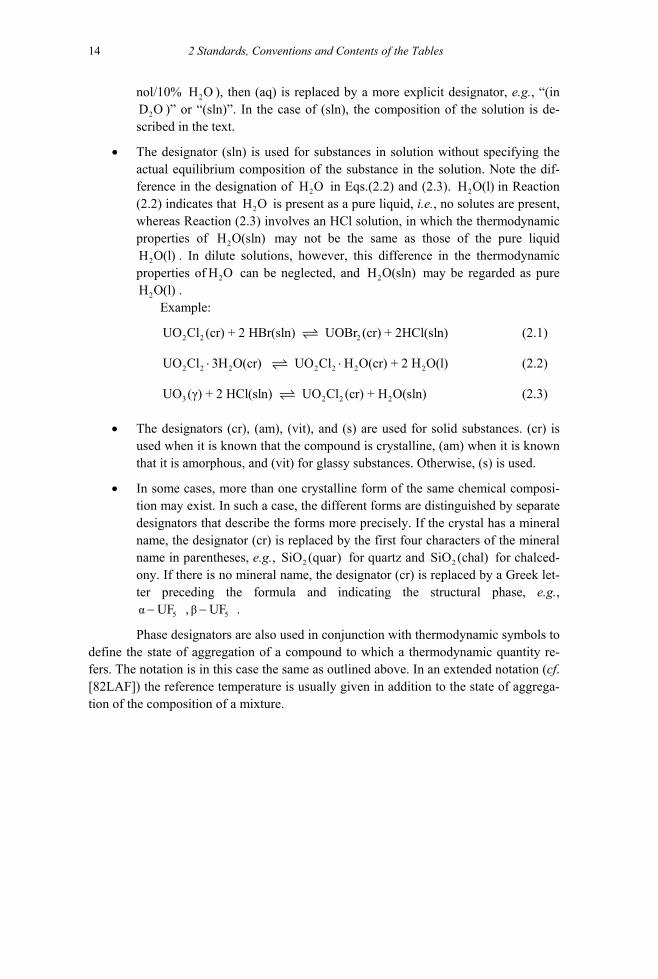
14 2 Standards, Conventions and Contents of the Tables
nol/10% ), then (aq) is replaced by a more explicit designator, e.g., “(in )” or “(sln)”. In the case of (sln), the composition of the solution is de-
scribed in the text.
2H O
H
2 2Cl (cr)
2 2Cl 3
(γ) +
UF−
2D O
2H O(
2H O(
U
α UF−
• The designator (sln) is used for substances in solution without specifying the actual equilibrium composition of the substance in the solution. Note the dif-ference in the designation of in Eqs.(2.2) and (2.3). in Reaction (2.2) indicates that is present as a pure liquid, i.e., no solutes are present, whereas Reaction (2.3) involves an HCl solution, in which the thermodynamic properties of may not be the same as those of the pure liquid
. In dilute solutions, however, this difference in the thermodynamic properties of can be neglected, and may be regarded as pure
.
2H O 2H O(l)2H O
(sln)2H O
2Ol)
l)2H O(sln)
Example:
2UO + 2 HBr(sln) UOBr (cr) + 2HCl(sln) (2.1)
2 2 2 2 2O H O(cr) UO Cl H O(cr) + 2 H O(l)⋅ ⋅ (2.2)
3 2 2UO 2 HCl(sln) UO Cl (cr) + H O(sln)2 (2.3)
• The designators (cr), (am), (vit), and (s) are used for solid substances. (cr) is used when it is known that the compound is crystalline, (am) when it is known that it is amorphous, and (vit) for glassy substances. Otherwise, (s) is used.
• In some cases, more than one crystalline form of the same chemical composi-tion may exist. In such a case, the different forms are distinguished by separate designators that describe the forms more precisely. If the crystal has a mineral name, the designator (cr) is replaced by the first four characters of the mineral name in parentheses, e.g., for quartz and S for chalced-ony. If there is no mineral name, the designator (cr) is replaced by a Greek let-ter preceding the formula and indicating the structural phase, e.g.,
, β .
2SiO (quar) 2iO (chal)
5 5
Phase designators are also used in conjunction with thermodynamic symbols to define the state of aggregation of a compound to which a thermodynamic quantity re-fers. The notation is in this case the same as outlined above. In an extended notation (cf. [82LAF]) the reference temperature is usually given in addition to the state of aggrega-tion of the composition of a mixture.

2.1 Symbols, terminology and nomenclature 15
Example: +
f m (Na , 298.15 K)Gο∆
(UO (SO ) 2.5H OS ο ⋅
standard molar Gibbs energy of forma-tion of aqueous at 298.15 K +Na
m 2 4 2 , cr, 298.15 K) standard molar entropy of 2 4 2UO (SO ) 2.5H O(cr)⋅ at 298.15 K
ο,m 3(UO , , 298.15 K)pC α standard molar heat capacity of
α − at 298.15 K 3UO
f m 2(HF, sln, HF 7.8H O)H∆ ⋅ enthalpy of formation of HF diluted
1:7.8 with water.
2.1.5 Processes Chemical processes are denoted by the operator ∆ , written before the symbol for a property, as recommended by IUPAC [82LAF]. An exception to this rule is the equilib-rium constant, cf. section 2.1.6. The nature of the process is denoted by annotation of the ∆, e.g., the Gibbs energy of formation, , the enthalpy of sublimation,f mG∆ sub mH∆ , etc. The abbreviations of chemical processes are summarised in Table 2-3.
Table 2-3: Abbreviations used as subscripts of ∆ to denote the type of chemical process.
Subscript of ∆ Chemical process
at separation of a substance into its constituent gaseous atoms (atomisation) dehyd elimination of water of hydration (dehydration) dil dilution of a solution f formation of a compound from its constituent elements fus melting (fusion) of a solid hyd addition of water of hydration to an unhydrated compound mix mixing of fluids r chemical reaction (general) sol process of dissolution sub sublimation (evaporation) of a solid tr transfer from one solution or liquid phase to another trs transition of one solid phase to another vap vaporisation (evaporation) of a liquid
The most frequently used symbols for processes are f G∆ and f H∆ , the Gibbs
energy and the enthalpy of formation of a compound or complex from the elements in their reference states (cf. Table 2-6).

16 2 Standards, Conventions and Contents of the Tables
2.1.6 Spectroscopic constants and statistical mechanics calculations for gaseous species
In most cases, the thermal functions for gaseous species have been calculated by well-known statistical-mechanical relations (see for example Chapter 27 of [61LEW/RAN]). The required molecular parameters are given in the current text, see Tables 9-1 and 9-4, for example.
The parameters defining the vibrational and rotational energy levels of the molecule in terms of the rotational (J) and vibrational (v) quantum numbers, and thus many of its thermodynamic properties, are:
• for diatomic molecules (non-rigid rotator, anharmonic oscillator approximation): ω (vibrational frequency in wavenumber units), x (anharmonicity constant), B (rota-tional constant for equilibrium position), D (centrifugal distortion constant), α (ro-tational constant correction for excited vibrational states), and σ (symmetry num-ber), where the energy levels with quantum numbers v and J are given by:
(2.4) 2 J( , )
2 2
E / h c ( 1/ 2) ( 1/ 2) ( 1)
( 1) ( 1/ 2) ( 1)v J v x v B J
D J J v J J
= ω + − ω + + +
− + − α + +
• for linear polyatomic molecules, the parameters are the same as those for diatomic molecules, except that the contributions for anharmonicity are usually neglected.
• for non-linear polyatomic molecules (rigid rotator, harmonic oscillator approxima-tion): Ix Iy Iz, the product of the principal moments of inertia (readily calculated from the geometrical structure of the molecule), v(i), the vibration frequencies and σ, the symmetry number. While the vibrational energy levels for polyatomic mole-cules are given approximately by the first term of equation (2.4) for each of the normal vibrations, the rotational energy levels cannot be expressed as a simple gen-eral formula. However, the required rotational partition function can be expressed with sufficient accuracy simply in terms of the product of the principal moments of inertia. As for linear polyatomic molecules, anharmonic contributions are usually neglected.
In each case, the symmetry number σ, the number of indistinguishable posi-tions into which the molecule can be turned by simple rotations, is required to calculate the correct entropy.
The relations for calculating the thermal functions from the partition function defined by the energy levels are well-known – again, see Chapter 27 of [61LEW/RAN], for a simple description. In each case, the relevant translational and electronic contribu-tions (calculated from the molar mass and the electronic energy levels and degeneracies) must be added. Except where accurate spectroscopic data exist, the geometry and pa-rameters of the excited states are assumed to be the same as those for the ground state.

2.1 Symbols, terminology and nomenclature 17
2.1.7 Equilibrium constants The IUPAC has not explicitly defined the symbols and terminology for equilibrium constants of reactions in aqueous solution. The NEA has therefore adopted the conven-tions that have been used in the work Stability Constants of Metal Ion Complexes by Sillén and Martell [64SIL/MAR], [71SIL/MAR]. An outline is given in the paragraphs below. Note that, for some simple reactions, there may be different correct ways to in-dex an equilibrium constant. It may sometimes be preferable to indicate the number of the reaction to which the data refer, especially in cases where several ligands are dis-cussed that might be confused. For example, for the equilibrium:
(2.5) M + L M Lm qm qboth and (2.5) would be appropriate, and (2.5) is accepted, too. Note that, in general, K is used for the consecutive or stepwise formation constant, and β is used for the cumulative or overall formation constant. In the following outline, charges are only given for actual chemical species, but are omitted for species containing general symbols (M, L).
,q mb b ,q mb
2.1.7.1 Protonation of a ligand
+1H + H L H L r r− 1, +
1
H L =
H H Lr
rr
K−
(2.6)
+ H + L H L rr 1, +
H L =
H L
rr r
b (2.7)
This notation has been proposed and used by Sillén and Martell [64SIL/MAR], but it has been simplified later by the same authors [71SIL/MAR] from 1,rK to rK . This re-view retains, for the sake of consistency, cf. Eqs.(2.8) and (2.9), the older formulation of
1,rK .
For the addition of a ligand, the notation shown in Eq.(2.8) is used.
1HL + L HL q q−1
HL =
HL Lq
K−
(2.8).
Eq.(2.9) refers to the overall formation constant of the species . H Lr q
+ H + L H L r qr q , +
H L =
H L
r qq r r q
b (2.9).
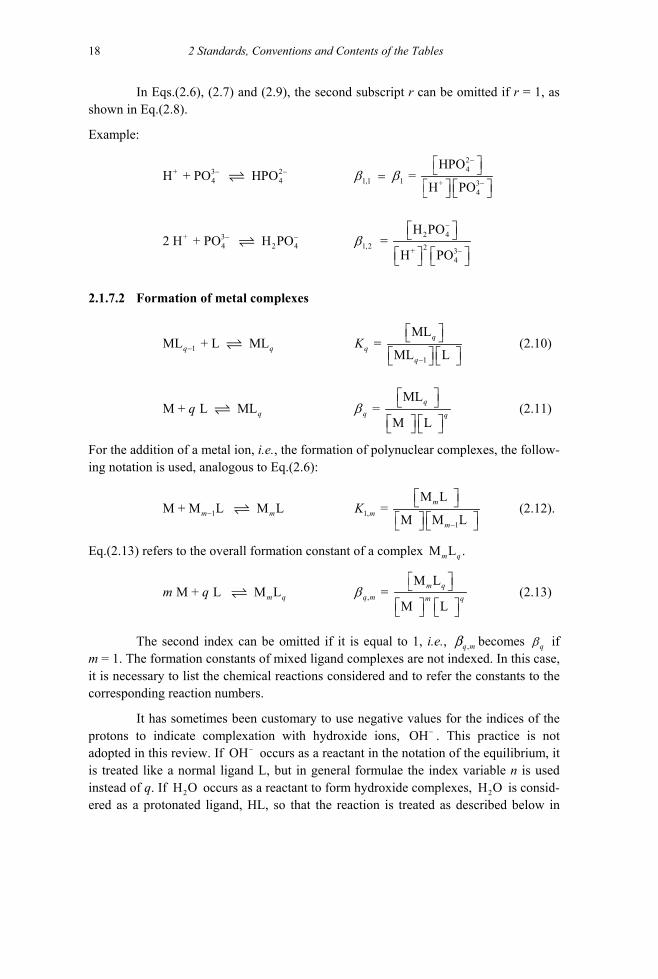
18 2 Standards, Conventions and Contents of the Tables
In Eqs.(2.6), (2.7) and (2.9), the second subscript r can be omitted if r = 1, as shown in Eq.(2.8).
Example:
+ 34 4H + PO HPO− −2
2−4
1,1 1 + 34
HPO =
H PO −
=
β β
+ 34 22 H + PO H PO− −
42 4
1,2 2+ 34
H PO =
H PO −
−
β
2.1.7.2 Formation of metal complexes
1ML + L ML q q−1
ML =
ML Lq
K−
(2.10)
M + L ML qqML
= M L
qq q
β (2.11)
For the addition of a metal ion, i.e., the formation of polynuclear complexes, the follow-ing notation is used, analogous to Eq.(2.6):
1M + M L M L m m− 1,1
M L =
M M Lm
mm
K−
M L .
(2.12).
Eq.(2.13) refers to the overall formation constant of a complex m q
M + L M L m qm q ,
M L =
M L
m qq m m q
β (2.13)
The second index can be omitted if it is equal to 1, i.e., becomes ,q mb qβ if m = 1. The formation constants of mixed ligand complexes are not indexed. In this case, it is necessary to list the chemical reactions considered and to refer the constants to the corresponding reaction numbers.
It has sometimes been customary to use negative values for the indices of the protons to indicate complexation with hydroxide ions, OH− . This practice is not adopted in this review. If occurs as a reactant in the notation of the equilibrium, it is treated like a normal ligand L, but in general formulae the index variable n is used instead of q. If H occurs as a reactant to form hydroxide complexes, is consid-ered as a protonated ligand, HL, so that the reaction is treated as described below in
OH−
2O 2H O

2.1 Symbols, terminology and nomenclature 19
Eqs.(2.14) to (2.16) using n as the index variable. For convenience, no general form is used for the stepwise constants for the formation of the complex MmLqHr. In many ex-periments, the formation constants of metal ion complexes are determined by adding a ligand in its protonated form to a metal ion solution. The complex formation reactions thus involve a deprotonation reaction of the ligand. If this is the case, the equilibrium constant is supplied with an asterisk, as shown in Eqs.(2.14) and (2.15) for mononuclear and in Eq.(2.16) for polynuclear complexes.
+1ML + HL ML + Hq q−
+
1
* ML H =
ML HL−
q
K (2.14)
+M + HL ML + Hqq q+ q
* ML H=
M HL
qq q
b (2.15)
+ M + HL M L + Hm qm q q+ q
q,* M L H
= M HL
m qq m m
b (2.16)
Example:
2+ + +2 2UO + HF(aq) UO F H+
+ +2
1 1 2+2
* * UO F H = =
UO HF(aq)K
b
2+ + +2 2 2 3 53 UO + 5 H O(l) (UO ) (OH) + 5 H
5+ +2 3 5
5,3 32+2
(UO ) (OH) H =
UO*
b
Note that an asterisk is only assigned to the formation constant if the proto-nated ligand that is added is deprotonated during the reaction. If a protonated ligand is added and coordinated as such to the metal ion, the asterisk is to be omitted, as shown in Eq.(2.17).
M + H L M(H L) r rq q
M(H L) =
M H L
r qq q
r
b (2.17)
Example:
2+2 2 4 2 2UO + 3 H PO UO (H PO )− −
4 32 2 4 3
3 32+2 2 4
UO (H PO ) =
UO H PO−
−
b

20 2 Standards, Conventions and Contents of the Tables
2.1.7.3 Solubility constants Conventionally, equilibrium constants involving a solid compound are denoted as “sol-ubility constants” rather than as formation constants of the solid. An index “s” to the equilibrium constant indicates that the constant refers to a solubility process, as shown in Eqs.(2.18) to (2.20).
(2.18). M L (s) M + L a b a b [ ] [ ],0 = M LasK b
,0sK is the conventional solubility product1, and the subscript “0” indicates that the equilibrium reaction involves only uncomplexed aqueous species. If the solubility constant includes the formation of aqueous complexes, a notation analogous to that of Eq.(2.13) is used:
M L (s) M L + La b m qm m qa a
−
b (
, , = M L L−
mb qa
s q m m qK) (2.19).
Example:
+2 2 2UO F (cr) UO F + F− +
,1,1 ,1 2= = UO F Fs sK K − .
Similarly, an asterisk is added to the solubility constant if it simultaneously in-volves a protonation equilibrium:
+M L (s) + H M L + HLa b m qm mb mbq qa a a
− −
( )−mb q
, ,( )+
* M L HL =
H−
am q
s q m mb qa
K (2.20)
Example: + 2+
4 2 2 4 2 4 2U(HPO ) 4H O(cr) + H UHPO + H PO + 4 H O(l)−⋅
2+ −4 2 4
,1,1 ,1 +* * UHPO H PO
= = Hs sK K
.
1 In some cases, most noticeably when dealing with the solubility of actinide oxides, the
,0sK notation is customarily applied in NEA TDB reviews to denote the constants for equilibria such as AnO2(s) + 2 H2O(l) An4+ + 4OH–. A reference to the appropriate chemical equation is attached to the symbol for the equilibrium constant when there is a risk of confusion.
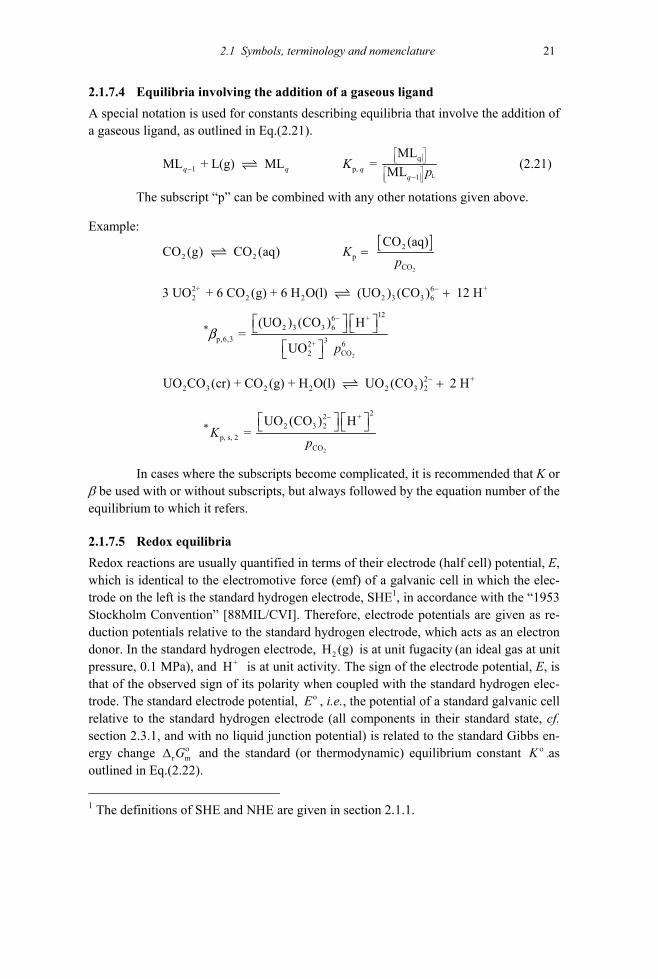
2.1 Symbols, terminology and nomenclature 21
2.1.7.4 Equilibria involving the addition of a gaseous ligand A special notation is used for constants describing equilibria that involve the addition of a gaseous ligand, as outlined in Eq.(2.21).
1ML + L(g) ML q q−L
qp,
1
ML = MLq
qK p
−
(2.21)
The subscript “p” can be combined with any other notations given above.
Example:
2 2CO (g) CO (aq)[ ]
2
2p
CO
CO (aq) K
p=
6−
2+ +2 2 2 2 3 3 63 UO + 6 CO (g) + 6 H O(l) (UO ) (CO ) 12 H+
2
2 3 3 6p,6,3 32+ 6
2 CO
* (UO ) (CO ) H =
UO p
b
O (cr) + CO (g) + H O(l) UO (
126 +−
2 +2 3 2 2 2 3 2UO C CO ) 2 H− +
2
2 3 2p, s, 2
CO
* UO (CO ) H = K
p
22 +−
In cases where the subscripts become complicated, it is recommended that K or β be used with or without subscripts, but always followed by the equation number of the equilibrium to which it refers.
2.1.7.5 Redox equilibria Redox reactions are usually quantified in terms of their electrode (half cell) potential, E, which is identical to the electromotive force (emf) of a galvanic cell in which the elec-trode on the left is the standard hydrogen electrode, SHE1, in accordance with the “1953 Stockholm Convention” [88MIL/CVI]. Therefore, electrode potentials are given as re-duction potentials relative to the standard hydrogen electrode, which acts as an electron donor. In the standard hydrogen electrode, is at unit fugacity (an ideal gas at unit pressure, 0.1 MPa), and is at unit activity. The sign of the electrode potential, E, is that of the observed sign of its polarity when coupled with the standard hydrogen elec-trode. The standard electrode potential,
2H (g)+H
Eο , i.e., the potential of a standard galvanic cell relative to the standard hydrogen electrode (all components in their standard state, cf. section 2.3.1, and with no liquid junction potential) is related to the standard Gibbs en-ergy change and the standard (or thermodynamic) equilibrium constant r mGο∆ K ο .as outlined in Eq.(2.22).
1 The definitions of SHE and NHE are given in section 2.1.1.

22 2 Standards, Conventions and Contents of the Tables
r m1 R = = lnF F
TE Gn n
Kο ο− ∆ ο (2.22)
οand the potential, E, is related to E by:
(2.23). = (R / F) lniE E T n aο − ν∑ i
For example, for the hypothetical galvanic cell:
Pt H2(g, p = 1 bar) HCl(aq, a±
= 1, = 1) 2Hf
Fe(ClO4)2 2+Fe= 1(aq, )a
Fe(ClO4)3 3+Fe= 1(aq, )a
Pt (2.24)
where denotes a liquid junction and a phase boundary, the reaction is:
3+ 2+ +2
1Fe + H (g) Fe + H2
(2.25)
For convenience Reaction (2.25) can be represented by half cell reactions, each involving an equal number of “electrons”, (designated “ e− ”), as shown in the following equations:
(2.26) 3+ 2+Fe + Fe−e
+2
1 H (g) H + 2
−e . (2.27)
The terminology is useful, although it must be emphasised “ e− ” here does not represent the hydrated electron.
Equilibrium (2.27) and Nernst law can be used to introduce ea − :
E = E (2.27) ο+2H H
ln( /( ))F e
T f a a −
R+ (2.28)
According to the SHE convention Eο (2.27) = 0, = 1, = 1, hence 2Hf +H
a
R = lnF e
TE a −− (2.29).
This equation is used to calculate a numerical value of e
a − -from emf meas-urements vs. the SHE; hence, as for the value of E (V vs. the SHE), the numerical value of depends on the SHE convention. Equilibrium constants may be written for these half cell reactions in the following way:
ea −
K ο (2.26) = 2+
3+
Fe
Fe e
aa a −⋅
(2.30)
K ο (2.27) = +
2
H
H
1ea a
f−⋅
= (by definition) (2.31)

2.1 Symbols, terminology and nomenclature 23
In addition, ∆ (2.27) = 0, r mGοr mH ο∆ (2.27) = 0, r mS ο∆ (2.27) = 0 by definition,
at all temperatures, and therefore rGmο∆ (2.26) = r mGο∆ (2.25). From r mGο∆ (2.27) and the
values given at 298.15 K in Table 8.1 for H2(g) and H+, the corresponding values for e–
can be calculated to be used in thermodynamic cycles involving half cell reactions. The following equations describe the change in the redox potential of Reaction (2.25), if
and are equal to unity (cf. Eq.(2.23)): 2Hp +H
a
E(2.25) = Eο (2.25) – 2+
3+
Fe
Fe
na
Ta
a
R l (2.32)
For the standard hydrogen electrode e− = 1 (by the convention expressed in Eq.(2.31)), while rearrangement of Eq.(2.30) for the half cell containing the iron per-chlorates in cell (2.24) gives:
= 10 elog a −− 10log K ο (2.26)–
2+
3+
Fe10
Fe
logaa
and from Eq.(2.28):
= 10 elog a −− 10log K ο (2.25)–
2+
3+
Fe10
Fe
logaa
(2.33)
Fand 10 elog =
R ln(10)a
T−− (2.25) (2.34) E
which is a specific case of the general equation (2.29).
The splitting of redox reactions into two half cell reactions by introducing the symbol“ ”, which according to Eq.(2.28) is related to the standard electrode potential, is arbitrary, but useful (this e
e−
– notation does not in any way refer to solvated electrons). When calculating the equilibrium composition of a chemical system, both “ ”, and
can be chosen as components and they can be treated numerically in a similar way: equilibrium constants, mass balance, etc. may be defined for both. However, while represents the hydrated proton in aqueous solution, the above equations use only the activity of “
e−
+H+H
e− ”, and never the concentration of “ e− ”. Concentration to activity con-versions (or activity coefficients) are never needed for the electron (cf. Appendix B, Example B.3).
In the literature on geochemical modelling of natural waters, it is customary to represent the “electron activity” of an aqueous solution with the symbol “pe” or “pε”( ) by analogy with pH (10log
ea −= − +10 H
log a= − ), and the redox potential of an aqueous solution relative to the standard hydrogen electrode is usually denoted by either “Eh” or “ ” (see for example [81STU/MOR], [82DRE], [84HOS], [86NOR/MUN]). HE

24 2 Standards, Conventions and Contents of the Tables
In this review, the symbol 'E ο is used to denote the so called “formal poten-tial” [74PAR]. The formal (or “conditional”) potential can be regarded as a standard potential for a particular medium in which the activity coefficients are independent (or approximately so) of the reactant concentrations [85BAR/PAR] (the definition of
parallels that of “concentration quotients” for equilibria). Therefore, from
'E ο
' R = lnF iTE E c
nο − υ∑ i (2.35)
'E ο is the potential E for a cell when the ratio of the concentrations (not the activities) on the right–hand side and the left–hand side of the cell reaction is equal to unity, and
' r mR = ln F Fi i
GTE En n
ο ο ∆− υ ρ γ = −∑ (2.36)
where the are the molality activity coefficients and iγ mis ( iic )
+H
ρ , the ratio of molality to molarity (cf. section 2.2). The medium must be specified.
2.1.8 pH Because of the importance that potentiometric methods have in the determination of equilibrium constants in aqueous solutions, a short discussion on the definition of “pH” and a simplified description of the experimental techniques used to measure pH will be given here.
The acidity of aqueous solutions is often expressed in a logarithmic scale of the hydrogen ion activity. The definition of pH as:
+ +10 10H HpH = log = log ( )a m− − γ
can only be strictly used in the limiting range of the Debye–Hückel equation (that is, in extremely dilute solutions). In practice the use of pH values requires extra assumptions as to the values for single ion activities. In this review values of pH are used to describe qualitatively the ranges of acidity of experimental studies, and the assumptions de-scribed in Appendix B are used to calculate single ion activity coefficients.
The determination of pH is often performed by emf measurements of galvanic cells involving liquid junctions [69ROS], [73BAT]. A common setup is a cell made up of a reference half cell (e.g. Ag(s)/AgCl(s) in a solution of constant chloride concentra-tion), a salt bridge, the test solution, and a glass electrode (which encloses a solution of constant acidity and an internal reference half cell):
Pt(s) Ag(s) AgCl(s) KCl(aq) salt bridge
test solution
KCl(aq) AgCl(s) Ag(s) Pt(s)
a b (2.37)
where stands for a glass membrane (permeable to hydrogen ions).

2.1 Symbols, terminology and nomenclature 25
The emf of such a cell is given by:
+ jH* R = ln +
FTE E a E
n−
E
where is a constant, and is the liquid junction potential. The purpose of the salt bridge is to minimise the junction potential in junction “b”, while keeping constant the junction potential for junction “a”. Two methods are most often used to reduce and con-trol the value of . An electrolyte solution of high concentration (the “salt bridge”) is a requirement of both methods. In the first method, the salt bridge is a saturated (or nearly saturated) solution of potassium chloride. A problem with a bridge of high potassium concentration is that potassium perchlorate might precipitate
*E j
jE
1 inside the liquid junction when the test solution contains a high concentration of perchlorate ions.
In the other method the salt bridge contains the same high concentration of the same inert electrolyte as the test solution (for example, 3 M NaClO4). However, if the concentration of the background electrolyte in the salt bridge and test solutions is re-duced, the values of are dramatically increased. For example, if both the bridge and the test solution have [C = 0.1 M as background electrolyte, the dependence of the liquid junction at “b” on acidity is ≈ – 440 × [H
jE4lO ]−
jE +] mV·dm3 mol–1 at 25°C [69ROS] (p.110), which corresponds to an error at pH = 2 of ≥ 0.07 pH units.
Because of the problems in eliminating the liquid junction potentials and in defining individual ionic activity coefficients, an “operational” definition of pH is given by IUPAC [88MIL/CVI]. This definition involves the measurement of pH differences between the test solution and standard solutions of known pH and similar ionic strength (in this way similar values of and cancel each other when emf values are sub-stracted).
+Hγ jE
The measurement and use of pH in equilibrium analytical investigations cre-ates many problems that have not always been taken into account by the investigators, as discussed in many reviews in Appendix A. In order to deduce the stoichiometry and equilibrium constants of complex formation reactions and other equilibria, it is neces-sary to vary the concentrations of reactants and products over fairly large concentration ranges under conditions where the activity coefficients of the species are either known, or constant. Only in this manner is it possible to use the mass balance equations for the various components together with the measurement of one or more free concentrations to obtain the information desired [61ROS/ROS], [90BEC/NAG], [97ALL/BAN], p. 326-327. For equilibria involving hydrogen ions, it is necessary to use concentration units, rather than hydrogen ion activity. For experiments in an ionic medium, where the concentration of an “inert” electrolyte is much larger than the concentration of reactants and products we can ensure that, as a first approximation, their trace activity coeffi-
1 KClO4(cr) has a solubility of ≈ 0.15 M in pure water at 25°C

26 2 Standards, Conventions and Contents of the Tables
cients remain constant even for moderate variations of the corresponding total concen-trations. Under these conditions of fixed ionic strength the free proton concentration may be measured directly, thereby defining it in terms of – log10[H+] rather than on the activity scale as pH, and the value of – log10[H+] and pH will differ by a constant term, i.e., +10 H
log γ . Equilibrium constants deduced from measurements in such ionic media are therefore conditional constants, because they refer to the given medium, not to the standard state. In order to compare the magnitude of equilibrium constants obtained in different ionic media it is necessary to have a method for estimating activity coefficients of ionic species in mixed electrolyte systems to a common standard state. Such proce-dures are discussed in Appendix B.
Note that the precision of the measurement of – log10[H+] and pH is virtually the same, in very good experiments, ± 0.001. However, the accuracy is generally con-siderably poorer, depending in the case of glass electrodes largely on the response of the electrode (linearity, age, pH range, etc.), and to a lesser extent on the calibration method employed, although the stoichiometric – log10[H+] calibration standards can be prepared far more accurately than the commercial pH standards.
2.1.9 Order of formulae To be consistent with CODATA, the data tables are given in “Standard Order of Ar-rangement” [82WAG/EVA]. This scheme is presented in Figure 2-1 below, and shows the sequence of the ranks of the elements in this convention. The order follows the ranks of the elements.
For example, for uranium, this means that, after elemental uranium and its monoatomic ions (e.g., ), the uranium compounds and complexes with oxygen would be listed, then those with hydrogen, then those with oxygen and hydrogen, and so on, with decreasing rank of the element and combinations of the elements. Within a class, increasing coefficients of the higher rank elements go before increasing coeffi-cients of the lower rank elements. For example, in the U–O–F class of compounds and complexes, a typical sequence would be , , , ,
, , , ,
4+U
UO2UOF (cr)
2 2F (g) UO4UOF (cr)
2 3F4UOF (g) 2UO F(aq)
+2UO F 2 2UO F (aq) 2 2F (cr) UO − , 2
42UO F − , , etc. [92GRE/FUG]. Formulae with identical stoichiometry are in alphabetical order of their designators.
2 3U O 6F (cr)

2.1 Symbols, terminology and nomenclature 27
Figure 2-1: Standard order of arrangement of the elements and compounds based on the periodic classification of the elements (from [ ]82WAG/EVA ).
�
�
�
�
�
�
�
�
�
�
�
�
�
�
�
�
�
�
�
�
�
�
�
�
�
�
�
�
�
�
�
�
�
�
�
�
�
�
�
�
�
�
�
�
�
�
�
�
�
�
�
�
�
�
�
�
�
�
�
���
� ��
� � � � � ��
�� � �� ��
� �� �� �� �� � �� �� �� �� �� � �� ��
�� �� �� � �� �� �� �� �� �� � � � � ��
� � ! �� �� �� �" �� �� � �� � �� �" ��
�
�
�
�
�
�
�
�
�
�
�
�
�
�
�
�
� � � � � � � � � � � � � �
� � � � � � � � � � � � � ��
# ��
�� ��
� �� �
�� � $
�� �� #�
�� �� ��
�� �� �� �% % &� �� � '( �� &� % $� #�
� �� ) �* �� �% �% �+ � &� �% �� �� #�

28 2 Standards, Conventions and Contents of the Tables
2.1.10 Reference codes The references cited in the review are ordered chronologically and alphabetically by the first two authors within each year, as described by CODATA [87GAR/PAR]. A refer-ence code is made up of the final two digits of the year of appearance (if the publication is not from the 20th century, the year will be put in full). The year is followed by the first three letters of the surnames of the first two authors, separated by a slash.
If there are multiple reference codes, a “2” will be added to the second one, a “3” to the third one, and so forth. Reference codes are always enclosed in square brack-ets.
2.2 Units and conversion factors Thermodynamic data are given according to the Système International d'unités (SI units). The unit of energy is the joule. Some basic conversion factors, also for non-thermodynamic units, are given in Table 2-4.
Table 2-4: Unit conversion factors.
To convert from (non-SI unit symbol)
to (SI unit symbol)
multiply by
ångström (Å) metre (m) 1×10⁻¹⁰ (exactly) standard atmosphere (atm) pascal (Pa) 1.01325×10⁵ (exactly) bar (bar) pascal (Pa) 1×10⁵ (exactly) thermochemical calorie (cal) joule (J) 4.184 (exactly) entropy unit 1 1e.u. cal K mol− −⋅ ⋅ 1 1J K mol− −⋅ ⋅ 4.184 (exactly)
Since a large part of the NEA TDB project deals with the thermodynamics of
aqueous solutions, the units describing the amount of dissolved substance are used very frequently. For convenience, this review uses “M” as an abbreviation of “ ” for molarity, c, and, in Appendices B and C, “m” as an abbreviation of “ ” for molality, m. It is often necessary to convert concentration data from molarity to molality and vice versa. This conversion is used for the correction and extrapolation of equilib-rium data to zero ionic strength by the specific ion interaction theory, which works in molality units (cf. Appendix B). This conversion is made in the following way. Molality is defined as moles of substance B dissolved in 1000 grams of pure water. Molarity is defined as c moles of substance B dissolved in
3mol dm−⋅1l kg−⋅mo
BmB B(1000 )c M−ρ grams of pure wa-
ter, where ρ is the density of the solution and M the molar weight of the solute.
From this it follows that:
BB
B
1000 = 1000
cmc M−ρ
.
Baes and Mesmer [76BAE/MES], (p.439) give a table with conversion factors (from molarity to molality) for nine electrolytes and various ionic strengths. Conversion
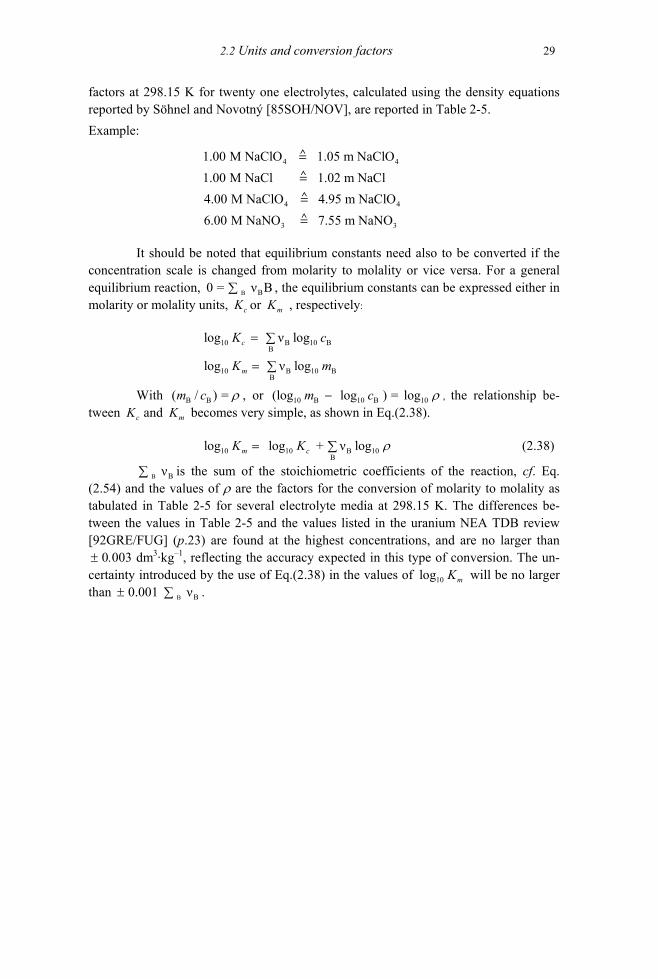
2.2 Units and conversion factors 29
factors at 298.15 K for twenty one electrolytes, calculated using the density equations reported by Söhnel and Novotný [85SOH/NOV], are reported in Table 2-5. Example:
4 41.00 M NaClO 1.05 m NaClO
4 4
3 3
1.00 M NaCl 1.02 m NaCl4.00 M NaClO 4.95 m NaClO6.00 M NaNO 7.55 m NaNO
It should be noted that equilibrium constants need also to be converted if the concentration scale is changed from molarity to molality or vice versa. For a general equilibrium reaction, , the equilibrium constants can be expressed either in molarity or molality units,
B B0 = ν B∑cK or mK , respectively:
10 B 10 B
B
10 B 10 BB
log ν log
c
mK m= ∑
B B ) = m c
= ∑
ρ 10 B(log l−
log ν logK c
With ( / , or 10 B 10og ) = logm c ρ , the relationship be-tween cK and mK becomes very simple, as shown in Eq.(2.38).
10 10 B 10B
log log + ν logm cK K= ∑ ρ (2.38)
B B ν∑ is the sum of the stoichiometric coefficients of the reaction, cf. Eq. (2.54) and the values of ρ are the factors for the conversion of molarity to molality as tabulated in Table 2-5 for several electrolyte media at 298.15 K. The differences be-tween the values in Table 2-5 and the values listed in the uranium NEA TDB review [92GRE/FUG] (p.23) are found at the highest concentrations, and are no larger than
0.003 dm± 3·kg–1, reflecting the accuracy expected in this type of conversion. The un-certainty introduced by the use of Eq.(2.38) in the values of 10log mK will be no larger than 0.001 . ± B B ν∑

30 2. Standards, Conventions and Contents of the Tables
Table 2-5: Factors for the conversion of molarity, , to molality, , of a substance B, in various media at 298.15 K (calculated from densities in [85SOH/NOV]).
ρ Bc Bm
3
B B 2= / (dm of solution per kg of H O)m cρ
c (M) HClO4 NaClO4 LiClO4 NH4ClO4 Ba(ClO4)2 HCl NaCl LiCl
0.10 1.0077 1.0075 1.0074 1.0091 1.0108 1.0048 1.0046 1.0049 0.25 1.0147 1.0145 1.0141 1.0186 1.0231 1.0076 1.0072 1.0078 0.50 1.0266 1.0265 1.0256 1.0351 1.0450 1.0123 1.0118 1.0127 0.75 1.0386 1.0388 1.0374 1.0523 1.0685 1.0172 1.0165 1.0177 1.00 1.0508 1.0515 1.0496 1.0703 1.0936 1.0222 1.0215 1.0228 1.50 1.0759 1.0780 1.0750 1.1086 1.1491 1.0324 1.0319 1.0333 2.00 1.1019 1.1062 1.1019 1.2125 1.0430 1.0429 1.0441 3.00 1.1571 1.1678 1.1605 1.3689 1.0654 1.0668 1.0666 4.00 1.2171 1.2374 1.2264 1.0893 1.0930 1.0904 5.00 1.2826 1.3167 1.1147 1.1218 1.1156 6.00 1.3547 1.4077 1.1418 1.1423
c (M) KCl NH4Cl MgCl2 CaCl2 NaBr HNO3
NaNO3 LiNO3
0.10 1.0057 1.0066 1.0049 1.0044 1.0054 1.0056 1.0058 1.0059 0.25 1.0099 1.0123 1.0080 1.0069 1.0090 1.0097 1.0102 1.0103 0.50 1.0172 1.0219 1.0135 1.0119 1.0154 1.0169 1.0177 1.0178 0.75 1.0248 1.0318 1.0195 1.0176 1.0220 1.0242 1.0256 1.0256 1.00 1.0326 1.0420 1.0258 1.0239 1.0287 1.0319 1.0338 1.0335 1.50 1.0489 1.0632 1.0393 1.0382 1.0428 1.0478 1.0510 1.0497 2.00 1.0662 1.0855 1.0540 1.0546 1.0576 1.0647 1.0692 1.0667 3.00 1.1037 1.1339 1.0867 1.0934 1.0893 1.1012 1.1090 1.1028 4.00 1.1453 1.1877 1.1241 1.1406 1.1240 1.1417 1.1534 1.1420 5.00 1.2477 1.1974 1.1619 1.1865 1.2030 1.1846 6.00 1.2033 1.2361 1.2585 1.2309
c (M) NH4NO3 H2SO4 Na2SO4 (NH4)2SO4 H3PO4 Na2CO3 K2CO3 NaSCN
0.10 1.0077 1.0064 1.0044 1.0082 1.0074 1.0027 1.0042 1.0069 0.25 1.0151 1.0116 1.0071 1.0166 1.0143 1.0030 1.0068 1.0130 0.50 1.0276 1.0209 1.0127 1.0319 1.0261 1.0043 1.0121 1.0234 0.75 1.0405 1.0305 1.0194 1.0486 1.0383 1.0065 1.0185 1.0342 1.00 1.0539 1.0406 1.0268 1.0665 1.0509 1.0094 1.0259 1.0453 1.50 1.0818 1.0619 1.0441 1.1062 1.0773 1.0170 1.0430 1.0686 2.00 1.1116 1.0848 1.1514 1.1055 1.0268 1.0632 1.0934 3.00 1.1769 1.1355 1.2610 1.1675 1.1130 1.1474 4.00 1.2512 1.1935 1.4037 1.2383 1.1764 1.2083 5.00 1.3365 1.2600 1.3194 1.2560 1.2773 6.00 1.4351 1.3365 1.4131 1.3557

2.3 Standard and reference conditions 31
2.3 Standard and reference conditions
2.3.1 Standard state A precise definition of the term “standard state” has been given by IUPAC [82LAF]. The fact that only changes in thermodynamic parameters, but not their absolute values, can be determined experimentally, makes it important to have a well-defined standard state that forms a base line to which the effect of variations can be referred. The IUPAC [82LAF] definition of the standard state has been adopted in the NEA–TDB project. The standard state pressure, = 0.1 MPa (1 bar), has therefore also been adopted, cf. section 2.3.2. The application of the standard state principle to pure substances and mix-tures is summarised below. It should be noted that the standard state is always linked to a reference temperature, cf. section 2.3.3.
pο
• The standard state for a gaseous substance, whether pure or in a gaseous mixture, is the pure substance at the standard state pressure and in a (hypothetical) state in which it exhibits ideal gas behaviour.
• The standard state for a pure liquid substance is (ordinarily) the pure liquid at the standard state pressure.
• The standard state for a pure solid substance is (ordinarily) the pure solid at the standard state pressure.
• The standard state for a solute B in a solution is a hypothetical liquid solution, at the standard state pressure, in which 1= = 1 mol kgBm m −ο ⋅ , and in which the ac-tivity coefficient is unity. Bγ
οIt should be emphasised that the use of superscript, , e.g., in f mH ο∆ , implies that the compound in question is in the standard state and that the elements are in their reference states. The reference states of the elements at the reference temperature (cf. section 2.3.3) are listed in Table 2-6.
Table 2-6: Reference states for some elements at the reference temperature of 298.15 K and standard pressure of 0.1 MPa [82WAG/EVA], [89COX/WAG], [91DIN].
O2 gaseous Al crystalline, cubic H2 gaseous Zn crystalline, hexagonal He gaseous Cd crystalline, hexagonal Ne gaseous Hg liquid Ar gaseous Cu crystalline, cubic Kr gaseous Ag crystalline, cubic Xe gaseous Fe crystalline, cubic, bcc F2 gaseous Tc crystalline, hexagonal Cl2 gaseous V crystalline, cubic
(Continued on next page)

2. Standards, Conventions and Contents of the Tables 32
Table 2-6: (continued)
Br2 liquid Ti crystalline, hexagonal I2 crystalline, orthorhombic Am crystalline, dhcp S crystalline, orthorhombic Pu crystalline, monoclinic Se crystalline, hexagonal (“black”) Np crystalline, orthorhombic Te crystalline, hexagonal U crystalline, orthorhombic N2 gaseous Th crystalline, cubic P crystalline, cubic (“white”) Be crystalline, hexagonal As crystalline, rhombohedral (“grey”) Mg crystalline, hexagonal Sb crystalline, rhombohedral Ca crystalline, cubic, fcc Bi crystalline, rhombohedral Sr crystalline, cubic, fcc C crystalline, hexagonal (graphite) Ba crystalline, cubic Si crystalline, cubic Li crystalline, cubic Ge crystalline, cubic Na crystalline, cubic Sn crystalline, tetragonal (“white”) K crystalline, cubic Pb crystalline, cubic Rb crystalline, cubic B β, crystalline, rhombohedral Cs crystalline, cubic
2.3.2 Standard state pressure The standard state pressure chosen for all selected data is 0.1 MPa (1 bar) as recom-mended by the International Union of Pure and Applied Chemistry IUPAC [82LAF].
However, the majority of the thermodynamic data published in the scientific literature and used for the evaluations in this review, refer to the old standard state pres-sure of 1 “standard atmosphere” (= 0.101325 MPa). The difference between the ther-modynamic data for the two standard state pressures is not large and lies in most cases within the uncertainty limits. It is nevertheless essential to make the corrections for the change in the standard state pressure in order to avoid inconsistencies and propagation of errors. In practice the parameters affected by the change between these two standard state pressures are the Gibbs energy and entropy changes of all processes that involve gaseous species. Consequently, changes occur also in the Gibbs energies of formation of species that consist of elements whose reference state is gaseous (H, O, F, Cl, N, and the noble gases). No other thermodynamic quantities are affected significantly. A large part of the following discussion has been taken from the NBS tables of chemical ther-modynamic properties [82WAG/EVA], see also Freeman [84FRE].
The following expressions define the effect of pressure on the properties of all substances:
= (1 )pT
H VV T V Tp T
∂ ∂ − = − α ∂ ∂ (2.39)

2.3 Standard and reference conditions 33
2
2 = p
pT
C VTp T
∂ ∂− ∂ ∂
(2.40)
= = pT
S VVp T
∂ ∂ − α − ∂ ∂ (2.41)
= T
G Vp
∂ ∂
(2.42)
where 1 p
VV T
∂ α ≡ ∂ (2.43)
For ideal gases, R = p
TV and R =
1pV Tα = . The conversion equations listed below (Eqs.
(2.44) to (2.51)) apply to the small pressure change from 1 atm to 1 bar (0.1 MPa). The quantities that refer to the old standard state pressure of 1 atm are assigned the super-script and those that refer to the new standard state pressure of 1 bar are assigned the superscript .
( ) ,atm
( )bar
For all substances the changes in the enthalpy of formation and heat capacity are much smaller than the experimental accuracy and can be disregarded. This is exactly true for ideal gases.
(2.44) (bar) (atm)
f f( ) ( ) = 0H T H T∆ − ∆
(2.45) (bar) (atm) ( ) ( ) = 0p pC T C T−
For gaseous substances, the entropy difference is:
(atm)
(bar) (atm)(bar)( ) ( ) = R ln = R ln 1.01325pS T S T
p
−
(2.46) -1 -1 = 0.1094 J K mol⋅ ⋅
This is exactly true for ideal gases, as follows from Eq.(2.41) with = pVRα . The
entropy change of a reaction or process is thus dependent on the number of moles of gases involved:
(atm)
(bar) (atm)r r (bar) = δ R ln pS S
p
∆ − ∆ ⋅
× ⋅
(2.47) -1 -1 = δ 0.1094 J K mol⋅
where δ is the net increase in moles of gas in the process.
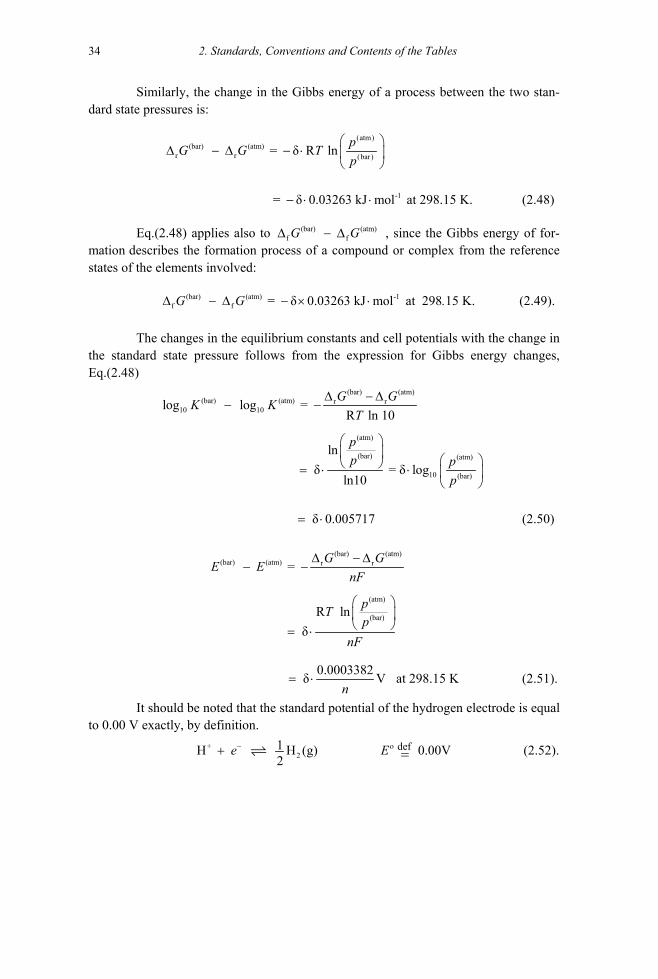
2. Standards, Conventions and Contents of the Tables 34
Similarly, the change in the Gibbs energy of a process between the two stan-dard state pressures is:
(atm)(bar) (atm)
r r (bar) = δ R ln pG G Tp
∆ − ∆ − ⋅
at 298.15 K. (2.48) -1 = δ 0.03263 kJ mol− ⋅ ⋅
Eq.(2.48) applies also to , since the Gibbs energy of for-mation describes the formation process of a compound or complex from the reference states of the elements involved:
(bar) (atm)f f G G∆ − ∆
at 298.15 K. (2.49). (bar) (atm) -1f f = δ 0.03263 kJ molG G∆ − ∆ − × ⋅
The changes in the equilibrium constants and cell potentials with the change in the standard state pressure follows from the expression for Gibbs energy changes, Eq.(2.48)
(bar) (atm)(bar) (atm) r r
10 10log log = R ln 10
G GK KT
∆ − ∆− −
(atm)
(bar) (atm)
10 (bar)
ln δ = δ log
ln10
pp p
p
= ⋅ ⋅
δ 0.005717
= ⋅ (2.50)
(bar) (atm)(bar) (atm) r r = G GE E
nF∆ − ∆
− −
(atm)
(bar)R ln δ
pTp
nF
= ⋅
0.0003382 δ V n
= ⋅ at 298.15 K (2.51).
It should be noted that the standard potential of the hydrogen electrode is equal to 0.00 V exactly, by definition.
+ 2
def1H H (g) 0.00V2 =
−+ e Eο (2.52).

2.4 Fundamental physical constants 35
This definition will not be changed, although a gaseous substance, , is involved in the process. The change in the potential with pressure for an electrode po-tential conventionally written as:
2H (g)
+Ag + Ag (cr)−e
should thus be calculated from the balanced reaction that includes the hydrogen elec-trode,
+ +2
1Ag + H (g) Ag (cr) + H2
Here δ = − 0.5. Hence, the contribution to δ from an electron in a half cell reaction is the same as the contribution of a gas molecule with the stoichiometric coefficient of 0.5. This leads to the same value of δ as the combination with the hydrogen half cell.
Example: + 2+ (bar) (atm)
2
(bar) (bar
2 2 10 10
Fe(cr) + 2 H Fe + H (g) = 1 = 0.00017 V
CO (g) CO (aq) = 1 log log
δ −
δ − −
E E
K K ) = 0.0057−
⋅
)
(bar) (atm) -1
3 2 2 r r
(bar) (atm)
2 2 4 f f
5 3NH (g) + O NO(g) + H O(g) = 0.25 = 0.008 kJ mol
4 21
Cl (g) + 2 O (g) + e ClO = 3 = 2
− −
δ ∆ − ∆ −
δ − ∆ − ∆
G G
G G -10.098 kJ mol⋅
2.3.3 Reference temperature The definitions of standard states given in section 2.3 make no reference to fixed tem-perature. Hence, it is theoretically possible to have an infinite number of standard states of a substance as the temperature varies. It is, however, convenient to complete the definition of the standard state in a particular context by choosing a reference tempera-ture. As recommended by IUPAC [82LAF], the reference temperature chosen in the NEA–TDB project is T = 298.15 K or t = 25.00°C. Where necessary for the discussion, values of experimentally measured temperatures are reported after conversion to the IPTS–68 [69COM]. The relation between the absolute temperature T (K, kelvin) and the Celsius temperature t (°C) is defined by t = ( oT T− where T = 273.15 K. o
2.4 Fundamental physical constants The fundamental physical constants are taken from a publication by CODATA [86COD]. Those relevant to this review are listed in Table 2-7.

2. Standards, Conventions and Contents of the Tables 36
Table 2-7: Fundamental physical constants. These values have been taken from CODATA [86COD]. The digits in parentheses are the one–standard–deviation uncer-tainty in the last digits of the given value.
Quantity Symbol Value Units
speed of light in vacuum c 299 792 458 m·s–1
permeability of vacuum µ0 4π×10-7 = 12.566 370 614… 7 210 N A− −⋅
permittivity of vacuum є ο21 / c
οµ = 8.854 187 817… 12 2 1 110 C J m− − −⋅ ⋅
34−
Planck constant h 6.626 0755(40) 10 J S⋅
19−
elementary charge e 1.602 177 33(49) 10 C
23 1mol−
Avogadro constant NA 6.022 1367(36) 101C mol−⋅
Faraday constant F 96 485.309(29)
molar gas constant R 8.314 510(70) 1 1J K mol− −⋅ ⋅
Boltzmann constant, R/NA k 1.380 658(12) 23 1− −10 J K⋅
Non-SI units used with SI: electron volt, (e/C) J eV 1.602 177 33(49) 1910 J−
27−
atomic mass unit, u 1.660 5402(10) 10 kg
12
u
11u = ( )12
m m= C
2.5 Uncertainty estimates One of the principal objectives of the NEA TDB development effort is to provide an idea of the uncertainties associated with the data selected in the reviews. In general the uncertainties should define the range within which the corresponding data can be repro-duced with a probability of 95%. In many cases, a full statistical treatment is limited or impossible due to the availability of only one or a few data points. Appendix C de-scribes in detail the procedures used for the assignment and treatment of uncertainties, as well as the propagation of errors and the standard rules for rounding.
2.6 The NEA-TDB system A database system has been developed at the NEA Data Bank that allows the storage of thermodynamic parameters for individual species as well as for reactions. The structure of the database system allows consistent derivation of thermodynamic data for individ-ual species from reaction data at standard conditions, as well as internal recalculations of data at standard conditions. If a selected value is changed, all the dependent values will be recalculated consistently. The maintenance of consistency of all the selected data, including their uncertainties (cf. Appendix C), is ensured by the software devel-oped for this purpose at the NEA Data Bank. The literature sources of the data are also stored in the database.

2.6 The NEA-TDB system 37
The following thermodynamic parameters, valid at the reference temperature of 298.15 K and at the standard pressure of 1 bar, are stored in the database:
f mο∆ G the standard molar Gibbs energy of formation from the elements in
their reference state ( kJ 1mol−⋅ )
f mH ο∆ the standard molar enthalpy of formation from the elements in their reference state ( 1kJ mol−⋅ )
mS ο the standard molar entropy ( 1 1J K mol− −⋅ ⋅ ) ο −
,mpC the standard molar heat capacity ( 1 1J K mol−⋅ ⋅ ).
For aqueous neutral species and ions, the values of f mGο∆ , f mH ο∆ , and mS ο
,mpCο correspond to the standard partial molar quantities, and for individual aqueous ions they are relative quantities, defined with respect to the aqueous hydrogen ion, ac-cording to the convention [89COX/WAG] that f mH ο∆ ( , aq, T) = 0 and that ( , aq, T) = 0. Furthermore, for an ionised solute B containing any number of different ca-tions and anions:
+H mS ο +H
f m + f m f m+
(B , aq) = (cation, aq) + (anion, aq)H H Hο ο ο± −
−∆ υ ∆ υ ∆∑ ∑
ο ο ο m + m m+
(B , aq) = (cation, aq) + (anion, aq)S S S± −−
υ υ∑ ∑
As the thermodynamic parameters vary as a function of temperature, provision is made for including the compilation of the coefficients of empirical temperature func-tions for these data, as well as the temperature ranges over which they are valid. In many cases the thermodynamic data measured or calculated at several temperatures were published for a particular species, rather than the deduced temperature functions. In these cases, a linear regression method is used in this review to obtain the most sig-nificant coefficients of the following empirical function for a thermodynamic parameter, X:
2 1 2( ) = ln ln
3 3 + + + .
X X X X X X X
XX X X
ih T j T k TT
−⋅ ⋅ + ⋅ (2.53)
X T a b T c T d T e T f T g T T− −+ ⋅ + ⋅ + ⋅ + ⋅ + ⋅ + ⋅
2
Most temperature variations can be described with three or four parameters. In the present review, only C , i.e., the thermal functions of the heat capacities of individual species are considered and stored in the database. They refer to the relation:
,m ( )p T
2 1,m ( ) = pC T a b T c T d T e T− −+ ⋅ + ⋅ + ⋅ + ⋅
(where the subindices for the coefficients have been dropped) and are listed in Tables 3.3, 4.3, 5.3, 6.3 and 7.3.
The pressure dependence of thermodynamic data has not been the subject of critical analysis in the present compilation. The reader interested in higher temperatures and pressures, or the pressure dependency of thermodynamic functions for geochemical applications, is referred to the specialised literature in this area, e.g., [82HAM],

2. Standards, Conventions and Contents of the Tables 38
[84MAR/MES], [88SHO/HEL], [88TAN/HEL], [89SHO/HEL], [89SHO/HEL2], [90MON], [91AND/CAS].
Selected standard thermodynamic data referring to chemical reactions are also compiled in the database. A chemical reaction “r”, involving reactants and products ‘B”, can be abbreviated as:
(2.54) BB
0 υ Br= ∑
where the stoichiometric coefficients Brυ are positive for products, and negative for
reactants. The reaction parameters considered in the NEA TDB system include:
10log rK ο the equilibrium constant of the reaction, logarithmic
r mGο∆ the molar Gibbs energy of reaction ( 1kJ mol−⋅ )
r mH ο∆ the molar enthalpy of reaction ( 1kJ mol−⋅ )
r mS ο∆ the molar entropy of reaction ( 1 1J K mol− −⋅ ⋅ )
r ,mpCο∆ the molar heat capacity of reaction ( 1 1J K mol− −⋅ ⋅ )
The temperature functions of these data, if available, are stored according to Eq.(2.53). The equilibrium constant, rK ο , is related to r mGο∆ according to the following
relation: r m
10log = R ln(10)r
GKT
οο ∆
−
and can be calculated from the individual values of (for example, those given in Tables 3.1 and 4.1), according to:
f m (B)Gο∆
10 B f mB
1log = υ (B)R ln(10)
rrK
Tο − ∆∑ Gο (2.55).
2.7 Presentation of the selected data The selected data are presented in Chapters 3, 4, 5, 6 and 7. Unless otherwise indicated, they refer to standard conditions (cf. section 2.3) and 298.15 K (25.00°C) and are pro-vided with an uncertainty which should correspond to the 95% confidence level (see Appendix C).
Chapters 3, 4, 5, 6 and 7 contain tables of selected thermodynamic data for indi-vidual compounds and complexes of uranium, neptunium, plutonium, americium and technetium (Tables 3.1, 4.1, 5.1, 6.1 and 7.1, respectively), tables of selected reaction data (Tables 3.2, 4.2, 5.2, 6.2 and 7.2) for reactions concerning uranium, neptunium, plutonium, americium and technetium species, respectively, and tables containing se-lected thermal functions of the heat capacities of individual species of uranium, neptu-nium, plutonium, americium and technetium (Tables 3.3, 4.3, 5.3, 6.3 and 7.3, respec-

2.7 Presentation of the selected data 39
tively). The selection of these data is discussed in Part III. The fitted heat capacity coef-ficients for the gaseous species in Tables 3.3, 4.3, 5.3, 6.3 and 7.3 are valid only up to the maximum temperatures given. These temperatures vary in order to retain only small differences (generally < 0.25 J · K–1 · mol–1) between the fitted and calculated heat ca-pacities.
Chapter 14 contains, for auxiliary compounds and complexes that do not con-tain uranium, neptunium, plutonium, americium or technetium, a table of the thermody-namic data for individual species (Table 8.1) and a table of reaction data (Table 8.2). Most of these values are the CODATA Key Values [89COX/WAG]. The selection of the remaining auxiliary data is discussed in [92GRE/FUG], [99RAR/RAN] and [2001LEM/FUG].
All the selected data presented in Tables 3.1, 3.2, 4.1, 4.2, 5.1, 5.2, 6.1, 6.2, 7.1 and 7.2 are internally consistent. This consistency is maintained by the internal consis-tency verification and recalculation software developed at the NEA Data Bank in con-junction with the NEA TDB database system, cf. section 2.6. Therefore, when using the selected data for uranium, neptunium, plutonium, americium or technetium species, the auxiliary data in Chapter 8 must be used together with the data in Chapter 3, 4, 5, 6 and 7 to ensure internal consistency of the data set.
It is important to note that Tables 3.2, 4.2, 5.2, 6.2, 7.2 and 8.2 include only those species for which the primary selected data are reaction data. The formation data derived there from and listed in Tables 3.1, 4.1, 5.1, 6.1 and 7.1 are obtained using aux-iliary data, and their uncertainties are propagated accordingly. In order to maintain the uncertainties originally assigned to the selected data in this review, the user is advised to make direct use of the reaction data presented in Tables 3.2, 4.2, 5.2, 6.2, 7.2 and 8.2, rather than taking the derived values in Tables 3.1, 4.1, 5.1, 6.1, 7.1 and 8.1 to calculate the reaction data with Eq.(2.55). The latter approach would imply a twofold propagation of the uncertainties and result in reaction data whose uncertainties would be considera-bly larger than those originally assigned.
The thermodynamic data in the selected set refer to a temperature of 298.15 K (25.00°C), but they can be recalculated to other temperatures if the corresponding data (enthalpies, entropies, heat capacities) are available [97PUI/RAR]. For example, the temperature dependence of the standard reaction Gibbs energy as a function of the stan-dard reaction entropy at the reference temperature (T = 298.15 K), and of the heat ca-pacity function is:
0
0
0
r ,mr m 0
( ) ( ) d ,
T
T p
T
C TT S T T
T
οο
∆− ∆ +
∫
r m r m 0 r ,m( ) = ( ) + ( ) dT
pG T H T C T Tο ο ο∆ ∆ ∆∫

2. Standards, Conventions and Contents of the Tables 40
and the temperature dependence of the standard equilibrium constant as a function of the standard reaction enthalpy and heat capacity is:
0 0
0
r ,mr ,m
R ln(10)
( ) 1 1 ( ) d + d ,R ln(10) R ln(10)
οο
∆
− ∆∫ ∫T T p
pT T
T T
C TC T T T
T T
r m 010 10 0
( ) 1 1log ( ) = log ( ) ο
ο ο ∆− −
H TK T K T
where R is the gas constant (cf. Table 2-7).
In the case of aqueous species, for which enthalpies of reaction are selected or can be calculated from the selected enthalpies of formation, but for which there are no selected heat capacities, it is in most cases possible to recalculate equilibrium constants to temperatures up to 100 to 150°C, with an additional uncertainty of perhaps about 1 to 2 logarithmic units, due to neglecting the heat capacity contributions to the temperature correction. However, it is important to observe that “new” aqueous species, i.e., species not present in significant amounts at 25°C and therefore not detected, may be significant at higher temperatures, see for example the work by Ciavatta et al. [87CIA/IUL]. Addi-tional high–temperature experiments may therefore be needed in order to ascertain that proper chemical models are used in the modelling of hydrothermal systems. For many species, experimental thermodynamic data are not available to allow a selection of pa-rameters describing the temperature dependence of equilibrium constants and Gibbs energies of formation. The user may find information on various procedures to estimate the temperature dependence of these thermodynamic parameters in [97PUI/RAR]. The thermodynamic data in the selected set refer to infinite dilution for soluble species. Ex-trapolation of an equilibrium constant K, usually measured at high ionic strength, to K ο at I = 0 using activity coefficients γ, is explained in Appendix B. The corresponding Gibbs energy of dilution is:
dil m r m r m = G Gο∆ ∆ − ∆ G (2.56)
r = R lnT ±− ∆ γ (2.57)
Similarly ∆ can be calculated from dil mS ln ±γ and its variations with T, while:
2dil m r = R ( ln ) pH T
T ±∂∆ ∆
∂γ (2.58)
depends only on the variation of γ with T, which is neglected in this review, when no data on the temperature dependence of γ ’s are available. In this case the Gibbs energy of dilution is entirely assigned to the entropy difference. This entropy of reac-tion is calculated using the Gibbs-Helmholtz equation, the above assumption
dil mG∆
dil mH∆ = 0, and . dil∆ mG

41
Part II
Tables of selected data


43
Chapter 3
3 Selected Data for Uranium
3.1 General considerations
This chapter presents updated chemical thermodynamic data for uranium species, as described in detail in Chapter 9 of this volume. The newly selected data represent revi-sions to those chosen in the previous NEA TDB review [92GRE/FUG]. In this respect, it will be found that while new species appear in the Tables, some others have been re-moved from them. Table 3–1 contains the recommended thermodynamic data of the uranium compounds and complexes, Table 3–2 the recommended thermodynamic data of chemical equilibrium reactions by which the uranium compounds and complexes are formed, and Table 3–3 the temperature coefficients of the heat capacity data of Table 3–1 where available.
The species and reactions in Table 3–1, Table 3–2 and Table 3–3 appear in standard order of arrangement (cf. Figure 2.1). Table 3–2 contains information only on those reactions for which primary data selections are made in this review. These se-lected reaction data are used, together with data for key uranium species (for example U4+) and auxiliary data listed in Table 8–1, to derive the corresponding formation quan-tities in Table 3–1. The uncertainties associated with values for the key uranium species and for some of the auxiliary data are substantial, leading to comparatively large uncer-tainties in the formation quantities derived in this manner. The inclusion of a table for reaction data (Table 3–2) in this report allows the use of equilibrium constants with total uncertainties that are directly based on the experimental accuracy. This is the main rea-son for including both the table for reaction data (Table 3–2) and the table of
f m f m m, ,G H Sο ο ο∆ ∆ and ,mpCο values (Table 3–1). In a few cases, the correlation of small uncertainties in values for ligands has been neglected in calculations of uncertainty val-ues for species in Table 3–1 from uncertainty values in Table 3–2. However, for those species the effects are less than 2% of the stated uncertainties.
The selected thermal functions of the heat capacities, listed in Table 3–3, refer to the relation:
2 1 2,m ( ) = pC T a b T c T d T e T− −+ ⋅ + ⋅ + ⋅ + ⋅ (3.1)

3 Selected uranium data
44
No references are given in these tables since the selected data are generally not directly attributable to a specific published source. A detailed discussion of the selection procedure is presented in [92GRE/FUG] and in Chapter 9 of this volume.
3.2 Precautions to be observed in the use of the tables Geochemical modelling in aquatic systems requires the careful use of the data selected in the NEA TDB reviews. The selected data in the tables must not be adopted without taking into account the chemical background information discussed in the correspond-ing sections of this book. In particular the following precautions should be observed when using data from the Tables.
• The addition of any aqueous species and its data to this internally consistent da-tabase can result in a modified data set which is no longer rigorous and can lead to erroneous results. The situation is similar, to a lesser degree, with the addition of gases and solids. It should also be noted that the data set presented in this chapter may not be “complete” for all the conceivable systems and conditions. Gaps are pointed out in both the previous NEA TDB review and the present up-date.
• Solubility data for crystalline phases are well defined in the initial state, but not necessarily in the final state after “equilibrium” has been attained. Hence, the solubility calculated from these phases may be very misleading, as discussed for the solubility data of MO2(cr), M = U, Np, Pu.
• The selected thermodynamic data in [92GRE/FUG], [95SIL/BID] and [2001LEM/FUG] contain thermodynamic data for amorphous phases. Most of these refer to Gibbs energy of formation deduced from solubility measurements. In the present review all such data have been removed. However, the corresponding log10K values have been retained. The reasons for these changes are: o Thermodynamic data are only meaningful if they refer to well–
defined systems; this is not the case for amorphous phases. It is well known that their solubility may change with time, due to re–crystallisation with a resulting change in water content and surface area/crystal size; the time scale for these changes can vary widely. These kinetic phenomena are different from those encountered in sys-tems where there is a very high activation barrier for the reaction, e.g., electron exchange between sulphate and sulphide.
o The solubility of amorphous phases provides useful information for users of the database when modelling the behaviour of complex sys-tems. Therefore, the solubility products have been given with the pro-viso that they are not thermodynamic quantities.

3 Selected uranium data
45
Table 3–1: Selected thermodynamic data for uranium compounds and complexes. All ionic species listed in this table are aqueous species. Unless noted otherwise, all data refer to the reference temperature of 298.15 K and to the standard state, i.e., a pressure of 0.1 MPa and, for aqueous species, infinite dilution (I = 0). The uncertainties listed below each value represent total uncertainties and correspond in principle to the statisti-cally defined 95% confidence interval. Values in bold typeface are CODATA Key Val-ues and are taken directly from reference [89COX/WAG] without further evaluation. Values obtained from internal calculation, cf. footnotes (a) and (b), are rounded at the third digit after the decimal point and may therefore not be exactly identical to those given in Part III. Systematically, all the values are presented with three digits after the decimal point, regardless of the significance of these digits. The data presented in this table are available on computer media from the OECD Nuclear Energy Agency.
f mGο∆ f mH ο∆ mS ο,mpCο
Compound (kJ · mol–1) (kJ · mol–1) (J · K–1 · mol–1) (J · K–1 · mol–1)
U(cr) 0.000 0.000 50.200±0.200
27.660±0.050
(c)
U(g) 488.400±8.000
(a) 533.000±8.000
199.790±0.030
23.690±0.030
(c)
U3+ –476.473±1.810
(b) –489.100±3.712
(b) –188.172±13.853
(b) –150.000±50.000
U4+ –529.860±1.765
(b) –591.200±3.300
–416.895±12.553
(a) –220.000±50.000
UO(g) 5.327±10.018
(a) 35.000±10.000
252.300±2.000
39.600±2.000
(c)
UO2(cr) –1031.833±1.004
(a) –1085.000±1.000
77.030±0.200
63.600±0.080
(c)
UO2(g) –481.064±20.036
(a) –477.800±20.000
266.300±4.000
59.500±2.000
(c)
UO2+ –961.021
±1.752 (b) –1025.127
±2.960 (a) –25.000
±8.000
UO22+ –952.551
±1.747 (a) –1019.000
±1.500 –98.200
±3.000 42.400
±3.000 (c)
β–UO2.25(d) –1069.083
±1.702 (a) –1127.400
±1.700 85.400
±0.200 (c)
UO2.25(cr)(e) –1069.125±1.702
(a) –1128.000±1.700
83.530±0.170
73.340±0.150
(c)
α–UO2.3333 82.170±0.500
71.420±0.300
(c)
β–UO2.3333 –1079.572±2.002
(a) –1141.000±2.000
83.510±0.200
71.840±0.140
(c)
(Continued on next page)

3 Selected uranium data
46
Table 3–1: (continued)
f mGο∆ f mH ο∆ mS ο,mpCο
Compound (kJ · mol–1) (kJ · mol–1) (J · K–1 · mol–1) (J · K–1 · mol–1)
UO2.6667(cr) –1123.157±0.804
(a) –1191.600±0.800
94.180±0.170
79.310±0.160
(c)
UO2.86. 0.5 H2O(cr) –1367.000±10.000
UO2.86. 1.5 H2O(cr) –1666.000±10.000
α–UO2.95 –1211.280±1.284
(b)
α–UO3 –1135.330±1.482
(a) –1212.410±1.450
99.400±1.000
81.840±0.300
β–UO3 –1142.301±1.307
(a) –1220.300±1.300
96.320±0.400
81.340±0.160
(c)
γ–UO3 –1145.739±1.207
(a) –1223.800±1.200
96.110±0.400
81.670±0.160
(c)
δ–UO3 –1213.730±1.440
ε–UO3 –1217.200±1.300
UO3(g) –784.761±15.012
(a) –799.200±15.000
309.500±2.000
64.500±2.000
(c)
β–UH3 –72.556±0.148
(a) –126.980±0.130
63.680±0.130
49.290±0.080
UOH3+ –763.918±1.798
(b) –830.120±9.540
(b) –199.946±32.521
(b)
UO2OH+ –1159.724±2.221
(b) –1261.371±15.072
(a) 17.000±50.000
UO3. 0.393 H2O(cr) –1347.800±1.300
UO3. 0.648 H2O(cr) –1424.600±1.300
α–UO3. 0.85 H2O –1491.900±1.300
α–UO3. 0.9 H2O –1374.560±2.460
(a) –1506.300±1.300
126.000±7.000
140.000±30.000
δ–UO3H0.83 –1285.140±2.020
(b)
(Continued on next page)

3 Selected uranium data
47
Table 3–1: (continued)
f mGο∆ f mH ο∆ mS ο,mpCο
Compound (kJ · mol–1) (kJ · mol–1) (J · K–1 · mol–1) (J · K–1 · mol–1)
UO2(OH)2(aq) –1357.479±1.794
(b)
β–UO2(OH)2 –1398.683±1.765
(a) –1533.800±1.300
138.000±4.000
141.000±15.000
(c)
γ–UO2(OH)2 –1531.400±1.300
U(OH)4(aq) –1421.309±8.189
(b) –1624.607±11.073
(a) 40.000±25.000
205.000±80.000
UO2(OH)3 – –1548.384
±2.969 (b)
UO3. 2 H2O(cr) –1636.506±1.705
(a) –1826.100±1.700
188.540±0.380
172.070±0.340
(c)
UO2(OH)42– –1716.171
±4.260 (b)
UO4. 2 H2O(cr) –1784.000±4.200
UO4. 4 H2O(cr) –2384.700±2.100
(UO2)2OH3+ –2126.830±6.693
(b)
(UO2)2(OH)22+ –2347.303
±3.503 (b) –2572.065
±5.682 (a) –38.000
±15.000
(UO2)3(OH)42+ –3738.288
±5.517 (b)
(UO2)3(OH)5+ –3954.594
±5.291 (b) –4389.086
±10.394 (a) 83.000
±30.000
(UO2)3(OH)7 – –4333.835
±6.958 (b)
(UO2)4(OH)7+ –5345.179
±9.029 (b)
UF(g) –76.876±20.020
(a) –47.000±20.000
251.800±3.000
37.900±3.000
(c)
UF3+ –865.153±3.474
(b) –932.150±3.400
(b) –269.133±16.012
(b)
UF2(g) –558.697±25.177
(a) –540.000±25.000
315.700±10.000
56.200±5.000
(c)
(Continued on next page)

3 Selected uranium data
48
Table 3–1: (continued)
f mGο∆ f mH ο∆ mS ο,mpCο
Compound (kJ · mol–1) (kJ · mol–1) (J · K–1 · mol–1) (J · K–1 · mol–1)
UF22+ –1187.431
±4.632 (b) –1265.400
±3.597 (b) –139.195
±18.681 (b)
UF3(cr) –1432.531±4.702
(a) –1501.400±4.700
123.400±0.400
95.100±0.400
(c)
UF3(g) –1062.947±20.221
(a) –1065.000±20.000
347.500±10.000
76.200±5.000
(c)
UF3+ –1499.378
±5.466 (b) –1596.750
±5.540 (b) –37.537
±24.410 (b)
UF4(aq) –1806.302±6.388
(b) –1941.030±8.565
(b) 3.905±21.374
(b)
UF4(cr) –1823.538±4.201
(a) –1914.200±4.200
151.700±0.200
116.000±0.100
(c)
UF4(g) –1576.851±6.698
(a) –1605.200±6.530
(b) 360.700±5.000
95.100±3.000
(c)
α–UF5 –1968.688±6.995
(a) –2075.300±5.900
199.600±12.600
132.200±4.200
(c)
β–UF5 –1970.595±5.635
(a) –2083.200±4.200
179.500±12.600
132.200±12.000
(c)
UF5(g) –1862.083±15.294
(a) –1913.000±15.000
386.400±10.000
110.600±5.000
(c)
UF5 – –2095.760
±5.739 (b)
UF6(cr) –2069.205±1.842
(a) –2197.700±1.800
227.600±1.300
166.800±0.200
(c)
UF6(g) –2064.440±1.893
(a) –2148.600±1.868
(b) 376.300±1.000
129.400±0.500
(c)
UF62– –2389.098
±6.028 (b)
U2F9(cr) –3812.000±17.000
–4015.923±18.016
(a) 329.000±20.000
251.000±16.700
(c)
U2F10(g) –3993.200±30.366
(b)
U4F17(cr) –7464.000±30.000
–7849.665±32.284
(a) 631.000±40.000
485.300±33.000
(c)
UOF2(cr) –1434.127±6.424
(a) –1504.600±6.300
119.200±4.200
(Continued on next page)

3 Selected uranium data
49
Table 3–1: (continued)
f mGο∆ f mH ο∆ mS ο,mpCο
Compound (kJ · mol–1) (kJ · mol–1) (J · K–1 · mol–1) (J · K–1 · mol–1)
UOF4(cr) –1816.264±4.269
(a) –1924.600±4.000
195.000±5.000
UOF4(g) –1704.814±20.142
(a) –1763.000±20.000
363.200±8.000
108.100±5.000
(c)
UO2F+ –1263.527±1.911
(b) –1352.650±1.637
(b) –7.511±3.321
(b)
UO2F2(aq) –1565.999±2.276
(b) –1687.600±1.994
(b) 50.293±3.783
(b)
UO2F2(cr) –1557.322±1.307
(a) –1653.500±1.300
135.560±0.420
103.220±0.420
(c)
UO2F2(g) –1318.081±10.242
(a) –1352.500±10.084
(b) 342.700±6.000
86.400±3.000
(c)
UO2F3 – –1859.338
±2.774 (b) –2022.700
±2.480 (b) 76.961
±4.417 (b)
UO2F42– –2146.226
±3.334 (b) –2360.110
±3.038 (b) 74.248
±5.115 (b)
U2O3F6(cr) –3372.730±14.801
(a) –3579.200±13.546
(b) 324.000±20.000
U3O5F8(cr) –4890.135±9.771
(a) –5192.950±3.929
(b) 459.000±30.000
304.100±4.143
H3OUF6(cr) –2641.400±3.157
(b)
UOFOH(cr) –1336.930±12.948
(a) –1426.700±12.600
121.000±10.000
UOFOH. 0.5 H2O(cr) –1458.117±6.970
(a) –1576.100±6.300
143.000±10.000
UOF2. H2O(cr) –1674.474±4.143
(a) –1802.000±3.300
161.100±8.400
UF4. 2.5 H2O(cr) –2440.282±6.188
(a) –2671.475±4.277
263.500±15.000
263.700±15.000
UO2FOH. H2O(cr) –1721.700±7.500
–1894.500±8.400
178.345±37.770
(a)
UO2FOH. 2 H2O(cr) –1961.032±8.408
(b) –2190.010±9.392
(b) 223.180±38.244
(b)
UO2F2. 3 H2O(cr) –2269.658±6.939
(a) –2534.390±4.398
(b) 270.000±18.000
(Continued on next page)
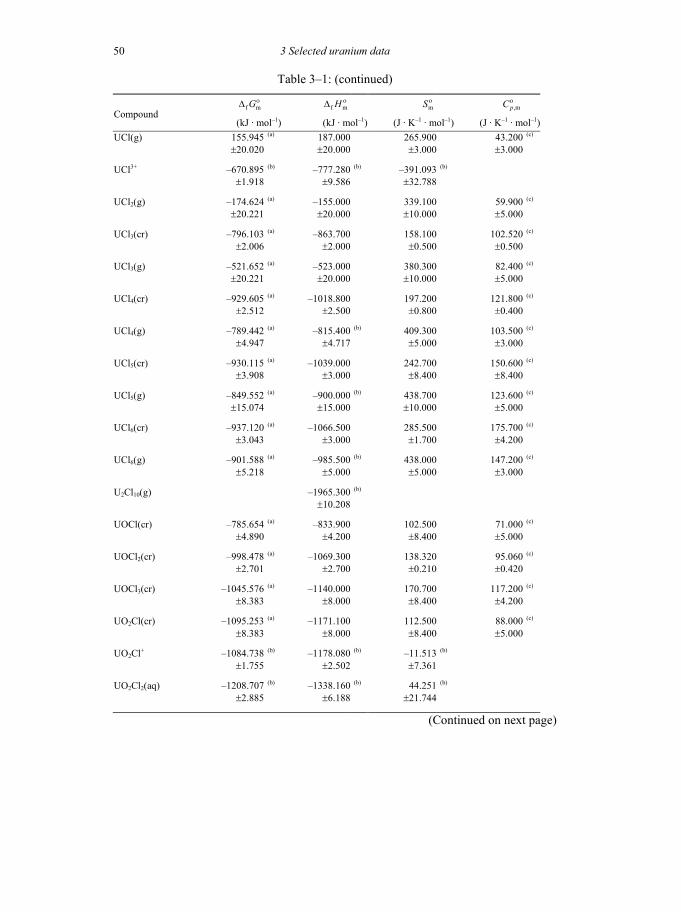
3 Selected uranium data
50
Table 3–1: (continued)
f mGο∆ f mH ο∆ mS ο,mpCο
Compound (kJ · mol–1) (kJ · mol–1) (J · K–1 · mol–1) (J · K–1 · mol–1)
UCl(g) 155.945±20.020
(a) 187.000±20.000
265.900±3.000
43.200±3.000
(c)
UCl3+ –670.895±1.918
(b) –777.280±9.586
(b) –391.093±32.788
(b)
UCl2(g) –174.624±20.221
(a) –155.000±20.000
339.100±10.000
59.900±5.000
(c)
UCl3(cr) –796.103±2.006
(a) –863.700±2.000
158.100±0.500
102.520±0.500
(c)
UCl3(g) –521.652±20.221
(a) –523.000±20.000
380.300±10.000
82.400±5.000
(c)
UCl4(cr) –929.605±2.512
(a) –1018.800±2.500
197.200±0.800
121.800±0.400
(c)
UCl4(g) –789.442±4.947
(a) –815.400±4.717
(b) 409.300±5.000
103.500±3.000
(c)
UCl5(cr) –930.115±3.908
(a) –1039.000±3.000
242.700±8.400
150.600±8.400
(c)
UCl5(g) –849.552±15.074
(a) –900.000±15.000
(b) 438.700±10.000
123.600±5.000
(c)
UCl6(cr) –937.120±3.043
(a) –1066.500±3.000
285.500±1.700
175.700±4.200
(c)
UCl6(g) –901.588±5.218
(a) –985.500±5.000
(b) 438.000±5.000
147.200±3.000
(c)
U2Cl10(g) –1965.300±10.208
(b)
UOCl(cr) –785.654±4.890
(a) –833.900±4.200
102.500±8.400
71.000±5.000
(c)
UOCl2(cr) –998.478±2.701
(a) –1069.300±2.700
138.320±0.210
95.060±0.420
(c)
UOCl3(cr) –1045.576±8.383
(a) –1140.000±8.000
170.700±8.400
117.200±4.200
(c)
UO2Cl(cr) –1095.253±8.383
(a) –1171.100±8.000
112.500±8.400
88.000±5.000
(c)
UO2Cl+ –1084.738±1.755
(b) –1178.080±2.502
(b) –11.513±7.361
(b)
UO2Cl2(aq) –1208.707±2.885
(b) –1338.160±6.188
(b) 44.251±21.744
(b)
(Continued on next page)

3 Selected uranium data
51
Table 3–1: (continued)
f mGο∆ f mH ο∆ mS ο,mpCο
Compound (kJ · mol–1) (kJ · mol–1) (J · K–1 · mol–1) (J · K–1 · mol–1)
UO2Cl2(cr) –1145.838±1.303
(a) –1243.600±1.300
150.540±0.210
107.860±0.170
(c)
UO2Cl2(g) –938.984±15.106
(a) –970.300±15.000
373.400±6.000
92.600±3.000
(c)
U2O2Cl5(cr) –2037.306±4.891
(a) –2197.400±4.200
326.300±8.400
219.400±5.000
(c)
(UO2)2Cl3(cr) –2234.755±2.931
(a) –2404.500±1.700
276.000±8.000
203.600±5.000
(c)
UO2ClO3+ –963.308
±2.239 (b) –1126.900
±1.828 (b) 60.592
±4.562 (b)
U5O12Cl(cr) –5517.951±12.412
(a) –5854.400±8.600
465.000±30.000
UO2Cl2. H2O(cr) –1405.003±3.269
(a) –1559.800±2.100
192.500±8.400
UO2ClOH. 2 H2O(cr) –1782.219±4.507
(a) –2010.400±1.700
236.000±14.000
UO2Cl2. 3 H2O(cr) –1894.616±3.028
(a) –2164.800±1.700
272.000±8.400
UCl3F(cr) –1146.573±5.155
(a) –1243.000±5.000
162.800±4.200
118.800±4.200
UCl2F2(cr) –1375.967±5.592
(a) –1466.000±5.000
174.100±8.400
119.700±4.200
UClF3(cr) –1606.360±5.155
(a) –1690.000±5.000
185.400±4.200
120.900±4.200
UBr(g) 199.623±15.027
(a) 245.000±15.000
278.500±3.000
44.500±3.000
(c)
UBr3+ –642.044±2.109
(b)
UBr2(g) –86.896±15.294
(a) –40.000±15.000
359.700±10.000
61.400±5.000
(c)
UBr3(cr) –673.198±4.205
(a) –698.700±4.200
192.980±0.500
105.830±0.500
(c)
UBr3(g) –408.115±20.494
(a) –371.000±20.000
403.000±15.000
85.200±5.000
(c)
UBr4(cr) –767.479±3.544
(a) –802.100±2.500
238.500±8.400
128.000±4.200
(c)
(Continued on next page)

3 Selected uranium data
52
Table 3–1: (continued)
f mGο∆ f mH ο∆ mS ο,mpCο
Compound (kJ · mol–1) (kJ · mol–1) (J · K–1 · mol–1) (J · K–1 · mol–1)
UBr4(g) –634.604±4.951
(a) –605.600±4.717
(b) 451.900±5.000
106.900±3.000
(c)
UBr5(cr) –769.308±9.205
(a) –810.400±8.400
292.900±12.600
160.700±8.000
(c)
UBr5(g) –668.212±15.295
(a) –647.945±15.000
(b) 498.700±10.000
129.000±5.000
(c)
UOBr2(cr) –929.648±8.401
(a) –973.600±8.400
157.570±0.290
98.000±0.400
(c)
UOBr3(cr) –901.498±21.334
(a) –954.000±21.000
205.000±12.600
120.900±4.200
(c)
UO2Br+ –1057.657±1.759
(b)
UO2Br2(cr) –1066.422±1.808
(a) –1137.400±1.300
169.500±4.200
116.000±8.000
(c)
UO2BrO3+ –937.077
±1.914 (b) –1085.600
±1.609 (b) 75.697
±3.748 (b)
UO2Br2. H2O(cr) –1328.644±2.515
(a) –1455.900±1.400
214.000±7.000
UO2BrOH. 2 H2O(cr) –1744.162±4.372
(a) –1958.200±1.300
248.000±14.000
UO2Br2. 3 H2O(cr) –1818.486±5.573
(a) –2058.000±1.500
304.000±18.000
UBr2Cl(cr) –714.389±9.765
(a) –750.600±8.400
192.500±16.700
UBr3Cl(cr) –807.114±9.766
(a) –852.300±8.400
238.500±16.700
UBrCl2(cr) –760.315±9.765
(a) –812.100±8.400
175.700±16.700
UBr2Cl2(cr) –850.896±9.765
(a) –907.900±8.400
234.300±16.700
UBrCl3(cr) –893.500±9.202
(a) –967.300±8.400
213.400±12.600
UI(g) 288.861±25.045
(a) 342.000±25.000
286.500±5.000
44.800±5.000
(c)
UI3+ –588.719±2.462
(b)
(Continued on next page)

3 Selected uranium data
53
Table 3–1: (continued)
f mGο∆ f mH ο∆ mS ο,mpCο
Compound (kJ · mol–1) (kJ · mol–1) (J · K–1 · mol–1) (J · K–1 · mol–1)
UI2(g) 40.341±25.177
(a) 103.000±25.000
376.500±10.000
61.900±5.000
(c)
UI3(cr) –466.122±4.892
(a) –466.900±4.200
221.800±8.400
112.100±6.000
(c)
UI3(g) –198.654±25.178
(a) –137.000±25.000
431.200±10.000
86.000±5.000
(c)
UI4(cr) –512.671±3.761
(a) –518.300±2.800
263.600±8.400
126.400±4.200
(c)
UI4(g) –369.585±6.210
(a) –305.000±5.731
(b) 499.100±8.000
108.800±4.000
(c)
UO2IO3+ –1090.305
±1.917 (b) –1228.900
±1.819 (b) 90.959
±4.718 (b)
UO2(IO3)2(aq) –1225.718±2.493
(b)
UO2(IO3)2(cr) –1250.206±2.410
(b) –1461.281±3.609
(a) 279.000±9.000
UClI3(cr) –615.789±11.350
(a) –643.800±10.000
242.000±18.000
UCl2I2(cr) –723.356±11.350
(a) –768.800±10.000
237.000±18.000
UCl3I(cr) –829.877±8.766
(a) –898.300±8.400
213.400±8.400
UBrI3(cr) –589.600±10.000
UBr2I2(cr) –660.400±10.000
UBr3I(cr) –727.600±8.400
US(cr) –320.929±12.600
(a) –322.200±12.600
77.990±0.210
50.540±0.080
(c)
US1.90(cr) –509.470±20.900
(a) –509.900±20.900
109.660±0.210
73.970±0.130
(c)
US2(cr) –519.241±8.001
(a) –520.400±8.000
110.420±0.210
74.640±0.130
(c)
US3(cr) –537.253±12.600
(a) –539.600±12.600
138.490±0.210
95.600±0.250
(c)
(Continued on next page)

3 Selected uranium data
54
Table 3–1: (continued)
f mGο∆ f mH ο∆ mS ο,mpCο
Compound (kJ · mol–1) (kJ · mol–1) (J · K–1 · mol–1) (J · K–1 · mol–1)
U2S3(cr) –879.787±67.002
(a) –879.000±67.000
199.200±1.700
133.700±0.800
(c)
U2S5(cr) 243.000±25.000
U3S5(cr) –1425.076±100.278
(a) –1431.000±100.000
291.000±25.000
USO42+ –1311.423
±2.113 (b) –1492.540
±4.283 (b) –245.591
±15.906 (b)
UO2SO3(aq) –1477.696±5.563
(b)
UO2SO3(cr) –1530.370±12.727
(a) –1661.000±12.600
157.000±6.000
UO2S2O3(aq) –1487.824±11.606
(b)
UO2SO4(aq) –1714.535±1.800
(b) –1908.840±2.229
(b) 46.010±6.173
(b)
UO2SO4(cr) –1685.775±2.642
(a) –1845.140±0.840
163.200±8.400
145.000±3.000
(c)
U(SO3)2(cr) –1712.826±21.171
(a) –1883.000±21.000
159.000±9.000
U(SO4)2(aq) –2077.860±2.262
(b) –2377.180±4.401
(b) –69.007±16.158
(b)
U(SO4)2(cr) –2084.521±14.070
(a) –2309.600±12.600
180.000±21.000
UO2(SO4)22– –2464.190
±1.978 (b) –2802.580
±1.972 (b) 135.786
±4.763 (b)
UO2(SO4)34– –3201.801
±3.054 (b)
U(OH)2SO4(cr) –1766.223±3.385
(b)
UO2SO4. 2.5 H2O(cr) –2298.475±1.803
(b) –2607.000±0.900
246.053±6.762
(a)
UO2SO4. 3 H2O(cr) –2416.561±1.811
(b) –2751.500±4.600
274.087±16.582
(a)
UO2SO4. 3.5 H2O(cr) –2535.595±1.806
(b) –2901.600±0.800
286.520±6.628
(a)
(Continued on next page)

3 Selected uranium data
55
Table 3–1: (continued)
f mGο∆ f mH ο∆ mS ο,mpCο
Compound (kJ · mol–1) (kJ · mol–1) (J · K–1 · mol–1) (J · K–1 · mol–1)
U(SO4)2. 4 H2O(cr) –3033.310±11.433
(a) –3483.200±6.300
359.000±32.000
U(SO4)2. 8 H2O(cr) –3987.898±16.735
(a) –4662.600±6.300
538.000±52.000
USe(cr) –276.908±14.600
(a) –275.700±14.600
96.520±0.210
54.810±0.170
(c)
α–USe2 –427.072±42.000
(a) –427.000±42.000
134.980±0.250
79.160±0.170
(c)
β–USe2 –427.972±42.179
(a) –427.000±42.000
138.000±13.000
USe3(cr) –451.997±42.305
(a) –452.000±42.000
177.000±17.000
U2Se3(cr) –721.194±75.002
(a) –711.000±75.000
261.400±1.700
U3Se4(cr) –988.760±85.752
(a) –983.000±85.000
339.000±38.000
U3Se5(cr) –1130.611±113.567
(a) –1130.000±113.000
364.000±38.000
UO2SeO3(cr) –1522.000±2.300
UO2SeO4(cr) –1539.300±3.300
UOTe(cr) 111.700±1.300
80.600±0.800
UTeO5(cr) –1603.100±2.800
UTe3O9(cr) –2275.800±8.000
UN(cr) –265.082±3.001
(a) –290.000±3.000
62.430±0.220
47.570±0.400
(c)
β–UN1.466 –362.200±2.300
α–UN1.59 –338.202±5.201
(a) –379.200±5.200
65.020±0.300
α–UN1.606 –381.400±5.000
(Continued on next page)
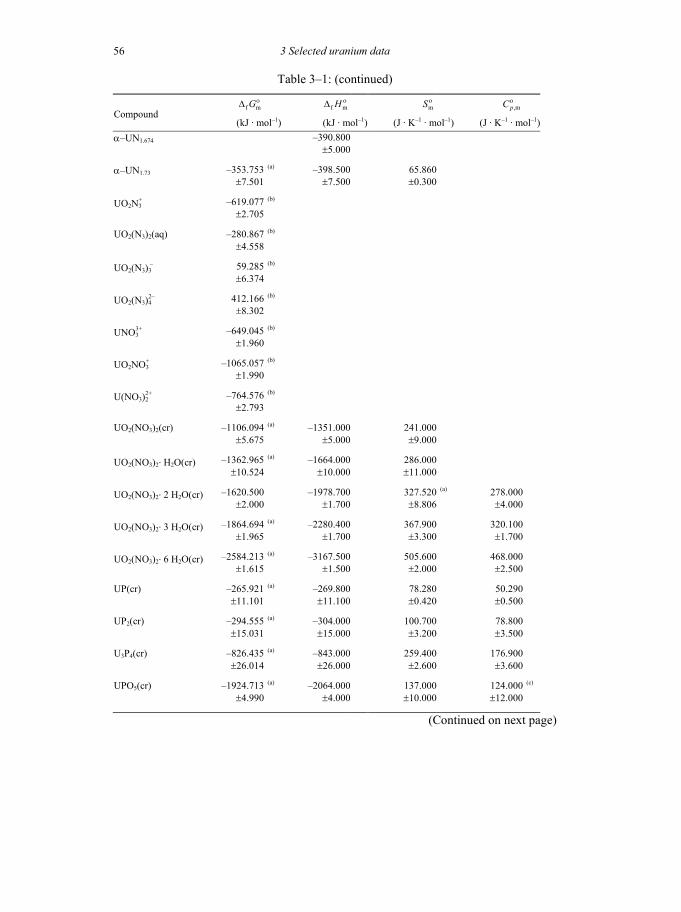
3 Selected uranium data
56
Table 3–1: (continued)
f mGο∆ f mH ο∆ mS ο,mpCο
Compound (kJ · mol–1) (kJ · mol–1) (J · K–1 · mol–1) (J · K–1 · mol–1)
α–UN1.674 –390.800±5.000
α–UN1.73 –353.753±7.501
(a) –398.500±7.500
65.860±0.300
UO2N3+ –619.077
±2.705 (b)
UO2(N3)2(aq) –280.867±4.558
(b)
UO2(N3)3 – 59.285
±6.374 (b)
UO2(N3)42– 412.166
±8.302 (b)
UNO33+ –649.045
±1.960 (b)
UO2NO3+ –1065.057
±1.990 (b)
U(NO3)22+ –764.576
±2.793 (b)
UO2(NO3)2(cr) –1106.094±5.675
(a) –1351.000±5.000
241.000±9.000
UO2(NO3)2. H2O(cr) –1362.965±10.524
(a) –1664.000±10.000
286.000±11.000
UO2(NO3)2. 2 H2O(cr) –1620.500±2.000
–1978.700±1.700
327.520±8.806
(a) 278.000±4.000
UO2(NO3)2. 3 H2O(cr) –1864.694±1.965
(a) –2280.400±1.700
367.900±3.300
320.100±1.700
UO2(NO3)2. 6 H2O(cr) –2584.213±1.615
(a) –3167.500±1.500
505.600±2.000
468.000±2.500
UP(cr) –265.921±11.101
(a) –269.800±11.100
78.280±0.420
50.290±0.500
UP2(cr) –294.555±15.031
(a) –304.000±15.000
100.700±3.200
78.800±3.500
U3P4(cr) –826.435±26.014
(a) –843.000±26.000
259.400±2.600
176.900±3.600
UPO5(cr) –1924.713±4.990
(a) –2064.000±4.000
137.000±10.000
124.000±12.000
(c)
(Continued on next page)

3 Selected uranium data
57
Table 3–1: (continued)
f mGο∆ f mH ο∆ mS ο,mpCο
Compound (kJ · mol–1) (kJ · mol–1) (J · K–1 · mol–1) (J · K–1 · mol–1)
UO2PO4 – –2053.559
±2.504 (b)
UP2O7(cr) –2659.272±5.369
(a) –2852.000±4.000
204.000±12.000
184.000±18.000
(UO2)2P2O7(cr) –3930.002±6.861
(a) –4232.600±2.800
296.000±21.000
258.000±26.000
(c)
(UO2)3(PO4)2(cr) –5115.975±5.452
(a) –5491.300±3.500
410.000±14.000
339.000±17.000
(c)
UO2HPO4(aq) –2089.862±2.777
(b)
UO2H2PO4+ –2108.311
±2.378 (b)
UO2H3PO42+ –2106.256
±2.504 (b)
UO2(H2PO4)2(aq) –3254.938±3.659
(b)
UO2(H2PO4)(H3PO4)+ –3260.703±3.659
(b)
UO2HPO4. 4 H2O(cr) –3064.749±2.414
(b) –3469.968±7.836
(a) 346.000±25.000
U(HPO4)2. 4 H2O(cr) –3844.453±3.717
(b) –4334.818±8.598
(a) 372.000±26.000
460.000±50.000
(UO2)3(PO4)2. 4 H2O(cr) –6138.968 ±6.355
(b) –6739.105±9.136
(a) 589.000±22.000
(UO2)3(PO4)2. 6 H2O(cr) –6613.025 ±13.392
(a) –7328.400±10.700
669.000±27.000
UAs(cr) –237.908±8.024
(a) –234.300±8.000
97.400±2.000
57.900±1.200
UAs2(cr) –252.790±13.005
(a) –252.000±13.000
123.050±0.200
79.960±0.100
U3As4(cr) –725.388±18.016
(a) –720.000±18.000
309.070±0.600
187.530±0.200
UAsO5(cr) 138.000±14.000
(c)
UO2(AsO3)2(cr) –1944.911±12.006
(a) –2156.600±8.000
231.000±30.000
201.000±20.000
(c)
(Continued on next page)

3 Selected uranium data
58
Table 3–1: (continued)
f mGο∆ f mH ο∆ mS ο,mpCο
Compound (kJ · mol–1) (kJ · mol–1) (J · K–1 · mol–1) (J · K–1 · mol–1)
(UO2)2As2O7(cr) –3130.254±12.006
(a) –3426.000±8.000
307.000±30.000
273.000±27.000
(c)
(UO2)3(AsO4)2(cr) –4310.789±12.007
(a) –4689.400±8.000
387.000±30.000
364.000±36.000
(c)
UO2HAsO4(aq) –1707.994±4.717
(b)
UO2H2AsO4+ –1726.260
±4.582 (b)
UO2(H2AsO4)2(aq) –2486.326±8.283
(b)
UAsS(cr) 114.500±3.400
80.900±2.400
UAsSe(cr) 131.900±4.000
83.500±2.500
UAsTe(cr) 139.900±4.200
81.300±2.400
USb(cr) –140.969±7.711
(a) –138.500±7.500
104.000±6.000
75.000±7.000
USb2(cr) –173.666±10.901
(a) –173.600±10.900
141.460±0.130
80.200±0.100
U4Sb3(cr) 379.000±20.000
U3Sb4(cr) –457.004±22.602
(a) –451.900±22.600
349.800±0.400
188.200±0.200
UC(cr) –98.900±3.000
–97.900±4.000
59.294±16.772
(a) 50.100±1.000
(c)
α–UC1.94 –87.400±2.100
–85.324±2.185
(a) 68.300±2.000
60.800±1.500
(c)
U2C3(cr) –189.317±10.002
(a) –183.300±10.000
137.800±0.300
107.400±2.000
(c)
UO2CO3(aq) –1537.188±1.799
(b) –1689.230±2.512
(b) 58.870±7.438
(b)
UO2CO3(cr) –1564.701±1.794
(b) –1691.302±1.798
(a) 144.200±0.300
120.100±0.100
UO2(CO3)22– –2103.161
±1.982 (b) –2350.960
±4.301 (b) 181.846
±13.999 (b)
(Continued on next page)
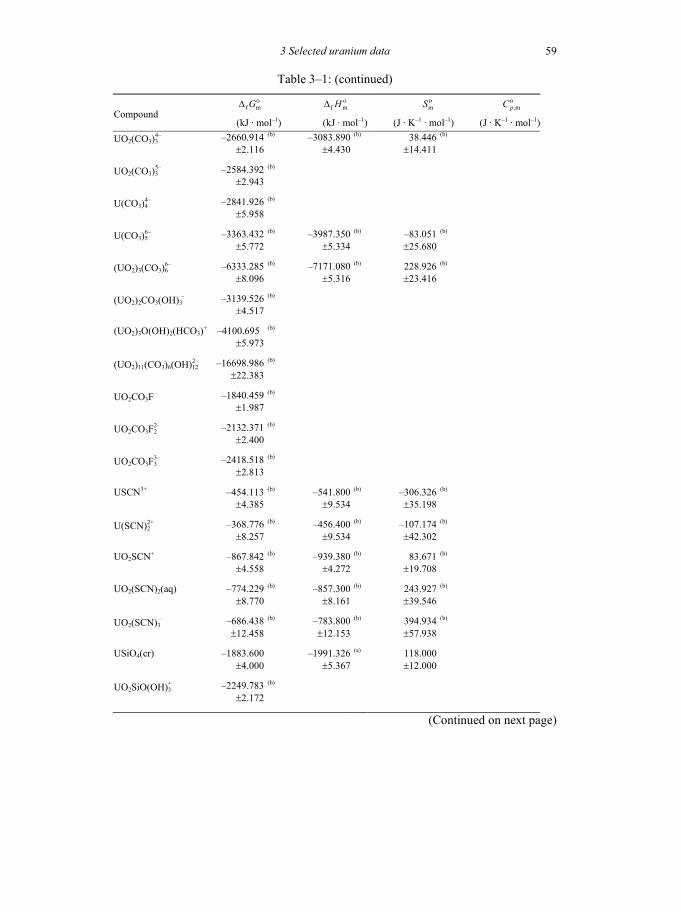
3 Selected uranium data
59
Table 3–1: (continued)
f mGο∆ f mH ο∆ mS ο,mpCο
Compound (kJ · mol–1) (kJ · mol–1) (J · K–1 · mol–1) (J · K–1 · mol–1)
UO2(CO3)34– –2660.914
±2.116 (b) –3083.890
±4.430 (b) 38.446
±14.411 (b)
UO2(CO3)35– –2584.392
±2.943 (b)
U(CO3)44– –2841.926
±5.958 (b)
U(CO3)56– –3363.432
±5.772 (b) –3987.350
±5.334 (b) –83.051
±25.680 (b)
(UO2)3(CO3)66– –6333.285
±8.096 (b) –7171.080
±5.316 (b) 228.926
±23.416 (b)
(UO2)2CO3(OH)3 – –3139.526
±4.517 (b)
(UO2)3O(OH)2(HCO3)+ –4100.695±5.973
(b)
(UO2)11(CO3)6(OH)122– –16698.986
±22.383 (b)
UO2CO3F – –1840.459±1.987
(b)
UO2CO3F22– –2132.371
±2.400 (b)
UO2CO3F33– –2418.518
±2.813 (b)
USCN3+ –454.113±4.385
(b) –541.800±9.534
(b) –306.326±35.198
(b)
U(SCN)22+ –368.776
±8.257 (b) –456.400
±9.534 (b) –107.174
±42.302 (b)
UO2SCN+ –867.842±4.558
(b) –939.380±4.272
(b) 83.671±19.708
(b)
UO2(SCN)2(aq) –774.229±8.770
(b) –857.300±8.161
(b) 243.927±39.546
(b)
UO2(SCN)3 – –686.438
±12.458 (b) –783.800
±12.153 (b) 394.934
±57.938 (b)
USiO4(cr) –1883.600±4.000
–1991.326±5.367
(a) 118.000±12.000
UO2SiO(OH)3+ –2249.783
±2.172 (b)
(Continued on next page)

3 Selected uranium data
60
Table 3–1: (continued)
f mGο∆ f mH ο∆ mS ο,mpCο
Compound (kJ · mol–1) (kJ · mol–1) (J · K–1 · mol–1) (J · K–1 · mol–1)
Tl2U4O11(cr) 360.200±20.000
(c)
Zn0.12UO2.95(cr) –1938.070±1.060
(UO2)2(PuO2)(CO3)66– –6140.119
±9.582 (b)
(UO2)2(NpO2)(CO3)66– –6176.973
±16.977 (b)
Be13U(cr) –165.508±17.530
(a) –163.600±17.500
180.100±3.300
242.300±4.200
α–Mg0.17UO2.95 –1291.440±0.990
MgUO4(cr) –1749.601±1.502
(a) –1857.300±1.500
131.950±0.170
128.100±0.300
MgU3O10(cr) 338.600±1.000
305.600±5.000
β–CaUO4 124.700±2.700
CaUO4(cr) –1888.706±2.421
(a) –2002.300±2.300
121.100±2.500
123.800±2.500
Ca3UO6(cr) –3305.400±4.100
CaU6O19. 11 H2O(cr) –10305.460±13.964
(b)
SrUO3(cr) –1672.600±8.600
α–SrUO4 –1881.355±2.802
(a) –1989.600±2.800
153.150±0.170
130.620±0.200
β–SrUO4 –1988.400±5.400
Sr2UO4.5(cr) –2494.000±2.800
Sr2UO5(cr) –2632.900±1.900
Sr3UO6(cr) –3263.500±3.000
Sr3U2O9(cr) –4620.000±8.000
301.800±3.000
(c)
(Continued on next page)

3 Selected uranium data
61
Table 3–1: (continued)
f mGο∆ f mH ο∆ mS ο,mpCο
Compound (kJ · mol–1) (kJ · mol–1) (J · K–1 · mol–1) (J · K–1 · mol–1)
Sr2U3O11(cr) –5243.700±5.000
SrU4O13(cr) –5920.000±20.000
Sr5U3O14(cr) –7248.600±7.500
Sr3U11O36(cr) –15903.800±16.500
1064.200±10.600
(c)
BaUO3(cr) –1690.000±10.000
BaUO4(cr) –1883.805±3.393
(a) –1993.800±3.300
154.000±2.500
125.300±2.500
Ba3UO6(cr) –3044.951±9.196
(a) –3210.400±8.000
298.000±15.000
BaU2O7(cr) –3052.093±6.714
(a) –3237.200±5.000
260.000±15.000
Ba2U2O7(cr) –3547.015±7.743
(a) –3740.000±6.300
296.000±15.000
Ba2MgUO6(cr) –3245.900±6.500
Ba2CaUO6(cr) –3295.800±5.900
Ba2SrUO6(cr) –3257.300±5.700
Li0.12UO2.95(cr) –1254.970±1.225
(b)
γ–Li0.55UO3 –1394.535±2.779
(b)
δ–Li0.69UO3 –1434.525±2.367
(b)
LiUO3(cr) –1522.300±1.800
Li2UO4(cr) –1853.190±2.215
(a) –1968.200±1.300
133.000±6.000
Li4UO5(cr) –2639.400±1.700
(Continued on next page)

3 Selected uranium data
62
Table 3–1: (continued)
f mGο∆ f mH ο∆ mS ο,mpCο
Compound (kJ · mol–1) (kJ · mol–1) (J · K–1 · mol–1) (J · K–1 · mol–1)
Li2U2O7(cr) –3213.600±5.300
Li0.19U3O8(cr) –3632.955±3.113
(b)
Li0.88U3O8(cr) –3837.090±3.748
(b)
Li2U3O10(cr) –4437.400±4.100
Na0.12UO2.95(cr) –1247.372±1.877
(b)
α–Na0.14UO3 –1267.234±1.804
(b)
δ–Na0.54UO3 –1376.954±5.482
(b)
NaUO3(cr) –1412.495±10.001
(a) –1494.900±10.000
132.840±0.400
108.870±0.400
(c)
α–Na2UO4 –1779.303±3.506
(a) –1897.700±3.500
166.000±0.500
146.700±0.500
(c)
β–Na2UO4 –1884.600±3.600
Na3UO4(cr) –1899.909±8.003
(a) –2024.000±8.000
198.200±0.400
173.000±0.400
(c)
Na4UO5(cr) –2457.000±2.200
Na2U2O7(cr) –3011.454±4.015
(a) –3203.800±4.000
275.900±1.000
227.300±1.000
(c)
Na0.20U3O8(cr) –3626.450±3.252
(b)
Na6U7O24(cr) –10841.700±10.000
Na4UO2(CO3)3(cr) –3737.836±2.342
(b)
KUO3(cr) –1522.900±1.700
137.000±10.000
(c)
K2UO4(cr) –1798.499±3.248
(a) –1920.700±2.200
180.000±8.000
(Continued on next page)

3 Selected uranium data
63
Table 3–1: (continued)
f mGο∆ f mH ο∆ mS ο,mpCο
Compound (kJ · mol–1) (kJ · mol–1) (J · K–1 · mol–1) (J · K–1 · mol–1)
K2U2O7(cr) –3250.500±4.500
229.000±20.000
(c)
K2U4O13(cr) 425.000±50.000
(c)
K2U6O19. 11 H2O(cr) –10337.081±10.956
(b)
RbUO3(cr) –1520.900±1.800
Rb2UO4(cr) –1800.141±3.250
(a) –1922.700±2.200
203.000±8.000
Rb2U2O7(cr) –3232.000±4.300
Rb2U4O11(cr) 365.600±25.000
(c)
Rb2U4O13(cr) 420.000±50.000
(c)
Rb2U(SO4)3(cr) 348.000±30.000
(c)
Cs2UO4(cr) –1805.370±1.232
(a) –1928.000±1.200
219.660±0.440
152.760±0.310
(c)
Cs2U2O7(cr) –3022.881±10.005
(a) –3220.000±10.000
327.750±0.660
231.200±0.500
(c)
Cs2U4O12(cr) –5251.058±3.628
(a) –5571.800±3.600
526.400±1.000
384.000±1.000
(c)
Cs4U5O17(cr) 750.000±50.000
(c)
(a) Value calculated internally with the Gibbs–Helmholtz equation, f m f m m,ii
G H T Sο ο ο∆ = ∆ − ∑ . (b) Value calculated internally from reaction data (see Table 3–2). (c) Temperature coefficients of this function are listed in Table 3–3. (d) Stable phase of UO2.25 (≡ U4O9) above 348 K. The thermodynamic parameters, however, refer
to 298.15 K. (e) Stable phase of UO2.25 (≡ U4O9) below 348 K.

3 Selected uranium data
64
Table 3–2: Selected thermodynamic data for reactions involving uranium compounds and complexes. All ionic species listed in this table are aqueous species. Unless noted otherwise, all data refer to the reference temperature of 298.15 K and to the standard state, i.e., a pressure of 0.1 MPa and, for aqueous species, infinite dilution (I = 0). The uncertainties listed below each value represent total uncertainties and correspond in principle to the statistically defined 95% confidence interval. Values obtained from in-ternal calculation, cf. footnote (a), are rounded at the third digit after the decimal point and may therefore not be exactly identical to those given in Part III. Systematically, all the values are presented with three digits after the decimal point, regardless of the sig-nificance of these digits. The data presented in this table are available on computer me-dia from the OECD Nuclear Energy Agency.
Species Reaction
10log K οr mGο∆ r mH ο∆ r mSο∆
(kJ · mol–1) (kJ · mol–1) (J · K–1 · mol–1)
U3+ U4+ + e – U3+ –9.353
±0.070 (b) 53.387
±0.400 102.100
±1.700 163.383
±5.857 (a)
U4+ 4H+ + UO22+ + 2 e – 2H2O(l) + U4+
9.038±0.041
–51.589±0.234
UO2(am, hyd) U4+ + 4OH – 2H2O(l) + UO2(am, hyd)
54.500±1.000
–311.088±5.708
UO2+ UO2
2+ + e – UO2+
1.484±0.022
(b) –8.471±0.126
α–UO2.95 0.15UO2.6667(cr) + 0.85 γ–UO3 α–UO2.95
7.690±0.770
UOH3+ H2O(l) + U4+ H+ + UOH3+
–0.540±0.060
3.082±0.342
46.910±8.951
(a) 147.000±30.000
UO2OH+ H2O(l) + UO22+ H+ + UO2OH+
–5.250±0.240
29.967±1.370
δ–UO3H0.83 0.415H2(g) + δ–UO3 δ–UO3H0.83
–71.410±2.480
(Continued on next page)

3 Selected uranium data
65
Table 3–2: (continued)
Species Reaction
10log K οr mGο∆ r mH ο∆ r mSο∆
(kJ · mol–1) (kJ · mol–1) (J · K–1 · mol–1)
UO2(OH)2(aq) 2H2O(l) + UO22+ 2H+ + UO2(OH)2(aq)
–12.150±0.070
69.353±0.400
U(OH)4(aq) 4OH – + U4+ U(OH)4(aq)
46.000±1.400
–262.570±7.991
UO2(OH)3 – 3H2O(l) + UO2
2+ 3H+ + UO2(OH)3 –
–20.250±0.420
115.588±2.397
UO2(OH)42– 4H2O(l) + UO2
2+ 4H+ + UO2(OH)42–
–32.400±0.680
184.941±3.881
(UO2)2OH3+ H2O(l) + 2UO22+ (UO2)2OH3+ + H+
–2.700±1.000
15.412±5.708
(UO2)2(OH)22+ 2H2O(l) + 2UO2
2+ (UO2)2(OH)22+ + 2H+
–5.620±0.040
32.079±0.228
(UO2)3(OH)42+ 4H2O(l) + 3UO2
2+ (UO2)3(OH)42+ + 4H+
–11.900±0.300
67.926±1.712
(UO2)3(OH)5+ 5H2O(l) + 3UO2
2+ (UO2)3(OH)5+ + 5H+
–15.550±0.120
88.760±0.685
(UO2)3(OH)7 – 7H2O(l) + 3UO2
2+ (UO2)3(OH)7 – + 7H+
–32.200±0.800
183.799±4.566
(UO2)4(OH)7+ 7H2O(l) + 4UO2
2+ (UO2)4(OH)7+ + 7H+
–21.900±1.000
125.010±5.708
UF3+ F – + U4+ UF3+
9.420±0.510
–53.770±2.911
–5.600±0.500
161.562±9.907
(a)
(Continued on next page)

3 Selected uranium data
66
Table 3–2: (continued)
Species Reaction
10log K οr mGο∆ r mH ο∆ r mSο∆
(kJ · mol–1) (kJ · mol–1) (J · K–1 · mol–1)
UF22+ 2F – + U4+ UF2
2+
16.560±0.710
–94.525±4.053
–3.500±0.600
305.300±13.741
(a)
UF3+ 3F – + U4+ UF3
+
21.890±0.830
–124.949±4.738
0.500±4.000
420.758±20.796
(a)
UF4(aq) 4F – + U4+ UF4(aq)
26.340±0.960
–150.350±5.480
–8.430±7.464
(a) 476.000±17.000
UF4(g) UF4(cr) UF4(g)
309.000±5.000
UF5 – 5F – + U4+ UF5
–
27.730±0.740
–158.284±4.224
UF6(g) UF6(cr) UF6(g)
49.100±0.500
UF62– 6F – + U4+ UF6
2–
29.800±0.700
–170.100±3.996
U2F10(g) 2UF5(g) U2F10(g)
–167.200±4.700
UO2F+ F – + UO22+ UO2F+
5.160±0.060
–29.453±0.342
1.700±0.080
104.489±1.180
(a)
UO2F2(aq) 2F – + UO22+ UO2F2(aq)
8.830±0.080
–50.402±0.457
2.100±0.190
176.093±1.659
(a)
UO2F2(g) UO2F2(cr) UO2F2(g)
301.000±10.000
(Continued on next page)
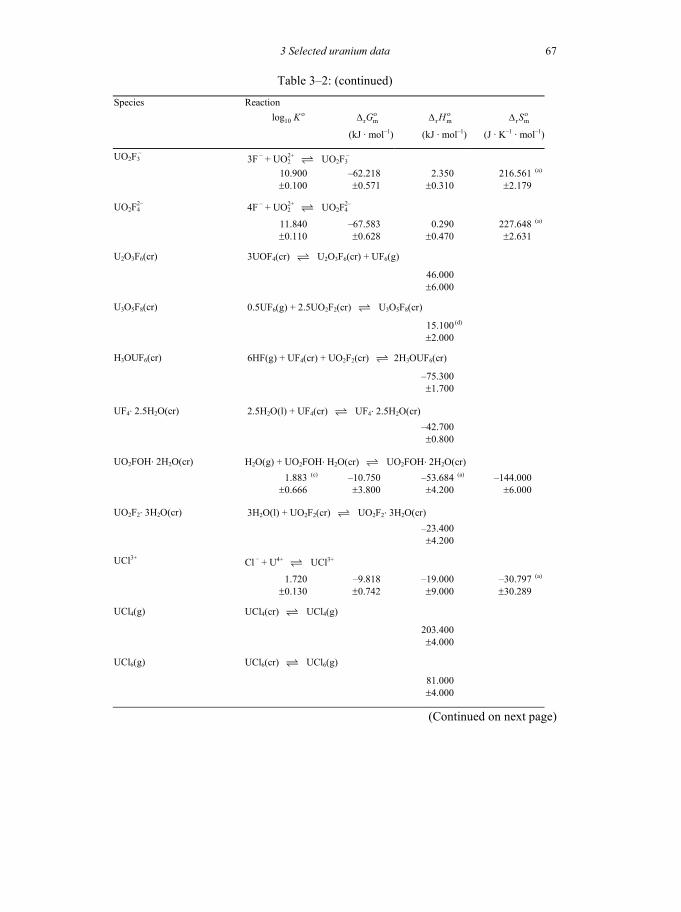
3 Selected uranium data
67
Table 3–2: (continued)
Species Reaction
10log K οr mGο∆ r mH ο∆ r mSο∆
(kJ · mol–1) (kJ · mol–1) (J · K–1 · mol–1)
UO2F3 – 3F – + UO2
2+ UO2F3 –
10.900±0.100
–62.218±0.571
2.350±0.310
216.561±2.179
(a)
UO2F42– 4F – + UO2
2+ UO2F42–
11.840±0.110
–67.583±0.628
0.290±0.470
227.648±2.631
(a)
U2O3F6(cr) 3UOF4(cr) U2O3F6(cr) + UF6(g)
46.000±6.000
U3O5F8(cr) 0.5UF6(g) + 2.5UO2F2(cr) U3O5F8(cr)
15.100±2.000
(d)
H3OUF6(cr) 6HF(g) + UF4(cr) + UO2F2(cr) 2H3OUF6(cr)
–75.300±1.700
UF4. 2.5H2O(cr) 2.5H2O(l) + UF4(cr) UF4. 2.5H2O(cr) –42.700
±0.800
UO2FOH. 2H2O(cr) H2O(g) + UO2FOH. H2O(cr) UO2FOH. 2H2O(cr) 1.883
±0.666 (c) –10.750
±3.800 –53.684
±4.200 (a) –144.000
±6.000
UO2F2. 3H2O(cr) 3H2O(l) + UO2F2(cr) UO2F2. 3H2O(cr) –23.400
±4.200
UCl3+ Cl – + U4+ UCl3+
1.720±0.130
–9.818±0.742
–19.000±9.000
–30.797±30.289
(a)
UCl4(g) UCl4(cr) UCl4(g)
203.400±4.000
UCl6(g) UCl6(cr) UCl6(g)
81.000±4.000
(Continued on next page)

3 Selected uranium data
68
Table 3–2: (continued)
Species Reaction
10log K οr mGο∆ r mH ο∆ r mSο∆
(kJ · mol–1) (kJ · mol–1) (J · K–1 · mol–1)
U2Cl10(g) Cl2(g) + 2UCl4(cr) U2Cl10(g)
72.300±8.900
UO2Cl+ Cl – + UO22+ UO2Cl+
0.170±0.020
–0.970±0.114
8.000±2.000
30.087±6.719
(a)
UO2Cl2(aq) 2Cl – + UO22+ UO2Cl2(aq)
–1.100±0.400
6.279±2.283
15.000±6.000
29.251±21.532
(a)
UO2ClO3+ ClO3
– + UO22+ UO2ClO3
+
0.500±0.070
–2.854±0.400
–3.900±0.300
–3.508±1.676
(a)
UBr3+ Br – + U4+ UBr3+
1.460±0.200
–8.334±1.142
UBr4(g) UBr4(cr) UBr4(g)
196.500±4.000
UBr5(g) 0.5Br2(g) + UBr4(g) UBr5(g)
–57.800±2.700
UO2Br+ Br – + UO22+ UO2Br+
0.220±0.020
–1.256±0.114
UO2BrO3+ BrO3
– + UO22+ UO2BrO3
+
0.630±0.080
–3.596±0.457
0.100±0.300
12.397±1.833
(a)
UI3+ I – + U4+ UI3+
1.250±0.300
–7.135±1.712
UI4(g) UI4(cr) UI4(g)
213.300±5.000
(Continued on next page)
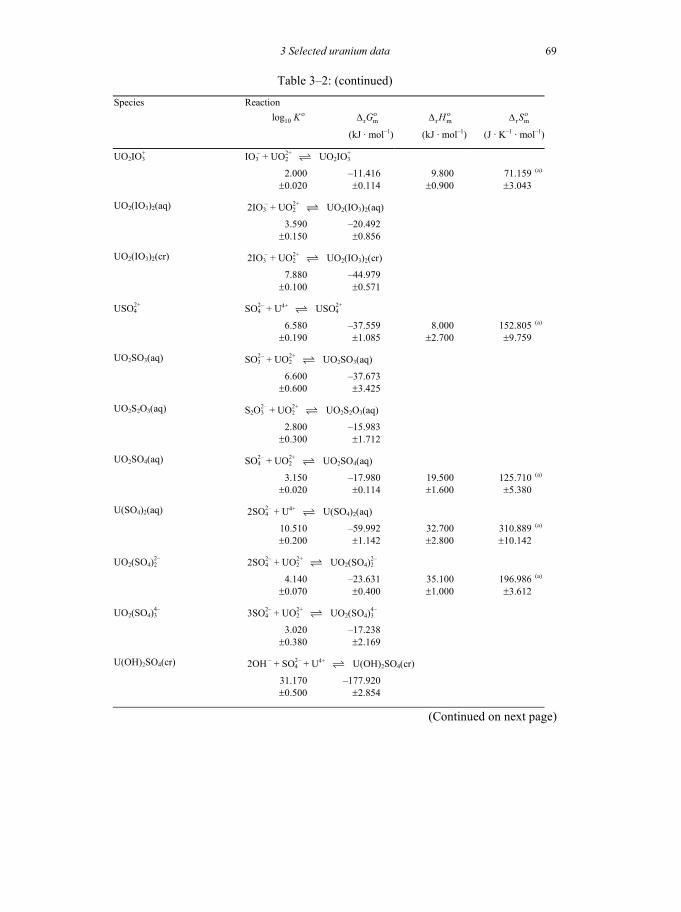
3 Selected uranium data
69
Table 3–2: (continued)
Species Reaction
10log K οr mGο∆ r mH ο∆ r mSο∆
(kJ · mol–1) (kJ · mol–1) (J · K–1 · mol–1)
UO2IO3+ IO3
– + UO22+ UO2IO3
+
2.000±0.020
–11.416±0.114
9.800±0.900
71.159±3.043
(a)
UO2(IO3)2(aq) 2IO3 – + UO2
2+ UO2(IO3)2(aq)
3.590±0.150
–20.492±0.856
UO2(IO3)2(cr) 2IO3 – + UO2
2+ UO2(IO3)2(cr)
7.880±0.100
–44.979±0.571
USO42+ SO4
2– + U4+ USO42+
6.580±0.190
–37.559±1.085
8.000±2.700
152.805±9.759
(a)
UO2SO3(aq) SO32– + UO2
2+ UO2SO3(aq)
6.600±0.600
–37.673±3.425
UO2S2O3(aq) S2O32– + UO2
2+ UO2S2O3(aq)
2.800±0.300
–15.983±1.712
UO2SO4(aq) SO42– + UO2
2+ UO2SO4(aq)
3.150±0.020
–17.980±0.114
19.500±1.600
125.710±5.380
(a)
U(SO4)2(aq) 2SO42– + U4+ U(SO4)2(aq)
10.510±0.200
–59.992±1.142
32.700±2.800
310.889±10.142
(a)
UO2(SO4)22– 2SO4
2– + UO22+ UO2(SO4)2
2–
4.140±0.070
–23.631±0.400
35.100±1.000
196.986±3.612
(a)
UO2(SO4)34– 3SO4
2– + UO22+ UO2(SO4)3
4–
3.020±0.380
–17.238±2.169
U(OH)2SO4(cr) 2OH – + SO42– + U4+ U(OH)2SO4(cr)
31.170±0.500
–177.920±2.854
(Continued on next page)

3 Selected uranium data
70
Table 3–2: (continued)
Species Reaction
10log K οr mGο∆ r mH ο∆ r mSο∆
(kJ · mol–1) (kJ · mol–1) (J · K–1 · mol–1)
UO2SO4. 2.5H2O(cr) 2.5H2O(l) + SO42– + UO2
2+ UO2SO4. 2.5H2O(cr) 1.589
±0.019 (c) –9.070
±0.110
UO2SO4. 3H2O(cr) UO2SO4. 3.5H2O(cr) 0.5H2O(g) + UO2SO43H2O(cr) –0.831
±0.023 4.743
±0.131
UO2SO4. 3.5H2O(cr) 3.5H2O(l) + SO42– + UO2
2+ UO2SO4. 3.5H2O(cr) 1.585
±0.019 (c) –9.050
±0.110
UO2N3+ N3
– + UO22+ UO2N3
+
2.580±0.090
–14.727±0.514
UO2(N3)2(aq) 2N3 – + UO2
2+ UO2(N3)2(aq)
4.330±0.230
–24.716±1.313
UO2(N3)3 – 3N3
– + UO22+ UO2(N3)3
–
5.740±0.220
–32.764±1.256
UO2(N3)42– 4N3
– + UO22+ UO2(N3)4
2–
4.920±0.240
–28.084±1.370
UNO33+ NO3
– + U4+ UNO33+
1.470±0.130
–8.391±0.742
UO2NO3+ NO3
– + UO22+ UO2NO3
+
0.300±0.150
–1.712±0.856
U(NO3)22+ 2NO3
– + U4+ U(NO3)22+
2.300±0.350
–13.128±1.998
UO2PO4 – PO4
3– + UO22+ UO2PO4
–
13.230±0.150
–75.517±0.856
(Continued on next page)
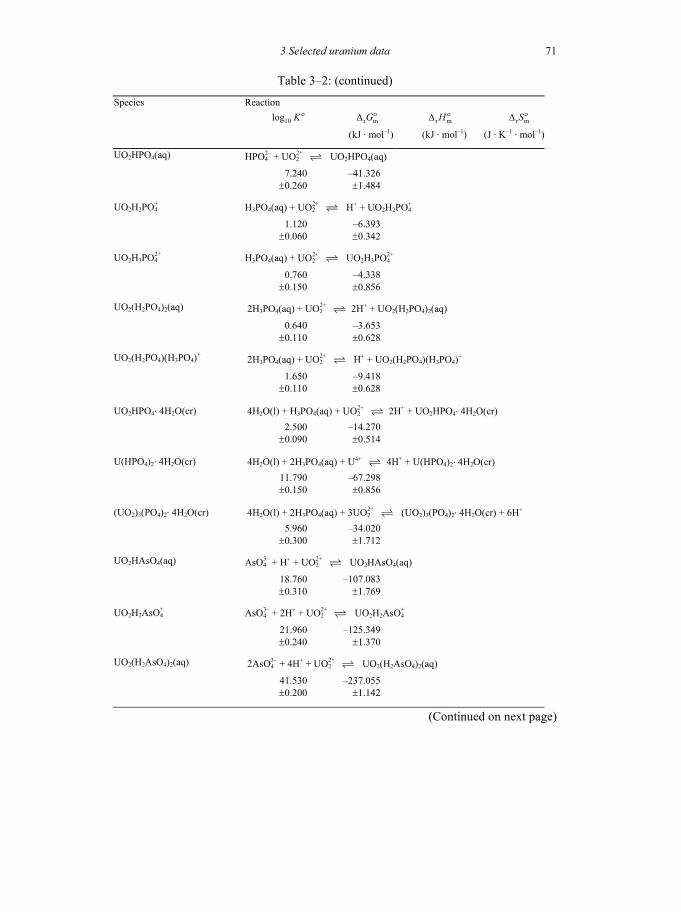
3 Selected uranium data
71
Table 3–2: (continued)
Species Reaction
10log K οr mGο∆ r mH ο∆ r mSο∆
(kJ · mol–1) (kJ · mol–1) (J · K–1 · mol–1)
UO2HPO4(aq) HPO42– + UO2
2+ UO2HPO4(aq)
7.240±0.260
–41.326±1.484
UO2H2PO4+ H3PO4(aq) + UO2
2+ H+ + UO2H2PO4+
1.120±0.060
–6.393±0.342
UO2H3PO42+ H3PO4(aq) + UO2
2+ UO2H3PO42+
0.760±0.150
–4.338±0.856
UO2(H2PO4)2(aq) 2H3PO4(aq) + UO22+ 2H+ + UO2(H2PO4)2(aq)
0.640±0.110
–3.653±0.628
UO2(H2PO4)(H3PO4)+ 2H3PO4(aq) + UO22+ H+ + UO2(H2PO4)(H3PO4)+
1.650±0.110
–9.418±0.628
UO2HPO4. 4H2O(cr) 4H2O(l) + H3PO4(aq) + UO22+ 2H+ + UO2HPO4. 4H2O(cr)
2.500±0.090
–14.270±0.514
U(HPO4)2. 4H2O(cr) 4H2O(l) + 2H3PO4(aq) + U4+ 4H+ + U(HPO4)2. 4H2O(cr) 11.790
±0.150 –67.298
±0.856
(UO2)3(PO4)2. 4H2O(cr) 4H2O(l) + 2H3PO4(aq) + 3UO22+ (UO2)3(PO4)2. 4H2O(cr) + 6H+
5.960±0.300
–34.020±1.712
UO2HAsO4(aq) AsO43– + H+ + UO2
2+ UO2HAsO4(aq)
18.760±0.310
–107.083±1.769
UO2H2AsO4+ AsO4
3– + 2H+ + UO22+ UO2H2AsO4
+
21.960±0.240
–125.349±1.370
UO2(H2AsO4)2(aq) 2AsO43– + 4H+ + UO2
2+ UO2(H2AsO4)2(aq)
41.530±0.200
–237.055±1.142
(Continued on next page)
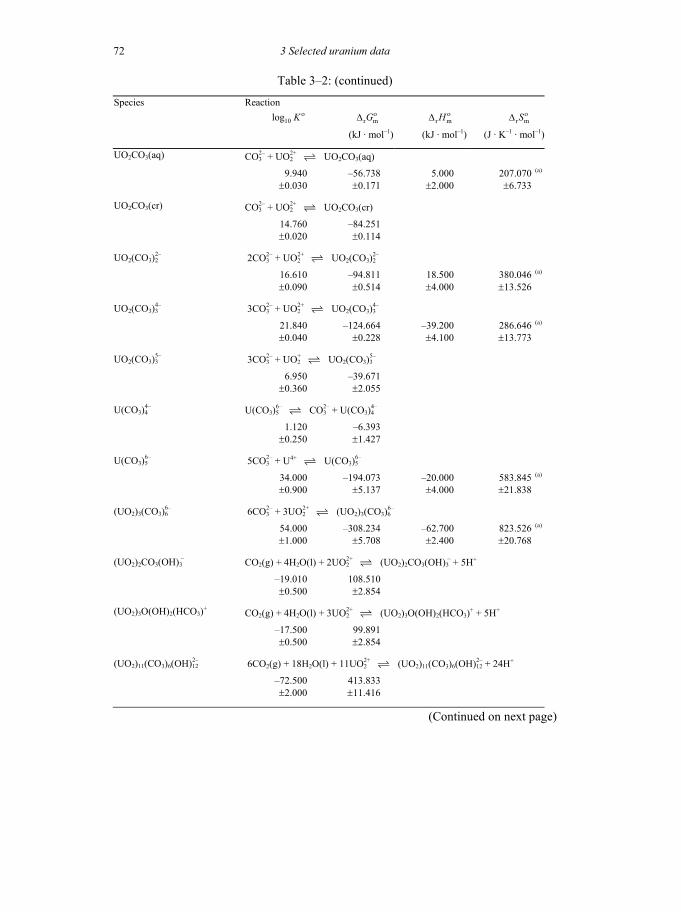
3 Selected uranium data
72
Table 3–2: (continued)
Species Reaction
10log K οr mGο∆ r mH ο∆ r mSο∆
(kJ · mol–1) (kJ · mol–1) (J · K–1 · mol–1)
UO2CO3(aq) CO32– + UO2
2+ UO2CO3(aq)
9.940±0.030
–56.738±0.171
5.000±2.000
207.070±6.733
(a)
UO2CO3(cr) CO32– + UO2
2+ UO2CO3(cr)
14.760±0.020
–84.251±0.114
UO2(CO3)22– 2CO3
2– + UO22+ UO2(CO3)2
2–
16.610±0.090
–94.811±0.514
18.500±4.000
380.046±13.526
(a)
UO2(CO3)34– 3CO3
2– + UO22+ UO2(CO3)3
4–
21.840±0.040
–124.664±0.228
–39.200±4.100
286.646±13.773
(a)
UO2(CO3)35– 3CO3
2– + UO2+ UO2(CO3)3
5–
6.950±0.360
–39.671±2.055
U(CO3)44– U(CO3)5
6– CO32– + U(CO3)4
4–
1.120±0.250
–6.393±1.427
U(CO3)56– 5CO3
2– + U4+ U(CO3)56–
34.000±0.900
–194.073±5.137
–20.000±4.000
583.845±21.838
(a)
(UO2)3(CO3)66– 6CO3
2– + 3UO22+ (UO2)3(CO3)6
6–
54.000±1.000
–308.234±5.708
–62.700±2.400
823.526±20.768
(a)
(UO2)2CO3(OH)3 – CO2(g) + 4H2O(l) + 2UO2
2+ (UO2)2CO3(OH)3 – + 5H+
–19.010±0.500
108.510±2.854
(UO2)3O(OH)2(HCO3)+ CO2(g) + 4H2O(l) + 3UO22+ (UO2)3O(OH)2(HCO3)+ + 5H+
–17.500±0.500
99.891±2.854
(UO2)11(CO3)6(OH)122– 6CO2(g) + 18H2O(l) + 11UO2
2+ (UO2)11(CO3)6(OH)122– + 24H+
–72.500±2.000
413.833±11.416
(Continued on next page)
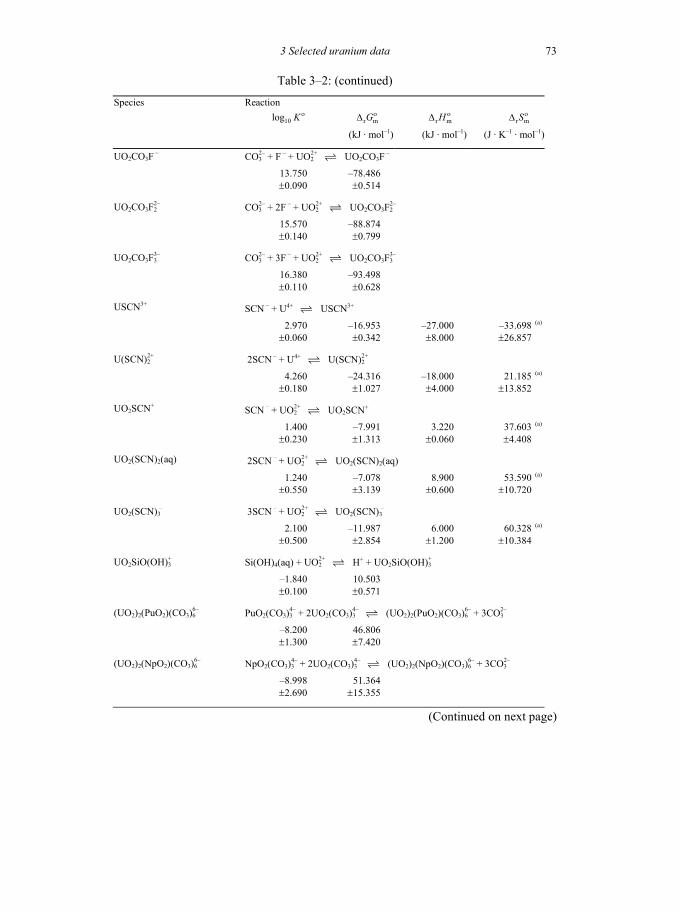
3 Selected uranium data
73
Table 3–2: (continued)
Species Reaction
10log K οr mGο∆ r mH ο∆ r mSο∆
(kJ · mol–1) (kJ · mol–1) (J · K–1 · mol–1)
UO2CO3F – CO32– + F – + UO2
2+ UO2CO3F –
13.750±0.090
–78.486±0.514
UO2CO3F22– CO3
2– + 2F – + UO22+ UO2CO3F2
2–
15.570±0.140
–88.874±0.799
UO2CO3F33– CO3
2– + 3F – + UO22+ UO2CO3F3
3–
16.380±0.110
–93.498±0.628
USCN3+ SCN – + U4+ USCN3+
2.970±0.060
–16.953±0.342
–27.000±8.000
–33.698±26.857
(a)
U(SCN)22+ 2SCN – + U4+ U(SCN)2
2+
4.260±0.180
–24.316±1.027
–18.000±4.000
21.185±13.852
(a)
UO2SCN+ SCN – + UO22+ UO2SCN+
1.400±0.230
–7.991±1.313
3.220±0.060
37.603±4.408
(a)
UO2(SCN)2(aq) 2SCN – + UO22+ UO2(SCN)2(aq)
1.240±0.550
–7.078±3.139
8.900±0.600
53.590±10.720
(a)
UO2(SCN)3 – 3SCN – + UO2
2+ UO2(SCN)3 –
2.100±0.500
–11.987±2.854
6.000±1.200
60.328±10.384
(a)
UO2SiO(OH)3+ Si(OH)4(aq) + UO2
2+ H+ + UO2SiO(OH)3+
–1.840±0.100
10.503±0.571
(UO2)2(PuO2)(CO3)66– PuO2(CO3)3
4– + 2UO2(CO3)34– (UO2)2(PuO2)(CO3)6
6– + 3CO32–
–8.200±1.300
46.806±7.420
(UO2)2(NpO2)(CO3)66– NpO2(CO3)3
4– + 2UO2(CO3)34– (UO2)2(NpO2)(CO3)6
6– + 3CO32–
–8.998±2.690
51.364±15.355
(Continued on next page)

3 Selected uranium data
74
Table 3–2: (continued)
Species Reaction
10log K οr mGο∆ r mH ο∆ r mSο∆
(kJ · mol–1) (kJ · mol–1) (J · K–1 · mol–1)
CaU6O19. 11H2O(cr) Ca2+ + 18H2O(l) + 6UO22+ CaU6O19. 11H2O(cr) + 14H+
–40.500±1.600
231.176±9.133
Li0.12UO2.95(cr) 0.12LiUO3(cr) + 0.15UO2.6667(cr) + 0.73 γ–UO3 Li0.12UO2.95(cr)
–0.180±0.820
γ–Li0.55UO3 0.55LiUO3(cr) + 0.45 γ–UO3 γ–Li0.55UO3
–6.560±2.540
δ–Li0.69UO3 0.69LiUO3(cr) + 0.31 γ–UO3 δ–Li0.69UO3
–4.760±1.980
Li0.19U3O8(cr) 0.19LiUO3(cr) + 3UO2.6667(cr) Li0.19U3O8(cr) + 0.19 γ–UO3
–1.440±1.940
Li0.88U3O8(cr) 0.88LiUO3(cr) + 3UO2.6667(cr) Li0.88U3O8(cr) + 0.88 γ–UO3
0.390±2.160
Na0.12UO2.95(cr) 0.12NaUO3(cr) + 0.15UO2.6667(cr) + 0.73 γ–UO3 Na0.12UO2.95(cr)
4.130±1.140
α–Na0.14UO3 0.14NaUO3(cr) + 0.86 γ–UO3 α–Na0.14UO3
–5.480±0.480
δ–Na0.54UO3 0.54NaUO3(cr) + 0.46 γ–UO3 δ–Na0.54UO3
–6.760±0.770
Na0.2U3O8(cr) 0.2NaUO3(cr) + 3UO2.6667(cr) Na0.2U3O8(cr) + 0.2 γ–UO3
2.570±0.870
(Continued on next page)

3 Selected uranium data
75
Table 3–2: (continued)
Species Reaction
10log K οr mGο∆ r mH ο∆ r mSο∆
(kJ · mol–1) (kJ · mol–1) (J · K–1 · mol–1)
Na4UO2(CO3)3(cr) 4Na+ + UO2(CO3)34– Na4UO2(CO3)3(cr)
5.340±0.160
–30.481±0.913
K2U6O19. 11H2O(cr) 18H2O(l) + 2K+ + 6UO22+ 14H+ + K2U6O19. 11H2O(cr)
–37.100±0.540
211.768±3.082
(a) Value calculated internally with the Gibbs–Helmholtz equation, r m r m r mG H T Sο ο ο∆ = ∆ − ∆ .
(b) Value calculated from a selected standard potential.
(c) Value of 10log K ο calculated internally from r mGο∆ .
(d) For the reaction 0.5UF6(g) + 2.5 UO2F2(cr) U3O5F8(cr), a heat capacity of
r ,mpCο∆ (298.15 K) = – (18.7 ± 4.0) J·K–1·mol–1 is selected.

3 Selected uranium data
76
76
Table 3–3: Selected temperature coefficients for heat capacities marked with (c) in Table 3–1, according to the form 2 2
,m ( )pC T a bT cT eT −= + + + . The functions are valid be-tween the temperatures Tmin and Tmax (in K). The notation E±nn indicates the power of 10. ,mpC units are J · K–1 · mol–1. Compound a b c e T min T max U(cr) 2.69200E+01 –2.50200E–03 2.65560E–05 –7.69860E+04 298 941U(g) 3.25160E+01 –2.25394E–02 1.46050E–05 –3.02280E+05 298 900UO(g) 3.00540E+01 5.28803E–02 –4.22663E–05 –2.21060E+05 298 500UO2(cr) 6.27740E+01 3.17400E–02 0 –7.69300E+05 250 600UO2(g) 5.78390E+01 9.01050E–03 –9.36370E–07 –7.83110E+04 298 1000UO2
2+ (a) 283 328
β–UO2.25 7.90890E+01 1.36500E–02 0 –1.03800E+06 348 600UO2.25(cr) 1.48760E+03 –6.97370E+00 9.73600E–03 –1.78600E+07 250 348α–UO2.3333 6.41490E+01 4.91400E–02 0 –6.72000E+05 237 347β–UO2.3333 6.43380E+01 4.97900E–02 0 –6.55000E+05 232 346UO2.6667(cr) 8.72760E+01 2.21600E–02 0 –1.24400E+06 233 600β–UO3 8.61700E+01 2.49840E–02 0 –1.09150E+06 298 678γ–UO3 8.81030E+01 1.66400E–02 0 –1.01280E+06 298 850UO3(g) 6.44290E+01 3.17330E–02 –1.51980E–05 –7.14580E+05 298 1000β–UO2(OH)2 4.18000E+01 2.00000E–01 0 3.53000E+06 298 473UO3. 2 H2O(cr) 8.42380E+01 2.94590E–01 0 0 298 400UF(g) 3.68030E+01 3.76720E–02 –3.33230E–05 –6.33380E+05 298 500UF2(g) 4.30910E+01 4.23483E–02 –1.97810E–05 1.96710E+05 298 900UF3(cr) 1.06539E+02 7.05000E–04 0 –1.03550E+06 298 1768UF3(g) 8.13270E+01 –4.30000E–06 2.42700E–06 –4.76300E+05 298 1800UF4(cr) 1.38865E+02 –3.20680E–02 2.79880E–05 –1.40200E+06 298 1309UF4(g) 1.03826E+02 9.54900E–03 –1.45100E–06 –1.02132E+06 298 3000α–UF5 1.25159E+02 3.02080E–02 0 –1.92500E+05 298 1000β–UF5 1.25159E+02 3.02080E–02 0 –1.92500E+05 298 1000UF5(g) 1.16738E+02 3.13041E–02 –1.25380E–05 –1.27300E+06 298 1100UF6(cr) 5.23180E+01 3.83798E–01 0 0 298 337UF6(g) 1.37373E+02 3.96050E–02 –2.17880E–05 –1.58687E+06 298 700U2F9(cr) 2.35978E+02 5.99149E–02 0 –2.17568E+05 298 600U4F17(cr) 4.53546E+02 1.18491E–01 0 –2.67776E+05 298 600UOF4(g) 1.16407E+02 2.85419E–02 –1.38740E–05 –1.38364E+06 298 900UO2F2(cr) 1.06238E+02 2.83260E–02 0 –1.02080E+06 298 2000UO2F2(g) 8.85810E+01 3.46640E–02 –1.76390E–05 –9.74480E+05 298 800UCl(g) 6.30000E+01 –4.14373E–02 2.89720E–05 –8.93400E+05 298 700UCl2(g) 5.78070E+01 3.46400E–04 2.38800E–06 1.58480E+05 298 1100UCl3(cr) 1.06967E+02 –2.08595E–02 3.63890E–05 –1.29994E+05 298 1115UCl3(g) 8.40180E+01 –3.47320E–03 3.61300E–06 –7.98900E+04 298 1700UCl4(cr) 1.16320E+02 3.10837E–02 0 –3.40402E+05 298 863UCl4(g) 1.10634E+02 3.23750E–03 –3.12000E–07 –7.15600E+05 298 3000UCl5(cr) 1.40164E+02 3.55640E–02 0 0 298 600UCl5(g) 1.28655E+02 1.06600E–02 –2.66100E–06 –7.10000E+05 298 1900UCl6(cr) 1.73427E+02 3.50619E–02 0 –7.40568E+05 298 452UCl6(g) 1.57768E+02 9.73000E–05 –1.10000E–08 –9.46160E+05 298 3000UOCl(cr) 7.58140E+01 1.43510E–02 0 –8.28430E+05 298 900UOCl2(cr) 9.88120E+01 2.22100E–02 0 –9.22160E+05 298 700UOCl3(cr) 1.05270E+02 3.99150E–02 0 –2.09200E+04 298 900UO2Cl(cr) 9.01230E+01 2.22590E–02 0 –7.74040E+05 298 1000UO2Cl2(cr) 1.15000E+02 1.82230E–02 0 –1.14180E+06 298 650UO2Cl2(g) 9.59130E+01 1.96284E–02 –8.92180E–06 –7.46590E+05 298 1000U2O2Cl5(cr) 2.34300E+02 3.55640E–02 0 –2.26770E+06 298 700(UO2)2Cl3(cr) 2.25940E+02 3.55640E–02 0 –2.92880E+06 298 900
(Continued on next page)

3 Selected uranium data
77
Table 3–3 :(continued) Compound a b c e T min T max UBr(g) 6.34750E+01 –4.16971E–02 2.94940E–05 –8.16640E+05 298 700UBr2(g) 5.81290E+01 –1.74200E–04 2.62000E–06 2.70820E+05 298 1100UBr3(cr) 9.79710E+01 2.63600E–02 0 0 298 600UBr3(g) 8.44060E+01 –3.95240E–03 3.76800E–06 1.41230E+05 298 1700UBr4(cr) 1.19244E+02 2.97064E–02 0 0 298 792UBr4(g) 1.10817E+02 3.13740E–03 –3.02000E–07 –4.30880E+05 298 3100UBr5(cr) 1.50624E+02 3.34720E–02 0 0 298 400UBr5(g) 1.27620E+02 1.32749E–02 –4.04900E–06 –2.01280E+05 298 1400UOBr2(cr) 1.10580E+02 1.36820E–02 0 –1.47900E+06 298 900UOBr3(cr) 1.30540E+02 2.05020E–02 0 –1.38070E+06 298 1100UO2Br2(cr) 1.04270E+02 3.79380E–02 0 0 298 500UI(g) 6.35060E+01 –4.15266E–02 2.95180E–05 –7.94920E+05 298 700UI2(g) 5.81850E+01 –2.65300E–04 2.66100E–06 3.17020E+05 298 1100UI3(cr) 1.05018E+02 2.42672E–02 0 0 298 800UI3(g) 8.44400E+01 –3.99330E–03 3.78200E–06 2.11250E+05 298 1700UI4(cr) 1.45603E+02 9.95792E–03 0 –1.97486E+06 298 720UI4(g) 1.10978E+02 2.95700E–03 –2.55000E–07 –2.70780E+05 298 3000US(cr) 5.28560E+01 6.51570E–03 0 –3.78290E+05 298 2000US1.90(cr) 7.80570E+01 6.63580E–03 0 –5.38900E+05 298 1900US2(cr) 7.56630E+01 8.93700E–03 0 –3.27780E+05 298 1800US3(cr) 1.00670E+02 1.12130E–02 0 –7.44750E+05 298 1100U2S3(cr) 1.29450E+02 1.46860E–02 0 0 298 2000UO2SO4(cr) 1.12470E+02 1.08780E–01 0 0 298 820USe(cr) 5.41470E+01 7.96240E–03 0 –1.52180E+05 298 800α–USe2 7.96930E+01 8.64870E–03 0 –2.64830E+05 298 800UN(cr) 5.05400E+01 1.06600E–02 0 –5.23800E+05 298 1000UPO5(cr) 1.10430E+02 8.52280E–02 0 –1.03790E+06 298 600(UO2)2P2O7(cr) 2.50670E+02 1.54300E–01 0 –3.40030E+06 298 600(UO2)3(PO4)2(cr) 3.26370E+02 1.96440E–01 0 –4.08400E+06 298 600UAsO5(cr) 1.30700E+02 6.42580E–02 0 –1.05420E+06 298 800UO2(AsO3)2(cr) 2.08460E+02 8.89100E–02 0 –3.03460E+06 298 750(UO2)2As2O7(cr) 3.07410E+02 1.05820E–01 0 –5.85130E+06 298 850(UO2)3(AsO4)2(cr) 3.31150E+02 2.11360E–01 0 –2.68180E+06 298 850UC(cr) 5.55710E+01 9.35940E–03 0 –7.32310E+05 298 600α–UC1.94 6.57750E+01 2.03740E–02 0 –9.86520E+05 298 600U2C3(cr) 1.14820E+02 3.10060E–02 0 –1.48450E+06 298 600Tl2U4O11(cr) 3.68200E+02 2.48860E–02 0 –1.37500E+06 298 673Sr3U2O9(cr) 3.19180E+02 1.16020E–01 0 –4.62010E+06 298 1000Sr3U11O36(cr) 9.62720E+02 3.55260E–01 0 –3.95400E+05 298 1000NaUO3(cr) 1.15490E+02 1.91670E–02 0 –1.09660E+06 415 931α–Na2UO4 1.62540E+02 2.58860E–02 0 –2.09660E+06 618 1165Na3UO4(cr) 1.88900E+02 2.51790E–02 0 –2.08010E+06 523 1212Na2U2O7(cr) 2.62830E+02 1.46530E–02 0 –3.54900E+06 390 540KUO3(cr) 1.33258E+02 1.25580E–02 0 0 298 714K2U2O7(cr) 1.49084E+02 2.69500E–01 0 0 391 683K2U4O13(cr) 4.71068E+02 –4.68900E–02 0 –2.87540E+06 411 888Rb2U4O11(cr) 3.30400E+02 1.41340E–01 0 –6.19800E+05 396 735Rb2U4O13(cr) 4.12560E+02 2.50000E–02 0 0 325 805Rb2U(SO4)3(cr) 3.86672E+02 6.88300E–02 0 –5.25917E+06 298 628Cs2UO4(cr) 1.64880E+02 1.70230E–02 0 –1.52850E+06 298 1061Cs2U2O7(cr) 3.55325E+02 8.15759E–02 0 –1.31956E+07 298 852Cs2U4O12(cr) 4.23726E+02 7.19405E–02 0 –5.43750E+06 361 719Cs4U5O17(cr) 6.99211E+02 1.71990E–01 0 0 368 906 (a) The thermal function is 2+
,m 25308(UO , ) (350.5 0.8722 )
190pC T TT
ο = − −−
J · K–1 · mol–1 for 283K 328KT≤ ≤ .


79
Chapter 4
4 Selected Data for Neptunium
4.1 General considerations This chapter presents updated chemical thermodynamic data for neptunium species, as described in detail in Chapter 10 of this volume. The newly selected data represent revi-sions to those chosen in the previous NEA TDB review [2001LEM/FUG]. In this re-spect, it will be found that while new species appear in the Tables, some others have been removed from them. Table 4–1 contains the recommended thermodynamic data of the neptunium compounds and complexes, Table 4–2 the recommended thermodynamic data of chemical equilibrium reactions by which the neptunium compounds and com-plexes are formed, and Table 4–3 the temperature coefficients of the heat capacity data of Table 4–1 where available.
The species and reactions in Table 4–1, Table 4–2 and Table 4–3 appear in standard order of arrangement (cf. Figure 2.1). Table 4–2 contains information only on those reactions for which primary data selections are made in this review. These se-lected reaction data are used, together with data for key neptunium species (for example Np4+) and auxiliary data listed in Table 8–1, to derive the corresponding formation quantities in Table 4–1. The uncertainties associated with values for the key neptunium species and for some of the auxiliary data are substantial, leading to comparatively large uncertainties in the formation quantities derived in this manner. The inclusion of a table for reaction data (Table 4–2) in this report allows the use of equilibrium constants with total uncertainties that are directly based on the experimental accuracies. This is the main reason for including both the table for reaction data (Table 4–2) and the table of
f m f m m, ,G H Sο ο ο∆ ∆ and ,mpCο values (Table 4–1). In a few cases, the correlation of small uncertainties in values for ligands has been neglected in calculations of uncertainty val-ues for species in Table 4–1 from uncertainty values in Table 4–2. However, for those species the effects are less than 2% of the stated uncertainties.
The selected thermal functions of the heat capacities, listed in Table 4–3, refer to the relation:
2 1 2,m ( ) = pC T a b T c T d T e T− −+ ⋅ + ⋅ + ⋅ + ⋅ (4.1)

4 Selected neptunium data
80
No references are given in these tables since the selected data are generally not directly attributable to a specific published source. A detailed discussion of the selection procedure is presented in [2001LEM/FUG] and in Chapter 10 of this volume.
4.2 Precautions to be observed in the use of the tables Geochemical modelling in aquatic systems requires the careful use of the data selected in the NEA TDB reviews. The data in the tables of selected data must not be adopted without taking into account the chemical background information discussed in the cor-responding sections of this book. In particular the following precautions should be ob-served when using data from the Tables.
• The addition of any aqueous species and its data to this internally consistent database can result in a modified data set which is no longer rigorous and can lead to erroneous results. The situation is similar, to a lesser degree, with the addition of gases and solids. It should also be noted that the data set presented in this chapter may not be “complete” for all the conceivable systems and con-ditions. Gaps are pointed out in both the previous NEA TDB review and the present update.
• Solubility data for crystalline phases are well defined in the initial state, but not necessarily in the final state after “equilibrium” has been attained. Hence, the solubility calculated from these phases may be very misleading, as discussed for the solubility data of MO2(cr), M = U, Np, Pu.
• The selected thermodynamic data in [92GRE/FUG], [95SIL/BID] and [2001LEM/FUG] contain thermodynamic data for amorphous phases. Most of these refer to Gibbs energy of formation deduced from solubility measure-ments. In the present review all such data have been removed. However, the corresponding log10K values have been retained. The reasons for these changes are:
o Thermodynamic data are only meaningful if they refer to well–defined systems; this is not the case for amorphous phases. It is well known that their solubility may change with time, due to re–crystallisation with a resulting change in water content and surface area/crystal size; the time scale for these changes can vary widely. These kinetic phenomena are different from those encountered in sys-tems where there is a very high activation barrier for the reaction, e.g., electron exchange between sulphate and sulphide.
o The solubility of amorphous phases provides useful information for users of the database when modelling the behaviour of complex sys-tems. Therefore, the solubility products have been given with the pro-viso that they are not thermodynamic quantities.
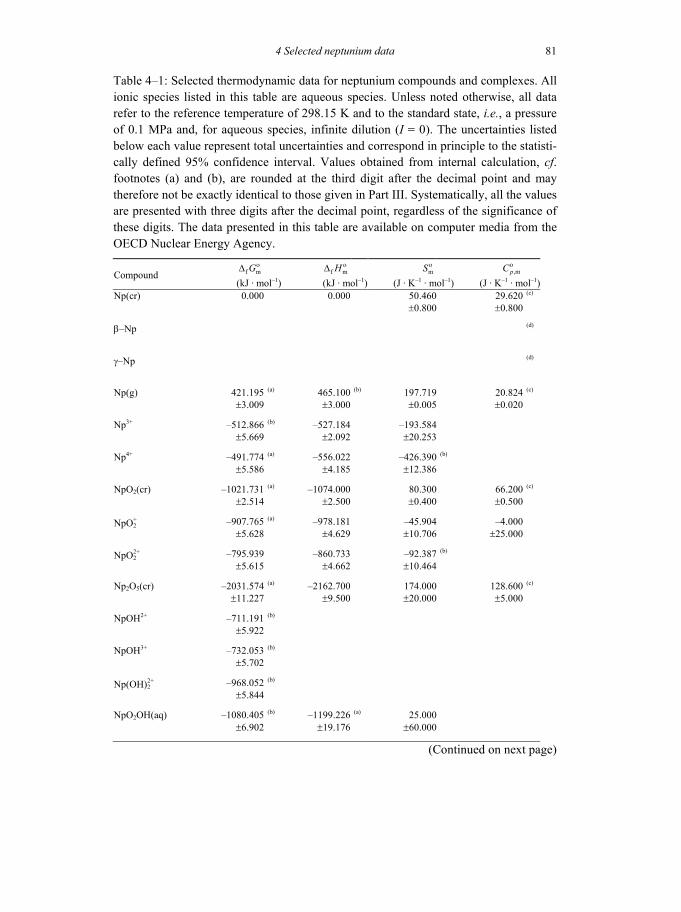
4 Selected neptunium data
81
Table 4–1: Selected thermodynamic data for neptunium compounds and complexes. All ionic species listed in this table are aqueous species. Unless noted otherwise, all data refer to the reference temperature of 298.15 K and to the standard state, i.e., a pressure of 0.1 MPa and, for aqueous species, infinite dilution (I = 0). The uncertainties listed below each value represent total uncertainties and correspond in principle to the statisti-cally defined 95% confidence interval. Values obtained from internal calculation, cf. footnotes (a) and (b), are rounded at the third digit after the decimal point and may therefore not be exactly identical to those given in Part III. Systematically, all the values are presented with three digits after the decimal point, regardless of the significance of these digits. The data presented in this table are available on computer media from the OECD Nuclear Energy Agency.
f mGο∆ f mH ο∆ mS ο,mpCο
Compound (kJ · mol–1) (kJ · mol–1) (J · K–1 · mol–1) (J · K–1 · mol–1)
Np(cr) 0.000 0.000 50.460±0.800
29.620±0.800
(c)
β–Np (d)
γ–Np (d)
Np(g) 421.195±3.009
(a) 465.100±3.000
(b) 197.719±0.005
20.824±0.020
(c)
Np3+ –512.866±5.669
(b) –527.184±2.092
–193.584±20.253
Np4+ –491.774±5.586
(a) –556.022±4.185
–426.390±12.386
(b)
NpO2(cr) –1021.731±2.514
(a) –1074.000±2.500
80.300±0.400
66.200±0.500
(c)
NpO2+ –907.765
±5.628 (a) –978.181
±4.629 –45.904
±10.706 –4.000
±25.000
NpO22+ –795.939
±5.615 –860.733
±4.662 –92.387
±10.464 (b)
Np2O5(cr) –2031.574±11.227
(a) –2162.700±9.500
174.000±20.000
128.600±5.000
(c)
NpOH2+ –711.191±5.922
(b)
NpOH3+ –732.053±5.702
(b)
Np(OH)22+ –968.052
±5.844 (b)
NpO2OH(aq) –1080.405±6.902
(b) –1199.226±19.176
(a) 25.000±60.000
(Continued on next page)
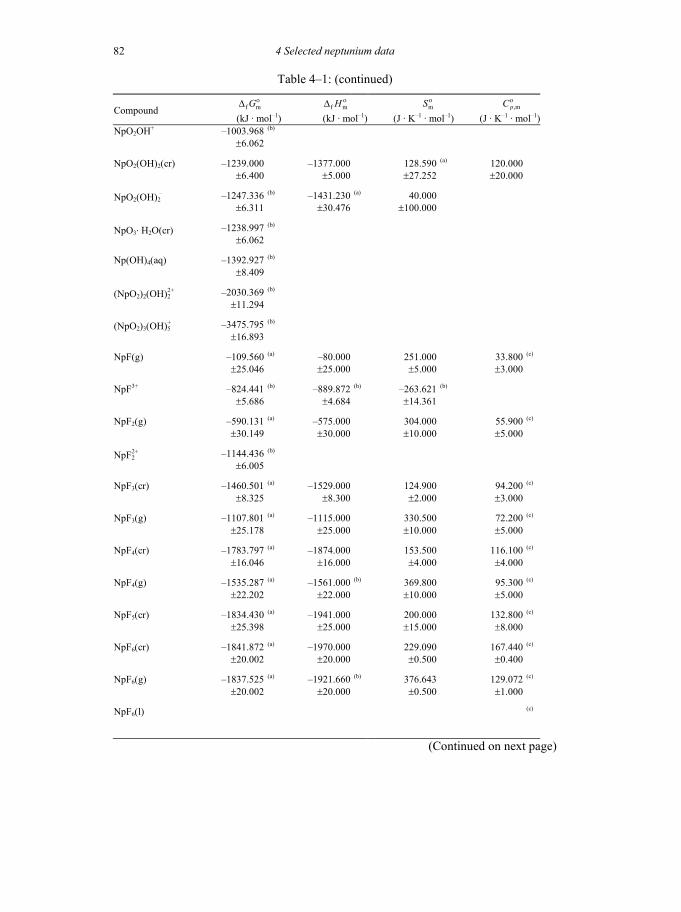
4 Selected neptunium data
82
Table 4–1: (continued)
f mGο∆ f mH ο∆ mS ο,mpCο
Compound (kJ · mol–1) (kJ · mol–1) (J · K–1 · mol–1) (J · K–1 · mol–1)
NpO2OH+ –1003.968±6.062
(b)
NpO2(OH)2(cr) –1239.000±6.400
–1377.000±5.000
128.590±27.252
(a) 120.000±20.000
NpO2(OH)2 – –1247.336
±6.311 (b) –1431.230
±30.476 (a) 40.000
±100.000
NpO3. H2O(cr) –1238.997±6.062
(b)
Np(OH)4(aq) –1392.927±8.409
(b)
(NpO2)2(OH)22+ –2030.369
±11.294 (b)
(NpO2)3(OH)5+ –3475.795
±16.893 (b)
NpF(g) –109.560±25.046
(a) –80.000±25.000
251.000±5.000
33.800±3.000
(c)
NpF3+ –824.441±5.686
(b) –889.872±4.684
(b) –263.621±14.361
(b)
NpF2(g) –590.131±30.149
(a) –575.000±30.000
304.000±10.000
55.900±5.000
(c)
NpF22+ –1144.436
±6.005 (b)
NpF3(cr) –1460.501±8.325
(a) –1529.000±8.300
124.900±2.000
94.200±3.000
(c)
NpF3(g) –1107.801±25.178
(a) –1115.000±25.000
330.500±10.000
72.200±5.000
(c)
NpF4(cr) –1783.797±16.046
(a) –1874.000±16.000
153.500±4.000
116.100±4.000
(c)
NpF4(g) –1535.287±22.202
(a) –1561.000±22.000
(b) 369.800±10.000
95.300±5.000
(c)
NpF5(cr) –1834.430±25.398
(a) –1941.000±25.000
200.000±15.000
132.800±8.000
(c)
NpF6(cr) –1841.872±20.002
(a) –1970.000±20.000
229.090±0.500
167.440±0.400
(c)
NpF6(g) –1837.525±20.002
(a) –1921.660±20.000
(b) 376.643±0.500
129.072±1.000
(c)
NpF6(l) (c)
(Continued on next page)
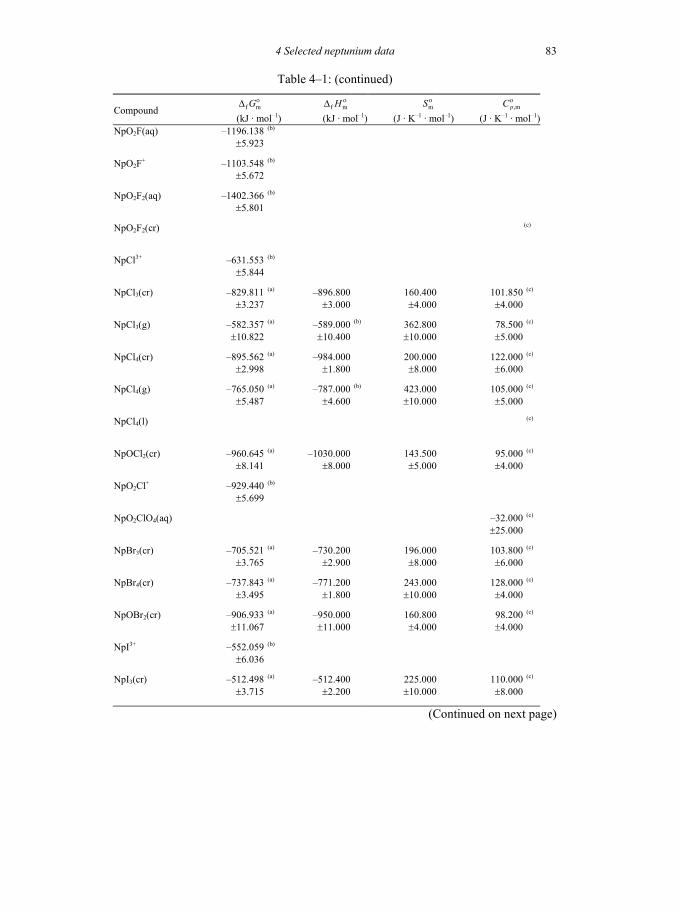
4 Selected neptunium data
83
Table 4–1: (continued)
f mGο∆ f mH ο∆ mS ο,mpCο
Compound (kJ · mol–1) (kJ · mol–1) (J · K–1 · mol–1) (J · K–1 · mol–1)
NpO2F(aq) –1196.138±5.923
(b)
NpO2F+ –1103.548±5.672
(b)
NpO2F2(aq) –1402.366±5.801
(b)
NpO2F2(cr) (c)
NpCl3+ –631.553±5.844
(b)
NpCl3(cr) –829.811±3.237
(a) –896.800±3.000
160.400±4.000
101.850±4.000
(c)
NpCl3(g) –582.357±10.822
(a) –589.000±10.400
(b) 362.800±10.000
78.500±5.000
(c)
NpCl4(cr) –895.562±2.998
(a) –984.000±1.800
200.000±8.000
122.000±6.000
(c)
NpCl4(g) –765.050±5.487
(a) –787.000±4.600
(b) 423.000±10.000
105.000±5.000
(c)
NpCl4(l) (c)
NpOCl2(cr) –960.645±8.141
(a) –1030.000±8.000
143.500±5.000
95.000±4.000
(c)
NpO2Cl+ –929.440±5.699
(b)
NpO2ClO4(aq) –32.000±25.000
(c)
NpBr3(cr) –705.521±3.765
(a) –730.200±2.900
196.000±8.000
103.800±6.000
(c)
NpBr4(cr) –737.843±3.495
(a) –771.200±1.800
243.000±10.000
128.000±4.000
(c)
NpOBr2(cr) –906.933±11.067
(a) –950.000±11.000
160.800±4.000
98.200±4.000
(c)
NpI3+ –552.059±6.036
(b)
NpI3(cr) –512.498±3.715
(a) –512.400±2.200
225.000±10.000
110.000±8.000
(c)
(Continued on next page)

4 Selected neptunium data
84
Table 4–1: (continued)
f mGο∆ f mH ο∆ mSο,mpCο
Compound (kJ · mol–1) (kJ · mol–1) (J · K–1 · mol–1) (J · K–1 · mol–1)
NpO2IO3(aq) –1036.957±5.934
(b)
NpO2IO3+ –929.126
±5.922 (b)
NpSO42+ –1274.887
±5.809 (b) –1435.522
±9.796 (b) –176.635
±32.277 (b)
NpO2SO4(aq) –1558.666±5.641
(b) –1753.373±4.706
(b) 44.920±10.667
(b)
NpO2SO4 – –1654.281
±5.850 (b) –1864.321
±8.569 (b) 58.833
±26.920 (b)
Np(SO4)2(aq) –2042.873±6.360
(b) –2319.322±5.871
(b) 7.964±18.924
(b)
NpO2(SO4)22– –2310.775
±5.705 (b) –2653.413
±4.880 (b) 121.798
±11.402 (b)
NpN(cr) –280.443±10.013
(a) –305.000±10.000
63.900±1.500
48.700±0.900
(c)
NpNO33+ –613.413
±5.667 (b)
NpO2(NO3)2. 6 H2O(s) –2428.069±5.565
(a) –3008.241±5.022
516.306±8.000
NpO2HPO4(aq) –1927.314±7.067
(b)
NpO2HPO4 – –2020.589
±5.870 (b)
NpO2H2PO4+ –1952.042
±6.491 (b)
NpO2(HPO4)22– –3042.135
±8.598 (b)
NpSb(cr) 101.400±6.100
48.900±2.900
NpC0.91(cr) –76.024±10.028
(a) –71.100±10.000
72.200±2.400
50.000±1.000
(c)
Np2C3(cr) –192.427±19.436
–187.400±19.200
135.000±10.000
110.000±8.000
NpO2CO3(aq) –1377.040±6.617
(b)
(Continued on next page)

4 Selected neptunium data
85
Table 4–1: (continued)
f mGο∆ f mH ο∆ mSο,mpCο
Compound (kJ · mol–1) (kJ · mol–1) (J · K–1 · mol–1) (J · K–1 · mol–1)
NpO2CO3(s) –1407.156±6.233
(b)
NpO2CO3 – –1463.988
±5.652 (b)
NpO2(CO3)22– –1946.015
±7.033 (b)
NpO2(CO3)23– –2000.861
±5.685 (b)
Np(CO3)33– –2185.949
±15.451 (b)
NpO2(CO3)34– –2490.208
±5.759 (b) –2928.323
±6.254 –12.070
±17.917
NpO2(CO3)35– –2522.859
±5.733 (b) –3017.120
±6.893 –135.050
±20.467
Np(CO3)44– –2812.775
±8.240 (b)
Np(CO3)56– –3334.567
±8.425 (b)
(NpO2)3(CO3)66– –5839.709
±19.185 (b)
NpO2(CO3)2OH4– –2170.417±8.785
(b)
(NpO2)2CO3(OH)3 – –2814.914
±14.665 (b)
(NH4)4NpO2(CO3)3(s) –2850.284±6.106
(b)
Np(SCN)3+ –416.198±7.081
(b) –486.622±6.520
(b) –248.165±25.449
(b)
Np(SCN)22+ –329.777
±10.166 (b) –412.222
±12.748 (b) –89.545
±50.953 (b)
Np(SCN)3+ –241.072
±13.541 (b) –339.822
±15.573 (b) 54.707
±66.304 (b)
Sr3NpO6(cr) –3125.800±5.900
Ba3NpO6(cr) –3085.600±9.600
(Continued on next page)

4 Selected neptunium data
86
Table 4–1: (continued)
f mGο∆ f mH ο∆ mSο,mpCο
Compound (kJ · mol–1) (kJ · mol–1) (J · K–1 · mol–1) (J · K–1 · mol–1)
Ba2MgNpO6(cr) –3096.900±8.200
Ba2CaNpO6(cr) –3159.300±7.900
Ba2SrNpO6(cr) –3122.500±7.800
Li2NpO4(cr) –1828.200±5.800
α–Na2NpO4 –1763.800±5.700
β–Na2NpO4 –1748.500±6.100
β–Na4NpO5 –2315.400±5.700
Na2Np2O7(cr) –2894.000±11.000
Na3NpF8(cr) –3521.239±21.305
(a) –3714.000±21.000
(b) 369.000±12.000
(b) 272.250±12.000
(c)
Na3NpO2(CO3)2(cr) –2830.592±6.365
(b)
NaNpO2CO3.3.5 H2O(cr) –2590.397±5.808
(b)
K2NpO4(cr) –1784.300±6.400
K2Np2O7(cr) –2932.000±11.000
KNpO2CO3(s) –1793.235±5.746
(b)
K3NpO2(CO3)2(s) –2899.340±5.765
(b)
K4NpO2(CO3)3(s) –3660.395±7.641
(b)
Rb2Np2O7(cr) –2914.000±12.000
Cs2NpO4(cr) –1788.100±5.700
(Continued on next page)

4 Selected neptunium data
87
Table 4–1: (continued)
f mGο∆ f mH ο∆ mSο,mpCο
Compound (kJ · mol–1) (kJ · mol–1) (J · K–1 · mol–1) (J · K–1 · mol–1)
Cs2NpCl6(cr) –1833.039±4.871
(a) –1976.200±1.900
410.000±15.000
Cs2NpO2Cl4(cr) –2056.100±5.400
Cs3NpO2Cl4(cr) –2449.100±4.800
Cs2NpBr6(cr) –1620.121±3.616
(a) –1682.300±2.000
469.000±10.000
Cs2NaNpCl6(cr) –2217.200±3.100
(a)Value calculated internally with the Gibbs–Helmholtz equation, f m f m m,ii
G H T Sο ο ο∆ = ∆ − ∑ . (b)Value calculated internally from reaction data (see Table 4–2). (c)Temperature coefficients of this function are listed in Table 4–3. (d)A temperature function for the heat capacity is given in Table 4–3.
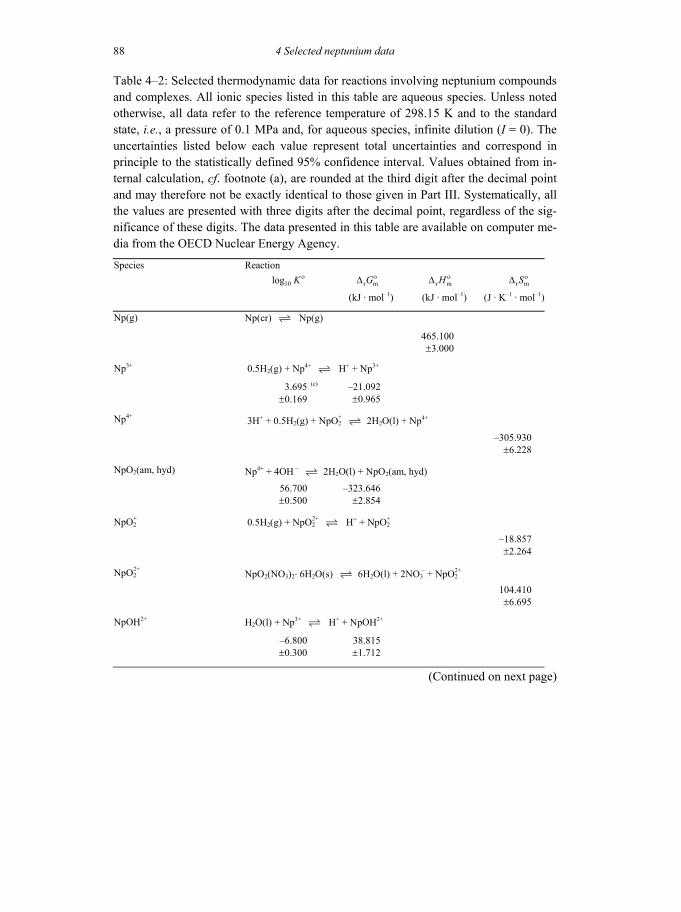
4 Selected neptunium data
88
Table 4–2: Selected thermodynamic data for reactions involving neptunium compounds and complexes. All ionic species listed in this table are aqueous species. Unless noted otherwise, all data refer to the reference temperature of 298.15 K and to the standard state, i.e., a pressure of 0.1 MPa and, for aqueous species, infinite dilution (I = 0). The uncertainties listed below each value represent total uncertainties and correspond in principle to the statistically defined 95% confidence interval. Values obtained from in-ternal calculation, cf. footnote (a), are rounded at the third digit after the decimal point and may therefore not be exactly identical to those given in Part III. Systematically, all the values are presented with three digits after the decimal point, regardless of the sig-nificance of these digits. The data presented in this table are available on computer me-dia from the OECD Nuclear Energy Agency.
Species Reaction
10log K οr mGο∆ r mH ο∆ r mSο∆
(kJ · mol–1) (kJ · mol–1) (J · K–1 · mol–1)
Np(g) Np(cr) Np(g)
465.100±3.000
Np3+ 0.5H2(g) + Np4+ H+ + Np3+
3.695±0.169
(c) –21.092±0.965
Np4+ 3H+ + 0.5H2(g) + NpO2+ 2H2O(l) + Np4+
–305.930±6.228
NpO2(am, hyd) Np4+ + 4OH – 2H2O(l) + NpO2(am, hyd)
56.700±0.500
–323.646±2.854
NpO2+ 0.5H2(g) + NpO2
2+ H+ + NpO2+
–18.857±2.264
NpO22+ NpO2(NO3)2. 6H2O(s) 6H2O(l) + 2NO3
– + NpO22+
104.410±6.695
NpOH2+ H2O(l) + Np3+ H+ + NpOH2+
–6.800±0.300
38.815±1.712
(Continued on next page)

4 Selected neptunium data
89
Table 4–2: (continued)
Species Reaction
10log K οr mGο∆ r mH ο∆ r mSο∆
(kJ · mol–1) (kJ · mol–1) (J · K–1 · mol–1)
NpOH3+ H2O(l) + Np4+ H+ + NpOH3+ 0.550
±0.200 –3.139
±1.142
Np(OH)22+ 2H2O(l) + Np4+ 2H+ + Np(OH)2
2+
0.350±0.300
–1.998±1.712
NpO2OH(am, aged) H2O(l) + NpO2+ H+ + NpO2OH(am, aged)
–4.700±0.500
26.828±2.854
NpO2OH(am, fresh) H2O(l) + NpO2+ H+ + NpO2OH(am, fresh)
–5.300±0.200
30.253±1.142
NpO2OH(aq) H2O(l) + NpO2+ H+ + NpO2OH(aq)
–11.300±0.700
64.501±3.996
NpO2OH+ H2O(l) + NpO22+ H+ + NpO2OH+
–5.100±0.400
29.111±2.283
NpO2(OH)2 – 2H2O(l) + NpO2
+ 2H+ + NpO2(OH)2 –
–23.600±0.500
134.710±2.854
NpO3. H2O(cr) 2H2O(l) + NpO22+ 2H+ + NpO3. H2O(cr)
–5.470±0.400
31.223±2.283
Np(OH)4(aq) 4H2O(l) + Np4+ 4H+ + Np(OH)4(aq)
–8.300±1.100
47.377±6.279
(NpO2)2(OH)22+ 2H2O(l) + 2NpO2
2+ (NpO2)2(OH)22+ + 2H+
–6.270±0.210
35.789±1.199
(NpO2)3(OH)5+ 5H2O(l) + 3NpO2
2+ (NpO2)3(OH)5+ + 5H+
–17.120±0.220
97.722±1.256
(Continued on next page)

4 Selected neptunium data
90
Table 4–2: (continued)
Species Reaction
10log K οr mGο∆ r mH ο∆ r mSο∆
(kJ · mol–1) (kJ · mol–1) (J · K–1 · mol–1)
NpF3+ F – + Np4+ NpF3+
8.960±0.140
–51.144±0.799
1.500±2.000
176.570±7.224
(a)
NpF22+ 2F – + Np4+ NpF2
2+
15.700±0.300
–89.616±1.712
NpF4(g) NpF4(cr) NpF4(g)
313.000±15.000
NpF6(g) NpF6(cr) NpF6(g)
48.340±0.070
NpO2F(aq) F – + NpO2+ NpO2F(aq)
1.200±0.300
–6.850±1.712
NpO2F+ F – + NpO22+ NpO2F+
4.570±0.070
–26.086±0.400
NpO2F2(aq) 2F – + NpO22+ NpO2F2(aq)
7.600±0.080
–43.381±0.457
NpCl3+ Cl – + Np4+ NpCl3+
1.500±0.300
–8.562±1.712
NpCl3(g) NpCl3(cr) NpCl3(g)
307.800±10.000
NpCl4(g) NpCl4(cr) NpCl4(g)
197.000±3.000
NpO2Cl+ Cl – + NpO22+ NpO2Cl+
0.400±0.170
–2.283±0.970
(Continued on next page)
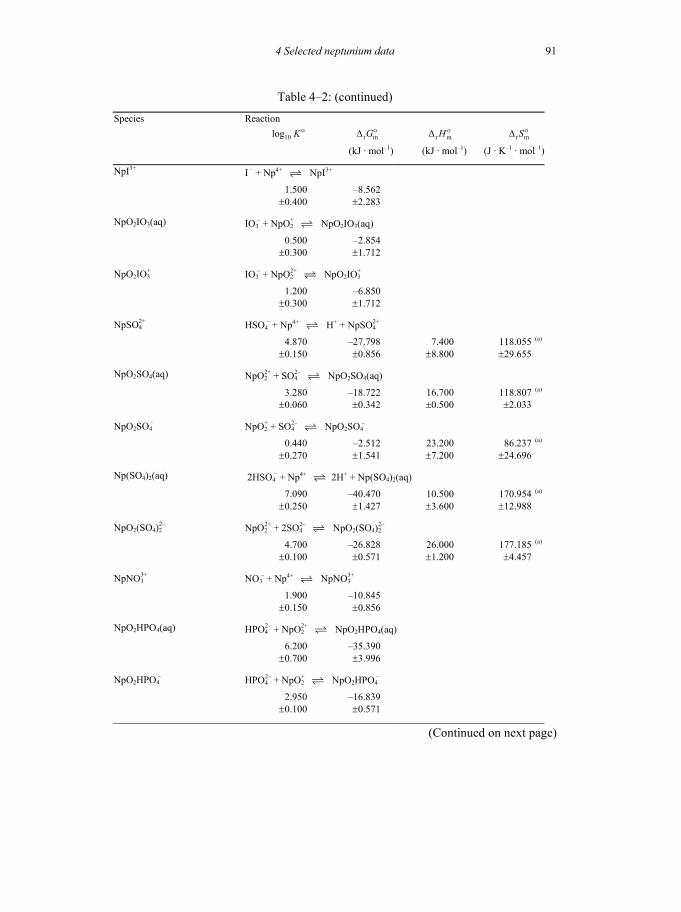
4 Selected neptunium data
91
Table 4–2: (continued)
Species Reaction
10log K οr mGο∆ r mH ο∆ r mSο∆
(kJ · mol–1) (kJ · mol–1) (J · K–1 · mol–1)
NpI3+ I – + Np4+ NpI3+
1.500±0.400
–8.562±2.283
NpO2IO3(aq) IO3 – + NpO2
+ NpO2IO3(aq)
0.500±0.300
–2.854±1.712
NpO2IO3+ IO3
– + NpO22+ NpO2IO3
+
1.200±0.300
–6.850±1.712
NpSO42+ HSO4
– + Np4+ H+ + NpSO42+
4.870±0.150
–27.798±0.856
7.400±8.800
118.055±29.655
(a)
NpO2SO4(aq) NpO22+ + SO4
2– NpO2SO4(aq)
3.280±0.060
–18.722±0.342
16.700±0.500
118.807±2.033
(a)
NpO2SO4 – NpO2
+ + SO42– NpO2SO4
–
0.440±0.270
–2.512±1.541
23.200±7.200
86.237±24.696
(a)
Np(SO4)2(aq) 2HSO4 – + Np4+ 2H+ + Np(SO4)2(aq)
7.090±0.250
–40.470±1.427
10.500±3.600
170.954±12.988
(a)
NpO2(SO4)22– NpO2
2+ + 2SO42– NpO2(SO4)2
2–
4.700±0.100
–26.828±0.571
26.000±1.200
177.185±4.457
(a)
NpNO33+ NO3
– + Np4+ NpNO33+
1.900±0.150
–10.845±0.856
NpO2HPO4(aq) HPO42– + NpO2
2+ NpO2HPO4(aq)
6.200±0.700
–35.390±3.996
NpO2HPO4 – HPO4
2– + NpO2+ NpO2HPO4
–
2.950±0.100
–16.839±0.571
(Continued on next page)

4 Selected neptunium data
92
Table 4–2: (continued)
Species Reaction
10log K οr mGο∆ r mH ο∆ r mSο∆
(kJ · mol–1) (kJ · mol–1) (J · K–1 · mol–1)
NpO2H2PO4+ H2PO4
– + NpO22+ NpO2H2PO4
+
3.320±0.500
–18.951±2.854
NpO2(HPO4)22– 2HPO4
2– + NpO22+ NpO2(HPO4)2
2–
9.500±1.000
–54.226±5.708
NpO2CO3(aq) CO32– + NpO2
2+ NpO2CO3(aq)
9.320±0.610
(c) –53.201±3.480
NpO2CO3(s) CO32– + NpO2
2+ NpO2CO3(s)
14.596±0.469
(c) –83.317±2.678
NpO2CO3 – CO3
2– + NpO2+ NpO2CO3
–
4.962±0.061
–28.323±0.348
NpO2(CO3)22– 2CO3
2– + NpO22+ NpO2(CO3)2
2–
16.516±0.729
(c) –94.276±4.162
NpO2(CO3)23– CO3
2– + NpO2CO3 – NpO2(CO3)2
3–
1.572±0.083
–8.973±0.474
Np(CO3)33– Np(CO3)5
6– + e – 2CO32– + Np(CO3)3
3–
–16.261±2.265
92.818±12.929
NpO2(CO3)34– NpO2(CO3)3
5– NpO2(CO3)34– + e –
–5.720±0.095
(c) 32.651±0.540
NpO2(CO3)34– 3CO3
2– + NpO22+ NpO2(CO3)3
4–
–41.900±4.100
NpO2(CO3)35– CO3
2– + NpO2(CO3)23– NpO2(CO3)3
5–
–1.034±0.110
5.902±0.628
(Continued on next page)

4 Selected neptunium data
93
Table 4–2: (continued)
Species Reaction
10log K οr mGο∆ r mH ο∆ r mSο∆
(kJ · mol–1) (kJ · mol–1) (J · K–1 · mol–1)
NpO2(CO3)35– NpO2(CO3)3
4– + e – NpO2(CO3)35–
–88.800±2.900
Np(CO3)44– 4CO3
2– + 2H2O(l) + NpO2(am, hyd) Np(CO3)44– + 4OH –
–17.790±0.220
101.550±1.256
Np(CO3)56– CO3
2– + Np(CO3)44– Np(CO3)5
6–
–1.070±0.300
6.108±1.712
(NpO2)3(CO3)66– 3NpO2(CO3)3
4– (NpO2)3(CO3)66– + 3CO3
2–
–8.272±1.447
(c) 47.215±8.260
NpO2(CO3)2OH4– NpO2(CO3)35– + OH – CO3
2– + NpO2(CO3)2OH4–
3.195±1.164
(c) –18.238±6.644
(NpO2)2CO3(OH)3 – 7H+ + 2NpO2(CO3)3
4– (NpO2)2CO3(OH)3 – + 5CO2(g) + 2H2O(l)
49.166±1.586
(c) –280.640±9.053
(NH4)4NpO2(CO3)3(s) 4NH4+ + NpO2(CO3)3
4– (NH4)4NpO2(CO3)3(s)
7.443±0.297
(c) –42.485±1.698
Np(SCN)3+ Np4+ + SCN – Np(SCN)3+
3.000±0.300
–17.124±1.712
–7.000±3.000
33.956±11.586
(a)
Np(SCN)22+ Np4+ + 2SCN – Np(SCN)2
2+
4.100±0.500
–23.403±2.854
–9.000±9.000
48.308±31.668
(a)
Np(SCN)3+ Np4+ + 3SCN – Np(SCN)3
+
4.800±0.500
–27.399±2.854
–13.000±9.000
48.293±31.668
(a)
Na3NpF8(cr) 3NaF(cr) + NpF6(g) 0.5F2(g) + Na3NpF8(cr)
7.876±1.350
(c) –44.954±7.705
(a) –62.678±6.900
–59.447±11.500
(Continued on next page)

4 Selected neptunium data
94
Table 4–2: (continued)
Species Reaction
10log K οr mGο∆ r mH ο∆ r mSο∆
(kJ · mol–1) (kJ · mol–1) (J · K–1 · mol–1)
Na3NpO2(CO3)2(cr) 2CO32– + 3Na+ + NpO2
+ Na3NpO2(CO3)2(cr)
14.220±0.500
–81.168±2.854
NaNpO2CO3. 3.5H2O(cr) CO32– + 3.5H2O(l) + Na+ + NpO2
+ NaNpO2CO3. 3.5H2O(cr) 11.000
±0.240 –62.788
±1.370
KNpO2CO3(s) CO32– + K+ + NpO2
+ KNpO2CO3(s)
13.150±0.190
–75.061±1.085
K3NpO2(CO3)2(s) 2CO32– + 3K+ + NpO2
+ K3NpO2(CO3)2(s)
15.460±0.160
–88.246±0.913
K4NpO2(CO3)3(s) 4K+ + NpO2(CO3)34– K4NpO2(CO3)3(s)
7.033±0.876
(c) –40.147±5.001
(a) Value calculated internally with the Gibbs–Helmholtz equation, r m r m r mG H T Sο ο ο∆ = ∆ − ∆ .
(b) Value calculated from a selected standard potential.
(c) Value of 10log K ο calculated internally from r mGο∆ .

4 Selected neptunium data
95
Table 4–3: Selected temperature coefficients for heat capacities marked with (c) in Table 4–1, according to the form 2 1 2
,m ( )pC T a bT cT dT eT− −= + + + + . The functions are valid between the temperatures Tmin and Tmax (in K). The notation E±nn indicates the power of 10. ,mpC units are J·K–1·mol–1. Compound a b c d e T min T max Np(cr) –4.05430E+00 8.25540E–02 0 0 8.05710E+05 298 553β–Np 3.93300E+01 0 0 0 0 553 849γ–Np 3.64010E+01 0 0 0 0 849 912Np(g) 1.77820E+01 3.35250E–03 6.68070E–06 0 1.28800E+05 298 800 1.41320E+01 1.55670E–02 –1.59546E–06 0 –3.98870E+05 800 2000NpO2(cr) 6.75110E+01 2.65990E–02 0 0 –8.19000E+05 220 800Np2O5(cr) 9.92000E+01 9.86000E–02 0 0 0 298 750NpF(g) 3.59880E+01 2.30310E–03 –7.30170E–07 0 –2.50010E+05 298 1400NpF2(g) 6.74740E+01 5.56480E–03 –5.95160E–06 0 –1.12930E+06 298 600NpF3(cr) 1.05200E+02 8.12000E–04 0 0 –1.00000E+06 298 1735NpF3(g) 8.16540E+01 1.20840E–03 –2.42780E–07 0 –8.67160E+05 298 3000NpF4(cr) 1.22640E+02 9.68400E–03 0 0 –8.36470E+05 298 1305NpF4(g) 1.05840E+02 8.61400E–04 1.57430E–06 0 –9.75640E+05 298 1500NpF5(cr) 1.26000E+02 3.00000E–02 0 0 –1.90000E+05 298 600NpF6(cr) 6.23330E+01 3.52550E–01 0 0 0 298 328NpF6(g) 1.43240E+02 2.44160E–02 –1.13120E–05 0 –1.81740E+06 298 1000NpF6(l) 1.50340E+02 1.10080E–01 0 0 0 328 350NpO2F2(cr) 1.06240E+02 2.83260E–02 0 0 –1.02080E+06 298 1000NpCl3(cr) 8.96000E+01 2.75000E–02 0 0 3.60000E+05 298 1075NpCl3(g) 7.19890E+01 2.47410E–02 –8.48420E–06 0 –1.15000E+04 298 1000NpCl4(cr) 1.12500E+02 3.60000E–02 0 0 –1.10000E+05 298 811NpCl4(g) 1.08770E+02 –2.86580E–03 3.15880E–06 0 –2.80770E+05 298 1800NpCl4(l) 1.08000E+02 6.00000E–02 0 0 0 811 1000NpOCl2(cr) 9.88000E+01 2.20000E–02 0 0 –9.20000E+05 298 1000NpO2ClO4(aq)(a) 3.56770E+03 –4.95930E+00 0 –6.32340E+05 0 291 398NpBr3(cr, hex) 1.01230E+02 2.06800E–02 0 0 –3.20000E+05 298 975NpBr4(cr) 1.19000E+02 3.00000E–02 0 0 0 298 800NpOBr2(cr) 1.11000E+02 1.37000E–02 0 0 –1.50000E+06 298 800NpI3(cr) 1.04000E+02 2.00000E–02 0 0 0 298 975NpN(cr) 4.76700E+01 1.31740E–02 0 0 –2.57620E+05 298 2000NpC0.91(cr) 6.12500E+01 –3.52750E–02 3.62830E–05 0 –3.48420E+05 298 1000Na3NpF8(cr) 2.70000E+02 5.66000E–02 0 0 –1.30000E+06 298 800
(a) partial molar heat capacity of solute.


97
Chapter 5
5 Selected Data for Plutonium
5.1 General considerations This chapter presents updated chemical thermodynamic data for plutonium species, as described in detail in Chapter 11 of this volume. The newly selected data represent revi-sions to those chosen in the previous NEA TDB review [2001LEM/FUG]. In this re-spect, it will be found that while new species appear in the Tables, some others have been removed from them. Table 5–1 contains the recommended thermodynamic data of the plutonium compounds and complexes, Table 5–2 the recommended thermodynamic data of chemical equilibrium reactions by which the plutonium compounds and com-plexes are formed, and Table 5–3 the temperature coefficients of the heat capacity data of Table 5–1 where available.
The species and reactions in Table 5–1, Table 5–2 and Table 5–3 appear in standard order of arrangement (cf. Figure 2.1). Table 5–2 contains information only on those reactions for which primary data selections are made in this review. These se-lected reaction data are used, together with data for key plutonium species (for example Pu4+) and auxiliary data listed in Table 8–1, to derive the corresponding formation quan-tities in Table 5–1. The uncertainties associated with values for the key plutonium spe-cies and for some of the auxiliary data are substantial, leading to comparatively large uncertainties in the formation quantities derived in this manner. The inclusion of a table for reaction data (Table 5–2) in this report allows the use of equilibrium constants with total uncertainties that are directly based on the experimental accuracies. This is the main reason for including both the table for reaction data (Table 5–2) and the table of
f m f m m, ,G H Sο ο ο∆ ∆ and ,mpCο values (Table 5–1). In a few cases, the correlation of small uncertainties in values for ligands has been neglected in calculations of uncertainty val-ues for species in Table 5–1 from uncertainty values in Table 5–2. However, for those species the effects are less than 2% of the stated uncertainties.
The selected thermal functions of the heat capacities, listed in Table 5–3, refer to the relation:
2 1 2,m ( ) = pC T a b T c T d T e T− −+ ⋅ + ⋅ + ⋅ + ⋅ (5.1)

5 Selected plutonium data
98
No references are given in these tables since the selected data are generally not directly attributable to a specific published source. A detailed discussion of the selection procedure is presented in [2001LEM/FUG] and in Chapter 11 of this volume.
5.2 Precautions to be observed in the use of the tables Geochemical modelling in aquatic systems requires the careful use of the data selected in the NEA TDB reviews. The data in the tables of selected data must not be adopted without taking into account the chemical background information discussed in the cor-responding sections of this book. In particular the following precautions should be ob-served when using data from the Tables.
• The addition of any aqueous species and its data to this internally consistent database can result in a modified data set which is no longer rigorous and can lead to erroneous results. The situation is similar, to a lesser degree, with the addition of gases and solids. It should also be noted that the data set presented in this chapter may not be “complete” for all the conceivable systems and con-ditions. Gaps are pointed out in both the previous NEA TDB review and the present update.
• Solubility data for crystalline phases are well defined in the initial state, but not necessarily in the final state after “equilibrium” has been attained. Hence, the solubility calculated from these phases may be very misleading, as discussed for the solubility data of MO2(cr), M = U, Np, Pu.
• The selected thermodynamic data in [92GRE/FUG], [95SIL/BID] and [2001LEM/FUG] contain thermodynamic data for amorphous phases. Most of these refer to Gibbs energy of formation deduced from solubility measure-ments. In the present review all such data have been removed. However, the corresponding log10K values have been retained. The reasons for these changes are:
o Thermodynamic data are only meaningful if they refer to well–defined systems; this is not the case for amorphous phases. It is well known that their solubility may change with time, due to re–crystallisation with a resulting change in water content and surface area/crystal size; the time scale for these changes can vary widely. These kinetic phenomena are different from those encountered in sys-tems where there is a very high activation barrier for the reaction, e.g., electron exchange between sulphate and sulphide.
o The solubility of amorphous phases provides useful information for users of the database when modelling the behaviour of complex sys-tems. Therefore, the solubility products have been given with the pro-viso that they are not thermodynamic quantities.

5 Selected plutonium data
99
Table 5–1: Selected thermodynamic data for plutonium compounds and complexes. All ionic species listed in this table are aqueous species. Unless noted otherwise, all data refer to the reference temperature of 298.15 K and to the standard state, i.e., a pressure of 0.1 MPa and, for aqueous species, infinite dilution (I = 0). The uncertainties listed below each value represent total uncertainties and correspond in principle to the statisti-cally defined 95% confidence interval. Values obtained from internal calculation, cf. footnotes (a) and (b), are rounded at the third digit after the decimal point and may therefore not be exactly identical to those given in Part III. Systematically, all the values are presented with three digits after the decimal point, regardless of the significance of these digits. The data presented in this table are available on computer media from the OECD Nuclear Energy Agency.
f mGο∆ f mH ο∆ mS ο,mpCο
Compound (kJ · mol–1) (kJ · mol–1) (J · K–1 · mol–1) (J · K–1 · mol–1)
Pu(cr) 0.000 0.000 54.460±0.800
31.490±0.400
(c)
β–Pu (d)
δ–Pu (d)
δ'–Pu (d)
γ–Pu (d)
ε–Pu (d)
Pu(g) 312.415±3.009
(a) 349.000±3.000
(b) 177.167±0.005
20.854±0.010
(c)
Pu3+ –578.984±2.688
–591.790±1.964
–184.510±6.154
(b)
Pu4+ –477.988±2.705
–539.895±3.103
–414.535±10.192
PuO1.61(bcc) –834.771±10.113
(a) –875.500±10.000
83.000±5.000
61.200±5.000
(c)
PuO2(cr) –998.113±1.031
(a) –1055.800±1.000
66.130±0.260
66.250±0.260
(c)
PuO2+ –852.646
±2.868 (b) –910.127
±8.920 (a) 1.480
±30.013 (b)
PuO22+ –762.353
±2.821 –822.036
±6.577 –71.246
±22.120
(Continued on next page)

5 Selected plutonium data
100
Table 5–1: (continued)
f mGο∆ f mH ο∆ mS ο,mpCο
Compound (kJ · mol–1) (kJ · mol–1) (J · K–1 · mol–1) (J · K–1 · mol–1)
Pu2O3(cr) –1580.375±10.013
(a) –1656.000±10.000
163.000±0.600
117.000±0.500
(c)
PuOH2+ –776.739±3.187
(b)
PuOH3+ –718.553±2.936
(b)
Pu(OH)22+ –955.693
±3.203 (b)
Pu(OH)3(cr) –1200.218±8.975
(b)
Pu(OH)3+ –1176.280
±3.542 (b)
PuO2OH(aq) ≥ –1034.247 (b)
PuO2OH+ –968.099±4.013
(b) –1079.866±16.378
(b) –12.680±55.786
(b)
PuO2(OH)2(aq) –1161.287±9.015
(b)
Pu(OH)4(aq) –1378.031±3.936
(b)
PuO2(OH)2. H2O(cr) –1442.380±6.368
(b) –1632.809±13.522
(a) 190.000±40.000
170.000±20.000
(PuO2)2(OH)22+ –1956.176
±8.026 (b)
PuF(g) –140.967±10.113
(a) –112.600±10.000
251.000±5.000
33.500±3.000
(c)
PuF3+ –809.970±2.850
(b) –866.145±3.859
(b) –228.573±12.753
(b)
PuF2(g) –626.151±6.704
(a) –614.300±6.000
297.000±10.000
51.500±5.000
(c)
PuF22+ –1130.651
±3.246 (b) –1199.595
±6.026 (b) –104.666
±20.058 (b)
PuF3(cr) –1517.369±3.709
(a) –1586.700±3.700
126.110±0.360
92.640±0.280
(c)
PuF3(g) –1161.081±4.758
(a) –1167.800±3.700
(b) 336.110±10.000
72.240±5.000
(c)
(Continued on next page)

5 Selected plutonium data
101
Table 5–1: (continued)
f mGο∆ f mH ο∆ mS ο,mpCο
Compound (kJ · mol–1) (kJ · mol–1) (J · K–1 · mol–1) (J · K–1 · mol–1)
PuF4(cr) –1756.741±20.002
(a) –1850.000±20.000
147.250±0.370
116.190±0.290
PuF4(g) –1517.874±22.202
(a) –1548.000±22.000
(b) 359.000±10.000
92.400±5.000
(c)
PuF6(cr) –1729.856±20.174
(a) –1861.350±20.170
(b) 221.800±1.100
168.100±2.000
(c)
PuF6(g) –1725.064±20.104
(a) –1812.700±20.100
(b) 368.900±1.000
129.320±1.000
(c)
PuOF(cr) –1091.571±20.222
(a) –1140.000±20.000
96.000±10.000
69.400±10.000
(c)
PuO2F+ –1069.905±3.121
(b)
PuO2F2(aq) –1366.783±4.059
(b)
PuCl2+ –717.051±2.923
(b)
PuCl3+ –619.480±3.204
(b)
PuCl3(cr) –891.806±2.024
(a) –959.600±1.800
161.700±3.000
101.200±4.000
(c)
PuCl3(g) –641.299±3.598
(a) –647.400±1.868
(b) 368.620±10.000
78.470±5.000
(c)
PuCl4(cr) –879.368±5.826
(a) –968.700±5.000
201.000±10.000
121.400±4.000
PuCl4(g) –764.683±10.438
(a) –792.000±10.000
(b) 409.000±10.000
103.400±5.000
(c)
PuOCl(cr) –882.409±1.936
(a) –931.000±1.700
105.600±3.000
(b) 71.600±4.000
(c)
PuO2Cl+ –894.883±2.829
(b)
PuO2Cl2(aq) –1018.224±3.308
(b)
PuCl3. 6 H2O(cr) –2365.347±2.586
(a) –2773.400±2.100
420.000±5.000
PuBr3+ –590.971±3.206
(b)
(Continued on next page)

5 Selected plutonium data
102
Table 5–1: (continued)
f mGο∆ f mH ο∆ mS ο,mpCο
Compound (kJ · mol–1) (kJ · mol–1) (J · K–1 · mol–1) (J · K–1 · mol–1)
PuBr3(cr) –767.324±2.697
(a) –792.600±2.000
198.000±6.000
101.800±6.000
(c)
PuBr3(g) –529.808±15.655
(a) –488.000±15.000
(b) 423.000±15.000
(b) 81.600±10.000
(c)
PuOBr(cr) –838.354±8.541
(a) –870.000±8.000
(b) 127.000±10.000
(b) 73.000±8.000
(c)
PuI2+ –636.987±3.529
(b)
PuI3(cr) –579.000±4.551
(a) –579.200±2.800
228.000±12.000
110.000±8.000
(c)
PuI3(g) –366.517±15.655
(a) –305.000±15.000
435.000±15.000
82.000±5.000
(c)
PuOI(cr) –776.626±20.495
(a) –802.000±20.000
130.000±15.000
75.600±10.000
(c)
PuSO4+ –1345.315
±4.599 (b) –1483.890
±2.976 (b) –33.301
±15.108 (b)
PuSO42+ –1261.329
±3.270 (b)
PuO2SO4(aq) –1525.650±3.072
(b) –1715.276±6.616
(b) 65.963±22.543
(b)
Pu(SO4)2(aq) –2029.601±4.225
(b)
Pu(SO4)2 – –2099.545
±5.766 (b) –2398.590
±16.244 (b) 1.520
±56.262 (b)
PuO2(SO4)22– –2275.477
±3.156 (b) –2597.716
±11.176 (b) 194.214
±37.627 (b)
PuSe(cr) 92.100±1.800
59.700±1.200
PuTe(cr) 107.900±4.300
73.100±2.900
PuN(cr) –273.719±2.551
(a) –299.200±2.500
64.800±1.500
49.600±1.000
PuNO33+ –599.913
±2.868 (b)
PuO2(NO3)2. 6H2O(cr) –2393.300±3.200
(Continued on next page)

5 Selected plutonium data
103
Table 5–1: (continued)
f mGο∆ f mH ο∆ mS ο,mpCο
Compound (kJ · mol–1) (kJ · mol–1) (J · K–1 · mol–1) (J · K–1 · mol–1)
PuP(cr) –313.757±21.078
(a) –318.000±21.000
81.320±6.000
50.200±4.000
PuPO4(s, hyd) –1744.893±5.528
(b)
PuH3PO44+ –1641.055
±3.569 (b)
PuAs(cr) –241.413±20.111
(a) –240.000±20.000
94.300±7.000
51.600±4.000
PuSb(cr) –152.063±20.126
(a) –150.000±20.000
106.900±7.500
52.800±3.500
PuBi(cr) –119.624±20.223
(a) –117.000±20.000
120.000±10.000
PuBi2(cr) –124.527±22.395
(a) –126.000±22.000
163.000±14.000
PuC0.84(cr) –49.827±8.028
(a) –45.200±8.000
74.800±2.100
47.100±1.000
(c)
Pu3C2(cr) –123.477±30.046
(a) –113.000±30.000
210.000±5.000
136.800±2.500
(c)
Pu2C3(cr) –156.514±16.729
(a) –149.400±16.700
150.000±2.900
114.000±0.400
(c)
PuO2CO3(aq) –1344.479±4.032
(b)
PuO2CO3(s) –1373.876±3.912
(b)
PuO2CO3 – –1409.771
±3.002 (b)
PuO2(CO3)22– –1902.061
±4.088 (b) –2199.496
±7.714 (b) 19.625
±27.657 (b)
PuO2(CO3)34– –2448.797
±4.180 (b) –2886.326
±6.915 (b) –6.103
±25.198 (b)
PuO2(CO3)35– –2465.031
±6.096 (b) –2954.927
±12.344 (b) –116.406
±45.084 (b)
Pu(CO3)44– –2800.785
±7.013 (b)
Pu(CO3)56– –3320.979
±7.261 (b)
(Continued on next page)

5 Selected plutonium data
104
Table 5–1: (continued)
f mGο∆ f mH ο∆ mS ο,mpCο
Compound (kJ · mol–1) (kJ · mol–1) (J · K–1 · mol–1) (J · K–1 · mol–1)
PuSCN2+ –493.704±5.333
(b) –515.390±5.988
(b) –15.355±26.906
(a)
Sr3PuO6(cr) –3042.100±7.900
BaPuO3(cr) –1654.200±8.300
Ba3PuO6(cr) –2997.000±10.000
Ba2MgPuO6(cr) –2995.800±8.800
Ba2CaPuO6(cr) –3067.500±8.900
Ba2SrPuO6(cr) –3023.300±9.000
Cs2PuCl6(cr) –1838.243±6.717
(a) –1982.000±5.000
412.000±15.000
Cs3PuCl6(cr) –2208.045±9.491
(b) –2364.415±9.040
(b) 454.925±10.959
(b) 258.600±10.000
(c)
CsPu2Cl7(cr) –2235.119±5.284
(b) –2399.380±5.734
(b) 424.000±7.281
(b) 254.900±10.000
(c)
Cs2PuBr6(cr) –1634.326±6.150
(a) –1697.400±4.200
470.000±15.000
Cs2NaPuCl6(cr) –2143.496±5.184
(a) –2294.200±2.600
440.000±15.000
(a) Value calculated internally with the Gibbs–Helmholtz equation, f m f m m,ii
G H T Sο ο ο∆ = ∆ − ∑ . (b) Value calculated internally from reaction data (see Table 5–2). (c) Temperature coefficients of this function are listed in Table 5–3 . (d) A temperature function for the heat capacity is given in Table 5–3.
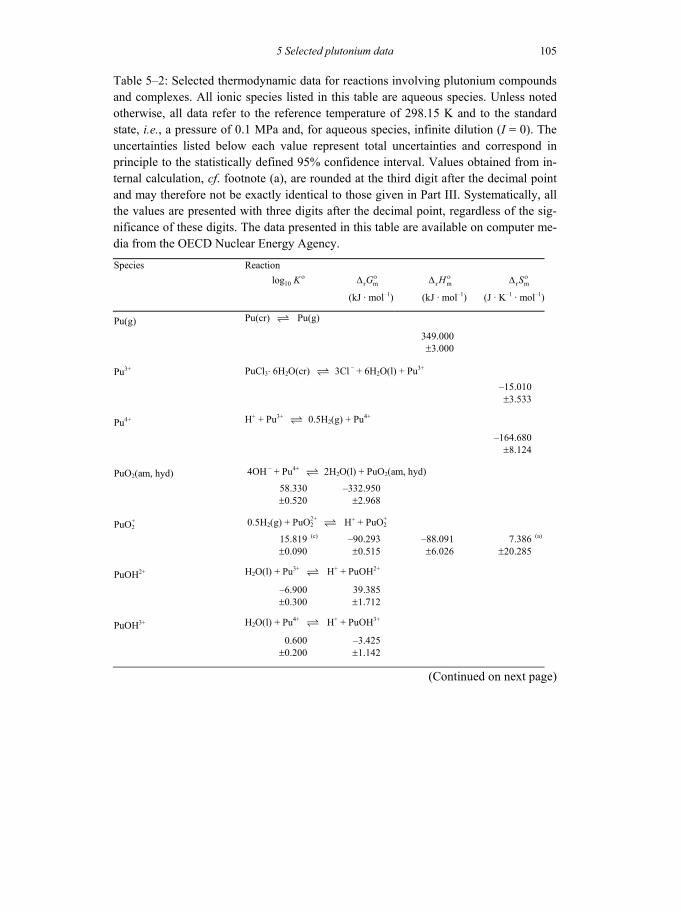
5 Selected plutonium data
105
Table 5–2: Selected thermodynamic data for reactions involving plutonium compounds and complexes. All ionic species listed in this table are aqueous species. Unless noted otherwise, all data refer to the reference temperature of 298.15 K and to the standard state, i.e., a pressure of 0.1 MPa and, for aqueous species, infinite dilution (I = 0). The uncertainties listed below each value represent total uncertainties and correspond in principle to the statistically defined 95% confidence interval. Values obtained from in-ternal calculation, cf. footnote (a), are rounded at the third digit after the decimal point and may therefore not be exactly identical to those given in Part III. Systematically, all the values are presented with three digits after the decimal point, regardless of the sig-nificance of these digits. The data presented in this table are available on computer me-dia from the OECD Nuclear Energy Agency.
Species Reaction
10log K οr mGο∆ r mH ο∆ r mSο∆
(kJ · mol–1) (kJ · mol–1) (J · K–1 · mol–1)
Pu(g) Pu(cr) Pu(g)
349.000±3.000
Pu3+ PuCl3. 6H2O(cr) 3Cl – + 6H2O(l) + Pu3+ –15.010
±3.533
Pu4+ H+ + Pu3+ 0.5H2(g) + Pu4+
–164.680±8.124
PuO2(am, hyd) 4OH – + Pu4+ 2H2O(l) + PuO2(am, hyd)
58.330±0.520
–332.950±2.968
PuO2+ 0.5H2(g) + PuO2
2+ H+ + PuO2+
15.819±0.090
(c) –90.293±0.515
–88.091±6.026
7.386±20.285
(a)
PuOH2+ H2O(l) + Pu3+ H+ + PuOH2+
–6.900±0.300
39.385±1.712
PuOH3+ H2O(l) + Pu4+ H+ + PuOH3+
0.600±0.200
–3.425±1.142
(Continued on next page)

5 Selected plutonium data
106
Table 5–2: (continued)
Species Reaction
10log K οr mGο∆ r mH ο∆ r mSο∆
(kJ · mol–1) (kJ · mol–1) (J · K–1 · mol–1)
Pu(OH)22+ 2H2O(l) + Pu4+ 2H+ + Pu(OH)2
2+
0.600±0.300
–3.425±1.712
Pu(OH)3(cr) 3H2O(l) + Pu3+ 3H+ + Pu(OH)3(cr)
–15.800±1.500
90.187±8.562
Pu(OH)3+ 3H2O(l) + Pu4+ 3H+ + Pu(OH)3
+
–2.300±0.400
13.128±2.283
PuO2OH(am) H2O(l) + PuO2+ H+ + PuO2OH(am)
–5.000±0.500
28.540±2.854
PuO2OH(aq) H2O(l) + PuO2+ H+ + PuO2OH(aq)
≤ –9.730 ≥ 55.539
PuO2OH+ H2O(l) + PuO22+ H+ + PuO2OH+
–5.500±0.500
31.394±2.854
28.000±15.000
–11.384±51.213
(a)
PuO2(OH)2(aq) 2H2O(l) + PuO22+ 2H+ + PuO2(OH)2(aq)
–13.200±1.500
75.346±8.562
Pu(OH)4(aq) 4H2O(l) + Pu4+ 4H+ + Pu(OH)4(aq)
–8.500±0.500
48.518±2.854
PuO2(OH)2. H2O(cr) 3H2O(l) + PuO22+ 2H+ + PuO2(OH)2. H2O(cr)
–5.500±1.000
31.394±5.708
(PuO2)2(OH)22+ 2H2O(l) + 2PuO2
2+ (PuO2)2(OH)22+ + 2H+
–7.500±1.000
42.810±5.708
PuF3+ F – + Pu4+ PuF3+
8.840±0.100
–50.459±0.571
9.100±2.200
199.762±7.623
(a)
(Continued on next page)

5 Selected plutonium data
107
Table 5–2: (continued)
Species Reaction
10log K οr mGο∆ r mH ο∆ r mSο∆
(kJ · mol–1) (kJ · mol–1) (J · K–1 · mol–1)
PuF22+ 2F – + Pu4+ PuF2
2+
15.700±0.200
–89.616±1.142
11.000±5.000
337.469±17.202
(a)
PuF3(g) PuF3(cr) PuF3(g)
418.900±0.500
PuF4(g) PuF4(cr) PuF4(g)
301.800±3.600
PuF6(cr) PuF6(g) PuF6(cr)
–48.650±1.000
PuF6(g) F2(g) + PuF4(cr) PuF6(g)
37.300±2.400
PuO2F+ F – + PuO22+ PuO2F+
4.560±0.200
–26.029±1.142
PuO2F2(aq) 2F – + PuO22+ PuO2F2(aq)
7.250±0.450
–41.383±2.569
PuCl3+ Cl – + Pu4+ PuCl3+
1.800±0.300
–10.274±1.712
PuCl3(g) PuCl3(cr) PuCl3(g)
312.200±0.500
PuCl4(g) 0.5Cl2(g) + PuCl3(cr) PuCl4(g)
167.600±1.000
PuOCl(cr) H2O(g) + PuCl3(cr) 2HCl(g) + PuOCl(cr)
128.710±0.490
(Continued on next page)

5 Selected plutonium data
108
Table 5–2: (continued)
Species Reaction
10log K οr mGο∆ r mH ο∆ r mSο∆
(kJ · mol–1) (kJ · mol–1) (J · K–1 · mol–1)
PuO2Cl+ Cl – + PuO22+ PuO2Cl+
0.230±0.030
–1.313±0.171
PuO2Cl2(aq) 2Cl – + PuO22+ PuO2Cl2(aq)
–1.150±0.300
6.564±1.712
PuBr3+ Br – + Pu4+ PuBr3+
1.600±0.300
–9.133±1.712
PuBr3(g) PuBr3(cr) PuBr3(g)
–41.565±2.728
(c) 237.257±15.570
(a) 304.400±15.000
225.200±14.000
PuOBr(cr) H2O(g) + PuBr3(cr) 2HBr(g) + PuOBr(cr)
–8.893±0.914
(c) 50.764±5.218
(a) 91.700±5.000
137.300±5.000
PuI2+ I – + Pu3+ PuI2+
1.100±0.400
–6.279±2.283
PuSO4+ HSO4
– + Pu3+ H+ + PuSO4+
1.930±0.610
–11.017±3.482
–5.200±2.000
19.509±13.468
(a)
PuSO42+ HSO4
– + Pu4+ H+ + PuSO42+
4.910±0.220
–28.026±1.256
PuO2SO4(aq) PuO22+ + SO4
2– PuO2SO4(aq)
3.380±0.200
–19.293±1.142
16.100±0.600
118.709±4.326
(a)
Pu(SO4)2(aq) 2HSO4 – + Pu4+ 2H+ + Pu(SO4)2(aq)
7.180±0.320
–40.984±1.827
Pu(SO4)2 – 2HSO4
– + Pu3+ 2H+ + Pu(SO4)2 –
1.740±0.760
–9.932±4.338
–33.000±16.000
–77.370±55.602
(a)
(Continued on next page)

5 Selected plutonium data
109
Table 5–2: (continued)
Species Reaction
10log K οr mGο∆ r mH ο∆ r mSο∆
(kJ · mol–1) (kJ · mol–1) (J · K–1 · mol–1)
PuO2(SO4)22– PuO2
2+ + 2SO42– PuO2(SO4)2
2–
4.400±0.200
–25.115±1.142
43.000±9.000
228.460±30.428
(a)
PuNO33+ NO3
– + Pu4+ PuNO33+
1.950±0.150
–11.131±0.856
PuPO4(s, hyd) PO43– + Pu3+ PuPO4(s, hyd)
24.600±0.800
–140.418±4.566
PuH3PO44+ H3PO4(aq) + Pu4+ PuH3PO4
4+
2.400±0.300
–13.699±1.712
Pu(HPO4)2(am, hyd) 2HPO42– + Pu4+ Pu(HPO4)2(am, hyd)
30.450±0.510
–173.810±2.911
PuO2CO3(aq) CO32– + PuO2
2+ PuO2CO3(aq)
9.500±0.500
–54.226±2.854
PuO2CO3(s) CO32– + PuO2
2+ PuO2CO3(s)
14.650±0.470
–83.623±2.683
PuO2CO3 – CO3
2– + PuO2+ PuO2CO3
–
5.120±0.140
–29.225±0.799
PuO2(CO3)22– 2CO3
2– + PuO22+ PuO2(CO3)2
2–
14.700±0.500
–83.908±2.854
–27.000±4.000
190.871±16.481
(a)
PuO2(CO3)34– 3CO3
2– + PuO22+ PuO2(CO3)3
4–
18.000±0.500
–102.745±2.854
–38.600±2.000
215.143±11.689
(a)
PuO2(CO3)35– 3CO3
2– + PuO2+ PuO2(CO3)3
5–
5.025±0.920
(c) –28.685±5.250
–19.110±8.500
32.115±33.509
(a)
(Continued on next page)

5 Selected plutonium data
110
Table 5–2: (continued)
Species Reaction
10log K οr mGο∆ r mH ο∆ r mSο∆
(kJ · mol–1) (kJ · mol–1) (J · K–1 · mol–1)
Pu(CO3)44– 4CO3
2– + Pu4+ Pu(CO3)44–
37.000±1.100
–211.198±6.279
Pu(CO3)56– 5CO3
2– + Pu4+ Pu(CO3)56–
35.650±1.130
–203.492±6.450
PuSCN2+ Pu3+ + SCN – PuSCN2+
1.300±0.400
–7.420±2.283
0.000±4.000
24.888±15.448
(a)
Cs3PuCl6(cr) CsCl(cr) + 0.2CsPu2Cl7(cr) 0.4Cs3PuCl6(cr)
3.922±0.638
(c) –22.387±3.640
(a) –23.580±3.426
–4.000±4.130
CsPu2Cl7(cr) CsCl(cr) + 2PuCl3(cr) CsPu2Cl7(cr)
6.605±0.594
(c) –37.700±3.390
(a) –37.870±3.160
–0.570±4.120
(a) Value calculated internally with the Gibbs–Helmholtz equation, r m r m r mG H T Sο ο ο∆ = ∆ − ∆ .
(b) Value calculated from a selected standard potential.
(c) Value of 10log K ο calculated internally from r mGο∆ .

5 Selected plutonium data
111
Table 5–3: Selected temperature coefficients for heat capacities marked with (c) in Table 5–1, according to the form 2 2
,m ( )pC T a bT cT eT −= + + + . The functions are valid be-tween the temperatures Tmin and Tmax (in K). The notation E±nn indicates the power of 10. for ,mpC units are J · K–1 · mol–1.
Compound a b c e T min T max Pu(cr) 1.81260E+01 4.48200E–02 0 0 298 398β–Pu 2.74160E+01 1.30600E–02 0 0 398 488δ–Pu 2.84780E+01 1.08070E–02 0 0 593 736δ'–Pu 3.55600E+01 0 0 0 736 756γ–Pu 2.20230E+01 2.29590E–02 0 0 488 593ε–Pu 3.37200E+01 0 0 0 756 913Pu(g) 2.05200E+01 –9.39140E–03 2.57550E–05 7.51200E+04 298 500 4.59200E+00 3.31521E–02 –5.64466E–06 7.01590E+05 500 1100 –9.58800E+00 4.60885E–02 –8.63248E–06 5.01446E+05 1100 2000PuO1.61(bcc) 6.59100E+01 1.38500E–02 0 –8.75700E+05 298 2300PuO2(cr) 8.44950E+01 1.06390E–02 –6.11360E–07 –1.90060E+06 298 2500Pu2O3(cr) 1.69470E+02 –7.99800E–02 0 –2.54590E+06 298 350 1.22953E+02 2.85480E–02 0 –1.50120E+05 350 2358PuF(g) 3.66410E+01 9.20600E–04 –1.44430E–07 –3.02540E+05 298 3000PuF2(g) 5.73100E+01 7.27000E–04 –1.47210E–07 –5.38960E+05 298 3000PuF3(cr) 1.04080E+02 7.07000E–04 0 –1.03550E+06 298 1700PuF3(g) 7.92670E+01 5.60920E–03 –2.20240E–06 –7.55940E+05 298 1300PuF4(g) 1.05110E+02 2.84120E–03 –6.88730E–07 –1.19680E+06 298 2400PuF6(cr) 7.23480E+01 3.21300E–01 0 0 298 325PuF6(g) 1.43990E+02 2.32110E–02 –1.07640E–05 –1.83430E+06 298 1000PuOF(cr) 7.20000E+01 1.60000E–02 –3.30000E–06 –6.20000E+05 298 1500PuCl3(cr) 9.13500E+01 2.40000E–02 0 2.40000E+05 298 1041PuCl3(g) 7.71030E+01 1.29970E–02 –4.31250E–06 –1.88730E+05 298 1100PuCl4(g) 1.10430E+02 4.08180E–03 –9.76160E–07 –7.23430E+05 298 3000PuOCl(cr) 7.30300E+01 1.71000E–02 0 –5.83000E+05 298 1100PuBr3(cr) 1.04500E+02 1.50000E–02 0 –6.38000E+05 298 935PuBr3(g) 8.31350E+01 3.90000E–06 0 –1.38320E+05 298 1500PuOBr(cr) 7.37000E+01 1.70000E–02 0 –5.15000E+05 298 1100PuI3(cr) 1.04000E+02 2.00000E–02 0 0 298 930PuI3(g) 8.31500E+01 1.40000E–06 0 –1.00000E+05 298 1500PuOI(cr) 6.70000E+01 3.57000E–02 –1.20000E–05 –9.00000E+04 298 1000PuC0.84(cr) 7.15910E+01 –5.95040E–02 4.94350E–05 –9.93200E+05 298 1875Pu3C2(cr) 1.20670E+02 4.68600E–02 0 1.94560E+05 298 850Pu2C3(cr) 1.56000E+02 –7.98730E–02 7.04170E–05 –2.17570E+06 298 2285Cs3PuCl6(cr) 2.56600E+02 3.46000E–02 0 –7.40000E+05 298 900CsPu2Cl7(cr) 2.37800E+02 5.15000E–02 0 1.55000E+05 298 900

113
Chapter 6
6 Selected Data for Americium
6.1 General considerations This chapter presents updated chemical thermodynamic data for americium species, as described in detail in Chapter 12 of this volume. The newly selected data represent revi-sions to those chosen in the previous NEA TDB review [95SIL/BID]. In this respect, it will be found that while new species appear in the Tables, some others have been re-moved from them. Table 6–1 contains the recommended thermodynamic data of the americium compounds and complexes, Table 6–2 the recommended thermodynamic data of chemical equilibrium reactions by which the americium compounds and com-plexes are formed, and Table 6–3 the temperature coefficients of the heat capacity data of Table 6–1 where available.
The species and reactions in Table 6–1, Table 6–2 and Table 6–3 appear in standard order of arrangement (cf. Figure 2.1). Table 6–2 contains information only on those reactions for which primary data selections are made in this review. These se-lected reaction data are used, together with data for key americium species (for example Am3+) and auxiliary data listed in Table 8–1, to derive the corresponding formation quantities in Table 6–1. The uncertainties associated with values for the key americium species and for some of the auxiliary data are substantial, leading to comparatively large uncertainties in the formation quantities derived in this manner. The inclusion of a table for reaction data (Table 6–2) in this report allows the use of equilibrium constants with total uncertainties that are directly based on the experimental accuracies. This is the main reason for including both the table for reaction data (Table 6–2) and the table of
f m f m m, ,G H Sο ο ο∆ ∆ and ,mpCο values (Table 6–1). In a few cases, the correlation of small uncertainties in values for ligands has been neglected in calculations of uncertainty val-ues for species in Table 6–1 from uncertainty values in Table 6–2. However, for those species the effects are less than 2% of the stated uncertainties.
The selected thermal functions of the heat capacities, listed in Table 6–3, refer to the relation:
2 1 2,m ( ) = pC T a b T c T d T e T− −+ ⋅ + ⋅ + ⋅ + ⋅ (6.1)

6 Selected americium data
114
No references are given in these tables since the selected data are generally not directly attributable to a specific published source. A detailed discussion of the selection procedure is presented in [95SIL/BID] and in Chapter 12 of this volume.
6.2 Precautions to be observed in the use of the tables Geochemical modelling in aquatic systems requires the careful use of the data selected in the NEA TDB reviews. The data in the tables of selected data must not be adopted without taking into account the chemical background information discussed in the cor-responding sections of this book. In particular the following precautions should be ob-served when using data from the Tables.
• The addition of any aqueous species and its data to this internally consistent database can result in a modified data set which is no longer rigorous and can lead to erroneous results. The situation is similar, to a lesser degree, with the addition of gases and solids. It should also be noted that the data set presented in this chapter may not be “complete” for all the conceivable systems and con-ditions. Gaps are pointed out in both the previous NEA TDB review and the present update.
• Solubility data for crystalline phases are well defined in the initial state, but not necessarily in the final state after “equilibrium” has been attained. Hence, the solubility calculated from these phases may be very misleading, as discussed for the solubility data of MO2(cr), M = U, Np, Pu.
• The selected thermodynamic data in [92GRE/FUG], [95SIL/BID] and [2001LEM/FUG] contain thermodynamic data for amorphous phases. Most of these refer to Gibbs energy of formation deduced from solubility measure-ments. In the present review all such data have been removed. However, the corresponding log10K values have been retained. The reasons for these changes are:
o Thermodynamic data are only meaningful if they refer to well–defined systems; this is not the case for amorphous phases. It is well known that their solubility may change with time, due to re–crystallisation with a resulting change in water content and surface area/crystal size; the time scale for these changes can vary widely. These kinetic phenomena are different from those encountered in sys-tems where there is a very high activation barrier for the reaction, e.g., electron exchange between sulphate and sulphide.
o The solubility of amorphous phases provides useful information for users of the database when modelling the behaviour of complex sys-tems. Therefore the solubility products have been given, however with the proviso that they are not thermodynamic quantities.

6 Selected americium data
115
Table 6–1: Selected thermodynamic data for americium compounds and complexes. All ionic species listed in this table are aqueous species. Unless noted otherwise, all data refer to the reference temperature of 298.15 K and to the standard state, i.e., a pressure of 0.1 MPa and, for aqueous species, infinite dilution (I = 0). The uncertainties listed below each value represent total uncertainties and correspond in principle to the statisti-cally defined 95% confidence interval. Values obtained from internal calculation, cf. footnotes (a) and (b), are rounded at the third digit after the decimal point and may therefore not be exactly identical to those given in Part III. Systematically, all the values are presented with three digits after the decimal point, regardless of the significance of these digits. The data presented in this table are available on computer media from the OECD Nuclear Energy Agency.
f mGο∆ f mH ο∆ mS ο,mpCο
Compound (kJ · mol–1) (kJ · mol–1) (J · K–1 · mol–1) (J · K–1 · mol–1)
Am(cr) 0.000 0.000 55.400±2.000
25.500±1.500
(c)
β–Am (d)
γ–Am (d)
Am(l) (d)
Am(g) 242.312±1.614
(a) 283.800±1.500
194.550±0.050
20.786±0.010
(c)
Am2+ –376.780±15.236
(b) –354.633±15.890
(a) –1.000±15.000
Am3+ –598.698±4.755
(a) –616.700±1.500
–201.000±15.000
Am4+ –346.358±8.692
(a) –406.000±6.000
–406.000±21.000
AmO2(cr) –877.683±4.271
(a) –932.200±3.000
77.700±10.000
66.170±10.000
(c)
AmO2+ –739.796
±6.208 (a) –804.260
±5.413 (b) –21.000
±10.000
AmO22+ –585.801
±5.715 (a) –650.760
±4.839 (b) –88.000
±10.000
Am2O3(cr) –1605.449±8.284
(a) –1690.400±8.000
133.600±6.000
117.500±15.000
(c)
AmH2(cr) –134.661±15.055
(a) –175.800±15.000
48.100±3.800
38.200±2.500
(c)
(Continued on next page)

6 Selected americium data
116
Table 6–1: (continued)
f mGο∆ f mH ο∆ mS ο,mpCο
Compound (kJ · mol–1) (kJ · mol–1) (J · K–1 · mol–1) (J · K–1 · mol–1)
AmOH2+ –794.740±5.546
(b)
Am(OH)2+ –986.787
±6.211 (b)
Am(OH)3(aq) –1160.568±5.547
(b)
Am(OH)3(cr) –1221.073±5.861
(b) –1353.198±6.356
(a) 116.000±8.000
AmF2+ –899.628±5.320
(b)
AmF2+ –1194.851
±5.082 (b)
AmF3(cr) –1519.765±14.126
(a) –1594.000±14.000
110.600±6.000
AmF3(g) –1147.798±16.771
(a) –1156.500±16.589
(b) 330.400±8.000
72.200±5.000
AmF4(cr) –1632.503±17.177
(a) –1724.000±17.000
154.100±8.000
AmCl2+ –731.285±4.759
(b)
AmCl2+ –856.908
±4.769 (b)
AmCl3(cr) –905.105±2.290
(a) –977.800±1.300
146.200±6.000
103.000±10.000
AmOCl(cr) –897.052±6.726
(a) –949.800±6.000
(b) 92.600±10.000
(b) 70.400±10.000
(c)
AmBr3(cr) –773.674±6.728
(a) –804.000±6.000
182.000±10.000
AmOBr(cr) –848.485±9.794
(a) –887.000±9.000
(b) 104.900±12.800
(b)
AmI3(cr) –609.451±10.068
(a) –615.000±9.000
211.000±15.000
AmS(cr) 92.000±12.000
AmSO4+ –1361.538
±4.849 (b)
(Continued on next page)
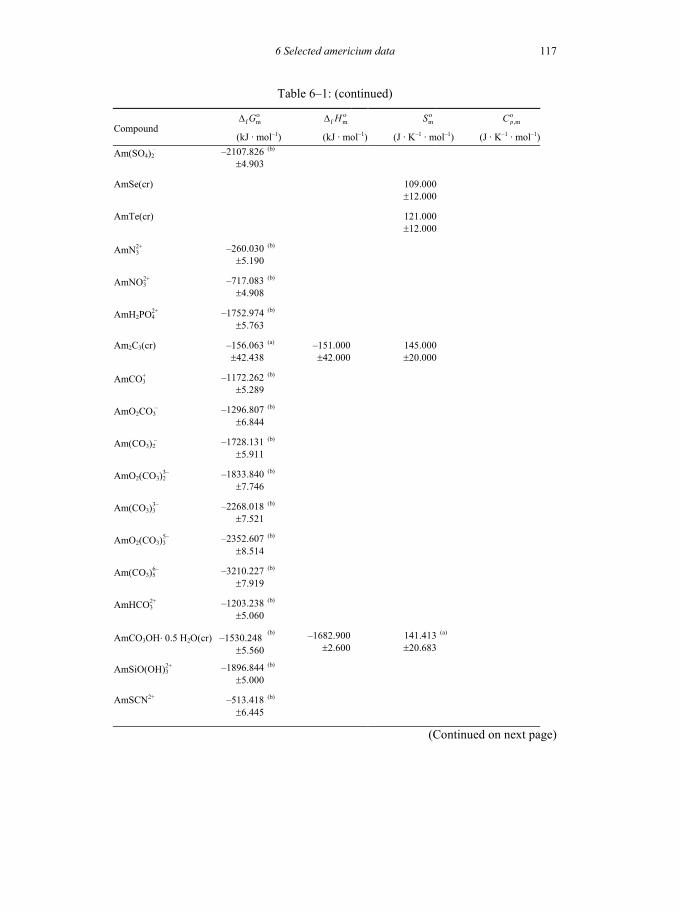
6 Selected americium data
117
Table 6–1: (continued)
f mGο∆ f mH ο∆ mS ο,mpCο
Compound (kJ · mol–1) (kJ · mol–1) (J · K–1 · mol–1) (J · K–1 · mol–1)
Am(SO4)2 – –2107.826
±4.903 (b)
AmSe(cr) 109.000±12.000
AmTe(cr) 121.000±12.000
AmN32+ –260.030
±5.190 (b)
AmNO32+ –717.083
±4.908 (b)
AmH2PO42+ –1752.974
±5.763 (b)
Am2C3(cr) –156.063±42.438
(a) –151.000±42.000
145.000±20.000
AmCO3+ –1172.262
±5.289 (b)
AmO2CO3 – –1296.807
±6.844 (b)
Am(CO3)2 – –1728.131
±5.911 (b)
AmO2(CO3)23– –1833.840
±7.746 (b)
Am(CO3)33– –2268.018
±7.521 (b)
AmO2(CO3)35– –2352.607
±8.514 (b)
Am(CO3)56– –3210.227
±7.919 (b)
AmHCO32+ –1203.238
±5.060 (b)
AmCO3OH. 0.5 H2O(cr) –1530.248±5.560
(b) –1682.900±2.600
141.413±20.683
(a)
AmSiO(OH)32+ –1896.844
±5.000 (b)
AmSCN2+ –513.418±6.445
(b)
(Continued on next page)

6 Selected americium data
118
Table 6–1: (continued)
f mGο∆ f mH ο∆ mS ο,mpCο
Compound (kJ · mol–1) (kJ · mol–1) (J · K–1 · mol–1) (J · K–1 · mol–1)
SrAmO3(cr) –1539.000±4.100
BaAmO3(cr) –1544.600±3.400
NaAmO2CO3(s) –1591.867±6.627
(b)
NaAm(CO3)2. 5H2O(cr) –3222.021±5.605
(b)
Cs2NaAmCl6(cr) –2159.151±4.864
(a) –2315.800±1.800
421.000±15.000
260.000±15.000
(a) Value calculated internally with the Gibbs–Helmholtz equation, f m f m m,ii
G H T Sο ο ο∆ = ∆ − ∑ . (b) Value calculated internally from reaction data (see Table 6–2). (c) Temperature coefficients of this function are listed in Table 6–3. (d) A temperature function for the heat capacity is given in Table 6–3.

6 Selected americium data
119
Table 6–2: Selected thermodynamic data for reactions involving americium compounds and complexes. All ionic species listed in this table are aqueous species. Unless noted otherwise, all data refer to the reference temperature of 298.15 K and to the standard state, i.e., a pressure of 0.1 MPa and, for aqueous species, infinite dilution (I = 0). The uncertainties listed below each value represent total uncertainties and correspond in principle to the statistically defined 95% confidence interval. Values obtained from in-ternal calculation, cf. footnote (a), are rounded at the third digit after the decimal point and may therefore not be exactly identical to those given in Part III. Systematically, all the values are presented with three digits after the decimal point, regardless of the sig-nificance of these digits. The data presented in this table are available on computer me-dia from the OECD Nuclear Energy Agency.
Species Reaction
10log K οr mGο∆ r mH ο∆ r mSο∆
(kJ · mol–1) (kJ · mol–1) (J · K–1 · mol–1)
Am(g) Am(cr) Am(g)
283.800±1.500
Am2+ Am3+ + e – Am2+
–38.878±2.536
(b) 221.920±14.476
AmO2+ Am3+ + 2H2O(l) AmO2
+ + 4H+ + 2 e –
384.100±5.200
AmO22+ Am3+ + 2H2O(l) AmO2
2+ + 4H+ + 3 e –
537.600±4.600
AmOH2+ Am3+ + H2O(l) AmOH2+ + H+
–7.200±0.500
41.098±2.854
Am(OH)2+ Am3+ + 2H2O(l) Am(OH)2
+ + 2H+
–15.100±0.700
86.191±3.996
AmO2OH(am) AmO2+ + H2O(l) AmO2OH(am) + H+
–5.300±0.500
30.253±2.854
Am(OH)3(cr) Am3+ + 3H2O(l) Am(OH)3(cr) + 3H+
–15.600±0.600
89.045±3.425
(Continued on next page)

6 Selected americium data
120
Table 6–2: (continued)
Species Reaction
10log K οr mGο∆ r mH ο∆ r mSο∆
(kJ · mol–1) (kJ · mol–1) (J · K–1 · mol–1)
Am(OH)3(am) Am3+ + 3H2O(l) Am(OH)3(am) + 3H+
–16.900±0.800
96.466±4.566
Am(OH)3(aq) Am3+ + 3H2O(l) Am(OH)3(aq) + 3H+
–26.200±0.500
149.551±2.854
AmF2+ Am3+ + F – AmF2+
3.400±0.400
–19.407±2.283
AmF2+ Am3+ + 2F – AmF2
+
5.800±0.200
–33.107±1.142
AmF3(g) AmF3(cr) AmF3(g)
437.500±8.900
AmCl2+ Am3+ + Cl – AmCl2+
0.240±0.030
–1.370±0.171
AmCl2+ Am3+ + 2Cl – AmCl2
+
–0.740±0.050
4.224±0.285
AmOCl(cr) AmCl3(cr) + H2O(g) AmOCl(cr) + 2HCl(g)
–8.066±1.115
(c) 46.042±6.364
(a) 85.213±5.900
131.380±8.000
AmOBr(cr) AmBr3(cr) + H2O(g) AmOBr(cr) + 2HBr(g)
–8.246±2.661
(c) 47.070±15.188
(a) 86.256±15.000
131.430±8.000
AmSO4+ Am3+ + SO4
2– AmSO4+
3.300±0.150
–18.837±0.856
Am(SO4)2 – Am3+ + 2SO4
2– Am(SO4)2 –
3.700±0.150
–21.120±0.856
(Continued on next page)

6 Selected americium data
121
Table 6–2: (continued)
Species Reaction
10log K οr mGο∆ r mH ο∆ r mSο∆
(kJ · mol–1) (kJ · mol–1) (J · K–1 · mol–1)
AmN32+ Am3+ + N3
– AmN32+
1.670±0.100
–9.532±0.571
AmNO22+ Am3+ + NO2
– AmNO22+
2.100±0.200
–11.987±1.142
AmNO32+ Am3+ + NO3
– AmNO32+
1.330±0.200
–7.592±1.142
AmPO4(am, hyd) Am3+ + PO43– AmPO4(am, hyd)
24.790±0.600
–141.500±3.425
AmH2PO42+ Am3+ + H2PO4
– AmH2PO42+
3.000±0.500
–17.124±2.854
AmCO3+ Am3+ + CO3
2– AmCO3+
8.000±0.400
–45.664±2.283
AmO2CO3 – AmO2
+ + CO32– AmO2CO3
–
5.100±0.500
–29.111±2.854
Am(CO3)2 – Am3+ + 2CO3
2– Am(CO3)2 –
12.900±0.600
–73.634±3.425
AmO2(CO3)23– AmO2
+ + 2CO32– AmO2(CO3)2
3–
6.700±0.800
–38.244±4.566
Am(CO3)33– Am3+ + 3CO3
2– Am(CO3)33–
15.000±1.000
–85.621±5.708
Am2(CO3)3(am) 2Am3+ + 3CO32– Am2(CO3)3(am)
16.700±1.100
–95.324±6.279
(Continued on next page)

6 Selected americium data
122
Table 6–2: (continued)
Species Reaction
10log K οr mGο∆ r mH ο∆ r mSο∆
(kJ · mol–1) (kJ · mol–1) (J · K–1 · mol–1)
AmO2(CO3)35– AmO2
+ + 3CO32– AmO2(CO3)3
5–
5.100±1.000
–29.111±5.708
Am(CO3)56– Am(CO3)3
3– + 2CO32– Am(CO3)5
6– + e –
–20.100±0.900
(b) 114.730±5.137
AmHCO32+ Am3+ + HCO3
– AmHCO32+
3.100±0.300
–17.695±1.712
AmCO3OH. 0.5H2O(cr) Am3+ + CO32– + 0.5H2O(l) + OH – AmCO3OH. 0.5H2O(cr)
22.400±0.500
–127.860±2.854
AmCO3OH(am, hyd) Am3+ + CO32– + OH – AmCO3OH(am, hyd)
20.200±1.000
–115.302±5.708
AmSiO(OH)32+ Am3+ + Si(OH)4(aq) AmSiO(OH)3
2+ + H+
–1.680±0.180
9.590±1.027
AmSCN2+ Am3+ + SCN – AmSCN2+
1.300±0.300
–7.420±1.712
NaAmO2CO3(s) AmO2+ + CO3
2– + Na+ NaAmO2CO3(s)
10.900±0.400
–62.218±2.283
NaAm(CO3)2. 5H2O(cr) Am3+ + 2CO32– + 5H2O(l) + Na+ NaAm(CO3)2. 5H2O(cr)
21.000±0.500
–119.869±2.854
(a) Value calculated internally with the Gibbs–Helmholtz equation, r m r m r mG H T Sο ο ο∆ = ∆ − ∆ .
(b) Value calculated from a selected standard potential.
(c) Value of 10log K ο calculated internally from r mGο∆ .

6 Selected americium data
123
Table 6–3: Selected temperature coefficients for heat capacities marked with (c) in Table 6–1, according to the form 2 2
,m ( )pC T a bT cT eT −= + + + . The functions are valid be-tween the temperatures Tmin and Tmax (in K). The notation E±nn indicates the power of 10. ,mpC units are J · K–1 · mol–1.
Compound a b c e T min T max Am(cr) 2.11870E+01 1.11990E–02 3.24620E–06 6.08500E+04 298 1042β–Am 1.94410E+01 1.08360E–02 2.25140E–06 5.20870E+05 1042 1350γ–Am 3.97480E+01 0 0 0 1350 1449Am(l) 4.18400E+01 0 0 0 1449 3000Am(g) 2.07860E+01 0 0 0 298 1100AmO2(cr) 8.47390E+01 1.07200E–02 –8.15900E–07 –1.92580E+06 298 2000Am2O3(cr) 1.13930E+02 5.93700E–02 –2.30100E–05 –1.07100E+06 298 1000AmH2(cr) 2.48000E+01 4.50000E–02 0 0 298 1200AmF3(g) 8.16540E+01 1.20840E–03 –2.42780E–07 –8.67160E+05 298 3000AmOCl(cr) 6.12840E+01 4.58930E–02 –1.73070E–05 –2.69380E+05 298 1100


125
Chapter 7
7 Selected Data for Technetium
7.1 General considerations This chapter presents updated chemical thermodynamic data for technetium species, as described in detail in Chapter 13 of this volume. The newly selected data represent revi-sions to those chosen in the previous NEA TDB review [99RAR/RAN]. According to the discussion in Chapter 13 of this volume, this update has not resulted in any changes to the values selected there. However it should be noted that several typographical er-rors slipped into the selected value tables published in [99RAR/RAN]. For this reason, the tables reproduced here have been recalculated and all the entries in them are now in agreement with the discussions presented in [99RAR/RAN] and in this volume. Table 7–1 contains the recommended thermodynamic data of the technetium compounds and complexes, Table 7–2 the recommended thermodynamic data of chemical equilibrium reactions by which the technetium compounds and complexes are formed, and Table 7–3 the temperature coefficients of the heat capacity data of Table 7–1 where available.
The species and reactions in Table 7–1, Table 7–2 and Table 7–3 appear in standard order of arrangement (cf. Figure 2.1). Table 7–2 contains information only on those reactions for which primary data selections are made in this review. These se-lected reaction data are used, together with data for key technetium species (for example
4TcO− ) and auxiliary data listed in Table 8–1, to derive the corresponding formation quantities in Table 7–1. The uncertainties associated with values for the key technetium species and for some of the auxiliary data are substantial, leading to comparatively large uncertainties in the formation quantities derived in this manner. The inclusion of a table for reaction data (Table 7–2) in this report allows the use of equilibrium constants with total uncertainties that are directly based on the experimental accuracies. This is the main reason for including both the table for reaction data (Table 7–2) and the table of
f m f m m, ,G H Sο ο ο∆ ∆ and ,mpCο values (Table 7–1). In a few cases, the correlation of small uncertainties in values for ligands has been neglected in calculations of uncertainty val-ues for species in Table 7–3 from uncertainty values in Table 7–2. However, for those species the effects are less than 2% of the stated uncertainties.

7 Selected technetium data
126
The selected thermal functions of the heat capacities, listed in Table 7–3, refer to the relation:
2 1 2,m ( ) = pC T a b T c T d T e T− −+ ⋅ + ⋅ + ⋅ + ⋅ (7.1)
No references are given in these tables since the selected data are generally not directly attributable to a specific published source. A detailed discussion of the selection procedure is presented in [99RAR/RAN] and in Chapter 13 of this volume.
7.2 Precautions to be observed in the use of the tables Geochemical modelling in aquatic systems requires the careful use of the data selected in the NEA TDB reviews. The data in the tables of selected data must not be adopted without taking into account the chemical background information discussed in the cor-responding sections of this book. In particular the following precautions should be ob-served when using data from the Tables.
• The addition of any aqueous species and its data to this internally consistent database can result in a modified data set which is no longer rigorous and can lead to erroneous results. The situation is similar, to a lesser degree, with the addition of gases and solids. It should also be noted that the data set presented in this chapter may not be “complete” for all the conceivable systems and con-ditions. Gaps are pointed out in both the previous NEA TDB review and the present update.
• Solubility data for crystalline phases are well defined in the initial state, but not necessarily in the final state after “equilibrium” has been attained. Hence, the solubility calculated from these phases may be very misleading, as discussed for the solubility data of MO2(cr), M = U, Np, Pu.

7 Selected technetium data
127
Table 7–1: Selected thermodynamic data for technetium compounds and complexes. Selected thermodynamic functions for some Tc species are also given in Appendix B. All ionic species listed in this table are aqueous species. Unless noted otherwise, all data refer to 298.15 K and a pressure of 0.1 MPa and, for aqueous species, infinite dilution (I = 0). The uncertainties listed below each value represent total uncertainties and corre-spond in principle to the statistically defined 95% confidence interval. Values obtained from internal calculation, cf. footnotes (a) and (b), are rounded at the third digit after the decimal point and may therefore not be exactly identical to those given in Chapter V. Systematically, all the values are presented with three digits after the decimal point, regardless of the significance of these digits. It should be noted that insufficient auxil-iary data are available in a number of cases to derive formation data from the reactions listed in Table 7–2. The data presented in this table are available on computer media from the OECD Nuclear Energy Agency.
f mGο∆ f mH ο∆ mS ο,mpCο
Compound (kJ · mol–1) (kJ · mol–1) (J · K–1 · mol–1) (J · K–1 · mol–1)
Tc(cr) 0.000 0.000 32.506±0.700
24.879±1.000
(c, d)
Tc(g) 630.711±25.001
(a) 675.000±25.000
(b) 181.052±0.010
20.795±0.010
(c, d)
TcO(g) 357.494±57.001
(a) 390.000±57.000
244.109±0.600
31.256±0.750
(d)
TcO2+ > –116.799 (b)
TcO2(cr) –401.850±11.762
(a) –457.800±11.700
50.000±4.000
TcO4 – –637.406
±7.616 (a) –729.400
±7.600 199.600
±1.500 –15.000
±8.000
TcO42– –575.759
±8.133 (b)
Tc2O7(cr) –950.280±15.562
(a) –1126.500±14.900
192.000±15.000
160.400±15.000
(c, d)
Tc2O7(g) –904.820±16.462
(a) –1008.100±16.063
(b) 436.641±12.000
146.736±5.000
(d)
TcO(OH)+ –345.377±9.009
(b)
TcO(OH)2(aq) –568.247±8.845
(b)
TcO2. 1.6 H2O(s) –758.479±8.372
(b)
(Continued on next page)

7 Selected technetium data
128
Table 7–1: (continued)
f mGο∆ f mH ο∆ mS ο,mpCο
Compound (kJ · mol–1) (kJ · mol–1) (J · K–1 · mol–1) (J · K–1 · mol–1)
TcO(OH)3 – –743.170
±9.135 (b)
Tc2O7. H2O(s) –1194.300±15.500
–1414.146±14.905
(b) 278.933±72.138
(a)
TcF6(cr, cubic) 253.520±0.510
157.840±0.320
TcF6(g) 359.136±4.500
120.703±2.629
TcO3F(g) 306.879±0.677
77.261±0.308
(c)
TcO3Cl(g) 317.636±0.797
80.365±0.308
(c)
TcS(g) 491.925±65.001
(a) 549.000±65.000
255.990±1.000
34.474±1.000
(d)
NH4TcO4(cr) –721.998±7.632
(b)
TcC(g) 765.602±40.250
(a) 826.500±40.000
242.500±15.000
TcCO3(OH)2(aq) –968.899±9.010
(b)
TcCO3(OH)3 – –1158.662
±9.486 (b)
TlTcO4(cr) –700.173±7.653
(b)
AgTcO4(cr) –578.975±7.654
(b)
NaTcO4. 4 H2O(s) –1843.411±7.622
(b)
KTcO4(cr) –932.921±7.604
(a) –1035.100±7.600
164.780±0.330
123.300±0.250
CsTcO4(cr) –949.700±7.700
(b)
(a) Value calculated internally with the Gibbs–Helmholtz equation, f m f m m,ii
G H T Sο ο ο∆ = ∆ − ∑ . (b) Value calculated internally from reaction data. (c) Temperature coefficients of this function are listed in Table 7–3. (d) Tables giving the temperature dependence of thermodynamic functions for this substance or compound
can be found in appendix B of the NEA TDB review on Tc [99RAR/RAN]

7 Selected technetium data
129
Table 7–2: Selected thermodynamic data for reactions involving technetium compounds and complexes. All ionic species listed in this table are aqueous species. Unless noted otherwise, all data refer to 298.15 K and a pressure of 0.1 MPa and, for aqueous spe-cies, infinite dilution (I = 0). The uncertainties listed below each value represent total uncertainties and correspond in principle to the statistically defined 95% confidence interval. Values obtained from internal calculation, cf. footnote (a), are rounded at the third digit after the decimal point and may therefore not be exactly identical to those given in Chapter 13. Systematically, all the values are presented with three digits after the decimal point, regardless of the significance of these digits. The data presented in this table are available on computer media from the OECD Nuclear Energy Agency. Species Reaction
10log K οr mGο∆ r mH ο∆ r mSο∆
(kJ · mol–1) (kJ · mol–1) (J · K–1 · mol–1)
Tc(g) Tc(cr) Tc(g)
675.000±25.000
TcO2+ 2H+ + TcO(OH)2(aq) 2H2O(l) + TcO2+
< 4.000 > –22.832
TcO42– TcO4
– + e – TcO42–
–10.800±0.500
(b) 61.647±2.854
Tc2O7(g) Tc2O7(cr) Tc2O7(g)
118.400±6.000
TcO(OH)+ H+ + TcO(OH)2(aq) H2O(l) + TcO(OH)+
2.500±0.300
–14.270±1.712
TcO(OH)2(aq) TcO2. 1.6H2O(s) 0.6H2O(l) + TcO(OH)2(aq) –8.400
±0.500 47.948
±2.854
TcO2. 1.6H2O(s) 4H+ + TcO4 – + 3 e – 0.4H2O(l) + TcO2. 1.6H2O(s)
37.829±0.609
(b) –215.930±3.476
TcO(OH)3 – H2O(l) + TcO(OH)2(aq) H+ + TcO(OH)3
–
–10.900±0.400
62.218±2.283
(Continued on next page)

7 Selected technetium data
130
Table 6–2: (continued)
Species Reaction
10log K οr mGο∆ r mH ο∆ r mSο∆
(kJ · mol–1) (kJ · mol–1) (J · K–1 · mol–1)
Tc2O7. H2O(s) H2O(g) + Tc2O7(cr) Tc2O7. H2O(s) –45.820
±0.400
TcF6(g) TcF6(cr, cubic) TcF6(g)
–0.535±0.327
(c) 3.055±1.868
(a) 34.540±1.300
105.600±4.500
TcO2Cl43– H2O(l) + TcOCl5
2– Cl – + 2H+ + TcO2Cl43–
–2.950±0.150
16.839±0.856
NH4TcO4(cr) NH4+ + TcO4
– NH4TcO4(cr)
0.910±0.070
–5.194±0.400
(NH4)2TcCl6(cr) 2NH4+ + TcCl6
2– (NH4)2TcCl6(cr)
7.988±1.000
–45.596±5.708
(NH4)2TcBr6(cr) 2NH4+ + TcBr6
2– (NH4)2TcBr6(cr)
6.680±1.000
–38.130±5.708
TcCO3(OH)2(aq) CO2(g) + TcO(OH)2(aq) TcCO3(OH)2(aq)
1.100±0.300
–6.279±1.712
TcCO3(OH)3 – CO2(g) + H2O(l) + TcO(OH)2(aq) H+ + TcCO3(OH)3
–
–7.200±0.600
41.098±3.425
TlTcO4(cr) TcO4 – + Tl+ TlTcO4(cr)
5.320±0.120
–30.367±0.685
AgTcO4(cr) Ag+ + TcO4 – AgTcO4(cr)
3.270±0.130
–18.665±0.742
NaTcO4. 4H2O(s) 4H2O(l) + Na+ + TcO4 – NaTcO4. 4H2O(s)
–0.790±0.040
4.509±0.228
(Continued on next page)
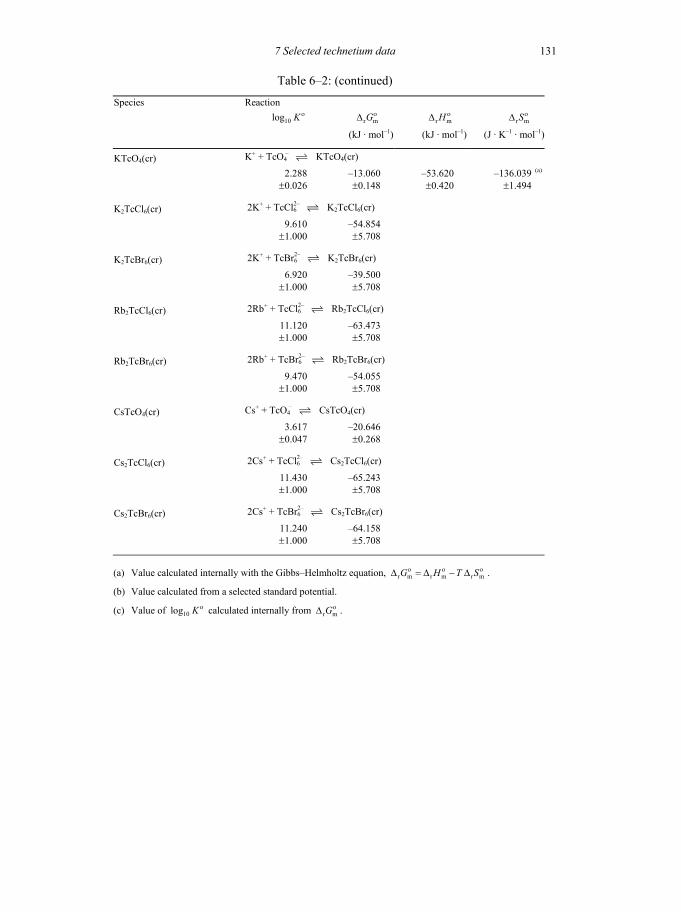
7 Selected technetium data
131
Table 6–2: (continued)
Species Reaction
10log K οr mGο∆ r mH ο∆ r mSο∆
(kJ · mol–1) (kJ · mol–1) (J · K–1 · mol–1)
KTcO4(cr) K+ + TcO4 – KTcO4(cr)
2.288±0.026
–13.060±0.148
–53.620±0.420
–136.039±1.494
(a)
K2TcCl6(cr) 2K+ + TcCl62– K2TcCl6(cr)
9.610±1.000
–54.854±5.708
K2TcBr6(cr) 2K+ + TcBr62– K2TcBr6(cr)
6.920±1.000
–39.500±5.708
Rb2TcCl6(cr) 2Rb+ + TcCl62– Rb2TcCl6(cr)
11.120±1.000
–63.473±5.708
Rb2TcBr6(cr) 2Rb+ + TcBr62– Rb2TcBr6(cr)
9.470±1.000
–54.055±5.708
CsTcO4(cr) Cs+ + TcO4 – CsTcO4(cr)
3.617±0.047
–20.646±0.268
Cs2TcCl6(cr) 2Cs+ + TcCl62– Cs2TcCl6(cr)
11.430±1.000
–65.243±5.708
Cs2TcBr6(cr) 2Cs+ + TcBr62– Cs2TcBr6(cr)
11.240±1.000
–64.158±5.708
(a) Value calculated internally with the Gibbs–Helmholtz equation, r m r m r mG H T Sο ο ο∆ = ∆ − ∆ .
(b) Value calculated from a selected standard potential.
(c) Value of 10log K ο calculated internally from r mGο∆ .

7 Selected technetium data
132
Table 7–3: Selected temperature coefficients for heat capacities marked with (c) in Table 7–1, according to the form 2 2
,m ( )pC T a bT cT eT −= + + + . The functions are valid be-tween the temperatures Tmin and Tmax (in K). The notation E±nn indicates the power of 10. ,mpC units are J · K–1 · mol–1.
Compound a b c e T min T max Tc(cr) 2.50940E+01 4.31450E–03 –2.75460E–07 –1.31300E+05 298 2430Tc(g) 2.49130E+01 –1.91830E–02 2.51280E–05 –5.61800E+04 298 600Tc2O7(cr) 1.55000E+02 8.60000E–02 0 –1.80000E+06 298 392TcF6(cr, cubic) 7.20810E+01 2.87666E–01 0 0 268 311TcO3F(g) 7.61200E+01 5.34274E–02 –2.53393E–05 –1.11446E+06 298 1000TcO3Cl(g) 8.03360E+01 4.63950E–02 –2.20086E–05 –1.05321E+06 298 1000

133
Chapter 8
8 Selected auxiliary data This chapter presents the chemical thermodynamic data for auxiliary compounds and complexes which are used within the NEA TDB project. Most of these auxiliary species are used in the evaluation of the recommended uranium, neptunium, plutonium, ameri-cium and technetium data in Table 3–1, Table 3–2, Table 4–1, Table 4–2, Table 5–1, Table 5–2, Table 6–1, Table 6–2, Table 7–1 andTable 7–2. It is therefore essential to always use these auxiliary data in conjunction with the selected data for uranium, nep-tunium, plutonium, americium and technetium. The use of other auxiliary data can lead to inconsistencies and erroneous results.
The values in the tables of this chapter are either CODATA Key Values, taken from [89COX/WAG], or were evaluated within the NEA TDB project, as described in Chapter VI of [92GRE/FUG] and [99RAR/RAN], and in Chapter 14 of this review.
Table 8–1 contains the selected thermodynamic data of the auxiliary species and Table 8–2 the selected thermodynamic data of chemical reactions involving auxil-iary species. The reason for listing both reaction data and entropies, enthalpies and Gibbs energies of formation is, as described in Chapters 3, 4, 5, 6 and 7, that uncertain-ties in reaction data are often smaller than those derived for mS ο , f mH ο∆ and f mGο∆ , due to uncertainty accumulation during the calculations.
All data in Table 8–1 and Table 8–2 refer to a temperature of 298.15 K, the standard state pressure of 0.1 MPa and, for aqueous species and reactions, to the infinite dilution reference state (I = 0).
The uncertainties listed below each reaction value in Table 8–2 are total uncer-tainties, and correspond mainly to the statistically defined 95% confidence interval. The uncertainties listed below each value in Table 8–1 have the following significance:
• for CODATA values from [89COX/WAG], the ± terms have the meaning: “it is probable, but not at all certain, that the true values of the thermodynamic quantities differ from the recommended values given in this report by no more than twice the ± terms attached to the recommended values”.
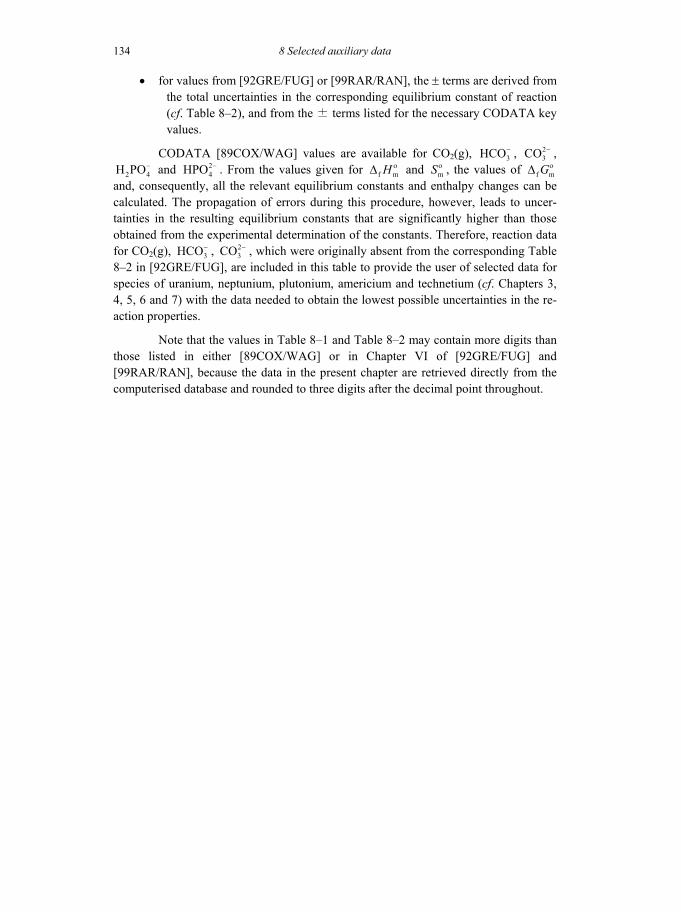
8 Selected auxiliary data
134
• for values from [92GRE/FUG] or [99RAR/RAN], the ± terms are derived from the total uncertainties in the corresponding equilibrium constant of reaction (cf. Table 8–2), and from the ± terms listed for the necessary CODATA key values.
CODATA [89COX/WAG] values are available for CO2(g), 3HCO− , 23CO − ,
2 4H PO− and 24HPO − . From the values given for f mH ο∆ and mS ο , the values of f mGο∆
and, consequently, all the relevant equilibrium constants and enthalpy changes can be calculated. The propagation of errors during this procedure, however, leads to uncer-tainties in the resulting equilibrium constants that are significantly higher than those obtained from the experimental determination of the constants. Therefore, reaction data for CO2(g), 3HCO− , 2
3CO − , which were originally absent from the corresponding Table 8–2 in [92GRE/FUG], are included in this table to provide the user of selected data for species of uranium, neptunium, plutonium, americium and technetium (cf. Chapters 3, 4, 5, 6 and 7) with the data needed to obtain the lowest possible uncertainties in the re-action properties.
Note that the values in Table 8–1 and Table 8–2 may contain more digits than those listed in either [89COX/WAG] or in Chapter VI of [92GRE/FUG] and [99RAR/RAN], because the data in the present chapter are retrieved directly from the computerised database and rounded to three digits after the decimal point throughout.

8 Selected auxiliary data
135
Table 8–1: Selected thermodynamic data for auxiliary compounds and complexes, in-cluding the CODATA Key Values [89COX/WAG] of species not containing uranium, neptunium, plutonium, americium or technetium as well as other data that were evalu-ated in Chapter VI of [92GRE/FUG] and [99RAR/RAN]. All ionic species listed in this table are aqueous species. Unless noted otherwise, all data refer to 298.15 K and a pres-sure of 0.1 MPa and, for aqueous species, a reference state or standard state of infinite dilution (I = 0). The uncertainties listed below each value represent total uncertainties and correspond in principle to the statistically defined 95% confidence interval. Values in bold typeface are CODATA Key Values and are taken directly from reference [89COX/WAG] without further evaluation. Values obtained from internal calculation, cf. footnotes (a) and (b), are rounded at the third digit after the decimal point and may therefore not be exactly identical to those given in Chapter VI of Ref. [92GRE/FUG] or [99RAR/RAN]. Systematically, all the values are presented with three digits after the decimal point, regardless of the significance of these digits. The data presented in this table are available on computer media from the OECD Nuclear Energy Agency.
f mGο∆ f mH ο∆ mS ο,mpCο
Compound (kJ · mol–1) (kJ · mol–1) (J · K–1 · mol–1) (J · K–1 · mol–1)
O(g) 231.743±0.100
(a) 249.180±0.100
161.059±0.003
21.912±0.001
O2(g) 0.000 0.000 205.152±0.005
29.378±0.003
H(g) 203.276±0.006
(a) 217.998±0.006
114.717±0.002
20.786±0.001
H+ 0.000 0.000 0.000 0.000
H2(g) 0.000 0.000 130.680±0.003
28.836±0.002
OH – –157.220±0.072
(a) –230.015±0.040
–10.900±0.200
H2O(g) –228.582±0.040
(a) –241.826±0.040
188.835±0.010
33.609±0.030
H2O(l) –237.140±0.041
(a) –285.830±0.040
69.950±0.030
75.351±0.080
H2O2(aq) –191.170±0.100
(c)
He(g) 0.000 0.000 126.153±0.002
20.786±0.001
Ne(g) 0.000 0.000 146.328±0.003
20.786±0.001
Ar(g) 0.000 0.000 154.846±0.003
20.786±0.001
(Continued on next page)

8 Selected auxiliary data
136
Table 8–1: (continued)
f mGο∆ f mH ο∆ mS ο,mpCο
Compound (kJ · mol–1) (kJ · mol–1) (J · K–1 · mol–1) (J · K–1 · mol–1)
Kr(g) 0.000 0.000 164.085±0.003
20.786±0.001
Xe(g) 0.000 0.000 169.685±0.003
20.786±0.001
F(g) 62.280±0.300
(a) 79.380±0.300
158.751±0.004
22.746±0.002
F – –281.523±0.692
(a) –335.350±0.650
–13.800±0.800
F2(g) 0.000 0.000 202.791±0.005
31.304±0.002
HF(aq) –299.675±0.702
(b) –323.150±0.716
(b) 88.000±3.362
(a)
HF(g) –275.400±0.700
(a) –273.300±0.700
173.779±0.003
29.137±0.002
HF2 – –583.709
±1.200 (b) –655.500
±2.221 (b) 92.683
±8.469 (a)
Cl(g) 105.305±0.008
(a) 121.301±0.008
165.190±0.004
21.838±0.001
Cl – –131.217±0.117
(a) –167.080±0.100
56.600±0.200
Cl2(g) 0.000 0.000 223.081±0.010
33.949±0.002
ClO – –37.669±0.962
(b)
ClO2 – 10.250
±4.044 (b)
ClO3 – –7.903
±1.342 (a) –104.000
±1.000 162.300
±3.000
ClO4 – –7.890
±0.600 (a) –128.100
±0.400 184.000
±1.500
HCl(g) –95.298±0.100
(a) –92.310±0.100
186.902±0.005
29.136±0.002
HClO(aq) –80.023±0.613
(b)
HClO2(aq) –0.938±4.043
(b)
(Continued on next page)
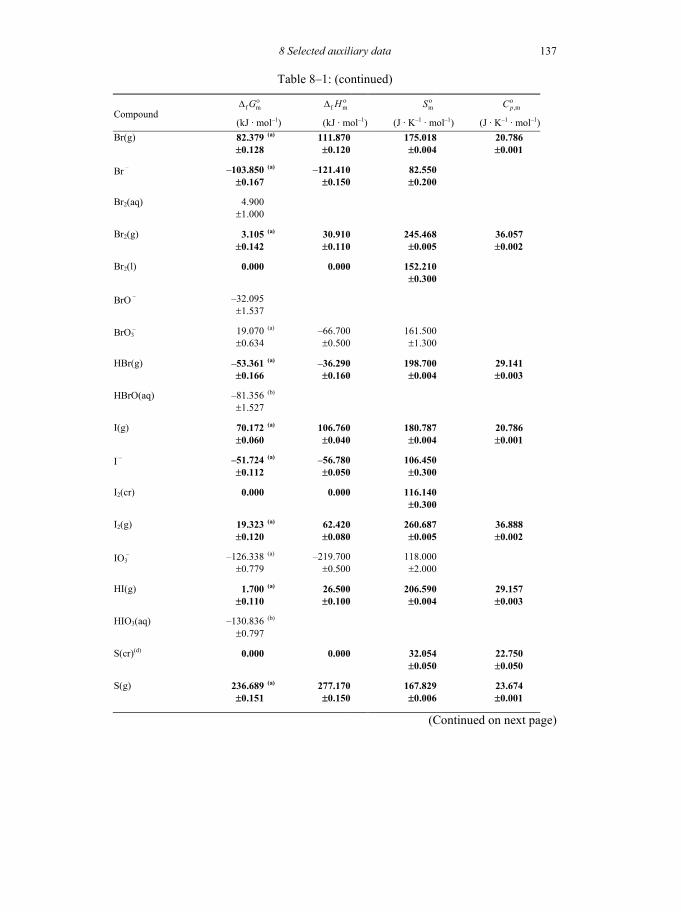
8 Selected auxiliary data
137
Table 8–1: (continued)
f mGο∆ f mH ο∆ mS ο,mpCο
Compound (kJ · mol–1) (kJ · mol–1) (J · K–1 · mol–1) (J · K–1 · mol–1)
Br(g) 82.379±0.128
(a) 111.870±0.120
175.018±0.004
20.786±0.001
Br – –103.850±0.167
(a) –121.410±0.150
82.550±0.200
Br2(aq) 4.900±1.000
Br2(g) 3.105±0.142
(a) 30.910±0.110
245.468±0.005
36.057±0.002
Br2(l) 0.000 0.000 152.210±0.300
BrO – –32.095±1.537
BrO3 – 19.070
±0.634 (a) –66.700
±0.500 161.500
±1.300
HBr(g) –53.361±0.166
(a) –36.290±0.160
198.700±0.004
29.141±0.003
HBrO(aq) –81.356±1.527
(b)
I(g) 70.172±0.060
(a) 106.760±0.040
180.787±0.004
20.786±0.001
I – –51.724±0.112
(a) –56.780±0.050
106.450±0.300
I2(cr) 0.000 0.000 116.140±0.300
I2(g) 19.323±0.120
(a) 62.420±0.080
260.687±0.005
36.888±0.002
IO3 – –126.338
±0.779 (a) –219.700
±0.500 118.000
±2.000
HI(g) 1.700±0.110
(a) 26.500±0.100
206.590±0.004
29.157±0.003
HIO3(aq) –130.836±0.797
(b)
S(cr)(d) 0.000 0.000 32.054±0.050
22.750±0.050
S(g) 236.689±0.151
(a) 277.170±0.150
167.829±0.006
23.674±0.001
(Continued on next page)

8 Selected auxiliary data
138
Table 8–1: (continued)
f mGο∆ f mH ο∆ mS ο,mpCο
Compound (kJ · mol–1) (kJ · mol–1) (J · K–1 · mol–1) (J · K–1 · mol–1)
S2– 120.695±11.610
(b)
S2(g) 79.686±0.301
(a) 128.600±0.300
228.167±0.010
32.505±0.010
SO2(g) –300.095±0.201
(a) –296.810±0.200
248.223±0.050
39.842±0.020
SO32– –487.472
±4.020 (b)
S2O32– –519.291
±11.345 (b)
SO42– –744.004
±0.418 (a) –909.340
±0.400 18.500
±0.400
HS – 12.243±2.115
(a) –16.300±1.500
67.000±5.000
H2S(aq) –27.648±2.115
(a) –38.600±1.500
126.000±5.000
H2S(g) –33.443±0.500
(a) –20.600±0.500
205.810±0.050
34.248±0.010
HSO3 – –528.684
±4.046 (b)
HS2O3 – –528.366
±11.377 (b)
H2SO3(aq) –539.187±4.072
(b)
HSO4 – –755.315
±1.342 (a) –886.900
±1.000 131.700
±3.000
Se(cr) 0.000 0.000 42.270±0.050
25.030±0.050
SeO2(cr) –225.100±2.100
SeO32– –361.597
±1.473 (b)
HSeO3 – –409.544
±1.358 (b)
(Continued on next page)
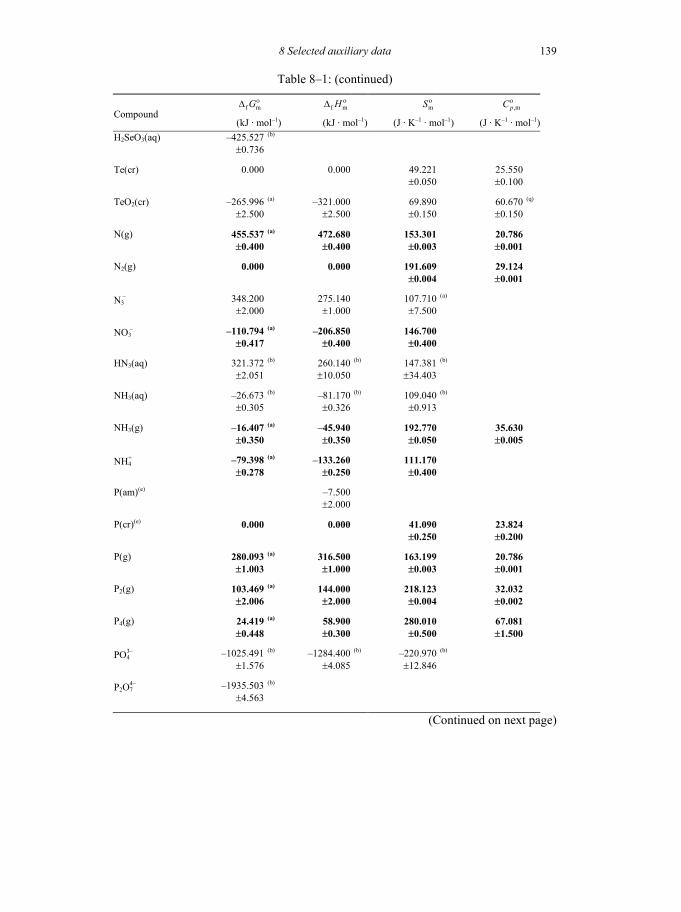
8 Selected auxiliary data
139
Table 8–1: (continued)
f mGο∆ f mH ο∆ mS ο,mpCο
Compound (kJ · mol–1) (kJ · mol–1) (J · K–1 · mol–1) (J · K–1 · mol–1)
H2SeO3(aq) –425.527±0.736
(b)
Te(cr) 0.000 0.000 49.221±0.050
25.550±0.100
TeO2(cr) –265.996±2.500
(a) –321.000±2.500
69.890±0.150
60.670±0.150
(q)
N(g) 455.537±0.400
(a) 472.680±0.400
153.301±0.003
20.786±0.001
N2(g) 0.000 0.000 191.609±0.004
29.124±0.001
N3 – 348.200
±2.000 275.140
±1.000 107.710
±7.500 (a)
NO3 – –110.794
±0.417 (a) –206.850
±0.400 146.700
±0.400
HN3(aq) 321.372±2.051
(b) 260.140±10.050
(b) 147.381±34.403
(b)
NH3(aq) –26.673±0.305
(b) –81.170±0.326
(b) 109.040±0.913
(b)
NH3(g) –16.407±0.350
(a) –45.940±0.350
192.770±0.050
35.630±0.005
NH4+ –79.398
±0.278 (a) –133.260
±0.250 111.170
±0.400
P(am)(e) –7.500±2.000
P(cr)(e) 0.000 0.000 41.090±0.250
23.824±0.200
P(g) 280.093±1.003
(a) 316.500±1.000
163.199±0.003
20.786±0.001
P2(g) 103.469±2.006
(a) 144.000±2.000
218.123±0.004
32.032±0.002
P4(g) 24.419±0.448
(a) 58.900±0.300
280.010±0.500
67.081±1.500
PO43– –1025.491
±1.576 (b) –1284.400
±4.085 (b) –220.970
±12.846 (b)
P2O74– –1935.503
±4.563 (b)
(Continued on next page)

8 Selected auxiliary data
140
Table 8–1: (continued)
f mGο∆ f mH ο∆ mS ο,mpCο
Compound (kJ · mol–1) (kJ · mol–1) (J · K–1 · mol–1) (J · K–1 · mol–1)
HPO42– –1095.985
±1.567 (a) –1299.000
±1.500 –33.500
±1.500
H2PO4 – –1137.152
±1.567 (a) –1302.600
±1.500 92.500
±1.500
H3PO4(aq) –1149.367±1.576
(b) –1294.120±1.616
(b) 161.912±2.575
(b)
HP2O73– –1989.158
±4.482 (b)
H2P2O72– –2027.117
±4.445 (b)
H3P2O7 – –2039.960
±4.362 (b)
H4P2O7(aq) –2045.668±3.299
(b) –2280.210±3.383
(b) 274.919±6.954
(b)
As(cr) 0.000 0.000 35.100±0.600
24.640±0.500
AsO2 – –350.022
±4.008 (a) –429.030
±4.000 40.600
±0.600
AsO43– –648.360
±4.008 (a) –888.140
±4.000 –162.800
±0.600
As2O5(cr) –782.449±8.016
(a) –924.870±8.000
105.400±1.200
116.520±0.800
As4O6(cubic)(f) –1152.445±16.032
(a) –1313.940±16.000
214.200±2.400
191.290±0.800
As4O6(mono)(g) –1154.009±16.041
(a) –1309.600±16.000
234.000±3.000
HAsO2(aq) –402.925±4.008
(a) –456.500±4.000
125.900±0.600
H2AsO3 – –587.078
±4.008 (a) –714.790
±4.000 110.500
±0.600
H3AsO3(aq) –639.681±4.015
(a) –742.200±4.000
195.000±1.000
HAsO42– –714.592
±4.008 (a) –906.340
±4.000 –1.700
±0.600
H2AsO4 – –753.203
±4.015 (a) –909.560
±4.000 117.000
±1.000
(Continued on next page)

8 Selected auxiliary data
141
Table 8–1: (continued)
f mGο∆ f mH ο∆ mS ο,mpCο
Compound (kJ · mol–1) (kJ · mol–1) (J · K–1 · mol–1) (J · K–1 · mol–1)
H3AsO4(aq) –766.119±4.015
(a) –902.500±4.000
184.000±1.000
(As2O5)3. 5 H2O(cr) –4248.400±24.000
Sb(cr) 0.000 0.000 45.520±0.210
25.260±0.200
Bi(cr)(h) 0.000 0.000 56.740±0.420
25.410±0.200
C(cr) 0.000 0.000 5.740±0.100
8.517±0.080
C(g) 671.254±0.451
(a) 716.680±0.450
158.100±0.003
20.839±0.001
CO(g) –137.168±0.173
(a) –110.530±0.170
197.660±0.004
29.141±0.002
CO2(aq) –385.970±0.270
(a) –413.260±0.200
119.360±0.600
CO2(g) –394.373±0.133
(a) –393.510±0.130
213.785±0.010
37.135±0.002
CO32– –527.900
±0.390 (a) –675.230
±0.250 –50.000
±1.000
HCO3 – –586.845
±0.251 (a) –689.930
±0.200 98.400
±0.500
SCN – 92.700±4.000
76.400±4.000
144.268±18.974
(a)
Si(cr) 0.000 0.000 18.810±0.080
19.789±0.030
Si(g) 405.525±8.000
(a) 450.000±8.000
167.981±0.004
22.251±0.001
SiO2(quar)(i) –856.287±1.002
(a) –910.700±1.000
41.460±0.200
44.602±0.300
SiO2(OH)22– –1175.651
±1.265 (b) –1381.960
±15.330 (b) –1.488
±51.592 (b)
SiO(OH)3 – –1251.740
±1.162 (b) –1431.360
±3.743 (b) 88.024
±13.144 (b)
Si(OH)4(aq) –1307.735±1.156
(b) –1456.960±3.163
(b) 189.973±10.245
(b)
(Continued on next page)
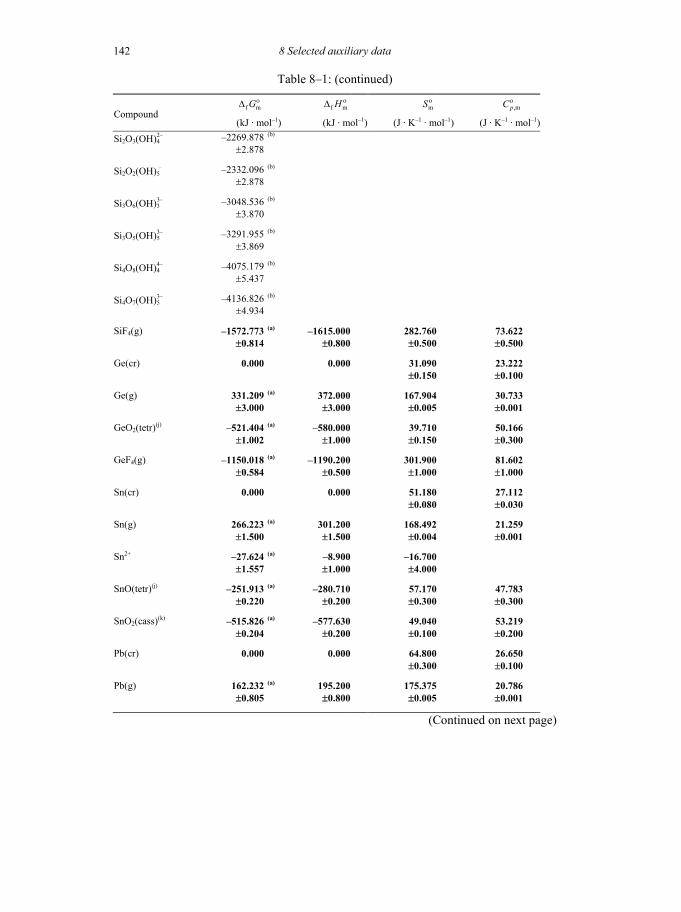
8 Selected auxiliary data
142
Table 8–1: (continued)
f mGο∆ f mH ο∆ mS ο,mpCο
Compound (kJ · mol–1) (kJ · mol–1) (J · K–1 · mol–1) (J · K–1 · mol–1)
Si2O3(OH)42– –2269.878
±2.878 (b)
Si2O2(OH)5 – –2332.096
±2.878 (b)
Si3O6(OH)33– –3048.536
±3.870 (b)
Si3O5(OH)53– –3291.955
±3.869 (b)
Si4O8(OH)44– –4075.179
±5.437 (b)
Si4O7(OH)53– –4136.826
±4.934 (b)
SiF4(g) –1572.773±0.814
(a) –1615.000±0.800
282.760±0.500
73.622±0.500
Ge(cr) 0.000 0.000 31.090±0.150
23.222±0.100
Ge(g) 331.209±3.000
(a) 372.000±3.000
167.904±0.005
30.733±0.001
GeO2(tetr)(j) –521.404±1.002
(a) –580.000±1.000
39.710±0.150
50.166±0.300
GeF4(g) –1150.018±0.584
(a) –1190.200±0.500
301.900±1.000
81.602±1.000
Sn(cr) 0.000 0.000 51.180±0.080
27.112±0.030
Sn(g) 266.223±1.500
(a) 301.200±1.500
168.492±0.004
21.259±0.001
Sn2+ –27.624±1.557
(a) –8.900±1.000
–16.700±4.000
SnO(tetr)(j) –251.913±0.220
(a) –280.710±0.200
57.170±0.300
47.783±0.300
SnO2(cass)(k) –515.826±0.204
(a) –577.630±0.200
49.040±0.100
53.219±0.200
Pb(cr) 0.000 0.000 64.800±0.300
26.650±0.100
Pb(g) 162.232±0.805
(a) 195.200±0.800
175.375±0.005
20.786±0.001
(Continued on next page)

8 Selected auxiliary data
143
Table 8–1: (continued)
f mGο∆ f mH ο∆ mS ο,mpCο
Compound (kJ · mol–1) (kJ · mol–1) (J · K–1 · mol–1) (J · K–1 · mol–1)
Pb2+ –24.238±0.399
(a) 0.920±0.250
18.500±1.000
PbSO4(cr) –813.036±0.447
(a) –919.970±0.400
148.500±0.600
B(cr) 0.000 0.000 5.900±0.080
11.087±0.100
B(g) 521.012±5.000
(a) 565.000±5.000
153.436±0.015
20.796±0.005
B2O3(cr) –1194.324±1.404
(a) –1273.500±1.400
53.970±0.300
62.761±0.300
B(OH)3(aq) –969.268±0.820
(a) –1072.800±0.800
162.400±0.600
B(OH)3(cr) –969.667±0.820
(a) –1094.800±0.800
89.950±0.600
86.060±0.400
BF3(g) –1119.403±0.803
(a) –1136.000±0.800
254.420±0.200
50.463±0.100
Al(cr) 0.000 0.000 28.300±0.100
24.200±0.070
Al(g) 289.376±4.000
(a) 330.000±4.000
164.554±0.004
21.391±0.001
Al3+ –491.507±3.338
(a) –538.400±1.500
–325.000±10.000
Al2O3(coru)(l) –1582.257±1.302
(a) –1675.700±1.300
50.920±0.100
79.033±0.200
AlF3(cr) –1431.096±1.309
(a) –1510.400±1.300
66.500±0.500
75.122±0.400
Tl+ –32.400±0.300
Zn(cr) 0.000 0.000 41.630±0.150
25.390±0.040
Zn(g) 94.813±0.402
(a) 130.400±0.400
160.990±0.004
20.786±0.001
Zn2+ –147.203±0.254
(a) –153.390±0.200
–109.800±0.500
ZnO(cr) –320.479±0.299
(a) –350.460±0.270
43.650±0.400
(Continued on next page)

8 Selected auxiliary data
144
Table 8–1: (continued)
f mGο∆ f mH ο∆ mS ο,mpCο
Compound (kJ · mol–1) (kJ · mol–1) (J · K–1 · mol–1) (J · K–1 · mol–1)
Cd(cr) 0.000 0.000 51.800±0.150
26.020±0.040
Cd(g) 77.230±0.205
(a) 111.800±0.200
167.749±0.004
20.786±0.001
Cd2+ –77.733±0.750
(a) –75.920±0.600
–72.800±1.500
CdO(cr) –228.661±0.602
(a) –258.350±0.400
54.800±1.500
CdSO4. 2.667 H2O(cr) –1464.959±0.810
(a) –1729.300±0.800
229.650±0.400
Hg(g) 31.842±0.054
(a) 61.380±0.040
174.971±0.005
20.786±0.001
Hg(l) 0.000 0.000 75.900±0.120
Hg2+ 164.667±0.313
(a) 170.210±0.200
–36.190±0.800
Hg22+ 153.567
±0.559 (a) 166.870
±0.500 65.740
±0.800
HgO(mont)(m) –58.523±0.154
(a) –90.790±0.120
70.250±0.300
Hg2Cl2(cr) –210.725±0.471
(a) –265.370±0.400
191.600±0.800
Hg2SO4(cr) –625.780±0.411
(a) –743.090±0.400
200.700±0.200
Cu(cr) 0.000 0.000 33.150±0.080
24.440±0.050
Cu(g) 297.672±1.200
(a) 337.400±1.200
166.398±0.004
20.786±0.001
Cu2+ 65.040±1.557
(a) 64.900±1.000
–98.000±4.000
CuCl(g) 77.000±10.000
CuSO4(cr) –662.185±1.206
(a) –771.400±1.200
109.200±0.400
Ag(cr) 0.000 0.000 42.550±0.200
25.350±0.100
(Continued on next page)

8 Selected auxiliary data
145
Table 8–1: (continued)
f mGο∆ f mH ο∆ mS ο,mpCο
Compound (kJ · mol–1) (kJ · mol–1) (J · K–1 · mol–1) (J · K–1 · mol–1)
Ag(g) 246.007±0.802
(a) 284.900±0.800
172.997±0.004
20.786±0.001
Ag+ 77.096±0.156
(a) 105.790±0.080
73.450±0.400
AgCl(cr) –109.765±0.098
(a) –127.010±0.050
96.250±0.200
Ti(cr) 0.000 0.000 30.720±0.100
25.060±0.080
Ti(g) 428.403±3.000
(a) 473.000±3.000
180.298±0.010
24.430±0.030
TiO2(ruti)(n) –888.767±0.806
(a) –944.000±0.800
50.620±0.300
55.080±0.300
TiCl4(g) –726.324±3.229
(a) –763.200±3.000
353.200±4.000
95.408±1.000
Th(cr) 0.000 0.000 51.800±0.500
26.230±0.050
Th(g) 560.745±6.002
(a) 602.000±6.000
190.170±0.050
20.789±0.100
ThO2(cr) –1169.238±3.504
(a) –1226.400±3.500
65.230±0.200
Be(cr) 0.000 0.000 9.500±0.080
16.443±0.060
Be(g) 286.202±5.000
(a) 324.000±5.000
136.275±0.003
20.786±0.001
BeO(brom)(o) –580.090±2.500
(a) –609.400±2.500
13.770±0.040
25.565±0.100
Mg(cr) 0.000 0.000 32.670±0.100
24.869±0.020
Mg(g) 112.521±0.801
(a) 147.100±0.800
148.648±0.003
20.786±0.001
Mg2+ –455.375±1.335
(a) –467.000±0.600
–137.000±4.000
MgO(cr) –569.312±0.305
(a) –601.600±0.300
26.950±0.150
37.237±0.200
MgF2(cr) –1071.051±1.210
(a) –1124.200±1.200
57.200±0.500
61.512±0.300
(Continued on next page)
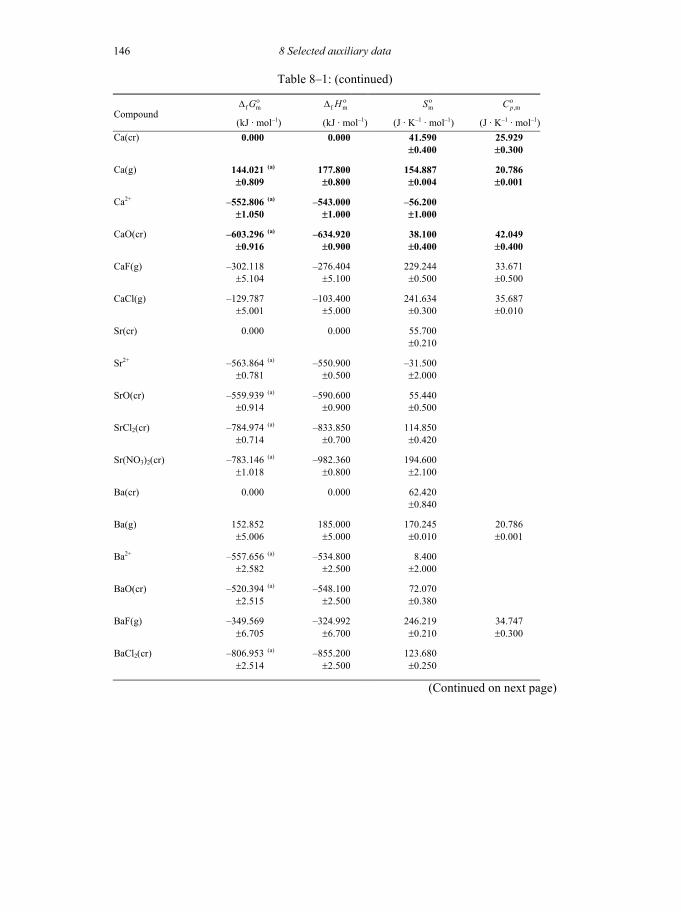
8 Selected auxiliary data
146
Table 8–1: (continued)
f mGο∆ f mH ο∆ mS ο,mpCο
Compound (kJ · mol–1) (kJ · mol–1) (J · K–1 · mol–1) (J · K–1 · mol–1)
Ca(cr) 0.000 0.000 41.590±0.400
25.929±0.300
Ca(g) 144.021±0.809
(a) 177.800±0.800
154.887±0.004
20.786±0.001
Ca2+ –552.806±1.050
(a) –543.000±1.000
–56.200±1.000
CaO(cr) –603.296±0.916
(a) –634.920±0.900
38.100±0.400
42.049±0.400
CaF(g) –302.118±5.104
–276.404±5.100
229.244±0.500
33.671±0.500
CaCl(g) –129.787±5.001
–103.400±5.000
241.634±0.300
35.687±0.010
Sr(cr) 0.000 0.000 55.700±0.210
Sr2+ –563.864±0.781
(a) –550.900±0.500
–31.500±2.000
SrO(cr) –559.939±0.914
(a) –590.600±0.900
55.440±0.500
SrCl2(cr) –784.974±0.714
(a) –833.850±0.700
114.850±0.420
Sr(NO3)2(cr) –783.146±1.018
(a) –982.360±0.800
194.600±2.100
Ba(cr) 0.000 0.000 62.420±0.840
Ba(g) 152.852±5.006
185.000±5.000
170.245±0.010
20.786±0.001
Ba2+ –557.656±2.582
(a) –534.800±2.500
8.400±2.000
BaO(cr) –520.394±2.515
(a) –548.100±2.500
72.070±0.380
BaF(g) –349.569±6.705
–324.992±6.700
246.219±0.210
34.747±0.300
BaCl2(cr) –806.953±2.514
(a) –855.200±2.500
123.680±0.250
(Continued on next page)

8 Selected auxiliary data
147
Table 8–1: (continued)
f mGο∆ f mH ο∆ mS ο,mpCο
Compound (kJ · mol–1) (kJ · mol–1) (J · K–1 · mol–1) (J · K–1 · mol–1)
Li(cr) 0.000 0.000 29.120±0.200
24.860±0.200
Li(g) 126.604±1.002
(a) 159.300±1.000
138.782±0.010
20.786±0.001
Li+ –292.918±0.109
(a) –278.470±0.080
12.240±0.150
Na(cr) 0.000 0.000 51.300±0.200
28.230±0.200
Na+ –261.953±0.096
(a) –240.340±0.060
58.450±0.150
NaF(cr)(p) –546.327±0.704
(a) –576.600±0.700
51.160±0.150
46.820
NaCl(cr)(p) –384.221±0.147
–411.260±0.120
72.150±0.200
50.500
NaNO3(cr) –467.580±0.410
K(cr) 0.000 0.000 64.680±0.200
29.600±0.100
K(g) 60.479±0.802
(a) 89.000±0.800
160.341±0.003
20.786±0.001
K+ –282.510±0.116
(a) –252.140±0.080
101.200±0.200
Rb(cr) 0.000 0.000 76.780±0.300
31.060±0.100
Rb(g) 53.078±0.805
(a) 80.900±0.800
170.094±0.003
20.786±0.001
Rb+ –284.009±0.153
(a) –251.120±0.100
121.750±0.250
(Continued on next page)

8 Selected auxiliary data
148
Table 8–1: (continued)
f mGο∆ f mH ο∆ mS ο,mpCο
Compound (kJ · mol–1) (kJ · mol–1) (J · K–1 · mol–1) (J · K–1 · mol–1)
Cs(cr) 0.000 0.000 85.230±0.400
32.210±0.200
Cs(g) 49.556±1.007
(a) 76.500±1.000
175.601±0.003
20.786±0.001
Cs+ –291.456±0.535
(a) –258.000±0.500
132.100±0.500
CsCl(cr) –413.807±0.208
(a) –442.310±0.160
101.170±0.200
52.470
CsBr(cr)(p) –391.171±0.305
–405.600±0.250
112.940±0.400
52.930
(a) Value calculated internally with the Gibbs–Helmholtz equation, f m f m m,ii
G H T Sο ο ο∆ = ∆ − ∑ . (b) Value calculated internally from reaction data (see Table 8–2) . (c) From [82WAG/EVA], uncertainty estimated in the uranium review [92GRE/FUG]. (d) Orthorhombic. (e) P(cr) refers to white, crystalline (cubic) phosphorus and is the reference state for the element phosphorus.
P(am) refers to red, amorphous phosphorus. (f) Cubic. (g) Monoclinic. (h) Data from [82WAG/EVA], [73HUL/DES], with the uncertainty in S ο from the latter (i) α-Quartz. (j) Tetragonal. (k) Cassiterite, tetragonal. (l) Corundum. (m) Montroydite, red. (n) Rutile. (o) Bromellite. (p) Data from [82GLU/GUR], compatible with [89COX/WAG]. (q) Temperature coefficients of this function are given in Section 14.1.1.1.

8 Selected auxiliary data
149
Table 8–2: Selected thermodynamic data for reactions involving auxiliary compounds and complexes used in the evaluation of thermodynamic data for the NEA TDB project data. All ionic species listed in this table are aqueous species. The selection of these data is described in Chapter VI of the uranium review [92GRE/FUG]. Unless noted otherwise, all data refer to 298.15 K and a pressure of 0.1 MPa and, for aqueous spe-cies, a reference state or standard state of infinite dilution (I = 0). The uncertainties listed below each value represent total uncertainties and correspond in principle to the statistically defined 95% confidence interval. Systematically, all the values are pre-sented with three digits after the decimal point, regardless of the significance of these digits. The data presented in this table are available on computer media from the OECD Nuclear Energy Agency. Species Reaction
10log K οr mGο∆ r mH ο∆ r mSο∆
(kJ · mol–1) (kJ · mol–1) (J · K–1 · mol–1)
HF(aq) F – + H+ HF(aq)
3.180±0.020
–18.152±0.114
12.200±0.300
101.800±1.077
(a)
HF2 – F – + HF(aq) HF2
–
0.440±0.120
–2.511±0.685
3.000±2.000
18.486±7.090
(a)
ClO – HClO(aq) ClO – + H+
–7.420±0.130
42.354±0.742
19.000±9.000
–78.329±30.289
(a)
ClO2 – HClO2(aq) ClO2
– + H+
–1.960±0.020
11.188±0.114
HClO(aq) Cl2(g) + H2O(l) Cl – + H+ + HClO(aq)
–4.537±0.105
25.900±0.600
HClO2(aq) H2O(l) + HClO(aq) 2H+ + HClO2(aq) + 2 e –
–55.400±0.700
(b) 316.230±3.996
BrO – HBrO(aq) BrO – + H+
–8.630±0.030
49.260±0.171
30.000±3.000
–64.600±10.078
(a)
HBrO(aq) Br2(aq) + H2O(l) Br – + H+ + HBrO(aq)
–8.240±0.200
47.034±1.142
(Continued on next page)
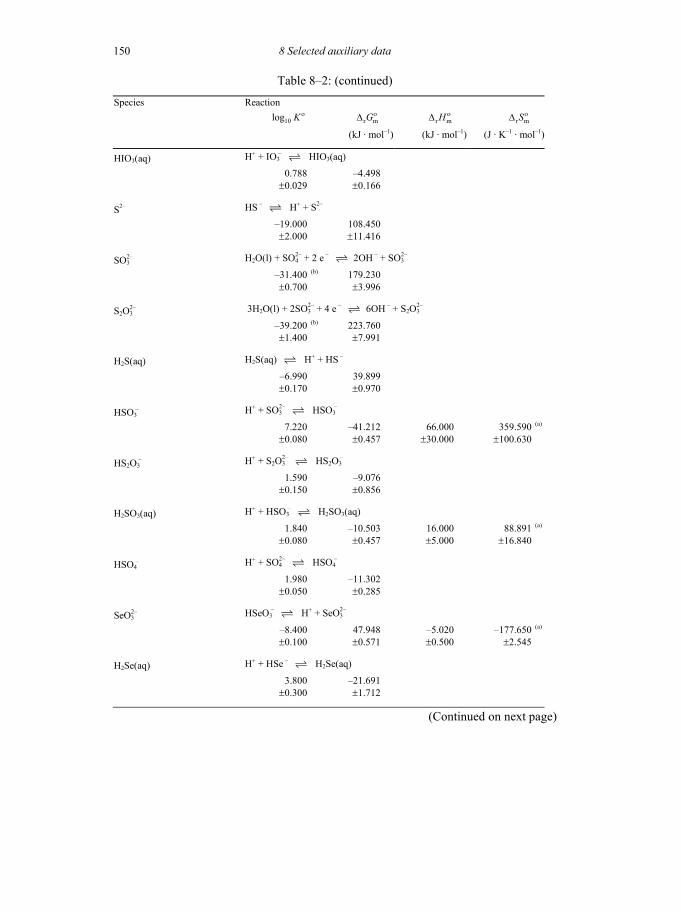
8 Selected auxiliary data
150
Table 8–2: (continued)
Species Reaction
10log K οr mGο∆ r mH ο∆ r mSο∆
(kJ · mol–1) (kJ · mol–1) (J · K–1 · mol–1)
HIO3(aq) H+ + IO3 – HIO3(aq)
0.788±0.029
–4.498±0.166
S2– HS – H+ + S2–
–19.000±2.000
108.450±11.416
SO32– H2O(l) + SO4
2– + 2 e – 2OH – + SO32–
–31.400±0.700
(b) 179.230±3.996
S2O32– 3H2O(l) + 2SO3
2– + 4 e – 6OH – + S2O32–
–39.200±1.400
(b) 223.760±7.991
H2S(aq) H2S(aq) H+ + HS –
–6.990±0.170
39.899±0.970
HSO3 – H+ + SO3
2– HSO3 –
7.220±0.080
–41.212±0.457
66.000±30.000
359.590±100.630
(a)
HS2O3 – H+ + S2O3
2– HS2O3 –
1.590±0.150
–9.076±0.856
H2SO3(aq) H+ + HSO3 – H2SO3(aq)
1.840±0.080
–10.503±0.457
16.000±5.000
88.891±16.840
(a)
HSO4 – H+ + SO4
2– HSO4 –
1.980±0.050
–11.302±0.285
SeO32– HSeO3
– H+ + SeO32–
–8.400±0.100
47.948±0.571
–5.020±0.500
–177.650±2.545
(a)
H2Se(aq) H+ + HSe – H2Se(aq)
3.800±0.300
–21.691±1.712
(Continued on next page)

8 Selected auxiliary data
151
Table 8–2: (continued)
Species Reaction
10log K οr mGο∆ r mH ο∆ r mSο∆
(kJ · mol–1) (kJ · mol–1) (J · K–1 · mol–1)
HSeO3 – H2SeO3(aq) H+ + HSeO3
–
–2.800±0.200
15.983±1.142
–7.070±0.500
–77.319±4.180
(a)
H2SeO3(aq) 3H2O(l) + 2I2(cr) + Se(cr) 4H+ + H2SeO3(aq) + 4I –
–13.840±0.100
78.999±0.571
HSeO4 – H+ + SeO4
2– HSeO4 –
1.800±0.140
–10.274±0.799
23.800±5.000
114.290±16.983
(a)
HN3(aq) H+ + N3 – HN3(aq)
4.700±0.080
–26.828±0.457
–15.000±10.000
39.671±33.575
(a)
NH3(aq) NH4+ H+ + NH3(aq)
–9.237±0.022
52.725±0.126
52.090±0.210
–2.130±0.821
(a)
HNO2(aq) H+ + NO2 – HNO2(aq)
3.210±0.160
–18.323±0.913
–11.400±3.000
23.219±10.518
(a)
PO43– HPO4
2– H+ + PO43–
–12.350±0.030
70.494±0.171
14.600±3.800
–187.470±12.758
(a)
P2O74– HP2O7
3– H+ + P2O74–
–9.400±0.150
53.656±0.856
H2PO4 – H+ + HPO4
2– H2PO4 –
7.212±0.013
–41.166±0.074
–3.600±1.000
126.000±3.363
(a)
H3PO4(aq) H+ + H2PO4 – H3PO4(aq)
2.140±0.030
–12.215±0.171
8.480±0.600
69.412±2.093
(a)
HP2O73– H2P2O7
2– H+ + HP2O73–
–6.650±0.100
37.958±0.571
(Continued on next page)

8 Selected auxiliary data
152
Table 8–2: (continued)
Species Reaction
10log K οr mGο∆ r mH ο∆ r mSο∆
(kJ · mol–1) (kJ · mol–1) (J · K–1 · mol–1)
H2P2O72– H3P2O7
– H+ + H2P2O72–
–2.250±0.150
12.843±0.856
H3P2O7 – H4P2O7(aq) H+ + H3P2O7
–
–1.000±0.500
5.708±2.854
H4P2O7(aq) 2H3PO4(aq) H2O(l) + H4P2O7(aq)
–2.790±0.170
15.925±0.970
22.200±1.000
21.045±4.673
(a)
CO2(aq) H+ + HCO3 – CO2(aq) + H2O(l)
6.354±0.020
–36.269±0.114
CO2(g) CO2(aq) CO2(g)
1.472±0.020
–8.402±0.114
HCO3 – CO3
2– + H+ HCO3 –
10.329±0.020
–58.958±0.114
SiO2(OH)22– Si(OH)4(aq) 2H+ + SiO2(OH)2
2–
–23.140±0.090
132.080±0.514
75.000±15.000
–191.460±50.340
(a)
SiO(OH)3 – Si(OH)4(aq) H+ + SiO(OH)3
–
–9.810±0.020
55.996±0.114
25.600±2.000
–101.950±6.719
(a)
Si(OH)4(aq) 2H2O(l) + SiO2(quar) Si(OH)4(aq)
–4.000±0.100
22.832±0.571
25.400±3.000
8.613±10.243
(a)
Si2O3(OH)42– 2Si(OH)4(aq) 2H+ + H2O(l) + Si2O3(OH)4
2–
–19.000±0.300
108.450±1.712
Si2O2(OH)5 – 2Si(OH)4(aq) H+ + H2O(l) + Si2O2(OH)5
–
–8.100±0.300
46.235±1.712
(Continued on next page)

8 Selected auxiliary data
153
Table 8–2: (continued)
Species Reaction
10log K οr mGο∆ r mH ο∆ r mSο∆
(kJ · mol–1) (kJ · mol–1) (J · K–1 · mol–1)
Si3O6(OH)33– 3Si(OH)4(aq) 3H+ + 3H2O(l) + Si3O6(OH)3
3–
–28.600±0.300
163.250±1.712
Si3O5(OH)53– 3Si(OH)4(aq) 3H+ + 2H2O(l) + Si3O5(OH)5
3–
–27.500±0.300
156.970±1.712
Si4O8(OH)44– 4Si(OH)4(aq) 4H+ + 4H2O(l) + Si4O8(OH)4
4–
–36.300±0.500
207.200±2.854
Si4O7(OH)53– 4Si(OH)4(aq) 3H+ + 4H2O(l) + Si4O7(OH)5
3–
–25.500±0.300
145.560±1.712
(a) Value calculated internally with the Gibbs–Helmholtz equation, r m r m r mG H T Sο ο ο∆ = ∆ − ∆ .
(b) Value calculated from a selected standard potential.
(c) Value of 10log K ο calculated internally from r mGο∆ .


Part III
Discussion of new data selection
155


Chapter 9Equation Section 9
9 Discussion of new data selection for Uranium
9.1 Elemental uranium (V.1) 9.1.1 Uranium metal (V.1.1) The only new data on condensed uranium are those by Sheldon and Mulford [91SHE/MUL]. These authors have re-measured the emissivity of U(l), and calculated the concomitant corrections (which are appreciable) to the earlier measurements of
for U(l) from 2357 to 5340 K by Mulford and Sheldon [88MUL/SHE]. Unfortunately, this correction removes the previous good agreement with the enthalpy data of Stephens [74STE] from levitation calorimetry and corresponds to a higher emissivity at the melting point. However Stephens' data at the lower tem-peratures, relevant to the vapour pressure measurements, are in good accord with the conventional enthalpy drop calorimetric measurements by Levinson [64LEV]. Thus, the current values of the heat capacity of U(l) used in the derivation of
m m( ) (298.15K)H T H ο−
sub mH∆ (U, cr, 298.15 K), namely those given by [82GLU/GUR], have been retained until the discrep-ancy in the emissivity is resolved.
Yoo et al. [98YOO/CYN] have reported X–ray diffraction measurements on uranium up to temperatures of 4300 K and pressures of 100 GPa. Details of the results are given in Appendix A. The data for U ( , , , l)α β γ assessed by McBride and Gordon [93MCB/GOR] are essentially identical to those given by [82GLU/GUR], which form the basis of the CODATA Key Values selection used in [92GRE/FUG], which are thus retained.
Boivineau et al. [93BOI/ARL] have also measured the thermophysical proper-ties of uranium at high temperatures, but this study does not provide any new data rele-vant to this review.
9.1.2 Uranium gas (V.1.2) The latest listing of the energy levels of U(g) [92BLA/WYA], required for statistical–mechanical calculations, gives a total of 2252 levels with a total statistical weight of 26050, up to ca. 50 cm–1 below the ionisation limit. This is a noticeable increase in the number of levels used in previous compilations (1133 by Oetting et al. [76OET/RAN]
157

9 Discussion of new data selection for Uranium 158
and 1596 by Glushko et al. [82GLU/GUR]). However, most of the new energy levels are above 20000 cm–1, so the calculated values of the thermodynamic functions at 298.15 K,
(U, g, 298.15 K) = (199.79 ± 0.03) J · KmS ο –1 · mol–1,
,mpCο (U, g, 298.15 K) = (23.69 ± 0.03) J · K–1 · mol–1,
are the same as those given in [92GRE/FUG]; the differences at higher temperatures remain small − see below.
The enthalpy of formation selected by [92GRE/FUG] is from the CODATA Key Values [89COX/WAG], which is based on four reasonably consistent measure-ments of the vapour pressure from ca.1900 to 2400 K. Over this temperature range, the revised values of ( G T )/T for U(g) differ from those used in the CODATA assessment by 0.003 to 0.004 J · K
m m( ) (298.15K)H ο−–1 · mol–1, so the derived value of the en-
thalpy of sublimation using the revised thermal functions will differ from this value by less than 0.01 kJ · mol–1. The value selected in [92GRE/FUG] is therefore retained:
f mH ο∆ (U, g, 298.15 K) = (533.0 ± 8.0) kJ · mol–1.
9.2 Simple uranium aqua ions (V.2) No new experimental thermodynamic data related to this section appeared since the previous review in this series [92GRE/FUG]. However, a number of points call for at-tention.
This is particularly the case of the evaluation of the partial molar heat capaci-ties of the U3+ and U4+ ions. In [92GRE/FUG], the estimates of Lemire and Tremaine [80LEM/TRE], were based on the Criss-Cobble relationships [64CRI/COB], [64CRI/COB2], giving:
,mpC (U3+) = − (64 ± 22) J · K–1 · mol–1 (T = 298 to 473 K),
,mpC (U4+) = − (48 ± 15) J · K–1 · mol–1 (T = 298 to 473 K).
These are average values for the temperature range 298.15 to 473 K. However, in the last decade or so, several authors have pointed out the severe limitations of the Criss-Cobble relationships when applied to tri- and tetravalent aqueous ions. This was the case of Shock and Helgeson [88SHO/HEL] who used estimation methods based on revised Helgeson–Kirkham–Flowers (HKF) equations of state for aqueous ions. Along this line, Shock et al. [97SHO/SAS2] (as discussed in Appendix A) estimated ,mpCο (U3+, 298.15 K) = – 152.3 J · K–1 · mol–1, thus ca. 90 J · K–1 · mol–1 more negative than the value accepted in [92GRE/FUG], and ,mpCο (U4+, 298.15 K) = 0.8 J · K–1 · mol–1. The latter value was based on the experimental result ,mpCο (Th4+, 298.15 K) = − (1 ± 11) J · K–1 · mol–1 by Morss and McCue [76MOR/MCC] (see Appendix A).

9.2 Simple uranium aqua ions (V.2)
159
More recently, Hovey [97HOV] (see Appendix A) determined the value ,mpCο (Th4+, 298.15 K) = − (224 ± 5) J · K–1 · mol–1. Using a more recent value for the
heat capacity of the nitrate ion, this author also recalculated the results of Morss and McCue, obtaining − (60 ± 11) J · K–1 · mol–1. Thus, the difference between the two sets amounts to ca. 140 − 160 J · K–1 · mol–1. The experimental conditions used by [97HOV], especially in terms of minimising thorium hydrolysis and complexation, were preferable to those selected by [76MOR/MCC]. Reasons for the discrepancy of the value of ,mpCο (Th4+) = 111 J · K–1 · mol–1 obtained by [75APE/SAH] using the bulk heat capacity of thorium nitrates solutions at 303 K are briefly discussed in the comments on [97HOV] (see Appendix A).
In an earlier study of Al3+, Hovey and Tremaine [86HOV/TRE] also deter-mined ,mpCο (Al3+, 298.15 K) = − 119 J · K–1 · mol–1, while the Criss-Cobble relations led to a value of 16 J · K–1 · mol–1, thus giving a similar difference of 135 J · K–1 · mol–1. In view of the above, this review adopts:
,mpCο (U3+, 298.15 K) = − (150 ± 50) J · K–1 · mol–1,
,mpCο (U4+, 298.15 K) = − (220 ± 50) J · K–1 · mol–1.
The large uncertainties are due, in part, to the fact that the comparison between average values for the temperature range 298.15 to 473 K with values at 298.15 K is not strictly correct. The experimental basis for the selected values is not yet satisfactory and revisions might occur as a result of new studies. The selected heat capacity values should not be used at temperatures above 373 K.
The value ,mpCο ( , 298.15 K) = (42.4 ± 3.0) J · K2+2UO –1 · mol–1 adopted by
[92GRE/FUG] on the basis of the experimental results of [89HOV/NGU] is maintained.
The reduction behaviour of U(VI) to U(IV) in aqueous solutions has been stud-ied by quantum chemical calculations [99VAL/MAR]. As discussed in Appendix A, this approach might soon provide new support when selecting thermodynamic data. Theoretical predictions of redox properties are also given in [2000HAY/MAR] (see Appendix A).
Finally, with regard to simple aqueous uranium ions, semi–theoretical data of entropies, Gibbs energy and enthalpy of hydration of monatomic aqueous ions (U3+, U4+) are discussed in [98DAV/FOU] (see Appendix A). The stability of the oxida-tion states is discussed in [99MIK/RUM].
9.2.1 (V.2.1) 2+2UO
The entropy value, ( , 298.15 K) = − (98.2 ± 3.0) J · KmS ο 2+2UO –1 · mol–1 selected in
[92GRE/FUG] has been questioned in [94SER/DEV] and [97GUR/SER]. According to Gurevich et al. this value is too low by about 15 to 20 J · K–1 · mol–1. As discussed in Appendix A, this review retains the value selected previously.
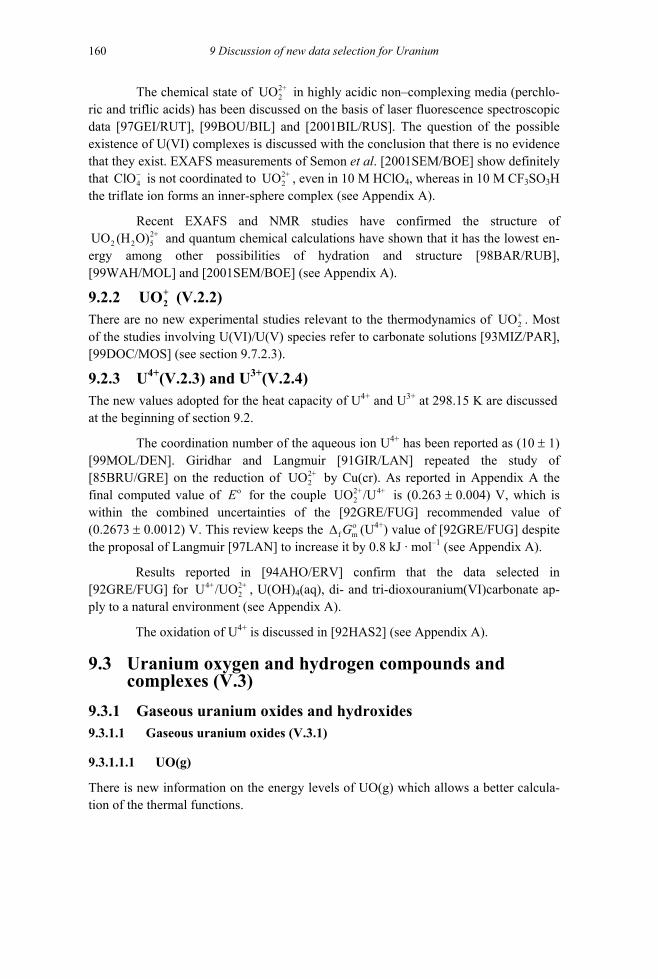
9 Discussion of new data selection for Uranium 160
The chemical state of in highly acidic non–complexing media (perchlo-ric and triflic acids) has been discussed on the basis of laser fluorescence spectroscopic data [97GEI/RUT], [99BOU/BIL] and [2001BIL/RUS]. The question of the possible existence of U(VI) complexes is discussed with the conclusion that there is no evidence that they exist. EXAFS measurements of Semon et al. [2001SEM/BOE] show definitely that is not coordinated to , even in 10 M HClO
2+2UO
2+2UO4ClO−
4, whereas in 10 M CF3SO3H the triflate ion forms an inner-sphere complex (see Appendix A).
Recent EXAFS and NMR studies have confirmed the structure of and quantum chemical calculations have shown that it has the lowest en-
ergy among other possibilities of hydration and structure [98BAR/RUB], [99WAH/MOL] and [2001SEM/BOE] (see Appendix A).
2+2 2 5UO (H O)
9.2.2 (V.2.2) +2UO
There are no new experimental studies relevant to the thermodynamics of . Most of the studies involving U(VI)/U(V) species refer to carbonate solutions [93MIZ/PAR], [99DOC/MOS] (see section 9.7.2.3).
+2UO
9.2.3 U4+(V.2.3) and U3+(V.2.4) The new values adopted for the heat capacity of U4+ and U3+ at 298.15 K are discussed at the beginning of section 9.2.
The coordination number of the aqueous ion U4+ has been reported as (10 ± 1) [99MOL/DEN]. Giridhar and Langmuir [91GIR/LAN] repeated the study of [85BRU/GRE] on the reduction of by Cu(cr). As reported in Appendix A the final computed value of for the couple is (0.263 ± 0.004) V, which is within the combined uncertainties of the [92GRE/FUG] recommended value of (0.2673 ± 0.0012) V. This review keeps the
2+2UO
Eο 2+ 4+2UO /U
f mGο∆ (U4+) value of [92GRE/FUG] despite the proposal of Langmuir [97LAN] to increase it by 0.8 kJ · mol–1 (see Appendix A).
Results reported in [94AHO/ERV] confirm that the data selected in [92GRE/FUG] for , U(OH)4+ 2+
2U /UO 4(aq), di- and tri-dioxouranium(VI)carbonate ap-ply to a natural environment (see Appendix A).
The oxidation of U4+ is discussed in [92HAS2] (see Appendix A).
9.3 Uranium oxygen and hydrogen compounds and complexes (V.3)
9.3.1 Gaseous uranium oxides and hydroxides 9.3.1.1 Gaseous uranium oxides (V.3.1)
9.3.1.1.1 UO(g)
There is new information on the energy levels of UO(g) which allows a better calcula-tion of the thermal functions.

9.3 Uranium oxygen and hydrogen compounds and complexes (V.3)
161
Earlier data derived from matrix isolation studies have been amplified by the recent detailed spectroscopic studies of Kaledin et al. [94KAL/MCC] and Kaledin and Heaven [97KAL/HEA]. They have derived the electronic levels of 16 low-lying elec-tronic states of UO(g), and estimated the distribution of missing energy levels up to 40000 cm–1. Although they have given partial vibrational-rotational data for three of the low-lying levels, we have preferred to use the better-established parameters for the ground state for all the excited levels, as given in Table 9-1, to calculate the thermal functions, using the usual non-rigid rotator, anharmonic oscillator approximation, plus electronic contributions. The derived values at 298.15 K are:
mS ο (UO, g, 298.15 K) = (252.3 ± 2.0) 1 1J K mol− −⋅ ⋅ , ο 1 1− −
,mpC (UO, g, 298.15 K) = (39.6 ± 2.0) J K mol⋅ ⋅ .
Table 9-1: Molecular parameters for UO(g) *.
r (Å) ω (cm–1) ωx (cm–1) B (cm–1) α (cm–1) D (cm–1) Symmetry number
1.838 846.5 2.3 0.3333 3.24 x 10⁻³ 3.43 x 10⁻⁷ 1
Electronic levels (multiplicities) cm–1
0 (2) 294.1 (2) 651.1 (2) 958.7 (2) 1043.0 (2) 1181.3 (2) 1253.7 (1) 1493.3 (2) 1574.1 (2) 1941.5 (2) 2118.8 (2) 2235.0 (2) 2272.0 (1) 2276.5 (2) 2412.6 (1) 2461.9 (2) 5000 (96) 10000 (313) 15000 (507) 20000 (879) 25000 (1271) 30000 (3576) 35000 (6999) 40000 (12810)
*: See section 2.1.6 for notations
We have recalculated the enthalpy of formation from the seven Gibbs energy studies discussed in [82GLU/GUR], giving considerably more weight to mass-loss effu-sion measurements (under mass-spectrometric monitoring) than to the purely mass-spectroscopic data, since the more recent paper by Storms [85STO2] suggests that the ionisation cross-sections of the gaseous uranium oxides are far from certain. The more reliable data [66DRO/PAT], [68PAT/DRO], [69ACK/RAU] give values of f m
ο∆ H (UO, g, 298.15 K) from 31.5 to 42.4 kJ · mol–1, from third-law analyses.
The selected value is:
f mH ο∆ (UO, g, 298.15 K) = (35.0 ± 10.0) kJ · mol–1,
where the uncertainty is increased due to the appreciable discrepancy with the second-law enthalpy values.
This value is just consistent with the value of (7.81 ± 0.1) eV for the dissocia-tion energy of UO(g) derived from appearance potentials given by Capone et al. [99CAP/COL], which corresponds to f mH∆ (UO, g) = (25.4 ± 10.0) kJ · mol–1, if their value is taken to refer to 0 K.

9 Discussion of new data selection for Uranium 162
9.3.1.1.2 UO3(g)
Ebbinghaus [95EBB] has repeated the calculations of the thermal functions of UO3(g), using essentially the same molecular parameters as those used by Glushko et al. [82GLU/GUR], which were adopted by [92GRE/FUG]. Krikorian et al. [93KRI/EBB] have reported transpiration data on the pressure of UO3(g) in equilibrium with U3O8(cr) and oxygen gas from 1273 to 1573 K. Their pressures of UO3(g) from the reaction:
3 8 2 31 1 U O (cr) + O (g) UO (g)3 6
are in good agreement with the similar data by [74DHA/TRI], and other literature data which form the basis of the choice of f mGο∆ (UO3, g) in [82GLU/GUR] and [92GRE/FUG]. The [92GRE/FUG] data for UO3(g) are therefore retained. It is difficult to derive any substantial conclusions from the work of Guido and Balducci [91GUI/BAL], who report values of the equilibrium constant for the reaction UO(g) + UO3(g) 2 UO2(g) at three temperatures from 2304 to 2414 K, measured mass-spectrometrically. The derived third-law value of f mH ο∆ (298.15 K) for this reaction is − 197.3 kJ · mol–1, with a large uncertainty due to the uncertain cross-sections and cor-rections for fragmentation. This is in good agreement with that derived from the se-lected values, − (191.4 ± 33.5) kJ · mol–1. On the other hand the second-law value from the measurements of [91GUI/BAL] is considerably different, at − (138.6 ± 2.9) kJ · mol−1, perhaps due to the quite small temperature range. The most can be said is that these data are not inconsistent with the selected values
9.3.1.2 Gaseous uranium hydroxides
9.3.1.2.1 UO2(OH)2(g)
There are a number of studies relating to gaseous dioxouranium(VI) hydroxide. Dhar-wadkar et al. [74DHA/TRI] were the first to show that the volatility of the higher ura-nium oxides above 1300 K, is substantially enhanced in the presence of water vapour, due to the formation of UO2(OH)2(g). Krikorian et al. [93KRI/EBB] have repeated these measurements, but find equilibrium constants for the reaction:
3 8 2 2 2 21 1U O (cr) + O (g) + H O(g) UO (OH) (g)3 6
,
smaller by a factor of more than 300. More recently, Krikorian et al. [97KRI/FON] have studied the release of uranium-containing species from a 238PuO2 sample containing 3.3 mol% of 234UO2 under similar conditions. Despite some uncertainties in the calculation (particularly of the activity of UO2 in the (U, Pu)O2+x solid solution presumably formed), the releases were in general agreement with those predicted from the data of [93KRI/EBB].
Both Ebbinghaus [95EBB] and Gorokhov and Sidorova [98GOR/SID] have calculated the thermal functions of this species by statistical mechanical calculations,

9.3 Uranium oxygen and hydrogen compounds and complexes (V.3)
163
:
using estimated molecular parameters. However, as noted in Appendix A, the different estimates of the molecular parameters, principally the vibration frequencies, lead to cal-culated standard entropies, which differ by ca. 22.5 J · K–1 · mol–1.
The transpiration measurements of Dharwadkar et al. [74DHA/TRI] and Krikorian et al. [93KRI/EBB] have been analysed with both sets of calculated thermal functions of UO2(OH)2(g) in the respective entries in Appendix A. The results are sum-marised in the first four rows of Table 9-2.
Alexander and Ogden [87ALE/OGD] have also studied reactions involving UO2(OH)2(g). They report, with no further details, the Gibbs energy of the gaseous reaction
3 2 2 2UO (g) + H O(g) UO (OH) (g) (9.1)
to be (9.1) = − 333500 + 156.9 T, J · molr mG∆ –1 over an unspecified temperature range. Although the scantily-reported results of [87ALE/OGD] could never be used as a basis to select data, given the discrepant data from the two other studies of gaseous dioxoura-nium(VI) hydroxide, we have processed the data by second- and third-law analyses. The derived standard enthalpies of formation are included in Table 9-2.
Table 9-2: Derived values of f mο∆ H (UO2(OH)2, g, 298.15 K), kJ · mol–1.
Thermal functions Reference Method
[95EBB] [98GOR/SID] [74DHA/TRI] Second-law – (1212.9 ± 21.5) – (1218.2 ± 21.5) [74DHA/TRI] Third-law – (1262.6 ± 7.8) – (1291.8 ± 10.4)
[93KRI/EBB] Second-law – (1153.6 ± 58.1) – (1157.6 ± 58.1) [93KRI/EBB] Third-law – (1197.2 ± 12.5) – (1224.5 ± 13.3)
[87ALE/OGD] Second-law – 1388.9 – 1397.8 [87ALE/OGD] Third-law – 1301.3 – 1339.6
As noted in Appendix A, Hashizume et al. [99HAS/WAN] have also studied this system. The principal aims were to clarify the kinetics and mechanism of the vola-tilisation process and to assess the validity of selected thermodynamic data needed to interpret the experimental data. However, no new thermodynamic data can be derived from this paper and the authors used the data proposed in the related paper by Olander [99OLA], based principally on the data of Krikorian et al. [93KRI/EBB] and Ebbing-haus [95EBB], to interpret their results.
As can be seen from the Table 9-2, there is a wide variation in the values for the derived enthalpy of formation of UO2(OH)2(g). These big differences, especially the unexplained large discrepancy between the results of the similar studies by [74DHA/TRI] and [93KRI/EBB], plus the appreciably different thermal functions pro-posed by [95EBB], [98GOR/SID] and the substantial differences in the second- and

9 Discussion of new data selection for Uranium 164
third-law analyses shown in Table 9-2, mean that no reliable data for this species can be selected in this review.
9.3.2 Aqueous uranium hydroxide complexes (V.3.2) All the experimental data since 1991 have confirmed the chemical models selected in [92GRE/FUG] and in most cases also the numerical values of the corresponding equi-librium constants. For U(VI), no new species nor the composition of those selected in [92GRE/FUG] have been added or changed. Only some selected equilibrium constants have been revised. For U(IV), the hydrolysis of U4+ has been reviewed according to the behaviour of the other aqueous actinide (IV) ions. New equilibrium constants have been selected.
Different experimental methods have been used with spectroscopy evolving into a very powerful tool for the determination of speciation and calculation of equilib-rium constants, in addition to conventional potentiometric and solubility measurements. Spectroscopy provides a direct measure of the concentration of the U(VI) complexes formed, as compared to standard potentiometry where these quantities must be calcu-lated from known total concentrations of the reactants and the free hydrogen-ion con-centration. The concordant results of these two very different experimental methods provide very strong support for the selected stoichiometry and equilibrium constants. There are in general no serious systematic discrepancies between the results gained from the different approaches. New theoretical developments on both U(VI) and U(IV) have appeared recently and these can be used as a guide for the selection of species.
The reader should note that the name schoepite is commonly applied to a min-eral or synthetic preparation with a formula close to UO3·2H2O. It should be named me-taschoepite [98FIN/HAW] (see Appendix A and section 9.3.3.1.2). However, through-out this review the name ‘schoepite’, commonly used by chemists, is retained.
9.3.2.1 U(VI) hydroxide complexes (V.3.2.1) A number of new papers dealing with U(VI) hydrolysis have appeared since the previ-ous review, [92GRE/FUG]. Those that contain thermodynamic data of dioxoura-nium(VI) hydrolysis species fall into three categories.
The first consists of papers that give new independent data with regard to the constants selected in [92GRE/FUG]. They are evaluated and compared with those in [92GRE/FUG], and provide the basis for new selected values and/or uncertainty ranges. The equilibrium constants for the formation of complexes are collected in Table 9-3 and those for the solubility products of solid phases in Table 9-5. These papers are discussed in sections 9.3.2.1.1 to 9.3.2.1.5 and reviewed in Appendix A.
The second category comprises papers that confirm the [92GRE/FUG] selec-tions on either a quantitative or qualitative basis, where the qualitative support is ob-tained by comparing chemical modelling based on the [92GRE/FUG] data with observations of field or laboratory data from “real” systems. The data are briefly discussed in the appropriate sections 9.3.2.1.1 to 9.3.2.1.5, (and reviewed in Appendix

9.3 Uranium oxygen and hydrogen compounds and complexes (V.3)
165
the appropriate sections 9.3.2.1.1 to 9.3.2.1.5, (and reviewed in Appendix A) with a special emphasis on the possibility of estimating the uncertainties in the previous se-lected data.
The third category of papers deals with the aqueous chemistry of U(VI). It pro-vides thermodynamic information only through the use of the constants selected in [92GRE/FUG]: behaviour of uranium in environmental solutions [97BRU/CAS], [97ELL/ARM], [97GEI/BER], [97MUR], [98CHA/TRI], [98KAP/GER], [99MEI/VOL]; dissolution of spent fuel [96PAR/PYO], [98SER/RON], [98WER/SPA], [2000BRU/CER], [2000BUR/OLS]; spectroscopic identification of species [95ELI/BID], [97SCA/ANS], [98KIT/YAM], [98MOU/LAS] and the calculation of thermodynamic quantities as functions of temperature and pressure [97SHO/SAS]. Some of these papers are reviewed in Appendix A.
There are also papers from which no thermodynamic data can be derived at all, because they lack reliable solubility data [96DIA/GAR], information on the solid phase [97VAL/RAG] or sufficient experimental information [89SER/SAV], [96RAK/TSY] and [97RED].
Experimentally derived equilibrium data reported in the original publications for the equilibrium:
, (9.2) 2+ 2 +2 2 2 UO + H O(l) (UO ) (OH) + H−m n
m nm n n
are given in Table 9-3 as lo . The experimental studies of [92SAN/BRU], [93MEI/KAT], [96MEI/KAT], [98MEI2], [98MEI3], [98YAM/KIT] and [2002RAI/FEL] are based on solubility data and those of [92KRA/BIS], [93FER/SAL], [95PAL/NGU] and [2002BRO] on potentiometry. Most of the data refer to 0.1 M ionic strength, but a wide range of ionic strength is covered. They are useful to ascertain that the chemical models do not vary with ionic strength or ionic medium.
10 ,*g n mb

9 Discussion of new data selection for Uranium 166
Table 9-3: Experimental equilibrium constants for the U(VI) hydroxide system for the equilibria: . 2+ 2 +
2 2 2 UO + H O(l) (UO ) (OH) + H−m nm nm n n
n:m t (°C) Method I (medium) 10 ,
*logn m
b Reference
1:1 25 dis 0.1 M (NaClO4) 1 M (NaClO4)
– (5.91 ± 0.08) – (5.75 ± 0.07)
[91CHO/MAT]
2:1 25 dis 0.1 M (NaClO4) 1 M (NaClO4)
– (12.43 ± 0.09) – (12.29 ± 0.09)
[91CHO/MAT]
2:2 25 pot 0.1 M (NaClO4) – (5.40 ± 0.03)(a) [92KRA/BIS] 5:3 25 pot 0.1 M (NaClO4) – (15.85 ± 0.04)(a) [92KRA/BIS] 5:3 25 pot 0.1 M (NaClO4) – (17.04 ± 0.18)(b) [92KRA/BIS] 3:1 25 sol 0.5 M (NaClO4) − (19.83 ± 0.34)
− (20.18 ± 0.19) − (19.67 ± 0.17)
[92SAN/BRU]
7:3 25 sol 0.5 M (NaClO4) − (32.00 ± 0.17) − (33.32 ± 0.22)
[92SAN/BRU]
2:2 25 pot 3 M (NaClO4) – (5.98 ± 0.02) [93FER/SAL] 5:3 25 pot 3 M (NaClO4) – (16.23 ± 0.05) [93FER/SAL] 2:2 24 sol, sp 0.1 M (NaClO4) – (5.89 ± 0.12) [93MEI/KAT] 2:2 24 sp 0.1 M (NaClO4) – (5.97 ± 0.06) [93MEI/KAT] 2:2 25 pot 0.1 m (tmatfms)* – (5.77 ± 0.01)
– (5.70 ± 0.01)(c) [95PAL/NGU]
5:3 25 pot 0.1 m (tmatfms) – (16.10 ± 0.01) – (16.18 ± 0.01)(c)
[95PAL/NGU]
7:3 25 pot 0.1 m (tmatfms) – (28.80 ± 0.04) – (28.25 ± 0.04)(c)
[95PAL/NGU]
8:3 25 pot 0.1 m (tmatfms) – (37.62 ± 0.07) [95PAL/NGU] 10:3 25 pot 0.1 m (tmatfms) – (60.53 ± 0.08) [95PAL/NGU] 2:2 25 pot 3 M (NaClO4) – (6.24 ± 0.02) [97LUB/HAV2] 5:3 25 pot 3 M (NaClO4) – (16.80 ± 0.04) [97LUB/HAV2] 4:3 25 pot 3 M (NaClO4) – (12.8 ± 0.1) [97LUB/HAV2] 2:2 25 sp 3 M (NaClO4) – (6.13 ± 0.02) [97LUB/HAV2] 5:3 25 sp 3 M (NaClO4) – (16.81 ± 0.02) [97LUB/HAV2] 4:3 25 sp 3 M (NaClO4) – (12.57 ± 0.02) [97LUB/HAV2] 1:2 25 RAMAN var 0.1 to 2.3 M
(tmatfms) (2.1 ± 0.2) to (2.7 ± 0.3)
[2000NGU/PAL]
11:3 25 RAMAN var 0.02 to 0.56 M (tmatfms)
– (78 ± 8) [2000NGU/PAL]
5:3 25 sol, sp 0.1 M (NaClO4) – (17.14 ± 0.13) [96MEI/KAT] 2:2 25 sp 0.1 M (NaClO4) – (6.14 ± 0.08) [96MEI/SCH], [97MEI/SCH] 2:2 25 sp 0.1 M (NaClO4) – (6.145 ± 0.088) [97MEI] 5:3 25 sp 0.1 M (NaClO4) – (17.142 ± 0.138) [97MEI] 2:2 25 sp 0.1 M (NaClO4) – (6.237 ± 0.103) [98MEI] 5:3 25 sp 0.1 M (NaClO4) – (17.203 ± 0.157) [98MEI] 5:3 25 sp 0.1 M (NaClO4) – (17.00 ± 0.17) [98MEI2] 5:3 25 sol 0.1 M (NaClO4) – (17.16 ± 0.18) [98MEI2] 2:2 25 sol 0.1 M (NaClO4) – (6.168 ± 0.056)(d) [98MEI3] 5:3 25 sol 0.1 M (NaClO4) – (17.123 ± 0.069)(d) [98MEI3] 2:2 25 sol 0.1 M (NaClO4) – (6.145 ± 0.088) [98MEI3] 5:3 25 sol 0.1 M (NaClO4) – (17.142 ± 0.014) [98MEI3]
(Continued on next page)

9.3 Uranium oxygen and hydrogen compounds and complexes (V.3)
167
Table 9-3 (continued)
n:m t (°C) Method I (medium) 10 ,
*logn m
b Reference
1:1 25 pot 0.1 M (NaClO4) – (5.01 ± 0.03) [2002BRO] 2:2 25 pot 0.1 M (NaClO4) – (5.98 ± 0.04) [2002BRO] 4:3 25 pot 0.1 M (NaClO4) – (12.39 ± 0.05) [2002BRO] 5:3 25 pot 0.1 M (NaClO4) – (16.36 ± 0.05) [2002BRO] 1:1 25 pot 0.1 M (KCl) – (5.17 ± 0.03) [2002BRO] 2:2 25 pot 0.1 M (KCl) – (5.86 ± 0.04) [2002BRO] 4:3 25 pot 0.1 M (KCl) – (12.00 ± 0.06) [2002BRO] 5:3 25 pot 0.1 M (KCl) – (16.09 ± 0.06) [2002BRO] 1:1 25 pot 1.0 M (KNO3) – (5.85 ± 0.03) [2002BRO] 4:3 25 pot 1.0 M (KNO3) – (11.95 ± 0.05) [2002BRO] 5:3 25 pot 1.0 M (KNO3) – (16.40 ± 0.06) [2002BRO] 7:4 25 pot 1.0 M (KNO3) – (21.79 ± 0.06) [2002BRO]
(*) Tetramethylammonium trifluoromethanesulphonate. (a) Calculated from log with = (13.78 ± 0.01).
10 ,n mb wpK
(b) Reinterpretation by [98MEI2]. (c) Fixing log = − 5.50, = − 22.67.
10 1,1*b
10 7 , 4
*log b(d) Uncertainty in pH not taken into account.
Table 9-4 gives the experimental values of for the equilibria: 10 ,1log nb
2 +2 2 7 2 2 20.5 Na U O H O + ( 3)OH UO (OH) + Na ( 1.5) H O(l)n
nx n x− −⋅ − + − (9.3) (x = 3 to 5).
Table 9-4: Experimental equilibrium constants for the U(VI) hydroxide system for the equilibria (9.3).
n:m t (°C) Method I (medium) 10 ,
*logn m
b Reference
3:1 25 sol 0.5 M (NaClO4) – (7.28 ± 0.37) [98YAM/KIT] 1 M (NaClO4) – (7.45 ± 0.38) [98YAM/KIT] 2 M (NaClO4) – (6.04 ± 0.11) [98YAM/KIT]
4:1 25 sol 0.5 M (NaClO4) – (5.05 ± 0.06) [98YAM/KIT] 1 M (NaClO4) – (4.87 ± 0.04) [98YAM/KIT] 2 M (NaClO4) – (4.50 ± 0.14) [98YAM/KIT]
Table 9-5 gives the solubility product of the solid phases used to deduce equi-librium constants for U(VI) hydrolysis. The solubility product for UO3·2 H2O,
refers to the reaction: 10 ,0log sK
. (9.4) 2+3 2 2 2UO 2H O(cr) UO + 2 OH + H O(l)−⋅
The solubility product for sodium uranate refers to the reaction:
1/2 Na2U2O7(s) + 3/2 H2O(l) Na+ + + 32+2UO OH− , (9.5)
where the values at zero ionic strength were calculated with the SIT by [92SAN/BRU], [98YAM/KIT] or by this review. In selecting values for equilibrium constants, this re-view has considered the relative importance of systematic and random errors. These

9 Discussion of new data selection for Uranium 168
points are discussed in the reviews of individual papers (see Appendix A). In this way, the experimental methods have been compared.
Table 9-5: Literature data for the solubility product of UO3·2H2O and Na2U2O7(s) according to the reactions (9.4) and (9.5), (t = 25°C).
compound I (medium) 10 ,0
logs
K 10 ,0
log ο
sK Reference
UO3·2H2O(cr) I = 0 – (23.19 ± 0.43)(a) [92GRE/FUG] UO3·2H2O(s) 0.1 M (NaClO4) – (22.21 ± 0.01)
– (21.77 ± 0.03)(b) – (22.81 ± 0.01) – (22.37 ± 0.03)
[92KRA/BIS] [92KRA/BIS]
UO3·2H2O(cr) UO3·2H2O(am)
0.5 M (NaClO4) 0.5 M (NaClO4)
– (21.25 ± 0.14) – (20.89 ± 0.14)
– (22.03 ± 0.14) – (21.67 ± 0.14)
[92SAN/BRU] [92SAN/BRU]
UO3·2H2O(s) 0.1 M (NaClO4) – (22.28 ± 0.19) – (22.88 ± 0.19) [93MEI/KIM2] UO3·2H2O(s) 0.1 M (NaClO4) − (22.30 ± 0.07)
− (21.84 ± 0.02)(d)
− (22.90 ± 0.07) − (22.44 ± 0.02)
[96MEI/KAT] [96MEI/KAT]
UO3·2H2O(s) 0.1 M (NaClO4) − (22.15 ± 0.06) – (22.75 ± 0.06) [96KAT/KIM] UO3·2H2O(s) 0.1 M (NaClO4) – (21.81 ± 0.03) – (22.41 ± 0.03) [98MEI2] UO3·2H2O(s) 1 M (NaCl) – (21.94 ± 0.08)(d) – (22.62 ± 0.20) [94TOR/CAS] UO3·2H2O(s) 0.5 m (NaClO4) – 22.35 (d,f) – 23.14 (f) [98DIA/GRA]
Na2U2O7 (cr) I = 0 – (30.7 ± 0.5)(a) [92GRE/FUG]
Na2U2O7 ·x H2O x = 3-5
0.5, 1.0 and 2.0 M (NaClO4)
[98YAM/KIT]
I = 0 – (29.45 ± 1.04)(c) [98YAM/KIT] Na2U2O7·x H2O 0.1 M (NaClO4) – (29.2 ± 0.1)(e) – (29.7 ± 0.1)(e) [98MEI/FIS]
(a) Calculated from thermochemical data for crystalline solids. (b) Reinterpretation by [98MEI2]. (c) Calculated using the formation constant of tricarbonato dioxouranium(VI) of [92GRE/FUG]
(see 9.3.2.1.5.2.2). (d) Value derived using mainly hydrolysis constants selected in [92GRE/FUG]. (e) Calculated from log
10 , 0
*s
K = (24.2 ± 0.2) in 0.1 M NaClO4 and 10 , 0
*logs
K ο = (24.6 ± 0.2). (f) Given without uncertainty.
9.3.2.1.1 Major polymeric species at 298.15 K (V.3.2.1.1)
The solubility of UO2(OH)2·H2O and UO2CO3 were studied by Kramer–Schnabel et al. [92KRA/BIS] at 298.15 K in 0.1 M NaClO4 in the absence and the presence of carbon-ate. The pH range was generally 4.5 to 5.5 for the study with no added carbonate. Spec-trophotometric measurements showed the presence of the 2:2, (UO and 5:3,
, species. The solubility data were then used to obtain lo = (22.16 ± 0.03), lo = (53.05 ± 0.04) and lo
2+2 2 2) (OH)
+2 3 5(UO ) (OH) 10 2,2g b
10 5,3g b 10 ,0g sK (UO2·2H2O) = − (22.21 ± 0.01). This review has recalculated these data to obtain equilibrium constants for the corre-sponding reactions (9.2) using pKw = (13.78 ± 0.01) at I = 0.1 M, and obtains
= − (5.40 ± 0.03) and lo = − (15.85 ± 0.04). Using the interaction 10 2,2*log b 10 5,3
*g b

9.3 Uranium oxygen and hydrogen compounds and complexes (V.3)
169
coefficients in [92GRE/FUG] this review finds at zero ionic strength:
= − (5.19 ± 0.09), 10 2,2*log οb*log οb = − (15.22 ± 0.17), 10 5,3
log K ο 10 ,0s (UO3·2H2O) = − (22.81 ± 0.01),
where is significantly different from that of [92GRE/FUG], where the se-lected values are:
ο10 2,2
*log b
ο10 2,2
*log b*log οb
= − (5.62 ± 0.04), 10 5,3
log= − (15.55 ± 0.12),
K ο10 ,0s (UO3·2H2O) = − (23.19 ± 0.43).
The solubility product of schoepite in [92GRE/FUG] is based on the value = − (27.47 ± 2.44) kJ · molr mGο∆ –1 for the reaction:
+ 2+3 2 2 2UO 2H O(cr) + 2 H UO + 3 H O(l)⋅ ,
10 ,0*log sK ο = (4.81 ± 0.43) ). r mGο∆ is obtained from the appropriate f mGο∆ values, with (UOf mGο∆
f mGο∆3·2 H2O, cr) coming from the Gibbs energy of hydration of γ−UO3(cr) and
from ( ) (in [92GRE/FUG]). Part of the data of [92KRA/BIS] has been rein-terpreted in [98MEI2] (see below).
2+2UO
Potentiometric titrations by Ferri et al. [93FER/SAL] in 3.0 M NaClO4 at 298.15 K were interpreted in terms of hydrolysis with the equilibrium constants
= − (5.98 ± 0.02) and = − (16.23 ± 0.05). The respective values at zero ionic strength using SIT values from [92GRE/FUG] calculated by this review are − (5.54 ± 0.04) and − (15.08 ± 0.70), which are in good agreement with those of [92GRE/FUG].
10 2,2*log b 10 5,3
*log b
Palmer and Nguyen-Trung [95PAL/NGU] used potentiometric titrations of U(VI) in a 0.1 M tetramethylammonium trifluoromethanesulphonate (tmatfms) medium (298.15 K), over the pH range 2.4 to 11.9, to obtain equilibrium constants for the cati-onic U(VI) hydroxide species 2:2 and 5:3, = − (5.77 ± 0.01) and
= − (16.10 ± 0.01), and the anionic 7:3 complex, 10 2,2
*log b10 5,3
*log b ¯2 3 7) (OH)
+2 4 7) (OH)
(UO
+2 4 7) (OH)
7,4b
, = − (28.80 ± 0.04). If two additional complexes UO
10 7,3*log b
2OH+ and (UO are added to the previous chemical model slightly different values of the equilibrium constants are obtained, despite the fact that these species are present in only small amounts. The equi-librium constants for the 1:1, UO2OH+, and 7:4, , complexes could not be determined from the data of [95PAL/NGU], instead the values from [79SYL/DAV] were used. The values lo = − 5.50 and = − 22.76, were used as fixed parameters in a least-squares fit that gave the following values at I = 0.1 M:
(UO
10*log10 1,1
*g b

9 Discussion of new data selection for Uranium 170
10 2,2*log b*log b
= − (5.70 ± 0.01),
10 5,3*log b
= − (16.18 ± 0.01),
10 7,3 = − (28.25 ± 0.04). These values compare well with other data in Table V.5 (page 99) of
[92GRE/FUG]. A reinterpretation made by this review using the primary experimental data obtained from the authors, using the LETAGROP least-squares program, gives similar values as shown in the discussion of the paper in Appendix A, and hence, the values at zero ionic strength are also in agreement.
The formation constants of other trimeric species (8:3, 10:3 and 11:3) reported in [95PAL/NGU] are not accepted and not retained by this review as discussed in sec-tion 9.3.2.1.3 below and in the Appendix A.
Meinrath and co–workers have devoted a number of papers to the determina-tion of and and the solubility product of schoepite, [93MEI/KAT], [93MEI/KIM2], [96MEI/KAT], [96MEI/SCH], [97MEI/SCH], [97MEI], [98MEI], [98MEI2] and [98MEI3], using spectroscopic and solubility meas-urements. These studies have been made in 0.1 M NaClO
10 2,2*log b 10 5,3
*log b
4, at a pH less than 6–7 and temperatures between 297.15 to 298.15 K, under variable partial pressures of CO2,
2. It is not always clear if the authors consider new experimental data in each paper
or use already published data for their reinterpretation. COp
Values of lo are very sensitive to random and systematic errors in the measurement of [H
10 ,*g n mb
+]. Meinrath et al. have paid attention to this. They have made multi-ple calibration points of the glass electrode (mV vs. pH of NIST reference solutions). These data were used in a least-squares analysis to determine a calibration curve. This calibration gives the statistical pH∆ (random error) for a given potential. For instance, from a 5 point pH calibration (1.7 to 10) they derived the following relation between the pH and the measured emf, E, where E is in mV:
pH = (7.078 ± 0.047) − (0.017029 ± 0.000339) E.
It is unfortunate that Meinrath et al. have not calibrated their electrode directly in concentration units to obtain the free hydrogen ion concentration. They instead as-sume = − 0.09, which is in reasonable agreement with the value − 0.1092 de-duced from the SIT method [97MEI], [98MEI3]. It can be noted that hydrogen ion con-centration as
+10 Hlog γ
10log− [H+] can be measured more precisely than the ± 0.047 given in the previous calibration equation. A general comment from this review is that more atten-tion should be given to electrode calibrations in potentiometric determinations of equi-librium constants and where practical, they should also be made in concentration units.
The two first papers of the series [93MEI/KAT] and [93MEI/KIM2] comple-ment each other and give:
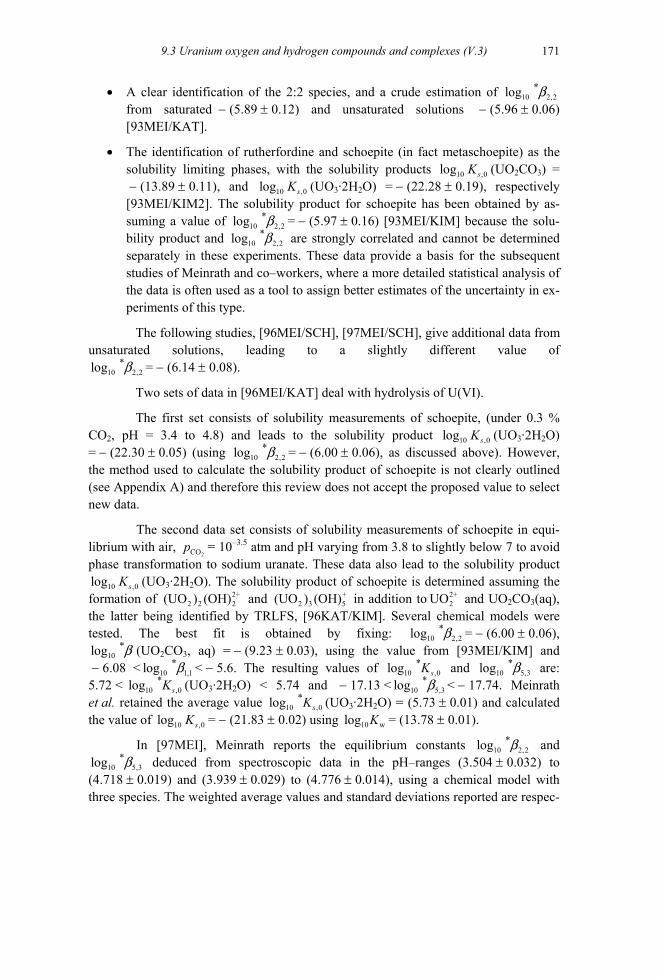
9.3 Uranium oxygen and hydrogen compounds and complexes (V.3)
171
• A clear identification of the 2:2 species, and a crude estimation of from saturated − (5.89 ± 0.12) and unsaturated solutions − (5.96 ± 0.06) [93MEI/KAT].
10 2,2*log b
• The identification of rutherfordine and schoepite (in fact metaschoepite) as the solubility limiting phases, with the solubility products 10 ,0log sK (UO2CO3) = − (13.89 ± 0.11), and lo 10 ,0g sK (UO3·2H2O) = − (22.28 ± 0.19), respectively [93MEI/KIM2]. The solubility product for schoepite has been obtained by as-suming a value of lo = − (5.97 ± 0.16) [93MEI/KIM] because the solu-bility product and are strongly correlated and cannot be determined separately in these experiments. These data provide a basis for the subsequent studies of Meinrath and co–workers, where a more detailed statistical analysis of the data is often used as a tool to assign better estimates of the uncertainty in ex-periments of this type.
10g10log
2,2*b
2,2*b
The following studies, [96MEI/SCH], [97MEI/SCH], give additional data from unsaturated solutions, leading to a slightly different value of
= − (6.14 ± 0.08). 10 2,2*log b
Two sets of data in [96MEI/KAT] deal with hydrolysis of U(VI).
The first set consists of solubility measurements of schoepite, (under 0.3 % CO2, pH = 3.4 to 4.8) and leads to the solubility product lo 10 ,0g sK (UO3·2H2O) = − (22.30 ± 0.05) (using = − (6.00 ± 0.06), as discussed above). However, the method used to calculate the solubility product of schoepite is not clearly outlined (see Appendix A) and therefore this review does not accept the proposed value to select new data.
10 2,2*log b
The second data set consists of solubility measurements of schoepite in equi-librium with air,
2= 10COp –3.5 atm and pH varying from 3.8 to slightly below 7 to avoid
phase transformation to sodium uranate. These data also lead to the solubility product 10 ,0log sK (UO3·2H2O). The solubility product of schoepite is determined assuming the
formation of (UO and in addition to and UO2+2(OH)
10*
2 2)
1,1b
+2 3 5(UO ) (OH) 2+
2UO
10 2,2*b
,0
2CO3(aq), the latter being identified by TRLFS, [96KAT/KIM]. Several chemical models were tested. The best fit is obtained by fixing: = − (6.00 ± 0.06),
(UOlog
10*
10*log b 2CO3, aq) = − (9.23 ± 0.03), using the value from [93MEI/KIM] and
− 6.08 < < − 5.6. The resulting values of log log sK and are: 5.72 <
10 5,3*log b
10*
,0log sK (UO3·2H2O) < 5.74 and − 17.13 < lo < − 17.74. Meinrath et al. retained the average value
10*
5,3bg10 ,0
*log sK (UO3·2H2O) = (5.73 ± 0.01) and calculated the value of 10log ,0sK = − (21.83 ± 0.02) using lo 10 wg K = (13.78 ± 0.01).
In [97MEI], Meinrath reports the equilibrium constants and deduced from spectroscopic data in the pH–ranges (3.504 ± 0.032) to
(4.718 ± 0.019) and (3.939 ± 0.029) to (4.776 ± 0.014), using a chemical model with three species. The weighted average values and standard deviations reported are respec-
10 2,2*log b
10 5,3*log b

9 Discussion of new data selection for Uranium 172
tively = − (6.145 ± 0.088) and = − (17.142 ± 0.138). The model-ling and least-squares analysis relies on statistical criteria using a multivariate technique for analysing the optical density versus pH data. Part of these data (pH = 3.939 to 4.776) is refined in [98MEI] and results in slightly different values of lo = − (6.237 ± 0.103) and lo = − (17.203 ± 0.157).
10 2,2*log b
UO
2,2b+
2 3 5(OH)
10 5,3*log b
2,2
10 2,2*g b
10 5,3*g b
2
10 5,3*g b
lo
10 5,3*log b
2,2b10 ,0g sK lo
10 2,2*g b 10 5,3
*log b10 ,0log sK
10 2,2*b
lo
10 2,2*g οb* ο
In [98MEI2], Meinrath combines new solubility data for schoepite under at-mospheric pressure (pH = 4 to 5.5), with previous data from [93MEI/KIM], [92KRA/BIS], [96MEI/KAT] and [96KAT/KIM], which relate to the same system and analyses them by using chemometric methods. As the direct determination of the free concentration, [ ], from the spectroscopic data is very uncertain, was calculated from the measured concentrations of [H
2+2 lo
2++] and (UO by taking = − (6.145 ± 0.088) [97MEI]. From the concentrations of [H
2 2) (OH)
10 ,0log
10*log
(UO )
+] and one then obtains = − (17.00 ± 0.17). By modelling the solubil-
ity data with the same value of lo Meinrath finds 10 5,3
*g b10
*g b sK (UO3·2H2O) = − (21.81 ± 0.03) and = − (17.16 ± 0.18) where he considers the latter value more precise than the one obtained by spectroscopy. According to Meinrath et al. the species 5:3 dominates only in the narrow region close to the solubility limit of schoepite, [98MEI]. This is the optimal region for the determination of * . 5,3b
Reinterpretation of [92KRA/BIS] data by [98MEI] with a fixed value of * , gives lo (UO3·2H2O) = − (21.77 ± 0.03) and = − (17.04 ± 0.18). 10 5,3
*g b
The paper [98MEI3] gives some additional spectroscopic and solubility data, which do not change their previous values, only the uncertainties, which seem to depend on the calculation methods employed (see Table 9-3).
The investigations of Meinrath and co–workers clearly show the difficulty of finding a set of data fitting both spectroscopic measurements and solubility data. They emphasise the importance of the 2:2 species in U(VI) hydrolysis because its concentra-tion can be determined spectroscopically.
This review considers the most recent equilibrium constants reported by Mein-rath [98MEI3] as the most reliable, lo = − (6.145 ± 0.088), = − (17.16 ± 0.18) and (UO3·2H2O) = − (21.81 ± 0.03), because they were es-tablished from the more precise and cross-checked experimental data that the author obtained (see Appendix A). This review also notes that the values of pro-posed by Meinrath have decreased in magnitude and increased in accuracy from 1993 to 1998 and that the uncertainty in
log
10 ,0g sK (UO3·2H2O) seems very low. Using the auxil-iary data in [92GRE/FUG] to derive values at zero ionic strength from 0.1 M NaClO4 gives:
lolog b
= − (5.93 ± 0.09),
10 5,3
log ο
= − (16.51 ± 0.18), K10 ,0s (UO3·2H2O) = − (22.41 ± 0.03).

9.3 Uranium oxygen and hydrogen compounds and complexes (V.3)
173
As mentioned above, the selected values in [92GRE/FUG] are:
10 2,2*log οb*log οb
= − (5.62 ± 0.04),
10 5,3
log ο
= − (15.55 ± 0.12), K10 ,0s (UO3·2H2O) = − (23.19 ± 0.43).
There are obvious systematic deviations between all of the values from Mein-rath et al. and those selected by [92GRE/FUG]. The solubility product is 0.8 orders of magnitude higher, *
2,2οb is 0.3 orders of magnitude lower and 5,3
* οb is one order of mag-nitude lower. Selected values by [92GRE/FUG] are based on the analysis of numerous compatible experimental values obtained by different groups and different experimental methods. A plausible explanation for the observed discrepancy could be either a sys-tematic error in the determination of lo [H10g +] or a real chemical effect caused by the difference in ionic strength and perchlorate concentration between the experiments of Meinrath et al. (0.1 M NaClO4) and those of most other investigators who in general have worked at much higher ionic strength. For example, an error of 0.15 in log10[H+] would result in log10 2,2
ο*b = − 5.62 and log10 5,3* οb = − 15.75. Small differences in the
crystallinity of schoepite (in fact metaschoepite) could be also a reason for the differ-ences in the values of 10g ,0
* οlo sK .
This review has compared speciation diagrams in 0.1 and 3 M NaClO4 for the U(VI) hydroxide system using the equilibrium constants proposed by Meinrath and co-workers for species 2:2 and 5:3 and those selected in [92GRE/FUG] for zero ionic strength and recalculated to 0.1 and 3 M NaClO4 (see [98MEI] in Appendix A). The − log10[H+] ranged from 2.5 to 5 and the concentration of uranium was chosen as 10−2 M, which optimises the chances of finding the 5:3 species. This concentration is within the range suitable for potentiometric studies. The data selected in [92GRE/FUG] result in much higher concentrations of (U 2 3 5O ) (OH)+ than found when using the data of Meinrath et al. As a matter of fact it would be very difficult to identify this species from potentiometric data if the constant proposed by Meinrath and recalculated to high ionic strength is correct.
This review does not select the Meinrath values despite the fact that his ex-perimental and modelling work are well done. There are no arguments to reject the pre-vious experimental values of 2,2
* οb , 5,3* οb and ,0sK ο which are supported by other recent
studies. On the other hand, a weighted average of all the log10 2,2* οb , log10 5,3
* οb and log10 ,0sK ο values would not change significantly the values selected by [92GRE/FUG] due to the large number of other determinations on which they are based.
The recent potentiometric data of Brown [2002BRO] in 0.1 M NaClO4, 0.1 M KCl and 1.0 M KNO3 (pH = 3 to 6), (see Appendix A) support well the values
and selected by [92GRE/FUG]. This review has calculated from the data obtained in perchlorate medium,
10 2,2*log οb 10 5,3
*log οb10 2,2
*log οb = − (5.76 ± 0.04) and lo = − (15.77 ± 0.05).
10 5,3*g οb

9 Discussion of new data selection for Uranium 174
In conclusion, considering the new data with regard to the determination of log10 2,2
* οb and log10 5,3* οb , this review accepts the equilibrium constants values selected
by [92GRE/FUG] (see Table 9-6).
From the data of Brown [2002BRO], this review has also calculated = − (11.93 ± 0.06) which agrees very well with the value selected by
[92GRE/FUG]. Therefore, the value of [92GRE/FUG] is retained. 10 4,3
*log οb
Papers that give a quantitative confirmation of the data in [92GRE/FUG] focus on the 2:2 and 5:3 species. Only one, [95PAL/NGU], covers a broad concentration − log10[H+] range that involves other species as well. One solubility experiment by Diaz et al. [98DIA/GRA] at 298.15 K in 0.5 molal NaClO4 (– log10[H+] = 4.70), in which crystalline schoepite was characterised as the solid phase, yielded 10 ,0
*log sK = 5.14, which by applying SIT reduces to 10 ,0
*log sK ο (UO3·2H2O) = 4.86 and gives 10 ,0log ο
sK (UO3·2H2O) = − 23.14, which is close to the value selected in [92GRE/FUG] (see Appendix A).
Rizkalla et al. [94RIZ/RAO] conducted calorimetric titrations of solutions con-taining the 2:2 species (I = 1 M, CO2 free tetramethylammonium chloride) and found
r mH ο∆ (2:2) = (44.4 ± 1.9) kJ · mol–1 and r mS ο∆ (2:2) = − (36 ± 6) J · K–1 · mol–1 values close to the ones reported in [92GRE/FUG], p.118, Table V. 8. Dai et al. [98DAI/BUR] reported the determination of the enthalpy of reaction from spectroscopic measurements in 1 M CF3SO3H: r m
ο∆ H (2:2) = 45.5 kJ · mol–1. This value is also in agreement with the values reported in [92GRE/FUG] (Table V.8, p.118).
Sergeyeva et al. [94SER/DEV] analysed the same literature data as [92GRE/FUG] and came to slightly different thermodynamic values at zero ionic strength (298.15 K, 1 bar), due probably to a different appreciation of the validity of experimental data and the method used for extrapolation to I = 0, as discussed in Ap-pendix A.
The solubility study of UO3·2 H2O in 0.1 M NaClO4 (298.15 K) made by Kato et al. [96KAT/KIM] gives a solubility product of this hydrated oxide which, recalcu-lated to zero ionic strength, is 10 ,0log sK ο (UO3·2H2O) = − (22.75 ± 0.06), lower than the value obtained by [92SAN/BRU] for crystalline UO3·2H2O, 10 ,0log sK ο = − (22.03 ± 0.14) and within the uncertainty bands of the value selected in [92GRE/FUG], − (23.19 ± 0.43). The observed difference might be due to differences in the crystallinity of the samples used.
Wruck et al. [97WRU/PAL] used laser induced photoacoustic spectroscopy (LIPAS) to investigate the hydrolysis of U(VI) in 0.1 m NaClO4 solutions and a tem-perature of (298.15 ± 0.5) K in the pH range 3 to 5. Modelling of these data included three species: , UO2+
2UO 2OH+ and (UO with fixed = − 5.8, and resulted in an equilibrium constant = − (5.45 ± 0.05). This value is not very sensitive to the choice of . Extrapolation by this review to zero ionic strength
2+2 2 2) (OH)
10 2,2*log b
10 1,1*log b
10 1,1*log b

9.3 Uranium oxygen and hydrogen compounds and complexes (V.3)
175
using the Davies equation gives 10 2,2*log οb = − (5.23 ± 0.05) and
= − (5.24 ± 0.05) using the SIT approach. These values are considerably different from the value selected by [92GRE/FUG], (see Appendix A).
10 2,2*log οb
10 2,2*log οb
,0sK ο
10 2,2* οb
5,3* οb
10 1,1*g b
10 1,1*g b
Raman spectroscopic data of Nguyen-Trung et al. [2000NGU/PAL] confirmed the existence of the species 2:2, 5:3 and 1:2 in acidic medium (pH < 5.6) of variable ionic strengths as discussed in Appendix A. The corresponding values of the formation constants agree with those of [95PAL/NGU] and [92GRE/FUG] (see above). In the same way, Raman and infrared spectra obtained by Quilès et al. [2000QUI/BUR] con-firmed the presence of the species 2:2 and 5:3 at pH < 4.2, but the values of and of 10 5,3
*log οb are higher than those selected by [92GRE/FUG] (see Appendix A).
Solubility studies in 1 M NaCl (298.15 K) involving dissolution of synthetic amorphous schoepite and precipitation of schoepite on UO2 seeds are described, but no experimental results other than figures are made available [94TOR/CAS]. The authors present only lo 10 ,0
*g sK values which were derived from a speciation model using the data of [92GRE/FUG], and find 10
*log = (5.57 ± 0.08) and (5.92 ± 0.08), respec-tively, for the amorphous and crystalline phases. Further refinement yielded
10 ,0*log sK ο = (5.38 ± 0.20) and (5.73 ± 0.28). The second of these values is considera-
bly higher than that recommended by [92GRE/FUG], 10 ,0*log sK ο = (4.81 ± 0.43). The
reason for this is not clear due to lack of experimental detail in the paper.
For reasons discussed in Appendix A the values of = − (5.80 ± 0.04) or − (5.69 ± 0.04),
log10log = − (15.65 ± 0.70 ) or − (15.66 ± 0.70)
and = − (15. 00 ± 0.90) or − (14.78 ± 0.90 ) derived from the study of Lubal and Havel [97LUB/HAV2], are not considered by this review despite the fact that the two first sets confirm the selected data.
10 4,3*log οb
All the reported data, which use the [92GRE/FUG] selected data as input pa-rameters in modelling, do not reduce the uncertainties in the thermodynamic values.
Data reported in [92FUG] which includes those of [92FUG/KHO] are consid-ered in [92GRE/FUG].
9.3.2.1.2 Monomeric cationic and neutral hydrolysis species (V.3.2.1.2)
The first and second hydrolysis constants for the mononuclear hydroxo species 1:1 and 2:1, , were determined by Choppin and Mathur [91CHO/MAT] at 298.15 K using a solvent extraction technique, in aqueous solutions with the ionic strength 0.1 and 1.0 m NaClO
2 2UO (OH) (aq)
2,1*b
10*log
4. The solutions were in the pH range 5 to 7.5 and were open to the atmosphere. The resulting hydrolysis constants are lo = − (5.91 ± 0.08) (I = 0.1 M) and = − (5.75 ± 0.07) (I = 1.0 M), and
= − (12.43 ± 0.09) and − (12.29 ± 0.09), respectively. The latter value is consistent with that reported for in [2001LEM/FUG] based on the data from [95PAS/KIM], = − 13.15 and gives confidence that the data of Choppin and Mathur are not affected by the presence of carbonate complexes.
lo
2+2
10logPuO
2,1b
9 Discussion of new data selection for Uranium 176
Based on the SIT model and using the values of the ion interaction parameters of [92GRE/FUG], the infinite dilution hydrolysis constants are:
10 1,1*log οb*log οb
= − (5.74 ± 0.88) (from I =1.05 m),
10 1,1
* ο
= − (5.73 ± 0.38) (from I = 0.10 m),
10 2,1log b*log οb
= − (12.07 ± 0.10) (from I = 1.05 m),
10 2,1 = − (12.23 ± 0.09) (from I = 0.10 m).
The selected value for from Table V.7 p.107 of [92GRE/FUG] is − (5.2 ± 0.3), while for only an upper limit − 10.3 is given.
10 1,1*log b
2,110*log b
From the potentiometric data of Brown [2002BRO], this review has calculated = − (4.72 ± 0.37) which is compatible with the value selected by
[92GRE/FUG] within the large uncertainty limit. 10 1,1
*log οb
Based on the new data this review selects the weighted average value of from [92GRE/FUG], [91CHO/MAT] and [2002BRO], lo =
− (5.25 ± 0.24) and 10 1,1
*log οb 10 1,1*g οb
10 2,1*log οb = − (12.15 ± 0.07) which is the weighted average value
of the constants obtained by [91CHO/MAT]. The value 10 2,1*log οb = − (11.3 ± 1.0) ob-
tained by Rai et al. [2002RAI/FEL] from a solubility study of becquerelite has not been considered for the selection for reasons discussed in Appendix A.
9.3.2.1.3 Anionic hydrolysis species (V.3.2.1.3)
The stoichiometry and equilibrium constant of the limiting complex formed in strong alkaline solutions were left open in [92GRE/FUG]. A number of publications dealing with this problem have appeared since 1991.
The data of Sandino [91SAN] reported in [92GRE/FUG] have been reinter-preted [92SAN/BRU] leading to lo 10 7,3
*g οb = − (32.2 ± 0.8) and lo = − (20.1 ± 0.5). These are the unweighted averages derived from solubility measure-ments of crystalline and amorphous schoepite for which solubility products are, respec-tively,
10 3,1*g οb
10 ,0log sK ο = − (22.03 ± 0.14) and − (21.67 ± 0.14). These values are higher than the solubility product deduced from calorimetric data for crystalline schoepite,
10log ,0sK ο
3,1οb lo
= − (23.19 ± 0.43) [92GRE/FUG]. The weighted averaged values of and obtained by [92SAN/BRU] are slightly different but the un-
certainties are reduced (see Appendix A). 10
*log 10 7,3*g οb
The study of Palmer and Nguyen-Trung [95PAL/NGU] has been discussed previously. They interpret their data using a set of trimeric species 7:3 (UO , 8:3 , and 10:3 (UO
2 3 7) (OH)−
22 3 8(UO ) (OH) − 4
2 3 10) (OH) − , which are formed in the pH range 6 to 10. These data are discussed in Appendix A. Based on the review in Appendix A, only the identification of the 7:3 species with the value = − (28.80 ± 0.04) is ac-cepted. Extrapolation to zero ionic strength using SIT with interaction parameters valid
10 7,3*log b

9.3 Uranium oxygen and hydrogen compounds and complexes (V.3)
177
in perchlorate media gives 10 7,3*log οb = − (28.40 ± 0.04) which is far from the value of
Sandino and Bruno [92SAN/BRU].
3 UO
2 2+ 3 H O(l)
2 2+ 4 H O(l)
2UO (OH)
This review selects the value from Sandino and Bruno: lo = − (32.2 ± 0.8), which is based on consistent solubility data and do not assume the for-mation of the 8:3 and 10:3 species, that are not accepted by this review.
10 7,3*g οb
The existence of the species 8:3 and 10:3 is not sufficiently established by the potentiometric titrations, cf. Appendix A. The Raman spectroscopic data of Nguyen et al. [2000NGU/PAL] do not allow a determination of the stoichiometry of the anionic species, as discussed in Appendix A, except for the complex 2
2UO (OH)4− . The identifi-
cation of trimeric species in the pH range 7 to 13 at uranium concentrations above 10–4 M, which have also been postulated by [49SUT], [72MUS], remains a problem to be solved.
Yamamura et al. [98YAM/KIT] have determined the equilibrium constant for the species 3:1, and 4:1 2UO (OH)− 2
2 (OH)4− for reactions:
2+ +2 3UO UO (OH) + 3 H−
2+ 2 +−
,
2 4UO UO (OH) + 4 H .
The solid-state structure of the latter complex was determined by Clark et al. [99CLA/CON]. The structure of the limiting complex at high hydroxide concentrations using EXAFS has also been determined by Clark et al. [99CLA/CON] and by Wahlgren et al. [99WAH/MOL]. The two groups give different interpretations of the experimental findings. Clark et al. propose the species 5:1, 3
2UO (OH)5− , as the limiting complex
based on the co–ordination number determined by EXAFS. Wahlgren et al. find the same co–ordination number and bond distances as Clark et al., but suggest the tetra–hydroxide as the limiting complex, based on a comparison of the experimental U(VI)−OH bond length in the solid and solution at high pH. In addition a comparison is made between these experimental data and the bond lengths calculated for 4:1 and 5:1 complexes and 2
2UO (OH) −4 5
3− using ab initio methods of the theoretical study of Vallet et al. [2001VAL/WAH]. The problem has recently been discussed by Moll et al. [2000MOL/REI] and their conclusion is that 2
2 (OH)4UO − has a very broad range of existence at high pH, but with evidence for the formation of small amounts of
at pH > 14 (see Appendix A). 32UO (OH)5
−
Nguyen et al. [2000NGU/PAL] concluded from their data that there is no evi-dence for the existence of the species 5:1, and they propose 10 4,1
*log οb
10 3,1*g
= − (32.2 ± 1.6), close to the value of [92GRE/FUG]. The solubility experiments of Yamamura et al. [98YAM/KIT] are also in agreement with this interpretation and give more precise val-ues of the equilibrium constants than those of Nguyen et al. This review includes the data of [98YAM/KIT] recalculated to zero ionic strength lo οb = − (20.86 ± 0.79) and = − (32.40 ± 0.68) in the set used to deduce the selected equilibrium con-stants.
10 4,1*log οb
9 Discussion of new data selection for Uranium 178
All these data have been used to revise the corresponding equilibrium con-stants given in [92GRE/FUG]. The new selected value of 10 3,1
*log οb = − (20.25 ± 0.42) is based on the weighted average of values given by [92SAN/BRU] ( lo = − (20.1 ± 0.5)) and [98YAM/KIT] ( lo
10 3,1*g οb
10 3,1*g οb
10 4,1*log
= − (20.86 ± 0.79)). The value for £ − 21.5 [2002RAI/FEL] has not been considered in this selection (see Ap-
pendix A). The selected value 10 3,1
*log οbοb = − (32.40 ± 0.68) is taken from
[98YAM/KIT], (see Appendix A) (Table 9-6). The estimated uncertainty is large in all experimental determinations and more precise new information is desirable.
The recent potentiometric study of Brown [2002BRO] in 1.0 M KNO3 medium (pH = 3 to 6) has shown the formation of (UO2 4 7) (OH)− with lo = − (21.79 ± 0.06) (see Appendix A). This value is close to that selected by [92GRE/FUG] which is therefore retained by this review.
10 7,4*g b
The behaviour of U(VI) in alkaline conditions is still under investigation [2000KON/CLA], [2000NGU/BUR], [2002NGU] and has been the subject of previous investigations [95HOB/KAR] (see Appendix A).
9.3.2.1.4 Other polymeric cationic hydrolysis species (V.3.2.1.4)
Some potentiometric titrations (298.15 K) in sulphate medium (pH less than 6.8) [93GRE/LAG], [2000COM/BRO], [2000MOL/REI] and EXAFS and NMR measure-ments, provide evidence for the existence of ternary polynuclear U(VI) complexes con-taining sulphate and hydroxide/oxide of the type with m = 2, 3 and 4; n = 2, 4, 5 and 7, while the value of r varies between 2 and 4 [2000COM/BRO], [93GRE/LAG].
2 22 4(UO ) (OH) (SO ) m n r
m n r− −
The EXAFS data indicate that the sulphate ligand is bonded as a chelate to U(VI), with no evidence of sulphate bridges. The conditional equilibrium constants, cf. Appendix A, are precise, while the values of depend strongly on the method used to correct the activity coefficient variations in the test solutions, cf. Appendix A and are much less precise.
10 , ,log m n rοb
No values are therefore selected by this review.
9.3.2.1.5 Relevant solubility studies
This section deals with the selection of equilibrium constants for the dissolution of some U(VI) compounds including: UO3·2H2O, named “schoepite”. The section 9.3.3.1.2 deals with thermodynamic data for U(VI) oxide hydrates, UO3·xH2O and U(VI) hydroxide hydrate, UO2(OH)2.
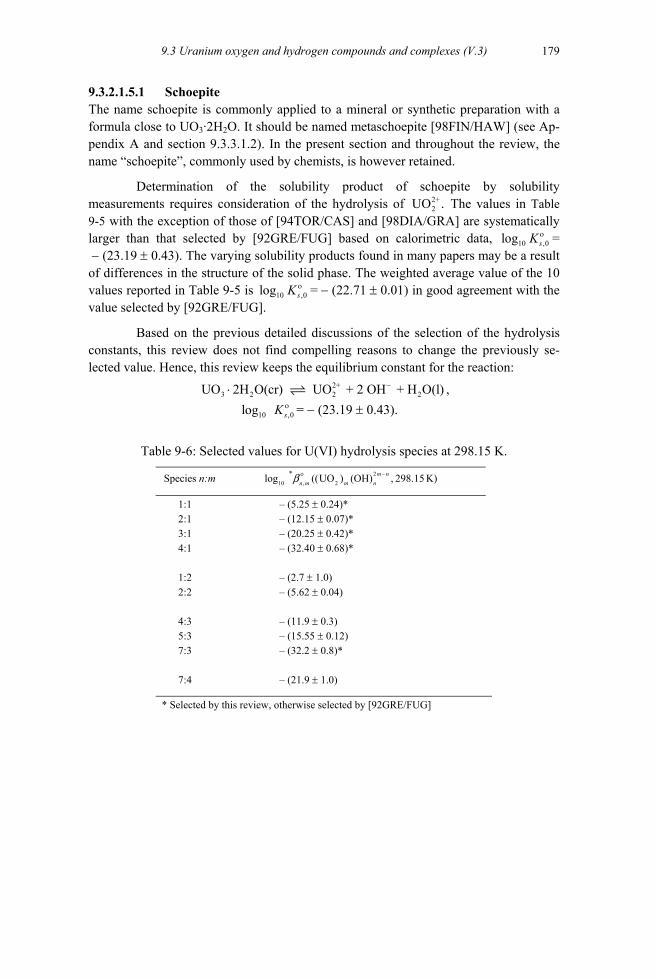
9.3 Uranium oxygen and hydrogen compounds and complexes (V.3)
179
9.3.2.1.5.1 Schoepite The name schoepite is commonly applied to a mineral or synthetic preparation with a formula close to UO3·2H2O. It should be named metaschoepite [98FIN/HAW] (see Ap-pendix A and section 9.3.3.1.2). In the present section and throughout the review, the name “schoepite”, commonly used by chemists, is however retained.
Determination of the solubility product of schoepite by solubility measurements requires consideration of the hydro f 2+
2UO . The values in Table 9-5 with the exception of those of [94TOR/CAS] and [98DIA/GRA] are systematically larger than that selected by [92GRE/FUG] based on calorimetric data, lo
lysis o
10 ,0g sK ο = − (23.19 ± 0.43). The varying solubility products found in many papers may be a result of differences in the structure of the solid phase. The weighted average value of the 10 values reported in Table 9-5 is lo 10 ,0g ο
sK = − (22.71 ± 0.01) in good agreement with the value selected by [92GRE/FUG].
Based on the previous detailed discussions of the selection of the hydrolysis constants, this review does not find compelling reasons to change the previously se-lected value. Hence, this review keeps the equilibrium constant for the reaction:
2+3 2 2 2UO 2H O(cr) UO + 2 OH + H O(l)−⋅ ,
ο10 ,0log sK = − (23.19 ± 0.43).
Table 9-6: Selected values for U(VI) hydrolysis species at 298.15 K.
Species n:m 210 , 2
*log ((UO ) (OH) , 298.15 K)m nn m m nο −b
1:1 – (5.25 ± 0.24)*
2:1 – (12.15 ± 0.07)* 3:1 – (20.25 ± 0.42)* 4:1 – (32.40 ± 0.68)* 1:2 – (2.7 ± 1.0) 2:2 – (5.62 ± 0.04) 4:3 – (11.9 ± 0.3) 5:3 – (15.55 ± 0.12) 7:3 – (32.2 ± 0.8)* 7:4 – (21.9 ± 1.0)
* Selected by this review, otherwise selected by [92GRE/FUG]

9 Discussion of new data selection for Uranium 180
9.3.2.1.5.1.1 Temperature dependence (V.3.2.1.5) Few reliable data can be extracted from the paper [89SER/SAV] dealing with the hy-drolysis of U(VI) as a function of temperature.
The results of the investigation of Redkin [97RED] on the solubility of UO3·H2O in water in the presence of Cu2O/CuO between 473 and 773 K show that there is a progressive dehydration of the oxide to UO3·0.33H2O (423 < T < 573 K) followed by the precipitation of U(VI) hydroxides. The molal solubility of uranium, m(U), in the presence of the two copper oxides is given by:
log10m(U) = 15375.3 T –1 + 0.0647 T − 67.05 (T = 473–573 K) log10m(U) = − 221.7 T –1 − 2.71 (T = 573–773 K)
with postulated to be the predominant species. No additional quantitative thermodynamic information can be extracted from this paper. The solubility of UO
2 3 7(UO ) (OH)−
3·H2O as a function of T is further discussed in section V.3.3.1 in [92GRE/FUG], p.133.
The results of [98DAI/BUR] mentioned in section 9.3.2.1 are discussed in Ap-pendix A.
9.3.2.1.5.2 Polyuranates
9.3.2.1.5.2.1 CaU6O19 · 11H2O(cr) Solubility measurements of the solid phase becquerelite CaU6O19·11H2O(cr) were per-formed by Sandino and Grambow [94SAN/GRA] at 298.15 K in 1 molal CaCl2 at sev-eral pH values, following the equilibrium:
+ 2+ 2+6 19 2 2 2CaU O 11H O (cr) + 14 H Ca + 6 UO + 18H O(l)⋅ .
The mean values for 10 ,0*log sK were calculated by this review as
10 ,0*log sK (CaU6O19·11H2O) = (44.4 ± 0.9), which yielded 10 ,0
*log οsK values of
(39.5 ± 1.0) using SIT. This infinite dilution constant disagrees for unknown reasons substantially from those tabulated by the authors. Rai et al. [2002RAI/FEL] have made a very careful study of the solubility product of a synthetic becquerelite in 2·10–2, 0.1 and 0.5 M CaCl2 at (296 ± 2) K. In the pH range 4.4 to 9, the data refined using hy-drolysis data for U(VI) selected by [92GRE/FUG] and a Pitzer approach give
10 ,0*log sK ο = (41.4 ± 0.2). For reasons discussed in Appendix A, this review increases
the uncertainty and retains lo 10*g ,0sK ο = (41.4 ± 1.2) for the selection of the solubility
product of becquerelite. The selected value is the average of the values (39.5 ± 1.0) and (41.4 ± 1.2):
10 ,0*log sK ο = (40.5 ± 1.6).
The value given by Vochten et al. [90VOC/HAV], 10 ,0*log sK = (43.6 ± 0.3) at
ionic strength 10–2 M is not considered by this review for reasons discussed in Appendix A. The Gibbs energy of formation calculated from lo 10 ,
*g 0οsK is:
9.3 Uranium oxygen and hydrogen compounds and complexes (V.3)
181
f mο∆ G (CaU6O19·11H2O, cr, 298.15 K) = − (10305.5 ± 14.0) . 1kJ mol−⋅
Using natural well characterised becquerelite, Casas et al. [97CAS/BRU] de-rived from solubility measurements at low ionic strength, lo 10 ,0
*g sK ο = (29 ± 1) (see Appendix A). The discrepancy with the [94SAN/GRA] results is attributed to the differ-ences in experimental conditions with regard to aqueous phases and size of the crystal-lites.
9.3.2.1.5.2.2 Na2U2O7 · x H2O(cr) Yamamura et al. [98YAM/KIT] have determined the solubility of a solid phase claimed to contain 3–5 waters of crystallisation. A discussion of the data is given in Appendix A. The experimental solubility data refer to the reaction:
(9.6) 2 42 2 7 3 2 2 3 30.5 Na U O (s) + 3CO + 1.5H O(l) UO (CO ) + 3OH + Na− − +−
3 3
By combining this equilibrium constant with that taken from [92GRE/FUG] for the reaction: 2+ 2 4
2 3 2UO + 3 CO UO (CO )− − , (9.7)
they calculate the solubility product 10 ,0log οsK (9.8) = − (29.45 ± 1.04) and
10 ,0*log sK ο (9.9) = (25.1 ± 2.1) for the reactions:
, (9.8) 2+ +2 2 7 2 20.5 Na U O (s) + 1.5H O(l) UO + 3OH + Na−
+ 2+2 2 7 2 2
+Na U O (s) + 6 H 2 UO + 3 H O(l) + 2 Na . (9.9)
The value of 10 ,0*log sK ο (9.9) = (25.1 ± 2.1) is consistent with, but less precise
than, the value calculated using the data in [92GRE/FUG], 10 ,0*log sK ο
10 ,0log(9.9) =
(22.6 ± 1.0). The respective values for equilibrium (9.8) are sK ο (9.8) = − (29.45 ± 1.04) [98YAM/KIT] and lo 10 ,0g sK ο (9.8) = − (30.7 ± 0.5) [92GRE/FUG]. The Gibbs energy of formation 7of 2 2Na U O (cr) in [92GRE/FUG] refers to a crystalline anhydrous phase. The good agreement between the two values indicates either that the Gibbs energy contribution of structural water is not significantly different from that of free liquid water, or that the solid phase used in [98YAM/KIT] is anhydrous.
The solubility product for reaction (9.9) has also been calculated by Meinrath et al. [98MEI/FIS], lo 10 ,0
*g sK ο = (24.6 ± 0.2), but as indicated in Appendix A, this value is based on assumptions of the composition of the solid phase that are not justified, so even if these data confirm the values given above, they are not used to calculate the solubility product for equation (9.9).
This review keeps the value selected in [92GRE/FUG].
9.3.2.1.5.2.3 NaxUO(3+x/2)·H2O(cr) Díaz Arocas and Grambow [98DIA/GRA] studied the precipitation of U-containing phases and found compositions of hydrated NaxUO(3+x/2) phases with values of x from 0

9 Discussion of new data selection for Uranium 182
+
to 1, in NaCl, as the ratio Na+/H+ is increased. For x = 1/3 the solubility product for the reaction:
+ 2+0.33 3.165 2 2 2Na UO 2H O(s) + 2.33 H UO + 3.165 H O(l) + 0.33 Na⋅
is 10 ,0*log sK = (7.95 ± 0.15), at 298.15 K, and I = 3 m NaCl. The authors give
10 ,0*glo sK ο
= (7.13 ± 0.15) (see Appendix A). No other reliable solubility product for this phase has been reported and this review does not select a value for the solubility product for Na2U6O19·12 H2O.
9.3.2.1.5.2.4 K2U6O19 · 11H2O(cr) Solubility measurements of the compreignacite, K2U6O19·11H2O(cr), were performed by Sandino and Grambow [94SAN/GRA] at 298.15 K in 1 molal KCl at several pH values, following the equilibrium:
+ + 2+2 6 19 2 2 2K U O 11H O (cr) + 14H 2K + 6 UO + 18H O(l)⋅ .
The mean values for 10 ,0*log sK was calculated by this review as
10 ,0*log sK (K2U6O19·11H2O) = (40.2 ± 1.2), which yielded a 10 ,0
*log οsK value of
(37.1 ± 0.5) using SIT. This infinite dilution constant disagrees for unknown reasons substantially from those tabulated by the authors. This review retains the recalculated solubility products. The Gibbs energies of formation calculated from lo 10
*g ο,0sK is:
1−f m
ο∆ G (K2U6O19·11H2O, cr, 298.15 K) = − (10337.1 ± 11.0) kJ . mol⋅
9.3.2.2 U(IV) hydroxide complexes (V.3.2.3) The hydrolysis behaviour of U4+ aqueous ions is difficult to ascertain, because of the easy oxidation of U(IV) to U(VI) and the precipitation of hydrous oxide phases, with poor crystallinity and small particle size, which are commonly denoted UO2(am) and microscrystalline UO2(cr). The problem encountered in these systems has been exten-sively discussed in [92GRE/FUG] where it was concluded that it was only possible to select the following thermodynamic quantities:
10 1*log οb
ο
(UOH3+) = − (0.54 ± 0.06) (page 123),
f mG∆ (UO2, cr, 298.15 K) = − (1031.8 ± 1.0) 1kJ mol−⋅ (page 140), ο
f mG∆ (U(OH)4, aq, 298.15 K) = − (1452.5 ± 8.0) 1kJ mol−⋅ (page 126).
To clarify the following discussion in this section, we have used auxiliary data of [92GRE/FUG] to calculate the equilibrium constants for the following reactions:
+ 4+2UO (cr) + 4 H U + 2H O(l)2 10 ,0
*log sK ο = − (4.85 ± 0.33), 4+UO (cr) + 2H O(l) U + 4OH− log K ο
2 2 10 ,0s = − (60.86 ± 0.36),
ο2 2 4UO (cr)+ 2H O(l) U(OH) (aq) 10 ,4log sK = − (9.5 ± 1.0),
which are consistent with a value of 10 4log οb = (51.36 ± 1.06).

9.3 Uranium oxygen and hydrogen compounds and complexes (V.3)
183
In [92GRE/FUG] no thermodynamic quantities are selected for UO2(am), be-cause thermodynamic constants are not defined for an amorphous phase and will vary with the "ripening" of this phase. However, thermodynamic data were given for some other amorphous phases in [92GRE/FUG]. The present review prefers, for the reason given, not to select Gibbs energies of formation for amorphous phases. A solubility product for UO2(am) is given in Table 9-7 with a remark that it is selected as the value to be used to calculate the U(IV) concentration in the presence of UO2(am). The litera-ture data for ∆ (UOf mGο
2, am, 298.15 K) range from − 977 to − 1003.6 [92GRE/FUG].
1kJ mol−⋅
Some additional information can be extracted from the papers, which have ap-peared either since 1991, dealing with U(VI) hydrolysis [94SER/DEV], [95RAI/FEL], [95YAJ/KAW], [96RAK/TSY], [97LAN], [97RED], [97TOR/BAR], [98CAS/PAB], [99NEC/KIM] and [2001NEC/KIM] or before 1991, [90PHI].
The report of Philips [90PHI] is not explicitly mentioned in [92GRE/FUG], but his selected values for U(IV) hydrolysis, are either estimated or less critically evaluated than those selected in [92GRE/FUG], as discussed in Appendix A. The same is the case for the paper of Sergeyeva et al. [94SER/DEV]. Analysis of the same data in [94SER/DEV] and [92GRE/FUG] leads to slight differences at zero ionic strength (298.15 K), probably due to different conclusions as to the accuracy of experimental data and the method used for extrapolation to I = 0. For instance for the reaction:
4+ 3+ +2U + H O(l) UOH + H
the value recommended by Sergeyeva et al. is 10 1*log οb = − (0.4 ± 0.2), while the value
selected in [92GRE/FUG] is 10 1*log οb = − (0.54 ± 0.06).
Langmuir [97LAN] reviewed the literature data including those considered in [92GRE/FUG] and questioned the selected values concerning U(OH)4(aq) and UO2(am). This review gives comments on the remarks of Langmuir in Appendix A.
In a critical review of the hydrolysis data of all the tetravalent actinides and from theoretical considerations, Neck and Kim [99NEC/KIM] calculated = 13.8,
10 1log οb10 2log οb = 27.5, = 36.2 and 10 3log οb 10 4log οb = 45.7, by assuming as an input
experimental parameter lo 10 1g οb = (13.6 ± 0.2) (see Appendix A). This last value is different from that selected in [92GRE/FUG]. Neck and Kim take an averaged value of the values selected by [92GRE/FUG] 10log 1
* οb = − (0.54 ± 0.06) and by [92FUG/KHO], = − (0.34 ± 0.20). The reason is that the selection of [92FUG/KHO] is not explicitly discussed in [92GRE/FUG]. The value taken by Neck and Kim, = − (0.4 ± 0.2) is the same as the recommended value of [94SER/DEV]. Refined estimated values are given by Neck and Kim in [2001NEC/KIM] and are considered by this review;
10log
1* οb
1* οb
10log
10 2log οb = (26.9 ± 1.0) and 10log 3
οb = (37.3 ± 1.0), but are not retained (see 9.3.2.2.4) for the selection of equilib-
9 Discussion of new data selection for Uranium 184
rium constants. The lo value derived from solubility data is discussed in section 9.3.2.2.3.
10 4,1g οb
f mGο∆
10*log
U
UO (am)
10 ,0*log sK ο
kJ mol⋅
UO (am,
No evidence for the formation of the anionic complex 5U(OH)− has been given since the estimate of ( 5U(OH)− , 298.15 K) by [92GRE/FUG]. This review does not select any value for 5
οb .
The following discussion concerns the dissolution of, first UO2(am), and then UO2(cr).
Grenthe et al. [92GRE/FUG] reported a formation constant for the polynuclear U(IV) hydroxide complex 9
6 (OH) + , proposed by Baes and Mesmer [76BAE/MES] from a reanalysis of the potentiometric titration study of Hietanen [56HIE]. However, it is not possible to extrapolate the value of lo (3 M NaClO10 15,6
*g b 4) = − (16.9 ± 0.6) to I = 0. For a complex of such high charge there are no SIT coefficients available nor can they be estimated by analogies.
15
9.3.2.2.1 Solubility of UO2(am) (≡ UO2(am, hydr.))
In the previous review [92GRE/FUG] no thermodynamic data have been selected for UO2(am). The equilibrium constants reported for the reactions:
(9.10) + 4+2 + 4 H U + 2 H O(l) 2
are largely discrepant. They range from 10 ,0*log sK ο (9.10) = − (3.2 ± 0.2), [78NIK/PIR]
to an upper limit of (9.10) < 4.3 [60STE/GAL] for an active form of hydrated oxide. The values determined by Bruno et al. [86BRU/FER] in 3 M NaClO4,
10 ,0*log sK (9.10) = (0.5 ± 0.3) for an amorphous phase and 10 ,0
*log sK
63 5U(CO )
(9.10) = − (1.2 ± 0.1) for the "ripened" phase, show the effect of differences in crystallinity. The data of Rai et al. [98RAI/FEL] on the solubility of UO2(am) in carbonate media, corrected by taking into account the formation constant of , give −
10 ,0*log sK ο (9.10) = − 0.2 (see Appendix A).
The solubility of freshly precipitated amorphous UO2(am, hydr.) was measured by Rai et al. [97RAI/FEL] at various ionic strengths (0.03 to 6 m NaCl, 1 to 3 m MgCl2) in the pH range 2 to 4.5 and under conditions designed to prevent U(IV) oxidation. The data were processed by the Pitzer ion-interaction approach to give f mGο∆
∆
of U4+, UOH3+ and UO2(am). The two first values are very close to the recommended values of [92GRE/FUG] as discussed in Appendix A. The reported value of (UOf mGο
2, am, 298.15 K) = − 990.77 by [97RAI/FEL] is within the range of values given in [92GRE/FUG] (see section 9.3.2.2). The corresponding value of the equilibrium con-stant for
1−
4+2 2 hydr.) + 2 H O(l) U + 4OH− (9.11)
is 10 ,0log οsK (UO2, am, hydr., (9.11)) = − 53.45. The data of [97RAI/FEL] are consid-
ered in the section 9.3.2.2.3 below to derive a selected value of 10 ,0log οsK (UO2, am,
hydr., (9.11)).
9.3 Uranium oxygen and hydrogen compounds and complexes (V.3)
185
9.3.2.2.2 Solubility of UO2(cr)
The solubility of UO2(cr) is discussed in a short paper by Redkin [97RED]. He gives a value of 2·10–9 molal for the solubility of UO2(cr) over the temperature range 573.15–873.15 K. The fugacity of oxygen was controlled by Ni–NiO and Fe2O3–Fe3O4 couples and the pressure was 1 kbar. This confirms earlier results of the negligible temperature dependence [87DUB/RAM], [89RED/SAV] of the solubility of UO2, also discussed in [92GRE/FUG]. For the dissolution reaction:
, (9.12) 2 2 4UO (cr) + 2 H O(l) U(OH) (aq)
Redkin gives 10 ,4log sK ο = − 8.7 (pH = 7, 1 kbar) compared to an average value of 10 ,4log sK ο = − (9.47 ± 0.56) reported by [88PAR/POH] from data at pH > 4 over the
temperature range 373 − 573 K (0.5 kbar of H2). This paper also gives other data on the solubility of UO2(cr) in acidic and basic solutions at various redox potentials from which little quantitative thermodynamic information can be extracted.
Rakitskaya et al. [96RAK/TSY] showed that the solubility of non–stoichiometric UO2(cr) (O/U = 2.005 to 1.985) in water (pH = 7) at 300 K, after one year of equilibration, is higher for the oxide which contains the highest content of U(VI). This behaviour is not surprising. According to these authors, the solubility of UO2 is dependent on oxide ion diffusion. On the other hand, the work of Torrero et al. [97TOR/BAR] shows that the dissolution rate of UO2(cr) in NaClO4 is pH and O2 de-pendent with a fractional rate order that indicates that adsorbed oxygen acts as an oxi-dant (a layer of UO2+x is formed with, according to the authors, O/U = 2.25 at pH > 6.7).
The solubilities of crystalline and microcrystalline UO2(cr) were measured by Yajima et al. [95YAJ/KAW] in 0.1 M NaClO4 (pH = 2 to 12, T = 298.15 K), where the approach to equilibrium was both from under- and over-saturation. In general, lower solubilities were obtained than in [90RAI/FEL]. Below pH = 2, the slope of log10m(U) versus pH, was approximately − 4, whereas above pH = 4 the uranium concentration was independent of pH. The constants derived from the experimental results are scat-tered with lo 10 ,0
*g sK ο = (0.34 ± 0.4) and 10 ,4log sK ο = − (8.7 ± 0.4), respectively, for the reactions:
+ 4+2UO (cr) + 4 H U + 2 H O(l),2 (9.13)
2 2 4UO (cr) + 2 H O(l) U(OH) (aq). (9.14)
The solubility constant for the reaction,
UO2(cr) + 2 H2O U4+ + 4 OH–, (9.15)
is more than four orders of magnitude larger than lo 10 ,0g sK ο (UO2, cr, 298.15 K, (9.15)) = − (60.86 ± 0.36) calculated from the f mGο∆ values of UO2(cr) and U4+ and auxiliary data selected in [92GRE/FUG]. This could be due to either poor control on the redox

9 Discussion of new data selection for Uranium 186
potential or formation of UO2(am)1. The value of 10 4*log οb
(OH) (aq)
= − (9.0 ± 0.5) or = (47.0 ± 0.5) is in reasonable agreement with [2001NEC/KIM]. This value is considered in the next section for the selection of thermodynamic data.
10 4log οb
10log
4οb
10 3g οb
,0sK ο4οb
U(OH)
10 ,0sK ο = − made avai
culated from
(60.20 ± 0.24) for t -librium, UO2(cr) + 2H2O U4+ + 4OH–, lable [2003RAI/ s latter value is very clo that cal calorimetric data. The value
< − 11.6 (or
he equiYUI]. Thi
9.3.2.2.3 Comparison of the solubilities of UO2(am) and UO2(cr)
All the recent [95YAJ/KAW], [97RAI/FEL] and earlier [83RYA/RAI], [90RAI/FEL] experimental data on the solubility of UO2(am) and UO2(cr) as a function of − log10[H+], have been reinterpreted by Neck and Kim [99NEC/KIM], [2001NEC/KIM], taking into account the literature data on other tetravalent actinides (see Appendix A).
What appears new in these studies is that the U(IV) concentrations in equilib-rium with UO2(cr) and UO2(am) are the same at pH above 6, such that UO2(am) is the solubility limiting solid phase of U(IV) in neutral and alkaline aqueous solutions2. Ac-cording to [2001NEC/KIM], the experimental data determined with UO2(cr) must be ascribed to the dissolution of an amorphous surface layer according to :
2 2 4UO (am) + 2H O(l) U . (9.16)
Consequently the f mGο∆ (U(OH)4, aq, 298.15 K) value must be revised. Indeed this value comes from studies which assume that UO2(cr) is the equilibrium phase [92GRE/FUG].
For UO2(am) [2001NEC/KIM] provides the best fit of solubility data and gives 10 ,0log ο
sK (UO2, am, hydr., (9.11)) = − (54.5 ± 1.0) and 4οb = (46.0 ± 1.4), deduced
according to the relationship:
10 4log [U(OH) (aq)] = 10 ,0log sK ο (UO2, am, (9.11)) + 10 4log οb = − (8.5 ± 1).
The constants ,0sK ο (9.11) for UO2(am) and derived by Neck and Kim come from experimental data and values of 2
οb and 3οb are estimated on the basis of selected
values of as discussed above. For U(IV) this is currently the best manner in which to derive the thermodynamic values
1οb
10g 2lo οb and lo .
Using the relationship:
10 ,4log sK ο (UO2, cr) = 10log (UO2, cr, (9.15)) + , 10log
this review has calculated for the reaction:
2 2 4UO (cr) + 2 H O(l) (aq) ,
1 During the Peer Review process the value log
se to10g
was
10 4*log οb 4lo οb < 44.4) was al de available.
2 e Peer Revi tional ade available [2003RAI/YUI] supporting this conclusion.
so ma data was mDuring th ew process addi

9.3 Uranium oxygen and hydrogen compounds and complexes (V.3)
187
10 ,4log sK ο
f mGο∆(UO2, cr) = − (14.86 ± 1.44), which using auxiliary data gives
(U(ΟΗ)4, aq, 298.15 K) = − (1421.30 ± 8.18) 1kJ mol−⋅
10 ,0g. This review does not
select any value of (UOf mGο∆ 2, am, 298.15 K) from lo sK ο (UO2, am, hydr., (9.11)) and auxiliary data following [92GRE/FUG] for the reasons discussed above (section 9.3.2.2).
9.3.2.2.4 Selection of equilibrium constants
The review retains as new selected equilibrium constants for U(IV), the value = (46.0 ± 1.4) given by Neck and Kim [2001NEC/KIM]. The values = (26.9 ± 1.0) and
10 4log οb10 2log οb 10 3log οb
U(OH
10 1log
= (37.3 ± 1.0) also given by Neck and Kim [2001NEC/KIM], which are estimated, cannot be selected according to the NEA TDB Guidelines because only data supported by experiment can be selected. The estimation of and lo is well founded. It relies on general principles of actinide complexation chemistry and correlation among different actinides and oxidation states. There is some evidence for in [89GRE/BID] and for in [87BRU/CAS] (see [92GRE/FUG]). As no new experimental data have appeared since the previous review on the formation of the species UOH
10log 2οb 10 3g οb
2+2) +
3U(OH)
3+, this review keeps the value selected by [92GRE/FUG], οb = (13.46 ± 0.06), ( 10 1
*log οb = − (0.54 ± 0.06)). The value lo 10g ,0
οsK (UO2, am, hydr., (9.11)) = − (54.5 ± 1.0) is selected as a constant to
be used to calculate a concentration of U(IV) in aqueous solutions equilibrated with UO2(am). Table 9-7 summarises the selected equilibrium constants by this review and [92GRE/FUG] for U(IV) hydroxide complexes and compounds and a value for
10 ,0log οsK (UO2, am, hydr., (9.11)).
Table 9-7: Solubility products and overall formation constants [2001NEC/KIM].
Species or compound 10 ,0log οsK 10log ο
mb
UO2(am, hydr.) – (54.5 ± 1.0) *# UO2(cr) – (60.86 ± 0.36)**
3U(OH) + (13.46 ± 0.06)**, 13.8(a), (13.6 ± 0.2)(b) 2U(OH)2
+ (26.9 ± 1.0)(a)
3
U(OH) (U(OH)+ (37.3 ± 1.0)(a)
4 aq) (46.0 ± 1.4)*
* selected by this review, (a) estimated. ** from [92GRE/FUG]. (b) averaged selected constants (see text). # to calculate U(IV) concentration in equilibrium with UO2(am).
Casas et al. [98CAS/PAB] used all the selected values by [92GRE/FUG] for U(IV) hydrolysis for modelling the solubility of UO2(cr) and uraninite UO2+x(cr) in an-oxic (and oxic) conditions. As discussed in Appendix A, discrepancies between pre-dicted and measured uranium concentrations could be due to the size of microcrystal-lites of uranium dioxide.

9 Discussion of new data selection for Uranium 188
9.3.2.3 U(III) hydroxide complexes (V.3.2.4) No experimental data have been reported but thermodynamic estimations can be found in [98SAV]. They have not been retained for reasons given in Appendix A.
9.3.3 Crystalline and amorphous uranium oxides and hydroxides (V.3.3)
9.3.3.1 U(VI) oxides and hydroxides (V.3.3.1)
9.3.3.1.1 Other forms of anhydrous UO3(cr) (V.3.3.1.2)
The value selected in [92GRE/FUG] for the enthalpy of formation of δ–UO3, − (1209 ± 5) kJ · mol–1, was based on an early determination by Cordfunke [64COR] who used a sample which was a mixture of α–UO3 and δ–UO3. More recently, in a the-sis, [90POW] reported a new value, using a sample of δ–UO3 prepared by thermal de-composition, at 648 K, of β–UO3⋅H2O. X–ray powder diffraction indicated that no phases other than δ–UO3 were present. The medium used for the dissolution of the sam-ple was the same as that used by Cordfunke and Ouweltjes [77COR/OUW2], 0.0350 M Ce(SO4)2 + 1.505 M H2SO4. The author [90POW] reported sol mH∆ (UO3, δ) = − (94.71 ± 0.72) kJ · mol–1 (the uncertainty limits being ours). These results are also reported with less detail by Dickens et al. [89DIC/LAW]. The use of the enthalpy of solution of γ–UO3 from [77COR/OUW2] (– (84.64 ± 0.38) kJ · mol–1), together with the [92GRE/FUG] value for the standard enthalpy of formation of γ–UO3, leads to:
f mH ο∆ (UO3, δ, 298.15 K) = − (1213.73 ± 1.44) kJ · mol–1
which is the accepted value, consistent with, but more precise than, that selected in [92GRE/FUG].
Using the same medium, Dickens et al. [88DIC/POW] report sol mH∆ (UO3, α) = − (96.03 ± 0.72) kJ · mol–1. This value leads to:
f mH ο∆ (UO3, α, 298.15 K) = − (1212.41 ± 1.45) kJ · mol–1,
which we accept, being more precise than that selected in [92GRE/FUG] ( f mH ο∆ (UO3, α, 298.15 K) = − (1217.5 ± 3.0) kJ · mol–1) and consistent with the selection for the δ phase.
It is worth recalling here that α–UO3 has a vacancy structure [66LOO/COR] and that small variations in stoichiometry may be responsible for variations in the en-thalpies of solution.
9.3.3.1.2 U(VI) hydrated oxides and hydroxides (V.3.3.1.5)
Structural and thermodynamic data on synthetic or natural uranium trioxide hydrates and dioxouranium hydroxide are discussed in [92GRE/FUG]. The inter-relationships between all of them is complicated and it is generally difficult to identify, at the condi-tions reported in papers dealing with solubility studies, which solid phase is really pre-

9.3 Uranium oxygen and hydrogen compounds and complexes (V.3)
189
sent. Since the previous review, Finch et al. [92FIN/MIL] focus on the synthetic and naturally occurring trioxide UO3·2H2O. Gurevich et al. [97GUR/SER] discuss some transformations among dioxouranium hydroxide and the uranium trioxide hydrates. Finch et al. [98FIN/HAW], [96FIN/COO] and Sowder et al. [99SOW/CLA] clarified the situation among U(VI) trioxide hydrates with the identification of schoepite as (UO2)8O2(OH)12·12H2O (formally UO3·2.25H2O), metaschoepite as (UO2)8O2(OH)12·10H2O (formally UO3·2H2O) and dehydrated schoepite as UO2O(0.25−x)(OH)(1.5+2x) 0 < x < 0.25 (formally UO3·0.75H2O to UO3·H2O). Schoepite and metaschoepite are orthorhombic and dehydrated schoepite is isostructural with α-UO2(OH)2 but with anion vacancies. All forms of schoepite are structurally and chemi-cally distinct from the three dioxouranium hydrates, UO2(OH)2.
To summarise, for UO3·xH2O three polymorphs exist (α-orthorhombic: schoepite, x = 2.25; β-orthorhombic: metaschoepite, x = 2 and γ-orthorhombic: dehy-drated schoepite, x < 0.75) and for UO2(OH)2 or UO3·H2O three polymorphs exist (α-orthorhombic, β-orthorhombic and γ-monoclinic) (see [98FIN/HAW] in Appendix A). Numerous compositions for x = 0.9 to 0.333 have been identified, but it is not clear to which series they belong.
9.3.3.1.2.1 UO3·2H2O (cr) The value = − (1826.1 ± 1.7) f m 3 2(UO 2H O, 298.15 K)H ο∆ ⋅ 1kJ mol−⋅
kJ m was selected in
[92GRE/FUG] on the basis of an assessed value of − (30.6 ± 1.2) 1ol−⋅ for the dif-ference of dissolution in dilute hydrofluoric acid of UO3·2H2O(cr) and γ–UO3. The fol-lowing thermodynamic quantities were also selected in [92GRE/FUG]:
= (188.54 ± 0.38) J Km 3 2(UO 2H O, cr, 298.15 K)S ο ⋅ 1 1mol− −⋅ ⋅ , ο = 84.238 + 0.294592 T ,m 3 2(UO 2H O, cr, 298.15 K)pC ⋅ 1 1J K mol− −⋅ ⋅
which gives: C = (172.070 ± 0.340) ,m 3 2(UO 2H O, cr, 298.15 K)pο ⋅ 1 1J K mol− −⋅ ⋅ . Fi-
nally, = − (1636.5 ± 1.7) f m (UGο3 2O 2H O, cr, 298.15 K)∆ ⋅ 1kJ mol−⋅ .
These selected values come mainly from [88TAS/OHA] (see Appendix A).
There were no more recent determinations on these compounds, which are nevertheless mentioned here for the convenience of the following discussions.
The Gibbs enthalpy of dissolution of UO2(OH)2(aq) is calculated from the value selected by this review, of 10 2,1
*log οb = − (12.15 ± 0.07) (see Table 9-6). For the reaction:
, 3 2 2 2 2UO 2H O (cr) UO (OH) (aq) + H O(l)⋅
the value r mGο∆ = (41.9 ± 2.5) 1kJ mol−⋅ is obtained using auxiliary data.
9.3.3.1.2.2 UO2(OH)2(cr) or UO3·H2O(cr) The values of and ,m m, pC Sο ο
f mGο∆ for β–orthorhombic UO3·H2O(cr) at 298.15 K have been selected in [92GRE/FUG].
9 Discussion of new data selection for Uranium 190
Recently, Gurevich et al. [97GUR/SER] reported heat capacity measurements on UO2(OH)2(α, orth) in the temperature range 14 − 316 K. It should be noted that throughout the paper the abbreviation "rhomb β" was mistakenly given for "orth β". The experimental results were fitted by a polynomial of the type:
[1 - exp( 0.001 )] , 1 to 5.xx
x
A T x− =∑
At room temperature, the following values were reported:
,mpCο3 2(UO H O, α, orth, 298.15K)⋅ = (113.96 ± 0.12) 1 1J K mol− −⋅ ⋅
1 1
,
ο − −mS = (128.10 ± 0.20) 3 2(UO H O, α, orth, 298.15K)⋅ J K mol⋅ ⋅ ,
οm m(298.15 K) (0)−H = 19.703 J K 1 1mol− −⋅ ⋅ . H
These values do not appear incompatible with those selected in [92GRE/FUG] for the β–phase, which is also orthorhombic:
,mpCο3 2(UO H O, , orth, 298.15K)⋅ β = (141 ± 15) 1 1J K mol− −⋅ ⋅
1 1
,
ο − − = (138 ± 4) mS 3 2(UO H O, , orth, 298.15K)⋅ β J K mol⋅ ⋅ ,
nor with the selected values for the heat capacity and entropy of UO3·2H2O(cr), given the difference of one H2O.
Since the selections by [92GRE/FUG] rest partially on reaction enthalpies by [73HOE/SIE], it is appropriate to note here that the lattice parameters given by [97GUR/SER] for the α–phase are in reasonable agreement with those given for the same phase by [73HOE/SIE].
Gurevich et al. derived from their data, as discussed in Appendix A,
f mH ο∆ 3 2(UO H O, α orth, 298.15 K)⋅ = − (1536.87 ± 1.30) kJ , 1mol−⋅
f mH ο∆ 3 2(UO H O, β orth, 298.15 K)⋅ = − (1533.87 ± 1.30) kJ . 1mol−⋅
The second value agrees with the selected value by [92GRE/FUG], − (1533.8 ± 1.3) . 1kJ mol−⋅
The first value was obtained by extrapolation of literature values to x = 1, as − (27.4 ± 0.2) kJ , for 1mol−⋅ r mH ο∆ (298.15 Κ) for the reaction:
3 2 3 2UO + H O(l) UO H O( , orth)x xγ − ⋅ α ,
using the results of [72SAN/VID] for x = 0.393 and 0.648, [64COR] for x = 0.85 and [88OHA/LEW] for x = 0.9.
As discussed in Appendix A, a new extrapolation taking equally into account all experimental values leads to − (26.8 ± 1.5) kJ 1mol−⋅ , which is nearly the same value as that obtained by [97GUR/SER] with greatly increased uncertainty limits. Keeping in mind the precarious character of such an extrapolation, we calculate:
f mH ο∆ 3 2(UO H O, α orth, 298.15 K)⋅ = − (1536.4 ± 1.9) . 1kJ mol−⋅

9.3 Uranium oxygen and hydrogen compounds and complexes (V.3)
191
In order to obtain another cycle in the evaluation of the stability of UO3 · H2O(α, orth) we have used (as done initially by [97GUR/SER]) the results of [71NIK/PIR] who measured potentiometrically the solubility of the compound in the temperature range 295 − 423 K.
For the reaction:
(9.17) + 2+3 2 2 2UO H O ( , orth) + 2 H UO + 2 H O(l)⋅ α
we recalculate, at infinite dilution, a value of lo 10 ,0*g sK ο ((9.17), 298.15 K) =
− (5.80 ± 0.10) leading to f mGο∆ 3 2(UO H O, α, orth, 298.15K)⋅ = − (1393.72 ± 1.84) . The values for 1kJ mol−⋅ 10 ,0glo ο
sK (9.17) at temperatures up to 423 K have also been recalculated, but, as discussed in Appendix A, they are given for information only.
Using = (128.10 ± 0.20) de-termined by [97GUR/SER] and other auxiliary values accepted by this review, we ob-tain from the above Gibbs energy value,
mS ο3 2(UO H O, α, orth, 298.15K)⋅ 1 1J K mol− −⋅ ⋅
f mH ο∆ 3 2(UO H O, α, orth, 298.15K)⋅ = − (1531.79 ± 1.84) , which is slightly different from the value obtained by the extrapolation above. Taking the average of the two values
1kJ mol−⋅ yields,
f mH ο∆ 3 2(UO H⋅ O, α, orth, 298.15K) = − (1534.1 ± 4.1) 1kJ mol−⋅
f mG. Consequently with
the value of the entropy given by [97GUR/SER], ο∆ 3 2(UO H O, α, orth, 298.15K)⋅ = − (1396.0 ± 4.2) . 1kJ mol−⋅
From this result and f mGο∆ 3 2(UO H O, β, orth, 298.15K)⋅ = − (1398.7 ± 1.8) selected by [92GRE/FUG], it is impossible to decide which of the two forms
is thermodynamically more stable. The claim of [97GUR/SER] as to the metastability of the β–phase toward the α–phase cannot be supported or rejected. Indeed these authors pointed out that the β– to α–phase transformation could be due to mostly uncontrollable factors.
1kJ mol−⋅
The value f mH ο∆ 3 2(UO H O, γ, mono, 298.15 K)⋅ = − (1531.4 ± 1.3) was also selected in [92GRE/FUG], with the indication that this species could corre-spond to a metastable form. No further information has appeared on this compound.
1kJ mol−⋅
9.3.3.1.2.3 UO3·xH2O The values of f mH ο∆ (UO3·xH2O) for x = 0.9, 0.85, 0.648, and 0.393 are given by [92GRE/FUG], and the variations of f mH ο∆ , mS ο and f mGο∆ as a function of x are dis-cussed by [88OHA/LEW].
According to [72TAY/KEL], the transformation reaction of the α−UO3 · 0.85 H2O(cr) to the β orthorhombic UO3·H2O phase:
UO3 · 0.85 H2O(cr) + 0.15 H2O(l) UO3·H2O(cr)
is accompanied by an enthalpy change of − 5.69 1kJ mol−⋅ at 298.15 K. As noted by [92GRE/FUG], this effect is not consistent with the values adopted in this review for the

9 Discussion of new data selection for Uranium 192
enthalpies of formation of these two hydrates. It is also not consistent with the value adopted above for (α, orth). 3 2UO H O⋅
f mο∆ H
4 24H O(cr)
Gurevich et al. [97GUR/SER] give estimates of the standard entropy and en-thalpy of formation of the species UO3·0.5H2O(cr). These values are mentioned in Ap-pendix A but are not selected here.
9.3.3.1.3 U(VI) peroxides (V.3.3.1.4)
Three misprints in the [92GRE/FUG] text of this section were pointed out by [95GRE/PUI]. The revised text below incorporates these corrections and includes a dis-cussion of an earlier relevant reference.
Cordfunke [66COR] measured the enthalpy of precipitation of UO4·4 Η2Ο (cr), when adding a 0.5% solution of H2O2 to a solution of dioxouranium(VI) nitrate in wa-ter, to be − (31.21 ± 0.29) kJ · mol–1. The data in [82WAG/EVA] indicate that the en-thalpy of formation of H2O2 in the 0.5% solution will be negligibly different from that at infinite dilution, (H2O2, aq, 298.15 K) = − (191.17 ± 0.10) kJ · mol–1. Thus, the value f m
ο∆ H (UO4 · 4Η2Ο, cr, 298.15 K) = − (2384.7 ± 2.1) kJ · mol–1 is calculated. The enthalpy of dehydration of the tetrahydrate to form the dihydrate,
4 2 2UO UO 2 H O(cr) + 2H O(g)⋅ ⋅ (9.18)
was calculated to be (117.02 ± 1.00) kJ · mol–1 from vapour pressure measurements of [63COR/ALI] (312.1 to 331.8 K), corrected by [66COR] to take account of the fact that the mercury in the manometer was at a variable temperature, different from 0°C. The correction of this enthalpy from the mean temperature to 298.15 K is estimated to be an order of magnitude smaller than the final uncertainty, so this value of f m
ο∆ H (9.18) = (117.02 ± 1.00) kJ · mol–1 is assumed to apply at 298.15 K, and hence
f mο∆ H (UO4·2Η2Ο, cr, 298.15 K) = − (1784.0 ± 4.2) kJ · mol–1 is calculated. The uncer-
tainties for the enthalpies of formation given above are those proposed by Cordfunke and O’Hare [78COR/OHA].
The enthalpy of formation of UO4·2Η2Ο(cr) can also be determined using the early work of Pissarjewsky [00PIS], who measured the enthalpy of dissolution of an analysed sample of this compound and that of UO3·H2O(s) in 1 M sulphuric acid. As described in Appendix A, this review calculates from these results,
f mο∆ H (UO4·2Η2Ο, cr, 298.15 K) = − (1789.7 ± 4.1) kJ · mol–1 , in good agreement with
the results discussed immediately above. This agreement had been implicitly noted by [66COR], who compared his results with those given in the NBS Circular 500 Tables [52ROS/WAG], which were based on the data of Pissarjewsky [00PIS].
This review maintains the selections made on the basis of the results of [66COR] and [63COR/ALI]:
f mο∆ H (UO4·4Η2Ο, cr, 298.15 K) = − (2384.7 ± 2.1) kJ · mol–1,
9.3 Uranium oxygen and hydrogen compounds and complexes (V.3)
193
f mο∆ H (UO4·2Η2Ο, cr, 298.15 K) = − (1784.0 ± 4.2) kJ · mol–1.
No entropy or Gibbs energy data are available for these peroxide hydrates.
9.3.3.2 U(IV) oxides (V.3.3.2)
9.3.3.2.1 Crystalline UO2 (uraninite) (V.3.3.2.1)
Fink [2000FIN] has updated her earlier assessment [81FIN/CHA] of the thermodynamic and transport properties of UO2(cr, l), to incorporate an appreciable amount of new data, principally on the liquid. Fink gives two fitting equations for the enthalpy increment of UO2(cr), one a polynomial, and one containing terms representing the individual contri-butions to the enthalpy and heat capacity. These equations give very similar values for both and , and either (see Appendix A) can be used to represent the data for UO
m m( ) (298.15K)H T H ο− ,m ( )pC T2(cr) up to its melting point.
The equation for ,mpC (UO2, cr) in [92GRE/FUG], valid only to 600 K, gives values which are close to those derived from the revised assessment by Fink, [2000FIN], so the selected data [92GRE/FUG] will not be adjusted. Takahashi [97TAK] has also reported briefly on additional enthalpy increment measurements on UO2(cr) from ca. 300 to 1500 K consistent with the earlier measurements.
Fink also gives recommended data for the heat capacity of the liquid, which decreases sharply from ca. 136 J · K–1 · mol–1 at the melting point (3120 K) to ca. 66 J K (at 4500 K) and the enthalpy of fusion (70 ± 4) kJ · mol1 mol−⋅ ⋅ 1− –1. 9.3.3.3 Mixed valence oxides (V.3.3.3)
9.3.3.3.1 UO2.3333 (≡ 1/3 U3O7) (V.3.3.3.2)
The data selected by [92GRE/FUG] for β–UO2.3333 make this phase stable with respect to U4O9 and U3O8 from 298.15 to ca. 400 K, for which there is no experimental evi-dence. We therefore select a value of f mH ο∆ (UO2.3333) which is more positive by 1 kJ · mol–1, within the [92GRE/FUG] uncertainty, thereby removing the problem, so that the new selected value is:
f mH ο∆ (UO2.3333, β, 298.15 K) = − (1141.0 ± 2.0) kJ · mol–1.
9.3.3.3.2 Hydrogen insertion compounds
Powell [90POW] reported the enthalpy of formation of the insertion species δ−H0.83UO3, obtained by hydrogen spill-over and characterised by X–ray diffraction and redox titration (mean oxidation state of uranium). The determination rests on the en-thalpy of solution of the constituents of the equation: 3 8 2 0.83 3 30.415 U O + 0.415 H O(l) H UO + 0.245 UOα − δ − γ − (9.19)
The medium was that used by [77COR/OUW2], [81COR/OUW] (see section 9.10.2.1.) and the values for the dissolution of the binary oxides and the transfer of H2O

9 Discussion of new data selection for Uranium 194
are taken from these authors. The enthalpy of solution of the compound is reported as − (142.25 ± 1.64) kJ · mol–1. This leads to r m
ο∆ H ((9.19), 298.15 K) = − (17.19 ± 1.73) kJ · mol–1. With NEA selected values, we obtain:
f mο∆ H (H0.83UO3, δ, 298.15 K)= − (1285.14 ± 2.02) kJ · mol–1.
For the insertion reaction:
(9.20) 2 3 0.0.415 H (g) + UO H UOδ − δ − 83 3
using the revised value for the standard enthalpy of formation of δ–UO3 (see section 9.3.3.1.1), we obtain:
r mο∆ H ((9.20), 298.15 K) = − (71.41 ± 2.48) kJ · mol–1.
Powell also quotes without any reference earlier results on α−H1.08UO3, which we shall not consider further here.
9.3.3.3.3 Other mixed valence oxides (V.3.3.3.4)
[93PAT/DUE] have reported the standard enthalpy of formation of hexagonal α–UO2.95 using an oxide sample characterised by powder X–ray diffraction. The O/U ratio was accurately determined by potentiometric titration (dissolution in potassium dichromate and back titration using a standard solution). Fe(II)
The calorimetric determination was based on the enthalpy of solution of the constituents of the reaction:
. (9.21) 3 8 3 2.950.05 U O + 0.85 UO UOα − γ − α −
The calorimetric reagent was 0.274 M + 0.484 M + 0.93 M H
4 2Ce(SO )
1mol
3H BO3
2SO4, the same as that used by [81COR/OUW2] for the dissolution of γ–UO3, and α−U3O8. In fact, the values for the enthalpy of dissolution of the last two reagents were taken from these authors (– (79.94 ± 0.48) kJ −⋅ and − (354.61 ± 1.70) , respectively).
1kJ mol−⋅
sol mH∆ (UO2.95, α) was determined to be − (93.37 ± 0.65) , the reported uncertainty limits being for the 1.96σ interval. These values lead to
1ol−kJ m⋅
r mH ο∆ ((9.21), 298.15 K) = (7.69 ± 0.77) 1lkJ mo −⋅ . Using NEA accepted values for the standard enthalpy of formation of γ–UO3 and α–U3O8, we recalculate: f mH ο∆ (UO2.95, α, 298.15K) = − (1211.28 ± 1.28) 1kJ mol−⋅ , identical, except for the uncertainty limits, to that reported by [93PAT/DUE]. This value, accepted here, is consistent with: f mH ο∆ (UO3, α, 298.15K) = − (1212.41 ± 1.45)
selected above. 1kJ mol−⋅
9.3.4 Uranium hydrides (V.3.4) The only relevant new study on uranium hydrides is that by Ito et al. [98ITO/YAM] who give pressure-composition isotherms for the hydrogenation of U6Mn(s) and U6Ni(s) at 573 and 673 K, and compare them to those for the binary U–H system. Ter-

9.4 Uranium group 17 (halogen) compounds and complexes (V.4)
9.4 Uranium group 17 (halogen) compounds and complexes (V.4)
195
nary hydrides of approximate composition U6MnH18(s) and U6NiH14(s) are probably formed and the amount of hydrogen in the alloys in equilibrium with these phases is much higher than for unalloyed uranium. The preparation of high density essentially stoichiometric UH3 (s) and UD3(s) has been reported by [90COS/LAK].
9.4.1 General The data for the condensed phases of the uranium halides have not been changed, ex-cept to correct a few minor errors in [92GRE/FUG] and to modify slightly some heat capacity equations in order to extend their range of applicability.
However, the data for nearly all the uranium halide gaseous species have been changed, for reasons noted in section 9.4.2.1.2. For convenience, the molecular parame-ters of all the relevant gaseous species used are summarised in this section.
9.4.1.1 Molecular parameters of the gaseous uranium halide species The thermal functions have been calculated with the natural atomic masses [92IUP] for non-actinide elements and uranium and the most common isotopes of the other actinides [99FIR], as given in Table 9-8.
Table 9-8: Atomic mass used for the calculation of thermal functions.
Element Isotope Molar mass (g · mol–1) Americium 241 241.057 Bromine 79.904 Chlorine 35.4527 Fluorine 18.99840 Iodine 126.90447 Neptunium 237 237.048 Oxygen 15.9994 Plutonium 239 239.052 Uranium 238 238.0289
Most of the thermal functions for the gaseous species were calculated from the structural parameters and energy levels of the molecules. For convenience, these data are summarised here in Table 9-9, but the sources of these data are discussed, where necessary, under each species. In fact, most of these molecular parameters are the same as, or based on, those estimated by [82GLU/GUR] for the fluorides, and [85HIL/GUR] for the Cl, Br and I species. The principal exceptions are for the four tetrahalides, where, as noted in the text, there are experimental measurements for UF4(g) and UCl4(g).

9 Discussion of new data selection for Uranium 196
The estimated thermal functions calculated from these data are generally valid for temperatures up to 3000 K; electronic energy levels which contribute only above this temperature, have, nevertheless, been included for completeness.
The uncertainties in mS ο and ,mpCο at 298.15 K arise mainly from the estimated electronic levels and vibration frequencies. They are fairly conservative, and are se-lected to encompass the likely results of any subsequent measurements or calculations.
Some uncertainties have been revised from those given in [92GRE/FUG]. In particular, those for the UX(g) species, with only one estimated vibration frequency, have generally been reduced, while those for a few higher halides, with many frequen-cies, have been increased.
The estimates in Table 9-9 are mostly taken from the assessments of Glushko et al., [82GLU/GUR] and Hildenbrand et al., [85HIL/GUR]. While this review was being peer-reviewed, Joubert and Maldivi published details of theoretical predictions of the structural and vibrational parameters of the uranium trihalide gases [2001JOU/MAL], using seven different approximations. All the calculated parameters depend appreciably on the approximation used, but the general results for the intera-tomic distances and angles are in rather good agreement with the estimates in Table 9-9, except that interatomic distances in UI3(g) might be slightly too large. There are also indications that the low frequency vibrations in UBr3(g) and UI3(g) have been over–estimated. Theoretical calculations of this type [2001JOU/MAL] will clearly become very valuable when they become more precise, but for the current review we have re-tained the estimated parameters, which form a consistent set for all the uranium halides. The associated uncertainties of the thermal functions do, in fact, cover those calculated from typical calculated parameters in [2001JOU/MAL].
Table 9-9: Molecular parameters of uranium halide gaseous species*. Part A: diatomic species.
r Å
ω cm–1
ωx cm–1
B cm–1
α cm–1
D cm–1
Symmetry number
UF 2.03 600 1.7 0.230 1.00 10–3 1.40 10–7 1 UCl 2.50 350 0.8 0.0875 4.00 10–4 2.00 10–7 1 UBr 2.65 200 0.8 0.0401 4.00·10–4 2.00·10–7 1 UI 2.85 150 0.4 0.0251 4.00 10–4 2.00 10–7 1 Electronic levels (multiplicities) cm–1 UF 0(2) 1000(6) 3000(12) 5000(20) 1000(120) 20000(300) 30000(500) 40000(500) UCl 0(2) 500(2) 1000(6) 3000(20) 5000(30) 10000(100) 20000(250) 30000(300) UBr 0(2) 500(2) 1000(6) 3000(20) 5000(30) 10000(100) 20000(250) 30000(300) UI 0(2) 500(2) 1000(6) 3000(20) 5000(30) 10000(100) 20000(250) 30000(300)
(Continued on next page)

9.4 Uranium group 17 (halogen) compounds and complexes (V.4)
197
Table 9-9: (continued): Part B: polyatomic species.
Species Point Group (Symmetry number)
Interatomic Distance
Å
Angle
deg
Vibration frequencies, (multiplicities)
cm–1
Product of mo-ments of inertia
(g3·cm–6) UF2 C2v (2) 2.10 110 530 115 510 3.92 10–114 UF3 C3v (3) 2.10 110 570 80 520(2) 130(2) 1.84 10–113 UF4 Td (12) 2.059 109.5 625 123(2) 539(3)
114(3) 4.54 10–113
UF5 C2v (2) 2.02 100 649 572 130 515 60 200 593(2) 200(2) 180(2)
7.72 10–113
UF6 Oh (24) 1.9962 90 668.2 534.5(2) 627.7(3) 187.5(3) 201.0(3)143.0(3)
1.27 10–112
UO2F2 C2v (2) U–O = 1.80 U–F = 2.00
O–U–O = 100 F–U–F = 120
830 550 200 150 150 850 180 600 200
2.21 10–113
UOF4 C4v (4) U–O = 1.80 U–F = 2.00
O–U–F = 105 830 650 150 500 200 180 600(2) 200(2) 170(2)
5.92 10–113
UCl2 C2v (2) 2.50 100 310 75 295 6.74 10–113 UCl3 C3v (3) 2.55 110 325 55 315(2) 90(2) 3.26 10–112 UCl4 Td (12) 2.506 109.5 327 62(2) 337(3) 72(3) 9.58 10–112 UCl5 C2v (2) 2.50 100 350 325 90 295 70 135
360(2) 125(2) 105(2) 1.80 10–111
UCl6 Oh (24) 2.52 90 350 275(2) 320(3) 130(3) 150(3) 110(3)
3.34 10–111
UO2Cl2 C2v (2) U– O= 1.80 U–Cl = 2.50
O–U–O= 100 Cl–U–Cl = 120
810 290 180 80 100 850 130 300 150
1.33 10–112
UBr2 C2v (2) 2.65 100 210 65 190 7.83 10–112 UBr3 C3v (3) 2.65 110 200 100 170(2) 90(2) 4.88 10–111 UBr4 Td (12) 2.693 109.5 220 50(2) 233(3) 45(3) 1.69 10–110 UBr5 C2v (2) 2.66 100 240 210 60 200 60 70
220(2) 70(2) 65(2) 2.95 10–110
UI2 C2v (2) 2.85 100 170 45 130 3.70 10–111 UI3 C3v (3) 2.85 110 150 60 140(2) 55(2) 2.88 10–110 UI4 Td (12) 2.85 109.5 150 30(2) 150 25(3) 9.51 10–110
(Continued on next page)
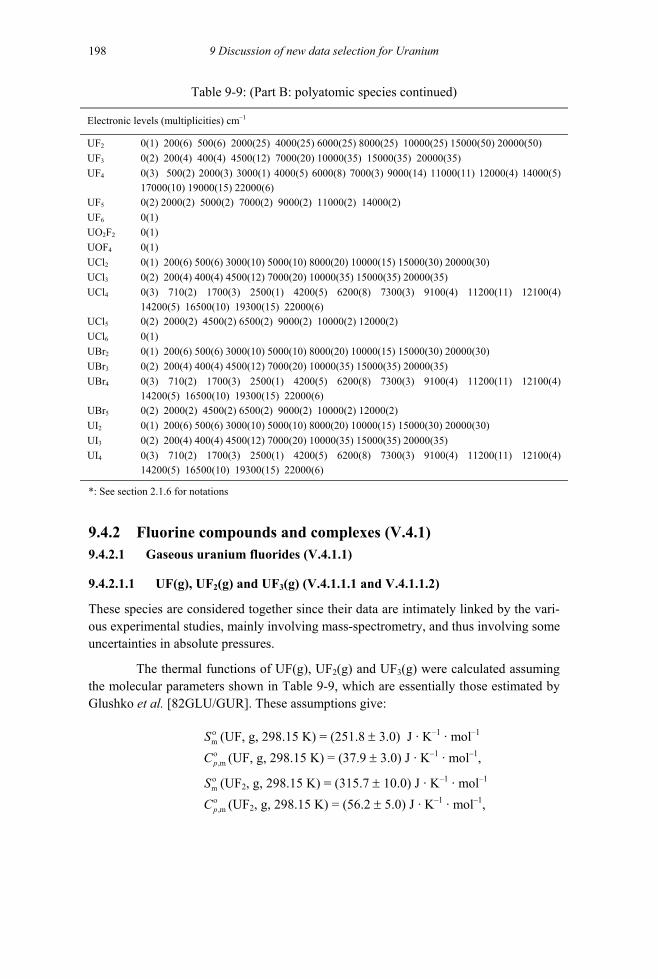
9 Discussion of new data selection for Uranium 198
Table 9-9: (Part B: polyatomic species continued)
Electronic levels (multiplicities) cm–1
UF2 0(1) 200(6) 500(6) 2000(25) 4000(25) 6000(25) 8000(25) 10000(25) 15000(50) 20000(50) UF3 0(2) 200(4) 400(4) 4500(12) 7000(20) 10000(35) 15000(35) 20000(35) UF4 0(3) 500(2) 2000(3) 3000(1) 4000(5) 6000(8) 7000(3) 9000(14) 11000(11) 12000(4) 14000(5)
17000(10) 19000(15) 22000(6) UF5 0(2) 2000(2) 5000(2) 7000(2) 9000(2) 11000(2) 14000(2) UF6 0(1) UO2F2 0(1) UOF4 0(1) UCl2 0(1) 200(6) 500(6) 3000(10) 5000(10) 8000(20) 10000(15) 15000(30) 20000(30) UCl3 0(2) 200(4) 400(4) 4500(12) 7000(20) 10000(35) 15000(35) 20000(35) UCl4 0(3) 710(2) 1700(3) 2500(1) 4200(5) 6200(8) 7300(3) 9100(4) 11200(11) 12100(4)
14200(5) 16500(10) 19300(15) 22000(6) UCl5 0(2) 2000(2) 4500(2) 6500(2) 9000(2) 10000(2) 12000(2) UCl6 0(1) UBr2 0(1) 200(6) 500(6) 3000(10) 5000(10) 8000(20) 10000(15) 15000(30) 20000(30) UBr3 0(2) 200(4) 400(4) 4500(12) 7000(20) 10000(35) 15000(35) 20000(35) UBr4 0(3) 710(2) 1700(3) 2500(1) 4200(5) 6200(8) 7300(3) 9100(4) 11200(11) 12100(4)
14200(5) 16500(10) 19300(15) 22000(6) UBr5 0(2) 2000(2) 4500(2) 6500(2) 9000(2) 10000(2) 12000(2) UI2 0(1) 200(6) 500(6) 3000(10) 5000(10) 8000(20) 10000(15) 15000(30) 20000(30) UI3 0(2) 200(4) 400(4) 4500(12) 7000(20) 10000(35) 15000(35) 20000(35) UI4 0(3) 710(2) 1700(3) 2500(1) 4200(5) 6200(8) 7300(3) 9100(4) 11200(11) 12100(4)
14200(5) 16500(10) 19300(15) 22000(6)
*: See section 2.1.6 for notations
9.4.2 Fluorine compounds and complexes (V.4.1) 9.4.2.1 Gaseous uranium fluorides (V.4.1.1)
9.4.2.1.1 UF(g), UF2(g) and UF3(g) (V.4.1.1.1 and V.4.1.1.2)
These species are considered together since their data are intimately linked by the vari-ous experimental studies, mainly involving mass-spectrometry, and thus involving some uncertainties in absolute pressures.
The thermal functions of UF(g), UF2(g) and UF3(g) were calculated assuming the molecular parameters shown in Table 9-9, which are essentially those estimated by Glushko et al. [82GLU/GUR]. These assumptions give:
(UF, g, 298.15 K) = (251.8 ± 3.0) J · KmοSο
–1 · mol–1 ,mpC (UF, g, 298.15 K) = (37.9 ± 3.0) J · K–1 · mol–1,
(UFmοSο
2, g, 298.15 K) = (315.7 ± 10.0) J · K–1 · mol–1
,mpC (UF2, g, 298.15 K) = (56.2 ± 5.0) J · K–1 · mol–1,
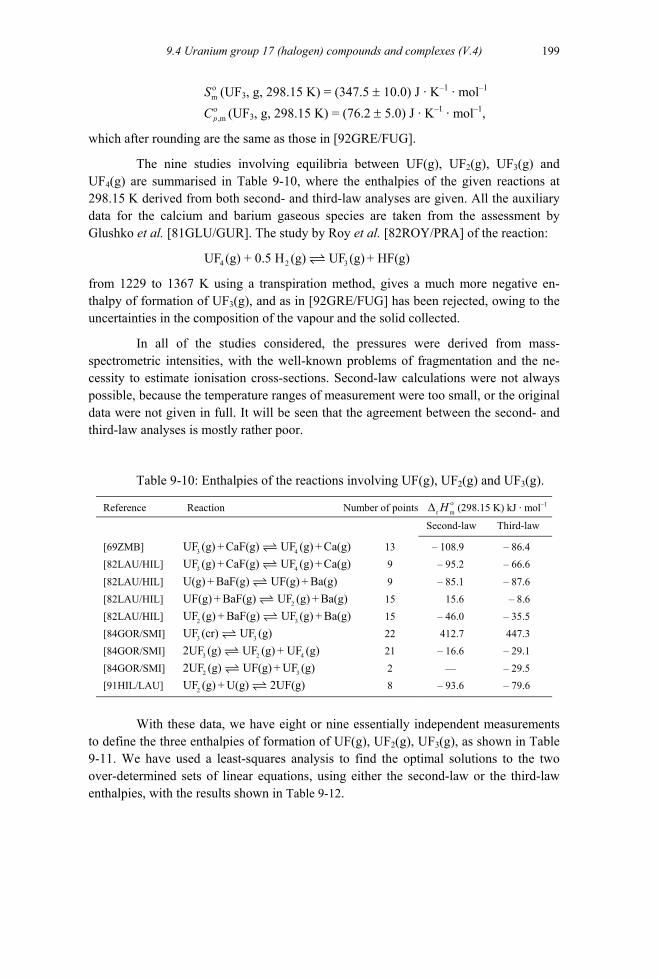
9.4 Uranium group 17 (halogen) compounds and complexes (V.4)
199
mοSο
(UF3, g, 298.15 K) = (347.5 ± 10.0) J · K–1 · mol–1 ,mpC (UF3, g, 298.15 K) = (76.2 ± 5.0) J · K–1 · mol–1,
which after rounding are the same as those in [92GRE/FUG].
The nine studies involving equilibria between UF(g), UF2(g), UF3(g) and UF4(g) are summarised in Table 9-10, where the enthalpies of the given reactions at 298.15 K derived from both second- and third-law analyses are given. All the auxiliary data for the calcium and barium gaseous species are taken from the assessment by Glushko et al. [81GLU/GUR]. The study by Roy et al. [82ROY/PRA] of the reaction:
4 2 3UF (g) + 0.5 H (g) UF (g) + HF(g)
from 1229 to 1367 K using a transpiration method, gives a much more negative en-thalpy of formation of UF3(g), and as in [92GRE/FUG] has been rejected, owing to the uncertainties in the composition of the vapour and the solid collected.
In all of the studies considered, the pressures were derived from mass-spectrometric intensities, with the well-known problems of fragmentation and the ne-cessity to estimate ionisation cross-sections. Second-law calculations were not always possible, because the temperature ranges of measurement were too small, or the original data were not given in full. It will be seen that the agreement between the second- and third-law analyses is mostly rather poor.
Table 9-10: Enthalpies of the reactions involving UF(g), UF2(g) and UF3(g).
Reference Reaction Number of points r mο∆ H (298.15 K) kJ · mol–1
Second-law Third-law
[69ZMB] 3 4UF (g) + CaF(g) UF (g) + Ca(g) 13 – 108.9 – 86.4 [82LAU/HIL] 3 4UF (g) + CaF(g) UF (g) + Ca(g) 9 – 95.2 – 66.6
[82LAU/HIL] U(g) + BaF(g) UF(g) + Ba(g) 9 – 85.1 – 87.6 [82LAU/HIL] 2UF(g) + BaF(g) UF (g) + Ba(g) 15 15.6 – 8.6 [82LAU/HIL] 2 3UF (g) + BaF(g) UF (g) + Ba(g) 15 – 46.0 – 35.5 [84GOR/SMI] 3 3UF (cr) UF (g) 22 412.7 447.3 [84GOR/SMI] 3 22UF (g) UF (g) + UF (g)4
3
21 – 16.6 – 29.1 [84GOR/SMI] 22UF (g) UF(g) + UF (g) 2 –– – 29.5 [91HIL/LAU] 2UF (g) + U(g) 2UF(g) 8 – 93.6 – 79.6
With these data, we have eight or nine essentially independent measurements to define the three enthalpies of formation of UF(g), UF2(g), UF3(g), as shown in Table 9-11. We have used a least-squares analysis to find the optimal solutions to the two over-determined sets of linear equations, using either the second-law or the third-law enthalpies, with the results shown in Table 9-12.
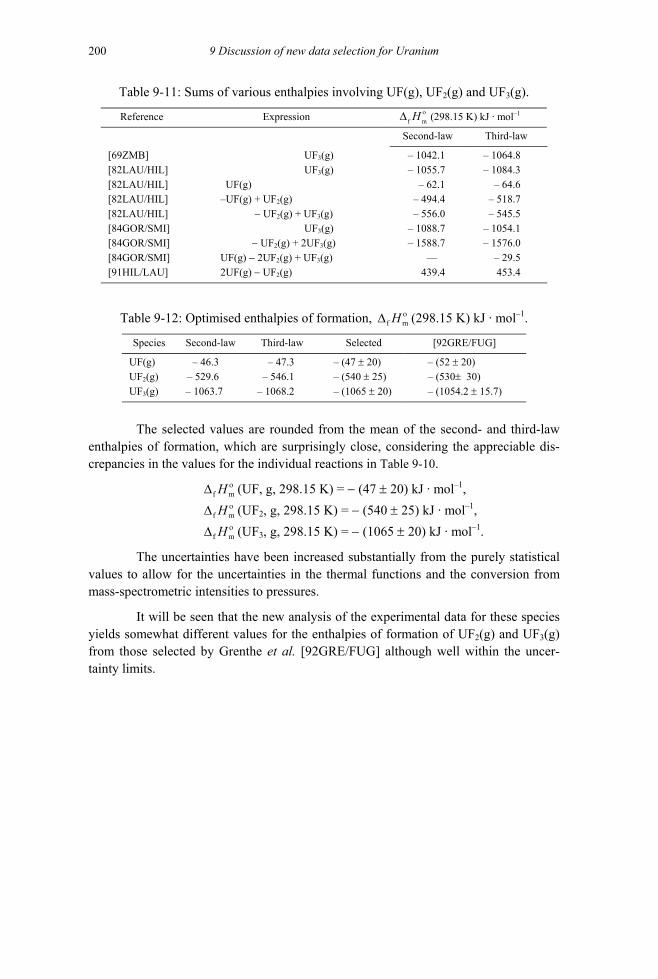
9 Discussion of new data selection for Uranium 200
Table 9-11: Sums of various enthalpies involving UF(g), UF2(g) and UF3(g).
Reference Expression f mο∆ H (298.15 K) kJ · mol–1
Second-law Third-law
[69ZMB] UF3(g) – 1042.1 – 1064.8 [82LAU/HIL] UF3(g) – 1055.7 – 1084.3 [82LAU/HIL] UF(g) – 62.1 – 64.6 [82LAU/HIL] –UF(g) + UF2(g) – 494.4 – 518.7 [82LAU/HIL] − UF2(g) + UF3(g) – 556.0 – 545.5 [84GOR/SMI] UF3(g) – 1088.7 – 1054.1 [84GOR/SMI] − UF2(g) + 2UF3(g) – 1588.7 – 1576.0 [84GOR/SMI] UF(g) − 2UF2(g) + UF3(g) –– – 29.5 [91HIL/LAU] 2UF(g) − UF2(g) 439.4 453.4
Table 9-12: Optimised enthalpies of formation, f mο∆ H (298.15 K) kJ · mol–1.
Species Second-law Third-law Selected [92GRE/FUG]
UF(g) – 46.3 – 47.3 – (47 ± 20) – (52 ± 20) UF2(g) – 529.6 – 546.1 – (540 ± 25) – (530± 30) UF3(g) – 1063.7 – 1068.2 – (1065 ± 20) – (1054.2 ± 15.7)
The selected values are rounded from the mean of the second- and third-law
enthalpies of formation, which are surprisingly close, considering the appreciable dis-crepancies in the values for the individual reactions in Table 9-10.
f mο∆ H (UF, g, 298.15 K) = − (47 ± 20) kJ · mol–1, ο
f m∆ H (UF2, g, 298.15 K) = − (540 ± 25) kJ · mol–1, ο
f m∆ H (UF3, g, 298.15 K) = − (1065 ± 20) kJ · mol–1.
The uncertainties have been increased substantially from the purely statistical values to allow for the uncertainties in the thermal functions and the conversion from mass-spectrometric intensities to pressures.
It will be seen that the new analysis of the experimental data for these species yields somewhat different values for the enthalpies of formation of UF2(g) and UF3(g) from those selected by Grenthe et al. [92GRE/FUG] although well within the uncer-tainty limits.
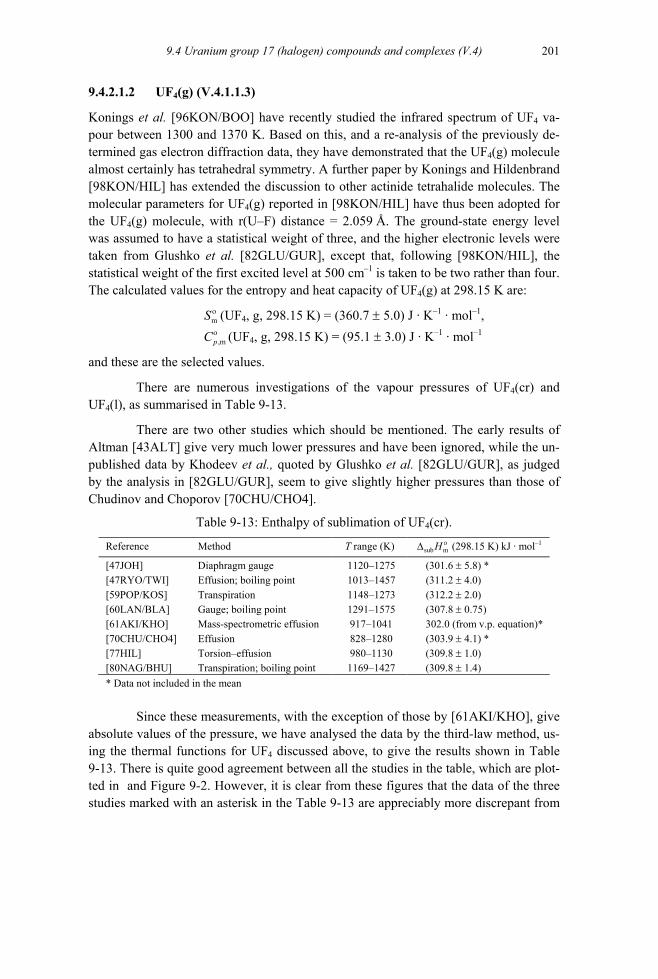
9.4 Uranium group 17 (halogen) compounds and complexes (V.4)
201
9.4.2.1.2 UF4(g) (V.4.1.1.3)
Konings et al. [96KON/BOO] have recently studied the infrared spectrum of UF4 va-pour between 1300 and 1370 K. Based on this, and a re-analysis of the previously de-termined gas electron diffraction data, they have demonstrated that the UF4(g) molecule almost certainly has tetrahedral symmetry. A further paper by Konings and Hildenbrand [98KON/HIL] has extended the discussion to other actinide tetrahalide molecules. The molecular parameters for UF4(g) reported in [98KON/HIL] have thus been adopted for the UF4(g) molecule, with r(U–F) distance = 2.059 Å. The ground-state energy level was assumed to have a statistical weight of three, and the higher electronic levels were taken from Glushko et al. [82GLU/GUR], except that, following [98KON/HIL], the statistical weight of the first excited level at 500 cm–1 is taken to be two rather than four. The calculated values for the entropy and heat capacity of UF4(g) at 298.15 K are:
mοSο
(UF4, g, 298.15 K) = (360.7 ± 5.0) J · K–1 · mol–1,
,mpC (UF4, g, 298.15 K) = (95.1 ± 3.0) J · K–1 · mol–1
and these are the selected values.
There are numerous investigations of the vapour pressures of UF4(cr) and UF4(l), as summarised in Table 9-13.
There are two other studies which should be mentioned. The early results of Altman [43ALT] give very much lower pressures and have been ignored, while the un-published data by Khodeev et al., quoted by Glushko et al. [82GLU/GUR], as judged by the analysis in [82GLU/GUR], seem to give slightly higher pressures than those of Chudinov and Choporov [70CHU/CHO4].
Table 9-13: Enthalpy of sublimation of UF4(cr).
Reference Method T range (K) sub mH ο∆ (298.15 K) kJ · mol–1
[47JOH] Diaphragm gauge 1120–1275 (301.6 ± 5.8) * [47RYO/TWI] Effusion; boiling point (311.2 ± 4.0) [59POP/KOS] Transpiration 1148–1273 (312.2 ± 2.0) [60LAN/BLA] Gauge; boiling point 1291–1575 (307.8 ± 0.75) [61AKI/KHO] Mass-spectrometric effusion 917–1041 302.0 (from v.p. equation)* [70CHU/CHO4] Effusion 828–1280 (303.9 ± 4.1) * [77HIL] Torsion–effusion 980–1130 (309.8 ± 1.0) [80NAG/BHU] Transpiration; boiling point 1169–1427 (309.8 ± 1.4) * Data not included in the mean
1013–1457
Since these measurements, with the exception of those by [61AKI/KHO], give
absolute values of the pressure, we have analysed the data by the third-law method, us-ing the thermal functions for UF4 discussed above, to give the results shown in Table 9-13. There is quite good agreement between all the studies in the table, which are plot-ted in and Figure 9-2. However, it is clear from these figures that the data of the three studies marked with an asterisk in the Table 9-13 are appreciably more discrepant from

9202 Discussion of new data selection for Uranium
the mean than those of the other five studies. The selected enthalpy of sublimation is therefore based on the weighted mean of the studies shown in .
sub mο∆ H (UF4, 298.15 K) = (309.0 ± 5.0) 1kJ mol−⋅
where the uncertainty has been increased substantially from the statistical 1.96 σ value (± 0.5 1kJ mol−⋅ ) to allow for uncertainties in the thermal functions of UF4(g). This value is also in good accord with that (307.4 ± 10.7) 1kJ mol−⋅ given by a second-law analysis of the more extensive mass-spectrometric data given by [61AKI/KHO] for which no absolute pressures are reported.
The derived enthalpy of formation of UF4(g) is thus:
f mο∆ H (UF4, g, 298.15K) = − (1605.2 ± 6.5) 1kJ mol−⋅ .
The vapour pressures for the liquid are calculated with an enthalpy of fusion of 47 based on the enthalpy drop measurements of Dworkin [72DWO]. The vapour pressure data would actually be best fitted with an enthalpy of fusion as low as 36 kJ , but Dworkin's data seem quite reliable, and the higher value has been preferred.
1kJ mol−⋅
1mol−⋅
Figure 9-1: Vapour pressure of UF4(cr, l), included data.
0.6 0.7 0.8 0.9 1.0 1.1 1.2-9
-8
-7
-6
-5
-4
-3
-2
-1
0
log 10
P/b
ar
1000/T (K-1)
[47RYO/TWI] [59POP/KOS] [60LAN/BLA] [77HIL] [80NAG/BHU]
Calculated from selected values

9.4
203 Uranium group 17 (halogen) compounds and complexes (V.4)
Figure 9-2: Vapour pressure of UF4(cr, l), excluded data.
0.6 0.7 0.8 0.9 1.0 1.1 1.2-9
-8
-7
-6
-5
-4
-3
-2
-1
0
log 10
P/b
ar
1000/T (K-1)
[47JOH] [61AKI/KHO] [70CHU/CHO]
Calculated from selected values
9.4.2.1.3 UF5(g) (V.4.1.1.4)
The data for UF5(g) are not of high precision, for a number of reasons, apart from its high reactivity. The region of the U–F system between UF4 and UF6 is quite complex, both in the solid and gaseous states. Thus most of the data are derived from mass-spectrometric intensities, with the well-known problems of fragmentation and the ne-cessity to estimate cross-sections. At higher pressures the dimer U2F10(g) is by far the dominant species, so that substantial corrections to vapour pressure data are required.
The thermal functions of UF5(g) were calculated assuming the molecular pa-rameters shown in Table 9-9, which are those estimated by Glushko et al. [82GLU/GUR]. The molecule is assumed to be a square pyramid with a slight distortion to reduce the symmetry to C2v. These assumptions give:
mοSο(UF5, g, 298.15 K) = (386.4 ± 10.0) J · K–1 · mol–1,
C ,mp (UF5, g, 298.15 K) = (110.6 ± 5.0) J · K–1 · mol–1,
which are not significantly different from those in [92GRE/FUG].
The reactions used to calculate the stability of UF5(g) are summarised in Table 9-14 and are now discussed in detail.
Leitnaker [80LEI] has re-analysed the transpiration measurements of the va-pour pressure of UF5(cr, l) by Wolf et al. [65WOL/POS] to take account of the dimeri-sation of UF5(g) and the probable formation of U2F11(g) in the presence of the transport-ing gas UF6(g). There is a minor flaw in Leitnaker's re-analysis; it was difficult to im-

9 Discussion of new data selection for Uranium 204
pose a constraint of equal vapour pressure at the known melting point (621 K) when refitting the vapour equations for the solid and liquid. However, in our final analysis, this is not important, since we have only utilised the data over the solid, which are ap-preciably more consistent than those over the liquid. For each data point given by Wolf et al. we have used Leitnaker's extrapolation of the effective pressure peff = 5 2 10
to 6
= 0, and calculated the individual pressures of UFUF (g) U F (g)+ 2 p p UF (g) p 5(g) and U2F10(g), using the equilibrium constant given by Kleinschmidt and Hildenbrand [79KLE/HIL].
Gorokhov et al. [84GOR/SMI] have used three reactions to obtain the stability of UF5(g):
, 4 6 5UF (g) + UF (g) 2 UF (g)
4 17 6 51 7 U F (cr) + UF (g) UF (g)3 3
,
4 2 5UF (g) + CuF (g) UF (g) + CuF(g) .
We have included the first two reactions in the analysis, but not the third. The stabilities of both CuF(g) and CuF2(g) are quite poorly defined - there is a difference of 11.3 kJ · mol–1 in the relevant (CuF(g)–CuFf mG∆ 2(g)) at 1000 K, (near the mid point of the experimental temperature range of [84GOR/SMI]) between two current authoritative assessments [98CHA], [2000LAN].
Smirnov and Gorokhov [84SMI/GOR] and Lau et al. [85LAU/BRI] have both used the decomposition of UO2F2(cr) to investigate the stability of UF5(g). They both find that the principal gaseous species over UO2F2(cr) are UO2F2(g), UF5(g), O2(g), UF4(g) and UOF4(g). These authors choose to use the equilibrium constants of two dif-ferent reactions to derive ∆ (UFf m
οG 5(g)):
[84SMI/GOR]: (1397-1539 K) 2 2 5 4 2UO F (g) + 2 UF (g) 3 UF (g) + O (g)
[85LAU/BRI]: 2 2 5 2 2.66675 312 2 2UO F (cr) UF (g) + O (g) + UO (cr) (896-1036 K).
We have utilised the results of [85LAU/BRI] (see Table 9-14), but we cannot use the data of [84SMI/GOR], as they report only the derived f m
ο∆ H (UF5, g, 298.15 K) value, − (1908 ± 13) kJ · mol–1, using, presumably, the data of [82GLU/GUR] for the auxiliary data.

9.4 Uranium group 17 (halogen) compounds and complexes (V.4)
205
Table 9-14: Enthalpy of formation f mο∆ H (UF5, g, 298.15 K).
Reference Reaction T range (K) f mH ο∆ (kJ · mol–1) Third-law
[80LEI] 5 5UF (cr) UF (g) 556–615 – (1918.0 ± 4.2)
[84GOR/SMI] 4 6 5UF (cr) + UF (g) 2 UF (g) 440–452 – (1911.7 ± 4.8)
[84GOR/SMI] 4 17 6 51/3 U F (cr) + UF (g) 7/3 UF (g) 440–452 – (1927.9 ± 4.9)
[85LAU/BRI] 2 2 5 2 2.66675/2UO F (cr) UF (g) +1/2O (g) +3/2 UO (cr) 896–1036 – (1894.1 ± 24.3)*
[87BON/KOR] 4 6 5UF (cr) + UF (g) 2 UF (g) 663–809 – (1908.1 ± 3.4)
[93NIK/TSI] 4 2 5UF (g) +1/2 NiF (cr) UF (g) + 1/2 Ni (cr) 1017–1109 – (1914.3 ± 4.4)
* Second-law value Bondarenko et al. [87BON/KOR] have made mass-spectrometric measure-ments of the reaction:
4 6 5UF (g) + UF (g) 2 UF (g) ,
with results that are quite similar to those of [84GOR/SMI] for the same reaction.
Nikitin and Tsirel'nikov [93NIK/TSI] have measured the ratio of UF5/UF4 in equilibrium with the Ni/NiF2 couple from 1017 to 1090 K − see Table 9-14.
The mass-spectrometric studies by Hildenbrand [77HIL] and Hildenbrand and Lau [91HIL/LAU2] of the reaction:
5 4UF (g) + Ag (g) UF (g) + AgF (g)
give stabilities markedly different from the assembled studies, as noted by [92GRE/FUG] and by Nikitin and Tsirel'nikov [93NIK/TSI]. However, as for the cop-per fluorides used by [84GOR/SMI], the thermodynamic data for AgF(g) are far from well-established, and these studies have not been included in the current analysis.
The selected value is the mean of the four most consistent results, and is also close to the mean of the six studies:
f mο∆ H (UF5, g, 298.15 K) = − (1913 ± 15) 1kJ mol−⋅ ,
the uncertainty having been increased to allow for the uncertainties in ionisation cross-sections, etc.
9.4.2.1.4 UF6(g) (V.4.1.1.5)
Uranium hexafluoride gas is one of the few uranium fluorides whose data are not de-pendent in some way on those for UF4(g), and since there have been no new experimen-tal studies since the publication of Grenthe et al. [92GRE/FUG], the data proposed there have been accepted. For completeness, they are summarised below.

9 Discussion of new data selection for Uranium 206
The thermal functions of UF6(g) ideal gas were calculated assuming the mo-lecular parameters given in Table 9-9, using the rigid–rotator, harmonic-oscillator ap-proximation. The molecule is taken to be octahedral with Oh symmetry. All the molecu-lar parameters are taken from the comprehensive paper by Aldridge et al. [85ALD/BRO].
mοS (UF6, g, 298.15 K) = (376.3 ± 1.0) 1 1J K mol− −⋅ ⋅ , ο − −
,mpC (UF6, g, 298.15 K) = (129.4 ± 0.5) 1 1J K mol⋅ ⋅ .
These are both slightly smaller than the values selected in [92GRE/FUG].
However, with these data, the enthalpy of sublimation derived from the eight consistent determinations of the vapour pressure noted in [92GRE/FUG] remains un-changed at sub mH ο∆ (UF6, g, 298.15 K) = (49.1 ± 0.5) kJ · mol–1, corresponding to the unchanged selected value of the enthalpy of formation:
f mH ο∆ (UF6, g, 298.15 K) = − (2148.6 ± 1.9) kJ · mol–1.
Calculations of the populations of the rotational and vibrational states and band contours of UF6(g) around 300 K have been reported by Oda [93ODA]. This reference is given for information only, as it does not lead to changes in the selections reported above.
9.4.2.1.5 U2F10(g) and U2F11(g) (V.4.1.1.6)
Kleinschmidt and Hildenbrand [79KLE/HIL] have measured by mass-spectrometry the dimerisation constants for the reaction:
, (9.22) 5 2 12 UF (g) U F (g)0
108523log ( /bar) = 8.744−K
T, (608 to 866 K)
corresponding to: r m
ο∆ G (9.22) = − 163170 + 167.40 T J · mol–1.
We have not estimated any thermal functions for U2F10(g), but instead used the following procedure: the enthalpy of formation at the mid-range temperature (737 K) has been recalculated to 298.15 K by assuming that the value of
for reaction (9.22) is 4000 J · molm m( (737 K) (298.15K))H H ο− –1, slightly larger than that for the similar reaction involving Mo, (3489 J · mol–1), the data for MoF5(g) and Mo2F10(g) being taken from the NIST–JANAF database [98CHA].
Thus, ο∆r mH ((9.22), 298.15 K) = − (167.2 ± 4.7) kJ · mol–1, giving finally:
f mο∆ H (U2F10(g), 298.15 K) = − (3993 ± 30) kJ · mol–1,
which is the selected value. This is appreciably less negative than that selected in [92GRE/FUG], 1 (4021 30) kJ mol−− ± ⋅
f mο∆
, since they erroneously included in their aver-age a value of H (U2F10(g), 298.15 K) from Hildenbrand et al. [85HIL/GUR], de-
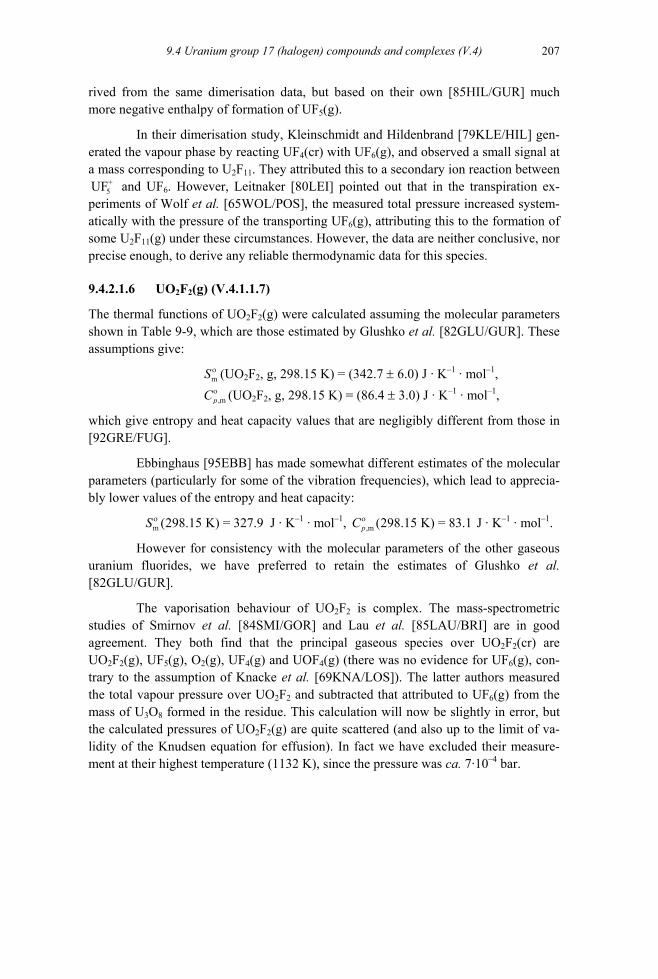
9.4 Uranium group 17 (halogen) compounds and complexes (V.4)
207
rived from the same dimerisation data, but based on their own [85HIL/GUR] much more negative enthalpy of formation of UF5(g).
In their dimerisation study, Kleinschmidt and Hildenbrand [79KLE/HIL] gen-erated the vapour phase by reacting UF4(cr) with UF6(g), and observed a small signal at a mass corresponding to U2F11. They attributed this to a secondary ion reaction between
and UF+5UF 6. However, Leitnaker [80LEI] pointed out that in the transpiration ex-
periments of Wolf et al. [65WOL/POS], the measured total pressure increased system-atically with the pressure of the transporting UF6(g), attributing this to the formation of some U2F11(g) under these circumstances. However, the data are neither conclusive, nor precise enough, to derive any reliable thermodynamic data for this species.
9.4.2.1.6 UO2F2(g) (V.4.1.1.7)
The thermal functions of UO2F2(g) were calculated assuming the molecular parameters shown in Table 9-9, which are those estimated by Glushko et al. [82GLU/GUR]. These assumptions give:
mοSο
(UO2F2, g, 298.15 K) = (342.7 ± 6.0) J · K–1 · mol–1,
,mpC (UO2F2, g, 298.15 K) = (86.4 ± 3.0) J · K–1 · mol–1,
which give entropy and heat capacity values that are negligibly different from those in [92GRE/FUG].
Ebbinghaus [95EBB] has made somewhat different estimates of the molecular parameters (particularly for some of the vibration frequencies), which lead to apprecia-bly lower values of the entropy and heat capacity:
m (298.15 K) = 327.9S ο J · K–1 · mol–1, J · K,m (298.15 K) = 83.1pCο –1 · mol–1.
However for consistency with the molecular parameters of the other gaseous uranium fluorides, we have preferred to retain the estimates of Glushko et al. [82GLU/GUR].
The vaporisation behaviour of UO2F2 is complex. The mass-spectrometric studies of Smirnov et al. [84SMI/GOR] and Lau et al. [85LAU/BRI] are in good agreement. They both find that the principal gaseous species over UO2F2(cr) are UO2F2(g), UF5(g), O2(g), UF4(g) and UOF4(g) (there was no evidence for UF6(g), con-trary to the assumption of Knacke et al. [69KNA/LOS]). The latter authors measured the total vapour pressure over UO2F2 and subtracted that attributed to UF6(g) from the mass of U3O8 formed in the residue. This calculation will now be slightly in error, but the calculated pressures of UO2F2(g) are quite scattered (and also up to the limit of va-lidity of the Knudsen equation for effusion). In fact we have excluded their measure-ment at their highest temperature (1132 K), since the pressure was ca. 7·10–4 bar.
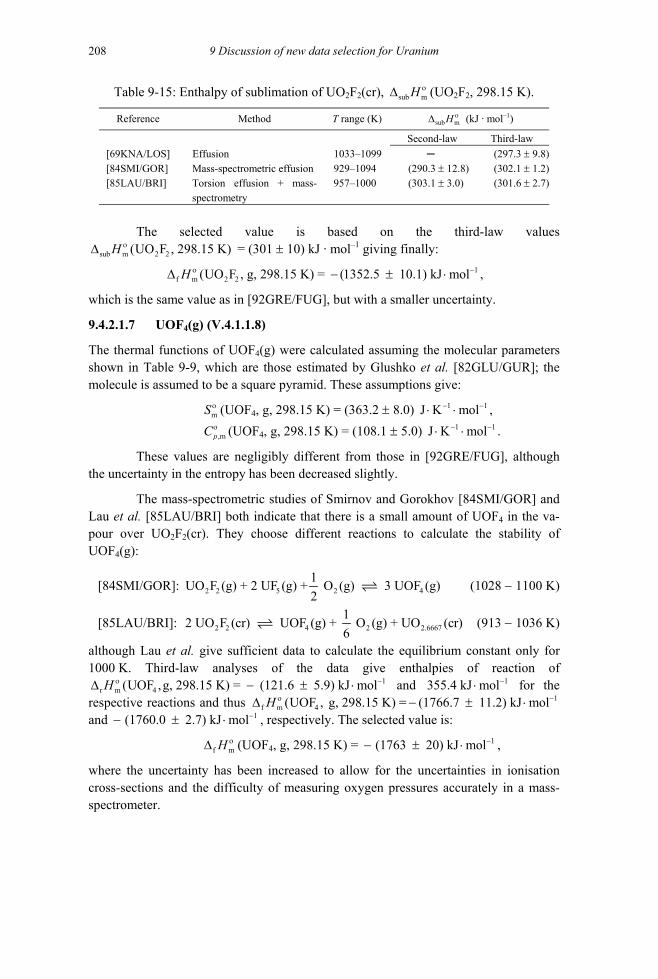
9 Discussion of new data selection for Uranium 208
Table 9-15: Enthalpy of sublimation of UO2F2(cr), sub mο∆ H (UO2F2, 298.15 K).
Reference Method T range (K) sub mH ο∆ (kJ · mol–1)
Second-law Third-law [69KNA/LOS] Effusion 1033–1099 ─ (297.3 ± 9.8)[84SMI/GOR] Mass-spectrometric effusion 929–1094 (290.3 ± 12.8) (302.1 ± 1.2)[85LAU/BRI] Torsion effusion + mass-
spectrometry 957–1000 (303.1 ± 3.0) (301.6 ± 2.7)
The selected value is based on the third-law values
= (301 ± 10) kJ · molsub m 2 2(UO F , 298.15 K) H ο∆ –1 giving finally: 1
f m 2 2(UO F , g, 298.15 K) = (1352.5 10.1) kJ molH ο −∆ − ± ⋅ ,
which is the same value as in [92GRE/FUG], but with a smaller uncertainty.
9.4.2.1.7 UOF4(g) (V.4.1.1.8)
The thermal functions of UOF4(g) were calculated assuming the molecular parameters shown in Table 9-9, which are those estimated by Glushko et al. [82GLU/GUR]; the molecule is assumed to be a square pyramid. These assumptions give:
mοS (UOF4, g, 298.15 K) = (363.2 ± 8.0) 1 1J K mol− −⋅ ⋅ , ο − −
,mpC (UOF4, g, 298.15 K) = (108.1 ± 5.0) 1 1J K mol⋅ ⋅ .
These values are negligibly different from those in [92GRE/FUG], although the uncertainty in the entropy has been decreased slightly.
The mass-spectrometric studies of Smirnov and Gorokhov [84SMI/GOR] and Lau et al. [85LAU/BRI] both indicate that there is a small amount of UOF4 in the va-pour over UO2F2(cr). They choose different reactions to calculate the stability of UOF4(g):
[84SMI/GOR]: 2 2 5 2 41UO F (g) + 2 UF (g) + O (g) 3 UOF (g)2
(1028 − 1100 K)
[85LAU/BRI]: 2 2 4 2 2.666712 UO F (cr) UOF (g) + O (g) + UO (cr)6
(913 − 1036 K)
although Lau et al. give sufficient data to calculate the equilibrium constant only for 1000 K. Third-law analyses of the data give enthalpies of reaction of
and for the respective reactions and thus
1r m 4(UOF ,g, 298.15 K) = (121.6 5.9) kJ molο −∆ − ±H
f m 4(UOF , g, 298.15 K)⋅ 1355.4 kJ mol−⋅
1766.7 11.2) kJ 1 = ( molο −±∆ H1 (1760.0 2.7) kJ mol−− ± ⋅
− ⋅ and , respectively. The selected value is:
f mο∆ H (UOF4, g, 298.15 K) = 1(1763 20) kJ mol−− ± ⋅ ,
where the uncertainty has been increased to allow for the uncertainties in ionisation cross-sections and the difficulty of measuring oxygen pressures accurately in a mass-spectrometer.

9.4 Uranium group 17 (halogen) compounds and complexes (V.4)
209
9.4.2.2 Aqueous uranium fluorides (V.4.1.2)
9.4.2.2.1 Aqueous U(VI) fluorides (V.4.1.2.1)
9.4.2.2.1.1 Binary complexes The only new study providing information on equilibrium constants is the study of Ferri et al. [93FER/SAL] who performed potentiometric titrations of U(VI) solutions at − log10[H+] = 3.50, the ionic strength being 3 M (NaClO4) (298.15 K). As discussed in Appendix A the formation constants for the binary complexes 2
2UO F −qq , =
(4.86 ± 0.02), = (8.62 ± 0.04), = (11.71 ± 0.06) and lo = (13.78 ± 0.08) are retained by this review. As the average number of coordinated fluo-ride ligands per U(VI) reaches 2.35, the uncertainty in lo seems surprisingly low. Ferri et al. reported an equilibrium constant K
10 1log b10 4g b10 2log b 10 3log b
10 4g b5 = 3.0 M–1 at 269.4 K for the reaction:
2 32 4 2 5UO F + F UO F− − −
obtained by 19F NMR data. However, more recent NMR investigations [2002VAL/WAH] indicate that this value is too large and that K5 = (0.60 ± 0.05) M–1 is a better estimate. The complex is weak and is therefore only formed in very concentrated fluoride solutions, where its presence is clearly demonstrated by the
32 5UO F −
19F NMR data in both studies. No equilibrium constant has been selected by this review for
. 32 5UO F −
By combining these data with those of [71AHR/KUL] at 1 M ionic strength, the following values of the ion interaction parameters are given by Ferri et al. [93FER/SAL]: +
2(UO F , ClO )4−ε(Uε
+4), Na or ClO )
= (0.28 ± 0.04) kg · mol–1, = − (0.14 ± 0.05) kg · mol
+2 3(UO F , Na )−ε
–1 and = − (0.30 ± 0.06) kg · mol22 4O F , Na )− + –1. They also
give 2 2(UO F (aq −ε = (0.13 ± 0.05) kg · mol–1 (see Appendix A). The first value agrees well with the selected value (0.29 ± 0.05) kg · mol–1 in [92GRE/FUG], whereas the other values are new.
Extrapolation to zero ionic strength gives:
10 1log οb = (5.16 ± 0.06),
which agrees with the value (5.09 ± 0.13) previously selected [92GRE/FUG],
10 2log οb = (8.83 ± 0.08),
10 3log οb = (10.90 ± 0.10)
10 4log οb = (11.84 ± 0.11),
which differ only slightly, even for 10 4log οb , from the values of [92GRE/FUG] ( = (8.62 ± 0.04), 10 2log οb 10 3log οb = (10.9 ± 0.4) and 10 4log οb = (11.7 ± 0.7)). As the selected values in [92GRE/FUG] are based on estimated ε values for the fluoride com-plexes, this review selects the new results of [93FER/SAL] for the complexes, n = 1 to 4.
22UO F n
n−
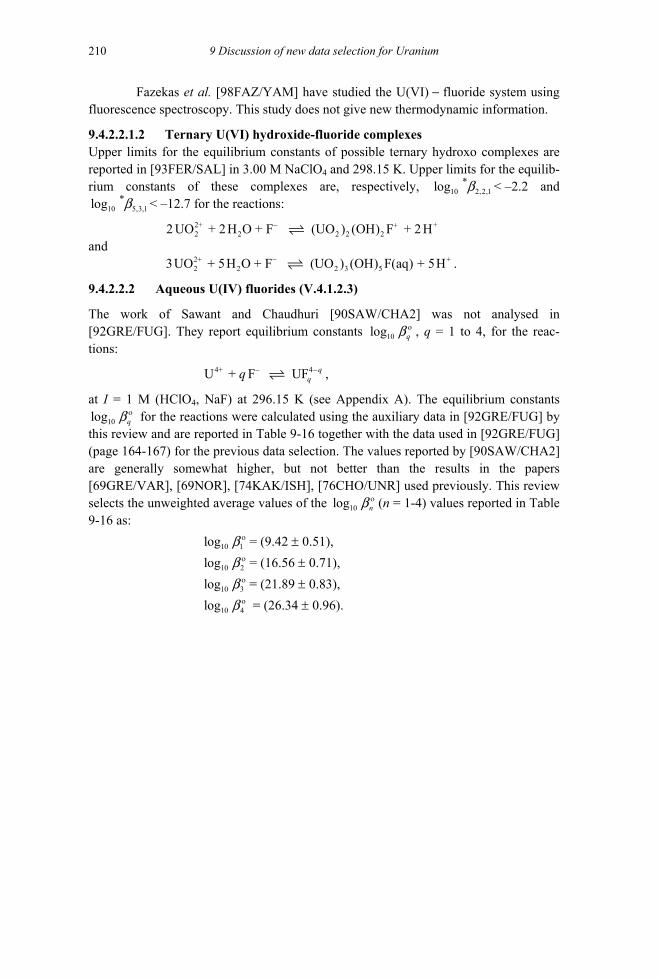
9 Discussion of new data selection for Uranium 210
Fazekas et al. [98FAZ/YAM] have studied the U(VI) − fluoride system using fluorescence spectroscopy. This study does not give new thermodynamic information.
9.4.2.2.1.2 Ternary U(VI) hydroxide-fluoride complexes Upper limits for the equilibrium constants of possible ternary hydroxo complexes are reported in [93FER/SAL] in 3.00 M NaClO4 and 298.15 K. Upper limits for the equilib-rium constants of these complexes are, respectively, < –2.2 and
< –12.7 for the reactions: 10 2,2,1
*log b
+
10 5,3,1*log b
2+2 2 2 2 22 UO + 2H O + F (UO ) (OH) F + 2 H− +
and 2+ +2 2 2 3 53UO + 5H O + F (UO ) (OH) F(aq) + 5H− .
9.4.2.2.2 Aqueous U(IV) fluorides (V.4.1.2.3)
The work of Sawant and Chaudhuri [90SAW/CHA2] was not analysed in [92GRE/FUG]. They report equilibrium constants 10log ο
qb , q = 1 to 4, for the reac-tions:
4+ 4U + F UF qqq − − ,
at I = 1 M (HClO4, NaF) at 296.15 K (see Appendix A). The equilibrium constants for the reactions were calculated using the auxiliary data in [92GRE/FUG] by
this review and are reported in Table 9-16 together with the data used in [92GRE/FUG] (page 164-167) for the previous data selection. The values reported by [90SAW/CHA2] are generally somewhat higher, but not better than the results in the papers [69GRE/VAR], [69NOR], [74KAK/ISH], [76CHO/UNR] used previously. This review selects the unweighted average values of the
10log οqb
10log nοb (n = 1-4) values reported in Table
9-16 as:
10 1log οbο
= (9.42 ± 0.51),
10 2log bο
= (16.56 ± 0.71),
10 3log bο
= (21.89 ± 0.83),
10 4log b = (26.34 ± 0.96).
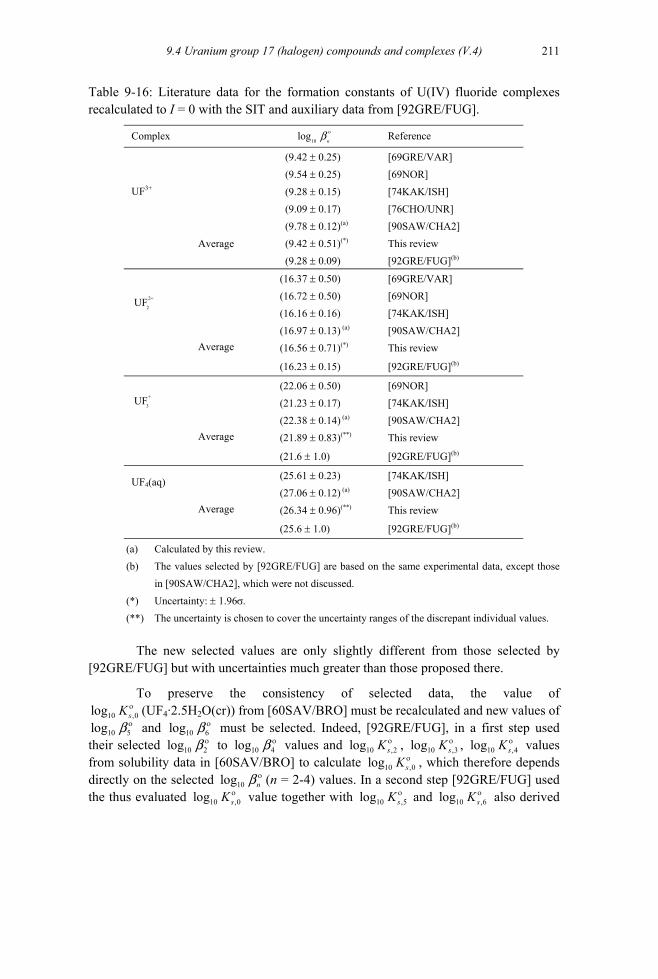
9.4 Uranium group 17 (halogen) compounds and complexes (V.4)
211
Table 9-16: Literature data for the formation constants of U(IV) fluoride complexes recalculated to I = 0 with the SIT and auxiliary data from [92GRE/FUG].
Complex 10log n
οb Reference
(9.42 ± 0.25) [69GRE/VAR] (9.54 ± 0.25) [69NOR] (9.28 ± 0.15) [74KAK/ISH] (9.09 ± 0.17) [76CHO/UNR]
UF3+
(9.78 ± 0.12)(a) [90SAW/CHA2] Average (9.42 ± 0.51)(*) This review
(9.28 ± 0.09) [92GRE/FUG](b)
(16.37 ± 0.50) [69GRE/VAR] (16.72 ± 0.50) [69NOR] (16.16 ± 0.16) [74KAK/ISH]
2+
2UF
(16.97 ± 0.13) (a) [90SAW/CHA2] Average (16.56 ± 0.71)(*) This review
(16.23 ± 0.15) [92GRE/FUG](b)
(22.06 ± 0.50) [69NOR] (21.23 ± 0.17) [74KAK/ISH]
+
3UF
(22.38 ± 0.14) (a) [90SAW/CHA2] Average (21.89 ± 0.83)(**) This review
(21.6 ± 1.0) [92GRE/FUG](b)
(25.61 ± 0.23) [74KAK/ISH] UF4(aq) (27.06 ± 0.12) (a) [90SAW/CHA2]
Average (26.34 ± 0.96)(**) This review (25.6 ± 1.0) [92GRE/FUG](b)
(a) Calculated by this review. (b) The values selected by [92GRE/FUG] are based on the same experimental data, except those
in [90SAW/CHA2], which were not discussed. (*) Uncertainty: ± 1.96σ.
(**) The uncertainty is chosen to cover the uncertainty ranges of the discrepant individual values.
The new selected values are only slightly different from those selected by [92GRE/FUG] but with uncertainties much greater than those proposed there.
To preserve the consistency of selected data, the value of 10 ,0log sK ο
10 5log οb(UF4·2.5H2O(cr)) from [60SAV/BRO] must be recalculated and new values of
and lo must be selected. Indeed, [92GRE/FUG], in a first step used their selected to
10 6g οb10 2log οb 10 4log οb values and 10 ,2log sK ο , 10 ,3log sK ο , 10 ,4log sK ο values
from solubility data in [60SAV/BRO] to calculate 10log ,0sK ο , which therefore depends directly on the selected 10g nlo οb
,0
(n = 2-4) values. In a second step [92GRE/FUG] used the thus evaluated 10log sK ο value together with 10 ,log 5sK ο and 10log ,6sK ο also derived

9 Discussion of new data selection for Uranium 212
from the solubility data in [60SAV/BRO] to calculate 10 5log οb and , which therefore also depend on the selected
10 6log οb10log n
οb (n = 2-4).
10 ,0log sK ο
lo g
Following the procedure applied in [92GRE/FUG] (Appendix A, review of [60SAV/BRO]), the lo 10 ,g s nK ο values calculated in [92GRE/FUG] from the solubility data for UF4·2.5 H2O(cr) reported by Savage and Browne [60SAV/BRO] lead to:
10 ,2log sK ο = − (13.15 ± 0.04),
10 ,3log sK ο = − (8.47 ± 0.09),
10 ,4log sK ο = − (3.96 ± 0.03),
which give, respectively :
10 ,0log sK ο = − (29.71 ± 0.71),
10 ,0log sK ο = − (30.36 ± 0.83),
10 ,0log sK ο = − (30.30 ± 0.96),
and an unweighted average value of (UF4·2.5 H2O(cr)) = − (30.12 ± 0.70).
Using this solubility constant and 10 ,5g sK ο = − (2.39 ± 0.25) and lo 10 ,6sK ο = − (0.32 ± 0.08) as evaluated by [92GRE/FUG] from the experimental data of [60SAV/BRO], the formation constants of the penta- and hexa-fluoro complexes are calculated to be:
10 5log οb = (27.73 ± 0.74),
10 6log οb = (29.80 ± 0.70),
which are selected by this review. These are somewhat different from those selected in [92GRE/FUG], = (27.01 ± 0.30) and lo10 5log οb 10 6g οb = (29.08 ± 0.18) although they overlap within the combined uncertainties.
The solubility study of Savage and Browne [60SAV/BRO] was not used by [92GRE/FUG] to select thermodynamic data for UF4·2.5 H2O(cr), because this value is considerably larger than 10 ,0log sK ο (UF4·2.5 H2O(cr)) = − (33.5 ± 1.2) as calculated from the selected thermochemical data.
The solubility measurements of UO2(cr) at 773.15 K, 1 kbar, in HF solutions reported by Redkin [97RED] give no reliable new thermodynamic data.
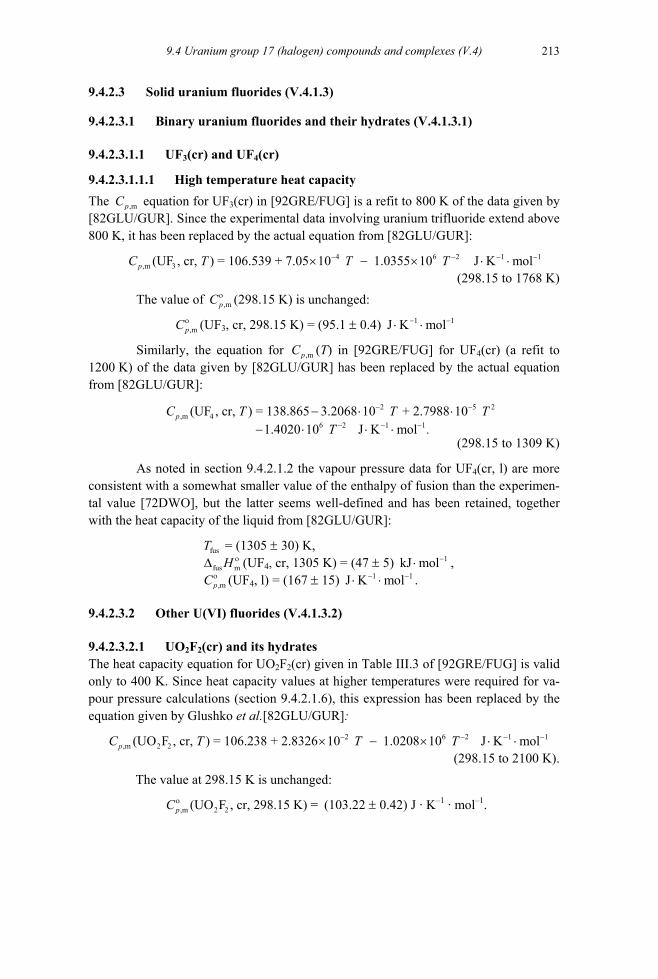
9.4 Uranium group 17 (halogen) compounds and complexes (V.4)
213
9.4.2.3 Solid uranium fluorides (V.4.1.3)
9.4.2.3.1 Binary uranium fluorides and their hydrates (V.4.1.3.1)
9.4.2.3.1.1 UF3(cr) and UF4(cr)
9.4.2.3.1.1.1 High temperature heat capacity The ,mpC equation for UF3(cr) in [92GRE/FUG] is a refit to 800 K of the data given by [82GLU/GUR]. Since the experimental data involving uranium trifluoride extend above 800 K, it has been replaced by the actual equation from [82GLU/GUR]:
4 6,m 3(UF , cr, ) = 106.539 + 7.05 10 1.0355 10 pC T T− −× − × 2T 1 1J K mol− −⋅ ⋅
(298.15 to 1768 K) The value of ,m
οpC (298.15 K) is unchanged:
,mοpC (UF3, cr, 298.15 K) = (95.1 ± 0.4) 1 1J K mol− −⋅ ⋅
Similarly, the equation for ,mpC (T) in [92GRE/FUG] for UF4(cr) (a refit to 1200 K) of the data given by [82GLU/GUR] has been replaced by the actual equation from [82GLU/GUR]:
2 5,m 4
6 2 1 1.(UF , cr, ) = 138.865 3.2068 10 + 2.7988 10
1.4020 10 J K molpC T T
T
− −
− − −
− ⋅ ⋅− ⋅ ⋅ ⋅
2T
(298.15 to 1309 K)
As noted in section 9.4.2.1.2 the vapour pressure data for UF4(cr, l) are more consistent with a somewhat smaller value of the enthalpy of fusion than the experimen-tal value [72DWO], but the latter seems well-defined and has been retained, together with the heat capacity of the liquid from [82GLU/GUR]:
fusT = (1305 ± 30) K, fus m
ο∆ H (UF4, cr, 1305 K) = (47 ± 5) 1kJ mol−⋅ , οC 1 1ol−
,mp (UF4, l) = (167 ± 15) J K m−⋅ ⋅ .
9.4.2.3.2 Other U(VI) fluorides (V.4.1.3.2)
9.4.2.3.2.1 UO2F2(cr) and its hydrates The heat capacity equation for UO2F2(cr) given in Table III.3 of [92GRE/FUG] is valid only to 400 K. Since heat capacity values at higher temperatures were required for va-pour pressure calculations (section 9.4.2.1.6), this expression has been replaced by the equation given by Glushko et al.[82GLU/GUR]:
2 6 2,m 2 2(UO F , cr, ) = 106.238 + 2.8326 10 1.0208 10 J K molpC T T T 1 1− − −× − × ⋅ ⋅ −
(298.15 to 2100 K). The value at 298.15 K is unchanged:
,m 2 2(UO F , cr, 298.15 K) =pCο (103.22 ± 0.42) J · K–1 · mol–1.

9 Discussion of new data selection for Uranium 214
9.4.3 Chlorine compounds and complexes (V.4.2) 9.4.3.1 Uranium chlorides (V.4.2.1)
9.4.3.1.1 Gaseous uranium chlorides (V.4.2.1.1)
9.4.3.1.1.1 UCl(g), UCl2(g) and UCl3(g) These species are considered together since their data are linked by the four mass-spectrometic studies, which thus involve some uncertainties in absolute pressures.
The thermal functions of UCl(g), UCl2(g) and UCl3(g) were calculated assum-ing the molecular parameters shown in Table 9-9, which are essentially those estimated by Hildenbrand et al. [85HIL/GUR]. These assumptions give:
mοSο
(UCl, g, 298.15 K) = (265.9 ± 3.0) J · K–1 · mol–1
,mpC (UCl, g, 298.15 K) = (43.2 ± 3.0) J · K–1 · mol–1,
mοSο
(UCl2, g, 298.15 K) = (339.1 ± 10.0) J · K–1 · mol–1
,mpC (UCl2, g, 298.15 K) = (59.9 ± 5.0) J · K–1 · mol–1,
mοSο
(UCl3, g, 298.15 K) = (380.3 ± 10.0) J · K–1 · mol–1
,mpC (UCl3, g, 298.15 K) = (82.4 ± 5.0) J · K–1 · mol–1,
which after rounding are the same as those in [92GRE/FUG].
Lau and Hildenbrand [84LAU/HIL] have studied four equilibria between UCl(g), UCl2(g), UCl3(g) and UCl4(g) which are summarised in Table 9-17, where the enthalpies of the given reactions at 298.15 K derived from both second- and third-law analyses are given. The auxiliary data for Ca(g) and CaCl(g) are taken from the CODATA assessments [87GAR/PAR], [89COX/WAG]; the data for CuCl(g) are dis-cussed in chapter 14. In addition there were “tentative” measurements of the vapour pressure of UCl3(cr, l) by Altman [43ALT]. However, such studies are not straightfor-ward, since UCl3 is known to disproportionate to U(cr, l) and UCl4(g) (and possibly UCl5(g)) − see discussions in [83FUG/PAR], section 8.5.B.1.5 and [51KAT/RAB], pages 458-459. This presumably accounts for the fact that the pressures measured by Altman are appreciably higher than those calculated for the simple vaporisation of UCl3(cr) with the selected data. The measurements of Altman [43ALT] are therefore not included in the analysis.

9.4 Uranium group 17 (halogen) compounds and complexes (V.4)
215
Table 9-17: Enthalpies of the reactions involving UCl(g), UCl2(g) and UCl3(g).
Reference Reaction Number of points r mο∆ H (298.15 K) kJ · mol–1
Second-law Third-law
[84LAU/HIL] UCl2(g) + CaCl(g) UCl3(g) +Ca(g) 14 – 92.3 – 89.9 [84LAU/HIL] UCl(g) + CaCl(g) UCl2(g)+Ca(g) 6 – 78.3 – 68.8 [84LAU/HIL] UCl2(g) + U(g) 2UCl(g) 9 17.5 6.4 [84LAU/HIL] UCl3(g)+ CuCl(g) UCl4(g)+Cu(g) 10 – 51.3 – 34.9
Of necessity, the pressures for most of these reactions were derived from mass-spectrometric intensities, leading to uncertainties in the absolute pressures. It will be seen that the agreement between the second- and third-law analyses is mostly quite poor.
Table 9-18: Sums of various enthalpies involving UCl(g), UCl2(g) and UCl3(g).
Reference Expression mfο∆ H (298.15 K) kJ · mol–1
Second-law Third-law
[84LAU/HIL] – UCl2(g) + UCl3(g) – 373.5 – 371.1 [84LAU/HIL] – UCl(g) + UCl2(g) – 359.5 – 350.0 [84LAU/HIL] –2 UCl(g) + UCl2(g) – 515.5 – 526.6 [84LAU/HIL] UCl3(g) – 503.7 – 520.1
With these data, we have four quasi–independent measurements to define the
three enthalpies of formation of UCl(g), UCl2(g), UCl3(g), as shown in Table 9-18. We have used a least-squares analysis to find the optimal solutions to the two over–determined sets of linear equations, using either the second-law or the third-law enthal-pies, with the results shown in Table 9-19.
Table 9-19: Optimised enthalpies of formation, f mο∆ H (298.15 K), kJ · mol–1.
Species Second-law Third-law Selected [92GRE/FUG]
UCl(g) 187.4 187.1 (187 ± 20) (188.2 ± 20.0) UCl2(g) – 151.1 – 156.0 – (155 ± 20) – (163.0 ± 22.3) UCl3(g) – 514.2 – 523.6 – (523 ± 20) – (537.1 ± 15.8)
The noticeable differences from the values selected in [92GRE/FUG] for
UCl2(g) and UCl3(g) are due principally to the difference in the auxiliary data. The se-lected values are thus:
f mο∆ H (UCl, g, 298.15 K) = (187 ± 20) kJ · mol–1, ο∆ H f m (UCl2, g, 298.15 K) = − (155 ± 20) kJ · mol–1, ο∆ H f m (UCl3, g, 298.15 K) = − (523 ± 20) kJ · mol–1.

9 Discussion of new data selection for Uranium 216
The uncertainties have been increased substantially from the purely statistical values to allow for the uncertainties in the thermal functions and the conversion from mass-spectrometric intensities to pressures.
9.4.3.1.1.2 UCl4(g) Haarland et al. [95HAA/MAR] have studied the electron diffraction and infrared spec-troscopy of UCl4(g) and have concluded that the molecule is an undistorted tetrahedron, with a U–Cl distance of 2.503 to 2.51 Å; we have taken the value of 2.506 Å suggested by Konings and Hildenbrand [98KON/HIL]. We also accept the vibration frequencies given by these authors [95HAA/MAR], [98KON/HIL]; the electronic states were taken to be those given by Hildenbrand et al. [85HIL/GUR], which are a simplification of the levels deduced by Gruber and Hecht [73GRU/HEC] from their spectroscopic measure-ments. The full data used are given in Table 9-9.
The calculated values for the entropy and heat capacity of UCl4(g) at 298.15 K are:
mοSο
(UCl4, g, 298.15 K) = (409.3 ± 5.0) J · K–1 · mol–1,
,mpC (UCl4, g, 298.15 K) = (103.5 ± 3.0) J · K–1 · mol–1,
and these are the selected values.
The vapour pressures of UCl4(cr) and UCl4(l) have been measured by a number of investigators, as summarised in Table 9-20.
Table 9-20: Vapour pressure data for the vaporisation of UCl4(cr, l).
Reference Method T range (K) msubο∆ H (298.15 K) kJ · mol–1
[42JEN/AND] Boiling point 873–1103 (202.4 ± 4.0) [45DAV] Tube flow 710–775 (204.2 ± 1.9) [45DAV/STR] Effusion 640–732 (204.5 ± 1.8) [45WAG/GRA] Boiling point 864-1064 (202.1 ± 0.8) [46GRE2] Diaphragm gauge 823-1044 (202.1 ± 2.4) [48MUE] Effusion 630-763 (205.1 ± 2.2) [48THO/SCH] Effusion 603–783 (203.8 ± 2.4) [56SHC/VAS2] Effusion 631–708 (204.0 ± 1.1) [58JOH/BUT] Transpiration 723–948 (196.9 ± 2.3) * [58YOU/GRA] Boiling point 864–1064 (202.0 ± 0.6) [68CHO/CHU] Effusion 648–748 (202.1 ± 1.5) [75HIL/CUB] Mass-spectrometric effusion 575–654 (203.6 ± 3.7) [78SIN/PRA] Transpiration 763–971 (202.7 ± 1.1) [91COR/KON] Transpiration 699–842 (205.5 ± 1.3) [91HIL/LAU] Torsion–effusion 588–674 (204.0 ± 0.9)
(*) Data not included in the mean
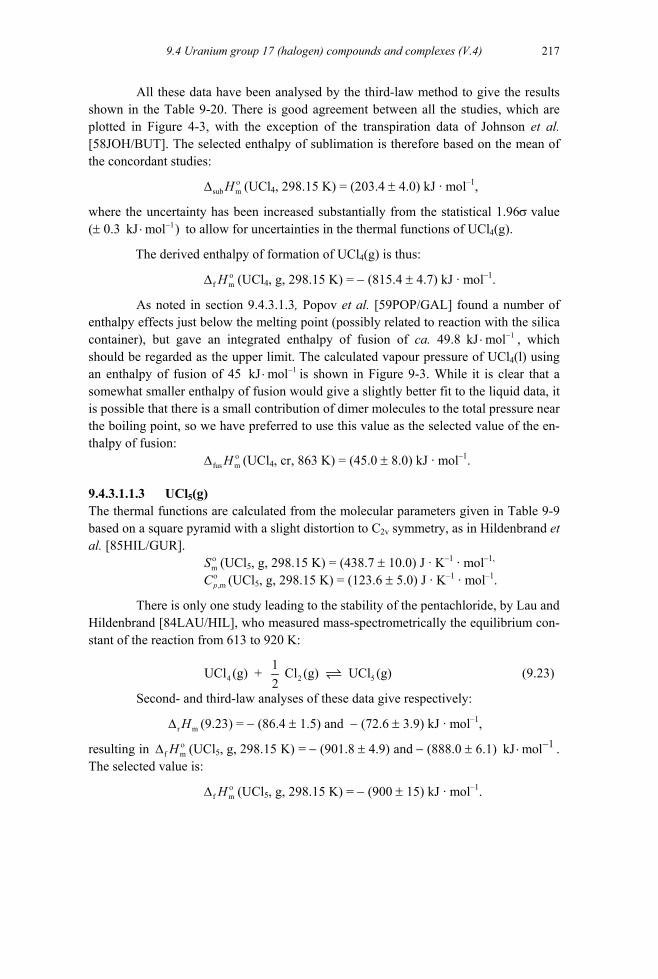
9.4 Uranium group 17 (halogen) compounds and complexes (V.4)
217
All these data have been analysed by the third-law method to give the results shown in the Table 9-20. There is good agreement between all the studies, which are plotted in Figure 4-3, with the exception of the transpiration data of Johnson et al. [58JOH/BUT]. The selected enthalpy of sublimation is therefore based on the mean of the concordant studies:
sub mο∆ H (UCl4, 298.15 K) = (203.4 ± 4.0) kJ · mol–1,
where the uncertainty has been increased substantially from the statistical 1.96σ value (± 0.3 to allow for uncertainties in the thermal functions of UCl1kJ mol )−⋅ 4(g).
The derived enthalpy of formation of UCl4(g) is thus: ο
f m∆ H (UCl4, g, 298.15 K) = − (815.4 ± 4.7) kJ · mol–1.
As noted in section 9.4.3.1.3, Popov et al. [59POP/GAL] found a number of enthalpy effects just below the melting point (possibly related to reaction with the silica container), but gave an integrated enthalpy of fusion of ca. 49.8 , which should be regarded as the upper limit. The calculated vapour pressure of UCl
1kJ mol−⋅4(l) using
an enthalpy of fusion of 45 kJ 1mol−⋅ is shown in Figure 9-3. While it is clear that a somewhat smaller enthalpy of fusion would give a slightly better fit to the liquid data, it is possible that there is a small contribution of dimer molecules to the total pressure near the boiling point, so we have preferred to use this value as the selected value of the en-thalpy of fusion:
οfus m∆ H (UCl4, cr, 863 K) = (45.0 ± 8.0) kJ · mol–1.
9.4.3.1.1.3 UCl5(g) The thermal functions are calculated from the molecular parameters given in Table 9-9 based on a square pyramid with a slight distortion to C2v symmetry, as in Hildenbrand et al. [85HIL/GUR].
mοSο(UCl5, g, 298.15 K) = (438.7 ± 10.0) J · K–1 · mol–1,
C ,mp (UCl5, g, 298.15 K) = (123.6 ± 5.0) J · K–1 · mol–1.
There is only one study leading to the stability of the pentachloride, by Lau and Hildenbrand [84LAU/HIL], who measured mass-spectrometrically the equilibrium con-stant of the reaction from 613 to 920 K:
4 21UCl (g) + Cl (g) UCl (g)2 5 (9.23)
Second- and third-law analyses of these data give respectively:
r m∆ H (9.23) = − (86.4 ± 1.5) and − (72.6 ± 3.9) kJ · mol–1,
resulting in ∆f mοH (UCl5, g, 298.15 K) = − (901.8 ± 4.9) and − (888.0 ± 6.1) .
The selected value is:
1kJ mol−⋅
f mο∆ H (UCl5, g, 298.15 K) = − (900 ± 15) kJ · mol–1.

9218 Discussion of new data selection for Uranium
Figure 9-3: Vapour pressure of UCl4(cr, l).
0.8 0.9 1.0 1.1 1.2 1.3 1.4 1.5 1.6 1.7 1.8 1.9-9
-8
-7
-6
-5
-4
-3
-2
-1
0
1
log 10
p /
bar
1000/T (K-1)
[42JEN/AND] [45DAV] [45DAV/STR] [45WAG/GRA] [46GRE2] [48JOH/BUT] [48MUE] [48THO/SCH] [56SHC/VAS] [58YOU/GRA] [68CHO/CHU] [75HIL/CUB] [78SIN/PRA] [91COR/KON] [91HIL/LAU] Calculated from selected values
9.4.3.1.1.4 UCl6(g) Although the data for UCl6(g) are independent of those for other gaseous uranium hal-ides there are new experimental data on the vapour pressure to supplement the (early) studies considered by Grenthe et al. [92GRE/FUG].
The thermal functions of UCl6(g) ideal gas were calculated from the estimated molecular parameters given in Table 9-9, using the rigid–rotator, harmonic oscillator approximation. The molecule is taken to be octahedral with Oh symmetry.
mοSο
(UCl6, g, 298.15K) = (438.0 ± 5.0) J · K–1 · mol–1,
,mpC (UCl6, g, 298.15K) = (147.2 ± 3.0) J · K–1 · mol–1.
Sevast'yanov et al. [90SEV/ALI] have used slightly different molecular pa-rameters for similar calculations to obtain values of (UClmS 6, g) at 285, 320 and 353 K which differ from those derived from the selected values by ca. 2.4 J · K–1 · mol–1.
The heat capacities of the vapour have been refitted to the expression:
65 8 2
,m UCl , g, ( ) = 157.768 + 9.730 10 1.059 10 9.4616 10 p TC T T 5 2T− − −⋅ − ⋅ − ⋅ (in J · K–1 · mol–1, 298.15 to 1000 K).
Table 9-21 shows the results of third-law analyses of the three measurements of the vapour pressure of UCl6(cr) by Altman et al. [43ALT/LIP] (clicker gauge) and by Johnson et al. [58JOH/BUT] by transpiration (work done in 1944) and the more recent study by Knudsen effusion by Sevast'yanov et al. [90SEV/ALI].

9.4 Uranium group 17 (halogen) compounds and complexes (V.4)
219
Table 9-21: Vapour pressure data for the sublimation of UCl6(cr).
Reference Method T range (K) msubο∆ H (298.15 K) kJ · mol–1
[43ALT/LIP] Clicker gauge 327–417 (76.8 ± 3.0) [58JOH/BUT] Transpiration 349–411 (81.4 ± 1.6) [90SEV/ALI] Mass-spectrometric effusion 285–353 (81.1 ± 2.1)
The higher vapour pressures measured by Altman et al. [43ALT/LIP] probably
result from partial decomposition to UCl5, which becomes noticeable around 420 K. The selected value for the enthalpy of sublimation is sub m
ο∆ H (298.15 K) = (81.0 ± 4.0) kJ · mol–1, where the uncertainty includes that in the thermal functions and other uncer-tainties. The corresponding enthalpy of formation is:
f mο∆ H (UCl6, g, 298.15 K) = − (985.5 ± 5.0) kJ · mol–1,
which is the selected value.
9.4.3.1.1.5 U2Cl8(g) We have not attempted to estimate the molecular parameters of U2Cl8(g) in order to calculate the thermal functions. In [92GRE/FUG], values of the thermal functions from [84COR/KUB] were adopted, based on the procedure suggested by Kubaschewski [84KUB] for gaseous dimers from the monomer values. However, the monomer values (of UCl4(g)) used were different from the selected values of [92GRE/FUG], which must lead to an inconsistency between the experimental and calculated equilibrium constants for the dimerisation reaction. We shall defer selection of any thermal function values at this time.
Binnewies and Schäfer [74BIN/SCH] give mass-spectrometric data from which the equilibrium constant of the dimerisation reaction:
2 UCl4(g) U2Cl8(g)
is calculated to be 4.2 bar–1 at 710 K and 1.25 bar–1 at 737 K. Given the very short tem-perature range, and the uncertainties in the ionisation cross-sections of UCl4(g) and U2Cl8(g), we have not attempted to use these values to provide data for U2Cl8(g) at 298.15 K.
9.4.3.1.1.6 U2Cl10(g) As with U2Cl8(g), we have not attempted to estimate the molecular parameters of U2Cl8(g) in order to calculate the thermal functions.
Gruen and McBeth [69GRU/MCB] studied spectrometrically the reaction of UCl4(cr) with Cl2(g) (at pressures of ca. 3 bar) from 460 to 660 K. They were not able to define unambiguously the vapour species formed, but on the basis of a much greater consistency for the calculated equilibrium constants, suggested that the principal reac-tion was:

9 Discussion of new data selection for Uranium 220
, (9.24) 4 2 2 102 UCl (cr) + Cl (g) U Cl (g)
rather than the formation of monomeric UCl5(g) or higher chlorides. This conclusion is confirmed by calculations with our selected data, for which the pressures of UCl5(g) are less than 1% of the measured total pressures.
The equilibrium constants for the formation of U2Cl10(g) correspond to r m∆ H ((9.24), 560 K) = (63.3 ± 8.0) kJ · mol–1. In order to reduce this to 298.15 K, we
assume that ( for reaction (9.24) is − (9.0 ± 4.0) kJ · molm m(560K) (298.15K))−H H
1ol )−r
–1, slightly greater than that of the corresponding reaction with molybdenum (− 9.9 kJ [98CHA]. Thus m⋅ m
ο∆ H ((9.24), 298.15 K) = (72.3 ± 8.9) kJ · mol–1, giving the selected value:
f mο∆ H (U2Cl10, g, 298.15 K) = − (1965.3 ± 10.2) kJ · mol–1.
9.4.3.1.1.7 UO2Cl2(g) No new data have been reported for this species, but the data in [92GRE/FUG] have been slightly modified to take account of the recent spectroscopic results of UCl4(g).
The thermal functions were calculated from estimated data given in Table 9-9; the derived values of the standard entropy and heat capacity are:
mοS (UO2Cl2 , g, 298.15 K) = (373.4 ± 6.0) J · K–1 · mol–1,
,mοpC (UO2Cl2, g, 298.15 K) = (92.6 ± 3.0) J · K–1 · mol–1.
The enthalpy of formation was calculated from the investigation of the reac-tion: U3O8(cr) + 3 Cl2(g) 3 UO2Cl2(g) + O2(g) (9.25)
by Cordfunke and Prins [74COR/PRI] from 1135 to 1327 K. Second- and third-law treatments of their results give r mH∆
f m
(9.25) = (648.6 ± 15.0) kJ · mol–1 and (665.0 ± 3.1) kJ · mol–1, giving for ο∆ H (UO2Cl2, g, 298.15 K) = − (975.4 ± 5.1) kJ · mol–1 and − (969.0 ± 1.3) kJ · mol–1, respectively. However, the uncertainty in the selected value has been increased substantially, since the reaction is almost certainly more complex than assumed, and U3O8(cr) will certainly be sub-stoichiometric under the conditions of the experimentation. The selected value is the weighted mean:
f mο∆ H (UO2Cl2, g, 298.15 K) = − (970.3 ± 15.0) kJ · mol–1.
Kangro [63KAN] has also studied reaction (9.25) from 1273 to 1373 K, with quite different results from those of Cordunke and Prins [74COR/PRI]. However, the entropy change calculated from his results (ca. 91 J · K–1 · mol–1) is too small to corre-spond to a reaction in which there is a net formation of one mole of gas, and those re-sults have been discounted.
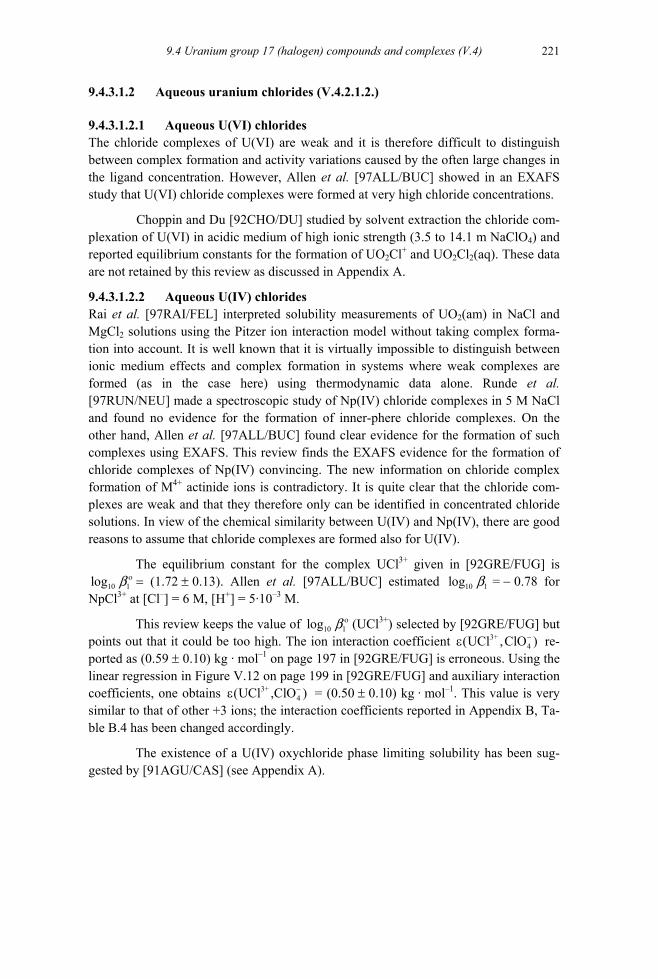
9.4 Uranium group 17 (halogen) compounds and complexes (V.4)
221
9.4.3.1.2 Aqueous uranium chlorides (V.4.2.1.2.)
9.4.3.1.2.1 Aqueous U(VI) chlorides The chloride complexes of U(VI) are weak and it is therefore difficult to distinguish between complex formation and activity variations caused by the often large changes in the ligand concentration. However, Allen et al. [97ALL/BUC] showed in an EXAFS study that U(VI) chloride complexes were formed at very high chloride concentrations.
Choppin and Du [92CHO/DU] studied by solvent extraction the chloride com-plexation of U(VI) in acidic medium of high ionic strength (3.5 to 14.1 m NaClO4) and reported equilibrium constants for the formation of UO2Cl+ and UO2Cl2(aq). These data are not retained by this review as discussed in Appendix A.
9.4.3.1.2.2 Aqueous U(IV) chlorides Rai et al. [97RAI/FEL] interpreted solubility measurements of UO2(am) in NaCl and MgCl2 solutions using the Pitzer ion interaction model without taking complex forma-tion into account. It is well known that it is virtually impossible to distinguish between ionic medium effects and complex formation in systems where weak complexes are formed (as in the case here) using thermodynamic data alone. Runde et al. [97RUN/NEU] made a spectroscopic study of Np(IV) chloride complexes in 5 M NaCl and found no evidence for the formation of inner-phere chloride complexes. On the other hand, Allen et al. [97ALL/BUC] found clear evidence for the formation of such complexes using EXAFS. This review finds the EXAFS evidence for the formation of chloride complexes of Np(IV) convincing. The new information on chloride complex formation of M4+ actinide ions is contradictory. It is quite clear that the chloride com-plexes are weak and that they therefore only can be identified in concentrated chloride solutions. In view of the chemical similarity between U(IV) and Np(IV), there are good reasons to assume that chloride complexes are formed also for U(IV).
The equilibrium constant for the complex UCl3+ given in [92GRE/FUG] is = (1.72 ± 0.13). Allen et al. [97ALL/BUC] estimated = − 0.78 for
NpCl10 1log οb 10 1log b
3+ at [Cl–] = 6 M, [H+] = 5·10–3 M.
This review keeps the value of 10 1log οb
)
(UCl3+) selected by [92GRE/FUG] but points out that it could be too high. The ion interaction coefficient re-ported as (0.59 ± 0.10) kg · mol
3+4(UCl ,ClO )−ε
–1 on page 197 in [92GRE/FUG] is erroneous. Using the linear regression in Figure V.12 on page 199 in [92GRE/FUG] and auxiliary interaction coefficients, one obtains 3+
4(UCl ,ClO−ε = (0.50 ± 0.10) kg · mol–1. This value is very similar to that of other +3 ions; the interaction coefficients reported in Appendix B, Ta-ble B.4 has been changed accordingly.
The existence of a U(IV) oxychloride phase limiting solubility has been sug-gested by [91AGU/CAS] (see Appendix A).

9 Discussion of new data selection for Uranium 222
9.4.3.1.3 Solid uranium chlorides (V.4.2.1.3)
9.4.3.1.3.1 UCl3(cr) There are a number of errors in the heat capacity data in the tables and text relating to UCl3(cr) in [92GRE/FUG] as noted in [95GRE/PUI], so the original data have been re-examined and refitted.
The two sets of data on the low temperature heat capacities [44FER/PRA] (from the citation in [58MAC]), [89COR/KON] agree excellently. Although [89COR/KON] only give their data as a small graph, plus the actual values of ,m
οpC and
at 298.15 K, these have been preferred, since they almost certainly pertain to a purer sample. The data of [44FER/PRA] at 298.15 K are 0.5 J · K
mοS
–1 · mol–1 higher than the preferred values, so their ,mpC values from 270 − 320 K have been decreased by the same amount in the fitting. These data (four points) and the enthalpy drop measurements of Ginnings and Corruccini [47GIN/COR] (nine values of ( mH (T) − mH (273.15 K)) from 323.5 to 997.0 K) have been fitted simultaneously with a constraint of ,m
οpC (298.15 K) = 102.52 J · K–1 · mol–1 [89COR/KON]. A four-term
,mοpC expression was preferred, since this avoids a shallow minimum in ,m
οpC just above
300 K.
The final fit gives: 2 5 2
,m 35 2 1 1
(UCl , cr, ) = 106.967 2.0859 10 + 3.63895 10 1.29994 10 J K mol (298.15 to 1115 K).
pC T T TT
− −
− − −
− ⋅ ⋅− ⋅ ⋅ ⋅
Note that the value of the heat capacity at 298.15 K is incorrectly quoted in [92GRE/FUG]. The correct value is:
,mοpC (UCl3, cr, 298.15 K) = (102.52 ± 0.50) J · K–1 · mol–1.
The selected melting point and enthalpy of fusion are those measured by dif-ferential thermal analysis by Kovács et al. [96KOV/BOO]; the melting point agrees with those (1108 − 1115 K) found in work in the Manhattan Project (see references quoted in [96KOV/BOO]):
Tfus = (1115 ± 2) K, fus m
ο∆ H (1115 K) = (49.0 ± 2.0) 1kJ mol−⋅ .
The selected heat capacity of UCl3(l) in the temperature range from the melting point to 1200 K, is that suggested by [83FUG/PAR], although the source of this is not clear:
,mpC (UCl3, l, T) = (129.7 ± 10.0) J · K–1 · mol–1. (1115 to 1200 K)

9.4 Uranium group 17 (halogen) compounds and complexes (V.4)
223
9.4.3.1.3.2 UCl4(cr) The data for the heat capacity of UCl4(cr) in [92GRE/FUG] are also unsatisfactory, in that the equation given in their Table III.3 does not reproduce the correct ,mpC at 298.15 K, so as for UCl
ο
3, we have re-examined and refitted the original data. There are three determinations: Ferguson et al. [44FER/PRA2], reported in detail in [51KAT/RAB], measured the heat capacity from 15 to 355 K, and Ginnings and Cor-ruccini [47GIN/COR] gave enthalpy increments ( mH (T) − mH (273.15 K)) from 323.4 to 699.9 K for a (probably) purer sample contained in a Nichrome capsule.
Later, Popov et al. [59POP/GAL] reported ,mpC measurements from 381 to 920 K (thus extending into the liquid range). Since these experiments were apparently carried out using a silica vessel, it is not surprising that the resultant data are rather scat-tered. In particular, the data at temperatures close to the melting point showed irregu-larities, and the reported values below 450 K are appreciably lower than those from the other two studies (which agree well, but not perfectly). In fitting the data, we have given double weight to the most accurate data of [47GIN/COR], ignored the data of [59POP/GAL] below 450 K and imposed a constraint of ,m
οpC (298.15 K)
= (121.8 ± 0.4) J · K–1 · mol–1 [44FER/PRA2].
,mpC
2,m 4(UCl ,cr, ) = 116.362 + 3.10837 10 3.40402 10 pC T T 5 2T− −⋅ − ⋅ J · K–1 · mol–1
(298.15 to 863 K).
The resulting ,mοpC for UCl4(cr) fits all the data used within their uncertainties.
Note that the selected value of ,mοpC (298.15 K) = 121.8 J · K–1 · mol–1 as given
in [51KAT/RAB], is slightly lower than that suggested by [83FUG/PAR] and hence [92GRE/FUG]. This latter value (122.0 J · K–1 · mol–1) seems to have suffered from a "J to cal to J" rounding error during conversion of the original data of [44FER/PRA2], [51KAT/RAB], which were given in joules. Similarly we select the original [44FER/PRA2] value of the standard entropy:
mοS (UCl4, cr, 298.15 K) = (197.2 ± 0.8) J · K–1 · mol–1,
rather than the perturbed value of 197.1 J · K–1 · mol–1 used in [92GRE/FUG].
The melting point of UCl4(cr) is taken to be (863 ± 1) K, as given in early work summarised by Katz and Rabinowitch [51KAT/RAB] in agreement with the less precise value from the thermal study by Popov et al. [59POP/GAL]. The latter authors found a number of enthalpy effects just below the melting point (possibly related to reaction with the silica container), but gave an integrated enthalpy of fusion of ca. 49.8 . However, the vapour pressure data suggest an appreciably smaller fu-sion enthalpy (see section 9.4.3.1.1). The selected value is:
1kJ mol−⋅
fus mο∆ H (UCl4, cr, 863 K) = (45.0 ± 8.0) 1kJ mol−⋅ ,
which still gives excellent, if not optimal, agreement with the vapour pressure data - as shown in Figure 9-3 (section 9.4.3.1.1).

9 Discussion of new data selection for Uranium 224
9.4.3.1.3.3 UCl6(cr) The value for (UClm
οS 6, cr, 298.15 K) = (285.8 ± 1.7) J · K–1 · mol–1 selected by Grenthe et al. [92GRE/FUG] was based on the value of 68.3 cal·K–1 · mol–1 selected by Fuger et al. [83FUG/PAR], in turn based on the original low temperature heat capacity meas-urements by Ferguson and Rand [45FER/RAN]. However, the latter were actually re-ported as 285.54 J · K–1 · mol–1.
We therefore select:
mοS (UCl6, cr, 298.15 K) = (285.5 ± 1.7) J · K–1 · mol–1,
for the standard entropy of UCl6(cr), where the relatively high uncertainty arises from the presence of 6.3% of UCl4(cr) in the calorimetric sample.
The heat capacity at 298.15 K has not suffered from the same "J to cal to J" conversions and remains unchanged:
,mοpC (UCl6, cr, 298.15 K) = (175.7 ± 4.2) J · K–1 · mol–1.
9.4.3.2 Uranium hypochlorites
9.4.3.2.1 Aqueous U(VI) hypochlorites
Kim et al. [94KIM/CHO] reported an increase (up to twofold) in the solubility of schoepite with increasing ClO– concentration in 0.1 NaCl (pH = 5 to 10), but were un-able to decide if this was a result of the formation of hypochlorite complex(es) formed from the hydrolysed species, (U or , or not. 2+
2 2 2O ) (OH) +2 3 5(UO ) (OH)
9.4.4 Bromine compounds and complexes (V.4.3) 9.4.4.1 Gaseous uranium bromides (V.4.3.1.1)
9.4.4.1.1 UBr(g), UBr2(g) and UBr3(g)
These species are considered together since their data are linked by six experimental studies, mainly involving mass-spectrometry, and thus involving some uncertainties in absolute pressures.
The thermal functions of UBr(g), UBr2(g) and UBr3(g) were calculated assum-ing the molecular parameters shown in Table 9-9, which are those estimated by Hilden-brand et al. [85HIL/GUR], except that higher electronic energy levels (assumed to be the same as for the corresponding chlorides) have been included. These calculations give:
(UBr, g, 298.15 K) = (278.5 ± 3.0) J · KmοSο
–1 · mol–1 C ,mp (UBr, g, 298.15 K) = (44.5 ± 3.0) J · K–1 · mol–1,
(UBrmοSο
2, g, 298.15 K) = (359.7 ± 10.0) J · K–1 · mol–1 C ,mp (UBr2, g, 298.15 K) = (61.4 ± 5.0) J · K–1 · mol–1,
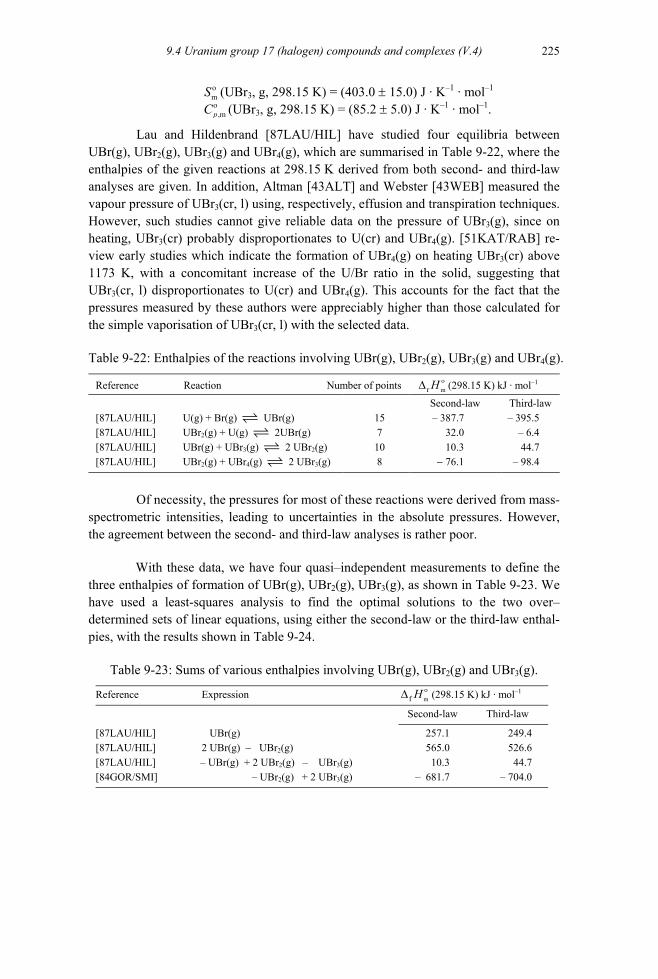
9.4 Uranium group 17 (halogen) compounds and complexes (V.4)
225
(UBrmοSο
3, g, 298.15 K) = (403.0 ± 15.0) J · K–1 · mol–1 C ,mp (UBr3, g, 298.15 K) = (85.2 ± 5.0) J · K–1 · mol–1.
Lau and Hildenbrand [87LAU/HIL] have studied four equilibria between UBr(g), UBr2(g), UBr3(g) and UBr4(g), which are summarised in Table 9-22, where the enthalpies of the given reactions at 298.15 K derived from both second- and third-law analyses are given. In addition, Altman [43ALT] and Webster [43WEB] measured the vapour pressure of UBr3(cr, l) using, respectively, effusion and transpiration techniques. However, such studies cannot give reliable data on the pressure of UBr3(g), since on heating, UBr3(cr) probably disproportionates to U(cr) and UBr4(g). [51KAT/RAB] re-view early studies which indicate the formation of UBr4(g) on heating UBr3(cr) above 1173 K, with a concomitant increase of the U/Br ratio in the solid, suggesting that UBr3(cr, l) disproportionates to U(cr) and UBr4(g). This accounts for the fact that the pressures measured by these authors were appreciably higher than those calculated for the simple vaporisation of UBr3(cr, l) with the selected data.
Table 9-22: Enthalpies of the reactions involving UBr(g), UBr2(g), UBr3(g) and UBr4(g).
Reference Reaction Number of points mrο∆ H (298.15 K) kJ · mol–1
Second-law Third-law [87LAU/HIL] U(g) + Br(g) UBr(g) 15 – 387.7 – 395.5 [87LAU/HIL] UBr2(g) + U(g) 2UBr(g) 7 32.0 – 6.4 [87LAU/HIL] UBr(g) + UBr3(g) 2 UBr2(g) 10 10.3 44.7 [87LAU/HIL] UBr2(g) + UBr4(g) 2 UBr3(g) 8 − 76.1 – 98.4
Of necessity, the pressures for most of these reactions were derived from mass-
spectrometric intensities, leading to uncertainties in the absolute pressures. However, the agreement between the second- and third-law analyses is rather poor.
With these data, we have four quasi–independent measurements to define the three enthalpies of formation of UBr(g), UBr2(g), UBr3(g), as shown in Table 9-23. We have used a least-squares analysis to find the optimal solutions to the two over–determined sets of linear equations, using either the second-law or the third-law enthal-pies, with the results shown in Table 9-24.
Table 9-23: Sums of various enthalpies involving UBr(g), UBr2(g) and UBr3(g).
Reference Expression mfο∆ H (298.15 K) kJ · mol–1
Second-law Third-law
[87LAU/HIL] 2 UBr(g) − 257.1 249.4 [87LAU/HIL] 2 UBr(g) − UBr2(g) 565.0 526.6 [87LAU/HIL] – UBr(g) + 2 UBr2(g) – UBr3(g) 10.3 44.7 [84GOR/SMI] – UBr2(g) + 2 UBr3(g) – 681.7 – 704.0

9 Discussion of new data selection for Uranium 226
The selected values are:
f mο∆ H (UBr, g, 298.15 K) = (245 ± 15) 1kJ mol−⋅ , ο∆ H mol−⋅ f m (UBr2, g, 298.15 K) = − (40 ± 15) kJ 1 , ο∆ H 1kJ mol−⋅ f m (UBr3, g, 298.15 K) = − (371 ± 20) ,
where the uncertainties have been estimated here. It will be seen that the new analysis of the experimental data for these species yields somewhat different values for the enthal-pies of formation of UBr2(g) and UBr3(g) from those selected by Grenthe et al. [92GRE/FUG], although well within the substantial uncertainty limits.
Table 9-24: Optimised enthalpies of formation, f mο∆ H (298.15 K) . 1kJ mol−⋅
Species Second-law Third-law Selected [92GRE/FUG]
UBr(g) 257.8 245.1 (245 ± 15) (247 ± 17) UBr2(g) – 48.8 – 39.7 − (40 ± 15) − (31 ± 25) UBr3(g) – 365.3 – 371.3 − (371 ± 20) − (364 ± 37)
9.4.4.1.2 UBr4(g)
The UBr4(g) molecule is assumed to have Td symmetry, as for UF4(g) and UCl4(g), with a U–Br distance of 2.693 Å (see Konings and Hildenbrand [98KON/HIL]). We also accept the vibration frequencies given by these authors; the electronic states were as-sumed to be the same as those given by Hildenbrand et al. [85HIL/GUR] for UCl4(g).
The calculated values for the entropy and heat capacity of UBr4(g) at 298.15 K are:
mοSο(UBr4, g, 298.15 K) = (451.9 ± 5.0) J · K–1 · mol–1,
,mpC (UBr4, g, 298.15 K) = (106.9 ± 3.0) J · K–1 · mol–1,
and these are the selected values.
There are several measurements of the vapour pressures of UBr4(cr) and UBr4(l), with excellent agreement. The early data of Thompson and Schelberg, and Not-torf and Powell are summarised by Katz and Rabinowitch [51KAT/RAB], and those by Gregory [46GRE3] are given in the report by Mueller [48MUE]. Subsequently Prasad et al. [79PRA/NAG] studied the vaporisation of (principally) the liquid, while Hilden-brand and Lau [91HIL/LAU2] used a torsion effusion technique to study the sublima-tion. The latter study is particularly valuable, since it shows that the molar mass of the vaporising species corresponds closely to that of UBr4 in the range of their experiments. Since the enthalpy of fusion of UBr4(cr) is not well-defined, only the vapour pressures of the solid have been used to derive, by a third-law analysis, the enthalpy of sublima-tion (Table 9-25) .
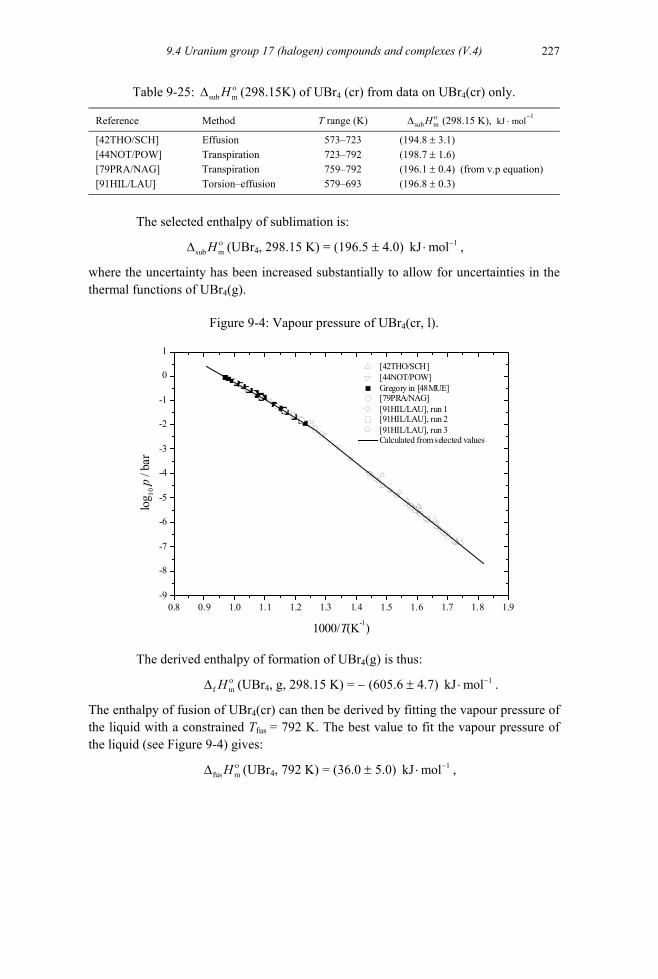
9.4
227 Uranium group 17 (halogen) compounds and complexes (V.4)
Table 9-25: sub mH ο∆ (298.15K) of UBr4 (cr) from data on UBr4(cr) only.
Reference Method T range (K) sub mH ο∆ (298.15 K), 1kJ mol−⋅
[42THO/SCH] Effusion 573–723 (194.8 ± 3.1) [44NOT/POW] Transpiration 723–792 (198.7 ± 1.6) [79PRA/NAG] Transpiration 759–792 (196.1 ± 0.4) (from v.p equation) [91HIL/LAU] Torsion–effusion 579–693 (196.8 ± 0.3)
The selected enthalpy of sublimation is:
sub mο∆ H (UBr4, 298.15 K) = (196.5 ± 4.0) kJ 1mol−⋅ ,
where the uncertainty has been increased substantially to allow for uncertainties in the thermal functions of UBr4(g).
Figure 9-4: Vapour pressure of UBr4(cr, l).
0.8 0.9 1.0 1.1 1.2 1.3 1.4 1.5 1.6 1.7 1.8 1.9-9
-8
-7
-6
-5
-4
-3
-2
-1
0
1
log 10
p /
bar
1000/T(K-1)
[42THO/SCH] [44NOT/POW] Gregory in [48MUE] [79PRA/NAG] [91HIL/LAU], run 1 [91HIL/LAU], run 2 [91HIL/LAU], run 3 Calculated from selected values
The derived enthalpy of formation of UBr4(g) is thus:
f mH ο∆ (UBr4, g, 298.15 K) = − (605.6 ± 4.7) 1kJ mol−⋅ .
The enthalpy of fusion of UBr4(cr) can then be derived by fitting the vapour pressure of the liquid with a constrained Tfus = 792 K. The best value to fit the vapour pressure of the liquid (see Figure 9-4) gives:
fus mο∆ H (UBr4, 792 K) = (36.0 ± 5.0) 1kJ mol−⋅ ,
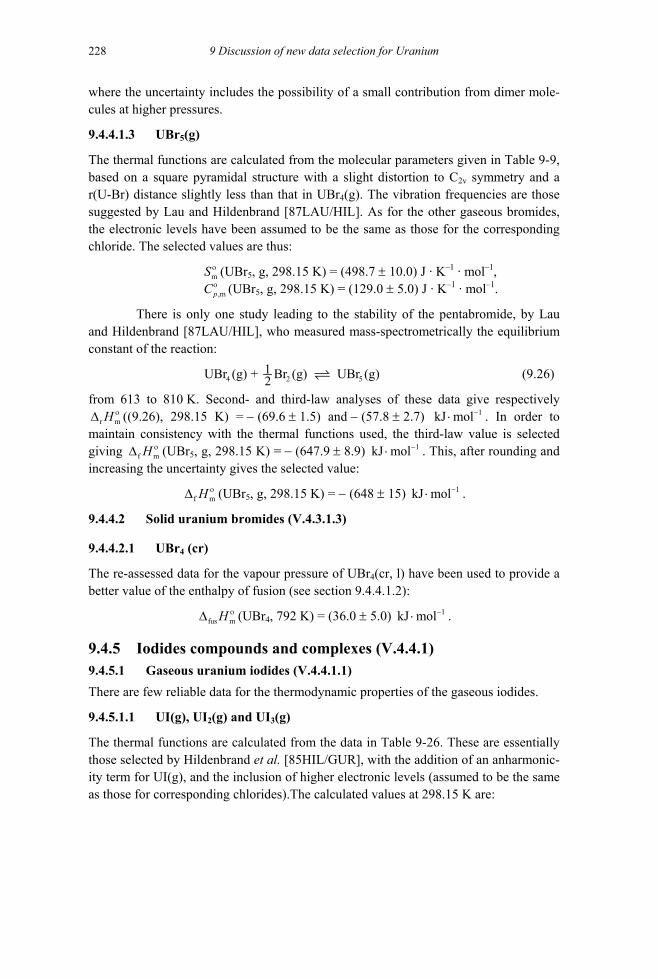
9 Discussion of new data selection for Uranium 228
where the uncertainty includes the possibility of a small contribution from dimer mole-cules at higher pressures.
9.4.4.1.3 UBr (g) 5
The thermal functions are calculated from the molecular parameters given in Table 9-9, based on a square pyramidal structure with a slight distortion to C2v symmetry and a r(U-Br) distance slightly less than that in UBr4(g). The vibration frequencies are those suggested by Lau and Hildenbrand [87LAU/HIL]. As for the other gaseous bromides, the electronic levels have been assumed to be the same as those for the corresponding chloride. The selected values are thus:
(UBr , g, 298.15 K) = (498.7 ± 10.0) J · K · mol , –15
–1
(UBr , g, 298.15 K) = (129.0 ± 5.0) J · K · mol . 5–1 –1
mοSοC ,mp
There is only one study leading to the stability of the pentabromide, by Lau and Hildenbrand [87LAU/HIL], who measured mass-spectrometrically the equilibrium constant of the reaction:
(9.26)
from 613 to 810 K. Second- and third-law analyses of these data give respectively ((9.26), 298.15 K) = − (69.6 ± 1.5) and − (57.8 ± 2.7) . In order to
maintain consistency with the thermal functions used, the third-law value is selected giving (UBr , g, 298.15 K) = − (647.9 ± 8.9) 5 . This, after rounding and increasing the uncertainty gives the selected value:
4 212UBr (g) + Br (g) UBr (g)5
r mο∆ H 1kJ mol−⋅
f mο∆ H 1kJ mol−⋅
f mο∆ H 1kJ mol−⋅(UBr5, g, 298.15 K) = − (648 ± 15) .
9.4.4.2 Solid uranium bromides (V.4.3.1.3)
9.4.4.2.1 UBr (cr) 4
The re-assessed data for the vapour pressure of UBr (cr, l) have been used to provide a better value of the enthalpy of fusion (see section 9.4.4.1.2):
4
(UBr , 792 K) = (36.0 ± 5.0) 4 .
9.4.5 Iodides compounds and complexes (V.4.4.1)
fus mο∆ H 1kJ mol−⋅
9.4.5.1 Gaseous uranium iodides (V.4.4.1.1) There are few reliable data for the thermodynamic properties of the gaseous iodides.
9.4.5.1.1 UI(g), UI (g) and UI (g) 2 3
The thermal functions are calculated from the data in Table 9-26. These are essentially those selected by Hildenbrand et al. [85HIL/GUR], with the addition of an anharmonic-ity term for UI(g), and the inclusion of higher electronic levels (assumed to be the same as those for corresponding chlorides).The calculated values at 298.15 K are:

9.4 Uranium group 17 (halogen) compounds and complexes (V.4)
229
(UI, g, 298.15 K) = (286.5 ± 5.0) J · K–1 · mol–1 (UI, g, 298.15 K) = (44.8 ± 5.0) J · K · mol , –1
mοSοC –1
,mp
(UI2, g, 298.15 K) = (376.5 ± 10.0) J · K–1 · mol–1 (UI , g, 298.15 K) = (61.9 ± 5.0) J · K · mol ,
mοSοC ,mp 2
–1
(UI , g, 298.15 K) = (431.2 ± 10.0) J · K · mol 3–1
(UI , g, 298.15 K) = (86.0 ± 5.0) J · K–1 · mol . –1
As noted by [92GRE/FUG], all the data for these species are estimated by Hil-denbrand et al. [85HIL/GUR] from (UI4, g, 298.15 K), assuming the bond ener-gies of these lower iodides follow the same pattern as the chlorides and bromides [84LAU/HIL]. We have rescaled this calculation, using a revised value for ∆ (UI , g, 298.15 K) from the next section. The revised values for the enthalpies of formation are:
4
(UI, g, 298.15 K) = (342 ± 25) , (UI , g, 298.15 K) = (103 ± 25) , (UI , g, 298.15 K) = − (137 ± 25) 3 ,
where the uncertainties are those selected by [92GRE/FUG].
9.4.5.1.2 UI (g) 4
4 d 4 4
The calculated values for the entropy and heat capacity of UI (g) at 298.15 K are:
4
(UI4, g, 298.15 K) = (499.1 ± 8.0) , 4
and these are the selected values.
Following [92GRE/FUG] we prefer the effusion data of Schelberg and Thomp-son [42SCH/THO] for the vapour pressure of UI4(cr), since these were measured at lower temperatures (573 to 683 K) than those of Gregory [46GRE] for the liquid (823 to 837 K), and will thus suffer less from the problems of dissociation to UI and I (g). A third-law analysis of their data gives: ∆ (UI , g, 298.15 K) = (213.3 ± 5.0)
, and thus the selected value for the enthalpy of formation:
–1
–1mοSοC 3,mp
f mH ο∆
r mH ο
f mο∆ H 1kJ mol−⋅ο 1−
f m∆ H kJ mol⋅ο −
2
f m∆ H 1kJ mol⋅
The UI (g) molecule is assumed to have T symmetry, as for UF (g) and UCl (g) with a U–I distance of 2.85 Å (see Konings and Hildenbrand [98KON/HIL]). We also accept the vibration frequencies given by these authors; the electronic states were assumed to be the same as those given by Hildenbrand et al. [85HIL/GUR] for UCl (g). 4
mοS 1 1J K mol− −⋅ ⋅οC J K mol− −⋅ ⋅,mp
1 1(UI , g, 298.15 K) = (108.8 ± 4.0) ,
3 2
sub mοH
1kJ mol−⋅4
f mο∆ H 1kJ mol−⋅(UI4, g, 298.15 K) = − (305.0 ± 5.7) ,
where the uncertainty has been increased from the statistical value (3.0 kJ ) to allow for the uncertainty in the thermal functions of UI (g) and possible dissociation.
1mol−⋅4
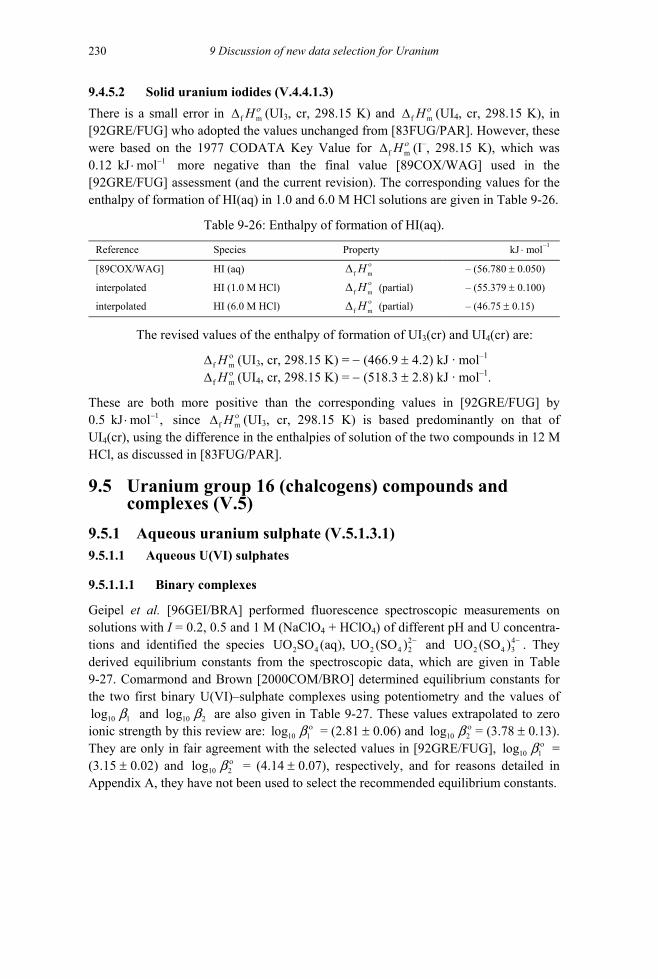
9 Discussion of new data selection for Uranium 230
9.4.5.2 Solid uranium iodides (V.4.4.1.3) There is a small error in (UI , cr, 298.15 K) and (UI , cr, 298.15 K), in [92GRE/FUG] who adopted the values unchanged from [83FUG/PAR]. However, these were based on the 1977 CODATA Key Value for (I , 298.15 K), which was 0.12 more negative than the final value [89COX/WAG] used in the [92GRE/FUG] assessment (and the current revision). The corresponding values for the enthalpy of formation of HI(aq) in 1.0 and 6.0 M HCl solutions are given in Table 9-26.
f m∆ H οf m∆ H ο
f∆ mH ο
1kJ mol−⋅
3 4
–
Table 9-26: Enthalpy of formation of HI(aq).
Reference Species Property
[89COX/WAG] HI (aq) – (56.780 ± 0.050)
interpolated HI (1.0 M HCl) (partial) – (55.379 ± 0.100)
interpolated HI (6.0 M HCl) (partial) – (46.75 ± 0.15)
1kJ mol−⋅
f mH ο∆
f mH ο∆
f mH ο∆
The revised values of the enthalpy of formation of UI3(cr) and UI4(cr) are:
f mο∆ Hο∆ H
(UI , cr, 298.15 K) = − (466.9 ± 4.2) kJ · mol 3–1
(UI , cr, 298.15 K) = − (518.3 ± 2.8) kJ · mol . f m 4–1
These are both more positive than the corresponding values in [92GRE/FUG] by 0.5 since (UI , cr, 298.15 K) is based predominantly on that of UI (cr), using the difference in the enthalpies of solution of the two compounds in 12 M HCl, as discussed in [83FUG/PAR].
1kJ mol ,−⋅ f mο∆ H 3
4
9.5 Uranium group 16 (chalcogens) compounds and complexes (V.5)
9.5.1 Aqueous uranium sulphate (V.5.1.3.1) 9.5.1.1 Aqueous U(VI) sulphates
9.5.1.1.1 Binary complexes
Geipel et al. [96GEI/BRA] performed fluorescence spectroscopic measurements on solutions with I = 0.2, 0.5 and 1 M (NaClO4 + HClO4) of different pH and U concentra-tions and identified the species and . They derived equilibrium constants from the spectroscopic data, which are given in Table 9-27. Comarmond and Brown [2000COM/BRO] determined equilibrium constants for the two first binary U(VI)–sulphate complexes using potentiometry and the values of
and are also given in Table 9-27. These values extrapolated to zero ionic strength by this review are: lo = (2.81 ± 0.06) and = (3.78 ± 0.13). They are only in fair agreement with the selected values in [92GRE/FUG], lo = (3.15 ± 0.02) and = (4.14 ± 0.07), respectively, and for reasons detailed in Appendix A, they have not been used to select the recommended equilibrium constants.
22 4 2 4 2UO SO (aq), UO (SO ) − 4
2 4 3UO (SO ) −
10 1log b 10 2log b10 1g οb 10 2log οb
10g 1οb
10log 2οb

9.5 Uranium group 16 (chalcogens) compounds and complexes (V.5)
231
+The values at zero ionic strength are calculated by Geipel et al. ac-
cording to SIT theory using = − 0.24 estimated from as an analogue. The two first values are somewhat higher than those se-
lected in [92GRE/FUG] (see above) with larger uncertainty. The weighted averaged values of the constants given by [92GRE/FUG] and [96GEI/BRA] are lo = (3.15 ± 0.02) and = (4.15 ± 0.06). These values do not cause noticeable changes in the values selected by [92GRE/FUG] which are retained by this review.
This review selects,
= (3.02 ± 0.38),
which is the only value available and recalculated in Appendix A, review of [96GEI/BRA].
Some indications on saturated solutions of dioxouranium(VI) sulphate are given in [97DEM/SER].
Table 9-27: Equilibrium constants for binary complexes 1
from spectroscopic measurements [96GEI/BRA]. Species , I = 0.2 M
(aq) (2.42 ± 0.14) (3.35 ± 0.15) (3.30 ± 0.17) (4.21 ± 0.17)
, I = 1 M
10log οrb
42 4 3(UO (SO ) , Na )−ε 1kg mol−⋅
42 7P O , Na− +
log10 1g οb
10 2οb
10 3log οb
2 22 4UO (SO ) r
r−
10log rb (a)
10log οrb
2UO SO42
2 4 2) −UO (SO
10log rb 10log rοb
2UO SO42
2 4 2) −
4UO (SO ) −
UO (SO
2 4 3
(aq) (1.88 ± 0.27) (3.33 ± 0.29) (2.9 ± 0.4) (4.29 ± 0.45) (3.2 ± 0.25) (2.73 ± 0.33)
from potentiometric measurements [2000COM/BRO].
Species 10log rb
2UO SO42
2 4 2UO (SO ) −
, Sulphate concentration, mol · kg -1
0 0.1004 1.027 1.566
(2.81 ± 0.06) (1.92 ± 0.03) (1.06 ± 0.19) (1.9 ± 0.19)(b) (aq) (3.78 ± 0.13) (2.90 ± 0.08) (2.06 ± 0.32) (2.29 ± 0.24)(b)
2 2
2 4UO (SO ) r
r
−(a) r is the number of ligands in the complex . (b) calculated by [2000COM/BRO] from [2000MOL/REI2] and [93GRE/LAG].
1 During the Peer Review process, the following sets of unpublished data by L. Ciavatta et al. (submitted to Ann. Chim. (Rome)), related to 3 M NaClO at 298.15 K were given to the review-ers:
4
10 1log b = (1.77 ± 0.01) and 10 2log b = (2.99 ± 0.02), 10 1log b = (1.83 ± 0.06) and 10 2log b = (2.83 ± 0.10), 10 1log b = (1.82 ± 0.07) and 10 2log b = (2.95 0.05), obtained from , spectrophotometry and solubility of UO2(IO3)2, respectively, which are consistent with those listed in this Table.
± potentiometry

9 Discussion of new data selection for Uranium 232
−
9.5.1.1.2 Ternary hydroxide-sulphate complexes
Ternary hydroxo sulphato complexes, (UO , have been identified by Grenthe and Lagerman [93GRE/LAG] by combining new potentiometric titrations in a 0.5 M Na SO + 2 M NaClO with previous data in 1.5 M Na SO [61PET] at 298.15 K. The first step in the analysis is a determination of the conditional equilibrium constants in the two media that provides information on the stoichiometric coefficients m and n. In the second step the stoichiometric coefficient r was determined from the sulphate concentration dependence of these constants. This is not straightforward and requires estimates of the activity coefficients of reactants and products in the two media investigated. Grenthe and Lagerman [93GRE/LAG] used the SIT model for this pur-pose, but the resulting equilibrium constants for the reactions:
2 22 4) (OH) (SO ) m n r
m n r− −
2 4 4 2 4
2+ 2 2 2 +2 2 4 2 4 UO + H O + SO (UO ) (OH) (SO ) + Hm n r
m n rm n r n− −
are uncertain because of the approximate nature of the method. Grenthe and Lagerman [93GRE/LAG] propose the following m:n:r set for the ternary complexes: 2:2:2, 3:4:3, 3:4:4 and 5:8:6 (see Appendix A).
Moll et al. [2000MOL/REI2] repeated the potentiometric measurements at the same conditions as in [93GRE/LAG] and [61PET], but used data that covered a larger range of − log [H ] and total concentration of U(VI). These data confirm the previous conditional equilibrium constants. Moll et al. tested the chemical model proposed by Comarmond and Brown [2000COM/BRO] and found that inclusion of the species with m = 4, n = 7, as suggested by Comarmond and Brown, gave a slightly better fit of the experimental data. From the EXAFS data Moll et al. [2000MOL/REI2] conclude that the sulphate ions form bidentate complexes both in the binary U(VI)-sulphate com-plexes and in the ternary complexes. There is no evidence for bridging sulphate in the systems as suggested in [93GRE/LAG]. Grenthe and Lagerman give tentative SIT inter-action coefficients for the media considered, but they indicate that these coefficients should be used with caution.
+10
Comarmond and Brown [2000COM/BRO] added new additional potentiomet-ric data in 0.1 and 1 M Na SO to those from the two previous studies. From the ex-perimental data they proposed that species with m:n:r 1:0:1, 1:0:2, 2:2:2, 3:4:3, 4:7:4 and 5:8:4 were formed. The and interaction coefficients, ε, and the extrapolated values from SIT, are given in Table 9-28 together with the data from [93GRE/LAG] and [61PET]. The SIT analysis in [2000COM/BRO] is not identical with the one in [93GRE/LAG]. This difference is reflected both in the different sulphate stoichiometry proposed for the (8,5) complex and in the equilibrium constants. This difference may be used as an estimate of the model/extrapolation uncertainty. Because of this, no equilibrium constants have been retained in the present review. However, the stoichiometry and equilibrium constants proposed in the experimental studies discussed here may be used as guidance.
2 4
, ,m n rb, ,m n r
οb

9.5 Uranium group 16 (chalcogens) compounds and complexes (V.5)
233
Table 9-28: Equilibrium constants for ternary complexes, lo , and interaction coefficient in kg · mol .
110 , ,
*g m n rb2 2 +
2 4 r((UO ) (OH) (SO ) , Na )m n rm n
− −ε –1
Species ε 10 , ,*log m n rb
22 2 2 4 2(UO ) (OH) (SO ) −
4(UO ) (OH) (SO ) −2 3 4 4 3
7(UO ) (OH) (SO ) −2 4 7 4 4
6(UO ) (OH) (SO ) −2 8 45
22 2 2 4 2(UO ) (OH) (SO ) −
4(UO ) (OH) (SO ) −2 3 4 4 3
6(UO ) (OH) (SO ) −2 3 4 4 4
10(UO ) (OH) (SO ) −2 8 45
kg · mol–1 mol · kg –1 (a)
0 0.1004 1.027 1.566
–(0.14 ± 0.22) – (0.64 ± 0.01) – (2.17 ± 0.15) – (3.02 ± 0.68) – (3.20 ± 0.82) (c)
(0.6 ± 0.6) – (5.9 ± 0.2) – (6.60 ± 0.17) – (7.18 ± 0.70) – (9.01 ± 0.87) (c)
(2.8 ± 0.7) – (18.9 ± 0.2) – (15.85 ± 0.28) – (18.4 ± 1.3) – (22.6 ± 1.2) (c)
(1.1 ± 0.5) – (18.7 ± 0.1) – (17.69 ± 0.20) – (19.61 ± 0.73) – (20.14 ± 0.88) 4
Sulphate concentration, M (b)
Species 1.500 M Na SO 2 4 0.500 M Na SO + 2.00 M NaClO 2 4 4
– (3.26 ± 0.46) – (2.73 ± 0.09) – (8.64 ± 0.69) – (8.15 ± 0.17) – (8.81 ± 0.69) – (7.84 ± 0.17)
– (19.79 ± 1.20) 6 – (18.53 ± 0.25) (a) from [2000COM/BRO]. (b) from [93GRE/LAG]. (c) calculated by [2000COM/BRO] from [2000MOL/REI2] and [93GRE/LAG].
9.5.2 Aqueous uranium selenate (V.5.2.3.1) The data reported by Kumok and Batyreva [90KUM/BAT], and Serezhkina and Serezhkin [94SER/SER] on the solubility of do not allow derivation of any reliable thermodynamic data. It is the same for the solubility data reported by Tatarinova et al. [89TAT/SER] for some seleniate compounds (see Appendix A). Lubal and Havel [97LUB/HAV] identified the species (aq) and by spectrophotometry in solutions at I = 3 M (NaClO + NaSeO ) at 298.15 K and reported
= (1.576 ± 0.016) and = (2.423 ± 0.013). They also carried out poten-tiometric measurements at variable low ionic strengths, less than 10 M, from which
= (2.64 ± 0.01) can be calculated. If it is assumed that this value is equal to
it is possible to calculate a SIT interaction coefficient, ε = − 0.21 , in fair agreement with the corresponding interaction coefficient for sulphate
–2
2 4 2UO SeO 4H O⋅
2 4UO SeO 22 4UO (SeO ) −
2 +4 , Na )−
10 1log b
10 1log b10 1log οb
1kg mol−⋅
10 2log b
(SeO
2
4 4
1 During the Peer Review process, the following sets of unpublished data by L. Ciavatta et al. (submitted to Ann. Chim. (Rome)) related to 3 M NaClO4 at 298.15 K were given to the review-ers: = − (2.94 ± 0.03), = − (9.82 ± 0.06), 10 2,2,2
*log b 10 3,4,1*log b 10 2,1,1
*log b =
,6,2 = − (14.40 − (0.30 ± 0.09),
± 0.09), ± 0.09), ± 0.06). Only stoichiometry of the
other complexes in the study of Ciavatta et al. are not consistent with those in the table, possibly because of different sulphate concentrations.
10logth
2,1,2*b = (1.09
e constant log10
*log b3,5,1 = − (15.04 is consistent with thos
10 4*log b
e listed in this table. The 10 2,2,2b

9 Discussion of new data selection for Uranium 234
−
as discussed in Appendix A. For reasons given in Appendix A this review does not se-lect any equilibrium constants for selenate complexes.
9.5.3 Tellurium compounds (V.5.3) 9.5.3.1 Uranium tellurides (V.5.3.1)
9.5.3.1.1 Binary uranium tellurides (V.5.3.1.1)
No data for the uranium tellurides are selected in [92GRE/FUG], nor here, but the cau-tious use of the data assessed by [84GRO/DRO] is recommended. Similar caution probably applies to the use of the heat capacity value of:
derived from a small graph of the low–temperature heat capacity measurements given by Ochiai et al. [94OCH/SUZ]. The sample, characterised only by X–ray diffraction, showed a pronounced ferromagnetic peak in C , at a temperature different by several K from earlier studies.
1 1,m (UTe, cr, 298.15K ) = (84 8) J K molpCο −± ⋅ ⋅
3mol dm−⋅
f mH ο∆ 1kJ mol−⋅
f mH ο∆ 1kJ mol−⋅
f mH ο∆1kJ mol−⋅ f mH ο∆
1mol−kJ ⋅
3mol dm−⋅ γ f mH ο∆1kJ mol−⋅ f mH ο∆
1kJ mol−⋅
5 3 8 2123 UTeO (cr) U O (cr) + O (g) + 3 TeO (g)
,mp
9.5.3.2 Solid uranium tellurites (V.5.3.2.2) There are consistent thermodynamic data for two U(VI) tellurites, UO TeO (cr), (schmitterite) referred to herein as UTeO (cr), and UTe O (cr).
2 3
5 3 9
9.5.3.2.1 Uranium(VI) monotellurites
Brandenburg [78BRA] measured the enthalpies of dissolution of γ−UO3, TeO2(cr) and UTeO5(cr) in ca. 11 HF solution. The enthalpy of formation given in [92GRE/FUG] as (UO TeO , cr, 298.15 K) = − (1605.4 ± 1.3) , as re-ported by [78BRA] was based on (TeO , cr, 298.15 K) = − 322.6 with-out specified uncertainty limits. As noted in the auxiliary section (chapter 14), we now prefer a slightly more positive value of (TeO , cr, 298.15 K) = − (321.0 ± 2.5)
, based on more recent data and thus obtain (UTeO , cr, 298.15 K) = − (1603.7 ± 2.9) .
2 3
2
2
5
Basu et al. [99BAS/MIS] have recently made similar measurements in 11 HCl solution, but with β−UO3 rather than –UO . With (TeO , cr, 298.15 K) = − (321.0 ± 2.5) , these data give (UTeO , cr, 298.15 K) = − (1602.5 ± 2.8) , in excellent agreement with the earlier data [78BRA].
3 2
5
In addition to these calorimetric data, there are three measurements which lead to the Gibbs energy of UTeO (cr). Mishra et al. [98MIS/NAM] have studied the partial pressure of TeO (g) in the decomposition of UTeO (cr) in pure oxygen according to the reaction:
5
2 5
(9.27) 2
and Krishnan et al. [97KRI/RAM], [98KRI/RAM] have made similar measurements by Knudsen effusion but at the self-generated oxygen pressure of the reaction.
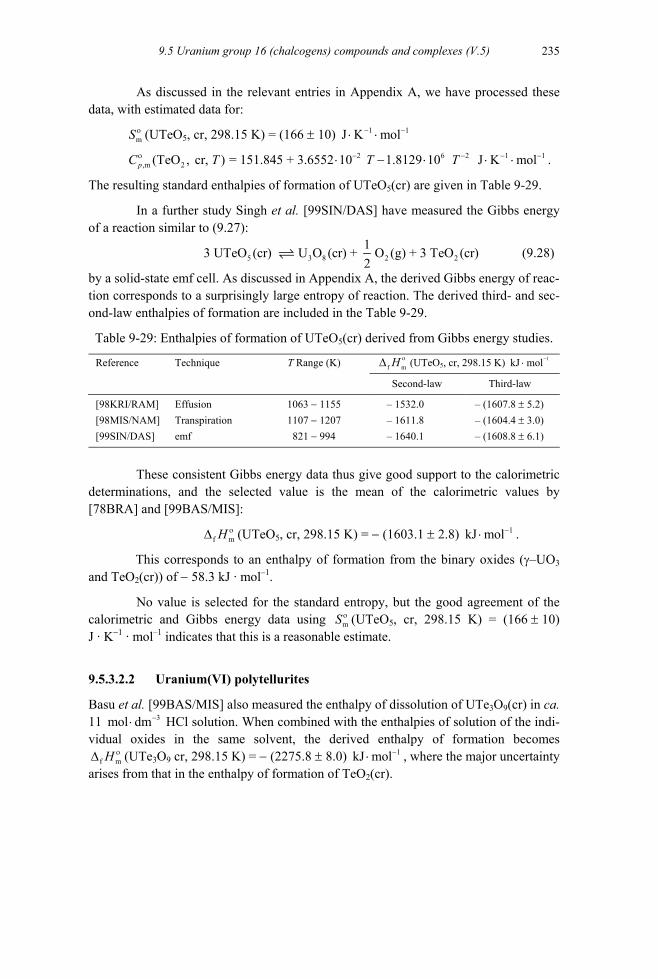
9.5 Uranium group 16 (chalcogens) compounds and complexes (V.5)
235
As discussed in the relevant entries in Appendix A, we have processed these data, with estimated data for:
mS ο 1 1J K mol− −⋅ ⋅(UTeO5, cr, 298.15 K) = (166 ± 10)
.
The resulting standard enthalpies of formation of UTeO (cr) are given in Table 9-29. 5
In a further study Singh et al. [99SIN/DAS] have measured the Gibbs energy of a reaction similar to (9.27):
(9.28)
by a solid-state emf cell. As discussed in Appendix A, the derived Gibbs energy of reac-tion corresponds to a surprisingly large entropy of reaction. The derived third- and sec-ond-law enthalpies of formation are included in the Table 9-29.
Table 9-29: Enthalpies of formation of UTeO (cr) derived from Gibbs energy studies. 5
2 6 2 1,m 2(TeO , cr, ) = 151.845 + 3.6552 10 1.8129 10 J K molpC T T Tο −⋅ − ⋅ ⋅ ⋅ 1− − −
5 3 8 213 UTeO (cr) U O (cr) + O (g) + 3 TeO (cr)2 2
f mH ο∆ 1kJ mol−⋅Reference Technique T Range (K) (UTeO , cr, 298.15 K) 5
Second-law Third-law
[98KRI/RAM] Effusion 1063 − 1155 – (1607.8 ± 5.2) – 1532.0 1107 − 1207 [98MIS/NAM] Transpiration – 1611.8 – (1604.4 ± 3.0)
[99SIN/DAS] emf – 1640.1 – (1608.8 ± 6.1)
These consistent Gibbs energy data thus give good support to the calorimetric determinations, and the selected value is the mean of the calorimetric values by [78BRA] and [99BAS/MIS]:
(UTeO , cr, 298.15 K) = − (1603.1 ± 2.8) . 5
3
2–1
5−1 –1
9.5.3.2.2 Uranium(VI) polytellurites
Basu et al. [99BAS/MIS] also measured the enthalpy of dissolution of UTe O (cr) in ca. 11 mo HCl solution. When combined with the enthalpies of solution of the indi-vidual oxides in the same solvent, the derived enthalpy of formation becomes
9
(UTe O cr, 298.15 K) = − (2275.8 ± 8.0) 3 9 , where the major uncertainty arises from that in the enthalpy of formation of TeO (cr).
821 − 994
f mH ο∆ 1kJ mol−⋅
mS ο
3l dm−⋅
f mH ο∆ 1kJ mol−⋅
This corresponds to an enthalpy of formation from the binary oxides (γ–UO and TeO (cr)) of − 58.3 kJ · mol .
No value is selected for the standard entropy, but the good agreement of the calorimetric and Gibbs energy data using (UTeO , cr, 298.15 K) = (166 ± 10) J · K · mol indicates that this is a reasonable estimate.
3
2

9 Discussion of new data selection for Uranium 236
In their studies of the decomposition reactions of dioxouranium(VI) tellurites noted above, both Mishra et al. [98MIS/NAM] and Krishnan et al. [98KRI/RAM] also measured the partial pressure of TeO (g) in the decomposition reaction: 2
. (9.29)
3 9
Reference Temperature range K (UTe O , cr, 298.15K) 3
3 9 5 2UTe O (cr) UTeO (cr) + 2 TeO (g)
Table 9-30: Enthalpies of formation of UTe O (cr) derived from Gibbs energy studies.
Technique f mH ο∆ 1kJ mol−⋅9
Second-law Third-law
[98KRI/RAM] Effusion 1063 − 1155 – 2274.9 – (2249.0 ± 6.2) [98MIS/NAM] Transpiration 947 − 1011 – 2270.8 – (2252.1 ± 6.4)
As noted in the Appendix A reviews, our processing of the data, with estimated
data for the entropy and heat capacity of UTe3O (cr), gives the second- and third-law enthalpies of formation
9
(UTe O , cr, 298.15 K ) given in Table 9-30. These con-sistent Gibbs energy data thus give support to the calorimetric value for the enthalpy of formation, which is the selected value:
3 9
(UTe O , cr, 298.15 K) = − (2275.8 ± 8.0) 3 9 .
This corresponds to an enthalpy of formation from the binary oxides (γ–UO and TeO (cr)) of − 87.5 kJ · mol .
3
2–1
9.6 Uranium group 15 compounds and complexes (V.6)
9.6.1.1 Uranium nitrides (V.6.1.1) Following the position adopted in [92GRE/FUG], this review does not include any de-tailed treatment of the complex U-N system. However, for interest it may be noted that Nakagawa et al. [98NAK/NIS] have studied the nitrogen pressures in the α−U N single-phase region for 0.26 < x < 0.52, as noted in Appendix A.
2 3+x
9.6.1.1.1 UN(cr) (V.6.1.1.1)
Hayes et al. [90HAY/THO] have made a comprehensive review/assessment of the thermodynamics and vaporisation of UN(cr), which is mentioned only briefly in [92GRE/FUG]. Table 9-31 is a comparison of the two sets of selected values for the heat capacity and entropy at 298.15 K.
f mH ο∆
f mH ο∆ 1kJ mol−⋅
9.6.1 Nitrogen compounds and complexes (V.6.1)

9.6 Uranium group 15 compounds and complexes 237
Table 9-31: Comparison of selected values from [90HAY/THO] and [92GRE/FUG].
Property [92GRE/FUG]
(298.15 K) (J · mol ·K ) –1 –1 47.96 (47.57 ± 0.40)
(298.15 K) (J · mol ·K ) –1 62.68 (62.43 ± 0.22)
The two assessments overlap within the combined uncertainties and we shall retain the values selected in [92GRE/FUG].
Suzuki and Arai [98SUZ/ARA] have reviewed the properties of the actinide mononitrides, including the vaporisation behaviour, but have not presented any new data that are relevant to this assessment.
Ogawa et al. [98OGA/KOB] have discussed the discrepancy in the Gibbs en-ergies of formation of UN(cr) derived from calorimetric and vaporisation data, as have [92GRE/FUG] and other authors. They [98OGA/KOB] prefer a Gibbs energy expres-sion derived from an early assessment which predates many of the experimental data, and the proposed equation for (UN, T) has an entropy of formation near 2000 K about 4.3 J · K · mol different from the well-defined value calculated from the calo-rimetric data. We therefore prefer to retain the data selected in [92GRE/FUG].
–1 –1
Ogawa [93OGA] has presented an interesting discussion on modelling of sub-stoichiometric (U, Pu) nitrides, which is beyond the scope of the present review. Ogorodinkov and Rogovoi [93OGO/ROG] have attempted to establish regularities be-tween six thermodynamic parameters at 298.15 K for the mononitrides of 5d transition elements plus Th, U, and Pu. From their relations, they predict missing values, includ-ing the specific heat capacity ( ). As briefly discussed in Appendix A, their value for UN(cr) seems reasonable, but that for PuN(cr) is probably too small.
Venugopal et al. [92VEN/KUL] have added to the studies on vaporisation of UN(cr), using Knudsen effusion mass-spectrometry from 1757 to 2400 K. The principal reaction is the loss of N (g) to form a nitrogen–saturated U(l), but U(g) and UN(g) are also pre-sent in the vapour. The pressures of U(g) were measured from 1757 to 2396 K and the lower pressures of UN(g) from 2190 to 2400 K.
2
As noted in [92GRE/FUG], such studies relate to vaporisation from a uranium liquid saturated with nitrogen. Venugopal et al. used a tantalum effusion cell, so in this instance the relevant phase will also contain some tantalum, since this metal is appre-ciably soluble in U(l).
The uranium ion intensity became steady state after an initial period (perhaps due to the time needed to establish the UN(cr) + U(l) phase equilibrium), and corre-sponded to the equation:
[90HAY/THO]
,mpCο
mS ο –1
f mG∆
vC
9.6.1.1.2 UN(g)

9 Discussion of new data selection for Uranium 238
(1757 to 2396 K)
with very good consistency among six different runs. The reported pressure at 2000 K is at the lower end of the range of pressures given by five previous studies (quoted in [92GRE/FUG]).
As noted in Appendix A, it is therefore not surprising that the derived enthal-pies of sublimation of U(cr) are appreciably more positive than the CODATA value for pure uranium adopted by [92GRE/FUG]. In the absence of any measurements of the co–existing nitrogen pressures, no data pertaining to UN(cr) can be derived from this study.
The pressures for UN(g), corresponding to the sublimation:
, (9.30)
(although the solid will in fact be slightly hypostoichiometric) were fitted to the equa-tion:
Thus, (9.30) .
, from which we derive:
This is the first significant experimental determination of the stability of UN(g). However, since no thermal functions are available for UN(g), these Gibbs en-ergy values cannot be reliably converted to provide standard state data at 298.15 K.
9.6.1.2 Uranium Nitrates (V.6.1.3)
Cohen-Adad et al. [95COH/LOR] (see Appendix A) have analysed the solubility of as a function of temperature, and give at T = 298.15 K,
m = 3.21 . However since this value is smaller than all except one of the twelve experimental values at 298.15 K, we have retained the value of m = 3.24 selected by Cox et al. [89COX/WAG]. Apelblat and Korin
sat
10 U26857log ( /bar) = 5.59 −p
T
UN(cr) UN(g)
10 UN37347log ( /bar) = 7.19 −p
T
r mG∆ = 715003 137.65 − T 1(J mol )−⋅
f m (UN, cr)G∆
f m (UN, cr∆
f m∆
f m (UN, cr, 2οH
, ) = G T
(UN, cr, )G T98.15 K)
1304890 + 88.2 (J mol )T −− ⋅ f m (UN, g, )G∆ T
∆
1f m (UN, g, ) 417407 50.12 J mol−∆ = −G T T
(2190 to 2400 K).
The authors combine this equation with values of derived from the assessment by Matsui and Ohse [87MAT/OHS],
to define (but seem to have made a numerical error in their first term). We have changed the equation for to be consistent with the [92GRE/FUG] selected value for and to relate to the mid–temperature of the measurements involving UN(g), 2300 K. The NEA TDB compatible equation from 2200 to 2400 K is then:
1f m (UN, cr, ) 297596 + 87.53 J mol−∆ = −G T T ⋅
(2200 − 2400 K). ⋅
9.6.1.2.1 Aqueous U(VI) nitrates
2 3 2 2UO (NO ) 6H O⋅1mol kg−⋅
1mol kg−⋅sat

9.6 Uranium group 15 compounds and complexes 239
[98APE/KOR] have measured the vapour pressure of aqueous solutions saturated with - from 278 to 323 K. They derived the enthalpy of dissolution of dioxouranium(VI) ni-trate hexahydrate in saturated solutions as (298.15 K, m = 3.323 ) = 43.4 . (As noted in Appendix A, this saturation molality is slightly higher than one selected by Cox et al. [89COX/WAG], 3.24 mo
sat
and retained here). From the values given in [92GRE/FUG], this review calculates (Appendix A) the enthalpy of dilution from m = 3.323 mo to the standard state at infinite dilution,
(298.15 K) = − 23.6 with an unknown uncertainty.
It may be noted that the isopiestic measurements of Robinson and Lim [51ROB/LIM] extend up to a concentration of 5.511 mo consid-erably above the saturation limit. The occurrence of supersaturation in isopiestic measurements is not uncommon, as noted in the Appendix A entry for [98APE/KO
sol mο∆ H 1mol kg−⋅
1kJ mol−⋅1l kg−⋅
1l kg−⋅
dil∆ mοH 1kJ mol−⋅
l 3 2O ) ,
R]
UO 2UO (HPO aq) 2UO (PO
1kg−⋅ 2UO (N
2+2UO
2 2 4(H PO )+4 )( 4 )−
.
As previously noted in the U(VI) chloride section 9.4.3.1.2.1, the paper of Choppin et al. [92CHO/DU], which deals also with complexing of by nitrate at high ionic strengths (3 to 7 M), does not contribute any additional data to those in [92GRE/FUG].
9.6.2 Uranium sulphamate 9.6.2.1 Aqueous U(VI) sulphamate Standritchuk et al. [89STA/MAK] give estimated data on the solubility of U(VI) sul-phamate UO (SO NH ) (see Appendix A). 2 3 2 2
9.6.3 Uranium phosphorus compounds and complexes (V.6.2) 9.6.3.1 Aqueous uranium phosphorus species (V.6.2.1.)
9.6.3.1.1 The uranium–phosphoric acid system (V.6.2.1.1)
9.6.3.1.1.1 Complex formation in the U(VI)–H PO system 3 4
Few additional data have appeared in the literature since the last review [92GRE/FUG] where a detailed discussion on the dominant species in the system U(VI)–H PO is given.
3 4
Scapolan et al. [98SCA/ANS] have used fluorescence spectroscopy to identify the species , and in phosphoric acid (10 to 10 M) between pH = 1.5 and 7.5. These data provide an independent confirmation of the identity of these species and their formation constants as reported in [92GRE/FUG].
–4
–3
Brendler et al. [96BRE/GEI] have also used spectroscopy to identify the two first complexes in dilute phosphoric acid near pH = 3.5. In addition, they have carried out potentiometric titrations of phosphoric solutions at very low variable ionic strengths

9 Discussion of new data selection for Uranium 240
4
(at ca. 10 M). The latter data are less reliable for reasons discussed in Appendix A. Brendler et al. reported the following values at zero ionic strength using the Davies equation for the reactions:
.
From potentiometry they obtain:
= (19.87 ± 0.29),
= (22.58 ± 0.17),
= (46.90 ± 0.22)
and from spectroscopy, the values are:
= (19.53 ± 0.14),
= (22.31 ± 0.16).
The values selected by [92GRE/FUG], from experimental values ob-tained at high ionic strength, refer to:
,
.
Using the data from the spectroscopic measurements of [96BRE/GEI] and the auxiliary data on phosphoric acid [92GRE/FUG] page 387, the following val-ues are obtained:
= (7.18 ± 0.14) and = (0.61 ± 0.16).
The potentiometric value for the formation of is lo = 3.50.
The equilibrium constant for the formation of in [96BRE/GEI] is in excellent agreement with the value of [92GRE/FUG]; the latter value has therefore been retained. The agreement between the equilibrium constants for the formation of
is poorer and this review has chosen to retain the value in [92GRE/FUG]. As indicated in Appendix A, this review is not confident about the potentiometric data obtained by Brendler et al. [96BRE/GEI]. This review also retains the value of
selected by [92GRE/FUG].
Sandino and Bruno [92SAN/BRU] studied the solubility of in the pH range 3 to 9 in 0.5 M NaClO at 298.15 K. They inter-
preted the variation of the solubility curve between pH 4 to 9 as being due to the forma-tion of UO and
4
for which they derived the equilibrium constants: = (6.03 ± 0.09) and = (11.29 ± 0.08), respectively, for the reactions:
–2
2+ + 3 2 -32 4 2UO H PO UO H (PO )− ++ + r q
r qr q
10 2 4log (UO HPO (aq))οb+
10 2 2 4log (UO H (PO ))οb
10 2 2 4 2log (UO (H PO ) (aq))οb
2+ +2 3 4 2 2 4 2UO 2 H PO (aq) UO (H PO ) (aq) 2H+ + 10log (0.64 0.11)K ο = ±
10log οK
10 2 4log (UO HPO (aq))οb+
10 2 2 4log (UO H PO )οb
10log οK
(7.24 ± 0.26), 2+ 22 4 2 4UO HPO UO HPO (aq)−+ 10log K ο =2+ + +2 3 4 2 2 4UO H PO (aq) UO H PO H+ + 10
*log (1.12 0.06)ο = ±K*
10 2 4log (UO HPO , aq)K ο +10 2 2 4log (UO H PO )K ο
2 2 4 2UO (H PO ) (aq) 10*g K ο
2 4UO HPO (aq)
2 2 4UO H PO+
10*log (UOK ο
2 2 4 2(H PO ) , aq)
2 3 4 2 2(UO ) (PO ) 4H O⋅
2 4HPO (aq) 2 4UO PO−
10log β 10log β

9.6 Uranium group 15 compounds and complexes 241
2+ 22 4 2 4UO HPO UO HPO (aq)−+ ,
SIT–extrapolation to zero ionic strength using the interaction coefficients of [92GRE/FUG] gives lo = (7.28 ± 0.10) and = (13.25 ± 0.09), respec-tively.
The solubility product of the dioxouranium(VI) orthophosphate is = − (48.48 ± 0.16), at I = 0.5 M and = − (53.32 ± 0.17) at zero ionic
strength. These values are derived using the equilibrium value for the formation of from phosphoric acid as given in [92GRE/FUG].
All these data have been already included in [92GRE/FUG] but under the ref-erence [91SAN].
9.6.3.1.1.2 Complex formation in the U(IV)–H PO system 3 4
There is no quantitative information to add to that given in [92GRE/FUG]. However, there are two studies reported by Baes [56BAE] and Louis and Bessière [87LOU/BES] that were not discussed in [92GRE/FUG]. Both are based on the observation that U(VI) is reduced to U(IV) by Fe(II) in phosphoric acid solutions according to:
U(VI) + 2 Fe(II) U(IV) + 2 Fe(III), (9.31)
where the composition of the phosphate complexes on the reactant and product sides are not known. [56BAE] and [87LOU/BES] report conditional equilibrium constants for the equation (9.31), however it is impossible to deduce the stoichiometry of the species and therefore no equilibrium constants can be selected. From the experimental results, the authors conclude that the phosphate complexes of U(IV) are stronger than those of U(VI). Addition of fluoride to the test solutions containing phosphoric acid increases the ease of reduction of U(VI) even more. The experiments referred to above have been performed at low pH; at higher pH sparingly soluble phosphate phases are formed.
9.6.3.2.1 Uranium orthophosphates (V.6.2.2.5)
9.6.3.2.1.1 U(VI) orthophosphates [92GRE/FUG] give data for two solid normal dioxouranium(VI) phosphate hydrates, (UO2) (PO ) · 4H O(cr) and (UO ) (PO ) · 6H O(cr). The Gibbs energy of formation of the tetrahydrate is calculated from the solubility data discussed in section V.6.2.1.1.b of [92GRE/FUG], while the data for the hexahydrate are estimated from two observa-tions of its decomposition to the tetrahydrate and water. However, there seems to have been an error in this estimation, since the Gibbs energy at 298.15 K of the reaction:
3 4 2 2 2 4 2 2
(UO ) (PO ) · 4H O(cr) + 2 H O(l) (UO ) (PO ) · 6H O(cr), 2 3 4 2 2 2 3 4 2 2
2+ 32 4 2UO PO UO PO4
− −+
10g οb 10log οb
.
10 ,0log sK 10 ,0log οsK
2 2UO H PO4+
9.6.3.2 Solid uranium phosphorus compounds (V.6.2.2)
3
2

9 Discussion of new data selection for Uranium 242
•
•
from the values selected by [92GRE/FUG] is − 4.753 kJ · mol , implying that the hexa-hydrate is the stable hydrate in equilibrium with the saturated solution at 298.15 K.
–1
This review has reworked the calculation, using the two items of information from Appendix A in [92GRE/FUG]:
[54SCH/BAE]. The hexahydrate decomposes to the tetrahydrate below 373 K.
[78KOB/KOL].Both the tetra- and hexa-hydrates are “stable” at 298.15 K; we have replaced their suggested log K = ca.– 3.54 for the reaction: 10
(UO ) (PO ) · 6H O(cr) (UO ) (PO ) · 4H O(cr) + 2 H O(g) 3 4 2 2 2 3 4 2 2 2
10
For these calculations, we have estimated the standard entropy contribution of H O in hydrates to be (40 ± 8) J · K · mol (H O) by comparison with other hydrates with well-known entropies. Thus,
2–1
2–1
((UO ) (PO ) · 6H O, cr, 298.15 K) = 2 3 2 2 ((UO ) (PO ) · 4H O, cr, 298.15K) 2 3 4 2 2
+ (80 ± 16) J · K–1 · mol
((UO ) (PO ) · 6H O, cr, 298.15 K) = (669 ± 27) J · K2 3 4 2 2–1 · mol . –1
A value of ((UO ) (PO ) · 6H O, cr, 298.15 K) = − 7328.4 kJ · mol , then gives consistency with the above observations and keeps the hexahydrate unstable with re-spect to the tetrahydrate and water at 298.15 K.
2 3 4 2 2
The following are thus the revised selected values for the hexahydrate:
((UO ) (PO ) · 6H O, cr, 298.15 K) = − (7328.4 ± 10.7) kJ · mol , 2 4 2 2–1
((UO ) (PO ) · 6H O, cr, 298.15 K) = (669 ± 27) J · K · mol , 2 3 4 2–1 –1
((UO ) (PO ) · 6H O, cr, 298.15 K) = − (6613 ± 13) kJ · mol . 2 3 4 2 2–1
9.6.3.2.2 U(VI) phosphates and vanadates (V.6.2.2.10)
Langmuir [97LAN] proposed Gibbs energies of formation for some crystalline U(VI) minerals like autunite, H (UO ) (PO ) , carnotite, K (UO )(VO ) and tyuyamunite, Ca(UO ) (VO ) which can be used as examples of calculations (see Appendix A). For U(IV) he gave the value for ningyoite, CaU(PO ) ·2H O(cr).
2 2 4 2 2 2 4 2
2 2 4
4 2 2
9.6.3.2.3 U(VI) fluorophosphates
Numerous reactions leading to uranium fluorophosphates are described by [89PET/SEL] and their enthalpy effects listed. However, as no details were given, the paper is cited for information only.
2
mS οmS ο
mS ο
f mH ο∆
f mH ο∆
mS ο
f mGο∆
by the more accurate log K > − 3.54 (if the tetrahydrate is the phase in equilibrium with the saturated solution at 298.15 K).
4–1
–1
3
2
2
2

9.6 Uranium group 15 compounds and complexes 243
9.6.4 U(VI) arsenates (V.6.3.2.1) 9.6.4.1 Aqueous U(VI) arsenates
Rutsch et al. [97RUT/GEI], [99RUT/GEI] have used fluorescence spectroscopy to iden-tify the species , and in 0.1 M NaClO4 between pH 1.5 and 5. The values of and according to:
are given in Table 9-32. The values at I = 0 are calculated by the authors using Davies equation; these values are not significantly different when the SIT model is used.
Table 9-32: Equilibrium constants related to the reaction (9.32) [99RUT/GEI].
Species (I = 0.1 M)
(20.39 ± 0.24) (21.96 ± 0.24)
(aq) (17.19 ± 0.31) (18.76 ± 0.31)
(aq) (38.61 ± 0.20) (41.53 ± 0.20)
These values are new and are selected by this review. This review has calcu-lated the values of the constants with , and as components to compare the complexation of U(VI) with and as described in [92GRE/FUG]. We have used the protonation constants of H A derived from [92GRE/FUG] (see Appendix A).
= (2.26 ± 0.20), = (6.76 ± 0.20),
= (11.60 ± 0.20).
The results are the following:
= (7.16 ± 0.37),
= (1.34 ± 0.42),
= (0.29 ± 0.53).
9.6.5 USb(cr) (V.6.4.1)
2 2 4UO (H AsO )+2 4UO (HAsO )(aq)
10log b2 2 4 2UO (H AsO ) (aq)
10 ,log q rb,q rο
2+UO H+ 3 AsO UO+ +r q 2 3(AsO ) +r q− (9.32) 2 4 2Hr q4−
10 ,log q rb 10 ,log q rοb
2 2 4UO (H AsO )+
2 4UO (HAsO )
UO (H AsO )2 2 4 2
All equilibrium formation constants agree within the uncertainty with those in the corresponding phosphate system (see 9.6.3.1).
2+2UO 2
4HAsO −3H AsO
3H PO3 s
4
4
4
3H AsO 4
O
+2 4 3 4H AsO + H H AsO (aq)−
10 1*log K ο
2 +− − * ο4 2HAsO + H H AsO 10 2log K
3 + 2− − * ο
4
4 4AsO + H HAsO 10 3log K
2+ 22 4 2 4UO + HAsO UO (HAsO )(aq)−
10log οK2+ +2 3 4 2 2 4UO + H AsO (aq) UO (H AsO ) + H+
10*log οK
2+ +2 3 4 2 2 4 2UO + 2 H AsO (aq) UO (H AsO ) (aq) + 2H 10
*log οK
Ochiai et al. [94OCH/SUZ] have measured the heat capacity of an uncharacterised sample of USb(cr) from 2 to 300 K. The material showed a pronounced ferromagnetic peak at 218 K, slightly different from earlier values. The data are presented only in the form of a small graph, from which the selected value:
9 Discussion of new data selection for Uranium 244
,m (USb, cr, 298.15 K) = (75 7)pCο ± J · K–1 · mol –1
is obtained, the relatively high uncertainty reflecting the lack of characterisation of the sample.
9.7 Uranium group 14 compounds and complexes (V.7) 9.7.1 Uranium carbides (V.7.1.1) 9.7.1.1 UC(cr) (V.7.1.1.1) As part of a study of the vaporisation behaviour in the U–Ce–C system, Naik et al. [93NAI/VEN] have measured, by Knudsen effusion mass-spectrometry, the uranium pressures over monophasic UC(cr) (1922 to 2247 K) and the diphasic U(l) + UC(cr) region (1571 to 2317 K). These studies, which within the combined uncertainties, agree well with earlier data, do not provide any new data on the Gibbs energy of formation of UC(cr).
9.7.2.1 Uranium(VI) carbonates A large number of additional papers dealing with various aspects of the chemistry of the aqueous uranium(VI)–carbonate system have appeared since the previous review. These papers contain structural information, equilibrium data, and discussions of the rates and mechanisms of ligand exchange reactions. There is also new information on the chemi-cal properties of the ternary U(VI)–carbonate–fluoride, and U(VI)–carbonate–hydroxide systems. The new experimental data refer mainly to experiments made in 0.1 M NaClOand the corresponding equilibrium constants, including the ones recalculated to zero ionic strength, are given in Table 9-33.
4
9.7.2 The aqueous uranium carbonate system (V.7.1.2.1)

9.7 Uranium group 14 compounds and complexes (V.7)
245
Table 9-33: Equilibrium constants in the U(VI) carbonate systems.
Reaction Ionic medium t C o
NaClO4 10log K 10log K ο
2 32+ 22 3
UO CO (s)
UO + CO −
2+ 22 3
2 3
UO CO
UO CO (aq)
−+
2+ 22 3
22 3 2
UO 2 CO
UO (CO )
−
−
+
2+ 22 3
42 3 3
UO 3 CO
UO (CO )
−
−
+
2 22 3 2 3
42 3 3
UO (CO ) CO
UO (CO )
− −
−
+
42 3 3
62 3 6
+
3
3UO (CO ) 3 H
(UO ) (CO ) 3 HCO
−
3− −
+
+
2+ 22 3
62 3 3 6
3 UO 6 CO
(UO ) (CO )
−
−
+
2 34
2 2 3
3UO (OH) 3 HCO
3 H O + UO (CO )
−
−
−+
2+2 2
2 3 3
2
+2
2UO CO (g) 4H O(l)
(UO ) CO (OH) 5H
+ −
+
+
2+ 22 3
22 3 2
UO CO 2OH
(UO )CO (OH)
+ + − −
−
3
2+ 22 3
42 2 2
UO 2CO 2OH
UO (CO ) (OH)
+ +− −
−
Reference
0.10 M
0.10 M 0.10 M 0.10 M 0.10 M
25 (22±2) 25
25 22
–(13.50 ± 0.22)
–(14.18 ± 0.03) –(13.89 ± 0.11) –(14.10 ± 0.14)
–(14.34 ± 0.22) –(14.39 ± 0.14) –(15.02 ± 0.06)
–(14.94 ± 0.14) –(14.39 ± 0.14) –(14.49 ± 0.04)
[97PAS/CZE]* [93MEI/KIM] [93MEI/KIM2] [96KAT/KIM]
[92GRE/FUG]# 0.10 M 0.10 M 0.10 M
25 (22±2)
25
(8.81 ± 0.08)
(9.23 ± 0.04) (8.60 ± 0.18)
(9.97 ± 0.05) (10.07 ± 0.08) (9.14 ± 0.23)
[96MEI/KLE] [97PAS/CZE]* [93MEI/KIM]
[92GRE/FUG]#
0.10 M 0.10 M
25
25
(15.5 ± 0.8) (15.7 ± 0.2)
(16.3 ± 0.8) (16.5 ± 0.2) (16.22 ± 0.34)
[96MEI/KLE] [97PAS/CZE]* [93MEI/KIM]
0.10 M
[96MEI/KLE] –(13.55 ± 0.14)
24 –(14.73 ± 0.11)
0.10 M –(13.55 ± 0.14) [93PAS/RUN]**
(9.65 ± 0.08) (9.13 ± 0.05)
25 3.0 M [79CIA/FER]
(9.67 ± 0.05) 0.10 M
(22±2) (15.38 ± 0.17)
(16.94 ± 0.12) [92GRE/FUG] 25 (21.74 ± 0.44)
(21.6 ± 0.3) (21.86 ± 0.05)
(21.74 ± 0.44) [96MEI/KLE] [97PAS/CZE]* [93MEI/KIM]
(21.6 ± 0.3) (21.86 ± 0.10) (21.60 ± 0.05)
0.10 M (22±2) 0.10 M 25
[92GRE/FUG]
0.50 M 0.1–2m
25 25-80
(6.35 ± 0.05)
(4.98 ± 0.09) 4.49
[91BID/CAV] [89SER/SAV]
2.5 m
25 (18.1 ± 0.5) (12.4 ± 0.7) [95ALL/BUC]
2.5 m 25 (55.6 ± 0.5) (55.6 ± 0.5) [95ALL/BUC]
0.1 M
3
25(?) (8.5 ± 0.5) (7.2 ± 0.5)*
< 10 M –3 25(?) [98GEI/BER3]
0.5–5 M 25 <22.6 [98YAM/KIT]
0.5–5 M
25 <23.5
* recalculated by this review. # these data are those revised in Appendix D of [95SIL/BID]. ** this is the same value as in [97PAS/CZE].
[98GEI/BER]
– (18.9 ± 1.0)
[98YAM/KIT]

9 Discussion of new data selection for Uranium 246
9.7.2.1.1 Binary U(VI) carbonate complexes
The weighted average of the constants are given in Table 9-33 with previous data from [92GRE/FUG] and the estimated uncertainties have been calculated using the SIT method, as described in [92GRE/FUG]. The following values at 298.15 K were ob-tained and selected:
= − (14.76 ± 0.02), = − (0.330 ± 0.011) mol·kg , –1
= − (0.38 ± 0.06) mol·kg .
= (9.94 ± 0.03), = (0.232 ± 0.027) mol·kg , –1
= (0.38 ± 0.06) mol·kg .
= (16.61 ± 0.09), = (0.454 ± 0.052) mol·kg , –1
= (0.32 ± 0.15) mol·kg .
= (21.84 ± 0.04), = (0.233 ± 0.046) mol·kg ,
–1
= (0.24 ± 0.18) mol·kg .
The equilibrium constant for the reaction,
determined in [95ALL/BUC], = (55.6 ± 0.5), is in good agreement with the value selected in [92GRE/FUG] and so the latter is therefore retained.
The equilibrium constants given above are weighted average values with their corresponding uncertainties estimated as described in Appendix C. The addition of new experimental data at I = 0.1 M results in a change in most of the values given in [92GRE/FUG]. As judged by the estimated uncertainty in the average values these de-viations are significant; however, considering the largest uncertainty in the individual experimental determinations, the difference in the two averages is acceptable. It is clear that the uncertainty estimates must be looked upon with caution as discussed in the in-troduction in Appendix C. The uncertainty reported is a measure of the precision of an experiment, not its accuracy. The values of for the various reactions are in fair agreement with the tabulated values for the individual reactants/products as seen above. In view of the uncertainty in these parameters this review has not considered a revision of the individual values.
2+ 22 3 2 3UO CO (cr) UO CO −+ 10 ,0log sK ο
∆ε
cal∆ε
2+ 2 42 3 2 3UO + 3 CO UO (CO )− −
10 3log οb∆ε
∆ε
ε
–1cal∆ε
2+ 22 3 2 3UO + CO UO CO (aq) −
10 1log οb∆ε
–1
2+ 2 22 3 2 3UO + 2 CO UO (CO )− −
10 2log οb2
∆ε–1
cal∆ε
3
–1cal∆ε
2+ 2 62 3 2 3 33 UO + 6 CO (UO ) (CO )6
− −
10 6,3log οb

9.7 Uranium group 14 compounds and complexes (V.7)
247
The solubility product lo (UO CO (cr)) = − (14.76 ± 0.02) deserves a special comment; all new values of the solubility product have been obtained in 0.1 M NaClO and most of them are systematically somewhat lower than those obtained by previous investigators. This review has no explanation for this discrepancy; it may pos-sibly be due to differences in the degree of crystallinity of the solid phases. This is sup-ported by the fact that most of the stability constants for the complexes deduced from the solubility data are in good agreement with data from other sources.
10 ,0g sK ο2 3
4
The only experimental study of a solution where is a predominant complex has been made by Bidoglio et al. [91BID/CAV], who studied the equilibrium:
22 3UO (CO )2
−
2 22 3 2 3 2 3 3UO (CO ) CO UO (CO )4− −+ − (9.33).
Their data give lo = (4.98 ± 0.09).
By combining the value of Bidoglio et al. [91BID/CAV] with the value = (21.84 ± 0.04) we obtain = (16.86 ± 0.10), in agreement both with
the values obtained in direct determinations of (cf. Table 9-33) and with the value selected in [92GRE/FUG].
10 3g K ο
10 3log οb 10 2log οb10 2log οb
The enthalpy of reaction for the equilibrium (9.33) at 298.15 K has also been studied by Sergeyeva et al. [89SER/SAV], and the value (9.33) = − 61 is in good agreement with the value − 59.1 selected in [92GRE/FUG]. How-ever, it is not clear from the abstract of [89SER/SAV], if these data refer to experiments that are based on previous experimental information, or not.
The study of Sergeyeva et al. [89SER/SAV] has not been taken into account because of lack of experimental information.
Additional data on U(VI) carbonate complexes are given in [91BRU/GLA], [91CAR/BRU], [92KIM/SER], [92LIE/HIL] and [99MEI/KAT].
9.7.2.1.2 Ternary U(VI) hydroxide carbonate complexes
2
r mH ο∆ 1kJ mol−⋅1kJ mol−⋅
The experimental solubility studies of Yamamura et al. [98YAM/KIT] in the ternary U(VI) – – system, vide infra, confirm the value for the equilibrium constant for formation of given in [92GRE/FUG]. The structure and dynamics in the ternary complex (UO have been studied using EXAFS and NMR [2000SZA/MOL], which provide an independent confirmation of the stoichiometry of this species. The following structure shows the bridge arrangement in the complex, where U denotes the UO –unit with the axial “yl” oxygen atoms perpendicular to the plane of the paper:
OH− 23CO −
UO 42 3 3(CO ) −
2 2) (C 3 3O )(OH)−
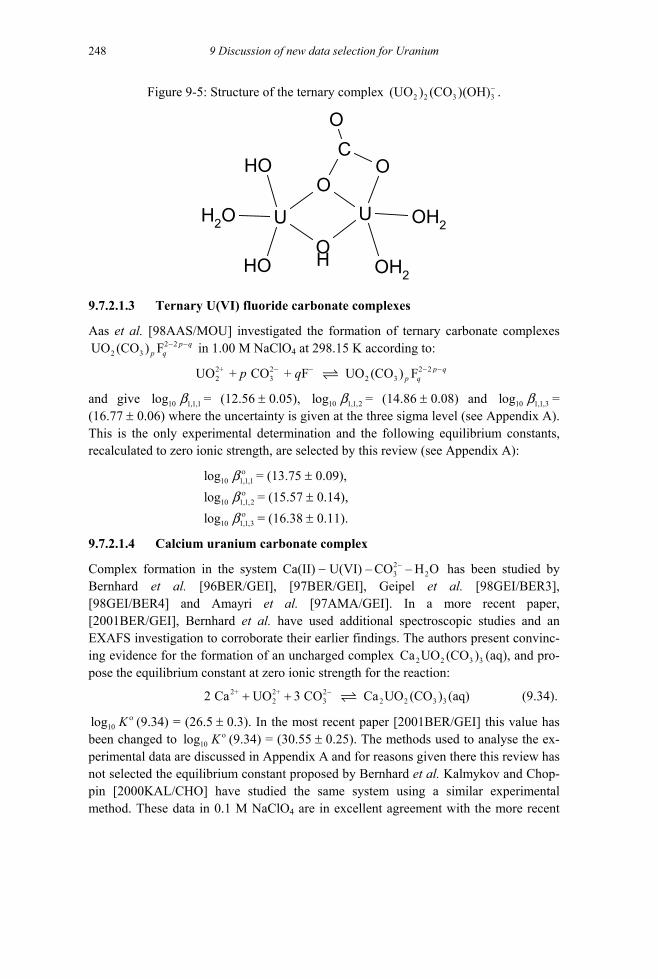
9 Discussion of new data selection for Uranium 248
Figure 9-5: Structure of the ternary complex .
9.7.2.1.3 xes
et al. [ nary carbonate complexes
2 2 3 3(UO ) (CO )(OH)−
UU
OH
OH
H2OO
OOH2
OH2
OC
O
H
Ternary U(VI) fluoride carbonate comple
2+ 2 2 22 3 2 3UO + CO + F UO (CO ) F p q
p qp q− − − −
l (see AppendiThis is the erimental determinatio the following equilibrium s, recalculated to zero ionic strength, are selected by this review (see Appendix A):
10 1,1,1log οb = (13.75 ± 0.09), ο
= (16.38 ± 0.11).
Complex formation in the system Ca(II) U(VI) –Bernhard et al. [96BER/GEI], [97BER/GEI], [98GEI/BER4] and Amayri et al. [97AMA/GEI]. In a more recent paper, [2001BER GEI], Bernhard et al. have used additional spectroscopic studies and an EXAFS investigation to corroborate their earlier findings. The authors present convinc-ing evidence for the formation of an uncharged complex 2 2 3 3Ca UO (CO ) (aq), and pro-pose the equilibrium constant at zero ionic strength for the reaction:
2+ 2+ 22 3 2 2 3 32 Ca UO 3 CO Ca UO−+ +
lo I] this value has
al data are discussed in Appendix A and for reasons given there this review has not selected the equilibrium constant proposed by Bernhard et al. Kalmykov and Chop-pin [2000KAL/CHO] have studied the same system using a similar experimental method. These data in 0.1 M NaClO4 are in excellent agreement with the more recent
Aas 98AAS/MOU] investigated the formation of ter2 2UO (CO F − −p q in 1.00 M NaClO at 298.15 K according4 to: 2 3 ) p q
and give = (12.56 ± 0.05), = (14.86 ± 0.08) and = (16.77 ± he uncertainty is gi hree sigma leve
only exp n and constant
= (15.57 ± 0.14),
9.7.2.1.4 Calcium uranium carbonate complex
−
10 1,1,1log b0.06) where t
10 1,1,2log bven at the t
10 1,1,3log bx A).
10 1,1,2log bο
10 1,1,3log b
23CO − – has been studied by
et al. [98GEI/BER3],
/
(9.34).
2H OGeipel
(CO ) (aq)
10g K ο
been changed to 10log K ο(9.34) = (26.5 ± 0.3). In the most recent paper [2001BER/GE
(9.34) = (30.55 ± 0.25). The methods used to analyse the ex-periment

9.7 Uranium group 14 compounds and complexes (V.7)
249
value of Bernhard et al. Kalmykov and Choppin have also studied the ionic strength dependence of the reaction and used the SIT model to calculate the value,
10log K ο (9.34) = (29.22 ± 0.25), which is based on information over a larger ionic strength range than that proposed by Bernhard et al. [97BER/GEI]. The agreement be-
e equilibrium constants at zero ionic strength proposed in [2000KAL/CHO] and [2001BER/GEI] is good. However, for reasons given in the discussion of [2000KAL/CHO] and [2001BER/GEI] in Appendix A, this review does not accept these data. There is no doubt that extensive ionic interactions occur between
42 3 3UO (CO ) − and counter-ions; the constant proposed in [2000KAL/CHO] and
[2001BER/GEI] may be used as guidance.
9.7.2.2 Solid U(VI) carbonates compounds
3 2
NaK3UO (CO3)3 · H2O, were measured by O’Btemperatures of 293.15 and 298.15 K in the ormer case, and at 278.75 to 298.15 K for the latter solid he compositions of the test solution were speciated into as many as 35 species resulting in the equilibria:
+ 2+ 2+ 23 2 3 3 4
fT
NaCa UO (CO ) SO F 10H O(cr) Na + 3Ca + UO 3CO −⋅ +
olution val
lely on the Debye–Hückel slope gave 10 ,0log sK ο = − (38.53 ± 0.06), which in turn yielded :
1f m (NaCa UO (CO ) SO F 10H O, 29 (8073.5 2.8) kJ molGο −∆ ⋅ − ± ⋅ ,
compounded by a lack of knowledge of the major anions present. At 298.15 K and 0.428 m ionic strength, 10 ,0log sK = − (26.47 ± 0.06). O'Brien and Williams also report:
1(NaK UO H O, 298.15 K) = (4051.3 1.8) kJ molGο −∆ ⋅ − ± ⋅ ,
1 ,
tween th
The solu2
b
NaK U
For twas 298.15 K
based so
essentially − (8077.3
dilution
th ±
ilities of schröckingerite, NaCa UO (CO3)3 SO4 F·10H2O, and grimselite, rien and Williams [83OBR/WIL] at
.
2 2 3
24 2 SO F 10H O(l),− −+ + +
+ + 2+ 2−3 2 3 3 2 2 3 2O (CO ) H O(cr) Na + 3K + UO 3CO H O(l)⋅ + + .
he case of schröckingerite the ionic strength for the three s tions at ca. 0.1 m, with 10 ,0log sK = − (35.53 ± 0.06). The infinite dilu ue
3 2 3 3 4 2 8.15 K) =
e same as that reported by O'Brien and Williams [83OBR/WIL], 8.7) kJ mol–1.
s a significant problem in extrapolation to infinite The corresponding equilibrium constant for grimselite was determined at ionic
strengths to 0.439 m, which present
f m 3 2 3 3 2(CO )
f m 3 2 3 3 2(NaK UO (CO ) H O, 298.15 K) = (4359.0 1.8) kJ molH ο −∆ ⋅ − ± ⋅
but these values appear to be without substantiation.

9 Discussion of new data selection for Uranium 250
9.7.2.3 Uranium(V) carbonates
9.7.2.3.1 Aqueous U(V) carbonates complexes
Mizuguchi et al. [93MIZ/PAR] and Capdevila and Vitorge [99CAP/VIT] have studied the redox potential U(VI)/U(V) in carbonate media using cyclic voltammetry. The measured potential from Mizuguchi et al. has been recalculated to the NHE scale by this review and the value in a 1 M Na2CO3 ionic medium is − 0.50 V, in good agreement with that reported by Caja and Pradvic [69CAJ/PRA], = − 0.492 V. The paper of Capdevila and Vitorge contains a reinterpretation of their previous data [90CAP/VIT] and [92CAP], and the authors propose lo = (6.95 ± 0.36) for the reaction:
,
where the uncertainty is given at the 1.96σ level. Capdevila and Vitorge have made a more extensive study of the ionic strength dependence of the equilibrium constant than in the previous study. As a result the value for the half–cell reaction:
is changed from − (0.62 ± 0.15) kg · mol selected in the [95SIL/BID] revision of [92GRE/FUG] to − (0.97 ± 0.2) kg · mol . The difference between the two sets of val-ues is within the estimated uncertainty ranges. In addition, the SIT extrapolation is un-certain for ions with the high charges encountered here. Nevertheless, the present re-view selects the revised value,
–1
–1
= (6.95 ± 0.36). 9.7.2.4 Uranium(IV) carbonates
9.7.2.4.1 Binary U(IV) carbonate complexes
The equilibrium constants for the reactions:
, (9.35)
(9.36)
Eο
10 3g οb+ 22 3 2UO + 3 CO UO (CO )5
3 3− −
63 5U(CO ) −
63 5An(CO ) −
∆ε4 5
2 3 3 2 3 3UO (CO ) + e UO (CO )− − −
10 3log οb
The new experimental data concern the structure and stoichiometry of the limiting com-plex , which has been confirmed both in the solid state using single crystal X–ray diffraction on the corresponding Pu(IV) complex [96CLA/CON] and in solution using EXAFS [98RAI/FEL]. The uranium(IV)–hydroxide–carbonate complex has been studied by Rai et al. [98RAI/FEL]. This group also did similar investigations on the corresponding Th(IV), [2000RAI/MOO], and Np(IV), [99RAI/HES], systems. These data are discussed in Appendix A, and the conclusion of this review is that the stoichiometry of the limiting complex, , An = Th, U, and Np, and its struc-ture, are well established.
+ 2 62 3 3 5UO (am) + 4 H + 5 CO U(CO ) + 2H O(l)− −
2
3 5−4+ 2 6
3U + 5 CO U(CO )−

9.7 Uranium group 14 compounds and complexes (V.7)
251
are reported to be lo (9.35) = 33.8 and (9.36)= 31.3 [98RAI/FEL]. The latter value depends on the solubility constant of UO (am, hydr.). Using lo2 (UO , am, hydr., (9.11)) = − (54.5 ± 1.0) selected in the present review (cf. section 9.3.2.2.1) and an estimated uncertainty for the value of Rai et al. [98RAI/FEL] (cf. Appendix A), the resulting equilibrium constant, (9.36) = (32.3 ± 1.4), is in fair agreement with the value, = (34.0 ± 0.9) selected in [92GRE/FUG].
10 ,5*g sK ο
10 5log οb10 ,0g ο
sK
10*log ,5sK ο
10 5log οb, 298.15ο −6
3 5U(CO )10 5og ( K)bl
2
The chemistry of the An(IV)–carbonate–hydroxide system is complicated. In addition, the use of solubility data to deduce the chemical speciation complicates mat-ters further. The solubility data of Rai et al. are of high quality and the chemical model proposed gives a reasonable representation of them. However, this does not mean un-equivocally that this chemical model is correct as discussed in Appendix A. For this reason and the lack of an analysis of the uncertainty of the constants proposed, this re-view has not accepted the equilibrium constants proposed in [98RAI/FEL].
9.7.2.4.2 Ternary U(IV) hydroxide carbonate complexes
Rai et al. [95RAI/FEL] determined the solubility of UO (am, hydr.) and ThO (am, hydr.) in alkaline carbonate and bicarbonate solutions of varying composition which clearly showed the formation of ternary hydroxide-carbonate complexes, but [95RAI/FEL] do not propose a thermodynamic interpretation. In a later paper contain-ing some additional experimental data, Rai et al. [98RAI/FEL] suggest the formation of one ternary complex , with equilibrium constants, (9.37) = − 4.8 and lo (9.38) = 41.3 , for the reactions:
2 2
, (9.37)
. (9.38)
In combination with the solubility constant selected in the present review for UO (am, hydr.), the latter value becomes (9.38) = 42.4.
The stoichiometries of ternary Np(IV) hydroxide–carbonate complexes have been determined by Eriksen et al. [93ERI/NDA]. The experimental results obtained for the Np(IV) and the U(IV) systems are not concordant as one would expect for these chemically very similar systems. There is additional experimental evidence for the for-mation of a ternary hydroxide-carbonate complex with the composition
from studies of the corresponding Th(IV) complex [94OST/BRU]. This review accepts the evidence for the formation of ternary complexes containing hydroxide. However, the experimental method used by Rai et al. does not allow a de-termination of the number of coordinated carbonate ions, cf. Appendix A. The proposed equilibrium constants in [98RAI/FEL] can be used as phenomenological parameters to describe the solubility at high carbonate and hydroxide concentrations.
22 3 2U(OH) (CO ) −
10log K ο
10 1,2,2g οb2
2 3 2UO (am) + 2 HCO U(OH) (CO )3 2− −
4+ 2 23U + 2 CO + 2 OH U(OH) (CO )2 3 2
− − −
10 1,2,2log οb2
3 3M(OH) (CO )−

9 Discussion of new data selection for Uranium
(a): The uncertainty has been increased by a factor of three by the reviewers.
From Table 9-34 it is obvious that there is a large scatter in the experimental data that should be resolved from new experiments.
252
The transformation from the limiting complex via ternary hydrox-ide-carbonate complexes to , takes place over a rather narrow pH,
region. The stoichiometry of the complexes formed and their equilibrium con-stants are not known in sufficient detail to allow chemical modelling. This is an impor-tant area for future research, which will require the use of methods other than the solu-bility technique used so far.
9.7.3 Silicon compounds and complexes (V.7.2) 9.7.3.1 Aqueous uranium silicates (V.7.2.1) The only additional information on aqueous uranium silicates since the previous review of [92GRE/FUG] refers to the reaction:
Two factors make it difficult to identify the stoichiometry and the equilibrium constants of the complexes formed:
• Si(OH) (aq) is a very weak acid, and the formation of hydroxide complexes must be considered when interpreting the experimental data.
4
• The formation of silicate polymers in solution, cf. section (VI.4.2) in [92GRE/FUG].
The dissolved silica is often prepared by hydrolysis of tetramethyl-orthosilicate [98MOL/GEI], [98JEN/CHO] in order to avoid polymerisation.
Fluorescence spectroscopy is the most sensitive tool to detect differences in ligand bonding, and the two studies made by Moll et al. [97MOL/GEI], [98MOL/GEI] seem to make it possible to differentiate between monomers and polymers through the fluorescence lifetime of the U(VI) complexes. The experimental data are collected in Table 9-34:
Reaction ionic medium NaClO 4
t(°C)
63 5An(CO ) ,−
4An(OH) (s)23pCO −
(9.39) 2+ +2 4 2 3UO + Si(OH) (aq) UO SiO(OH) + H+
Table 9-34: Equilibrium constants of the reaction (9.39).
10
*log K 10
*log K ο
2+2 4
+ +2 3
UO + Si(OH) (aq) UO SiO(OH) + H
Reference
0.3 M
20 – (1.74 ± 0.20) – (1.44 ± 0.20) [98MOL/GEI] 0.2 M 25 – (2.01 ± 0.09) – (1.74 ± 0.09) [92SAT/CHO] 0.1 M 25 – (2.92 ± 0.06) – (2.65 ± 0.06) [98JEN/CHO]
– (1.94 ± 0.06) [99HRN/IRL](a) 0.2 M 25 – (2.21 ± 0.06) 0.2 M 25 – (1.98 ± 0.13) – (1.71 ± 0.13) [71POR/WEB]

9.7 Uranium group 14 compounds and complexes (V.7)
253
Moll et al. [97MOL/GEI], [98MOL/GEI], studied equilibrium (9.39) at 293.15 K in a 0.3 M NaClO4 ionic medium, using Time Resolved Laser-induced Fluo-rescence Spectroscopy (TRLFS). A detailed discussion of the two investigations is given in Appendix A. The first study provides qualitative evidence for the formation of complexes between U(VI) and polysilicates, while the second study provides the most complete experimental data and also quantitative information of the equilibrium con-stant for reaction (9.39). For reasons given in Appendix A, it was necessary to re-evaluate the experimental data. This results in the following value of the equilibrium constant for reaction (9.39) in 0.3 M NaClO and at zero ionic strength, (9.39) = − (1.74 ± 0.20) and (9.39) = − (1.44 ± 0.20), respectively.
There are three additional experimental determinations of the equilibrium con-stants for reaction (9.39) that are discussed in Appendix A, Satoh and Choppin [92SAT/CHO], Jensen and Choppin [98JEN/CHO], and Hrnecek and Irlweck [99HRN/IRL]. In the first study solvent–solvent extraction methodology was used to evaluate the equilibrium constant for reaction (9.39). These data, later re-interpreted by Jensen and Choppin, are given in the Table 9-34. The resulting equilibrium constant is in excellent agreement with the previous determination by [71POR/WEB], while the agreement is just within the estimated uncertainty range with that of [98MOL/GEI]. The equilibrium constant for reaction (9.39) from the second study [98JEN/CHO] is about one order of magnitude smaller than the previous values; the discrepancy between the two sets of data was ascribed to the presence of polysilicates in [92SAT/CHO]. For rea-sons given in Appendix A, this review has chosen not to use this value when selecting the equilibrium constant for reaction (9.39). Hrnecek and Irlweck [99HRN/IRL] have also used a solvent extraction technique to determine the equilibrium constants in the U(VI) silicate system. They have taken care to identify both equilibria between the sili-cate monomer and polymers ( S , and presented evidence that the latter reaction resulted in the formation of an uncharged U(VI) silicate complex. Be-cause the stoichiometry of the polymer is not known, this review does not select the proposed equilibrium constant, lo = − (5.85 ± 0.06), for the reaction:
..
However, it can be used as a guideline to evaluate the effect of silicate poly-mers on speciation. Hrnecek and Irlweck point out that the dioxouranium(VI) ion shows similar binding strength to polymeric and low oligomeric silicic acids.
The extrapolations to zero ionic strength have been made using an estimated interaction coefficient, = 0.3 .
4
4 10*log K
10*log οK
3OSi(OH)− i(OH)) j≡
10*g K
2+ +2 2UO + ( SiOH) ( SiOH) ( SiO) UO + 2 H− ≡ ≡ ≡ j j 2 2
4+
2 3(UO SiO(OH) ,ClO )−ε 1kg mol−⋅
Moll et al. [96MOL/GEI] have determined the solubility and speciation of in a 0.1 M NaClO ionic medium at 298.15 K. These data are dis-
cussed in Appendix A, and in section 9.7.3.2.3. The experimental results of this study are consistent with the selected equilibrium constant for the formation of
. No value for the equilibrium constant for the formation of
2 2 4 2(UO ) SiO 2H O⋅
2 3UO SiO(OH)+

9 Discussion of new data selection for Uranium 254
32UO SiO(OH)+ was selected in [92GRE/FUG], because only one experimental determi-nation, [71POR/WEB], was available. Using the additional information from [71POR/WEB], [92SAT/CHO], [98MOL/GEI] and [99HRN/IRL], listed in Table 9-34, this review has selected for the reaction:
10*log K ο
f m 4(USiO , aο∆ G
1mol−⋅
1mol−⋅
2 2(UO ) SiO
2+ + +2 4 2 3UO + Si(OH) (aq) UO SiO(OH) + H
= − (1.84 ± 0.10), where the uncertainty is at the 1.96σ level. 9.7.3.2 Solid uranium silicates (V.7.2.2)
9.7.3.2.1 Solid U(IV) silicates
On the basis of solubility measurements Langmuir [97LAN] proposed a value of which is not selected as explained in Appendix A. m)
9.7.3.2.2 Solid U(VI) silicates
Clark et al. [98CLA/EWI], Chen et al. [99CHE/EWI], [99CHE/EWI2] describe a method for estimation of standard Gibbs energies of formation of U(VI) layered oxide hydrates and silicates. Because of the very few experimental thermodynamic data avail-able for minerals, we found it relevant to include this study, despite the fact that it is based on estimations. Clark et al. have extended a method originally suggested by Tardy and Garrels [74TAR/GAR] for layer silicates, by using data on the structural hi-erarchy for a large number of uranium(VI) solid phases from Burns et al. [96BUR/MIL]. The estimation method uses the standard energies of formation of crys-talline schoepite, silica and oxides of Na, K, Mg and Ca from the NEA TDB and CODATA databases together with an estimated value for the standard Gibbs energy contribution of structural water equal to − 247 1kJ mol−⋅ . The authors have made an error propagation analysis of the estimated energies of formation and a comparison with experimental data. The uncertainty in the estimates is fairly large, ranging from 8 to 90 kJ . The difference between experimental and estimated data is larger, ranging from 34 to 124 kJ . The discrepancy for becquerelite is unexpectedly large, 440 kJ . The authors do not offer any explanation for this discrepancy. Clark et al. [98CLA/EWI] also report the Gibbs energy contribution of structural water that is useful for other uranium phases.
1mol−⋅
9.7.3.2.3 (UO2)2SiO4·2H2O (soddyite) (V.7.2.2.1)
Moll et al. [96MOL/GEI] determined the solubility constant of soddyite in 0.1 M Na-ClO4 at 298.15 K, using a well characterised crystalline solid. Because the test solutions at pH = 3 used by Moll et al. are over-saturated with respect to silica, this review has made a reinterpretation of their data and propose a slightly different value of the solubil-ity product for the reaction:
(9.40). ( )+ 2+4 2 2 24
2H O(sodd) + 4 H 2 UO + Si OH (aq) + 2 H O(l)⋅
9.7 Uranium group 14 compounds and complexes (V.7)
255
10*log sK (9.40) = (7.1 ± 0.5) in 0.1 M NaClO4 and lo 10
*g sK ο (9.40) = (6.7 ± 0.5) at zero ionic strength, cf. Appendix A.
Moroni and Glasser [95MOR/GLA] have studied reactions between cement components and U(VI) oxide at 85°C, in aqueous solutions at high pH, cf. Appendix A. Soddyite is one of the phases formed and this review has used the data where this is the single solid present to evaluate the equilibrium constant for the reaction: (UO2)2SiO4(cr) + SiO2 + 2H2O(l) +2 H+ 2[UO2(H3SiO4)+], from the experimental values of the total concentrations of dissolved uranium and silica. By combining this equilibrium constant with the equilibrium constant for the reaction:
+ Si(OH)2+2UO 4(aq) UO2(H3SiO4)+ + H+,
selected in this review and assuming that the solubility reaction is independent of tem-perature, we obtain 10
*log sK (9.40) = 6.4, in fair agreement with the value proposed by Moll et al. The equilibrium constant obtained from the data [95MOR/GLA] is not se-lected by this review, although it supports the value reported by Moll et al.
Pérez et al. [97PER/CAS] studied the solubility of soddyite in bicarbonate so-lutions and their proposed solubility constant is 10
*log sK ο (9.40) = (3.9 ± 0.7). However, there is a systematic variation in the solubility product, cf. Appendix A, and the pro-posed equilibrium constant has therefore not been accepted by this review.
Nguyen et al. [92NGU/SIL] measured the solubilities of soddyite in water under an inert atmosphere at pH = (3.00 ± 0.05) and
T = 303 K. Calculations of solubility products are performed according to the following equilibrium:
2 2 4 2(UO ) SiO 2H O,⋅
( )+ 2+2 2 4 2 2 24
(UO ) SiO 2H O(cr) + 4 H 2 UO + Si OH (aq) + 2 H O(l)⋅ (9.41)
The authors assume that, in the pH range 3 to 4.5, Si is only present as H4SiO4(aq). Using the total measured concentrations of U and Si in the equilibrated solutions, free concentrations of all the species are calculated using thermodynamic data on U(VI) hydrolysis, silicon and other cation species taken from [92GRE/FUG]. The
10*log sK (9.41) value, T = 303 K, is derived and then that for 10
*log sK ο , according to the TDB Guidelines. The value for soddyite is: 10
*log sK ο (9.41) = (5.74 ± 0.21).
In view of non-concordant solubility constants, this review does not recom-mend a value, but suggests that the average value from Nguyen et al. [92NGU/SIL] and Moll et al. [96MOL/GEI], with increased uncertainty,
10*log sK ο (9.41) = (6.2 ± 1.0)
may be used as a guideline until it has been confirmed. The estimated uncertainty cov-ers the uncertainty ranges of the two studies.

9 Discussion of new data selection for Uranium 256
9.7.3.2.4 Ca(UO2)2(SiO3OH)2·5 H2O (uranophane), Na(UO2)(SiO3OH) ·2 H2O (sodium boltwoodite) and Na2(UO2)2(Si2O5)3 · 4H2O (sodium weeksite)
Nguyen et al. [92NGU/SIL] measured the solubilities of synthetic uranophane Ca(UO2)2(SiO3OH)2·5 H2O sodium boltwoodite, Na(UO2)(SiO3OH) ·2 H2O and sodium weeksite 2 2 2 2 5 3 2Na (UO ) (Si O ) 4H O⋅ in water under an inert atmosphere at pH = (3.50 ± 0.05) for uranophane and pH = (4.50 ± 0.05) for the other salts (T = 303 K). Calculations of the solubility constants are made according to the following equilibria1:
( )+ 2+ 2+3 2 2 2 4 2 2 2 24
Ca(H O) (UO ) (SiO ) 3H O(cr)+6H Ca +2UO (aq) +2Si OH (aq)+5H O(l)⋅ (9.42)
( )+ + 2+3 2 4 2 2 24
Na(H O)UO SiO H O(cr) + 3H Na + UO + Si OH (aq) + 2H O(l)⋅ (9.43)
( )+ + 2+2 2 2 2 5 3 2 2 2 4
Na (UO ) (Si O ) 4H O(cr) + 6H 5H O(l) 2 Na +2UO + 6Si OH (aq)⋅ + (9.44).
The solubility data were analysed as described above for soddyite to derive 10
*log sK values at T = 303 K and then those for 10*log sK ο , according to the TDB
Guidelines. The values are:
10*log sK ο
*
(9.42) = (9.42 ± 0.48) for uranophane,
10log sK ο
*
(9.43) > (5.82 ± 0.16) for Na–boltwoodite,
10log sK ο (9.44) = (1.50 ± 0.08) for Na–weeksite.
For Na–boltwoodite the equilibrium phase is assumed to be pure.
For reasons discussed in Appendix A concerning the purity of the phases and the calculations, and the fact that solutions are probably supersaturated with respect to silica, these values are not selected, but can be used in scoping calculations.
Pérez et al. [2000PER/CAS] have also investigated the solubility of a synthetic urano-phane in bicarbonate solutions at 298.15 K of low ionic strength (2·10–2 M or less, pH 8 to 9, 10–3 M < [H < 2·103CO ]− –2 M). The solid phase was characterised by both X–ray diffraction and partial chemical analysis. However, this review finds it unlikely that the solid used has the composition suggested by the authors (for a discussion see Appendix A). The average value of 10
*log sK ο (9.42) = (11.7 ± 0.6) differs from the value of [92NGU/SIL]. This large discrepancy of 10
*log sK ο for uranophane leads this review to not select any value for this mineral.
1 Nguyen et al. [92NGU/SIL] used the chemical formula Ca(H3O)2(UO2)2(SiO4)2
.3H2O for uranophane and Na(H3O)(UO2)(SiO4)·H2O for sodium boltwoodite, which are equivalent to Ca(UO2)2(SiO3OH)2·5H2O and Na(UO2)(SiO3OH)·2H2O, respectively.

9.9 Uranium group 2 (alkaline-earth) compounds (V.9)
9.9 Uranium group 2 (alkaline-earth) compounds (V.9)
257
2
Uranophane is one of the solid phases found in the study by Moroni and Glasser [95MOR/GLA], but these data do not allow a determination of thermodynamic constants.
Murphy [97MUR] attempts to solve the problem of UO2 alteration by water under environmental conditions according to the well-known sequence: schoepite (in fact metaschoepite, ), soddyite and uranophane
. He used [92GRE/FUG] data to predict the solubilities as a function of temperature, but this approach was not successful.
2 2 2UO (OH) H O⋅
2 2) 5H O⋅2 2 4 2(UO ) SiO 2H O⋅
2 2 3Ca(UO ) (SiO OH
9.8 Uranium actinide complexes (V.8) 9.8.1 Actinides–actinides interactions (V. 8.1) Stout et al. [93STO/CHO] give a new value of the formation constant of the cation-cation in 6 M NaClO2+ +
2UO NpO⋅ 4, pH = 1 to 2:
= (2.25 ± 0.03) L · molb –1,
which is in agreement with previous values reported in [92GRE/FUG], and the follow-ing values:
f mο∆ H = − (12.0 ± 1.7) 1kJ mol−⋅ ,
= − (34 ± 6) r mο∆ S 1 1J K mol− −⋅ ⋅ ,
at (298.15 ± 0.10) K, for this association reaction. Additional data, = (2.4 ± 0.2) L · mol
b–1 (I = 6 M, NaClO4) of Stout et al. [2000STO/HOF] do not change this result.
The value of = (2.2 ± 1.5) L · molbUO
–1 has been reported by Stout et al [2000STO/HOF] for the association reaction. 2+ +
2 PuO⋅ 2
9.9.1 Magnesium compounds (V.9.2) Two papers ([92DUE/FLE], [93PAT/DUE]) describe the chemical and electrochemical insertion of Mg in α–U3O8 to form MgxU3O8 (0 < x < 0.6) and in α–UO2.95 to form MgxUO2.95 (0 < x < 0.26). Similar studies were also carried out on the insertion of Li, Na and Zn [95DUE/PAT].
Such species are single phases over a wide range of composition; for instance, the phase MgxU3O8 retains the orthorhombic U3O8 structure with x up to 0.5. However, the experimental phase boundaries depend greatly on the preparation method (chemical or electrochemical) and conditions (temperature, applied potential).
In the case of α–UO2.95 insertion compounds, Mg0.17UO2.95 was described [93PAT/DUE] as a pure phase (hexagonal, isomorphous with α–UO2.95), based on
9 Discussion of new data selection for Uranium 258
X−ray diffraction data. Its standard enthalpy of formation (using well characterised samples) was obtained from dissolution data of MgO(cr), γ–UO3, and α–U3O8 in: 0.274 3mol dm−⋅ Ce(SO4)2 + 0.484 3mol dm−⋅ H3BO3 + 0.93 3mol dm−⋅ H2SO4, which is the same medium as that used by Cordfunke and Ouweltjes [81COR/OUW2].
The authors [93PAT/DUE] measured only the dissolution enthalpies of:
Mg0.17 UO2.95 : 1sol m 0.17 2.95(Mg UO ) = (143.99 0.60) kJ mol−∆ − ±H ⋅ ,
MgO(cr): 1sol m (MgO) = (149.50 0.55) kJ molH −∆ − ± ⋅ .
The values for the dissolution enthalpies of:
γ–UO3: 1sol m 3( UO ) = (79.94 0.48) kJ mol−∆ γ − − ± ⋅H ,
α–U3O8: 1sol m 3 8( U O ) = (354.61 1.70) kJ molH −∆ α − − ± ⋅ ,
were taken from [81COR/OUW2].
The enthalpy change corresponding to the formation of the insertion compound from the stoichiometric oxides:
3 3 8 0.17 2.950.17 MgO(cr) + 0.34 UO + 0.22 U O Mg UO (cr)γ− α− (9.45)
is calculated to be r mο∆ H ((9.45), 298.15 K) = (13.38 ± 0.73) 1kJ mol−⋅ , suggesting it is
metastable with respect to the component oxides. With NEA adopted values, this gives: 1
f m 0.17 2.95(Mg UO , , 298.15 K) = (1291.44 0.99) kJ molH ο −∆ α − ± ⋅ .
Using the same experimental scheme, the authors also measured: , (recalculated in section
9.3.3.3.3).
1f m 2.95(UO , , 298.15 K) = (1211.28 1.28) kJ molH ο −∆ α − ± ⋅
From this value and the above, one calculates the enthalpy effect associated with the insertion:
2.95 0.17 2.950.17 Mg + UO ( ) Mg UO (cr)α (9.46)
as r mο∆ H ((9.46), 298.15 K) = − (80.16 ± 1.62) kJ · mol–1.
Electrochemical measurements (charging and discharging curves, open circuit voltages) using the cell:
34 2 2.95Mg(amalgam) 0.5 mol dm Mg(ClO ) (DMF) Mg UOx
−⋅
(DMF = dimethylformamide) allowed the authors [93PAT/DUE] to calculate the Gibbs energy change for reaction:
(9.47) 2.95 2.95 Mg + α UO Mg UO (cr)xx −

9.9 Uranium group 2 (alkaline-earth) compounds (V.9)
259
as ((9.47), 294 K) = − 473·x r m∆ G 1kJ mol−⋅ . For x = 0.17, this relation yields 1mol80.4 kJ −− ⋅ , very close to the value of the enthalpy change deduced by calo-
rimetry, indicating a negligible entropy change.
Oxygen potentials in the (Mg, Ln, U) − O systems have been measured by Fu-jino and co-workers ([2001FUJ/PAR] for Ln = Ce and [2001FUJ/SAT], Ln = Eu); such studies are beyond the scope of the current review.
9.9.2 Calcium compounds (V.9.3) 9.9.2.1 Calcium uranates (V.9.3.1.) Although no thermodynamic data are reported, Pialoux and Touzelin [98PIA/TOU] give interesting information on the complex phase relationships in the system U − Ca − O, based on X–ray diffraction studies up to about 1800 K and at oxygen pressures over the range 10–19 ≤
2 ≤ 1. Fuller details are given in Appendix A. The authors present
a schematic pseudo-binary phase diagram of the UOO / barp
2 − CaO system; they, like others, were unable to prepare pure stoichiometric CaUO3.
9.9.2.1.1 CaUO4(cr) (V.9.3.1.1)
Moroni and Glasser [95MOR/GLA] have studied the solubility of U(VI) oxides at 358 K at high pH, in the presence of Ca2+. As noted in Appendix A, these data provide an approximate value of (CaUOf m
ο∆ G 4, cr, 298.15 K) of − 1848 kJ · mol–1, which, with all the assumptions involved, gives a qualitative confirmation of the well-founded value of − (1888.7 ± 2.4) kJ · mol–1 selected in [92GRE/FUG].
9.9.2.1.2 CaUO6O19 · 11H2O(cr)
The solubility of this compound is discussed in section 9.3.2.1.5.2.1.
9.9.2.1.3 Other calcium uranates
Microprobe analysis and X–ray diffraction [97VAL/RAG] showed that the well-crystallised form of was obtained by treatment, at 573 K and 0.5 kbar, of a poorly crystallised material,
3 4.5 16.5Ca U O (cr)CaU1.6 5.8 2O 2.5H O⋅ in pure water or a 0.01
solution of CaCl
3mol dm−⋅2. The solubility of the final product of the treatment ranged, in all ex-
periments, between 10–5.9 and 10–6.3 3mol dm−⋅ . These data cannot be used to deduce thermodynamic constants and are given for information only.
As noted in Appendix A, Takahashi et al. [93TAK/FUJ] have made Gibbs en-ergy measurements on non–stoichiometric calcium uranates which are beyond the scope of the present review.
9.9.3 Strontium compounds (V.9.4) Although no thermodynamic data are reported, Pialoux and Touzelin [99PIA/TOU] give interesting information on the complex phase relationships in the system U − Sr − O, based on X–ray diffraction studies up to about 1800 K and at oxygen pressures over the

9 Discussion of new data selection for Uranium 260
range 10–19 ≤2
≤ 1. Fuller details are given in Appendix A. The authors present a schematic pseudo-binary phase diagram between "SrUO
O / barp3" and SrUO4, although they,
like others, were unable to prepare pure stoichiometric SrUO3. 9.9.3.1 SrUO3(cr) Fuger et al. [93FUG/HAI] have used the Goldschmidt tolerance factor [70GOO/LON], page 132, to correlate experimental values of the enthalpy of formation of MM'O3 ox-ides from the binary oxides (M = Ba, and M' = Ti, Hf, Zr, Ce, Tb, U, Pu, Am, Cm, and M = Sr, and M' = Ti, Mo, Zr, Ce, Tb, Am). They thus estimated the enthalpy of forma-tion of SrUO3 to be 3 kJ less negative than the sum of the enthalpies of forma-tion of the binary oxides. Thus, using [92GRE/FUG] accepted data, we find:
1mol−⋅
f mο∆ H (SrUO3, cr, 298.15 K) = − (1672.6 ± 8.6) 1kJ mol−⋅ , (including the uncer-
tainty arising from the correlation). This value is in accord with that, − (1675 ± 10) , estimated by Cordfunke and Ijdo [94COR/IJD], using experimentally avail-
able data for SrM'O
1mol−kJ ⋅3 compounds only.
Huang et al. [97HUA/YAM] carried out vaporisation studies over the tempera-ture range 1534 − 1917 K using a mixture of "SrUO3" and UO2, due to the reported dif-ficulties in preparing single phase SrUO3. From the mass spectrometric measurements, the composition of the ternary oxide was estimated to be SrUO3.1, based on X−ray dif-fraction data. Using an estimated enthalpy increment and values of
estimated from those of SrZrOm m( ) (298.15 K)H T H ο− 3, they obtained the standard enthalpy of formation of "SrUO3". We have assumed this applies to the final oxide (see full discussion in Appendix A):
f mο∆ H (SrUO3.1, cr, 298.15 K) = − (1785 ± 60) and − (1698.1 ± 5.0) , 1kJ mol−⋅
from the second- and third-law treatments, respectively, where the latter is recalculated by this review. The latter value is (6 ± 10) 1kJ mol−⋅ more negative than the sum of
f mο∆ H (UO2.1, cr, 298.15 K) = − (1102 ± 5) 1kJ mol−⋅ (our estimate) and f m
ο∆ H (SrO, cr, 298.15 K) = − (590.6 ± 0.9) 1kJ mol−⋅ [92GRE/FUG]. The suggestion that stoichiomet-ric SrUO3 is of very marginal stability compared to the binary oxides is supported by the difficulty in obtaining a pure phase, as acknowledged by [97HUA/YAM] and by the observations of [94COR/IJD]. We therefore select for the stoichiometric oxide:
1f m 3(SrUO , cr, 298.15 K) = (1672.6 8.6) kJ molο −∆ − ±H ⋅ ,
as proposed by [93FUG/HAI]. This value is not incompatible with the conclusions of [97HUA/YAM]. Yamashita and Fujino [89YAM/FUJ] have measured the oxygen po-tential of SryYyU1–2y O2+x (y = 0.05 and 0.025) solid solutions by thermogravimetric methods between 1123 and 1673 K, but such studies are not part of the current NEA review effort.

9.9 Uranium group 2 (alkaline-earth) compounds (V.9)
261
9.9.3.2 Strontium uranates (VI)
9.9.3.2.1 α–SrUO4 (V.9.4.1.1)
Takahashi et al. [93TAK/FUJ] have determined the molar enthalpy of formation of α-SrUO4–x at 298.15 K for 0 < x < 0.478, based on the dissolution of well-characterised compounds in 5.94 mo HCl. The authors also made use of the enthalpy of disso-lution of SrCl
3l dm−⋅l d2(cr) in 1 mo 3m−⋅
mol d HCl [83MOR/WIL] and of the enthalpy of transfer of
SrCl2(cr) from 1 to 5.94 3m−⋅ HCl [78PER/THO]. Their results, recalculated for a 95% confidence interval with the NEA accepted auxiliary values, are summarised be-low.
Table 9-35: Enthalpies sol m f m 4and of SrUO −∆ ∆ xH H .
4 in SrUO xx − 1
sol m (kJ mol ) H −⋅∆ 1
f m (kJ mol ) H −⋅∆
0.478 – (170.55 ± 1.89) – (1894.31 ± 2.83) 0.380 – (152.71 ± 0.60) – (1926.14 ± 2.09) 0.297 – (149.24 ± 0.99) – (1941.47 ± 2.19) 0.127 – (143.40 ± 7.90) – (1971.61 ± 8.11) 0.0 – (142.86 ± 2.45) – (1990.28 ± 3.22)
The value for the enthalpy of formation of the stoichiometric α–SrUO4 sup-ports that selected in [92GRE/FUG]:
, 1f m 4(SrUO , , 298.15 K) = (1989.6 2.8) kJ molH ο −∆ α − ± ⋅
which was based on the results of [67COR/LOO]. We thus maintain this selection.
Following the authors, we have fitted the five data points in Table 9-35 to the quadratic function:
, 2f m 4 x(SrUO , , 298.15 K) = 1989.3 + 98.1 x + 202.8 x−∆ α −H
from which the partial molar enthalpy of solution of oxygen can be approximated as a function of x.
9.9.3.2.2 β–SrUO4 (V.9.4.1.2)
In a rather comprehensive paper, Cordfunke et al. [99COR/BOO] recently reported the enthalpies of formation of β–SrUO4 together with those of a series of strontium uran-ates, based on dissolution of well-characterised compounds in appropriate media at 298.15 K. For β–SrUO4 and for Sr3UO6, Sr3U11O36 and Sr5U3O14, the medium was 5.075 3mol dm−⋅
3mol dm−⋅
HCl (sln. A). In the same paper, the authors also reported the enthal-pies of formation of Sr2UO4.5 and Sr2UO5 from dissolution in 1.00 mo HCl + 0.0470
3l dm−⋅ FeCl3 (sln. B). The authors also give a recalculation of an earlier
study [67COR/LOO] of the dissolution of β–SrUO4 in 6.00 3mol dm−⋅ HNO3, discussed below. The auxiliary data on the enthalpies of formation of the relevant solids and the partial molar enthalpies of formation of HCl and HNO3 in the solutions are listed in the

9 Discussion of new data selection for Uranium 262
discussion of [99COR/BOO] in Appendix A. The dissolution in the appropriate media of mixtures of SrCl2 and γ–UO3 with variable stoichiometric ratios was also carried out in order to close the relevant thermodynamic cycles.
The authors also report a new determination of the enthalpy of solution of 3γ UO− in 6.00 HNO3mol dm−⋅ 3 as:
3 1sol m 3 3(UO , , 6.00 mol dm HNO ) = (72.10 0.33) kJ mol− −∆ γ ⋅ − ± ⋅H .
Previous determinations by the same group yielded − (71.30 ± 0.13) [64COR] and − (72.05 ± 0.25)
1kJ mol−⋅1kJ mol−⋅
kJ mo
[75COR], cited by [78COR/OHA], for this quantity. In subsequent calculations involving γ–UO3 in this medium, we will use the weighted average − (71.53 ± 0.50) 1l−⋅ , keeping conservative uncertainty limits.
As discussed in the entry for [99COR/BOO] in Appendix A, the two recalcu-lated values for f m
ο∆ H (SrUO4, β, 298.15 K) are − (1985.75 ± 1.57) from dis-solution in (sln. A) and − (1991.13 ± 2.72)
1kJ mol−⋅1kJ mol−⋅ from dissolution in
6.00 3mol dm−⋅ HNO3.
As these two values do not overlap within their uncertainties, and since we have no reason to prefer one to the other, we shall accept, with increased uncertainty limits, their average,
f mο∆ H (SrUO4, β, 298.15 K) = − (1988.4 ± 5.4) 1kJ mol−⋅ ,
as the selected value. This value is slightly different from that adopted by [92GRE/FUG], − (1990.8 ± 2.8) 1kJ mol−⋅ .
9.9.3.2.3 SrU4O13 (V.9.4.2)
In their recent publication on strontium uranates, containing new structural results in the range 0.25 < Sr/U < 0.33, [99COR/BOO] note that a compound previously believed [67COR/LOO] to be SrU4O13 (but always containing some U3O8) could not correspond to a pure phase. Consequently, we shall no longer give data for this species.
9.9.3.2.4 Sr2UO5 (V.9.4.3)
As for β–SrUO4, discussed in section 9.9.3.2.2, we have recalculated f mο∆ H (Sr2UO5, cr,
298.15 K) to be − (2631.50 ± 2.31) 1kJ mol−⋅ from dissolution in (sln. B) and from dissolution in 6.00 mo1 (2635.88 3.38) kJ mol−− ± ⋅ 3l dm−⋅ HNO3. The two val-
ues overlap within their uncertainties and we adopt the weighted mean:
f mο∆ H (Sr2UO5, cr, 298.15 K) = − (2632.9 ± 1.9) 1kJ mol−⋅
which overlaps with the value in [92GRE/FUG], − (2635.6 ± 3.4) within the uncertainties.
1kJ mol−⋅
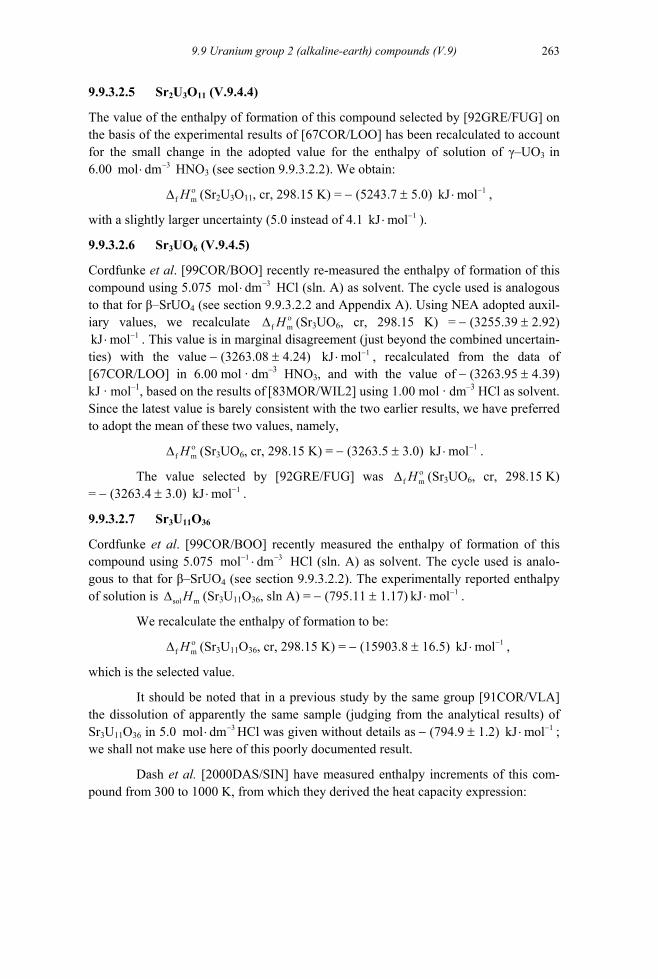
9.9 Uranium group 2 (alkaline-earth) compounds (V.9)
263
9.9.3.2.5 Sr2U3O11 (V.9.4.4)
The value of the enthalpy of formation of this compound selected by [92GRE/FUG] on the basis of the experimental results of [67COR/LOO] has been recalculated to account for the small change in the adopted value for the enthalpy of solution of γ–UO3 in 6.00 3mol dm−⋅ HNO3 (see section 9.9.3.2.2). We obtain:
f mο∆ H (Sr2U3O11, cr, 298.15 K) = − (5243.7 ± 5.0) 1kJ mol−⋅ ,
with a slightly larger uncertainty (5.0 instead of 4.1 1kJ mol−⋅ ).
9.9.3.2.6 Sr3UO6 (V.9.4.5)
Cordfunke et al. [99COR/BOO] recently re-measured the enthalpy of formation of this compound using 5.075 3mol dm−⋅ HCl (sln. A) as solvent. The cycle used is analogous to that for β–SrUO4 (see section 9.9.3.2.2 and Appendix A). Using NEA adopted auxil-iary values, we recalculate f m
ο∆ H (Sr3UO6, cr, 298.15 K) = − (3255.39 ± 2.92) . This value is in marginal disagreement (just beyond the combined uncertain-
ties) with the value − (3263.08 ± 4.24)
1kJ mol−⋅1kJ mol−⋅ , recalculated from the data of
[67COR/LOO] in 6.00 mol · dm–3 HNO3, and with the value of − (3263.95 ± 4.39) kJ · mol–1, based on the results of [83MOR/WIL2] using 1.00 mol · dm–3 HCl as solvent. Since the latest value is barely consistent with the two earlier results, we have preferred to adopt the mean of these two values, namely,
f mο∆ H (Sr3UO6, cr, 298.15 K) = − (3263.5 ± 3.0) kJ 1mol−⋅ .
The value selected by [92GRE/FUG] was f mο∆ H (Sr3UO6, cr, 298.15 K)
= − (3263.4 ± 3.0) . 1kJ mol−⋅
9.9.3.2.7 Sr3U11O36
Cordfunke et al. [99COR/BOO] recently measured the enthalpy of formation of this compound using 5.075 HCl (sln. A) as solvent. The cycle used is analo-gous to that for β–SrUO
1mol dm− ⋅ 3−
4 (see section 9.9.3.2.2). The experimentally reported enthalpy of solution is sol m∆ H (Sr3U11O36, sln A) = − (795.11 ± 1.17) 1kJ mol−⋅ .
We recalculate the enthalpy of formation to be:
f mο∆ H (Sr3U11O36, cr, 298.15 K) = − (15903.8 ± 16.5) , 1kJ mol−⋅
which is the selected value.
It should be noted that in a previous study by the same group [91COR/VLA] the dissolution of apparently the same sample (judging from the analytical results) of Sr3U11O36 in 5.0 HCl was given without details as − (794.9 ± 1.2) kJ ; we shall not make use here of this poorly documented result.
3mol dm−⋅ 1mol−⋅
Dash et al. [2000DAS/SIN] have measured enthalpy increments of this com-pound from 300 to 1000 K, from which they derived the heat capacity expression:
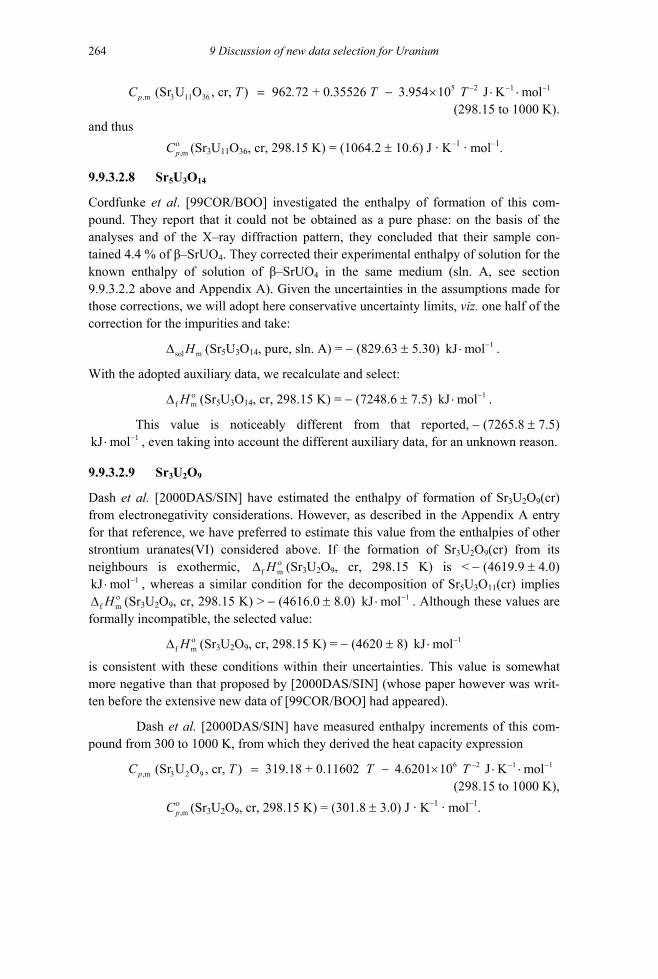
9 Discussion of new data selection for Uranium 264
,mpC 5 2 13 11 36(Sr U O , cr, ) 962 72 + 0.35526 3.954 10 J K mol 1− − −= − × ⋅T . T T ⋅
(298.15 to 1000 K). and thus ,m
οpC (Sr3U11O36, cr, 298.15 K) = (1064.2 ± 10.6) J · K–1 · mol–1.
9.9.3.2.8 Sr5U3O14
Cordfunke et al. [99COR/BOO] investigated the enthalpy of formation of this com-pound. They report that it could not be obtained as a pure phase: on the basis of the analyses and of the X–ray diffraction pattern, they concluded that their sample con-tained 4.4 % of β–SrUO4. They corrected their experimental enthalpy of solution for the known enthalpy of solution of β–SrUO4 in the same medium (sln. A, see section 9.9.3.2.2 above and Appendix A). Given the uncertainties in the assumptions made for those corrections, we will adopt here conservative uncertainty limits, viz. one half of the correction for the impurities and take:
sol m∆ H (Sr5U3O14, pure, sln. A) = − (829.63 ± 5.30) 1kJ mol−⋅ .
With the adopted auxiliary data, we recalculate and select:
f mο∆ H (Sr5U3O14, cr, 298.15 K) = − (7248.6 ± 7.5) 1kJ mol−⋅ .
This value is noticeably different from that reported, − (7265.8 ± 7.5) , even taking into account the different auxiliary data, for an unknown reason. 1kJ mol−⋅
9.9.3.2.9 Sr3U2O9
Dash et al. [2000DAS/SIN] have estimated the enthalpy of formation of Sr3U2O9(cr) from electronegativity considerations. However, as described in the Appendix A entry for that reference, we have preferred to estimate this value from the enthalpies of other strontium uranates(VI) considered above. If the formation of Sr3U2O9(cr) from its neighbours is exothermic, f m
ο∆ H (Sr3U2O9, cr, 298.15 K) is < − (4619.9 ± 4.0) , whereas a similar condition for the decomposition of Sr1kJ mol−⋅
f mο∆
5U3O11(cr) implies H (Sr3U2O9, cr, 298.15 K) > − (4616.0 ± 8.0) 1kJ mol−⋅ . Although these values are
formally incompatible, the selected value:
f mο∆ H (Sr3U2O9, cr, 298.15 K) = − (4620 ± 8) 1kJ mol−⋅
is consistent with these conditions within their uncertainties. This value is somewhat more negative than that proposed by [2000DAS/SIN] (whose paper however was writ-ten before the extensive new data of [99COR/BOO] had appeared).
Dash et al. [2000DAS/SIN] have measured enthalpy increments of this com-pound from 300 to 1000 K, from which they derived the heat capacity expression
,mpC 6 2 13 2 9(Sr U O , cr, ) 319.18 + 0.11602 4.6201 10 J K mol 1− − −= − × ⋅T T T ⋅
(298.15 to 1000 K), ,m
οpC (Sr3U2O9, cr, 298.15 K) = (301.8 ± 3.0) J · K–1 · mol–1.
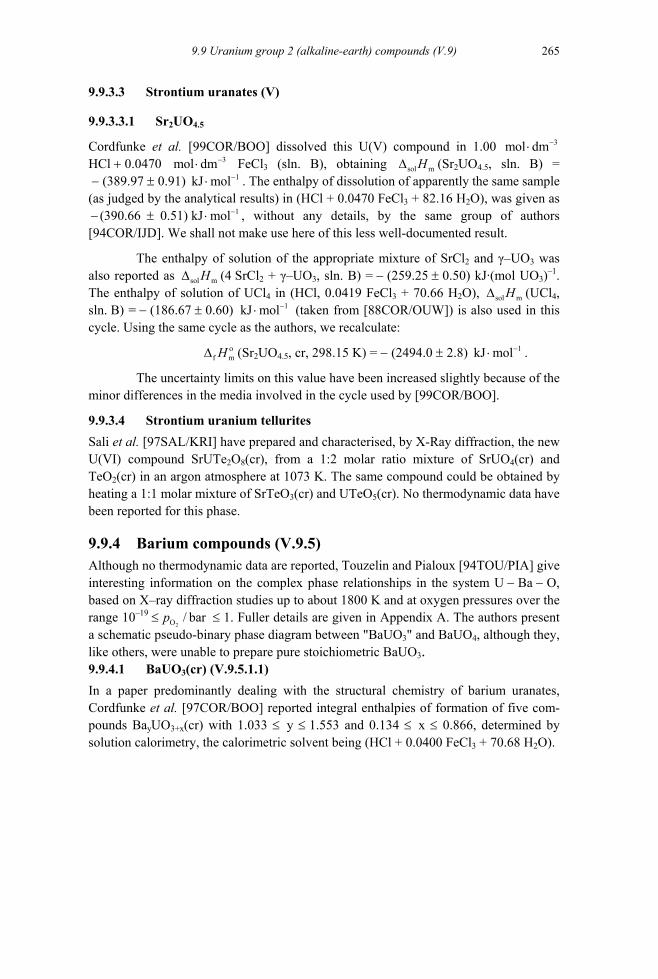
9.9 Uranium group 2 (alkaline-earth) compounds (V.9)
265
9.9.3.3 Strontium uranates (V)
9.9.3.3.1 Sr2UO4.5
Cordfunke et al. [99COR/BOO] dissolved this U(V) compound in 1.00 HCl + 0.0470 FeCl
3mol dm−⋅3mol dm−⋅ 3 (sln. B), obtaining sol m∆ H (Sr2UO4.5, sln. B) =
− (389.97 ± 0.91) . The enthalpy of dissolution of apparently the same sample (as judged by the analytical results) in (HCl + 0.0470 FeCl
1−
1−
kJ mol⋅
0.51) kJ mol⋅3 + 82.16 H2O), was given as
, without any details, by the same group of authors [94COR/IJD]. We shall not make use here of this less well-documented result.
(390.66 − ±
The enthalpy of solution of the appropriate mixture of SrCl2 and γ–UO3 was also reported as sol m∆ H (4 SrCl2 + γ–UO3, sln. B) = − (259.25 ± 0.50) kJ·(mol UO3)–1. The enthalpy of solution of UCl4 in (HCl, 0.0419 FeCl3 + 70.66 H2O), sol m∆ H (UCl4, sln. B) = − (186.67 ± 0.60) 1kJ mol−⋅ (taken from [88COR/OUW]) is also used in this cycle. Using the same cycle as the authors, we recalculate:
f mH ο∆ (Sr2UO4.5, cr, 298.15 K) = − (2494.0 ± 2.8) . 1kJ mol−⋅
The uncertainty limits on this value have been increased slightly because of the minor differences in the media involved in the cycle used by [99COR/BOO].
9.9.3.4 Strontium uranium tellurites Sali et al. [97SAL/KRI] have prepared and characterised, by X-Ray diffraction, the new U(VI) compound SrUTe2O8(cr), from a 1:2 molar ratio mixture of SrUO4(cr) and TeO2(cr) in an argon atmosphere at 1073 K. The same compound could be obtained by heating a 1:1 molar mixture of SrTeO3(cr) and UTeO5(cr). No thermodynamic data have been reported for this phase.
9.9.4 Barium compounds (V.9.5) Although no thermodynamic data are reported, Touzelin and Pialoux [94TOU/PIA] give interesting information on the complex phase relationships in the system U − Ba − O, based on X–ray diffraction studies up to about 1800 K and at oxygen pressures over the range 10–19 ≤
2 ≤ 1. Fuller details are given in Appendix A. The authors present
a schematic pseudo-binary phase diagram between "BaUOO / barp
3" and BaUO4, although they, like others, were unable to prepare pure stoichiometric BaUO3. 9.9.4.1 BaUO3(cr) (V.9.5.1.1) In a paper predominantly dealing with the structural chemistry of barium uranates, Cordfunke et al. [97COR/BOO] reported integral enthalpies of formation of five com-pounds BayUO3+x(cr) with 1.033 ≤ y ≤ 1.553 and 0.134 ≤ x ≤ 0.866, determined by solution calorimetry, the calorimetric solvent being (HCl + 0.0400 FeCl3 + 70.68 H2O).

9 Discussion of new data selection for Uranium 266
As noted in Appendix A, our calculated values of the enthalpies of formation are appreciably less negative than those reported by the authors, whose reaction scheme contained an error. We obtain:
f mο∆ H (Ba1.033UO3.134, cr, 298.15 K) = − (1721.68 ± 3.57) , 1kJ mol−⋅
f mο∆ H (Ba1.065UO3.172, cr, 298.15 K) = − (1733.43 ± 3.65) , 1kJ mol−⋅
f mο∆ H (Ba1.238UO3.407, cr, 298.15 K) = − (1868.05 ± 4.16) , 1kJ mol−⋅
f mο∆ H (Ba1.400UO3.604, cr, 298.15 K) = − (1982.10 ± 4.38) , 1kJ mol−⋅
f mο∆ H (Ba1.553UO3.866, cr, 298.15 K) = − (2116.90 ± 4.38) . 1kJ mol−⋅
The authors note a linear change of the enthalpy of formation as a function of the Ba/U from Ba3UO6 to Ba1.033UO3.134 in these compounds, including the values of
f mο∆ H (BaUO3.05, cr, 298.15 K) = − (1700.4 ± 3.1) 1kJ mol−⋅ and f m
ο∆ H (BaUO3.08, cr, 298.15 K) = − (1710.0 ± 3.0) 1kJ mol−⋅ of unspecified origin. Since these two results may suffer from the same error as the detailed measurements, they have been dis-counted.
However, since both the Ba/U ratio and the uranium valence are changing, this approximately linear relation for the five samples measured must be fortuitous (or per-haps related to the oxygen pressure during preparation). Thus the authors' derived value for the enthalpy of formation of BaUO3(cr) as − (1680 ± 10) 1kJ mol−⋅ (which be-comes − (1688 ± 10) with the corrected values) by extrapolation of this linear relationship must be treated with some circumspection.
1kJ mol−⋅
At this stage, we see no argument to modify the previously adopted value for stoichiometric BaUO3(cr) [92GRE/FUG],
f mο∆ H (BaUO3, cr, 298.15 K) = − (1690 ± 10) 1kJ mol−⋅ ,
based on the solution calorimetry by [84WIL/MOR] who used two samples of BaUO3+x(cr) with x = 0.20 and 0.06.
Cordfunke et al. [97COR/BOO] also measured the oxygen potential as a func-tion of the composition of Ba1.033UO3+x samples using a reversible emf cell of the type:
21.033 3+x 2 O(Pt) Ba UO (cr) CaO stabilized ZrO air (Pt), = 0.202 bar− p
The authors used a linear extrapolation of the potentials to x = 0 to approxi-mate the value of the equilibrium oxygen potential of stoichiometric BaUO3(cr) at 1060 K, which becomes − 629 1kJ mol−⋅ with our refitted equation (see Appendix A). This is, in fact, likely to be an upper limit for the oxygen potential, which probably drops sharply near x = 0 as all the uranium becomes quadrivalent (cf. UO2+x). Such a value is low enough to make the preparation of unoxidised stoichiometric BaUO3 rather difficult, thus supporting the long reported failure ([75BRA/KEM], [82BAR/JAC],

9.10 Uranium group 1 (alkali) compounds (V.10)
9.10 Uranium group 1 (alkali) compounds (V.10)
267
[84WIL/MOR]) to obtain this phase. Hinatsu [93HIN] also reported a composition of BaUO3.023 as the lowest oxygen content that he could attain when reducing BaUO4 in a flow of hydrogen. The thermophysical properties of the "BaUO3" phase reported by Yamanaka et al. [2001YAM/KUR] also concern a compound with an oxygen content greater than BaUO3, similar to those reported by other authors, as judged by the lattice parameter.
Yamawaki et al. [96YAM/HUA] have studied the vaporisation of a sample of “BaUO3” by Knudsen effusion mass spectrometry, finding BaO(g), Ba(g) and UO2(g) in the vapour. They processed their results (with estimated thermal functions for BaUO3(cr)) to derive second- and third-law enthalpies of formation f m
ο∆ H (BaUO3, cr, 298.15 K) of − (1742.5 ± 10.0) 1kJ mol−⋅ (uncertainty increased) and (1681.8 20 8).− ± kJ · mol–1, respectively. However, as noted in Appendix A, it is very probable that the vaporisation was non-congruent, with likely changes in the Ba/U as well as the O/U ratio.
The calculated values are in general agreement with calorimetric data dis-cussed above, but clearly cannot be used to establish the properties of a barium uranate of any defined composition.
Fujino et al. [91FUJ/YAM] have measured the oxygen potential of solid solu-tions of composition Ba0.05Y0.05 U0.9 O2+x between 1173 and 1573 K and made an exten-sive comparison with UO2+x and lanthanide ternary and quaternary oxide systems. These non–stoichiometric quaternary phases are beyond the scope of the present review.
9.10.1 General Iyer, Jayanthi and Venugopal [92VEN/IYE], [97IYE/JAY], [97JAY/IYE], [98JAY/IYE], have made a number of studies on the thermodynamic properties (en-thalpy increments and Gibbs energies) of numerous uranates of the alkali metals. Ex-perimental details are given in Appendix A, and the Gibbs energy studies are discussed both in Appendix A and under the headings for the various compounds. For conven-ience, the published data on the enthalpy increments of these uranates are summarised and compared here.
The authors have fitted their experimental increments to simple polynomials in T ; unfortunately, in most of the studies, they have not im-posed the necessary constraint of = 0 at T = 298.15K, so their calculated heat capacities near 298.15 K will be in error. All their enthalpy increment measurements have therefore been recalculated with the proper constraint. The data points are somewhat scattered (deviations of 5% from the fitted curve are not uncom-mon), and the heat capacities at the ends of the (rather narrow) temperature ranges de-
m m( ) (298.15 K)H T H ο−
m m( ) (298.15 K)H T H ο−

9 Discussion of new data selection for Uranium 268
Figure 9-6: Heat capacity versus temperature for some alkali uranates.
It is clear that while much of the data forms a consistent pattern, some of the
ariations of
Figure 9-6: Heat capacity versus temperature for some alkali uranates.
It is clear that while much of the data forms a consistent pattern, some of the
ariations of
pend appreciably on the equation used in the fit. Thus the heat capacities at 298.15 K have appreciable uncertainties.
e fit. Thus the heat capacities at 298.15 K have appreciable uncertainties.
The best fits are shown in Table 9-36 and Figure 9-6, which also include data for related compounds from [92GRE/FUG]. The best fits are shown in Table 9-36 and Figure 9-6, which also include data for related compounds from [92GRE/FUG].
T (K)
300 400 500 600 700100
200
300
400
500
600
700
800
K2U
4O
13
Rb2U
4O
13 Rb2U
4O
11
Cs2U
2O
7 K2U
2O
7
Na2U
2O
7
KUO3
NaUO3
Cs2U
4O
12
K2U
4O
12
Rb2U
4O
12
Cs2U
4O
13
Cs4U
5O
17 [92GRE/FUG] [92VEN/IYE] [97IYE/JAY] [97JAY/IYE] [98JAY/IYE] [2001BAN/PRA]
Cp,
m (J
·K–1
· mol
–1 )
vv ,m,mpC with temperature are not realistic, perhaps due to decomposition dur-ing the
in bold and are in-cluded i e 9-36.
measurements. In particular, the data for K2U4O12(cr), Rb2U4O12(cr), Cs2U4O13(cr), appear anomalous and have not been accepted.
Heat capacity data are selected only for those compounds n Tabl

9.10 Uranium group 1 (alkali) compounds (V.10)
269
T
Table 9-36: Derived heat capacity equations.
Phase T range (K)
Heat capacity coefficients 2
,m a + b + epC T −= ⋅ ⋅ J · K–1 · mol–1 ,m
ο
pC , 298.15 K J · K–1 · mol–1
a b e
KUO3(cr) (a) 369 − 714 1.332577 102 1.2558 10–2 0 (137 ± 10)
K2U2O7(cr) (a) 391 − 683 1.490840 102 2.6950 10–1 0 (229 ± 20)
K2U4O12(cr) (b) 426 − 770 2.022090 102 4.7780 10–1 0
K2U4O13(cr) (b) 411 − 888 4.710680 102 – 4.6890 10–2 – 2.8754 106 (425 ± 50)
Rb2U4O11(cr) (c) 396 − 735 3.304 102 1.4134 10–2 – 6.198 105 (365.6 ± 25.0)
Rb2U4O11(cr) (c) 365 − 735 3.321400 102 7.1252 10–2 0 (353 ± 25)
Rb2U4O12(cr) (d) 375 − 755 1.897590 102 1.5487 10–1 1.9903 107
Rb2U4O13(cr) (d) 325 − 805 4.125600 102 2.5000 10–2 0 (420 ± 50)
Cs2U2O7(cr) (e, f) 298.15 − 852 3.553248 102 8.15759 10–2 – 1.31959 107 (231.2 ± 0.5)
Cs2U4O12(cr) (d, g) 361 − 719 4.237260 102 7.19405 10–2 – 5.43750 106 (384.0 ± 1.0)
Cs2U4O13(cr) (d) 347 − 753 7.128220 102 – 4.2745 10–1 – 6.8805 105
Cs4U5O17 (cr) (e) 368 − 906 6.992110 102 1.7199 10–1 0 (750 ± 50)
(a) [98JAY/IYE] (d) [92VEN/IYE] (g) [80COR/WES] (b) [97IYE/JAY] (e) [97JAY/IYE] (c) [2001BAN/PRA] (f) [81OHA/FLO]
9.10.2 Lithium compounds (V.10.1) 9.10.2.1 Other uranates The preparation, characterisation, thermochemical and electrochemical properties of δ−Li0.69UO3, γ–Li0.55UO3 and Li0.88U3O8(cr) were reported by Dickens et al. [89DIC/LAW]. More experimental details on this work are given in Appendix A in the reviews of [86DIC/PEN, [89DIC/LAW], [90POW] as well as in the original references. The calorimetric reagent for the dissolution, 0.0350 mol · dm–3 Ce(SO4)2 + 1.505 mol · dm–3 H2SO4, was the same as that used in the studies by [77COR/OUW2], [81COR/OUW], [88DIC/POW] and [90POW].
The enthalpies of solution were given as:
sol m∆ H (Li0.69UO3, δ) = − (165.24 ± 1.94) kJ · mol–1,
sol m∆ H (Li0.55UO3, γ) = − (146.12 ± 2.52) kJ · mol–1,
sol m∆ H (Li0.88U3O8, cr) = − (460.52 ± 1.60) kJ · mol–1.
With the auxiliary enthalpies of solution of the binary uranium oxides used also in [90POW], and that for LiUO3(cr), − (208.35 ± 0.53) kJ · mol–1 (all original data are from [77COR/OUW2], [81COR/OUW]), the selected enthalpies of the reactions from the stoichiometric phases are calculated as in Table 9-37.

9 Discussion of new data selection for Uranium 270
Table 9-37: Derived enthalpies of reactions from stoichiometric phases. Phase Reaction r m∆ H (kJ · mol–1)
Li0.69UO3(δ) 3 3 0.69 30.69 LiUO (cr) + 0.31UO ( ) Li UO ( )γ δ – (4.76 ± 1.98) (a)
Li0.55UO3(γ) 3 3 0.550.55 LiUO (cr) + 0.45 UO ( ) Li UO ( )3γ γ – (6.56 ± 2.54) (a)
Li0.88U3O8(cr) 3 3 8 0.88 3 8 30.88 LiUO (cr) + U O (cr) Li U O (cr) + 0.88 UO ( )γ (0.39 ± 2.16) (a)
Li0.12UO2.95(cr) 3 3 8 3 0.12 2.950.12 LiUO (cr) + 0.05 U O ( ) + 0.73 UO ( ) Li UO (cr)α γ – (0.18 ± 0.82) (b)
Li0.19U3O8(cr) 3 3 8 3 0.19 3 80.19 LiUO (cr) + U O ( ) 0.19 UO Li U O (cr) ( ) +α γ – (1.44 ± 1.94) (b)
(a) [89DIC/LAW] (b) [95DUE/PAT]
Using NEA accepted values, we obtain the selected enthalpies of formation:
f mο∆ H (Li0.69UO3, δ, 298.15K) = − (1434.5 ± 2.4) kJ · mol–1, ο∆ Hf m (Li0.55UO3, γ, 298.15K) = − (1394.5 ± 2.8) kJ · mol–1, ο∆ Hf m (Li0.88U3O8, cr, 298.15K) = − (3837.1 ± 3.8) kJ · mol–1.
For the insertion reactions one then obtains, using NEA accepted values, the values in Table 9-38. The electrochemical results are commented upon in Appendix A and will not be further used here.
Dueber et al. [95DUE/PAT] report similar calorimetric and electrochemical studies on two single phased compounds Li0.12UO2.95 and Li0.19U3O8. The enthalpies of solution were given as:
sol m∆ H (Li0.12UO2.95, cr) = − (100.91 ± 0.73) kJ · mol–1, ∆ Hsol m (Li0.19U3O8, cr) = − (377.57 ± 0.91) kJ · mol–1.
With the above auxiliary data, the enthalpies of the reactions from uranium ox-ides are calculated to be those given in Table 9-38.
Table 9-38: Derived enthalpies of insertion reactions.
Phase Reaction r m∆ H
kJ · mol–1 r m∆ H
kJ · (mol Li)–1
Li0.69UO3(δ) 3 0.690.69 Li(cr) + UO ( ) Li UO ( )γ 3 δ – (220.79 ± 2.77) – (319.99 ± 4.01)
Li0.55UO3(α) 3 0.550.55 Li(cr) + UO ( ) Li UO ( )γ 3 γ – (170.73 ± 3.03) – (310.42 ± 5.51)
Li0.88U3O8(cr) 3 8 0.88 3 80.88 Li(cr) + U O ( ) Li U O (cr)α – (262.29 ± 4.45) – (298.06 ± 5.06)
Li0.12UO2.95 (cr) 2.95 0.12 2.950.12 Li(cr) + UO ( ) Li UO (cr)α – (43.69 ± 1.78) – (364.08 ± 14.83)
Li0.19U3O8(cr) 3 8 0.19 3 80.19 Li(cr) + U O ( ) Li U O (cr)α – (58.16 ± 3.11) – (306.10 ± 16.37)
Using NEA accepted values, we recalculate from the values in Table 9-37 the
selected enthalpies of formation:
f mο∆ H (Li0.12UO2.95, cr, 298.15 K) = − (1255.0 ± 1.2) kJ · mol–1,

9.10 Uranium group 1 (alkali) compounds (V.10)
271
f mο∆ H (Li0.19U3O8, cr, 298.15 K) = − (3633.0 ± 3.1) kJ · mol–1.
The enthalpy changes corresponding to the insertion of lithium into the binary oxides are calculated to be those in Table 9-38, where the selected value of
f mο∆ H (UO2.95, α, 298.15 K) = − (1211.28 ± 1.28) kJ · mol–1 (see 9.3.3.3.3) from the
determination of [93PAT/DUE] has been used. The values per mole of lithium are in general agreement with the more precise values of [89DIC/LAW].
From electrochemical measurements analogous to those reported by [93PAT/DUE] for MgUO2.95 (see section 9.9.1), Dueber et al. [95DUE/PAT] also report
(Lif mο∆ G 0.12UO2.95, 298.15 K) = − 42.8 kJ · mol–1 and f m
ο∆ (LiG 0.19U3O8, 298.15 K) = − 55.2 kJ · mol–1, in agreement with the calorimetric values, indicating a negligible entropy effect.
9.10.3 Sodium compounds (V.10.2) 9.10.3.1 Sodium monouranates (VI) (V.10.2.1.1) The data for four monouranates of U(VI) selected by [92GRE/FUG] were mainly based on the study by Cordfunke and Loopstra [71COR/LOO]. However, small changes to the auxiliary data used in their reaction schemes have necessitated the recalculation of the enthalpies of formation; full details are given in Appendix A. For the final selections of the data for the monouranates, for convenience given below,
f mο∆ H (Na4UO5, cr, 298.15 K) = − (2457.0 ± 2.2) kJ · mol–1, ο∆ Hf m (Na2UO4, α, 298.15 K) = − (1897.7 ± 3.5) kJ · mol–1, ο∆ Hf m (Na2UO4, β, 298.15 K) = − (1884.6 ± 3.6) kJ · mol–1,
only those for Na4UO5(cr) have been changed from the previously selected values [92GRE/FUG],
Note however that a substantial correction has been made to the data for Na6U7O24(cr) (see section 9.10.3.4.2).
9.10.3.2 Sodium monouranates (V) (V.10.2.1.2)
9.10.3.2.1 NaUO3(cr)
Jayanthi et al. [94JAY/IYE] have reported measurements of the pressure of Na(g) (by both mass-loss and mass-spectroscopic Knudsen effusion) and the oxygen activity (emf with CaO–ZrO2 electrolyte) in the three–phase field NaUO3(cr) + Na2UO4(cr) + Na2U2O7(cr). They use these measurements to derive values for the Gibbs energy of formation of NaUO3(cr), more positive than those selected by [92GRE/FUG] by about 30 kJ · mol–1. As noted in Appendix A, their oxygen potential values seem to be much too negative, and we have therefore preferred to maintain the values selected by [92GRE/FUG] for the enthalpy of formation of NaUO3(cr), based on an enthalpy of solution. However, in view of the above discrepancy, and the existence of another dis-
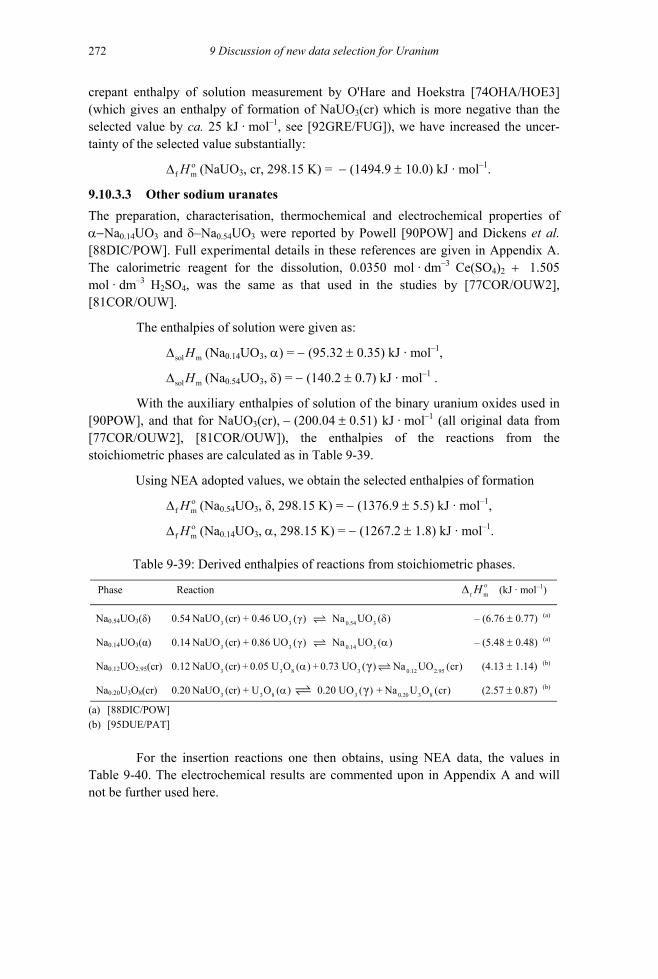
9 Discussion of new data selection for Uranium 272
crepant enthalpy of solution measurement by O'Hare and Hoekstra [74OHA/HOE3] (which gives an enthalpy of formation of NaUO3(cr) which is more negative than the selected value by ca. 25 kJ · mol–1, see [92GRE/FUG]), we have increased the uncer-tainty of the selected value substantially:
f mο∆ H (NaUO3, cr, 298.15 K) = − (1494.9 ± 10.0) kJ · mol–1.
9.10.3.3 Other sodium uranates The preparation, characterisation, thermochemical and electrochemical properties of α−Na0.14UO3 and δ–Na0.54UO3 were reported by Powell [90POW] and Dickens et al. [88DIC/POW]. Full experimental details in these references are given in Appendix A. The calorimetric reagent for the dissolution, 0.0350 mol · dm–3 Ce(SO4)2 + 1.505 mol · dm–3 H2SO4, was the same as that used in the studies by [77COR/OUW2], [81COR/OUW].
The enthalpies of solution were given as:
sol m∆ H (Na0.14UO3, α) = − (95.32 ± 0.35) kJ · mol–1,
sol m∆ H (Na0.54UO3, δ) = − (140.2 ± 0.7) kJ · mol–1 .
With the auxiliary enthalpies of solution of the binary uranium oxides used in [90POW], and that for NaUO3(cr), − (200.04 ± 0.51) kJ · mol–1 (all original data from [77COR/OUW2], [81COR/OUW]), the enthalpies of the reactions from the stoichiometric phases are calculated as in Table 9-39.
Using NEA adopted values, we obtain the selected enthalpies of formation
f mο∆ H (Na0.54UO3, δ, 298.15 K) = − (1376.9 ± 5.5) kJ · mol–1,
f mο∆ H (Na0.14UO3, α, 298.15 K) = − (1267.2 ± 1.8) kJ · mol–1.
Table 9-39: Derived enthalpies of reactions from stoichiometric phases.
Phase Reaction r mο∆ H (kJ · mol–1)
Na0.54UO3(δ) 3 3 0.540.54 NaUO (cr) + 0.46 UO ( 3γ) Na UO ( )δ – (6.76 ± 0.77) (a)
Na0.14UO3(α) 3 3 0.140.14 NaUO (cr) + 0.86 UO ( 3γ) Na UO ( )α – (5.48 ± 0.48) (a)
Na0.12UO2.95(cr) 3 3 8 3 0.12 2.950.12 NaUO (cr) + 0.05 U O ( ) + 0.73 UO ( ) Na UO (cr)γα (4.13 ± 1.14) (b)
Na0.20U3O8(cr) 3 3 8 3 0.20 3 80.20 NaUO (cr) + U O ( ) 0.20 UO ( ) + Na U O (cr)γα (2.57 ± 0.87) (b)
(a) [88DIC/POW] (b) [95DUE/PAT]
For the insertion reactions one then obtains, using NEA data, the values in
Table 9-40. The electrochemical results are commented upon in Appendix A and will not be further used here.

9.10 Uranium group 1 (alkali) compounds (V.10)
273
Dueber et al. [95DUE/PAT] report similar calorimetric and electrochemical studies on two single phased compounds Na0.12UO2.95 and Na0.20U3O8. The enthalpies of solution, using 0.274 mol · dm–3 Ce(SO4)2 + 0.484 mol · dm–3 H3BO3 + 0.93 mol · dm–3
H2SO4 as solvent, were given as:
sol m∆ H (Na0.12UO2.95, cr) = − (103.00 ± 1.08) kJ · mol–1,
sol m∆ H (Na0.20U3O8, cr) = − (379.17 ± 0.78) kJ · mol–1.
With the auxiliary data as above, the enthalpies of the reactions from the stoichiometric phases are calculated to be those given in Table 9-39.
Table 9-40: Derived enthalpies of insertion reactions.
Phase Reaction r m∆ H
kJ · mol–1 r m∆ H
kJ · (mol Na)–1
Na0.54UO3(δ) 3 0.540.54 Na(cr) + UO ( ) Na UO ( )δ 3 δ – (163.2 ± 5.7) – (302.2 ± 10.5)
Na0.14UO3(α) 3 0.140.14 Na(cr) + UO ( ) Na UO ( )α 3 α – (54.8 ± 2.3) – (391.4 ± 16.4)
Na0.12UO2.95 2.95 0.12 2.950.12 Na(cr) + UO ( ) Na UO (cr)α – (36.1 ± 2.3) – (300.8 ± 19.2)
Na0.20U3O8 3 8 0.14 3 80.20 Na(cr) + U O ( ) Na U O (cr)α – (51.6 ± 3.2) – (258.0 ± 16.0)
Using NEA adopted values, we recalculate from the values in Table 9-39 the selected enthalpies of formation:
f mο∆ H (Na0.12UO2.95, cr, 298.15 K) = − (1247.4 ± 1.9) kJ · mol–1,
f mο∆ H (Na0.20U3O8, cr, 298.15 K) = − (3626.4 ± 3.2) kJ · mol–1 .
The enthalpy changes corresponding to the insertion of sodium into the binary oxides are calculated to be those in Table 9-40, where the recalculated value of
f mο∆ H (UO2.95, α, 298.15 K) = − (1211.28 ± 1.28) kJ · mol–1 from the determination of
[93PAT/DUE] (see 9.3.3.3.3) has been used.
[95DUE/PAT] deduced from electrochemical measurements (cf. section 9.9.1) the Gibbs energies at 298.15 K of the insertion reactions in the last two rows of Table 9-40 to be − 37.7 kJ · mol–1 and − 50.7 kJ · mol–1. These values are close to the corre-sponding enthalpies of reaction, showing that the entropies of reaction are small, as ex-pected for a condensed phase reaction.
From electrochemical measurements analogous to those reported by [93PAT/DUE] for MgUO2.95 (see section 9.9.1), Dueber et al. [95DUE/PAT] also re-port:
r mο∆ G (Na0.12UO2.95, 298.15 K) = − 42.8 kJ · mol–1,
r mο∆ G (Na0.20U3O8, 298.15 K) = − 55.2 kJ · mol–1,

9 Discussion of new data selection for Uranium 274
in agreement with the calorimetric values, indicating a negligible entropy effect.
9.10.3.4 Sodium polyuranates (V.10.2.2)
9.10.3.4.1 Na2U2O7(cr) (V.10.2.2.1)
The solubility of this compound is also discussed in 9.3.2.1.5.2.2.
For reasons indicated in Appendix A, the data obtained by Díaz Arocas and Grambow [98DIA/GRA], and by Valsami-Jones and Ragnarsdottir [97VAL/RAG], who measured the solubilities of polyuranates, are not selected by this review. [97ALL/SHU] gives spectroscopic information on uranates precipitated at pH above 8.
9.10.3.4.2 Na6U7O24(cr) (V.10.2.2.3)
A substantial error has been found in the value of the enthalpy of formation of Na6U7O24(cr) selected by [92GRE/FUG], due to a mis-reporting of a datum in the origi-nal paper by Cordfunke and Loopstra [71COR/LOO]. As noted in Appendix A, their reported value for the enthalpy of solution of this compound is clearly that for 1/7 of a mole of Na6U7O24(cr), rather than 1 mole. The recalculated enthalpy of formation be-comes:
f mο∆ H (Na6U7O24, cr, 298.15 K) = − (10841.7 ± 10.0) 1kJ mol−⋅ .
With this value, the phase relationships in the Na–U–O system at around 800 K are in good accord with experimental observations, as summarised by Lindemer et al. [81LIN/BES].
9.10.4 Potassium compounds (V.10.3) 9.10.4.1 KUO3 (cr) (V.10.3.1) Jayanthi et al. [99JAY/IYE] have reported measurements of the pressure of K(g) (by mass-loss Knudsen effusion) and the oxygen activity (emf with CaO–ZrO2 electrolyte) in the three–phase field KUO3(cr) + K2UO4(cr) + K2U2O7(cr), similar to the studies on the corresponding sodium compounds by [94JAY/IYE]. The authors use these meas-urements to derive values for the Gibbs energy of formation of KUO3(cr), using esti-mated values [81LIN/BES], [92GRE/FUG] for the entropies of the hexavalent uranates. We have reversed this procedure, as described in Appendix A, to compare the experi-mental oxygen and potassium activities in the three phase field with those calculated with the enthalpies of formation selected by [92GRE/FUG], the estimated entropies (as above) and the heat capacities also measured by [99JAY/IYE]. The agreement with the oxygen potentials is quite good, whereas that of the potassium activities is rather poor. In view of the need to use estimated entropies in the calculation and possible sources of error, such as lack of complete equilibrium in the experimentation, we shall retain the enthalpies of formation selected by [92GRE/FUG].

9.10 Uranium group 1 (alkali) compounds (V.10)
275
1−
In addition to the Gibbs energy measurements, [99JAY/IYE] measured en-thalpy increments of KUO3(cr) (and K2U2O7(cr)) up to ca. 700 K using a high tempera-ture Calvet calorimeter. As noted in section 9.10.1 these data have been refitted to a polynomial, which gives on differentiation:
2 1,m 3(KUO , cr, ) = 133.258 + 1.2558 10 (J K mol )− −× ⋅ ⋅pC T T
(298.15 to 714 K).
9.10.4.2 K2U2O7(cr) (V.10.3.3) Jayanthi et al. [98JAY/IYE], [99JAY/IYE], have reported enthalpy increment meas-urements for this phase. As described in Appendix A, their data have been refitted to obtain heat capacities given by the equation summarised in section 9.10.1.
The heat capacity increases with temperature appreciably more rapidly than would be expected for a compound containing hexavalent uranium.
9.10.4.3 K2U4O12(cr), K2U4O13(cr) Iyer et al. [97IYE/JAY] have reported enthalpy increment measurements for these phases. As described in Appendix A, their data have been refitted to obtain heat capaci-ties given by the equations summarised in section 9.10.1. However, as shown in the plot of heat capacities in section 9.10.1, the expressions for K2U4O12(cr) are not consistent with the general behaviour of the heat capacities of the alkali–metal uranates, and the data for this compound have not been selected in this review.
Iyer et al. [97IYE/JAY] also give details of measurements of the oxygen activ-ity (emf with CaO–ZrO2 electrolyte) in the mixtures K2U4O12(cr) + K2U4O13(cr) from 1053 to 1222 K with air
2 = 0.21 bar) as the reference electrode. The authors have
used these Gibbs energies of reaction to derive data at 298.15 K for KO( p
2U4O12(cr), using their heat capacity data (extrapolated from ca. 750 K) and literature data at 298.15 K for the hexavalent compounds. However, we have not pursued this approach since the data for the enthalpy of formation and entropy of K2U4O13(cr) at 298.15 K are estimated, so any derived data for K2U4O12(cr) would have appreciable uncertainties.
9.10.4.4 K2U6O19 · 11H2O(cr)
The solubility of this compound is discussed in section 9.3.2.1.5.2.4.
9.10.5 Rubidium compounds (V.10.4) 9.10.5.1 RbUO3(cr) (V.10.4.1)
Jayanthi et al. [96JAY/IYE] have reported measurements of the pressure of Rb(g) (by mass-loss Knudsen effusion) and the oxygen activity (emf with CaO–ZrO2 electrolyte) in the three–phase field RbUO3(cr) + Rb2UO4(cr) + Rb2U2O7(cr), similar to the studies from the same laboratory on the corresponding sodium [94JAY/IYE] and potassium compounds [99JAY/IYE]. The authors use these measurements to derive values for the

9 Discussion of new data selection for Uranium 276
Gibbs energy of formation of RbUO3(cr), using estimated values [81LIN/BES], [92GRE/FUG] for the entropies of the hexavalent uranates.
However, as noted in Appendix A, the entropy term in the expression for the vaporisation of Rb(g) according to the reaction:
3 2 4 2 2 7RbUO (cr) + Rb UO (cr) Rb U O (cr) + Rb(g)
is far too small (18.2 J · K–1 · mol–1) to relate to a vaporisation reaction. In view of this, and the need to use estimated data for many of the properties of the solids in further calculations, we have not processed the data further, and will retain the calorimetric enthalpy of formation selected by [92GRE/FUG] namely,
f mο∆ H (RbUO3, cr, 298.15 K) = − (1520.9 ± 1.8) kJ · mol–1.
9.10.5.2 Rb2U3O8.5(cr), Rb2U4O11(cr), Rb2U4O12(cr) and Rb2U4O13(cr)
Sali et al. [94SAL/KUL] reported the preparation and characterisation, by X–ray dif-fraction, of the first two phases, but no thermodynamic data were presented. Banerjee et al. [2001BAN/PRA], (which is assumed to supersede the conference paper by [98BAN/SAL]), Iyer et al. [90IYE/VEN], and Venugopal et al. [92VEN/IYE] have reported enthalpy increment measurements for the last three phases. As described in Appendix A, their data have mostly been refitted, to obtain heat capacities given by the equations summarised in section 9.10.1. However, as shown in the plot of heat capaci-ties in that section, the heat capacity data for Rb2U4O12(cr) are inconsistent with the general behaviour of the heat capacities of the alkali-metal uranates (indeed
,mpC (Rb2U4O12, cr) decreases as the temperature increases), and no data for this com-pound have been selected in this review.
Venugopal et al. [92VEN/IYE] also give details of measurements of the oxy-gen activity (emf with CaO–ZrO2 electrolyte) in the mixtures Rb2U4O12(cr) + Rb2U4O13(cr) from 1075 to 1203 K with air (
2= 0.21 bar) as the reference electrode.
The authors have used these Gibbs energies of reaction to derive data at 298.15 K for Rb
Op
2U4O12(cr), using their heat capacity data (extrapolated from ca. 750 K) and literature data at 298.15 K for the hexavalent compound. However, we have not pursued this ap-proach since the data for the enthalpy of formation and entropy of Rb2U4O13(cr) at 298.15 K are estimated, so any derived data for Rb2U4O12(cr) would have appreciable uncertainties.
For the same reason the data on the oxygen potentials in the diphasic Rb2U4O11(cr) + Rb2U4O12(cr) region from 985 to 1186 K reported by Sali et al. [95SAL/JAY] and Iyer et al. [96IYE/JAY], reviewed in Appendix A, have not be used to derive any room temperature data for Rb2U4O11(cr). Sali et al. [95SAL/JAY] have also reported the enthalpy of oxidation of Rb2U4O11(cr) to Rb2U4O13(cr) at 673 K:
Rb2U4O11(cr) + O2(g) Rb2U4O13(cr),

9.10 Uranium group 1 (alkali) compounds (V.10)
277
r mH∆ (673 K) = − (279 ± 15) kJ · mol–1.
Again, in the absence any experimental data on the enthalpy of formation of Rb2U4O13(cr), this value cannot be processed further. 9.10.5.3 Rb2U(SO4)3(cr) Jayanthi et al. [93JAY/IYE] and Saxena et al. [99SAX/RAM] have studied rubidium uranium sulphate using DSC, DTA and TGC techniques, and measured enthalpy incre-ments from 373 to 803 K using a H.T. Calvet calorimeter.
Two solid state transitions were observed at 616 and 773 K (DSC) and 628 and 780 K by DTA/TG. The compound starts to decompose at 893 K.
The enthalpy data for the low–temperature polymorph [93JAY/IYE] are quite consistent with the subsequent heat capacities from 273 to 623 K measured by DSC, reported briefly by Saxena et al. [99SAX/RAM], and these two sets of data have been combined to define the enthalpy increments and heat capacity of this phase:
2 6 2 1,m 2 4 3(Rb U(SO ) , cr, ) = 386.672 + 6.883 10 5.25917 10 (J K mol )pC T T T− −⋅ − ⋅ ⋅ ⋅ 1− −
1− −
(298.15 to 628 K),
and thus 1 1
,m 2 4 3(Rb U(SO ) , cr, 298.15 K) = (348.0 30.0) J K molο − −± ⋅ ⋅pC .
As noted in Appendix A, the measurements of the enthalpy increments for the two polymorphs stable above 628 K are not precise enough to define reliable heat ca-pacities, and our calculated enthalpy of the transition at ca. 628 K, 3.7 kJ · mol–1, is smaller than that given by the authors.
9.10.6 Caesium compounds (V.10.5) 9.10.6.1 Caesium monouranate (V.10.5.1) Huang et al. [98HUA/YAM] have measured the vapour phase composition in the de-composition of Cs2UO4(s) from 873 to 1373 K, in Pt cells both in vacuo and in a D2/D2O environment. As discussed in detail in Appendix A, no data relevant to the re-view can be obtained from this study.
9.10.6.2 Caesium polyuranates (V.10.5.2)
9.10.6.2.1 Cs2U2O7(cr) (V.10.5.2.1)
Jayanthi et al. [97JAY/IYE] have reported enthalpy increment measurements for this phase. As described in Appendix A, the data have been refitted with a constraint of
, selected in [92GRE/FUG] from the low–temperature measurements of [81OHA/FLO]. The derived heat capacity expres-sions are given in the Table 9-36 in section 9.10.1; the heat capacity increases surpris-ingly rapidly with temperature.
1,m 2 2 7(Cs U O , cr, 298.15 K) = 231.2 J K molο ⋅ ⋅pC

9 Discussion of new data selection for Uranium 278
The enthalpy of formation and the entropy are unchanged from those selected in [92GRE/FUG]:
(Cs U O , cr, 298.15 K) = − (3220 ± 10) kJ · mol , 2–1
f mο∆ H 2 7
(Cs2U O , cr, 298.15 K) = (327.75 ± 0.66) J · K–1 · mol–1. mοS 2 7
9.10.6.2.2 Cs U O (cr) 4 5 17
Jayanthi et al. [97JAY/IYE] have reported enthalpy increment measurements for this phase. As described in Appendix A, the data have been refitted with a constraint of
= 0 at T = 298.15 K. The derived heat capacity expressions are given in the Table 9-36 in section 9.10.1.
These authors also studied the oxygen activity (emf with a CaO–ZrO electro-lyte) in the three–phase region Cs U O (cr) + Cs U O (cr) + Cs U O (cr) with air (
2 = 0.21 bar) as the reference electrode. Their recalculated results (see Appendix A)
for the Gibbs energy of the relevant reaction:
2
4
m m( ) (298.15 K)H T H ο−
5 17 2 2 7 2 4
(9.48) are: (9.48) = − 136044 + 96.985 T J · mol (1048 to 1206 K). –1
4 5 17
2 4 12 2 13
Venugopal et al. [92VEN/IYE], have reported enthalpy increment measurements for these phases. As described in Appendix A, the data for Cs U O (cr), which extend to 898 K, agree excellently with those reported by Cordfunke and Westrum [80COR/WES]. Since the latter authors gave a fitted equation for C which is a smooth continuation of their low–temperature data, this equation, adopted by [92GRE/FUG], has been retained. For Cs U O (cr), however, the heat capacity data for Cs U O (cr) derived from the enthalpy increments of [92VEN/IYE] are inconsistent with the general behaviour of the heat capacities of the alkali–metal uranates as shown in the plot of heat capacities in section 9.10.1, (indeed the heat capacity of Cs U O (cr) decreases sharply as the temperature increases), and no data for this compound have been selected in this review.
2 4
12
Op
2 4 12 2 2 7 2 4 5 17Cs U O (cr) + 3 Cs U O + 0.5 O (g) 2 Cs U O (cr)
r m∆ G
The authors have used these Gibbs energies of reaction to derive data at 298.15 K for Cs U O (cr), using their heat capacity data (extrapolated from ca. 800 K) and literature data at 298.15 K for the hexavalent compounds. However, we have not pursued this approach since many of the relevant data have not been selected for this review (see for example comments in [92VEN/IYE]).
9.10.6.2.3 Cs U O (cr) and Cs U O (cr) 4
12
,m ( )p T
2 4 13
2 4 13
2 4 13
Une [85UNE] and Venugopal et al. [92VEN/IYE] have both studied the oxy-gen activity (emf with solid electrolytes) in the mixtures Cs U O (cr) + Cs U O (cr) with air
2 = 0.21 bar) as the reference electrode. Their recalculated results (see Ap-
pendix A) for the Gibbs energy of the relevant reaction:
2 4 12 2 4 13
O( p

9.11 Uranium compounds with elements from other groups
13
9.11 Uranium compounds with elements from other groups
279
(9.49) 4 12 2 2 4 13CsU O + 0.5O (g) Cs U O (cr)
are in good agreement, although the corresponding individual enthalpy and entropy terms differ somewhat:
[85UNE]: (9.49) = − 190108 + 151.758 T J · mol (1048 to 1173 K), –1r m∆ G
[92VEN/IYE]: (9.49) = − 174638 + 136.100 T J · mol (1019 to 1283 K). –1r m∆ G
At 1100 K, these equations give ((9.49), 1100 K) = − 23.17 and − 24.93 kJ · mol respectively.
r m∆ G–1
The authors [92VEN/IYE] have used their Gibbs energies of reaction to derive a value at 298.15 K for Cs U O (cr), using their heat capacity data (extrapolated from ca. 750 K) and literature data at 298.15 K for Cs U O (cr). However, for reasons given in detail in Appendix A, we have not pursued this approach since the uncertainties in the additional data required means that any derived data for Cs U O (cr) would have appreciable uncertainties.
f mGο∆ 2 4 13
2 4 12
2 4 13
In summary, the following data for Cs U O (cr) are unchanged from those se-lected in [92GRE/FUG]:
2 4 12
f m∆ H (Cs2U O , cr, 298.15 K) = − (5571.8 ± 3.6) kJ · mol–1, 4 12
(Cs U O , cr, 298.15 K) = (526.4 ± 1.0) J · K · mol , –12 4 12
–1mοS
,mοpC (Cs U O , cr, 298.15 K) = (384.0 ± 1.0) J · K · mol , 2
–1–14 12
2 6 2,m 2 4 12(Cs U O , cr, ) = 423.7260 + 7.19405 10 5.43750 10 J K molpC T T T 1 1− − −× − × ⋅ ⋅ −
(298.15 − 898 K).
No data for Cs U O (cr) are selected in this review. 2 4
9.11.1 Thallium compounds 9.11.1.1 Thallium uranates Sali et al. [93SAL/KUL], [96SAL/IYE] have reported the preparation of two new thal-lium uranates Tl U O and Tl U O , and give their structural data. The latter paper also gives details of measurements of the oxygen potential in the diphasic fields, Tl U O + Tl U O and Tl U O + Tl U O , obtained from solid-state emf cells. As described in Appendix A, the recalculated values of the Gibbs energies of the two relevant reactions:
2 3 9 2 4 11
2 4 11
2 4 12 2 4 12 2 4 13
2 4 11 2 2 4 121Tl U O (cr) + O (g) Tl U O (cr)2
, (9.50)
, (9.51)
are finally:
2 4 12 2 2 4 131Tl U O (cr) + O (g) Tl U O (cr)2

9 Discussion of new data selection for Uranium 280
r m∆ G (9.50) = − 390.53 + 0.2032·T (kJ · mol ), –1
(9.51) = − 136.85 + 0.0841·T (kJ · mol ). –1
However, in the absence of any experimental data for any of the three individ-ual thallium uranates involved, no reliable data for any of these can be derived from this study.
r m∆ G
More recently, Banerjee et al. [2001BAN/PRA] measured enthalpy increments of pelleted Tl U O (cr) in a Calvet calorimeter from 301 to 735 K. Values of
were tabulated for thirteen temperatures from 301 to 673 K and fitted by a Shomate analysis, using an estimated value of (Tl U O , cr, 298.15 K) = (360.1 ± 20.0) J · K–1 · mol–1 from the sum of the heat capacities of the component oxides, Tl O(cr) +2 UO (cr) + 2 UO (cr). The resulting (corrected) equation for
gives on differentiation:
2 4 11
m m( ) (298.15K)ο−H T H,m
οpC
m m( ) (298.15K)ο−H T H
2 4 11
2 2 3
= (Tl U O , cr, T) = 368.2 +2.4886·10–2·T − 1.375·106·T–2 J · K–1 · mol–1 ,mpC 2 4 11
(298.15 to 673 K).
9.11.2 Zinc compounds. Dueber et al. [95DUE/PAT] report calorimetric and electrochemical measurements on the formation of the insertion compound Zn UO (cr), similar to the corresponding compounds of magnesium (section 9.9.1), lithium (section 9.10.2.1) and sodium (sec-tion 9.10.3.3). From the enthalpies of solution of the constituents of the equation:
0.12 2.95
(9.52)
these authors report ((9.52), 298.15 K) = + (11.36 ± 0.78) kJ · mol . Using NEA adopted values, we recalculate:
–1
(Zn UO , cr, 298.15 K) = − (1238.07 ± 1.06) kJ · mol .
3 3 8 0.12 2.950.12 ZnO(cr) + 0.49 UO ( ) 0.17 U O ( ) Zn UO (cr)γ + α
r mο∆ H
0.12–1
f mο∆ H 2.95
Using the recalculated value (see section 9.3.3.3.3) (UO , α, 298.15K) = − (1211.28 ± 1.28) kJ · mol from the determination of [93PAT/DUE], the enthalpy effect corresponding to the insertion of zinc according to reaction:
f mο∆ H 2.95
(9.53)
is obtained as ((9.53), 298.15 K) = − (26.79 ± 1.50) kJ · mol . –1
–1
2.95 0.12 2.950.12 Zn(cr) + UO ( ) Zn UO (cr)α
r mο∆ H
From electrochemical measurements, [95DUE/PAT] also reported ((9.53), 298.15 K) = − 25.2 kJ · mol . This value is in agreement with the calo-
rimetric result if ((9.53), 298.15 K) is assumed to be negligible.
–1r m
ο∆ Gr m
ο∆ S

9.11 Uranium compounds with elements from other groups
281
9.11.3 Polyoxometallates The actinides form complexes with different heteropolyanions and some of these are very strong. There is an extensive literature on the chemistry of these systems with a good review article by Yusov and Shilov [99YUS/SHI] that can be consulted for details. The non-protonated anions have very high negative charges and are also fairly strong bases, the basicity varying with the degree of protonation. There are no experimental studies that have identified the proton content of the complexes studied experimentally and this review has therefore not selected any equilibrium constants. Some conditional equilibrium constants are listed below. Shilov [91SHI] estimated the stability of the U(IV) complex with the polyoxo anion (PWO). This anion does not form complexes with U(VI) in acidic media, but it is a strong complexing anion for U(IV). As explained in Appendix A, Bion et al. [95BIO/MOI] determined the equilibrium con-stants in HNO for the reactions: 3
The U(IV) is the sum of U and nitrato complexes. Their results are reported in Table 9-41.
4+
Table 9-4 : Conditional equilibrium constants K and K at different concentrations of H
2+
[ ] – 0.3 0
log K10 1
102 17 61P W O −
1
2 2
U(IV) + PWO U(PWO) ,U(IV) + 2 PWO U(PWO) .
KK
1 1
10log +H 0.3
(7 ± 0.25) (8 ± 0.25) (9 ± 0.25)
(11.5 ± 0.25) (13.5 ± 0.25) (15.5 ± 0.25) log10K2
Saito and Choppin [98SAI/CHO] investigated the complex formation between U(VI) and different polyoxometallate anions, Lx–, which form stable complexes around pH = 4 (0.1 M NaClO ). They used a liquid-liquid extraction technique and these data are discussed in Appendix A. These authors have assumed simple association reactions between and Lx–, an assumption that we find too simplistic in view of the fairly strong basicity of the polyoxometallate ions as mentioned above.
4
2+2UO
The equilibrium constants given in Table 9-41 and Table 9-42 are conditional equilibrium constants and are therefore not selected by this review.

9 Discussion of new data selection for Uranium
282
Table 9-42: Conditional equilibrium constants of U(VI) with some polyoxometalate anions. These are ternary systems where the species formed have the general composition (UO ) H L , where in this case p = 1, q is not known and r = 1 and 2. The values of log K are only valid at pH ≈ 4 in this study.
2 p q r
10
(3.88 ± 0.3) (3.53 ± 0.2)
610 28V O − 6
7 24Mo O − 36 24 6CrMo O H − 5
6 24IMo O − 66 24TeMo O − 6
9 32MnMo O −
10 1log K (2.40 ± 0.1) (2.05 ± 0.06) (2.57 ± 0.07) (3.16 ± 0.04)
(5.25 ± 0.3)
9.12 Uranium mineral phases
In view of the importance of the mineral systems, the NEA TDB review has extended the mineral section in [92GRE/FUG] and [95SIL/BID] with a discussion of thermodynamic data obtained by using estimation methods. However, no data of this type have been selected; they have been included to provide estimates when no experimental information is available.
-
-
-
-
-
Minerals are characterised by their specific structure type and chemical composition; the latter is rarely stoichiometric. The variable stoichiometry is a complicating factor for experimental studies of their thermodynamics. Thermodynamic data for min-erals are therefore often estimates from the precisely known structures and experimental thermodynamic information for a few pure phases containing structure elements of dif-ferent types present in the more complex minerals. The thermodynamic properties of the minerals are considered to be a sum of the contributions from these different constitu-ents (see [97FIN] and references within in Appendix A).
9.12.2 Review of papers
Two studies presented by O’Brien and Williams [81OBR/WIL], [83OBR/WIL] deal with the stability of different secondary uranyl minerals. These references are Parts 3 and 4 of a series of papers; Parts 1 and 2 [79HAA/WIL], [80ALW/WIL] were reviewed and discussed by Grenthe et al. [92GRE/FUG] (Sections V.5.1.3.2.c and V.7.1.2.2.b, pp. 254–255 and 328, and in Appendix A, pp. 646–648).
O’Brien and Williams [81OBR/WIL] reported the Gibbs energies of formation of sodium, potassium and ammonium zippeites, (basic dioxouranium(VI) sulphates).
10 2log K
9.12.1 Introduction
Only part of the literature on mineral phases was reviewed by Grenthe et al. [92GRE/FUG] and the following studies [81OBR/WIL], [81VOC/PIR], [83OBR/WIL], [83VOC/PEL], [84VOC/GRA], [84VOC/GOE], [86VOC/GRA], [88ATK/BEC], [90VOC/HAV] were not included. For reasons given below this omission does not affect the set of selected thermodynamic uranium data given in the [92GRE/FUG].

9.12 Uranium mineral phases 283
There are almost no experimental details on the technique and data analysis used in this work and no information about the auxiliary data used. In [83OBR/WIL], O’Brien and Williams reported the Gibbs energy of formation, of schröckingerite, Ca NaUO (CO ) FSO ·10H O(cr), and grimselite, K NaUO (CO ) ·H O(cr), calculated from solubility experiments. The method used is essentially the same as previously described by Haacke et al., [79HAA/WIL] in Part 1 of the series. The authors performed corrections for ionic strength effects on the equilibrium constants for the aqueous com-plexes, but the data suffer from the same flaw as previous studies, i.e. neglect of the formation of hydrolysis species, which in the investigated pH range (7.69 to 10.00) are expected to dominate the uranium speciation. As a result the calculated solubility prod-ucts and thermodynamic data deduced from them are not reliable.
3 2 3 3 4 2 2 3 3 2
-
-
-
-
-
The solubility products of cobalt, nickel, and copper uranyl phosphate, (meta-torbenite) were measured by Vochten et al., [81VOC/PIR]. The solid compounds were synthesised and adequately characterised. However, the solubility experiments and the corresponding data analysis have serious limitations, e.g., lack of uranium and phosphorus analyses, standardisation of the pH electrode with buffer solutions which were out-side the pH range under investigation, lack of correction for ionic strength effects on the auxiliary thermodynamic data (which were taken from Sillén and Martell [64SIL/MAR], and only included uranyl phosphate complexes), etc. Furthermore, the authors did not specify in which ionic medium the solubility experiments were made. In view of these limitations the data of Vochten et al., [81VOC/PIR] could not be used for an evaluation of reliable thermodynamic data.
2 4 4 4 2
Bassetite is a secondary uranyl phosphate and has the ideal composition Fe(UO ) (PO ) ·8H O(cr). Vochten et al. [84VOC/GRA] synthesised this mineral and its fully oxidised form and made extensive studies of them using X–ray powder diffraction, Mössbauer and infrared spectroscopy, zeta-potential measurements and thermal analysis. They also measured the solubility as a function of the acidity in the range 2.4 < pH < 6.0, but the ionic strength of the experiments is not reported. The solubility value was based on measuring the total iron concentration in solution. No information is given about the speciation of the solution phase under the conditions used. Hence it is impossible to calculate the thermodynamic data for the dissolution reaction or for the solid phases studied.
2 4 2 2
Vochten and Goeminne [84VOC/GOE] and Vochten et al. [86VOC/GRA] have reported the synthesis and properties of several uranyl arsenates. In [84VOC/GOE] they describe solubility measurements of copper (meta-zeunerite), cobalt (meta-
3
Sabugalite is a hydrated acid aluminium uranyl phosphate, with an ideal composition corresponding to HAl(UO ) (PO ) ·16H O(cr). Vochten and Pelsmaekers, [83VOC/PEL], have measured the solubility of the mineral in phosphoric and hydrochloric acid, but with no experimental details and no primary experimental data. This study can therefore not be used to determine thermodynamic data for the solid.
2
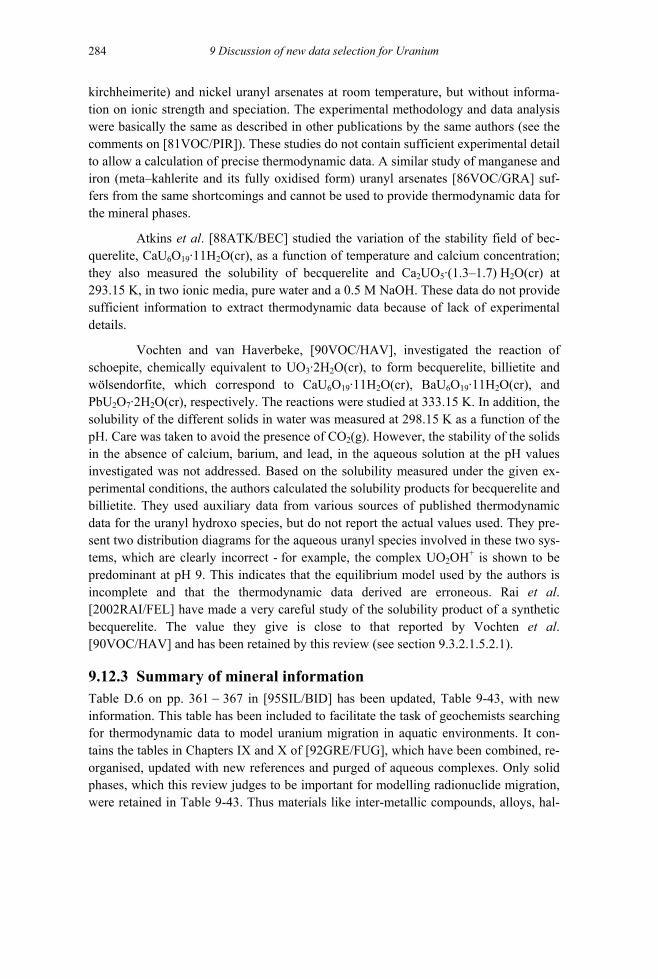
9 Discussion of new data selection for Uranium
284
-
-
-
-
kirchheimerite) and nickel uranyl arsenates at room temperature, but without informa-tion on ionic strength and speciation. The experimental methodology and data analysis were basically the same as described in other publications by the same authors (see the comments on [81VOC/PIR]). These studies do not contain sufficient experimental detail to allow a calculation of precise thermodynamic data. A similar study of manganese and iron (meta–kahlerite and its fully oxidised form) uranyl arsenates [86VOC/GRA] suf-fers from the same shortcomings and cannot be used to provide thermodynamic data for the mineral phases.
Atkins et al. [88ATK/BEC] studied the variation of the stability field of becquerelite, CaU O ·11H O(cr), as a function of temperature and calcium concentration; they also measured the solubility of becquerelite and Ca UO ·(1.3–1.7) H O(cr) at 293.15 K, in two ionic media, pure water and a 0.5 M NaOH. These data do not provide sufficient information to extract thermodynamic data because of lack of experimental details.
6 19 2
2 5 2
Vochten and van Haverbeke, [90VOC/HAV], investigated the reaction of schoepite, chemically equivalent to UO ·2H O(cr), to form becquerelite, billietite and wölsendorfite, which correspond to CaU O ·11H O(cr), BaU O ·11H O(cr), and PbU O ·2H O(cr), respectively. The reactions were studied at 333.15 K. In addition, the solubility of the different solids in water was measured at 298.15 K as a function of the pH. Care was taken to avoid the presence of CO (g). However, the stability of the solids in the absence of calcium, barium, and lead, in the aqueous solution at the pH values investigated was not addressed. Based on the solubility measured under the given experimental conditions, the authors calculated the solubility products for becquerelite and billietite. They used auxiliary data from various sources of published thermodynamic data for the uranyl hydroxo species, but do not report the actual values used. They pre-sent two distribution diagrams for the aqueous uranyl species involved in these two sys-tems, which are clearly incorrect - for example, the complex UO OH is shown to be predominant at pH 9. This indicates that the equilibrium model used by the authors is incomplete and that the thermodynamic data derived are erroneous. Rai et al. [2002RAI/FEL] have made a very careful study of the solubility product of a synthetic becquerelite. The value they give is close to that reported by Vochten et al. [90VOC/HAV] and has been retained by this review (see section 9.3.2.1.5.2.1).
3 2
6 19 2 6 19 2
2 7 2
2
2+
9.12.3 Summary of mineral information Table D.6 on pp. 361 − 367 in [95SIL/BID] has been updated, Table 9-43, with new information. This table has been included to facilitate the task of geochemists searching for thermodynamic data to model uranium migration in aquatic environments. It contains the tables in Chapters IX and X of [92GRE/FUG], which have been combined, re-organised, updated with new references and purged of aqueous complexes. Only solid phases, which this review judges to be important for modelling radionuclide migration, were retained in Table 9-43. Thus materials like inter-metallic compounds, alloys, hal

9.12 Uranium mineral phases 285
ides and nitrates have been excluded, as have compounds which have been discussed in [92GRE/FUG] and in earlier sections of this review. The solid phases have been ar-ranged into families (phosphates, sulphates, etc.). Note that Table 9-43 does not bring new information to the reader and is provided only as a convenience to geochemical modellers; in combination with Chapter IX in [92GRE/FUG] it provides a survey of the bibliographic information used by the NEA TDB review.
The users have to consult the main text to obtain information on the thermodynamic data in Tabl for which selected values are available.
-e 9-43
-
-
-
-
As noted above, geochemists have often been forced to use estimated thermodynamic data for mineral phases. There are several methods used and Saxena has given a survey of some of them in Chapter VIII in [97ALL/BAN]. A recent paper by Chen, Ewing and Clark [99CHE/EWI], followed by [99CHE/EWI2], provides additional information of the potential of structure-based estimation methods. The paper describes the estimation of Gibbs energies and enthalpies of formation of a large number of U(VI) phases, also those formed as a result of weathering of uraninite, UO (cr), and is there-fore highly relevant both for uranium geology and for the modelling of transformation of spent nuclear fuel. The agreement between estimated and measured values of the enthalpy of formation and the Gibbs energy of formation is very good, often less than 0.2 %. With these rather high molecular weight species, however, even such small percentage differences are not insignificant. For instance, in the case of andersonite, Na Ca(UO )(CO ) · 6H O, the difference between estimated and measured Gibbs energy of formation is only 0.08%, corresponding to 4.7 kJ · mol . The method relies on the use of proper “end-member” structures for the calibration of the model, but data for them are not always available. The agreement between model and experiment is then less satisfactory, cf. Table 7 in [99CHE/EWI].
2
2 2 3 2
Thermodynamic data for uranium silicate minerals are discussed in the main text, section 9.7.3.2.
2–1

9 Discussion of new data selection for Uranium
286
Table 9-43: Minerals of uranium and related solid phases of interest for geochemical modelling. The inclusion of these formulae in this table is to be understood as informa-tion on the existence of published material. It does not imply that the authors of this table give any credit to either the thermodynamic data or the chemical composition or existence of these species. The compounds for which selected data are presented in Chapter III of [92GRE/FUG], as well as those which are discussed, but for which no data are recommended in Ref. [92GRE/FUG], are marked correspondingly.
Ternary and quaternary oxides and hydroxides (a) Reference
2 7 2 wölsendorfite [90VOC/HAV] Ni(UO ) O (OH) 4
23 3 · 6H O(cr) 2 [91VOC/HAV] Mn(UO ) O (OH) 4
23 3 · 6H O(cr) 2 [91VOC/HAV] MgUO (cr) data selected in [92GRE/FUG] MgU O (cr) 2 6 [81GOL/TRE2] MgU2O (cr) [81GOL/TRE2] MgU O (cr) 3 10 data selected in [92GRE/FUG]
2 6 4 2 [91VOC/HAV] Mg U O (cr) 3 10 [83FUG]
4 data selected in [92GRE/FUG]
PbU O ·2H O(cr) 2
−
−
10 −
data selected in [71NAU/RYZ] 4 data selected in [92GRE/FUG]
data selected in [92GRE/FUG] 2 6 [81GOL/TRE], [82MOR],[83FUG],
[85PHI/PHI], [86MOR], [88PHI/HAL] CaU O (cr) 2 7 calciouranoite, anhydr. [81GOL/TRE], [82MOR], [83FUG], [85PHI/PHI], [86MOR], [88PHI/HAL] CaU O ·11H O(cr) 6 19 2 becquerelite data selected in this review [94CAS/BRU], [94SAN/GRA]
data selected in [92GRE/FUG] data selected in [92GRE/FUG]
[83KOH]
data selected in [92GRE/FUG] BaUO (cr) 3 data selected in [92GRE/FUG] BaUO (cr) 4 data selected in [92GRE/FUG] Ba3UO6(cr) data selected in [92GRE/FUG]
bauranoite, anhydr. data selected in [92GRE/FUG]
2
4
7
Mg(UO ) O (OH) 6 ·13H O(cr) 3
CaUO (cr) α-CaUO 4
ß-CaUO Ca UO (cr) 3 6
CaU O (cr)
α-SrUO (cr) 4
ß-SrUO (cr) 4
[79TAG/FUJ], [86MOR]
Sr UO (cr) 5 data selected in [92GRE/FUG] Sr UO (cr) 6 data selected in [92GRE/FUG] Sr U O (cr) 3 11 data selected in [92GRE/FUG]
SrUO (cr) 4
2
3
2
SrU4O (cr) 13
BaU2O (cr) 7
Ba U O (cr) 2 2 7 data selected in [92GRE/FUG] Ba Dy (UO ) (cr) 6 2 6 3 [82MOR]
(Continued on next page)

9.12 Uranium mineral phases 287
Table 9-43 (continued) Ternary and quaternary oxides and hydroxides (a) Reference Ba MgUO (cr) 2 6 data selected in [92GRE/FUG] Ba CaUO (cr) 2 6 data selected in [92GRE/FUG]
data selected in [92GRE/FUG] billietite [90VOC/HAV]
data selected in [92GRE/FUG] 5 data selected in [92GRE/FUG]
[71COR/LOO], [78COR/OHA],
[81LIN/BES], [82HEM], [82WAG/EVA], [83FUG], [85PHI/PHI], [85TSO/BRO],[86MOR], [88PHI/HAL]
data selected in [92GRE/FUG] 6 7 21 [78COR/OHA]
7 24 data selected in [92GRE/FUG] [71COR/LOO], [81LIN/BES, [82HEM], [82MOR], [82WAG/EVA], [83FUG], [86MOR]
[82WAG/EVA] [65MUT], [82WAG/EVA]
3 data selected in [92GRE/FUG] [81COR/OUW], [81LIN/BES], [82HEM], [82MOR], [83FUG], [83KAG/KYS], [85PHI/PHI],[86MOR], [88PHI/HAL] K2UO4(cr) data selected in [92GRE/FUG] K UO (cr) 4 5 [81LIN/BES]
data selected in [92GRE/FUG] [75OHA/HOE2], [81LIN/BES, [85FUG], [86MOR] K U O (cr) 2 4 13 [81LIN/BES] K U O ·11H O(cr) 2 6 19 2 compreignacite data selected in this review K U O (cr) 2 7 22 [81LIN/BES]
References
Ca NaUO (CO ) FSO ·10H O(cr) 3 2 3 3 4 2 schröckingerite [82HEM], [83OBR/WIL] Zn (UO ) (SO ) (OH) ·8H O(cr) 2 6 4 3 10 2 Zn-zippeite [79HAA/WIL], [81OBR/WIL],
[82HEM] (d)
Co (UO ) (SO ) (OH) ·8H O(cr) 2 2 6 4 3 10 2 Co-zippeite [79HAA/WIL], [81OBR/WIL], [82HEM] (d)
Ni (UO ) (SO ) (OH) ·8H O(cr) 2 2 6 4 3 10 2 Ni-zippeite [79HAA/WIL], [81OBR/WIL],
Na-zippeite [81OBR/WIL], [82HEM] zippeite [81OBR/WIL], [82HEM]
(Continued on next page)
Ba SrUO (cr) 2 6
BaU6O19·11H O(cr) 2
NaUO (cr) 3 data selected in [92GRE/FUG] α-Na2UO4 data selected in [92GRE/FUG] ß-Na2UO4 data selected in [92GRE/FUG] Na UO (cr) 3 4
Na UO (cr) 4
Na2U2O7(cr) Na U O (cr) Na U O (cr) 6
Na O UO ·9H O(cr) 4 4 4 2
Na U O ·1.5H O(cr) 2 2 7 2
KUO (cr)
K2U O (cr) 2 7
Sulphates (b,c):
2
[82HEM] (d)
Mg (UO ) (SO ) (OH) ·8H O(cr) 2 2 6 4 3 10 Mg-zippeite [79HAA/WIL],[81OBR/WIL], [82HEM] (d)
Na (UO ) (SO ) (OH) ·4H O(cr) 4 2 4 3 10
2
6 2
K (UO ) (SO ) (OH) ·4H O(cr) 4 2 6 4 3 10 2
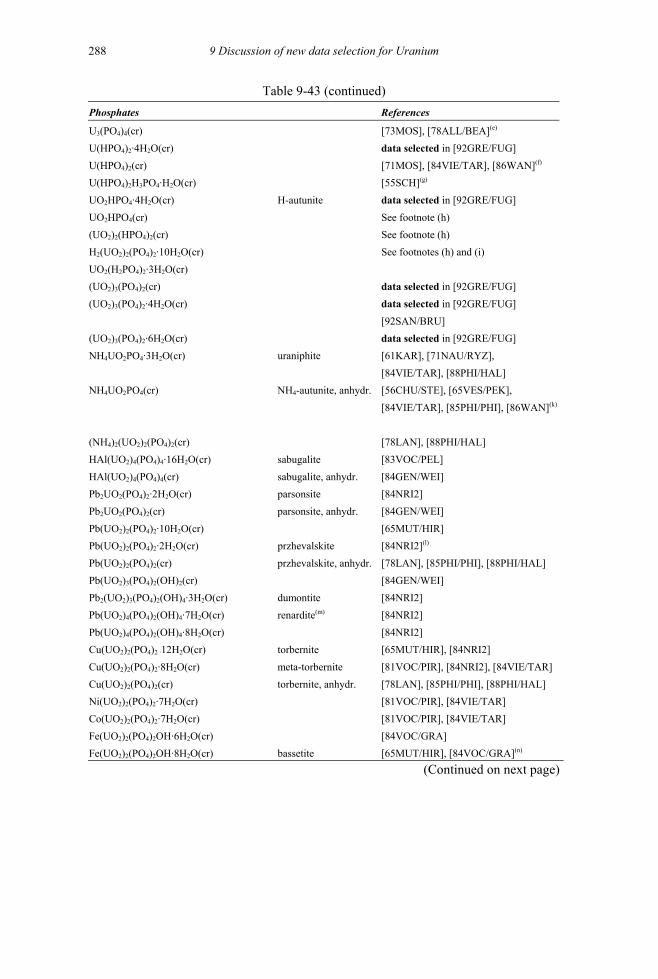
9 Discussion of new data selection for Uranium
288
Table 9-43 (continued) Phosphates References
U (PO ) (cr) 3 4 4 [73MOS], [78ALL/BEA] (e)
U(HPO4) ·4H O(cr) 2 2 data selected in [92GRE/FUG] U(HPO
HAl(UO cr)
4)2(cr) [71MOS], [84VIE/TAR], [86WAN] (f)
U(HPO ) H PO ·H O(cr) 4 2 3 4 2 [55SCH] (g)
UO HPO ·4H O(cr) 2 4 2 H-autunite data selected in [92GRE/FUG] UO HPO (cr) 2 4 See footnote (h) (UO ) (HPO ) (cr) 2 2 4 2 See footnote (h) H (UO ) (PO ) ·10H O(cr) 2 2 2 4 2 2 See footnotes (h) and (i) UO (H PO ) ·3H O(cr) 2 2 4 2 2 (UO ) (PO ) (cr) 2 3 4 2 data selected in [92GRE/FUG] (UO ) (PO ) ·4H O(cr) 2 3 4 2 2 data selected in [92GRE/FUG] [92SAN/BRU] (UO ) (PO ) ·6H O(cr) 2 3 4 2 2 data selected in [92GRE/FUG] NH UO PO ·3H O(cr) 4 2 4 2 uraniphite
[61KAR], [71NAU/RYZ], [84VIE/TAR], [88PHI/HAL]
NH UO PO (cr) 4 2 4 NH -autunite, anhydr. 4
[56CHU/STE], [65VES/PEK], [84VIE/TAR], [85PHI/PHI], [86WAN] (k)
(NH ) (UO ) (PO ) (cr) 4 2 2 2 4 2 [78LAN], [88PHI/HAL] HAl(UO ) (PO ) ·16H O(cr) 2 4 4 4 2 sabugalite [83VOC/PEL]
2)4(PO4)4( sabugalite, anhydr. [84GEN/WEI] Pb UO (PO4) ·2H O(cr) 2 2 2 2 parsonsite [84NRI2] Pb UO (PO ) (cr) 2 2 4 2 parsonsite, anhydr. [84GEN/WEI] Pb(UO ) (PO ) ·10H O(cr) 2 2 4 2 2 [65MUT/HIR] Pb(UO2)2(PO ) ·2H O(cr) 4 2 2 przhevalskite [84NRI2] (l)
Pb(UO2) (PO ) (cr) 2 4 2 przhevalskite, anhydr. [78LAN], [85PHI/PHI], [88PHI/HAL] Pb(UO2)3(PO ) (OH) (cr) 4 2 2 [84GEN/WEI] Pb (UO ) (PO ) (OH) ·3H O(cr) 2 2 3 4 2 4 2 dumontite [84NRI2] Pb(UO2) (PO ) (OH) ·7H O(cr) 4 4 2 4 2 renardite (m) [84NRI2] Pb(UO ) (PO ) (OH) ·8H O(cr) 2 4 4 2 4 2 [84NRI2] Cu(UO ) (PO ) 12H O(cr) 2 2 4 2 · 2 torbernite [65MUT/HIR], [84NRI2] Cu(UO ) (PO ) ·8H O(cr) 2 2 4 2 2 meta-torbernite [81VOC/PIR], [84NRI2], [84VIE/TAR] Cu(UO ) (PO ) (cr) 2 2 4 2 torbernite, anhydr. [78LAN], [85PHI/PHI], [88PHI/HAL] Ni(UO ) (PO ) ·7H O(cr) 2 2 4 2 2 [81VOC/PIR], [84VIE/TAR] Co(UO ) (PO ) ·7H O(cr) 2 2 4 2 2 [81VOC/PIR], [84VIE/TAR] Fe(UO ) (PO ) OH·6H O(cr) 2 2 4 2 2 [84VOC/GRA] Fe(UO ) (PO ) OH·8H O(cr) 2 2 4 2 2 bassetite [65MUT/HIR], [84VOC/GRA] (n)
(Continued on next page)
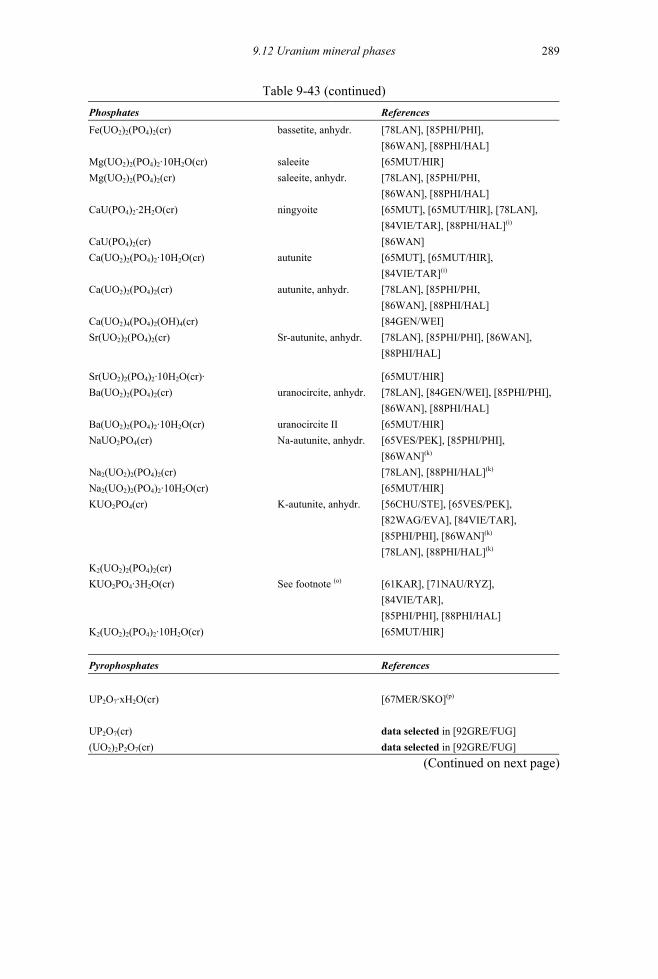
9.12 Uranium mineral phases 289
Table 9-43 (continued) Phosphates References Fe(UO2)2(PO4)2(cr) bassetite, anhydr. [78LAN], [85PHI/PHI], [86WAN], [88PHI/HAL] Mg(UO2)2(PO4)2·10H2O(cr) saleeite [65MUT/HIR] Mg(UO2)2(PO4)2(cr) saleeite, anhydr. [78LAN], [85PHI/PHI, [86WAN], [88PHI/HAL] CaU(PO4)2·2H2O(cr) ningyoite [65MUT], [65MUT/HIR], [78LAN],
[84VIE/TAR], [88PHI/HAL](i) CaU(PO4)2(cr) Ca(UO2)2(PO4)2·10H2O(cr) autunite [65MUT], [65MUT/HIR],
[84VIE/TAR](i) Ca(UO2)2(PO4)2(cr) autunite, anhydr. [78LAN], [85PHI/PHI, [86WAN], [88PHI/HAL] Ca(UO2)4(PO4)2(OH)4(cr) [84GEN/WEI] Sr(UO2)2(PO4)2(cr) Sr-autunite, anhydr. [78LAN], [85PHI/PHI], [86WAN], [88PHI/HAL]
Sr(UO2)2(PO4)2·10H2O(cr)· [65MUT/HIR] Ba(UO2)2(PO4)2(cr) uranocircite, anhydr. [78LAN], [84GEN/WEI], [85PHI/PHI], [86WAN], [88PHI/HAL] Ba(UO2)2(PO4)2·10H2O(cr) uranocircite II [65MUT/HIR] NaUO2PO4(cr) Na-autunite, anhydr. [65VES/PEK], [85PHI/PHI], [86WAN](k) Na2(UO2)2(PO4)2(cr) [78LAN], [88PHI/HAL](k) Na2(UO2)2(PO4)2·10H2O(cr) [65MUT/HIR] KUO2PO4(cr) K-autunite, anhydr. [56CHU/STE], [65VES/PEK], [82WAG/EVA], [84VIE/TAR], [85PHI/PHI], [86WAN](k) [78LAN], [88PHI/HAL](k) K2(UO2)2(PO4)2(cr) KUO2PO4·3H2O(cr) See footnote (o) [61KAR], [71NAU/RYZ],
[84VIE/TAR], [85PHI/PHI], [88PHI/HAL] K2(UO2)2(PO4)2·10H2O(cr) [65MUT/HIR]
Pyrophosphates References
UP2O7·xH2O(cr) [67MER/SKO](p) UP2O7(cr) data selected in [92GRE/FUG] (UO2)2P2O7(cr) data selected in [92GRE/FUG]
[86WAN]
(Continued on next page)
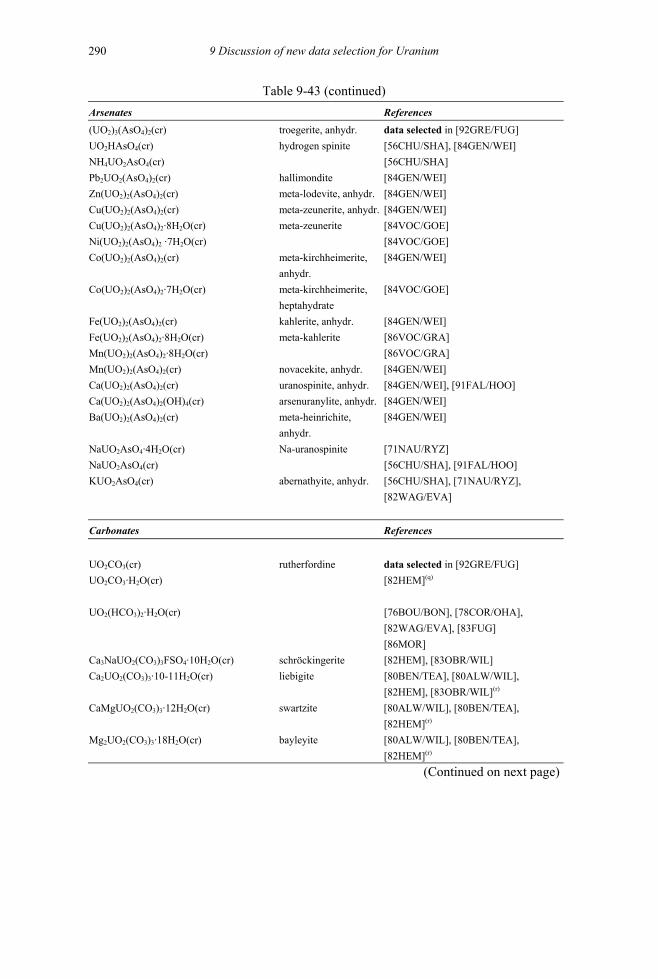
9 Discussion of new data selection for Uranium
290
Table 9-43 (continued) Arsenates References (UO2)3(AsO4)2(cr) troegerite, anhydr. data selected in [92GRE/FUG] UO2HAsO4(cr) hydrogen spinite [56CHU/SHA], [84GEN/WEI] NH4UO2AsO4(cr) [56CHU/SHA] Pb2UO2(AsO4)2(cr) hallimondite [84GEN/WEI] Zn(UO2)2(AsO4)2(cr) meta-lodevite, anhydr. [84GEN/WEI] Cu(UO2)2(AsO4)2(cr) meta-zeunerite, anhydr. [84GEN/WEI] Cu(UO2)2(AsO4)2·8H2O(cr) meta-zeunerite [84VOC/GOE] Ni(UO2)2(AsO4)2 ·7H2O(cr) [84VOC/GOE] Co(UO2)2(AsO4)2(cr) meta-kirchheimerite,
anhydr. [84GEN/WEI]
Co(UO2)2(AsO4)2·7H2O(cr) meta-kirchheimerite, [84VOC/GOE] heptahydrate Fe(UO2)2(AsO4)2(cr) kahlerite, anhydr. [84GEN/WEI] Fe(UO2)2(AsO4)2·8H2O(cr) meta-kahlerite [86VOC/GRA] Mn(UO2)2(AsO4)2·8H2O(cr) [86VOC/GRA] Mn(UO2)2(AsO4)2(cr) novacekite, anhydr. [84GEN/WEI] Ca(UO2)2(AsO4)2(cr) uranospinite, anhydr. [84GEN/WEI], [91FAL/HOO] Ca(UO2)2(AsO4)2(OH)4(cr) arsenuranylite, anhydr. [84GEN/WEI] Ba(UO2)2(AsO4)2(cr) meta-heinrichite,
anhydr. [84GEN/WEI]
NaUO2AsO4·4H2O(cr) Na-uranospinite [71NAU/RYZ] NaUO2AsO4(cr) [56CHU/SHA], [91FAL/HOO] KUO2AsO4(cr) abernathyite, anhydr. [56CHU/SHA], [71NAU/RYZ], [82WAG/EVA]
Carbonates References
UO2CO3(cr) rutherfordine data selected in [92GRE/FUG] UO2CO3·H2O(cr)
[82HEM](q) UO2(HCO3)2·H2O(cr) [76BOU/BON], [78COR/OHA], [82WAG/EVA], [83FUG] [86MOR] Ca3NaUO2(CO3)3FSO4·10H2O(cr) schröckingerite [82HEM], [83OBR/WIL] Ca2UO2(CO3)3·10-11H2O(cr) liebigite [80BEN/TEA], [80ALW/WIL], [82HEM], [83OBR/WIL](r) CaMgUO2(CO3)3·12H2O(cr) swartzite [80ALW/WIL], [80BEN/TEA], [82HEM](r) Mg2UO2(CO3)3·18H2O(cr) bayleyite [80ALW/WIL], [80BEN/TEA], [82HEM](r)
(Continued on next page)

9.12 Uranium mineral phases 291
Table 9-43 (continued) Carbonates References CaNa2UO2(CO3)3·6H2O(cr) andersonite [80ALW/WIL], [80BEN/TEA], [83OBR/WIL](r) Ca2CuUO2(CO3)4·6H2O(cr) voglite [82HEM] Ca3Mg3(UO2)2(CO3)6(OH)4·18H2O(cr) rabbittite [82HEM] Na4UO2(CO3)3(cr) data selected in [92GRE/FUG] K3NaUO2(CO3)3·H2O(cr) grimselite [83OBR/WIL]
Silicates References
USiO4(cr) coffinite data selected in [92GRE/FUG] (UO2)2SiO4·2H2O(cr) soddyite [82HEM], [92NGU/SIL], [94CAS/BRU] PbUO2SiO4·H2O(cr) kasolite [82HEM] K(H3O)UO2SiO4(cr) boltwoodite(s) [82HEM] Na0.7K0.3(H3O)UO2SiO4·H2O(cr) Na-boltwoodite(s) [82HEM], [92NGU/SIL] Cu(UO2)2(SiO3OH)2·6H2O(cr) cupro sklodowskite [82HEM] Mg(UO2)2(SiO3OH)2·5H2O(cr) sklodowskite [82HEM](t) Ca(UO2)2(SiO3OH)2(cr) uranophane, anhydr. [78LAN], [80BEN/TEA], [86WAN], [88LEM], [88PHI/HAL] Ca(UO2)2(SiO3OH)2 5H2O(cr) uranophane [82HEM], [92NGU/SIL], [94CAS/BRU] Ca(UO2)2Si6O15·5H2O(cr) haiweeite [82HEM] Na2(UO2)2Si6O15·4H2O(cr) Na-weeksite [92NGU/SIL] K2(UO2)2Si6O15·4H2O(cr) weeksite [82HEM]
Vanadates References
Pb(UO2)2(VO4)2(cr) curienite, anhydr. [84GEN/WEI] Al(UO2)2(VO4)2OH(cr) vanuralite, anhydr. [84GEN/WEI] CuUO2VO4(cr) sengierite, anhydr. [84GEN/WEI] Ca(UO2)2(VO4)2(cr) tyuyamunite, anhydr. [78LAN], [80BEN/TEA], [85PHI/PHI], [88PHI/HAL] Ba(UO2)2(VO4)2(cr) francevillite, anhydr. [84GEN/WEI] NaUO2VO4(cr) strelkinite, anhydr. [84GEN/WEI] K2(UO2)2(VO4)2·H2O(cr) carnotite [62HOS/GAR] K2(UO2)2(VO4)2(cr) carnotite, anhydr. [78LAN],[80BEN/TEA], [85PHI/PHI], [88PHI/HAL]

9 Discussion of new data selection for Uranium
292
(a) Simple oxides and hydroxides are discussed in Section V.3.3 (pp.131–148) of [92GRE/FUG]. (b) Only binary and ternary sulphates are listed. Simple uranium sulphates are discussed in Section
V.5.1.3.2. (pp.249–254) of [92GRE/FUG]. (c) It should be noted that there is some disagreement in the literature on the number of water molecules in
the formulae of the zippeite family. (d) See Section V.5.1.3.2.c (pp.254–255) and the discussion of [79HAA/WIL] in Appendix A (p.646) of
[92GRE/FUG]. (e) See the discussion in Section V.6.2.2.5.b (p.294) of [92GRE/FUG]. (f) See the discussion in Section V.6.2.2.7.b (p.297) of [92GRE/FUG]. (g) See the discussion in Section V.6.2.2.9 (p.298) of [92GRE/FUG]. (h) Compounds with formula H2(UO2)2(PO4)2·xH2O(cr) (x = 0 to 10) are discussed in Sections V.6.2.1.1.b
and V.6.2.2.10.c (pp.284–286 and 299–300 respectively) of [92GRE/FUG]. Grenthe et al. selected thermodynamic data for UO2HPO4·4H2O(cr), cf. Table III.1 in [92GRE/FUG].
(i) See the discussion of [65MUT] in Appendix A (p.599) of [92GRE/FUG]. (j) See the discussions in Sections V.6.2.1.1.b and V.6.2.2.8 (pp.284–286 and 298) and the comments of
[54SCH/BAE] in Appendix A (p.564) of [92GRE/FUG]. (k) Veselý et al. ([65VES/PEK]) reported solubility products for hydrated alkali phosphates. Grenthe et al.
([92GRE/FUG]) reinterpreted the results of [65VES/PEK], cf. Table V.40 (p.283), Section V.6.2.1.1.b (p.286), and Appendix A (pp.600–601) of [92GRE/FUG]. It should be noted that Langmuir ([78LAN]) incorrectly referred to the anhydrous compounds as sodium and potassium autunite.
(l) Nriagu ([84NRI2]) gives four waters of hydration for this mineral (Table 1). (m) The stoichiometry of the mineral renardite is not clear, although it is related to dewindtite:
Pb3(UO2)6(PO4)4O2(OH)2·12H2O(s) ([91FIN/EWI]). (n) Muto et al. ([65MUT/HIR]) give ten molecules of water of hydration for this mineral. (o) This formula is related to meta–ankoleite: K2(UO2)2(PO4)2·6H2O(cr). (p) See the discussion of [67MER/SKO] in Appendix A (p.603) of [92GRE/FUG]. (q) Hemingway ([82HEM]) incorrectly assigned the name of sharpite to this solid. (r) Discussed in section V.7.1.2.2.b (pp.327–328) of [92GRE/FUG]. (s) There is some uncertainty in the composition of boltwoodite and Na–boltwoodite, cf. [81STO/SMI],
[91FIN/EWI], [92NGU/SIL]. (t) Hemingway ([82HEM]) reports estimated data for a solid with six water molecules.

Chapter 9Equation Section 9 Chapter 10Equation Section 10
10 Discussion of new data selection for Neptunium
10.1 Neptunium aqua ions (7) There are few experimental data that have appeared after those discussed in [2001LEM/FUG].
EXAFS spectra of +2NpO and Np4+ obtained by Allen et al. [97ALL/BUC] and
those of Np(IV), +2NpO and 2+
2NpO obtained by Reich et al. [2000REI/BER] do not give consistent results on the hydration number of +
2NpO , respectively, five and (3.6 ± 0.6). It should be noted that coordination numbers determined by EXAFS are not particularly precise. Hence, the coordination number for Np4+ given as (10 ± 1), [97ALL/BUC], is uncertain and this review suggests a coordination number of (9 ± 1).
Soderholm et al. [99SOD/ANT] have also given the full EXAFS spectra of the aqueous ions of Np(III) to Np(VI) (see Appendix A). Soderholm et al. [99SOD/ANT] have combined EXAFS and electrochemical measurements and propose values of the formal redox potential of the 2+ +
2 2NpO / NpO and 4+ 3+Np / Np couples in 1 M HClO4. This is an interesting approach, but in the opinion of this review, it does not result in more precise data than the traditional electrochemical methods. The review also notices that the values obtained are very far from those obtained in other studies discussed in [2001LEM/FUG].
The values selected by [2001LEM/FUG] are therefore retained in the present review (see Appendix A).
Bolvin et al. [2001BOL/WAH] have given the structure of the Np(VII) species predominant in strong alkaline solution: 3
4 2NpO (OH) − , thus closing the debate that has gone on since the discovery of the Np(VII) species (see [2001LEM/FUG] page 92 and in Appendix A [2001WIL/BLA] and [97CLA/CON]). Consequently, the equation 7.2 of [2001LEM/FUG] must be written :
34 2NpO (OH) − + 2 H2O(l) + e– 2
2 4NpO (OH) − + 2 OH–. The close similarity in the coordination of Np in the species involved in the re-
dox couple Np(VII)/Np(VI) explains why it is stable and reproducible in alkaline solu-tions.
293

10 Discussion of new data selection for Neptunium 294
Evaluations of and from lit-erature data have been conducted by Kaszuba and Runde [99KAS/RUN]. These data are the same as in [2001LEM/FUG], but the method used to calculate the Gibbs energy is different. The values obtained in the two evaluations are very similar and, as explained in Appendix A, there is no reason to revise the selected values of [2001LEM/FUG], in favour of these new evaluations.
+f m 2(NpO , 298.15 K)Gο∆ 4+
f m (Np , 298.15 K)Gο∆
10.2 Neptunium oxygen and hydrogen compounds and complexes (8)
10.2.1 Aqueous neptunium hydroxide complexes (8.1)
10.2.1.1 Neptunium (VI) hydroxide complex (8.1.2) An error of sign for the values of 2 3 5 4((NpO ) (OH) ,ClO )+ −ε and
exists in [2001LEM/FUG] on pages 105 and 814. The cor-rect values are:
22 2 2 4((NpO ) (OH) ,ClO )+ −ε
2 3 5 4((NpO ) (OH) ,ClO )+ −ε2
= (0.45 ± 0.20) kg · mol–1, + −
2 2 2 4((NpO ) (OH) ,ClO )ε = (0.57 ± 0.10 kg · mol–1.
These errors do not affect the calculated equilibrium constants or Gibbs energy values given on pages 105, 106, and 639 of [2001LEM/FUG] which have been calcu-lated with the correct values. ∆ε
10.2.1.2 Neptunium(V) hydroxide complexes (8.1.3) An analysis of the literature data concerning Np(V) behaviour in aqueous solutions was carried out by Kaszuba and Runde [99KAS/RUN]. These authors give values for
in very close agreement with those of [2001LEM/FUG], which are retained by this review as selected values (see Appendix A).
10 1,1 10 2,1log and logοb οb
Experimental results on the solubility of Np(V) hydroxide compounds have been reported by Peretrukhin et al. [96PER/KRY]. As discussed in Appendix A no thermodynamic data can be extracted from this study.
10.2.1.3 Neptunium(IV) hydroxide complexes (8.1.4) The main advance in knowledge since the previous review concerns the hydrolysis of Np(IV). As discussed in [2001LEM/FUG] the situation is the same as for the other tet-ravalent actinides [92GRE/FUG]. Due to phenomena difficult to control, like formation of colloids and the evolution of the limiting solubility of solid phases between crystal-line and amorphous forms of the dioxide or tetrahydroxide, the description of actinide (IV) hydrolysis in terms of thermodynamic constants is rather uncertain.

10.2 Neptunium oxygen and hydrogen compounds and complexes (8)
295
Only the value lo 10 1,1*g οb = − (0.29 ± 1.00) was selected by [2001LEM/FUG].
The large uncertainty comes from the unweighted average of three scattered experimen-tal values. Due to large uncertainties in the literature data, [2001LEM/FUG] did not select values for the hydrolysis constants and A value of lo = (46.17 ± 1.12) is also reported by [2001LEM/FUG] from solubility data, or can be cal-culated as an alternative route from the selected values of the Gibbs energy of formation of NpO
2,1b 3,1.b
f m
10 4,1g οb
2(am) and Np(OH)4(aq) (pages 115 and 128 of [2001LEM/FUG], see also the review of [99NEC/KIM] in Appendix A). Indeed ο∆ G (NpO2, am, 298.15 K) and
(Np(OH)f mο∆ G 4(aq), 298.15 K) given by [2001LEM/FUG] are derived from the same
solubility data (see 10.2.2.2.). This review has clearly taken the position not to select Gibbs energies of amorphous phases (see section 9.3.2.2).
None of the spectroscopic studies considered in [2001LEM/FUG] for the selec-tion of could identify two distinct absorption bands, i.e., one for Np10 1,1
*log οb 4+ and one for Np(OH)3+. There is not even a shift of the characteristic Np(IV) absorption bands. (The same is true for the spectroscopic studies on Pu(IV) hydrolysis, cf. section 11.2.1.2). The only effect observed was the decrease of the absorption band when pH was increased. Neck et al. [2001NEC/KIM2] demonstrated by spectroscopic and LIBD measurements that (1) the decrease of the Np(IV) absorption bands is a function of both pH and total Np(IV) concentration, i.e., it cannot be due to mononuclear hydrolysis, and (2) the onset of the decrease of absorption is consistent with the onset of colloid forma-tion.
Neck and Kim [99NEC/KIM], [2001NEC/KIM] have made critical surveys of the literature data of actinide(IV) hydrolysis as done partially by [2001LEM/FUG], but from the standpoint of correlations and semi-theoretical considerations to predict the values of successive hydrolysis constants of M4+ aqueous ions. The parameters from these theoretical methods are fitted from sets of experimental thermodynamic constants of trivalent (Am, Cm) and tetravalent (Pu) actinides with the first hydrolysis constant,
, as the input parameter. For Np10 1,1log οb 4+, starting with 10 1,1log οb = (14.55 ± 0.2) ( = 0.55 ± 0.2) obtained at very low neptunium concentrations [77DUP/GUI], they predicted, depending on the method used (correlation or semi-empirical model),
= 28.0 or 28.3 (in close agreement with the experimental value (28.35 ± 0.3) from [77DUP/GUI]), lo = 39.0 or 39.4 and
10 1,*log οb
10 2,1log οb
1
10 3,1g οb 10 4,1log οb = 46.6 or 47.5. The choice of the value of reflects the necessity of using data from experiments where the presence of colloids has been avoided as in [77DUP/GUI] where the Np concentration is at tracer levels. The value is consistent with the value obtained from rein-terpretation of the solubility data of amorphous neptunium dioxide, as shown in the fol-lowing section 10.2.2.2 (
1,1οb
10 4,1log οb
10log 4,1οb = (47.7 ± 1.1)).
The reinterpretation of the available literature data on Np(IV) hydrolysis made by Neck and Kim [2001NEC/KIM] changes the lo 10 1,1g οb value selected by [2001LEM/FUG] and confirms the value of 10 4,1log οb , which can be calculated, for in-stance, from the appropriate Gibbs energies of formation selected by [2001LEM/FUG].
10 Discussion of new data selection for Neptunium 296
A revision of the hydrolysis constants of Np4+ is required.
This review considers the hydrolysis constants lo and determined in the solvent extraction study of Duplessis and Guillaumont
[77DUP/GUI], and the value estimated by [2001NEC/KIM] as the best avail-able. The value estimated by [2001NEC/KIM] is close to the value calculated from solubility data (see section 10.2.2.2.2 and Table 11-1, footnote (b)).
10 1,1g οb10 2,1log οb
10 3,1log οb10 4,1log οb
The following equilibrium constants are selected at 298.15 K for the reactions: 4+ 4Np + OH Np(OH) n
nn − − (10.1) 4+ 4 +
2Np + H O(l) Np(OH) + Hnnn − n , (10.2)
10 1log οb (10.1) = (14.55 ± 0.20) 10 1*log οb (10.2) = (0.55 ± 0.20), * 10 2log οb (10.1) = (28.35 ± 0.30) 10 2log οb (10.2) = (0.35 ± 0.30), * 10 4log οb (10.1) = (47.7 ± 1.1) 10 4log οb (10.2) = − (8.3 ± 1.1).
According to NEA TDB guidelines the estimated values, (10.1) = (39.2 ± 1.0), lo (10.2) = − (2.8 ± 1.0), are not selected by this review.
10 3log οb10 3
*g οb
Solubility data of Neck et al. [2001NEC/KIM2] obtained by using spectro-scopic methods for determining the Np(IV) concentration show that the species
2+2Np(OH) is dominant in the range log10[H+] = − 1.6 to − 2.7 at very low concentra-
tions of Np(IV). This confirms the hydrolysis results obtained at tracer scale by [77DUP/GUI] (see Appendix A).
Corresponding values can be calculated (see on section 11.2.3 of this review which gives a comparison of thermodynamic data on tetra-valent actinides).
4f m (Np(OH) , 298.15 K)n
nGο −∆
Peretrukhin et al. [96PER/KRY] proposed the formation of 5Np(OH)− from the increase in the solubility of Np(IV) hydroxide in 0.5 to 14.1 M NaOH. However, for the reasons given in Appendix A the present review does not extract thermodynamic quanti-ties from these data.
10.2.2 Crystalline and amorphous neptunium oxides and hydroxides (8.2)
10.2.2.1 Solubility of neptunium(V) oxides and hydroxides (8.2.4) Kaszuka and Runde [99KAS/RUN] re-analysed the solubility data on NpO2OH reported by [92NEC/KIM], [95NEC/FAN] and [96RUN/NEU], which agree within 0.02 log-units for fresh, and 0.07 log-units for aged NpO2OH, and give, respectively, the aver-aged solubility product lo 10 ,0g ο
sK = − (8.77 ± 0.09) and lo 10 ,0g οsK = − (9.48 ± 0.16).
These values are very close to the values selected by [2001LEM/FUG] from the same

10.2 Neptunium oxygen and hydrogen compounds and complexes (8)
297
experimental data, (Table 8.5, p. 126 in [2001LEM/FUG]), lo 10 ,0*g ο
sK (NpO2OH, am, fresh) = (5.3 ± 0.2), ( 10 ,0log ο
sK = − (8.7 ± 0.2)), 10 ,0*log ο
sK (NpO2OH, am, aged) = (4.7 ± 0.5), ( 10 ,0log ο
sK = − (9.3 ± 0.5)).
f mο∆ H
1kJ mol−⋅ mοS
1J K m−⋅ ⋅ 1ol−
10log+ +
2 + 0.5H2 50.5 Np O (cr 2O(l)
10 ,0* ο
sK2 5 2Np O H Ox⋅
m
f mοG∆
1l−
10logf mGο∆
10 ,0g sK ο
Therefore, there is no reason to change the values selected by [2001LEM/FUG].
Based on enthalpies of solution measurements with well-crystallised anhydrous Np2O5, [2001LEM/FUG] selected (Np2O5, cr, 298.15 K) = − (2162.7 ± 9.5) and, using the estimate (Np2O5, cr, 298.15 K) = (174 ± 20) , obtained f m
ο∆ G,0
(Np2O5, cr, 298.15 K) = − (2031.6 ± 11.2) , corresponding to 1kJ mol−⋅ * ο
sK = (1.8 ± 1.0 ) for the reaction:
) + H NpO .
Recently Efurd et al. [98EFU/RUN], not cited in [2001LEM/FUG], reported a value of log = (2.6 ± 0.4) for the solubility of a solid described as a poorly crys-talline hydrated (see Appendix A). Although not corresponding to com-pounds of the same crystallinity and water content, the results of Efurd et al. are not incompatible with the adopted values for crystalline anhydrous Np2O5(cr). However, this lack of knowledge of the exact composition of the compounds in equilibrium with the aqueous phase, makes it impossible to deduce Gibbs energies from the data of Efurd et al. [98EFU/RUN].
This review retains the value of fο∆ G (Np2O5, cr, 298.15 K) selected by
[2001LEM/FUG].
10.2.2.2 Neptunium(IV) oxides and hydroxides (8.2.5)
10.2.2.2.1 Solubility of crystalline oxide NpO2(cr) (8.2.5.1) No new experimental data have appeared since the last review.
According to the values of Gibbs energy of formation of NpO2(cr) selected by [2001LEM/FUG], (NpO2, cr, 298.15 K) = − (1021.731 ± 2.514) and
(Np
1kJ mol−⋅
f mο∆ G 4+, 298.15 K) = − (491.8 ± 5.6) kJ mo⋅
,0
and the auxiliary values from [92GRE/FUG], this review calculates lo 10g ο
sK (NpO2, cr) = − (65.75 ± 1.07). A some-what different value has been proposed in the recent literature [99NEC/KIM], [2001NEC/KIM] with reference to [87RAI/SWA], as = − (63.7 ± 1.8). The difference comes mainly from the value of
,0 2(NpO ,sK ο cr)(Np4+, 298.15 K)
= − (502.9 ± 7.5) kJ · mol–1 [76FUG/OET] used to calculate lo (see section 11.2.3).
This review does not change the value of Gibbs energy of formation of NpO2(cr) selected by [2001LEM/FUG].
10. Discussion of new data selection for Neptunium 298
10.2.2.2.2 Solubility of amorphous oxide NpO2(am, hydr.) (8.2.5.2) The constant for the reaction,
4+2 2NpO (am, hydr.) + 2H O(l) Np + 4OH− (10.3)
consistent with the selections in [2001LEM/FUG] is lo 10 ,0g οsK (NpO2, am, hydr., (10.3))
= − (54.5 ± 1.0) derived from lo 10 ,0*g ο
sK (NpO2, am, hydr.) = (1.53 ± 1.0). This latter value is calculated from the concentration of Np(IV) in equilibrium with the solid and
= − (0.29 ± 1.00). The large uncertainty in lo10 1,1*log οb 10
*g ,0οsK is estimated. The ex-
perimental solubility data come from [87RAI/SWA]. Lemire et al. [2001LEM/FUG] calculated and selected (NpOf m
ο∆ G 2, am, 298.15 K) = − (953.3 ± 8.0) . This method of calculating the Gibbs energy of formation of an amorphous phase does not appear valid to this review for the reason put forward in the section 9.3.2.2.
1kJ mol−⋅
Neck and Kim [99NEC/KIM], [2001NEC/KIM], (see Appendix A) re-interpreted the solubility data of [87RAI/SWA] at pH below 3 with the hydrolysis con-stants 10 1,1log οb , from [77DUP/GUI] and an estimated value for lo (see section 10.2.1.3), and give
10 2,1log οb 10 3,1g οb10 ,0log ο
sK (NpO2, am, hydr., (10.3)) = − (56.7 ± 0.5). With this value and all the solubility data of [85RAI/RYA], [93ERI/NDA] and [96NAK/YAM] corresponding to pH = 5 to 13, they calculate 10 4,1log οb = (47.7 ± 1.1) according to the relationship:
log10[Np(OH)4(aq)] = 10 ,0log οsK (NpO2, am, hydr., (10.3)) 10 4,1+ log οb = − (9 ± 1).
The large uncertainty covers the rather large scatter in the data. This value is close to the one obtained by semi-empirical estimation methods, (see section 10.2.1.3), but, as suggested, higher than that selected by [2001LEM/FUG]. The recent experimen-tal data obtained by Neck et al. [2001NEC/KIM2], using spectroscopic techniques to measure the Np concentration, after removing colloids, in solutions equilibrated with Np(OH)4(am) is 10 ,0log ο
sK (NpO2, am, hydr., (10.3)) = − (56.5 ± 0.4).
The authors of [2001LEM/FUG] suggested that the solubility of NpO2(am) re-tained to derive the thermodynamic values 10 ,0log ο
sK (NpO2, am, hydr., (10.3)) and "might require revision" (p. 114). The present review selects the following
equilibrium constants reported by [2001NEC/KIM]: 10 4,1log οb
10 ,0log οsK (NpO2, am, hydr., (10.3), 298.15 K) = − (56.7 ± 0.5),
10 4,1log οb (Np(OH)4, aq, 298.15 K) = (47.7 ± 1.1).
However, for the reasons already given in sections 9.3.2.2, the present review does not select a value of (NpOf m
ο∆ G 2, am, hydr.) for this Np(IV) compound, since it is not chemically well-defined - it could be the hydroxide, amorphous hydrous oxide or oxyhydroxide.
An interpretation of the solubility data of NpO2(am) by Kaszuba and Runde [99KAS/RUN] does not add additional information.

10.3 Neptunium halide compounds (9.1) 299
The new value selected for the solubility constant of NpO2(am, hydr.), 10 ,0log ο
sK (NpO2, am, hydr., (10.3)) = − (56.7 ± 0.5) or 10 ,0*log ο
sK (NpO2, am, hydr.,) = − (0.7 ± 0.5) would correspond to a standard Gibbs energy of f m
ο∆ G (NpO2, am, 298.15 K) = − (970.0 ± 6.3) which is 12.7 kJ · mol–1 lower than the value selected in [2001LEM/FUG].
10.3 Neptunium halide compounds (9.1) 10.3.1 Neptunium fluoride compounds (9.1.2)
10.3.1.1 NpF(g), NpF2(g), NpF3(g) (9.1.2.1, 9.1.2.3) There are no experimental data for these species and their enthalpies of formation were estimated in [2001LEM/FUG] to be close to the mean of the enthalpies of formation of the corresponding UFn(g) and PuFn(g) compounds from [92GRE/FUG] and [2001LEM/FUG], respectively. Since, in this review, the enthalpies of formation of the lower uranium fluoride gaseous species have been revised (see section 9.4.2.1.1), for the sake of consistency, we have made the corresponding changes to the estimated enthal-pies of formation of the neptunium fluoride gases, although the changes are well within the assigned uncertainties.
The revised values are:
f mο∆ H (NpF, g, 298.15 K) = − (80 ± 25) kJ · mol–1,
f mο∆ H (NpF2, g, 298.15 K) = − (575 ± 30) kJ · mol–1,
f mο∆ H (NpF3, g, 298.15 K) = − (1115 ± 25) kJ · mol–1.
The standard entropies and heat capacities of these species are unchanged.

10. Discussion of new data selection for Neptunium 300
10.4 Neptunium group 15 compounds and complexes (11) 10.4.1 Neptunium nitrogen compounds (11.1)
10.4.1.1 NpN(cr) (11.1.1.1) The data for NpN(cr) in [2001LEM/FUG] were essentially estimated to be close to the mean of UN and PuN at 298.15 K, where the order of stability is thus UN < NpN < PuN. However, the thermal data for the elements and the nitrides are such that with the current data for NpN(cr), this does not hold for at higher temperatures. For ex-ample, at 2100 K, the order of stability is NpN < PuN < UN. As a matter of interest, the main reasons for this are the different thermal properties of the elements, rather than the nitrides. This weakens the argument for taking 298.15 K as the base temperature for the “interpolation”.
f mG∆
As noted in [2001LEM/FUG], Nakajima et al. [97NAK/ARA] confirmed the earlier findings of Olson and Mulford [66OLS/MUL2] that pure NpN vaporises to Np(liq) and N2(g). Their paper actually gives little further data on ∆ (NpN), since calculation of this requires a knowledge of the nitrogen pressure in the Np(l) + NpN(cr) system, rather than , which is close to that of pure Np. Because the measurements of Olson and Mulford [66OLS/MUL2] were at appreciably higher temperatures (2480 − 3100 K), where the solubility of nitrogen in Np(l) becomes appreciable, the data of [97NAK/ARA] were not used in [2001LEM/FUG] to define (NpN).
f mG
f mG∆
Npp
However, the same authors [99NAK/ARA] have now measured in a sys-tem of NpN "co-loaded" with PuN. Under these conditions, PuN dissociates into Pu(g) + 0.5 N
Npp
2(g), which provides a known 2
, viz. half that of (also determined), after allowing for the faster effusion of N
Np Pup2(g). This is high enough to suppress the formation
of Np, so (NpN) can be calculated from the known pressures in the vaporisation reaction NpN(cr) Np(g) + 0.5 N
f mG∆2(g). [99NAK/ARA] checked that no solid solutions
of NpN and PuN were formed.
The results of the two studies [97NAK/ARA], [99NAK/ARA] are in reason-able agreement and suggest that around 2000 K, (NpN, cr) does indeed lie be-tween those of UN(cr) and PuN(cr) (with UN the most stable), and is ca. 10 kJ · mol
f mG∆–1
more negative than the values derived from the data in [2001LEM/FUG].
We therefore select:
f mH ο∆ (NpN, cr, 298.15 K) = − (305 ± 10) kJ · mol–1,
with unchanged values for (298.15 K) and mS ο,mpCο (298.15 K).
10.6 Neptunium carbon compounds and complexes (12.1) 301
10.4.2 Neptunium antimony compounds
10.4.2.1 Neptunium antimonides
10.4.2.1.1 Neptunium monoantimonide Hall et al. [91HAL/HAR] measured the heat capacity of a sample of high purity NpSb from 2 to 300 K. Small single crystals of NpSb were pressed into a cylinder which was sealed into a silver calorimeter under helium. A sharp λ-peak in the ,mpC curve at 198 K is attributed to the known anti-ferromagnetic transition; an additional broad anomaly, of unknown origin, was observed in the ,mpC curve at ca. 150 K. The values obtained for the heat capacity and entropy at 298.15 K were:
,mpCο (NpSb, cr, 298.15 K) = (48.9 ± 2.9) J · K–1 · mol–1,
(NpSb, cr, 298.15 K) = (101.4 ± 6.1) J · KmS ο –1 · mol–1,
and these are the selected values. The authors note that the value of ,mpCο (298.15 K) is lower than that calculated from the low-temperature electronic and lattice heat capaci-ties, which may suggest a change in the lattice structure below room temperature.
10.5 Neptunium chloride (9.2.2), nitrate (11.1.4.1) complexes and complexes with other actinides
The recent papers on the complexation of Np (and Pu) in various oxidation states deal mainly with chloride complexation [97RUN/NEU], [97ALL/BUC], but also with nitrate complexation [98SPA/PUI]. However, these papers were not included in the discussion of the previous review, but do not contain information that would justify changing the values selected by [2001LEM/FUG] (see Appendix A). Moreover, this review has pointed out that for trivalent actinides, the association constants for these weak 1:1 and 2:1 complexes have been overestimated. Therefore, this review considers that the selec-tions of [2001LEM/FUG] of chloride and nitrate complexes for trivalent Np (and Pu) must be used with caution.
New data exist for the cation-cation complexes +2
2+2NpO UO⋅ (see 9.8.1) and
+ 42
+NpO Th⋅ , for which Stoyer et al. [2000STO/HOF] reported equilibrium constants of β = (2.4 ± 0.2) L · mol–1 and (1.8 ± 0.9) L · mol–1 , respectively in 6 M NaClO4.
10.6 Neptunium carbon compounds and complexes (12.1) 10.6.1 Aqueous neptunium carbonate complexes (12.1.2.1) All currently available studies of the binary carbonate complexes of Np(III), Np(IV), Np(V) and Np(VI) have already been discussed in [2001LEM/FUG] and the selected values are retained in the present review.

10. Discussion of new data selection for Neptunium 302
10.6.1.1 Ternary Np(IV) hydroxide-carbonate complexes For the reasons discussed in Appendix A in the reviews of [93ERI/NDA], [99RAI/HES], and [2001KIT/KOH], the equilibrium constants determined for the ter-nary Np(IV) hydroxide-carbonate complexes Np(OH)3(CO3)– [93ERI/NDA], Np(OH)4(CO3)2– [93ERI/NDA], 4
4 3 2Np(OH) (CO ) − [2001KIT/KOH], and 2
2 3 2Np(OH) (CO ) − [99RAI/HES], [2001KIT/KOH] are not selected.
Figure 10-1 shows experimental solubility data for NpO2(am, hydr.) deter-mined by Eriksen et al. [93ERI/NDA] and by Kitamura and Kohara [2001KIT/KOH] at total carbonate concentrations of ([ 3HCO− ] + [ 2
3CO − ]) = 0.1 and 0.01 mol · L–1 in 0.5 M NaClO4 solution. For comparison the corresponding solubility curves calculated with the equilibrium constants proposed by Rai et al. [99RAI/HES] are included as well. The comparison in Figure 10-1 shows that not only are the proposed stoichiometries of the ternary Np(IV) complexes contradictory, but so are the underlying experimental solubil-ity data.
The increased solubility at − log10[H+] = 8 – 11 (compared to a carbonate-free solution) may be explained by the formation of either Np(OH)3(CO3)– [93ERI/NDA] or
22 3 2Np(OH) (CO ) −
10 ,5log [99RAI/HES], [2001KIT/KOH]. According to the equilibrium con-
stant of sK ο = − 21.15 [99RAI/HES], the complex 63 5Np(CO ) − has no significant
contribution to the total Np(IV) concentration. At − log10[H+] = 8 − 9.5 and 0.1 M total carbonate (Figure 10-1-a), the solubilities calculated with the equilibrium constants of [93ERI/NDA] and [99RAI/HES] are consistent, whereas those of [2001KIT/KOH] are about one order of magnitude higher. In solutions containing 0.01 M total carbonate (Figure 10-1-b), the results of [93ERI/NDA] agree with those of [2001KIT/KOH], whereas the model of [99RAI/HES] predicts no significant effect of Np(IV) hydroxide-carbonate complexes. It should be noted that in a former solubility study of Rai and Ryan [85RAI/RYA], the Np(IV) concentration in 0.01 M carbonate solutions of pH 7 − 14 was found to be at the detection limit for 237Np (10–8.3 − 10–8.4 mol · L–1).
The pH-independent solubility data at − log10[H+] > 11 can be ascribed either to the formation of Np(OH)4(CO3)2– [93ERI/NDA] or 4
4 3 2Np(OH) (CO ) − [2001KIT/KOH]. However, the experimental data of Eriksen et al. [93ERI/NDA] are one order of magnitude higher than those of Kitamura and Kohara [2001KIT/KOH], Rai and Ryan [85RAI/RYA], and Rai et al. [99RAI/HES] found no evidence for the forma-tion of Np(OH)4(CO3)2– or 4
4 3 2Np(OH) (CO ) .−
The solubility behaviour of NpO2(am, hydr.) in carbonate solution observed by Eriksen et al. [93ERI/NDA] is clearly different from that reported by Rai et al. [99RAI/HES] and Kitamura and Kohara [2001KIT/KOH]. The results of the two latter studies show a comparable dependence on pH. However, the solubility curves are shifted by about 1.3 units in log10[Np(IV)]tot. This indicates a systematic difference in the solubility product of the two solid phases, but having the same stoichiometry of the complexes and reflects the difference between = − (10.4 ± 0.4) calculated in 10 ,1,2,2log sK ο

10.6 Neptunium carbon compounds and complexes (12.1) 303
this review from experimental data of [2001KIT/KOH] (cf. Appendix A) and = − 11.75 [99RAI/HES]. Kitamura and Kohara [2001KIT/KOH] deter-
mined their solubility data from the direction of over-saturation after precipitation of possibly very small solid particles at a total Np concentration of 10
10 ,1,2,2log sK ο
2
–5 mol · L–1 in 0.5 M NaClO4. Rai et al. [99RAI/HES] determined the solubility of NpO2(am, hydr.) from under-saturation and the particle size of the solid used was probably larger. However, there is no information available to confirm this possible explanation in terms of particle size effect. Eriksen et al. [93ERI/NDA] used electrodeposited NpO2(am, hydr.) and their solubility data was determined from under-saturation. As indicated above, the data of Eriksen et al. are inconsistent with those of [99RAI/HES] and [2001KIT/KOH]. This review has not selected any equilibrium constants for the ternary Np(IV) hydroxide car-bonate complexes because of the uncertainty of the solubility product of the solid phase used in the solubility experiments. However, the experimental data in [99RAI/HES] and [2001KIT/KOH] strongly indicate that complexes with the stoichiometry
23 2Np(OH) (CO ) − and Np(OH)4(CO3)2– or 4
4 3 2Np(OH) (CO ) − are formed.
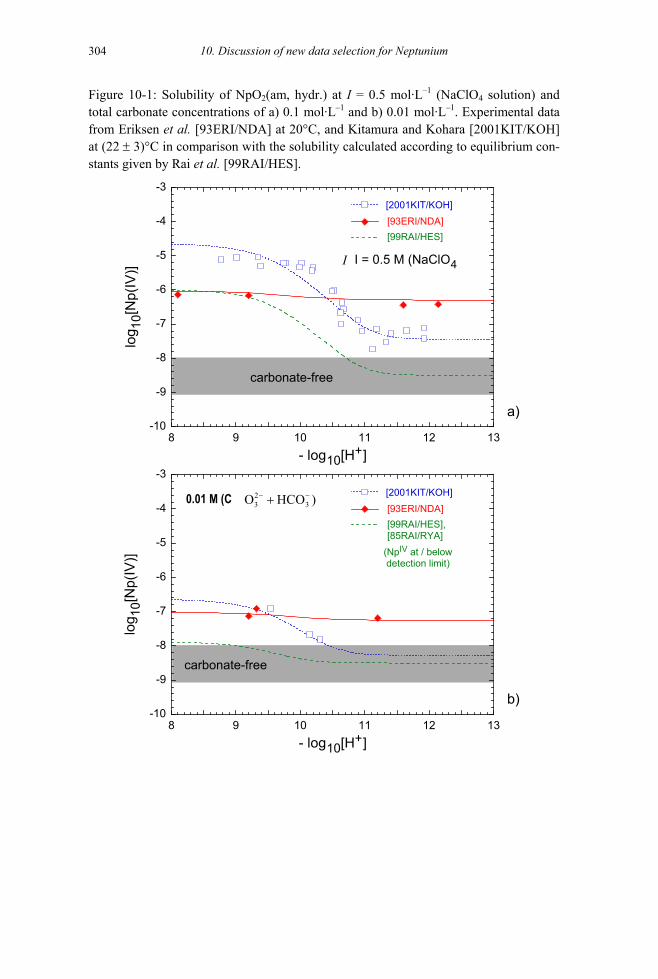
10. Discussion of new data selection for Neptunium 304
Figure 10-1: Solubility of NpO2(am, hydr.) at I = 0.5 mol·L–1 (NaClO4 solution) and total carbonate concentrations of a) 0.1 mol·L–1 and b) 0.01 mol·L–1. Experimental data from Eriksen et al. [93ERI/NDA] at 20°C, and Kitamura and Kohara [2001KIT/KOH] at (22 ± 3)°C in comparison with the solubility calculated according to equilibrium con-stants given by Rai et al. [99RAI/HES].
-10
-9
-8
-7
-6
-5
8 9 10 11 12 13
log 1
0[N
p(IV
)]
)
carbonate-free
- log10[H+]
a)
-10
-9
-8
-7
-6
-5
-4
-3
8 9 10 11 12 13
log 1
0[N
p(IV
)]
- log10[H+]
(NpIV at / below detection limit)
carbonate-free
[93ERI/NDA] [2001KIT/KOH]
[99RAI/HES],[85RAI/RYA]
b)
O32- + HCO3
-) 23 3O HCO )− −+0.01 M (C
I = 0.5 M (NaClO4I
-4
-3
[93ERI/NDA] [2001KIT/KOH]
[99RAI/HES]
0.1 M (CO32- + HCO3
-) 0.1 M 23 3(CO HCO )− −+

10.6 Neptunium carbon compounds and complexes (12.1) 305
10.6.2 Solid neptunium carbonates (12.1.2.2)
10.6.2.1 Solid alkali metal neptunium(V) carbonates hydrates (12.1.2.2.2) The published literature on solid alkali metal and ammonium neptunium(V) carbonates was reviewed in [2001LEM/FUG], but thermodynamic data were selected only for the sodium dioxoneptunium(V) carbonates, NaNpO2CO3 · xH2O(s) and Na3NpO2(CO3)2 · xH2O(s), (pages 275 and 279). However, there is further information to be gleaned from the extensive study by [94RUN/KIM] which was only briefly discussed in [2001LEM/FUG]. Also, as discussed in Appendix D (Section D.2.2), there are difficul-ties in assigning the most appropriate SIT interaction coefficients in assessing values for the solubility products of the sodium neptunium(V) carbonates. Therefore, the solubility constants for the sodium dioxoneptunium(V) carbonates are reinvestigated in the pre-sent review.
10.6.2.1.1 Sodium neptunium(V) carbonates In the previous review [2001LEM/FUG], the data selection for NaNpO2CO3 · xH2O(s) is mainly based on the solubility studies of [83MAY] in 1 M NaClO4 and of Grenthe et al. [86GRE/ROB] in 3 M NaClO4. The latter results were also published in an IAEA seminar report [84VIT] and shown in a figure of [90RIG]. As a consequence of the dif-ferent 10 ,0log sK ο values obtained by using the selected SIT coefficients for conversion to I = 0, [2001LEM/FUG] concluded that the study of [83MAY] refers to a hydrated solid phase, whereas the data of [86GRE/ROB] and the lowest of the widely scattered solubil-ity data measured by Lemire et al. [93LEM/BOY] at 30°C in 1 M NaClO4, were as-cribed to an aged, less hydrated solid phase. The following solubility constants were selected in [2001LEM/FUG] for the reaction:
+2 3 2 3
2NaNpO CO (s) Na NpO + CO+ −+ (10.4)
10 ,0log sK ο (NaNpO2CO3 · 3.5H2O, s, fresh, 298.15 K) = − (11.16 ± 0.35)
10 ,0log sK ο (NaNpO2CO3, s, aged, 298.15 K) = − (11.66 ± 0.50).
The solubility constants determined by Neck et al. [94NEC/RUN], [94NEC/KIM], [95NEC/RUN] in 0.1 − 5 M NaClO4 (partly published in an earlier re-port [91KIM/KLE]), were suspected by [2001LEM/FUG] to include systematic errors, because they yield a value of ∆ε which is not consistent with the SIT coefficients se-lected in the NEA TDB and because the carbonic acid dissociation constants determined in 1 M NaClO≥ 4 deviate from those calculated with NEA TDB auxiliary data. From these studies, Lemire et al. [2001LEM/FUG] accepted only the value extrapolated to I = 0. The results of Meinrath [94MEI] in 0.1 M NaClO4 were found to be consistent with those of [94NEC/RUN], but were not considered further [2001LEM/FUG]. The solubil-ity constants determined by [94NEC/KIM] in 5 M NaCl and by Runde et al. [94RUN/KIM], [96RUN/NEU] in 0.1 − 5 M NaCl were also not included in the discus-sion of data selection, despite the fact that the corresponding ∆ε(10.4) value (see Figure

10. Discussion of new data selection for Neptunium 306
10-2) and the carbonic acid dissociation constants determined in these studies are in agreement with NEA TDB auxiliary data and other widely accepted databases [84HAR/MOL], [91PIT].
The carbonic acid dissociation constants in NaClO4 solutions from [94NEC/RUN] were later used to derive ternary Pitzer parameters for in NaClO2
3CO −4
solutions [96FAN/NEC] and the 4 value discussed in Appendix D.
Table 10-1 lists the reported experimental solubility constants. The values grouped un-der (A) and (B) in Table 10-1 were converted to I = 0 with the SIT (the uncertainties are omitted for easier comparison):
+ 23 NaClO(Na ,CO )−ε
(A) exclusively based on the interaction coefficients selected in [2001LEM/FUG]
(B) based on the same interaction coefficients as calculation (A), with the exception that = − (0.08 ± 0.03) and
4= (0.04 ± 0.05)
kg · mol
+ 23 NaCl(Na ,CO )−ε
+ 23a ,CO )−
+ 23 NaClO(Na ,CO )−ε
–1 (the latter value is derived from the carbonic acid dissociation con-stants reported by [96FAN/NEC]) are used instead of the single unique value of
= − (0.08 ± 0.03) kg · mol(Nε –1.
Calculation (A), with a unique value of + 23(Na ,CO )−ε = − (0.08 ± 0.03)
kg · mol–1 leads to consistent 10 ,0log sK ο values from the data in dilute to concentrated NaCl media and in 0.1 M NaClO4, while the lo 10 ,0g sK ο values calculated from data in NaClO4 media decrease systematically with increasing NaClO4 concentration. Calcula-tion (B), with the individual values of = − (0.08 ± 0.03) kg · mol+ 2
3 NaCCO )−
10log
l
,0
(Na ,ε –1 and
4= (0.04 ± 0.05) kg · mol+ 2
3 NaClO(Na ,CO )−ε –1, yields consistent values at I = 0, (for all data in both media) with a mean value of sK ο (NaNpO2CO3 · 3.5H2O, cr) = − (11.0 ± 0.2).
An analogous observation is made if the conditional solubility constants re-ported for Na3NpO2(CO3)2(s) in 1.0, 3.0 and 5 M NaClO4 [86GRE/ROB], [95NEC/RUN] and in 5 M NaCl [94RUN/KIM], [95NEC/RUN] for the reaction:
+ +3 2 3 2 2
23Na NpO (CO ) (s) 3Na + NpO + 2CO − (10.5)
are converted to I = 0 by calculations (A) and (B) (Table 10-1). Calculation (B) with = − (0.08 ± 0.03) kg · mol+ 2
3 NaCl(Na ,CO )−ε –1 and 4
ε = (0.04 ± 0.05) kg · mol
+ 23 NaClO(Na ,CO )−
–1 yields fairly consistent 10 ,0log sK ο values with a mean value of 10 ,0log sK ο (Na3NpO2(CO3)2, s) = − (14.0 ± 0.4). The solubility constant selected by
[2001LEM/FUG], − (14.70 ± 0.66), is lower and the assigned uncertainty is larger.
However, as noted in Appendix D the present review does not accept the value of
4 (0.04 ± 0.05) kg · mol–1 derived from the carbonic acid disso-
ciation constants of Fanghänel et al. [96FAN/NEC]. Therefore the equilibrium con-stants calculated with this interaction coefficient are not selected.
+ 23 NaClO(Na ,CO )−ε =

10.6 Neptunium carbon compounds and complexes (12.1) 307
Table 10-1: Solubility constants of NaNpO2CO3·3.5H2O(s) and Na3NpO2(CO3)2(s) at 20 − 25°C and conversion to I = 0 with the SIT
Reference Medium t (°C) 10 ,0
logs
K 10 ,0
logs
K ο (A)
10 ,0log
sK ο
(B)
NaNpO2CO3 ·3.5H2O(s)
[96RUN/NEU] 0.1 M NaCl 23 – (10.40 ± 0.2) – 11.05 – 11.05 [94RUN/KIM] 1.0 M NaCl 22 – (9.77 ± 0.16) – 10.98 – 10.98 [96RUN/NEU] 3.0 M NaCl 23 – (9.40 ± 0.2) – 10.86 – 10.86 [94RUN/KIM] 5.0 M NaCl 22 – (9.61 ± 0.11) – 11.21 * – 11.21 * [94NEC/KIM] 5.0 M NaCl 25 – (9.52 ± 0.04) – 11.12 * – 11.12 * [94NEC/RUN] 0.1 M NaClO4 25 – (10.28 ± 0.04) – 10.92 – 10.91 [94MEI] 0.1 M NaClO4 25 – (10.22 ± 0.02) – 10.86 – 10.85 [94NEC/RUN] 1.0 M NaClO4 25 – (10.10 ± 0.03) – 11.13 – 10.99 [83MAY] 1.0 M NaClO4 25 – (10.14 ± 0.04) – 11.17 – 11.04 [94NEC/RUN] 3.0 M NaClO4 25 – (10.45 ± 0.04) – 11.31 – 10.89 [86GRE/ROB] 3.0 M NaClO4 20 – 10.56 – 11.42 – 11.00 [94NEC/RUN] 5.0 M NaClO4 25 – (11.06 ± 0.06) – 11.54 * – 10.76 *
Na3NpO2(CO3)2(s)
[94RUN/KIM] 5.0 M NaCl 22 – (11.46 ± 0.23) – 14.22 * – 14.22 * [95NEC/RUN] 1.0 M NaClO4 25 – (12.23 ± 0.15) – 14.44 – 14.19 [86GRE/ROB] 3.0 M NaClO4 20 – 12.44 – 14.62 – 13.78 [95NEC/RUN] 3.0 M NaClO4 25 – (12.59 ± 0.10) − 14.77 – 13.93 [95NEC/RUN] 5.0 M NaClO4 22 – (13.57 ± 0.11) – 15.34 * – 13.78 *
(A) calculated with the SIT coefficients of the NEA TDB: = − 0.08 kg · mol+ 2
3(Na , CO )−ε+
2(NpO , ClO )−ε
–1, ε = 0.01 kg · mol+
4(Na , ClO )−
+
2(NpO , Clε
–1, = 0.03 kg · mol+(Na , Cl )−ε
2CO
–1, = 0.25 kg · mol4
–1 and = 0.09 kg · mol)− –1. −(B) calculated with the same SIT coefficients as in (A), except for 3 in NaClO4 solution:
4
+ 23 NaClO(Na ,CO )−ε = 0.04 kg · mol–1 and + 2
3 NaCl(Na ,CO )−ε = − 0.08 kg · mol–1.
* At this high ionic strength the SIT calculation gives rise to relatively large uncertainties.

10. Discussion of new data selection for Neptunium 308
Figure 10-2: SIT extrapolation to I = 0 for the reaction: Figure 10-2: SIT extrapolation to I = 0 for the reaction:
+ + 22 3 2 2 3 2
+ + 22 3 2 2 3 2NaNpO CO 3.5H O(s) Na + NpO + CO + 3.5 H O(l)−⋅ .
The SIT regression lines are not fitted to the data but calculated with fixed ∆ε values: ∆ε = 0.04 kg · mol–1 in NaCl solution is calculated using exclusively data from [2001LEM/FUG], while ∆ε = 0.30 kg · mol–1 in NaClO4 solution is calculated with
4= 0.04 kg · mol+ 2
3 NaClO(Na ,CO )−ε –1 derived from [96FAN/NEC], corresponding to calculation (B) in Table 10-1. Calculation (A), with ∆ε = 0.18 kg · mol–1 in NaClO4 so-lution [2001LEM/FUG] is shown as dotted lines.
-13.0
-12.5
-12.0
-11.5
-11.0
-10.5
-10.0
0 1 2 3 4 5 6 7
log
NaCl
NaClO4
[94RUN/KIM], [96RUN/NEU]
NaClO4: ∆ε = 0.30 kg.mol -1 (fixed)
NaCl: ∆ε = 0.04 kg.mol -1 (fixed)
NaNpO2CO3.3.5 H2O(s)
[94NEC/KIM]
[94NEC/RUN]
[94MEI]
[83MAY] [86GRE/ROB]
,
log 1
0Ks,
0 - 6
D +
3.5
log 1
0aw
I (mol.kg-1) Concerning the chemical nature of NaNpO2CO3 · xH2O(s), it has been shown by X–ray powder diffraction that the solubility data in [94NEC/RUN], [94NEC/KIM], [94RUN/KIM], [95NEC/RUN], [96RUN/NEU] refer to the same solid characterised earlier by Volkov et al. [77VOL/VIS] and Maya [83MAY]: hydrated NaNpO2CO3 · 3.5H2O(cr). Only Meinrath [94MEI] reported another (hexagonal) modification with a different X–ray pattern. Furthermore, the solids used in [94NEC/RUN], [94NEC/KIM], [94RUN/KIM], [95NEC/RUN], [96RUN/NEU] were left to age at least several weeks up to more than six months. The solid used in these studies and that of [83MAY], which was also left to age to a crystalline solid prior to the solubility measurement, are not fresh precipitates as assumed in [2001LEM/FUG], but are well-crystallised compounds.
For this reason and because of the possible ambiguities in lo 10 ,0g sK ο values

10.6 Neptunium carbon compounds and complexes (12.1) 309
derived from data at higher NaClO4 concentrations, the present review does not agree with the two values selected by [2001LEM/FUG] for NaNpO2CO3 · 3.5H2O(s, fresh) and NaNpO2CO3(s, aged). The revised selection of 10 ,0log sK ο is based exclusively on experimental studies which fulfil the following prerequisites:
10 ,0g sK ο
2 3 3(CO )
• The solubility study must refer to NaNpO2CO3 · 3.5H2O(cr) described by [77VOL/VIS] and [83MAY], and include sufficient data at low carbonate con-centrations, with free +
2NpO as the predominant species.
• The carbonic acid dissociation constants used by the authors to calculate from the measured – log2
10 3log [CO ]−10[H+] values must be consistent with auxil-
iary data from the NEA TDB.
• The recalculation to I = 0 must not include data at high ionic strengths where large uncertainties arise because the validity range of the SIT is exceeded or am-biguity exists concerning the interaction coefficient of the carbonate ion.
All these prerequisites are fulfilled for the five studies in 0.1 M NaClO4 [94NEC/RUN], 1 M NaClO4 [83MAY], and 0.1, 1.0 and 3.0 M NaCl [94RUN/KIM], [96RUN/NEU]. The unweighted average of the lo values calculated in Table 10-1 with the SIT coefficients from [2001LEM/FUG] is selected:
10 ,0log sK ο (NaNpO2CO3 · 3.5H2O, cr, 298.15 K) = − (11.00 ± 0.24) and (NaNpOf mGο∆ 2CO3 · 3.5H2O, cr, 298.15 K) = − (2590.4 ± 5.8) kJ · mol–1.
With regard to the changed selection compared to the previous review [2001LEM/FUG], it has to be pointed out that all experimental studies used for the re-evaluation of thermodynamic data for NaNpO2CO3·3.5H2O(cr) were performed with a crystalline compound aged at least for several weeks and not with a fresh, gelatinous precipitate. Such fresh precipitates might have a different water content or even a differ-ent chemical composition, possibly with a stoichiometry of Na0.6NpO2(CO3)0.8·xH2O(cr) as reported by [79VOL/VIS2]. They are assumed to be metastable and to convert gradu-ally into NaNpO2CO3·xH2O(cr) (cf. discussion in [2001LEM/FUG], p. 274). Thermal treatment of NaNpO2CO3·xH2O(cr) can lead to a decrease of the water content, i.e., 3.5 ≥ x ≥ 0 at 20 − 130°C, and to changing XRD patterns as shown by Volkov et al. [77VOL/VIS].
The solubility constant selected in [2001LEM/FUG] for Na3NpO2(CO3)2(s) is based on the solubility data reported by Simakin [77SIM] for the reaction:
2 53 2 3 2 3Na NpO (CO ) (s) + CO NpO + 3Na− − (10.6) +
with 10 ,3log sK (10.6) = − (1.46 ± 0.09) at I = 3 M (NaNO3 − Na2CO3). There is a prob-lem with this study that was not mentioned in the discussion in [2001LEM/FUG]. The
concentration was varied in the range of 0.25 − 1 mol · L23CO − –1, which does not allow
both the Na+ concentration and ionic strength to be kept constant. If the ionic strength

10. Discussion of new data selection for Neptunium 310
were kept constant at I = 3 M, then [Na+], which is involved directly in the equilibrium constant of reaction (10.6), decreases from 2.75 to 2.0 mol · L–1. If [Na+] were kept con-stant at 3.0 mol · L–1 then I increases from 3.25 to 4.0 mol · L–1.
Moreover, as shown in Appendix D.2.1, the SIT coefficient for the complex 5
2 3 3NpO (CO ) − depends significantly on the anion of the electrolyte medium. [2001LEM/FUG] used the value of +
2 3 3(Na , NpO (CO ) )5−ε = − (0.53 ± 0.19) kg · mol–1 determined from data in NaClO4 solutions and calculated from the data of Simakin [77SIM]:
10 ,3log sK ο (10.6) = − (9.20 ± 0.65)
10 ,0log sK ο (Na3NpO2(CO3)2, s, 298.15 K) = − (14.70 ± 0.66).
With regard to the NaNO3-Na2CO3 solutions used in [77SIM], the value of = − (0.29 ± 0.11) kg · mol+
2 3 3(Na , NpO (CO ) )−ε 5
5
–1 derived from data of [94RUN/KIM] in NaCl solution and close to +
2 3 3(K , NpO (CO ) )−ε = − (0.23 ± 0.02) kg · mol–1 derived from data of [97NOV/ALM] in pure carbonate solution (cf. Appendix A), might be a better approximation. It leads to considerably different equilibrium constants:
10 ,3log sK (10.6) = − (8.39 ± 0.50)
10 ,0log sK ο (Na3NpO2(CO3)2, s, 298.15 K) = − (13.89 ± 0.52).
The values of + 23(Na ,CO )−ε
10 3log= − (0.08 ± 0.03) kg · mol–1, =
− (0.04 ± 0.03) kg · mol
+3(Na , NO )−ε
-1 and οb ( 52 3 3NpO (CO ) − , 298.15 K) = (5.50 ± 0.15) used
in these calculations are taken from [2001LEM/FUG].
The solubility constant derived in Table 10-1 from data determined by [94RUN/KIM] in 5 M NaCl at 2
3CO − concentrations in the range of 10–3 − 10–1 mol · L−1 does not involve the ambiguities discussed above and, hence, appears more reliable. The solid used by [94RUN/KIM] was also well characterised by X–ray diffrac-tion. Therefore, the present review selects:
10 ,0log sK ο (Na3NpO2(CO3)2, cr, 298.15 K) = − (14.22 ± 0.50)
f mGο∆ (Na3NpO2(CO3)2, cr, 298.15 K) = − (2830.6 ± 6.4) kJ · mol–1.
The large uncertainty for lo 10 ,0g sK ο arises mainly from the term ∆ε(10.5) = (0.02 ± 0.08) kg · mol–1 applied to the data in 5.6 m NaCl. It is noteworthy that this solubility constant agrees with the values of 10 ,0log sK ο (10.5) = − (14.1 ± 0.3) and − (14.3 ± 0.2), calculated from the value in 5.6 m NaCl by using the Pitzer models of [95NEC/FAN] and [96RUN/NEU], respectively. The auxiliary data used in these papers for Np(V) and in NaCl solution are consistent with the NEA TDB selections. 2
3CO −
10.6.2.1.2 Potassium neptunium(V) carbonates In two recent studies not discussed in [2001LEM/FUG], Novak et al. [97NOV/ALM] and Al Mahamid et al. [98ALM/NOV] determined accurate solubility data for

10.6 Neptunium carbon compounds and complexes (12.1) 311
KNpO2CO3 · xH2O(s) and K3NpO2(CO3)2 · xH2O(s) in K2CO3 solutions and KCl-K2CO3 mixtures.
The solids formed in K2CO3 solutions below 0.4 molal gave X–ray powder dif-fraction patterns comparable with those reported by Keenan and Kruse [64KEE/KRU] for KNpO2CO3 · xH2O(s). The same solid was stable in KCl-K2CO3 mixtures with mKCl = 0.003 − 3.2 mol · kg–1 and mK2CO3
= 0.001, 0.01, and 0.1 mol · kg–1. At higher K2CO3 concentrations, two modifications of K3NpO2(CO3)2 · xH2O(s) were identified as the phases A and B described by Volkov et al. [74VOL/KAP2] and Visyashcheva et al. [74VIS/VOL]. Phase B is stable over a broad range of K2CO3 concentrations and phase A is preferentially formed at K2CO3 concentrations above 2 molal [97NOV/ALM], [74VOL/KAP2]. Their solubilities do not differ markedly.
The water content in KNpO2CO3 · xH2O(s) and K3NpO2(CO3)2 · xH2O(s), phase B, was estimated in [74VIS/VOL] to be x ≤ 2 and x ≈ 1.6, respectively, but it is not exactly known. Therefore, this study disregarded in the evaluation of thermody-namic data as was done by [2001LEM/FUG] in the case of sodium neptunium(V) car-bonates.
Novak et al. [97NOV/ALM] extended the set of equilibrium constants and ion interaction Pitzer parameters reported in [95FAN/NEC] for the system Np(V)-Na-OH-CO3-Cl-H2O (298.15 K) and calculated 10 ,0log sK ο = − (13.6 ± 0.1) for KNpO2CO3(s) and 10 ,0log sK ο = − (15.9 ± 0.1) for K3NpO2(CO3)2(s).
In the present review, the experimental data of [97NOV/ALM] and [98ALM/NOV] are re-evaluated using the SIT model (cf. Appendix A). Neglecting the small difference in temperature (experimental data at (295.15 ± 1.00) K compared to the standard state of 298.15 K) the following results are obtained for the reactions, (where the hydration water molecules are omitted):
22 3 3 2 3 3KNpO CO (s) + 2CO NpO (CO ) + K− 5 +− , (10.7)
10 ,3log sK ο ((10.7), 298.15 K) = − (7.65 ± 0.11),
∆ε(10.7) = − (0.25 ± 0.06) kg · mol–1 and
2 53 2 3 2 3 2 3 3K NpO (CO ) (s) + CO NpO (CO ) + 3K− +− , (10.8)
10 ,3log sK ο ((10.8), 298.15 K) = − (9.96 ± 0.06),
∆ε(10.8) = − (0.22 ± 0.02) kg · mol–1.
Combined with auxiliary data from [2001LEM/FUG], the values of ∆ε(10.7) and ∆ε(10.8) lead to a consistent interaction coefficient which is selected in this review:
5 +2 3 3(NpO (CO ) , K )−ε = − (0.22 ± 0.03) kg · mol–1.
By combining lo 10 ,3g sK ο ((10.7), 298.15 K) and 10 ,3log sK ο ((10.8), 298.15 K)

10. Discussion of new data selection for Neptunium 312
with (10 3log οb 52 3 3NpO (CO ) −
2 3KNpO CO (s)
, 298.15 K) = (5.50 ± 0.15) [2001LEM/FUG], we obtain the following solubility constants which are selected in the present review:
10 ,0log sK ο
3 2 3K NpO (CO )
10 ,0log sK ο
+ +2 3 K + NpO + CO2− (10.9)
(KNpO2CO3, s, 298.15 K) = − (13.15 ± 0.19) and
+ +2 2 3(s) 3K + NpO + 2CO2− (10.10)
(K3NpO2(CO3)2, s, 298.15 K) = − (15.46 ± 0.16).
The solubility of the potassium dioxoneptunium(V) carbonates is about two or-ders of magnitude lower than that of the corresponding sodium dioxoneptunium(V) car-bonates. Therefore, the solubility of Np(V) in quaternary Na-K-Cl-CO3 solutions will be controlled by KNpO2CO3(s) even if the concentration of Na+ is much higher than that of K+ [98ALM/NOV].
Chapter 11Equation Section 11
11 Discussion of new data selection for Plutonium
11.1 Plutonium aqua ions (16.1) EXAFS fine structure spectra of aqueous ions Pu(III to VI): Pu3+, Pu4+, in 1 M HClO
2+2PuO
4 and at pH = 6 are given by Conradson et al. [98CON/ALM]. +2PuO
11.2 Plutonium oxygen and hydrogen compounds and complexes (17)
11.2.1 Aqueous hydroxide complexes (17.1)
11.2.1.1 Plutonium(V) hydroxide complexes (17.1.2) The disproportionation of Pu(V) in concentrated NaOH solutions has been investigated by Budantseva et al. [98BUD/TAN] but, as explained in Appendix A, no thermody-namic values can be derived from the published data.
11.2.1.2 Plutonium(IV) hydroxides complexes (17.1.3) New experimental data on the solubility of Pu(OH)4 leading to thermodynamic values have appeared since the previous review in [98CAP/VIT], [98CHA/TRI], [98EFU/RUN], [99KNO/NEC], [99RAI/HES2], and re-interpretations of most of the data on Pu4+ hydrolysis, already considered in [2001LEM/FUG], have been proposed in [99KNO/NEC], [99NEC/KIM] and [2001NEC/KIM].
With Pu(IV), the phenomena already mentioned for tetravalent actinides con-cerning hydrolysis are exacerbated, among others with colloid formation; in addition, it is difficult to prevent Pu(IV) from oxidising with subsequent disproportionation of Pu(V) in acidic media. With regard to colloid formation, Knopp et al. [99KNO/NEC] showed by LIBD (Laser-Induced Breakdown Detection) and ultrafiltration that when the Pu(IV) concentration exceeds the solubility of amorphous PuO2(am, hydr.), colloids are the predominant species in solution (see Appendix A).
Considering this particular tendency of Pu(IV), this review starts with the prob-lem of the selection of hydrolysis constants. The values of 10 ,0log ο
sK are given in sec-tion 11.2.2.1.
313

11 Discussion of new data selection for Plutonium 314
Knopp et al. [99KNO/NEC], and Neck and Kim [99NEC/KIM], [2001NEC/KIM], pointed out that to make theoretical calculations according to the methods already mentioned (see Chapters on U and Np), the initial choice of must involve an experimental value corresponding to experimental conditions where colloids are not likely to be formed. These conditions seem not to be fulfilled for solutions in which spectroscopic measurements have been made, because the total concentrations of Pu are higher than the solubility of PuO
1,1οb
2(am, hydr.). Therefore, the value retained by Neck and Kim is = (14.6 ± 0.2) derived from experiments at tracer levels [72MET/GUI], [73MET]. All the other values reported in the literature mentioned in [2001LEM/FUG] are smaller. The model calculation in [2001NEC/KIM] led to
= 14.6, lo = 28.3,
10 1,1log οb
10 2,1g οb10 1,1log οb 10 3,1log οb = 39.4 and 10 4,1log οb = 47.5, which are in close agreement with the experimental values of [72MET/GUI], [73MET]: lo = (14.6 ± 0.2), = (28.6 ± 0.3),
10g 1,1οb
10g 2,1οblo 10 3,1log οb = (39.7 ± 0.4) and lo =
(47.5 ± 0.5). There are no experimental data other than those of [72MET/GUI], [73MET] to check the values of
10g 4,1οb
2,1οb and 3,1
οb , but the value of 4,1οb was confirmed from
solubility experiments (see section 11.2.2.1). [2001LEM/FUG] selected for Pu(IV), = − (0.78 ± 0.60), (10 1,1
*log οb 10g 1,1lo οb = (13.22 ± 0.60)) as the average value of the most reliable results of spectroscopic measurements. No other values are selected for the hy-drolysis constants. None of the spectroscopic studies considered in [2001LEM/FUG] could identify two distinct absorption bands for Pu4+ and Pu(OH)3+ or a shift of the ab-sorption maximum. The only effect observed was the decrease of the absorption band when pH was increased and the solubility limit of PuO2(am, hydr.) was exceeded [99KNO/NEC]. For these reasons, and despite the fact that [2001LEM/FUG] noticed some ambiguities in the interpretation of the solvent extraction data of Metivier and Guillaumont [72MET/GUI] and analogous data for Np(IV) [77DUP/GUI] (cf. section 10.2.1.3), we rely on these hydrolysis constants.
As mentioned for U(IV) and Np(IV), the hydrolysis constants reported by Neck and Kim [2001NEC/KIM] are derived in a systematic and consistent manner (and also for Th) taking into account colloid formation, and appear to this review to be the "best values" that can be derived from the available data.
This review retains the equilibrium constants from the solvent extraction study of Metivier and Guillaumont [72MET/GUI] converted to I = 0 using the SIT model and selects the values proposed by [99KNO/NEC], [99NEC/KIM] and [2001NEC/KIM] at 298.15 K for the reactions:
4+ 4Pu + OH Pu(OH) nnn − − , (11.1)
. (11.2) 4+ 4 +2Pu + H O(l) Pu(OH) + Hn
nn − n
10 1log οb (11.1) = (14.6 ± 0.2) 10 1*log οb (11.2) = (0.6 ± 0.2), * 10 2log οb (11.1) = (28.6 ± 0.3) 10 2log οb (11.2) = (0.6 ± 0.3), * 10 3log οb (11.1) = (39.7 ± 0.4) 10 3log οb (11.2) = − (2.3 ± 0.4),

11.2 Plutonium oxygen and hydrogen compounds and complexes (17)
315
10 4log οb (11.1) = (47.5 ± 0.5) 10 4*log οb (11.2) = − (8.5 ± 0.5).
Peretrukhin et al. [96PER/KRY] determined the formation of negatively charged hydroxide complexes 2
6Pu(OH) − , from the increase in the solubility of Pu(IV) hydroxide in 0.5 to 14.1 M NaOH. However, for the reasons given in Appendix A, the present review does not derive thermodynamic data from the results reported by [96PER/KRY].
The standard Gibbs energy values f mGο∆ ( 4Pu(OH) nn
− , 298.15 K) can be calcu-lated from (11.2) and r mGο∆ f mGο∆ (Pu4+, 298.15 K) = − (478.0 ± 2.7) kJ · mol–1 (see 11.2.3).
The previous NEA TDB review [2001LEM/FUG] used the temperature de-pendence of the first hydrolysis constant determined in [57RAB], [60RAB/KLI] to cal-culate r m
ο∆ H ((11.2), n =1, 298.15 K) = (36 ± 10) kJ · mol–1 and mοS (PuOH3+, 298.15 K)
= − (239 ± 37) J · K–1 · mol–1. However, as shown by [99KNO/NEC], these are two typical studies where the total Pu concentration exceeds the solubility of PuO2(am, hydr.). Therefore, these values are rejected by the present review.
11.2.2 Solid plutonium oxides and hydroxides (17.2)
11.2.2.1 Plutonium(IV) oxides and hydroxides Haschke et al. [2000HAS/ALL], [2001HAS/ALL], [2002HAS/ALL] have suggested that a solid solution, PuO2+x (0 < x < 0.25), can be formed by exposing an oxide with a composition close to PuO1.97 to water vapour at temperatures from 300 to 623 K for some days. They cite as evidence the formation of H2(g) and a small increase in the lat-tice parameter of the oxide; there was no independent analysis of the composition of the oxide. However, PuO2 is known to adsorb oxygen and/or water to give an apparent bulk composition of at least PuO2.09 [61WAT/DOU], [63JAC/RAN] and of course, hydrogen is one of the major products of water radiolysis. Moreover, the increase in lattice pa-rameters (from an ill-defined starting value) is within the range found in PuO2.00 due to radiation damage [62RAN/FOX]. Thus, the evidence for the formation of a thermody-namically stable bulk phase with O/Pu > 2 is far from conclusive. Such non-stoichiometric oxides (like UO2+x) fall outside the scope of this review, but further work is clearly required on the interesting phenomena observed by Haschke et al.
11.2.2.1.1 Solubility of crystalline oxide PuO2(cr) (17.2.1.2) No new experimental data have appeared since the last review. According to the values of Gibbs energy of formation of PuO2(cr) selected by [2001LEM/FUG]:
f mο∆ G (PuO2, cr, 298.15 K) = − (998.1 ± 1.0) 1kJ mol−⋅ ,
f mο∆ G (Pu4+, 298.15 K) = − (478.0 ± 2.7) 1kJ mol−⋅
and the auxiliary values discussed in [92GRE/FUG], this review calculates:
11 Discussion of new data selection for Plutonium 316
10 ,0log οsK (PuO2, cr) = − (64.04 ± 0.51).
The solubility product values calculated by other authors who used somewhat different thermodynamic data for Pu4+ and PuO2(cr) are − (63.8 ± 1.0) [89KIM/KAN] and − (64.1 ± 0.7) [87RAI/SWA], respectively.
This review retains the thermodynamic data selected by [2001LEM/FUG].
11.2.2.1.2 Solubility of amorphous oxide and hydroxide PuO2(am, hydr.) The value selected by [2001LEM/FUG] for the solubility equilibrium for aged PuO2(am, hydr.),
4+2 2PuO (am, hydr.) + 2H O(l) 4OH Pu− + , (11.3)
is 10 ,0log οsK (PuO2, am, hydr., (11.3)) = − (58 ± 1). All the values recently reported
agree with this value, but with reduced uncertainty.
The literature data on the solubility of PuO2(am, hydr.) for acidic and basic media (pH = 0 to 13) have been reviewed by Neck and Kim [99NEC/KIM], [2001NEC/KIM], and Knopp et al. [99KNO/NEC], and re-interpreted on the basis of the hydrolysis constants (see above) from [72MET/GUI] resulting in 10 ,0log ο
sK (PuO2, am, hydr., (11.3)) = − (58.7 ± 0.9) (see Appendix A). The analysis in [99KNO/NEC], [99NEC/KIM] and [2001NEC/KIM] incorporated experimental solubility data of [49KAS], [65PER], [84RAI], [86LIE/KIM] and [89KIM/KAN], where the aqueous Pu(IV) concentration was confirmed experimentally.
To calculate 10 ,0log οsK (PuO2, am, hydr., (11.3)), Capdevila and Vitorge
[98CAP/VIT] used a non-conventional method explained in Appendix A. They calcu-lated the [Pu4+] in equilibrium with Pu(IV) hydroxide from the measured equilibrium concentrations of the aqueous ions Pu at constant − log+ 2+
2 2O , PuO and Pu ,3+10[H+].
The solutions studied were 0.1 M HClO4 + (x − 0.1) M NaClO4 media, x = 0.1, 0.5, 1, 2 and 3. [Pu4+] remains always lower than 10−4 M, but the electrochemical method used to derive [Pu4+] is independent of the hydrolysis of that ion. As explained in Appendix A, the values obtained are 10log ,0
οsK (PuO2, am, hydr., (11.3)) = − (58.3 ± 0.5) and
= (0.85 ± 0.20) kg · mol4+4(Pu ,ClO )−ε –1.
In three very recent studies by Fujiwara et al. [2001FUJ/YAM], Rai et al. [2001RAI/MOO] and [2002RAI/GOR], the solubility of PuO2(am, hydr.) in the range 4 <− log10[H+] < 9 was determined under reducing and oxidizing conditions, respec-tively.
Fujiwara et al. [2001FUJ/YAM] measured the solubility of Pu(IV) hydrous oxide under reducing conditions in 1.0 M NaClO4 solutions. The data refer to the reac-tion:
3+2 2PuO (am) + 2H O + e Pu + 4OH .− − (11.4)

11.2 Plutonium oxygen and hydrogen compounds and complexes (17)
317
Extrapolation to I = 0 with the SIT model and combining with the redox poten-tials selected in [2001LEM/FUG] for the couple Pu4+/Pu3+ leads to a solubility product of 10 ,0log ο
sK (PuO2, am, hydr., 298.15 K, (11.3)) = − (58.1 ± 0.4).
Rai et al. [2001RAI/MOO] determined the solubility of amorphous Pu(IV) hydrous oxide in different air-equilibrated NaClO4 and NaCl solutions at I = 0.4 and 4.0 mol · L–1. A similar previous study in 0.0015 M CaCl2 [84RAI] is also included to evaluate the equilibrium constant for the reaction:
+2PuO (am, hydr.) PuO + e .2
− (11.5)
By combining the values of 10log K ο (11.5) from [84RAI] and [2001RAI/MOO] with the redox potential and other auxiliary data selected in [2001LEM/FUG], the solubility product is calculated to be
+ 42PuO /Pu +
10 ,0log οsK (PuO2, am,
hydr., (11.3)) = − 58.0 and − 57.4, respectively. As the equilibrium constants are given without uncertainty limits and include unknown uncertainties arising from the measured pe values [2001RAI/MOO] (cf. Appendix A), they are not used in this review for the selection of 10 ,0log sK ο (PuO2, am, hydr., 298.15 K, (11.3)).
Rai et al. [2002RAI/GOR] have made a precise and well described experimen-tal study of the solubility of PuO2(am) under controlled reducing conditions in NaCl solutions at low ionic strength, less than 0.025 M. They measured the equilibrium con-stant of reaction (11.4). Using a Pitzer approach and combining appropriate data from [2001LEM/FUG] they calculated 10 ,0log ο
sK (PuO2, am, hydr., (11.3)) = − (58.2 ± 0.97) (see Appendix A) nearly the same as that given by Fujiwara et al. [2001FUJ/YAM].
Based on the solubility constants determined for PuO2(am, hydr.) by [99KNO/NEC], [98CAP/VIT], [2001FUJ/YAM] and [2002RAI/GOR] who used three different, independent methods, the present review selects the following unweighted mean value:
10 ,0log οsK (PuO2, am, hydr., 298.15 K, (11.3)) = − (58.33 ± 0.52)
with the uncertainty given as 1.96σ. This equilibrium constant describes best the solu-bility of tetravalent plutonium hydrous oxides.
However, for the reasons already given in section 9.3.2.2, the present review does not select a value of (PuOf mGο∆ 2, am, hydr.) for this chemically ill-defined Pu(IV) hydroxide, amorphous hydrous oxide or oxyhydroxide.
For the solubility of PuO2(am, hydr.), more or less well-characterised in a set of solutions of various compositions, the values of log10[Pu(OH)4(aq)] = − (7.7 ± 0.4), − (10.4 ± 0.5) and − (10.2 ± 0.8) have been reported, respectively, by Efurd et al. [98EFU/RUN], Rai et al. [99RAI/HES2] and Chandratillake et al. [98CHA/TRI] in the range of pH = 8 to 13. As discussed in Appendix A, the concentration of Pu(IV) of ca. 10−7.7 M in basic solutions indicates the probable presence of colloids. With
10 ,0log οsK (PuO2, am, hydr., 298.15 K, (11.3)) = − (58.33 ± 0.52) as selected above,

11 Discussion of new data selection for Plutonium 318
these new solubility data suggest a value of lo 10 4,1g οb = (47.9 ± 0.7), somewhat larger than the value obtained from the solvent extraction study of Metivier and Guillaumont [72MET/GUI], lo = (47.5 ± 0.5). 10 4,1g οb
10 ,0g οsK
nO (am or c
f m (AnOG− ο∆
4 (aq)
2(AnO am, hy
,0 f m = (
sGο ο− ∆
nO (am)
, 4 10 = log Aο
f∆
This review considers lo 10 4,1g οb = (47.5 ± 0.5) as the best experimental value.
11.2.3 Comparison of thermodynamic data for oxides and hydroxide complexes of tetravalent actinides
11.2.3.1 Solid oxides and aqueous hydroxide complexes of tetravalent actinides Table 11-1 and Table 11-2 give a summary of the thermodynamic constants retained in this review governing the behaviour of tetravalent actinides (except Pa(IV)). Data are given in relation to the studies of [92GRE/FUG], [95SIL/BID] and [2001LEM/FUG].
Table 11-1: Summary of solubility and equilibrium constants for tetravalent actinides retained for discussion or selected by this review.
Th U Np Pu Am
lo (a)
AnO2(cr)
– (54.3 ± 1.1)(e)
– (60.86 ± 0.36)(c)
– (65.75 ± 1.07)(d)
{– (63.7 ± 1.8)}(f) – (64.04 ± 0.51)(d)
– (65.4 ± 1.7)(h)
AnO2(am,hydr.) – (47.0 ± 0.8)(g – (54.5 ± 1.0)* – (56.7 ± 0.5)* – (58.33 ± 0.52)*
10 ,4log οsK (b) – (8.5 ± 0.6) (g) – (8.5 ± 1.0) – (9.0 ± 1.0) – (10.4 ± 0.5)
10 1,1log οb (11.8 ± 0.2) (g) (13.46 ± 0.06)(c) (14.55 ± 0.20)(g)* (14.6 ± 0.2)*
10 2,log ο1b (22.0 ± 0.6) (g) (26.9 ± 1.0)(g) (28.35 ± 0.30)(g)* (28.6 ± 0.3)*
10 3,1log οb (31.0 ± 1.0) (g) (37.3 ± 1.0)(g) (39.2 ± 1.0)(g) (39.7 ± 0.4)*
10 4,log ο1b (39.0 ± 0.5) (g) (46.0 ± 1.4)* (47.7 ± 1.1)* (47.5 ± 0.5)*
* selected by this review as described in the corresponding section. (a) solubility product at 298.15 K for the equilibrium: 4+
2 2A r) + 2 H O(l) An + 4 OH−
) am or cr) 2 (H O, l) , G ο− ∆−4+
f m 2 f m 2 R An ) + 4 (OHlnT K G ο∆
+ 2 H O(l) An(OH).
(b) for equilibrium A 2 2
n(OH) (aq) = log[ ]K10 4 10 ,0 10 4 ,1
log dr.)) + log(s s
K ο οblog
. K ο log οbThe 10 ,4s values and hence the 10 4,1 values derived for Th(IV), U(IV) and Np(IV) from ex-
perimental solubilities of AnO2(am, hydr.) in neutral and alkaline solutions might represent upper limits because it is difficult to ascertain that the experimental data are not affected by contributions from col-loids or oxidation state conversions.
(c) selected by [92GRE/FUG]. (d) selected by [2001LEM/FUG]. (e) calculated by this review using f mG ο∆ (ThO2, cr, 298.15 K) = − (1169.238 ± 3.504) kJ · mol–1 from
CODATA [89COX/WAG] selected by [92GRE/FUG] and mG ο (Th4+, 298.15 K) = − (704.6 ± 5.4) kJ · mol–1 from [76FUG/OET].
(f) selected by [76FUG/OET]. (g) equilibrium constants from [2001NEC/KIM]. (h) selected by [95SIL/BID].
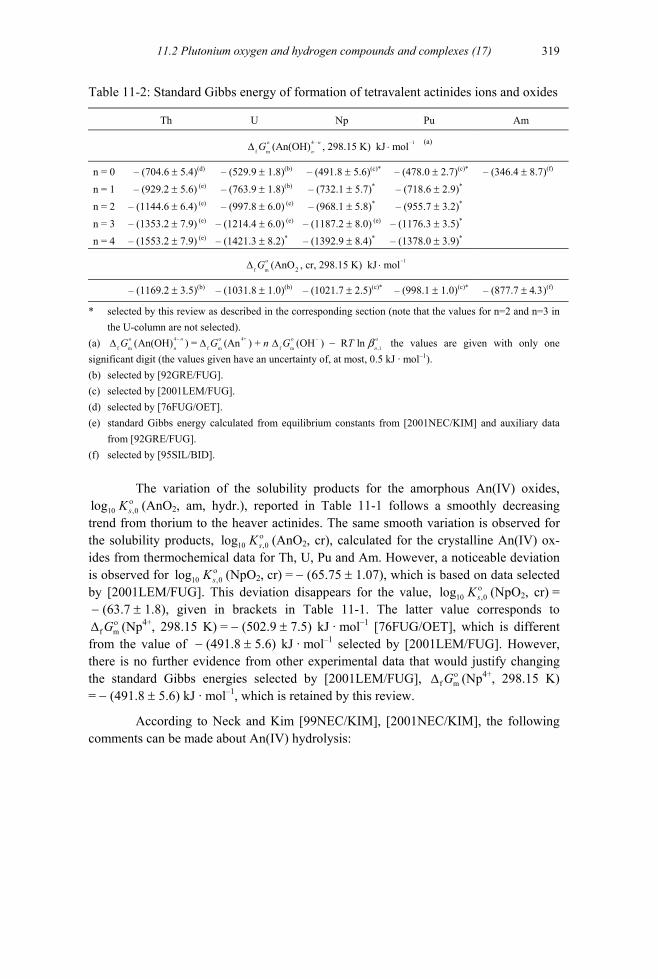
11.2 Plutonium oxygen and hydrogen compounds and complexes (17)
319
Table 11-2: Standard Gibbs energy of formation of tetravalent actinides ions and oxides
Th U Np Pu Am
4 1
f m
(a)(An(OH) , 298.15 K) kJ moln
nG ο − −∆ ⋅
n = 0 – (704.6 ± 5.4)(d) – (529.9 ± 1.8)(b) – (491.8 ± 5.6)(c)* – (478.0 ± 2.7)(c)* – (346.4 ± 8.7)(f)
n = 1 – (929.2 ± 5.6) (e) – (763.9 ± 1.8)(b) – (732.1 ± 5.7)* – (718.6 ± 2.9)* n = 2 – (1144.6 ± 6.4) (e) – (997.8 ± 6.0) (e) – (968.1 ± 5.8)* – (955.7 ± 3.2)* n = 3 – (1353.2 ± 7.9) (e) – (1214.4 ± 6.0) (e) – (1187.2 ± 8.0) (e) – (1176.3 ± 3.5)* n = 4 – (1553.2 ± 7.9) (e) – (1421.3 ± 8.2)* – (1392.9 ± 8.4)* – (1378.0 ± 3.9)*
1
f m 2(AnO , cr, 298.15 K) kJ molο −∆ ⋅G
– (1169.2 ± 3.5)(b) – (1031.8 ± 1.0)(b) – (1021.7 ± 2.5)(c)* – (998.1 ± 1.0)(c)* – (877.7 ± 4.3)(f)
* selected by this review as described in the corresponding section (note that the values for n=2 and n=3 in the U-column are not selected).
(a) the values are given with only one significant digit (the values given have an uncertainty of, at most, 0.5 kJ · m
4 4+
f m f m f m ,1(An(OH) ) = (An ) + (OH ) R lnn
n nG G n Gο − ο ο −∆ ∆ ∆ − bT ο
). ol–1
(b) selected by [92GRE/FUG]. (c) selected by [2001LEM/FUG]. (d) selected by [76FUG/OET]. (e) standard Gibbs energy calculated from equilibrium constants from [2001NEC/KIM] and auxiliary data
from [92GRE/FUG]. (f) selected by [95SIL/BID].
The variation of the solubility products for the amorphous An(IV) oxides,
10 ,0log sK ο (AnO2, am, hydr.), reported in Table 11-1 follows a smoothly decreasing trend from thorium to the heaver actinides. The same smooth variation is observed for the solubility products, 10 ,0log sK ο (AnO2, cr), calculated for the crystalline An(IV) ox-ides from thermochemical data for Th, U, Pu and Am. However, a noticeable deviation is observed for 10log ,0sK ο (NpO2, cr) = − (65.75 ± 1.07), which is based on data selected by [2001LEM/FUG]. This deviation disappears for the value, 10 ,0log sK ο (NpO2, cr) = − (63.7 ± 1.8), given in brackets in Table 11-1. The latter value corresponds to
(Npf mGο∆ 4+, 298.15 K) = − (502.9 ± 7.5) kJ · mol–1 [76FUG/OET], which is different from the value of − (491.8 ± 5.6) kJ · mol–1 selected by [2001LEM/FUG]. However, there is no further evidence from other experimental data that would justify changing the standard Gibbs energies selected by [2001LEM/FUG], f mGο∆ (Np4+, 298.15 K) = − (491.8 ± 5.6) kJ · mol–1, which is retained by this review.
According to Neck and Kim [99NEC/KIM], [2001NEC/KIM], the following comments can be made about An(IV) hydrolysis:
11 Discussion of new data selection for Plutonium 320
• truly low solubility of U, Np and Pu (excluding colloids) can be explained by the presence of monomeric species in contrast to the case of Th which forms poly-mers,
• with regard to crystalline oxide, the An(IV) concentrations in acidic media de-pends on the crystallinity of the solid and are considerably lower than those corre-sponding to amorphous AnO2 even after several months or years of equilibration,
• in near-neutral and alkaline solutions where An(OH)4(aq) predominates, the limit-ing solubility phase is always an amorphous oxide giving higher concentrations than those predicted according to lo , which is 6 - 7 orders of magnitude lower than log
10 ,0 2g (AnO , cr)οsK
10 ,0sK ο (AnO2, am, hydr.). Such affirmation about con-centration is valuable provided that colloids have been removed and the oxidation state of the actinide checked.
Among the points to be clarified to have a better understanding of An(IV) solubility, the identification of the solid phases and particularly their surface properties are of great importance because solubility depends strongly on surface effects.
Surface composition is dependent on the redox properties of the investigated system and can be non-stoichiometric. The size of the solid particles also plays a role as Bundschuh et al. [2000BUN/KNO] have recently proven (see Appendix A), as does radioactivity, which can lead to alteration of the surface.
More precise knowledge is required of the speciation of the aqueous species in the equilibrium solution, as well as of any colloids that may be present.
11.2.3.2 Crystalline and amorphous oxides As already mentioned, the thermodynamics of solubility reactions are determined by the properties of the surface phase, which can differ significantly from that of the bulk, in particular for crystalline oxides. The information on the stoichiometry, particle size and the crystallinity of the surface phases is often incomplete, and it is therefore not surpris-ing that the equilibrium constants for solubility reactions obtained directly may differ substantially from those calculated from calorimetric data. In general the former are larger than the latter. Some examples are given in the Table 11-3, which includes equi-librium constants, 10 ,0log sK ο , for the dissolution of actinide oxides and hydroxides, de-fined as amorphous, or crystalline in the original papers. The data for "crystalline" and "amorphous" selected in this review may indicate the magnitude of the effect of an in-complete knowledge of the surface state of the solid. For this reason, the selected values of 10 ,0log sK ο are not used to calculate the standard Gibbs energies of formation, , but the recommended equilibrium constants,
f mGο∆
10 ,0log sK ο , are useful for the geochemical modelling of actinide solubilities.

11.2 Plutonium oxygen and hydrogen compounds and complexes (17)
321
Table 11-3: Comparison of equilibrium constants lo 10 ,0g sK ο (298.15 K) derived from thermochemical data and solubility experiments.
Solid from thermochemical data from solubility data (a)
UO3 · 2H2O(cr) – (23.19 ± 0.43) [92GRE/FUG] – (22.03 ± 0.14) [92SAN/BRU] UO2(OH)2(am) – (21.67 ± 0.14) [92SAN/BRU]]
– (22.81 ± 0.01) [92KRA/BIS] – (22.88 ± 0.19) [93MEI/KIM] – (22.90 ± 0.07) [96MEI/KAT] – (22.44 ± 0.02) [96MEI/KAT] – (22.75 ± 0.06) [96KAT/KIM] – (22.41 ± 0.03) [98MEI2] – (22.62 ± 0.20) [94TOR/CAS]
UO3 · 2H2O(s) or UO2(OH)2(s, hydr)
– (23.14) [98DIA/GRA] Na2U2O7(cr) – (30.7 ± 0.5) [92GRE/FUG] Na2U2O7(s, hydr) – (29.45 ± 1.04) [98YAM/KIT] Np2O5(cr) – (12.2 ± 0.8) [2001LEM/FUG]
– (11.4 ± 0.4) [98EFU/RUN] Np2O5(cr) – (10.10 ± 0.02) [98PAN/CAM]
NpO2OH("aged") – (9.3 ± 0.5) [2001LEM/FUG] NpO2OH(am) – (8.7 ± 0.2) [2001LEM/FUG] Am(OH)3(cr) – (25.2 ± 1.0) [97MER/LAM] – (26.4 ± 0.6) present review Am(OH)3(am) – (25.1 ± 0.8) present review ThO2(cr) – (54.3 ± 1.1) (b) (c) ThO2(cr, hydr) (20 nm particles)
– (52.8 ± 0.3) [2000BUN/KNO]
ThO2(am, hydr) – (47.0 ± 0.8) [2001NEC/KIM] UO2(cr) – (60.86 ± 0.36) [92GRE/FUG] (c) UO2(am, hydr) – (54.5 ± 1.0) present review (c) NpO2(cr) – (65.75 ± 1.07) [2001LEM/FUG] (c) NpO2(am, hydr) – (56.7 ± 0.5) present review (c) PuO2(cr) – (64.04 ± 0.51) [2001LEM/FUG] (c) PuO2(am, hydr) – (58.33 ± 0.52) present review (c)
(a) The conditional constants given in the original papers are converted to I = 0 with the SIT model. (b) Recalculated in this review using for mS ο (Th, cr, 298.15 K) = (51.8 ± 0.5) J·K–1·mol–1,
mS ο (ThO2, cr, 298.15 K) = (65.23 ± 0.20) J·K–1·mol–1 and f mH ο∆ (ThO2, cr, 298.15 K) = − (1226.4 ± 3.5) kJ·mol–1 from CODATA [89COX/WAG] and f mG ο∆ (Th4+, cr, 298.15 K) = − (704.6 ± 5.4) kJ·mol–1 from [76FUG/OET].
(c) Not relevant for the solubility in neutral to alkaline solutions.

11 Discussion of new data selection for Plutonium 322
The solubility studies in neutral to alkaline solutions generally lead to solubili-ties which are, for tetravalent actinides compounds, six and more orders of magnitude higher and consistent with those of the amorphous solids, AnO2(am, hydr). This is sur-prising as the least soluble phase should have the highest thermodynamic stability. The experimental information indicates that this is not the case, which suggests that there are chemical processes that are not understood. Therefore, they are not included in the thermodynamic description of these systems (see selected values in Chapter 5).
11.3 Plutonium group 17 complexes 11.3.1 Aqueous plutonium chloride complexes (18.2.2.1)
11.3.1.1 Pu(III) chloride complexes An EXAFS study of Allen et al. [97ALL/BUC] shows no evidence for the formation of Pu(III) chloride complexes up to LiCl concentrations of 12 mol · L–1, while a later EXAFS study [2000ALL/BUC] indicates the formation of Am(III) and Cm(III) chloride complexes according to the reaction:
3+ 3An + Cl AnCl nnn − − (11.6)
with n = 1 − 2 in 8 − 12.5 M LiCl. The EXAFS studies of Allen et al. [97ALL/BUC], [2000ALL/BUC] and the new spectroscopic data for Am(III) and Cm(III) chloride complexes lead to the selection of lo 10 1g οb (11.6) = 0.24 and lo 10 2g οb (11.6) = − 0.74 (cf. section 12.4.1.3). The equilibrium constant selected by [2001LEM/FUG],
(PuCl10 1log οb 2+, 298.15 K) = (1.2 ± 0.2) based on the study of Ward et al. [56WAR/WEL], appears to be overestimated. It is therefore rejected by the present re-view, which prefers to base its selection on EXAFS data rather on ionic exchange data. As the value of the formation constant for PuCl2+ seems smaller than was assessed in [2001LEM/FUG], the value for the formation constant of PuCl3+ based, in part on the study of Rabideau and Cowan [55RAB/COW], may also need to be reassessed.
Additional data are given in [95NOV/CRA] and [99CHO].

11.4 Plutonium group 16 compounds and complexes (19)
11.4 Plutonium group 16 compounds and complexes (19)
323
2
11.3.1.2 Pu(VI) chloride complexes Runde et al. [97RUN/NEU], [99RUN/REI] investigated the formation of Pu(VI) chlo-ride complexes by absorption spectroscopy and EXAFS. In 1 M HCl or HClO4 solutions containing 1.5 NaCl − 16 M LiCl they observed evidence for the reactions:
2+ 22PuO + Cl PuO Cl n
nn − − (11.7)
up to n = 4 [97RUN/NEU]. Runde et al. [99RUN/REI] have obtained, by absorption spectroscopy, the formation constants for the reactions of PuO2Cl+ and PuO2Cl2(aq) as
(11.7) = (0.23 ± 0.03) and 10 1log οb 10 2log οb (11.7) = − (1.7 ± 0.2). As discussed in de-tail in Appendix A, [99RUN/REI], this review selects:
(PuO10 1log οb 2Cl+, 298.15 K) = (0.23 ± 0.03),
with ∆ε((11.7), n = 1) = − (0.13 ± 0.03) kg · mol–1 in NaCl solution and
(PuO10 2log οb 2Cl2, aq, 298.15 K) = − (1.15 ± 0.30).
These values are significantly different from 10 1log οb (11.7) = (0.70 ± 0.13) and (11.7)= − (0.6 ± 0.2) selected by [2001LEM/FUG] from the spectroscopic study of Giffaut [94GIF], but are close to the values selected by [92GRE/FUG] from numerous and well-ascertained data for the analogous U(VI) chloride complexes. The reasons for the revised data selection and a discussion of the data in [94GIF] are also included in Appendix A, discussion of [99RUN/REI].
10 2log οb
11.3.1.3 Cation-cation complexes of Pu(V) New papers on plutonium complexation have dealt also with neptunium complexation (see 10.5). New data are available concerning the cation-cation complex . Stoyer et al. [2000STO/HOF] determined a value of β = (2.2 ± 1.5) L · mol
+ 22 2PuO UO⋅ +
2+2
–1 for the formation of in 6 M NaClO+
2PuO UO⋅ 4. This result was already discussed in section 9.8.1.
11.4.1 Plutonium selenium compounds
11.4.1.1 Plutonium selenides
11.4.1.1.1 Plutonium monoselenide Hall et al. [91HAL/MOR] have measured the heat capacity of a sample of high purity PuSe from 7 to 300 K. The sample was annealed at 1273 K for 2 hours in high purity argon immediately prior to the measurements to remove any stored damage to the crys-talline structure due to radioactive decay. In keeping with the lack of magnetism in

11 Discussion of new data selection for Plutonium 324
PuSe, no anomalies were found in the ,mpC curve. The values obtained for the heat ca-pacity and entropy at 298.15 K were:
,mpCο
ο
(PuSe, cr, 298.15 K) = (59.7 ± 1.2) J · K–1 · mol–1, (PuSe, cr, 298.15 K) = (92.1 ± 1.8) J · KmS –1 · mol–1,
and these are the selected values.
11.4.2 Plutonium tellurium compounds
11.4.2.1 Plutonium tellurides
11.4.2.1.1 Plutonium monotelluride Hall et al. [90HAL/JEF2] have measured the heat capacity of a sample of high purity PuTe from 10 to 300 K. Small single crystals of PuTe were pressed into a cylinder which was sealed into a silver calorimeter under helium. A very small anomaly, of un-known origin, was observed in the ,mpC curve at 269 K. The values obtained for the heat capacity and entropy at 298.15 K were:
,mpCο (PuTe, cr, 298.15 K) = (73.1 ± 2.9) J · K–1 · mol–1,
(PuTe, cr, 298.15 K) = (107.9 ± 4.3) J · KmS ο –1 · mol–1,
and these are the selected values.
11.5 Plutonium nitrogen compounds and complexes 11.5.1 Plutonium nitrides
11.5.1.1 PuN(cr) Ogawa et al. [98OGA/KOB] have given an equation for ∆ (PuN, T), based on an assessment of the existing data. However, as for their similar suggestion for UN(cr), their equation does not reproduce the reasonably well-defined entropy of formation of PuN(cr) (differing by ca. 6.2 J·K
f mG
–1·mol–1), and we prefer to retain the data selected in [2001LEM/FUG].
11.6 Plutonium carbon compounds and complexes (21.1.2) 11.6.1 Aqueous plutonium carbonates (21.1.2.1) The aqueous plutonium carbonate systems were discussed in [2001LEM/FUG]; how-ever, two important experimental studies published in 1993 [93PAS/RUN] and 1997 [97PAS/CZE] were overlooked. This review does not share some of the judgments made by the prior NEA TDB review as discussed in the following section. These facts result in important changes in some of the selected values.

11.6 Plutonium carbon compounds and complexes (21.1.2)
325
11.6.1.1 Pu(VI) carbonate complexes (21.1.2.1.1) Pashalidis et al. [93PAS/RUN], and Pashalidis et al. [97PAS/CZE] studied the solubil-ity of UO2CO3 and PuO2CO3 in aqueous carbonate solutions as discussed in Appendix A. These are two precise experimental studies where the uranium(VI) data are in excel-lent agreement with other studies, cf. section 9.7.2.1. This indicates that the procedures used are satisfactory and that the experiments are not affected by systematic errors. However, the precision in the plutonium(VI) data is much lower than that of the corre-sponding uranium(VI) data. The equilibrium constants proposed in [93PAS/RUN] and [97PAS/CZE] have been recalculated to zero ionic strength using the SIT model by this review and are:
2+ 22 3 2 3PuO + CO PuO CO (aq)− 10 1log οb = (9.7 ± 0.3), 2+ 2 22 3 2PuO + 2 CO PuO (CO )−
3 2−
10 2log οb = (15.3 ± 0.5), 2+ 2 42 3 2PuO + 3 CO PuO (CO )−
3 3−
10 3log οb = (18.4 ± 0.2).
This review has scrutinised the discussions of previous experimental data given in [2001LEM/FUG]; the data reported in [62GEL/MOS] and [67GEL/MOS] are not reliable as confirmed by this review. The data of Sullivan and Woods [82SUL/WOO] were accepted in [2001LEM/FUG], but the value of 10 1log οb
g
= 13.2 for Pu is very dif-ferent from the values of the corresponding uranium(VI) and neptunium(VI) complexes. There is no chemical reason to expect this and according to the present review, this is sufficient reason to disregard the results in [82SUL/WOO]. The only two experimental studies that are reliable are those of Robouch and Vitorge [87ROB/VIT], and Ullman and Schreiner [88ULL/SCH]. Robouch and Vitorge report lo 10 1
οb = 9.3. The values of reported in [87ROB/VIT] and [88ULL/SCH] are 13.6 and 15.1, respectively,
whereas the values of lo10 2log οb
10 3g οb are 17.0 and 18.5. The equilibrium constants in [88ULL/SCH] are in good agreement with those of [97PAS/CZE], while the constants from [87ROB/VIT] differ slightly. These data were determined in 3 M NaClO4 and the error in the extrapolation to zero ionic strength, ± 0.5, is therefore larger than that in the other two studies.
This review selects the following average values of [87ROB/VIT], [88ULL/SCH], [93PAS/RUN] and [97PAS/CZE]:
10 1log οb = (9.5 ± 0.5),
10 2log οb = (14.7 ± 0.5),
10 3log οb = (18.0 ± 0.5).
The formation constant for the polynuclear Pu(VI) hydroxide complex 6
2 3 3 6(PuO ) (CO ) − is discussed in [2001LEM/FUG] where it is pointed out that, by com-parison to similar U and Np complexes, no good data exist for the interaction coeffi-cient. As extrapolation to zero ionic strength cannot done properly, this review does not retain this data in the table of selected values.

11 Discussion of new data selection for Plutonium 326
11.6.1.2 Pu(IV) carbonate complexes (21.1.2.1.3) Capdevila et al. [96CAP/VIT] investigated the formation of the limiting carbonate complex:
4 23 4 3 3 5Pu(CO ) + CO Pu(CO )6− − − . (11.8)
by absorption spectroscopy in NaClO4/NaHCO3/Na2CO3 solutions of varying ionic strength. They estimated an equilibrium constant of 10 5log K ο (11.8) = − (1.36 ± 0.09) which was selected in [2001LEM/FUG]. [96CAP/VIT] also reported the formation constant of the pentacarbonate complex, ( Pu10 5log b 6
3 5CO )( − , 298.15 K) = (35.8 ± 1.3) in 3 M NaClO4/NaHCO3/Na2CO3. The latter value is based on redox equilibria including the disproportionation of Pu(V) and was not used by [2001LEM/FUG] for the evaluation of thermodynamic data.
Clark et al. [98CLA/CON] studied the structure of the ion in the solid state and in aqueous solution; this study confirms the stoichiometry of the limiting carbonate complex deduced from potentiometric and spectroscopic studies [92CAP], [96CAP/VIT].
63 5Pu(CO ) −
Rai et al. [99RAI/HES2] have studied the solubility of PuO2(am) in the system. The methodology is the same as used in prior
studies on Th(IV) [97FEL/RAI], U(IV) [98RAI/FEL] and Np(IV) [99RAI/HES]. The authors used the ion interaction approach of Pitzer to determine the following equilib-rium constants (given without uncertainty limits) for the reaction:
+ 23 3 2K HCO CO OH H O− − −− − − −
2 62 2 3 3 5AnO (am) + 2H O + 5CO An(CO ) 4 OH− − + − (11.9)
10 ,5log sK ο ((11.9), An = Th) = − 18.4 [97FEL/RAI],
10 ,5log sK ο ((11.9), An = U) = − 22.2 [98RAI/FEL],
10 ,5log sK ο ((11.9), An = Np) = − 21.15 [99RAI/HES],
10 ,5log sK ο ((11.9), An = Pu) = − 22.68 [99RAI/HES2].
The reported Pitzer parameters for the pairs Na+ or K+ and are rea-sonable for ions of this charge. However, the solubility constants at I = 0 are highly cor-related with the simultaneously calculated ion interaction coefficients. Therefore, this review ascribes rather large uncertainty estimates of ± 1 log
63 5An(CO ) −
10-units to the reported equi-librium constants. By combining the 10 ,5log sK ο values with the solubility constants of AnO2(am, hydr.) selected in the present review:
10 ,0log sK ο (ThO2, am, hydr., 298.15 K) = − (47.0 ± 0.8),
10 ,0log sK ο (UO2, am, hydr., 298.15 K) = − (54.5 ± 1.0),
10 ,0log sK ο (NpO2, am, hydr., 298.15 K) = − (56.7 ± 0.5),
10 ,0log sK ο (PuO2, am, hydr., 298.15 K) = − (58.33 ± 0.52),

11.6 Plutonium carbon compounds and complexes (21.1.2)
327
we obtain the following formation constants of the limiting An(IV) carbonate com-plexes:
10 5log οb ( 63 5Th(CO ) − , 298.15 K) = (28.6 ± 1.3),
10 5log οb ( 63 5U(CO ) − , 298.15 K) = (32.3 ± 1.4),
10 5log οb ( 63 5Np(CO ) − , 298.15 K) = (35.6 ± 1.1),
10 5log οb ( 63 5Pu(CO ) − , 298.15 K) = (35.65 ± 1.13).
The formation constant of 63 5U(CO ) − derived from the data in [98RAI/FEL]
and the value selected in [92GRE/FUG], lo 10g 5οb ( 6
3 5U(CO ) − , 298.15 K) = (34.0 ± 0.9), overlap within the uncertainty limits. The formation constant of 6
3 5Np(CO ) − selected in [2001LEM/FUG], (10 5log οb 6
3 5Np(CO ) − , 298.15 K) = (35.61 ± 1.09), is identical with the value calculated above, although the former value results from a re-interpretation of the experimental data in [99RAI/HES] combined with other equilibrium constants se-lected in [2001LEM/FUG]. For these reasons and the systematic trend in the series of the tetravalent actinides, the present review relies also on the value for and selects:
63 5O ) −Pu(C
10 5log οb ( 63 5Pu(CO ) − , 298.15 K) = (36.65 ± 1.13).
Combining this value with 10 5log K ο (11.8) = − (1.36 ± 0.09) [2001LEM/FUG] leads to:
10 4log οb ( 43 4Pu(CO ) − , 298.15 K) = (37.0 ± 1.1).
Felmy et al. [97FEL/RAI] and Rai et al. [98RAI/FEL], [99RAI/HES], [99RAI/HES2] also studied the formation of the mixed An(IV) hydroxide-carbonate complexes based on their solubility measurements. In the case of Th(IV), [97FEL/RAI] adopted the equilibrium constant determined by Östhols et al. [94OST/BRU] for the complex Th(OH)3(CO3)–, whereas the solubility data for U(IV), Np(IV) and Pu(IV) were modelled by assuming the reaction:
2 22 2 3 2 3 2AnO (am) + 2H O + 2CO An(OH) (CO ) 2 OH− − + − (11.10)
with (11.10) = − 12.11 for U(IV) [98RAI/FEL], − 11.75 for Np(IV) [99RAI/HES] and − 12.09 for Pu(IV) [99RAI/HES2]. Uncertainty limits and Pitzer parameters for these complexes were not reported.
10 ,1,2,2log sK ο
The solubilities of ternary Np(IV) hydroxide-carbonate complexes have been discussed in section 10.6.1.1. A comparison of these solubility data with those from the corresponding Pu(IV) system is given in Figure 11-1 that shows the solubility, log10[An(IV)], versus − log10[H+] for solubility data for Pu(IV) from [94YAM/SAK] and [99RAI/HES2], and corresponding data for Np(IV) from [2001KIT/KOH]. It is obvious that the solubility is the same in these systems, in particular for the data deter-mined from the direction of over-saturation, i.e., for the Pu(IV) data of [94YAM/SAK]

11 Discussion of new data selection for Plutonium 328
and the Np(IV) data of [2001KIT/KOH]. This indicates that the composition of the ter-nary complexes is the same.
The calculated curves in Figure 11-1 are based on the equilibrium constants proposed by Rai et al. [99RAI/HES2] ( lo = − 12.1 for P ) and Yamaguchi et al. [94YAM/SAK] ( lo = − (10.2 ± 0.5) for and = − (5.9 ± 0.3) for P
10 ,1,2,2g sK ο
10 ,1,2,2g sK ο
44 3(OH) (CO )
22 3 2u(OH) (CO ) −
2Pu(OH) (CO 23 2) −
10 ,1,4,2log sK ο2u − , converted to I = 0 in this review
by using the SIT). The equilibrium constant lo 10g ,4sK ο = − (10.4 ± 0.5) for Pu(OH)4(aq) is taken from the study of [99RAI/HES2]. It should be noted that [99RAI/HES2] re-ported experimental data in K2CO3 solutions containing 0.01 M KOH which are con-cordant with those of [94YAM/SAK], but they did not use these results to evaluate an equilibrium constant for the complex 4
34u(OH) (CO )2P − .
As the solubility product, 10 ,0log sK ο (PuO2, am, hydr.) = − (58.33 ± 0.52), is somewhat lower than lo 10 ,0g sK ο (NpO2, am, hydr.) = − (56.7 ± 0.5), the formation con-stants of the ternary Pu(IV) hydroxide-carbonate complexes are accordingly higher than those of the analogous Np(IV) complexes. However, as the solubility product of the amorphous oxide phases used in these experiments is uncertain, this review has not se-lected equilibrium constants for the ternary complexes. Additional work is necessary to quantify their formation constants.

11.6 Plutonium carbon compounds and complexes (21.1.2) utonium carbon compounds and complexes (21.1.2)
329
329
Figure 11-1. Solubility data for PuO2(am, hydr.) from Yamaguchi et al. [94YAM/SAK] in 0.1 M NaHCO3-NaClO4 and Na2CO3-NaClO4-NaOH, and from Rai et al. [99RAI/HES2] in KHCO3 and K2CO3 (+ 0.01 M KOH) at total carbonate concentra-tions of a) 0.1 mol·L–1 and b) 0.01 mol·L–1. Experimental Np(IV) solubility data from Kitamura and Kohara [2001KIT/KOH] are shown for comparison. The solubility curves are calculated for I = 0.1 mol·L–1 according to the equilibrium constants reported by [94YAM/SAK] and [99RAI/HES2].
Figure 11-1. Solubility data for PuO2(am, hydr.) from Yamaguchi et al. [94YAM/SAK] in 0.1 M NaHCO3-NaClO4 and Na2CO3-NaClO4-NaOH, and from Rai et al. [99RAI/HES2] in KHCO3 and K2CO3 (+ 0.01 M KOH) at total carbonate concentra-tions of a) 0.1 mol·L–1 and b) 0.01 mol·L–1. Experimental Np(IV) solubility data from Kitamura and Kohara [2001KIT/KOH] are shown for comparison. The solubility curves are calculated for I = 0.1 mol·L–1 according to the equilibrium constants reported by [94YAM/SAK] and [99RAI/HES2].
0.1 M (CO 32- + HCO 3
-) 0.1M ( CO ) 23 3HCO− −+
-11
-10
-9
-8
-7
-6
-5
-4
-3
8 9 10 11 12 13
log 10
[Pu(
IV)]
carbonate-free
[94YAM/SAK][99RAI/HES2]
[2001KIT/KOH] Np(IV) at I = 0.5 M
model
- log 10 [H +]
I = 0.1 - 0.3 M
a)
-11
-10
-9
-8
-7
-6
-5
-4
-3
8 9 10 11 12 13
0.01 M (CO 32- + HCO 3
-)
I Š 0.1 M
0.01M ( CO ) 23 3HCO− −+
I ≤ 0.1 M model
carbonate-free
[94YAM/SAK][99RAI/HES2]
[2001KIT/KOH] Np(IV) at I = 0.5 M
- log 10 [H +]
log 10
[Pu(
IV)]
b)

11 Discussion of new data selection for Plutonium 330
11.6.2 Solid plutonium carbonate (21.1.2.2)
11.6.2.1 Solid Pu(VI) carbonates (21.1.2.2.1) In the previous NEA TDB review [2001LEM/FUG] the solubility constant for the reac-tion:
2+ 22 3 2 3PuO CO (s) PuO + CO − (11.11)
was selected from a study of Robouch and Vitorge [87ROB/VIT] in 3 M NaClO4 at 293.15 K:
10 ,0log οsK ((11.11), 298.15 K) = – (14.2 ± 0.3).
Pashalidis et al. [93PAS/RUN] reported a solubility study in 0.1 M NaClO4 at 295.15 K, which was not discussed in [2001LEM/FUG]. A second paper [97PAS/CZE], which arrived too late for a critical evaluation in the previous review [2001LEM/FUG], includes the experimental data of [93PAS/RUN] and extends the former solubility study to higher carbonate concentrations. The solubility constant recalculated in the present review from these data and extrapolated to I = 0 with the SIT (cf. Appendix A),
10 ,0log οsK (11.11) = − (15.0 ± 0.2), is lower than that from [87ROB/VIT] indicating a
less crystalline solid in the former study. However, as the formation constants of the Pu(VI) carbonate complexes in [87ROB/VIT] and [97PAS/CZE] are in reasonable agreement, the crystallinity does not seem to have changed during the experiments.
In a later study, Reilly et al. [2000REI/NEU] determined the solubility constant of PuO2CO3(s) in 0.1, 0.2, 0.5, 1.0, 2.1, 3.8 and 5.6 m NaCl, and for comparison in 5.6 m NaClO4. The experimental 10 ,0log sK values are given without correction for chloride complexation, which explains the difference between the values in 5.6 m NaCl ( 10 ,0log sK = − (14.0 ± 0.1)) and 5.6 M NaClO4 ( lo 10 ,0g sK = − (14.5 ± 0.1)). The ionic strength dependence of the experimental 10log ,0sK values at I < 3 mol · kg–1 is in excellent agreement with ∆ε = (0.13 ± 0.04) kg · mol–1, as predicted with the interaction coefficients 2
3, CO )(Na+ −ε2+2 ,Cl )−
= − (0.08 ± 0.03) kg · mol–1 and = = (0.21 ± 0.02) kg · mol2+
2(PuO ,Cε l )− (UOε –1 [2001LEM/FUG]. In the present review the equilibrium constant at I = 0 is calculated to be 10 ,0log ο
sK (11.11) = − (14.67 ± 0.10), cf. Appendix A.
Although the uncertainty in the extrapolation to I = 0 is larger for the experi-mental data of [87ROB/VIT] in 3.5 m NaClO4 than for the later studies in 0.1 m Na-ClO4 [93PAS/RUN], [97PAS/CZE] and 0.1 − 2.1 m NaCl solutions [2000REI/NEU], the present review selects the unweighted mean value from these studies:
10 ,0log οsK ((11.11), 298.15 K) = − (14.65 ± 0.47).
The uncertainty (95% confidence interval) may also reflect possible differences in the crystallinity of the solid. Similar differences have been observed in the solubility data for the isostructural solid UO2CO3(s) (cf. discussion in 9.7.2.1.1).

11.7 Plutonium group 2 (alkaline-earth) compounds
11.7 Plutonium group 2 (alkaline-earth) compounds
331
11.7.1 Plutonium-strontium compounds (22.1) The compound SrPu2Ti4O12(cr), along with Pu2Ti3O8.79(cr) and Pu2Ti2O7(cr), in which Pu is in the trivalent state, has been prepared and identified by X-ray diffraction [96SHO/BAM]. No thermodynamic data exist for these compounds.
11.7.2 Plutonium-barium compounds (22.1)
11.7.2.1 BaPuO3(cr) (22.2.2) Nakajima et al. [99NAK/ARA2] have measured the partial pressures of BaO(g) and Ba(g) over a diphasic sample containing a mixture of BaPuO3 and PuO2 by Knudsen-cell mass-spectrometry from 1673 to 1873 K. As noted in Appendix A, they analysed their results in terms of the reaction:
BaPuO3(cr) BaO(g) + PuO2(cr)
although in practice, the vaporisation is likely to be more complex than this.
Using estimated thermal functions for BaPuO3(cr), [99NAK/ARA2] derived second- and third-law enthalpies of formation, f m
ο∆ H (BaPuO3, cr, 298.15 K) of − 1661 and − 1673 kJ · mol–1, respectively, with no quoted uncertainties.
Considering the use of estimated thermal functions for BaPuO3(cr) and the likely complexity of the actual vaporisation process, these values are in good accord with the relatively precise calorimetric value from the study by Morss and Eller [89MOR/ELL], adopted by [2001LEM/FUG]:
f mο∆ H (BaPuO3, cr, 298.15 K) = − (1654.2 ± 8.3) kJ · mol–1
which is retained here.


Chapter 12Equation Section 12
12 Discussion of new data selection for Americium
12.1 Introductory remarks 12.1.1 Estimation of standard entropies (V.4.2.1.2)
The standard entropies of many americium ionic solid compounds have been revised from those suggested in [95SIL/BID] to take account of the improved procedure sug-gested by Konings [2001KON]. As noted in Appendix A, in this procedure the entropy is assumed to be the sum of a lattice contribution, estimated from known values of simi-lar actinide species, and an excess contribution, representing mainly electronic effects. Such a scheme gives good agreement for many lanthanide and actinide compounds, and indeed is the basis of the existing NEA estimates for the aqueous americium ions. How-ever, since the 7F0 ground state of Am3+ is non-degenerate and any excited states do not contribute to the entropy at 298.15 K, the excess entropy is zero for most Am(III) com-pounds. This leads to appreciably smaller standard entropies than estimated in [95SIL/BID] for these species.
To avoid repetition, the values used for the lattice and excess contributions are summarised in Table 12-1, with references to fuller text discussions.
333

12 Discussion of new data selection for Americium 334
Table 12-1: Summary of entropy contributions for some Am solid compounds (J·K–1·mol–1).
Species mS (lattice) mS (excess) mS (total) [95SIL/BID] Comment
AmO2(cr) (65.2 ± 8.0) (12.5 ± 6.0) (77.7 ± 10.0) (67.0 ± 10.0) [2001KON2] Am2O3(cr) (133.6 ± 6.0) 0 (133.6 ± 6.0) (160.0 ± 15.0) [2001KON] Am(OH)3(cr) (116 ± 8) 0 (116 ± 8) none See 12.3.2.2 AmF3(cr) (110.6 ± 6.0) 0 (110.6 ± 6.0) (127.6 ± 5.0) [2001KON] AmF4(cr) (141.6 ± 6.0) (12.5 ± 5.0) (154.1 ± 8.0) (148.5 ± 5.0) See 12.4.2.2.2 AmCl3(cr) (146.2 ± 6.0) 0 (146.2 ± 6.0) (164.8 ± 6.0) [2001KON] AmOCl(cr) --- --- (92.6 ± 10.0) (111.0 ± 10.0) See 12.4.2.3.2 Cs2NaAmCl6(cr) --- --- (421 ± 15) (440 ± 15) See 12.4.2.3.3 AmBr3(cr) (182.0 ± 10.0) 0 (182.0 ± 10.0) (205 ± 17) See 12.4.2.4.1.1 AmOBr(cr) --- --- (104.9 ± 12.8) (128.0 ± 20.0) See 12.4.2.4.2 AmI3(cr) (211 ± 15) 0 (211 ± 15) (234 ± 20) See 12.4.2.5.1.1 Am(OH)CO3·0.5H2O(cr) (141 ± 21) 0 (141 ± 21) none See 12.6.1.1.3.1
12.1.2 Introductory remarks on the inclusion of thermodynamic da-ta of aqueous Cm(III) complexes in this review It is well known that chemical compounds and aqueous species of the trivalent actinides and lanthanides have similar chemical properties [94CHO/RIZ]. This is true both for their coordination chemistry and their complex formation reactions in solution; a no-ticeable and very important exception is their redox properties. Certain systematic trends in the thermodynamic data and equilibrium constants often correlate with the variation of the ionic radius, e.g., with the decrease of the ionic radius from La3+ to Lu3+ [94CHO/RIZ], [96BYR/SHO]. In particular Cm(III), but also the lanthanides Nd(III) and Eu(III), are often used as analogs for Am(III), because of the similarity in ionic size: e.g., for coordination number CN = 8, the crystal radii are 1.10 Å (Am3+), 1.09 Å (Cm3+), 1.11 Å (Nd3+) and 1.07 Å (Eu3+) [76SHA], [94CHO/RIZ].
In the same way there are pronounced similarities and trends in most of the chemical properties of the actinide elements in the oxidation states An(IV, V or VI), with the exception of their redox properties [80COT/WIL], [84GRE/EAR], [83CHO2] and [94CHO/RIZ]. This chemically well-established principle has been used by [2001LEM/FUG] for the comparison and partly for the estimation of thermodynamic data for aqueous species of pentavalent and hexavalent U, Np and Pu, and recently for the tetravalent actinides [99NEC/KIM], [2001NEC/KIM].
Making use of this oxidation state analogy principle, the present review includes experimental data for Cm(III) when evaluating thermodynamic data for aqueous Am(III) complexes, because the former are often more accurate than the latter. Particularly in the case of complex formation reactions of Cm(III) there is a large amount of accurate information available from spectroscopic data obtained with the very sensitive time-resolved laser fluorescence spectroscopy (TRLFS). In some cases the discussion of data evaluation is supported by comparing analogous chemical

12.2 Elemental americium (V.1)
12.2 Elemental americium (V.1)
335
data evaluation is supported by comparing analogous chemical reactions and data for the trivalent lanthanides. We have used these oxidation state analogies for the following purposes:
• To evaluate activity coefficients and ion interaction coefficients of aqueous Am(III) species by using experimental data for Nd3+ or aqueous Cm(III) complexes.
• To select equilibrium constants for aqueous Am(III) complexes by using spectroscopic data for analogous complex formation reactions of Cm(III).
• To compare the chemical behaviour and thermodynamic data of some isostructural solids of Am(III) and the lanthanides, Nd(III) and Eu(III), and to estimate standard entropies of crystalline Am(III) hydroxide and hy-droxycarbonate.
The differences in the activity coefficients and ion interaction coefficients of Am(III), Cm(III), Nd(III) and Eu(III) species are considered to be negligible [90FEL/RAI], [97KON/FAN], [98FAN/KIM] and the differences in the formation con-stants of analogous aqueous complexes are in most cases smaller than the experimental uncertainties [98NEC/FAN], whereas the solubility constants of isostructural solids can differ considerably.
12.2.1 Americium ideal monatomic gas (V.1.2)
12.2.1.1 Heat capacity and entropy (V.1.2.1) The thermal functions of Am(g) in [95SIL/BID] were calculated using 33 spectroscopic levels up to 18000 cm–1 given by Brewer [84BRE], plus 18 levels between 18000 and 30000 cm–1 previously communicated by Fred [75FRE] to Oetting et al. [76OET/RAN]. Since these data were assembled, Blaise and Wyart [92BLA/WYA] have published a comprehensive listing of the known energy levels of all the actinide gases containing 204 levels for Am(g) up to 40600 cm–1. However, these 204 levels do not include three relatively low-lying levels estimated by Brewer [84BRE] at 14539, 16639 and 18294 cm–1. These have been added to the energy level list, together with seven further miss-ing levels estimated by this review to lie between 17800 and 25000 cm–1.
The revised values of the thermal functions have been calculated from these 214 levels with a total statistical weight of 1625; the Gibbs energy functions begin to differ from those used by [95SIL/BID] by more than 0.005 J · K–1 · mol–1 at about 2500 K.

12 Discussion of new data selection for Americium 336
The values at 298.15 K for the 241Am isotope (molar mass = 241.0568 g · mol-1 [99FIR]) are:
,mpCο (Am, g, 298.15 K) = (20.786 ± 0.010) J · K–1 · mol–1 ,
(Am, g, 298.15 K) = (194.55 ± 0.05) J · KmS ο –1 · mol–1.
These are unchanged from the values calculated from the energy levels used in [95SIL/BID]. However, owing to a typographical error, the entropy was misquoted (as (195.6 ± 2.0) J · mol–1 · K–1) in both the text and tables. Note that the uncertainty has also been greatly reduced, due to the much larger number of electronic levels now available.
The calculated heat capacity of Am(g) from 298.15 to 1100 K is essentially constant as given in Table 6.3.
12.2.1.2 Enthalpy of formation (V.1.2.2) The enthalpy of formation selected by [95SIL/BID] is based on three reasonably consis-tent measurements of the vapour pressure from ca 1000 to 1600 K. Over this tempera-ture range, the revised values of ( G T )/T(Am, g, 298.15 K) differ from those used in the earlier assessment by only 0.001 J · K
m m( ) (298.15 K)H ο−–1 · mol–1, so the derived
value of the enthalpy of sublimation using the revised thermal functions will differ neg-ligibly from the value selected by [95SIL/BID] (which utilised the correct value of
(Am, g, 298.15 K) – see above). This value is therefore retained. mS ο
f mH ο∆ (Am, g, 298.15 K) = (283.8 ± 1.5) kJ · mol–1.
The calculated Gibbs energy of formation thus becomes:
(Am, g, 298.15 K) = (242.3 ± 1.6) kJ · molf mGο∆ –1.
12.3 Americium oxygen and hydrogen compounds and complexes (V.3)
12.3.1 Aqueous americium hydroxide complexes (V.3.1)
12.3.1.1 Aqueous Am(III) and Cm(III) hydroxide complexes (V.3.1.1) The hydrolysis of americium(III) has been critically discussed in the previous NEA re-view [95SIL/BID]. As the published data vary by orders of magnitude, as a result of experimental shortcomings, the values from most publications were rejected by [95SIL/BID]. A number of new experimental studies have appeared since the previous review. They will be discussed below together with the studies used in the previous re-view for the selection of thermodynamic data.

12.3 Americium oxygen and hydrogen compounds and complexes (V.3)
337
n
The hydrolysis reactions of Am(III) can be described by:
, (12.1) 3+ (3 ) +2Am + H O(l) Am(OH) + Hn
nn −
with n = 1, 2 and 3. As discussed in the previous review [95SIL/BID] there is neither evidence for the formation of polynuclear complexes nor for anionic hydroxide com-plexes up to pH = 13 − 14. The lack of evidence for polynuclear species is to some ex-tent a result of the low total concentrations of Am(III) used in the experiments.
The selection of thermodynamic data in [95SIL/BID] was based on the follow-ing studies in NaClO4 solution: the solubility experiments of Silva [82SIL], and Stadler and Kim [88STA/KIM] in 0.1 M NaClO4, the solvent extraction study of Lundqvist [82LUN] in 1 M NaClO4 and the potentiometric study of Nair et al. [82NAI/CHA] in 1 M NaClO4. After reinterpretation of these studies the following equilibrium constants at I = 0 were selected by Silva et al. [95SIL/BID]:
10 1*log οb*
((12.1), 298.15 K) = − (6.4 ± 0.7),
10 2log οb*
((12.1), 298.15 K) = − (14.1 ± 0.6),
10 3log οb ((12.1), 298.15 K) = − (25.7 ± 0.5).
In an earlier review, Fuger [92FUG] selected lower formation constants from the same studies, although the uncertainty limits of the two sets overlap:
((12.1), 298.15 K) = − (7.1 ± 0.5), 10 1*log οb* ((12.1), 298.15 K) = − (14.8 ± 0.5). 10 2log οb
Experimental data in NaCl solutions, from the solubility of Am(OH)3(s) in 0.1 and 0.6 M NaCl solutions [88STA/KIM] and a solvent extraction study in 0.7 M NaCl [83CAC/CHO], were not included or disregarded in the discussion and the data selec-tion of Silva et al. [95SIL/BID]. Additional data are available from a solubility study of Runde and Kim [94RUN/KIM] in 5 M NaCl.
As an extension of the previous review [95SIL/BID], the present review also discusses experimental studies on curium (III). Systematic investigations by means of TRLFS clearly demonstrated that chloride complexation of the Cm3+ ion is negligible even in concentrated NaCl [95FAN/KIM] and hence the formation of ternary hydrox-ide-chloride complexes can be ruled out as well. Moreover, Fanghänel et al. [94FAN/KIM] reported a TRLFS study on the hydrolysis of curium (III) ranging from very dilute to concentrated NaCl. The new data selection in the present review is based on both the studies already discussed in [95SIL/BID] and the large amount of new ex-perimental data for Am(III) and Cm(III) hydroxide complexes. A significant change between the evaluation in [95SIL/BID] and the present review concerns the inclusion of additional data in NaCl solutions from the study of Stadler and Kim [88STA/KIM]. The literature data used in [95SIL/BID] and in the present review for the evaluation of hy-drolysis constants at I = 0 are summarised in Table 12-2.
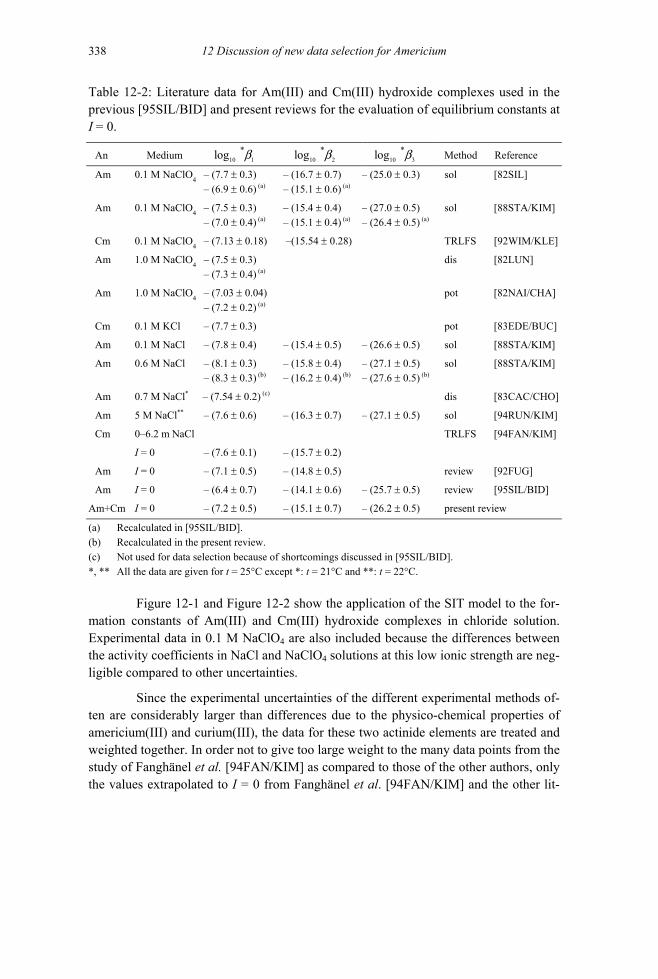
12 Discussion of new data selection for Americium 338
Table 12-2: Literature data for Am(III) and Cm(III) hydroxide complexes used in the previous [95SIL/BID] and present reviews for the evaluation of equilibrium constants at I = 0.
An Medium 10 1*log b 10 2
*log b 10 3*log b Method Reference
Am – (7.7 ± 0.3) – (16.7 ± 0.7) – (25.0 ± 0.3) sol [82SIL]
0.1 M NaClO4
– (6.9 ± 0.6) (a) – (15.1 ± 0.6) (a)
Am – (7.5 ± 0.3) – (15.4 ± 0.4) – (27.0 ± 0.5) sol [88STA/KIM]
0.1 M NaClO4
– (7.0 ± 0.4) (a) – (15.1 ± 0.4) (a) – (26.4 ± 0.5) (a)
Cm 0.1 M NaClO4 – (7.13 ± 0.18) –(15.54 ± 0.28) TRLFS [92WIM/KLE]
Am – (7.5 ± 0.3) dis [82LUN]
1.0 M NaClO4
– (7.3 ± 0.4) (a)
Am – (7.03 ± 0.04) pot [82NAI/CHA]
1.0 M NaClO4
– (7.2 ± 0.2) (a)
Cm 0.1 M KCl – (7.7 ± 0.3) pot [83EDE/BUC]
Am 0.1 M NaCl – (7.8 ± 0.4) – (15.4 ± 0.5) – (26.6 ± 0.5) sol [88STA/KIM]
Am – (8.1 ± 0.3) – (15.8 ± 0.4) – (27.1 ± 0.5) sol [88STA/KIM]
0.6 M NaCl
– (8.3 ± 0.3) (b) – (16.2 ± 0.4) (b) – (27.6 ± 0.5) (b)
Am 0.7 M NaCl* – (7.54 ± 0.2) (c) dis [83CAC/CHO]
Am 5 M NaCl** – (7.6 ± 0.6) – (16.3 ± 0.7) – (27.1 ± 0.5) sol [94RUN/KIM]
Cm 0–6.2 m NaCl TRLFS [94FAN/KIM]
I = 0 – (7.6 ± 0.1) – (15.7 ± 0.2)
Am I = 0 – (7.1 ± 0.5) – (14.8 ± 0.5) review [92FUG]
Am I = 0 – (6.4 ± 0.7) – (14.1 ± 0.6) – (25.7 ± 0.5) review [95SIL/BID]
Am+Cm I = 0 – (7.2 ± 0.5) – (15.1 ± 0.7) – (26.2 ± 0.5) present review
(a) Recalculated in [95SIL/BID]. (b) Recalculated in the present review. (c) Not used for data selection because of shortcomings discussed in [95SIL/BID]. *, ** All the data are given for t = 25°C except *: t = 21°C and **: t = 22°C.
Figure 12-1 and Figure 12-2 show the application of the SIT model to the for-mation constants of Am(III) and Cm(III) hydroxide complexes in chloride solution. Experimental data in 0.1 M NaClO4 are also included because the differences between the activity coefficients in NaCl and NaClO4 solutions at this low ionic strength are neg-ligible compared to other uncertainties.
Since the experimental uncertainties of the different experimental methods of-ten are considerably larger than differences due to the physico-chemical properties of americium(III) and curium(III), the data for these two actinide elements are treated and weighted together. In order not to give too large weight to the many data points from the study of Fanghänel et al. [94FAN/KIM] as compared to those of the other authors, only the values extrapolated to I = 0 from Fanghänel et al. [94FAN/KIM] and the other lit-

12.3 Americium oxygen and hydrogen compounds and complexes (V.3)
339
erature data are used for the evaluation of the average values of and .
10 1*log οb
10 2*log οb
The study of Fanghänel et al. [94FAN/KIM], which covers a wide range of NaCl concentrations, was used to determine ∆ε for the reactions ((12.1), n = 1, 2) and the ion interaction coefficients of the different An(III) hydroxide complexes.
The experimental equilibrium constants for the first hydroxide complex of Am(III) or Cm(III) are based on the following experimental methods: solubility studies with Am(OH)3(s) [88STA/KIM], [94RUN/KIM], potentiometric titration [83EDE/BUC], solvent extraction [83CAC/CHO], and laser fluorescence spectroscopy [92WIM/KLE], [94FAN/KIM]. For the reaction:
, (12.2) 3+ 2+ +2An H O(l) AnOH + H+
where An3+ stands for Am3+ and Cm3+, the values of 10 1*log οb and 1∆ε (Figure 12-1)
are:
((12.2), 298.15 K) = − (7.2 ± 0.5) , 10 1*log οb
(12.2) = − (0.15 ± 0.06) 1∆ε 1kg mol−⋅ .
The uncertainty within and between the different studies is covered. With = (0.23 ± 0.02) kg3+(Am , Cl )−ε 1mol−⋅ and +(H , Cl )−ε = (0.12 ± 0.01) ,
the ion interaction coefficient between AmOH
1kg mol−⋅2+ and Cl– is calculated to be:
2+ 1(AmOH , Cl ) = (0.04 0.07) kg mol− −ε − ± ⋅ .
If the value in NaCl solution or 1∆ε 1∆ε = (0.04 ± 0.05) kg as esti-mated in [95SIL/BID] for NaClO
1mol−⋅
1*
4 solution, is used to calculate 10log οb
1*
from the two studies in 1 M NaClO4 (the solvent extraction study of Lundqvist [82LUN] and the po-tentiometric study of Nair et al. [82NAI/CHA]), the calculated 10log οb values are in the range − 6.2 to − 6.5. Certain effects like sorption or precipitation (cf. discussion in [95SIL/BID]) might have led to overestimated hydrolysis constants in these studies. For these reasons the data in [82LUN], [82NAI/CHA] are disregarded in the present review.

12 Discussion of new data selection for Americium 340
Figure 12-1: Application of the SIT model to literature data in dilute to concentrated NaCl and 0.1 m NaClO4, for the equilibrium: . 3+ 2+ +
2An + H O(l) An(OH) + HThe filled and open symbols denote experimental data for Am(III) and Cm(III), respec-tively. The solid line is calculated with 10 1
*log οb = − (7.2 ± 0.5) and ∆ε1 = − (0.15 ± 0.06) kg · mol–1. The dotted lines show the associated uncertainties (95 % confidence interval).
-8.5
-8.0
-7.5
-7.0
-6.5
-6.0
-5.5
-5.0
-4.5
0 1 2 3 4 5 6
[88STA/KIM] [83CAC/CHO] [94RUN/KIM]
Am(III) Cm(III) [94FAN/KIM]
[83EDE/BUC] [92WIM/KLE]
3+ 2+ +2 An H O An(OH) + H+
log 1
0* β 1 +
4 D
– lo
g 10 a H
2O
I (mol·kg–1)
The experimental data for the formation of the second hydroxide complex have large uncertainties. This holds for both solubility studies with Am(OH)3(s), [88STA/KIM], [94RUN/KIM] and fluorescence spectroscopy with Cm(III), [92WIM/KLE], [94FAN/KIM], in the latter case, because of the low solubility at in-creased pH values and sorption effects.
For the reaction:
, (12.3) 3+ + +2 2An 2 H O(l) An(OH) + 2 H+
the following values of 10 2*log οb and 2∆ε are selected (Figure 12-2):
((12.3), 298.15 K) = − (15.1 ± 0.7), 10 2*log οb
(12.3) = − (0.26 ± 0.20) 2∆ε 1kg mol−⋅ .
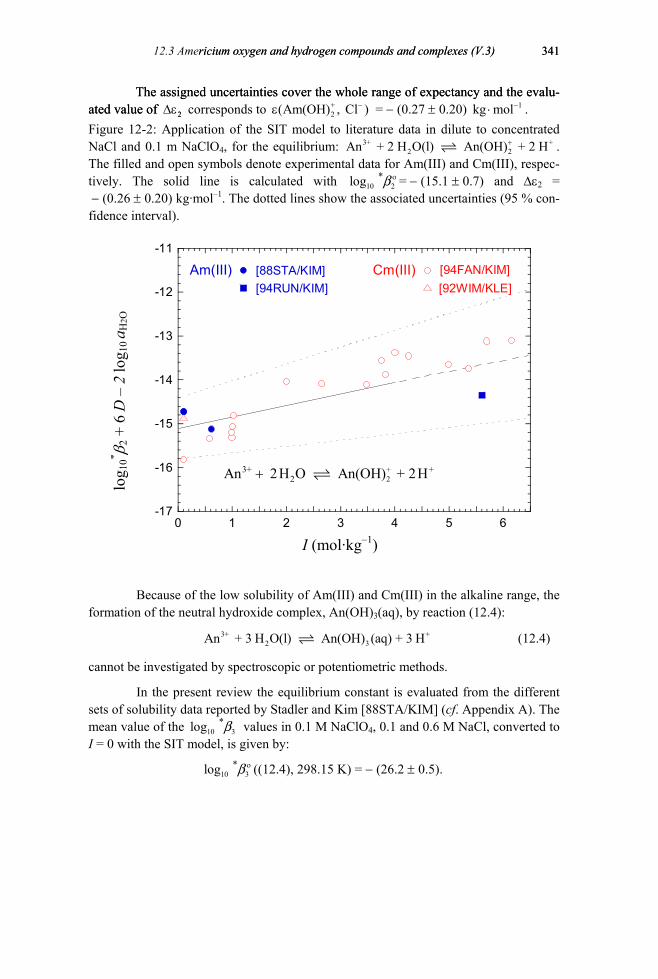
12.3 Americium oxygen and hydrogen compounds and complexes (V.3) ricium oxygen and hydrogen compounds and complexes (V.3)
341
341
The assigned uncertainties cover the whole range of expectancy and the evalu-ated value of
The assigned uncertainties cover the whole range of expectancy and the evalu-ated value of 22∆ε corresponds to +
2(Am(OH) , Cl )−ε = − (0.27 ± 0.20) . 1kg mol−⋅Figure 12-2: Application of the SIT model to literature data in dilute to concentrated NaCl and 0.1 m NaClO4, for the equilibrium: . The filled and open symbols denote experimental data for Am(III) and Cm(III), respec-tively. The solid line is calculated with lo
3+ +2 2An + 2 H O(l) An(OH) + 2 H+
10 2*g οb = − (15.1 ± 0.7) and ∆ε2 =
− (0.26 ± 0.20) kg·mol–1. The dotted lines show the associated uncertainties (95 % con-fidence interval).
-17
-16
-15
-14
-13
-12
-11
0 1 2 3 4 5 6
[88STA/KIM] [94RUN/KIM]
Am(III) Cm(III) [94FAN/KIM] [92WIM/KLE]
+2
3+ +2 An 2H O An(OH) + 2H+
I (mol·kg–1)
log 1
0* β 2 +
6 D
– 2
log 1
0 a H
2O
Because of the low solubility of Am(III) and Cm(III) in the alkaline range, the
formation of the neutral hydroxide complex, An(OH)3(aq), by reaction (12.4):
(12.4) 3+ +2 3An + 3 H O(l) An(OH) (aq) + 3 H
cannot be investigated by spectroscopic or potentiometric methods.
In the present review the equilibrium constant is evaluated from the different sets of solubility data reported by Stadler and Kim [88STA/KIM] (cf. Appendix A). The mean value of the lo values in 0.1 M NaClO10 3
*g b 4, 0.1 and 0.6 M NaCl, converted to I = 0 with the SIT model, is given by:
((12.4), 298.15 K) = − (26.2 ± 0.5). 10 3*log οb

12 Discussion of new data selection for Americium 342
The upper limit value of 10 3log οb < 13.4 ( 10 3*log οb
CO
<– 28.6) given in [90FEL/RAI], already mentioned in [95SIL/BID], is not accepted in the present review. The value of [90FEL/RAI] was derived from solubility data determined with AmOHCO3(cr) at pH 12.5 − 13.1 and carbonate concentrations of 0.07 mol · L–1. With the equilibrium con-stants selected for AmOHCO3(cr) and Am(OH)3(aq) one would expect a solubility of about 10–7 mol · L–1 at [OH–] = 0.1 mol · L–1 and [ 2
3− ] = 0.07 mol · L–1. However,
according to the data selected in [95SIL/BID] and the present review, the initial solid AmOHCO3(cr) must be expected to convert into Am(OH)3(cr), which is more stable and has hence a lower solubility under these conditions. This would explain the lower solubilities in the range of 10–7.5 − 10–9.1 mol · L–1 measured by [90FEL/RAI].
The equilibrium constants, lo 10*g ο
nb ((12.1), 298.15 K), selected in the present review, correspond to the following standard Gibbs energies of formation:
= − (794.7 ± 5.5) 2+f m (AmOH , 298.15 K)Gο∆ 1kJ mol−⋅ ,
= − (986.8 ± 6.2) +f m 2(Am(OH) , 298.15 K)Gο∆ 1kJ mol−⋅ ,
= − (1160.6 ± 5.5) kJf m 3(Am(OH) ,aq, 298.15 K)ο∆ G 1mol−⋅ .
As discussed in the previous review [95SIL/BID] the solubility data of Stadler and Kim [88STA/KIM] show that anionic hydroxide complexes, e.g., the reaction:
3Am(OH) (aq) + OH Am(OH)4− − (12.5)
are negligible at OH– concentrations below 0.1 mol · L–1.
12.3.1.2 Aqueous Am(V) hydroxide complexes (V.3.1.2) In the previous NEA review, [95SIL/BID], no thermodynamic data were selected for Am(V) hydroxide complexes. The only experimental data available, formation con-stants for the complex AmO2OH(aq), which were derived from solubility studies in 5 M NaCl ( lo = (1.5 ± 0.5), [85MAG/CAR]) and 3 M NaCl ( lo = (1.7 ± 0.6), [88STA/KIM], [88STA/KIM2]), were not accepted because of experimental shortcom-ings [95SIL/BID].
10 1g b 10 1g b
More reliable data were reported by Runde and Kim [94RUN/KIM], who measured the solubility of amorphous AmO2OH(am) over a wide range of H+ concen-trations in 5 M NaCl (8.0 < − log10[H+] < 13.5) at 295.15 K:
(AmO10 1log b 2OH, aq, 5 M NaCl) = (3.62 ± 0.27),
= (5.89 ± 0.22). 10 2 2 2log (AmO (OH) , 5 M NaCl)−b
An analogous solubility study with an aged precipitate of Np(V) hydroxide in the same medium led to almost the same formation constants for the analogous Np(V) hydroxide complexes:
(NpO10 1log b 2OH, aq, 5 M NaCl) = (3.66 ± 0.22) [94RUN/KIM],
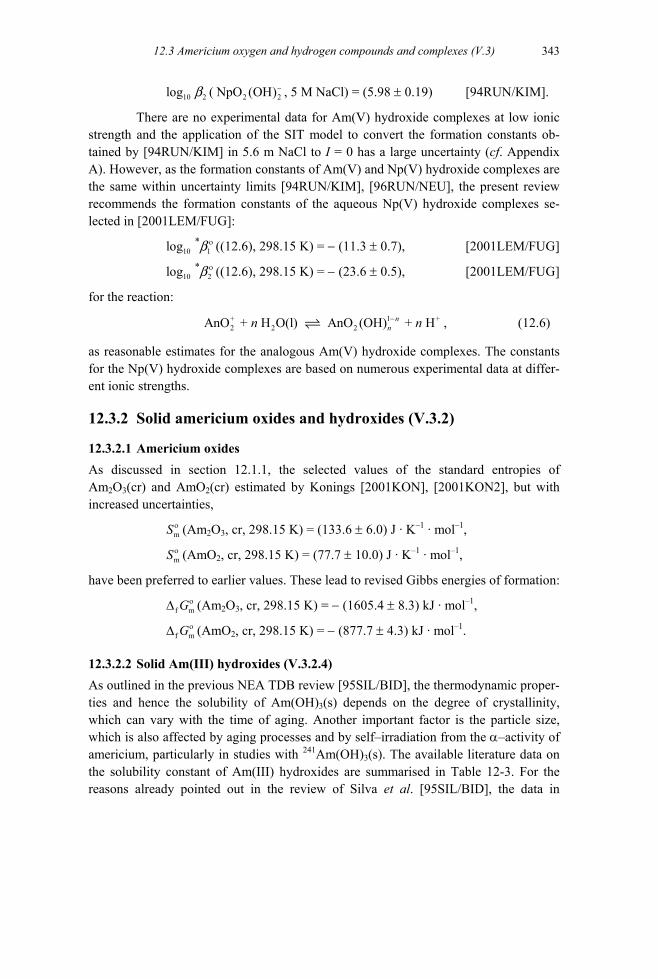
12.3 Americium oxygen and hydrogen compounds and complexes (V.3)
343
2 (10 2log b 2NpO (OH)− , 5 M NaCl) = (5.98 ± 0.19) [94RUN/KIM].
There are no experimental data for Am(V) hydroxide complexes at low ionic strength and the application of the SIT model to convert the formation constants ob-tained by [94RUN/KIM] in 5.6 m NaCl to I = 0 has a large uncertainty (cf. Appendix A). However, as the formation constants of Am(V) and Np(V) hydroxide complexes are the same within uncertainty limits [94RUN/KIM], [96RUN/NEU], the present review recommends the formation constants of the aqueous Np(V) hydroxide complexes se-lected in [2001LEM/FUG]:
((12.6), 298.15 K) = − (11.3 ± 0.7), [2001LEM/FUG] 10 1*log οb* ((12.6), 298.15 K) = − (23.6 ± 0.5), [2001LEM/FUG] 10 2log οb
for the reaction:
, (12.6) +2 2 2AnO + H O(l) AnO (OH) + H−n
nn 1 +n
as reasonable estimates for the analogous Am(V) hydroxide complexes. The constants for the Np(V) hydroxide complexes are based on numerous experimental data at differ-ent ionic strengths.
12.3.2 Solid americium oxides and hydroxides (V.3.2)
12.3.2.1 Americium oxides As discussed in section 12.1.1, the selected values of the standard entropies of Am2O3(cr) and AmO2(cr) estimated by Konings [2001KON], [2001KON2], but with increased uncertainties,
mS ο (Am2O3, cr, 298.15 K) = (133.6 ± 6.0) J · K–1 · mol–1,
mS ο (AmO2, cr, 298.15 K) = (77.7 ± 10.0) J · K–1 · mol–1,
have been preferred to earlier values. These lead to revised Gibbs energies of formation:
f mGο∆ (Am2O3, cr, 298.15 K) = − (1605.4 ± 8.3) kJ · mol–1,
f mGο∆ (AmO2, cr, 298.15 K) = − (877.7 ± 4.3) kJ · mol–1.
12.3.2.2 Solid Am(III) hydroxides (V.3.2.4) As outlined in the previous NEA TDB review [95SIL/BID], the thermodynamic proper-ties and hence the solubility of Am(OH)3(s) depends on the degree of crystallinity, which can vary with the time of aging. Another important factor is the particle size, which is also affected by aging processes and by self–irradiation from the α–activity of americium, particularly in studies with 241Am(OH)3(s). The available literature data on the solubility constant of Am(III) hydroxides are summarised in Table 12-3. For the reasons already pointed out in the review of Silva et al. [95SIL/BID], the data in
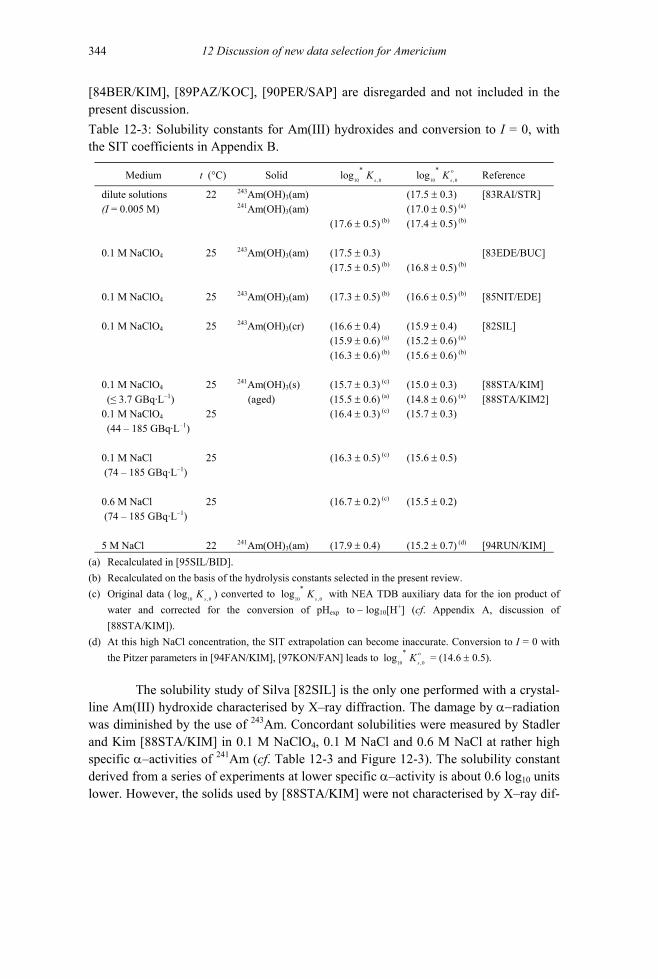
12 Discussion of new data selection for Americium 344
[84BER/KIM], [89PAZ/KOC], [90PER/SAP] are disregarded and not included in the present discussion. Table 12-3: Solubility constants for Am(III) hydroxides and conversion to I = 0, with the SIT coefficients in Appendix B.
Medium t (°C) Solid 10 ,0
*logs
K 10 ,0
*logs
K ο Reference
dilute solutions 22 243Am(OH)3(am) (17.5 ± 0.3) [83RAI/STR] (I = 0.005 M) 241Am(OH)3(am) (17.0 ± 0.5) (a) (17.6 ± 0.5) (b) (17.4 ± 0.5) (b) 0.1 M NaClO4 25 243Am(OH)3(am) (17.5 ± 0.3) [83EDE/BUC] (17.5 ± 0.5) (b) (16.8 ± 0.5) (b) 0.1 M NaClO4 25 243Am(OH)3(am) (17.3 ± 0.5) (b) (16.6 ± 0.5) (b) [85NIT/EDE]
0.1 M NaClO4 25 243Am(OH)3(cr) (16.6 ± 0.4) (15.9 ± 0.4) [82SIL]
(15.9 ± 0.6) (a) (15.2 ± 0.6) (a) (16.3 ± 0.6) (b) (15.6 ± 0.6) (b) 0.1 M NaClO4 25 241Am(OH)3(s) (15.7 ± 0.3) (c) (15.0 ± 0.3) [88STA/KIM]
(≤ 3.7 GBq·L–1) (aged) (15.5 ± 0.6) (a) (14.8 ± 0.6) (a) [88STA/KIM2]
0.1 M NaClO4 25 (16.4 ± 0.3) (c) (15.7 ± 0.3) (44 – 185 GBq·L–1) 0.1 M NaCl 25 (16.3 ± 0.5) (c) (15.6 ± 0.5) (74 – 185 GBq·L–1) 0.6 M NaCl 25 (16.7 ± 0.2) (c) (15.5 ± 0.2) (74 – 185 GBq·L–1) 5 M NaCl 22 241Am(OH)3(am) (17.9 ± 0.4) (15.2 ± 0.7) (d) [94RUN/KIM]
(a) Recalculated in [95SIL/BID]. (b) Recalculated on the basis of the hydrolysis constants selected in the present review. (c) Original data (
10 ,0log
sK ) converted to
10 ,0
*logs
K with NEA TDB auxiliary data for the ion product of water and corrected for the conversion of pHexp to − log10[H+] (cf. Appendix A, discussion of [88STA/KIM]).
(d) At this high NaCl concentration, the SIT extrapolation can become inaccurate. Conversion to I = 0 with the Pitzer parameters in [94FAN/KIM], [97KON/FAN] leads to
10 ,0
*logs
K ο = (14.6 ± 0.5). The solubility study of Silva [82SIL] is the only one performed with a crystal-
line Am(III) hydroxide characterised by X–ray diffraction. The damage by α−radiation was diminished by the use of 243Am. Concordant solubilities were measured by Stadler and Kim [88STA/KIM] in 0.1 M NaClO4, 0.1 M NaCl and 0.6 M NaCl at rather high specific α–activities of 241Am (cf. Table 12-3 and Figure 12-3). The solubility constant derived from a series of experiments at lower specific α–activity is about 0.6 log10 units lower. However, the solids used by [88STA/KIM] were not characterised by X–ray dif-
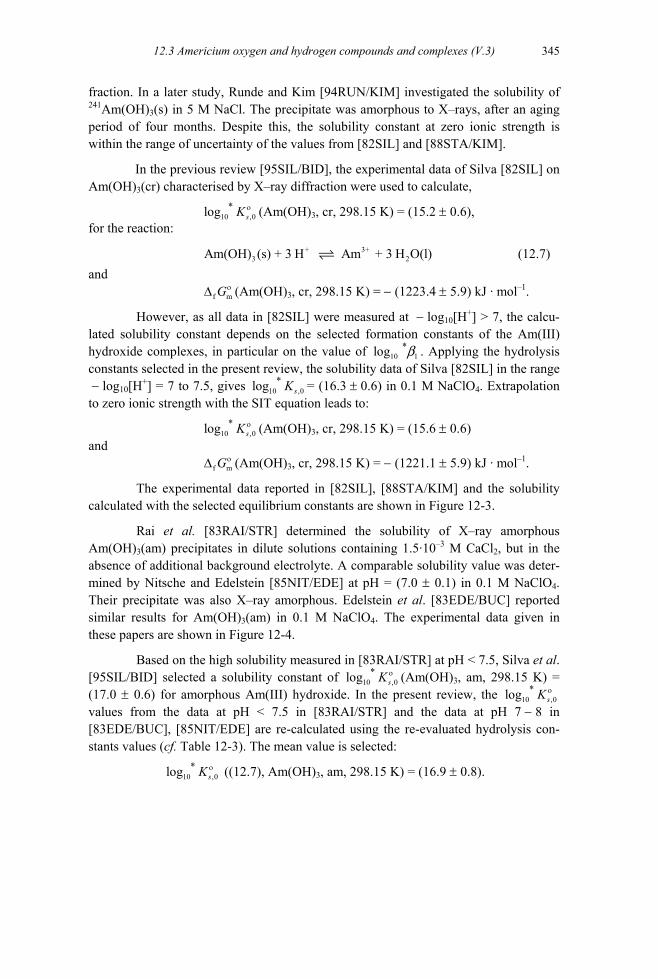
12.3 Americium oxygen and hydrogen compounds and complexes (V.3)
345
fraction. In a later study, Runde and Kim [94RUN/KIM] investigated the solubility of 241Am(OH)3(s) in 5 M NaCl. The precipitate was amorphous to X–rays, after an aging period of four months. Despite this, the solubility constant at zero ionic strength is within the range of uncertainty of the values from [82SIL] and [88STA/KIM].
In the previous review [95SIL/BID], the experimental data of Silva [82SIL] on Am(OH)3(cr) characterised by X–ray diffraction were used to calculate,
10 ,0*log ο
sK (Am(OH)3, cr, 298.15 K) = (15.2 ± 0.6), for the reaction:
(12.7) + 3+3Am(OH) (s) + 3 H Am + 3 H O(l)2
and (Am(OH)f m
ο∆ G 3, cr, 298.15 K) = − (1223.4 ± 5.9) kJ · mol–1.
However, as all data in [82SIL] were measured at − log10[H+] > 7, the calcu-lated solubility constant depends on the selected formation constants of the Am(III) hydroxide complexes, in particular on the value of lo . Applying the hydrolysis constants selected in the present review, the solubility data of Silva [82SIL] in the range − log
10 1*g b
10[H+] = 7 to 7.5, gives 10 ,0*log sK = (16.3 ± 0.6) in 0.1 M NaClO4. Extrapolation
to zero ionic strength with the SIT equation leads to:
10 ,0*log ο
sK (Am(OH)3, cr, 298.15 K) = (15.6 ± 0.6) and (Am(OH)f m
ο∆ G 3, cr, 298.15 K) = − (1221.1 ± 5.9) kJ · mol–1.
The experimental data reported in [82SIL], [88STA/KIM] and the solubility calculated with the selected equilibrium constants are shown in Figure 12-3.
Rai et al. [83RAI/STR] determined the solubility of X–ray amorphous Am(OH)3(am) precipitates in dilute solutions containing 1.5·10–3 M CaCl2, but in the absence of additional background electrolyte. A comparable solubility value was deter-mined by Nitsche and Edelstein [85NIT/EDE] at pH = (7.0 ± 0.1) in 0.1 M NaClO4. Their precipitate was also X–ray amorphous. Edelstein et al. [83EDE/BUC] reported similar results for Am(OH)3(am) in 0.1 M NaClO4. The experimental data given in these papers are shown in Figure 12-4.
Based on the high solubility measured in [83RAI/STR] at pH < 7.5, Silva et al. [95SIL/BID] selected a solubility constant of 10 ,0
*log οsK (Am(OH)3, am, 298.15 K) =
(17.0 ± 0.6) for amorphous Am(III) hydroxide. In the present review, the 10 ,0*log ο
sK values from the data at pH < 7.5 in [83RAI/STR] and the data at pH 7 − 8 in [83EDE/BUC], [85NIT/EDE] are re-calculated using the re-evaluated hydrolysis con-stants values (cf. Table 12-3). The mean value is selected:
10 ,0*log ο
sK ((12.7), Am(OH)3, am, 298.15 K) = (16.9 ± 0.8).

12 Discussion of new data selection for Americium 346
Figure 12-3: Solubility measurements of crystalline Am(III) hydroxide [82SIL] and aged Am(OH)3(s) [88STA/KIM] in 0.1 M NaClO4 and NaCl at 298.15 K. The solid curve is calculated with 10 ,0
*log οsK (Am(OH)3, cr) = (15.6 ± 0.6) and the hydrolysis
constants selected in the present review, corrected to I = 0.1 mol · L–1. The dotted lines show the associated uncertainty range (95% confidence interval). The dashed line is calculated with the constants selected in the previous review [95SIL/BID].
– log10[H+]
-12
-11
-10
-9
-8
-7
-6
-5
-4
-3
-2
6 7 8 9 10 11 12 13
Am(OH)3(cr, aged)
log 1
0[A
m(I
II)]
[88STA/KIM] O Exp. A (≤3.7 GBq·L–1)
Exp. B (44–185 GBq·L–1) Exp. C (74–185 GBq·L–1) [82SIL]
- - - -[95SIL/BID]
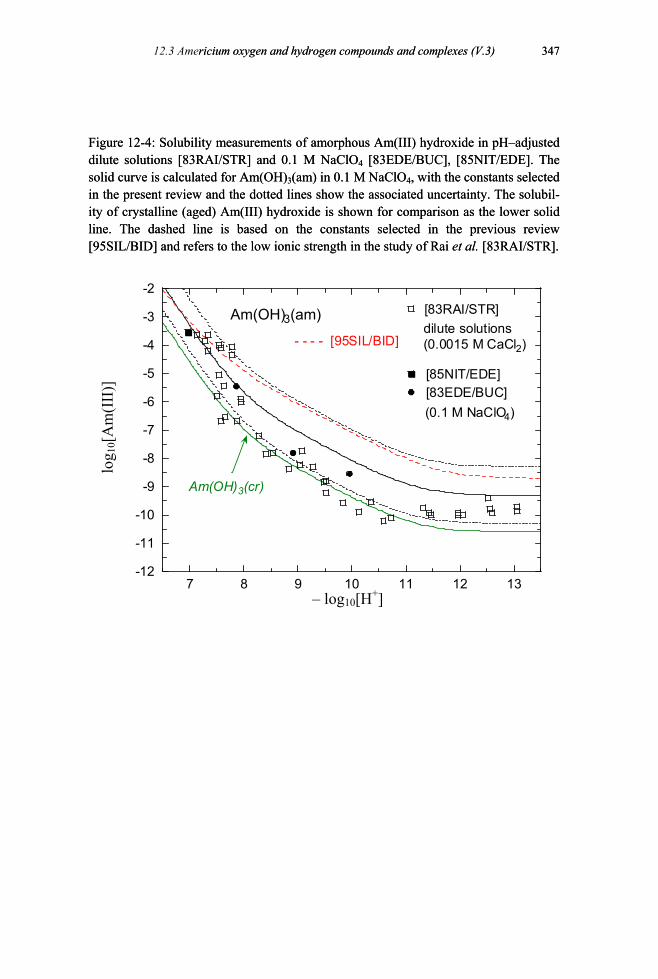
12.3 Americium oxygen and hydrogen compounds and complexes (V.3) ricium oxygen and hydrogen compounds and complexes (V.3)
347
347
Figure 12-4: Solubility measurements of amorphous Am(III) hydroxide in pH–adjusted dilute solutions [83RAI/STR] and 0.1 M NaClO4 [83EDE/BUC], [85NIT/EDE]. The solid curve is calculated for Am(OH)3(am) in 0.1 M NaClO4, with the constants selected in the present review and the dotted lines show the associated uncertainty. The solubil-ity of crystalline (aged) Am(III) hydroxide is shown for comparison as the lower solid line. The dashed line is based on the constants selected in the previous review [95SIL/BID] and refers to the low ionic strength in the study of Rai et al. [83RAI/STR].
Figure 12-4: Solubility measurements of amorphous Am(III) hydroxide in pH–adjusted dilute solutions [83RAI/STR] and 0.1 M NaClO4 [83EDE/BUC], [85NIT/EDE]. The solid curve is calculated for Am(OH)3(am) in 0.1 M NaClO4, with the constants selected in the present review and the dotted lines show the associated uncertainty. The solubil-ity of crystalline (aged) Am(III) hydroxide is shown for comparison as the lower solid line. The dashed line is based on the constants selected in the previous review [95SIL/BID] and refers to the low ionic strength in the study of Rai et al. [83RAI/STR].
– log10[H+]
-12
-11
-10
-9
-8
-7
-6
-5
-4
-3
-2
7 8 9 10 11 12 13
[83RAI/STR]
[83EDE/BUC]
dilute solutions (0.0015 M CaCl2)
Am(OH)3(am)
(0.1 M NaClO4)
[85NIT/EDE]
- - - - [95SIL/BID]
Am(OH)3(cr)
log 1
0[A
m(I
II)]

12 Discussion of new data selection for Americium 348
The use of the notation “crystalline” and “amorphous” to describe a solid phase might indicate an oversimplified model. The X–ray data give information on the bulk structure, while the solubility is determined by the surface characteristics. These are not necessarily identical. However, the data for “crystalline” and “amorphous” Am(OH)3(s) selected in this review may indicate the magnitude of the effect of an incomplete knowledge of the surface state of the solid.
This is confirmed by the solubility data of Rai et al. [83RAI/STR] (cf. Figure 12-4) that do not correlate with the X–rays investigations carried out in parallel. All the investigated fresh or aged precipitates at pH < 9.6 were found amorphous to X–rays. However, the solubility in the pH range 8 − 11 is comparable with that calculated for Am(OH)3(cr) (lower solid line in Figure 12-4). Only some data at pH 7 − 8 show a markedly increased solubility. On the other hand, Rai et al. [83RAI/STR] observed the appearance of X–ray diffraction peaks for aged precipitates at pH = 13, while the meas-ured solubility remained in the range of the value for Am(OH)3(am) (upper solid line in Figure 12-4).
In numerous studies Am(III) solubilities at pH = 11 − 13 were found in the range [Am(III)] = 10–10 − 10–11 mol · L–1 (Table 12-4), independent of the α–activity and the crystallinity of the bulk solid. Combining lo 10 3
*g οb ((12.4), 298.15 K) = − (26.2 ± 0.5) with the solubility constants for amorphous and crystalline or aged Am(OH)3(s), respectively, the equilibrium constant for the reaction:
(12.8) 3Am(OH) (s) Am(OH) (aq)3
is given by: 10 ,3log ο
sK ((12.8), 298.15 K) = − (9.3 ± 1.0) for Am(OH)3(am),
10 ,3log οsK ((12.8), 298.15 K) = − (10.6 ± 0.8) for Am(OH)3(cr).
The solubilities reported in [86EWA/HOW], [84BER/KIM], [88STA/KIM], [91VIT/TRA] for alkaline solutions of low or moderate ionic strength (Table 12-4), are concordant with the value calculated for crystalline (or aged) Am(OH)3(s). The data of Rai et al. (log10[Am(III)] = − (9.8 ± 0.3), [83RAI/STR]) are closer to the value calcu-lated for Am(OH)3(am). The increased solubility measured by Runde and Kim [94RUN/KIM] in alkaline 5 M NaCl solutions with an X–ray amorphous hydroxide, log10[Am(OH)3(aq)] = − (9.3 ± 0.3), is in accord with the value calculated for Am(OH)3(am). Alternatively, it could be interpreted by assuming the presence of aged Am(OH)3(s) and an ionic strength dependence of:
∆ε (12.8) = +3(Am(OH) (aq), Na ) + (Am(OH) (aq), Cl )3
−ε = − (0.23 ± 0.15) kg · molε –1.
However, as the nature of the Am(OH)3(s) in [94RUN/KIM] is not definitely known, the ionic strength dependence of reaction (12.8) requires further experimental investigation.
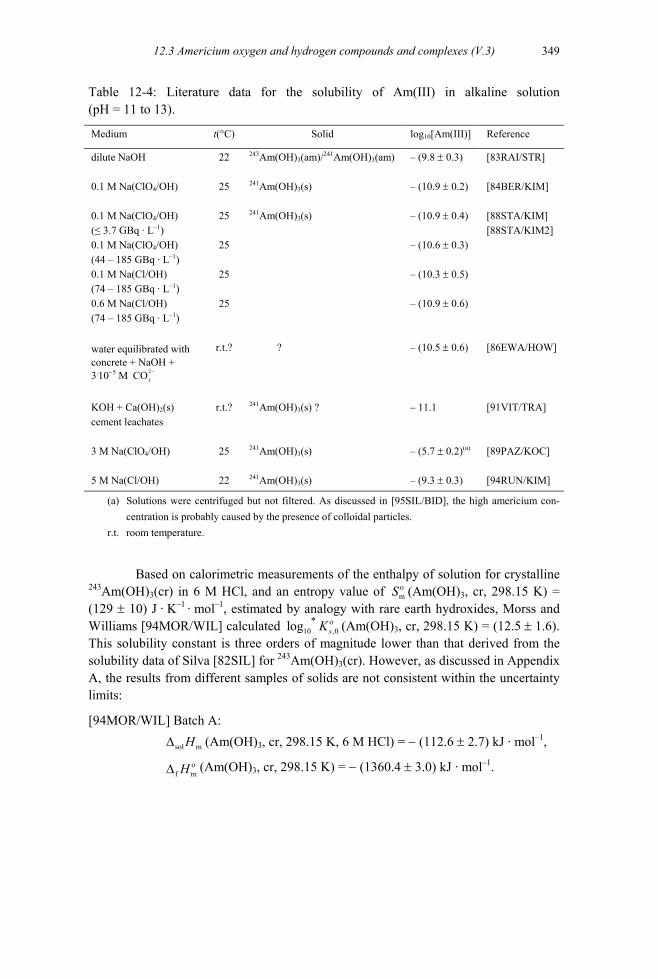
12.3 Americium oxygen and hydrogen compounds and complexes (V.3)
349
Table 12-4: Literature data for the solubility of Am(III) in alkaline solution (pH = 11 to 13).
Medium t(°C) Solid log10[Am(III)] Reference
dilute NaOH 22 243Am(OH)3(am)/241Am(OH)3(am) – (9.8 ± 0.3) [83RAI/STR] 0.1 M Na(ClO4/OH) 25 241Am(OH)3(s) – (10.9 ± 0.2) [84BER/KIM]
0.1 M Na(ClO4/OH) 25 241Am(OH)3(s) – (10.9 ± 0.4) [88STA/KIM]
(≤ 3.7 GBq · L–1) [88STA/KIM2] 0.1 M Na(ClO4/OH) 25 – (10.6 ± 0.3) (44 – 185 GBq · L–1) 0.1 M Na(Cl/OH) 25 – (10.3 ± 0.5) (74 – 185 GBq · L–1) 0.6 M Na(Cl/OH) 25 – (10.9 ± 0.6) (74 – 185 GBq · L–1)
r.t.? ? – (10.5 ± 0.6) [86EWA/HOW] water equilibrated with concrete + NaOH + 3.10−5 M CO 2
3
−
r.t.? 241Am(OH)3(s) ? – 11.1 [91VIT/TRA] KOH + Ca(OH) (s)
cement leachates 3 M Na(ClO4/OH) 25 241Am(OH)3(s) – (5.7 ± 0.2)(a) [89PAZ/KOC] 5 M Na(Cl/OH) 22 241Am(OH)3(s) – (9.3 ± 0.3) [94RUN/KIM]
2
(a) Solutions were centrifuged but not filtered. As discussed in [95SIL/BID], the high americium con-centration is probably caused by the presence of colloidal particles.
r.t. room temperature.
Based on calorimetric measurements of the enthalpy of solution for crystalline 243Am(OH)3(cr) in 6 M HCl, and an entropy value of m
οS (Am(OH)3, cr, 298.15 K) = (129 ± 10) J · K–1 · mol–1, estimated by analogy with rare earth hydroxides, Morss and Williams [94MOR/WIL] calculated 10 ,0
*log οsK (Am(OH)3, cr, 298.15 K) = (12.5 ± 1.6).
This solubility constant is three orders of magnitude lower than that derived from the solubility data of Silva [82SIL] for 243Am(OH)3(cr). However, as discussed in Appendix A, the results from different samples of solids are not consistent within the uncertainty limits:
[94MOR/WIL] Batch A: sol m∆ H (Am(OH)3, cr, 298.15 K, 6 M HCl) = − (112.6 ± 2.7) kJ · mol–1,
f mH ο∆ (Am(OH)3, cr, 298.15 K) = − (1360.4 ± 3.0) kJ · mol–1.

12 Discussion of new data selection for Americium 350
[94MOR/WIL] Batch B: sol m∆ H (Am(OH)3, cr, 298.15 K, 6 M HCl) = − (101.9 ± 5.1) kJ · mol–1,
f mH ο∆ (Am(OH)3, cr, 298.15 K) = − (1371.1 ± 5.3) kJ · mol–1.
These discrepancies indicate that there are chemical differences in the solid samples, which possibly do not represent homogeneous Am(OH)3(cr).
In an analogous study Merli et al. [97MER/LAM] determined the enthalpy of solution for 241Am(OH)3(cr) in 6 M HCl. Their experimental data differ considerably from those in [94MOR/WIL] as they obtain:
sol m∆ H (Am(OH)3, cr, 298.15 K, 6 M HCl) = − (129.4 ± 1.1) kJ · mol–1,
f m
ο∆ H (Am(OH)3, cr, 298.15 K) = − (1343.6 ± 1.8) kJ · mol–1.
Merli et al. [97MER/LAM] used a similar entropy estimate of (Am(OH)mοS 3,
cr, 298.15 K) = (126 ± 8) J · K–1 · mol–1 and calculated a solubility constant of 10 ,0
*log οsK (Am(OH)3, cr, 298.15 K) = (16.8 ± 1.0) for crystalline americium(III) hy-
droxide. The entropy estimate used by [97MER/LAM] was obtained from (Eu(OH)mοS 3,
cr, 298.15 K) = (119.9 ± 0.2) J · K–1 · mol–1, experimentally determined by Chirico and Westrum [80CHI/WES], by adding a correction of 5.7 J · K–1 · mol–1 for the greater mass of americium. However, in trivalent europium, but not in americium, the 7F1 and 7F2 electronic levels contribute to the entropy. For americium compounds, therefore, this contribution of 9.5 J · K–1 · mol–1 should be deduced from the Eu-based values (cf. Konings [2001KON]). Inclusion of this additional correction leads to:
mοS (Am(OH)3, cr, 298.15 K) = (116 ± 8) J · K–1 · mol–1 .
With this value the calorimetric results of [97MER/LAM] lead to the solubility constant:
10 ,0*log ο
sK (Am(OH)3, cr, 298.15 K) = (17.3 ± 1.0).
This latter value is 1.7 log10 units larger than 10 ,0*log ο
sK = (15.6 ± 0.6) calcu-lated from the solubility data reported in [82SIL] for 243Am(OH)3(cr), but closer to
10 ,0*log ο
sK = (16.9 ± 0.8) selected for Am(OH)3(am). This is a rather unexpected result, because calorimetric data determined with well-crystallised solids usually lead to lower solubility constants than experimental solubility data. The reason for this discrepancy is not obvious, because the solid phase characterisation in [97MER/LAM] indicates that the solid phase is crystalline, not amorphous as a result of α-radiation damage.
Similar observations are reported for analogous lanthanide hydroxides Ln(OH)3(cr) with Ln = Pr, Nd, Sm, Eu [98DIA/RAG]. The solubility constants calcu-lated from thermochemical data for the crystalline hydroxides of these lanthanides ex-ceed the values from solubility measurements by 1 - 3 orders of magnitude. As pointed out in [97MER/LAM] and [98DIA/TAG], particularly for Nd(OH)3(cr), the entropy and enthalpy of solution are well determined and there is good agreement between experi-

12.3 Americium oxygen and hydrogen compounds and complexes (V.3)
351
mental data from different laboratories. Diakonov et al. [98DIA/RAG] concluded that most likely the discrepancies between 10 ,0
*log sK ο values from solubility and thermo-chemical data arise from uncertainties or erroneous data for the standard enthalpies and entropies of the aqueous ions. However, the present review is convinced that there is no reason to cast doubt on:
f mο∆ H (Am3+, 298.15 K) = − (616.7 ± 1.5) kJ · mol–1
and (Amm
οS 3+, 298.15 K) = − (201 ± 15) J · K–1 · mol–1,
selected in [95SIL/BID]. The standard molar entropy of Am3+ selected in [95SIL/BID] is based on the experimental value of Pu3+ taking into account the difference in elec-tronic configuration and a parallel correlation for the lanthanide aqueous ions.
Combining *lo 10 ,0g οsK (Am(OH)3, cr, 298.15 K) = (15.6 ± 0.6) and
((12.7) 298.15 K) = − (89.045 ± 3.424) kJ · molr mο∆ G –1 selected from the solubility
measurements in [82SIL] with f mο∆ H (Am(OH)3, cr, 298.15 K) = − (1343.6 ± 1.8)
kJ · mol–1 determined in [97MER/LAM] and mοS (Am3+, 298.15 K) = − (201 ± 15)
J · K−1 · mol–1 as adopted in [95SIL/BID], the standard molar entropy of crystalline Am(III) hydroxide would be: m
οS (Am(OH)3, cr, 298.15 K) = (149 ± 20) J · K–1 · mol–1. The uncertainty limits of this value and the estimate used above, m
οS (Am(OH)3, cr, 298.15 K) = (116 ± 8) J · K–1 · mol–1, do not overlap. Moreover, an entropy of
(Am(OH)mοS
mοS
f mGο∆
3, cr, 298.15 K) = (149 ± 20) J · K–1 · mol–1 is not compatible with the standard molar entropy of crystalline Am(III) hydroxycarbonate,
(AmOHCO3 · 0.5H2O, cr, 298.15 K) = (144 ± 10) J · K−1 · mol–1 or (141 ± 21) J · K−1 · mol–1 as re-calculated for reasons of internal consistency from
(AmOHCO3 · 0.5H2O, cr, 298.15 K) = − (1530.2 ± 5.6) kJ · mol–1 selected in this review (cf. section 12.6.1.1.3.1). In contrast to the good agreement between thermochemical and solubility data for AmOHCO3 · 0.5H2O(cr), the data for the crystalline Am(III) hydroxide are conflicting. Accepting the selected value:
1f m 3(Am(OH) , cr, 298.15 K) = (1221.1 5.9) kJ molGο −∆ − ± ⋅ ,
derived from the solubility study in [82SIL] and the entropy estimate selected in the present review:
mοS (Am(OH)3, cr, 298.15 K) = (116 ± 8) J · K–1 · mol–1,
the standard molar enthalpy of crystalline Am(III) hydroxide is calculated to be:
f mο∆ H (Am(OH)3, cr, 298.15 K) = − (1353.2 ± 6.4) kJ · mol–1.
This value is selected, but it is in disagreement with f mο∆ H (Am(OH)3, cr,
298.15 K) = − (1343.6 ± 1.8) kJ · mol–1 determined in [97MER/LAM]. However, the available solubility and thermochemical data do not allow a better selection of
f mο∆ H (Am(OH)3, cr, 298.15 K).

12 Discussion of new data selection for Americium 352
12.3.2.3 Solid Am(V) hydroxides (V.3.2.5) There are only a few studies of the solubility of Am(V) precipitates in near neutral and alkaline solutions. The solubility constant for the reaction:
+2AmO OH(am) AmO + OH2
− (12.9)
was reported to be 10 ,0log sK ((12.9), 298.15 K) = − (9.3 ± 0.5) in both 5 M NaCl [85MAG/CAR] and 3 M NaCl [88STA/KIM], [88STA/KIM2]. The solid phase was not characterised in these studies. It was already pointed out in the previous review [95SIL/BID] that since it is not clear whether the pH measurements in these papers were corrected for the liquid junction potential, the data reported in [85MAG/CAR], [88STA/KIM], [88STA/KIM2] cannot be used for the selection of thermodynamic data. In a less ambiguous later study, Runde and Kim [94RUN/KIM] investigated the solubil-ity of an X–ray amorphous 241Am(V) hydroxide precipitate at 295.15 K in 5 M NaCl. From the solubility data in the range 8.0 < − log10[H+] < 9.5, the solubility constant was calculated to be: lo 10 ,0g sK (12.9) = − (8.94 ± 0.42). This value is consistent with an analogous value reported in [96ROB/SIL] for NpO2OH(am) and with the thermody-namic data selected in [2001LEM/FUG] for fresh precipitates of amorphous Np(V) hy-droxide (cf. Figure 12-5). Accordingly, the solubility constants for NpO2OH(am) and AmO2OH(am) are the same within the range of uncertainty.
Neglecting the slight difference in temperature between the standard state and 22°C in the study of [94RUN/KIM] and increasing the uncertainty to ± 0.5 log10 units, because there are no Am(V) data at lower ionic strength for comparison, the present review selects:
10 ,0*log ο
sK (AmO2OH, am, 298.15 K) = (5.3 ± 0.5),
for the reaction:
. (12.10) + +2AmO OH(am) + H AmO + H O(l)2 2
For the ternary Am(V) hydroxides M 2 2 2AmO (OH) x H O(cr)⋅ , M = Li, Na, K, and , M = Na, K prepared by Tananaev [90TAN] and char-acterised by X–ray diffraction, no thermodynamic data are available. Peretrukhin et al. [96PER/KRY] measured the solubility of
2 2 3 2M AmO (OH) x H O(cr)⋅
2 2 3 2Na AmO (OH) x H O(s)⋅ in 1.6 − 11.7 M NaOH, but because of the shortcomings and ambiguities discussed in Appendix A, the present review does not derive thermodynamic data from this source. Additional data on the behaviour of Am(V) hydroxides are given in [96KUL/MAL].

12.3 Americium oxygen and hydrogen compounds and complexes (V.3) ricium oxygen and hydrogen compounds and complexes (V.3)
353
353
Figure 12-5: Solubility constants of amorphous Np(V) and Am(V) hydroxides in 0.3 − 5.6 m NaCl solution (for the reaction: ). The data in [96ROB/SIL] for Np(V) and in [94RUN/KIM] for Am(V) are in good agreement with those calculated (solid line) for fresh amorphous Np(V) hydroxide (dotted lines show the associated uncertainty) with
Figure 12-5: Solubility constants of amorphous Np(V) and Am(V) hydroxides in 0.3 − 5.6 m NaCl solution (for the reaction: ). The data in [96ROB/SIL] for Np(V) and in [94RUN/KIM] for Am(V) are in good agreement with those calculated (solid line) for fresh amorphous Np(V) hydroxide (dotted lines show the associated uncertainty) with
+2 2AnO OH(am) AnO + OH−
10 ,0log
+2 2AnO OH(am) AnO + OH−
10 ,0log οsK (NpO2OH, am, 298.15 K)
= − (8.7 ± 0.2) and (0.09 ± 0.05) kg · mol+2(NpO , Cl )−ε
== –1 [2001LEM/FUG] and
(0.04 ± 0.01) kg · mol+(Na , OH )−ε –1 [95SIL/BID]. For the reasons given in the pre-vious review [95SIL/BID], the solubility constants from [85MAG/CAR], [88STA/KIM] are not used for the selection of thermodynamic data.
mNaCl (mol·kg–1 H2O)
10.0
-9.5
-9.0
-8.5
-8.0
-7.5
-7.0
0 1 2 3 4 5 6
94R5M8S
[96ROB/SIL] [ UN/KIM][8 AG/CAR][8 TA/KIM]
NpO2OH(am) AmO2OH(am) □ [96ROB/SIL] ■ [94RUN/KIM] [85MAG/CAR] [88STA/KIM]
log 1
0 K
s,0
12 Discussion of new data selection for Americium 354
12.4 Americium group 17 (halogen) compounds and complexes (V.4)
12.4.1 Aqueous group 17 (halogen) complexes (V.4.1)
12.4.1.1 Aqueous Am(III) fluorides (V.4.1.1) Few additional studies on Am(III) fluoride complexation have been published since the previous review [95SIL/BID]. For reasons given earlier this review has also considered experimental studies on the complexation of Cm(III) with fluoride. The experimental data for the reactions:
3+ (3 )An + F AnF− −nnn , (12.11)
with An = Am(III), Cm(III) are summarised in Table 12-5.
Suganuma et al. [97SUG/SAT], [97SUG/SAT2] determined formation con-stants of AmF2+ in water and mixed water/solvent systems using a solvent extraction technique. This review considers only the complexation constant in pure aqueous solu-tions. In both papers the same value is presented for the formation constant of AmF2+:
= (2.51 ± 0.06) at a constant ionic strength of 0.1 mol · L10 1log b10 1log οb
–1, corresponding to = (3.15 ± 0.1) when converted to I = 0 with the SIT. This value agrees fairly
well with the selected data of the previous review [95SIL/BID], 10 1log οb = (3.4 ± 0.4).
A compilation of literature data is reported in [97CHA/SAW], but no new ex-perimental data on the fluoride complexation of Am(III) and Cm(III) are presented.
Experimental data for the formation of Cm(III) fluoride complexes have been published by Feay [54FEA], Aziz and Lyle [69AZI/LYL], Degischer and Choppin [75DEG/CHO], and Choppin and Unrein [76CHO/UNR]; these papers were discussed in the previous review. For the reasons given in [95SIL/BID], the results of [54FEA], [69AZI/LYL], [75DEG/CHO] are not used for the evaluation of thermodynamic data.
Recently the fluoride complexation of Cm(III) was studied by TRLFS in 0 − 5 mol · kg–1 NaCl solutions [99AAS/STE]. The data were extrapolated to zero ionic strength using the Pitzer model to give:
(CmF10 1log οb 2+, 298.15 K) = (3.44 ± 0.05).
This value is in excellent agreement with the formation constant at I = 0 se-lected by [95SIL/BID] for AmF2+:
(AmF10 1log οb 2+, 298.15 K) = (3.4 ± 0.4).
In addition to the experimental data for AmF2+ of Choppin and Unrein [76CHO/UNR], and Nash and Cleveland [84NAS/CLE], which were selected by the previous review, the data determined by Suganuma et al. [97SUG/SAT], [97SUG/SAT2], Choppin and Unrein, and Aas et al. [99AAS/STE] for CmF2+ are used

12.4 Americium group 17 (halogen) compounds and complexes (V.4)
355
to calculate the thermodynamic formation constant of the monofluoro complex of triva-lent actinides. The estimated value of the ion interaction coefficient given in the previ-ous review, ∆ε = − (0.12 ± 0.1) kg · mol–1, is used for the extrapolation to infinite dilu-tion. The unweighted average of the selected experimental data extrapolated to I = 0 with the SIT and the lo value given by Aas et al. [99AAS/STE] lead to the fol-lowing equilibrium constant:
10 1g οb
(AnF10 1log οb 2+, 298.15 K) = (3.4 ± 0.3).
No new data are available for other Am(III) and Cm(III) fluoride complexes. The present review retains the equilibrium constant for selected by [95SIL/BID]: +
2AmF
= (5.8 ± 0.2). +10 2 2log (AmF , 298.15K)οb
Table 12-5: Literature values of the formation constants for (3 )AnF −nn and
complexes.
(3 )CmF −nn
Method
Medium t (°C) An 10 1log b 10 2log b 10 3log b Reference
sol 0.1 M HClO4 23 Cm (a) [54FEA] Am (a) dis 0.5 M NaClO4 25 Cm 3.34 6.18 9.08 [69AZI/LYL] Am 3.39 6.11 9.0 dis 1.0 M NaClO4 25 Cm (2.93 ± 0.10) [75DEG/CHO] Am (2.93 ± 0.10) dis 1.0 M NaClO4 10 Cm (2.50 ± 0.02) [76CHO/UNR] Am (2.39 ± 0.01) 25 Cm (2.61 ± 0.02) Am (2.49 ± 0.02) 40 Cm (2.68 ± 0.05) Am (2.57 ± 0.02) 55 Cm (2.81 ± 0.02) Am (2.71 ± 0.03) dis 0.1 M NaClO4 25 Am (2.51 ± 0.06) [97SUG/SAT]
[97SUG/SAT2] ix 0.1 M NaClO4 25 Am (2.59 ± 0.01) (4.75 ± 0.04) [84NAS/CLE] TRLFS 0–5 m NaCl 25 Cm [99AAS/STE] I = 0 (3.44 ± 0.05)
(a) For the stepwise reaction , Feay reports+
2AnF + F AnF (aq)−
3 10 3log K = 3.90 for Cm and 3.11 for Am.

12 Discussion of new data selection for Americium 356
12.4.1.2 Aqueous Am(III) chloride complexes (V.4.1.2)
12.4.1.3 Aqueous Am(III) and Cm(III) chlorides (V.4.1.2.1) The published data on the chloride complexation of trivalent actinides can be divided into two groups. Most of the experimental data have been determined by methods based on two–phase equilibria such as ion exchange or liquid–liquid extraction. The other group of data is based on spectroscopic methods. The evaluated complexation constants are similar within each group. However, the spectroscopically determined complexation constants are about two orders of magnitude smaller than those deduced from solvent extraction and ion exchange equilibria. The latter methods are unable to distinguish between ion–ion interaction and inner–sphere complexation. Changes in activity coeffi-cients caused by the replacement of most of the background electrolyte by a weak ligand like chloride are often misinterpreted as complex formation. The effects ob-served in phase equilibrium studies, i.e., when the NaClO4 background medium is suc-cessively replaced by NaCl, can be described by using the correct ion interaction term of the SIT (instead of constant activity coefficients) to calculate the activity coefficients of the Am3+ ion:
3+4
3+ 3+10 4Am ClO Cl
log 9D + (Am ,ClO ) m (Am ,Cl ) m− −− −γ = − ε ⋅ + ε ⋅
− 3+
−with = (0.49 ± 0.03) kg · mol3+
4(Am ,ClO )ε –1 and (Am ,Cl )ε = (0.23 ± 0.02) kg · mol–1 (Table B-4, Appendix B). An interpretation in terms of chloride complexation would mean that the observed effect on phase equilibria is accounted for twice. To avoid such inconsistencies the present review prefers to rely on equilibrium constants derived from spectroscopic data.
The spectroscopic studies of Barbanel and Mikhailova [69BAR/MIK] on Am(III), of Shiloh and Marcus [64SHI/MAR], and Marcus and Shiloh [69MAR/SHI] on Am(III), Np(III) and Pu(III) in concentrated HCl and LiCl solutions, as well as the recent detailed TRLFS studies of Fanghänel et al. [95FAN/KIM] and Könnecke et al. [97KON/FAN] on Cm(III) in concentrated CaCl2 solutions, have demonstrated that in-ner–sphere chloride complexes are formed only at very high chloride concentrations (above 4–5 molal), as indicated by changes in the absorption and fluorescence spectra. This is in contradiction to the complexation constant for the monochloro complex, AmCl2+ recommended by the previous review [95SIL/BID], lo 10 1g οb = (1.05 ± 0.06). An equilibrium constant of this magnitude would result in the presence of about 50% of the monochloro complex in a 1 molal chloride solution. In the TRLFS study of Fanghänel et al. [95FAN/KIM], no detectable complex formation was observed even in 4 m chloride concentrations. The fluorescence emission spectra of Cm(III) in 4 molal chloride (2 m CaCl2) and in dilute HClO4 solutions show no significant differences in the peak location and the peak shape. Similar observations have been made in the ab-sorption spectra of Am(III) by Giffaut [94GIF] in 3 M NaCl and NaClO4, and Runde et al. [97RUN/NEU] in 5 M NaCl and HClO4 solutions. In both cases the absorption spec-tra are identical.
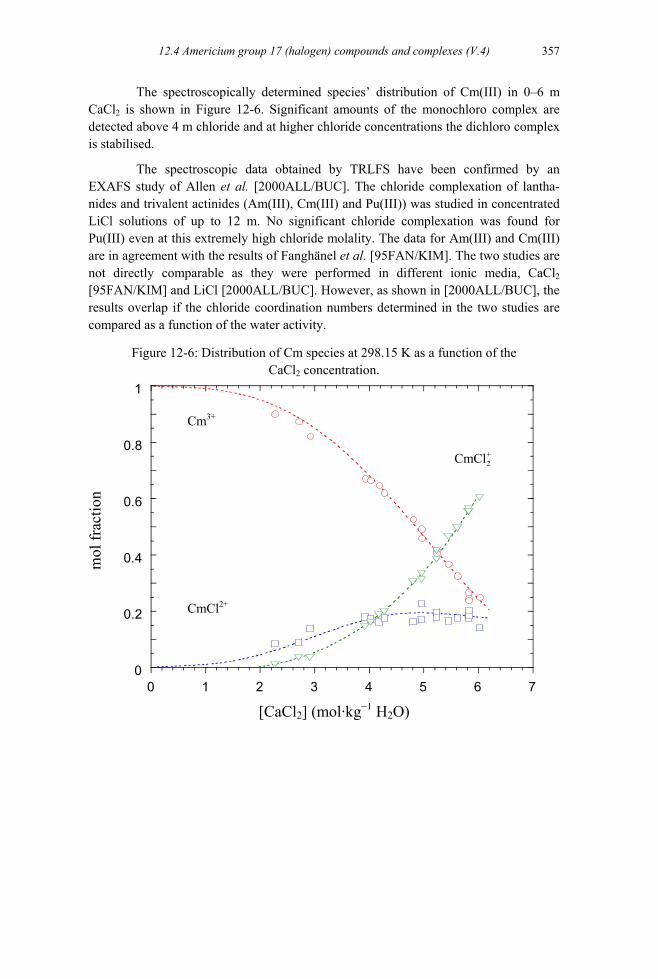
12.4 Americium group 17 (halogen) compounds and complexes (V.4)
357
The spectroscopically determined species’ distribution of Cm(III) in 0–6 m CaCl2 is shown in Figure 12-6. Significant amounts of the monochloro complex are detected above 4 m chloride and at higher chloride concentrations the dichloro complex is stabilised.
The spectroscopic data obtained by TRLFS have been confirmed by an EXAFS study of Allen et al. [2000ALL/BUC]. The chloride complexation of lantha-nides and trivalent actinides (Am(III), Cm(III) and Pu(III)) was studied in concentrated LiCl solutions of up to 12 m. No significant chloride complexation was found for Pu(III) even at this extremely high chloride molality. The data for Am(III) and Cm(III) are in agreement with the results of Fanghänel et al. [95FAN/KIM]. The two studies are not directly comparable as they were performed in different ionic media, CaCl2 [95FAN/KIM] and LiCl [2000ALL/BUC]. However, as shown in [2000ALL/BUC], the results overlap if the chloride coordination numbers determined in the two studies are compared as a function of the water activity.
Figure 12-6: Distribution of Cm species at 298.15 K as a function of the CaCl2 concentration.
0
0.2
0.4
0.6
0.8
1
0 1 2 3 4 5 6 7
+2CmCl
Cm3+
mol
frac
tion
CmCl2+
[CaCl2] (mol·kg–1 H2O)

12 Discussion of new data selection for Americium 358
Fanghänel et al. [95FAN/KIM] and Könnecke et al. [97KON/FAN] have used their data to derive a quantitative model of chloride complexation of trivalent actinides in chloride solutions over a wide concentration range applying the ion–interaction ap-proach of Pitzer. The Pitzer approach was applied as the ionic strength range covered by this study is far beyond the range of applicability of the SIT approach. The lowest ionic strength at which chloride complexation was detected (about I = 12 mol·kg–1) consid-erably exceeds the validity range of the SIT approach, which is in general considered to be limited to I ≤ 3 − 4 mol · kg–1. The equilibrium constants at zero ionic strength for the two complexes formed were determined to be:
(AnCl10 1log οb 2+, 298.15 K) = (0.24 ± 0.03) and ( , 298.15 K) = − (0.74 ± 0.05). 10 2log οb +
2AnCl
The equilibrium constants and the uncertainty estimates given by [97KON/FAN] represent the best estimates for the complexes AnCl2+ and , both for Cm and Am, and are therefore selected by this review.
+2AnCl
The data from Yeh et al. [2000YEH/MAD] are not considered for reasons given in Appendix A.
12.4.2 Americium halide compounds (V.4.2)
12.4.2.1 Enthalpies of formation Silva et al. [95SIL/BID] estimated the enthalpies of formation of the solid americium trihalides except AmCl3(cr), by plotting the enthalpy difference ( f mH ο∆ (MX3, cr, 298.15 K) − f mH ο∆ (M3+, 298.15 K) (where M = U, Np, Pu and X = F, Br, I) against the ionic radius of the M3+ ion. The values for the relevant data for all the species were taken from [76FUG/OET], [83FUG/PAR], since the NEA review for Np and Pu was not then available. We have therefore repeated these estimations, using the current NEA data in this review and including, in the estimation of f mH ο∆ (AmBr3, cr, 298.15 K), experimental results on the enthalpy of formation of CfBr3(cr) [90FUG/HAI] and Cf3+ [84FUG/HAI].
This has resulted in the small differences in the estimated enthalpies of forma-tion given in Table 12-6.
The change in f mH ο∆ (AmBr3, cr, 298.15 K) results in the same change in f mH ο∆ (AmOBr, cr, 298.15 K), which thus becomes − (887.0 ± 9.0) kJ · mol–1.
A similar procedure was used to estimate the enthalpy of formation of AmF4(cr), using ThF4 and UF4. The difference from the earlier estimate is somewhat bigger in this case, since (unlike [95SIL/BID]), we have excluded the estimated value for f mH ο∆ (PuF4, cr, 298.15 K) from the analysis, (although the estimated data for this phase are consistent with the extrapolation procedure within its appreciable uncer-tainty).

12.4 Americium group 17 (halogen) compounds and complexes (V.4)
359
Table 12-6: Estimated enthalpies of formation of americium halides at 298.15 K.
Species f mH ο∆ (kJ · mol–1)
[95SIL/BID] This review
AmF3(cr) – (1588.0 ± 13.0) – (1594.0 ± 14.0)
AmBr3(cr) – (810.0 ± 10.0) – (804.0 ± 6.0)
AmI3(cr) – (612.0 ± 7.0) – (615.0 ± 9.0)
AmF4(cr) – (1710.0 ± 21.0) – (1724.0 ± 17.0)
12.4.2.2 Americium fluoride compounds (V.4.2.2)
12.4.2.2.1 Americium trifluoride (V.4.2.2.1)
12.4.2.2.1.1 AmF3(cr) The revised standard entropy from the estimate of [2001KON], (see Table 12-1) is:
mS ο (AmF3, cr, 298.15 K) = (110.6 ± 6.0) J · K–1 · mol–1.
As noted in section 12.4.2.1, the enthalpy of formation has been revised to:
f mH ο∆ (AmF3, cr, 298.15 K) = − (1594.0 ± 14.0) kJ · mol–1,
leading to the Gibbs energy of formation:
f mGο∆ (AmF3, cr, 298.15 K) = − (1519.8 ± 14.1) kJ · mol–1.
The heat capacities of AmF3(cr), required for the analysis of the vapour pres-sure data, have been estimated to be the same as those of PuF3(cr):
,mpC (AmF3, cr, T) = 104.078 + 0.707·10–3 T − 10.355·105 T –2 J · K–1 · mol–1,
from 298.15 to 1500 K.
As already mentioned in the previous review [95SIL/BID], there is a consid-erably discrepancy between the thermochemical data for AmF3(cr) and results from solubility measurements. Combining the standard Gibbs energies selected for AmF3(cr) and Am3+ with the auxiliary data for F– yields a solubility constant of lo 10 ,0g sK ο (AmF3, cr, 298.15 K) = − (13.3 ± 2.5). Nash and Cleveland [84NAS/CLE2] observed a decrease of the Am concentration (initially 10–8 M in 0.1 M NaClO4 solutions of pH 3.5) at fluo-ride concentrations above 0.01 M. This was ascribed to the formation of solid AmF3 particles or "merely to the adsorption of Am3+ by negatively charged colloidal particles which stick to the walls of the polyethylene container". There was no positive observa-tion of a solid phase. However, judging from the behaviour of the PuF3–H2O [53JON] and LnF3–H2O [75STO/KHA] systems, any precipitated solid was very probably hy-drated.
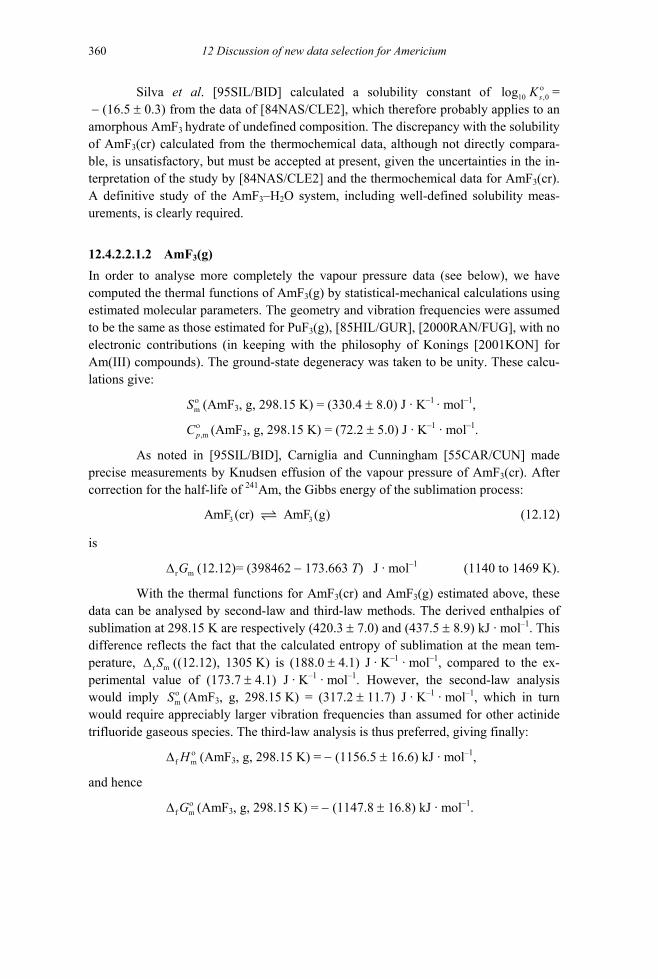
12 Discussion of new data selection for Americium 360
Silva et al. [95SIL/BID] calculated a solubility constant of lo 10 ,0g sK ο = − (16.5 ± 0.3) from the data of [84NAS/CLE2], which therefore probably applies to an amorphous AmF3 hydrate of undefined composition. The discrepancy with the solubility of AmF3(cr) calculated from the thermochemical data, although not directly compara-ble, is unsatisfactory, but must be accepted at present, given the uncertainties in the in-terpretation of the study by [84NAS/CLE2] and the thermochemical data for AmF3(cr). A definitive study of the AmF3–H2O system, including well-defined solubility meas-urements, is clearly required.
12.4.2.2.1.2 AmF3(g) In order to analyse more completely the vapour pressure data (see below), we have computed the thermal functions of AmF3(g) by statistical-mechanical calculations using estimated molecular parameters. The geometry and vibration frequencies were assumed to be the same as those estimated for PuF3(g), [85HIL/GUR], [2000RAN/FUG], with no electronic contributions (in keeping with the philosophy of Konings [2001KON] for Am(III) compounds). The ground-state degeneracy was taken to be unity. These calcu-lations give:
mS ο (AmF3, g, 298.15 K) = (330.4 ± 8.0) J · K–1 · mol–1,
,mpCο (AmF3, g, 298.15 K) = (72.2 ± 5.0) J · K–1 · mol–1.
As noted in [95SIL/BID], Carniglia and Cunningham [55CAR/CUN] made precise measurements by Knudsen effusion of the vapour pressure of AmF3(cr). After correction for the half-life of 241Am, the Gibbs energy of the sublimation process:
(12.12) 3AmF (cr) AmF (g)3
is
(12.12)= (398462 − 173.663 T) J · molr mG∆ –1 (1140 to 1469 K).
With the thermal functions for AmF3(cr) and AmF3(g) estimated above, these data can be analysed by second-law and third-law methods. The derived enthalpies of sublimation at 298.15 K are respectively (420.3 ± 7.0) and (437.5 ± 8.9) kJ · mol–1. This difference reflects the fact that the calculated entropy of sublimation at the mean tem-perature, ((12.12), 1305 K) is (188.0 ± 4.1) J · Kr mS∆
S
–1 · mol–1, compared to the ex-perimental value of (173.7 ± 4.1) J · K–1 · mol–1. However, the second-law analysis would imply (AmFm
ο3, g, 298.15 K) = (317.2 ± 11.7) J · K–1 · mol–1, which in turn
would require appreciably larger vibration frequencies than assumed for other actinide trifluoride gaseous species. The third-law analysis is thus preferred, giving finally:
f mH ο∆ (AmF3, g, 298.15 K) = − (1156.5 ± 16.6) kJ · mol–1,
and hence
(AmFf mGο∆ 3, g, 298.15 K) = − (1147.8 ± 16.8) kJ · mol–1.

12.4
361
Americium group 17 (halogen) compounds and complexes (V.4)
The experimental vapour pressures and the fitted line are shown in Figure 12-7.
Figure 12-7: Vapour Pressure of AmF3(cr).
1000T
0.65 0.70 0.75 0.80 0.85 0.90-10
-9
-8
-7
-6
-5 [55CAR/CUN]
Selected values
log 1
0 p/
bar
(K–1)
12.4.2.2.2 Americium tetrafluoride (V.4.2.2.2) The standard entropy has been estimated by the same procedure as that used by Konings [2001KON] for Am(III) compounds. The lattice contribution is estimated to be (141.59 ± 6.00) J · K–1 · mol–1 from the average of the lattice contributions of ThF4(cr), UF4(cr), PuF4(cr) by subtracting the excess entropy contribution from the measured en-tropies, as in Table 12-7. The excess contributions are calculated from the splitting of the energy levels of the ground state, as computed by Carnall et al. [91CAR/LIU].
(AmFmS ο4, cr, 298.15 K) is then obtained from the sum of the lattice and excess contri-
butions, the latter being calculated from the energy levels of the ground state, computed by Liu et al. [94LIU/CAR].

12 Discussion of new data selection for Americium 362
Table 12-7: Calculations of mS ο (AnF4, cr, 298.15 K).
Solid mS ο (298.15 K) total J · K–1 · mol–1
mS ο (298.15 K) excess J · K–1 · mol–1
mS ο (298.15 K) lattice J · K–1 · mol–1
ThF4 142.05 0.0 142.05 UF4 151.70 7.75 143.95 PuF4 147.25 8.48 138.77 AmF4 154.10 12.51 141.59
The selected value is thus:
(AmFmS ο4, cr, 298.15 K) = (154.1 ± 8.0) J · K–1 · mol–1.
As noted in section 12.4.2.1, the enthalpy of formation has been revised to:
f mH ο∆ (AmF4, cr, 298.15 K) = − (1724.0 ± 17.0) kJ · mol–1,
leading to the Gibbs energy of formation:
f mGο∆ (AmF4, cr, 298.15 K) = − (1632.5 ± 17.2) kJ · mol–1.
12.4.2.3 Americium chlorides (V.4.2.3)
12.4.2.3.1 Americium trichloride (V.4.2.3.2)
12.4.2.3.1.1 AmCl3(cr) The revised standard entropy from the estimate of [2001KON], (see section 12.1.1) is:
mS ο (AmCl3, cr, 298.15 K) = (146.2 ± 6.0) J · K–1 · mol–1.
The enthalpy of formation remains unchanged:
f mH ο∆ (AmCl3, cr, 298.15 K) = − (977.8 ± 1.3) kJ · mol–1,
and thus
(AmClf mGο∆ 3, cr, 298.15 K) = − (905.1 ± 2.3) kJ · mol–1.
12.4.2.3.2 Americium oxychloride (V.4.2.3.3) Two studies [54KOC/CUN], [76WEI/WIS] of the equilibrium constants of the reaction:
(12.13) 3 2AmCl (cr) + H O(g) AmOCl(cr) + 2 HCl(g)
were analysed in [95SIL/BID] to give:
((12.13), 298.15 K) = 127.81 + 3.57 = (131.38 ± 8.00) J · Kr mS ο∆ –1 · mol–1.
With the revised value of mS ο (AmCl3, cr, 298.15 K) = (146.2 ± 6.0) J · K−1 · mol–1 (see section 12.4.2.3.1), the modified value of the standard entropy of AmOCl(cr) becomes:

12.4 Americium group 17 (halogen) compounds and complexes (V.4)
363
mS ο (AmOCl, cr, 298.15 K) = (92.6 ± 10.0) J · K–1 · mol–1.
This is close to the weighted sum of the entropies of Am2O3(cr) and AmCl3(cr), (93.3 ± 2.8) J · K–1 · mol–1.
The enthalpy of formation remains unchanged:
f mH ο∆ (AmOCl, cr, 298.15 K) = − (949.8 ± 6.0) kJ · mol–1,
and thus
(AmOCl, cr, 298.15 K) = − (897.1 ± 6.7) kJ · molf mGο∆ –1.
12.4.2.3.3 Quaternary chloride Cs2NaAmCl6(cr) (V.4.2.3.4.2) As in [95SIL/BID], the entropy of Cs2NaAmCl6(cr) was estimated to be close to the sum of the constituent chlorides; the revised standard entropy of Cs2NaAmCl6(cr) be-comes (420.7 ± 15.0) J · K–1 · mol–1, which we round to:
mS ο (Cs2NaAmCl6, cr, 298.15 K) = (421 ± 15) J · K–1 · mol–1.
12.4.2.4 Americium bromides (V.4.2.4)
12.4.2.4.1 Americium tribromide (V.4.2.4.2)
12.4.2.4.1.1 AmBr3(cr) The standard entropy has been revised to be consistent with those of the other Am(III) compounds (see section 12.1.1). The lattice entropy has been estimated from that of
(UBrmS ο3, cr, 298.15 K) [92GRE/FUG] by subtracting the excess entropy from the ex-
perimental value (in this context, increased by R·ln2, see [2001KON]). In the absence of any data on the electronic levels for UBr3(cr), its excess entropy is estimated to be the mean of those for UF3(cr) and UCl3(cr), (16.74 ± 6.0) J · K–1 · mol–1 [2001KON].
Thus,
mS ο (AmBr3, cr, 298.15 K) = (182.0 ± 10.0) J · K–1 · mol–1,
where the uncertainty has been increased to allow for the uncertainty of the estimation procedure.
As noted in section 12.4.2.1, the enthalpy of formation has been revised to:
f mH ο∆ (AmBr3, cr, 298.15 K) = − (804.0 ± 6.0) kJ · mol–1,
the Gibbs energy of formation is:
f mGο∆ (AmBr3, cr, 298.15 K) = − (773.7 ± 6.7) kJ · mol–1.

12 Discussion of new data selection for Americium 364
12.4.2.4.2 Americium oxybromide (V.4.2.4.3) The study [82WEI/WIS] of the equilibrium constants of the reaction:
(12.14) 3 2AmBr (cr) + H O(g) AmOBr(cr) + 2 HBr(g)
was analysed in [95SIL/BID] to give:
r mS ο∆ ((12.14), 298.15 K) = 127.72 + 3.71 = (131.43 ± 8.00) J · K–1 · mol–1.
With the revised value of mS ο (AmBr3, cr, 298.15 K) = (182.0 ± 10.0) J · K−1 · mol–1 (see section 12.4.2.4.1), the modified value of the standard entropy of AmOBr(cr) becomes:
mS ο (AmOBr, cr, 298.15 K) = (104.9 ± 12.8) J · K–1 · mol–1.
This is close to the weighted sum of the entropies of Am2O3(cr) and AmBr3(cr), (105.2 ± 3.9) J · K–1 · mol–1.
As a consequence of the change in the enthalpy of formation of AmBr3(cr), the enthalpy of formation has been revised to:
f mH ο∆ (AmOBr, cr, 298.15 K) = − (887.0 ± 9.0) kJ · mol–1
leading to the Gibbs energy of formation:
(AmOBr, cr, 298.15 K) = − (848.5 ± 9.8) kJ · molf mGο∆ –1.
12.4.2.5 Americium iodides (V.4.2.5)
12.4.2.5.1 Americium triiodide (V.4.2.5.2)
12.4.2.5.1.1 AmI3(cr) The standard entropy has been revised to be consistent with those of the other Am(III) compounds (see section 12.1.1). The lattice entropy has been estimated from that of
(UImS ο3, cr, 298.15 K) by subtracting its excess entropy from the selected value
[92GRE/FUG] (in this context, increased by R·ln2, see [2001KON]). In the absence of any data on the electronic levels for UI3(cr), the excess entropy is estimated to be the mean of those for UF3(cr) and UCl3(cr), (16.74 ± 6.0) J · K–1 · mol–1 [2001KON].
Thus,
(AmImS ο3, cr, 298.15 K) = (211 ± 15) J · K–1 · mol–1,
and as noted in section 12.4.2.1, the enthalpy of formation has been revised to:
f mH ο∆ (AmI3, cr, 298.15 K) = − (615.0 ± 9.0) kJ · mol–1,
leading to the Gibbs energy of formation:
(AmIf mGο∆ 3, cr, 298.15 K) = − (609.5 ± 10.1) kJ · mol–1.

12.5 Americium group 16 (chalcogen) compounds and complexes (V.5)
12.5 Americium group 16 (chalcogen) compounds and complexes (V.5)
365
12.5.1 Americium sulphates (V.5.1.2)
12.5.1.1 Aqueous Am(III) and Cm(III) sulphate complexes(V.5.1.2.1) There are no new experimental data on the sulphate complexation of Am(III) since the previous review [95SIL/BID] was published. The equilibrium constants selected by the previous review [95SIL/BID] for the formation of the monosulphate and disulphate complexes of Am(III) for the following reactions:
(12.15) 3+ 2 (3 2 )4 4Am + SO Am(SO ) − − n
nn
are ((12.15), 298.15 K) = (3.85 ± 0.03), 10 1log οb
((12.15), 298.15 K) = (5.4 ± 0.7). 10 2log οb
They are based on experimental data determined at pH = 3 − 4 by using solvent extraction techniques [64SEK], [65SEK2], [67CAR/CHO], [68AZI/LYL], [72MCD/COL], [80KHO/MAT], ion exchange [68AZI/LYL], [68NAI], and electromi-gration [90ROS/REI].
More recently, [96PAV/FAN] and [98NEC/FAN] investigated sulphate com-plexes of Cm(III) by using TRLFS to identify the complexes, viz. , and
+4CmSO 4 2Cm(SO )−
34 3Cm(SO ) − . The highest sulphate concentration studied by [96PAV/FAN] was a
4.7 m Cs2SO4 solution. The formation of the trisulphate complex was observed only at sulphate concentrations above 1 mol · kg–1. The formation constants of the complexes
and were determined in 3 m NaCl/Na+4SO CmCm 4 2(SO )−
2SO4 at pH 2, with the sul-phate concentration varying in the range [ 2
4SO − ] = 0.03 − 0.37 mol · kg–1. In another study reported in [98NEC/FAN], Cm(III) sulphate complexation was investigated as a function of the ionic medium composition (0 − 5.8 m NaCl) at two values of constant sulphate concentration (0.15 and 0.55 m Na2SO4).
The spectroscopically determined lo values in [96PAV/FAN] and [98NEC/FAN] are about 0.6 logarithmic units lower than the literature data for Am(III) and Cm(III) in NaClO
10 1g b
4–Na2SO4 or NH4ClO4–(NH4)2SO4 solutions of comparable ionic strength and the values are 1.5 to 2 orders of magnitude smaller (cf. Figure 12-8). These differences can only partly be attributed to the different activity coeffi-cients in NaCl compared to NaClO
10 2log b
4 or NH4ClO4 solutions. The large discrepancies in the data from the two groups of methods are far beyond the experimental uncertainties of two types of methods, and are typical for systems where weak complexes are formed (see also section 12.4.1.3.).
The experimental techniques based on two–phase equilibria such as ion ex-change and solvent extraction are in these cases unable to distinguish between ion−ion interaction and inner–sphere complexation. The replacement of large parts of the back-

12 Discussion of new data selection for Americium 366
ground electrolyte by the ligand causes changes in the activity coefficients, which are misinterpreted as complex formation. The same can hold for activity changes caused by the formation of outer–sphere complexes or ion pairs. In some of the ion exchange and solvent extraction studies [67CAR/CHO], [68AZI/LYL], [72MCD/COL] analogous experiments with both Am(III) and Cm(III) gave very similar equilibrium constants for the two actinides (cf. Figure 12-8) indicating that discrepancies between the spectro-scopic results of [96PAV/FAN] and [98NEC/FAN], and previous non–spectroscopic methods are primarily not a result of chemical differences, but rather that the two types of experiments measure different phenomena. This review has based the selection of equilibrium constants for aqueous sulphate complexes on the spectroscopically deter-mined data rather than on those from other sources.
These considerations are supported by a comparison of thermodynamic data for aqueous complexes of Am(III) and U(VI). The formation constants selected in the previous review for the Am(III) sulphate complexes ( lo 10 1g οb ( 4AmSO+ , 298.15 K) = (3.85 ± 0.03), (10 2log οb 4 2Am(SO )− , 298.15 K) = (5.4 ± 0.7) [95SIL/BID]) are signifi-cantly higher than the selected data for U(VI) sulphate complexes ( lo (UO10g 1
οb 2SO4, aq, 298.15 K) = (3.15 ± 0.02), 10 2glo οb ( 2
4 2)2UO (SO − , 298.15 K) = (4.14 ± 0.07) [92GRE/FUG], and this review). This finding is inconsistent with the known chemical systematics and correlations among formation constants of actinide complexes (cf. [97ALL/BAN]). The formation constants of Am(III) complexes with other inorganic ligands (e.g., carbonate, hydroxide, fluoride, phosphate) are generally close to, or smaller than, those of the corresponding U(VI) complexes. We therefore conclude that the equilibrium constants of [95SIL/BID] for the aqueous Am(III) sulphate complexes are systematically too large, cf. Figure 12-8.
In Figure 12-8, the formation constants reported in [98NEC/FAN] for the monosulphate and disulphate complexes of Cm(III) are extrapolated to zero ionic strength. Application of the SIT to the data in Na2SO4–NaCl solutions of I ≤ 4 mol · kg–1 leads to: = (3.28 ± 0.03), ∆ε10 1log οb 1 = − (0.14 ± 0.02) kg · mol–1,
= (3.59 ± 0.03), ∆ε10 2log οb 2 = − (0.24 ± 0.01) kg · mol–1.
If the SIT is applied only to the two 10 1log οb values in 0.15 and 0.55 m Na2SO4 without additions of NaCl, a somewhat lower formation constant of lo = (3.15 ± 0.03) is calculated, but the value of ∆ε
10 1g οb1 = − 0.14 kg · mol–1 remains the same.
The formation constants determined in 3 m NaCl − Na2SO4 solutions, = (0.93 ± 0.08) and = (0.61 ± 0.08) [96PAV/FAN] are somewhat
higher (cf. Figure 12-8). With the values of ∆ε10 1log b 10 2log b
1 and ∆ε2 derived from the data in Na2SO4 − NaCl solutions of varying ionic strength, the formation constants at I = 0 are calculated to be = (3.45 ± 0.10) and lo10 1log οb 10 2g οb = (3.81 ± 0.09).

12.5 Americium group 16 (chalcogen) compounds and complexes (V.5) cium group 16 (chalcogen) compounds and complexes (V.5)
367
367
Figure 12-8: Extrapolation to I = 0 of experimental data for the formation of Am(III) and Cm(III) sulphate complexes Figure 12-8: Extrapolation to I = 0 of experimental data for the formation of Am(III) and Cm(III) sulphate complexes 4AnSO4AnSO+ and 4 2An(SO )− at pH = 2–4. Circles refer to literature data in NaClO4–Na2SO4 [64BAN/PAT], [64SEK], [65SEK2], [67CAR/CHO], [68NAI], [68AZI/LYL], [72MCD/COL], [80KHO/MAT], [90ROS/REI], which are based on ion exchange or solvent extraction methods. These results were used in the previous review for the determination of thermodynamic data. Open triangles are de-rived from spectroscopic data in 0.15 and 0.55 m Na2SO4 solutions containing additions of NaCl (from [98NEC/FAN]), and the squares refer to a series of spectra in 3 m NaCl–Na2SO4 [96PAV/FAN]. The solid lines are calculated with the data selected in the pre-vious and present reviews and the dotted lines show the associated uncertainties.
3.0
3.5
4.0
4.5
5.0
0 1 2 3 4 5 6
open symbols: Cm(III)filled symbols: Am(III)
3+ 2 +4 4An SO AnSO−+
3.0
4.0
5.0
6.0
7.0
8.0
0 1 2 3 4 5 6
open symbols: Cm(III)filled symbols: Am(III)3+ 2
4 4 2An 2SO An(SO )− −+
TRLFS (NaCl-Na2SO4)
Ion exchange orsolvent extraction(NaClO4-Na2SO4)
[95SIL/BID]
TRLFS (NaCl–Na2SO4)
Ion exchange or solventextraction (NaClO4–Na2SO4)
log 1
0β1 +
12 D
I (mol·kg–1 H2O)
log 1
0β2 +
16 D
I (mol·kg–1 H2O)

12 Discussion of new data selection for Americium 368
The conditional constants determined in [96PAV/FAN] at I = 3 mol · kg–1 are based on a series of spectra at varying sulphate concentration ([ 2
4SO − ] = 0.03 − 0.37 m), whereas each of the data points reported in [98NEC/FAN] is derived from a single spec-trum at the corresponding ionic strength.
Therefore, the present review selects the mean values:
(10 1log οb 4AmSO+ , 298.15 K) = (3.30 ± 0.15),
(10 2log οb 4 2Am(SO )− , 298.15 K) = (3.70 ± 0.15),
with the estimated uncertainties covering the whole range of the spectroscopic data de-termined by [96PAV/FAN] and [98NEC/FAN] (cf. Figure 12-8). However, no specific ion interaction coefficients are selected. The investigation of An(III) sulphate complexa-tion requires electrolyte mixtures with fairly high sulphate concentrations and it is not possible to estimate the unknown interaction coefficients and from these data in NaCl-Na
3+ 24(An , SO )−ε
3+(An , Cl )−ε+ 24 4(AnSO , SO )−ε+4(AnSO , Cl )−
2SO4 mixtures where and ε have a simultaneous effect on the activity coefficients.
12.6 Americium group 14 compounds and complexes (V.7) 12.6.1 Carbon compounds and complexes (V.7.1)
12.6.1.1 Americium carbonate compounds and complexes (V.7.1.2)
12.6.1.1.1 Aqueous Am(III) and Cm(III) carbonate complexes In the previous review [95SIL/BID] it was shown that the available experimental stud-ies of aqueous Am(III) complexes in carbonate solutions can be described by the reac-tions: , (12.16) 3+ 2 (3 2 )
3Am + CO Am(CO ) nnn −
3−
with n = 1, 2 and 3. Based on the spectroscopic studies of [89NIT/STA], [91MEI/KIM] in 0.1 M NaClO4, the solvent extraction study of Lundqvist [82LUN] in 1 M NaClO4 and three solubility studies, a) in dilute solution [90FEL/RAI], b) in 0.1 M NaClO4 [91MEI/KIM] and c) in 3.0 M NaClO4 [89ROB], the following formation constants were selected at zero ionic strength:
10 1log οb ( , 298.15 K) = (7.8 ± 0.3) (based on 6 studies), 3AmCO+
ο 10 2log b ( , 298.15 K) = (12.4 ± 0.4) (based on 3 studies), 3 2Am(CO )−
ο 3− 10 3log b ( , 298.15 K) = (15.2 ± 0.6) (based on 1 study). 3 3Am(CO )
Additional new data for Am(III) carbonate complexes are available from the solubility studies by Giffaut [94GIF] in 0.1 and 4 M NaCl, Runde and Kim [94RUN/KIM] in 5 M NaCl, and from a spectroscopic study by Wruck et al. [97WRU/PAL] in 0.1 M NaClO4. As already noted in the previous review [95SIL/BID], Am(III) solubility studies in carbonate solutions are associated with ambiguities and

12.6 Americium group 14 compounds and complexes (V.7)
369
uncertainties arising from possible solid phase transformations and/or alterations. This can lead to considerable errors in the calculated formation constants. In order to mini-mise such errors, the present review uses the stepwise formation constants for the evaluation of thermodynamic data.
The present review also considers the available experimental data for the analogous Cm(III) carbonate complexes [94KIM/KLE], [98FAN/WEG2], [99FAN/KON]. These studies are based on TRLFS and provide a systematic investiga-tion of the stepwise carbonate complexation of Cm(III) in dilute to concentrated NaCl [99FAN/KON]. In another TRLFS study [95FAN/KIM] demonstrated that chloride complexation of Cm3+ is negligible even in concentrated NaCl and hence the formation of ternary carbonate–chloride complexes can be ruled out. Because of the considerably increased experimental information for Am(III) and Cm(III) carbonate complexes, par-ticularly in NaCl solutions, the thermodynamic data and ion–interaction coefficients of the carbonate complexes are re-evaluated in the present review. The results of the new studies and the former studies used in [95SIL/BID] for the selection of thermodynamic data are summarised in Table 12-8.
Table 12-8: Data for Am(III) and Cm(III) carbonate complexes discussed in the present and previous [95SIL/BID] reviews for the evaluation of stepwise formation constants at I = 0.
reaction: 3+ 2 +3 3An + CO AnCO−
An Medium t(°C) Method 10 1log b 10 1log οb Reference
Am 1.0 M NaClO4 25 dis (5.81 ± 0.04) (8.00 ± 0.10) (a) [82LUN]
Am 0.1 M NaClO4 22.5 (6.69 ± 0.16) (7.98 ± 0.16) (b) [89NIT/STA] Am 0.1 M NaClO4 25 (6.48 ± 0.03) (7.77 ± 0.1) (b) [91MEI/KIM] Am 0.1 M NaClO4 25 LIPAS (6.26 ± 0.12) (7.55 ± 0.24) (b) [97WRU/PAL]
50 (6.68 ± 0.12) 75 (7.54 ± 0.43) Cm 0.1 M NaClO4 r.t TRLFS (6.65 ± 0.07) (7.95 ± 0.14) (b) [94KIM/KLE]
Cm 1.0 M NaCl 25 TRLFS (5.90 ± 0.1) (8.21 ± 0.1) (b) [98FAN/WEG2]
Cm 0.1 – 6 m NaCl I = 0
25 TRLFS 8.30
[99FAN/KON]
Am I = 0 r.t. sol 7.6 [90FEL/RAI]
Am 0.1 M NaClO4 25 sol (5.97 ± 0.15) [91MEI/KIM]
(6.1 ± 0.3) (a) (7.3 ± 0.3) (a) Am 3.0 M NaClO4 20 sol (5.45 ± 0.12) [89ROB]
(5.73 ± 0.24) (a) (7.80 ± 0.32) (a) Am 0.1 M NaCl 21 sol (7.7 ± 0.4) (9.0 ± 0.4) (b) [94GIF]
Am 4 M NaCl 21 sol (7.6 ± 0.4) (c) (10.0 ± 0.4)(b) (c) [94GIF]
Am 5 M NaCl 22 sol (5.7 ± 0.4) (8.04 ± 0.43) (b) [94RUN/KIM]
Am I = 0 25 review (7.8 ± 0.3) [95SIL/BID]
Am+Cm I = 0 25 review (8.1 ± 0.3) [98NEC/FAN], [99FAN/KON]
Am+Cm I = 0 25 review (8.0 ± 0.4) present review
(continued next page)
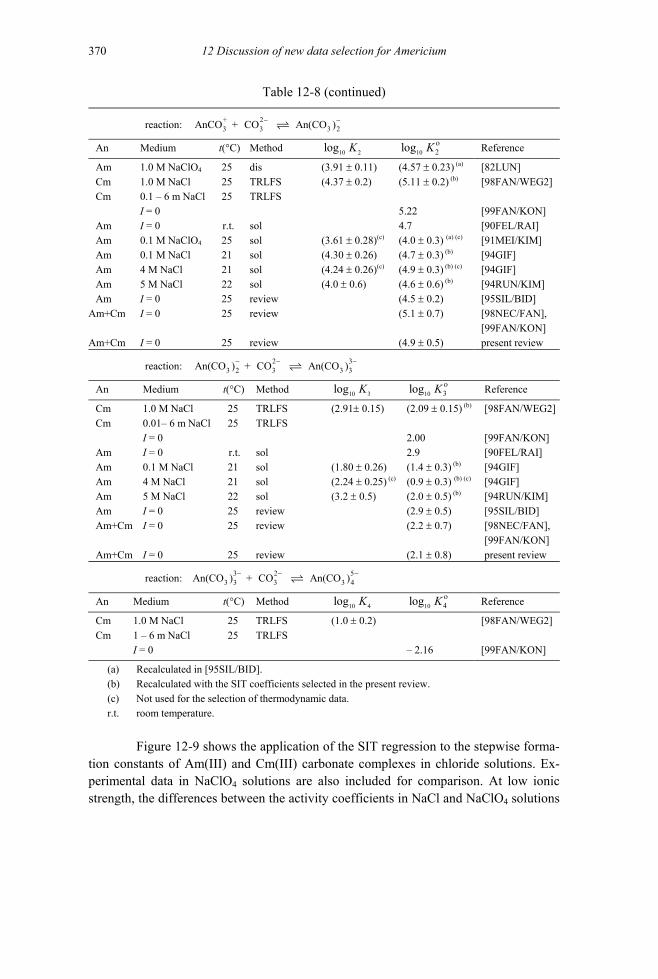
12 Discussion of new data selection for Americium 370
Table 12-8 (continued)
reaction: + 23 3 3AnCO + CO An(CO )2
− −
An Medium t(°C) Method 10 2log K 10 2log οK Reference
Am 1.0 M NaClO4 25 dis (3.91 ± 0.11) (4.57 ± 0.23) (a) [82LUN]
Cm 1.0 M NaCl 25 TRLFS (4.37 ± 0.2) (5.11 ± 0.2) (b) [98FAN/WEG2]
Cm 0.1 – 6 m NaCl 25 TRLFS I = 0 5.22 [99FAN/KON]
Am I = 0 r.t. sol 4.7 [90FEL/RAI]
Am 0.1 M NaClO4 25 sol (3.61 ± 0.28)(c) (4.0 ± 0.3) (a) (c) [91MEI/KIM]
Am 0.1 M NaCl 21 sol (4.30 ± 0.26) (4.7 ± 0.3) (b) [94GIF]
Am 4 M NaCl 21 sol (4.24 ± 0.26)(c) (4.9 ± 0.3) (b) (c) [94GIF]
Am 5 M NaCl 22 sol (4.0 ± 0.6) (4.6 ± 0.6) (b) [94RUN/KIM]
Am I = 0 25 review (4.5 ± 0.2) [95SIL/BID]
Am+Cm I = 0 25 review (5.1 ± 0.7) [98NEC/FAN], [99FAN/KON]
Am+Cm I = 0 25 review (4.9 ± 0.5) present review
reaction: 2 33 2 3 3 3An(CO ) + CO An(CO )− − −
An Medium t(°C) Method 10 3log K 10 3log οK Reference
Cm 1.0 M NaCl 25 TRLFS (2.91± 0.15) (2.09 ± 0.15) (b) [98FAN/WEG2]
Cm 0.01– 6 m NaCl 25 TRLFS I = 0 2.00 [99FAN/KON]
Am I = 0 r.t. sol 2.9 [90FEL/RAI]
Am 0.1 M NaCl 21 sol (1.80 ± 0.26) (1.4 ± 0.3) (b) [94GIF]
Am 4 M NaCl 21 sol (2.24 ± 0.25) (c) (0.9 ± 0.3) (b) (c) [94GIF]
Am 5 M NaCl 22 sol (3.2 ± 0.5) (2.0 ± 0.5) (b) [94RUN/KIM]
Am I = 0 25 review (2.9 ± 0.5) [95SIL/BID]
Am+Cm I = 0 25 review (2.2 ± 0.7) [98NEC/FAN], [99FAN/KON]
Am+Cm I = 0 25 review (2.1 ± 0.8) present review
reaction: 3 23 3 3 3 4An(CO ) + CO An(CO )− − 5−
An Medium t(°C) Method 10 4log K 10 4log οK Reference
Cm 1.0 M NaCl 25 TRLFS (1.0 ± 0.2) [98FAN/WEG2] Cm 1 – 6 m NaCl 25 TRLFS I = 0 – 2.16 [99FAN/KON]
(a) Recalculated in [95SIL/BID]. (b) Recalculated with the SIT coefficients selected in the present review. (c) Not used for the selection of thermodynamic data. r.t. room temperature.
Figure 12-9 shows the application of the SIT regression to the stepwise forma-
tion constants of Am(III) and Cm(III) carbonate complexes in chloride solutions. Ex-perimental data in NaClO4 solutions are also included for comparison. At low ionic strength, the differences between the activity coefficients in NaCl and NaClO4 solutions
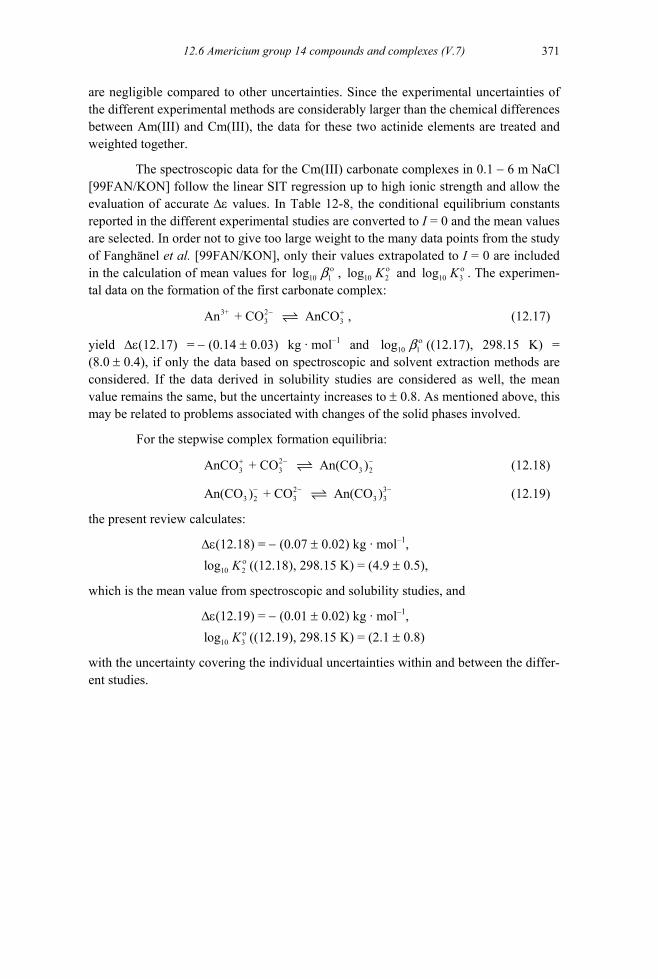
12.6 Americium group 14 compounds and complexes (V.7)
371
are negligible compared to other uncertainties. Since the experimental uncertainties of the different experimental methods are considerably larger than the chemical differences between Am(III) and Cm(III), the data for these two actinide elements are treated and weighted together.
The spectroscopic data for the Cm(III) carbonate complexes in 0.1 − 6 m NaCl [99FAN/KON] follow the linear SIT regression up to high ionic strength and allow the evaluation of accurate ∆ε values. In Table 12-8, the conditional equilibrium constants reported in the different experimental studies are converted to I = 0 and the mean values are selected. In order not to give too large weight to the many data points from the study of Fanghänel et al. [99FAN/KON], only their values extrapolated to I = 0 are included in the calculation of mean values for lo 10 1g οb , 10 2log οK and 10 3log οK . The experimen-tal data on the formation of the first carbonate complex:
3+ 23An + CO AnCO3
− + , (12.17)
yield ∆ε(12.17) = − (0.14 ± 0.03) kg · mol–1 and 10 1log οb ((12.17), 298.15 K) = (8.0 ± 0.4), if only the data based on spectroscopic and solvent extraction methods are considered. If the data derived in solubility studies are considered as well, the mean value remains the same, but the uncertainty increases to ± 0.8. As mentioned above, this may be related to problems associated with changes of the solid phases involved.
For the stepwise complex formation equilibria:
(12.18) 23 3 3AnCO + CO An(CO )+ −
2−
3− (12.19) 23 2 3 3 3An(CO ) + CO An(CO )− −
the present review calculates:
∆ε(12.18) = − (0.07 ± 0.02) kg · mol–1, 10 2log οK ((12.18), 298.15 K) = (4.9 ± 0.5),
which is the mean value from spectroscopic and solubility studies, and
∆ε(12.19) = − (0.01 ± 0.02) kg · mol–1, 10 3log οK ((12.19), 298.15 K) = (2.1 ± 0.8)
with the uncertainty covering the individual uncertainties within and between the differ-ent studies.

12 Discussion of new data selection for Americium 372
Figure 12-9: Application of the SIT method to the stepwise formation constants of Am(III) (filled symbols) and Cm(III) (open symbols) carbonate complexes in dilute to concentrated NaCl solutions [94GIF], [94RUN/KIM], [98FAN/WEG2], [99FAN/KON]. The data in dilute solutions [90FEL/RAI], 0.1 m NaClO4 [89NIT/STA], [91MEI/KIM], [94KIM/KLE], [97WRU/PAL], 1.05 m NaClO4 [82LUN] and 3.5 m NaClO4 [89ROB] are included for comparison. The solid and dotted lines are calculated with the selected values and uncertainty limits of lo 10g nK ο ((12.17)-(12.19)) and ∆ε((12.17)-(12.19)).
3 2 53 3 3 3 4Cm(CO ) + CO Cm(CO )− − −
3+ 2 +3 3An + CO AnCO−
3+ 23 3 2AnCO + CO An(CO )− −
3 32 3
2 3 3An(CO ) + CO An(CO )− − −
-3
-2
-1
0
1
2
3
4
5
6
7
8
9
10
11
12
13
0 1 2 3 4 5
[82LUN]
MEI/KI
sU/P
A I) [94WIM/KLE]
(1)(2)
(3)(4)
(5)
(3) [94GIF] *
) [94RUN/KIM] * ) [89ROB]
(1) (3)(4)
(1)
(3) (4)
[89NIT/STA] m(III) Cm(II
[98FAN/WEG2] *[91 ] [99FAN/KÖN] *M[96WR AL] Solubility tudies
(2) [91MEI/KIM] (5(1) [90FEL/RAI] (4
6
I(mol·kg–1)
log 1
0K –
∆z2 D

12.6 Americium group 14 compounds and complexes (V.7)
373
4
+
+
Because of the lack of sufficient experimental data, the previous review [95SIL/BID] used estimated ion interaction coefficients of:
= (0.17 ± 0.04) kg · mol+3(AmCO , ClO )−ε
+−
–1, = − (0.05 ± 0.05) kg · mol3 2(Am(CO ) , Na )ε
3−
–1 = − (0.15 ± 0.05) kg · mol3 3(Am(CO ) , Na )ε –1.
Based on ∆ε((12.16)−(12.18)) in NaCl solutions, ε = (0.23 ± 0.02) kg · mol
3+(Am , Cl )−
+3(Na , CO )−ε–1 (selected in this review, Appendix B) and =
− (0.08 ± 0.03) kg · mol
2
–1, the present review calculates the following ion interaction coefficients for the carbonate complexes of Cm(III) and Am(III):
+3(AmCO , Cl )−ε
−
= (0.01 ± 0.05) kg · mol–1, +
3 2(Am(CO ) , Na )ε3−
= − (0.14 ± 0.06) kg · mol–1,
3 3(Am(CO ) , Na )ε = − (0.23 ± 0.07) kg · mol–1 .
They are consistent with values of corresponding charge types or estimates given in [95SIL/BID].
The selected values of lo 10 1g οb and the stepwise equilibrium constants 10 2log οK and lo 10 3g οK lead to the following overall formation constants:
( An , 298.15 K) = (8.0 ± 0.4), 10 1log οb +3CO
(10 2log οb 3 2An(CO )− , 298.15 K) = (12.9 ± 0.6),
(10 3log οb 33 3An(CO ) − , 298.15 K) = (15.0 ± 1.0).
The standard molar Gibbs energies of formation for the carbonate complexes of Am(III) derived from the selected formation constants are:
, + 1f m 3(AmCO , 298.15 K) = (1172.3 5.3) kJ molGο −∆ − ± ⋅
−⋅−⋅
, 1f m 3 2(Am(CO ) , 298.15 K) = (1728.1 5.9) kJ molGο −∆ − ±
. 3 1f m 3 3(Am(CO ) , 298.15 K) = (2268.0 7.5) kJ molGο −∆ − ±
12.6.1.1.1.1 Tetracarbonato complex The formation of the tetracarbonato complex, M(C 5
3 4O ) − , has been observed for Cm(III) by TRLFS [98FAN/WEG2], [99FAN/KON] and also for lanthanide ions, from the limiting slopes in a solubility study with Ce(III) [83FER/GRE] and solvent extrac-tion experiments with Eu(III) [89CHA/RAO], [91RAO/CHA]. For chemical reasons one would expect the same behaviour for Am(III). However, the available spectroscopic and solubility data for Am(III) do not provide evidence for the reaction:
3+ 2 53Am + 4 CO Am(CO )3 4
− − (12.20)
up to carbonate concentrations of 1 mol · L–1. We cannot exclude that, in the case of the

12 Discussion of new data selection for Americium 374
complex , M(C , where the central ion is highly coordinated by bidentate carbonate ligands, the very small differences in the ionic radii of Cm
53 4O ) −
3+ and Am3+ may cause somewhat larger differences in the formation constant. (Such effects are known for che-late ligands used for the separation of trivalent actinides and lanthanides). Therefore, the present review selects no thermodynamic data for the complex, . 5
3 4Am(CO ) −
Moreover, the conditional equilibrium constants for Cm 53 4(CO ) − determined in
the TRLFS studies of Fanghänel et al. yield 10 4log K ο = − 2.16 as calculated in [99FAN/KON] with the Pitzer approach, whereas the linear SIT extrapolation to I = 0 would lead to a considerably different value, lo 10g 4K ο = − (1.6 ± 0.1), as indicated by the dashed line in Figure 12-9. This reflects a general problem concerning the evalua-tion of equilibrium constants at zero ionic strength when highly charged aqueous spe-cies are involved in the reaction.
12.6.1.1.1.2 Am(III) and Cm(III) bicarbonate complexes After a critical discussion of the published literature, the previous review [95SIL/BID] concluded that there is no experimental evidence for the existence of strong americium bicarbonate complexes. However, evidence for rather weak bicarbonate complexes was found for a number of trivalent lanthanides with , 0.7 M NaClO2+
10 1 3log (LnHCOb 4, 298.15 K) in the range of 1.6 to 1.9 [93LEE/BYR], and for yttrium(III) with
, 298.15 K) = (2.4 ± 0.1) [85SPA]. 2+10 1 3log (YHCOοb
A spectroscopic study of the first Cm(III) bicarbonate complex was reported later by Fanghänel et al. [98FAN/WEG]. Using TRLFS in 1 M NaCl solutions of pH 3 − 6 under carbon dioxide partial pressures of 0.5 to 11 bar, Fanghänel et al. [98FAN/WEG] demonstrated the formation of a Cm(III) bicarbonate complex,
: 2+3CmHCO
. (12.21) 3+ 2+3Cm + HCO CmHCO−
3
⋅
The reported formation constant ( lo ( , 1 m NaCl, 298.15 K) = (1.9 ± 0.2) [98FAN/WEG]) is converted using the SIT to I = 0 (cf. Appendix A) and accepted in the present review for the analogous Am(III) complex:
10 1g b 2+3CmHCO
((12.21), 298.15 K) = (3.1 ± 0.3) 10 1log οband . 2+ 1
f m 3(AmHCO , 298.15 K) = (1203.2 5.1) kJ molGο −∆ − ±
As the formation constant of is about five orders of magnitude lower than that of the carbonate complex, , the weak bicarbonate complex be-comes predominant only under high carbon dioxide partial pressures above 1 bar.
2+3AmHCO
+3AmCO
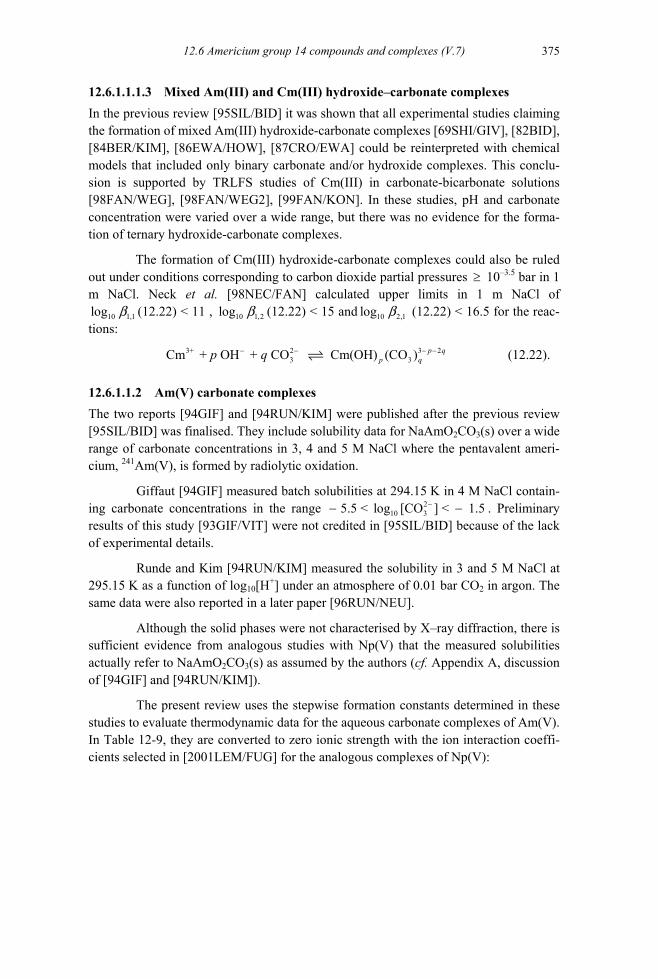
12.6 Americium group 14 compounds and complexes (V.7)
375
12.6.1.1.1.3 Mixed Am(III) and Cm(III) hydroxide–carbonate complexes In the previous review [95SIL/BID] it was shown that all experimental studies claiming the formation of mixed Am(III) hydroxide-carbonate complexes [69SHI/GIV], [82BID], [84BER/KIM], [86EWA/HOW], [87CRO/EWA] could be reinterpreted with chemical models that included only binary carbonate and/or hydroxide complexes. This conclu-sion is supported by TRLFS studies of Cm(III) in carbonate-bicarbonate solutions [98FAN/WEG], [98FAN/WEG2], [99FAN/KON]. In these studies, pH and carbonate concentration were varied over a wide range, but there was no evidence for the forma-tion of ternary hydroxide-carbonate complexes.
The formation of Cm(III) hydroxide-carbonate complexes could also be ruled out under conditions corresponding to carbon dioxide partial pressures ≥ 10–3.5 bar in 1 m NaCl. Neck et al. [98NEC/FAN] calculated upper limits in 1 m NaCl of
(12.22) < 11 , (12.22) < 15 and (12.22) < 16.5 for the reac-tions:
10 1,1log b 10 1,2log b 10 2,1log b
(12.22). 3+ 2 3 23 3Cm + OH + CO Cm(OH) (CO ) p q
p qp q− − − −
12.6.1.1.2 Am(V) carbonate complexes The two reports [94GIF] and [94RUN/KIM] were published after the previous review [95SIL/BID] was finalised. They include solubility data for NaAmO2CO3(s) over a wide range of carbonate concentrations in 3, 4 and 5 M NaCl where the pentavalent ameri-cium, 241Am(V), is formed by radiolytic oxidation.
Giffaut [94GIF] measured batch solubilities at 294.15 K in 4 M NaCl contain-ing carbonate concentrations in the range . Preliminary results of this study [93GIF/VIT] were not credited in [95SIL/BID] because of the lack of experimental details.
210 35.5 < log [CO ] < 1.5−− −
Runde and Kim [94RUN/KIM] measured the solubility in 3 and 5 M NaCl at 295.15 K as a function of log10[H+] under an atmosphere of 0.01 bar CO2 in argon. The same data were also reported in a later paper [96RUN/NEU].
Although the solid phases were not characterised by X–ray diffraction, there is sufficient evidence from analogous studies with Np(V) that the measured solubilities actually refer to NaAmO2CO3(s) as assumed by the authors (cf. Appendix A, discussion of [94GIF] and [94RUN/KIM]).
The present review uses the stepwise formation constants determined in these studies to evaluate thermodynamic data for the aqueous carbonate complexes of Am(V). In Table 12-9, they are converted to zero ionic strength with the ion interaction coeffi-cients selected in [2001LEM/FUG] for the analogous complexes of Np(V):

12 Discussion of new data selection for Americium 376
+2(NpO , Cl )−ε = (0.09 ± 0.05) kg · mol–1,
−2 3(NpO CO , Na )+ε
3
= − (0.18 ± 0.15) kg · mol–1, −
2 3 2(NpO (CO ) , Na )+ε5
= − (0.33 ± 0.17) kg · mol–1, − +
2 3 3(NpO (CO ) , Na )ε = − (0.53 ± 0.19) kg · mol–1.
Because of the high ionic strength employed, application of the SIT equation for the extrapolation to zero ionic strength leads to large uncertainties which increase with the NaCl concentration. Therefore, the present review selects the weighted aver-ages of the values converted to I = 0. As can be seen from the comparison in Table 12-9 they are close to the equilibrium constants selected in [2001LEM/FUG] for the analo-gous Np(V) complexes.
The selected values of the stepwise equilibrium constants correspond to the following overall formation constants for the reactions:
, (12.23) + 2 12 3 2 3AmO + CO AmO (CO ) − n
nn 2−
3 (10 1log οb 2AmO CO− , 298.15 K) = (5.1 ± 0.5), ο (10 2log b 3
2 3 2AmO (CO ) − , 298.15 K) = (6.7 ± 0.8), ο 5− (10 3log b 2 3 3AmO (CO ) , 298.15 K) = (5.1 ± 1.0).
The possible error due to the somewhat lower temperature in [94GIF], [94RUN/KIM] compared to the standard state of 298.15 K is negligible compared to other uncertainties. The standard molar Gibbs energies of formation for the carbonate complexes of Am(V) derived from the selected formation constants are:
, 1f m 2 3(AmO CO , 298.15 K) = (1296.8 6.8) kJ molGο −∆ − ±
ο −
−⋅−± ⋅−± ⋅
, 3 1f m 2 3 2(AmO (CO ) , 298.15 K) = (1833.8 7.7) kJ molG∆ −
5 1ο − . f m 2 3 3(AmO (CO ) , 298.15 K) = (2352.6 8.5) kJ molG∆ −

12.6 Americium group 14 compounds and complexes (V.7)
377
3
Table 12-9: Stepwise formation constants of aqueous Am(V) carbonate complexes from the solubility studies in [94GIF], [94RUN/KIM]
reaction: + 22 3 2AmO + CO AmO CO− −
Medium, t(°C) 10 1log b 10 1log οb Reference
3.0 M NaCl 22 (4.74 ± 0.09) (5.09 ± 0.74) (a) [94RUN/KIM]
4.0 M NaCl 21 (5.4 ± 0.3) (5.56 ± 0.91) (a) [94GIF]
5.0 M NaCl 22 (4.69 ± 0.04) (4.63 ± 0.95) (a) [94RUN/KIM]
I = 0, weighted average (5.1 ± 0.5) present review I = 0, Np(V) 25 (4.96 ± 0.06) [2001LEM/FUG]
reaction: 2 32 3 3 2 3 2AmO CO + CO AmO (CO ) − − −
Medium, t(°C) 10 2log K 10 2log K ο Reference
3.0 M NaCl 22 (2.68 ± 0.10) (1.44 ± 0.74) (a) [94RUN/KIM]
4.0 M NaCl 21 (3.6 ± 0.2) (2.22 ± 1.04) (a) [94GIF]
5.0 M NaCl 22 (2.85 ± 0.08) (1.35 ± 1.29) (a) [94RUN/KIM]
I = 0, weighted average (1.6 ± 0.6) present review I = 0, Np(V) 25 (1.57 ± 0.08) [2001LEM/FUG]
reaction: 3 2 52 3 2 3 2 3 3AmO (CO ) + CO AmO (CO ) − − −
οMedium, t(°C) 10 3log K 10 3log K Reference
3.0 M NaCl 22 (2.12 ± 0.13) – (1.16 ± 0.83) (a) [94RUN/KIM]
4.0 M NaCl 21 (1.4 ± 0.3) – (2.25 ± 1.16) (a) [94GIF]
5.0 M NaCl 22 (2.09 ± 0.09) – (1.81 ± 1.45) (a) [94RUN/KIM]
I = 0, weighted average – (1.6 ± 0.6) present review I = 0, Np(V) 25 – (1.03 ± 0.11) [2001LEM/FUG]
(a) Converted to the molal units and extrapolated to I = 0 with the ion interaction coefficients selected in [2001LEM/FUG] for the analogous Np(V) complexes.
12.6.1.1.3 Solid americium carbonates (V.7.1.2.2)
12.6.1.1.3.1 Americium(III) hydroxycarbonate AmOHCO3(s) The solubility constant selected in the previous NEA review [95SIL/BID] for the reac-tion:
3+ 23AmOHCO (cr) Am + OH + CO3
− − (12.24)
is based on two largely discrepant values derived in the solubility studies of Silva and Nitsche [84SIL/NIT] and Runde et al. [92RUN/MEI], and thus has a large uncertainty:
10 ,0log οsK (AmOHCO3, cr, 298.15 K) = − (21.2 ± 1.4).

12 Discussion of new data selection for Americium 378
In both studies [84SIL/NIT], [92RUN/MEI] the solid was characterised by X–ray diffraction and identified as orthorhombic Am(III) hydroxycarbonate. No solubility data are available for the hexagonal form observed by Standifer and Nitsche [88STA/NIT] at 333.15 K. The solubility study in [84BER/KIM] was disregarded, be-cause the solid was not characterised. The authors’ assumption that, under the constant CO2 partial pressure of
2= 10
COp –3.5 bar, the initial solid Am(OH)3(s) converted rapidly
enough into the more stable AmOHCO3(s), was not considered as sufficiently proven.
Table 12-10: Solubility constants reported for Am(III) hydroxycarbonate. All data for crystalline solids refer to the orthorhombic modification.
Medium t(°C) solid 10 ,0log sK 10 ,0log οsK Reference
0.1 M NaClO4 25 241AmOHCO3(s) – (18.70 ± 0.12) – (20.2 ± 0.2) (b) [92RUN/MEI]
0.1 M NaClO4 25 243AmOHCO3(cr) – (20.8 ± 0.3) (a) – (22.3 ± 0.3) (a) [84SIL/NIT]
dilute solutions (corr. to I = 0)
r.t. 243AmOHCO3(cr) – 22.5 (c) [90FEL/RAI]
0.1 M NaClO4 25 241AmOHCO3(s) ? not characterised
– (21.03 ± 0.11) – (22.5 ± 0.2) (b) [84BER/KIM]
0.1 M NaCl 21 241AmOHCO3(s) ? not characterised
– (21.0 ± 0.4) – (22.5 ± 0.4) (b) [94GIF]
4 M NaCl 21 241AmOHCO3(s) ? not characterised
– (20.7 ± 0.4) – (23.3 ± 0.5) (b) [94GIF]
I = 0 241AmOHCO3·0.5 H2O(cr) – (23.1 ± 1.0) (d)
– (22.6 ± 1.0) (d, e)
[96MER/FUG]
(a) Re-calculated in [95SIL/BID]. (b) Re-calculated with the SIT coefficients in Appendix B. The uncertainty corresponds to the 95% con-
fidence interval. (c) Felmy et al. [90FEL/RAI] combined their solubility measurements at pH > 6.5 with those of
[84SIL/NIT], from which the solubility constant at I = 0 is re-calculated with the ion–interaction (Pitzer) approach.
(d) Calculated from thermochemical data (e) Re-calculated in the present review. r.t. Room temperature.
In a later study, Giffaut [94GIF] performed batch solubility experiments at
I = 0.1 and 4.0 mol · L–1 (NaHCO3/Na2CO3/NaCl). The precipitates were not character-ised. AmOHCO3(s) was assumed to be the solubility limiting solid as concluded from the observed dependence of the americium concentration on log10[H+], log10[ CO ], and the CO
23
−
2 partial pressure.
Merli and Fuger [96MER/FUG] determined the standard enthalpy of formation of and of crystalline and amorphous lanthanide hydroxycar-bonates ( with Ln = Nd, Sm;
2413 2AmOHCO 0.5H O(cr)⋅
3 2LnOHCO 0.5H O(c⋅ r) 3 2LnOHCO 0.5H O(am)⋅ with Ln = Dy, Yb) from their enthalpies of solution in 1 M HCl (cf. Appendix A). The reported

12.6 Americium group 14 compounds and complexes (V.7)
379
⋅
standard enthalpy of formation, deduced by a thermodynamic cycle and NEA auxiliary data selected in [95SIL/BID]:
is retained in the present review. Merli and Fuger [96MER/FUG] estimated a value of (AmOHCO · 0.5H O, cr, 298.15 K) = (154 ± 10) J · K · mol which is based on
their selection of (Am(OH) , cr, 298.15 K), and ultimately on the experimental value of (Eu(OH) , cr, 298.15 K). The present review includes, as in the case of Am(OH) (cr) (cf. section 12.3.2.2), an entropy correction of − 9.5 J · K · mol arising from the contribution of thermally populated higher electronic states in europium com-pounds lacking in Am(III) species, leading to:
3–1 –1
3
3
3–1 –1
(AmOHCO · 0.5H O, cr, 298.15 K) = (144 ± 10) J · K · mol . 3 2–1 –1
(12.25)
(AmOHCO3 · 0.5H O, cr, 298.15 K) = − (22.6 ± 1.0) 2
are calculated. This latter value is in excellent agreement with the results from solubility measurements in [84SIL/NIT], [90FEL/RAI], [84BER/KIM], [94GIF] (cf. Table 12-10). The good agreement between thermochemical and solubility data for crystalline Am(III) hydroxycarbonate is further corroborated by analogous results for the orthorhombic modification of crystalline Nd(III) hydroxycarbonate. The solubility constant deter-mined in [96MER/FUG] from thermochemical data,
(NdOHCO · 0.5H O(cr), 298.15 K) = − (21.3 ± 0.7), 3
is in excellent agreement with those derived from solubility experiments with Nd hy-droxycarbonate (re-calculated to I = 0 as described in Appendix A, discussion of [96MER/FUG]):
= − (20.7 ± 0.2) [91MEI/KIM2],
= − (21.4 ± 0.3) [92RUN/MEI],
= − (21.6 ± 0.2) [93MEI/TAK],
= − (21.75 ± 0.3) [93CAR].
For crystalline Am(III) hydroxycarbonate, AmOHCO · 0.5H O(cr), we select the mean value of the solubility constants determined by [84SIL/NIT], who did not ana-lyse their solid for the water content, and [96MER/FUG]:
3 2
1f m 3 2(AmOHCO 0.5H O, cr, 298.15 K) = (1682.9 2.6) kJ molο −∆ ⋅ − ±H
mS ο
mS ο
mS ο
2
mS ο
With this value, the Gibbs energy for the reaction: 3 2
3 2 3 2AmOHCO 0.5H O(cr) Am + OH + CO + 0.5H O(l) + − −⋅
and a solubility constant of:
10 ,0log οsK
10 ,0log οsK 2
10 ,0log οsK
10 ,0log οsK
10 ,0log οsK
10 ,0log οsK

12 Discussion of new data selection for Americium 380
(AmOHCO · 0.5H O, cr, 298.15 K) = − (22.4 ± 0.5) 10 ,0log οsK 3
and (AmOHCO · 0.5H O, cr, 298.15 K) = − (1530.2 ± 5.6) kJ · mol . 3 2
–1
By combining the standard molar Gibbs energy with the selected value of:
3 2–1
from [96MER/FUG] and auxiliary data from [95SIL/BID], the internally consistent and thus selected value of the standard molar entropy is calculated to be:
(AmOHCO · 0.5H O, cr, 298.15 K) = (141 ± 21) J · K · mol . 2–1 –1
The enthalpy of solution determined in [96MER/FUG] with a sample of AmOHCO (cr) aged for 40 days was about 40 kJ · mol more negative than for sam-
ples of freshly prepared solids. As noted in Appendix A, [96MER/FUG] indicated that the difference with a fresh solid could have been caused by partial loss of crystallinity and very likely chemical alteration as a result of α–irradiation. In any case, differences of the same magnitude were observed between crystalline and amorphous lanthanide hydroxycarbonates. The standard entropies of the amorphous hydroxycarbonates can hardly be estimated, but their solubility constants are expected to be at least two orders of magnitude higher [96MER/FUG]. Such an effect would explain the difference be-tween the solubility data measured in [92RUN/MEI] with AmOHCO (s) and in [84SIL/NIT] with AmOHCO (cr). Therefore, the solubility constant determined by Runde et al. [92RUN/MEI] is ascribed to an aged solid, rendered amorphous by α-irradiation. As there are no other data for comparison and because solubility data for amorphous solids are often widely scattered, the solubility constant given in [92RUN/MEI] is selected with the uncertainty increased to ± 1 log unit:
241 –1
2413
2433
10
(AmOHCO · xH O, am, hydr., 298.15 K) = − (20.2 ± 1.0). 3 2
12.6.1.1.3.2 Americium(III) carbonate Am (CO ) (s) 3
Solubility data for hydrated Am2(CO ) · xH O(s) have been determined by Meinrath and Kim [91MEI/KIM], [91MEI/KIM2], and Runde et al. [92RUN/MEI] in 0.1 M Na-ClO and by Robouch [89ROB] in 3.0 M NaClO (Table 12-11). The reported content of crystal water, which can vary over a wide range (from x = 2 to 8), was disregarded in the previous review [95SIL/BID]. The reported conditional constants for the reaction:
3 3 2
4 4
(12.26)
2 3 3 2
2
f mο∆ G
f mο∆ H (AmOHCO · 0.5H O, cr, 298.15 K) = − (1682.9 ± 2.6) kJ · mol
mοS 3
3
10 ,0log οsK
2 3
3+ 22 3 3 3
1
2 2Am (CO ) (s) Am + CO3 −
were extrapolated to I = 0 with the SIT coefficients in Appendix B. The value calculated from the data in [89ROB] was found to be strongly discrepant, but there was no reason to discard it. The Am (CO ) ·xH O(s) prepared in [92RUN/MEI] was X–ray amorphous, whereas Robouch [89ROB] reported an X–ray diffraction pat-
10 ,0log οsK

12.6 Americium group 14 compounds and complexes (V.7)
381
tern analogous to those of lanthanide carbonates. Silva et al. [95SIL/BID] recommended a mean value of:
((12.26), 298.15 K) = − (16.7 ± 1.1),
for crystalline Am (CO ) (cr). No new experimental investigations appeared since the publication of the previous review [95SIL/BID]. However, the solid in [92RUN/MEI] was explicitly described as X–ray amorphous and the solids in [91MEI/KIM], [91MEI/KIM2] were only identified by their chemical behaviour, which was analogous to that of lanthanide carbonates. In addition it is not clear whether the lower solubility constant,
2 3
, which was calculated by extrapolating the data of [89ROB] in 3 M NaClO to zero ionic strength is actually due to a higher degree of crystallinity . There-fore, contrary to [95SIL/BID], the present review ascribes the mean value of the re-ported solubility constants not to a well-defined crystalline Am (CO ) (cr), but to an amorphous solid phase, Am (CO ) · xH O(am), and selects:
41
2 3 3
2 3 3 2
2 3 3 2
Table 12-11: Solubility constants reported for the reaction: 1/2 Am (CO ) (s) Am +2 3
3+
Medium t (°C) Reference
4 25 – (14.90 ± 0.13) – (16.54 ± 0.18) (a) [91MEI/KIM]
4 22 – (14.785 ± 0.05) – (16.38 ± 0.10) (a) [91MEI/KIM2]
4 25 – (14.725 ± 0.09) – (16.32 ± 0.18) (a) [92RUN/MEI]
10 ,0log οsK
3
10 ,0log οsK
(Am (CO ) · xH O, am, 298.15 K) = − (16.7 ± 1.1). 10 ,0log οsK
2
33/2 CO −
g K
3
10 ,0lo s 10 ,0log οsK
0.1 M NaClO 0.1 M NaClO 0.1 M NaClO 3.0 M NaClO 20 – (15.08 ± 0.15) [89ROB] 4
– (15.27 ± 0.15) ( b) – (17.54 ± 0.24) (a,b)
(a) Converted to I = 0 in [95SIL/BID] with: 3+
4(Am , ClO )−ε + 23(Na , CO )−ε = (0.49 ± 0.03) kg · mol and = − (0.08 ± 0.03) kg · mol . –1 –1
(b) Recalculated in [95SIL/BID].
12.6.1.1.3.3 Sodium americium(III) carbonates Keller and Fang [69KEL/FAN] synthesised NaAm(CO ) · xH O(s) and Na Am(CO ) · xH O(s) and investigated their thermal decomposition. For the latter solid no thermodynamic data are available. The only thermodynamic data for NaAm(CO ) · xH O(s) cited in the previous review [95SIL/BID] are based on solubil-
3 2 2
3 3 3 2
3 2 2
1If the conditional solubility constant determined by [89ROB] in 3 M NaClO4 is converted to I = 0 using
= (0.49 ± 0.03) kg · mol–1 [95SIL/BID] and ε = (0.04 ± 0.05) kg · mol–1 derived from [96FAN/NEC] instead of
3+4(Am ,ClO )−ε
4
+ 23 NaClO(Na ,CO )−
+ 23(Na ,CO )−ε
,0
= – (0.08 ± 0.03) kg · mol–1 [95SIL/BID] (cf. Appendix D.2.2), the resulting value of 10log sK ο (12.26)= – (16.74 ± 0.32) is consistent with the log10 ,0sK ο values derived from the studies of [91MEI/KIM], [91MEI/KIM2], [92RUN/MEI] in 0.1 M NaClO4 (Table 12-11).

12 Discussion of new data selection for Americium 382
ity experiments performed by Vitorge [84VIT] within the MIRAGE project, but these data are not published in the open literature. Due to the lack of experimental details, the solubility constants calculated from these data, lo (NaAm(CO ) (s)) = − 18.32 at I = 0.1 mol · L [85KIM], [85KIM2] corresponding to lo (12.28) = − 20.3 if converted to I = 0 with the SIT coefficients, (12.28) = − 17.56 at I = 0 [85KIM2] and (12.28) = − 17.38 at I = 0 [86AVO/BIL] are accepted neither in the previous nor in the present review.
10 ,0g sK10 ,0g ο
sK10 ,log 0
οsK
10 ,0log οsK
3 2
Meinrath [91MEI], and Runde and Kim, [94RUN/KIM] investigated the solu-bility of NaAm(CO ) ·xH O(s) in carbonate solutions containing 5 M NaCl, under an atmosphere of 1 % CO in argon (
2= 0.01 bar). The solids were characterised by
thermogravimetry, IR spectroscopy and X–ray powder diffraction patterns. Well known analogous lanthanide compounds were prepared for comparison, NaNd(CO ) ·xH O(s) in [91MEI], [94RUN/KIM], NaEu(CO ) ·xH O(s) in [94RUN/KIM], and used as refer-ence compounds. At low carbonate concentrations, Meinrath [91MEI], and Runde and Kim [94RUN/KIM] reported comparable solubilities, but at log [
3
] > − 4, Mein-rath obtained two sets of higher and lower solubility data. He assumed the formation of two solids with different crystallinity and evaluated only the constant ((12.27), 5 M NaCl) = − (3.85 ± 0.20) for the reaction:
–1
2 2
2 COp
23CO −
10log ,3sK
3 2 2
3 2 2
10
(12.27)
Because of these ambiguities and shortcomings in the pH measurement for the determination of carbonate concentrations (cf. Appendix A), the experimental data of Meinrath [91MEI] are not used for the selection of thermodynamic data. Runde and Kim [94RUN/KIM] evaluated a solubility constant of lo ((12.28), 5 M NaCl) = − (16.5 ± 0.3) for the reaction:
(12.28)
2 + 33 2 2 3 3 3 2NaAm(CO ) xH O(cr) + CO Na + Am(CO ) + xH O(l) − −⋅
10 ,0g sK
+ 3+ 23 2 2 3 2NaAm(CO ) xH O(cr) Na + Am + 2 CO + x H O(l) −⋅
In order to calculate the solubility constant at I = 0, the number of water mole-cules of crystallisation is set equal to x = (5 ± 1). (The reported values for NaAm(CO ) · xH O(s) and the analogous Eu and Nd compounds are x = 4 [69KEL/FAN], x = 5 [91MEI], [94RUN/KIM] or x = 6 [91MEI], [74MOC/NAG]). The water activity in 5.6 m NaCl,
2= 0.7786, is estimated using the Pitzer model
[91PIT]. Applying the SIT equation and a value of ∆ε(12.28) = (0.10 ± 0.06) kg · mol according to the selected interaction coefficients in Appendix B, the solubility constant at I = 0 is calculated to be ((12.28), 298.15 K) = − (21.0 ± 0.5). In regard to the high ionic strength it is noteworthy that the same value, ((12.28), 298.15 K) = − (21.0 ± 0.4), has been calculated in [98NEC/FAN] with the Pitzer model. Accordingly, the present review recommends the following thermodynamic data:
3
–1
2 2
H Oa
,010log οsK
10 ,0log οsK
(NaAm(CO3) · 5H O, cr, 298.15 K) = − (21.0 ± 0.5) 10 ,0log οsK 2 2
and (NaAm(CO ) · 5H O, cr, 298.15 K) = − (3222.0 ± 5.6) kJ · mol . 3 2 2
–1f m
ο∆ G

12.6 Americium group 14 compounds and complexes (V.7)
383
The selected solubility constant is supported by a similar value reported for the analogous Nd(III) compound. Rao et al. [96RAO/RAI], [99RAO/RAI] performed ex-tensive solubility studies with NaNd(CO ) · 6H O(cr), as a function of pH in NaHCO and Na CO solutions and mixtures with NaCl. Using the Pitzer model they evaluated a solubility constant of
3 2 2 3
2 3
(NaNd(CO ) ·6H O, cr, 298.15 K) = − 21.39 (given without uncertainty).
310 ,0log sK ο2 2
12.6.1.1.3.4 Sodium dioxoamericium(V) carbonate NaAmO CO (s) 2 3
Solubility data for NaAmO CO (s) in 3, 4 and 5 M NaCl have been reported in [93GIF/VIT], [94GIF], [94RUN/KIM], [96RUN/NEU]. The preliminary results re-ported by Giffaut and Vitorge [93GIF/VIT] for the solubility of Am(V), formed by radiolytic oxidation of Am(III) in 4 M NaCl at 294.15 K, were not credited by the previous review [95SIL/BID], because no details were given in that paper.
2
241
241
3
Slightly different data were presented in Giffaut’s doctoral thesis [94GIF], in which the batch experiments are described in detail. The solid phase formed in these solutions was not characterised, but the assumption of NaAmO CO (s) as the solubility controlling solid is justified, because the analogous Np(V) carbonate compound is known to be the stable solid under the conditions used in [94GIF] (cf. [2001LEM/FUG]). This assumption is further corroborated by Runde and Kim [94RUN/KIM], and Runde et al. [96RUN/NEU], who measured the solubility of both NaAmO CO (s) and NaNpO CO (s) in 3 and 5 M NaCl at 295.15 K as a function of log [H+] under an atmosphere of 0.01 bar CO in argon. The solubility data for
Am(V) are similar to those obtained with NaNpO CO (s) characterised by X–ray diffraction. The dependence of the solubility on log [ ] is the same for both Am(V) and Np(V), which indicates that the solids have the same composition.
2 3
2 3
241
2 3
10 2
2 323CO −
10
The experimental solubilities measured by Giffaut [94GIF] in the range − 5.5 < log [ ] < − 1.5 in 4 M NaCl compare well with those of Runde and Kim [94RUN/KIM] at the same carbonate concentrations in 3 and 5 M NaCl. However, the solubility constant given in [94GIF], = − (10.4 ± 0.25), in 4 M NaCl is highly speculative because of the lack of data in the range log [ ] < − 5.5, where the un-complexed (aq) ion contributes significantly to the total Am(V) concentration. The solubility constants given in [94RUN/KIM], [96RUN/NEU], (12.29) = − (9.65 ± 0.19) in 3 M NaCl and − (9.56 ± 0.13) in 5 M NaCl, are based on a suffi-ciently large number of solubility data in the range − 7 < log [ CO ] < − 5.5, where the solid is in equilibrium with . Conversion to I = 0 with: = (0.03 ± 0.01) kg · mol , = − (0.08 ± 0.03) kg · mol , set equal to = (0.09 ± 0.05) kg · mol [2001LEM/FUG] leads to
(12.29) = − (10.93 ± 0.27) and − (10.77 ± 0.36), respectively, for the reaction,
1023CO −
10 ,0log sK23CO −
+2AmO
10 ,0log sK
23
−
+2O
23 )
Am+ CO
+(Naε , Cl )−
(Na , −εl )−
+2O , Cl−(Amε )
+2 , C(NpOε
10 ,0log sK ο
10
10
–1 –1
–1
. (12.29) + +2 3 2 3
2NaAmO CO (s) Na + AmO + CO −

12 Discussion of new data selection for Americium 384
Accordingly the following thermodynamic data are selected:
(NaAmO CO , s, 298.15 K) = − (10.9 ± 0.4), 2 310 ,0log οsK
(NaAmO2CO3, s, 298.15 K) = − (1591.9 ± 6.6) kJ · mol–1.
12.6.2 Aqueous americium silicates (V.7.2.2) f m
ο∆ G
Up to the release of the previous review [95SIL/BID] no data were available for aque-ous actinide(III) silicate complexes. Recently, Wadsak et al. [2000WAD/HRN] applied a solvent extraction method to study the interaction between silicate and Am(III) in 0.2 M NaClO4 at 298.15 K. Keeping the total silica concentration constant at 0.03 mol · L–1 and varying pH in the range 3.0 − 3.8, they determined an equilibrium con-stant of ((12.30), 0.2 M NaClO4) = − (2.16 ± 0.04) for the reaction: 10
*log K
. (12.30) 3+ 2+ +4Am + Si(OH) (aq) AmSiO(OH) + H3
This review increases the uncertainty to the 1.96σ level (cf. Appendix A) and recalculates the values at I = 0 with the SIT using interaction coefficients of:
= (0.49 ± 0.03) kg · mol [95SIL/BID], –1
= − (0.08 ± 0.03) kg · mol [95SIL/BID],
3+4(Am , ClO )−ε
+ –1
= (0.39 ± 0.04) kg · mol [95SIL/BID], –13(Na , SiO(OH) )−ε
2+3(AmSiO(OH) , ClO )4
−ε
for other Am(III) complexes with monovalent anions. This leads to:
10*log οK ((12.30), 298.15 K) = − (1.61 ± 0.08).
Steinle et al. [97STE/FAN] investigated the complexation of Cm(III) with monosilicic acid at room temperature by TRLFS. From the spectra at pH = 5.0 − 5.5 in 0.1 M NaClO the authors calculated 4 ((12.31), 0.1 M NaClO ) = 7.4 (with an uncertainty of ± 0.1 as estimated in this review, Appendix A) for the reaction:
410log K
. (12.31) 3+ 2+3Cm + SiO(OH) CmSiO(OH) −
3
Applying the known first dissociation constant of Si(OH) (aq) (Table 8-2), the equilibrium constant according to reaction (12.30) is calculated to be:
4
((12.30), 0.1 M NaClO ) = − (2.2 ± 0.1), 4
((12.30), 298.15 K) = − (1.76 ± 0.10).
The formation constants reported in [2000WAD/HRN] for and in [97STE/FAN] for the analogous Cm(III) complex, overlap within the uncertainty limits. The present review selects the unweighted average of:
and ( , 298.15 K) = − (1896.8 ± 5.0) kJ · mol . –1
10*log K* ο
10log K2+3AmSiO(OH)
((12.30), 298.15 K) = − (1.68 ± 0.18) 10*log οK
f mο∆ G 2+
3AmSiO(OH)
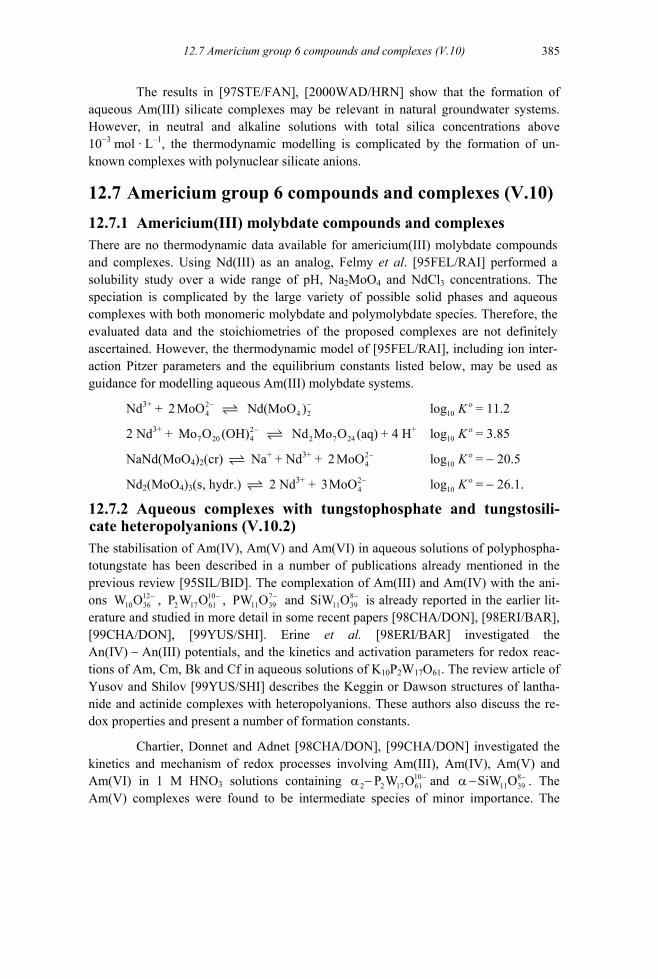
12.7 Americium group 6 compounds and complexes (V.10)
12.7 Americium group 6 compounds and complexes (V.10)
385
The results in [97STE/FAN], [2000WAD/HRN] show that the formation of aqueous Am(III) silicate complexes may be relevant in natural groundwater systems. However, in neutral and alkaline solutions with total silica concentrations above 10 mol · L , the thermodynamic modelling is complicated by the formation of un-known complexes with polynuclear silicate anions.
−3 –1
There are no thermodynamic data available for americium(III) molybdate compounds and complexes. Using Nd(III) as an analog, Felmy et al. [95FEL/RAI] performed a solubility study over a wide range of pH, Na MoO and NdCl concentrations. The speciation is complicated by the large variety of possible solid phases and aqueous complexes with both monomeric molybdate and polymolybdate species. Therefore, the evaluated data and the stoichiometries of the proposed complexes are not definitely ascertained. However, the thermodynamic model of [95FEL/RAI], including ion inter-action Pitzer parameters and the equilibrium constants listed below, may be used as guidance for modelling aqueous Am(III) molybdate systems.
2 4 3
Nd + 3+ = 11.2
2 Nd3+ + + 4 H + = 3.85
4 2+ 3+
Nd (MoO ) (s, hydr.) 2 Nd + 2 43+ = − 26.1.
12.7.2 Aqueous complexes with tungstophosphate and tungstosili-cate heteropolyanions (V.10.2) The stabilisation of Am(IV), Am(V) and Am(VI) in aqueous solutions of polyphospha-totungstate has been described in a number of publications already mentioned in the previous review [95SIL/BID]. The complexation of Am(III) and Am(IV) with the ani-ons , , and is already reported in the earlier lit-erature and studied in more detail in some recent papers [98CHA/DON], [98ERI/BAR], [99CHA/DON], [99YUS/SHI]. Erine et al. [98ERI/BAR] investigated the An(IV) − An(III) potentials, and the kinetics and activation parameters for redox reac-tions of Am, Cm, Bk and Cf in aqueous solutions of K P W O . The review article of Yusov and Shilov [99YUS/SHI] describes the Keggin or Dawson structures of lantha-nide and actinide complexes with heteropolyanions. These authors also discuss the re-dox properties and present a number of formation constants.
10 2 17 61
3
12.7.1 Americium(III) molybdate compounds and complexes
242MoO −
4 2Nd(MoO )−10log K ο
27 20 4Mo O (OH) −
2 7 24Nd Mo O (aq) 10log K ο
NaNd(MoO ) (cr) Na + Nd + = − 20.5 242MoO −
10log K ο
243MoO −
10log K ο3
1210 36W O − 10
2 17 61P W O − 711 39PW O − 8
11 39SiW O −
Chartier, Donnet and Adnet [98CHA/DON], [99CHA/DON] investigated the kinetics and mechanism of redox processes involving Am(III), Am(IV), Am(V) and Am(VI) in 1 M HNO solutions containing and . The Am(V) complexes were found to be intermediate species of minor importance. The
102 2 17 61P W O −α − 8
11 39SiW O −α −
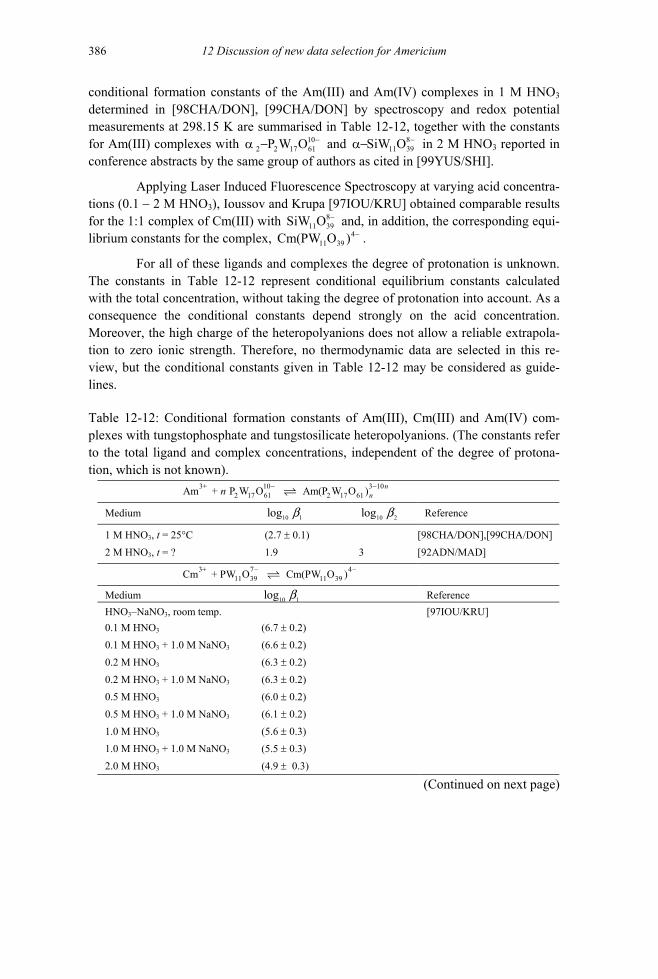
12 Discussion of new data selection for Americium 386
conditional formation constants of the Am(III) and Am(IV) complexes in 1 M HNO determined in [98CHA/DON], [99CHA/DON] by spectroscopy and redox potential measurements at 298.15 K are summarised in Table 12-12, together with the constants for Am(III) complexes with and in 2 M HNO reported in conference abstracts by the same group of authors as cited in [99YUS/SHI].
3
3
Applying Laser Induced Fluorescence Spectroscopy at varying acid concentra-tions (0.1 − 2 M HNO3), Ioussov and Krupa [97IOU/KRU] obtained comparable results for the 1:1 complex of Cm(III) with SiW and, in addition, the corresponding equi-librium constants for the complex, .
For all of these ligands and complexes the degree of protonation is unknown. The constants in Table 12-12 represent conditional equilibrium constants calculated with the total concentration, without taking the degree of protonation into account. As a consequence the conditional constants depend strongly on the acid concentration. Moreover, the high charge of the heteropolyanions does not allow a reliable extrapola-tion to zero ionic strength. Therefore, no thermodynamic data are selected in this re-view, but the conditional constants given in Table 12-12 may be considered as guide-lines.
Table 12-12: Conditional formation constants of Am(III), Cm(III) and Am(IV) com-plexes with tungstophosphate and tungstosilicate heteropolyanions. (The constants refer to the total ligand and complex concentrations, independent of the degree of protona-tion, which is not known).
Reference
1 M HNO , t = 25°C 3 (2.7 ± 0.1) 2 M HNO , t = ? 3 1.9 3 [92ADN/MAD]
Medium Reference HNO –NaNO , room temp. 3 3 0.1 M HNO 3 (6.7 ± 0.2)
3 3 (6.6 ± 0.2) 0.2 M HNO 3 (6.3 ± 0.2) 0.2 M HNO + 1.0 M NaNO 3 3 (6.3 ± 0.2) 0.5 M HNO 3 0.5 M HNO + 1.0 M NaNO 3 3 (6.1 ± 0.2)
3 (5.6 ± 0.3) 1.0 M HNO + 1.0 M NaNO 3 (5.5 ± 0.3) 2.0 M HNO3 (4.9 ± 0.3)
(Continued on next page)
102 2 17 61P W O −α − 8
11 39SiW O −α−
11O4
11Cm(PW −
1017 61W O Am(P 3 10
61O ) nn
− −
10 1log b 10 2log b
739 11O Cm(PW 4 − −
10 1log b
839
−
39O )
3+2 2 17Am + P Wn
3+11 39Cm + PW O )
Medium
[98CHA/DON],[99CHA/DON]
[97IOU/KRU]
0.1 M HNO + 1.0 M NaNO
(6.0 ± 0.2)
1.0 M HNO
3
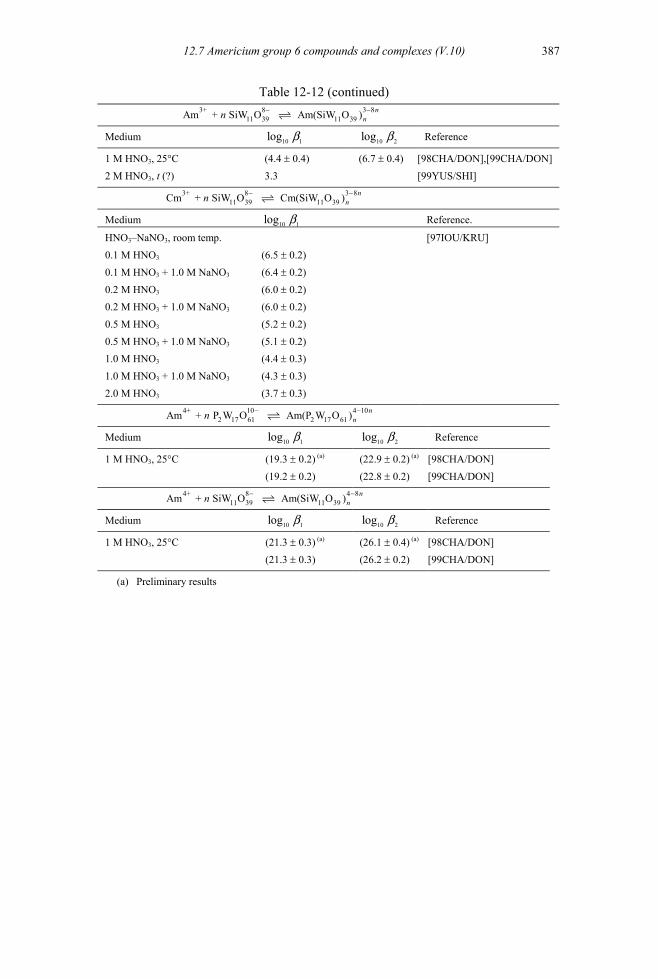
12.7 Americium group 6 compounds and complexes (V.10)
Medium Reference
1 M HNO , 25°C 3 (6.7 ± 0.4) [98CHA/DON],[99CHA/DON] 2 M HNO , t (?) 3 3.3 [99YUS/SHI]
Medium Reference.
HNO –NaNO , room temp. 3 [97IOU/KRU] 0.1 M HNO 3 (6.5 ± 0.2) 0.1 M HNO + 1.0 M NaNO 3 3 (6.4 ± 0.2)
3 (6.0 ± 0.2) 0.2 M HNO + 1.0 M NaNO 3 3 0.5 M HNO 3 (5.2 ± 0.2) 0.5 M HNO + 1.0 M NaNO 3 3 (5.1 ± 0.2) 1.0 M HNO (4.4 ± 0.3) 1.0 M HNO + 1.0 M NaNO 3 3 (4.3 ± 0.3) 2.0 M HNO 3 (3.7 ± 0.3)
Medium Reference
1 M HNO , 25°C 3 (19.3 ± 0.2) (a)
387
Table 12-12 (continued) 3+ 8 3 8
11 39 11 39Am + SiW O Am(SiW O ) nnn − −
10 1log b 10 2log b
(4.4 ± 0.4)
3+ 8 3 811 39 11 39Cm + SiW O Cm(SiW O ) n
nn − −
10 1log b3
0.2 M HNO (6.0 ± 0.2)
3
4+ 10 4 102 17 61 2 17 61Am + P W O Am(P W O ) n
nn − −
10 1log b 10 2log b
(22.9 ± 0.2) (a) [98CHA/DON] (19.2 ± 0.2) (22.8 ± 0.2) [99CHA/DON]
4+ 8 4 811 39 11 39Am + SiW O Am(SiW O ) n
nn − −
Medium Reference
1 M HNO , 25°C
10 1log b 10 2log b
3 (21.3 ± 0.3) (a) (26.1 ± 0.4) (a) [98CHA/DON] (21.3 ± 0.3) (26.2 ± 0.2) [99CHA/DON]
(a) Preliminary results

Chapter 13
13 Discussion of new data selection for Technetium
13.1 Elemental technetium (V.1) 13.1.1 Heat capacity and entropy (V.1.1.2) There are three recent papers concerning the heat capacity of Tc(cr). In her thesis, Bou-charat [97BOU] reports DSC measurements from 673 to 1583 K, as described in Ap-pendix A. However, her results show a maximum in around 1080 K and a mini-mum around 1540 K, and are ca. 10 - 20% lower than the experimental data by Spitsyn et al. [75SPI/ZIN]. There is no structural reason why Tc(cr) should have extrema in its heat capacity in this temperature range and these results have been discounted.
Van der Laan and Konings [2000LAA/KON] have studied the heat capacity of an alloy of approximate composition Tc Ru from ca. 300 to 973 K, using a differ-ential scanning calorimeter. The sample was formed by neutron irradiation of a disc of pure Tc metal, (from the same source as the metal used by Boucharat [97BOU]), which transmutes some of the Tc to Ru. Isotope Dilution Mass Spectrometry (IDMS) indicated that the average ruthenium content was (15.0 ± 0.4) atom-%, although EPMA measurements showed a higher concentration of Ru at the rim of the sample, owing to shielding effects.
0.85
99
99 100
,mpC
0.15
Heat capacities of pure Tc were derived by assuming a zero change of heat ca-pacity upon alloying. As noted in Appendix A, these derived heat capacities are 3 − 7 % greater than the values estimated by [99RAR/RAN]. Such differences are well within the combined uncertainties.
Very recently, Shirasu and Minato [2002SHI/MIN] have determined the heat capacity of 99Tc(cr) by DSC measurements from room temperature up to about 1100 K. Their measurements were made on a disk of Tc(cr) metal, prepared from highly-pure technetium metal powder (15 ppm total metallic impurities) by arc melting of the pow-der under an atmosphere of purified argon. Their data, which are presented only in the form of a figure and a fitted equation, agree excellently with those estimated in
389

13 Discussion of new data selection for Technetium
390
[99RAR/RAN]. Since the data of [99RAR/RAN] form a completely consistent set for , , and enthalpy increments, these values are retained. ,mpCο
mS ο
[2002SHI/MIN] also reported data for an alloy of composition Tc Ru (cr), which are close to the corresponding weighted sums of the heat capaci-ties of Tc(cr) and Ru(cr).
,mpCο
0.51 0.49
Puigdomènech and Bruno [95PUI/BRU] provides no new thermodynamic data and their calculated thermodynamic quantities for aqueous and solid compounds were not used in the assessment of [99RAR/RAN].
13.2 Simple technetium aqua ions of each oxidation state (V.2)
13.2.1 (V.2.1) Ben Said et al. [98BEN/FAT] measured E for the couple in HCl/NaCl media in the presence of variable ratios of Fe(III)/Fe(II) using solvent extraction to de-termine the Tc concentration in the aqueous phase. The potential readings were as expected, highly dependent on the nature of the Tc(IV) species in solution (hydrolysis and chloride complexation). Therefore, is suggested for the standard potential of the Tc couple in 1 M H /1.3 M Cl solutions.
4TcO−
4TcO / Tc(IV)−
0.006 V/NHE±
4O−
> 0.844 οE4O / Tc(IV)− + –
During preparation of this review, abstracts from “The Third Russian-Japanese Seminar on Technetium” [2002GER/KOD] were published that contained a number of interesting summaries of structural, [2002GER/GRI], [2002KIR/GER] and [2002MAS/PER], spectroscopic and electrochemical studies of Tc(VII). However, as no detailed experimental data were provided, these results have not be considered further in this review.
13.3 Oxide and hydrogen compounds and complexes (V.3) 13.3.1 The acid/base chemistry of Tc(IV) (V.3.1.1) A partial charge model, which is based on the electronegativity equalisation principle, was used by Henry and Merceron [94HEN/MER] to predict the speciation of Tc(IV) solutions as a function of pH at ambient conditions. The speciation is in qualitative agreement with [99RAR/RAN], but no quantitative equilibrium data are provided.
13.3.2 The protonation of Tc (V.3.1.2.1) 4O−
Solvent extraction experiments [94OMO/MUR] at 298.15 K of from 1 M HCl/NaCl solutions produced a value of (1.02 ± 0.18), which is higher than any listed in [99RAR/RAN], but also appears to be dubious in view of methodology employed and the relatively high acidity at which this acid dissociates. Suzuki et al. [99SUZ/TAM] described solvent partitioning experiments involving HTcO , but these
4TcO−
10 Clog K
4

13.4 Group 17 (halogen) compounds and complexes (V.4)
2
13.4 Group 17 (halogen) compounds and complexes (V.4) 13.4.1 Aqueous Tc(IV) halides (V.4.2.1.1) The speciation of Tc(IV) was studied in 1 − 6 M HCl solutions by UV-visible and Ra-man spectrophotometry, EXAFS and electrochemistry [2000BEN/FAT]. These results confirm that in 6.0 M HCl, Tc is the predominant species [99RAR/RAN], but that aging for 10 days in 1.0 M HCl produced mainly Tc with minor contribu-tions form and No thermodynamic data are provided. Vi-chot et al. [2000VIC/FAT] attempted to synthesize a sulphate complex by substitution in , but no direct evidence for its existence was provided.
13.4.2 Other aqueous halides (V.4.2.1.3)
391
results are beyond the scope of the present review. Omori et al. [97OMO/MIY] deal with the solvent extraction of pertechnetate without disclosing the experimental data and is considered beyond the scope of this review.
13.3.3 General properties, hydration number (V.3.2.5.1) Lefort [63LEF] had reported that pulse radiolysis of in H SO solutions led to reduction to Tc(IV) [99RAR/RAN]. However, Ben Said et al. [2001BEN/SEI] observed that no reduction occurred when 10 M in 0.01 M CO (pH = 11) was irradi-ated from a gamma source. The radical is believed to oxidise Tc(IV) to Tc(VII), whereas irradiation in the presence of 0.01 M HCOO produces colloidal TcO .
4TcO−
4TcO− 23
−
3CO•−
2 4
–4
–2
Maslennikov et al. [97MAS/COU] describe electrochemical measurements for the irreversible reduction of Tc(VII) to Tc(III) which subsequently catalysed the reduc-tion of the nitrate medium at more negative potentials. Maslennikov et al. [98MAS/MAS] report electrolysis experiments performed on Tc(VII) solutions contain-ing nitrate and formate at a graphite electrode. No thermodynamic data are contained in this paper although the rate of reduction is tentatively described in terms of two dimeric Tc-formate complexes.
Kremer et al. [97KRE/GAN] contains single crystal X-ray diffraction data for a Tc(V) coordination compound, [TcO2(tn)2]I·H O, where tn is trimethylenediamine.
26Cl −
5 2Cl (OH )−
4 2 2TcCl (OH ) (aq) 26TcCl .−
26TcCl −
Gorshkov et al. [2000GOR/MIR] give formation constants (see Table A-49) for the Tc(I) complexes, , where X = Cl, Br, I, SCN, from
based on NMR and potentiometric titrations. However, no supporting results are presented and the constants for the halides are too small to be meaningful, whereas those for the thiocyanide complexes appear to be unsubstantiated.
(1 )5 2 3Tc(CO) (H O) X n
n n− +
−+
3 2 3Tc(CO) (H O)

13 Discussion of new data selection for Technetium
392
13.5 Technetium nitrido compounds (V.6.1.3.1) Solvent extraction experiments at 298.15 K were used to investigate HCl/NaCl solu-tions (I = 1 M) believed to contain the dimer , which is in equilibrium with the tetrachloronitrido monomer at [H+] > 0.2 M according to the fol-lowing reaction [97ASA/SUG]:
{ } 2
2 3 2(H O)Cl NTc) ( O)
− µ −
These authors reported a lo value in molar units of (5.455 ± 0.01). At [H ] < 0.2 M, further hydrolysis is believed to result in the formation of , but no equilibrium constant was determined. Baldas et al. [98BAL/HEA] used a sophis-ticated combination of cyclic and alternating current voltametry in conjunction with in situ spectrophotometric observations of the Tc(V/IV) couple of technetium oxy and nitrido halides. However, these measurements were conducted in a non-aqueous me-dium and are therefore not relevant to this review.
{ } 2 +4 2 2 3 2
2 TcNCl + 3 H O(l) (H O)Cl NTc) ( O) + 2 H + 2 Cl−− − µ −
*10g K
{ } 2
2 22Cl NTc) ( O)
− µ −
+

Chapter 14Equation Section 14
14 Discussion of new auxiliary data selection
14.1 Group 16 (chalcogen) auxiliary species 14.1.1 Tellurium auxiliary species
14.1.1.1 TeO2(cr) This review accepts the values assessed by Cordfunke et al. [90COR/KON], but with increased uncertainties for the standard entropy and heat capacity. Note that there is a typographical error in Table 65, p. 389 of [90COR/KON]; the value of the standard en-thalpy of formation of TeO (cr) derived by Mallika and Sreedharan [86MAL/SRE] is − (321.1 ± 1.3) kJ·mol–1, not − (327.1 ± 1.3) kJ · mol . The selected values are:
2
(TeO , cr, 298.15 K) = − (321.0 ± 2.5) kJ · mol , 2–1
(TeO , cr, 298.15 K) = (69.89 ± 0.15) J · K · mol , 2–1
(TeO , cr, 298.15 K) = (60.67 ± 0.15) J · K · mol , 2–1 –1
(TeO , cr, T) = 63.271 + 2.1893·10 · T − 8.1142·10 · T J · K · mol 2–2 5 –2 –1
(298.15 to 1000 K).
14.2 Other auxiliary species 14.2.1 Copper auxiliary species
CuCl(g) is used in one study [84LAU/HIL] to determine the stability of UCl (g). The enthalpy of formation of CuCl(g) has been calculated from the two measurements of the dissociation energy at 0 K, D
3
0 (0 K) = (374.9 ± 8.4) kJ · mol by [96HIL/LAU] from the reaction, Ag(g) + CuCl(g) Cu(g) + AgCl(g), and D (0 K) = (382.4 ± 8.4) kJ · mol by [72GUI/GIG] from the polymerisation reaction, 3CuCl(g) Cu Cl (g); the uncer-tainty in the latter study has been increased from the purely statistical value of 3.3 kJ · mol given by the authors.
–1
0 –1
3
–1
For the enthalpy of the relevant reaction,
–1
f mο∆ H
–1mοS
,mοpC
–1,mpC
14.2.1.1 CuCl(g)
3
393
14 Discussion of new auxiliary data selection 394
CuCl(g) Cu(g) + Cl(g), (14.1)
the mean value of ((14.1), g, 0 K) = (378.7 ± 10.0) kJ · mol (where the uncer-tainty has been increased to allow for uncertainties in the ion cross-sections) leads fi-nally, with enthalpies of formation of the gaseous atoms from [89COX/WAG], to the selected value:
-1
(CuCl, g, 298.15 K) = (77.0 ± 10.0) kJ · mol–1
14.3 Group 2 (alkaline earth) auxiliary data 14.3.1 Calcium Auxiliary data
14.3.1.1 CaF(g) All data for CaF(g) are taken from the assessment by Glushko et al. [81GLU/GUR], which are based on early CODATA compatible data.
14.3.1.2 CaCl(g) All data for CaCl(g) are taken from the assessment by Glushko et al. [81GLU/GUR], which are based on early CODATA compatible data.
14.3.2.1 Ba(g) All data for Ba(g) are taken from the assessment by Glushko et al. [81GLU/GUR], which are based on early CODATA compatible data.
14.3.2.2 BaF(g) All data for BaF(g) are taken from the assessment by Glushko et al.
[81GLU/GUR], which are based on early CODATA compatible data.
14.4 Sodium auxiliary data 14.4.1 NaNO (cr) and NaNO (aq). 3
The following data were assessed and employed in [92GRE/FUG], page 620 and are collected here for reference. The enthalpy of formation of NaNO (cr) 3
(NaNO , cr, 298.15K) = − (467.58 ± 0.41) kJ mol 3–1
+
3 3
(NaNO , 6 M HNO , 298.15K) = (15.44 ± 0.21) kJ · mol 3–1
was taken from the work of Cordfunke, as cited in [75COR/OUW].
r m∆ H
f mο∆ H
14.3.2 Barium Auxiliary data
3
f mH ο∆
was based on the CODATA values for Na and and the weighted average of the enthalpies of solution from Table II-1 of the same reference [89COX/WAG], while the enthalpy of solution of NaNO in 6 M HNO
3NO−
sol mH∆ 3

Appendices
395

Equation Section 1
Appendix A
Discussion of selected references This appendix comprises discussions relating to a number of key publications which contain experimental information cited in this review. These discussions are fundamen-tal in explaining the accuracy of the data concerned and the interpretation of the ex-periments, but they are too lengthy or are related to too many different sections to be included in the main text. The notation used in this appendix is consistent with that used throughout the present book, and not necessarily consistent with that used in the publi-cation under discussion.
[00PIS]
The relevant part of this calorimetric study deals with UO4·2H2O(s). Analysed samples of this compound were dissolved, at an unspecified temperature, in 1 M H2SO4 (two measurements) and 2 M H2SO4 (one measurement), according to reaction:
4 2 2 4 2 4 2 2 2UO 2H O(s) + H SO (sln) (UO SO + H O + 2H O)(sln)⋅ . (A.1)
The author also dissolved (two measurements) 3 2UO H O(s) ⋅ in 1 M H2SO4,
3 2 2 4 2 4 2UO H O(s) + H SO (sln) (UO SO + 2H O)(sln)⋅ . (A.2)
For the enthalpy of reaction (A.1), the author accepted as valid for 1 M H2SO4 the average of the values obtained from the two media, which we also take with increased uncertainty limits, from which r m
ο∆ H ((A.1), 298.15 K) = (0.427 ± 0.500) kJ · mol–1. The uncertainty in the reported value of r m
ο∆ H (A.2), has also been increased, r m
ο∆ H (A.2) = − (64.218 ± 0.700) kJ · mol–1. To obtain f mο∆ H ( cr,
298.15 K) from these results, we make the assumption that the peroxide used by the author was crystalline and that his results are valid for 298.15 K.
4 2UO 2H O,⋅
[92GRE/FUG] give f mο∆ H ( 3 2UO H O,⋅ β, 298.15 K) = − (1533.8 ± 1.3)
kJ · mol–1, but since it is not known which polymorph of this phase was used by the au-thor, we increase the uncertainty to ± 4.0 kJ · mol–1. We also assume the enthalpy of formation of H2O2 in 1 M H2SO4 to be the same, within the uncertainty limits, as the infinite dilution value, f m
ο∆ H (H2O2, aq, 298.15 K) = − (191.17 ± 0.10) kJ · mol–1 and
397
Discussion of selected references 398
thus obtain f mο∆ H ( cr, 298.15 K) = − (1789.6 ± 4.1) kJ · mol4 2UO 2H O,⋅ –1. This value
gives very good support to the value selected by [92GRE/FUG] on the basis of the re-sults of [63COR/ALI] and [66COR], f m
ο∆ H ( 4 2UO 2H O,⋅ cr, 298.15 K) = − (1784.0 ± 4.2) kJ · mol–1 .
sol H∆
f mH ο∆
f mH ο∆
The author gives results on the dissolution of the mixed peroxy compound (Na2O2)2UO4 · 9H2O(s), also previously described in the literature. This review will not consider this species further.
[71COR/LOO]
It recently became clear that the value of the enthalpy of formation of the compound Na6U7O24(cr) accepted in [92GRE/FUG], based on its enthalpy of solution in 6.00 mol⋅dm–3 HNO3 as reported by [71COR/LOO], was quite incompatible with the stabili-ties of the other Na–U(VI) uranates. In fact, the calculated value given by [71COR/LOO] for the enthalpy of formation of the compound was itself not in agree-ment with their enthalpy of solution. The situation was clarified when it became appar-ent that the enthalpy of solution of the compound was mistakenly reported by the au-thors for a formula unit containing only one uranium atom, namely, Na6/7UO24/7.
A recalculation of the enthalpy of formation using m (Na6U7O24, cr) = − (595.72 ± 2.05) kJ · mol–1, which is seven times the value listed by [71COR/LOO], was made using the following auxiliary data: (NaNO3, cr) = − (467.58 ± 0.41) kJ · mol–1 from [89COX/WAG]; sol mH∆ (NaNO3, 6.00 mol⋅dm–3 HNO3) = (15.44 ± 0.21) kJ · mol–1 from [75COR/OUW], as in [92GRE/FUG]; sol mH∆ (γ–UO3, 6.00 mol·dm–3 HNO3) = − (71.53 ± 0.50) kJ · mol–1, slightly different from the value adopted in [92GRE/FUG] as discussed in the comments on [99COR/BOO];
f mH∆
f m
(HNO3, partial, 6.00 mol·dm–3 HNO3) = − (200.315 ± 0.402) kJ · mol–1 and H∆ (H2O, partial, 6.00 mol·dm–3 HNO3) = − (286.372 ± 0.040) kJ · mol–1, both inter-
polated from the enthalpy of dilution data given by Parker [65PAR], using densities from Table 2.5. The value obtained,
(Na6U7O24, cr, 298.15 K) = − (10841.7 ± 10.0) kJ · mol–1
adopted here, is appreciably different from that accepted in [92GRE/FUG], − (11351 ± 14) kJ · mol–1. It does, however, remove the discrepancy with the other so-dium uranates reported by [71COR/LOO], which are discussed below.
As seen above, we use a slightly different value, in this assessment for the en-thalpy of solution of γ–UO3 in 6.00 mol·dm–3 HNO3. We have thus recalculated the val-ues for the enthalpies of formation of the uranates originating from the HNO3 cycle used in [71COR/LOO].
For α–Na2UO4, we obtain f mH ο∆ (Na2UO4, α, 298.15 K) = − (1892.55 ± 2.28) kJ · mol–1, instead of − (1892.4 ± 2.3) kJ · mol–1 in [92GRE/FUG]. In the latter assess-

Discussion of selected references 399
ment the final value was obtained by making a weighted average of the HNO3 cycle with the results from four other cycles (in HCl and H2SO4 media) unaffected by the pre-sent discussion. The same procedure yields here,
f mH ο∆ (Na2UO4, α, 298.15 K) = − (1897.7 ± 3.5) kJ · mol–1
which is the adopted value, identical to that accepted in [92GRE/FUG].
For β–Na2UO4, we recalculate, from the [71COR/LOO] cycle, f mH ο∆ (Na2UO4, β, 298.15 K) = − (1886.35 ± 2.05) kJ · mol–1. However, the value adopted in [92GRE/FUG] was based on the best value for the difference of the enthalpies of solu-tion of the α– and β–phases, (13.1 ± 0.8) kJ · mol–1. Consequently, the value adopted here remains the same as in [92GRE/FUG]:
f mH ο∆ (Na2UO4, β, 298.15 K) = − (1884.6 ± 3.6) kJ · mol–1.
For β–Na4UO5, we recalculate f mH ο∆ (Na4UO5, cr, 298.15 K) = − (2456.47 ± 3.47) kJ · mol–1, only slightly different (as expected) from the value of − (2456.2 ± 3.0) kJ · mol–1 derived in Appendix A of [92GRE/FUG]. In the main text however, uncertainty limits of only ± 2.1 kJ · mol–1 were given that are obviously too small. The assessment of the final value for the enthalpy of formation of the compound is made, as in [92GRE/FUG], by taking the weighted average of the result originating from the measurements of [71COR/LOO] and of those from [85TSO/BRO] who re-ported − (2457.3 ± 2.8) kJ · mol–1. This yields:
f mH ο∆ (Na4UO5, cr, 298.15 K) = − (2457.0 ± 2.2) kJ · mol–1,
which is the value adopted here, as compared to − (2456.6 ± 1.7) kJ · mol–1 in [92GRE/FUG]. For Na2U2O7(cr), we recalculate f mH ο∆ (Na2U2O7, cr, 298.15 K) = − (3196.46 ± 3.09) kJ · mol–1 while [92GRE/FUG] give − (3196.1 ± 3.9) kJ · mol–1, from the [71COR/LOO] data. However, for their final selection, [92GRE/FUG] pre-ferred a value based on the results of [85TSO/BRO], namely:
f mH ο∆ (Na2U2O7, cr, 298.15 K) = − (3203.8 ± 4.0) kJ · mol–1.
We see no reason to alter this choice.
With these revised data, and reasonable estimates for the missing entropies and heat capacities of the Na–U(VI) uranates, the phase relationships in the whole Na–U–O system around 800 K are in good agreement with those summarised by [81LIN/BES].
[71NIK/PIR]
This paper has been cited but was not reviewed in [92GRE/FUG]. It gives first a survey of the literature data on the solubility of dehydrated schoepite 3 2UO H O,⋅ UO2(OH)2, up to 1971. Some references [55GAY/LEI], [58BRU], [60BAB/KOD] have been taken into account and discussed in [92GRE/FUG]. The data contained in all the quoted pa-pers are reported in Table A-1. As shown, up to 1971, the data are controversial.

Discussion of selected references 400
Table A-1: Literature data for the solubility of dehydrated schoepite.
T (K) 10 ,0log sK ο Reference
298.15 – 22.950 [54MIL] 298.15 – 23.176 [60OOS] 298.15 – 19.698 [62PER/BER] 298.15 – 22.130 [67GRY/KOR] 293 − 323 – 21.12 to − 20.6 [67GRY/KOR] 298.15 – 21.04 [55GAY/LEI] 293.15 – 17.778 [58BRU] 298.15 – 21.255 [60BAB/KOD]
Nikolaeva and Pirozhkov give also in the paper considered here values of the
constant for the equilibrium:
2+2 2 2UO (OH) UO + 2 OH− ,
in the range 295 to 423 K.
Experiments were conducted starting with 3 2UO H O⋅ (precipitated UO3 hy-drate heated to 393 K). Excess amounts of this compound with regard to complete neu-tralisation of the acids were equilibrated with HClO4 (HNO3 and H2SO4) for which ini-tial concentrations were known, and were always less than 10–2 M. Equilibrium pH measurements (ranging from 3 to 5) as a function of the temperature T (± 0.5 K), were conducted by two complementary methods. Repeated measurements on a given solution gave a reproducibility of ∆pH = 0.02 to 0.08. U concentrations were obtained by U3O8 gravimetry for solutions up to 363 K. Uncertainties in the acid and U concentrations, and in pH, were not given.
For HClO4 and HNO3 solutions, free concentrations of were calculated from the initial acid concentration, [H , taken as proton activity at each T and the con-centrations of the species (UO , and UO
2+2UO
+ ]2+2(OH)2 2) +
2UO (OH) 2(OH)2(aq) were calcu-lated from their formation constants at each T according to the data of [71NIK]. For sulphuric acid solutions, the complex UO2SO4(aq) was also taken into account in [71NIK]. Solubility products were calculated using [OH ]− which were derived from
values on the basis of K+[H ] w values determined at the test temperature, according to the data of [67PER/KRY].
Using activity instead of [H gives mixed solubility products. For the condi-tions of this work
+ ]+H
γ is not less than 0.911 (0.01 M HClO4) and does not change by more than 3 to 4 % within the range of temperature. Another point is that the calculated values of the U concentrations, when measured, are higher than the experimental values (7 to 10 %). It is difficult to check if this discrepancy is due to the values of the con-stants used or to an incomplete separation of the solid phase from the solution (as quoted by the authors in some cases). The review of [71NIK] on page 621 of

Discussion of selected references 401
[92GRE/FUG] considers the hydrolysis constants of as well as the sulphate complexation constant reported by Nikolaeva and Pirozhkov as not reliable and only gives these values as indicative. Ionic strengths are sufficiently low to consider that the obtained solubility products correspond to I = 0.
2+2UO
+2 2 H O(l)
Taking all the data for HClO4 (295 to 423 K) and HNO3 (295 to 363 K) media, the authors give the following variation of 10 ,0log sK ο with T:
10 ,0log sK ο = − 26.050 + 5349.583 T–1 − 1253404 T–2.
The experimentally reported values of the solubility in these two media agree to within 0.1 log10 units. At 295.15 K these values are (log10 units) − 22.284 and − 22.320, respectively (taken as the average reported experimental data). At the same temperature the value for the H2SO4 medium is reported as − 22.093. The tem-perature dependence of the values in this medium is also slightly different. Because the corrections made for sulphate complexation and sulphuric acid dissociation result in additional uncertainty in the corrections of the experimental data, the values for this medium will not be considered further here.
With the accepted NEA values for the ionic product of water [75OLO/HEP], we calculate for reaction:
+ 23 2 2UO H O (orth, ) + 2 H UO +T⋅ (A.3)
at 298.15 K for the perchloric medium, lo 10 ,0*g sK (A.3) = − (5.80 ± 0.10) and obtain:
( α, orth, 298.15 K) = − (1393.72 ± 1.84 ) kJ · molf mGο∆ 3 2UO H O,⋅ –1.
Using the experimental results in perchloric media as a function of tempera-ture, we have also calculated the lo 10g K (A.3) value as (5.05 ± 0.1) at 323.15 K; (4.47 ± 0.1) at 343.15 K; (4.05 ± 0.1) at 363.15 K; (3.75 ± 0.2) at 373.15 K; (3.39 ± 0.2) at 398.15 K and (2.94 ± 0.2) at 423.15 K.
The uncertainty limits affecting all of these recalculated values represent only an estimate of the internal consistency of the experimental results of the authors, as am-ple caution was given above concerning the complexing and hydrolysis constants they used. In fact, the values at 298.15 K are only used to help assess, in combination with data from another source (see the main text), the Gibbs energy of formation of the com-pound, and the values above room temperature are given here for information only.
[74DHA/TRI]
The authors report transpiration measurements of the total pressures of uranium bearing species over U3O8(s) in the presence of both dry and moist oxygen which show that the mass loss in the presence of water vapour is much larger than the loss of UO3(g) in dry oxygen, due to the formation of a UO3·(H2O)n vapour species.

Discussion of selected references 402
By variation of the water vapour pressure in the transpiring oxygen, the H2O/UO3 ratio in the hydroxide gas was shown to be (1.08 ± 0.10), indicating the for-mation of UO2(OH)2(g).
The authors' pressures of UO3(g) from the reaction:
3 8 2 31 1U O (s) + O (g) UO (g)3 6
(A.4)
from 1525 to 1675 K are in good agreement with the literature data which form the ba-sis of the choice of (UOf mGο∆ 3, g) in [82GLU/GUR] and [92GRE/FUG].
The authors tabulate the results of 14 experiments (with replicated mass losses) using oxygen with known amounts of water vapour from 1323 to 1623 K in the relevant reaction:
3 8 2 2 2 21 1U O (s) + O (g) + H O(g) UO (OH) (g)3 6
(A.5)
In calculating the pressure of UO2(OH)2(g), allowance was made for the (much smaller) mass loss due to the simultaneous vaporisation of UO3(g).
The authors' equation for the Gibbs energy of reaction (A.5) seems to be based solely on the series of experiments with a partial pressure of water vapour of 23 Torr. It is clear from the abstract, though not from the text, that their equation (3) for the pres-sure of UO2(OH)2(g), equivalent to:
2 210 UO (OH)
log ( / bar)p = − 9612 T –1 + 1.13
refers to this series only.
Since the paper was published, two somewhat different estimates of the ther-mal functions of UO2(OH)2(g) have been published: [95EBB], [98GOR/SID].
We have therefore preferred to use all the fourteen tabulated values to calculate the equilibrium constant and thus the Gibbs energy of reaction (A.5), and further calcu-late the second– and third–law values for r mH ο∆ ((A.5), 298.15 K) and hence
f mH ο∆ (UO2(OH)2, g, 298.15 K).
Our calculations for the Gibbs energies of reaction (A.5) can be fitted to:
r mG∆ (A.5) (A.6) 1= 200050 60.422 J mol ( 1323 to 1623 K)−− ⋅ =T T
in reasonable agreement with the authors' equation, recalculated from their pressure equation to be
r mG∆ (A.5) (A.7) 1= 184020 - 50.638 J mol ( 1273 to 1623 K).−⋅ =T T
The results of the calculations of f mH ο∆ (UO2(OH)2, g, 298.15 K) are shown in Table A-2. As noted in section 9.3.1.2.1 the big differences in this table are com-pounded by the very much smaller equilibrium constants of reaction (A.5) obtained in

Discussion of selected references 403
the more recent measurements by [93KRI/EBB]. In view of these large and unexplained differences, no data for this compound can be selected in this review.
Table A-2: Derived values of f mH ο∆ (UO2(OH)2, g, 298.15 K), kJ · mol–1.
Thermal functions Method
[95EBB] [98GOR/SID] Second–law, Eq.(A.6) – (1212.9 ± 21.5) – (1218.2 ± 21.5) Second–law, Eq.(A.7) – (1229.2 ± 15.4) – (1234.5 ± 15.4) Third–law – (1262.6 ± 7.8) – (1291.8 ± 10.4)
[76MOR/MCC]
This paper reports as experimental data i) the values of the integral heat of dissolution of Th(NO3)4·5H2O(cr) in HClO4 10–2 M at 15, 25 and 35°C (± 0.02°C), the final solu-tions being 0.303 to 2.270·10–3 m (15°C), 0.516 to 6.350·10–3 m (25°C) and 0.547 to 2.052·10–3 m (35°C) and ii) the molality of the saturated solution of Th(NO3)4·5H2O(cr) in HClO4 10–2 M, m(Th(NO3)4) = (3.66 ± 0.02) m. Thorium nitrate pentahydrate is the stable hydrate at 25°C, its properties including ,mpCο values are well known and it was chemically characterised before being used in the calorimetric experiments. All molar integral heats of dissolution were corrected to give the r mH ο∆ (A.8) values for the reac-tion:
Th(NO3)4·5 H2O(cr) {Th4+ + 4 3NO− , infinite dilution} (A.8)
Morss and McCue calculated r mH ο∆ (A.8) using a second-order Debye-Hückel treatment. By means of the Van't Hoff equation, these values were corrected, again at each temperature, for the first hydrolysis of Th4+, using 1,1
* οb = 1.4·10–4 (log10 1,1* οb =
− 3.85) at 25°C and the enthalpy corresponding to this first hydrolysis, as given by Baes et al. [65BAE/MEY]. Formation of Th 3
3NO + was included in the calculation of r mH ο∆ (A.8). The corrected values of r mH ο∆ (A.8) are the following: − (14066 ± 154)
J · mol–1 for 15°C, − (19807 ± 71) J · mol–1 for 25°C and − (23094 ± 38) J · mol–1 for 35°C, giving [ = − 574 J · K25
,m 15]pC∆
,mpCο
–1 · mol–1 and [ = − 329 J · K3525],mpC∆ –l · mol–1. The
average value of ∆ for 25°C is taken as = − (450 ± 10) J · K,mpCο∆ –1 · mol–1. Using ,mpCο ( 3NO− , 298.15 K) = − 86.61 J · K–l · mol–1 and auxiliary data for heat capacities,
leads to ,mpCο (Th4+, 298.15 K) = − (1 ± 11) J · K–l · mol–1.
To obtain the entropy of Th4+, Morss and McCue calculated first ((A.8), 298.15 K) = − 10970 J · mol
r mGο∆–1 for the equilibrium mentioned above. They used
(3.7 ± 0.1) mol · kg–1 for the molal concentration of the saturated solution of thorium nitrate in 10–2 M HClO4 and the data of Robinson and Levien [47ROB/LEV] for the mean activity coefficient of thorium nitrate and water derived from vapour pressure
Discussion of selected references 404
measurements. Combining r mGο∆ (298.15 K) and r mH ο∆ (298.15 K) gives S (Thmο 4+,
298.15 K) = − (424.0 ± 3.6) J · mol–1 · K–1.
,mpο
,mpο
3 2 (CO
,0sK
23CO −
24
−
10 ,0g οsK
f mο∆ G
The semi-empirical Morss and Cobble relationship (correlation of the entropy of monoatomic aqueous ions at 25°C with their charges and radii [70MOR/COB]) briefly discussed in [76MOR/MCC] predicts mS ο (Th4+, 298.15 K) = − (390 ± 30) J · K–1
· mol–1, essentially in agreement with the experimental value reported by [76MOR/MCC]. Using this last value, the Criss and Cobble relation, which gives ,mpCο as a function of , yields mS ο C (Th4+, 298.15 K) = − 28 J · K–l · mol–1, a value outside the uncertainty limits given for the experimental value.
This paper gives the first valuable data on C of the aqueous thorium ion. The later study of Hovey [97HOV] (see this review) gave different values, of which
,mpCο
,m
(Th4+, 298.15 K) = − (224 ± 5) J · K–l · mol–1 is used to question the value of pCο (U4+, 298.15 K) selected by [92GRE/FUG].
[83OBR/WIL]
Schröckingerite, 3 3 4 2NaCa UO ) SO F 10H O⋅ , was synthesised and recrystallised from water, but still contained gypsum as an impurity. The solubility was measured at 25°C whereby the dioxouranium(VI) and sulphate concentrations were measured and the excess sulphate over the stoichiometric ratio of 1:1 was assumed to be the level of gypsum impurity. X–ray diffraction of the solid phase following the dissolution experi-ments was used as the criterion that this solid dissolved congruently. Grimselite,
3 2 3 3 2NaK UO (CO ) H O⋅ , was synthesised and characterised based on its water content and XRD pattern.
The solubilities were measured at temperatures of 20 and 25°C in the former case (I = 0.105 − 0.108 M), and from 5.6 to 25.0°C for the latter solid (I = 0.428 − 0.439 M). The solutions were speciated based on data taken from a variety of sources and ac-tivity coefficients were derived from the methods of Reardon and Langmuir [76REA/LAN], Kielland [37KIE], and Alwan [80ALW]. The average 10log value at 25°C for the dissolution of schröckingerite:
NaCa3UO2(CO3)3SO4F·10 H2O(cr) Na+ + 3Ca2+ + + 3 2+2UO
+ SO + F– + 10 H2O(l)
was reported as − (35.16 ± 0.04), which led to a lo value of − 38.76 using their activity coefficient model, whereas the simple Debye-Hückel approach [92GRE/FUG] gives − 38.97. A value for of − (8077.3 ± 8.7) kJ · mol–1 (schröckingerite) was reported, which is well within the uncertainty range of that obtained from the latter ap-proach. In the case of grimselite, the ionic strengths are too high to use only the Debye-Hückel term when calculating activity coefficients. For the dissolution of grimselite:
NaK3UO2(CO3)3·H2O(cr) Na+ + 3K+ + + 3 CO2+2UO 2
3− + H2O(l)
Discussion of selected references 405
the 10 ,0log sK value at 25°C is reported as − 26.45, from which they derive a 10 ,0log οsK
value of − 38.76 and subsequently the following thermodynamic parameters, = − (4051.3 ± 1.8) kJ · mol
f mο∆ G
–1 and f mο∆ H = − (4359.0 ± 1.8) kJ · mol–1 (grimselite). How-
ever, considering the uncertainties in the speciation and activity coefficients, particu-larly at these higher ionic strengths, and the relative narrow range of temperature inves-tigated, these estimates must be considered as only being provisional.
[85UNE]
The paper reports measurements of the oxygen activity (emf with Y2O3–ZrO2 electro-lyte) in the mixtures of Cs2U4O12(cr) and Cs2U4O13(cr).
Cs2U4O13(cr) was prepared by heating appropriate amounts of β–UO3 with Cs2CO3 in air at 873 K for 12 hours; the 3.10 % weight loss was slightly greater than that calculated (3.00%) The lower uranate was obtained by decomposing the U(VI) compound in high–purity Ar at 1223 K for six hours; the 1.08 % weight loss was in good agreement with the theoretical prediction (1.10%). The products were character-ised by X–ray diffraction.
The oxygen potentials were studied using a Y2O3–ZrO2 electrolyte tube in flowing argon, from 1048 to 1198 K with air (
2 ) = 0.203 bar) as the reference elec-
trode. Correction of their emf values (omitting the somewhat deviant point at 1198 K) to the standard pressure gives, after recalculation:
O (gp
r mG∆ (A.9) = − 190108 + 151.758 T J · mol–1 (T = 1048 to 1173 K)
for the reaction:
(A.9). 2 4 12 2 2 4 13Cs U O (cr) + 0.5 O (g) Cs U O (cr)
The author's expression is slightly different. The calculated decomposition temperature of Cs2U4O13(cr) in air is 1201 K, noticeably lower than the value of 1310 K indicated by Cordfunke et al. [75COR/EGM].
The Gibbs energy values agree well with the later work by Venugopal et al. [92VEN/IYE] although the individual enthalpy and entropy terms differ by ca. 10%.
These authors have used these Gibbs energies of reaction to derive data for 298.15 K for Cs2U4O12(cr), using the literature data [80COR/WES] for Cs2U4O13(cr). However, we have not pursued this approach for reasons given in detail in the discus-sion of [92VEN/IYE].
[86DIC/PEN]
This paper reports the synthesis of novel compounds involving lithium insertion into several uranium oxides: U3O8(s) and α–, γ– and δ–UO3. The lithiating agent was LiI dissolved in organic solvents. The progress of the reaction was determined by titration of the liberated iodine with sodium thiosulphate, the products being characterised by

Discussion of selected references 406
powder X–ray diffraction. Galvanostatic and open circuit discharge curves were used to define the various (sometimes narrow) monophasic regions in the oxides, within the overall range of 0 < Li/U < 1.13. Diffusion coefficients of Li in the various phases were obtained by electrochemical pulse methods. From Gibbs–Duhem integrations of the open circuit data, the authors deduce a value of about − 300 kJ per mol of Li for the Gibbs energy of insertion into UOn, in line with later results by the same group [89DIC/LAW], [95DUE/PAT]. No further quantitative thermodynamic information can be extracted from this paper.
[87ALE/OGD]
This is a paper describing project work on fission product release from irradiated fuel, using a modulated beam operable up to 2400 K, coupled to a mass spectrometer. The only section of the paper relevant to the current review is that on the formation of UO2(OH)2(g), in which the authors give the Gibbs energy of the gaseous reaction:
3 2 2 2UO (g) + H O (g) UO (OH) (g) (A.10)
to be (A.10) = − 333500 + 156.9 T J · molr mG∆ –1 with no indication of the relevant temperature range or experimental description of any kind.
We are thus quite unable to ascertain the experimental validity this expression, but because of the considerable discrepancy in the other thermodynamic data for UO2(OH)2(g), have nevertheless derived the enthalpies of formation r mH ο∆ (UO2(OH)2, g, 298.15 K) by second- and third- law analyses, assuming a temperature range of 1900 − 2100 K. The second- and third–law values vary between − 1301 and − 1398 kJ · mol–1 with unknown (but large) uncertainties and are discussed further in section 9.3.1.2.1.
[88DIC/POW]
Except for the compound δ–Na0.54UO3, details on the preparation and characterisation of the compounds studied are given in [90POW]. This latter thesis, however, does not con-tain work on the thermochemistry of α–UO3 and δ–Na0.54UO3.
δ–Na0.54UO3 was obtained by ambient temperature insertion of Na by reaction of sodium benzophenone in tetrahydrofurane with δ–UO3. It was characterised as de-scribed in [90POW]. The dissolution medium was the same as for α–Na0.14UO3 [90POW] and the enthalpy of solution was reported as − (140.2 ± 0.7) kJ · mol–1. From this value, one obtains f mH ο∆ (Na0.54UO3, α, 298.15 K) = − (1377.0 ± 5.5) kJ · mol–1. For the insertion reaction:
3 0.540.54 Na (cr) + UO ( ) Na UO ( )3δ δ (A.11)
we obtain using f mH ο∆ (UO3, δ, 298.15 K) recommended in this review (section 9.3.3.1), r mH ο∆ ((A.11), 298.15 K) = − (163.2 ± 5.7) kJ · mol–1.

Discussion of selected references 407
The enthalpy of solution of α–UO, prepared as described previously [85DIC/LAW] and characterised by X–ray diffraction, is reported as − (96.03 ± 0.72) kJ · mol–1, to be compared with sol mH∆ (UO3, γ) = − (84.64 ± 0.38) kJ · mol–1, obtained in the same medium by [77COR/OUW2]. With the NEA adopted value for the enthalpy of formation of γ–UO3, we obtain f mH ο∆ (UO3, α, 298.15 K) = − (1212.41 ± 1.45) kJ · mol–1, compared with the value accepted by [92GRE/FUG], − (1217.5 ± 3.0) kJ · mol–1 for a compound which, as noted by [66LOO/COR] could not have had the exact UO3.00 composition. The former value is accepted here, because, given the enthalpies of solution, the α and the δ phases should have enthalpies of forma-tion close to each other and about 10 kJ · mol–1 less negative than the γ phase.
[88KEN/MIK]
This paper presents electrochemical and chemical preparations of technetium formate complexes for use as radiological image enhancers. The former technique is based on controlled potential electrolysis (– 600 mV versus SCE) at a graphite foil working elec-trode of millimolar KTcO4 in 4 M formate at pH = 3.21 under aerobic and anaerobic conditions. The reduced species formed at the working electrode were separated by an-ion exchange chromatography. Chemical production involved reduction with stannous chloride and sodium borohydride. Although three bands were observed by chromatog-raphy that were assigned to a yellow reduced complex, a colourless intermediate com-plex and a red oxidised technetium formate complex, no further detailed characterisa-tion was forthcoming and no thermodynamic information was presented.
[88OHA/LEW]
This paper is cited on pages 139 and 140 of [92GRE/FUG] but is not reviewed in Ap-pendix A of that publication. It deals with:
• the determination of ∆ ⋅ = − (1506.3 ± 2.1) kJ · mol
f m 3 2(UO 0.9H O, , 298.15 K) H ο α
3 20.9H O, , 298.15 K) α
m 3(UO 0.9H OS ο
f m 3 2(UO 0.9H O, , 298.15 K) Gο α
–1 and ∆ ⋅ = − (1374.4 ± 2.6) kJ · molf m (UOGο –1 on the basis of an estimated entropy value of = (125 ± 5) J · K
2 , , 298.15 K) ⋅ α–1 · mol–1. [92GRE/FUG] keep the enthalpy value but take a
slightly higher value of entropy, (126 ± 7) J · K–1 · mol–1 and consequently arrive at the selected value ∆ ⋅ = − (1374.4 ± 2.6) kJ · mol–1, that differs slightly from that of O'Hare et al.,
• the derivation of thermodynamic values for the dehydration steps of hydrates of uranium trioxide, and
• the derivation of thermodynamic values for aqueous dissolution of UO3·xH2O compounds.
Discussion of selected references 408
The synthesised compound used in this work is the alpha form of well characterised by X–ray diffraction and chemical analysis. The en-
thalpy change for the reaction: 3 2UO 0.9H O,⋅
3 2 2 2 2UO 0.9H O (cr) + 2 HF(aq) UO F (aq) + 1.9 H O(l)⋅
is measured as r mH∆ = − (80.91 ± 0.34) kJ · mol–1.
The value = − (1506.3 ± 2.1) kJ · molf m 3 2(UO 0.9H O, , 298.15 K) H ο∆ ⋅ α –1 is calculated through a thermochemical cycle including the measured r mH∆ value, previ-ous data on the dissolution of UO3(γ) in HF(aq) and auxiliary CODATA values, as done in [88TAS/OHA]. So data of the two papers are consistent and the value of r mH ο∆ for:
(A.12) 3 2 3 2 2UO 2H O(cr) UO 0.9H O(cr)+ 1.1H O(g)⋅ ⋅
is calculated as r mH ο∆ (A.12) = (54.08 ± 0.49) kJ · mol–1.
On the basis of previous literature data the authors give a set of values of f mH ο∆ at 298.15 K for the compounds 3 2UO xH O,⋅ x = 2, 1, 0.9, 0.85, 0.64 and 0.39
(not systematically reported in [92GRE/FUG]).
The question of is addressed considering at 298.15 K for reaction (A.12) for which the vapour pressure equation in equilib-
rium is used:
m 3 2(UO 0.9H O, , 298.15 K) S ο ⋅ α
r mS ο∆
100
2568.9log 6.843pp T
= − +
to deduce r mH ο∆ = (54.08 ± 0.49) kJ · mol–1 and the values of entropy of dehydration of many oxides hydrates (reflected by the term 6.843, but this point is rather
vague in the paper). From that equation it follows r mS ο∆
r mS ο∆
m 2(HS ο
= 144 J · K–1 · mol–1 from which = (125 ± 5) J · Km 3(UO 20.9H O, , 298.15 K) S ο ⋅ α
m 3 2(UO 2H O, cr, 2S ο ⋅
–1 · mol–1 is derived using known values for and 98.15 K) O, g, 298.15 K).
The authors handle all the literature data concerning the dehydration of in the same way as for x = 0.9 and give 3 2UO xH O ⋅ mS ο and f mGο∆ at 298.15 K for x =
2, 1, 0.9, 0.85, 0.64 and 0.39. These data are not mentioned in [92GRE/FUG].
The third part of the paper deals with estimation of r mGο∆ of schoepite for the reactions:
23 2 2 2UO .2H O (cr) + 2 H UO + 3 H O(l)+ + (A.13)
23 2 2 2UO 0.9H O (cr) + 2 H UO + 1.9 H O(l)+ +⋅ (A.14)
at 298.15 K (and other higher temperatures) using values of Gibbs energy of formation obtained in this paper, in [88TAS/OHA] and auxiliary data: = − (952.7 ± 2.1) kJ · mol
2+f m 2(UO , 298.15K)Gο∆
f m 2(H O, l, 298.15 K)Gο∆
–1 (the value selected by [92GRE/FUG] is − (952.551 ± 1.747) kJ · mol–1) and the CODATA value = − (237.14 ± 0.04) kJ · mol–1. The values for 10 ,0
*log οsK for the reactions derived from

Discussion of selected references 409
r mGο∆ = − 27.3 and − 29.0 kJ · mol–1 (for reactions (A.13) and (A.14), respectively) are 4.78 and 5.08. The value given for reaction (A.13) by [80LEM/TRE] is (5.6 ± 0.5). The value of 4.78 [88OHA/LEW] is consistent with the value of [92GRE/FUG], 10log K ο = − 5.5, for reaction (V.9) on page 113 of [92GRE/FUG]:
lo
10 2,1*g οb
,0
(A.15) 3 2 2 2 2UO 2H O (cr) UO (OH) (aq) + H O(l)⋅
and 10 2,1*g ο <b − 10.3 selected for:
2 +2 2 2 2UO + 2 H O(l) UO (OH) (aq) + 2 H+
which give together, 10 ,0*log ο
sK = 4.8. The value of lo 10 ,0*g sK ο (A.13) calculated from
the data of [92GRE/FUG] is − (4.81 ± 0.43). This review has selected = − (12.15 ± 0.07), which gives lo
lo10g K ο (A.15) = − (7.35 ± 0.43) and f Gm
ο∆ (UO2(OH)2, aq, 298.15 K)= − 1357.5 kJ · mol–1.
[88STA/KIM]
This paper is reviewed together with [88STA/KIM2].
[88STA/KIM2]
This review also includes the review of [88STA/KIM].
The authors investigated the pH dependence of the solubility of 241Am(OH)3(s) at (25 ± 0.5)°C. The interference of CO2 was carefully excluded. According to the ex-perimental pH titration procedure the precipitates had several weeks for ageing, but no attempts were made to characterise the solid phases. The effect of α–radiation on the solubility was studied using different total concentrations of 241Am. One set of solubility data (experiment A) was performed in 0.1 M NaClO4 (pH = 6.9 − 12.9) at low specific α–radiation (≤ 1.2·10–4 M). In three additional series in 0.1 M NaClO4 (B), 0.1 M NaCl (C), and 0.6 M NaCl (D), larger amounts of 241Am (1.42·10–3 M to 6·10–3 M) were used in order to extend the solubility measurements to lower pH values in the range 6.2 − 6.6. A few additional data measured in 5 M NaClO4 do not provide sufficient information to derive reliable equilibrium constants, and an additional series in 3 M NaCl resulted in radiolytic oxidation of Am(III) to Am(V).
Series B, C and D include data at pH = 6.2 − 6.6, where the effect of mononu-clear hydrolysis is small or negligible. In addition, the Am3+ ion concentration was de-termined by spectroscopy to exclude a possible interference of polynuclear species in the calculation of the solubility constant. The hydrolysis constants were then calculated from the data in the whole pH range by least squares fitting. Experiment A (in 0.1 M NaClO4 and lower specific α–activity) contains only data at pH ≥ 7. As there are no data with a significant amount of free , the fitted solubility and hydrolysis con-stants are highly correlated (cf. comparison in Figure A.1). Hence the hydrolysis con-stants were adopted from series B (also in 0.1 M NaClO
3+Am
4) and only 10log sK was fit-

Discussion of selected references 410
ted. In the review of Silva et al. [95SIL/BID], the results from series B, C, and D were not discussed within the data selection. Only the data from experiment A (at lower spe-cific α–activity) were used and recalculated by fitting simultaneously 10 ,0log sK and the hydrolysis constants. The fitted constants differ considerably from those proposed in [88STA/KIM]. In the present review the constants given in the original paper as
10 ,0log sK and (reactions formulated with OH10log nb,0
*
– ions, cf. Table A-3) are con-verted to 10log sK and values with the NEA–TDB auxiliary data for the ion product of water and corrected with respect the relations between the experimental pH values (pH
10*log nb
exp) and − log10[H+] or log10[OH–]. For the 0.1 M NaClO4 and NaCl solutions, the corrections are very small (0.02 units in log10[H+]), but in the case of 0.6 M NaCl they become significant (0.17 units in log10[H+]). Using the same equipment for pH measurement in 0.6 M NaCl as in [88STA/KIM], Felmy et al. [91FEL/RAI] reported the relation − log10[H+] = pHexp + 0.04, which has been confirmed in the laboratories of the present reviewer.
10 ,0log sK 10 3log b
10 ,*log sK 10 3
*log b
, 0sK Am
nb 3+Am
Table A-3: Equilibrium constants for Am(OH)3(s) and Am(III) hydroxide complexes derived from the solubility experiments of Stadler and Kim [88STA/KIM] (all data at 25°C).
Original data given in [88STA/KIM] (a)
Exp Medium 10 1log b 10 2log b
A 0.1 M NaClO4 (≤ 3.7 GBq·L–1)
– (25.7 ± 0.3) (6.3 ± 0.3) (b) (12.2 ± 0.4) (b) (14.4 ± 0.5) (b)
B 0.1 M NaClO4 (44–185 GBq·L–1)
– (25.0 ± 0.2) (6.3 ± 0.3) (12.2 ± 0.3) (14.4 ± 0.2)
C 0.1 M NaCl (74–185 GBq·L–1)
– (25.1 ± 0.5) (6.0 ± 0.4) (12.2 ± 0.5) (14.8 ± 0.5)
D 0.6 M NaCl (74–185 GBq·L–1)
– (25.0 ± 0.1) (5.6 ± 0.3) (11.6 ± 0.4) (14.1 ± 0.5)
present review
Exp Medium 0 10 1*log b 10 2
*log b
A 0.1 M NaClO4 (≤ 3.7 GBq·L–1)
(15.7 ± 0.3) – (7.5 ± 0.3) (b) – (15.4 ± 0.4) (b) – (27.0 ± 0.5) (b)
B 0.1 M NaClO4 (44–185 GBq·L–1)
(16.4 ± 0.3) – (7.5 ± 0.3) – (15.4 ± 0.3) – (27.0 ± 0.2)
C 0.1 M NaCl (74–185 GBq·L–1)
(16.3 ± 0.5) – (7.8 ± 0.4) – (15.4 ± 0.5) – (26.6 ± 0.5)
D 0.6 M NaCl (74 − 185 GBq·L–1)
(16.7 ± 0.2) – (8.3 ± 0.3) – (16.2 ± 0.4) – (27.6 ± 0.5)
(a) 10
log refers to the reaction 3+
3(OH) (s) Am + 3 OH−
3 + OH Am(OH) nn
log − −10 refers to the reaction n .
(b) adopted from experiment B.

Discussion of selected references 411
Figure A-1 shows the good agreement between solubility data in experiment B of [88STA/KIM] and those determined by Silva [82SIL] for 243Am(OH)3(cr) in the range 7 ≤ − log10[H+] ≤ 9.5. However, the solubility curve calculated with the equilib-rium constants re-evaluated by Silva et al. [95SIL/BID] from the data in [82SIL] (solid curve) deviates 0.5 log10 units from the data of [88STA/KIM] at − log10[H+] < 6.5, where the Am3+ ion is the predominant aqueous species. Although Silva et al. [95SIL/BID] applied a correct fitting procedure, the redundancy between the fitted con-stants led to a solubility constant, which is somewhat too low, and consequently to overestimated hydrolysis constants and lo compared, for example, to those determined by spectroscopic methods [92WIM/KLE], [94FAN/KIM]. On the other hand it is noteworthy that the discrepancies do not exceed the uncertainty limits of 0.6 log
10 1*log b 10 2
*g b
10 units given in [95SIL/BID].
Figure A-1: Comparison of solubility measurements for Am(OH)3(cr) [82SIL] and aged Am(OH)3(s) [88STA/KIM] in 0.1 M NaClO4 at 25°C. The solid curve is calculated with the equilibrium constants evaluated in [95SIL/BID] from the solubility data of Silva [82SIL]: lo . 10 ,0
*g = (15.9 0.6);sK ± 10 1*log = (6.9 0.6);− ±b 10 2
*log = (15.1 0.6)− ±bThe dashed curve is calculated with the constants derived by Stadler and Kim [88STA/KIM] from the data in experiment B: ,
, , . 10 ,0
*log = (16.4 0.2)sK ±
10 3*g = (27.0 0.2)− ±b10 1
*log = (7.5 0.3)− ±b 10 2*log = (15.4 0.3)− ±b lo
-11
-10
-9
-8
-7
-6
-5
-4
-3
-2
6 7 8 9 10 11 12 13
[95SIL/BID][82SIL]
[88STA/KIM]
– log10[H+]
log 1
0[A
m(I
II)]
Exp. B (44 - 185 GBq·L–1)

Discussion of selected references 412
[88TAS/OHA]
The results presented in this paper are considered on pages 136–137 of [92GRE/FUG]. They concern: C (T ranging from 7.59 to 343.88 K and from 350 to 400 K) and ,m ( ),p T
f mH ο∆ 3 2H O, cr, 298(UO 2 .15 K).⋅ The derived values of:
mS ο3 2(UO 2H O, cr, 298.15 K)⋅ = (188.54 ± 0.38) J · K–1 · mol–1
,mpC 3 2(UO 2H O, cr, 298.15 K < < 400 K)T⋅ = 84.238 + 0.294592 T J · K–1 · mol–1
and the proposed values by the authors of:
f mH ο∆ 3 2(UO 2H O, cr, 298.15 K)⋅ = − (1826.1 ± 1.7) kJ · mol–1 and
f mGο∆ 3 2(UO 2H O, cr, 298.15 K)⋅ = − (1636.5 ± 1.7) kJ · mol–1
were selected. But no discussion of this key paper is given in Appendix A of [92GRE/FUG], except for a short comment on page 675 concerning the values of stan-dard entropies of and used to calculate the Gibbs energy of formation,
2O (g) 2H (g)
f m .Gο∆
In this work, schoepite, 2 2 2 3 2UO (OH) H O (UO 2H O)⋅ ≡ ⋅
,m (p
,m ( )pC Tm m (0)) /H T
K)
( )T
is well character-ised. Direct data involving low temperature measurements of C are corrected to take into account the small degree of dehydration of schoepite above 270 K. No anom-aly in the sigmoid curve for appears. Incremental values of ,
and are given (10 to 360 K). Enthalpy meas-urements of up to 400 K are also corrected for the vapor pres-sure over schoepite. A smoothed polynomial variation is given for
and is derived (see above) with the conditional limit = 172.07 J · K
)T
m ( )S Tο
m m( ) (0)H T H−
m m( ) (H T H ο−
,m (298.15K)pCο
( ( )G T− −
m m (298.15H ο
) ,mpC
( )H T −
298.15K–1 · mol–1 given by the low temperature data.
The standard molar enthalpy for:
3 2 2 2 2UO 2H O (cr) + 2 HF(aq) UO F (aq) + 3 H O(sln)⋅
is measured as r mH ο∆ = − (76.25 ± 0.35) kJ · mol–1. The value f mH ο∆ (UO3·2H2O, cr, 298.15 K) = − (1825.4 ± 2.1) kJ · mol–1 is calculated through a thermochemical cycle including that r mH ο∆ value, previous data on dissolution of UO3 ( ) γ in HF(aq) and auxiliary CODATA values.
The authors also discuss three previous sets of results from [64COR], [66DRO/KOL] and [71SAN/VID] leading to f mH ο∆ 3 2(UO 2H O, cr, 298.15 K)⋅ values. Taking the weighed average of these values and the value obtained by them, they give − (1826.1 ± 1.7) kJ·mol–1 as a recommended value to be used. [92GRE/FUG] followed the authors' recommendation.
However, [92GRE/FUG] state (page 136 in V.3.3.1.5): “The recent work of Tasker et al. [88TAS/OHA] report a similarly determined experimental value (enthalpy of hydration of γ–UO3 to give schoepite) of − (29.93 ± 0.52) kJ · mol–1”. Such an ex-

Discussion of selected references 413
plicit value is not reported in this paper. But from the value (see above) and
= − (1223.8 ± 1.2) kJ · mol
1f m 3 2(UO .2H O, cr, 298.15 K) = (1825.4 2.1) kJ molο −∆ −Hf m 3(UO , , 298.15 K)H ο∆ γ ∆
± ⋅–1 and =
(285.83 ± 0.04) kJ · molf m 2(H O, l, 298.15 K)H ο
–1, it is possible to obtain − 29.4 kJ · mol–1 for enthalpy of hy-dration of γ–UO3 to give schoepite.
[89DIC/LAW]
These authors report the preparation, characterisation, and thermochemical studies on δ–UO3, δ–Li0.69UO3, γ–Li0.55UO3 and Li0.88U3O8(cr). The three latter compounds were also studied using electrochemical techniques. Insertion of lithium was achieved [86DIC/PEN] through reaction with anhydrous LiI or, for the latter compound, with n-butyl lithium. Characterisation techniques were the same as those described in [90POW], with, in addition, the determination of Li by atomic absorption spectrometry. The calorimetric reagent for the dissolution, 0.0350 mol·dm–3 Ce(SO4)2 +1.505 mol·dm–3
H2SO4 [77COR/OUW2], [81COR/OUW], was the same as in [88DIC/POW] and in [90POW]. Uncertainty limits are reported as twice the standard deviation of the mean. The calorimetric results are discussed in greater detail in [90POW] and will not be re-peated here. The other values for the enthalpies of solution were reported as:
sol m∆ H (Li0.69UO3, δ) = − (165.24 ± 1.94) kJ · mol–1
sol m∆ H (Li0.55UO3, γ) = − (146.12 ± 2.52) kJ · mol–1
sol m∆ H (Li0.88U3O8, cr) = − (460.52 ± 1.60) kJ · mol–1.
Using the auxiliary enthalpies of solution of the binary uranium oxides used also in [90POW], and that for LiUO3(cr), − (208.35 ± 0.53) kJ · mol–1 (all original data from [77COR/OUW2], [81COR/OUW]), the enthalpies of the following reactions:
0.69 LiUO3(cr) + 0.31 γ–UO3 δ–Li0.69UO3 (A.16)
0.55 LiUO3(cr) + 0.45 γ–UO3 γ–Li0.55UO3 (A.17)
0.88 LiUO3(cr) + U3O8(cr) Li0.88U3O8(cr) + 0.88 γ–UO3 (A.18)
were obtained as ∆r mοH ((A.16), 298.15 K) = − (4.76 ± 1.98) kJ · mol–1, r m
ο∆ H ((A.17), 298.15 K) = − (6.56 ± 2.54) kJ · mol–1 and r m
ο∆ H ((A.18), 298.15 K) = (0.39 ± 2.16) kJ · mol–1. Using NEA adopted values, we obtain:
f mο∆ H (Li0.69UO3, δ, 298.15 K) = − (1434.52 ± 2.37) kJ · mol–1
f mο∆ H (Li0.55UO3, γ, 298.15 K) = − (1394.53 ± 2.78) kJ · mol–1
f mο∆ H (Li0.88U3O8, cr, 298.15 K) = − (3837.09 ± 3.75) kJ · mol–1.
For the insertion reactions:
0.69 Li(cr) + γ–UO3 δ–Li0.69UO3 (A.19)

Discussion of selected references 414
0.55 Li(cr) + γ–UO3 γ–Li0.55UO3 (A.20)
0.88 Li(cr) + U3O8(cr) Li0.88U3O8(cr) (A.21)
one then obtains, using NEA accepted values:
r mο∆ H ((A.19), 298.15 K) = − (220.79 ± 2.77) kJ · mol–1
r mο∆ H ((A.20), 298.15 K) = − (170.73 ± 3.03) kJ · mol–1
r mο∆ H ((A.21), 298.15 K) = − (262.29 ± 4.45) kJ · mol–1.
Per mole of inserted lithium, these values correspond to − (319.99 ± 4.01) kJ · mol–1, − (310.42 ± 5.51) kJ · mol–1, and − (298.06 ± 5.06) kJ · mol–1, respectively.
The authors also deduce integral Gibbs energy changes for the insertion reac-tions from discharge and open circuit voltage curves using cells of the type:
4 xLi(cr) 1 M LiClO (1:1 P.C./DME) Li UOn
n
where P.C./DME is presumably a propylene carbonate / dimethyletherethylene glycol mixture.
The Gibbs energies of the insertion reactions:
(A.22) Li(cr) + UO (cr) Li UO (cr)n xx
obtained by graphical integration, (presented only in a graph) for δ–LixUO3 appear to be an approximately linear function of x, but the calorimetric result indicated on their plot, for comparison, at x = 0.55, actually corresponds to γ–Li0.55UO3, (for which, no equilib-rium emf value could be obtained) and the value for δ–Li0.69UO3 is omitted (it falls close to the curve for the Gibbs energies). The curve for ∆ (A.22) for Lir mG xU3O8, as a function of x flattens off to have a slope close to zero as x approaches 1.0. These elec-trochemical results will not be considered further in this review.
[89GUR/DEV]
This abstract gives results of calorimetric measurements on pure samples of UO2(OH)2(cr) and UO2CO3(cr) (10 to 340 K). The standard enthalpy of formation of UO2CO3(cr) was calculated from solution calorimetry data. By combining the results with literature data, recommended values of the standard molar thermodynamic proper-ties of the compounds and the reactions:
2 2 2 2 2 2UO (OH) H O(cr) UO (OH) (cr) + H O(l)⋅
2 3 2 2 2 2UO CO (cr) + H O(l) UO (OH) (cr) + CO (g)
were obtained. These results are reported and discussed in [97GUR/SER] (see the re-view of this paper).

Discussion of selected references 415
[89PET/SEL]
Numerous reactions leading to uranium fluorophosphates are described. IR spectra and X–ray diffraction were used to characterise the compounds, but no details were given.
The enthalpy effect associated with the thermal decomposition (in an argon at-mosphere) of some compounds is given without any details, as follows:
2 2 2 2 2 3 31
r m
UO (PO F ) (s) UO PO F(s) + POF (g) (423 773 K)
(298 K) = (89.6 1.2) kJ molH ο −
−
∆ ± ⋅
2 2 4 3 2 31
r m
U(PO F ) (s) U(PO F) (s) + 2 POF (g) (423 773 K)
(298 K) = (218.8 10.0) kJ molH ο −
−
∆ ± ⋅
2 2 2 2 3 2 2 3
1r m
2 2 2UO (PO F )F(s) UO PO F(s) + UO F (s) + POF (g) ( > 403 K)
(298 K) = (39.1 0.95) kJ mol
T
H ο −∆ ± ⋅
1 1 1
2 3 2 3 4 2 3
1r m
3 3UO PO F(s) (UO ) (PO ) (s) + POF (g) (953 993 K)
(298 K) = (64.6 1.0) kJ molH ο −
−
∆ ± ⋅
1 1
[89SER/SAV]
The solubility of uraninite was measured in “pure” water and aqueous HCl (0.0001 − 1 molal), KCl + HCl (1 − 1.1 molal Cl–) at 300, 400, 500 and 600°C at 1 kbar, whereby the oxygen fugacity was controlled with either magnetite/haematite or nickel/nickel oxide buffers. The solubility in “pure” water was independent of temperature and the nature of the buffer with an average value of 10–(9.0 ± 0.5). The formation of and is proposed over the entire range of temperature and pH with the apparent formation of undisclosed chloride complexes.
4U(OH) (aq)+3U(OH)
The solubility of in water was measured at 100°C under argon. In addition, the solubility of was measured in water and
2 2UO (OH) (cr)2 3UO CO (cr) 3NaHCO solu-
tions (0.001 − 0.1 molar) under a atmosphere = 7.7–20.93 atm) at 100 and 200°C.
2CO2CO(p
The system was studied spectrophotometrically from 25 to 80°C, under a
2 ranging from 0.52 to 0.97 atm at ionic strengths of 0.1 to 2.0 molal
. The concentrations measured ranged as follows: , , and
3 2 2UO CO H O− −
COp
= 0.015 0.15 mo−4(NaClO )
m(NaHCOm(U) = 0.002 molal
3 ) lar pH = 5.15 7.35− . From these data it was sug-gested that the following formation reaction dominated:
2 22 3 2 3 2 3 3UO (CO ) + CO UO (CO )4− − − (A.23)

Discussion of selected references 416
and the stepwise formation constant 10log K = 4.49, at infinite dilution was given by the expression: . Access to the experimental data is needed before the re-sults summarised here can be evaluated.
13193 6.22− −T
At 25°C this gives r mH ο∆ (A.23)= − 61 kJ · mol–1, which is in good agreement with the value − 59.1 kJ · mol–1 selected in [92GRE/FUG]. However, it is not clear from the abstract if the new data are based on the older ones obtained by some of the authors. The old data were used in the selection of enthalpies of reaction in [92GRE/FUG].
[89STA/MAK]
Salts of sulphamic acid, designated as 3 2HSO NH = HX, MX z , have an exceptionally high solubility in water while HX solubility itself is low. The standard Gibbs energy for the dissolution of crystalline MXz is given at 298.15 K by:
1sol m 10 ,0 sol m sol m(kJ mol ) 5.71 log 298.15sG K Hο − ο ο∆ ⋅ = = ∆ − ⋅ ∆ S ο
,0οsK being the solubility product of sulphamates, which also gives the solubility in wa-
ter if Mz+ is not hydrolysed to allow aqueous ion Mz+ to exist.
In this paper a good fit is shown between calculated sol mο∆ G and sol m
ο∆ H (cal-culated through ) for M, Msol m
ο∆ S
sol mο
2+ and M3+ single ions and some experimental data according to an electrostatic model. The ionic radius of Mz+ is the driving parameter. Giving the ionic radius of 146 pm to , the authors calculate ∆ = − 169.1 kJ · mol
2+2UO sol m
οG–1 and ∆ H = − 40.5 kJ · mol–1, m
οS = 431.3 J · K–1 · mol–1 (which means a solubility of (63 ± 10) g/(100g water), but do not take into account U(VI) hydrolysis). For U(III) with a radius of 103 pm for Mz+ they obtain sol m
ο∆ G = − 603.6 kJ · mol–1 and sol m
ο∆ H = − 447.7 kJ · mol–1, mοS = 525.8 J · K–1 · mol–1 (which means a solubility of
(144 ± 20) g/(100 g water)).
The estimated data cannot be included in the TDB II selected data because of the lack of several experimental values for the oxidation of heavy elements which could have given some confidence in the application of the model used for U(VI). For UX3 the situation is better. Indeed experimental and calculated values for lanthanides are very close (± 5%). The estimated solubility of U(VI) sulphamate: UO2X2 is less than for sul-phate (157.7 g/(100 g water)), chloride (328 g/(100 g water)) and nitrate (121.8 g/(100 g water)).
[89TAT/SER]
The solid phases, and 2 4 2Li XO H O⋅ 2 4 2UO XO 2.5H O (X = S, Se)⋅ were prepared by interaction of the appropriate acid with either Li or β − UO2 3CO 3·H2O, and were re-crystallised from water. Chemical analyses, XRD (powder and single crystal), and TGA were used to characterise the solids. Equilibrium was reached at 25°C with respect to the solid phases in 8–10 hours for the sulphate system. The phase diagram shows the

Discussion of selected references 417
formation of . Solutions saturated at 0 and 5°C give the same solid phases, , and tend to refute earlier claims of Oechsner and Chauvenet [05OEC/CHA] for the formation of
2 4 2UO SO 3.5H O(s)⋅
2 2 4 2 2UO (SO ) H O(s)⋅Li2 2 4 2 2Li UO (SO ) 4H O(s)⋅ . The selenium
system is more viscous and consequently attained equilibrium only after 70 − 80 to 150 hours. The congruently soluble compounds, 2 2 4 2Li UO (SeO ) 5 2H O(cr)⋅ and
, are formed with solubilities of 65.7 and 67.0 %, respec-tively. The former is triclinic, whereas the latter is monoclinic and isomorphic with
.
4 2 ) (S
2 2O )
3 4 5 2eO ) 16H O(cr)⋅
3 4 5 2(SeO ) 16H O(cr)⋅
Li (UO
Mg (U
,mpC ο
mS ο
[89YAM/FUJ]
This abstract concerns the oxygen potential of SryYyU1–2y O2+x (y = 0.05 and 0.025) solid solutions measured by thermogravimetric methods between 1123 and 1673 K.
This paper (and related papers by the same group) will not be considered further in this review as the work reported deals only with non–stoichiometric compounds, which are not part of the current NEA review effort.
[90COS/LAK]
The authors have prepared high density essentially stoichiometric UH3 and UD3 by heating U in high pressure H2 or D2 (125 MPa) above the melting point of U (1408 K) and cooling slowly still under high pressures (decreasing with T). No thermodynamic data are given, except to report that UH3–x with H/U ca. 2.5 melts at ca. 1338 K, but this is probably taken from the earlier work by [78LAK].
[90HAY/THO]
This paper, which is a comprehensive review/assessment of the thermodynamics and vaporisation of UN(cr), is mentioned only briefly in [92GRE/FUG], presumably be-cause it appeared only just before finalisation of [92GRE/FUG]. Table A-4 is a com-parison of the two sets of selected values (J · K–1 · mol–1·).
Table A-4: Comparison of selected values from [90HAY/THO] and [92GRE/FUG].
Property [90HAY/THO] [92GRE/FUG]
(298.15 K) 47.96 (47.57 ± 0.40)
(298.15 K) 62.68 (62.43 ± 0.22)
The two assessments overlap within the combined uncertainties.
Discussion of selected references 418
[90IYE/VEN]
This conference paper reports measurements of the oxygen activity (emf with CaO−ZrO2 electrolyte) in the mixtures Rb2U4O12(cr) + Rb2U4O13(cr) and preliminary data on the enthalpy increments of the compounds. The oxygen potential data are the same as those presented in [92VEN/IYE], where the more complete data for the en-thalpy measurements are also given. There are thus no additional data to be derived from this paper.
[90KUM/BAT]
Isopiestic measurements were carried out at 25°C by Kumok and Batyreva [90KUM/BAT] on only five concentrated solutions (2.0097–6.2602 mol·kg2K SeO
log
4–1)
using NaCl(aq) as the standard. Mean stoichiometric activity coefficients were calcu-lated from an equation for the osmotic coefficient by [62LIE/STO] as a function of mo-lality and the resulting Gibbs–Duhem equation. Given the limited number of concentra-tions studied and the high concentrations, the usefulness of the reported recalculated solubility product (from an untraceable reference) and Gibbs energy of formation of
(cr) appear suspect, i.e., 2 4 2UO SeO 4H O⋅ os,0K = − (2.25 ± 0.04) and
(298.15 K) = − (2357.4 ± 3.0) kJ · mol
of mG∆
–1.
[90PHI]
This report is not explicitly mentioned in [92GRE/FUG], although all the data are con-sidered in it. The values selected by the authors are similar to those selected in [92GRE/FUG]. They concern mainly of o o
f m f m m, , G H S∆ ∆ o 3UOH + , , , ,
22U(OH) +
3U(OH)+4U(OH) (aq) 5U(OH)− and 4OH) (s).U(
Experimental data are processed in the same way as in [92GRE/FUG] using the same CODATA auxiliary values. Nevertheless slight differences exist (about 1 kJ · mol–1 or less for Gibbs energy and enthalpy) between the two sets of values (except for , which are not selected in [92GRE/FUG]). For instance, the analysis by Philips of a part of the experimental data considered by [92GRE/FUG] led him to propose lo = − (0.61 ± 0.05) while [92GRE/FUG] selected lo = − (0.54 ± 0.06). In other cases, the differences seem to be due to small differences in the relevant thermodynamic values concerning the
22U(OH) +
3U(OH)+
10 1*g b ο
10 1*g οb
4U + aqua ion or . In the opinion of the reviewer, this report does not provide information that makes it necessary to revise the analysis by [92GRE/FUG]. The following values, mostly estimates, are given by the author: = − 2.76 (without uncertainty), lo
2UO
3
(cr)
10 2* οblog 10
*g οb = − 3.79 (with-out uncertainty), = − (4.83 ± 0.50), 10 4
* οblog 10log 5* οb = − (15.09 ± 0.50) and
10 ,4log sK ο = − (9.47 ± 0.30).
Discussion of selected references 419
[90POW]
Various hydrogen, lithium, and sodium insertion compounds with uranium oxides were prepared and studied using X–ray diffraction, neutron scattering, and thermogravimetric techniques. Related work on other oxides is also reported.
Enthalpies of formation derived from enthalpies of solution have been reported for δ–UO3, α–Na0.14UO3 and δ–H0.83UO3. The medium used for the dissolution of the sample was identical to that used by [77COR/OUW2], [81COR/OUW], namely 0.0350 mol · dm–3 Ce(SO4)2 + 1.505 mol · dm–3 H2SO4. In the study by [90POW], use was made of these authors' data for sol m∆ H (UO3, γ) = − (84.64 ± 0.38) kJ · mol–1,
sol m∆ H (U3O8, α) = − (351.27 ± 1.34) kJ · mol–1 and ∆sol mH (NaUO3, cr) = − (200.04 ± 0.51) kJ · mol–1 (uncertainties are quoted at the 1.96σ level).
The sample of δ–UO3 was prepared by thermal decomposition, at 648 K, of β−UO2(OH)2. The X–ray powder diffraction of the sample agreed with that in the litera-ture [55WAI] and showed no phase other than δ–UO3. The authors reported
sol m∆ H (UO3, δ) = − (94.71 ± 0.72) kJ · mol–1 (our 1.96σ uncertainty limits). The differ-ence between the enthalpies of solution of δ– and γ–UO3, together with the NEA ac-cepted value for the standard enthalpy of formation of γ–UO3 leads to f m
ο∆ H (UO3, δ, 298.15 K) = − (1213.73 ± 1.44) kJ · mol–1.
The α–Na0.14UO3 sample was prepared by heating a mixture of α–UO3 and NaUO3 in an evacuated silica tube [73GRE/CHE]. The compound was characterised by X–ray diffraction and the uranium mean oxidation state was ascertained by redox titra-tion (dissolution in a potassium dichromate solution and back titration with Fe2+). The author deduced from open circuit voltage curves that the sample was monophasic.
The determination is based on the enthalpy of solution of the constituents of the reaction:
0.14 NaUO3(cr) + 0.86 γ–UO3 α–Na0.14 UO3 (A.24).
The enthalpy of solution of α–Na0.14UO3 was determined as − (95.32 ± 0.35) kJ · mol–1 (1.96σ). Thus, r m
ο∆ H ((A.24), 298.15 K) = − (5.48 ± 0.48) kJ · mol–1, (not − (6.76 ± 0.77) kJ · mol–1 as given in the thesis). Using NEA adopted values, we obtain:
f mο∆ H (Na0.14UO3, α, 298.15 K) = − (1267.23 ± 1.80) kJ · mol–1;
the author's value of − (1276.19 ± 0.87) kJ · mol–1 seems to be in error.
For the insertion reaction:
0.14 Na (cr) + α–UO3 α–Na0.14UO3 (A.25)
we obtain, r mο∆ H ((A.25), 298.15 K) = − (54.82 ± 2.31) kJ · mol–1, in general agreement
with other insertion compounds of Na in uranium oxides.
Discussion of selected references 420
[90POW] also cites earlier data [88DIC/POW] on the enthalpy of formation of cubic δ–Na0.54UO3.
The δ–H0.83UO3 sample was obtained by a process described as hydrogen spill–over and characterised by X–ray diffraction and redox titration (mean oxidation state of uranium). The determination is based on the enthalpy of solution of the constituents of the equation:
0.415 α–U3O8 + 0.415 H2O(l) δ–H0.83UO3 + 0.245 γ–UO3 (A.26).
The enthalpy of transfer of H2O, − 0.05 kJ · mol–1, was taken from [81COR/OUW]. The enthalpy of solution of the compound is reported as − (142.25 ± 1.64) kJ · mol–1, which leads to r m
ο∆ H ((A.26), 298.15 K) = − (17.19 ± 1.73) kJ · mol–1. With NEA adopted values, we obtain:
f mο∆ H (H0.83UO3, δ, 298.15 K) = − (1285.14 ± 2.02) kJ · mol–1.
For the insertion reaction:
0.415 H2(g) + δ–UO3 δ–H0.83UO3 (A.27)
using the accepted value for the standard enthalpy of formation of δ–UO3 (see section 9.3.3.1), we obtain r m
ο∆ H ((A.27), 298.15 K) = − (71.41 ± 2.48) kJ · mol–1.
Powell also cites without any reference earlier results on α–H1.08UO3. which we shall not consider further.
[90SAW/CHA2]
This paper was not reviewed in [92GRE/FUG]. It deals with the complexation of U(IV) with fluoride ion. A commercial combination (fluoride sensitive (FSE)/ silver–silver chloride) electrode was employed with NaCl/ 4NaClO
4HClO filling solution at °C.
The ionic strength was maintained at 1.0 M ( , NaF) with the calculated total hydrogen ion molarity as high as 0.9273 M. The fluoride concentration generally reached was less than 0.5 M. Liquid junction potentials were measured by a method described previously [85SAW/RIZ] and the absolute values were generally large (− 9.0 to − 29.8 mV). The correction for formation was considered. It is not clear from the paper if the authors used weighted
(23 1)±
HF (aq)n values in the least squares refinement of
the data. Two fitting algorithms used by the authors were an in-house program and MINIQUAD. The final tabulated values converted to the molal scale using a density of 1.0568 g·mL–1, corresponding to an ionic strength of 1.046 m ( ) are reported in Table A-5 for the formation constants of the
4HClO4MF −nn species. The correction factor used
to convert from the molar to the molal scale is log10ρ = 0.02.
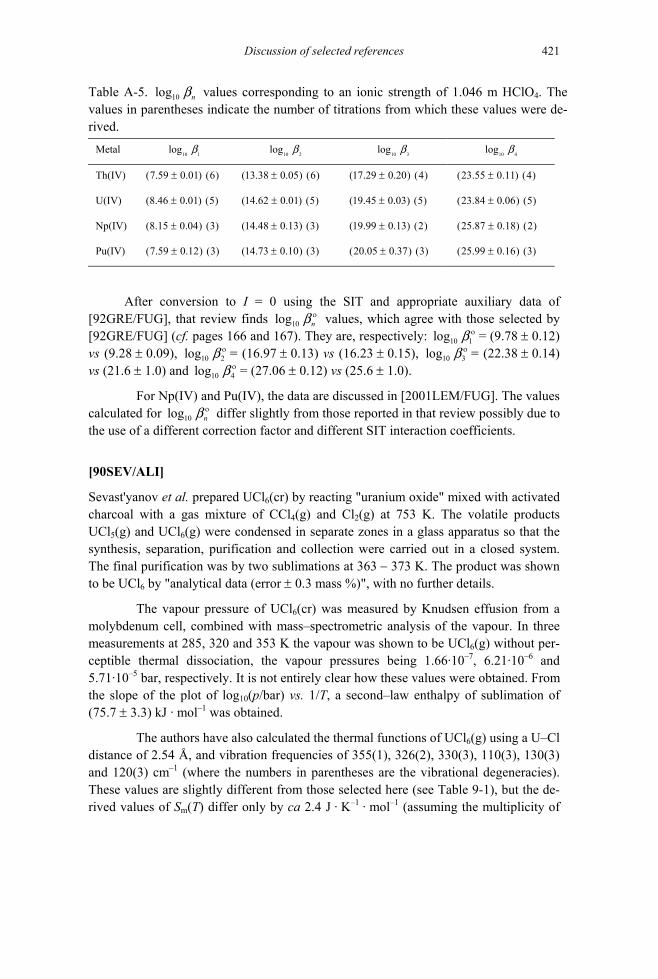
Discussion of selected references 421
Table A-5. values corresponding to an ionic strength of 1.046 m HClO10log nb 4. The values in parentheses indicate the number of titrations from which these values were de-rived.
Metal 10 1log b 10 2log b 10 3log b 10 4log b
Th(IV) (7.59 0.01) (6)± (13.38 0.05) (6)± (17.29 0.20) (4)± (23.55 0.11) (4)±
U(IV) (8.46 0.01) (5)± (14.62 0.01) (5)± (19.45 0.03) (5)± (23.84 0.06) (5)±
Np(IV) (8.15 0.04) (3)± (14.48 0.13) (3)± (19.99 0.13) (2)± (25.87 0.18) (2)±
Pu(IV) (7.59 0.12) (3)± (14.73 0.10) (3)± (20.05 0.37) (3)± (25.99 0.16) (3)±
After conversion to I = 0 using the SIT and appropriate auxiliary data of [92GRE/FUG], that review finds 10log ο
nb values, which agree with those selected by [92GRE/FUG] (cf. pages 166 and 167). They are, respectively: lo 10 1g οb
10 3log= (9.78 ± 0.12)
vs (9.28 ± 0.09), = (16.97 ± 0.13) vs (16.23 ± 0.15), 10 2log οb οb = (22.38 ± 0.14) vs (21.6 ± 1.0) and = (27.06 ± 0.12) vs (25.6 ± 1.0). 10 4log b ο
For Np(IV) and Pu(IV), the data are discussed in [2001LEM/FUG]. The values calculated for lo differ slightly from those reported in that review possibly due to the use of a different correction factor and different SIT interaction coefficients.
10g nοb
[90SEV/ALI]
Sevast'yanov et al. prepared UCl6(cr) by reacting "uranium oxide" mixed with activated charcoal with a gas mixture of CCl4(g) and Cl2(g) at 753 K. The volatile products UCl5(g) and UCl6(g) were condensed in separate zones in a glass apparatus so that the synthesis, separation, purification and collection were carried out in a closed system. The final purification was by two sublimations at 363 − 373 K. The product was shown to be UCl6 by "analytical data (error ± 0.3 mass %)", with no further details.
The vapour pressure of UCl6(cr) was measured by Knudsen effusion from a molybdenum cell, combined with mass–spectrometric analysis of the vapour. In three measurements at 285, 320 and 353 K the vapour was shown to be UCl6(g) without per-ceptible thermal dissociation, the vapour pressures being 1.66·10–7, 6.21·10–6 and 5.71·10–5 bar, respectively. It is not entirely clear how these values were obtained. From the slope of the plot of log10(p/bar) vs. 1/T, a second–law enthalpy of sublimation of (75.7 ± 3.3) kJ · mol–1 was obtained.
The authors have also calculated the thermal functions of UCl6(g) using a U–Cl distance of 2.54 Å, and vibration frequencies of 355(1), 326(2), 330(3), 110(3), 130(3) and 120(3) cm–1 (where the numbers in parentheses are the vibrational degeneracies). These values are slightly different from those selected here (see Table 9-1), but the de-rived values of Sm(T) differ only by ca 2.4 J · K–1 · mol–1 (assuming the multiplicity of

Discussion of selected references 422
the ground state is unity, rather than their quoted value of two). From these thermal functions the authors report a third–law enthalpy of (88.8 ± 4.0) kJ · mol–1, though this is probably a misprint for (80.8 ± 4.0) kJ · mol–1, since their average of their second- and third-law values is quoted to be (78.2 ± 5.0) kJ · mol–1 and the third-law enthalpy of sublimation using our slightly different thermal functions (see section 9.4.3.1.1.4) is (81.2 ± 4.0) kJ · mol–1.
[90VOC/HAV]
This paper was not reviewed in [92GRE/FUG] nor in [95SIL/BID] but it is cited in [95GRE/PUI] and in the Appendix on "Thermodynamics of Uranium" in [95SIL/BID]. Synthetic becquerelite is obtained by reacting schoepite with a solution of CaCl2 at 60°C for one week and characterised by chemical analyses and X-ray diffraction. The solubility of Ca[(UO2)6O4(OH)6]·8 H2O in water is measured in the absence of CO2 for five pH values in the range 4.50 to 6.28 after one week of equilibration at 25°C. Total concentrations of Ca and U are measured and the values of solubility of becquerelite are calculated to change from 1.45·10–3 to 0.25·10–5 M with the increase in pH. The chemi-cal model used to process the data takes into account the U(VI) species,
22(UO ) (OH) m n
m n− , with (n:m) = (1,1), (2:1), (2:2), (4:3) and (5:3). The values of
are those given by Sillen and Martell [71SIL/MAR], and Högfeldt [82HOG]. The value of the equilibrium constant for:
10 ,log n mb
Ca[(UO2)6O4(OH)6]·8 H2O Ca2+ + 6 + 14 OH2+2UO – + 4 H2O
is given as 10 ,0log sK = − (152.4 ± 0.3).
In this study the ionic strength is less than 2·10–2 M and variable. The values of are not given, but Vochten and Van Haverbeke report the distribution of the
U(VI) species as a function of pH which clearly show that they are incorrect. For in-stance, the species UO
10 ,log m nb
2OH+ is predominant at pH 9. The solid phase in the presence of water after one week was not characterised.
From 10 ,0log sK = − (152.4 ± 0.3) one can calculate 10 ,0*log sK = (43.6 ± 0.3)
which is close to the values reported by [2002RAI/FEL] (see this review). Casas et al. [97CAS/BRU] calculated from the data of Vochten and Van Haverbeke a value of
10 ,0*log sK ο = 41.4 using the aqueous thermodynamic model of Grenthe et al.
[92GRE/FUG]. Due to the lack of information in this study and the use of erroneous auxiliary data, this review does not consider the value reported by Vochten and Van Haverbeke for the selection of a solubility product for becquerelite.
This paper also gives additional information on the solubility of billietite, Ba[(UO2)6O4(OH)6]·8 H2O, but as the data are processed in the same manner as were those of becquerelite, the value 10 ,0log sK = − (158.7 ± 0.6) is not retained by this re-view.

Discussion of selected references 423
[91AGU/CAS]
This paper gives some information on the solubility of nanocrystalline UO2 particles (30 to 60 Å) obtained by reducing U(VI) in acidic solution by H2 in presence of Pd then raising its pH to 7. In the presence of NaCl the equilibrium concentration of U decreases and stabilises to (4.65 ± 0.06)·10–6 M in the range 5·10–2 to 4 M NaCl (pH = 7.5). This decrease (from 4·10–5 M in NaClO4) cannot be explained by the formation of chloro-complexes. The authors propose the presence of UO2Cl2 (or at least the presence of a Cl containing phase) from X–ray diffraction of the solid phase. This is very unlikely as this compound is very soluble.
[91BID/CAV]
The carbonate complexation of U(VI) has been investigated at 25°C by thermal lensing spectroscopy (TLS) at a wavelength of 448 nm. This very sensitive laser spectroscopic method was used to determine the stepwise equilibrium:
2 22 3 2 3 2 3 3UO (CO ) + CO UO (CO )4− − − (A.28)
at a total U(VI) concentration of 4·10–6 mol·L–1, which is low enough to exclude the interference of the trimer, 6
2 3 3 6(UO ) (CO ) − . Experimental details and auxiliary data used for the carbonic acid dissociation constants and fitting procedures are well described. Solutions of the composition 0.02 M NaHCO3/0.48 M NaClO4 were titrated with 0.2 M HClO4/0.3 M NaClO4 and equilibrated at 25°C with a gas stream of 100% CO2 or a CO2/N2 (10.33 % CO2) mixture to vary the 2
3CO − concentration in the range 10–5 to 10−8.5 mol · L–1. All solutions contained a constant U(VI) concentration of 4·10–6 mol · L–1.
The evaluation of the spectroscopic results requires knowledge of the normal-ised TLS signals, Sn, at 448 nm for the different species, . The value of S
2 22 3UO (CO ) − n
n
3 was determined from a solution at higher carbonate concentration and the ratio of S2/S3 was fitted simultaneously with the equilibrium constant for reaction (A.28). The variation of estimations for the ratios S1/S3 and S0/S3 had no significant effect on the results. The best fitted value for the stepwise carbonate complexation constant was re-ported to be lo 10 3g K ((A.28), 0.5 M NaClO4, 298.15 K) = (6.35 ± 0.05). Conversion to I = 0 with ∆ε(A.28) = (0.09 ± 0.15) kg · mol–1 according to the SIT coefficients of the NEA TDB [95SIL/BID] leads to lo 10 3g οK ((A.28), 298.15 K) = (4.98 ± 0.09), which is somewhat higher than the value of 10log 3
οK ((A.28), 298.15 K) = (4.66 ± 0.13), result-ing from the constants lo (298.15 K) = (16.94 ± 0.12) and 10 2g οb 10 3log οb (298.15 K) = (21.60 ± 0.05) selected in [92GRE/FUG].

Discussion of selected references 424
[91BRU/GLA]
This is a kinetic study of the rate of exchange of carbonate between and free carbonate. The study confirms the stoichiometry of the limiting complex and indi-cates according to the reviewers that the exchange mechanism is dissociative. This con-clusion is drawn from the fact that the entropy of activation has a fairly large positive value.
42 3 3UO (CO ) −
[91CAR/BRU]
Two sets of experiments were performed. The first involved measurements of U(VI) sorption isotherms on calcite suspensions in in a flow reactor in the presence of 0 1 . Initially a relatively high
2 was maintained, fol-
lowed by degassing to 10 to 10
30.005 M NaHCOCOp20 M U(VI)−−
2− 3− bar to encourage co-precipitation of a uranium–calcium carbonate phase. Apparently the equilibrations were done at room temperature.
The second type of experiment involved measurements in a flow reactor of the sorption kinetics of U(VI) onto calcite at
2CO 0.97 atm=p3
as a function of [U(VI)], [Ca] and pH in a solution of . Less than 2% of the uranium in solution was sorbed by the calcite and no co-precipitation was observed. Sorption was rapid and ap-parently reversible.
0.005 M NaHCO
The sorption experiments could be described by either the formation of a solid solution, or by an exchange reaction, which is limited by the surface adsorption sites on the calcite crystals according to the equilibrium:
2 22 3 2 3 (surface)UO CaCO (s) UO CO Ca+ ++ + .
This equilibrium constant is independent of pH (5.4 to 7.7) with a value of: . The kinetic study shows that both Calog (5.12 0.53)= ±K 2+ and approach
steady-state values with time at lower [U(VI)]. Rates of U(VI) adsorption are given at lower [U(VI)] where the percentage adsorption is significant, but no time units are indi-cated.
H+
[91CHO/MAT]
In [92GRE/FUG], this paper was incorrectly listed as belonging to vol. 53/54 of the same Journal. As the paper appeared when [92GRE/FUG] was at the proof stage, the relevant values were inserted as footnotes on pages 111 and 113, with a brief indication of their consistency with those selected.
The first and second hydrolysis constants for the mononuclear hydroxo species were studied at 25°C by solvent extraction techniques from aqueous solutions of 0.1 and 1.0 molar 4NaClO . This method involved the use of diglycolate as a competitive ligand in the aqueous phase and dibenzoylmethane (DBM) as the extractant. The pH ranged from 5.34 to 7.29 at 0.1 M ionic strength and from 6.22 to 7.22 at 1.0 M. Uranium con-
Discussion of selected references 425
centrations were monitored by liquid scintillation counting. The pH was calibrated ver-sus dilute at the appropriate ionic strengths. The extracted species was con-firmed to be , whereas in the aqueous phase, only the 1:1 species was formed as confirmed by variations in the DGA concentration at different pH values. The mean values of
4HClOUO (2 DBM)2 2UO DGA(aq)
10 1log β were given as (5.31 0.02) , 0.1 MI± = and , where the uncertainties represent 1σ. The concentration of
free dioxouranium(VI) was estimated to be on the order of 10 . However, the con-centration of total dioxouranium(VI) in either phase was not given. The resulting hy-drolysis constants for the formation of
(4.94 0.02), 1.0I± M=8 M−
2 (OH)UO + are =10 1*g blo (5.91 0.08) ,− ±
2) (aq) I =
0.1 M and = I = 1.0 M, whereas for the cor-responding values are
10*log b1
10 2*log b (5.75− ± 0.07) ,
(12.432UO (OH
0.09)− ± and (12.29 0.09)− ±
0.38) , from
3 0.09), fr
±
±
.
10 1
10 2
*
*
log
log
b
b
(5.74
(
= −
= −
ο
ο
0.88
12.07 0.1
±
±
), from
0), fro
1.05
m 1.0
=
=
m and (
5 m and
−
−
10 1*g
5.73
12
0.10 m
om 0.10 m
=
=
I I
I I.2οb
2 OH) , Cl 4O )(UO ( + −
10.3≤ −
(200.7ο∆ =
∆ε (5.2 − ±
(1≤ −
sub m (298H
3 11U O
U O
0.3)2.15
.15 K)
36
4UCl (
2.0
4U
cr)
) kJ mol±
4l (g)
13O
10glo
1⋅
( p / bar) 1008
−
14 9.878,T −− +
Based on the SIT model and corresponding parameters for the ion interaction parameters in [92GRE/FUG], the infinite dilution molal hydrolysis constants are:
(
The large uncertainty in lo stems from the uncertainty in . The selected values from Table V.7 of [92GRE/FUG] are
and . Those selected by this current review are − (5.25 ± 0.24) and ±0.07), (see Table 9-6).
[91COR/KON]
This paper, which was included in the references quoted in [92GRE/FUG], reports data on the vapour pressure of by the transpiration technique from 699 to 842 K (18 points). Their fitted vapour pressure equation, = is in good agreement with the many earlier studies. The data were processed to give
. However, this value was based on a dis-torted tetrahedral structure for UC ; since it is now known that the molecule is al-most certainly tetrahedral (see [95HAA/MAR]), this value has changed in the new as-sessment (see section 9.4.3.1.1.2).
[91COR/VLA]
This is a renewed study of Sr3U11O36, a compound previously described by the same group ([67COR/LOO]) as Sr (cr), within a general study of strontium uranates. The present (predominantly structural) study shows the composition of the compound to be Sr (cr).
The compound was prepared by heating a stoichiometric mixture of SrO(s) and (cr) in a gold boat for 20 hours at 1273 K with repeated cycles of heating and 3 8
Discussion of selected references 426
grinding. The authors report that in previous studies [67COR/LOO] with Sr/U close to 0.25, (cr) was always present. 3 8U O
94.9 − ±
SrCl
2.43 ± 0.85)−
3(Sr Uο
The compound was fully analysed and showed no impurities. The structure ob-tained from X–ray, electron and neutron diffraction techniques, is related to that of U3O8, orthorhombic, space group Pmmm, in which U atoms are found with both octahe-dral and pentagonal-bipyramidal coordination. Heated in air above 1400 K, the com-pound decomposes to Sr (cr) and (cr) [67COR/LOO]. 2 3 11U O 3 8U O
The enthalpy of formation of the compound was obtained from its dissolution in 5.0 mol · dm–3 HCl and reported, without any experimental details, as
. Combination of this value with the enthalpy of solution of (cr) in the same medium,
1 (7 1.2) kJ mol−⋅
2SrCl 1(34.19 0.49) kJ mol−− ± , and the enthalpy of forma-tion of (cr) as determined by [90COR/KON2] (see [92GRE/FUG]), leads to a reported
⋅
98 K) (15905.6 22.5)2
f m 3 11 36(Sr U O ,H 1cr, 2 kJ molο −±∆ = − ⋅
⋅
. This calculation must also involve the dissolution of a polymorph of UO3 in the same medium, but no details of which polymorph, nor its enthalpies of formation and dissolution, are given by the authors.
However, the value of used by this group, [90COR/KON2], is slightly different from the value ac-
cepted in [92GRE/FUG],
f m 2(SrCl , cr)ο∆ H
.850 ± 0.70)
1 (83 kJ mol−
(833− 1olkJ m −⋅4.2 kJ mol
; with the latter, would become ca. f m 11 36O , cr, 298 K)∆ H 1−⋅ more negative.
More recently [99COR/BOO], the same group of authors reported, together with results on other strontium uranates, details on the dissolution of Sr3U11O36 in 5.075 mol·dm–3 HCl and on a cycle leading to the enthalpy of formation of this compound. As the sample used was apparently the same (as judged by the analytical results) as that of [91COR/VLA], we will not consider further the thermochemical results reported in this paper.
The results given in [99COR/BOO] lead to a recalculated value of − (15903.81 ± 16.45) kJ · mol–1 for the standard enthalpy of Sr3U11O36(cr), as discussed in this Appendix.
[91FUJ/YAM]
This paper deals with the solubility of Ba in 2UO x+ in the presence of Y and of the oxygen potential of the solid solutions of composition, 0.0.05 0.05 0.9 2Ba Y U O x+ . Solid solu-tions were formed between 1273 and 1673 K if x is smaller than or equal to 0.1. Phase characterisation and the lattice parameter (for the fcc phase) are given. Oxygen non-stoichiometry was determined by redox titration of uranium. Oxygen potentials were determined between 1173 and 1573 K.

Discussion of selected references 427
Extensive comparison with 2UO x+ and lanthanide ternary and quaternary sys-tems is made.
Such interesting studies on non–stoichiometric polynary oxides fall outside the scope of this review.
[91GIR/LAN]
Giridhar and Langmuir [91GIR/LAN] repeated the study [85BRU/GRE] of the reaction: at 25°C (0.3 to 2.6 molal
HClO
2+ + 4+ 2+2UO + Cu(s) + 4 H U + Cu + 2 H O(l)
3+4(UOH , ClO )−ε 3+
4(La , ClO
2
4 − NaClO4). However, they relied on accurate analyses of the molalities of the component ions, rather than measuring the cell potential. They also ran one equilibra-tion from supersaturation and allowed 3 to 17 days to achieve equilibrium. This ap-proach removed the need to estimate liquid junction potentials and ensured complete reaction, which were issues in the previous study [92GRE/FUG]. Activity coefficients were computed using the SIT model with any required data taken from [92GRE/FUG] with set equal to )−ε
3+4(UOH , ClO )
. Their analysis led to a value of −ε
2+ 4+2UO / U
3+4(UOH , ClO )
of 1.42 kg · mol–1 as giving the minimum standard deviation in E° for the couple, , and a related E° value that is independent of the perchlorate molality. The authors claim without giving any details that a non-linearity exists in the [92GRE/FUG] derivation of −ε giving rise to the lower recommended value of (0.76 ± 0.06) kg · mol–1. This latter value is significantly lower than the one proposed by Giridhar and Langmuir. The "non–linearity" is due to a systematic devia-tion of the value at the lowest ionic strengths were the activity factor varia-tions are the largest (cf. the discussion in [92GRE/FUG]). They also chose a value for
of − 0.65 from [76BAE/MES], cf. − (0.54 ± 0.06) [92GRE/FUG]. In keeping with [92GRE/FUG], the authors adopted the [92GRE/FUG] hydrolysis constant value for the formation of the species, as the only other hydrolysis product in this system (actually representing < 0.02% of the total reduced uranium). The final com-puted value of E° derived in an iterative fashion for the couple, , is (0.263 ± 0.004) V, which is within the combined uncertainties of the [92GRE/FUG] recommended value of (0.2673 ± 0.0012) V.
10 1*log οb
10 1*log οb
4U(OH) (aq)
2+ 4+2UO / U
[91HIL/LAU] This paper was included in the references quoted in [92GRE/FUG]. It reports new tor-sion–effusion measurements for the sublimation of (26 points from 588 to 674 K) and (43 points from 579 to 693 K). Data are also given for the subli-mation of . Two orifice sizes were used, and a small correction made for ori-fice size in the data for (cr). Detailed data points as well as fitted equations are given.
4UCl (cr)4UBr (cr)
4ThI (cr)4UCl
Comparison is made with the assessed values given by [83FUG/PAR] and two other studies. The authors' interpretation of the significance of the entropies of sublima-

Discussion of selected references 428
tion has been overtaken by new data on the symmetry of species, but their ba-sic data have been included in the reassessment of the vapour pressures of the tetrahal-ides.
4UX (g)
[91HIL/LAU2] This paper was included in the references (but not the reviews) in [92GRE/FUG]. It reports mass–spectrometric measurements of the stability of UF5(g) via the gaseous reaction: Ag(g) + UF5(g) AgF(g) + UF4(g) (1091 to 1384 K), and of the gaseous reaction: U(g) + UF2(g) 2 UF(g) (2103 to 2405 K). Additional data on the gaseous reaction: AgF(g) + Cu(g) Ag(g) + CuF(g) (1217 to 1336 K) are used to define the stability of AgF(g). Detailed data points as well as fitted equations are given.
All these results are included in the assessment of the gaseous uranium fluo-rides in section 9.4.2.1.
[91MEI] Most of the investigations reported in this Ph.D. thesis are published in a series of pa-pers on the solubility and complexation of Am(III) in carbonate solution [91MEI/KIM], [91MEI/KIM2], [92RUN/MEI]. These papers were already discussed in the previous review [95SIL/BID]. In addition, Meinrath [91MEI] investigated the solubility of NaAm(CO3)2·xH2O(s) at 25°C in 5 M NaCl carbonate solution, under an atmosphere of 1% CO2 in argon (
2= 0.01 bar). The carbonate concentration was varied by pH titra-
tion followed by equilibration with the COCO
p2/Ar mixture. The 231Am solid and an analo-
gous Nd compound were characterised by chemical analysis, thermogravimetry, IR spectroscopy and X–ray powder diffraction. The prepared solids of NaAm(CO3)2·xH2O(s) and NaNd(CO3)2
.xH2O(s) gave comparable X–ray patterns. Meinrath used Ross glass electrodes calibrated against pH buffers containing 5 M NaCl. As the addition of NaCl does not have an equivalent effect on the different pH buffers, the measured pH values are meaningless and cannot be converted into H+ or OH– con-centrations. On the other hand, the relations between the measured pH values and the analytical bicarbonate and carbonate concentrations were determined experimentally by potentiometric titration, so that the determination of lo [10g 2
3CO − ] from measured pH is internally consistent. The present reviewer assumes that the error in [ ] is less than 0.2 log
10log 23CO −
10 units.
In a later study of the same laboratory, Runde and Kim [94RUN/KIM] re-peated the solubility experiment of Meinrath [91MEI] at 22°C with both, NaAm(CO3)2·xH2O(s) and NaEu(CO3)2·xH2O(s). The sodium americium carbonate was characterised by comparing the X–ray powder diffraction pattern with those of the analogous Eu and Nd compounds. In contrast to the procedure applied in [91MEI], Runde and Kim [94RUN/KIM] calibrated the pH electrode against H+ and OH– concen-tration in 5 M NaCl solutions. The carbonic acid dissociation constants determined in

Discussion of selected references 429
[94RUN/KIM] are in reasonable agreement with widely accepted literature data (cf. discussion of [94RUN/KIM]).
The experimental solubility data reported in the two studies [91MEI], [94RUN/KIM] are shown in Figure A-2. At low carbonate concentrations, the authors measured comparable solubilities. At [ CO10log 2
3− ] > − 4, Meinrath [91MEI] measured
an upper curve, when the carbonate concentration was decreased by adding HCl and a lower curve by back titration with NaOH. Particularly in the case of the latter data, the present review doubts whether the equilibrium state was reached by bubbling the CO2/Ar mixture through the solutions titrated with NaOH. Meinrath ascribed the dis-crepant data to the presence of two solids with different crystallinity or the alteration of amorphous components of the initial solid.
Figure A-2. Solubility of 3 2 2NaAm(CO ) xH O(s)⋅ determined in [91MEI], [94RUN/KIM] at 25°C and 22°C, respectively, in 5.6 m NaCl solution under an atmos-phere of
2= 10
COp –2 bar in argon. The solid line is calculated with the thermodynamic
constants selected in the present review, converted to I = 5.6 mol·kg–1 with the SIT coef-ficients in Appendix B. The dotted lines show the associated uncertainty (95 % confi-dence level).
-9
-8
-7
-6
-5
-4
-3
-2
-1
-7 -6 -5 -4 -3 -2 -1 0
[91MEI][94RUN/KIM]
3 2 2NaAm(CO ) xH O(s)⋅
2COp
in 5.6 m NaCl = 10–2 bar
log 1
0[A
m(I
II)]
(mol
·kg–1
)
2 110 3log [CO ] (mol kg )− −⋅
Runde and Kim [94RUN/KIM] calculated a solubility constant of
10 ,0log sK (A.29), 5 M NaCl) = − (16.5 ± 0.3) for the reaction: + 3+ 2
3 2 2 3 2NaAm(CO ) xH O(s) Na Am + 2 CO + xH O(l) −⋅ + (A.29)

Discussion of selected references 430
In order to calculate the solubility constant at I = 0, the present review sets the number of crystal water molecules equal to x = (5 ± 1). (The reported values for
3 2 2NaAm(CO ) xH O(s)⋅ and the analogous Eu and Nd compounds are x = 4 [69KEL/FAN], x = 5 [91MEI], [94RUN/KIM] or x = 6 [91MEI], [74MOC/NAG]). The water activity in 5.6 m NaCl, aw = 0.7786, is calculated with the ion–interaction ap-proach of Pitzer [91PIT]. Applying the SIT, with ∆ε(A.29) = (0.10 ± 0.06) kg · mol–1 according to the selected interaction coefficients in Appendix B, the solubility constant at I = 0 is calculated to be 10 ,0log ο
sK ((A.29), 298.15 K) = − (21.0 ± 0.5).
At [ ] > − 2, the solubility data of both authors, lo [Am]10log 23CO −
10gAm(
tot vs. [ ], increase with a slope of (+1), indicating the formation of as
the limiting carbonate complex: 10log 2
3CO − 33 3CO ) −
2 + 33 2 2 3 3 3 2NaAm(CO ) 5H O(s) + CO Na Am(CO ) + 5 H O(l) − −⋅ + (A.30).
From the solubility data converted to the molal scale, lo 10 ,3g sK ((A.30), 5.6 m NaCl) is calculated to be − (2.75 ± 0.2) and − (3.8 ± 0.2) for the upper and lower curves in [91MEI], respectively, and − (3.55 ± 0.25) [94RUN/KIM]. Combining
10 ,0log sK ο ((A.29), 298.15 K) = − (21.0 ± 0.5) and lo 10 3g οb
,3
(298.15 K) = (15.0 ± 1.0) as selected in the present review with the SIT coefficients in Appendix B and aw = 0.7786, the solubility constant is calculated to be lo 10g sK ((A.30), 5.6 m NaCl, 298.15 K) = − (3.2 ± 1.1) and covers the experimental data of both, Meinrath [91MEI] and Runde and Kim [94RUN/KIM].
[91SHE/MUL]
The authors report a correction to an earlier paper [88MUL/SHE] in which properties, including the ,mpC of U(l), were measured up to ca. 5000 K using rapid heat pulsing. The later paper reports (appreciable) corrections to the temperatures involved due to improved measurements of emissivity used to convert the brightness temperatures to thermodynamic temperatures.
The derived constant, 1(U, l, 1408 to 5000 K) = 50.2 J K molpC 1− −⋅ ⋅
f m (U, g, 298.15 K)H ο
1 1mol
, is to be contrasted with the values given by [82GLU/GUR] used by the CODATA Key Values team [89COX/WAG] to derive ∆ from the vapour pressure. These increase steadily from 47.9 J K− −⋅ ⋅ 1 1J K mol at 1408 K to 58.4 − −⋅ ⋅ at 5000 K.
Moreover, this emissivity correction removes the previous good agreement with the enthalpy data of Stephens [74STE] from levitation calorimetry, and corre-sponds to a higher emissivity at the melting point. However, since Stephens' data at the lower temperatures, of relevance to the vapour pressure measurements, are in good ac-cord with the conventional enthalpy drop measurements by Levinson [64LEV], the cur-rently selected values of the heat capacity of U(l) have been retained until the discrep-ancy in the emissivity is resolved.

Discussion of selected references 431
[92ADN/MAD]
In this conference abstract no experimental details are given. The authors report the fol-lowing apparent formation constants for 1:1 and 2:1 complexes of Am(III), Pu(IV) and U(VI) with in 2 M HNO10
2 17 61P W O −3:
Am(III) lo b = 1.9, lo = 3, 10 1g 10 2g b Pu(IV) lo b = 8, lo = 13, 10 1g 10 2g b U(VI) lo b = 0.99. 10 1g Due to the lack of experimental data, these values are not considered by this review.
[92BLA/WYA]
This is a comprehensive (480 pp.) listing of the known energy levels of all the gaseous actinide elements (Ac to Es) and their gaseous ions. 2252 levels are given for U(g) and 204 for Am(g), substantially more than the number of levels that were available in the calculations on which the values in [92GRE/FUG] and [95SIL/BID] were based (ca. 1596 for U and only 51 for Am). The values of ,mpCο and m
οS at 298.15 K for U(g) and Am(g) calculated by this review from the larger number of levels are essentially un-changed from earlier calculations (although m
οS (Am, g, 298.15 K) is misquoted in [95SIL/BID]) and the values in the temperature range of the measurements of vapour pressures change so little that no changes in and
are required. f m (U, g, 298.15 K)ο∆ H
f m (Am, g, 298.15 K)ο∆ H
[92CHO/DU]
Solvent extraction was used to determine the stability constants for and with and
22UO + 3Eu +
Cl−3NO− at ionic strengths of 3.5, 6.5, 10.0, and 14.1 m at 25°C. 4aClO(N )
152Eu and 233U tracers were used in conjunction with dinonylnaphthalenesulphonic acid (HDNNS) in heptane at concentrations optimised as a function of ionic strength to give distribution ratios (D = total metal in the organic phase/total metal in the aqueous phase) in the range 0.1 to 10. For the first two solutions, [H and 0.5 M for the latter. Equilibration times were four hours with constant shaking. Values of the stability con-stants,
] 0.1 M+ =
1β and 2β , were obtained from the dependence of D on ligand concentration according to the relationship:
21 2ο ο ο
1 1 [L] [L]D D D D
= + × + ×β β
where is the distribution ratio in the absence of ligand, L ( ClοD − or 3NO− ). The ex-perimental results are shown in figure form (1/D versus [Cl ]− ) at 3.5 and 10.0 m chlo-ride, and the resulting lo values are given in tabular form (Table A-6), summa-rised here for the dioxouranium(VI) case only.
10g nb

Discussion of selected references 432
Table A-6: Equilibrium constant lo 10 ng β for 22UO + with Cl− and 3NO− .
I 10 1log b 10 2log b (molal) (molar) (molal) (molar) (molal)
Chloride
3.5 (3.0 M) (0.090 ± 0.032) (0.054 ± 0.049) – (0.36 ± 0.05) – (0.42 ± 0.09)
6.5 (5.0 M) – (0.092 ± 0.050) – (0.152 ± 0.068) – (0.01 ± 0.006) – (0.018 ± 0.073)
10.0 (7.0 M) – (0.707 ± 0.104) (0.570 ± 0.190) – (0.560 ± 0.038) (0.407 ± 0.053)
14.1 (9.0 M) – (0.930 ± 0.190) (0.749 ± 0.140)
Nitrate
3.5 (3.0 M) – (0.180 ± 0.033) – (0.208 ± 0.033)
6.5 (5.0 M) – (0.092 ± 0.050) – (0.152 ± 0.068) – (0.728 ± 0.079) – (0.790 ± 0.054)
10.0 (7.0 M) – (0.01 ± 0.04) – (0.082 ± 0.089)
The authors used the SIT analysis and some (only nine for the chloride com-plex and three for nitrate) values from [92GRE/FUG] that are shown in two plots fol-lowing the OECD guidelines. For the former, the values of above
deviate substantially from linearity based on the recommended slope of kg · mol
10 1log 4 D+b
09
3.5 molal=I 0.25∆ε = − –1. On the other hand, the three values for nitrate are highly scat-
tered around the recommended slope corresponding to 0.∆ε = − kg · mol–1. In view of the deviation and scatter in these new values and the fact that undisclosed values are taken from [92GRE/FUG] in these plots, this study does not appear to warrant addition to the current database. There is an error in the ordinates of Figures 5 and 6, which read
rather than , but this must be a carry-over from the corre-sponding
10 1log 6 D+b3Eu
10 1log 4 D+b+ data in the previous two figures and the correct values are plotted in
these figures.
[92DUC/SAN]
A modified version of the Wilcox's equation [62WIL] is used to estimate the values of f m
ο∆ H (4800 compounds tested) and f mο∆ (2700 compounds tested) of binary inor-
ganic compounds in the solid state. The maximum deviation between the calculated and the experimentally determined values is less than 15.4 kcal · mol
G
–1. The values used to test the equations are those assessed by [82WAG/EVA], and those published later in Journal of Chemical Thermodynamics up to 1988. The method is based on the use of structural increments which are the numbers of anions, na, cations, nb, and the apparent number of bonds, nL. The model depends on these three parameters and three constants, XA, YA and WA, for the anion and three constants, XB, YB and WB, for the cation. The equations are:
1 2f m a b A B a A b B L
BA
WW (kcal mol ) = ( + ) (X X ) + Y + Y + H n n n nο −− ∆ ⋅ ⋅ − n
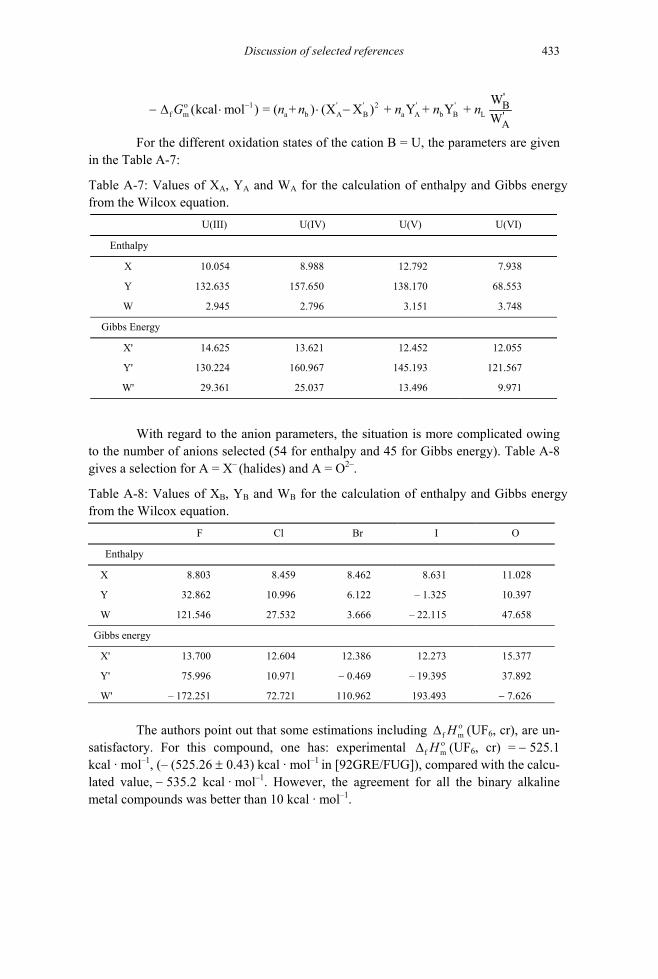
Discussion of selected references 433
1 ' ' 2 ' 'f m a b A B a A b B L
'B'A
WW
(kcal mol ) = ( + ) (X X ) + Y + Y + G n n n nο −− ∆ ⋅ ⋅ − n
For the different oxidation states of the cation B = U, the parameters are given in the Table A-7:
Table A-7: Values of XA, YA and WA for the calculation of enthalpy and Gibbs energy from the Wilcox equation.
U(III) U(IV) U(V) U(VI)
Enthalpy
X 10.054 8.988 12.792 7.938
Y 132.635 157.650 138.170 68.553
W 2.945 2.796 3.151 3.748
Gibbs Energy
X' 14.625 13.621 12.452 12.055
Y' 130.224 160.967 145.193 121.567
W' 29.361 25.037 13.496 9.971
With regard to the anion parameters, the situation is more complicated owing to the number of anions selected (54 for enthalpy and 45 for Gibbs energy). Table A-8 gives a selection for A = X– (halides) and A = O2–.
Table A-8: Values of XB, YB and WB for the calculation of enthalpy and Gibbs energy from the Wilcox equation.
F Cl Br I O
Enthalpy
X 8.803 8.459 8.462 8.631 11.028
Y 32.862 10.996 6.122 – 1.325 10.397
W 121.546 27.532 3.666 – 22.115 47.658
Gibbs energy
X' 13.700 12.604 12.386 12.273 15.377
Y' 75.996 10.971 − 0.469 – 19.395 37.892
W' – 172.251 72.721 110.962 193.493 − 7.626
The authors point out that some estimations including f m
ο∆ H (UF6, cr), are un-satisfactory. For this compound, one has: experimental f m
ο∆ H (UF6, cr) = − 525.1 kcal · mol–1, (– (525.26 ± 0.43) kcal · mol–1
in [92GRE/FUG]), compared with the calcu-lated value, − 535.2 kcal · mol–1. However, the agreement for all the binary alkaline metal compounds was better than 10 kcal · mol–1.

Discussion of selected references 434
Values of the X, Y and W parameters are also given for the anion and many cations.
24UO −
Better estimation methods are available for the compounds of the actinide se-ries, based on trends within the actinide and lanthanide series alone, and no use has been made of the reported correlations.
[92DUE/FLE]
The chemical and electrochemical insertion of Mg into 3 8α U O− to form 3 8Mg U O (0 0.6)x x< <
x
is described. These phases have an orthorhombic structure, with parameters similar to ; the IR absorption spectra are also very similar. Compounds with and were single phase, although the ob-served phase boundaries depend greatly on the method of preparation (chemical or elec-trochemical) and conditions (temperature, applied potential).
3 8α U O−0.27= −0.20 0.40x >
The Gibbs energies of formation of these phases from Mg and were determined at "ambient temperature"
3 8α U O−(294 2 ) K± from an electrochemical cell using
Mg amalgam as a reference electrode, and were described by a linear function of x.
[92FIN/MIL]
Structural and thermodynamic data on synthetic or natural uranium trioxide hydrates are important as products of leaching or weathering of or uraninite ( ). How-ever, the situation is quite complicated as discussed in [92GRE/FUG]; it is generally difficult to identify in a given situation which compound is really present. This paper focuses on polytypes of schoepite studied by X–ray diffraction and scanning electron microscopy, but does not give new thermodynamic data with respect to those [88OHA/LEW], [89BRU/SAN] already reported in [92GRE/FUG].
2UO 2 xUO +
According to the review by the authors to clarify the situation, synthetic ura-nium trioxide dihydrate presents two polytypes, referred to as schoepite and metaschoepite ( ), both orthorhombic, and naturally occurring "uranyl dehydrate" presents three polytypes, also orthorhombic, corresponding to slight losses of water, whose characteristics are established in this paper. Four synthetic polymorphs of uranium trioxide monohydrate,
3 2UO 2H O⋅
3 22H O⋅UO
3 2UO H O⋅ , are well identified, , and . The authors point out that the problem of inter–
relationships between all these phases is not yet clear.
3 2UO 0.8H O⋅α , β− − 2 2OH)γ − UO (
Two of the three natural polytypes of uranium trioxide dihydrate might be identical with schoepite and metaschoepite, the third one being a mixture of schoepite, the monohydrate and fluid inclusions.
3 2UO 2H O⋅ (cr) is stable in water below 40°C. Its structure is not known. The ideal structure of β (cr) is described as coordinated to six equatorial 3 2UO 2H O− ⋅ 2UO

Discussion of selected references 435
hydroxyl groups, forming a layer structure and having the composition . 2 2 2UO (OH) H O⋅
10log
2 2(UO ) OH
10 3log β2 3UO 3CO + −+
log
[92FUG]
This descriptive critical assessment of available experimental results is divided into sec-tions for each valence state and those referring to uranium species are mentioned here.
For the U(IV) species, values of the hydrolysis constants are presented from [92GRE/FUG] and Fuger et al. [92FUG/KHO], both in press at the time of [92FUG], whereby the latter give, for the reaction,
4+ 4 +2U + H O U(OH) H− +n
nn n ,
at 25°C, – (0.34 ± 0.02), – (1.1 ± 0.3), and − (5.4 ± 0.2). Corresponding values cited from [92GRE/FUG] were − (0.54 ± 0.06) and lo – 4.7. All these results are based on data prior to those of [90RAI/FEL]. The author concurred with the opinion of [92GRE/FUG] that the re-sults of [90RAI/FEL] would lead to a much lower value for
1* ο =b
10g
10 3*log =οb 10 4
*log =οb10 1,1
*log ο =b4
* =οb
10 4*log οb and that further
experimental work was needed to resolve such a discrepancy. The author also con-cluded that "the existence of 3H)U(O + was not fully demonstrated".
For the hexavalent state, the author states that this system was analysed in greater depth in [92GRE/FUG] compared to the [92FUG/KHO] study. The only conten-tious issues appear to be the formation constants of two mononuclear species and the dimer, . The IAEA compilation [92FUG/KHO] prefers values: 3+
10 1,1*log (5.76 0.10)ο = − ±b*log (13.0 0.25)ο = − ±b
10 2,1*log (4.06 0.15)ο = − ±b
10 1,2
2+
for the reaction, , while [92GRE/FUG] selected the values:
2 +2 2 2UO + H O(l) (UO ) (OH) Hm n
m nm n n− +
10 1,1*log (5.2 0.3)ο = − ±b*log 10.3ο ≤ −b
,
10 2,1*log (2.7ο ≤ −b
(estimated),
10 1,2 1.0)± (estimated). The author also notes, without discussion, that the results on the temperature
dependence of the hydrolysis reactions of are rather controversial. 2+2UO
For the quadrivalent uranium carbonate complexes there is unanimity for the formation constants of 4
2 3 3UO (CO ) − and 63 5U(CO ) − between the author and the rec-
ommended values in [92GRE/FUG]. For the pentavalent complex, , the 52 3 3UO (CO ) −
value selected by [92FUG/KHO] was (13.3 1.0)± for the reaction, , at an ionic strength of 3.0 while [92GRE/FUG]
recommended . For the hexavalent species (1:1, 2:1, 3:1 and
2 UOοb
2 3 3(CO ) −
(7.41 0.27= ±
5
10 3 )

Discussion of selected references 436
ommended . For the hexavalent species (1:1, 2:1, 3:1 and 6:3), the [92GRE/FUG] and [92FUG/KHO] reviews recommended formation constants and enthalpies of reaction at zero ionic strength that are in agreement within the assigned uncertainties.
10 3log (7.41 0.27)ο = ±b
f m, cr, 298.15 K) (XnH ο∆ −
1kJ mol−⋅
2CaX 3X
15 cr) = 523 kJ molο −− ⋅
252−
N
[92HAS2]
The paper deals with the mechanism of oxidation of tetravalent aqueous uranium ion by oxidizing species of Pt(IV), Ir(IV), Np(IV, V, VI), Fe(III), Pu(IV,VI), Cr(VII), Ce(IV) and V(V). Through a compilation of literature data it is shown that there is a linear cor-relation between the activation Gibbs energy and values of the standard redox potential for the oxidation reactions.
[92HIS/BEN]
This paper deals with correlations in . The function f m (MX )ο∆ nH (MX )n∆ is defined as . For two different metals M and
, and given n, and any halogen X, the correlation is found to hold within about 10
f m (MX K)−
'M ∆, g, 298.15H ο∆
'∆(M X )n(MX ) = a + bn
, but with some more substantial deviations.
NaX(cr), (cr), Al (cr), (cr), and 4UX 5NbX (cr) were used for the cor-relations according to the valency.
Values for 28 unknown enthalpies of formation are predicted, including and f m (UI ,H∆ 1
f m 2 2(UO I , cr) = 992 kJ molH ο −−1mol
∆ , compared with values of − 112 and kJ −⋅ estimated from a different correlation [89LIE/GRE].
⋅
However, neither of these phases is likely to be stable under normal conditions, so these enthalpy values have not been considered in the current review.
[92KIM/SER]
This paper discusses the application of three different Photoacoustic Spectroscopy (PAS) methods (FT–LIPAS for solution, and UV–Vis–NIR PAS, FT–IR PAS for solid phase) for speciation of U(VI) in 4aClO / NaHCO solutions (I = 0.1 M) and for char-acterisation of U(VI) precipitates obtained from these solutions. Additional UV–Vis absorption spectroscopic measurements are made to identify some species using their known spectra and the composition of the solutions and solid phases according to the thermodynamic data selected by [92GRE/FUG] using the MINTEQ geochemical code.
3

Discussion of selected references 437
Five solutions, all 10–2 M in U, are studied by classical spectroscopy:
31. 0.1 M NaHCO , pH = 6.8 to 9.1,
3 42. 0.05 M NaHCO /NaClO , pH = 5.9 to 8.2,
3 43. 0.02 M NaHCO /NaClO , pH = 4.4 held constant,
3 44. 0.01 M NaHCO /NaClO , pH = 4.1 held constant,
45. 0.1 M NaClO , pH = 3.0 held constant.
Species identified in the above test solutions are:
1. , 42 3 3UO (CO ) −
2. , which transforms with time to and then a precipitation occurs at pH 8.2 (solid 1, see discussion below),
22 3 2UO (CO ) − 4
2 3 3UO (CO ) −
3. , which transforms with time to and then a precipitation occurs at pH 4.4 (solid 2, see discussion below),
+2 3 5(UO ) (OH) 2+
2 2 2(UO ) (OH)
4. , 2+2 2 2(UO ) (OH)
5. 2+2UO
Two solutions both 10–4 M in U were studied by PAS:
3 4
4
6. 0.01 M NaHCO /NaClO , pH = 9.1,7. 0.1 M NaClO , pH = 4.8.
For the lowest U concentration the species identified are: 4
2 3 36. UO (CO ) ,− 227. UO .+
The speciation calculation agrees with these experimental observations except for solutions 2 and 3. For solution 2, precipitation is not predicted at pH = 8.2 and for solution 3, the species (U 2 3 5O ) (OH)+ is not predicted. A possible reason for these dis-crepancies might be ionic strength effects, as it is not indicated if the thermodynamic data used have been corrected for ionic strength.
UV-Vis-NIR PAS spectrum of solid 1 is the same as observed for the precipi-tate produced from 1 M 3NaHCO (probably amorphous ) and the spectrum of solid 2 is the same as that obtained from the precipitate produced from 1 M
2 3UO CO (s)4NaClO
(poorly crystalline identified by X–ray diffraction). According to the thermo-dynamic data, precipitation of solid 1 is expected at pH less than 6.6, while solid 2 is predicted to appear at a pH more than 7. At pH = 4.4, rutherfordine is expected to be the stable phase. These discrepancies are probably due to lack of information on the compo-sition of the solids and may indicate that the phases are not pure.
3UO (s)

Discussion of selected references 438
This paper gives only some confirmation on the values of selected formation constants in [92GRE/FUG].
[92KRA/BIS]
The solubility of UO2(OH)2·H2O(cr) and rutherfordine UO2CO3(ruth.) were studied [92KRA/BIS] at 25°C in 0.1M NaClO4 in the absence and presence of carbonate (equilibration times 3 –14 days). The relevant molar concentrations are provided. The pH range was generally 4.5 − 5.5 for the study with no added carbonate and of all com-binations of species considered in fitting the data, only those which represented more than 5% of the total uranium in solution were considered. Using additional information from a spectrophotometric characterisation of the solutions, which showed peaks at 420 and 428 nm, it was concluded that the 2:2 and 5:3 species dominated with values of (22.16 ± 0.03) and (53.05 ± 0.04), respectively, for the reaction:
10 ,log m nb
2+ (2 )2 2UO OH (UO ) (OH) n m
n mn m − −+ .
These stability constants are given in Table 3 of [92KRA/BIS] and refer to 0.1 M ionic strength. Using pKw = − (13.78 ± 0.01) in 0.1 M NaClO4 and application of the SIT to make the conversion to infinite dilution in the hydrogen ion form gives val-ues of = − (5.40 ± 0.04) and lo − (15.85 ± 0.06) in 0.1 M NaClO10 2,2
*log b10 2,2
* οb10 5,3
*g b5,3
*4
and = –(5.19 ± 0.04) and log 10log οb − (15.21 ± 0.06).
The authors also reported for crystalline schoepite, lo 10 ,0g sK = − (22.21 ± 0.01) at I = 0 M which gives, using the SIT, 10 ,0log ο
sK = − (22.81 ± 0.01).
[92LIE/HIL]
In this paper, there are considerations of the variation of the ratios R: 2 4
2 3 2 2 3 3
+ +2 2
UO (CO ) UO (CO )
UO OH UO OHR = and R =
− −
3
for U(VI) aqueous solutions, at different pH (pH = 6, 7, 8) as a function of the total car-bonate concentration, [ 2
2 3(aq)C] = [CO ] + [HCO ] + [CO ]− − . The thermodynamic con-stants are those selected in [71SIL/MAR]. All log10R vs. log10C plots are straight lines which intersect at significant R values, at Ci. It is concluded that:
• above pH = 6 and above C = 10–2 M the carbonato complexes prevail over the monohydroxocomplexes;
• at pH = 8, this holds for C < 10–4 M (sea water);
• at a given pH the tricarbonato complex prevails for C > Ci.
None of these observations provides new data. Other observations developed in this paper concern thorium species.

Discussion of selected references 439
[92MOR/WIL]
This paper contains an estimation of thermochemical properties for Am(III) and Cm(III) hydroxides. The authors applied an empirical acid–base correlation to r m
ο∆ H for the reaction:
2 3 2 31 23 3M O (s) + H O(l) M(OH) (s).
The required empirical acidity parameter was calculated from known thermo-chemical data for Pu(III) and the solubility constant for Pu(III) hydroxide and adopted for Am(III) and Cm(III). For Am(OH)3(s) the following estimates are given without uncertainties:
mοS (Am(OH)3, s, 298.15 K) = 129 J · K–1 · mol–1,
f mο∆ H (Am(OH)3, s, 298.15 K) = − 1346 kJ · mol–1,
f mο∆ G (Am(OH)3, s, 298.15 K) = − 1218 kJ · mol–1,
10 ,0log οsK (Am(OH)3, s, 298.15 K) = − 25.7,
(i.e., lo 10 ,0*g ο
sK (Am(OH)3, s, 298.15 K) = 16.3).
These estimates agree well with the data obtained later by Merli et al. [97MER/LAM] from their calorimetric measurements with Am(OH)3(cr).
[92NGU/BEG]
Raman spectroscopy records the symmetric stretching vibration of the linear group. The corresponding wave number has been shown to decrease with a
change in the inner coordination sphere of complexes of U. For instance, with increas-ing value of n, the number of OH groups per U, it decreases according to ν
O=U=O
1(cm–1) = − A·n + 870, with A = (21.5 ± 1.0) and n up to 4. This is due to the weaken-ing of the O=U=O bonds. This paper represents an extension of such a linear relation-ship for the following ligands of interest in the context of the present review: fluoro, chloro, bromo, sulphato, hydrogenosulphato, carbonato, nitrato and perchlorato.
Solutions of different ionic strengths, pH and compositions, depending on the ligand, are examined, 5 1 to 0.5 m in U. pH is adjusted with trifluoromethanesulfo-nic acid, HC , and tetramethyl-ammonium hydroxide. (CH
30−⋅
Cl
3F SO
2 4UO ClO+
3 3)4NOH is used to avoid the precipitation of ternary U(VI) oxides. This allows investigations at higher U(VI) concentrations in alkaline solutions. The calculated speciation is based on data selected by [92GRE/FUG]. ν1 frequencies are related to the nature of the species, in-cluding which appears as an exception because ν1 increases with respect to
(A = − 15). That probably means a decrease of the hydration shell of the core and a coordination of
22UO + 2+
2UO4O− with an energy similar to that of water.

Discussion of selected references 440
4Br , HSO and NO− −
F (4 )n− ≥ (4 1)±3− ligands give outer–sphere complexes. The A values are
for , for , (12 1)± Cl (5 )n− ≥ (9 1)± for SO and for .
24 (3 )n− ≥ (19 1)±
23CO (4 )n− ≥
Furthermore, the following general relationships are established for mononu-clear complexes on the basis of data including OH 2 2
4 3, F , Cl , SO and CO :− − − − −
10 2 1log (UO L) 0.52( ) 1.61,= − ∆ν −b
10 2 2 1
10 2 3 1
log (UO L ) 0.50( ) 4.10,log (UO L ) 0.46( ) 5.86.
= − ∆ν −= − ∆ν −
bb
These data do not bring new thermodynamic information on U(VI) complexa-tion.
[92NGU/SIL]
Soddyite, , and uranophane, , are natural uranyl silicate minerals whose structures are known. Pure natural sodium uranyl boltwoodite,
2 2 4 2(UO ) SiO 2H O⋅
3 2
3 2 2 2 4 2 2Ca(H O) (UO ) (SiO ) 3H O⋅
4 2Na(H O)UO SiO H O⋅ , is often mixed with the potassium form, but a synthetic mineral, as well as a synthetic sodium weeksite mineral,
2 2 2 2 5 3 2Na (UO2UO
) (Si O ) 4H O⋅ , are known. All have been identified as secondary products of spent fuel or the leaching of nuclear glasses. Procedures for the synthesis of these compounds and XRD data for checking their structure are available. Some differ-ent formula of these minerals are reported in the literature as pointed out by [99CHE/EWI], which differ by the number of H2O or the inclusion of a "H3O versus SiO3OH" unit. This can influence the Gibbs energy of formation, but has probably little influence on the solubility product.
The authors have prepared synthetic well-crystallised minerals and checked their composition by X–ray diffraction, FTIR (comparison with natural minerals except for weeksite) and chemical analysis. There are some discrepancies regarding the theo-retical and experimental mass fractions of U (6% for uranophane and 1% for the other), Si (up to 10%), Ca (20%) and Na (up to 10%), depending on the mineral, but X–ray and IR data fit very well with reference compounds and give confidence that the minerals are the ones expected with slightly distorted stoichiometry. Nevertheless, these devia-tions could be a sign of a perturbation in the system caused by silica precipitation (see below). Chemical analyses are made after dissolution in acidic media (0.1 M + traces of HF).
4HClO
Solubility measurements from under-saturation of several washed samples un-der Ar (mass fraction less than 55 10−⋅ in and 10 ) at a temperature of
in a pH controlled device are carried out over a period of 150 days. Ionic strength is not kept constant to avoid uncontrolled precipitation. pH is continuously checked (calibrated at pH = 7 and 4) and adjusted. The chosen values for solubility
2O 72CO−
(30 0.5) Cο±

Discussion of selected references 441
measurements are pH (3.00 0.05)= ± for soddyite, pH (3.50 0.05)= ± for uranophane and pH (4.50= ±
(1.64
0.05)
4(3.61 0.09) 10 M−± ⋅20.03) 10 M−± ⋅
for the other salts. Solutions are filtered down to a 4.1 nm cut off and analysed for U, Si, Na and Ca. The U concentration is determined by atomic absorption spectrometry, absorption spectroscopy for the uranyl cation and alpha liquid scintillation counting. Other elements are measured by atomic absorption spectrometry. After 100 days the increase in U concentration stops , after which the systems are con-sidered to be in equilibrium. The increase in steady-state U concentration is as follows, for Na–weeksite: , for Na–boltwoodite: , for uranophane: and for soddyite: ( . Other total concentrations of Si, Ca and Na are also given which sometimes do not match exactly the expected values for congruent dissolution. This could be a result of the composition of the compounds (see above).
4.12) 10 M−± ⋅M
(4.64 021.93 0.03) 10−± ⋅
22UO +
2SiO
2 22 2
2
22 2
(aq) 4H O(l)
a 2UO 2SiO
SiO (aq) 4H O
+ + +
+
+ +
+ +
+ + +22 22UO 6SiO (aq++ +
(aq) H+
2 2
2
(aq) 9H O
(l)
+
2) 7H O(l)+
2Ca :+
2 2 4
3 2 2
3 2
2 2 2 2
O ) SiO 2H
(H O) (UO )
(H O)UO SiO
(UO ) (Si O
22(U O SiO+ +
2
2 4 2 2
4 2
5 3 2
O(sodd) 4H
(SiO ) 3H O(uran
H O(bolt) 3H
) 4H O(week)
⋅ +
⋅ +
⋅ +
2 (aq) O
2U
)
6H
22
10g b
10*log
1mol kg−⋅22O ]+
0 C)ο10
* ( ) ( 3sK I t = sK ο
2* *ο
X–ray diffraction data recorded on the solid phases in equilibrium with the so-lutions show that no phase change and no secondary phases occur with soddyite, urano-phane and Na–weeskite, but that secondary phase(s) occur with Na–boltwoodite (probably soddyite).
All experimental solubility data seem correct to the reviewer.
Calculations of the solubility products are made according to equilibria involv-ing solid compounds and, in aqueous solution, the species, , , , and
Na+
Ca 6H C (l)
Na Na UO
Na
+ +
⋅ +
2Na+ +
Free concentrations of these species are calculated using a code (HALTAFALL) and thermodynamic data on U(VI) hydrolysis, silicate anions and other cationic species taken from a draft version of [92GRE/FUG]. This review has verified that the hydrolysis constants used are those finally selected in [92GRE/FUG] (all the m and n values are taken into account) and that the other constants are those selected as auxiliary data in [92GRE/FUG] for I = 0. No more details are given by the authors of the calculations. They accepted (or the code shows) that, in the pH range 3 to 4.5, Si is only present as SiO . So the [U ]+ seems to be the only calculated free concen-tration in each case, but it is not clear how the values of lo and I ( ) are obtained. From the [U values and the other experimental concentration values,
are derived and then the log values, according to [2000GRE/WAN]:
10 10log log ( )s sK K I D Z= − ∆

Discussion of selected references 442
The values r m* R ln sG Tο∆ = − K ο
12
1 2+
(237.53 0.04) kJ mol for H O(l)
(552.5 1.05) kJ mol for Ca
−
−
− ± ⋅
− ± ⋅
are further used to calculate for the compounds with auxiliary data for the following standard molar Gibbs energies:
f mGο∆
1
12
1 2+2
(262.17 0.08) kJ mol for Na (833.79 3.01) kJ mol for SiO (aq)
(953.70 1.76) kJ mol for UO
− +
−
−
− ± ⋅
− ± ⋅
− ± ⋅
which are slightly different from the values selected in [92GRE/FUG]. The reported equilibrium constants are listed in Table A-9.
Table A-9: Solubility product and Gibbs energy of formation of soddyite, uranophane, Na–boltwoodite and Na–weeksite.
10
*log sK ο 1
f m (kJ mol )G ο −∆ ⋅
Soddyite (5.74 0.21)± (3658.0 4.8)− ±
Uranophane (9.42 0.48)± (6210.6 7.6)− ±
Na–boltwoodite (5.82 0.16)≥ ± (2966.0 3.6)≥ − ±
Na–weeksite (1.50 0.08)± (9088.5 18.4)− ±
Uncertainties are propagated standard deviations of the analytical results. For Na–boltwoodite the equilibrium phase is assumed to be pure.
The authors have not considered complex formation between silicate and , but this has only a minor influence on speciation at pH = 3 and 3.5. A problem-
atic point in the experiment and the analysis is the possible formation of a precipitate of SiO
2+2UO
2(am), which would be difficult to detect by X–ray diffraction. The mole ratio U/Si in solutions of soddyite, uranophane and weeksite are 3.26, 2.30 and 0.04, respectively. These values differ considerably from the theoretical values for congruent dissolution of the solids used, which are 2, 1 and 0.33, respectively. This may be indicative of precipi-tation of amorphous silica in the test solutions. Precipitation will not influence the de-termination of the solubility product, unless there is sorption of dissolved uranium on the silica. According to the data in [92GRE/FUG], the solubility of fine–grained crystal-line quartz is 1.8·10–4 M. The solubility of amorphous silica is expected to be higher and the analytical value of the total concentrations of silica reported in [92NGU/SIL] seems reasonable. The low uranium concentration in the weeksite sample may be due to strong sorption of uranium(VI) at the higher pH used in this experiment. To conclude, this re-view considers the reported values of the Gibbs energy of formation of soddyite and uranophane as the best available estimates, but in the opinion of the reviewer the ther-modynamic data must be re-evaluated. This has tentatively been done by [99CHE/EWI]
Discussion of selected references 443
taking into account the data of [96MOL/GEI] and [97PER/CAS], and selecting 10
*log sK ο = (5.96 ± 0.5) for soddyite, 10*log sK ο = (11.7 ± 0.6) for uranophane and giv-
ing, finally:
2.9) kJ molο −± ⋅
94) kJ mol± ⋅
3.9) kJ molο −± ⋅
9.8) kJ molο −± ⋅
4 (aq)UO
UO
2+UO + + 3 H−
1f m = (3653.0 G∆ − for soddyite,
1f m = (6192.3 3.Gο −∆ − for uranophane,
1f m = (2844.8 G∆ − for sodium boltwoodite,
1f m = (7993.9 ∆ −G for sodium weeksite.
[92SAN/BRU]
This is a publication based on Sandino´s thesis [91SAN] that was reviewed in [92GRE/FUG]. The experimental data are the same, but the publication contains a more extensive literature review of solid phosphate phases. The title of the paper is somewhat misleading because the paper also contains a solubility study of schoepite (in fact me-taschoepite) that is used to deduce information on hydroxide complexes of U(VI). The authors report data on the solubility of (UO2)3(PO4)2· 4H2O(cr) as a function of − log10[H+] in 0.5 M NaClO4 under a N2(g) atmosphere at 25°C. The concentration of phosphate was maintained at 10–2 M and − log10[H+] varied from 2.5 to 9.5. From these data, the following equilibrium constants were determined at I = 0.5 M and I = 0 using the SIT:
= (6.03 ± 0.09) 2+ 22 4 2 + HPO UO HPO−
10log blog οb10 = (7.28 ± 0.10)
= (11.29 ± 0.08) 2+ 32 4 2 + PO UO PO− −
10log blog οb
4
10 = (13.25 ± 0.09)
= − (19.67 ± 0.17) 2 2 2 3 + 3 H O(l) UO (OH) 10 3,1*log b*log οb10 3,1 = − (19.74 ± 0.18)
2+ 32 3 4 2 2 2 4 2(UO ) (PO ) 4H O(cr) 3UO + 2 PO + 4H O(l)−⋅ 10 ,0log sK = − (48.48 ± 0.16)
ο 10 ,0log sK = − (53.32 ± 0.17).
The uncertainties are at the 2σ level. The equilibrium constants for the forma-tion of UO2HPO4 and , and the solubility product of the phosphates have been considered in [92GRE/FUG] under the reference [91SAN]. The values reported by [92GRE/FUG] differ very slightly from those quoted here.
2UO PO−4
In order to model the solubility of (UO the authors had to use equilibrium constants for the formation of the hydrolysed U(VI) species. They re-analysed the data of [89BRU/SAN] using the value selected by [92GRE/FUG], except for and * . The data of [89BRU/SAN] concern the solubility of crystalline and amorphous schoepite in neutral and alkaline media ( − log
2 3 4 2 2) (PO ) 4H O(cr),⋅
7,3* οb 3,1
οb10[H+] = 6.9 to 8.2) obtained

Discussion of selected references 444
by potentiometric titration at 25°C in 0.5 M NaClO4. The best fit gives the following values, respectively, for amorphous and crystalline schoepite as the solubility limiting phase:
10 7,3*log b*
= − (32.00 ± 0.17) and = − (33.32 ± 0.22), 10 7,3*log b
*10 3,1log b
*
= − (19.83 ± 0.34) and = − (20.18 ± 0.19), 10 3,1log b*
10 ,0log sK = (6.59 ± 0.14) and lo 10 ,0g sK = (6.23 ± 0.14),
where the uncertainties are at the 2σ level. The table below summarises all the data of the authors at I =0.
Table A-10: Equilibrium constants at zero ionic strength for the U(VI) hydroxide system [92SAN/BRU].
2 3 4 2 2(UO ) (PO ) 4 H O⋅ 3 2UO 2 H O(am)⋅ 3 2UO 2 H O(cr)⋅
10 7 ,3
*log οb – (31.55 ± 0.17) – (32.87 ± 0.22)
10 3,1log b
*
* ο – (19.74 ± 0.18) – (19.90 ± 0.34) – (20.25 ± 0.19)
10 , 0log
sK – (53.32 ± 0.17) (6.33 ± 0.14) (5.97 ± 0.14)
The weighed average of the values of 10 3,1*log οb
10log (three values) and lo
(two values) calculated by this review are 10 7,3
*g οb3,1
* οb = − (20.14 ± 0.16) and = − (32.04 ± 0.13). 10 7,3
*log οb
Sandino and Bruno gave unweighted average values of lo 10 3,1*g οb
3,1
correspond-ing to amorphous and crystalline schoepite as 10
*log οb = − (20.1 ± 0.5) and = − (32.2 ± 0.8) taking uncertainties to cover the whole range of individual
uncertainties. These average values are in good agreement. So, this review keeps the values from Sandino and Bruno to select equilibrium values of lo and
.
10 7,3*log οb
10 7,3*log οb
10 3,1* οb
*
g
The previous values given by [89BRU/SAN] were lo = − (19.69 ± 0.01) and lo
10 3,1g οb10 7,3
*g οbg= − (31.9 ± 0.1), whereas [92GRE/FUG] selected
= − (19.2 ± 0.4) and lo10 3,1*log οb 10 7,3
* οb = − (31 ± 2).
[92SAT/CHO]
This paper is discussed together with [98JEN/CHO].
[92VEN/IYE]
The paper reports measurements of the oxygen activity (emf with CaO–ZrO2 electro-lyte) in the mixtures, A2U4O12(cr) + A2U4O13(cr) (A = Cs or Rb), and complementary data on the enthalpy increments of the four uranates.

Discussion of selected references 445
The U(VI) compounds were prepared by heating appropriate amounts of U3O8 with the alkali metal carbonates in air at 1173 K for 20 hours in gold boats; the lower uranates were prepared by decomposing the U(VI) compounds in purified Ar at 1273 K for 200 hours. The products were characterised by X–ray diffraction. The uranium con-tent in Rb2U4O12(cr) was determined potentiometrically to be (72.69 ± 0.31) mass %, in good agreement with the theoretical value of 72.40 %.
The oxygen potentials were studied using a CaO–ZrO2 electrolyte tube in flow-ing argon, from ca. 1020 to 1283 K with air ( = 0.
2Op 2121 bar) as the reference elec-trode.
Correction of their emf values to the standard pressure gives, after recalcula-tion:
r mG∆ (A.31) 1 = 174638 + 136.100 J mol (1019 to 1283 K) T −− ⋅
r mG∆ (A.32) = 1 102082 + 54.378 J mol (1075 to 1203 K) T −− ⋅
for the reactions:
2 4 12 2 2 4 13Cs U O (cr) + 0.5 O (g) Cs U O (cr) (A.31)
2 4 12 2 2 4 13Rb U O (cr) + 0.5 O (g) Rb U O (cr) (A.32)
The data below 1075 K for reaction (A.32) were not used, because a non-equilibrium state exists. The considerable differences in the entropies of these reactions and in the calculated decomposition temperatures of the U(VI) compounds in air (1225 K for Cs2U4O13(cr) and 1680 K for Rb2U4O13(cr)) are somewhat surprising.
Drop calorimetric measurements are reported for the four compounds, using a Calvet high temperature calorimeter. The data were fitted by a simple polynomial, but the authors' expressions for are not equal to zero at T = 298.15 K, so the enthalpy data have been refitted with this constraint. The derived heat capacity expressions are given in Table A-11.
m m( ) (298.15K)ο−H T H
Table A-11: Heat capacity coefficients and standard heat capacity for Rb2U4O12(cr) Rb2U4O13(cr), Cs2U4O12(cr) and Cs2U4O13(cr).
Heat capacity coefficients 2 1
,ma + b + e J K mol 1− − −= ⋅ ⋅ ⋅ ⋅
pC T T Phase T range (K)
a b e
,m(298.15 K)
pC ο
1 1J K mol− −⋅ ⋅
Rb2U4O12(cr) 375 − 755 1.897590·102 1.5487·10–1 1.9903·107 –
Rb2U4O13(cr) 325 − 805 4.125600·102 2.5000·10–2 0.0000 (420 ± 50)
Cs2U4O12(cr) 361 − 719 3.926650·102 1.0180·10–1 0.0000 (423 ± 40)
Cs2U4O13(cr) 347 − 753 7.128220·102 – 4.2745·10–1 – 6.8805·105 –

Discussion of selected references 446
However, as shown in the plot of heat capacities in section 9.10.1, the expres-sions for Rb2U4O12(cr) and Cs2U4O13(cr) are not consistent with the general behaviour of the heat capacities of the alkali–metal uranates, and these data have not been selected in this review.
The authors have used these Gibbs energies of reaction to derive data at 298.15 K for Cs2U4O12(cr) and Rb2U4O12(cr), using their heat capacity data (extrapo-lated up from ca. 750 K) and literature data at 298.15 K for the hexavalent compounds. However, we have not pursued this approach since:
• there are two transformations in Cs2U4O13(cr) at 898 and 968 K [92GRE/FUG], which the authors have neglected;
• all of the data for Rb2U4O13(cr) at 298.15 K are estimated;
• there are unexpected differences in the Gibbs energies of the similar reac-tions (A.31), for Cs and (A.32), for Rb.
Thus any derived data would have quite large uncertainties.
[92VEN/KUL]
The authors investigated the vaporisation of UN(cr) from 1757 to 2400 K by Knudsen effusion mass spectrometry. The principal reaction is the loss of N2(g) to form a nitro-gen-saturated U(l), but U(g) and UN(g) are also present in the vapour. The pressures of U(g) were measured from 1757 to 2396 K and the lower pressures of UN(g) from 2190 to 2400 K.
The UN(cr) was in the form of sintered microspheres prepared by heating mi-crospheres of UO2 + C in flowing nitrogen in unspecified conditions. The uranium con-tent was (94.42 ± 0.40) mass %, in good agreement with the theoretical value of 94.44%; the residual oxygen level was (0.08 ± 0.01) mass %.
The mass–spectrometric measurements were carried out in a tantalum effusion cell inside a tantalum cell; silver was added to the sample as a calibrant. N2, U, UN and UO were detected in the vapour. The pressure of UO(g) was larger than for either U(g) or UN(g) in fresh samples, but decreased as oxygen was lost from the sample. The background nitrogen pressure was too large for reliable nitrogen pressures to be deter-mined. The ion currents due to U(g) and UN(g) were converted to pressures by calibra-tion with Ag and atomic cross–sections given by Mann [70MAN]; that for UN was as-sumed to be a factor of 0.75 smaller than the sum of the cross–sections of U and N.
The uranium ion currents were steady after an initial period (perhaps due to the time needed to establish the UN(cr) + U(l) phase field and loss of the initial oxygen impurity), and corresponded to the equation:
110log ( (U)/bar) = 5.59 26857p T −− ⋅ (1757 to 2396 K)

Discussion of selected references 447
with very good consistency between six different runs. The reported pressure at 2000 K is at the lower end of the range of pressures given by five previous studies.
The authors used the thermal functions from Hultgren et al. [73HUL/DES] to calculate the third–law enthalpy of sublimation of uranium at 298.15 K,
sub mH ο∆ (U, 298.15 K) = (564.4 ± 7.4) kJ · mol–1. The second–law value is somewhat smaller, sub mH ο∆ (U, 298.15 K) = (554.6 ± 10.3) kJ · mol–1. These values relate to va-porisation from a uranium liquid saturated with nitrogen; it will also contain some tanta-lum, since this metal is appreciably soluble in U(l) [81CHI/AKH]. It is therefore not surprising that the authors' values are appreciably more positive than the CODATA value of (533 ± 8) kJ · mol–1 for pure uranium adopted by [92GRE/FUG].
The pressures for UN(g), corresponding to the sublimation of UN,
UN(cr) UN(g) (A.33)
(although the solid will in fact be slightly hypostoichiometric) were fitted to the equa-tion:
110log ( (UN)/bar) = 7.19 37347p T −− ⋅ (2190 to 2400 K)
The experimental pressures were rather more scattered than the (appreciably larger) pressures of U(g). Thus (A.33) . r mG∆ 1= 715003 137.65 J molT −− ⋅ ⋅
The authors combine this equation with values of ∆ (UN, cr) derived from the assessment by Matsui and Ohse [87MAT/OHS], ∆ (UN, cr, T) = − to define (UN, g, T) (but seem to have made a numerical error in their first term). We have changed the equation for (UN, cr, T) to that which is consistent with the value selected in [92GRE/FUG] for
f mGf mG
∆
1 304890 + 88.2 J molT −⋅ ⋅ f mG∆
f mGf mH∆ (UN, cr,
298.15 K) and to relate to the mid-temperature of the measurements involving UN(g), 2300 K. The NEA-TDB–compatible equation from 2200 to 2400 K is then (UN, cr, T) =
f∆ mG1mol297596 + 87.53 JT −− ⋅ ⋅ , from which we derive
f mG∆ (UN, g, T) = 417 (2200 − 2400 K). 1407 50.12 (J mol )T −− ⋅ ⋅
This is the first significant experimental determination of the stability of UN(g). However, since no thermal functions are available for UN(g), these Gibbs en-ergy values cannot be reliably converted to provide standard data at 298.15 K.
[92WIM/KLE]
The equilibrium constants for the formation of CmOH2+ and 2Cm(OH)+ have been de-termined by TRLFS at 25°C in 0.1 M NaClO4. The method allows a direct determina-tion of the concentrations of Cm3+ and the two complexes. The accuracy of the equilib-rium constant thus depends mainly on the experimental determination of the free hydro-gen ion concentration. There are few details on the electrode calibration and the review-ers have therefore discussed the procedures used with the authors. The electrode was

Discussion of selected references 448
calibrated against commercial standard buffers at pH = 4, 5, 6, 7, 8, 9 and 10 and the measured potentials were fitted by linear regression. The concentration of OH– was cal-culated from the measured pH by using the relation: − log10[OH–] = − 13.78 + pH + log10γ±, where − 13.78 is the ionic product of water in 0.1 M NaClO4, and γ± is the mean activity coefficient of NaClO4. This means that the single ion activity coefficient of H+ is assumed to be equal to the mean activity coefficient of NaClO4. This assump-tion has not been justified and this review has therefore calculated the single ion activity coefficient for H+ using the SIT and finds +H
γ = 0.80. The recalculated values are = (6.67 ± 0.18) and = (12.06 ± 0.28). The authors point out that these
values are very different from those obtained by solvent extraction and electro–migration, but in good agreement with the values obtained by Stadler and Kim [88STA/KIM] for americium using solubility measurements. The study of Wimmer et al. gives more direct information on the species formed than the earlier studies and the constants reported are therefore retained by this review and considered in the discussion of selected data. Recalculation of the constants to zero ionic strength, using the interac-tion coefficients for the americium system gives
10 1log b 10 2log b
10 1glo οb = (7.31 ± 0.18) and lo = (13.11 ± 0.28). These values are consistent with those selected in [95SIL/BID],
= (7.6 ± 0.7) and
10 2g οb
10 1log οb 10 2glo οb = (13.9 ± 0.6), but are more precise.
3−
[93BOI/ARL] Results are reported of rapid (ca. 100 µsec) heating of a uranium wire under a constant pressure of 120 MPa, to determine a number of thermophysical properties. However, no temperature measurements are reported, the temperatures being derived from the en-thalpies given by [76OET/RAN] and [56STU/SIN]. Thus, no information of interest to the present review is given. It may be noted that their enthalpy increments as a function of volume are appreciably smaller than those given by [88MUL/SHE], [91SHE/MUL] and others.
[93ERI/NDA] The authors have studied the solubility of Tc(IV) and Np(IV) hydrous oxides as a func-tion of pH and carbonate concentration and from these data deduced the stoichiometry and equilibrium constants of the following complex formation reactions:
TcO2·nH2O(s) TcO(OH)2(aq) + (n–1) H2O(l) 10log K = − (8.17 ± 0.05)
TcO2·nH2O(s) + (n–2) HTcO(OH) 2O(l) + H+ 10log K = − (19.06 ± 0.24)
Np(OH)4(s) Np(OH)4(aq) 10log K = − (8.28 ± 0.23)
Np(OH)4(s) +2NpO + e– + 2H2O(l) 10log K = − (9.40 ± 0.50)
TcO2·nH2O(s) + CO2(g) Tc(OH)2CO3(aq) + (n–1) H2O(l) 10log K = − (7.09 ± 0.08)
TcO2·nH2O(s) + CO2(g) Tc(OH)3 3CO− +H++(n–2) H2O(l) 10log K = − (15.35 ± 0.07)

Discussion of selected references 449
Np(OH)4(aq) + Np(OH)23CO −
423CO − 10log K = (3.00 ± 0.12)
Np(OH)4(aq) + H CO Np(OH)3−
3 3CO− + H2O(l) 10log K = (3.23 ± 0.12).
The experiments have been carried out at room temperature and in a medium of low ionic strength. The solid phases were prepared by electroreduction of and Np(V) on a Pt–net that was used in the following solubility measurements. This seems to be a practical method to prepare the solid phases and the scatter of the solubility data is small. The formula of the hydroxo carbonato complexes proposed by Eriksen et al. are surprising as discussed in [2001LEM/FUG].
4TcO−
A test of the methodology can be obtained by comparing the value of the equi-librium constant for the reaction:
Np(OH)4(s, am) +2NpO + e– + 2H2O(l),
obtained in [93ERI/NDA], with that given in [2001LEM/FUG], lo 10g K = − (8.68 ± 1.71). The latter value is deduced from the standard potential of the couple:
Np(OH)4(s, am) +2NpO + e– + 2H2O(l), 10log K = − (17.68 ± 0.17)
and the solubility product of amorphous Np(OH)4(s). The very large uncertainty ranges of the two values, lo 10g K = − (8.68 ± 1.71) and 10log K = − (9.4 ± 0.5), respectively, overlap, but the uncertainties remain large.
The following speciation diagram (Figure A-3 and Figure A-4) show the influ-ence of the proposed carbonate complexes on the speciation of Np(IV) in solutions stud-ied by Rai et al. [98RAI/FEL]. The equilibrium constants for the complexes U(OH)4(CO3)2– and U(OH)3(CO3)– are those for the corresponding Np(IV) species given by Eriksen et al., (substitution of neptunium to uranium) while the equilibrium constant for corresponds to the reaction: 2
2 3 2U(OH) (CO ) −
4+ 2 2 +3 2 2 3 2U + 2 CO 2 H O(l) U(OH) (CO ) + 2 H− −+
with log10K = 20.0, calculated from the equilibrium constants determined by Rai et al. [98RAI/FEL], but changing the solubility product for UO2(am) so that the value of the equilibrium constant for the formation of 6
3 5U(CO ) − conforms with the value in [92GRE/FUG]. This change is 2.7 log10 units and the corresponding change has also been made for the equilibrium above. The two figures below have been calculated at a total carbonate concentration of 0.2 and 0.02 M.
The modelling results indicate that the complex, , is the pre-dominant species under the conditions used by Eriksen et al., but this is inconsistent with their experimental results. These two experimental determinations are obviously not concordant and the review has therefore not used them.
22 3 2U(OH) (CO ) −
The conclusions above are valid both for the Tc(IV) and Np(IV) systems.

Discussion of selected references 450
Figure A-3: Speciation diagram of [U4+] = 10–7 M and [ 23CO − ] = 1.5·10–3 M, using equi-
librium constants of neptunium given by Eriksen et al.
6 7 8 9 100.0
0.2
0.4
0.6
0.8
1.0
Fra
ctio
n
pH
U(OH)4
UO2(am)
[U4+]TOT = 0.10 µM [CO32−]TOT = 1.50 mM
U(OH)3CO3−
U(OH)2(CO3)22−
U ( O H ) 2 (C O 3 )2 2 −
Figure A-4: Speciation diagram of [U4+] = 10–7 M and [ CO23
− ] = 2.1·10–1 M.
8 9 10 11 12 13 0.0
0.2
0.4
0.6
0.8
1.0
Frac
tion
pH
U (O H ) 4 C O 3 2 − [ U 4 + ]T O T = 0 . 1 0 µ M [ C O 3
2 −] T O T = 2 1 0 . 0 0 m M

Discussion of selected references 451
[93FER/SAL] This paper reports mainly the determination of the formation constant of U(VI) fluoride complexes. It also gives new values of the hydrolysis constants for the species,
and (UO . +2 2 2(UO ) (OH) +
2 3 5) (OH)
Potentiometric titrations utilised an Ag | AgCl and a glass electrode cell with-out liquid junction at 3.0 M ionic strength ( [N 1
4aClO ] 3.496 mol kg−≡ ⋅Ag
) at 25°C. One series of titrations was carried out at constant U(VI) and + concentrations with vary-ing [ ] in the absence of fluoride, while another series varied fluoride at constant U(VI) and [H
H+
]+ concentrations. Seven titrations in the latter mode were performed at four H+ concentrations ( 10log [H ]+− = 3.5 4.5− , [U(VI)] = 0.001 0.075 M− ). In addi-tion, 19 NMR spectra were recorded for dioxouranium(VI) solutions of containing 0.1 M NaF and showed chemical shifts to higher frequency relative to the solution in the absence of uranium.
F 4NaClO3 M
The potentiometric titrations in the absence of fluoride were interpreted in terms of three species, yielding the hydrolysis constants: l and . From the values of in [92GRE/FUG], the values of lo
10 2,2og (5.98 0.02)= − ±b4(nm, ClO , Na )− +ε10 5,3log (16.23 0.05)= − ±b
10 2,2*g οb = (5.54 0.04)− ± 10 5,3
*log οb and = − were calculated. They are in good agreement with the values se-lected by [92GRE/FUG].
(15.08 0.70)±
From the titrations with [U and , the follow-ing values were obtained for the formation of the binary complexes, ,
: lo ;
3(VI)] 10 M−=
10 2log
10log [H ] 3.50+− =
10log nb1 4= − g
22UO F n
n−
n 10 1 =b (4.86 0.02)± =b (8.6 2 0.04)± ; 10 3log =b (11.71 ± 0.06) and 10 4log =b (13.78 0.08)± . The fit derived from these constants in terms of z (the average number of coordinated fluoride ligands per U(VI)) as a function of the free fluoride concentration is given. However, the individual values only reach a maximum of ca. 2.35, so that it is perhaps surprising that for 4b 2
2 4UO F − could be determined with such a small estimated uncertainty. The reason is that small uncertainties are often an artefact introduced by the choice of error variables used in the least squares refine-ment and the weights of the different experimental data. Using 19 NMR, evidence is presented for the formation of the fifth complex,
F3
2 5FUO − , for which a stepwise forma-tion constant of 3 M was reported. This value is in error as indicated in a later study by Vallet et al. [2001VAL/WAH]. The error is due to the spectrometer and software system. By using a more advanced spectrometer and better software, Vallet et al. find K = 0.6 M
1−
n
–1 at − 4°C. This value has been accepted by this review. From [71AHR/KUL] the values of lo at 1 M ionic strength were used in conjunction with the present values and the ion interaction parameters for the reactants (from [92GRE/FUG]) to give the following (in kg · mol
10g b
–1):
2(UO F ,ClO )+ε 4− = (0.28 ± 0.04),
2 2 4(UO F (aq), Na or ClO )+ −ε = (0.13 ± 0.05),
Discussion of selected references 452
2 3(UO F , Na )− +ε2−
= – (0.14 ± 0.05),
2 4(UO F , Na )+ε = – (0.30 ± 0.06).
In a simple specific ion interaction theory, 2 2 4(UO F (aq), Na or ClO )+ −ε should be equal to zero.
For the ternary system, analysis of the titrations performed at the three higher concentrations revealed the formation of multinuclear species. However, at the
higher fluoride concentrations the titration curves became independent of the dioxoura-nium(VI) concentration. At , the data could be resolved simply in terms of the above–mentioned hydroxo and fluoro complexes. The results at the highest concentration and [U
H+
10log [H ] 3.6 and 3.9+− =
(VI)] 0.003 MH+ = deviated from this speciation model, but could not be rationalised in terms of mixed hydroxofluoro complexes and were as-cribed to the formation of a fine precipitate.
[93GRE/LAG] Glass electrode potentiometric titrations of the U(VI) – SO2
4− – OH– system were carried
out at 25.0°C in solutions containing 0.500 M Na2SO4 and 2.00 M NaClO4 with U(VI) concentrations in the range 0.003487 to 0.02000 M. The glass electrode was calibrated on the molar scale in the same ionic medium. A least–squares analysis of the condi-tional equilibrium constants for the reactions:
2+ 2 +2 2 4 2"UO " + H O(l) + SO "(UO ) (OH) " + H p qp q r q− (A.34)
where "U represents 2+2O " { }2+ 2
2 2 4 2 4UO UO SO (aq) + UO (SO )2−+ and 2"(UO ) (OH) "p q
represents the complexes, { }2 22 4(UO ) (OH) (SO ) p q r
p q r− − , was carried out first to deter-
mine the values of the coefficients p and q based on the speciation model of Peterson [61PET]. The general equation (A.34), stands for:
2+ 2 2 2 +2 2 4 2 4UO + H O(l) + SO (UO ) (OH) (SO ) + Hp q r
p q rp q r q− − −
2 +q−
2 2 +q− −
2 22 4 2 4 2 4UO SO (aq) + H O(l) + ( )SO (UO ) (OH) (SO ) + Hp q r
p q rp q r p − −−2 2
2 4 2 2 4 2 4UO (SO ) (aq) + H O(l) + ( 2 )SO (UO ) (OH) (SO ) + Hp q rp q rp q r p− −−
The data from Peterson [61PET], who studied this system in 1.5 M Na2SO4, were also used in a least-squares analysis (note that in the review of [92GRE/FUG] this work was not considered due to the high ionic strength and difficulty in estimating the uncertainties, although conditional formation constants were recalculated). The primary experimental data, on which this data analysis was based, are not given in the paper; only n versus − log10[H+] data. The original speciation was finally limited to three hy-drolyzed U(VI) species (viz., p:q values of: 2:–2; 3:–4; and 3:–8) giving an improved fitting factor such that the 3:–5 and 4:–6 species proposed by Peterson were considered to be redundant. The conditional constants were then further refined using and values taken from [92GRE/FUG] for the two unhydrolysed sulphate complexes and
1b 2b

Discussion of selected references 453
applying the SIT to adjust these values to the ionic strengths of both studies. The final regression to obtain the coefficient r and the corresponding *
, ,p q rb
24(SO )− −
values for the equi-librium:
3, 4,3−
2+ 2 2 +2 2 4 2UO + H O + SO (UO ) (OH) + H p q r
p q rp q r q−
was carried out by assuming that one ternary complex containing the maximum number of sulphate ligands was formed for each set of p:q values in the two studies, which when treated together provide two different sulphate concentrations for the regression. The SIT was used to reconcile the two different ionic strengths and *
, ,p q rb
log
values were estimated, viz. = − (3.26 ± 0.46), = − (8.64 ± 0.69) or
= − (8.81 ± 0.69) and = − (19.79± 1.20) in 1.500 M Na10 2, 2,2
*log −b 10*log b
10 3, 4,4*log −b*log b
10 5, 8,6*log −b
*log b2SO4;
10 2, 2,2− = − (2.73 ± 0.09), = − (8.15 ± 0.17) or = − (7.84 ± 0.17) and 6 = − (18.53 ± 0.25) in 0.500 M Na
10 3, 4,3− 10 3, 4,4*
−b10 5, 8,
*log −b 2SO4, 2.00 M NaClO4. Semi–quantitative and structural arguments are given in support of the proposed speci-ation.
The text of this paper shows that the two 3:–4 (p:q) complexes are given as alter-native species, but in the main text of this review they are both listed as coexisting spe-cies. The constants given in the footnote on page 241 of [92GRE/FUG] are not the same as in [93GRE/LAG] and should therefore be disregarded. The constants in this latter publication agree well with those in two later studies ([2000COM/BRO] and [2000MOL/REI]).
[93JAY/IYE] Enthalpy increments for Rb2U(SO4)3(cr) were measured from 373 to 803 K using a high temperature Calvet calorimeter, supplemented by DSC and simultaneous DTA and TGA measurements. Rb2U(SO4)3(s) was prepared by dissolution of UO3(cr) in an H2SO4 solution, electrolytic reduction, addition of Rb2CO3(cr) dissolved in 0.5 M H2SO4, followed by crystallisation.
The product was analysed for total U and sulphate, and showed good agree-ment with theoretical values and by AES, which showed < 300 ppm impurities (mainly Al and Si). X–ray diffraction was used to check that the material had not been modified during the experiment. Pellets, dried at 400 K, were used for the measurements, NBS standard sapphire being used to calibrate the calorimeter.
Two solid state transitions were observed at 616 and 773 K (DSC), and 628 and 780 K by DTA and TGA. The compound starts to decompose at 893 K.
The results of the enthalpy increment measurements were tabulated and fitted into three separate ranges from 370 to 628 K, 630 to 760 K and 765 to 800 K.
The enthalpy data for the low–temperature polymorph are consistent with the values of the heat capacities from 273 to 623 K subsequently reported briefly by Saxena

Discussion of selected references 454
et al. [99SAX/RAM], and these two sets of data have been combined to define the en-thalpy increments and heat capacity of this phase − see section 9.10.5.3.
The nine measurements of the enthalpy increments for the phase stable from ca. 628 to 763 K are not precise enough to define a reliable heat capacity for this phase. The authors fitted their measurements to the expression:
mH (T) − mH ο (298.15 K) = 3279 + 13.4 · T + 0.3063 · T 2 J · mol–1 (630–760 K)
which corresponds to a heat capacity rising sharply from 399 J · K–1 · mol–1 at 630 K to 479 J · K–1 · mol–1 at 760 K, but a constant heat capacity of 437.6 J · K–1 · mol–1 fits the data almost as well.
The authors’s calculated enthalpy of transition at ca. 628 K seems to include some sensible heat also; our calculated values for mH (628 K) − mH ο (298.15 K) for the two polymorphs are 128793 and 132494 J · mol–1, giving a transition enthalpy of 3.7 kJ · mol–1.
The reported values for the polymorph stable above 780 K correspond to an implausibly large heat capacity, presumably due to incipient decomposition by loss of SO2(g).
The authors also estimated the entropy of (cr) from the sum of values for Rb
3 4Rb U(SO )3
2SO4(cr) and U(SO4)2.
[93KRI/EBB]
This is a report of project work involving the vaporisation of actinide species from waste oxide processors. The only work relevant to the current review is a study of the vaporisation behaviour of U3O8(cr) in oxygen and water vapour, similar to the study by Dharwadkar et al. [74DHA/TRI]; like this, it comprises transpiration measurements of the total pressures of uranium–bearing species over U3O8 in the presence of both dry and moist oxygen. The mass loss in the presence of water vapour is larger than the loss of UO3(g) in dry oxygen, due to the formation of a UO3·(H2O)n vapour species.
The variation of the water content in the transpiring oxygen suggested that the H2O/UO3 ratio in the hydroxide gas formed was close to 1, although the relevant data are quite scattered.
The authors' pressures of UO3(g) from the reaction:
3 8 2 31 13 6U O (cr) + O (g) UO (g) (A.35)
from 1273 to 1573 K are in good agreement with the similar data by [74DHA/TRI], and other literature data which form the basis of the choice of (UOf mG∆ 3, g) in [82GLU/GUR] and [92GRE/FUG].

Discussion of selected references 455
The authors tabulate the results of 20 experiments (including replicates) using oxygen with known amounts of water vapour from 1173 to 1373 K (results at higher temperatures were discounted by the authors) involving the reaction:
3 8 2 2 2 21 13 6U O (cr) + O (g) + H O(g) UO (OH) (g) (A.36)
In calculating the pressure of UO2(OH)2(g), allowance was made for the smaller mass loss due to the simultaneous vaporisation of UO3(g).
The authors' results are somewhat scattered (replicated pressures differ by as much as a factor of 7), but give values of pK for reaction (A.36) which are lower by a factor of ca. 330 than those of the similar study by Dharwadkar et al. [74DHA/TRI]. However, recently, Krikorian et al. [97KRI/FON] studied the release of uranium-containing species from a 238PuO2 sample containing 3.3 mol% of 234UO2 under similar conditions. Despite some uncertainties in the calculation (particularly of the activity of UO2 in the (U,Pu)O2+x solid solution presumably formed), the releases were in general agreement with those predicted from the data of [93KRI/EBB].
As noted in the review of [74DHA/TRI], there are two appreciably different es-timates of the thermal functions of UO2(OH)2(g) by Ebbinghaus [95EBB] and Gorok-hov and Sidorova [98GOR/SID], with which these results can be combined.
We have used the twenty tabulated values of pK to calculate the Gibbs energy of reaction (A.36), and further calculate the second– and third–law values for
r mH ο∆ ((A.36), 298.15 K) and hence f mH ο∆ (UO2(OH)2, g, 298.15 K).
As can be seen, there is a considerable variation in the values for the derived enthalpy of formation of UO2(OH)2(g). The big differences in the Table A-12 and the unexplained large differences between the results of this study and those of [74DHA/TRI], mean that no reliable data for this compound can be selected in this re-view.
Table A-12: Derived values of f mH ο∆ (UO2(OH)2, g, 298.15 K), kJ · mol–1
Method Thermal functions
[95EBB] [98GOR/SID]
Second-law – (1153.6 ± 58.1) – (1157.6 ± 58.1)
Third-law – (1197.2 ± 12.5) – (1224.5 ± 13.3)
[93MCB/GOR]
Assessed data for are given as tables, graphs and U( , , , liq)α β γ ,mpC coefficients. The values are essentially identical to those given by [82GLU/GUR], which form the basis of the CODATA Key Values selection used in [92GRE/FUG]. In fact the only values other than those at 298.15 K quoted in [92GRE/FUG] are for C up to 942 K, which are the very similar to values given by [76OET/RAN].
,m (U,p α)

Discussion of selected references 456
[93MEI/KAT]
This paper supplements/complements [93MEI/KIM].
This paper gives: i) the proof of the existence of 22 2 2(UO ) (OH) + (abbreviated
as 2:2) on the basis of solubility and spectroscopic measurements, and ii) the fine struc-ture of both absorption and emission spectra of this species. Many of the additional studies from this group after 1993 will use these data. In this paper a less precise value of (with respect to the 1998 values for instance) is given from only spectros-copy data coming from both saturated and undersaturated U(VI) solutions. Finally this paper bridges hydrolysis data to those reported in [92GRE/FUG]. The new spectro-scopic data also confirm previous characterisations of hydrolysed U(VI) species (2:2 and 5:3, ) [63RUS/JOH], [63BAR/SOM] (Cited in [92GRE/FUG]).
10 2,2*log b
(UO2 3 5) (OH)+
• Identification of 22 2 2(UO ) (OH) + species:
The solubility measurements of rutherfordine, , in 0. at as a function of pH = 2.8 to 4.15, under 8% and 100 and of
schoepite, (in fact metaschoepite), pH = 3.4 to 4.8 under 1%, 0.3% and show that in the presence of the oxide phase, has no influence on the
solubility whereas the solubility does depend o 2O wh 3 (cr) is the solubility-limiting solid phase. The slope of the straight lin t(VI)] versus pH, is − 2 which is compatible with species bearing a charge 2 2
2O
2 3UO CO (cr)
2COn C e
e, +: U
41 M NaClO2% CO
2UO COU
(24 2) Cο±
20.03% CO3 2UO 2H O(cr)⋅
n log[
+ or 2 2(UO ) (OH 22) + .
Indeed, according to: 2
3 2 2 22
UO 2H O(scho) UO 2OH H O (l)+ −
+ −
⋅ + +
+3 2 2 2 2 22 2
2 3 2 32
2 3 2 2 2 2 3
2 UO 2H O(scho) (UO ) (OH) 2OH 2 H O(l)
UO CO (ruth) UO CO
2 UO CO (ruth) 2H O(l) (UO ) (OH) 2HCO
+ −
+ −
⋅ +
+
+ +
2,2*b ,0
sKand the definitions of and , it can be derived: 2
10 2 10 s,0 3 2 10 W 10 Hlog [UO ] log (UO 2H O) 2log 2log 2 pHK K +
+ = ⋅ − − γ −
2
10 2 2 2 10 s,0 3 2 10 W
10 2,2 10 H*
log [(UO ) (OH) ] 2log (UO 2H O) 4log
log 2log 2pH
K K
+
= ⋅ −
+ − γ −b2log [UO ] log (UO CO ) log log 2pK K+ = − −∑
+
−
2
210 2 10 s,0 2 3 10 CO Hp
210 2 2 2 10 s,0 2 3 10 CO
10 10 2,2H*
log [(UO ) (OH) ] 2log (UO CO ) 2 log 2log 2 log log 2pH
K K p
+
= − −∑+ γ + −b
log∑
+
Kwith 10 = − 17.62 (sum of the log10 of the Henry constant for CO2 and the log10 of the dissociation constants of aqueous CO2), H
log +γ = − 0.11 and 10 wlog K

Discussion of selected references 457
(13.78 0.01)= − ±
2 2(UO ) (
. According to these relationships the dependence of the solubility on pH is, in each case, the same. Hence from solubility experiments alone it is not possible to deduce a chemical model; that is to say to choose one species or another. But as pH of the saturated solutions increases, the UV–Vis absorption spectra of (340 to 520 nm) disappears and a new spectrum appears. This could be identified as arising from the species in the solutions. The single component spectrum of the dimer is then derived with λ = and a value of the extinction coefficient 20 times higher than that of . From the peak areas of the spectra of the two species the ratio:
22UO +
22OH) +
max 420 nm22UO +
2 222
[(UO ) (OHR[UO ]+=
3 2O 2H O) = ⋅10log R lo 10 s,0g K (U
10log R lo s,0g ( 2 3 10*O CO ) log 10logUK K p= +
2CO R2CO 2
2 2(UO ) (O
10 2,2*log b
10 s,0g K
22UO +
2,2*b
22
+UO2
2 2 2(UO ) (OH) + τ
10 2,2*log b
22) ]+
is calculated and shown to be independent of pH as expected from the relationships:
10 2,2*log+ b − 10 W2log K
or
22,2 10 COH 2 log log++ γ − −∑b
depending on the solid phase controlling the solubility. (4.9 0.9)R = ± for pH = 3.7 to 4.2 under 1, 0.3 and 0.03% of , and (1.9 0.4)= ±
22H)
for pH = 3.2 to 4.4 under 8% of (For 100% CO only the dioxouranium(VI) cation is present). All these data provide proof of the existence of + .
Furthermore, the value is evaluated from the ra-tio of the values of the free concentration of the two species (to be compared with the value − 5.94 given by [63RUS/JOH] in 1 M ). No attempt to calculate the solu-bility products of the solids is made in this paper. Conversely, previous
= (5.89 0.12)− ±
4NaClOlo values
[93MEI/KIM] of rutherfordine and schoepite are used to check the R values with a good accuracy.
In the same way, fluorescence characteristics of the saturated solutions change drastically with increasing pH and deconvolution of the spectra on the basis of the emis-sion spectrum of the well known ion at the same concentration as that used to calculate gives the single emission spectrum of (U 2
2 2 2O ) (OH) + , as well as the fluorescence lifetime ( : 473, 488, 510, 534, 560 and 587 nm, τ = ; 1 sµ
: 499, 519, 542, 566 nm, (2.9 0.9) s= ± µ ). A short explanation of the origin of the emission spectra is given.
All these data obtained from more than 30 test solutions give confidence in the identification of the dimer.
• Determination of from undersaturated solutions.
According to the thermodynamic data known in 1993, and listed in [92GRE/FUG], the authors defined the conditions where U(VI) can be found in solutions containing the

Discussion of selected references 458
species and 2:2 (less than 5% of 1:1, UO22UO +
2OH+ and 5:3, ). The conditions are: pH and uranium concentration, respectively, less than 4 and 5 1 . They investigated by absorption spectroscopy 34 test solutions with pH from 2.07 to 3.85 at different U concentrations (
2 3 5(UO ) (OH)+
0⋅ 3 M−
45 10−⋅ to 10 ) and reported . The reviewer accepts the lo values reported
here as being new and independent .
2−
10*gM
2,2b10*log (5.97 0.06)− ±b2,2 =
[93MEI/KIM]
This is a solubility study using UO2CO3(s) made in 0.1 M NaClO4 at 25°C and 2=
1 bar. The solid is well characterised and the authors have assumed that equilibrium was attained in the test solutions. The chemical model is consistent with the one described in [92GRE/FUG]. The authors have measured pH instead of − log
COp
10[H+], but they do not describe how the conversion was made. They give a reference but this was not available to the reviewers. We have therefore compared the dissociation constant for the reaction:
, with the value calculated from the data at zero ionic strength (largely based on CODATA) in [92GRE/FUG]. This indicates that the authors have made a correction of pH to − log
22 2 3CO (g) + H O(l) CO + 2 H− +
10[H+]. There is, however, a small differ-ence between the two values, log10K = − (17.62 ± 0.07), vs. log10K = − (17.52 ± 0.02). This indicates that the calculated values of log10[ 2
3CO − ] are too low, which in turn re-sults in a small systematic error in the equilibrium constants. If this suggestion is correct it will result in values that are 0.1, 0.2 and 0.3 units lower than those reported by the authors, explaining some of the (small) differences between the equilibrium con-stants found by Meinrath and Kimura in this paper and those reported in [92GRE/FUG]. We have recalculated the equilibrium constants in [93MEI/KIM] to zero ionic strength and find = (10.07 ± 0.08), lo
10log nb
10 1log οb 10 2g οb = (16.22 ± 0.34), 10 3log οb = (21.84 ± 0.10), and 10 ,0log sK ο
10 1g οb= − (15.02 ± 0.06), where the uncertainty estimates are given as 1.96σ.
The value of lo is higher, and that of 10 2glo οb lower, than those selected in [92GRE/FUG]. The solubility product of UO2CO3(s) reported in [93MEI/KIM] is sig-nificantly lower than that in [92GRE/FUG].
[93MEI/KIM2]
This paper supplements/complements [93MEI/KAT].
This paper provides: i) the identification of and , and their solubilities in aqueous solutions, at pH = 2 to 5, under variable pressures of
(air atmosphere to 100% ) and ii) values of their solubility products on the basis of solubility measurements, qualitative spectroscopic measurements and previous thermodynamic data on U(VI) hydrolysis. This paper couples hydrolysis and solubility product data with those reported in [92GRE/FUG].
2 3UO CO (cr) 3 2UO 2H O(s)⋅
2CO 2CO
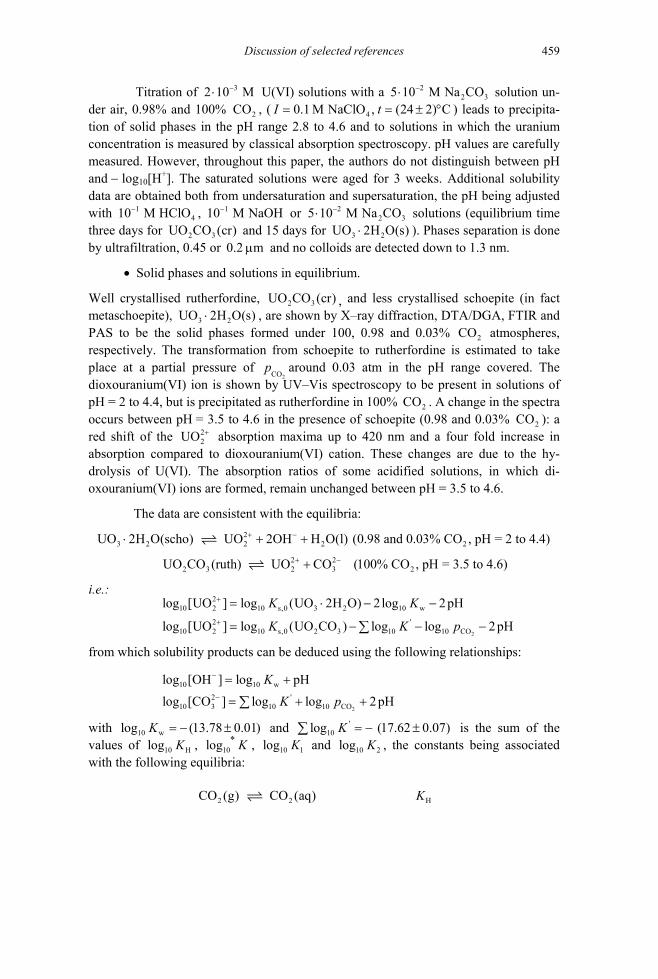
Discussion of selected references 459
Titration of U(VI) solutions with a solution un-der air, 0.98% and 100% , (
32 10 M−⋅
2CO
225 10 M Na CO−⋅
(24 2) Ct3
40.1 M NaClO ,I = = ± °
2 3COO(s)
) leads to precipita-tion of solid phases in the pH range 2.8 to 4.6 and to solutions in which the uranium concentration is measured by classical absorption spectroscopy. pH values are carefully measured. However, throughout this paper, the authors do not distinguish between pH and − log10[H+]. The saturated solutions were aged for 3 weeks. Additional solubility data are obtained both from undersaturation and supersaturation, the pH being adjusted with , or solutions (equilibrium time three days for and 15 days for
1410 M HClO−
UO C
110 M N−
2 3O (cr)aOH 25 10 M Na−⋅
3 2UO 2H⋅ ). Phases separation is done by ultrafiltration, 0.45 or and no colloids are detected down to 1.3 nm. 0.2 mµ
• Solid phases and solutions in equilibrium.
Well crystallised rutherfordine, , and less crystallised schoepite (in fact metaschoepite), , are shown by X–ray diffraction, DTA/DGA, FTIR and PAS to be the solid phases formed under 100, 0.98 and 0.03% 2O atmospheres, respectively. The transformation from schoepite to rutherfordine is estimated to take place at a partial pressure of
2COp around 0.03 atm in the pH range covered. The
dioxouranium(VI) ion is shown by UV–Vis spectroscopy to be present in solutions of pH = 2 to 4.4, but is precipitated as rutherfordine in 0% 2CO . A change in the spectra occurs between pH = 3.5 to 4.6 in the presence of schoepite (0.98 and 0.03% 2CO ): a red shif the 2
2UO + absorption maxima up to 420 nm and a four fold increase in absorption compared to dioxouranium(VI) cation. These changes are due to the hy-drolysis of U(VI). The absorption ratios of some acidified solutions, in which di-oxouranium(VI) ions are formed, remain unchanged between
2 3UO CO (cr)3 2UO 2H O(s)⋅
C
10
t of
pH = 3.5 to 4.6.
2+
−
−
The data are consistent with the equilibria: 2
3 2 2 2 2UO 2H O(scho) UO 2OH H O(l) (0.98 and 0.03% CO , pH = 2 to 4.4)+ −⋅ + +
2 22 3 2 3 2UO CO (ruth) UO CO (100% CO , pH = 3.5 to 4.6)+ −+
i.e.:
2
10 2 10 s,0 3 2 10 w
2 '10 2 10 s,0 2 3 10 10 CO
log [UO ] log (UO 2H O) 2log 2pH
log [UO ] log (UO CO ) log log 2pH
K K
K K p+
= ⋅ − −
= − −∑
from which solubility products can be deduced using the following relationships:
2
10 10 w2 '
10 3 10 10 CO
log [OH ] log pH
log [CO ] log log 2 pH
K
K p−
= +
= + +∑
w (13.78 0.01)
= − ± '10log (17.62K = −with 10log K and ∑ is the sum of the
values of lo0.07)±
10 Hg K , 10*log K , 10log 1K and lo 10 2g K , the constants being associated
with the following equilibria:
2 2CO (g) CO (aq) HK
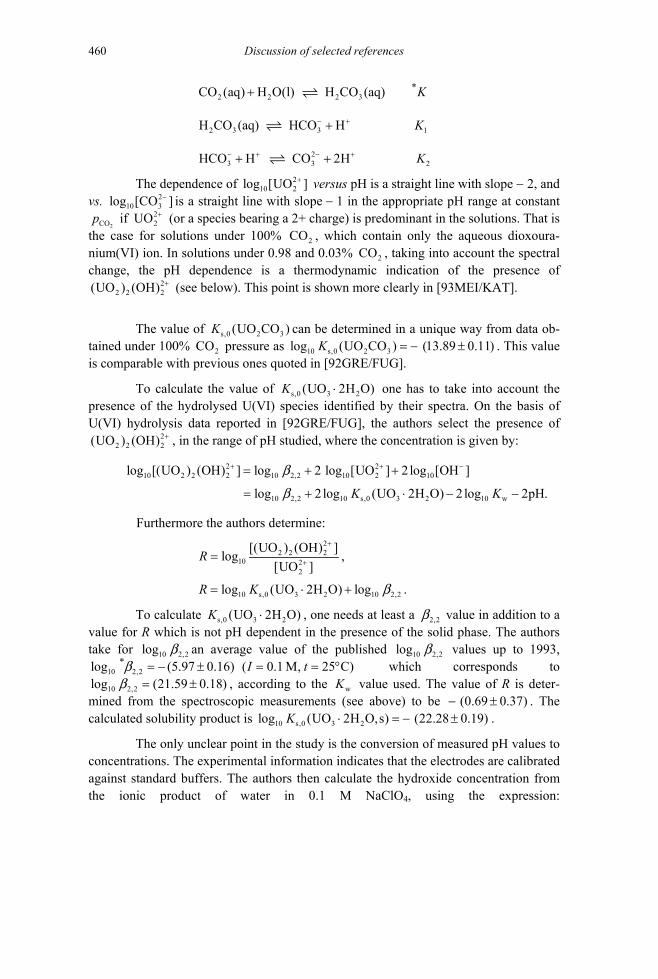
Discussion of selected references 460
2 2 2 3*CO (aq) H O(l) H CO (aq) K+
2 3 3H CO (aq) HCO H K− ++ 1
2
23 3HCO H CO 2H K− + − ++ +
The dependence of 210 2log [UO ]+ versus pH is a straight line with slope − 2, and
vs. 210 3log [CO ]− is a straight line with slope − 1 in the appropriate pH range at constant
2 if (or a species bearing a 2+ charge) is predominant in the solutions. That is
the case for solutions under 100% , which contain only the aqueous dioxoura-nium(VI) ion. In solutions under 0.98 and 0.03% CO , taking into account the spectral change, the pH dependence is a thermodynamic indication of the presence of
COp
(U
22UO +
22 2 2O ) (OH)
2CO2
+ (see below). This point is shown more clearly in [93MEI/KAT].
The value of can be determined in a unique way from data ob-tained under 100% pressure as
s,0 2 3(UO CO )K2 lCO og (UO CO ) (13.89 0.11)K10 s,0 2 3 . This value
is comparable with previous ones quoted in [92GRE/FUG]. = − ±
To calculate the value of s,0 3 2(UO 2H O)K ⋅ one has to take into account the presence of the hydrolysed U(VI) species identified by their spectra. On the basis of U(VI) hydrolysis data reported in [92GRE/FUG], the authors select the presence of
22 2 2(UO ) (OH) + , in the range of pH studied, where the concentration is given by:
2 2+ + −10 2 2 2 10 2,2 10 2 10
10 2,2 10 s,0 3 2 10 w
log [(UO ) (OH) ] log 2 log [UO ] 2log [OH ]
log 2log (UO 2H O) 2log 2pH.K K
= + +
= + ⋅ − −
b
b
Furthermore the authors determine: 2
2 2 210 2
2
[(UO ) (OH) ]log[UO ]
R+
+=
log (UO 2H O)R K= ⋅
,
. 10 s,0 3 2 10 2,2log+ b
To calculate s,0 3 2(UO 2H O)K ⋅ , one needs at least a value in addition to a value for R which is not pH dependent in the presence of the solid phase. The authors take for an average value of the published values up to 1993,
which corresponds to , according to the
2,2b
2,2b10 2,2log b,2 (5.97= −
(21.59=
10log10 2
*log 25 C)t = °b10 2,2log b w
0.16) ( 0.1 M,I± =0.18)± K value used. The value of R is deter-
mined from the spectroscopic measurements (see above) to be (0.69 0.37)− ±0.19)
. The calculated solubility product is l 10 s,0og K 3(UO 2H2O,s) (22.28⋅ = − ± .
The only unclear point in the study is the conversion of measured pH values to concentrations. The experimental information indicates that the electrodes are calibrated against standard buffers. The authors then calculate the hydroxide concentration from the ionic product of water in 0.1 M NaClO4, using the expression:

Discussion of selected references 461
log10[OH−] = − 13.78 + pH, indicating that they have mixed concentrations and activi-ties. The carbonate concentration is then calculated from the measured dissociation con-stant of carbonic acid in 0.1 M NaClO4, again using pH instead of − log10[H+]. In this way, the two errors cancel, and the solubility product reported for UO2CO3(s), log10Ks,0 = − (13.89 ± 0.11) is therefore accepted by the reviewers. Conversion to I = 0 with the SIT gives = − (14.73 ± 0.11). The solubility data for schoepite has to be corrected for the presence of the dimer, . This was done using averaged literature data for the concentration equilibrium constant that are in excellent agreement with the value in [92GRE/FUG]. In this way, cf. Equation (12) on p. 83 in [93MEI/KIM2], the error in using pH instead of − log
10 ,0 2 3log (UO CO , s)sK ο
2 2UO 2H O,s)⋅
2 2UO 2H O,s)⋅
2+2 2 2(UO ) (OH)
10[H+] also cancels out in this case and the equilibrium constant reported by the authors is accepted by this review,
= − (22.28 ± 0.19) in 0.1 M NaClO10 ,0log (sK10 ,0log (sK ο
4 and, using the SIT = − (22.88 ± 0.19).
• Thermodynamic evaluation.
From the obtained solubility products the authors calculated for the reactions: or mG∆
2 22 3 2 3UO CO UO CO (s)+ −+ (A.37) 22 2 3UO 2OH H O(l) UO 2H O(s)+ −+ + ⋅ 2 , (A.38)
r mGο∆ (A.37) 1= (79.28 0.62) kJ mol−± ⋅
r mGο∆ (A.38) 1= (127.17 1.10) kJ mol .−± ⋅
According to the following auxiliary data: o 2 1
f m 2o 2 1
(UO ) (952 2) kJ mol ,G + −
− −f m 3
o 1f m 2
o 1f m
(CO ) (530.94 0.58) kJ mol ,
(H O, l) (237.140 0.040) kJ mol ,(OH ) (158.49 0.10) kJ mol ,
G
GG
−
− −
∆ = − ± ⋅
∆ = − ± ⋅
∆ = − ± ⋅
o 1f m 2 3(UO CO ,s) (1562.2 3.3) kJ mol ,G −
∆ = − ± ⋅
∆ = − ±they calculate:
o 1f m 3 2(UO 2H O,s) (1633.3 3.5) kJ mol .G −
⋅
∆ ⋅ = − ± ⋅
We have made a recalculation using the selected data in [92GRE/FUG] and find (UOf mGο∆ 2CO3, s) = − (1564.5 ± 1.9) kJ · mol–1, consistent with the value − (1563.05 ± 1.8) kJ · mol–1 selected in [92GRE/FUG]. In the same way we have recal-culated the data for schoepite and find f mGο∆ UO3( · 2H2O, s) = − (1634.7 ± 2.1) kJ · mol–1, consistent with the value, − (1636.5 ± 1.7) kJ · mol–1, selected in [92GRE/FUG].

Discussion of selected references 462
[93MIZ/PAR]
The authors give a summary of what is known about the reduction of U(VI) in bicar-bonate and carbonate solutions. In the former case the U(V) produced disproportionates to U(VI) and U(IV), and in the later case U(V) remains stable. Using classical cyclic voltammetry and spectrophotometry through a grid Pt cathode (path length
, wavelength: 230 to 800 nm) they show that in solutions 10 U(VI), 1 the reaction: (0.78 0.02) mm±
M Na C
2 M−
42 3 2 3 3O (where UO (CO ) is present)−
42 3 3UO (CO ) e U(V)− −+
holds quasi-reversibly at (vs. Ag/AgCl, 3 M NaCl) with the ex-change of electrons. Absorption spectroscopic observations are con-sistent with the presence of only U(V) and allow calculation of log
(0.85 0.01) VEο = − ±5)(0.99 0.0n = ±
10 [U(VI)] [U(V)]Eο
vs. the applied potential, E (five experimental points), which gives the n and values.
In acidic solution 10 U(VI), 10 or (pH < 1.5, proba-bly) they confirm produced by cyclic voltammetry about the quasi–reversible reduction of to with (vs. Ag/AgCl, 3 M NaCl).
2 M−
0.138= −
14M HClO−
4LiClO
22UO +
2UO+ VEο
The quasi–reversibility is due, as reported previously, to further reduction of U(V) to U(IV) through a mechanism which cannot be validated by the spectroelectro-chemistry data.
The reviewer retains the data in carbonate solutions.
[93NAI/VEN]
As part of a study of the vaporisation behaviour in the U–Ce–C system, Naik et al. have measured, by Knudsen effusion mass–spectrometry, the uranium pressures over mono-phasic UC(cr) (1922 to 2247 K) and the diphasic U(l) + UC(cr) region (1571 to 2317 K). The samples were contained in a carburised tantalum cup inside a molybde-num effusion cell, and silver was added as a pressure calibrant. The carbide samples, prepared from UO2 + C microspheres, clearly initially contained some residual oxygen, since the intensity of the UO+ signal was initially larger than that of all other species, but "became less later".
The pressure of U over UC0.981 ± 0.033 at 2100 K agreed with those from earlier studies, within the combined uncertainties of composition and pressure, as did that over the U(l) + UC region, which is, of course, somewhat lower than that over pure U(l) due to carbon dissolution.
No new information on the thermodynamics of the U–C system can be derived from this study.

Discussion of selected references 463
[93NIK/TSI]
Mass–spectrometric data are presented from which (with a number of correc-tions/assumptions for fragmentation, dissolution, etc.) the equilibrium constants of the reaction:
2 4 51 12 2NiF (cr) + UF (g) Ni(cr) + UF (g)
are calculated over the temperature range 1017 − 1109 K. Their derived value of f mH∆ (UF5, g, 0 K) = − (1914.8 ± 16.0) kJ · mol–1 is compared comprehensively with
ten other values in the literature, which range from − 1806 to − 1949 kJ · mol–1. Their recommended value is f mH∆
f m
(UF5, g, 0 K) = − (1913.9 ± 15.2) kJ · mol–1. (The corre-sponding value from [92GRE/FUG] would be (UF5, g, 0 K) = − (1905.2 ± 15.0) kJ · mol–1). These data have been incorporated into the reassessment of the properties of UF5(g) − see section 9.4.2.1.3.
H∆
[93ODA]
This report contains calculations of the populations of the rotational and vibrational states and band contours of around 300 K, based on the molecular parameters given by [85ALD/BRO], except for a slightly larger interatomic distance, from an ear-lier interpretation of the spectra. The data selected by [92GRE/FUG] are based on the values of [85ALD/BRO], (although the actual values used are not stated there) and there is no reason to make any changes.
6UF (g)
[93OGA]
This is an interesting paper on modelling of substoichiometric (U, Pu) nitrides. How-ever, since the present review does not deal with such ternary or non–stoichiometric phases, this paper is of no immediate relevance.
[93OGO/ROG]
The authors attempt to establish regularities in the relation between six thermodynamic parameters at 298.15 K (volume coefficient of thermal expansion, the bulk modulus, molar volume, atomisation energy, ,mpC and Gruneisen parameter) for the mononitrides of 5d transition elements plus Th, U and Pu. From six universal relations between these parameters, they predict missing values, including Cv, the specific heat capacity. The predicted values of Cv are: Cv(UN, cr, 298.15 K) = 48.97 J ·K–1 · mol–1 and Cv(PuN, cr, 298.15 K) = 50.05 J· K–1 · mol–1, compared to the currently assessed values for ,mpC
,m
of (47.57 ± 0.40) and (49.6 ± 1.00) J · K–1 · mol–1, respectively. Their “regularised” value of Cv for UN seems reasonable, but that for PuN is probably too small (since pC > Cv). No new thermodynamic data of relevance to the review are presented.

Discussion of selected references 464
[93PAS/RUN]
This paper is reviewed together with [97PAS/CZE].
[93PAT/DUE]
This paper yields thermochemical information on 2.95UOα −
2
and on its insertion with Mg. α–UO2.95 was prepared by heating 4UO 2H O⋅ to 792 K for eight hours, following Cordfunke and Aling [63COR/ALI]. Reaction with dibutylmagnesium at ambient tem-peratures for 48 hours achieved the insertion to form 2.95UO (0 0.26)xMg x < < . The hexagonal α–UO2.95 was characterised by powder X–ray diffraction and the O/U ratio was accurately determined by potentiometric titration (dissolution in potassium dichro-mate solution and back titration using a Fe2+ standard solution).
0.17 2.95Mg UOa 3=
was shown to be a pure phase by X–ray diffraction, with a hex-agonal lattice, Å, .964 c 4.172= Å, similar to the values for α–UO2.95, ( Å, c 4 Å). a 3.= 985 .1= 63
The determination of the enthalpy of formation of α–UO2.95 was based on the enthalpy of solution of the constituents of the reaction
0.05 α–U3O8 + 0.85 γ–UO3 α–UO2.95 (A.39)
The calorimetric reagent was 0.274 mol·dm–3 Ce(SO4)2 + 0.484 mol·dm–3
H3BO3 + 0.93 mol·dm–3 H2SO4, the same as that used by [81COR/OUW2] for the disso-lution of γ–UO3 and α–U3O8. In fact, the values for the enthalpy of dissolution of these two latter reagents were taken from these authors as − (79.94 ± 0.48 ) kJ · mol–1 and − (354.61 ± 1.70) kJ · mol–1, respectively. sol mH∆ (UO2.95, α) was determined as − (93.37 ± 0.65) kJ · mol–1, the reported uncertainty limits being for the 1.96σ interval. These values lead to r mH ο∆ ((A.39), 298.15 K) = (7.69 ± 0.77) kJ · mol–1.
Using NEA accepted values for the standard enthalpy of formation of γ–UO3 and α–U3O8, we recalculate r mH ο∆ (UO2.95, α, 298.15 K) = − (1211.28 ± 1.28) kJ · mol–1, identical, except for the uncertainty limits, to that reported by [93PAT/DUE]. This value, accepted here, is consistent with f mH ο∆ (UO3, α, 298.15 K) = − (1212.41 ± 1.45) kJ · mol–1 (see section 9.3.3.1).
The same reagent was used for the determination of the enthalpy of formation of Mg0.17UO2.95. The values for the dissolution of Mg0.17UO2.95 and MgO were deter-mined as − (143.99 ± 0.60) and − (149.50 ± 0.55) kJ · mol–1, respectively. The enthalpy change corresponding to the reaction:
0.17 MgO(cr) + 0.34 γ–UO3 + 0.22 α–U3O8 Mg0.17UO2.95(cr) (A.40)
was obtained as r mH ο∆ ((A.40) , 298.15 K) = (13.38 ± 0.73) kJ · mol–1. This value corre-sponds to the formation of the insertion compound from the stoichiometric oxides, with respect to which it is therefore presumably unstable.

Discussion of selected references 465
Using NEA adopted values, we recalculate, from the equation above:
f mH ο∆ (Mg0.17UO2.95, cr, 298.15 K) = − (1291.44 ± 0.99 ) kJ · mol–1.
With f mH ο∆ (UO2.95, α, 298.15 K) = − (1211.28 ± 1.28) kJ · mol–1 discussed above, the enthalpic effect associated with the insertion,
0.17 Mg + α–UO2.95 Mg0.17UO2.95 (cr) (A.41)
is obtained as
r mH∆ ((A.41), 298.15 K) = − (80.16 ± 1.62) kJ · mol–1.
Electrochemical measurements (discharge and charge curves, open circuit volt-ages) using the cell:
34 2 x 2.95Mg(amalgam) 0.5 mol dm Mg(ClO ) , DMF Mg UO−⋅
allowed the calculation of the Gibbs energy change for reaction:
x Mg + α–UO2.95 MgxUO2.95(cr) (A.42)
as ((A.42), 294 K) = − 473·x kJ · molr mG∆ –1 , with x up to 0.27. For x = 0.17, this ex-pression yields − 80.4 kJ · mol–1, very close to the calorimetric enthalpy of reaction, indicating a negligible entropy change.
[93STO/CHO] 2+2UO and +
2NpO are known to give cation–cation species with β values increasing with ionic strength: (0.69 ± 0.01) L · mol–1 at I = 3.0 M, (2.5 ± 0.5) L · mol–1 at I = 6.26 M and (3.7 ± 0.1) L · mol–1 at I = 7 M. This paper gives β = (2.25 ± 0.03) L · mol–1 at I = 6.0 M as well as r mH∆ = − (12.0 ± 1.7) kJ · mol–1 and = − (34 ± 6) J · Kr mS∆ –1· mol–1 at (25 ± 0.1) °C for the association reaction.
All these data are obtained by spectrophotometric determinations in the system: NaClO4, pH = 1 to 2, U concentration: 6.1·10–2 to 0.489 M, Np concentration held con-stant at 10–3 M, t = (25 ± 0.1) to (65 ± 0.1) °C. Free +
2NpO concentration is measured at 978.4 nm, εmax = 368 L · mol–1 · cm–1. Purity of the Np and U solutions before mixing are checked by spectrophotometry, U at 416 nm, ε = 7.82 L · mol–1 · cm–1 (HClO4 > 10−2 M), Np(V) at 980.4 nm, ε = 395 L · mol–1 · cm–1, Np(IV) at 960 nm and Np(VI) at 1222 nm (HClO4 0.2 M).
[93TAK/FUJ]
The first part of this paper is concerned with the change of the crystallographic proper-ties (lattice parameters, atomic positions, oxygen vacancies) of substoichiometric cal-cium and strontium uranates (rhombohedral, space group R3m ) as a function of the ionic radii of the alkaline earth cation and the oxygen non-stoichiometry.

Discussion of selected references 466
The second part is devoted to the determination of the molar enthalpy of formation of SrUO4–x (α, 298.15 K) for x = 0 to 0.478.
The procedures for the preparation and characterisation of the samples are de-tailed. Orthorhombic β–SrUO4 was the starting material for rhombohedral α–SrUO4 and α–SrUO3.5. It was obtained by heating a stoichiometric mixture of high purity SrCO3(cr) and UO2(cr) in air at 1273 K for 48 hours. Its lattice parameters were in good agreement with literature values. α–SrUO3.5 was obtained by reducing β–SrUO4 in a stream of H2 at 1073 K for six hours. α–SrUO4 was obtained by heating α–SrUO3.5 in air for six hours, at 773 K; this temperature being low enough to avoid the transition to β–SrUO4. The intermediate oxides α–SrUO4–x, (0 < x < 0.5) were obtained by heating the calculated amounts of α–SrUO4 and α–SrUO3.5 in vacuum sealed quartz ampoules at 1273 K for 12 hours. The oxygen non-stoichiometry in the compounds was determined by Ce(IV) back titration against Fe2+; the error in x is estimated to be ± 0.003. X–ray diffraction analy-sis provided information on the oxygen positional parameters as a function of x.
The enthalpies of solution of the compounds in 5.94 mol·dm–3 HCl, recalcu-lated for the 95 % confidence interval, are given in Table A-13. The enthalpies of for-mation, also given in Table A-13, were recalculated using the cycle given by the au-thors, with auxiliary enthalpies of formation either adopted by NEA:
f mH ο∆ (SrCl2, cr, 298.15 K) = − (833.85 ± 0.70) kJ·mol–1,
f mH ο∆ (UO2Cl2, cr, 298.15 K) = − (1243.6 ± 1.3) kJ·mol–1,
f mH ο∆ (UCl4, cr, 298.15 K) = − (1018.8 ± 2.5) kJ·mol–1,
or compatible with the NEA values:
sol mH∆ (SrCl2, cr, in 5.94 mol·dm–3 HCl) = − (38.1 ± 1.1) kJ·mol–1
(calculated from the enthalpy of solution of SrCl2 in 1 mol·dm–3 HCl for the 95% confi-dence interval by [83MOR/WIL] and the enthalpy of transfer from 1 to 5.94 mol·dm–3 HCl by [78PER/THO]1),
sol mH∆ (UO2Cl2, cr, 5.94 mol·dm–3 HCl) = − (64.2 ± 0.5) kJ · mol–1 (interpolated from [83FUG/PAR], the uncertainty limits being ours),
sol mH∆ (UCl4, cr, 5.94 mol·dm–3 HCl) = − (64.2 ± 0.5) kJ · mol–1 (idem),
f mH∆ (H2O, 5.94 mol·dm–3 HCl, partial) = − (286.646 ± 0.150) kJ · mol–1
(extrapolated from the value for 6.00 mol·dm–3 HCl [2000RAN/FUG])
f mH∆ (HCl, 5.94 mol·dm–3 HCl, partial) = − (153.400 ± 0.150) kJ · mol–1 (idem).
1 The confidence limits of the alkaline earth chlorides dilution values by [78PER/THO] could not be ascertained, as these authors do not report individual results.

Discussion of selected references 467
Table A-13: Enthalpies of solution and formation of SrUO . 4–x
x in SrUO 4–x sol mH∆ f mH∆
0.380 – (152.71 ± 0.60)
0.297 – (149.24 ± 0.99) – (1941.47 ± 2.19)
0.127 – (143.40 ± 7.90) – (1971.61 ± 8.11)
0 – (142.86 ± 2.45) – (1990.28 ± 3.22)
, kJ·mol kJ·mol–1 –1
0.478 – (170.55 ± 1.89) – (1894.31 ± 2.83)
– (1926.14 ± 2.09)
The value for the enthalpy of formation of the stoichiometric α–SrUO4 is in ex-cellent agreement with that selected in [92GRE/FUG], − (1989.6 ± 2.8) kJ · mol–1, based on the results of [67COR/LOO]. If the five data points above are fitted (as did the au-thors) to a quadratic function of x, the best fit is given by:
f mH∆ (SrUO4–x, α, 298.15 K) (kJ · mol–1) = − 1989.3 + 98.1·x + 202.8·x2,
a relation from which the partial molar enthalpy of solution of oxygen can be approxi-mated as a function of x.
[94AHO/ERV]
Dissolved U(VI) and U(IV) concentrations, EH and pH values, as well as chemical com-positions are available for filtered undergroundwater ( 0.45 m< µ ) taken from several boreholes drilled in the Palmottu site. Seven samples are well characterised. Modelling on the basis of thermodynamical data selected by [92GRE/FUG] and from the CHEMVAL database (1992) is compared to these experimental data. Species involved in the pH range 6.87 to 9.05 are mono-, di-, and tri-dioxouranium(VI)carbonates and
(aq) for U(IV). In this pH range both databases give the same predominant species. The equilibria, which account for experimental data, are those between
and the di- and tri-carbonate U(VI) complexes. Indeed experimental and calculated U(VI)/U(IV) ratios using [92GRE/FUG] data are in good agreement, as well as the slope, E
4U(OH)
4U(OH) (aq)
H /pH, deduced from these experimental data and the one calculated from the equilibria.
[94COR/IJD]
Sr2UO4.5(s) was obtained from Sr2UO5(s) by reduction in an Ar/H2 gas mixture at tem-peratures from 1200 to 1300 K. The sample characterisation is described in detail; these are given also in the paper by [99COR/BOO], in both cases with similar information for other strontium uranates. The compound is indexed as pseudo–orthorhombic, isostruc-tural with the high temperature form of Ca2UO4.5(s) and lattice parameters nearly equal to those of Sr3UO6(s). The enthalpy of dissolution of the compound in (HCl + 0.0470
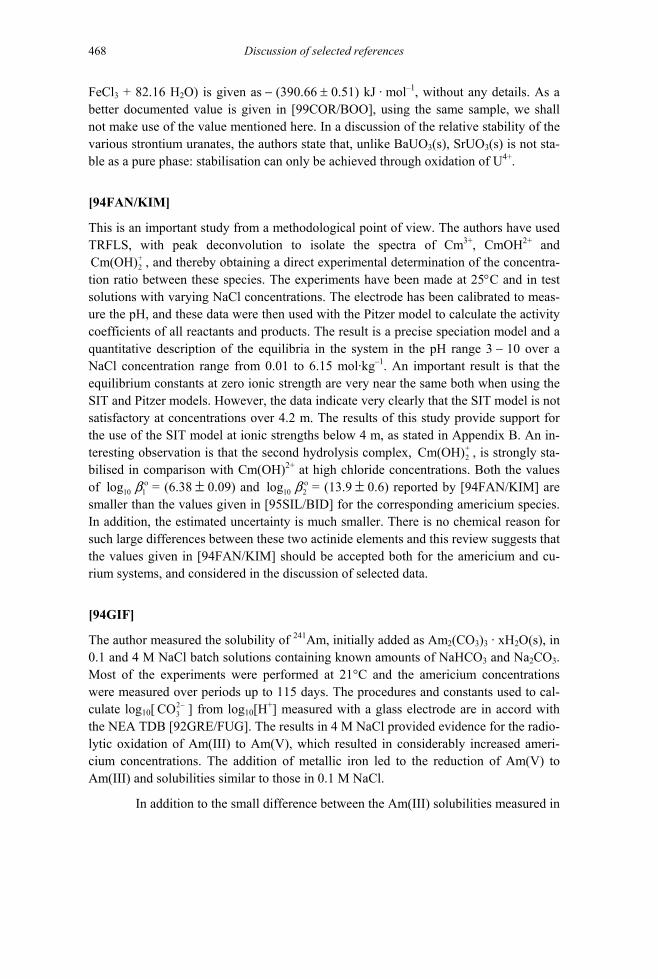
Discussion of selected references 468
FeCl3 + 82.16 H2O) is given as − (390.66 ± 0.51) kJ · mol–1, without any details. As a better documented value is given in [99COR/BOO], using the same sample, we shall not make use of the value mentioned here. In a discussion of the relative stability of the various strontium uranates, the authors state that, unlike BaUO3(s), SrUO3(s) is not sta-ble as a pure phase: stabilisation can only be achieved through oxidation of U4+.
[94FAN/KIM]
This is an important study from a methodological point of view. The authors have used TRFLS, with peak deconvolution to isolate the spectra of Cm3+, CmOH2+ and
, and thereby obtaining a direct experimental determination of the concentra-tion ratio between these species. The experiments have been made at 25°C and in test solutions with varying NaCl concentrations. The electrode has been calibrated to meas-ure the pH, and these data were then used with the Pitzer model to calculate the activity coefficients of all reactants and products. The result is a precise speciation model and a quantitative description of the equilibria in the system in the pH range 3 − 10 over a NaCl concentration range from 0.01 to 6.15 mol·kg
+2Cm(OH)
10 1log οb
–1. An important result is that the equilibrium constants at zero ionic strength are very near the same both when using the SIT and Pitzer models. However, the data indicate very clearly that the SIT model is not satisfactory at concentrations over 4.2 m. The results of this study provide support for the use of the SIT model at ionic strengths below 4 m, as stated in Appendix B. An in-teresting observation is that the second hydrolysis complex, , is strongly sta-bilised in comparison with Cm(OH)
+2Cm(OH)
2+ at high chloride concentrations. Both the values of = (6.38 ± 0.09) and 10 2log οb = (13.9 ± 0.6) reported by [94FAN/KIM] are smaller than the values given in [95SIL/BID] for the corresponding americium species. In addition, the estimated uncertainty is much smaller. There is no chemical reason for such large differences between these two actinide elements and this review suggests that the values given in [94FAN/KIM] should be accepted both for the americium and cu-rium systems, and considered in the discussion of selected data.
[94GIF]
The author measured the solubility of 241Am, initially added as Am2(CO3)3 · xH2O(s), in 0.1 and 4 M NaCl batch solutions containing known amounts of NaHCO3 and Na2CO3. Most of the experiments were performed at 21°C and the americium concentrations were measured over periods up to 115 days. The procedures and constants used to cal-culate log10[ ] from log2
3CO −10[H+] measured with a glass electrode are in accord with
the NEA TDB [92GRE/FUG]. The results in 4 M NaCl provided evidence for the radio-lytic oxidation of Am(III) to Am(V), which resulted in considerably increased ameri-cium concentrations. The addition of metallic iron led to the reduction of Am(V) to Am(III) and solubilities similar to those in 0.1 M NaCl.
In addition to the small difference between the Am(III) solubilities measured in

Discussion of selected references 469
0.1 and 4 M NaCl, UV–Vis–NIR absorption spectra of Am(III) solutions in 0.2 M HClO4 containing 3 M NaCl or 3 M NaClO4 did not show any differences. The author concluded that the formation of Am(III) chloride complexes requires NaCl concentra-tions above 4 mol · L–1. This is in accord with a spectroscopic (TRLFS) investigation of the chloride complexation of Cm(III) [95FAN/KIM] and the thermodynamic data se-lected in the present review. (Giffaut’s studies on the chloride complexation of neptu-nium and plutonium in the oxidation states III to VI were already considered and dis-cussed in the corresponding sections of [2001LEM/FUG]. In the present volume, a more complete analysis for the chloride complexation of Pu(VI), encompassing results of this study, the work of [99RUN/REI] and corresponding U(VI) studies [92GRE/FUG], is provided in the Appendix A entry for [99RUN/REI].)
• Am(III) carbonates
The solids formed in the solubility studies were not characterised by X–ray diffraction or other methods. In a preliminary paper [93GIF/VIT], the initially added Am2(CO3)3 · xH2O(s) was assumed to be the equilibrium solid phase and the solubility data were interpreted accordingly. The suggested results were not credited in the previ-ous review [95SIL/BID]. In his thesis, Giffaut re-analysed the Am(III) solubilities and concluded that the formation of AmOHCO3(s) was the solubility-limiting solid. The present review accepts this interpretation. The evaluated solubility constants for the re-action:
AmOHCO3(s) Am3+ + OH– + 23CO − (A.43)
are log10Ks,0 = − (21.0 ± 0.4) in 0.1 M NaCl and − (20.7 ± 0.4) in 4 M NaCl correspond-ing to 10 ,0log sK ο = − (22.5 ± 0.4) and − (23.3 ± 0.5), respectively, if converted to I = 0 with the SIT coefficients selected in Appendix B. They are in reasonable agreement with other data for AmOHCO3(cr), [84SIL/NIT], [84BER/KIM], [90FEL/RAI], [96MER/FUG] (cf. discussion of data selection, section 12.6.1.1.3.1). The formation constants for the complexes, + 3
3 3 2AmCO , Am(CO ) and Am(CO )3 3− − , evaluated from the
solubility in 0.1 M NaCl are also included in the selection of thermodynamic data (cf. section 12.6.1.1.1). The formation constants calculated from the solubility in 4 M NaCl are outside the range of those from other studies. The deviations are possibly caused by the formation of NaAm(CO3)2(s), particularly at carbonate concentrations above 10–2 mol·L–1.
Giffaut also measured Am(III) solubilities at different temperatures in the range 20–70°C. The carbonate concentration in 4 M NaCl–NaHCO3–Na2CO3 batch solutions (partly controlled by
2= 1 bar) was varied in the range, log
COp 10[ ] = − 5
to 0, and the solubility data were interpreted assuming the formation of either AmOHCO
23CO −
3(s) or NaAm(CO3)2(s) as equilibrium solid phases. As the solids were not unambiguously characterised or identified, these measurements do not allow the determination of thermodynamic data. However, it is noteworthy, that the observed effect of temperature over the range studied is rather small. The measured americium

Discussion of selected references 470
concentrations vary less than 0.5 log10 units.
• Am(V) carbonates
The solid Am(V) carbonate formed in the 4 M NaCl solutions was not characterised, but the assumption of NaAmO2CO3(s) as the solubility-controlling solid is justified, be-cause the analogous Np(V) carbonate compound is well known to be the stable solid under the conditions in [94GIF] (cf. [2001LEM/FUG]). The experimental solubilities measured by Giffaut in the range, –5.5 < log10[ 2
3CO − ] < − 1.5, in 4 M NaCl compare well with those of Runde and Kim [94RUN/KIM], and Runde et al. [96RUN/NEU] at the same carbonate concentrations in 3 and 5 M NaCl. The reported equilibrium con-stants log10Ks,n (n = 1, 2, 3) for the reaction:
2 + 1 22 3 3 2 3NaAmO CO (s) + ( 1) CO Na + AmO (CO ) n
nn − −− (A.44)
are shown in Table A-14 in comparison with the corresponding data of [94RUN/KIM]. The values of log10Ks,1 and log10Ks,3 are in good agreement, whereas the larger devia-tions in the log10Ks,2 values indicate that the uncertainties are underestimated in [94GIF], [94RUN/KIM].
The stepwise formation constants of Am(V) carbonate complexes given by:
log10Kn = log10Ks,n − log10Ks,(n–1)
are used in section 12.6.1.1.2, together with the corresponding data of [94RUN/KIM] for the selection of thermodynamic data for the Am(V) carbonate complexes.
Because of the lack of data in the range, log10[ CO23
− ] < –5.5, i.e., with the un-complexed ion as the predominant solution species, the solubility constant of log
+2AmO
10Ks,0(4 M NaCl) = − (10.4 ± 0.25) [94GIF] proposed by Giffaut for the reaction:
NaAmO2CO3(s) Na+ + + CO+2AmO 2
3− (A.45)
is highly speculative. This becomes evident in Figure IV.4 (p. 144) in [94GIF], where the solubility curve is extrapolated to lower carbonate concentrations with a value of log10Ks,0 = − 9.6 in 4 M NaCl, which is consistent with the solubility constants given in [94RUN/KIM], [96RUN/NEU], (log10Ks,0 = − (9.65 ± 0.19) in 3 M NaCl and − (9.56 ± 0.13) in 5 M NaCl). There is no reason to prefer the calculations in Figure IV.5 (p. 145) in [94GIF], where the solubility curve is extrapolated to lower carbonate concentrations with the proposed value of log10Ks,0 = − 10.4.

Discussion of selected references
471
Table A-14: Equilibrium constants for the dissolution of NaAmO2CO3(s). + 2
2 3 2 3NaAmO CO (s) Na + AmO + CO+ −
Medium, t(°C) log10Ks,0 Ref.
3.0 M NaCl, 22°C – (9.65 ± 0.19) [94RUN/KIM]
4.0 M NaCl, 21°C – (10.4 ± 0.25) (a) [94GIF]
5.0 M NaCl, 22°C – (9.56 ± 0.13) [94RUN/KIM]
+
2 3 2 3NaAmO CO (s) Na + AmO CO−
Medium, t(°C) log10Ks,1 Ref.
3.0 M NaCl, 22°C – (4.91 ± 0.21) [94RUN/KIM]
4.0 M NaCl, 21°C – (5.00 ± 0.17) [94GIF]
5.0 M NaCl, 22°C – (4.87 ± 0.14) [94RUN/KIM]
2 + 3
2 3 3 2 3 2NaAmO CO (s) + CO Na + AmO (CO )− −
Medium, t(°C) log10Ks,2 Ref.
3.0 M NaCl, 22°C – (2.23 ± 0.19) [94RUN/KIM]
4.0 M NaCl, 21°C – (1.4 ± 0.12) [94GIF]
5.0 M NaCl, 22°C – (2.02 ± 0.15) [94RUN/KIM]
2 + 5
2 3 3 2 3 3NaAmO CO (s) + 2 CO Na + AmO (CO )− −
Medium, t(°C) log10Ks,3 Ref.
3.0 M NaCl, 22°C − (0.11 ± 0.23) [94RUN/KIM]
4.0 M NaCl, 21°C (0.0 ± 0.25) [94GIF]
5.0 M NaCl, 22°C (0.09 ± 0.13) [94RUN/KIM]
(a) Not accepted for the reasons described in the text.
[94HEN/MER]
This paper describes the partial charge model, which is based on the electronegativity equalisation principle (EEP) to predict the speciation of Al, U, and Tc solutions as a function of pH. For the uranium (IV and VI) systems the models deal only with mono-nuclear species, but do predict the existence of 5U(OH)− and 2 3UO (OH)− (presumably in extremely dilute solutions), respectively, in dilute to strong base. Although there is no mention of further hydrolysis at high pH, the figures do indicate the formation of dou-bly–charged anions by a pH of 14. The speciation of Tc(IV) is predicted to vary from

Discussion of selected references
472
being dominated by TcO2+ at pH = − 1 to 3TcO(OH)− at pH = 14. No thermodynamic information is forthcoming, but the speciation models may be compared to those sug-gested by Raman and EXAFS results.
[94JAY/IYE]
This paper reports measurements of the pressure of Na(g) (by both mass–loss and mass–spectroscopic Knudsen effusion) and the oxygen activity (emf with CaO–ZrO2 electro-lyte) in the three–phase field NaUO3(cr) + Na2UO4(cr) + Na2U2O7(cr).
Na2UO4(cr) and Na2U2O7(cr) were prepared by heating appropriate amounts of U3O8(cr) or UO3(cr) with Na2CO3(s) in air at 1400 and 1000 K, respectively, and NaUO3(cr) by heating the relevant proportions of Na2UO4(cr) and UO2(cr) in purified argon at 1050 K. The products were characterised by X–ray diffraction.
The mass–spectrometric Knudsen effusion measurements were carried out in a graphite cell, further contained in a molybdenum cell, from 1117 to 1290 K, with Ag as a standard. Graphite could possibly have reduced at least the surface U(VI) uranates, although the X–ray diffraction pattern of the sample was unchanged after the measure-ments. The mass–loss Knudsen effusion measurements (in an unspecified cell, but probably again graphite) extended from 1283 to 1330 K, using a Cahn microbalance.
The oxygen potentials were studied using a CaO–ZrO2 electrolyte tube in flow-ing argon, from 923 to 1118 K. Air (
2Op = 0.21 bar) and Ni/NiO were used as the refer-
ence electrodes.
The sodium pressures from the mass–loss and mass–spectrometric studies agreed well; the latter showed a distinct change of slope (of the 10log p vs. 1/T plot) at around 1195 K, close to the temperature of the α to β transition in Na2UO4(cr) (1193 K, [82COR/MUI]). However, the change in slope corresponds to a bigger enthalpy than that expected for a simple phase transformation, and like the authors, we have preferred to use only the data below 1193 K, with an increased uncertainty since these are not absolute pressure measurements. These give:
110 Nalog ( / bar) = 12.92 22701p T −− ⋅ (1117 to 1193 K)
over the three-phase field, NaUO3(cr) + Na2UO4(cr) + Na2U2O7(cr).
The authors do not state the Gibbs energies of formation of NiO(cr) used to convert the study with a Ni–NiO reference electrode to oxygen potentials. We have used the values assessed by Taylor and Dinsdale [90TAY/DIN], which include consideration of the magnetic transitions in Ni and NiO. Their data in the relevant temperature range can be expressed as 1
f m (NiO, cr, ) = 234220 + 85.042 (J mol )G T T −∆ − ⋅ ⋅ from 900 to 1200 K. Our derived values for the sodium and oxygen potentials in the relevant three–phase field are then:
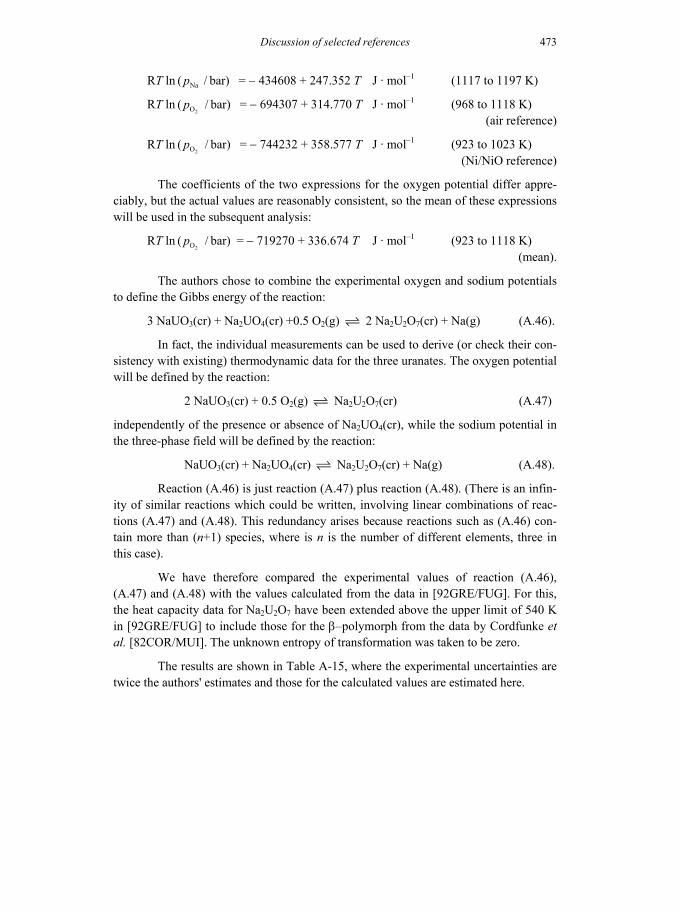
Discussion of selected references
473
RT ln Na ( / bar) p = − 434608 + 247.352 T J · mol–1 (1117 to 1197 K)
RT ln2O ( / bar) p = − 694307 + 314.770 T J · mol–1 (968 to 1118 K)
(air reference)
RT ln2O ( / bar) p = − 744232 + 358.577 T J · mol–1 (923 to 1023 K)
(Ni/NiO reference)
The coefficients of the two expressions for the oxygen potential differ appre-ciably, but the actual values are reasonably consistent, so the mean of these expressions will be used in the subsequent analysis:
RT ln2O ( / bar) p = − 719270 + 336.674 T J · mol–1 (923 to 1118 K)
(mean).
The authors chose to combine the experimental oxygen and sodium potentials to define the Gibbs energy of the reaction:
3 NaUO3(cr) + Na2UO4(cr) +0.5 O2(g) 2 Na2U2O7(cr) + Na(g) (A.46).
In fact, the individual measurements can be used to derive (or check their con-sistency with existing) thermodynamic data for the three uranates. The oxygen potential will be defined by the reaction:
2 NaUO3(cr) + 0.5 O2(g) Na2U2O7(cr) (A.47)
independently of the presence or absence of Na2UO4(cr), while the sodium potential in the three-phase field will be defined by the reaction:
NaUO3(cr) + Na2UO4(cr) Na2U2O7(cr) + Na(g) (A.48).
Reaction (A.46) is just reaction (A.47) plus reaction (A.48). (There is an infin-ity of similar reactions which could be written, involving linear combinations of reac-tions (A.47) and (A.48). This redundancy arises because reactions such as (A.46) con-tain more than (n+1) species, where is n is the number of different elements, three in this case).
We have therefore compared the experimental values of reaction (A.46), (A.47) and (A.48) with the values calculated from the data in [92GRE/FUG]. For this, the heat capacity data for Na2U2O7 have been extended above the upper limit of 540 K in [92GRE/FUG] to include those for the β–polymorph from the data by Cordfunke et al. [82COR/MUI]. The unknown entropy of transformation was taken to be zero.
The results are shown in Table A-15, where the experimental uncertainties are twice the authors' estimates and those for the calculated values are estimated here.

Discussion of selected references
474
Table A-15: Experimental and calculated Gibbs energies of sodium uranate reactions.
T/ K r mG∆ (A.47) (kJ · mol–1) r mG∆ (A.48) (kJ · mol–1) r mG∆ (A.46) (kJ · mol–1)
Exp. Cal. Exp. Cal. Exp. Cal.
900 – (208.1 ± 0.2) – (131.0 ± 0.3) (212.0 ± 13.4) (181.8 ± 50.7) (3.9 ± 13.4) (50.8 ± 10.2)
1000 – (191.3 ± 0.2) – (122.0 ± 0.3) (187.3 ± 13.4) (169.7 ± 50.7) – (4.0 ± 13.4) (47.7 ± 10.3)
1100 – (174.5 ± 0.2) – (112.9 ± 0.3) (162.5 ± 13.4) (157.7 ± 50.7) – (11.9 ± 13.4) (44. ± 10.3)
1200 – (157.6 ± 0.2) – (103.1 ± 0.3) (137.8 ± 13.4) (146.0 ± 50.8) – (19.8 ± 13.4) (42.9 ± 10.4)
The measured sodium pressures (reaction (A.48)) agree reasonably well with the calculated values, especially in the range of temperature where they were measured (1100 − 1200 K). However, the oxygen potentials (reaction (A.47)) seem to be much too negative, perhaps due to a lack of equilibrium between the three solids. The authors' measurements for reaction (A.47) would suggest an enthalpy of formation of NaUO3 which is ca. 30 kJ · mol-1 more positive than the selected value. However, this would mean that NaUO3 would not be a stable phase on the Na–U–O isothermal section at 800 K, cf. Figure 1 in the paper.
It may be noted that there is a discrepant calorimetric value for f mH∆ (NaUO3) (by reaction with XeO3(g)) from the study by O'Hare and Hoekstra [74OHA/HOE3], but this is 25 kJ · mol–1 more negative than the selected value.
We do not see any reason to change the currently selected enthalpy of forma-tion of NaUO3, but in view of these two discrepant values, we have increased its uncer-tainty substantially.
[94KAL/MCC]
This paper incorporates the data on the electronic levels of UO(g), derived by laser spectroscopy, from a number of earlier papers by the same authors (then at different Institutions); further levels between 15000 and 21000 cm–1 have been identified in a later paper [97KAL/HEA]. All these data have been used to refine the thermal functions of UO(g) - see section 9.3.1.1.1.
[94KAT/MEI]
Kato et al. describe the de-convolution of the spectra from six U(VI) solutions, 40.1 M NaClOI = , pH = 3.87, 4.06, 4.98, 5.77, 6.02 and 7, and 65 10−⋅ to 22 10−⋅ M in
U, obtained by equilibration with schoepite in an open atmosphere, on the basis of sin-gle component emission spectra of the species n:m 2
2(UO ) (OH) m nm n
− ,0:1, 2:2, 5:3 and

Discussion of selected references
475
the monocarbonato dioxouranium(VI), 1:0:1, 1:0:q 2 22 3UO (CO ) q
q− . The single compo-
nent spectra are given in [93MEI/KIM].
The results seem compatible (however, the uranium concentrations of the solu-tions are not given) with the prediction of the composition of the solutions on the basis of formation constant of species: 1:1 [83CAC/CHO2], 2:2 [93MEI/KAT], 5:3 [93MEI/KIM], 1:0:1, 1:0:2 and 1:0:3 [93MEI/KIM]. The species 1:0:2 and 1:0:3, which predominate above pH = 7, do not fluoresce.
This paper does not give any new information. It confirms previous results on fluorescence lifetime values.
[94KIM/CHO]
Titrations were performed at 25°C and 0.1 M ionic strength (NaCl) in two identical cells housed in a 2CO free glove box. Equilibrium was approached from supersaturation by addition of 0.1 M NaOH to 49.789 10 M−⋅ U(VI) to give a pH of 9.5. After overnight equilibration, 49.824 10 M−⋅ NaClO was added to one cell. A steady state was achieved after four days whereupon a sample was taken and the pH of the remaining solution was readjusted. Batch experiments with schoepite were also performed with different ratios of hypochlorite. X–ray diffraction was used to characterise the precipitates. The pres-ence of hypochlorite increased the solubility of schoepite by a factor of 100. However, although the effect of ClO− is clearly an oxidation process and spectroscopic evidence is supplied to confirm the presence of 2
2UO + , 22 2 2(UO ) (OH) + and 2 3 5(UO ) (OH)+ , this is
by the authors’ admission, not an equilibrium reaction. Moreover, the pH dependence of the schoepite solubility profile for those experiments without hypochlorite present shows an increase in solubility with pH that is inconsistent with the established thermo-dynamics.
[94KIM/KLE]
The formation constants for the complexes, 3 23Cm(CO ) n
n− , n = 1, 2, 3, have been deter-
mined at room temperature (no information is given in the paper and we assume that the temperature is close to 25°C) in a 0.1 M NaClO4 ionic medium.
There is ample information on the experimental details and the chemical model proposed by the authors is in good agreement with previous information on similar sys-tems. It is not clear whether the authors measure pH or − log10[H+]. As all concentra-tions are given in molar units, the reviewers are confident that the equilibrium constants reported are concentration constants, valid in 0.1 M sodium perchlorate. The free car-bonate concentration is calculated from the expression, log10[ 2
3CO − ] = log10K + log10
2COp + 2 pH, where log10K = − (17.62 ± 0.07) refers to the reaction:
2 +2 2 3CO (g) + H O(l) CO + 2 H− .

Discussion of selected references
476
This value is in fair agreement with the one calculated from the selected values in [92GRE/FUG], log10K = − (17.52 ± 0.04). The formation constant for +
3CmCO in 0.1 M NaClO4 is reported as 10 1log b = (6.65 ± 0.07) at room temperature (25°C?), practi-cally the same as for Eu(III), 10 1log b = (6.57 ± 0.08). These values are in excellent agreement with most of the previous literature information, as discussed by the authors, cf. their Table 5. The reviewers have recalculated these data to zero ionic strength using the SIT, with the following interaction constants: 3+
4(Cm , ClO )−ε = 0.49, +3 4(CmCO , ClO )−ε = 0.2 and 2 +
3(CO , Na )−ε = − 0.08 kg · mol–1 , and find 10 1log οb = (7.94 ± 0.10), in good agreement with the selected value for Am(III), 10 1log οb = (7.8 ± 0.3), selected in [95SIL/BID].
[94MOR/WIL]
The authors determined the enthalpy of solution of 243Am(OH)3(cr) in 6 M HCl and calculated the standard molar enthalpy, standard molar Gibbs energy, and solubility constant for crystalline Am(III) hydroxide. Am(III) oxalate was precipitated and cal-cined to AmO2(s). The AmO2(s) was reduced to Am2O3(s) under H2(g) at 800°C and finally hydrated in the presence of steam at 230°C. The reported X–ray powder diffrac-tion and IR investigations confirmed that the prepared solids refer to hexagonal Am(OH)3(cr). However, the X–ray powder patterns showed in addition two weak unas-signed lines at d = 0.2678 and 0.1904 nm.
The experimental measurements with solid samples from the same batch of preparation (batch A: sol mH∆ (Am(OH)3, cr, 298.15 K, 6 M HCl) = − 113.5 and − 111.6 kJ · mol–1; batch B: − 103.8, − 103.0, and − 99.0 kJ · mol–1) are in reasonable agreement, while the mean values from A (– (112.6 ± 2.7)) and B (– (101.9 ± 5.1)) are not. This indicates that the solids in batches A and B are not chemically identical. The authors proposed an overall mean value of sol mH∆ (Am(OH)3, cr, 298.15 K, 6 M HCl) = − (106.2 ± 7.6) kJ · mol–1. Based on a value of sol mH∆ (Am, cr, 6 M HCl) = − (617.5 ± 2.1) kJ · mol–1 for the enthalpy of solution of americium metal, the standard molar enthalpy of formation of well–crystallised Am(OH)3(cr) was calculated to be
f mH ο∆ (Am(OH)3, cr, 298.15 K) = − (1371.2 ± 7.9) kJ · mol–1. An entropy value of mS ο (Am(OH)3, cr, 298.15 K) = (129 ± 10) J · K–1 · mol–1 was estimated by analogy with
Nd and Eu hydroxides and used together with mS ο (Am3+, 298.15 K), mS ο (OH–, 298.15 K) and f mH ο∆ (OH–, 298.15 K) consistent with the values selected in [95SIL/BID], to calculate r mGο∆ = (168.2 ± 9.2) kJ · mol–1 for the reaction:
3+3Am(OH) (cr) Am + 3 OH− .
Accordingly, the solubility constant was calculated to be 10 ,0log sK ο (Am(OH)3, cr, 298.15 K) = − (29.5 ± 1.6), which corresponds to 10 ,0
*log sK ο (Am(OH)3, cr, 298.15 K) = (12.5 ± 1.6). In this calculation, however, Morss and Williams used for
f mH ο∆ (Am3+) a value 4.5 kJ · mol–1 more negative than that adopted by [95SIL/BID]. For reasons of consistency, the present review combines the experimental data of Morss

Discussion of selected references
477
and Willams, sol mH∆ (Am, cr, 6 M HCl) = − (613.1 ± 1.4) kJ · mol–1 and f mH ο∆ (Am3+) = − (616.7 ± 1.5) kJ · mol–1 as selected in [95SIL/BID]. The standard molar enthalpy of formation is then calculated to be f mH ο∆ (Am(OH)3, cr, 298.15 K) = − (1366.8 ± 7.7) kJ · mol–1. With mS ο (Am(OH)3, cr, 298.15 K) = (116 ± 8) J · K–1 · mol–1 as estimated in the present review (cf. section 12.3.2.2) the solubility constant becomes
10 ,0log sK ο (Am(OH)3, cr, 298.15 K) = − (28.7 ± 1.6) or 10 ,0*log sK ο (Am(OH)3, cr,
298.15 K) = (13.3 ± 1.6).
As their calculated solubility constant was considerably lower than those de-rived from solubility measurements, e.g., in [82SIL], Morss and Williams [94MOR/WIL] proposed a “working value” of 10 ,0
*log sK ο (Am(OH)3, s, 298.15 K) = (14.5 ± 2.0) for a less crystalline Am(OH)3(s), typical for a hydroxide in contact with an aqueous solution. Applying a correlation of the relative basicity of actinide and lantha-nide hydroxides as a function of ionic size, the authors proposed further “working val-ues” of 10 ,0
*log sK ο (Pu(OH)3, s, 298.15 K) = (15.5 ± .2.0) and 10 ,0*log sK ο (Cm(OH)3, s,
298.15 K) = (14.0 ± 2.0). The experimental value for f mH ο∆ (Am(OH)3, cr, 298.15K) reported by [94MOR/WIL] differs significantly from an earlier estimate by the same authors [92MOR/WIL].
[94OCH/SUZ]
Single crystals of UTe and USb were grown by the Bridgman technique from high pu-rity elements. 10% excess of Te and Sb were added to allow for their evaporation, but no further details of the preparation, or elemental analyses of the products are given. The lattice constants of 6.160 and 6.210 Å were a little larger than previously reported values.
Electrical resistivity and heat capacity were measured from 2 to 300 K, with very few details of the apparatus used. Preliminary results of the heat capacity are pre-sented in small graphs. Both materials show pronounced ferromagnetic peaks at 102 and 218 K, respectively, several K different from earlier values. The values of
,mpC (298.15 K) read from the graphs are about 75 J · K–1 · mol–1 for USb(cr) and 84 J · K–1 · mol–1 for UTe(cr). Although the authors state that the results were sample de-pendent and that higher quality materials are desirable for more precise measurements, these data have been included in the review with fairly high uncertainties.
[94OMO/MUR]
Omori et al. determined the distribution coefficient for pertechnetate between chloro-form and water (1 molar ionic strength, HCl and NaCl) at 298.15 K. Tetraphenylar-sonium chloride (TPAC) was the extraction agent employed and it was detected spec-trophotometrically, whereas the 99Tc tracer was measured by liquid scintillation count-ing. 4TcO− was identified by paper chromatography. The distribution coefficient for

Discussion of selected references
478
TPAC ([TPAC]org/[TPAC]aq) was determined to be 29.5 from the [H+] dependence at constant chloride molality (viz., 1 M). The protonation constant for TPAC in the aque-ous phase was also calculated in this manner to be 1.36 M–1, using a value of 0.079 M for the chloride dissociation of TPAC. Addition of 4TcO− yielded an extraction constant (K) for the equilibrium, 4 4TcO + TPAC(org) TPATcO (org) + Cl− − , of (3.0 ± 0.2)·104 leading to a value for the acid (molar) dissociation constant of HTcO4(aq) of 10 Clog K = (1.02 ± 0.18). This value is even higher than those in Table V.10 of [99RAR/RAN] who considered all of these values to be unreliable and possible artefacts of misrepresented medium effects. Indeed, although no data are tabulated, the plot provided of 1/D’ versus [H+] is quite flat such that the slope (
C1
K K⋅= ) is virtually zero within the experimental uncertainty. The slight deviation from zero slope could be accounted for by activity co-efficient variations as Na+ is substituted systematically by H+ over the range 0.1 to about 0.95 M.
[94RIZ/RAO]
This study describes a direct calorimetric determination of the enthalpy changes for the formation of 2+
2 2 2(UO ) (OH) , PuO2OH+ and PuO2(OH)2(aq), the uranium system having been studied in 1.0 M tetramethylammonium chloride and the plutonium system in 1.0 M sodium perchlorate, both at 25oC. The experimental procedures are satisfactory and the experimental results for the uranium system are in good agreement with previous determinations in other ionic media. The U(VI) concentration has been varied from 1.6 mM to 149.9 mM in the − log10[H+] range 3 to 5. Corrections for heats of dilution were made using experimental data and corrections for the enthalpy of formation of water from H+ and OH– were made using p wK = 13.79 and mr H∆ = 56.6 kJ · mol–1 (according to the authors and probably corresponding to 1 M tetramethylammonium chloride). The ratio of added hydroxide to the concentration of U(VI) was at most 0.86. The formation constant for 2+
2 2 2(UO ) (OH) in 1 M tetramethylammonium chloride is assumed to be the same as in 1 M sodium perchlorate. The value used, 10 2,2
*log 5.89= −b from [62BAE/MEY], is in fair agreement with the value selected in [92GRE/FUG].
The average value for the enthalpy of formation of the (2:2) complex 2+
2 2 2(UO ) (OH) , r mH∆ (2:2) is (44.4 ± 1.9) kJ · mol–1 and the value of r mS∆ (2:2) is (36 ± 6) J · K−1 · mol−1. The enthalpy and entropy data for 2+
2 2 2(UO ) (OH) are in good agreement with the values given in Table V.8 of [92GRE/FUG], despite the fact that the ionic strength is different. The ionic strength dependence of enthalpies of reaction are discussed in Chapter IX.10 of [97ALL/BAN]. Using the selected value
10 2,2
*log (5.62 0.04)= − ±b ο , in [92GRE/FUG] and auxiliary data (D, Im, ∆ε ) corre-sponding to a 1 M NaClO4 medium, we obtain 10 2,2
*log (5.93 0.06)= − ±b and 1
r m (2 : 2) 33.8 kJ molG −∆ = ⋅ , which in turn results in 1r m (2 : 2) 42.7 kJ molH −∆ = ⋅ and
1 1r m (2 : 2) 30 J K molS − −∆ = ⋅ ⋅ . These values are the same as those of [62BAE/MEY].
The plutonium data have been discussed in [2001LEM/FUG].

Discussion of selected references 479
[94RUN/KIM]
This report (thesis of W. Runde) contains experimental data on the solubility, hydrolysis and carbonate complexation of trivalent and pentavalent americium and pentavalent neptunium in sodium chloride solution. All experiments were performed at room tem-perature (22 ± 1)°C with the nuclides 241Am and 237Np, mainly in 5 M NaCl. The solu-bility and carbonate complexation of Am(V) and Np(V) were also investigated in 3 M NaCl and 1 M NaCl, respectively. The formation constant of the monocarbonate com-plex of Np(V) was additionally investigated by absorption spectroscopy in 0.1, 3 and 5 M NaCl. The solubility experiments were performed in titration cells, either under an inert argon atmosphere or under a defined carbon dioxide partial pressure of 0.01 bar in argon. The oxidation states of Am(III) and radiolytically oxidised Am(V) were con-firmed by absorption spectroscopy. A combined pH glass electrode was calibrated against H+ and OH– concentrations in the NaCl solutions. The equilibrium constants between H+, OH–, and 3HCO− 2
3CO − determined in [94RUN/KIM] are in reasonable agreement with widely accepted literature data in NaCl solution (e.g., with those calcu-lated with SIT coefficients of the NEA TDB or with those calculated for higher NaCl molalities with the Pitzer coefficients in [84HAR/MOL], [91PIT]).
An attempt was made to correct the apparent solubility constants of solid Am(III) and Am(V) hydroxides and carbonates in 5 M NaCl for the formation of chlo-ride complexes. As the applied chloride complexation constants were too large, these considerations must be rejected. (According to the corresponding data selected in the present review for Am(III) and in [2001LEM/FUG] for Np(V), chloride complexation is negligible up to 5 M NaCl). In a later paper, modelling Np(V) and Am(V) in alkaline and carbonate containing solutions with the Pitzer approach, Runde et al. [96RUN/NEU] also neglected the formation of An(V) chloride complexes and inter-preted the different equilibrium constants in chloride and perchlorate media in terms of ion interaction and activity coefficient effects.
• Am(III) hydroxides
Runde and Kim measured the solubility of an X–ray amorphous precipitate Am(OH)3(am), in the range 7 < − log10[H+] < 14 and evaluated a solubility constant of log10Ks,0((A.49), 5 M NaCl) = − (25.8 ± 0.4) for the reaction:
Am(OH)3(am) Am3+ + 3 OH– (A.49)
corresponding to 10 ,0*log sK ο = (15.2 ± 0.7), if converted to I = 0 with the SIT coeffi-
cients in Appendix B, or (14.6 ± 0.5) as calculated in [94FAN/KIM], [97KON/FAN] with the Pitzer approach. These values correspond rather to the solubility constant se-lected in this review for the crystalline hydroxide, 10 ,0
*log sK ο (Am(OH)3, cr, 298.15 K) = (15.6 ± 0.6). On the other hand, the solubility at − log10[H+] > 11 corresponds to
10 ,3log sK (A.50) = − (9.3 ± 0.3),
3Am(OH) (s) Am(OH) (aq)3 (A.50)

Discussion of selected references 480
which is consistent with the data selected for Am(OH)3(am) (cf. section 12.3.2.2, Fig. 12-4). Because of these ambiguities and possible inaccuracies arising from the ionic strength corrections, the constants lo 10 ,0g sK ((A.49), 5 M NaCl) and 10 ,3log sK ((A.50), 5 M NaCl) derived in [94RUN/KIM] are not used for the selection of thermodynamic data. The formation constants reported for the first and second hydroxide complex,
(AmOH10 1log b 2+, 5 M NaCl) = (6.9 ± 0.6) and ( , 5 M NaCl) = (12.8 ± 0.7), are in good or at least fair agreement with data for the analogous Cm(III) complexes [94FAN/KIM], determined by time resolved laser fluorescence spectroscopy (cf. discussion of data selection, section 12.3.1.1, Fig.12-2 and 12-2).
10 2log b +2)Am(OH
• Am(III) carbonates
Measuring the solubility of NaAm(CO3)2·xH2O(s) as a function of log10[H+] under an atmosphere of
2= 0.01 bar in argon, Runde and Kim repeated the solubility study of
Meinrath [91MEI]. In addition, they performed an analogous experiment with NaEu(CO
COp
3)2·xH2O(s). The sodium americium carbonate was characterised by compar-ing its X–ray powder diffraction pattern with those of the analogous Eu and Nd com-pounds. The evaluated solubility constant was lo 10 ,0g sK ((A.51), 5 M NaCl) = − (16.5 ± 0.3) for the reaction:
+ 3+ 23 2 2 3 2NaAm(CO ) H O(s) Na + Am + 2 CO + H O(l)x x−⋅ (A.51).
With the number of crystal water molecules, x = (5 ± 1) (cf. discussion of [91MEI]), aw = 0.7786 in 5.6 m NaCl [91PIT], and ∆ε(A.51) = (0.10 ± 0.06) kg · mol–1 according to the SIT coefficients in Appendix B, the solubility constant at I = 0 is calcu-lated in this review to be 10 ,0log sK ο (A.51) = − (21.0 ± 0.5). The uncertainty reflects those of the ε values, but the use of the SIT equation in 5.6 m NaCl may also include other uncertainties. However, this value at I = 0 is consistent with lo 10 ,0g sK ο
33 3O )
(A.51) = − (21.0 ± 0.4) as calculated in [98NEC/FAN], [99FAN/KON] with the Pitzer approach and is therefore selected in the present review. The carbonate complexation constants evaluated from this solubility study, lo ( , 5 M NaCl) = (5.7 ± 0.4),
( , 5 M NaCl) = (9.7 ± 0.5), and (10 1g b +
3AmCO10log b10 2log b 3 2Am(CO )−
3 Am(C − , 5 M NaCl) = (12.9 ± 0.2) are comparable with those determined for aqueous Cm(III) carbonate com-plexes by time resolved laser fluorescence spectroscopy [99FAN/KON].
• Am(V) and Np(V) hydroxides
Runde and Kim measured the solubility of amorphous Am(V) and Np(V) hydroxides in 5 M NaCl as a function of the H+ concentration in the range 7.8 < − log10[H+] < 13.5. Both data sets indicate the formation of a neutral and an anionic hydroxide complex, AnO2OH(aq) and . The solubility data for the Np(V) hydroxide are shifted to lower concentrations compared to those of the Am(V) hydroxide. A difference of 0.6 log
2AnO (OH)−2
10 units is constant over the whole pH range investigated. This observation was as-cribed to the aging of NpO2OH(am) as already claimed in [92NEC/KIM] for analogous

Discussion of selected references 481
data in 1 and 3 M NaClO4. The evaluated solubility constants and formation constants of the hydroxide complexes, given for the reactions:
+2AnO OH(am) AnO + OH2
− (A.52) and +
2AnO + OH AnO (OH) nnn 1
2− − (A.53)
are summarised in Table A-16. For comparison the corresponding constants selected in [2001LEM/FUG], 10 ,0
*log sK ο (NpO2OH, am, 298.15 K) = (5.3 ± 0.2) and (4.7 ± 0.5) for fresh and aged precipitates, respectively, 10 1
*log οb (NpO2OH, aq, 298.15 K) = − (11.3 ± 0.7), and 10
*log 2οb ( 2 2 2NpO (OH )− , 298.15 K) = − (23.6 ± 0.5) are
extrapolated to 5 M NaCl with the SIT coefficients selected in [2001LEM/FUG] ( = (0.04 ± 0.01) kg · mol+(Na ,OH )−ε –1, +
2(NpO ,Cl )−ε
2
= (0.09 ± 0.05) kg · mol–1, = − (0.01 ± 0.07) kg · mol+
2(Na ,NpO ( 2 )−OH)ε –1). Runde and Kim’s solubility constant for NpO2OH(aged) is consistent with the SIT calculation based on the data in [2001LEM/FUG] and the solubility constant for AmO2OH(am) is consistent with the SIT calculation for NpO2OH(am, fresh) (cf. Table A-16). However, the calculations for the hydroxide complexes, NpO2OH(aq) and 2NpO (OH)− , are considerably less in accord with Runde and Kim’s experimental data in 5 M NaCl. An accurate fit would require additional interaction coefficients, 2(NpO OH(aq),Cl )−ε = − (0.12 ± 0.13) kg · mol–1 and ε = − (0.17 ± 0.13) kg · mol2 2(OH) ,Cl )− −(NpO –1. However, the interactions of neutral complexes or anion–anion interactions are usually neglected in the SIT, whereas they are included in the Pitzer parameterisations proposed in [96RUN/NEU] and [95FAN/NEC]. It is noteworthy that the equilibrium constants at I = 0 calculated in [96RUN/NEU] with the Pitzer approach are in excellent agreement with the thermodynamic data selected in [2001LEM/FUG] from experimental data in NaClO4 solution (cf. Table A-16).
Besides data from Runde and Kim in 5 M NaCl there are no other reliable data for Am(V) hydroxide complexes, but according to the results in [94RUN/KIM] it seems justifiable to use the formation constants of the aqueous Np(V) hydroxide complexes selected in [2001LEM/FUG] as reasonable estimates for the analogous Am(V) hydrox-ide complexes.
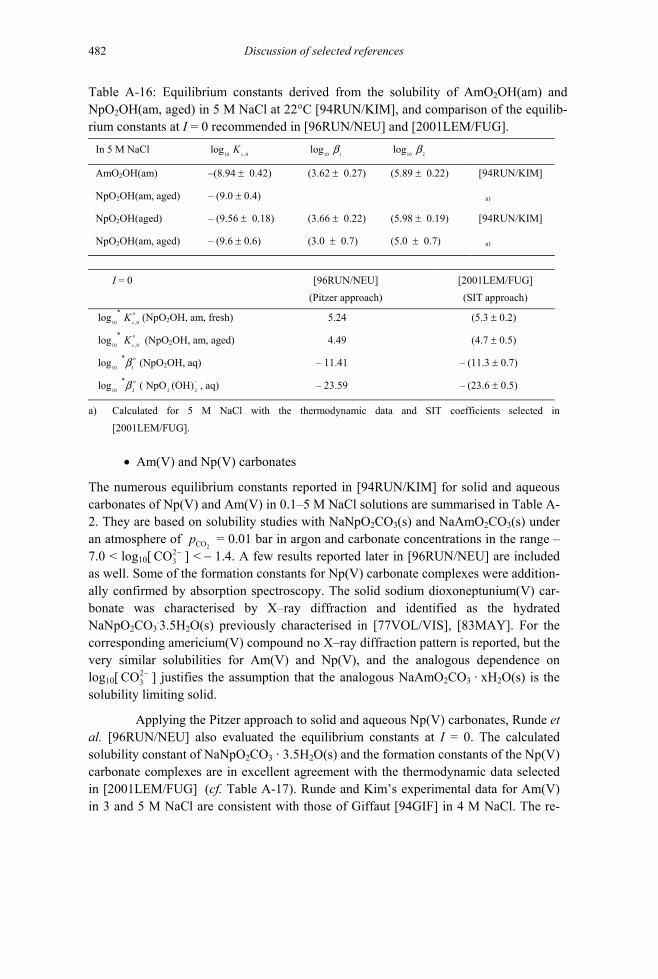
Discussion of selected references 482
Table A-16: Equilibrium constants derived from the solubility of AmO2OH(am) and NpO2OH(am, aged) in 5 M NaCl at 22°C [94RUN/KIM], and comparison of the equilib-rium constants at I = 0 recommended in [96RUN/NEU] and [2001LEM/FUG].
In 5 M NaCl 10 ,0
logs
K 10 1log b 10 2log b
AmO2OH(am) –(8.94 ± 0.42) (3.62 ± 0.27) (5.89 ± 0.22) [94RUN/KIM]
NpO2OH(am, aged) – (9.0 ± 0.4) a)
NpO2OH(aged) – (9.56 ± 0.18) (3.66 ± 0.22) (5.98 ± 0.19) [94RUN/KIM]
NpO2OH(am, aged) – (9.6 ± 0.6) (3.0 ± 0.7) (5.0 ± 0.7) a)
I = 0 [96RUN/NEU] (Pitzer approach)
[2001LEM/FUG] (SIT approach)
10 ,0
*logs
K ο (NpO2OH, am, fresh) 5.24 (5.3 ± 0.2)
10 ,0log
s
* K ο (NpO2OH, am, aged) 4.49 (4.7 ± 0.5)
10 1log b* ο
* ο (NpO2OH, aq) – 11.41 – (11.3 ± 0.7)
10 2log b ( , aq) 2NpO (OH)−
2 – 23.59 – (23.6 ± 0.5)
a) Calculated for 5 M NaCl with the thermodynamic data and SIT coefficients selected in [2001LEM/FUG].
• Am(V) and Np(V) carbonates
The numerous equilibrium constants reported in [94RUN/KIM] for solid and aqueous carbonates of Np(V) and Am(V) in 0.1–5 M NaCl solutions are summarised in Table A-2. They are based on solubility studies with NaNpO2CO3(s) and NaAmO2CO3(s) under an atmosphere of
2 = 0.01 bar in argon and carbonate concentrations in the range –
7.0 < logCOp
10[ ] < − 1.4. A few results reported later in [96RUN/NEU] are included as well. Some of the formation constants for Np(V) carbonate complexes were addition-ally confirmed by absorption spectroscopy. The solid sodium dioxoneptunium(V) car-bonate was characterised by X–ray diffraction and identified as the hydrated NaNpO
23CO −
2CO3.3.5H2O(s) previously characterised in [77VOL/VIS], [83MAY]. For the
corresponding americium(V) compound no X–ray diffraction pattern is reported, but the very similar solubilities for Am(V) and Np(V), and the analogous dependence on log10[ CO ] justifies the assumption that the analogous NaAmO2
3−
2CO3 · xH2O(s) is the solubility limiting solid.
Applying the Pitzer approach to solid and aqueous Np(V) carbonates, Runde et al. [96RUN/NEU] also evaluated the equilibrium constants at I = 0. The calculated solubility constant of NaNpO2CO3 · 3.5H2O(s) and the formation constants of the Np(V) carbonate complexes are in excellent agreement with the thermodynamic data selected in [2001LEM/FUG] (cf. Table A-17). Runde and Kim’s experimental data for Am(V) in 3 and 5 M NaCl are consistent with those of Giffaut [94GIF] in 4 M NaCl. The re-

Discussion of selected references 483
sults reported in these two theses are used in the present review to evaluate thermody-namic data for Am(V) carbonate complexes from experimental data for Am(V), and so are not based solely by analogy with Np(V) (cf. discussion of selected data, sections 12.6.1.1.2. and 12.6.1.1.3.4). The conditional constants in 3 − 5 M NaCl are converted to I = 0 with the SIT coefficients selected in [2001LEM/FUG] for the analogous Np(V) species, and the weighted average values are selected for the Am(V) carbonates:
10 ,0log sK ο (NaAmO2CO3, s, 298.15 K) = − (10.9 ± 0.4)
10 1log οb ( 2AmO CO3− , 298.15 K) = (5.1 ± 0.5)
10 2log οb ( 32 3AmO (CO )2
− , 298.15 K) = (6.6 ± 0.8)
10 3log οb ( 52 3 3AmO (CO ) − , 298.15 K) = (5.1 ± 1.0).
They are similar to the thermodynamic data selected in [2001LEM/FUG] for the analogous Np(V) compounds (cf. Table A-17), but the uncertainty limits are consid-erably larger.
Table A-17: Equilibrium constants derived in [94RUN/KIM], [96RUN/NEU] from the solubility studies with NaNpO2CO3(s) and NaAmO2CO3(s) in NaCl solutions at 22°C.
Medium An 10 ,0
logs
K 10 1log b 10 2log b 10 3log b
Np – (10.4 ± 0.2) (a) (4.8 ± 0.1) (a) 0.1 M NaCl Np (4.68 ± 0.03) (b)
1.0 M NaCl Np – (9.77 ± 0.16) (4.32 ± 0.07) (6.49 ± 0.09) (8.43 ± 0.06)
Np – (9.4 ± 0.2) (a) (4.3 ± 0.1) (a) (7.1 ± 0.2) (a) (9.2 ± 0.2) (a)
Np (4.67 ± 0.07) (b) 3.0 M NaCl Am – (9.65 ± 0.19) (4.74 ± 0.09) (7.42 ± 0.03) (9.54 ± 0.13)
Np – (9.61 ± 0.11) (4.71 ± 0.04) (7.54 ± 0.05) (9.63 ± 0.05)
Np (4.72 ± 0.13) (b) (7.63 ± 0.19)(b) 5.0 M NaCl Am – (9.56 ± 0.13) (4.69 ± 0.04) (7.54 ± 0.07) (9.65 ± 0.05)
I = 0
[96RUN/NEU] Np – 11.14 (c) 5.06 6.49 5.43
[2001LEM/FUG] Np – (11.16 ± 0.35)(c) (4.96 ± 0.06) (6.53 ± 0.10) (5.50 ± 0.15)
This review Am – (10.9 ± 0.4) (d) (5.1 ± 0.5) (d) (6.6 ± 0.8) (d) (5.1 ± 1.0) (d)
(a) Determined in [96RUN/NEU], all other data were determined in [94RUN/KIM]. (b) Determined by absorption spectroscopy (c) NaNpO2CO3
.3.5H2O(s) (d) Calculated from the data reported in [94GIF], [94RUN/KIM] for Am(V) in 3 – 5 M NaCl,
(cf. section 12.6.1.1.2.).

Discussion of selected references 484
[94SAL/KUL] During a study of the reaction of UO2(cr) with alkali metal chromates up to 1473 K in an inert atmosphere, new uranate phases, Rb2U4O11, Rb2U3O8.5 and Na2U3O9, were ob-served, based on their characterisation by X–ray diffraction, thermal and chemical methods. NayU1–yO2–x (y = 0 − 0.2) was reported as a solid solution of Na2O in UO2.
No thermodynamic information on ternary uranium oxides can be deduced di-rectly from this investigation.
[94SAN/GRA] Solid phases (schoepite, 3 2UO 2H O⋅ (in fact metaschoepite); becquerelite,
and compreignacite, 6 19 2CaU O 11H O⋅ 2 6 19 2O 11H OK U ⋅ ) were characterised by XRD, SEM and SEM–EDX. Synthetic methods for the latter two phases involving hydrother-mal precipitation are described. The solubility experiments with these solids were per-formed at 25°C in either 1 molal or KCl at the following conditions: schoepite in
at 2CaCl
2CaCl pH 3.97, 7.47= and in KCl at pH 4.25, 6.00= with samples taken after three, five and nine months; becquerelite in Ca at pH 4.16, 4.46, 5.85 and com-preignacite in KCl at
2ClpH = 3.12, 4.46, 5.83 with samples taken after three months. The
pH measurements were corrected for liquid junction potentials. Conversion of the schoepite was complete within three months and these solids did not change further in more than one year. The general equilibrium can be written:
+ + 2+x 6 19 2 2 2M U O 11H O(cr)+(12 x ) H x M +6 UO +18H O(l).nn⋅ −
The authors followed the SIT extrapolation model to derive the infinite dilution solubility constants. Consequently, the authors ignored the presence of and
, and after the undisclosed results of a Pitzer treatment, they also ne-glected specific chloride complexation. The concentrations of dioxouranium(VI) and pH are displayed in the form of a figure , but the values are not tabulated. The results of duplicate runs with the Ca– and K–containing solids yielded the following solubility constants:
2UO (OH)+
2 2(UO )(OH) (aq)
10 s,0
o
*
*
M Ca :
log (42.9 0.2) and (44.7 0.1)
log (41.9 0.5) and (43.7 0.5)
K
K
=
= ± ±
= ± ±10 s,0
10 s,0
o10 s,0
*
*
M K :
log (38.2 0.2) and (40.5 0.2)
log (36.8 0.3) and (39.2 0.3).
K
K
=
= ± ±
= ± ±
The values for becquerelite compare favourably with that of [90VOC/HAV], 43.2 in "pure" water at 25°C. The authors state that using the NEA recommended values

Discussion of selected references 485
for the solubility constant of schoepite and the solubility data from their study, equilib-rium constants for the transformation reaction:
+ +x 6 19 2 2 2 2M U O 11H O(cr) + x H xM +6UO (OH) H O(cr)nn⋅ ⋅
are lo 10 ,0*g sK ο = 13.03 and 7.96 for becquerelite and compreignacite, respectively.
[94SER/DEV] The first part of the paper is a history on the work done on actinide chemistry in the former USSR, as well as on the international attempts to select databases on these ele-ments. [92GRE/FUG] is included as the latest attempt. Then, the paper presents the characteristics of the DiaNIK database aimed at selecting recommended values for 145 actinide species (Ac to Am) on the basis of the examination of 500 references dealing with aqueous inorganic complexes, updated from 1989 to 1993 and including all the references of [92FUG/KHO]. [92GRE/FUG] also includes references and material from [92FUG/KHO].
Analysis of the same data by [94SER/DEV] and [92GRE/FUG] leads generally to slight differences for values at zero ionic strength (298.15 K, 1 bar), due probably to different methods for extrapolation to I = 0. For, UO 2
2+ + Cl– UO2Cl+, for instance
10log K ο is (0.27 ± 0.15) versus (0.17 ± 0.02) [92GRE/FUG], using the SIT theory.
The set of recommended 10log K ο values (as compared to those selected in [92GRE/FUG]) are:
U4+ + H2O(l) UOH3+ + H+ 10 1*log οb*
= − 0.4 ± 0.2 (– 0.54 ± 0.06)
UO + H22
+2O(l) UO2OH+ + H+ 10 1log οb = − 5.8 ± 0.1 (– 5.2 ± 0.3)
*UO + 3 H22
+2O(l) UO2(OH) 3
− + 3 H+ 10 3,1log οb = − 19.7 ± 0.5 ( − 19.2 ± 0.4) + * ο3UO 2
2 + 5 H2O(l) (UO2)3(OH) 5+ + 5 H+ 10 5,3log b = − 15.4 ± 0.21 (– 15.55 ± 0.12)
2+ − * ο3 UO + 7 H2 2O(l) (UO2)3(OH) 7 + 7 H+ lo 10 7,3g b = − 31.9 ± 0.8 (– 31 ± 2) + οUO +2
224HPO − UO2HPO4(aq) 10 1log b = 7.1 ± 0.2 (7.24 ± 0.26)
UO + PO UO22
+ 34
−2PO 4
−10 1log οb = 12.9 ± 0.3 (13.23 ± 0.15).
But more importantly, the authors question the validity of the CODATA selec-tion ([89COX/WAG]), = − (98.2 ± 3.0) J · K2+
m 2(UO )S ο –1 · mol–1. According to them, the uncertainty in this value will affect the calculated equilibrium constant involving the aqueous dioxouranium(VI) ion by one order of magnitude and might have some bear-ings also on other uranium and actinyl ions.
The CODATA value (adopted in NEA TDB) is based on the following ex-perimental data: the heat capacity of UO2(NO3)2· 6H2O(cr) [40COU/PIT] down to tem-peratures approaching 0 K; its enthalpy of solution at infinite dilution according to equation:

Discussion of selected references 486
2+2 3 2 2 2 3 2UO (NO ) 6H O(cr) UO + 2NO + 6H O(l)−⋅
and its solubility as discussed in [92GRE/FUG].
The thermodynamic routes suggested by Sergeyeva et al. [94SER/DEV] to calculate lead to higher values. For instance, the route: 2+
m 2(UO )S ο
+ 2+2 2 2 2 2UO (OH) H O(cr) + 2 H UO + 3 H O(l) ⋅
gives − (77.3 ± 3.0) J · K–1 · mol–1. This important difference was raised previously in [92KHO]. At that time, Pitzer gave the following comment: "… for the system UO2(OH)2 H2O(cr) + 2 H+ UO 2
2+ + 3 H2O(l), the entropy of the solid appears to be
accurate, but the of the reaction is quite uncertain, in my view. There are various OH
mS∆
2 (cr)
– complexes of which must be involved in the saturated solution of UO
2+2UO
2(OH)2·H2O(cr). [92GRE/FUG] in Table III.1 pp. 32–33 give values of S = (17 ± 50) for UO
mο
2(OH)+, − (38 ± 15) for and (83 ± 30) J · K2+2 2 2(UO ) (OH)
2 3UO (NO )
–1 · mol–1 for . These values suggest a rather large uncertainty for via the
route. In summary, is a far simpler system which is dominated by the uranyl ion."
+2 3 5(UO ) (OH)
2 2UO (OH) H⋅
2+m 2(UO )S ο
O 2 (aq)
In the paper under review, no mention is made of these comments which are available in a written form.
As no other data (apparently) have appeared in the literature since [92GRE/FUG] to support a re-evaluation of the value of obtained via the nitrate route, the value accepted by CODATA, − (98.2 ± 3.0) J · K
2+m 2(UO )S ο
–1 · mol–1, is retained in this update.
The thermodynamic values of , and (cr) used by [94SER/DEV] in their discussion are discussed in
[92GRE/FUG].
2 2UO (OH) (cr) 2 3UO CO (cr)2 4 2UO SO 2.5H O⋅
In addition, Sergeyeva et al. recommended the following 10log K ο values for Np(V) complexes where the values in [2001LEM/FUG] are given in parenthesis:
+2 2 2
+NpO + H O(l) NpO OH + H 10 1*log οb = − 9.0 ± 0.3 (– 11.3 ± 0.7)
+ 22 3 2 3NpO + CO NpO CO− − 10 1log οb = 4.7 ± 0.2 (4.96 ± 0.06) + 22 3 2
33 2NpO + 2 CO NpO (CO )− −
10 2log οb = 6.7 ± 0.4 (6.53 ± 0.10)
The agreement is good except for the first hydrolysis constant.
For Pu, they propose the following equilibrium constants with the values from [2001LEM/FUG] within parenthesis:
3+ 24 4Pu + SO PuSO− + 10 1log οb = 4.5 ± 0.5 (3.91 ± 0.61)
3+ 24 4Pu + 2 SO Pu(SO )− −
2 10 2log οb = 6.7 ± 0.6 (5.70 ± 0.77) 4+ 2 +
4 4Pu + HSO PuSO + H− + 10 1*log οb = 5.5 ± 0.5 (4.91 ± 0.22)

Discussion of selected references 487
4+ +4 4 2Pu + 2 HSO Pu(SO ) + 2 H− 10 2
*log οb = 7.7 ± 0.7 (7.18 ± 0.32)
For Pu(III) the values have been calculated from lo 10 1*g οb = (1.93 ± 0.61) and
= (1.74 ± 0.76) related to the formation of complexes from [2001LEM/FUG] with lo = (1.980 ± 0.050).
10 2*log οb 4HSO−
10 4g (HSO )K ο −
For Am, Sergeyeva et al. recommend: 3+ 2 +
4 4Am + SO AmSO− 10 1log οb = (4.2 ± 0.4) 3+ 2
4 4Am + 2 SO Am(SO )−2−
10 2log οb = (6.1 ± 0.5).
[95SIL/BID] selected = (3.85 ± 0.03) and 10 1log οb 10 2log οb = (5.4 ± 0.7), respectively.
All the data for Np and Pu are not considered further in this review because they have been discussed in [2001LEM/FUG].
[94SER/SER] From this study, it can be concluded that an aqueous saturated solution of dioxoura-nium(VI) selenate obtained by dissolution of (cr) is in equilibrium with (cr) and at 25°C the composition of the solution is 68.7 wt% of
(cr). Other data are not relevant for this review.
2 4 2UO SeO 2H O⋅
2 4 2UO SeO 4.5H O⋅
2 4SeOUO
[94TOR/CAS] Three sets of solubility experiments carried out at (298 ± 0.5) K in 1 M NaCl (pH = 4 to 9, oxic condition) are discussed. The first two sets of experiments involved unirradiated, crystalline UO2 (powder of 10–50 µm size) under an oxidizing atmosphere of 5% O2 in N2. In the first case, the solid was equilibrated at pH = 5.0, whereupon HCl was added to achieve a pH = 3.5. After one month the pH was raised to 8.2 leading to the precipita-tion of a “yellow solid phase”, which was characterised as being amorphous. This sec-ondary phase was metaschoepite (UO3·2H2O). The pH of the solution in contact with these two phases was then adjusted with acid or base and sampled after about three weeks such that “equilibrium” was approached from under- and super-saturation. The second set of experiments were similar, but did not involve the precipitation of the sec-ondary yellow phase.
For comparison, a “poorly crystalline dioxouranium(VI) hydroxide hydrated phase” was prepared with an X–ray diffraction pattern corresponding to metaschoepite. The third set of experiments involved contacting this phase with 1 M NaCl for up to nine months prior to adding NaOH in a stepwise manner with each equilibration taking about three weeks. Equilibrium was apparently established within the initial three months with some enhancement in the crystallinity of the solid phase. The experimental data are only shown graphically as U(VI) concentrations (10–3–10–6 M ) as a function of pH with two distinct curves corresponding to data set 1 and 3. They were modelled us-ing the equilibrium constants from [92GRE/FUG] and the SIT approach for all the potentially important hydrolysed U(VI) species, UO2Cl+ and , except for +
2 2UO Cl

Discussion of selected references 488
tentially important hydrolysed U(VI) species, UO2Cl+ and , except for (UO
+2 2UO Cl
10 2,1log οb 2(OH)2) taken as 10 2,1*log οb = − 11.5 from [92SIL].
The values of lo 10 ,0*g sK for the dissolution of metaschoepite:
+ 2+3 2 2 2UO 2H O(s) + 2 H UO + 3 H O⋅ (l)
were extracted from the data sets 1 and 3 as described above, namely, lo 10 ,0*g sK =
(5.92 ± 0.08) for metaschoepite and (5.57 ± 0.08) for prepared metaschoepite, which give, respectively, 10 ,0
*log sK ο = (5.73 ± 0.28) and (5.38 ± 0.20), accordingly 10 ,0log οsK
= − (22.27 ± 0.28) and 10log ,0οsK = − (22.62 ± 0.20).
The fits to these two data sets indicate that the upper limit for the stability con-stant of in [92GRE/FUG] may be overestimated, but this finding is really only based on three data points.
2 2UO (OH) (aq)
The solubilities of UO2(s) in oxidizing, basic solutions are in reasonable agreement with those for crystalline metaschoepite corresponding to the [92GRE/FUG] model for crystalline schoepite (in fact, metaschoepite). However, in acidic to neutral solutions the solubilities are almost independent of pH within the large scatter of the data, perhaps indicating the formation of metastable surface phases or a high degree of supersaturation.
[94TOU/PIA]
Although no thermodynamic data are reported, this paper gives interesting information on the complexity of the phase relationships in the system U–Ba–O, based on X–ray diffraction studies up to about 1800 K. The two instruments used (either a graphite re-sistance furnace or a Pt/Rh resistance furnace) allowed measurements over the range
. 2
19O10 / bar 1− ≤ ≤p
For the studies with the Pt/Rh resistance furnace, compounds of nominal com-position, Ba3UO6, BaUO4 and BaUO3, were obtained by reacting stoichiometric quanti-ties of BaCO3 and U3O8 under the appropriate oxygen pressure. The samples were pel-leted and sintered prior to use. The lattice parameters of the "as prepared" compounds are in general agreement with literature results. For the studies in the graphite furnace, mixtures of BaCO3 and UO2 were pelleted and reacted in the furnace itself.
The authors indicate that the exact composition of the phases (in particular, as noted by this review, their oxygen content) was not known, but was inferred from the change of lattice parameters as a function of temperature and oxygen pressure.
For "Ba3UO6", a tetragonal to cubic transformation is observed above 1063 K. For the samples with a Ba/U ratio near unity, the orthorhombic phase "BaUO4" can be reduced above 1423 K to cubic BaUO3+x in oxygen pressures below 10–12 bar. At this temperature, an order-disorder transformation is observed when x ≤ 0.10. At lower

Discussion of selected references 489
temperatures, the homogeneity range is smaller, with the lowest oxygen content at 293 K (obtained by extrapolation) corresponding to x = 0.17.
The authors present a schematic pseudo-binary phase diagram between "BaUO3" and "BaUO4".
[95ALL/BUC]
This study consists of two parts, one structure determination of the complex 6
2 3 3 6(UO ) (CO ) − in the solid state and in solution, the other a determination of the equi-librium constant for the reaction:
4 + 62 3 3 2 3 3 63 UO (CO ) + 3 H (UO ) (CO ) + 3 HCO− −
3−
at 25°C and I = 2.5 m. The authors report = (18.1 ± 0.5). From this value and the protonation constants of CO
10 6,3log b23
− the authors calculate lo 10 6,3g οb = (55.6 ± 0.5) for the reaction:
2 22 3 2 33 UO + 6 CO (UO ) (CO )+ − 6
3 6−
which is in fair agreement with the value 10 6,3log οb = (54 ± 1) given in [92GRE/FUG]. In addition, there is information on the U–O stretching frequency in the dioxoura-nium(VI) group. The structure determinations are excellent and provide independent non-thermodynamic proof of the existence and structure of the tri-nuclear complex.
[95BAN/GLA]
This paper deals with the rates of exchange of the carbonato group between free and or
23CO −
62 3 3 6(UO ) (CO ) − 4
2 3 3UO (CO ) − . The authors have studied the exchange reactions using 17O enriched U(VI) and 13C enriched carbonate in solutions I = 1 M (HClO4, NaOH, Na2CO3) under a CO2 atmosphere (
2= 1 atm). There are no new determina-
tions of thermodynamic data, but the findings confirm the stoichiometry and structure of the carbonate complexes and also the previously determined equilibrium constants dis-cussed in [92GRE/FUG].
COp
[95BIO/MOI]
The unsaturated polyanions, PWO = 102 17 61X W O − series (X = P, As), are strong aqueous
complexing agents for actinides(IV), forming the limiting complex, M(PWO)2. The structure of written as 16
2 17 61 2U(P W O ) − 162O)U(PW − and
written as K are well established [97BIO/MOI]. The aqueous complex displays a charge transfer band (U
16 2 17 61 2 2K [U(P W O ) ] 38H O⋅
510 nm
16 2[U(PWO) ]⋅ 238H O4+ to W6+), with ε = 1009 M–1 · cm–1.
Complexometric titrations of U(IV), 5.9·10–4 M, with PWO, 3.1·10–3 M (as K10P2W17O61) are conducted in 2 M H/KNO3 media, [H+] = 0.5, 1 and 2 M at (21 ± 2)°C. The U(IV) solutions contain trace amounts of sulphuric acid (1 to 5 10–3 M)

Discussion of selected references 490
and zinc (3 10–5 M) and are 0.05 M in hydrazinium nitrate. Due to low sulphate concen-tration and weak complexation with Zn2+ their presence is inconsequential. But the presence of 2 M nitrate ions can not be dismissed. The constants for:
U(IV) + PWO U(PWO) K1
2U(IV) + 2 PWO U(PWO) K2.
where U(IV) represents the sum of the concentrations of U4+ and nitrato complexes. The plots of 10 1log K and 10 2log K vs. − log10[H+] are linear with slopes 3.3 and 5.8. Ignor-ing nitrato complexes, the complexation of U4+ is as follows, considering the a1pK = 4.49, a2pK = 3.75 and a3pK = 2.0 values of the PWO anion :
4+ 7 6 +3U + H PWO U(PWO) + 3 H− −
4+ 7 16 +3 2U + 2 H PWO U(PWO) + 6 H− −
or 4+ 10 6U + PWO U(PWO)− −1b
4+ 10 162U + 2 PWO U(PWO)− − 2b
with 10 1 10 1 a1 a2 a3log log + (pK + pK pK ) 3 pHK= +b −
−10 2 10 2 a1 a2 a3log log + 2 (pK + pK pK ) 6 pHK= +b .
All the results appear in Table A-18:
Table A-18: Equilibrium constants obtained in various experimental conditions.
– log10[H+] – 0.3 0 0.3
10 2log K (7 ± 0.25) (8 ± 0.25) (9 ± 0.25)
10 1log K (11.5 ± 0.25) (13.5 ± 0.25) (15.5 ± 0.25)
10 1log b (18.3 ± 0.3)
10 2log b (34.0 ± 1.1)
PWO does not form complexes with U(VI) as shown by spectrophotometry, cyclic voltammetry (0.1 M HClO4 in the presence or absence of PWO, E1/2 = 0.065 V for U(VI)/U(V) reduction), polarography (E1/2 value remains constant) and –NMR. 31 P
Complexometric titrations of Pu(IV), 6.3·10–3 M, at the same acidity and ionic strength as for U(IV) yielded only lo > 8 and > 14. In the presence of PWO, a nitric acid solution of Pu(III) becomes intense blue (an unstable mixed valency anion Pu(III)–W(V)–W(IV) is formed). When the colour has disappeared, the absorp-tion spectrum shows the presence of the Pu(IV)PWO complex. The change in the redox potential value of the Pu(IV)/Pu(III) couple in 1 M HNO
10 1g b 10 2log b
3 in the presence of PWO is estimated on the basis of literature data on Ce, Am, Bk, Np, Cm and Cf. The redox po-tential shifts from 0.92 V to 0 V and this is why PWO can oxidise Pu(III) to Pu(IV).

Discussion of selected references 491
[95CLA/HOB]
This paper gives a complete review of structural data of actinide carbonates and on thermodynamic data, including both equilibria between solids and species in aqueous solution, and equilibria between species in aqueous solution, the latter being taken from [92GRE/FUG]. Classification is done according to oxidation states. A short part is de-voted to the hydrolysis of Th, U, Np, Pu and Am.
For U hydrolysis there are no new references that were not included in [92GRE/FUG]. A short discussion of the behaviour of U(IV) and U(VI) is given.
For U carbonate compounds and complexes there are no new references that have not been examined in [92GRE/FUG] or discussed in the present review .
[95COH/LOR]
This paper gives two examples of how the solubility data of pure compounds in water as a function of temperature are compiled, selected and tabulated for IUPAC publications ([94SIE/PHI]) concerning actinides, particularly nitrates; many ternary systems are also considered.
From semi-empirical considerations it is suggested that the solubility of a salt can be modelled by the equation: 2MX H Or⋅
0 0 fus
m m Aln( ) ( 1) = + B ln( ) + C Dm m
T TT T
− − +
where A, B, C and D are adjustable coefficients from the liquidus curve of the binary system, T is the temperature (K), Tfus is the melting temperature of the salt, m is the mo-lality of the saturated solution (mol · kg–1), and mo is equal to
H O2, and
2 is
the molar mass of water in kg · mol1
Mr H OM–1 and r is the hydration number. The reference state
for the activity coefficient is the infinitely dilute solution.
It is not trivial to calculate m and then, the solubility. For the binary system (r = 6 is the stable hydrate at 298.15 K) in the temperature
range 253 – 334 K, the experimental data (from 1900 to 1984) are fitted to give: 2 3 2 2 2UO (NO ) 6H O H O⋅ −
A = (964.618 ± 0.0149) mol · kg–1 · K
B = − (23711.09 ± 4.57) mol · kg–1
C = − (172.094 ± 0.00261) mol · kg–1 · K–1
D = (0.3187 ± 0.0000489) mol · kg–1
mo = (9.25 ± 0.0149) mol · kg–1

Discussion of selected references 492
from which the solubility of (cr) can be derived as a function of temperature with T
2 3 2 2UO (NO ) 6H O⋅fus = 333.4 K. The uncertainties are one standard deviation; the ap-
preciable uncertainty in mo arises from the fact that r may exceed six below 298.15 K.
At T = 298.15 K the calculated solubility is 3.21 mol · kg–1. In a later paper Apelblat and Korin, [98APE/KOR] have used a value of msat = 3.323 mol · kg–1.
However, both these values are at (or beyond) the extremes of the twelve ex-perimental values of msat at 298.15 K quoted by [95COH/LOR]. These comprise ten very consistent values ranging from 3.213 to 3.26 mol · kg–1, with two outliers at 3.04 and 3.3 mol · kg–1. We therefore prefer to retain the solubility selected for the CODATA Key Values [89COX/WAG], namely msat(298.15 K) = 3.24 mol · kg–1. This value is essential in the derivation of . 2+
m 2(UO , aq)S ο
This paper [95COH/LOR] contains helpful phase diagrams of the solubility as a function of temperature up to 450 K, where the lower hydrates with r = 3 and 2 are in equilibrium with the saturated solution.
[95DUE/PAT]
This paper covers similar ground to the earlier papers by the same group on insertion of uranium oxides with hydrogen, alkali and alkaline earth metals. Here, new enthalpy and Gibbs energy values are given for Li0.12UO2.95(cr), Na0.12UO2.95(cr), Zn0.12UO2.95(cr), Li0.19U3O8(cr) and Na0.20U3O8(cr).
As in [93PAT/DUE], the calorimetric reagent was 0.274 mol · dm–3 Ce(SO4)2 + 0.484 mol · dm–3 H3BO3 + 0.93 mol · dm–3 H2SO4, identical to that used by [81COR/OUW2] for the dissolution of UO3(γ) and U3O8(α). The enthalpy change corre-sponding to reactions:
0.12 LiUO3(cr) + 0.05 U3O8(α) + 0.73 UO3(γ) Li0.12UO2.95 (cr) (A.54)
and
0.19 LiUO3(cr) + U3O8(α) 0.19 UO3 (γ) + Li0.19U3O8 (cr) (A.55)
were obtained as r mH ο∆ ((A.54), 298.15 K) = − (0.18 ± 0.82) kJ · mol–1 and r mH ο∆ ((A.55), 298.15 K) = − (1.44 ± 1.94 ) kJ · mol–1, respectively, from the enthalpies
of dissolution of the various components into the same medium as that used by the same group for Mg0.19UO2.95 (see section 9.9.1). It should be noted that, in [95DUE/PAT], (Table 6), the value for the enthalpy of dissolution of U3O8 was misprinted as − (345.61 ± 1.94) kJ · mol–1 instead of − (354.61 ± 1.94 ) kJ · mol–1.
Using values selected in [92GRE/FUG], we recalculate from equations (A.54) and (A.55):
f mH ο∆ (Li0.12UO2.95, cr, 298.15 K) = − (1254.97 ± 1.23 ) kJ · mol–1 and

Discussion of selected references 493
f mH ο∆ (Li0.19U3O8, cr, 298.15 K) = − (3632.95 ± 3.11) kJ · mol–1.
Using the recalculated value (see section 9.3.3.3.3.), f mH ο∆ (UO2.95, α, 298.15 K) = − (1211.28 ± 1.28 ) kJ · mol–1, from the determination of [93PAT/DUE], the enthalpy change corresponding to the insertion of the lithium according to reactions:
0.12 Li(cr) + UO2.95(α) Li0.12UO2.95 (cr) (A.56)
0.19 Li(cr) + U3O8(α) Li0.19U3O8(cr) (A.57)
are obtained as r mH ο∆ ((A.56), 298.15 K) = − (43.69 ± 1.78) kJ · mol–1 and r mH ο∆ ((A.57), 298.15 K) = − (58.16 ± 3.11) kJ · mol–1, respectively. Calculated per
mole of inserted lithium, these values become − (364.08 ± 14.83) and − (306.10 ± 16.37) kJ · mol–1, in general agreement with the more precise values of [89DIC/LAW].
From electrochemical measurements analogous to those reported by [93PAT/DUE] for MgUO2.95 (see section 9.9.1.), the authors also report ((A.56), 298.15 K) = − 42.8 kJ · mol
r mGο∆–1 and r mGο∆ ((A.57), 298.15 K) = − 55.2 kJ · mol–1, close to
the calorimetric values, indicating a small entropy effect.
[95DUE/PAT] also report calorimetric and electrochemical measurements on the species, Na0.12UO2.95(cr) and Na0.20U3O8(cr). The enthalpies of solution of the con-stituents of the equations:
0.12 NaUO3(cr) + 0.05 U3O8(α) + 0.73 UO3(γ) Na0.12UO2.95 (cr) (A.58)
and 0.20 NaUO3(cr) + U3O8(α) Na0.20U3O8 (cr) + 0.20 UO3(γ) (A.59)
led to the values, r mH ο∆ ((A.58), 298.15 K) = (4.13 ± 1.14 ) kJ · mol–1 and r mH ο∆ ((A.59)298.15 K) = (2.57 ± 0.87) kJ · mol–1, respectively. Using NEA adopted
enthalpies of formation, we recalculate:
f mH ο∆ (Na0.12UO2.95, cr, 298.15 K) = − (1247.37 ± 1.88 ) kJ · mol–1 and f mH ο∆ (Na0.20U3O8, cr, 298.15 K) = − (3626.45 ± 3.25) kJ · mol–1.
The latter value is ca.3 kJ · mol–1 more positive than that listed by the authors.
The enthalpies of insertion according to the reactions:
0.12 Na(cr) + UO2.95(α) Na0.12UO2.95(cr) (A.60) and 0.20 Na(cr) + U3O8(α) Na0.20U3O8(α) (A.61)
are obtained as r mH ο∆ ((A.60), 298.15 K) = − (36.09 ± 1.94) kJ · mol–1 and r mH ο∆ ((A.61), 298.15 K) = − (51.65 ± 3.14) kJ · mol–1, respectively.
The authors deduce from electrochemical measurements (cf. section 9.10.3.3) the values r mGο∆ ((A.60), 298.15 K) = − 37.7 kJ · mol–1 and r mGο∆ ((A.61), 298.15 K) =

Discussion of selected references 494
− 50.7 kJ · mol–1. These values are close to the corresponding enthalpies of reaction, showing that the entropies of reaction are small, as expected for a condensed phase reaction.
From the enthalpies of solution of the constituents of the equation:
0.12 ZnO(cr) + 0.49 UO3(γ) + 0.17 U3O8(α) Zn0.12UO2.95(cr) (A.62)
the authors report r mH ο∆ ((A.62), 298.15 K) = (11.36 ± 0.78) kJ · mol–1. This value cor-responds to the enthalpy of formation of the insertion compound from the binary stoichiometric oxides. Using NEA adopted values, we recalculate:
f mH ο∆ (Zn0.12UO2.95, cr, 298.15 K) = − (1238.07 ± 1.06 ) kJ · mol–1 .
Using the recalculated value (see section 9.3.3.3.3), f mH ο∆ (UO2.95, α, 298.15 K) = − (1211.28 ± 1.28 ) kJ · mol–1, from the determination of [93PAT/DUE], the en-thalpy effect corresponding to the insertion of zinc according to the reaction,
0.12 Zn (cr) + UO2.95(α) Zn0.12UO2.95(cr) (A.63)
is obtained as r mH ο∆ ((A.63), 298.15 K) = − (26.79 ± 1.50) kJ · mol–1.
From electrochemical measurements, [95DUE/PAT] also report ((A.63), 298.15 K) = − 25.2 kJ · mol
r mGο∆–1. This value is compatible with the calorimetric result if
((A.63), 298.15 K) is small, as is very likely. r mS ο∆
[95EBB]
Thermal functions for the species, AnO3(g), AnO2(OH)2(g), AnO2Cl2(g) and AnO2F2(g), (with An = U, Np, Pu and Am), have been calculated using known and estimated mo-lecular constants. The trioxide gases were taken to be T–shaped (as previously shown for UO3(g)) and the MO2X2(g) species were assigned C2v symmetry, based on the known structures and bond lengths of the corresponding Cr, Mo and W analogues. The vibration frequencies were also based on the same analogies, and the earlier data for UCl4(g) (not the revised values reported in [95HAA/MAR]). No higher electronic levels were included for the U compounds; those for the Np and Pu compounds were esti-mated from the levels of the corresponding ions, , in solids or in aqueous solu-tion.
2+2MO
The hydroxyl groups were assumed to undergo hindered rotation, with esti-mated internal rotation barriers.
No uncertainty values are quoted, nor is there any discussion of enthalpies of formation, even where these data are available.
The data for UO3(g), being based on the same experimental data, are very simi-lar to those adopted in [82GLU/GUR], [92GRE/FUG]. For UO2F2(g) and UO2Cl2(g), the calculated entropies are smaller than those adopted in [92GRE/FUG] (and the cur-

Discussion of selected references 495
rent update), due predominantly to the assumption of higher vibration frequencies. For these molecules, however, where reasonably well–defined vaporisation data are avail-able, the entropies of the vaporisation reactions are consistent with the existing entro-pies of the UO2F2 species, which are therefore retained (but with increased uncertain-ties) until experimental vibration frequencies become available.
The author's calculated entropies for UO2(OH)2(g) are, however, greater than those calculated by Gorokhov and Sidorova [98GOR/SID] (by as much as 22.6 J · K−1 · mol–1 at 298.15 K), principally because Ebbinghaus has assumed internal rota-tion of the OH groups (conceptually equivalent to a very small bending frequency), whereas Gorokhov and Sidorova [98GOR/SID] have assumed a higher bending fre-quency.
As noted in section 9.3.1.2.1, no data for UO2(OH)2(g) are selected for this re-view.
[95ELI/BID]
This paper is a careful analysis of the emission spectra of aerated U(VI) solutions (mainly at I = 0.5 M HClO4/NaClO4, room temperature) which are know to contain the hydrolysis species, 1:1, 2:1, 3:1, 2:2, 5:3, 7:3, in addition to the dioxouranium(VI) cation. Test solutions studied cover large ranges of pH and uranium concentration. Some data refer to 1 M HClO4 or to basic solutions at variable ionic strength. The as-signment of the species is made on the basis of the lo 10 ,
*g m nοb values selected by
[92GRE/FUG] (except for the 2:1 species) and corrected for I = 0.5 M. pH measure-ments are given with a precision of 0.04 units (glass electrode filled with 0.5 M Na-ClO4). Data obtained for pH less than five give clear results on the assignment of life-times and spectra of the 1:1, 3:1, 2:2 and 5:3 complexes (where the reviewer has some doubts about the species 2:1). Species 3:1 is predominant in pH range 10–12.
Characteristics of the emission spectrum of are confirmed (emission lines, fluorescence lifetime, activation energy).
2+2UO
By combining data obtained from solutions at constant pH (3, 4, 5, 9.8 and 11) and variable U concentration (3: 10–5 to 10–3 M; 4: 10–4 to 10–3 M; 5: 10–6 to 10–3 M, 9.8: 10–6 to 10–4 and 11: 5 10–5 M) and the reverse (pH: 2.3 to 4.05 at U: 10–4 M), fluo-rescence lifetimes are identified and measured for all species, but the individual spectra of some of the complexes are poorly defined. Some indications are given on the fluores-cence intensities.
The given selected lifetime values (in µs) are the following: (1.7 ± 0.2) for 0:1 species, (32.8 ± 2) for 1:1 species, (3.2 ± 0.2) for 1:2 species, (0.4 ± 0.1) for 1:3 species, (9.5 ± 0.3) for 2:2 species, (6.6 ± 0.3) for 5:3 species and (10 ± 2) for 7:3 species.
Discussion of selected references 496
Comparisons are made with previous literature on the same topic. Some data in the presence of phosphoric acid are also given.
[95FAN/KIM]
The formation of chloride complexes of Cm(III) has been studied at 25°C using time resolved laser fluorescence spectroscopy over the chloride concentration range 0 to 20 mol · kg–1. The authors present a table of concentration equilibrium constants and note that chloride complexes are only important at chloride concentrations larger than 3 m. A detailed thermodynamic analysis of these data is given in [97KON/FAN].
[95HAA/MAR]
The results of a study of the geometry of UCl4(g) by electron diffraction at a (nozzle) temperature of 900 K are in agreement with a strictly tetrahedral structure with a U–Cl bond distance of 2.503 Å. The gas–phase IR adsorption spectra were recorded from 25 to 3400 cm–1 at temperatures from 700 to 900 K, and the stretching and deformation vibrations have been determined to be 337.4 and 71.7 cm–1, respectively .
These findings are confirmed by density function calculations, which suggest a tetrahedral structure with r(U–Cl) = 2.51 Å, and frequencies of 68 and 341 cm–1. Re-finement of these calculations, taking into account the experimental IR data allow the two IR inactive modes to be predicted (326.6 and 61.5 cm–1 ).
There is a short discussion of the comparison of the calculated and experimen-tal entropies of vaporisation, which are in reasonable agreement. These are important new data on the properties of UCl4(g) which have required that the data for this species (and all the other gaseous U–halides) have been re-evaluated.
[95HOB/KAR]
Data are reported on the solubilities of U and Pu in strong basic media, but highly con-centrated in salts (nine different salts are present in the studied solutions). The identified solid phases are Na2U2O7 and PuO2 ·xH2O. The variations of the concentrations of U and Pu with sodium hydroxide concentration do not allow derivation of thermodynamic values.
[95MOL/MAT]
This paper is reviewed together with [96MOL/GEI].

Discussion of selected references 497
[95MOR/GLA]
The authors describe the solubility of uranium(VI) oxide at 85°C at high pH, under con-ditions that may be encountered in cement systems. A careful phase analysis has been made and a number of new uranium silicate phases have been identified. The phase characterisation has been made using electron microscopy, X–ray diffraction and energy dispersive X–ray analysis. The analytical methods have been calibrated against phases of known composition. The composition of the aqueous phase has also been determined. The analytical methods are described in detail. This review has used some of the data in attempt to extract thermodynamic information.
Samples 1–5, in the range 11.0 < pH < 13.1, contain, in addition to the aqueous phase, two solid phases, soddyite (UO2)2SiO4·2 H2O(s) calcium uranate CaUO4(s). However, the data do not permit a calculation of the equilibrium constant for the two-phase equilibrium,
(UO2)2SiO4·2H2O(s) + 2 Ca2+(aq) + 2 H2O(l) 2 CaUO4(s) + 22 4H SiO − (aq) + 6 H+(aq)
(A.64)
because there is no information on the total concentration of dissolved silica. A rough value of the solubility product of CaUO4(s) can be estimated from the solubility equilib-rium,
CaUO4(s) + 2 H2O(l) Ca2+ + 22UO (OH)4
− (A.65)
using 10 ,4log οsK = log10[U(VI)]tot + log10[Ca]tot , where, in the pH range studied,
[U(VI)]tot = [ ]. The average value of 22 (OH) −
4UO 10 ,4log οsK for the first four experimen-
tal data is − (9.3 ± 0.7). By combination of this value with the equilibrium constant for the reaction:
2+2UO + 4 H2O(l) 2
2UO (OH)4− + 4 H+
10 4*log οb = − (32.4 ± 0.7), from the present review, we obtain for the reaction:
CaUO4(s) + 4 H+ Ca2+ + + 2 H2+2UO 2O(l), (A.66)
10 ,0*log sK ο = (23.1 ± 0.9).
If this value is taken to be the same at 298.15 K, the Gibbs energy of formation of CaUO4(s) is calculated to be − 1848 kJ · mol–1. This value is considerably different from the value − (1888.7 ± 2.0) kJ · mol–1 selected in [92GRE/FUG], based on sound thermochemical measurements.
The experimental points 16, 34, 38 and 41 [95MOR/GLA] also refer to solu-tions in equilibrium with two solid phases, soddyite and uranophane. From the determi-nation of the pH and the concentration of Ca it is possible to decide if the system has attained equilibrium, or not. We have:
(UO2)2SiO4(s) + H4SiO4 + Ca2+(aq) Ca(UO2)2(HSiO4)2(s) + 2 H+(aq) (A.67)

Discussion of selected references 498
for which the ratio [H+]2 / [H4SiO4][Ca2+] should be constant at equilibrium. This is not the case, as the ratio varies by five orders of magnitude. We have therefore not at-tempted to extract any thermodynamic data. Finally, the experimental points 44, 45 and 46 of [95MOR/GLA] refer to a system with only one solid phase, soddyite. These data have been used to estimate the equilibrium constant, 10
*log sK (A.68), for the reaction:
(UO2)2SiO4(s) + 4 H+ 2 + H2+2UO 4SiO4 (A.68)
by combining equilibrium constants for the following reactions:
(UO2)2SiO4(s) + SiO2 + 2H2O(l) +2 H+ 2[UO2(H3SiO4)+] (A.69)
10*log sK (A.69) = 3.1 and the equilibrium constant lo 10
*g sK (A.70) = − 1.84 is se-lected by this review for the reaction :
2+2UO + H4SiO4 UO2(H3SiO4)+ + H+ (A.70)
This calculation has been made assuming that the equilibrium constant for equation (A.69) is independent of temperature. The value 10log sK (A.68) = 6.8 is in good agreement with the value lo 10g sK (A.68) = (6.3 ± 0.5), which is the mean value calcu-lated in this review from [92NGU/SIL] and [96MOL/GEI] (cf. discussion in section 9.7.3.2.3).
[95NOV/CRA]
A thermodynamic database is presented for predicting the behaviour of trivalent acti-nides (Am(III) and Pu(III)) in concentrated brines of the Waste Isolation Pilot Plant (WIPP). The ion-interaction approach (Pitzer equations) is applied for activity coeffi-cient calculations. The database provides a set of Pitzer parameters and standard chemi-cal potentials of the relevant species. For the background electrolyte solutions (sea wa-ter system) the models of Harvie et al. [84HAR/MOL] and Felmy and Weare [86FEL/WEA] are applied. Pitzer parameters and chemical potentials for the actinide species are taken from various literature publications on Nd(III), Am(III) and Pu(III). The database is used to predict the solubility of trivalent actinides under various condi-tions (NaCl concentration, pH, CO2 − fugacity). There are no new experimental data presented in the paper.
[95NOV/ROB]
The Pitzer equations were applied to the thermodynamic modelling of Np(V) solubili-ties in carbonate-free and carbonate-containing NaClO4 and NaCl solutions. A set of Pitzer parameters and formation constants at I = 0 was proposed for the aqueous Np(V) hydroxide and carbonate complexes, and solubility constants at I = 0 for NpO2OH(s) and NaNpO2CO3(s). In later papers [97NOV/ALM], [98ALM/NOV], which are based on more experimental data, the proposed parameters and constants were refined and extended. Experimental data are reported for the solubility of amorphous Np(V) hydrox-
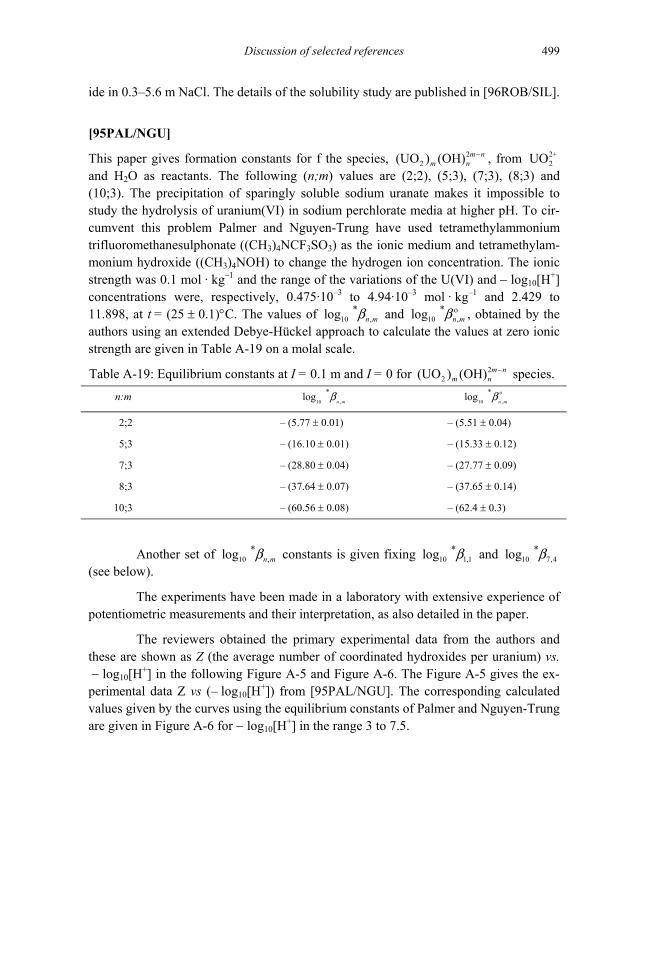
Discussion of selected references 499
ide in 0.3–5.6 m NaCl. The details of the solubility study are published in [96ROB/SIL].
[95PAL/NGU]
This paper gives formation constants for f the species, 22(UO ) (OH) −m n
m n
10 ,*log
, from and H
2+2UO
2O as reactants. The following (n;m) values are (2;2), (5;3), (7;3), (8;3) and (10;3). The precipitation of sparingly soluble sodium uranate makes it impossible to study the hydrolysis of uranium(VI) in sodium perchlorate media at higher pH. To cir-cumvent this problem Palmer and Nguyen-Trung have used tetramethylammonium trifluoromethanesulphonate ((CH3)4NCF3SO3) as the ionic medium and tetramethylam-monium hydroxide ((CH3)4NOH) to change the hydrogen ion concentration. The ionic strength was 0.1 mol · kg–1 and the range of the variations of the U(VI) and − log10[H+] concentrations were, respectively, 0.475·10–3 to 4.94·10–3 mol · kg–1 and 2.429 to 11.898, at t = (25 ± 0.1)°C. The values of and 10 ,
*log n mb οn mb , obtained by the
authors using an extended Debye-Hückel approach to calculate the values at zero ionic strength are given in Table A-19 on a molal scale.
Table A-19: Equilibrium constants at I = 0.1 m and I = 0 for (UO species. 22 ) (OH) −m n
m n
n:m 10 ,
*logn m
b 10 ,
*log ο
n mb
2;2 – (5.77 ± 0.01) – (5.51 ± 0.04)
5;3 – (16.10 ± 0.01) – (15.33 ± 0.12)
7;3 – (28.80 ± 0.04) – (27.77 ± 0.09)
8;3 – (37.64 ± 0.07) – (37.65 ± 0.14)
10;3 – (60.56 ± 0.08) – (62.4 ± 0.3)
Another set of lo constants is given fixing and (see below).
10 ,*g n mb 10 1,1
*log b 10 7,4*log b
The experiments have been made in a laboratory with extensive experience of potentiometric measurements and their interpretation, as also detailed in the paper.
The reviewers obtained the primary experimental data from the authors and these are shown as Z (the average number of coordinated hydroxides per uranium) vs. − log10[H+] in the following Figure A-5 and Figure A-6. The Figure A-5 gives the ex-perimental data Z vs (– log10[H+]) from [95PAL/NGU]. The corresponding calculated values given by the curves using the equilibrium constants of Palmer and Nguyen-Trung are given in Figure A-6 for − log10[H+] in the range 3 to 7.5.

Discussion of selected references 500
Figure A-5. Experimental data of [95PAL/NGU] as Z versus − log10[H+]
0 0.5
1 1.5
2 2.5
3 3.5
4 4.5
2 3 4 5 6 7 8 9 10 11 12 – log10[H+]
Z
0.0005 M U(VI) 0.0007 M U(VI) 0.0012 M U(VI) 0.0025 M U(VI)
Figure A-5 and Figure A-6 immediately indicate that the chemical model used by the authors is not satisfactory at pH > 7. We have therefore reinterpreted the experi-mental data using the LETAGROP program, with the same error carrying variables as in [95PAL/NGU], but giving all data equal weight. In Table A-20 and Table A-21, we describe the re-interpretation in some detail.
In the first attempts, the set of equilibrium constants given by Palmer and Nguyen-Trung, with fixed values of two constants: lo = –5.50 (fixed),
= –(5.7 ± 0.01), = − (16.18 ± 0.01), =– (28.25 ± 0.04), =– (37.62 ± 0.07), = − (60.53 ± 0.08), = − 22.76
(fixed) (Model 1). We have also re-interpreted the data without any fixed values of the constants (Model 2). σ(Z) is the standard deviation in Z in the LETAGROP refinement. Titrations 5, 6, 7, 8 and 10 up to a value of Z
10 1,1*g b
10 7,3*log b
10log10 2,2
*log b10 8,3
*log b10 5,3
*log b10log 10.3
*b 7,4*b
max = − 3.33, were used in the refinement. The result are given in Table A-22.
Table A-20: − log10[H+] ranges used in the various titrations.
Titration 1 2 3 4 5 6 7 8 9 10 11
– log10[H+] 3.1–6.06
3.0–6.06
3.4–6.09
3.9–5.7
3.7–11.45
3.7–11.30
2.8–11.3
2.8–4.15
2.85–11.02
2.82–11.86
2.49–5.3
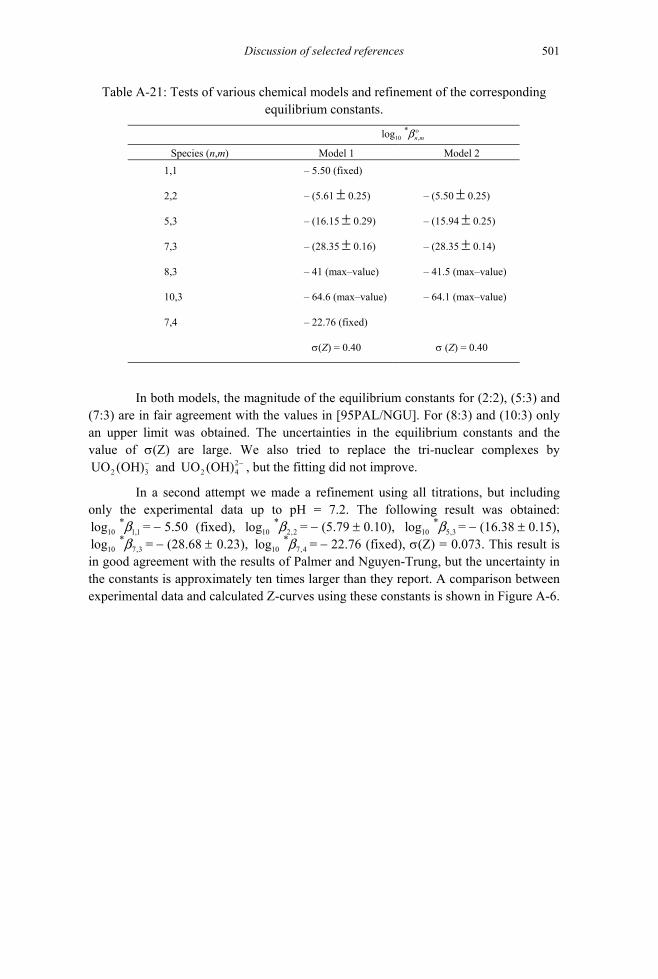
Discussion of selected references 501
Table A-21: Tests of various chemical models and refinement of the corresponding equilibrium constants.
10 ,*log n m
οb
Species (n,m) Model 1 Model 2 1,1 – 5.50 (fixed)
2,2 – (5.61 ± 0.25) – (5.50 ± 0.25)
5,3 – (16.15 ± 0.29) – (15.94 ± 0.25)
7,3 – (28.35 ± 0.16) – (28.35 ± 0.14)
8,3 – 41 (max–value) – 41.5 (max–value)
10,3 – 64.6 (max–value) – 64.1 (max–value)
7,4 – 22.76 (fixed)
σ(Z) = 0.40 σ (Z) = 0.40
In both models, the magnitude of the equilibrium constants for (2:2), (5:3) and (7:3) are in fair agreement with the values in [95PAL/NGU]. For (8:3) and (10:3) only an upper limit was obtained. The uncertainties in the equilibrium constants and the value of σ(Z) are large. We also tried to replace the tri-nuclear complexes by
and , but the fitting did not improve. 2UO (OH)−3 4
22UO (OH) −
In a second attempt we made a refinement using all titrations, but including only the experimental data up to pH = 7.2. The following result was obtained:
= − 5.50 (fixed), = − (5.79 ± 0.10), = − (16.38 ± 0.15), = − (28.68 ± 0.23), = − 22.76 (fixed), σ(Z) = 0.073. This result is
in good agreement with the results of Palmer and Nguyen-Trung, but the uncertainty in the constants is approximately ten times larger than they report. A comparison between experimental data and calculated Z-curves using these constants is shown in Figure A-6.
10 1,1*log b
10 7,3*log b
10 2,2*log b
10 7,*log b
10 5,3*log b
4

Discussion of selected references 502
Figure A-6. Experimental data Z vs (– log[H+]) from [95PAL/NGU] and the correspond-ing calculated values (the curves) from the equilibrium constants obtained by this review using the LETAGROP least-squares program. The calculated curves using the equilib-rium constants from [95PAL/NGU] practically coincide with the experimental point.
0
0.5
1
1.5
2
2.5
3 3.5 4 4.5 5 5.5 6 6.5 7 7.5
Z
0.0005 M U(VI) 0.0007 M U(VI) 0.0012 M U(VI) 0.0025 M U(VI)
– log10[H+]
The stoichiometry of the uranium(VI) complexes at high pH has also been studied by direct structure methods using EXAFS technique, [98CLA/CON], [99WAH/MOL] and [2000MOL/REI2]. These studies, vide infra, show conclusively that no polynuclear species are formed even at ten times higher total concentrations than used by Palmer and Nguyen-Trung. However, the EXAFS studies were made at much higher hydroxide concentrations than used by Palmer and Nguyen-Trung. The conclu-sion of this review is that the data in [95PAL/NGU] are affected by large errors at higher pH, while the experimental data at pH < 6 seem to be more precise. The review-ers do not find that the proposed stoichiometry and equilibrium constants for the (8:3) and (10:3) complexes have been established. The data at lower pH can be used to evalu-ate equilibrium constants that are in good agreement with previously published data.
In conclusion, this review includes the value of = − (28.80 ± 0.04) in the data for the selection of the equilibrium constants. Palmer and Nguyen-Trung give
= − (27.77± 0.09). This review calculates, using the SIT and auxiliary data for NaClO
10 7,3*log b
10 7,3*log οb
4, with ε = (0.00 ± 0.05) kg · mol+2 3 7((UO ) (OH) , Na )− –1, =
− (28.40 ± 0.04). 10 7,3
*log οb
[95PUI/BRU]
This paper contains no new data, but presents a review of existing studies on Tc aque-ous and solid-state thermodynamic properties with estimations of heat capacities and

Discussion of selected references 503
entropies not available in the literature. The final results are presented in terms of tabu-lated data for ∆ and f m m, G Sο ο
,mpCο with input modules that can be directly imported into the EQ3/6 database. It should be noted that [99RAR/RAN] considered this and earlier reviews, but derived their own thermodynamic parameters based on more recent data. Some species are considered in this review that were not assigned values by [99RAR/RAN], such as those for HTcO4(cr), HTcO4(aq), 4HTcO− and H2TcO4(aq), which must be considered suspect due to the difficulty in obtaining significant quantities of these species under unambiguous experimental conditions.
[95RAI/FEL]
The authors have measured the solubility of amorphous MO2(am) for M = Th and U, as a function of the concentration of carbonate and NaOH. The experiments are described in some detail, which is important because there are a number of experimental difficul-ties in studies of this type. The authors have taken adequate precautions to avoid oxida-tion of U(IV) and they have tried to eliminate colloidal particles when sampling. A re-maining source of uncertainty is the rate of change of the crystallinity of the solid used. However, the procedures used are in the opinion of this review adequate to draw quali-tative or semi-quantitative conclusions from the data. Most of the experiments have been made at very high pH and it seems questionable to use pH measurements cali-brated against buffers under these conditions. The hydroxide concentrations can be well estimated from the analytical composition of the test solutions. The authors confirm that the limiting carbonate complex formed by the two M(IV) ions is ; they also give strong evidence for the formation of mixed hydroxide/carbonate complexes at high hydroxide concentrations. Rai et al. propose compositions such as and
. The solubility of ThO
63 5M(CO ) −
M(OH) 24 3CO −
3M(OH) CO−3 2(am) at constant carbonate concentration and vary-
ing total concentrations of NaOH has a slope of − 2 (on a logarithmic scale), indicating a stoichiometry, Th(CO3)n(OH)2, where the stoichiometric coefficient n, cannot be de-termined as the carbonate concentration is constant. Other investigators have proposed the formation of ternary hydroxide/carbonate complexes in the Th(IV) system [94OST/BRU], but at a much lower pH. In this case the number of coordinated carbon-ate ligands could be determined by varying the partial pressure of CO2. It should be pointed out that this complex should be present in very small amounts at the high pH used by Rai et al. It is not straight-forward to suggest the stoichiometric composition of these complexes using information on the co-ordination chemistry of these elements. The limiting carbonato complex, 6
3 5M(CO ) − , is ten-coordinate, while the coordination number of the limiting hydroxide complex, M(OH)4(aq), is unknown. There might be substantial changes both in coordination number and coordination geometry when ter-nary complexes are formed. The reviewers find it unlikely that a moderate increase in the concentration of hydroxide would result in the replacement of four carbonate ligands from 6
3 5M(CO ) − ; a species such as 62(OH)3 4M(CO ) − seems more plausible. This is cer-
Discussion of selected references 504
tainly an area where more experimental work is required. Some additional studies on this system have been made in a later study by Rai et al. [98RAI/FEL].
[95RAI/FEL2]
The paper describes a study on the sulphate complexation of trivalent actinides. For this purpose existing literature data for the Am(III) sulphate system have been re-examined and new experimental solubility data have been measured for NdPO4(cr) in the presence of sulphate. NdPO4(cr) is considered as analog for AmPO4(cr). The experimental and literature data are evaluated by applying the ion–interaction (Pitzer) approach. The rela-tively weak sulphate complexation of Am(III) is treated by introducing a β(2) Pitzer pa-rameter for the interaction Am3+– SO2
4− . Am(III)–sulphate complexation constants are
not incorporated into the thermodynamic model explicitly. The presented model de-scribes the experimental solubility data fairly well.
[95SAL/JAY]
This conference paper reports measurements of the oxygen potential over mixtures of Rb2U4O11(cr) + Rb2U4O12(cr), most of which have been reported subsequently in more detail in the journal paper [96IYE/JAY]. However, one result reported in this paper, but not in [96IYE/JAY], is the enthalpy of oxidation to Rb2U4O13(cr) at 673 K:
Rb2U4O11(cr) + O2(g) Rb2U4O13(cr)
r mH∆ (673 K) = − (279 ± 15) kJ · mol–1.
In the absence any experimental data on the enthalpy of formation of Rb2U4O13(cr), this value cannot be processed further.
[95YAJ/KAW]
The solubility of UO2(cr), which was prepared by reduction of ammonium diuranate at 650°C for two hours (50:50 mixture of N2 and H2), was measured in 0.1 M NaClO4 (not as stated in the abstract, NaCl) at 25°C. The crystallinity was confirmed by XRD and the observed pattern is shown.
The approach to equilibrium was varied from under- and over-saturation. In the former experiments, a uranium(IV) stock solution was diluted with 0.01 M Na2S2O4 to a concentration of ca. 0.003 M (apparently no seeds of UO2(cr) were added). In the case of under-saturation, 30 mg of UO2(cr) were added to 30 mL of 0.01 M Na2S2O4. The ionic strength was adjusted, then either HClO4 or NaOH was added to give pH values of 2 – 12, which were measured after equilibration lasting 7, 14 and 28 days. No details were given as to how the pH was buffered in the intermediate range when uranium con-centrations of ca. 10–9 M were measured by ICPMS. Experimental results are only given as figures. In general these authors obtained lower solubilities than Rai et al.

Discussion of selected references 505
[90RAI/FEL]. Below pH = 2 the slope of log10[U] versus pH was approximately − 4, whereas above pH = 4 the uranium concentrations were independent of pH, correspond-ing to the reactions:
UO2(cr) + 4H+ U4+ + 2 H2O(l)
UO2(cr) + 2 H2O(l) U(OH)4(aq).
Activity coefficients were estimated with the Davies equation resulting in re-ported values of 10 ,0
*log οsK = (0.34 ± 0.4) and 10 ,4log ο
sK = − (8.7 ± 0.4). Given the form of the Davies equation in the paper, the lo 10
*g ,0sK value at 0.1 M ionic strength would have been (1.63 ± 0.4). Applying the SIT to this value gives: 10 ,0
*log οsK = (0.52 ± 0.41).
This indicates that the UO2 used in this study was only partially crystallised, as the rec-ommended value for UO2(cr) is 10
*g ,0lo οsK = − (4.86 ± 0.36), [92GRE/FUG].
The value for 10 ,4log sK ο is higher than the solubility of − (9.47 ± 0.56) aver-aged over all temperatures in [92GRE/FUG], but is within the combined uncertainties. This apparent agreement for the neutral species in equilibrium with a crystalline solid is at odds with the result for lo 10
*g ,0sK , being more consistent with an amorphous like solid phase.
[96ALL/SHU]
These papers deal with the identification of precipitates at pH = 7.2, 8.2 and 11.6 (9 weeks ageing) obtained by addition of 1 M NaOH to three U(VI) solutions 0.6 mM in U, HCl 6 mM and Na2SO4 1 mM under a CO2-free Ar atmosphere. U(VI) ox-ide/hydroxide precipitates are often more or less amorphous so EXAFS is an appropri-ated technique to identify it by the U–O and U–U bond lengths (R), and O and U coor-dination number (N). The reference used in this work to identify solid phases is me-taschoepite (given as UO2(OH)2·H2O by the authors) characterised by XRD and ob-tained at pH 7 by precipitation of uranium with NaOH from a supersaturated 0.1 mM U(VI), 0.1 M HCl solution. Schoepite and its polymorph are described by [92FIN/MIL].
U–O and U–U distances in the solid compound prepared at pH = 7.2, as well as O and U coordination numbers, confirm that it is metaschoepite while U(VI) oxides precipitated at higher pH values probably contain some uranates or polyuranates (bond lengths close to those found in the structural determination of Na2UO4(cr), Na2U2O7(cr) or K2U7O22(cr), precipitated at pH = 8.2, and Na2U3O10.xH2O, precipitated at pH = 11.2). Table 1 gives R and N values and 95 % confidence limits.
Analysis of the EXAFS data is made with the code FEFF6 based on the struc-ture of α–UO2(OH)2 published in [71TAY/HUR].

Discussion of selected references 506
[96BER/GEI]
This paper gives spectroscopic evidence (TRLFS) of the existence of the complex, Ca2[UO2(CO3)3](aq) (di-calcium tri-carbonato uranium(VI)), under such conditions as: 10–5 M U, 2·10–2 M Ca2+, 10–3 M 2
3CO − , pH = 8, which can arise in some seepage wa-ters from U mine tailing. The evidence presented include:
• a specific TRLFS spectrum for the solution which is supposed to con-tain the complex. It differs from those of , hydrolysed U(VI) species, and sulphato or phosphato U(VI) complexes (recall the carbonato complex,
, does not show any emission spectrum). The characteristic peaks of the spectrum (natural water) are located at 463.5, 483.6, 502,8, 524.03 and 555.4 nm and the lifetime is τ = (64 ± 17) ns (much shorter than for the previ-ously cited U(VI) species, which is in the µs range). These values depend on the origin of the solution, natural or synthetic. In the latter case, τ is shorter, (43 ± 12) ns and the position of the emission maxima differ from one to five nm depending on the wavelength. Furthermore, the substitution of Mg for Ca drastically modifies the spectrum,
2+2UO
42 3 3UO (CO ) −
• similarities in the main emission maxima of the postulated species with those of the spectra of the solid compounds: liebigite Ca2[UO2(CO3)3]·10 H2O and zellerite Ca[UO2(CO3)2]·5 H2O. Corresponding τ values are however different,
• the postulated species does not sorb on an anionic exchanger, in con-trast to the complex, 4
2 3 3UO (CO ) − , that sorbs strongly.
The equilibrium constant for :
2 Ca2+ + 42 3 3UO (CO ) − Ca2[UO2(CO3)3]
at I = 0.1 M, t = 25°C, derived from the spectroscopic measurements, is lo 10g K = (5.0 ± 0.7). Using 4
10 2 3 3log (UO (CO ) )−b = (21.8 ± 0.1) [82MAY], (the selected value by [92GRE/FUG] is (21.6 ± 0.05) at zero ionic strength), = (26.8 ± 0.8) is cal-culated for:
10log b
2 Ca2+ + UO 22
+ + 3 CO 23
− Ca2[UO2(CO3)3].
The identification of this complex comes from the impossibility of fitting the TRLFS measurements of a natural sample of water with regard to the known TRLFS characteristics of the expected species on the basis of [92GRE/FUG] selected data.
The paper gives spectroscopic parameters for the U species.
The paper [97AMA/GEI] reports a synthesis of liebigite (orthorhombic) with fluorescence signals the same as for the natural mineral. In a further study, Amayri et al. [98AMA/BER] report the solubility of liebigite to be (9.9 ± 0.5) g · L–1 (0.1 M NaClO4, 25°C , pH = 8), U being present in the solution as Ca2[UO2(CO3)3](aq).

Discussion of selected references 507
[96BRE/GEI]
In this work, precipitation of uranium in the presence of phosphate anions is avoided by using low concentrations of the element, less than 10–4 M (potentiometry) and 10–5 M (TRLFS). For potentiometric measurements a stock solution is used, 10–4 M UO2(NO3)2·6H2O. Aliquots with variable contents of U(VI), 1.641 to 8.071·10–5 M and 10–3 M H3PO4 are titrated with NaOH at 21.8 to 22.4°C, pH ranging from 2.65 to 4.97 (variable ionic strength 7.2 to 9.9 10–3 M). pH is carefully measured with a mean devia-tion of 0.037 pH units. The selected glass electrode is calibrated with six different NIST buffers (pH = 6.86 to 1.00). More than 300 experimental data from 20 titrations are used to calculate lo values for the species identified as UO10g οb 2(HPO4)(aq), UO2(H2PO4)+, UO2(H2PO4)2(aq) (at 22°C). Correction for ionic strength is made according to the Da-vies equation. The value are :
10log οb (UO2(HPO4), aq) = (19.87 ± 0.29),
10log οb (UO2(H2PO4)+) = (22.58 ± 0.17),
10log οb (UO2(H2PO4)2, aq) = (46.9 ± 0.22),
where uncertainties are quoted at the 3σ level .
The composition and equilibrium constants in the potentiometric study were deduced by measuring the free ligand concentration by means of the free hydrogen ion concentration. The accuracy of the data is determined by the difference between the total phosphate concentration and the sum of concentrations of H3PO4(aq), ,
and . As the total concentration of U(VI) is only 10% of the total phos-phate concentration and the accuracy is low. The error is largest in the solutions below pH = 4. The experiments have been made at low ionic strength; this does not mean that the extrapolation to zero ionic strength is facilitated. On the contrary, the variation in the activity coefficients of reactants and products are larger at low ionic strength than at higher when the total concentration of the reactants are varied. For this reason, the re-view has not used the potentiometric equilibrium constants when evaluating the selected values. The situation is very different in the spectroscopic measurements where the con-centrations of the different complexes are measured directly without any thermody-namic assumptions. Therefore, only these data have been considered by the review.
2 4H PO−
24HPO − 3
4PO −
TRLFS measurements are made on two sets of solutions: 10–5 M U(VI), PO concentrations up to 10
34
−
–3 M, pH = 3.02 – 3.06 and 5·10–6 M U(VI), 10–3 M , pH ranging from 3.06 to 3.46, both at (20 ± 0.5)°C. It is expected that three species are pre-sent: . Characteristics of the fluorescence spectra of the dioxouranium(VI) cation agree with what is known (τ = (1.1 ± 0.1) µs, from previously reported values are 0.83 µs [93MEI/KAT] and 1.0 µs [94KAT/MEI]). Fluorescence spectra of the complexes cannot be resolved with regard to the maxima wavelengths and lifetime (494.39, 515.92, 536.84 and 564.37 nm, τ = (14.0 ± 1.3) µs) when the conditions of recording the spectra are the same. But varying the delay time
34PO −
2+ +2 2 2 4 2 4UO , UO (H PO ) and UO (HPO )(aq)
Discussion of selected references 508
and gate width when recording the spectra gives the possibility of differentiating be-tween the two complexes and consequently calculating the lo 10g οb values. They are :
10 2 4log (UO (HPO ), aq)οb = (19.53 ± 0.14), +
10 2 2 4log (UO (H PO ) )οb = (22.31 ± 0.16),
where the ionic strength correction has been made using the Davies equations for I from 0.9 to 1.1·10–4 M. This review has recalculated them using the SIT and finds the same values for I ranging from 10–4 to 0.9 M.
No valuable comparisons of fluorescence spectra in phosphoric solutions can be made with previous results where the species are not identified.
[96DIA/GAR]
The aim of this work is to measure the solubilities of elements coprecipitated with ura-nium from U solutions as the pH is increased. Solubilities of these elements from such solids are less than the solubilities measured from the pure phase obtained from single component solutions. The paper also gives data on the solubilities of Na-polyuranates. The solids are prepared from titration under an inert atmosphere (Ar or N2) of solutions 2.5 or 4.5·10–3 m in uranium / 5 m NaCl with carbonate-free 0.1 m NaOH / 5 m NaCl (25 ± 0.2)°C. Solids are selected for pH = 5.5, and pH between 5.7 and 10.2, and they are considered ready for starting solubilities experiments when the U solubility concen-tration in the mother liquor remains constant for two weeks. All precipitates have a Na/U ratio of 0.3. pH is measured and corrected to take into account the high ionic strength.
Solubilities of U(VI) at pH = 10.25, in 5 m NaCl are 2·10–5 m (filtration through 1.2 nm pore size) up to 400 hours and 5·10–5 m at pH = 5.5 (filtration through 0.2 µm pore size) after 500 hours. The U(VI) concentration decreases in between, but the data are scattered.
No thermodynamic data can be derived from the solubility values reported in this paper.
[96GEI/BRA]
Two sets of uranium(VI) sulphate solutions and one set without sulphate are studied by TRLFS. In each case the integrated fluorescence signal (over 450 to 600 nm to include the four emission maxima) is fitted with a sum of experimental decay functions to calculate lifetimes and fractions of the different species.
Solutions are prepared from a stock solution made with Na2U2O7(s) dissolved in 1 M HClO4, NaOH, NaClO4 and 1 M H2SO4. pH is measured within ± 0.05 pH units at 20°C.
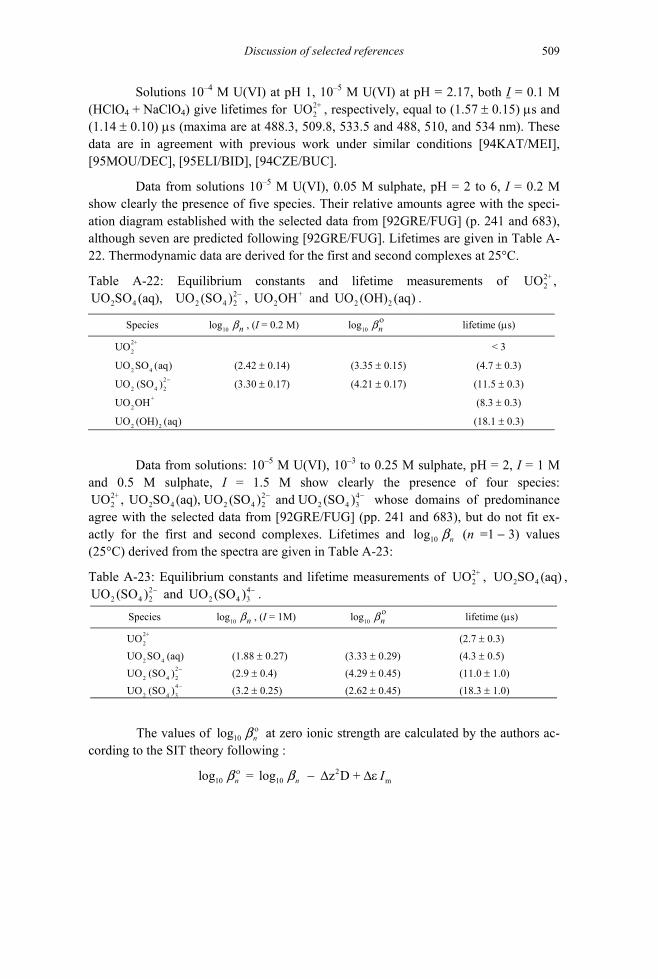
Discussion of selected references 509
Solutions 10–4 M U(VI) at pH 1, 10–5 M U(VI) at pH = 2.17, both I = 0.1 M (HClO4 + NaClO4) give lifetimes for , respectively, equal to (1.57 ± 0.15) µs and (1.14 ± 0.10) µs (maxima are at 488.3, 509.8, 533.5 and 488, 510, and 534 nm). These data are in agreement with previous work under similar conditions [94KAT/MEI], [95MOU/DEC], [95ELI/BID], [94CZE/BUC].
2+2UO
Data from solutions 10–5 M U(VI), 0.05 M sulphate, pH = 2 to 6, I = 0.2 M show clearly the presence of five species. Their relative amounts agree with the speci-ation diagram established with the selected data from [92GRE/FUG] (p. 241 and 683), although seven are predicted following [92GRE/FUG]. Lifetimes are given in Table A-22. Thermodynamic data are derived for the first and second complexes at 25°C.
Table A-22: Equilibrium constants and lifetime measurements of UO , and .
2+2 ,
2 4UO SO (aq), 22 4 2UO (SO ) − +
2UO OH 2 2UO (OH) (aq)
Species 10log nb , (I = 0.2 M) 10log nοb lifetime (µs)
2+2UO < 3
2 4UO SO (aq)2
(2.42 ± 0.14) (3.35 ± 0.15) (4.7 ± 0.3)
2 4 2UO (SO ) − (3.30 ± 0.17) (4.21 ± 0.17) (11.5 ± 0.3) +
2UO OH (8.3 ± 0.3)
2 2UO (OH) (aq) (18.1 ± 0.3)
Data from solutions: 10–5 M U(VI), 10–3 to 0.25 M sulphate, pH = 2, I = 1 M and 0.5 M sulphate, I = 1.5 M show clearly the presence of four species:
2+ 2 42 2 4 2 4 2 2 4UO , UO SO (aq), UO (SO ) and UO (SO )3
− − whose domains of predominance agree with the selected data from [92GRE/FUG] (pp. 241 and 683), but do not fit ex-actly for the first and second complexes. Lifetimes and lo (n =1 − 3) values (25°C) derived from the spectra are given in Table A-23:
10g nb
Table A-23: Equilibrium constants and lifetime measurements of , , and .
2+2UO 2 4UO SO (aq)
22 4 2UO (SO ) − 4
2 4 3UO (SO ) −
Species 10log nb , (I = 1M) 10log nοb lifetime (µs)
2+2UO (2.7 ± 0.3)
2 OUO (SO
42
2 4 2) −
4UO (SO ) −
UO S (aq) (1.88 ± 0.27) (3.33 ± 0.29) (4.3 ± 0.5) (2.9 ± 0.4) (4.29 ± 0.45) (11.0 ± 1.0)
2 4 3 (3.2 ± 0.25) (2.62 ± 0.45) (18.3 ± 1.0)
The values of lo at zero ionic strength are calculated by the authors ac-cording to the SIT theory following :
10g nοb
210 10 mlog = log z D + n n Iο − ∆ ∆εb b

Discussion of selected references 510
the symbols having their usual meaning. The ε values are: = 0.46, = − 0.12, = − 0.12 and ε =
− 0.24 kg · mol
2+2(UO ,ClO )−ε
42 4 3(UO (SO ) ,−
4+Na )2 +
4(SO , Na )−ε 2 +2 4 2(UO (SO ) ,Na )−ε
42 7
–1 estimated from P O − . The calculated values are given in Table A-22 and Table A-23. They are somewhat higher than those selected in [92GRE/FUG] for n = 1 and 2, respectively, = (3.15 ± 0.02) and 10 1g οblo 10 2log οb = (4.14 ± 0.07). This review suggests using = − (0.01 ± 0.11) kg · mol4 +
2 3 3CO ) , Na )−(UOεNa )
(+
–1 as an estimate for and increasing the uncertainty to ± 0.2 kg · mol4
3 ,2 4(UO (SO ) −ε
10 3log οb
–1 which will give = (3.02 ± 0.38).
[96IYE/JAY]
This paper reports the preparation and identification of Rb2U4O11(cr) and measurements of oxygen potential over its mixtures with Rb2U4O12(cr).
The reported new compound, Rb2U4O11(cr), was obtained by reacting Rb2U2O7(cr) and UO2(cr) under argon at 1473 K in an alumina boat. The X–ray diffrac-tion pattern was indexed and indicates a tetragonal cell, with a = 9.378 Å and c = 19.922 Å. Unspecified analyses for Rb and U were said to confirm the suggested com-position.
As the cell used was:
2 4 11 2 4 12Pt Rb U O + Rb U O CSZ Ni + NiO Pt
where CSZ is calcia (15 mol %) stabilised zirconia, the cell reaction corresponds to:
Rb2U4O11 (cr) + NiO (cr) Rb2U4O12 (cr) + Ni (cr) (A.71).
A least square fit of consistent individual results on two samples was given as:
E (mV) = 802 − 0.645·T (985 –1186 K).
The recalculated Gibbs energy for reaction (A.71) is:
r mG∆ (A.71) = − 154.76 + 0.1245·T kJ · mol–1.
The authors use the molar Gibbs energy of NiO from [87VEN/IYE], (NiO, cr, T) = − 231.76 + 0.0839·T kJ · molf mG∆ –1, but as for similar papers from the
same group, we prefer to use that derived from the assessment of [90TAY/DIN], based on a larger number of Gibbs energy studies involving NiO. This, in the relevant tem-perature range, gives (NiO, cr, T) = − 234.22 + 0.08504·T kJ · molf mG∆ –1.
Hence the derived Gibbs energy of the oxidation reaction (A.72):
Rb2U4O11 (cr) + 0.5O2 (g) Rb2U4O12 (cr) (A.72)
becomes (A.72) = − 388.98 + 0.2095 T kJ · molr mG∆ –1.
The authors combine their results with their values for ∆fGm(Rb2U4O12, cr) suggested in [92VEN/IYE], but for reasons quoted in the review of that paper, the data

Discussion of selected references 511
for this compound have not been selected for the current assessment, so the oxygen po-tentials in the current paper cannot be processed further.
[96JAY/IYE]
The authors report measurements of the pressure of Rb(g) by mass–loss Knudsen effu-sion and the oxygen activity (emf with CaO–ZrO2 electrolyte) in the three–phase field RbUO3(cr) + Rb2UO4(cr) + Rb2U2O7(cr).
Rb2UO4(cr) and Rb2U2O7(cr) were prepared by heating appropriate amounts of U3O8(cr) with Rb2CO3(cr) in air at 1000 K, respectively, for 16 hours in alumina boats, and RbUO3(cr) by reducing Rb2U2O7(cr) with hydrogen at 1000 K. The products were characterised only by X–ray diffraction.
The effusion measurements were carried out from 1305 to 1459 K in a boron nitride cell, attached to a Cahn microbalance.
The oxygen potentials were studied using a CaO–ZrO2 electrolyte tube in flow-ing argon, from 920 to 1100K. Air ( = 0.
2O (g)p 21 bar) and Ni/NiO were used as the reference electrodes.
The rubidium pressures were fitted to the equation: 1
10 Rblog ( /bar) = 0.95 7977 p −− ⋅T
⋅
⋅
⋅
⋅
(1117 to 1193 K)
over the three-phase field, RbUO3(cr) + Rb2UO4(cr) + Rb2U2O7(cr).
As for the earlier similar study on the Na compounds, we have used the values assessed by Taylor and Dinsdale [90TAY/DIN], for the Gibbs energies of formation of NiO(cr), (NiO, cr, T) = − 234220 +85.042 T J molf mG∆ –1 from 900 to 1200 K, to con-vert the study with a Ni–NiO reference electrode to oxygen potentials. Our derived val-ues for the rubidium and oxygen potentials in the relevant three–phase field are then:
1RbR ln( /bar) = 152719 + 18.188 J mol T p T −− (1305 to 1495 K)
2
1OR ln( /bar) = 531440 + 189.726 J mol T p T −− (981 to 1090 K)
(air ref.)
2
1OR ln( /bar) = 558749 + 214.081 J mol T p T −− (920 to 1100 K)
(Ni/NiO ref.)
The first expression for the oxygen potential is different from that given by the authors, who seem to have neglected the correction from air to pure oxygen. The mean of the last two expressions for the oxygen potentials is the preferred relation:
2
1OR ln( /bar) = 545095 + 201.903 J mol T p T −− (920 to 1100 K)
(mean)
Discussion of selected references 512
However, the coefficient of T in the expression for which should correspond to the entropy change for the relevant reaction:
RbR ln( /bar),T p
RbUO3(cr) + Rb2UO4(cr) Rb2U2O7(cr) + Rb(g)
is far too small to refer to a vaporisation process − the corresponding terms in the simi-lar studies on NaUO3 [94JAY/IYE] and KUO3 [99JAY/IYE] are 247.4 and 243.0 J · K−1 · mol–1, respectively. This suggests that either equilibrium was not reached or maintained in the Knudsen cell, or some adventitious high temperature reaction was occurring.
No further processing of these data has therefore been carried out.
[96KAT/KIM]
This is a carefully made solubility study with U(VI) and Np(VI) at 25°C in a 0.1 M NaClO4 medium. The authors have taken precautions to assure the composition of the solid phases and that the oxidation state of Np(VI) does not change during the experiments. The conversion of pH to − log10 [H+] has been properly made and both the activity coefficient for H+, and the value for log10KW are close to the values calculated from the SIT and the interaction coefficients in [92GRE/FUG]. Some of the experimental solubility data deviate from the expected linear relations shown in Figure 3 and Figure 4 of this publication, indicating experimental shortcomings. However, the main part of the experiments conform well to the proposed solubility model. The equilibrium constants of Kato et al. have been recalculated to zero ionic strength by this review, using the uncertainty estimate of the authors. We find 10 ,0log sK ο (NpO2CO3, cr) = − (15.46 ± 0.12), 10 ,0log sK ο (UO2CO3, cr) = − (14.94 ± 0.14), and
10 ,0log sK ο (NpO3·H2O, cr) = –(22.32±0.14) , and − (22.34 ± 0.22), lo 10g ,0sK ο (UO3·2H2O, cr) = − (22.75 ± 0.06). The experimental value in 0.1 M NaClO4 converted to I = 0 with the SIT, taking into account hydrolysis of U(VI) is lo 10 ,0g ο
sK = − (22.90 ± 0.05), which is more accurate than that given in [93MEI/KIM2], lo 10 ,g 0
οsK = − (22.88 ± 0.19). The
latter quantity can be compared with the corresponding quantity, 10log ,0sK ο (UO3·2H2O, cr) = − (23.19 ± 0.43) calculated from the Gibbs energy of formation of UO3·2H2O(cr), obtained from calorimetric data selected by [92GRE/FUG]. Sandino [91SAN] has reported 10 ,0glo sK ο (UO3·2H2O, cr) = − (23.06 ± 0.18) and after re-interpretation of the solubility data of [89BRU/SAN] for amorphous and crystalline schoepite (in fact metaschoepite) [92SAN/BRU], lo 10 ,0g ο
sK (UO3·2H2O, am) = − (21.67 ± 0.14) and 10 ,0log ο
sK (UO3·2H2O, cr) = − (22.03 ± 0.14). These values differ considerably indicating differences in crystallinity between the samples used.
[96KON/BOO]
The IR spectrum of has been measured from 4UF (g) 175 700 cm−− between 1300 and 1370 K. Absorptions were found at 3 537ν = and 1
4 114 cm−ν = in good agreement

Discussion of selected references 513
with the (less reliable) matrix isolation data. Earlier electron–diffraction data utilised appreciably higher estimated values of 4ν and these were re–interpreted with the lower experimentally determined data. The electron diffraction data were consistent with a tetrahedral structure with Å, and vibration frequencies of 625, 123, 539 and . With the same electronic contributions as for , the calculated en-tropy of is
r(U F) 2− =
(498.8 2.3
.056
) J
1114 cm−
4UF (4UCl
g, 1050 K) 1K mol 1− −⋅
3l
3UH
m (49.0 2ο∆ =
UCl
± ⋅
UC
fus H
, in tolerable agreement with that determined from the vapour pressure data and ,
. m 4(UF , cr, 1050 K)
1275 cm−
+2AmO
S
-1mol⋅
3l
1 1
4UF (g)
2I (g)
1cm−
(49
(111
Fe(C
2.8 3.0) J± ⋅
4UF
5 2) K±
36N) −
K mol− −⋅
3UCl
46Fe(CN) −
The data in this paper have been used in the re–assessment of the vapour pres-sure of and the stability of and other uranium fluoride gaseous species.
[96KOV/BOO]
The melting point and heat of fusion of were determined by DTA, in a molybde-num crucible.
The sample was prepared from and HCl at 623 to 673 K and puri-fied by transport reaction with ; it was stored in an Ar glove box to minimise reac-tion with water and air. Six determinations of the melting point gave a mean of
in good agreement with earlier, somewhat less precise data. The integra-tion of the sharp melting peaks gave . .0) kJ±
Two runs were also made of the IR spectrum of UC at an unspecified tem-perature. The band at 338 was attributed to (formed by the known dis-proportionation); in the second run where the Mo crucible was outgassed to a pressure of 10
4 (g
UC
)
3l
–8 bar at 1273 K prior to the measurements, an additional band at was observed. This was attributed to the stretching band of (g).
[96KUL/MAL]
The behaviour of transplutonium (Am, Cm, Bk, Cf) and rare earth elements was studied in acidic and alkaline ferricyanide solutions. In 0.01 − 1 M mineral acid solutions con-taining 0.1 − 0.5 M K3Fe(CN)6, the precipitation of An(III) ferricyanides, AnFe(CN)6 · xH2O(s), was observed for An = Am, Cm, Bk and Cf. The ratio of metal: ferricyanide in the isolated precipitates was analysed to be 1:1. Gradual reduction of
to in the precipitated transplutonium ferricyanides was ascribed to radiolysis effects in the solids. In alkaline solutions, the different redox behaviour of Am enables its separation from Cm, Bk and Cf. A precipitate of americium(III) hydrox-ide suspended in 2 − 8 M NaOH / 0.1– 0.5 M K3Fe(CN)6 was dissolved as the ferricyanide complex. The oxidation of Am(III) to Am(V) was confirmed by spectros-copy. After one day, Am(V) precipitated as a hydroxide assumed to be Na2AmO2(OH)3 · xH2O(s). Neither solubilities nor thermodynamic data are reported in this paper.
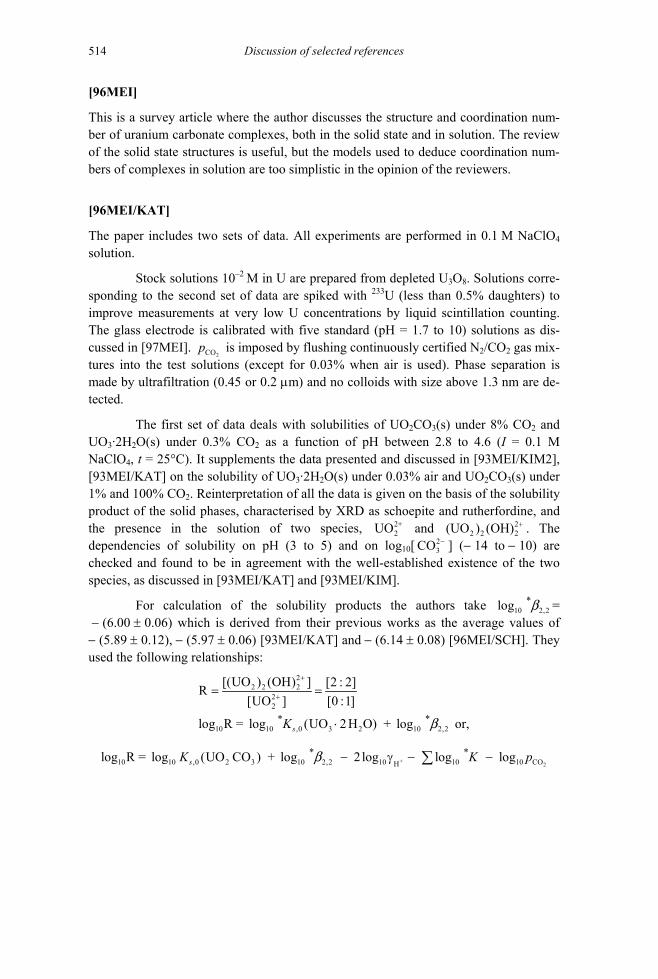
Discussion of selected references 514
[96MEI]
This is a survey article where the author discusses the structure and coordination num-ber of uranium carbonate complexes, both in the solid state and in solution. The review of the solid state structures is useful, but the models used to deduce coordination num-bers of complexes in solution are too simplistic in the opinion of the reviewers.
[96MEI/KAT]
The paper includes two sets of data. All experiments are performed in 0.1 M NaClO4 solution.
Stock solutions 10–2 M in U are prepared from depleted U3O8. Solutions corre-sponding to the second set of data are spiked with 233U (less than 0.5% daughters) to improve measurements at very low U concentrations by liquid scintillation counting. The glass electrode is calibrated with five standard (pH = 1.7 to 10) solutions as dis-cussed in [97MEI].
2 is imposed by flushing continuously certified NCOp 2/CO2 gas mix-
tures into the test solutions (except for 0.03% when air is used). Phase separation is made by ultrafiltration (0.45 or 0.2 µm) and no colloids with size above 1.3 nm are de-tected.
The first set of data deals with solubilities of UO2CO3(s) under 8% CO2 and UO3·2H2O(s) under 0.3% CO2 as a function of pH between 2.8 to 4.6 (I = 0.1 M NaClO4, t = 25°C). It supplements the data presented and discussed in [93MEI/KIM2], [93MEI/KAT] on the solubility of UO3·2H2O(s) under 0.03% air and UO2CO3(s) under 1% and 100% CO2. Reinterpretation of all the data is given on the basis of the solubility product of the solid phases, characterised by XRD as schoepite and rutherfordine, and the presence in the solution of two species, and . The dependencies of solubility on pH (3 to 5) and on log
2+2UO 2
2 2 2(UO ) (OH) +
10[ 23CO − ] (− 14 to − 10) are
checked and found to be in agreement with the well-established existence of the two species, as discussed in [93MEI/KAT] and [93MEI/KIM].
For calculation of the solubility products the authors take lo = − (6.00 ± 0.06) which is derived from their previous works as the average values of − (5.89 ± 0.12), − (5.97 ± 0.06) [93MEI/KAT] and − (6.14 ± 0.08) [96MEI/SCH]. They used the following relationships:
10 2,2*g b
22 2 2
22
[(UO ) (OH) ] [2 : 2]R[0 :1][UO ]
+
+= =
log R = log (UO 2 HK ⋅
10 10 ,0 3 2 10 2,2* *O) + logs b or,
+ 210 10 ,0 2 3 10 2,2 10 10 10 COH* *log R = log (UO CO ) + log 2 log log logsK K p− γ − −∑b

Discussion of selected references 515
depending on the solid phase controlling solubility at a given pH and 2, with COp
10*log K ο∑ = − 18.1451 (sum of the log of Henry constant for CO2 and the logs of the
first and second dissociation constants of H2CO3 and +10 Hlog γ = − 0.091). R values, in-
dependent of pH, could be obtained by spectroscopy [93MEI/KAT] or by solving a mass balance, according to:
t[U] [0 :1] + 2 [2 : 2]= ⋅
2 2
2,2 2* [2 : 2][H ] [H ] = R
[0 :1][0 :1]
+ +
= ⋅β
The equation:
t 2,222
[U]2 R + R = 0
[H ]+− b*
gives: 1
2* t 2,2
2
[U]1R = 1 + 8 14 [H ]+
⋅ −
β
t 2,2*[U] = [⋅ b
.
R will be independent of pH if , where α is a constant available from the experimental data.
2H ]+α ⋅
The authors give as selected values, l = (5.26 ± 0.07) and (5.72 ± 0.02) determined under 0.3 and 0.03 % CO
10 ,0 3 2*og (UO 2H O, cr)⋅sK
10 ,0log sK2, and = − (14.05 ± 0.08) (8% CO
2 3(UO CO , cr)2) according to the equilibria:
+ 2+3 2 2 2UO 2H O(cr) + 2 H UO + 3 H O(l) ⋅
2+ 22 3 2 3UO CO (cr) UO + CO −
The two values of lo 10 ,0*g sK (UO3 · 2H2O, cr) determined under
2=
3 · 10CO
p−3 and 3 · 10–4 bar, extrapolated to I = 0 with the SIT, correspond to
= − (22.90 ± 0.07) and − (22.44 ± 0.02), respectively, and differ somewhat from the values determined previously by [93MEI/KIM], [93MEI/KIM2].
10 ,0 3 2log (UO 2H O, cr)ο ⋅sK
Because of the ambiguities in the calculation procedure, they are not retained by the reviewers.
The second set of data is related to the solubility of UO3·2H2O(cr) between pH = 3.8 and 8.5 in an open atmosphere. For pH > 7, schoepite transforms to sodium uran-ate so these data are discarded. Here the U(VI) solubility is interpreted on the basis of the formation of the species: 0:1, ; 2:2, (UO ; 5:3, ; and
(aq) identified by TRLFS according to the data of [94KAT/MEI], mainly by fluorescence lifetime measurements. The presence of , which has a low inten-
2+2UO 2+
2) (OH)
+2UO OH
2 5
3
3(UO) (OH)+
2UO CO
1 these values differ from that given in [93MEI/KAT].
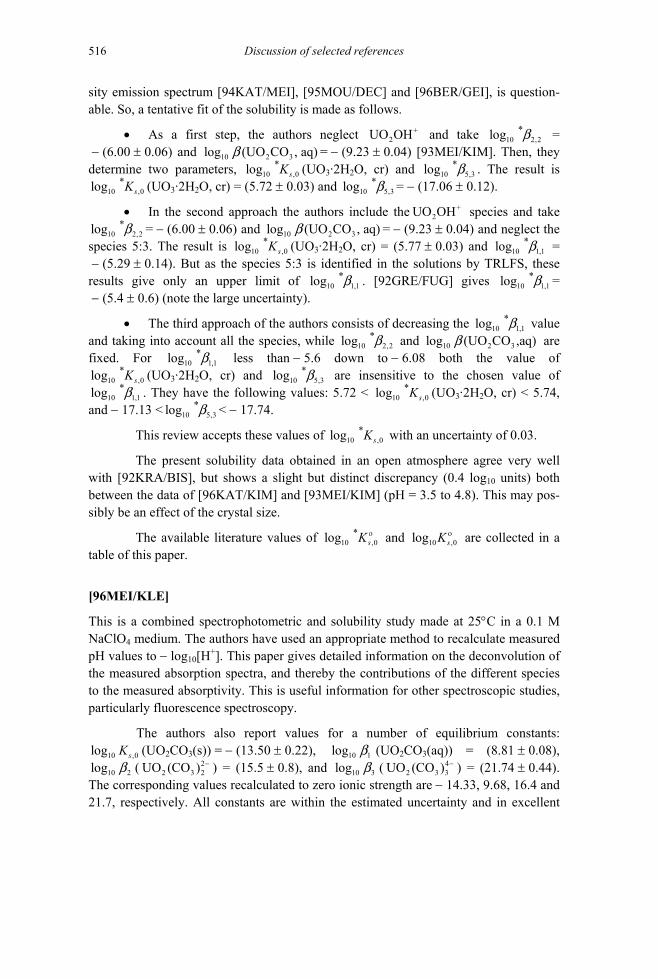
Discussion of selected references 516
sity emission spectrum [94KAT/MEI], [95MOU/DEC] and [96BER/GEI], is question-able. So, a tentative fit of the solubility is made as follows.
• As a first step, the authors neglect and take lo = − (6.00 ± 0.06) and = − (9.23 ± 0.04) [93MEI/KIM]. Then, they determine two parameters, lo
+2UO OH 10 2,2
*g b10 2 3log (UO CO , aq)b
10 ,0*g sK (UO3·2H2O, cr) and . The result is 10 5,3
*log b10 ,0
*log sK (UO3·2H2O, cr) = (5.72 ± 0.03) and = − (17.06 ± 0.12). 10log 5,3*b
+• In the second approach the authors include the species and take = − (6.00 ± 0.06) and = − (9.23 ± 0.04) and neglect the
species 5:3. The result is
2UO OH10 2,2
*log b 10 2 3log (UO CO , aq)b,0
*10log sK (UO3·2H2O, cr) = (5.77 ± 0.03) and =
− (5.29 ± 0.14). But as the species 5:3 is identified in the solutions by TRLFS, these results give only an upper limit of lo . [92GRE/FUG] gives lo = − (5.4 ± 0.6) (note the large uncertainty).
10 1,1*log b
10 1,1*g b10 1,1
*g b
• The third approach of the authors consists of decreasing the value and taking into account all the species, while and are fixed. For lo less than − 5.6 down to − 6.08 both the value of
10 1,1*log b
2 3UO CO ,aq10 2,2*log b 10log ( )b
10 1,1*g b
10 ,0*log sK (UO3·2H2O, cr) and are insensitive to the chosen value of
. They have the following values: 5.72 < 10 5,3
*log b10 1,1
*log b 10log ,0*
sK (UO3·2H2O, cr) < 5.74, and − 17.13 < < − 17.74. 10 5,3
*log b*This review accepts these values of lo 10 ,0g sK with an uncertainty of 0.03.
The present solubility data obtained in an open atmosphere agree very well with [92KRA/BIS], but shows a slight but distinct discrepancy (0.4 log10 units) both between the data of [96KAT/KIM] and [93MEI/KIM] (pH = 3.5 to 4.8). This may pos-sibly be an effect of the crystal size.
The available literature values of lo 10 ,0*g sK ο and 10 ,0log sK ο are collected in a
table of this paper.
[96MEI/KLE]
This is a combined spectrophotometric and solubility study made at 25°C in a 0.1 M NaClO4 medium. The authors have used an appropriate method to recalculate measured pH values to − log10[H+]. This paper gives detailed information on the deconvolution of the measured absorption spectra, and thereby the contributions of the different species to the measured absorptivity. This is useful information for other spectroscopic studies, particularly fluorescence spectroscopy.
The authors also report values for a number of equilibrium constants: 10 ,0log sK (UO2CO3(s)) = − (13.50 ± 0.22), (UO10 1log b
10 3g b2CO3(aq)) = (8.81 ± 0.08),
( ) = (15.5 ± 0.8), and lo (10 2log b 22 3 2UO (CO ) − 4
2 3 3UO (CO ) − ) = (21.74 ± 0.44). The corresponding values recalculated to zero ionic strength are − 14.33, 9.68, 16.4 and 21.7, respectively. All constants are within the estimated uncertainty and in excellent

Discussion of selected references 517
agreement with the values selected in [92GRE/FUG]. The equilibrium constants have been deduced from the spectrophotometric data and the fairly large uncertainty is a re-sult of the fact that both the equilibrium constants and molar absorptivities (through the deconvolution) have to be determined from the experimental data for each absorbing species. The large uncertainty for the second complex is probably due to the small amounts present, cf. Figure 1 on p. 82 in the publication. The small uncertainty for the first complex is due to the fact that the absorption spectrum of can be determined separately. The authors have used the equilibrium constant for the formation of
2+2UO
22 2 2(UO ) (OH) + from [96MEI/SCH] discussed in the present review: (0.1 M
NaClO10 2,2
*log b2,24, 298.15 K) = − (6.14 ± 0.08) corresponding to 10
*log οb (298.15 K) = − (5.93 ± 0.08), which is slightly smaller than the value proposed in [92GRE/FUG], − (5.62 ± 0.04). However, this value will not affect the magnitude of the equilibrium constants for the carbonate species under the experimental conditions used.
10 2,2*log b
10 1,1*log b +
[96MEI/SCH]
This paper is discussed together with [97MEI/SCH].
In these papers the authors analyse the UV–Vis (340–520 nm) spectra of 23 U(VI) aerated solutions (0.03% partial pressure of CO2, 2
= 0.3 kPa), I = 0.1 M Na-ClO
COp4, pH = 2.9 to 4.8, 10–4 to 10–2 in uranium. Solutions are allowed to stand for three
weeks at 25°C to reach equilibrium and are then filtered through 220 nm pore filters. They are considered as under-saturated. The focus of this review is on the determination of .
The analysis is conducted with a factor analysis method which is well ex-plained. It shows the existence of two species, in the more acidic solutions and a second one at higher pH, to be identified. Each one has a characteristic spectrum with absorption maxima for, , ε
2+2UO
2+2UO 413.88nm = (9.7 ± 0.2) cm2 · mol–1 , and for the second,
ε421.8nm= (101 ± 2) cm2 · mol–1 . The last one is similar to the spectra of the hydrolysed 2:2 species identified in [93MEI/KAT]. Furthermore a test assuming
= − (4.67 ± 0.17) for the unknown species, 2UO OH , shows that this value is too large as compared with the previous data, for instance [92GRE/FUG], [93MEI/KAT] and [96MEI/KAT]. The data from ten solutions (pH = 3.5 to 4.04) con-taining the two species are used to calculate = − (6.14 ± 0.08). This value agrees with [93MEI/KAT] and is discussed by the authors with respect to the previous value in [98MEI].
10*log 2,2b
The reviewer accepts this improved value, which when recalculated to I = 0 with the SIT,
10 2,2*log b
10 2,2*log οb = − (5.93 ± 0.08), is in reasonable agreement with the
value of − (5.62 ± 0.04) selected by [92GRE/FUG].

Discussion of selected references 518
[96MER/FUG]
The standard enthalpy of formation of crystalline (orthorhombic) and amorphous lanthanide hydroxycarbonates, LnOHCO3 · 0.5H2O(cr) with Ln = Nd, Sm, LnOHCO3 · 0.5H2O(am), with Ln = Dy, Yb and, 241AmOHCO3 · 0.5H2O(cr) have been determined by calorimetry at 298.15 K, p° = 101.325 kPa, in 1 M HCl. In addition, the enthalpy of formation of Nd2(CO3)3(am) has been determined under the same conditions. All experiments are described in detail. The solid phases have been well characterised by gravimetry, thermogravimetry, IR spectroscopy and X–ray powder diffraction. The enthalpy of solution of AmOHCO3 · 0.5H2O(cr) was determined from three samples. The average value from samples A and B, with the measurements performed in triplicate, was sol mH∆ (AmOHCO3 · 0.5H2O, cr, 298.15 K, 1 M HCl) = − (61.3 ± 2.5) kJ · mol–1. The results from preparation C (– 104.9 and − 102.4 kJ · mol–1) refer to samples aged for 40 days. The more negative enthalpy of solution determined for the aged samples was considered to be caused by partial loss of crystallinity (and very likely chemical alteration) as a result of α-irradiation. The aged solid was not further characterised.
The enthalpy of solution from samples A and B is combined with auxiliary data consistent with the NEA TDB, to deduce the standard molar enthalpy of formation of crystalline americium hydroxycarbonate by a well-defined thermodynamic cycle. The calculated value of:
f mH ο∆ (AmOHCO3 · 0.5H2O, cr, 298.15 K) = − (1682.9 ± 2.6) kJ · mol–1
is accepted in the present review. The authors have further used an estimated standard entropy of mS ο (AmOHCO3 · 0.5H2O, cr, 298.15 K) = (154 ± 10) J · K–1 · mol–1 and
(AmmS ο 3+, aq, 298.15 K) = − (201 ± 15) J · K–1 · mol–1 as estimated in [95SIL/BID] to calculate the Gibbs energy for the reaction:
(A.73) 3+ 23 2 3 2AmOHCO 0.5H O(cr) Am + OH + CO + 0.5H O(l)− −⋅
and the solubility constant of lo 10 ,0g sK ο (AmOHCO3 · 0.5H2O, cr, 298.15 K) = − (23.1 ± 1.0).
For the reasons discussed in sections 12.1.1 and 12.6.1.1.3 the present review includes an entropy correction of − 9.5 J · K–1 · mol–1 arising from the thermally popu-lated higher electronic states in europium compounds, leading to:
mS ο (AmOHCO3 · 0.5H2O, cr, 298.15 K) = (144 ± 10) J · K–1 · mol–1 and 10 ,0log sK ο (AmOHCO3 · 0.5H2O, cr, 298.15 K) = − (22.6 ± 1.0).
This latter value is in excellent agreement with the results from solubility measurements in [84SIL/NIT], [90FEL/RAI], [84BER/KIM], [94GIF] (cf. Table 12-9 in section 12.6.1.1.3.1).

Discussion of selected references 519
It should be noted that the analogous results and calculations for the ortho-rhombic Nd hydroxycarbonate lead to 10 ,0log sK ο (NdOHCO3 · 0.5H2O, cr, 298.15 K) = − (21.3 ± 0.7), which is in excellent agreement with the solubility constants derived from various solubility measurements (cf. Table A-24).
It is difficult to estimate accurate standard entropies of the amorphous hy-droxycarbonates, but their distinctly more negative enthalpies of solution compared to those of the crystalline compounds point to solubility constants at least two orders of magnitude higher [96MER/FUG]. This gives a reasonable explanation for the different solubility constants determined for crystalline 243AmOHCO3(cr), 10 ,0log sK ο
10g
(A.73) = − (22.3 ± 0.3) as re-calculated in [95SIL/BID] from the data in [84SIL/NIT], and a solid of 241AmOHCO3(s) possibly rendered amorphous with lo ,0sK ο (A.73) = − (20.2 ± 0.2) during the solubility study of Runde et al. [92RUN/MEI].
Table A-24: Comparison of the solubility constants reported for orthorhombic NdOHCO3 · 0.5H2O(cr).
Reference Medium t (°C) 10 ,0
logs
K 10 ,0
logs
K ο
[96MER/FUG] I = 0 25 – (21.3 ± 0.7) a) [91MEI/KIM2] 0.1 M NaClO4, (22 ± 1) – (19.19 ± 0.08) b) – (20.7 ± 0.2) c) [92RUN/MEI] 0.1 M NaClO4, 25 – (19.94 ± 0.16) b) – (21.4 ± 0.3) c) [93MEI/TAK] 0.1 M NaClO4, (24 ± 2) – (20.12 ± 0.09) b) – (21.6 ± 0.2) c) [93CAR] dilute solutions,
corrected to I = 0 (25) – (21.75 ± 0.29) b)
a) Calculated from thermochemical data b) Solubility measurements c) Corrected to I = 0 with the SIT coefficients in Appendix B. The uncertainty is increased to the 95 %
confidence interval.
[96MOL/GEI]
Moll et al. [96MOL/GEI] have determined the solubility and speciation of (UO2)2SiO4 · 2H2O in a 0.1 M NaClO4 ionic medium at 25°C. The solid phase has been well characterised, as described in [95MOL/MAT]. The authors have studied the solu-bility over the pH range from 3 to 9. The experiments are described in detail and the solid phase has been characterised both before and after equilibrium using X–ray dif-fraction. No phase transformation could be observed. The data at pH = 3, 4 and 5 indi-cate that the system is in, or close to, equilibrium. The data at higher pH are much more scattered and we have not found it meaningful to use them. Moll et al. only used the data at pH 3 to determine the solubility constant. This is not satisfactory and we have therefore reinterpreted their data. The reaction studied is:
(UO2)2SiO4 · 2H2O(s) + 4 H+ 2 + Si(OH)2+2UO 4(aq) + 2 H2O(l) (A.74).
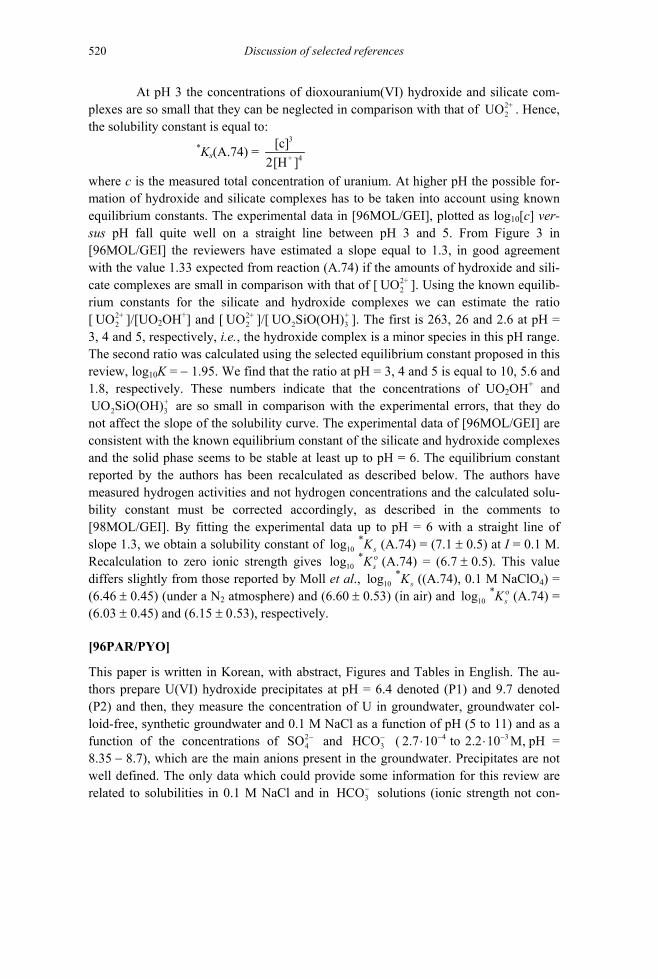
Discussion of selected references 520
At pH 3 the concentrations of dioxouranium(VI) hydroxide and silicate com-plexes are so small that they can be neglected in comparison with that of . Hence, the solubility constant is equal to:
2+2UO
*Ks(A.74) = 3
+ 4
[c]2[H ]
where c is the measured total concentration of uranium. At higher pH the possible for-mation of hydroxide and silicate complexes has to be taken into account using known equilibrium constants. The experimental data in [96MOL/GEI], plotted as log10[c] ver-sus pH fall quite well on a straight line between pH 3 and 5. From Figure 3 in [96MOL/GEI] the reviewers have estimated a slope equal to 1.3, in good agreement with the value 1.33 expected from reaction (A.74) if the amounts of hydroxide and sili-cate complexes are small in comparison with that of [ ]. Using the known equilib-rium constants for the silicate and hydroxide complexes we can estimate the ratio [ ]/[UO
2+2UO
2+2UO
UO Si
2OH+] and [ ]/[ ]. The first is 263, 26 and 2.6 at pH = 3, 4 and 5, respectively, i.e., the hydroxide complex is a minor species in this pH range. The second ratio was calculated using the selected equilibrium constant proposed in this review, log
2+2UO +
2UO SiO(OH)
10g
3
3
10K = − 1.95. We find that the ratio at pH = 3, 4 and 5 is equal to 10, 5.6 and 1.8, respectively. These numbers indicate that the concentrations of UO2OH+ and
are so small in comparison with the experimental errors, that they do not affect the slope of the solubility curve. The experimental data of [96MOL/GEI] are consistent with the known equilibrium constant of the silicate and hydroxide complexes and the solid phase seems to be stable at least up to pH = 6. The equilibrium constant reported by the authors has been recalculated as described below. The authors have measured hydrogen activities and not hydrogen concentrations and the calculated solu-bility constant must be corrected accordingly, as described in the comments to [98MOL/GEI]. By fitting the experimental data up to pH = 6 with a straight line of slope 1.3, we obtain a solubility constant of lo
+2 O(OH)
*sK (A.74) = (7.1 ± 0.5) at I = 0.1 M.
Recalculation to zero ionic strength gives lo 10g *sK ο (A.74) = (6.7 ± 0.5). This value
differs slightly from those reported by Moll et al., 10*glo sK ((A.74), 0.1 M NaClO4) =
(6.46 ± 0.45) (under a N2 atmosphere) and (6.60 ± 0.53) (in air) and 10*log sK ο (A.74) =
(6.03 ± 0.45) and (6.15 ± 0.53), respectively.
[96PAR/PYO]
This paper is written in Korean, with abstract, Figures and Tables in English. The au-thors prepare U(VI) hydroxide precipitates at pH = 6.4 denoted (P1) and 9.7 denoted (P2) and then, they measure the concentration of U in groundwater, groundwater col-loid-free, synthetic groundwater and 0.1 M NaCl as a function of pH (5 to 11) and as a function of the concentrations of SO2
4− and 3HCO− ( 2.7 pH =
8.35 − 8.7), which are the main anions present in the groundwater. Precipitates are not well defined. The only data which could provide some information for this review are related to solubilities in 0.1 M NaCl and in HC
4 10 to 2.2 10 M,− −⋅ ⋅ 3
3O− solutions (ionic strength not con-

Discussion of selected references 521
trolled). In NaCl the solubility of P2 lies around 10–6 M from pH = 7 to 11. In bicarbon-ate solutions, the P1 solubility increases from 7·10–5 to 2·10–4 M, but the P2 solubility remains constant around 2·10–3 M.
No modelling is done. Furthermore, no characterisation of the solid phases has been made. The groundwater was filtered before use to remove colloids, but no attempts seem to have been made to remove colloids before analysis of the uranium solubility. The solubility of the phases prepared at pH = 9.7 differ by three orders of magnitude between the groundwaters and the 0.1 M NaCl. The latter has the lowest solubility. In addition, the solubility of both phases is independent of pH in the range 7 < pH < 11. These results are not compatible with the known equilibrium constants, indicating that experimental artefacts affect the results. From the abstract it is impossible to obtain suf-ficient information to suggest possible flaws in the procedures used. The data in this paper are not credited by the present review.
[96PAV/FAN]
The authors have used TRLFS to evaluate the stoichiometry for the complexes, , n = 1, 2, 3 in a 3 m Na3 2
4Cm(SO ) nn
−
log
10 1log οb
2SO4/NaCl ionic medium. The individual spectra of the different complexes are well resolved, allowing a precise determination of the stoichiometry and equilibrium constants for the first two complexes. There are pro-nounced variations in the lifetime of the various species, ranging from 65.2 µs for Cm3+ to 171 µs in 4.12 m Na2SO4. This is a clear indication that the complexes formed are of inner-sphere type with bidentate coordination of sulphate. The equilibrium constants reported, = (0.93 ± 0.08) and lo = (0.61 ± 0.08), refer to the ionic strength, 3 m. They were recalculated to zero ionic strength, using ∆ε
10 1b 10 2g b1 = − (0.14 ± 0.02)
and ∆ε2 = − (0.24 ± 0.01) kg · mol–1 derived from data in Na2SO4-NaCl mixtures of varying ionic strength [98NEC/FAN] (cf. Figure 12-8, section 12.5.1.1) to give
= (3.45 ± 0.10) and 10 2log οb = (3.81 ± 0.09). The very large change in the equi-librium constants is a result of the large Debye–Hückel term for these reactions, which involve species with high charges.
[96PER/KRY]
This report was not analysed in [2001LEM/FUG]. It gives an overview of the literature data on the solubility of Np, Pu, Am, and Tc hydroxo compounds in alkaline solutions, and was partially covered in [95SIL/BID], [99RAR/RAN] and [2001LEM/FUG], and also provides experimental results. With regard to actinides, they concern mainly the solubility of Np(IV), Pu(IV), Np(V) and Pu(V) hydroxides. No thermodynamic con-stants can be extracted from the data, which were obtained for operational purposes.
The authors report experimental solubility data for Am(III), Np(IV), Pu(IV), Tc(IV), Np(V), Pu(V), Am(V) and Tc(V) hydroxides in 0.5 − 14 M NaOH solutions at (25 ± 2)°C. In addition, the solubilities of Np(IV), Pu(IV) and Tc(IV) hydroxides were

Discussion of selected references 522
measured in 1.0 and 4.0 M NaOH containing additions of fluoride, phosphate, carbon-ate, oxalate and some organic ligands. The experimental procedures involve an essential shortcoming: the authors prepared NaOH stock solutions without special precautions to prevent contact with atmospheric carbon dioxide. They assumed that a maximum car-bonate concentration of about 0.01 M in concentrated NaOH should not have a signifi-cant effect and interpreted their results exclusively with the formation of solid hydrox-ides and aqueous hydroxide complexes. However, such a carbonate contamination can also lead to the formation of carbonate or ternary hydroxide-carbonate complexes. An-other possible source of error, i.e., too high apparent solubilities, could arise from insuf-ficient separation of small colloidal species from true aqueous actinide species. The authors mentioned the application of centrifugation without giving details, but do not mention the use of ultrafiltration techniques.
• Americium(III) and americium(V)
The solubility of freshly precipitated Am(OH)3(am) was determined in 1 and 5 M NaOH after equilibration for three days and found to be 6.0·10–6 and 6.9·10–6 mol·L–1, respectively. These concentrations are similar to those reported in [89PAZ/KOC] at pH > 11 in 3 M NaClO4, but are several orders of magnitude higher than those expected according to the thermodynamic data selected in the present review. Analogous experi-ments with a precipitate aged by boiling for three hours led to americium concentrations of 5.9·10−7 and 3.6·10–7 mol · L–1. Solubilities of Am(V) were measured in 1.6 − 11.7 M NaOH with Na2AmO2(OH)3·xH2O(s) as the starting material. They increased only slightly with the NaOH concentration, from 2.0·10–4 to 2.9·10–4 mol · L–1.
• Neptunium(IV) and plutonium(IV)
NaOH solutions of Np(IV) were prepared from Cs2NpCl6 and those of Pu(IV) from a stock solution of Pu(NO3)4 using 2·10–4 mole of the element. Np(IV) is stabilised with 0.1 M Na2S2O4 and Pu(IV) with 0.1 M N2H5OH. The solubilities of fresh precipi-tates of Np(OH)4(am) and Pu(OH)4(am) were measured in the presence of 0.1 M N2H5OH as the reducing agent. The Np(OH)4(am) suspensions were additionally purged with argon to avoid oxidation by traces of oxygen, whereas Pu(IV) was considered to be stable against oxidation by atmospheric oxygen. The concentrations measured after con-tact times of 3 − 4 hours increased from log10[Np] = − 6.5 to − 4.7 and from log10[Pu] = − 7.8 to − 5.0 in 0.5 to 14.1 M NaOH, t = (26 ± 0.2)°C. When plotted versus log10aNaOH, slopes of +1 and +2 were observed and ascribed to the formation of anionic hydroxide complexes according to:
Np(OH)4(aq) + OH– 5Np(OH)− (A.75) and Pu(OH)4(aq) + 2 OH– 2
6Pu(OH) − (A.76)
respectively. It is to be noted that the Np(IV) solubilities measured by Peretrukhin et al. in 0.5 − 2 M NaOH are about two orders of magnitude higher than those reported by Rai

Discussion of selected references 523
and Ryan [85RAI/RYA] for corresponding NaOH solutions. The reverse is true for Pu(IV) when comparing to literature data. This could be due to traces of carbonate or oxygen in the first case and only oxygen in the second case. If we assume a carbonate content of about 0.001 − 0.01 mol · L–1 in the study of Peretrukhin et al., approximately proportional to the NaOH concentration, the solubility increase could be caused by the formation of ternary hydroxide-carbonate complexes, e.g., by the reactions:
24 3 4 3
2Np(OH) (aq) + CO Np(OH) (CO ) − − (A.77) or 2
4 3 4Pu(OH) (aq) + 2 CO Pu(OH) (CO ) 43 2
− − (A.78).
The reactions (A.77) and (A.78) were proposed by other authors to interpret the increasing solubility of Np(OH)4(am) [93ERI/NDA] and Pu(OH)4(am) [94YAM/SAK] in alkaline solutions (pH = 12 − 13) containing well-defined carbonate concentrations in the range 0.001 − 0.1 mol · L–1. Because of the ambiguities connected with a very prob-able but unknown carbonate contamination, the data of Peretrukhin et al. are not con-sidered as sufficiently reliable to estimate thermodynamic data for anionic hydroxide complexes of Np(IV) or Pu(IV).
In 1 and 4 M NaOH containing additions of 0.05 and 0.5 M Na2CO3, Peretrukhin et al. measured Np and Pu concentrations which were enhanced by factors between 2 and 26. In similar experiments, the solubility enhancing effect was studied for additions of 0.01 and 0.05 M phosphate, 0.02 and 0.1 M fluoride, 0.1 and 0.5 M glycolate, 0.03 and 0.3 M citrate, 0.05 and 0.2 M EDTA, and 0.03 and 0.075 M oxalate. However, the experimental data do not allow the identification of the aqueous com-plexes formed.
• Neptunium(V) and plutonium(V)
The solubilities of Np(V) and Pu(V) hydroxide compounds were determined after an equilibration time of three days. The initial solid phases were Na2NpO2(OH)3 · xH2O(s), which was characterised by X–ray powder diffraction, and Na2PuO2(OH)3 · xH2O(s). The measured concentrations increased from log10[Np] = − 3.9 to − 3.25 in 0.5 to 17.5 M NaOH and from log10[Pu] = − 4.3 to − 3.4 in 0.6 to 14.0 M NaOH. The authors explained the somewhat lower solubility of Pu(V) in 0.6 − 6 M NaOH with a possible disproportionation of Pu(V) or the instability of Na2PuO2(OH)3 · xH2O(s). The stability of the solid Np(V) hydroxides is discussed in more detail. In 5 M NaOH, NpO2OH · xH2O(s) was transformed into Na2NpO2(OH)3 · xH2O(s), whereas NaNpO2(OH)2 · xH2O(s) was the more stable solid at lower NaOH concentrations. At the highest hydroxide concentration of 17.5 mol · L–1 the authors assumed the formation of Na3NpO2(OH)4 · xH2O(s). At (25 ± 2)°C the variation of log10[Np(V)] versus log10[OH] (0.5 to 14 M NaOH) show more or less two slopes which were assigned to a change of Na2NpO2(OH)3 · xH2O to NaNpO2(OH)2 · xH2O (checked by X–ray diffraction) and further interpreted as the presence in solution of 2
2 3NpO (OH) − and 32 4NpO (OH) − . The behaviour of Pu under the
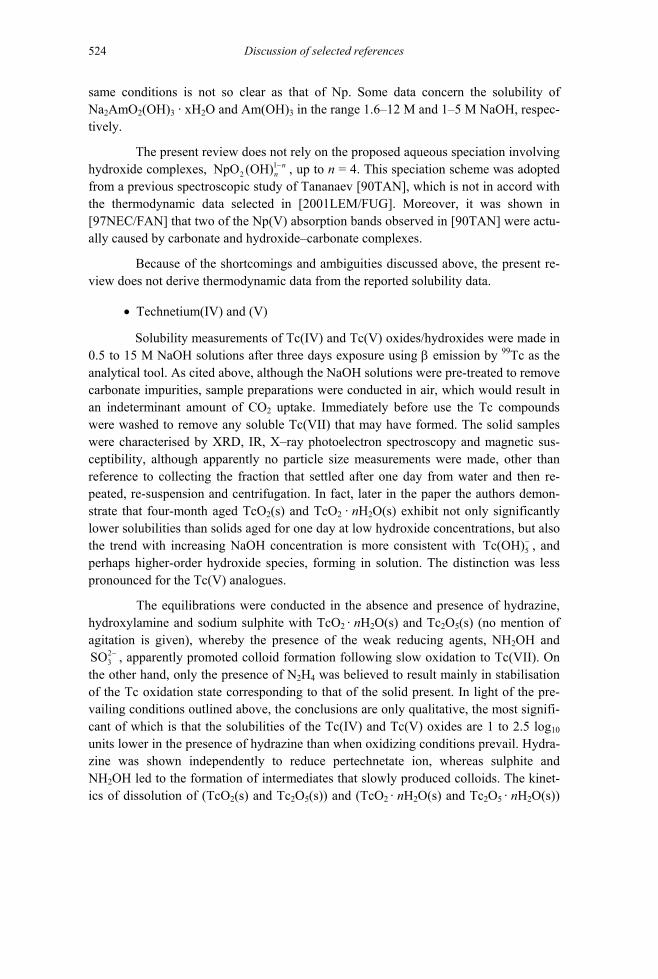
Discussion of selected references 524
same conditions is not so clear as that of Np. Some data concern the solubility of Na2AmO2(OH)3 · xH2O and Am(OH)3 in the range 1.6–12 M and 1–5 M NaOH, respec-tively.
The present review does not rely on the proposed aqueous speciation involving hydroxide complexes, 1
2NpO (OH) nn− , up to n = 4. This speciation scheme was adopted
from a previous spectroscopic study of Tananaev [90TAN], which is not in accord with the thermodynamic data selected in [2001LEM/FUG]. Moreover, it was shown in [97NEC/FAN] that two of the Np(V) absorption bands observed in [90TAN] were actu-ally caused by carbonate and hydroxide–carbonate complexes.
Because of the shortcomings and ambiguities discussed above, the present re-view does not derive thermodynamic data from the reported solubility data.
• Technetium(IV) and (V)
Solubility measurements of Tc(IV) and Tc(V) oxides/hydroxides were made in 0.5 to 15 M NaOH solutions after three days exposure using β emission by 99Tc as the analytical tool. As cited above, although the NaOH solutions were pre-treated to remove carbonate impurities, sample preparations were conducted in air, which would result in an indeterminant amount of CO2 uptake. Immediately before use the Tc compounds were washed to remove any soluble Tc(VII) that may have formed. The solid samples were characterised by XRD, IR, X–ray photoelectron spectroscopy and magnetic sus-ceptibility, although apparently no particle size measurements were made, other than reference to collecting the fraction that settled after one day from water and then re-peated, re-suspension and centrifugation. In fact, later in the paper the authors demon-strate that four-month aged TcO2(s) and TcO2 · nH2O(s) exhibit not only significantly lower solubilities than solids aged for one day at low hydroxide concentrations, but also the trend with increasing NaOH concentration is more consistent with T , and perhaps higher-order hydroxide species, forming in solution. The distinction was less pronounced for the Tc(V) analogues.
5c(OH)−
The equilibrations were conducted in the absence and presence of hydrazine, hydroxylamine and sodium sulphite with TcO2 · nH2O(s) and Tc2O5(s) (no mention of agitation is given), whereby the presence of the weak reducing agents, NH2OH and
, apparently promoted colloid formation following slow oxidation to Tc(VII). On the other hand, only the presence of N
23SO −
2H4 was believed to result mainly in stabilisation of the Tc oxidation state corresponding to that of the solid present. In light of the pre-vailing conditions outlined above, the conclusions are only qualitative, the most signifi-cant of which is that the solubilities of the Tc(IV) and Tc(V) oxides are 1 to 2.5 log10 units lower in the presence of hydrazine than when oxidizing conditions prevail. Hydra-zine was shown independently to reduce pertechnetate ion, whereas sulphite and NH2OH led to the formation of intermediates that slowly produced colloids. The kinet-ics of dissolution of (TcO2(s) and Tc2O5(s)) and (TcO2 · nH2O(s) and Tc2O5 · nH2O(s))

Discussion of selected references 525
were also followed for 30 days. In the latter case, the kinetics were also monitored in the presence of 0.041 M NH2OH and 0.022 M N2H4 (noting that the Tc(V) species are ap-parently mislabelled in the Figures). Significantly, in the presence of N2H4, a plateau in Tc concentration is reached within ca. 10 − 20 days indicating that an equilibrium was attained, whereas at all other conditions the concentrations increased linearly, consistent with continuous oxidation. However, the former finding would indicate that a three-day equilibration was insufficient to reach a stable concentration.
The references cited in this review are discussed in [89PAZ/KOC] for [95SIL/BID] and for all the others in [2001LEM/FUG].
[96RAK/TSY]
The interaction of uranium dioxide (grain size (12 ± 2) µm) of varying stoichiometries (O:U = 2.005 − 1.985) with Artesian aqueous solutions containing up to 1.5·10–3 M, Ca2+; 1.4·10–3 M, Cl– and other ions and nominally pH = 7, was measured at 300 K. The duration of the experiments in stirred and static reactors was 100, 240, 350, 600, 1440, and 7560 hours with no difference observed either in the method used, or the uranium isotope used (235U or 238U). Higher uranium concentrations were found at higher O:U ratios, e.g., after 7560 hours, 0.13–0.35 mg · L–1 for a ratio of 1.985 compared with 15 mg · L–1 for 2.005. This trend was thought to be due to the higher content of U(VI) in the latter solid and is consistent with the observed decrease in the O:U ratio after the dissolution experiment. The diffusion of oxygen ions to the surface during dissolution is discussed. The higher uranium content in the aqueous phase, compared to solubility values (2·10–4 to 2·10–1 mg · L–1) in pure water reported in the literature, is ascribed to the presence of various cations and anions in the aqueous solution samples. No allusion is made to the effect of oxygen: in fact, no mention is made of any attempt to control or verify the oxygen content. However, as neither the exact solution composition and pH are given, nor is it established that equilibrium was definitely reached after 7560 hours, no reliable solubility data can be derived from this study.
[96ROB/SIL]
This paper was briefly reviewed in [2001LEM/FUG]. The solubility of amorphous di-oxoneptunium(V) hydroxide was measured in 0.30, 0.60, 1.0, 1.8, 3.0, and 5.6 molal NaCl at room temperature (21 ± 2)°C over a period of 39 days. The solid was prepared by precipitation from +
2NpO solutions with carbonate-free NaOH. The H+ and OH– concentrations were determined by an appropriate method. The absence of carbonate and hydroxide complexes was ascertained by spectroscopy and by keeping the solutions at pH < 10. The SIT was applied to evaluate the solubility constant
10 ,0*log sK ο = (5.21 ± 0.12), which is in good agreement with the value selected in
[2001LEM/FUG], 10 ,0*log sK ο = (5.3 ± 0.2). The same holds for the interaction coeffi-
cient of = (0.08 ± 0.05) kg · mol+2NpO ,(ε Cl )− –1 derived from the ionic strength de-
Discussion of selected references 526
pendence of the solubility product. It is almost equal to +2(NpO ,Cl )−ε = (0.09 ± 0.05)
kg · mol–1 as calculated in [2001LEM/FUG] from the +2NpO trace activity coefficients
determined in [95NEC/FAN] with a solvent extraction method.
Pt
21 bar) Pt
+ Ni(cr))
[96SAL/IYE]
This paper reports the preparation and identification of Tl2U3O9(cr) and Tl2U4O11(cr), together with measurements of the oxygen potential over the diphasic fields, Tl2U4O11 + Tl2U4O12 and Tl2U4O12 + Tl2U4O13.
The U(VI) uranates, Tl2U2O7(cr) and Tl2U4O13(cr), were first prepared by reacting appropriate amounts of Tl2CO3(cr) and U3O8(cr) in dry air at 973 K; Tl2U4O12(cr) was then obtained by reduction of Tl2U4O13(cr) in flowing Ar at 1000 K, as for the analogous rubidium compound. The products were characterised by X–ray diffraction. The new compounds Tl2U3O9(cr) and Tl2U4O11(cr) were prepared by annealing mixtures of Tl2U2O (cr) and UO (cr) in a platinum boat under Ar at 1000 K for eight hours. Redox and X–ray fluorescence analyses confirmed the composition of the sam-ples. Their X–ray diffraction patterns were indexed as hexagonal, with a = 3.972 Å and c = 9.960 Å for Tl U O (cr) and tetragonal, with a = 9.741 Å and c = 19.922 Å for Tl U O (cr), isostructural with Rb U O (cr).
7 2
2 3 9
2 4 11 2 4 11
The cells used for the emf measurements were:
(I) 2 4 11 2 4 12Pt Tl U O + Tl U O CSZ Ni + NiO
and (II) 22 4 12 2 4 13 OPt Tl U O + Tl U O CSZ air ( =0.21p
where CSZ is calcia (15 mol %) stabilised zirconia.
Least square fits of consistent individual results on the two cells were given as
E (mV) = 709.2 − 0.4694·T (805 − 1179 K) for cell (I)
E (mV) = 810.0 − 0.6124·T (996 − 1141 K) for cell (II).
The reaction in cell (I) is:
(A.79)
and the recalculated Gibbs energy for this reaction is:
(A.79) = − 156.31 + 0.1182 T kJ · mol–1.
The derived Gibbs energies of the oxidation reactions (A.80) and (A.81):
2 4 11 2 4 12Tl U O (cr) + NiO(cr) Tl U O (cr
r mG∆
As for similar papers from the same group, we have used the Gibbs energies of formation of NiO(cr) assessed by [90TAY/DIN], to convert the emf of cell (I) to oxygen potentials.

Discussion of selected references 527
2 4 11 2 2 4 12Tl U O (cr) + 0.5 O (g) Tl U O (cr) (A.80)
2 4 12 2 2 4 13Tl U O (cr) + 0.5 O (g) Tl U O (cr) (A.81)
are finally:
r mG∆ (A.80) = − 390.53 + 0.2032 T kJ · mol–1
r mG∆ –1(A.81) = − 136.85 + 0.0841 T kJ · mol .
The authors' expression for (A.81) seems to have an incorrect entropy term.
r m2 G⋅ ∆
The authors combine their oxygen potential results with values for (Tlf mG∆ 2U4O13, cr) estimated by [81LIN/BES], (by calculations which need correction
for the above error) to derive Gibbs energy expressions for the lower uranates. How-ever, in the absence of any experimental data for a thallium uranate, we do not select these for the review.
[96SHO/BAM]
The compounds SrPu2Ti4O12(cr), Pu2Ti3O8.79(cr), and Pu2Ti2O7(cr), in which plutonium is in the (III) oxidation state, have been prepared and identified by X–ray diffraction. The solid solubility limits of Pu2Ti2O7(cr) in Ln2Ti2O7(cr) were shown to increase as the size of the lanthanide ion decreases. Attempts to synthesise analogous compounds with Pu(IV) or solid solutions containing Pu(IV) and Ce(IV) were unsuccessful.
This paper contains no thermodynamic data.
[96YAM/HUA]
A Knudsen effusion mass–spectrometric study showed that the major gaseous species in the vaporisation of a sample of 'BaUO3' are, in decreasing order, BaO(g), Ba(g) and UO2(g). The starting 'BaUO3' sample was prepared by hydrogen reduction of BaUO4 for eight hours at 1673 K. Analyses of both BaUO4 and BaUO3 were by X–ray diffraction only, so the precise Ba/U and O/U ratios in the solid were not established unambigu-ously; the lattice parameter of 4.416 Å corresponds to BaUO3.02. The following reac-tions were assumed to occur in the Knudsen cell:
BaUO3(cr) BaO(g) + UO2(cr) (A.82)
BaO(g) Ba(g) + 1 2 O2(g) (A.83)
UO2(cr) UO2(g) (A.84)
but in view of the complexities of the chemistry of the Ba–U–O system, other reactions could easily have occurred − see below. As usual in this type of study, estimated cross

Discussion of selected references 528
sections for BaO(g) and UO2(g) were used to convert ion currents to pressures, with an attendant uncertainty.
The authors processed their reported pressure equations:
10 BaOlog ( / bar)p = 18.37 − 53246·T–1
10 Balog ( / bar)p = 19.14 − 58202·T–1
210 UOlog ( / bar)p = 21.22 − 63078 T–1
using estimated thermal functions for BaUO3(cr) and values for BaO(g) and UO2(g) from [90COR/KON] to derive third- and second-law enthalpies of formation of BaUO3(cr), f H∆ (BaUO3, cr, 298,15 K) of − (1742.5 ± 10.0) kJ · mol–1 (uncertainty increased) and − (1681.8 ± 20.8) kJ · mol–1, respectively. However, the lattice parameter of the sample after the experiments had increased to 4.405 Å, corresponding to a com-position of BaUO3.12. This, and the lack of agreement between the second- and third-law enthalpies of formation, indicates that the vaporisation was non-congruent, with prob-able changes in the Ba/U as well as the O/U ratio.
The calculated values of the enthalpy of formation are in general agreement with more recent calorimetric data of barium uranates given by [97COR/BOO], but clearly cannot be used to define the properties of a barium uranate of any defined com-position.
[97ALL/BUC]
Formation of weak complexes between UO ,2+2
+2NpO
2 3Cl
, Np4+, Pu3+ and Cl– is investigated at (25 ± 1)°C by EXAFS in appropriate HCl or LiCl solutions to avoid hydrolysis and under conditions to avoid redox reactions. The chloride concentration was varied up to 14 M. Systematic changes of the EXAFS spectra obtained up to 13 Å–1 in the k-space in transmission mode (U) or fluorescence mode (Np and Pu) with an increase in [Cl–] show the build up of inner sphere complexes except for Pu3+. The limiting complexes, determined from the EXAFS spectra, are UO − (Cl coordination number, NCl, equal to 2.6), NpO2Cl, (NCl = 1.0) and 2+
2NpCl , (NCl = 2.0).
From this study only values are estimated by the authors from data corresponding to N
10log b10g bCl = 0.5: lo = − 0.48 for UO2Cl+ , = − 0.78 for NpCl10log b 3+
and = − 0.85 for NpO10log b 2Cl (95% limits are ± 12%). The chloride concentration at which they are formed is given by [Cl–] = 1/β in acidic media.
These values are lower than those previously reported. Although no interac-tions M–Cl are detected at a distance from M above 4 Å, the presence of outer sphere complexes in the solution cannot be excluded. Furthermore, the EXAFS show that on Dowex 50 equilibrated with the more concentrated chloride solutions, the anionic spe-cies, 2
2 4UO Cl − or 26NpCl − , are captured.

Discussion of selected references 529
This paper gives the hydration numbers of aqueous ions, N = 5.3 for , N = 5 for
2+2UO
+2NpO , N = 11.2 for Np4+ and N = 10.2 for Pu3+. They are derived from spectra
corresponding to solutions with the lowest chloride concentration. For Np4+ the authors suggest that the number of water molecules around this ion is between 9 and 11. These values are in agreement with previous results. This paper was not quoted in [2001LEM/FUG].
[97ASA/SUG]
The extraction experiments were initiated by equilibrating tetraphenylarsonium tetra-chloronitridotechnetate(VI) anion, [{(H2O)Cl3NTc}2)(µ–O)]2–, dissolved in chloroform for 210 minutes at 298.15 K with an aqueous HCl/NaCl solution at 1 M ionic strength. 99Tc was used as a tracer. The distribution ratio (concentration in the organic to aqueous phase) increases with acid and TPAC concentration. The overall extraction constant (Kex), which can be defined by the equilibrium:
, with R = tetraphenylarsonium, 4TcNCl + RCl(org) RTcNCl (org) + Cl− −4
3
which in the aqueous phase can be broken down into a dimerisation step, followed by two hydrolysis steps each involving the loss of two chloride ions. The [{(H2O)Cl3NTc}2)(µ–O)]2– anion has a peak at 540 nm, which is observed at [H+] = 0.2–1.0 M, whereas no peak was seen at 557 nm, which would correspond to the forma-tion of the tetrachloro analogue, i.e., [{Cl4NTc}2)(µ–O)]4–. Hence, in this range of acid-ity the dominant reaction in the aqueous phase is believed to be:
4 22 TcNCl + 3 H O(l) − [{(H2O)Cl3NTc}2)(µ–O)]2– + 2 H+ + 2 Cl–. Assuming that these are the dominant aqueous species and in excess TPAC(org), the data were regressed to yield a value for this equilibrium constant β2 of (2.85 ± 0.06)·105 M3 with Kex = (8.8 ± 0.2)·103. For comparison, Kex = (2.99 ± 0.19)·104 for extraction of water by TPAC in chloroform. In 1 M HCl, 95% of the aqueous Tc is in the form of the monomer. At [H
4TcO−
+] < 0.2 M, further hydrolysis was suggested due to the appearance of a peak at 342 nm, which is believed to result from the forma-tion of [{Cl2NTc}2)(µ–O)2]2–.
[97BER/GEI]
This paper validates the stoichiometry and the formation constant of the complex Ca2[UO2(CO3)3] identified in [96BER/GEI]. TRLFS and LIPAS are used to study solu-tions of the following composition: U, 2·10–5 M; HC 2
3O / CO− − , 8·10–3 M; Ca2+ 10–4 to 5·10–3 M; pH = 8.0 (I =0.1 M, NaClO4) where two equilibria are supposed to exist:
2+ 4 (4 2 )2 3 3 2 3 3Ca + UO (CO ) Ca UO (CO ) (aq)− − b
bb − K
= 3.1 2+ 23 3Ca + CO CaCO (aq)−
10log οb

Discussion of selected references 530
From the function:
log10
(4-2 )2 3 3
(4-2 )tot 2 3 3
[Ca UO (CO ) (aq)][U ] [Ca UO (CO ) ]
−
−−
bb
bb
= log10 R = b log10[Ca2+] + log10K
where R is measured through TRLFS, the authors obtain b = (1.80 ± 0.2) and log10K = (6.8 ± 0.7). Using the Davies equation, they obtain 10log K ο = 4.1 and with
( ) = (21.6 ± 0.05) [92GRE/FUG] they obtain lo = (25.7 ± 0.7) for the equilibrium:
10log οb 42UO (CO) −
3 10 2,3g οb
2 Ca2+ + UO + 3 CO 322
+ 2− Ca2[UO2(CO3)3](aq).
This value is considered by the authors to be better than the previous one (26.8 ± 0.8) given in [96BER/GEI].
Additional proof of the existence of the di-calcium tri-carbonato uranium(VI) complex is given by a comparison with the LIPAS spectrum which is different from that of 4
2UO (CO)3− : a slight red shift of 0.35 at 462 nm and 458 nm, outside of the measur-
ing errors.
[97BOU] This thesis gives data on the thermophysical properties, including heat capacity and thermal diffusivity, of Tc and some Nb–Tc alloys. Tc was prepared by heating NH4TcO4(cr) in Ar–H2 mixtures at 873 K, followed by arc–melting in Cu under an ar-gon atmosphere. Chemical analyses showed the arc–melted samples were 99.94 % pure, the major impurities being oxygen and rhenium; however, no analysis for nitrogen was reported.
Heat capacities were measured in a DSC apparatus from 673 to 1583 K; the re-sults are presented only in the form of a graph. For Tc(cr), the heat capacity has a maximum around 1080 K and a minimum around 1540 K and are ca. 10–20% lower than the only other experimental values derived from the thermal diffusivity measure-ments of Spitsyn et al. [75SPI/ZIN] (which have an uncertainty of at least 5%). More-over, Boucharat's thermal diffusivity measurements give values which are also 10-30% lower than those from two earlier (and consistent) studies. Since there is no physical reason why there should be extrema in ,mpC (Tc, cr) in the relevant temperature range, these results have not been accepted for this review.
It may be noted that Van der Laan and Konings [2000LAA/KON] have studied the heat capacity up to 973 K of a Tc–Ru alloy made by neutron irradiation of a similar batch of Tc(cr) to that used by Boucharat.

Discussion of selected references 531
[97BRU/CAS]
Eh/pH data collected from Cigare Lake ore deposit boreholes along the path of under-groundwater, together with analysis data of uraninite, are consistent with equilibrium of the water with UO2 (reducing water in contact with the ore, pH = 7) and then U3O7 (less reducing water, pH < 7 due to U(VI) hydrolysis). The database used is included in the HARPHRQ code, which is a geochemical code speciation based on PHREEQE, 1991.
[97CAS/BRU]
The solubility of a natural becquerelite, Ca(UO2)6O4(OH)6·8H2O or CaU6O19·11H2O (see [94SAN/GRA]), was measured at 25°C under a nitrogen atmosphere. XRD, EMPA, SEM and EDS were used to characterise treated (pre-washed for 3 – 4 hours with doubly-distilled water) and untreated samples; no schoepite was detected (< 5% vol.) after the experiments. A sequence of collecting four data points over a period of 622 days was reported including an initial period 81 days exposure of 0.0215 g of solid to 450 mL of water with constant stirring. The pH (± 0.2) was adjusted with NaOH and HClO4 after each equilibration. The speciation of U(VI) and formation constants were determined according to [92GRE/FUG] with the species considered being: , UO
2+2UO
2(OH)+, , 2 2UO (OH) (aq) 2 3UO (OH)− , 22 4UO (OH) − , 3
2 2(UO ) (OH) + , (UO , 22OH) +
2 2) (24H)2 3(UO ) (O + , 2 3(UO ) (O 5H)+ , 2 3 7) (OH)(UO − and (UO2 4) (OH)7
+ (except for which was assigned a value of − 12.05 (cf. 10 2,1
*log b ≤ − 10.3 [92GRE/FUG] and − (12.15 ± 0.07) in the current review). The SIT was used to represent the activity coef-ficients at these low ionic strengths. The observed total U concentration was regressed in terms of the measured hydrogen ion and calcium concentrations including the forma-tion constants and activity coefficients mentioned above to yield a 10 ,0
*log sK ο value of (29 ± 1) for the dissolution of becquerelite, viz.,
Ca(UO2)6O4(OH)6·8H2O)(cr) + 14 H+ Ca2+ + 6 + 18 H2+2UO 2O(l).
The calcium levels exceeded the 1:6 stoichiometry (Ca:U) indicating either in-congruent dissolution or the presence of a calcium containing solid phase impurity. The uranium concentrations are significantly less than would be expected from schoepite, uranophane, or soddyite. One contribution for the much lower solubility observed in this study compared with those reported previously, 10 ,0
*log sK ο = 41.9 − 43.7 [94SAN/GRA] and 10 ,0
*log sK ο = 43.2, [90VOC/HAV], was suggested to be the larger crystal size used in their experiments, but the difference would appear much too large to be accounted for solely by this effect. No explanation can be offered at this time for the disparity between these results. The solubility constant, 10
*log ,0sK ο = (29 ± 1), is not accepted in this re-view (see [90VOC/HAV]).

Discussion of selected references 532
[97CLA/CON]
This is the first attempt to identify by X ray Absorption Spectroscopy, XAS, a species of Np(VII) in strong alkaline solution where Np(VII) is stable. EXAFS fluorescence spectra of a test solution 3 10–2 M in Np in 2.5 M NaOH under an ozone atmosphere were recorded in the k space up to 10 Å−1. The Fourier Transform (FT) of these spectra is interpreted as resulting from a coordination of Np by two oxo oxygen atoms, four hydroxo oxygen (N = (4 ± 1)) atoms and by one molecule of water. This FT is close to that of 5
2 3 3NpO (CO ) − , and this similarity confirms, according to the authors, the pres-ence of the NpO2 core in the species which is proposed to be 2
2 4 2NpO (OH) H O − . These results were refuted by [2001WIL/BLA] and [2001BOL/WAH].
[97COR/BOO]
The structure of the perovskite-related phases, Ba1+yUO3+x and (Ba,Sr))1+yUO3+x, was investigated over a wide range of x and y by X–ray and neutron diffraction. The struc-tural properties within the series, BaUO3(cr) to Ba3UO6(cr), are discussed in detail. In-tegral enthalpies of formation of the compounds, Ba1+yUO3+x, with 1.033 ≤ y ≤ 1.553 and 3.134 ≤ x ≤ 3.866 were determined by solution calorimetry; in addition, the stability of BaUO3+x was investigated by oxygen potential determinations.
The alkaline earth uranates were prepared in various Ba/U ratios by heating the purified binary oxides (BaO, UO2) in a Ar + H2 atmosphere at 950°C followed by heat-ing at 1300°C in stabilised zirconia crucibles. Chemical analyses were carried after ion exchange separation of the alkaline earth ions. Total uranium was determined titrimetri-cally with dichromate and Ba by complexometry. The oxygen content was obtained from the analysed Ba/U ratio and the weight increase to Ba3UO6(cr) + BaUO4(cr) upon heating the samples in O2 to 1000°C.
The calorimetric dissolution medium was (HCl + 0.0400 FeCl3 + 70.68 H2O) referred to below as (sln). In addition to the samples, mixtures of BaCl2 + UCl4 with Ba/U ratios varying from 0.83 to 2.49 were also dissolved and the values corresponding to the Ba1+yUO3+x, needed to close the thermodynamic cycles, were interpolated. Also used in the cycles were the values of sol mH∆ (UO2Cl2, cr) = − (102.18 ± 0.63) kJ · mol–1
from [88COR/OUW], the standard enthalpies of formation of UCl4, UO2Cl2, BaCl2 and the partial molar enthalpies of formation of HCl and H2O in the medium.
In our recalculations, we have used the values f mH∆ (HCl, sln, partial) = − (164.71 ± 0.11) kJ · mol–1 and f mH∆ (H2O, sln, partial) = − (285.84 ± 0.04) kJ · mol–1. These values are based on a free chloride concentration of (0.81 ± 0.015) mol · dm–3 which takes into account the complexing effect of the ferric ion. For the interpolation of the BaCl2/UCl4 enthalpies of solution, we have fitted the experimental results to a quad-ratic function. We obtain:
Discussion of selected references 533
f mH ο∆ (Ba1.033UO3.134, cr, 298.15 K) = − (1721.68 ± 3.57) kJ · mol–1,
f mH ο∆ (Ba1.065UO3.172, cr, 298.15 K) = − (1733.43 ± 3.65) kJ · mol–1,
f mH ο∆ (Ba1.238UO3.407, cr, 298.15 K) = − (1868.05 ± 4.16) kJ · mol–1,
f mH ο∆ (Ba1.400UO3.604, cr, 298.15 K) = − (1982.10 ± 4.38) kJ · mol–1,
f mH ο∆ (Ba1.553UO3.866, cr, 298.15 K) = − (2116.90 ± 4.38) kJ · mol–1.
These enthalpies of formation are appreciably less negative than those reported by the authors, whose reaction scheme (Table 7 of their paper) contains a numerical error - the value used in reaction 2 in that table corresponds to the oxidation of one mole of UCl4(cr), not the 0.899 mole of the relevant equation.
The authors report a linear change of the enthalpy of formation from Ba3UO6 to Ba1.033UO3.134 as a function of the Ba/U(total) ratio in the compounds. In this relation-ship, they include two further values, f mH ο∆ (BaUO3.05, cr, 298.15 K) = − (1700.4 ± 3.1) kJ · mol–1 and f mH ο∆ (BaUO3.08, cr, 298.15 K) = − (1710.0 ± 3.0) kJ · mol–1, of unspeci-fied origin. Since these two results may suffer from the same error as the detailed meas-urements, they have been discounted.
However, since both the Ba/U ratio and the uranium valency are changing in these compounds, this approximately linear relation for the five samples measured must be by chance (or perhaps related to the oxygen pressure during preparation). Thus the authors' derived value for the enthalpy of formation of BaUO3(cr) is − (1680 ± 10) kJ · mol–1 (which becomes − (1688 ± 10) kJ · mol–1 from the corrected values) by extrapola-tion of this linear relationship and must be treated with some circumspection.
At this stage, we see no argument to modify the previously selected value
f mH ο∆ (BaUO3., cr, 298.15 K) = − (1690 ± 10) kJ · mol–1.
The authors also measured the oxygen potential as a function of the oxygen content of Ba1.033UO3+x(cr), using a reversible emf cell of the type:
21.033 3+x 2 2 O(Pt)Ba UO Calcia Stabilized ZrO O (Pt), = 0.202 bar p−
After each equilibration, the actual composition of the sample was determined on the rapidly cooled sample, assuming that during cooling the composition did not change. The fitted equations were:
E(mV) =1595.9 − 1138.2·x at 1060 K
E(mV) =1494.4 − 874.8·x at 1090 K
for 0.15< x <0.335
The authors used a linear extrapolation of the potentials to x = 0 to give an ap-proximate value of the equilibrium oxygen potential of stoichiometric BaUO3(cr) at 1060 K, which becomes − 629 kJ · mol–1 with our refitted equation. This is, in fact,

Discussion of selected references 534
likely to be an upper limit for the oxygen potential, which probably drops sharply near x = 0 as all the uranium becomes quadrivalent (cf. UO2+x). Such a value is low enough to support the long reported failure [75BRA/KEM], [82BAR/JAC], [84WIL/MOR] to ob-tain stoichiometric BaUO3(cr).
[97DEM/SER]
Aqueous saturated solutions of dioxouranium(VI) sulphate, UO2SO4·2.5 H2O, are in equilibrium with UO2SO4·3.5 H2O(cr) and at 25°C the composition of the solution is 60.8 wt% of UO2SO4. These are the only relevant data which can be derived from this paper.
[97ELL/ARM]
This paper deals with the solubility of uranium from well-characterised (according to particle size) U-contaminated soils in synthetic acid rain water ([H2SO4] = 5·10–5 M and [HNO3] = 10–4 M in a 2/1 ratio, pH = 4), simulated groundwater ([NaHCO4] = [MgSO4] = 2·10–3 M, [CaCl2] = [CaSO4] = 10–3 M, pH = 7.9 and I = 1.7·10–2) and other solutions (lung serum and stomach-like solutions) which are of no interest for this review. The equilibrium chemistry of the experiments were modelled using Geochemist's Workbench version 2 code1 to predict speciation and precipitation of saturated phases. Solubility data ( in a natural isotopic ratio) are rather good, but could not be used to deduce thermodynamic data. The species and minerals put forward to explain solubilities are:
235 238U and U
2UO (C 23 2O ) ,− 4
2 3 3UO (CO ) − , and uranophane , haiweeite
2 3UO (CO )(OH)−
2 2 6 15 2Si O 5H O3
2 2 2 7(UO ) Si O ⋅ 25H OCa Ca(UO ) ⋅ , soddyite . This review suggests that the species, , should
be2 2 4(UO ) SiO ⋅
2 2(UO ) (C2H O
3 3)(OH)−2
O2 3UO (CO )(OH)−
3 . The formula of uranophane is Ca(UO2)2(SiO3OH)2
.5H2O.
[97FIN]
Accurate thermodynamic data for minerals are rare and such data therefore often have to be estimated. This paper describes one estimation method, originally proposed by Tardy and Garrels [76TAR/GAR], where the f mGο∆ value for each mineral is estimated from the sum of the constituent oxide contributions, and developed by Saxena [97SAX]. The values given in Table 1 in [97FIN] refer to the molar contributions of these constituents in various mineral phases. The values are listed in Table A-25, where the selected values for the pure oxides are also given:
f mGο∆
1 Bethke, C. M., Urbana–Champaign, University of Illinois, USA

Discussion of selected references 535
Table A-25: Comparison between f mGο∆ calculated from the sum of constituent oxide contributions and ∆ selected in [92GRE/FUG]. f mGο
Oxide Calculated (kJ·molf mG ο∆ –1) at 298.15 K for the oxide constituents in mineral phases
Selected f mG ο∆ (kJ·mol–1) at 298.15 K for the pure phases from [92GRE/FUG]
UO3(s) – 1153.5 – 1145.74 (UO3 –γ)
H2O(l) – 242.6 – 237.14
CaO(s) – 716.4 – 603.30
SiO2(s) – 865.9 – 856.29 (quartz)
CO2(g) – 404.6 – 394.37
The paper by Finch contains a list of f mGο∆ values for oxide, carbonate and silicate minerals, most of which have a layer structure. Some of these values refer to experimental data discussed in this review under [92NGU/SIL] or in [92GRE/FUG] under [88OHA/LEW]. The Gibbs energy of formation for other minerals listed has been calculated using the method outlined above, but without estimated uncertainty ranges. The stability ranges of the different minerals can be calculated using the Gibbs energy of formation and presented graphically in activity − activity diagrams; Finch gives sev-eral examples. It is important to notice that the phase boundaries are strongly dependent on the accuracy of the estimated Gibbs energy of formation. To take one example: the phase boundary between metaschoepite and becquerelite is at log10[Ca2+]/[H+]2 = 11.58 using the values given by Finch. A change in the estimated Gibbs energy of formation of the two phases by 10 kJ · mol–1 results in a shift of the phase boundary of 3.5 units along the log10[Ca2+]/[H+]2 axis. Diagrams of this type are useful for putting constraints on thermodynamic data, estimated or experimental, but also when discussing mineral formation. It is essential that the method is used only for structurally related phases, e.g., the layer structures discussed by Finch. The f mGο∆ values given in Table II of [97FIN] can be used as estimates of the Gibbs energy of formation for the listed miner-als, but they are not sufficiently precise to be included as selected values. Table A-26 lists the Gibbs energy of formation proposed by Finch, however the user should consult the original publication for more details. The values given in parentheses are not con-sidered reliable by Finch. For the experimental value of liebigite this is due to the large surface area of the mineral samples. The estimated values that are considered unreliable have different structures from those of the minerals used for calibration.

Discussion of selected references 536
Table A-26: Estimated and experimental Gibbs energy of formation for some ura-nium(VI) minerals. All data refer to 298.15 K and are given in kJ · mol–1.
Mineral Formula f mG ο∆ (kJ·mol–1)Estimated (Est) or
Experimental (Exp)
Schoepite [(UO2)8O2(OH)12](H2O)12 – 13334.7 Est.
Metaschoepite [(UO2)8O2(OH)12](H2O)10 – 13092.1 Exp.
Dehydrated schoepite a)
[(UO2)O0.25–x(OH)1.5+2x], 0<x<0.15 – 1362.3 Exp.
Becquerelite Ca[(UO2)6O4(OH)6](H2O)8 – 10305.8 Est.
Ca–protasite Ca2[(UO2)6O6(OH)4](H2O)8 – 10779.6 Est.
Metacalciouranoite Ca3[(UO2)6O8(OH)2](H2O)6 – 10768.3 Est.
Calciouranoite Ca3[(UO2)6O8(OH)2](H2O)9 – 11496.1 Est.
Soddyite (UO2)2SiO4(H2O)2 – 3658.0 Exp.
Swamboite (UO2)[(UO2)(SiO3OH)]6(H2O)30 – 21092.4 Est.
Uranosilite (UO2)(Si7O15) (– 7214.5) Est.
Uranophane Ca[(UO2)(SiO3OH)]2(H2O)5 – 6210.6 Exp.
Haiweeite Ca[(UO2)2(Si2O5)3](H2O)5 (– 9431.4) Est.
Ursilite Ca4[(UO2)4(Si2O5)5(OH)6](H2O)15 (– 20504.6) Est.
Rutherfordine UO2CO3 – 1563.1 Exp.
Joliotite UO2CO3(H2O)1–2 – 2043.3 Est.
Sharpite Ca(UO2)6(CO3)5(OH)4(H2O)3 – 11601.1 Est.
Fontanite Ca(UO2)3(CO3)4(H2O)3 – 6523.1 Est.
Urancalcarite Ca(UO2)2(CO3)(OH)6(H2O)3 – 6037.0 Est.
Zellerite Ca(UO2)(CO3)2(H2O)3 (– 3892.1) Est.
Liebigite Ca2(UO2)(CO3)3(H2O)10 (– 6226.0) Exp.
a): This formulation corresponds to UO3·yH2O, y = 0.75 to 0.9. In [98FIN/HAW] the possible range of variation of y for the dehydrated schoepite is 0.75 to 1.00.
[97GEI/BER]
This paper gives fluorescence data on species which are assumed to exist in natural so-lutions according to the data selected by [92GRE/FUG] for U concentration between 9·10–3 and 7.3·10–2 M.

Discussion of selected references 537
Table A-27: Main characteristics of fluorescence spectra of some aqueous complexes.
pH Species Main fluorescence lines, nm fluorescence lifetime, µs
7.13–7.82 2 2 3 3Ca UO (CO ) (aq) 465, 484, 504, 524 (0.043 ± 0.012)
9.76 4
2 3 3UO (CO ) − no fluorescence
2.6 2
2 4 2 2UO SO (aq) + traces of UO (SO) − 477, 493, 514, 538 (4.3 ± 0.4)
2+
2UO 472, 488, 510, 533 (1.6 ± 0.2)
These data can be used for identification of species.
[97GEI/RUT]
The issue of this paper is to decide if the dependence of the fluorescence lifetime, τ, of U(VI) in perchloric acid or perchloric acid/perchlorate solutions can be a result of a U(VI) perchlorate complex. This question has also been raised in [99BOU/BIL]. Geipel et al. show that there is no evidence of the existence of such a complex. On the contrary, it shows that the lifetime, τ, decreases linearly with increasing concentration of H2O (from 3 M in concentrated perchloric and sulphuric acid solutions to 55.5 M in pure water) as a result of the quenching effect of water (Stern-Vollmer mechanism). Fur-thermore the emission wavelength of the fluorescence spectra in HClO4 (up to 11.5 M) around 510.5 nm remains constant (± 1 nm) and the fluorescence decay is always de-scribed by a single exponential.
[97GUR/SER]
It should be noted that throughout the English version of this paper, the term "rhomb" is erroneously used instead of "orth". In this discussion we have adopted the correct termi-nology. Partial results were given in [89GUR/DEV].
The paper has four parts.
• The first part deals with the synthesis, characterisation and measurement of ,mpCm )
of UO2(OH)2(α, orth) from 14 to 316 K, from which and are de-rived by calculation.
m ( )S Tοm ( ) (0H T H−
• The second part is a survey of published experimental results (structure of com-pounds but mainly thermochemical data) on the systems O–U(VI), O–H–U(VI), O−C−U(VI), O–H–S–U(VI), O–H–N–U(VI) and O–H–C–U(VI) leading to a selection of thermodynamic values. Of the 70 references cited, none are more recent than 1992, (which is surprising for a paper submitted at the end of 1995 and published in 1997), except for a personal communication of Estigneev from 1996 (see below). Conse-quently, this survey does not add much to the discussions of [92GRE/FUG] about the compounds and complexes belonging to these systems.

Discussion of selected references 538
• The third part concerns derived thermodynamic data obtained according to the new experimental results on UO2(OH)2(α, orth).
• The last part is a discussion about a possible error in mS ο ( , 298.15 K) which again questions the validity of all the data based on the entropy of that ion. This topic was already discussed in the review of [94SER/DEV] (see this Appendix). Some of the results in the first and third parts were given briefly in an earlier paper [89GUR/DEV].
2+2UO
There are several misprints in the text.
• Part 1: The system O–H–U(VI), to which belongs UO3·xH2O, 0 < x < 1, UO2(OH)2(α, orth), UO2(OH)2 (β, orth), schoepite: UO2(OH)2·H2O(cr, ortho), is com-plicated because many polymorph compounds can appear and transform under chemical or physical conditions. Two samples of UO2(OH)2(α, orth) are synthesised and charac-terised as the member x = 1 of the series: UO3 · xH2O(α, orth) by XRD (lattice parame-ters are given) and chemical analysis (amount of U: 78.24 %). Adiabatic calorimetric measurements on m = 3.29 g lead to ,mpCο = f (T, 14.67 to 316.82 K) from which Gure-vich et al. calculate:
,mpCο (298.15 K) = (113.96 ± 0.12) J · K–1 · mol–1
mS ο (298.15 K) = (128.10 ± 0.20) J · K–1 · mol–1
m (298.15 K) (0)H ο − mH = (19.703 ± 0.015) kJ · mol–1.
Expansion of ,mpC = f(T) is given as a sum of Aοx[1 − exp (–0.001 T )x], x ranging from 0
to 5. From this function ,mpC is calculated. ο
• Part 2: According to literature data, r mH ο∆ and/or r mGο∆ are selected at 298.15 K for 16 heterogeneous reactions belonging to the systems mentioned above. All the used data are known and given in [92GRE/FUG]. This review notices, however, some minor discrepancies between the given data and those obtained using the selected data in [92GRE/FUG].
The authors claim that UO2(OH)2(β, orth) is clearly metastable with respect to UO2(OH)2(α, orth) and that confusion existed between the β and α forms in [72NIK/SER]. This mistake is said to have been replicated in several papers and particularly in [92GRE/FUG]. Nevertheless, this has no influence on the estimated value of (UOmS ο
2(OH)2(β, orth)) given on p.138 [92GRE/FUG], because the final selected value comes from [66ROB].
[97GUR/SER] also cite their extrapolation to zero ionic strength of the solubil-ity measurements (by potentiometry) on UO3·H2O(α, orth) in the temperature range 295 − 523 K by [71NIK/PIR], not cited in [92GRE/FUG]. For the reaction :
+ 2+3 2 2 2UO H O ( , orth, ) + 2 H UO + 2 H O(l)T⋅ α

Discussion of selected references 539
at infinite dilution the following 10*log K ο values are obtained: (5.5 ± 0.1), at 295 K,
(5.0 ± 0.1), at 323 K, (4.4 ± 0.1), at 352 K, (3.9 ± 0.1), at 363 K, (3.6 ± 0.2), at 373 K, (3.1 ± 0.2), at 398 K and (2.7 ± 0.2) at 423 K.
By assuming that 10*log K ο has the same value at 295 and 298.15 K, we ob-
tain:
f m 3 2(UO H O, α, orth, 298.15 K)Gο∆ ⋅ = − (1395.44 ± 1.75) kJ · mol–1.
• Part 3: This part describes calculation of the following new thermodynamic values:
f m 2 2(UO (OH) , α, orth, 298.15 K)H ο∆ = − (1536.87 ± 1.30) kJ · mol–1
and also of:
f m 2 2(UO (OH) , , orth, 298.15 K)H ο∆ β = − (1533.87 ± 1.30) kJ · mol–1
f m 2 2 2(UO (OH) H O, scho, 298.15 K)H ο∆ ⋅ = − (1825.86 ± 1.20) kJ · mol–1
which both agree with selected values in [92GRE/FUG], − (1533.8 ± 1.3) kJ · mol–1 and − (1826.1 ± 1.7) kJ · mol–1, respectively.
For the calculation of , [97GUR/SER] extrapolate to x = 1, the literature values for
f m 2 2(UO (OH) , α, orth, 298.15 K)H ο∆
f mH ο∆ for the reaction:
3 2 3 2UO ( ) + x H O(l) UO xH O( , orth)γ ⋅ α
being based on the differences in the enthalpies of solution of the two compounds and calculate a value of − (27.4 ± 0.2) kJ · mol–1. Literature values used for these differences were, for x = 0.393 and x = 0.648, − (11.71 ± 0.52) and − (15.61 ± 0.57) kJ · mol–1, re-spectively, from [72SAN/VID]; for x = 0.9, − (25.27 ± 0.51) kJ · mol–1 from [88OHA/LEW]; for x = 0.85, [97GUR/SER] used a value of − (23.60 ± 0.18) kJ · mol–1 incorrectly cited from [64COR], instead of − (24.65 ± 0.25) kJ · mol–1.
The difference in the enthalpies of solution between UO3·xH2O(α, orth) and UO3(γ) is an approximation of the difference in their enthalpies of formation when the enthalpy of transfer of water from infinite dilution to the dissolution medium is negligi-ble. This was the case for the experiments of [72SAN/VID] and [88OHA/LEW] who used a dilute HF medium. In the case of [64COR], the difference in enthalpy of transfer of 0.85 mole of H2O from an infinitely dilute medium to 6.0 M HNO3 amounts to − (0.54 ± 0.04) kJ · mol–1. Thus, from the results of [64COR], the difference in enthalpy of formation between UO3 · 0.85H2O(α, orth) and UO3(γ) becomes − (25.17 ± 0.25) kJ · mol–1. A new extrapolation to x = 1 of the difference between the enthalpies of for-mation of UO3·xH2O(α, orth) and UO3(γ), giving equal weight to each experimental point, gives − (26.8 ± 1.5) kJ · mol–1, which is very similar to that selected by [92GRE/FUG], but with substantially increased uncertainty limits. Keeping in mind the precarious character of this extrapolation, we calculate f mH ο∆ (UO2(OH)2, α, orth, 298.15 K) = − (1536.4 ± 1.9) kJ · mol–1.

Discussion of selected references 540
The authors also use the new entropy value, = (128.10 ± 0.20) J · K
m 2 2(UO (OH) ,α, orth, 298.15 K)S ο
m 3 2(UO 0.5H O, cr)S ο ⋅–1 · mol–1, in order to calculate by taking :
m 3 2 m 3 m 2 2
1 1
(UO 0.5H O, cr, 298.15 K) = [ (UO ( ) + (UO (OH) ( , orth)] 2
= (112 2) J K mol .
S S S
− −
⋅ γ
± ⋅ ⋅
1ο ο ο α
H ο∆Interpolation of r m (298.15 K) for:
3 2 3 2UO ( ) + H O(l) UO H O( , orth)x xγ ⋅ α
from experimental values for x equal to 0.648 and 0.393 gives:
r mH ο∆ (x = 0.5, 298.15 K) = − (13.35 ± 0.61) kJ · mol–1
and leads to:
r mH ο∆ (UO3·0.5H2O, cr, 298.15 K) = − (1380.07 ± 1.30) kJ · mol–1.
The reported value for UO3·0.5H2O is not selected by this review.
• Part 4: The value of = − (98.2 ± 3.0) J · K2+m 2(UO , 298.15 K)S ο –1 · mol–1 selected in
[92GRE/FUG] is derived from data related to : 2+
2 3 2 2 2 3 2UO (NO ) 6H O(cr) UO + 2 NO 6 H O(l)−⋅ +
sol mH ο∆ (298.15 K) = (19.35 ± 0.20) kJ · mol–1
sol mGο∆ (298.15 K) = − (13.24 ± 0.21) kJ · mol–1.
Following the authors, three other independent alternative routes allow calcula-tions of , which all lead to higher values. These are: 2+
m 2(UO )S ο
+ 2+2 2 2 2 2UO (OH) H O + 2 H UO + 3 H O(l)⋅
leading to = − (77.3 ± 3.0) J · K2+m 2(UO )S ο –1 · mol–1,
2+ 22 3 2 3UO CO (ruth) UO + CO −
leading to = − (71.8 ± 10.0) J · K2+m 2(UO )S ο –1 · mol–1 and, finally:
2+ 22 4 2 2 4 2UO SO 2.5H O(cr) UO + SO + 2.5 H O(l)−⋅
leading to = − (77.2 ± 15.0) J · K2+m 2(UO )S ο –1 · mol–1.
These routes take into account solubility products derived from solubility measurements of the appropriate sparingly soluble compounds as the key primary data. These data are less reliable than the calorimetric heat of dissolution of dioxoura-nium(VI) nitrate hexahydrate measured by numerous authors and given by Gurevich et al.
In this publication, the authors reproduce the argument already developed by [94SER/DEV] and in a more condensed manner by [92KHO].These references have
Discussion of selected references 541
already been considered by this review with the conclusion that the value of the entropy of the dioxouranium(VI) ion selected in [92GRE/FUG] should be maintained.
[97HOV]
This is an important study as it is a precise determination of the partial molar heat ca-pacity and volume of a M4+ ion. By selecting Th(IV), the author has been able to control the experimental difficulties due to hydrolysis. The procedure, the data and the data treatment are detailed in the paper. The constancy of the results for the system Th(ClO4)4 + HClO4 has been tested using Young's rule and the Pitzer ion-interaction model with a concordant result over the entire concentration range 1.0 to 2.9 m investi-gated. Hovey reports ,mpCο (Th4+) = − (224 ± 5) J · K–1 · mol–1. The author has also re-viewed the previous attempts [76MOR/MCC], [75APE/SAH] to estimate the partial molar heat capacity of Th4+ and finds that the results deviate strongly from his own ex-perimental data. The data of Morss and McCue [76MOR/MCC] based on the integral heat of dilution of Th(NO3)4 at 15, 25 and 35°C, recalculated using a new value of the partial molar heat capacity of 3NO− , ,mpCο = − 72 J · K–1 · mol–1 [88HOV/HEP3], gives
,mpCο (Th4+, 298.15 K) = − (60 ± 11) J · K–1 · mol–1 close to the value selected by [92GRE/FUG] for U4+ , ,mpC (U4+, T = 298 to 473 K) = − (48 ± 15) J · K–1 · mol–1. The data of Apelbat and Sahar [75APE/SAH] at 30°C based on measurement of bulk heat capacity of Th(NO3)4 solutions given as a linear function of m1/2 for the range 0 to 2.9 m lead to ,mpCο (Th4+) = 111 J · K–1 · mol–1, as calculated by Hovey, using ,mpC (ο
3NO− , 298.15 K) = − 63.7J · K–1 · mol–1 [89HOV/HEP], who plausibly argue that the discrep-ancy is not surprising, given the fact that specific molalities and heat capacities are not reported and also the improbable ability of a simple linear equation to represent heat capacities over such a wide range of temperature.
The experimental conditions chosen by Hovey are preferable to those of [76MOR/MCC], i.e., little hydrolysis and no complexation.
A parent paper [86HOV/TRE] discusses ,mpCο (Al3+), where the ,mpC (Alο 3+) value is found to be − 119 J · K–1 · mol–1 , while the Criss-Cobble equation [64CRI/COB2] leads to 16 J · K–1 · mol–1.
In addition, the correlation methods of [97SHO/SAS2] (see this Appendix) give ,mpCο (U4+ aq, 298.15 K) = 0.8 J · K–1 · mol–1 (based on the results of [76MOR/MCC] for the thorium ion) in disagreement with the selected value in [92GRE/FUG].
It seems that the Criss–Cobble equation for calculation of heat capacity from the entropy breaks down for multicharged ions. As Hovey noticed, the correspondence between the result of Morss and McCue for Th4+ and the Criss-Cobble prediction for U4+ could be fortuitous.

Discussion of selected references 542
Hovey's studies cast serious doubt on the value selected on p.95 of [92GRE/FUG] based on the selected partial molar entropy, mS ο (U4+), and the Criss-Cobble estimate by Lemire and Tremaine [80LEM/TRE], as well as on ,mpC (Uο 3+, T = 298 to 473 K) = − (64 ± 22) J · K–1 · mol–1 although a comparison between values at 298.15 K and average values for the temperature range 298.15 to 473 K may not be strictly correct. Indeed, it should be pointed out that the value selected by [92GRE/FUG] is an average value for this temperature range. This review prefers the value of Hovey in the temperature range 273 to 473 K.
[97HUA/YAM]
The enthalpy effect associated with the formation of SrUO3(cr) has been deduced from vaporisation studies of this compound over the temperature range 1534 − 1917 K, using Knudsen effusion mass spectrometry. The sample was obtained by reduction of SrUO4(cr) with hydrogen. As stated in the text, "A mixture of SrUO3(cr) and UO2(cr) was employed for the mass spectrometry study, since it was not easy to prepare single phase SrUO3". X–ray diffraction analysis yielded a content of 23wt.% UO2 in the mix-ture. After the mass spectrometric measurements, the formula of the compound was estimated to have changed to SrUO3.1(cr), based on X–ray diffraction data.
On the basis of the main vapour species detected, the following reactions were postulated to occur in the Knudsen cell:
SrUO3(cr) Sr(g) + 0.5 O2(g) + UO2(cr)
Sr(g) + 0.5 O2(g) SrO(g)
UO2(cr) UO2(g)
but the change in lattice parameters of the sample suggests that this is a considerable simplification, and the vaporisation is in fact non–congruent. The corresponding partial vapour pressures were fitted to the following expressions (recalculated in bar):
log10 pSr (bar) = 1.115 − 13405.7 · T–1
log10 pSrO (bar) = 8.984 − 33827.0 · T–1
210 UOlog p (bar) = 7.334 − 29918.8 · T–1.
To obtain the standard enthalpy of formation of "SrUO3(cr)", its enthalpy incre-ment and Gibbs energy function, [ , were estimated by as-suming the values of for (SrMO
m m( ( ) (298.15 K)]/G T H T−
m m (298.15K)οH( ) −H T 3(cr)–SrO(cr)–MO2(cr)) were the same for M = Zr and U. This assumption appears reasonable in view of the close-ness of crystal structures of SrUO3 and SrZrO3. All the necessary thermodynamic data were taken from [90COR/KON]. The values for the standard enthalpy of formation of "SrUO3"(cr) were − (1785 ± 60) and − (1698.1 ± 5.0) kJ · mol–1 from the second- and third-law treatments, respectively, where the latter is recalculated by this review. Given

Discussion of selected references 543
the change in composition of the sample during the experiment, it is not clear to which composition these values refer; we have assumed they apply to the final composition, so
f mο∆ H (SrUO3.1, cr, 298.15 K) = − (1785 ± 60) and − (1698.1 ± 5.0) kJ . 1mol−⋅
[97HUA/YAM] also estimated values for the enthalpies of formation of a series of compounds with the formula, SrMO3(cr), based on experimental values for the Ti, Hf, Zr [93KUB/ALC] and U compounds, by plotting their enthalpies of formation from the corresponding binary oxides as a function of M4+ ionic radii. Unfortunately, these authors were not aware of the fact that experimental values for the standard enthalpies of formation of other SrMO3 compounds had been published, namely with M = Ce, Tb, Am [90GOU/HAI] and that relationships based on experimental values for the enthal-pies of formation of SrMO3 and BaMO3, and the packing of the ions in the lattice (Gold-schmidt tolerance factor t [70GOO/LON], page 132) had been also published [93FUG/HAI].
From their relationship [97HUA/YAM] obtain for the standard enthalpy of for-mation of "SrUO3"(cr), an estimated value of − (1684 ± 20) kJ · mol–1, compared with the third-law treatment of f m
ο∆ H (SrUO3.1, cr, 298.15 K) = − (1698.6 ± 2.2) kJ·mol–1
from the vaporisation study. Using f mH ο∆
f m
(SrO, cr, 298.15 K) = − (590.6 ± 0.9) kJ · mol–1 from [92GRE/FUG] and H ο∆ (UO2.1, cr, 298.15K) = − (1102.0 ± 5) kJ · mol–1 (our estimate), the above third-law value is (6 ± 10) kJ · mol–1 more negative than the sum of the enthalpies of formation of SrO(cr) and UO2.1(cr).
The relationship used by [93FUG/HAI] leads to a value 3 kJ · mol–1 more posi-tive than the sum of the enthalpies of formation of the binary oxides, with an average standard deviation of ± 8.5 kJ · mol–1 (calculated for all experimental points). The opin-ion that SrUO3(cr) is of very marginal stability compared to the binary oxides is sup-ported by the difficulty in obtaining a pure phase as acknowledged (see above) by [97HUA/YAM]. As a consequence, we find it preferable to adopt the less negative value:
f mH ο∆ (SrUO3, cr, 298.15 K) = − (1672.6 ± 8.6 ) kJ · mol–1
obtained by using the relationship proposed by [93FUG/HAI] and the NEA adopted values for the binary oxides. This value is not incompatible with the conclusions of [97HUA/YAM].
[97ION/MAD]
This paper shows that, taking into account covalency effects, the values for the enthal-pies of formation of the lanthanide and actinide trihalides can be estimated with a better accuracy than when a purely ionic model ([85BRA/LAG], [86BRA/LAG]) is used. For instance, for the tribromides of U, Np and Pu, the predicted values are within 0 − 4 kJ · mol–1 of the experimental ones when using the covalent model, while the ionic model leads to differences ranging between 16 and 26 kJ · mol–1. For the corresponding

Discussion of selected references 544
iodides, the covalent model yields predictions within 2 to 14 kJ · mol–1, while the ionic model gives estimates within 2 to 29 kJ · mol–1 of the experimental values.
In the case of the americium trihalides, the predictions of the covalent model are − 1609, − 978, − 809 and − 585 kJ · mol–1 for the enthalpies of formation of the trifluoride, trichloride, tribromide and triiodide, respectively, while the values adopted by NEA [95SIL/BID] (and not changed by this review) are − (1588 ± 13), − (977.8 ± 1.3) (experimental), − (810 ± 10) and − (612 ± 7) kJ · mol–1.
The procedure adopted by the NEA TDB for the estimation of a number of ex-perimentally missing enthalpies of formation of halides is described in [83FUG/PAR] and is based on an extrapolation from neighbouring actinides of the difference
versus the actinide ionic radius. It has also been adopted [2001LEM/FUG] for the estimation of the enthalpies of formation of NpF
f m f m[ (MX , cr, 298.15 K) (M , aq, 298.15 K)]nnH Hο ο +∆ − ∆
3 (cr) and NpCl3 (cr).
[97IOU/KRU]
The authors applied laser–induced fluorescence spectroscopy to investigate the complex formation of 244Cm(III) with the heteropolyanions 7
11 39PW O − and SiW 811 39O − in 0.1 − 2 M
nitric acid solutions with and without addition of 1 M NaNO3. The study was performed at room temperature with Cm(III) concentrations of 10–3 mol · L–1 and ligand concentra-tions varying from 10–6 to 10–3 mol · L–1. The experimental techniques, excitation and luminescence spectra are well described. In the solutions investigated, only the forma-tion of 1:1 complexes could be ascertained unambiguously, but a notable decrease of the luminescence intensity at high 7
11 39PW O − concentrations was interpreted as indication for the formation of the 2:1 complex Cm 11
11 39 2W O )(P − . Since the degree of protonation of the ligands and complexes is unknown, the authors calculated apparent equilibrium con-stants (based on the total concentrations of the complex and uncomplexed ligand) which decrease by 2 − 3 orders of magnitude when the HNO3 concentration is increased from 0.1 to 2.0 mol · L–1 (cf. Table 12-12., section 12.7.2).
[97IYE/JAY]
The paper reports measurements of the oxygen activity (emf with CaO–ZrO2 electro-lyte) in the mixtures, K2U4O12(cr) + K2U4O13(cr), and complementary data on the en-thalpy increments of the two uranates.
K2U4O13(cr) was prepared by heating appropriate amounts of UO3 with potas-sium carbonate in air at 900 K for several hours in platinum boats; the lower uranate by decomposing the U(VI) compound in high-purity Ar at an unspecified temperature. The products were characterised by X–ray diffraction, and oxidation of the lower uranate in dry air corresponded to the uptake of 0.5 mole of O2(g) per mole of K2U4O12.

Discussion of selected references 545
The oxygen potentials were studied using a CaO–ZrO2 electrolyte tube in flow-ing argon, from 1053 to 1222 K with air ( = 0.2121 bar) as the reference electrode.
2Op
Correction of their emf values to the standard pressure gives, after recalculation
r mG∆ (A.85) = − 30640 + 78.46 · T J · mol–1 (1053 to 1222 K)
K2U4O12(cr) + 0.5 O2(g) K2U4O13(cr). (A.85)
This expression is different from that given by the authors, who seem to have neglected the correction from air to pure oxygen. The calculated decomposition tem-perature of K2U4O13(cr) in air is 1538 K.
Drop calorimetric measurements are reported for the two compounds, using a Calvet high temperature calorimeter. The data were fitted to a simple polynomial, but the authors' expressions for are not equal to zero at T = 298.15 K, so the enthalpy data have been refitted with this constraint. The derived heat capacity expressions are given in the Table A-28.
m m( ) (298.15 K) ο−H T H
Table A-28: Temperature coefficients for K2U4O12(cr) and K2U4O13(cr) compounds. Heat capacity coefficients
,mpC = a + b · T + d · T–2 J · K–1 · mol–1 ,mpCο (298.15 K) J · K–1 · mol–1
Phase T range (K)
a b d
K2U4O12(cr) 426 − 770 2.022090·102 4.7780·10–1 0 – K2U4O13(cr) 411 − 888 4.710680·102 – 4.6890·10–2 – 2.8754·106 (425 ± 50)
However, as shown in the plot of heat capacities in section 9.10.1, the expres-sion for K2U4O12(cr) is not consistent with the general behaviour of the heat capacities of the alkali-metal uranates, and the data for this compound have not been selected in this review.
The authors have used these Gibbs energies of reaction to derive data at 298.15 K for K2U4O12(cr), using their heat capacity data (extrapolated from ca. 750 K) and literature data at 298.15 K for the hexavalent compounds. However, we have not pursued this approach since the data for the enthalpy of formation and entropy of K2U4O13(cr) at 298.15 K are estimated, so any derived data for K2U4O12(cr) would have appreciable uncertainties.
[97JAY/IYE]
The paper reports measurements of the oxygen activity (emf with CaO–ZrO2 electro-lyte) in the mixtures, Cs4U5O17(cr) + Cs2U2O7(cr) + Cs2U4O12(cr), and complementary data on the enthalpy increments of the first two uranates.
The U(VI) uranates, Cs2U4O13(cr), Cs4U5O17(cr) and Cs2U2O7(cr), were pre-pared by heating appropriate amounts of U3O8 with caesium carbonate in air at 1000 K

Discussion of selected references 546
in alumina boats; the lower uranate by decomposing the U(VI) compound in high–purity Ar at 1200 K. The products were characterised by X–ray diffraction.
The oxygen potentials were studied using a CaO–ZrO2 electrolyte tube in flow-ing argon, from 1048 to 1206 K with air ( = 0.2121 bar) as the reference electrode.
2Op
Correction of their emf values to the standard pressure gives, after recalcula-tion:
r mG∆ = − 136044 + 96.985 · T J · mol–1 (1048 to 1206 K)
for the reaction:
Cs2U4O12(cr) + 3Cs2U2O7(cr) + 0.5 O2(g) 2 Cs4U5O17(cr) (A.86)
This expression is different from that given by the authors, who seem to have neglected the correction from air to pure oxygen.
Drop calorimetric measurements are reported for Cs2U2O7(cr) and Cs4U5O17(cr), using a Calvet high temperature calorimeter. The authors fitted the data to simple polynomials, but these expressions for are not equal to zero at T = 298.15 K, so the enthalpy data have been refitted with this constraint. In addition, there are precise measurements of the heat capacity of Cs
m m( ) (298.15 K) H T H−
2U2O7(cr) up to 350 K [81OHA/FLO], so for this phase the additional constraint of ,mpC (Cs2U2O7, cr, 298.15 K) = 231.2 J · K–1 · mol–1 from this work, was also imposed. The derived heat capacity expressions are given in the Table A-29.
Like K2U2O7(cr) (see [99JAY/IYE]), but not Na2U2O7(cr), the heat capacity in-creases more rapidly with temperature than expected for a U(VI) compound.
Table A-29: Temperature coefficient for Cs2U2O7(cr) and Cs4U5O17(cr) compounds. Heat capacity coefficients
,mpC = a + b · T + d · T–2 J · K–1 · mol–1
,mpC ο (298.15 K)
J · K–1 · mol–1 Phase T range (K)
a b d
Cs2U2O7(cr) 298.15 − 852 3.553248·102 8.15759·10–2 – 1.31959·107 (231.2 ± 0.5)
Cs4U5O17(cr) 368 − 906 6.992110·102 1.7199·10–1 0 (750 ± 50)
The authors have used these Gibbs energies of reaction to derive data for 298.15 K for Cs4U5O17(cr), using their heat capacity data (extrapolated from ca. 800 K) and literature data at 298.15 K for the hexavalent compounds. However, we have not pursued this approach since many of the relevant data have not been selected for this review − see for example comments in [92VEN/IYE].

Discussion of selected references 547
[97KON/FAN]
The two studies [95FAN/KIM] and [97KON/FAN] address a classical problem in solu-tion coordination chemistry to distinguish between complex formation and other types of ionic interactions. In these two studies the problem is resolved by using fluorescence spectroscopy to identify the very weak complexes CmCl2+ and Cm , formed in the Cm(III)–chloride system and to measure their equilibrium constants. The data have been used to give a quantitative model of chloride complexation in CaCl
+2Cl
2 solutions over a wide chloride concentration range using the Pitzer formalism. For this purpose they have used estimated values of β(o) and β(1) for Cm3+ using data from the NdCl3–H2O system, and an estimated value of β(1) for CmCl2+ and 2CmCl+ using a method described in [97ALL/BAN], Ch.IX.8, p. 378, extended by the authors to 1:2 electrolytes. The equilibrium constants at zero ionic strength and the additional Pitzer parameters were determined by regression. In this way a unified description of the thermodynamics and speciation is given for concentrations of CaCl2 ranging from 0 to 6 mol · kg–1. The equi-librium constants at zero ionic strength for the two complexes formed are = (0.24 ± 0.03) and = − (0.74 ± 0.05). The value of lo
10 1log οb10 2log οb 10 1g οb differs considera-
bly from the one given in [95SIL/BID], who do not report a value for lo . This discrepancy illustrates the large error that can arise when using the SIT method to treat the ionic strength dependence of weak complexes. The numerical values of equilibrium constants and interaction parameters from these two studies are far superior to data ob-tained by other methods such as solvent extraction and ion exchange. The equilibrium constants and the uncertainty estimate given by [97KON/FAN] represent the best esti-mates for the complexes, AnCl
10 2οbg
2+ and , both for Cm and Am. +2AnCl
[97KON/NEC]
Isopiestic measurements of NaTcO4 solutions and mixtures with NaCl were made ver-sus NaCl reference solutions at 298.15 K. By combining their results with those of Boyd [78BOY], recalculated by Rard and Miller [91RAR/MIL], for concentrations to ≤ 8.0 m NaTcO4 the following ion interaction Pitzer parameters were determined: β = 0.01111,
4= 0.1595,
4
+4
(0)Na / TcO−
+(1)Na / TcO−β +Na / TcO
C −Φ = 0.00236,
4TcO / Cl− −
10 ,0
θ = 0.067, and 4
= − 0.0085. The solubility of CsTcO
+TcO /Cl / Na− −Ψ4(cr) was measured in CsCl solutions (0 − 7.4 m) at
298.15 K. In pure water the solubility was found to be (0.0184 ± 0.0004) m. The pa-rameters resulting from fitting these data are: log sK ο (CsTcO4) = − (3.607 ± 0.023),
4 = − 0.1884,
4= − 0.1588,
4+
(0)Cs / TcO−β +
(1)Cs / Tc
βO− + / TcCs
CO−
φ = 0, and = − 0.0011, whereby
4 could be determined independently from
4. Further com-
bination of the two sets of experimental data yielded Pitzer parameters in good agree-ment with the independently obtained values and also gave rise to estimates of the solu-bility of CsTcO
+Cs4TcO / Cl /− −Ψ+TcO / Cl / Cs− −+Cs / TcO
C −φ
4TcO
Ψ
4(cr) in NaCl solution to the saturation limit of the latter. The paper con-cludes with a discussion of the “like anion” interactions in the mixing terms being dif-ferent for − as compared to Cl 4O− , a difference that tends to zero in their trace ac-tivity coefficients.

Discussion of selected references 548
[97KRE/GAN]
X–ray diffraction measurements of single crystals of [TcO2(tn)2]I · H2O, tn = trimethyl-enediamine, were made. Similar to other Tc(V) and Re(V) analogues, the trans– core has two N–bonded tn ligands in the equatorial plane. The calculated differences in conformational energies for the different geometries of the tn ligands are too small (ca. 0.4 kJ · mol
+2TcO
–1) to infer which structure could be the most stable in solution.
[97KRI/RAM]
The mass loss Knudsen effusion measurements of the reaction:
3 UTeO5(cr) U3O8(cr) + 3 TeO2(g) + 12 O2(g) (A.87)
from 1063 to 1155 K in this conference report have been reported more fully in the journal paper by the same authors [98KRI/RAM].
[97LAN]
This book presents selected thermodynamic constants for aqueous species of U(IV) and U(VI), and common natural compounds (minerals) on the basis of the literature data available up to 1995. Most of them come from [92GRE/FUG], but Langmuir questions the validity of some constants selected by [92GRE/FUG] and suggests other selected data, which are given without uncertainty. He discusses the geochemistry of uranium.
• The first question is for ∆ . He gives the value − 529.066 kJ · mol
4+f m (U )Gο
-1, 0.794 kJ · mol–1 higher than that selected by [92GRE/FUG] as − (529.860 ± 1.765) kJ · mol–1. The value of Langmuir is consistent with the value of the = (0.263 ± 0.004) V couple and 2+ 4+
2(UO /U )Eο10 1
*log οb = − 0.65 for the reaction U4+ + H2O(l) U(OH)3+ + H+ (t = 25°C) discussed in [91GIR/LAN] (see this re-view). The corresponding values selected by [92GRE/FUG] are (0.2673 ± 0.0012) V and − (0.54 ± 0.06) [90BRU/GRE]. Langmuir states that data leading to were not corrected for the complexation of U
2+ 4+2(UO /U )Eο
4+ by hydroxide and sulphate anions. This statement is erroneous. Bruno et al. [90BRU/GRE] made the appropriate corrections and also corrected the required auxiliary data. The Eο value of Langmuir is within the uncertainty given by Grenthe et al. [92GRE/FUG]. The present review retains = − (0.54 ± 0.06) from [92GRE/FUG]. So this review does not change the selected value of given by [92GRE/FUG].
10 1*log οb
4+f m (U )Gο∆
• Langmuir also questions the values given by [92GRE/FUG] for on the basis of new literature data that ap-
peared since 1992. The present review has an extensive discussion of new data up to 2001, and selects new values different from both [92GRE/FUG] and those proposed by Langmuir. This review does not agree that one should remove of , n = 2 and 3, species from speciation codes as proposed by Langmuir.
f m 4 f m 2(U(OH) , aq) and (UO , am),G Gο ο∆ ∆
4U(OH) nn
−
Discussion of selected references 549
• For USiO4, Langmuir proposes to take ∆ = − 1885.98 kJ · mol
f m 4(USiO , cr)Gο
–1, a value estimated by Hemingway [82HEM]. [92GRE/FUG] selected − (1883.6 ± 4.0) kJ · mol–1. These values are compatible. For the amorphous coffinite a value of = − 1835.227 kJ · molf m 4(USiO , am)Gο∆ –1 is given by Langmuir on the basis of an ion activity product in three groundwaters from coffinite-bearing formations. This value is new but not selected by this review due to the lack of identification of the solid phase.
• For U(IV) the value of the Gibbs energy of formation of ningyoite, CaU(PO4)2·2H2O(cr), from [65MUT] is proposed.
• For , Langmuir suggests a value of − 1358.126 kJ · mol
f m 2 2(UO (OH) , aq)Gο∆–1, 10 kJ · mol–1 higher that the limit given by [92GRE/FUG]. The value se-
lected by Langmuir is derived from the data of [91CHO/MAT] (see Appendix A) for the equilibrium:
2+ +2 2 2 2UO + 2 H O(l) UO (OH) + 2 H
which is calculated to be 10 2,1*log οb = − 12.0. The present review selects for this equilib-
rium, 10 2,1*log οb = − (12.15 ± 0.07) leading to ∆ = − (1357.5 ± 1.8)
kJ · molf m 2 2(UO (OH) , aq)Gο
–1.
• Langmuir gives the Gibbs energy of formation of several dioxouranium(VI) phosphates starting with the value for H–autunite , H2(UO2)2(PO4)2(cr), and using equi-librium constants of the exchange reaction of this mineral with several cations.
(Hf mGο∆ 2(UO2)2(PO4)2, cr) is calculated assuming r mGο∆ = 0 for:
2 U(HPO4)2·4H2O H2(UO2)2(PO4)2(cr) + 8 H2O(l)
and with f mGο∆ (U(HPO4)2·4H2O, cr) = − (3844.453 ± 3.717) kJ · mol–1, the value se-lected by [92GRE/FUG]. Values of the Gibbs energy of formation for crystalline di-oxouranium(VI) vanadates, carnotite, K2(UO2)2(VO4)2 and tyuyamunite, Ca(UO2)2(VO4)2 are calculated from the solubility data of [62HOS/GAR]. As the deri-vation of these values is rather speculative this review does not select any of them, al-though they can be used as guidance. Finally, values for several dioxouranium(VI) sili-cates are taken from [92NGU/SIL] (see Appendix A).
[97LUB/HAV]
Selenate solutions of U(VI), I = 3 M (NaClO4 + Na2SeO4) are investigated by spectro-photometry at (298.2 ± 0.5) K after stabilisation (more than 24 hours). Log10[H+] is cal-culated from potentiometric measurements using a glass electrode filled with an inner 2.99 M NaClO4 + 0.01 NaCl solution saturated by AgCl. The electrode was calibrated according to the Gran method ( +
10 j2.30259 R
F= + ( log [H ] + )TE E Eο ⋅ − ). UO2(ClO4)2 · xH2O(cr) is the starting material used to prepare the stock solution with a dioxouranium(VI) content determined by gravimetry as U3O8(cr) by the 8−hydroxy-

Discussion of selected references 550
8−hydroxyquinoline method. The selenate concentration varied between 0 and 0.6 M while − log10[H+] varied from 2.26 to 2.86. The U concentration was kept constant at 3.31·10–2 M.
Absorbances of 21 solutions at 50 wavelengths in the range 360 to 500 nm are analysed by factor analysis. Three species, UO , UO2+
2 2(SeO4)(aq) and are identified by their absorption spectra which show very close absorption maxima, but have different molar absorptivities. The authors found no evidence for the formation of hydroxy species in the range − log
22 4UO (SeO ) −
2
2
10[H+] = 1.4 to 3.0.
The data for the complexes, UO2(SeO4) and 22 4UO (SeO ) − , are lo =
(1.576 ± 0.016) and = (2.423 ± 0.013), (I = 3M). 10 1g b
10 2log b
The authors also report some attempts to measure and from potentiometric measurements using a uranium electrode, the response mechanism of which is not completely clear, but which can apparently be used successfully at low ionic strength. Experiments are conducted without adjusting the ionic strength, at − log
10 1log b
10 1
10 2log b
10[H+] = 3.5, U and selenate concentrations ranging from 0.1 to 0.5·10–3 M and up to 3·10–2 M, respectively. Only lo = (2.64 ± 0.01) can be calculated. If it is as-sumed, following the authors, that this value is equal to
10 1g blog οb
0 1 it is possible to calcu-
late according to, 2 +4(SeO , Na )−ε 10log 1 m + 8 D = 1log Iο − ∆εβ β , with
but this is highly debatable. =∆ε
2 +4eO , Na ) (− −ε 2+
2(S UO ,ClO− ε 4 ),−
Lubal et al. used an erroneous value, 2+2(UO ,ClO )4
−ε = 0.26 kg · mol–1, in this calculation and arrived at = − 0.009 kg ⋅mol2 +
4(SeO , Na )−ε
2 4ClO )−
–1. With the correct interac-tion coefficient, = 0.46 kg · mol2+(UO ,ε –1, this review obtains ε = − 0.21 kg · mol
2 +4(SeO , Na )−
–1, very different from the value ε = − 0.12 kg · mol24(SO , Na )− + –1. Con-
sequently, the mean activity coefficient of sodium selenate can be calculated from: 1
⋅2
12
2 +10 4
0.51052 (3 )log = + 2 (SeO , Na )1 1.5 (3 )
m mm
−±
− ⋅ ⋅γ ε
+ ⋅ ⋅,
where m is the molal concentration. The values of lo and lo obtained by spectrophotometry are comparable with those of the sulphate complexes, UO
10 1g b 10 2g b2SO4(aq)
and . This provides a certain confidence. However, because of the ambi-guities discussed above, the present review does not select the data reported by [97LUB/HAV].
22 4 2UO (SO ) −
[97LUB/HAV2]
This paper concerns the determination of equilibrium constants of species, 2
2(UO ) (OH) m nm n
− , with the following (n,m) values (2,2), (5,3) and (4,3) using several computer programs to process spectrophotometric and potentiometric data obtained at (25 ± 0.2)°C in 3 M NaClO4 solutions with U(VI) concentrations in the range 8.3·10–3 to 3.3·10–3 M and − log10[H+] in the ranges 2 to 4 (spectrophotometric studies), or 3 to 5
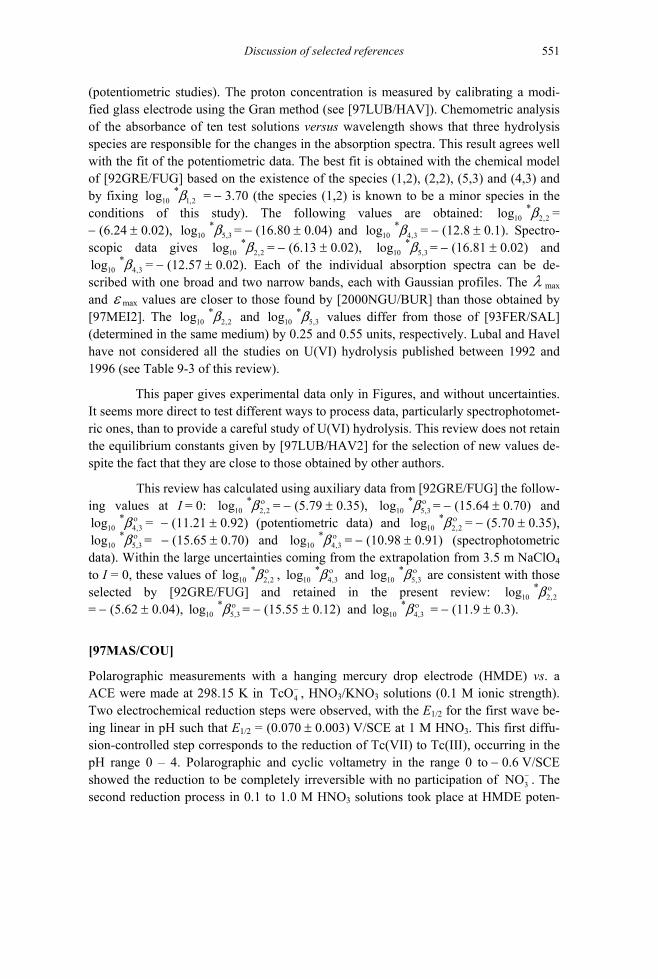
Discussion of selected references 551
(potentiometric studies). The proton concentration is measured by calibrating a modi-fied glass electrode using the Gran method (see [97LUB/HAV]). Chemometric analysis of the absorbance of ten test solutions versus wavelength shows that three hydrolysis species are responsible for the changes in the absorption spectra. This result agrees well with the fit of the potentiometric data. The best fit is obtained with the chemical model of [92GRE/FUG] based on the existence of the species (1,2), (2,2), (5,3) and (4,3) and by fixing = − 3.70 (the species (1,2) is known to be a minor species in the conditions of this study). The following values are obtained: lo = − (6.24 ± 0.02), = − (16.80 ± 0.04) and lo = − (12.8 ± 0.1). Spectro-scopic data gives = − (6.13 ± 0.02), = − (16.81 ± 0.02) and
= − (12.57 ± 0.02). Each of the individual absorption spectra can be de-scribed with one broad and two narrow bands, each with Gaussian profiles. The
10 1,2*log b
10log10 2,2
*g b5,3
*b10log
10 4,3*g b10 5,
*log b2,2*b 3
10 4,3*log b
λ max and ε max values are closer to those found by [2000NGU/BUR] than those obtained by [97MEI2]. The and values differ from those of [93FER/SAL] (determined in the same medium) by 0.25 and 0.55 units, respectively. Lubal and Havel have not considered all the studies on U(VI) hydrolysis published between 1992 and 1996 (see Table 9-3 of this review).
10log 2,2*b
log
10 5,3*log b
10 2,2* οb 10 5
*log ,3οb
log10 4,3*log οb 10
10 5,3*log οb 10
*g
10 2,*
2g οb 10*log 10 5,3
*log οb
10 4,3*g
10 2,2*log οb
10 5,*g οb 3
οb
4O−
This paper gives experimental data only in Figures, and without uncertainties. It seems more direct to test different ways to process data, particularly spectrophotomet-ric ones, than to provide a careful study of U(VI) hydrolysis. This review does not retain the equilibrium constants given by [97LUB/HAV2] for the selection of new values de-spite the fact that they are close to those obtained by other authors.
This review has calculated using auxiliary data from [92GRE/FUG] the follow-ing values at I = 0: = − (5.79 ± 0.35), = − (15.64 ± 0.70) and
= − (11.21 ± 0.92) (potentiometric data) and 2,2* οb = − (5.70 ± 0.35),
= − (15.65 ± 0.70) and lo 4,3οb = − (10.98 ± 0.91) (spectrophotometric
data). Within the large uncertainties coming from the extrapolation from 3.5 m NaClO4 to I = 0, these values of lo , 4,3
οb and are consistent with those selected by [92GRE/FUG] and retained in the present review: = − (5.62 ± 0.04), lo = − (15.55 ± 0.12) and lo = − (11.9 ± 0.3).
[97MAS/COU]
Polarographic measurements with a hanging mercury drop electrode (HMDE) vs. a ACE were made at 298.15 K in Tc , HNO3/KNO3 solutions (0.1 M ionic strength). Two electrochemical reduction steps were observed, with the E1/2 for the first wave be-ing linear in pH such that E1/2 = (0.070 ± 0.003) V/SCE at 1 M HNO3. This first diffu-sion-controlled step corresponds to the reduction of Tc(VII) to Tc(III), occurring in the pH range 0 – 4. Polarographic and cyclic voltametry in the range 0 to − 0.6 V/SCE showed the reduction to be completely irreversible with no participation of 3NO− . The second reduction process in 0.1 to 1.0 M HNO3 solutions took place at HMDE poten-

Discussion of selected references 552
tials of − 0.6 to − 0.8 V/SCE corresponding to the Tc(III) catalysed reduction of nitrate ions. Using a graphite cathode at − 0.5 V/SCE in 4 M HNO3 (5·10–4 M Tc ) caused 9% of the Tc to electrodeposit on the cathode with the formation of a brown solution consistent with Tc(V) formation characterised by an absorption band at 480 nm.
4O−
[97MEI]
As discussed in detail in the analysis of [98MEI] this paper deals with the formation of the two hydrolysis species: (2:2) and (5:3) from UO studied in 26 test solutions undersaturated with U(VI), 0.1 M NaClO
2+2 2 2(UO ) (OH)
10 5,*log b
+2 3 5(UO ) (OH) 2
2+
4, 6·10–3 to 2·10–4 M in uranium, pH = 2.4 to 4.8. Meinrath has used UV–Vis spectral data processed by factor analysis, a model-free multivariate technique for analysing multiple observations simultaneously. What is specific and new in this paper, is the discussion of pH meas-urements and the analysis of the contribution of pH errors and then effects on the free concentration of the different species at the 95% confidence level attributed to
and . From 21 solutions (pH from (3.504 ± 0.032) to (4.718 ± 0.019)) and 14 solutions (pH from (3.939 ± 0.029) to (4.776 ± 0.014)), the weighted average values and standard deviations given by Meinrath are, respectively,
= − (6.145 ± 0.088) and = − (17.142 ± 0.138) (the last digit in all these values to be taken with caution). Some of these data are used in [98MEI].
10 2,2*log b
10 2,2*log b
10 5,3*log b
3
Under the conditions used in the present work, the species 1:1, 2:1, 7:4, or 4:3 were not observed probably as a result of the low U concentrations employed. Their existence seemed improbable to Meinrath or their concentrations were too low to be detected by spectroscopy. Based on the values of lo in [92GRE/FUG] one ex-pects the species 1:1, 2:1, 7:4 and 4:3 to be present in small amounts. Whether they can be detected or not depends on the molar absorptivity, log
10 ,*g n mb
10ε, of the complexes. If log10ε = 2 to 3, as for the other species identified by Meinrath, it should have been possible to detect them.
Due to the high sensitivity of lo to [H10 ,*g n mb +], the pH measurement is of ma-
jor importance. In all experiments a multiple point calibration of the glass electrode (mV vs pH of reference solutions) is done which allows use of a calibration line set up by linear regression. This gives in turn the statistical ∆pH (random error) for a given potential. For instance from five different pH calibration points (1.7 to 10),
pH = (7.078 ± 0.047) − (0.017029 ± 0.000339) emf (mV). For the values, uncertainties in pH and free concentrations have
similar contributions. This review notes that the equation obtained by Meinrath bears an uncertainty as large as ± 0.047 log units and that calibration with standard buffers is not the best that can be recommended. A better approach is the use of potentiometric titra-tion. It is unfortunate that Meinrath has used pH buffers for the calibration of the glass electrode, but when determining concentration equilibrium constants it is obviously better to work with concentrations throughout i.e., − log
10 ,*log n mb
10[H+] instead of pH.

Discussion of selected references 553
A comparison of the values with previous ones reported in [92GRE/FUG] is given in the analysis of [98MEI].
10 ,*log n mb
[97MEI2]
Meinrath reviews here the spectral characteristics of species: 0:1, , 2:2, 2+2UO
22 2 2(UO ) (OH) + , 5:3, 2 3 5(UO ) (OH)+ and and discusses the advan-
tages/disadvantages of UV–Vis and TRLFS to determine the U(VI) speciation in envi-ronmental samples. The possible origin of the absorption and emission spectra of U(VI) in aqueous solution is discussed. Some examples are shown of deconvolution of the spectra of U(VI) into single components taken from previous results. There are no new experimental data in this paper.
2 3UO CO (aq)
The UV–Vis spectra of hydrolysed species are dominated by the spectroscopic properties of the O=U=O group (electronic and vibrational). The red shifts of the maxi-mum of absorption of increase very little with increasing number of coordinated OH groups, but the molar extinction coefficient increases by more than one order of magnitude. The emission spectra clearly show the vibrational structure and that the life-time of the excited state is rather long. The U(VI) monocarbonato complex spectrum presents only shoulders on the absorption edge toward the UV region, but a well-defined emission spectrum. Free carbonate ion concentrations of more than 10
2+2UO
–7 M quench the fluorescence very efficiently and the di- and tri-carbonato dioxouranium(VI) complexes can therefore not be detected by TRLFS. Table A-30 gives of the main char-acteristics of species under consideration.
Table A-30: Spectroscopic data of some U(VI) complexes.
2+
2UO 2
2 2UO (OH) + 3 5UO (OH)+ 2 3UO CO (aq)
Absorption max, nm 413.8 421.8 429.0 400(sh)
ε, L · mol–1 · cm–1 (9.7 ± 0.2) (101 ± 2) (474 ± 1) (36 ± 3)
Lifetime, µs (0.9 ± 0.3) (2.9 ± 0.4) (7 ± 1) (35 ± 5)
Emission max, nm 473, 488, 509, 534, 560, 588
499, 519, 542, 556 500, 516, 533, 554 450(sh), 464, 481, 504, 532(sh)
[97MEI/SCH]
This paper is reviewed together with [96MEI/SCH].
[97MER/LAM]
The authors carried out an experiment similar to that reported by Morss and Williams

Discussion of selected references 554
[94MOR/WIL]. 241Am(IV) dioxide was reduced by a H2 flow at 1090 K. The resulting hexagonal Am2O3(cr) was then hydrated to Am(OH)3(cr) in an autoclave at (403 ± 5) K and a water saturation pressure of 275 kPa. The prepared Am(OH)3(cr) was investigated and characterised by gravimetry, X–ray diffraction and FTIR spectroscopy. One weak extraneous line at d = 0.289 nm was attributed to small impurities of Am2O3(cr). The molar enthalpy of solution of Am(OH)3(cr) was determined in 6 M HCl to be
sol mH ο∆ (Am(OH)3, cr, 298.15 K, 6 M HCl) = − (129.4 ± 1.1) kJ · mol–1 (mean value of five measurements with samples from the same solid), which differs from the mean value reported in [94MOR/WIL] by (23 ± 8) kJ · mol–1. Combining sol mH ο∆ (Am(OH)3, cr, 298.15 K, 6 M HCl) with the molar enthalpy of solution for americium metal se-lected in [95SIL/BID], sol mH ο∆ (Am, cr, 298.15 K, 6 M HCl) = − (613.1 ± 1.4) kJ · mol–
1, the standard molar enthalpy of formation was calculated to be f mH ο∆ (Am(OH)3, cr, 298.15 K) = − (1343.6 ± 1.8) kJ · mol–1. Using an estimate of mS ο (Am(OH)3, cr, 298.15 K) = (126 ± 8) J · K–1 · mol–1 and thermochemical data for Am3+ and OH– se-lected in [95SIL/BID], the following data were calculated: rGm
ο∆ = (144.1 ± 5.6) kJ · mol–1 for the reaction:
Am(OH)3(cr) Am3+ + 3 OH–
corresponding to 10 ,0log sK ο (Am(OH)3, cr, 298.15 K) = − (25.2 ± 1.0) and 10 ,0*log sK ο
(Am(OH)3, cr, 298.15 K) = (16.8 ± 1.0). With mS ο (Am(OH)3, cr, 298.15 K) = (116 ± 8) J · K–1 · mol–1 as estimated in the present review (cf. section 12.3.2.2) the solubility con-stant becomes:
10 ,0*log sK ο (Am(OH)3, cr, 298.15 K) = (17.3 ± 1.0).
This value is 1.7 log10 units larger than 10 ,0*log sK ο = (15.6 ± 0.6) as re-calculated in the
present review from the solubility data reported in [82SIL] for 243Am(OH)3(cr) and close to 10 ,0
*log sK ο = (16.9 ± 0.8) selected for Am(OH)3(am). There is no clear-cut ex-planation for this contradiction, because the solid phase characterisation reported in [97MER/LAM] does not indicate a degradation of 241Am(OH)3(cr) to an amorphous phase by α–radiation damage.
[97MOL/GEI]
This paper is reviewed together with [98MOL/GEI].

Discussion of selected references 555
[97MUR]
The paper deals with the problem of UO2 alteration by water in environmental conditions according to the sequence schoepite (in fact metaschoepite UO3·2H2O), soddyite ((UO2)2SiO2·2H2O) and uranophane (Ca(UO2)2[SiO3(OH)]2·5H2O).
The calculated solubility of schoepite decreases from 10−3.1 to 10−4.8 M when T decreases from 100 to 25°C. All data used to calculate 10 ,0
*log sK = f(T) for
UO3·2H2O + 2 H+ UO 22
+ + 3 H2O(l)
are from [92GRE/FUG], UO3·2H2O being considered as crystalline dioxouranium(VI) hydroxide hydrate.
Uncertainties in the data are too large to calculate the dissolution of soddyite ac-cording to:
(UO2)2SiO4·2H2O + 4 H+ 2UO 22
+ + SiO2(aq) + 4 H2O(l).
The values given by [92NGU/SIL] are 10*log sK = (5.74 ± 0.21) at 30°C and
10*log sK = (6.03 ± 0.45) at 25°C. Furthermore, the experimental conditions do not guaran-
tee that equilibrium is obtained. For uranophane data are lacking. Considerations of possi-ble retrograde solubilities of these minerals are developed.
[97NEU/REI]
This paper describes solubility and speciation studies in the Pu(VI) carbonate system. Pre-caution was taken by the authors to maintain the hexavalent oxidation state during the ex-periments. The bi- and tri-carbonato complexes are identified by spectrophotometric titra-tion experiments and confirm previously published results. Equilibrium constants are re-ported for both complexes in 0.1 M NaClO4 at 25°C. The values given are in agreement with previous measurements. However, the authors have not presented the experimental data in detail. Information on the accuracy of the measurements and the evaluated com-plexation constants are missing as well. Therefore, this review is unable to judge the pub-lished complexation constants.
In the second part of the paper, the solubility of solid dioxoplutonium(VI) carbon-ate, PuO2CO3(cr), has been studied. The synthesised solid, which is characterised by XRD and EXAFS analysis, is isostructural with the homologous uranium compound. The solu-bility product of PuO2CO3(cr) was determined as a function of the NaCl concentration. The experimental data are of a preliminary character as the authors themselves have pointed out. More detailed results are presented in [2000REI/NEU], (cf. discussion of that paper).

Discussion of selected references 556
[97OMO/MIY]
This paper deals with the extraction of pertechnetate from aqueous solution by solutions of chloroform containing tetraphenylarsonium chloride and 3,5-dichlorophenol at 25°C. The effect of association of the latter two solutes on the extraction constant is demonstrated yielding values for these two constants of (3.53 ± 0.08)·104 M and (1.33 ± 0.03)·103 M, respectively. No experimental results are given and this paper may be considered to be outside the scope of this review.
[97PAS/CZE] This review includes the review of [93PAS/RUN] and concerns U(VI) and Pu(VI).
These two studies have been made at 22oC using the same solubility technique in a 0.1 M NaClO4 ionic medium. The correction of the measured pH values to − log10[H+] is not well described. [97PAS/CZE] used the expression:
log10[ CO ] = − 17.55 − log23
−10
2COp + 2 pH,
to calculate the carbonate concentration from the measured pH, while [93PAS/RUN] used:
log10[ CO ] = − 17.65 − log23
−10
2COp + 2 pH.
The experimental pH values have to be recalculated to − log10[H+]. The error made in [97PAS/CZE] seems to be due to an erroneous citation of [96FAN/NEC]. The correct expression for calculating the carbonate concentration given in [96FAN/NEC] is:
log10[ CO ] = − 17.56 − log23
−10
2COp − 2 log10[H+].
In order to account for the systematic error made in [97PAS/CZE] their equilib-rium constants have been recalculated by this review using the auxiliary data from [92GRE/FUG]. The original equilibrium constants for the U(VI) carbonate system,
10 ,0log sK for UO2CO3(s) and lo for the complexes , and the recalcu-lated values in 0.1 M NaClO
10g nb2 2
2 3UO (CO ) nn
−
4 are:
10 ,0log sK = − (13.35 ± 0.14), recalculated: − (13.55 ± 0.14),
= (8.93 ± 0.05), recalculated: (9.13 ± 0.05), 10 1log b
= (15.3 ± 0.2), recalculated: (15.7 ± 0.2), 10 2log b
= (21.0 ± 0.3), recalculated: (21.6 ± 0.3). 10 3log b
These recalculated values are converted to zero ionic strength using the SIT:
10 ,0log sK ο = − (14.39 ± 0.14),
= (9.97 ± 0.05), 10 1log οb
= (16.5 ± 0.2), 10 2log οb
= (21.6 ± 0.3). 10 3log οb
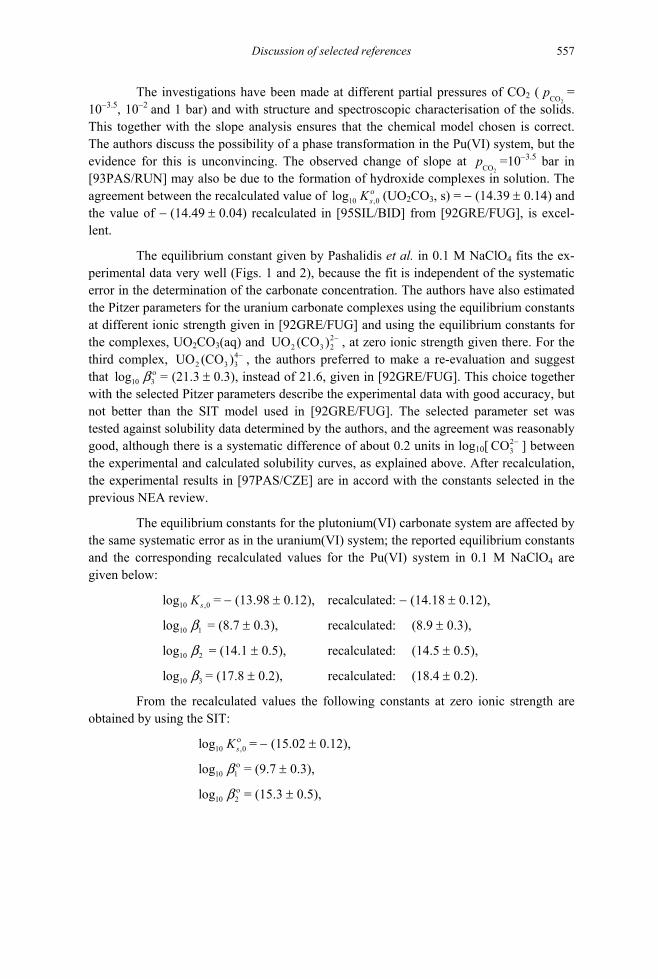
Discussion of selected references 557
The investigations have been made at different partial pressures of CO2 (2=
10CO
p−3.5, 10−2 and 1 bar) and with structure and spectroscopic characterisation of the solids.
This together with the slope analysis ensures that the chemical model chosen is correct. The authors discuss the possibility of a phase transformation in the Pu(VI) system, but the evidence for this is unconvincing. The observed change of slope at
2=10
COp −3.5 bar in
[93PAS/RUN] may also be due to the formation of hydroxide complexes in solution. The agreement between the recalculated value of 10 ,0log sK ο (UO2CO3, s) = − (14.39 ± 0.14) and the value of − (14.49 ± 0.04) recalculated in [95SIL/BID] from [92GRE/FUG], is excel-lent.
The equilibrium constant given by Pashalidis et al. in 0.1 M NaClO4 fits the ex-perimental data very well (Figs. 1 and 2), because the fit is independent of the systematic error in the determination of the carbonate concentration. The authors have also estimated the Pitzer parameters for the uranium carbonate complexes using the equilibrium constants at different ionic strength given in [92GRE/FUG] and using the equilibrium constants for the complexes, UO2CO3(aq) and 2
2 3 2UO (CO ) − , at zero ionic strength given there. For the third complex, , the authors preferred to make a re-evaluation and suggest that = (21.3 ± 0.3), instead of 21.6, given in [92GRE/FUG]. This choice together with the selected Pitzer parameters describe the experimental data with good accuracy, but not better than the SIT model used in [92GRE/FUG]. The selected parameter set was tested against solubility data determined by the authors, and the agreement was reasonably good, although there is a systematic difference of about 0.2 units in log
42 3 3UO (CO ) −
10 3log οb
10[ ] between the experimental and calculated solubility curves, as explained above. After recalculation, the experimental results in [97PAS/CZE] are in accord with the constants selected in the previous NEA review.
23CO −
The equilibrium constants for the plutonium(VI) carbonate system are affected by the same systematic error as in the uranium(VI) system; the reported equilibrium constants and the corresponding recalculated values for the Pu(VI) system in 0.1 M NaClO4 are given below:
10 ,0log sK = − (13.98 ± 0.12), recalculated: − (14.18 ± 0.12),
= (8.7 ± 0.3), recalculated: (8.9 ± 0.3), 10 1log b
= (14.1 ± 0.5), recalculated: (14.5 ± 0.5), 10 2log b
= (17.8 ± 0.2), recalculated: (18.4 ± 0.2). 10 3log b
From the recalculated values the following constants at zero ionic strength are obtained by using the SIT:
10 ,0log sK ο = − (15.02 ± 0.12),
= (9.7 ± 0.3), 10 1log οb
= (15.3 ± 0.5), 10 2log οb

Discussion of selected references 558
= (18.4 ± 0.2). 10 3log οb
The equilibrium constant for the first complex does not differ much from the corresponding uranium system and the differences for the second and third complexes can be rationalised in terms of differences in ionic radii between the two MO ions. The equilibrium constants at zero ionic strength do not agree well with those proposed in [2001LEM/FUG]. The value of
2+2
10 1log οb = (9.7 ± 0.3) is very different from the value = 13.8 obtained from the data of Sullivan and Woods [82SUL/WOO]. There are
no chemical reasons to assume large differences in this stability constant between and , indicating that the data in [82SUL/WOO] are affected by some systematic errors. The solubility product of PuO
10 1log οb
PuO
2+2UO
2+2
2CO3(s) is larger in [87ROB/VIT] than in [97PAS/CZE], indicating a less crystalline solid in the former study. However, the crystal-linity does not seem to have changed during the experiments as indicated by the good agreement between the stability constants for the carbonate complexes in the two studies.
[97PER/CAS] Soddyite was synthesised [92NGU/SIL] and characterised as a pure single phase before and after the experiments by X−ray diffraction, SEM and IR methods, (BET surface area = (25.4 ± 0.2) m2 · g−1). Dissolution was studied at room temperature in 0.001 M Na2SiO3 and 0.007 M NaClO4, with added Na2CO3 in the range 0.001 to 0.02 M (0.25 g of soddyite in 100 mL of stirred solution). The effluent was analysed for uranium and presumably pH was measured on the activity scale (8.53 to 9.11). Data are analysed according to:
4 +2 2 4 2 3 2 3 3 4 4 2(UO ) SiO 2H O (cr) + 6 HCO 2 UO (CO ) + H SiO (aq) + 2 H + 2H O(l)− −⋅
(A.88)
Steady-state U(VI) concentrations were reached after ca. 400 hours at low car-bonate concentrations and within 100 hours at the highest concentrations. The silicic acid concentration was determined from mass balance according to the above equation and the uranium speciation was determined by the HARPHRQ code and extrapolation of the re-sulting equilibrium constants was performed with the SIT [92GRE/FUG], from which
10*log sK values were estimated for the equilibrium:
+ 2+2 2 4 2 2 4 4 2(UO ) SiO 2H O (cr) + 4H 2 UO + H SiO (aq) + 2H O(l)⋅ (A.89)
The authors state that complexes other than 42 3 3UO (CO ) − are important at
[ ] = 0.002 M, and therefore an average 3HCO−10
*log sK ο value, (3.9 ± 0.7), was calculated from the higher concentrations of carbonate. However, to this review there is a clear mono-tonic trend in the lo 10
*g sK ο values even at [ 3HCO− ] > 0.002 M, e.g., [ ] = 0.005, 0.005, 0.008, 0.010, 0.015, 0.020; lo
3HCO−
10*g sK ο = 4.60, 4.42, 3.80, 4.24, 3.77, 2.58, respec-
tively. The authors refer to two previous studies conducted at only one pH with lo 10*g sK ο
values of 5.74 [92NGU/SIL] and 6.15 [96MOL/GEI].
The kinetics of reaction (A.88) were treated by the detailed balancing equation, which expresses the rate of the net reaction as:

Discussion of selected references 559
6 4 21 3 1 2 3 3 4 4
d[U] = k [HCO ] k [UO (CO ) ] [H SiO (aq)][H ]dt
− −−− + 2 (A.90).
This equation simply relies on the stoichiometry of the equilibrium (A.88) to fix the rate order for each component, such that K1 = k1/k−1. Further assumptions were made that the bicarbonate, silicic acid and pH remained constant during the reaction. Based on the integrated rate equation (A.90), the ratio of the two rate constants gave a value of K1 which was converted to a 10
*log sK value of (4.3 ± 0.6). Although this kinetic approach appears to favour the solubility constant determined by direct measurement in this study, the concept of a rate law involving sixth- and fifth-order rate determining steps is very questionable and likely represents a misuse of the theory of microscopic reversibility to obtain rate constants.
The authors have taken only the formation of 42 3 3UO (CO ) − into account and
claim that the observed variation in the solubility product is due to this assumption. The reviewers have repeated this calculation by taking the formation of all carbonate com-plexes into account. There is still a large systematic variation in the experimental
10*log sK values, indicating some systematic error in the measurements. In addition, one
notices very large uncertainties in the pH determinations that result in a large uncertainty in the solubility product. In view of these shortcomings this review has not considered the solubility constant, lo 10
*g sK ο = (3.9 ± 0.7), suggested by Pérez et al. when selecting the recommended value.
[97RAI/FEL] Solubility experiments were conducted on freshly−precipitated amorphous UO2(am) and ThO2(am) whereby equilibrium was approached from undersaturation. Detailed precau-tions were taken to prevent oxidation of the UO2(am) and dissolved uranium, including the addition of EuCl2. Experiments with UO2(am) were performed in 0.03, 0.1, 0.2, 1.0, and 6.0 m NaCl and in 1.0, 2.0 and 3.0 m MgCl2, whereas for ThO2(am) runs were made in 4.0 and 6.0 m NaCl, and in 1.0, 1.82 and 3.0 m MgCl2. Molal hydrogen ion concentrations were determined from glass electrode measurements corrected according to an empirical Gran plot ( +H
pm = pHobs + A). Eh of the U solutions was measured with platinum elec-trodes and confirmed by either UV−Vis−IR or solvent extraction. X−ray diffraction pat-terns of the products show predominantly one, low−intensity, broad peak at 3.157 Å con-sistent with previous findings for amorphous solids [87BRU/CAS], [90RAI/FEL]. All the solubility results presented could be fitted with a single line (log10CU versus pcH) with a slope of ca. − 3 and little variation for samples taken after 1 to 438 days. However, U(VI) appears to have been present in some solutions of low chloride concentrations (< 0.1 m) leading to higher scatter than observed at high chloride concentrations. The authors evalu-ated binary Pitzer parameters for U4+−Cl−: β(0) = 1.644; β(1) = 15.5; Cφ = 0.0995 and U(OH)3+−Cl−: β(0) = 1.0; β(1) = 7.856; Cφ = 0.0. No mixing terms are provided.
Values of ∆ are given for Uf m / RGο T 4+, U(OH)3+ and UO2(am). They correspond to (Uf mGο∆ 4+, 298.15 K) = − 530.97 kJ · mol−1 (cf., recommended value in [92GRE/FUG]:

Discussion of selected references 560
− (529.9 ± 1.8) kJ · mol−1), f mGο∆
,0
(U(OH)3+, 298.15 K) = − 765.26 kJ · mol−1 (cf. recom-mended value in [92GRE/FUG]: − (763.9 ± 1.8) kJ · mol−1), and (UOf mGο∆ 2(am), 298.15 K) = − 990.77 kJ · mol−1.
sK ο
(aq)
aq)
For the solubility product of the reaction:
UO2(am) + 2 H2O(l) U4+ + 4 OH−
the authors calculated lo 10g = − 53.45. The Pitzer parameters yielded excellent agree-ment for the formation constant of U(OH)3+ with the study of Kraus and Nelson [50KRA/NEL].
[97RED] This paper, in which few experimental details are given, examines the solubility of UO2(cr) in pure water, acid chloride mixtures, hydrofluoric acids, sodium carbonate and mixtures of sodium carbonate and oxalate solutions, at various redox potentials. The be-haviour of UO3·H2O(cr) in pure water is also examined.
In the temperature range 300 − 600°C, with f(O2) controlled by Ni−NiO and Fe2O3−Fe3O4 couples, the author confirmed earlier results ([87DUB/RAM], [89RED/SAV]) on the negligible temperature dependence of the solubility over the tem-perature range covered. The reported solubility was 2·10−9 mol U/kg H2O. For the gener-ally accepted dissolution reaction, UO2(cr) + 2 H2O(l) , this gives 4U(OH)
10 ,4log sK = − 8.7 (1 kbar, pH = 7) compared to an average value of 10 ,4log sK = − (9.47 ± 0.56) reported by [88PAR/POH] at pH > 4 over the temperature range 100 to 300°C (50 MPa H2).
The solubility of UO2(cr) at 500°C (Ni−NiO buffer) in HCl ranged between log10mU = − (7.2 ± 0.1) in 10−4 m HCl and log10mU = − (3.0 ± 0.3) for 1 m HCl and corre-sponded roughly to the relation mU = 10−3 mHCl. From these results, the author suggested the presence of as the predominant species. 3U(OH) Cl(
For chloride media of composition mKCl + mHCl = 1 mol · kg−1 H2O, various equa-tions were given over the temperature range 400 to 600°C (Ni−NiO buffer), but the ac-knowledged existence of higher uranium oxidation states prevents us, in the opinion of the reviewer, from drawing further conclusions.
In HF solutions (10−3 − 0.1 mol · kg−1 H2O) at 500°C and 1 kbar, the following solubility equations were given:
mU = 2.353·10−2 (mHF)2 + 8.293·10−4 mHF + 10−6 (Ni−NiO)
mU = 0.1158 (mHF)2 + 3.207 · 10−2 mHF + 10−6 (Fe2O3−Fe3O4).
From this, the author suggested the presence of as the predomi-nant species.
2 2U(OH) F (aq)

Discussion of selected references 561
The solubility of UO2(cr) in 0.25 m NaOH + 0.25 m Na2C2O4, and 0.5 m Na2CO3 (1 kbar, Ni−NiO, 14 days) is reported as 3·10−6 mol U · kg−1 H2O. The authors indicated that this is three orders of magnitude lower than those reported by [76NGU/POT].
Starting with trioxide U(VI) monohydrate, UO3·H2O(cr), at room temperature, the progressive dehydration to UO3·0.33 H2O in contact with water was reported between 150 and 300°C (in the Eh domain of existence of Cu2O(cr) or CuO(cr)). After an undefined period during which “U(VI) hydroxides” precipitated, the following solubility relation-ships were given for the range 200 to 500°C:
log10mU = 15375.3 T−1 + 0.0647 T − 67.05 473−573 K
log10mU = − 221.7 T−1 − 2.71 573−773 K.
The predominant presence of (UO2 3 7) (OH)− was deduced by the author from these results. Except for the U(OH)4(aq) species, very little quantitative thermodynamic information can be extracted from this paper.
[97RUN/NEU] Spectroscopic techniques (TRLFS, Raman, UV−Vis absorption, EXAFS) have been ap-plied to investigate the speciation of actinides in concentrated chloride solutions. The in-teractions of actinides in various oxidation states, Am(III), Np(IV), Np(V), Pu(VI), U(VI) with chloride were studied. Spectra of trivalent Am, tetravalent and pentavalent Np in 5 M NaCl and 5 M NaClO4 show no significant differences. The authors conclude that under this condition inner-sphere chloride complexes are not stable. On the contrary, the hexava-lent actinides U(VI) and Pu(VI) show substantial changes in the spectroscopic data when the chloride concentration is changed, adding LiCl up to 16 M. Inner-sphere chloro com-plexes of the type, , with n = 1, 2, 3 and 4, are formed. The tetrachloro complex was identified only in solutions of very high chloride concentrations (> 15 M). There are no thermodynamic data given in the paper, but the spectroscopic results contain useful information for the interpretation of measured thermodynamic data.
22AnO Cl n
n−
[97RUT/GEI] This paper is discussed together with [99RUT/GEI].
[97SAL/KRI] This conference paper describes X−ray and thermal studies of the new compound SrUTe2O8(cr), which is reported as resulting from the 1:2 molar ratio mixture of a SrUO4(cr) and TeO2(cr) mixture in an argon atmosphere at 1073 K. The same compound could be obtained by heating a 1:1 molar mixture of SrTeO3(cr) and UTeO5(cr).
The X−ray diffraction pattern was indexed on the basis of a monoclinic cell with a0 = 13.028 Å, b0 = 5.434 Å, c0 = 12.576 Å and β = 93.21°. No details are given.
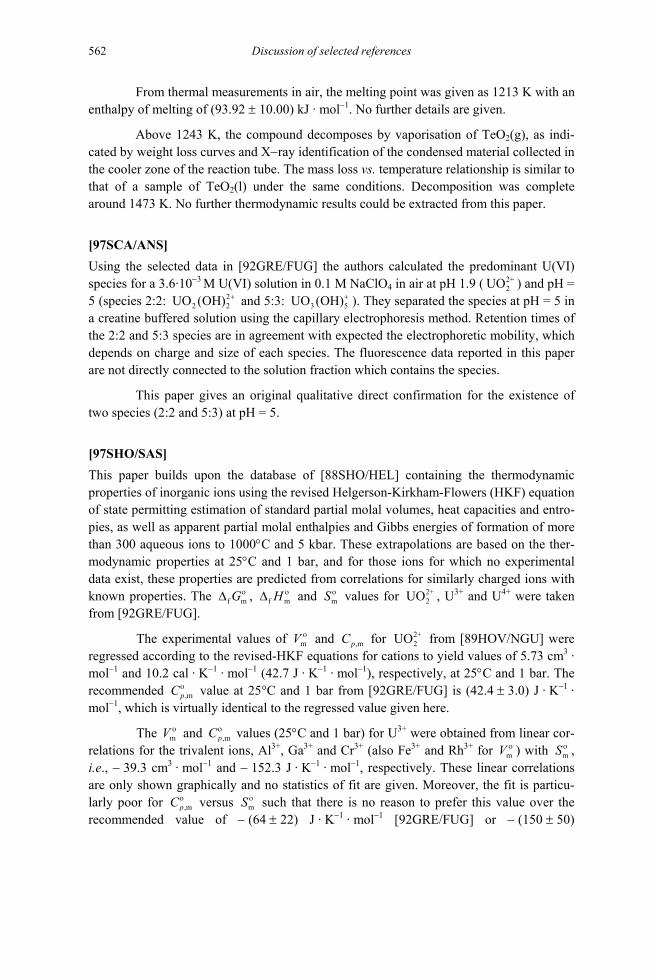
Discussion of selected references 562
From thermal measurements in air, the melting point was given as 1213 K with an enthalpy of melting of (93.92 ± 10.00) kJ · mol−1. No further details are given.
Above 1243 K, the compound decomposes by vaporisation of TeO2(g), as indi-cated by weight loss curves and X−ray identification of the condensed material collected in the cooler zone of the reaction tube. The mass loss vs. temperature relationship is similar to that of a sample of TeO2(l) under the same conditions. Decomposition was complete around 1473 K. No further thermodynamic results could be extracted from this paper.
[97SCA/ANS] Using the selected data in [92GRE/FUG] the authors calculated the predominant U(VI) species for a 3.6·10−3 M U(VI) solution in 0.1 M NaClO4 in air at pH 1.9 ( ) and pH = 5 (species 2:2: and 5:3:
2+2UO
22UO (OH) +
2 53UO (OH)+ ). They separated the species at pH = 5 in a creatine buffered solution using the capillary electrophoresis method. Retention times of the 2:2 and 5:3 species are in agreement with expected the electrophoretic mobility, which depends on charge and size of each species. The fluorescence data reported in this paper are not directly connected to the solution fraction which contains the species.
This paper gives an original qualitative direct confirmation for the existence of two species (2:2 and 5:3) at pH = 5.
[97SHO/SAS] This paper builds upon the database of [88SHO/HEL] containing the thermodynamic properties of inorganic ions using the revised Helgerson-Kirkham-Flowers (HKF) equation of state permitting estimation of standard partial molal volumes, heat capacities and entro-pies, as well as apparent partial molal enthalpies and Gibbs energies of formation of more than 300 aqueous ions to 1000°C and 5 kbar. These extrapolations are based on the ther-modynamic properties at 25°C and 1 bar, and for those ions for which no experimental data exist, these properties are predicted from correlations for similarly charged ions with known properties. The , f m
ο∆ G f mο∆ H and m
οS values for , U2+2UO 3+ and U4+ were taken
from [92GRE/FUG].
The experimental values of mοV and ,mpC for from [89HOV/NGU] were
regressed according to the revised-HKF equations for cations to yield values of 5.73 cm
2+2UO
3 · mol−1 and 10.2 cal · K−1 · mol−1 (42.7 J · K−1 · mol−1), respectively, at 25°C and 1 bar. The recommended ,m
οpC value at 25°C and 1 bar from [92GRE/FUG] is (42.4 ± 3.0) J · K−1 ·
mol−1, which is virtually identical to the regressed value given here.
The mοV and ,m
οpC values (25°C and 1 bar) for U3+ were obtained from linear cor-
relations for the trivalent ions, Al3+, Ga3+ and Cr3+ (also Fe3+ and Rh3+ for V ) with , i.e., − 39.3 cm
mο
mοS
3 · mol−1 and − 152.3 J · K−1 · mol−1, respectively. These linear correlations are only shown graphically and no statistics of fit are given. Moreover, the fit is particu-larly poor for ,m
οpC versus such that there is no reason to prefer this value over the
recommended value of − (64 ± 22) J · KmοS
−1 · mol−1 [92GRE/FUG] or − (150 ± 50)
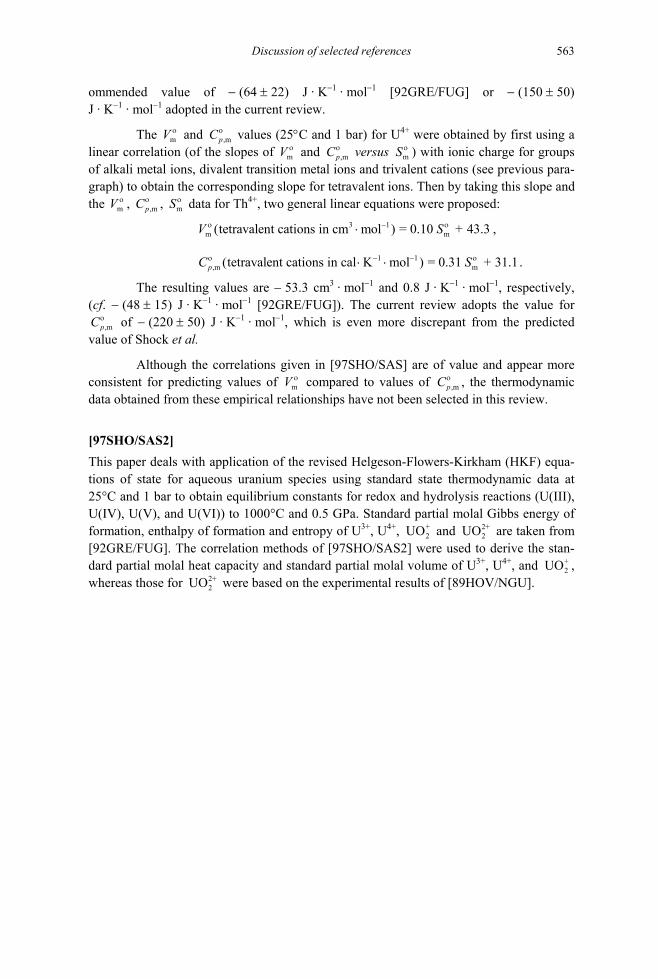
Discussion of selected references 563
ommended value of − (64 ± 22) J · K−1 · mol−1 [92GRE/FUG] or − (150 ± 50) J · K−1 · mol−1 adopted in the current review.
The mοV and ,m
οpC values (25°C and 1 bar) for U4+ were obtained by first using a
linear correlation (of the slopes of mοV and ,m
οpC versus m
οS ) with ionic charge for groups of alkali metal ions, divalent transition metal ions and trivalent cations (see previous para-graph) to obtain the corresponding slope for tetravalent ions. Then by taking this slope and the V , m
ο,m
οpC , data for Thm
οS 4+, two general linear equations were proposed: 3 1
m m(tetravalent cations in cm mol ) = 0.10 + 43.3ο −⋅V S ο
ο
,
1 1,m m(tetravalent cations in cal K mol ) = 0.31 + 31.1pC Sο − −⋅ ⋅ .
The resulting values are − 53.3 cm3 · mol−1 and 0.8 J · K−1 · mol−1, respectively, (cf. − (48 ± 15) J · K−1 · mol−1 [92GRE/FUG]). The current review adopts the value for
,mοpC of − (220 ± 50) J · K−1 · mol−1, which is even more discrepant from the predicted
value of Shock et al.
Although the correlations given in [97SHO/SAS] are of value and appear more consistent for predicting values of m
οV compared to values of ,mοpC , the thermodynamic
data obtained from these empirical relationships have not been selected in this review.
[97SHO/SAS2] This paper deals with application of the revised Helgeson-Flowers-Kirkham (HKF) equa-tions of state for aqueous uranium species using standard state thermodynamic data at 25°C and 1 bar to obtain equilibrium constants for redox and hydrolysis reactions (U(III), U(IV), U(V), and U(VI)) to 1000°C and 0.5 GPa. Standard partial molal Gibbs energy of formation, enthalpy of formation and entropy of U3+, U4+, and are taken from [92GRE/FUG]. The correlation methods of [97SHO/SAS2] were used to derive the stan-dard partial molal heat capacity and standard partial molal volume of U
+2UO 2+
2UO
3+, U4+, and , whereas those for were based on the experimental results of [89HOV/NGU].
+2UO
2+2UO
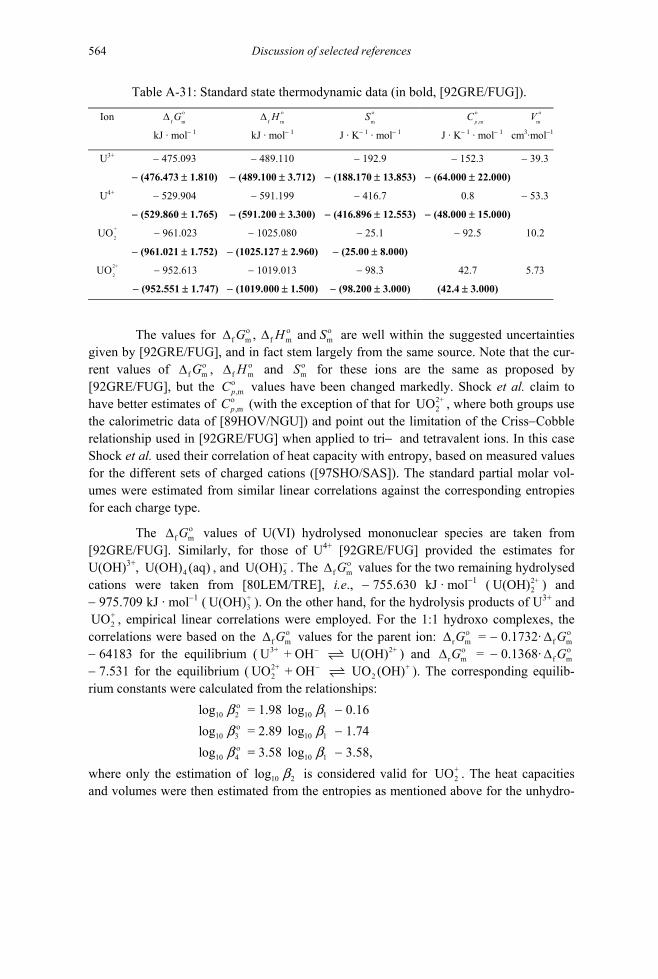
Discussion of selected references 564
Table A-31: Standard state thermodynamic data (in bold, [92GRE/FUG]).
Ion f mG ο∆ f mH ο∆ mS ο ,mp
C ο mV ο kJ · mol− 1 kJ · mol− 1 J · K− 1 · mol− 1 J · K− 1 · mol− 1 cm3·mol−1
U3+ − 475.093
− (476.473 ± 1.810)
− 489.110
− (489.100 ± 3.712)
− 192.9
− (188.170 ± 13.853)
− 152.3
− (64.000 ± 22.000)
− 39.3
U4+ − 529.904
− (529.860 ± 1.765)
− 591.199
− (591.200 ± 3.300)
− 416.7
− (416.896 ± 12.553)
0.8
− (48.000 ± 15.000)
− 53.3
+
2UO − 961.023
− (961.021 ± 1.752)
− 1025.080
− (1025.127 ± 2.960)
− 25.1
− (25.00 ± 8.000)
− 92.5 10.2
2+
2UO − 952.613
− (952.551 ± 1.747)
− 1019.013
− (1019.000 ± 1.500)
− 98.3
− (98.200 ± 3.000)
42.7
(42.4 ± 3.000)
5.73
The values for are well within the suggested uncertainties given by [92GRE/FUG], and in fact stem largely from the same source. Note that the cur-rent values of ,
f m f m m, and G H Sο ο∆ ∆
f m
ο
f mGο∆ H ο∆ mS and ο for these ions are the same as proposed by [92GRE/FUG], but the ,mpC values have been changed markedly. Shock et al. claim to have better estimates of
ο
,mpCο (with the exception of that for , where both groups use the calorimetric data of [89HOV/NGU]) and point out the limitation of the Criss−Cobble relationship used in [92GRE/FUG] when applied to tri− and tetravalent ions. In this case Shock et al. used their correlation of heat capacity with entropy, based on measured values for the different sets of charged cations ([97SHO/SAS]). The standard partial molar vol-umes were estimated from similar linear correlations against the corresponding entropies for each charge type.
2+2UO
The values of U(VI) hydrolysed mononuclear species are taken from [92GRE/FUG]. Similarly, for those of U
f mGο∆
4U(OH) (aq
4+ [92GRE/FUG] provided the estimates for U(OH)3+, , and ) 5U(OH)− . The f mGο∆ values for the two remaining hydrolysed cations were taken from [80LEM/TRE], i.e., − 755.630 kJ · mol−1 ( U(OH ) and − 975.709 kJ · mol
2+2)
−1 ( ). On the other hand, for the hydrolysis products of U+3)
f G
U(OH 3+ and , empirical linear correlations were employed. For the 1:1 hydroxo complexes, the
correlations were based on the
+2UO
mο∆ values for the parent ion: r mGο∆
r mG = − 0.1732·
− 64183 for the equilibrium ( ) and f mGο∆
3+U 2+ + OH (OH)− U ο∆ = − 0.1368· − 7.531 for the equilibrium ( ). The corresponding equilib-rium constants were calculated from the relationships:
f mGο∆2+UO +2 2 + OH UO (OH)−
10 2log οbο
= 1.98 − 0.16 10 1log b
10 3log bο
= 2.89 − 1.74 10 1log b
10 4log b = 3.58 − 3.58, 10 1log bwhere only the estimation of is considered valid for . The heat capacities and volumes were then estimated from the entropies as mentioned above for the unhydro-
10 2log b +2UO

Discussion of selected references 565
lysed cations. The values of these estimated thermodynamic properties are given in Table A-32.
Table A-32: Standard state thermodynamic data (in bold, [92GRE/FUG]).
Ion f mG ο∆ f mH ο∆ mS ο C,mp
ο V m
ο
kJ · mol− 1 kJ · mol− 1 J · K− 1 · mol− 1 J · K− 1 · mol− 1 cm3·mol−1 2+U(OH) − 676.97 − 701.66 5.0 − 161.5 5.1 +U(OH)2
U(OH) (
− 914.10 − 6929.75 143.1 − 263 26
3 aq)
U(OH)−
− 1065.6 − 1144.0 291.2 − 530 43
43+U(OH)
− 1242.9 − 1381.7 321.0 669 59
− 763.99 − (763.918 ± 1.798)
− 830.11 − (830.120 ± 9.540)
− 200.0 −(199.946 ± 32.521)
72.4
− 2.8
2+2U(OH)+U(OH)
− 1012.8 − 1089.6 − 69.8 − 170 18
3
U(OH) (
− 1212.8 − 1351.9 22.2 84 27
4 aq) − 1452.5 − (1452.500 ± 8.000)
− 1658.3 − (1655.798 ± 10.934)
30.8 (40.000 ± 25.000)
231 (205.000 ± 80.000)
41
5U(OH)− − 1621.1 >− 1621.144
− 1915.6 − 33.0 444 41
2UO (OH)(aq)−
− 1094.5 − 1238.0 − 58.2 103.8 14.5
2 2UO (OH)+UO (OH)
− 1227.1 − 1430.6 − 11.7 103 30.6
2 − 1160.01(a)
− (1160.009 ± 2.447) − 1261.5(a)
− (1261.657 ± 15.107)17.2(a)
(17.000 ± 50.000) 18.0
2 2UO (OH) (aq) − 1368.0 ≥− 1368.038
− 1539.4
− 15.9
72
32.8
2 3UO (OH)− − 1554.2 − (1554.377 ± 2.878)
− 1804.2 − 14.2 168 36.4
224UO (OH) − − 1712.8
− (1712.746 ± 11.550)− 2020.2 26.4 − 35.2 51.4
(a) attributed to [92GRE/FUG] in the original
In the absence of experimental results, these correlations are at least indicative of the relative stabilities of these species and were also used by Shock et al. to construct pre-dictive Pourbaix diagrams involving these hydrolysed species and also incorporating ura-nium complexes.
[97STE/FAN] This paper, included in a report, describes the complex formation between Cm(III) and monosilicic acid as studied by fluorescence spectroscopy. The experimental method has been detailed in previous papers from the laboratory. The key uncertainty in this study is the speciation of silica in the system (monosilicic acid has been prepared by rapid acidifi-cation of sodium silicate, which may result in the presence of polymers). The concentra-tion of monosilicic acid in the experiments is 3.6·10−4 M, which is only slightly larger than the solubility of silica in water. The stoichiometry of the complex formed is well estab-

Discussion of selected references 566
lished and the equilibrium constant is reported as lo = (7.4 ± 0.1), at room tempera-ture in 0.1 M NaClO
10 1g b4, where the uncertainty is estimated by the reviewers.
[97TAK] In this description of a new device to measure heat capacities at high temperatures, Taka-hashi reports (in the form of a small graph) new measurements of the heat capacity of UO2(cr) from ca. 300 to 1500 K. The results, deemed to have an uncertainty of ± 3%, are about 2% lower than earlier values from enthalpy drop measurements.
[97TOR/BAR] No thermodynamic data could be inferred from these experiments on the mechanism of UO2 dissolution. Nevertheless it is shown that the dissolution rate of UO2(cr) in NaClO4 and O2 concentration is dependent (pH = 3 to 6.7,
2 = 5, 21 and 100 % in NOp 2), but in a
rather complex way. In this pH range, adsorbed oxygen acts as the oxidant. Above pH = 6.7 a layer of UO2.25 appears due to oxygen diffusion, as shown by deconvolution of the XPS peak and the data do not convey evidence for UO4
7/2fU 2(cr) dissolution. This point is interesting to note with regard to solubility data for uranium dioxide at high pH in oxic conditions. These results confirm numerous previous observations.
[97VAL/RAG] The solubility measurements were carried out at 300°C and 0.5 kbar, in pure water and a 0.01 mol · dm−3 Ca(OH)2 solution. Starting materials were microcrystalline γ−UO3 and poorly crystallised CaU1.6O5.8·2.5H2O. As demonstrated by the authors, the starting materi-als changed with time during contact with the aqueous phase. The UO3 samples recrystal-lised markedly, although microprobe analysis indicated a composition of pure UO3, the X−ray diffraction pattern was different from that of the initial material. CaU1.6O5.8·2.5H2O evolved into Ca3U4.5O16.5 of good crystallinity. For all the experiments, equilibrium, post recrystallisation solubilities span a narrow range between 10−5.9 and 10−6.3 mol · dm−3. So-lutions were not filtered prior to the analysis. There was essentially no difference between experiments in water (equilibrium pH = 5.7−5.8) and 0.01 mol · dm−3 Ca(OH)2 (equilib-rium pH = 9.4). Because of the lack of thermodynamic information on the uranate phases involved in this study, the authors did not attempt to model their results. In the case of UO3, the lack of pH dependence of the results contrasted with the changes that could be calculated using the geochemical model EQ3NR with the NEA database. The authors ob-tained a better fit of their results by including in their calculations the stability constants for from [72NIK/SER]. However, in [92GRE/FUG], the results of these latter authors were extensively analysed and were not credited.
2 2UO (OH) (aq)
[97WRU/PAL] The formation constant of the Am(III) carbonate complex, Am , from Am+
3CO 3+ and

Discussion of selected references 567
23CO − has been investigated in 0.1 m NaClO4/NaHCO3 by LIPAS at 25, 50 and 75°C. At a
constant Am concentration of 1.0·10−6 mol · kg−1, the pH was varied in the range 4.0 to 6.5 and log10[ CO2
3− ] in the range − 8.2 to − 4.8. In this paper, an extended conference abstract,
the spectroscopic measurements and LIPAS apparatus are well described and a series of spectra are shown in a Figure, but no details are reported on the pH measurements at ele-vated temperature and the calculation of log10[ CO2
3− ]. From the evaluated formation con-
stants at I = 0.1 mol · kg−1 and different temperatures, = (6.26 ± 0.12) at (25 ± 0.5)°C, (6.68 ± 0.12) at (50 ± 2)°C, and (7.54 ± 0.43) at (75 ± 3)°C, the authors esti-mated an enthalpy of reaction ( ) of
10 1log b
r m3+ 2 +
3 3Am +CO mCOA− H∆ (0.1 m NaClO4) = (37 ± 11) kJ · mol−1 by applying the Van’t Hoff relation.
+3CO
10 1log b
1,1
22
10 2,2*g b
1
10*g b
10*log
210 2,2
* *log Z 1
I+
b b A− ⋅ ∆ 0.3 I
−
2,2* οb
10*log 2
42 3(CO )
The formation constant at 25°C is considered together with other literature values for the selection of ( , 298.15 K). In contrast to the series of spectra re-corded at 25°C, those at 50 and 75°C do not show an isosbestic point. As this is neither discussed nor explained, the reported values at 50 and 75°C, and enthalpy of re-action are not selected in the present review.
10 1log οb Am
Laser−Induced Photoacoustic Spectroscopy (LIPAS), is used to study the hy-drolysis of UO in 0.1 m NaClO+
4 at (25 ± 0.5)°C between pH = 3.0 and 5.6. Two ura-nium concentrations are used, 10−6 and 10−4 M. In the first case species 0:1 and 1:1 (UO2OH+) are expected to be present , but the LIPAS spectra do not show any change with increasing pH. At higher U(VI) concentrations a clear increase in absorption is measured. A fit with three species 0:1, 1:1 (with fixed lo = − 5.8) and 2:2 ( ) gives = − (5.45 ± 0.05). This value is not very sensitive to the choice of
. Extrapolation to zero ionic strength according to the Davies equation written as:
22 2 2(UO ) (OH) +
lo1,b
12
12
10 2,2log = I
ο
with A = 0.511, I = 0.1, ∆Z2 = − 2, gives, according to the authors, = − (5.56 ± 0.05), which agrees with the selected value of
10 2,2*log οb
10log = − (5.62 ± 0.04) in [92GRE/FUG]. However, the authors seem to have made a calculation error. Using the Davies equation given by [97WRU/PAL] this review calculates = − (5.23 ± 0.05) and according to the SIT, we obtain practically the same value,
= − (5.24 ± 0.05), which is considerably different from the value selected by [92GRE/FUG].
10 2,2*g οblo
2,οb
[98AAS/MOU] Aqueous U(VI) ternary complexes including F and CO3 ligands, 2 2
2 3UO (CO ) F p qp q
− −
3
, p = 1 and q = 1, 2 and 3, have been the subject of two studies, one dealing with the eluci-dation of structure for q = 2 and 3, as well as for UO − , [97SZA/AAS], [95BAN/GLA] and the present work dealing with thermodynamic data. Potentiometric

Discussion of selected references 568
titrations of U(VI) solutions in 1 M NaClO4 were made using a quinhydrone and a specific fluoride electrode against a Ag/AgCl electrode, to measure [F−] and log10[H+] (t = (25.00 ± 0.05)°C). The
2was maintained constant with a purified N
COp 2−CO2 gas mix-
ture. U and F total concentrations were fixed ([U] = (2.3 to 5.7)·10−3 M and [F−] = (8 to 40)·10−3 M) and the carbonate concentration was varied by adding HClO4 (pH varied from 3.7 to 5.8) to the test solutions having fixed amounts of NaHCO3.
lo
CO
O (g) +
O (g) +
+ CO
log
The data were processed to give the average number of carbonato ligands, n , bound to the UO2 core versus 10 3g [HCO ]− taking into account the equilibria:
2+ +2 2 2 2 3UO + H O(l) + (g) + F UO (CO ) F + 2 H−
p qp p q p+
2 2 3C H O(l) HCO + H− 1aK
2 +2 2 3C H O(l) CO + 2 H−
1aK2aK
with log10 1aK (1M NaClO4) = − (7.625 ± 0.01) (measured in this work) and
2aK (1 M NaClO4) = − 9.57 from [58FRY/NIL]. The value of n can reach 1.5 at log10[ ] = − 1.5 when both U and F concentrations are the highest. q values are re-fined with LETAGROP program.
3−HCO
The formation of these complexes was described by: 2+ 2 2 22 3 2 3UO + F UO (CO ) F − − − −p q
p qp q
because no polynuclear complexes ( n greater than 1) were indicated by NMR (19F) or the LETAGROP program. The contribution of the species, UO2(CO3)2F3−, is estimated to be less than 4%.
The values of the formation constants are lo = (12.56 ± 0.05), = (14.86 ± 0.08), = (16.77 ± 0.06) (uncertainty 3σ). These results indicate that these complexes have a pentagonal bipyramidal geometry.
10 1,1,1g b 10 1,1,2log b10 1,1,3log b
This review has calculated the value of the equilibrium constant at zero ionic strength using the SIT and assuming 2 3(UO CO F , Na )− +ε = (0.00 ± 0.05),
22 3 2(UO CO F , Na )− +ε = − (0.02 ± 0.09) and 3
2 3 3(UO CO F , Na )− +ε = − (0.25 ± 0.05) kg · mol−1. The values are: 10 1,1,1
οb = (13.75 ± 0.09), = (15.57 ± 0.14) and = (16.38 ± 0.11).
10 1,1,2log οb10 1,1,3log οb
[98ALM/NOV] This paper is discussed together with [95NOV/ROB] and [97NOV/ALM].
The two papers report reliable and accurate solubility data for the potassium di-oxoneptunium(V) carbonates, KNpO2CO3(s) and K3NpO2(CO3)2(s), which are used in the present review to evaluate the solubility constants at I = 0 and 25°C. The authors also pro-posed a comprehensive set of ion interaction Pitzer parameters for Np(V) carbonate com-plexes. All solubility experiments were performed batch-wise at room temperature,

Discussion of selected references 569
(22 ± 1)°C. The measurements were conducted over periods of 150 − 200 days. The time was sufficient to ensure a steady-state equilibrium, when the initial solid was transformed into a more stable, less soluble one. The solids formed under the experimental conditions (cf. Table A-33) were identified and characterised by X−ray powder diffraction.
In the first paper [97NOV/ALM], the solubility of Np(V) was determined in 0.01 − 4.8 M K2CO3 solutions, with either freshly precipitated NpO2OH(am) or KNpO2CO3·xH2O(s) as initial solids. For K2CO3 solutions up to 0.4 M, a KNpO2CO3(s) solid was formed, which gave X−ray powder diffraction patterns comparable with those of the KNpO2CO3·xH2O(s) solid reported by Keenan and Kruse [64KEE/KRU]. At higher K2CO3 concentrations, two modifications of K3NpO2(CO3)2·xH2O(s) were formed, the phases A and B described in the earlier papers of Volkov et al. [74VOL/KAP2] and Visya-shcheva et al. [74VIS/VOL]. Phase B was formed over a broad range of K2CO3 concentra-tions, whereas phase A only formed at the highest concentration (4.8 M K2CO3) and unex-pectedly in one solution of relatively low concentration (0.25 M K2CO3). According to [74VOL/KAP2] phase A is preferentially formed at K2CO3 concentrations above 2 molal. In contrast to phase A, where the crystal lattice parameters change with hydration in a moist atmosphere or when wetted and with dehydration by heating up to 400°C, those of form B remain unaffected [74VOL/KAP2]. The water content in KNpO2CO3·xH2O(s) and K3NpO2(CO3)2·xH2O(s), phase B, was estimated in [74VIS/VOL] to be x ≤ 2 and x ≈ 1.6, respectively. As the number of hydration water molecules is not exactly known, they are disregarded in the calculations of Novak et al. and also in the present review.
In the second paper of this group, [98ALM/NOV], the solubility of KNpO2CO3(s) was determined in KCl−K2CO3 mixtures with mKCl = 0.003 − 3.2 mol · kg−1 and mK2CO3
= 0.001, 0.01, and 0.1 mol · kg−1. In these experiments the initial KNpO2CO3(s) remained the stable solid over the whole period of 160 days. In two additional experiments at higher carbonate concentrations (1 m KCl + 1 m K2CO3), the initial solids used, KNpO2CO3(s) and NpO2OH(am), were both transformed into K3NpO2(CO3)2(s) and the same steady state Np(V) concentration was obtained. The solubility was also investigated in quaternary Na−K−Cl−CO3 solutions of high Na+ and low K+ concentrations (5 m NaCl + 0.1 m KCl + 3.5·10−4 to 1.0 m Na2CO3). In these solutions, the solubility was either controlled by KNpO2CO3(s) (at
3< 0.01 mol · kg2COm −
−1) or by Na3NpO2(CO3)2(s) (at 3
m > 0.01 mol · kg
2CO −
−1). The X−ray pattern of a solid formed at the highest ionic strength could not be identified by comparison with literature data.

Discussion of selected references 570
Table A-33: Np(V) carbonate solids observed in [97NOV/ALM], [98ALM/NOV].
Solution initial solid final solid
0.01 − 0.1 M K2CO3 NpO2OH(am) KNpO2CO3(s)
0.03 − 0.4 M K2CO3 KNpO2CO3(s) KNpO2CO3(s)
0.5 − 2.0 M K2CO3 NpO2OH(am) K3NpO2(CO3)2(s) B
0.25 M K2CO3 NpO2OH(am) K3NpO2(CO3)2(s) A
4.8 M K2CO3 NpO2OH(am) K3NpO2(CO3)2(s) A
4.8 M K2CO3 KNpO2CO3(s) K3NpO2(CO3)2(s) A
(0.003 − 3.2) m KCl + (0.001 − 0.1) m K2CO3 KNpO2CO3(s) KNpO2CO3(s)
1 m KCl + 1 m K2CO3 NpO2OH(am) K3NpO2(CO3)2(s)
1 m KCl + 1 m K2CO3 KNpO2CO3(s) K3NpO2(CO3)2(s)
5 m NaCl + 0.1 m KCl + (3.5.10−4 − 0.01) m Na2CO3 KNpO2CO3(s) KNpO2CO3(s)
5 m NaCl + 0.1 m KCl + (0.01 − 0.22) m Na2CO3 Na3NpO2(CO3)2(s) Na3NpO2(CO3)2(s)
5 m NaCl + 0.1 m KCl + 1.0 m Na2CO3 Na3NpO2(CO3)2(s) unidentified
• Thermodynamic modelling.
Adopting the parameter set of Harvie et al. [84HAR/MOL] for the seawater salt system, Novak et al. [97NOV/ALM] extended the Pitzer parameters reported in [95FAN/NEC] for the system Np(V)−Na−OH−CO3−Cl−H2O (25°C) to K+ containing so-lutions and calculated binary Pitzer parameters β(0), β(1), β(2), and Cφ for the interactions between K+ and 5
2 3 3NpO (CO ) − . Since the parameter set of Fanghänel et al. [95FAN/NEC] was designed for actinide and carbonate trace concentrations, it can be inaccurate at
> 0.1 mol · kg23COm −
−1. Modelling the solubility data of Ueno and Saito [75UEN/SAI] in 0.05 − 1.6 M Na2CO3 and their own experimental data at high K2CO3 concentrations, No-vak et al. [97NOV/ALM] evaluated in addition a ternary parameter, θ, accounting for an-ion−anion interactions between 5
2 3 3NpO (CO ) − and CO23
− . Based on the Np(V) carbonate complexation constants at I = 0 from [95FAN/NEC], the following solubility constants of the potassium dioxoneptunium(V) carbonates were fitted simultaneously from the solubil-ity data in K2CO3 solution: lo 10 ,0g sK ο = − (13.6 ± 0.1) for KNpO2CO3(s) and 10 ,0log sK ο = − (15.9 ± 0.1) for K3NpO2(CO3)2(s). The combined set of Pitzer parameters and equilib-rium constants at I = 0 (solubility constants of solid Np(V) hydroxide and carbonates, and formation constants of Np(V) hydroxide and carbonate complexes) from [95FAN/NEC], [97NOV/ALM], was then applied in [98ALM/NOV] to calculate the Np(V) solubilities in more complex systems. For all K−Cl−CO3 and Na−K−Cl−CO3 solutions, and even for three synthetic Na−Mg−K−Cl brines of various compositions and I = 0.86, 3.0, and 7.8,

Discussion of selected references 571
the model calculations were, within the uncertainty range, consistent with the experimental solubilities. Both the stable carbonate solid and the total Np(V) concentration were well predicted.
For reasons of consistency with the NEA−TDB system, the experimental data re-ported in the two papers are re-evaluated in the present review on the basis of the SIT. The small difference in temperature, experimental data at (22 ± 1)°C compared to the standard state of 25°C, is considered to be within the range of other uncertainties. As there are no solubility data at low carbonate concentrations, with the uncomplexed +
2NpO ion as the predominant aqueous species, the solubility constants, 10 ,0log sK ο , cannot be evaluated di-rectly. In K2CO3 solutions above 0.17 mol · kg−1, the limiting carbonate complex,
52 3 3NpO (CO ) − , represents more than 95% of the total Np(V) concentration, and the disso-
lution reactions can be written as:
(A.91) 22 3 3 2 3 3KNpO CO (s) + 2 CO NpO (CO ) + K− 5 +−
+−and (A.92) 2 5
3 2 3 2 3 2 3 3K NpO (CO ) (s) + CO NpO (CO ) + 3 K−
with the solubility constants, 10 ,3log sK , given by the sums of ( 10 ,0log sK + ). In Figure A-7 and Figure A-8, the SIT extrapolation is applied to the experimental data in K
10 3log b
2CO3 solutions ≥ 0.17 mol · kg−1. In addition, Figure A-7 includes the solubility in 0.1 m K2CO3 + 3.2 m KCl, where the total Np(V) concentration is also practically equal to that of
52 3 3NpO (CO ) − . (Data at
3m = 0.1 mol · kg2−CO
−1 and lower ionic strengths are not included in the SIT extrapolation, because other Np(V) species may contribute considerably to the total Np(V) concentration). The following results are obtained by extrapolation to I = 0:
Figure A-7: 10 ,3log sK ο ((A.91), 298.15 K) = − (7.65 ± 0.11), ∆ε = − (0.25 ± 0.06) kg · mol−1 and
hence = − (0.21 ± 0.07) kg · mol5 +2 3 3pO (CO ) , K )−(Nε −1
Figure A-8: 10 ,3log sK ο ((A.92), 298.15 K) = − (9.96 ± 0.06), ∆ε = − (0.22 ± 0.02) kg · mol−1 and
hence = − (0.23 ± 0.02) kg · mol5 +2 3 3pO (CO ) , K )−(Nε −1.
The two values of calculated with auxiliary SIT coeffi-cients from [2001LEM/FUG] agree within the uncertainty range. This is noteworthy, be-cause they are derived from data in different media (predominantly a KCl medium and pure K
5 +2 3 3(NpO (CO ) , K )−ε
2CO3 solutions, respectively).
Combining 10 ,3log sK ο ((A.91), 298.15 K) and lo 10 ,3g sK ο ((A.92), 298.15 K) with = (5.50 ± 0.15) selected in the previous NEA review [2001LEM/FUG], we ob-
tain: 10 3log οb
10 ,0log sK ο ((A.93), 298.15 K) = − (13.15 ± 0.19)
for the reaction: + +2 3 2 3KNpO CO (s) K + NpO + CO 2− (A.93)
and 10 ,0log sK ο ((A.94), 298.15 K) = − (15.46 ± 0.16)

Discussion of selected references 572
for the reaction: + +3 2 3 2 2 3K NpO (CO ) (s) 3K + NpO + 2CO 2− (A.94)
The derived constants, 10 ,0log sK ο , differ by 0.4 to 0.5 logarithmic units from the values given in [97NOV/ALM]. These discrepancies are mainly due to the different ion interaction approaches (SIT or Pitzer equations) used to calculate activity coefficients for the highly charged complex, 5
2 3 3NpO (CO ) − . In particular, the Pitzer parameters β(2) and θ included in the model of [97NOV/ALM], [98ALM/NOV], which are of course correlated with the simultaneously fitted constants at I = 0, cause deviations from the SIT extrapola-tion to I = 0.
Figure A-7: Application of the SIT to Np(V) solubility data in K2CO3 solutions ≥ 0.17 mol · kg−1, reaction: . 2 5
2 3 3 2 3 3KNpO (CO )(s) + 2 CO NpO (CO ) + K− − +
2 52 3 3 2 3 3KNpO CO (s) + 2CO NpO (CO ) + K− − +
-8.5
-8.0
-7.5
-7.0
-6.5
-6.0
-5.5
0 0.5 1 1.5 2 2.5 3 3.5 4
0.17 - 0.41 m K2CO3
[98 ALM/NOV] 0.10 m K2CO3+ 3.2 M KCl
[97NOV/ALM]
0.10 m K2CO3 + 0.03 m KCl 0.10 m K2CO3 + 0.32 m KCl
[98ALM/NOV][74VIS/VOL] 0.1 m K2CO3
mK (mol·kg–1)
log 1
0Ks,3
– 1
8D

Discussion of selected references 573
+ .
Figure A-8: Application of the SIT to Np(V) solubility data in K2CO3 solutions ≥ 0.17 mol.kg−1, reaction: K 2 5
3 2 3 2 3 2 3 3NpO (CO ) (s) + CO NpO (CO ) + 3K− −
[74VIS/VOL]
open points: filled points: phase (B)
phase (A)
[97NOV/ALM]
5 4 3 2 1 -11.0
0
3 2
2 52 3 3 2 3 3( )K NpO CO (s) + CO NpO (CO ) + 3K− − +
-10.0 log 1
0Ks,3
– 2
4D
mK (mol·kg–1)
-8.0
-8.5
-9.0
-9.5
-10.5

Discussion of selected references 574
[98APE/KOR] The vapour pressure of water over saturated aqueous solutions of dioxouranium(VI) nitrate hexahydrate (purity > 99 %) as a function of temperature (K) follows the relationship:
1ln( / kPa) = (224.504 35.298) (15151.1 1573.0) (30.345 5.269) lnp T −± − ± ⋅ − ± ⋅ T
in the range 278 to 323 K. The derived water activity and molar enthalpy of vaporisation of water at 298.15 K are (0.698 ± 0.020) and (50.75 ± 0.70) kJ · mol−1, where the uncer-tainties are selected by this review. The water activity is lower than the value of 0.7325 selected for the CODATA Key Values [89COX/WAG] from the assessment by Goldberg [79GOL] of the literature data (principally from Robinson and Lim [51ROB/LIM] in this concentration range).
With the temperature variation of the solubility of dioxouranium(VI) nitrate hexa-hydrate from Broul et al. [81BRO/NYV] and the variation of osmotic coefficient with con-centration from Robinson and Stokes [59ROB/STO], the authors finally derived the en-thalpy of dissolution of dioxouranium(VI) nitrate hexahydrate in saturated solutions. Their calculated value at 298.15 K is: sol mH ο∆ (298.15 K, msat = 3.323 mol · kg−1) = 43.4 kJ · mol−1. The enthalpy of dilution to infinite dilution from msat, using data from [92GRE/FUG], is then − 23.6 kJ · mol−1, with unknown uncertainty.
The authors suggest there is a large variation in the reported solubilities of di-oxouranium(VI) nitrate hexahydrate in water at 298.15 K, but this results from a misread-ing of the paper of Robinson and Lim [51ROB/LIM]. These authors did indeed make measurements on solutions up to 5.511 molal, but they make no statement that these are below the saturation limit, as implied by [98APE/KOR]. In fact, very considerable super-saturation of nitrate solutions can occur in isopiestic experiments of the type undertaken by Robinson and Lim [51ROB/LIM] (cf. for example the studies on Eu(NO3)3 solutions up to 6.3858 molal by Rard and Spedding [82RAR/SPE], although the saturation limit at 298.15 K is 4.2732 molal [84RAR]).
The saturation molality at 298.15 K used by the authors, 3.323 mol · kg−1, is no-ticeably higher than that selected by [89COX/WAG], 3.24 mol · kg−1. However, the latter is retained as the selected value, as detailed in the entry for [95COH/LOR] in Appendix A. The values of msat and the activity of water are of some importance since they form the basis of the derivation of ( ) and by comparison, the entropies of other actinide ions.
mS ο 2+2UO
[98BAL/HEA] Cyclic and alternating current voltametry were employed with in situ spectrophotometric measurements made through an optically transparent electrode in the study of Bu4N+ salts of [TcVINX4] and [TcVOX4] complexes, where X = Cl and Br, in anhydrous dichloro-methane/Bu4NBF6 solutions. Half−wave potentials are listed (0.5 M Bu4NBF6 at 298.15 K) versus SCE (referenced to [Fe(C5H5)2]+/0): [TcOCl4] +1.84 V (VI/V), − 0.52 V (V/IV);

Discussion of selected references 575
[TcOBr4] + 1.73 V (VI/V), − 0.39 V (V/IV); [TcNCl4] + 0.21 V (VI/V); [TcNBr4] + 0.32 V (VI/V). Excess halide affected neither the E½ values nor the visible reflectance signal indicating that these species do not change their five coordinate symmetry. The reversibil-ity of the VI/V couple at 298.15 K allowed the spectral characteristics of the nitrido com-plexes to be tabulated. Reflectance spectra of the equivalent solid state complexes were also measured and tabulated. Geometries of the Tc(V) and Tc(VI) species were calculated assuming C4v symmetry and compared with experimentally derived values where available for the Tc(V) ions. Good correspondence was found. Reduction is manifested by a shorten-ing of the Tc−X bond and a slight expansion of the N−Tc−X and O−Tc−X angles, whereas the Tc−N and Tc−O bonds are unaffected.
[98BAN/SAL] This conference paper gives preliminary data on the thermal properties of Rb2U4O11(cr) from 366 to 735 K. The final results and processing of the data to derive the heat capacity of this phase are described in the later full publication [2001BAN/PRA].
[98BAR/RUB] U(VI) aqueous/acetone/HClO4, CF3SO3H, HBF4 solutions are prepared from UO3·xH2O(s) and investigated by proton NMR in the temperature range t = − 95 to 25°C. The use of a mixed acetone/water solvent is necessary in order to obtain separate peaks for coordinated and free solvent water (the rate of exchange is fast at room temperature). The peak inte-grals for bound and free water are used to determine the coordination number for water and the line broadening to determine the rate of exchange and the activation energy for the exchange reaction. NMR spectra obtained from solutions where the ratios M(VI):H2O:acetone were varied all gave the coordination number five, within the experi-mental uncertainty of ± 5%. The authors used 35Cl NMR to ascertain that no inner-sphere complexes with perchlorate were formed. Other counter ions such as CF result in ion association and a lower number of coordinated water molecules. A similar study using Np(VI) gave concordant results, while the Pu(VI) system could not be studied due to extensive line broadening from the paramagnetic Pu(VI). However, there is no chemical reason to expect a different coordination number for Pu(VI). The experimental data have been obtained in a mixed solvent, which is unlikely to affect the stoichiometry and geometry of the MO complexes. However, the kinetic parameters deduced cannot directly be transferred to pure water. For Am, the number of coordinated water molecules is still unknown.
3 3 4SO and BF− −
2+2 2(OH )5
[98BEN/FAT] The aim of this work is to establish the potential of the 4TcO− /Tc(IV) couple in HCl/NaCl media (I = 1.00 to 1.66 M) under a N2 atmosphere in a cell in which high Fe3+/Fe2+ con-centrations at variable ratios are maintained (i.e., 0.001 − 0.12, cf. 10−11 to 10−4 M Tc). The

Discussion of selected references 576
measured potentials are reported relative to a saturated calomel electrode with a half-cell potential of 0.242 V (cf. 0.2412 V given in [99RAR/RAN]). E° for the Fe(III)/Fe(II) cou-ple is set at 0.770V (E’° = 0.700V in 1.0 M HCl). 4TcO− is determined by extraction (TPACl in chloroform) under the assumptions that the extraction process (two minutes) is much faster than the oxidation of Tc(IV) (several hours) during extraction and only the Tc(VII) and Tc(IV) states exist in solution. The general redox reaction, in which several Tc(IV) species are considered, is defined as:
l m nn
197 m
Tc
3 24 + P− −
3 24 + P− −
+ 2+ ( 4)4 2 8TcO + H + Cl + 3 Fe TcH O C + (4 )H O(l) + 3Fem p pm n p− − − − +
+ − − 3+2
from which
E = + 'iE ο +4
10 10[TcO ]0.0197 log + 0.0 log [H ]
[Tc(IV)aq]
−
⋅
'E
.
οThe authors report values of i in 1 M HCl (ionic strengths 1.31 − 1.66) that range from 0.602 to 0.844 V/NHE compared to calculated values for the individual groups of Tc(IV) containing species, viz., 0.584 V/NHE for Tc(IV) as TcO(OH)2(aq); 0.645 V/NHE for Tc(IV) in the form of mixed oxide/chloride complexes, ; and 0.676 V/NHE for Tc(IV) as chloro complexes. Hence the potential of the
2TcOCl nn
−
4TcO− /Tc(IV) couple is highly dependent on the speciation of Tc(IV) in acidic chloride solutions, e.g., in 1 M HCl with an additional 0.3 M Cl−, the formal potential of the 4O− /Tc(IV) couple is higher than (0.844 ± 0.006) V/NHE.
[98BUD/TAN] Pu(V) behaviour in basic media is controversial. This paper gives data on the stability of Pu(V) in NaOH solutions (mainly at 40°C) prepared with NH4PuCO3(cr). At 8 M NaOH and above, Pu(V) is stable for at least one week. Below 8 M NaOH, disproportionation of Pu(V) into Pu(IV) (of which a large amount precipitates as hydroxide) and Pu(VI) is achieved within five hours. Concentrations of the Pu species in each oxidation state can be measured, or estimated, to calculate the equilibrium constant, Kdis, for the reaction:
2 4 2 2 52 PuO (OH) + 2 H O(l) PuO (OH) u(OH) + 3 OH − −
−
or
2 4 2 2 42 PuO (OH) + 2H O(l) PuO (OH) u(OH) (aq) + 4 OH
Values of Kdis are given in the paper. Pu(VI) and Pu(V) concentrations are meas-ured by spectrophotometry, while [Pu(IV)] is estimated from the solubility of Pu(IV) as a function of the NaOH concentration [96PER/KRY] (see Appendix A). Variation of log10Kdis is reported to be a linear function of sodium hydroxide concentration. Recombina-tion of Pu(OH)4 and Pu(VI) in 1 to 10 M NaOH gives an equilibrium constant Krep that is very different from the one calculated from the reverse reaction. The system is apparently not in equilibrium and therefore, no reliable thermodynamic constant can be extracted.

Discussion of selected references 577
[98CAP/VIT] This paper gives a determination of 10 ,0log sK ο for Pu(IV) following a path which is inde-pendent of the hydrolysis of Pu4+. The authors use spectrophotometric and potentiometric measurements to determine indirectly the [Pu4+] in equilibrium with Pu(IV) hydroxide. The solutions studied have the composition, 0.1 M + (x − 0.1) M 4HClO 4NaClO
4 (am), x = 0.1,
0.5, 1, 2 and 3, and contain assumed as the solid phase. All free ion concentrations except for [Pu
+ 2+2 2PuO , Pu3+ nd Pu4+ with Pu(OH)PuO , a
4+] are directly measured by spec-troscopy and [Pu4+] is calculated by:
3+ 2+4+ ' '2
6 / 5 4 / 3+2
FR
[Pu ] [PuO ][Pu ] = exp ( ( ) ( ))
[PuO ] T E I E Iο ο⋅ −
)
I ( )Iwhere E 'o6 / 5 ( and E 'o
4 / 3 are the formal potentials of the couples at the ionic strength I = x. These potentials are known for the conditions of the experiments from earlier meas-urements [95CAP/VIT]. The solubility product is then calculated from the measured con-centrations of Pu3+, + 2+
2 2 PuO aPu nd log10[O , H+]. The [Pu4+] always remains lower than 10−4 M. The SIT is used in all calculations. The lo 10 ,0g sK ο value obtained is − (58.3 ± 0.5) which agrees well with values obtained by solubility measurements. The authors have also determined a value for the interaction coefficient, 4+
4(Pu , ClO )−ε = (0.85 ± 0.20) kg · mol−1 in good agreement with that given in a previous paper, = (0.82 ± 0.07) kg · mol
4+4(Pu , ClO )−ε
−1 [95CAP/VIT]. To deduce these values the authors used an analogy of 3+ , ClO4(Pu )−ε = 3+(Nd , 4 ClO )−ε = (0.49 ± 0.03) kg · mol−1.
[98CAS/DIX] (CH3)4NTcO2F4 and TcO2F3·CH3CN were characterised by 19F, 17O, and 99Tc NMR. The study of the first compound dissolved in CH3CN established that the oxygen atoms are cis to one another. In HF the caesium salt showed rapid exchange of the trans fluoride ligands even at − 80°C. From the 19F NMR spectrum of TcO2F3·CH3CN, it is assumed that the nitrogen bound the acetonotrile molecule lies trans to one oxygen, with the oxygen atoms again being in a cis configuration. The crystal structure of LiTcO2F4 was recorded and shown to exhibit a distorted octahedral symmetry consistent with the NMR assignment of ligand geometry. Raman spectra were also recorded for Li+, Cs+ and +
3 4 2 4(CH ) N TcO F−⋅
and TcO2F3·CH3CN in CH3CN. Density functional theory calculations were used to predict that the cis dioxo isomers of 2 4TcO F− and TcO2F3·CH3CN, as described above, are the minimum energy structures.
[98CAS/PAB] The solubility of a 20−50 µm powder of UO2(cr) (UO2.01 in the bulk) is measured in 8·10−3 M NaClO4 and 1 M NaCl solutions under more or less reducing conditions and over a large pH range from 1.0 to 9.5 with an uncertainty of ± 0.1. Reducing conditions are maintained using highly purified H2 bubbling in the presence of Pd black, and monitored by pe values in the range from 3 to − 3, (t = 25°C). The uranium concentrations, CU, are

Discussion of selected references 578
measured from filtered solutions using a filter with a cut-off at 0.22 µm. In order to model the results of the log10CU versus pH data, all the U(IV) and U(VI) oxo-hydroxo and chlo-ride complexes and the U(IV) and U(VI) oxides, UO2, U3O7, U4O9, UO2OH and UO3 should be used. The selected formation constants and solubility products are those of [92GRE/FUG] using the SIT to get the values at a given ionic strength. The equilibrium constant, log10Ks,4, of the solubility reaction:
2 2UO (cr) + 2H O(l) U(OH)4 (aq)
is used as a fitting parameter. In perchlorate solutions the best fit is for log10Ks,4 = − 7.3. In sodium chloride medium this value also gives a good fit. The value selected by [92GRE/FUG] is 10 ,4log ο
sK = − (9.5 ± 1.0). To explain the difference the authors took into account the variation of the solubility with the molar surface area of the dioxide which is supposed to control the solubility. Taking the value of 10 4log οb selected by [92GRE/FUG] gives for:
+ 4+2 2UO (cr) + 4 H U + 2 H O(l)
the solubility constant, lo 10 ,0*g sK ο = − (2.3 ± 0.2). If the value, 10 ,0
*log sK ο (UO2, cr) = − (4.86 ± 0.36), given by [92GRE/FUG] is corrected for a molar surface area of 9000 m2 · mol−1, measured for a microcrystalline UO2, a value of − 2.7 is obtained, close to − 2.3. It thus seems that the data selected by [92GRE/FUG] allow modelling of solubility data for amorphous phases if the molar surface area is known. This is interesting, however, such a modelling would still require information on the time dependence of the re-crystallisation of the amorphous phases. This is outside the scope of the present review.
This review has revised the values selected by [92GRE/FUG] and has selected 10 ,4log sK ο (UO2, am) = − (8.5 ± 1.0) and 10 ,0
*log sK ο (UO2, am) = (1.5 ± 1.0).
Casas et al. also give data on the solubility of different uraninite minerals, (U4+, U6+, M)O2+x, in a granitic groundwater for pH between 5.5 and 8.5, and under a H2− CO2 (1%) atmosphere, which are not considered in this review because no thermody-namic constants were derived.
[98CHA/DON] This paper is reviewed together with [99CHA/DON].
[98CHA/TRI] In order to select the best database to account for the measured concentrations of the acti-nides, U and Pu, in Drigg water, the authors compare three databases, CHEMVAL Version 6 Database [96FAL/REA], BNFL internal database and HATCHES NEA Version 91, the 1HATCHES NEA Version 9, Harwell/Nirex Thermodynamic Database for Chemical Equilibrium Studies, pub-lished to Nuclear Energy Agency, OECD as NEA Version 9, November 1996.

Discussion of selected references 579
latter including the thermodynamic data selected in [92GRE/FUG] for U and in [95SIL/BID] for Am. They retain this database as the more appropriate because it includes all the ingredients of Drigg water.
Tests of U(VI) solubility (over-saturation and under-saturation) in Drigg water, pH = 8.2, are in agreement with modelling using either α − UO2(OH)2 ( 10 ,0log sK = 4.94) or UO3·2H2O(cr) ( 10 ,0log sK = 4.82) as solubility limiting phases and all other selected equilibrium constants from [92GRE/FUG]. The experiments consisted of stepwise addition of a dioxouranium(VI) solution to Drigg water followed by addition of NaOH to bring the solution back to the initial pH value. The uranium concentration was measured after re-moval of colloids.
The authors mention that the NEA data do not fit the U(IV) solubility data given by [95YAJ/KAW] in contrast to the CHEMVAL database that gives a better fit.
It is difficult to draw any conclusions from these experiments. However, the re-sults do not contradict the data selected in [92GRE/FUG].
The solubility of a Pu(OH)4(s) precipitate in cementitous water (pH = 9 to 12.5) is in agreement with modelling using 10 4
*log οb = − 10.54 ( lo 10 4g οb = 45.46, HATCHES NEA Version 9) and 10 ,0log sK ο
,0
= − 55.66 giving log10[Pu(OH)4(aq)] = − (10.2 ± 0.8) esti-mated from a figure). The sK ο value differs from the value selected by [2001LEM/FUG],
10 ,0log sK ο = − (58 ± 1), and other values given by [99NEC/KIM] and [2001NEC/KIM].
As there are few experimental data in the study of Chandratillake et al. and a lack of experimental details, this review does not take these Pu data into account.
[98CLA/CON] The structure of [Pu(CO3)5]6− has been determined both in the solid state and in solution. The first study was performed by using single crystal X−ray diffraction of the solid (Na6Pu(CO3)5)2Na2CO3 · 33H2O. This is a precise structure determination from which ac-curate bond distances and angles could be deduced. The experimental EXAFS data extend to 12 Å−1 which allows the identification of three shells around Pu, corresponding to 10.2 Pu−O distances in the first coordination sphere, 5.0 Pu−C distances from the coordinated carbonate and 5.0 Pu−O distances from the non-coordinated carbonate oxygen, in excellent agreement with the X−ray structure. The electronic absorption spectrum of the solid agreed very well with the absorption spectrum in 2.5 M carbonate solution; a strong indication that the complexes are identical in both phases. The authors point out an interesting struc-tural similarity between [Pu(CO3)5]6− and [PuO2(CO3)3]4− where the former is obtained by replacing the “yl”− oxygen in the latter by a chelating carbonate groups. From this study both the stoichiometry and structure of the limiting carbonate complex of Pu(IV) are estab-lished definitively.

Discussion of selected references 580
[98CON/ALM] EXAFS fine structure spectra of aqueous ions Pu(III to VI) (Pu3+, Pu4+, in 1 M HClO
2+2PuO
4 and at pH = 6) are given. The edge energy (L+2PuO III) variation is linear with the
formal oxidation state of Pu. This paper gives literature references for U and Np EXAFS spectra.
[98DAI/BUR] This paper reports the determination of the enthalpy of dimerisation of the dioxoura-nium(VI) cation according to the reaction:
2+ 2+ +2 2 2 2 22 UO + 2 H O(l) (UO ) (OH) + 2H
in a solution 8·10−2 M in U(VI), 1 M CF3SO3H, the pH being adjusted with (Bu)4NOH. The UV−Vis spectroscopic data (15 spectra in the range 390−470 nm) are processed using FA−SM methodology1. The pH−meter is equipped with a temperature compensation capa-bility. As temperature increases (8 to 75°C) pH decreases slowly (3.20 to 2.95). Calibra-tion of pH-meter is made at room temperature at pH = 3.16 (t around 25 °C). Two species are detected by FA−SM and confirmed by an isosbestic point (420 nm). The spectra of
and are identified according to known UV−Vis characteristics, ac-cording to [93MEI/KAT], [95ELI/BID], [96MEI/SCH]. K values are computed as a func-tion of temperature. The given value is
2+2UO 2+
2 2 2(UO ) (OH)
r mH ο∆ = 45.5 kJ · mol−1. All the activity coeffi-cients are supposed to remain constant. The authors do not calculate or estimate the confi-dence level of the proposed enthalpy value which agrees with the [94RIZ/RAO] value and compares with older data [57HEA/WHI], [62BAE/MEY].
[98DAV/FOU] EXAFS spectra of 1 M HCl solutions of M3+ = U, Np, Pu, Am, Cf (U(III) obtained by Zn reduction of U(IV)) show no inner-sphere complexes. The M−O bond distances are calcu-lated within an uncertainty of (± 0.01) Å and the coordination numbers are given between 9 and 10. These data are used to discuss the covalent bonding in aqueous M3+ ions using a formula which gives ionic Gibbs hydration energies of gaseous M3+ cations, with on the absolute scale. This point is particularly relevant for updating the thermodynamic data for U
hyd mG∆
3+, which is difficult to stabilise in aqueous solutions. From a general point of view, thermodynamics of hydration of gaseous species are important to check the theoreti-cal calculations on actinides, which are growing in the literature (see [99VAL/MAR] in this Appendix).
1 FA−SM: Factor analysis and self modelling give the number of components contributing to a spectral response and permit the deconvolution of overlapped spectra to obtain a resolved spectrum of each individual spectrum.

Discussion of selected references 581
For monatomic ions with ionic character is supposed to depend on five quantities which are: the number of water molecules in the primary shell, N, and in the second hydration shell, H, of the aqueous ion; the M
hyd mG∆
n+, ion crystallographic radius, Rc; the effective charge, q, of the ion and the size of the water molecule, Rw. The experimental distance, d, between the ion and the closest oxygen atom, is Rc(N) + Rw. The N values could be non-integers and the distance, d, can be measured by EXAFS. These parameters are not all independent, for instance, Rc depends on N, Rw depends on Rc and so on. These relations are analysed by the authors in later papers (see below). An expression for ∆ (on the absolute scale) gives this review an indication that the hydration theory is:
hyd mG
2 1 2 3− − −hyd m c W c W c W
2 4 3c W c W disp.
a q (R + 2R ) + b q N(R + R ) + cq N(R + R )
+ d q N(R + R ) + e H + w (R + R ) +
G
G−
∆ =
∆
hyd mG
This expression shows that for a given temperature ∆ is a function of q, N, Rc, Rw, and H, as well as coefficients, a, b, c, etc., and depends on seven different terms, successively, the Born term, the influences of dipole, quadrupole and induced dipole inter-actions, the influence of water molecules in the second hydration sphere, the cavity forma-tion and the dispersion effect, , arising from dispersion forces. Most of these terms are discussed in many papers and text books.
(sub)disp.G∆
The parameters a, b, c, etc., have been evaluated using 27 experimental values of for halides, alkalis, alkaline-earths and trivalent lanthanides. The calculated values
deviate from experimental values by less than 0.3%. Application to lanthanides and acti-nides needs to take into account the covalent effect, which is quantified by the decrease of the distance, d, compared to a pure ionic situation, and consequently the decrease of R
hyd mG∆
c and Rw as well. Change in the ground state energy of M3+ ion in the transition from gaseous to aqueous state (the so called nephelauxetic effect) must also be considered.
Discussion of the structure and thermodynamics of trivalent lanthanide and acti-nide aqueous ions is given in [85DAV/FOU], [86DAV] and [97DAV/FOU]. Another pa-per [2001DAV/VOK] deals with the last developments in calculating Gibbs energy of hy-dration for these elements. Data on actinides have been given in an abstract [2000DAV/FOU].
Calculated values, hyd mGο∆ (Mn+, 298.15 K), given by David et al. for this review for the reaction :
2M (g) + H O(l) M (aq)n+ n+ , n = 3 and 4
are given in Table A-34. They are derived from calculated values on the absolute scale on the basis of (Hhyd mGο∆ +, 298.15 K) = − 1056 kJ · mol−1, according to:
hyd m hyd m(abs) = 1056 q + G Gο ο∆ − ∆ .

Discussion of selected references 582
Table A-34: Enthalpy of the hydration reaction for trivalent and tetravalent ions, Mn+.
M3+(q) hyd m
G ο∆ (kJ · mol− 1) M4+(q) hyd m
G ο∆ (kJ · mol− 1)
U (2.750) 236 Th (3.539) − 1124
Np (2.755) 191 U (3.869) − 1793
Pu (2.761) 147 Np (3.904) − 1940
Am (2.766) 102 Pu (3.985) − 2162
Cm (2.773) 72
Derivation of versus T permits a definition of an entropy model which gives the absolute entropy of hydration, (hyd), for a monatomic ion. Then adding the calculated entropy of the gaseous ion, the absolute entropy of the ion is derived. A pro-posed expression by the authors is:
hyd mG∆
mS
i=6
m ii=1
(hyd) = M mi⋅∑S
depending on six terms, Mi, each depending on parameters and coefficients included in (d, q, N, H, Rhyd mG∆ c, Rw, a, b, c, etc.) and five coefficients mi to be fitted to experimental
entropy data. These coefficients are the derivative of d, N, H, quadrupole moment and po-larisability versus T. They have been fitted to the experimental data of for hal-ides, alkalis, alkaline-earths and trivalent lanthanides.
m (hyd)S
The deviation between the 38 experimental values and those calculated is about some tens of J · K−1 · mol−1.
The values obtained by David et al. for mS ο (Mn+, 298.15 K) are compared in Table A-35 with the values selected by TDB reviews and, for Th4+, by [85BAR/PAR]. These are derived from the appropriate expression of absolute entropy, on the basis of (HmS ο +, abs., 298.15 K) = − 22.2 J · K−1 · mol−1.
Table A-35: Comparison between the calculated molar standard entropy (J · K–1 · mol–1) and values selected by TDB review.
Mn+ m
οS calculated m
οS selected Reference
U3+ − 178 − (188.170 ± 13.853) [92GRE/FUG] Np3+ − 183 − (193.584 ± 20.253) [2001LEM/FUG] Pu3+ − 193 − (184.510 ± 6.154) [2001LEM/FUG] Am3+ − 201 − (201.00 ± 15.00) [95SIL/BID] Th4+ − 438 − 423 [85BAR/PAR] U4+ − 433 − (416.896 ± 12.553 [92GRE/FUG] Np4+ − 420 − (426.390 ± 12.386) [2001LEM/FUG] Pu4+ − 409 − (414.535 ± 10.192) [2001LEM/FUG] Am4+ − (406.00 ± 21.00) [95SIL/BID]

Discussion of selected references 583
This model gives coherent values with the two experimental measurements of the entropy of aqueous Th4+ and Pu3+ ions - although the latter involves the estimated entropy for PuCl3·6H2O - and also gives good predictions for trivalent and tetravalent actinides.
[98DIA/GRA] In this paper, solubility experiments are described in which precipitation after NaOH addi-tion is monitored under pH-stat conditions from supersaturated U(VI) solutions, where pH is calibrated on the molality scale. In regard to this review, it shows clearly that starting with a 10−2 m solution of U(VI) (UO2Cl2 in 0.5 m NaClO4), crystalline metaschoepite plates about 1 mm in diameter, UO3·2H2O, precipitate from NaClO4 solutions (I = 0.5 m) when the pH is increased and maintained between 4.7 to 6.3. The equilibrium concentra-tion of U(VI) and hydrolysis constants taken from [92GRE/FUG] using the SIT procedure give lo 10 ,0
*g sK = 5.14 at 25°C for the equilibrium:
. + 2+3 2 2 2UO 2H O(scho) + 2H UO + 3H O(l)⋅
To derive the value at zero ionic strength according to :
2 4 2 4
10 ,0 10 ,0 10 10 10 WUO (ClO ) HClO* *log = log + 3log 4 log 3logs sK K aο
± ±γ − γ +
the following data are used : 2 4 2(UO (ClO )±γ = 0.522,
4= 0.726 and aHClO±γ w = 0.996 to get
10 ,0*log sK ο = 4.7. As no numerical experimental results are given in this paper, uncertain-
ties in this value could not be determined. Using the SIT this review calculates lo 10 ,0*g ο
sK = 4.86 which gives 10 ,0log ο
sK = − 23.14.
Contrary to the results in 0.5 m NaClO4 solution, polyuranates precipitate, in NaCl solutions (I = 3 and 5 m), according to:
(2 ) +1 x(UO ) (OH) (y + 1 + ) H O(l) + x Na m n n− + −2 2
+x (3+x/2) 2
2
Na UO y H O + (2 + x ) H
m nm mnm
⋅ −
the Na/U ratio depending on the Na+/H+ ratio in solution.
From 3 m NaCl solutions at pH 5.2 to 7.2 precipitates with the average composi-tion of Na0.3UO3.15·y H2O (y = 1.56 to 5.5) were formed. The water content increased with pH and the particles were finer at pH 7.2. Precipitates formed from 5 m NaCl in the pH range 4.8 to 6.5 were similar to those obtained from 3 m NaCl, but were finer (0.2 µm in diameter). At higher pH, the same phase was formed initially, but lost crystallinity with time and had a higher sodium content and a slightly elevated uranium level. Three orders of magnitude variations in final uranium concentration were measured at a given pH and can be accounted for by variations in the size of the precipitates; stepwise addition of base led to the largest particle sizes and the lowest solubilities. An orange precipitate was formed at pH higher than 7.6 and exhibited a regular trend of decreasing solubility with increasing pH.

Discussion of selected references 584
The phase, Na0.33UO3.16·2 H2O (Na2U6O19·12 H2O), was formed at 104 < Na+/H+ < 106. To calculate the solubility product using only data in the pH range, 5.2 to 6.0, the hydrolysis constant of in 3 m NaCl from [63DUN/SIL] was taken, and gave
2+2UO
10 ,0*log sK = (7.95 ± 0.15) at 25°C. Extrapolation to zero ionic strength of the con-
stant referring to:
+ 2+0.33 3.165 2 2 2
+Na UO 2H O + 2.33H UO +3.165H O(l) + 0.33Na⋅
is done according to (Pitzer approach):
2 210 ,0 10 ,0 10 10 NaClUO Cl
10 HCl 10 W
log = log + 3log + 0.66log
4.66 log + 3.165logs sK K
a
ο±±
±
γ γ
− γ
HCl±γ NaCl±
* *
γwith 2 2UO Cl±γ = 0.619, = 0.974, = 0.714 and aw = 0.893. The result is
10log ,0* ο
sK = (7.13 ± 0.15) (presumably misprinted in the paper as (13 ± 0.15)). Applica-tion of the SIT by the review yields (6.52 ± 0.15). The uncertainty in lo 10 ,0
*g οsK of 0.15
incorporates variations in the solid phases with pH by taking the mean value for each pH and the corresponding standard deviation in the mean.
Precipitation from NaCl solution results in the formation of schoepite after one year when the ratio, Na+/H+, is less than 103. The equilibrium value of the U concentration in equilibrium over schoepite in 3 m NaCl led the authors to give 10 ,0
*log sK = 5.43 at 25°C and 010 ,
*log οsK = 4.7. When the Na+/H+ ratio reaches 1012, the Na/U ratio in the
precipitate reaches 1 which could correspond to the stoichiometric phase, Na2U2O7. The value of 10 ,0
*log sK ο is estimated by the authors to be 26, which is higher than the value
given by [92GRE/FUG].
The authors made a review of the solubility of schoepite including [91SAN], [93MEI/KIM], [92KRA/BIS], [94TOR/CAS] and other references before 1992. They did a comparison of all the lo 10 ,0g ο
sK values (without taking uncertainties into account) and concluded that an average value of the solubility product of schoepite (excluding their data) is 10 ,0log ο
sK = (5.37 ± 0.25) (uncertainty estimated). They pointed out that with amorphous or microcrystalline material, higher solubilities of schoepite can be achieved than that corresponding to this solubility product. On the other hand, lower U concentra-tions can be encountered, approaching that given by the solubility constant of 10 ,0log ο
sK = 4.83, derived from calorimetric measurements [92GRE/FUG]. A review of the solubility of Na-polyuranates is presented in this paper
This review considers only the data obtained for schoepite in perchlorate solu-tions converted to I = 0 using the SIT theory.
[98EFU/RUN] This paper is not cited in [2001LEM/FUG].
In this study the solubilities of Np and Pu were investigated at 25, 60 and 90°C in

Discussion of selected references 585
a Yucca Mountain groundwater of low ionic strength (I ≈ 3.7.10−3 mol · L−1) and a total carbonate concentration of 2.8.10−3 mol · L−1. The solutions were spiked with small amounts of Np und Pu stock solutions and the pH was adjusted to 6, 7, and 8.5.
The solubility of Np was determined from both oversaturation (after 50−450 days) and undersaturation (after 25−160 days with the precipitates formed in the oversaturation experiments). The diffuse and somewhat ambiguous X−ray powder diffraction patterns of the dark greenish brown precipitates were interpreted with the formation of a poorly crys-talline hydrated Np2O5·xH2O(s). The solubility data at pH = 6 were almost independent of temperature and those at pH = 7 and 8.5 decreased about half an order of magnitude when the temperature was increased from 25 to 90°C. Using the solubility data at pH = 6 and 7 and t = 25°C, where the formation of hydroxide and carbonate complexes could be ex-cluded, the solubility constant for the reaction:
+ +2 5 2 2
1 1Np O (s) + H NpO + H O(l)2 2
*log
K οwas calculated to be 10 ,0s = (2.6 ± 0.4) for poorly crystalline, possibly hydrated Np2O5(s). This solubility constant is 1.3 orders of magnitude lower than the value of
10 ,0*log sK ο = (3.90 ± 0.02) from the solubility study of Pan and Campbell [95PAN/CAM],
[98PAN/CAM], who claimed crystalline Np2O5(cr) to be the equilibrium solid phase. The solubility constant of Efurd et al. is compatible with the data selected in the NEA review [2001LEM/FUG] from calorimetric data and the estimated entropy of crystalline Np2O5(cr):
f mGο∆ (Np2O5, cr, 298.15 K) = − (2031.6 ± 11.2) kJ · mol−1
10 ,0*log sK ο = (1.85 ± 1.0).
The solubility of plutonium was studied only from oversaturation. The diffuse and broad X−ray diffraction peaks of the precipitate at 25°C and the somewhat sharper peaks for the precipitate at 95°C were ascribed to an amorphous PuO2(s), which possibly in-cludes an aged Pu(IV) polymer or Pu(OH)4(am). The Pu concentrations measured after 50 − 400 days decreased somewhat with increasing temperature: log10[Pu] = − (7.7 ± 0.4) at 25°C, − (8.1 ± 0.2) at 60°C and − (8.4 ± 0.2) at 90°C. Small Pu(IV) colloids (< 4 nm) were supposed to be the predominant species in solution. This might explain the higher Pu concentrations compared to those of log10[Pu] = − (10.4 ± 0.5) measured at room tempera-ture by Rai et al. [99RAI/HES2] with PuO2(am) in dilute KOH solutions of pH = 8 − 13. In addition, when dissolving parts of the aged Pu(IV) solid in 3 M HCl, the authors de-tected impurities of Pu(VI) that were assumed to have originated from the solid.
[98FAN/KIM] This is a review of earlier work and preliminary results published later by Fanghänel et al. [94FAN/KIM], [95FAN/KIM], [98FAN/WEG2], [98FAN/WEG], and [99FAN/KON], Könnecke et al. [97KON/FAN], and Paviet et al. [96PAV/FAN]. It contains a detailed

Discussion of selected references 586
description of experimental methodology and a useful table of Pitzer β(0) and β(1) parame-ters for Cm3+ and the various Cm(III) complexes studied. A discussion of the number of coordinated water molecules in the sulphate complexes gives strong evidence for bidentate sulphate coordination and coordination number of nine around the central ion. A compari-son between the number of coordinated water molecules in the corresponding carbonate system ([98FAN/WEG], page 52) reveals fairly large differences, 1.6 coordinated water in
, versus 2.4 in 33 3Cm(CO ) − 3
4 3Cm(SO ) − . These variations may indicate the accuracy of the semi-empirical method used to estimate the water coordination from the lifetimes of the various complexes.
[98FAN/WEG] The equilibrium constant and stoichiometry of 2
3CmHCO + have been determined using time resolved laser fluorescence spectroscopy (at room temperature, close to 25°C) in a 1 m NaCl ionic medium. The experimental methods are satisfactory and the authors identify the formation of one weak bicarbonate complex with = 1.9. This assignment is supported by an independent potentiometric identification of this species for La(III), [81CIA/FER] and Y(III) by Spahiu, [85SPA]. The study by Bidoglio [82BID], claims the formation of strong bicarbonate complexes with Am
10log b
3+, however, this is the result of an erroneous interpretation of the experimental data, cf. [95SIL/BID]. The carbonate, bicarbonate concentrations and pH are calculated using the EQ3/6 code and Pitzer parameters and data from Harvie et al. [84HAR/MOL]; no details are given, but the equilibrium constant is accepted as a good estimate. It should be noted that this species is only formed at very high partial pressures of CO2, several bars, or more.
The lifetime of the excited level of Cm 23HCO + is somewhat shorter than that for
Cm3+, indicating the formation of an inner-sphere complex with bicarbonate, presumably involving coordination of both carboxylate oxygen atoms. The equilibrium constant has been recalculated to zero ionic strength by the reviewers using = 0.23,
= 0.16 and ε = 0.0 kg · mol
3+(Cm , Cl )−εlog2
3(CmHCO , Cl )+ −ε + Na )3(HCO ,− −1 to give = (3.1 ± 0.3).
10οb
[98FAN/WEG2] The formation constants for , n = 1−4 have been determined at 25°C in 1 m NaCl, using time resolved laser fluorescence spectroscopy. Electrode calibration and measurements of “pH” = − log
3 23Cm(CO ) n
n−
10 mH+ are described in detail. The slope of the pH vs. emf line from the glass electrode is consistent with the theoretical value. The possible forma-tion of ternary hydroxide carbonate complexes for trivalent actinides has been discussed by several investigators, [82BID], [84BER/KIM] and [95SIL/BID]. However, the spectro-scopic evidence in the present study does not indicate the formation of such complexes. Fanghänel et al. also discuss the formation of bicarbonate complexes, but more details are given in [98FAN/WEG]. There is a discussion of the mode of coordination of the carbon-

Discussion of selected references 587
ate ion and the present review agrees with the conclusion that bidendate complexes are formed. However, the discussion on the number of coordinated water molecules, based on the empirical relationship (1) on page 50 in [98FAN/WEG2] is inconsistent with a coordi-nation number of nine, indicating that equation (1) is only an approximation. The stepwise equilibrium constants reported are: = (5.90 ± 0.1), log10 1log b 10K2 = (4.37 ± 0.2), log10K3 = (2.91 ± 0.15), and log10K4 = (1.0 ± 0.2). The stoichiometry of the limiting complex is in agreement with experimental data on trivalent lanthanides, as referenced in [98FAN/WEG2].
A thermodynamic analysis of the Cm(III) carbonate system in the concentration range 0 < mNaCl < 6 is given in a later paper [99FAN/KON].
[98FAZ/YAM] This paper gives some spectroscopic data on and fluoro complexes in solution: 1 M NaClO
2+2UO
4, [U] = 10−2 M , [NaF] = 0 to 6·10−2 M, initial pH = 2, temperature range t = 17 to 38°C. These results add to what is already known and do not contribute to the thermody-namic database. The lifetime of the excited level of UO 2
2+ is found to be 1.83 µs at 25°C.
Speciation is made according to the data of [93FER/SAL].
[98FIN/HAW] The name schoepite is commonly applied to any mineral or synthetic preparation with a formula close to UO3·2H2O, but a distinction should be made between schoepite (UO2)8O2(OH)12·12 H2O (formally UO3·2.25 H2O), metaschoepite (UO2)8O2(OH)12·10 H2O (formally UO3·2 H2O) and dehydrated schoepite, (UO2)8O0.25(OH)1.5 (formally UO3·0.75 H2O), which are structurally and chemically distinct from the four dioxouranium(VI) hy-droxides: α-UO2(OH)2, β-UO2(OH)2, γ-UO2(OH)2 (formally UO3·H2O) and U3O8(OH)2. In fact dehydrated schoepite is a solid solution represented by UO2O0.25-x(OH)1.5+2x (0 < x < 0.25) (formally UO3·0.75 H2O to UO3·H2O). Schoepite and metaschoepite are very difficult to distinguish between on the basis of X-ray powder diffraction data alone: their diffraction patterns are very similar. Relationships between hydrated oxides and hy-droxides of U(VI) are addressed in [92FIN/MIL] and [97GUR/SER] (see this review) in addition to the papers reviewed in [92GRE/FUG]. Many papers deal with the this issue and are well summarised in [98FIN/HAW]. This paper is a detailed study of the chemical and structural transformations of schoepite to metaschoepite and finally to dehydrated schoepite with connection to the structure of α-UO2(OH)2. It complements [92FIN/MIL] and confirms previous data.
The structure of schoepite was firmly established by Finch et al. [96FIN/COO] as sheets of pentagonal bipyramidal polyhedra of the form [(UO2)xOy(OH)z](2x−2y−z) (general structure of dioxouranium(VI) oxide hydrates) with x = 8, y = 2 and z = 12, bonded to-gether by 12 water molecules through hydrogen bonds. Using single-crystal X-ray diffrac-tion techniques, Finch et al. show that schoepite transforms slowly in air at ambient tem-

Discussion of selected references 588
perature to metaschoepite losing two of the interlayer H2O groups which are more weakly bonded than the remaining ten. The orthorhombic cell structure change only slightly (about 2% for the a parameter), which is why only a precise determination of unit-cell parameters can distinguish between schoepite and metaschoepite. Above 120°C, schoepite transforms to dehydrated schoepite by losing all the interlayer H2O molecules ((UO2)8O2(OH)12) re-sulting in the complete collapse of the layer structure giving the structure of α-UO2(OH)2·(UO2O0.25(OH)1.5) according to:
(UO2)8O2(OH)12 = 8 UO2O0.25(OH)1.5
but with anion vacancies. Finally, dehydrated schoepite, isostructural with α-UO2(OH)2, is formulated as UO2O0.25-x(OH)1.5+2x (0 < x < 0.25). It is known to be stable in air and does not react with water except under hydrothermal conditions. This paper gives a summary of the thermal stability in presence of water of all the phases identified here (less than 100°C) and of the three polymorphs of dioxouranium(VI) hydroxide, which do not contain H2O bonded molecules (above 100°C). Table A-36 gives the parameters of the unit cells of some of these phases. According to Sowder et al. [99SOW/CLA] the dehydration of me-taschoepite to dehydrated schoepite has an intermediate step involving (UO2)8O2(OH)12·1.5 H2O. The paper [98FIN/HAW] refutes the existence of a para-schoepite phase which has been postulated previously. The synthetic UO3·2H2O commonly prepared by heating in water above 50°C, is metaschoepite.
Table A-36: Unit cell parameters (Å) for schoepite, metaschoepite and dehydrated schoepite crystals according to [98FIN/HAW] and for α-UO2(OH)2 crystals according to [97GUR/SER].
a(Å) b(Å) c(Å) Space group
schoepite 14.337 16.813 14.731 P21ca
metaschoepite 13.99 16.72 14.73 Pbna
Dehydrated schoepite 6.86 4.26 10.20 Abcm (?)
α-UO2(OH)2, average of 2 values 6.898 4.225 10.204
[98GEI/BER] The authors have determined the formation constant for using photo-acoustic spectroscopy. In this way the authors have been able to work at low total concen-trations of U(VI), 5·10
42 3 3UO (CO ) −
−4 to 10−5 M. The experiments were conducted in the pH range 5 to 10 in 0.1 M NaClO4. The main emphasis of this paper is a description of the experimental equipment and methodology. The authors have determined the equilibrium constant for the reaction:
42 3 3 2 3 3 2UO (OH) + 3 HCO UO (CO ) + 3 H O(l)− − −

Discussion of selected references 589
and report a value of 10log K = (8.5 ± 0.7). Extrapolation to zero ionic strength using the Davies equation gives 10log K ο
log
= (9.8 ± 0.7). The authors seem to have made a sign error, since extrapolation to zero ionic strength using the SIT and the interactions coefficients from [92GRE/FUG] gives 10 K ο = (7.2 ± 0.7). Using the equilibrium constant for the formation of 32UO (OH)− selected in the present review, 10 3,1
*log οb = − (20.25 ± 0.42), we obtain 10log 3
οb = (17.9 ± 0.8) for the formation of 42 3 3(CO )UO − from the components,
which differs considerably from the selected value of (21.6 ± 0.05) in [92GRE/FUG] and (21.84 ± 0.04) in the present review. However, the uncertainty in the proposed constant is large and there are some experimental information missing, e.g. whether the measured pH refers to activities or concentrations. The most important information is that the pH range where is predominant extends to much lower pH than indicated in [92GRE/FUG]. This in turn implies a larger range of existence of UO
2 (OH)−
10*log b
3
3οb
3
2ο
2UO (CO
UO
2 (OH)−
10log
2(OH)2(aq). Since this first review was published, the equilibrium constant for the formation of UO2(OH)2(aq) has been reassessed [91CHO/MAT], [2002BRO] and the present review has selected = − (12.15 ± 0.07), i.e. a value much lower than that used to calcu-late the speciation diagram given on page 116 of [92GRE/FUG]. This equilibrium constant is in much better agreement with the results of Geipel et al. because it indicates that
UO is the predominant hydroxide complex at pH > 6.7. In conclusion, the study of Geipel et al. gives strong support to the speciation model proposed already in [92GRE/FUG], and also to the re-evaluation of the equilibrium constant of UO2(OH)2(aq). However, the numerical value is too uncertain to be included when selecting the “best” value of for 4
3 3) − . Preliminary results are given in [98GEI/BER2].
[98GEI/BER2] This is a short version of the [98GEI/BER] paper and does not contain any new informa-tion. LIPAS spectroscopic data are used to study the formation of in solu-tions at low total concentrations of uranium ([U] = 5·10
42 3 3UO (CO ) −
−5 to 10−4 M) and at the partial pres-sure of CO2 in air. The pH region explored begins at a pH greater than 7. Under these conditions it is expected that the LIPAS spectrum belongs to the species,
(2 2)2 3UO (CO ) x
x− −
2
. This spectrum shows six maxima in the range 380 to 480 nm. The con-centration of the unknown species was measured from the absorptivity and the free con-centration of UO was then obtained from the uranium mass balance. A plot of, 2+
(2 2)2 3
10 3(2 2)2 3
[UO (CO ) ]log . log [HCO ]
[Utot] [UO (CO ) ]
xx
xx
vs− −
−− −−
,
−gives a straight line with a slope of x = 2.9 ± 0.3, (8·10−4 < [HCO 3 ] < 5·10−3 M).
The calculation of 10 3log οb ( 42 3 3UO (CO ) − ) gives (21.57 ± 0.70), which is very
close to (21.60 ± 0.05) selected by [92GRE/FUG]. This value, lo ( ) = (21.57 ± 0.70), is also reported in [98GEI/BER], but seems to be uncer-tain, as explained in this review.
10 3g οb4
2 3 3UO (CO ) −

Discussion of selected references 590
[98GEI/BER3] This is an extended abstract describing studies of complex formation in the U(VI)−carbonate-hydroxide system using laser spectroscopic methods. The authors report a value of log10K = − (18.9 ± 1.0) for the reaction:
2+ +2 2 2 2 2 3 32 UO + CO (g) + 4 H O(l) (UO ) CO (OH) + 5H− .
As this work is only published as an abstract the proposed equilibrium constant is not used in this update.
[98GEI/BER4] The conditions of formation of the complex, , [96BER/GEI], [97BER/GEI] are extended to solutions I = 0.1 M (NaClO
2 2 3 3Ca [UO (CO ) ]
42 3 3UO (CO )
4), pH = 8 and 9, [U] = 5·10−5 M, = 102
3HCO / CO−3
− −2 M (to ensure that the complex, − , is formed) and Ca2+, 10−2 and 10−3 M (to ensure that the complex Ca is formed). Na2 2 3 3(CO ) ][UO 2EDTA is added to these solutions to control the concentration of free Ca2+ through the reaction:
Ca2+ + Na2EDTA CaEDTA + 2 Na+, = 10.59. 10log οb
The other equilibria considered are:
Ca2+ + CaCO23CO −
3(aq), = 3.1 10log οb2+ 2 42 3 2UO + 3CO UO (CO )− −
3 3
−
, = 21.6 10 3log οb2+ 4 (4 2 )
2 3 3 2 3 3Ca + UO (CO ) Ca UO (CO ) (aq)bbb − − K
Increasing the concentration of EDTA reduces [Ca2+] and the intensity of TRLFS spectrum of decreases. As in [97BER/GEI], the variation of (4-2 )
2 3 3Ca UO (CO ) −bb
(4-2 )
2 3 310 4
2 3 3
[Ca UO (CO ) (aq)]log R = [UO (CO ) ]
bb
−
− vs. [Ca2+], according to :
log10R = b log10[Ca2+] + log10K gives b = (1.66 ± 0.35) and log10K = (7.55 ± 0.23).
Recalculation of for 10 2,1,3log b
2 Ca2+ + UO 22 + 3 CO+ 2
3− Ca2[UO2(CO3)3](aq)
gives = (29.15 ± 0.30) and = (25.7 ± 0.7) already given in [97BER/GEI].
10 2,1,3log b 10 2,1,3log οb
This paper confirms the result of [97BER/GEI].

Discussion of selected references 591
[98GOR/SID] Earlier experimental work [74DHA/TRI], [87ALE/OGD] has shown that the vaporisation of uranium-bearing species from uranium oxides increases in the presence of a water va-pour, owing to the formation of UO2(OH)2(g) in addition to UO3(g), with other possible molecules in the gas phase being UO2OH(g) and UOOH(g).
Gorokhov and Sidorova have calculated the thermal functions of UO2(OH)2(g) from estimated molecular parameters. UO2(OH)2(g) is assumed to have a C2v symmetry with 15 vibrational frequencies, νι. Bond lengths, angles and νι values are derived from the isoelectronic molecule UO2F2(g) and other molecules with C2v symmetry, MO2F2 (M = Cr, Mo, W). Since the molecule contains hexavalent uranium, there were assumed to be no low-lying excited electronic states. The classical thermodynamic functions are calculated in the approximation of the rigid rotator harmonic oscillator.
These data are used to compare the two experimental studies [74DHA/TRI], [87ALE/OGD] of the reaction: UO3(g) + H2O(g) UO2(OH)2(g), which give rather similar Gibbs energies, but very different entropies of reaction. The calculated entropy of this reaction at 1500 K is − 132.1 J · K−1 · mol−1, compared with the experimental value of − 93.0 J · K−1 · mol−1 from [74DHA/TRI], whereas at 1800 K, the calculated and experi-mental [87ALE/OGD] values are − 129.4 and − 156.9 J · K−1 · mol−1. The (marginally) better agreement in the second case leads the authors to prefer these experimental data from Alexander and Ogden [87ALE/OGD] and they derive finally f mH ο∆ (UO2(OH)2, g, 298.15 K) = − (1345.5 ± 30.0) kJ · mol− 1.
It should be noted that there are no experimental details of any kind given in the paper by [87ALE/OGD] − see review in this Appendix A.
Ebbinghaus [95EBB] has estimated appreciably different thermal functions for UO2(OH)2(g), and as noted in the review of this paper in Appendix A and in the discussion in section 9.3.1.2, this review does not select any data for this species.
[98HUA/YAM] The authors report measurements on the vapour phase composition in the decomposition of Cs2UO4(s) from 873 to 1373 K, in Pt cells both in vacuo and in a D2/D2O environment. In agreement with earlier work, Cs(g) is the major decomposition product in the vapour, to give Cs2U4O12(cr) by the reaction:
4 Cs2UO4(cr) Cs2U4O12(cr) + 6 Cs(g) + 2 O2(g).
Unlike earlier workers, they also found X−ray diffraction evidence of UO2(cr) in the residue, which was ascribed to the reaction:
Cs2U4O12(cr) 4 UO2(cr) + 2 Cs(g) + 2 O2(g).

Discussion of selected references 592
No mention is made of the many other mixed valency uranates which could be formed.
Because the oxygen pressure in the Knudsen cell is not well defined, no reliable thermodynamic data can be derived from the measurements of the Cs(g) pressures.
In the presence of D2/D2O, the pressure of Cs(g) increases, presumably due to a decrease in the oxygen pressure. CsOD(g) is also observed, and the residue contains Cs2U2O7, attributable to the reaction:
2 Cs2UO4(cr) + D2O(g) Cs2U2O7(cr) + 2 CsOD(g).
Enthalpy changes for the above reaction at 1300 K from the mass spectrometric data for three runs with differing D2/D2O ratios were (364.5 ± 13.5), (444.2 ± 90.5) and (308.5 ± 14.2) kJ · mol−1. The mean of these quite discrepant values, (372.4 ± 47.9) kJ · mol−1, is close to that calculated by the authors from literature data, i.e., 366.2 kJ · mol−1.
No data relevant to this review can be abstracted from this paper.
[98ITO/YAM] This paper gives pressure composition isotherms for the hydrogenation of U6Mn(s) and U6Ni(s) at 573 and 673 K and compares them to those for U−H. Ternary hydrides of ap-proximate composition, U6MnH18(s) and U6NiH14(s), are probably formed and the amount of hydrogen in the alloys in equilibrium with these is much higher than for unalloyed ura-nium.
The data for the U−H system are indistinguishable from the existing data, which are therefore retained.
[98JAY/IYE] Drop calorimetric measurements are reported for KUO3(cr) (370 − 714 K) and K2U2O7(cr) (391 − 683 K). Preparative details (and the same data) are reported in [99JAY/IYE].
There are some inconsistencies in both papers, and the enthalpy data have been refitted with an exact constraint of = 0 at 298.15 K. The derived heat capacity expressions:
m m( ) (298.15 K)H T H ο−
2 1,m 3(KUO , cr, ) = 133.2577 + 1.2558 10 J K mol 1− − −⋅ ⋅ ⋅pC T T
1 1,m 2 2 7(K U O , cr, ) = 149.0840 + 2.6950 10 J K mol 1− − −⋅ ⋅ ⋅pC T T
are assumed to be valid from 298.15 to 750 K, although the temperature coefficient of the heat capacity of K2U2O7(cr) is much greater than would be anticipated for a simple U(VI) compound.

Discussion of selected references 593
[98JEN/CHO] The investigations in [92SAT/CHO] and [98JEN/CHO] were carried out at constant silica concentration and varying H+ concentrations. The first study was made with a silicic acid concentration of 6.7·10−2 M in a 0.2 M NaClO4 ionic medium at 25°C. The experimental method was liquid−liquid extraction with thenoyl-trifluoroacetone, TTA, and dibenzoyl-methane as extractants and benzene as the organic solvent. There are a number of experi-mental problems in [92SAT/CHO] that were not considered by these authors. These are discussed in [98JEN/CHO] and the original equilibrium constant log10
*K(A.95) = − (2.44 ± 0.06), for the reaction (A.95):
2+ + +2 4 2 3UO + Si(OH) (aq) UO (OSi(OH) ) + H , (A.95)
was therefore recalculated to be log10*K(A.95) = − (2.01 ± 0.09). Extrapolation to zero
ionic strength gives log10*Ko(A.95) = − (1.74 ± 0.09). In the second study, Jensen and
Choppin used a spectrophotometric competition method to determine the equilibrium con-stant for Equation (A.95). The authors have prepared the silica solutions used by hydroly-sis of tetramethyl-orthosilicate to avoid polymer formation. The experiments were made at a silicic acid concentration of 1.7·10−3 M, in 0.1 M NaClO4 at 25°C. The authors report a value, log10
*K(A.95) = − (2.92 ± 0.06), that is significantly smaller than other determina-tions. Jensen and Choppin suggest that the higher values reported by other investigators might be due to the presence of polysilicates. This review is not convinced by this argu-ment, as Moll et al. [98MOL/GEI] used the same method as Jensen and Choppin to pre-pare their silicate solutions, but found an equilibrium constant that was about one order of magnitude larger. They also showed that the fluorescence lifetime was different from that in test solutions where polymer formation was suspected. [98JEN/CHO] discuss possible sources of error in their data. They found no experimental evidence for interactions be-tween dissolved silica and pyrocathecols (the ligand used in [98JEN/CHO]) reported in the literature. Three different direct experimental methods give concordant results, when using silicic acid solutions prepared in two different ways, suggesting to this review that there might be undetected experimental errors in studies of this type. It has therefore not been considered when selecting the equilibrium constant for reaction (A.95), which is based on the average of the determinations of [71POR/WEB], [92SAT/CHO] (recalculated), and [98MOL/GEI].
[98KAP/GER] This paper deals with U(VI) sorption on natural carbonate minerals at high pH values, in the 8.3 to 12 range. The uranium concentration varies but is always lower than 3.36·10−7 M. The ionic strength varies but is always smaller than 0.014 M. Experimental Kd values are correlated with the concentration of the different species in solution and with the satu-ration index of aragonite, calcite, schoepite and some silicates. The authors have used thermodynamic data from [92GRE/FUG] and the speciation is calculated with a version of the MINTEQ A2 code. The predominant species at pH < 10 are UO2(CO3) and 2
2−

Discussion of selected references 594
UO2(CO3) 3 , and at pH > 11.8, UO4−2(OH) 3
− , with a mixture of UO2(CO3) and UO
43
−
2(OH) in between. At high pH, uranium seems to coprecipitate with CaCO3−
3 (rhombo-hedric aragonite or orthorhombic calcite), but it is not clear if U(VI) precipitates also as haiweeite (Ca(UO2)2Si6O15·5H2O).
2+2
The paper does not give any new thermodynamic information.
[98KIT/YAM] Characteristics of fluorescence spectra (peak emission and fluorescence lifetime) of the following (UO2)p(OH)q complexes denoted: 0:1, 2:2 (present in acid solutions) and 3:1, 4:1 (present in basic solutions) are reported. The test solutions have been prepared using the equilibrium constants given by [92GRE/FUG] for the 2:2 species and by [98YAM/KIT] for the 3:1 and 4:1 species. The ionic medium of the solutions was 1 M HClO4 or NaClO4, which were undersaturated and always kept under an Ar atmosphere. The following spe-cies predominate at 25°C. In 1 M HClO4, is present at a total concentration of 0.010 M. At the same total concentration of uranium, the 2:2 complex is predominant at pH = 2.7, the 3:1 complex at pH = 12.3 (the total concentration is 10
UO
−5 M). The complex 4:1, finally, is predominant in 1 M NaOH with a total concentration of 3·10−4 M.
Each emission spectrum is analysed on the basis of five Gaussian functions corre-sponding to decay from five vibrational levels of the fluorescent excited state to the ground state. The λ(νο− νο) corresponds to a pure electronic transition located at the lower wave-length range of the spectra.
At 25°C only the aqueous dioxouranium(VI) ion and the 2:2 species fluoresce with emission peaks and lifetimes, τ, consistent with previous data (except for τ2:2 meas-ured by Meinrath [93MEI/KAT], [98MEI]) (see Table A-37). The ν values are found to be rather constant, 860 - 870 cm−1.
All species give characteristic fluorescence spectra at 77 K, but only the room temperature characteristics are listed in Table A-37.
Table A-37: Spectroscopic characteristic of 1:1 and 2:2 species at 25°C.
Species pH I M [U] M λ(νο− νο )*nm τ µs Reference
1:0
3.6 2.0
1 HClO4 1 HClO4
0.1 3 1 1
10−2 10−4 10−2
488.04 487.80 490.19 489.47
0.83 1.8 5.9 7.5
[93MEI/KAT] [90PAR/SAK] [95ELI/BID] [98KIT/YAM]
2:2
3.6 3.0 4.0 2.7
0.1 3 0.5 1
10−2 5·10−4 10−2
490 495.04 497.51 499.25
2.9 8.3 9.5
10
[93MEI/KAT] [90PAR/SAK] [95ELI/BID] [98KIT/YAM]
* Rounded values for λ

Discussion of selected references 595
[98KON/HIL] The recent data on the spectra and structure of [95HAA/MAR] and [96KON/BOO] suggest strongly that these halides are strictly tetrahedral in shape. The authors have reexamined the spectroscopic and vapour pressure data of the actinide tetra-halides in the light of this new information.
4UCl (g) 4UF (g)
New estimates of the vibration frequencies of thirteen actinide halides, , species have been used to calculate their thermal functions, including entropies which are compared with experimental entropies of sublimation calculated from vapour pressure measurements. Although few details are given, the comparison suggests strongly that all of the species are tetrahedral. This has been assumed in the Np/Pu review [2001LEM/FUG], and the data for the stabilities of the species have been re-viewed in detail for the present review, leading to changes in almost all the values for gaseous uranium halides, since many of these are dependent on the values for tetrahalide gaseous species.
4MX (g)
4MX (g)4UX (g)
[98KRI/RAM] Knudsen effusion measurements using mass loss in a Cahn microbalance were used to determine the vapour pressures of TeO2(g), in the presence of the co−existing pressure of oxygen, in the reactions:
5 3 8 21 1UTeO (cr) U O (cr) + O (g) + TeO (g)3 6 2 (A.96)
and UTe3O9(cr) UTeO5 (cr) + 2 TeO2 (g) (A.97).
The compounds were prepared by heating in air mixtures of UO3(s) and TeO2(s) in the appropriate ratios 1:1 and 1:3, in a ceramic boat for five hours at 903 and 970 K, respectively. The products were identified by X−ray diffraction.
There are, however, a number of uncertainties in the interpretation of first reac-tion, since the oxygen pressure in the system was not controlled independently. The au-thors assumed the oxygen pressures were those given by the emf measurements of the oxygen potential in a study from the same laboratory [99SIN/DAS]. However, such oxy-gen pressures are very much less than 1/6 of the pressure of TeO2(g), so the relevant de-composition would not be that of reaction (A.96). We have therefore preferred to assume that
2/
2 = 1/6, as given by reaction (A.96), although this is not entirely consistent,
since even at these higher oxygen pressures, the uranium oxide phase in equilibrium would be oxygen deficient, U
Op TeOp
3O8−x , introducing another small uncertainty into the interpretation of the results.
Nevertheless, we have adopted this procedure, and thus in calculating 2
(and from this,
2), have decreased the authors' measured mass losses by 3.34% (correspond-
ing to a mole ratio of TeO
TeOpOp
2:O2 = 6:1).
Discussion of selected references 596
From the tabulated data of total mass loss, with the above assumptions, the Gibbs energy of reaction (A.96) is calculated to be:
r mG∆ (A.96) = 243194 − 145.402 · T J · mol−1 (1063 − 1155 K).
The studies relating to reaction (A.97) are more straightforward, and the measured pressures have been refitted to the equation:
2
110 TeOlog ( / bar) = 14486 + 12.682p T −− (888 − 948 K)
for reaction (A.97), corresponding to the Gibbs energies of reaction:
r mG∆ (A.97) = 558379 − 409.01 · T J · mol−1 (888 − 948 K).
The authors' equation for l seems to give pressures lower than the tabulated values by a factor of four.
210 TeOog ( / bar) p
For consistency with the similar study by Mishra et al. [98MIS/NAM], we have used the data for TeO2(g) derived from the study by [94SAM] to obtain values at 298.15 K from these data.
Thus, the experimental data for reaction (A.96) were processed by a third−law method, using the estimated thermal functions for UTeO5(cr), as in the emf study by [99SIN/DAS]. The resulting third−law enthalpy of reaction (A.96) is then:
r mH ο∆ ((A.96), 298.15 K) = (363.4 ± 1.6) kJ · mol− 1.
With NEA data for U3O8(α) and f mH ο∆
f m
(TeO2, g, 298.15 K) = − (52.8 ± 2.7) kJ · mol−1 derived above from the data of Samant, cited by [98MIS/NAM] (see review of the paper by [98MIS/NAM]), we obtain H ο∆ (UTeO5, cr, 298.15 K) = − (1607.8 ± 5.2) kJ · mol− 1. The second-law value, however, is f mH ο∆ (UTeO5, cr, 298.15 K) = − 1532.0 kJ · mol− 1, with an unknown uncertainty. The first value is in good agreement with other studies, section 9.5.3.2.1.
This study, like that of [98MIS/NAM] thus supports the stability derived from the more precise calorimetric data, and the estimated entropy of UTeO5(cr).
A similar analysis of pressures of TeO2(g) from the decomposition of UTe3O9(cr) by reaction (A.97), has been carried out, using thermal functions estimated here:
(UTemS ο3O9, cr, 298.15 K) = (305.8 ± 15) J · K−1 · mol−1 and ,mpC (UTe3O9, cr, T) = 278.5
+ 8.017·10− 2 T − 3.44·106 T−2, J · K−1 · mol−1, to calculate the thermal functions of UTe3O9(cr). The derived third- and second-law enthalpies of reaction (A.97) at 298.15 K are (540.3 ± 3.1) and 585.3 kJ · mol−1, (uncertainty unknown) The derived enthalpies of formation of UTe3O9(cr) then depend on that taken for UTeO5(cr). Using the value of − (1603.1 ± 2.8) kJ · mol−1 selected in section 9.5.3.2.1 the respective third- and second-law enthalpies of formation are f mH ο∆ (UTe3O9, cr, 298.15 K) = − (2249.0 ± 6.2) and − 2274.9 kJ · mol−1, in reasonable agreement (considering the use of estimated thermal

Discussion of selected references 597
functions) with the calorimetric value, recalculated from [99BAS/MIS] as − (2275.8 ± 8.0) kJ · mol−1.
[98MAS/MAS] Electrolysis experiments were performed on Tc(VII) solutions (1.56 < pH < 8.50) contain-ing nitrate and formate (1 M) using a graphite cathode at potentials of − 0.6 to − 1.6 V/SCE at 298.15 K. At − 0.4 to − 0.6 V/SCE, a violet solution was produced with UV−Visible absorption bands at 530 and 290 nm, which are indicative of a Tc(IV) formate complex containing the Tc group with contribution from Tc8+
2 4O− to the second band. Deposition of a black amorphous Tc material increased with increased pH (maximum near pH = 7.37) and decreased applied potential to about 1.2 − 1.3 V/SCE (60% recovery at pH = 7.37 and − 1.3 V/SCE after 30 min). The solution became pale yellow during electrolysis (λmax = 652 nm) is believed to indicate the presence of a Tc −formate species in solution and the deposit is suggested to be in the form: TcO
7+2
(2− x)· yH2O, where x = 0 − 0.25 and y = 1.6 − 2.0. Electrodeposition yields of up to 95.7 % were achieved at the following condi-tion: − 1.4 V/SCE after two hours at 298.15 K, [Tc]o = 2·10−3 M, pH = 7.37 in 1 M HCOONa. The percentage of Tc deposited decreased with increasing Tc concentration in the bulk solution and the rate of deposition was found to be first order with respect to the Tc concentration. The rate-determining step is therefore thought to involve diffusion of
and T22 2 6Tc O (HCOO) − 3
6HCOO)2 2c O ( − to the electrode surface. The authors speculate that these species hydrolyse completely at pH > 5.5, allowing the electrodeposition to pro-ceed to a higher degree. Lowering the concentration of 3NO− and the build up of TcO(2− x) · yH2O deposits on the electrode surface tend to limit further deposition.
[98MEI] This is a more recent paper of a series of papers written by G. Meinrath and co-workers that give spectroscopic and thermodynamic data on the following hydrolysis species: 0:1,
; 2:2, ; and 5:3, or . The papers in the series are: [93MEI/KAT], [96MEI/SCH], [97MEI] (UV−Vis), [93MEI/KAT], [94KAT/MEI] (fluorescence), [97MEI2], [98MEI/KAT] (UV−Vis and fluorescence), [96KAT/KIM], [96MEI/KAT] (solubilities). Structural data are known [69ABE], [70ABE]. Other papers deal also with spectroscopic and thermodynamic data of hydro-lysed U(VI) species, [95ELI/BID], [98KIT/YAM] (fluorescence).
2+2UO 2+
2 2 2(UO ) (OH) +2 3 5(UO ) (OH) +
2UO O(OH)3
The most important result to be discussed is the determination of and made at I = 0.1 M (NaClO
10 2,2*log b
10 5,3*log b 4) and t = 25°C using spectroscopic analysis of U(VI)
solutions under-saturated with respect to UO3·2H2O(s). [97MEI2] deals with the same topic but gives more experimental details. Equilibrium concentrations of the species 1:1, 2:2 and 5:3 refer to the reactions:
UO 22 + H+
2O(l) UO2(OH)+ + H+

Discussion of selected references 598
2 UO + 2 H22
+2O(l) (UO + 2 H2+
2 2 2) (OH) +
3 UO + 5 H22
+2O(l) (UO + 5 H+
2 3 5) (OH) +
and are derived by using the following characteristics of individual spectra: 1:1, ε413.8 = (9.7 ± 0.2) L · mol−1 · cm−1; 2:2, ε421.8 = (101 ± 2) L · mol−1 · cm−1; and 5:3, ε429.0 = (474 ± 7) L · mol−1 · cm−1. The pH measurements are discussed in [97MEI] and log10[H+] is taken as:
log10[H+] = pH − +10 Hlog γ = pH − ( − 0.09).
The concentration of the species UO2(OH)+ is in every case negligible.
The weighted average value of the equilibrium constants from 13 solutions (stud-ied in the pH range (3.939 ± 0.029) to (4.776 ± 0.014)) are = − (6.237 ± 0.103) and = − (17.203 ± 0.157) (95% confidence limit including precisions in concen-tration and pH).
10 2,2*log b
10 5,3*log b
In this paper Meinrath uses a statistical analysis of data from 25 solutions in the concentration ranges indicated above. Only three species are needed to reproduce the measured absorption spectra of the solutions in the range 340 − 520 nm. That eliminates the presence of other species such as 1:2, (UO2)2OH3+ and 4:3, (UO2)3(OH) . 2
4+
Meinrath points out that the 5:3 species is formed in minute amounts in the pH region close to saturation with respect of UO3·2H2O(s). It can be detected spectroscopi-cally (down to (1 ± 0.25)·10−6 M) because of its high molar absorption coefficient but only with difficulty from solubility measurements.
The experimental values of and at I = 0.1 M reported in [92GRE/FUG] range from − 5.68 to − 6.45 and from − 15.6 to − 17.7, respectively. The weighted average of from Meinrath falls in this range.
10 2,2*log b 10 5,3
*log b
10 2,2*log b
This review accepts these refined data.
This review has compared the speciation diagrams obtained by using the equilib-rium constants proposed by Meinrath and those selected in [92GRE/FUG]. The total con-centration of U(VI), 10 mM, is within the range for the concentrations used in potentiomet-ric studies of U(VI) hydrolysis and should optimise the chances of finding the 5:3 com-plex.
Figure A-9 shows a speciation using constants at zero ionic strength calculated from the constants given by Meinrath.

Discussion of selected references 599
Figure A-9: Speciation at zero ionic strength calculated using equilibrium constants given by Meinrath.
2.5 3.0 3.5 4.0 4.5 5.0 0.0
0.2
0.4
0.6
0.8
1.0
Frac
tion
pH
(UO2 )2 OH3 +
(UO2 )4 (OH ) 7 +
UO 2 ( O H ) 2 . H 2 O ( c )
[ U O 2 2 + ] T O T = 1 0 . 0 0 m M
U O 2 2 +
(UO2 )2 (OH)22 +
Figure A-10 has been calculated using the constants given in [92GRE/FUG] also at zero ionic strength. As it can be seen there is a pronounced difference in speciation.

Discussion of selected references 600
Figure A-10: Speciation in the U(VI) hydroxide system at zero ionic strength using the equilibrium constants selected in [92GRE/FUG].
2.5 3.0 3.5 4.0 4.5 5.00.0
0.2
0.4
0.6
0.8
1.0
Fra
ctio
n
pH
(UO2)2OH3+
(UO2)4(OH)7+
[UO22+]TOT = 10.00 mM
UO22+
(UO2)3(OH)5+
(UO2)2(OH)22+
The following three figures (Figures A. 11, A. 12 and A.13) show speciation diagrams under the experimental conditions used by Meinrath (0.1 M NaClO4) and by the Sillén school (3 M NaClO4) with equilibrium constants given by Meinrath or [92GRE/FUG].

Discussion of selected references 601
Figure A-11: Speciation in the U(VI) hydroxide system in 0.1 M NaClO4 using the equi-librium constants of Meinrath.
(UO2)3(OH)5+
2.5 3.0 3.5 4.0 4.5 5.00.0
0.2
0.4
0.6
0.8
1.0
Fra
ctio
n
pH
(UO2)2OH3+
(UO2)4(OH)7+
UO2(OH)2.H2O(c)
[UO22+]TOT = 10.00 mM
UO22+
(UO2)2(OH)22+

Discussion of selected references 602
Figure A-12: Speciation in the U(VI) hydroxide system using the equilibrium constants from Meinrath recalculated to 3 M NaClO4.
2.5 3.0 3.5 4.0 4.5 5.00.0
0.2
0.4
0.6
0.8
1.0
Fra
ctio
n
pH
(UO2)2OH3+
(UO2)4(OH)7+
UO2OH+
UO2(OH)2.H2O(c)
[UO22+]TOT = 10.00 mM
UO22+
(UO2)2(OH)22+
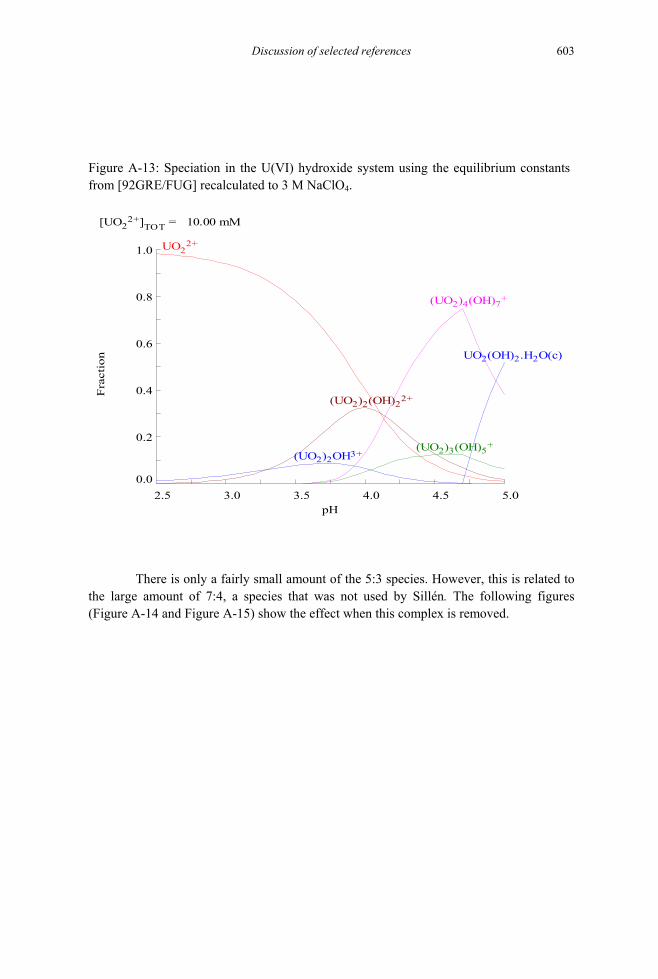
Discussion of selected references 603
Figure A-13: Speciation in the U(VI) hydroxide system using the equilibrium constants from [92GRE/FUG] recalculated to 3 M NaClO4.
2.5 3.0 3.5 4.0 4.5 5.00.0
0.2
0.4
0.6
0.8
1.0
Fra
ctio
n
pH
(UO2)2OH3+
(UO2)4(OH)7+
UO2(OH)2.H2O(c)
[UO22+]TOT = 10.00 mM
UO22+
(UO2)2(OH)22+
(UO2)3(OH)5+
There is only a fairly small amount of the 5:3 species. However, this is related to the large amount of 7:4, a species that was not used by Sillén. The following figures (Figure A-14 and Figure A-15) show the effect when this complex is removed.

Discussion of selected references 604
Figure A-14: Speciation in the U(VI) hydroxide system using the equilibrium constants from Meinrath recalculated to 3 M NaClO4, but excluding the 7:4 species.
2.5 3.0 3.5 4.0 4.5 5.00.0
0.2
0.4
0.6
0.8
1.0
Fra
ctio
n
pH
(UO2)2OH3+
UO2OH+
UO2(OH)2.H2O(c)
[UO22+]TOT = 10.00 mM
UO22+
(UO2)2(OH)22+

Discussion of selected references 605
Figure A-15: Speciation in the U(VI) hydroxide system using the equilibrium constants from [92GRE/FUG] recalculated to 3 M NaClO4, but excluding the 7:4 species.
2.5 3.0 3.5 4.0 4.5 5.00.0
0.2
0.4
0.6
0.8
1.0
Fra
ctio
n
pH
(UO2)2OH3+
UO2(OH)2.H2O(c)
[UO22+]TOT = 10.00 mM
UO22+
(UO2)2(OH)22+
(UO2)3(OH)5+
The last two diagrams, Figure A-14 and Figure A-15, indicate very clearly that the experimental data of Meinrath and Sillén are not consistent. The experimental method used by the Sillén group is a very sensitive indicator of the nuclearity of these systems.
With the equilibrium constants deduced by Meinrath it should not be possible to identify the complex (UO2)3(OH) 5
+ under the conditions used in the potentiometric studies.
However, the potentiometric studies have been made at much higher ionic strength than those of Meinrath. If the complex of higher charge, the (2:2), is stabilised by high concentrations of perchlorate, in the same way as complexes of negative charge, e.g.,
and are stabilised by high concentrations of Na22 3 3UO (CO ) − 4
2 3 3UO (CO ) − +, the observed differences are understandable.
[98MEI2] This paper discusses previous papers on U(VI) hydrolysis and gives additional information to the study of [98MEI]. The experimental data considered here are solubility measure-ments of UO3·2H2O(cr), made at t = (24 ± 2)°C in solutions in equilibrium with a gas phase with a partial pressure of CO2 equal to 0.03 kPa (air). The ionic medium is 0.1 M
Discussion of selected references 606
NaClO4 and the pH range studied, 4 to 5.5. In addition, Meinrath uses data taken from [92KRA/BIS], [93MEI/KIM], [96MEI/KAT] and [96KAT/KIM], which relate to the same saturated system. In the present case, solutions are equilibrated for six months after which the solid phase is characterised as schoepite (yellow crystallite size > 0.1 µm). Solutions are filtered (220 nm pore size). The hydrogen ion concentrations are derived from pH us-ing = − 0.092 as explained previously. +10 H
log γ
The species , (UO2+2UO 2)2(OH) 2
2+ and (UO2)3(OH) 5
+ are identified in the solu-tions from their spectra (340 to 540 nm) [96MEI/SCH], [97MEI2] (aqueous ion: λmax = 413.8 nm, ε = (9.7 ± 0.2) L·mol−1·cm−1; (2:2) species: λmax = 421.8 nm, ε = (101 ± 2) L·mol−1·cm−1; (5:3) species: λmax = 429 nm, ε = (474 ± 7) L·mol−1·cm−1).
Analysis of the data is conducted using multivariate data analysis (chemometric methods) which shows that three species must be considered to model the data.
The main problem in deriving the equilibrium constants is the direct determina-tion of the free concentration [ ], due to its very low molar absorbance coefficient, compared to those of the other species. The modelling is done as follows. = − (6.145 ± 0.088) is taken from [97MEI] to calculate from the measured free concentrations of the 2:2 and 5:3 species according to:
2+2UO
10 2,2*log b
10 5,3*log b
+10 5,3 10 10 10 2,2 10 H* *log = log [5:3] log [2:2] + log 2pH 2 log .3 3
2 2− −b b*g b
− γ
The average value is lo = − (17.00 ± 0.17). The concentration of free is then calculated from * and the measured concentration of the 2:2 species. A
good fit of the data is obtained by summing up all the free concentrations of the different species and comparing this with the total analytical uranium concentration.
10 5,3
2,2b2+2UO
The solubility data and those of [92KRA/BIS] and [96MEI/KAT], which are very similar and depend on the equilibrium constant, *
,0sK , * and * , are modelled using = − (6.145 ± 0.088) as a fixed parameter. It is impossible to determine both
2,2b 5,3b10 2,2
*log b,0
*sK and from these data because of a very strong covariance between them. Mein-
rath obtains 2,2
*blog10 ,0
*sK = (5.75 ± 0.03) and lo = − (17.16 ± 0.18) (and considers
this value as “better” than that obtained by spectroscopy). 10 5,3
*bg
Reinterpretation of the [92KRA/BIS] data with fixed gives 2,2b 10 ,0*log sK =
(5.79 ± 0.03) and = − (17.04 ± 0.18). 10 5,3*log b
The solubility constant, 10 ,0*log sK , refers to the reaction [93MEI/KIM]:
UO3·2H2O(cr) + 2 H+ UO 22
+ + 3 H2O(l).
As the value for the solubility product 10 ,0log sK refers to the reaction:
UO3·2H2O (cr) UO 22
+ + 2 OH− + H2O(l),
we have, lo 10 ,0*g sK = 10 ,0log sK − 2 10log wK , with 10log wK = − (13.78 ± 0.01).

Discussion of selected references 607
Meinrath finds lo 10 ,0g sK (UO3·2H2O, cr) = − (21.81 ± 0.03) and 10 ,0log sK (UO3·2H2O, cr) = − (21.77 ± 0.03) from the re-interpretation of [92KRA/BIS] data.
[98MEI3] The focus of this paper is on aspects of the environmental chemistry of U(VI). It has nine chapters. Two chapters are of a special interest for this review: hydrolytic behaviour of U(VI) and assessment of uncertainties in evaluation of pH.
Meinrath promotes the use of spectroscopy for the determination of the formation constants of species. He gives the example of statistical evaluation by factor analysis (FA) of 26 UV−Vis absorption spectra of U(VI) solutions (I = 0.1 M Na-ClO
22(UO ) (OH) n m
n m−
4, t = 25°C, − 2.4 < log10[U] < − 3.5, and 2.4 < pH < 5), under-saturated with respect to schoepite. FA shows that three species must be selected to account for the absorptivity in the wavelength range 350 to 500 nm: 0:1, 2:2 and 5:3. The experimental data are not new. The application of FA is discussed at length. Values of the constants and de-fined as :
2,2*b 5,3
*b
+2+ 2+
10 2,2 10 2 2 2 10 2 10 H*log log [(UO ) (OH) ] 2 log [UO ] 2 pH 2 log= − − − γb
+ 2+*
+10 5,3 10 2 3 5 10 2 10 Hlog log [(UO ) (OH) ] 3log [UO ] 5 pH 5 log= − − − γb
are given for 26 pH values with uncertainties depending on whether pH errors (± 0.025 at 95% confidence level, see below) are taken into account, or not. These values show that the uncertainties in pH determinations contribute in similar magnitude to the overall uncer-tainty in the constants, as do the uncertainties in the concentrations of the species. The fi-nal average values are, = − (6.168 ± 0.0565) and = − (17.123 ± 0.069), or alternatively = − (6.145 ± 0.088) and = − (17.1424 ± 0.1383) depending on the way followed to calculate both the mean values and the total uncertainties (within 95% confidence). The third digits must be taken with caution. They are quoted here only to avoid giving a rounded value after a statistical treat-ment of numerous data.
10 2,2*log b
10log10 5,3
*log b10 5,3
*log b2,2*b
Schoepite (in fact metaschoepite) is the solubility limiting solid for U(VI) under ambient conditions and pH < 7, which readily transforms to a sodium uranate at pH > 7, even at low ionic strength. The species 5:3 is formed only in minor amounts in a pH region close to the saturation limit and is therefore difficult to detect by concentration dependent methods. In contrast, UV−Vis spectroscopy is more convenient due to the high molar ab-sorption of this species.
This paper gives eight additional solubility data of schoepite (in fact me-taschoepite), for an equilibration time of more than three months, to the data of [92KRA/BIS], [93MEI/KIM], [95KAT/KIM] and [96MEI]. Spectroscopy allows explora-tion only of the pH range 4 to 5.4. The value obtained from assessment of the spectra is
= − (17.00 ± 0.5), using = − (6.14 ± 0.05) (value for pH = 5.34), where all the uncertainties are taken into account.
10 5,3*log b 10 2,2
*log b

Discussion of selected references 608
To measure the pH values a multiple calibration procedure (MCP) is used. A glass electrode is calibrated against several standard buffer solutions of NIST. The data pairs mV (± 0.1 mV) versus pH (± 0.02) are interpreted by linear least square regression (OLS) using mV = α + β·pH. From data accumulated over years, uncertainties in α and β are de-rived. The β values never fit exactly with the theoretical Nernst value − 59.16 mV pH−1, but are higher.
To show the importance of neglecting pH uncertainty Meinrath gives the example of the CO2−H2O system where,
2
210 3 10 10 COlog [CO ] log + log 2pHK p− = + .
Without taking into account the uncertainty in pH, log10K = − (17.62 ± 0.07) whereas by including it, log10K = − (17.63 ± 0.18) with an uncertainty that is almost three times larger.
A summary of the spectroscopic properties of U(VI) species can be found in this paper.
[98MEI/FIS] The authors have studied the solubility of uranium solids as a function of pH in 0.1 M Na-ClO4 and 1 M NaCl. Schoepite (in fact metaschoepite) is the solubility limiting phase at pH < 7.5 while at pH > 7.5 sodium uranates are formed. The latter solids are not well crys-tallised and it is therefore difficult to characterise them by X−ray diffraction; the authors propose both Na6U7O24 and Na2U2O7·xH2O. The authors have taken care in their attempts to identify the solid phase used in these solubility experiments and the problems encoun-tered are clearly pointed out. The solubility has been measured in the pH region, 7.8 to 8.6, where schoepite is not stable and where the dominant uranium species in solution is
, i.e., the reaction studied is then either of: 42 3 3UO (CO ) −
42 2 7 3 2 3 3 2Na U O (s) + 6 HCO 2 UO (CO ) + 3 H O(l) + 2 +Na− − (A.98)
4 +6 7 24 3 2 3 3
+Na U O (s) + 21HCO 7 UO (CO ) + 6 Na + H− − (A.99).
The authors have not provided information of the total carbonate concentration and it is therefore impossible for the reviewers to analyse the data. A slope analysis of log10s versus pH is not straightforward as the slope will depend on the solid phase selected. The authors have selected equation (A.98) and used their experimental solubility data in 0.1 M NaClO4, the equilibrium constant, lo 10 3g οb = 21.86, for the formation of
and the standard Gibbs energy of formation of , Na42 3 3UO (CO ) − 2+
2UO + and H2O(l), to obtain the solubility product for the reaction:
Na2U2O7(s) + 6 H+ 2 Na+ + 2 + 3 H2+2UO 2O(l) (A.100).
These auxiliary data for , Na2+2UO + and H2O(l) are not significantly different
from the ones given in [92GRE/FUG]. Meinrath et al. obtains 10 ,0*log sK (A.100) =

Discussion of selected references 609
(24.2 ± 0.2) (There is a mistake in the sign in this paper). This review has recalculated this value using the selected value of lo 10 3g οb = 21.60 and obtains 10 ,0
*log sK (A.100) = (23.7 ± 0.2), which recalculated to zero ionic strength gives 10 ,0
*glo sK ο (A.100) = (24.1 ± 0.2). This value is in fair agreement both with the value obtained by Yamamura et al. [98YAM/KIT], 10 ,0
*log sK ο
2+2 2(OH)
(A.100) = (25.1 ± 2.1), and the value obtained by using the standard Gibbs energy of formation of Na2U2O7(cr) given in [92GRE/FUG]. In view of the lack of information of experimental details in [98MEI/FIS], these data have not been used for the selection of the solubility product of reaction (A.100).
2 3) (OH)
2 (CO )
UO CO
81 13 6(cr) + O
112.1 −
110.9 p T −
2(cr)
2TeO / bar)
2TeO / bar)
[98MEI/KAT] This work is the continuation of those reported in [93MEI/KAT], [94KAT/MEI], [96MEI/KAT] and gives additional spectroscopic data to [97MEI2].
Both absorption and emission spectra of U(VI) solutions containing the species: 0:1, ; 2:2, ; 5:3, ; and have been collected. They permit measurement of the wavelength for the pure electronic transition between the ground state and excited levels of the species. Solutions containing UO and
do not show emission spectra due to CO
2+2UO
2 (CO )
UO +5(UO 2 3UO CO (aq)
23
23 3
−
43 3UO − − quenching.
The λ(νο−νο) transitions are the following in nm: 0:1, (488 ± 0.7); 2:2, (497 ± 1); 5:3, (499.5 ± 1.5); and , (464 ± 0.9). 2 3 (aq)
[98MIS/NAM] Mass loss measurements (transpiration technique) were used to determine the vapour pres-sures of TeO2(g), in the presence of one atmosphere of oxygen, in the reactions:
5 3 2UTeO U O (g) + TeO (g) (A.101)
and UTe3O9(cr) UTeO5(cr) + 2 TeO2(g) (A.102)
The compounds were obtained by heating thoroughly ground mixtures of UO2(cr) and TeO2(cr) in the ratios 1:1 and 1:3, in air in a ceramic boat for eight hours at 1023 and 900 K, respectively, followed by isothermal heating (eight hours) with frequent grindings. The products were reported as showing only the characteristic X−ray diffraction lines of the expected species. In the study of reaction (A.101), the global mass loss was corrected for the loss of O2 using the molar ratio, TeO2:O2 = 6:1.
From the tabulated data of TeO2(g) mass loss, the following fitted equations were given (pressures converted to bar):
10log ( = 185 + 11.555p T− 1107− 1207 K
for reaction (A.101), and:
10log ( = 145 + 10.422− 947 − 1011 K

Discussion of selected references 610
for reaction (A.102), corresponding to the Gibbs energies of reaction:
r mG∆ (A.101) = 351500 − 218.62· T J · mol−1 (1063 − 1155 K).
r mG∆ (A.102) = 532602 − 376.02 T J · mol−1 (947 − 1011 K).
For further processing of these data, the authors chose to combine their measured pressures of TeO2(g) with those over TeO2(cr) measured in the same apparatus in a thesis study by Samant, cited by [98MIS/NAM] as:
TeO2
110log ( / bar) = 12632.9 + 8.689p Tο −− (A.103)
for reaction (A.104):
TeO2(cr) TeO2(g). (A.104)
Since this involves extrapolation of the latter data (and subsequent processing in-volves data for metastable TeO2(cr) above its melting point), we have adopted a slightly different approach, which also allows a check on the consistency of the data in equation (A.103) with literature data.
The sublimation data in equation (A.103) have been combined with the thermal functions of TeO2(cr) and TeO2(g) from the assessment of [90COR/KON], using a ‘pseudo’ third−law processing, to derive the corresponding enthalpy of sublimation of TeO2(cr):
sub mH ο∆ (TeO2, cr, 298.15 K) = (268.2 ± 0.9) kJ · mol−1
in good agreement with other vaporisation studies (cf. the table quoted by [90COR/KON]). Using f mH∆ (TeO2, cr, 298.15 K) = − (321.0 ± 2.5) kJ · mol−1, this corresponds to
f mH∆ (TeO2, g, 298.15 K) = − (52.8 ± 2.7) kJ · mol−1 (cf. − (54.8 ± 2.6) kJ · mol−1 selected by [90COR/KON]).
The experimental data for reaction (A.101) can now be processed by a third−law method, using the estimated thermal functions for UTeO5(cr), as in the emf study by [99SIN/DAS]. The resulting third−law enthalpy of reaction (A.101) is then:
r mH ο∆ ((A.101), 298.15 K) = (360.04 ± 1.12) kJ · mol−1.
With NEA data for U3O8(α) and f mH∆ (TeO2, g, 298.15 K) = − (52.8 ± 2.7) kJ · mol−1, we obtain f mH ο∆
f m
(UTeO5, cr, 298.15 K) = − (1604.4 ± 3.0) kJ · mol−1. The sec-ond law value is H ο∆ (UTeO5, cr, 298.15 K) = − 1611.8 kJ · mol−1, with an unknown uncertainty. These values, particularly the first, are in good agreement with other studies, see section 9.5.3.2.1.
This study thus supports the stability derived from the calorimetric data, and the estimated entropy of UTeO5(cr).
A similar analysis of pressures of TeO2(g) from the decomposition of UTe3O9(cr) by reaction (A.102), has been carried out, using data estimated here: (UTemS ο
3O9, cr,

Discussion of selected references 611
298.15 K) = (305.8 ± 15) J · K−1 · mol−1 and ,mpC (UTe3O9, cr, T) = 278.5 + 8.017 · 10−2 T − 3.44·106 T−2, J · K−1 · mol−1, to calculate the thermal functions of UTe3O9(cr). The de-rived third- and second-law enthalpies of reaction (A.102) at 298.15 K are (543.4 ± 2.1) and 562.1 kJ · mol−1 (uncertainty unknown). The derived enthalpies of formation of UTe3O9(cr) then depend on that taken for UTeO5(cr). Using the value of − (1603.1 ± 2.8) kJ · mol−1 selected in section 9.5.3.2.1, the respective third- and second-law enthalpies of formation are f mH∆
2[UO OSi
(UTe3O9, cr, 298.15 K) = − (2252.1 ± 6.4) and − 2270.8 kJ · mol−1, in tolerable agreement (considering the use of estimated thermal functions) with the calo-rimetric value, recalculated from [99BAS/MIS] as − (2275.8 ± 8.0) kJ · mol−1.
UO
[98MOL/GEI] This review includes also the review of [97MOL/GEI].
[97MOL/GEI] is a preliminary version of [98MOL/GEI]. The following discus-sion will mainly refer to the second paper. The equilibrium constant for the reaction:
2+ +2 4 2 3UO Si(OH) (aq) SiO(OH) + H++
was studied using time resolved laser fluorescence spectroscopy (TRLFS) in solutions with constant pH equal to 3.9 and silicic acid concentrations varying from 10−3.8 to 10−2.2 M. The study was made at 20°C in a 0.3 M NaClO4 ionic medium. In order to avoid the for-mation of polysilicates, the test solutions were prepared by hydrolysis of (CH3O)4Si, rather than by neutralizing sodium silicate. The TRLFS method gives information on both the fluorescence spectra and the fluorescence lifetime of the species present in the test solu-tions. Most of these showed bi−exponential fluorescence decay, indicating the presence of two emitting species. One of them is , for which both the lifetime and fluorescence spectrum agree well with previous studies in the binary U(VI)−H
2+2UO
2+free]
2O system e.g., [95ELI/BID]. The second component had a lifetime of 19 µs, which is different from that of UO2OH+, 32.8 µs [95ELI/BID], the predominant hydrolysis species in the pH range studied. The silicic acid solutions in [97MOL/GEI] were prepared by acidifying solutions of sodium silicate (personal information from Dr. Moll). The test solutions contain polysilicates, which result in species with different fluorescence lifetimes. There are two components in solution, one with a lifetime of 36 µs, and the other with a lifetime longer than 95 µs. The experimental results of these two studies demonstrate the interaction be-tween and dissolved silica. They also show that one may neglect the formation of hydroxide complexes in most of the test solutions. UO
2+2UO
10log
2OH+ is the predominant ura-nium(VI) hydroxide complex under the experimental conditions used. Using the known equilibrium constant from [92GRE/FUG], we find that the ratio, [ ]/[UO2+
2UO 2OH+], is less than 0.05 at pH = 3.9 and hydrolysis will not affect the interpretation of the data sig-nificantly. The assumed complex formation reaction requires a slope close to one in the plot of ( − pH) versus log+
3 2(OH) ] /[UO 10[Si(OH)4(aq)]; the authors re-port (0.80 ± 0.13), cf. Figure 4 in [98MOL/GEI]. This review prefers to put a smaller weight on the experimental point at the lowest concentration of silicic acid and thereby

Discussion of selected references 612
obtains a slope of 0.95, which gives better agreement between the experimental data and the proposed model. This will result in a larger equilibrium constant,
= − (1.85 ± 0.20). The authors have made their experiments at a constant pH of 3.9. They have not recalculated the measured hydrogen ion activity to con-centrations and their equilibrium constant must therefore be recalculated to obtain the con-centration constant. This was done using the specific ion interaction theory with the inter-action coefficient = 0.14 kg · mol
+10 2 3log (UO SiO(OH) )b
+(H ,ε 4 ClO )− −1. We find +10 Hlog γ = − 0.111 in the 0.3 M
NaClO4 ionic medium used. The recalculated value of l is then − (1.74 ± 0.20). The extrapolation to zero ionic strength was made using the SIT and the interaction coefficients given in [92GRE/FUG] and assuming = 0.3 kg · mol
+2 3UO SiO(OH) )
+2SiO(OH) )
(
10*og (K
(UOε
+3OH) )
2+2UO
3−1, and gave = − (1.44 ± 0.20). The value of [71POR/WEB],
recalculated to zero ionic strength is = − 1.71, and the two val-ues agree within their estimated range of uncertainty. The term,
, in the various test solutions varies from − 0.4 to 0.7, i.e., the silicate complex is a major species in most of the test solutions. With an equilibrium constant ten times smaller, as suggested in [98JEN/CHO], would have been pre-dominant, which is not consistent with the spectroscopic observations.
+3SiO(OH) )10
*log10
*log K
+10 2 3log [UO OSi(OH) ] /[U
2(UOο
2+2O ]
2(UO SiOK ο
[98MOU/LAS] This paper gives the characteristics of fluorescence spectra of the U(VI) species, 1:1, 2:1, 3:1, 2:2, 5:3 and 7:3, in carbonate-free solutions (I = 0.1 M NaClO4, t = 20°C) obtained by dilutions and pH adjustments (NaOH) of a stock solution under a N2 atmosphere. The stock solution is prepared by dissolution of U metal in HClO4 and the initial uranium con-centration is measured by mass spectrometry.
pH and [U(VI)]t concentrations of the test solutions submitted to laser excitation are chosen according to the thermodynamic data selected by [92GRE/FUG] for all the spe-cies, except for the species 2:1 [80LEM/TRE], to have the smallest number of species con-sistent with spectroscopic data (no more than three). Gate delays and duration time of the measurements are selected in such a way that only one complex, one fluorescence lifetime, could be registered. The authors did not correct the hydrolysis constant for I = 0.1 M and did not take into account the uncertainties of the constants.
The appropriate conditions to find the species in the solutions are the following: species 0:1, 4·10−7 M, pH = 4; species 1:1 + 0:1, 4·10−8 M, pH = 5; species 3:1, 4·10−7 M, pH = 8.5 and 4·10−8 M, pH = 10 and 4·10−6 M, pH = 9.5; species 2:1 + 1:1 + 3:1, 4·10−8 M, pH = 7; species 5:3, 4·10−6 M, pH = 6.8 and 4·10−5 M, pH = 6.5; species 7:3 + 3:1, 4·10−5 M, pH = 8.5.
Despite the fact that the thermodynamic data used are open to criticism, different well-resolved individual spectra and decay lifetimes (except for 2:1 species) of each spe-cies are given and compared to previous data. Good agreement is found for 0:1 and 2:2, but the other species’ lifetimes are found to be longer. The longer the lifetime (single ex-

Discussion of selected references 613
ponential), the smaller is the influence of artefacts (quenching, temperature effect, etc.). Table A-38 summarises the data.
Some spectroscopic features are also given. The vibrational quantum is rather constant for all spectra, which shows that hydrolysis has no (or little) effect on the ground state of the UO2 group. Red shifts and broadening of peaks are observed as hydrolysis pro-gresses, but no clear trend is observed on the lifetime of mononuclear species while for polymeric species, an increase is clearly seen. Peak positions do not depend on the excita-tion wavelength, but the intensities are dependent.
The methodology followed by the authors in setting up the data is the same as in [95ELI/BID] (but different from that of [94KAT/MEI] for species, 2:2 and 5:3).
Table A-38: Spectroscopic characterisation of 0:1, 1:1, 2:1, 3:1, 2:2, 5:3 and 7:3 species.
Species Main fluorescence wavelength (nm) Fluorescence lifetime (µs) Reference
0:1 488, 509, 533, 559 489, 510, 535, 560 488, 509, 534, 560
(2 ± 0.1) (1.7 ± 0.2) 0.9
[98MOU/LAS] [95ELI/BID] [94KAT/MEI]
1:1 497, 519, 544, 570 496, 518, 542, 566
(80 ± 5) (32.8 ± 2)
[98MOU/LAS] [95ELI/BID]
2:1 488, 508, 534, 558 10−20 (3.2 ± 0.2)
[98MOU/LAS] [95ELI/BID]
3:1 499, 519, 543, 567 506, 524, 555, 568
(0.8 ± 0.1) (0.4 ± 0.1)
[98MOU/LAS] [95ELI/BID]
2:2 497, 519, 542, 570 498, 518, 544 499, 519, 542, 566
(9 ± 1) (9.5 ± 0.3) 2.9
[98MOU/LAS] [95ELI/BID] [94KAT/MEI]
5:3 496, 5514, 535, 556 515, 536 500, 516, 533, 554
(23 ± 3) (6.6 ± 0.3) 7
[98MOU/LAS] [95ELI/BID] [94KAT/MEI]
7:3 503, 523, 547, 574 (230 ± 20) (10 ± 2)
[98MOU/LAS] [95ELI/BID]
[98NAK/NIS] Pressures of nitrogen were measured in the 2 3 xU N +α − single-phase region for
. The starting material with 0.26 x 0.52< < N / U 1.80> was prepared from (s) and 3UH3NH (g) by heating at successive temperatures of 873 and 1273 K. Nitrogen pressures
(0.001 to 0.2 bar) were measured from 673 to 1173 K; equilibrium was assumed to have been achieved when no pressure change was observed after 20 hours. The partial molal enthalpies and entropies of solution of 2N (g) were compared with earlier data, but not the pressures or Gibbs energies.

Discussion of selected references 614
Such non-stoichiometric systems are not considered in any detail in the NEA-TDB reviews, and thus this paper contains no data relevant to this review.
[98NEC/FAN] This report contains a review of the literature on the aqueous americium(III) and cu-rium(III) complexes with numerous inorganic ligands. Based on selected literature data and (partly preliminary) experimental data of Fanghänel et al., the authors applied the Pitzer approach for the thermodynamic modelling of trivalent actinides in NaCl solution. Considering Cm(III) as an analogue for Am(III) the authors proposed a comprehensive set of ion interaction Pitzer parameters and equilibrium constants at I = 0 and 25°C, without distinguishing between these two actinides. Literature data for aqueous Eu(III) and Nd(III) were also presented for comparison. The evaluated thermodynamic data and Pitzer pa-rameters for aqueous An(III) ions and complexes were used to calculate the solubility of Am(III) hydroxide and carbonate solids as a function of the H+ and 2
3CO − concentrations up to concentrated NaCl. The results were compared with solubility data available from the literature.
The cited experimental data of Fanghänel et al., time resolved laser fluorescence studies of the aqueous Cm(III) complexes with chloride [95FAN/KIM], [97KON/FAN], hydroxide [94FAN/KIM], carbonate [98FAN/WEG], [98FAN/WEG2], [99FAN/KON], fluoride [99AAS/STE], silicate [97STE/FAN] and sulphate [96PAV/FAN], are also pub-lished in a series of papers. These papers are discussed in the corresponding sections and in Appendix A of the present review and the experimental data are re-analysed by applying the SIT instead of the Pitzer approach.
The only experimental data in this report, which were not published elsewhere, are cited as unpublished results of Könnecke, Paviet-Hartmann, Fanghänel and Kim. They are aimed at the study of Cm(III) sulphate complexes as a function of ionic strength in two series of 0.15 and 0.55 m Na2SO4 solutions containing 0 - 5.8 m NaCl at pH = 2. They are a continuation of the study at I = 3 mol · kg−1 (NaCl-Na2SO4) [96PAV/FAN], where the experimental procedures were described in detail.
Applying the Pitzer approach the authors calculated the formation constants, = 3.25 and lo = 3.70, for 10 1log οb 10 2g οb 4AnSO+ and 4 2An(SO )− , respectively, without
giving uncertainty limits, for the reactions: 3+ 2 3 2
4An + SO An(SO ) nnn −
4− (A.105)
The present review recalculates the formation constants at zero ionic strength by applying the SIT to the experimental data at I ≤ 4 (cf. Figure 12-8, section 12.5.1.1) and obtains:
10 1log οb (A.105) = (3.28 ± 0.03) and ∆ε1 = − (0.14 ± 0.02) kg · mol−1
and

Discussion of selected references 615
10 2log οb (A.105) = (3.59 ± 0.03) and ∆ε2 = − (0.24 ± 0.01) kg · mol−1.
It is to be noted that the electrolyte mixtures include considerable sulphate con-centrations. By applying the SIT only to the two lo 10 1g οb values in 0.15 and 0.55 m Na2SO4 without additions of NaCl, a somewhat different constant of = (3.15 ± 0.03) is obtained, but the value of ∆ε
10 1log οb1 = − 0.14 kg · mol−1 is the same.
[98NEC/KON] These authors determined Pitzer ion−interaction parameters for the system: Cs+/Na+/K+/Mg2+/Cl− / SO /2
4−
4TcO− /H2O at 25°C and measured the solubility of CsTcO4(cr) in pure water, and in MgCl2, Mg2SO4, Na2SO4 and Cs2SO4 solutions at 298.15 K. The solubility of CsTcO4(cr) is so low that its component ions were considered as trace components of the solution. The authors use a previously measured value of
10 ,0log sK ο = − (3.607 ± 0.023) [97KON/NEC], which when combined with = − 0.001 [97KON/NEC] and
4 4
+4Cs /TcO /Cl− −Ψ
2/ SOTcO− −θ = 0.179 [98NEC/KON2], gives 4 4
= 0.0242. The remaining Pitzer parameters were derived mainly from [84HAR/MOL] and measurements of Rard and Miller [82RAR/MIL]. An analysis of the
+ 2Cs /TcO /SO−Ψ
,0
−
10log sK values for the four media using the SIT by this review gave a linear relationship with the ionic strength only for MgCl2 solutions (truncated at an ionic strength of 7 m). This is not sur-prising. Activity coefficients in sulphate systems are notoriously difficult to model. Fixing
10 ,0log sK ο
,0( /sK ο
at − 3.607 resulted in a ∆ε value of − (0.0335 ± 0.0027) kg · mol−1. The mean activity coefficients of CsTcO4(cr) derived from the ion-interaction treatment are shown graphically to reproduce closely the corresponding stoichiometric values, γ± = .
4Cs TcOm m 1/ 2)
[98NEC/KON2] Isopiestic measurements were performed at 298.15 K on pure Mg(TcO4)2 solutions and mixtures of NaTcO4/NaCl, Mg(TcO )2/MgCl2, Mg(TcO4)2/NaTcO4, Mg(TcO4)2/MgSO4, and NaTcO4/Na2SO4, using NaCl and CaCl2 reference solutions, with the concentrations at equilibrium being determined gravimetrically. The authors list the binary Pitzer parameters for NaTcO4(cr) from [97KON/NEC] as:
4+
(0)Na / TcO
β − = 0.01111, 4
β +(1)Na / TcO− = 0.1595, and
4= 0.00236. From the present isopiestic study of Mg(TcO+Na / TcO
C −ϕ
4)2 (0.16 − 3.8 m), the binary parameters are reported as:
4β 2+
(0)Mg / TcO− = 0.3138,
42+
(1)Mg / TcOβ − = 1.840, and
4=
0.0114. The solubility of KTcO2+Mg / TcO
C −ϕ
4(cr) was measured at 25°C in KCl, K2SO4, MgCl2 and CaCl2 solutions. From the results in KCl (and taking
4TcO / Cl− −θ = 0.067 [97KON/NEC]), it was determined that lo 10 ,0g sK ο (KTcO4) = − (2.239 ± 0.013),
4= − 0.0578,
4= 0.006, and
4= 0, and
4
+(0)K / Tβ
cO−
+(1)K / TcOβ − +K / TcO−
ϕC +K / TcO / Cl− −Ψ
4O
= − 0.0113 (where the covariance of the latter two parameters was so large that only one value could be justified). The solubil-ity of KTcO4(cr) in pure water was measured at (0.1040 ± 0.0015) mol · kg−1. The solubil-ity data for KTcO4(cr) in CaCl2 solutions (≤ 4.36 m) yielded the parameters:
4=
0.2964, = 1.661, 2+
(0)Ca / TcOβ −
2+4
(1)Ca / TcO−β 2+Ca / Tc
C −ϕ = 0, and 2+Ca / T 4 / ClcO− −Ψ = − 0.033. The mixing parame-
4

Discussion of selected references 616
ter, 4
2+Mg / TcO / Cl− −Ψ = − 0.0115, was determined from the solubility data for KTcO4(cr) in MgCl2 solutions (≤ 4.65 m). From the osmotic coefficient measurements of the sulphate mixtures and the solubility of KTcO4(cr) in K2SO4 (≤ 0.62 m), the following mixing pa-rameters were reported:
4 4= 0.179,
4 42TcO / SO−θ − 2+Na /TcO / SO− −Ψ = − 0.003,
4 4+K /TcO / SO− 2−Ψ = 0.002,
4 4= − 0.030. Isopiestic measurements in Mg(TcO2+ 2/TcO / SO− −Mg
Ψ 4)2/NaTcO4 mixtures yielded the ternary parameter, + 2Na /Mg +
4/TcO−Ψ = − 0.020 given that + 2+Na / Mgθ = 0.07 (cf.
[84HAR/MOL]).
10 ,0*g sK ο
+ +22 5Np O (cr) H NpO + +
f mGο∆
f∆
f H ο
mS ο
,0lo sο
19O / bar− ≤ ≤p
[98PAN/CAM] The experimental data and results reported in this paper were already published in an ear-lier report of the same authors [95PAN/CAM], which has been extensively discussed in the NEA-TDB review of neptunium and plutonium [2001LEM/FUG]. The reported solubility data at pH < 8 refer to a solubility constant of lo = (3.90 ± 0.02) for the reaction:
21 1 H O(l)2 2
and (Np2O5, cr, 298.15 K) = − (2008 ± 11) kJ · mol−1, which is considerably less negative than (NpmGο
2O5, cr, 298.15 K) = − (2031.6 ± 11.2) kJ · mol−1 calculated in [2001LEM/FUG] for ideal crystalline Np2O5(cr) with the selected values of m∆ (Np2O5, cr, 298.15 K) = − (2162.7 ± 9.5) kJ · mol−1 and (Np2O5, cr, 298.15 K) = (174 ± 20) J · K–1 · mol−1.
The conclusion that the Np2O5(cr) samples used in the solubility experiments might have had large numbers of active sites on the surface [2001LEM/FUG] is supported by the lower solubilities measured by Efurd et al. [98EFU/RUN] with poorly crystalline Np2O5(s, hydr.) ( 10
*g K = (2.6 ± 0.4)).
[98PIA/TOU] Using the same high temperature X−ray diffraction techniques as in two other publications [94TOU/PIA], [99PIA/TOU], the authors studied the reaction between UO2 and CaCO3 (1/1), UO2 and CaO (Ca/U = 1, 2 or 3), together with the thermal decomposition of Ca3UO6, CaUO4 and Ca2UO5 at oxygen pressures in the range
210 1 . The
rhombohedral phase, "α−CaUO4", has a large homogeneity range, extending down to O/U = 3.15 according to the authors. The lattice parameters at 293 K given for the samples containing the highest and the lowest O/U ratios are in reasonable agreement with earlier literature results.
A monoclinic "CaUO3" perovskite phase, not previously described in the litera-ture, with an O/U ratio of ca. 3, is observed between 1573 and 1753 K, under the most reducing conditions. It is described as being isomorphous with Ca3UO6 (space group P21), which can be written Ca2(Ca,U)O6, but less distorted and with distinctly larger lattice pa-rameters. The decrease in lattice dimensions from CaUO3 to Ca2(Ca,U)O6 is attributed to the replacement of U(IV) by the smaller U(VI). The authors also attribute the limited sta-bility of "CaUO3", to the fact that the Goldschmidt tolerance factor ([70GOO/LON] page

Discussion of selected references 617
132) is so close to the limit of existence of this structure. Given the uncertainty in the stoichiometry of the CaUO3 described in this paper, the results of [98PIA/TOU] are not incompatible with the previously described trend (see, for instance, [90GOU/HAI], [93FUG/HAI]) of a decreasing stability, with reference to the binary component oxides, of the M(II)M'(IV)O3 oxides, with the decreasing size of the M(II) ion and the increasing size of the M'(IV) ion. The authors also give arguments for a monoclinic − to − orthorhombic transformation of the "CaUO3" phase around 1773 K.
Above ca. 1773 K, under reducing conditions, a fluorite solid solution U1−δCaδO2−δ is formed.
The authors also present a schematic pseudo-binary UO2−CaO phase diagram, but provide no thermodynamic data.
[98RAI/FEL] This is a continuation of [95RAI/FEL], where Rai et al. make an attempt to quantify previ-ous experimental information and propose stoichiometric compositions and equilibrium constants for the ternary hydroxide/carbonate complexes of U(IV). One part of the paper describes an EXAFS study of the structure of 6
3 5U(CO ) − , the limiting carbonate complex. This provides an excellent, non-thermodynamic, confirmation of the stoichiometry and mode of coordination in this complex. It was helpful to have more details on the EXAFS data, including an estimate of the uncertainty in the estimated parameters. The presence of
in the test solutions was confirmed by spectrophotometry. However, the quanti-tative interpretation of the solubility data is not satisfactory in the opinion of the reviewers. The experimental methods used are excellent and precautions have been taken to ensure that the uranium is present as U(IV). This turned out to be impossible at high concentra-tions of hydroxide (> 0.11 m) and at low carbonate concentrations, cf. Table 1 in [98RAI/FEL]. Despite the precautions taken one cannot rule out that the measured solubil-ity might be affected by the presence of U(VI). The authors use the Pitzer model to inter-pret their experimental results. This is fine in principle. However, when using experimental data for a simultaneous determination of the equilibrium constant at zero ionic strength and a set of interaction parameters for the complexes, one is faced with a large correlation be-tween the parameters. The problems are described in Chapter IX of [97ALL/BAN]. Hence it is essential to present an error estimate of the quantities deduced. Rai et al. [98RAI/FEL] have not done this. The agreement between the experimental solubility and that calculated from the proposed model is unsatisfactory as shown in the figures of this paper. The most important step in any interpretation of experimental data is to establish the chemical model, i.e., the stoichiometry of the complexes. The experimental data in Na
43 4U(CO ) −
2CO3 solu-tions indicate the predominance of the well-established 6
3 5U(CO ) − , but also a large devia-tion between the measured and calculated solubility at carbonate concentrations larger than 1 m. Figure 5 of [95RAI/FEL] indicates that this can be up to 0.5 logarithmic units. No explanation is given for this discrepancy. The deviations both in the slope and the meas-

Discussion of selected references 618
ured solubility are even larger in the K2CO3 system. As the limiting complex is well estab-lished this review suggests that the observed deviations are a result of oxidation of U(IV) and/or the formation of additional complexes. The Pitzer parameters used are estimates but seem to be reasonable.
In regard to the data obtained in solutions of alkali carbonate and alkali hydrox-ide, the experimental data given in Figure 6 of [95RAI/FEL] show very clearly that the stoichiometry proposed by Rai et al. is incorrect. A slope of two is in much better agree-ment with the experimental data, indicating that the predominant equilibrium in these solu-tions may involve two OH− ions on the product side, i.e.,
2 (2 3 2 3 2UO (am) + CO + 2H O(l) U(CO ) (OH) + 2OHx
xx 2 2 )− − −
where the reviewers suggest the value of x is equal to three or four. This would retain a high coordination number for U(IV), eight or ten, and involve the replacement of only one or two coordinated carbonate ligands. Slope analysis can be used in this case because K2CO3 is present in much larger concentrations than NaOH, and thus acts as an ionic me-dium. The reviewers have used the data in their Table A2, which contains the two-day ex-periments to calculate the following solubility equilibrium:
2 62 3 2 3 4 2UO (am) + 4CO + 2H O(l) U(CO ) (OH) + 2OH− − −
for which 2
10 s 10 10 10 3log = log + 2 log [OH ] 4 log [CO ]K s − −− = − (5.47 ± 0.25)
where s is the measured solubility. This is a concentration equilibrium constant valid in the ionic medium used, i.e., 3 m K2CO3 + NaOH (0.01 − 0.1) m.
The data in bicarbonate solutions have also been reinterpreted. Slope analysis of the data in NaHCO3 solutions indicates clearly the presence of 6
3 5U(CO ) − as the limiting complex. The decrease in slope observed at the lower bicarbonate concentrations is not due to the presence of 2
2 3U(OH) (CO )2− as suggested by Rai et al., whereas the formation of
seems also probable. There may be problems with the experimental data, with evidence of extensive oxidation at low bicarbonate concentrations. The data in KHCO
43 4U(CO ) −
3 solutions deviate strongly from the quantitative model used by Rai et al. The majority of the experimental data fall close on a line with the slope of five. To conclude, the quantita-tive equilibrium constants and the Pitzer parameters proposed by Rai et al. describe the measured solubility fairly well, but they are better regarded as phenomenological parame-ters until an independent verification of the speciation is available. Rai et al. proposed a solubility constant of 10 ,5log sK ο for the reaction:
2 62 2 3 3 5UO (am) + 2 H O(l) + 5 CO U(CO ) + 4OH− − −
without giving uncertainty limits. If we combine the value 10 ,5log sK ο = − 22.15 proposed by Rai et al. with the corresponding equilibrium constants for the reactions:
UO2(am) + 4H+ U4+ + 2 H2O(l)
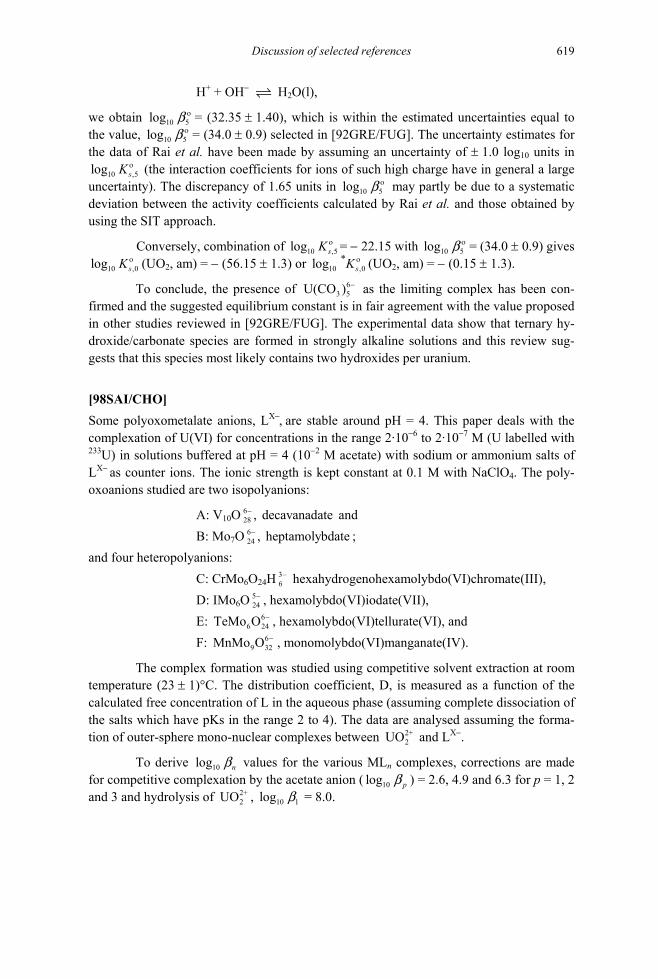
Discussion of selected references 619
H+ + OH− H2O(l),
we obtain = (32.35 ± 1.40), which is within the estimated uncertainties equal to the value, = (34.0 ± 0.9) selected in [92GRE/FUG]. The uncertainty estimates for the data of Rai et al. have been made by assuming an uncertainty of ± 1.0 log
10 5log οb10 5log οb
10 units in 10 ,5log sK ο (the interaction coefficients for ions of such high charge have in general a large
uncertainty). The discrepancy of 1.65 units in 10 5log οb may partly be due to a systematic deviation between the activity coefficients calculated by Rai et al. and those obtained by using the SIT approach.
Conversely, combination of 10 ,5log sK ο = − 22.15 with 10 5log οb = (34.0 ± 0.9) gives 10 ,0log sK ο (UO2, am) = − (56.15 ± 1.3) or 10log ,0
*sK ο (UO2, am) = − (0.15 ± 1.3).
6−To conclude, the presence of 3 5U(CO ) as the limiting complex has been con-firmed and the suggested equilibrium constant is in fair agreement with the value proposed in other studies reviewed in [92GRE/FUG]. The experimental data show that ternary hy-droxide/carbonate species are formed in strongly alkaline solutions and this review sug-gests that this species most likely contains two hydroxides per uranium.
[98SAI/CHO] Some polyoxometalate anions, LX−, are stable around pH = 4. This paper deals with the complexation of U(VI) for concentrations in the range 2·10−6 to 2·10−7 M (U labelled with 233U) in solutions buffered at pH = 4 (10−2 M acetate) with sodium or ammonium salts of LX− as counter ions. The ionic strength is kept constant at 0.1 M with NaClO4. The poly-oxoanions studied are two isopolyanions:
A: V10O 628 and , decavanadate−
− B: Mo7O 624 , hept ; amolybdate
and four heteropolyanions: C: CrMo6O24H 3
6− hexahydrogenohexamolybdo(VI)chromate(III),
D: IMo6O 524
− , hexamolybdo(VI)iodate(VII), 6 E: Te 6 24Mo O − , hexamolybdo(VI)tellurate(VI), and 6− F: 9 32MnMo O , monomolybdo(VI)manganate(IV).
The complex formation was studied using competitive solvent extraction at room temperature (23 ± 1)°C. The distribution coefficient, D, is measured as a function of the calculated free concentration of L in the aqueous phase (assuming complete dissociation of the salts which have pKs in the range 2 to 4). The data are analysed assuming the forma-tion of outer-sphere mono-nuclear complexes between and L2+
2UO X−.
To derive lo values for the various ML10g nb n complexes, corrections are made for competitive complexation by the acetate anion ( lo 10g pb ) = 2.6, 4.9 and 6.3 for p = 1, 2 and 3 and hydrolysis of , = 8.0. 2+
2UO 10 1log b
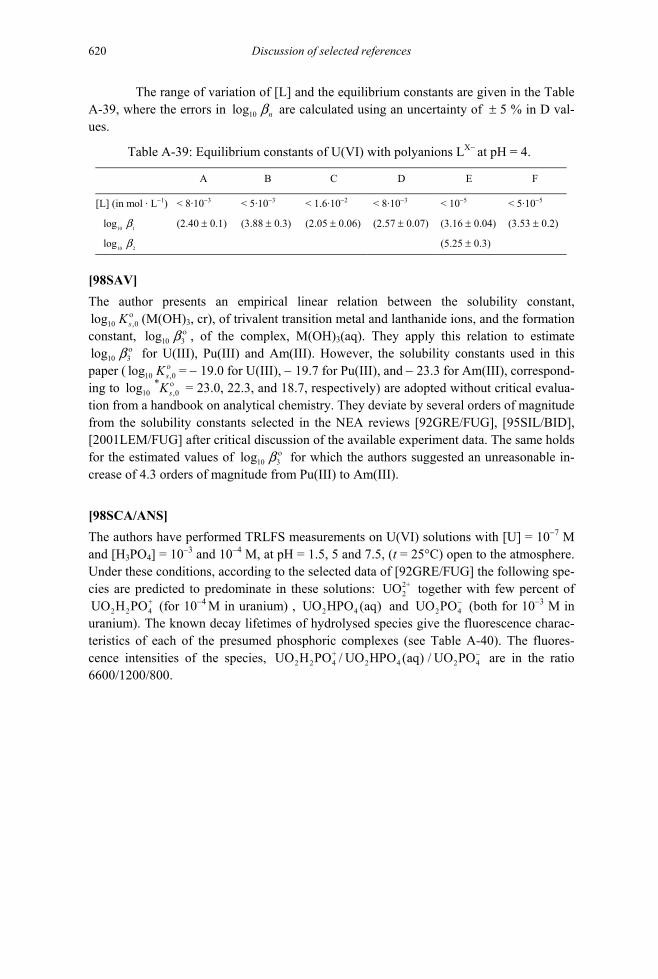
Discussion of selected references 620
The range of variation of [L] and the equilibrium constants are given in the Table A-39, where the errors in are calculated using an uncertainty of ± 5 % in D val-ues.
10log nb
Table A-39: Equilibrium constants of U(VI) with polyanions LX− at pH = 4.
A B C D E F
[L] (in mol · L−1) < 8·10−3 < 5·10−3 < 1.6·10−2 < 8·10−3 < 10−5 < 5·10−5
10 1log b (2.40 ± 0.1) (3.88 ± 0.3) (2.05 ± 0.06) (2.57 ± 0.07) (3.16 ± 0.04) (3.53 ± 0.2)
10 2log b (5.25 ± 0.3)
[98SAV] The author presents an empirical linear relation between the solubility constant,
10 ,0log sK ο
10 3log οblog
(M(OH)3, cr), of trivalent transition metal and lanthanide ions, and the formation constant, , of the complex, M(OH)10 3log οb
10 ,0
3(aq). They apply this relation to estimate for U(III), Pu(III) and Am(III). However, the solubility constants used in this
paper ( sK ο = − 19.0 for U(III), − 19.7 for Pu(III), and − 23.3 for Am(III), correspond-ing to 10 ,0
*log sK ο = 23.0, 22.3, and 18.7, respectively) are adopted without critical evalua-tion from a handbook on analytical chemistry. They deviate by several orders of magnitude from the solubility constants selected in the NEA reviews [92GRE/FUG], [95SIL/BID], [2001LEM/FUG] after critical discussion of the available experiment data. The same holds for the estimated values of 10 3log οb for which the authors suggested an unreasonable in-crease of 4.3 orders of magnitude from Pu(III) to Am(III).
[98SCA/ANS] The authors have performed TRLFS measurements on U(VI) solutions with [U] = 10−7 M and [H3PO4] = 10−3 and 10−4 M, at pH = 1.5, 5 and 7.5, (t = 25°C) open to the atmosphere. Under these conditions, according to the selected data of [92GRE/FUG] the following spe-cies are predicted to predominate in these solutions: together with few percent of
(for 10
2+2UO
)+2 2 4UO H PO −4 M in uranium) , and 2 4UO HPO (aq 2UO PO4
− (both for 10−3 M in uranium). The known decay lifetimes of hydrolysed species give the fluorescence charac-teristics of each of the presumed phosphoric complexes (see Table A-40). The fluores-cence intensities of the species, / /+
2 2 4H PO UOUO 2 4HPO (aq) 2UO P 4O− are in the ratio 6600/1200/800.

Discussion of selected references 621
Table A-40: Emission wavelengths and lifetimes of emission of , , and .
2+2UO +
2 2 4UO H PO2 4UO HPO (aq) 2 4UO PO−
Species λ max, nm lifetime, µs
2+
2UO 488, 509, 533, 559 (2 ± 0.1) +
2 2 4UO H PO 494, 515, 539, 565 (11 ± 1)
2 4UO HPO (aq)−
497, 519, 543, 570 (6 ± 0.5)
2 4UO PO 499, 520, 544, 571 (24 ± 2)
Ionic strength is not given (I around 10−3 M) and the manner in which the
thermodynamic data have been utilised is not provided. The lifetime of UO does not agree with data of [96BRE/GEI]. These results confirm indirectly the thermodynamic constant selected by [92GRE/FUG].
2 4O (aq)HP
[98SER/RON] This paper is a good review of the problems encountered with spent fuel leaching. It gives the cumulative fraction (%) and normalised cumulative fraction (g·cm−2) of U released into deionised water from UOX, MOX, Simfuels and UO2 as a function of time, over more than 1000 hours in contact with air. The normalised release of uranium is more or less the same, around 10−5 g·cm−2 , after 1000 hours. No other data are measured.
[98SHI] The author reviews published data on the chemistry of actinides in oxidation states (III) to (VII) in alkaline solutions and suggests formal potentials for the couple An(V)/An(IV) in 1 M NaOH. The values suggested for U, Np, Pu, Am and Cm are, − 0.13, 0.13, 0.53, 0.31 and 1.20 V, respectively, against the NHE. The values for U, Pu, Am and Cm are esti-mated from the formal potentials of the Np system in acidic and alkaline solutions by as-suming that the species and their equilibrium constants are the same for all elements. The interpretation of the available experimental data given by Shilov [98SHI] is not straight forward, as activity variations and the formation of sparingly soluble phases have to be taken into account.
The first issue discussed is the formal potential of the Np(VII)/Np(VI) couple where the data (Figure 1 in [98SHI]) indicate a half cell reaction:
2 32 4 4 2 2NpO (OH) + 2OH NpO (OH) + 2H O(l) + e− − − − (A.106).
This speciation of Np(VI) is consistent both with the stoichiometry of the limiting hydroxide complex in the U(VI) system, discussed in section 9.3.2.1., and the X−ray struc-tural data. Shilov discusses the stepwise formation of hydroxide complexes of Np(VII) based on slope analyses of the formal potentials as a function of the activity of OH–. As the formal potential also includes the (unknown) activity coefficients of the Np(VI) and

Discussion of selected references 622
Np(VII) species, only an approximate value of the formal potential for reaction (A.106) equal to 0.38 V, or log10K(A.106) = 6.4, can be estimated from the data in Figure 1 of [98SHI]. In view of these shortcomings, this review does not consider the proposed stoichiometry of the complexes, 4 2 2NpO (H O)− and 2
4 2NpO OH(H O) − to be sufficiently well established to be included in the selected data. The same holds for the analogous con-siderations reported for the system Pu(VII)/Pu(VI).
Shilov [98SHI] also used the formal potential of the Np(VI)/Np(V) couple versus to obtain information of the speciation and suggests that the following electrode
reactions take place in dilute alkali: 10 OH
log a −
+2 2 5 2 3 2 2NpO (H O) + 3OH NpO (OH) (H O) + 4 H O(l)e− − − + (A.107)
where “dilute alkali” corresponds to concentrations between 0.1 and 1 M. It is well known from data reviewed in [2001LEM/FUG] that Np(V) is extensively hydrolysed in this con-centration region. Shilov [98SHI] suggests two other reactions at higher hydroxide concen-trations:
22 2 2 2 4 2NpO (OH) (H O) + 2OH NpO (OH) + H O(l) + n n e− − − − (A.108)
and 2 2
2 3 2 2 4 2NpO (OH) (H O) + OH NpO (OH) + H O(l) + m m− − − e− . (A.109)
As there is no evidence for the formation of Np(V) hydroxide complexes with the stoichiometry, 2
2 3 2NpO (OH) (H O)m− , these proposals are at best speculative. Therefore,
this review does not accept the conclusions drawn by Shilov on the speciation in the Np(VI)/Np(V) system. The selected value in [2001LEM/FUG] for the formal potential of the Np(VI)/Np(V) couple in 1 M HClO4 is 0.743 V. The value in 1 M NaOH estimated from curves 2 and 3 in Figure 1 in [98SHI] is (0.15 ± 0.04) V. Using the selected value for the formation of 2 2NpO (OH)− and an estimated value for the formation of 2
2 4NpO (OH) − from the corresponding U(VI) system, we obtain an estimated value of 0.26 V for the for-mal potential in 1 M NaOH. The deviation from the experimental value is large, indicating that no quantitative conclusions can be drawn from the analysis given by Shilov.
Analogous considerations are reported for the Pu(VI)/Pu(V) system in highly al-kaline solution. The proposed redox equations are based on a Pu(V) speciation including hydroxide complexes with the stoichiometries, 2
2PuO (OH)3− and even . As
mentioned above there is no proof for the existence of such aqueous An(V) hydroxides [2001LEM/FUG].
32PuO (OH) −
4
n−
Shilov [98SHI] also discusses the formal potential of the Np(V)/Np(IV) couple, where the interpretation is complicated by precipitation of Np(OH)4(s). The formal poten-tial was described using the following half-cell reactions:
(A.110) 4 2 4 2 2 2(Np(OH) ) + 2OH + H O(l) (Np(OH) ) + NpO (OH) (H O) + n m e− −
and

Discussion of selected references 623
25 2 2 3 2 2Np(OH) (H O) + 2OH NpO (OH) (H O) + ( ) H O(l) + x m x m− − − − e− . (A.111)
The experimental slope is − 3 and deviates significantly from the values expected from equations (A.110) and (A.111). In addition there is no satisfactory experimental evi-dence for the formation of 5Np(OH)− , cf [2001LEM/FUG].
The formal potential of the Pu(IV)/Pu(III) couple in 0.5 − 14 M NaOH, which is found to be − 0.96 V at = 1, was described with the reaction:
OHa −
3 2 5 2 2Pu(OH) (H O) + 2 OH Pu(OH) (H O) + ( )H O + m x m x e− − − − . (A.112)
The formation of anionic Pu(IV) hydroxide complexes is concluded from solubilities of Pu(OH)
5Pu(OH)−
4(am), which increase from 1.4·10−8 to 9.8·10−6 mol · L−1 in 0.5 − 14 M NaOH. The aqueous form of Pu(III) is assumed to be predominantly Pu(OH)3(aq) in these solutions, in analogy with the speciation of Am(III). The solubility of Am(OH)3(s) is claimed to remain at a constant value of about 1.6·10−6 mol · L−1, in dilute and 3−5 M NaOH. However, as discussed in the section 12.3.2.2 (cf. Table 12-3), these americium concentrations considerably exceed most of the experimental solubility data in alkaline solutions.
This paper was not quoted in [2001LEM/FUG], but it does not provide data that could lead changes in [2001LEM/FUG].
[98SPA/PUI] The problem of analysing experimental data for weak complexes is discussed in the paper. A method is proposed which considers the change of activity coefficients when the ionic medium composition is changed. The method is applied for a reinterpretation of literature data on the formation of nitrate complexes of Pu and Np. It is shown that only the mononi-trato complex of the tetravalent Np and Pu are relevant at I < 6 M and at [ 3NO− ] < 2 M whereas the formation of nitrate complexes of actinides in the penta- and hexavalent state could not be confirmed. It is demonstrated that the complexation constants for An(V) and An(VI) nitrato complexes published in the literature are a result of variations in the activity coefficients caused by changes of the ionic medium when the ligand concentration is in-creased and approaches that of the ionic medium. This is again an example of the impossi-bility of distinguishing between complex formation and activity coefficient variations from experimental solution thermodynamics in systems where weak complexes are formed. The equilibrium constant for the formation of the first complex can be obtained from solutions where the ligand concentration is not too high and the numerical value is less affected by activity factor variations.
The equilibrium constants at infinite dilution are reported for the complexes 3+3NpNO and . Both values are consistent with the formation constants selected in
[92GRE/FUG] for uranium.
3+3PuNO

Discussion of selected references 624
[98WER/SPA] Data on solubilities from two independent sources (The Swedish − SKB programme and USA−Pacific Northwest Lab.), of U, Np, Pu and Am (at 20 − 25°C, under oxic/anoxic conditions, using groundwater/deionised water, and with all samples filtered using the same technique) obtained from spent nuclear fuel are in rather good agreement, but cannot be explained on the basis of thermodynamic data. Both sets of experimental data come from spent nuclear fuel of comparable burn up that have been studied over a period of four to five years. The formation of secondary phases (schoepite ?) is demonstrated but these phases are not characterised.
The speciation of U in the equilibrium solutions was calculated using the data se-lected by [92GRE/FUG]. Under oxic conditions at pH = 7, where schoepite (in fact me-taschoepite) is stable, one expects that the 5:3 species is predominant with a solubility of 10−4 M. However, the measured solubility in deionised water is three to four orders of magnitude lower. If the solubility is determined by the formation of U3O7 on the surface of UO2, a better agreement is obtained (a solubility of 10−7 M as compared to an experimental value of 10−8 M). However, there is no evidence that this phase is formed.
Another factor that must be considered when trying to model chemical processes in this type of « real » system is that mixed phases are formed for which the thermody-namic data for pure phases are not applicable.
The authors have also made modelling calculations assuming Pu(OH)4(am), Np(OH)4(am) and AmOHCO3(am) are the limiting solubility phases, but with little suc-cess.
This paper does not give any data useful for this review.
[98YAM/KIT] This is a solubility study of the system, Na+− OH−− 2+
2UO − 23CO − − Cl 4O− − H2O at 25°C,
with [OH−] ranging from 2·10−3 to 1 M, and 23[CO ]− from 10−3 to 0.5 M. Three different
ionic strengths, 0.5, 1.0 and 2.0 M, were used. The authors have used the solid phase, Na2U2O7·xH2O(cr) (x = 3 − 5), which has been partly characterised by powder X−ray dif-fraction. In order to ensure that solubility equilibrium has been attained, the equilibrium was approached from both under- and over-saturated solutions, with concordant results. The hydrogen ion concentrations have been properly measured, with corrections for liquid junction effects. The experimental solubility equilibria refer to the following reactions:
2 42 2 7 3 2 2 3 3
1 3Na U O (s) + 3 CO + H O(l) UO (CO ) + 3 OH + +Na2 2
− − − (A.113)
and

Discussion of selected references 625
22 2 7 2 2
1 3 +Na U O (s) + ( 3) OH + H O(l) UO (OH) + Nannn − −−
2 2, n = 3 and 4
(A.114)
i.e., the authors have only considered the formation of binary mononuclear complexes. It is unlikely that polynuclear complexes are formed at the low uranium concentrations in the test solutions. The absence of ternary complexes containing both carbonate and hydroxide is more unexpected, and the authors have only been able to make estimates of the maxi-mum values of equilibrium constants for such hypothetical complexes. This review accepts the chemical model, but suggests that additional experimental efforts should be made to establish if ternary complexes are formed, and under what conditions they should be stud-ied. The solid phase used in these experiments should also be better characterised.
The solubility product of the solid expressed as: 2+ 3 +
,0 2 [UO ] [OH ] [Na ]sK ο −=
was determined indirectly using the experimental equilibrium constant for equation (A.113) and the value of the equilibrium constant for the formation of from [92GRE/FUG]. The experimental data were extrapolated to zero ionic strength using the SIT. The following values were obtained for the formation of the tri- and tetra-hydroxide complexes from the components and
42 3 3UO (CO ) −
2+2UO OH− : and
The experimental value of 10 3log = οb
= 0.21(21.1 0.8)±
10 4log = (23.6 0.7).ο ±b ∆ε
3
kg · mol−1 for reaction (A.113) is in good agreement with the value calculated from the revised interaction coeffi-cients given in [95SIL/BID], kg · mol= 0.27∆ε
4 Na
−1. The interaction coefficients between and UO and are equal to − (0.82 ± 0.20) and − 0.16 kg · mol2 3UO (OH)−
2 (OH)2− + −1, respectively. The interaction coefficient for 2 (OH)UO − has a surprisingly large negative value, which differs substantially from the estimate in [92GRE/FUG] − (0.09 ± 0.05) kg · mol−1. The interaction coefficient for 2
4(OH)2UO − , on the other hand, agrees well with the experimental values for both for U(VI) complexes and other anions with a charge of − 2. Water is a reactant in the reactions studied, but the authors have not taken the variations in the activity of water into account when making the ionic strength corrections. The error is small, at most 0.02 log10 units in the reported equilibrium constants at zero ionic strength and less than 0.02 units in .∆ε
The value of 10 ,0log sK ο is − (29.45 ± 1.04), as compared to the value − (30.7 ± 0.5), obtained from the standard Gibbs energies of formation given in [92GRE/FUG]. The latter value was erroneously calculated to be − (28.09 ± 0.47) in [98YAM/KIT]. The authors claim “a definite difference between both values may be … attributed to different solid phases”. The difference, however, is small and within the esti-mated uncertainty of the two determinations.
The state of hydration of the solid phase after equilibrium does not seem to have been determined. If there is a variation in the water content it does not have a large effect on the solubility product. The thermodynamic data for Na2U2O7(cr) are discussed in [92GRE/FUG]. The solubility products obtained from calorimetry and solubility experi-

Discussion of selected references 626
ments are consistent with one another, however, the uncertainty is large in the solubility experiments. In view of the difficulties encountered in the characterisation of the solid phase the two sets of experiments may well refer to solids of different composition, at least of different water content. Yamamura et al. claim that there is a large discrepancy between the equilibrium constant for the formation of 2UO (OH)3
− between this study and a previ-ous investigation by Sandino and Bruno [92SAN/BRU]. We do not agree with this state-ment. Sandino and Bruno used two different phases to determine the stoichiometry and equilibrium constants of anionic uranium(VI) complexes. By using schoepite (in fact me-taschoepite) they obtain 10 3
*log οb for the reaction: 2+ +2 2 2 3UO + 3 H O(l) UO (OH) + 3 H− (A.115)
equal to − (19.90 ± 0.34) and − (20.25 ± 0.19), for an amorphous and crystalline schoepite phase, respectively. These values differ somewhat from those given in [92GRE/FUG], which were taken from Sandino´s thesis [91SAN]. Using and OH2+
2UO − as components, is equal to (22.10 ± 0.34) and (21.75 ± 0.19), respectively. Sandino and Bruno
[92SAN/BRU] also used solubility measurements of (UO10 3log οb
10 3*log οb
2)3(PO4)2 · 4H2O(s) to determine the equilibria in the hydroxide system. The equilibrium constant for reaction (A.115) is
= − (19.74 ± 0.18) and, 10 3log οblog
= (22.26 ± 0.18). The agreement between the different experimental determinations of 10 3
οb
2
in [92SAN/BRU] is satisfactory, taking both the experimental difficulties and the different chemical systems into account. The average value of lo is equal to (22.0 ± 0.4), where the uncertainty covers those in the different experiments. The solubility data for the three phases are thus consistent with the value (21.14 ± 0.79) in [98YAM/KIT]. Yamamura et al. also estimate upper values for the ternary complexes,
10 3g οb
22 3O )(OH)UO (C − ( lo < 22.6) and
( < 23.5) at I = 0.5 M, but give no justification for the proposed stoichiometry. 10g b 4
2 3 2 2(CO ) (OH) −UO10log b
This is a study that clears up some of the contradictory information on the stoichiometry of uranium(VI) hydroxide complexes in alkaline solution. Yamamura et al. seem to be unaware of the study by Palmer and Nguyen−Trung [95PAL/NGU]. Because of the small total concentrations of uranium used in [98YAM/KIT], it is impossible to obtain information as to whether polynuclear species may form at high pH, or not, cf. [95PAL/NGU]. The formation of 2
2UO (OH)4− as the predominant complex, cf.
[2000MOL/REI2], at high hydroxide concentrations is in agreement with a combined theo-retical and experimental study by Wahlgren et al. [99WAH/MOL], but not with the work of Clark et al. [99CLA/CON].
[98YOO/CYN] Uranium metal was studied by X−ray diffraction at pressures up to 100 GPa and tempera-tures up to 4300 K, in a diamond anvil cell, using laser heating. The tetragonal β−phase is stable only to ~3 GPa, (confirming previous work), but the orthorhombic α−phase is stable to ~70 GPa at about 2000 K; the phase in equilibrium with the liquid at all pressures is the γ−phase (bcc). Other findings are:
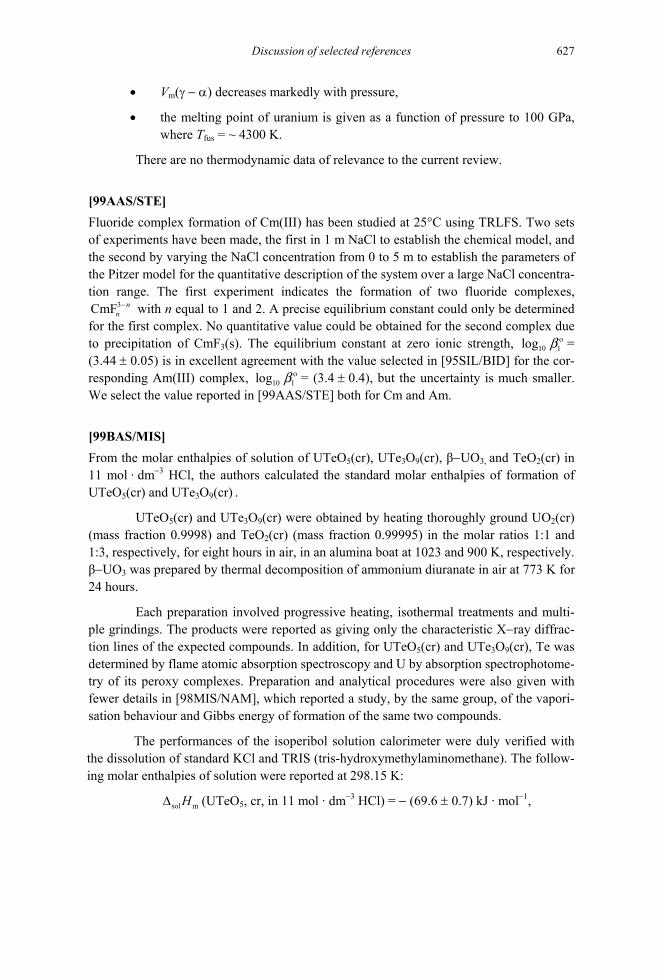
Discussion of selected references 627
• Vm(γ − α) decreases markedly with pressure,
• the melting point of uranium is given as a function of pressure to 100 GPa, where Tfus = ~ 4300 K.
There are no thermodynamic data of relevance to the current review.
[99AAS/STE] Fluoride complex formation of Cm(III) has been studied at 25°C using TRLFS. Two sets of experiments have been made, the first in 1 m NaCl to establish the chemical model, and the second by varying the NaCl concentration from 0 to 5 m to establish the parameters of the Pitzer model for the quantitative description of the system over a large NaCl concentra-tion range. The first experiment indicates the formation of two fluoride complexes,
with n equal to 1 and 2. A precise equilibrium constant could only be determined for the first complex. No quantitative value could be obtained for the second complex due to precipitation of CmF
3CmF nn
−
3(s). The equilibrium constant at zero ionic strength, = (3.44 ± 0.05) is in excellent agreement with the value selected in [95SIL/BID] for the cor-responding Am(III) complex,
10 1log οb
10 1log οb = (3.4 ± 0.4), but the uncertainty is much smaller. We select the value reported in [99AAS/STE] both for Cm and Am.
[99BAS/MIS] From the molar enthalpies of solution of UTeO5(cr), UTe3O9(cr), β−UO3, and TeO2(cr) in 11 mol · dm−3 HCl, the authors calculated the standard molar enthalpies of formation of UTeO5(cr) and UTe3O9(cr) .
UTeO5(cr) and UTe3O9(cr) were obtained by heating thoroughly ground UO2(cr) (mass fraction 0.9998) and TeO2(cr) (mass fraction 0.99995) in the molar ratios 1:1 and 1:3, respectively, for eight hours in air, in an alumina boat at 1023 and 900 K, respectively. β−UO3 was prepared by thermal decomposition of ammonium diuranate in air at 773 K for 24 hours.
Each preparation involved progressive heating, isothermal treatments and multi-ple grindings. The products were reported as giving only the characteristic X−ray diffrac-tion lines of the expected compounds. In addition, for UTeO5(cr) and UTe3O9(cr), Te was determined by flame atomic absorption spectroscopy and U by absorption spectrophotome-try of its peroxy complexes. Preparation and analytical procedures were also given with fewer details in [98MIS/NAM], which reported a study, by the same group, of the vapori-sation behaviour and Gibbs energy of formation of the same two compounds.
The performances of the isoperibol solution calorimeter were duly verified with the dissolution of standard KCl and TRIS (tris-hydroxymethylaminomethane). The follow-ing molar enthalpies of solution were reported at 298.15 K:
sol mH∆ (UTeO5, cr, in 11 mol · dm−3 HCl) = − (69.6 ± 0.7) kJ · mol−1,

Discussion of selected references 628
sol mH∆ (UTe3O9, cr, in 11 mol · dm−3 HCl) = − (142.5 ± 0.8) kJ · mol−1,
sol mH∆ (TeO2, cr, in 11 mol · dm−3 HCl) = − (52.1 ± 0.8) kJ · mol−1,
sol mH∆ (UO3, β, in 11 mol · dm−3 HCl) = − (78.7 ± 0.6) kJ · mol−1,
the uncertainties representing twice the standard deviation of the mean.
With f mH ο∆ (UO3, β, 298.15 K) = − (1220.3 ± 1.3) kJ · mol−1 (selected in [92GRE/FUG], and taken by the authors) and f mH ο∆ (TeO2, cr, 298.15 K) = − (321.0 ± 2.5) kJ · mol−1 (see section 14.1), the enthalpies of formation are recalculated to be:
f mH ο∆ (UTeO5, cr, 298.15 K) = − (1602.5 ± 2.8) kJ · mol−1,
f mH ο∆ (UTe3O9, cr, 298.15 K) = − (2275.8 ± 8.0) kJ · mol−1.
These correspond to enthalpies of formation from the binary oxides (γ−UO3 and TeO2(cr)) of − 57.2 and − 87.5 kJ · mol−1 for UTeO5(cr) and UTe3O9(cr), respectively.
[99BOU/BIL] The fluorescence lifetime of has been reported to vary from 1.4 to 59 µs and to in-crease with the increase of concentration. This paper gives data on τ as a func-tion of HClO
2+2UO
+H 2+2(UO )
4 concentration (10−2 to 12.59 M) in perchloric acid solution and as a function of perchlorate anion concentration in HClO4 + NaClO4 mixtures, up to 8 M ([H+] = 1, 3, 4 and 6 M which is the solubility limit of NaClO4) and finally as the concentration of CF3SO3H (triflic acid, 10−2 to 11.3 M) at room temperature. Triflate forms weaker com-plexes than perchlorate. In perchlorate media the uranium concentration is kept constant at 5·10−4 M (or 10−1 M for absorption spectra). The concentration is not indicated in the tri-flate study, but could be estimated to 10−4 − 10−3 M. All solutions are kept in polyethylene bottles under an inert atmosphere between each measurement.
In perchloric acid and perchlorate media the main fluorescence lines are at the same positions: 488, 509, 534, and 558 nm. τ increases from 1.6 µs (HClO4, 10−2 M) to 91 µs (HClO4, 10 M) and then decreases slightly up to 12 M. The absorption spectra remain unchanged. At constant concentration around 6 M, τ is more or less constant up to [H
4 ClO−
+] = 3 to 4 M. At higher [H+], the fluorescence decay is bi−exponential and can be re-solved into two lifetimes: τ1 = (16.6 ± 0.5) µs and τ2 = (30 ± 2) µs.
Triflic acid and perchloric acid show the same behaviour at concentrations less than 1.5 M. For pure triflic acid, 11.3 M, there is a red shift in the fluorescence spectrum (494, 516, 544, 570 nm) which are those of dioxouranium(VI) triflate in powder form (wavelengths of 494, 516, 544, 570 nm), but the fluorescence lifetimes change in a com-plicated way as the acid concentration increases, being more or less constant up to 6 M (4.5 µs), followed by a drastic increase at 10 M and then a drastic decrease.
These data cannot be explained by the current mechanisms to account for the in-crease of fluorescence lifetimes of dioxouranium(VI) cation versus [H+], which are dis-

Discussion of selected references 629
cussed in some detail. The authors assume the formation of complex above 4.5 M , the existence of which is mainly supported by the increase of both τ and the in-tensity of fluorescence. This paper raises the question of the coordination of the perchlo-rate anion to in concentrated solutions of HClO
+2UO ClO
2+2
4
4ClO−
2+2UO 4 but the arguments presented are not
clear and convincing. An answer to this question is given in additional studies [2001BIL/RUS] and [2001SEM/BOE]. In [2001BIL/RUS] it is shown that the dependen-cies of τ and emission spectra with HClO4 and NaClO4 concentrations (up to 10 M) cannot be attributed to the formation of an inner-sphere complex. That conclusion is based on the study of the quenching process of the fluorescence of by chloride ion. The paper [2001SEM/BOE] deals with EXAFS measurements and shows definitively that is not coordinated to , even in 10 M HClO
UO4ClO−
2+2UO 4 (see Appendix A)
[99CAP/COL] This paper is a comprehensive study of the ionisation and dissociation energies of the gaseous uranium and plutonium oxides by mass spectrometry of molecular beams pro-duced by Knudsen effusion at high temperatures. The values obtained constitute a set of self−consistent quantities which agree with the existing thermodynamic data for these gaseous oxides within the combined uncertainties.
For this review, the only relevant data are the derived dissociation energies of UO(g), UO2(g) and UO3(g), which are, respectively, (7.81 ± 0.1), (15.7 ± 0.2) and (21.6 ± 0.3) eV, where the uncertainty for UO2(g) is estimated here. The temperature for which such values apply is not very clear, but is conventionally taken to be 0 K. Correction to 298.15 K and SI units gives (757.2 ± 9.6), (1521.3 ± 19.3) and (2095.6 ± 28.9) kJ · mol−1 for the dissociation energies at 298.15 K and hence enthalpies of formation of:
f mH ο∆ (UO, g, 298.15 K) = (25.3 ± 12.5) kJ · mol−1,
f mH ο∆ (UO2, g, 298.15 K) = − (489.9 ± 20.8) kJ · mol−1,
f mH ο∆ (UO3, g, 298.15 K) = − (815.1 ± 30.0) kJ · mol−1.
These values are consistent with the TDB-NEA selected values, (35.0 ± 10.0), − (477.8 ± 20.0) and − (799.2 ± 15.0) kJ · mol−1.
[99CAP/VIT] The authors have previously determined equilibrium constants at different temperatures and ionic strengths from measurements of the formal potential, E (the average of two half-wave potentials obtained in cyclic voltammetry). This paper gives results on the variation of (mV/SHE) (± 1 mV) for the M(VI)/M(V) redox potential for M = Pu in 0.3 (I = 0.9 M), 0.5, 1 and 1.5 M Na
( , )E T Iο
2CO3 (I = 4.5 M) solutions between 9 and 65°C, and gives a reinterpretation of data published in [90CAP/VIT] and [92CAP] for M = U. Under the conditions used the solutions are considered to contain the limiting tricarbonato complexes

Discussion of selected references 630
of M. The authors describe with a second degree polynomial and then deduce the temperature dependence of and
( , )E T Iο
ε ∆ε
3
in the SIT model using these data. For the reaction: , the standard redox potential for the
couple is obtained from the and
42 3 3MO (CO ) + MOe− −
42 3 3 2(MO (CO ) / MO (CO )−
2 3 3 2(MO (CO ) / MO (CO )
5−2 3(CO )
53 3 )−
4 53 3 )− −
( ,0)E Tο
( ,0)T∆ε values, and then, ∆ and ∆ are obtained by plotting versus T at constant I, which in turn gives the ionic strength influence when these values are plotted versus I at constant T. Furthermore, con-sidering the relation:
( , )S T Iο ( , )pC T Iο
( , )E T Iο
( )VI) ,
4 53 3) )
− 2 +2
1
MO ) =
(V) log
+
−
2 3( ,0)(MO (CO )
E Tο −
E
3 2/ MO (C
O
( ,0)(MO /E T− ο
(
ο 53 )(UO (C −
mS ο∆
,mpCο∆
Eο
3
3
(V) (VI)
ο
ο
b
(VI)
∆ε
10logb
10 3g οb 10
5
3 (V)οb
+Na )2(UO (COε(U
2
10 3 0 3R ln(10) log
FT ο οb b
the standard redox potential involving aqueous cations can be derived from the values of the formation constants of tricarbonato complexes at I = 0, when known, or the reverse.
Data concerning U in 0.2 M Na2CO3 + 0.6 to 1.4 M NaClO4 are reported as:
(SHE, 298.15 K, 0) 42 3 3 2 3O ) / UO (CO )− = − (779 ± 10) mV,
(the selected value in [92GRE/FUG] is − (752 ± 16)),
(298.15 K, 0) = − (174 ± 5) J · K−1 · mol−1,
(298.15 K, 0) = − (414 ± 176) J · K−1 · mol−1.
From:
(SHE, 298.15 K, 0) = (87.9 ± 1.3) mV, 2+ +2(MO / MO )2
selected in [92GRE/FUG], they derive:
= − (14.65 ± 0.17),
from which using lo = (21.60 ± 0.05) [92GRE/FUG], the value = (6.95 ± 0.18) is proposed.
log
The variation of (T, 0) = with T is also given. At 25°C the value is (0.97 ± 0.1) kg · mol
4 +2 3 3 3 3O (CO ) , Na ) ) ,− −ε −
−1.
All uncertainties in these calculations correspond to 1 σ.
[99CHA/DON] This review includes the review of [98CHA/DON].
[98CHA/DON] describe the mechanism of redox processes involving Am(III), Am(IV), Am(V) and Am(VI) in 1 M HNO3. A table is presented including formation con-
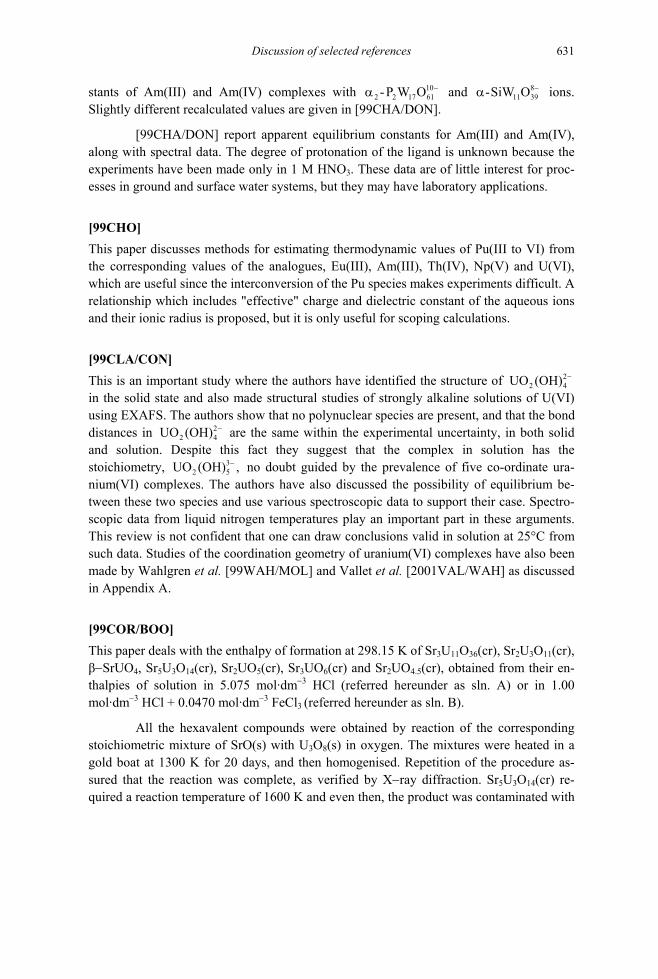
Discussion of selected references 631
stants of Am(III) and Am(IV) complexes with 102 2 17 61-P W O −α and ions.
Slightly different recalculated values are given in [99CHA/DON].
811 39-SiW O −α
[99CHA/DON] report apparent equilibrium constants for Am(III) and Am(IV), along with spectral data. The degree of protonation of the ligand is unknown because the experiments have been made only in 1 M HNO3. These data are of little interest for proc-esses in ground and surface water systems, but they may have laboratory applications.
[99CHO] This paper discusses methods for estimating thermodynamic values of Pu(III to VI) from the corresponding values of the analogues, Eu(III), Am(III), Th(IV), Np(V) and U(VI), which are useful since the interconversion of the Pu species makes experiments difficult. A relationship which includes "effective" charge and dielectric constant of the aqueous ions and their ionic radius is proposed, but it is only useful for scoping calculations.
[99CLA/CON] This is an important study where the authors have identified the structure of in the solid state and also made structural studies of strongly alkaline solutions of U(VI) using EXAFS. The authors show that no polynuclear species are present, and that the bond distances in are the same within the experimental uncertainty, in both solid and solution. Despite this fact they suggest that the complex in solution has the stoichiometry, no doubt guided by the prevalence of five co-ordinate ura-nium(VI) complexes. The authors have also discussed the possibility of equilibrium be-tween these two species and use various spectroscopic data to support their case. Spectro-scopic data from liquid nitrogen temperatures play an important part in these arguments. This review is not confident that one can draw conclusions valid in solution at 25°C from such data. Studies of the coordination geometry of uranium(VI) complexes have also been made by Wahlgren et al. [99WAH/MOL] and Vallet et al. [2001VAL/WAH] as discussed in Appendix A.
22 4UO (OH) −
22UO (OH) −
2UO (OH)
4
35 ,−
[99COR/BOO] This paper deals with the enthalpy of formation at 298.15 K of Sr3U11O36(cr), Sr2U3O11(cr), β−SrUO4, Sr5U3O14(cr), Sr2UO5(cr), Sr3UO6(cr) and Sr2UO4.5(cr), obtained from their en-thalpies of solution in 5.075 mol·dm−3 HCl (referred hereunder as sln. A) or in 1.00 mol·dm−3 HCl + 0.0470 mol·dm−3 FeCl3 (referred hereunder as sln. B).
All the hexavalent compounds were obtained by reaction of the corresponding stoichiometric mixture of SrO(s) with U3O8(s) in oxygen. The mixtures were heated in a gold boat at 1300 K for 20 days, and then homogenised. Repetition of the procedure as-sured that the reaction was complete, as verified by X−ray diffraction. Sr5U3O14(cr) re-quired a reaction temperature of 1600 K and even then, the product was contaminated with
Discussion of selected references 632
SrUO4(cr) or Sr2UO5(cr). Pentavalent Sr2UO4.5(cr) was obtained by reduction in an Ar/H2
gas mixture at 1200 < T < 1300 K. X−ray diffraction and chemical analyses were used to characterise the samples. Sr was determined spectrophotometrically with EDTA after ion exchange separation. U(IV) in the compounds arising from the disproportionation of U(V) was determined titrimetrically with K2Cr2O7, back titrated with Fe2+. U(VI) was also ti-trated with Fe2+ according to a described procedure [79LIN/KON]. All samples were han-dled in an O2 - and H2O - free Ar atmosphere.
The calorimeter and related procedure have been described in earlier publications. The results of the various dissolution experiments are given (including those of mixtures of SrCl2 and UO3 with variable stoichiometric ratios) with a confidence level of twice the standard deviation of the mean and are taken as such by this review. However, the enthal-pies of formation are recalculated here using NEA adopted or NEA compatible auxiliary values, namely:
f mH ο∆ (SrCl2, cr, 298.15 K) = − (833.85 ± 0.70) kJ · mol−1,
f mH ο∆ (Sr(NO3)2, cr, 298.15 K) = − (982.36 ± 0.80) kJ · mol−1,
f mH ο∆ (UO3, γ, 298.15 K) = − (1223.8 ± 1.2) kJ · mol−1,
f mH ο∆ (UCl4, cr, 298.15 K) = − (1018.8 ± 2.5) kJ · mol−1,
f mH∆ (HCl, partial, sln.A) = − (155.835 ± 0.102) kJ · mol−1,
f mH∆ (H2O, partial, sln.A) = − (286.371 ± 0.040) kJ · mol−1,
f mH∆ (HCl, partial, sln.B) = − (164.260 ± 0.110) kJ · mol−1,
f mH∆ (H2O, partial, sln.B) = − (285.850 ± 0.040) kJ · mol−1.
Values in solution B are based on an effective chloride concentration of ca. 1.06 mol · dm−3, calculated to be that arising from the chloride complexing by the ferric ion.
f mH∆ (HNO3, partial, 6.00 mol·dm−3 HNO3) = − (200.315 ± 0.402) kJ · mol−1,
f mH∆ (H2O, partial, 6.00 mol·dm−3 HNO3) = − (286.372 ± 0.040) kJ · mol−1.
• β−SrUO4.
The enthalpies of solution reported by the authors are:
sol mH∆ (SrUO4, β, sln.A) = − (145.20 ± 0.32) kJ · mol−1,
sol mH∆ (1 SrCl2 + 1 γ−UO3, sln.A) = − (98.60 ± 0.62) kJ · (mol UO3)−1.
From these and the above relevant auxiliary values we recalculate:
f mH ο∆ (SrUO4, β, 298.15 K) = − (1985.75 ± 1.57) kJ · mol−1.
The authors also report a new determination of the enthalpy of solution of γ−UO3 in 6.00 mol·dm−3 HNO3 as sol mH∆ (UO3, γ, 6.00 mol·dm−3 HNO3) = − (72.10 ± 0.33)

Discussion of selected references 633
kJ · mol−1. Previous determinations by the same group yielded − (71.30 ± 0.13) kJ · mol−1 [64COR] and − (72.05 ± 0.25) kJ · mol−1 [75COR], cited by [78COR/OHA]. In subsequent calculations involving γ−UO3 in this medium, we will use the weighted average − (71.53 ± 0.50) kJ · mol−1, keeping conservative uncertainty limits. Our recalculation of earlier results on the dissolution of β−SrUO4 in 6.00 mol·dm−3 HNO3 by authors of the same laboratory [67COR/LOO] yield f mH ο∆ (β−SrUO4, cr, 298.15 K) = − (1991.13 ± 2.72) kJ · mol−1.
• Sr3U11O36(cr).
The reported enthalpies of solution are:
sol mH∆ (Sr3U11O36, sln.A) = − (795.11 ± 1.17) kJ · mol−1,
sol mH∆ (0.273 SrCl2 + 1 UO3, γ, sln.A) = − (73.77 ± 0.87) kJ · (mol UO3)−1.
It should be noted that in a previous study by the same group [91COR/VLA] the enthalpy of dissolution of apparently the same sample (as judged from the analytical re-sults) of Sr3U11O36(cr) in 5.0 mol·dm−3 HCl was given without details as − (794.9 ± 1.2) kJ · mol−1; we shall not make use of this less documented result in the present review. We thus recalculate f mH ο∆ (Sr3U11O36, cr, 298.15 K) = − (15903.81 ± 16.45) kJ · mol−1.
The authors note that a compound previously believed [67COR/LOO] to be SrU4O13 (but always containing some U3O8) cannot correspond to a pure phase, in view of new structural results in the range 0.25 < Sr/U < 0.33.
• Sr2U3O11(cr).
The authors only give a recalculation based on earlier results [67COR/LOO], which gave sol mH∆ (Sr2U3O11, 6.00 mol·dm−3 HNO3) = − (357.7 ± 2.1) kJ · mol−1. Using auxiliary data
accepted in this review, we obtain:
f mH ο∆ (Sr2U3O11, cr, 298.15 K) = − (5243.73 ± 4.99) kJ · mol−1..
The small difference from the value selected by [92GRE/FUG] is due to the fact that we have adopted here (see above) a slightly different value for the enthalpy of solution of γ−UO3 in 6.00 mol · dm−3 HNO3 and we calculate slightly larger uncertainty limits (4.99 instead of 4.1).
When using the above auxiliary data, the value for the enthalpy of formation as-sessed by [83FUG] is the same within 0.4 kJ · mol−1.
• Sr5U3O14(cr).
This compound could not be obtained as a pure phase; on the basis of the analyses and the X−ray diffraction pattern, the authors accepted the preparation as consisting of (0.9538 ± 0.0216) mass fraction Sr5U3O14(cr), the remainder being β−SrUO4. This as-sumed composition is necessarily approximate, especially as the Sr/U ratio is not the same in the two compounds. The enthalpy of solution of “as prepared” Sr5U3O14 in solution A

Discussion of selected references 634
was reported as − (592.21 ± 1.08) J · g−1 and was corrected for the known enthalpy of solu-tion of β−SrUO4 to yield − (602.85 ± 1.08) J · g−1. Given the uncertainties in the assump-tions made for those corrections, we will adopt here conservative uncertainty limits, i.e., half the correction for the impurities and take sol mH∆ (Sr5U3O14, pure, sln.A) = − (829.63 ± 5.30) kJ · mol−1. With sol mH∆ (1.667 SrCl2 + 1 γ−UO3, sln.A) = − (121.36 ± 0.45) kJ · (mol UO3)−1 and the adopted auxiliary data, we recalculate and se-lect:
f mH ο∆ (Sr5U3O14, cr, 298.15 K) = − (7248.6 ± 7.5) kJ · mol−1.
This value is noticeably different from that reported, − (7265.8 ± 7.5) kJ · mol−1, even taking into account the different auxiliary data, for an unknown reason.
• Sr2UO4.5(cr).
This pentavalent compound was dissolved in solution B, yielding sol mH∆ (Sr2UO4.5, cr, sln.B) = − (389.97 ± 0.91) kJ · mol−1. The enthalpy of dissolution of the same sample (as shown by the analytical results) in (HCl 0.0470 mol · dm–3 FeCl3 + 82.16 H2O) was given as − (390.66 ± 0.51) kJ · mol−1, without any details, by the same group of authors [94COR/IJD]. We will not make use here of this less documented result.
The enthalpy of solution of the appropriate mixture of SrCl2 and γ−UO3 was also reported as sol mH∆ (4 SrCl2 + 1 γ−UO3, sln.B) = − (259.25 ± 0.50) kJ · (mol UO3)−1. Also used in the cycle is the enthalpy of solution of UCl4(cr), sol mH∆ (UCl4, cr, sln.B) = − (186.67 ± 0.60) kJ · mol−1 (taken from [88COR/OUW] for the dissolution in (HCl + 0.0419 mol · dm–3 FeCl3 + 70.66 H2O).
Using the same cycle as the authors, we recalculate:
f mH ο∆ (Sr2UO4.5, cr, 298.15 K) = − (2493.99 ± 2.75) kJ · mol−1.
The uncertainty limits on this value have been slightly increased to account for the small differences in the media involved in the cycle used by [99COR/BOO].
• Sr3UO6(cr).
The reported enthalpies of solution are sol mH∆ (Sr3UO6, cr, sln.A) = − (560.94 ± 1.43) kJ · mol−1 and sol mH∆ (3 SrCl2 + 1 γ−UO3, sln.A) = − (166.88 ± 0.49) kJ · (mol UO3)−1. Using a cycle analogous to those used for the other U(VI) compounds, we recalculate:
f mH ο∆ (Sr3UO6, cr, 298.15 K) = − (3255.39 ± 2.91) kJ · mol−1.
This value is in marginal agreement with the value − (3263.08 ± 4.24) kJ · mol−1, recalculated from the data of [67COR/LOO] in 6.00 mol · dm−3 HNO3, and with the value of − (3263.95 ± 4.39) kJ · mol−1, based on the results of [83MOR/WIL2] working in 1.00 mol·dm−3 HCl. Note that, for the dissolution of γ−UO3 in 6.00 mol · dm−3 HNO3, a slightly different value (− (71.53 ± 0.50) kJ · mol−1) was used here instead of − (71.30 ± 0.13)

Discussion of selected references 635
kJ · mol−1 taken by [92GRE/FUG]. The value selected by [92GRE/FUG] was f mH ο∆ (Sr3UO6, cr, 298.15 K) = − (3263.4 ± 3.0) kJ · mol−1.
• Sr2UO5(cr).
The reported enthalpies of solution are sol mH∆ (Sr2UO5, cr, sln.B) = − (341.02 ± 1.10) kJ · mol−1 (erroneously listed in the text as − (341.96 ± 1.10)) and sol mH∆ (2SrCl2 + γ−UO3, sln.B) = − (166.36 ± 0.71) kJ · (mol UO3)−1.
From these, we recalculate f mH ο∆ (Sr2UO5, cr, 298.15 K) = − (2631.50 ± 2.31) kJ · mol−1. The value selected in [92GRE/FUG] was − (2635.6 ± 3.4) kJ · mol−1 (which we recalculate as − (2635.88 ± 3.38) kJ · mol−1 with the value used here for the dissolution of γ−UO3) on the basis of earlier results of the same group [67COR/LOO] working in 6.00 mol · dm−3 HNO3. The two values are in marginal agreement.
[99DOC/MOS] The authors report observations on the voltammetric behaviour of U in concentrated car-bonate solutions that confirm the results of a previous study [93MIZ/PAR]. They report that the U(VI)/U(V) couple becomes irreversible compared to behaviour in less complex-ing media and report a formal potential at − 0.78 V versus SCE (the average of cathodic and anodic half-wave potentials 1 2E ).
From a solution of 1 M Na2CO3 (pH = 11.95), and 10 mM U(VI), U(V) is gener-ated by controlled potential coulometry at − 1.2 V versus SCE. This colourless solution is stable enough (two hours) to record EXAFS spectra under N2 atmosphere The EXAFS spectra confirm the existence of 5
2 3 3UO (CO ) − . Full cluster multiple scattering calculations were used to fit the data assuming D3h symmetry. These EXAFS structure parameters, bond distances, Debye−Waller factors and the frequencies of the different distances are reported.
[99FAN/KON] This paper presents a careful thermodynamic analysis of the speciation in the Cm(III)−carbonate−NaCl system based on the Pitzer model. The authors report equilib-rium constants at zero ionic strength and a set of interaction parameters. The Pitzer pa-rameters for Cm3+ are the same as in [97KON/FAN], while the binary interaction parame-ters for the complexes were obtained in the fitting of model parameters to the experimental data. It is of interest to have uncertainty estimates of the various Pitzer parameters. In this way one could explore how sensitive the equilibrium constants at zero ionic strength are to variations in these parameters within the given uncertainty ranges. The authors calculated the following equilibrium constants at zero ionic strength, (A) using only their spectro-scopic data for Cm(III) in 0 − 6 m NaCl and giving no uncertainty limits and (B) including, as well, literature data for Am(III) and Cm(III) carbonate complexes:

Discussion of selected references 636
(A) (B)
10 1log οb 8.30 (8.1 ± 0.3)
10 2log οb 13.52 (13.0 ± 0.6)
10 3log οb 15.52 (15.2 ± 0.4)
10 4log οb 13.36 (13.0 ± 0.5)
In calculation (B) the ionic strength corrections are based on Pitzer parameters determined from the spectroscopic data in 0 − 6 m NaCl. A similar calculation is per-formed in the present review by using the SIT to select the best estimate of the various equilibrium constants. Using the derived parameter set the authors have made a reinterpre-tation of previous solubility experiments from [84BER/KIM], [90FEL/RAI], [91MEI], [94RUN/KIM] and [94GIF], which gives both a valuable comparison between the results of different investigators and also provides a validation of the parameters proposed by Fanghänel et al.
[99FEL/RAI] In this paper Felmy and Rai review the application of Pitzer’s equations for modelling the aqueous thermodynamics of actinide species in natural waters. The paper includes tables of ion interaction parameters and associated standard state equilibrium constants for tri-, tetra-, penta- and hexavalent actinides. Examples comparing experimental data and model calculations are presented for tri- and tetravalent actinides. The applicability of oxidation state analogues, e.g., the use of Nd(III) data for trivalent actinides and the use of Np(V) and U(VI) data for Pu(V) and Pu(VI), is also pointed out.
The solubilities of Am(III) and Nd(III) hydroxides (experimental data at I = 0.1 M from [82SIL], [96RAO/RAI2] and in dilute solutions from [83RAI/STR]) are shown to be the same within experimental uncertainties and similar to that of Pu(III) hydroxide [89FEL/RAI]. The authors present examples which show the applicability of the Pitzer approach for modelling the solubility of Pu(III) hydroxide in concentrated NaCl solutions and the solubility of NdPO4(cr) in molybdate solutions (taken from [95FEL/RAI]). They also present a model for Am(III) in sulphate solutions, which is based solely on ion inter-action parameters, without accounting for Am(III) sulphate complexes (cf. Appendix A, review of [95RAI/FEL2]).
The authors compare their own set of Pitzer parameters for trivalent actinide-carbonate systems with those of Fanghänel et al. [98NEC/FAN], [99FAN/KON] and point out the discrepancies. As a matter of fact, the parameters of these two groups are different because the underlying evaluation procedures are different. Felmy and Rai derived binary interaction parameters for the carbonate complexes of trivalent or tetravalent actinides from data in dilute to concentrated NaHCO3 and Na2CO3 (or KHCO3 and K2CO3) solutions

Discussion of selected references 637
[90FEL/RAI], [96RAO/RAI], [97FEL/RAI], [98RAI/FEL], [99RAI/HES], [99RAI/HES2]. In a second step, additional ternary interaction parameters with chloride were calculated from data in carbonate-chloride mixtures [99FEL/RAI]. Conversely, Fanghänel et al. de-rived binary parameters for tri- and pentavalent actinide species from experimental data in dilute to concentrated NaCl solutions considering CO2
3− and other ligands like OH− and F−,
as trace components [95FAN/NEC] [94FAN/KIM], [98NEC/FAN], [99AAS/STE]. As a consequence the validity of their parameter sets for actinide carbonate systems are limited to carbonate concentrations < 0.1 mol·kg−1. They are not appropriate for concentrated bi-carbonate or carbonate solutions. Conversely, the parameter sets of Felmy and Rai are not appropriate for modelling actinides in chloride solutions of lower carbonate concentrations if they do not include ternary interaction parameters with chloride.
The importance of these ternary interaction parameters is demonstrated by new experimental solubility data for ThO2(am) in 0.1 − 2.3 m Na2CO3 solutions containing 2.33 m or 4.67 m NaCl. Using only the binary parameters for +
3 56Na Th(CO ) −−
Th(CO
derived from solubility data in Na2CO3 solutions [97FEL/RAI], the solubility predicted for the Na2CO3 − NaCl mixtures would be overestimated by orders of magnitude. Modelling of these data requires mixing parameters θ and ψ for the interactions and
. Felmy and Rai [99FEL/RAI] also show that the corresponding ternary interaction parameters with perchlorate, derived in [97FEL/RAI] from ThO
63 5) Cl− − −
+63 5Th(CO ) Cl Na− −− −
2(am) solubilities in Na2CO3 − NaClO4 solutions [94OST/BRU], would underestimate the solu-bility in Na2CO3−NaCl solutions by orders of magnitude. This observation supports the discussion in Appendix D on the importance of ternary interaction coefficients and the different activity coefficients of negatively charged actinide complexes in NaCl and Na-ClO4 solutions.
[99HAS/WAN] The rates of volatilisation from UO2(s) in pure steam, steam/Ar, steam/He and steam/Ar/H2 were measured thermogravimetrically at atmospheric pressure and temperatures from 1523 to 1873 K. The principal aim was to clarify the kinetics and mechanism of the volatilisa-tion process and to assess the validity of selected thermodynamic data needed to interpret the experimental data. The volatilisation rates depended significantly on the flow rates and gas mixtures, and the thermodynamic data recommended by Olander [99OLA] were used to interpret the volatilisation data. Thus there are no new thermodynamic data to be de-rived from this paper.
[99HRN/IRL] This is a detailed study of the interaction between silicate and uranium(VI) made by using a solvent extraction technique. The silicate concentrations varied between 0.01 and 0.067 M in the pH range 3.3 to 4.5. The experiments are made at 25°C in 0.2 M NaClO4. The pH
Discussion of selected references 638
electrodes have been calibrated with buffer solutions and corrections made to convert measured pH to − log10[H+].
[99JAY/IYE] This paper reports measurements of the pressure of K(g) (by mass−loss Knudsen effusion) and the oxygen activity (emf with CaO − ZrO2 electrolyte) in the three-phase field, KUO3(cr) + K2UO4(cr) + K2U2O7(cr), similar to the studies on the corresponding sodium compounds by [94JAY/IYE]. In addition, enthalpy increments of KUO3(cr) and K2U2O7(cr) up to ca. 700 K using a high temperature Calvet calorimeter are reported. The preparative and experimental details for the Gibbs energy measurements were similar to those described in [94JAY/IYE], except that a boron nitride effusion cell was used, rather than a graphite cell.
A number of errors in the paper have been corrected.
The enthalpy increment measurements (and fitted expressions) are those reported in the Conference Proceedings reviewed under [98JAY/IYE]. As noted there, and in sec-tion 9.10.4, these enthalpy data have been refitted.
The potassium pressures were fitted to the equation:
10 Klog ( / bar)p = 12.693 − 23198 T−1, (1265 to 1328 K)
and hence,
KR ln( / bar)T p = − 444123 + 243.006 T kJ · mol−1, (1265 to 1328 K)
over the three-phase field, KUO3(cr) + K2UO4(cr) + K2U2O7(cr).
The authors used a reference electrode of Pt/air (2= 0.21 bar) in their emf cell.
Correction of their emf values to the standard pressure gives, after recalculation: Op
2OR ln( / bar)T p = − 499021 + 276.176 T kJ · mol−1 (941 to 1150 K).
Since there are currently only estimated values [81LIN/BES], [92GRE/FUG], for the entropies of the potassium uranates involved, these data cannot immediately be used to derive further reliable thermodynamic quantities for any of the solids involved.
However, in view of the discrepancies between the experimental and calculated values for the reactions in the corresponding study of the sodium uranates [94JAY/IYE], (possibly due to lack of true equilibrium), we have made a similar comparison for the Gibbs energies, using estimated entropies [81LIN/BES], of the three reactions:
3 KUO3(cr) + K2UO4(cr) + 0.5 O2(g) 2 K2U2O7(cr) + K(g), (A.116)
2 KUO3(cr) + 0.5 O2(g) K2U2O7(cr), (A.117)
KUO3(cr) + K2UO4(cr) K2U2O7(cr) + K(g), (A.118)

Discussion of selected references 639
(see the discussion in [94JAY/IYE] for the relation between these three equations). In ad-dition to the entropy estimates, the heat capacity of K2UO4(cr) was estimated from that of Na2UO4 (cr) (see review of [94JAY/IYE] in Appendix A).
The results are shown in the Table A-41, where the experimental uncertainties are twice the authors' estimates.
Table A-41: Experimental and calculated Gibbs energies of potassium uranate reactions.
T(K) r mG∆ (A.117) (kJ · mol−1) r mG∆ (A.118) (kJ · mol−1) r mG∆ (A.116) (kJ · mol−1)
Exp. Calc. Exp. Calc. Exp. Calc.
900 − (125.1 ± 1.2) − (124.0 ± 15.0) (225.4 ± 0.4) (163.3 ± 15.0) (100.2 ± 1.3) (39.3 ± 22.0)
1000 − (111.4 ± 1.2) − (116.4 ± 15.0) (201.1 ± 0.4) (148.4 ± 15.0) (89.7 ± 1.3) (32.0 ± 22.0)
1100 − (97.6 ± 1.2) − (109.9 ± 15.0) (176.8 ± 0.4) (132.5 ± 15.0) (79.2 ± 1.3) (22.6 ± 22.0)
1200 − (83.8 ± 1.2) − (104.6 ± 15.0) (152.5 ± 0.4) (115.3 ± 15.0) (68.7 ± 1.3) (10.6 ± 22.0)
[99KAS/RUN] This paper is a critical review of the literature on thermodynamic data of Np complexes (hydroxo, carbonato, phosphato) and compounds (hydroxide, oxide, carbonate). Most of the scrutinised papers are considered in [2001LEM/FUG], except for the following: [84ALL/OLO], [85NIT/EDE], [97LAN], [97NOV/ALM], [98ALM/NOV] and [98EFU/RUN]. Zero ionic strength values are calculated for the standard thermodynamic constant values using the SIT, as described in [92GRE/FUG]. For reasons discussed in the paper the authors have selected thermodynamic data only for Np(V) and Np(IV).
• Aqueous ions.
The value, (f mGο∆ +2NpO
2+2
f mGο∆
, 298.15 K) = − (907.9 ± 5.8) kJ · mol−1, is calculated using = (1.161 ± 0.014) V (an average value of [89RIG/ROB] and
[70BRA/COB]) and (
+2 NpO )(NpO /Eο
2+2NpO , 298.15 K) of [76FUG/OET]. The change in gives
a value of Eο
f mGο∆ ( +2NpO , 298.15 K), 7.1 kJ · mol−1 greater than that of [76FUG/OET], but
very close to that selected in [2001LEM/FUG], f mGο∆ ( +2NpO , 298.15 K) = − (907.8 ± 5.6)
kJ · mol−1.
The value, (Npf mGο∆ 4+, 298.15 K) = − (491.1 ± 9.5) kJ · mol−1, is calculated using = (0.596 ± 0.078) V and 4+ +
2(Np / NpO )Eοf mGο∆ ( +
2NpO , 298.15 K) = − (907.9 ± 5.8) kJ · mol−1. Eο comes from a reinterpretation of the value of [52COH/HIN] that seems more precise than that in [76FUG/OET]. This gives a value, 11.8 kJ · mol−1, greater than that of [76FUG/OET] and very close to that in [2001LEM/FUG], f mGο∆ (Np4+, 298.15 K) = − (491.8 ± 5.6) kJ · mol−1.

Discussion of selected references 640
The values proposed by the authors are essentially the same as those selected by [2001LEM/FUG] and no revision is required.
• Hydrolysis.
The values, = (2.7 ± 0.2), 10 1,1log οb 10 2,1log οb = (4.35 ± 0.15) ( 10 1,1*log οb = − (11.3 ± 0.2)
and = − (23.65 ± 0.15)), for Np(V) are those of [92NEC/KIM], obtained from solubility experiments performed under a well-controlled CO
10*log 2,1
οb2-free argon atmosphere.
[2001LEM/FUG] have selected lo 10 1,*g 1
οb = − (11.3 ± 0.7) and = − (23.6 ± 0.5). All these values are in close agreement.
10 2,1*log οb
Using 10 ,0*log sK ο = (1.5 ± 0.3) for NpO2·xH2O(cr) and a solubility of 10−8.3 M at
pH greater than 7 from [87RAI/SWA], Kaszuba and Runde propose, lo = − (10 ± 1). Neck and Kim [99NEC/KIM], [2001NEC/KIM], have proposed a value that the present review considers more accurate (see this Appendix). For the first hydrolysis constant an average value of
10 4,1g οb
10 1,1*log οb
3,1οb
= − (0.4 ± 0.7) is chosen by the authors which is consistent with (UOH10 1,1
*log οb2,1οb
3+) = − (0.54 ± 0.06) selected by [92GRE/FUG]. The hy-drolysis constants, , and 5,1
οb10
*, proposed in the literature are rejected.
[2001LEM/FUG] have selected lo 1,1g οb = − (0.29 ± 1.00) and 10 ,0*glo sK ο =
(1.53 ± 1.00), and a value for 10 4,1log οb equal to − (9.8 ± 1.1).
• Carbonato complexes.
For the well-defined species , n = 1, 2 and 3, the proposed values of the constants are those of [94NEC/RUN] (and of other authors who give very similar values),
= (4.81 ± 0.15),
(1 2 )2 3NpO (CO ) n
n−
10 2g10 1log οb lo οb = (6.55 ± 0.23) and lo 10 3g οb = (5.54 ± 0.19), but in-creasing the uncertainty by 0.09 for the tricarbonato complex. [2001LEM/FUG] have se-lected (4.96 ± 0.06), (6.53 ± 0.10) and (5.50 ± 0.15), respectively.
The situation is less clear with carbonato complexes of Np(IV) with the existence of , n < 5, having not been proven. The limiting complex n = 5 is isostruc-tural with those of U(IV) and Pu(IV) [92GRE/FUG], [95CLA/HOB]. The authors of the present paper adjust (Np(IV)) from (U(IV)) = (34.3 ± 0.9) [92GRE/FUG] by the difference in the
(4 2 )3Np(CO ) n
n−
10 1,0,5log οb 10 1,0,5log οbf mGο∆ (298.15 K)/(298.15⋅R) between Np4+ and U4+
and give (Np(IV)) = (33.9 ± 2.6). There is no rationale given for this and the present review does not accept this estimate. This value is in agreement with
(Th) = (32.3 ± 0.4) [94OST/BRU] and lo (Np(IV)) = 33.4 obtained by [99RAI/HES] (the uncertainty is not given by these authors). By analogy with U(IV),
(Np(IV)) = (35.1 ± 2.6) is proposed.
10 1,log οb
10 1,0,5g οb
10 1,0,4g οb
0,5
lo
lo
10 1,0,5οbg
[2001LEM/FUG] have not selected values for Np(IV) carbonate complexes, but give the following estimated values: = (38.98 ± 1.97) (p. 261) and = (36.69 ± 1.03) (p. 264). The value of comes from [99RAI/HES] who reported a value of (35.62 ± 1.15), which is not accepted in the present review.
10 1,0,5log οb10 1,0,5log οb
10 1,0,4log οb

Discussion of selected references 641
• Hydroxocarbonato complexes.
The existence of mixed complexes has been discussed in several papers, but the arguments based on solubility experiments are not convincing. The recent spectroscopic data of [97NEC/FAN] obtained in 3 M NaOH/Na2CO3/NaClO4 are corrected by the authors to zero ionic strength using the SIT parameters of 3
2 3 2NpO (CO ) − and 52 3 3NpO (CO ) −
[94NEC/RUN] to get = (7.1 ± 0.8) and = (6.0 ± 0.6) for 10 1,2,1log οb 10 1,1,2log οb3
2 2 3NpO (OH) (CO ) − and 42 3 2NpO (OH)(CO ) − . These values are considered as a first ap-
proximation. [2001LEM/FUG] have not selected any values although the same literature data have been considered.
• Phosphato complexes.
Only one complex, 2 4NpO HPO− , is well established. The value, lo 10g οb = (2.9 ± 0.6), is an average from several literature values. [2001LEM/FUG] have selected = (2.95 ± 0.10) for this Np(V) species. For other complexes the information is conflicting.
10log οb
No experimental data have been published for the Np(IV) phosphate system. There are only estimations.
• Solid phases.
It is well established that in Np(V) solutions Np2O5(s) and NpO2OH(s) are the stable limit-ing solubility phases in the absence of carbonate, while in the presence of carbonate, MNpO2CO3·xH2O(s) and M3NpO2(CO3)2(s) are formed, with the stability ranges depend-ing on the concentrations of carbonate and M.
The thermodynamic solubility products reported by [92NEC/KIM], [95NEC/FAN] and [96RUN/NEU] agree within 0.02 log units for fresh, and 0.07 log units for aged, NpO2OH(s). Average values are 10 ,0log sK ο = − (8.77 ± 0.09) and 10 ,0log sK ο = − (9.48 ± 0.16), respectively.
The recent value of 10 ,0*log sK ο
= (2.6 ± 0.4) for Np2O5(s) [98EFU/RUN] obtained from solubility measurements agrees with that of [94MER/FUG], obtained from calo-rimetry, 10 ,0
*log sK ο = (2.25 ± 0.95). It is retained by the authors of this paper.
[2001LEM/FUG] have selected (Table 8.5, p. 126) lo 10 ,0*g sK ο
(NpO2OH, fresh) = (5.3 ± 0.2), 10 ,0
*log sK ο (NpO2OH, aged) = (4.7 ± 0.5) for:
NpO2OH(s) + H+ + H+2NpO 2O(l),
and 10 ,0*log sK ο (Np2O5, cr) = (1.8 ± 1.0) for:
0.5 Np2O5(s) + H+ + 0.5 H+2NpO 2O(l).
The solubility products of NaNpO2CO3·3.5H2O(s) and Na3NpO2(CO3)2(s) given by [95NEC/FAN] and [96RUN/NEU] agree within 0.02 log units. The recommended av-eraged values are 10 ,0log sK ο = − (11.06 ± 0.17) and 10 ,0log sK ο = − (14.28 ± 0.24), respec-tively. [2001LEM/FUG] have selected 10 ,0log sK ο = − (11.16 ± 0.35) for fresh, and

Discussion of selected references 642
10 ,0log sK ο = − (11.66 ± 0.50) for aged (or less hydrated), sodium dioxoneptunium(V) monocarbonate (p. 276) and 10 ,0log sK ο = − (14.70 ± 0.66) for the trisodium dioxoneptu-nium(V) dicarbonate (p. 279). The two different values for the monocarbonato phase are an artefact of using erroneous activity coefficients for the carbonate ion at high NaClO4 concentration. All the data from Neck et al. [95NEC/FAN] and Runde et al., [96RUN/NEU] were obtained with aged (more than half a year old) solid phases.
53 3) −
(Puε
10 ,0log sK ο
Solubility data for the corresponding potassium compounds have been obtained in conditions where 2NpO (CO predominates, so the calculated solubility product in-cludes uncertainties of aqueous Np(V) species (± 0.2 log unit). The values, 10 ,0log sK ο = − (13.6 ± 0.1) and 10 ,0log sK ο = − (15.9 ± 0.1) [97NOV/ALM], are considered as a first es-timate by Runde et al. [96RUN/NEU].
NpO2(s) and Np(OH)4(am) are the stable solid phases in Np(IV) systems at low carbonate concentrations. However, as formation constants are not known for carbonato and hydroxo carbonato complexes, their solubility products cannot be calculated, as is the case for Pu(IV). The solubility product of NpO2·xH2O(s) retained by Kaszuba and Runde is that of [87RAI/SWA].
[99KNO/NEC] The first part of this paper deals with the critical survey of Pu(IV) hydrolysis behaviour in non-complexing media and reproduces the essentials of the discussion and literature data of [99NEC/KIM] and [2001NEC/KIM] as far as Pu is concerned (see the review in Ap-pendix A). Additional comments bear on:
• the difficulty in preventing the Pu(IV) from oxidizing (and subsequently pre-venting Pu(V) from disproportionating in acidic media) and in identifying the nature of the limiting solubility phase, hydrated oxide or hydroxide,
• the close link between the determination of the solubility product of that phase and the values of hydrolysis constants of Pu(IV), as well as with the presence of colloids.
Extrapolation of literature data to zero ionic strength is done according to the SIT with = (0.83 ± 0.1) kg · mol4+
4, ClO )− −1. This value comes from a recent work [98CAP/VIT] and is used in place of the value (1.03 ± 0.05) kg · mol−1 given in [92GRE/FUG]. Knopp et al. use the data of [49KAS], [65PER], [84RAI], [86LIE/KIM], [89KIM/KAN] and hydrolysis constants of [72MET/GUI] to calculate the corresponding
values of which the average value is lo 10 ,0g sK ο = − (58.7 ± 0.9).
The second part of the paper is a study of colloid formation of Pu(IV) starting with a solution of Pu(VI), 3·10−3 M. The progressive reduction of Pu(VI) by H2O2 in 0.1 M HClO4, which leads first to Pu(V), then to a colloid of Pu(IV), was monitored by UV−Vis spectroscopy and LIBD (Laser Induced Breakdown Detection) on filtered aliquots. When the Pu(IV) concentration is higher than the concentration calculated with 10 ,0log sK ο =

Discussion of selected references 643
− (58.7 ± 0.9) combined with hydrolysis constants from [72MET/GUI], colloids are al-ways present. This indicates that spectrophotometric data used to select lo in [2001LEM/FUG] are not the best ones.
10 1,1g οb
3 10log10g
[99MEI/KAT] This paper compares literature data on the solubility products of U(VI) and Np(VI) car-bonates as well as formation constants of the species, An , n = 1, 2 and 3. The U data sets concerned are: set 1, [92KRA/BIS], set 2, [93MEI/KIM2], set 3, [93PAS/RUN], set 4, [93MEI/KIM], set 5, [97MEI2] and set 6, [97PAS/CZE], all refer-ring to I = 0.1 M NaClO
2 22 3O (CO ) n
n−
10log4. It appears that the average values of ,0sK is scattered be-tween − 14.25 to − 13.25 (but data sets 1, 5 and 6 overlap). For An (aq), values are in the range 8.7 to 9.3 (sets 1, 4, 5 and 6), for
2CO2
3 2)O
2AnO (CO1b
− all the lo values overlap at 15.3 (sets 4, 5 and 6) and for
2b4
2 3 3AnO (CO ) − the average value of from set 6 has no meaning while data sets 4 and 5 give similar values 21.8 and
22.0. 10 3log b
This is a useful paper with a good description of statistical methods for hypothesis testing and estimation of uncertainty ranges of published data. These are issues that have been a concern to experimental solution chemists since the nineteen forties. The early at-tempts to estimate the uncertainty involved the use of different experimental methods, a strategy used by solution chemists at the University of Lund (Lund school led by I. Leden, S. Fronaeus and S. Ahrland). These scientists also pointed out the importance of avoiding bias in the experiments by collecting about the same number of experimental data in the regions where the different complexes had their maximum concentrations. Species that were present in small amounts, say less than 5%, were looked upon with suspicion. The Stockholm school, with L. G. Sillén as the driving force, developed a very different strat-egy. Their work was dominated by one experimental technique, potentiometry, and a very large number of data points were measured for the system under scrutiny. These data were then treated by a least-squares program, LETAGROP. The uncertainty estimate was based on the assumption of normal distributed errors and that the error-square function could be approximated by a generalised second degree surface. It was not uncommon to find that the chemical models proposed using this methodology contained complexes that were pre-sent in such small amounts in the test solutions that they might be computational artefacts.
The estimation of the uncertainty of published data has been and still is a problem in the NEA-TDB reviews, because the primary experimental data are rarely available. The reviewers have therefore used both the authors’ estimates and their own expert experience on the precision expected of a given experimental method when estimating the uncertainty of equilibrium constants. In systems where one can obtain independent experimental in-formation on speciation by different methods (e.g., potentiometry, ion-exchange, solubility measurements and spectroscopy), one often finds an excellent agreement between the methods, indicating that the uncertainty estimates are reasonable. It should also be pointed

Discussion of selected references 644
out that the uncertainty estimates rarely change the conclusions of predictive geochemical modelling.
The conclusion of this review is that the paper by Meinrath et al. provides very useful information to experimentalists both when planning an experiment and when inter-preting experimental data. It seems particularly important to use the potential of these methods when only a fairly small number of data points are available. The following pa-pers deal with the same topic, but they do not contain any new thermodynamic data: [2000MEI], [2000MEI2], [2000MEI/EKB] and [2000MEI/HUR].
[99MEI/VOL] No new thermodynamic data other than those already published by Meinrath and reviewed in this Appendix, are reported in this paper. It is an attempt to explain the behaviour of U in aqueous field samples of old Saxonia (Germany) mines. The different samples have different concentrations of uranium and different compositions of the major components and pH. The authors compare these values with the predicted concentrations using
h pH−E4+U /
predominance diagrams. The data (I = 0.1 and 1 M) used includes redox poten-tial ( , , , ), formation constants for hydrolysis (U(IV) and U(VI)), carbonate (U(IV) and U(VI)) and sulphate (U(VI)) complexation, all selected by Meinrath from his early works, except those of U(IV) which are derived by analogy with Pu(IV). It is concluded that U solubilities under oxic conditions are mainly due to sulphato and carbonato U(VI) species.
3+U + 42UO / U + 2+ +
2 2UO / UO 2+ 4+2UO / U
[99MIK/RUM] This paper deals with considerations on the electronic structures of M, M2+ and M3+ to ex-plain why the divalent state of lanthanides and actinides can be observed in some particular redox conditions. The role of hyd mGο∆ (M2+), hyd mGο∆ (M3+) and the excitation energies from d to f shells are emphasised.
[99NAK/ARA] The authors have measured the partial pressures of Np(g) and Pu(g) over a physical mix-ture of NpN(s) + PuN(s) by Knudsen−cell mass spectrometry from 1950 − 2070 K, sup-plementing their earlier study of pure NpN(s) [97NAK/ARA]. The partial pressures of Pu(g) agreed with the relatively consistent measurements of the congruent sublimation of PuN(s) summarised in [2001LEM/FUG]. Thus it was assumed that the partial pressure of N2(g) in the vaporisation of the mixture was the same as that involved in the congruent effusion of PuN(s):
2
2
NN P
Pu
M = 0.5
Mp p u ,

Discussion of selected references 645
where and M2NM Pu are the relative molar masses.
This pressure of nitrogen is high enough to suppress the formation of Np(liq), so (NpN) can be calculated from the known pressures in the vaporisation reaction,
NpN(cr) Np(g) + 0.5 Nf mG∆
2(g). [99NAK/ARA] checked that no solid solutions of NpN and PuN were formed.
The derived Gibbs energy of formation of NpN from this study is given by the equation:
f mG∆ (NpN, cr, T) = − 269000 + 74.0 T J · mol−1 (1950 to 2070 K).
The Gibbs energies from the above equation are 3 − 6 kJ · mol−1 more negative than those derived from the earlier study [97NAK/ARA], with a smaller temperature de-pendence.
These two papers form the basis of a revision of the stability of NpN(cr), as de-scribed in section 13.4.1.
[99NAK/ARA2] The authors have measured the partial pressures of BaO(g) and Ba(g) over a diphasic sam-ple containing a 50:50 mixture of BaPuO3(s) and PuO2(s) by Knudsen−cell mass spec-trometry from 1673 − 1873 K in Pt effusion cells inside a tantalum holder. The compo-nents of the mixture were identified by X−ray diffraction. The partial pressure of BaO(g) was about a factor of ten greater than that of Ba(g); so the predominant reaction during vaporisation was assumed to be:
BaPuO3(cr) BaO(g) + PuO2(cr).
Ba(g) was assumed to be formed from BaO(g). In practice, the vaporisation is likely to be more complex than this, especially as PuO2(cr) will certainly lose oxygen at these temperatures, particularly in an environment containing tantalum.
Using estimated thermal functions for BaPuO3(cr), the authors have derived sec-ond− and third−law enthalpies of formation, f mH ο∆ (BaPuO3, cr, 298.15 K) of − 1661 and − 1673 kJ · mol−1, respectively, with no quoted uncertainties.
Considering the use of estimated thermal functions for BaPuO3(cr) and the likely complexity of the actual vaporisation process, these values are in good accord with the relatively precise calorimetric value from the study by Morss and Eller [89MOR/ELL] adopted by [2001LEM/FUG]:
f mH ο∆ (BaPuO3, cr, 298.15 K) = − (1654.2 ± 8.3) kJ · mol−1,
which is thus retained here.

Discussion of selected references 646
[99NEC/KIM] This paper is very important in understanding the hydrolytic properties of tetravalent acti-nides, An(IV). Up until now, only separated and specific element descriptions of (Th, U, Np, Pu) in terms of thermodynamic constants have been presented in the literature. This paper gives a unified view.
Many problems complicate the experimental investigation and thermodynamic evaluation of the constants: polymerisation of monomeric species, colloid formation, sta-bility of the tetravalent state in solution, lack of well-defined unique dioxide phase with a crystallinity that depends on many factors and the tendency of this dioxide to become amorphous with increasing pH of the equilibrium solutions. As aqueous An4+ ions hydro-lyse readily at low pH, there are no solubility data for AnO2(cr) and AnO2(am), An(OH)4(am), AnO2·xH2O(am) or (am), n = 0 − 2 in the presence of An2AnO (OH)n− 2n
4+. So a calculation of the solubility product of these materials requires a knowledge of the hydrolysis constants of the aqueous ions. Furthermore, solubility products of AnO2(cr) derived from acidic media depend on details of the method of preparation of the oxide, such as temperature, pre-treatment, etc.
Only data from low ionic strength (I < 1 M) and the most dilute available solu-tions are considered by the authors.
This review considers only the constants at zero ionic strength calculated using the SIT. Data related to Th are also reported.
In the following, data for monomeric U(IV) hydroxide complexes and solubility products of the oxide and amorphous oxide, are discussed first. Then, similar data for Np(IV) and Pu(IV) are considered.
Neck and Kim [99NEC/KIM] select lo 10 1g οb = (13.6 ± 0.2) for UOH3+ as an av-erage value deduced from the selected values, 10 1
*log οb = − (0.54 ± 0.06) by [92GRE/FUG] and − (0.34 ± 0.20) by [92FUG/KHO]. The selection of [92FUG/KHO] is not explicitly discussed in [92GRE/FUG]. Taking the average value of the two selected data gives lo = − (0.4 ± 0.2), which is the value recommended by [94SER/DEV] (see this Appendix). On the basis of an empirical correlation and a semi-empirical electro-static model using only
10 1*g οb
10 1log οb for UOH3+ as an input parameter, Neck and Kim [99NEC/KIM] predicted the value, 10log 1
οb = 13.8, and derived lo = 27.5, = 38.2 and = 45.7. The semi-theoretical considerations are based on
experimental data for Pu(IV) and trivalent Am and Cm. The value, = 13.8, is in close agreement with the experimental value. The value of
10 2g οb
10 1οb
10 3log οb 10 4οblog
log10 4log οb is checked from solu-
bility measurements of UO2(am) (see below).
The value selected by [92GRE/FUG] for the solubility product of crystalline UO2 is 10 ,0log sK ο (UO2, cr) = − (60.86 ± 0.36). To evaluate the corresponding value for amor-phous dioxide, the data of [83RYA/RAI], [90RAI/FEL], [95YAJ/KAW], [97RAI/FEL] and [99GRA/MUL] (cited in [99NEC/KIM] as private communication) are analysed. They

Discussion of selected references 647
are all related to the solubility of U(IV) as a function of − lo [H10g
lo
+], from 1 to 13, at 25°C and different ionic strengths in perchlorate and chloride media.
63 5O ) )−
10 ,0g sK ο
ο→ sK
*→ sK
4ο→ b
4* ο→ b
ο→ K
From the data corresponding to pH < 5, and taking 10 1g οb = 13.6, lo = 27.5 and lo = 38.2, it is found that lo
10 2g οb10 3g οb 10 ,0g sK ο = − (55.2 ± 1.0). This value differs
from that of [90RAI/FEL] and [97RAI/FEL], 10log ,0sK ο = − 53.45, who included in the fitting only UOH3+ and U(OH)4(aq), but is consistent with that of [95YAJ/KAW], who include only U(OH)4(aq) in the fitting, 10log ,0sK ο = − (55.7 ± 0.3).
From the data corresponding to pH > 5 and according to:
10log [U(OH)4(aq)] = 10 ,0log sK ο + 10 4log οb = − (8.5 ± 1.0),
the authors derive = (46.7 ± 1.0), in close agreement with the estimated value. This value differs from the value of 45.45 proposed by [90RAI/FEL] and [97RAI/FEL], but is consistent with that of [95YAJ/KAW], (47.0 ± 0.5).
10 4log οb
The authors point out that most of the reported solubility data of UO2(cr) (t = 25°C and 100 to 300°C) correspond in fact to the solubility of a surface layer of amor-phous oxide. This point is important because some data ( f m m ,m, , pG S Cο ο ο∆ ) given in [92GRE/FUG] on U(OH)4(aq) are based on the assumption that UO2(cr) remains the equi-librium phase in the presence of aqueous solutions.
The value of the solubility product re-evaluated by Neck and Kim [99NEC/KIM], solves some inconsistencies in the thermodynamic data of U(IV) carbonate solutions of [98RAI/FEL]. For instance, the value for lo 10 5g οb (U(C deduced from the experi-mental data using 10 ,0log sK ο = − 53.45 [97RAI/FEL] for U(OH)4(s), does not agree with the selected value of [92GRE/FUG], but does so using lo = − (55.2 ± 1.0).
To discuss the hydrolysis of Np(IV), with regard to the nature of amorphous hy-drated oxide, NpO2(am), or NpO2·xH2O(am) or hydroxide, Np(OH)4(am), of Np(IV), it is necessary to recall the meaning of some equilibrium constants:
Np(OH)4(am) Np4+ + 4 OH−
NpO2(am) + 2 H2O Np4+ + 4 OH− ,0
Np(OH)4(am) + 4 H+ Np4+ + 4 H2O(l)
NpO2(am) + 4 H+ Np4+ + 2 H2O(l) ,0ο
Np4+ + 4 OH− Np(OH)4(aq)
Np4+ + 4 H2O(l) Np(OH)4(aq) + 4 H+
Np(OH)4(am) Np(OH)4(aq) or
NpO2(am) + 2 H2O(l) Np(OH)4(aq) ,4s
Discussion of selected references 648
For Np(IV) the value of 10 1*log οb
10 4log
= − (0.29 ± 1.00) is selected by [2001LEM/FUG]. The large uncertainty comes from the unweighted average of three ex-perimental values. Due to large uncertainties in literature data [2001LEM/FUG] do not select a value for . The value, 10 2log οb οb = (46.2 ± 1.1), is derived from solubility data of NpO2(am) in acidic and basic aqueous solutions. The former data give lo 10 ,0
*g sK ο = (1.53 ± 1.0) using = − (0.29 ± 1.00) which, when used with the value of log10[Np(OH)4(aq)] = − (8.3 ± 0.3), gives
10*log 1
οb10 4
*log οb = − (9.8 ± 1.1) ( lo = (46.2 ± 1.1)). These data come from [87RAI/SWA].
10 4g οb
[99NEC/KIM] selected the value, 10 1log οb
10log
= (14.55 ± 0.2) ( = 0.55), determined at very low neptunium concentrations [77DUP/GUI] to predict lo = 28.0 or 28.2 depending on the evaluation method used (in close agreement with the experimen-tal value of (28.35 ± 0.3) from [77DUP/GUI]),
10 1*log οb
10g b2ο
3οb = 39.0 or 39.2 and =
46.7 or 47.2 (this last value agrees with the value selected by [2001LEM/FUG]). Neck and Kim pointed out that the validity of other literature data is suspect due to colloid formation.
10g 4οblo
The thermochemical value, 10 ,0log sK ο (NpO2, cr) = − (63.7 ± 1.8) [87RAI/SWA] cited by Neck and Kim [99NEC/KIM], comes from several critically evaluated standard data at 298.15 K: ∆ (NpO2, cr), f mGο
mS ο (NpO2, cr), [72FUG], mS ο (Np, cr) [76OET/RAN] and (Np4+) = − (502.9 ± 7.5) kJ · mol−1 [76FUG/OET]. According to the values of the Gibbs energy of formation of NpO2(cr) selected by [2001LEM/FUG], (NpO2, cr, 298.15 K) = − (1021.731 ± 2.514) kJ · mol−1 and
f mGο∆
f mGο∆
f mGο∆ (Np4+, cr, 298.15 K) = − (491.8 ± 5.6) kJ · mol−1, and with the auxiliary values from [92GRE/FUG], this review calculates 10log ,0sK ο (NpO2, cr) = − (65.75 ± 1.07).
The value selected by [2001LEM/FUG] for 10 ,0log sK ο (NpO2, am) is − (54.5 ± 1.0) coming from 10 ,0
*log sK ο (NpO2, am) = (1.53 ± 1.0) (see above). The large uncertainty given is estimated.
Neck and Kim [99NEC/KIM] reinterpreted the solubility data of [87RAI/SWA] at pH below three with the new values of the , and hydrolysis constants of Np4+ and give
1b 2b 3b10 ,0log sK ο
10 4log οb
= − (56.7 ± 0.4). With this value and all the solubility data of [85RAI/RYA], [93ERI/NDA] and [96NAK/YAM] corresponding to the range 5 to 13 they calculate = (47.7 ± 1.1) according to [Np(OH)4(aq)] = 10log 10 ,0log sK ο +
= − (9.0 ± 1.0). The large uncertainty covers the rather large spread of the data. 10 4log οb
The values for the Np(IV) species revised by Neck and Kim [99NEC/KIM] are re-tained by this review, with the exception of the estimated value for lo . 10 3g οb
[2001LEM/FUG] selected for Pu(IV), 10 1*log οb = − (0.78 ± 0.6), ( =
(13.22 ± 0.6)), as the average value of the most reliable results of spectroscopic measure-ments (see below). No other values are selected for the hydrolysis constants.
10 1log οb
For Pu(IV) the situation is the same as for Np(IV). [99NEC/KIM] discuss the lit-erature data and retain, to make predictions, those corresponding to experimental condi-tions where colloids are less likely to form [72MET/GUI]. These conditions seem not to

Discussion of selected references 649
have been fulfilled for solutions on which spectroscopic measurements have been made, because their total concentrations in Pu are higher than the solubility of PuO2(am) allows. Taking 10 1log οb = (14.6 ± 0.2) (all the other values reported in the literature are smaller) they calculate lo = 14.4, 10 1g οb 10 2log οb = 28.4, 10 3log οb = 39.4 and lo = 47.5, the experimental values being, respectively, (28.6 ± 0.3), (39.7 ± 0.4) and (47.5 ± 0.5). These results are a good test of the Neck and Kim model.
10 4g οb
The thermochemical values of 10 ,0log sK ο (PuO2, cr) given by Neck and Kim [99NEC/KIM] are those of [89KIM/KAN], − (63.8 ± 1.0) or [87RAI/SWA], − (64.1 ± 0.7). From (PuO2, cr, 298.15 K) = − (998.1 ± 1.0) kJ · mol−1 and
(Pu4+, cr, 298.15 K) = − (478.0 ± 2.7) kJ · mol−1, and the auxiliary values from [92GRE/FUG] this review calculates lo
f mGο∆
f mGο∆
10 ,0g sK ο (PuO2, cr) = − (64.04 ± 0.51). The value selected by [2001LEM/FUG] for 10log ,0sK ο (PuO2, am) is − (58 ± 1).
The literature data on the solubility of PuO2(am) in acidic and basic media (pH = 0 to 13) are reviewed by [99NEC/KIM] and reinterpreted on the basis of the hydrolysis constants (see above) which gives lo 10 ,0g sK ο = − (58.7 ± 0.9). Neck and Kim [99NEC/KIM] select, as the best value, the average of that value and 10 ,0log sK ο = − (58.3 ± 0.5), the latter coming from a method independent of Pu(IV) hydrolysis [98CAP/VIT]. They recommend the value, 10log ,0sK ο = − (58.5 ± 1.1). This review selects
10 ,0log sK ο = − (58.33 ± 0.52).
All the papers considered by Neck and Kim [99NEC/KIM] have been considered in [2001LEM/FUG].
[99OLA] Assessments of the thermodynamic data for UO2+x(cr), UO3(g) and UO2(OH)2(g) are re-viewed, with emphasis on those in computer codes used in the analysis of reactor acci-dents, in which the reaction of UO2 with steam is important. No additional experimental data are presented.
For UO3(g), Olander [99OLA] has considered the recent experimental work by Krikorian et al. [93KRI/EBB] as well as the earlier work on which the current selection of the stability by [92GRE/FUG] is based. For reasons that are not detailed, the author prefers the data of [93KRI/EBB], which are (presumably) the basis of the value of f mH ο∆ (UO3, g, 298.15 K) = − (796.7 ± 3.5) kJ · mol−1, given in an unpublished report by Ebbinghaus, as quoted by Olander (compared with the value of − (799.2 ± 15.0) kJ · mol−1 selected by [82GLU/GUR] and [92GRE/FUG]).
For UO2(OH)2(g), [99OLA] again selects, without comment, the value of f mH ο∆ (UO2(OH)2, g, 298.15 K)= − (1200 ± 10) kJ · mol−1, from the same unpublished
report by Ebbinghaus. As noted in the review of [93KRI/EBB] and in section 9.3.1.2., the data for the stability of this species are very discordant and no values are selected in this

Discussion of selected references 650
review. The uncertainties quoted by Olander [99OLA] for the enthalpies of formation of both gases seem to be far too small.
[99PIA/TOU] Using the same high temperature X−ray diffraction techniques as in previous publications [94TOU/PIA], [98PIA/TOU], the authors studied the reaction between SrO and UO2. No thermodynamic data are reported. With a 1:1 ratio, under an atmosphere of oxygen, ortho-rhombic "β-SrUO4" (which the authors call α) is observed between 1123 and 1373 K. At 293 K, the reported lattice parameters are in agreement with the many literature values. The authors interpret the increase in lattice parameters between 1123 and 1373 K as being due to a change in the O:U ratio from 3.67 to 3.62.
Under more reducing conditions (2
10 6O / bar 10 5− −≤ ≤p ), a rhombohedral
"α-SrUO4" (called β by the authors) is stable above 1108 K, with an upper O:U value of 3.60, lower than usually reported in the literature for this phase. Under the most reducing conditions (
2), another rhombohedral phase is observed, with a lower O:U
ratio of 3.11, also distinctly lower than reported in the literature.
14O / bar 10−≤p
The authors also report the progressive formation of an orthorhombic "SrUO3" phase upon heating under
2
14O / bar 10−≤p of SrUO4 or a mixture UO2/SrO at temperatures
between 1173 and 1773 K. This phase could never be isolated in a pure state. Some evi-dence for a second-order monoclinic to orthorhombic transformation at 1073 K is pre-sented. This monoclinic form does not appear to be isomorphous with Sr3UO6, in contrast with the situation for the corresponding Ca compounds [98PIA/TOU]. Arguments are pre-sented for the isomorphism of both α- and β-SrUO3 with Sr3UO5 (produced by reduction of Sr3UO6) with the same second-order transition temperature.
At temperatures above 1523 K, in a reducing atmosphere, the disordered fluorite phase, U1−δSrδO2−δ is formed, possibly after a transition to an intermediary tetragonal "SrUO3" phase.
The authors also present a schematic pseudo-binary "SrUO3"−SrUO4 phase dia-gram.
[99RAI/HES] This paper is a continuation of the studies of [95RAI/FEL], [97FEL/RAI] and [98RAI/FEL] of An(IV) OH− systems. The experiments are described in detail, but the interpretation of the data suffers from the same shortcomings as the previous papers, i.e., the lack of justification for the Pitzer parameters used, with the exception of those for
23CO HCO−− − 3
− −
63 5Np(CO ) −
2 22 3
for which the authors used the parameters for the analogous U(IV) complex; in addition, no uncertainty estimate has been made of the proposed equilibrium constants. This review finds sufficient evidence to support the assumption that Np(OH) (CO ) n
n− is formed; the authors’ Figure 1c. refers to solubility data measured in

Discussion of selected references 651
an approximately constant ionic medium, 1.78 M K2CO3 where the concentration [OH−] has been varied from 0.01 to 1 M. The experimental data are close to a straight line with the slope − 2, indicating that the reaction studied is:
Np(OH)4(am) + 23 COn − 2 2
2 3Np(OH) (CO ) nn
− + 2 OH−
As the concentration of carbonate is high and constant in the experiment, it is impossible to determine the stoichiometric coefficient n, although the (conditional) equi-librium constant for the reaction above can be determined. In order to make some state-ments about the stoichiometry one must use known characteristics of the coordination chemistry of the M(IV) actinides. The limiting carbonate complex, , is ten-fold coordinated as shown by several different investigators and also by the authors of this pa-per. Some additional comments on the coordination geometry of these complexes are given in the comments to papers [95RAI/FEL] and [98RAI/FEL]. This paper has also been reviewed in [2001LEM/FUG]. The conclusions are essentially the same as drawn here, except for the comments on the composition of the ternary complexes. The paper contains useful data on the structure of the penta-carbonate complex, determined by EXAFS. In conclusion, the quantitative equilibrium data for this system are less reliable, with the ex-ception of and
63 5M(CO ) −
10 5log οb 10 4log οb given in [2001LEM/FUG] for the formation of and . As the authors have used the same approach when determin-
ing the equilibrium constant for the
63 5M(CO ) − 4
3 4O ) −M(C6
3 5M(CO ) − complexes of Th, U, Np and Pu [99RAI/HES2], the variation of the equilibrium constants is probably more precise.
[99RAI/HES2] This is an excellent experimental study where the authors have analysed the solubility of amorphous PuO2(am) in carbonate/hydrogen carbonate solutions over a wide pH and con-centration range. The difficult experiments are described in detail, as is the strategy for analysing the data. The analysis is anchored on the limiting complex, , which predominates over a wide concentration range where it has been characterised by EXAFS spectroscopy. By using the Pitzer model the authors then can determine both interaction parameters and the equilibrium constant for the complex; the latter requires in addition the solubility product for the amorphous hydroxide. This review accepts both the analysis and the conclusions drawn about the stoichiometry, structure and equilibrium constant of the limiting complex. The authors report for the reaction:
63 5Pu(CO ) −
4+ 2 63Pu + 5 CO Pu(CO ) 3 5
− − (A.119)
10 5log οb = 34.18, but with no estimate of the uncertainty. This review has estimated the uncertainty to be at least ± 1.0 log10 units. In combination with 10 ,0log sK ο (PuO2, am) = − (58.33 ± 0.52) selected in the present review, the formation constant of the limiting car-bonate complex is calculated to be lo 10 5g οb = (35.65 ± 1.13).
The authors have shown that the limiting complex is also predominant at high bi-carbonate concentrations and that the solubility can be described with the same equilibrium

Discussion of selected references 652
constant as deduced from the carbonate data. This review agrees with this general conclu-sion, although it can be observed from Figure 8 in [99RAI/HES2] that the calculated solu-bility at high [ ] is systematically higher than the experimental data. 3HCO−
The authors have also analysed the solubility at lower concentrations of and interpret these results with the complex, , with 3HCO−
10log
22 3Pu(OH) (CO ) −
2
K ο = 44.76, for the reaction: 4+ 2 2
3Pu + 2 CO 2OH Pu(OH) (CO )2 3 2− −+ − (A.120)
By using the equilibrium constants for equations (A.119) and (A.120) above, to-gether with the Pitzer model, the authors are able to describe the experimental solubility fairly well. However, according to this review, the authors have not demonstrated the stoichiometry of the mixed hydroxide-carbonate complex and this means that the result should be used with caution. The equilibrium can certainly be used to describe the solubil-ity in the concentration range studied, but care must be exercised when estimating the solubility of amorphous PuO2 outside the concentration range studied by Rai et al.
There is no doubt that ternary complexes are formed in these systems. In a previ-ous study under comparable conditions, Yamaguchi et al. [94YAM/SAK] proposed the same complex stoichiometry. However, measuring solubility data from the direction of over-saturation, they obtained an equilibrium constant for ,
= − (10.2 ± 0.5) if converted to I = 0 with the SIT. This value is considerably higher than − 12.1 from [99RAI/HES2]. Further solubility data in 0.01 − 0.1 M carbonate solutions at pH 12 and 13 were ascribed to the formation of P [94YAM/SAK]. The latter experimental data are concordant with those determined by Rai et al. in 0.1 − 1 M K2CO3 solutions containing 0.01 M KOH. However, [99RAI/HES2] did not use these results to evaluate an equilibrium constant for the complex,
.
22 3 2Pu(OH) (CO ) −
44 3u(OH) (CO ) −
10 ,(1,2,2)log sK ο
4Pu(OH) (CO
2
43 2) −
In addition, Rai et al. report solubility data of PuO2(am) in carbonate-free dilute KOH solutions at (23 ± 2)°C. The total Pu concentrations determined by oxidation state analyses after equilibration for one week are illustrated in Figure 5 of [99RAI/HES2]. From the seven data points at pH 8.3 − 13.0, this review calculates a mean value of log10[Pu(OH)4(aq)] = − (10.4 ± 0.5) (1.96 σ), which is in good agreement with experimen-tal data of other authors, log10[Pu(OH)4(aq)] = − (10.4 ± 0.2), [86LIE/KIM] and − (10.2 ± 0.8), [98CHA/TRI].
[99RUN/REI] The paper [97RUN/NEU] (see this review) shows by spectroscopic measurements that in solutions, [H+] = 1 M, [Cl−] = 2 to 15 M, where complexes of Pu(VI) of the type,
with x = 1, 2, 3 and 4, are formed. The paper [99RUN/REI] is a study of the complexation of by Cl− in HClO4/NaCl solutions, [H+] = 0.1 m, up to I = 5.19 m by conventional absorption spectrophotometry (t = 23°C).
2 x2 xPuO Cl −
2+2PuO

Discussion of selected references 653
The literature survey of the authors does not include the data of [94GIF], which have been used by [2001LEM/FUG] to select values of 10 1log οb =(0.70 ± 0.13) and
= − (0.6 ± 0.2), respectively, for the equilibria: 10 2log οb2+ +2PuO + Cl PuO Cl−
2
2 2
(A.121) and
2+2PuO + 2Cl PuO Cl (aq)− (A.122)
with the following estimated values, ∆ε(1) (A.121)= − (0.08 ± 0.08) kg · mol−1 and ∆ε(2)(A.122) = − (0.43 ± 0.20) kg · mol−1. The Giffaut [94GIF] values, from which the are derived, are in good agreement with the previously published values, at the same common ionic strengths, ≥ 2 M. Giffaut performed experiments up to I = 4.5 M (see review in Appendix A of [2001LEM/FUG]).
10log b10log οb
The study of [99RUN/REI] is a careful investigation which shows that to derive the free concentration of Pu , the variation of the molar absorption coefficient of this species at (830.6 ± 0.1) nm with the ionic strength ([HClO4] = 0.1 m + [NaClO4] = 0.1 to 5.13 m ) must be taken into account. This is the result of a decrease of the coordinated wa-ter molecules, as EXAFS spectra show also in NaCl solutions (1 to 5 M). The de-convolution of the spectra in solutions, [HClO4] = 0.1 m + NaCl up to 5.19 m, is clear. The two chloride complexes have absorption maxima at (837.6 ± 0.2) and (843 ± 0.4) nm, re-spectively, with different molar absorptivities.
2+2O
The values of given by Runde et al. using the SIT to extrapolate the val-ues of at zero ionic strength are given in the Table A-42, as well as the corre-sponding values for U(VI) selected by [92GRE/FUG] for comparison. The ∆ε values used to calculate the SIT interaction coefficients are also given. The U and Pu values seem in reasonable agreement. There is no value for
10log οb10log b
2+2(PuO ,Cl )−ε
2+2(UO ,Cl )
, but taking for this coefficient the corresponding value of uranium, −ε = (0.21 ± 0.02) kg·mol−1, gives
+2Cl ,Cl(PuO )−ε = (0.11 ± 0.04) kg · mol−1.
Table A-42: ∆ε values used to calculate the SIT interaction coefficients and lo for , , and , .
10g οb+
2PuO Cl 2 2PuO Cl (aq) +2UO Cl 2 2UO Cl (aq)
∆ε (kg · mol−1) 10log οb Reference
+2PuO Cl − (0.13 ± 0.03) (0.23 ± 0.03) [99RUN/REI]
+UO Cl2
PuO Cl − (0.25 ± 0.02) (0.17 ± 0.02) [92GRE/FUG]
2 2 (aq)UO Cl (aq)
− (0.4 ± 0.1) − (1.7 ± 0.2) [99RUN/REI]
2 2 − (0.62 ± 0.17) − (1.07 ± 0.35) [92GRE/FUG]
All the thermodynamic data at I = 0 obtained by Runde et al. disagree signifi-cantly from those selected by [2001LEM/FUG], (see above). It is necessary to try to un-

Discussion of selected references 654
derstand this disparity by comparing carefully the values of 10log nοb and ε(n) or ∆ε(n) for
the U(VI) and Pu(VI) chloride complexes, 2AnO Cl+ and in [92GRE/FUG], [94GIF] and [99RUN/REI] within the framework of the application of the SIT in the range of ionic strength where data are available.
2 2O Cl (aqAn )
The lo values and particularly the ∆ε(n) values for U(VI) and Pu(VI) should be very similar. Monodentate complexes like
10g nοb
2AnO Cl+ and AnO2Cl2(aq) are typical ex-amples where the oxidation state analogy principle should be valid. Fortunately, in the case of the uranium complexes there are many experimental data, down to low ionic strength, and application of the SIT to the accepted experimental data appears to be straightforward ([92GRE/FUG], p.192 − 196).
It is noteworthy that the data for U(VI) and those of Giffaut for Pu(VI) refer to mixed chloride-perchlorate media (at constant ionic strength). The evaluated SIT coeffi-cients, and 2+
2(AnO ,ClO )−ε 4 4+
2(AnO Cl ,ClO )−ε , refer to pure perchlorate solutions. How-ever, this is a simplification because firstly, the chloride concentration is considerably dif-ferent from zero and not constant, and secondly the interaction coefficients,
2+2 4,ClO )(AnO −ε and +
2 4Cl ,ClO )(AnO −ε+
2(AnO Cl ,Cl )−, are different, usually larger than ε
and . Therefore, ∆ε is not really constant, which makes a correct applica-tion of SIT complicated.
2+2(AnO ,Cl )−
ε
In the study of [99RUN/REI] this problem is avoided, because the spectroscopic data were determined in almost pure NaCl solutions (if we neglect the addition of 0.1 M HClO4). However, we have to be aware that the SIT coefficients evaluated in [99RUN/REI] are and 2+
2(PuO ,Cl )−ε +2(PuO Cl ,Cl )−ε , not those with perchlorate as given
in [92GRE/FUG], [94GIF].
Table A-43 : Equilibrium constant, 10 1log οb , and interaction coefficient, ∆ε(1), for the first chloride complexes of U(VI) and Pu(VI).
Reference An 10 1log οb ∆ε (1) (kg · mol−1)
[92GRE/FUG] U (0.17 ± 0.02) − (0.25 ± 0.02)a) [94GIF] Pu (0.70 ± 0.13) − (0.08 ± 0.08)a) [99RUN/REI] Pu (0.23 ± 0.03) − (0.13 ± 0.03) b)
a) for NaClO4 medium b) for NaCl medium
As mentioned above, similar lo 10 1g οb values must be expected for U(VI) and Pu(VI). The same should hold for ∆ε(1) values in the case of U(VI) and Pu(VI) in NaClO4 medium ([92GRE/FUG] and [94GIF]). This is, however, not the case (Table A-43). It is to be noted that Giffaut reported an experimental series only at relatively high ionic strength (I = 2.2 and 3.5 mol · kg−1). If we do not apply the SIT extrapolation to I = 0 by linear regression to the Giffaut values, but use a fixed value of ∆ε(1) = − (0.25 ± 0.02) kg · mol−1 (the well-ascertained value for U(VI) from [92GRE/FUG]) for the conversion to I = 0, we

Discussion of selected references 655
obtain values similar to those in [92GRE/FUG] and [99RUN/REI]:
10 1log b (I = 2.2 m) = − (0.07 ± 0.09) [94GIF] giving lo 10 1g οb = (0.3 ± 0.1)
10 1log b (I = 3.5 m) = − (0.06 ± 0.07) [94GIF] giving lo 10 1g οb = (0.1 ± 0.1).
The SIT regression plot in [99RUN/REI] is based on many data over a wide range of ionic strength (I = 0.25 − 3.5 mol · kg−1) and hence is much more accurate. The fact that ∆ε(1) = − (0.13 ± 0.03) kg · mol−1 in NaCl [99RUN/REI] is different from ∆ε(1) = − (0.25 ± 0.02) kg · mol−1 in NaClO4 medium [92GRE/FUG] is not surprising, because particularly ε = 0.21 kg · mol−1 is smaller than 2
2(AnO ,Cl )+ − 22(AnO ,ClO )4
+ −ε = 0.46 kg · mol−1. The value of 2Cl ,Cl )(PuO + −ε = (0.11 ± 0.04) kg · mol−1 [99RUN/REI] is reason-able for a 1:1 electrolyte and also reasonable in relation to = (0.33 ± 0.04) kg · mol−1 [92GRE/FUG] (interaction coefficients of actinide cations with chloride are always smaller than those with perchlorate; this is a general trend).
2 4Cl ,ClO )+ −(UOε
For these reasons the values of 10 1log οb , ∆ε(1) and 2(PuO Cl ,Cl )+ −ε determined by [99RUN/REI] are the best available. They are selected by this review.
Table A-44: Equilibrium constant, lo 10 2g οb , and interaction coefficient, ∆ε(2), for the sec-ond chloride complexes of U(VI) and Pu(VI).
Reference An 10 2log οb ∆ε(2) (kg · mol−1)
[92GRE/FUG] U − (1.1 ± 0.4) − (0.62 ± 0.17) a) [94GIF] Pu − (0.6 ± 0.2) − (0.43 ± 0.20) a) [99RUN/REI] Pu − (1.7 ± 0.2) − (0.4 ± 0.1) b)
a) for NaClO4 medium b) for NaCl medium
Comparing Giffaut’s lo 10 2g οb
+Cl
and ∆ε(2) (Table A-44) data with those for U(VI) discussed in [92GRE/FUG], similar comments could be made as in the case of the mono chloro-complex. It can be noted here that Giffaut [94GIF] did not measure absorption at the wavelengths 843 - 844 nm (PuO2Cl2(aq)) and deduced from the total concen-tration of Pu and that of . However, the situation is not so clear.
10 2log b2PuO
The value evaluated in [99RUN/REI] appears to be low. Unfortunately, in this case the ionic strength range of experimental data (I = 1.8 − 3.5 mol · kg−1) is much narrower than used for the determination of
10 2log οb
10 1log οb and there are no data at low ionic strength. Therefore, the extrapolation to I = 0 depends appreciably on the ∆ε(2) value. In this respect the experimental data in Figure 6 of [99RUN/REI], which gives ( + ∆z2·D) as a function of I, show large error bars. If we apply
10 2log b2(PuO Cl ,Cl )+ −ε = 0.21 kg ·
mol−1 and set the SIT coefficients for the neutral complex, PuO2Cl2(aq), equal to zero as it is usually done in the NEA-TDB reviews, we obtain ∆ε(2) = − (0.27 ± 0.03) kg · mol−1 and
= − (1.3 ± 0.1). 10 2log οb
For these reasons, this review selects as the best value for the average 10 2log οb

Discussion of selected references 656
value of those of [94GIF] and [99RUN/REI], 10 2log οb = − (1.15 ± 0.30), taking a larger uncertainty than that given by these authors.
34sO ])−
UO H
2 2(H AsO
The study of Runde et al. appears more complete than the previous ones.
The reference [96RUN/NEU] in this paper should in fact be [97RUN/NEU].
[99RUT/GEI] This paper reproduces mainly the results of [97RUT/GEI] and concerns the interaction of uranium(VI) with arsenate(V). Additional experimental information is given. The ranges of the variations of the parameters controlling the compositions of the solutions are slightly modified (arsenic acid, 5·10−6 to 5·10−2 M, pH = 1.5 to 3, [U] = 10−6 M).
Deconvolution of the TRLFS spectra shows the existence of three species in addi-tion to that of (τ = 1.70 ± 0.50 µs) for which characteristics are given in Table A-45. The species are taken to be the same as those in the U(VI)−phosphoric acid system, since the pKa values of the acids are very similar. The pKa of arsenic acid used by the authors are those derived from auxiliary data selected by [92GRE/FUG] but without considering un-certainties. For the neutral complexes the spectra are those of the mineral trogerite and the solids, UO2(HAsO4)·4H2O and UO2(H2AsO4)2·H2O.
2+2UO
The stoichiometric U/As ratios of the different species are given by slope analyses of:
2+2
[Complex] = f([A[UO ]
and their dependence on pH. The complex formation constants are reported for the follow-ing reaction:
2+ + 3 2 32 4 2UO + H + AsO (AsO ) r q
r qr q − +4
− .
The values of and 10log b 10log οb are given in Table A-45 (the values at I = 0 are calculated using the Davies equation).
Table A-45. Equilibrium constants derived from spectroscopic measurements.
Species τ (I = 0.1) µs
Emission bands nm
10log b (I = 0.1) 2σ
10log οb 2σ
+
2 2 4UO (H AsO ) (12.25 ± 1.20) 478, 494, 514, 539, 563 (20.39 ± 0.24) (21.96 ± 0.24)
2 4UO (HAsO )(aq) 0.1 < τ < 1 504, 525, 547 (17.19 ± 0.31) (18.76 ± 0.31)
2 2 4 2UO (H AsO ) (aq) (38.3 ± 3.50) 481, 497, 518, 541, 571 (38.61 ± 0.20) (41.53 ± 0.20)
The concentration of the complex is always very low (less than 1%) but it has a strong fluorescence intensity. Dioxouranium(VI) phosphate com-
4 2UO ) (aq)

Discussion of selected references 657
plexes are stronger than those for arsenic. This review has calculated the equilibrium con-stants for the formation of the complexes from 2+
2 an 24O UO d HAs − or 4sO . The
protonation constants o 4O have been derived from the auxiliary data selected by [92GRE/FUG], page 63. For each
3H Af 3H As
10log οK value a large uncertainty: ± 0.99 is reported. This review has re-examined the experimental data of the protonation constants of H3PO4 (H3L). The values collected in Table A-46, for I = 0, often without uncertainty, do not al-low us to reduce the uncertainty.
10g οK
10log
Table A-46: Values of lo for protonation of arsenic acid at 25°C.
Reaction οK Reference
(2.26 ± 0.99) [92GRE/FUG] 2.15 [98MAR/SMI] 2.223 [53AGA/AGA] 2.30 [69SAL/HAK]
H2L− + H+ H3L
2.26 [76TOS]
(6.76 ± 0.99) [92GRE/FUG] 6.65 [98MAR/SMI] 6.980 [53AGA/AGA]
HL2− + H+ H2L−
5.76 [76TOS]
(11.60 ± 0.99) [92GRE/FUG] 11.80 [98MAR/SMI] L3− + H+ HL2−
11.29 [76TOS]
The lo 10g K ο values from [92GRE/FUG] in Table A-46 have been calculated from the Gibbs energy of formation of the various species and not from the direct experi-mental determinations; this is the reason for the large uncertainty estimates which can be reduced ([92GRE/FUG], page 390). A more reasonable estimate is ± 0.20 in 10log K ο , which is used in the main text to select the equilibrium constants.
[99SAX/RAM] This conference paper reports preliminary results of the heat capacity of rubidium uranium sulphate, Rb2U(SO4)3(s), measured by DSC. No details of the material under study are given. The DSC graph (373−673 K) shows a transition at ca. 630 K. The heat capacities are tabulated at rounded temperatures from 273 to 623 K. Except for the last point at 623 K, these are consistent with the enthalpy drop measurements from the same laboratory [93JAY/IYE] (which are not cited), and have been combined with them to provide heat capacities for this phase − see section 9.10.5.3.

Discussion of selected references 658
[99SIN/DAS] This paper reports measurements of the oxygen activity (emf with a CaO − ZrO2 electro-lyte) in the three-phase field, U3O8(cr) + TeO2(cr) + UTeO5(cr) from 821 to 994 K.
UTeO5(cr) was prepared by repeatedly heating appropriate amounts of U3O8(cr) with TeO2(cr) in dry air at 973 K for 400 hours, grinding and reheating until no phases other than UTeO5(cr) were detected by X−ray diffraction. Equimolar amounts of the three phases were pelleted and annealed at 800 K before the emf measurements were made. These utilised a cell with a CaO − ZrO2 electrolyte tube in flowing argon, with Ni/NiO as the reference electrode.
To convert the measurements to oxygen potentials, we have used the values as-sessed by Taylor and Dinsdale [90TAY/DIN], which include consideration of the magnetic transitions in Ni and NiO. Their data in the relevant temperature range can be expressed as
(NiO, cr, T) = − 234220 + 85.042 T, J · mol−1. f mG∆
The recalculated values for the oxygen potentials in the relevant three-phase field are then:
0.5 RT ln = − 382363 + 206.420 T J · mol−1 (821 to 994 K) 2O( / barp )
corresponding to the Gibbs energy of the reaction:
U3O8(cr) + 3 TeO2(cr) + 0.5 O2(g) 3 UTeO5(cr). (A.123)
It will be seen that the entropy change is appreciably larger than that expected for a reaction involving a change of 0.5 mole of a simple gas.
Any further processing of these data requires the values for mS ο (298.15 K) and ,mpC (T) for UTeO5(cr) up to 1000 K, which are not known. Following the authors, these
can be estimated to be the sum of the values for UO3(cr) [92GRE/FUG] and TeO2(cr) [90COR/KON], giving:
mS ο (UTeO5, cr, 298.15 K) = (166 ± 10) J · K−1 · mol−1
,mpC (TeO2, cr, T) = 151.845 + 3.6552·10−2 T − 1.8129·106 T−2 J · K−1 · mol−1.
A third-law treatment of the data gives r mH ο∆ ((A.123), 298.15 K) = − (288.7 ± 10.7) kJ · mol−1 and thus f mH ο∆ (UTeO5, cr, 298.15 K) = − (1608.8 ± 6.1) kJ · mol−1 where the standard enthalpy of formation of TeO2(cr) is taken from the assess-ment by Cordfunke et al. [90COR/KON] − see section 14.1 This third-law value is close to two calorimetrically-determined values − see section 9.5.3.2.1. However, the second-law value of the enthalpy of reaction (A.123) is very different from the third-law value (in keeping with the unexpectedly large entropy change) r mH ο∆ ((A.123), 298.15 K) = − 372.8 kJ · mol−1, with an unknown uncertainty, implying f mH ο∆ (UTeO5, cr, 298.15 K) = − 1640.1 kJ · mol−1.

Discussion of selected references 659
This study thus supports the stabilities derived from the more precise (and thus preferred) calorimetric data, and the estimated entropy of UTeO5(cr).
[99SOD/ANT] XANES is used to identify and measure the concentrations of Np3+, Np4+, +
2NpO and 2+2NpO (± 5%) in 1 M HClO4 (22 ± 2°C). Spectra are recorded versus the applied poten-
tial, E, (± 0.01 V) to an electrochemical cell working with a Pt wire electrode and a refer-ence electrode Ag/AgCl, 3 M NaCl (0.196 V at 25°C) under a N2/H2O saturated atmos-phere. The characteristics of the XANES spectra (edge position at ± 2 eV) are first estab-lished in solutions where aqueous ions are shown to exist by classical optical spectroscopy. All the XANES spectra are similar to those of Pu [98CON/ALM]. The data are analysed by diagonalisation of the absorption/energy matrix (17.595 to 17.665 eV) and as a result four components are identified in the aqueous ion spectra. A Nernst plot of E versus log10[Np(x+1)]/[Np(x)] gives for x = 5 and 3 a transfer of 0.94 electrons and the following formal potentials in 1 M HClO4:
(VI/V)Eο = (0.931 ± 0.015) V
(IV/III)Eο = − (0.053 ± 0.001) V.
The average values quoted by the authors from the literature are, respectively, (0.941 ± 0.001) V and − (0.045 ± 0.005) V. [2001LEM/FUG] have selected the values
= (1.137 ± 0.001) V (SHE) for the formal potential of (VI/V)Eο 2+ +2 2NpO / NpO (Table 7.2 p.
95) and (0.219 ± 0.010) V (SHE) for the standard potential of Np4+/Np3+ (Table 7.3 p. 100). The calculated formal potential for the latter redox couple is (0.155 ± 0.001) V (SHE) (Figure 7.2 p. 103). The reported values in this paper ((1.127 ± 0.015) V (SHE) and (0.241 ± 0.001) V (SHE)) are far from those selected by [2001LEM/FUG].
The work of Soderholm et al. [99SOD/ANT] is more aimed at checking the appli-cability of the XANES method than to improve the method to measure redox potentials.
[99SUZ/TAM] Distribution experiments on HTcO4 were conducted at 298.2 K between aqueous solutions (0.01 − 7.0 M HNO3 and 1.5·10−5 − 1.5·10−1 M) in contact with n−dodecane (ten minutes of agitation) containing cyclic amides and mixtures thereof (0.008 − 1.0 M). The amides investigated were:
• N−(2−ethyl)hexylbutyrolactam (EHBLA), • N−(2−ethyl)hexylvalerolactam (EHVAL), • N−(2−ethyl)hexyl−caprolactam (EHCLA), • N−octylcaprolactam (OCLA), • a mixture of 3−octyl−N−(2−ethyl)hexylvalerolactam and
4−octyl−N−(2−ethyl)hexylvalerolactam (3,4,OEHVLA), • 2−octyl−N−(2−ethyl)hexylcaprolactam (2OEHCLA),
Discussion of selected references 660
• a mixture of 3−octyl−N−(2−ethyl)hexylcaprolactam and of 5−octyl−N−(2−ethyl)hexylcaprolactam (3,5,OEHCLA), and
• a mixture of 3−octyl−N−octylcaprolactam and 5−octyl−N−octylcaprolactam (3,5,OOCLA).
Plots of the distribution constant as a function of amide concentration and nitric acid concentration are given allowing estimates of the number of molecules per HTcO4 moiety in the extracted complex. A third phase was observed in the absence of octyl groups substituted onto the ring. However, no thermodynamic data are given so that this paper falls outside the scope of this review.
[99VAL/MAR] This paper deals with relativistic quantum mechanical calculations on the species, , AnOOH2+ and An (An = actinide in the VI, V and IV oxidation state, respectively), with the aim of checking the nature of the bonds in the species and to calculate their ener-gies. To check the validity of the calculations the following route is followed.
2+2AnO
2+2(OH)
The change in energy, mU∆ ((A.124), An), for an assumed two-step reduction mechanism of the overall reduction of , according to: 2+
2AnO2+2AnO (g, 0 K) + H2O (g, 0 K) (g, 0 K) + 0.5 O2 (g, 0 K) (A.124) 2+
2An(OH)
can be calculated from the individual energies of the species. Then, all the species are hy-drated leading to the equilibrium:
2+2AnO (298.15 K) + H2O (aq, 298.15 K)
2+2An(OH) (298.15 K) + 0.5 O2 (aq, 298.15 K) (A.125)
for which the Gibbs energy is r mGο∆ ((A.125), An). All the hydrations correspond to a Gibbs energy . It is obvious that: 2+
hyd m 2(AnO )Gο∆
r mGο∆ ((A.125), An) = mU∆ ((A.124), An) + . 2+hyd m 2(AnO )Gο∆
In a third step the values of r mGο∆ ((A.126), An): 2+2AnO (298.15 K) + 2 H+(298.15 K) + H2 (g, 298.15 K)
An4+ (298.15 K) + 2 H2O (l, 298.15 K) (A.126)
can be calculated from ((A.125), An), which gives the standard redox potential VI/IV between / An4+, , according to
r mGο∆2+2AnO VI/IVEο
r mGο∆ ((A.126), An) = − 2·F· . Fi-nally, calculated values of the redox potential can be compared with the experimental ones.
VI/IVEο
Unfortunately, all the required experimental data to calculate ∆ ((A.125), An) and are known only for U. So the authors derived
r mGο
mhyd m (An)Gο∆ rGο∆ ((A.125), U) from
the values selected by [92GRE/FUG] for of , U4+ and the hydrolysis constant, , of U4+. This value gives ∆ , from the calculated value, . They assumed that this value of applies to the other actinides, Np, Pu and Am,
f m (An)Gο∆
hyd m (U)G)
2+2UO
2,1οb 1(U)U∆
hyd mG∆ (U

Discussion of selected references 661
and that is also the same within the actinide series under consideration. Consequently all the
2,1οb
22 4
−(OH)
3 6 2) ]
3−2 (OH)
VI/IVEο values can be calculated. Despite the crude approximations the calculated and experimental values are consistent.
Improvements and cross checking could be given to these considerations using the data selected in this review for U, Np, Pu and Am.
Theoretical calculations on actinides are now in progress and must be taken into account in the future as providing strong support of selecting thermodynamic constants.
This work emphasises the importance of values, which will be always needed to compare theoretical calculations with experimental data for aqueous solutions, see [98DAV/FOU].
[99WAH/MOL] This paper reports complementary results from EXAFS measurements and theoretical quantum chemical calculations on U(VI) species, and those present in alkaline solu-tions. In regard to the aim of this review, the main result is the strong evidence that in alka-line aqueous solutions the species, , is present. So the controversial statements arising from the papers [95PAL/NGU], [98YAM/KIT], [99CLA/CON] and [2000NGU/PAL] (see this review) about the nature of the anionic species of U(VI), which predominate above pH 10, have been answered.
EXAFS measurements were made in 0.1 M HClO4, 1 and 3 M tetramethylammo-nium hydroxide (TMA − OH) solutions, 5·10−2 M in U(VI). The experimental data have a better resolution than in [99CLA/CON]. Quantum chemical calculations on ,
, , and are the best that can be done at the present time.
TMA−OH EXAFS spectra show that there is no U−U interaction. The (U−O)eq distance determined with a high precision is the same as in the solid compound
(cr) where discrete units exist and is shorter than (U−O)eq in . The U−O bond length of the dioxouranium(VI) group is greater than in the aqueous ion. Nevertheless, the analysis of the spectra yields a coordination number of U of (5 ± 0.5). However, the determination of coordination num-ber by EXAFS is less accurate than that of the bond length, so EXAFS measurements can-not distinguish unambiguously between , and
. Calculations show that the formation of leads to an increase of (U−O)ax and a diminution of (U−O)eq compared to unhydrolyzed aqueous ions and that the coordination of one molecule of water has an opposite effect on (U−O)ax. Finally, in the five U coordinated species , the (U−O)eq is much longer than in the four-coordinate species and far from the experimental value.
All these findings indicate strongly the existence of , in alkaline aqueous solutions. It may be noted that this anion has an uncommon octahedral coordina-
hyd mG∆
2+2UO
22UO (OH)4
−
22 2 5UO (H O) +
UO 22 2UO O(OH) − 2
2 4 2UO (OH) (H O) − 32UO (OH)5
−
2 4 3 2[Co(NH [UO (OH) ] 2H O⋅ 22UO O(OH)2
−
25O)2 2UO (H +
22 4UO (OH) − 2
2 4 2UO (OH) (H O) −
245UO 2 (OH)UO −
32 (OH)5UO −
22UO (OH) −
4
Discussion of selected references 662
tion sphere for U(VI). The fact that Yamamura et al. [98YAM/KIT] find that the limiting complex is provides strong support for the interpretation of Wahlgren et al. [99WAH/MOL].
22UO (OH) −
4
2
The paper gives much more structural information on U(VI) species, such as the probable non-existence of the species, . It shows that quantum chemical cal-culations are very useful in selecting between ambiguous formulations of the hydrolysed species.
[99YUS/SHI] This is a review article describing the structure and properties of lanthanide and actinide complexes with unsaturated heteropolyanions with Keggin or Dawson structures. A num-ber of equilibrium constants are reported but the degree of protonation of the complexes is not known. The charge of the heteropolyanions is very high, making it very difficult to make extrapolations to zero ionic strength. These results are of interest mainly for labora-tory systems. However, it should be noted that these ligands bind most actinides strongly.
[2000ALL/BUC]
22UO O(OH) −
This EXAFS study discusses two important questions:
• the chemical similarity/difference between trivalent lanthanides and actinides, and the systematic variation in chloride complexation throughout these two groups of f−elements.
• the comparison of speciation as deduced from EXAFS, spectroscopic and other solution chemical data, i.e., the possibility of distinguishing between complex formation and activity coefficient variations when weak complexes are formed.
The authors present convincing evidence for the formation of chloride complexes in both groups of elements, but with the important difference that the chloride complexa-tion decreases with decreasing ionic radius for the lanthanide group, while it increases for the actinides. The authors have made a quantitative comparison between their data and spectroscopic information from the Cm(III) − Cl system [95FAN/KIM]. The agreement between the two sets of data, obtained by using very different experimental techniques, is excellent. The experimental data indicate that chloride complexes are not formed for Pu(III).
[2000BEN/FAT]
The speciation of Tc(IV) in HCl (1.0 − 6.0 M) was examined by UV−Visible and Raman spectroscopy, EXAFS and electrochemistry. In 6.0 M HCl the predominant species is
, whereas in 1.0 M HCl this anion slowly aquates (requiring approximately ten 2TcCl −6

Discussion of selected references 663
days at room temperature) to give the general composition of Tc as manifested by a blue shift in the peak at 338 nm ( Tc ) to 320 nm. Peaks are also observed at ≈ 240 and ≈ 245 nm. The presence of dissolved oxygen leads to the formation of (290 nm), which is a trace impurity in the starting solution.
An aged Tc(IV) solution in 1.0 M HCl showed bands at 332 − 344 cm−1, indica-tive of Tc−Cl bonding and 911 cm−1 characteristic of Tc=O bonds (a band at 400 cm−1 may also be due to Tc−O stretch from H2O). Pure exhibits bands at 332 − 344 cm−1 according to [69SCH/KRA], whereas Tc has bands at 323 and 912 cm−1. EXAFS shows two types of Tc(IV) first neighbours: Cl at 2.32 − 2.34 Å and 2.48 − 2.51 Å; O at 1.63 − 1.64 Å and 1.90 Å. A better fit of the EXAFS data has five chlorine atoms and one oxygen bound to the Tc centre (the oxygen could be either Tc=O or Tc−O(H2O)), rather than four chlorine and two oxygen atoms. The Raman and electrochemical information seem to reject the possibility of a Tc=O bond and therefore favour TcCl5(OH2)− as the dominant species in aged 1.0 M HCl solutions, with minor components being most likely TcCl4(OH2)2 and , although the general formula given above is not completely ruled out, i.e., the presence of Tc=O bonds.
2O (H O) Cl (OH)q np
− −
2Cl2 6n q p n q− − −
6−
4
−
10 ,0g sK10 ,0glo sK ο
TcO−
26TcCl
4O−
26TcCl −
[2000BRU/CER] This paper does not add new thermodynamic data to [92GRE/FUG], [95SIL/BID] and [2001LEM/FUG]. It aims to compare the solubilities of Th, U, Np, Pu, Am and Tc calcu-lated from databases with values derived from spent fuel leaching and natural analogues. Sensitivity to variations in pH (7 to 9), Eh (− 180 to − 60 mV), carbonate concentration (from calcite equilibrium) and t (15 to 60°C) is checked for granite waters and granite wa-ter saturated with bentonite. Each radioelement has its own response to these parameters depending on the solubility limiting phase and the species in equilibrium.
[2000BUN/KNO] Colloids of thorium are formed in non-complexing aqueous solutions when their concen-trations reach the solubility limit. As the LIBD technique is a powerful tool to detect col-loid generation, the solubility product can be determined by measuring the threshold of the breakdown probability for solutions of a given Th concentration, as a function of pH, in the range where Th4+ is the dominant species. Solutions with Th concentrations, 2.8·10−2 to 8.9·10−5 M (Th(NO3)4 in 0.5 M NaCl), have been investigated with increasing pH in the range 1.4 to 2.8. The mean from seven solutions gives lo (ThO2 · xH2O, coll) = − (49.54 ± 0.22). Extrapolation to I = 0 with the SIT gives = − (52.8 ± 0.3). This value is just consistent with (ThO2, cr) = − (54.2 ± 1.3) calculated from thermo-dynamic data from [87RAI/SWA]. The difference is suggested to be a result of different particle sizes; the solubility of 20 nm colloids is calculated to be a factor of 10 to 25 larger than for a crystalline sample. This paper gives an overview of the solubility data of ThO2(cr) and ThO2(am).
10 ,0log sK ο

Discussion of selected references 664
[2000BUR/OLS] This paper is highly relevant for the understanding of degradation of nuclear waste glass at elevated temperatures. The authors report the formation of a new uranium silicate and its structure, which has general interest; it has a layered structure consisting of Si4O12 units which share four corners with adjacent tetramers. The uranium is located between the sil-ica layers and is coordinated to four oxygen atoms, two from two adjacent tetramers in one plane and two from the plane below. This results in a less common octahedral co-ordination geometry around uranium, two oxygen and four silicate oxygen atoms in the plane perpendicular to the linear UO2−unit; most uranium silicates have a pentagonal bipyramid coordination geometry.
[2000COM/BRO] This paper deals with the hydrolysis of U(VI) in the presence of constant sulphate anion concentrations (0.1 and 1 M Na2SO4, 0.2·10−3 < U < 2.2·10−3 M, pH 3.8 to 6.8, t = (25.0 ± 0.1)°C) and gives additional results to similar previous studies conducted at higher ionic strengths, 3 M (0.5 M Na2SO4 + 2 M NaClO4) [93GRE/LAG] and 1.5 M Na2SO4 [61PET], [93GRE/LAG]. The aim of this paper is to determine formation constants of hy-droxo−sulphato complexes.
In all the studies noted above, potentiometric titrations were used. In this work, computations were carried out using the MINIQUAD program and the selected data meet two criteria: standard deviation less than 10 % and normalised agreement factor less than 0.002.
The stoichiometric ratios UO2/OH, which fit the data in 0.1 M Na2SO4, are 1/1, 2/2, 3/4, 3/5, 4/7 and 5/8. At a higher concentration, 1 M, the ratios are 2/2, 3/4, 4/7 and 5/8. The main difference with [93GRE/LAG] is the introduction to the model of the ratios 4/7 and 3/5, which also exist in non-complexing media. Stability constants, , of possi-ble complexes, , in the presence of complexing sulphate anion are given, which cannot be compared to data selected in [92GRE/FUG] in non-complexing solution. These values differ, as expected, and recognised in [93GRE/LAG].
On the other hand, ternary dioxouranium(VI) hydroxo-sulphato and dioxoura-nium(VI) sulphato complexes can be identified and the corresponding formation constants calculated, according to:
p + q H2O(l) + r + q H+.
,m nb2
2(UO ) (OH) m nm n
−
2+2UO 2
4SO − 2 22 4 (UO ) (OH) (SO ) p q r
p q r− −
The p, q, r values selected in this work are (1, 0, 1), (1, 0, 2), (2, 2, 2), (3, 4, 3), (4, 7, 4) and (5, 8, 4). The values are given in Table A-47. The p, q, r set (3, 4, 4) is excluded on the basis of spectroscopic results of Moll et al. [2000MOL/REI2].
, ,p q rb
To determine the extrapolated values at zero ionic strength of the values of the hydroxo complexes according to the SIT, the authors have used the data of
, ,p q rb

Discussion of selected references 665
[93GRE/LAG], [61PET] and [2000MOL/REI2]. From data at three different ionic strengths they calculate the and values shown in Table A-47.
Table A-47. and ε (p, q, r, Na+) (kg · mol−1).
Sulphate concentration, mol · kg−1
p, q, r species 0 0.1004 1.027
10 , ,log p q rοb ε
10 , ,log pοb
3,5,3b
q r
1.566
2, 2, 2
− (0.64 ± 0.01)
− (0.14 ± 0.22)
− (2.17 ± 0.15)
ε
ε
ε
ε
− (3.02 ± 0.68)
− (3.20 ± 0.82)(c)
3, 4, 3
− (5.9 ± 0.2)
(0.6 ± 0.6)
− (6.60 ± 0.17)
− (7.18 ± 0.70)
− (9.01 ± 0.87)(c)
4, 7, 4
− (18.9 ± 0.2)
(2.8 ± 0.7)
− (15.85 ± 0.28)
− (18.4 ± 1.3)
− (22.6 ± 1.2)(c)
5, 8, 4
− (18.7 ± 0.1)
(1.1 ± 0.5)
− (17.69 ± 0.20)
− (19.61 ± 0.73)
− (20.14 ± 0.88)
1, 0, 1 (3.15 ± 0.02)(a) (1.92 ± 0.03) (1.06 ± 0.19) (1.9 ± 0.19)(b)
1, 0, 2 (4.14 ± 0.07)(a) (2.90 ± 0.08) (2.06 ± 0.32) (2.29 ± 0.24)(b)
(a) From [92GRE/FUG]. (b) From [93GRE/LAG]. (c) Calculated from [2000MOL/REI2] and [93GRE/LAG].
Additional considerations are given in this paper on the structures of the com-plexes and the value, lo = − (11.7 ± 0.2), is given for 0.1 m Na2SO4.
[2000DAS/SIN] Enthalpy increments of two strontium uranates, Sr3U2O9(cr) and Sr3U11O36(cr), were measured from ca. 300 to 1000 K, using a Calvet microcalorimeter.
The compounds were prepared by heating the stoichiometric amounts of U3O8(s) with the SrCO3(s) in air at 1100 K for ca. 20 hours in alumina boats and were characterised by X−ray diffraction.
The enthalpy increments were fitted to a simple polynomial, using the Shomate procedure. The heat capacities at 298.15 K were constrained to the values:
(Sr3U2O9, cr, 298.15 K) = (301.8 ± 3.0) J · K−1 · mol−1
(Sr3U11O36, cr, 298.15 K) = (1064.2 ± 10.6) J · K−1 · mol−1
calculated from their own detailed enthalpy increments from 299 to 339 K.
10g
,mpCο
,mpCο
The derived enthalpy equations give on differentiation:
(Sr3U2O9, cr, T) = 319.18 + 0.11602 T − 4.6201·106 T−2 J · K−1 · mol−1 (298.15 to 1000 K)
,mpC

Discussion of selected references 666
(Sr3U11O36, cr, T) = 962.72 + 0.35526 T − 3.954·105 T−2 J · K−1 · mol−1 (298.15 to 1000 K).
The enthalpy of formation of Sr3U11O36(cr) has been determined experimentally, but not that of Sr3U2O9(cr). The authors have estimated this from electronegativity consid-erations, to be − 4594.9 kJ · mol−1, with an unknown uncertainty. However, since the en-thalpies of formation of several strontium uranates(VI) are now known fairly precisely, we have preferred to estimate this from the data for the other strontium uranates(VI). If the formation of Sr3U2O9(cr) from its neighbours is exothermic, (Sr3U2O9, cr, 298.15 K) is < − (4619.9 ± 4.0) kJ · mol−1, whereas a similar condition for the decomposition of Sr5U3O11(cr) implies (Sr3U2O9, cr, 298.15 K) > − (4616.0 ± 8.0) kJ · mol−1. Al-though these are formally incompatible, the selected value:
(Sr3U2O9, cr, 298.15 K) = − (4620 ± 8) kJ·mol−1,
is consistent with these conditions within their uncertainties. This value is somewhat more negative than that proposed by [99SIN/DAS] (whose paper was written before the exten-sive new data of [99COR/BOO] had appeared).
,mpC
f mH ο∆
f mH ο∆
f mH ο∆
The authors also estimate the entropies of the two uranates to be 301.8 and 1277.9 J · K−1 · mol−1, without uncertainties, but these estimates are not selected for the review at this time.
[2000FIN] This paper is an update of the author's 1981 assessment [81FIN/CHA] of the thermody-namic and transport properties of UO2(cr, l), to incorporate an appreciable amount of new data, principally on the liquid. For example, the heat capacity data for the liquid now ex-tend up to 4500 K. The thermodynamic properties assessed include the enthalpy increment,
, thermal expansion, density, surface tension and total vapour pressure. Only the thermal data are discussed here, with a minor comment on the vapour pressure.
Two fitting equations are given for as a function of T. The first has three terms, which give an approximate representation of the important con-tributions to the enthalpy and heat capacity, whereas the second is a simple polynomial fit.
The two equations for the enthalpy increment up to the melting point, 3120 K, are:
= c1·θ·[(exp(θ/T) −1)−1 − (exp(θ/298.15) −1)−1] + c2 (T 2 − 298.152) + c3 exp(−Ea/T) (A.127)
= ∑ . (A.128)
,m ,pC fus m∆ H
m m( ) (298.15K)ο−H T H
m m( ) (298.15K)ο−H T H
m m( ) (298.15K)ο−H T H5
36
0
(a (10 ) ) + a (1000 / )n
nn
n
T=
−
=
T

Discussion of selected references 667
The coefficients are listed in Table A-48.
Table A-48: Values and units of the coefficients of equations (A.127) and (A.128).
Coefficient Value Units
c1 81.613 J · K−1 · mol-1
c2 2.285·10−3 J · K−2 · mol-1
c3 J · mol-1
θ 548.68 K
18531.7 K
a0 − 21.1762
a1 52.1743 J · K−1 · mol-1
43.9735 J · K−2 · mol-1
a3 − 28.0804 J · K−3 · mol-1
2.360·107
Ea
J · mol-1
a2
a4 7.88552 J · K−4 · mol-1
a5 − 0.52668 J · K−5 · mol-1
a6 0.71391 J · K · mol-1
These equations give very similar values for both and (T), and either can be used to represent the data for UO2(cr) up to its melting point.
For UO2(l), all the experimental data on the enthalpy increment and heat capacity have been fitted to the expression:
= 80383 + 0.25136 T − 1.3288·109 T−1 J · mol−1
m m( ) (298.15K)ο−H T H,mpC
m m( ) (298.15K)ο−H T H (3120 to 4500 K),
which gives a heat capacity decreasing from ca. 137 J · K−1 · mol−1 at the melting point, to ca. 66 J · K−1 · mol−1 at 4500 K. Combination of the two equations for the enthalpy incre-ments gives for the enthalpy of fusion:
(UO2, cr, 3120 K) = (70 ± 4) kJ · mol−1.
The equation for (UO2, cr) in [92GRE/FUG] is valid only to 600 K and gives values which are close to those derived from the revised assessment by [2000FIN], so these data [92GRE/FUG] will not be adjusted.
The author also discusses the data for the total vapour over liquid UO2, again to take account of additional data at very high temperatures, which in general are beyond the scope of the present review.
fus mH∆
,mpC
[2000GOR/MIR] Tc(I) compounds are known to be good radiological imaging agents. Each test solution was prepared quantitatively according to the following reaction:

Discussion of selected references 668
Tc(CO)5X + 3 H2O(l) + X− + 2 CO(g),
for X = Cl, Br, I, and SCN. 99Tc NMR and potentiometric titrations were the methods of choice. At OH/Tc ratios < 1/1, three species, identified by NMR, were shown to form slowly and sequentially, namely: [T (s), [Tc(CO)3(µ−OH)(H2O)2]2 (s), and [Tc(CO)3(µ−OH)]4 (s) characterised by chemical shifts at − 1055, − 763 and − 585 ppm, respectively. Formation constants (presumably stepwise) for T complexes are listed (see Table A-49), but no description is given as to the method em-ployed and no other supporting results are given.
+3 2Tc(CO) (H O)3
23 2c(CO) (OH)(H O) ]
(1 )3 2 3-c(CO) (H O) X n
n n− +
Table A-49. Formation constants for complexes. (1 )3 2 3Tc(CO) (H O) X n
n n− +
−
Cl− Br− I− SCN−
K1 1.32 1.39 2.67 697
K2 0.17 0.21 1.26 106
K3 0.05 0.07 0.66 13
The values for the halides are too small to be meaningful and those for the thio-cyanide complexes must be considered as unsubstantiated at this time. However, the IR spectrum of [Tc(CO)3(H2O)2(NCS)] isolated from solution ([2000GOR/LUM]) apparently indicates that the thiocyanate ligand is bonded to Tc via the nitrogen. Weak complexes with acetate ions are claimed to have been observed, with a much stronger tridentate com-plex being formed with tartrate.
[2000HAS/ALL] The authors have studied the reaction of an oxide of initial composition PuO1.97(s) with adsorbed water at 298 to 623 K, for periods up to 30 days. Mass spectrometric analysis showed that H2(g) is the only gaseous reaction product. Oxidation rates were measured at constant temperature and
2 by microbalance and p−V−T techniques, but precise details
of the experimentation are not given. A plot of the lattice parameter of the oxide as a func-tion of the O/Pu ratio is given, but it is unclear how the ratios were determined − possibly from the weight gain (assuming only oxygen is absorbed) or from the volume of hydrogen produced (again from the assumed reaction: PuO2(s) + x H2O(ads) PuO2+x(s) + x H2(g)). The lattice parameter at first decreased sharply to 5.3975 Å at O/Pu = 2 and then increased slowly to a value of ca. 5.405 Å m at an indicated ratio, O/Pu = 2.25.
With such little experimental detail given, it is difficult to assess the results of this study. However, it may be noted that it is well known that PuO2(cr) can adsorb oxygen or water to compositions up to at least PuO2.09(s) [61WAT/DOU], [63JAC/RAN], and that the observed change in the lattice parameter is well within that known to occur in PuO2.0(s) due to irradiation self−damage [62RAN/FOX].
H Op

Discussion of selected references 669
Until more detailed analyses of the composition of the plutonium oxide in such studies are available, the evidence for the formation of a thermodynamically stable bulk phase with O/Pu > 2 cannot be regarded as conclusive. Further work is clearly required on the interesting phenomena observed by [2000HAS/ALL].
[2000HAY/MAR] Theoretical studies on actinide species are increasing in the chemical literature. These cal-culations can be verified by comparing bond lengths with EXAFS and X−ray measure-ments, vibration frequencies with spectroscopic properties and energetics with thermody-namic constants in aqueous solutions, when solvation of the species can be estimated. This paper is an example of the state of the art in this area. It deals first with the structures and vibration frequencies of and , and then with the energy of these species together with AnO2(H2O)4(OH)+. Additional calculations bear on the ener-gies of different species with n = 4 and 6.
Updates of the literature both on calculation methods applied to actinides and ex-perimental data on U, Np and Pu can be found in this paper.
This review focuses mainly on the predictive chemistry of the cited species in aqueous solution. Solvent effect are treated using a dielectric continuum model.
22 2 5AnO (H O) +
2 2 5AnO (H O)+
22 2AnO (H O)n
+
It is shown that must be the stable species in the gaseous phase, but that hydration stabilises the pentahydrate, as known experimentally. Hydrolysis of in aqueous solution according to:
2+2 2 6UO (H O)
2+2UO
2+2 2 5UO (H O) + H2O(l) UO2(H2O)4(OH)+ + H3O+
is predicted to be endothermic by 55.2 kJ · mol−1, but according to [92GRE/FUG] the ex-perimental value is only 18.0 kJ · mol−1. In the gas phase the reaction is predicted to be exothermic by − 121 kJ · mol−1. This difference emphasises the role of solvation but does not explain the discrepancy between the two (298.15 K) values. r mGο∆
Calculations on U(VI) (5f0) do not need to take into account spin−orbit effects, which must be included in all other cases dealing with U(V) and Np or Pu in the V and VI oxidation states. Calculations of the redox potentials show that the relativistic effect inhibits the reduction of in the gas phase (by 0.3 eV for U, 1.27 eV for Np and 0.2 eV for Pu). The predicted values of are the following: 2.37 V for U, 4.00 V for Np and 3.28 V for Pu, far from the experimental values, but the overall trends of the values are the same. The systematic error of 2 − 3 eV is not explained.
VI/VEο
2+2AnO
VI/VEο
[2000KAL/CHO] This is a series of investigations where the complex formation between Ca2+ and
has been investigated using spectroscopic techniques. All studies indicate a very strong interaction, resulting in a pronounced increase in the fluorescence intensity and
42 3 3UO (CO ) −

Discussion of selected references 670
fluorescence lifetime. Bernhard et al. [96BER/GEI], [97BER/GEI], Amayri et al. [97AMA/GEI] and Geipel et al. [98GEI/BER4] present convincing evidence for the for-mation of an uncharged complex, Ca2UO2(CO3)3(aq). These authors have estimated an equilibrium constant for the reaction:
2 Ca2+ + + Ca2UO2(CO3)3(aq) (A.129)
(A.129) = (26.5 ± 0.3). Kalmykov and Choppin [2000KAL/CHO] have studied the same system using a similar experimental method. The data in 0.1 M NaClO4 are in excellent agreement with those of Geipel et al. [98GEI/BER4], [97BER/GEI]. Kalmykov and Choppin [2000KAL/CHO] have also studied the ionic strength dependence of the re-action and used the SIT to calculate the equilibrium constant at zero ionic strength. This value, (A.129) = (29.2 ± 0.25), is based on information over a larger ionic strength range than that proposed by Geipel et al. [98GEI/BER4], [97BER/GEI]. The pre-sent reviewers notice two features in the analysis of the data of Kalmykov and Choppin [2000KAL/CHO]. The first is that the equilibrium constant for the reaction:
2 Ca2+ + Ca2UO2(CO3)3(aq)
is nearly independent of the ionic strength in the range 0.1 to 1 M; the second is that the value of for this reaction has a large positive value, 2.67 kg · mol−1, as estimated from Figure 3 in [2000KAL/CHO]. This results in an interaction coefficient for the uncharged complex, ≈ 3.3 kg · mol−1. This value is surprisingly high and sug-gests that the data treatment should be modified. We suggest the following alternative in-terpretation of the experimental data; the strong interaction between Ca2+ and
indicates that there might be a similar, albeit weaker, specific interaction between Na+ and the tris-carbonato complex. Hence the reaction studied is:
2+2UO 2
33 CO −
10log K ο
lo 10g K ο
42 3UO (CO )3
−
∆ε
Caε
43O ) −
2 2 3 3UO (CO ) (aq)
32UO (C
42 3 3Na UO (CO )x
x− + 2 Ca2+ Ca2UO2(CO3)3(aq) + x Na+,
where for simplicity, x is assumed to be equal to four such that both complexes are un-charged. With this assumption the reported equilibrium constants are conditional constants. The equilibrium constants given in the authors’ Table 3 should be multiplied by [Na+]4 in order to obtain the equilibrium constant for the reaction given above. The resulting
values are 0.90, 2.76, 4.41, 5.12 and 7.85 at the ionic strengths investigated. The resulting SIT plot is approximately linear over the entire ionic strength range investigated and gives = (5.33 ± 0.10) and = (0.56 ± 0.03) kg · mol−1 for this last reaction. This in turn means that the difference between the ε values for the uncharged complexes is at most 0.06, which seems quite reasonable. The conclusion is that great care should be used when applying the SIT, or any other specific ion interaction model, on systems where there are indications of a specific chemical interaction between anion and cation.
10log K
10log οK ∆ε
[2000KON/CLA] This paper reports the identification by several spectroscopic techniques of a dimeric di-oxouranium(VI) hydroxide species, in equi-4 4
2 3 2 2 2 8O )(OH) ( OH) (UO ) H)) (Om − −− =((U

Discussion of selected references 671
librium with the already well-known 4:1 species (UV spectrum λ max = 412 nm, = 45 M−1 · cm−1, Raman O=U=O frequency 816 cm−1). This species has been identi-fied at high U(VI) concentration (5·10−2 M) in tetramethylammonium hydroxide (TMAOH) solutions and in a gel corresponding to 0.5 M TMAOH. When the gel is washed with tetrahydrofuran, a yellow solid is obtained which also contains the dimer. No thermodynamic data are available. As these data have not been published, this review quotes them only as being indicative.
22 4(OH)UO −
,mp
ε
[2000LAA/KON] This paper is a study of the heat capacity of an alloy of approximate composition, Tc0.85Ru0.15, from ca. 300 to 973 K, using a differential scanning calorimeter. The sample was unusual, in that it was formed by neutron irradiation of a disc of pure 99Tc metal, which transmutes some of the 99Tc to 100Ru. Isotope dilution mass spectrometry (IDMS) indicated that the ruthenium content was (15.0 ± 0.4) atom%. However, EPMA showed that due to shielding effects there was substantially more Ru in the outer parts of the disc, with more than 30% Ru at the rim. The sample was thus not of uniform composition. In-deed, there is a minor discrepancy in the IDMS and EPMA results, since the integrated composition of the disc from the radial distribution plot (the authors' Figure 2) would be noticeably greater than 15 atom% of Ru, as given by EPMA.
Two DSC runs on the same sample gave results differing by ca. 4%, indicating an uncertainty of at least 2% in the derived heat capacities.
The authors calculated the heat capacity of pure 99Tc assuming the change of C upon mixing was zero. They used values for C (100Ru, cr, T) obtained by combining their own DSC C measurements with earlier enthalpy drop measurements by Cord-funke et al. [89COR/KON], both using natural ruthenium. The molar masses for 99Tc and 100Ru used by the authors in these calculations seem to be too low by ca. 1 g · mol-1. We have therefore repeated these calculations, using the correct values of 98.9063 and 99.9042 g · mol−1, respectively, together with the recent assessment of the heat capacity of Ru(cr) by Arblaster [95ARB]. The fitted equation for the heat capacity of 99Tc, assuming ∆ is zero for the alloy is then:
(Tc, cr, T) = 24.383 + 6.6288·10-3 T − 54995 T-2 , J · K−1 · mol−1 (300 to 973 K).
,mp
,mp
f ,mpC
,mpC
These values of are 3 to 7 % higher than those suggested in [99RAR/RAN] and were based on a slight reworking of the values proposed by Guillermet and Grimvall [89GUI/GRI]. Considering the combined uncertainties in the experimental results, the in-homogeneity of the Tc0.85Ru0.15 sample and the assumption of = 0, this agreement is considered to be well within the uncertainty of the values selected in the technetium review [99RAR/RAN], and their values are retained.
As noted by [2000LAA/KON], Boucharat [97BOU] has made DSC measure-ments on samples of Tc(cr) from the same source as that used by [2000LAA/KON]. How-
,mpC
f ,mpC∆

Discussion of selected references 672
ever, her derived heat capacities have a maximum around 1080 K and a minimum around 1540 K, for which there is no obvious explanation and have been discounted in this re-view.
[2000MOL/REI] This paper complements [99WAH/MOL] and [99CLA/CON], which report contradictory results on the U(VI) species present in alkaline aqueous solutions: and/or
(see this review). EXAFS spectra are recorded (in k space up to 17.5 Å−1 and in the transmission mode) from three test solutions, 0.05 M (pH = 4.1), 0.5 M (pH = 13.7) and 3 M in (CH3)4NOH and a total concentration of U(VI) equal to 5·10−2 M. All test-solutions are kept under an argon atmosphere. Schoepite (in fact metaschoepite) precipi-tates from the first test solution when its pH is increased up to 7. Additional NMR (17O-NMR) data are obtained on solutions, 5 10−2 M U(VI) (17O enriched "yl" oxygen), 5 % D2O or 1 to 3.5 M (CD3)4NOD.
EXAFS data at pH 4.1 are consistent with previous structural data on and (UO . The distances, UOax, UOeq and U−U, in schoepite or
metaschoepite are those of [96ALL/SHU]. At pH 13-14, EXAFS data show clearly an oc-tahedral coordination for [99WAH/MOL] without coordinated water in the equatorial plane and that the concentration of in these solutions must be small. NMR measurements were used to probe the coexistence of these two species. 17O-NMR spectra in 3 M (CD3)4NOD show at 298 K a broadening of the single line obtained in 1 M (CD3)4NOD. Resolution of this signal in two peaks is obtained, at 258 K, by addi-tion of methanol to the solutions. These peaks provide strong evidence of a rapid equilib-rium between and . A value of the stepwise equilibrium constant for :
+ OH−
is tentatively given from the intensity of the deconvoluted peaks as 0.4. This value must be smaller in water in order to be consistent with EXAFS data and a value around 0.1 is pro-posed by Moll et al.
In conclusion these data confirm the formation and structure of in alkaline solutions, but also indicate the formation of small amounts of at [OH−] > 3 M.
[2000MOL/REI2] This paper gives numerous spectroscopic, EXAFS and 17O NMR ( enriched) data on sulphate solutions of U(VI), which are discussed with regard to the predominant spe-cies, UO2SO4(aq) and , according to the data of [61PET], [93GRE/LAG] and [96GEI/BRA]. The aim of the work is to gain information on sulphato ligand bonding.
22UO (OH) −
4
5
4
32UO (OH) −
2+2 2 2(UO ) (OH) +
2 3 5) (OH)
2UO (OH)2−
32UO (OH)5
−
22 4(OH) − UOUO 3(OH)2 5
−
22UO (OH)4
− 32 5UO (OH) −
22UO (OH) −
32UO (OH) −
4
5
2
17 2+2U O
22 4UO (SO ) −

Discussion of selected references 673
Of interest to this review are the potentiometric titrations (25.00 ± 0.05)°C per-formed in 0.5 M Na2SO4 + 2 M NaClO4 and 1.5 M Na2SO4 (I = 3 M) at U concentrations, 2·10−3 to 2·10−2 M (conditions similar to the studies by [61PET] and [93GRE/LAG]), and in the pH range 4.3 to 5.8. These titrations were intended to characterise hydroxo sulphato dioxouranium(VI) complexes. The data are interpreted according to:
using the LETAGROP least-squares program, which gives the number of OH groups bound to UO2 groups. The UO2/OH ratios that fit the data are 2/2, 3/4, 5/8 and possibly 4/7, while the p, q, r sets are (2, 2, 2), (3, 4, 3) and (5, 8, 6), and possibly (4, 7, 4), EXAFS data do not distinguish between polymeric complexes.
2+ 2 (2 2 ) +2 2 4 2 4UO + H O(l) + SO (UO ) (OH) (SO ) + Hp q r
p q rp q r q− − −
The values given by Moll et al. agree with those of [61PET] and [93GRE/LAG]. A fit of the potentiometric data is also obtained by incorporating the spe-cies with the ratios (OH/UO2) of 7/4 and 8/5.
In conclusion, this work establishes the stoichiometry of the species, but does not give new thermodynamic data useful for this review.
[2000NEC/KIM] This paper describes an empirical method for the prediction of stability constants using the relationship:
where is an electrostatic repulsion term, calculated from Coulomb’s law and requiring in addition to the formal charges, knowledge/estimates of the geometry of the complexes, and determination of an electrostatic shielding parameter (an “effective” dielectric con-stant). The latter is an empirical parameter that is obtained by calibration using known sta-bility constants. The authors present a table of predicted and measured equilibrium con-stants for the carbonate complexes of Am(III), Cm(III), Np(V), U(VI), Pu(VI), U(IV) and Pu(IV). The agreement between the model and experimental data is surprisingly good, better than 0.5 log10 units. Using the model, the authors have proposed stability constants for the formation of , M(CO3)2(aq), and , where M is U(IV) and Pu(IV). The values, 13.7, 24.3 and 31.9 for U(IV) and, 13.6, 24.0 and 31.5 for Pu(IV), are reasonable. However, they are not included among the selected values as they are not based on experiments.
[2000NGU/BUR] This extended abstract reports the individual UV−Visible spectra of spe-cies (in short n, m2m−n) derived from an analysis of the spectra of NaClO4 (pH < 4.5) or (CH3)4NCF3SO3 (pH > 11) solutions, 10−2 M in U (t = 25°C). Speciation is derived from
10 ,log q pb
repL
10 10 1(ML )log = log
R ln10n
nEnT
ο ο −b b
repLE
2+3MCO 2
3 3M(CO ) −
10log nbο
22(UO ) (OH) m n
m n−

Discussion of selected references 674
[2000NGU/PAL] and [95PAL/NGU] (see Appendix A). Seventy test solutions have been measured. These data, which are not yet published, are given here as being indicative only.
Table A-50: Values of the molar extinction coefficient , ε, for species.
Species (n, m) max (nm) (L · mol− 1 · cm− 1)
0,12+
22(UO ) (OH) m n
m n−
λ ε
414 8.5(a) 2,22+ 421 58(b) 5,3+ 429 234(c) 7,3+ 429 223 8,32− 419 74 11,35− 420 82 4,22− 400 17
Meinrath [97MEI2] reported (a): 9.7, (b):101, (c): 474 l · mol− 1 · cm− 1
[2000NGU/PAL] This paper follows [92NGU/BEG] and [95PAL/NGU] and gives additional information on U(VI) hydrolysed species through careful examination of Raman spectra, the determina-tion and analysis of which are described in detail. The authors used peak deconvolution of the overlapping Raman bands in their analysis of the data1. Characteristic ν1 values (sym-metric stretching vibration of the linear UO2 group) of the species, (in short n,m2m−n), as well as their concentrations, are derived for the following solutions: U concentration 3.8·10−3 to 6.74·10−1 M, pH = 0.24 to 14.96, variable ionic strengths 0.02 to 2.3 M. pH is adjusted using HCF3SO3 and/or (CH3)4NOH, (t = 25°C). Corresponding val-ues of ν1 and n:m sets are selected by combining the spectroscopic data and the thermody-namic data of [95PAL/NGU], and taking also into account literature data for discussion.
This review first gives the main features of this work, according to the authors, and then additional comments.
For pH < 5.6 the three ν1 values of the most intense bands correspond to the well-known species, 0,12+, 2,22+ and 5,3+. In addition a weak band could be attributed to the species 1,23+. For pH > 12 only one ν1 value is found. According to [95PAL/NGU] the corresponding species is 4,12− but [99CLA/CON] suggested that it could be 5,13−. Several reasons are advanced for rejecting the 5,13− species, the main one being that the ν1 values of the sets 0,12+, 2,22+, 5,3+, and 4,1 fit well the relationship:
,
ν1 (cm−1) = − 22 r + 870 (A.130)
where r is the ratio n/m = OH/UO2, while the ν1 values for the species 0,12+, 2,22+, 5,3+ and 5,13− do not. On the basis of the relation (A.130) the species 1,23+ is confirmed [92GRE/FUG].
Between pH = 5.6 and 12, four deconvoluted bands appear which are attributed to the sets: 7,3 (r = 2.33), 8,3 (2.67), 10,3 (3.33) [95PAL/NGU] and 11,3 (3.67), because the
22(UO ) (OH) −m n
m n

Discussion of selected references 675
associated ν1 values fit exactly the equation (A.130), but the ratios OH/UO2 = 9/4, 11/4, 13/4 and 15/4 could be also selected to fit that relation. Reinterpretation of the data of [95PAL/NGU] by this review concludes (see Appendix A) that the existence of the species 8,32− and 10,34− are not proven by the potentiometric titrations of [95PAL/NGU]. So the question as to the presence of these species remains open.
The species 4,32+(r =1.33) [92GRE/FUG], predominant at pH less than 3 and at high U concentration (> 1 m), should have ν1 at 841 cm−1. Nguyen et al. [2000NGU/PAL] did not find any signal for the species 7,4+ (r = 1.75, ν1 = 832 cm−1) which should exist in the solutions examined, because it is dominant between pH = 6 and 8 at U concentration higher than 10−3 M. The species 1,1+, 2,1, 3,1− are not present in the solutions that are not sufficiently dilute in U. The predicted ν1 values are respectively 848, 826 and 804 cm−1.
Thermodynamic constants are deduced for all the species characterised by a ν1 band. They confirm the data of [95PAL/NGU] at I = 0.1, but are less accurate. The only new data concern (1,23+), for which values range from (2.1 ± 0.2) to (2.7 ± 0.3) when I decreases from 2.3 to 0.1 M, and (11,35−). For this constant, the value is (78 ± 8 ), (0.02 < I < 0.56). But as no correction for ionic strength is possible, the value of the constant given in this paper is not considered for the revision of the values selected by [92GRE/FUG].
Finally the authors propose a structure for the species 8,32− and 11,35− (on the ba-sis of those established for the species 5,3+ and 7,3− and 10,34−.
The comments are the following:
• This review considers that the success of the peak deconvolution depends on the ability to correct for possible changes in the base line, the number of species present and the spacing of their individual spectra.
• There is no problem with peak deconvolution for the major species present in the acid test solutions pH < 5.6. The matter is somewhat different for the minor species. (UO2)2OH3+ seems well established from the spectrum in the authors’ Figure 2-b, but the reviewers are less convinced by the minor peak at ν = 883 cm−1 at pH = 0.24 which was assigned to with less than five coordinated water molecules. The base line varies throughout the experiments, cf. the authors’ Figures 3-a, b and 5-c, d. It would have been of value to know how the base line correction was made, e.g., using spline functions, but no information is given.
• In the alkaline region there are many species present simultaneously according to the previous potentiometric study [95PAL/NGU], cf. Figures 4-a and b, 7-e and 9-b, c, d. It seems very difficult to make the deconvolution unless an assumption is made about the number of peaks (as done by the authors), hence it is doubtful if the Ra-man data provide independent proof of the speciation. However they do indicate very clearly that there are a number of different species formed between
and .
10log b10log b
2+2UO
+2 3 5(UO ) (OH) 2
2 4UO (OH) −

Discussion of selected references 676
• The equilibrium constants are consistent between potentiometry and the Raman data up to the complex 7,3−. For the higher complexes the difference between the two sets is gradually increasing, with a very large uncertainty reported for the Raman data. There is clear evidence for the formation of in very strongly alka-line solution, and that the predominant hydrolytic species in the acid range are
and , with (UO2)2(OH)3+ as a minor species. This finding and the proposed equilibrium constants are in good agreement with the con-clusions in [92GRE/FUG]. However, the speciation in the alkaline region is still not conclusive. From a speciation diagram, cf. the Figure A-16, based on the proposed potentiometric equilibrium constants, this review finds that the polynuclear com-plexes should be predominant in the concentration range where EXAFS data [2000MOL/REI2] and [99CLA/CON] show that the system is mononuclear. To conclude, this paper gives an independent confirmation of the stoichiometry and equilibrium constants of known U(VI) species, and presents evidence for other spe-cies in the alkaline region.
• More precisely, this paper confirms the existence of the hydrolysed species with n,m sets: 1,23+, 2,22+, 5,3+, 7,3− (respectively, (UO2)2(OH)3+,
, , ) and give strong evidence of the species, 4,12−, , in basic media, but do not resolve the ambiguities on the existence of 8,32− and 10,34− species, despite the fact that a nice correlation be-tween the ν1 frequency of UO2 with the ratio OH/UO2 is established. All these spe-cies have been already considered to fit potentiometric data. Up until now the exis-tence of the new species 11,35− is only supported by spectroscopic Raman measure-ments.
The stoichiometries and equilibrium constants of the species presented in this pa-per are not sufficiently well supported by experiments to be selected by this review.
1Two internal standards, (CH3)4N+ and , which were present in excess of the total dioxouranium(VI) concentration to fix the ionic strength, were used to determine the relative peak areas of the dioxouranium(VI) and dioxouranium(VI) hydroxide species. The relationship used in these calculations (equation 6 in [2000NGU/PAL]) involves the molar scattering coefficient, JX (JX = (6.3 ± 0.4) and (3.6 ± 0.3)), for the symmetrical stretching bands at 765 and 753 cm−1, respectively,
[molarity of U− species] = JX{(area of band)/(standard band area)} [molarity of standard].
This method yielded directly the molarities of the dominant dioxouranium(VI) species at pH ≤ 4.53, but at higher pH where the 0,1 species was minor, the concen-tration was calculated from the hydrolysis quotients of the lower-order dioxouranium(VI) hydrolysed species determined previously at lower pH. The total molar stoichiometric ura-nium concentration was considered known to ± 1%. Chi squared values (χ = {Σ(obs2 − calc2)}/calc) were generally < 0.05 for the total band areas compared to those
22UO (OH)4
−
2+2 2 2(UO ) (OH) +
2 3 5(UO ) (OH)
22(UO ) (OH) m n
m n−
2+2 2 2(UO ) (OH) +
2 3 5(UO ) (OH) 2 3 7(UO ) (OH)−
22 4(OH)UO −
3CF SO3−
2+2UO

Discussion of selected references
677
calculated from the speciation at each pH value and total dioxouranium(VI) concentration. The hydrolysis quotients at each ionic strength were averaged with the mean value and the single standard deviation given in the paper.
Figure A-16. Speciation diagram of U(VI) in alkaline solutions according to constants given in [2000NGU/PAL] where precipitation of dioxouranium(VI) phases has been sup-pressed.
7 8 9 10 11 12 13 14-9
-7
-5
-3
-1
Log
Con
c.
pH
H+
(UO2)2(OH)22+
(UO2)3(OH)82− (UO2)3(OH)104−
(UO2)3(OH)115−
OH−UO2(OH)2.H2O(c)
O22+]TOT = 50.00 mM[U
(UO2)3(OH)7−
UO2(OH)42−
(UO2)3(OH)5+
UO22+
[2000PER/CAS] The solubility and the rates of dissolution of uranophane (Ca(UO2)2(SiO3OH)2 · 5H2O), were studied as a function of bicarbonate concentration (0.001 to 0.02 M) near room tem-perature. The solid was synthesised as described by [92NGU/SIL] and characterised by XRD, SEM, FTIR and BET (surface area = 35.4 ± 0.5 m2 · g−1). ICP-MS analysis of the dissolved solid (preliminary experiments) showed that the U and Si levels were consistent with the stoichiometry of uranophane, but the Ca content corresponded only to (0.80 ± 0.05) mol Ca rather than the expected value of 1, and it was assumed that Na pro-vided charge balance. Batch and flow-through reactors were used. The authors have also taken care to ascertain that no transformation of the solid phase had taken place during the solubility experiments. The pH on the activity scale was monitored continuously, whereas U, and occasionally Ca and Si, were analysed periodically. As in a previous study [97PER/CAS], at [ ] = 0.005 M, the speciation calculations (HARPHRQ code) de-termined to be the dominant U(VI) species in solution and sporadic Ca and Si analyses confirmed congruent dissolution according to:
(A.131)
3HCO−
43 3) −
2UO (CO
2+ 43 2 2 2 4 2 2 3 2 3 3
4 4 2
Ca(H O) (UO ) (SiO ) 3H O(cr) + 6 HCO Ca + 2 UO (CO ) + 2H SiO (aq) + 5H O(l).
− −⋅

Discussion of selected references 678
The reviewer is surprised to find a solid phase containing H3O+ prepared from a solution at pH 8.8 and questions the stoichiometry proposed by the authors and suggests that an equivalent and more realistic chemical formula for uranophane would be Ca(UO2)2(SiO3OH)2
.5H2O. The SIT model was used to account for activity coefficients and from lo (A.131), the equilibrium constant (A.132) was calculated for the reaction:
(A.132)
The experimental values of (A.132) given in Table 3 of [2000PER/CAS] vary considerably, ranging from − 10.75 to − 12.74. The value of
(A.132), averaged over nine measurements at [ ] = 0.005 to 0.020 M, was reported at (11.7 ± 0.6) (note, taking the average of the actual values rather than their loga-rithms yields (12.0 ± 0.6)) and compares with a single value presented by Nguyen et al. [92NGU/SIL] of (9.4 ± 0.5). The authors comment on the large discrepancy between the existing values of the solubility product. Pérez et al. [2000PER/CAS] used a solid phase of the uncertain composition and their proposed value for the solubility constant of urano-phane at zero ionic strength, lo (A.132)= (11.7 ± 0.6), is therefore not accepted by this review.
10*g sK 10
*log sK
+ 2+ 2+3 2 2 2 4 2 2 3 2
4 4 2
Ca(H O) (UO ) (SiO ) 3H O(cr) + 6 H O Ca + 2 UO + 2 H SiO (aq) + 11H O(l).
⋅
*log K10 s
10*log sK ο
3HCO−
10*g sK ο
The rates of dissolution of uranophane, normalised to the mass ratio of solid to liquid, are expressed in units of mol·s−1·m−2. The batch rates are greater than those obtained from the flow-through technique by almost one order of magnitude, but this is slightly less than the combined experimental error, and were fitted according to the equation:
log10 rate (mol · s−1 · m−2) = a + b · log10 [ ] 3HCO−
where a = − (8.3 ± 0.6) and − (9.2 ± 0.4); b = (0.7 ± 0.3) and (0.7 ± 0.2) for the batch and flow-through techniques, respectively. These are both reasoned to be “initial” rates such that the uranium concentration is much less than the equilibrium value. In view of the in-herent difficulties in conducting kinetic experiments of this type, these results appear to be quite reasonable.
[2000QUI/BUR] The free aqueous ion displays symmetric (νs) and antisymmetric (νa) stretching modes in Raman scattering at 870 cm−1 and infrared absorption at 962 cm−1. Replacement of water molecule in the equatorial plane weakens the oxo bond, resulting in an increase of the U−O distance and a decrease of the wave number of the νs and νa modes. For solutions containing a mixture of different species, this results in broad Raman and IR spectra. Equi-librium constants were calculated from the spectra using band fitting programs that in-cludes assumptions on the number and profile of the individual species. IR-attenuated total reflectance (IR ATR) and Raman spectra have been obtained on 13 test solutions HNO3/NaNO3 (ionic strength, 0.23 to 0.35 M), 0.1 M in U(VI), in the pH range 1.55 to
2+2UO

Discussion of selected references 679
4.20 at 25°C. All the data (IR and Raman) were processed together using a chemometric approach starting with the three (n:m)(2m−n) species : (0:1)2+, (2:2)2+ and (5:3)+. Mixtures of Lorentzian and Gaussian curves were used. Attempts to fit the spectra including other species in the chemical model failed. The set of values reported at zero ionic strength, but without explanation of the method used to correct for activity factors, are: = − (5.44 ± 0.11) and = − (5.28 ± 0.25); = − (15.16 ± 0.09) and lo = − (14.62 ± 0.33) from Raman and IR data, respectively. This study is more focused on the spectroscopy of U(VI) species than on the thermody-namics of U(VI) hydrolysis. Due to lack of information the equilibrium constants are not retained by this review.
[2000REI/BER] This paper gives results on the coordination numbers of Tc(VII) and Np(IV, V and VI) derived from EXAFS spectra measured in transmission mode (except for diluted Tc solu-tions) in the k space up to 21 Å−1 for , 12 A−1 for Np(IV) and 18 A−1 for and
. The test solutions were 0.127 M or 1.3·10−3 M in Tc (NaTcO4 in water), 5·10−2 M in Np in 0.1 M HNO3 + 2 M H2SO4 for Np(IV) and in 0.1 M HNO3 for and . The coordination of Tc by oxygen atoms is found to be N = (3.9 ± 0.6) and N = (4.1 ± 0.2) as expected. That of Np(IV) is N = (11 ± 1) which agrees with previous data in a 1 M HCl solution [97ALL/BUC]. The number of water molecules around and are respectively four (N= (3.6 ± 0.6) for the second shell of oxygen atoms), and five (N = (4.6 ± 0.6)). The calculated number of coordinated water molecules for Np(V) is one less than that reported by [97ALL/BUC]; the data of Reich et al. are more precise than those in [97ALL/BUC] due to the larger k-space range and better signal to noise ratio. This paper follows [97NEU/REI] (see Appendix A).
(2 )2(UO ) (OH) m n
m n−
10 2,2*log οb 10
*log 2,2οb 10 5,3
*log οb10 5,3
*g οb
+2NpO
2+2
+2 NpO
NpO 2+2NpO
4TcO−
NpONpO 2+
2
+2
[2000REI/NEU] Reilly, Neu and Runde [2000REI/NEU] determined the solubility of PuO2CO3(s) as a function of the H+ concentration in 0.1, 0.2, 0.5, 1.0, 2.1, 3.8 and 5.6 m NaCl, and for comparison in 5.6 m NaClO4. The solid phase is characterised by powder XRD, EXAFS and diffuse reflectance spectroscopy; however, the spectra and other experimental details are not given in this extended conference abstract. The reviewer obtained additional infor-mation by personal communication and considers the experimental and calculation proce-dures used in [2000REI/NEU] are reliable.
The experimental values are given in a Figure as a function of the mo-lal ionic strength and compared to previous literature values [87ROB/VIT], [93PAS/RUN]. The solubility constants in NaCl solutions are not corrected for chloride complexation, although the presence of chloride complexes is assumed from the formation constants of the Pu(VI) mono- and dichloro complexes determined by this group of authors in another study (viz., = (0.23 ± 0.03) and = − (1.7 ± 0.2) [99RUN/REI]). Chloride
10 ,0log sK
10 1log οb 10 2log οb

Discussion of selected references 680
complexation is given as an explanation for the higher solubility product in 5.6 m NaCl ( = − (14.0 ± 0.1)) compared to that in 5.6 M NaClO4 ( = − (14.5 ± 0.1)). However, the difference might be, at least partly, also a result of activity coefficient differ-ences in the two media.
10 ,0log sK 10 ,0log sK
+ 23a ,CO )−
2+(PuO ,Cε
The authors further report that Pu(VI) is stable in concentrated NaCl solutions, whereas in dilute NaCl or in NaClO4 solutions Pu(V) and, after disproportionation, poly-meric Pu(IV) is formed at a variable rate.
The present review has applied the SIT to convert the experimental data reported in [2000REI/NEU] and by other authors [87ROB/VIT], [93PAS/RUN], [97PAS/CZE] for the reaction:
(A.133)
to zero ionic strength (cf. Table A-51). As the reported experimental uncertainties are given only as error bars in the figure of [2000REI/NEU], and are generally in the range of 0.05 − 0.15 log10 units, they are omitted from Table A-53. The values of ∆ε = (0.13 ± 0.04) kg · mol−1 and ∆ε = (0.38 ± 0.06) kg · mol−1 in NaCl and NaClO4 solutions, respectively, are calculated from the known interaction coefficient, = − (0.08 ± 0.03) kg · mol−1, and by assuming = = (0.21 ± 0.02) kg · mol−1 and
= ε = (0.46 ± 0.05) kg · mol−1 [2001LEM/FUG].
2+ 22 3 2 3PuO CO (s) PuO + CO −
(Nε2+2(PuO ,Cl )−ε 2+
2(UO ,Cl )−ε
2 4lO )− 2+2(UO ,C 4lO )−
At NaCl molalities below 3 mol · kg−1, the ionic strength dependence of the data reported by [2000REI/NEU] are in good agreement with the expected value of ∆ε = (0.13 ± 0.04) kg · mol−1 and the SIT extrapolation to I = 0 leads to:
10 ,0log οsK ((A.133), 298.15 K) = − (14.67 ± 0.10).
At higher NaCl and NaClO4 molalities, the SIT equation may become inaccurate, in particular because of the increasing effect from Pu(VI) chloride complexation. There-fore, these data are not included in the linear SIT regression.

Discussion of selected references 681
Table A-51: Solubility constants for PuO2CO3(s) (molal scale) and conversion to I = 0 with the SIT coefficients in Appendix B.
Medium t(°C) 10 ,0
logs
K10 ,0
log ο
sK Reference
0.1 m NaCl r.t. − 13.8 − 14.7 [2000REI/NEU]
0.2 m NaCl − 13.6 − 14.7
0.5 m NaCl − 13.4 − 14.7
1.0 m NaCl − 13.1 − 14.6
2.1 m NaCl − 14.7 − 13.1
3.8 m NaCl − 13.45 − 15.0 a)
5.6 m NaCl − 14.0 − 15.4 a)
0.1 m NaClO4 − 14.2 b) 22 − 15.0 [93PAS/RUN],
[97PAS/CZE]
3.5 m NaClO4 − 13.5 − (14.2 ± 0.3) a, c) [87ROB/VIT]
5.6 m NaClO4 r.t. − 14.5 − 14.5 a) [2000REI/NEU]
a) At this ionic strength the SIT extrapolation to I = 0 may include unknown large uncertainties.
b) Recalculated in the present review. c) Recalculated and selected in [2001LEM/FUG]. r.t. room temperature.
[2000STO/HOF] LIPAS is used to identify the complexes formed between or with Th4+ and
, and to quantify their stoichiometries and equilibrium constants. The technical ad-vantage of LIPAS is its high sensitivity (which means that the study can be made at low concentrations of the reactant elements) and the possibility to perform experiments under an undisturbed inert atmosphere. In this way it is, for instance, possible to prevent dispro-portionation of . In all experiments, concentrations of the pentavalent species are less than 0.25·10−3 M for Np and 10−4 M for Pu, while those of Th and U are higher but could also reach millimolar level. The ionic strength (I = 6 M) is maintained with NaClO4 and all experiments are conducted at pH < 3, t = 25 °C.
The results of the LIPAS technique are checked on the system, / .
The equilibrium constant obtained for the formation of the cation-cation complex · is K = (2.4 ± 0.2) L · mol−1, very close to that previously reported by
[93STO/CHO], using conventional absorption spectrophotometry (K = (2.25 ± 0.03) L · mol−1, I = 6 M) and Raman spectroscopy (K = (2.5 ± 0.5) L · mol−1., I = 6.26 M). There is previous evidence for the cation-cation complex, ·Th4+, but the equilibrium con-
20
+2PuO +
2NpO2+2UO
+2PuO
+2NpO 2+
2UO
+2NpO 2+
2UO
+2NpO

Discussion of selected references 682
stant obtained in this study is the first one reported, K = (1.8 ± 0.9) L · mol−1. There is no previous study of the cation-cation complex, · . The equilibrium constant ob-tained is K = (2.2 ± 1.5) L · mol−1. The large uncertainty comes from the small change in
absorbance during complexation due to the low Pu concentration used.
[2000SZA/MOL] The ion, , is predominant in aqueous solutions of U(VI) at pH > 7 pro-vided the ratio of U concentration to carbonate concentration, is higher than unity. In this complex the U atoms can be bridged through carbonato and/or hydroxo ligands and four isomers are expected to exist due to these bridges. In each isomer, each U atom accommo-dates a coordination number of five in the equatorial plane. EXAFS, 13C and 17O NMR measurements have been undertaken on this ternary complex (and on other binary carbon-ato complexes, , , for comparisons) in order to determine which species predominates.
EXAFS data show the existence of one short U-O bond with r = (1.3 ± 0.3) Å and four longer bonds with r = (3.9 ± 0.6) Å, as well as a U−U interaction. This favours the predominance of the most asymmetrical isomer whose abundance is about 80 % as shown by NMR. U−U bridge formation in the predominant isomer is achieved by one OH group and one O atom belonging to the carbonato ligand. In the second isomer, which is about 15 % of the total concentration, the bridges are formed by two OH groups.
This paper does not yield thermodynamic data but gives important structural in-formation.
[2000VIC/FAT] Attempts to prepare technetium sulphate complexes by substitution of sulphate (up to 0.4 M) for chloride in Tc in 3 M Cl− (pH = 0 to 1.6) after two months apparently yielded one species, which was thought to have hydroxide rather than sulphate ligands. The spectrum contained three peaks at 251, 316 and 492 nm. Similar spectra were obtained by reducing in 1 M HTFMS (trifluoromethanesulphonic acid) and by reduction in 3 M chloride solutions at pH = 1 in a potentiostat. The species formed in each case, whereby in the latter two methods precipitation of TcO2(s) ensued, was suggested to be analogous to Mo3O4·9H2O(cr) with hexacoordinated technetium centres and one shared, bridging oxygen atom. However, no direct evidence for such a species was provided.
[2000WAD/HRN] This is a detailed study of the interaction between silicate and americium(III) using a sol-vent extraction technique. The total concentration of silica was constant, 0.03 M and the pH was varied between 2.99 to 3.76. The experiments are carried out at 25°C in 0.2 M NaClO4. The pH electrodes were calibrated with buffer solutions and corrections made to
+2PuO
66
2+2UO
+2PuO
−
2 2 3 3(UO ) CO (OH)−
42UO (CO )3 3
−2 3 3(UO ) (CO )
26Cl −
4TcO−

Discussion of selected references 683
convert the measured pH to − log10[H+]. The amount of polymeric silicate species present in the test solutions was in the range, 10 to 17 %. The Do value for the extraction of Am(III) in the absence of silicate gave an extraction equilibrium constant in excellent agreement with previous literature information (see [65STA]). The equilibrium constant,
= (6.9 ± 0.7)·10−3 ( lo = − (2.16 ± 0.04)) for the reaction:
[2000YEH/MAD] In this paper solvent extraction is used to study the formation complexes of Am3+ and Eu3+ with chloride ions between 25 to 75°C. The organic phase used is TBP-toluene, whereas the aqueous phase is 1 M NaClO4 at pH = 2. (In this paper there seems to be a misprint concerning the ionic strength: the running text and Table 1 refer to 1 M NaClO4 while fig-ures refer to 0.1 M NaClO4 as ionic medium). The chloride concentration of the aqueous phase was varied in the range 2·10−4 M < [Cl−] < 1.2·10−3 M. The TBP concentration was varied up to 100 % to have a distribution coefficient, D (in the presence of Cl− in aqueous phases), and D0 (without Cl− in the aqueous phase) in range 10 to 10−2, depending on the temperature, to avoid toluene evaporation. The Am concentration was at tracer level and the Eu concentration was very low.
The data shown in Figure 2 give a straight line for the predicted variation, D0/D = 1 + β1·[Cl−]. For Am, the authors report formation constants of = (0.11 ± 0.05) at (25 ± 0.5)°C and = (0.38 ± 0.05) at (50 ± 0.5)°C. From these two values a linear Van’t Hoff relation gives = (19.39 ± 7.35) kJ·mol−1. The data for Eu3+ support the values obtained for Am3+, showing also a quite small effect of temperature on complex formation ( lo = − (0.053 ± 0.033), (0.21 ± 0.15) and (0.45 ± 0.14) for 25, 50 and 75°C) due to a small reaction enthalpy, = (19.94 ± 8.34) kJ·mol−1). Literature data on Nd3+ also support a positive reaction enthalpy; however, data for Eu3+ indicate an exo-thermic reaction. So the question of the small positive or negative value of remains open.
Contrary to the data interpretation given in [2000YEH/MAD], the present review takes the position that the variation of phase equilibria and distribution coefficients should rather be considered as a result of varying activity coefficients than being ascribed to the
*K 10*g K
3+ 2+ +4 3Am + Si(OH) (aq) AmOSi(OH) + H
was deduced from the experimental data. The uncertainty reported by the authors is given at the 1σ level. The uncertainty used in this review is twice as large. The equilibrium con-stant at zero ionic strength calculated from the Davies equation was = − (1.61 ± 0.04). This value was recalculated by this review using the SIT with ∆ε = 0.05 kg · mol−1 estimated from other reactions involving ions of the same charge type given in [95SIL/BID]; the uncertainty was increased as indicated above. This review obtains
= − (1.61 ± 0.08). This is a precise study with sufficient experimental details to judge the quality. This value is in good agreement with a value determined by TRLFS for the analogous Cm(III) complex, [97STE/FAN].
10*log K ο
10*log K ο
10 1log b10 1log b
r mH∆
10g 1br mH∆
r mH∆

Discussion of selected references 684
formation of chloride complexes (cf. section 12.4.1.2). In addition, the present review has doubts on the reliability of the experimental data presented, because the experimental un-certainty is at least an order of magnitude higher than the measured effects. Indeed the authors evaluate the complex formation constants from the increase of the quotient, D0/D. This quotient typically increased in the range from 1.000 to 1.001 (Figure 2 in [2000YEH/MAD]). The measured effect is in the range of 0.1%. The error bars given in this figure refer to an uncertainty of about ± 0.02 %. Such extreme accuracy cannot be achieved by the experimental procedures described in the paper [2000YEH/MAD]. Distri-bution coefficients were measured from only a 1 mL of the aqueous and organic phases. However, volumetric sampling of 1 mL organic phase can hardly lead to an accuracy bet-ter than ± 1%, even if the authors were weighing their volumes (which is not mentioned in the paper); special precautions would have been necessary to achieve an accuracy of ± 0.1 %. Furthermore, the authors report that the analytical Am and Eu concentrations were de-termined by counting the gamma-activities until counting statistics at the 1σ level were achieved. This does certainly not allow the quantification of effects in the range of ± 0.1 %. Nevertheless, it should be noted that the reported results are in the expected range of magnitude if the change in distribution coefficient is due to a change in the activity coeffi-cient of Am3+ from HClO4 to HCl. Chloride complexes of Am(III) are only expected to be significant at high chloride concentrations.
[2001BAN/PRA] The U(V) uranates Rb2U4O11(cr) and Tl2U4O11(cr), were prepared from the diuranates, M2U2O7(cr) and UO2(cr), at temperatures up to 1473 K in argon as described in references, [96IYE/JAY] for Rb2U4O11(cr), and [94SAL/KUL] for Tl2U4O11(cr). The principal analy-ses (before and after the experiments) were by X−ray diffraction, but undefined analyses for Rb and U (for Rb2U4O11(cr)) and X−ray fluorescence analyses (for Tl2U4O11(cr)) matched the indicated compositions. Enthalpy increments were determined in a Calvet calorimeter from 301 to 735 K on pelleted materials. The calorimeter was calibrated using synthetic sapphire (NIST standard reference material).
Values of are tabulated for ten temperatures from 396.3 to 735 K for Rb2U4O11(cr) and thirteen temperatures from 301 to 673 K for Tl2U4O11(cr). The resulting enthalpy differences were fitted by a Shomate analysis, using estimated val-ues of C (Rb2U4O11, cr, 298.15 K) = 365.56 J · K−1· mol-1 and (Tl2U4O11, cr, 298.15 K) = 360.134 J · K−1 · mol−1 from the sum of the heat capacities of the component oxides, M2O(cr) + 2UO2(cr) + 2UO3(cr).
The resulting equations for give on differentiation:
(Rb2U4O11, cr, T) = 330.4 + 1.4134·10−2·T − 6.198·105·T −2 (J · K−1 · mol−1) (298.15 to 735 K)
and
m m( ) (298.15K)ο−H T H
,mοp ,m
οpC
m m( ) (298.15K)ο−H T H
,mpC

Discussion of selected references 685
,mpC (Tl2U4O11, cr, T) = 368.2 + 2.4886·10−2·T − 1.375·105·T −2 (J · K−1 · mol−1) (298.15 to 673 K)
where in each case a wrong coefficient in the text has been corrected.
[2001BEN/SEI] This paper deals with the effects of carbonate (with formate as a free radical scavenger) on the gamma radiation induced reduction of . Lefort [63LEF] reported that γ−irradiation of TcO2 in alkaline solution caused oxidation to , whereas Tc(VII) is reduced to Tc(VI) by pulse radiolysis in alkaline and neutral solutions. The gamma source used in [2001BEN/SEI] was 60Co. In = 10−2 M, with [T = 10−4 M at pH = 11 (argon or oxygen-saturated atmosphere) the absorption spectrum (244 nm, = 622 m2 · mol−1; 289 nm, ε = 236 m2 · mol−1) of Tc did not change, i.e., no reduction oc-curred. Conversely, in the presence of 10−2 M formate under an argon atmosphere, direct evidence was obtained for the formation of colloidal TcO2. Addition of varying concentra-tions of carbonate to the starting solution did not inhibit the reduction reaction. The and radical reactions with formate produce the reducing radical, , which in turn is responsible for the formation of Tc(VI), which undergoes a two-step disproportionation to give Tc(IV). On the other hand, it is proposed that the carbonate radical oxidises Tc(VI) back to Tc(VII), and under gamma radiolysis conditions, the concentrations of radi-cals can build up while the concentration of Tc(VI) is limited to low steady-state concen-trations. The conclusion from this study is that exposure of Tc to gamma radiation in the presence of carbonate may lead to enhanced mobilisation due to stabilisation of the Tc(VII) state.
[2001BER/GEI] This is a continuation of previous investigations of the Ca2UO2(CO3)3(aq) complex as re-ported in [96BER/GEI], [97BER/GEI], [98GEI/BER3], [98GEI/BER4] and [97AMA/GEI]. The authors have used both TRLFS and EXAFS data to obtain information on the stoichiometry, structure and equilibrium constant of this species. The experiments are carefully described, but there are several unclear points, one being the ionic strength. From the description in the “Experimental” section one gets the impression that no ionic medium has been used; however in Table 4 they refer to the ionic strength, 0.1 M. The reviewer and the authors notice that the slope analysis results in a non-integral value. This clearly indicates large experimental errors, or that it has been impossible to resolve the spectra into different components. This means that the equilibrium constants proposed are not precise. It is not an acceptable procedure to use the experimental data and calculate an equilibrium constant assuming a slope of two, as the authors seem to have done. Addi-tional evidence for problems with the calculation method used is provided by a comparison of the constants, = 30.55 (for Ca2UO2(CO3)3(aq)) and lo = 25.4 (for
). From these values we obtain the equilibrium constant for the reactions:
4TcO−
4TcO−
23[CO ]−
4cO ]−
ε
4O−
Hi
OHi2CO −i
3−i CO
10 2,1,3log οb 10 1,1,3g οb2
2 3 3CaUO (CO ) −
Discussion of selected references 686
4 2+2 3 3 2 2 3 3UO (CO ) + 2Ca Ca UO (CO ) (aq)−
10 2log K = 8.95 and
= 3.8
i.e., the binding constant of Ca2+ to is much larger than that to ; this is not likely in the opinion of the reviewer.
The EXAFS data are well analysed but unfortunately they do not provide strong support for the formation of Ca − bonding. A structural model could have foreseen this problem; it would have been better to study the corresponding Mg or Sr complexes. For reasons given above, this review does not accept the equilibrium constants proposed by Bernhard et al.; however their study provide additional evidence for the complex forma-tion between and cations; this, itself, is an important observation.
[2001BOL/WAH] This paper gives the structure of the Np(VII) species: which is predominant in 2.5 M NaOH solution (1.5·10−2 M in Np). The structure is derived from XANES and EXAFS absorption spectra obtained in the transmission mode over an extended k space (up to 17 Å−1 ) and from theoretical calculations using Hartree-Fock and Density Functional Theory methods. The test solution was sealed under an ozone atmosphere. This study; i) shows that the species postulated by Shilov [98SHI], , from the variation of the reversible formal potential of the Np(VII)/Np(VI) redox couple in strongly alkaline solution and by Peretrukhine et al. [95PER/SHI] (see [2001LEM/FUG] page 92), was cor-rect, ii) confirms the suggestion concerning the existence of this species by Williams et al. [2001WIL/BLA] based also both on XAS data (fluorescence mode and k space data up to 12 Å−1) and theoretical calculations, and, iii) refutes, as did the study of Williams et al. [2001WIL/BLA], the interpretation of Clark et al. [96CLA/CON] who gave as the major species present in alkaline solution of Np(VII), on the basis of XAS spectra (fluorescence in k space up to 10 Å−1).
High quality EXAFS data obtained by [2001BOL/WAH] suggest four short oxo Np−O bonds (N = (3.6 ± 0.3)) and two long hydroxo Np−O (N = (3.3 ± 1.3)) bonds. The large uncertainty in the number of coordinated OH ligands does not allow an easy choice of N. The retained value, N = 2, comes from the excellent agreement of the bond distances calculated for a square bipyramidal O arrangement around Np (D2d point group symmetry) with those measured on the compounds, Co(NH3)6NpO4(OH)2·2H2O and Na3NpO4(OH)2·n H2O. But the main argument comes from theoretical calculations, both for the gaseous and solvated Np(VII)/Np(VI) species: / and
/ . Indeed, calculated bond lengths for the solvated species, , are in excellent agreement with single crystal X-ray and solution EXAFS
data. Furthermore, the entity has been shown to be square planar [2001BOL/WAH2].
4 2+2 3 3 2 3 3UO (CO ) + Ca CaUO (CO )− −
10 1log K2
22 3 3CaUO (CO ) −
42 3 3UO (CO ) −
42 3 3UO (CO ) −
34 2NpO (OH) −
34 2NpO (OH) −
2 4NpO (OH)−
34 2NpO (OH) − 4
4 2NpO (OH) −
2 4NpO (OH)− 22 2NpO (OH) −
23
4NpO (OH) −
4NpO−
Discussion of selected references 687
The reversibility of the redox couple, / , could be due to fast proton exchanges between the two species, which have the same coordination geometry
34 2NpO (OH) − 2
2 4NpO (OH) −
.
This paper closes the long story in existence since the eighties on the identifica-tion of the species of Np(VII) in strong alkaline solution.
[2001FUJ/YAM] Fujiwara et al. determined the solubility of Pu(IV) hydrous oxide under reducing condi-tions in 1.0 M NaClO4 solutions containing Na2S2O4, under an Ar atmosphere at (25 ± 1)°C. They used appropriate analytical methods for the determination of the H+ and Pu concentrations. For solutions of high Pu concentration, the presence of Pu3+ was con-firmed by absorption spectroscopy. Aqueous Pu species in other oxidation states could not be detected. The solubility data measured after 1 − 3 months in the range 4 < − log10[H+] < 6 refer to the reaction:
PuO2(am, hydr.) + e− + 2 H2O(l) Pu3+ + 4 OH− (A.134) .
The authors calculated ((A.134), 298.15 K) = − (38.39 ± 0.19) in 1 M NaClO4, with the uncertainty given as the standard deviation and extrapolated this value to zero ionic strength with the SIT coefficients of [92GRE/FUG]. The uncertainty given by [2001FUJ/YAM] is increased here to the 95% confidence interval (1.96 σ) and the result is
((A.134), 298.15 K) = − (40.44 ± 0.39).
10log K
10log K ο
If this value is combined with lo ((A.135), 298.15 K) = − (17.69 ± 0.04) se-lected in [2001LEM/FUG] or − (17.64 ± 0.17) [95CAP/VIT] as used by Fujiwara et al. for the reaction:
10g K ο
Pu4+ + e− Pu3+ (A.135)
the solubility constant for the reaction:
PuO2(am, hydr.) + 2 H2O(l) Pu4+ + 4 OH− (A.136)
is calculated to be:
10 ,0log sK ο (A.136)= − (58.1 ± 0.4).
This value is comparable with other recently determined values of (Pu(OH)4, am, 298.15 K) = − (58.3 ± 0.5) [98CAP/VIT], and is based on a simi-
lar indirect experimental procedure, and (Pu(OH)4, am, 298.15 K) = − (58.7 ± 0.9) [99KNO/NEC], which has been calculated from the available literature data of experimental Pu(IV) concentrations corrected for hydrolysis with the hydrolysis con-stants of [72MET/GUI].
The Pu concentrations measured in the range 7.5 < − log10[H+] < 9.0, log10[Pu] = − (8.9 ± 0.2), were ascribed mainly to small Pu(IV) polymers, as supported by ultrafiltra-
10 ,0log sK ο
10 ,0log sK ο
Discussion of selected references 688
tion. Fujiwara et al. used a simple approach to model the polymerisation equilibria and to estimate the concentration of mononuclear Pu(OH)4(aq). The calculated result, log10[Pu(OH)4(aq)] = − (10.3 ± 0.2), is in good agreement with experimental data deter-mined by other authors, (log10[Pu(OH)4(aq)] = − (10.4 ± 0.2) [86LIE/KIM], − (10.2 ± 0.8) [98CHA/TRI] and − (10.4 ± 0.5) [99RAI/HES2]), and the reported value of
(Pu(OH)4, aq, 298.15 K) ≥ 47.5 [2001FUJ/YAM] is consistent with the formation constant selected in the present review, lo = (47.5 ± 0.5).
[2001KIT/KOH] The authors present solubility measurements with Np(IV) in carbonate containing NaClO4 solutions at (22 ± 3)°C. The batch experiments were performed from oversaturation. Re-duction of 10−5 − 10−3 M Np(V) solutions led to the precipitation of Np(OH)4(am).·The reducing agent was Na2S2O4. The ionic strength was adjusted to either 0.5 or 1.0 mol.L−1. Appropriate analytical methods were used for the determination of the H+ and Np(IV) con-centrations. In batch samples containing an initial total carbonate concentration of Ctot = [ ] + [ CO ] = 0.1 mol·L−1, the H+ concentration was varied in the range, − log10[H+] = 8.5 - 12.5. In further samples at -log10[H+] = 8.5 - 10.5, Ctot was varied from 0.005 to 0.1 mol·L-1. The samples were shaken for two and four weeks and the Np(IV) concentration was determined after 10 000 Dalton ultrafiltration and subsequent solvent extraction with 0.5 M TTA in xylene.
10 4log οb10 4g οb
3HCO− 23
−
The solubilities measured at varying total carbonate and H+ concentrations in the range of - log10[H+] = 10 - 11 are highly scattered. Under these conditions, the solubility is very sensitive to a slight variation of Ctot or log10[H+]. The solubility measured at Ctot = 0.1 mol·L-1 in 0.5 and 1.0 M NaClO4 was ascribed to the following reactions.
− log10[H+] > 11: Np(OH)4(am) + 2 ; (A.137) 2
3CO − 44 3 2Np(OH) (CO ) −
− log10[H+] < 11: Np(OH)4(am) + 2 + 2 H2O(l). (A.138)
The latter reaction can be rewritten as:
Np(OH)4(am) + 2 + 2OH− . (A.139)
3HCO− 22 3 2Np(OH) (CO ) −
23CO − 2
2 3 2Np(OH) (CO ) −
Using reasonable estimates for the SIT coefficients of the ternary complexes, the equilibrium constants at I = 0 were calculated to be (A.137) = − (6.82 ± 1.03) and (A.138) = − (3.81 ± 0.35) or (A.139) = − (11.15 ± 0.35).
The predominance of the complexes, and , derived from the experimental data is consistent with the speciation proposed in [90PRA/MOR], [94YAM/SAK] and [99RAI/HES]. As also noted by Kitamura and Ko-
10 ,(1,4,2)log sK ο
,(1,2,2)sK ο10 ,(1,2,2)log sK ο
10log2
2 3 2Np(OH) (CO ) − 44 3 2Np(OH) (CO ) −

Discussion of selected references 689
hara, in particular the pH-independent solubility at − log10[H+] > 11 could also be assumed by analogy to involve the same complex as proposed by [93ERI/NDA].
The calculation of the and concentrations from Ctot and − log10[H+] includes a substantial error. The authors obviously used the carbonic acid dissociation con-stants at I = 0 instead of the conditional constants in 0.5 and 1.0 M NaClO4. This has a significant impact on lo derived from experimental data at − log10[H+] < 11, while the calculation of is primarily based on experimental data at − log10[H+] > 11 where [ CO ] ≈ Ctot, independent of whether p = 10.33 or the pK2 values in 0.5 and 1.0 M NaClO4 are used for calculation. A re-evaluation of Kitamura and Kohara’s most accurate set of data at Ctot = 0.1 mol·L−1 and I = 0.5 mol·L−1 yields:
24 3Np(OH) (CO ) −
3HCO− 23CO −
,(1,2,2)
10 ,(1,4,2)g sK
,(1,4,2)sK 10 ,0g sK
,(1,4,2)sK ο
,(1,4,1)sK 10 ,0g sK
,(1,4,1)sK ο
,(1,2,2)sK 10 ,0g sK
,(1,2,2)sK ο
10 ,(1,2,2)log sK ο
10 ,(1,2,2)log sK ο
log
10g sKlo
23
−2Kο
for : = lo + 44 3 2Np(OH) (CO ) −
10log 10 1,4,2log b = − (5.5 ± 0.4) at I = 0.5 mol.L−1 = − (6.9 ± 0.4) 10logor alternatively:
for : = lo + 24 3Np(OH) (CO ) −
10log 10 1,4,1log b = − (6.5 ± 0.4) at I = 0.5 mol·L−1 = − (6.5 ± 0.4) and
10log
for : = lo + 22 3 2Np(OH) (CO ) −
10log 10 1,2,2log b = − (10.8 ± 0.4) at I = 0.5 mol·L−1 = − (10.4 ± 0.4). 10log
These re-calculations include a fixed concentration of log10[Np(OH)4(aq)] = − 8.3 taken from [93ERI/NDA]. The values at I = 0 are obtained by using NEA-TDB auxiliary data and estimated SIT coefficients of ε(Na+, Np(IV) complex) = − 0.1 kg · mol−1 for com-plexes with a charge of − 2 and − 0.2 kg · mol−1 for complexes with a charge of − 4.
The difference between = − (10.4 ± 0.4) calculated in this review from data in [2001KIT/KOH] and = − 11.75 determined by Rai et al. [99RAI/HES] might be due to a difference in . The solubility data of Kitamura and Kohara refer to small solid particles formed from over-saturation at a total Np concen-tration of 10−5 mol·L−1 in 0.5 M NaClO4, while those of Rai et al. [99RAI/HES] were de-termined from under-saturation with a solid of probably larger particle size. On the other hand, the pH-independent solubility at − log10[H+] > 11 can be described with lo = − (6.5 ± 0.4), which is clearly lower than the value of = − (5.3 ± 0.3) de-termined by Eriksen et al. [93ERI/NDA].
10 ,0sK ο
10 ,(1,4,1)g sK ο
10 ,(1,4,1)log sK ο

Discussion of selected references 690
The data presented in the report [2001KIT/KOH] and the additional data at I = 2 M are included in a manuscript submitted by the same authors for publication in the pro-ceedings of the conference Actinides 2001 (Hayama, Japan)1.
[2001KON] The standard entropies of the trivalent oxides, fluorides and chlorides of the actinide ele-ments from U to Cf have been estimated by a semi-empirical method in which the total entropy is described as the sum of a lattice entropy and an excess entropy. The latter repre-sents the distribution of the electrons over their various energy levels, including the contri-bution due to the splitting of the ground state term by the crystalline field. This is, in fact, the method already adopted within the other reviews of this series [92GRE/FUG], [95SIL/BID], [2001LEM/FUG], as well as in earlier reviews (for example [76FUG/OET]) to estimate the entropies of some aqueous actinide ions.
For the solids, this approach was verified by calculations on the iso-electronic lanthanide(III) compounds, the entropies of most of which have been determined experimentally. For the trihydroxides, trifluorides and trichlorides, the deviations from the model are about 1 − 2%; the deviations are a little larger for the sesquioxides owing to the presence of two sites of different symmetry in the crystal.
For the actinides, the lattice contribution has been calculated from the known en-tropies of Pu2O3, UF3(cr), PuF3(cr) and UCl3(cr), and is assumed to decrease slightly as the atomic number of the actinide element increases, as in the lanthanide series. It should be noted, however, that the experimental standard entropies of UF3(cr) and UCl3(cr) have been increased by R·ln2, to allow for the fact that the experimental measurements (rather incompletely documented by Cordfunke et al. [89COR/KON]) probably did not extend to low enough temperatures to include the antiferromagnetic transition between 0 and 10 K. The excess contributions for the trichlorides were calculated from the well-known energy levels in these compounds, but those for the trifluorides and sesquioxides are less well es-tablished.
The important conclusion from this work is that the entropy values previously estimated for ionic Am solids, especially those containing Am(III), are probably apprecia-bly too large. This is because the ground level of Am(III) is 7F0 and is thus non-degenerate, while the first excited 7F1 level is at ca. 2750 cm−1 above the ground state, and hence does not contribute meaningfully to the standard entropy at 298.15K. The excess entropy term is thus zero for Am(III) compounds, resulting in standard entropies notably smaller than those for the corresponding U and Pu compounds.
We have therefore revised the estimates of the standard entropies of the ionic am-ericium compounds in accordance with this model, as summarised in section 12.1.1 (Table 12-1).
1 Journal of Nuclear Science and Technology, Supplement 3, November 2002

Discussion of selected references 691
[2001NEC/KIM] This paper takes into account the material collected in the Report FZKA 6350, [99NEC/KIM] (see this Appendix) enlarged by new data. The discussion of the data is improved by a deeper analysis and some slight changes in the values of thermodynamic constants. For instance, estimation methods of unknown hydrolysis constants are explained in more detail and this point is important. The results of colloid formation by the powerful LIBD method are also taken into account. For Th(IV) new reliable literature data on hy-drolysis constants are included, leading to slightly different proposed constants. New solu-bility data for ThO2(cr) are also included, which lead to minor revisions of the solubility product. Thermodynamic constants for Th are only included in this review for comparison (see below). The following points are relevant for this review.
• U(IV)
The unknown hydrolysis constants, lo to , are estimated by two different methods (see [99NEC/KIM]) and the average estimates are selected as = (26.9 ± 1.0) and = (37.3 ± 1.0). In the report [99NEC/KIM] only one estimation method was used giving lo = (27.5 ± 1.0) and = (38.2 ± 1.0). Estimated values of (average value = (44.7 ± 1.0)) differ somewhat from the experimen-tal value (see below). Accordingly, from and the calculated solubility product for UO2(am) from the solubility data at pH < 5 is (UO2(am)) = − (54.5 ± 1.0). This is different from the previous = − (55.2 ± 1.0) of [99NEC/KIM].
10 2g οb 10 4log οb10 2log οb
10 3log οb10 2g οb 10 3log οb
4οb 10log 4
οb2οb 3
οb10 ,0log sK ο
10 ,log 0sK ο
Comparison of the calculated solubility curves (Figure 3.3, page 23 in [99NEC/KIM] and Figure 6 in this paper) shows almost no difference between the previ-ous and the new calculations. This shows how much the calculated solubility product de-pends on the estimated hydrolysis constants. Combining the solubility data of UO2(am) at pH > 5 (log10[U(OH)4(aq)] = − (8.5 ± 1.0)) and lo yields as discussed in [99NEC/KIM], = (46.0 ± 1.4), which differs slightly from the value in [99NEC/KIM].
For the U(IV) system, Neck and Kim point out that the solubility of UO2(cr) in acidic solution (pH = 1 to 2) agrees with lo derived from calorimetric measure-ments ( (UO2, cr) = − (1031.83 ± 1.00) kJ · mol− 1 and = 60.85), but as pH increases the U(IV) concentration reaches the limiting value of UO2(am), seven orders of magnitude higher than expected. This clearly demonstrates that UO2(am) is growing as a surface layer onto UO2(cr) as the pH increases.
10 ,0g sK ο
10 4log οb
10 ,0g sK ο
f mGο∆ 10 ,0log sK ο
The equilibrium constant for the reaction, UO2(am) + 2 H2O(l) U(OH)4(aq) is = − (8.5 ± 1.0).
In conclusion, for U(IV) two constants are calculated, and , and two are derived using these values and the solubility data, , and . This review retains all these values.
10 ,4log sK
2οb 3
οb,0sK ο
4οb

Discussion of selected references 692
• Np(IV) There are no differences between the two references. However, in Table 4.1 of [99NEC/KIM] (summary of selected constants) there is a typing error: lo = 28.3 as written in the text, not 28.2 as given in the table. The value for: NpO2(am) + 2 H2O(l) Np(OH)4(aq), is = − (9.0 ± 1.0). As mentioned in the review of [99NEC/KIM], these values are retained by this review.
• Pu(IV) Neck and Kim point out the role of colloids which is reviewed in [99KNO/NEC]. New solubility data of PuO2(am) from [99RAI/HES2] are included in the analysis as log10[Pu(IV)] = − (10.4 ± 0.5) at pH 8 − 13. This value concerns [Pu(IV)] after an equili-bration of one week at (23 ± 2)°C and is estimated from a figure. The four hydrolysis con-stants of Pu4+ are the same as in [99NEC/KIM].
The calculation in [99NEC/KIM] with = − (58.5 ± 0.7) and = (47.5 ± 0.5) (from [72MET/GUI]) predicts log10[Pu(OH)4(aq)] = − (11.0 ± 1.0),
which agrees within the uncertainty. Combined with the solubility product, the new solu-bility data of Rai et al. [99RAI/HES2] suggest a somewhat larger constant of
= (48.1 ± 1.0). The value for: PuO2(am) + 2 H2O (l) Pu(OH)4(aq)
is − (10.4 ± 0.5). In regard to PuO2(cr), Neck and Kim [2001NEC/KIM] report the value, (PuO2, cr) = − (62.9 ± 0.4), derived from the data of [89KIM/KAN] in 1 M
HClO4. It is one order of magnitude greater than the value, lo (PuO2, cr) = − (64.0 ± 0.5), derived by calculation (see [99NEC/KIM]). The proposed thermodynamic data at zero ionic strength are given in the Table A-52.
Table A-52 Thermodynamic data at zero ionic strength proposed in [2001NEC/KIM].
Th U Np Pu
AnO2(cr) − (54.2 ± 1.3) − (60.86 ± 0.36) − (63.7 ± 1.8) − (64.0 ± 1.2)
10 2g οb
10 ,4log sK ο
10 ,0log sK ο
10 4log οb
10 4log οb 10 ,4log sK ο
10 ,0log sK ο
10 ,0g sK ο
10 ,0log
sK ο
10 , 4log
sK ο
10log n
οb
4+
4 1An (OH)9+An (OH)6 1
AnO2·xH2O(am) − (47.0 ± 0.8) − (54.5 ± 1.0) − (56.7 ± 0.5) − (58.5 ± 0.7) − (8.5 ± 0.6) (b) − (8.5 ± 1.0) (b) − (9.0 ± 1.0) (b) − (10.4 ± 0.5) (b)
n = 1 (11.8 ± 0.2) (13.6 ± 0.2) (14.5 ± 0.2) (14.6 ± 0.2) (26.9 ± 1.0) (a) (28.3 ± 0.3) (28.6 ± 0.3) n = 2 (22.0 ± 0.6)
n = 3 (31.0 ± 1.0) (37.3 ± 1.0) (a) (39.2 ± 1.0) (a) (39.7 ± 0.4) n = 4 (39.0± 0.5)
(38.5 ± 1.0) (b) (44.7 ± 1.0) (a) (46.0 ± 1.4) (b)
(47.1 ± 1.0) (a) (47.7 ± 1.1) (b)
(47.5 ± 0.5) (48.1 ± 0.9) (b)
n = 5 < 39.5 (b) < 47 (b) < 48.5 (b) < 49 (b) 141.3 2
5 176.0 (a) estimated, (b) derived from experimental solubility data

Discussion of selected references 693
This paper is the best available, updating all the data on the hydrolysis of tetrava-lent Th, U, Np and Pu aqueous ions and on the solubility of their crystalline or amorphous dioxide. It includes the supporting figures, which show all the data and the fits according to the constants reported in Table A-52.
[2001NEC/KIM2] This paper confirms the data on Np(IV) hydrolysis and the solubility of amorphous diox-ides NpO2(am), by [2001NEC/KIM] (see Appendix A) with additional experiments using UV−Vis spectroscopy, LIPAS and LIBD. These techniques permit exploration of the be-haviour of Np(IV) over a large range of concentrations, provided that the correct condi-tions are respected: use of deutered water and deutered acid for LIPAS, and nanofiltration of background electrolytes for LIBD (porosity of 1 nm). The Np(IV) solutions used were prepared electrochemically.
Neck et al. [2001NEC/KIM2] make clear that Np(IV) colloids appear in solutions when the Np concentration exceeds the solubility of Np(OH)4(am) (calculated from
and the hydrolysis constants of [77DUP/GUI], [2001NEC/KIM]) at a given acidity in the range log10[H+] = 0 to − 2.5. The experimental concentrations required to obtain undersaturated solutions in 0.1 M − HClO4 (or deutered solutions) were derived using LIBD. Spectroscopy data of over− and under−saturated solutions were then analysed and clarified, showing that some literature data are erroneous. Unfortunately, these were, nevertheless, the basis of the determination of the first hydrolysis constant of Np4+ selected in [2001LEM/FUG]. LIPAS is used to measure the very low solubility of Np after settling or removal of colloids as a function of log10[H+]. According to:
10 ,0log sK
4NaClO
,04[Np(IV)] = 1 [OH] )
[OH]s n
n
K +
∑ β , (⋅
the data show that between log10[H+] = − 1.6 and − 2.7 the dominant species is (see Figure A-17 and Figure A-18). This confirms hydrolysis results obtained at the tracer level [77DUP/GUI]. Using the value of [2001NEC/KIM], the authors calculate
(Np(OH)4(am)) = − (54.4 ± 0.4) and derived, lo = − (56.5 ± 0.4), using the SIT. The last value is close to that calculated in [2001NEC/KIM] from solubility data obtained by Rai et al. [87RAI/SWA] from over-saturation, = − (56.7 ± 0.5).
2+2Np(OH)
nb10 ,0log sK 10 ,0g sK ο
10 ,log 0sK ο

Discussion of selected references 694
Figure A-17. Experimental Np(IV) solubility data measured for freshly-formed solid par-ticles of Np(OH)4(am) as a function of the H+ or D+ concentration in 0.1 M perchlorate solution (above). The solid curve and the dashed speciation lines are calculated with
= − 54.4 (at I = 0.1 M) and the hydrolysis constants from [77DUP/GUI] and [2001NEC/KIM].
10 ,0log sK
-7
-6
-5
-4
-3
1 2 3 4
log 10
[Np(
IV)]
ctr.D
Np(OH)3+
Np(OH)22+
Np(OH)3+Np4+
I = 0.1 M
D2O solution
H2O solution
LPAS
UV/Vis speLIB
LIBD
- log10[H+] (- log10 [D+] )
Figure A-18. Np(IV) species distribution in 0.1 M HClO4−NaClO4.
0
20
40
60
80
100
1 2
Np(
IV) s
peci
es (%
)
Np4+
Np(OH)3+
Np(OH)22+
Np(OH)3+
I = 0.1 M I = 0.1 M
- log10
3 4
Np(OH)4(aq)
[H+]

Discussion of selected references 695
[2001RAI/MOO] Rai et al. determined the solubility of amorphous Pu(IV) hydrous oxide in different air-equilibrated electrolyte media (0.4 and 4.0 M NaClO4, and 0.4 and 4.0 M NaCl). The ana-lytical methods, determination of the H+ and Pu concentrations, and oxidation state analy-ses are well described. The solubility data in the range 4 < − log10[H+] < 9 are measured after equilibration periods of seven and 106 − 110 days. The high solubility data observed in the 4 M NaCl solutions equilibrated for a long time, where radiolytic oxidation leads to increased pe values, are caused by the formation of Pu(VI), while all other results are as-cribed to the reaction:
+2PuO (am) PuO + e2
− (A.140) or
(A.141)
This is consistent with the slope of − 1 in the plots of log10[Pu] versus − log10[H+]. The variation of the solubility in the four different media is explained by the variation of the activity coefficient. This effect is well described by using the Pitzer ion interac-tion parameters reported in [95NEC/FAN] for the ion as analogues for the
ion.
+ +2 2 2
1PuO (am) + H + O (g) PuO + H O(l)4 2 2
1
+2PuO
+2NpO
+2PuO
Similar solubility data from a previous study in 0.0015 M CaCl2 solutions lead to (A.140) = − 19.45 [84RAI] and have been used in [2001RAI/MOO] to estimate
the effective oxygen fugacities. However, the results of the latter study yield a somewhat different equilibrium constant, lo (A.140) = − 18.85 [2001RAI/MOO].
10log K ο
10g K ο
By combining these constants of [84RAI] and [2001RAI/MOO], which are given without uncertainty limits, with the /Pu4+ redox potential and other auxiliary data selected in [2001LEM/FUG], the solubility constant for the reaction
+2PuO
PuO2(am) + 2 H2O(l) Pu4+ + 4 OH− (A.142)
is calculated to be (A.142) = − 58.0 and − 57.4, respectively. These values are slightly higher than those determined in other recent studies: lo ((A.142), 298.15 K) = − (58.3 ± 0.5) [98CAP/VIT], − (58.7 ± 0.9) [99KNO/NEC] and − (58.1 ± 0.4) [2001FUJ/YAM]. As pointed out by [2001RAI/MOO], the measured pe values or the ef-fective oxygen fugacities may include unknown uncertainties. Therefore, the data given in [2001RAI/MOO] are not used for the selection of thermodynamic equilibrium constants.
10 ,0log sK ο
10 ,0g sK ο
[2001SEM/BOE] The possibility of the coordination of or anions to in very acidic solutions of HClO4 and CF3SO3H (up to 10 M) has been raised to account for the large variations of the fluorescence lifetime and of the intensity of fluorescence spectra of with the increase of the concentrations of these anions ([99BOU/BIL], [2001BIL/RUS]). No clear evidence of complexation of dioxouranium(VI) cation was found. To check the
4ClO−3CF SO3
− 2+2UO
2+2UO

Discussion of selected references 696
first coordination sphere of , EXAFS spectra of 10−2 M U(VI) solutions in HClO4 up to 11.5 M and in mixtures of NaClO4 and HClO4 (14 test solutions), as well as in CF3SO3H up to 10 M (5 test solutions) have been recorded in the transmission mode (k space up to 13 Å−1). EXAFS spectra of U(VI) perchlorate and U(VI) triflate were taken as references. For all the aqueous perchlorate solutions, the experimental EXAFS oscillations are due to the contributions of the two axial oxygen atoms and the five equatorial oxygen atoms (N = (4.6 ± 0.5)) surrounding the U atom. No chlorine-scattering contribution is observed. The U−O distances ((1.75 ± 0.01) to (1.76 ± 0.01)) Å and ((2.40 ± 0.02) to (2.43 ± 0.02)) Å, respectively, agree with all the values measured for aqueous UO ion in somewhat dif-ferent conditions of acidity and /U ratios and in U(VI) perchlorate heptahydrate. For solutions of U(VI) in 1 to 8 M triflic acid the two shells of oxygen atoms are found, as well as in 10 M, but for this concentration with a third shell of sulphur atoms (N = (1.3 ± 0.5)). The U−S distance is (3.62 ± 0.02) Å, near to the U-S distance of 3.67 Å in the dioxoura-nium(VI) triflato-hydrate benzo-[15]-crown-5, ([UO2(CF3SO3)2]·2 C14H20O5). These data indicate clearly the absence of a perchlorate anion in the inner sphere of , even in 11.5 M HClO4. In contrast, one triflate anion is bound to in 10 M CF3SO3H through an oxygen atom, giving the complex . Quantum mechanical calcula-tions in the gas phase reported in this paper give some support to these conclusions.
2+2UO
Cl
2+2
4O−
2+2UO
2+2UO
+42 3 3 2UO CF SO (H O)
22 2 5F (H O) n
n nUO −−
24
−UO
2 2H O)2 3F (UO −
[2001VAL/WAH] The structures of the complexes, n = 3 − 5, have been studied by EXAFS. All have pentagonal bipyramidal geometry with U − F and U − O(H2O) distances equal to 2.26 and 2.48 Å, respectively. On the other hand, the complex has a square bipyramidal geometry both in the solid state and in solution. The structures of hydroxide and fluoride complexes have also been investigated with wave function based and DFT methods in order to explore the possible reasons for the observed structural differences. These studies include models that describe the solvent by using a discrete second coordina-tion sphere, a model with a spherical, or shape-adapted cavity in a conductor such as a polarisable continuum medium (CPCM), or a combination of the two. Solvent effects were shown to give the main contribution to the observed structure variations between the ura-nium(VI) tetrahydroxide and the tetrafluoride complexes. Without a solvent model both UO2(OH)4(H2O)2− and UO2F4(H2O)2− have the same square bipyramidal geometry, with the water molecule located at a distance of more than 4 Å from the uranium and with a charge distribution that is nearly identical in the two complexes. Of the models tested, only the CPCM models were able to describe the experimentally observed square- and pentagonal-bipyramidal geometry in the tetrahydroxide and tetrafluoride complexes. The geometries and the relative energies of the different isomers of are very similar, indi-cating that both isomers are present in comparable amounts in solution. All calculated bond distances are in good agreement with the experimental observations, provided that a proper model of the solvent is used. This study provides structural information but no thermodynamic data.
2 (OH)

Discussion of selected references 697
[2001WIL/BLA] XANES and EXAFS spectra (fluorescence mode and k space up to 12 Å−1) have been ob-tained in 1 M NaOH solutions, 6.5·10−3 M, during the electrochemical reduction of Np(VII) to Np(VI). They show clearly a change in the coordination number of Np. The Np(VI) coordination is consistent with, respectively, two and four oxygen atoms at short and long distances (as for U(VI) under similar conditions) while for Np(VII) the central ion is coordinated to four and two oxygen atoms, respectively, at short and long distances. This result refutes that of Clark et al. [97CLA/CON] who found the reverse for Np(VII) in similar conditions. Williams et al. [2001WIL/BLA] found a resolved peak in the Fourier transform of Np(VI) and Np(VII) spectra attributed to a strong Np−Na ion pairing. This is a very surprising finding and one does not expect such a short distance between two metal ions with formal oxidation states +VII and +I. In the more accurate EXAFS study of Bolvin et al. [2001BOL/WAH] this peak is absent. As tetraoxo coordination of Np(VII) was rather unusual, except in solid state, the authors calculated the energy of different con-figurations of the entity in different point group symmetries, Td, D4h and D2d using Density Functional Theory. They showed that in the gaseous state, the D2d structure of this ion has the lowest energy and suggested that could be the species of Np(VII) present in alkaline solution. This suggestion was confirmed by Bolvin et al. [2001BOL/WAH] who obtained better XAS experimental data.
[2002BRO]
4MO−
34 2NpO (OH) −
This study is a potentiometric determination of log10β n,m values for the equilibria: 2+ (2 ) +2 2 2 UO + H O (U(l O ) (OH) H) +m n
m nm n n−
at 25°C in 0.1 M KCl, 0.1 M NaClO4 and 1.0 M KNO3, the concentration of U and the − log10[H+] values being, respectively, in the range (0.2 to 2 10−3 M, 3.5 to 5.9), (0.2 to 1.9 10−3 M, 3.7 to 6.1) and (0.2 to 4 10−3 M, 3.3 to 5.2). The potentiometric data were analysed with the computer program MINIQUAD. It gives the values and the associated uncertainties for the couples of (n,m) species, summarised in Table A-53.
10 ,*log n mb
Table A-53: Values of for (1,1), (2,2), (4,3)¸ (5,3), (7,4) in 0.1 M KCl, 0.1 M NaClO4 and 1.0 M KNO3.
10 ,*log n mb
Species (n,m) 0.1 M KCl 0.1 M NaClO4 1.0 M KNO3
(1,1) − (5.17 ± 0.03) − (5.01 ±0.03)
(2,2) − (5.86 ± 0.04) − (5.98 ± 0.04) − (5.85 ± 0.03)
(4,3) − (12.00 ± 0.06) − (12.39 ± 0.05) − (11.95 ± 0.05)
(5,3) − (16.09 ± 0.06) − (16.36 ± 0.05) − (16.40 ± 0.06)
(7,4) − (21.79 ± 0.06)
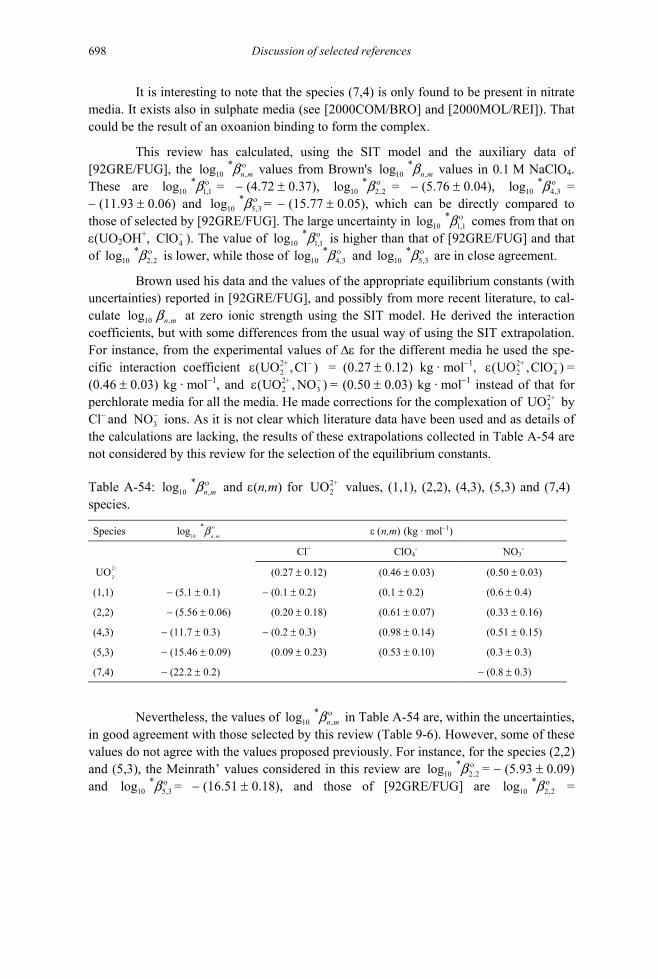
Discussion of selected references 698
It is interesting to note that the species (7,4) is only found to be present in nitrate media. It exists also in sulphate media (see [2000COM/BRO] and [2000MOL/REI]). That could be the result of an oxoanion binding to form the complex.
This review has calculated, using the SIT model and the auxiliary data of [92GRE/FUG], the values from Brown's lo values in 0.1 M NaClO4. These are lo = − (4.72 ± 0.37), = − (5.76 ± 0.04), = − (11.93 ± 0.06) and = − (15.77 ± 0.05), which can be directly compared to those of selected by [92GRE/FUG]. The large uncertainty in lo comes from that on ε(UO2OH+, ). The value of is higher than that of [92GRE/FUG] and that of is lower, while those of and are in close agreement.
10 ,*log n m
οb1,1οb
10 ,*g n mb
2,210*g 10
*log οb 10 4,3*log οb
10 5,*log οb 3
10g 1,1* οb
4ClO−10 1,1
*log οb10
*log10 2*log οb ,2 4,3
οb 10 5,3*log οb
Brown used his data and the values of the appropriate equilibrium constants (with uncertainties) reported in [92GRE/FUG], and possibly from more recent literature, to cal-culate at zero ionic strength using the SIT model. He derived the interaction coefficients, but with some differences from the usual way of using the SIT extrapolation. For instance, from the experimental values of ∆ε for the different media he used the spe-cific interaction coefficient = (0.27 ± 0.12) kg · mol−1, = (0.46 ± 0.03) kg · mol−1, and ε = (0.50 ± 0.03) kg · mol−1 instead of that for perchlorate media for all the media. He made corrections for the complexation of by Cl− and ions. As it is not clear which literature data have been used and as details of the calculations are lacking, the results of these extrapolations collected in Table A-54 are not considered by this review for the selection of the equilibrium constants.
10 ,log n mb
2+2(UO ,Cl )−ε2+2(UO , NO
2+2 4(UO ,ClO )−ε
3 )−
2+2UO
3NO−
Table A-54: lo and ε(n,m) for values, (1,1), (2,2), (4,3), (5,3) and (7,4) species.
10 ,*g n m
οb 2+2UO
ε (n,m) (kg · mol−1) Species 10 ,
*logn m
οb
2+
2UO
ClO4- NO3
- Cl−
(0.27 ± 0.12) (0.46 ± 0.03) (0.50 ± 0.03)
(1,1) − (5.1 ± 0.1) − (0.1 ± 0.2) (0.1 ± 0.2) (0.6 ± 0.4)
(2,2) − (5.56 ± 0.06) (0.20 ± 0.18) (0.61 ± 0.07) (0.33 ± 0.16)
(4,3) − (11.7 ± 0.3) − (0.2 ± 0.3) (0.98 ± 0.14) (0.51 ± 0.15)
(5,3) − (15.46 ± 0.09) (0.09 ± 0.23) (0.53 ± 0.10) (0.3 ± 0.3)
(7,4) − (22.2 ± 0.2) − (0.8 ± 0.3)
Nevertheless, the values of in Table A-54 are, within the uncertainties, in good agreement with those selected by this review (Table 9-6). However, some of these values do not agree with the values proposed previously. For instance, for the species (2,2) and (5,3), the Meinrath’ values considered in this review are = − (5.93 ± 0.09) and = − (16.51 ± 0.18), and those of [92GRE/FUG] are =
10 ,*log n m
οb
10 2,2*log οb
10 5,3*log οb 10 2,2
*log οb

Discussion of selected references 699
− (5.62 ± 0.04) and lo = − (15.55 ± 0.12). The interactions coefficients proposed by Brown (Table A-54) differ from those selected by [92GRE/FUG].
This review has calculated two speciation diagrams based on Brown’s data for perchlorate and nitrate media (Figure A-19 and Figure A-20, respectively). They show some overlap between the (4,3) and (5,3) complexes. The equilibrium constant for the (5,3) complex would be larger if one does not include the (4,3) complex in the chemical model. Therefore, as the (5,3) complex predominates over a large pH region, the effect of including the (4,3) complex is not expected to be large. Presumably there is a large correla-tion between the equilibrium constants for the (5,3) and the (4,3) complexes.
10 5,3*g οb
Figure A-19: Speciation diagram obtained in perchlorate media assuming that no precipi-tation occurs.
3.5 4.0 4.5 5.0 5.5 6.00.0
0.2
0.4
0.6
0.8
1.0
Fra
ctio
n
pH
(UO2)3(OH)42+
[UO22+]TOT = 1.90 mM
(UO2)3(OH)5+
UO22+
(UO2)2(OH)22+

Discussion of selected references 700
Figure A-20: Speciation diagram obtained in nitrate media (no precipitation of dioxoura-nium(VI) species is assumed).
3.5 4.0 4.5 5.0 5.5 6.00.0
0.2
0.4
0.6
0.8
1.0
Fra
ctio
n
pH
(UO2)3(OH)42+
[UO22+]TOT = 1.90 mM
UO22+
(UO2)4(OH)7−
(UO2)2(OH)22+
(UO2)3(OH)5+
[2002GER/KOD] During the review process, a volume of extended abstracts appeared summarizing the presentations at “The Third Russian-Japanese Seminar on Technetium” held in Dubna, Russia, June 23-July 1, 2002. The editors were K.G. German, G.E. Kodina and T. Sekine. The material presented in these abstracts is generally given in the form of figures and no thermodynamic information can be extracted. However, some of the abstracts contain in-teresting information that is relevant to the main to topic of technetium chemistry covered by this review and these are summarised below.
Interesting structural information were provided on HTcO4(cr), [2002KIR/GER], (C3H7)4NTcO4, [2002GRI/GER], Zr(TcO4)4·4H2O [2002GER/GRI], (UO2)2(TcO4)4·3H2O, [2002GER/GRI], (NpO2)2(TcO4)4·3H2O [2002GER/GRI].
NMR and spectroscopic data [2002KIR/GER] were also given in the various ab-stracts. Dark-red crystals of HTcO4(cr) were prepared and 1H- and 99Tc-NMR spectra indi-

Discussion of selected references 701
cated that the powder was not a hydrate, but consisted of a polymeric framework of four- and six-coordinated Tc.
Another work [2002GRI/GER] described solubility measurements on crystalline (C3H7)4NTcO4 and (C4H9)4NTcO4 in HNO3 and the corresponding tetraalkylammonium hydroxide (the temperature was not given). The solubility product of the former salt was given as 1.93·10−4 averaged over the ionic strength range of ca. 0.01 to unknown molarity. Clearly these results are informative, but are not quantitatively verifiable.
An interesting study was reported by Maslennikov et al. [2002MAS/PER], involving the electrochemical reduction of . They observed a diffusion-controlled reduction of Tc(VII) to Tc(III) in 0.1 − 1.0 M HNO3 at 0.069 to − 0.205 V/SCE (standard mercury-dropping electrode, SMDE) with a second reaction at − 0.71 V/SCE associated with reduction catalysed by Tc(III). Time−resolved polarography and differential capacity measurements at pH 3.5 − 6.0 (acetate buffer) led to the conclusion that the Tc(VII)/Tc(III) reduction wave reported in the literature is actually associated with Tc(VII)/Tc(V) reduc-tion, followed by disproportionation to form insoluble Tc(IV), which is adsorbed by the electrode and there reduced to Tc(III). Fast-polarography, differential pulse polarography and cyclic voltammetry were used with a SMDE with 0.1 to 6.0 M NaOH solutions to ob-serve the facile reduction of Tc(VII) to Tc(VI) at − 0.775 to − 0.705 V/SCE. Further reduc-tion of was complicated by coupled disproportionation reactions of Tc(VI) and Tc(V), although below 2.0 M NaOH, Tc(IV) was the principal reduction product.
4TcO−
3NO−
24TcO −
Topics of other papers presented at this conference appear to be beyond the scope of the present review.
[2002NGU] This study is a published thesis, which includes all the results of [2000NGU/PAL], (see review in this Appendix A) and gives additional results on U(VI) hydrolysis. It deals mainly with the use of vibration spectroscopy (Raman and IR as IR ATR - Infra Red At-tenuated Total Reflectance) to identify U(VI) species in aqueous non-complexing organic electrolytes (2.70 < − log10mH+< 14.42) which allow U(VI) concentrations, CU, up to 0.1 M to be attained in neutral and basic solutions.
Some drawbacks in the Raman spectra recorded to identify and quantify species, and consequently to calculate equilibrium constants were underlined in the review of [2000NGU/PAL]. In particular, the strong and broad Raman band centred at 753 cm−1 of one the two electrolytes used, (CH3)4NOH, (3 M) can overlap with the bands that can be assigned to the species (U , in short n:m2m−n, with m = 3 or n > 4 in basic solutions, which are located in the range 780 - 824 cm−1. Furthermore, the half-width of some of the bands is variable, which is unexpected from a theoretical point of view. This review has considered that convincing data were not presented in [2000NGU/PAL] to re-tain the species 8:32−, 10:34− and 11:35− in selecting equilibrium constants for U(VI) hy-
22O ) (OH) m n
m n−

Discussion of selected references 702
drolysis. These species have been detected at total concentrations of uranium above 0.3 M and at − log10mH+ around 13.
To overcome the difficulties encountered in [2000NGU/PAL], Nguyen has made a new study, where the electrolyte (C2H5)4NOH (2.92 < − log10mH+ < 14.50) was used to prepare basic solutions of U(VI) (CU = 5·10−3 to 10−1 M). The ionic strength varied be-tween 6·10−2 to 3.21 M. (C2H5)4NOH interferes much less with the Raman spectra of ani-onic U(VI) species than (CH3)4NOH. This electrolyte has a sharp Raman band at 718 cm−1. It was possible to record spectra with a good signal to noise ratio. Two deconvolution methods (methods 1 and 2)* of the spectra have been employed after systematic subtrac-tion of the background from the electrolyte in the spectra. In this way the spectra of U(VI) species in the range 700 to 950 cm−1 (domain of the symmetrical stretching mode of UO2 core, ν1) were obtained. Additional data were obtained using IR ATR (anti-symmetrical stretching mode of UO2 core, ν2) and UV-visible spectroscopy. They qualitatively confirm the Raman data, but they do not bring new information. IR ATR is used in an attempt to overcome the large IR absorption of H2O below 900 cm−1 and permits spectra to be to re-corded down to CU = 10−3 M.
The main results of this study in basic solutions are summarised in Table A-55 where the concentration of U(VI), CU, in M, the ionic strength, I, in M, the wavelength of the ν1 mode in cm−1 and values are reported for the species identified in basic media. The results for the species 2:22+ and 5:3+ and 7:3− are the same as in [2000NGU/PAL] and are not given in the Table A-55.
10 ,*log n mb
These results do not change drastically the data of [2000NGU/PAL] about anionic species except that a new species, 6:14− is proposed at the highest concentration of (C2H5)4NOH used (− log10mH+ >14); it also raises doubts about the species 10:34− for which the identification depends of the method used to process the data. The introduction of the complex, , casts serious doubts about the method used. There is no structural evidence for U(VI) complexes with six coordinated unidentate ligands. As a matter of fact the preferred coordination geometry for mononuclear U(VI) hydroxide complexes seems to be a pentagonal bipyramid. There are indications of the formation of small amounts of
from NMR studies [2000MOL/REI], but the NMR data indicate that the stepwise equilibrium constant from 4:12− to 5:13− could be between 0.1 and 1, far from the value calculated from Nguyen’s data. The Raman and IR spectra of di- and tri-dioxouranium(VI) species are expected to have one elongated Raman and one IR single band provided that an equatorial pentagonal environment of U is respected. Nguyen ob-tained precise IR spectra in solutions of (C2H5)4NOD in D2O. Deconvolution of IR spectra has not been done. So a unique assignment of the Raman and a IR spectrum to each spe-cies was impossible.
42UO (OH) −
35
−
6
2UO (OH)
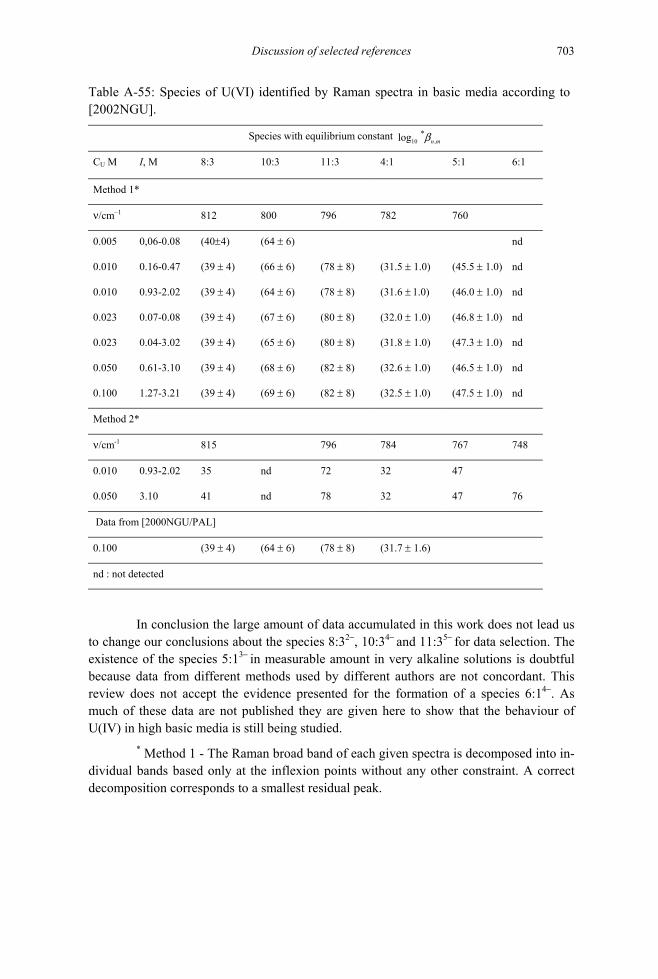
Discussion of selected references 703
Table A-55: Species of U(VI) identified by Raman spectra in basic media according to [2002NGU].
Species with equilibrium constant 10 ,*log n mb
CU M I, M 8:3 10:3 11:3 4:1 5:1 6:1
Method 1*
n/cm−1 812 800 796 782 760
0.005 0,06-0.08 (40±4) (64 ± 6) nd
0.010 0.16-0.47 (39 ± 4) (66 ± 6) (78 ± 8) (31.5 ± 1.0) (45.5 ± 1.0) nd
0.010 0.93-2.02 (39 ± 4) (64 ± 6) (78 ± 8) (31.6 ± 1.0) (46.0 ± 1.0) nd
0.023 0.07-0.08 (39 ± 4) (67 ± 6) (80 ± 8) (32.0 ± 1.0) (46.8 ± 1.0) nd
0.023 0.04-3.02 (39 ± 4) (65 ± 6) (80 ± 8) (31.8 ± 1.0) (47.3 ± 1.0) nd
0.050 0.61-3.10 (39 ± 4) (68 ± 6) (82 ± 8) (32.6 ± 1.0) (46.5 ± 1.0) nd
0.100 1.27-3.21 (39 ± 4) (69 ± 6) (82 ± 8) (32.5 ± 1.0) (47.5 ± 1.0) nd
Method 2*
n/cm-1 815 796 784 767 748
0.010 0.93-2.02 35 nd 72 32 47
0.050 3.10 41 nd 78 32 47 76
Data from [2000NGU/PAL]
0.100 (39 ± 4) (64 ± 6) (78 ± 8) (31.7 ± 1.6)
nd : not detected
In conclusion the large amount of data accumulated in this work does not lead us to change our conclusions about the species 8:32−, 10:34− and 11:35− for data selection. The existence of the species 5:13− in measurable amount in very alkaline solutions is doubtful because data from different methods used by different authors are not concordant. This review does not accept the evidence presented for the formation of a species 6:14−. As much of these data are not published they are given here to show that the behaviour of U(IV) in high basic media is still being studied.
* Method 1 - The Raman broad band of each given spectra is decomposed into in-dividual bands based only at the inflexion points without any other constraint. A correct decomposition corresponds to a smallest residual peak.

Discussion of selected references 704
Method 2 - The Raman broad band of all the spectra is decomposed giving to each species a Gaussian spectrum with a constant Full Width at Half Maximum (FWHM) centred at a given ν1 value (convergent self-consistent method). The procedure is iterative. It starts with the peak with the smallest FWHM and ends when the number of species with a given FWHM added by the procedure gives for the residual peak the background of the measurements.
[2002RAI/FEL] The solubility of becquerelite, Ca(UO2)6O4(OH)6·8H2O (or CaU6O19·11H2O) is addressed in this review together with a discussion of previous studies [94SAN/GRA] and [97CAS/BRU], which covered a much more restricted pH and Ca-concentration range. The present study concerns the solubility of synthetic becquerelite in 0.02, 0.1 and 0.5 M CaCl2 in the − log10[H+] range, 4.4 to 11.4 at (22 ± 2)°C under a N2 atmosphere. The pH is adjusted with HNO3 or (C2H5)4NOH and measured with a glass electrode calibrated by the Gran method. Tests solutions are filtered (0.0018 micrometer pore size), the U content is measured by ICPMS and the equilibrated solid phases are identified by X-ray diffraction, EXAFS (k space up to 13 Å−1) and chemical analysis. The time for equilibration varied up to 70 days, but after four days a steady state is attained at all solution concentrations. The main problem noticed by the authors is the characterisation of the solid phases. For − log10[H+] < 8, XRD and chemical analysis show that becquerelite is the dominant phase, essentially pure, but with a small amount of another phase. Above this value other phases with a lower U/Ca ratio appear. Variations of U concentration with both − log10[H+] and log10[Ca2+] confirm that equilibrium phase cannot be other uranates, such as CaUO4, Ca2UO5(H2O)1.3-1.7, Ca3UO6, or CaU2O7. The solubility data are modelled in several steps using initially the data selected by [92GRE/FUG] for aqueous species and the Pitzer model for the ion-interaction parameters. The best fit up to − log10[H+] = 9 is obtained with
= (41.4 ± 0.2) for the solubility product of becquerelite:
Ca(UO2)6O4(OH)6·8H2O(cr) + 14 H+ Ca2+ + 6 + 18 H2O(l).
The large uncertainty in the solubility data in the concentration range where the species, UO2(OH)2(aq), is expected to be dominant (− log10[H+] from six to around nine) explains the large uncertainty in the derived value of lo = − (11.3 ± 1.0) for the formation of UO2(OH)2(aq). This value is closer to those of [92SIL] and [91CHO/MAT] (− 11.5 and − 12.05, respectively). Note that no value was selected by [92GRE/FUG], only an upper limit < − 10.3 was given. The value of lo < − 21.5 is also de-rived for the formation of , but this species is not important when − log10[H+] is less than nine. For all the other aqueous U(VI) species (n:m = 1:1, 4:1, 2:2, 4:3, 5:3 and 7:3) the values of the formation constants selected by [92GRE/FUG] are used in the mod-elling. The equilibrium constants obtained in this study are able to describe the solubility of U(VI) measured by Sandino et al. in 1 M CaCl2 [94SAN/GRA] up to − log10[H+] = 6. Sandino et al. report an average value of = (39.5 ± 1.0) (see this review). Voch-
10 ,0*log sK ο
2+2UO
10 2,1*g οb
10*g10 2,1
*log οb 3,1οb
2UO (OH)3−
10 ,0*log sK ο

Discussion of selected references 705
ten et al. [90VOC/HAV] give, according to this paper, for becquerelite, = 43.2. In fact the value given in [90VOC/HAV] is = (43.6 ± 0.3), (see this review). Casas et al. [97CAS/BRU] calculated from the data of Vochten et al. a value of
= 41.4 using the aqueous thermodynamic model of Grenthe et al. [92GRE/FUG], but the value of they reported for natural becquerelite, (29 ± 1), is very far from those of [94SAN/GRA] [90VOC/HAV] and [2002RAI/FEL] for synthetic becquerelite. Clearly the study of Rai et al. is more detailed than the others. This is the only experimental study available where a careful phase analysis and a subsequent analysis of the experimental solubility data over a large concentration range have been carried out. However, the uncertainty of ± 0.2 on for becquerelite given in [2002RAI/FEL] appears to be too small, as it would correspond to an accuracy of ± 0.03 in log10[U(VI)]tot for the experimental data or calculated curves. In regard to Figures 1 to 4 in [2002RAI/FEL], an uncertainty of ± 0.2 in log10[U(VI)]tot is evaluated by this review and hence an uncertainty of ± 1.2 in . This review therefore retains the value,
(becquerelite) = (41.4 ± 1.2), for the selection of a solubility product for syn-thetic becquerelite, and notes that the value of = − (11.3 ± 1.0) or = (16.7 ± 1.0) is consistent with the value selected in this review from other data:
= − (12.15 ± 0.07), or = (15.85 ± 0.07). These values just agree within their uncertainty limits. This is not the case for lo < − 21.5 or < 20.5 compared to the selected values, = − (20.25 ± 0.42), or = (21.75 ± 0.42), which are inconsistent. This review agrees with the author’s remark that above pH 8, the pH-independent solubility of U(VI) does not refer to becquerelite but to a calcium di-uranate. The decrease of the U/Ca ratio from 5.5 to 2 could be due to the reaction:
1/2 CaU2O7·x H2O 1/2 Ca2+ + + (x−3)/2 H2O(l)
which could have affected the calculated value.
[2002RAI/GOR] This paper reports data on the solubility of PuO2(am) in presence of 5.2·10−4 M hydro-quinone or 10−3 M FeCl2 in the pH range 0.5 to 11 (ionic strength less than 0.025 M), at (23 ± 2) °C and under Ar atmosphere, with the identification of the oxidation state of Pu. The pH is adjusted with HCl or NaOH and measured with a glass electrode calibrated against standard buffers. The Eh is measured using a Pt electrode calibrated against stan-dard redox buffers. Tests solutions are filtered (0.0036 µ pore size), the Pu content was measured by liquid scintillation (detection limit about 10−9.5 M) and the Pu oxidation state quantified by UV-Vis-IR spectroscopy and solvent extraction at the lowest Pu concentra-tions. All equilibria reach a steady state within four days, but measurements are performed up to 90 days. In both systems the measured potential, and pe values calculated from Eh values, follow the variations expected from thermodynamic data on Fe(II)/Fe(III) and hy-droquinone systems with measured pH. It is concluded by the authors, from experimental data and thermodynamic arguments, that the dominant oxidation state of Pu in solution is
10 ,0*log sK ο
10 ,0*log sK
10 ,0*log sK ο
10 ,0*log sK ο
10log ,0*
sK ο
10*log ,0sK ο
10 ,0*log sK ο
10 2*log ,1
οb 10log 2,1οb
10 2,1*log οb 10 2,1log οb
10*g 3,1
οb 10 3,1log οb10
*log 3,1οb 10 3,1g οblo
2UO (OH)3−
10g 2,1*lo οb

Discussion of selected references 706
Pu(III) and that PuO2(am) is the solid equilibrium phase in the systems, at least up to pH 7 to 8. For higher pH, when the detection limit of Pu is reached, the data are not considered for modelling. On this basis the dominant reaction controlling the solubility is:
PuO2(am) + 4 H+ + e− Pu3+ + 2 H2O(l) (A.143)
for which an equilibrium constant is calculated as = (15.5 ± 0.7) from pH, pe and Pu3+ concentrations using the Pitzer model and the values of and for Pu3+ taken from [99FEL/RAI]. In a similar work, Fujiwara et al. [2001FUJ/YAM] give
= (15.56 ± 0.39) for reaction (A.143) (see this review). From the value = (15.5 ± 0.7), and using equilibrium constants, = − 0.78 for Pu4+ and = (17.70 ± 0.67) for, Pu4+ + e− Pu3+, selected by [2001LEM/FUG], Rai et al [2002RAI/GOR] report for the solubility product of PuO2(am), = − (58.20 ± 0.97) while the selected value by [2001LEM/FUG] is − (58 ± 1). These authors note that their values are close to those that they calculate from the data reported in [84RAI] and the values for the redox couple, Pu(V)/Pu(IV) and Pu(VI)/Pu(IV), selected by [2001LEM/FUG]. These values are = − (57.99 ± 0.77) and − (58.33 ± 0.85), re-spectively. The value given by Fujiwara et al. [2001FUJ/YAM] from similar measure-ments and calculations is = − (58.1 ± 0.4). Other values considered in this review for the solubility product of PuO2(am) are − (58.7 ± 0.9) [99KNO/NEC] and − (58.3 ± 0.5) [98CAP/VIT]. This work of Rai et al. is a precise and well-described experimental study and the equilibrium constants confirm previous results. The authors’ value of
(PuO2(am))= − (58.2 ± 0.97) is included by this review in the assessment of the solubility constant for PuO2(am, hydr.).
10log K ο
10 1log οb 10 2log οb
10log K ο10log K ο
10 1glo οb 10log K ο
10log ,0sK ο
10 ,0log sK ο
10log ,0sK ο
10 ,0log sK ο
B Appendix B
Ionic strength corrections1
Thermodynamic data always refer to a selected standard state. The definition given by IUPAC [82LAF] is adopted in this review as outlined in Section 2.3.1. According to this definition, the standard state for a solute B in a solution is a hypothetical solution, at the standard state pressure, in which 1
B = = 1 mol kgm mο −⋅ , and in which the activity coeffi-cient γB is unity. However, for many reactions, measurements cannot be made accurately (or at all) in dilute solutions from which the necessary extrapolation to the standard state would be simple. This is invariably the case for reactions involving ions of high charge. Precise thermodynamic information for these systems can only be obtained in the presence of an inert electrolyte of sufficiently high concentration that ensures activity factors are reasonably constant throughout the measurements. This appendix describes and illustrates the method used in this review for the extrapolation of experimental equilibrium data to zero ionic strength.
The activity factors of all the species participating in reactions in high ionic strength media must be estimated in order to reduce the thermodynamic data obtained from the experiment to the state I = 0. Two alternative methods can be used to describe the ionic medium dependence of equilibrium constants:
• One method takes into account the individual characteristics of the ionic media by using a medium dependent expression for the activity coefficients of the species involved in the equilibrium reactions. The medium dependence is described by
1 This Appendix essentially contains the text of the TDB-2 Guideline written by Grenthe and Wanner [2000GRE/WAN], earlier versions of which have been printed in the previous NEA TDB reviews [92GRE/FUG], [95SIL/BID], [99RAR/RAN] and [2001LEM/FUG]. The equations presented here are an essential part of the review procedure and are required to use the selected thermodynamic values. The contents of Tables B.4 and B.5 have been revised.
707
B Ionic strength corrections 708
virial or ion interaction coefficients as used in the Pitzer equations [73PIT] and in the specific ion interaction theory.
• The other method uses an extended Debye−Hückel expression in which the activ-ity coefficients of reactants and products depend only on the ionic charge and the ionic strength, but it accounts for the medium specific properties by introducing ion pairing between the medium ions and the species involved in the equilibrium reactions. Earlier, this approach has been used extensively in marine chemistry, cf. Refs. [79JOH/PYT], [79MIL], [79PYT], [79WHI2].
The activity factor estimates are thus based on the use of Debye-Hückel type equa-tions. The “extended” Debye-Hückel equations are either in the form of specific ion interaction methods or the Davies equation [62DAV]. However, the Davies equation should in general not be used at ionic strengths larger than 0.1 mol · kg−1. The method preferred in the NEA Thermochemical Data Base review is a medium-dependent expression for the activity coefficients, which is the specific ion interaction theory in the form of the Brøn-sted-Guggenheim-Scatchard approach. Other forms of specific ion interaction methods (the Pitzer and Brewer “B-method” [61LEW/RAN] and the Pitzer virial coefficient method [79PIT]) are described in the NEA Guidelines for the extrapolation to zero ionic strength [2000GRE/WAN].
The specific ion interaction methods are reliable for intercomparison of experi-mental data in a given concentration range. In many cases this includes data at rather low ionic strengths, I = 0.01 to 0.1 M, cf. Figure B-1, while in other cases, notably for cations of high charge ( + 4 and ≤ − 4), the lowest available ionic strength is often 0.2 M or higher, see for example Figures V.12 and V.13 in [92GRE/FUG]. It is reasonable to assume that the extrapolated equilibrium constants at I = 0 are more precise in the former than in the latter cases. The extrapolation error is composed of two parts, one due to experimental er-rors, and the other due to model errors. The model errors seem to be rather small for many systems, less than 0.1 units in lo
≥
10g K ο . For reactions involving ions of high charge, which may be extensively hydrolyzed, one cannot perform experiments at low ionic strengths. Hence, it is impossible to estimate the extrapolation error. This is true for all methods used to estimate activity corrections. Systematic model errors of this type are not included in the uncertainties assigned to the selected data in this review.
It should be emphasised that the specific ion interaction model is approximate. Modifying it, for example by introducing the equations suggested by Ciavatta ([90CIA], Eqs. (8−10), cf. Section B.1.4), would result in slightly different ion interaction coefficients and equilibrium constants. Both methods provide an internally consistent set of values. However, their absolute values may differ somewhat. Grenthe et al. [92GRE/FUG] esti-

B.1 The specific ion interaction equations 709
mate that these differences in general are less than 0.2 units in 10log K ο , i.e., approximately 1 kJ · mol−1 in derived values. f mGο∆
B.1 The specific ion interaction equations
B.1.1 Background The Debye-Hückel term, which is the dominant term in the expression for the activity coef-ficients in dilute solution, accounts for electrostatic, non-specific long-range interactions. At higher concentrations, short range, non-electrostatic interactions have to be taken into account. This is usually done by adding ionic strength dependent terms to the Debye-Hückel expression. This method was first outlined by Brønsted [22BRO], [22BRO2] and elaborated by Scatchard [36SCA] and Guggenheim [66GUG]. Biedermann [75BIE] high-lighted its practical value, especially for the estimation of ionic medium effects on equilib-rium constants. The two basic assumptions in the specific ion interaction theory are de-scribed below.
• Assumption 1: The activity coefficient γj of an ion j of charge zj in the solution of
ionic strength Im may be described by Eq. (B.1): 2
10log = ( , , )γ − + ε∑j jk
z D j k I mm k (B.1)
D is the Debye-Hückel term:
= 1 +
m
j m
A ID
B a I (B.2)
where Im is the molal ionic strength: 21 =
2m ii
iI m z∑
A and B are constants. which are temperature and pressure dependent, and aj is an ion size parameter (“distance of closest approach”) for the hydrated ion j. The Debye-Hückel limit-ing slope, A, has a value of (0.509 ± 0.001) 1
2kg mol 12−⋅ at 25°C and 1 bar, (cf. Section
B.1.2). The term Baj in the denominator of the Debye-Hückel term has been assigned a value of Baj = 1.5 1
2kg mol−⋅1
2 at 25°C and 1 bar, as proposed by Scatchard [76SCA] and accepted by Ciavatta [80CIA]. This value has been found to minimise, for several species, the ionic strength dependence of ( , , )ε mj k I
, )mI
between Im = 0.5 m and Im = 3.5 m. It should be mentioned that some authors have proposed different values for Baj ranging from Baj = 1.0 [35GUG] to Baj = 1.6 [62VAS]. However, the parameter Baj is empirical and as such is correlated to the value of . Hence, this variety of values for Ba( ,ε j k j does not repre-sent an uncertainty range, but rather indicates that several different sets of Baj and
may describe equally well the experimental mean activity coefficients of a given ( , , )ε mj k I

B Ionic strength corrections 710
electrolyte. The ion interaction coefficients at 25°C listed in Table B-4, Table B-5 and Table B-6 have thus to be used with Baj = 1.5 1 1
2 2kg mol−⋅ .
ε
The summation in Eq. (B.1) extends over all ions k present in solution. Their mo-lality is denoted by mk, and the specific ion interaction parameters, ( , , )ε mj k I
)
, in general depend only slightly on the ionic strength. The concentrations of the ions of the ionic me-dium are often very much larger than those of the reacting species. Hence, the ionic me-dium ions will make the main contribution to the value of log10γj for the reacting ions. This fact often makes it possible to simplify the summation ( , ,ε∑ m km
k, so that only ion
interaction coefficients between the participating ionic species and the ionic medium ions are included, as shown in Eqs. (B.4) to (B.8).
j k I
• Assumption 2: The ion interaction coefficients, ( , , )mj k I are zero for ions of the same charge sign and for uncharged species. The rationale behind this is that ε, which de-scribes specific short-range interactions, must be small for ions of the same charge since they are usually far from one another due to electrostatic repulsion. This holds to a lesser extent also for uncharged species.
Eq. (B.1) will allow fairly accurate estimates of the activity coefficients in mix-tures of electrolytes if the ion interaction coefficients are known. Ion interaction coeffi-cients for simple ions can be obtained from tabulated data of mean activity coefficients of strong electrolytes or from the corresponding osmotic coefficients. Ion interaction coeffi-cients for complexes can either be estimated from the charge and size of the ion or deter-mined experimentally from the variation of the equilibrium constant with the ionic strength.
Ion interaction coefficients are not strictly constant but may vary slightly with the ionic strength. The extent of this variation depends on the charge type and is small for 1:1, 1:2 and 2:1 electrolytes for molalities less than 3.5 m. The concentration dependence of the ion interaction coefficients can thus often be neglected. This point was emphasised by Guggenheim [66GUG], who has presented a considerable amount of experimental material supporting this approach. The concentration dependence is larger for electrolytes of higher charge. In order to reproduce accurately their activity coefficient data, concentration de-pendent ion interaction coefficients have to be used, cf. Lewis et al. [61LEW/RAN], Baes and Mesmer [76BAE/MES], or Ciavatta [80CIA]. By using a more elaborate virial expan-sion, Pitzer and co−workers [73PIT], [73PIT/MAY], [74PIT/KIM], [74PIT/MAY], [75PIT], [76PIT/SIL], [78PIT/PET], [79PIT] have managed to describe measured activity coefficients of a large number of electrolytes with high precision over a large concentration range. Pitzer’s model generally contains three parameters as compared to one in the specific ion interaction theory. The use of the theory requires knowledge of all these parameters. The derivation of Pitzer coefficients for many complexes, such as those of the actinides

B.1 The specific ion interaction equations 711
would require a very large amount of additional experimental work, since few data of this type are currently available.
The way in which the activity coefficient corrections are performed in this review according to the specific ion interaction theory is illustrated below for a general case of a complex formation reaction. Charges are omitted for brevity.
+2M + L + H O(l) M L (OH) + Hm q nm q n n
The formation constant of , determined in an ionic medium (1:1 salt NX) of the ionic strength I
, ,*M L (OH) , m q n q n mb
ο
m , is related to the corresponding value at zero ionic strength, by Eq.(B.3). , ,
*q n mοb
2
+
10 , , 10 , , 10 M 10 L 10 H O
10 , , 10 H log log
q n m q n m
q n m n− γ − γ
M L (OH)m q n
* *log = log + log + log + log m q n aγ γb b (B.3)
The subscript (q,n,m) denotes the complex ion, . If the concentrations of N and X are much greater than the concentrations of M, L, and HM Lm q (OH)n
+, only the molalities mN and mX have to be taken into account for the calculation of the term,
k in Eq. (B.1). For example, for the activity coefficient of the metal cation
M, γ( , , )ε∑ m kj k I mM, Eq. (B.4) is obtained at 25°C and 1 bar.
2 0.509−z IM10 M Xlog = + (M ,X, )
1 + 1.5γ εm
mm
I mI
(B.4)
Under these conditions, Im ≈ mX = mN Substituting the log10γ j values in Eq. (B.3) with the corresponding forms of Eq. (B.4) and rearranging leads to:
210 , , 10 H O 10 , ,
q n m q n m m
2* *log z log = log D n a Iο− ∆ − − ∆ εb b
2 2Lz
(B.5)
where, at 25°C and 1 bar: 2 2
M L M = ( ) + z m z q z n n mz q∆ − − − − (B.6)
0.509 m = 1 + 1.5 m
ID
I (B.7)
= ( , , , N or∆ε ε q n m X) (H, X) (N, L) (M, X)+ ε − ε − εn q m (B.8)
Here ( , zM L m z q z n− − ) M and zL are the charges of the complex, , the metal ion M and the ligand L, respectively.
M L (OH)m q n
Equilibria involving H2O(l) as a reactant or product require a correction for the activity of water, . The activity of water in an electrolyte mixture can be calculated as:
2H Oa
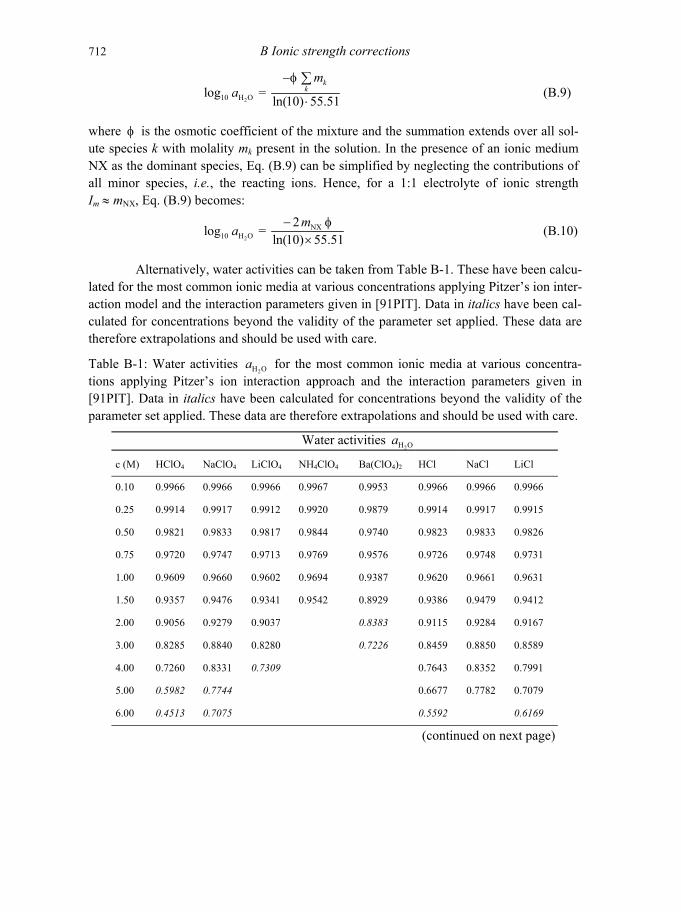
B Ionic strength corrections 712
210 H Olog =
ln(10) 55.51ka⋅
∑ (B.9)
km−φ
where is the osmotic coefficient of the mixture and the summation extends over all sol-ute species k with molality m
φk present in the solution. In the presence of an ionic medium
NX as the dominant species, Eq. (B.9) can be simplified by neglecting the contributions of all minor species, i.e., the reacting ions. Hence, for a 1:1 electrolyte of ionic strength Im ≈ mNX, Eq. (B.9) becomes:
2
NX10 H O
2log =
ln(10) 55.51− φ
×m
a (B.10)
Alternatively, water activities can be taken from Table B-1. These have been calcu-lated for the most common ionic media at various concentrations applying Pitzer’s ion inter-action model and the interaction parameters given in [91PIT]. Data in italics have been cal-culated for concentrations beyond the validity of the parameter set applied. These data are therefore extrapolations and should be used with care.
Table B-1: Water activities 2
for the most common ionic media at various concentra-tions applying Pitzer’s ion interaction approach and the interaction parameters given in [91PIT]. Data in italics have been calculated for concentrations beyond the validity of the parameter set applied. These data are therefore extrapolations and should be used with care.
H Oa
Water activities 2H Oa
c (M) HClO4 NaClO4 LiClO4 NH4ClO4 Ba(ClO4)2 HCl NaCl LiCl
0.10 0.9966 0.9966 0.9966 0.9967 0.9953 0.9966 0.9966 0.9966
0.25 0.9914 0.9917 0.9912 0.9920 0.9879 0.9914 0.9917 0.9915
0.50 0.9821 0.9833 0.9817 0.9844 0.9740 0.9823 0.9833 0.9826
0.75 0.9720 0.9747 0.9713 0.9769 0.9576 0.9726 0.9748 0.9731
1.00 0.9609 0.9660 0.9602 0.9694 0.9387 0.9620 0.9661 0.9631
1.50 0.9357 0.9476 0.9341 0.9542 0.8929 0.9386 0.9479 0.9412
2.00 0.9056 0.9279 0.9037 0.8383 0.9115 0.9284 0.9167
3.00 0.8285 0.8840 0.8280 0.7226 0.8459 0.8850 0.8589
4.00 0.7260 0.8331 0.7309 0.7643 0.8352 0.7991
5.00 0.5982 0.7744 0.6677 0.7782 0.7079
6.00 0.4513 0.7075 0.5592 0.6169
(continued on next page)

B.1 The specific ion interaction equations 713
Table B-1 (Continued)
c (M) KCl NH4Cl MgCl2 CaCl2 NaBr HNO3 NaNO3 LiNO3
0.10 0.9966 0.9966 0.9953 0.9954 0.9966 0.9966 0.9967 0.9966
0.25 0.9918 0.9918 0.9880 0.9882 0.9916 0.9915 0.9919 0.9915
0.50 0.9836 0.9836 0.9744 0.9753 0.9830 0.9827 0.9841 0.9827
0.75 0.9754 0.9753 0.9585 0.9605 0.9742 0.9736 0.9764 0.9733
1.00 0.9671 0.9669 0.9399 0.9436 0.9650 0.9641 0.9688 0.9635
1.50 0.9500 0.9494 0.8939 0.9024 0.9455 0.9439 0.9536 0.9422
2.00 0.9320 0.9311 0.8358 0.8507 0.9241 0.9221 0.9385 0.9188
3.00 0.8933 0.8918 0.6866 0.7168 0.8753 0.8737 0.9079 0.8657
4.00 0.8503 0.8491 0.5083 0.5511 0.8174 0.8196 0.8766 0.8052
5.00 0.8037 0.3738 0.7499 0.7612 0.8446 0.7390
6.00 0.6728 0.7006 0.8120 0.6696
c (M) NH4NO3 Na2SO4 (NH4)2SO4 Na2CO3 K2CO3 NaSCN
0.10 0.9967 0.9957 0.9958 0.9956 0.9955 0.9966
0.25 0.9920 0.9900 0.9902 0.9896 0.9892 0.9915
0.50 0.9843 0.9813 0.9814 0.9805 0.9789 0.9828
0.75 0.9768 0.9732 0.9728 0.9720 0.9683 0.9736
1.00 0.9694 0.9653 0.9640 0.9637 0.9570 0.9641
1.50 0.9548 0.9491 0.9455 0.9467 0.9316 0.9438
2.00 0.9403 0.9247 0.9283 0.9014 0.9215
3.00 0.9115 0.8735 0.8235 0.8708
4.00 0.8829 0.8050 0.7195 0.8115
5.00 0.8545 0.5887 0.7436
6.00 0.8266 0.6685

B Ionic strength corrections 714
Values of osmotic coefficients for single electrolytes have been compiled by vari-ous authors, e.g., Robinson and Stokes [59ROB/STO]. The activity of water can also be calculated from the known activity coefficients of the dissolved species. In the presence of an ionic medium,
+N X ,ν ν−
of a concentration much larger than those of the reacting ions, the osmotic coefficient can be calculated according to Eq. (B.11) (cf. Eqs. (23−39), (23−40) and (A4−2) in [61LEW/RAN]).
3
ln(10) 11 = 1 2ln(1 )( ) 1j m j m
A z zB a I B a I
I B a B a I+ −
− φ + − + −
+
= ν νz z
NX ln(10) (N,X)
m j j m
m + −
+ −
ν ν
− ε ν + ν
and + −ν ν
(B.11)
where are the number of cations and anions in the salt formula ( )+ + − −
and in this case:
NX = ( )2mI z z m+ − + −
1ν + ν
The activity of water is obtained by inserting Eq. (B.11) into Eq. (B.10). It should be mentioned that in mixed electrolytes with several components at high concentrations, it might be necessary to use Pitzer’s equation to calculate the activity of water. On the other hand,
2 is nearly constant in most experimental studies of equilibria in dilute aqueous
solutions, where an ionic medium is used in large excess with respect to the reactants. The medium electrolyte thus determines the osmotic coefficient of the solvent.
H Oa
In natural waters the situation is similar; the ionic strength of most surface waters is so low that the activity of H2O(l) can be set equal to unity. A correction may be necessary in the case of seawater, where a sufficiently good approximation for the osmotic coefficient may be obtained by considering NaCl as the dominant electrolyte.
In more complex solutions of high ionic strengths with more than one electrolyte at significant concentrations, e.g., (Na+, Mg2+, Ca2+) (Cl−, 2
4SO − ), Pitzer’s equation (cf. [2000GRE/WAN]) may be used to estimate the osmotic coefficient; the necessary interac-tion coefficients are known for most systems of geochemical interest.
Note that in all ion interaction approaches, the equation for the mean activity co-effi-cients can be split up to give equations for conventional single ion activity coefficients in mixtures, e.g., Eq. (B.1). The latter are strictly valid only when used in combinations which yield electroneutrality. Thus, while estimating medium effects on standard potentials,

B.1 The specific ion interaction equations 715
a combination of redox equilibria with, +2
1 H (2
−+ eH , is necessary (cf. Example B.3).
g)
B.1.2 Ionic strength corrections at temperatures other than 298.15 K Values of the Debye-Hückel parameters A and B in Eqs. (B.2) and (B.11) are listed in Table B-2 for a few temperatures at a pressure of 1 bar below 100°C and at the steam saturated pressure for t 100°C. The values in Table B-2 may be calculated from the static dielec-tric constant and the density of water as a function of temperature and pressure, and are also found for example in Refs. [74HEL/KIR], [79BRA/PIT], [81HEL/KIR], [84ANA/ATK], [90ARC/WAN].
≥
The term, Baj, in the denominator of the Debye−Hückel term, D, cf. Eq. (B.2), has been assigned in this review a value of 1.5 1
2kg mol 12−⋅ at 25°C and 1 bar, cf. Section B.1.1
At temperatures and pressures other than the reference and standard state, the following possibilities exist:
• The value of Baj is calculated at each temperature assuming that ion sizes are inde-pendent of temperature and using the values of B listed in Table B-2.
• The value Baj is kept constant at 1.5 12kg mol 1
2−⋅ . Due the variation of B with temperature, cf. Table B-2, this implies a temperature dependence for ion size parameters. Assuming for the ion size is in reality constant, then it is seen that this simplification introduces an error in D, which increases with temperature and ionic strength (this error is less than ± 0.01 at t ≤ 100°C and I < 6 m, and less than ± 0.006 at t ≤ 50°C and I ≤ 4 m).
• The value of Baj is calculated at each temperature assuming a given temperature variation for aj and using the values of B listed in Table B-2. For example, in the aqueous ionic model of Helgeson and co−workers ([88TAN/HEL], [88SHO/HEL], [89SHO/HEL], [89SHO/HEL2]) ionic sizes follow the rela-tion: ( ) = (298.15 K, 1 bar) + ( , )j j ja T a z g T p [90OEL/HEL], where g(T, p) is a temperature and pressure function which is tabulated in [88TAN/HEL], [92SHO/OEL], and is approximately zero at temperatures below 175°C.
The values of , obtained with the methods described in Section B.1.3 at temperatures other than 25°C, will depend on the value adopted for Ba
( , , )ε mj k Ij.. As long as a con-
sistent approach is followed, values of ( , , )ε mj k I absorb the choice of Baj , and for moder-ate temperature intervals (between 0 and 200°C) the choice Baj = 1.5 1
2kg mol−⋅1
2 .is the simplest one and is recommended by this review.

B Ionic strength corrections 716
The variation of with temperature is discussed by Lewis et al. [61LEW/RAN], Millero [79MIL], Helgeson et al. [81HEL/KIR], [90OEL/HEL], Giffaut et al. [93GIF/VIT2] and Grenthe and Plyasunov [97GRE/PLY]. The absolute values for the reported ion interaction parameters differ in these studies due to the fact that the De-bye−Hückel term used by these authors is not exactly the same. Nevertheless, common to all these studies is the fact that values of
( , , )ε mj k I
( / )∂ ε ∂ pT are usually ≤ 0.005 kg·mol−1·K−1 for temperatures below 200°C. Therefore, if values of ( , , )ε mj k I obtained at 25°C are used in the temperature range 0 to 50°C to perform ionic strength corrections, the error in
10log /γ j mI will be ≤ 0.13. It is clear that in order to reduce the uncertainties in solubility calculations at t ≠ 25°C, studies on the variation of ( , , )ε mIj k values with temperature should be undertaken.
Table B-2: Debye-Hückel constants as a function of temperature at a pressure of 1 bar be-low 100°C and at the steam saturated pressure for t 100°C. The uncertainty in the A pa-rameter is estimated by this review to be ± 0.001 at 25°C, and ± 0.006 at 300°C, while for the B parameter the estimated uncertainty ranges from ± 0.0003 at 25°C to ± 0.001 at 300°C.
≥
t(°C) p(bar) A (1
1 2(kg mol )−⋅ ) B × 10−10 (1 12 2 1kg mol m−−
⋅ ⋅ )
0 1.00 0.491 0.3246
5 1.00 0.494 0.3254
10 1.00 0.498 0.3261
15 1.00 0.501 0.3268
20 1.00 0.505 0.3277
25 1.00 0.509 0.3284
30 1.00 0.513 0.3292
35 1.00 0.518 0.3300
40 1.00 0.525 0.3312
50 1.00 0.534 0.3326
75 1.00 0.564 0.3371
100 1.013 0.600 0.3422
125 2.32 0.642 0.3476
150 4.76 0.690 0.3533
175 8.92 0.746 0.3593
200 15.5 0.810 0.365
250 29.7 0.980 0.379
300 85.8 1.252 0.396

B.1 The specific ion interaction equations 717
B.1.3 Estimation of ion interaction coefficients
B.1.3.1 Estimation from mean activity coefficient data Example B.1:
The ion interaction coefficient +(H ,Cl )−ε can be obtained from published values of : ±, HCl HCl versus mγ
+10 , HCl 10 10H Cl2 log = log log −±γ γ + γ
m
2
++ +
Cl H+
10 , HCl HCl
= + (H ,Cl ) (Cl ,H )
log = + (H ,Cl )
−− −
−±
− ε − + ε
γ − ε
D m D
D m
10 ,HCl(log )±γ + D
By plotting versus mHCl a straight line with the slope is obtained. The degree of linearity should in itself indicate the range of validity
of the specific ion interaction approach. Osmotic coefficient data can be treated in an analogous way.
+(H ,Cl )−ε
B.1.3.2 Estimations based on experimental values of equilibrium constants at differ-ent ionic strengths
Example B.2:
Equilibrium constants are given in Table B-3 for the reaction: 2+ +2UO + Cl UO Cl− (B.12)
The following formula is deduced from Eq. (B.5) for the extrapolation to I = 0:
10 1 10 1log + 4 = log ο − ∆ε mDb b I (B.13)
The linear regression is done as described in Appendix C. The following results are obtained:
10 1log = (0.170 0.021)ο ±b
∆ε(B.12) = 1(0.248 0.022) kg mol−− ± ⋅ .
The experimental data are depicted in Figure B-1, where the dashed area repre-sents the uncertainty range that is obtained by using the results in 10 1log οb and ∆ε and cor-recting back to I ≠ 0.
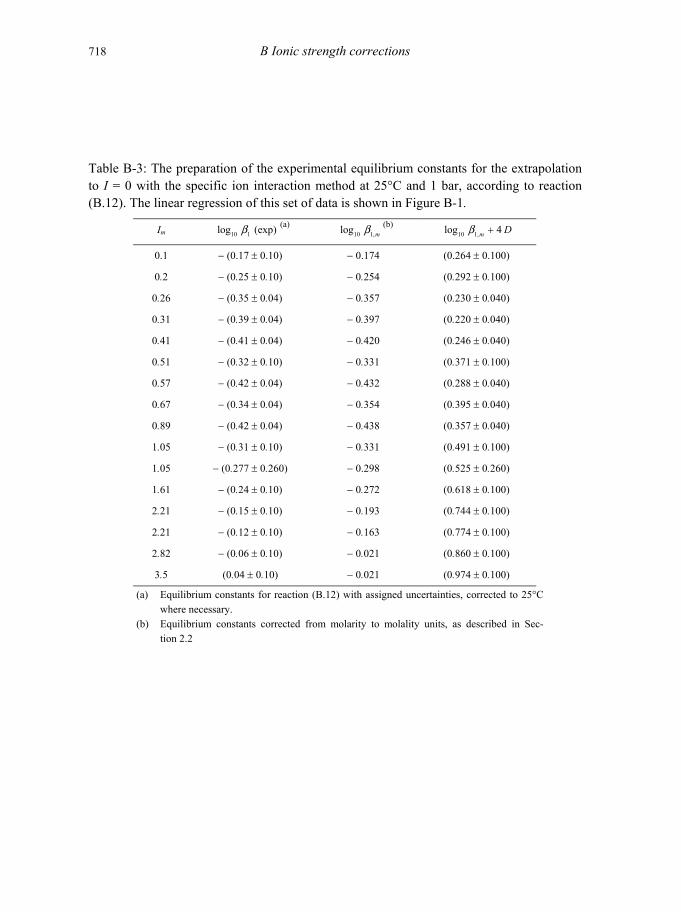
B Ionic strength corrections 718
Table B-3: The preparation of the experimental equilibrium constants for the extrapolation to I = 0 with the specific ion interaction method at 25°C and 1 bar, according to reaction (B.12). The linear regression of this set of data is shown in Figure B-1.
Im 10 1log (exp)b (a) 10 1,log mb (b)
10 1,log 4+m Db
0.1 − (0.17 ± 0.10) − 0.174 (0.264 ± 0.100)
0.2 − (0.25 ± 0.10) − 0.254 (0.292 ± 0.100)
0.26 − (0.35 ± 0.04) − 0.357 (0.230 ± 0.040)
0.31 − (0.39 ± 0.04) − 0.397 (0.220 ± 0.040)
0.41 − (0.41 ± 0.04) − 0.420 (0.246 ± 0.040)
0.51 − (0.32 ± 0.10) − 0.331 (0.371 ± 0.100)
0.57 − (0.42 ± 0.04) − 0.432 (0.288 ± 0.040)
0.67 − (0.34 ± 0.04) − 0.354 (0.395 ± 0.040)
0.89 − (0.42 ± 0.04) − 0.438 (0.357 ± 0.040)
1.05 − (0.31 ± 0.10) − 0.331 (0.491 ± 0.100)
1.05 − (0.277 ± 0.260) − 0.298 (0.525 ± 0.260)
1.61 − (0.24 ± 0.10) − 0.272 (0.618 ± 0.100)
2.21 − (0.15 ± 0.10) − 0.193 (0.744 ± 0.100)
2.21 − (0.12 ± 0.10) − 0.163 (0.774 ± 0.100)
2.82 − (0.06 ± 0.10) − 0.021 (0.860 ± 0.100)
3.5 (0.04 ± 0.10) − 0.021 (0.974 ± 0.100)
(a) Equilibrium constants for reaction (B.12) with assigned uncertainties, corrected to 25°C where necessary.
(b) Equilibrium constants corrected from molarity to molality units, as described in Sec-tion 2.2

B.1 The specific ion interaction equations 719
Figure B-1: Plot of 10 1log 4 D+b10 1log 4 D+b versus Im for reaction (B.12), at 25°C and 1 bar. The
straight line shows the result of the weighted linear regression, and the dotted lines repre-sent the uncertainty range obtained by propagating the resulting uncertainties at I = 0 back to I = 4 m.
Figure B-1: Plot of versus Im for reaction (B.12), at 25°C and 1 bar. The straight line shows the result of the weighted linear regression, and the dotted lines repre-sent the uncertainty range obtained by propagating the resulting uncertainties at I = 0 back to I = 4 m.
0.0 0.5 1.0 1.5 2.0 2.5 3.0 3.5 4.00.0
0.2
0.4
0.6
0.8
1.0
1.2
1.4
log10
β1
))
lo
1
Ioni lal
10 1log b ο
101
log
β +
4 D
= (0.17 ± 002)
∆ε = – (0.25 ± 0.02)
I (mol · kg–1)
Example B.3: Example B.3:
When using the specific ion interaction theory, the relationship between the redox potential of the couple, , in a medium of ionic strength, I2+ 4+
2PuO /Pu2+ 4+2PuO /Pu m, and the corresponding quan-
tity at I = 0 should be calculated in the following way. The reaction in the galvanic cell:
When using the specific ion interaction theory, the relationship between the redox potential of the couple, , in a medium of ionic strength, Im, and the corresponding quan-tity at I = 0 should be calculated in the following way. The reaction in the galvanic cell:
Pt Pt H2(g, r)H H+(r)H 2+ 4+ +2 2PuO , Pu , H , H O(l)2+ 4+ +2 2PuO , Pu , H , H O(l) Pt Pt 2(g, r) +(r)
is:
(B.14) 2+ + + 4+2 2 2PuO + H (g, r) + 4H 2 H (r) Pu 2H O(l)− +
where "r" is used to indicate that H2(g) and H+ are at the chemical conditions in the refer-ence electrode compartment, i.e., standard conditions when the reference electrode is the SHE. However, activities of H+, H2O(l) and the ratio of activity of to Pu2+
2PuO 4+ depend on

B Ionic strength corrections 720
the conditions of the experimental measurements (i.e., non−standard conditions, usually high ionic strength to improve the accuracy of the measurement).
For reaction (B.14):
4+ +
2H Oa a a ⋅ ⋅
2
2+ + 22
Pu H (r)10 10 4
H (r)PuO H
log = logKa a f
ο ⋅ ⋅
+2H (r) H1 and
.
= γfSince by definition of the SHE, (r)
1= ,
4+ 2+ + 2210 10 10 10 10 10 H OPu PuO H
log = log + log log 4log + 2 logο γ − γ − γK K a ,
and
4+4
4+10 4Pu ClO
log = 16 + (Pu ,ClO ) −−γ − εD m
−2+2 4
2+10 2 4PuO ClO
log = 4 + (PuO ,ClO ) −γ − εD m
+4
+10 4H C
log = + (H ,ClO )lO−
−γ − εD m
Hence,
4
2
10 10 4 2 4 4 ClO
10 H O 2 log+ a
4+ 2+ +log = log 8 + ( (Pu , ClO ) (PuO , ClO ) 4 (H , ClO ) ) −ο − − −− ε − ε − εK K D m
(B.15)
The relationship between the equilibrium constant and the redox potential is:
ln = Rn FK E
Tο′ (B.16)
ln = ο n FK E .ο
R T (B.17)
Eο′ is the redox potential in a medium of ionic strength I, οE is the corresponding standard potential at I = 0, and n is the number of transferred electrons in the reaction con-sidered. Combining Eqs. (B.15), (B.16) and (B.17) and rearranging them leads to Eq.(B.18):
2 410 H O ClO(8 2log )E D a E m
n F n F−
ο ο′ − − = − ∆ε
R ln(10) R ln(10)T T
m
(B.18)
For n = 2 in the present example and T = 298.15 K, Eq.(B.18) becomes:
2 410 H O ClO[mV] 236.6 59.16 log = [mV] 29.58 E D a E −
ο ο′ − + − ∆ε
where

B.1 The specific ion interaction equations 721
4+ 2+ +4 2 4 = (Pu , ClO ) (PuO , ClO ) 4 (H , ClO )4− − −∆ε ε − ε − ε .
The value of can be taken from experimental data or calculated from equa-tions (B.10) and (B.11).
2H Oa
In general, formal potentials are reported with reference to the standard hydrogen electrode, cf. Section 2.1.6.5, as exemplified in Tables V.2 and V.3 of the uranium NEA review [92GRE/FUG]. In that case, the H+ appearing in the reduction reaction is already at standard conditions. For example, experimental data are available on the formal potentials for reactions:
(B.19) 2+ + 4+2PuO 4H + 2 Pu 2H O(l)−+ +e 2
2
and
. (B.20). 2+ +2PuO PuO−+ e
While reaction (B.19) corresponds to (B.14), reaction (B.20) is equivalent to:
2+ + +2 2 2
1PuO H (g) PuO H2
+ + (B.21)
where the designator "(r)" has been omitted, since in these equations only the H+ in the ref-erence compartment is relevant.
The cations in reaction (B.14) represent aqueous species in the ionic media used during the experiments. In reaction (B.21) H+ represents the cation in the standard hydrogen electrode, and therefore it is already in standard conditions, and its activity coefficient must not be included in any extrapolation to I = 0 of experimental values for reaction (B.20). Re-actions (B.20) and (B.21) are equivalent, as are reactions (B.14) and (B.19), as can be seen if any of these equations are combined with reaction (2.26). Hence Eq. (B.18) can be ob-tained more simply by using Eq. 2.33 for reaction (B.19).
B.1.4 On the magnitude of ion interaction coefficients Ciavatta [80CIA] made a compilation of ion interaction coefficients for a large number of electrolytes. Similar data for complexations of various kinds were reported by Spahiu [83SPA] and Ferri et al. [83FER/GRE]. These and some other data for 25°C and 1 bar have been collected and are listed in Section B.3.
It is obvious from the data in these tables that the charge of an ion is of great im-portance for determining the magnitude of the ion interaction coefficient. Ions of the same charge type have similar ion interaction coefficients with a given counter-ion. Based on the tabulated data, Grenthe et al. [92GRE/FUG] proposed that it is possible to estimate, with an error of at most ± 0.1 kg · mol−1 in ε, ion interaction coefficients for cases where there are
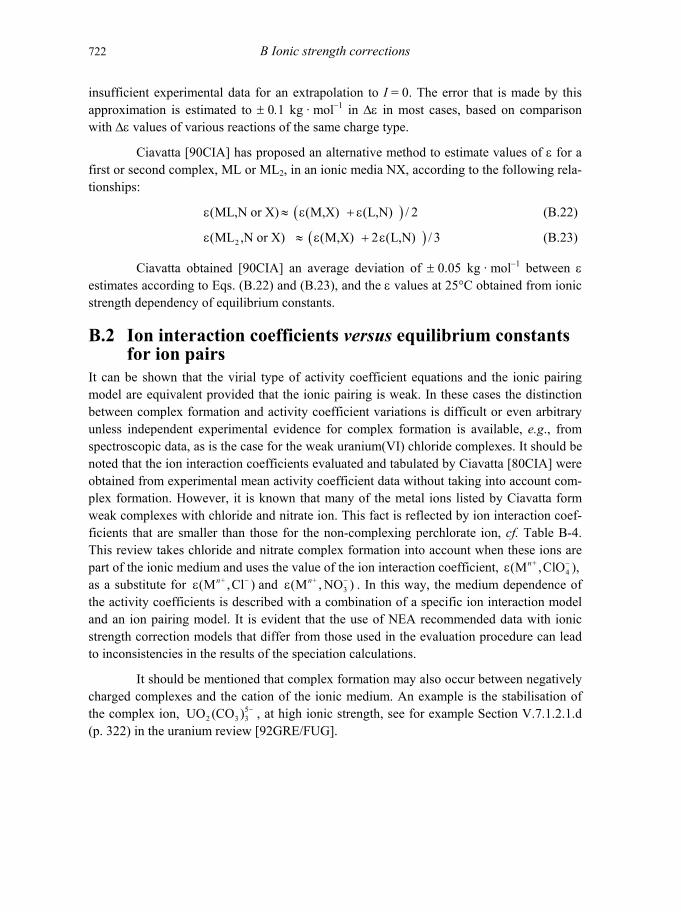
B Ionic strength corrections 722
insufficient experimental data for an extrapolation to I = 0. The error that is made by this approximation is estimated to ± 0.1 kg · mol−1 in ∆ε in most cases, based on comparison with ∆ε values of various reactions of the same charge type.
Ciavatta [90CIA] has proposed an alternative method to estimate values of ε for a first or second complex, ML or ML2, in an ionic media NX, according to the following rela-tionships:
≈ (ML,N or X)ε ( )(M,X) (L,N) / 2ε + ε (B.22)
≈ 2(ML ,N or X) ε ( )(M,X) 2 (L,N) / 3ε + ε (B.23)
Ciavatta obtained [90CIA] an average deviation of ± 0.05 kg · mol−1 between ε estimates according to Eqs. (B.22) and (B.23), and the ε values at 25°C obtained from ionic strength dependency of equilibrium constants.
B.2 Ion interaction coefficients versus equilibrium constants for ion pairs
It can be shown that the virial type of activity coefficient equations and the ionic pairing model are equivalent provided that the ionic pairing is weak. In these cases the distinction between complex formation and activity coefficient variations is difficult or even arbitrary unless independent experimental evidence for complex formation is available, e.g., from spectroscopic data, as is the case for the weak uranium(VI) chloride complexes. It should be noted that the ion interaction coefficients evaluated and tabulated by Ciavatta [80CIA] were obtained from experimental mean activity coefficient data without taking into account com-plex formation. However, it is known that many of the metal ions listed by Ciavatta form weak complexes with chloride and nitrate ion. This fact is reflected by ion interaction coef-ficients that are smaller than those for the non-complexing perchlorate ion, cf. Table B-4. This review takes chloride and nitrate complex formation into account when these ions are part of the ionic medium and uses the value of the ion interaction coefficient, as a substitute for and
+4(M ,ClO ),n −ε
+(M ,Cl )n −ε +3(M , NO )n −ε . In this way, the medium dependence of
the activity coefficients is described with a combination of a specific ion interaction model and an ion pairing model. It is evident that the use of NEA recommended data with ionic strength correction models that differ from those used in the evaluation procedure can lead to inconsistencies in the results of the speciation calculations.
It should be mentioned that complex formation may also occur between negatively charged complexes and the cation of the ionic medium. An example is the stabilisation of the complex ion, , at high ionic strength, see for example Section V.7.1.2.1.d (p. 322) in the uranium review [92GRE/FUG].
52 3 3UO (CO ) −

B.3 Tables of ion interaction coefficients 723
B.3 Tables of ion interaction coefficients Table B-4, Table B-5 and Table B-6 contain the selected specific ion interaction coefficients used in this review, according to the specific ion interaction theory described. Table B-4 contains cation interaction coefficients with 4Cl , ClO and NO3
− − − . Table B-5 anion interac-tion coefficients with Li+, Na+ (or +
4NH ) and K+. The coefficients have the units of kg·mol−1 and are valid for 298.15 K and 1 bar. The species are ordered by charge and appear, within each charge class, in standard order of arrangement, cf. Section 2.1.9.
In some cases, the ionic interaction can be better described by assuming ion inter-action coefficients as functions of the ionic strength rather than as constants. Ciavatta [80CIA] proposed the use of Eq. (B.24) for cases where the uncertainties in Table B-4 and Table B-5 are ± 0.03 kg·mol−1 or greater.
1 2 10 = + logε ε ε mI (B.24)
For these cases, and when the uncertainty can be improved with respect to the use of a constant value of , the values ε 1ε and 2ε given in Table B-6 should be used.
It should be noted that ion interaction coefficients tabulated in Table B-4, Table B-5 and Table B-6 may also involve ion pairing effects, as described in Section B.3. In direct comparisons of ion interaction coefficients, or when estimates are made by analogy, this aspect must be taken into account.

B Ionic strength corrections 724
Table B-4: Ion interaction coefficients ( , )ε j k (kg·mol−1) for cations j with k = Cl−, and
4ClO−
3NO− , taken from Ciavatta [80CIA], [88CIA] unless indicated otherwise. The uncertain-ties represent the 95% confidence level. The ion interaction coefficients marked with † can be described more accurately with an ionic strength dependent function, listed in Table B-6. The coefficients and +(M , Cl )−ε n +
3, NO(M )−ε n reported by Ciavatta [80CIA] were evalu-ated without taking chloride and nitrate complexation into account, as discussed in Section B. 2.
j k → ↓ Cl− 4ClO− 3NO−
+H (0.12 ± 0.01) (0.14 ± 0.02) (0.07 ± 0.01) +4NH − (0.01 ± 0.01) − (0.08 ± 0.04)† − (0.06 ± 0.03)†
+2H gly+Tl
− (0.06 ± 0.02)
− (0.21 ± 0.06)† +3ZnHCO
+
0.2(a)
CdCl+
(0.25 ± 0.02)
CdI (0.27 ± 0.02)
+CdSCN+
(0.31 ± 0.02)
HgCl+
(0.19 ± 0.02)
Cu+ (0.11 ± 0.01)
Ag
YCO
(0.00 ± 0.01) − (0.12 ± 0.05)†
3+
Am(OH)
(0.17 ± 0.04)(b)
2+
AmF+
− (0.27 ± 0.20)(q) (0.17 ± 0.04)(c)
2
AmSO
(0.17 ± 0.04)(c)
4+
AmCO+
(0.22 ± 0.08)(d)
3
PuO+
(0.01 ± 0.05)(r) (0.17 ± 0.04)(c)
2
PuO F
(0.24 ± 0.05)(e)
2+
2PuO Cl+
(0.29 ± 0.11)(f)
(0.50 ± 0.09)(g)
2NpO+ (0.09 ± 0.05) (0.25 ± 0.05)(h)
2 H+NpO O − (0.06 ± 0.40)(i)
(Continued on next page)

B.3 Tables of ion interaction coefficients 725
Table B-4 (Continued)
j k → ↓ Cl− 4ClO− 3NO−
2 3 5(NpO ) (OH)+ (0.45 ± 0.20)
2
NpO Cl+
NpO F+ (0.29 ± 0.12)(j)
2
NpO IO+
(0.50 ± 0.14)(k)
2 3
Np(SCN)+
(0.33 ± 0.04)(l)
3
UO+
(0.17 ± 0.04)(m)
2
UO
(0.26 ± 0.03)(n)
2 OH+
(UO ) (O
− (0.06 ± 0.40)(n) (0.51 ± 1.4)(n)
2 3 5H)+
UF+
(0.81 ± 0.17)(n) (0.45 ± 0.15)(n) (0.41 ± 0.22)(n)
3
UO
(0.1 ± 0.1)(o) (0.1 ± 0.1)(o)
2 F+
UO Cl+
(0.04 ± 0.07)(p) (0.28 ± 0.04)
2
UO ClO+
(0.33 ± 0.04)(n)
2 3
UO Br+
(0.33 ± 0.04)(o)
2
UO BrO+
(0.24 ± 0.04)(o)
2 3
UO IO+
(0.33 ± 0.04)(o)
2 3
UO N+
(0.33 ± 0.04)(o)
2 3
UO NO
(0.3 ± 0.1)(o)
2 3+
UO SCN+
(0.33 ± 0.04)(o)
22+Pb
(0.22 ± 0.04)(o)
(0.15 ± 0.02) − (0.20 ± 0.12)† 2+AlOH 0.09(s) 0.31(s)
22 3 2Al CO (OH) +
2+Zn
0.26(s)
(0.33 ± 0.03) (0.16 ± 0.02) 23ZnCO +
2+Cd
(0.35 ± 0.05)(a)
(0.09 ± 0.02) 2+Hg2+
(0.34 ± 0.03) − (0.1 ± 0.1)†
2Hg (0.09 ± 0.02) − (0.2 ± 0.1)†
2+Cu (0.08 ± 0.01) (0.32 ± 0.02) (0.11 ± 0.01)
2+Ni2+
(0.17 ± 0.02)
Co (0.16 ± 0.02) (0.34 ± 0.03) (0.14 ± 0.01)
(Continued on next page)

B Ionic strength corrections 726
Table B-4 (Continued)
j k → ↓ Cl− 4ClO− 3NO−
2FeOH + 0.38(b) 2FeSCN + 0.45(b)
2+Mn (0.13 ± 0.01)
23YHCO +
2AmOH +
(0.39 ± 0.04)(b)
− (0.04 ± 0.07)(q) (0.39 ± 0.04)(c) 2AmF + (0.39 ± 0.04)(c)
2AmCl + (0.39 ± 0.04)(c) 2AmN +3
2AmNO +
(0.39 ± 0.04)(c)
22AmNO +
(0.39 ± 0.04)(c)
32AmH PO
(0.39 ± 0.04)(c)
2 4+
2AmSCN +
(0.39 ± 0.04)(c)
(0.39 ± 0.04)(c) 2PuO +22PuF +
(0.46 ± 0.05)(t)
22PuCl +
(0.36 ± 0.17)(j)
(0.39 ± 0.16)(u) 2PuI + (0.39 ± 0.04)(v)
22NpO + (0.46 ± 0.05)(w)
22 2 2(OH) +
2NpF +
(NpO ) (0.57 ± 0.10)
22NpSO +
(0.38 ± 0.17)(j)
4
Np(SCN)
(0.48 ± 0.11) 22
+
2UO +
(0.38 ± 0.20)(j)
2
(UO )
(0.21 ± 0.02)(x) (0.46 ± 0.03) (0.24 ± 0.03)(v) 2
2 2 2(OH) +
2(UO ) (OH) +
(0.69 ± 0.07)(n) (0.57 ± 0.07)(n) (0.49 ± 0.09)(n)
2 3 42UF +
(0.50 ± 0.18)(n) (0.89 ± 0.23)(n) (0.72 ± 1.0)(n)
22USO
(0.3 ± 0.1)(o)
4+
U(NO )
(0.3 ± 0.1)(o) 2
3 2+
2Mg +
(0.49 ± 0.14)(y)
(0.19 ± 0.02) (0.33 ± 0.03) (0.17 ± 0.01) 2Ca + (0.14 ± 0.01) (0.27 ± 0.03) (0.02 ± 0.01) 2Ba + (0.07 ± 0.01) (0.15 ± 0.02) − (0.28 ± 0.03)
(Continued on next page)

B.3 Tables of ion interaction coefficients 727
Table B-4 (Continued)
j k → ↓ Cl− 4ClO− 3NO−
3Al + (0.33 ± 0.02) 3Fe + (0.56 ± 0.03) (0.42 ± 0.08) 3Cr + (0.30 ± 0.03) (0.27 ± 0.02) 3La + (0.22 ± 0.02) (0.47 ± 0.03) 3 3Lu+ +→
3Am +
La 0.47 → 0.52(b)
(0.23 ± 0.02)(G) (0.49 ± 0.03)(c) 3Pu + (0.49 ± 0.05)(z)
3+
3PuF +
PuOH (0.50 ± 0.05)(i)
(0.56 ± 0.11)(i) 3PuCl + (0.85 ± 0.09)(#) 3PuBr + (0.58 ± 0.16)(A)
3PuSCN +
3Np +
(0.39 ± 0.04)(B)
(0.49 ± 0.05)(z) 3+
3NpF +
NpOH (0.50 ± 0.05)(i)
(0.58 ± 0.07)(C) 3NpCl + (0.81 ± 0.09)(D)
3NpI + (0.77 ± 0.26)(E) 3+
3U +
NpSCN (0.76 ± 0.12)(j)
(0.49 ± 0.05)(y) 3+
3UF +
UOH (0.48 ± 0.08)(y)
(0.48 ± 0.08)(o) 3UCl + (0.50 ± 0.10)(k) 3UBr + (0.52 ± 0.10)(o)
3UI + (0.55 ± 0.10)(o) 33
+
3Be OH
UNO (0.62 ± 0.08)(y)
2+
33 3Be (OH) +
(0.50 ± 0.05)(F)
(0.30 ± 0.05)(F) (0.51 ± 0.05)(y) (0.29 ± 0.05)(F) 4
3 3 4) +
4Fe (OH) +
Al CO (OH 0.41(s)
2 2 0.82(b)
(Continued on next page)

B Ionic strength corrections 728
Table B-4: (Continued)
j k → ↓ Cl− 4ClO− 3NO−
42 3Y CO + (0.80 ± 0.04)(b)
4Pu + (0.82 ± 0.07)(H) 4Np + (0.84 ± 0.06)(I)
4U + (0.76 ± 0.06)(J)(o) 4Th + (0.25 ± 0.03) (0.11 ± 0.02)
53 4H) +Al (O 0.66(s) 1.30(s)
(a) Taken from Ferri et al. [85FER/GRE].
(b) Taken from Spahiu [83SPA].
(c) Estimated in [95SIL/BID].
(d) Evaluated in [95SIL/BID].
(e) Derived from ∆ε = (0.22 ± 0.03) kg · mol22 4 2 = (PuO ,ClO ) (PuO ,ClO )+ − + −ε − ε
2 4
1PuO , ClO( ) (0.17 0.05) kg mol + − −ε ±=4
−1 [95CAP/VIT]. In [92GRE/FUG], was tabulated based on [89ROB], [89RIG/ROB] and [90RIG]. Capdevila and Vitorge’s data [92CAP], [94CAP/VIT] and [95CAP/VIT] were unavailable at that time.
⋅
(f) Estimated in [2001LEM/FUG] by analogy with ∆ε of the corresponding Np(IV) reaction.
(g) From ∆ε evaluated by Giffaut [94GIF].
(h) As in [92GRE/FUG], derived from ∆ε = = (0.21 ± 0.03)kg · mol2
2 4 2 4 (NpO , ClO ) NpO , ClO(+ − + −ε − ε ) −1 [87RIG/VIT], [89RIG/ROB] and [90RIG].
(i) Estimated in [2001LEM/FUG].
(j) Estimated in [2001LEM/FUG] by analogy with ∆ε of the corresponding U(IV) reaction.
(k) Estimated in [2001LEM/FUG] by analogy with ∆ε of the corresponding P(VI) reaction.
(l) Estimated in [2001LEM/FUG] by assuming . 2 3 4 2 3 4NpO IO , ClO UO IO , ClO( ) (+ − + −ε ≈ ε ))
1−⋅
(m) Estimated in [2001LEM/FUG] by assuming . 3 4 2 4Np(SCN) , ClO AmF , ClO( ) (+ − + −ε ≈ ε
(n) Evaluated in the uranium review [92GRE/FUG], using , where X = Cl
2 1
2UO , X (0.46 0.03) kg mol ( )+ −ε = ± ⋅−, and . 4ClO−
3NO−
(o) Estimated in the uranium review [92GRE/FUG].
(p) Taken from Riglet et al. [89RIG/ROB], where the following assumptions were made: as for other (M3 3
4 4Np , ClO Pu , ClO 0.49 kg mol( ) ( )+ − + −ε ≈ ε = 3+, 4ClO− ) interactions, and . 2 2
2 4 2 4NpO , ClO PuO , ClO UO , C( ) ( ) (+ − + −ε ≈ ε ≈ ε 2
2 4lO 0.46 kg mol) + − = 1−⋅

B.3 Tables of ion interaction coefficients 729
(q) Evaluated in the Section 12.3.1.1 from ∆ε (in NaCl solution) for the reactions . 2
3+ (3 ) +An + H O(l) An(OH) + Hnnn n−
(r) Evaluated in the section (12.6.1.1.1) from ∆ε
Am (in NaCl solution) for the reactions
(based on = (0.23 ± 0.02) kg · mol3
3+ 2 (3 )3An + CO An(CO ) n
nn −
2
3Na , CO( )+ −ε
− )
)
3 , Cl( + −ε −1 and = − (0.08 ± 0.03) kg · mol−1.
(s) Taken from Hedlund [88HED].
(t) By analogy with ε as derived from isopiestic measurements in [92GRE/FUG]. The uncer-tainty is increased because the value is estimated by analogy.
2
2 4UO , ClO( + −
(u) Estimated in [2001LEM/FUG] by analogy with ∆ε of the corresponding Am(III) reaction.
(v) Estimated in [2001LEM/FUG] by assuming and .
2 2
4 4PuI , ClO AmSCN , ClO( ) (+ − + −ε ≈ ε ))
4 )
- +
4I , NH SCN , Na( ) (− +ε ≈ ε
(w) By analogy with ε as derived from isopiestic measurements noted in [92GRE/FUG]. The un-certainty is increased because the value is estimated by analogy.
2+
2UO , ClO( −
(x) These coefficients were not used in the NEA− TDB uranium review [92GRE/FUG] because they were evalu-ated by Ciavatta [80CIA] without taking chloride and nitrate complexation into account. Instead, Grenthe et al. used , for X = Cl2
2UO , X (0.46 0.03) kg mol( )+ −ε = ± ⋅ 1
4O−, Cl − and 3NO− .
(y) Evaluated in the uranium review [92GRE/FUG] using 4 1U , X (0.76 0.06) kg mol( )+ −ε = ± ⋅ .
(z) Estimated by analogy with [83SPA] as in previous books in this series [92GRE/FUG], [95SIL/BID]. The uncertainty is increased because the value is estimated by analogy.
3
4Ho , ClO( + −ε )
(#) Derived from the evaluated in [2001LEM/FUG]. ∆ε
(A) Estimated in [2001LEM/FUG] by analogy with ∆ε of the corresponding U(IV) reaction, and by assuming . + +Br ,H Br ,Na( ) (− −ε ≈ ε )
)(B) Estimated in [2001LEM/FUG] by assuming . 2 2
4 4PuSCN , ClO AmSCN , ClO( ) (+ − + −ε ≈ ε
(C) Evaluated in [2001LEM/FUG].
(D) Derived from the selected in [2001LEM/FUG]. ∆ε
(E) Estimated in [2001LEM/FUG] by analogy with ∆ε of the corresponding Np(IV) chloride reaction, and by assuming . + +I ,H I ,Na( ) (− −ε ≈ ε )
−⋅ )
)
(F) Taken from Bruno [86BRU], where the following assumptions were made: as for other = 0.17 kg · mol2 1
4Be , ClO 0.30 kg mol( )+ −ε =2M , Cl( )+ −ε 3Be , NO( )+ −
2 2
4M , ClO Be , Cl( ); (+ − + −ε ε2 1ol−⋅ 2
3M , NO( )+ −ε
−1 as for other ; and ε = as for other . 0.17 kg m
(G) The ion interaction coefficient for An = Am and Cm is assumed to equal to which is calculated from trace activity coefficients of Nd
3An , Cl( + −ε 3Nd , Cl( )+ −ε3+ ion in 0− 4 m NaCl. These trace activity coeffi-
cients are based on the ion interaction Pitzer parameters evaluated in [97KON/FAN] from osmotic coeffi-cients in aqueous NdCl3 − NaCl and NdCl3 − CaCl2 .
B Ionic strength corrections 730
(H) Derived from 4+ 3+ 14 4∆ = (Pu ,ClO ) (Pu ,ClO ) = (0.33± 0.035) kg mol− −ε ε − ε ⋅
11.03± 0.05) kg mol
− [95CAP/VIT]. Uncertainty estimated in [2001LEM/FUG] (see Appendix A). In the first book of this series [92GRE/FUG],
3+ -4ε(Pu ,ClO ) = ( −⋅ was tabulated based on references [89ROB], [89RIG/ROB], [90RIG].
Capdevila and Vitorge’s data [92CAP], [94CAP/VIT] and [95CAP/VIT] were unavailable at that time.
(I) Derived from ∆ε 4+ - 3+ - 14 4 = ε(Np ,ClO ) ε(Np ,ClO ) = (0.35±0.03) kg mol−− ⋅ [89ROB], [89RIG/ROB],
[90RIG].
(J) Using the measured value of 4+ 3+ 14 4∆ε = ε(U ,ClO ) ε(U ,ClO ) = (0.35±0.06) kg mol− − −− ⋅
3 1kg mol −⋅ 4
4U , ClO( )+ −ε4
4Np , ClO( )+ − 4
4Pu , ClO( )+ −ε 4
4U , ClO( +ε4
4U , ClO( )+ −
p.89 [90RIG], where the uncertainty is recalculated in [2001LEM/FUG] from the data given in this thesis, and
(see footnote (y)), a value for can be calculated in the same way as is done for and . This value, = (0.84 ± 0.06) kg · mol
4U , ClO (0.49 0.05) ( )+ −ε = ±
ε
4
4U , ClO( )+ −ε
)−
−1 is consistent with that tabulated ε = (0.76 ± 0.06) kg·mol−1, since the uncertainties overlap. The authors of the present work do not believe that a change in the previously selected value for
is justified at present.

B.3 Tables of ion interaction coefficients 731
Table B-5: Ion interaction coefficients, ε(j,k) kg · mol–1, for anions j with k = Li, Na and K, taken from Ciavatta [80CIA], [88CIA] unless indicated otherwise. The uncertainties repre-sent the 95% confidence level. The ion interaction coefficients marked with † can be de-scribed more accurately with an ionic strength dependent function, listed in Table B-6.
j k → ↓
Li+ Na+ K+
OH− − (0.02 ± 0.03)† (0.04 ± 0.01) (0.09 ± 0.01) F− (0.02 ± 0.02)(a) (0.03 ± 0.02)
2
Cl−HF− − (0.11 ± 0.06)(a)
(0.10 ± 0.01) (0.03 ± 0.01) (0.00 ± 0.01)
3
ClO−ClO− − (0.01 ± 0.02)
4
Br− (0.15 ± 0.01) (0.01 ± 0.01)
(0.13 ± 0.02) (0.05 ± 0.01) (0.01 ± 0.02)
3
I−BrO− − (0.06 ± 0.02)
(p) (0.16 ± 0.01) (0.08 ± 0.02) (0.02 ± 0.01)
3
HSOIO− − (0.06 ± 0.02)(b)
4−
N− − (0.01 ± 0.02)
3
NO− (0.0 ± 0.1)(b)
2
NO− (0.06 ± 0.04)† (0.00 ± 0.02) − (0.04 ± 0.02)
3
H PO (0.08 ± 0.01) − (0.04 ± 0.03)† − (0.11 ± 0.04)†
2 4−
HCO− − (0.08 ± 0.04)† − (0.14 ± 0.04)†
3
SCN− (0.00 ± 0.02)(d) − (0.06 ± 0.05)(i) (0.05 ± 0.01) − (0.01 ± 0.01)
HCOO−
CH COO (0.03 ± 0.01)
3−
SiO(OH)− (0.05 ± 0.01) (0.08 ± 0.01) (0.09 ± 0.01)
3
Si O (OH) − (0.08 ± 0.03)(a)
2 2 5−
B(OH)− − (0.08 ± 0.04)(b)
4
Am(SO − (0.07 ± 0.05)†
4 2)−
Am(CO )− − (0.05 ± 0.05)(c)
3 2
PuO CO− − (0.14 ± 0.06)(r)
2 3
NpO (OH) − (0.18 ± 0.18)(o)
2 2−
NpO CO− − (0.01 ± 0.07)(q)
2 3
(NpO ) CO − (0.18 ± 0.15)(f)
2 2 3 3(OH)−
UO (OH)− (0.00 ± 0.05)(k)
2 3
UO F− − (0.09 ± 0.05)(b)
2 3
UO (N − (0.14 ± 0.05)(b)
2 3 3)−
(UO ) CO (0.0 ± 0.1)(b)
2 2 3 3(OH)− (0.00 ± 0.05)(b)
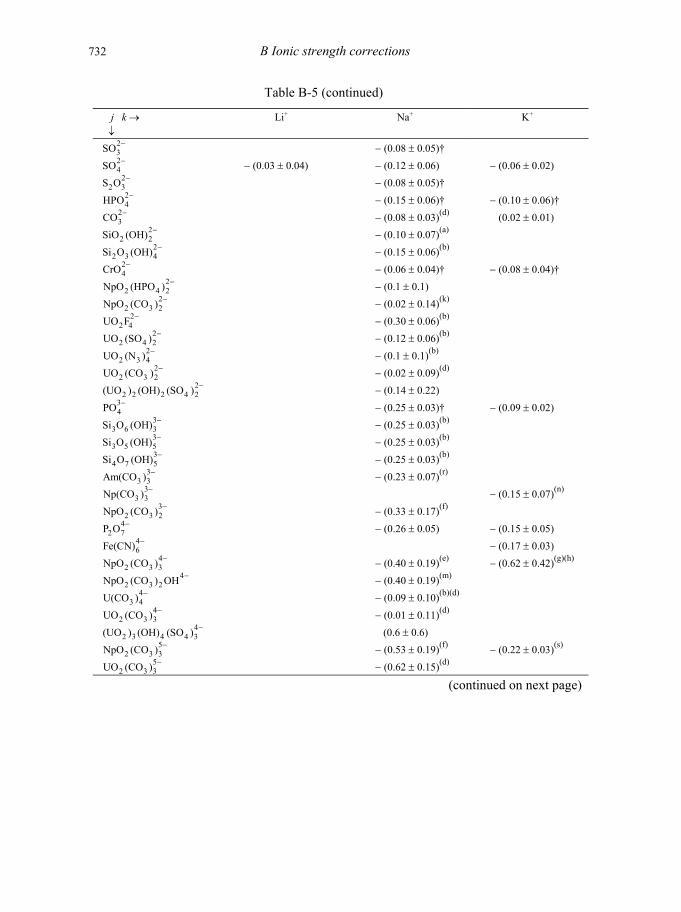
B Ionic strength corrections 732
Table B-5 (continued)
j k → ↓
Li+ Na+ K+
23SO − − (0.08 ± 0.05)† 2SO −4
2S O − − (0.03 ± 0.04) − (0.12 ± 0.06) − (0.06 ± 0.02)
2 32HPO −
− (0.08 ± 0.05)†
42CO −
− (0.15 ± 0.06)† − (0.10 ± 0.06)†
3
SiO ( − (0.08 ± 0.03)(d) (0.02 ± 0.01)
22 2OH) −
2Si O (OH) − − (0.10 ± 0.07)(a)
2 3 42CrO −
− (0.15 ± 0.06)(b)
4
NpO ( − (0.06 ± 0.04)† − (0.08 ± 0.04)†
22 4HPO ) −
2NpO (CO ) −2 − (0.1 ± 0.1)
2 3 22UO F −
− (0.02 ± 0.14)(k)
2 4
UO (SO − (0.30 ± 0.06)(b)
22 4 2) −
2UO (N ) − − (0.12 ± 0.06)(b)
2 3 42UO (CO ) − (0.1 ± 0.1)(b)
2 3 2−
(UO ) (OH) − (0.02 ± 0.09)(d)
22 2 2 4 2(SO ) −
3PO − − (0.14 ± 0.22)
4
Si O − (0.25 ± 0.03)† − (0.09 ± 0.02)
33 6 3(OH) −
3Si O (OH) − − (0.25 ± 0.03)(b)
3 5 53Si O (OH) −
− (0.25 ± 0.03)(b)
4 7 53Am(CO ) −
− (0.25 ± 0.03)(b)
3 33Np(CO ) −
− (0.23 ± 0.07)(r)
3 3
NpO (CO ) − (0.15 ± 0.07)(n) 3
2 3 2−
4P O − − (0.33 ± 0.17)(f)
2 7
Fe(CN) − (0.26 ± 0.05) − (0.15 ± 0.05) 46
−
NpO (CO − (0.17 ± 0.03)
42 3 3) −
NpO (CO ) O − (0.40 ± 0.19)(e) − (0.62 ± 0.42)(g)(h)
42 3 2 H −
4U(CO ) − − (0.40 ± 0.19)(m)
3 4
UO (CO ) − (0.09 ± 0.10)(b)(d) 4
2 3 3−
(UO ) (OH) − (0.01 ± 0.11)(d)
42 3 4 4 3(SO ) −
5NpO (CO ) − (0.6 ± 0.6)
2 3 35UO (CO ) −
− (0.53 ± 0.19)(f) − (0.22 ± 0.03)(s)
2 3 3 − (0.62 ± 0.15)(d)
(continued on next page)

B.3 Tables of ion interaction coefficients 733
Table B-5 (continued)
j k → ↓
Li+ Na+ K+
63 5Np(CO ) − − (0.73 ± 0.68)(j)
62 3 3 6) −
6U(CO ) −(NpO ) (CO − (0.46 ± 0.73)(e)
3 5
(UO ) (CO − (0.30 ± 0.15)(d) − (0.70 ± 0.31)(i)
62 3 3 6) −
(UO ) NpO (C (0.37 ± 0.11)(d)
62 2 2 3 6O ) −
6(UO ) (OH) (SO ) − (0.09 ± 0.71)(l)
2 5 8 4 47(UO ) (OH) (SO ) −
(1.10 ± 0.5)
2 4 7 4 4 (2.80 ± 0.7)
(a) Evaluated in the NEA−TDB uranium review [92GRE/FUG].
(b) Estimated in the NEA−TDB uranium review [92GRE/FUG].
(c) Estimated in the NEA−TDB americium review [95SIL/BID].
(d) These values differ from those reported in the NEA−TDB uranium review. See the discussion in [95GRE/PUI]. Values for and 2
3CO −3HCO− are based on [80CIA].
(e) Calculated in [2001LEM/FUG] (Section 12.1.2.1.2)
(f) Calculated in [2001LEM/FUG] (Section 12.1.2.1.3)
(g) Calculated in [2001LEM/FUG] (Section 12.1.2.2.1)
(h) is calculated in [2001LEM/FUG] (Section 12.1.2.2.1) 42 3 3 4NpO (CO ) , NH (0.78 0.25) kg mol( )− +ε = − ± 1−⋅
(i) Calculated in [2001LEM/FUG] from Pitzer coefficients [98RAI/FEL]
(j) Calculated in [2001LEM/FUG] (Section 12.1.2.1.4)
(k) Estimated by analogy in [2001LEM/FUG] (Section 12.1.2.1.2)
(l) Estimated by analogy in [2001LEM/FUG] (Section 12.1.2.2.1)
(m) Estimated in [2001LEM/FUG] by analogy with 42 3 3NpO (CO ) −
(n) Estimated by analogy in [2001LEM/FUG] (Section 12.1.2.1.5)
(o) Estimated in [2001LEM/FUG] by analogy with 2 3NpO CO , Na( )− +ε
(p) 14I , NH SCN , Na (0.05 0.01) kg mol( ) ( ) = − + − +ε ≈ ε ± ⋅ −
−
(q) Estimated in [2001LEM/FUG] (Section 8.1.3)
(r) Evaluated in section 12.6.1.1.1 from ∆εn (in NaCl solution) for the reactions (based on 3+ 2 (3 )
3An CO An(CO ) nnn −+ 3
3 1Am , Cl (0.23 0.02) kg mol( ) = + − −ε ± ⋅−⋅
+
)
and 2 1 kg mol3Na , CO (0.08 0.03)( ) = + −ε ±−
(s) Evaluated in Appendix A, discussion of [98ALM/NOV] from ∆ε for the reactions (in K5
2 3 323 2 3KNpO CO (s) + 2 CO NpO (CO ) + K−−
2 53 2 3 3CO NpO (CO )− −
2CO3−KCl solution) and K3NpO2(CO3)2(s) + +3 K+ (in K2CO3 solution) (based on = (0.02 ± 0.01) kg·mol2
3K , CO( + −ε −1).

B Ionic strength corrections 734
Table B-6: Ion interaction coefficients, ε(1,j,k) and ε(2,j,k) kg · mol–1, for cations j with k = Cl−, and 4ClO−
3NO− (first part), and for anions j with k = Li+, Na+ and K+ (second part), according to the relationship ε = ε1 + ε2 log10Im. The data are taken from Ciavatta [80CIA], [88CIA]. The uncertainties represent the 95% confidence level.
j k →
↓
Cl− 4ClO− 3NO−
ε1 ε2 ε1 ε2 ε1 ε2
+4NH − (0.088 ± 0.002) (0.095 ± 0.012) − (0.075 ± 0.001) (0.057 ± 0.004)
+Tl − (0.18 ± 0.02) (0.09 ± 0.02)
+Ag − (0.1432 ± 0.0002)− (0.0971 ± 0.0009)
2+Pb − (0.329 ± 0.007) − (0.288 ± 0.018)
2+Hg − (0.145 ± 0.001) − (0.194 ± 0.002)
2+2Pb − (0.2300 ± 0.0004)− (0.194 ± 0.002)
j k → ↓
+Li +Na +K
ε1 ε2 ε1 ε2 ε1 ε2
OH− − (0.039 ± 0.002) (0.072 ± 0.006)
2NO− (0.02 ± 0.01) (0.11 ± 0.01)
3NO− − (0.049 ± 0.001) (0.044 ± 0.002) − (0.131 ± 0.002) (0.082 ± 0.006)
2 4H PO− − (0.109 ± 0.001) (0.095 ± 0.003) − (0.1473 ± 0.0008) (0.121 ± 0.004)
4B(OH)− − (0.092 ± 0.002) (0.103 ± 0.005)
23SO − − (0.125 ± 0.008) (0.106 ± 0.009)
24SO − − (0.068 ± 0.003) (0.093 ± 0.007) − (0.184 ± 0.002) (0.139 ± 0.006)
22 3S O − − (0.125 ± 0.008) (0.106 ± 0.009)
22 4H PO −
− (0.19 ± 0.01) (0.11 ± 0.03) − (0.152 ± 0.007) (0.123 ± 0.016)
24CrO − − (0.090 ± 0.005) (0.07 ± 0.01) − (0.123 ± 0.003) (0.106 ± 0.007)
34PO − − (0.29 ± 0.02) (0.10 ± 0.01)

C
Appendix C
Assigned uncertainties1
This Appendix describes the origin of the uncertainty estimates that are given in the TDB tables of selected data. The original text in [92GRE/FUG] has been retained in [95SIL/BID], [99RAR/RAN] and [2001LEM/FUG], except for some minor changes. Because of the importance of the uncertainty estimates, the present review offers a more comprehensive description of the procedures used.
C.1 The general problem. The focus of this section is on the uncertainty estimates of equilibria in solution, where the key problem is analytical, i.e., the determination of the stoichiometric composition and equi-librium constants of complexes that are in rapid equilibrium with one another. We can for-mulate analyses of the experimental data in the following way: From n measurements, yi, of the variable y we would like to determine a set of N equilibrium constants kr, r = 1, 2,…, N, assuming that we know the functional relationship:
y = f(k1, k2, …kr...kN; a1, a2,….) (C.1)
where a1, a2 , etc. are quantities that can be varied but whose values (a1i; a2i; etc.) are as-sumed to be known accurately in each experiment from the data sets (yi, a1i, a2i,…), i = 1, 2, …n. The functional relationship (C.1) is obtained from the chemical model proposed and in general several different models have to be tested before the "best" one is selected. Details of the procedures are given in Rossotti and Rossotti [61ROS/ROS].
When selecting the functional relationship (C.1) and determining the set of equilib-rium constants that best describes the experiments one often uses a least-squares method.
1 This Appendix essentially contains the text of the TDB-3 Guideline, [99WAN/OST], earlier versions of which have been printed in the previous NEA TDB reviews [92GRE/FUG], [95SIL/BID], [99RAR/RAN] and [2001LEM/FUG]. Because of its importance in the selection of data and to guide the users of the values in Chap-ters 3, 4, 5, 6, 7 and 8, the text is reproduced here with minor revisions.
735

C. Assigned uncertainties 736
Within this method, the “best” description is the one that will minimise the residual sum of squares, U:
(C.2) [ 21 1 2 ( ... ; , ...)= −∑ i i N i i
i
U w y F k k a a ]where wi is the weight of each experimental measurement yi.
The minimum of the function (C.2) is obtained by solving a set of normal equa-tions:
0, 1,.....= =∂ r
rk
∂U N (C.3)
A "true" minimum is only obtained if:
• the functional relationship (C.1) is correct, i.e., if the chemical model is correct.
• all errors are random errors in the variable y, in particular there are no systematic errors.
• the random errors in y follow a Gaussian (normal) distribution.
• the weight wi(yi, a1i, a2i,….) of an experimental determination is an exact measure of its inherent accuracy.
To ascertain that the first condition is fulfilled requires chemical insight, such as in-formation of the coordination geometry, relative affinity between metal ions and various donor atoms, etc. It is particularly important to test if the chemical equilibrium constants of complexes that occur in small amounts are chemically reasonable. Too many experimental-ists seem to look upon the least-squares refinement of experimental data more as an exercise in applied mathematics than as a chemical venture. One of the tasks in the review of the literature is to check this point. An erroneous chemical model is one of the more serious type of systematic error.
The experimentalist usually selects the variable that he/she finds most appropriate to fulfill the second condition. If the estimated errors in a1i, a2i … are smaller than the error in yi, the second condition is reasonably well fulfilled. The choice of the error-carrying vari-able is a matter of choice based on experience, but one must be aware that it has implica-tions, especially in the estimated uncertainty.
The presence of systematic errors is, potentially, the most important source of un-certainty. There is no possibility to handle systematic errors using statistics; statistical meth-ods may indicate their presence, no more. Systematic errors in the chemical model have been mentioned. In addition there may be systematic errors in the methods used. By com-paring experimental data obtained with different experimental methods one can obtain an

C.2 Uncertainty estimates in the selected thermodynamic data. 737
indication of the presence and magnitude of such errors. The systematic errors of this type are accounted for both in the review of the literature and when taking the average of data obtained with different experimental methods. This type of systematic error does not seem to affect the selected data very much, as judged by the usually very good agreement between the equilibrium data obtained using spectroscopic, potentiometric and solubility methods.
The electrode calibration, especially the conversion between measured pH and − log10[H+] is an important source of systematic error. The reviewers have when possible corrected this error, as seen in many instances in Appendix A.
The assumption of a normal distribution of the random errors is a choice made in the absence of better alternatives.
Finally, a comment on the weights used in least-squares refinements; this is impor-tant because it influences the uncertainty estimate of the equilibrium constants. The weights of individual experimental points can be obtained by repeating the experiment several times and then calculating the average and standard deviation of these data. This procedure is rarely used, instead most experimentalists seem to use unit weight when making a least-squares analysis of their data. However, also in this case there is a weighting of the data by the number of experimental determinations in the parameter range where the different com-plexes are formed. In order to have comparable uncertainty estimates for the different com-plexes, one should try to have the same number of experimental data points in the concentration ranges where each of these complexes is predominant; a procedure very rarely used. As indicated above, the assignment of uncertainties to equilibrium constants is not a straightforward procedure and it is complicated further when there is lack of primary ex-perimental data. The uncertainty estimates given for the individual equilibrium constants reported by the authors and for some cases re-estimated by this review are given in the ta-bles of this and previous reviews. The procedure used to obtain these estimates is given in the original publications and in the Appendix A discussions. However, this uncertainty is still a subjective estimate and to a large extent based on "expert judgment".
C.2 Uncertainty estimates in the selected thermodynamic data.
The uncertainty estimate in the selected thermodynamic data is based on the uncertainty of the individual equilibrium constants or other thermodynamic data, calculated as described in the following sections. A weighted average of the individual log10K values is calculated us-ing the estimated uncertainty of the individual experimental values to assign its weight. The uncertainty in this average is then calculated using the formulae given in the following text. This uncertainty depends on the number of experimental data points − for N data point with

C. Assigned uncertainties 738
the same estimated uncertainty, σ, the uncertainty in the average is / Nσ . The average and the associated uncertainty reported in the tables of selected data are reported with many more digits than justified only in order to allow the users to back-track the calculations. The reported uncertainty is much smaller than the estimated experimental uncertainty and the users of the tables should look at the discussion of the selected constants in order to get a better estimate of the uncertainty in an experimental determination using a specific method.
One of the objectives of the NEA Thermochemical Data Base (TDB) project is to provide an idea of the uncertainties associated with the data selected in this review. As a rule, the uncertainties define the range within which the corresponding data can be repro-duced with a probability of 95% at any place and by any appropriate method. In many cases, the statistical treatment is limited or impossible due to the availability of only one or few data points. A particular problem has to be solved when significant discrepancies occur be-tween different source data. This appendix outlines the statistical procedures, which were used for fundamentally different problems, and explains the philosophy used in this review when statistics were inapplicable. These rules are followed consistently throughout the se-ries of reviews within the TDB Project. Four fundamentally different cases are considered:
1. One source datum available
2. Two or more independent source data available
3. Several data available at different ionic strengths
4. Data at non-standard conditions: Procedures for data correction and recalculation.
C.3 One source datum The assignment of an uncertainty to a selected value that is based on only one experimental source is a highly subjective procedure. In some cases, the number of data points, on which the selected value is based, allows the use of the “root mean square” [82TAY] deviation of the data points, Xi, to describe the standard deviation, sX, associated with the average, X :
2X
1 = ( )
1 =
−− ∑ i
i
1 N
s X XN
(C.4)
The standard deviation, sX, is thus calculated from the dispersion of the equally weighted data points, Xi, around the average X , and the probability is 95% that an Xi is within X ± 1.96 sX, see Taylor [82TAY] (pp. 244-245). The standard deviation, sX, is a measure of
the precision of the experiment and does not include any systematic errors.

C.4 Two or more independent source data
739
Many authors report standard deviations, sX, calculated with Eq. (C.4) (but often not multiplied by 1.96), but these do not represent the quality of the reported values in abso-lute terms. Therefore, it is thus important not to confuse the standard deviation , sX, with the uncertainty, σ. The latter reflects the reliability and reproducibility of an experimental value and also includes all kinds of systematic errors, sj, that may be involved. The uncertainty, σ, can be calculated with Eq. (C.5), assuming that the systematic errors are independent.
2 = + ( )2X X
jjs sσ ∑ (C.5)
The estimation of the systematic errors sj (which, of course, have to relate to X and be expressed in the same units), can only be made by a person who is familiar with the experimental method. The uncertainty, σ, has to correspond to the 95% confidence level preferred in this review. It should be noted that for all the corrections and recalculations made (e.g., temperature or ionic strength corrections) the rules of the propagation of errors have to be followed, as outlined in Section C.6.2.
More often, the determination of sX is impossible because either only one or two data points are available, or the authors did not report the individual values. The uncertainty σ in the resulting value can still be estimated using Eq. (C.5) assuming that 2
Xs is much smaller than 2( )∑ j
js , which is usually the case anyway.
C.4 Two or more independent source data Frequently, two or more experimental data sources are available, reporting experimental determinations of the desired thermodynamic data. In general, the quality of these determi-nations varies widely, and the data have to be weighted accordingly for the calculation of the mean. Instead of assigning weight factors, the individual source data, Xi, are provided with an uncertainty, σi, that also includes all systematic errors and represents the 95% con-fidence level, as described in Section C.1. The weighted mean X and its uncertainty, σX , are then calculated according to Eqs. (C.6) and (C.7).
21=
σ
∑N
i
i
21
1=
≡ σ
∑
i
N
i i
X
X (C.6)
11
σ =X N
2
1= i i
(C.7) ∑
σ

C. Assigned uncertainties 740
Eqs. (C.6) and (C.7) may only be used if all the Xi belong to the same parent distribution. If there are serious discrepancies among the Xi, one proceeds as described below under Section C.2.1. It can be seen from Eq. (C.7) that Xσ is directly dependent on the absolute magni-tude of the σi values, and not on the dispersion of the data points around the mean. This is reasonable because there are no discrepancies among the Xi, and because the σi values al-ready represent the 95% confidence level. The selected uncertainty, σX , will therefore also represent the 95% confidence level.
In cases where all the uncertainties are equal, σi = σ, Eqs. (C.6) and (C.7) reduce to Eqs. (C.8) and (C.9).
1=
= ∑ ii
1 NX X
N (C.8)
σσ =X N
(C.9)
Example C.1:
Five data sources report values for the thermodynamic quantity, X. The reviewer has as-signed uncertainties that represent the 95% confidence level as described in Section C.3.
i Xi σι
1 25.3 0.5
2 26.1 0.4
3 26.0 0.5
4 24.85 0.25
5 25.0 0.6
According to Eqs.(C.6) and (C.7), the following result is obtained:
X = (25.3 ± 0.2).
The calculated uncertainty, σX = 0.2, appears relatively small, but is statistically correct, as the values are assumed to follow a Gaussian distribution. As a consequence of Eq. (C.7), σX will always come out smaller than the smallest σi. Assuming σ4 = 0.10 in-stead of 0.25 would yield X = (25.0 ± 0.1) and σ4 = 0.60 would result in X = (25.6 ± 0.2). In fact, the values (Xi ± σi) in this example are at the limit of consistency, i.e., the range (X4 ± σ4) does not overlap with the ranges (X2 ± σ2) and (X3 ± σ3). There might be a better way to solve this problem. Three possible choices seem more reasonable:

C.4 Two or more independent source data
741
i. The uncertainties, σi, are reassigned because they appear too optimistic after further consideration. Some assessments may have to be reconsidered and the uncertainties reassigned. For example, multiplying all the σi by 2 would yield X = (25.3 ± 0.3).
ii. If reconsideration of the previous assessments gives no evidence for reassigning the Xi and σi (95% confidence level) values listed above, the statistical conclusion will be that all the Xi do not belong to the same parent distribution and cannot therefore be treated in the same group (cf. item iii below for a non−statistical explanation). The values for i =1, 4 and 5 might be considered as belonging to Group A and the values for i = 2 and 3 to Group B. The weighted average of the values in Group A is XA (i = 1, 4, 5) = (24.95 ± 0.21) and of those in Group B, XB (i = 2, 3) = (26.06 ± 0.31), the second digit after the decimal point being carried over to avoid loss of information. The selected value is now determined as described below under “Discrepancies” (Section C.4.1, Case I). XA and XB are averaged (straight average, there is no reason for giving XA a larger weight than XB), and σX is chosen in such a way that it covers the complete ranges of expectancy of XA and XB. The selected value is then X = (25.5 ± 0.9).
iii. Another explanation could be that unidentified systematic errors are associated with some values. If this seems likely to be the case, there is no reason for splitting the values up into two groups. The correct way of proceeding would be to calculate the unweighted average of all the five points and assign an uncertainty that covers the whole range of expectancy of the five values. The resulting value is then X = (25.45 ± 1.05), which is rounded according to the rules in Section C.6.3 to X = (25.4 ± 1.1).
C.4.1 Discrepancies Two data are called discrepant if they differ significantly, i.e., their uncertainty ranges do not overlap. In this context, two cases of discrepancies are considered. Case I: Two signifi-cantly different source data are available. Case II: Several, mostly consistent source data are available, one of them being significantly different, i.e., an “outlier”.
Case I. Two discrepant data: This is a particularly difficult case because the number of data points is obviously insufficient to allow the preference of one of the two values. If there is absolutely no way of discarding one of the two values and selecting the other, the only solution is to average the two source data in order to obtain the selected value, because the underlying reason for the discrepancy must be unrecognised systematic errors. There is no point in calculating a weighted average, even if the two source data have been given different uncertainties, because there is obviously too little information to give

C. Assigned uncertainties 742
even only limited preference to one of the values. The uncertainty, σX , assigned to the se-lected mean, X , has to cover the range of expectation of both source data, X1, X2, as shown in Eq.(C.10),
maxσ = − + σiX X X (C.10)
where i =1, 2, and is the larger of the two uncertainties σι, see Example C.1.ii and Ex-ample C.2.
maxσ
Example C.2:
The following credible source data are given:
X1 = (4.5 ± 0.3)
X2 = (5.9 ± 0.5).
The uncertainties have been assigned by the reviewer. Both experimental methods are satisfactory and there is no justification to discard one of the data. The selected value is then:
X = (5.2 ± 1.2).
Figure C-1: Illustration for Example C.2
X
X2 X1
X 4 4.5 5 5.5 6 6.5
Case II. Outliers: This problem can often be solved by either discarding the outlying data point, or by providing it with a large uncertainty to lower its weight. If, however, the outly-ing value is considered to be of high quality and there is no reason to discard all the other data, this case is treated in a way similar to Case I. Example C.3 illustrates the procedure.

C.4 Two or more independent source data
743
Example C.3:
The following data points are available. The reviewer has assigned the uncertainties and sees no justification for any change.
i Xi σi
1 4.45 0.35
2 5.9 0.5
3 5.7 0.4
4 6.0 0.6
5 5.2 0.4
There are two data sets that, statistically, belong to different parent distributions, A and B. According to Eqs. (C.6) and (C.7), the following average values are found for the two groups: XA (i =1) = (4.45 ± 0.35) and XB (i = 2, 3, 4, 5) = (5.62 ± 0.23). The selected value will be the straight average of XA and XB, analogous to Example C.1:
X = (5.0 ± 0.9).
C.5 Several data at different ionic strengths The extrapolation procedure for aqueous equilibria used in this review is the specific ion interaction model outlined in Appendix B. The objective of this review is to provide se-lected data sets at standard conditions, i.e., among others, at infinite dilution for aqueous species. Equilibrium constants determined at different ionic strengths can, according to the specific ion interaction equations, be extrapolated to I = 0 with a linear regression model, yielding as the intercept the desired equilibrium constant at I = 0, and as the slope the stoichiometric sum of the ion interaction coefficients, ∆ε . The ion interaction coefficient of the target species can usually be extracted from ∆ε and would be listed in the correspond-ing table of Appendix C.
The available source data may sometimes be sparse or may not cover a sufficient range of ionic strengths to allow a proper linear regression. In this case, the correction to I = 0 should be carried out according to the procedure described in Section C.6.1.
If sufficient data are available at different ionic strengths and in the same inert salt medium, a weighted linear regression will be the appropriate way to obtain both the constant at I = 0, X ο , and . The first step is the conversion of the ionic strength from the fre-quently used molar (mol·dm
∆ε−3, M) to the molal (mol·kg−1, m) scale, as described in Section

C. Assigned uncertainties 744
2.2. The second step is the assignment of an uncertainty, σi, to each data point Xi at the mo-lality, mk,i, according to the rules described in Section C.3. A large number of commercial and public domain computer programs and routines exist for weighted linear regressions. The subroutine published by Bevington [69BEV] (pp.104 − 105) has been used for the cal-culations in the examples of this appendix. Eqs. (C.11) through (C.15) present the equations that are used for the calculation of the intercept X ο and the slope − ∆ε :
X
X οσ
*b
10g
2,1 N N N Nm m mX
, ,
2 2 2 21 1 1 1
k i k i k i ii
i i i ii i i i
X ο
= = = =
= −∆ σ σ σ σ ∑ ∑ ∑ ∑ (C.11)
, ,1 1N N N Nk i i k i im X m X
−∆ε = −∑ ∑ ∑ ∑2 2 21 1 1 1i i i ii i i= = = =
∆ σ σ σ (C.12)
2,
2
1 Nk im
οσ = ∑
2i
σ
1X
i i=∆ σ (C.13)
2
1 1N
∆εσ = ∑1i i=∆ σ
2, ,
Nk im m
− ∑2
2 2
1N Nk i∆ = ∑ ∑
(C.14)
where 21 1 1i i ii i i= = =
σ σ σ . (C.15)
In this way, the uncertainties, σi, are not only used for the weighting of the data in Eqs. (C.11) and (C.12), but also for the calculation of the uncertainties, and , in Eqs. (C.13) and (C.14). If the σ
∆εσi represents the 95% confidence level, and will also do
so. In other words, the uncertainties of the intercept and the slope do not depend on the dis-persion of the data points around the straight line, but rather directly on their absolute uncer-tainties, σi.
X οσ
∆εσ
Example C.4:
Ten independent determinations of the equilibrium constant, , for the reaction: 10log
(C.16) 2+ + +2UO HF(aq) UO F H+ 2 +
are available in HClO4/NaClO4 media at different ionic strengths. Uncertainties that repre-sent the 95% confidence level have been assigned by the reviewer. A weighted linear re-gression, ( + 2D) vs. m10
*log b∆ε
k, according to the formula, lo (C.16) + 2D = (C.16) − m
*b10
*log οb k, will yield the correct values for the intercept, (C.16), 10*log οb
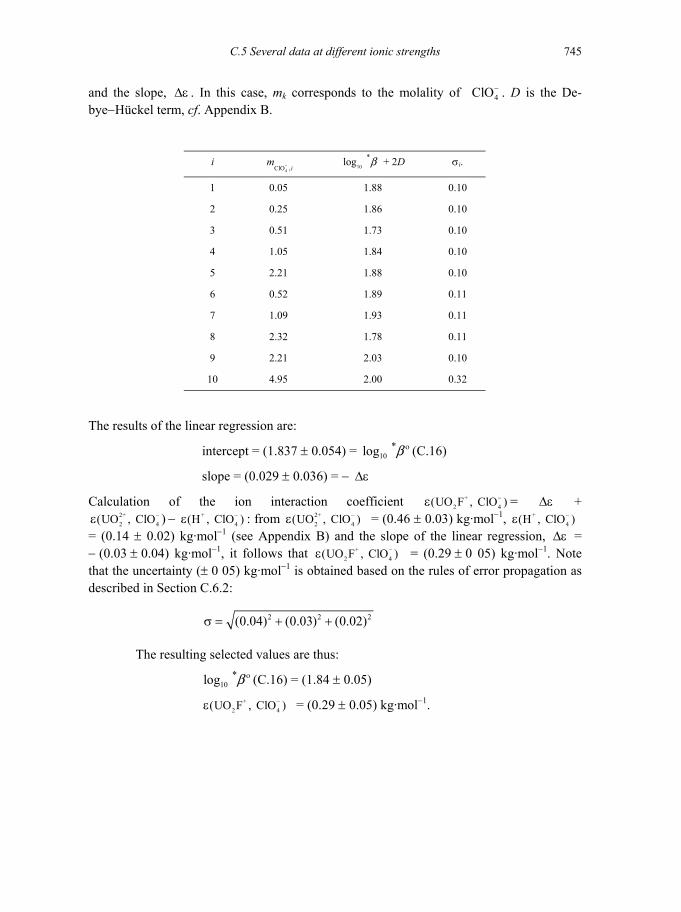
C.5 Several data at different ionic strengths 745
and the slope, . In this case, m∆ε k corresponds to the molality of 4ClO− . D is the De-bye−Hückel term, cf. Appendix B.
+2 4, ClO−
(Hε
i 4ClO ,
i
m − 10
*log b + 2D σi.
1 0.05 1.88 0.10
2 0.25 1.86 0.10
3 0.51 1.73 0.10
4 1.05 1.84 0.10
5 2.21 1.88 0.10
6 0.52 1.89 0.11
7 1.09 1.93 0.11
8 2.32 1.78 0.11
9 2.21 2.03 0.10
10 4.95 2.00 0.32
The results of the linear regression are:
intercept = (1.837 ± 0.054) = 10*log οb (C.16)
slope = (0.029 ± 0.036) = − ∆ε
Calculation of the ion interaction coefficient (UO F )ε = + − : from ε = (0.46 ± 0.03) kg·mol
∆ε, Cl2+
2 4(UO , ClO )−ε +4, ClO )− 2+
2 4(UO , ClO )−
+2(UO F ,ε
−1, = (0.14 ± 0.02) kg·mol
+4(H O )−ε
−1 (see Appendix B) and the slope of the linear regression, ∆ε = − (0.03 ± 0.04) kg·mol−1, it follows that = (0.29 ± 0 05) kg·mol4 ClO )− −1. Note that the uncertainty (± 0 05) kg·mol−1 is obtained based on the rules of error propagation as described in Section C.6.2:
2 2(0.04) (0.03) (0.02)σ = + + 2
4
The resulting selected values are thus:
10*log οb (C.16) = (1.84 ± 0.05)
+2(UO F , ClO )−ε = (0.29 ± 0.05) kg·mol−1.

C. Assigned uncertainties 746
C.5.1 Discrepancies or insufficient number of data points Discrepancies are principally treated as described in Section C.4. Again, two cases can be defined. Case I: Only two data points are available. Case II: An “outlier” cannot be dis-carded. If only one data point is available, the procedure for correction to zero ionic strength outlined in Section C.4 should be followed.
Case I. Too few molalities: If only two source data are available, there will be no straightforward way to decide whether or not these two data points belong to the same par-ent distribution unless either the slope of the straight line is known or the two data refer to the same ionic strength. Drawing a straight line right through the two data points is an inap-propriate procedure because all the errors associated with the two source data would accu-mulate and may lead to highly erroneous values of 10log K ο and ∆ε . In this case, an ion interaction coefficient for the key species in the reaction in question may be selected by analogy (charge is the most important parameter), and a straight line with the slope as calculated may then be drawn through each data point. If there is no reason to discard one of the two data points based on the quality of the underlying experiment, the selected value will be the unweighted average of the two standard state data point obtained by this proce-dure, and its uncertainty must cover the entire range of expectancy of the two values, analo-gous to Case I in Section C.4. It should be mentioned that the ranges of expectancy of the corrected values at I = 0 are given by their uncertainties, which are based on the uncertain-ties of the source data at I ≠ 0 and the uncertainty in the slope of the straight line. The latter uncertainty is not an estimate, but is calculated from the uncertainties in the ion interaction coefficients involved, according to the rules of error propagation outlined in Section C.6.2. The ion interaction coefficients estimated by analogy are listed in the table of selected ion interaction coefficients (Appendix B), but they are flagged as estimates.
∆ε
Case II. Outliers and inconsistent data sets: This case includes situations where it is difficult to decide whether or not a large number of points belong to the same parent distribution. There is no general rule on how to solve this problem, and decisions are left to the judgment of the reviewer. For example, if eight data points follow a straight line rea-sonably well and two lie way out, it may be justified to discard the “outliers”. If, however, the eight points are scattered considerably and two points are just a bit further out, one can probably not consider them as “outliers”. It depends on the particular case and on the judg-ment of the reviewer whether it is reasonable to increase the uncertainties of the data to reach consistency, or whether the slope, ∆ε , of the straight line should be estimated by analogy.
Example C.5:
Six reliable determinations of the equilibrium constant, lo , of the reaction: 10g b
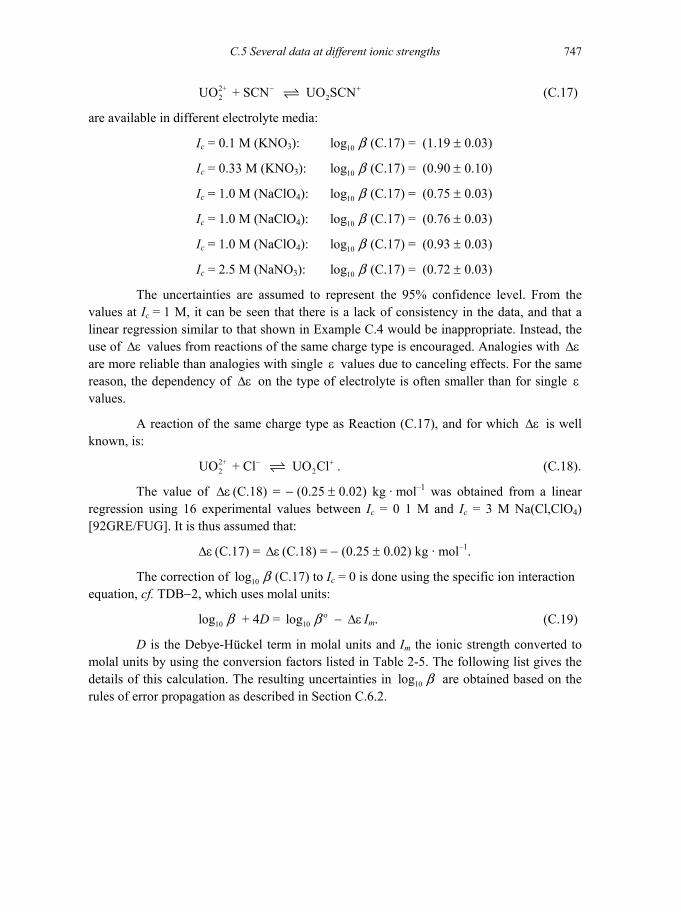
C.5 Several data at different ionic strengths 747
2+2UO + SCN UO SCN2
− + (C.17)
are available in different electrolyte media:
Ic = 0.1 M (KNO3): (C.17) = (1.19 ± 0.03) 10log b
Ic = 0.33 M (KNO3): (C.17) = (0.90 ± 0.10) 10log b
Ic = 1.0 M (NaClO4): (C.17) = (0.75 ± 0.03) 10log b
Ic = 1.0 M (NaClO4): (C.17) = (0.76 ± 0.03) 10log b
Ic = 1.0 M (NaClO4): (C.17) = (0.93 ± 0.03) 10log b
Ic = 2.5 M (NaNO3): (C.17) = (0.72 ± 0.03) 10log b
The uncertainties are assumed to represent the 95% confidence level. From the values at Ic = 1 M, it can be seen that there is a lack of consistency in the data, and that a linear regression similar to that shown in Example C.4 would be inappropriate. Instead, the use of values from reactions of the same charge type is encouraged. Analogies with are more reliable than analogies with single
∆ε ∆εε values due to canceling effects. For the same
reason, the dependency of on the type of electrolyte is often smaller than for single values.
∆ε ε
A reaction of the same charge type as Reaction (C.17), and for which ∆ε is well known, is:
2+2UO + Cl UO Cl2
− + . (C.18).
The value of (C.18) = − (0.25 ± 0.02) kg · mol∆ε –1 was obtained from a linear regression using 16 experimental values between Ic = 0 1 M and Ic = 3 M Na(Cl,ClO4) [92GRE/FUG]. It is thus assumed that:
∆ε (C.17) = ∆ε (C.18) = − (0.25 ± 0.02) kg · mol–1.
The correction of (C.17) to I10log b c = 0 is done using the specific ion interaction equation, cf. TDB−2, which uses molal units:
10log b + 4D = lo 10g οb − ∆ε Im. (C.19)
D is the Debye-Hückel term in molal units and Im the ionic strength converted to molal units by using the conversion factors listed in Table 2-5. The following list gives the details of this calculation. The resulting uncertainties in are obtained based on the rules of error propagation as described in Section C.6.2.
10log b
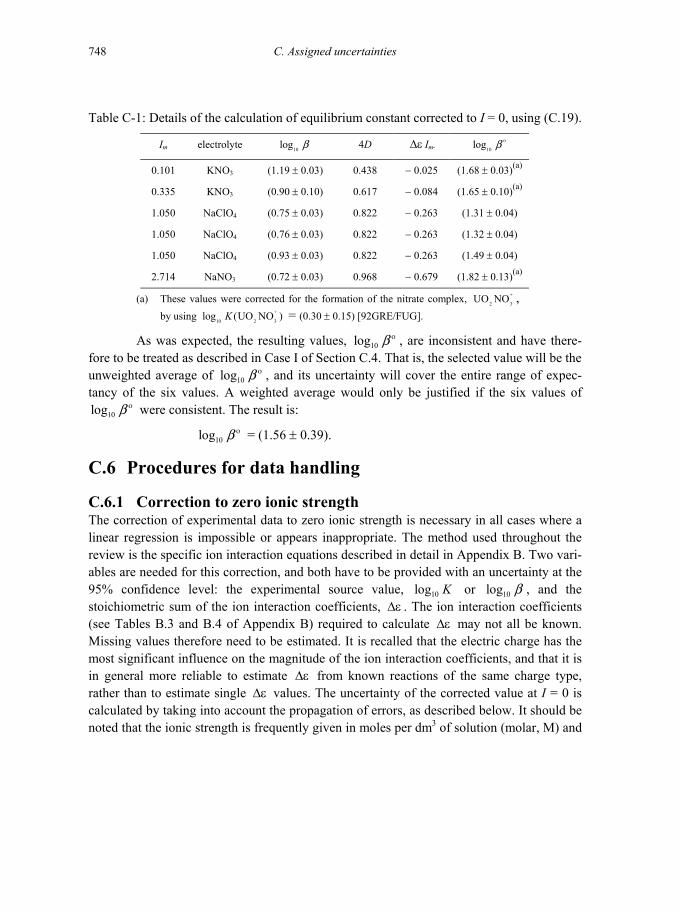
C. Assigned uncertainties 748
Table C-1: Details of the calculation of equilibrium constant corrected to I = 0, using (C.19).
Im electrolyte 10log b 4D ∆ε Im. 10log οb
0.101 KNO3 (1.19 ± 0.03) 0.438 − 0.025 (1.68 ± 0.03)(a)
0.335 KNO3 (0.90 ± 0.10) 0.617 − 0.084 (1.65 ± 0.10)(a)
1.050 NaClO4 (0.75 ± 0.03) 0.822 − 0.263 (1.31 ± 0.04)
1.050 NaClO4 (0.76 ± 0.03) 0.822 − 0.263 (1.32 ± 0.04)
1.050 NaClO4 (0.93 ± 0.03) 0.822 − 0.263 (1.49 ± 0.04)
2.714 NaNO3 (0.72 ± 0.03) 0.968 − 0.679 (1.82 ± 0.13)(a)
(a) These values were corrected for the formation of the nitrate complex, , by using = (0.30 ± 0.15) [92GRE/FUG].
+
2 3UO NO+
10 2 3log (UO NO )K
As was expected, the resulting values, lo 10g οb , are inconsistent and have there-fore to be treated as described in Case I of Section C.4. That is, the selected value will be the unweighted average of 10log οb , and its uncertainty will cover the entire range of expec-tancy of the six values. A weighted average would only be justified if the six values of
were consistent. The result is: 10log οb
10log οb = (1.56 ± 0.39).
C.6 Procedures for data handling
C.6.1 Correction to zero ionic strength The correction of experimental data to zero ionic strength is necessary in all cases where a linear regression is impossible or appears inappropriate. The method used throughout the review is the specific ion interaction equations described in detail in Appendix B. Two vari-ables are needed for this correction, and both have to be provided with an uncertainty at the 95% confidence level: the experimental source value, 10log K or , and the stoichiometric sum of the ion interaction coefficients,
10log b∆ε . The ion interaction coefficients
(see Tables B.3 and B.4 of Appendix B) required to calculate ∆ε may not all be known. Missing values therefore need to be estimated. It is recalled that the electric charge has the most significant influence on the magnitude of the ion interaction coefficients, and that it is in general more reliable to estimate ∆ε from known reactions of the same charge type, rather than to estimate single values. The uncertainty of the corrected value at I = 0 is calculated by taking into account the propagation of errors, as described below. It should be noted that the ionic strength is frequently given in moles per dm
∆ε
3 of solution (molar, M) and

C.6 Procedures for data handling 749
has to be converted to moles per kg H2O (molal, m), as the model requires. Conversion fac-tors for the most common inert salts are given in Table 2.5.
Example C.6:
For the equilibrium constant of the reaction:
M3+ + 2 H2O(l) , (C.20) +2M(OH) + 2 H+
only one credible determination in 3 M NaClO4 solution is known to be, (C.20) = − 6.31, to which an uncertainty of ± 0.12 has been assigned. The ion interaction coefficients are as follows:
10*log b
3+4(M , ClO )−ε = (0.56 ± 0.03) kg·mol−1,
2 4(M(OH) , ClO )+ −ε = (0.26 ± 0.11) kg·mol−1, +
4(H , ClO )−ε = (0.14 ± 0.02) kg·mol−1.
The values of and ∆ε ∆εσ can be obtained readily (cf. Eq. (C.22)): + + 3+2 4 4 4
1(M(OH) , ClO ) (H , ClO ) (M , ClO ) = + 2 0.02 kg mol− − − −∆ε ε ε − ε = − ⋅ ,
2 2 2 = (0.11) (2 0.02) (0.03) 0.12 kg mol 1−∆εσ + × + = ⋅ .
The two variables are thus:
10*log b (C.20) = − (6.31 ± 0.12),
∆ε = − (0.02 ± 0.12) kg·mol−1.
According to the specific ion interaction model the following equation is used to correct for ionic strength for the reaction considered here:
10*log b (C.20) + 6D = lo 10
*g οb (C.20) − 4ClO−∆ε m
D is the Debye-Hückel term:
0.509(1 1.5 )
m
m
ID
I=
+.
The ionic strength, Im, and the molality, 4ClO
m − (4ClOmI m −≈ ), have to be expressed
in molal units, 3 M NaClO4 corresponding to 3.5 m NaClO4 (see Section 2.2), giving D = 0.25. This results in:
(C.20) = − 4.88. 10*log οb

C. Assigned uncertainties 750
The uncertainty in 10*log οb is calculated from the uncertainties in and
(cf. Eq. (C.22)): 10
*log b∆ε
* * -10 10 4
2 2 2 2log log ClO
= + ( ) (0.12) (3.5 0.12) = 0.44.mο ∆εσ σ σ = + ×b b
The selected, rounded value is:
(C.20) = − (4.9 ± 0.4). 10*log οb
C.6.2 Propagation of errors Whenever data are converted or recalculated, or other algebraic manipulations are per-formed that involve uncertainties, the propagation of these uncertainties has to be taken into account in a correct way. A clear outline of the propagation of errors is given by Bevington [69BEV]. A simplified form of the general formula for error propagation is given by Eq.(C.21), supposing that X is a function of Y1, Y2,…,YN .
2N
YX ∂
2
2)
2
1iX
i iY=
σ = σ ∂ ∑ (C.21)
Eq. (C.21) can be used only if the variables, Y1, Y2,…,YN , are independent or if their uncertainties are small, i.e., the covariances can be disregarded. One of these two as-sumptions can almost always be made in chemical thermodynamics, and Eq. (C.21) can thus almost universally be used in this review. Eqs. (C.22) through (C.26) present explicit formu-las for a number of frequently encountered algebraic expressions, where c, c1, c2 are con-stants.
X = c1Y1 ± c2Y2 : (C.22) 1
2 21 2( ) (X Y Yc cσ = σ + σ
X = ± cY1Y2 and X =2Y
: 1 2X Y Y
(C.23)
2X Yc
X Yσ σ
=
1cY± 1 2
2 22Y YX
σ σ σ= +
21
cc Y ±X = : (C.24)
21
c Yc e±2
XYc
Xσ
= σX = : (C.25)
ln(c ± 1Y
X cYσ
σ =X = : (C.26) 1 2 )c Y
Example C.7:
A few simple calculations illustrate how these formulas are used. The values have not been rounded.

C.6 Procedures for data handling 751
Eq. (C.22) : = 2·[ − (277.4 ± 4.9)] kJ·molr mG∆ −1 − [ − (467.3 ± 6.2)] kJ·mol−1
= − (87.5 ± 11.6) kJ·mol−1.
Eq. (C.23) : (0.038 0.002)±±(8.09 0.92)
(0.0047 0.0005)K = =
±
Eq. (C.24) : K = 4·(3.75 ± 0.12)3 = (210.9 ± 20.3)
Eq. (C.25) : ;K e= r mGο∆ = − (2.7 ± 0.3) kJ·mol−1 r m
RGT
ο−∆ο
R = 8.3145 J·K−1·mol−1
T = 298.15 K
K ο = (2.97 ± 0.36).
Note that powers of 10 have to be reduced to powers of e, i.e., the variable has to be multiplied by ln(10), e.g.,
10 10log (ln(10) log )10log (2.45 0.10); 10 (282 65).K KK K e ⋅= ± = = = ±
Eq. (C.26) : r m R ln ;G T Kο ο∆ = − K ο = (8.2 ± 1.2) × 106
R = 8.3145 J·K−1·mol−1
T = 298.15 K
= − (39.46 ± 0.36) kJ·molr mGο∆ −1
ln K ο = (15.92 ± 0.15)
10log ln / ln(10) (6.91 0.06).K Kο ο= = ±
Again, it can be seen that the uncertainty in 10log K ο cannot be the same as in ln K ο . The constant conversion factor of ln(10) = 2.303 is also to be applied to the uncer-tainty.
C.6.3 Rounding The standard rules to be used for rounding are:
1. When the digit following the last digit to be retained is less than 5, the last digit re-tained is kept unchanged.
2. When the digit following the last digit to be retained is greater than 5, the last digit retained is increased by 1.
C. Assigned uncertainties 752
3. When the digit following the last digit to be retained is 5 and
a) there are no digits (or only zeroes) beyond the 5, an odd digit in the last place to be retained is increased by 1 while an even digit is kept un-changed.
b) other non−zero digits follow, the last digit to be retained is increased by 1, whether odd or even.
This procedure avoids introducing a systematic error from always dropping or not dropping a 5 after the last digit retained.
When adding or subtracting, the result is rounded to the number of decimal places (not significant digits) in the term with the least number of places. In multiplication and division, the results are rounded to the number of significant digits in the term with the least number of significant digits.
In general, all operations are carried out in full, and only the final results are rounded, in order to avoid the loss of information from repeated rounding. For this reason, several additional digits are carried in all calculations until the final selected data set is de-veloped, and only then are data rounded.
C.6.4 Significant digits The uncertainty of a value basically defines the number of significant digits a value should be given.
Example: (3.478 ± 0.008)
(3.48 ± 0.01)
(2.8 ± 0.4)
(10 ± 1)
(105 ± 20).
In the case of auxiliary data or values that are used for later calculations, it is often inconvenient to round to the last significant digit. In the value (4.85 ± 0.26), for example, the “5” is close to being significant and should be carried along a recalculation path in order to avoid loss of information. In particular cases, where the rounding to significant digits could lead to slight internal inconsistencies, digits with no significant meaning in absolute terms are nevertheless retained. The uncertainty of a selected value always contains the same number of digits after the decimal point as the value itself.

D Appendix D
Some limitations encountered in the use of the ionic strength correction procedures In the first book in the NEA-TDB series, [92GRE/FUG], the SIT approach was adopted as the procedure for ionic strength corrections needed to compare experimental data obtained in different ionic media and to reduce these to the standard state chosen for the NEA-TDB database. The publication of the subsequent NEA-TDB reviews, [95SIL/BID], [99RAR/RAN] and [2001LEM/FUG] has established that the SIT approach provides an adequate basis for the description of a very large category of aqueous systems.
In the OECD/NEA publication ”Modelling in Aquatic Chemistry” [97ALL/BAN], there is an extensive discussion of ionic strength corrections showing that in most cases the specific ion interaction theory (SIT) [80CIA] is a good approximation, in particular when estimating ion interaction parameters from thermodynamic equilibrium constants deter-mined in a single ionic medium; this is the most common situation encountered when evalu-ating published data. However, in some particular cases, the simplifications introduced in the SIT approach (cf. Appendix B) can lead to inaccuracies in the extrapolation to evaluate equilibrium constants at I = 0 (when using experimental data at low and high ionic strengths and for equilibria involving ions with charge |z| > 3), and in the calculation of equilibrium constants in other ionic media. Some of these limitations, not discussed in the previous re-views of the NEA-TDB series, are presented in the following sections. For a more extensive discussion the readers are referred to [97ALL/BAN]. The following discussion makes fre-quent reference to the Pitzer ion interaction model [91PIT], which can be formulated with-out some of the underlying simplifications of the SIT approach. The reader should be aware, however, that the correct use of Pitzer equations relies on the existence of very precise ex-perimental data, such as are available for the ions in mixtures of strong electrolytes, but are unavailable for chemical systems containing complexes. For this reason, in practice, the Pitzer method has only been used on chemical systems where the speciation is well known. There are no studies where the stoichiometry, equilibrium constants and the interaction pa-
753

D Some limitations encountered in the use of the ionic strength correction procedures 754
rameters have been determined by use of the Pitzer model in a unique manner; the reason being the very strong correlation between the parameters in the Pitzer model. Some of these problems are discussed with examples in [97ALL/BAN]. In order to use the Pitzer model to describe experimental equilibrium constants it is necessary to have data at low ionic strength, but if such data are unavailable, then the equilibrium constant at zero ionic strength can be estimated more expediently by the SIT approach as was done throughout the NEA-TDB series.
D.1 Implications of neglecting ternary ion interactions and the use of constant values for , ,j k I( )ε m
Within the SIT approach (Eq.(B.1) in section. B.1.1), activity coefficients are described by a Debye-Hückel term and an expansion accounting for ion-ion interactions between pairs of ions of opposite charge. The ion interaction coefficients, ( , , )mj k Iε , are not strictly constant but may vary with the ionic strength, particularly at very low and high ionic strengths. How-ever, in practice, the ionic strength dependence of the ion interaction coefficients can only be determined for strong electrolyte systems and not for complexes, and this is the reason why in the SIT approach this dependence is most frequently neglected (see Appendix B.3). Consequently, the specific ion interaction term of Eq. (B.1) is a linear function of the molal electrolyte concentration. With increasing ionic strength, in particular at Im > 4 mol · kg−1, experimental data often deviate from this linear relationship. At these high ionic strengths, the Pitzer approach is a priori more accurate because it takes more ion-ion interactions into account, such as triple ion interactions (reflected in the terms containing the and parameters). The possible inaccuracies when using the SIT at I
,Ci jφ
, ,i j kψm > 4 mol · kg−1 are well-
known and already mentioned in section B.1.1.
At low ionic strength (Im < 0.1 m), the use of constant values for ( , )j kε in the SIT approach may also impose a limitation. This is circumvented in Pitzer’s model by the intro-duction of semi-empirical functions including the binary parameters, (0)
,i jβ , and , which enable accurate fits to be made to experimental osmotic and activity coefficients for the cases of 3:1 and 2:2 electrolytes.
(1),i jβ (2)
,i jβ
[97ALL/BAN] contains an extensive discussion of the magnitude of ion interaction coefficients and the relation between the SIT coefficients, ( , )i jε , and the corresponding Pitzer parameters, β and β . The concentration dependence of the ion interaction coeffi-cients in the SIT equation is of minor importance at low ionic strengths as the effect of the interaction coefficients, , on log
(0),i j
(1),i j
)i j( ,ε 10γi is limited. Unfortunately, the Pitzer equations are often used incorrectly as a tool to describe experimental data as accurately as possible by an arbitrary fit, which does not necessarily constrain the equilibrium constants and activity co-efficients to realistic values. Numerous recent publications use the ion interaction equations

D.1: Implications of neglecting ternary ion interactions and the use of constant values for ε(j,k,Im)
755
of Pitzer for ionic strength corrections, once a suitable chemical speciation model has been established. In these cases, if highly charged ions are involved in the reaction, the values obtained for equilibrium constants at I = 0 may differ from those obtained with the SIT ap-proach (as in this and other reviews of the NEA-TDB series). The magnitude of the ob-served differences is illustrated below for some cases taken from the present review.
Examples for differences in equilibrium constants at I = 0 obtained with the SIT and Pitzer equations
The following examples illustrate that it is inadvisable to “mix“ ionic interaction parameters and equilibrium constants at zero ionic strength obtained by the SIT and Pitzer methods. The present review selects in all cases the values extrapolated to I = 0 with the SIT approach. Therefore, these constants should not be combined with Pitzer parameters for the back-extrapolation to high ionic strength for reasons that are apparent in the following case studies.
a) Fanghänel et al. [98FAN/WEG2], [99FAN/KON] reported spectroscopic data in 1 − 6 m NaCl for the stepwise formation of the tetracarbonate complex of Cm(III) according to the reaction:
3 23 3 3 3 4Cm(CO ) + CO Cm(CO )5− − − . (D.1)
The linear SIT extrapolation to I = 0 (Figure 12-9, section 12.6.1.1.1) appears to be straightforward and leads to 10 4log K ο = − (1.6 ± 0.2). However, using a fixed value of
10 4log K ο = − 1.6 it is impossible to fit the experimental data in a reasonable way with the Pitzer equations. Conversely, using the Pitzer method throughout for the extrapolation to I = 0, Fanghänel et al. [99FAN/KON] calculated a significantly different value of 10 4log K ο = − 2.16 (the uncertainty estimation is lacking in the original publication, but it is deemed to be smaller than 0.6 logarithmic units).
b) In general the discrepancies between the two methods are much smaller than in the first example. As observed by [95FAN/NEC] and [97PAS/CZE] for the formation con-stants of 5
2 3 3NpO (CO ) − and 42 3 3UO (CO ) − , the Pitzer model [95FAN/NEC] calculated
(10 3log οb 52 3 3NpO (CO ) − , 298.15 K) = (5.37 ± 0.36), while the SIT gave (5.54 ± 0.09), close
to (5.50 ± 0.15) selected by [2001LEM/FUG]. Based on the experimental data accepted in [92GRE/FUG], Pashalidis et al. [97PAS/CZE] calculated 10 3log οb ( , 298.15 K) = 21.3 (no uncertainty reported) with the Pitzer equations, which is somewhat lower than (21.60 ± 0.05) obtained in [92GRE/FUG] with the SIT.
42 3 3UO (CO ) −
c) In Appendix A, (cf. discussion of [97NOV/ALM] and [98ALM/NOV]), the SIT extrapolation yielded lo 10 ,3g sK ο (D.2) = − (7.65 ± 0.11) and 10 ,3log sK ο (D.3) = − (9.96 ± 0.06) for the reactions:

D Some limitations encountered in the use of the ionic strength correction procedures 756
(D.2) 22 3 3 2 3 3KNpO CO (s) + 2 CO NpO (CO ) + K− 5 +−
+− . (D.3) 2 53 2 3 2 3 2 3 3K NpO (CO ) (s) + CO NpO (CO ) + 3K−
while the [97NOV/ALM] calculated 10 ,3log sK ο (D.2) = − (8.2 ± 0.1) and 10 ,3log sK ο (D.3) = − (10.5 ± 0.1) with the Pitzer equations.
D.2 Implications of neglecting anion-anion and cation-cation interactions
In section B.1.1 the simplification is made that ion interaction coefficients, , may be set equal to zero for ions j and k of the same charge sign (assumption 2). This simplification is an extension of the convention, ε(i,i) = 0, between the same ions, which is generally im-plied in the calculation of ionic activity coefficients, γ
( , )j kε
i, with the SIT. Ionic activity coeffi-cients calculated with the Pitzer equations are usually based on an analogous convention (λ(i,i) = 0, µ(
X)
i,i,i) = 0). In the simple case of a binary electrolyte solution MX this leads to:
M X ± (M = = γ γ γ (D.4)
(splitting convention for ionic activity coefficients).
The use of conventional activity coefficients follows a general principle in the field of aqueous thermodynamics (e.g., the standard Gibbs energies of formation are based on the convention, (Hf mGο∆ +, 298.15 K) = 0) because the absolute single ion values cannot be de-termined directly by experiments. Their evaluation or estimation requires the application of extra-thermodynamic assumptions (cf. [85MAR2]). For example: the electrochemical stud-ies of Rabinovich et al. [74RAB/ALE] and Schwabe et al. [74SCH/KEL] have shown that absolute activity coefficients, *γi, of cation M and anion X in binary electrolyte solutions (MX = HCl, NaCl, NaClO4, etc.) are quite different. The ratio (*γM/*γX) increases as a func-tion of the electrolyte concentration, e.g., (*γNa/*γCl) increases from 1.1 in 0.1 m NaCl to 2.9 in 3 m NaCl [74RAB/ALE]. The effect of neglecting ion-ion interactions between ions of the same charge is illustrated in the following:
(1) The interactions between like ions, e.g., Na+-Na+, Cl−-Cl− or - in pure NaCl or NaClO
4ClO−4ClO−
4 solutions, respectively, may be neither negligible nor equal to one other. However, the convention, ε(i,i) = 0, has no impact on the modelling of equilibrium reactions or on their ionic strength dependencies, because the reactions are electroneutral (∆z = 0). Therefore, single-ion activity coefficients can always be combined into mean ionic activity coefficients, which are thermodynamically well defined. In the same way, the dis-crepancies between the conventional and absolute f mGο∆ values of aqueous ions cancel out in the standard Gibbs energies of reaction r mGο∆ .

D.2 Implications of neglecting anion-anion and cation-cation interactions 757
(2) The SIT interaction coefficients, ε(A, X) and ε(C, M) of anion A and cation C in a solution of electrolyte, MX, may differ considerably from ε(A, X’) and ε(C, M’) in an other electrolyte solution, M’X’ (e.g., for an anion A in NaCl or NaClO4 solution:
). The consequences of neglecting these interactions are dis-cussed in the following sections. Anion-anion and cation-cation interactions are included in the Pitzer equations and are allowed for by the introduction of the mixing parameters, θ
4A, Cl (A, ClO )( ) − −ε ≠ ε 0≠
ij.
D.2.1 On the magnitude of anion-anion and cation-cation interactions As shown above, the binary cation-anion interaction coefficients used in the NEA-TDB to calculate the trace activity coefficients of cation C or anion A in an electrolyte solution, MX (denoted here by “ε(C, X)” and “ε(A, M)”), include the non-zero anion-anion and cation-cation interactions, i.e., they are used for the sums:
“ε(C, X)”= ε(C, X) + ε(C, M) (D.5)
and
“ε(A, M)”= ε(A, M) + ε(A, X), (D.6)
respectively. In most cases, the inaccuracies arising from setting ε(C, M) and ε(A, X) equal to zero are negligible compared to other uncertainties. This holds for most univalent cations and anions. However, there are some cases where the inaccuracies become sufficiently large to merit attention. The examples below illustrate the magnitude of the possible inaccuracies and their chemical implications. For ease of understanding the interaction coefficients, “ε(C, X)” and “ε(A, M)”, are given with indices denoting the medium, MX, in which the interac-tion coefficients are derived:
MX(C, X) = (C, X) + (C, M)ε ε ε , (D.7)
MX(A, M) = (A, M) + (A, X)ε ε ε . (D.8)
Example 1: Trace activity coefficients of the H+ ion in NaCl and CsCl solution
The compilation of Pitzer [91PIT] includes interaction coefficients for the ternary systems, HCl-NaCl and HCl-CsCl, with mixing parameters derived from emf data for traces of HCl in the two chloride media. The trace activity coefficients of the H+ ion in NaCl and CsCl solutions become increasingly different with increasing ionic strength (Figure D-1). These differences are neglected by the SIT approach which, in contrast to the Pitzer equations, does not account for the interactions between H+ and Na+ or Cs+ ions.
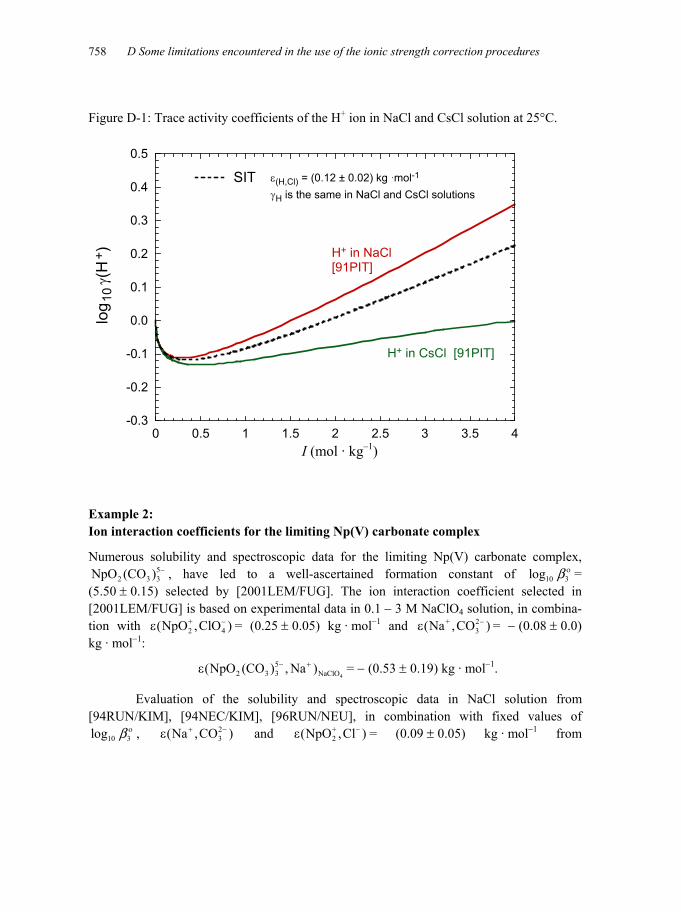
D Some limitations encountered in the use of the ionic strength correction procedures 758
Figure D-1: Trace activity coefficients of the H+ ion in NaCl and CsCl solution at 25°C.
-0.3
-0.2
-0.1
0.0
0.1
0.2
0.3
0.4
0.5
0 0.5 1 1.5 2 2.5 3 3.5 4
log 1
0 γ(
H+ ) H+ in NaCl
[91PIT]
H+ in CsCl [91PIT]
SIT ε(H,Cl) = (0.12 ± 0.02) kg .mol-1
γH is the same in NaCl and CsCl solutions
I (mol · kg–1)
Example 2: Ion interaction coefficients for the lim arbonate complex
Numerous solubility and spectroscopic5
2 3 3NpO (CO ) −
(Nε
, have led to a wel(5.50 ± 0.15) selected by [2001LEM/F[2001LEM/FUG] is based on experimention with = (0.25 ± 0.+
2pO ,ClO )−4
kg · mol−1: 5
2 3 3(NpO (CO ) , Na−ε
Evaluation of the solubility [94RUN/KIM], [94NEC/KIM], [96RU
, and 10 3log οb 23(Na ,CO )+ε − (ε
iting Np(V) c
data for the limiting Np(V) carbonate complex, l-ascertained formation constant of = UG]. The ion interaction coefficient selected in tal data in 0.1 − 3 M NaClO
10 3log οb
4 solution, in combina-05) kg · mol−1 and + 2
3(Na ,CO )−ε = − (0.08 ± 0.0)
4NaClO)+ = − (0.53 ± 0.19) kg · mol−1.
and spectroscopic data in NaCl solution from N/NEU], in combination with fixed values of
+2NpO ,Cl )− = (0.09 ± 0.05) kg · mol−1 from
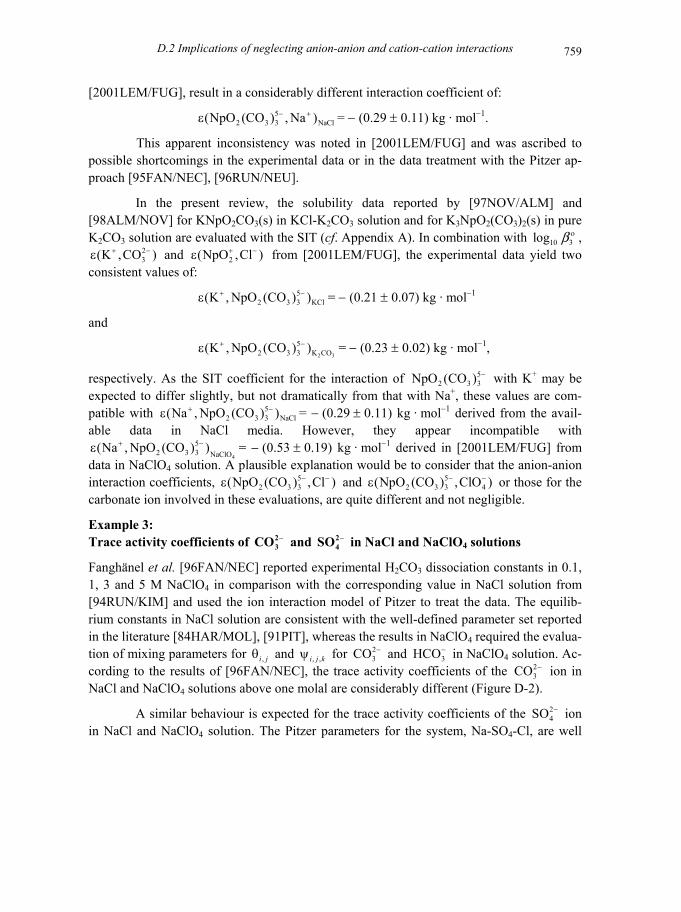
D.2 Implications of neglecting anion-anion and cation-cation interactions 759
[2001LEM/FUG], result in a considerably different interaction coefficient of: 5
2 3 3 Na(NpO (CO ) , Na )− +ε Cl
−
Cl−
= − (0.29 ± 0.11) kg · mol−1.
This apparent inconsistency was noted in [2001LEM/FUG] and was ascribed to possible shortcomings in the experimental data or in the data treatment with the Pitzer ap-proach [95FAN/NEC], [96RUN/NEU].
In the present review, the solubility data reported by [97NOV/ALM] and [98ALM/NOV] for KNpO2CO3(s) in KCl-K2CO3 solution and for K3NpO2(CO3)2(s) in pure K2CO3 solution are evaluated with the SIT (cf. Appendix A). In combination with ,
and ε from [2001LEM/FUG], the experimental data yield two consistent values of:
10 3log οb23(K ,CO )+ε 2(NpO ,Cl )+ −
52 3 3 K(K , NpO (CO ) )+ε = − (0.21 ± 0.07) kg · mol−1
and
2 3
52 3 3 K CO(K , NpO (CO ) )+ −ε = − (0.23 ± 0.02) kg · mol−1,
respectively. As the SIT coefficient for the interaction of 52 3 3NpO (CO ) − with K+ may be
expected to differ slightly, but not dramatically from that with Na+, these values are com-patible with = − (0.29 ± 0.11) kg · mol5
2 3 3 Na(Na , NpO (CO ) )+ε
52 3 3 NaClO(CO ) )+ −
52 3(NpO (CO )
Cl− −1 derived from the avail-
able data in NaCl media. However, they appear incompatible with
4= − (0.53 ± 0.19) kg · mol(Na , NpOε −1 derived in [2001LEM/FUG] from
data in NaClO4 solution. A plausible explanation would be to consider that the anion-anion interaction coefficients, 3 ,Cl )− −ε and 5
2 3 3(CO ) ,ClO )4(NpO − −ε or those for the carbonate ion involved in these evaluations, are quite different and not negligible.
Example 3: Trace activity coefficients of −2
3CO and −24SO in NaCl and NaClO4 solutions
Fanghänel et al. [96FAN/NEC] reported experimental H2CO3 dissociation constants in 0.1, 1, 3 and 5 M NaClO4 in comparison with the corresponding value in NaCl solution from [94RUN/KIM] and used the ion interaction model of Pitzer to treat the data. The equilib-rium constants in NaCl solution are consistent with the well-defined parameter set reported in the literature [84HAR/MOL], [91PIT], whereas the results in NaClO4 required the evalua-tion of mixing parameters for and ,i jθ , ,i j kψ for 2
3CO − and 3HCO− in NaClO4 solution. Ac-cording to the results of [96FAN/NEC], the trace activity coefficients of the ion in NaCl and NaClO
23CO −
4 solutions above one molal are considerably different (Figure D-2).
A similar behaviour is expected for the trace activity coefficients of the SO ion in NaCl and NaClO
24
−
4 solution. The Pitzer parameters for the system, Na-SO4-Cl, are well

D Some limitations encountered in the use of the ionic strength correction procedures 760
known [84HAR/MOL], [91PIT]. There are no data for the ternary system Na-SO4-ClO4, but such data do exist for the analogous system, Na-SO4-TcO4. The physical and chemical prop-erties of the ion are very similar to those of the 4TcO−
4ClO− ion [97KON/NEC] and the Pitzer parameters determined by isopiestic measurements in the system, Na-SO4-TcO4, [98NEC/KON2] have been also confirmed by solubility experiments [98NEC/KON], [98NEC/KON2]. The corresponding trace activity coefficients of the SO2
4− ion in NaCl and
NaTcO4 solutions are shown in Figure D-3. Indeed, the differences in the trace activity coef-ficients of and SO in chloride and perchlorate media are comparable, not only qualitatively but also quantitatively.
23CO − 2
4−
These differences cannot be described with the simplified SIT approach applied in the NEA-TDB reviews (cf. calculated dashed lines in Figure D-2 and Figure D-3), where the interaction coefficients between ions of the same charge sign are generally set equal to zero. The consequences of these findings, in particular for the important actinide carbonate sys-tems, are discussed in the following section.

D.2 Implications of neglecting anion-anion and cation-cation interactions 761
Figure D-2: Trace activity coefficients of the 23CO − ion in NaCl and NaClO4 solutions at
25°C.
-2.0
-1.5
-1.0
-0.5
0.0
0 1 2 3 4 5 6
log 1
0 γ(
CO
32-)
CO32- in NaClO4 [96FAN/NEC]
CO32- in NaCl
[91PIT], [84HAR/MOL]
SIT ε(Na,CO3) = -(0.08 ± 0.03) kg .mol-1
γCO3 is the same in NaCl and NaClO4 solutions
-1I (mol · kg )
Figure D-3: Trace activity coefficients of the 24SO − ion in NaCl and NaTcO4 solutions at
25°C.
-2.0
-1.5
-1.0
-0.5
0.0
0
log 1
0 γ(
SO42-
)
1 2 3 4 5 6
SO42- in NaTcO4 [98NEC/KON]
SO42- in NaCl [91PIT], [84HAR/MOL]
SIT ε(Na,SO4) = -(0.12 ± 0.06) kg .mol-1
γSO4 is the same in NaCl and NaTcO4 solutions
I (mol . kg-1)
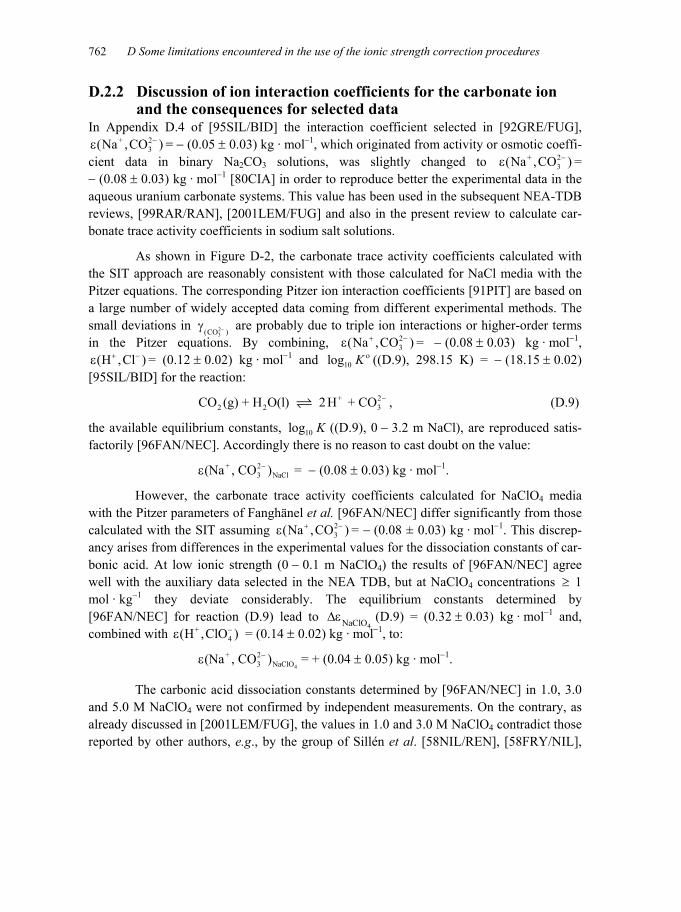
D Some limitations encountered in the use of the ionic strength correction procedures 762
D.2.2 Discussion of ion interaction coefficients for the carbonate ion and the consequences for selected data
In Appendix D.4 of [95SIL/BID] the interaction coefficient selected in [92GRE/FUG], = − (0.05 ± 0.03) kg · mol+ 2
3(Na ,CO )−ε −1, which originated from activity or osmotic coeffi-cient data in binary Na2CO3 solutions, was slightly changed to = − (0.08 ± 0.03) kg · mol
+ 23(Na ,CO )−ε
−1 [80CIA] in order to reproduce better the experimental data in the aqueous uranium carbonate systems. This value has been used in the subsequent NEA-TDB reviews, [99RAR/RAN], [2001LEM/FUG] and also in the present review to calculate car-bonate trace activity coefficients in sodium salt solutions.
As shown in Figure D-2, the carbonate trace activity coefficients calculated with the SIT approach are reasonably consistent with those calculated for NaCl media with the Pitzer equations. The corresponding Pitzer ion interaction coefficients [91PIT] are based on a large number of widely accepted data coming from different experimental methods. The small deviations in
3 are probably due to triple ion interactions or higher-order terms
in the Pitzer equations. By combining, 2(CO )−γ
23(Na ,CO )+ −
10gε = − (0.08 ± 0.03) kg · mol−1,
= (0.12 ± 0.02) kg · mol(H ,Cl )+ −ε −1 and lo K ο ((D.9), 298.15 K) = − (18.15 ± 0.02) [95SIL/BID] for the reaction:
+2 2CO (g) + H O(l) 2H + CO2
3− , (D.9)
the available equilibrium constants, lo 10g K ((D.9), 0 − 3.2 m NaCl), are reproduced satis-factorily [96FAN/NEC]. Accordingly there is no reason to cast doubt on the value:
− (0.08 ± 0.03) kg · mol+ 23 NaCl(Na , CO ) =−ε −1.
However, the carbonate trace activity coefficients calculated for NaClO4 media with the Pitzer parameters of Fanghänel et al. [96FAN/NEC] differ significantly from those calculated with the SIT assuming 2
3(Na ,CO )+ −
NaC
ε = − (0.08 ± 0.03) kg · mol−1. This discrep-ancy arises from differences in the experimental values for the dissociation constants of car-bonic acid. At low ionic strength (0 − 0.1 m NaClO4) the results of [96FAN/NEC] agree well with the auxiliary data selected in the NEA TDB, but at NaClO4 concentrations 1 mol · kg
≥−1 they deviate considerably. The equilibrium constants determined by
[96FAN/NEC] for reaction (D.9) lead to 4lO∆ε (D.9) = (0.32 ± 0.03) kg · mol−1 and,
combined with = (0.14 ± 0.02) kg · mol+4(H ,ClO )−ε −1, to:
= + (0.04 ± 0.05) kg · mol4
+ 23 NaClO(Na , CO )−ε −1.
The carbonic acid dissociation constants determined by [96FAN/NEC] in 1.0, 3.0 and 5.0 M NaClO4 were not confirmed by independent measurements. On the contrary, as already discussed in [2001LEM/FUG], the values in 1.0 and 3.0 M NaClO4 contradict those reported by other authors, e.g., by the group of Sillén et al. [58NIL/REN], [58FRY/NIL],

D.2 Implications of neglecting anion-anion and cation-cation interactions 763
and are therefore not accepted. However, as the actinide carbonates are of great importance in natural systems, the possible consequences of different ion interaction coefficients in NaCl and NaClO4 media will have to be discussed in light of additional experimental data.
If there are sufficient experimental data at different ionic strengths in a given me-dium to perform a linear SIT regression as shown in Figure B-1, Appendix B.1.3.2, the val-ues of ∆ε and lo 10 ,g s nK ο for carbonate solids are not affected. The same holds for ∆ε and
for aqueous carbonate complexes (e.g., for the formation constants selected for the Np(V) carbonate complexes in [2001LEM/FUG]). Of course, different individual ε(j,k), values would be calculated from ∆ε if = (0.04 ± 0.05) kg · mol
10log οb
4
+ 23 NaClO(Na ,CO )−ε −1 is used
instead of − (0.08 ± 0.03) kg · mol−1.
On the other hand, if the experimental data set is more restricted, particularly if determined at higher ionic strengths, the interaction coefficients used for the conversion to I = 0 may have a significant effect on the selected equilibrium constant. This problem arises for instance in the calculated solubility constants of solid Np(V) carbonates, NaNpO2CO3 · 3.5H2O(s) and Na3NpO2(CO3)2(s), and solid Am(III) carbonate, Am2(CO3)3 · xH2O(s). The possible consequences are discussed in detail in sections 10.6.2.1.1 and 12.6.1.1.3.2, respectively.


Bibliography [00PIS] Pissarjewsky, L., Die Überuran-, Übermolybdän- und Überwolf-
ramsäuren und entsprechende Säuren, Z. Anorg. Chem., 24, (1900), 108-122, in German. Cited on pages: 192, 397.
[05OEC/CHA] Oechsner de Coninck, W.,Chauvenet, Sur un sulfate double de
lithium et d'uranyle, Bull. Cl. Sci., Acad. R. Belg., (1905). Cited on page: 417.
[22BRO] Brønsted, J. N., Studies of solubility: IV. The principle of spe-
cific interaction of ions, J. Am. Chem. Soc., 44, (1922), 877-898. Cited on page: 709.
[22BRO2] Brønsted, J. N., Calculation of the osmotic and activity functions
in solutions of uni-univalent salts, J. Am. Chem. Soc., 44, (1922), 938-948. Cited on page: 709.
[35GUG] Guggenheim, E. A., The specific thermodynamic properties of
aqueous solutions of strong electrolytes, Philos. Mag., 19, (1935), 588-643. Cited on page: 709.
[36SCA] Scatchard, G., Concentrated solutions of strong electrolytes,
Chem. Rev., 19, (1936), 309-327. Cited on page: 709. [37KIE] Kielland, J., Individual activity coefficients of ions in aqueous
solutions, J. Am. Chem. Soc., 59, (1937), 1675-1678. Cited on page: 404.
[40COU/PIT] Coulter, L. V., Pitzer, K. S., Latimer, W. M., Entropies of large
ions: The heat capacity, entropy and heat of solution of K2PtCl6, (CH3)4NI and UO2(NO3)2.6H2O, J. Am. Chem. Soc., 62, (1940), 2845-2851. Cited on page: 485.
[42JEN/AND] Jenkins, F. A., Anderson, O. E., Reports RL 4.6.3 and 4.6.4,
(1942), (from the citation in [48MUE]). Cited on page: 216. [42SCH/THO] Schelberg, A., Thompson, R. W., (1942), Report A-809, (from
the citation in [51KAT/RAB]). Cited on page: 229.
765

BIBLIOGRAPHY 766
[42THO/SCH] Thompson, R. W., Schelberg, A., (1942), Report A-179, (from the citation in [51KAT/RAB]). Cited on page: 227.
[43ALT/LIP] Altman, D., Lipkin, D., Weissman, S., (1943), Report RL-4.6.22,
(from the citation in [51KAT/RAB]). Cited on pages: 218, 219. [43ALT] Altman, D., (1943), Report RL-4.6.156, (from the citation in
[51KAT/RAB]). Cited on pages: 201, 214, 225. [43WEB] Webster, R. A., (1943), Report CK-873, (from the citation in
[51KAT/RAB]). Cited on page: 225. [44FER/PRA] Ferguson, W. J., Prather, J., (1944), Report A-3143, (from the
citation in [58MAC]). Cited on page: 222. [44FER/PRA2] Ferguson, W. J., Prather, J., Scott, R. B., (1944), Report A-1920,
(from the citation in [51KAT/RAB]). Cited on page: 223. [44NOT/POW] Nottorf, R., Powell, J., The vapor pressure of UBr4, Ames Pro-
ject, Chemical Research 10 May to 10 June, 1944, Spedding, F.H., Wilhelm, H. A., Eds., Report CC-1504 (A-2087), pp. 9-17, (1944). Cited on page: 227.
[45DAV/STR] Davidson, P. H., Streeter, I., The equilibrium vapor pressure of
UCl4 above UOCl2, (1945), Report RL-4.6.920, (from the cita-tion in [48MUE]). Cited on page: 216.
[45DAV] Davidson, P. H., The flow of UCl4 vapor through tubes of cylin-
drical cross-section, (1945), Report RL-4.6.931, (from the cita-tion in [48MUE]). Cited on page: 216.
[45FER/RAN] Ferguson, W. J., Rand, R. D., U.S. Natl. Bureau of Standards,
Report A-3357, (1945). Cited on page: 224. [45WAG/GRA] Wagner, E. L., Grady, H. F., Miller, A. J., The vapor pressure
curves of uranium tetrachloride, Report C.2350.5, (1945), (fromthe citation in [48MUE]). Cited on page: 216.
[46GRE] Gregory, N. W., The vapor pressure of uranium tetraiodide, US
Atomic Energy Commission, Report AECD-3342, (1946). Cited on page: 229.
BIBLIOGRAPHY 767
[46GRE2] Gregory, N. W., Applications of a diaphragm gauge for the in-vestigation of vapor pressures and chemical equilibria at hightemperatures: I. The vapor pressure and gas density of UCl4, Report BC-16, (1946), (from the citation in [48MUE]). Cited on page: 216.
[46GRE3] Gregory, N. W., The vapour pressure of UCl3Br, UCl2Br2, and
UBr4, Report BC-3, (1946), (from the citation in [48MUE]). Cited on page: 226.
[47GIN/COR] Ginnings, D. C., Corruccini, R. J., Heat capacities at high tem-
peratures of uranium, uranium trichloride and uranium tetrachlo-ride, J. Res. Natl. Bur. Stand., 39, (1947), 309-316. Cited on pages: 222, 223.
[47JOH] Johnsson, K. O., The vapor pressure of uranium tetrafluoride,
Carbon and Carbon Chemicals Corporation, Report Y-42, (1947), 19 pp. Cited on page: 201.
[47ROB/LEV] Robinson, R. A., Levien, B. J., The vapor pressures of potas-
sium ferricyanide and thorium nitrater solutions at 25°C Trans. R. Soc. N.Z., 76, (1947), 295. Cited on page: 403.
[47RYO/TWI] Ryon, A. D., Twichell, L. P., Carbide and chemicals corporation,
Oak Ridge, Tennesse, USA, Report, (1947). Cited on page: 201. [48MUE] Mueller, M. E., The vapor pressure of uranium halides, U.S.
Atomic Energy Commission, Report AECD-2029, (1948), 118 pp. Cited on pages: 216, 226.
[48THO/SCH] Thompson, R. W., Schelberg, A., OSRD Proj. SSRC-5 Princeton
Report 24 A-809, (1948), (from the citation in [48MUE]). Cited on page: 216.
[49KAS] Kasha, M., Reactions between plutonium ions in perchloric acid
solution: rates, mechanisms and equilibria, The transuranium elements, research papers, Seaborg, G. T., Katz, J. J., Manning, W. M., Eds., pp. 295-334, McGraw-Hill, New York, USA, (1949). Cited on pages: 316, 642.
[49SUT] Sutton, J., The hydrolysis of the uranyl ion Part, I., J. Chem.
Soc., S57, (1949), 275-286. Cited on page: 177.

BIBLIOGRAPHY 768
[50KRA/NEL] Kraus, K. A., Nelson, F., Hydrolytic behavior of metal ions: I.The acid constants of uranium(IV) and plutonium(IV), J. Am. Chem. Soc., 72, (1950), 3901-3906. Cited on page: 560.
[51KAT/RAB] Katz, J. J., Rabinowitch, E., The chemistry of uranium, Dover
Publications, New York, (1951), 609 pp. Cited on pages: 214,223, 225, 226.
[51ROB/LIM] Robinson, R. A., Lim, C. K., The osmotic and activity coeffi-
cients of uranyl nitrate, chloride, and perchlorate at 25oC, J. Chem. Soc., (1951), 1840-1843. Cited on pages: 239, 574.
[52COH/HIN] Cohen, D., Hindman, J. C., The neptunium(IV)-neptunium(V)
couple in perchloric acid. The partial molal heats and free ener-gies of formation of neptunium ions, J. Am. Chem. Soc., 74, (1952), 4682-4685. Cited on page: 639.
[52ROS/WAG] Rossini, F. D., Wagman, D. D., Evans, W. H., Levine, S., Jaffe,
I., Selected values of chemical thermodynamic properties, NBSCircular, Report 500, (1952). Cited on page: 192.
[53AGA/AGA] Agalonova, A. L., Agafonov, I. L., Ionisation constants of inor-
ganic acids and bases in aqueous solution, Zh. Fiz. Khim., 27, (1953), 1137. Cited on page: 657.
[53JON] Jones, M. M., A study of plutonium trifluoride precipitated from
aqueous solution, Hanford Atomic Products Operation, Richland Washington, USA, Report HW-30384, (1953). Cited on page: 359.
[54FEA] Feay, D. C., Some chemical properties of curium, Ph. D. Thesis,
Radiation Laboratory, University of California, (1954), Berke-ley, 50 pp. , UCRL-2547. Cited on pages: 354, 355.
[54KOC/CUN] Koch, C. W., Cunningham, B. B., The vapor phase hydrolysis of
the actinide halides. I. Heat and free energy of the reactionAmCl3(s) + H2O(g) AmOCl(s) + 2HCl(g), J. Am. Chem. Soc., 76, (1954), 1470-1471. Cited on page: 362.
[54MIL] Milkey, R. G., Stability of dilute solutions of uranium, lead and
thorium ions., Anal. Chem., 26, (1954), 1800-1803. Cited on page: 400.

BIBLIOGRAPHY 769
[54SCH/BAE] Schreyer, J. M., Baes, Jr., C. F., The solubility of uranium(VI)orthophosphates in phosphoric acid solutions, J. Am. Chem. Soc., 76, (1954), 354-357. Cited on pages: 242, 292.
[55CAR/CUN] Carniglia, S. C., Cunningham, B. B., Vapor pressures of ameri-
cium trifluoride and plutonium trifluoride, heats and free ener-gies of sublimation, J. Am. Chem. Soc., 77, (1955), 1451-1453. Cited on page: 360.
[55GAY/LEI] Gayer, K. H., Leider, H., The solubility of uranium trioxide,
UO3.H2O, in solutions of sodium hydroxide and perchloric acidat 25oC, J. Am. Chem. Soc., 77, (1955), 1448-1550. Cited on pages: 399, 400.
[55RAB/COW] Rabideau, S. W., Cowan, H. D., Chloride complexing and dis-
proportionation of Pu(IV) in hydrochloric acid, J. Am. Chem. Soc., 77, (1955), 6145-6148. Cited on page: 322.
[55SCH] Schreyer, J. M., The solubility of uranium(IV) orthophosphates
in phosphoric acid solutions, J. Am. Chem. Soc., 77, (1955), 2972-2974. Cited on page: 288.
[55WAI] Wait, E., A cubic form of uranium trioxide, Inorg. Nucl. Chem.
Lett., 1, (1955), 309-312. Cited on page: 419. [56BAE] Baes, Jr., C. F., A spectrophotometric investigation of uranyl
phosphate complex formation in perchloric acid solution, J. Phys. Chem., 60, (1956), 878-883. Cited on page: 241.
[56CHU/SHA] Chukhlantsev, V. G., Sharova, A. K., Solubility products of
uranyl arsenates, Russ. J. Inorg. Chem., 1, (1956), 39-44. Cited on page: 290.
[56CHU/STE] Chukhlantsev, V. G., Stepanov, S. I., Solubility of uranyl and
thorium phosphates, Russ. J. Inorg. Chem., 1, (1956), 135-141. Cited on pages: 288, 289.
[56HIE] Hietanen, S., Studies on the hydrolysis of metal ions: 17. The
hydrolysis of the uranium(IV) ion, U4+, Acta Chem. Scand., 10, (1956), 1531-1546. Cited on page: 184.

BIBLIOGRAPHY 770
[56SHC/VAS2] Shchukarev, S. A., Vasil'kova, I. V., Efimov, A. I., Kirdyashev,V. P., Determination of the saturated vapor pressure of UCl4 and the disproportionation pressure of UOCl2, Zh. Neorg. Khim., 1, (1956), 2272-2277, in Russian. Cited on page: 216.
[56STU/SIN] Stull, D. R., Sinke, G. C., Thermodynamic properties of the ele-
ments, American Chemical Society, Washington, D.C., (1956).Cited on page: 448.
[56WAR/WEL] Ward, M., Welch, G. A., The chloride complexes of trivalent
plutonium, americium and curium, J. Inorg. Nucl. Chem., 2, (1956), 395-402. Cited on page: 322.
[57HEA/WHI] Hearne, J. A., White, A. G., Hydrolysis of the uranyl ion, J.
Chem. Soc., (1957), 2168-2174. Cited on page: 580. [57RAB] Rabideau, S. W., The hydrolysis of plutonium(IV), J. Am. Chem.
Soc., 79, (1957), 3675-3677. Cited on page: 315. [58BRU] Brusilovskii, S. A., Investigation of the precipitation of hexava-
lent uranium hydroxide, Proc. Acad. Sci. USSR, 120, (1958), 343-347. Cited on pages: 399, 400.
[58FRY/NIL] Frydman, M., Nilsson, G., Rengemo, T., Sillén, L. G., Some
solution equilibria involving calcium sulfite and carbonate: III.The acidity constants of H2CO3 and H2SO3, and CaCO3 + CaSO3
equilibria in NaClO4 medium at 25oC, Acta Chem. Scand., 12, (1958), 868-872. Cited on pages: 568, 763.
[58JOH/BUT] Johnson, O., Butler, T., Newton, A. S., Preparation, purification,
and properties of anhydrous uranium chlorides, Chemistry of uranium, Katz, J. J., Rabinowitch, E., Eds., vol. 1, pp. 1-28, USA Energy Commission, Oak Ridge, Tennessee, USA, (1958). Cited on pages: 216, 217, 218, 219.
[58MAC] MacWood, G. E., Thermodynamic properties of uranium com-
pounds, Chemistry of uranium: Collected papers, Katz, J. J., Rabinowitch, E., Eds., pp. 543-609, US Atomic Energy Com-mission, Oak Ridge, Tennessee, USA, (1958). Cited on page:222.
BIBLIOGRAPHY 771
[58NIL/REN] Nilsson, G., Rengemo, T., Sillén, L. G., Some solution equilibria involving calcium sulfite and carbonate: I. Simple solubility equilibria of CO2, SO2, CaCO3, and CaSO4, Acta Chem. Scand., 12, (1958), 868-872. Cited on page: 763.
[58YOU/GRA] Young, H. S., Grady, H. F., Physical constants of uranium tetra-
chloride, Chemistry of uranium, Katz, J. J., Rabinowitch, E., Eds., vol. 2, pp. 749-756, USA Energy Commission, Oak Ridge, Tennessee, USA, (1958). Cited on page: 216.
[59POP/GAL] Popov, M. M., Gal'chenko, G. L., Senin, M. D., Specific heats
and heats of fusion of UCl4 and UI4 and heat of transformation of UI4, Russ. J. Inorg. Chem., 4, (1959), 560-562. Cited on pages: 217, 223.
[59POP/KOS] Popov, M. M., Kostylev, F. A., Zubova, N. V., Vapour pressure
of uranium tetrafluoride, Russ. J. Inorg. Chem., 4, (1959), 770-771. Cited on page: 201.
[59ROB/STO] Robinson, R. A., Stokes, R. H., Electrolyte solutions, 2nd. Edi-
tion, Butterworths, London, (1959), 559 pp. Cited on pages: 574,714.
[60BAB/KOD] Babko, A. K., Kodenskaya, V. S., Equilibria in solutions of
uranyl carbonate complexes, Russ. J. Inorg. Chem., 5, (1960), 1241-1244. Cited on pages: 399, 400.
[60LAN/BLA] Langer, S., Blankenship, F. F., The vapour pressure of uranium
tetrafluoride, J. Inorg. Nucl. Chem., 14, (1960), 26-31. Cited on page: 201.
[60OOS] Oosting, M., Quantitative extraction equilibriums. IV, Recl.
Trav. Chim. Pays-Bas, 79, (1960), 627-634. Cited on page: 400. [60RAB/KLI] Rabideau, S. W., Kline, R. J., A spectrophotometric study of the
hydrolysis of plutonium(IV), J. Phys. Chem., 64, (1960), 680-682. Cited on page: 315.
[60SAV/BRO] Savage, Jr., A. W., Browne, J. C., The solubility of uranium(IV)
fluoride in aqueous fluoride solutions, J. Am. Chem. Soc., 82, (1960), 4817-4821. Cited on pages: 211, 212.

BIBLIOGRAPHY 772
[60STE/GAL] Stepanov, M. A., Galkin, N. P., The solubility product of the hydroxide of tetravalent uranium, Sov. At. Energy, 9, (1960), 817-821. Cited on page: 184.
[61AKI/KHO] Akishin, P. A., Khodeev, Yu. S., Determination of the heat of
sublimation of uranium tetrafluoride by the mass-spectroscopic method, Russ. J. Phys. Chem., 35, (1961), 574-575. Cited on pages: 201, 202.
[61KAR] Karpov, V. I., The solubility of triuranyl phosphate, Russ. J.
Inorg. Chem., 6, (1961), 271-272. Cited on pages: 288, 289. [61LEW/RAN] Lewis, G. N., Randall, M., Thermodynamics, as revised by
Pitzer, K. S. and Brewer, L., 2nd. Edition, McGraw-Hill, New York, (1961), 723 pp. Cited on pages: 16, 708, 710, 714, 716.
[61PET] Peterson, A., Studies on the hydrolysis of metal ions: 32. The
uranyl ion, UO22+, in Na2SO4 medium, Acta Chem. Scand., 15,
(1961), 101-120. Cited on pages: 232, 452, 664, 665, 672, 673. [61ROS/ROS] Rossotti, F. J. C., Rossotti, H., The determination of stability
constants and other equilibrium constants in solution, McGraw-Hill, New York, (1961). Cited on pages: 25, 735.
[61WAT/DOU] Waterbury, G. R., Douglass, R. M., Metz, Thermogravimetric
behavior of plutonium metal, nitrate, sulfate and oxalate, Anal. Chem., 33, (1961), 1018-1023. Cited on pages: 315, 668.
[62BAE/MEY] Baes, Jr., C. F., Meyer, N. J., Acidity measurements at elevated
temperatures: I. Uranium(VI) hydrolysis at 25 and 94oC, Inorg. Chem., 1, (1962), 780-789. Cited on pages: 478, 580.
[62DAV] Davies, C. W., Ion association, Butterworths, London, (1962),
190 pp. Cited on page: 708. [62GEL/MOS] Gel'man, A. D., Moskvin, A. I., Zaitseva, V. P., Carbonate com-
pounds of plutonyl, Sov. Radiochem., 4, (1962), 138-145. Cited on page: 325.

BIBLIOGRAPHY 773
[62HOS/GAR] Hostetler, P. B., Garrels, R. M., Transportation and precipitation of U and V at low temperature with special reference to sand-stone-type U deposits, Econ. Geol., 57, (1962), 137-167. Cited on pages: 291, 549.
[62LIE/STO] Lietzke, M.H., Stoughton, R.W., The calculation of activity co-
efficients from osmotic coefficient data, J. Phys. Chem., 66, (1962), 508-509. Cited on page: 418.
[62PER/BER] Perez-Bustamante, J. A., Bermudez Polonio, J., Fernandez Cel-
lini, R., Contribution to the study of the carbonate complexes ofuranium, An. Fís. Quím., 58B, (1962), 677-704, in Spanish. Cited on page: 400.
[62RAN/FOX] Rand, M. H., Fox, A. C., Street, R. S., Radiation self-damage in
plutonium compounds, Nature (London), 195, (1962), 567-568. Cited on pages: 315, 668.
[62VAS] Vasil'ev, V. P., Influence of ionic strength on the instability con-
stants of complexes, Russ. J. Inorg. Chem., 7, (1962), 924-927. Cited on page: 709.
[62WIL] Wilcox, D. E., A method for estimating the heat of formation
and free energy of formation of inorganic compounds, Univ. of California, UCRL report, (1962). Cited on pages: 5, 432.
[63BAR/SOM] Bartušek, M., Sommer, L., Ph. D. Thesis, Institut für Analytische
Chemie der J.E. Purkyne Universität, (1963), Brno, Czechoslo-vakia. Cited on page: 456.
[63COR/ALI] Cordfunke, E. H. P., Aling, P., Thermal decomposition of hy-
drated uranium peroxides, Recl. Trav. Chim. Pays-Bas, 82, (1963), 257-263. Cited on pages: 192, 398, 464.
[63DUN/SIL] Dunsmore, H. S., Sillén, L. G., Studies on the hydrolysis of
metal ions: 47. Uranyl ion in 3 M (Na)Cl medium, Acta Chem. Scand., 17, (1963), 2657-2663. Cited on page: 584.
[63JAC/RAN] Jackson, E. E., Rand, M. H., The oxidation behaviour of pluto-
nium dioxide and solid solutions containing plutonium dioxide, UK Atomic Energy Authorithy, Report AERE R 3636, (1963). Cited on pages: 315, 668.

BIBLIOGRAPHY 774
[63KAN] Kangro, W., Recovery of heavy metals, especially uranium, frompoor ores with the aid of chlorine gas. I, Z. Erzbergbau Metallhüttenwes., 16, (1963), 107-112, in German. Cited on p age: 220.
[63LEF] Lefort, M., Oxydo-réduction du couple TcO2-TcO4– en solutions
diluées sous l'effet du rayonnement γ, Bull. Soc. Chim. Fr., (1963), 882-884, in French. Cited on pages: 391, 685.
[63RUS/JOH] Rush, R. M., Johnson, J. S., Hydrolysis of uranium(VI): Absorp-
tion spectra of chloride and perchlorate solutions, J. Phys. Chem., 67, (1963), 821-825. Cited on pages: 456, 457.
[64BAN/PAT] Bansal, B. M. L., Patil, S. K., Sharma, H. D., Chloride, nitrate
and sulphate complexes of europium (III) and americium (III), J. Inorg. Nucl. Chem., 26, (1964), 993-1000. Cited on page: 367.
[64COR] Cordfunke, E. H. P., Heats of formation of some hexavalent ura-
nium compounds, J. Phys. Chem., 68, (1964), 3353-3356. Cited on pages: 188, 190, 262, 412, 539, 633.
[64CRI/COB] Criss, C. M., Cobble, J. W., The thermodynamic properties of
high temperature aqueous solutions. IV. Entropies of the ions upto 200oC and the correspondence principle, J. Am. Chem. Soc., 86, (1964), 5385-5390. Cited on page: 158.
[64CRI/COB2] Criss, C. M., Cobble, J. W., The thermodynamic properties of
high temperature aqueous solutions. V. The calculation of ionicheat capacities up to 200oC. Entropies and heat capacities above 200oC, J. Am. Chem. Soc., 86, (1964), 5390-5393. Cited on pages: 158, 541.
[64KEE/KRU] Keenan, T. K., Kruse, F. H., Potassium double carbonates of
pentavalent neptunium, plutonium and americium, Inorg. Chem., 3, (1964), 1231-1232. Cited on pages: 311, 569.
[64LEV] Levinson, L. S., Heat content of molten uranium, J. Chem. Phys.,
40, (1964), 3584-3585. Cited on pages: 157, 430. [64SEK] Sekine, T., Complex formation of La(III), Eu(III), Lu(III) and
Am(III) with oxalate, sulphate, chloride and thiocyanate ions, J. Inorg. Nucl. Chem., 26, (1964), 1463-1465. Cited on pages: 365, 367.
BIBLIOGRAPHY 775
[64SHI/MAR] Shiloh, M., Marcus, Y., The chemistry of trivalent neptunium
plutonium and americium in halide solutions, Israel Atomic En-ergy Commission, Report IA-924, (1964), 26 pp. Cited on page: 356.
[64SIL/MAR] Sillén, L. G., Martell, A. E., Stability constants of metal ion
complexes, Special Publication, No. 17, Chemical Society, Lon-don, (1964), 754 pp. Cited on pages: 17, 283.
[65BAE/MEY] Baes, Jr., C. F., Meyer, N. J., Roberts, C. E., The hydrolysis of
thorium(IV) at 0 and 95oC, Inorg. Chem., 4, (1965), 518-527. Cited on page: 403.
[65MUT/HIR] Muto, T., Hirono, S., Kurata, H., Some aspects of fixation of
uranium from natural waters, Japanese Atomic Energy ResearchInstitute, Report NSJ-Tr 91, (1965), 27 pp. Cited on pages: 288, 289, 292.
[65MUT] Muto, T., Thermochemical stability of ningyoite, Mineral. J., 4,
(1965), 245-274. Cited on pages: 287, 289, 292, 549. [65PAR] Parker, V. B., Thermal properties of aqueous uni-univalent elec-
trolytes, National Standard Reference Data Series, National Bu-reau of Standards, Ed., No. Rep NSRDS-NBS-2, US Govern-ment printing office, Washington, D.C., (1965), 66 pp. Cited onpage: 398.
[65PER] Perez-Bustamante, J. A., Solubility product of tetravalent pluto-
nium hydroxide and study of the amphoteric character ofhexavalent plutonium hydroxide, Radiochim. Acta, 4, (1965), 67-75. Cited on pages: 316, 642.
[65SEK2] Sekine, T., Solvent extraction study of trivalent actinide and lan-
thanide complexes in aqueous solutions. II. Sulfate complexes of La(III), Eu(III), Lu(III), and Am(III) in 1 M Na(ClO4), Acta Chem. Scand., 19, (1965), 1469-1475. Cited on pages: 365, 367.
[65STA] Stary, J., Study of complexes of americium and promethium by
using solvent extraction, Nucl. Sci. Abstr., 19, (1965), 275. Cited on page: 683.

BIBLIOGRAPHY 776
[65VES/PEK] Veselý,V., Pekárek, V., Abbrent, M., A study of uranyl phos-phates: III. Solubility products of uranyl hydrogen phosphate,uranyl orthophosphate and some alkali uranyl phosphates, J. Inorg. Nucl. Chem., 27, (1965), 1159-1166. Cited on pages: 288, 289, 292.
[65WOL/POS] Wolf, A. S., Posey, J. C., Rapp, K. E., α-uranium pentafluoride:
I. Characterization, Inorg. Chem., 4, (1965), 751-757. Cited onpages: 203, 207.
[66COR] Cordfunke, E. H. P., Thermodynamic properties of hexavalent
uranium compounds, Thermodynamics, Proc. Symp. held 22-27 July, Vienna, Austria, vol. 2, pp. 483-495, International Atomic Energy Agency, Vienna, (1966). Cited on pages: 192, 398.
[66DRO/KOL] Drobnic, M., Kolar, D., Calorimetric determination of the en-
thalpy of hydration of UO3, J. Inorg. Nucl. Chem., 28, (1966), 2833-2835. Cited on page: 412.
[66DRO/PAT] Drowart, J., Pattoret, A., Smoes, S., Mass spectrometric studies
of the vaporization of refractory compounds, Proc. Br. Ceram. Soc., (1966), 67-89. Cited on page: 161.
[66GUG] Guggenheim, E. A., Applications of Statistical Mechanics,
Clarendon Press, Oxford, (1966). Cited on pages: 709, 710. [66LOO/COR] Loopstra, B. O., Cordfunke, E. H. P., On the structure of α-UO3,
Recl. Trav. Chim. Pays-Bas, 85, (1966), 135-142. Cited on pages: 188, 407.
[66OLS/MUL2] Olson, W. M., Mulford, R. N. R., The melting point and decom-
position pressure of neptunium mononitride, J. Phys. Chem., 70, (1966), 2932-2934. Cited on page: 300.
[66ROB] Robins, R. G., Hydrolysis of uranyl nitrate solutions at elevated
temperatures, J. Inorg. Nucl. Chem., 28, (1966), 119-123. Cited on page: 538.
[67CAR/CHO] de Carvalho, R. G., Choppin, G. R., Lanthanide and actinide
sulfate complexes: I. Determination of stability constants, J. Inorg. Nucl. Chem., 29, (1967), 725-735. Cited on pages: 365, 366, 367.

BIBLIOGRAPHY 777
[67COR/LOO] Cordfunke, E. H. P., Loopstra, B. O., Preparation and properties
of the uranates of calcium and strontium, J. Inorg. Nucl. Chem., 29, (1967), 51-57. Cited on pages: 261, 262, 263, 425, 426, 467, 633, 634, 635.
[67GEL/MOS] Gel'man, A. D., Moskvin, A. I., Zaitsev, L. M., Mefod'eva, M.
P., Complex compounds of transuranides, Davey, New York, (1967), 152 pp. Cited on page: 325.
[67GRY/KOR] Gryzin, Yu. I., Koryttsev, K. Z., A study of the behaviour of
UO3 and its hydrates in solutions with an electrode of the thirdkind, Russ. J. Inorg. Chem., 12, (1967), 50-53. Cited on page: 400.
[67MER/SKO] Merkusheva, S. A., Skorik, N. A., Kumok, V. N., Serebrennikov,
V. V., Thorium and uranium(IV) pyrophosphates, Sov. Radio-chem., 9, (1967), 683-685. Cited on pages: 289, 292.
[67PER/KRY] Perkovec, V. D., Kryukov, P. A., Ionisation constants for water
at temperature up to 150oC, VINITI, Report 189-68, (1967). Cited on page: 400.
[68AZI/LYL] Aziz, A., Lyle, S. J., Naqvi, S. J., Chemical equilibria in ameri-
cium and curium sulphate and oxalate systems and an applica-tion of a liquid scintillation counting method, J. Inorg. Nucl. Chem., 30, (1968), 1013-1018. Cited on pages: 365, 366, 367.
[68CHO/CHU] Choporov, D. Y., Chudinov, E. T., Melting point and saturated
vapor pressure of neptunium tetrachloride, Sov. Radiochem., 10, (1968), 208-213. Cited on page: 216.
[68NAI] Nair, G. M., Americium(III)-sulphate complexes, Radiochim.
Acta, 10, (1968), 116-119. Cited on pages: 365, 367. [68PAT/DRO] Pattoret, A., Drowart, J., Smoes, S., Etudes thermodynamiques
par spectrométrie de masse sur le système uranium-oxygène, Thermodynamics of nuclear materials 1967, pp. 613-636, IAEA, Vienna, (1968). Cited on page: 161.
[69ABE] Aberg, M., Crystal structure of [(UO2)2(OH)2Cl2(H2O)4], Acta
Chem. Scand., 23, (1969), 791. Cited on page: 597.

BIBLIOGRAPHY 778
[69ACK/RAU] Ackermann, R. J., Rauh, E. G., Chandrasekharaiah, M. S., A
themodynamic study of the urania-uranium system, J. Phys. Chem., 73, (1969), 762-769. Cited on page: 161.
[69AZI/LYL] Aziz, A., Lyle, S. J., Equilibrium constants for aqueous fluoro
complexes of scandium, yttrium, americium(III) and curium(III)by extraction into di-2-ethylhexyl phosphoric acid, J. Inorg. Nucl. Chem., 31, (1969), 3471-3480. Cited on pages: 354, 355.
[69BAR/MIK] Barbanel', Yu. A., Mikhailova, N. K., Study of the complex
formation of Am(III) with the Cl– ion in aqueous solutions by the method of spectrophotometry, Sov. Radiochem., 11, (1969), 576-579. Cited on page: 356.
[69BEV] Bevington, P. R., Data reduction and error analysis for the
physical sciences, McGraw-Hill, New York, (1969), 336 pp. Cited on pages: 744, 750.
[69CAJ/PRA] Caja, J., Pravdic, V., Contribution to the electrochemistry of
uranium(V) in carbonate solutions, Croat. Chem. Acta, 41, (1969), 213-222. Cited on page: 250.
[69COM] Comité International des Poids et des Mesures, The International
Practical Temperature Scale of 1968, Metrologia, 5, (1969), 35-47. Cited on page: 35.
[69GRE/VAR] Grenthe, I., Varfeldt, J., A potentiometric study of fluoride com-
plexes of uranium(IV) and uranium(VI) using the U(VI)/U(IV) redox couple, Acta Chem. Scand., 23, (1969), 988-998. Cited on pages: 210, 211.
[69GRU/MCB] Gruen, D. M., McBeth, R. L., Vapor complexes of uranium pen-
tachloride and uranium tetrachloride with aluminium chloride:The nature of gaseous uranium pentachloride, Inorg. Chem., 8, (1969), 2625-2633. Cited on page: 219.
[69KEL/FAN] Keller, C., Fang, D., Über Karbonatokomplexe des dreiwertigen
Americiums sowie des vier- und sechswertigen Urans und Plu-toniums, Radiochim. Acta, 11, (1969), 123-127, in German. Cited on pages: 381, 382, 430.

BIBLIOGRAPHY 779
[69KNA/LOS] Knacke, O., Lossmann, G., Müller, F., Zur thermischen Dis-soziation und Sublimation von UO2F2, Z. Anorg. Allg. Chem., 371, (1969), 32-39, in German. Cited on pages: 207, 208.
[69MAR/SHI] Marcus, Y., Shiloh, M., A spectrophotometric study of trivalent
actinide complexes in solution. IV. Americium with chloride ligands, Isr. J. Chem., 7, (1969), 31-43. Cited on page: 356.
[69NOR] Norén, B., A solvent extraction and potentiometric study of fluo-
ride complexes of thorium(IV) and uranium(IV), Acta Chem. Scand., 23, (1969), 931-942. Cited on pages: 210, 211.
[69ROS] Rossotti, H., Chemical applications of potentiometry, D. Van
Nostrand, Princeton N. J., (1969), 229 pp. Cited on pages: 24, 25.
[69SAL/HAK] Salomaa, P., Hakala, R., Vesala, S., Aalto, T., Solvent deuterium
isotope effects on acid-base reactions: Part III. Relative acidity constants of inorganic oxyacids in light and heavy water. Kineticapplications, Acta Chem. Scand., 23, (1969), 2116-2126. Cited on page: 657.
[69SCH/KRA] Schwochau, K., Krasser, W., Schwingungsspektren und
Kraftkonstanten der Hexahalogeno-Komplexe des Techne-tium(IV) und Rhenium(IV), Z. Naturforsch., 24a, (1969), 403-407, in German. Cited on page: 663.
[69SHI/GIV] Shiloh, M., Givon, M., Marcus, Y., A spectrophotometric study
of trivalent actinide complexes in solutions. III. Americium withbromide, iodide, nitrate and carbonate ligands, J. Inorg. Nucl. Chem., 31, (1969), 1807-1814. Cited on page: 375.
[69ZMB] Zmbov, K. F., Heats of formation of lower actinide fluorides
from mass spectrometric studies, Proc. 1st International Conf. onCalorimetry and Thermodynamics, Polish Scientific Publisher, Warsaw, Poland, (1969). Cited on pages: 199, 200.
[70ABE] Aberg, M., On the structures of the predominant hydrolysis
products of uranyl(VI) in solution, Acta Chem. Scand., 24, (1970), 2901-2915. Cited on page: 597.

BIBLIOGRAPHY 780
[70BRA/COB] Brand, J. R., Cobble, J. W., The thermodynamic functions of neptunium(V) and neptunium(VI), Inorg. Chem., 9, (1970), 912-917. Cited on page: 639.
[70CHU/CHO4] Chudinov, E. G., Choporov, D. Y., Vapor pressure of solid ura-
nium tetrafluoride, Russ. J. Phys. Chem., 44, (1970), 1106-1109. Cited on page: 201.
[70GOO/LON] Goodenough, J. B., Longo, J. M., Crystallographic and magnetic
properties of perovskite and perovskite-related compounds, Lan-dolt-Börnstein Tables, III, 4A, pp. 126-314, Springer Berlin, (1970). Cited on pages: 260, 543, 617.
[70MAN] Mann, J. B., Ionization cross sections of the elements, Recent
developments in Mass Spectroscopy, Ogata, K., Ed., pp. 814-819, Univ. Park Press, Baltimore, (1970). Cited on page: 446.
[70MOR/COB] Morss, L. R., Cobble, J. W., 160th National meeting of the
American Chemical Society, Chicago, (1970). Cited on page:404.
[71AHR/KUL] Ahrland, S., Kullberg, L., Thermodynamics of metal complex
formation in aqueous solution: I. A potentiometric study of fluo-ride complexes of hydrogen, uranium(VI) and vanadium(IV), Acta Chem. Scand., 25, (1971), 3457-3470. Cited on pages: 209, 451.
[71COR/LOO] Cordfunke, E. H. P., Loopstra, B. O., Sodium uranates: Prepara-
tion and thermochemical properties, J. Inorg. Nucl. Chem., 33, (1971), 2427-2436. Cited on pages: 271, 274, 287, 398, 399.
[71JEN] Jensen, K. A., Nomenclature of inorganic chemistry, IUPAC
Commission on Nomenclature of Inorganic Compounds, Perga-mon Press, Oxford, (1971), 110 pp. Cited on page: 13.
[71MOS] Moskvin, A. I., Correlation of the solubility products of actinide
compounds with the properties of the metal ions and acid anionsforming them, Sov. Radiochem., 13, (1971), 299-300. Cited on page: 288.

BIBLIOGRAPHY 781
[71NAU/RYZ] Naumov, G. B., Ryzhenko, B. N., Khodakovsky, I. L., Hand-book of thermodynamic data, Atomizdat, Moscow, (1971), in Russian; Engl. transl.: Report USGS-WRD-74-001 (Soleimani, G. J., translator; Barnes I., Speltz, V., eds.), U.S. Geological Survey, Menlo Park, California, USA, 1974, 328p. Cited onpages: 286, 288, 289, 290.
[71NIK/PIR] Nikolaeva, N. M., Pirozhkov, A. V., Determination of the solu-
bility product of uranyl hydroxide at elevated temperatures, Izv. Sib. Otd. Akad. Nauk SSSR, Ser. Khim. Nauk, 4, (1971), 73-81, in Russian. Cited on pages: 191, 399, 538.
[71NIK] Nikolaeva, N. M., The study of hydrolysis and complexing of
uranyl ions in sulphate solutions at elevated temperatures, Izv. Sib. Otd. Akad. Nauk SSSR, Ser. Khim. Nauk, 7, (1971), 61-67. Cited on page: 400.
[71POR/WEB] Porter, R. A., Weber, Jr., W. J., The interaction of silicic acid
with iron(III) and uranyl ions in dilute aqueous solutions, J. Inorg. Nucl. Chem., 33, (1971), 2443-2449. Cited on pages: 252, 253, 254, 593, 612.
[71SAN/VID] Santalova, N. A., Vidavskii, L. M., Dunaeva, K. M., Ippolitova,
E. A., Enthalpy of formation of uranium trioxide dihydrate, Sov. Radiochem., 13, (1971), 608-612. Cited on page: 412.
[71SIL/MAR] Sillén, L. G., Martell, A. E., Stability constants of metal ion com-
plexes, Suppl. No. 1, Special Publication, No. 25, Chemical Society, London, (1971), 865 pp. Cited on pages: 17, 422, 438.
[71TAY/HUR] Taylor, J. C., Hurst, H. J., The hydrogen atom location in α and
β forms of uranyl hydroxide, Acta Crystallogr., B27, (1971), 2018-2022. Cited on page: 505.
[72DWO] Dworkin, A. S., Enthalpy of uranium tetrafluoride from 298 to
1400 K: Enthalpy and entropy of fusion, J. Inorg. Nucl. Chem., 34, (1972), 135-138. Cited on pages: 202, 213.
[72FUG] Fuger, J., Thermodynamic properties of simple actinide com-
pounds, Lanthanides and actinides, Bagnall, K. W., Ed., vol. 7, pp. 157-210, Butterworths, London, (1972). Cited on page: 648.

BIBLIOGRAPHY 782
[72GUI/GIG] Guido, M., Gigli, G., Balducci, G., Dissociation energy of CuCland Cu2Cl2(g) gaseous molecules, J. Chem. Phys., 57, (1972), 3731-3735. Cited on page: 393.
[72MCD/COL] McDowell, W. J., Coleman, C. F., The sulfate complexes of
some trivalent transplutonium actinides and europium, J. Inorg. Nucl. Chem., 34, (1972), 2837-2850. Cited on pages: 365, 366, 367.
[72MET/GUI] Metivier, H., Guillaumont, R., Hydrolyse du plutonium tétrava-
lent, Radiochem. Radioanal. Lett., 10, (1972), 27-35, in French. Cited on pages: 314, 316, 318, 642, 643, 648, 687, 692.
[72MUS] Musikas, C., Formation d'uranates solubles par hydrolyse des
ions uranyle(VI), Radiochem. Radioanal. Lett., 11, (1972), 307-316, in French. Cited on page: 177.
[72NIK/SER] Nikitin, A. A., Sergeyeva, E. I., Khodakovsky, I. L., Naumov, G.
B., Hydrolysis of uranyl in the hydrothermal region, Geokhimiya, (1972), 297-307, in Russian; Engl. transl.: AECL translation Nr. 3554, Atomic Energy of Canada Ltd., Pinawa,Manitoba, Canada, 21pp. Cited on pages: 538, 566.
[72SAN/VID] Santalova, N. A., Vidavskii, L. M., Dunaeva, K. M., Ippolitova,
E. A., Enthalpy of formation of uranium trioxide hemihydrate, Sov. Radiochem., 14, (1972), 741-745. Cited on pages: 190, 539.
[72TAY/KEL] Taylor, J. C., Kelly, J. W., Downer, B., A study of the β → α
phase transition in UO2(OH)2 by dilatometric, microcalorimetric and X-ray diffraction techniques, J. Solid State Chem., 5, (1972), 291-299. Cited on page: 191.
[73BAT] Bates, R. G., Determination of pH, theory and practice, John
Wiley & Sons, New York, (1973), 479 pp. Cited on page: 24. [73GRE/CHE] Greaves, C., Cheetham, A. K., Fender, B. E. F., Sodium uranium
bronze and related phases, Inorg. Chem., 12, (1973), 3003-3007. Cited on page: 419.
[73GRU/HEC] Gruber, J. B., Hecht, H. G., Interpretation of the vapor spectrum
of UCl4, J. Chem. Phys., 59, (1973), 1713-1720. Cited on page: 216.

BIBLIOGRAPHY 783
[73HOE/SIE] Hoekstra, H. R., Siegel, S., The uranium trioxide-water system, J. Inorg. Nucl. Chem., 35, (1973), 761-779. Cited on page: 190.
[73HUL/DES] Hultgren, R., Desai, P. D., Hawkins, D. T., Gleiser, M., Kelley,
K. K., Wagman, D. D., Selected values of the thermodynamic properties of the elements, American Society for Metals, Metals Park, Ohio, USA, (1973), 636 pp. Cited on pages: 148, 447.
[73MET] Metivier, H., Contribution à l'étude de l'hydrolyse du plutonium
tétravalent et de sa complexation par des acides d'intérêt biologique, Ph. D. Thesis, Université Paris VI, (1973), Paris,France, in French. Also published as CEA-R-4477. Cited on page: 314.
[73MOS] Moskvin, A. I., Some thermodynamic characteristics of the
processes of formation of actinide compounds in a solid form: I. Energy and entropy of the crystal lattice, heats of formation andheats of solution, Sov. Radiochem., 15, (1973), 356-363. Cited on page: 288.
[73PIT] Pitzer, K. S., Thermodynamics of electrolytes: I. Theoretical
basis and general equations, J. Phys. Chem., 77, (1973), 268-277. Cited on pages: 708, 710.
[73PIT/MAY] Pitzer, K. S., Mayorga, G., Thermodynamics of electrolytes. II.
Activity and osmotic coefficients for strong electrolytes with oneor both ions univalent, J. Phys. Chem., 77, (1973), 2300-2308. Cited on page: 710.
[74BIN/SCH] Binnewies, M., Schäfer, H., Gasförmige Halogenidkomplexe
und ihre Stabilität, Z. Anorg. Allg. Chem., 407, (1974), 327-344, in German. Cited on page: 219.
[74COR/PRI] Cordfunke, E. H. P., Prins, G., Equilibria involving volatile
UO2Cl2, J. Inorg. Nucl. Chem., 36, (1974), 1291-1293. Cited on page: 220.

BIBLIOGRAPHY 784
[74DHA/TRI] Dharwadkar, S. R., Tripathi, S. N., Karkhanavala, M. D.,Chandrasekharaiah, M. S., Thermodynamic properties of gase-ous uranium hydroxide, 4th Thermodynamic of Nuclear Materi-als Symp., held 21-25 October 1974, in Vienna, vol. 2, pp. 455-465, IAEA, Vienna, Austria, (1974). Cited on pages: 162, 163,401, 454, 455, 591.
[74HEL/KIR] Helgeson, H. C., Kirkham, D. H., Theoretical prediction of the
thermodynamic behavior of aqueous electrolytes at high pres-sures and temperatures: I. Summary of the thermodynamic/ elec-trostatic properties of the solvent, Am. J. Sci., 274, (1974), 1089-1198. Cited on page: 715.
[74KAK/ISH] Kakihana, H., Ishiguro, S., Potentiometric and spectrophotomet-
ric studies of fluoride complexes of uranium(IV), Bull. Chem. Soc. Jpn., 47, (1974), 1665-1668. Cited on pages: 210, 211.
[74MOC/NAG] Mochizuki, A., Nagashima, K., Wakita, H., The synthesis of
crystalline hydrated double carbonates of rare earth elements andsodium, Bull. Chem. Soc. Jpn., 47, (1974), 755-756. Cited on pages: 382, 430.
[74OHA/HOE3] O'Hare, P. A. G., Hoekstra, H. R., Thermochemistry of uranium
compounds: IV. Standard enthalpy of formation of sodium ura-nium(V) trioxide (NaUO3), J. Chem. Thermodyn., 6, (1974), 965-972. Cited on pages: 272, 474.
[74PAR] Parsons, R., Manual of Symbols and Terminology for Physico-
chemical. Quantities and Units. Appendix III. Electrochemicalnomenclature, Pure Appl. Chem., 37, (1974), 503-516. Cited on page: 24.
[74PIT/KIM] Pitzer, K. S., Kim, J. J., Thermodynamics of electrolytes. IV.
Activity and osmotic coefficients for mixed electrolytes, J. Am. Chem. Soc., 96, (1974), 5701-5707. Cited on page: 710.
[74PIT/MAY] Pitzer, K. S., Mayorga, G., Thermodynamics of electrolytes. III.
Activity and osmotic coefficients for 2-2 electrolytes, J. Solution Chem., 3, (1974), 539-546. Cited on page: 710.

BIBLIOGRAPHY 785
[74RAB/ALE] Rabinovich, V. A., Alekseeva, T. E., Real activity coefficients of the individual ions in solutions of electrolytes. II. Comparison of the real and chemical activity coefficients of the ions in solutionsof hydrogen chloride and alkali metal chlorides at 25oC, Sov. Electrochem., 10, (1974), 502-506. Cited on page: 756.
[74SCH/KEL] Schwabe, K., Kelm, H., Queck, C., Zum Problem der Einze-
lionenaktivitäten in konzentrierten Elektrolytlösungen, Z. Phys. Chem. (Leipzig), 255, (1974), 1149-1156, in German. Cited on page: 756.
[74STE] Stephens, H. P., Determination of the enthalpy of liquid copper
and uranium with a liquid argon calorimeter, High Temp. Sci., 6, (1974), 156-166. Cited on pages: 157, 430.
[74TAR/GAR] Tardy, Y., Garrels, R. M., A method of estimating the Gibbs
energies of formation of layer silicates, Geochim. Cosmochim. Acta, 38, (1974), 1101-1116. Cited on page: 254.
[74VIS/VOL] Visyashcheva, G. I., Volkov, Y. F., Simakin, G. A., Kapshukov,
I. I., Bevz, A. S., Yakovlev, G. N., Carbonate compounds ofpentavalent actinides with alkali metal cations: I. Composition and some properties of solid carbonates of pentavalent neptu-nium with potassium obtained from K2CO3 solutions, Sov. Ra-diochem., 16, (1974), 832-837. Cited on pages: 311, 569.
[74VOL/KAP2] Volkov, Y. F., Kapshukov, I. I., Visyashcheva, G. I., Yakovlev,
G. N., Carbonate compounds of pentavalent actinides with alkali metals cations: IV. X-Ray investigation of dicarbonates of nep-tunium(V), plutonium(V) and americium(V) with potassium, Sov. Radiochem., 16, (1974), 846-850. Cited on pages: 311, 569.
[75APE/SAH] Apelblat, A., Sahar, A., Properties of aqueous thorium nitrate
solutions. 3. Partial molal heat capacities and heats of dilution at30oC, J. Chem. Soc. Faraday Trans., 1, (1975), 71. Cited on pages: 159, 541.
[75BIE] Biedermann, G., Ionic media, Dahlem workshop on the nature of
seawater, pp. 339-362, Dahlem Konferenzen, Berlin, (1975). Cited on page: 709.

BIBLIOGRAPHY 786
[75BRA/KEM] von Braun, R., Kemmler-Sack, S., Roller, H., Seemann, I., Wall, I., Uber Perowskitphasen im System BaO-UO2+x mit x<1, Z. Anorg. Allg. Chem., 415, (1975), 133-155, in German. Cited on pages: 266, 534.
[75COR/EGM] Cordfunke, E. H. P., van Egmond, A. B., van Voorst, G., Inves-
tigations on cesium uranates-I. Characterization of the phases in the Cs-U-O system, J. Inorg. Nucl. Chem., 37, (1975), 1433-1436. Cited on page: 405.
[75COR/OUW] Cordfunke, E. H. P., Ouweltjes, W., Prins, G., Standard enthal-
pies of formation of uranium compounds: I. β-UO3 and γ-UO3, J. Chem. Thermodyn., 7, (1975), 1137-1142. Cited on pages: 394, 398.
[75COR] Cordfunke, E. H. P., (1975), Personal communication, (from the
citation in [76FUG/OET]). Cited on pages: 262, 633. [75DEG/CHO] Degischer, G., Choppin, G. R., Complex chemistry in aqueous
solutions, Gmelin Handbuch der anorganischen Chemie: Tran-surane, Band 20,Teil D1: Chemie in Lösung, pp. 129-176, Springer-Verlag, Berlin, (1975). Cited on pages: 354, 355.
[75FRE] Fred, M., (1975), Argonne National Laboratory, private commu-
nication, (from the citation in [76OET/RAN]). Cited on page: 335.
[75HIL/CUB] Hildenbrand, D. L., Cubicciotti, D. D., Mass spectrometric study
of the molecular species formed during vaporization of UCl4 in Cl2 and AlCl3, No. UCRL-13657, Lawrence Livermore National Laboratory, Stanford, Res. Inst., Menlo Prak, California, USA, (1975), 22 pp. Cited on page: 216.
[75OHA/HOE2] O'Hare, P. A. G., Hoekstra, H. R., Thermochemistry of uranium
compounds: VI. Standard enthalpy of formation of Cs2U2O7, thermodynamics of formation of cesium and rubidium uranates at elevated temperatures, J. Chem. Thermodyn., 7, (1975), 831-838. Cited on page: 287.
[75OLO/HEP] Olofsson, G., Hepler, L. G., Thermodynamics of ionization of
water over ranges of temperaure and pressure, J. Solution Chem., 4, (1975), 127-143. Cited on page: 401.

BIBLIOGRAPHY 787
[75PIT] Pitzer, K. S., Thermodynamics of electrolytes. V. Effects ofhigher-order electrostatic terms, J. Solution Chem., 4, (1975), 249-265. Cited on page: 710.
[75SPI/ZIN] Spitsyn, V. I., Zinov'ev, V. E., Gel'd, P. V., Balakhovskii, O. A.,
Thermophysical and magnetic properties of technetium over a wide range of temperatures, Proc. Acad. Sci. USSR Phys. Chem. Sect., 221, (1975), 225-228. Cited on pages: 389, 530.
[75STO/KHA] Stozhenko, T. P., Khanaev, E., Afanas'ev, Yu. A., The enthalpies
of additio of water to certain lanthanide trifluorides, Russ. J. Phys. Chem., 49, (1975), 1241-1242. Cited on page: 359.
[75UEN/SAI] Ueno, K., Saito, A., Solubility and absorption spectra of a car-
bonato complex of pentavalent neptunium, Radiochem. Radio-anal. Lett., 22, (1975), 127-133. Cited on page: 570.
[76BAE/MES] Baes, Jr., C. F., Mesmer, R. E., The hydrolysis of cations, Wiley
& Sons, New York, (1976), 489 pp. Cited on pages: 28, 184,427, 710.
[76BOU/BON] Bousquet, J., Bonnetot, B., Claudy, P., Mathurin, D., Turck, G.,
Enthalpies de formation standard des formiates d'uranyle anhy-dre et hydrate par calorimétrie de réaction, Thermochim. Acta, 14, (1976), 357-367, in French. Cited on page: 290.
[76CHO/UNR] Choppin, G. R., Unrein, P. J., Thermodynamic study of actinide
fluoride complexation, 4th International Transplutonium Ele-ment Symposium, held in Baden-Baden, 13-17 September, 1975, pp. 97-107, North-Holland Publ., Amsterdam, Holland, (1976). Cited on pages: 210, 211, 354, 355.
[76FUG/OET] Fuger, J., Oetting, F. L., The chemical thermodynamics of acti-
nide elements and compounds: Part 2. The actinide aqueousions, International Atomic Energy Agency, Vienna, (1976), 65 pp. Cited on pages: 297, 318, 319, 321, 358, 639, 648, 690.
[76MOR/MCC] Morss, L. R., McCue, M. C., Partial molal entropy and heat ca-
pacity of the aqueous thorium(IV) ion. Thermochemistry of tho-rium nitrate pentahydrate, J. Chem. Eng. Data, 21, (1976), 337-341. Cited on pages: 158, 159, 403, 404, 541.
BIBLIOGRAPHY 788
[76NGU/POT] Nguyen-Trung, C., Poty, B., Solubilité de UO2 en milieu aqueux à 400-500oC à 1 kbar, (1976). Annual Report (CREGU, Nancy) 37-39. Cited on page: 561.
[76OET/RAN] Oetting, F. L., Rand, M. H., Ackermann, R. J., The chemical
thermodynamics of actinide elements and compounds: Part 1.The actinide elements, International Atomic Energy Agency, Vienna, (1976), 111 pp. Cited on pages: 157, 335, 448, 455, 648.
[76PIT/SIL] Pitzer, K. S., Silvester, L. F., Thermodynamics of electrolytes.
VI. Weak electrolytes including H3PO4, J. Solution Chem., 5, (1976), 269-278. Cited on page: 710.
[76REA/LAN] Reardon, E. J., Langmuir, D., Activity coefficients of MgCO3
0
and CaSO40 ion pairs as a function of ionic strength, Geochim.
Cosmochim. Acta, 40, (1976), 549-554. Cited on page: 404. [76SCA] Scatchard, G., Equilibrium in solutions: Surface and colloid
chemistry, Harvard University Press, Cambridge, Massachusetts, (1976), 306 pp. Cited on page: 709.
[76SHA] Shannon, R. D., Revised effective ionic radii and systematic
studies of interatomic distances in halides and chalcogenides,Acta Crystallogr., A32, (1976), 751-767. Cited on page: 334.
[76TAR/GAR] Tardy, Y., Garrels, R. M., Prediction of Gibbs energies of forma-
tion: I. Relationships among Gibbs energies of formation of hy-droxides, oxides and aqueous ions, Geochim. Cosmochim. Acta, 40, (1976), 1051-1056. Cited on page: 534.
[76TOS] Tossidis, I. A., Dissociation of phosphoric and arsenic acid in
aqueous organic solvents, Inorg. Nucl. Chem. Lett., 12, (1976), 609. Cited on page: 657.
[76WEI/WIS] Weigel, F., Wishnevsky, V., Hauske, H., The vapor phase hy-
drolysis of 241AmCl3 and 243AmCl3, heats of formation of 241AmOCl and 243AmOCl, Transplutonium 1975, Muller, W., Lindner, R., Eds., pp. 217-226, North-Holland, Amsterdam, (1976). Cited on page: 362.

BIBLIOGRAPHY 789
[77COR/OUW2] Cordfunke, E. H. P., Ouweltjes, W., Standard enthalpies offormation of uranium compounds: IV. α-UO2SO4, β-UO2SeO4, and UO2SeO3, J. Chem. Thermodyn., 9, (1977), 1057-1062. Cited on pages: 188, 193, 269, 272, 407, 413, 419.
[77DUP/GUI] Duplessis, J., Guillaumont, R., Hydrolyse du neptunium tétrava-
lent, Radiochem. Radioanal. Lett., 31, (1977), 293-302, in French. Cited on pages: 295, 296, 298, 314, 648, 693, 694.
[77FER] Fernelius, W. C., How to name an inorganic substance, IUPAC
Commission on Nomenclature of Inorganic Compounds, Perga-mon Press, Oxford, (1977), 36 pp. Cited on page: 13.
[77HIL] Hildenbrand, D. L., Thermochemistry of gaseous uranium penta-
fluoride and uranium tetrafluoride, J. Chem. Phys., 66, (1977), 4788-4794. Cited on pages: 201, 205.
[77SIM] Simakin, G. A., Real oxidation potentials of the couples AmO2
2+-AmO2
+, NpO22+-NpO2
+ in solutions of potassium and sodium carbonates, Sov. Radiochem., 19, (1977), 424-426. Cited on pages: 309, 310.
[77VOL/VIS] Volkov, Y. F., Visyashcheva, G. I., Kapshukov, I. I., Study of
carbonate compounds of pentavalent actinides with alkali metal cations: V. Production and identification of hydrate forms ofsodium monocarbonatoneptunylate, Sov. Radiochem., 19, (1977), 263-266. Cited on pages: 308, 309, 482.
[78ALL/BEA] Allard, B., Beall, G. W., Predictions of actinide species in the
groundwater, Workshop on the environmental chemistry and research of the actinide elements, held 8-12 October, 1978, in Warrenton, Virginia, USA, (1978). Cited on page: 288.
[78BOY] Boyd, G. E., Osmotic and activity coefficients of aqueous
NaTcO4 and NaReO4 solutions at 25oC, J. Solution Chem., 7, (1978), 229-238. Cited on page: 547.
[78BRA] Brandenburg, N. P., Methods for estimating the enthalpy of for-
mation of inorganic compounds; Thermochemical and crystallo-graphic investigations of uranyl salts of group VI elements, Ph.D. Thesis, University of Amsterdam, (1978), Amsterdam, TheNetherlands, 141 pp. Cited on pages: 234, 235.

BIBLIOGRAPHY 790
[78COR/OHA] Cordfunke, E. H. P., O'Hare, P. A. G., The chemical thermody-namics of actinide elements and compounds: Part 3. Miscellane-ous actinide compounds, International Atomic Energy Agency, Vienna, (1978), 83 pp. Cited on pages: 192, 262, 287, 290, 633.
[78KOB/KOL] Kobets, L. V., Kolevich, T. A., Umreiko, D. S., Crystalline hy-
drated forms of triuranyl diorthophosphate, Russ. J. Inorg. Chem., 23, (1978), 501-505. Cited on page: 242.
[78LAK] Lakner, J. F., Isotherms for the U-UH3-H2 system at tempera-
tures of 700-1065oC and pressures to 137.9 MPa, Lawrence Liv-ermore National Laboratory, Report UCRL-52518, (1978). Cited on page: 417.
[78LAN] Langmuir, D., Uranium solution - mineral equilibria at low tem-
peratures with applications to sedimentary ore deposits, Geo-chim. Cosmochim. Acta, 42, (1978), 547-569. Cited on pages: 288, 289, 291, 292.
[78NIK/PIR] Nikolaeva, N. M., Pirozhkov, A. V., The solubility product of
U(IV) hydroxide at the elevated temperatures, Izv. Sib. Otd. Akad. Nauk SSSR, Ser. Khim. Nauk, 5, (1978), 82-88, in Russian. Cited on page: 184.
[78PER/THO] Perachon, G., Thourey, J., Etude par calorimétrie de la solvata-
tion des halogénures alcalino-terreux dans les solutions aqueuses d'acides halogénés correspondants: I. Enthalpies de dissolution et de dilution des halogénures alcalino-terreux, Thermochim. Acta, 27, (1978), 111-124, in French. Cited on pages: 261, 466.
[78PIT/PET] Pitzer, K. S., Peterson, J. R., Silvester, L. F., Thermodynamics of
electrolytes: IX. Rare earth chlorides, nitrates, and perchlorates, J. Solution Chem., 7, (1978), 45-56. Cited on page: 710.
[78SIN/PRA] Singh, Z., Prasad, R., Venugopal, V., Sood, D. D., The vaporiza-
tion thermodynamics of uranium tetrachloride, J. Chem. Ther-modyn., 10, (1978), 129-134. Cited on page: 216.
[79BRA/PIT] Bradley, D. J., Pitzer, K. S., Thermodynamics of electrolytes. 12.
Dielectric properties of water and Debye-Hückel parameters to 350oC and 1 kbar, J. Phys. Chem., 83, (1979), 1599-1603. Cited on page: 715.

BIBLIOGRAPHY 791
[79CIA/FER] Ciavatta, L., Ferri, D., Grimaldi, M., Palombari, R., Salvatore,F., Dioxouranium(VI) carbonate complexes in acid solution, J. Inorg. Nucl. Chem., 41, (1979), 1175-1182. Cited on page: 245.
[79GOL] Goldberg, R. N., Evaluated activity coefficients and osmotic
coefficients for aqueous solutions: Bi-univalent compounds of lead, copper, manganese and uranium, J. Phys. Chem. Ref. Data, 8, (1979), 1005-1050. Cited on page: 574.
[79HAA/WIL] Haacke, D. F., Williams, P. A., The aqueous chemistry of ura-
nium minerals: Part I. Divalent cation zippeite, Mineral. Mag., 43, (1979), 539-541. Cited on pages: 282, 283, 287, 292.
[79JOH/PYT] Johnson, K. S., Pytkowicz, R. M., Ion association and activity
coefficients in multicomponent solutions, Activity coefficients in electrolyte solutions, Pytkowicz, R. M., Ed., II, pp. 1-62, CRC Press, Boca Raton, Florida, (1979). Cited on page: 708.
[79KLE/HIL] Kleinschmidt, P. D., Hildenbrand, D. L., Thermodynamics of the
dimerization of gaseous UF5, J. Chem. Phys., 71, (1979), 196-201. Cited on pages: 204, 206, 207.
[79LIN/KON] Lingerak, W. A., Konijn, P. C., Slanina, J., The high precision
determination of uranium by computer controlled titrimetry,Proceedings of the first annual symposium on safeguards andnuclear material management, pp. 157-159, Brussels, Belgium, (1979). Cited on page: 632.
[79MIL] Millero, F. J., Effects of pressure and temperature on activity
coefficients, Activity coefficients in electrolyte solutions, Pytko-wicz, R. M., Ed., II, pp. 63-151, CRC Press, Boca Raton, Flor-ida, (1979). Cited on pages: 708, 716.
[79PIT] Pitzer, K. S., Theory: Ion Interaction Approach, Activity coeffi-
cients in electrolyte solutions, Pytkowicz, R. M., Ed., vol. 1, pp. 157-208, CRC Press, Boca Raton, Florida, (1979). Cited on pages: 708, 710.

BIBLIOGRAPHY 792
[79PRA/NAG] Prasad, R., Nagarajan, K., Singh, Z., Bhupathy, M., Venugopal,V., Sood, D. D., Thermodynamics of the vaporization of thorium and uranium halides, Thermodynamics of nuclear materials 1979, Proc. Symp. held 29 January to 2 February, 1979, in Jülich, Federal Republic of Germany, vol. 1, p. 45, International Atomic Energy Agency, Vienna, Austria, (1979). Cited onpages: 226, 227.
[79PYT] Pytkowicz, R. M., Activity coefficients, ionic media, and equi-
libria in solutions, Activity coefficients in electrolyte solutions, Pytkowicz, R. M., Ed., II, pp. 301-305, CRC Press, Boca Raton, Florida, (1979). Cited on page: 708.
[79SYL/DAV] Sylva, R. N., Davidson, M. R., The hydrolysis of metal ions: Part
1. Copper(II), J. Chem. Soc. Dalton Trans., (1979), 232-235. Cited on page: 169.
[79TAG/FUJ] Tagawa, H., Fujino, T., Yamashita, T., Formation and some
chemical properties of alkaline-earth metal monouranates, J. Inorg. Nucl. Chem., 41, (1979), 1729-1735. Cited on page: 286.
[79VOL/VIS2] Volkov, Yu. F., Visyashcheva, G. I., Tomilin, S. V., Kapshukov,
I. I., Rykov, A. G., X-ray diffraction analysis of composition and crystal structure of some pentavalent actinide carbonates, Nauchno-Issledovatel'skij Inst. Atomnykh Reaktorov, Report NIIAR-16(375), (1979), 29 pp. Cited on page: 309.
[79WHI] Whitfield, M., Activity coefficients in natural waters, Activity
coefficients in electrolyte solutions, Pytkowicz, R. M., Ed., II, pp. 153-299, CRC Press, Boca Raton, Florida, (1979). Cited on pages: 11, 12.
[79WHI2] Whiffen, D. H., Manual of symbols and terminology for physico-
chemical quantities and units, IUPAC Commission on Physico-chemical Symbols, Terminology and Units, Pergamon Press, Oxford, (1979), 41 pp. Cited on page: 708.
[80ALW/WIL] Alwan, A. K., Williams, P. A., The aqueous chemistry of ura-
nium minerals: Part II. Minerals of the liebigite group, Mineral. Mag., 43, (1980), 665-667. Cited on pages: 282, 290, 291.

BIBLIOGRAPHY 793
[80ALW] Alwan, A. K., The chemistry of formation of some mineral spe-cies, Ph. D. Thesis, University of Wales, UK, (1980). Cited onpage: 404.
[80BEN/TEA] Benson, L. V., Teague, L. S., A tabulation of thermodynamic
data for chemical reactions involving 58 elements common toradioactive waste package systems, Lawrence Berkeley Labora-tory, Report LBL-11448, (1980), 97 pp. Cited on pages: 290, 291.
[80CHI/WES] Chirico, R. D., Westrum, Jr., E. F., Thermophysics of the lantha-
nide hydroxides: I. Heat capacities of La(OH)3, Gd(OH)3, and Eu(OH)3 from near 5 to 350 K. Lattice and Schottky contribu-tions, J. Chem. Thermodyn., 12, (1980), 71-85. Cited on page: 350.
[80CIA] Ciavatta, L., The specific interaction theory in evaluating ionic
equilibria, Ann. Chim. (Rome), 70, (1980), 551-567. Cited on pages: 709, 710, 721, 722, 723, 724, 729, 731, 733, 735, 753,762.
[80COR/WES] Cordfunke, E. H. P., Westrum, Jr., E. F., Investigations on cae-
sium uranates: VII. Thermochemical properties of Cs2U4O12, Thermodynamics of nuclear materials 1979, Proc. Symp. held 29 January to 2 February, 1979, in Jülich, Federal Republic of Ger-many, pp. 125-141, International Atomic Energy Agency, Vi-enna, Austria, (1980). Cited on pages: 269, 278, 405.
[80COT/WIL] Cotton, F. A., Wilkinson, G., Advanced inorganic chemistry. A
comprehensive Text, 4th. Edition, Wiley-Interscience, New York, (1980). Cited on page: 334.
[80KHO/MAT] Khopkar, P. K., Mathur, J. N., Complexing of californium(III)
and other trivalent actinides by inorganic ligands, J. Inorg. Nucl. Chem., 42, (1980), 109-113. Cited on pages: 365, 367.
[80LEI] Leitnaker, J. M., Re-interpretation of the vapor pressure meas-
urements over UF5, High Temp. Sci., 12, (1980), 289-296. Cited on pages: 203, 205, 207.

BIBLIOGRAPHY 794
[80LEM/TRE] Lemire, R. J., Tremaine, P. R., Uranium and plutonium equilib-ria in aqueous solutions to 200oC, J. Chem. Eng. Data, 25, (1980), 361-370. Cited on pages: 158, 409, 542, 564, 612.
[80NAG/BHU] Nagarajan, K., Bhupathy, M., Prasad, R., Singh, Z., Venugopal,
V., Sood, D. D., Vaporization behaviour of uranium tetra-fluoride, J. Chem. Thermodyn., 12, (1980), 329-333. Cited on page: 201.
[81BRO/NYV] Broul, M., Nyvlt, J., Soehnel, O., Solubility in inorganic two-
component systems, Elsevier Sci. Publ., Amsterdam, (1981). Cited on page: 574.
[81CHI/AKH] Chiotti, P., Akhachinskij, V. V., Ansara, I., Rand, M. H., The
chemical thermodynamics of actinide elements and compounds: Part 5. The actinide binary alloys, International Atomic Energy Agency, Vienna, (1981), 275 pp. Cited on page: 447.
[81CIA/FER] Ciavatta, L., Ferri, D., Grenthe, I., Salvatore, F., Spahiu, K.,
Studies on metal carbonate equilibria: 3. The lanthanum(III)carbonate complexes in aqueous perchlorate media, Acta Chem. Scand., A35, (1981), 403-413. Cited on page: 586.
[81COR/OUW] Cordfunke, E. H. P., Ouweltjes, W., Standard enthalpies of
formation of uranium compounds: VI. MUO3 (M = Li, Na, K, and Rb), J. Chem. Thermodyn., 13, (1981), 187-192. Cited on pages: 193, 269, 272, 287, 413, 419, 420.
[81COR/OUW2] Cordfunke, E. H. P., Ouweltjes, W., Standard enthalpies of for-
mation of uranium compounds: VII. UF3 and UF4 (by solution calorimetry), J. Chem. Thermodyn., 13, (1981), 193-197. Cited on pages: 194, 258, 464, 492.
[81FIN/CHA] Fink, J. K., Chasanov, M. G., Leibowitz, L., Thermophysical
properties of uranium dioxide, J. Nucl. Mater., 102, (1981), 17-25. Cited on pages: 193, 666.
[81GLU/GUR] Glushko, V. P., Gurvich, L. V., Bergman, G. A., Veits, I. V.,
Medvedev, V. A., Khachkuruzov, G. A., Yungman, V. S., Ther-modynamic properties of individual substances, vol. 3, Hemi-sphere Publ., New York, (1981). Cited on pages: 199, 394.

BIBLIOGRAPHY 795
[81GOL/TRE] Gol'tsev, V. P., Tretyakov, A. A., Kerko, P. F., Barinov, V. I.,Thermodynamic characteristics of calcium uranates, Vestsi Akad. Navuk BSSR, Ser. Fiz.-Ener. Navuk, (1981), 24-29, in Russian. Cited on page: 286.
[81GOL/TRE2] Gol'tsev, V. P., Tretyakov, A. A., Kerko, P. F., Barinov, V. I.,
Malevich, V. M., Thermodynamic characteristics of magnesiumuranates, Vestsi Akad. Navuk BSSR, Ser. Fiz.-Ener. Navuk, (1981), 18-23, in Russian. Cited on page: 286.
[81HEL/KIR] Helgeson, H. C., Kirkham, D. H., Flowers, G. C., Theoretical
prediction of the thermodynamic behavior of aqueous electro-lytes at high pressures and temperatures: IV. Calculation of ac-tivity coefficients, osmotic coefficients, and apparent molal and standard and relative partial molal properties to 600oC and 5 kb, Am. J. Sci., 281, (1981), 1249-1516. Cited on pages: 715, 716.
[81LIN/BES] Lindemer, T. B., Besmann, T. M., Johnson, C. E., Thermody-
namic review and calculations: Alkali-metal oxide systems with nuclear fuels, fission products, and structural materials, J. Nucl. Mater., 100, (1981), 178-226. Cited on pages: 274, 276, 287, 399, 527, 638.
[81OBR/WIL] O'Brien, T. J., Williams, P. A., The aqueous chemistry of ura-
nium minerals: Part 3. Monovalent cation zippeites, Inorg. Nucl. Chem. Lett., 17, (1981), 105-107. Cited on pages: 282, 287.
[81OHA/FLO] O'Hare, P. A. G., Flotow, H. E., Hoekstra, H. R., Cesium diuran-
ate(Cs2U2O7): Heat capacity (5 to 350 K) and thermodynamic functions to 350 K; A re-evaluation of the standard enthalpy of formation and the thermodynamics of (cesium + uranium + oxy-gen), J. Chem. Thermodyn., 13, (1981), 1075-1080. Cited on pages: 269, 277, 546.
[81STO/SMI] Stohl, F. V., Smith, D. K., The crystal chemistry of the uranyl
silicates minerals, Am. Mineral., 66, (1981), 610-625. Cited on page: 292.
[81STU/MOR] Stumm, W., Morgan, J. J., Aquatic Chemistry. An introduction
emphasizing chemical equilibria in natural waters, 2nd. Edition, John Wiley and Sons, New York, (1981), 780 pp. Cited on page:23.
BIBLIOGRAPHY 796
[81VOC/PIR] Vochten, R., Piret, P., Goeminne, A., Synthesis, crystallographic data, solubility and electrokinetic properties of copper-, nickel-and cobalt-uranylphosphate, Bull. Minéral., 104, (1981), 457-467. Cited on pages: 282, 283, 284, 288.
[82BAR/JAC] Barrett, S. A., Jacobson, A. J., Tofield, B. C., Fender, B. E. F.,
The preparation and structure of barium uranium oxide BaUO3+x, Acta Crystallogr., B38, (1982), 2775-2781. Cited on pages: 266, 534.
[82BID] Bidoglio, G., Characterization of Am(III) complexes with bicar-
bonate and carbonate ions at groundwater concentration levels, Radiochem. Radioanal. Lett., 53, (1982), 45-60. Cited on pages: 375, 586.
[82COR/MUI] Cordfunke, E. H. P., Muis, R. P., Ouweltjes, W., Flotow, H. E.,
O'Hare, P. A. G., The thermodynamic properties of Na2UO4, Na2U2O7, and NaUO3, J. Chem. Thermodyn., 14, (1982), 313-322. Cited on pages: 472, 473.
[82DRE] Drever, J. I., The geochemistry of natural waters, Prentice-Hall,
Englewood Cliffs, N. J., (1982), 388 pp. Cited on page: 23. [82GLU/GUR] Glushko, V. P., Gurvich, L. V., Bergman, G. A., Veits, I. V.,
Medvedev, V. A., Khachkuruzov, G. A., Yungman, V. S., Ther-modynamic properties of individual substances, Glushko, V. P., Ed., Vol. IV, Nauka, Moscow, USSR, (1982), 623 pp. , in Rus-sian. Cited on pages: 148, 157, 158, 161, 162, 195, 196, 198,201, 203, 204, 207, 208, 213, 402, 430, 454, 455, 494, 649.
[82HAM] Hamann, S. D., The influence of pressure on ionization equilib-
ria in aqueous solutions, J. Solution Chem., 11, (1982), 63-68. Cited on page: 37.
[82HEM] Hemingway, B. S., Thermodynamic properties of selected ura-
nium compounds and aqueous species at 298.15 K and 1 bar and at higher temperatures. Preliminary models for the origin of cof-finite deposits, US Geological Survey, Open File Report 82-619, (1982), 89 pp. Cited on pages: 287, 290, 291, 292, 549.

BIBLIOGRAPHY 797
[82HOG] Högfeldt, E., Inorganic ligands, Stability constants of metal-ion complexes, vol. 21, IUPAC Chemical Data Series, A, Pergamon Press, (1982). Cited on page: 422.
[82LAF] Laffitte, M., A report of IUPAC commission I.2 on
thermodynamics: Notation for states and processes, significance of the word “standard”' in chemical thermodynamics, andremarks on commonly tabulated forms of thermodynamicfunctions, J. Chem. Thermodyn., 14, (1982), 805-815. Cited on pages: 14, 15, 31, 32, 35, 707.
[82LAU/HIL] Lau, K. H., Hildenbrand, D. L., Thermochemical properties of
the gaseous lower valent fluorides of uranium, J. Chem. Phys., 76, (1982), 2646-2652. Cited on pages: 199, 200.
[82LUN] Lundqvist, R., Hydrophilic complexes of the actinides: I. Car-
bonates of trivalent americium and europium, Acta Chem. Scand., A36, (1982), 741-750. Cited on pages: 337, 338, 339, 368, 369, 370, 372.
[82MAY] Maya, L., Hydrolysis and carbonate complexation of dioxoura-
nium(VI) in the neutral-pH range at 25oC, Inorg. Chem., 21, (1982), 2895-2898. Cited on page: 506.
[82MOR] Morss, L. R., Complex oxide systems of the actinides, Actinides
in perspective, pp. 381-407, Pergamon Press, Oxford, (1982). Cited on pages: 286, 287.
[82NAI/CHA] Nair, G. M., Chander, K., Joshi, J. K., Hydrolysis constants of
plutonium(III) and americium(III), Radiochim. Acta, 30, (1982), 37-40. Cited on pages: 337, 338, 339.
[82RAR/MIL] Rard, J. A., Miller, D. G., Isopiestic determination of osmotic
and activity coefficients of aqueous CsCl, SrCl2 and mixtures of NaCl and CsCl at 25oC, J. Chem. Eng. Data, 27, (1982), 169-173. Cited on page: 615.
[82RAR/SPE] Rard, J. A., Spedding, F. H., Isopiestic determination of the ac-
tivity coefficients of some aqueous rare-earth electrolyte solu-tions at 25oC, J. Chem. Eng. Data, 27, (1982), 454-461. Cited on page: 574.

BIBLIOGRAPHY 798
[82ROY/PRA] Roy, K. N., Prasad, R., Venugopal, V., Singh, Z., Sood, D. D.,Studies on (2 UF4 + H2 2 UF3 + 2 HF) and vapour pressure of UF3, J. Chem. Thermodyn., 14, (1982), 389-394. Cited on page: 199.
[82SIL] Silva, R. J., The solubilities of crystalline neodymium and am-
ericium trihydroxides, Lawrence Berkeley Laboratory, Report LBL-15055, (1982), 57 pp. Cited on pages: 337, 338, 344, 345,346, 349, 350, 351, 411, 477, 554, 636.
[82SUL/WOO] Sullivan, J. C., Woods, M., Thermodynamics of plutonium(VI)
interaction with bicarbonate, Radiochim. Acta, 31, (1982), 45-50. Cited on pages: 325, 558.
[82TAY] Taylor, J. R., An introduction to error analysis: The study of
uncertainties in physical measurements, University Science Books, Mill Valley, CA, USA, (1982), 270 pp. Cited on page:738.
[82WAG/EVA] Wagman, D. D., Evans, W. H., Parker, V. B., Schumm, R. H.,
Halow, I., Bailey, S. M., Churney, K. L., Nuttall, R. L., The NBStables of chemical thermodynamic properties: Selected values for inorganic and C1 and C2 organic substances in SI units, J. Phys. Chem. Ref. Data, 11, Suppl. 2, (1982), 1-392. Cited on pages: 26, 31, 32, 148, 192, 287, 289, 290, 432.
[82WEI/WIS] Weigel, F., Wishnevsky, V., Güldner, R., The vapor phase hy-
drolysis of PuBr3 and AmBr3: Heats of formation of PuOBr and AmOBr, J. Less-Common Met., 84, (1982), 147-155. Cited on page: 364.
[83CAC/CHO] Caceci, M. S., Choppin, G. R., The determination of the first
hydrolysis constant of Eu(III) and Am(III), Radiochim. Acta, 33, (1983), 101-104. Cited on pages: 337, 338, 339.
[83CAC/CHO2] Caceci, M. S., Choppin, G. R., The first hydrolysis constant of
uranium(VI), Radiochim. Acta, 33, (1983), 207-212. Cited on page: 475.
[83CHO2] Choppin, G. R., Solution chemistry of the actinides, Radiochim.
Acta, 32, (1983), 43-45. Cited on page: 334.

BIBLIOGRAPHY 799
[83EDE/BUC] Edelstein, N. M., Bucher, J. J., Silva, R. J., Nitsche, H., Thermo-dynamic properties of chemical species in nuclear waste, Law-rence Berkeley Laboratory, Report ONWI-399 and LBL-14325, (1983), 115 pp. Cited on pages: 338, 339, 344, 345, 347.
[83FER/GRE] Ferri, D., Grenthe, I., Salvatore, F., Studies on metal carbonate
equilibria. 7. Reduction of the tris(carbonato)dioxouranate(VI) ion, UO2(CO3)3
4–, in carbonate solutions, Inorg. Chem., 22, (1983), 3162-3165. Cited on pages: 373, 721.
[83FUG/PAR] Fuger, J., Parker, V. B., Hubbard, W. N., Oetting, F. L., The
chemical thermodynamics of actinide elements and compounds: Part 8. The actinide halides, International Atomic Energy Agency, Vienna, (1983), 267 pp. Cited on pages: 214, 222, 223,224, 230, 358, 427, 466, 544.
[83FUG] Fuger, J., Uranium: chemical thermodynamic properties-selected
values, Gmelin Handbook of Inorganic Chemistry, Suppl. A6, pp. 165-192, Springer-Verlag, Berlin, (1983). Cited on pages: 286, 287, 290, 633.
[83KAG/KYS] Kaganyuk, D. S., Kyskin, V. I., Kazin, I. V., Calculation of en-
thalpies of formation for radioelement compounds, Sov. Radio-chem., 25, (1983), 65-69. Cited on page: 287.
[83KOH] Kohli, R., Heat capacity and thermodynamic properties of alkali
metal compounds: II. Estimation of the thermodynamic proper-ties of cesium and rubidium zirconates, Thermochim. Acta, 65, (1983), 285-293. Cited on page: 286.
[83MAY] Maya, L., Hydrolysis and carbonate complexation of dioxonep-
tunium(V) in 1.0 M NaClO4 at 25oC, Inorg. Chem., 22, (1983), 2093-2095. Cited on pages: 305, 307, 308, 309, 482.
[83MOR/WIL] Morss, L. R., Williams, C. W., Enthalpies of formation of stron-
tium dichloride and of the strontium ion (Sr2+) in water and in 1 mol . dm–1 HCl, and an assessment of the enthalpies of formation of alkaline-earth dichlorides, J. Chem. Thermodyn., 15, (1983), 279-285. Cited on pages: 261, 466.

BIBLIOGRAPHY 800
[83MOR/WIL2] Morss, L. R., Williams, C. W., Choi, I. K., Gens, R., Fuger, J.,Thermodynamics of actinide perkovskite-type oxides: II. En-thalpy of formation of Ca3UO6, Sr3UO6, Ba3UO6, Sr3NpO6, and Ba3NpO6, J. Chem. Thermodyn., 15, (1983), 1093-1102. Cited on pages: 263, 634.
[83OBR/WIL] O'Brien, T. J., Williams, P. A., The aqueous chemistry of ura-
nium minerals: 4. Schröckingerite, grimselite, and related alkali uranyl carbonates, Mineral. Mag., 47, (1983), 69-73. Cited on pages: 249, 282, 283, 287, 290, 291, 404.
[83RAI/STR] Rai, D., Strickert, R. G., Moore, D. A., Ryan, J. L., Am(III) hy-
drolysis constants and solubility of Am(III) hydroxide, Radio-chim. Acta, 33, (1983), 201-206. Cited on pages: 344, 345, 347, 348, 349, 636.
[83RYA/RAI] Ryan, J. L., Rai, D., The solubility of uranium(IV) hydrous oxide
in sodium hydroxide solutions under reducing conditions, Poly-hedron, 2, (1983), 947-952. Cited on pages: 186, 646.
[83SPA] Spahiu, K., Carbonate complex formation in lanthanoid and acti-
noid systems, Ph. D. Thesis, The Royal Institute of Technology, (1983), Stockholm, Sweden. Cited on pages: 721, 728, 729.
[83VOC/PEL] Vochten, R., Pelsmaekers, J., Synthesis, solubility, electrokinetic
properties and refined crystallographic data of sabugalite, Phys. Chem. Miner., 9, (1983), 23-29. Cited on pages: 282, 283, 288.
[84ALL/OLO] Allard, B., Olofson, U., Torstenfelt, B., Environmental Actinide
Chemistry, Inorg. Chim. Acta, 94, (1984), 205-221. Cited on page: 639.
[84ANA/ATK] Ananthaswamy, J., Atkinson, G., Thermodynamics of concen-
trated electrolyte mixtures. 4. Pitzer-Debye-Hückel limiting slopes for water from 0 to 100oC and from 1 atm to 1 kbar, J. Chem. Eng. Data, 29, (1984), 81-87. Cited on page: 715.
[84BER/KIM] Bernkopf, M. F., Kim, J. I., Hydrolysereaktionen und Karbonat-
komplexierung von dreiwertigem Americium im natürlichen aquatischen System, Inst. für Radiochemie der Tech. Univ.München, Report RCM-02884, (1984), 200 pp. Cited on pages: 344, 348, 349, 375, 378, 379, 469, 518, 586, 636.

BIBLIOGRAPHY 801
[84BRE] Brewer, L., The responsibility of high temperature scientists,High Temp. Sci., 17, (1984), 1-30. Cited on page: 335.
[84COR/KUB] Cordfunke, E. H. P., Kubaschewski, O., The thermochemical
properties of the system uranium-oxygen-chlorine, Thermochim. Acta, 74, (1984), 235-245. Cited on page: 219.
[84FRE/LAN] Handbook on the physics and chemistry of the actinides, Free-
man, A. J., Lander, G. H., Eds., vol. 1, North-Holland, Amster-dam, (1984), 515 pp. Cited on page: 4.
[84FRE] Freeman, R. D., Conversion of standard (1 atm) thermodynamic
data to the new standard-state pressure, 1 bar (105 Pa), J. Chem. Eng. Data, 29, (1984), 105-111. Cited on page: 32.
[84FUG/HAI] Fuger, J., Haire, R. G., Peterson, J. R., The enthalpy of solution
of californium metal and the standard enthalpy of formation ofCf3+(aq), J. Less-Common Met., 98, (1984), 315-321. Cited on page: 358.
[84GEN/WEI] van Genderen, A. C. G., van der Weijden, C. H., Prediction of
Gibbs energies of formation and stability constants of some sec-ondary uranium minerals containing the uranyl group, Uranium, 1, (1984), 249-256. Cited on pages: 288, 289, 290, 291.
[84GOR/SMI] Gorokhov, L. N., Smirnov, V. K., Khodeev, Yu. S., Thermo-
chemical characterization of uranium UFn molecules, Russ. J. Phys. Chem., 58, (1984), 980. Cited on pages: 199, 200, 204, 205, 225.
[84GRE/EAR] Greenwood, N. N., Earnshaw, A., Chemistry of the elements,
Pergamon Press, Oxford, (1984). Cited on page: 334. [84GRO/DRO] Grønvold, F., Drowart, J., Westrum, Jr., E. F., The chemical
thermodynamics of actinide elements and compounds: Part 4,The actinide chalcogenides (excluding oxides), International Atomic Energy Agency, Vienna, (1984), 265 pp. Cited on page:234.

BIBLIOGRAPHY 802
[84HAR/MOL] Harvie, C. E., Moller, N., Weare, J. H., The prediction of min-eral solubilities in natural waters: The Na-K-Mg-Ca-H-Cl-SO4-OH-HCO3-CO3-CO2-H2O system to high ionic strengths at 25oC, Geochim. Cosmochim. Acta, 48, (1984), 723-751. Cited on pages: 306, 479, 498, 570, 586, 615, 616, 759, 760.
[84HOS] Hostettler, J. D., Electrode electrons, aqueous electrons, and re-
dox potentials in natural waters, Am. J. Sci., 284, (1984), 734-759. Cited on page: 23.
[84KUB] Kubaschewski, O., An empirical estimation of entropies and heat
capacities of gaseous double molecules, High Temp. High Pres-sures, 16, (1984), 197-198. Cited on page: 219.
[84LAU/HIL] Lau, K. H., Hildenbrand, D. L., Thermochemical studies of the
gaseous uranium chlorides, J. Chem. Phys., 80, (1984), 1312-1317. Cited on pages: 214, 215, 217, 229, 393.
[84MAR/MES] Marshall, W. L., Mesmer, R. E., Pressure-density relationships
and ionization equilibria in aqueous solutions, J. Solution Chem., 13, (1984), 383-391. Cited on page: 38.
[84NAS/CLE] Nash, K. L., Cleveland, J. M., The thermodynamics of pluto-
nium(IV) complexation by fluoride and its effect on pluto-nium(IV) speciation in natural waters, Radiochim. Acta, 36, (1984), 129-134. Cited on pages: 354, 355.
[84NAS/CLE2] Nash, K. L., Cleveland, J. M., Thermodynamics of the system:
Americium(III)-fluoride. Stability constants, enthalpies, entro-pies and solubility products, Radiochim. Acta, 37, (1984), 19-24. Cited on pages: 359, 360.
[84NRI2] Nriagu, J. O., Formation and stability of base metal phosphates
in soils and sediments, Phosphate minerals, Nriagu, J. O., Moore, P. B., Eds., pp. 318-329, Springer-Verlag, Berlin, (1984). Cited on pages: 288, 292.
[84RAI] Rai, D., Solubility product of Pu(IV) hydrous oxide and equilib-
rium constants of Pu(IV)/Pu(V), Pu(IV)/Pu(VI) andPu(V)/Pu(VI) couples, Radiochim. Acta, 35, (1984), 97-106. Cited on pages: 316, 317, 642, 695, 706.

BIBLIOGRAPHY 803
[84RAR] Rard, J. A., Solubility of Eu(NO3)3.6H2O(c) in water at 298.15 K, J. Chem. Thermodyn., 16, (1984), 921-925. Cited on page: 574.
[84SIL/NIT] Silva, R. J., Nitsche, H., Thermodynamic properties of chemical
species of waste radionuclides, NRC Nuclear waste geochemis-try'83, Alexander, D. H., Birchard, G. F., Eds., NUREG/CP-0052, pp. 70-93, U.S. Nuclear Regulatory Commission, Wash-ington, D.C., USA, (1984). Cited on pages: 377, 378, 379, 380,469, 518, 519.
[84SMI/GOR] Smirnov, V. K., Gorokhov, L. N., Thermodynamics of the sub-
limation and decomposition of uranyl fluoride, Russ. J. Phys. Chem., 58, (1984), 346-348. Cited on pages: 204, 207, 208.
[84VIE/TAR] Vieillard, P., Tardy, Y., Thermochemical properties of phos-
phates, Phosphate minerals, Nriagu, J. O., Moore, P. B., Eds., pp. 171-198, Springer-Verlag, Berlin, (1984). Cited on pages: 288, 289.
[84VIT] Vitorge, P., Mesure de constantes thermodynamiques de compo-
sés trans-uraniens pour prévoir leur géochimie: complexation duNp(V) et de l'Am(III) par les carbonates, hydrolyse du Pu(VI) etde l'Am(III), Seminar held 6-10 Febr. in Sofia (Bulgaria), Inter-national Atomic Energy Agency, Report IAEA-SR-104/25, (1984), 14 pp. Cited on pages: 305, 382.
[84VOC/GOE] Vochten, R., Goeminne, A., Synthesis, crystallographic data,
solubility and electrokinetic properties of meta-zeunerite, meta-kirchheimerite and nickel-uranylarsenate, Phys. Chem. Miner., 11, (1984), 95-100. Cited on pages: 282, 283, 290.
[84VOC/GRA] Vochten, R., de Grave, E., Pelsmaekers, J., Mineralogical study
of bassetite in relation to its oxidation, Am. Mineral., 69, (1984), 967-978. Cited on pages: 282, 283, 288.
[84WIL/MOR] Williams, C. W., Morss, L. R., Choi, I. K., Stability of tetrava-
lent actinides in perovskites, Geochemical behavior of disposedradioactive waste, vol. 246, ACS Symp. Ser., pp. 323-334, American Chemical Society, (1984). Cited on pages: 266, 267, 534.

BIBLIOGRAPHY 804
[85ALD/BRO] Aldridge, J. P., Brock, E. G., Filip, H., Flicker, H., Fox, K.,Galbraith, H. W., Holland, R. F., Kim, K. C., Krohn, B. J.,Magnuson, D. W., Maier II, W. B., McDowell, R. S., Patterson,C. W., Person, W. B., Smith, D. F., Werner, G. K., Measurement and analysis of the infrared-active stretching fundamental (ν3) of UF6, J. Chem. Phys., 83, (1985), 34-48. Cited on pages: 206, 463.
[85BAR/PAR] Bard, A. J., Parsons, R., Jordan, J., Standard Potentials in Aque-
ous Solution, Bard, A. J., Parsons, R., Jordan, J., Eds., Interna-tional Union of Pure and Applied Chemistry. Marcel Dekker, Inc., New York, (1985), 834 pp. Cited on pages: 24, 582.
[85BRA/LAG] Bratsch, S. G., Lagowski, J. J., Lanthanide thermodynamic pre-
dictions. 6. Thermodynamics of gas-phase ions and revised en-thalpy equations for solids at 298.15 K, J. Phys. Chem., 89, (1985), 3310-3316. Cited on page: 5, 543.
[85BRU/GRE] Bruno, J., Grenthe, I., Potentiometric techniques applied to the
modelling of actinide migration in natural water systems, Toxi-col. Environ. Chem., 10, (1985), 257-264. Cited on pages: 160, 427.
[85DAV/FOU] David, F., Fourest, B., Duplessis, J., Hydration thermodynamics
of plutonium and transplutonium ions, J. Nucl. Mater., 130, (1985), 273-279. Cited on page: 581.
[85DIC/LAW] Dickens, P. G., Lawrence, S. D., Weller, M. T., Lithium inser-
tion into α-UO3 and U3O8, Mater. Res. Bull., 20, (1986), 635-641. Cited on page: 407.
[85FER/GRE] Ferri, D., Grenthe, I., Hietanen, S., Nàer-Neumann, E.,
Salvatore, F., Studies on metal carbonate equilibria: 12. Zinc(II) carbonate complexes in acid solution, Acta Chem. Scand., A39, (1985), 347-353. Cited on page: 728.
[85FRE/KEL] Handbook on the physics and chemistry of the actinides, Free-
man, A. J., Keller, C., Eds., vol. 3, North-Holland, Amsterdam, (1985), 520 pp. Cited on page: 4.
BIBLIOGRAPHY 805
[85FRE/LAN] Handbook on the physics and chemistry of the actinides, Free-man, A. J., Lander, G. H., Eds., vol. 2, North-Holland, Amster-dam, (1985), 503 pp. Cited on page: 4.
[85FUG] Fuger, J., Thermochemistry of the alkali metal and alkaline
earth-actinide complex oxides, J. Nucl. Mater., 130, (1985), 253-265. Cited on page: 287.
[85HIL/GUR] Hildenbrand, D. L., Gurvich, L. V., Yungman, V. S., The chemi-
cal thermodynamics of actinide elements and compounds: Part13. The gaseous actinide ions, International Atomic Energy Agency, Vienna, (1985), 187 pp. Cited on pages: 195, 196, 206, 207, 214, 216, 217, 224, 226, 228, 229, 360.
[85KIM] Kim, J. I., Basic actinide and fission products chemistry in the
CEC-coordinated project: Migration of Radionuclides in theGeosphere, (MIRAGE), Inst. für Radiochemie, Tech. Univ.München, Germany, Report RCM-02085, (1985). Cited on page: 382.
[85KIM2] Kim, J. I., Basic actinide and fission product chemistry, and first
summary report covering work period January to December1984, MIRAGE project, EUR-9543-EN, pp. 9-40, Inst. für Ra-diochemie, Tech. Univ. München, Germany, (1985). Cited onpage: 382.
[85LAU/BRI] Lau, K. H., Brittain, R. D., Hildenbrand, D. L., Complex subli-
mation/decomposition of uranyl fluoride: Thermodynamics ofgaseous UO2F2 and UOF4, J. Phys. Chem., 89, (1985), 4369-4373. Cited on pages: 204, 205, 207, 208.
[85MAG/CAR] Magirius, S., Carnall, W. T., Kim, J. I., Radiolytic oxidation of
Am(III) to Am(V) in NaCl solutions, Radiochim. Acta, 38, (1985), 29-32. Cited on pages: 342, 352, 353.
[85MAR2] Marcus, Y., Ion solvation, John Wiley and Sons limited, Chich-
ester, (1985). Cited on page: 756. [85MUL] Muller, A. B., (1985), Private communication, OECD Nuclear
Energy Agency, Paris. Cited on page: 4.

BIBLIOGRAPHY 806
[85NIT/EDE] Nitsche, H., Edelstein, N. M., Solubility and speciation of acti-nide ions in near-neutral solutions, Lawrence Berkeley Labora-tory, Report LBL-18900, (1985), 75 pp. Cited on pages: 344, 345, 347, 639.
[85PHI/PHI] Phillips, S. L., Phillips, C. A., Skeen, J., Hydrolysis, formation
and ionization constants at 25oC, and at high temperature-high ionic strength, Lawrence Berkeley Laboratory, Report LBL-14996, (1985). Cited on pages: 286, 287, 288, 289, 291.
[85RAI/RYA] Rai, D., Ryan, J. L., Neptunium(IV) hydrous oxide solubility
under reducing and carbonate conditions, Inorg. Chem., 24, (1985), 247-251. Cited on pages: 298, 302, 523, 648.
[85SAW/RIZ] Sawant, R. M., Rizvi, G. H., Chaudhuri, N. K., Patil, S. K., De-
termination of the stability constant of Np(V) fluoride complexusing a fluoride ion selective electrode, J. Radioanal. Nucl. Chem., 89, (1985), 373-378. Cited on page: 420.
[85SOH/NOV] Söhnel, O., Novotný,P., Densities of aqueous solutions of inor-
ganic substances, Elsevier, Amsterdam, (1985), 335 pp. Cited on pages: 29, 30.
[85SPA] Spahiu, K., Studies on metal carbonate equilibria: 11.
Yttrium(III) carbonate complex formation in aqueous perchlorate media of various ionic strengths, Acta Chem. Scand., A39, (1985), 33-45. Cited on pages: 374, 586.
[85STO2] Storms, E. K, Sublimation thermodynamics of UO2-x, J. Nucl.
Mater., 132, (1985), 231-243. Cited on page: 161. [85TSO/BRO] Tso, T. C., Brown, D., Judge, A. I., Halloway, J. H., Fuger, J.,
Thermodynamics of the actinoid elements: Part 6. The prepara-tion and heats of formation of some sodium uranates(VI), J. Chem. Soc. Dalton Trans., (1985), 1853-1858. Cited on pages: 287, 399.
[85UNE] Une, K., Oxygen potential of Cs2U4O12/Cs2U4O13 equilibrium, J.
Nucl. Sci. Technol., 22, (1985), 586-588. Cited on pages: 278, 279, 405.

BIBLIOGRAPHY 807
[86AVO/BIL] Avogadro, A., Billon, A., Cremers, A., Henrion, P., Kim, J. I., Jensen, B. S., Hooker, P. J., The MIRAGE project: Actinide andfission product physico-chemical behaviour in geological envi-ronment, Radioactive Waste Management and Disposal, pp. 331-345, Cambridge University Press, Luxembourg, (1986). Cited onpage: 382.
[86BRA/LAG] Bratsch, S. G., Lagowski, J. J., Actinide thermodynamic predic-
tions: 3. Thermodynamics of compounds and aquo ions of the2+, 3+, and 4+ oxidation states and standard electrode potentialsat 298.15 K, J. Phys. Chem., 90, (1986), 307-312. Cited on page: 5, 543.
[86BRU/FER] Bruno, J., Ferri, D., Grenthe, I., Salvatore, F., Studies on metal
carbonate equilibria: 13. On the solubility of uranium(IV) diox-ide, UO2(s), Acta Chem. Scand., 40, (1986), 428-434. Cited on page: 184.
[86BRU] Bruno, J., Stoichiometric and structural studies on the Be2+-H2O-
CO2(g) system, Ph. D. Thesis, The Royal Institute of Technol-ogy, (1986), Stockholm, Sweden. Cited on page: 729.
[86COD] CODATA, The 1986 adjustment of the fundamental physical
constants. A report of the CODATA Task Group on Fundamen-tal Constants, prepared by Cohen, E. R. and Taylor, B. N., Per-gamon Journals, Oxford, CODATA Bulletin, Report 63, (1986), 36 pp. Cited on pages: 35, 36.
[86DAV] David, F., Thermodynamic properties of the lanthanide and acti-
nide ions in aqueous solution, J. Less-Common Met., 121, (1986), 27-42. Cited on page: 581.
[86DIC/PEN] Dickens, P. G., Penny, D. J., Weller, M. T., Lithium insertion in
uranium oxide phases, Solid State Ionics, 18-19, (1986), 778-782. Cited on pages: 89DIC/LAW, 269, 405, 413.
[86EWA/HOW] Ewart, F. T., Howse, R. M., Thomason, H. P., Williams, S. J.,
Cross, J. E., The solubility of actinides in the near-field, Scien-tific Basis for Nuclear Waste Management IX, held 9-11 Sep-tember 1985, in Stockholm, vol. 50, pp. 701-708, (1986). Cited on pages: 348, 349, 375.
BIBLIOGRAPHY 808
[86FEL/WEA] Felmy, A. R., Weare, J. H., The prediction of borate mineralequilibria in natural waters: application to Searles Lake, Califor-nia, Geochim. Cosmochim. Acta, 50, (1986), 2771-2783. Cited on page: 498.
[86FRE/KEL] Handbook on the physics and chemistry of the actinides, Free-
man, A. J., Keller, C., Eds., vol. 4, North-Holland, Amsterdam, (1986), 567 pp. Cited on page: 4.
[86GRE/ROB] Grenthe, I., Robouch, P., Vitorge, P., Chemical equilibria in ac-
tinide carbonate systems, J. Less-Common Met., 122, (1986), 225-231. Cited on pages: 305, 306, 307.
[86HOV/TRE] Hovey, J. K., Tremaine, P. R., Thermodynamics of aqueous
aluminium : Standard partial molar heat capacities of alumin-ium(+3) from 10 to 55oC, Geochim. Cosmochim. Acta, 50, (1986), 453-459. Cited on pages: 159, 541.
[86KAT/SEA] The chemistry of the actinide elements, 2nd. Edition, Katz, J. J.,
Seaborg, G. T., Morss, L. R., Eds., Chapman and Hall, London, (1986), 1674 pp. Cited on page: 4.
[86LIE/KIM] Lierse, Ch., Kim, J. I., Chemisches Verhalten von Plutonium in
natürlichen aquatischen Systemen: Hydrolyse, Carbonatkom-plexierung und Redoxreaktionen, Inst. Für Radiochemie, Tech-nische Universität München, Report RCM-02286, (1986), 234 pp. Cited on pages: 316, 642, 652, 688.
[86MAL/SRE] Mallika, C., Sreedharan, O. M., Thermodynamic stabilities of
TeO2 and Sb2Te3 by a solid-oxide electrolyte e.m.f. technique, J. Chem. Thermodyn., 18, (1986), 727-734. Cited on page: 393.
[86MOR] Morss, L. R., Thermodynamic properties, The chemistry of the
actinide elements, 2nd ed., Katz, J. J., Seaborg, G. T., Morss, L. R., Eds., vol. 2, pp. 1278-1360, Chapman and Hall, London, (1986). Cited on pages: 286, 287, 290.
[86NOR/MUN] Nordstrom, D. K., Munoz, J. L., Geochemical Thermodynamics,
Blackwell Sci. Publ., Palo Alto, (1986). Cited on page: 23.

BIBLIOGRAPHY 809
[86VOC/GRA] Vochten, R., de Grave, E., Pelsmaekers, J., Synthesis, crystallo-graphic and spectroscopic data, solubility and electrokinetic properties of metakahlerite and its Mn analogue, Am. Mineral., 71, (1986), 1037-1044. Cited on pages: 282, 283, 284, 290.
[86WAN] Wanner, H., Modelling interaction of deep groundwaters with
bentonite and radionuclide speciation, National Co-operative for the Storage of Radioactive Waste (Nagra), Report EIR-Bericht Nr. 589 and Nagra NTB 86-21, (1986), 103 pp. Cited on pages: 288, 289, 291.
[87ALE/OGD] Alexander, C. A., Ogden, J. S., Real time mass spectrometric
evaluation of fission product transport at temperature and pres-sure, Proceedings of the symposium on chemical phenomenaassociated with radioactivity releases during severe nuclear plant accidents, held at 9-12 September 1986, Anaheim, California, pp. 21-34, U. S. Nucl. Regul. Comm. NUREG CP-0078, (1987). Cited on pages: 163, 406, 591.
[87BON/KOR] Bondarenko, A. A., Korobov, M. V., Sidorov, L. N., Karasev, N.
M., Enthalpy of formation of gaseous uranium pentafluoride,Russ. J. Phys. Chem., 61, (1987), 1367-1370. Cited on page: 205.
[87BRU/CAS] Bruno, J., Casas, I., Lagerman, B., Muñoz, M., The determina-
tion of the solubility of amorphous UO2(s) and the mononuclear hydrolysis constants of uranium(IV) at 25oC, Sci. Basis Nucl. Waste Management X, Symp. held 1-4 December, 1986 in Bos-ton, Massachusetts, vol. 84, pp. 153-160, (1987). Cited on pages: 187, 559.
[87CIA/IUL] Ciavatta, L., Iuliano, M., Porto, R., The hydrolysis of the La(III)
ion in aqueous perchlorate solution at 60oC, Polyhedron, 6, (1987), 1283-1290. Cited on page: 40.
[87CRO/EWA] Cross, J. E., Ewart, F. T., Tweed, C. J., Thermochemical model-
ling with application to nuclear waste processing and disposal,UK Atomic Energy Authority, Report AERE-R12324, (1987), 45 pp. Cited on page: 375.

BIBLIOGRAPHY 810
[87DUB/RAM] Dubessy, J., Ramboz, C., Nguyen-Trung, C., Cathelineau, M., Charoy, B., Cuney, M., Leroy, J., Poty, B., Weisbrod, A., Physi-cal and chemical controls (f(O2), T, pH) of the opposite behav-iour of U and Sn-W as exemplified by hydrothermal deposits in France and Great-Britain and solubility data, Bull. Minéral., 110, (1987), 261-281. Cited on pages: 185, 560.
[87FRE/LAN] Handbook on the physics and chemistry of the actinides, Free-
man, A. J., Lander, G. H., Eds., vol. 5, North-Holland, Amster-dam, (1987), 375 pp. Cited on page: 4.
[87GAR/PAR] Garvin, D., Parker, V. B., White, Jr., H. J., CODATA thermody-
namic tables: Selection of some compounds of calcium and re-lated mixtures: A prototype set of tables, Springer-Verlag, Ber-lin, (1987), 356 pp. Cited on pages: 28, 214.
[87LAU/HIL] Lau, K. H., Hildenbrand, D. L., Thermochemistry of the gaseous
uranium bromides UBr through UBr5, J. Phys. Chem., 86, (1987), 2949-2954. Cited on pages: 225, 228.
[87LOU/BES] Louis, C., Bessiere, J., Diagrammes potentiel-niveau d'acidité
dans les milieux H2O-H3PO4 -II. Systèmes électrochimiques faisant intervenir le proton, Talanta, 34, (1987), 771-777, in French. Cited on page: 241.
[87MAT/OHS] Matsui, T., Ohse, R. W., Thermodynamic properties of uranium
nitride, plutonium nitride and uranium-plutonium mixed nitride, High Temp. High Pressures, 19, (1987), 1-17. Cited on pages: 238, 447.
[87RAI/SWA] Rai, D., Swanson, J. L., Ryan, J. L., Solubility of
NpO2.xH2O(am) in the presence of Cu(I)/Cu(II) redox buffer, Radiochim. Acta, 42, (1987), 35-41. Cited on pages: 297, 298, 316, 640, 642, 648, 649, 663, 693.
[87RIG/VIT] Riglet, C., Vitorge, P., Grenthe, I., Standard potentials of the
(MO22+/MO2
+) systems for uranium and other actinides, Inorg. Chim. Acta, 133, (1987), 323-329. Cited on page: 728.
[87ROB/VIT] Robouch, P., Vitorge, P., Solubility of PuO2(CO3), Inorg. Chim.
Acta, 140, (1987), 239-242. Cited on pages: 325, 330, 558, 679, 680, 681.

BIBLIOGRAPHY 811
[87VEN/IYE] Venugopal, V., Iyer, V. S., Sundaresh, V., Singh, Z., Prasad, R.,Sood, D. D., Standard molar Gibbs free energy of formation ofNaCrO2 by e.m.f. measurements, J. Chem. Thermodyn., 19, (1987), 19-25. Cited on page: 510.
[88ATK/BEC] Atkins, M., Beckley, A., Glasser, F. P., Influence of cement on
the near field environment and its specific interaction with ura-nium and iodine, Radiochim. Acta, 44/45, (1988), 255-261. Cited on pages: 282, 284.
[88CIA] Ciavatta, L., (1988), Università de Napoli, Naples, Italy, Private
Communication, (from the citation in [92GRE/FUG]). Cited onpages: 724, 731, 735.
[88COR/OUW] Cordfunke, E. H. P., Ouweltjes, W., Standard enthalpies of
formation of uranium compounds: XIV. BaU2O7 and Ba2U2O7, J. Chem. Thermodyn., 20, (1988), 235-238. Cited on pages: 265, 532, 634.
[88DIC/POW] Dickens, P. G., Powell, A. V., Chippindale, A. M., Alkali metal
insertion of uranium oxides, Solid State Ionics, 28/30, (1988), 1123-1127. Cited on pages: 188, 269, 272, 406, 413, 420.
[88HED] Hedlund, T., Studies of complexation and precipitation equilibria
in some aqueous aluminium(III) systems, Ph. D. Thesis, Univer-sity of Umeå, (1988), Sweden. Cited on page: 729.
[88HOV/HEP3] Hovey, J. K., Hepler, L. G., Tremaine, P. R., Apparent molar
heat capacities and volumes of aqueous HClO4, HNO3, (CH3)4NOH, and K2SO4 at 298.15 K, Thermochim. Acta, 126, (1988), 245-253. Cited on page: 541.
[88KEN/MIK] Kennedy, C. M., Mikelsons, M. V., Lawson, B. L., Pinkerton, T.
C., A formate based precursor for the preparation of technetium complexes, Appl. Radiat. Isot., 39, (1988), 213-225. Cited on page: 407.
[88LEM] Lemire, R. J., Effects of high ionic strength groundwaters on
calculated equilibrium concentrations in the uranium-water sys-tem, Atomic Energy of Canada Ltd., Report AECL-9549, (1988), 40 pp. Cited on page: 291.

BIBLIOGRAPHY 812
[88MIL/CVI] Mills, I., Cvitaš,T., Homann, K., Kallay, N., Kuchitsu, K., Quan-tities, units and symbols in physical chemistry, IUPAC, Black-well Scientific Publications, Oxford, (1988), 134 pp. Cited on pages: 11, 21, 25.
[88MUL/SHE] Mulford, R. N. R., Sheldon, R. I., Density and heat capacity of
liquid uranium at high temperatures, J. Nucl. Mater., 154, (1988), 268-275. Cited on pages: 157, 430, 448.
[88OHA/LEW] O'Hare, P. A. G., Lewis, B. M., Nguyen, S. N., Thermochemistry
of uranium compounds: XVII. Standard molar enthalpy of for-mation at 298.15 K of dehydrated schoepite UO3.0.9H2O. Ther-modynamics of (schoepite + dehydrated schoepite + water), J. Chem. Thermodyn., 20, (1988), 1287-1296. Cited on pages: 190, 191, 407, 409, 434, 535, 539.
[88PAR/POH] Parks, G. A., Pohl, D. C., Hydrothermal solubility of uraninite,
Geochim. Cosmochim. Acta, 52, (1988), 863-875. Cited on pages: 185, 560.
[88PHI/HAL] Phillips, S. L., Hale, F. V., Silvester, L. F., Siegel, M. D., Ther-
modynamic tables for nuclear waste isolation: Vol.1, Aqueous solutions database, Lawrence Berkeley Lab., Report LBL-22860, NUREG/CR-4864, SAND87-0323, (1988). Cited on pages: 286, 287, 288, 289, 291.
[88SHO/HEL] Shock, E. L., Helgeson, H. C., Calculation of the thermodynamic
and transport properties of aqueous species at high pressures and temperatures: Correlation algorithms for ionic species and equa-tion of state predictions to 5 kb and 1000oC, Geochim. Cosmo-chim. Acta, 52, (1988), 2009-2036. Cited on pages: 38, 158, 562, 715.
[88STA/KIM] Stadler, S., Kim, J. I., Chemisches Verhalten von Americium in
natürlichen wässrigen Lösungen: Hydrolyse, Radiolyse und Re-dox-reaktionen, Inst. für Radiochemie der Technischen Univer-sität, München, Report RCM-01188, (1988), 141 pp. Cited on pages: 337, 338, 339, 340, 341, 342, 344, 345, 346, 348, 349,352, 353, 409, 410, 411, 448.

BIBLIOGRAPHY 813
[88STA/KIM2] Stadler, S., Kim, J. I., Hydrolysis reactions of Am(III) and Am(V), Radiochim. Acta, 44/45, (1988), 39-44. Cited on pages: 342, 344, 349, 352, 409.
[88STA/NIT] Standifer, E. M., Nitsche, H., First evidence for hexagonal
AmOHCO3, Lanthanide Actinide Res., 2, (1988), 383-384. Cited on page: 378.
[88TAN/HEL] Tanger, IV, J. C., Helgeson, H. C., Calculation of the thermody-
namic and transport properties of aqueous species at high pres-sures and temperatures: Revised equations of state for the stan-dard partial molal properties of ions and electrolytes, Am. J. Sci., 288, (1988), 19-98. Cited on pages: 38, 715.
[88TAS/OHA] Tasker, I. R., O'Hare, P. A. G., Lewis, B. M., Johnson, G. K.,
Cordfunke, E. H. P., Thermochemistry of uranium compounds:XVI. Calorimetric determination of the standard molar enthalpyof formation at 298.15 K, low-temperature heat capacity, and high-temperature enthalpy increments of UO2(OH)2.H2O (schoepite), Can. J. Chem., 66, (1988), 620-625. Cited on pages: 189, 408, 412.
[88ULL/SCH] Ullman, W. J., Schreiner, F., Calorimetric determination of the
enthalpies of the carbonate complexes of U(VI), Np(VI), andPu(VI) in aqueous solution at 25oC, Radiochim. Acta, 43, (1988), 37-44. Cited on page: 325.
[88WAN] Wanner, H., The NEA Thermochemical Data Base Project, Ra-
diochim. Acta, 44/45, (1988), 325-329. Cited on page: 4. [89BRU/SAN] Bruno, J., Sandino, M. C. A., The solubility of amorphous and
crystalline schoepite in neutral to alkaline solutions, Sci. BasisNucl. Waste Management XII, held 10-13 October, in Berlin, vol. 127, pp. 871-878, (1989). Cited on pages: 434, 443, 444, 512.
[89CHA/RAO] Chatt, A., Rao, R. R., Complexation of europium(III) with car-
bonate ions in groundwater, Mater. Res. Soc. Symp. Proc., 127, (1989), 897-904. Cited on page: 373.

BIBLIOGRAPHY 814
[89COR/KON] Cordfunke, E. H. P., Konings, R. J. M., Westrum, Jr., E. F., Re-cent thermochemical research on reactor materials and fission products, J. Nucl. Mater., 167, (1989), 205-212. Cited on pages: 222, 671, 690.
[89COX/WAG] Cox, J. D., Wagman, D. D., Medvedev, V. A., CODATA Key
Values for Thermodynamics, Hemisphere Publ. Corp., New York, (1989), 271 pp. Cited on pages: 5, 31, 37, 39, 45, 133,134, 135, 148, 158, 214, 230, 238, 239, 318, 321, 394, 398, 430,485, 492, 574.
[89DIC/LAW] Dickens, P. G., Lawrence, S. D., Penny, D. J., Powell, A. V.,
Insertion compounds of uranium oxides, Solid State Ionics, 32-33, (1989), 77-83. Cited on pages: 188, 269, 270, 271, 406, 413, 493.
[89FEL/RAI] Felmy, A. R., Rai, D., Schramke, J. A., Ryan, J. L., The solubil-
ity of plutonium hydroxide in dilute solution and in high-ionic-strength chloride brines, Radiochim. Acta, 48, (1989), 29-35. Cited on page: 636.
[89GRE/BID] Grenthe, I., Bidoglio, G., Omenetto, N., Use of thermal lensing
spectrophotometry (TLS) for the study of mononuclear hydroly-sis of uranium(IV), Inorg. Chem., 28, (1989), 71-74. Cited on page: 187.
[89GUI/GRI] Guillermet, A. F., Grimvall, G., Thermodynamic properties of
technetium, J. Less-Common Met., 147, (1989), 195-211. Cited on page: 671.
[89GUR/DEV] Gurevich, V. M., Devina, O. A., Sergeyeva, E. I., Gavrichev, K.
S., Gorbunov, V. E., Efimov, M. E., Khodakovsky, I. L., Ex-perimental study of thermodynamic properties of UO2(OH)2(c) and UO2CO3(c), Academy of Sciences of the USSR, Report 3-10, (1989), 1 pp. Cited on pages: 414, 537, 538.
[89HOV/HEP] Hovey, J. K., Hepler, L. G., Apparent and partial molar heat ca-
pacities and volumes of aqueous HClO4 and HNO3 from 10 to 55oC, Can. J. Chem., 67, (1989), 1489-1495. Cited on page: 541.

BIBLIOGRAPHY 815
[89HOV/NGU] Hovey, J. K., Nguyen-Trung, C., Tremaine, P. R., Thermody-namics of aqueous uranyl ion: Apparent and partial molar heatcapacities and volumes of aqueous uranyl perchlorate from 10 to55oC, Geochim. Cosmochim. Acta, 53, (1989), 1503-1509. Cited on pages: 159, 562, 563, 564.
[89KIM/KAN] Kim, J. I., Kanellakopulos, B., Solubility products of pluto-
nium(IV) oxide and hydroxide, Radiochim. Acta, 48, (1989), 145-150. Cited on pages: 316, 642, 649, 692.
[89LIE/GRE] Liebman, J. F., Greenberg, A., From atoms to polymers: isoelec-
tric analogies, vol. 11, Molecular structure and energetics, VCH Publishers, New York, USA, (1989). Cited on pages: 5, 436.
[89MOR/ELL] Morss, L. R., Eller, P. G., Enthalpy of formation of BaPuO3;
stability of perovskite as a nuclear-waste matrix for Pu4+, Radio-chim. Acta, 47, (1989), 51-54. Cited on pages: 331, 645.
[89NIT/STA] Nitsche, H., Standifer, E. M., Silva, R. J., Americium(III) car-
bonate complexation in aqueous perchlorate solution, Radio-chim. Acta, 46, (1989), 185-189. Cited on pages: 368, 369, 372.
[89PAZ/KOC] Pazukhin, E. M., Kochergin, S. M., Stability constants of hydro-
lyzed forms of americium(III) and solubility product of itshydroxide, Sov. Radiochem., 31, (1989), 430-436. Cited on pages: 344, 349, 522, 525.
[89PET/SEL] Petrov, V. G., Seleznev, V. P., Pozdnyakov, S. V., Synthesis
methods and physico-chemical properties of uranium fluoro-phosphates, Mendeleyev Chemico-Technological Institute, Re-port 4-32, (1989), 2 pp. Cited on pages: 242, 415.
[89RED/SAV] Red'kin, A. F., Savelyeva, N. I., Sergeyeva, E. I., Omelyanenko,
B. I., Ivanov, I. P., Khodakovsky, I. L., Investigation of uraninite (UO2(c)) solubility under hydrothermal conditions, Sci. Geol., Bull., 42, (1989), 329-334. Cited on pages: 185, 560.
[89RIG/ROB] Riglet, C., Robouch, P., Vitorge, P., Standard potentials of the
(MO22+/-MO2
+) and (M4+/M3+) redox systems for neptunium and plutonium, Radiochim. Acta, 46, (1989), 85-94. Cited on pages: 639, 728, 730.

BIBLIOGRAPHY 816
[89ROB] Robouch, P., Contribution à la prévision du comportement del'américium, du plutonium et du neptunium dans la géosphère; données chimiques, Commissariat à l'Energie Atomique, Report CEA-R-5473, (1989). Cited on pages: 368, 369, 372, 380, 381, 728, 730.
[89SER/SAV] Sergeyeva, E. I., Savelyeva, N. I., Red'kin, A. F., Zotov, A. V.,
Omelyanenko, B. I., Ivanov, I. P., Khodakovsky, I. L., Complex formation of U(IV) and U(VI) in aqueous solutions in the range25-600oC and 1-1000 bars (experimental study), Proceedings of a Workshop, Academy of Sciences of the USSR, Report 3-11, (1989), 1 pp. Cited on pages: 165, 180, 245, 247, 415.
[89SHO/HEL] Shock, E. L., Helgeson, H. C., Corrections to Shock and Hel-
geson (1988) Geochimica et Cosmochimica Acta, 52, 2009-2036, Geochim. Cosmochim. Acta, 53, (1989), 215. Cited on pages: 38, 715.
[89SHO/HEL2] Shock, E. L., Helgeson, H. C., Sverjensky, D. A., Calculation of
the thermodynamic and transport properties of aqueous species at high pressures and temperatures: Standard partial molal prop-erties of inorganic neutral species, Geochim. Cosmochim. Acta, 53, (1989), 2157-2183. Cited on pages: 38, 715.
[89STA/MAK] Standritchuk, O. Z., Maksin, V. I., Zapol'skii, A. K., Thermody-
namic aspects of the solubility of sulphamates, Russ. J. Phys. Chem., 63, (1989), 1282-1286. Cited on pages: 239, 416.
[89TAT/SER] Tatarinova, E. E., Serezhkina, L. B., Serezhkin, V. N., Solubility
in the Li2XO4-UO2XO4-H2O (X = S, Se) systems at 25oC, Zh. Neorg. Khim., 34, (1989), 2157-2159, in Russian, English trans-lation in [89TAT/SER2]. Cited on pages: 233, 416.
[89TAT/SER2] Tatarinova, E. E., Serezhkina, L. B., Serezhkin, V. N., Solubility
in the Li2XO4-UO2XO4-H2O (X = S, Se) systems at 25oC, Russ. J. Inorg. Chem., 34, (1989), 1227-1228. From a citation in this Bibliography
[89YAM/FUJ] Yamashita, T., Fujino, T., Thermodynamics of quaternary stron-
tium-yttrium-uranium oxides, Japan Atomic Energy Research Institute, Report 3-7, (1989), 2 pp. Cited on pages: 260, 417.

BIBLIOGRAPHY 817
[90ARC/WAN] Archer, D. G., Wang, P., The dielectric constant of water andDebye-Hückel limiting law slopes, J. Phys. Chem. Ref. Data, 19, (1990), 371-411. Cited on page: 715.
[90BEC/NAG] Beck, M. T., Nagypál, I., Chemistry of complex equilibria, Hor-
wood Limited Publishers, New York, (1990), 402 pp. Cited onpage: 25.
[90BRU/GRE] Bruno, J., Grenthe, I., Lagerman, B., On the UO2
2+/U4+ redox potential, Acta Chem. Scand., 44, (1990), 896-901. Cited on page: 548.
[90CAP/VIT] Capdevila, H., Vitorge, P., Temperature and ionic strength influ-
ence on U(VI/V) and U(IV/III) redox potentials in aqueousacidic and carbonate solutions, J. Radioanal. Nucl. Chem., 143, (1990), 403-414. Cited on pages: 250, 629.
[90CIA] Ciavatta, L., The specific interaction theory in equilibrium
analysis: Some empirical rules for estimating interaction coeffi-cients of metal ion complexes, Ann. Chim. (Rome), 80, (1990), 255-263. Cited on pages: 708, 722.
[90COR/KON] Cordfunke, E. H. P., Konings, R. J. M., Potter, P. E., Prins, G.,
Rand, M. H., Thermochemical data for reactor materials and fission products, Cordfunke, E. H. P., Konings, R. J. M., Eds., North-Holland, Amsterdam, (1990), 695 pp. Cited on pages:393, 528, 542, 610, 658.
[90COR/KON2] Cordfunke, E. H. P., Konings, R. J. M., Ouweltjes, W., The
standard enthalpies of formation of MO(s), MCl2(s), and M2+(aq, ∞), (M = Ba, Sr), J. Chem. Thermodyn., 22, (1990), 991-996. Cited on pages: 4, 426.
[90COS/LAK] Costantino, M. S., Lakner, J. F., Bastasz, R., Synthesis of mono-
lithic uranium hydride and uranium deuteride, J. Less-Common Met., 159, (1990), 97-108. Cited on pages: 195, 417.
[90FEL/RAI] Felmy, A. R., Rai, D., Fulton, R. W., The solubility of AmO-
HCO3(c) and the aqueous thermodynamics of the system Na+-Am3+-HCO3
–-CO32–-OH–-H2O, Radiochim. Acta, 50, (1990), 193-
204. Cited on pages: 335, 342, 368, 369, 370, 372, 378, 379,469, 518, 636, 637.

BIBLIOGRAPHY 818
[90FUG/HAI] Fuger, J., Haire, R. G., Wilmarth, W. R., Peterson, J. R., MolarEnthalpy of formation of californium tribromide, J. Less-Common Met., 158, (1990), 99-104. Cited on page: 358.
[90GOU/HAI] Goudiakas, J., Haire, R. G., Fuger, J., Thermodynamics of lan-
thanide and actinide perovskite-type oxides. IV. Molar enthal-pies of formation of MM'O3 (M = Ba or Sr, M' = Ce, Tb, or Am) compounds, J. Chem. Thermodyn., 22, (1990), 577-587. Cited on pages: 543, 617.
[90HAL/JEF2] Hall, R. O. A., Jeffery, A. J., Mortimer, M. J., Spirlet, J. C., Heat
capacity of PuTe between 10 and 300 K, AEA Technology re-port, Report AERE-R-13490, (1990). Cited on page: 324.
[90HAY/THO] Hayes, S. L., Thomas, J. K., Peddicord, K. L., Material property
correlations for uranium mononitride IV. Thermodynamic prop-erties, J. Nucl. Mater., 171, (1990), 300-318. Cited on pages: 236, 237, 417.
[90IYE/VEN] Iyer, V. S., Venugopal, V., Sood, D. D., Thermodynamic studies
on the Rb2U4O12(s)-Rb2U4O13(s) system, J. Radioanal. Nucl. Chem., 143, (1990), 157-165. Cited on pages: 276, 418.
[90KUM/BAT] Kumok, V. N., Batyreva, V. A., Interpretation of the solubility
diagrams of selenate systems at 25oC, Zh. Neorg. Khim., 35, (1990), 2663-2667, in Russian, English translation in [90KUM/BAT2]. Cited on pages: 233, 418.
[90KUM/BAT2] Kumok, V. N., Batyreva, V. A., Interpretation of the solubility
diagrams of selenate systems at 25oC, Russ. J. Inorg. Chem., 35, (1990), 1514-1517. From a citation in this Bibliography
[90LEI] Leigh, G. J., Nomenclature of inorganic chemistry,
recommendations 1990, issued by the Commission on Nomenclature of Inorganic Chemistry, IUPAC, Ed., Blackwell Sci. Publ., Oxford, (1990), 289 pp. Cited on page: 13.
[90MON] Monnin, C., The influence of pressure on the activity coeffi-
cients of the solutes and on the solubility of minerals in the sys-tem Na-Ca-Cl-SO4-H2O to 200oC and 1 kbar, and to high NaCl concentration, Geochim. Cosmochim. Acta, 54, (1990), 3265-3282. Cited on page: 38.
BIBLIOGRAPHY 819
[90OEL/HEL] Oelkers, E. H., Helgeson, H. C., Triple-ion anions and polynu-clear complexing in supercritical electrolyte solutions, Geochim. Cosmochim. Acta, 54, (1990), 727-738. Cited on pages: 715, 716.
[90PAR/SAK] Park, Y. Y., Sakai, Y., Abe, R., Ishii, T., Harada, M., Kojima,T.,Tomiyasu, H., Desactivation mechanism of excited ura-nium(VI) complexes in aqueous solutions, J. Chem. Soc. Fara-day Trans., 86, (1990), 55. Cited on page: 594.
[90PER/SAP] Pershin, A. S., Sapozhnikova, T. V., Hydrolysis of Am(III), J. Radioanal. Nucl. Chem., 143, (1990), 455-462. Cited on page: 344.
[90PHI] Phillips, S. L., Calculation of thermodynamic properties formonomeric U(VI) hydrolysis products at 298.15 K and zeroionic strength, Lawrence Berkeley Laboratory, Report LBL-28015, (1990), 20 pp. Cited on pages: 183, 418.
[90POW] Powell, A. V., The preparation and characterisation of uraniumoxide insertion compounds and related phases, Ph. D. Thesis,University of Oxford, (1990), UK. Cited on pages: 188, 193,269, 272, 406, 413, 419, 420.
[90PRA/MOR] Pratopo, M. I., Moriyama, H., Higashi, K., Carbonate complexa-tion of neptunium(IV) and analogous complexation of ground-water uranium, Radiochim. Acta, 51, (1990), 27-31. Cited on page: 688.
[90RAI/FEL] Rai, D., Felmy, A. R., Ryan, J. L., Uranium(IV) hydrolysis con-stants and solubility product of UO2.xH2O(am), Inorg. Chem., 29, (1990), 260-264. Cited on pages: 185, 186, 435, 505, 559, 646, 647.
[90RIG] Riglet, C., Chimie du neptunium et autres actinides en milieucarbonate, Commissariat à l'Energie Atomique, Report CEA-R-5535, (1990), 267 pp. Cited on pages: 305, 728, 730.
[90ROS/REI] Rösch, F., Reimann, T., Buklanov, V., Milanov, M., Khalkin, V.
A., Dreyer, R., Electromigration of carrier-free radionuclides. XIV. Complex formation of 241Am-Am(III) with oxalate and sulphate in aqueous solution, J. Radioanal. Nucl. Chem., 140, (1990), 159-169. Cited on pages: 365, 367.

BIBLIOGRAPHY 820
[90SAW/CHA2] Sawant, R. M., Chaudhuri, N. K., Patil, S. K., Potentiometricstudies on aqueous fluoride complexes of actinides: stabilityconstants of Th(IV)-, U(IV)-, and Pu(IV)-fluorides, J. Radio-anal. Nucl. Chem., 143, (1990), 295-306. Cited on pages: 210, 211, 420.
[90SEV/ALI] Sevast'yanov, R. G., Alikhanyan, A. S., Krasovskaya, T. I.,
Kuznetsov, N. T., Synthesis and evaporation of uranium hexa-chloride, Vys. Vesh., (1990), 103-105, Part 6, in Russian, English translation available. Cited on pages: 218, 219, 421.
[90TAN] Tananaev, I. G., Hydroxides of pentavalent americium, Sov. Ra-
diochem., 32, (1990), 305-307. Cited on pages: 352, 524. [90TAY/DIN] Taylor, J. R., Dinsdale, A. T., A thermodynamic assessment of
the Ni-O, Cr-O and Cr-Ni-O systems using the ionic liquid and compound energy models, Z. Metallkd., 81, (1990), 354-366. Cited on pages: 472, 510, 511, 526, 658.
[90VOC/HAV] Vochten, R., van Haverbeke, L., Transformation of schoepite
into the uranyl oxide hydrates: becquerelite, billietite and wöl-sendorfite, Mineral. Petrol., 43, (1990), 65-72. Cited on pages: 180, 282, 284, 286, 287, 422, 484, 531, 705.
[91AGU/CAS] Aguilar, M., Casas, I., de Pablo, J., Torrero, M. E., Effect of
chloride concentration on the solubility of amorphous uraniumdioxide at 25oC under reducing conditions, Radiochim. Acta, 52/53, (1991), 13-15. Cited on pages: 221, 423.
[91AND/CAS] Anderson, G. M., Castet, S., Schott, J., Mesmer, R. E., The den-
sity model for estimation of thermodynamic parameters of reac-tions at high temperatures and pressures, Geochim. Cosmochim. Acta, 55, (1991), 1769-1779. Cited on page: 38.
[91BID/CAV] Bidoglio, G., Cavalli, P., Grenthe, I., Omenetto, N., Qi, P., Ta-
net, G., Studies on metal carbonate equilibria, Part 21: Study of the U(VI)-H2O-CO2(g) system by thermal lensing spectropho-tometry, Talanta, 38, (1991), 433-437. Cited on pages: 245, 247, 423.

BIBLIOGRAPHY 821
[91BRU/GLA] Brücher, E., Glaser, J., Toth, I., Carbonate exchange for thecomplex UO2(CO3)3
4– in aqueous solution as studied by 13C NMR spectroscopy, Inorg. Chem., 30, (1991), 2239-2241. Cited on pages: 247, 424.
[91CAR/BRU] Carroll, S. A., Bruno, J., Mineral-solution interactions in the
U(VI)-CO2-H2O system, Radiochim. Acta, 52, (1991), 187-193. Cited on pages: 247, 424.
[91CAR/LIU] Carnall, W. T., Liu, G. K., Williams, C. W., Analysis of the
crystal field spectra of the actinide tetrafluorides. I. UF4, NpF4
and PuF4, J. Chem. Phys., 95, (1991), 7194-7203. Cited on page: 361.
[91CHO/MAT] Choppin, G. R., Mathur, J. N., Hydrolysis of actinyl(VI) cations,
Radiochim. Acta, 52/53, (1991), 25-28. Cited on pages: 166, 175, 176, 424, 549, 589, 704.
[91COR/KON] Cordfunke, E. H. P., Konings, R. J. M., The vapour pressure of
UCl4, J. Chem. Thermodyn., 23, (1991), 1121-1124. Cited on pages: 216, 425.
[91COR/VLA] Cordfunke, E. H. P., van Vlaanderen, P., Onink, M., Ijdo, D. J.
W., Sr3U11O36: crystal structure and thermal stability, J. Solid State Chem., 94, (1991), 12-18. Cited on pages: 263, 425, 426, 633.
[91DIN] Dinsdale, A. T., SGTE data for pure elements, CALPHAD:
Comput. Coupling Phase Diagrams Thermochem., 15, (1991), 317-425. Cited on page: 31.
[91FAL/HOO] Falck, W. E., Hooker, P. J., Uranium solubility and solubility
controls in selected Needle's Eye groundwaters, UK Department of the Environment, Report DoE/HMIP/RR/91/008, (1991), 24pp. Cited on page: 290.
[91FEL/RAI] Felmy, A. R., Rai, D., Mason, M. J., The solubility of hydrous
thorium(IV) oxide in chloride media: Development of an aque-ous ion-interaction model, Radiochim. Acta, 55, (1991), 177. Cited on page: 410.

BIBLIOGRAPHY 822
[91FIN/EWI] Finch, R. J., Ewing, R. C., Uraninite alteration in an oxidizing environment and its relevance to the disposal of spent nuclear fuel, Swedish Nucl. Fuel Waste Managem. Co., Report SKB-TR-91-15, (1991), 137 pp. Cited on page: 292.
[91FRE/KEL] Handbook on the physics and chemistry of the actinides, Free-
man, A. J., Keller, C., Eds., vol. 6, North-Holland, Amsterdam, (1991), 742 pp. Cited on page: 4.
[91FUJ/YAM] Fujino, T., Yamashita, T., Ouchi, K., Phase relation and thermo-
dynamic properties of cubic fluorite-type solid solution, Bay/2Yy/2U1-yO2+x (x < 0 or x > 0), J. Nucl. Mater., 183, (1991), 46-56. Cited on pages: 267, 426.
[91GIR/LAN] Giridhar, J., Langmuir, D., Determination of Eo for the UO2
2+/U4+
couple from measurement of the equilibrium: UO22+ + Cu(s) +
4H+ U4+ + Cu2+ + 2H2O at 25oC and some geochemical im-plications, Radiochim. Acta, 54, (1991), 133-138. Cited on pages: 160, 427, 548.
[91GUI/BAL] Guido, M., Balducci, G., Identification and stability of U2O2,
U2O3 and U2O4 gaseous oxides molecules, J. Chem. Phys., 95, (1991), 5373-5376. Cited on page: 162.
[91HAL/HAR] Hall, R. O. A., Harding, S. R., Mortimer, M. J., Spirlet, J. C.,
Heat capacity of NpSb between 2-300 K, AEA Technology re-port, Report AEA-FS-0049, (1991), 12 pp. Cited on page: 301.
[91HAL/MOR] Hall, R. O. A., Mortimer, M. J., Harding, S. R., Spirlet, J. C.,
Low temperature heat capacity of plutonium selenide over the temperature range 7-300 K, AEA Technology report, Report AEA-FS-0048H, (1991). Cited on page: 323.
[91HIL/LAU] Hildenbrand, D. L., Lau, K. H., Brittain, R. D., The entropies
and probable symmetries of the gaseous thorium and uraniumtetrahalides, J. Chem. Phys., 94, (1991), 8270-8275. Cited on pages: 199, 200, 216, 227, 427.
[91HIL/LAU2] Hildenbrand, D. L., Lau, K. H., Redetermination of the thermo-
chemistry of gaseous UF5, UF2 and UF, J. Chem. Phys., 94, (1991), 1420-1425. Cited on pages: 205, 226, 428.

BIBLIOGRAPHY 823
[91KIM/KLE] Kim, J. I., Klenze, R., Neck, V., Sekine, T., Kanellakopulos, B., Hydrolyse, Carbonat- und Humat-Komplexierung von Np(V), Institut für Radiochemie, Technische Universität München, Re-port RCM 01091, (1991), 61 pp. Cited on page: 305.
[91MEI/KIM] Meinrath, G., Kim, J. I., The carbonate complexation of the
Am(III) ion, Radiochim. Acta, 52/53, (1991), 29-34. Cited on pages: 368, 369, 370, 372, 380, 381, 428.
[91MEI/KIM2] Meinrath, G., Kim, J. I., Solubility products of different Am(III)
and Nd(III) carbonates, Eur. J. Solid State Inorg. Chem., 28, (1991), 383-388. Cited on pages: 379, 380, 381, 428, 519.
[91MEI] Meinrath, G., Carbonate complexation of the trivalent americium
under groundwater conditions, Ph. D. Thesis, Technische Uni-versität München, (1991), Garching, Germany, 199 pp. , in Ger-man. Cited on pages: 382, 428, 429, 430, 480, 636.
[91PIT] Pitzer, K. S., Ion interaction approach: theory and data correla-
tion, Activity coefficients in electrolyte solutions, Pitzer, K. S., Ed., pp. 75-153, CRC Press, Boca Raton, Florida, (1991). Cited on pages: 306, 382, 430, 479, 480, 712, 753, 757, 759, 760, 762.
[91RAO/CHA] Rao, R. R., Chatt, A., Studies on stability constants of euro-
pium(III) carbonate complexes and application of SIT and ion-pairing models, Radiochim. Acta, 54, (1991), 181-188. Cited on page: 373.
[91RAR/MIL] Rard, J. A., Miller, D. G., Corrected values of osmotic and activ-
ity coefficients of aqueous NaTcO4 and HTcO4 at 25oC, J. Solu-tion Chem., 20, (1991), 1139-1147. Cited on page: 547.
[91SAN] Sandino, M. C. A., Processes affecting the mobility of uranium
in natural waters, Ph. D. Thesis, The Royal Institute of Technol-ogy, (1991), Stockholm, Sweden. Cited on pages: 176, 241, 443,512, 584, 626.
[91SHE/MUL] Sheldon, R. I., Mulford, R. N. R., Correction to the uranium
equation of state, J. Nucl. Mater., 185, (1991), 297-298. Cited on pages: 157, 430, 448.

BIBLIOGRAPHY 824
[91SHI] Shilov, V. P., Estimated stability of the U(V) complex withP2W17O61
10–, Sov. Radiochem., 33, (1991), 622-624. Cited on page: 281.
[91VIT/TRA] Vitorge, P., Tran The, P., Solubility limits of radionuclides in
interstitial water - Americium in cement. Task 3 - Characteriza-tion of radioactive waste forms. A series of final reports (1985-89) - No. 34, Commission of the European Communities Lux-embourg, Report EUR 13664, (1991), 39 pp. Cited on pages: 348, 349.
[91VOC/HAV] Vochten, R., van Haverbeke, L., Sobry, R., Transformation of
schoepite into uranyl oxide hydrates of the bivalent cationsMg2+, Mn2+ and Ni2+, J. Mater. Chem., 1, (1991), 637-642. Cited on page: 286.
[91WAN] Wanner, H., On the problem of consistency of chemical thermo-
dynamic data bases, Scientific basis for nuclear waste manage-ment XIV, vol. 212, pp. 815-822, Materials Research Society, (1991). Cited on page: 4.
[92ADN/MAD] Adnet, J. M., Madic, C., Bourges, J., Redox and extraction
chemistry of actinides U, Np, Pu, Am complexed with the phos-photungstate ligand: P2W17O61
10–, 22ème Journées des Actinides, 22-25 April, 1992, Méribel, France, pp. 15-16, (1992). Cited on pages: 386, 431.
[92BLA/WYA] Blaise, J., Wyart, J. F., Selected constants: Energy levels and
atomic spectra of actinides, Delplanque, M., Dayet, J., Gasgnier, N., Pépin, I., Eds., International Tables of Selected Constants, No. 20, Tables Internationales des Constantes, Paris, (1992).Cited on pages: 157, 335, 431.
[92CAP] Capdevila, H., Données thermodynamiques sur l'oxydoréduction
du plutonium en milieux acide et carbonate. Stabilité de Pu(V), Ph. D. Thesis, Université de Paris-Sud, Orsay, France, 5 June, (1992), in French. Also published as CEA-R-5643 Commissariat à l'Energie Atomique, France, (1993). Cited on pages: 250, 326,629, 728, 730.

BIBLIOGRAPHY 825
[92CHO/DU] Choppin, G. R., Du, M., f-Element complexation in brine solu-tions, Radiochim. Acta, 58/59, (1992), 101-104. Cited on pages: 221, 239, 431.
[92DUC/SAN] Ducros, M., Sannier, H., Method of estimation of the enthalpy of
formation and free enthalpy of formation of inorganic com-pounds, Thermochim. Acta, 196, (1992), 27-43. Cited on pages: 5, 432.
[92DUE/FLE] Dueber, R. E., Fleetwood, J. M., Dickens, P. G., The insertion of
magnesium into α-U3O8, Solid State Ionics, 50, (1992), 329-337. Cited on pages: 257, 434.
[92FIN/MIL] Finch, R. J., Miller, M. L., Ewing, R. C., Weathering of natural
uranyl oxide hydrates: schoepite polytypes and dehydration ef-fects, Radiochim. Acta, 58/59, (1992), 433-443. Cited on pages: 189, 434, 505, 587.
[92FUG/KHO] Fuger, J., Khodakovsky, I. L., Sergeyeva, E. I., Medvedev, V.
A., Navratil, J. D., The Chemical Thermodynamics of Actinide Elements and Compounds, Part 12. The Actinide Aqueous Inor-ganic Complexes, International Atomic Energy Agency, Vienna, (1992), 224 pp. Cited on pages: 4, 175, 183, 435, 436, 485, 646.
[92FUG] Fuger, J., Thermodynamic properties of actinide aqueous species
relevant to geochemical problems, Radiochim. Acta, 58/59, (1992), 81-91. Cited on pages: 175, 337, 338, 435.
[92GRE/FUG] Grenthe, I., Fuger, J., Konings, R. J. M., Lemire, R. J., Muller,
A. B., Nguyen-Trung, C., Wanner, H., Chemical Thermodynam-ics of Uranium, Wanner, H., Forest, I., Nuclear Energy Agency, Organisation for Economic Co-operation, Development, Eds., vol. 1, Chemical Thermodynamics, North Holland Elsevier Sci-ence Publishers B. V., Amsterdam, The Netherlands, (1992), 715 pp. Cited on pages: xi, 4, 5, 6, 26, 29, 39, 43, 44, 80, 98, 114,133, 134, 135, 148, 149, 157, 158, 159, 160, 162, 164, 165, 168,169, 170, 172, 173, 174, 175, 176, 177, 178, 179, 180, 181, 182, 183, 184, 185, 186, 187, 188, 189, 190, 191, 192, 193, 195, 196,199, 200, 203, 205, 206, 207, 208, 209, 210, 211, 212, 213, 214,

BIBLIOGRAPHY 826
[92GRE/FUG] 215, 218, 219, 220, 221, 222, 223, 224, 226, 229, 230, 231, 234,236, 237, 238, 239, 240, 241, 242, 243, 245, 246, 247, 250, 251, 252, 254, 255, 257, 259, 260, 261, 262, 263, 266, 268, 271, 272,274, 276, 277, 278, 279, 282, 284, 285, 286, 287, 288, 289, 290,291, 292, 294, 297, 299, 315, 318, 319, 321, 323, 327, 363, 364,366, 394, 397, 398, 399, 401, 402, 404, 407, 408, 409, 412, 416, 417, 418, 420, 421, 422, 423, 424, 425, 426, 427, 428, 431, 432,433, 434, 435, 436, 438, 439, 441, 442, 443, 444, 446, 447, 449,451, 452, 453, 454, 455, 456, 457, 458, 460, 461, 463, 467, 468,469, 473, 476, 478, 485, 486, 487, 488, 489, 491, 492, 494, 495, 497, 505, 506, 509, 510, 512, 516, 517, 530, 531, 535, 536, 537,538, 539, 540, 541, 542, 543, 548, 549, 551, 552, 553, 555, 556,557, 558, 559, 560, 562, 563, 564, 565, 566, 567, 574, 578, 579,582, 583, 584, 587, 589, 593, 594, 598, 599, 600, 603, 605, 608, 609, 611, 612, 619, 620, 621, 623, 624, 625, 626, 628, 630, 633,635, 638, 639, 640, 642, 646, 647, 648, 649, 653, 654, 655, 656,657, 658, 660, 663, 664, 665, 667, 669, 674, 675, 676, 687, 690,698, 699, 704, 705, 708, 721, 723, 728, 729, 730, 733, 736, 748,749, 754, 756, 763.
[92HAS2] Hassan, Refat M., The oxidation of uranium(IV) by polyvalent
metal ions. A linear free-energy correlation, J. Coord. Chem., 27, (1992), 255-266. Cited on pages: 160, 436.
[92HIS/BEN] Hisham, M. W. M., Benson, S. W., Thermochemistry of inor-
ganic solids. 10. Empirical relations between the enthalpies of formation of solid halides and the corresponding gas phase hal-ide anions, J. Chem. Eng. Data, 37, (1992), 194-199. Cited on pages: 5, 436.
[92IUP] IUPAC Commission on Atomic Weights & Isotopic Abun-
dances, Atomic weights of the elements 1991, Pure Appl. Chem., 64, (1992), 1519-1534. Cited on page: 195.
[92KHO] Khodakovsky, I. L., About possible systematic error in thermo-
dynamic properties of uranyl and U4+ aqueous ions, Abstracts of papers, IUPAC conference on Chem. Thermodyn., Snowbird,UT, US, 16-21 August 1992, p. 308, (1992). Cited on pages: 486, 540.

BIBLIOGRAPHY 827
[92KIM/SER] Kimura, T., Serrano, G. J., Nakayama, S., Takahashi, K., Takei-shi, H., Speciation of uranium in aqueous solutions and in pre-cipitates by photoacoustic spectroscopy, Radiochim. Acta, 58/59, (1992), 173-178. Cited on pages: 247, 436.
[92KRA/BIS] Kramer-Schnabel, U., Bischoff, H., Xi, R. H., Marx, G., Solubil-
ity products and complex formation equilibria in the systemsuranyl hydroxide and uranyl carbonate at 25oC and I = 0.1 M, Radiochim. Acta, 56, (1992), 183-188. Cited on pages: 165, 166, 168, 169, 172, 321, 438, 516, 584, 606, 607, 643.
[92LIE/HIL] Lieser, K. H., Hill, R., Hydrolysis and colloid formation of tho-
rium in water and consequences for its migration behaviour -comparison with uranium, Radiochim. Acta, 56, (1992), 37-45. Cited on pages: 247, 438.
[92MOR/WIL] Morss, L. R., Williams, C. W., Enthalpies of formation of rare
earth and actinide(III) hydroxides; their acid-base relationships and estimation of their thermodynamic properties, Sci. BasisNucl. Waste Management XV, symp. held 4-7 November 1991 in Strasbourg, vol. 257, pp. 283-288, (1992). Cited on pages: 439, 477.
[92NEC/KIM] Neck, V., Kim, J. I., Kanellakopulos, B., Solubility and hydroly-
sis behaviour of neptunium(V), Radiochim. Acta, 56, (1992), 25-30. Cited on pages: 296, 480, 640, 641.
[92NGU/BEG] Nguyen-Trung, C., Begun, G. M., Palmer, D. A., Aqueous ura-
nium complexes. 2. Raman spectroscopic study of the complexformation of the dioxouranium(VI) ion with a variety of inor-ganic and organic ligands, Inorg. Chem., 31, (1992), 5280-5287. Cited on pages: 439, 674.
[92NGU/SIL] Nguyen, S. N., Silva, R. J., Weed, H. C., Andrews, Jr., J. E.,
Standard Gibbs free energies of formation at the temperature303.15 K of four uranyl silicates: soddyite, uranophane, sodiumboltwoodite and sodium weeksite, J. Chem. Thermodyn., 24, (1992), 359-376. Cited on pages: 255, 256, 291, 292, 440, 442, 498, 535, 549, 555, 558, 677, 678.

BIBLIOGRAPHY 828
[92RUN/MEI] Runde, W., Meinrath, G., Kim, J. I., A study of solid-liquid phase equilibria of trivalent lanthanide and actinide ions in car-bonate systems, Radiochim. Acta, 58/59, (1992), 93-100. Cited on pages: 377, 378, 379, 380, 381, 428, 519.
[92SAN/BRU] Sandino, M. C. A., Bruno, J., The solubility of
(UO2)3(PO4)2. 4H2O(s) and the formation of U(VI) phosphate complexes: Their influence in uranium speciation in natural wa-ters, Geochim. Cosmochim. Acta, 56, (1992), 4135-4145. Cited on pages: 165, 166, 167, 168, 174, 176, 177, 178, 240, 288, 321,443, 444, 512, 626.
[92SAT/CHO] Satoh, I., Choppin, G. R., Interaction of uranyl(VI) with silicic
acid, Radiochim. Acta, 56, (1992), 85-87. Cited on pages: 252, 253, 254, 444, 593.
[92SHO/OEL] Shock, E. L., Oelkers, E. H., Johnson, J. W., Sverjensky, D. A.,
Helgeson, H. C., Calculation of the thermodynamic properties ofaqueous species at high pressures and temperatures. Effective electrostatic radii, dissociation constants and standard partialmolal properties to 1000oC and 5 kbar, J. Chem. Soc. Faraday Trans., 88, (1992), 803-826. Cited on page: 715.
[92SIL] Silva, R. J., Mechanisms for the retardation of uranium(VI) mi-
gration, Sci. Basis Nucl. Waste Management XV, vol. 257, pp. 323-330, (1992). Cited on pages: 488, 704.
[92VEN/IYE] Venugopal, V., Iyer, V. S., Jayanthi, K., Thermodynamic studies
on A2U4O12 and A2U4O13 (A = Cs/Rb) system by emf and calo-rimetric measurements at high temperatures, J. Nucl. Mater., 199, (1992), 29-42. Cited on pages: 267, 269, 276, 278, 279, 405, 418, 444, 510, 546.
[92VEN/KUL] Venugopal, V., Kulkarni, S. G., Subbanna, C. S., Sood, D. D.,
Vapour pressures of uranium and uranium nitride over UN(s), J. Nucl. Mater., 186, (1992), 259-268. Cited on pages: 237, 446.
[92WIM/KLE] Wimmer, H., Klenze, R., Kim, J. I., A study of hydrolysis reac-
tion of curium(III) by time resolved laser fluorescence spectros-copy, Radiochim. Acta, 56, (1992), 79-83. Cited on pages: 338, 339, 340, 411, 447.
BIBLIOGRAPHY 829
[93BOI/ARL] Boivineau, M., Arlès, L., Vermeulen, J. M., Thévenin, T., High-pressure thermophysical properties of solid and liquid uranium,Physica B (Amsterdam), 190, (1993), 31-39. Cited on pages: 157, 448.
[93CAR] Carroll, S. A., Precipitation of Nd-Ca carbonate solid solution at
25oC, Geochim. Cosmochim. Acta, 57, (1993), 3383-3393. Cited on pages: 379, 519.
[93ERI/NDA] Eriksen, T. E., Ndalamba, P., Cui, D., Bruno, J., Caceci, M. S.,
Spahiu, K., Solubility of the redox sensitive radionuclides 99Tc and 237Np under reducing conditions in neutral to alkaline solu-tions. Effect of carbonate, SKB, SKB Technical Report, Report TR-93-18, (1993), 32 pp. Cited on pages: 251, 298, 302, 303, 304, 448, 449, 523, 648, 689.
[93FER/SAL] Ferri, D., Salvatore, F., Vasca, E., Glaser, J., Grenthe, I., Com-
plex formation in the U(VI)-OH–-F– system, Acta Chem. Scand., 47, (1993), 855-861. Cited on pages: 165, 166, 169, 209, 210, 451, 551, 587.
[93FUG/HAI] Fuger, J., Haire, R. G., Peterson, J. R., Molar enthalpies of for-
mation of BaCmO3 and BaCfO3, J. Alloys Compd., 200, (1993), 181-185. Cited on pages: 260, 543, 617.
[93GIF/VIT] Giffaut, E., Vitorge, P., Evidence of radiolytic oxidation of
241Am in Na+ / Cl– /HCO3– / CO3
2– media, Sci. Basis Nucl. Waste Management XVI, vol. 294, pp. 747-751, (1993). Cited on pages: 375, 383, 469.
[93GIF/VIT2] Giffaut, E., Vitorge, P., Capdevila, H., Corrections de tempéra-
ture sur les coefficients d'activité calculés selon la TIS, Commis-sariat à l'Energie Atomique, Report CEA-N-2737, (1993), 29 pp. Cited on page: 716.
[93GRE/LAG] Grenthe, I., Lagerman, B., Ternary metal complexes: 2. The
U(VI)-SO42–-OH– system, Radiochim. Acta, 61, (1993), 169-176.
Cited on pages: 178, 231, 232, 233, 452, 453, 664, 665, 672,673.
[93HIN] Hinatsu, Y., The magnetic susceptibility and structure of BaUO3,
J. Solid State Chem. 102, (1993), 566-569. Cited on page: 267.

BIBLIOGRAPHY 830
[93JAY/IYE] Jayanthi, K., Iyer, V. S., Singh Mudher, K. D., Venugopal, V.,High-temperature calorimetric studies on the thermal propertiesof Rb2U(SO4)3(s), Thermochim. Acta, 230, (1993), 95-102. Cited on pages: 277, 453, 657.
[93KRI/EBB] Krikorian, O. H., Ebbinghaus, B. B., Adamson, M. G., Fontes,
Jr., A. S., Fleming, D. L., Experimental studies and thermody-namic modeling of volatilities of uranium, plutonium, and am-ericium from their oxides interacted with ash, University of Cali-fornia, Lawrence Livermore National Laboratory, Report UCRL-ID-114774, (1993). Cited on pages: 162, 163, 403, 454, 455, 649.
[93KUB/ALC] Kubaschewski, O., Alcock, C. B., Spencer, P. J., Materials
thermochemistry, 6th. Edition, Pergamon Press Ltd., Oxford, (1993), 363 pp. Cited on page: 543.
[93LEE/BYR] Lee, J. H., Byrne, R. H., Complexation of trivalent rare earth
elements (Ce, Eu, Gd, Tb, Yb) by carbonate ions, Geochim. Cosmochim. Acta, 57, (1993), 295-302. Cited on page: 374.
[93LEM/BOY] Lemire, R. J., Boyer, G. D., Campbell, A. B., The solubilities of
sodium and potassium dioxoneptunium(V) carbonate hydrates at 30, 50 and 75oC, Radiochim. Acta, 61, (1993), 57-63. Cited on page: 305.
[93MCB/GOR] McBride, B.J., Gordon, S., Reno, M. A., Thermodynamic data
for fifty reference elements, NASA, Report 3287, (1993), 7 pp. Cited on pages: 157, 455.
[93MEI/KAT] Meinrath, G., Kato, Y., Yoshida, Z., Spectroscopic study of the
uranyl hydrolysis species (UO2)(OH)22+, J. Radioanal. Nucl.
Chem., 174, (1993), 299-314. Cited on pages: 165, 166, 170, 171, 456, 458, 460, 475, 507, 514, 515, 517, 580, 594, 597, 609.
[93MEI/KIM] Meinrath, G., Kimura, T., Carbonate complexation of the
uranyl(VI) ion, J. Alloys Compd., 202, (1993), 89-93. Cited on pages: 171, 172, 245, 321, 456, 457, 458, 475, 514, 515, 516,584, 606, 607, 643.

BIBLIOGRAPHY 831
[93MEI/KIM2] Meinrath, G., Kimura, T., Behaviour of U(VI) solids under con-ditions of natural aquatic systems, Inorg. Chim. Acta, 204, (1993), 79-85. Cited on pages: 168, 170, 171, 245, 458, 461, 512, 514, 515, 643.
[93MEI/TAK] Meinrath, G., Takeishi, H., Solid-liquid equilibria of Nd3+ in
carbonate solutions, J. Alloys Compd., 194, (1993), 93-99. Cited on pages: 379, 519.
[93MIZ/PAR] Mizuguchi, K., Park, Y. Y., Tomiyasu, H., Electrochemical and
spectroelectrochemical studies on uranyl carbonato and aquacomplexes, J. Nucl. Sci. Technol., 30, (1993), 542-548. Cited on pages: 160, 250, 462, 635.
[93NAI/VEN] Naik, J. S., Venugopal, V., Kulkarni, S. G., Subbanna, C. S.,
Sood, D. D., Vaporization studies over U(l) + UC, UC and(U0.79Ce0.21)C by Knudsen effusion mass spectrometry, Met. Ma-ter. Processes, 5, (1993), 23-32. Cited on pages: 244, 462.
[93NIK/TSI] Nikitin, M. I., Tsirel'nikov, V. I., Determination of enthalpy of
formation of gaseous uranium pentafluoride, High Temp., 30, (1993), 730-735. Cited on pages: 205, 463.
[93ODA] Oda, T., Statistical thermodynamic properties of uranium
hexafluoride, Dept. of Fuel Safety Research, Tokai Research Est., Japan Atomic Energy Research Institute, Report JAERI-M 93-052, (1993). Cited on pages: 206, 463.
[93OGA] Ogawa, T., Thermodynamic properties of (U, Pu)N1-x with a
sublattice formalism - Equilibria involving the nonstoichiometric nitrides, J. Nucl. Mater., 201, (1993), 284-292. Cited on pages: 237, 463.
[93OGO/ROG] Ogorodnikov, V. V., Rogovoi, Yu J., Regularities in the changes
of properties of cubic transition metal mononitrides, Inorg. Ma-ter., 29, (1993), 591-595. Cited on pages: 237, 463.
[93PAS/RUN] Pashalidis, I., Runde, W., Kim, J. I., A study of solid-liquid
phase equilibria of Pu(VI) and U(VI) in aqueous carbonate sys-tems, Radiochim. Acta, 61, (1993), 141-146. Cited on pages: 245, 324, 325, 330, 464, 556, 557, 643, 679, 680, 681.

BIBLIOGRAPHY 832
[93PAT/DUE] Patat, S., Dueber, R. E., Dickens, P. G., Thermochemical andelectrochemical study of magnesium insertion into α-UO3-x, Solid State Ionics, 59, (1993), 151-155. Cited on pages: 194, 257, 258, 271, 273, 280, 464, 492, 493, 494.
[93SAL/KUL] Sali, S. K., Kulkarni, N. K., Sampath, S., Jayadevan, N. C.,
Thermochemical studies on Tl-U-O system, Proc. IX National Symposium of Thermal Analysis, Goa, India, pp. 325-328, Bom-bay, India, (1993). Cited on page: 279.
[93STO/CHO] Stout, B. E., Choppin, G. R., Nectoux, F., Pagès, M., Cation-
cation complexes of NpO2+, Radiochim. Acta, 61, (1993), 65-67.
Cited on pages: 257, 465, 681. [93TAK/FUJ] Takahashi, K., Fujino, T., Morss, L. R., Crystal chemical and
thermodynamic study on CaUO4-x, (Ca0.5Sr0.5)UO4-x and α−SrUO4-x (x = 0 0.5), J. Solid State Chem., 105, (1993), 234-246. Cited on pages: 259, 261, 465.
[94AHO/ERV] Ahonen, L., Ervanne, H., Kaakola, T., Blomqvist, R., Redox
chemistry in uranium-rich groundwater of Palmottu uranium deposit, Finland, Radiochim. Acta, 66/67, (1994), 115-121. Cited on pages: 160, 467.
[94CAP/VIT] Capdevila, H., Vitorge, P., Potentiels redox des couples PuO2
2+
/PuO2+ et Pu4+/Pu3+ à force ionique et température variables. En-
tropie et capacité calorifique, Commissariat à l'Energie Atomi-que, Report CEA-N-2762, (1994), 73 pp. Cited on pages: 728, 730.
[94CAS/BRU] Casas, I., Bruno, J., Cera, E., Finch, R. J., Ewing, R. C., Kinetic
and thermodynamic studies of uranium minerals. Assessment of the long-term evolution of spent nuclear fuel, Swedish Nucl.Fuel Waste Manag. Co., Report SKB-TR-94-16, (1994), 73 pp. Cited on pages: 286, 291.
[94CHO/RIZ] Choppin, G. R., Rizkalla, E. N., Solution chemistry of actinides
and lanthanides, Ch.128, Handbook on the physics and chemistry of rare earths, Gschneidner Jr., K. A., Eyring, L., Choppin, G. R., Lander, G. H., Eds., vol. 18, pp. 559-590, Elsevier Science B.V. Amsterdam, (1994). Cited on page: 334.

BIBLIOGRAPHY 833
[94COR/IJD] Cordfunke, E. H. P., Ijdo, D. J. W., Sr2UO4.5: a new perovskite-type strontium uranate, J. Solid State Chem., 109, (1994), 272-276. Cited on pages: 260, 265, 467, 634.
[94CZE/BUC] Czerwinski, K. R., Buckau, G., Scherbaum, F., Kim, J. I., Com-
plexation of the uranyl ion with aquatic humic acid, Radiochim. Acta, 65, (1994), 111-119. Cited on page: 509.
[94FAN/KIM] Fanghänel, T., Kim, J. I., Paviet, P., Klenze, R., Hauser, W.,
Thermodynamics of radioactive trace elements in concentrated electrolyte solutions: hydrolysis of Cm3+ in NaCl-solutions, Ra-diochim. Acta, 66/67, (1994), 81-87. Cited on pages: 337, 338, 339, 340, 344, 411, 468, 479, 480, 585, 614, 637.
[94GIF] Giffaut, E., Influence des ions chlorure sur la chimie des acti-
nides, Ph. D. Thesis, Université de Paris-Sud, Orsay, France, (1994), 259 pp. , in French. Cited on pages: 323, 356, 368, 369,370, 372, 375, 376, 377, 378, 379, 383, 468, 470, 471, 482, 483,518, 636, 653, 654, 655, 656, 728.
[94HEN/MER] Henry, M., Merceron, T., An independent method for data selec-
tion of long-life radionuclides (actinides and fission products) in the geosphere, Radiochim. Acta, 66/67, (1994), 57-61. Cited on pages: 390, 471.
[94JAY/IYE] Jayanthi, K., Iyer, V. S., Kulkarni, S. G., Rama Rao, G. A.,
Venugopal, V., Molar Gibbs energy of formation of NaUO3(s), J. Nucl. Mater., 211, (1994), 168-174. Cited on pages: 271, 274, 275, 472, 512, 638, 639.
[94KAL/MCC] Kaledin, L. A., McCord, J. E., Heaven, M. C., Laser spectros-
copy of UO: characterization and assignment of states in the 0 to 3 eV range, with a comparison to the electronic structure of ThO,J. Mol. Spectrosc., 164, (1994), 27-65. Cited on pages: 161, 474.
[94KAT/MEI] Kato, Y., Meinrath, G., Kimura, T., Yoshida, Z., A study of
U(VI) hydrolysis and carbonate complexation by time-resolved laser-induced fluorescence spectroscopy (TRLFS), Radiochim. Acta, 64, (1994), 107-111. Cited on pages: 474, 507, 509, 515, 516, 597, 609, 613.

BIBLIOGRAPHY 834
[94KIM/CHO] Kim, W. H., Choi, K. C., Park, K. K., Eom, T. Y., Effects ofhypochlorite on the solubility of amorphous schoepite at 25oC in neutral to alkaline solutions, Radiochim. Acta, 66/67, (1994), 45-49. Cited on pages: 224, 475.
[94KIM/KLE] Kim, J. I., Klenze, R., Wimmer, H., Runde, W., Hauser, W., A
study of the carbonate complexation of Cm(III) and Eu(III) by time resolved laser fluorescence spectroscopy, J. Alloys Compd., 213/214, (1994), 333-340. Cited on pages: 369, 372, 475.
[94LIU/CAR] Liu, G. K., Carnall, W. T., Jursich, G., Williams, C. W., Analy-
sis of the crystal field spectra of the actinide tetrafluorides. II. AmF4, CmF4, Cm4+:CeF4, and Bk4+:CeF4, J. Chem. Phys., 101, (1994), 8277-8289. Cited on page: 361.
[94MEI] Meinrath, G., Np(V) carbonates in solid state and aqueous solu-
tion, J. Radioanal. Nucl. Chem., 186, (1994), 257-272. Cited on pages: 305, 307, 308.
[94MER/FUG] Merli, L., Fuger, J., Thermochemistry of a few neptunium and
neodymium oxides and hydroxides, Radiochim. Acta, 66/67, (1994), 109-113. Cited on page: 641.
[94MOR/WIL] Morss, L. R., Williams, C. W., Synthesis of crystalline ameri-
cium hydroxide, Am(OH)3, and determination of its enthalpy of formation; estimation of the solubility-product constants of acti-nide(III) hydroxides, Radiochim. Acta, 66/67, (1994), 89-93. Cited on pages: 349, 350, 476, 477, 554.
[94NEC/KIM] Neck, V., Kim, J. I., Kanellakopulos, B., Thermodynamisches
Verhalten von Neptunium(V) in konzentrierten NaCl- und Na-ClO4-Lösungen, Kernforschungszentrum Karlsruhe, Report KfK5301, (1994), 37 pp. Cited on pages: 305, 307, 308, 758.
[94NEC/RUN] Neck, V., Runde, W., Kim, J. I., Kanellakopulos, B., Solid-liquid
equilibrium reactions of neptunium(V) in carbonate solution at different ionic strength, Radiochim. Acta, 65, (1994), 29-37. Cited on pages: 305, 306, 307, 308, 309, 640, 641.

BIBLIOGRAPHY 835
[94OCH/SUZ] Ochiai, A., Suzuki, Y., Shikama, T., Hotta, E., Haga, Y., Suzuki, T., Transport properties and specific heat of UTe and USb,Physica B (Amsterdam), 199-200, (1994), 616-618. Cited on pages: 234, 243, 477.
[94OMO/MUR] Omori, T., Muraoka, Y., Suganuma, H., Solvent extraction
mechanism of pertechnetate with tetraphenylarsonium chloride, J. Radioanal. Nucl. Chem., 178, (1994), 237-243. Cited on pages: 390, 477.
[94OST/BRU] Östhols, E., Bruno, J., Grenthe, I., On the influence of carbonate
on mineral dissolution: III. The solubility of microcrystalline ThO2 in CO2-H2O media, Geochim. Cosmochim. Acta, 58, (1994), 613-623. Cited on pages: 251, 327, 503, 637, 640.
[94RIZ/RAO] Rizkalla, E. N., Rao, L. F., Choppin, G. R., Sullivan, J. C.,
Thermodynamics of uranium(VI) and plutonium(VI) hydrolysis, Radiochim. Acta, 65, (1994), 23-27. Cited on pages: 174, 478, 580.
[94RUN/KIM] Runde, W., Kim, J. I., Chemical behaviour of trivalent and pen-
tavalent americium in saline NaCl-solutions. Studies of transfer-ability of laboratory data to natural conditions, Technische Uni-versität München, Report RCM 01094, (1994), 236 pp. Cited onpages: 305, 306, 307, 308, 309, 310, 337, 338, 339, 340, 342,343, 344, 345, 348, 349, 352, 353, 368, 369, 370, 372, 375, 376, 377, 382, 383, 428, 429, 430, 470, 471, 479, 480, 481, 482, 483,636, 758, 759.
[94SAL/KUL] Sali, S. K., Kulkarni, N. K., Sampath, S., Jayadevan, N. C., Solid
state reactions of uranium oxide and alkali metal chromates: characterisation of new uranates, J. Nucl. Mater., 217, (1994), 294-299. Cited on pages: 276, 484, 684.
[94SAM] Samant, M. S., Ph. D. Thesis, University of Bombay, (1994).
Cited on page: 596. [94SAN/GRA] Sandino, M. C. A., Grambow, B., Solubility equilibria in the
U(VI)-Ca-K-Cl-H2O system: transformation of schoepite into becquerelite and compreignacite, Radiochim. Acta, 66/67, (1994), 37-43. Cited on pages: 180, 181, 182, 286, 484, 531, 704, 705.

BIBLIOGRAPHY 836
[94SER/DEV] Sergeyeva, E. I., Devina, O. A., Khodakovsky, I. L., Thermody-namic database for actinide aqueous inorganic complexes, J. Alloys Compd., 213/214, (1994), 125-131. Cited on pages: 159, 174, 183, 485, 486, 538, 540, 646.
[94SER/SER] Serezhkina, L. B., Serezhkin, V. N., Solubility in the UO2SeO4-
(CH3)2NCONH2-H2 system, Radiochemistry (Moscow), 36, (1994). Cited on pages: 233, 487.
[94SIE/PHI] Siekierski, S., Phillips, S. L., Solubility data series: Actinide
Nitrates, vol. 55, IUPAC Publications, Oxford University Press, Oxford, UK, (1994). Cited on page: 491.
[94TOR/CAS] Torrero, M. E., Casas, I., de Pablo, J., Sandino, M. C. A., Gram-
bow, B., A comparison between unirradiated UO2(s) and schoepite solubilities in 1 M NaCl medium, Radiochim. Acta, 66/67, (1994), 29-35. Cited on pages: 168, 175, 179, 321, 487, 584.
[94TOU/PIA] Touzelin, B., Pialoux, A., U-Ba-O system study by high tem-
perature X-ray diffraction under controlled atmosphere, J. Nucl. Mater., 217, (1994), 233. Cited on pages: 265, 488, 616, 650.
[94YAM/SAK] Yamaguchi, T., Sakamoto, Y., Ohnuki, T., Effect of the com-
plexation on solubility of Pu(IV) in aqueous carbonate system,Radiochim. Acta, 66/67, (1994), 9-14. Cited on pages: 327, 328, 329, 523, 652, 688.
[95ALL/BUC] Allen, P. G., Bucher, J. J., Clark, D. L., Edelstein, N. M., Ek-
berg, S. A., Godhes, J. W., Hudson, E. A., Kaltsoyannis, N.,Lukens, W. W., Neu, M. P., Palmer, P. D., Reich, T., Shuh, D.K., Tait, C. D., Zwick, B. D., Multinuclear NMR, Raman,EXAFS, and X-ray structure of [C(NH2)3]6[(UO2)3(CO3)6] .6.5H2O, Inorg. Chem., 34, (1995), 4797-4807. Cited on pages: 245, 246, 489.
[95ARB] Arblaster, J. W., The thermodynamic properties of ruthenium on
ITS-90, CALPHAD: Comput. Coupling Phase Diagrams Ther-mochem., 19, (1995), 339-347. Cited on page: 671.

BIBLIOGRAPHY 837
[95BAN/GLA] Banyai, I., Glaser, J., Micskei, K., Toth, I., Zékany, L., Kineticbehavior of carbonate ligands with different coordination modes: Equilibrium dynamics for uranyl(2+) carbonato complexes in aqueous solution. A 13C and 17O NMR study, Inorg. Chem., 34, (1995), 3785-3796. Cited on pages: 489, 567.
[95BIO/MOI] Bion, L., Moisy, P., Madic, C., Use of heteropolyanion ligand as
analytical reagent for off-line analysis of uranium(IV) in the PUREX process, Radiochim. Acta, 69, (1995), 251-257. Cited on pages: 281, 489.
[95CAP/VIT] Capdevila, H., Vitorge, P., Redox potentials of PuO2
2+ / PuO2+ and
Pu4+ / Pu3+ at different ionic strengths and temperatures. Entropy and heat capacity, Radiochim. Acta, 68, (1995), 51-62. Cited on pages: 577, 687, 728, 730.
[95CLA/HOB] Clark, D. L., Hobart, D. E., Neu, M. P., Actinide carbonate com-
plexes and their importance for actinide environmental chemis-try, Los Alamos National Laboratory, Report LA-UR-94-1718, (1995), 85 pp. Cited on pages: 491, 640.
[95COH/LOR] Cohen-Adad, R., Lorimer, J. W., Phillips, S. L., Salomon, M., A
consistent approach to tabulation of evaluated data: Applicationto the binary systems RbCl-H2O and UO2(NO3)2-H2O, J. Chem. Inf. Comput. Sci., 35, (1995), 675-696. Cited on pages: 238, 491, 492, 574.
[95DUE/PAT] Dueber, R. E., Patat, S., Dickens, P. G., Thermochemical and
electrochemical study of sodium and zinc insertion into α-UO3 - y
and α-U3O8, Solid State Ionics, 80, (1995), 231-238. Cited on pages: 257, 270, 271, 272, 273, 280, 406, 492, 493, 494.
[95EBB] Ebbinghaus, B. B., Calculated thermodynamic functions for gas
phase uranium, neptunium, plutonium, and americium oxides(AnO3), oxyhydroxides (AnO2(OH)2), oxychlorides (AnO2Cl2) and oxyfluorides(AnO2F2), Lawrence Livermore National Labo-ratory, Report UCRL-JC-122278, (1995), 45 pp. Cited on pages: 162, 163, 207, 402, 403, 455, 494, 591.

BIBLIOGRAPHY 838
[95ELI/BID] Eliet, V., Bidoglio, G., Omenetto, N., Parma, L., Grenthe, I.,Characterisation of hydroxide complexes of uranium(VI) by time-resolved fluorescence spectroscopy, J. Chem. Soc. Faraday Trans., 91, (1995), 2275-2285. Cited on pages: 165, 495, 509, 580, 594, 597, 611, 613.
[95FAN/KIM] Fanghänel, T., Kim, J. I., Klenze, R., Kato, Y., Formation of
Cm(III) chloride complexes in CaCl2 solutions, J. Alloys Compd., 225, (1995), 308-311. Cited on pages: 337, 356, 357, 358, 369, 469, 496, 547, 585, 614, 662.
[95FAN/NEC] Fanghänel, T., Neck, V., Kim, J. I., Thermodynamics of neptu-
nium(V) in concentrated salt solutions: II. Ion interaction (Pitzer)parameters for Np(V) hydrolysis species and carbonate com-plexes, Radiochim. Acta, 69, (1995), 169-176. Cited on pages: 311, 481, 570, 637, 755, 759.
[95FEL/RAI] Felmy, A. R., Rai, D., Mason, M. J., Fulton, R. W., The aqueous
complexation of Nd(III) with molybdate: The effects of both monomeric molybdate and polymolybdate species, Radiochim. Acta, 69, (1995), 177-183. Cited on pages: 385, 636.
[95GRE/PUI] Grenthe, I., Puigdomènech, I., Rand, M. H., Sandino, M. C. A.,
Corrections to the Uranium NEA-TDB review, Appendix D, in: Chemical Thermodynamics of Americium (authored by Silva, R.J., Bidoglio, G., Rand, M. H. and Robouch, P. B., Wanner, H.,Puigdomènech, I.), Nuclear Energy Agency, Organisation for Economic Co-operation, Development, Ed., pp. 347-374, North Holland Elsevier Science Publishers B. V., Amsterdam, TheNetherlands, (1995). Cited on pages: 192, 222, 422, 733.
[95HAA/MAR] Haaland, A., Martinsen, K.-G., Swang, O., Volden, H. V., Booij,
A. S., Konings, R. J. M., Molecular structure of monomeric ura-nium tetrachloride determined by gas electron diffraction at 900 K, gas phase infrared spectroscopy and quantum-chemical den-sity-functional calculations, J. Chem. Soc. Dalton Trans., (1995), 185-190. Cited on pages: 216, 425, 494, 496, 595.
[95HOB/KAR] Hobbs, D. T., Karraker, D. G., Recent results on the solubility of
uranium and plutonium in Savannah river site waste supernate, Nucl. Technol., 114, (1995), 318-324. Cited on pages: 178, 496.

BIBLIOGRAPHY 839
[95KAT/KIM] Kato, Y., Kimura, T., Yoshida, Z., Nitani, N., Solid-liquid phase equilibria of Np(V) and of U(VI) under controlled CO2 partial pressures, Radiochim. Acta, 74, (1995), 21-25. Cited on page: 607.
[95MOL/MAT] Moll, H., Matz, W., Schuster, G., Brendler, E., Bernhard, G.,
Nitsche, H., Synthesis and characterization of uranyl orthosili-cate (UO2)2SiO4.2H2O, J. Nucl. Mater., 227, (1995), 40-49. Cited on pages: 496, 519.
[95MOR/GLA] Moroni, L. P., Glasser, F. P., Reaction between cement compo-
nents and U(VI) oxide, Waste Manage. (Oxford), 15, (1995), 243-254. Cited on pages: 255, 257, 259, 497, 498.
[95MOU/DEC] Moulin, C., Decambox, P., Moulin, V., Decaillon, J. G., Ura-
nium speciation in solution by time-resolved laser-induced fluo-rescence, Anal. Chem., 67, (1995), 348-353. Cited on pages: 509, 516.
[95NEC/FAN] Neck, V., Fanghänel, T., Rudolph, G., Kim, J. I., Thermodynam-
ics of neptunium(V) in concentrated salt solutions: Chloridecomplexation and ion interaction (Pitzer) parameters for the NpO2
+ ion, Radiochim. Acta, 69, (1995), 39-47. Cited on pages: 296, 310, 526, 641, 642, 695.
[95NEC/RUN] Neck, V., Runde, W., Kim, J. I., Solid-liquid equilibria of neptu-
nium(V) in carbonate solutions of different ionic strengths: II. Stability of the solid phases, J. Alloys Compd., 225, (1995), 295-302. Cited on pages: 305, 306, 307, 308.
[95NOV/CRA] Novak, C. F., Crafts, C. C., Dhooge, N. J., A data base for ther-
modynamic modeling of +III actinide solubility in concentrated Na-Cl-SO4-CO3-PO4 electrolytes, Sandia National Lab., Report-SAND-95-2010C, (1995), 17 pp. Cited on pages: 322, 498.
[95NOV/ROB] Novak, C. F., Roberts, K. E., Thermodynamic modeling of nep-
tunium(V) solubility in concentrated Na-CO3-HCO3-Cl-ClO4-H-OH-H2O systems, Scientific Basis for Nuclear Waste Management XVIII, held 1994, in Kyoto, vol. 353, pp. 1119-1128, (1995). Cited on pages: 498, 568.

BIBLIOGRAPHY 840
[95PAL/NGU] Palmer, D. A., Nguyen-Trung, C., Aqueous uranyl complexes. 3. Potentiometric measurements of the hydrolysis of uranyl(VI) ionat 25oC, J. Solution Chem., 24, (1995), 1282-1291. Cited on pages: 165, 166, 169, 170, 174, 175, 176, 499, 500, 501, 502,626, 661, 674, 675.
[95PAN/CAM] Pan, P., Campbell, A. B., Dissolution of Np2O5(c) in CO2 free
aqueous solutions at 25oC and pH 6-13: Final report, Atomic Energy of Canada Limited, Report RC-1407 and COG-I-95-203, (1995), 45 pp. Cited on pages: 585, 616.
[95PAS/KIM] Pashalidis, I., Kim, J. I., Ashida, T., Grenthe, I., Spectroscopic
study of the hydrolysis of PuO22+ in aqueous solution, Radiochim.
Acta, 68, (1995), 99-104. Cited on page: 175. [95PER/SHI] Peretrukhin, V. F., Shilov, V. P., Pikaev, A. K., Alkaline chemis-
try of transuranium elements and technetium elements and tech-netium and the treatment of alkaline radioactive wastes, West-inghouse Hanford Company, Report WHC-EP-0817, (1995), 171 pp. Cited on page: 686.
[95PUI/BRU] Puigdomènech, I., Bruno, J., A thermodynamic data base for Tc
to calculate equilibrium solubilities at temperatures up to 300oC, Swedish Nucl. Fuel Waste Manag. Co., Report SKB TR-95-09, (1995), 52 pp. Cited on pages: 390, 502.
[95RAI/FEL] Rai, D., Felmy, A. R., Moore, D. A., Mason, M. J., The solubil-
ity of Th(IV) and U(IV) hydrous oxides in concentrated Na-HCO3 and Na2CO3 aqueous solutions, Scientific Basis for Nu-clear Waste management XVIII, held 1994, in Kyoto, vol. 353, pp. 1143-1150, (1995). Cited on pages: 183, 251, 503, 617, 618, 650, 651.
[95RAI/FEL2] Rai, D., Felmy, A. R., Fulton, R. W., Nd3+ and Am3+ ion interac-
tions with sulfate ion and their influence on NdPO4(c) solubility, J. Solution Chem., 24, (1995), 879-895. Cited on pages: 504, 636.

BIBLIOGRAPHY 841
[95SAL/JAY] Sali, S. K., Jayanthi, K., Iyer, V. S., Sampath, S., Venugopal, V.,High temperature chemistry of Rb2U4O11-Rb2U4O12 system, NUCAR-95: nuclear and radiochemistry symposium, held inKalpakkam, India, 21-24 Feb. 1995, pp. 222-223, Bhabha Atomic Research Centre, Mumbai, India, (1995). Cited on pages: 276, 504.
[95SIL/BID] Silva, R. J., Bidoglio, G., Rand, M. H., Robouch, P., Wanner, H.,
Puigdomènech, I., Chemical Thermodynamics of Americium, Nuclear Energy Agency, Organisation for Economic Co-operation, Development, Ed., vol. 2, Chemical Thermodynamics, North Holland Elsevier Science Publishers B. V., Amsterdam, The Netherlands, (1995), 374 pp. Cited on pages: xi, 4, 6, 44, 80, 98, 113, 114, 245, 250, 282, 284, 318, 319, 333, 334, 335, 336,337, 338, 339, 342, 343, 344, 345, 346, 347, 349, 351, 352, 353, 354, 355, 356, 358, 359, 360, 362, 363, 364, 365, 366, 368, 369,370, 373, 374, 375, 377, 378, 379, 380, 381, 383, 384, 385, 410,411, 422, 423, 428, 431, 448, 468, 469, 476, 477, 487, 518, 519,521, 525, 544, 547, 554, 557, 579, 582, 586, 620, 625, 627, 663, 683, 690, 728, 729, 733, 735, 753, 762.
[95YAJ/KAW] Yajima, T., Kawamura, Y., Ueta, S., Uranium(IV) solubility and
hydrolysis constants under reduced conditions, Scientific basisfor nuclear waste management XVIII, held in Kyoto, 1994, vol. 353, pp. 1137-1142, (1995). Cited on pages: 183, 185, 186, 504, 579, 646, 647.
[96ALL/SHU] Allen, P. G., Shuh, D. K., Bucher, J. J., Edelstein, N. M., Palmer,
C. E. A., Silva, R. J., Nguyen, S. N., Marquez, L. N., Hudson, E. A., Determinations of uranium structures by EXAFS: Schoepiteand other U(VI) oxide precipitates, Radiochim. Acta, 75, (1996), 47-53. Cited on pages: 505, 672.
[96BER/GEI] Bernhard, G., Geipel, G., Brendler, V., Nitsche, H., Speciation in
uranium in seepage waters of a mine tailing pile studied by time-resolved laser-induced fluorescence spectroscopy, Radiochim. Acta, 74, (1996), 87-91. Cited on pages: 248, 506, 516, 529, 530, 590, 670, 685.

BIBLIOGRAPHY 842
[96BRE/GEI] Brendler, V., Geipel, G., Bernhard, G., Nitsche, H., Complexa-tion in the system UO2
2+/PO43–/OH–(aq): potentiometric and spec-
troscopic investigations at very low ionic strengths, Radiochim. Acta, 74, (1996), 75-80. Cited on pages: 239, 240, 507, 621.
[96BUR/MIL] Burns, P. C., Miller, M. L., Ewing, R. C., U6+ minerals and inor-
ganic phases : a comparison and hierarchy of crystal structures, Can. Mineral., 34, (1996), 845-880. Cited on page: 254.
[96BYR/SHO] Byrne, R. H., Sholkovitz, E. R., Marine chemistry and geochem-
istry of the lanthanides, Handbook on the physics and chemistry of rare earths, Gschneidner Jr., K. A., Eyring, L., Eds., vol. 23, pp. 497-593, Elsevier Science B.V. Amsterdam, (1996). Cited onpage: 334.
[96CAP/VIT] Capdevila, H., Vitorge, P., Giffaut, E., Delmau, L., Spectropho-
tometric study of the dissociation of the Pu(IV) carbonate limit-ing complex, Radiochim. Acta, 74, (1996), 93-98. Cited on page: 326.
[96CLA/CON] Clark, D. L., Conradson, S. D., Ekberg, S. A., Hess, N. J., Neu,
M. P., Palmer, P. D., Runde, W., Tait, C. D., EXAFS studies ofpentavalent neptunium carbonato complexes. Structural elucida-tion of the principal constituents of neptunium in groundwater environments, J. Am. Chem. Soc., 118, (1996), 2089-2090. Cited on pages: 250, 686.
[96DIA/GAR] Díaz Arocas, P., Garcia-Serrano, J., Quiñones, J., Geckeis, H.,
Grambow, B., Coprecipation of mono-, di-, tri-, tetra- and hexavalent ions with Na-polyuranates, Radiochim. Acta, 74, (1996), 51-58. Cited on pages: 165, 508.
[96FAL/REA] Falck, W. E., Read, D., Thomas, J. B., CHEMVAL2: Thermo-
dynamic Database, Report, (1996). Cited on page: 578. [96FAN/NEC] Fanghänel, T., Neck, V., Kim, J. I., The ion product of H2O, dis-
sociation constants of H2CO3 and Pitzer parameters in the system Na+/H+/OH–/HCO3
–/CO32–/ClO4
–/H2O at 25oC, J. Solution Chem., 25, (1996), 327-343. Cited on pages: 306, 308, 556, 759, 762.

BIBLIOGRAPHY 843
[96FIN/COO] Finch, R. J., Cooper, M. A., Hawthorne, F. C., Ewing, R. C., Thecrystal structure of schoepite, [(UO2)8O2(OH)12](H2O)12, Can. Mineral., 34, (1996), 1071-1088. Cited on pages: 189, 587.
[96GEI/BRA] Geipel, G., Brachmann, A., Brendler, V., Bernhard, G., Nitsche,
H., Uranium(VI) sulfate complexation studied by time-resolved laser-induced fluorescence spectroscopy (TRLFS), Radiochim. Acta, 75, (1996), 199-204. Cited on pages: 230, 231, 508, 672.
[96HIL/LAU] Hildenbrand, D. L., Lau, K. H., Thermochemistry of gaseous
AgCl, Ag3Cl3 and CuCl, High Temp. Mater. Sci., 35, (1996), 11-20. Cited on page: 393.
[96IYE/JAY] Iyer, V. S., Jayanthi, K., Sali, S. K., Sampath, S., Venugopal, V.,
Molar Gibbs free energy of formation of Rb2U4O11(s) by solid oxide electrolyte galvanic cell, J. Alloys Compd., 235, (1996), 1-6. Cited on pages: 276, 504, 510, 684.
[96JAY/IYE] Jayanthi, K., Iyer, V. S., Rama Rao, G. A., Venugopal, V., Molar
Gibbs energy formation of RbUO3(s), J. Nucl. Mater., 232, (1996), 233-239. Cited on pages: 275, 511.
[96KAT/KIM] Kato, Y., Kimura, T., Yoshida, Z., Nitani, N., Solid-liquid phase
equilibria of Np(VI) and of U(VI) under controlled CO2 partial pressures, Radiochim. Acta, 74, (1996), 21-25. Cited on pages: 168, 171, 172, 174, 245, 321, 512, 516, 597, 606.
[96KON/BOO] Konings, R. J. M., Booij, A. S., Kovács, A., Girichev, G. V.,
Giricheva, N. I., Krasnova, O. G., The infrared spectrum andmolecular structure of gaseous UF4, J. Mol. Struct., 378, (1996), 121-131. Cited on pages: 201, 512, 595.
[96KOV/BOO] Kovács, A., Booij, A. S., Cordfunke, E. H. P., Kok-Scheele, A.,
Konings, R. J. M., On the fusion and vaporisation behaviour ofUCl3, J. Alloys Compd., 241, (1996), 95-97. Cited on pages: 222, 513.
[96KUL/MAL] Kulyako, Y. M., Malikov, D. A., Trofimov, T. I., Myasoedov, B.
F., Behaviour of transplutonium and rare earth elements in acidicand alkaline solutions of potassium ferricyanide, Mendeleev Commun., 5, (1996), 173-174. Cited on pages: 352, 513.

BIBLIOGRAPHY 844
[96MEI/KAT] Meinrath, G., Kato, Y., Kimura, T., Toshida, Z., Solid-aqueous phase equilibria of uranium(VI) under ambient conditions, Ra-diochim. Acta, 75, (1996), 159-167. Cited on pages: 165, 166, 168, 170, 171, 172, 321, 514, 517, 597, 606, 609.
[96MEI/KLE] Meinrath, G., Klenze, R., Kim, J. I., Direct spectroscopic speci-
ation of uranium(VI) in carbonate solutions, Radiochim. Acta, 74, (1996), 81-86. Cited on pages: 245, 516.
[96MEI/SCH] Meinrath, G., Schweinberger, M., Hydrolysis of the uranyl(VI)
ion - A chemometric approach, Radiochim. Acta, 75, (1996), 205-210. Cited on pages: 166, 170, 171, 514, 517, 553, 580, 597,606.
[96MEI] Meinrath, G., Coordination of uranyl(VI) carbonate species in
aqueous solutions, J. Radioanal. Nucl. Chem., 211, (1996), 349-362. Cited on pages: 514, 607.
[96MER/FUG] Merli, L., Fuger, J., Thermochemistry of selected lanthanide and
actinide hydroxycarbonates and carbonates, Radiochim. Acta, 74, (1996), 37-43. Cited on pages: 378, 379, 380, 469, 518, 519.
[96MOL/GEI] Moll, H., Geipel, G., Matz, W., Bernhard, G., Nitsche, H., Solu-
bility and speciation of (UO2)2SiO4.2H2O in aqueous systems, Radiochim. Acta, 74, (1996), 3-7. Cited on pages: 253, 254, 255, 443, 496, 498, 519, 520, 558.
[96NAK/YAM] Nakayama, S., Yamaguchi, T., Sekine, K., Solubility of neptu-
nium(IV) hydrous oxide in aqueous solutions, Radiochim. Acta, 74, (1996), 15-19. Cited on pages: 298, 648.
[96PAR/PYO] Park, Y. J., Pyo, H. R., Kim, W. H., Chun, K. S., Solubility stud-
ies of uranyl hydrolysis precipitates, J. Korea. Chem. Soc., 40, (1996), 599-606. Cited on pages: 165, 520.
[96PAV/FAN] Paviet, P., Fanghänel, T., Klenze, R., Kim, J. I., Thermodynam-
ics of curium(III) in concentrated electrolyte solutions: formation of sulfate complexes in NaCl/Na2SO4 solutions, Radiochim. Acta, 74, (1996), 99-103. Cited on pages: 365, 366, 367, 368, 521, 585, 614.
BIBLIOGRAPHY 845
[96PER/KRY] Peretrukhin, V. F., Kryutchov, S. V., Silin, V. I., Tananaev, I. G.,Determination of the solubility of Np(IV)-(VI), Pu(III)-(VI), Am(III)-(VI) and Tc(IV), (V) hydroxo compounds in 0.5-14 M NaOH solutions, Westinghouse Hanford Company, P.O. Box 1970, Richland, Washington, (1996). Cited on pages: 294, 296,315, 352, 521, 576.
[96RAK/TSY] Rakitskaya, E. M., Tsyplenkova, V. L., Panov, A. S., Interaction
of uranium dioxide with water, Russ. J. Inorg. Chem., 41, (1996), 1893-1894. Cited on pages: 165, 183, 185, 525.
[96RAO/RAI] Rao, L., Rai, D., Felmy, A. R., Fulton, R. W., Novak, C. F.,
Solubility of NaNd(CO3).6H2O(c) in concentrated Na2CO3 and NaHCO3 solutions, Radiochim. Acta, 75, (1996), 141-147. Cited on pages: 383, 637.
[96RAO/RAI2] Rao, L., Rai, D., Felmy, A. R., Solubility of Nd(OH3)(c) in 0.1
M NaCl at 25oC and 90oC, Radiochim. Acta, 72, (1996), 151-155. Cited on page: 636.
[96ROB/SIL] Roberts, K. E., Silber, H. B., Torretto, P. C., Prussin, T., Becraft,
K., Hobart, D. E., Novak, C. F., The experimental determination of the solubility product for NpO2OH in NaCl solutions, Radio-chim. Acta, 74, (1996), 27-30. Cited on pages: 352, 353, 499, 525.
[96RUN/NEU] Runde, W., Neu, M. P., Clark, D. L., Neptunium(V) hydrolysis
and carbonate complexation: Experimental and predicted nep-tunyl solubility in concentrated NaCl using the Pitzer approach, Geochim. Cosmochim. Acta, 60, (1996), 2065-2073. Cited on pages: 296, 305, 307, 308, 309, 310, 343, 375, 383, 470, 479,481, 482, 483, 641, 642, 656, 758, 759.
[96SAL/IYE] Sali, S. K., Iyer, V. S., Jayanthi, K., Sampath, S., Venugopal, V.,
Thallium uranates and other (Tl,U,O) compounds: a structural and thermodynamic study, J. Alloys Compd., 237, (1996), 49-57. Cited on pages: 279, 526.
[96SHO/BAM] Shoup, S. S., Bamberger, C. E., Haire, R. G., Novel plutonium
titanate compounds and solid solutions Pu2Ti2O7-Ln2Ti2O7: rele-vance to nuclear waste disposal, J. Am. Ceram. Soc., 79, (1996), 1489-1493. Cited on pages: 331, 527.

BIBLIOGRAPHY 846
[96YAM/HUA] Yamawaki, M., Huang, J., Yamaguchi, K., Yasumoto, M., Sa-kurai, H., Suzuki, Y., Investigation of the vaporization of BaUO3
by means of mass spectrometry, J. Nucl. Mater., 231, (1996), 199-203. Cited on pages: 267, 527.
[97ALL/BAN] Allard, B., Banwart, S. A., Bruno, J., Ephraim, J. H., Grauer, R.,
Grenthe, I., Hadermann, J., Hummel, W., Jakob, A., Karapiperis,T., Plyasunov, A. V., Puigdomènech, I., Rard, J. A., Saxena, S., Spahiu, K., Modelling in Aquatic Chemistry, Grenthe, I., Puigdomènech, I., Eds., Nuclear Energy Agency, Organisation for Economic Co-operation and Development, Paris, France, (1997), 724 pp. Cited on pages: 25, 285, 366, 478, 547, 617, 753, 754.
[97ALL/BUC] Allen, P. G., Bucher, J. J., Shuh, D. K., Edelstein, N. M., Reich,
T., Investigation of aquo and chloro complexes of UO22+, NpO2
+, Np4+, and Pu3+ by X-ray absorption fine structure spectroscopy, Inorg. Chem., 36, (1997), 4676-4683. Cited on pages: 221, 293, 301, 322, 528, 679.
[97ALL/SHU] Allen, P. G., Shuh, D. K., Bucher, J. J., Edelstein, N. M., Palmer,
C. E. A., Marquez, L. N., EXAFS spectroscopic studies of ura-nium(VI) oxide precipitates, Aqueous chemistry and geochemis-try of oxides and oxyhydroxides, vol. 432, pp. 139-143, (1997). Cited on page: 274.
[97AMA/GEI] Amayri, S., Geipel, G., Schuster, G., Baraniak, L., Bernhard, G.,
Nitsche, H., Synthesis and characterization of calcium uranyl carbonate: Ca2[UO2(CO3)3] . 10 H2O, Forschungszentrum Rossendorf Institute of Radiochemistry, Annual report, (1997).Cited on pages: 248, 506, 670, 685.
[97ASA/SUG] Asahina, K., Suganuma, H., Omori, T., Solvent extraction of
tetrachloronitridotechnetate(VI) ion with tetraphenylarsoniumchloride, J. Radioanal. Nucl. Chem., 222, (1997), 25-28. Cited on pages: 392, 529.
[97BER/GEI] Bernhard, G., Geipel, G., Brendler, V., Reich, T., Nitsche, H.,
Validation of complex formation of Ca2+, UO22+ and CO3
2–, For-schungszentrum Rossendorf Institute of Radiochemistry, Annual report, (1997). Cited on pages: 248, 249, 529, 590, 670, 685.
BIBLIOGRAPHY 847
[97BIO/MOI] Bion, L., Moisy, P., Vaufrey, F., Méot-Reymond, S., Simoni, E., Madic, C., Coordination of U4+ in the complex in solid sate and in aqueous solution, Radiochim. Acta, 78, (1997), 73-82. Cited on page: 489.
[97BOU] Boucharat, N., Etude métallurgique du technétium en vue de sa
transmutation en réacteur à neutrons rapides, Ph. D. Thesis, Uni-versité d'Aix-Marseille I, (1997), in French. Cited on pages: 389, 530, 671.
[97BRU/CAS] Bruno, J., Casas, I., Cera, E., Duro, L., Development and appli-
cation of a model for the long-term alteration of UO2 spent nu-clear fuel, test of equilibrium and kinetic mass transfer models inthe Cigar Lake ore deposit, J. Contam. Hydrol., 26, (1997), 19-26. Cited on pages: 165, 531.
[97CAS/BRU] Casas, I., Bruno, J., Cera, E., Finch, R. J., Ewing, R. C., Charac-
terization and dissolution behavior of a becquerelite from Shin-kolobwe, Zaire, Geochim. Cosmochim. Acta, 61, (1997), 3879-3884. Cited on pages: 181, 422, 531, 704, 705.
[97CHA/SAW] Chaudhuri, N. K., Sawant, R. M., Stability constants of the fluo-
ride complexes of actinides in aqueous solution and their correla-tion with fundamental properties, Bangladesh Agricultural Re-search Council, Report E/022, (1997), 48 pp. Cited on page: 354.
[97CLA/CON] Clark, D. L., Conradson, S. D., Neu, M. P., Palmer, P. D.,
Runde, W., Tait, C. D., XAFS structural determination of Np(VII). Evidence for trans dioxo cation under alkaline solution conditions, J. Am. Chem. Soc., (1997), 5259-5260. Cited on pages: 293, 532, 697.
[97COR/BOO] Cordfunke, E. H. P., Booij, A. S., Smit-Groen, V., van
Vlaanderen, P., Structural and thermodynamic characterizationof the perovskite-related Ba1 + yUO3 + x and (Ba, Sr)1 + yUO3 + x
phases, J. Solid State Chem., 131, (1997), 341-349. Cited on pages: 265, 266, 528, 532.
[97DAV/FOU] David, F., Fourest, B., Structure of trivalent lanthanide and acti-
nide aquo ions, New J. Chem., 21, (1997), 167-176. Cited on page: 581.

BIBLIOGRAPHY 848
[97DEM/SER] Demchenko, E. A., Serezhkina, L. B., Gar'kin, V. P., Serezhkin,V. N., Solubility in UO2-RCONH2-H2O (R = CHCl2 or CCl3) systems, Russ. J. Inorg. Chem., 42, (1997), 726-728. Cited on pages: 231, 534.
[97ELL/ARM] Elless, M. P., Armstrong, A. Q., Lee, S. Y., Characterization and
solubility measurements of uranium-contaminated soils to sup-port risk assessment, Health Physics, 72, (1997), 716-726. Cited on pages: 165, 534.
[97FEL/RAI] Felmy, A. R., Rai, D., Sterner, S. M., Mason, M. J., Hess, N. J.,
Conradson, S. D., Thermodynamic models for highly chargedaqueous species: Solubility of Th(IV) hydrous oxide in concen-trated NaHCO3 and Na2CO3 aqueous solutions, J. Solution Chem., 26, (1997), 233-248. Cited on pages: 326, 327, 637, 650.
[97FIN] Finch, R. J., Thermodynamic stabilities of U(VI) minerals: Esti-
mated and observed relationships, Mater. Res. Soc. Symp. Proc., 465, (1997), 1185-1192. Cited on pages: 282, 534, 535.
[97GEI/BER] Geipel, G., Bernhard, G., Brendler, V., Brachmann, A., Nitsche,
H., Speciation of uranium in natural waters of an uranium min-ing area, NRC4 4th International Conference on Nuclear and Radiochemistry, held 8-13 September 1996 in St Malo, France, vol. 2, p. EP48, (1997). Cited on pages: 165, 536.
[97GEI/RUT] Geipel, G., Rutsch, M., Bernhard, G., Nitsche, H., Increase of
the ionic strength of uranyl containing solutions, Forschungszen-trum Rossendorf Institute of Radiochemistry, Annual report, (1997). Cited on pages: 160, 537.
[97GRE/PLY] Grenthe, I., Plyasunov, A., On the use of semiempirical electro-
lyte theories for the modeling of solution chemical data, Pure Appl. Chem., 69, (1997), 951-958. Cited on page: 716.
[97GUR/SER] Gurevich, V. M., Sergeyeva, E. I., Gavrichev, K. S., Gorbunov,
V. E., Kuznetova, T. P., Khodakovskii, I. L., Thermodynamicproperties of uranyl hydroxide UO2(OH)2(cr, α, rhomb), Geo-chem. Int., 35, (1997), 74-87. Cited on pages: 159, 189, 190, 191, 192, 414, 537, 538, 539, 587, 588.

BIBLIOGRAPHY 849
[97HOV] Hovey, J. K., Thermodynamics of hydration of a 4+ aqueous ion:partial molar heat capacities and volumes of aqueous tho-rium(IV) from 10 to 55oC, J. Phys. Chem. B, 101, (1997), 4321-4334. Cited on pages: 159, 404, 541.
[97HUA/YAM] Huang, J., Yamawaki, M., Yamaguchi, K., Yasumoto, M., Sa-
kurai, H., Suzuki, Y., Investigation of vaporization thermody-namics of SrUO3 by means of mass spectrometry, J. Nucl. Ma-ter., 247, (1997), 17-20. Cited on pages: 260, 542, 543.
[97ION/MAD] Ionova, G., Madic, C., Guillaumont, R., Covalency effects in the
standard enthalpies of formation of trivalent lanthanide and acti-nide halides, Radiochim. Acta, 78, (1997), 83-90. Cited on pages: 5, 543.
[97IOU/KRU] Ioussov, A., Krupa, J. C., Luminescence properties and stability
constants of curium(III) complexes with lacunary heteropolyan-ions PW11O39
7– and SiW11O398– in nitric acid solutions, Radiochim.
Acta, 78, (1997), 97-104. Cited on pages: 386, 387, 544. [97IYE/JAY] Iyer, V. S., Jayanthi, K., Venugopal, V., Thermodynamic proper-
ties of K2U4O12(s) and K2U4O13(s) by emf and calorimetric measurements, J. Solid State Chem., 132, (1997), 342-348. Cited on pages: 267, 269, 275, 544.
[97JAY/IYE] Jayanthi, K., Iyer, V. S., Venugopal, V., Thermodynamic studies
on Cs4U5O17(s) and Cs2U2O7(s) by emf and calorimetric meas-urements, J. Nucl. Mater., 250, (1997), 229-235. Cited on pages: 267, 269, 277, 278, 545.
[97KAL/HEA] Kaledin, L. A., Heaven, M. C., Electronic spectroscopy of UO,
J. Mol. Spectrosc., 185, (1997), 1-7. Cited on pages: 161, 474. [97KON/FAN] Könnecke, T., Fanghänel, T., Kim, J. I., Thermodynamics of
trivalent actinides in concentrated electrolyte solutions. Model-ling the chloride complexation of Cm(III), Radiochim. Acta, 76, (1997), 131-135. Cited on pages: 335, 344, 356, 358, 479, 496, 547, 585, 614, 635, 729.

BIBLIOGRAPHY 850
[97KON/NEC] Könnecke, T., Neck, V., Fanghänel, T., Kim, J. I., Activity coef-ficients and Pitzer parameters in the systems Na+/Cs+/Cl–/TcO4
–
or ClO4–/H2O at 25oC, J. Solution Chem., 26, (1997), 561-577.
Cited on pages: 547, 615, 760. [97KRE/GAN] Kremer, C., Gancheff, J., Kremer, E., Mombrú,A. W., González,
O., Mariezcurrena, R., Suescun, L., Cubas, M. L., Ventura, O. N., Structural and conformational analysis of Tc(V) and Re(V)dioxo complexes. X-ray crystal structure of [TcO2(tn)2]I .H2O, Polyhedron, 16, (1997), 3311-3316. Cited on pages: 391, 548.
[97KRI/FON] Krikorian, O. H., Fontes, Jr. A. S., Ebbinghaus, B. B., Adamson,
M. G., Transpiration studies on the volatilities of PuO3(g) and PuO-2(OH)2(g) from PuO2(s) in the presence of steam and oxy-gen and application to plutonium volality in mixed-waste ther-mal oxidation processes, J. Nucl. Mater., 247, (1997), 161-171. Cited on pages: 162, 455.
[97KRI/RAM] Krishnan, K., Rama Rao, G. A., Singh Mudher, K. D.,
Venugopal, V., Vapour pressure measurements of TeO2(g) over UTeO5(s), NUCAR 97: nuclear and radiochemistry symposium.Held in Calcutta, India, 21-24 Jan 1997, pp. 220-221, Bhabha Atomic Research Centre, Mumbai, India, (1997). Cited onpages: 234, 548.
[97LAN] Langmuir, D., Aqueous environmental geochemistry, Prentice
Hall, New Jersey, USA, (1997). Cited on pages: 160, 183, 242,254, 548, 639.
[97LUB/HAV] Lubal, P., Havel, J., The study of complex equilibria of ura-
nium(VI) with selenate, Talanta, 44, (1997), 457-466. Cited on pages: 233, 549, 550, 551.
[97LUB/HAV2] Lubal, P., Havel, J., Spectrophotometric and potentiometric
study of uranyl hydrolysis in perchlorate medium. Is derivativespectrophotometry suitable for search of the chemical model ?, Chem. Pap., 51, (1997), 213-220. Cited on pages: 166, 175, 550, 551.

BIBLIOGRAPHY 851
[97MAS/COU] Maslennikov, A. G., Courson, O., Peretrukhin, V. F., David, F.,Masson, M., Technetium electrochemical reduction in nitric so-lutions at mercury and carbon electrodes, Radiochim. Acta, 78, (1997), 123-129. Cited on pages: 391, 551.
[97MEI/SCH] Meinrath, G., Schweinberger, M., Merkel, B. J., Hydrolysis of
the uranyl(VI) ion - A chemometric approach, NRC4 4th Inter-national Conference on Nuclear and Radiochemistry, held 8-13 September 1996 in St Malo, France, vol. 1, p. DP7, (1997). Citedon pages: 166, 170, 171, 517, 553.
[97MEI] Meinrath, G., Chemometric and statistical analysis of ura-
nium(VI) hydrolysis at elevated U(VI) concentrations, Radio-chim. Acta, 77, (1997), 221-234. Cited on pages: 166, 170, 171, 172, 514, 552, 597, 598, 606.
[97MEI2] Meinrath, G., Uranium(VI) speciation by spectroscopy, J. Ra-
dioanal. Nucl. Chem., 224, (1997), 119-126. Cited on pages: 551, 553, 597, 606, 609, 643, 674.
[97MER/LAM] Merli, L., Lambert, B., Fuger, J., Thermochemistry of lantha-
num, neodymium, samarium and americium trihydroxides andtheir relation to the corresponding hydroxycarbonates, J. Nucl. Mater., 247, (1997), 172-176. Cited on pages: 321, 350, 351, 439, 553, 554.
[97MOL/GEI] Moll, H., Geipel, G., Reich, T., Brendler, V., Bernhard, G.,
Nitsche, H., Interaction of uranium(VI) with silicon species inaqueous solutions, NRC4 4th International Conference on Nu-clear and Radiochemistry, held 8-13 September 1996 in St Malo, France, vol. 1, p. DP8, (1997). Cited on pages: 252, 253, 554,611.
[97MUR] Murphy, W. H., Retrograde solubility of source term phases,
Scientific basis for nuclear waste management XX, vol. 465, pp. 713-720, (1997). Cited on pages: 165, 257, 555.
[97NAK/ARA] Nakajima, K., Arai, Y., Suzuki, Y., Vaporization behaviour of
neptunium mononitride, J. Nucl. Mater., 247, (1997), 33-36. Cited on pages: 300, 644, 645.

BIBLIOGRAPHY 852
[97NEC/FAN] Neck, V., Fanghänel, T., Kim, J. I., Mixed hydroxo-carbonate complexes of neptunium(V), Radiochim. Acta, 77, (1997), 167-175. Cited on pages: 524, 641.
[97NEU/REI] Neu, M. P., Reilly, S. D., Runde, W., Plutonium solubility and
speciation to be applied to the separation of hydrothermal wastetreatment effluent, Mater. Res. Soc. Symp. Proc., 465, (1997), 759-765. Cited on pages: 555, 679.
[97NOV/ALM] Novak, C. F., Al Mahamid, I., Becraft, K. A., Carpenter, S. A.,
Hakem, N., Prussin, T., Measurement and thermodynamic mod-eling of Np(IV) solubility in aqueous K2CO3 solutions to high concentrations, J. Solution Chem., 26, (1997), 681-697. Cited on pages: 310, 311, 498, 568, 569, 570, 572, 639, 642, 755, 756,759.
[97OMO/MIY] Omori, T., Miyairi, M., Suganuma, H., Effect of 3,5-
dichlorophenol on the extraction of technetium complexes with tetraphenylarsonium chloride, J. Radioanal. Nucl. Chem., 224, (1997), 39-43. Cited on pages: 391, 556.
[97PAS/CZE] Pashalidis, I., Czerwinski, K. R., Fanghänel, T., Kim, J. I., Solid-
liquid phase equilibria of Pu(VI) and U(VI) in aqueous carbonate systems. Determination of stability constants., Radiochim. Acta, 76, (1997), 55-62. Cited on pages: 245, 324, 325, 330, 464, 556, 557, 558, 643, 680, 681, 755.
[97PER/CAS] Pérez, I., Casas, I., Torrero, M. E., Cera, E., Duro, L., Bruno, J.,
Dissolution studies of soddyite as a long-term analogue of the oxidative alteration of the spent nuclear fuel matrix, Mater. Res. Soc. Symp. Proc., 465, (1997), 565-572. Cited on pages: 255, 443, 558, 677.
[97PUI/RAR] Puigdomènech, I., Rard, J. A., Plyasunov, A. V., Grenthe, I.,
Temperature corrections to thermodynamic data and enthalpycalculations, Modelling in Aquatic Chemistry, Grenthe, I., Puigdomènech, I., Eds., pp. 427-493, Nuclear Energy Agency, Organisation for Economic Co-operation and Development, Paris, France, (1997). Cited on pages: 39, 40.

BIBLIOGRAPHY 853
[97RAI/FEL] Rai, D., Felmy, A. R., Sterner, S. M., Moore, D. A., Mason, M.J., The solubility of Th(IV) and U(IV) hydrous oxides in concen-trated NaCl and MgCl2 solutions, Radiochim. Acta, 79, (1997), 239-247. Cited on pages: 184, 186, 221, 559, 646, 647.
[97RED] Red'kin, A. F., Influence of oxygen fugacity and solution com-
position on uranium oxides solubility at temperatures to 600oC and P=1 kbar (by experimental and thermodynamic data), NRC4 4th International Conference on Nuclear and Radiochemistry, held 8-13 September 1996 in St Malo, France, vol. 2, p. EP61, (1997). Cited on pages: 165, 180, 183, 185, 212, 560.
[97RUN/NEU] Runde, W., Neu, M. P., Conradson, S. D., Clark, D. L., Palmer,
P. D., Reilly, S. D., Scott, B. L., Tait, C. D., Spectroscopic inves-tigation of actinide speciation in concentrated chloride solution, Mater. Res. Soc. Symp. Proc., 465, (1997), 693-703. Cited on pages: 221, 301, 323, 356, 561, 652, 656.
[97RUT/GEI] Rutsch, M., Geipel, G., Brendler, V., Berhard, G., Nitsche, H.,
Studies of the complex formation between uranyl and arsenateby time-resolved laser-induced fluorescence spectroscopy (TRLFS), Forschungszentrum Rossendorf Institute of Radio-chemistry, Annual report, (1997). Cited on pages: 243, 561, 656.
[97SAL/KRI] Sali, S. K., Krishnan, K., Singh Mudher, K. D., Sampath, S.,
Venugopal, V., X-ray and thermal studies on SrUTe2O8, NUCAR 97: Nuclear and Radiochemistry Symposium. Held inCalcutta, India, 21-24 Jan 1997, pp. 218-219, Bhabha Atomic Research Centre, Mumbai, India, (1997). Cited on pages: 265,561.
[97SAX] Saxena, S. K., VIII. Systematization and estimation of thermo-
chemical data on silicates, Modelling in Aquatic Chemistry, Grenthe, I. And Puigdomènech, I., Eds., pp. 289-323, Nuclear Energy Agency, Organisation for Economic Co-operation and Development, Paris, France, (1997). Cited on page: 534.

BIBLIOGRAPHY 854
[97SCA/ANS] Scapolan, S., Ansoborlo, E., Moulin, C., Madic, C., Uraniumspeciation in aqueous medium by means of capillary electropho-resis and time-resolved laser-induced fluorescence, NRC4 4th International Conference on Nuclear and Radiochemistry, held 8-13 September 1996 in St Malo, France, vol. 1, p. DP5, (1997).Cited on pages: 165, 562.
[97SHO/SAS] Shock, E. L., Sassani, D. C., Willis, M., Sverjensky, D. A., Inor-
ganic species in geologic fluids: Correlations among standard molal thermodynamic properties of aqueous ions and hydroxidecomplexes, Geochim. Cosmochim. Acta, 61, (1997), 907-950. Cited on pages: 165, 562, 563, 564.
[97SHO/SAS2] Shock, E. L., Sassani, D. C., Betz, H., Uranium in geologic flu-
ids: Estimates of standard partial molal properties, oxidation,potentials, and hydrolysis constants at high temperatures andpressures, Geochim. Cosmochim. Acta, 61, (1997), 4245-4266. Cited on pages: 158, 541, 563.
[97STE/FAN] Steinle, E., Fanghänel, T., Klenze, R., Complexing of Cm(III)
with monosilicic acid, Wiss. Ber. - Forschungszent. Karlsruhe, (1997), 143-152, in German. Cited on pages: 384, 385, 565, 614, 683.
[97SUG/SAT] Suganuma, H., Satoh, I., Omori, T., Choppin, G. R., Am3+-F–
interaction in mixed system of dimethyl sulfoxide and water,Radiochim. Acta, 77, (1997), 211-214. Cited on pages: 354, 355.
[97SUG/SAT2] Suganuma, H., Satoh, I., Omori, T., Yagi, M., Am3+-F– interac-
tion in mixed system of methanol and water, Radiochim. Acta, 77, (1997), 207-209. Cited on pages: 354, 355.
[97SZA/AAS] Szabó, Z., Aas, W., Grenthe, I., Structure, isomerism, and ligand
dynamics in dioxouranium(VI) complexes, Inorg. Chem., 36, (1997), 5369-5375. Cited on page: 567.
[97TAK] Takahashi, Y., High temperature heat-capacity measurement up
to 1500 K by the triple-cell DSC, Pure Appl. Chem., 69, (1997), 2263-2269. Cited on pages: 193, 566.

BIBLIOGRAPHY 855
[97TOR/BAR] Torrero, M. E., Baraj, E., de Pablo, J., Giménez, J., Casas, I.,Kinetics of corrosion and dissolution of uranium dioxide as afunction of pH, Int. J. Chem. Kinet., 29, (1997), 261-267. Cited on pages: 183, 185, 566.
[97VAL/RAG] Valsami-Jones, E., Ragnarsdottir, K. V., Solubility of uranium
oxide and calcium uranate in water, and Ca(OH)2-bearing solu-tions, Radiochim. Acta, 79, (1997), 249-257. Cited on pages: 165, 259, 274, 566.
[97WRU/PAL] Wruck, David A., Palmer, C. E. A., Silva, Robert J., Actinide
speciation in elevated temperature aqueous solutions by laserphotoacoustic spectroscopy, Book of abstracts, 212th ACS Na-tional Meeting, Orlando, FL, August 25-29, 1996, p. 3, Ameri-can Chemical Society, Washington, D.C., Washington, D.C., USA, (1997). Cited on pages: 174, 368, 369, 372, 566, 567.
[98AAS/MOU] Aas, W., Moukhamet-Galeev, A., Grenthe, I., Complex forma-
tion in the ternary U(VI)-F-L system (L= Carbonate, oxalate and picolinate), Radiochim. Acta, 82, (1998), 77-82. Cited on pages: 248, 567.
[98ALM/NOV] Al Mahamid, I., Novak, C. F., Becraft, K. A., Carpenter, S. A.,
Hakem, N., Solubility of Np(V) in K-Cl-CO3 and Na-K-Cl-CO3
solutions to high concentrations: measurements and thermody-namic model predictions, Radiochim. Acta, 81, (1998), 93-101. Cited on pages: 310, 311, 312, 498, 568, 569, 570, 572, 639,734, 755, 759.
[98AMA/BER] Amayri, S., Bernhard, G., Nitsche, H., Solubility of
Ca2[UO2(CO3)3] . 10H2O, liebigite, Forschungszentrum Rossen-dorf Institute of Radiochemistry, Annual report, (1998). Cited on page: 506.
[98APE/KOR] Apelblat, A., Korin, E., Vapour pressures of saturated aqueous
solutions of ammonium iodide, potassium iodide, potassium nitrate, strontium chloride, lithium sulphate, sodium thiosul-phate, magnesium nitrate and uranyl nitrate from T = (278 to 323) K, J. Chem. Thermodyn., 30, (1998), 459-471. Cited on pages: 239, 492, 574.

BIBLIOGRAPHY 856
[98BAL/HEA] Baldas, J., Heath, G. A., Macgregor, S. A., Moock, K. H., Nis-sen, S. C., Raptis, R. G., Spectroelectrochemical and computa-tional studies of tetrachloro and tetrabromo oxo- and nitrido-technetium(V) and their Tc(VI) counterparts, J. Chem. Soc. Dal-ton Trans., (1998), 2303-2314. Cited on pages: 392, 574.
[98BAN/SAL] Banerjee, A., Sali, S. K., Venugopal, V., Calorimetric studies on
Rb2U4O11(s), THERMANS 98: Eleventh National Symposium on Thermal Analysis, held in Jammu, India, 2-5 Mar., pp. 94-95, Indian Thermal Analysis Society, Mumbai, India, (1998). Citedon pages: 276, 575.
[98BAR/RUB] Bardin, N., Rubini, P., Madic, C., Hydration of actinyl(VI),
MO22+, M = U, Np, Pu. An NMR study, Radiochim. Acta, 83,
(1998), 189-194. Cited on pages: 160, 575. [98BEN/FAT] Ben Said, K., Fattahi, M., Delorme-Hiver, A., Abbé, J. C., A
novel approach to the oxidation potential of the Tc(VII)/Tc(IV)couple in hydrochloric acid medium through the reduction ofTcO4
– by Fe2+ ion, Radiochim. Acta, 83, (1998), 195-203. Cited on pages: 390, 575.
[98BUD/TAN] Budantseva, N. A., Tananaev, I. G., Fedoseev, A. M., Delegard,
C. H., Behaviour of plutonium(V) in alkaline media, J. Alloys Compd., 271-273, (1998), 813-816. Cited on pages: 313, 576.
[98CAP/VIT] Capdevila, H., Vitorge, P., Solubility product of Pu(OH)4(am),
Radiochim. Acta, 82, (1998), 11-16. Cited on pages: 313, 316, 317, 577, 642, 649, 687, 695, 706.
[98CAS/DIX] Casteel, W. J., Dixon, D. A., LeBlond, N., Mercier, H. P. A.,
Schrobilgen, G. J., Lewis-acid properties of technetium(VII) dioxide trifluoride, TcO2F3: Characterization by 19F, 17O, and 99Tc NMR spectroscopy and Raman spectroscopy, density func-tional theory calculations of TcO2F3, M+TcO2F4
– [M = Li, Cs, N(CH3)4], and TcO2F3.CH3CN, and X-ray crystal structure of Li+TcO2F4
–, Inorg. Chem., 37, (1998), 340-353. Cited on page: 577.
BIBLIOGRAPHY 857
[98CAS/PAB] Casas, I., de Pablo, J., Giménez, J., Torrero, M. E., Bruno, J.,Cera, E., Finch, R. J., Ewing, R. C., The role of pe, pH, and car-bonate on the solubility of UO2 and uraninite under nominally reducing conditions, Geochim. Cosmochim. Acta, 62, (1998), 2223-2231. Cited on pages: 183, 187, 577.
[98CHA/DON] Chartier, D., Donnet, L., Adnet, J. M., Electrochemical oxidation
of Am(III) with lacunary heteropolyanions and silver nitrate, Radiochim. Acta, 83, (1998), 129-134. Cited on pages: 385, 386, 387, 578, 630.
[98CHA/TRI] Chandratillake, M., Trivedi, D. P., Randall, M. G., Humphreys,
P. N., Kelly, E. J., Criteria for compilation of a site-specific thermodynamic database for geochemical speciation calcula-tions, J. Alloys Compd., 271-273, (1998), 821-825. Cited on pages: 165, 313, 317, 578, 652, 688.
[98CHA] Chase, Jr., M. W., Monograph No. 9. NIST-JANAF Thermo-
chemical Tables, J. Phys. Chem. Ref. Data, (1998). Cited on pages: 204, 206, 220.
[98CLA/CON] Clark, D. L., Conradson, S. D., Keogh, D. W., Palmer, P. D.,
Scott, B. L., Tait, C. D., Identification of the limiting species inthe plutonium(IV) carbonate system. Solid state and solution molecular structure of the [Pu(CO3)5]6- ion, Inorg. Chem., 37, (1998), 2893-2899. Cited on pages: 326, 502, 579.
[98CLA/EWI] Clark, S. B., Ewing, R. C., Schaumloffel, J. C., A method to pre-
dict free energies of formation of mineral phases in the U(VI)-SiO2-H2O system, J. Alloys Compd., 271-273, (1998), 189-193. Cited on page: 254.
[98CON/ALM] Conradson, S. D., Al Mahamid, I., Clark, D. L., Hess, N. J.,
Hudson, E. A., Neu, M. P., Palmer, P. D., Runde, W., Tait, C.D., Oxidation state determination of plutonium aquo ions using X-ray absorption spectroscopy, Polyhedron, 17, (1998), 599-602. Cited on pages: 313, 580, 659.
BIBLIOGRAPHY 858
[98DAI/BUR] Dai, S., Burleigh, M. C., Simonson, J. M., Mesmer, R. E., Xue,Z.-L., Application of chemometric methods in UV-vis absorp-tion spectroscopic studies of uranyl ion dimerization reaction inaqueous solutions, Radiochim. Acta, 81, (1998), 195-199. Cited on pages: 174, 180, 580.
[98DAV/FOU] David, F., Fourest, B., Hubert, S., Le Du, J. F., Revel, R., Den
Auwer, C., Madic, C., Morss, L. R., Ionova, G., Mikalko, V.,Vokhmin, V., Nikonov, M., Berthet, J. C., Ephritikine, M., Aquoions of some trivalent actinides, EXAFS data and thermody-namic consequences, OCDE-AEN Workshop Proceedings, Speciation, techniques and facilities for radioactive materials at synchrotron light sources, Grenoble, France, October 4-6, p. 95, (1998). Cited on pages: 159, 580, 661.
[98DIA/GRA] Díaz Arocas, P., Grambow, B., Solid-liquid phase equilibria of
U(VI) in NaCl solutions, Geochim. Cosmochim. Acta, 62, (1998), 245-263. Cited on pages: 168, 174, 179, 181, 274, 321, 583.
[98DIA/RAG] Diakonov, I. I., Ragnarsdottir, K. V., Tagirov, B. R., Standard
thermodynamic properties and heat capacity equations of rare earth hydroxides: II. Ce(III)-, Pr-, Sm-, Eu(III)-, Gd-, Tb-, Dy-, Ho-, Er-, Tm-, Yb-, and Y-hydroxides. Comparison of thermo-chemical and solubility data, Chem. Geol., 151, (1998), 327-347. Cited on pages: 350, 351.
[98DIA/TAG] Diakonov, I. I., Tagirov, B. R., Ragnarsdottir, K. V., Standard
thermodynamic properties and heat capacity equations for rare earth element hydroxides. I. La(OH)3(s) and Nd(OH)3(s). Com-parison of thermochemical and solubility data., Radiochim. Acta, 81, (1998), 107-116. Cited on page: 350.
[98EFU/RUN] Efurd, D. W., Runde, W., Banar, J. C., Janecky, D. R., Kaszuba,
J. P., Palmer, P. D., Roensch, F. R., Tait, C. D., Neptunium andplutonium solubilities in a Yucca mountain groundwater, Envi-ron. Sci. Technol., 32, (1998), 3893-3900. Cited on pages: 297, 313, 317, 321, 584, 616, 639, 641.

BIBLIOGRAPHY 859
[98ERI/BAR] Erin, E. A., Baranov, A. A., Volkov, A. Y., Chistyakov, V. M.,Timofeev, G. A., Thermodynamics of actinide redox reactions inpotassium phosphotungstate solutions, J. Alloys Compd., 271-273, (1998), 782-785. Cited on page: 385.
[98FAN/KIM] Fanghänel, T., Kim, J. I., Spectroscopic evaluation of thermody-
namics of trivalent actinides in brines, J. Alloys Compd., 271-273, (1998), 782-785. Cited on pages: 335, 585.
[98FAN/WEG] Fanghänel, T., Weger, H. T., Schubert, G., Kim, J. I., Bicarbon-
ate complexes of trivalent actinides - stable or unstable?, Radio-chim. Acta, 82, (1998), 55-57. Cited on pages: 374, 375, 585, 586, 614.
[98FAN/WEG2] Fanghänel, T., Weger, H. T., Könnecke, T., Neck, V., Paviet-
Hartmann, P., Steinle, E., Kim, J. I., Thermodynamics of Cm(III) in concentrated electrolyte solutions. Carbonate complexation at constant ionic strength (1 m NaCl), Radiochim. Acta, 82, (1998), 47-53. Cited on pages: 369, 370, 372, 373, 375, 585, 586, 587,614, 755.
[98FAZ/YAM] Fazekas, Z., Yamamura, T., Tomiyasu, H., Deactivation and
luminescence lifetimes of excited uranyl ion and its fluoro com-plexes, J. Alloys Compd., 271-273, (1998), 756-759. Cited on pages: 210, 587.
[98FIN/HAW] Finch, R. J., Hawthorne, F. C., Ewing, R. C., Structural relations
among schoepite, metaschoepite and "dehydrated schoepite",Can. Mineral., 36, (1998), 831-845. Cited on pages: 164, 179, 189, 536, 587, 588.
[98GEI/BER] Geipel, G., Bernhard, G., Brendler, V., Nitsche, H., Complex
formation between UO22+ and CO3
2–: studied by laser-induced photoacoustic spectroscopy (LIPAS), Radiochim. Acta, 82, (1998), 59-62. Cited on pages: 245, 588, 589.
[98GEI/BER2] Geipel, G., Bernhard, G., Brendler, V., Nitsche, H., Complex
formation between UO22+ and CO3
2–: studied by laser-induced photoacoustic spectroscopy (LIPAS), Forsch. Ross., (1998), 22. Cited on page: 589.
BIBLIOGRAPHY 860
[98GEI/BER3] Geipel, G., Bernhard, G., Brendler, V., Nitsche, H., Uranyl hy-droxo carbonate complexes by laser induced spectroscopy, Forsch. Ross., (1998), 23. Cited on pages: 245, 248, 590, 685.
[98GEI/BER4] Geipel, G., Bernhard, G., Nitsche, H., Validation of the complex
formation between Ca2+, UO22+ and CO3
2– using EDTA adjust Ca2+ concentration, Forsch. Ross., (1998), 11. Cited on pages: 248, 590, 670, 685.
[98GOR/SID] Gorokhov, L. N., Sidorova, I. V., UO2(OH)2 molecules in the U-
O-H system and water vapor effects on the rate of uranium diox-ide vaporization, Russ. J. Phys. Chem., 72, (1998), 1038-1040. Cited on pages: 162, 163, 402, 403, 455, 495, 591.
[98HUA/YAM] Huang, J., Yamawaki, M., Yamaguchi, K., Ono, F., Yasumoto,
M., Sakurai, H., Sugimoto, J., Thermodynamic study of the va-porization of Cs2UO4 by high temperature mass spectrometry, J. Alloys Compd., 271-273, (1998), 625-628. Cited on pages: 277, 591.
[98ITO/YAM] Ito, H., Yamaguchi, K., Yamamoto, T., Yamawaki, M., Hydro-
gen absorption properties of U6Mn and U6Ni, J. Alloys Compd., 271-273, (1998), 629-631. Cited on pages: 194, 592.
[98JAY/IYE] Jayanthi, K., Iyer, V. S., Venugopal, V., Thermal properties of
KUO3(s) and K2U2O7 by high temperature Calvet calorimeter, THERMANS 98: Eleventh National Symposium on ThermalAnalysis, held in Jammu, India, 2-5 Mar., pp. 74-76, Indian Thermal Analysis Society, Mumbai, India, (1998). Cited onpages: 267, 269, 275, 592, 638.
[98JEN/CHO] Jensen, M. P., Choppin, G. R., Complexation of uranyl(VI) by
aqueous orthosilicic acid, Radiochim. Acta, 82, (1998), 83-88. Cited on pages: 252, 253, 444, 593, 612.
[98KAP/GER] Kaplan, D. I., Gervais, T. L., Krupka, K. M., Uranium(VI) sorp-
tion to sediments under high pH and ionic strength conditions,Radiochim. Acta, 80, (1998), 201-211. Cited on pages: 165, 593.
BIBLIOGRAPHY 861
[98KIT/YAM] Kitamura, A., Yamamura, T., Hase, H., Yamamoto, T., Mori-yama, H., Measurement of hydrolysis species of U(VI) by time-resolved laser-induced fluorescence spectroscopy, Radiochim. Acta, 82, (1998), 147-152. Cited on pages: 165, 594, 597.
[98KON/HIL] Konings, R. J. M., Hildenbrand, D. L., The vibrational frequen-
cies, molecular geometry and thermodynamic properties of the actinide tetrahalides, J. Alloys Compd., 271-273, (1998), 583-586. Cited on pages: 201, 216, 226, 229, 595.
[98KRI/RAM] Krishnan, K., Rama Rao, G. A., Singh Mudher, K. D.,
Venugopal, V., Thermal stability and vapour pressure studies onUTe3O9 and UTeO5(s), J. Nucl. Mater., 254, (1998), 49-54. Cited on pages: 234, 235, 236, 548, 595.
[98MAR/SMI] Martell, A. E., Smith, R. M., Montecates R. J., NIST critically
selected stability constants of metal complexes, Report Version V, (1998). Cited on page: 657.
[98MAS/MAS] Maslennikov, A. G., Masson, M., Peretrukhin, V. F., Lecomte,
M., Technetium electrodeposition from aqueous formate solu-tions: electrolysis kinetics and material balance study, Radio-chim. Acta, 83, (1998), 31-37. Cited on pages: 391, 597.
[98MEI/FIS] Meinrath, G., Fischer, S., Köhncke, K., Voigt, W., Solubility
behaviour of uranium(VI) in alkaline solution, Uranium mining and hydrology II, Proceedings of the international conferenceand workshop in Freiberg, Germany in September, pp. 246-255, Verlag Sven von Loga, Köln, Germany, (1998). Cited on pages:168, 181, 608, 609.
[98MEI/KAT] Meinrath, G., Kato, Y., Kimura, T., Yoshida, Z., Stokes relation-
ship in absorption and fluorescence spectra of U(VI) species, Radiochim. Acta, 82, (1998), 115-120. Cited on pages: 597, 609.
[98MEI] Meinrath, G., Chemometric analysis: Uranium(VI) hydrolysis by
UV-vis spectroscopy, J. Alloys Compd., 275-277, (1998), 777-781. Cited on pages: 166, 170, 172, 173, 517, 552, 553, 594,597, 605.

BIBLIOGRAPHY 862
[98MEI2] Meinrath, G., Direct spectroscopic speciation of schoepite-aqueous phase equilibria, J. Radioanal. Nucl. Chem., 232, (1998), 179-188. Cited on pages: 165, 166, 167, 168, 169, 170, 172, 321, 605.
[98MEI3] Meinrath, G., Aquatic Chemistry of Uranium. A review focusing
on aspects of environmental chemistry, Freiberg Online Geo-science, 1, (1998), 101. Cited on pages: 165, 166, 170, 172, 607.
[98MIS/NAM] Mishra, R., Namboodiri, P. N., Tripathi, S. N., Bharadwaj, S. R.,
Dharwadkar, S. R., Vaporization behaviour and Gibbs energy of formation of UTeO5 and UTe3O9, J. Nucl. Mater., 256, (1998), 139-144. Cited on pages: 234, 235, 236, 596, 609, 610, 627.
[98MOL/GEI] Moll, H., Geipel, G., Brendler, V., Bernhard, G., Nitsche, H.,
Interaction of uranium(VI) with silicic acid in aqueous solutions studied by time-resolved laser-induced fluorescence spectros-copy (TRLFS), J. Alloys Compd., 271-273, (1998), 765-768. Cited on pages: 252, 253, 254, 520, 554, 593, 611.
[98MOU/LAS] Moulin, C., Laszak, I., Moulin, V., Tondre, C., Time-resolved
laser-induced fluorescence as a unique tool for low-level ura-nium speciation, Appl. Spectrosc., 52, (1998), 528-535. Cited on pages: 165, 612, 613.
[98NAK/NIS] Nakagawa, T., Nishimaki, K., Urabe, T., Katsura, M., Thermo-
dynamic study on α-U2N3+x using N-rich starting materials (x≥0.6), J. Alloys Compd., 271-273, (1998), 658-661. Cited on pages: 236, 613.
[98NEC/FAN] Neck, V., Fanghänel, T., Kim, J. I., Aquatic Chemistry and
thermodynamic modeling of trivalent actinides, Wiss. Ber. - For-schungszent. Karlsruhe, (1998), 1-108, (in German). Cited on pages: 335, 365, 366, 367, 368, 369, 370, 375, 382, 480, 521,614, 636, 637.
[98NEC/KON] Neck, V., Könnecke, T., Fanghänel, T., Kim, J. I., Activity coef-
ficients and Pitzer parameters for the fission product ions Cs+
and TcO4– in the system Cs+/-Na+/-K+/-Mg2+/-Cl–/-SO4
2–/-TcO4–/-
H2O at 25oC, Radiochim. Acta, 83, (1998), 75-80. Cited on pages: 615, 760.

BIBLIOGRAPHY 863
[98NEC/KON2] Neck, V., Könnecke, T., Fanghänel, T., Kim, J. I., Pitzer parame-ters for the pertechnetate ion in the system Na+/-K+/-Mg2+/-Ca2+/-Cl–/-SO4
2–/-TcO4–/-H2O at 25oC, J. Solution Chem., 27,
(1998), 107-120. Cited on pages: 615, 760. [98OGA/KOB] Ogawa, T., Kobayashi, F., Sato, T., Haire, R. G., Actinide ni-
trides and nitride-halides in high-temperature systems, J. Alloys Compd., 271-173, (1998), 347-354. Cited on pages: 237, 324.
[98PAN/CAM] Pan, P., Campbell, A. B., The characterization of Np2O5(c) and
its dissolution in CO2-free aqueous solutions at pH 6-13 and 25oC, Radiochim. Acta, 81, (1998), 73-82. Cited on pages: 321, 585, 616.
[98PIA/TOU] Pialoux, A., Touzelin, B., Etude du système U-Ca-O par diffrac-
tométrie de rayons X à haute température, J. Nucl. Mater., 255, (1998), 14-25. Cited on pages: 259, 616, 617, 650.
[98RAI/FEL] Rai, D., Felmy, A. R., Hess, N. J., Moore, D. A., Yui, M., A
thermodynamic model for the solubility of UO2(am) in the aque-ous K+-Na+-HCO3
–-CO32–-OH–-H2O system, Radiochim. Acta, 82,
(1998), 17-25. Cited on pages: 184, 250, 251, 326, 327, 449, 504, 617, 637, 647, 650, 651, 733.
[98SAI/CHO] Saito, A., Choppin, G. R., Complexation of uranyl(VI) with
polyoxometalates in aqeous solutions, J. Alloys Compd., 271-273, (1998), 751-755. Cited on pages: 281, 619.
[98SAV] Savenko, V. S., Stability constants of M(OH)3
0 hydroxo com-plexes from the solubility products of the corresponding crystal-line hydroxides, Russ. J. Inorg. Chem., 43, (1998), 461-463. Cited on pages: 188, 620.
[98SCA/ANS] Scapolan, S., Ansoborlo, E., Moulin, C., Madic, C., Investiga-
tions by time-resolved laser-induced fluorescence and capillary electrophoresis of the uranyl-phosphate species: application to blood serum, J. Alloys Compd., 271-273, (1998), 106-111. Cited on pages: 239, 620.

BIBLIOGRAPHY 864
[98SER/RON] Serrano, J. A., Rondinella, V. V., Glatz, J. P., Toscano, E. H.,Quiñones, J., Díaz Arocas, P., García-Serrano, J., Comparison of the leaching behaviour of irradiated fuel, SIMFUEL, and non-irradiated UO2 under oxic conditions, Radiochim. Acta, 82, (1998), 33-37. Cited on pages: 165, 621.
[98SHI] Shilov, V. P., Probable forms of actinides in alkali solutions,
Radiochemistry (Moscow), 40, (1998), 11-16. Cited on pages: 621, 622, 686.
[98SPA/PUI] Spahiu, K., Puigdomènech, I., On weak complex formation: re-
interpretation of literature data on the Np and Pu nitratecomplexation, Radiochim. Acta, 82, (1998), 413-419. Cited on pages: 301, 623.
[98SUZ/ARA] Suzuki, Y., Arai, Y., Thermophysical and thermodynamic prop-
erties of actinide mononitrides and their solid solutions, J. Alloys Compd., 271-273, (1998), 577-582. Cited on page: 237.
[98WER/SPA] Werme, L. O., Spahiu, K., Direct disposal of spent nuclear fuel:
comparison between experimental and modelled actinide solu-bilities in natural waters, J. Alloys Compd., 271-273, (1998), 194-200. Cited on pages: 165, 624.
[98YAM/KIT] Yamamura, T., Kitamura, A., Fukui, A., Nishikawa, S., Yama-
moto, T., Moriyama, H., Solubility of U(VI) in highly basic so-lutions, Radiochim. Acta, 83, (1998), 139-146. Cited on pages: 165, 167, 168, 177, 178, 181, 245, 247, 321, 594, 609, 624, 625,626, 661, 662.
[98YOO/CYN] Yoo, C., Cynn, H., Söderlind, P., Phase diagram of uranium at
high pressures and temperatures, Phys. Rev. B, 57, (1998), 10359-10362. Cited on pages: 157, 626.
[99AAS/STE] Aas, W., Steinle, E., Fanghänel, T., Kim, J. I., Thermodynamics
of Cm(III) in concentrated electrolyte solutions. Fluoride com-plexation in 0-5 m NaCl at 25oC, Radiochim. Acta, 84, (1999), 85-88. Cited on pages: 354, 355, 614, 627, 637.

BIBLIOGRAPHY 865
[99BAS/MIS] Basu, M., Mishra, R., Bharadwaj, S. R., Namboodiri, P. N., Tri-pathi, S. N., Kerkar, A. S., Dharwadkar, S. R., The standard mo-lar enthalpies of formation of UTeO5 and UTe3O9, J. Chem. Thermodyn., 31, (1999), 1259-1263. Cited on pages: 234, 235, 597, 611, 627.
[99BOU/BIL] Bouby, M., Billard, I., Bonnenfant, A., Klein, G., Are the
changes in the lifetime of the excited uranyl ion of chemical orphysical nature?, Chem. Phys., 241, (1999), 353-370. Cited on pages: 160, 537, 628, 695.
[99CAP/COL] Capone, F., Colle, Y., Hiernaut, J. P., Ronchi, C., Mass spectro-
metric measurement of the ionization energies and cross sections of uranium and plutonium oxide vapors, J. Phys. Chem. A, 103, (1999), 10899-10906. Cited on pages: 161, 629.
[99CAP/VIT] Capdevila, H., Vitorge, P., Redox potentials of M(VI)/M(V)
limiting carbonate complexes (M = U or Pu) at different ionicstrengths and temperatures. Entropy and heat capacity, Czech. J. Phys., 49, (1999), 603-609. Cited on pages: 250, 629.
[99CHA/DON] Chartier, D., Donnet, L., Adnet, J. M., Evidence for a new com-
position of Am(IV) complexes with tungstophosphate (α2-P2W17O61
10–) and tungstosilicate (α-SiW11O398–) ligands in nitric
acid medium, Radiochim. Acta, 85, (1999), 25-31. Cited on pages: 385, 386, 387, 578, 630, 631.
[99CHE/EWI] Chen, F., Ewing, R. C., Clark, S. B., The Gibbs free energies and
enthalpies of formation of U6+ phases: An empirical method of prediction, Am. Mineral., 84, (1999), 650-664. Cited on pages: 254, 285, 440, 442.
[99CHE/EWI2] Chen, F., Ewing, R. C., Clark, S. B., Erratum of The Gibbs free
energies and enthalpies of formation of U6+ phases: An empirical method of prediction, Am. Mineral., 84, (1999), 1208. Cited on pages: 254, 285.
[99CHO] Choppin, G. R., Utility of oxidation state analogs in the study of
plutonium behavior, Radiochim. Acta, 85, (1999), 89-95. Cited on pages: 322, 631.

BIBLIOGRAPHY 866
[99CLA/CON] Clark, D. L., Conradson, S. D., Donohoe, R. J., Keogh, D. W., Morris, D. E., Palmer, P. D., Rogers, R. D., Tait, C. D., Chemi-cal specification of the uranyl ion under highly alkaline condi-tions. Synthesis, structures, and oxo ligand exchange dynamics, Inorg. Chem., 38, (1999), 1456-1466. Cited on pages: 177, 626, 631, 661, 672, 674, 676.
[99COR/BOO] Cordfunke, E. H. P., Booij, A. S., Huntelaar, M. E., The standard
enthalpies of formation of uranium compounds. XV. Strontium uranates, J. Chem. Thermodyn., 31, (1999), 1337-1345. Cited on pages: 261, 262, 263, 264, 265, 398, 426, 467, 468, 631, 634,666.
[99DOC/MOS] Docrat, T. I., Mosselmans, J. F. W., Charnock, J. M., Whiteley,
M. W., Collison, D., Livens, F. R., Jones, C., Edmiston, M. J.,X-ray absorption of tricarbonatodioxouranate(V), UO2(CO3)3
5– in aqueous solution, Inorg. Chem., 38, (1999), 1879-1882. Cited on pages: 160, 635.
[99FAN/KON] Fanghänel, T., Könnecke, T., Weger, H., Paviet-Hartmann, P.,
Neck, V., Kim, J. I., Thermodynamics of Cm(III) in concen-trated salt solutions: Carbonate complexation in 0-6 m NaCl at 25oC, J. Solution Chem., 28, (1999), 447-462. Cited on pages: 369, 370, 371, 372, 373, 374, 375, 480, 585, 587, 614, 635, 636,755.
[99FEL/RAI] Felmy, A. R., Rai, D., Application of Pitzer's Equation for mod-
eling the aqueous thermodynamics of actinide species in naturalwaters: A review, J. Solution Chem., 28, (1999), 533-553. Cited on pages: 636, 637, 706.
[99FIR] Firestone, R. B., Table of isotopes, Eight edition, Update, Bag-
lin, C. M., Franck Chu, S. Y., Eds., John Wiley & Sons, (1999).Cited on pages: 195, 336.
[99GRA/MUL] Grambow, B., Müller, R., Solids, colloids and hydrolysis of
U(VI) in chloride media, INE Forschungszentrum Karlsruhe, (1999), private communication, (from the citation in [99NEC/KIM]). Cited on page: 646.

BIBLIOGRAPHY 867
[99HAS/WAN] Hashizume, K., Wang, W. E., Olander, D. R., Volatilization ofurania in steam at elevated temperatures, J. Nucl. Mater., 275, (1999), 277-286. Cited on pages: 163, 637.
[99HRN/IRL] Hrnecek, E., Irlweck, K., Formation of uranium(VI) complexes
with monomeric and polymeric species of silicic acid, Radio-chim. Acta, 87, (1999), 29-35. Cited on pages: 252, 253, 254, 637.
[99JAY/IYE] Jayanthi, K., Iyer, V. S., Rama Rao, G. A., Venugopal, V., Molar
Gibbs energy formation of KUO3(s), J. Nucl. Mater., 264, (1999), 263-270. Cited on pages: 274, 275, 512, 546, 592, 638.
[99KAS/RUN] Kaszuba, J. P., Runde, W., The aqueous geochemistry of neptu-
nium: dynamic control of soluble concentrations with applica-tions to nuclear waste disposal, Environ. Sci. Technol., 33, (1999), 4427-4433. Cited on pages: 294, 296, 298, 639.
[99KNO/NEC] Knopp, R., Neck, V., Kim, J. I., Solubility, hydrolysis and col-
loid formation of plutonium(IV), Radiochim. Acta, 435, (1999), 1-8. Cited on pages: 313, 314, 315, 316, 317, 642, 687, 692, 695,706.
[99MEI/KAT] Meinrath, G., Kato, Y., Kimura, T., Yoshida, Z., Comparative
analysis of actinide(VI) carbonate complexation by Monte Carlo resampling methods, Radiochim. Acta, 84, (1999), 21-29. Cited on pages: 247, 643.
[99MEI/VOL] Meinrath, G., Volke, P., Helling, C., Dudel, E. G., Merkel, B. J.,
Determination and interpretation of environmental water sam-ples contaminated by uranium mining activities, J. Anal. Chem., 364, (1999), 191-202. Cited on pages: 165, 644.
[99MIK/RUM] Mikheev, N. B., Rumer, I. A., Stabilization of the divalent state
for the lanthanides and actinides in solutions, melts and clusters, Radiochim. Acta, 85, (1999), 49-55. Cited on pages: 159, 644.
[99MOL/DEN] Moll, H., Denecke, M. A., Jalilehvand, F., Sandström, M., Gren-
the, I., Structure of the aqua ions and fluoride complexes of ura-nium(IV) and thorium(IV) in aqueous solution an EXAFS study,Inorg. Chem., 38, (1999), 1795-1799. Cited on page: 160.

BIBLIOGRAPHY 868
[99NAK/ARA] Nakajima, K., Arai, Y., Suzuki, Y., Vaporization behavior ofNpN coloaded with PuN, J. Nucl. Mater., 275, (1999), 332-335. Cited on pages: 300, 644, 645.
[99NAK/ARA2] Nakajima, K., Arai, Y., Suzuki, Y., Yamawaki, M., Vaporization
behavior of BaPuO3, J. Mass Spectrom. Soc. Japan, 47, (1999), 46-48. Cited on pages: 331, 645.
[99NEC/KIM] Neck, V., Kim, J. I., Solubility and hydrolysis of tetravalent acti-
nides, Forschungszentrum Karlsruhe, Report FZKA 6350,(1999), 40 pp. Cited on pages: 183, 186, 295, 297, 298, 313, 314, 316, 319, 334, 579, 640, 642, 646, 647, 648, 649, 691, 692.
[99OLA] Olander, D. R., Thermodynamics of urania volatilization in
steam, J. Nucl. Mater., 270, (1999), 187-193. Cited on pages: 163, 637, 649, 650.
[99PIA/TOU] Pialoux, A., Touzelin, B., Etude du système U-Sr-O par diffrac-
tion X à haute température, Can. J. Chem., 77, (1999), 1384-1393, in French. Cited on pages: 259, 616, 650.
[99RAI/HES] Rai, D., Hess, N. J., Felmy, A. R., Moore, D. A., Yui, M., A
thermodynamic model for the solubility of NpO2(am) in the aqueous K+-HCO3
–-CO32–-OH–-H2O system, Radiochim. Acta, 84,
(1999), 159-169. Cited on pages: 250, 302, 303, 304, 326, 327, 637, 640, 650, 688, 689.
[99RAI/HES2] Rai, D., Hess, N. J., Felmy, A. R., Moore, D. A., Yui, M., Vi-
torge, P., A thermodynamic model for the solubility of PuO2(am) in the aqueous K+-HCO3-CO3
2–-OH–-H2O system, Radiochim. Acta, 86, (1999), 89-99. Cited on pages: 313, 317, 326, 327, 328, 329, 585, 637, 651, 652, 688, 692.
[99RAO/RAI] Rao, L., Rai, D., Felmy, A. R., Novak, C. F., Solubility of
NaNd(CO3)2.6H2O(c) in mixed electrolyte (Na-Cl-CO3-HCO3) and synthetic brine solutions, Proc. Am. Chem. Soc. Symp. Exp. Model Stud. Actinide Speciation Non-ideal Syst., pp. 153-169, Plenum Publisher, (1999). Cited on page: 383.

BIBLIOGRAPHY 869
[99RAR/RAN] Rard, J. A., Rand, M. H., Anderegg, G., Wanner, H., Chemical Thermodynamics of Technetium, Sandino, M. C. A., Östhols, E., Nuclear Energy Agency Data Bank, Organisation for EconomicCo-operation, Development, Eds., vol. 3, Chemical Thermody-namics, North Holland Elsevier Science Publishers B. V., Am-sterdam, The Netherlands, (1999). Cited on pages: xi, 4, 5, 6, 39, 125, 126, 128, 133, 134, 135, 389, 390, 391, 478, 503, 521, 576,671, 735, 753, 762.
[99RUN/REI] Runde, W., Reilly, S. D., Neu, M. P., Spectroscopic investiga-
tion of the formation of PuO2Cl+ and PuO2Cl2 in NaCl solutions and application for natural brine solutions, Geochim. Cosmo-chim. Acta, 63, (1999), 3443-3449. Cited on pages: 323, 469, 652, 653, 654, 655, 656, 679.
[99RUT/GEI] Rutsch, M., Geipel, G., Brendler, V., Bernhard, G., Nitsche, H.,
Interaction of uranium(VI) with arsenate(V) in aqueous solution studied by time-resolved laser-induced fluorescence spectros-copy (TRLFS), Radiochim. Acta, 86, (1999), 135-141. Cited on pages: 243, 561, 656.
[99SAX/RAM] Saxena, M. K., Ramakumar, K. L., Venugopal, V., Heat capacity
measurements on rubidium uranium sulphate (RBS), Rb2U(SO4)3, by differential scanning calorimetry (DSC), NUCAR 99, Mumbai, India, 19-22 Jan., pp. 393-394, Bhabha Atomic Research Centre, Mumbai, India, (1999). Cited onpages: 277, 454, 657.
[99SIN/DAS] Singh, Z., Dash, S., Krishnan, K., Prasad, R., Venugopal, V.,
Standard molar Gibbs energy of formation of UTeO5(s) by the electrochemical method, J. Chem. Thermodyn., 31, (1999), 197-204. Cited on pages: 235, 595, 596, 610, 658, 666.
[99SOD/ANT] Soderholm, L., Antonio, M. R., Williams, C., Wasserman, S. R.,
XANES spectroelectrochemistry: A new method for determining formal potentials, Anal. Chem., 71, (1999), 4622-4628. Cited on pages: 293, 659.
[99SOW/CLA] Sowder, A. G., Clark, S. B., Field, R. A., The transformation of
uranyl oxide hydrates: The effects of dehydration on syntheticmetaschoepite and its alteration to becquerelite, Environ. Sci. Technol., 33, (1999), 2552-3557. Cited on pages: 189, 588.

BIBLIOGRAPHY 870
[99SUZ/TAM] Suzuki, S., Tamura, K., Tachimori, S., Usui, Y., Solvent extrac-tion of technetium(VII) by cyclic amides, J. Radioanal. Nucl. Chem., 239, (1999), 377-380. Cited on pages: 390, 659.
[99VAL/MAR] Vallet, V., Maron, L., Schimmelpfennig, B., Leininger, T.,
Teichteil, C., Gropen, O., Grenthe, I., Wahlgren, U., Reduction behavior of the early actinyl ions in aqueous solution, J. Phys. Chem. B, 103, (1999), 9285-9289. Cited on pages: 159, 580, 660.
[99WAH/MOL] Wahlgren, U., Moll, H., Grenthe, I., Schimmelpfennig, B., Ma-
ron, L., Vallet, V., Gropen, O., Structure of uranium(VI) in strong alkaline solutions: a combined theoretical and experimen-tal investigation, J. Phys. Chem. A, 103, (1999), 8257-8264. Cited on pages: 160, 177, 626, 631, 661, 662, 672.
[99WAN/OST] Wanner, H., Östhols, E., TDB-3: Guidelines for the assignment
of uncertainties, Nuclear Energy Agency Data Bank, Organisa-tion for Economic Co-operation and Development, Report, (1999), 17 pp. Cited on page: 6.
[2000ALL/BUC] Allen, P. G., Bucher, J. J., Shuh, D. K., Edelstein, N. M., Craig,
I., Coordination chemistry of trivalent lanthanide and actinideions in dilute and concentrated chloride solutions, Inorg. Chem., 39, (2000), 595-601. Cited on pages: 322, 357, 662.
[2000BEN/FAT] Ben Said, K., Fattahi, M., Musikas, C., Revel, R., Abbé, J. C.,
The speciation of Tc(IV) in chloride solutions, Radiochim. Acta, 88, (2000), 567-571. Cited on pages: 391, 662.
[2000BRU/CER] Bruno, J., Cera, E., Grivé,M., de Pablo, J., Sillen, P., Duro, L.,
Determination and uncertainties of radioelement solubility limits to be used by SKB in the SR 97 performance assessment exer-cise, Radiochim. Acta, 88, (2000), 823-828. Cited on pages: 165, 663.
[2000BUN/KNO] Bundschuh, T., Knopp, R., Müller, R., Kim, J. I., Neck, V.,
Fanghänel, T., Application of LIBD to the determination of the solubility product of thorium(IV)-colloids, Radiochim. Acta, 88, (2000), 625-629. Cited on pages: 320, 321, 663.
BIBLIOGRAPHY 871
[2000BUR/OLS] Burns, P. C., Olson, R. A., Finch, R. J., Hanchar, J. M., Thibault, Y., KNa3(UO2)2(Si4O10)2(H2O)4, a new compound formed during vapor hydration of an actinide-bearing borosilicate waste glass, J. Nucl. Mater., 278, (2000), 290-300. Cited on pages: 165, 664.
[2000COM/BRO] Comarmond, M. J., Brown, P. L., The hydrolysis of uranium(VI)
in sulphate media, Radiochim. Acta, 88, (2000), 573-577. Cited on pages: 178, 230, 231, 232, 233, 453, 664, 698.
[2000DAS/SIN] Dash, S., Singh, Z., Prasad, R., Venugopal, V., Calorimetric
studies on the strontium-uranium-oxygen system, J. Nucl. Ma-ter., 279, (2000), 84-90. Cited on pages: 263, 264, 665.
[2000DAV/FOU] David, F., Fourest, B., Hubert, S., Purans, J., Vokhmin, V.,
Madic, C., Thermodynamic properties of Pu3+ and Pu4+ aquo ions, Plutonium Futures - The Science, Conference Transactions, Santa Fe, NM, USA, 10-13 July, p. 388, (2000). Cited on page: 581.
[2000FIN] Fink, J. K., Thermophysical properties of uranium dioxide, J.
Nucl. Mater., 279, (2000), 1-18. Cited on pages: 193, 666, 667. [2000GOR/LUM] Gorshkov, N. I., Lumpov, A. A., Miroslavov, A. E., Suglobov,
D. N., Synthesis of [Tc(CO3)3(H2O)3]+ ion and study of its reac-tion with hydroxyl ion in aqueous solutions, Radiochemistry (Moscow), 42, (2000), 231. Cited on page: 668.
[2000GOR/MIR] Gorshkov, N. I., Miroslavov, A. E., Lumpov, A. A., Suglobov,
D. N., Sukhov, V. Yu., Complexation of Tc(CO)3(H2O)3+ with
simple ligands in aqueous solutions and some data on its phar-marokinetics, NRC5 5th International Conference on Nuclearand Radiochemistry, Pontresina, Switzerland, 3-8 September, pp. 765-767, (2000). Cited on pages: 391, 667.
[2000GRE/WAN] Grenthe, I., Wanner, H., Östhols, E., TDB-2: Guidelines for the
extrapolation to zero ionic strength, OECD Nuclear EnergyAgency, Data Bank, Report, (2000), 34 pp. Cited on pages: 6, 441, 708, 714.
[2000HAS/ALL] Haschke, J. M., Allen, T. H., Morales, L. A., Reaction of pluto-
nium dioxide with water: formation and properties of PuO2+x, Science, 287, (2000), 285-287. Cited on pages: 315, 668, 669.
BIBLIOGRAPHY 872
[2000HAY/MAR] Hay, P. J., Martin, R. L., Schreckenbach, G., Theoretical studies of the properties and solution chemistry of AnO2
2+ and AnO2+
aquo complexes for An = U, Np, and Pu, J. Phys. Chem. A, 104, (2000), 6259-6270. Cited on pages: 159, 669.
[2000KAL/CHO] Kalmykov, S. N., Choppin, G. R., Mixed Ca2+/UO2
2+/CO32– com-
plex formation at different ionic strengths, Radiochim. Acta, 88, (2000), 603-606. Cited on pages: 248, 249, 669, 670.
[2000KON/CLA] Konze, W. V., Clark, D. L., Conradson, S. D., Donohoe, R. J.,
Gordon, J. C., Gordon, P., Keogh, D. W., Morris, D. E., Tait, C.D., Identification of oligomeric uranyl complexes under highlyalkaline conditions, Plutonium Futures - The Science, Confer-ence Transactions, Santa Fe, NM, USA, 10-13 July, p. 261, (2000). Cited on pages: 178, 670.
[2000LAA/KON] van der Laan, R. R., Konings, R. J. M., The heat capacity of
Tc0.85Ru0.15 alloy, J. Alloys Compd., 297, (2000), 104-108. Cited on pages: 389, 530, 671.
[2000LAN] Landolt-Bornstein Tables, Thermodynamic properties of inor-
ganic materials, vol. 19, New series, Group IV: Physical chemis-try, No. 3, compounds from CoCl3 to Ge3N4, Springer Verlag, Berlin, (2000). Cited on page: 204.
[2000MEI/EKB] Meinrath, G., Ekberg, C., Landgren, A., Liljenzin, J. O., As-
sessment of uncertainty in parameter evaluation and prediction, Talanta, 51, (2000), 231-246. Cited on page: 644.
[2000MEI/HUR] Meinrath, G., Hurst, S., Gatzweiler, R., Aggravation of licensing
procedures by doubtful thermodynamic data, J. Anal. Chem., 368, (2000), 561-566. Cited on page: 644.
[2000MEI] Meinrath, G., Robust spectral analysis by moving block boot-
strap designs, Radiochim. Acta, 415, (2000), 105-115. Cited on page: 644.
[2000MEI2] Meinrath, G., Computer-intensive methods for uncertainty esti-
mation on complex situations, Chemom. Intell. Lab. Syst., 51, (2000), 175-187. Cited on page: 644.

BIBLIOGRAPHY 873
[2000MOL/REI] Moll, H., Reich, T., Szabó,Z., The hydrolysis of dioxoura-nium(VI) investigated using EXAFS and 17O-NMR, Radiochim. Acta, 88, (2000), 411-415. Cited on pages: 177, 178, 453, 672, 698, 702.
[2000MOL/REI2] Moll, H., Reich, T., Henning, C., Rossberg, A., Szabó,Z., Gren-
the, I., Solution coordination chemistry of uranium in the binaryUO2
2+-SO42– and the ternary UO2
2+-SO42–-OH– system, Radiochim.
Acta, 88, (2000), 559-566. Cited on pages: 231, 232, 233, 502, 626, 664, 665, 672, 676.
[2000NEC/KIM] Neck, V., Kim, J. I., An electrostatic approach for the prediction
of actinide complexation constants with inorganic ligands-application to carbonate complexes, Radiochim. Acta, 88, (2000), 815-822. Cited on page: 673.
[2000NGU/BUR] Nguyen-Trung, C., Burneau, A., Quilès, F., Palmer, D. A., Dé-
termination des spectres d'absorption UV-visible des hydroxydes d'uranyle(VI) individuels en présence de deux électrolytes non complexants, NaClO4 et (CH3)4NCF3SO3, dans un large domaine de pH (0-14) par chimiométrie à 25oC, Journées Practis 1999, Villeneuve-lès-Avignon, France, 17-18 février, (2000). Cited on pages: 178, 551, 673.
[2000NGU/PAL] Nguyen-Trung, C., Palmer, D. A., Begun, G. M., Peiffert, C.,
Mesmer, R. E., Aqueous uranyl complexes 1. Raman spectro-scopic study of the hydrolysis of uranyl(VI) in solutions oftrifluoromethanesulfonic acid and/or tetramethylammonium hy-droxide at 25oC and 0.1 MPa, J. Solution Chem., 29, (2000), 101-129. Cited on pages: 166, 175, 177, 661, 674, 675, 676, 677,701, 702, 703.
[2000OST/WAN] Östhols, E., Wanner, H., TDB-0: The NEA Thermochemical
Data Base Project, Nuclear Energy Agency Data Bank, Organi-sation for Economic Co-operation and Development, Report, (2000), 21 pp. Cited on page: 6.
[2000PER/CAS] Pérez, I., Casas, I., Martín, M., Bruno, J., The thermodynamics
and kinetics of uranophane dissolution in bicarbonate test solu-tions, Geochim. Cosmochim. Acta, 64, (2000), 603-608. Cited on pages: 256, 677, 678.

BIBLIOGRAPHY 874
[2000QUI/BUR] Quilès, F., Burneau, A., Infrared and Raman spectra ofuranyl(VI) oxo-hydroxo complexes in acidic aqueous solutions: a chemometric study, 23, (2000), 241-251. Cited on pages: 175, 678.
[2000RAI/MOO] Rai, D., Moore, D. A., Oakes, C. S., Yui, M., Themodynamic
model for the solubility of thorium dioxide in the Na+-Cl–-OH–-H2O system at 23oC and 90oC, Radiochim. Acta, 88, (2000), 297. Cited on page: 250.
[2000RAN/FUG] Rand, M. H., Fuger, J., The thermodynamic properties of the
transuranium halides: Part 1, Neptunium and plutonium halides,ITU, European Commission Joint Research Centre, Report 17332 EN, (2000). Cited on pages: 360, 466.
[2000REI/BER] Reich, T., Bernhard, G., Geipel, G., Funke, H., Henning, C.,
Rossberg, A., Matz, W., Schell, N., Nitsche, H., The RossendorfBeam line ROBL-a dedicated experimental station for EXAFS measurements of actinides and other radionuclides, Radiochim. Acta, 88, (2000), 633-637. Cited on pages: 293, 679.
[2000REI/NEU] Reilly, S. D., Neu, M. P., Runde, W., Solubility and speciation
of plutonium(VI) carbonates and hydroxides, Plutonium Fu-tures - The Science, Conference Transactions, Santa Fe, NM,USA, 10-13 July, p. 269, (2000). Cited on pages: 330, 555, 679, 680, 681.
[2000STO/HOF] Stoyer, N. J., Hoffman, D. C., Silva, R. J., Cation-cation com-
plexes of PuO2+ and NpO2
+ with Th4+ and UO22+, Radiochim. Acta,
88, (2000), 279-282. Cited on pages: 257, 301, 323, 681. [2000SZA/MOL] Szabó,Z., Moll, H., Grenthe, I., Structure and dynamics in the
complex ion (UO2)2(CO3)(OH)3–, J. Chem. Soc. Dalton Trans.,
18, (2000), 3158-3161. Cited on pages: 247, 682. [2000VIC/FAT] Vichot, L., Fattahi, M., Musikas, C., Grambow, B., Effect of
sulfate on Tc(IV) speciation in aqueous solutions, NRC5 5thInternational Conference on Nuclear and Radiochemistry, Pon-tresina, Switzerland, 3-8 September, pp. 711-714, (2000). Cited on pages: 391, 682.

BIBLIOGRAPHY 875
[2000WAD/HRN] Wadsak, W., Hrnecek, E., Irlweck, K., Formation of ameri-cium(III) complexes with aqueous silicic acid, Radiochim. Acta, 88, (2000), 61-64. Cited on pages: 384, 385, 682.
[2000WAN/OST] Wanner, H., Östhols, E., TDB-1: Guidelines for the review pro-
cedure and data selection, Nuclear Energy Agency Data Bank, Organisation for Economic Co-operation and Development, Re-port, (2000), 5 pp. Cited on page: 6.
[2000YEH/MAD] Yeh, M., Madisson, A. P., Clark, S. B., Temperature dependence
of chloride complexation for the trivalent f-elements, J. Radio-anal. Nucl. Chem., 43, (2000), 645-650. Cited on pages: 358, 683, 684.
[2001BAN/PRA] Banerjee, A., Prasad, R., Venugopal, V., Calorimetric studies on
Rb2U4O11(s) and Tl2U4O11(s), J. Alloys Compd., 322, (2001), 265-268. Cited on pages: 269, 276, 280, 575, 684.
[2001BEN/SEI] Ben Said, K., Seimbeille, Y., Fattahi, M., Houee-Levin, C.,
Abbé, J. C., Gamma radiation effects on potassium pertechnetate in carbonate media, Annu. Rev. Nucl. Sci., (2001), 45-51. Cited on pages: 391, 685.
[2001BER/GEI] Bernhard, G., Geipel, G., Reich, T., Brendler, V., Amayri, S.,
Nitsche, H., Uranyl(VI) carbonate complex formation: Valida-tion of the Ca2UO2(CO3)3(aq) species, Radiochim. Acta, 89, (2001), 511-518. Cited on pages: 248, 249, 685.
[2001BIL/RUS] Billard, I., Rustenholtz, A., Sémon, L., Lützenkirchen, K.,
Fluorescence of UO22+ in a non-complexing medium :
HCLO4/NaClO4 up to 10 M, Chem. Phys., 270, (2001), 345-354. Cited on pages: 160, 629, 695.
[2001BOL/WAH] Bolvin, H., Wahlgren, U., Moll, H., Reich, T., Geipel, G.,
Fanghänel, T., Grenthe, I., On the structure of Np(VI) andNp(VII) species in alkaline solution studied by EXAFS and quantum chemical methods, J. Phys. Chem. A, 105, (2001), 11441-11445. Cited on pages: 293, 532, 686, 697.
[2001BOL/WAH2] Bolvin, H., Wahlgren, U., Gropen, O., Marsden, C., Ab initio
study of the iso-electronic molecules NpO4– and , 2
4UO − J. Phys. Chem. A, 105, (2001), 11570-11576. Cited on page: 686.

BIBLIOGRAPHY 876
[2001DAV/VOK] David, F., Vokhmin, V., Ionova, G., Water characteristics de-pend on the ionic environment. Thermodynamics and modelisa-tion of the aquo ions, J. Mol. Liq., 90, (2001), 45-62. Cited on page: 581.
[2001FUJ/PAR] Fujino, T., Park, K., Sato, N., Yamada, M., Thermodynamics of
(Mg, Ce,U)O2+x (x >=< 0) solid solutions, J. Nucl. Mater., 294, (2001), 104-111. Cited on page: 259.
[2001FUJ/SAT] Fujino, T., Sato, N., Yamada, K., Nakama, S., Fukuda, K., Seri-
zawa, H., Shiratori, T., Thermodynamics of the UO2 solid solu-tions with magnesium and europium oxides, J. Nucl. Mater., 297, (2001), 332-340. Cited on page: 259.
[2001FUJ/YAM] Fujiwara, K., Yamana, H., Fujii, T., Moriyama, H., Solubility
product of plutonium hydrous oxide, J. Nucl. Fuel Cycle Envi-ron., 7, (2001), 17-23. Cited on pages: 316, 317, 687, 688, 695, 706.
[2001HAS/ALL] Haschke, J. M., Allen, T. H., Morales, L. A., Reactions of pluto-
nium dioxide with water and hydrogen-oxygen mixtures: Mechanisms for corrosion of uranium and plutonium, J. Alloys Compd., 314, (2001), 78-91. Cited on page: 315.
[2001JOU/MAL] Joubert, L., Maldivi, P., A structural and vibrational study of
Uranium(III) molecules by density functional methods, J. Phys. Chem. A, 105, (2001), 9068-9076. Cited on page: 196.
[2001KIT/KOH] Kitamura, A., Kohara, Y., Solubility of Np(IV) under carbonate
conditions, Tokay Works, Japan Nuclear Fuel Cycle Develop-ment Institute, Muramatsu, Report JNC TC8400 2001-006, (2001). Cited on pages: 302, 303, 304, 327, 328, 329, 688, 689,690.
[2001KON] Konings, R. J. M., Estimation of the standard entropies of some
Am(III) and Cm(III) compounds, J. Nucl. Mater., 295, (2001), 57-63. Cited on pages: 333, 334, 343, 350, 359, 360, 361, 362,363, 364, 690.
[2001KON2] Konings, R. J. M., Thermochemical and thermophysical proper-
ties of curium and its oxides, J. Nucl. Mater., 298, (2001), 255-268. Cited on pages: 334, 343.

BIBLIOGRAPHY 877
[2001LEM/FUG] Lemire, R. J., Fuger, J., Nitsche, H., Potter, P. E., Rand, M. H.,Rydberg, J., Spahiu, K., Sullivan, J. C., Ullman, W. J., and Vi-torge, P., Wanner, H., Chemical Thermodynamics of Neptunium and Plutonium, Nuclear Energy Agency Data Bank, Organisa-tion for Economic Co-operation, Development, Ed., vol. 4, Chemical Thermodynamics, North Holland Elsevier Science Publishers B. V., Amsterdam, The Netherlands, (2001). Cited on pages: xi, 4, 6, 39, 44, 79, 80, 97, 98, 114, 175, 293, 294, 295, 296, 297, 298, 299, 300, 301, 305, 306, 308, 309, 310, 311, 312,313, 314, 315, 316, 317, 318, 319, 321, 322, 323, 324, 325, 326,327, 330, 331, 334, 343, 352, 353, 375, 376, 377, 383, 421, 449,469, 470, 478, 479, 481, 482, 483, 486, 487, 521, 524, 525, 526, 529, 544, 558, 571, 579, 582, 584, 585, 595, 616, 620, 622, 623,639, 640, 641, 643, 644, 645, 648, 649, 651, 653, 659, 663, 680,681, 686, 687, 690, 693, 695, 706, 728, 729, 730, 733, 735, 753,755, 758, 759, 762, 763.
[2001NEC/KIM] Neck, V., Kim, J. I., Solubility and hydrolysis of tetravalent acti-
nides, Radiochim. Acta, 89, (2001), 1-16. Cited on pages: 183, 186, 187, 295, 296, 297, 298, 313, 314, 316, 318, 319, 321, 334,579, 640, 642, 691, 692, 693, 694.
[2001NEC/KIM2] Neck, V., Kim, J. I., Seidel, B. S., Marquardt, C. M., Dardenne,
K., Jensen, M. P., Hauser, W., A spectroscopic study of the hy-drolysis, colloid formation and solubility of Np(IV), Radiochim. Acta, 89, (2001), 439-446. Cited on pages: 295, 296, 298, 693.
[2001RAI/MOO] Rai, D., Moore, D. A., Felmy, A. R., Choppin, G. R., Moore, R.
C., Thermodynamics of the PuO2+-Na+-OH–-ClO4
–-H2O system: Use of NpO2
+ Pitzer parameters for PuO2+, Radiochim. Acta, 89,
(2001), 491-498. Cited on pages: 316, 317, 695. [2001SEM/BOE] Sémon, L., Boehme, C., Billard, I., Henning, C., Lützenkirchen,
K., Reich, T., Rossberg, A., Rossini, I., Wipff, G., Do perchlo-rate and triflate anions bind to the uranyl cation in acidic aque-ous medium ? A combinated EXAFS and quantum mechanicalinvestigation, Chem. Phys., 2, (2001), 591-598. Cited on pages: 160, 629, 695.

BIBLIOGRAPHY 878
[2001VAL/WAH] Vallet, V., Wahlgren, U., Schimmelpfennig, B., Moll, H., Szabó, Z., Grenthe, I., Solvent Effects on Uranium(VI) fluoride and hydroxide complexes studied by EXAFS and Quantum Chemis-try, Inorg. Chem., 40, (2001), 3516-3525. Cited on pages: 177, 451, 631, 696.
[2001WIL/BLA] Williams, C. W., Blaudeau, J. P., Sullivan, J. C., Antonio, M. R.,
Bursten, B., Soderholm, L., The coordination geometry of Np(VII) in alkaline solution, J. Am. Chem. Soc., 13, (2001), 4346-4347. Cited on pages: 293, 532, 686, 697.
[2001YAM/KUR] Yamanaka, S., Kurosaki, K., Matsuda, T., Uno, M., Thermo-
physical properties of BaUO3, J. Nucl. Mater., 294, (2001), 99-103. Cited on page: 267.
[2002BRO] Brown, P. L., The hydrolysis of uranium(VI), Radiochim. Acta,
90, (2002), 589-593. Cited on pages: 165, 167, 173, 174, 176,178, 589, 697.
[2002GER/GRI] German, K. E., Grigoriev, M. S., Synthesis, structure and proper-
ties of zirconium(IV) and uranyl pertechnetate and perrhenate,The third Russian-Japanese seminar on technetium, Dubna, Rus-sia, (2002). Cited on pages: 390, 700.
[2002GER/KOD] German, K. G., Kodina, G. E., Sekine, T., The third Russian-
Japanese seminar on technetium, Dubna, Russia, (2002). Cited on pages: 390, 700.
[2002GRI/GER] Grigoriev, M. S., German, K. E., Den Auwer, C., Dancausse, J.
P., Masson, M., Simonoff, M., Structure and properties of tetra-propylammonium pertechnetate and perrhenate, The third Rus-sian-Japanese seminar on technetium, Dubna, Russia, (2002). Cited on pages: 700, 701.
[2002HAS/ALL] Haschke, J. M., Allen, T. H., Equilibrium and thermodynamic
properties of the PuO2+x solid solution, J. Alloys Compd., 336, (2002), 124-131. Cited on page: 315.

BIBLIOGRAPHY 879
[2002KIR/GER] Kirakosyan, G. A., German, K. E., Tarasov, V. P., Grigoriev, M.S., The structure and properties of pertechnetic acid in solid state and solutions as probed be NMR, The third Russian-Japanese seminar on technetium, Dubna, Russia, (2002). Cited on pages:390, 700.
[2002MAS/PER] Maslennikov, A. G., Peretrukhin, V. F., Silin, V. I., Kareta, A.V., Sladkov, V. E., David, F., Fourest, B., Courson, O., Masson, M., Lecomte, M., Delegard, C., Electrochemical reactions fortechnetium recovery and analysis in radwaste solutions, The third Russian-Japanese seminar on technetium, Dubna, Russia, (2002). Cited on pages: 390, 701.
[2002NGU] Nguyen-Trung, C., Etude expérimentale de l'hydrolyse en solu-tion aqueuse des ions uranyle(VI) en présence d'électrolytes noncomplexants par spectroscopie de vibration à 25°C, 0.1 MP, Ph.D. Thesis, Université Henri Poincaré, (2002), Nancy 1, France.Cited on pages: 178, 701, 703.
[2002RAI/FEL] Rai, D., Felmy, A. R., Hess, N. J., LeGore, V. L., McCready, D.E., Thermodynamics of the U(VI)-Ca2+-Cl–-OH–-H2O system: solubility product of becquerelite, Radiochim. Acta, 90, (2002), 495-503. Cited on pages: 165, 176, 178, 180, 284, 422, 704, 705.
[2002RAI/GOR] Rai, D., Gorby, Y. A., Fredrickson, J. K., Moore, D. A., Yui, M.,Reductive dissolution of PuO2(am): The effect of Fe(II) and hy-droquinone, J. Solution Chem., 31, (2002), 433-453. Cited on pages: 316, 317, 705, 706.
[2002SHI/MIN] Shirasu, Y., Minato, K., Heat capacities of technetium metal andtechnetium-ruthenium alloy, J. Alloys Compd., 337, (2002), 243-247. Cited on pages: 389, 390.
[2002VAL/WAH] Vallet, V., Wahlgren, U., Szabó, Z., Grenthe, I., Rates and mechanism of fluoride and water exchange in UO2F5
3– and [UO2F4(H2O)]2- studied by NMR spectroscopy and wave func-tion based methods, Inorg. Chem., 41, (2002), 5626-5633. Cited on page: 209.
[2003RAI/YUI] Rai, D. and Yui, M. and Moore, D. A., Solubility and solubility product at 22°C of UO2(c) precipitated from aqueous U(VI) solutions, J. Solution Chem., 32, (2003), 1-17. Cited on page:
86. 1
List of cited authors This chapter contains an alphabetical list of the authors of the references cited in this book. The reference codes given with each name corresponds to the publications of which the person is the author or a co-author. Note that inconsistencies may occur due to variations in spelling between different publications. No attempt has been made to correct for such inconsistencies in this volume.
Authors list
Author Reference Aalto, T. [69SAL/HAK] Aas, W. [97SZA/AAS], [98AAS/MOU], [99AAS/STE] Abbé, J. C. [98BEN/FAT], [2000BEN/FAT], [2001BEN/SEI] Abbrent, M. [65VES/PEK] Abe, R. [90PAR/SAK] Aberg, M. [69ABE], [70ABE] Ackermann, R. J. [69ACK/RAU], [76OET/RAN] Adamson, M. G. [93KRI/EBB], [97KRI/FON] Adnet, J. M. [92ADN/MAD], [98CHA/DON], [99CHA/DON] Afanas'ev, Yu. A. [75STO/KHA] Agafonov, I. L. [53AGA/AGA] Agalonova, A. L. [53AGA/AGA] Aguilar, M. [91AGU/CAS] Ahonen, L. [94AHO/ERV] Ahrland, S. [71AHR/KUL] Akhachinskij, V. V. [81CHI/AKH] Akishin, P. A. [61AKI/KHO] Al Mahamid, I. [97NOV/ALM], [98ALM/NOV], [98CON/ALM] Alcock, C. B. [93KUB/ALC] Aldridge, J. P. [85ALD/BRO] Alekseeva, T. E. [74RAB/ALE] Alexander, C. A. [87ALE/OGD] Alikhanyan, A. S. [90SEV/ALI] Aling, P. [63COR/ALI] Allard, B. [78ALL/BEA], [84ALL/OLO], [97ALL/BAN]
(Continued on next page)
880

LIST OF CITED AUTHORS 881
Authors list (continued) Author Reference Allen, P. G. [95ALL/BUC], [96ALL/SHU], [97ALL/BUC],
[97ALL/SHU], [2000ALL/BUC] Allen, T. H. [2000HAS/ALL], [2001HAS/ALL], [2002HAS/ALL] Altman, D. [43ALT/LIP], [43ALT] Alwan, A. K. [80ALW/WIL], [80ALW] Amayri, S. [97AMA/GEI], [98AMA/BER], [2001BER/GEI] Ananthaswamy, J. [84ANA/ATK] Anderegg, G. [99RAR/RAN] Anderson, G. M. [91AND/CAS] Anderson, O. E. [42JEN/AND] Andrews, Jr., J. E. [92NGU/SIL] Ansara, I. [81CHI/AKH] Ansoborlo, E. [97SCA/ANS], [98SCA/ANS] Antonio, M. R. [99SOD/ANT], [2001WIL/BLA] Apelblat, A. [75APE/SAH], [98APE/KOR] Arai, Y. [97NAK/ARA], [98SUZ/ARA], [99NAK/ARA],
[99NAK/ARA2] Arblaster, J. W. [95ARB] Archer, D. G. [90ARC/WAN] Arlès, L. [93BOI/ARL] Armstrong, A. Q. [97ELL/ARM] Asahina, K. [97ASA/SUG] Ashida, T. [95PAS/KIM] Atkins, M. [88ATK/BEC] Atkinson, G. [84ANA/ATK] Avogadro, A. [86AVO/BIL] Aziz, A. [68AZI/LYL], [69AZI/LYL] Babko, A. K. [60BAB/KOD] Baes, Jr., C. F. [54SCH/BAE], [56BAE], [62BAE/MEY],
[65BAE/MEY], [76BAE/MES] Bailey, S. M. [82WAG/EVA] Balakhovskii, O. A. [75SPI/ZIN] Baldas, J. [98BAL/HEA] Balducci, G. [72GUI/GIG], [91GUI/BAL] Bamberger, C. E. [96SHO/BAM] Banar, J. C. [98EFU/RUN] Banerjee, A. [98BAN/SAL], [2001BAN/PRA] Bansal, B. M. L. [64BAN/PAT] Banwart, S. A. [97ALL/BAN] Banyai, I. [95BAN/GLA] Baraj, E. [97TOR/BAR] Barbanel', Yu. A. [69BAR/MIK] Bard, A. J. [85BAR/PAR]
(Continued on next page)

LIST OF CITED AUTHORS 882
Authors list (continued) Author Reference Bardin, N. [98BAR/RUB] Barinov, V. I. [81GOL/TRE], [81GOL/TRE2] Barrett, S. A. [82BAR/JAC] Bartušek, M. [63BAR/SOM] Bastasz, R. [90COS/LAK] Basu, M. [99BAS/MIS] Bates, R. G. [73BAT] Batyreva, V. A. [90KUM/BAT] Beall, G. W. [78ALL/BEA] Beck, M. T. [90BEC/NAG] Beckley, A. [88ATK/BEC] Becraft, K. [96ROB/SIL] Becraft, K. A. [97NOV/ALM], [98ALM/NOV] Begun, G. M. [92NGU/BEG], [2000NGU/PAL] Ben Said, K. [98BEN/FAT], [2000BEN/FAT], [2001BEN/SEI] Benson, L. V. [80BEN/TEA] Benson, S. W. [92HIS/BEN] Bergman, G. A. [81GLU/GUR], [82GLU/GUR] Berhard, G. [97RUT/GEI] Bermudez Polonio, J. [62PER/BER] Bernhard, G. [95MOL/MAT], [96BER/GEI], [96BRE/GEI],
[96GEI/BRA], [96MOL/GEI], [97AMA/GEI], [97BER/GEI], [97GEI/BER], [97GEI/RUT], [97MOL/GEI], [98AMA/BER], [98GEI/BER], [98GEI/BER2], [98GEI/BER3], [98GEI/BER4], [98MOL/GEI], [99RUT/GEI], [2000REI/BER], [2001BER/GEI]
Bernkopf, M. F. [84BER/KIM] Berthet, J. C. [98DAV/FOU] Besmann, T. M. [81LIN/BES] Bessiere, J. [87LOU/BES] Betz, H. [97SHO/SAS2] Bevington, P. R. [69BEV] Bevz, A. S. [74VIS/VOL] Bharadwaj, S. R. [98MIS/NAM], [99BAS/MIS] Bhupathy, M. [79PRA/NAG], [80NAG/BHU] Bidoglio, G. [82BID], [89GRE/BID], [91BID/CAV], [95ELI/BID],
[95SIL/BID] Biedermann, G. [75BIE] Billard, I. [99BOU/BIL], [2001BIL/RUS], [2001SEM/BOE] Billon, A. [86AVO/BIL] Binnewies, M. [74BIN/SCH] Bion, L. [95BIO/MOI], [97BIO/MOI] Bischoff, H. [92KRA/BIS]
(Continued on next page)

LIST OF CITED AUTHORS 883
Authors list (continued) Author Reference Blaise, J. [92BLA/WYA] Blankenship, F. F. [60LAN/BLA] Blaudeau, J. P. [2001WIL/BLA] Blomqvist, R. [94AHO/ERV] Boehme, C. [2001SEM/BOE] Boivineau, M. [93BOI/ARL] Bolvin, H. [2001BOL/WAH], [2001BOL/WAH2] Bondarenko, A. A. [87BON/KOR] Bonnenfant, A.
[76BOU/BON] Booij, A. S.
Boucharat, N.
Bousquet, J. [76BOU/BON]
Brachmann, A. [96GEI/BRA], [97GEI/BER]
Brand, J. R. [70BRA/COB]
Brendler, E.
Brewer, L. [84BRE]
Brock, E. G. [85ALD/BRO]
[85TSO/BRO]
[99BOU/BIL] Bonnetot, B.
[95HAA/MAR], [96KON/BOO], [96KOV/BOO], [97COR/BOO], [99COR/BOO]
Bouby, M. [99BOU/BIL] [97BOU]
Bourges, J. [92ADN/MAD]
Boyd, G. E. [78BOY] Boyer, G. D. [93LEM/BOY] Brücher, E. [91BRU/GLA]
Bradley, D. J. [79BRA/PIT]
Brandenburg, N. P. [78BRA] Bratsch, S. G. [85BRA/LAG], [86BRA/LAG]
[95MOL/MAT] Brendler, V. [96BER/GEI], [96BRE/GEI], [96GEI/BRA],
[97BER/GEI], [97GEI/BER], [97MOL/GEI], [97RUT/GEI], [98GEI/BER], [98GEI/BER2], [98GEI/BER3], [98MOL/GEI], [99RUT/GEI], [2001BER/GEI]
Brittain, R. D. [85LAU/BRI], [91HIL/LAU]
Broul, M. [81BRO/NYV] Brown, D. Brown, P. L. [2000COM/BRO], [2002BRO] Browne, J. C. [60SAV/BRO] Bruno, J. [85BRU/GRE], [86BRU/FER], [86BRU], [87BRU/CAS],
[89BRU/SAN], [90BRU/GRE], [91CAR/BRU], [92SAN/BRU], [93ERI/NDA], [94CAS/BRU], [94OST/BRU], [95PUI/BRU], [97ALL/BAN], [97BRU/CAS], [97CAS/BRU], [97PER/CAS], [98CAS/PAB], [2000BRU/CER], [2000PER/CAS]
(Continued on next page)
LIST OF CITED AUTHORS 884
Authors list (continued) Author Reference Brusilovskii, S. A. [58BRU] Brønsted, J. N. [22BRO], [22BRO2] Bucher, J. J. [83EDE/BUC], [95ALL/BUC], [96ALL/SHU],
[97ALL/BUC], [97ALL/SHU], [2000ALL/BUC] Buckau, G. [94CZE/BUC] Budantseva, N. A. [98BUD/TAN]
[98DAI/BUR] Burneau, A.
[96BUR/MIL], [2000BUR/OLS] Bursten, B.
Byrne, R. H. [93LEE/BYR], [96BYR/SHO]
[69CAJ/PRA]
[90CAP/VIT], [92CAP], [93GIF/VIT2], [94CAP/VIT], [95CAP/VIT], [96CAP/VIT], [98CAP/VIT], [99CAP/VIT]
[97NOV/ALM], [98ALM/NOV]
[87BRU/CAS], [91AGU/CAS], [94CAS/BRU], [94TOR/CAS], [97BRU/CAS], [97CAS/BRU], [97PER/CAS], [97TOR/BAR], [98CAS/PAB], [2000PER/CAS]
[91AND/CAS]
[91BID/CAV]
[98CHA/TRI] Charnock, J. M.
[81FIN/CHA] Chase, Jr., M. W.
[89CHA/RAO], [91RAO/CHA]
Buklanov, V. [90ROS/REI] Bundschuh, T. [2000BUN/KNO] Burleigh, M. C.
[2000NGU/BUR], [2000QUI/BUR] Burns, P. C.
[2001WIL/BLA] Butler, T. [58JOH/BUT]
Caceci, M. S. [83CAC/CHO], [83CAC/CHO2], [93ERI/NDA] Caja, J. Campbell, A. B. [93LEM/BOY], [95PAN/CAM], [98PAN/CAM] Capdevila, H.
Capone, F. [99CAP/COL] Carnall, W. T. [85MAG/CAR], [91CAR/LIU], [94LIU/CAR] Carniglia, S. C. [55CAR/CUN] Carpenter, S. A. Carroll, S. A. [91CAR/BRU], [93CAR] Casas, I.
Casteel, W. J. [98CAS/DIX] Castet, S. Cathelineau, M. [87DUB/RAM] Cavalli, P. Cera, E. [94CAS/BRU], [97BRU/CAS], [97CAS/BRU],
[97PER/CAS], [98CAS/PAB], [2000BRU/CER] Chander, K. [82NAI/CHA] Chandrasekharaiah, M. S. [69ACK/RAU], [74DHA/TRI] Chandratillake, M.
[99DOC/MOS] Charoy, B. [87DUB/RAM] Chartier, D. [98CHA/DON], [99CHA/DON] Chasanov, M. G.
[98CHA] Chatt, A.
(Continued on next page)

LIST OF CITED AUTHORS 885
Authors list (continued) Author Reference Chaudhuri, N. K. [85SAW/RIZ], [90SAW/CHA2], [97CHA/SAW] Chauvenet
Chen, F. Chiotti, P.
Choporov, D. Y.
[70CHU/CHO4] Chudinov, E. T. [68CHO/CHU]
[56CHU/SHA], [56CHU/STE] Chun, K. S. [96PAR/PYO]
[82WAG/EVA] Ciavatta, L. [79CIA/FER], [80CIA], [81CIA/FER], [87CIA/IUL],
[88CIA], [90CIA] [95ALL/BUC], [95CLA/HOB], [96CLA/CON], [96RUN/NEU], [97CLA/CON], [97RUN/NEU], [98CLA/CON], [98CON/ALM], [99CLA/CON], [2000KON/CLA]
Clark, S. B. [98CLA/EWI], [99CHE/EWI], [99CHE/EWI2], [99SOW/CLA], [2000YEH/MAD]
Cleveland, J. M. [84NAS/CLE], [84NAS/CLE2]
[95COH/LOR]
Comarmond, M. J. [2000COM/BRO]
[05OEC/CHA] Cheetham, A. K. [73GRE/CHE]
[99CHE/EWI], [99CHE/EWI2] [81CHI/AKH]
Chippindale, A. M. [88DIC/POW] Chirico, R. D. [80CHI/WES] Chistyakov, V. M. [98ERI/BAR] Choi, I. K. [83MOR/WIL2], [84WIL/MOR] Choi, K. C. [94KIM/CHO]
[68CHO/CHU], [70CHU/CHO4] Choppin, G. R. [67CAR/CHO], [75DEG/CHO], [76CHO/UNR],
[83CAC/CHO], [83CAC/CHO2], [83CHO2], [91CHO/MAT], [92CHO/DU], [92SAT/CHO], [93STO/CHO], [94CHO/RIZ], [94RIZ/RAO], [97SUG/SAT], [98JEN/CHO], [98SAI/CHO], [99CHO], [2000KAL/CHO], [2001RAI/MOO]
Chudinov, E. G.
Chukhlantsev, V. G.
Churney, K. L.
Clark, D. L.
Claudy, P. [76BOU/BON]
Cobble, J. W. [64CRI/COB], [64CRI/COB2], [70BRA/COB], [70MOR/COB]
Cohen, D. [52COH/HIN] Cohen-Adad, R. Coleman, C. F. [72MCD/COL] Colle, Y. [99CAP/COL] Collison, D. [99DOC/MOS]
(Continued on next page)

LIST OF CITED AUTHORS 886
Authors list (continued) Author Reference Conradson, S. D. [96CLA/CON], [97CLA/CON], [97FEL/RAI],
[97RUN/NEU], [98CLA/CON], [98CON/ALM], [99CLA/CON], [2000KON/CLA]
Cooper, M. A.
Corruccini, R. J. [47GIN/COR]
Cotton, F. A. [80COT/WIL]
Courson, O. [97MAS/COU], [2002MAS/PER]
Craig, I. [2000ALL/BUC]
[64CRI/COB], [64CRI/COB2] Cross, J. E. [86EWA/HOW], [87CRO/EWA]
Cubicciotti, D. D. [75HIL/CUB]
[2002GRI/GER] Dardenne, K.
[99SIN/DAS], [2000DAS/SIN] David, F.
Davidson, P. H. [45DAV/STR], [45DAV]
[96FIN/COO] Cordfunke, E. H. P. [63COR/ALI], [64COR], [66COR], [66LOO/COR],
[67COR/LOO], [71COR/LOO], [74COR/PRI], [75COR/EGM], [75COR/OUW], [75COR], [77COR/OUW2], [78COR/OHA], [80COR/WES], [81COR/OUW], [81COR/OUW2], [82COR/MUI], [84COR/KUB], [88COR/OUW], [88TAS/OHA], [89COR/KON], [90COR/KON], [90COR/KON2], [91COR/KON], [91COR/VLA], [94COR/IJD], [96KOV/BOO], [97COR/BOO], [99COR/BOO]
Costantino, M. S. [90COS/LAK]
Coulter, L. V. [40COU/PIT]
Cowan, H. D. [55RAB/COW] Cox, J. D. [89COX/WAG] Crafts, C. C. [95NOV/CRA]
Cremers, A. [86AVO/BIL] Criss, C. M.
Cubas, M. L. [97KRE/GAN]
Cui, D. [93ERI/NDA] Cuney, M. [87DUB/RAM] Cunningham, B. B. [54KOC/CUN], [55CAR/CUN] Cvitaš,T. [88MIL/CVI] Cynn, H. [98YOO/CYN] Czerwinski, K. R. [94CZE/BUC], [97PAS/CZE] Díaz Arocas, P. [98SER/RON] Dai, S. [98DAI/BUR] Dancausse, J. P.
[2001NEC/KIM2] Dash, S.
[85DAV/FOU], [86DAV], [97DAV/FOU], [97MAS/COU], [98DAV/FOU], [2000DAV/FOU], [2001DAV/VOK], [2002MAS/PER]
Davidson, M. R. [79SYL/DAV]
Davies, C. W. [62DAV] (Continued on next page)
LIST OF CITED AUTHORS 887
Authors list (continued) Author Reference De Carvalho, R. G. [67CAR/CHO] De Grave, E. [84VOC/GRA], [86VOC/GRA] De Pablo, J. [91AGU/CAS], [94TOR/CAS], [97TOR/BAR],
[98CAS/PAB], [2000BRU/CER]
Decambox, P.
Delegard, C. Delegard, C. H.
Delorme-Hiver, A. [98BEN/FAT]
[98DAV/FOU], [2002GRI/GER]
Dixon, D. A.
Donohoe, R. J. [99CLA/CON], [2000KON/CLA] Douglass, R. M.
Drowart, J. [66DRO/PAT], [68PAT/DRO], [84GRO/DRO]
Dubessy, J. [87DUB/RAM]
Dueber, R. E.
Dunsmore, H. S.
Duro, L.
Díaz Arocas, P.
Decaillon, J. G. [95MOU/DEC] [95MOU/DEC]
Degischer, G. [75DEG/CHO] [2002MAS/PER] [98BUD/TAN]
Delmau, L. [96CAP/VIT]
Demchenko, E. A. [97DEM/SER] Den Auwer, C. Desai, P. D. [73HUL/DES] Devina, O. A. [89GUR/DEV], [94SER/DEV] Dharwadkar, S. R. [74DHA/TRI], [98MIS/NAM], [99BAS/MIS] Dhooge, N. J. [95NOV/CRA] Diakonov, I. I. [98DIA/RAG], [98DIA/TAG] Dickens, P. G. [85DIC/LAW], [86DIC/PEN], [88DIC/POW],
[89DIC/LAW], [92DUE/FLE], [93PAT/DUE], [95DUE/PAT]
Dinsdale, A. T. [90TAY/DIN], [91DIN] [98CAS/DIX]
Docrat, T. I. [99DOC/MOS] Donnet, L. [98CHA/DON], [99CHA/DON]
[61WAT/DOU] Downer, B. [72TAY/KEL] Drever, J. I. [82DRE] Dreyer, R. [90ROS/REI] Drobnic, M. [66DRO/KOL]
Du, M. [92CHO/DU]
Ducros, M. [92DUC/SAN] Dudel, E. G. [99MEI/VOL]
[92DUE/FLE], [93PAT/DUE], [95DUE/PAT] Dunaeva, K. M. [71SAN/VID], [72SAN/VID]
[63DUN/SIL] Duplessis, J. [77DUP/GUI], [85DAV/FOU]
[97BRU/CAS], [97PER/CAS], [2000BRU/CER] Dworkin, A. S. [72DWO]
[96DIA/GAR], [98DIA/GRA] Denecke, M. A. [99MOL/DEN]
(Continued on next page)

LIST OF CITED AUTHORS 888
Authors list (continued) Author Reference Earnshaw, A. [84GRE/EAR] Ebbinghaus, B. B. [93KRI/EBB], [95EBB], [97KRI/FON] Edelstein, N. M. [83EDE/BUC], [85NIT/EDE], [95ALL/BUC],
[96ALL/SHU], [97ALL/BUC], [97ALL/SHU], [2000ALL/BUC]
Edmiston, M. J. [99DOC/MOS]
[89GUR/DEV] [98EFU/RUN] [2000MEI/EKB] [95ALL/BUC], [96CLA/CON]
[89MOR/ELL] Elless, M. P.
[98DAV/FOU] Eriksen, T. E.
Ewart, F. T. Ewing, R. C.
Falck, W. E. Fang, D. Fanghänel, T.
[98FAZ/YAM] Feay, D. C.
Efimov, A. I. [56SHC/VAS2] Efimov, M. E. Efurd, D. W. Ekberg, C. Ekberg, S. A. Eliet, V. [95ELI/BID] Eller, P. G.
[97ELL/ARM] Eom, T. Y. [94KIM/CHO] Ephraim, J. H. [97ALL/BAN] Ephritikine, M.
[93ERI/NDA] Erin, E. A. [98ERI/BAR] Ervanne, H. [94AHO/ERV] Evans, W. H. [52ROS/WAG], [82WAG/EVA]
[86EWA/HOW], [87CRO/EWA] [91FIN/EWI], [92FIN/MIL], [94CAS/BRU], [96BUR/MIL], [96FIN/COO], [97CAS/BRU], [98CAS/PAB], [98CLA/EWI], [98FIN/HAW], [99CHE/EWI], [99CHE/EWI2] [91FAL/HOO], [96FAL/REA] [69KEL/FAN] [94FAN/KIM], [95FAN/KIM], [95FAN/NEC], [95NEC/FAN], [96FAN/NEC], [96PAV/FAN], [97KON/FAN], [97KON/NEC], [97NEC/FAN], [97PAS/CZE], [97STE/FAN], [98FAN/KIM], [98FAN/WEG], [98FAN/WEG2], [98NEC/FAN], [98NEC/KON], [98NEC/KON2], [99AAS/STE], [99FAN/KON], [2000BUN/KNO], [2001BOL/WAH]
Fattahi, M. [98BEN/FAT], [2000BEN/FAT], [2000VIC/FAT], [2001BEN/SEI]
Fazekas, Z. [54FEA]
Fedoseev, A. M. [98BUD/TAN] (Continued on next page)

LIST OF CITED AUTHORS 889
Authors list (continued) Author Reference Felmy, A. R. [86FEL/WEA], [89FEL/RAI], [90FEL/RAI],
[90RAI/FEL], [91FEL/RAI], [95FEL/RAI], [95RAI/FEL], [95RAI/FEL2], [96RAO/RAI], [96RAO/RAI2], [97FEL/RAI], [97RAI/FEL], [98RAI/FEL], [99FEL/RAI], [99RAI/HES], [99RAI/HES2], [99RAO/RAI], [2001RAI/MOO], [2002RAI/FEL]
Fender, B. E. F. [73GRE/CHE], [82BAR/JAC]
[62PER/BER] Fernelius, W. C. [77FER]
[79CIA/FER], [81CIA/FER], [83FER/GRE], [85FER/GRE], [86BRU/FER], [93FER/SAL]
Field, R. A. [99SOW/CLA] [85ALD/BRO]
Finch, R. J. [91FIN/EWI], [92FIN/MIL], [94CAS/BRU], [96FIN/COO], [97CAS/BRU], [97FIN], [98CAS/PAB], [98FIN/HAW], [2000BUR/OLS] [81FIN/CHA], [2000FIN]
Firestone, R. B. [99FIR] [98MEI/FIS]
Fleetwood, J. M. [92DUE/FLE] [93KRI/EBB]
Flicker, H. [85ALD/BRO]
[81HEL/KIR] [93KRI/EBB], [97KRI/FON] [85DAV/FOU], [97DAV/FOU], [98DAV/FOU], [2000DAV/FOU], [2002MAS/PER] [62RAN/FOX] [85ALD/BRO] [75FRE] [2002RAI/GOR] [84FRE] [58FRY/NIL] [72FUG], [76FUG/OET], [83FUG/PAR], [83FUG], [83MOR/WIL2], [84FUG/HAI], [85FUG], [85TSO/BRO], [90FUG/HAI], [90GOU/HAI], [92FUG/KHO], [92FUG], [92GRE/FUG], [93FUG/HAI], [94MER/FUG], [96MER/FUG], [97MER/LAM], [2000RAN/FUG], [2001LEM/FUG]
Ferguson, W. J. [44FER/PRA], [44FER/PRA2], [45FER/RAN] Fernandez Cellini, R.
Ferri, D.
Filip, H.
Fink, J. K.
Fischer, S.
Fleming, D. L.
Flotow, H. E. [81OHA/FLO], [82COR/MUI] Flowers, G. C. Fontes, Jr. A. S. Fourest, B.
Fox, A. C. Fox, K. Fred, M. Fredrickson, J. K. Freeman, R. D. Frydman, M. Fuger, J.
(Continued on next page)
LIST OF CITED AUTHORS 890
Authors list (continued)
[2001FUJ/YAM]
[2001FUJ/YAM] [2001FUJ/SAT]
[90FEL/RAI], [95FEL/RAI], [95RAI/FEL2], [96RAO/RAI]
[82WEI/WIS] [59POP/GAL] [85ALD/BRO] [60STE/GAL]
Author Reference Fujii, T. Fujino, T. [79TAG/FUJ], [89YAM/FUJ], [91FUJ/YAM],
[93TAK/FUJ], [2001FUJ/PAR], [2001FUJ/SAT]
[98YAM/KIT]
[2000REI/BER]
Garvin, D.
Gavrichev, K. S. [89GUR/DEV], [97GUR/SER]
Geckeis, H. [96DIA/GAR]
Gel'd, P. V. [75SPI/ZIN]
German, K. E. German, K. G. Gervais, T. L. Giffaut, E. Gigli, G. Giménez, J. Ginnings, D. C. Girichev, G. V. Giricheva, N. I. Giridhar, J. Givon, M.
Fujiwara, K. Fukuda, K. Fukui, A. Fulton, R. W.
Funke, H. Güldner, R. Gal'chenko, G. L. Galbraith, H. W. Galkin, N. P. Gancheff, J. [97KRE/GAN] Gar'kin, V. P. [97DEM/SER] García-Serrano, J. [96DIA/GAR], [98SER/RON] Garrels, R. M. [62HOS/GAR], [74TAR/GAR], [76TAR/GAR]
[87GAR/PAR] Gatzweiler, R. [2000MEI/HUR]
Gayer, K. H. [55GAY/LEI]
Geipel, G. [96BER/GEI], [96BRE/GEI], [96GEI/BRA], [96MOL/GEI], [97AMA/GEI], [97BER/GEI], [97GEI/BER], [97GEI/RUT], [97MOL/GEI], [97RUT/GEI], [98GEI/BER], [98GEI/BER2], [98GEI/BER3], [98GEI/BER4], [98MOL/GEI], [99RUT/GEI], [2000REI/BER], [2001BER/GEI], [2001BOL/WAH]
Gel'man, A. D. [62GEL/MOS], [67GEL/MOS] Gens, R. [83MOR/WIL2]
[2002GER/GRI], [2002GRI/GER], [2002KIR/GER] [2002GER/KOD] [98KAP/GER] [93GIF/VIT], [93GIF/VIT2], [94GIF], [96CAP/VIT] [72GUI/GIG] [97TOR/BAR], [98CAS/PAB] [47GIN/COR] [96KON/BOO] [96KON/BOO] [91GIR/LAN] [69SHI/GIV]
(Continued on next page)

LIST OF CITED AUTHORS 891
Authors list (continued) Author Reference Glaser, J. [91BRU/GLA], [93FER/SAL], [95BAN/GLA]
[88ATK/BEC], [95MOR/GLA] Glatz, J. P. [98SER/RON] Gleiser, M. [73HUL/DES] Glushko, V. P. Godhes, J. W. [95ALL/BUC] Goeminne, A. Gol'tsev, V. P. [81GOL/TRE], [81GOL/TRE2] Goldberg, R. N. [79GOL] González, O. [97KRE/GAN] Goodenough, J. B. [70GOO/LON]
[89GUR/DEV], [97GUR/SER] Gorby, Y. A. [2002RAI/GOR] Gordon, J. C. [2000KON/CLA] Gordon, P. [2000KON/CLA] Gordon, S. Gorokhov, L. N. [84GOR/SMI], [84SMI/GOR], [98GOR/SID] Gorshkov, N. I. [2000GOR/LUM], [2000GOR/MIR] Goudiakas, J. [90GOU/HAI]
Grambow, B. [94SAN/GRA], [94TOR/CAS], [96DIA/GAR], [98DIA/GRA], [99GRA/MUL], [2000VIC/FAT]
Greaves, C. [73GRE/CHE]
Greenwood, N. N. [84GRE/EAR] Gregory, N. W. [46GRE], [46GRE2], [46GRE3] Grenthe, I. [69GRE/VAR], [81CIA/FER], [83FER/GRE],
[85BRU/GRE], [85FER/GRE], [86BRU/FER], [86GRE/ROB], [87RIG/VIT], [89GRE/BID], [90BRU/GRE], [91BID/CAV], [92GRE/FUG], [93FER/SAL], [93GRE/LAG], [94OST/BRU], [95ELI/BID], [95GRE/PUI], [95PAS/KIM], [97ALL/BAN], [97GRE/PLY], [97PUI/RAR], [97SZA/AAS], [98AAS/MOU], [99MOL/DEN], [99VAL/MAR], [99WAH/MOL], [2000GRE/WAN], [2000MOL/REI2], [2000SZA/MOL], [2001BOL/WAH], [2001VAL/WAH], [2002VAL/WAH]
Grigoriev, M. S. [2002GER/GRI], [2002GRI/GER], [2002KIR/GER] Grimaldi, M. [79CIA/FER] Grimvall, G. [89GUI/GRI] Grivé,M. [2000BRU/CER]
Gruber, J. B. [73GRU/HEC]
Glasser, F. P.
[81GLU/GUR], [82GLU/GUR]
[81VOC/PIR], [84VOC/GOE]
Gorbunov, V. E.
[93MCB/GOR]
Grady, H. F. [45WAG/GRA], [58YOU/GRA]
Grauer, R. [97ALL/BAN]
Greenberg, A. [89LIE/GRE]
Gropen, O. [99VAL/MAR], [99WAH/MOL], [2001BOL/WAH2]
(Continued on next page)

LIST OF CITED AUTHORS 892
Authors list (continued) Author Reference Gruen, D. M. [69GRU/MCB]
[67GRY/KOR] Grønvold, F. [84GRO/DRO] Guggenheim, E. A. [35GUG], [66GUG] Guido, M. [72GUI/GIG], [91GUI/BAL] Guillaumont, R. [72MET/GUI], [77DUP/GUI], [97ION/MAD] Guillermet, A. F. [89GUI/GRI] Gurevich, V. M.
Haacke, D. F. [79HAA/WIL]
Hadermann, J. [97ALL/BAN]
Haire, R. G. [84FUG/HAI], [90FUG/HAI], [90GOU/HAI], [93FUG/HAI], [96SHO/BAM], [98OGA/KOB]
Hakala, R. [69SAL/HAK] Hakem, N. [97NOV/ALM], [98ALM/NOV]
[88PHI/HAL] Hall, R. O. A. [90HAL/JEF2], [91HAL/HAR], [91HAL/MOR] Halloway, J. H. [85TSO/BRO]
[82WAG/EVA] Hamann, S. D. [82HAM] Hanchar, J. M. [2000BUR/OLS] Harada, M. [90PAR/SAK] Harding, S. R. [91HAL/HAR], [91HAL/MOR]
[84HAR/MOL] Haschke, J. M. [2000HAS/ALL], [2001HAS/ALL], [2002HAS/ALL]
[98KIT/YAM] Hashizume, K. [99HAS/WAN]
[92HAS2] Hauser, W. [94FAN/KIM], [94KIM/KLE], [2001NEC/KIM2] Hauske, H. [76WEI/WIS] Havel, J. [97LUB/HAV], [97LUB/HAV2]
Hawthorne, F. C. [96FIN/COO], [98FIN/HAW]
Hayes, S. L. [90HAY/THO] Hearne, J. A. Heath, G. A. [98BAL/HEA] Heaven, M. C. Hecht, H. G. [73GRU/HEC] Hedlund, T.
Gryzin, Yu. I.
[89GUR/DEV], [97GUR/SER] Gurvich, L. V. [81GLU/GUR], [82GLU/GUR], [85HIL/GUR]
Haaland, A. [95HAA/MAR]
Haga, Y. [94OCH/SUZ]
Hale, F. V.
Halow, I.
Harvie, C. E.
Hase, H.
Hassan, Refat M.
Hawkins, D. T. [73HUL/DES]
Hay, P. J. [2000HAY/MAR]
[57HEA/WHI]
[94KAL/MCC], [97KAL/HEA]
[88HED] (Continued on next page)

LIST OF CITED AUTHORS 893
Authors list (continued) Author Reference Helgeson, H. C. [74HEL/KIR], [81HEL/KIR], [88SHO/HEL],
[88TAN/HEL], [89SHO/HEL], [89SHO/HEL2], [90OEL/HEL], [92SHO/OEL]
Hemingway, B. S. [82HEM]
Henrion, P. [86AVO/BIL] Henry, M. [94HEN/MER] Hepler, L. G. [75OLO/HEP], [88HOV/HEP3], [89HOV/HEP] Hess, N. J. [96CLA/CON], [97FEL/RAI], [98CON/ALM],
[98RAI/FEL], [99RAI/HES], [99RAI/HES2], [2002RAI/FEL]
Hiernaut, J. P. [99CAP/COL] Hietanen, S. Higashi, K. [90PRA/MOR] Hildenbrand, D. L. [75HIL/CUB], [77HIL], [79KLE/HIL], [82LAU/HIL],
[84LAU/HIL], [85HIL/GUR], [85LAU/BRI], [87LAU/HIL], [91HIL/LAU], [91HIL/LAU2], [96HIL/LAU], [98KON/HIL]
Hill, R. [92LIE/HIL] Hinatsu, Y. [93HIN]
Hirono, S. [65MUT/HIR] Hisham, M. W. M. [92HIS/BEN] Hobart, D. E. [95CLA/HOB], [96ROB/SIL] Hobbs, D. T. [95HOB/KAR] Hoekstra, H. R. [73HOE/SIE], [74OHA/HOE3], [75OHA/HOE2],
[81OHA/FLO] Hoffman, D. C. [2000STO/HOF] Holland, R. F. [85ALD/BRO]
[88MIL/CVI] Hooker, P. J. [86AVO/BIL], [91FAL/HOO] Hostetler, P. B. [62HOS/GAR] Hostettler, J. D. [84HOS] Hotta, E. [94OCH/SUZ] Houee-Levin, C. [2001BEN/SEI] Hovey, J. K. [86HOV/TRE], [88HOV/HEP3], [89HOV/HEP],
[89HOV/NGU], [97HOV] [86EWA/HOW]
Hrnecek, E. [99HRN/IRL], [2000WAD/HRN]
Hubbard, W. N. [83FUG/PAR]
Helling, C. [99MEI/VOL]
Henning, C. [2000MOL/REI2], [2000REI/BER], [2001SEM/BOE]
[56HIE], [85FER/GRE]
Hindman, J. C. [52COH/HIN]
Homann, K.
Howse, R. M.
Huang, J. [96YAM/HUA], [97HUA/YAM], [98HUA/YAM]
(Continued on next page)
LIST OF CITED AUTHORS 894
Authors list (continued) Author Reference Hubert, S. [98DAV/FOU], [2000DAV/FOU] Hudson, E. A. [95ALL/BUC], [96ALL/SHU], [98CON/ALM] Hultgren, R. [73HUL/DES]
[99COR/BOO]
[97ION/MAD], [98DAV/FOU], [2001DAV/VOK] Ioussov, A.
[71SAN/VID], [72SAN/VID] Irlweck, K.
[74KAK/ISH] Ishii, T.
[87CIA/IUL] Ivanov, I. P.
[87VEN/IYE], [90IYE/VEN], [92VEN/IYE], [93JAY/IYE], [94JAY/IYE], [95SAL/JAY], [96IYE/JAY], [96JAY/IYE], [96SAL/IYE], [97IYE/JAY], [97JAY/IYE], [98JAY/IYE], [99JAY/IYE]
Jackson, E. E.
[93SAL/KUL], [94SAL/KUL]
[86AVO/BIL] Jensen, K. A.
[88TAS/OHA] Johnson, J. S. [63RUS/JOH]
Hummel, W. [97ALL/BAN] Humphreys, P. N. [98CHA/TRI] Huntelaar, M. E. Hurst, H. J. [71TAY/HUR] Hurst, S. [2000MEI/HUR] Högfeldt, E. [82HOG] Ijdo, D. J. W. [91COR/VLA], [94COR/IJD] Ionova, G.
[97IOU/KRU] Ippolitova, E. A.
[99HRN/IRL], [2000WAD/HRN] Ishiguro, S.
[90PAR/SAK] Ito, H. [98ITO/YAM] Iuliano, M.
[89RED/SAV], [89SER/SAV] Iyer, V. S.
[63JAC/RAN] Jacobson, A. J. [82BAR/JAC] Jaffe, I. [52ROS/WAG] Jakob, A. [97ALL/BAN] Jalilehvand, F. [99MOL/DEN] Janecky, D. R. [98EFU/RUN] Jayadevan, N. C. Jayanthi, K. [92VEN/IYE], [93JAY/IYE], [94JAY/IYE],
[95SAL/JAY], [96IYE/JAY], [96JAY/IYE], [96SAL/IYE], [97IYE/JAY], [97JAY/IYE], [98JAY/IYE], [99JAY/IYE]
Jeffery, A. J. [90HAL/JEF2] Jenkins, F. A. [42JEN/AND] Jensen, B. S.
[71JEN] Jensen, M. P. [98JEN/CHO], [2001NEC/KIM2] Johnson, C. E. [81LIN/BES] Johnson, G. K.
(Continued on next page)

LIST OF CITED AUTHORS 895
Authors list (continued) Author Reference Johnson, J. W. [92SHO/OEL] Johnson, K. S. [79JOH/PYT] Johnson, O. [58JOH/BUT] Johnsson, K. O. [47JOH] Jones, C. [99DOC/MOS]
Judge, A. I.
Köhncke, K.
Kaakola, T.
Kakihana, H.
Kallay, N. [88MIL/CVI]
Kaltsoyannis, N. [95ALL/BUC]
Kangro, W. [63KAN]
Kapshukov, I. I. [74VIS/VOL], [74VOL/KAP2], [77VOL/VIS], [79VOL/VIS2]
Karasev, N. M. [87BON/KOR] Kareta, A. V. Karkhanavala, M. D. [74DHA/TRI] Karpov, V. I.
Jones, M. M. [53JON] Jordan, J. [85BAR/PAR] Joshi, J. K. [82NAI/CHA] Joubert, L. [2001JOU/MAL]
[85TSO/BRO] Jursich, G. [94LIU/CAR]
[98MEI/FIS] Könnecke, T. [97KON/FAN], [97KON/NEC], [98FAN/WEG2],
[98NEC/KON], [98NEC/KON2], [99FAN/KON] [94AHO/ERV]
Kaganyuk, D. S. [83KAG/KYS] [74KAK/ISH]
Kaledin, L. A. [94KAL/MCC], [97KAL/HEA]
Kalmykov, S. N. [2000KAL/CHO]
Kanellakopulos, B. [89KIM/KAN], [91KIM/KLE], [92NEC/KIM], [94NEC/KIM], [94NEC/RUN]
Kaplan, D. I. [98KAP/GER]
Karapiperis, T. [97ALL/BAN]
[2002MAS/PER]
[61KAR] Karraker, D. G. [95HOB/KAR] Kasha, M. [49KAS] Kaszuba, J. P. [98EFU/RUN], [99KAS/RUN] Kato, Y. [93MEI/KAT], [94KAT/MEI], [95FAN/KIM],
[95KAT/KIM], [96KAT/KIM], [96MEI/KAT], [98MEI/KAT], [99MEI/KAT]
Katsura, M. [98NAK/NIS] Katz, J. J. [51KAT/RAB] Kawamura, Y. [95YAJ/KAW] Kazin, I. V. [83KAG/KYS] Keenan, T. K. [64KEE/KRU] Keller, C. [69KEL/FAN]
(Continued on next page)

LIST OF CITED AUTHORS 896
Authors list (continued) Author Reference Kelley, K. K. [73HUL/DES] Kelly, E. J. [98CHA/TRI] Kelly, J. W.
Kemmler-Sack, S. [75BRA/KEM]
Keogh, D. W. [98CLA/CON], [99CLA/CON], [2000KON/CLA]
Kerko, P. F. [81GOL/TRE], [81GOL/TRE2]
[94KIM/CHO], [96PAR/PYO]
[72TAY/KEL] Kelm, H. [74SCH/KEL]
Kennedy, C. M. [88KEN/MIK]
Kerkar, A. S. [99BAS/MIS]
Khachkuruzov, G. A. [81GLU/GUR], [82GLU/GUR] Khalkin, V. A. [90ROS/REI] Khanaev, E. [75STO/KHA] Khodakovsky, I. L. [71NAU/RYZ], [72NIK/SER], [89GUR/DEV],
[89RED/SAV], [89SER/SAV], [92FUG/KHO], [92KHO], [94SER/DEV], [97GUR/SER]
Khodeev, Yu. S. [61AKI/KHO], [84GOR/SMI] Khopkar, P. K. [80KHO/MAT] Kielland, J. [37KIE] Kim, J. I. [84BER/KIM], [85KIM], [85KIM2], [85MAG/CAR],
[86AVO/BIL], [86LIE/KIM], [88STA/KIM], [88STA/KIM2], [89KIM/KAN], [91KIM/KLE], [91MEI/KIM], [91MEI/KIM2], [92NEC/KIM], [92RUN/MEI], [92WIM/KLE], [93PAS/RUN], [94CZE/BUC], [94FAN/KIM], [94KIM/KLE], [94NEC/KIM], [94NEC/RUN], [94RUN/KIM], [95FAN/KIM], [95FAN/NEC], [95NEC/FAN], [95NEC/RUN], [95PAS/KIM], [96FAN/NEC], [96MEI/KLE], [96PAV/FAN], [97KON/FAN], [97KON/NEC], [97NEC/FAN], [97PAS/CZE], [98FAN/KIM], [98FAN/WEG], [98FAN/WEG2], [98NEC/FAN], [98NEC/KON], [98NEC/KON2], [99AAS/STE], [99FAN/KON], [99KNO/NEC], [99NEC/KIM], [2000BUN/KNO], [2000NEC/KIM], [2001NEC/KIM], [2001NEC/KIM2]
Kim, J. J. [74PIT/KIM] Kim, K. C. [85ALD/BRO] Kim, W. H.
(Continued on next page)

LIST OF CITED AUTHORS 897
Authors list (continued) Author Reference Kimura, T. [92KIM/SER], [93MEI/KIM], [93MEI/KIM2],
[94KAT/MEI], [95KAT/KIM], [96KAT/KIM], [96MEI/KAT], [98MEI/KAT], [99MEI/KAT]
Kirakosyan, G. A. [2002KIR/GER] Kirdyashev, V. P.
[74HEL/KIR], [81HEL/KIR] Kitamura, A.
[99BOU/BIL] Kleinschmidt, P. D.
[91KIM/KLE], [92WIM/KLE], [94FAN/KIM], [94KIM/KLE], [95FAN/KIM], [96MEI/KLE], [96PAV/FAN], [97STE/FAN]
Kline, R. J. [69KNA/LOS]
Knopp, R. [99KNO/NEC], [2000BUN/KNO]
Kobets, L. V. [78KOB/KOL]
Kochergin, S. M. [89PAZ/KOC]
Kohli, R.
Kok-Scheele, A. [96KOV/BOO]
Kramer-Schnabel, U.
[69SCH/KRA] Kraus, K. A.
[56SHC/VAS2] Kirkham, D. H.
[98KIT/YAM], [98YAM/KIT], [2001KIT/KOH] Klein, G.
[79KLE/HIL] Klenze, R.
[60RAB/KLI] Knacke, O.
Kobayashi, F. [98OGA/KOB]
Koch, C. W. [54KOC/CUN]
Kodenskaya, V. S. [60BAB/KOD] Kodina, G. E. [2002GER/KOD] Kohara, Y. [2001KIT/KOH]
[83KOH] Kojima, T. [90PAR/SAK]
Kolar, D. [66DRO/KOL] Kolevich, T. A. [78KOB/KOL] Konijn, P. C. [79LIN/KON] Konings, R. J. M. [89COR/KON], [90COR/KON], [90COR/KON2],
[91COR/KON], [92GRE/FUG], [95HAA/MAR], [96KON/BOO], [96KOV/BOO], [98KON/HIL], [2000LAA/KON], [2001KON], [2001KON2]
Konze, W. V. [2000KON/CLA] Korin, E. [98APE/KOR] Korobov, M. V. [87BON/KOR] Koryttsev, K. Z. [67GRY/KOR] Kostylev, F. A. [59POP/KOS] Kovács, A. [96KON/BOO], [96KOV/BOO]
[92KRA/BIS] Krasnova, O. G. [96KON/BOO] Krasovskaya, T. I. [90SEV/ALI] Krasser, W.
[50KRA/NEL] (Continued on next page)

LIST OF CITED AUTHORS 898
Authors list (continued) Author Reference Kremer, C. [97KRE/GAN] Kremer, E. [97KRE/GAN] Krikorian, O. H. [93KRI/EBB], [97KRI/FON] Krishnan, K. [97KRI/RAM], [97SAL/KRI], [98KRI/RAM],
[99SIN/DAS] Krohn, B. J. [85ALD/BRO] Krupa, J. C. [97IOU/KRU]
Kubaschewski, O.
Kuznetsov, N. T.
[82LAF]
[85BRA/LAG], [86BRA/LAG]
[97MER/LAM]
[2000LAN]
[76REA/LAN], [78LAN], [91GIR/LAN], [97LAN]
LeBlond, N.
Lecomte, M. [98MAS/MAS], [2002MAS/PER]
Krupka, K. M. [98KAP/GER] Kruse, F. H. [64KEE/KRU] Kryukov, P. A. [67PER/KRY] Kryutchov, S. V. [96PER/KRY]
[84COR/KUB], [84KUB], [93KUB/ALC] Kuchitsu, K. [88MIL/CVI] Kulkarni, N. K. [93SAL/KUL], [94SAL/KUL] Kulkarni, S. G. [92VEN/KUL], [93NAI/VEN], [94JAY/IYE] Kullberg, L. [71AHR/KUL] Kulyako, Y. M. [96KUL/MAL] Kumok, V. N. [67MER/SKO], [90KUM/BAT] Kurata, H. [65MUT/HIR] Kurosaki, K. [2001YAM/KUR] Kuznetova, T. P. [97GUR/SER]
[90SEV/ALI] Kyskin, V. I. [83KAG/KYS] Lützenkirchen, K. [2001BIL/RUS], [2001SEM/BOE] Laffitte, M. Lagerman, B. [87BRU/CAS], [90BRU/GRE], [93GRE/LAG] Lagowski, J. J. Lakner, J. F. [78LAK], [90COS/LAK] Lambert, B. Landgren, A. [2000MEI/EKB] Landolt-Bornstein Langer, S. [60LAN/BLA] Langmuir, D. Laszak, I. [98MOU/LAS] Latimer, W. M. [40COU/PIT] Lau, K. H. [82LAU/HIL], [84LAU/HIL], [85LAU/BRI],
[87LAU/HIL], [91HIL/LAU], [91HIL/LAU2], [96HIL/LAU]
Lawrence, S. D. [85DIC/LAW], [89DIC/LAW] Lawson, B. L. [88KEN/MIK] Le Du, J. F. [98DAV/FOU]
[98CAS/DIX] LeGore, V. L. [2002RAI/FEL]
(Continued on next page)

LIST OF CITED AUTHORS 899
Authors list (continued) Author Reference Lee, J. H. [93LEE/BYR] Lee, S. Y. [97ELL/ARM] Lefort, M.
Leroy, J. [87DUB/RAM]
Levine, S. [52ROS/WAG]
Lewis, G. N.
Lierse, Ch. Lieser, K. H. Lietzke, M.H. Liljenzin, J. O.
Liu, G. K.
Longo, J. M.
Lorimer, J. W.
Lukens, W. W.
Lundqvist, R. Lyle, S. J. Müller, F. Müller, R. Méot-Reymond, S.
[63LEF] Leibowitz, L. [81FIN/CHA] Leider, H. [55GAY/LEI] Leigh, G. J. [90LEI] Leininger, T. [99VAL/MAR] Leitnaker, J. M. [80LEI] Lemire, R. J. [80LEM/TRE], [88LEM], [92GRE/FUG],
[93LEM/BOY], [2001LEM/FUG]
Levien, B. J. [47ROB/LEV]
Levinson, L. S. [64LEV] Lewis, B. M. [88OHA/LEW], [88TAS/OHA]
[61LEW/RAN] Liebman, J. F. [89LIE/GRE]
[86LIE/KIM] [92LIE/HIL] [62LIE/STO] [2000MEI/EKB]
Lim, C. K. [51ROB/LIM] Lindemer, T. B. [81LIN/BES] Lingerak, W. A. [79LIN/KON] Lipkin, D. [43ALT/LIP]
[91CAR/LIU], [94LIU/CAR] Livens, F. R. [99DOC/MOS]
[70GOO/LON] Loopstra, B. O. [66LOO/COR], [67COR/LOO], [71COR/LOO]
[95COH/LOR] Lossmann, G. [69KNA/LOS] Louis, C. [87LOU/BES] Lubal, P. [97LUB/HAV], [97LUB/HAV2]
[95ALL/BUC] Lumpov, A. A. [2000GOR/LUM], [2000GOR/MIR]
[82LUN] [68AZI/LYL], [69AZI/LYL] [69KNA/LOS] [99GRA/MUL], [2000BUN/KNO] [97BIO/MOI]
MacWood, G. E. [58MAC] (Continued on next page)
LIST OF CITED AUTHORS 900
Authors list (continued) Author Reference Macgregor, S. A. [98BAL/HEA] Madic, C. [92ADN/MAD], [95BIO/MOI], [97BIO/MOI],
[97ION/MAD], [97SCA/ANS], [98BAR/RUB], [98DAV/FOU], [98SCA/ANS], [2000DAV/FOU]
Madisson, A. P. [2000YEH/MAD] Magirius, S. [85MAG/CAR] Magnuson, D. W. [85ALD/BRO] Maier II, W. B. [85ALD/BRO] Maksin, V. I. [89STA/MAK] Maldivi, P. [2001JOU/MAL] Malevich, V. M. [81GOL/TRE2] Malikov, D. A. [96KUL/MAL] Mallika, C. [86MAL/SRE] Mann, J. B. [70MAN] Marcus, Y. [64SHI/MAR], [69MAR/SHI], [69SHI/GIV], [85MAR2]
[97KRE/GAN] Maron, L. [99VAL/MAR], [99WAH/MOL]
[2001BOL/WAH2] Marshall, W. L.
Martell, A. E.
[2001YAM/KUR]
[95MOL/MAT], [96MOL/GEI], [2000REI/BER]
Mariezcurrena, R.
Marquardt, C. M. [2001NEC/KIM2] Marquez, L. N. [96ALL/SHU], [97ALL/SHU] Marsden, C.
[84MAR/MES] Martín, M. [2000PER/CAS]
[64SIL/MAR], [71SIL/MAR], [98MAR/SMI] Martin, R. L. [2000HAY/MAR] Martinsen, K.-G. [95HAA/MAR] Marx, G. [92KRA/BIS] Maslennikov, A. G. [97MAS/COU], [98MAS/MAS], [2002MAS/PER] Mason, M. J. [91FEL/RAI], [95FEL/RAI], [95RAI/FEL],
[97FEL/RAI], [97RAI/FEL] Masson, M. [97MAS/COU], [98MAS/MAS], [2002GRI/GER],
[2002MAS/PER] Mathur, J. N. [80KHO/MAT], [91CHO/MAT] Mathurin, D. [76BOU/BON] Matsuda, T. Matsui, T. [87MAT/OHS] Matz, W. Maya, L. [82MAY], [83MAY] Mayorga, G. [73PIT/MAY], [74PIT/MAY] McBeth, R. L. [69GRU/MCB] McBride, B.J. [93MCB/GOR] McCord, J. E. [94KAL/MCC] McCready, D. E. [2002RAI/FEL] McCue, M. C. [76MOR/MCC]
(Continued on next page)

LIST OF CITED AUTHORS 901
Authors list (continued) Author Reference McDowell, R. S. [85ALD/BRO] McDowell, W. J. [72MCD/COL] Medvedev, V. A. [81GLU/GUR], [82GLU/GUR], [89COX/WAG],
[92FUG/KHO] Mefod'eva, M. P. [67GEL/MOS] Meinrath, G. [91MEI/KIM], [91MEI/KIM2], [91MEI], [92RUN/MEI],
[93MEI/KAT], [93MEI/KIM], [93MEI/KIM2], [93MEI/TAK], [94KAT/MEI], [94MEI], [96MEI/KAT], [96MEI/KLE], [96MEI/SCH], [96MEI], [97MEI/SCH], [97MEI], [97MEI2], [98MEI/FIS], [98MEI/KAT], [98MEI], [98MEI2], [98MEI3], [99MEI/KAT], [99MEI/VOL], [2000MEI/EKB], [2000MEI/HUR], [2000MEI], [2000MEI2]
Merceron, T. [94HEN/MER] Mercier, H. P. A. [98CAS/DIX] Merkel, B. J. [97MEI/SCH], [99MEI/VOL]
Merli, L. [94MER/FUG], [96MER/FUG], [97MER/LAM]
[62BAE/MEY], [65BAE/MEY] Micskei, K.
[98DAV/FOU] Mikelsons, M. V.
[69BAR/MIK] Mikheev, N. B.
[90ROS/REI] Milkey, R. G.
Miller, D. G. [82RAR/MIL], [91RAR/MIL]
[79MIL]
[2002SHI/MIN]
[98MIS/NAM], [99BAS/MIS]
Merkusheva, S. A. [67MER/SKO]
Mesmer, R. E. [76BAE/MES], [84MAR/MES], [91AND/CAS], [98DAI/BUR], [2000NGU/PAL]
Metivier, H. [72MET/GUI], [73MET] Metz [61WAT/DOU] Meyer, N. J.
[95BAN/GLA] Mikalko, V.
[88KEN/MIK] Mikhailova, N. K.
[99MIK/RUM] Milanov, M.
[54MIL] Miller, A. J. [45WAG/GRA]
Miller, M. L. [92FIN/MIL], [96BUR/MIL] Millero, F. J. Mills, I. [88MIL/CVI] Minato, K. Miroslavov, A. E. [2000GOR/LUM], [2000GOR/MIR] Mishra, R. Miyairi, M. [97OMO/MIY] Mizuguchi, K. [93MIZ/PAR] Mochizuki, A. [74MOC/NAG]
(Continued on next page)

LIST OF CITED AUTHORS 902
Authors list (continued) Author Reference Moisy, P. [95BIO/MOI], [97BIO/MOI] Moll, H. [95MOL/MAT], [96MOL/GEI], [97MOL/GEI],
[98MOL/GEI], [99MOL/DEN], [99WAH/MOL], [2000MOL/REI], [2000MOL/REI2], [2000SZA/MOL], [2001BOL/WAH], [2001VAL/WAH]
Moller, N. [84HAR/MOL] Mombrú,A. W. [97KRE/GAN]
Montecates R. J. [98MAR/SMI]
Moore, D. A. [83RAI/STR], [95RAI/FEL], [97RAI/FEL], [98RAI/FEL], [99RAI/HES], [99RAI/HES2], [2000RAI/MOO], [2001RAI/MOO], [2002RAI/GOR]
Morales, L. A. [2000HAS/ALL], [2001HAS/ALL]
Moriyama, H. [90PRA/MOR], [98KIT/YAM], [98YAM/KIT], [2001FUJ/YAM]
Morris, D. E. [99CLA/CON], [2000KON/CLA]
Mortimer, M. J. [90HAL/JEF2], [91HAL/HAR], [91HAL/MOR]
Moulin, C.
Muis, R. P.
Muraoka, Y. Murphy, W. H. Musikas, C. Muto, T.
Monnin, C. [90MON]
Moock, K. H. [98BAL/HEA]
[2003RAI/YUI] Moore, R. C. [2001RAI/MOO]
Morgan, J. J. [81STU/MOR]
Moroni, L. P. [95MOR/GLA]
Morss, L. R. [70MOR/COB], [76MOR/MCC], [82MOR], [83MOR/WIL], [83MOR/WIL2], [84WIL/MOR], [86MOR], [89MOR/ELL], [92MOR/WIL], [93TAK/FUJ], [94MOR/WIL], [98DAV/FOU]
Moskvin, A. I. [62GEL/MOS], [67GEL/MOS], [71MOS], [73MOS] Mosselmans, J. F. W. [99DOC/MOS] Moukhamet-Galeev, A. [98AAS/MOU]
[95MOU/DEC], [97SCA/ANS], [98MOU/LAS], [98SCA/ANS]
Moulin, V. [95MOU/DEC], [98MOU/LAS] Muñoz, M. [87BRU/CAS] Mueller, M. E. [48MUE]
[82COR/MUI] Mulford, R. N. R. [66OLS/MUL2], [88MUL/SHE], [91SHE/MUL] Muller, A. B. [85MUL], [92GRE/FUG] Munoz, J. L. [86NOR/MUN]
[94OMO/MUR] [97MUR] [72MUS], [2000BEN/FAT], [2000VIC/FAT] [65MUT/HIR], [65MUT]
Myasoedov, B. F. [96KUL/MAL] Nàer-Neumann, E. [85FER/GRE]
(Continued on next page)
LIST OF CITED AUTHORS 903
Authors list (continued) Author Reference
[79PRA/NAG], [80NAG/BHU] Nagashima, K. [74MOC/NAG] Nagypál, I.
Nair, G. M.
Nakajima, K.
Nakayama, S.
Naqvi, S. J.
Neck, V.
Nelson, F.
Nguyen-Trung, C.
Nikitin, M. I.
[98YAM/KIT]
[90BEC/NAG] Naik, J. S. [93NAI/VEN]
[68NAI], [82NAI/CHA] Nakagawa, T. [98NAK/NIS]
[97NAK/ARA], [99NAK/ARA], [99NAK/ARA2] Nakama, S. [2001FUJ/SAT]
[92KIM/SER], [96NAK/YAM] Namboodiri, P. N. [98MIS/NAM], [99BAS/MIS]
[68AZI/LYL] Nash, K. L. [84NAS/CLE], [84NAS/CLE2] Naumov, G. B. [71NAU/RYZ], [72NIK/SER] Navratil, J. D. [92FUG/KHO] Ndalamba, P. [93ERI/NDA]
[91KIM/KLE], [92NEC/KIM], [94NEC/KIM], [94NEC/RUN], [95FAN/NEC], [95NEC/FAN], [95NEC/RUN], [96FAN/NEC], [97KON/NEC], [97NEC/FAN], [98FAN/WEG2], [98NEC/FAN], [98NEC/KON], [98NEC/KON2], [99FAN/KON], [99KNO/NEC], [99NEC/KIM], [2000BUN/KNO], [2000NEC/KIM], [2001NEC/KIM], [2001NEC/KIM2]
Nectoux, F. [93STO/CHO] [50KRA/NEL]
Neu, M. P. [95ALL/BUC], [95CLA/HOB], [96CLA/CON], [96RUN/NEU], [97CLA/CON], [97NEU/REI], [97RUN/NEU], [98CON/ALM], [99RUN/REI], [2000REI/NEU]
Newton, A. S. [58JOH/BUT] Nguyen, S. N. [88OHA/LEW], [92NGU/SIL], [96ALL/SHU]
[76NGU/POT], [87DUB/RAM], [89HOV/NGU], [92GRE/FUG], [92NGU/BEG], [95PAL/NGU], [2000NGU/BUR], [2000NGU/PAL] , [2002NGU]
Nikitin, A. A. [72NIK/SER] [93NIK/TSI]
Nikolaeva, N. M. [71NIK/PIR], [71NIK], [78NIK/PIR] Nikonov, M. [98DAV/FOU] Nilsson, G. [58FRY/NIL], [58NIL/REN] Nishikawa, S. Nishimaki, K. [98NAK/NIS] Nissen, S. C. [98BAL/HEA] Nitani, N. [95KAT/KIM], [96KAT/KIM]
Nagarajan, K.
(Continued on next page)

LIST OF CITED AUTHORS 904
Authors list (continued) Author Reference Nitsche, H. [83EDE/BUC], [84SIL/NIT], [85NIT/EDE],
[88STA/NIT], [89NIT/STA], [95MOL/MAT], [96BER/GEI], [96BRE/GEI], [96GEI/BRA], [96MOL/GEI], [97AMA/GEI], [97BER/GEI], [97GEI/BER], [97GEI/RUT], [97MOL/GEI], [97RUT/GEI], [98AMA/BER], [98GEI/BER], [98GEI/BER2], [98GEI/BER3], [98GEI/BER4], [98MOL/GEI], [99RUT/GEI], [2000REI/BER], [2001BER/GEI], [2001LEM/FUG]
Norén, B. [69NOR] Nordstrom, D. K. [86NOR/MUN] Nottorf, R. [44NOT/POW] Novak, C. F. [95NOV/CRA], [95NOV/ROB], [96RAO/RAI],
[96ROB/SIL], [97NOV/ALM], [98ALM/NOV], [99RAO/RAI]
Novotný,P. [85SOH/NOV] Nriagu, J. O.
Nyvlt, J.
O'Hare, P. A. G.
Ohse, R. W.
Olofson, U.
Olson, R. A.
Omelyanenko, B. I.
Omori, T.
[84NRI2] Nuttall, R. L. [82WAG/EVA]
[81BRO/NYV] O'Brien, T. J. [81OBR/WIL], [83OBR/WIL]
[74OHA/HOE3], [75OHA/HOE2], [78COR/OHA], [81OHA/FLO], [82COR/MUI], [88OHA/LEW], [88TAS/OHA]
Oakes, C. S. [2000RAI/MOO] Ochiai, A. [94OCH/SUZ] Oda, T. [93ODA] Oechsner de Coninck, W. [05OEC/CHA] Oelkers, E. H. [90OEL/HEL], [92SHO/OEL] Oetting, F. L. [76FUG/OET], [76OET/RAN], [83FUG/PAR] Ogawa, T. [93OGA], [98OGA/KOB] Ogden, J. S. [87ALE/OGD] Ogorodnikov, V. V. [93OGO/ROG] Ohnuki, T. [94YAM/SAK]
[87MAT/OHS] Olander, D. R. [99HAS/WAN], [99OLA]
[84ALL/OLO] Olofsson, G. [75OLO/HEP]
[2000BUR/OLS] Olson, W. M. [66OLS/MUL2]
[89RED/SAV], [89SER/SAV] Omenetto, N. [89GRE/BID], [91BID/CAV], [95ELI/BID]
[94OMO/MUR], [97ASA/SUG], [97OMO/MIY], [97SUG/SAT], [97SUG/SAT2]
Onink, M. [91COR/VLA] (Continued on next page)

LIST OF CITED AUTHORS 905
Authors list (continued) Author Reference Ono, F. [98HUA/YAM] Oosting, M. [60OOS]
[91FUJ/YAM]
[79CIA/FER] [95PAN/CAM], [98PAN/CAM] [96RAK/TSY] [2001FUJ/PAR]
[90PAR/SAK], [93MIZ/PAR]
[95ELI/BID]
[64BAN/PAT], [85SAW/RIZ], [90SAW/CHA2] [85ALD/BRO] [66DRO/PAT], [68PAT/DRO] [94FAN/KIM], [96PAV/FAN]
[89PAZ/KOC]
[2000NGU/PAL]
[83VOC/PEL], [84VOC/GRA], [86VOC/GRA]
[78PER/THO]
Östhols, E. [94OST/BRU], [99WAN/OST], [2000GRE/WAN], [2000OST/WAN], [2000WAN/OST]
Ouchi, K. Ouweltjes, W. [75COR/OUW], [77COR/OUW2], [81COR/OUW],
[81COR/OUW2], [82COR/MUI], [88COR/OUW], [90COR/KON2]
Pérez, I. [97PER/CAS], [2000PER/CAS] Pagès, M. [93STO/CHO] Palmer, C. E. A. [96ALL/SHU], [97ALL/SHU], [97WRU/PAL] Palmer, D. A. [92NGU/BEG], [95PAL/NGU], [2000NGU/BUR],
[2000NGU/PAL] Palmer, P. D. [95ALL/BUC], [96CLA/CON], [97CLA/CON],
[97RUN/NEU], [98CLA/CON], [98CON/ALM], [98EFU/RUN], [99CLA/CON]
Palombari, R. Pan, P. Panov, A. S. Park, K. Park, K. K. [94KIM/CHO] Park, Y. J. [96PAR/PYO] Park, Y. Y. Parker, V. B. [65PAR], [82WAG/EVA], [83FUG/PAR],
[87GAR/PAR] Parks, G. A. [88PAR/POH] Parma, L. Parsons, R. [74PAR], [85BAR/PAR] Pashalidis, I. [93PAS/RUN], [95PAS/KIM], [97PAS/CZE] Patat, S. [93PAT/DUE], [95DUE/PAT] Patil, S. K. Patterson, C. W. Pattoret, A. Paviet, P. Paviet-Hartmann, P. [98FAN/WEG2], [99FAN/KON] Pazukhin, E. M. Peddicord, K. L. [90HAY/THO] Peiffert, C. Pekárek, V. [65VES/PEK] Pelsmaekers, J. Penny, D. J. [86DIC/PEN], [89DIC/LAW] Perachon, G. Peretrukhin, V. F. [95PER/SHI], [96PER/KRY], [97MAS/COU],
[98MAS/MAS], [2002MAS/PER] (Continued on next page)

LIST OF CITED AUTHORS 906
Authors list (continued)
Author Reference Perez-Bustamante, J. A. [62PER/BER], [65PER] Perkovec, V. D. [67PER/KRY] Pershin, A. S. [90PER/SAP] Person, W. B.
Petrov, V. G.
Phillips, S. L.
[94TOU/PIA], [98PIA/TOU], [99PIA/TOU] Pikaev, A. K. [95PER/SHI]
Piret, P. [81VOC/PIR]
Pissarjewsky, L. [00PIS]
[97ALL/BAN], [97GRE/PLY], [97PUI/RAR] Pohl, D. C.
Porto, R. [87CIA/IUL]
Potter, P. E. [90COR/KON], [2001LEM/FUG] Poty, B.
[44NOT/POW]
[78SIN/PRA], [79PRA/NAG], [80NAG/BHU], [82ROY/PRA], [87VEN/IYE], [99SIN/DAS], [2000DAS/SIN], [2001BAN/PRA]
Prather, J. [90PRA/MOR]
Pravdic, V.
Prussin, T.
[85ALD/BRO] Peterson, A. [61PET] Peterson, J. R. [78PIT/PET], [84FUG/HAI], [90FUG/HAI],
[93FUG/HAI] [89PET/SEL]
Phillips, C. A. [85PHI/PHI] [85PHI/PHI], [88PHI/HAL], [90PHI], [94SIE/PHI], [95COH/LOR]
Pialoux, A.
Pinkerton, T. C. [88KEN/MIK]
Pirozhkov, A. V. [71NIK/PIR], [78NIK/PIR]
Pitzer, K. S. [40COU/PIT], [73PIT], [73PIT/MAY], [74PIT/KIM], [74PIT/MAY], [75PIT], [76PIT/SIL], [78PIT/PET], [79BRA/PIT], [79PIT], [91PIT]
Plyasunov, A. V. [88PAR/POH]
Popov, M. M. [59POP/GAL], [59POP/KOS] Porter, R. A. [71POR/WEB]
Posey, J. C. [65WOL/POS]
[76NGU/POT], [87DUB/RAM] Powell, A. V. [88DIC/POW], [89DIC/LAW], [90POW] Powell, J. Pozdnyakov, S. V. [89PET/SEL] Prasad, R.
[44FER/PRA], [44FER/PRA2] Pratopo, M. I.
[69CAJ/PRA] Prins, G. [74COR/PRI], [75COR/OUW], [90COR/KON]
[96ROB/SIL], [97NOV/ALM] Puigdomènech, I. [95GRE/PUI], [95PUI/BRU], [95SIL/BID],
[97ALL/BAN], [97PUI/RAR], [98SPA/PUI] (Continued on next page)

LIST OF CITED AUTHORS 907
Authors list (continued)
Author Reference Purans, J. [2000DAV/FOU] Pyo, H. R. [96PAR/PYO]
Quiñones, J. [96DIA/GAR], [98SER/RON]
[55RAB/COW], [57RAB], [60RAB/KLI] Rabinovich, V. A.
[51KAT/RAB] Ragnarsdottir, K. V.
Rakitskaya, E. M. [96RAK/TSY]
[99SAX/RAM]
[62RAN/FOX], [63JAC/RAN], [76OET/RAN], [81CHI/AKH], [90COR/KON], [95GRE/PUI], [95SIL/BID], [99RAR/RAN], [2000RAN/FUG], [2001LEM/FUG]
[96RAO/RAI], [96RAO/RAI2], [99RAO/RAI]
[89CHA/RAO], [91RAO/CHA]
[98BAL/HEA]
Pytkowicz, R. M. [79JOH/PYT], [79PYT] Qi, P. [91BID/CAV] Queck, C. [74SCH/KEL]
Quilès, F. [2000NGU/BUR], [2000QUI/BUR] Rösch, F. [90ROS/REI] Rabideau, S. W.
[74RAB/ALE] Rabinowitch, E.
[97VAL/RAG], [98DIA/RAG], [98DIA/TAG] Rai, D. [83RAI/STR], [83RYA/RAI], [84RAI], [85RAI/RYA],
[87RAI/SWA], [89FEL/RAI], [90FEL/RAI], [90RAI/FEL], [91FEL/RAI], [95FEL/RAI], [95RAI/FEL], [95RAI/FEL2], [96RAO/RAI], [96RAO/RAI2], [97FEL/RAI], [97RAI/FEL], [98RAI/FEL], [99FEL/RAI], [99RAI/HES], [99RAI/HES2], [99RAO/RAI], [2000RAI/MOO], [2001RAI/MOO], [2002RAI/FEL], [2002RAI/GOR], [2003RAI/YUI]
Rama Rao, G. A. [94JAY/IYE], [96JAY/IYE], [97KRI/RAM], [98KRI/RAM], [99JAY/IYE]
Ramakumar, K. L. Ramboz, C. [87DUB/RAM] Rand, M. H.
Rand, R. D. [45FER/RAN] Randall, M. [61LEW/RAN] Randall, M. G. [98CHA/TRI] Rao, L. Rao, L. F. [94RIZ/RAO] Rao, R. R. Rapp, K. E. [65WOL/POS] Raptis, R. G. Rard, J. A. [82RAR/MIL], [82RAR/SPE], [84RAR], [91RAR/MIL],
[97ALL/BAN], [97PUI/RAR], [99RAR/RAN] (Continued on next page)
LIST OF CITED AUTHORS 908
Authors list (continued)
Author Reference Rauh, E. G. [69ACK/RAU] Read, D. [96FAL/REA] Reardon, E. J. [76REA/LAN]
Reimann, T. [90ROS/REI]
Reno, M. A. [93MCB/GOR]
Riglet, C. [87RIG/VIT], [89RIG/ROB], [90RIG] Rizkalla, E. N.
Roberts, C. E. Roberts, K. E.
Rogovoi, Yu J.
[99CAP/COL] Rondinella, V. V. [98SER/RON]
[2000MOL/REI2], [2000REI/BER], [2001SEM/BOE] Rossini, F. D. [52ROS/WAG]
[2001SEM/BOE] Rossotti, F. J. C. [61ROS/ROS]
[61ROS/ROS], [69ROS] Roy, K. N. [82ROY/PRA]
Rudolph, G. [95NEC/FAN]
Red'kin, A. F. [89RED/SAV], [89SER/SAV], [97RED] Reich, T. [95ALL/BUC], [97ALL/BUC], [97BER/GEI],
[97MOL/GEI], [2000MOL/REI], [2000MOL/REI2], [2000REI/BER], [2001BER/GEI], [2001BOL/WAH], [2001SEM/BOE]
Reilly, S. D. [97NEU/REI], [97RUN/NEU], [99RUN/REI], [2000REI/NEU]
Rengemo, T. [58FRY/NIL], [58NIL/REN]
Revel, R. [98DAV/FOU], [2000BEN/FAT]
[94CHO/RIZ], [94RIZ/RAO] Rizvi, G. H. [85SAW/RIZ]
[65BAE/MEY] [95NOV/ROB], [96ROB/SIL]
Robins, R. G. [66ROB] Robinson, R. A. [47ROB/LEV], [51ROB/LIM], [59ROB/STO] Robouch, P. [86GRE/ROB], [87ROB/VIT], [89RIG/ROB], [89ROB],
[95SIL/BID] Roensch, F. R. [98EFU/RUN] Rogers, R. D. [99CLA/CON]
[93OGO/ROG] Roller, H. [75BRA/KEM] Ronchi, C.
Rossberg, A.
Rossini, I.
Rossotti, H.
Rubini, P. [98BAR/RUB]
Rumer, I. A. [99MIK/RUM] (Continued on next page)

LIST OF CITED AUTHORS 909
Authors list (continued) Author Reference Runde, W. [92RUN/MEI], [93PAS/RUN], [94KIM/KLE],
[94NEC/RUN], [94RUN/KIM], [95NEC/RUN], [96CLA/CON], [96RUN/NEU], [97CLA/CON], [97NEU/REI], [97RUN/NEU], [98CON/ALM], [98EFU/RUN], [99KAS/RUN], [99RUN/REI], [2000REI/NEU]
Rush, R. M. [63RUS/JOH] Rustenholtz, A. [2001BIL/RUS]
Ryan, J. L. [83RAI/STR], [83RYA/RAI], [85RAI/RYA], [87RAI/SWA], [89FEL/RAI], [90RAI/FEL]
Rykov, A. G. [79VOL/VIS2]
[71NAU/RYZ] Söderlind, P. [98YOO/CYN]
[2001BIL/RUS], [2001SEM/BOE] Sahar, A. [75APE/SAH]
[75UEN/SAI], [98SAI/CHO] Sakai, Y. [90PAR/SAK]
[93SAL/KUL], [94SAL/KUL], [95SAL/JAY], [96IYE/JAY], [96SAL/IYE], [97SAL/KRI], [98BAN/SAL]
Salomaa, P.
Salvatore, F. [79CIA/FER], [81CIA/FER], [83FER/GRE], [85FER/GRE], [86BRU/FER], [93FER/SAL]
Samant, M. S.
Sandino, M. C. A. [89BRU/SAN], [91SAN], [92SAN/BRU], [94SAN/GRA], [94TOR/CAS], [95GRE/PUI]
[98OGA/KOB]
Savage, Jr., A. W. [60SAV/BRO]
Rutsch, M. [97GEI/RUT], [97RUT/GEI], [99RUT/GEI]
Rydberg, J. [2001LEM/FUG]
Ryon, A. D. [47RYO/TWI] Ryzhenko, B. N.
Sémon, L.
Saito, A.
Sakamoto, Y. [94YAM/SAK] Sakurai, H. [96YAM/HUA], [97HUA/YAM], [98HUA/YAM] Sali, S. K.
[69SAL/HAK] Salomon, M. [95COH/LOR]
[94SAM] Sampath, S. [93SAL/KUL], [94SAL/KUL], [95SAL/JAY],
[96IYE/JAY], [96SAL/IYE], [97SAL/KRI]
Sandström, M. [99MOL/DEN] Sannier, H. [92DUC/SAN] Santalova, N. A. [71SAN/VID], [72SAN/VID] Sapozhnikova, T. V. [90PER/SAP] Sassani, D. C. [97SHO/SAS], [97SHO/SAS2] Sato, N. [2001FUJ/PAR], [2001FUJ/SAT] Sato, T. Satoh, I. [92SAT/CHO], [97SUG/SAT], [97SUG/SAT2]
Savelyeva, N. I. [89RED/SAV], [89SER/SAV] (Continued on next page)

LIST OF CITED AUTHORS 910
Authors list (continued) Author Reference Savenko, V. S. [98SAV]
Saxena, M. K. [99SAX/RAM]
Saxena, S. K. [97SAX] Scapolan, S. [97SCA/ANS], [98SCA/ANS] Scatchard, G. [36SCA], [76SCA]
Schaumloffel, J. C. [98CLA/EWI] Schelberg, A. [42SCH/THO], [42THO/SCH], [48THO/SCH] Schell, N. [2000REI/BER] Scherbaum, F. [94CZE/BUC] Schimmelpfennig, B. [99VAL/MAR], [99WAH/MOL], [2001VAL/WAH] Schott, J. [91AND/CAS]
[89FEL/RAI] Schreckenbach, G. [2000HAY/MAR]
[88ULL/SCH] Schreyer, J. M. [54SCH/BAE], [55SCH] Schrobilgen, G. J. Schubert, G. Schumm, R. H. Schuster, G. Schwabe, K. [74SCH/KEL] Schweinberger, M. Schwochau, K. [69SCH/KRA] Scott, B. L. [97RUN/NEU], [98CLA/CON] Scott, R. B. [44FER/PRA2]
Seidel, B. S. [2001NEC/KIM2] Seimbeille, Y. [2001BEN/SEI] Sekine, K. [96NAK/YAM] Sekine, T. [64SEK], [65SEK2], [91KIM/KLE], [2002GER/KOD] Seleznev, V. P. [89PET/SEL]
Serebrennikov, V. V. [67MER/SKO]
Serezhkina, L. B. [89TAT/SER], [94SER/SER], [97DEM/SER] Sergeyeva, E. I.
Serizawa, H. [2001FUJ/SAT] Serrano, G. J.
Sawant, R. M. [85SAW/RIZ], [90SAW/CHA2], [97CHA/SAW]
Saxena, S. [97ALL/BAN]
Schäfer, H. [74BIN/SCH]
Schramke, J. A.
Schreiner, F.
[98CAS/DIX] [98FAN/WEG] [82WAG/EVA] [95MOL/MAT], [97AMA/GEI]
[96MEI/SCH], [97MEI/SCH]
Seemann, I. [75BRA/KEM]
Senin, M. D. [59POP/GAL]
Serezhkin, V. N. [89TAT/SER], [94SER/SER], [97DEM/SER]
[72NIK/SER], [89GUR/DEV], [89RED/SAV], [89SER/SAV], [92FUG/KHO], [94SER/DEV], [97GUR/SER]
[92KIM/SER] (Continued on next page)

LIST OF CITED AUTHORS 911
Authors list (continued) Author Reference Serrano, J. A. [98SER/RON]
Shannon, R. D. [76SHA]
Sharova, A. K. [56CHU/SHA] Shchukarev, S. A. [56SHC/VAS2] Sheldon, R. I. [88MUL/SHE], [91SHE/MUL] Shikama, T. [94OCH/SUZ]
Shilov, V. P. [91SHI], [95PER/SHI], [98SHI] Shirasu, Y. Shiratori, T. Shock, E. L.
Sholkovitz, E. R. Shoup, S. S. [96SHO/BAM] Shuh, D. K.
[87BON/KOR] Sidorova, I. V. [98GOR/SID] Siegel, M. D. [88PHI/HAL] Siegel, S.
[94SIE/PHI] Silber, H. B. [96ROB/SIL] Silin, V. I. [96PER/KRY], [2002MAS/PER] Sillén, L. G. [58FRY/NIL], [58NIL/REN], [63DUN/SIL],
[64SIL/MAR], [71SIL/MAR] [2000BRU/CER] [82SIL], [83EDE/BUC], [84SIL/NIT], [89NIT/STA], [92NGU/SIL], [92SIL], [95SIL/BID], [96ALL/SHU], [97WRU/PAL], [2000STO/HOF] [76PIT/SIL], [78PIT/PET], [88PHI/HAL] [74VIS/VOL], [77SIM] [97BIO/MOI]
Simonoff, M. [2002GRI/GER] Simonson, J. M.
[93JAY/IYE], [97KRI/RAM], [97SAL/KRI], [98KRI/RAM]
Singh, Z. [78SIN/PRA], [79PRA/NAG], [80NAG/BHU], [82ROY/PRA], [87VEN/IYE], [99SIN/DAS], [2000DAS/SIN]
Sevast'yanov, R. G. [90SEV/ALI]
Sharma, H. D. [64BAN/PAT]
Shiloh, M. [64SHI/MAR], [69MAR/SHI], [69SHI/GIV]
[2002SHI/MIN] [2001FUJ/SAT] [88SHO/HEL], [89SHO/HEL], [89SHO/HEL2], [92SHO/OEL], [97SHO/SAS], [97SHO/SAS2] [96BYR/SHO]
[95ALL/BUC], [96ALL/SHU], [97ALL/BUC], [97ALL/SHU], [2000ALL/BUC]
Sidorov, L. N.
[73HOE/SIE] Siekierski, S.
Sillen, P. Silva, R. J.
Silvester, L. F. Simakin, G. A. Simoni, E.
[98DAI/BUR] Singh Mudher, K. D.
(Continued on next page)

LIST OF CITED AUTHORS 912
Authors list (continued) Author Reference Sinke, G. C. [56STU/SIN] Skeen, J. [85PHI/PHI] Skorik, N. A.
Slanina, J. [79LIN/KON]
Smit-Groen, V. [97COR/BOO]
Smith, D. K. [81STO/SMI]
Smoes, S. [66DRO/PAT], [68PAT/DRO]
Soderholm, L. [99SOD/ANT], [2001WIL/BLA]
Sommer, L. [63BAR/SOM]
Stepanov, M. A.
Stephens, H. P.
Stokes, R. H. [59ROB/STO]
Stoughton, R.W. [62LIE/STO]
[2000STO/HOF] [75STO/KHA] [62RAN/FOX]
[67MER/SKO] Sladkov, V. E. [2002MAS/PER]
Smirnov, V. K. [84GOR/SMI], [84SMI/GOR]
Smith, D. F. [85ALD/BRO]
Smith, R. M. [98MAR/SMI]
Sobry, R. [91VOC/HAV]
Soehnel, O. [81BRO/NYV]
Sood, D. D. [78SIN/PRA], [79PRA/NAG], [80NAG/BHU], [82ROY/PRA], [87VEN/IYE], [90IYE/VEN], [92VEN/KUL], [93NAI/VEN]
Sowder, A. G. [99SOW/CLA] Spahiu, K. [81CIA/FER], [83SPA], [85SPA], [93ERI/NDA],
[97ALL/BAN], [98SPA/PUI], [98WER/SPA], [2001LEM/FUG]
Spedding, F. H. [82RAR/SPE] Spencer, P. J. [93KUB/ALC] Spirlet, J. C. [90HAL/JEF2], [91HAL/HAR], [91HAL/MOR] Spitsyn, V. I. [75SPI/ZIN] Sreedharan, O. M. [86MAL/SRE] Stadler, S. [88STA/KIM], [88STA/KIM2] Standifer, E. M. [88STA/NIT], [89NIT/STA] Standritchuk, O. Z. [89STA/MAK] Stary, J. [65STA] Steinle, E. [97STE/FAN], [98FAN/WEG2], [99AAS/STE]
[60STE/GAL] Stepanov, S. I. [56CHU/STE]
[74STE] Sterner, S. M. [97FEL/RAI], [97RAI/FEL] Stohl, F. V. [81STO/SMI]
Storms, E. K [85STO2]
Stout, B. E. [93STO/CHO] Stoyer, N. J. Stozhenko, T. P. Street, R. S.
(Continued on next page)

LIST OF CITED AUTHORS 913
Authors list (continued) Author Reference Streeter, I. [45DAV/STR] Strickert, R. G. [83RAI/STR] Stull, D. R.
Subbanna, C. S. [92VEN/KUL], [93NAI/VEN]
Suganuma, H. [94OMO/MUR], [97ASA/SUG], [97OMO/MIY], [97SUG/SAT], [97SUG/SAT2]
Suglobov, D. N. [2000GOR/LUM], [2000GOR/MIR]
Sundaresh, V. Sutton, J. Suzuki, S. Suzuki, T. Suzuki, Y.
Sverjensky, D. A. Swang, O. Swanson, J. L. Sylva, R. N. Szabó, Z.
Söhnel, O. Tachimori, S. Tagawa, H.
Tait, C. D.
[92KIM/SER], [93MEI/TAK]
[90TAN], [96PER/KRY], [98BUD/TAN]
Tasker, I. R.
[56STU/SIN] Stumm, W. [81STU/MOR]
Suescun, L. [97KRE/GAN]
Sugimoto, J. [98HUA/YAM]
Sukhov, V. Yu. [2000GOR/MIR] Sullivan, J. C. [82SUL/WOO], [94RIZ/RAO], [2001LEM/FUG],
[2001WIL/BLA] [87VEN/IYE] [49SUT] [99SUZ/TAM] [94OCH/SUZ] [94OCH/SUZ], [96YAM/HUA], [97HUA/YAM], [97NAK/ARA], [98SUZ/ARA], [99NAK/ARA], [99NAK/ARA2] [89SHO/HEL2], [92SHO/OEL], [97SHO/SAS] [95HAA/MAR] [87RAI/SWA] [79SYL/DAV] [97SZA/AAS], [2000MOL/REI], [2000MOL/REI2], [2000SZA/MOL], [2001VAL/WAH], [2002VAL/WAH] [85SOH/NOV] [99SUZ/TAM] [79TAG/FUJ]
Tagirov, B. R. [98DIA/RAG], [98DIA/TAG] [95ALL/BUC], [96CLA/CON], [97CLA/CON], [97RUN/NEU], [98CLA/CON], [98CON/ALM], [98EFU/RUN], [99CLA/CON], [2000KON/CLA]
Takahashi, K. [92KIM/SER], [93TAK/FUJ] Takahashi, Y. [97TAK] Takeishi, H. Tamura, K. [99SUZ/TAM] Tananaev, I. G. Tanet, G. [91BID/CAV] Tanger, IV, J. C. [88TAN/HEL] Tarasov, V. P. [2002KIR/GER] Tardy, Y. [74TAR/GAR], [76TAR/GAR], [84VIE/TAR]
[88TAS/OHA] (Continued on next page)

LIST OF CITED AUTHORS 914
Authors list (continued) Author Reference Tatarinova, E. E. [89TAT/SER] Taylor, J. C. [71TAY/HUR], [72TAY/KEL]
Thévenin, T. [93BOI/ARL]
Thomas, J. B. [96FAL/REA]
Thomason, H. P. [86EWA/HOW]
Torrero, M. E. [91AGU/CAS], [94TOR/CAS], [97PER/CAS], [97TOR/BAR], [98CAS/PAB]
Torstenfelt, B. [84ALL/OLO]
Tripathi, S. N. [74DHA/TRI], [98MIS/NAM], [99BAS/MIS] Trivedi, D. P.
Tsirel'nikov, V. I.
Tsyplenkova, V. L. [96RAK/TSY]
Taylor, J. R. [82TAY], [90TAY/DIN] Teague, L. S. [80BEN/TEA] Teichteil, C. [99VAL/MAR]
Thibault, Y. [2000BUR/OLS]
Thomas, J. K. [90HAY/THO]
Thompson, R. W. [42SCH/THO], [42THO/SCH], [48THO/SCH] Thourey, J. [78PER/THO] Timofeev, G. A. [98ERI/BAR] Tofield, B. C. [82BAR/JAC] Tomilin, S. V. [79VOL/VIS2] Tomiyasu, H. [90PAR/SAK], [93MIZ/PAR], [98FAZ/YAM] Tondre, C. [98MOU/LAS]
Torretto, P. C. [96ROB/SIL]
Toscano, E. H. [98SER/RON] Toshida, Z. [96MEI/KAT] Tossidis, I. A. [76TOS] Toth, I. [91BRU/GLA], [95BAN/GLA] Touzelin, B. [94TOU/PIA], [98PIA/TOU], [99PIA/TOU] Tran The, P. [91VIT/TRA] Tremaine, P. R. [80LEM/TRE], [86HOV/TRE], [88HOV/HEP3],
[89HOV/NGU] Tretyakov, A. A. [81GOL/TRE], [81GOL/TRE2]
[98CHA/TRI] Trofimov, T. I. [96KUL/MAL]
[93NIK/TSI] Tso, T. C. [85TSO/BRO]
Turck, G. [76BOU/BON] Tweed, C. J. [87CRO/EWA] Twichell, L. P. [47RYO/TWI] Ueno, K. [75UEN/SAI] Ueta, S. [95YAJ/KAW] Ullman, W. J. [88ULL/SCH], [2001LEM/FUG] Umreiko, D. S. [78KOB/KOL]
(Continued on next page)

LIST OF CITED AUTHORS 915
Authors list (continued) Author Reference Une, K. [85UNE] Uno, M. [2001YAM/KUR]
[98NAK/NIS]
[99VAL/MAR], [99WAH/MOL], [2001VAL/WAH], [2002VAL/WAH]
Van Vlaanderen, P.
Van der Laan, R. R. [2000LAA/KON]
Varfeldt, J. [69GRE/VAR]
Vasil'ev, V. P. [62VAS]
Vaufrey, F. [97BIO/MOI]
Ventura, O. N. [97KRE/GAN]
Vermeulen, J. M. [93BOI/ARL]
Veselý,V. [65VES/PEK]
Unrein, P. J. [76CHO/UNR] Urabe, T. Usui, Y. [99SUZ/TAM] Vallet, V.
Valsami-Jones, E. [97VAL/RAG] Van Egmond, A. B. [75COR/EGM] Van Genderen, A. C. G. [84GEN/WEI] Van Haverbeke, L. [90VOC/HAV], [91VOC/HAV]
[91COR/VLA], [97COR/BOO] Van Voorst, G. [75COR/EGM]
Van der Weijden, C. H. [84GEN/WEI]
Vasca, E. [93FER/SAL]
Vasil'kova, I. V. [56SHC/VAS2]
Veits, I. V. [81GLU/GUR], [82GLU/GUR]
Venugopal, V. [78SIN/PRA], [79PRA/NAG], [80NAG/BHU], [82ROY/PRA], [87VEN/IYE], [90IYE/VEN], [92VEN/IYE], [92VEN/KUL], [93JAY/IYE], [93NAI/VEN], [94JAY/IYE], [95SAL/JAY], [96IYE/JAY], [96JAY/IYE], [96SAL/IYE], [97IYE/JAY], [97JAY/IYE], [97KRI/RAM], [97SAL/KRI], [98BAN/SAL], [98JAY/IYE], [98KRI/RAM], [99JAY/IYE], [99SAX/RAM], [99SIN/DAS], [2000DAS/SIN], [2001BAN/PRA]
Vesala, S. [69SAL/HAK]
Vichot, L. [2000VIC/FAT] Vidavskii, L. M. [71SAN/VID], [72SAN/VID] Vieillard, P. [84VIE/TAR] Visyashcheva, G. I. [74VIS/VOL], [74VOL/KAP2], [77VOL/VIS],
[79VOL/VIS2] Vitorge, P. [84VIT], [86GRE/ROB], [87RIG/VIT], [87ROB/VIT],
[89RIG/ROB], [90CAP/VIT], [91VIT/TRA], [93GIF/VIT], [93GIF/VIT2], [94CAP/VIT], [95CAP/VIT], [96CAP/VIT], [98CAP/VIT], [99CAP/VIT], [99RAI/HES2], [2001LEM/FUG]
(Continued on next page)
LIST OF CITED AUTHORS 916
Authors list (continued) Author Reference Vochten, R. [81VOC/PIR], [83VOC/PEL], [84VOC/GOE],
[84VOC/GRA], [86VOC/GRA], [90VOC/HAV], [91VOC/HAV] [98MEI/FIS]
Vokhmin, V. [98DAV/FOU], [2000DAV/FOU], [2001DAV/VOK]
Volke, P. [99MEI/VOL] Volkov, A. Y. [98ERI/BAR]
[74VIS/VOL], [74VOL/KAP2], [77VOL/VIS], [79VOL/VIS2]
Von Braun, R. [75BRA/KEM] Wadsak, W. [2000WAD/HRN]
[52ROS/WAG], [73HUL/DES], [82WAG/EVA], [89COX/WAG]
Wagner, E. L. [45WAG/GRA]
Wait, E. [55WAI] Wakita, H. [74MOC/NAG] Wall, I. [75BRA/KEM]
[90ARC/WAN] Wang, W. E. [99HAS/WAN] Wanner, H. [86WAN], [88WAN], [91WAN], [92GRE/FUG],
[95SIL/BID], [99RAR/RAN], [99WAN/OST], [2000GRE/WAN], [2000OST/WAN], [2000WAN/OST], [2001LEM/FUG]
Ward, M. Wasserman, S. R. [99SOD/ANT] Waterbury, G. R.
[84HAR/MOL], [86FEL/WEA] Weber, Jr., W. J.
[43WEB] Weed, H. C. [92NGU/SIL]
[98FAN/WEG], [98FAN/WEG2], [99FAN/KON] Weigel, F. [76WEI/WIS], [82WEI/WIS]
[87DUB/RAM] Weissman, S. [43ALT/LIP] Welch, G. A. [56WAR/WEL]
[85DIC/LAW], [86DIC/PEN] Werme, L. O. [98WER/SPA] Werner, G. K. [85ALD/BRO]
Voigt, W.
Volden, H. V. [95HAA/MAR]
Volkov, Y. F.
Wagman, D. D.
Wahlgren, U. [99VAL/MAR], [99WAH/MOL], [2001BOL/WAH], [2001BOL/WAH2], [2001VAL/WAH], [2002VAL/WAH]
Wang, P.
[56WAR/WEL]
[61WAT/DOU] Weare, J. H.
[71POR/WEB] Webster, R. A.
Weger, H. T.
Weisbrod, A.
Weller, M. T.
(Continued on next page)
LIST OF CITED AUTHORS 917
Authors list (continued) Author Reference
White, A. G. [57HEA/WHI] White, Jr., H. J. [87GAR/PAR]
Whitfield, M. [79WHI]
Williams, C. [99SOD/ANT]
Williams, P. A. [79HAA/WIL], [80ALW/WIL], [81OBR/WIL], [83OBR/WIL]
Xi, R. H. [92KRA/BIS]
Yakovlev, G. N. [74VIS/VOL], [74VOL/KAP2]
Yamada, M. [2001FUJ/PAR]
Yamanaka, S.
[2000YEH/MAD]
Whiteley, M. W. [99DOC/MOS]
Wilcox, D. E. [62WIL] Wilkinson, G. [80COT/WIL]
Williams, C. W. [83MOR/WIL], [83MOR/WIL2], [84WIL/MOR], [91CAR/LIU], [92MOR/WIL], [94LIU/CAR], [94MOR/WIL], [2001WIL/BLA]
Williams, S. J. [86EWA/HOW] Willis, M. [97SHO/SAS] Wilmarth, W. R. [90FUG/HAI] Wimmer, H. [92WIM/KLE], [94KIM/KLE] Wipff, G. [2001SEM/BOE] Wishnevsky, V. [76WEI/WIS], [82WEI/WIS] Wolf, A. S. [65WOL/POS] Woods, M. [82SUL/WOO] Wruck, D. A. [97WRU/PAL] Wyart, J. F. [92BLA/WYA]
Xue, Z.-L. [98DAI/BUR] Yagi, M. [97SUG/SAT2] Yajima, T. [95YAJ/KAW]
Yamada, K. [2001FUJ/SAT]
Yamaguchi, K. [96YAM/HUA], [97HUA/YAM], [98HUA/YAM], [98ITO/YAM]
Yamaguchi, T. [94YAM/SAK], [96NAK/YAM] Yamamoto, T. [98ITO/YAM], [98KIT/YAM], [98YAM/KIT] Yamamura, T. [98FAZ/YAM], [98KIT/YAM], [98YAM/KIT] Yamana, H. [2001FUJ/YAM]
[2001YAM/KUR] Yamashita, T. [79TAG/FUJ], [89YAM/FUJ], [91FUJ/YAM] Yamawaki, M. [96YAM/HUA], [97HUA/YAM], [98HUA/YAM],
[98ITO/YAM], [99NAK/ARA2] Yasumoto, M. [96YAM/HUA], [97HUA/YAM], [98HUA/YAM] Yeh, M. Yoo, C. [98YOO/CYN]
Westrum, Jr., E. F. [80CHI/WES], [80COR/WES], [84GRO/DRO], [89COR/KON]
(Continued on next page)
LIST OF CITED AUTHORS
918
Authors list (continued) Author Reference Yoshida, Z. [93MEI/KAT], [94KAT/MEI], [95KAT/KIM],
[96KAT/KIM], [98MEI/KAT], [99MEI/KAT] Young, H. S.
Yungman, V. S.
Zaitsev, L. M. [67GEL/MOS]
Zapol'skii, A. K. [89STA/MAK]
Zmbov, K. F. [69ZMB]
Zubova, N. V. [59POP/KOS]
Whiffen, D. H. [79WHI2]
[58YOU/GRA] Yui, M. [98RAI/FEL], [99RAI/HES], [99RAI/HES2],
[2000RAI/MOO], [2002RAI/GOR], [2003RAI/YUI] [81GLU/GUR], [82GLU/GUR], [85HIL/GUR]
Zékany, L. [95BAN/GLA]
Zaitseva, V. P. [62GEL/MOS]
Zinov'ev, V. E. [75SPI/ZIN]
Zotov, A. V. [89SER/SAV]
Zwick, B. D. [95ALL/BUC]