Shape of Roll-type Uranium Deposits
34
UNITED STATES DEPARTMENT OF THE INTERIOR GEOLOGICAL SURVEY Shape of Roll-type Uranium Deposits By C. G. Warren, H. C. Granger, and J. H. Schock Open-File Report 80-100 1980 This report is preliminary and has not been edited or reviewed for conformity with U.S. Geological Survey standards and nomenclature.
-
Upload
khangminh22 -
Category
Documents
-
view
4 -
download
0
Transcript of Shape of Roll-type Uranium Deposits

UNITED STATES DEPARTMENT OF THE INTERIOR
GEOLOGICAL SURVEY
Shape of Roll-type Uranium Deposits
By
C. G. Warren, H. C. Granger, and J. H. Schock
Open-File Report 80-100
1980
This report is preliminary and has notbeen edited or reviewed for conformitywith U.S. Geological Survey standards
and nomenclature.

Contents
Page
Abstract.............................................................. 1
Introduction..........................................................2
Geologic description of rolls.........................................4
Processes that affect roll shape......................................5
Description of the computer model.....................................9
Flow and dispersion..................................................13
Mathematical procedure...............................................14
Results..............................................................21
Conclusi ons..........................................................27
References........................................................... 28

Illustrations
Page
Figure 1. Idealized uranium roll.....................................3
2. Plan view of an idealized oxidized tongue produced by a
variable flux of oxygen charged ground water.............6
3. Matrix representation containing a roll. A 64 by 200
matrix showing the redox interface at high resolution
is superimposed on a standard 32 by 100 matrix. See
table 1 line 10 for additional information concerning
this redox interface....................................10
4. Flow profiles. Vertical cross sections of selected ground
water flows are shown...................................11
5. Representative cell. Oxygen in the cell shown is controlled
by dispersion and ground water movement.................16
6. Cell cluster. The five cells shown are used to calculate
the new oxygen concentration of the center cell. Actual
calculations shown in example 1, p. 18..................19
7. Length ratio. Measurements used in calculating the length
ratio are shown. Length ratio = L/T....................23
Shape of Roll-type Uranium Deposits
by C. G. Warren, H. C. Granger, and J. H. Schock
Abstract
The Wyoming roll-type uranium deposits occur at the margins of tongues of
altered rock that are formed within pyrite-bearing host sandstones. The host
sandstones are confined between impermeable mudstone strata which largely
prevent the escape of ground water with its load of oxygen and ore bearing
components. Oxygen dissolves in the water at the surface and is transported
to the end of the altered tongue by two processes (1) velocity transport in
which oxygen is carried by moving ground water, and (2) dispersion transport
in which oxygen moves from regions of high concentrations to regions of low
concentration by diffusion. The altered tongues develop as a result of a
chemical reaction between oxygen and pyrite in which both components are
consumed. The size of the altered tongue provides a record of how much oxygen
was delivered. The shape of the oxidation interface (end of the altered
tongue) provides information on the relative effects of velocity and dis
persion transport.
Oxygen delivery can be simulated in a computer by mathematically
describing the movement of oxygen as the sum of velocity and dispersion
transport in a matrix of small cells. In this study a complete description of
oxygen movement near the end of the altered tongue is obtained after examining
a total of 3100 cells in a cross section which is 100 cells long and 31 cells
high. When oxygen is delivered to a cell containing pyrite, the computer
program permits them mutually to destroy one another. The entire process is
iterated until the oxidation interface takes on a fixed shape although the
interface continues slowly to migrate downstream.
The following two models were tested: in the "flow model," no oxygen is
permitted to escape across the confining upper and lower boundaries, but in
the "leaky model" oxygen is lost from the system by diffusion across these
boundaries. The typical roll shape developed only in flow models where water
flow was restricted or stagnant in a zone along the upper and lower boundaries
of an aquifer. This zone where water movement is restricted is narrow,
probably less than 10 cm across. The elongation of the roll is directly
proportional to the ground-water velocity. In computer simulation of the
leaky model, oxygen was allowed to escape slowly across the mudstone
boundaries. Even small rates of oxygen leakage with yearly fractional losses
4 x 10"4 from the entire aquifer produce the typical roll shape. Although the
leaky moder produces typical roll shapes in a computer model, field evidence
does not support the idea because oxidation penetrates the mudstone only
superficially.
Introduction
According to generally accepted concepts' (fig. 1), the Wyoming roll-type
deposits were formed by oxygen-charged solutions which percolated down
gradient, reacted with the reduced components in the host rocks, and deposited
their load of uranium. During this process an irregular, tongue-shaped,
altered zone was formed, and the uranium minerals were concentrated, almost as
if they had been filtered out, at the interface between the altered and
reduced rock. When the wide diversity of permeabilities among the individual
cut-and-filled sandstones, siltstones, and mudstones deposited by both
meandering and braided fluvial systems is considered, it seems remarkable that
the tongue-like altered zones are as geometrically regular as they are.
Although the oxidation-reduction interface or distal surface of the altered
tongue, is never a perfect C-shape, it is commonly so nearly so that numerous2

Impermeable rock
x x x Oxidized tongue * x x x
Unoxidized sandstone
Redox Interface
Impermeable rock
Figure 1. Idealized uranium roll

geologists have idealized it in illustrations that indicate near bilateral
symmetry about a subhorizontal plane (Adler and Sharp, 1967; Evseeva, Ivanov,
and Kochetkov, 1963; Germanov, 1960; Harshman, 1962; Kashirtseva, 1964;
Kholodov and others, 1961; King and Austin, 1965; Lisitsyn and Kuznetsova,
1967; Shawe and Granger, 1965). Either the flow rates of solutions (and their
dissolved reagent oxygen), were not in proportion to the permeabilities of the
rock units they traversed, or some process tended to even out the delivery of
reagents along the roll surface.
This study concerns the mechanisms by which reagents were delivered to
the oxidation-reduction interface of roll-type uranium deposits. Until
recently (Granger, 1976) we had assumed that dissolved oxygen had simply been
carried along the flow paths of ground water by velocity transport to the
surfaces of the altered tongue where minor diffusion occurred on a micro
scale, allowing the oxygen to contact and react with pyrite and other
oxidizable components of the rock and ore. Further investigation suggested,
however, that diffusion played a much more important role than first
suspected, and this study was undertaken to determine the relative effects
that flow and diffusion might have had on the shapes of ore rolls.
The mathematical methods developed in this paper are also applicable
without extensive modification to in situ solution mining. The movement of
oxidants that are deliberately injected into ore deposits is controlled by the
same laws that control the movement of natural oxidants.
Geologic descriptions of rolls
Uranium ore rolls are ordinarily found in gently dipping aquifer
sandstones that are sandwiched between less permeable mudstone beds. In
vertical sections (fig. 1) an altered tongue containing iron-oxide minerals
and lacking organic material projects into the unaltered rocks containing
4

disseminated authigenie pyrite and scattered coaly fossil-piant remains.
Epigenetic accumulations of uranium, selenium, molybdenum and other elements
commonly form the ore zone, largely in the reduced rock, adjacent to or near
.the borders of the oxidized tongue. In plan, (fig. 2) most oxidized tongues
associated with economic ores extend over several tens of square kilometers
and have a highly irregular almost amoeboid outline on their advancing edge.
The epigenetic or ore stage minerals appear to be incidental to the
rolls, which invariably consist of an oxidized tongue adjacent to pyrite-
bearing sandstone. This means that an essential process in the genesis of
roll deposits is the oxidation of pre-existing pyrite. Dissolved oxygen is
carried by flowing ground water and reacts with pyrite very soon after the two
reagents come in contact. The oxidized tongue continues to advance as long as
oxygen is supplied to the roll. Scattered plant debris, if present, also
consumes oxygen and may slow the advance of the roll but organic material does
not appear to be an essential component of the ore-forming process.
Processes that affect roll shape
Meteoric water equilibrates with oxygen in the atmosphere and then
percolates downward to the water table. If oxygen is not consumed by
reactions within the host rock, the water at the water table contains about 8
ppm dissolved oxygen at sea level, according to Henry's Law. As this
recharged water continues to move down dip, below the water table, it can no
longer equilibrate with the atmosphere, and its oxygen concentration decreases
through reactions with the surrounding environment. The position and shape of
a sandstone roll is largely dependent on the reactions between this dissolved
oxygen and pyrite in the host rock.
The variables that have a major effect on the shape of the roll are
related principally either to the distribution of pyrite or to the relative
5

Si- Schematic flow line Narrows indicate direction of movement
Redox interface""Former positions of redox
interface
oxidized sandstone unoxidized sandstone
Figure 2. Plan view of an idealized oxidized tongue produced by a
variable flux of oxygen charged ground water.

rates of oxygen delivery. If the pyrite distribution is uneven, the advancing
oxidation interface tends to be impeded in places where pyrite is most
abundant. Conversely, it advances more rapidly where pyrite is sparse.
.Oxygen is carried to the vicinity of the roll front (fig. 2) principally by
the flow of ground water in which it is dissolved. Therefore, the flow of
ground water is the dominant control of oxygen delivery at points along the
oxidation interface. Because the permeability of fluvial sandstone can vary
from depositional unit to depositional unit and even from point to point
within depositional units, ground-water velocities are irregular within most
aquifers and the delivery of oxygen must vary from point to point. These
variations can produce prominent bulges or irregularities in the oxidation
interface.
The effects of flow are especially evident when an entire basin is
considered (fig. 2). The relatively large distances that are involved
emphasize velocity transportation of oxygen and the shapes of the oxidized
tongue are predominantly dependent on the movement of water. When shorter
distances are considered, as in figure 1 which shows a vertical cross section
of an aquifer, oxygen diffusion becomes much more important. The diffusion
process has a distinct moderating effect on the delivery of oxygen.
The familiar roll shape of an oxidation interface can be created through
either or both of two conditions. (1) If the concentration of pyrite is
greater near the mudstone boundaries than at the center of the sandstone unit,i
then the oxidation interface will penetrate farthest at the center even with a
uniform delivery of oxygen. (2) If the rate of delivery of oxygen at the
center exceeds oxygen delivery at the boundaries, then the oxidized interface
will protrude farthest at the center even with a uniform distribution of
pyrite. The second condition can be realized for two situations: (a) The

water velocity is impeded near the boundaries or (b) some factor causes the
concentration of dissolved oxygen to be depleted at the boundaries.
If the delivery of oxygen was controlled exclusively by "velocity
transportation," this would be the only transport mechanism that needs to be
considered. However, diffusion tends to equalize concentrations of oxygen
whenever some factors such as a chemical reaction cause a concentration
imbalance to occur. In solutions which are moving through a porous medium,
the effects of diffusion are modified. Although the augmented process is
termed dispersion, it still has the same general characteristics as
diffusion. Dispersion tends to obscure the effects of velocity transportation
and to smooth the smaller irregularities in the oxidation interface.
In a homogeneous sandstone aquifer it is reasonable to assume that the
cross sectional roll shape would be symmetrical and a smooth curve. Small"
random inhomogeneties would not noticeably disrupt the shape because of the
smoothing affects of dispersion. However, continental sandstones are never
perfectly homogeneous and the cross sections of natural rolls are never
symmetrical or regular. Nevertheless, many geologists have preferred to
emphasize the underlying regularities and to describe idealized rolls in terms
of the symmetrical "C" shape.
Description of the computer model
The model is based on a permeable sandstone layer containing disseminated
pyrite and enclosed between relatively impermeable mudstbnes. Water
containing dissolved oxygen is percolated through the system parallel to the
sandstone-mudstone contacts and the oxygen is allowed to react with the
disseminated pyrite. Pyrite is spatially fixed within the model until it is
destroyed by the oxidation but oxygen is free both to be transported with the
water by flow and through the water by dispersion. The rate of flow of water
8

in the model can be arbitrarily adjusted to account for changes in
permeability across the aquifer. Two different versions of the basic model
described above were tested. In the first, the mudstone boundaries were
,tightly sealed and neither oxygen nor water was allowed to escape from the
aquifer. In the second, just enough oxygen was allowed to leak out of the
aquifer across the mudstones to noticeably affect the roll shape.
For purposes of the computer program, a cross section of the aquifer-
mudstone system is divided into a matrix of cells, 100 cells long and 31 cells
high (fig. 3). At the beginning of a program each of the 3100 cells is
assumed to contain the same amount of disseminated pyrite. Water containing a
given amount of dissolved oxygen is then allowed to flow through the matrix
and the oxygen reacts stoichiometrically with the pyrite in the first column
of cells. As soon as the pyrite in a cell is used up, the oxygen is allowed
to pass into the next cell, and so on.
To simplify, the permeability and flow rate are kept uniform throughout
each horizontal row of cells. The profile of flow velocities across the
aquifer was arbitrarily assumed to be symmetrical. Flow in the mudstone is
set at zero. Two general types of flow profiles were tested. The first is
termed parabolic flow (fig. 40). It has maximum flow velocity at the center
row in the aquifer and the velocity decreases steadily in each row toward the
edge of the aquifer. The other type we have termed step flow. Here the
velocities are equal and uniform across all the central rows of its aquifer
and then drop abruptly to zero in one or more steps in the last few rows along
the aquifer boundaries (fig. 4_A, 4j^, 4CJ. This decrease in flow is analogous
to a geologic setting where increased clay/sand ratios occur near the
mudstone.
.9

10
10
20
30
40
50
BO
7090
100
110
120
130
140
150
160
170
180
190
200
CELLS
Figure 3
.-Ma
trix
rep
rese
ntat
ion
cont
aini
ng a
roll.
A 64
by 2
00 m
atrix
show
ing
the
redo
x interface
at h
igh
reso
luti
on is
superimposed o
n a
standard 32
by
100
matr
ix.
See
table
1 line 10
for a
dditional
information
conc
erni
ng th
is
redo
x in
terf
ace.

Step
flow
A.
Modified
step
flow
B.
Mo
difi
ed
st
ep
flow
C.
Para
bolic
flo
w D.
Fig
ure
4.
F
low
pro
file
s.
Ve
rtic
al
cross
se
ctio
ns
of
sele
cted
grou
nd
wate
r flo
ws
are
sh
owru

The movement of oxygen through the matrix of cells is controlled both by
flow and dispersion. Flow is assumed to carry the oxygen straight ahead/through each row of cells. Dispersion permits oxygen to move into adjacent
cells, in any direction by a diffusion-controlled process.
A problem exists in matching the boundaries of the computer model with
actual deposits. In the model, three regions can be identified; these are
characterized by the importance of diffusion transport (D) relative to
velocity transport (V). In the large central region, oxygen is delivered by
both processes. In the narrow border regions where water velocity is reduced
to near zero, oxygen is only delivered by diffusion processes. Ultimately the
aquifer is completely sealed and oxygen cannot move by any process. Here D
and V are both zero. No experimental information exists concerning D and V in
actual deposits. This means that the mudstone-sandstone contact may mark
either the position where the aquifer is completely sealed to both diffusion
and water movement or the position where only the ground-water velocity
becomes zero while oxygen diffusion remains significant. The difference
between the two is the position of the narrow zone of restricted water flow in
which diffusion is important. It may reside entirely in the sandstone, the
mudstone, or some combination of the two.
If the mudstones are somewhat permeable it is conceivable that oxygen may
diffuse across the entire mudstone layer and ultimately leak out of the
aquifer. This possibility was investigated in the leaky oxygen model.
Studies of this model were simplified by assuming a uniform ground-water flow
throughout the sandstone. The shape of the oxidation front is due entirely to
small amounts of oxygen leaking from the aquifer.
12

Flow and dispersion
Although ground-water movement can be completely characterized by a
velocity profile of a cross section of the aquifer, flow is described in this
paper in terms of the average flow and a flow index. The flow index is the
average flow divided by the maximum velocity that occurs in the velocity
profile. It is a measure of the fraction of all the ground water in the
aquifer that is found in rapidly moving channels. The symbol "S" is assigned
to the term, 1 - flow index (an adaption from Rouse, 1961, p. 198). It is a
measure of the fraction of the ground water in the aquifer that moves slowly.
Pick's first law of diffusion states that the flux of a solute in a
stagnant solution is proportional to the concentration gradient. For a
solution that is moving through a porous medium such as a sandstone, however,
the flux of solutes becomes more complex. In such an environment, diffusion
is modified by factors related to (1) the flow rate of the solution, (2) the
porosity of the rock, and (3) tortuosity, which is a measure of the increased
distances solute particles must travel around sand grains in moving through a
porous medium. Diffusion modified by these factors is known as dispersion.
From a practical standpoint, at the very slow flow rates we are concerned with
only the tortuosity and porosity have any significant effects and a fairly
simple approximate relationship exists between diffusion and dispersion (Fried
and Combarmous, 1971). In a typical, moderately well sorted sandstone,
tortuosity reduces the effects of diffusion only by about 1/3 (Fried and
Cambannous, 1971); because only the interstices are occupied by fluid through
which diffusion can occur, diffusion transport is directly proportional to
porosity. Therefore the dispersion coefficient is about 2/3 PD, or 2/3 times
the porosity times the diffusion coefficient.
13

The ratio of D/V is a measure of the relative importance of dispersion
transport and velocity transport. This ratio is especially simple if both D
and V are expressed in terms of diffusion and interstitial velocity, as the
following derivation demonstrates.
£ - 2/3 x P x Diffusion Coefficient V P x Interstitial Velocity
P. _ 2/3 x Diffusion Coefficient V ~ Interstitial Velocity
where D is the dispersion coefficient
V is the bulk velocity
P is the porosity
All results of this paper that are dependent on D/V are given in terms of the
dispersion coefficient for 50 percent porosity and bulk velocity.
Mathematical Procedure
The rules governing the movement of oxygen in the oxidized tongue as the
ground water approaches the orebody are given in equation (1).
_at ax ax
Where
Z = two dimensional concentration of oxygen actually a volume
concentration over a unit area one unit thick;
R = two dimensional concentration of pyrite, expressed in units that are
equivalent to the oxygen on a stoichiometric basis;
X = longitudinal distance in the direction of water flow;
14

Y = transverse distance;
D = dispersion coefficient;
V = velocity of ground water;
t = time; and
3 = partial derivative.
This is similar to equations for heat flow given by Carslaw and Jaeger (1959)
in which oxygen concentrations replace expressions for heat content. The
equation is applicable to a small cell such as the one shown on figure 5. It
provides information on the increase or decrease of oxygen in the cell per
unit time. Similar information for all cells of the oxidized tongue provides
a complete picture of oxygen movements relative to time.3ZThe term, V-rv , of.equation (1), describes the transportation of oxygen
by the ground-water movement. The amount of oxygen moving across a vertical
boundary of the cell per unit time is proportional to the product VZ, the
velocity of water times the concentration of oxygen. The concentration of
oxygen, Z, is a variable and changes from point to point. Thus, if Z is
larger as the water enters the cell than it is as water leaves the cell and
oxygen is not consumed within the cell, the oxygen concentration in the cell
must increase. If the situation is reversed then the oxygen concentration
must decrease. The increase or decrease of oxygen in the cell is equal to the
product of the velocity times the difference in concentration of oxygen3Zentering and leaving the cell. The term V-ry determines how fast the oxygen
content of the cell increases or decreases because of the movement of ground
water.2 2
The expression, n 3 Z + p 3 Z deals with transportation of the oxygen by? 2 3X^ 3Y
dispersion. The first and second terms deal respectively with longitudinal
and transverse dispersion. The product of the dispersion coefficient and the
15

Oxidized sandstone
a\Ground w
ater
move
ment
mudstone
redox
interface
Pyri
tic
sandstone
dy o
r iy
Figure
5.
Representative c
ell.
Ox
ygen
in
the
cell sh
own
is c
ontr
olle
d
by d
ispe
rsio
n and
grou
nd w
ater m
ovement.

concentration gradient is equal to the rate at which the oxygen is transferred
by the dispersion process. If the concentration gradient remains constant
across the cell, the same amount of oxygen is diffusing into the cell as is
diffusing out of the cell. However, if the concentration gradient is large at
one side of cell and small at the opposite side, then the oxygen content of
the cell must increase. If the situation is reversed, the cell loses
oxygen. The loss or gain of oxidant is equal to the product of the dispersion
coefficient and change in the concentration gradient across the cell,
The term 3R/3t, representing the change in the amount of pyrite in a cell
is zero except along the redox interface. In the oxidized tongue where pyrite
is absent, the amount of pyrite cannot change and, therefore,3R/3t = 0. In
the unaltered rock where the oxygen content is zero and the pyrite is neither
being oxidized or destroyed, the amount of pyrite cannot change and,
therefore, 3R/3t = 0. Along the redox interface where both oxygen and pyrite
can coexist briefly in the same cell, a chemical reaction occurs which affects
the concentration of both components. The computer is programmed so that the
rules of equation (1) are applied in turn to each cell in 3100 separate
calculations. A typical calculation that is shown in the following example 1
adjusts the oxygen concentration of the central cell of figure 6. An
identical computation is then repeated for the next cell. After each cell is
examined, the concentrations of all cells are simultaneously adjusted for the
calculated changes in concentration. The results provide an equivalent of one
frame in a motion picture of the oxygen concentration in the ground water.
17
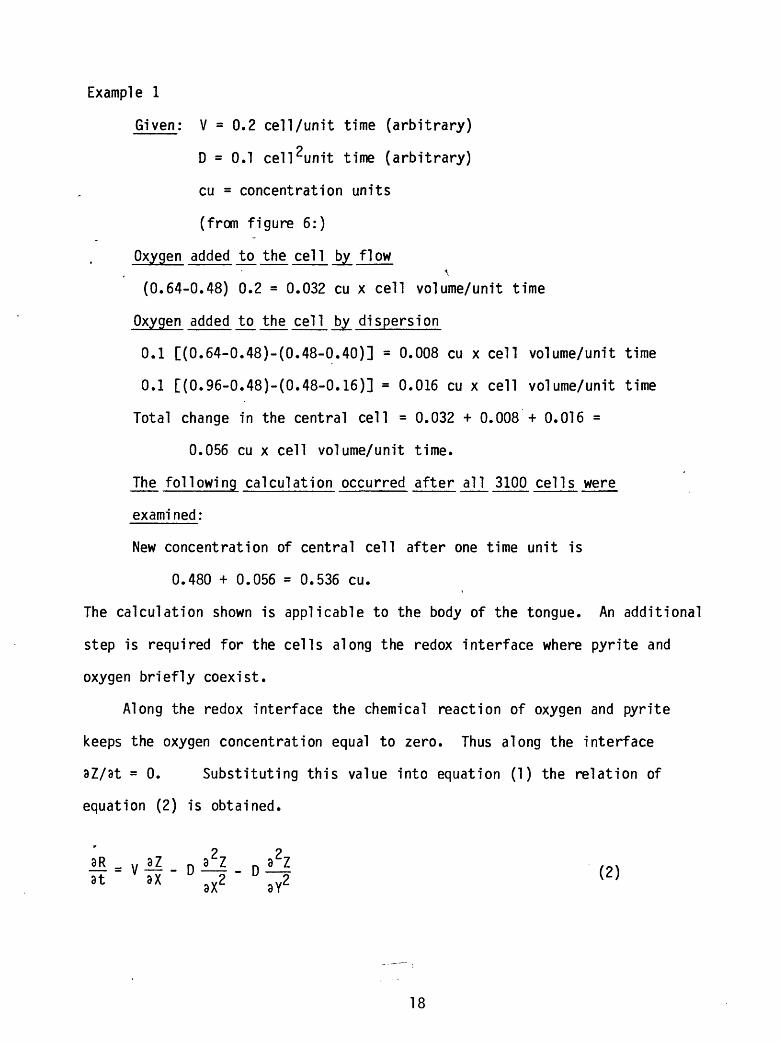
Example 1
6i ven : V = 0.2 cell /unit time (arbitrary)
D = 0.1 cel! 2unit time (arbitrary)
cu = concentration units
(from figure 6:)
Oxygen added to the cell by flow \
(0.64-0.48) 0.2 = 0.032 cu x cell volume/unit time
Oxygen added to the cell by dispersion
0.1 [(0. 64-0. 48)-(0. 48-0. 40)] = 0.008 cu x cell volume/unit time
0.1 [(0. 96-0. 48)-(0. 48-0. 16)] = 0.016 cu x cell volume/unit time
Total change in the central cell = 0.032 + 0.008 + 0.016 =
0.056 cu x cell volume/unit time.
The following calculation occurred after all 3100 cells were
examined:
New concentration of central cell after one time unit is
0.480 + 0.056 = 0.536 cu.
The calculation shown is applicable to the body of the tongue. An additional
step is required for the cells along the redox interface where pyrite and
oxygen briefly coexist.
Along the redox interface the chemical reaction of oxygen and pyrite
keeps the oxygen concentration equal to zero. Thus along the interface
3Z/3t = 0. Substituting this value into equation (1) the relation of
equation (2) is obtained.
- aX2 aY2
18

0.64 cu.
0.16 cu.
0.48 cu.
0.96 cu.
/\
0.40 cu. Y
\X '
cu . = c o n c e nt r a t i o n unit
Figure 6. Cell cluster. The five cells shown are used to calculate
the new oxygen concentration of the center cell. Actual
calculations shown in example 1, p. 18.
19

The equation indicates that the rate of dissolution of pyrite in chemical
equivalences is exactly equal to the rate at which oxygen is delivered to the
redox interface. To calculate the dissolution of pyrite in a given time, the
amount of oxygen delivered to a cell along the redox interface is determined
by the process previously described. The amount of oxygen delivered is then
subtracted in chemical equivalents, from the amount of pyrite in the cell.
This adjustment is made after the changes in concentration of all 3100 cells
are established. Conditions are generally adjusted so that between 7 and 50
iterations are required to completely remove the pyrite from the line of cells
along the pyrite interface. This is defined to be one step once the system
has reached a steady-state shape.
Flow velocities used in the model can be converted to conventional units
through the ratio of D/V. Conversion of V = 0.2 cells/unit time in the model
to V in cm/sec is illustrated in example 2.
Example 2
Given:
Cell length = 64.5 cm (arbitrary)o
D = 0.1 cell lengths/unit time (arbitrary)
! D = 6.3xlO"6 cm2 /sec
The problem is to convert a velocity of 20 cells/unit time to
cm/sec.
D/V = (0.1 cell Iengths 2/unit time)/
(20 cell length/unit time)
The dispersion coefficient of 6.3 x 10~° is 2/3 of the product of the porosity and diffusion coefficient. The diffusion coefficient of 1.9 x 10 for oxygen was obtained from International Critical Tables. Calculation is for 50 percent porosity.
20

D/V = 0.005 cell lengths
0.005 cell lengths are 0.323 cm
D/V = 0.323 cm
(6.3xlO" 6cm2/sec)/V = 0;323 cm
V = 1.95xlO~ 5cm/sec = 6.15 m/yr. ' >
wheVe V is bulk velocity.
Results
The shape of the oxidation interface is dependent on the conditions that
existed at the time the roll formed. Similarly the shape of a calculated
oxidation interface is dependent on the conditions that are used to solve the
problem. No computational method exists for starting with a" given shape and
working backwards to obtain the conditions under which the roll formed. This
means that many different conditions must be tested to find which conditions
produce the shapes that are similar to the shape of a natural roll. This is
done by specifying the conditions in the computer program and then running the
model until the shape of the oxidation interface reaches a steady state. The
shape usually evolves while it advances the first 150 cell lengths. Once
steady state is attained the shape remains fixed regardless of how far the
roll advances provided conditions are not changed. The steady-state shape
depends only on the conditions specified in computer program.
In the computer models emphasizing flow, all other controls are
minimized. The pre-ore pyrite content is held constant. Leakage across the
mudstone boundary is prevented by setting the dispersion coefficient in the
mudstone to zero. Symmetry and uniformity are used to reduce computer costs
and simplify the description of the results.
In computer models where the mudstone boundaries are sealed a crescent-
shaped roll (C) is always obtained when ground-water flow is somehow
21

restricted along the mudstone contact. Figure 3 shows the general shape that
is obtained. The extent of elongation of a roll is a very sensitive indicator
of conditions of formation. Elongation of the roll relative to its height
appears to be the most practical measure of the conditions under which the
roll formed. Figure 7 shows the measurements involved in deriving the length- >to-height ratio.^ The roll length is the horizontal distance from the tip of
the oxidized tongue to the last vestiges of unreacted pyrite along the upper
and lower boundaries of the sandstone. The height is the vertical distance
across the sandstone. The length-to-height ratio is defined as length/height
and is called the length ratio for convenience.
Table 1 shows the length ratios for computer models emphasizing various
kinds of ground-water flow. The length ratios are obtained from direct
measurements of the computer print out of the pyrite matrix after the roll
shape has reached a steady state. Measurements are to the nearest cell length
which means a measurement error approaching 3 percent.
The length ratio is proportional to ground-water velocity when other
conditions remain constant; for example, only the ground-water velocity varies
for lines 12, 13, and 14 of table 1. Examination of this data shows that the
length ratio is proportional to ground-water velocity. Comparison of lines
15, 16, and 17 reveals the proportionality of velocity and length ratio for
parabolic flow.
For step flows the length ratio is approximately proportional to
(1 - flow index) or S. Comparison of lines 8 and 9 (table 1) which have the
same ground-water velocity shows the proportionality between S and length
ratio. This simple proportionality does not hold very well when the value of
S becomes larger than about 5/31. Comparison of lines, 4, 5, 6, and 7
demonstrates the marked deviation from simple proportionality.
22

Transverse distance * (T) '
"Longitudinal distance
U)
Figure 7. Length ratio. Measurements used in calculating the length
ratio are shown. Length ratio = L/T.
23
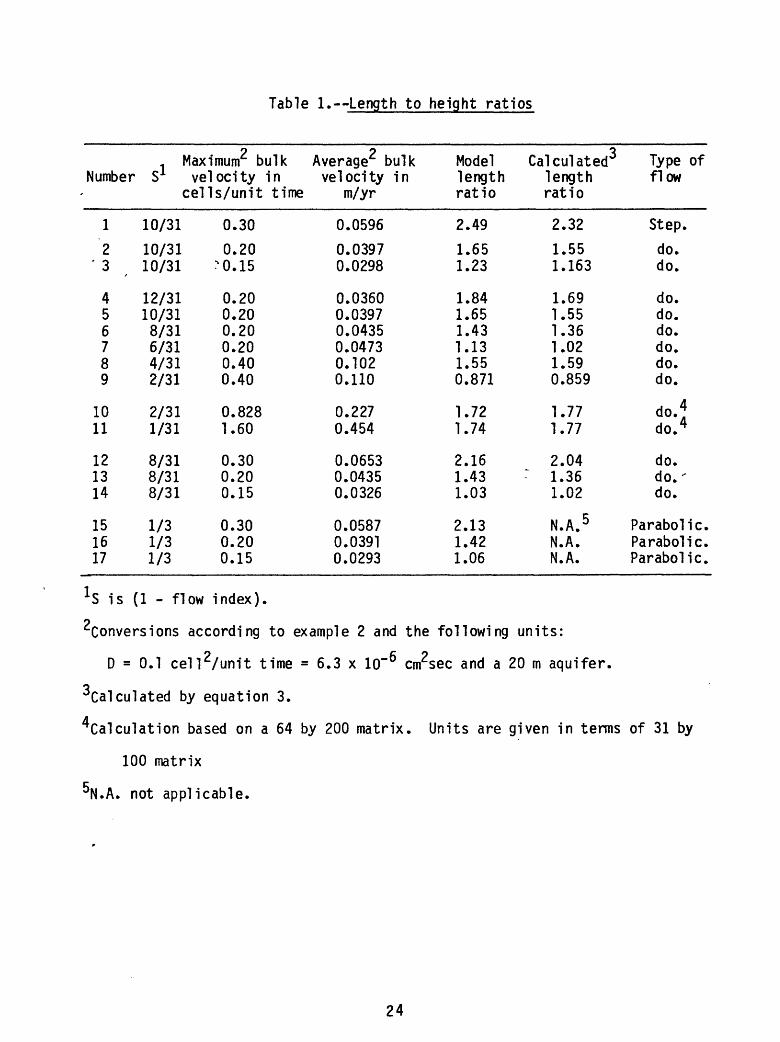
Table 1,--Length to height ratios
p p. Maximum bulk Average bulk Number S velocity in velocity in
cells/unit time m/yr
1
2' 3
456789
1011
121314
151617
10/31
10/3110/31
12/3110/318/316/314/312/31
2/311/31
8/318/318/31
1/31/31/3
0.30
0.20^0.15
0.200.200.200.200.400.40
0.8281.60
0.300.200.15
0.300.200.15
0.0596
0.03970.0298
0.03600.03970.04350.04730.1020.110
0.2270.454
0.06530.04350.0326
0.05870.03910.0293
Model length ratio
2.49
1.651.23
1.841.651.431.131.550.871
1.721.74
2.161.431.03
2.131.421.06
Calculated3 Type of length flow ratio
2.32
1.551.163
1.691.551.361.021.590.859
1.771.77
2.04- 1.36
1.02
N.A. 5N.A.N.A.
Step.
do.do.
do.do.do.do.do.do.
do. 4do. 4
do.do.'do.
Parabolic.Parabolic.Parabolic.
S is (1 - flow index).
P̂Conversions according to example 2 and the following units:p C p
D = 0.1 eel n/unit time = 6.3 x 10 cm sec and a 20 m aquifer.o^Calculated by equation 3.
^Calculation based on a 64 by 200 matrix. Units are given in terms of 31 by
100 matrix
^N.A. not applicable.
24

Length ratios produced by step flows with S less than 5/31 can be
represented by equation 3. This equation relates length ratio to velocity and
S for a 20 m thick sand.
LR - 121VS (3)
where L is the length ratio
where V is average velocity in m/yr
note V = (flow index) V max = (1-S) V max
S is 1 - flow index or the fraction of groundwater that is
relatively stagnant
From the examples used to illustrate equation (3) it might appear that the
equation is based on only the four examples of lines 8, 9, 10, and 11.
Equation (3) is actually the limit as S approaches zero of a more complex
equation (Schock, oral commun., 1979), that can be used to represent all step
flows of table 1 including large S values. However, there is no need to
consider large S values because these conditions are not significant from a
geologic viewpoint. Equation (3) is within the*3 percent measurement error
for lines 8, 9, 10, and 11 where S is less than 5/32. The equation gives
errors as much as 10 percent for some S values above 5/32 in table 1.
According to geologic evidence presented in a previous paper (Granger and
Warren, 1979) water flow during the early stages of ore formation was probably
faster than at the present and may have exceeded a bulk flow of 10 m/yr. Many
deposits have a length ratio of about five. When these numbers are
substituted into equation 3 the indicated S value for 10 m/yr velocity is
0.004 or 8 cm for a 20 m thick sandstone. This means that S values larger
than about 0.004 are not geologically significant and that the width of the
low velocity zone is probably less than 10 cm for a 20 m thick sandstone.
These restrictions exclude all parabolic flows.
25

As indicated earlier, the manner by which flow is terminated near the
mudstone contact is not understood. In an attempt to better visualize the
border region the standard model was expanded to a 200 by 64 matrix.
'Different kinds of terminations are illustrated by the following symetrical
flow profiles of 62 entries: (a) 0, 0, 1, 1, ...; (b) 0, 1/2, 1/2, 1, 1,...;
(c) 0, 1/3, 2/3,-1, 1,...; and (d) 0, 1/2, 3/4, 7/8, 7/8, 1,... All these
flow profiles have S equal to 2/31. When these flow profiles are used as
alternates for line 10 table 1 in the computer model the roll shapes were
virtually identical to the one shown in figure 4. This confirms that the
single most important measure of a flow profile is the S value. Various means
by which the ground water might be slowed include undulating contact, infusion
of clay a short distance into the aquifer and the sorting of sand grains. If
the bulk velocity of the ground water is 10 m/yr the zone of restricted
velocity is only about 8 cm wide for a 20 m thick sandstone and a length ratio
of 5.
Until now the discussion assumed that the clay-sandstone contact marked
the place where the entire system is completely sealed to both flow and
diffusion and that ground water flow slowed a few centimeters from this
contact. Other possibilities should be recognized. It may be possible that
flow continues across the entire sandstone aquifer all the way up to the
contact and that diffusion penetrates about 10 centimeters into the
mudstone. In this situation, ground-water flow stops at the contact and the
narrow stagnant zone resides entirely within the mudstone. The difficulty
with this situation is how to justify diffusion for a few centimeters into the
mudstone. There are no obvious features in the mudstone which would allow
diffusion for only a few centimeters. Field evidence suggests the oxidation
does actually penetrate a short distance into the mudstones in some
26
deposits. The few centimeters may represent a practical upper limit on
diffusion. If the mudstones are tightly packed, it would take an exceedingly
long time for oxygen to penetrate further than this.
Typical roll shapes were also produced in computer models that allowed
oxygen to leak from the aquifer. This model gave reasonable results that are
compatible with typical length ratios and ground-water velocities. A 20 m
thick aquifer leaking a 4 x 10"^ of its oxygen each year and with ground water
moving with a bulk velocity of 1 m/yr produced a roll with a length ratio of
5. Because this is very reasonable, there is nothing about the model itself
that would call its validity into question. However, oxygen must pass all the
way through the mudstone if it leaks from the aquifer and then all parts of
mudstones would be subject to the action of low concentrations of oxygen. The
existence of pyrite in the mudstone long after the oxidation interface passed
indicates either that oxygen was never present in the mudstone or that the
pyrite does not react with low concentrations of oxygen in a mudstone
environment. It is difficult to believe that oxygen and pyrite do not
ultimately react even under adverse circumstances. The presence of pyrite in
the mudstones appears to exclude the possibility that significant amounts of
oxygen can leak out of the aquifer by diffusion across the mudstone.
Conclusions
Computer modeling of geologic processes is not intended to be a
substitute for laboratory modeling or field studies. In some instances,
however, field studies are inconclusive and laboratory models require more
time or equipment than is available. In these instances computer modeling
allows a rapid study of dynamic processes. The development of roll type
deposits has proved to be ideal for such studies.
27

The paramount conclusion derived from the present study is that
dispersion and diffusion play a much larger part in determining the shapes of
roll type deposits than was first suspected. In fact, it was found that the
characteristic roll shape is dependent on a combination of fluid flow and
diffusion of dissolved oxygen. >
.In the model presented we have simulated the physical processes of oxygen
transport by diffusion and ground water movement, and of chemical reactions
between oxygen and pyrite disseminated in the host rock. As oxygen reacts
with pyrite, a concentration gradient is established and oxygen moves, by
diffusion, to eliminate this gradient. At the upper and lower surfaces of an
aquifer, water flow is reduced and oxygen delivery by ground-water movement is
restricted. Therefore, ground water near these surfaces cannot react with^as
much pyrite as ground water near the center of the aquifer. Hence, the redox
interface penetrates nearer the center than the margins of the sandstone.
Eventually, the process reaches a steady state. This comes when flow and
dispersion balance in such a way that equivalent vertical segments of the roll
front are all receiving oxygen at an equal rate.
Furthermore, the shape of the roll its length ratio can be«
quantitatively related to the velocity of ground water flow for a given set of
initial conditions. The faster the flow the more elongated the roll. Because
most natural rolls are not ideal, it is difficult to translate this relation
to known roll deposits but preliminary computer studies show that ground water
velocities of about 10 m/yr produce rolls in the model that have reasonable
ratios and resemble typical shapes observed in the Powder River Basin (Elmer
Santos, oral commun., 1978).
Although it was not a part of this study, computer modeling is also
applicable to solution mining of uranium ores. Most solution mining depends
28

on oxidation and solution of uranium in much the same way that our model
depends on oxidation and solution of pyrite. Hence, with certain
modifications in the computer program, the solution and transport of uranium
under such artificial conditions can be modeled just as readily as the
processes forming natural rolls.
REFERENCES
Adler, H. H., and Sharp, B. J., 1967, Uranium ore rolls-occurrence, genesis,
and physical and chemical characteristics: Utah Geological Society
Guidebook No. 21, Uranium District of Southeast Utah, 53-77.
Bear, Jacob, 1972, Dynamics of fluids in porous media: New York, American
Elsevier, 764 p.
Carslaw, H. S., and Jaeger, J. C., 1959, Conduction of heat in solids:
Oxford, Oxford University Press, 510 p.
Evseeva, L. S., Ivanov, K. E., and Kochetkov, V. I., 1963, Some laws of the
formation of epigenetic uranium ores in sandstone derived from expimental
and radiochemical data: Atomnaya Energiya, v. 14, no. 5, p. 474-482
[translation New York Consultants Bur., p. 492-498],
Fried, J. J., and Combarmous, M. A., 1971 S Dispersion in porous media, in Van
Te Chow, ed., Advances in hydroscience: New York, Academic Press, v. 7,
p. 170-182.
Germanov, A. N., 1960, Main genetic features of some infiltration-type
hydrothermal uranium deposits: Akademiya Nauk SSSR Izvestiya, Seriya
Geologicheskaya. no. 8, p. 60-72 [English translation].
Granger, H. C., 1976, Fluid flow and ionic diffusion and their roles in the
genesis of sandstone-type uranium ore bodies: U.S. Geological Survey
Open-File Report 76-454, 26 p., 11 figs.
29

Granger, H. C., and Warren, C. G., 1979, Some speculations on the genetic
geochemistry and hydrology of roll-type uranium deposits: Wyoming
Geological Association Guidebook, Thirtieth Annual Field Conference,
1978, p. 349-361.
Harshman, E. N., 1962, Alteration as a guide to uranium ore, Shirley Basin,
Wyoming, jjfshort papers in geology, hydrology, and topography: U.S.
Geological Survey Professional Paper 450-D, p. D8-D10.
Kashirtseva, M. F., 1964, Mineral and geochemical zonation of infiltration
uranium ores: Soviet Geology, no. 10, p. 51-65. [English translation].
Kholodov, V. N., Lisitsyn, A. K., Komarova, G. V., and Kondrat'yeva, I. A.,
1961, Epigene zoning of uranium mineralization in petroliferous carbonate
rocks: Akademiya Nauk SSSR Izvestiya Seriya Geologicheskaya no. 11, p.
43-56.
King, J. W., and Austin, R., 1965, Some characteristics of roll-type uranium
deposits at Gas Hills, Wyoming: Distributed by U.S. Atomic Energy
Commission, Grand Junction, Colo., 40 p.; abridged publication in Mining
Engineering 1966, 18, no. 5, p. 73-80.
Lisitsyn, A. K., and Kuznetsova, E. C., 1967, Role of microorganisms in
development of geochemical reduction barriers where limonitization bedded\
zones wedge-out: Akademiya Nauk SSSR Izvestiya Seriya Geologicheskaya
no. 1, p. 31-44. [English translation, International Geology Review v.
9, no. 9, p. 1180-1191, 1967]
Rouse, Hunter, 1961, Fluid mechanics for hydraulic engineers: New York, Dover
Publications, Inc., 422 p.
Shawe, D. R., and Granger, H. C., 1965, Uranium ore rolls an analysis:
Economic Geology, v. 60, no. 2, p. 420-450.
30

Warren, C. G., and Granger, H. C., 1973, The concept of growth and maturity of
ore-stage pyrite in roll-type uranium deposits: U.S. Geological Survey
Journal of Research, v. 2, no. 2, p. 151-155.
Warren, C. G., 1971, A method of discriminating between biogenic and chemical
origins of the ore-stage pyrite in a roll-type uranium deposit. Economic
Geology, no: 6, p. 919-128.
31