westmoreland uranium project national instrument 43-101 ...
276
-
Upload
khangminh22 -
Category
Documents
-
view
0 -
download
0
Transcript of westmoreland uranium project national instrument 43-101 ...


WESTMORELAND URANIUM PROJECT NATIONAL INSTRUMENT 43-101 TECHNICAL REPORT -
SCOPING STUDY 3182-STY-001
Table of Contents Page
3182\16.04\3182-STY-001_0
April 2016 Lycopodium Minerals Pty Ltd
1.0 SUMMARY 1.1 1.1 Introduction 1.1 1.2 Ownership 1.2 1.3 Geology and Mineralisation 1.3 1.4 Mining 1.6 1.5 Recovery Methods 1.9 1.6 Project Infrastructure 1.10
1.6.1 Water Supply 1.11 1.6.2 Power Supply 1.11 1.6.3 Access Roads, Accommodation Camp, Airstrip, Buildings,
and Sewage 1.12 1.6.4 Tailings Storage Facility 1.12
1.7 Operating and Capital Cost Estimates 1.12 1.8 Economic Analysis 1.14 1.9 Conclusions and Recommendations 1.15
2.0 INTRODUCTION 2.1 2.1 Laramide Resources Ltd 2.1 2.2 Background to the Report 2.1 2.3 Contributors to This Report 2.1 2.4 Principal Sources of Information 2.2 2.5 Site Visit 2.2 2.6 Qualifications and Experience 2.3
3.0 OTHER EXPERTS 3.1 3.1 Reliance on Other Experts 3.1
4.0 PROPERTY DESCRIPTION 4.1 4.1 Introduction 4.1 4.2 Property Details 4.1
4.2.1 Purchase Agreement 4.2 4.3 Royalties 4.3 4.4 Permits and Obligations 4.3
5.0 ACCESSIBILITY, CLIMATE, LOCAL RESOURCES, INFRASTRUCTURE AND PHYSIOGRAPHY 5.1 5.1 Description 5.1 5.2 Access 5.1 5.3 Climate 5.2 5.4 Local Resources 5.3 5.5 Infrastructure 5.4
6.0 HISTORY 6.1 6.1 Discovery and Ownership 6.1 6.2 Previous Resource and Reserve Estimates 6.3 6.3 Discussion 6.6
7.0 GEOLOGICAL SETTING AND MINERALISATION 7.1

WESTMORELAND URANIUM PROJECT NATIONAL INSTRUMENT 43-101 TECHNICAL REPORT -
SCOPING STUDY 3182-STY-001
Table of Contents Page
3182\16.04\3182-STY-001_0
April 2016 Lycopodium Minerals Pty Ltd
7.1 Regional Geology 7.1 7.2 Local Geology 7.8 7.3 Prospect Geology 7.13
7.3.1 Redtree 7.14 7.3.2 Huarabagoo 7.15 7.3.3 Junnagunna 7.16 7.3.4 Long Pocket 7.17
7.4 Oxidation and Weathering 7.18 7.5 Mineralization 7.19
7.5.1 Westmoreland–Pandanus Creek Uranium Field 7.19 7.5.2 Westmoreland Mineralisation 7.22 7.5.3 Alteration 7.31
8.0 DEPOSIT TYPES 8.1 8.1 Deposit Types 8.1
9.0 EXPLORATION 9.1 9.1 Exploration Program Undertaken 9.1 9.2 Airborne Radiometrics and Magnetics Survey 9.1 9.3 Geochemical and Radiometric Surveys 9.1 9.4 Drilling 9.2
9.4.1 First Program 2007 to 2008 9.2 9.4.2 Second Program 2008 9.2 9.4.3 Third Program 2009 9.2 9.4.4 Fourth Program 9.3 9.4.5 Fifth Program 9.3
9.5 Petrological and SEM Analysis 9.4 9.6 Metallurgical Studies 9.5
10.0 DRILLING 10.1 10.1 Westmoreland Exploration 2007 to 2008 10.1 10.2 Westmoreland Results 2007 to 2008 Drilling 10.4
10.2.1 Lithology and Stratigraphy 10.4 10.2.2 Mineralisation and Alteration 10.5 10.2.3 Validation of Historical Drilling 10.8 10.2.4 Westmoreland Exploration 2009 to 2010 10.8 10.2.5 Westmoreland Results of 2009 Drilling 10.9 10.2.6 Westmoreland Results of 2010 Drilling 10.9 10.2.7 Westmoreland Results of 2012 Drilling 10.10
11.0 SAMPLING METHOD AND APPROACH 11.1 11.1 Downhole Gamma Logging 11.1
11.1.1 Geological Logging 11.1 11.1.2 Sampling for Chemical Analysis 11.4 11.1.3 Petrology 11.7 11.1.4 SEM Samples 11.7 11.1.5 Metallurgy 11.7 11.1.6 Discussion 11.7
11.2 Sample Preparation, Analyses and Security 11.8

WESTMORELAND URANIUM PROJECT NATIONAL INSTRUMENT 43-101 TECHNICAL REPORT -
SCOPING STUDY 3182-STY-001
Table of Contents Page
3182\16.04\3182-STY-001_0
April 2016 Lycopodium Minerals Pty Ltd
11.2.1 Sample Preparation before Dispatch 11.8 11.3 Security 11.10 11.4 Laboratory Sample Preparation and Analysis 11.10 11.5 QA and QC 11.12
11.5.1 Standards 11.12 11.5.2 Blanks 11.14 11.5.3 Duplicates 11.16
11.6 Discussion 11.18
12.0 DATA VERIFICATION 12.1 12.1 Quality Control 12.1 12.2 Independent Samples 12.1 12.3 Site Visit July 2015 12.2
12.3.1 Summary of Site Visit Findings 12.4 12.4 Limits 12.4
13.0 METALLURGICAL TESTING 13.1 13.1 Introduction 13.1 13.2 Previous Metallurgical Testwork 13.1
13.2.1 Comminution 13.1 13.2.2 Heap Leaching 13.1 13.2.3 Agitated Leach Testwork 13.2 13.2.4 Solid Liquid Separation 13.2 13.2.5 U3O8 Recovery 13.2 13.2.6 Product Preparation 13.3
13.3 ANSTO 2011 Metallurgical Testwork Program 13.4 13.3.1 Samples Tested 13.5 13.3.2 Mineralogy 13.6 13.3.3 Scrubbing Tests 13.6 13.3.4 Size-by-Size Deportment 13.6 13.3.5 Grind Calibration 13.7 13.3.6 Dilute Acid Leach Tests 13.7 13.3.7 Conventional Leach Tests 13.7 13.3.8 Effect of Grind Size 13.9 13.3.9 Effect of pH 13.10 13.3.10 Effect of Pulp Temperature 13.11 13.3.11 Effect of Oxidation Potential 13.11 13.3.12 Effect of Oxidant Type 13.14 13.3.13 Leaching of Jack Lens Material 13.14 13.3.14 Leach Liquor Composition 13.15 13.3.15 Leach Residues 13.15 13.3.16 Bulk Leach Tests 13.16 13.3.17 Settling and Filtration Tests 13.17 13.3.18 Pulp Rheology 13.18 13.3.19 Uranium Recovery Tests 13.20 13.3.20 Ion Exchange Testwork 13.20 13.3.21 Uranyl Peroxide Precipitation 13.29 13.3.22 Solvent Extraction Testwork 13.30
13.4 Conclusions and Recommendations 13.31

WESTMORELAND URANIUM PROJECT NATIONAL INSTRUMENT 43-101 TECHNICAL REPORT -
SCOPING STUDY 3182-STY-001
Table of Contents Page
3182\16.04\3182-STY-001_0
April 2016 Lycopodium Minerals Pty Ltd
14.0 MINERAL RESOURCE ESTIMATE 14.1 14.1 Mineral Resources 14.1 14.2 Discussion 14.2
15.0 MINERAL RESERVE ESTIMATE 15.1 15.1 Introduction 15.1
16.0 MINING 16.1 16.1 Mining Model 16.1 16.2 Methodology 16.6 16.3 Tailings Cells 16.7 16.4 Mine Buildings and Structures 16.8
16.4.1 Workshop 16.8 16.4.2 Ablutions 16.8 16.4.3 Change Room Facilities 16.8 16.4.4 Wash Down Bays 16.8
16.5 Mining Costs 16.8 16.5.1 Trucking Requirements Calculation 16.9 16.5.2 Equipment Schedule 16.11 16.5.3 Equipment CAPEX Schedule 16.12 16.5.4 Mining Operating Cost Summary 16.15
16.6 Production Schedule 16.16
17.0 RECOVERY METHODS 17.1 17.1 Process Design 17.1
17.1.1 Selected Process Flowsheet 17.1 17.2 Process and Plant Description 17.3
17.2.1 Ore Recovery and Crushing 17.4 17.2.2 Crushed Ore Bin 17.5 17.2.3 Grinding and Classification 17.5 17.2.4 Pebble Crushing 17.6 17.2.5 Pre-Leach Thickening 17.6 17.2.6 Leach Circuit 17.6 17.2.7 Leach Residue Filtration 17.7 17.2.8 Continuous Ion Exchange 17.7 17.2.9 Impurity Removal 17.8 17.2.10 Crude UOC Production, Washing and Drying 17.9 17.2.11 UOC Packaging 17.9 17.2.12 Sulphuric Acid Production 17.9 17.2.13 Reagents Mixing and Storage 17.11 17.2.14 Water Services 17.12 17.2.15 Air Services 17.14
18.0 PROJECT INFRASTRUCTURE 18.1 18.1 Introduction 18.1 18.2 Project Water Supply 18.1 18.3 Project Electric Power Supply 18.4
18.3.1 Diesel Generation 18.4 18.3.2 Extension of High Voltage Line from Century Zinc 18.5

WESTMORELAND URANIUM PROJECT NATIONAL INSTRUMENT 43-101 TECHNICAL REPORT -
SCOPING STUDY 3182-STY-001
Table of Contents Page
3182\16.04\3182-STY-001_0
April 2016 Lycopodium Minerals Pty Ltd
18.3.3 Gas-fired Generation 18.5 18.4 Project Access Roads 18.6 18.5 Accommodation Camp and Airport 18.6 18.6 Administration, Mining and Process Buildings, Sewage
Treatment 18.7 18.7 Tailings Management 18.7
19.0 MARKETING STUDIES AND CONTRACTS 19.1 19.1 Introduction 19.1 19.2 Demand 19.1 19.3 Supply 19.2 19.4 Pricing 19.4
20.0 ENVIRONMENTAL STUDIES, PERMITTING AND SOCIAL OR COMMUNITY IMPACT 20.1 20.1 Environmental Considerations 20.1 20.2 Social and Community Considerations 20.2
21.0 CAPITAL AND OPERATING COSTS 21.1 21.1 Capital Cost Estimate 21.1
21.1.1 Summary 21.1 21.1.2 Estimating Currency and Base Date 21.1 21.1.3 Mining Capital Costs 21.2 21.1.4 Infrastructure Capital Costs 21.2 21.1.5 Quantity Development 21.3 21.1.6 Pricing Basis 21.3 21.1.7 Temporary Construction Facilities 21.4 21.1.8 Heavy Lift Cranage 21.4 21.1.9 Mobilisation / Demobilisation 21.4 21.1.10 Earthworks 21.4 21.1.11 Concrete 21.4 21.1.12 Steelwork 21.5 21.1.13 Platework / Tankage 21.5 21.1.14 Mechanical Equipment 21.5 21.1.15 Plant Pipework 21.5 21.1.16 Overland Conveyor 21.6 21.1.17 Electrical and Instrumentation 21.6 21.1.18 Erection and Installation 21.6 21.1.19 Architectural / Buildings 21.6 21.1.20 Freight 21.6 21.1.21 Management (EPCM) 21.6 21.1.22 Vendor Commissioning 21.6 21.1.23 Contingency 21.6
21.2 Infrastructure Capital Costs 21.7 21.3 Owner’s Costs 21.7
21.3.1 Spares 21.7 21.3.2 First Fill Consumables and Opening Stocks 21.8
21.4 Exclusions and Qualifications 21.8 21.5 Operating Costs 21.9

WESTMORELAND URANIUM PROJECT NATIONAL INSTRUMENT 43-101 TECHNICAL REPORT -
SCOPING STUDY 3182-STY-001
Table of Contents Page
3182\16.04\3182-STY-001_0
April 2016 Lycopodium Minerals Pty Ltd
21.5.1 Mining Costs 21.9 21.5.2 Plant and Administration Costs 21.9 21.5.3 Power 21.10 21.5.4 Operating Consumables 21.10 21.5.5 Labour (Processing / Maintenance and Administration) 21.11 21.5.6 General and Administration (Excluding G&A Labour) 21.12 21.5.7 Maintenance 21.12 21.5.8 Transport of UOC from Site to the Convertor 21.13 21.5.9 Exclusions 21.14
22.0 ECONOMIC ANALYSIS 22.1 22.1 Introduction 22.1
22.1.1 Principal Assumptions 22.1 22.1.2 Uranium Sale Price 22.1 22.1.3 Product Sales 22.1 22.1.4 Exchange Rates 22.1 22.1.5 Taxes 22.1 22.1.6 Goods and Services Tax 22.2 22.1.7 Royalties 22.2 22.1.8 Other Royalties 22.2 22.1.9 Revenue Deductions 22.2 22.1.10 Reclamation 22.2 22.1.11 Project Financing 22.2
22.2 Financial Model 22.2 22.3 Model Inputs 22.3
22.3.1 Production summaries 22.3 22.3.2 Capital Cost Summary 22.3 22.3.3 Operating Cost Summary 22.3 22.3.4 Economic Results 22.3
23.0 ADJACENT PROPERTIES 23.1 23.1 Introduction 23.1
24.0 OTHER RELEVANT DATA 24.1 24.1 Developing Northern Australia Initiative 24.1 24.2 Nuclear Fuel Cycle Royal Commission South Australia 24.1 24.3 Queensland State Government Policy on Uranium Mining 24.2
25.0 CONCLUSIONS 25.1 25.1 Geology and Resource Estimate 25.1 25.2 Mining Methods 25.1 25.3 Metallurgical Testwork 25.2 25.4 Process Plant 25.2 25.5 Infrastructure 25.2 25.6 Risks and Opportunities 25.3 25.7 Capital and Operating Costs 25.3 25.8 Financial Analysis 25.3
26.0 RECOMMENDATIONS 26.1

WESTMORELAND URANIUM PROJECT NATIONAL INSTRUMENT 43-101 TECHNICAL REPORT -
SCOPING STUDY 3182-STY-001
Table of Contents Page
3182\16.04\3182-STY-001_0
April 2016 Lycopodium Minerals Pty Ltd
26.1 Geological 26.1 26.2 Mining 26.1 26.3 Metallurgical Testing 26.1 26.4 Process Plant 26.1 26.5 Project Infrastructure 26.2
26.5.1 Project Water Supply 26.2 26.5.2 Project Electric Power Supply 26.2 26.5.3 Tailings Storage Facility 26.2
26.6 Project Development 26.3
27.0 REFERENCES 27.1
28.0 CERTIFICATES OF QUALIFIED PERSONS 28.1 TABLES Table 1.1.1 Westmoreland Mineral Resource Estimates - Indicated Category 2016 1.2 Table 1.1.2 Westmoreland Mineral Resource Estimates - Inferred Category 2016 1.2 Table 1.2.1 Laramide Tenements in Queensland as of October 2015 1.3 Table 1.7.1 Mining Cost Options 1.13 Table 1.7.2 Westmoreland Process Plant Operating Cost Summary 1.14 Table 1.7.3 Capital Estimate Summary (3Q15, ±35%) 1.14 Table 1.8.1 Principal Economic Analysis Assumptions 1.15 Table 1.8.2 Results of Economic Analysis 1.15 Table 2.3.1 Work Split between Contributors for Report Preparation 2.1 Table 2.6.1 Persons Who Prepared this Technical Report 2.3 Table 2.6.2 Persons Who Contributed to this Technical Report 2.3 Table 4.2.1 Laramide Tenements in Queensland as of April 2016 4.1 Table 5.5.1 Population Centres (from 2011 Census) 5.5 Table 6.2.1 Westmoreland Resources Identified by CRA 31 Aug 1995 (Anon,
1995) 6.5 Table 6.2.2 Resource Estimates (above 0.02% U3O8) from 2006 6.5 Table 6.2.3 Westmoreland Mineral Resource Estimates – Indicated Category, May
2009 6.6 Table 6.2.4 Westmoreland Mineral Resource Estimates – Inferred Category, May
2009 6.6 Table 10.1.1 Total Drilling at Redtree to 2008 10.1 Table 10.2.1 Summary of 2009 Drilling Results 10.9 Table 10.2.2 Summary of 2010 Drilling Results 10.10 Table 10.2.3 Summary of Reported 2012 Drilling 10.12 Table 10.2.4 Summary of 2012 Drilling Gold Assays 10.13 Table 11.4.1 Analytical Method 11.11 Table 11.5.1 Summary of LAM’s Certified Standards 11.13 Table 13.2.1 Comminution Test Results 13.1 Table 13.2.2 Heap Leach Test Results 13.2 Table 13.2.3 Agitated Leach Test Results – Blend Low and Hight Grade Oxides 13.3 Table 13.3.1 Testwork Sample Details 13.5 Table 13.3.2 Size-by-Size Uranium Distribution 13.6 Table 13.3.3 ANSTO Dilute Leach Test Results 13.7 Table 13.3.4 ANSTO Conventional Leach Test Results 13.8

WESTMORELAND URANIUM PROJECT NATIONAL INSTRUMENT 43-101 TECHNICAL REPORT -
SCOPING STUDY 3182-STY-001
Table of Contents Page
3182\16.04\3182-STY-001_0
April 2016 Lycopodium Minerals Pty Ltd
Table 13.3.5 Range of Parameters 13.9 Table 13.3.6 ANSTO Grind Size Optimisation Leach Test Results 13.10 Table 13.3.7 ANSTO Acidity Optimisation Leach Test Results 13.10 Table 13.3.8 ANSTO Slurry Treatment Optimisation Leach Test Results 13.11 Table 13.3.9 ANSTO ORP Optimisation Leach Test Results 13.12 Table 13.3.10 ANSTO Oxidant Comparison Leach Test Results 13.14 Table 13.3.11 ANSTO Jack Lens Optimisation Leach Test Results 13.15 Table 13.3.12 ANSTO Bulk Sample Leach Test Results 13.16 Table 13.3.13 ANSTO / FLSmidth Settling Test Results 13.18 Table 13.3.14 IX Feed Liquor Compositions (mg/L/ppm) 13.20 Table 13.3.15 Loading Kinetic Parameters Ambersep 920 and Amberjet 4400 13.23 Table 13.3.16 Metal Ions Loading for Ambersep 920 and Amberjet 4400 13.24 Table 13.3.17 Elution Kinetic Parameters Ambersep 920 and Amberjet 4400 13.25 Table 13.3.18 Uranyl Peroxide Compositions (as % of U) 13.30 Table 14.1.1 Westmoreland Mineral Resource Estimates – Indicated Category
2016 14.1 Table 14.1.2 Westmoreland Mineral Resource Estimates – Inferred Category 2016 14.1 Table 16.1.1 Westmoreland Mineral Resources Cut-off 0.02% U3O8 16.1 Table 16.5.1 Equipment Cost Assumptions Owner Operator 16.8 Table 16.5.2 Haul Profiles for Mill Location West of Garee 16.9 Table 16.5.3 Mining Equipment Schedule 16.11 Table 16.5.4 Estimated Mobile Equipment Capital Expenditure 16.13 Table 16.5.5 Mining Cost Options 16.15 Table 16.6.1 Westmoreland Production Summary 16.16 Table 16.6.2 Westmoreland Production Schedule for Constant 2 Mtpa Mill Feed 16.19 Table 16.6.3 Westmoreland Production Schedule by Pit 16.21 Table 17.1.1 Summary of Key Process Design Criteria 17.2 Table 18.2.1 Borefield Water Supply Operations 18.3 Table 18.2.2 Water Supply Option Capital Estimates 18.4 Table 18.3.1 Capital Cost Estimates of Power Supply Options 18.5 Table 21.1.1 Capital Estimate Summary (3Q15, ±35%) 21.1 Table 21.1.2 Mining Capital Costs 21.2 Table 21.5.1 Westmoreland Mine Operating Cost Summary 21.9 Table 21.5.2 Westmoreland Process Plant Operating Cost Summary 21.9 Table 21.5.3 Westmoreland Process Plant Power Cost by Plant Area 21.10 Table 21.5.4 Westmoreland Process Plant Consumables Cost 21.11 Table 21.5.5 Westmoreland Processing Plant and Admin Manning Levels 21.11 Table 21.5.6 Westmoreland Plant General and Administration Summary 21.12 Table 21.5.7 Westmoreland Plant Annual Maintenance Materials Cost 21.13 Table 22.2.1 Key Economic Assumptions Used in the Financial Model 22.2 Table 22.3.1 Economic Analysis Results 22.3 FIGURES Figure 1.1.1 Project Location 1.1 Figure 1.3.1 Geological Setting of Northern Australia (Jones, 2008) 1.3 Figure 1.3.2 Geology of the Westmoreland Project 1.4 Figure 1.4.1 Westmoreland Deposits and Pit Shells 1.7 Figure 1.4.2 Total Tonnes Mined by Pitt 1.8 Figure 1.4.3 Ore Tonnes and Grade Milled by Year 1.8

WESTMORELAND URANIUM PROJECT NATIONAL INSTRUMENT 43-101 TECHNICAL REPORT -
SCOPING STUDY 3182-STY-001
Table of Contents Page
3182\16.04\3182-STY-001_0
April 2016 Lycopodium Minerals Pty Ltd
Figure 1.4.4 Uranium Production by Year 1.9 Figure 1.5.1 Simplified Overall Treatment Flowsheet 1.10 Figure 1.7.1 Mining Unit Costs – Owner Miner vs. Contractor 1.13 Figure 4.2.1 Uranium Deposits (Black Dots) within Laramide’s Tenements 4.2 Figure 5.1.1 Topography (Satellite Raster Image) 5.1 Figure 5.2.1 Local Access 5.2 Figure 5.3.1 Average Temperature and Rainfall at Burketown 5.3 Figure 5.4.1 Artesian Water Flow 5.4 Figure 6.2.1 CRA’s Westmoreland Uranium Deposits (Anom, 1995) 6.4 Figure 7.1.1 Geological Setting of Northern Australia (Jones, 2008) 7.1 Figure 7.1.2 McArthur Basin – Westmoreland Located North Flank of Murphy Inlier
(Rawlings, 1999) 7.3 Figure 7.1.3 Tawallah Group 7.4 Figure 7.1.4 Simplified Stratigraphy of the Southern McArthur Basin (Polito et al,
2006) 7.5 Figure 7.1.5 Tectonic Events and Sedimentation Features of North-Central
Australia (Scott et al, 2000) 7.6 Figure 7.1.6 North Flank of Murphy Inlier (Jackson et al, 2000) 7.7 Figure 7.2.1 Geology of the Westmoreland Project 7.8 Figure 7.2.2 Long Section of North Flank of Murphy Inlier Corresponding to
Westmoreland Tenements 7.9 Figure 7.2.3 Legend for Westmoreland Map and Section 7.9 Figure 7.2.4 Redtree Deposit in Unit Ptw4 7.10 Figure 7.2.5 Radiometrics Over Magnetics 7.11 Figure 7.2.6 Westmoreland Conglomerate Dip Slope, Looking West 7.12 Figure 7.2.7 Westmoreland Conglomerate 7.13 Figure 7.3.1 Prospect Areas and Geology 7.14 Figure 7.3.2 Redtree – Four Lens of Mineralisation 7.15 Figure 7.3.3 Huarabagoo Cross Section 11110N 7.16 Figure 7.3.4 Junnagunna Deposit 7.17 Figure 7.3.5 Long Pocket Cross Section A-A 7.18 Figure 7.5.1 Geological Setting of the Westmoreland-Pandanus Creek Uranium
Field 7.20 Figure 7.5.2 Uranium Systems of the Westmoreland Region: Schematic Geolical
Cross-Section 7.22 Figure 7.5.3 Paragenesis in the Westmoreland Uranium Field 7.23 Figure 7.5.4 Uranium Mineralisation Styles at Westmoreland 7.24 Figure 7.5.5 Redtree, Huarabagoo, and Junnagunna Uranium Deposits 7.25 Figure 7.5.6 High Grade Mineralisation in WDD07-2 at 59.1m 7.26 Figure 7.5.7 Redtree Cross-Section 7600N 7.27 Figure 7.5.8 Fan of Drill Holes at Redtree 7.28 Figure 7.5.9 Junnagunna Cross-Section 14450N 7.29 Figure 7.5.10 Fan of Drill Holes at Junnagunna – Mineralisation East of Dyke 7.30 Figure 8.1.1 Basin-related Uranium Mineral Systems for a Hypothetical Basin,
During Extension or SAG Phase 8.2 Figure 8.1.2 Roll Front Uranium Deposit Model 8.2 Figure 8.1.3 Organic Matter (Reductant) Introduced from Underlying Hybrocarbons 8.3 Figure 9.4.1 Huarabagoo Cross Section 9.3 Figure 9.4.2 Cross Section within Structural Corridor 9.4

WESTMORELAND URANIUM PROJECT NATIONAL INSTRUMENT 43-101 TECHNICAL REPORT -
SCOPING STUDY 3182-STY-001
Table of Contents Page
3182\16.04\3182-STY-001_0
April 2016 Lycopodium Minerals Pty Ltd
Figure 10.1.1 Redtree – 2008 Drill Plan (AGD66/AMG54) 10.2 Figure 10.1.2 Junnagunna – 2008 Drill Location Plan (AGD66/AMG54) 10.3 Figure 10.1.3 Looking NE Along Redtree Dyke from Garee Lens 10.4 Figure 10.2.1 Fan of Drill Holes in Garee Lens, Redtree Prospect 10.5 Figure 10.2.2 Fan of Drill Holes at Redtree 10.6 Figure 10.2.3 Fan of Drill Holes at Junnagunna – Mineralisation East of Dyke 10.7 Figure 11.1.1 Orienting Core Prior to Logging (Jones, 2008) 11.2 Figure 11.1.2 Orienting Core (Jones, 2008) 11.3 Figure 11.1.3 Photographing of Core Trays (Jones, 2008) 11.3 Figure 11.1.4 Gamma Log Results (Jones, 2008) 11.4 Figure 11.1.5 Drill Holes Marked-up for Sawing and Sampling (Jones, 2008) 11.5 Figure 11.1.6 Breaking Core into 10 cm Sections to Fit in Saw Cradle (Jones, 2008) 11.6 Figure 11.1.7 Cutting Core Using a Diamond Saw (Jones, 2008) 11.6 Figure 11.2.1 Ten Sawn-Core Samples Packed into Each Yellow Poly Sack (Jones,
2008) 11.9 Figure 11.2.2 Metal Box (with Shelves) for Transport of Samples (Jones, 2008) 11.10 Figure 11.5.1 Results for Standard 101a 11.13 Figure 11.5.2 Results for Standard 101b 11.14 Figure 11.5.3 Assay Results of Blanks 11.15 Figure 11.5.4 Low Level Contamination in Blanks 11.16 Figure 11.5.5 Comparison of Half Core Duplicate Assays 11.16 Figure 11.5.6 Comparison of Coarse Split Duplicates 11.17 Figure 11.5.7 Comparison of Inter-Laboratory Repeats 11.18 Figure 12.3.1 Westmoreland Deposits, South Pit in Foreground 12.2 Figure 12.3.2 Westmoreland Conglomerate 12.3 Figure 12.3.3 High Grade Mineralisation in WDD07-2 at 59.1 m 12.3 Figure 13.3.1 ANSTO Base Case Conventional Leach Test Kinetics 13.9 Figure 13.3.2 ANSTO Ferric Iron Concentrations Junnagunna Composite 13.13 Figure 13.3.3 ANSTO Ferric Iron Concentrations Garee Redtree Composite 13.13 Figure 13.3.4 ANSTO Comparison of Oxidants Leach Kinetics 13.14 Figure 13.3.5 ANSTO Comparison of Bulk Leach Kinetics and Individual Sample
Leach Kinetics 13.17 Figure 13.3.6 Thickened Pulp Shear Rate vs Shear Stress – Bulk Sample 13.19 Figure 13.3.7 Thickened Pulp Yield Stress vs Slurry Solids Density – Bulk Sample 13.20 Figure 13.3.8 Uranium Resin Loading – RIP Resin Ambersep 920 13.21 Figure 13.3.9 Uranium Resin Loading – IX Resin Amberjet 4400 13.22 Figure 13.3.10 Uranium Resin Loading – RIP Resin Ambersep 920 and IX Amberjet
4400 13.22 Figure 13.3.11 Uranium Resin Breakthrough Curves 13.23 Figure 13.3.12 Uranium Elution Isotherm – RIP Resin Ambersep 920 13.24 Figure 13.3.13 Uranium Elution Isotherm – IX Resin Amberjet 4400 13.25 Figure 13.3.14 Uranium Elution Rate – RIP Resin Amberset 920 13.26 Figure 13.3.15 Uranium Elution Rate – IX Resin Amberjet 4400 13.27 Figure 13.3.16 Uranium and Impurity Elution – RIP Resin Amberset 920 13.27 Figure 13.3.17 Uranium and Impurity Elution – IX Resin Amberjet 4400 13.28 Figure 13.3.18 Bulk Eluate Concentrations – RIP Resin Ambersep 920 and IX Resin
Amberjet 4400 13.28 Figure 16.1.1 North Pit - Junnagunna 16.2 Figure 16.1.2 Westmoreland Deposits and Pit Shells 16.3

WESTMORELAND URANIUM PROJECT NATIONAL INSTRUMENT 43-101 TECHNICAL REPORT -
SCOPING STUDY 3182-STY-001
Table of Contents Page
3182\16.04\3182-STY-001_0
April 2016 Lycopodium Minerals Pty Ltd
Figure 16.1.3 South Pit - Garee 16.4 Figure 16.1.4 Central Pit 16.5 Figure 16.1.5 Westmoreland Deposits – South Pit in Foreground 16.6 Figure 16.3.1 Proposed Tailings Emplacement Cells Garee 16.7 Figure 16.5.1 Haulage Profile 16.10 Figure 16.5.2 Mining Unit Costs Owner Miner vs. Contractor 16.15 Figure 16.6.1 Material Mined 16.16 Figure 16.6.2 Pit Sequence 16.17 Figure 16.6.3 Ore Milled 16.17 Figure 16.6.4 Metal Produced 16.18 Figure 16.6.5 Mined Ore and Waste 16.20 Figure 16.6.6 Total Mined Tonnes by Pit 16.20 Figure 17.1.1 Schematic Overall Process Flow Diagram 17.3 Figure 18.2.1 Calculated In-Pit Rainfall Run-off 18.2 Figure 18.2.2 Hydrogeological Setting and Groundwater Supply Targets 18.3 Figure 18.4.1 Site Access Road Route 18.6 Figure 19.3.1 Uranium Supply and Demand – WNA Reference Scenario 19.2 Figure 19.3.2 Historical Role of Inventories 19.3 Figure 19.3.3 Uranium Mine Production Cost Curve 2010 19.4 Figure 19.4.1 Rise in Required Uranium Purchase by Global Utilities 19.5 Figure 22.3.1 Annual and Cumulative After Tax Cash Flow 22.4 Figure 22.3.2 NPV Sensitivity Analysis 22.5 Figure 23.1.1 LAM’s NT Tenements 23.1 Figure 23.1.2 LAM Holds a 50% Interest in EL 23573 23.2

WESTMORELAND URANIUM PROJECT NATIONAL INSTRUMENT 43-101 TECHNICAL REPORT - SCOPING STUDY
3182\16.04\3182-STY-001_0
Page i
April 2016 Lycopodium Minerals Pty Ltd
DISCLAIMER
This report has been prepared for Laramide Resources Ltd (LAM) by Lycopodium Minerals Pty Ltd (Lycopodium) as an independent consultant and is based in part on information furnished by LAM and in part on information not within the control of either LAM or Lycopodium. While it is believed that the information, conclusions and recommendations will be reliable under the conditions and subject to the limitations set forward herein, Lycopodium does not guarantee their accuracy. The use of this report and the information contained herein shall be at the user’s sole risk, regardless of any fault or negligence of Lycopodium.

WESTMORELAND URANIUM PROJECT
NATIONAL INSTRUMENT 43-101 TECHNICAL REPORT
3182-STY-001
Table of Contents Page
1.0 SUMMARY 1.1 1.1 Introduction 1.1 1.2 Ownership 1.2 1.3 Geology and Mineralisation 1.3 1.4 Mining 1.6 1.5 Recovery Methods 1.9 1.6 Project Infrastructure 1.10
1.6.1 Water Supply 1.11 1.6.2 Power Supply 1.11 1.6.3 Access Roads, Accommodation Camp, Airstrip, Buildings,
and Sewage 1.12 1.6.4 Tailings Storage Facility 1.12
1.7 Operating and Capital Cost Estimates 1.12 1.8 Economic Analysis 1.14 1.9 Conclusions and Recommendations 1.15
TABLES Table 1.1.1 Westmoreland Mineral Resource Estimates - Indicated Category 2016 1.2 Table 1.1.2 Westmoreland Mineral Resource Estimates - Inferred Category 2016 1.2 Table 1.2.1 Laramide Tenements in Queensland as of October 2015 1.3 Table 1.7.1 Mining Cost Options 1.13 Table 1.7.2 Westmoreland Process Plant Operating Cost Summary 1.14 Table 1.7.3 Capital Estimate Summary (3Q15, ±35%) 1.14 Table 1.8.1 Principal Economic Analysis Assumptions 1.15 Table 1.8.2 Results of Economic Analysis 1.15 FIGURES Figure 1.1.1 Project Location 1.1 Figure 1.3.1 Geological Setting of Northern Australia (Jones, 2008) 1.3 Figure 1.3.2 Geology of the Westmoreland Project 1.4 Figure 1.4.1 Westmoreland Deposits and Pit Shells 1.7 Figure 1.4.2 Total Tonnes Mined by Pitt 1.8 Figure 1.4.3 Ore Tonnes and Grade Milled by Year 1.8 Figure 1.4.4 Uranium Production by Year 1.9 Figure 1.5.1 Simplified Overall Treatment Flowsheet 1.10 Figure 1.7.1 Mining Unit Costs – Owner Miner vs. Contractor 1.13
3182\16.04\3182-STY-001_0 S1 April 2016 Lycopodium Minerals Pty Ltd
WESTMORELAND URANIUM PROJECT NATIONAL INSTRUMENT 43-101 TECHNICAL REPORT
3182\16.04\3182-STY-001_0 S1
Page 1.1
April 2016 Lycopodium Minerals Pty Ltd
1.0 SUMMARY
1.1 Introduction
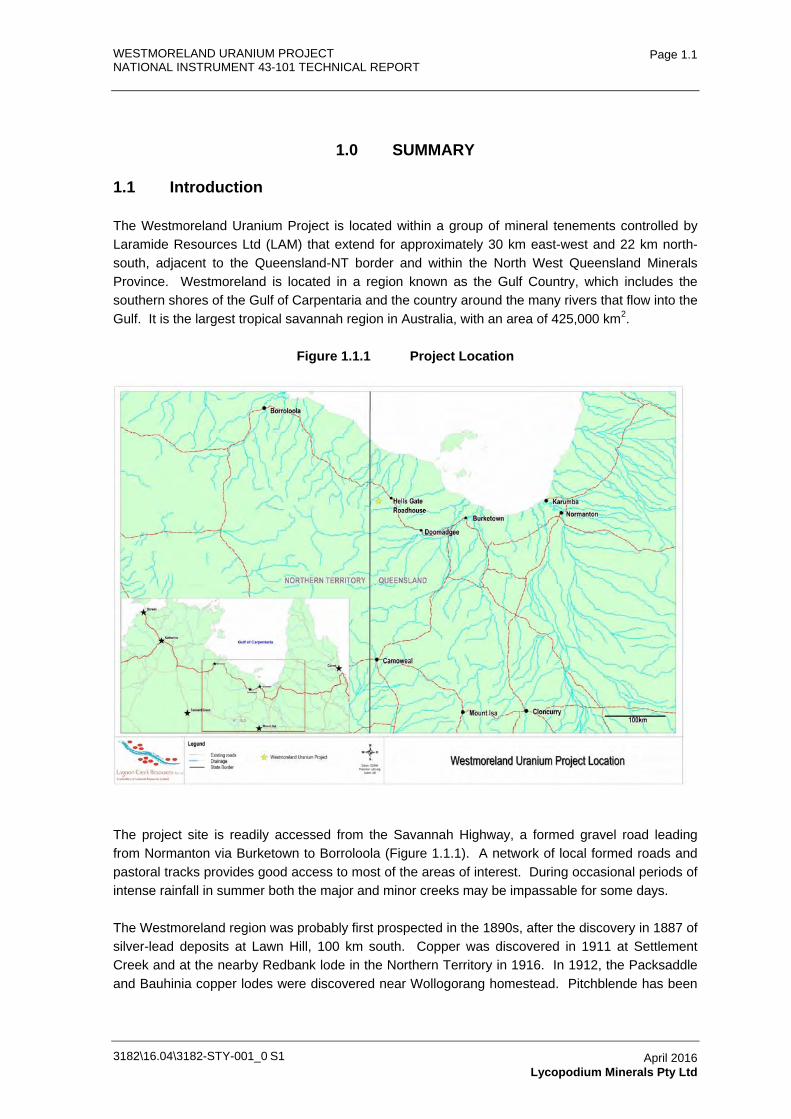
The Westmoreland Uranium Project is located within a group of mineral tenements controlled by Laramide Resources Ltd (LAM) that extend for approximately 30 km east-west and 22 km north-south, adjacent to the Queensland-NT border and within the North West Queensland Minerals Province. Westmoreland is located in a region known as the Gulf Country, which includes the southern shores of the Gulf of Carpentaria and the country around the many rivers that flow into the Gulf. It is the largest tropical savannah region in Australia, with an area of 425,000 km2.
Figure 1.1.1 Project Location
The project site is readily accessed from the Savannah Highway, a formed gravel road leading from Normanton via Burketown to Borroloola (Figure 1.1.1). A network of local formed roads and pastoral tracks provides good access to most of the areas of interest. During occasional periods of intense rainfall in summer both the major and minor creeks may be impassable for some days.
The Westmoreland region was probably first prospected in the 1890s, after the discovery in 1887 of silver-lead deposits at Lawn Hill, 100 km south. Copper was discovered in 1911 at Settlement Creek and at the nearby Redbank lode in the Northern Territory in 1916. In 1912, the Packsaddle and Bauhinia copper lodes were discovered near Wollogorang homestead. Pitchblende has been

WESTMORELAND URANIUM PROJECT NATIONAL INSTRUMENT 43-101 TECHNICAL REPORT
3182\16.04\3182-STY-001_0 S1
Page 1.2
April 2016 Lycopodium Minerals Pty Ltd
mined in the Peters Creek Volcanics, which overlie the Westmoreland Conglomerate, 20 to 30 km west of Redtree.
The mineral resource estimate has been classified under the Canadian Institute of Mining, Metallurgy and Petroleum’s (CIM) code of ore classification and has now been restated to comply with the JORC Code 2012 (refer to notes and other details in Section 14).
Table 1.1.1 Westmoreland Mineral Resource Estimates - Indicated Category 2016
Resource Category Deposit Resource Tonnes Grade % (U3O8) M lbs U3O8
Indicated cut-off 0.02% U3O8
Redtree (Garee) 12,858,750 0.09 25.5 Huarabagoo 1,462,000 0.08 2.7 Junnagunna 4,364,750 0.08 7.8
Subtotal 18,685,500 0.09 36.0 Note: reported tonnage and grade figures have been rounded off from raw estimates to the appropriate number of significant figures to reflect the order of accuracy of the estimate. Minor variations may occur
during the addition of rounded numbers.
Table 1.1.2 Westmoreland Mineral Resource Estimates - Inferred Category 2016
Resource Category Deposit Resource Tonnes Grade % (U3O8) M lbs U3O8
Inferred cut-off 0.02% U3O8
Redtree (Garee) 4,466,750 0.07 6.6 Huarabagoo 2,406,000 0.11 5.8 Junnagunna 2,149,500 0.08 3.6
Subtotal 9,022,250 0.08 15.9 Note: reported tonnage and grade figures have been rounded off from raw estimates to the appropriate number of significant figures to reflect the order of accuracy of the estimate. Minor variations may occur
during the addition of rounded numbers.
1.2 Ownership
LAM, operating as Lagoon Creek Resources Pty Ltd in Australia; owns 100% of the Westmoreland Uranium Project through its acquisition of a private Australian company, Tackle Resources Pty Ltd (TRPL).
A Schedule of Tenements has been provided by LAM. The ownership and status of the tenements has not been independently verified, apart from a search of the Queensland Interactive Resource and Tenement Map (IRTM) on-line database. The result of this search is shown in Table 1.2.1 below.

WESTMORELAND URANIUM PROJECT NATIONAL INSTRUMENT 43-101 TECHNICAL REPORT
3182\16.04\3182-STY-001_0 S1
Page 1.3
April 2016 Lycopodium Minerals Pty Ltd
Table 1.2.1 Laramide Tenements in Queensland as of October 2015
Original Applicant
Tenement No.
Area Sub-Blocks
Area Sq km
Laramide Interest Grant Date Expiry Date
Lagoon Creek Resources Pty Ltd EPM 14967 18 59 100% 31 Jul 2007 30 Jul 2017
Tackle Resources Pty Ltd
EPM 14558 100 328 100% 26 Jul 2005 25 Jul 2020 EPM 14672 50 163 100% 26 Jul 2005 25 Jul 2020
Total Area 168 550 - - -
LAM’s Westmoreland EPMs are contiguous. The group is centred about 380 km NNW of Mt Isa, a major city in northwest Queensland. The Redtree group of uranium deposits are almost all located within EPM 14558.
1.3 Geology and Mineralisation
LAM’s Westmoreland tenements are situated on the south-eastern margin of the southern McArthur River Basin, and contain sandstone hosted uranium deposits.
Figure 1.3.1 Geological Setting of Northern Australia (Jones, 2008)

WESTMORELAND URANIUM PROJECT NATIONAL INSTRUMENT 43-101 TECHNICAL REPORT
3182\16.04\3182-STY-001_0 S1
Page 1.4
April 2016 Lycopodium Minerals Pty Ltd
The Westmoreland tenements (uranium deposits - Redtree, Junnagunna and Huarabagoo) are centred about the outcropping Westmoreland Conglomerate of the Tawallah Group where the southern McArthur basin on laps the Cliffdale Volcanics of the Murphy Inlier. The Redtree deposit is located in the south west of EPM14558. The tenements cover the majority of the Westmoreland–Pandanus Creek uranium field.
Figure 1.3.2 Geology of the Westmoreland Project

WESTMORELAND URANIUM PROJECT NATIONAL INSTRUMENT 43-101 TECHNICAL REPORT
3182\16.04\3182-STY-001_0 S1
Page 1.5
April 2016 Lycopodium Minerals Pty Ltd
The Westmoreland uranium deposits are hosted largely within the shallow dipping Westmoreland Conglomerate. The Westmoreland Conglomerate is up to 1,800 m thick and is divided into five fining-upward units. Each unit comprises proximal fluvial deposits typical of debris flows, alluvial fans, and braided river systems that are overlain by medium- to coarse-grained, well-sorted sandstone. Breaks in sedimentation are indicated by angular unconformities or disconformities, with each new cycle of pebble or boulder conglomerate commonly defining the beginning of a new unit. Cobbles and coarse sand grains within the basal conglomerate are dominated by reworked quartz veins, chert, and clasts of felsic to mafic volcanic rocks that were likely derived from the Murphy tectonic ridge or similar basement rocks that once existed to the north. This detrital material and lithic clasts is considered to be a likely source for the uranium.
The Redtree uranium deposit flanks the Redtree dyke zone immediately north of the northwest-trending Namalangi fault. The deposit comprises horizontal mineralisation in the Jack, Garee and Langi lenses, and vertical mineralisation in the Namalangi lens with grades ranging from 0.15% to >2% U3O8.
The horizontal mineralisation in the Jack and Langi lenses is located on the northwest side of the dyke zone of the Westmoreland Conglomerate. It forms a sheet of mineralisation 0 to 10 m below ground surface (less than 20 m below the projected basal contact of the now removed Seigal Volcanics) up to 15 m thick (increasing with proximity to the dyke zone) and up to 500 m wide. The Garee lens consists of a mix of horizontal and vertical mineralisation in the Westmoreland Conglomerate on the eastern side of the dyke zone. Mineralisation is 5 to 30 m below the surface, up to 50 m thick adjacent to the dyke and thins to the east (away from the dyke). Vertical mineralisation at the Namalangi lens occurs over a strike length of more than 700 m within the dyke zone, particularly within the sandstone wedge between the two dykes.
The Huarabagoo deposit is about 3 km NE of Redtree along the Redtree dyke zone and straddles the contact of the Seigal Volcanics with the Westmoreland Conglomerate. The mineralisation outcrops at the southern end and is concealed to the north under 2 to 3 m of sandy alluvium and 5 to 8 m of weathered basalt of the Seigal Volcanics. The deposit comprises a 3 km zone of vertical mineralisation associated with a complex dyke geometry with vertical and horizontal branches between the two principal dykes.
The Junnagunna uranium deposit occurs at a fault intersection west of the Redtree dyke zone and south of the northwest trending Cliffdale fault. Mineralisation lies 0.5 to 10 m thick immediately beneath the Seigal-Westmoreland contact. The deposit is obscured by 3 to 10 m of alluvial sand, and 5 to 20 m of weathered and fresh basalt of the Seigal Volcanics.
Uranium mineralisation occurs on the northern side of the Cliffdale fault and the eastern side of the Redtree dolerite dyke zone. The Longpocket deposits (Outcamp, Sue and Black Hills) are situated 8 km east of the Junnagunna deposit and the Moogooma mineralisation is 5 km southwest of Redtree along the Redtree dyke. These additional deposits are all within Laramide’s EPM 14558.
The uranium mineralisation assemblage identified at the Westmoreland deposits is characterised by the later phase uraninite, hematite, illite, and minor rutile. Uraninite and hematite occur as matrix filling cement between detrital quartz grains. Uraninite also occurs as micron sized grains within the hematite (Polito, 2005). The hematite dominates the mineralised areas and results in a

WESTMORELAND URANIUM PROJECT NATIONAL INSTRUMENT 43-101 TECHNICAL REPORT
3182\16.04\3182-STY-001_0 S1
Page 1.6
April 2016 Lycopodium Minerals Pty Ltd
red-brown colour in hand specimens. Some uraninite fills fractures in pyrite. Pyrite appears to be contemporaneous with some uraninite but also brecciated pyrite is cemented by uraninite.
Secondary uranium minerals found at Redtree and Junnagunna include torbernite, met-torbernite, carnotite, coffinite, autinite, bassetite, and ningyoite.
1.4 Mining
The production schedule is planned at 2 Mtpa of mill feed, with constant annual material movement, and an aim to balance ore and waste and mining fleet within total material movement of 8 Mtpa, increasing after the 6th year of mining. Mining is undertaken over 12 years (including first year pre-strip) supplying 13 years of mill feed with a total ore production of 26.25 Mt at an average grade of 0.084%. Whittle Four-X software (“Whittle”) was used to define optimal pits for the three Westmoreland uranium deposits (Junnagunna, Huarabagoo and Redtree (Garee Lense) based on the mineral resource model.
Five pit shells in three areas were defined, as shown in Figure 1.4.1:
• North – Junnagunna – 1 shell.
• Central – Huarabagoo – 1 shell.
• South – Redtree - 3 shells.
The mining methodology is based on conventional methods and is summarised below:
• Pit mining using Excavator / FEL operation loading off-highway haul trucks.
• Conventional Drill & Blast (D&B) with Truck & Shovel (T&S) operation mining 5m benches with 2.5 m flitches.
• Sufficient working areas to allow for simultaneous D&B and T&S operation. Flexibility in the scheduling required.
• Likely Truck & Shovel combination to be Hitachi 1900 loading Hitachi EH1100 Haultrucks (63 t) on Waste, Hitachi 1200 loading EH110 Haultrucks on Ore supported by Cat 992 FEL loading EH110 Haultrucks on Waste and Ore.
The mining methodology is based on the following material movement schedule:
• A total of 131 Mt TMM (Total Material Moved) will be moved over 12 years of mining, with 104.8 Mt of waste and 26.3 Mt of ore being produced.
• Mining Schedule produces an average of 2.2 Mtpa Ore and 8.7 Mtpa of Waste.
• Mill feed: 2 Mtpa achieved in the second year onwards for the full mine life. The mill throughput reduces to approximately 0.227 Mtpa in the 15th and final year of production.

WESTMORELAND URANIUM PROJECT NATIONAL INSTRUMENT 43-101 TECHNICAL REPORT
3182\16.04\3182-STY-001_0 S1
Page 1.7
April 2016 Lycopodium Minerals Pty Ltd
• Mining commences in Garree Start-up Pit 5 to establish an initial tailings emplacement area before moving to Garee Pit 4.
• The first seven years (pre-strip and six years of operation) focus on production from Garee (Pit 4) and Junnagunna (Pit 1), with mining production coming from Garee and up to 300,000 tpa of clay brought from Junnagunna to Garee Tailings dams for tailing containment and sealing operations.
• In Year 8, production is focused solely on Pit 3 Junnagunna before being split between Junnagunna (Pit 3) and Huarabagoo (Pit 1) from Year 9 to the end of mining operations in Year 12 (see pit by pit production schedule in Table 16.6.3).
• It is proposed to initially construct a tailings emplacement in Pit 5 (Garee Start Up).after removal of ore and waste to a depth of 15 m. Pit 5 will have approximately 520,000 m3 tailings capacity after lining the Pit 5 void with 90,000 tonnes of clay from Junnagunna to a depth of 1 m thick.
Figure 1.4.1 Westmoreland Deposits and Pit Shells
South Pit Garee
North Pit Junnagunna
Central Pit

WESTMORELAND URANIUM PROJECT NATIONAL INSTRUMENT 43-101 TECHNICAL REPORT
3182\16.04\3182-STY-001_0 S1
Page 1.8
April 2016 Lycopodium Minerals Pty Ltd
The initial mining equipment capital expenditure is AUD28.2M, comprised of AUD22.2M for mining equipment and AUD6M for Auxiliary Equipment including contingency. As the equipment reaches the end of its useful life it is replaced with a further AUD58.4M being required over the life of the project.
The annual production statistics by pit are presented graphically in Figures 1.4.2 to 1.4.4 below.
Figure 1.4.2 Total Tonnes Mined by Pitt
Figure 1.4.3 Ore Tonnes and Grade Milled by Year

WESTMORELAND URANIUM PROJECT NATIONAL INSTRUMENT 43-101 TECHNICAL REPORT
3182\16.04\3182-STY-001_0 S1
Page 1.9
April 2016 Lycopodium Minerals Pty Ltd
Figure 1.4.4 Uranium Production by Year
1.5 Recovery Methods
The process treatment flowsheet selected as the basis of the scoping study involves ore preparation (crushing and milling) sulphuric acid atmospheric pressure leaching, leach residue filtration with dry cake disposal to an in pit tailings storage facility, continuous ion exchange recovery of uranium from the filtrate, impurities removal and hydrogen peroxide precipitation of uranium oxide concentrate, drying, and packaging. A brief description of the process follows, further details can be found in Section 17. A simplified overall flowsheet is shown in Figure 1.5.1.
The overall process flowsheet includes a single stage jaw crusher and a SAC grinding circuit in closed circuit with cyclones to achieve the final product size. The cyclone overflow stream will flow by gravity to a linear trash screen and then a pre-leach thickener. Barren solution ex the continuous ion exchange circuit is recycled to the leach residue filters and then, via the filter washate, returns to the pre-leach thickener. Pre-leach thickener overflow, which is acidic, is used as dilution water in the milling circuit. The thickened slurry is pumped to the leach circuit where it is mixed with concentrated sulphuric acid for uranium leaching. Manganese dioxide (as high quality milled pyrolusite) is added to the leach circuit to control the redox potential. The uranium leach step is carried out at a temperature of 40°C, and this temperature is provided partly from the heat of dilution of sulphuric acid and partly by live steam addition to the leach tanks. The leach tailings stream is filtered and washed to recover the Pregnant Liquor before being conveyed as a wet cake to the tailings storage facility. Pregnant leach solution flows to a continuous ion exchange circuit where the uranium and minor amounts of some other elements (in particular iron, manganese, aluminium, calcium, potassium, magnesium and arsenic) are adsorbed onto the resin.
The uranium, together with the minor elements as impurities is eluted from the resin with concentrated sulphuric acid to produce a concentrated eluate solution containing approximately 9.6 g/l U. The impurities present in the eluate solution are then removed, firstly by partial acid neutralisation with sodium hydroxide to produce a precipitate containing uranium, iron, aluminium, and arsenic. This precipitate is recycled to the leach step to recover the uranium. The partially

WESTMORELAND URANIUM PROJECT NATIONAL INSTRUMENT 43-101 TECHNICAL REPORT
3182\16.04\3182-STY-001_0 S1
Page 1.10
April 2016 Lycopodium Minerals Pty Ltd
neutralised solution is then treated with sodium hydroxide and 30% hydrogen peroxide to precipitate crude uranium oxide concentrate, UOC, with associated impurity levels acceptable for sale to a convertor. The barren solution produced, containing the remaining impurities including sodium and sulphate is discharge to an evaporation dam for disposal.
The UOC is then washed to remove entrained mother liquor, dried and then packaged into clean thick wall 200 litre drums and prepared for shipment.
Figure 1.5.1 Simplified Overall Treatment Flowsheet
1.6 Project Infrastructure
Project infrastructure for the Westmoreland project includes water supply, electric power supply, tailings storage, access roads, sewage treatment, an accommodation village, and airport.

WESTMORELAND URANIUM PROJECT NATIONAL INSTRUMENT 43-101 TECHNICAL REPORT
3182\16.04\3182-STY-001_0 S1
Page 1.11
April 2016 Lycopodium Minerals Pty Ltd
Administration, process, and mine infrastructure buildings are discussed in Sections 16 and 17. It is proposed to construct a tailings storage facility by emplacement in Pit 5 (Garee Start Up, all Garee pits will be filled over the life of mine) after initial pit development. Refer to Section 18.7 for further details.
1.6.1 Water Supply
A project water balance indicates an average water demand for the mine and treatment facility of 200 m3/hr. A further 2 m3/hr of potable quality water will be required for the accommodation village. An assessment of water supply options was undertaken by Groundwater Science Pty Ltd, and they noted the following:
• Estimated in-pit rainfall run-off is significant and may exceed water demand in some months.
• Estimated groundwater seepage to the mine pits is negligible.
• Sufficient water supply from local borefields is likely to be available.
Calculated average annual run-off volume based on the total estimated pit area ranges from 450,000 m3
to 830,000 m3. Maximum values range from 4,200 m3/day (lower estimate) to 7,400 m3/day (upper estimate) in February.
In-pit run-off will be pumped from the pit for use in the process plant. The water will exhibit low salinity and high suspended solids. Run-off may exceed demand for two to four months (December through March) per year. This can be managed by:
• Storage dams at surface to contain excess water.
• Mine pit scheduling to provide a lower sump / bench that can be inundated for one to two months per year.
Two bore field options for water supply exist:
• From the Great Artesian Aquifer 45 km east of the project site.
• Near mine aquifers from Westmoreland conglomerate sandstone located 20 km east of the project site.
1.6.2 Power Supply
The project maximum continuous power draw has been estimated at 13.7 MW with an average continuous power draw of 9.7 MW. The alternatives considered for supply of this power were:
• Owner-operated diesel generation.
• Extension of the high voltage line that runs from Mount Isa to the Century zinc mine, an additional 150 km, and purchase of power from the gas fired generation at Mount Isa.
WESTMORELAND URANIUM PROJECT NATIONAL INSTRUMENT 43-101 TECHNICAL REPORT
3182\16.04\3182-STY-001_0 S1
Page 1.12
April 2016 Lycopodium Minerals Pty Ltd
• A build, own, and operate gas-fired generator based on shale gas deposits roughly within 100 km of the project site.
At the scoping study level of investigation the economic case favours the gas-fired alternative with a capital investment of AUD31M and an operating cost of AUD0.08 /kWh inclusive of power station maintenance and gas cost.
1.6.3 Access Roads, Accommodation Camp, Airstrip, Buildings, and Sewage
The scoping study includes AUD3.9M for the construction of 30 km of site access roads, AUD30.2M for the construction of a fit for purpose accommodation camp and associated airstrip. Administration, plant and mine buildings, laboratory and general services including potable water, effluent and waste collection and treatment have been included in the estimate.
1.6.4 Tailings Storage Facility
Recent reviews of tailings management practices have identified the disposal of tailings as a filtered (dry) material and elimination of the supernatant pond as being the Best Available Technology. This technology presents a significantly lower risk of failure compared to conventional tailings disposal, reduction in seepage potential and additionally leads to significant water savings for the project. Knight Piésold examined options for disposal of filtered tailings at the Westmoreland Project. Following discussions with Laramide Resources and their Mining Consultant (Mining Associates) it was determined that it will be feasible to dispose of the tailings as a dry stack with the stack being constructed within the Redtree Pit. This allows for backfilling the pit sequentially as the pit is being mined, eliminating the final void and reducing the disturbed footprint of operations at the site.
The life of mine landform has been developed by Mining Associates based on the mine design. This landform can be constructed in parallel with mining operation and provides sufficient capacity for storage of tailings and a portion of waste rock to be generated as part of mining operations of the Redtree Pit and other pits at the project. The landform will be constructed from the base up over the life of mine which will allow for progressive rehabilitation of the facility.
Estimated capital and operating costs for the proposed in-pit disposal system (including pit reshaping, tailings stacking, waste rock bund construction and waste rock running surface) were developed by Mining Associates.
1.7 Operating and Capital Cost Estimates
Mining Associates prepared a comparison of the mining unit rate (AUD /t) based on an Owner Miner or a Contract Miner. The estimated unit rate is calculated based on 100 t excavators loading ore and 200 t excavators removing waste into 60 t trucks. A comparison of the unit rate by year is shown in Figure 1.7.1 below.

WESTMORELAND URANIUM PROJECT NATIONAL INSTRUMENT 43-101 TECHNICAL REPORT
3182\16.04\3182-STY-001_0 S1
Page 1.13
April 2016 Lycopodium Minerals Pty Ltd
Figure 1.7.1 Mining Unit Costs – Owner Miner vs. Contractor
The average unit rate for the two options including the pre-strip year is summarised in Table 1.7.1.
Table 1.7.1 Mining Cost Options
Unit Rate
Owner Operator Contractor
Mining Cost AUD/t AUD3.16* AUD4.48 *Note - Owner Miner Costs exclude Ownership costs but Contractor Costs include Ownership.
The drop in the unit rate from Year 7 on reflects the increase in Production Tonnage.
The increase in unit rate in Year 12 is predominately caused by a drop of tonnage as the mining is wound down over a ten month period.
Operating cost for the process treatment plant and infrastructure has been estimated by Lycopodium and is summarised in Table 1.7.2.

WESTMORELAND URANIUM PROJECT NATIONAL INSTRUMENT 43-101 TECHNICAL REPORT
3182\16.04\3182-STY-001_0 S1
Page 1.14
April 2016 Lycopodium Minerals Pty Ltd
Table 1.7.2 Westmoreland Process Plant Operating Cost Summary
Cost Centre AUD/y AUD/t ore USD /lb U3O8
Processing Labour 14,077,413 7.04 2.36 Power 6,838,997 3.42 1.15 Consumables 39,091,621 19.55 6.55 Maintenance Materials 8,410,156 4.21 1.41 Laboratory 1,032,000 0.52 0.17 General & Administration 12,961,697 6.48 2.17 Total 82,411,884 41.22 13.81
The total capital cost for the project has been estimated as of 3Q15 at AUD450M including contingency. The distribution of capital by major project area is summarised in Table 1.7.3.
Table 1.7.3 Capital Estimate Summary (3Q15, ±35%)
Main Area AUD
0 Construction Indirects 29,010,457 1 Treatment Plant Costs 120,678,769 2 Reagents and Plant Services 52,654,739 3 Infrastructure 40,313,339 4 Mining (pre-strip and equipment) 59,902,000 5 Management 33,074,268 6 Owners Project Costs (excluding mining) 46,689,436
Subtotal 382,323,008 Contingency 69,578,808 Fees, Taxes & Duties 0 Escalation 0
Grand Total 451,901,816
1.8 Economic Analysis
A financial model for evaluating the Project was developed in-house by Laramide Resources Ltd. Lycopodium reviewed the model logic, consistency of input assumptions and integrity of the calculations. All costs are constant in 2015 Australian dollars with no provision for inflation escalation.
The annual cash flow projections were estimated over the Project’s production life based on production schedule, sales revenue, production costs, capital expenditures, and corporate costs (taxation, royalties, etc.). The financial indicators examined included after-tax cash flow (ATCF), net present value (NPV) at 10% discount rate, internal rate of return (IRR), and payback period.
Table 1.8.1 list the principal assumptions made in performing the economic analysis.

WESTMORELAND URANIUM PROJECT NATIONAL INSTRUMENT 43-101 TECHNICAL REPORT
3182\16.04\3182-STY-001_0 S1
Page 1.15
April 2016 Lycopodium Minerals Pty Ltd
Table 1.8.1 Principal Economic Analysis Assumptions
Item Detail
Mill ore throughput, tpa 2,000,000 Mine life, years 13 Mill head grade, % U3O8 As per mine schedule Uranium selling price, USD/lb 65 Exchange rate, AUD/USD 0.7 Taxes
Corporate Tax 30% Depreciation Over asset useful life GST Not Applicable
Royalties QLD State Government 5% IRC 1% (up to AUD10M indexed)
Salvage value Nil Inflation Not Included Discount rate 10%
The results of economic analysis are shown in Table 1.8.2.
Table 1.8.2 Results of Economic Analysis
AUD USD
Capital Cost 452M 316M Operating Cost / tonne 56.72 39.70 Operating Cost / lb 33.20 23.30 Pre-Tax NPV 854M 598M Pre-Tax IRR 45.4% - Post Tax NPV 571M 400M Post Tax IRR 35.8% -
The project has a 13 year mine life. The mining is completed in 12 years (including pre-strip) and stockpiled lower grade ore is processed for the final two years. Project payback period is approximately 2.5 years.
Sensitivity analysis shows that the Project’s economics are most sensitive to commodity pricing assumptions and foreign exchange rate assumptions.
1.9 Conclusions and Recommendations
The opportunity for establishing a uranium mine and process facility at LAM’s Westmoreland prospect has been investigated at the scoping study (± 35% accuracy) level. Sufficient exploration drilling and modelling has been conducted to establish an Indicated Category resource estimate of

WESTMORELAND URANIUM PROJECT NATIONAL INSTRUMENT 43-101 TECHNICAL REPORT
3182\16.04\3182-STY-001_0 S1
Page 1.16
April 2016 Lycopodium Minerals Pty Ltd
18,685,500 t at 0.09% U3O8, and an Inferred Category resource estimate of 9,022,250 t at 0.08% U3O8.
Limited metallurgical testwork and associated sampling has been performed to date, but sufficient for scoping study level treatment flowsheet selection, development of material and energy balances, equipment sizing, and capital and operating cost estimates at the ± 35% accuracy level.
Financial modelling based on the capital and operating cost estimates and market assessment of future uranium prices indicates that, at the scoping study level of accuracy, a project based on the Westmoreland prospect would have sound economics.
It is recommended that LAM consider preceding with the Westmoreland Project by progressing to the next project phase i.e. a Pre-Feasibility study (± 25 % accuracy level).

WESTMORELAND URANIUM PROJECT
NATIONAL INSTRUMENT 43-101 TECHNICAL REPORT
3182-STY-001
Table of Contents Page
2.0 INTRODUCTION 2.1 2.1 Laramide Resources Ltd 2.1 2.2 Background to the Report 2.1 2.3 Contributors to This Report 2.1 2.4 Principal Sources of Information 2.2 2.5 Site Visit 2.2 2.6 Qualifications and Experience 2.3
TABLES Table 2.3.1 Work Split between Contributors for Report Preparation 2.1 Table 2.6.1 Persons Who Prepared this Technical Report 2.3 Table 2.6.2 Persons Who Contributed to this Technical Report 2.3
3182\16.04\3182-STY-001_0 S2 April 2016 Lycopodium Minerals Pty Ltd

WESTMORELAND URANIUM PROJECT NATIONAL INSTRUMENT 43-101 TECHNICAL REPORT
3182\16.04\3182-STY-001_0 S2
Page 2.1
April 2016 Lycopodium Minerals Pty Ltd
2.0 INTRODUCTION
2.1 Laramide Resources Ltd
This report has been prepared for Laramide Resources Ltd, for their Westmoreland Uranium prospect. Laramide Resources Ltd (LAM) is a uranium development company listed on the Toronto Stock Exchange (TSX) and the Australian Stock Exchange (ASX).
2.2 Background to the Report
In May 2007, GRD Minproc completed a Preliminary Assessment Report for Laramide Resources Ltd on the development of the Westmoreland Uranium Prospect located in north western Queensland, Australia. The Preliminary Assessment Report was prepared in general conformance with the Canadian National Instrument 43-101 Standards of Disclosure for Mineral Projects.
In May 2015, following further exploration and metallurgical testwork, LAM retained Lycopodium Minerals Pty Ltd to undertake a formal Scoping Study as a further step in the development of the Westmoreland prospect, and to prepare a Technical Report conforming to the requirements of the Canadian National Instrument 43-101 Standards of Disclosure for Mineral Projects.
2.3 Contributors to This Report
Table 2.3.1 lists the scope of work split between the various contributors in the preparation of this report.
Table 2.3.1 Work Split between Contributors for Report Preparation
Section No. Section Name Author
0 Cover Lycopodium
1 Summary Lycopodium / LAM / Mining Assoc.
2 Introduction Lycopodium 3 Other Experts Lycopodium 4 Property Description Mining Associates 5 Accessibility Climate Mining Associates 6 History Mining Associates 7 Geological Setting and Mineralisation Mining Associates 8 Deposit Types Mining Associates 9 Exploration Mining Associates
10 Drilling Mining Associates 11 Sample Preparation Mining Associates 12 Data Verification Mining Associates 13 Metallurgical Testing Lycopodium 14 Mineral Resource Estimate Mining Associates 15 Mineral Reserve Estimate Mining Associates 16 Mining Mining Associates

WESTMORELAND URANIUM PROJECT NATIONAL INSTRUMENT 43-101 TECHNICAL REPORT
3182\16.04\3182-STY-001_0 S2
Page 2.2
April 2016 Lycopodium Minerals Pty Ltd
Section No. Section Name Author
17 Recovery Methods Lycopodium 18 Project Infrastructure Lycopodium / Knight Piesold 19 Marketing Studies and Contracts LAM 20 Environment LAM 21 CAPEX and OPEX Lycopodium 22 Economic Analysis LAM 23 Adjacent Properties Mining Associates
24 Other Relevant Data Lycopodium / LAM / Mining Associates
25 Conclusions Lycopodium / Mining Assoc.
26 Recommendations Lycopodium / LAM / Mining Associates
27 References Lycopodium 28 Signature Page Lycopodium – sign-off by QP’s
Consent Certificates Each Qualified Person
2.4 Principal Sources of Information
Information used in this report has been gathered from a variety of sources including:
• Information provided by qualified geologists employed by LAM regarding the geology, drilling, sampling and other exploration procedures and processes adopted by the Company.
• Metallurgical testwork undertaken by recognised testwork laboratories, notably the Australian Nuclear Science and Technology Organisation (ANSTO).
• Information from LAM personnel in relation to past history and previous studies on the Westmoreland Project.
A listing of the principal sources of information is included in Section 27 of this document.
2.5 Site Visit
A site visit to the Westmoreland Project site was conducted on Thursday 9 July 2015 and attended by:
• Dr. Geoff Duckworth – Study Manager Lycopodium Minerals.
• Andrew Vigar - Principal Mining Associates.
WESTMORELAND URANIUM PROJECT NATIONAL INSTRUMENT 43-101 TECHNICAL REPORT
3182\16.04\3182-STY-001_0 S2
Page 2.3
April 2016 Lycopodium Minerals Pty Ltd
2.6 Qualifications and Experience
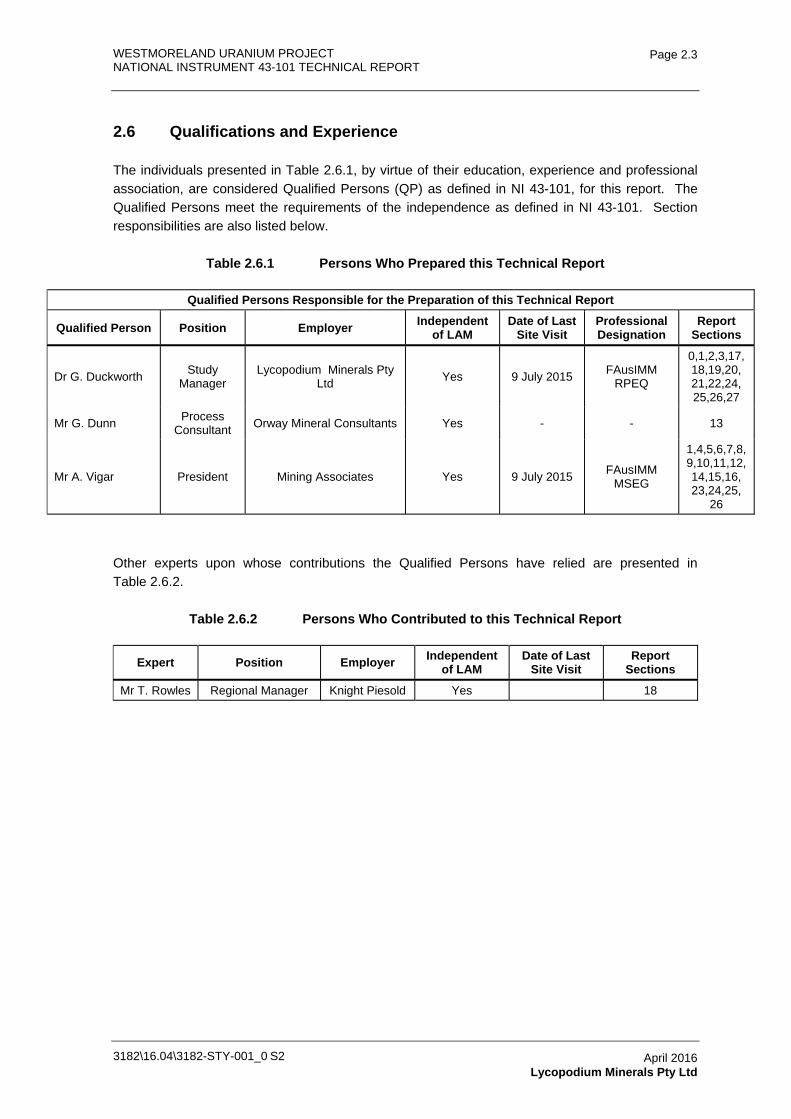
The individuals presented in Table 2.6.1, by virtue of their education, experience and professional association, are considered Qualified Persons (QP) as defined in NI 43-101, for this report. The Qualified Persons meet the requirements of the independence as defined in NI 43-101. Section responsibilities are also listed below.
Table 2.6.1 Persons Who Prepared this Technical Report
Qualified Persons Responsible for the Preparation of this Technical Report
Qualified Person Position Employer Independent of LAM
Date of Last Site Visit
Professional Designation
Report Sections
Dr G. Duckworth Study Manager
Lycopodium Minerals Pty Ltd Yes 9 July 2015 FAusIMM
RPEQ
0,1,2,3,17,18,19,20, 21,22,24, 25,26,27
Mr G. Dunn Process Consultant Orway Mineral Consultants Yes - - 13
Mr A. Vigar President Mining Associates Yes 9 July 2015 FAusIMM MSEG
1,4,5,6,7,8,9,10,11,12,14,15,16, 23,24,25,
26
Other experts upon whose contributions the Qualified Persons have relied are presented in Table 2.6.2.
Table 2.6.2 Persons Who Contributed to this Technical Report
Expert Position Employer Independent of LAM
Date of Last Site Visit
Report Sections
Mr T. Rowles Regional Manager Knight Piesold Yes 18

WESTMORELAND URANIUM PROJECT
NATIONAL INSTRUMENT 43-101 TECHNICAL REPORT
3182-STY-001
Table of Contents Page
3.0 OTHER EXPERTS 3.1 3.1 Reliance on Other Experts 3.1
3182\16.04\3182-STY-001_0 S3 April 2016 Lycopodium Minerals Pty Ltd

WESTMORELAND URANIUM PROJECT NATIONAL INSTRUMENT 43-101 TECHNICAL REPORT
3182\16.04\3182-STY-001_0 S3
Page 3.1
April 2016 Lycopodium Minerals Pty Ltd
3.0 OTHER EXPERTS
3.1 Reliance on Other Experts
The legality and currency of mining tenure is outside the expertise of the Project team. For Section 4 on property tenure, Lycopodium has relied entirely on the advice of Mining Associates and a previous tenement search result.
Lycopodium has relied upon the power supply options study performed by LAM for the relevant components Sections 18 and 21 of the NI 43-101 report.
Lycopodium has relied upon the water supply study performed by Ground Water Science Pty Ltd for LAM for the relevant components Sections 18 and 21 of the NI 43-101 report.
Lycopodium has relied upon the market studies from LAM for Section 19 of the NI 43-101 report.
Lycopodium has relied upon the product transportation study performed by C7 International for the relevant components of Section 21 of the NI 43-101 report.
Lycopodium has relied upon the environmental advice from LAM for Section 20 of the NI 43-101 report.
Lycopodium has relied upon the financial analysis from LAM for Section 22 of the NI 43-101 report. Lycopodium has reviewed the inputs and basis for the financial analysis.

WESTMORELAND URANIUM PROJECT
NATIONAL INSTRUMENT 43-101 TECHNICAL REPORT
3182-STY-001
Table of Contents Page
4.0 PROPERTY DESCRIPTION 4.1 4.1 Introduction 4.1 4.2 Property Details 4.1
4.2.1 Purchase Agreement 4.2 4.3 Royalties 4.3 4.4 Permits and Obligations 4.3
TABLES Table 4.2.1 Laramide Tenements in Queensland as of April 2016 4.1 FIGURES Figure 4.2.1 Uranium Deposits (Black Dots) within Laramide’s Tenements 4.2
3182\16.04\3182-STY-001_0 S4 April 2016 Mining Associates

WESTMORELAND URANIUM PROJECT NATIONAL INSTRUMENT 43-101 TECHNICAL REPORT
3182\16.04\3182-STY-001_0 S4
Page 4.1
April 2016 Mining Associates
4.0 PROPERTY DESCRIPTION
4.1 Introduction
Laramide Resources operates as Lagoon Creek Resources Pty Ltd in Australia; owns 100% of the Westmoreland Uranium Project through its acquisition of a private Australian company, Westmoreland Resources Pty Ltd (WRPL) and its wholly owned subsidiary Tackle Resources Pty Ltd (TRPL).
4.2 Property Details
A Schedule of Tenements has been provided by LAM. The ownership and status of the tenements has not been independently verified by Mining Associates, apart from a search of the Queensland MinesOnlineMaps database. The result of this search is shown in Table 4.2.1 below.
Table 4.2.1 Laramide Tenements in Queensland as of April 2016
Original Applicant Tenement No.
Area Sub-blocks
Area Sq. km
Laramide Interest Grant Date Expiry Date
Lagoon Creek Resources Pty Ltd EPM 14967 18 59 100% 31 July 2007 30 July 2017
Tackle Resources Pty Ltd EPM 14558 100 328 100% 26 July 2005 25 July 2020 EPM 14672 50 163 100% 26 July 2005 25 July 2020
Total Area 168 550
LAM’s Westmoreland EPMs and EPMAs are contiguous. The group is centred about 380 km NNW of Mt Isa, a major city in northwest Queensland. The Redtree group of uranium deposits are almost all located within EPMA 14558 (see Figure 4.2.1).

WESTMORELAND URANIUM PROJECT NATIONAL INSTRUMENT 43-101 TECHNICAL REPORT
3182\16.04\3182-STY-001_0 S4
Page 4.2
April 2016 Mining Associates
Figure 4.2.1 Uranium Deposits (Black Dots) within Laramide’s Tenements
There is a 600 m gap between the western edge of EPM 14672 and the Northern Territory border, as the Queensland Department of Natural Resources will only grant title up to the 138 parallel of longitude, while the Northern Territory border is 600 m west of this parallel.
4.2.1 Purchase Agreement
Tackle Resources Pty Ltd
On 28 April 2004, Laramide signed a binding letter of intent and paid Tackle Resources Pty Limited (Tackle) an initial AUD50,000 non-refundable payment. LAM was entitled to exercise its option and acquire 100% of Tackle by issuing up to 4.5 million shares of LAM, and agreeing to make a further payment of AUD100,000 on the anniversary date of the option exercise. LAM was not required to issue the shares for Tackle until such time as Tackle received formal granting of EPM 14558 – the permit covering the bulk of the Westmoreland deposits. The grant was issued by the Queensland government on 26 July 2005. Tackle had also applied for an adjacent exploration area which covers a number of smaller but prospective mineral occurrences. This EPM 14672 was also granted on 26 July 2005, and also formed part of the LAM acquisition.

WESTMORELAND URANIUM PROJECT NATIONAL INSTRUMENT 43-101 TECHNICAL REPORT
3182\16.04\3182-STY-001_0 S4
Page 4.3
April 2016 Mining Associates
On 16 August 2005 LAM announced that the acquisition of Tackle had been completed. A finder’s fee of 300,000 shares of LAM was paid to Ironbark Geoservices SRL for locating this project.
4.3 Royalties
In Australia, each state owns all petroleum and gold and most minerals. A royalty is payable to the state government when a mineral is sold, disposed of or used. In Queensland, the Mineral Resources Act 1989 requires that the holder of a mining lease or mining claim lodge a royalty return and any royalty payable at least annually for all leases and claims held, even if no production took place. Larger producers are required to pay royalties on a quarterly basis, while smaller producers generally pay royalties on an annual basis.
Note that the current Queensland Labor government has a policy not to approve uranium mining projects. However, during the previous LNP government of 2012 to 2015 a process preparing for the recommencement of uranium mining was undertaken. During this time, a Uranium Mining Implementation Committee was established to examine and recommend a best practice framework for the recommencement of uranium mining in Queensland. The committee recommended a royalty of 5% with a concessional rate of 2.5% for the first five years of any new mines. In the Mineral Resources Regulations 2013 - Schedule 3, S.13 includes a royalty rate of 5% if the average price per kilogram of uranium sold is AUD220 or less. Above AUD220 /kg the rate increases up to a maximum of 10%.
4.4 Permits and Obligations
In Australia all minerals belong to the Crown. Under the Australian Federal system the Commonwealth and State Governments are responsible for different aspects of the regulatory system. The Commonwealth Government is responsible for overall economic policy, tax, interest rates, foreign investment and corporate law, and for regulations regarding environmental and safety aspects of uranium mining and the sale of uranium product. The six States and the Northern Territory of Australia own and allocate mineral property rights for exploration and mining, regulate operations, and collect royalties on minerals produced.
The various regulatory authorities and other parties with responsibilities or interests in the area of the mining tenements are:
• Queensland Department of Natural Resources and Mines (DNRM).
• Queensland Department of Environment and Heritage Protection (EHP).
• Queensland Department of Transport.
• Burke Shire Council.
• Various Pastoral Lease holders.
• Native Title parties.

WESTMORELAND URANIUM PROJECT NATIONAL INSTRUMENT 43-101 TECHNICAL REPORT
3182\16.04\3182-STY-001_0 S4
Page 4.4
April 2016 Mining Associates
Before exploration can begin, a Queensland Exploration Permit for Minerals (EPM) must be granted. An EPM is a tenure granted for the purpose of exploration and if exploration is successful, may eventually lead to an application for a mineral development licence or mining lease. This type of permit may be granted for a period of up to five years (Queensland) and may be renewed. Registered native title parties have a right to be consulted about the proposed exploration permit, a right to object to the granting of the proposed exploration permit, and a right to negotiate with a view to reaching agreement about the granting of the proposed exploration permit.
In Queensland, “Mining Activity” is classified as an “Environmentally Relevant Activity” under the Environmental Protection Act 1994. An EPM will not be granted until an Environmental Authority (Exploration) has been issued by the EPA.
An EPM allows the holder to take action to determine the existence, quality and quantity of minerals on, in or under land by methods which include prospecting, geophysical surveys, drilling, and sampling and testing of materials to determine mineral bearing capacity or properties of mineralisation.
Once a significant mineral resource has been identified, a holder then has the option of undertaking further exploration under a mineral development licence. A mineral development licence allows the holder to undertake more thorough testing to evaluate the economic viability of developing the mineral resource.
A mining lease must be obtained before full-scale mining can take place. The term of the lease is determined in accordance with the amount of reserves identified and the projected mine life.
Under the Queensland Mining Act (Mineral Resources Act 1989), holders of EPM must comply with certain conditions to maintain tenure of their permits, the most important of which regarding the Laramide EPMs are as follows:
• Payment of an annual rental fee to the DNRM.
• Conduct of activities in accordance with EPA requirements.
• Compliance with all compensation agreements and making compensation payments as required
• Depositing security and financial assurance in the form of bank guarantees.

WESTMORELAND URANIUM PROJECT
NATIONAL INSTRUMENT 43-101 TECHNICAL REPORT
3182-STY-001
Table of Contents Page
5.0 ACCESSIBILITY, CLIMATE, LOCAL RESOURCES, INFRASTRUCTURE AND PHYSIOGRAPHY 5.1 5.1 Description 5.1 5.2 Access 5.1 5.3 Climate 5.2 5.4 Local Resources 5.3 5.5 Infrastructure 5.4
TABLES Table 5.5.1 Population Centres (from 2011 Census) 5.5 FIGURES Figure 5.1.1 Topography (Satellite Raster Image) 5.1 Figure 5.2.1 Local Access 5.2 Figure 5.3.1 Average Temperature and Rainfall at Burketown 5.3 Figure 5.4.1 Artesian Water Flow 5.4
3182\16.04\3182-STY-001_0 S5 April 2016 Mining Associates

WESTMORELAND URANIUM PROJECT NATIONAL INSTRUMENT 43-101 TECHNICAL REPORT
3182\16.04\3182-STY-001_0 S5
Page 5.1
April 2016 Mining Associates
5.0 ACCESSIBILITY, CLIMATE, LOCAL RESOURCES, INFRASTRUCTURE AND PHYSIOGRAPHY
5.1 Description
The tenements are situated in remote, sparsely populated, rugged hill country. Topography ranges from broad gentle valleys covered by open woodland dominated by grey box eucalypt trees, to steep rugged east-west trending ridges on the flanks of the valleys. The terrain ranges in elevation from 80 m to 360 m (Figure 5.1.1).
Figure 5.1.1 Topography (Satellite Raster Image)
5.2 Access
Westmoreland is located in a region known as the Gulf Country, which includes the southern shores of the Gulf of Carpentaria and the country around the many rivers that flow into the Gulf.

WESTMORELAND URANIUM PROJECT NATIONAL INSTRUMENT 43-101 TECHNICAL REPORT
3182\16.04\3182-STY-001_0 S5
Page 5.2
April 2016 Mining Associates
Figure 5.2.1 Local Access
Westmoreland is readily accessed from the Savannah Highway, a formed gravel road leading from Normanton via Burketown to Borroloola (Figure 5.2.1). A network of local formed roads and pastoral tracks provides good access to most of the areas of interest. During occasional periods of intense rainfall in summer, both the major and minor creeks may be impassable for some days. There is a small roadhouse and an airstrip suitable for medium twin-engine aircraft at Hell’s Gate, approximately 30 km ENE of Redtree. The roadhouse stocks fuel, and has basic accommodation facilities.
5.3 Climate
A number of the Gulf's climatic gradients appear to be aligned with the coast as well as having a north-south component. Average summer rainfall ranges between 400 mm in the south and up to 800 mm in the north, with moderate to high variability each year. Temperatures are hot with maximums around 36°C; however more frequent pleasant weather is recorded in the far north coastal sections and the extreme eastern areas in Queensland. Winter dry-season temperatures can drop, after warm, sunny days, to an average overnight low of 12°C.

WESTMORELAND URANIUM PROJECT NATIONAL INSTRUMENT 43-101 TECHNICAL REPORT
3182\16.04\3182-STY-001_0 S5
Page 5.3
April 2016 Mining Associates
Figure 5.3.1 shows climate data for Burketown, a small town (population 202) located 150 km east of the tenement block (see Figure 5.2.1). Weather observations have been recorded at Burketown since 1886. Westmoreland and Burketown are within the influence of the Gulf of Carpentaria, which modifies the temperatures somewhat from the extremes further inland. The bulk of the rainfall occurs during the summer monsoon from December through March. Average maximum precipitation in January, the wettest month, is 212 mm, although it can be as high as 1,000 mm.
Figure 5.3.1 Average Temperature and Rainfall at Burketown
Drawn by D. G. Jones from data provided by the Australian Bureau of Meteorology.
5.4 Local Resources
Lagoon Creek is the major local watercourse at Westmoreland. It is dry for half the year, but in the monsoon, the braided channels fill and overflow creating a floodway some 3 km wide and quite impassable. The nearest gauging station is on the Nicholson River at Doomadgee (see Figure 5.2.1 above). Mean discharge of the Nicholson River is 985,000 ML/day (data from National Land and Water Resources Audit, 2003) from its 72,000 km2
catchment area.
Although the creeks are dry during the winter, artesian water was observed flowing copiously from a bore near the Redtree uranium prospect (Figure 5.4.1). The most likely aquifer is the Westmoreland Conglomerate, and this may offer a ready source of water for any potential mineral processing plant in the area.

WESTMORELAND URANIUM PROJECT NATIONAL INSTRUMENT 43-101 TECHNICAL REPORT
3182\16.04\3182-STY-001_0 S5
Page 5.4
April 2016 Mining Associates
Figure 5.4.1 Artesian Water Flow
Photo taken by D. G. Jones adjacent to the Redtree Project, at UTM Zone 54K co-ordinates 0195711m N, 8066683m E.
5.5 Infrastructure
The largest city in the region, Mt Isa, has a population of 20,570 according to the 2011 Census. It is serviced by direct daily jet flights from Brisbane by Qantas, the Australian national air carrier. The main road and rail system in Queensland connects Mt Isa to Townsville, the largest city in Queensland outside of the capital. Mt Isa is a major mining industrial city. The population of other centres in the region are tabulated in Table 5.5.1.
The major land use in the region is pastoral, although most income is generated by mining with several large mines in the region, including the Mount Isa copper mine and the McArthur River and Century lead-zinc mines. The fishing industry is also a major employer in the region. Any skilled workforce for a mining development in the region would be expected to be drawn from Mt Isa.
The major towns in close proximity to the Westmoreland tenement block are tabulated below and shown on Figure 5.2.1 above. Facilities are as would be expected from small communities of the size indicated. There is a significant generation facility (total of 318 MW) at the Mica Creek Power station near Mt Isa and a further 302 MW gas turbine capacity at the newly constructed Diamantine Power Station project in Mount Isa. These stations supply the Mt Isa network, which covers

WESTMORELAND URANIUM PROJECT NATIONAL INSTRUMENT 43-101 TECHNICAL REPORT
3182\16.04\3182-STY-001_0 S5
Page 5.5
April 2016 Mining Associates
customers in Mount Isa, Cloncurry, and several mines in this area. Smaller towns generate their own power from diesel generators.
Table 5.5.1 Population Centres (from 2011 Census)
Town Population Distance (Radial km) Principal Activity
Mt Isa 20,570 400 Mining Cloncurry 2,313 440 Mining
Normanton 1,214 300 Fishing Karumba 586 275 Port / Fishing
Doomadgee 1,258 95 Indigenous Borroloola 926 250 Pastoral Burketown 202 145 Pastoral
There are two designated Gulf ports in the region, Burketown and Karumba. However, Burketown is a non-trading port and is not active.
The Port of Karumba is located at the mouth of the Norman River in the south-east corner of the Gulf of Carpentaria. It has strategic importance with relation to mining with the export of zinc from Century Mine, live animal exports, and provides a facility for the fishing and prawning fleets of the Gulf. Karumba Port also services several coastal communities for general freight, as well as being a major centre of export of live cattle to Asian countries.

WESTMORELAND URANIUM PROJECT
NATIONAL INSTRUMENT 43-101 TECHNICAL REPORT
3182-STY-001
Table of Contents Page
6.0 HISTORY 6.1 6.1 Discovery and Ownership 6.1 6.2 Previous Resource and Reserve Estimates 6.3 6.3 Discussion 6.6
TABLES Table 6.2.1 Westmoreland Resources Identified by CRA 31 Aug 1995 (Anon,
1995) 6.5 Table 6.2.2 Resource Estimates (above 0.02% U3O8) from 2006 6.5 Table 6.2.3 Westmoreland Mineral Resource Estimates – Indicated Category, May
2009 6.6 Table 6.2.4 Westmoreland Mineral Resource Estimates – Inferred Category, May
2009 6.6 FIGURES Figure 6.2.1 CRA’s Westmoreland Uranium Deposits (Anom, 1995) 6.4
3182\16.04\3182-STY-001_0 S6 April 2016 Mining Associates

WESTMORELAND URANIUM PROJECT NATIONAL INSTRUMENT 43-101 TECHNICAL REPORT
3182\16.04\3182-STY-001_0 S6
Page 6.1
April 2016 Mining Associates
6.0 HISTORY
6.1 Discovery and Ownership
The history of the project has previously been described in Vigar & Jones (2006).
The Westmoreland region was probably first prospected in the 1890’s, after the discovery in 1887 of silver-lead deposits at Lawn Hill, 100 km south. Copper was discovered in 1911 at Settlement Creek and at the nearby Redbank lode in the Northern Territory in 1916. In 1912 the Packsaddle and Bauhinia copper lodes were discovered near Wollogorang homestead. Pitchblende has been mined in the Peters Creek Volcanics, which overlie the Westmoreland Conglomerate, 20 to 30 km west of Redtree (Syvret, 1957).
Mount Isa Mines Limited (MIM) were granted Authority to Prospect (AP) 46M on 1 August 1956. The AP covered 1,800 sq miles (4,662 sq km) from Westmoreland station to Lawn Hill station, adjacent to the Queensland-Northern Territory border. The principal targets were copper and uranium. In early November 1956 the Bureau of Mineral Resources (BMR) commenced an airborne scintillometer survey of the Westmoreland area. Anomalies located by the BMR were notified to the MIM field team as soon as they came to hand, together with a comment as to their relative value. While following up one of these anomalies during the second week of November 1956, a “promising occurrence of torbernite was found in the Westmoreland Conglomerate, in the vicinity of Westmoreland”, by MIM prospector A Blackwell (Battey, 1956). The deposit was given the name Redtree.
During 1958 MIM drilled 277 m in 11 holes at Redtree using a wagon drill with a 6 cm bit. Target depth of the holes was 30 m, which was rarely attained. All the holes returned visible torbernite. The best assay was 12 m at 0.25% U3O8. Two core holes were drilled the following year, 1 to 37 m and 1 to 12 m depth. The core assays confirmed the wagon drill results.
Up to 12 mineralised horizons were reported by MIM in the secondary mineralisation, which averaged 7.3 m in thickness over an area 430 m long by 90 m wide. Grade ranged from 0.05% to 0.5%, averaging 0.15% U3O8 (Brooks, 1960).
Because of the low grade and the remote location of the deposit, MIM relinquished the AP but pegged three mining lease applications over Redtree and other known surface uranium mineralisation. The leases were granted in 1959 to a 50:50 MIM / Consolidated Zinc Pty Ltd joint venture. Consolidated Zinc later became CRA, which subsequently purchased a 100% interest in the leases.
Subsequent drilling (12,000 m of core), pitting and shaft sinking by Queensland Mines Ltd (QML) at the Redtree prospect during 1967 to 1969 indicated continuous primary uranium mineralisation between minimum depths of 15 m and maximum depths of 135 m extending for at least 4,800 m along a major joint system. The average width of mineralisation was stated to be 9.5 m. Assays varied between 0.05% and 1%, averaging 0.2% U3O8. The Queensland Geological Survey reports that: “At this stage, the total resource was estimated to contain 16,000 t of uranium oxide.” (Culpeper et al, 1999). The Huarabagoo deposit was discovered during this programme.

WESTMORELAND URANIUM PROJECT NATIONAL INSTRUMENT 43-101 TECHNICAL REPORT
3182\16.04\3182-STY-001_0 S6
Page 6.2
April 2016 Mining Associates
At the same time, BHP carried out an airborne radiometric survey of 1,224 line km cutting across the strike of the Westmoreland Conglomerate. Minor anomalies were recorded.
Following the discovery of the Nabarlek deposit in 1971, QML ceased exploration at Westmoreland to concentrate their efforts in the Alligator Rivers area of the NT. In 1975 QML formed a joint venture with Urangesellschaft Australia Pty Ltd (UAPL), Anglo Australian Resources NL and CRA Ltd. UAPL discovered the Junnagunna deposit in the period 1976 to 1983 when they were managing the joint venture. Omega Mines Ltd entered the joint venture in 1982 and completed a programme of drilling and re-assay of core for gold at Huarabagoo. Results confirmed some erratic high grades up to 86 g/t Au. In 1990 CRA took over management, and purchased 100% of the joint venture in 1996. Prior to this time, CRA had purchased a 100% interest in the old MIM mining leases at Redtree.
From 1960 to 1980, 14 EPMs were held and explored within the boundary of the present EPM 14558, generating 60 open file reports. Apart from the work discussed above, this exploration included:
• BHP (1967 to 1973) - airborne radiometrics followed up by percussion drilling (6,900 m) and diamond drilling (2,400 m) in 146 holes. Best intersection was 2 m at 0.92% U3O8 at the Amphitheatre prospect.
• US Steel International (1968 to 1970) - stream sampling for base metals around the Gulf of Carpentaria, as part of a manganese-uranium search.
• Westmoreland Minerals Limited (1970) - field inspection of base metal anomalies in Hedley’s Creek.
• Esso Mineral Enterprises Australia Ltd (1971 to 1972) - three vertical holes (664 m total) to maximum depth of 275 m in alluvial plain of Westmoreland without reaching the Seigal Volcanics / Westmoreland Conglomerate contact, considered to be the prospective horizon.
• Mt Arthur Molybdenum NL (1973 to 1979) - reconnaissance radiometrics, including 170 km of track etch lines, plus 3,000 m of auger drilling in 2,565 holes.
• Savage Exploration Pty Ltd (1975 to 1981) - soil geochemistry, airborne radiometrics, track etch, and diamond drilling 50 holes (2,500 m).
• Mines Administration Pty Ltd (1977 to 1979) - stream sediment geochemistry and ground radiometrics for uranium, tin and tungsten.
The surge in gold exploration from 1980 to 1990 was reflected in the increased tempo of exploration in the Westmoreland area. Ten EPMs were granted in the area now covered by EPM 14558; 35 open file reports record the work done through this decade. Some of the more significant exploration, apart from that already described above, was as follows:
• Minatome Australia Pty Ltd (1980 to 1982) - ground geophysics, costeans and nine percussion drill holes into dolerite dykes targeted to 200 m depth.

WESTMORELAND URANIUM PROJECT NATIONAL INSTRUMENT 43-101 TECHNICAL REPORT
3182\16.04\3182-STY-001_0 S6
Page 6.3
April 2016 Mining Associates
• Total Mining Australia Pty Ltd (1983 to 1984) - ground geophysics (including Track Etch) for uranium in the Westmoreland area.
• Central Electricity Generating Board Exploration (Australia) Pty Ltd (1983 - 1989) - BLEG sampling for gold and soil gas sampling for radon; RAB and percussion drilling (2,610 m).
• International Mining Corporation NL (1984 to 1985) - stream sediment sampling for gold, diamonds, uranium, and base metals.
• CSR Ltd (1987) - BLEG and rock chip sampling for epithermal gold in the Cliffdale Volcanics.
• Golden Plateau NL (1988 to 1989) - BLEG and rock chip sampling for gold.
• Uranerz Australia Pty Ltd (1982 to 1989) - BLEG sampling for gold; ground geophysics; RAB drilling (16 holes, 601 m); one percussion hole (44 m); one core hole (169 m).
Since 1990, the pace of exploration has declined, and between 1990 and 2005 there were only seven EPMs turned over in the area now covered by EPM 14558. Only 15 open file reports have been lodged with the GSQ detailing the exploration completed during this era, all by CRA describing the work outlined above.
By 1990 CRA Ltd held a dominant interest in tenements in the region. An internal reorganisation saw CRA absorbed into the Rio Tinto group. Rio Tinto relinquished its tenements in 2000 and subsequently Tackle Resources Pty Ltd filed applications over the areas previously held by Rio Tinto.
6.2 Previous Resource and Reserve Estimates
Numerous mineral resource studies have been carried out at Redtree by previous operators over a 25 year period from 1969 to 1994. These estimates have been discussed in Vigar & Jones (2006).
The earliest recorded estimate was carried out by Queensland Mines Limited (QML) in 1969 on the Jack Lens at Redtree. A model using the polygonal method was employed, based on data from 123 drill holes and 36.8 m of shaft sinking and driving within the lens. Assuming 10% dilution, QML reported that the Jack Lens contained 1.38 Mt at 0.115% U3O8, not including material within the adjacent MIM leases. At that time the adjacent Redtree deposit was estimated by MIM to contain 3.95 Mt at 0.2% U3O8. These estimates pre-date the CIM / JORC Codes and are not compliant in any respect.
When CRA Ltd (CRA) took over management of the Westmoreland tenements in 1990, the company commenced a complete review of the project (Figure 6.2.1). All previous exploration data was recorded and validated before entry into a Microsoft Access database. All drill-hole collars were re-surveyed and reported in Australian Map Grid (AMG) coordinates. Angled drill holes were surveyed down hole for dip and magnetic azimuth. It was assumed that vertical holes remained vertical throughout (this assumption has not been verified). A digital terrain model of the topography was compiled from aerial photographs. This work continued from 1990 through 1993.

WESTMORELAND URANIUM PROJECT NATIONAL INSTRUMENT 43-101 TECHNICAL REPORT
3182\16.04\3182-STY-001_0 S6
Page 6.4
April 2016 Mining Associates
By 1993, 1249 drill holes had been coded into the database. CRA’s 1993 models of the mineralisation at Redtree and Junnagunna were based on a single layer extending from the flat-lying mineralisation in the west, through the vertical mineralisation at the dyke, to the dipping, lensoidal mineralisation in the east. These models greatly over-estimated the volumes of material between the horizontal and vertical zones, and did not exclude the barren dyke material.
The 1994 models were more tightly constrained, with blocks modelled independently on either side of the dyke, as well as within the barren dyke itself (thus allowing its removal from the resource calculation), and as a series of discrete veins. Both the 1993 and 1994 estimates used the SG determinations of UAPL undertaken in 1982 which gave an average SG of 2.5. In 1995, CRA tested a further 276 samples, which gave an average SG of 2.52 at Junnagunna and 2.6 at Huarabagoo.
Figure 6.2.1 CRA’s Westmoreland Uranium Deposits (Anom, 1995)
For the 1994 and 1995 estimations, geological cross-sections were drawn and drilling data interpreted to define the extent of mineralisation and controlling features. The mineralisation was then enveloped using a cut-off grade of 0.03% U3O8 and a minimum width of 1 m. These envelopes were then modelled using Z-grid techniques. Variography was undertaken to test the variability of the mineralisation within the domains making up each deposit. Where the variograms were difficult to interpret, kriging parameters were identified by comparison with geologically similar mineralisation in other domains. Grade was interpolated using kriging, and was checked with inverse distance squared weightings, using the same scan distance parameters.
In 1995 Minenco were commissioned by CRA to update their earlier pre-feasibility study using a lower cut-off grade of 0.05% (Table 6.2.1).

WESTMORELAND URANIUM PROJECT NATIONAL INSTRUMENT 43-101 TECHNICAL REPORT
3182\16.04\3182-STY-001_0 S6
Page 6.5
April 2016 Mining Associates
Table 6.2.1 Westmoreland Resources Identified by CRA 31 Aug 1995 (Anon, 1995)
Deposit Indicated Inferred Total
tonnes % U3O8 t U3O8 tonnes % U3O8 t U3O8 tonnes % U3O8 t U3O8
Redtree 8,878,000 0.119 10,558 1,291,000 0.175 2,258 10,169,000 0.126 12,818 Junnagunna 5,080,000 0.096 4,867 353,000 0.130 457 5,433,000 0.098 5,324 Huarabagoo 1,254,000 0.153 1,918 540,000 0.206 1,113 1,794,000 0.169 3,031
Total 15,212,000 0.114 17,343 2,183,000 0.175 3,828 17,396,000 0.122 21,173
The 1995 resource estimates do not comply with the JORC / CIM Codes, as they have not been signed off by a “competent person”.
In 2006, a set of three dimensional (3D) geological interpretations were made by Mining Associates (Vigar & Jones, 2006) using a cut-off grade of 0.02% and a minimum width of one metre. The project was subdivided into three sub-areas of similar mineralisation directions and drilling directions for geological interpretation and resource estimation. Within these, domains of similar geological style were represented by one or more geological wirefames to constrain the final resource block model. The resources estimates were classified by Mining Associates above an economic cut-off grade of 0.02% U3O8, considered reasonable for such a shallow and flat lying deposit.
Table 6.2.2 Resource Estimates (above 0.02% U3O8) from 2006
Category Deposit Tonnes U3O8 Uncut U3O8 Cut U3O8 (kt) U3O8
(M lbs)
Inferred Redtree 10,928,500 0.094% 0.093% 10.2 22.4 Huarabagoo 2,925,250 0.122% 0.108% 3.2 7.0 Junnagunna 2,149,500 0.077% 0.075% 1.6 3.6
Total Inferred 16,003,250 0.097% 0.094% 14.9 32.9 Indicated Redtree 3,672,250 0.096% 0.096% 3.5 7.8
Huarabagoo 0 - - 0.0 0.0 Junnagunna 4,364,750 0.082% 0.081% 3.5 7.8
Total Indicated 8,037,000 0.088% 0.088% 7.1 15.6
In 2009, a further resource update was undertaken by Mining Associates (Vigar & Jones, May 2009) which included the 2007 and 2008 drilling results.
The May 2009 mineral resource estimate was classified under the Canadian Institute of Mining, Metallurgy and Petroleum’s (CIM) code of ore classification and is outlined in the following tables.

WESTMORELAND URANIUM PROJECT NATIONAL INSTRUMENT 43-101 TECHNICAL REPORT
3182\16.04\3182-STY-001_0 S6
Page 6.6
April 2016 Mining Associates
Table 6.2.3 Westmoreland Mineral Resource Estimates – Indicated Category, May 2009
Resource Category Deposit Tonnes Grade % (U3O8) M lbs U3O8
Indicated cut-off 0.02% U3O8
Redtree (Garee) 12,858,750 0.09 25.5 Huarabagoo 1,462,000 0.08 2.7 Junnagunna 4,364,750 0.08 7.8
Subtotal 18,685,500 0.09 36.0 Note: reported tonnage and grade figures have been rounded off from raw estimates to the appropriate number of significant figures to reflect the order of accuracy of the estimate. Minor variations may occur
during the addition of rounded numbers.
Table 6.2.4 Westmoreland Mineral Resource Estimates – Inferred Category, May 2009
Resource Category Deposit Tonnes Grade % (U3O8) M lbs U3O8
Inferred cut-off 0.02% U3O8
Redtree (Garee) 4,466,750 0.07 6.6 Huarabagoo 2,406,000 0.11 5.8 Junnagunna 2,149,500 0.08 3.6
Subtotal 9,022,250 0.08 15.9 Note: reported tonnage and grade figures have been rounded off from raw estimates to the appropriate number of significant figures to reflect the order of accuracy of the estimate. Minor variations may occur
during the addition of rounded numbers.
6.3 Discussion
All mineral resources reported in this section are provided for information purposes only and are superseded by the current Mineral Resource estimate contained in Section 14 of this report.
Historic Resource and Reserve Estimates presented are an estimate of the quantity, grade, and metal of the deposit over the life of the project. The May 2009 resource estimate has been verified as the current mineral resource by qualified person Mr A. Vigar when considering all exploration and drilling activity since May 2009. Refer to Section 14 of this report for verification of the current 2016 re-stated mineral resource.

WESTMORELAND URANIUM PROJECT
NATIONAL INSTRUMENT 43-101 TECHNICAL REPORT
3182-STY-001
Table of Contents Page
7.0 GEOLOGICAL SETTING AND MINERALISATION 7.1 7.1 Regional Geology 7.1 7.2 Local Geology 7.8 7.3 Prospect Geology 7.13
7.3.1 Redtree 7.14 7.3.2 Huarabagoo 7.15 7.3.3 Junnagunna 7.16 7.3.4 Long Pocket 7.17
7.4 Oxidation and Weathering 7.18 7.5 Mineralization 7.19
7.5.1 Westmoreland–Pandanus Creek Uranium Field 7.19 7.5.2 Westmoreland Mineralisation 7.22 7.5.3 Alteration 7.31
FIGURES Figure 7.1.1 Geological Setting of Northern Australia (Jones, 2008) 7.1 Figure 7.1.2 McArthur Basin – Westmoreland Located North Flank of Murphy Inlier
(Rawlings, 1999) 7.3 Figure 7.1.3 Tawallah Group 7.4 Figure 7.1.4 Simplified Stratigraphy of the Southern McAthur Basin (Polito et al,
2006) 7.5 Figure 7.1.5 Tectonic Events and Sedimentation Features of North-Central
Australia (Scott et al, 2000) 7.6 Figure 7.1.6 North Flank of Murphy Inlier (Jackson et al, 2000) 7.7 Figure 7.2.1 Geology of the Westmoreland Project 7.8 Figure 7.2.2 Long Section of North Flank of Murphy Inlier Corresponding to
Westmoreland Tenements 7.9 Figure 7.2.3 Legend for Westmoreland Map and Section 7.9 Figure 7.2.4 Redtree Deposit in Unit Ptw4 7.10 Figure 7.2.5 Radiometrics Over Magnetics 7.11 Figure 7.2.6 Westmoreland Conglomerate Dip Slope, Looking West 7.12 Figure 7.2.7 Westmoreland Conglomerate 7.13 Figure 7.3.1 Prospect Areas and Geology 7.14 Figure 7.3.2 Redtree – Four Lens of Mineralisation 7.15 Figure 7.3.3 Huarabagoo Cross Section 11110N 7.16 Figure 7.3.4 Junnagunna Deposit 7.17 Figure 7.3.5 Long Pocket Cross Section A-A 7.18 Figure 7.5.1 Geological Setting of the Westmoreland-Pandanus Creek Uranium
Field 7.20 Figure 7.5.2 Uranium Systems of the Westmoreland Region: Schematic Geolical
Cross-Section 7.22 Figure 7.5.3 Paragenesis in the Westmoreland Uranium Field 7.23 Figure 7.5.4 Uranium Mineralisation Styles at Westmoreland 7.24 Figure 7.5.5 Redtree, Huarabagoo, and Junnagunna Uranium Deposits 7.25 Figure 7.5.6 High Grade Mineralisation in WDD07-2 at 59.1m 7.26 Figure 7.5.7 Redtree Cross-Section 7600N 7.27 Figure 7.5.8 Fan of Drill Holes at Redtree 7.28 Figure 7.5.9 Junnagunna Cross-Section 14450N 7.29 Figure 7.5.10 Fan of Drill Holes at Junnagunna – Mineralisation East of Dyke 7.30
3182\16.04\3182-STY-001_0 S7 April 2016 Mining Associates

WESTMORELAND URANIUM PROJECT NATIONAL INSTRUMENT 43-101 TECHNICAL REPORT
3182\16.04\3182-STY-001_0 S7
Page 7.1
April 2016 Mining Associates
7.0 GEOLOGICAL SETTING AND MINERALISATION
7.1 Regional Geology
LAM’s Westmoreland tenements are situated on the south-eastern margin of the southern McArthur River Basin (Figure 7.1.1 and Figure 7.1.2). Current maps covering the area include:
• 1:250,000 scale “Westmoreland Geological Sheet SE 54-5”, Second Edition 1979, published by the GSQ.
• 1:100,000 scale “Seigal NT and Hedleys Creek Qld” First Edition 1980, published by the Bureau of Mineral Resources.
Figure 7.1.1 Geological Setting of Northern Australia (Jones, 2008)

WESTMORELAND URANIUM PROJECT NATIONAL INSTRUMENT 43-101 TECHNICAL REPORT
3182\16.04\3182-STY-001_0 S7
Page 7.2
April 2016 Mining Associates
The Palaeo-Mesoproterozoic McArthur basin is a 5 to 10 km thick package of mostly unmetamorphosed sedimentary and volcanic rocks that were deposited on the North Australian Craton between ca. 1800 and 1575.
The ca. 1850 Ma Murphy tectonic ridge (Murphy Inlier) defines the southern extent of this basin and separates the southern McArthur basin from the Mt Isa Inlier (Figure 7.1.2). The east-west–trending Urapunga fault zone separates the southern McArthur basin from the northern McArthur basin. The oldest sediments of the southern McArthur basin unconformably overlie the ca. 1850 Ma Cliffdale Volcanics (Murphy Inlier), the Scrutton Volcanics, and the Urapunga Granite. Deposition occurred in a variety of intracratonic settings, including proximal to distal fluvial, coastal, and shallow marine environments. The southern McArthur basin has been divided lithostratigraphically into the Tawallah, McArthur, Nathan, and Roper Groups. Except for the Karns Dolomite of the Nathan Group, the younger Groups are largely absent on the Wearyan Shelf (upon which the Westmoreland project is located) and only Tawallah Group is represented (Figure 7.1.3).
Three regionally correlatable stratigraphic successions or “superbasins” termed the Leichhardt (ca. 1800 to ca. 1740 Ma), the Calvert (ca. 1710 to 1690 Ma), and the Isa (ca. 1670 to 1575 Ma) superbasins are now recognized for the southern McArthur basin (Figure 7.1.4 and Figure 7.1.5; Jackson et al, 2000). These three major depositional episodes are separated by approximately 20 million year gaps. An eight fold pseudo-chronostratigraphic subdivision of these older Statherian rocks, through an 800 km-long outcrop belt from the Leichhardt River Fault Trough (near Mt Isa) to the Roper River (just south of Arnhem Land) has been proposed by Jackson et al (2000). The five older associations (A to E; Figure 7.1.5 and Figure 7.1.6) comprise the Leichhardt Superbasin Phase, while the younger three associations comprise the Calvert Superbasin Phase. These two superbasins are separated by a basin inversion event that produced a 20 million year gap in the stratigraphic record (1750 to 1730 Ma). The Calvert Superbasin is then separated from the overlying Isa Superbasin by a slightly longer (25 million year) gap in the stratigraphic record (1690 to 1665 Ma).
In the southern McArthur basin, the lithology of the Calvert and Leichhardt superbasins is represented by shallow marine and fluvial, siliciclastic successions, outer-ramp carbonate successions, turbiditic siliciclastic units, and bimodal igneous rocks. These sediments can be grouped into four broad facies associations. Rocks of the proximal fluvial facies association are composed of poorly sorted and immature, coarse- to fine-grained sandstone, pebbly sandstone, and conglomerate. These rocks are most common near the base of the Leichhardt superbasin in the Westmoreland Conglomerate, the lower Yiyinti Sandstone and the Sly Creek Sandstone, where they form successions ranging from several hundred meters to in excess of several kilometres.

WESTMORELAND URANIUM PROJECT NATIONAL INSTRUMENT 43-101 TECHNICAL REPORT
3182\16.04\3182-STY-001_0 S7
Page 7.3
April 2016 Mining Associates
Figure 7.1.2 McArthur Basin – Westmoreland Located North Flank of Murphy Inlier (Rawlings, 1999)

WESTMORELAND URANIUM PROJECT NATIONAL INSTRUMENT 43-101 TECHNICAL REPORT
3182\16.04\3182-STY-001_0 S7
Page 7.4
April 2016 Mining Associates
Figure 7.1.3 Tawallah Group
Note Wearyan Shelf (Rawlings, 1999)

WESTMORELAND URANIUM PROJECT NATIONAL INSTRUMENT 43-101 TECHNICAL REPORT
3182\16.04\3182-STY-001_0 S7
Page 7.5
April 2016 Mining Associates
Figure 7.1.4 Simplified Stratigraphy of the Southern McArthur Basin (Polito et al, 2006)

WESTMORELAND URANIUM PROJECT NATIONAL INSTRUMENT 43-101 TECHNICAL REPORT
3182\16.04\3182-STY-001_0 S7
Page 7.6
April 2016 Mining Associates
Figure 7.1.5 Tectonic Events and Sedimentation Features of North-Central Australia (Scott et al, 2000)

WESTMORELAND URANIUM PROJECT NATIONAL INSTRUMENT 43-101 TECHNICAL REPORT
3182\16.04\3182-STY-001_0 S7
Page 7.7
April 2016 Mining Associates
Figure 7.1.6 North Flank of Murphy Inlier (Jackson et al, 2000)

WESTMORELAND URANIUM PROJECT NATIONAL INSTRUMENT 43-101 TECHNICAL REPORT
3182\16.04\3182-STY-001_0 S7
Page 7.8
April 2016 Mining Associates
7.2 Local Geology
The Westmoreland tenements are centred about the outcropping Westmoreland Conglomerate of the Tawallah Group, where the southern McArthur basin on laps the Cliffdale Volcanics of the Murphy Inlier (Figure 7.2.1 and Figure 7.2.3). The Redtree deposit is located in the south west of EPM 14558.
Figure 7.2.1 Geology of the Westmoreland Project
Source: from Westmoreland, SE 54-5, 1979

WESTMORELAND URANIUM PROJECT NATIONAL INSTRUMENT 43-101 TECHNICAL REPORT
3182\16.04\3182-STY-001_0 S7
Page 7.9
April 2016 Mining Associates
Figure 7.2.2 Long Section of North Flank of Murphy Inlier Corresponding to Westmoreland Tenements
Source: from Westmoreland, SE 54-5, 1979
Figure 7.2.3 Legend for Westmoreland Map and Section
Source: from Westmoreland, SE 54-5, 1979

WESTMORELAND URANIUM PROJECT NATIONAL INSTRUMENT 43-101 TECHNICAL REPORT
3182\16.04\3182-STY-001_0 S7
Page 7.10
April 2016 Mining Associates
The Westmoreland uranium deposits, Redtree, Junnagunna and Huarabagoo, are hosted largely within the shallow dipping Westmoreland Conglomerate (Figure 7.2.4, Figure 7.2.6, and Figure 7.3.1).
The Westmoreland Conglomerate is up to 1,800 m thick and is divided into five fining-upward units termed Ptw1, Ptw2a, Ptw2b, Ptw3, and Ptw4 (Rheinberger et al, 1998; Polito et al, 2005). Each unit comprises proximal fluvial deposits typical of debris flows, alluvial fans, and braided river systems that are overlain by medium to coarse grained, well-sorted sandstone. Breaks in sedimentation are indicated by angular unconformities or disconformities, with each new cycle of pebble or boulder conglomerate commonly defining the beginning of a new unit. Cobbles and coarse sand grains within the basal conglomerate (Figure 7.2.7) are dominated by reworked quartz veins, chert, and clasts of felsic to mafic volcanic rocks that were likely derived from the Murphy tectonic ridge or similar basement rocks that once existed to the north. This detrital material and lithic clasts is considered by Polito et al (2005) to be a likely source for the uranium. Numerous NE trending fractures crosscut the Westmoreland Conglomerate, some filled with dolerite.
Figure 7.2.4 Redtree Deposit in Unit Ptw4
Source: after Rheinberger et al, 1998 Note Redtree Dyke and Cliffdale Fault
The Seigal Volcanics conformably overlie the Westmoreland Conglomerate. They are predominantly massive (but locally amygdaloidal) tholeiitic basaltic lava flows with minor siltstone and sandstone interbeds.
A number of aphyric, medium-grained dolerite dykes cut the Westmoreland Conglomerate and basement units belonging to the Murphy Inlier. These dykes (such as the Redtree dyke; Figure 7.2.4 and Figure 7.3.2) commonly occur in northeast-trending structures that likely reflect zones of weakness in the underlying basement (Figure 7.2.5). The dykes weather more easily than the conglomerate and thus tend to be obscured at surface. Fresh dykes in core are

WESTMORELAND URANIUM PROJECT NATIONAL INSTRUMENT 43-101 TECHNICAL REPORT
3182\16.04\3182-STY-001_0 S7
Page 7.11
April 2016 Mining Associates
brecciated and sheared, and extensively altered along the contact zones. The unaltered dyke is typically a dark green dolerite. The geochemistry of the Redtree dyke is consistent with that of the Seigal Volcanics, suggesting that the dykes may have been feeders for these lava flows (Rheinberger et al, 1998; Polito et al, 2005). The 15 km Redtree dyke zone is a series of en echelon dykes generally less than 20 m thick and 1 km in length.
Figure 7.2.5 Radiometrics Over Magnetics
Showing WNW and NW faults and mineralisation.

WESTMORELAND URANIUM PROJECT NATIONAL INSTRUMENT 43-101 TECHNICAL REPORT
3182\16.04\3182-STY-001_0 S7
Page 7.12
April 2016 Mining Associates
Figure 7.2.6 Westmoreland Conglomerate Dip Slope, Looking West
Source: Vigar & Jones, 2006

WESTMORELAND URANIUM PROJECT NATIONAL INSTRUMENT 43-101 TECHNICAL REPORT
3182\16.04\3182-STY-001_0 S7
Page 7.13
April 2016 Mining Associates
Figure 7.2.7 Westmoreland Conglomerate
Scintillomter is about 10 cm long, reading is equivalent to ppm Uranium Source: site visit 2015
7.3 Prospect Geology
As noted above, the Westmoreland uranium deposits, Redtree, Junnagunna, Huarabagoo and Long Pocket are hosted largely within the shallow dipping Westmoreland Conglomerate with alluvial overburden cover and overlying Seigal Volcanics in part (Figure 7.3.1).

WESTMORELAND URANIUM PROJECT NATIONAL INSTRUMENT 43-101 TECHNICAL REPORT
3182\16.04\3182-STY-001_0 S7
Page 7.14
April 2016 Mining Associates
Figure 7.3.1 Prospect Areas and Geology
7.3.1 Redtree
Drilling at Redtree intersected primarily the upper unit of the Westmoreland Conglomerate (Ptw4). Lithologies intersected within this unit were predominantly coarse quartz arenites with intervals grading into pebble conglomerate. These lithologies are underlain by coarser cobble conglomerates at depth.
The Redtree uranium deposit flanks the Redtree dyke zone immediately north of the northwest-trending Namalangi fault (Figure 7.2.4). The deposit comprises horizontal mineralisation in the Jack, Garee, and Langi lenses and vertical mineralisation in the Namalangi lens with grades ranging from 0.15% to >2% U3O8 (Rheinberger et al, 1998, Figure 7.3.2).
The horizontal mineralisation in Jack and Langi lenses on the northwest side of the dyke zone is entirely hosted within Ptw4 of the Westmoreland Conglomerate. It forms a sheet of mineralisation 0 to 10 m below ground surface (less than 20 m below the projected basal contact of the now removed Seigal Volcanics) up to 15 m thick (increasing with proximity to the dyke zone) and up to 500 m wide.
The Garee lens consists of a mix of horizontal and vertical mineralisation in the Ptw4 of the Westmoreland Conglomerate on the eastern side of the dyke zone. Mineralisation is 5 to 30 m below the surface, up to 50 m thick adjacent to the dyke and thins to the east (away from the dyke).
Vertical mineralisation at the Namalangi lens occurs over a strike length of more than 700 m within the dyke zone, particularly within the sandstone wedge between the two dykes.

WESTMORELAND URANIUM PROJECT NATIONAL INSTRUMENT 43-101 TECHNICAL REPORT
3182\16.04\3182-STY-001_0 S7
Page 7.15
April 2016 Mining Associates
Figure 7.3.2 Redtree – Four Lens of Mineralisation
7.3.2 Huarabagoo
This deposit is about 3 km NE of Redtree along the Redtree dyke zone and straddles the contact of the Seigal Volcanics with the Westmoreland Conglomerate (Figure 7.3.1).
The mineralisation outcrops at the southern end and is concealed to the north under 2 to 3 m of sandy alluvium and 5 to 8 m of weathered basalt of the Seigal Volcanics. The deposit comprises a 3 km zone of vertical mineralisation associated with a complex dyke geometry with vertical and

WESTMORELAND URANIUM PROJECT NATIONAL INSTRUMENT 43-101 TECHNICAL REPORT
3182\16.04\3182-STY-001_0 S7
Page 7.16
April 2016 Mining Associates
horizontal branches between the two principal dykes (Figure 7.3.3). Some 75% of the mineralisation is within the flanking Ptw4 sandstone (the remainder in the dykes) with individual lenses up to 20 m thick, 100 to 500 m long, and extending to a depth of about 80 m. Mineralisation rarely extends beyond the Ptw4 into Ptw3 conglomerate.
Figure 7.3.3 Huarabagoo Cross Section 11110N
7.3.3 Junnagunna
At Junnagunna, the Westmoreland Conglomerate is overlain by basalt of the Seigal Volcanics which are in turn overlain by about 8 m of Quaternary alluvial / colluvial clays and sand. Extremely to moderately weathered basalt was intersected to vertical depths of between approximately 10 and 25 m. The stratigraphy of the Westmoreland Conglomerate at Junnagunna differs from the Redtree area in that there are less of the coarse, pebble conglomerate units. The upper part of the sequence at Junnagunna is dominantly a medium to coarse grained sandstone underlain by a coarse sandstone with scattered pebbly clasts. The distinct pebbly conglomerate evident in the upper part of the Redtree deposit appears to be absent.
The Junnagunna uranium deposit occurs at a fault intersection west of the Redtree dyke zone and south of the northwest trending Cliffdale fault (Figure 7.2.4). The deposit is obscured by 3 to 10 m of alluvial sand and 5 to 20 m of weathered and fresh basalt of the Seigal Volcanics (Rheinberger et al, 1998). Extensive flat lying mineralisation hosted by Ptw4 sandstone is developed on either side of the Redtree dyke (Figure 7.3.4). Mineralisation lies 0.5 to 10 m thick immediately beneath the Seigal-Westmoreland contact. Note mineralisation associated with a parallel structure 400 m west of the Redtree dyke zone in Figure 7.3.4. Dolerite appears to be absent in this fault.

WESTMORELAND URANIUM PROJECT NATIONAL INSTRUMENT 43-101 TECHNICAL REPORT
3182\16.04\3182-STY-001_0 S7
Page 7.17
April 2016 Mining Associates
Figure 7.3.4 Junnagunna Deposit
Source: Rheinberger et al, 1998
7.3.4 Long Pocket
Uranium mineralisation occurs on the northern side of the Cliffdale fault and the eastern side of the Redtree dolerite dyke zone. The Longpocket deposits (Outcamp, Sue and Black Hills) are situated 8 km east of the Junnagunna deposit and the Moogooma mineralisation is 5 km southwest of Redtree along the Redtree dyke zone (Figure 7.2.4 and Figure 7.3.1). These additional deposits are all within LAM’s EPM 14558.

WESTMORELAND URANIUM PROJECT NATIONAL INSTRUMENT 43-101 TECHNICAL REPORT
3182\16.04\3182-STY-001_0 S7
Page 7.18
April 2016 Mining Associates
Drilling in 2010 at Long Pocket intersected horizontal uranium mineralisation over a 500 m strike length above a dolerite sill and immediately below the underlying sill contact (Figure 7.3.5).
Figure 7.3.5 Long Pocket Cross Section A-A
Refer Figure 7.3.1 for location
7.4 Oxidation and Weathering
Determining oxidation and weathering effects at Redtree can be problematic due to the resistive nature of the sandstone units. Competent partly silicified sandstone occurs at surface. Furthermore oxidation of the sandstone has occurred in parts of the deposit by oxidizing fluids which are at the earliest diagenetic. Clays are a common matrix infill material and are considered diagenetic rather than weathering products. An estimate of the weathering state of the rock has been made by assessing weathering of chlorite and primary hematite minerals in the matrix where present. Due to these considerations, consistent definition of the weathering front has been proven to be difficult.
As more quantitative measure of oxidation, sulphur analyses were examined. A generally consistent relationship between below detection limit sulphur analyses and the upper portion of the deposit was observed. It is considered that the base of oxidation should be based on a combination of logging and sulphur analyses.
Slight weathering is indicated throughout much of the drilled intervals but is restricted to slight weathering of chlorite to smectite and minor oxidation. The rock mass is essentially unweathered in terms of competency and density. The uranium mineralogy of the upper parts of the Redtree deposit on the eastern side of the dyke as indicated by SEM are primary uranium minerals (uraninite and coffinite) rather than secondary (weathering product) uranium minerals.
The base of oxidation based on sulphur assays varies between 0 and 26 m but for most holes the surface is at between 5 and 15 m below ground level.

WESTMORELAND URANIUM PROJECT NATIONAL INSTRUMENT 43-101 TECHNICAL REPORT
3182\16.04\3182-STY-001_0 S7
Page 7.19
April 2016 Mining Associates
At Junnagunna, the upper part of the Junnagunna deposit consists of extremely weathered alluvial / colluvial clays and sand deposits which overlie moderately to strongly weathered basalt of the Siegel Volcanics. In the areas drilled in 2008, the thickness of the alluvial sediments varies between 6 and 23 m, but is generally between 8 and 15 m. The base of the basalt is predominantly between 15 and 28 m. Underlying sandstones of the Westmoreland Conglomerate are generally slightly weathered to fresh, although determination of oxidation state is somewhat complicated by the factors outlined previously.
7.5 Mineralization
7.5.1 Westmoreland–Pandanus Creek Uranium Field
The Westmoreland–Pandanus Creek uranium field has four types of uranium occurrences (Figure 7.5.1):
• Type A: At the reverse-fault contact between the Cliffdale Volcanics (hanging wall) and Westmoreland Conglomerate (Type A1), or at the contact between the Seigal Volcanics and the conformably overlying Westmoreland Conglomerate (Type A2).
• Type B: Near a contact between impermeable vertical mafic dykes and the Westmoreland Conglomerate.
• Type C: Hosted by the Cliffdale Volcanics, beneath an exhumed unconformable contact with the overlying Westmoreland Conglomerate.
• Type D: Hosted by fractures in the Seigal Volcanics, at some distance above the contact with the Westmoreland Conglomerate.

WESTMORELAND URANIUM PROJECT NATIONAL INSTRUMENT 43-101 TECHNICAL REPORT
3182\16.04\3182-STY-001_0 S7
Page 7.20
April 2016 Mining Associates
Figure 7.5.1 Geological Setting of the Westmoreland-Pandanus Creek Uranium Field
Source: after Lally et al, 2006
Sandstone Hosted Westmoreland-Style
Polito et al (2005) and Polito et al (2006) presented a model for uranium mineralisation in the Westmoreland Conglomerate. In summary, clastic sediments in the southern McArthur basin, which are dominated by poorly sorted sandstone and conglomerate facies deposited in fluvial settings evolved through burial diagenesis to become diagenetic aquifers. These aquifers hosted basinal brines with chemical characteristics and ages indistinguishable from those which are reported from the Pb-Zn and U deposits of the southern McArthur basin. These brines formed primarily in the Westmoreland Conglomerate (Leichhardt superbasin) and the Warramana Sandstone and Gold Creek Volcanics (Calvert superbasin). The composition of the brines

WESTMORELAND URANIUM PROJECT NATIONAL INSTRUMENT 43-101 TECHNICAL REPORT
3182\16.04\3182-STY-001_0 S7
Page 7.21
April 2016 Mining Associates
suggests that they were capable of leaching Pb-Zn ± Cu and U from sediments and adjacent volcanic units and transporting them to a trap site.
Well-sorted, quartz-dominated lithologic units, such as marine and aeolian sediments that have excellent aquifer properties at or near the Earth’s surface, are commonly cemented by quartz overgrowths at depth, which destroys porosity and transforms these sediments into seals or diagenetic aquitards. This transformation typically occurs at less than 4 km burial depth. The sealing of well-sorted sandstones by quartz overgrowths commonly inhibits further diagenetic alteration at greater depths and, thus, effectively limits the potential of the rocks to be sources for mineralising brines.
Conversely, facies that were initially poor aquifers at or near the surface, due to their heterogeneous grain size and mineral composition, may undergo framework dissolution with the creation of secondary porosity at depths generally exceeding 4 km. Therefore, proximal fluvial deposits such as conglomerates and lacustrine and continental sandstones can, through diagenetic modification, become sources and conduits for metaliferous basinal brines after deep burial. Inherently unstable detrital minerals such as detrital feldspar and Fe and Mg silicates or clasts of chemical sediments such as aragonite are replaced by a stable mineral assemblage that may include illite, chlorite, kaolinite and/or dickite, calcite, dolomite, or albite. These authigenic minerals generally form in situ and their presence is diagnostic of diagenetic aquifers.
Silicate solubility increased at depth, which led to framework dissolution and the creation of secondary porosity in the Westmoreland Conglomerate and it became a conduit through which diagenetic fluids flowed. Illite and chlorite are the primary diagenetic phases that filled the secondary pore spaces. The basinal brines in the Leichhardt superbasin had temperatures of about 200°C. These temperatures correspond to burial depths of 5 to 9 km, given a thermal gradient of 25°C /km. The diagenetic aquifers were open to fluid migration as early as 1680 ± 21 Ma and continued to remain open until approximately 1541 ± 8 Ma. This coincides with and extends past the time when the ca. 1650 Ma Redtree - Junnagunna U deposits formed.
Cliffdale Volcanic-Hosted Eva-Style
Lally and Bajwah (2006) reported a 1987 classification of the uranium occurrences for the Westmoreland-Pandanus Creek area that separated the deposits into five types based on their hydrological and geological setting. McKay & Miezitis (2001) describe Eva by a newer local classification system of uranium occurrences within the Westmoreland–Pandanus Creek Uranium Field where Eva is classified as mineralisation associated with shear zones within altered acid volcanics (Cliffdale Volcanics). All settings for uranium mineralisation in the Westmoreland-Pandanus Creek area are either within or adjacent to the Westmoreland Conglomerate.
Therefore the prospect geology and the isotope studies indicate that the mineralising basinal brines migrated through the Westmoreland Conglomerate, along the unconformity (reverse faults) and into shear zones and permeable horizons (sandstone units) within the Cliffdale Volcanics whereby the uranium was precipitated due to reduction, possibly by diagenetic chlorite (Figure 7.5.2).

WESTMORELAND URANIUM PROJECT NATIONAL INSTRUMENT 43-101 TECHNICAL REPORT
3182\16.04\3182-STY-001_0 S7
Page 7.22
April 2016 Mining Associates
Figure 7.5.2 Uranium Systems of the Westmoreland Region: Schematic Geolical Cross-Section
Source: LAM, 2010
7.5.2 Westmoreland Mineralisation
The uranium mineralisation assemblage identified at the Westmoreland deposits is characterised by the later phase uraninite, hematite, illite and minor rutile (Figure 7.5.3). Uraninite and hematite occur as matrix filling cement between detrital quartz grains. Uraninite also occurs as micron sized grains within the hematite (Polito, 2005). The hematite dominates the mineralised areas and results in a red-brown colour in hand specimens. Some uraninite fills fractures in pyrite. Pyrite appears to be contemporaneous with some uraninite but also brecciated pyrite is cemented by uraninite.
Secondary uranium minerals found at Redtree and Junnagunna include torbernite, met-torbernite, carnotite, coffinite, autinite, bassetite and ningyoite.

WESTMORELAND URANIUM PROJECT NATIONAL INSTRUMENT 43-101 TECHNICAL REPORT
3182\16.04\3182-STY-001_0 S7
Page 7.23
April 2016 Mining Associates
Figure 7.5.3 Paragenesis in the Westmoreland Uranium Field
Source: Polito et al, 2005
Mineralisation occurs typically as vertical or horizontal zones (Figure 7.5.4). The vertical zones are adjacent to dolerite dykes (dark green unit Ptd) whilst horizontal mineralisation at Junnagunna lies beneath the Seigal Volcanics (light green Pts unit).

WESTMORELAND URANIUM PROJECT NATIONAL INSTRUMENT 43-101 TECHNICAL REPORT
3182\16.04\3182-STY-001_0 S7
Page 7.24
April 2016 Mining Associates
Figure 7.5.4 Uranium Mineralisation Styles at Westmoreland
Source: after Rheinberger et al, 1998
Uranium mineralisation has been recognised in the Westmoreland region in numerous structural and stratigraphic positions. These have been documented by Rheinberger et al (1998). The main deposits occur within the Ptw4 unit (of the Westmoreland Conglomerate; Figure 7.5.5) in association with mafic dykes and sills, particularly in close proximity to the overlying Seigal Volcanics.

WESTMORELAND URANIUM PROJECT NATIONAL INSTRUMENT 43-101 TECHNICAL REPORT
3182\16.04\3182-STY-001_0 S7
Page 7.25
April 2016 Mining Associates
Figure 7.5.5 Redtree, Huarabagoo, and Junnagunna Uranium Deposits
Source: Rheinberger et al, 1998
The Ptw4 subunit of the Westmoreland Conglomerate contains the bulk of the identified uranium at Westmoreland (Figure 7.5.4 and Figure 7.5.6). It is porous, coarse grained quartz sandstone, with cross-bedding and conglomerate portions. It is brown coloured in outcrop and white to pale grey when fresh. Within the deposit area, it is about 80 m thick with a basal discontinuous tuffaceous fine grained laminated siltstone.

WESTMORELAND URANIUM PROJECT NATIONAL INSTRUMENT 43-101 TECHNICAL REPORT
3182\16.04\3182-STY-001_0 S7
Page 7.26
April 2016 Mining Associates
Figure 7.5.6 High Grade Mineralisation in WDD07-2 at 59.1m
Source: site visit 2015 Note coarse blebs of uranite as replacement to the right of the Scintillometer
According to McKay & Miezitis compilation report (2001), the uranium mineralisation in the Eva area (Lagoon Creek / Murphy JV) occur in en-echelon shear zones up to 2 m wide that strike north-north-east and dip north-west. The host rocks are bleached, intensely altered acid volcanics (Cliffdale Volcanics) overlain by sandstone of the Westmoreland Conglomerate. The bulk of the ore is in a band of sericitic quartzite within porphyritic lava. Primary uraninite is present however the ore has mostly undergone supergene alteration to silicate minerals (sklodowskite, boltwoodite, and beta-uranophane) with minor phosphates (saleeite, autunite, and tobernite). Small amounts of galena, manganese oxides, and green copper carbonates have also been sighted. In addition, gold invariably occurs with uranium and increases in grade with increased U3O8.
Unlike Westmoreland, the uranium mineralisation at Eva is associated with shear zones within altered acid volcanics and is located within the contact aureole of a small granite stock. NuPower Resources Ltd has reported JORC indicated and inferred mineral resources at the Eva deposit.
Redtree Mineralisation
Mineralisation intersected at Redtree was found to be associated with chlorite and/or hematite alteration of coarse sandstone and pebble conglomerate. There appears to be a broad association between higher grade mineralisation and coarser grained intervals, particularly fine pebble conglomerate beds which are dominantly clast supported, although mineralisation has been observed in a range of sandstone and conglomerate types. Mineralisation and alteration contacts are mostly bedding parallel (gently dipping). In the central part of the deposit there is little evidence for significant steep, or dyke related mineralisation.

WESTMORELAND URANIUM PROJECT NATIONAL INSTRUMENT 43-101 TECHNICAL REPORT
3182\16.04\3182-STY-001_0 S7
Page 7.27
April 2016 Mining Associates
Flat lying, shallow mineralisation at Redtree is commonly associated with a pebble conglomerate layer that is continuous over a significant part of the deposit area. This includes the Jack Lens and the upper part of the Garee Lens. Mineralisation in these lenses is associated with moderate to strong hematite alteration with lesser chlorite and sericite alteration. Deeper lenses of mineralisation have also been intersected but tend to be associated with more variable stratigraphy, although higher grade mineralisation is again associated with coarser sandstone / pebble conglomerate units (Figure 7.5.7). Deeper mineralisation is commonly associated with chlorite altered sediments with lesser hematite and sericite alteration.
Figure 7.5.7 Redtree Cross-Section 7600N
Source: LAM 2010
Figure 7.5.8 shows an intersection of 12 to 14 m (approximate true width) sub-horizontal mineralisation at Redtree from a depth of about 10 m below the ground surface by WDD08-040 (far left) and WDD08-046 (middle).

WESTMORELAND URANIUM PROJECT NATIONAL INSTRUMENT 43-101 TECHNICAL REPORT
3182\16.04\3182-STY-001_0 S7
Page 7.28
April 2016 Mining Associates
Figure 7.5.8 Fan of Drill Holes at Redtree
Source: Jones & Vigar, 2009
SEM analysis of uranium mineralogy indicates relatively consistent uranium occurrence in the various lenses intersected during the first phase of drilling. For the majority of samples, 60 to 80% of uranium is contained within uraninite with the remainder being dominantly coffinite (2 to 15%) and meta-autunite (1 to 6%). Coffinite was found to be proportionally more abundant in two samples (40% and 32%) both of which were obtained from the lower part of the Garee lens. Brannerite was found to be absent or in trace quantities (<1% of uranium in brannerite).
Junnagunna Mineralisation
At Junnagunna, mineralisation was intersected within the vicinity of the dyke, broadly confirming historic drilling, however the association of uranium mineralisation with faulting was shown to be indirect. Mineralisation was not associated with the most strongly faulted and fractured rock, although some steeper mineralisation has been identified in steep structures close to the dyke (Figure 7.5.9).

WESTMORELAND URANIUM PROJECT NATIONAL INSTRUMENT 43-101 TECHNICAL REPORT
3182\16.04\3182-STY-001_0 S7
Page 7.29
April 2016 Mining Associates
Figure 7.5.9 Junnagunna Cross-Section 14450N
Figure 7.5.10 shows three holes drilled at Junnagunna from the west side of the Redtree dyke penetrating the dolerite to intersect mineralisation in Westmoreland Conglomerate on the east side of the dyke. Drill holes JDD08-012 (angled hole) and JDD08-031 (sub-vertical hole) intersect some 9 m (approximate true width) of sub-horizontal mineralisation at about 57 m below the ground surface that may have a vertical component immediately adjacent to the dyke.

WESTMORELAND URANIUM PROJECT NATIONAL INSTRUMENT 43-101 TECHNICAL REPORT
3182\16.04\3182-STY-001_0 S7
Page 7.30
April 2016 Mining Associates
Figure 7.5.10 Fan of Drill Holes at Junnagunna – Mineralisation East of Dyke
Source: Jones & Vigar, 2009
Strongest mineralisation was found to be associated with chlorite and hematite altered coarse pebbly sandstones broadly similar to that encountered at Redtree. Strongly silicified and fractured rock found adjacent to the dyke was generally poorly mineralised. Alteration and mineralisation contacts indicate a bedding parallel component to the mineralisation however the overall geometry of mineralisation indicates a vertical control. It is interpreted that higher grade mineralisation occurs partly within favourable horizons but laterally confined within a broad structural corridor.
Drilling also identified offsets in the position in the dyke suggesting cross faulting. The recognition of this offset allowed for repositioning drill holes at the completion of the program to test the southern extension of steep mineralisation. Drill hole JDD08-033 intersected 8 m at 0.52% U3O8 from 94 m, suggesting the continuation of this mineralisation to the south. A re-evaluation of the geological model suggests that the steep mineralisation is not adequately tested in the Junnagunna deposit due to these fault offsets and it is considered that further drilling will allow for better definition of this zone.

WESTMORELAND URANIUM PROJECT NATIONAL INSTRUMENT 43-101 TECHNICAL REPORT
3182\16.04\3182-STY-001_0 S7
Page 7.31
April 2016 Mining Associates
It is considered that there is potential for more laterally extensive lenses where other favourable sedimentary horizons occur, such as those intersected at Redtree.
7.5.3 Alteration
At Redtree primary uraninite is present, however the ore has mostly undergone supergene alteration to silicate minerals (sklodowskite, boltwoodite, and beta-uranophane) with minor phosphates (saleeite, autunite, and tobernite). Flat lying, shallow mineralisation at Redtree is associated with moderate to strong hematite alteration with lesser chlorite and sericite alteration.
At Junnagunna, the strongest mineralisation was found to be associated with chlorite and hematite altered coarse pebbly sandstones broadly similar to that encountered at Redtree. Strongly silicified and fractured rock found adjacent to the dyke was generally poorly mineralised.

WESTMORELAND URANIUM PROJECT
NATIONAL INSTRUMENT 43-101 TECHNICAL REPORT
3182-STY-001
Table of Contents Page
8.0 DEPOSIT TYPES 8.1 8.1 Deposit Types 8.1
FIGURES Figure 8.1.1 Basin-related Uranium Mineral Systems for a Hypothetical Basin,
During Extension or SAG Phase 8.2 Figure 8.1.2 Roll Front Uranium Deposit Model 8.2 Figure 8.1.3 Organic Matter (Reductant) Introduced from Underlying Hybrocarbons 8.3
3182\16.04\3182-STY-001_0 S8 April 2016 Mining Associates

WESTMORELAND URANIUM PROJECT NATIONAL INSTRUMENT 43-101 TECHNICAL REPORT
3182\16.04\3182-STY-001_0 S8
Page 8.1
April 2016 Mining Associates
8.0 DEPOSIT TYPES
8.1 Deposit Types
LAM’s Australian properties contain sandstone hosted uranium deposits. This type of deposit is discussed here in general terms. Further details of the deposits are described in other sections.
Sandstone uranium deposits are contained in fluvial (continental) or marginal-marine sandstone (Figure 8.1.1). The host rocks are medium to coarse-grained, poorly sorted, and contain pyrite and organic (plant) matter. The organic matter is either disseminated or forms lignite seams.
Uranium is mobile under oxidising conditions and precipitates under reducing conditions; thus the presence of a reducing environment is essential for the formation of uranium deposits in sandstone. Hydrogen sulphide, which is an effective reductant and uranium precipitant, can be generated by anaerobic decomposition of organic matter (Figure 8.1.3) or it can be introduced from underlying or overlying oil or gas horizons (Figure 8.1.2), thereby creating a favourable environment in an otherwise unfavourable host rock. Post-Silurian continental sandstone is a potentially favourable host because widespread development of land plants began in the Silurian. This abundant plant growth occurred in humid areas within the region bounded by latitudes 50° north and 50° south of the palaeo-equator. Organic matter is absent in the Proterozoic Westmoreland sandstone-hosted deposits, described in later sections of this report, however the abundant supply of divalent iron created a reducing environment.
Sandstone with a slight dip, such as on the margins of continental basins and coastal plains, is more favourable than sandstone that dips steeply, because the rates of groundwater movement and oxygen intake are slowed enough to preclude destruction of reducing environments. Beds with low dips also provide large surface areas for the capture and introduction of uraniferous groundwater (Figure 8.1.1).
Sandstone hosted deposits are often referred to as tabular deposits, roll-front deposits (Figure 8.1.2) or shear hosted (tectonic–lithologic). This subdivision is based on orebody shape, depositional environment or structural environment and the three can be gradational.
Tectonic–lithologic deposits (such as some of the Westmoreland deposits) occur along permeable fault zones which cut the sandstone mudstone sequence. Mineralisation forms tongue-shaped zones along the permeable sandstone layers adjacent to the fault. Often there are a number of mineralised zones ‘stacked’ vertically on top of each other within sandstone units adjacent to the fault zone.
Sandstone deposits contain a large proportion of the world’s known uranium resources, although they are commonly of low to medium grade (0.05 to 0.4% U3O8). In each province or basin there are usually many small to medium-size deposits, some of which can contain up to 50,000 t U3O8 (100 Mlb U3O8). The cumulative tonnage in the province or basin (e.g. Colorado Plateau) is often very large, up to several hundred thousand tonnes.

WESTMORELAND URANIUM PROJECT NATIONAL INSTRUMENT 43-101 TECHNICAL REPORT
3182\16.04\3182-STY-001_0 S8
Page 8.2
April 2016 Mining Associates
Figure 8.1.1 Basin-related Uranium Mineral Systems for a Hypothetical Basin, During Extension or SAG Phase
Soure: Skirrow et al, 2009
Figure 8.1.2 Roll Front Uranium Deposit Model
Source: Huston, 2010

WESTMORELAND URANIUM PROJECT NATIONAL INSTRUMENT 43-101 TECHNICAL REPORT
3182\16.04\3182-STY-001_0 S8
Page 8.3
April 2016 Mining Associates
Figure 8.1.3 Organic Matter (Reductant) Introduced from Underlying Hybrocarbons
Source: Huston, 2010

WESTMORELAND URANIUM PROJECT
NATIONAL INSTRUMENT 43-101 TECHNICAL REPORT
3182-STY-001
Table of Contents Page
9.0 EXPLORATION 9.1 9.1 Exploration Program Undertaken 9.1 9.2 Airborne Radiometrics and Magnetics Survey 9.1 9.3 Geochemical and Radiometric Surveys 9.1 9.4 Drilling 9.2
9.4.1 First Program 2007 to 2008 9.2 9.4.2 Second Program 2008 9.2 9.4.3 Third Program 2009 9.2 9.4.4 Fourth Program 9.3 9.4.5 Fifth Program 9.3
9.5 Petrological and SEM Analysis 9.4 9.6 Metallurgical Studies 9.5
FIGURES Figure 9.4.1 Huarabagoo Cross Section 9.3 Figure 9.4.2 Cross Section within Structural Corridor 9.4
3182\16.04\3182-STY-001_0 S9 April 2016 Mining Associates
WESTMORELAND URANIUM PROJECT NATIONAL INSTRUMENT 43-101 TECHNICAL REPORT
3182\16.04\3182-STY-001_0 S9
Page 9.1
April 2016 Mining Associates
9.0 EXPLORATION
9.1 Exploration Program Undertaken
A brief summary of the exploration by LAM via Lagoon Creek Resources since 2005 is discussed below. Further details regarding the drilling programs are presented in Chapter 10.
No exploration has been carried out on the property by Mining Associates on behalf of the issuer.
9.2 Airborne Radiometrics and Magnetics Survey
In 2005, a high resolution airborne radiometric and magnetic survey was carried out by UTS Geophysics Pty Ltd over the Westmoreland area.
9.3 Geochemical and Radiometric Surveys
Soil sampling, geological mapping, radiometric surveying, and an environmental study of the Junnagunna and Huarabagoo prospects were undertaken in September 2007. Soil and rock chip samples were collected during the program and analysed at ALS Laboratories.
A regional stream sediment sampling program over the project area was undertaken during 2008 and 2009. Approximately 150 samples were collected and analysed at ALS Laboratories.
A comprehensive radiological survey was undertaken between 2008 and 2009. The survey comprised a ground gamma survey which was designed to ‘ground truth’ the 2005 airborne radiometric survey, with 100 site measurements taken for instantaneous gamma at waist height using a Ludlum Gamma monitor. One hundred site measurements were also taken over a 3-monthly interval using ARPANSA TLD badges. Radon data was also collected using ‘AlphaTrack’ Track etch cups placed over the Junnagunna prospect for a period of 30 days in order to monitor radon exhalation. Results were contoured by Alpha Track of Canada. Atmospheric radon was measured with passive radon monitors supplied by Radiation detection systems. One hundred localities were monitored for a period of three months.
In 2010 ground scintillometer surveys, geological mapping and rock chip sampling was undertaken over radiometric anomalies in the Long Pocket area, approximately 8 km east of Junnagunna.
In 2011 an extensive soil sampling program with ground scintillometer points was completed over the Huarabagoo-Junnagunna prospect with over 1,000 samples collected. The samples were submitted to ALS Laboratories for analysis.
In 2011 a detailed follow up ground radiometric survey, geological mapping, and rock chip sampling program was carried out over radiometric anomalies at the Southern Valley and Southern Black Hills prospects within the Long Pocket area.

WESTMORELAND URANIUM PROJECT NATIONAL INSTRUMENT 43-101 TECHNICAL REPORT
3182\16.04\3182-STY-001_0 S9
Page 9.2
April 2016 Mining Associates
9.4 Drilling
9.4.1 First Program 2007 to 2008
The first Laramide drilling program commenced in December 2007 and continued into 2008. Two prospects, Redtree and Junnagunna, were drilled by an LF70 rig and two-man portable rigs. The primary objectives of the drilling program were:
• To provide quality controlled drill data within the Redtree and Junnagunna deposits from which to assess the accuracy and validity of historical drilling.
• To improve geological understanding of lithology, alteration, and structural controls on mineralisation.
• To provide closer spaced drilling to improve confidence levels on resource estimates.
At Redtree the drilling was helicopter assisted, using a combination of Bell 206 Jet Rangers and UH1 Huey helicopters. Drilling was completed in early July 2008 totalling 161 holes for 12,272 m. As part of the drilling program, downhole gamma data was collected.
Samples were collected from both Redtree and Junnagunna and were submitted for chemical analysis at ALS Laboratories. In addition, samples were sent for petrological analysis, SEM (scanning electron microscope) analysis, and a number of holes were drilled for metallurgical testing
9.4.2 Second Program 2008
The second drilling program focussed on the Jack lens at Redtree between September and October 2008. The program was helicopter supported due to the difficult terrain. The objective of the drilling was to validate historical drillhole data and to provide information about structure and mineralogy of the prospect. This Phase 2 diamond core drilling totalled 39 holes for 925.9 m. The results confirmed continuity of mineralisation identified in historical drilling and also indicated the potential for high grade lenses within the broader mineralised envelope.
Following this program an updated independent resource estimate was undertaken by Mining Associates. This resource calculation incorporated the results of the Phase 1 and 2 drilling programs. This document was compliant with NI43-101 requirements and was released to the Toronto Stock Exchange
9.4.3 Third Program 2009
A diamond core drilling program was undertaken between November and December 2009. Drilling targeted the northern most part of the Huarabagoo prospect, (see Figure 9.4.1), structurally controlled mineralisation within the Junnagunna deposit and the southern extension of the Junnagunna deposit. A total of 1,871.2 m was completed for 31 holes. The results confirmed continuity of mineralisation identified in historical drilling and also indicated the potential for high grade lenses within the broader mineralised envelope.

WESTMORELAND URANIUM PROJECT NATIONAL INSTRUMENT 43-101 TECHNICAL REPORT
3182\16.04\3182-STY-001_0 S9
Page 9.3
April 2016 Mining Associates
Figure 9.4.1 Huarabagoo Cross Section
9.4.4 Fourth Program
A diamond core drilling program was undertaken in August 2010 to further understanding of the Huarabagoo deposit and investigate the Sue and Outcamp prospects at Long Pocket. The program consisted of 19 drill holes for 1,377.9 m and comprised seven holes for 630.4 m at Huarabagoo, and 12 holes for 747.5 m at the Sue and Outcamp prospects at Long Pocket, approximately 7 km east of the resource area.
The Huarabagoo drilling confirmed the mineralisation is bound by steep structures broadly parallel to the Redtree Dyke, with indications of horizontal mineralisation in coarser more permeable sandstone facies. The drilling at Long Pocket confirmed the presence of a broad flat-lying and a relatively shallow zone of uranium mineralisation.
9.4.5 Fifth Program
A diamond drilling program was undertaken between August and November 2012 at the Huarabagoo prospect and the Huarabagoo-Junnagunna ‘Structural Corridor’. This program of diamond drilling comprised 31 drill holes for 4,117.9 m.
One portion of the drilling program was focused on the highly prospective structural corridor that connects the Huarabagoo and Junnagunna deposits – an area not extensively targeted in the past by Laramide. This drilling was one component of a broader program to assess the potential for additional uranium resources at Westmoreland. Initial drilling in the corridor resulted in the discovery of a new zone of mineralisation that was not previously known to the Company. In

WESTMORELAND URANIUM PROJECT NATIONAL INSTRUMENT 43-101 TECHNICAL REPORT
3182\16.04\3182-STY-001_0 S9
Page 9.4
April 2016 Mining Associates
addition, a shallowly dipping zone of mineralization, similar in style to the shallow mineralisation at Junnagunna, was intersected and shows the potential to further increase the overall size of the resource (Figure 9.4.2).
The second potion of the drilling program focused on the Huarabagoo deposit both in the existing resource and in the northern section outside of the resource area. Drilling was designed to better define the structurally controlled mineralisation in this area and, potentially, increase the resource within the existing deposit and along strike. Drilling delivered significant widths and grades at Huarabagoo. The drilling confirmed the Huarabagoo mineralisation is controlled by steep structures broadly parallel to the Redtree Dyke. Drilling in the northern portion of the prospect successfully identified a new intersection east of the dyke.
Figure 9.4.2 Cross Section within Structural Corridor
9.5 Petrological and SEM Analysis
A petrological, mineragraphic examination and semi quantitative electron microscopic identification of selected encrusting uranium bearing secondary minerals was undertaken in 2008. The work was based upon a selection of rock samples and a selection of quarter core samples chosen from the 2007 Phase 1 drilling.
A scanning electron microscope (SEM) analysis was conducted on assay pulps by SGS Minerals Services. The study included a general mineralogical analysis and specific uranium study of

WESTMORELAND URANIUM PROJECT NATIONAL INSTRUMENT 43-101 TECHNICAL REPORT
3182\16.04\3182-STY-001_0 S9
Page 9.5
April 2016 Mining Associates
uranium-bearing species and associated gangue minerals. The purpose was to provide accurate characterisation of the uranium species present in the Redtree and Junnagunna mineralisation.
In 2010 a QEMSCAN analysis of samples was also undertaken. SGS was contracted to analyse a number of uranium bearing ore samples to quantify their mineralogy, particularly with respect to uranium bearing minerals.
In 2015 analysis of drill core was undertaken using a hyperspectral PIMA (portable infrared mineral analyser). The purpose was to physically examine and interpret the mineralised intervals of the Westmoreland conglomerate, and to gain information on clay alteration halos present.
9.6 Metallurgical Studies
In 2010, ANSTO Minerals undertook a metallurgical test program on the extraction of uranium from four composite lens samples of the Westmoreland deposit. The overall aim of the study was to obtain data on process options for the recovery of uranium. A conceptual design flow-sheet, which comprises conventional acid leaching followed by IX or SX and uranium product recovery, was examined in this test program. Petrological SEM work and analysis was also undertaken by ANSTO as part of the metallurgical study. Refer to ‘ANSTO, 2011 Westmoreland Final Report’.

WESTMORELAND URANIUM PROJECT
NATIONAL INSTRUMENT 43-101 TECHNICAL REPORT
3182-STY-001
Table of Contents Page
10.0 DRILLING 10.1 10.1 Westmoreland Exploration 2007 to 2008 10.1 10.2 Westmoreland Results 2007 to 2008 Drilling 10.4
10.2.1 Lithology and Stratigraphy 10.4 10.2.2 Mineralisation and Alteration 10.5 10.2.3 Validation of Historical Drilling 10.8 10.2.4 Westmoreland Exploration 2009 to 2010 10.8 10.2.5 Westmoreland Results of 2009 Drilling 10.9 10.2.6 Westmoreland Results of 2010 Drilling 10.9 10.2.7 Westmoreland Results of 2012 Drilling 10.10
TABLES Table 10.1.1 Total Drilling at Redtree to 2008 10.1 Table 10.2.1 Summary of 2009 Drilling Results 10.9 Table 10.2.2 Summary of 2010 Drilling Results 10.10 Table 10.2.3 Summary of Reported 2012 Drilling 10.12 Table 10.2.4 Summary of 2012 Drilling Gold Assays 10.13 FIGURES Figure 10.1.1 Redtree – 2008 Drill Plan (AGD66/AMG54) 10.2 Figure 10.1.2 Junnagunna – 2008 Drill Location Plan (AGD66/AMG54) 10.3 Figure 10.1.3 Looking NE Along Redtree Dyke from Garee Lens 10.4 Figure 10.2.1 Fan of Drill Holes in Garee Lens, Redtree Prospect 10.5 Figure 10.2.2 Fan of Drill Holes at Redtree 10.6 Figure 10.2.3 Fan of Drill Holes at Junnagunna – Mineralisation East of Dyke 10.7
3182\16.04\3182-STY-001_0 S10 April 2016 Mining Associates

WESTMORELAND URANIUM PROJECT NATIONAL INSTRUMENT 43-101 TECHNICAL REPORT
3182\16.04\3182-STY-001_0 S10
Page 10.1
April 2016 Mining Associates
10.0 DRILLING
10.1 Westmoreland Exploration 2007 to 2008
Exploration by Laramide during the 2007 to 2008 period comprised a diamond drilling program resulting in 12,230.4 m of core. This drilling consisted of 8,836.7 m on the Redtree prospect and 3,393.7 m on the Junnagunna Prospect.
The primary objectives of the drilling program were:
• To provide quality controlled drill data within the Redtree and Junnagunna deposits from which to assess the accuracy and validity of historical drilling.
• To improve geological understanding of lithology, alteration and structural controls on mineralisation.
• To provide closer spaced drilling to improve confidence levels on resource estimates.
A total of 8,059 samples, consisting of 6,464 for Redtree and 1,595 for Junnagunna, were submitted for chemical analysis excluding duplicates, blanks and standards. In addition, some 26 samples were sent for petrological analysis, 20 for SEM (scanning electron microscopy) analysis, and 16 holes were drilled for metallurgical testing.
The Laramide diamond drill programs are the largest diamond drill programs undertaken at Redtree, and constitute more than half of the diamond drill holes drilled at Redtree. Table 10.1.1 provides brief history of drill programs to 2008 at Redtree.
Table 10.1.1 Total Drilling at Redtree to 2008
Company Period
Open Hole Percussion Reverse Circulation Diamond Core Total
No. Holes
Metres Drilled
No. Holes
Metres Drilled
No. Holes
Metres Drilled
No. Holes
Metres Drilled
QML 1969 – 1971 286 14,675 - - 49 7,637 335 22,312 MIM 1969 – 1970 26 700 - - 57 2,251.2 83 2,951.2 Minad 1975 - - - - 3 107.9 3 107.9 UG 1976 – 1978 - - - - 8 33 8 333 Omega 1977 - - - - 3 183 3 183 CRAE 1990 – 1995 81 2,842.6 - - 17 797.1 98 3,639.73 Laramide 2007 - 2008 - - - - 165 8,836.7 165 8,836.7
Total 393 18,217.6 - - 302 20,145.9 695 38,363.5
During the first phase of drilling (November 2007 to July 2008):
• 126 diamond holes were drilled for 7,908.3 m at the Redtree prospect (Figure 10.1.1).

WESTMORELAND URANIUM PROJECT NATIONAL INSTRUMENT 43-101 TECHNICAL REPORT
3182\16.04\3182-STY-001_0 S10
Page 10.2
April 2016 Mining Associates
• 34 holes for 3,393.7 m were drilled at the Junnagunna Prospect (Figure 10.1.2).
During the second phase of drilling (September 2008 to October 2008):
• 39 diamond holes were completed at Redtree for a total of 928.4 m. The majority of drilling was completed using NQ drill bits however a number of holes were drilled to HQ core size, primarily to obtain a larger sample for metallurgical testwork.
Figure 10.1.1 Redtree – 2008 Drill Plan (AGD66/AMG54)
Source: Jones & Vigar, 2009

WESTMORELAND URANIUM PROJECT NATIONAL INSTRUMENT 43-101 TECHNICAL REPORT
3182\16.04\3182-STY-001_0 S10
Page 10.3
April 2016 Mining Associates
Figure 10.1.2 Junnagunna – 2008 Drill Location Plan (AGD66/AMG54)
Due to the difficult terrain at Redtree and to minimise environmental impact, fans of drill holes were drilled from select drill pads during the first phase of the program to obtain the required drill density. Figure 10.1.3 shows the rugged nature of the ground with a small canyon in the outcropping Westmoreland Conglomerate where the Redtree dyke has preferentially weathered. The view is from Redtree looking north east towards Huarabagoo and Junnagunna.

WESTMORELAND URANIUM PROJECT NATIONAL INSTRUMENT 43-101 TECHNICAL REPORT
3182\16.04\3182-STY-001_0 S10
Page 10.4
April 2016 Mining Associates
Figure 10.1.3 Looking NE Along Redtree Dyke from Garee Lens
Source: Jones, 2008
10.2 Westmoreland Results 2007 to 2008 Drilling
10.2.1 Lithology and Stratigraphy
Drilling at Redtree intersected primarily the upper unit of the Westmoreland Conglomerate (Ptw4). Lithologies intersected within this unit were predominantly coarse quartz arenites with intervals grading into pebble conglomerate. These lithologies are underlain by coarser cobble conglomerates at depth.
At Junnagunna, the Westmoreland Conglomerate is overlain by basalt of the Seigal Volcanics which are in turn overlain by about 8 m of Quaternary alluvial / colluvial clays and sand. Extremely to moderately weathered basalt was intersected to vertical depths of between approximately 10 and 25 m. The stratigraphy of the Westmoreland Conglomerate at Junnagunna differs from the Redtree area in that there are less of the coarse, pebble conglomerate units. The upper part of the sequence at Junnagunna is dominantly a medium to coarse grained sandstone underlain by coarse sandstone with scattered pebbly clasts. The distinct pebbly conglomerate evident in the upper part of the Redtree deposit appears to be absent.
Drilling during the 2008 program focused on intersecting mineralisation in the vicinity of the dyke. The dyke was intersected in a number of holes and was shown to be strongly fractured and variably altered. Steeply dipping fault planes and fracture networks were observed within the dyke, on the dyke contacts and to a limited extent, into the surrounding sandstone.

WESTMORELAND URANIUM PROJECT NATIONAL INSTRUMENT 43-101 TECHNICAL REPORT
3182\16.04\3182-STY-001_0 S10
Page 10.5
April 2016 Mining Associates
10.2.2 Mineralisation and Alteration
Mineralisation intersected at Redtree was found to be associated with chlorite and/or hematite alteration of coarse sandstone and pebble conglomerate. There appears to be a broad association between higher grade mineralisation and coarser grained intervals, particularly fine pebble conglomerate beds which are dominantly clast supported, although mineralisation has been observed in a range of sandstone and conglomerate types. Mineralisation and alteration contacts are mostly bedding parallel (gently dipping). In the central part of the deposit there is little evidence for significant steep, or dyke related mineralisation.
Flat lying, shallow mineralisation at Redtree is commonly associated with a pebble conglomerate layer that is continuous over a significant part of the deposit area. This includes the Jack Lens and the upper part of the Garee Lens (Figure 10.2.1). Mineralisation in these lenses is associated with moderate to strong hematite alteration with lesser chlorite and sericite alteration. Deeper lenses of mineralisation have also been intersected but tend to be associated with more variable stratigraphy, although higher grade mineralisation is again associated with coarser sandstone / pebble conglomerate units. Deeper mineralisation is commonly associated with chlorite altered sediments with lesser hematite and sericite alteration.
Figure 10.2.1 Fan of Drill Holes in Garee Lens, Redtree Prospect
Source: Laramide, 2009

WESTMORELAND URANIUM PROJECT NATIONAL INSTRUMENT 43-101 TECHNICAL REPORT
3182\16.04\3182-STY-001_0 S10
Page 10.6
April 2016 Mining Associates
Figure 10.2.2 Fan of Drill Holes at Redtree
Source: Jones & Vigar, 2009
Figure 10.2.2 shows an intersection of 12 to 14 m (approximate true width) sub-horizontal mineralisation at Redtree from a depth of about 10 m below the ground surface by WDD08-040 (far left) and WDD08-046 (middle).
SEM analysis of uranium mineralogy indicates relatively consistent uranium occurrence in the various lenses intersected during the first phase of drilling. For the majority of samples, 60 to 80% of uranium is contained within uraninite with the remainder being dominantly coffinite (2 to 15%) and meta-autunite (1 to 6%). Coffinite was found to be proportionally more abundant in two samples (40% and 32%) both of which were obtained from the lower part of the Garee lens. Brannerite was found to be absent or in trace quantities (<1% of uranium in brannerite).
At Junnagunna, mineralisation was intersected within the vicinity of the dyke, broadly confirming historic drilling; however the association of uranium mineralisation with faulting was shown to be indirect. Mineralisation was not associated with the most strongly faulted and fractured rock, although some steeper mineralisation has been identified in steep structures close to the dyke.

WESTMORELAND URANIUM PROJECT NATIONAL INSTRUMENT 43-101 TECHNICAL REPORT
3182\16.04\3182-STY-001_0 S10
Page 10.7
April 2016 Mining Associates
Figure 10.2.3 Fan of Drill Holes at Junnagunna – Mineralisation East of Dyke
Source: Jones & Vigar, 2009
Figure 10.2.3 shows three holes drilled at Junnagunna from the west side of the Redtree dyke penetrating the dolerite to intersect mineralisation in Westmoreland Conglomerate on the east side of the dyke. Drill holes JDD08-012 (angled hole) and JDD08-031 (sub-vertical hole) intersect some 9 m (approximate true width) of sub-horizontal mineralisation at about 57 m below the ground surface that may have a vertical component immediately adjacent to the dyke.
Strongest mineralisation was found to be associated with chlorite and hematite altered coarse pebbly sandstones broadly similar to that encountered at Redtree. Strongly silicified and fractured rock found adjacent to the dyke was generally poorly mineralised. Alteration and mineralisation contacts indicate a bedding parallel component to the mineralisation however the overall geometry of mineralisation indicates a vertical control. It is interpreted that higher grade mineralisation occurs partly within favourable horizons but laterally confined within a broad structural corridor.

WESTMORELAND URANIUM PROJECT NATIONAL INSTRUMENT 43-101 TECHNICAL REPORT
3182\16.04\3182-STY-001_0 S10
Page 10.8
April 2016 Mining Associates
Drilling also identified offsets in the position in the dyke suggesting cross faulting. The recognition of this offset allowed for repositioning drill holes at the completion of the program to test the southern extension of steep mineralisation. Drill hole JDD08-033 intersected 8 m at 0.52% U3O8 from 94 m, suggesting the continuation of this mineralisation to the south. A re-evaluation of the geological model suggests that the steep mineralisation is not adequately tested in the Junnagunna deposit due to these fault offsets and it is considered that further drilling will allow for better definition of this zone.
It is considered that there is potential for more laterally extensive lenses where other favourable sedimentary horizons occur, such as those intersected at Redtree.
The results of drilling that intersected mineralisation at Junnagunna and Redtree in the 2007 to 2008 phase of drilling at Westmoreland are shown on tables 10 and 11 of the Westmoreland Mineral Resource Estimates – (Vigar & Jones, May 2009). A full table of the holes drilled in 2007 and 2008 is in Appendix 1 of the same report.
10.2.3 Validation of Historical Drilling
The objective of the 2007 to 2008 programme was to provide quality controlled drill data within the Redtree and Junnagunna deposits from which to assess the accuracy and validity of historical drilling. A number of holes were drilled adjacent to historic holes to validate past intersections. Due to the difficulty in placing drill rigs with helicopters, these holes were generally drilled within 5 to 10 m.
Comparisons of grade were considered acceptable, showing equivalent grades over mineralised intervals. Variations were considered within range taking into account dip and strike of the mineralised body, short range grade variations and nugget effects. These twinned holes have validated the historical drilling.
10.2.4 Westmoreland Exploration 2009 to 2010
Following the 2007 to 2008 field season drilling program, the next phase of drilling, part of a program assessing the potential for additional uranium resources in the Redtree-Junnagunna structural trend, was completed during the latter half of 2009 and 2010.
A total of 17 diamond drill holes for 1,871.2 m were drilled in November and December 2009. The drilling at Huarabagoo and Junnagunna was focused on defining steeper structurally controlled mineralisation.
In August and September 2010 an additional 19 diamond drill holes for 1,377.9 m were drilled. Of the 19 holes, seven holes were drilled at Huarabagoo and 12 holes were drilled at Long Pocket. The drilling at Huarabagoo was undertaken primarily to obtain structural data on mineralizing structures in the northern part of that prospect. Drilling at Long Pocket consisted of a single traverse of 50 m spaced holes and was undertaken to test the tenor and distribution of mineralisation at the historic Outcamp prospect.

WESTMORELAND URANIUM PROJECT NATIONAL INSTRUMENT 43-101 TECHNICAL REPORT
3182\16.04\3182-STY-001_0 S10
Page 10.9
April 2016 Mining Associates
10.2.5 Westmoreland Results of 2009 Drilling
Drilling confirmed continuity of mineralisation at Junnagunna and Huarabagoo and indicated that steeper structurally controlled mineralisation may extend beyond the defined boundaries of the existing resources. Holes were also analysed for gold but no significant gold was detected other than the weakly anomalous gold in WDD09-128.
Table 10.2.1 Summary of 2009 Drilling Results
Drill Hole AMG East*
AMG North*
Azimuth (degrees)
Dip (degrees)
RL (m)
From (m)
To (m)
Interval (m)
U3O8 (%)
Huarabagoo North WDD09-128 194494 8063127 309 -60 82.35 32 57 25 0.07
Including 48 57 9 0.14 WDD09-128 194494 8063127 309 -60 82.35 79 103 24 0.07
Including 90 96 6 0.13 WDD09-129 194494 8063127 309 -45 82.35 23 39 16 0.06 WDD09-130 194494 8063127 0 -90 82.35 53 60 7 0.08 WDD09-131 194494 8063127 129 -45 82.35 85 90 5 0.04 WDD09-131 194494 8063127 129 -45 82.35 107 117 10 0.04 WDD09-132 194678 8063348 309 -75 81.26 44 53 10 0.08 WDD09-132 194678 8063348 309 -75 81.26 72 75 3 0.06 WDD09-133 194678 8063348 309 -55 81.26 No Significant Assays WDD09-134 194678 8063348 129 -45 81.26 No Significant Assays WDD09-135 194678 8063348 0 -90 81 No Significant Assays
Junnagunna Deposit WDD09-136 196728 8065615 309 -80 76 60 65 5 0.18
And 73 75 2 0.24 And 79 81 2 0.14 And 90 100 10 0.10
WDD09-137 196764 8065649 309 -80 56 76 20 0.25 And 80 93 13 0.07
Junnagunna South WDD09-138 196139 8065001 309 -60 76.5 No Significant Assays WDD09-139 196139 8065001 129 -55 76.5 No Significant Assays WDD09-140 196139 8065001 129 -75 76.5 71 76 5 0.09 WDD09-141 196204 8064939 309 -60 76.6 No Significant Assays WDD09-142 196204 8064939 129 -60 76.6 No Significant Assays
Huarabagoo North WDD09-143 194551 8063076 309 -60 82.35 No Significant Assays WDD09-144 194551 8063076 0 -90 82.35 No Significant Assays
*Datum is AGD66 *Intersections calculated using a 0.02% U3O8 cut-off and minimum intersection of 2 metres.
10.2.6 Westmoreland Results of 2010 Drilling
The drilling at Huarabagoo confirmed the Huarabagoo mineralisation is bound by steep structures broadly parallel to the Redtree Dyke with indications of horizontal mineralisation in coarser more permeable sandstone facies.

WESTMORELAND URANIUM PROJECT NATIONAL INSTRUMENT 43-101 TECHNICAL REPORT
3182\16.04\3182-STY-001_0 S10
Page 10.10
April 2016 Mining Associates
Drilling at Long Pocket confirmed the presence of a broad, flat-lying and relatively shallow zone of uranium mineralisation. In the historic Outcamp prospect area the width of the mineralized zone (>0.02% U3O8) is approximately 500 m.
Table 10.2.2 Summary of 2010 Drilling Results
Drill Hole AMG East*
AMG North*
Azimuth (degrees)
Dip (degrees)
RL (m)
From (m)
To (m)
Interval (m)
U3O8 (%)
Huarabagoo** WDD10-145 194603.4 8063271.9 309 -45 80.75 No Significant Assays WDD10-146 194603.4 8063271.9 309 -70 80.75 28 38 10 0.04
40 45 5 0.05 WDD10-147 194603.4 8063271.9 0 -90 80.75 18 20 2 0.05
27 48 21 0.05 69 71 2 0.05
WDD10-148 194599.6 8063268.5 129 -60 80.47 No Significant Assays WDD10-149 194540.9 8063207.2 129 -45 81.41 No Significant Assays WDD10-150 194540.9 8063207.2 129 -70 81.38 19 35 16 0.08 WDD10-151 194540.9 8063207.2 0 -90 81.38 22 31 9 0.16
43 45 2 0.06 55 62 7 0.11
Long Pocket*** LPDD10-001 204262.5 8065022.9 0 -90 93.82 42 45 3 0.02 LPDD10-002 204166.8 8064992.1 0 -90 93.91 5 11 6 0.06
15 17 2 0.03 41 42 2 0.03
LPDD10-003 204084.4 8064936.4 0 -90 94.18 0 6 6 0.03 17 23 6 0.03
LPDD10-004 204005.5 8064877.0 0 -90 94.93 19 23 4 0.13 LPDD10-005 203915.6 8064837.6 0 -90 95.26 33 36 3 0.02 LPDD10-006 203822.1 8064799.0 0 -90 95.79 23 27 4 0.29 LPDD10-007 203732.6 8064759.3 0 -90 97.17 No Significant Assays LPDD10-008 204125.2 8064963.2 0 -90 94.26 8 11 3 0.02
29 31 2 0.03 39 41 2 0.02
LPDD10-009 204044.4 8064906.3 0 -90 94.57 5 20 15 0.09 LPDD10-010 203960.2 8064855.3 0 -90 95.42 22 26 4 0.04
35 37 2 0.02 LPDD10-011 203869 8064818.3 0 -90 95.27 26 30 4 0.04
32 35 3 0.02 LPDD10-012 204214.5 8065012.3 0 -90 93.89 4 9 5 0.04 *Datum is AGD66 **WDD10 = 200ppm U3O8 cut off and minimum intersection of 2 metres ***LPDD10 = 100ppm U3O8 cut off and minimum intersection of 2 metres
10.2.7 Westmoreland Results of 2012 Drilling
The 2012 drilling program comprised 31 diamond drill holes for 4,118m, of which 19 holes were drilled in the northern Huarabagoo deposit area, and 12 were drilled along the structural corridor that connects the Huarabagoo and Junnagunna deposits.

WESTMORELAND URANIUM PROJECT NATIONAL INSTRUMENT 43-101 TECHNICAL REPORT
3182\16.04\3182-STY-001_0 S10
Page 10.11
April 2016 Mining Associates
Results of this drilling campaign have identified new zones of mineralisation in both the Huarabagoo deposit area and the Structural Corridor, as described in press releases dated 17 October 2012 and 9 January 2013.
Drilling Highlights
A portion of the program was focused on the highly prospective structural corridor that connects the Huarabagoo and Junnagunna deposits in an area not extensively targeted in the past by Laramide or previous owner Rio Tinto. This drilling was one component of a broader program to assess the potential for additional uranium resources at Westmoreland.
Initial drilling in the corridor resulted in the discovery of a new zone of mineralisation (WDD12-152 - 11 m at 1,311 ppm U3O8) that was not previously known to the Company.
In addition, holes 155 and 156 intersected a flatly dipping mineralisation zone that has the potential for further resource development. This mineralisation intercepted in drill hole WDD12-155 (3 m at 1,094 ppm U3O8) and WDD12-156 (5 m at 805 ppm U3O8) is similar in style to the shallow mineralisation at Junnagunna and shows the potential to further increase the overall size of the resource.
The Huarabagoo deposit and Huarabagoo-Junnagunna structural corridor is the least understood of the three main deposits with the bulk of the Westmoreland resource base located in the Redtree deposit. The Huarabagoo deposit is approximately 3 km northeast of the Redtree deposit along the Redtree dyke which extends for 7 km to the Junnagunna deposit. A 2009 drilling program successfully targeted mineralisation in the southern extent of the Junnagunna deposit, and this new program demonstrates potential in the southern and central area of the structural corridor.
The second target area in the program focused on the Huarabagoo deposit both in the existing resource and in the northern section outside the resource area. Drilling was designed to better define the structurally controlled mineralisation in this area and, potentially, increase the resource within the existing deposit and along strike.
Drilling in this program delivered significant widths and grades from Huarabagoo which continues to establish the quality of the resource as seen in Hole WDD12-158 (52 m at 492 ppm U3O8). The drilling confirmed the Huarabagoo mineralisation is controlled by steep structures broadly parallel to the Redtree dyke with indications of horizontal mineralisation in coarser more permeable sandstone facies.
Drilling in the northern portion of the prospect successfully identified new intersections east of the dyke in Holes WDD12-160 (16 m at 983 ppm U3O8 from 62 m) and WDD12-169 (6 m at 377 ppm U3O8). In addition, a new mineralized zone was hit in Holes WDD12-159 (10 m at 970 ppm U3O8 within a broader zone of 18 m at 621 ppm U3O8) and WDD12-170 (10 m at 3,965 ppm U3O8 within a broader zone of 34 m at 1,467 ppm U3O8). These intersections were also a new zone previously unknown located east of the dyke.
Assay results of the reported drill holes are summarised below.

WESTMORELAND URANIUM PROJECT NATIONAL INSTRUMENT 43-101 TECHNICAL REPORT
3182\16.04\3182-STY-001_0 S10
Page 10.12
April 2016 Mining Associates
Table 10.2.3 Summary of Reported 2012 Drilling
Drill Hole AMG East*
AMG North*
Azimuth (degrees)
Dip (degrees) RL (m)
Hole Depth
(m) From (m) To (m) Interval
(m) U3O8 (ppm)
WDD12-152 195154 8064005 309 -75 77.5 138.0 72 75 3 484
87 98 11 1311 109 116 7 221 123 126 3 1087
WDD12-153 195154 8064005 309 -55 77.5 156.0 36 38 2 135
45 46 1 107 70 72 2 128
WDD12-154 Abandoned at 80 m WDD12-155 195281 8063885 309 -60 77.0 147.1 42 45 3 1094
133 136 3 161 WDD12-156 195281 8063885 129 -60 77.0 123.1 39 44 5 804 WDD12-157 195208 8063954 129 -60 77.5 120.1 42 45 3 196 WDD12-158 194452 8063086 0 -90 80.0 114.6 22 74 52 492
Includes 46 58 12 1480 WDD12-159 194481 8063059 129 -50 80.0 119.0 23 41 18 621
Includes 31 41 10 970 and 64 78 14 819
WDD12-160 194412 8062986 129 -60 81.0 123.0 10 14 4 130
49 54 5 214 62 78 16 983
WDD12-161 194405 8063115 129 -50 80.0 201.0 6 13 7 404
44 46 2 290 52 67 15 2778
Includes 55 61 6 6500 76 95 19 247
Includes 77 84 7 398 100 102 2 238
WDD12-162 194370 8063017 129 -50 80.0 132.0 36 75 39 983 Includes 49 67 18 1614
WDD12-163 194370 8063017 129 -65 80.0 123.3 42 50 8 3503 62 79 17 1289
Includes 63 67 4 3160 WDD12-164 194276 8062822 129 -70 81.0 120.0 27 38 11 164
54 56 2 201 76 78 2 175 89 92 3 1076
WDD12-165 194276 8062822 129 -85 81.0 111.3 4 6 2 352
14 16 2 526 21 39 18 252
WDD12-166 194276 8062822 309 -70 81.0 111.3 4 6 2 393 56 69 13 838
Includes 65 69 4 2341 74 76 2 328
WDD12-167 194108 8062643 129 -55 84.0 122.1 0 7 7 852 Includes 0 3 3 1663
11 14 3 833 18 23 5 272 28 35 7 590 55 59 4 369 64 67 3 777 86 95 9 842
WDD12-168 194108 8062643 129 -75 84.0 128.9 0 7 7 1454
17 23 6 894 27 63 36 858
Includes 33 38 5 1752 119 121 2 208
WDD12-169 194412 8062986 129 -45 81.0 121.8 32 38 6 377 WDD12-170 194481 8063059 129 -70 80.0 150.0 33 36 3 442
57 91 34 1467 Includes 60 70 10 3965
WDD12-171 195154 8064005 309 -65 77.5 155.1 48 51 3 163 125 128 3 383
WDD12-172 195154 8064005 129 -70 77.5 150.0 100 110 10 136 WDD12-173 195154 8064005 129 -85 77.5 162.1 30 35 5 205
* Datum is AGD66 ** Intersections calculated using a 100 ppm U3O8 cut-off and minimum intersection of 1 metre *** WDD12-154 was abandoned and therefore not assayed
In addition, several gold intersections were encountered in the drilling program as well, including hole WDD12-167 with 2 m at 6.1 g/t Au from 33 m, and 4 m at 30.9 g/t Au from 55 m.

WESTMORELAND URANIUM PROJECT NATIONAL INSTRUMENT 43-101 TECHNICAL REPORT
3182\16.04\3182-STY-001_0 S10
Page 10.13
April 2016 Mining Associates
Assay results of the reported drill hole gold intercepts are summarised below.
Table 10.2.4 Summary of 2012 Drilling Gold Assays
Table 10.8: Summary of 2012 Drilling Gold Assays
Drill Hole AMG East*
AMG North*
Azimuth (degrees)
Dip (degrees)
RL (m)
Hole Depth
(m) From (m) To (m) Interval
(m) Au
(g/t)
WDD12-163 194370 8063017 129 -65 80.0 123.3 62 63 1 0.6 WDD12-165 194276 8062822 129 -85 81.0 111.3 14 16 2 31.5 WDD12-166 194276 8062822 309 -70 81.0 111.3 54 56 2 1.6 WDD12-167 194108 8062643 129 -55 84.0 122.1 33 35 2 6.1
55 59 4 30.9 64 66 2 1.6
WDD12-168 194108 8062643 129 -75 84.0 128.9 13 14 1 2.7
28 31 3 0.8 55 57 2 1.1 61 62 1 1.7 72 73 1 0.6
* Datum is AGD66 ** Gold intersections calculated using 0.5 g/t Au cut-off and minimum intersection of 1 metre

WESTMORELAND URANIUM PROJECT
NATIONAL INSTRUMENT 43-101 TECHNICAL REPORT
3182-STY-001
Table of Contents Page
11.0 SAMPLING METHOD AND APPROACH 11.1 11.1 Downhole Gamma Logging 11.1
11.1.1 Geological Logging 11.1 11.1.2 Sampling for Chemical Analysis 11.4 11.1.3 Petrology 11.7 11.1.4 SEM Samples 11.7 11.1.5 Metallurgy 11.7 11.1.6 Discussion 11.7
11.2 Sample Preparation, Analyses and Security 11.8 11.2.1 Sample Preparation before Dispatch 11.8
11.3 Security 11.10 11.4 Laboratory Sample Preparation and Analysis 11.10 11.5 QA and QC 11.12
11.5.1 Standards 11.12 11.5.2 Blanks 11.14 11.5.3 Duplicates 11.16
11.6 Discussion 11.18 TABLES Table 11.4.1 Analytical Method 11.11 Table 11.5.1 Summary of LAM’s Certified Standards 11.13 FIGURES Figure 11.1.1 Orienting Core Prior to Logging (Jones, 2008) 11.2 Figure 11.1.2 Orienting Core (Jones, 2008) 11.3 Figure 11.1.3 Photographing of Core Trays (Jones, 2008) 11.3 Figure 11.1.4 Gamma Log Results (Jones, 2008) 11.4 Figure 11.1.5 Drill Holes Marked-up for Sawing and Sampling (Jones, 2008) 11.5 Figure 11.1.6 Breaking Core into 10 cm Sections to Fit in Saw Cradle (Jones, 2008) 11.6 Figure 11.1.7 Cutting Core Using a Diamond Saw (Jones, 2008) 11.6 Figure 11.2.1 Ten Sawn-Core Samples Packed into Each Yellow Poly Sack (Jones,
2008) 11.9 Figure 11.2.2 Metal Box (with Shelves) for Transport of Samples (Jones, 2008) 11.10 Figure 11.5.1 Results for Standard 101a 11.13 Figure 11.5.2 Results for Standard 101b 11.14 Figure 11.5.3 Assay Results of Blanks 11.15 Figure 11.5.4 Low Level Contamination in Blanks 11.16 Figure 11.5.5 Comparison of Half Core Duplicate Assays 11.16 Figure 11.5.6 Comparison of Coarse Split Duplicates 11.17 Figure 11.5.7 Comparison of Inter-Laboratory Repeats 11.18
3182\16.04\3182-STY-001_0 S11 April 2016 Mining Associates

WESTMORELAND URANIUM PROJECT NATIONAL INSTRUMENT 43-101 TECHNICAL REPORT
3182\16.04\3182-STY-001_0 S11
Page 11.1
April 2016 Mining Associates
11.0 SAMPLING METHOD AND APPROACH
Holes drilled during the LAM drilling are generally gamma logged at the completion of each hole. All holes are geotechnically and geologically logged and photographed. Based on Geological Logging, Downhole Gamma Logging and scintillometer readings, one metre lengths of core were selected for chemical analysis. Selection is based mainly on the gamma log, supported by hand-held scintillometer checking. Any section >50 ppm U3O8 (based on the gamma log) is sent for assay, plus a buffer either side of that interval (sampled in one-metre ½ core intervals).
Petrology samples were selected to provide a representative suite of mineralization and alteration across all mineralized zones. Metallurgical samples were collected by taking half HQ core 5 m composite samples.
11.1 Downhole Gamma Logging
Logging was undertaken inside the steel casing and after the hole had been filled with clean water. Logging was undertaken using an Auslog A088 probe at 10 cm intervals. Raw cps readings were recorded and stored in digital format.
Calibration holes have been established. Steel casing is left in the holes and the hole is re-logged on monthly intervals to check for instrument drift. The results showed consistent readings.
An approximate K-factor was calculated based on a comparison with assay results from the first few drillholes. Approximate eU3O8 values were used for initial interpretation of results and selecting sample intervals to assay, but are not intended to be used for resource estimation. Sampling intervals were selected by identifying broad intervals above 50 ppm eU3O8 and then a buffer extending sampling a further 2 to 5 m into “barren” material. Where multiple zones were encountered, the entire interval was sampled rather than having separate sub-intervals.
The relationship between gamma log results and assays has been monitored throughout the program to check for possible disequilibrium effects and to ensure that appropriate intervals were being sampled. Good correlation has been observed throughout the program and no discernable disequilibrium effects have been identified.
Results from gamma logging are stored electronically referencing the individual holes in the company’s drillhole library.
11.1.1 Geological Logging
Each tray is laid out in sequence on rollers to facilitate handling and logging of the core (Figure 11.1.1). Steel star pickets have been welded along the length of the logging table to provide a channel within which the core is reconstructed from the trays (Figure 11.1.2).
Once the core is assembled and oriented, geotechnical logging commences, followed by geological logging. The data is entered on to standard logging workbooks in Microsoft Excel format using a Panasonic Toughbook computer. Each hole is assigned a workbook containing a series of worksheets including a Collar Data worksheet, Survey Data, Lithology, Alteration, Geotechnical

WESTMORELAND URANIUM PROJECT NATIONAL INSTRUMENT 43-101 TECHNICAL REPORT
3182\16.04\3182-STY-001_0 S11
Page 11.2
April 2016 Mining Associates
(including Core Recovery details and Rock Quality Data (RQD)), Structure, Primary Sampling Data, Petrology, Standard and Duplicate Sample data. After the hole is logged, the program carries out a validation check using a built-in macro to ensure that all data has been correctly entered. A separate data base is maintained for the gamma logging of each hole.
All logs are backed up locally on to the site computer, and also downloaded to the server in Laramide’s Brisbane office. Once checked and verified by the supervising geologist, the logs are loaded into the principal database.
All drill core is photographed to provide a visual record of the core as it appears shortly after drilling (Figure 11.1.3). The photos are taken with the core oriented so that the reference line faces the bottom of the core tray. The system applies a standard camera mount to photograph two trays at a time prior to sawing of the core. An electronic flash is used and all photographs are taken under the same conditions to ensure compatibility in viewing the results. The camera is connected directly to the Panasonic Toughbook computer and the core images stored as high resolution image files.
Figure 11.1.1 Orienting Core Prior to Logging (Jones, 2008)

WESTMORELAND URANIUM PROJECT NATIONAL INSTRUMENT 43-101 TECHNICAL REPORT
3182\16.04\3182-STY-001_0 S11
Page 11.3
April 2016 Mining Associates
Figure 11.1.2 Orienting Core (Jones, 2008)
Yellow X marks driller’s break to fit in tray
Figure 11.1.3 Photographing of Core Trays (Jones, 2008)

WESTMORELAND URANIUM PROJECT NATIONAL INSTRUMENT 43-101 TECHNICAL REPORT
3182\16.04\3182-STY-001_0 S11
Page 11.4
April 2016 Mining Associates
11.1.2 Sampling for Chemical Analysis
After all logging and photography is completed, the assay sampling intervals are selected. Selection is based mainly on the gamma log, supported by hand-held scintillometer checking (Figure 11.1.4). Any section greater than 50 ppm U3O8 is sent for assay, plus a buffer either side of that interval.
Core is sampled at one-metre intervals within the selected zones. All core is sawn using a diamond saw (Figure 11.1.7). The core is cut along the orientation lines drawn by the geologist during logging (Figure 11.1.5). The samplers and other personnel in the vicinity of the core saw all wear suitable protective equipment (Figure 11.1.6). In addition, while away from the camp all staff and contractors wear radiation badges (dosimeters), in accordance with the requirements for all personnel exposed to ionising radiation (Section 38 of the Queensland Radiation Safety Act 1999). Dosimeters monitor exposure over a defined period of time, typically three months. Laramide use the special sealed thermo-luminescence dosimeter (TLD) provided by the Australian Radiation Protection and Nuclear Safety Agency (ARPANSA). These are designed for use in dusty conditions. The maximum annual dose allowed for radiation workers is 20 millisieverts (mSv) per annum, though in practice, doses are usually kept well below this level.
Figure 11.1.4 Gamma Log Results (Jones, 2008)

WESTMORELAND URANIUM PROJECT NATIONAL INSTRUMENT 43-101 TECHNICAL REPORT
3182\16.04\3182-STY-001_0 S11
Page 11.5
April 2016 Mining Associates
Figure 11.1.5 Drill Holes Marked-up for Sawing and Sampling (Jones, 2008)

WESTMORELAND URANIUM PROJECT NATIONAL INSTRUMENT 43-101 TECHNICAL REPORT
3182\16.04\3182-STY-001_0 S11
Page 11.6
April 2016 Mining Associates
Figure 11.1.6 Breaking Core into 10 cm Sections to Fit in Saw Cradle (Jones, 2008)
Figure 11.1.7 Cutting Core Using a Diamond Saw (Jones, 2008)

WESTMORELAND URANIUM PROJECT NATIONAL INSTRUMENT 43-101 TECHNICAL REPORT
3182\16.04\3182-STY-001_0 S11
Page 11.7
April 2016 Mining Associates
11.1.3 Petrology
Sample off-cuts were routinely selected for petrologic examination during core logging. Samples were given a sample number and their location recorded in drill logs and entered into the database. A selection of samples were submitted to Dr Jane Barron in St Ives, NSW for petrological description
Petrographic descriptions of samples selected from the Redtree area describe the sediments as variously silicified, poorly to moderately sorted quartz-rich arenites. The sandstones and conglomerates are considered to be formerly permeable quartz arenites which have become aquifer sediments in which variable proportions of cement (quartz, clay, chlorite) were deposited in pore spaces. Cementing clays are dominantly smectite and kaolinite. Alteration minerals occurring in the matrix are dominantly chlorite, sericite and hematite.
11.1.4 SEM Samples
The objectives of the SEM analysis (QEMSCAN) were to provide accurate characterisation of the uranium species present in the Redtree and Junnagunna deposits, a scanning electron microscope analysis was conducted on assay pulps from 20 mineralised intervals. The study included a general mineralogical analysis and specific uranium study of uranium bearing species and associated gangue minerals.
The predominant uranium bearing mineral was found to be uraninite (UO2) which with coffinite (U(SiO4)1-x(OH)4x) generally comprise >80% wt of uranium minerals. The species autunite (Ca(UO2)2(PO4)2•10-12H2O) and the dehydrated product meta-autunite is the other distinguishable uranium mineral of note, reporting up to 10% wt of the uranium.
The proportion of brannerite ((U,Ca,Ce)(Ti,Fe)2O6) is less than 1% of uranium mineralisation in 15 of 19 mineralised samples with values from 1 to 3.2% in four samples.
The results are consistent with previous SEM analyses undertaken by Rio Tinto in 1994.
11.1.5 Metallurgy
A total of 16 drill holes were drilled with HQ core size during the 2007 to 2008 program to obtain samples that may be submitted for metallurgical testwork. The holes were selected to provide representative samples throughout the Redtree deposit and to a lesser extent, Junnagunna. Samples consisted of five metre intervals of half HQ core. The samples were delivered to ANSTO at Lucas Heights in sealed 200 litre drums.
11.1.6 Discussion
Sampling methodology is carried out according to the procedures to a high standard; sample selection is based mainly on the gamma log, supported by hand-held scintillometer checking. Any section >50 ppm U3O8 is sent for assay, plus a buffer of between 2 to 5 m either side of that interval (sampled in one-metre ½ core intervals ), ensuring complete selection of the mineralised zones. Drill hole density within the resource area was planned to give the best possible coverage, although the rough terrain prevented a gridded pattern, the holes are splayed in order to gain the

WESTMORELAND URANIUM PROJECT NATIONAL INSTRUMENT 43-101 TECHNICAL REPORT
3182\16.04\3182-STY-001_0 S11
Page 11.8
April 2016 Mining Associates
best coverage, consequently the upper lenses have a higher drill density than the lower lenses, which provides better definition of the upper lenses.
Rock quality data indicated the core was competent and drill core recovery is excellent (average 97%). Areas of poorer recovery can be identified as near surface unconsolidated sediments (up to 20 m thick in places) or zones of poorer recovery below surface are generally associated with the dolerite dyke contact.
11.2 Sample Preparation, Analyses and Security
11.2.1 Sample Preparation before Dispatch
Sample numbers and intervals are recorded by the geologist into the sampling worksheet.
Blanks are inserted after each 40 samples, or one blank per hole using a stockpile of un-mineralised core.
A duplicate sample is added after each 20 to 25 samples or at least one in every drillhole, preferably within mineralised zones.
A stockpile of certified standard samples has been purchased by Laramide from OreSearch in Melbourne, Australia. The samples are from the Mt Gee uranium prospect in South Australia and at this stage only two standards are available, one certified at 390 ppm U3O8 and the other at 410 ppm U3O8. The standards are packed as 50 g quantities into sealed foil envelopes. Two of the same analyses are opened and combined into Kraft envelopes to provide a 100 g standard for insertion into the sample stream after each 40th sample (including blanks and duplicates).
Individual samples are packed into sealed and labelled plastic bags. A duplicate sample ticket is included inside the bag. Sample bags are packed, ten at a time, into yellow poly sacks (Figure 11.2.1). About ten yellow poly sacks are then packed into the bottom of a metal box (Figure 11.2.2), a plywood shelf placed on top, then another ten sacks, another plywood shelf, and a further ten sacks on top, and the metal lid sealed over the box containing 3 x 10 = 30 samples (maximum). A complete drill hole of 110 to 120 m might occupy up to four metal boxes. These are mounted on to pallets and loaded for transport as complete holes. Depending on the mode of transport (Toyota Landcruiser with or without a trailer; truck or semitrailer) one or more complete holes were transported at a time to Mt Isa for sample preparation.

WESTMORELAND URANIUM PROJECT NATIONAL INSTRUMENT 43-101 TECHNICAL REPORT
3182\16.04\3182-STY-001_0 S11
Page 11.9
April 2016 Mining Associates
Figure 11.2.1 Ten Sawn-Core Samples Packed into Each Yellow Poly Sack (Jones, 2008)

WESTMORELAND URANIUM PROJECT NATIONAL INSTRUMENT 43-101 TECHNICAL REPORT
3182\16.04\3182-STY-001_0 S11
Page 11.10
April 2016 Mining Associates
Figure 11.2.2 Metal Box (with Shelves) for Transport of Samples (Jones, 2008)
11.3 Security
A sample submission and chain of custody form is held by the driver for each batch of samples transported to Mt Isa and handed over to the laboratory on arrival at the laboratory. Prior to despatch, the metal sample boxes are checked with a scintillometer to ensure that the external radiation level is less than 5 µSv otherwise special labelling is required. Judicious packing (high-grade samples are packed at the centre surrounded by low-grade material) ensures that this standard is never exceeded. The laboratory manager is notified of the despatch before the driver departs. The journey takes 8 to 10 hours and the driver maintains contact with the camp by satellite phone or mobile telephone to ensure security of the cargo during transport.
11.4 Laboratory Sample Preparation and Analysis
The ALS-Chemex laboratory at Mount Isa is run by staff who have considerable experience in conventional and uranium sampling and assaying. ALS Brisbane holds NATA accreditation No. 825 and is certified as complying with the requirements of ISO/IEC 17025:2005 for ores and minerals analysis by AAS, AES (ICP), ICP / MS, XRF (suspended) and classical techniques.
On arrival at ALS’s laboratory at Enterprise Road, Mt Isa the sample submission forms are checked and accepted, the samples are unpacked, bar-coded and weighed, and a Work Order is prepared and faxed to ALS Brisbane. ALS Mt Isa has cordoned off an exclusive secure radiation hazard

WESTMORELAND URANIUM PROJECT NATIONAL INSTRUMENT 43-101 TECHNICAL REPORT
3182\16.04\3182-STY-001_0 S11
Page 11.11
April 2016 Mining Associates
area in which all uranium sample preparation is conducted. Personnel are required to wear special clothing to avoid dust inhalation.
The samples are crushed in a Rocklabs crusher and split to 1 kg for pulverising. The 1 kg aliquot is pulverised in a Labtech LM2 ring grinder to 95% passing 75 microns. A silicon wash is applied after every high-grade sample as determined by the laboratory’s hand-held scintillometer; less often for low grade samples.
The 1 kg pulp is then riffle split and a 30 g sub-sample taken and placed in a Kraft cardboard seed packet. Bar codes are generated and printed for each individual sample, using proprietary ALS software. The labelled samples are weighed and packed into cardboard boxes of approximately 100 samples, and a corresponding bar code label linked to the sample labels inside is generated for labelling the outside of the box. In this way the chain of custody can be tracked by both ALS and the customer through the proprietary ALS Webtrieve internet system. The boxes of 30 g samples from ALS Mt Isa arrive at the ALS Brisbane receiving area and the box label is scanned. The box is opened and the individual sample bar codes are scanned into Webtrieve.
The boxes are re-packed and sent to the “balance room” for storage until ready for analysis. From the balance room, the boxes are scanned in and each sample scanned and weighed. The Brisbane weights are matched with the Mt Isa weights as a cross-check. A small sub-sample from each 30 g Kraft envelope is then extracted, weighed and digested, using either aqua regia (partial digestion) or four-acid digestion if total dissolution is required.
Two ALS standards and two duplicates are inserted by ALS Brisbane for each 36 client samples. The samples are analysed in batches of 40.
In order to report the widest possible concentration range, both ICP-MS and ICP-AES are used. This gives a detection range for uranium, for example, from 0.1 to 10,000 ppm.
Table 11.4.1 Analytical Method
Method Code Elements
XRF05 U ME-ICP61 Ag, Al, As, Be, Ba, Bi, Ca, Cd, Co, Cr, Cu, Fe, K, La, Mg, Mn,
Mo, Na, Ni, P, Pb, S, Sb, Sr, Ti, U, V, W, Zn PGM-ICP23 Au, Pt, Pd
Europium is inserted into the lab standards as a means of correcting drift in the instrument and also enabling corrections for different responses to different sample matrices. All samples are also analysed by pressed pellet XRF (Table 11.4.1). Although weighing is not necessary in this method, ALS Brisbane weighs each sample after compression into aluminium disks to provide a cross-reference to the sample bar code. Two standards are inserted in each 40-sample batch. Because the method is non-destructive, the standards can be re-used and thus provide a way of monitoring any instrument drift.

WESTMORELAND URANIUM PROJECT NATIONAL INSTRUMENT 43-101 TECHNICAL REPORT
3182\16.04\3182-STY-001_0 S11
Page 11.12
April 2016 Mining Associates
11.5 QA and QC
The following QA and QC measures in place for the Westmoreland exploration include the following:
Quality Control
• Westmoreland Resource Drilling Program Guide to Drilling, Logging and Sampling. Lagoon Creek Resources.
• Report on a Field Visit to the Westmoreland Project, Northern Territory / Northwest Queensland for Lagoon Creek Resources Pty Ltd by D Jones.
The first document is a technical manual of procedures and the second document is an audit of logging and sampling procedures by D Jones in May 2008.
Quality Assurance
• On site procedures include:
- blank sample of unmineralised material (immediately following a mineralised sample) 1 per 40 samples
- mineralised duplicate every 20 to 25 samples
- certified standard sample every 40 samples
- sampling of barren material either side of mineralised zones.
• Laboratory procedures include:
- silicon wash after milling high grade samples and scanning of mill for residue
- use of sample weight as additional check on sample number
- analysis by two methods (ICP / MS or AES depending on grade versus XRF)
- insertion of two standards and two duplicates every 36 samples.
11.5.1 Standards
Eighty-six samples of Standard 101a and 81 samples of 101b were submitted for analysis during the 2007 to 2008 drilling program. Table 11.5.1 shows the summary statistics of the analysis of these samples.

WESTMORELAND URANIUM PROJECT NATIONAL INSTRUMENT 43-101 TECHNICAL REPORT
3182\16.04\3182-STY-001_0 S11
Page 11.13
April 2016 Mining Associates
Table 11.5.1 Summary of LAM’s Certified Standards
Standard Certified Value* 2 x Standard Dev.
Certified Value* Mean Assay 2 x Standard Dev.
ppm U3O8 ppm U3O8 ppm U3O8
101a 498 68 503 18.74 101b 467 24 472 17.28
*Converted from ppm U (U3O8 ppm = 1.179 x U ppm based on Atomic Weights)
Assay results for submitted standards are provided in Figure 11.5.1 and Figure 11.5.2. The certified value is shown as a green line and the red lines indicate two standard deviations from the mean value.
Figure 11.5.1 Results for Standard 101a

WESTMORELAND URANIUM PROJECT NATIONAL INSTRUMENT 43-101 TECHNICAL REPORT
3182\16.04\3182-STY-001_0 S11
Page 11.14
April 2016 Mining Associates
Figure 11.5.2 Results for Standard 101b
The Laramide submitted standards returned excellent accuracy, with the average grade well within the specified range of the certified grade, indicating reliability in the assay method.
11.5.2 Blanks
Blanks are prepared from half core samples obtained from exploration drillholes of equivalent material (Westmoreland Conglomerate). Blanks are selected using a scintillometer to obtain samples having less than 50 ppm U (56 ppm U3O8). Samples are stored in a drum before being inserted into the sampling sequence. Blanks are generally inserted within the mineralised intervals of each drill hole.
A total of 178 blanks were analysed during the first phase of drilling 2007 to 2008 (Figure 11.5.3). Some 93% of the blanks returned values less than 50 ppm U. Thirteen samples returned values greater than 50 ppm U. Six of these results were returned from the first two sample batches. Investigation of these results by re-assay of coarse splits and examination of samples indicated that some weakly mineralised material had been included in the blanks drum. Subsequently, each blank sample was screened individually before being sent to the laboratory.

WESTMORELAND URANIUM PROJECT NATIONAL INSTRUMENT 43-101 TECHNICAL REPORT
3182\16.04\3182-STY-001_0 S11
Page 11.15
April 2016 Mining Associates
Figure 11.5.3 Assay Results of Blanks
Material with concentrations closer to the detection limit was used for blanks for the second phase of 2007 to 2008 drilling. Core consisting of sandstone and conglomerate of the Westmoreland Conglomerate was selected from exploration drillholes and 20 representative samples sent for analysis. The samples returned uranium assays of between < 4 and 7 ppm U (8 ppm U3O8).
A comparison of blanks assayed during the second phase of drilling with the previous sample in the sequence was undertaken (Figure 11.5.4).
The comparison shows very low level contamination for blanks inserted after samples having a grade less than 4,000 ppm U3O8. For these samples the level of contamination is considered to be less than 10 ppm U3O8.
For blanks inserted following samples having a grade of about:
• 5,000 ppm U3O8 there is about 35 ppm (0.6%) contamination.
• 10,000 ppm U3O8 there is about 45 ppm (0.5%) contamination.
• 20,000 ppm U3O8 (i.e. 2% grade) is about 50 to 75 ppm (0.4%) contamination.
It should be noted that the precision of the analytical technique for grades above 10,000 ppm is 100 ppm which is greater than the indicated level of contamination.
In summary the analysis of blank/low grade samples submitted throughout the drilling program indicates that laboratory cross sample contamination is within acceptable limits and considered inconsequential as only assays over 200 ppm (0.02% U3O8) are included in the mineralised geological interpretation.
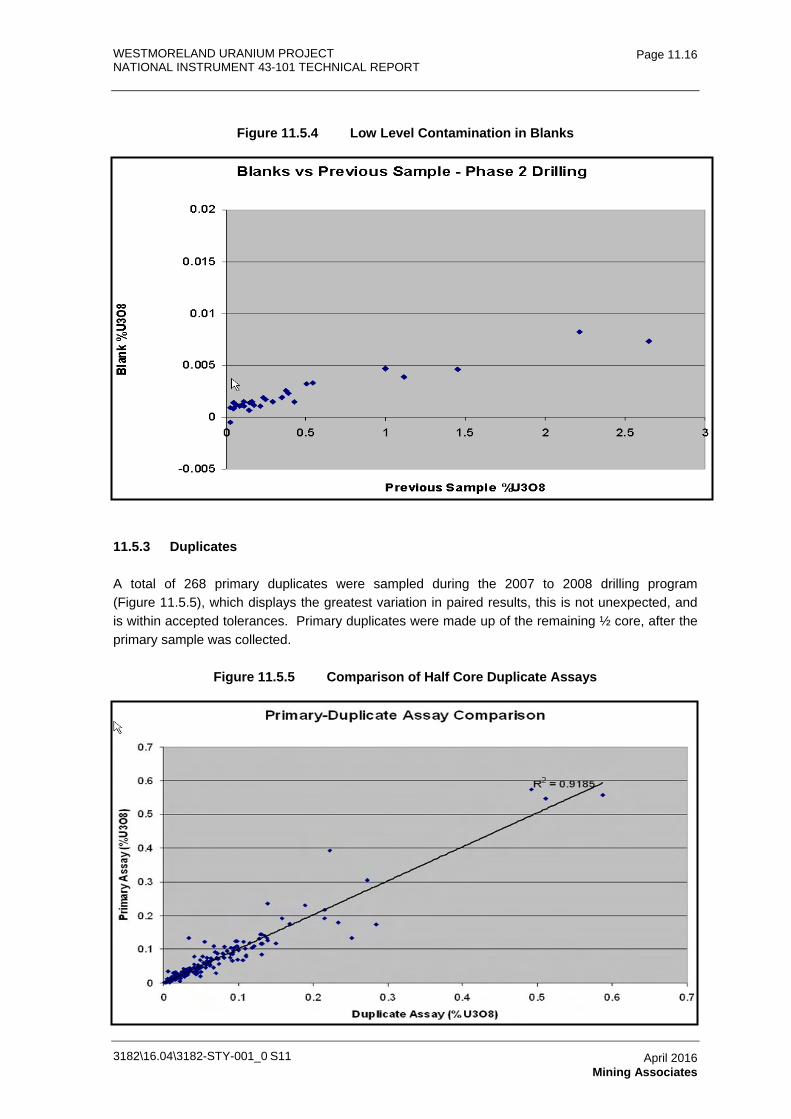
WESTMORELAND URANIUM PROJECT NATIONAL INSTRUMENT 43-101 TECHNICAL REPORT
3182\16.04\3182-STY-001_0 S11
Page 11.16
April 2016 Mining Associates
Figure 11.5.4 Low Level Contamination in Blanks
11.5.3 Duplicates
A total of 268 primary duplicates were sampled during the 2007 to 2008 drilling program (Figure 11.5.5), which displays the greatest variation in paired results, this is not unexpected, and is within accepted tolerances. Primary duplicates were made up of the remaining ½ core, after the primary sample was collected.
Figure 11.5.5 Comparison of Half Core Duplicate Assays

WESTMORELAND URANIUM PROJECT NATIONAL INSTRUMENT 43-101 TECHNICAL REPORT
3182\16.04\3182-STY-001_0 S11
Page 11.17
April 2016 Mining Associates
Coarse Split Residue Duplicates
A total of 100 samples of retained coarse material from initial jaw crushing were resubmitted as duplicates. The comparison of uranium assays between the primary and sample and the coarse split duplicate is presented in the following graph. The comparison shows a generally strong correlation indicating good repeatability.
Figure 11.5.6 Comparison of Coarse Split Duplicates
Inter-Laboratory Checks
150 pulp duplicates originally sent to ALS (Mt Isa) were re-submitted to AMDEL Laboratories in Mount Isa for uranium analysis (XRF). A comparison of the two sets of analyses is presented below.
Comparison of Coarse Split Duplicates
R2 = 0.9901
0
1000
2000
3000
4000
5000
6000
7000
8000
9000
10000
0 1000 2000 3000 4000 5000 6000 7000 8000 9000 10000
Primary U Assay
Coar
se S
plit
Reas
say

WESTMORELAND URANIUM PROJECT NATIONAL INSTRUMENT 43-101 TECHNICAL REPORT
3182\16.04\3182-STY-001_0 S11
Page 11.18
April 2016 Mining Associates
Figure 11.5.7 Comparison of Inter-Laboratory Repeats
11.6 Discussion
The field programme at Westmoreland was carried out to the highest professional standard. The layout and maintenance of the camp facility, the layout and conduct of the drill site, the attention to health and safety protocols, and the sample collection, logging and preparation at the site more than match industry standards.
The QA / QC procedures adopted for the submission of the drill samples are above industry standard and has enhance the reliability of the results from this programme. Blanks are inserted immediately after a high-grade interval (as indicated by the gamma log) to minimise potential carry-over contamination in the laboratory. Before insertion, blanks are checked first with a scintillometer. In the absence of high-grade sections, blanks are routinely inserted after each 40th sample or at least one blank in samples from each drillhole. Duplicates are inserted after each 25th sample, and a certified standard inserted after each 40th sample.
The adoption of site and laboratory quality assurance procedures to monitor blanks, standards and duplicates have ensured the assay results are accurate and well documented providing confidence in the overall sampling and analysing techniques adopted for the Westmoreland Project.
Interlab pulp Duplicates
R2 = 0.9985
0
2000
4000
6000
8000
10000
12000
14000
0 2000 4000 6000 8000 10000 12000
AMDEL XRF3 ppm U3O8
ALS
XRF5
ppm
U3O
8

WESTMORELAND URANIUM PROJECT
NATIONAL INSTRUMENT 43-101 TECHNICAL REPORT
3182-STY-001
Table of Contents Page
12.0 DATA VERIFICATION 12.1 12.1 Quality Control 12.1 12.2 Independent Samples 12.1 12.3 Site Visit July 2015 12.2
12.3.1 Summary of Site Visit Findings 12.4 12.4 Limits 12.4
FIGURES Figure 12.3.1 Westmoreland Deposits, South Pit in Foreground 12.2 Figure 12.3.2 Westmoreland Conglomerate 12.3 Figure 12.3.3 High Grade Mineralisation in WDD07-2 at 59.1 m 12.3
3182\16.04\3182-STY-001_0 S12 April 2016 Mining Associates

WESTMORELAND URANIUM PROJECT NATIONAL INSTRUMENT 43-101 TECHNICAL REPORT
3182\16.04\3182-STY-001_0 S12
Page 12.1
April 2016 Mining Associates
12.0 DATA VERIFICATION
During the 2008 drill programme an audit of logging and sampling procedures was undertaken in May 2008 by independent geologist Mr D. Jones (Jones 2008). Mr D. Jones verified drill procedures, chain of custody, security of samples, and independently verified the presence of gamma radiation with a dosimeter.
12.1 Quality Control
All logging and sampling information was recorded in customized excel workbooks. For each drillhole a workbook containing spreadsheets for collar, survey, lithology, alteration, geotechnical, Primary Samples, Duplicates and Standards and Petrology Samples was completed. The spreadsheets incorporate validation macros to ensure data entry is accurate and complete. Drill logging and database entry procedures are detailed in Westmoreland Resource Drilling Program Guide to Drilling, Logging and Sampling October 2007, Lagoon Creek Resources Pty Ltd.
After entry, logs are sent to Brisbane office for further checking before loading into the Database.
The drilling database (WM_Resource_DB) is an Access Database and contains Tables for Collar, Survey, Lithology, Alteration, Geotechnical, Petrology, Primary Samples and Standards and Duplicate Samples. The database contains only data from LAM drilling. This database is then used to update a copy of the Resource database supplied to Mining Associates used for the 2009 Resource calculation (Mangooroo2008).
The QA / QC procedures adopted for the submission of the drill samples are above industry standard and will further enhance the reliability of the results from this programme. Blanks are inserted immediately after a high-grade interval (as indicated by the gamma log) to minimise potential carry-over contamination in the laboratory. Before insertion, blanks are checked first with a scintillometer. In the absence of high-grade sections, blanks are routinely inserted after each 40th sample or at least one blank in samples from each drillhole. Duplicates are inserted after each 25th sample, and a certified standard inserted after each 40th sample.
The ALS-Chemex laboratory at Mount Isa (ALS-ISA) is run very professionally by staff who have considerable experience in conventional and uranium sampling and assaying. Their work can be relied upon. The chain-of-custody protocols initiated by ALS-Chemex are excellent and through their proprietary Webtrieve© internet facility enable customers to track their samples throughout the entire preparation, shipping and analysis process.
12.2 Independent Samples
Mining Associates acquired no independent samples, however dosimeter readings were observed along several core trays confirming the presence of significant gamma radiation (Figure 12.3.3). During the independent audit (Jones 2008) the drilling process and sample chain of custody was witnessed from core barrel to laboratory analysis.

WESTMORELAND URANIUM PROJECT NATIONAL INSTRUMENT 43-101 TECHNICAL REPORT
3182\16.04\3182-STY-001_0 S12
Page 12.2
April 2016 Mining Associates
12.3 Site Visit July 2015
A site visit was made by Mr Andrew J Vigar of Mining Associates on 9 July 2015. The following was undertaken and notes made:
1. Arrive at the base camp early morning, overview with the site staff and H&S induction.
2. Fly by Helicopter to the project area, overview of the mineralised areas and proposed plant site.
Figure 12.3.1 Westmoreland Deposits, South Pit in Foreground
Source: Site visit 2015
3. Ground traverse of the Garee area, including both the mineralised sedimentary units and sub-crop of the dolerite dyke.

WESTMORELAND URANIUM PROJECT NATIONAL INSTRUMENT 43-101 TECHNICAL REPORT
3182\16.04\3182-STY-001_0 S12
Page 12.3
April 2016 Mining Associates
Figure 12.3.2 Westmoreland Conglomerate
Source: Site visit 2015 Scintillometer is about 10 cm long
4. Examination of the sample storage, preparation and core logging areas at the base camp.
Figure 12.3.3 High Grade Mineralisation in WDD07-2 at 59.1 m
Note coarse blebs of uranite as replacement to the right of the Scintillometer. Source: site visit 2015

WESTMORELAND URANIUM PROJECT NATIONAL INSTRUMENT 43-101 TECHNICAL REPORT
3182\16.04\3182-STY-001_0 S12
Page 12.4
April 2016 Mining Associates
12.3.1 Summary of Site Visit Findings
The exploration program at Westmoreland is professionally managed by the company, from both a technical and health and safety point of view. The core storage and handling areas have been degraded slightly by recent cyclones and termite activity but are still in operational condition and can be repaired at low cost. Site access and communications are good.
The uranium mineralisation was observed during the visit in both outcrop and drill core and the style and strength of mineralisation was as described. This was both visual and observed in scintillometer readings taking during the visit. No independent assay samples were taken during this visit.
The lack of soil cover and minimal weathering, except along the dolerite dyke, is clearly seen from the air and on during the ground traverse. This is being taken into account during mine planning.
12.4 Limits
The location of the core drilled by previous explorers has not, at this stage, been ascertained so the core could not be inspected. The area of the LAM licences in Queensland and the Northern Territory was over-flown at low altitude and evidence of exploration work and mining was observed at all significant localities marked in open file reports but these were not accurately located via GPS on the ground.
As well as several hundred open file reports made available by the GSQ, a large volume of published data was reviewed. These publications are listed in the References. This independent material did not conflict with the information supplied by LAM.

WESTMORELAND URANIUM PROJECT
NATIONAL INSTRUMENT 43-101 TECHNICAL REPORT
3182-STY-001
Table of Contents Page
13.0 METALLURGICAL TESTING 13.1 13.1 Introduction 13.1 13.2 Previous Metallurgical Testwork 13.1
13.2.1 Comminution 13.1 13.2.2 Heap Leaching 13.1 13.2.3 Agitated Leach Testwork 13.2 13.2.4 Solid Liquid Separation 13.2 13.2.5 U3O8 Recovery 13.2 13.2.6 Product Preparation 13.3
13.3 ANSTO 2011 Metallurgical Testwork Program 13.4 13.3.1 Samples Tested 13.5 13.3.2 Mineralogy 13.6 13.3.3 Scrubbing Tests 13.6 13.3.4 Size-by-Size Deportment 13.6 13.3.5 Grind Calibration 13.7 13.3.6 Dilute Acid Leach Tests 13.7 13.3.7 Conventional Leach Tests 13.7 13.3.8 Effect of Grind Size 13.9 13.3.9 Effect of pH 13.10 13.3.10 Effect of Pulp Temperature 13.11 13.3.11 Effect of Oxidation Potential 13.11 13.3.12 Effect of Oxidant Type 13.14 13.3.13 Leaching of Jack Lens Material 13.14 13.3.14 Leach Liquor Composition 13.15 13.3.15 Leach Residues 13.15 13.3.16 Bulk Leach Tests 13.16 13.3.17 Settling and Filtration Tests 13.17 13.3.18 Pulp Rheology 13.18 13.3.19 Uranium Recovery Tests 13.20 13.3.20 Ion Exchange Testwork 13.20 13.3.21 Uranyl Peroxide Precipitation 13.29 13.3.22 Solvent Extraction Testwork 13.30
13.4 Conclusions and Recommendations 13.31 TABLES Table 13.2.1 Comminution Test Results 13.1 Table 13.2.2 Heap Leach Test Results 13.2 Table 13.2.3 Agitated Leach Test Results – Blend Low and Hight Grade Oxides 13.3 Table 13.3.1 Testwork Sample Details 13.5 Table 13.3.2 Size-by-Size Uranium Distribution 13.6 Table 13.3.3 ANSTO Dilute Leach Test Results 13.7 Table 13.3.4 ANSTO Conventional Leach Test Results 13.8 Table 13.3.5 Range of Parameters 13.9 Table 13.3.6 ANSTO Grind Size Optimisation Leach Test Results 13.10 Table 13.3.7 ANSTO Acidity Optimisation Leach Test Results 13.10 Table 13.3.8 ANSTO Slurry Treatment Optimisation Leach Test Results 13.11 Table 13.3.9 ANSTO ORP Optimisation Leach Test Results 13.12 Table 13.3.10 ANSTO Oxidant Comparison Leach Test Results 13.14 Table 13.3.11 ANSTO Jack Lens Optimisation Leach Test Results 13.15
3182\16.04\3182-STY-001_0 S13 April 2016 Lycopodium Minerals Pty Ltd

WESTMORELAND URANIUM PROJECT
NATIONAL INSTRUMENT 43-101 TECHNICAL REPORT
3182-STY-001
Table of Contents (Continued)
Page
3182\16.04\3182-STY-001_0 S13
April 2016 Lycopodium Minerals Pty Ltd
Table 13.3.12 ANSTO Bulk Sample Leach Test Results 13.16 Table 13.3.13 ANSTO / FLSmidth Settling Test Results 13.18 Table 13.3.14 IX Feed Liquor Compositions (mg/L/ppm) 13.20 Table 13.3.15 Loading Kinetic Parameters Ambersep 920 and Amberjet 4400 13.23 Table 13.3.16 Metal Ions Loading for Ambersep 920 and Amberjet 4400 13.24 Table 13.3.17 Elution Kinetic Parameters Ambersep 920 and Amberjet 4400 13.25 Table 13.3.18 Uranyl Peroxide Compositions (as % of U) 13.30 FIGURES Figure 13.3.1 ANSTO Base Case Conventional Leach Test Kinetics 13.9 Figure 13.3.2 ANSTO Ferric Iron Concentrations Junnagunna Composite 13.13 Figure 13.3.3 ANSTO Ferric Iron Concentrations Garee Redtree Composite 13.13 Figure 13.3.4 ANSTO Comparison of Oxidants Leach Kinetics 13.14 Figure 13.3.5 ANSTO Comparison of Bulk Leach Kinetics and Individual Sample
Leach Kinetics 13.17 Figure 13.3.6 Thickened Pulp Shear Rate vs Shear Stress – Bulk Sample 13.19 Figure 13.3.7 Thickened Pulp Yield Stress vs Slurry Solids Density – Bulk Sample 13.20 Figure 13.3.8 Uranium Resin Loading – RIP Resin Ambersep 920 13.21 Figure 13.3.9 Uranium Resin Loading – IX Resin Amberjet 4400 13.22 Figure 13.3.10 Uranium Resin Loading – RIP Resin Ambersep 920 and IX Amberjet
4400 13.22 Figure 13.3.11 Uranium Resin Breakthrough Curves 13.23 Figure 13.3.12 Uranium Elution Isotherm – RIP Resin Ambersep 920 13.24 Figure 13.3.13 Uranium Elution Isotherm – IX Resin Amberjet 4400 13.25 Figure 13.3.14 Uranium Elution Rate – RIP Resin Amberset 920 13.26 Figure 13.3.15 Uranium Elution Rate – IX Resin Amberjet 4400 13.27 Figure 13.3.16 Uranium and Impurity Elution – RIP Resin Amberset 920 13.27 Figure 13.3.17 Uranium and Impurity Elution – IX Resin Amberjet 4400 13.28 Figure 13.3.18 Bulk Eluate Concentrations – RIP Resin Ambersep 920 and IX Resin
Amberjet 4400 13.28

WESTMORELAND URANIUM PROJECT NATIONAL INSTRUMENT 43-101 TECHNICAL REPORT
3182\16.04\3182-STY-001_0 S13
Page 13.1
April 2016 Lycopodium Minerals Pty Ltd
13.0 METALLURGICAL TESTING
13.1 Introduction
Metallurgical testwork programmes and evaluations have been carried out on the Westmoreland deposit by various laboratories over several decades. These include AMDEL 1989, ANSTO 1992, 93, 94, 95, and 2011, JKTech 1993, and SGS 2008. The evaluation and interpretation of results reported here is based largely on the most recent ANSTO 2011 report, with reference to other sources as noted. This work has been reviewed by Lycopodium’s Process Consultant (Mr Grenvil Dunn). Key relevant aspects of the report together with Lycopodium’s comments are extracted and included in the sections that follow.
13.2 Previous Metallurgical Testwork
R. Nice (2012) undertook a review of the past testwork performed on the Westmoreland prospect. A brief summary of his findings are presented here.
13.2.1 Comminution
Very little comminution testwork has been done. Some comminution testwork was reported by JKTech 1993 - “Crushing Simulations for a Uranium Heap leach Project”, JKTech (JKMRC Commercial Division), May 1993. The results presented in Table 13.2.1.
Table 13.2.1 Comminution Test Results
Material Bond Ball
Work Index kWh/t
JK Parameters
A b Ab
Oxide 17.2 69.8 2.10 146.6 Fresh 19.4 79.0 1.80 142.2
The Bond ball work index values and the JKtech A and b parameter results are contradictory, suggesting that the tests were performed on different samples. In the ANSTO 2011 report, reference is made to the samples as competent ore, producing little fines during crushing, and consequently, for the purpose of the scoping study the Bond Ball mill results have been accepted as representative.
13.2.2 Heap Leaching
Early testwork conducted by ANSTO and AMDEL looked at heap leaching techniques. The use of heap leaching was discounted by LAM for good reason; the extractions of the Fresh material were very low.

WESTMORELAND URANIUM PROJECT NATIONAL INSTRUMENT 43-101 TECHNICAL REPORT
3182\16.04\3182-STY-001_0 S13
Page 13.2
April 2016 Lycopodium Minerals Pty Ltd
Table 13.2.2 Heap Leach Test Results
Material Leach Time Days
Extraction %
Size % -300 um
Acid kg/t
Peroxide kg/t
Oxide 34 92 – 93 9.3 4.2 0.6 Fresh 44 77 – 78 8.7 12.9 1.1
13.2.3 Agitated Leach Testwork
ANSTO previously carried out extensive leaching testwork and mineralogy on ore samples from several deposits in the Westmoreland area in 1992 to 1995. The testwork conditions used concentrated sulphuric acid (H2SO4) as the leachate, and hydrogen peroxide (H2O2) as the oxidant. The standard conditions were:
• Temperature: 40°C
• pH: 1.5
• ORP: 475 mV
• Slurry density: 55% w/w
• Grind size: ~35% - 75 µm.
Some optimisation tests were conducted looking at changes to each of these variables. The four separate samples tested were a low grade oxide, a low grade fresh, a high grade oxide, and a high grade fresh. The optimisation tests were conducted on a 1:1 blend of low and high grade oxide materials. Table 13.2.3 summarises the various agitated leach test results.
13.2.4 Solid Liquid Separation
Limited settling and filtration tests were carried out by ANSTO (ANSTO Report C1206) on slurries from Junnagunna and Redtree generated in the laboratory program at the base case grind of P80 = 250 μm and 30°C (pH 1.5, 500 mV). The batch tests were performed in a 1 L measuring cylinder. Magnafloc E10 at a concentration of 0.025 wt% was the flocculant used.
These preliminary flocculant and thickener requirements indicate that solid / liquid separation will not be an issue.
13.2.5 U3O8 Recovery
The early IX testwork looked at two ion exchange resins both of which performed well. The resin loaded to about 60 g/L of wet settled resin (g/L wsr) with U recovery of about 76%. About 20 bed volumes (BV) of liquor were treated before the uranium in the barren solutions started to climb (breakthrough). Elution of the resin was also tested and about 12 BV of 1 molar (M) sodium chloride (NaCl) and 0.1 M sulphuric acid eluant was used. The resulting eluate solution was

WESTMORELAND URANIUM PROJECT NATIONAL INSTRUMENT 43-101 TECHNICAL REPORT
3182\16.04\3182-STY-001_0 S13
Page 13.3
April 2016 Lycopodium Minerals Pty Ltd
relatively clean with only phosphorus and arsenic as significant impurities. SX tests were conducted and the extraction rates were very good after three stages of extraction.
A test of UOC production by direct precipitation was conducted on the leach solutions using hydrogen peroxide. The precipitate produced contained 53% U3O8 equivalent with very high amounts of iron (4.6% Fe) and aluminium (6.4% Al) suggesting that direct precipitation would not be technically viable.
Table 13.2.3 Agitated Leach Test Results – Blend Low and Hight Grade Oxides
Grind % -75 ppm
Leach hrs
Slurry % Solids
Temp °C
Extraction% pH Acid
kg/t ORP mV
H2O2 kg/t Oxidant
27 24 55 40 90.7 1.5 7.7 475 0.8 H2O2 36 24 55 40 92.5 1.5 9.5 475 1.2 H2O2 37 24 55 40 92.3 1.5 10.1 475 1.8 H2O2 41 24 55 40 93.0 1.5 10.3 475 2.1 H2O2 49 24 55 40 93.4 1.5 9.5 475 0.9 H2O2 36 24 55 40 98.2 0.5 26.4 475 1.2 H2O2 36 24 55 40 96.6 1.0 12.0 475 1.1 H2O2 36 24 55 40 92.5 1.5 9.5 475 1.2 H2O2 36 24 55 40 83.8 1.9 6.1 475 1.1 H2O2 36 24 55 40 83.0 1.5 10.5 270/337 1.2 None 36 24 55 40 92.5 1.5 9.5 475 1.2 H2O2 36 24 55 40 92.9 1.5 9.0 550 1.9 H2O2 36 24 55 40 95.6 1.5 8.3 479/530 1.2 H2O2/Fe3+
36 24 55 40 93.6 1.5 14.2 478/485 3.1 pyrolysite 36 24 55 40 94.0 1.5 9.8 498/643 1.2 NaC1O3 36 24 55 40 93.2 1.5 12.5 624/669 2.0 NaC1O3 36 24 55 40 95.4 1.5 11.0 433/602 1.1 NaC1O3 36 24 55 40 85.9 1.5 6.3 430/478 0.7 H2O2 36 24 55 30 91.3 1.5 9.3 475 1.0 H2O2 36 24 55 40 92.5 1.5 9.5 475 1.2 H2O2 36 24 55 60 96.1 1.5 9.8 475 1.1 H2O2 36 24 55 40 92.5 1.5 9.5 475 1.2 H2O2 36 24 65 40 94.3 1.5 11.0 475 1.7 H2O2
Average 92.4 1.5 10.5 1.3 H2O2
13.2.6 Product Preparation
One test investigated precipitation with ammonia based compounds to produce an ammonium diuranate (ADU). Using ammonium hydroxide (NH4OH) over 99.5% of the U3O8 equivalent was precipitated. The mean grade of the ADU was 78% U3O8 with the only significant impurity being arsenic at 1.2%. The product grade of 78% U3O8 equivalent is above the minimum specification of 65% U (76.6% U3O8). The arsenic level at 1.2% is well above the Cameco product specification of 0.05% with a reject level of 0.15% As. However, the Comurhex specification allows 1% As and rejects at 2.5% As. Further testwork is necessary to reduce this arsenic level.

WESTMORELAND URANIUM PROJECT NATIONAL INSTRUMENT 43-101 TECHNICAL REPORT
3182\16.04\3182-STY-001_0 S13
Page 13.4
April 2016 Lycopodium Minerals Pty Ltd
13.3 ANSTO 2011 Metallurgical Testwork Program
For the most recent testwork (2011), ANSTO Minerals was requested to undertake a metallurgical test program on the extraction of uranium from four composite lens samples (Junnagunna, Redtree Upper, Redtree Lower and Jack) of the Westmorland deposit. The overall aim of this work was to obtain data on process options for the recovery of uranium. A conceptual design flowsheet, which comprises conventional acid leaching followed by IX or SX and uranium product recovery, was examined in this test program. Petrological SEM work and analysis was also undertaken by ANSTO as part of the metallurgical study.
The results were reported by ANSTO in the June 2011 document, “The Extraction of Uranium from the Westmoreland Deposits”. The following program formed the basis of the testwork:
• Undertake quantitative XRD on the four lens samples to identify the proportions of major/minor gangue minerals. Four selected leach residues were similarly assessed.
• Undertake dilute leach tests on samples from each lens to determine the limit for uranium extraction under typical and more severe leach conditions.
• Develop laboratory grind calibration curves for the Redtree and Junnagunna composites.
• Undertake a series of tests to determine optimum leaching conditions for the Redtree and Junnagunna composites.
• Carry out two to three slurry leach tests on a sample of Jack lens composite.
• SEM examination of four selected leach residues to assist in identifying any factors limiting uranium extraction during leaching.
• Prepare a “bulk” composite for leaching and for the generation of pregnant liquor for use in uranium recovery work.
• Undertake batch laboratory ion exchange equilibrium, loading and elution tests.
• Undertake batch laboratory solvent extraction equilibrium and stripping tests.
• Produce uranium oxide concentrates from the IX and SX routes.
The individual samples were crushed to <25 mm and then combined to prepare composites for each of the four lenses:
• Junnagunna Lens.
• Garee Upper Lens.
• Garee Lower Lens.
• Jack Lens.

WESTMORELAND URANIUM PROJECT NATIONAL INSTRUMENT 43-101 TECHNICAL REPORT
3182\16.04\3182-STY-001_0 S13
Page 13.5
April 2016 Lycopodium Minerals Pty Ltd
The four crushed composite lens samples were split to provide sub-samples. One sub sample for each lens was used to determine size versus uranium distribution and to conduct scrubbing tests. A second sub-sample was crushed to <2 mm to provide samples for assay and leach testwork. The remaining sub-samples were retained.
13.3.1 Samples Tested
Four sets of samples were compiled by LAM from their 2008 drilling program for testwork by ANSTO. Table 13.3.1 summarises the make-up of these samples.
Table 13.3.1 Testwork Sample Details
Deposit Drill Hole From m
To m
Total m
U3O8 ppm
Weight kg
Junnagunna JDD08-023 45 65 20 2,250 70 JDD08-023 80 90 10 2,910 34 JDD08-026 20 70 50 850 179
80 1,443 283 Garee Upper Lens WDD08-009 30 50 20 540 69
WDD08-012 35 55 20 540 68 WDD08-037 12 36 24 610 86 WDD08-040 16 36 20 5,270 74
84 1,739 297 Garee Lower Lens WDD08-011 62 82 20 2,580 73
WDD08-012 60 80 20 510 68 WDD08-040 88 103 15 3,210 74
55 3,018 215 Jack Lens WDD08-054 11.5 20 18.5 90 35
WDD08-055 0 25 25 1,050 69 43.5 727 104
The samples were chosen to be representative intervals of specific recognizable lenses, which account for the majority of the resource base. Only limited leach testwork was done on the Jack Lens composite as it was considered to be surface oxidised ore.
The size by size analysis of each composite sample of crushed rock over the range 1 to 19 mm indicated that uranium was uniformly distributed in each size fraction, in proportion to the sample mass distribution, with a slight enrichment in the <1 mm fraction. Therefore, upgrading of ore could not be achieved by a size based separation.
It was noted that the weighted average grades of the samples were well above the nominated “resource average” of 1,000 ppm U3O8 and consequently the samples were not strictly representative of the ore to be treated over the life of mine. None the less, the samples are considered to be sufficiently representative of the deposit for the purpose of a scoping study.

WESTMORELAND URANIUM PROJECT NATIONAL INSTRUMENT 43-101 TECHNICAL REPORT
3182\16.04\3182-STY-001_0 S13
Page 13.6
April 2016 Lycopodium Minerals Pty Ltd
13.3.2 Mineralogy
LAM sent 20 samples from the 2008 drilling program to SGS Mineral Services (SGS) in Perth for mineralogical study. The results of this work indicated that uranium occurred predominantly as uraninite and coffinite with lesser torbenite and autunite. No Ningyoite was identified.
Quantitative XRD indicated that quartz was the dominant gangue mineral in all ore samples. Its relative concentrations varied from 88 to 92 wt%. The minor constituents (less than 5% each) were illite, hematite, jarosite, chamosite and hydroxylapatite. Chamosite (Fe rich chlorite), an acid consuming mineral, was found in four ores, whereas hydroxylapatite was detected only in Junnagunna ore. The uranium-bearing minerals were not abundant enough to be detectable by XRD.
SEM analysis on leach residues showed other gangue minerals such as rutile / anatase (TiO2), zircon (ZrSiO4), monazite ((Ce,La,Nd,Th)PO4), florencite ((Ce,La)Al3(PO4)2(OH)6), pyrite (FeS2), galena (PbS), iron copper sulphide, copper sulphide and barite (BaSO4) were also present in the samples. The U bearing minerals are closely associated with the quartz phases and, to a lesser degree, to the iron rich phases. In the near surface “weathered” profiles carnotite which is a potassium and vanadium oxide mineral is also present.
13.3.3 Scrubbing Tests
Following the crushing tests ANSTO assessed that the material was quite competent due to the surprisingly few ‘fines’ produced during crushing. On this basis, it was deemed that scrubbing would have no significant affect in any attempt to upgrade leach feed and no further testwork on scrubbing was performed.
13.3.4 Size-by-Size Deportment
Each composite was crushed to <25 mm and the screened with each fraction analysed for U. The results are shown in Table 13.3.2.
Table 13.3.2 Size-by-Size Uranium Distribution
Size mm
Junnagunna Garee Lower Garee Upper Jack Lens
Weight Uranium Weight Uranium Weight Uranium Weight Uranium
% ppm % % ppm % % ppm % % ppm %
19 25.5 1,223 25.1 24.3 1,139 21.8 21.9 1,967 28.0 23.7 616 18.0 16 13.2 1,246 13.3 14.1 1,013 11.3 12.5 864 7.0 14.9 674 12.4 12.5 12.2 1,277 12.6 13.8 1,390 15.2 13.2 1,467 12.6 12.3 902 13.7 9.4 12.3 1,159 11.5 12.7 1,505 15.1 12.0 1,103 8.6 12.3 872 13.2 7.4 9.5 1,330 10.2 10.2 1,347 10.8 9.6 1,353 8.4 10.0 737 9.1 2.0 7.6 1,170 7.2 7.8 1,294 7.9 8.5 1,195 6.6 7.9 868 8.4 1.0 4.0 1,099 3.5 4.0 1,121 3.5 5.6 1,299 4.8 5.2 739 4.7 <1.0 15.7 1,321 16.7 13.0 1,399 14.4 16.5 2,246 24.1 13.8 1,209 20.6
Calc 1,241 1,269 1,543 812 Assay 1,138 1,170 1,579 737

WESTMORELAND URANIUM PROJECT NATIONAL INSTRUMENT 43-101 TECHNICAL REPORT
3182\16.04\3182-STY-001_0 S13
Page 13.7
April 2016 Lycopodium Minerals Pty Ltd
There is very little upgrading on a size-by-size basis with U distributed on a similar basis to the particle size fraction. As a result upgrading by screening would not be beneficial.
13.3.5 Grind Calibration
Comminution tests were not conducted during the recent programme. However, grind calibration tests were conducted to determine the time required to reduce the <2 mm material to four different size distributions equivalent to eighty percent passing (P80=) 350, 250, 150, and 75 micron (µm) for the purpose of sample preparation.
13.3.6 Dilute Acid Leach Tests
ANSTO conducted dilute acid leach tests – two on each composite pulverised to determine the ultimate uranium extraction and provide an estimate of the propensity for gangue dissolution. The two tests per composite comprised:
1. A Base Case leach with pH at 1.5, temperature at 40 degrees Celsius (40°C) and an oxygen-reduction potential (ORP) of 500 millivolts (mV) by adding 1.5 g/L of ferric iron.
2. An Extreme Case leach with pH at 1.0, temperature at 60°C and an ORP of 500 mV by adding 1.5 g/L of ferric iron.
The results are summarised in Table 13.3.3. The uranium was readily leached with a similar high recovery of ~99% under either base case or extreme conditions. The relative dissolution of gangue can be assessed by comparing the concentrations of ions in the final dilute leach liquors. For the dilute base case conditions, the concentrations are relatively low, decreasing in the order Ca>Si>Al>K>Mg. Gangue dissolution was greatest for Garee Lower lens, and lowest for Jack Lens, noting that Fe dissolution could not be estimated because iron was added to the leach solution.
Table 13.3.3 ANSTO Dilute Leach Test Results
Lens Base Case Extreme Case
Head ppm1
Residue ppm1
Extraction %
Head ppm1
Residue ppm1
Extraction %
Junnagunna 1,370 14 99.0 1,370 9 99.3 Garee Lower 1,380 19 98.6 1,380 12 99.1 Garee Upper 1,862 21 98.9 1,862 14 99.2 Jack 929 22 97.6 929 14 98.5
Note 1. All values as U3O8 determined by DNA
13.3.7 Conventional Leach Tests
Conventional laboratory scale leach tests were then conducted on the composites. In addition, these tests were also optimised for acid addition, oxidant type and addition, temperature, and leach times. Sydney tap water was used in all tests as no site water was available. The following “base

WESTMORELAND URANIUM PROJECT NATIONAL INSTRUMENT 43-101 TECHNICAL REPORT
3182\16.04\3182-STY-001_0 S13
Page 13.8
April 2016 Lycopodium Minerals Pty Ltd
case” conditions were used based on previous historical testwork and general conventional acid leach conditions:
• Solids Density 55% solids by weight (w/w).
• Temperature 40°C.
• Leach Time 24 hrs.
• Grind Size Distribution P80 = 250 µm.
• Acidity (24hrs) pH = 1.5.
• ORP 500 mV.
The oxidant used by ANSTO in the laboratory was sodium permanganate. This oxidant is not used in operating plants but is used in the laboratory for convenience and ease of control. The results of these base case tests are summarised in Table 13.3.4.
Table 13.3.4 ANSTO Conventional Leach Test Results
Composite Head Grade ppm U3O8
Residue Grade ppm U3O8
Extraction %
Acid Add’n kg/t
Oxidant Add’n kg/t1
Junnagunna 1,370 34 97.5 20.6 1.6 Garee (Redtree) 1,704 59 96.5 17.1 1.6 Jack Lens 929 119 87.2 5.5 0.4
Note. 1. Sodium permanganate is an acid consumer in the leach being responsible for 1 kg per kg of oxidant applied.
The preliminary results are good for the two main composites the Jack Lens results less so. The Jack lens leaching tests are discussed in more detail in Section 13.3.13 below. The results confirmed that the ore is amenable to leaching with sulphuric acid. The leach kinetics indicate that leaching will be complete after 12 hours as shown in Figure 13.3.1.

WESTMORELAND URANIUM PROJECT NATIONAL INSTRUMENT 43-101 TECHNICAL REPORT
3182\16.04\3182-STY-001_0 S13
Page 13.9
April 2016 Lycopodium Minerals Pty Ltd
Figure 13.3.1 ANSTO Base Case Conventional Leach Test Kinetics
0
50
100
150
200
250
300
350
400
0 5 10 15 20 25
Leaching Time (h)
Res
idue
Gra
de (p
pm U
3O8)
Junnagunna pH 1.5 Redtree pH 1.5
Optimisation tests were then undertaken to ensure the correct leach conditions were established. A total of 43 tests were conducted looking at a range of parameters, as indicated below.
Table 13.3.5 Range of Parameters
Grind Size P80 = µm
Acidity pH
Oxidant ORP mV Oxidant Type Temperature
°C
350 2.0 450 Sodium permanganate 50 150 1.7 550 pyrolusite 30 75 1.3 450 + 1.0 g/L Fe3+
NB: Fe3+ indicates ferric iron added as ferric sulphate. Pyrolusite is a natural mineral containing about 75% manganese dioxide (MnO2) and is commonly used by operating uranium extraction plants.
13.3.8 Effect of Grind Size
The effect of grind size on uranium extraction was examined at varying P80 grind sizes of 350, 250, 150, and 75 μm under base case conditions (pH 1.5, 40°C and ORP of 500 mV) for both the Junnagunna and Garee Redtree composites by holding pH, Temperature, ORP, and leach time constant. Table 13.3.6 summarises the results for both composites. As shown, grind size has very little effect on the leach extraction.

WESTMORELAND URANIUM PROJECT NATIONAL INSTRUMENT 43-101 TECHNICAL REPORT
3182\16.04\3182-STY-001_0 S13
Page 13.10
April 2016 Lycopodium Minerals Pty Ltd
Table 13.3.6 ANSTO Grind Size Optimisation Leach Test Results
Grind Size P80 = µm
Head Grade ppm U3O8
Residue Gradeppm U3O8
Extraction %
Acid Add’n kg/t
Oxidant Add’n kg/t1
Junnagunna 1,370 350 40 97.1 18.8 1.4 250 34 97.5 20.6 1.6 150 41 97.0 19.4 1.5 75 27 98.1 19.8 1.7
Garee Redtree 1,704 350 56 96.7 16.4 1.4 250 59 96.5 17.1 1.6 150 56 96.7 16.4 1.5 75 54 96.8 17.3 1.7
Note 1. Potassium Permanganate oxidant
13.3.9 Effect of pH
The effect of pH on leaching performance for Junnagunna and Redtree was examined in four tests. For Junnagunna, except for leaching at pH 2, 24 hr uranium extractions were very similar at pH 1.3 to 1.7. Optimum conditions were leaching at pH 1.5 to 1.7 for 12 hr. However for the Redtree ore, the extraction increased with decreasing pH. The 24 hr extraction increased from 92% to 98% when the leaching pH was decreased from pH 2.0 to pH 1.3. The pH also had an impact on the initial leaching rate. For this ore, optimum conditions were leaching for 12 hr at pH 1.3 to 1.5. For both ores, acid requirements were relatively low, with an acid addition of 20 kg/t sufficient at the “optimum” conditions. Thus the Junnagunna composite is less sensitive to the acidity than the Garee Redtree composite, however both show that if the pH is held at 1.7 or lower, the extractions are quite good. Table 13.3.7 summarises the results for both composites.
Table 13.3.7 ANSTO Acidity Optimisation Leach Test Results
Acid pH
Head Grade ppm U3O8
Residue Gradeppm U3O8
Extraction %
Acid Add’n kg/t
Oxidant Add’n kg/t1
Junnagunna 1,370 2.0 52 96.2 9.8 1.2 1.7 36 97.3 14.7 1.5 1.5 34 97.5 20.6 1.6 1.3 28 97.9 25.0 1.7
Garee Redtree 1,704 2.0 130 92.4 11.8 1.0 2.0 116 93.2 9.5 1.0 1.7 73 95.7 11.4 1.3 1.5 59 96.5 17.1 1.6 1.5 55 96.8 16.7 1.4 1.3 31 98.2 20.4 1.6
Note 1. Potassium Permanganate oxidant

WESTMORELAND URANIUM PROJECT NATIONAL INSTRUMENT 43-101 TECHNICAL REPORT
3182\16.04\3182-STY-001_0 S13
Page 13.11
April 2016 Lycopodium Minerals Pty Ltd
13.3.10 Effect of Pulp Temperature
The effect of leaching temperature was investigated for Junnagunna and Redtree. These tests were carried out under similar base case conditions with temperature as the only variable. As expected, the uranium leaching rate increased with increasing temperatures from 30°C to 50°C. For both ores, leaching at 30°C significantly decreased the extraction rate, and to a lesser extent, the final extraction of uranium. The initial rate of leaching was reduced at 40°C, but extractions were quite similar to those at 50°C after 12 hours. Slurry pulp temperatures were varied while keeping other parameters constant. Table 13.3.8 summarises these results.
Table 13.3.8 ANSTO Slurry Treatment Optimisation Leach Test Results
Temperature °C
Head Grade ppm U3O8
Residue Gradeppm U3O8
Extraction %
Acid Add’n kg/t
Oxidant Add’n kg/t1
Junnagunna 1,370 30 55 96.0 14.3 1.1 40 34 97.5 20.6 1.6 50 27 98.0 24.1 1.8
Garee Redtree 1,704 30 98 94.2 12.4 1.1 40 59 96.5 17.1 1.6 50 41 97.6 19.0 1.8
Note 1. Potassium Permanganate oxidant
Although temperature has a significant effect on the initial extraction rate, there is also a significant relative increase in the acid addition. At the highest temperature, after eight hours leaching, the rate of gangue dissolution, as reflected in the acid addition, is much greater than the decrease in the uranium residue grade. Whereas at 30°C, the relative rates of uranium and gangue dissolution are still reasonably favourable after 24 hours.
13.3.11 Effect of Oxidation Potential
The effect of ORP on the leaching of the Junnagunna and Redtree composites is summarised in Table 13.3.9.

WESTMORELAND URANIUM PROJECT NATIONAL INSTRUMENT 43-101 TECHNICAL REPORT
3182\16.04\3182-STY-001_0 S13
Page 13.12
April 2016 Lycopodium Minerals Pty Ltd
Table 13.3.9 ANSTO ORP Optimisation Leach Test Results
ORP mV
Head Grade ppm U3O8
Residue Gradeppm U3O8
Extraction %
Acid Add’n kg/t
Oxidant Add’n kg/t
Junnagunna 1,370 550 28 97.9 18.3 1.8 500 34 97.5 20.6 1.6 500 38 97.2 20.0 2.9* 450 61 95.5 18.0 0.6
Garee Redtree 1,704 550 44 97.4 17.5 1.8 500 59 96.5 17.1 1.6 500 53 96.9 17.0 2.8* 450 106 93.8 15.0 0.8
*Indicates substitution of pyrolusite for the potassium permanganate
For both samples, there is a significant increase in oxidant demand for increasing the ORP from 450 to 500 mV, but only a further small addition is required to achieve 550 mV. The oxidant demand for both samples was very similar for both samples. Extraction is lower at the lowest ORP level of 450 mV. However, the differences between 500 mV and 550 mV are not so significant. The purpose of controlling ORP is to control the concentration of the ferric (Fe+3) iron. As shown in Figures 13.3.2 and 13.3.3, at an ORP of 450 mV, the ferric ion concentration is <1g/L for much of the leach, while at the higher ORP levels the Fe+3 reaches as much as 2.5 g/,L enabling higher leach extraction kinetics.

WESTMORELAND URANIUM PROJECT NATIONAL INSTRUMENT 43-101 TECHNICAL REPORT
3182\16.04\3182-STY-001_0 S13
Page 13.13
April 2016 Lycopodium Minerals Pty Ltd
Figure 13.3.2 ANSTO Ferric Iron Concentrations Junnagunna Composite
Figure 13.3.3 ANSTO Ferric Iron Concentrations Garee Redtree Composite
500
1000
1500
2000
2500
3000
3500
4000
0 6 12 18 24
Leach Time (h)
Ferr
ic Io
n C
onc.
(m
g/L)
450 mV
500 mV
550 mV
500 mV + 500 mg/L Fe
0
500
1000
1500
2000
2500
3000
0 6 12 18 24
Leach Time (h)
Ferr
ic C
onc.
(mg/
L)
450 mV500 mV550 mV500 mV + 0.5 g/L Fe

WESTMORELAND URANIUM PROJECT NATIONAL INSTRUMENT 43-101 TECHNICAL REPORT
3182\16.04\3182-STY-001_0 S13
Page 13.14
April 2016 Lycopodium Minerals Pty Ltd
13.3.12 Effect of Oxidant Type
For ease of control in the laboratory, ANSTO used sodium and potassium permanganate in most leach tests. Base case leaches for Junnagunna and Redtree were also carried out using pyrolusite to demonstrate that both oxidants gave equivalent results. The leach kinetics for each composite with the two oxidants are almost identical, as shown in Figure 13.3.4. ANSTO calculated that a pyrolusite containing 75% MnO2 would theoretically report a consumption of about 3.3 kg/t, which is close to the consumption experienced in the testwork.
Table 13.3.10 ANSTO Oxidant Comparison Leach Test Results
Composite Oxidant Type
ORP 24 hrs mV
Head Gradeppm
Residue Gradeppm
Extraction %
Acid Add’n kg/t
Oxidant Add’n kg/t
Junnagunna Permang 485 1,370 34 97.5 20.6 1.6 Pyroluste 481 38 97.2 20.0 2.9
Garee Redtree Permang 477 1,704 59 96.5 17.1 1.6 Pyrolusite 472 53 96.9 17.0 2.8
Figure 13.3.4 ANSTO Comparison of Oxidants Leach Kinetics
13.3.13 Leaching of Jack Lens Material
The Jack Lens composite material was tested separately from the Junnagunna and Garee composites because of the relatively small amount of this material expected to occur within the resources / reserves.
0
50
100
150
200
250
300
350
400
0 4 8 12 16 20 24
Leach Time (h)
Ura
nium
Lea
ch R
esid
ue G
rade
(ppm
U3O
8)
Permanganate R
Pyrolusite R
Permanganate J
Pyrolusite J

WESTMORELAND URANIUM PROJECT NATIONAL INSTRUMENT 43-101 TECHNICAL REPORT
3182\16.04\3182-STY-001_0 S13
Page 13.15
April 2016 Lycopodium Minerals Pty Ltd
Initially, only one leach test was conducted on the Jack Lens material. These results were using “Base Case” conditions and are reported in Table 13.3.4. The results were poor when compared to the Junnagunna and Garee results. Subsequently, some optimisation tests were conducted as summarised in Table 13.3.11. These tests were conducted at a constant 40°C, and a grind size distribution of P80 = 250 µm, except for one test at P80 = 150 µm, and all at 24 hours.
It is evident that to increase extraction from the Jack Lens material there will be a need to add ferric iron. Lowering the operating pH to 1.2 from 1.5 produced a better extraction than adding the ferric iron but almost doubled the acid addition. Lowering pH as well as adding ferric iron has no benefit and increases acid consumption. Reducing the grind size distribution also provides little benefit. The optimum conditions for Jack Lens would be either lower pH or the addition of ferric iron. ANSTO suggest that if Jack Lens was blended with the Junnagunna and/or Garee materials, the natural ferric from these materials would be enough to allow the Jack Lens extractions to improve.
ANSTO recommended further work to identify methods of improving extraction on the Jack lens ore.
Table 13.3.11 ANSTO Jack Lens Optimisation Leach Test Results
ORP mV pH Ferric Add’n
g/L Residue Grade
ppm U3O8 Extraction
% Acid Add’n
kg/t Oxidant Add’n kg/t
500 1.5 0 119 87.2 5.5 0.37 500 1.2 0 79 91.5 9.8 0.28 500 1.5 1.0 83 91.0 4.0 0.14 500 1.2 1.0 81 91.3 8.9 0.11 500 1.5 1.0 82 91.2* 4.3 0.28
* Indicates the grind size distribution of P80 = 150 µm
13.3.14 Leach Liquor Composition
ANSTO analysed the leach liquor for major and minor element composition. The concentrations of the minors, and elements that could report to final product as penalty elements, e.g, Mo, V, Zr, are low. Arsenic was at the greatest concentration (especially from Redtree ore) and may warrant additional attention in regards to waste water treatment. Ferric concentrations are reasonably high in Junnagunna and Redtree, which is a positive for leaching, but will result in some degree of iron loading if IX is used for uranium recovery. However, ANSTO note that none of the gangue element concentrations in solutions would be expected to result in downstream processing problems.
13.3.15 Leach Residues
ANSTO analysed the leach residues on a size-by-size basis and it was determined that the U was well leached from all fractions when compared with the size-by-size analyses of the feed material. There is a slight decrease of extraction in the coarser particle sizes but the differences are quite minor and do not warrant finer grinding to possibly allow more extraction. The uranium bearing minerals in the residues of Junnagunna and Redtree were predominantly enclosed within quartz.

WESTMORELAND URANIUM PROJECT NATIONAL INSTRUMENT 43-101 TECHNICAL REPORT
3182\16.04\3182-STY-001_0 S13
Page 13.16
April 2016 Lycopodium Minerals Pty Ltd
They did not appear altered by leaching. It is likely that the acid solution could not penetrate the enclosing quartz, since no liberated or partially exposed uranium minerals were found.
13.3.16 Bulk Leach Tests
LAM decided to have a bulk sample leached using a blended sample from the four lenses being investigated. A 70.4 kg sample was composited using the following mix:
• Junnagunna 22.3 kg.
• Garee Upper 13.5 kg.
• Garee Lower 13.5 kg.
• Jack 22.1 kg.
The leach parameters were as a result of the optimisation leach testwork:
• Grind Size P80 = 250 µm.
• Slurry Solids 55%.
• Duration 12 hrs.
• pH 1.5.
• ORP 550 mV.
• Oxidant pyrolusite.
• Temperature 40°C.
The assayed head grade of this composite was 1,360 ppm U3O8, compared with a calculated grade of 1,560 U3O8. Table 13.3.12 summarises the leach results
Table 13.3.12 ANSTO Bulk Sample Leach Test Results
Head Grade ppm U3O8
Residue Gradeppm U3O8
Extraction %
Acid Add’n kg/t
Oxidant Add’n kg/t
1,360 52 96.2 23.71 6.44 Note 1. 23% of the acid was employed to leach the oxidant
The uranium extraction was 96.2% for the bulk leach. This was below the extraction achieved on the Junnagunna and Redtree ores, but higher than the extraction achieved on Jack ore. From the three tests conducted under similar conditions on the individual ores the calculated extraction expected in the Bulk Leach is 95.6%. ANSTO considered that this increase may be due to the elevated ORP and iron levels enhancing the leaching of uranium from the Jack ore component of

WESTMORELAND URANIUM PROJECT NATIONAL INSTRUMENT 43-101 TECHNICAL REPORT
3182\16.04\3182-STY-001_0 S13
Page 13.17
April 2016 Lycopodium Minerals Pty Ltd
the composite. The acid consumption is higher than expected as was the oxidant consumption. Leach kinetics were as expected as shown in Figure 13.3.5.
ANSTO explain the higher acid and oxidant consumptions as due to the extra iron introduced by the mild steel grinding media used by Metcon when dry grinding the sample. The ORP was also held at a higher level for the bulk leach (550 mV) compared to the individual sample leaches (500 mV). The kinetics curve further confirms that 12 hours leach time should be adequate. The bulk leach liquors report much higher manganese due to the use of the pyrolusite as an oxidant.
In summary it can be said that the bulk leach tests was a strong confirmation of the individual sample testwork results and allows confident process design based on the results.
Figure 13.3.5 ANSTO Comparison of Bulk Leach Kinetics and Individual Sample Leach Kinetics
13.3.17 Settling and Filtration Tests
Vendor thickening and filtration tests were undertaken by FLSmidth on slurries from the bulk leach tests. ANSTO also undertook some batch cylinder settling tests. Table 13.3.13 summarises the FLSmidth and ANSTO test results. FLSmidth quoted an overflow solids concentration of less than 100 ppm.
0
50
100
150
200
250
300
0 5 10 15 20 25 30
Leaching Time (h)
Res
idue
Gra
de (p
pm U
3O8)
Junnagunna Redtree Bulk Composite

WESTMORELAND URANIUM PROJECT NATIONAL INSTRUMENT 43-101 TECHNICAL REPORT
3182\16.04\3182-STY-001_0 S13
Page 13.18
April 2016 Lycopodium Minerals Pty Ltd
Table 13.3.13 ANSTO / FLSmidth Settling Test Results
Parameter Units FLSmidth g/L
ANSTO
Junnagunna Garee
Feed Rate tph 30 30 30 Feed Solids % (w/w) 45 - - Feedwell Solids % (w/w) 7.5 7.5 6.6 Flocculant Addition g/t 50 – 100 62.5 71.6 Flocculant Type (Magnafloc) - 800 HP E10 E10 Rise Rate m/h 4.1 - - Free Settling Rate m/h 30 5.9 5.9 Expected Underflow Solids % (w/w) 60 – 61 39.9 37.6 Underflow Stress Yield Pa 14 – 19 - - Flux Rate t/m2/h 0.38 0.103 0.142 Thickener Diameter (at 30 tph) M 10 19.3 16.4 Thickener Diameter (at 125 tph) M 20 - -
Filtration Tests
FLSmidth conducted some preliminary filtration tests using the thickened samples from the settling tests. At a feed percent solids of 60%, the filtering rate was 0.472 t/m2/h.
13.3.18 Pulp Rheology
FLSmidth conducted viscosity tests at various slurry pulp densities as well as determining the stress versus shear rate relationship. Figure 13.3.6 illustrates the shear rate versus shear stress relationship.

WESTMORELAND URANIUM PROJECT NATIONAL INSTRUMENT 43-101 TECHNICAL REPORT
3182\16.04\3182-STY-001_0 S13
Page 13.19
April 2016 Lycopodium Minerals Pty Ltd
Figure 13.3.6 Thickened Pulp Shear Rate vs Shear Stress – Bulk Sample
The relationship for shear stress and slurry pulp density is illustrated in Figure 13.3.7. ANSTO concluded, based on these results, that the product slurry settled reasonably well and the filtration testwork conducted by FLSmidth indicated that the leach product slurry was amenable to filtration. The slurry filtration rate was reasonable and the filter cake could be washed to recover more than 99% of the soluble uranium without excessive wash water.
0
5
10
15
20
25
30
35
40
45
50
0 50 100 150 200 250
Shear rate (s-1)
Shea
r Stre
ss (P
a)
6064

WESTMORELAND URANIUM PROJECT NATIONAL INSTRUMENT 43-101 TECHNICAL REPORT
3182\16.04\3182-STY-001_0 S13
Page 13.20
April 2016 Lycopodium Minerals Pty Ltd
Figure 13.3.7 Thickened Pulp Yield Stress vs Slurry Solids Density – Bulk Sample
13.3.19 Uranium Recovery Tests
Liquor generated from the bulk leach testwork was used to investigate alternative methods to recover the U3O8. The use of ion exchange (IX) and solvent exchange (SX) techniques were tested, as well as precipitation of the U3O8 as an ammonium diurinate or as a uranyl peroxide.
The liquors for testing were as indicated in Table 13.3.14.
Table 13.3.14 IX Feed Liquor Compositions (mg/L/ppm)
Sample pH U3O8 Fe Al As Si V Mn S Ca Mg Mo K
Leach Liquor 1.8 1,605 5,350 609 100 589 21 3,750 9,910 312 170 13 236 RIP Feed 1.5 1,540 4,510 933 96 618 27 3,690 10,080 329 269 14 2 IX Feed 1.5 939 3,240 680 56 432 19 2,650 7,490 244 194 10 2
The IX feed has been diluted to simulate the effect of the wash water that would normally be used while the RIP feed solution is the PLS with no dilution.
13.3.20 Ion Exchange Testwork
The IX testwork looked at two options, resin-in-pulp (RIP) which adsorbs the uranium ions to the surface of specific resins while still within the leach pulps, and straight IX using clarified liquors, which are then put in contact with a resin and the uranium ions adsorb.

WESTMORELAND URANIUM PROJECT NATIONAL INSTRUMENT 43-101 TECHNICAL REPORT
3182\16.04\3182-STY-001_0 S13
Page 13.21
April 2016 Lycopodium Minerals Pty Ltd
The resin chosen by ANSTO for the RIP simulated testwork was Ambersep 920, which had a mean particle size diameter of 0.75 mm to 0.95 mm. The resin chosen for the IX simulated testwork was Amberjet 4400, which had a mean particle size diameter of 0.58 mm. Prior to use, both resins were conditioned by contacting them with sulphuric acid and water to convert exchange sites to the sulphate form from the chloride form. The Ambersep 920 was screened at 600 µm. The Amberjet 4400 was screened at 600 µm and at 300 µm. The test results reported for the Ambersep 920 were derived by treating the PLS, rather than placing the resin in the leached pulp. In addition to this limitation in the test representation, Lycopodium considers that further testwork around the highly siliceous nature of the ore to determine if high rates of resin abrasion would be experienced in simulated RIP conditions. RIP has not been selected as the preferred process for the scoping study.
Resin Loading
Figure 13.3.8 illustrates the loading curve for the RIP resin, Ambersep 920. The maximum loading for the RIP resin was 51 g/L wet settled resin (wsr). The anticipated loading from a solution concentration of 1,450 g/L U3O8 would be about 42 g/L wsr Ambersep 920.
Figure 13.3.8 Uranium Resin Loading – RIP Resin Ambersep 920
The equivalent curve for the Amberjet 4400 is shown in Figure 13.3.9.
0
10
20
30
40
50
0 200 400 600 800 1000 1200 1400 1600 1800 2000Final Liquor, U3O8 mg/L
Res
in lo
adin
g, U
3O8
g/L
wsr
Langmuir LC-3: Loading rate result Final Column Loading (LC-4)

WESTMORELAND URANIUM PROJECT NATIONAL INSTRUMENT 43-101 TECHNICAL REPORT
3182\16.04\3182-STY-001_0 S13
Page 13.22
April 2016 Lycopodium Minerals Pty Ltd
Figure 13.3.9 Uranium Resin Loading – IX Resin Amberjet 4400
The loading for the Amberjet 4400 is higher than that of the Ambersep 920. ANSTO also measured the loading rates for both resins as indicated in Figure 13.3.10.
Figure 13.3.10 Uranium Resin Loading – RIP Resin Ambersep 920 and IX Amberjet 4400
0
10
20
30
40
50
60
70
80
90
0 200 400 600 800 1000 1200 1400 1600Final liquor, U3O8 mg/L
Res
in lo
adin
g, U
3O8
g/L
wsr
Langmuir fit LC-4: Loading rate result Final column loading (LC-6)
0
10
20
30
40
50
60
70
80
90
100
0 200 400 600 800 1000 1200 1400 1600
Time (min.)
Resi
n Lo
adin
g (%
of f
inal
)
Ambersep 920 Amberjet 4400

WESTMORELAND URANIUM PROJECT NATIONAL INSTRUMENT 43-101 TECHNICAL REPORT
3182\16.04\3182-STY-001_0 S13
Page 13.23
April 2016 Lycopodium Minerals Pty Ltd
As can be seen the loading rate for the Ambersep 920 is slightly faster than that of the Amberjet 4400.
The kinetic parameters as calculated by ANSTO for the two resins are summarised in Table 13.3.15.
Table 13.3.15 Loading Kinetic Parameters Ambersep 920 and Amberjet 4400
Resin T50 minutes
T75 minutes
Final Resin Loadingg/L wsr U3O8 k
Ambersep 920 14.5 64.5 42 21.0 Amberjet 4400 32.0 77.0 63 26.6
This data indicates that the Ambersep 920 loads slightly quicker albeit to a lower maximum resin loading.
Column breakthrough curves were produced for each resin using leach solution delivered downflow to the column at a flow rate of 4 BV/h (1.05 m/h). The loading was conducted at 35°C for delivery of 100 BV of feed. A fraction of column effluent was taken every 2 BV and analysed for uranium and impurities. Figure 13.3.11 summarise the curves and shows that the Ambersep 920 requires about 50 bed volumes (BV) to reach saturation loading, and that loading occurs at 45.3 g/L which confirms the previous determination of 42 g/L WSR. The Amberjet 4400 reaches saturation at approximately 100 BV and loads to 79 g/L WSR, which is higher than previously determined. In all the tests indicate the Amberjet 4400 has a higher capacity than Ambersep 920, with a ratio of about 1.4:1.0 equivalent /L wsr.
Figure 13.3.11 Uranium Resin Breakthrough Curves
IX Amberjet 4400 RIP Resin Ambersep 920
Table 13.3.16 indicates resin loadings for some of the other elements in the PLS. Scrubbing stages may be required in the process flowsheet if these elements deport to the eluate in excessive amounts. It is noted that the high apparent silica loading on the Ambersep 920 might suggest that a RIP process would not be appropriate for the adsorption and recovery of uranium.

WESTMORELAND URANIUM PROJECT NATIONAL INSTRUMENT 43-101 TECHNICAL REPORT
3182\16.04\3182-STY-001_0 S13
Page 13.24
April 2016 Lycopodium Minerals Pty Ltd
Table 13.3.16 Metal Ions Loading for Ambersep 920 and Amberjet 4400
Resin U3O8 g/L wsr
Fe g/L wsr
SO4 g/L wsr
Si g/L wsr
P g/L wsr
Ambersep 920 45.3 1.6 59.4 17.6 0.4 Amberjet 4400 78.7 0.5 94.3 1.7 0.6
Resin Elution
The elution behaviour of each resin was characterised by performing equilibrium measurements, elution rate measurements and column elution behaviour with 1 M sulphuric acid and at 35°C. The isotherms for the resins are given in Figures 13.3.12 and 13.3.13.
Figure 13.3.12 Uranium Elution Isotherm – RIP Resin Ambersep 920
Ambersep 920
0
1000
2000
3000
4000
0 2 4 6 8Resin, g/L wsr U3O8
Elu
ate
mg/
LU3 O
8

WESTMORELAND URANIUM PROJECT NATIONAL INSTRUMENT 43-101 TECHNICAL REPORT
3182\16.04\3182-STY-001_0 S13
Page 13.25
April 2016 Lycopodium Minerals Pty Ltd
Figure 13.3.13 Uranium Elution Isotherm – IX Resin Amberjet 4400
Uranium loaded Ambersep 920 and Amberjet 4400 resins were contacted with 1 M sulphuric acid in bottle roll tests at 35°C. The rate of uranium elution was determined by monitoring the variation in the uranium concentration of the eluant over 24 hours. The elution kinetic parameters are shown in Table 13.3.17.
Table 13.3.17 Elution Kinetic Parameters Ambersep 920 and Amberjet 4400
Resin T50 minutes
T75 minutes
Final Resin Loading(g/L wsr U3O8) Initial k
Ambersep 920 9 22 45.3 0.8 Amberjet 4400 26 53 78.7 1.4
The elution rates were also determined as shown in Figures 13.3.14 and 13.3.15 and indicate that both resins were eluted efficiently by sulphuric acid. A final resin concentration of 1 g/L wsr U3O8 indicated practically complete elution.
ANSTO also conducted column elution testwork. These elution curves (at 35°C) are shown in Figures 13.3.16 and 13.3.17. The eluant was delivered to the column at a flow rate of 1 BV/h (0.09 m/h). ANSTO concluded that both elution curves indicate that uranium elution is achieved well within 20 BV of eluant delivered to the column with a stripped resin composition of 1 g/L wsr U3O8 reached after 7 BV of eluate for the Ambersep 920 and 14 BV for Amberjet 4400. The elution process is kinetically impaired at lower temperatures and a minimum temperature of 40°C is recommended. The elution behaviour of the two impurities, iron, and phosphorous are also included. Iron appears to elute prior to the uranium, particularly for Amberjet 4400. Ferric iron in its ferric sulphate complex form is less strongly bound compared to the uranium oxide sulphate
Amberjet 4400
0
1000
2000
3000
4000
0 2 4 6 8 10 12 14Resin, g/L wsr U3O8
Elu
ate,
mg/
L U3
O8

WESTMORELAND URANIUM PROJECT NATIONAL INSTRUMENT 43-101 TECHNICAL REPORT
3182\16.04\3182-STY-001_0 S13
Page 13.26
April 2016 Lycopodium Minerals Pty Ltd
complex and can be eluted with a weak acid or a reductant to effect a “scrubbibg step” therby improving the U/Fe ratio. Phosphorous elution is coincident with uranium for both resins and this may impact to some extent on precipitate purity during product recovery when direct precipitation of the uranium from the eluate is undertaken.
The variation of the uranium concentrations in the bulk eluate for both resins are compared in Figure 13.3.18 and show that bulk eluates can contain up to 8.8 g/L and 11.3 g/L U3O8 for the Ambersep and Amberjet after collection of 4 and 5 BV, respectively.
Figure 13.3.14 Uranium Elution Rate – RIP Resin Amberset 920
Loaded Ambersep 920
0255075
100125150175200225250275
0 200 400 600 800 1000 1200 1400
Time (min)
U S
olut
ion
conc
(mg/
L)

WESTMORELAND URANIUM PROJECT NATIONAL INSTRUMENT 43-101 TECHNICAL REPORT
3182\16.04\3182-STY-001_0 S13
Page 13.27
April 2016 Lycopodium Minerals Pty Ltd
Figure 13.3.15 Uranium Elution Rate – IX Resin Amberjet 4400
Figure 13.3.16 Uranium and Impurity Elution – RIP Resin Amberset 920
Loaded Amberjet 4400
050
100150200250300350400450
0 200 400 600 800 1000 1200 1400
Time (min)
U S
olut
ion
conc
(mg/
L)
Ambersep 920
0
2,000
4,000
6,000
8,000
10,000
12,000
14,000
0 2 4 6 8 10 12 14 16 18 20
V Eluate (BV)
U3O
8 in
elu
ate
(mg/
L)
0
50
100
150
200
250
Fe, P
in e
luat
e (m
g/L
)
U3O8 Fe P

WESTMORELAND URANIUM PROJECT NATIONAL INSTRUMENT 43-101 TECHNICAL REPORT
3182\16.04\3182-STY-001_0 S13
Page 13.28
April 2016 Lycopodium Minerals Pty Ltd
Figure 13.3.17 Uranium and Impurity Elution – IX Resin Amberjet 4400
Figure 13.3.18 Bulk Eluate Concentrations – RIP Resin Ambersep 920 and IX Resin Amberjet 4400
Amberjet 4400
0
2000
4000
6000
8000
10000
12000
14000
16000
18000
0 2 4 6 8 10 12 14 16 18 20
V Eluate (BV)
U3O
8 in
elu
ate
(mg/
L)
0
50
100
150
200
250
Fe, P
in e
luat
e (m
g/L
)
U3O8 Fe P
0.0
2.0
4.0
6.0
8.0
10.0
12.0
0 2 4 6 8 10 12 14 16 18 20
V eluant (BV)
U3O
8 in
bul
k el
uate
(mg/
L)
0
5
10
15
20
25
30
35
40
45
Aci
d C
onsu
mpt
ion
(g H
2SO
4/g
U3O
8)
Bulk eluate: Amberjet 4400 Bulk eluate: Ambersep 920Acid used: Amberjet 4400 Acid used: Ambersep 920

WESTMORELAND URANIUM PROJECT NATIONAL INSTRUMENT 43-101 TECHNICAL REPORT
3182\16.04\3182-STY-001_0 S13
Page 13.29
April 2016 Lycopodium Minerals Pty Ltd
13.3.21 Uranyl Peroxide Precipitation
ANSTO conducted some non-optimised precipitation tests using the eluate generated in the elution testwork and based their previous experience, to indicate impurity deportment, as well as U levels.
The method was based on a two stage process where gypsum (pH 1.5) and iron hydroxide (pH 3.5) were precipitated first and removed, prior to uranyl peroxide precipitation (UO4.2H2O) using hydrogen peroxide at pH 3.5 and 35°C. This final production reaction follows the equation below.
UO2(SO4)3 + H2O2 + 2NaOH + xH2O UO4xH2O + 2H2SO4 + Na2SO4
Table 13.3.18 presents the analyses of the products from the precipitation tests for both resins, and compares them to the specifications provided from the three converter companies, Comurhex, Converdyne, and Cameco. Not all elements are shown, only the more evident ones. Iron nearly met specification, but phosphorous exceeded reject specifications for Cameco and attention needs to be paid to managing it. The gypsum / iron cake composition indicated that some uranium losses occurred during the preliminary precipitation. XRF assays show that the gypsum from the Amberjet eluate contained 0.67% U3O8 and from the Ambersep 920 eluate, the gypsum contained 0.44% U3O8. The uranium in gypsum represented 12% and 6% of the uranium in feed for Amberjet and Ambersep, respectively. In practice this slurry could be recycled to the leach circuit and the wash liquor combined with the filtrate to recover this uranium. ANSTO believed that the high sulphate ion content resulted from poor cake washing during filtration. An alternative would be to employ magnesia or sodium hydroxide, with an iron precipitation step to control phosphate, but uranium recycle in the precipitate would be inevitable. The use of limestone should be avoided as a consequence of this reagent introducing calcium, and also manganese depending upon the source of limestone.

WESTMORELAND URANIUM PROJECT NATIONAL INSTRUMENT 43-101 TECHNICAL REPORT
3182\16.04\3182-STY-001_0 S13
Page 13.30
April 2016 Lycopodium Minerals Pty Ltd
Table 13.3.18 Uranyl Peroxide Compositions (as % of U)
Element Ambersep Amberjet Cameco Comurhex Converdyne
920 4400 Accept Reject Accept Reject Accept Reject
U* 71.0 71.2 - - - - - - V2O5 n/m n/m - - 0.30 0.30 - -
V <0.03 <0.03 0.05 0.10 - - 0.01 0.05 As <0.04 <0.03 0.05 0.15 1.00 2.50 0.01 0.04 B <0.04 <0.02 0.01 0.15 0.20 0.20 0.01 0.10 C n/m n/m - - 0.20 1.00 0.01 0.20
Ca 0.32 0.47 - - - - - - Cl <0.35 0.44 - - 0.15 0.25 0.05 0.10
CO3 n/m n/m - - 2.00 3.00 0.20 0.50 F <0.04 <0.03 - - 0.15 0.30 0.01 0.10 Fe 0.23 0.19 1.00 2.00 - - 0.15 0.50 K 0.41 0.26 1.00 2.00 - - 0.20 1.00
Mg <0.04 <0.03 3.00 4.00 - - 0.02 0.50 Mo <0.03 <0.02 0.10 0.30 0.10 0.30 0.10 0.30 Na 0.20 0.26 1.00 2.00 1.00 7.50 0.50 3.00 PO4 0.86 0.83 - 0.50 1.00 1.00 0.10 1.00
S 4.08 2.56 1.00 3.50 0 0 0 0 Se <0.03 <0.02 - - - - 0.01 0.04
SiO2 0.43 0.28 1.07 2.00 0.50 2.50 0.50 2.00 SO4 12.24 7.68 - - 3.00 10.00 1.00 4.00 Th <0.03 <0.02 0.50 2.00 - - 0.01 0.05 Ti <0.04 <0.03 0.05 0.10 - - 0.01 0.05 Zr <0.03 <0.02 0.10 0.50 0.20 2.00 0.01 0.50 Cd <0.04 <0.02 - - - - 0.01 0.04
Based on these results ANSTO concluded that precipitation of uranyl peroxide from the eluates generated a product for which the composition compared favourably to a Cameco, Comurhex and Converdyn (upper limit) purity specification. Iron phosphate precipitation during the iron removal stage or resin scrubbing prior to elution, may provide a solution to the high levels of phosphorus in the uranyl peroxide product.
13.3.22 Solvent Extraction Testwork
Bench scale solvent extraction testwork was also conducted by ANSTO and demonstrated that the ore was suited to this approach to uranium recovery. However, for environmental reasons LAM’s preference was for a flowsheet that excludes the use of ammonia and consequently the focus of the scoping study was on the use of ion exchange. Details of the solvent extraction testwork performed can be found in ANSTO Westmoreland Final Report 25 July 2011.

WESTMORELAND URANIUM PROJECT NATIONAL INSTRUMENT 43-101 TECHNICAL REPORT
3182\16.04\3182-STY-001_0 S13
Page 13.31
April 2016 Lycopodium Minerals Pty Ltd
13.4 Conclusions and Recommendations
The principal conclusions reached on the basis of the most recent ANSTO testwork are:
1. The Westmoreland material generally acid leaches very well with modest acid consumption and high U extractions.
2. Co leaching of gangue elements is not considered to present any problems for down-stream processing.
3. The Jack Lens material was the only exception and extraction was improved by adding ferric iron to assist oxidation of tetravalent uranium in the material. Further optimisation of leach conditions is expected to improve performance on Jack Lens material, for example treat as a blend with the other ores that release iron in the leach.
4. The grind size distribution required is relatively coarse which favours milling power consumption and filtration performance.
5. The leach kinetics are reasonably fast.
6. Recovery of the U from the leached slurry can be undertaken by several methods including continuous ion exchange.
7. Precipitation of the U as a concentrate to be sold to the market can be of a good quality and can be treated by any of the three main converters that will be treating the material.
8. Pulp settling rate is reasonable with a high solids underflow density and a relatively clear overflow pregnant leach solution (PLS).
9. The use of SX technology also has been tested and would be a technically viable treatment option.
A significant metallurgical test program, including closed circuit piloting will be required if the project moves to the next phase, including collection and testing of representative samples and composites, variability tests on specific zones of the deposits and comminution testwork over the range of lithologies expected to be encountered. ANSTO specifically recommended the following:
• Conduct leach tests using solution either from site or a synthetic solution to simulate expected leach make-up solution.
• Conduct optimisation tests on the expected composite feed, and use these blends for the pilot plant test program.
• Conduct downstream neutralisation testwork, on liquors generated from Redtree ore and a composite of all three ores, to ensure that the arsenic can be effectively immobilised into an iron precipitate.

WESTMORELAND URANIUM PROJECT NATIONAL INSTRUMENT 43-101 TECHNICAL REPORT
3182\16.04\3182-STY-001_0 S13
Page 13.32
April 2016 Lycopodium Minerals Pty Ltd
• Conduct a continuous pilot operation on the expected feed composite to confirm data generated in batch tests, and to generate slurry/solution for continuous downstream piloting.
• Conduct filtration, settling and rheology testwork on the product slurry from the continuous testwork.
• Conduct downstream continuous testwork, i.e. ion-exchange and/or solvent extraction.
• Consider tailings neutralisation treatment and recycle of liquor.

WESTMORELAND URANIUM PROJECT
NATIONAL INSTRUMENT 43-101 TECHNICAL REPORT
3182-STY-001
Table of Contents Page
14.0 MINERAL RESOURCE ESTIMATE 14.1 14.1 Mineral Resources 14.1 14.2 Discussion 14.2
TABLES Table 14.1.1 Westmoreland Mineral Resource Estimates – Indicated Category
2016 14.1 Table 14.1.2 Westmoreland Mineral Resource Estimates – Inferred Category 2016 14.1
3182\16.04\3182-STY-001_0 S14 April 2016 Mining Associates

WESTMORELAND URANIUM PROJECT NATIONAL INSTRUMENT 43-101 TECHNICAL REPORT
3182\16.04\3182-STY-001_0 S14
Page 14.1
April 2016 Mining Associates
14.0 MINERAL RESOURCE ESTIMATE
14.1 Mineral Resources
Mining Associates previously reported an NI43-101 / JORC compliant Mineral Resource Estimate in May 2009 (Vigar & Jones, May 2009) made up of Indicated Mineral Resources of 18.7 Mt at an average grade of 0.089% U3O8 containing 36 Mlbs of uranium (U3O8) and an additional Inferred mineral resource of 9 Mt at an average grade of 0.083% U3O8 containing 15.9 Mlbs of U3O8.
The estimates were reviewed in detail by one of the 2009 QP’s (Mr Vigar) in light of work since and to ensure compliance with JORC 2012. The drilling undertaken later in 2009, 2010, and 2012 was in peripheral areas, and has confirmed the earlier work but not significantly changed the resource.
The resource is re-stated here as compliant with both NI43-101 and JORC 2012 guidelines. Full details of the estimates can be found in (Vigar & Jones, May 2009) and the JORC table 1 attached to the press release.
The mineral resource estimate has been classified under the Canadian Institute of Mining, Metallurgy and Petroleum’s (CIM) code of ore classification and JORC 2012. The 2016 mineral resource estimate for Westmoreland is outlined in the following tables and should to be read in conjunction with the notes following.
Table 14.1.1 Westmoreland Mineral Resource Estimates – Indicated Category 2016
Resource Category Deposit Resource Tonnes Grade % (U3O8) M lbs U3O8
Indicated cut-off 0.02%
U3O8
Redtree (Garee) 12,858,750 0.09 25.5 Huarabagoo 1,462,000 0.08 2.7 Junnagunna 4,364,750 0.08 7.8
Subtotal 18,685,500 0.09 36.0 Note – reported tonnage and grade figures have been rounded off from raw estimates to the appropriate number of significant figures to reflect the order of accuracy of the estimate. Minor variations may occur during the addition of rounded numbers.
Table 14.1.2 Westmoreland Mineral Resource Estimates – Inferred Category 2016
Resource Category Deposit Resource Tonnes Grade % (U3O8) M lbs U3O8
Inferred cut-off 0.02%
U3O8
Redtree (Garee) 4,466,750 0.07 6.6 Huarabagoo 2,406,000 0.11 5.8 Junnagunna 2,149,500 0.08 3.6
Subtotal 9,022,250 0.08 15.9 Note – reported tonnage and grade figures have been rounder of rounded off from raw estimates to the appropriate number of significant figures to reflect the order and accuracy of the estimate. Minor variations may occur during the addition of rounded numbers.

WESTMORELAND URANIUM PROJECT NATIONAL INSTRUMENT 43-101 TECHNICAL REPORT
3182\16.04\3182-STY-001_0 S14
Page 14.2
April 2016 Mining Associates
Notes to accompany the Mineral Resource Estimate
• Geological model method used was sectional interpretation for 3D wireframes, each domain separately estimated.
• Total of 695 drill holes (including 393 open hole percussion and 302 diamond cored) for 38,363.5 m evaluated at Redtree Deposit, suspect and duplicate holes not used.
• Total of 361 drill holes (including 48 open hole percussion, 28 RC, and 285 diamond cored) for 32,320.3 m evaluated at Huarabagoo Deposit.
• Drill composite width of 1 m.
• Missing samples or intervals not used.
• Cut-off grade of 0.02% used on blocks and interval selection.
• Top cut applied and varied for each domain.
• Estimates made using ordinary krige method.
• Panel size of 20 m x 20 m x 4 m for estimation and sub-blocked to 5 m x 5 m x 2 m for volumes.
• Bulk density of 2.5 t/m3 throughout.
• No mining or metallurgical factors applied.
14.2 Discussion
The 2016 resource has been reviewed in detail by qualified person Mr Vigar (QP) to ensure compliance with JORC 2012. The 2016 Resource is suitable for mine design and planning.
Full details of the estimates can be found in Vigar & Jones, May 2009. The 2009 estimate has been found to be compliant and is re-stated here as April 2016.
The drilling undertaken in 2009, 2010, and 2012 has confirmed the earlier work but not significantly changed the resource area.

WESTMORELAND URANIUM PROJECT
NATIONAL INSTRUMENT 43-101 TECHNICAL REPORT
3182-STY-001
Table of Contents Page
15.0 MINERAL RESERVE ESTIMATE 15.1 15.1 Introduction 15.1
3182\16.04\3182-STY-001_0 S15 April 2016 Mining Associates

WESTMORELAND URANIUM PROJECT NATIONAL INSTRUMENT 43-101 TECHNICAL REPORT
3182\16.04\3182-STY-001_0 S15
Page 15.1
April 2016 Mining Associates
15.0 MINERAL RESERVE ESTIMATE
15.1 Introduction
As this technical report is at the Scoping Study stage this section is not applicable.

WESTMORELAND URANIUM PROJECT
NATIONAL INSTRUMENT 43-101 TECHNICAL REPORT
3182-STY-001
Table of Contents Page
16.0 MINING 16.1 16.1 Mining Model 16.1 16.2 Methodology 16.6 16.3 Tailings Cells 16.7 16.4 Mine Buildings and Structures 16.8
16.4.1 Workshop 16.8 16.4.2 Ablutions 16.8 16.4.3 Change Room Facilities 16.8 16.4.4 Wash Down Bays 16.8
16.5 Mining Costs 16.8 16.5.1 Trucking Requirements Calculation 16.9 16.5.2 Equipment Schedule 16.11 16.5.3 Equipment CAPEX Schedule 16.12 16.5.4 Mining Operating Cost Summary 16.15
16.6 Production Schedule 16.16 TABLES Table 16.1.1 Westmoreland Mineral Resources Cut-off 0.02% U3O8 16.1 Table 16.5.1 Equipment Cost Assumptions Owner Operator 16.8 Table 16.5.2 Haul Profiles for Mill Location West of Garee 16.9 Table 16.5.3 Mining Equipment Schedule 16.11 Table 16.5.4 Estimated Mobile Equipment Capital Expenditure 16.13 Table 16.5.5 Mining Cost Options 16.15 Table 16.6.1 Westmoreland Production Summary 16.16 Table 16.6.2 Westmoreland Production Schedule for Constant 2 Mtpa Mill Feed 16.19 Table 16.6.3 Westmoreland Production Schedule by Pit 16.21 FIGURES Figure 16.1.1 North Pit - Junnagunna 16.2 Figure 16.1.2 Westmoreland Deposits and Pit Shells 16.3 Figure 16.1.3 South Pit - Garee 16.4 Figure 16.1.4 Central Pit 16.5 Figure 16.1.5 Westmoreland Deposits – South Pit in Foreground 16.6 Figure 16.3.1 Proposed Tailings Emplacement Cells Garee 16.7 Figure 16.5.1 Haulage Profile 16.10 Figure 16.5.2 Mining Unit Costs Owner Miner vs. Contractor 16.15 Figure 16.6.1 Material Mined 16.16 Figure 16.6.2 Pit Sequence 16.17 Figure 16.6.3 Ore Milled 16.17 Figure 16.6.4 Metal Produced 16.18 Figure 16.6.5 Mined Ore and Waste 16.20 Figure 16.6.6 Total Mined Tonnes by Pit 16.20
3182\16.04\3182-STY-001_0 S16 April 2016 Mining Associates

WESTMORELAND URANIUM PROJECT NATIONAL INSTRUMENT 43-101 TECHNICAL REPORT
3182\16.04\3182-STY-001_0 S16
Page 16.1
April 2016 Mining Associates
16.0 MINING
16.1 Mining Model
The mineral resources used in the study are summarized in Table 16.1.1. Whittle Four-X software (Whittle) was used to define optimal pits for the three Westmoreland uranium deposits (Junnagunna, Huarabagoo, and Garee) based on the mineral resource model. The mineral resources which lie within the Whittle shells are also listed in Table 16.1.1. It is noted that the mineral resource figures in Table 16.1.1 labelled “Inside Whittle Shells” are before pit design, therefore are not “reserves”.
Table 16.1.1 Westmoreland Mineral Resources Cut-off 0.02% U3O8
JORC Category Mineral Resources Inside Whittle Shells
Tonnes Grade % (U3O8)
M lbs U3O8 Tonnes Grade %
(U3O8) M lbs U3O8
Inferred 9,022,250 0.08 15.9 7,751,500 0.075 12.8 Indicated 18,685,500 0.09 36.0 18,497,750 0.087 35.7
The pits were designed using the Whittle optimisation shell 50 from 2008 as a guide, but the full resource block model (maxres) was used for the actual designs, with maximum resolution of 2 m benches. Face angle is 60°, with a 5 m berm each 20 m, which is a conservative approach in the absence of geotechnical information.
Ramps are not included at this time, although the flat lying nature of the ore zones indicate that they will have little impact on the final design.
There are five pit shells in three areas as shown in Figure 16.1.1 to Figure 16.1.4:
• North – Junnagunna – one shell.
• Central – Huarabagoo – one shell.
• South – Garee - three shells.

WESTMORELAND URANIUM PROJECT NATIONAL INSTRUMENT 43-101 TECHNICAL REPORT
3182\16.04\3182-STY-001_0 S16
Page 16.2
April 2016 Mining Associates
Figure 16.1.1 North Pit - Junnagunna

WESTMORELAND URANIUM PROJECT NATIONAL INSTRUMENT 43-101 TECHNICAL REPORT
3182\16.04\3182-STY-001_0 S16
Page 16.3
April 2016 Mining Associates
Figure 16.1.2 Westmoreland Deposits and Pit Shells

WESTMORELAND URANIUM PROJECT NATIONAL INSTRUMENT 43-101 TECHNICAL REPORT
3182\16.04\3182-STY-001_0 S16
Page 16.4
April 2016 Mining Associates
Figure 16.1.3 South Pit - Garee

WESTMORELAND URANIUM PROJECT NATIONAL INSTRUMENT 43-101 TECHNICAL REPORT
3182\16.04\3182-STY-001_0 S16
Page 16.5
April 2016 Mining Associates
Figure 16.1.4 Central Pit

WESTMORELAND URANIUM PROJECT NATIONAL INSTRUMENT 43-101 TECHNICAL REPORT
3182\16.04\3182-STY-001_0 S16
Page 16.6
April 2016 Mining Associates
Figure 16.1.5 Westmoreland Deposits – South Pit in Foreground
Source: Site visit 2015
16.2 Methodology
The mining methodology is based on conventional methods and is summarised below:
• Pit mining using Excavator / FEL operation loading off-highway haul trucks.
• Conventional Drill and Blast (D&B) with Truck and Shovel (T&S) operation mining 5 m benches with 2.5 m flitches.
• Sufficient working areas to allow for simultaneous D&B and T&S operation. Flexibility in the scheduling required.
• Likely Truck & Shovel combination to be Hitachi 1900 loading Hitachi EH1100 Haultrucks (63 t) on Waste, Hitachi 1200 loading EH110 Haultrucks on Ore supported by Cat 992 FEL loading EH110 Haultrucks on Waste and Ore.
The mining methodology is based on the following material movement schedule:
• A total of 131 Mt TMM (Total Material Moved) will be moved over 12 years of mining with 104.8 Mt of Waste and 26.3 Mt of ore being produced.
• Mining Schedule produces an average of 2.2 Mtpa Ore and 8.7 Mtpa of Waste.
• Mill feed: 2 Mtpa achieved in the second year onwards for the full mine life. The mill throughput reduces to approximately 0.227 Mtpa in the 15th and final year of production.
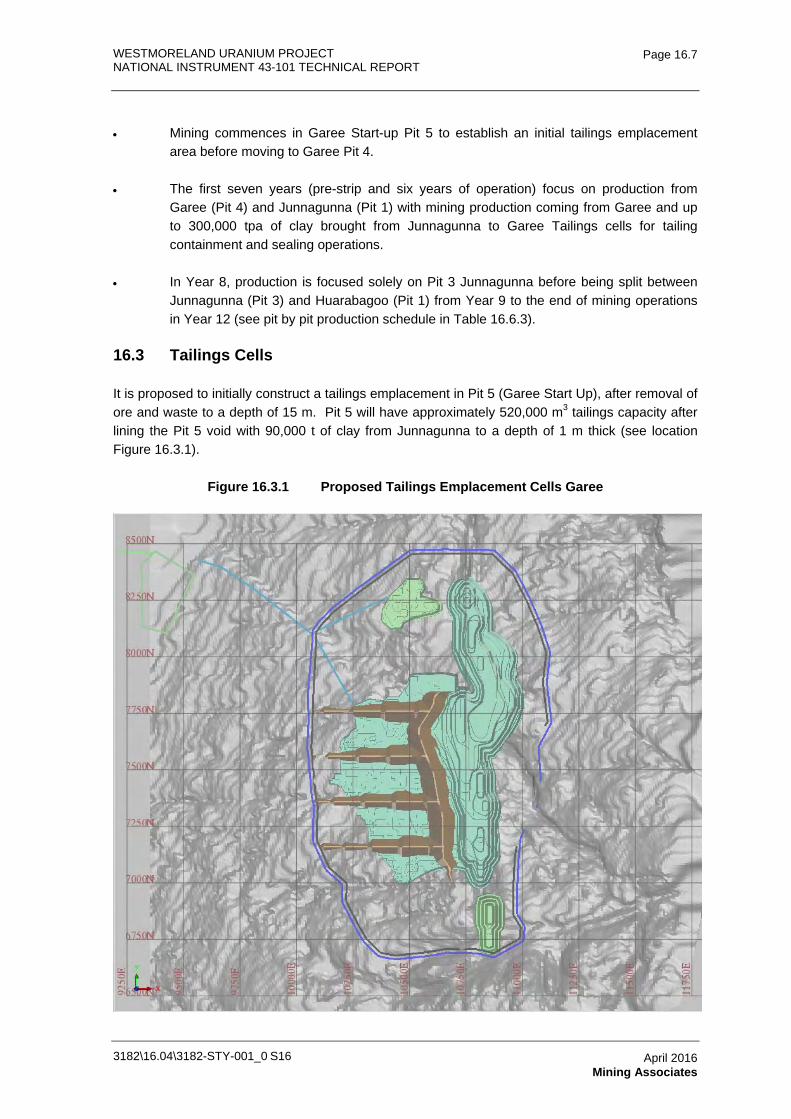
WESTMORELAND URANIUM PROJECT NATIONAL INSTRUMENT 43-101 TECHNICAL REPORT
3182\16.04\3182-STY-001_0 S16
Page 16.7
April 2016 Mining Associates
• Mining commences in Garee Start-up Pit 5 to establish an initial tailings emplacement area before moving to Garee Pit 4.
• The first seven years (pre-strip and six years of operation) focus on production from Garee (Pit 4) and Junnagunna (Pit 1) with mining production coming from Garee and up to 300,000 tpa of clay brought from Junnagunna to Garee Tailings cells for tailing containment and sealing operations.
• In Year 8, production is focused solely on Pit 3 Junnagunna before being split between Junnagunna (Pit 3) and Huarabagoo (Pit 1) from Year 9 to the end of mining operations in Year 12 (see pit by pit production schedule in Table 16.6.3).
16.3 Tailings Cells
It is proposed to initially construct a tailings emplacement in Pit 5 (Garee Start Up), after removal of ore and waste to a depth of 15 m. Pit 5 will have approximately 520,000 m3 tailings capacity after lining the Pit 5 void with 90,000 t of clay from Junnagunna to a depth of 1 m thick (see location Figure 16.3.1).
Figure 16.3.1 Proposed Tailings Emplacement Cells Garee

WESTMORELAND URANIUM PROJECT NATIONAL INSTRUMENT 43-101 TECHNICAL REPORT
3182\16.04\3182-STY-001_0 S16
Page 16.8
April 2016 Mining Associates
16.4 Mine Buildings and Structures
16.4.1 Workshop
The workshop will be fitted with gantry adequate to facilitate haul-truck engine rebuilds. A semi-enclosed structure will be erected to protect the workers against the elements. Also, high enough roof to enable tub repairs for a 60 t truck.
16.4.2 Ablutions
Ablution facilities will be adequate to service a +150 man camp.
16.4.3 Change Room Facilities
Change rooms with include washing machine and dryer facilities.
16.4.4 Wash Down Bays
Bays will be situated at every access and egress point to public roads and/or living quarters, eating, and office areas. The bays will be large enough to be suitable for road-trains and pit dump trucks.
16.5 Mining Costs
The estimated mining costs and capital requirements are based on parameters summarised in Table 16.5.1. The mining costs were based on the assumption that the primary production fleet would consist of a truck and shovel (T&S) match of 60 t trucks and 200 t excavators as well as a smaller 100 t excavator allocated to ore removal. Plant operating costs are inclusive of maintenance and servicing, Ground Engaging Tools (GET).
Table 16.5.1 Equipment Cost Assumptions Owner Operator
Type Capacity
(t) Productivity
(t's/hr) Fuel Burn
(ltrs/hr) CAPEX OPEX
(AUD/hr)
Trucks Hitachi EH1100 63 NA 60 2,000,000 124 Excavators EX1900-6BH 200 1,800 170 4,500,000 364
EX1200-6BE 100 1,100 100 1,300,000 275 Cat 992 FEL 95 810 Waste/865 Ore 80 2,100,000 282
Ancillary Equip. Production Drill N/A 80 3,500,000 268 Cat 992 FEL (Stockpile) 95 865 80 2,100,000 282 CAT16M Grader N/A 28 1,200,000 42 Cat 773 Water Truck N/A 75 2,400,000 78 Dozer Cat D10 N/A 74 1,700,000 70
In addition to the estimated plant operating rate, the mining unit rates also require the following cost of labour to be added (i) Ave Staff Costs AUD84.64 /hr, (ii) Labour costs: AUD57.14 /hr

WESTMORELAND URANIUM PROJECT NATIONAL INSTRUMENT 43-101 TECHNICAL REPORT
3182\16.04\3182-STY-001_0 S16
Page 16.9
April 2016 Mining Associates
16.5.1 Trucking Requirements Calculation
The primary determinate of haulage costs are the haul profiles. In the case of the Westmoreland operation, the haulage profiles differ between the three major working areas, Junnagunna, Huarabagoo, and Garee pits. In addition, the destination of the ore and waste is different between pits and the preferred location of the milling operation. Thus the haulage costs are determined by the materials location, destination, and fleet size each year. For the purpose of this scoping level study, it was assumed that the location for the milling site is on the Western side of the Garee pit. The haul profiles with respect to the three pits is summarised in Table 16.5.2.
Table 16.5.2 Haul Profiles for Mill Location West of Garee
Year Material Source Distance(m) Destination Elevation
(m) Cycle time
(min) Fleet Size
1 Ore Garee Pit 1,911 Garee Mill 32 13.33 3 6 Ore Garee Pit 2,870 Garee Mill 112 18.6 3 9 Ore Huarabagoo Pit 4,770 Garee Mill 37 21.93 3
12 Ore Huarabagoo Pit 5,650 Garee Mill 125 26.27 3 8 Ore Junnagunna Pit 9,470 Garee Mill 112 33.21 3
11 Ore Junnagunna Pit 9630 Garee Mill 128 35.25 3 1 Waste Garee Pit 722 Waste Dump 42 11.36 3 6 Waste Garee Pit 1,360 Waste Dump 106 15.34 3 9 Waste Huarabagoo Pit 720 Waste Dump 42 11.30 3
12 Waste Huarabagoo Pit 1,600 Waste Dump 130 15.69 3 8 Waste Junnagunna Pit 1,520 Waste Dump 122 11.35 3
11 Waste Junnagunna Pit 1,680 Waste Dump 138 13.71 3 1 Waste Junnagunna Pit 11,091 Garee Start-Up Pit 31 40.34 3
An illustration of the likely haulage routes is shown in Figure 16.5.1.

WESTMORELAND URANIUM PROJECT NATIONAL INSTRUMENT 43-101 TECHNICAL REPORT
3182\16.04\3182-STY-001_0 S16
Page 16.10
April 2016 Mining Associates
Figure 16.5.1 Haulage Profile

WESTMORELAND URANIUM PROJECT NATIONAL INSTRUMENT 43-101 TECHNICAL REPORT
3182\16.04\3182-STY-001_0 S16
Page 16.11
April 2016 Mining Associates
16.5.2 Equipment Schedule
The production schedule required 8 Mtpa TMM for the first six years, 16 Mtpa for the next four years then tapering off to 12.2 Mtpa and 6.8 Mtpa TMM in the final two years of mining (see Table 16.6.2). This schedule has been based on working 353 days per year on 2 x 12.5 hr shifts to provide hot seat labour coverage for start of shift and during crib operations.
The mining fleet required to meet this production consisted of a fleet of 60 t trucks being loaded by 200 t excavators on Waste (12 m3 bucket), 100 t excavators for Ore (5 m3 bucket) and a FEL (10 m3 bucket) for Ore and Waste support. The drill requirements were based on 100% Drill & Blast. Ancillary fleet is the minimum required to support the number of mining and dumping faces. The estimated number of trucks is based on the mill location at Garee, West of the Garee pit.
Table 16.5.3 Mining Equipment Schedule
Mining Equipment Prestrip Year
1 Year
2 Year
3 Year
4 Year
5 Year
6 Year
7 Year
8 Year
9 Year 10
Year 11
200t Exc. Waste 1 1 1 1 1 1 FEL on Waste & Ore 1 1 1 1 1 1 1 1 1 1 1 1
100t Exc. Ore 1 1 1 1 1 1 1 1 1 1 1 1 Haultrucks 5 5 6 6 6 6 8 8 8 10 9 6 Dozer 3 3 3 3 3 3 4 4 4 4 4 2 Grader 1 1 1 1 1 1 1 1 1 1 1 1 Fuelcart 1 1 1 1 1 1 1 1 1 1 1 1 Watercart 1 1 1 1 1 1 1 1 1 1 1 1 FEL on ROM Rehandle 1 1 1 1 1 1 1 1 1 1 1 1
Tyre Handler 1 1 1 1 1 1 1 1 1 1 1 1 Blasthole Drill 2 2 2 2 2 2 3 3 3 3 3 1
The equipment schedule is based on the following assumptions:
• Ore removal: the 100 t excavator fleet number calculated is based on it being allocated 100% to the removal of ore.
• Waste removal: the 200 t excavator fleet number calculated is based on it being allocated 100% to the removal of waste.
• Production Drill: the number of drill rigs required is based on drilling 16 m benches on a 7 m x 8 m drill pattern on Waste and a 3.3 m and 3.8 m tight drilling pattern of 5 m bench height for ore where required.
• Explosives have been assumed to be supplied on a down the hole basis with owner supplied shot-firing crew. The assumed split for wet and dry product is 33% and 67% respectively.

WESTMORELAND URANIUM PROJECT NATIONAL INSTRUMENT 43-101 TECHNICAL REPORT
3182\16.04\3182-STY-001_0 S16
Page 16.12
April 2016 Mining Associates
16.5.3 Equipment CAPEX Schedule
The initial mining equipment capital expenditure is AUD28.2M, comprised of AUD22.2M for mining equipment and AUD6M for Auxiliary Equipment including contingency. As the equipment reaches the end of its useful life it is replaced with a further AUD58.4M being required over the life of the project. Summary of Capital Requirements are contained in Table 16.5.4.

WESTMORELAND URANIUM PROJECT NATIONAL INSTRUMENT 43-101 TECHNICAL REPORT
3182\16.04\3182-STY-001_0 S16
Page 16.13
April 2016 Mining Associates
Table 16.5.4 Estimated Mobile Equipment Capital Expenditure
Equipment Current
WDV (AUD)
Opening SMU Hrs
Expected Life Hrs
Purchase Price (AUD)
Start Period
(Y) -1 1 2 3 4 5 6 7 8 9 10 11
Cat 992 FEL 715,350 7,676 45,000 2,100,000 1 715,350 - - - 2,100,000 - - - - - - -
Hitachi EX 1900-6 200 t Exc 4,500,000 - 45,000 4,500,000 6 - - - - - 4,500,000 -
EX 1200-6 100 t Exc (New) 1,144,778 6,265 40,000 1,300,000 1 1,144,778 - - - 1,300,000 - - - 1,300,000 - - -
EH-1100 Haul Truck (New) 2,000,000 - 45,000 2,000,000 1 2,000,000 - - - - - 2,000,000 - - - - -
EH-1100 Haul Truck (New) 2,000,000 - 45,000 2,000,000 1 2,000,000 - - - - - 2,000,000 - - - - -
EH-1100 Haul Truck (New) 2,000,000 - 45,000 2,000,000 1 2,000,000 - - - - - 2,000,000 - - - - -
EH-1100 Haul Truck (New) 2,000,000 - 45,000 2,000,000 1 2,000,000 - - - - - 2,000,000 - - - - -
EH-1100 Haul Truck (New) 2,000,000 - 45,000 2,000,000 1 2,000,000 - - - - - 2,000,000 - - - - -
EH-1100 Haul Truck (New) 2,000,000 - 45,000 2,000,000 3 - - 2,000,000 - - - - - 2,000,000 - - -
EH-1100 Haul Truck (New) 2,000,000 - 45,000 2,000,000 6 - - - - - 2,000,000 - - 2,000,000 - - -
EH-1100 Haul Truck (New) 2,000,000 - 45,000 2,000,000 6 - - - - - 2,000,000 - - 2,000,000 - - -
CAT D10 Dozer (Used) 654,500 4,500 25,000 1,731,000 1 654,500 - - - 1,731,000 - - - - - - -
CAT D10 Dozer (Used) 654,500 4,500 25,000 1,731,000 1 654,500 - - - 1,731,000 - - - - - - -
CAT D10 Dozer (Used) 654,500 4,500 25,000 1,731,000 1 654,500 - - - 1,731,000 - - - - - - -
CAT D10 Dozer (New) 1,731,000 - 25,000 1,731,000 6 - - - - - 1,731,000 - - - - - -
16M Grader (Used) 575,000 4,000 35,000 1,183,000 1 575,000 - - - - - - 1,183,000 - - - -
Metroliner Fuel Cart 184,155 4,000 40,000 450,000 1 184,155 - - - - - - - 450,000 - - -
Metroliner Water Cart 184,155 4,000 40,000 450,000 1 184,155 - - - - - - - 450,000 - - -
ROM Stockpile CAT992 FEL 715,350 7,676 45,000 2,100,000 1 715,350 - - - - - - - - - - -
Tyre Handler (Used) 657,651 1,500 30,000 750,000 1 657,651 - - - - - - - - - - -
Blasthole Drill (Used) 1,989,027 8,172 40,000 3,500,000 1 1,989,027 - - - - - - 3,500,000 - - - -
Blasthole Drill (Used) 1,989,027 8,172 40,000 3,500,000 1 1,989,027 - - - - - - 3,500,000 - - - -

WESTMORELAND URANIUM PROJECT NATIONAL INSTRUMENT 43-101 TECHNICAL REPORT
3182\16.04\3182-STY-001_0 S16
Page 16.14
April 2016 Mining Associates
Equipment Current
WDV (AUD)
Opening SMU Hrs
Expected Life Hrs
Purchase Price (AUD)
Start Period
(Y) -1 1 2 3 4 5 6 7 8 9 10 11
Blasthole Drill 3,500,000 8,172 40,000 3,500,000 6 - - - - - 3,500,000 - - - - - -
Ancillary Plant & Equip. 5,484,043 - - - 1 5,484,043 - - - 1,532,532 - 619,656 233,115 - - - -
Subtotal - - - - - 25,602,036 - 2,000,000 - 10,125,532 13,731,000 10,619,656 8,416,115 8,200,000 - - - Contingency - 10% - - - 2,560,204 - 200,000 - 1,012,553 1,373,100 1,061,966 841,612 820,000 - - -
TOTAL - - - - - 28,162,240 - 2,200,000 - 11,138,085 15,104,100 11,681,622 9,257,727 9,020,000 - - -

WESTMORELAND URANIUM PROJECT NATIONAL INSTRUMENT 43-101 TECHNICAL REPORT
3182\16.04\3182-STY-001_0 S16
Page 16.15
April 2016 Mining Associates
16.5.4 Mining Operating Cost Summary
A comparison of the mining unit rate (AUD/t) based on a Owner Miner or a Contract Miner options have been summarised in Figure16.5.5.
The estimated unit rate is calculated based on 100 t excavators loading ore and 200 t excavators removing waste into 60 t trucks. The average unit rate between the two options including the pre-strip year is summarised in Table 16.5.5.
Table 16.5.5 Mining Cost Options
Unit Rate
Owner Operator Contractor
Mining Cost AUD/t AUD3.16* AUD4.48 *Note - Owner Miner Costs exclude Ownership costs (as these are included in project CAPEX figures) but Contractor Costs include Ownership.
The drop in the unit rate from Year 7 on reflects the increase in Production Tonnage.
The increase in unit rate in Year 12 is predominately caused by a drop of tonnage as the mining is wound down over a ten month period.
Figure 16.5.2 Mining Unit Costs Owner Miner vs. Contractor

WESTMORELAND URANIUM PROJECT NATIONAL INSTRUMENT 43-101 TECHNICAL REPORT
3182\16.04\3182-STY-001_0 S16
Page 16.16
April 2016 Mining Associates
16.6 Production Schedule
The production schedule is planned at 2 Mtpa of mill feed, with constant annual material movement, and an aim to balance ore and waste and mining fleet within total material movement of 8 Mtpa. Mining is undertaken for 12 years (including first year pre-strip) with a total ore production of 26.25 Mt at an average grade of 0.084% (Table 16.6.1).
Table 16.6.1 Westmoreland Production Summary
Units Totals
Mining Life years 12 Total Material Moved tonnes 131,019,250 Waste Total tonnes 104,770,000 Inferred Ore Mined tonnes 7,751,500 Indicated Ore Mined tonnes 18,497,750 Inferred U3O8 Grade % 0.075 Indicated U3O8 Grade % 0.087 Ore Processed Tonnes 26,249,250 U3O8 Grade % 0.084
The total annual production figures are presented in Figure 6.6.1. The annual production statistics by pit are presented in Table 16.6.2 and graphically in Figure 16.6.1 to Figure 16.6.6.
Figure 16.6.1 Material Mined

WESTMORELAND URANIUM PROJECT NATIONAL INSTRUMENT 43-101 TECHNICAL REPORT
3182\16.04\3182-STY-001_0 S16
Page 16.17
April 2016 Mining Associates
Figure 16.6.2 Pit Sequence
Figure 16.6.3 Ore Milled

WESTMORELAND URANIUM PROJECT NATIONAL INSTRUMENT 43-101 TECHNICAL REPORT
3182\16.04\3182-STY-001_0 S16
Page 16.18
April 2016 Mining Associates
Figure 16.6.4 Metal Produced

WESTMORELAND URANIUM PROJECT NATIONAL INSTRUMENT 43-101 TECHNICAL REPORT
3182\16.04\3182-STY-001_0 S16
Page 16.19
April 2016 Mining Associates
Table 16.6.2 Westmoreland Production Schedule for Constant 2 Mtpa Mill Feed
Period Pre-Strip Yr 1 Yr 2 Yr 3 Yr 4 Yr 5 Yr 6 Yr 7 Yr 8 Yr 9 Yr 10 Yr 11 Yr 12 Yr 13 Total
Total Material Moved Tonnes 7,999,998 8,021,917 7,999,999 7,999,999 7,999,999 8,021,917 15,999,993 15,999,993 15,999,997 16,043,833 12,165,270 6,766,335 0 0 131,019,250
Waste Tonnes 7,365,037 6,337,312 5,281,065 3,717,178 35,967,566 5,051,670 13,333,493 15,622,389 13,165,217 12,683,751 10,622,250 5,623,072 0 0 104,770,000
High Grade Ore Tonnes 140,064 527,813 692,124 1,057,330 568,436 813,984 573,750 63,000 727,386 910,706 581,409 510,000 0 0 7,166,000
Low Grade Ore Tonnes 494,898 1,156,792 20,026,810 3,225,491 1,463,996 2,156,263 2,092,750 314,605 2,107,395 2,449,377 961,610 633,263 0 0 19,083,250
High Grade Ore % 0.20 0.16 0.22 0.23 0.20 0.18 0.18 0.11 0.13 0.12 0.14 0.17 - - 0.17
Low Grade Ore % 0.06 0.04 0.04 0.04 0.04 0.05 0.05 0.06 0.06 0.06 0.06 0.07 - - 0.05
Average Grade Mined % 0.09 0.08 0.09 0.09 0.09 0.09 0.07 0.06 0.07 0.08 0.09 0.11 - - 0.08
Ore Processed Tonnes 0 2,005,479 2,000,000 2,000,000 2,000,000 2,005,479 2,000,000 2,000,000 2,000,000 2,005,479 2,000,000 2,000,000 2,000,000 2,005,479 26,021,918
Grade Processed % 0 0.087 0.0951 0.0966 0.0898 0.0967 0.0866 0.0967 0.0899 0.0951 0.0874 0.0835 0.0439 0.0439 0.08
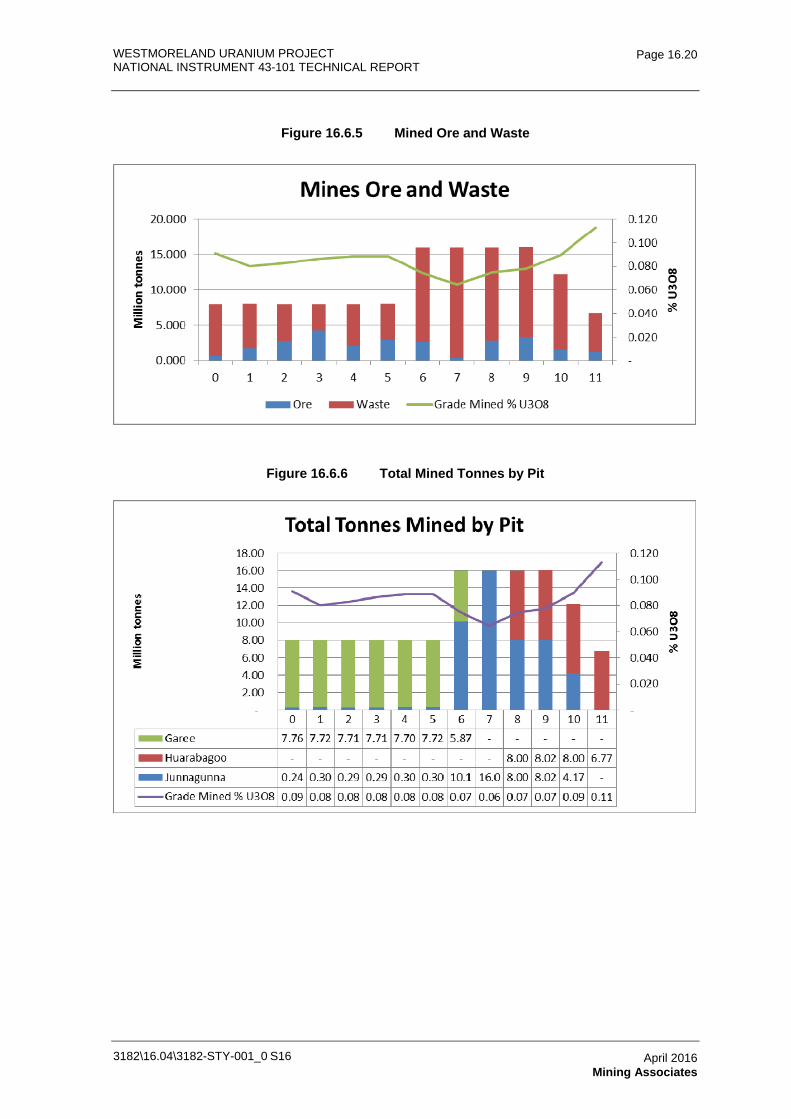
WESTMORELAND URANIUM PROJECT NATIONAL INSTRUMENT 43-101 TECHNICAL REPORT
3182\16.04\3182-STY-001_0 S16
Page 16.20
April 2016 Mining Associates
Figure 16.6.5 Mined Ore and Waste
Figure 16.6.6 Total Mined Tonnes by Pit

WESTMORELAND URANIUM PROJECT NATIONAL INSTRUMENT 43-101 TECHNICAL REPORT
3182\16.04\3182-STY-001_0 S16
Page 16.21
April 2016 Mining Associates
Table 16.6.3 Westmoreland Production Schedule by Pit
Years Pre-Strip 1 2 3 4 5 6 7 8 9 10 11 12 13 14 Totals
MINING All Pits TMM (tonnes) 7,999,998 8,021,917 7,999,999 7,999,999 7,999,999 8,021,917 15,999,993 15,999,993 15,999,997 16,043,833 12,165,270 6,766,335 0 0 0 131,019,250
All Pits Waste Mined (tonnes) 7,365,037 6,337,312 5,281,065 3,717,178 5,967,566 5,051,670 13,333,493 15,622,389 13,165,217 12,683,751 10,622,250 5,623,072 0 0 0 104,770,000
All Pits Inferred HG Ore Mined (tonnes) 97,000 25,000 20,250 93,250 110,000 197,500 147,000 18,750 120,500 177,841 479,659 274,500 0 0 0 1,761,250
All Pits Indicated HG Ore Mined (tonnes) 43,064 502,813 671,874 964,080 458,436 616,484 426,750 44,250 606,886 732,864 101,750 235,500 0 0 0 5,404,750
All Pits Inferred HG U3O8 Grade (%) 0.231 0.134 0.191 0.201 0.169 0.178 0.181 0.115 0.136 0.114 0.136 0.180 0.000 0.000 0.000 0.160
All Pits Indicated HG U3O8 Grade (%) 0.147 0.135 0.218 0.230 0.210 0.185 0.178 0.107 0.125 0.124 0.135 0.154 0.000 0.000 0.000 0.178
All Pits Inferred LG Ore Mined (tonnes) 165,250 246,750 506,250 734,750 286,000 665,500 936,750 127,855 908,895 446,627 777,110 188,513 0 0 0 5,990,250
All Pits Indicated LG Ore Mined (tonnes) 329,648 910,042 1,520,560 2,490,741 1,177,996 1,490,763 1,156,000 186,750 1,198,500 2,002,750 184,500 444,750 0 0 0 13,093,000
All Pits Inferred LG U3O8 Grade (%) 0.054 0.045 0.036 0.036 0.045 0.050 0.047 0.055 0.050 0.065 0.061 0.070 0.000 0.000 0.000 0.050
All Pits Indicated LG U3O8 Grade (%) 0.061 0.041 0.038 0.042 0.045 0.055 0.045 0.056 0.062 0.061 0.065 0.068 0.000 0.000 0.000 0.050
Garee Waste Mined (tonnes) 7,129,119 6,038,823 4,994,732 3,427,585 5,668,566 4,753,848 3,260,576 0 0 0 0 0 0 0 0 35,273,250
Garee Inferred HG Ore Mined (tonnes) 97,000 25,000 20,250 93,250 110,000 197,500 147,000 0 0 0 0 0 0 0 0 690,000
Garee Indicated HG Ore Mined (tonnes) 43,064 502,813 671,874 964,080 458,436 616,484 426,750 0 0 0 0 0 0 0 0 3,683,500
Garee Inferred HG U3O8 Grade (%) 0.230 0.134 0.191 0.201 0.169 0.178 0.181 0.000 0.000 0.000 0.000 0.000 0.000 0.000 0.000 0.187
Garee Indicated HG U3O8 Grade (%) 0.147 0.165 0.218 0.230 0.210 0.185 0.178 0.000 0.000 0.000 0.000 0.000 0.000 0.000 0.000 0.202
Garee Inferred LG Ore Mined (tonnes) 165,250 246,750 505,250 734,750 286,000 665,500 916,500 0 0 0 0 0 0 0 0 3,520,000
Garee Indicated LG Ore Mined (tonnes) 329,648 910,042 1,519,310 2,490,741 1,176,996 1,487,763 1,120,250 0 0 0 0 0 0 0 0 9,034,750
Garee Inferred LG U3O8 Grade (%) 0.054 0.045 0.036 0.036 0.045 0.050 0.047 0.000 0.000 0.000 0.000 0.000 0.000 0.000 0.000 0.044
Garee Indicated LG U3O8 Grade (%) 0.061 0.041 0.038 0.042 0.045 0.055 0.045 0.000 0.000 0.000 0.000 0.000 0.000 0.000 0.000 0.045
Huarabagoo Waste Mined (tonnes) 0 0 0 0 0 0 0 0 7,777,499 7,242,602 7,377,327 5,623,072 0 0 0 28,020,500 Huarabagoo Inferred HG Ore Mined
(tonnes) 0 0 0 0 0 0 0 0 8,000 59,591 216,909 274,500 0 0 0 559,000

WESTMORELAND URANIUM PROJECT NATIONAL INSTRUMENT 43-101 TECHNICAL REPORT
3182\16.04\3182-STY-001_0 S16
Page 16.22
April 2016 Mining Associates
Years Pre-Strip 1 2 3 4 5 6 7 8 9 10 11 12 13 14 Totals Huarabagoo Indicated HG Ore Mined
(tonnes) 0 0 0 0 0 0 0 0 0 46,000 82,250 235,500 0 0 0 363,750
Huarabagoo Inferred HG U3O8 Grade (%) 0.000 0.000 0.000 0.000 0.000 0.000 0.000 0.000 0.169 0.120 0.156 0.180 0.000 0.000 0.000 0.164
Huarabagoo Indicated HG U3O8 Grade (%) 0.000 0.000 0.000 0.000 0.000 0.000 0.000 0.000 0.000 0.135 0.141 0.154 0.000 0.000 0.000 0.149
Huarabagoo Inferred LG Ore Mined (tonnes) 0 0 0 0 0 0 0 0 179,250 188,973 222,513 188,513 0 0 0 779,250
Huarabagoo Indicated LG Ore Mined (tonnes) 0 0 0 0 0 0 0 0 35,250 484,750 101,000 444,750 0 0 0 1,065,750
Huarabagoo Inferred LG U3O8 Grade (%) 0.000 0.000 0.000 0.000 0.000 0.000 0.000 0.000 0.063 0.066 0.071 0.070 0.000 0.000 0.000 0.067
Huarabagoo Indicated LG U3O8 Grade (%) 0.000 0.000 0.000 0.000 0.000 0.000 0.000 0.000 0.045 0.055 0.071 0.068 0.000 0.000 0.000 0.062
Junnagunna Waste Mined (tonnes) 235,918 298,489 286,333 289,593 299,000 297,822 10,072,916 15,622,389 5,387,718 5,441,149 3,244,923 0 0 0 0 41,476,250 Junnagunna Inferred HG Ore Mined
(tonnes) 0 0 0 0 0 0 0 18,750 112,500 118,250 262,750 0 0 0 0 512,250
Junnagunna Indicated HG Ore Mined (tonnes) 0 0 0 0 0 0 0 44,250 606,886 686,864 19,500 0 0 0 0 1,357,500
Junnagunna Inferred HG U3O8 Grade (%) 0.000 0.000 0.000 0.000 0.000 0.000 0.000 0.115 0.133 0.112 0.119 0.000 0.000 0.000 0.000 0.120
Junnagunna Indicated HG U3O8 Grade (%) 0.000 0.000 0.000 0.000 0.000 0.000 0.000 0.107 0.125 0.123 0.109 0.000 0.000 0.000 0.000 0.123
Junnagunna Inferred LG Ore Mined (tonnes) 0 0 1,000 0 0 0 20,250 127,855 729,645 257,653 554,597 0 0 0 0 1,691,000
Junnagunna Indicated LG Ore Mined (tonnes) 0 0 1,250 0 1,000 3,000 35,750 186,750 1,163,250 1,518,000 83,500 0 0 0 0 2,992,500
Junnagunna Inferred LG U3O8 Grade (%) 0.000 0.000 0.030 0.000 0.000 0.000 0.059 0.055 0.049 0.064 0.058 0.000 0.000 0.000 0.000 0.054
Junnagunna Indicated LG U3O8 Grade (%) 0.000 0.000 0.030 0.000 0.040 0.040 0.048 0.056 0.063 0.063 0.057 0.000 0.000 0.000 0.000 0.062
STOCKPILES HG Stockpile Tonnes Added 160,064 0 81,250 509,205 0 213,765 22,000 0 0 17,750 0 0 0 0 0 984,034
HG Stockpile U3O8 Added 0.205 0.000 0.158 0.208 0.000 0.133 0.147 0.000 0.000 0.108 0.000 0.000 0.000 0.000 0.000 0.184
HG Stockpile Tonnes Removed 0 140,064 0 0 0 0 0 716,903 0 0 127,067 0 0 0 0 984,034
HG Stockpile U3O8 Removed 0.000 0.205 0.000 0.000 0.000 0.000 0.000 0.182 0.000 0.000 0.172 0.000 0.000 0.000 0.000 0.184
HG Stockpile Tonnes Balance 140,064 0 81,250 590,455 590,455 804,220 826,220 109,317 109,317 127,067 0 0 0 0 0 0
HG Stockpile U3O8 Balance 0.205 0.000 0.158 0.201 0.201 0.183 0.182 0.182 0.182 0.172 0.000 0.000 0.000 0.000 0.000 0
LG Stockpile Tonnes Added 494,898 0 637,684 1,773,616 32,433 751,002 644,500 0 834,871 1,336,853 0 0 0 0 0 6,505,765
LG Stockpile U3O8 Added 0.059 0.000 0.035 0.040 0.029 0.055 0.035 0.000 0.038 0.052 0.000 0.000 0.000 0.000 0.000 0.044
LG Stockpile Tonnes Removed 0 180,811 0 0 0 0 0 905,492 0 0 329,913 856,737 2,000,000 2,005,479 227,332 6,505,765

WESTMORELAND URANIUM PROJECT NATIONAL INSTRUMENT 43-101 TECHNICAL REPORT
3182\16.04\3182-STY-001_0 S16
Page 16.23
April 2016 Mining Associates
Years Pre-Strip 1 2 3 4 5 6 7 8 9 10 11 12 13 14 Totals
LG Stockpile U3O8 Removed 0.000 0.059 0.000 0.000 0.000 0.000 0.000 0.042 0.000 0.000 0.044 0.044 0.044 0.044 0.044 0.044
LG Stockpile Tonnes Balance 494,898 314,087 951,771 2,725,386 2,757,819 3,508,821 4,153,321 3,247,829 4,082,610 5,419,462 5,089,549 4,232,812 2,232,812 227,332 0 0
LG Stockpile U3O8 Balance 0.059 0.059 0.043 0.041 0.041 0.044 0.042 0.042 0.041 0.0440.044 0.044 0.044 0.044 0.044 0.000 0.000
Direct Feed Tonnes 0 1,684,605 2,000,000 2,000,000 2,000,000 2,005,479 2,000,000 377,605 2,000,000 2,005,479 1,543,019 1,143,263 0 0 0 18,759,451
Rehandle Tonnes 0 320,874 0 0 0 0 0 1,622,395 0 0 456,981 856,737 2,000,000 2,005,479 0 7,262,467
PLANT Plant Ore Processed (tonnes) 0 2,005,479 2,000,000 2,000,000 2,000,000 2,005,479 2,000,000 2,000,000 2,000,000 2,005,479 2,000,000 2,000,000 2,000,000 2,005,479 227,332 26,249,250
Plant U3O8 Grade (%) 0.000 0.087 0.095 0.097 0.090 0.097 0.087 0.097 0.090 0.095 0.087 0.084 0.044 0.44 0.044 0.084

WESTMORELAND URANIUM PROJECT
NATIONAL INSTRUMENT 43-101 TECHNICAL REPORT
3182-STY-001
Table of Contents Page
17.0 RECOVERY METHODS 17.1 17.1 Process Design 17.1
17.1.1 Selected Process Flowsheet 17.1 17.2 Process and Plant Description 17.3
17.2.1 Ore Recovery and Crushing 17.4 17.2.2 Crushed Ore Bin 17.5 17.2.3 Grinding and Classification 17.5 17.2.4 Pebble Crushing 17.6 17.2.5 Pre-Leach Thickening 17.6 17.2.6 Leach Circuit 17.6 17.2.7 Leach Residue Filtration 17.7 17.2.8 Continuous Ion Exchange 17.7 17.2.9 Impurity Removal 17.8 17.2.10 Crude UOC Production, Washing and Drying 17.9 17.2.11 UOC Packaging 17.9 17.2.12 Sulphuric Acid Production 17.9 17.2.13 Reagents Mixing and Storage 17.11 17.2.14 Water Services 17.12 17.2.15 Air Services 17.14
TABLES Table 17.1.1 Summary of Key Process Design Criteria 17.2 FIGURES Figure 17.1.1 Schematic Overall Process Flow Diagram 17.3
3182\16.04\3182-STY-001_0 S17 April 2016 Lycopodium Minerals Pty Ltd

WESTMORELAND URANIUM PROJECT NATIONAL INSTRUMENT 43-101 TECHNICAL REPORT
3182\16.04\3182-STY-001_0 S17
Page 17.1
April 2016 Lycopodium Minerals Pty Ltd
17.0 RECOVERY METHODS
17.1 Process Design
The process flowsheet selected as the study basis for the treatment of Westmoreland ore has been chosen after evaluation of the available geology, mineralogy and metallurgical testwork results (see Section 13). The objective has been to select a robust treatment method that provides a sound basis for estimating capital and operating costs at the scoping study level of accuracy, but also that takes advantage of recent trends in uranium milling technology.
17.1.1 Selected Process Flowsheet
The treatment plant design incorporates the following unit process operations:
• ROM pad blending of different ore types for optimum leach recovery.
• Single stage primary crushing in a Jaw crusher to produce a crushed product size of 80% passing (P80) of 125 mm.
• Crushed ore storage bin, COB, with a nominal 1,250 t live capacity to provide five hours of operation at design plant throughput.
• Crushed ore from the COB is reclaimed by an apron feeder positioned under the bin to feed the grinding circuit.
• The grinding circuit is an SAC type, which consists of a closed circuit SAG mill and pebble crusher. The SAG mill is in closed circuit with hydro-cyclones to produce a P80 grind size of 180 µm.
• A pre-leach thickener is included to increase slurry density to the leach circuit, minimise leach tank volume requirements and to partly neutralise filter wash which is returned to the milling circuit.
• Leach residue filtration to recover leached uranium in pregnant liquor and produce a washed dry filter cake containing acid gangue for final disposal.
• Continuous Ion exchange for the separation of soluble uranium from the leach pregnant solution and the production of barren liquor for recycle to the leach process.
• Impurity removal to separate predominantly iron and some manganese, silicon and aluminium by acid neutralisation with caustic soda prior to uranium oxide concentrate, (UOC) production.
• Crude UOC production, washing and drying. Crude UOC is precipitated from the cleaned liquor by treating with hydrogen peroxide and caustic soda. The precipitated UOC is separated from the mother liquor, washed, dried, and stored in preparation for packaging.

WESTMORELAND URANIUM PROJECT NATIONAL INSTRUMENT 43-101 TECHNICAL REPORT
3182\16.04\3182-STY-001_0 S17
Page 17.2
April 2016 Lycopodium Minerals Pty Ltd
• The dry UOC product is weighed and loaded in to 200 L drums which are then packed into 20 t containers in preparation for shipment.
A schematic overall process flow diagram depicting the unit operations incorporated in the selected process flowsheet is presented in Figure 17.1.1. The key issues considered in process and equipment selection are outlined in the next section. The key process design criteria listed in Table 17.1.1 form the basis of the detailed process design criteria and mechanical equipment list.
Table 17.1.1 Summary of Key Process Design Criteria
Units Design Source*
Plant Throughput tpa 2,000,000 Client Head Grade U ppm 1,000 Client Overall Recovery % 95 Client Crushing Plant Availability % 80.0 Lycopodium Plant Availability % 91.3 Lycopodium Bond Ball Mill Work Index (BWi) kWh/t 20.3 Testwork SMC Axb 28.1 Assumed Bond Abrasion Index (Ai) 0.703 Assumed Grind Size µm 180 Client Mill Discharge pH 4.0 Lycopodium Pre-Leach Thickener Solids Loading t/m2 h 0.38 Testwork Leach Residence Time h 12 Testwork Leach Temperature °C 40 Testwork Leach pH - 1.5 Testwork Leach [Fe] g/L >2.5 Testwork Leach ORP mV 550 Testwork Acid Addition kg/t 24 Testwork Leach extraction % 96 Testwork Leach Filter Flux kg d.s./m2h 315 Assumed
Pyrolusite P80 um 45 - 54 Testwork Pyrolusite Available MnO2 % 75 Assumed Pyrolusite Addition Rate kg/t 6.4 Testwork Ion Exchange Adsorption - Mod NIMCIX Assumed Ion Exchange Resin - Amberjet 4400 Testwork Exchange Form - SO4 , HCO3– form Assumed Total Exchange Capacity eq/L > 1.4 Assumed Design U load g/L(WSR) 40 Assumed Elutriation Volume m3/m3 resin 7.5 Assumed Acid Neutralisation pH - 2 – 3 Assumed Acid Neutralisation Temperature °C 40 Assumed Acid Neutralisation Reagent - NaOH Client Acid Neut. Reagent Addition Rate kg/kg U 10.4 Calculated 100% NaOH to UOC kg/kg U 1.04 Calculated 100% H2O2 to UOC kg/kg U 0.19 Calculated Acid Neut. Thickener Area Flux m2/t/h 16 Assumed Acid Neut Residue Filter Flux kg d.s./m2h 75 Assumed

WESTMORELAND URANIUM PROJECT NATIONAL INSTRUMENT 43-101 TECHNICAL REPORT
3182\16.04\3182-STY-001_0 S17
Page 17.3
April 2016 Lycopodium Minerals Pty Ltd
Figure 17.1.1 Schematic Overall Process Flow Diagram
17.2 Process and Plant Description
The overall process flowsheet includes feeding a blended ore mix to a single stage jaw crusher and a SAC grinding circuit which is in closed circuit with cyclones to achieve the final product size. The cyclone overflow stream will flow by gravity to a linear trash screen and then a pre-leach thickener. Barren solution leaving the continuous ion exchange circuit is recycled as wash to the leach residue filters and then, via the filter washate, returns to the pre-leach thickener where most of the contained acidity is neutralised by the gangue in the ore. Pre-leach thickener overflow, which is very mildly acidic, is used as dilution water in the milling circuit. The thickened slurry is pumped to the leach circuit where it is mixed with concentrated sulphuric acid for uranium leaching. Manganese dioxide (as high quality milled pyrolusite) is added to the leach circuit to control the redox potential. The uranium leach step is carried out at a temperature of 40°C and this

WESTMORELAND URANIUM PROJECT NATIONAL INSTRUMENT 43-101 TECHNICAL REPORT
3182\16.04\3182-STY-001_0 S17
Page 17.4
April 2016 Lycopodium Minerals Pty Ltd
temperature is provided partly from the heat of dilution of sulphuric acid and partly by live steam addition to the leach tanks. The leach tailings stream is filtered and washed to recover the Pregnant Liquor before being conveyed as a wet cake to the tailings storage facility. Pregnant leach solution flows to a continuous ion exchange circuit where the uranium and some iron, silicon and molybdenum are adsorbed onto the resin. Impurity elements of iron, aluminium, calcium, manganese, arsenic, etc are entrained with the resin in the interstitial fluid. The majority of the interstitial fluid is displaced prior to elution.
The uranium, together with the minor elements as impurities is eluted from the resin with concentrated sulphuric acid to produce a concentrated eluate solution containing approximately 9.6 g/l U. The impurities present in the eluate solution are then removed, firstly by partial acid neutralisation with sodium hydroxide to produce a precipitate containing uranium, iron, aluminium, and arsenic. This precipitate is recycled to the leach step to recover the uranium. The partially neutralised solution is then treated with sodium hydroxide and 30% hydrogen peroxide to precipitate crude uranium oxide concentrate UOC with associated impurity levels acceptable for sale to a convertor. The barren solution produced, containing the remaining impurities including sodium and sulphate is discharge to an evaporation dam for disposal.
The UOC is then washed to remove entrained mother liquor, dried, and then packaged into clean thick wall 200 L drums and prepared for shipment.
17.2.1 Ore Recovery and Crushing
Run-of-mine (ROM) ore from the open pit, at maximum lump size of 900 mm, will be transported to the plant by 60 t rear dump trucks. The trucks will tip directly into the ROM bin. When trucks are unable to tip into the ROM bin, the truck load will be dumped onto the ROM pad. The ROM pad will be primarily utilised for emergency storage and ore blending if required. ROM ore will be reclaimed to the ROM bin by a front-end loader.
A rock breaker will be installed to assist in breaking down, oversize material retained on the grizzly above the ROM bin. Ore will be withdrawn from the ROM bin via an apron feeder and passes to a vibrating grizzly ahead of the jaw crusher. Primary fines separated by the vibrating grizzly pass to the primary crusher discharge conveyor belt. Vibrating grizzly oversize is crushed by the jaw crusher and passes to the crusher discharge conveyor.
The crushed ore will be conveyed, via the crushed ore bin feed conveyor, to the crushed ore bin. The crushed ore bin feed conveyor will be fitted with a weightometer, to monitor primary crusher throughput, and for control of the apron feeder variable speed drive.
The crushing circuit will be serviced by a common dust collection system, consisting of multiple extraction hoods, ducting, and a dust scrubber. Dust collected by this system will be slurried in the dust scrubber and pumped by the dust scrubber disposal pump to the pre-leach thickener feed box. Radon gas collected by the extraction hoods will pass through the scrubber, and be vented to atmosphere via a 30 m tall scrubber vent stack.

WESTMORELAND URANIUM PROJECT NATIONAL INSTRUMENT 43-101 TECHNICAL REPORT
3182\16.04\3182-STY-001_0 S17
Page 17.5
April 2016 Lycopodium Minerals Pty Ltd
17.2.2 Crushed Ore Bin
The crushed ore bin will have a live capacity of approximately 1,250 t (equivalent to five hours of mill feed at 2 Mtpa).
Crushed ore will be reclaimed from the bin, by a variable speed apron feeder. The feeder will discharge onto the SAG mill feed conveyor which will convey the crushed ore to the SAG mill feed chute. The SAG mill feed conveyor will be fitted with a weightometer, used for controlling the speed of the reclaim feeder and for mass accounting of feed presented to the grinding circuit.
Dust extraction hoods are provided at the crushed ore bin and feed and discharge conveyor transfer points to convey dust and radon gas to a dust scrubber and vent stack.
17.2.3 Grinding and Classification
The grinding circuit is a SAC circuit, comprised of a single, variable speed, semi-autogenous grinding (SAG) mill. The SAG mill will operate in closed circuit with a pebble crusher and a hydro-cyclone classifier. The product particle size exiting the grinding circuit (cyclone overflow) will contain 80% passing 180 µm material.
To meet the design throughput, and achieve the required leach product size, a 7.3 m dia. x 6.2 m SAG mill, with 5.8 MW installed motor power is required.
Crushed ore, reclaimed from the crushed ore bin, will be conveyed to the SAG mill feed chute via the SAG mill feed conveyor. Process water will be added to the SAG mill feed chute, to control the in-mill pulp density. The process water is recycled from the pre-leach thickener overflow and consists of a mixture of fresh make-up water, acidic barren liquor recycled from the CIX circuit via the tailings filter wash, and scrubber bleed water from the ore prep dust scrubber and the leach circuit scrubber. The SAG mill will be fitted with discharge grates, which will allow slurry to pass through the mill and will also relieve the mill of pebble build-up. The SAG mill product will discharge to a mill trommel screen, for pebble dewatering.
Grinding media (125 mm balls) will be added to the SAG mill via the SAG mill feed chute, utilising a dedicated media hoist, kibble, and feed chute.
SAG mill discharge trommel screen oversize will be conveyed to a pebble crushing circuit. Undersize from the trommel screen will flow by gravity to the cyclone feed pump box. The slurry will then be pumped to the cyclone cluster by one of two (duty / standby) variable-speed cyclone feed pumps. Process water will be added to the cyclone feed pump box for cyclone feed density control.
The cyclone cluster overflow will flow by gravity through a metallurgical sampler then onto two linear trash screens in a parallel configuration. The trash screen undersize will be directed to the leach thickener feed whilst trash screen oversize will pass to a trash kibble and associated liquor will flow to a mill area sump pump. Slurry from the cyclone underflow launder, will be returned to the SAG mill feed chute.

WESTMORELAND URANIUM PROJECT NATIONAL INSTRUMENT 43-101 TECHNICAL REPORT
3182\16.04\3182-STY-001_0 S17
Page 17.6
April 2016 Lycopodium Minerals Pty Ltd
Spillage within the grinding circuit will be managed, utilising a dedicated drive-in sump and sump pump. Any spillage generated in the grinding area will be returned to the cyclone feed pump box.
17.2.4 Pebble Crushing
Oversize from the SAG mill discharge trommel will be conveyed to the pebble crusher feed bin, via a series of belt conveyors. A self cleaning belt magnet will be positioned at the head chute of the first conveyor to remove any scrap metal and steel media which could potentially damage the pebble crusher.
Downstream of the cross-belt magnet, the pebbles will pass under a metal detector, prior to discharging into the pebble crusher feed bin. The feed bin will provide surge capacity ahead of the pebble crusher and allow a controlled feed to be presented to the crusher. Should the pebble crusher not be operational, a diverter gate ahead of the pebble crusher feed bin will allow pebbles to bypass the pebble bin and crusher and feed directly to the pebble crusher discharge conveyor. Similarly, should the metal detector detect tramp metal (not removed by the cross-belt magnet), the diverter gate ahead of the pebble crusher feed bin will automatically allow pebbles to bypass the pebble bin and crushers and feed directly to the pebble crusher discharge conveyor.
Pebbles will be withdrawn from the pebble crusher feed bin, by a vibrating feeder, which will be variable speed. The pebble crusher will discharge crushed pebbles directly onto the pebble crusher discharge conveyor, which in turn will return the crushed pebbles to the SAG mill feed conveyor.
The pebble crusher discharge conveyor will be fitted with a weightometer, used for mass accounting of feed presented to the grinding circuit.
17.2.5 Pre-Leach Thickening
Trash screen undersize will flow by gravity directly to the pre-leach thickener feed box, where flocculant will be added to aid with particle settling. Overflow solution from the pre-leach thickener will flow by gravity to the pre-leach thickener overflow tank, and then be pumped to the SAG mill feed and cyclone feed as dilution water. Underflow from the leach thickener, at 55% solids, will be pumped by dedicated thickener underflow pumps, to the pre-leach thickener underflow tank. A thickener recycle pump is included to improve thickener operational flexibility when running, or ensure compaction of the thickener bed does not occur if the thickener is off-line for a plant shutdown.
The leach thickener area will be serviced by a dedicated floor sump pump. Spillage and wash down collected by the sump pump will be returned to the cyclone feed box.
Further testwork may negate the need for a pre-leach thickener if cyclone discharge is shown to provide adequate discharge density.
17.2.6 Leach Circuit
Pre-leach thickener underflow is pumped to a thickener underflow leach tank that provides a two hour surge capacity ahead of the leach circuit. The leach circuit consists of six mechanically

WESTMORELAND URANIUM PROJECT NATIONAL INSTRUMENT 43-101 TECHNICAL REPORT
3182\16.04\3182-STY-001_0 S17
Page 17.7
April 2016 Lycopodium Minerals Pty Ltd
agitated rubber lined and insulated mild steel tanks in series. A by-pass facility is provided between tanks to enable online maintenance. A total residence time of 12 hrs is provided in the six tanks. Sulphuric acid (98%) is added via a flash mixing tank to maintain a leach slurry pH of 1.5. The first leach tank receives approximately 4° of heat from the diluting acid and the balance of the energy required to raise the temperature to 40°C is provided from a direct steam addition. Pyrolusite oxidant (48% soluble Mn) is added as a finely ground slurry to the leach to maintain a Redox potential (ORP) of 500 to 550 mV (Ag / AgCl +3.8M KCl).
The leach process produces a metastable leachate containing interalia calcium, iron, potassium and arsenic, some of which precipitate after the leach. For this reason a fluid bed ion exchange system was selected to recover the uranium.
Emissions of dust and vapours from the atmospheric leach circuit are expected to be low and consequently no allowance has been made for vent collection and scrubbing. This needs further consideration and confirmation as the project moves into the next development stage.
17.2.7 Leach Residue Filtration
Leached slurry exits the leach circuit and passes to the leach discharge transfer tank after which it is flocculated in two stages prior to pressure filtration in vertical chambers which are fitted with inflatable membranes. The membranes consolidate the residue as a competent cake free of “tear drop’’ and facilitate the dewatering process and uranium recovery in a displacement wash employing the ion exchange barren liquor. The purpose of fines flocculation is to increase the slurry filtration rate on the residue filters.
The filter feed is provided by a high head centrifugal pump and three filters are employed in parallel. The primary filters have a filtration area of 1,386 m2 filtration area, and a cake volume capacity of 17 m3 post squeeze each. Unclarified filtrate from the primary filters flows to the Continuous Ion Exchange (CIX) feed tank.
Primary filter cake is discharged to a common residue repulp box where it is repulped with secondary leach filter residue washate and then pumped to the leach residue secondary filter feed tank. The repulped residue is then pumped to three leach residue discharge secondary filters. These filters are similar to the primary filters in area and volume.
Secondary filter filtrate is used to wash the primary filter cake which then reports to the CIX feed tank. CIX barren liquor is settled in a pond where after it is employed to wash the secondary filter cake and this washate then reports to the filter washate tank from where it is either pumped to the pre-leach thickener or for use as flocculant dilution in the leach residue filtration step.
The washed filter cake is removed from the filter chambers at an approximate 18.7% free moisture containing all the gangue acid solute and broken over cake breakers before being conveyed to a lined tailings facility designed to store the leach residue.
17.2.8 Continuous Ion Exchange
The continuous counter-current ion exchange step consists of a single fluid bed Modified NIMCIX extract column and eight fixed bed columns each of which is capable of being employed in resin

WESTMORELAND URANIUM PROJECT NATIONAL INSTRUMENT 43-101 TECHNICAL REPORT
3182\16.04\3182-STY-001_0 S17
Page 17.8
April 2016 Lycopodium Minerals Pty Ltd
receipt (from extract), rinse, elution, regeneration, wash and resin elutriation, and discharge to the extract column. These fixed bed columns are serviced with a multiport valve. Elutriation is independent of the multiport valve using barren liquor.
The extract column has typically 12 to 14 sieve trays and the PLS is intermittently stopped and a reversal in flow is accommodated to index the resin flow. From a review of the calculated PLS assay it is quite possible that a 40 g/L (WSR) U loading on the resin will be achieved (much higher loadings were achieved in laboratory loading trials). The barren liquor emanating the column is passed over a guard screen to remove any broken beads or misreporting resin and then stored in a pond to settle out fines and jarositic type precipitates.
Eluted and regenerated resins are restored to the top of the extract column where it commences its down flow in the column as described above.
The loaded resin is received in a column containing approximately 18 m3 of wet resin and rinsed in a single stage with clean water to displace solutes. Some minor solute carryover is likely thus it becomes a contaminant carried forward with the concentrated eluate.
The elution process is conducted at 40°C employing a 1.2 molar sulphuric acid liquor. The uranium peak in the elution curve is harvested as a concentrated eluate while the remaining weaker eluate is returned to the eluant tank. On completion of the elution process – any eluant in the trail column is displaced with clean water.
Approximately 10% of the eluted resin flow is regenerated to remove surficial silica foulant and a weak caustic soda regenerant is employed in this duty (if required). Silica levels are kept below 2% and typically below 1.5% on the resin inventory. The regenerated resin is restored to service in the hydroxide form and is then converted to the sulfate form in the flared section of the extract column.
A variety of vessels support the continuous ion exchange system. Resin make-up requirements are influenced by housekeeping and transfer practices. Recessed impeller pumps are employed along with hydraulically pumped elutriation systems to soften the resin transfer and minimise resin degredation.
The barren liquor from the extract column is stored in a surge pond with 24 hrs of retention time before being employed in the leach residue filter wash steps.
17.2.9 Impurity Removal
The Client nominated a preference to not employ any patented technologies and to not introduce an additional reagent in the form of limestone as an initial acid neutralisation step, instead incorporating sodium hydroxide to simultaneously remove the soluble iron transfer in the interstitial fluid. This step is a precursor to the precipitation of a uranium oxide concentrate (UOC).
Very few other impurities are removed in this step with manganese notably being the more difficult impurity (derived from pyrolusite – although laboratory results to date do not indicate significant Mn transfer) and small quantities of silicon and aluminium co-reporting to the UOC. The UOC may attract penalties as a consequence of this modified impurity removal step. Alternative neutralising

WESTMORELAND URANIUM PROJECT NATIONAL INSTRUMENT 43-101 TECHNICAL REPORT
3182\16.04\3182-STY-001_0 S17
Page 17.9
April 2016 Lycopodium Minerals Pty Ltd
agents exist that could be easily substituted into this duty without significant cost or process implications.
The iron precipitate is thickened in a very small thickener. A portion is recycled to the precipitation circuit as a seed with the remainder returned to the leach circuit after filtration where it is re-leached together with any co-precipitated uranium.
Alternative impurity removal in the form of a pre-elution mild acid or reducing scrub of the resin have been shown as effective in the minimisation of impurity transfer to the precipitation circuit.
17.2.10 Crude UOC Production, Washing and Drying
A crude Uranium Oxide Concentrate is precipitated from the iron–free pregnant eluant employing hydrogen peroxide as an oxidant and sodium hydroxide to neutralise the hydrolysis acid. The hydrogen peroxide will oxidise most polyvalent metals present in the pregnant eluant in addition to the uranium and consequently any remaining trace iron and manganese will co-report with the uranium product. The high sulphate containing matrix also results in some sulphur entrainment in the UOC, and potentially incomplete uranium precipitation. The UOC is thickened and a majority is recycled to the first tank in the precipitation cascade as a seed to coarsen the crystals and minimise the entrainment of sodium and sulphate into the product.
The UOC is washed to remove the sodium sulphate mother liquor in a combination of filtration and centrifuging process. This combination provides redundancy in the event of the failure of one of these two units. Alternately two centrifuges could be employed in a series-parallel mode. The washed UOC product is dried in a continuous horizontal kiln and transferred under gravity to a storage hopper before packaging. The use of bucket elevators and screw conveyors is avoided and the application is made of high face velocity extract vent systems in compliance with the ALARA principles that govern the engineering of the Controlled Areas in Uranium plant.
A “clean and dirty’’ change facility with radiation monitoring facilities is provided. The entire Controlled Area is closed to prevent uncontrolled access.
17.2.11 UOC Packaging
The dry product is weighed into clean thick wall 200 L drums and prepared for shipment. Approximately 300 kg of UOC is loaded into a drum. The UOC product will assay approximately 70% uranium. After packaging the drums are externally washed and dried. Filled drum storage is under roof cover and the filled drums are loaded into containers under roof. The drums are loaded into 20 t containers and strapped to the floor of the container in a prescribed securing map in compliance with regulations.
17.2.12 Sulphuric Acid Production
The project requires approximately 75,000 tpa (225 tpd) of 98% sulphuric acid for ore leaching and ion exchange elution. Acid will be produced from an onsite sulphur burning sulphuric acid plant, constructed as part of the project. A range of technology licence options exist for sulphuric acid production. This scoping study is based on Haldor Topsoe WSA technology, but alternative

WESTMORELAND URANIUM PROJECT NATIONAL INSTRUMENT 43-101 TECHNICAL REPORT
3182\16.04\3182-STY-001_0 S17
Page 17.10
April 2016 Lycopodium Minerals Pty Ltd
technologies could be considered as the project moves forward to the next phase. A brief description of the WSA process is provided below.
Combustion of Sulphur to SO2 Gas
The sulphur burner uses hot cooling air as combustion air, followed by waste heat boiler cooling of the SO2 process gas to produce steam. Before the SO2 process gas is sent into the WSA plant, it is mixed with steam to increase the H2O content in the gas, which is necessary to form sulphuric acid.
Oxidation of SO2 to SO3 in the SO2 Converter with Catalyst
The SO2 process gas is then sent to the SO2 reactor where it is catalytically oxidised in a multi bed reactor to SO3. To increase SO2 oxidation, the off-gas is cooled between the various catalyst beds by use of steam.
Cooling of the SO3 Containing Process Gas to Approximately 290°C
After oxidation, a major part of the SO3 will hydrate to gaseous H2SO4 at approximately 290°C. A substantial part of the heat of hydration is recovered via a steam-based heat recovery system.
Condensation of Concentrated Sulphuric Acid in the WSA Condenser
The WSA condenser is a heat exchanger with tubes made from shock and acid resistant glass, in which the process gas flows upwards. The tubes are cooled by atmospheric air flowing on the shell side of the heat exchanger. As the gas cools sulphuric acid condenses on the wall of the glass tubes, and as it flows downwards contacting the hot process gas, the acid concentrates to approximately 98% wt. The clean process gas leaves the WSA condenser at approximately 100°C and proceeds to the stack.
Sulphuric Acid Cooling
The produced acid leaves the WSA condenser at a condensation temperature of approximately 245°C. It is immediately cooled down by recirculation of cold acid, and final cooling to storage temperature is performed in a water-cooled Hastelloy plate heat exchanger.
All the heat of SO2 oxidation, and a large part of the heat of SO3 hydration and of acid condensation is recovered through the interbed coolers / steam system, and then used for steam export. The WSA process recovers the surplus energy as steam (up to 60 Barg). The steam is sent to a pass out turbo alternator, where a portion of the steam is extracted at 6 barg and used for live steam process heating in the acid leach circuit and the remainder condensed and returned to the acid plant waste heat boiler. The turboalternator generates 1.1 MW of electric power for use on the site.

WESTMORELAND URANIUM PROJECT NATIONAL INSTRUMENT 43-101 TECHNICAL REPORT
3182\16.04\3182-STY-001_0 S17
Page 17.11
April 2016 Lycopodium Minerals Pty Ltd
17.2.13 Reagents Mixing and Storage
The major reagents utilized within the process plant will include:
• Caustic soda (NaOH) for ion exchange resin regeneration, acid neutralisation, and crude UOC precipitation.
• Concentrated sulphuric acid for ore leaching and ion exchange elution and demineraliser resin regeneration.
• Hydrogen Peroxide for UOC precipitation.
• Pyrolusite (for Leach circuit redox potential control).
• Flocculants for thickening and filtration.
• Sulphur for the production of sulphuric acid.
• Water treatment chemicals for boiler feed water and cooling water treatment.
Sodium Hydroxide (NaOH)
Sodium hydroxide (caustic soda – ‘caustic’) will be delivered to site as solid pearl in 1 t bulk bags and dissolved in water to produce a 30% w/w caustic solution for addition to the process.
Concentrated Sulphuric Acid
Concentrated sulphuric acid (98% w/w) 225 tpd will be produced onsite in a dedicated sulphur burning contact sulphuric acid plant. The product acid will be stored in two 500 m3 acid storage tanks and pumped from storage to the leach and elution process steps.
Hydrogen Peroxide
Hydrogen Peroxide will be delivered to site in isotainers and offloaded into on-site storage tanks constructed for hydrogen peroxide service. The fluid will be diluted immediately prior to use in the uranium oxyhydrolysis step to approximately 30%. This lower concentration is preferred to prevent spontaneous decomposition by other polyvalent ions in the feed matrix.
Pyrolusite
The pyrolusite will be milled on site, depending on the source, and delivered as a 50% slurry with a P90 of 45 micron. Alternately a more expensive material will be received in 1 t bulka bags at the pre-assigned P80 and repulped in water to the same slurry density. The pyrolusite will contain 48 to 50% acid soluble manganese as manganese dioxide. The pyrolusite slurry will be able to be dosed into three of the leach tanks

WESTMORELAND URANIUM PROJECT NATIONAL INSTRUMENT 43-101 TECHNICAL REPORT
3182\16.04\3182-STY-001_0 S17
Page 17.12
April 2016 Lycopodium Minerals Pty Ltd
Flocculants
Flocculants are required to aid in both slurry pre-leach thickening and leach residue filtration. Allowance has been made for two separate flocculants each being prepared in a separate plant as described below.
Flocculant micro-breads powder will be delivered to site in 700 kg bags. The bulk bag will be lifted, by the flocculant hoist, to the storage hopper. Flocculant will be mixed in a proprietary mixing system, comprised of a bulk dry hopper, screw feeder, flocculant blower, and mixing tank. The flocculant plant will mix flocculant powder with fresh water to achieve the required storage concentration (0.25% w/w).
Flocculant will be withdrawn from the storage hopper by the flocculant screw feeder. The screw feeder will convey flocculant to the flocculant eductor, from which the flocculant powder will be pneumatically conveyed, to the flocculant mixer, by the flocculant blower. Fresh water will be added to the mixer, to hydrate the flocculant powder, prior to discharging into the agitated flocculant mixing tank. Upon completion of the mixing cycle, the flocculant will be transferred to the flocculant storage tank, by the flocculant transfer pump.
Sulphur
Solid sulphur is required onsite for the production of sulphuric acid. Annual sulphur requirement will be 30,000 tpy of prilled / flaked sulphur. Sulphur will be trucked from Townsville and stored in a covered storage shed on site adjacent to the sulphuric acid plant.
Water Treatment Chemicals
Miscellaneous chemicals will be required for water treatment for potable water, boiler feed water, and cooling water including the following:
• Chlorine.
• Corrosion inhibitors.
• Algaecide & Biocide.
• Dispersants.
17.2.14 Water Services
The process plant will utilise fresh water, process water, demineralised water, filtered water, gland water, and potable water.
Raw Water, Filtered Water and Fire Water
Fresh water for the process plant and mining operation will be sourced from local bores. The bores will pump to the raw water storage tank. Raw water is filtered and stored in a filtered fresh water

WESTMORELAND URANIUM PROJECT NATIONAL INSTRUMENT 43-101 TECHNICAL REPORT
3182\16.04\3182-STY-001_0 S17
Page 17.13
April 2016 Lycopodium Minerals Pty Ltd
storage tank from where it is distributed to all non acidic process water uses, including reagent make-up, gland water, cooling water make-up, and boiler feed water make-up.
The filtered fresh water tank will provide a combined filtered fresh water and fire water reserve.
Firewater will be supplied from the filtered fresh water storage tank, via a dedicated suction manifold. The firewater system will comprise:
• An electrical jockey pump.
• An electrical firewater pump.
• A diesel standby firewater pump.
The firewater system pressure will be maintained by the jockey water pump. An electric fire water pump will automatically start on a drop in line pressure. The diesel fire water pump will automatically start if the line pressure continues to drop below the target supply pressure, which will occur when there is significant fire water demand or during a power failure.
Process Water
Pre-leach thickener overflow provides the source of acidic process water. This water is used for a limited number of services including:
• SAG mill feed dilution water.
• SAG mill seal water.
• SAG mill discharge trammel sprays.
• Pre leach thickener / leach filter flocculant dilution water.
• Trash screen water sprays.
• Service points around the plant.
Demineralised Water
The sulphuric acid will generate high pressure (60 barg) steam from waste heat recovery during normal operation. Boiler feed water will be produced for this service by demineralising filtered fresh water in a standard SAC SBA demineraliser. Demineralised water will also be used as dilution water in the sulphuric acid plant.
Gland Water
Gland water will be filtered fresh water and stored in a dedicated gland water storage tank. Dedicated gland water pumps will supply gland seal water to the required pumps across the process plant.
WESTMORELAND URANIUM PROJECT NATIONAL INSTRUMENT 43-101 TECHNICAL REPORT
3182\16.04\3182-STY-001_0 S17
Page 17.14
April 2016 Lycopodium Minerals Pty Ltd
Potable Water
Fresh water for potable water use will be sourced from local water bores. The bores will pump to the potable water feed tank. Potable water will be distributed for human consumption across the site, and to the safety showers and eye wash stations throughout the process plant. The safety showers are reticulated from a dedicated safety shower water tank via a ring-main and dedicated safety shower water pumps. If the water temperature in the safety shower water tank becomes too high, then the ring-main will be discharged to the raw water tank whilst the water in the safety shower water tank is refreshed with replacement potable water.
17.2.15 Air Services
Plant and instrument air at 700 kPag will be provided by two high pressure air compressors, operating in a lead-lag configuration. The entire high pressure air supply will be dried and can be used to satisfy both plant air and instrument air demand. Dried air will be distributed via one dedicated air receiver for the entire process plant.

WESTMORELAND URANIUM PROJECT
NATIONAL INSTRUMENT 43-101 TECHNICAL REPORT
3182-STY-001
Table of Contents Page
18.0 PROJECT INFRASTRUCTURE 18.1 18.1 Introduction 18.1 18.2 Project Water Supply 18.1 18.3 Project Electric Power Supply 18.4
18.3.1 Diesel Generation 18.4 18.3.2 Extension of High Voltage Line from Century Zinc 18.5 18.3.3 Gas-fired Generation 18.5
18.4 Project Access Roads 18.6 18.5 Accommodation Camp and Airport 18.6 18.6 Administration, Mining and Process Buildings, Sewage
Treatment 18.7 18.7 Tailings Management 18.7
TABLES Table 18.2.1 Borefield Water Supply Operations 18.3 Table 18.2.2 Water Supply Option Capital Estimates 18.4 Table 18.3.1 Capital Cost Estimates of Power Supply Options 18.5 FIGURES Figure 18.2.1 Calculated In-Pit Rainfall Run-off 18.2 Figure 18.2.2 Hydrogeological Setting and Groundwater Supply Targets 18.3 Figure 18.4.1 Site Access Road Route 18.6
3182\16.04\3182-STY-001_0 S18 April 2016 Lycopodium Minerals Pty Ltd

WESTMORELAND URANIUM PROJECT NATIONAL INSTRUMENT 43-101 TECHNICAL REPORT
3182\16.04\3182-STY-001_0 S18
Page 18.1
April 2016 Lycopodium Minerals Pty Ltd
18.0 PROJECT INFRASTRUCTURE
18.1 Introduction
Project infrastructure for the Westmoreland project includes water supply, electric power supply, access roads, sewage treatment, an accommodation village, and airport. Administration, process, and mine infrastructure buildings are discussed in Sections 16 and 17. It is proposed to construct a tailings storage facility by emplacement in, initially, Pit 5 (Garee Start Up) after initial pit development, then utilise Pit 4 for the bulk of the operation. Refer to Section 16.3 for further details.
18.2 Project Water Supply
A project water balance indicates an average water demand for the mine and treatment facility of 200 m3/hr. A further 2 m3/hr of potable quality water will be required for the accommodation village. An assessment of water supply options was undertaken by Groundwater Science Pty Ltd, and they noted the following:
• Estimated in-pit rainfall run-off is significant and may exceed water demand in some months.
• Estimated groundwater seepage to the mine pits is negligible.
• Sufficient water supply from local borefields is likely to be available.
Available hydrogeological data were examined to identify potential water supply targets and provides estimates of mine pit rainfall run-off and groundwater seepage as inputs to the project water balance. The study applied an upper and lower estimated wetting threshold of 10 mm to 20 mm per months based on:
• Average four rainfall events per month in wet season (consecutive rain days are one event).
• Based on statistical analysis of rainfall data from Burketown Post office from 1887 to 2015.
• Wetting threshold per rain event of 5 mm. The recommended initial loss values for rocky steep catchments (>3% general slope) can vary from 0.5 mm to 7 mm per rainy event, depending on the wet conditions of the rock (US Soil Conservation Service Hydrology, 1986).
The results of the study indicated that In-pit run-off from May to September would be 0 mm (Figure 18.1.11). The maximum in-pit run-off in February ranges from 75 mm/month (Lower estimate), to 133 mm/month (Upper estimate).

WESTMORELAND URANIUM PROJECT NATIONAL INSTRUMENT 43-101 TECHNICAL REPORT
3182\16.04\3182-STY-001_0 S18
Page 18.2
April 2016 Lycopodium Minerals Pty Ltd
Calculated average annual run-off volume based on the total estimated pit area ranges from 450,000 m3 to 830,000 m3. Maximum values range from 4,200 m3/day (Lower Estimate) to 7,400 m3/day (Upper Estimate) in February.
In-pit run-off will be pumped from the pit for use in the process plant. The water will exhibit low salinity and high suspended solids. Run-off may exceed demand for two to four months (December through March) per year. This can be managed by:
• Storage dams at surface to contain excess water.
• Mine pit scheduling to provide a lower sump / bench that can be inundated for 1 to 2 months per year.
Figure 18.2.1 Calculated In-Pit Rainfall Run-off
Groundwater Seepage to the mine pit was calculated using the Dupoit-Forsheimer Equation. Seepage is negligible. Calculated rates for each pit range from 10 m3/day (best estimate) to 100 m3/day (conservative high estimate) in the first year of mining. No management is required. Seepage will evaporate in dry months and be subsumed by rainfall run-off in wet months.
Two bore field options for water supply exist (see Figure 18.2.2.):
• From the Great Artesian Aquifer 45 km east of the project site.
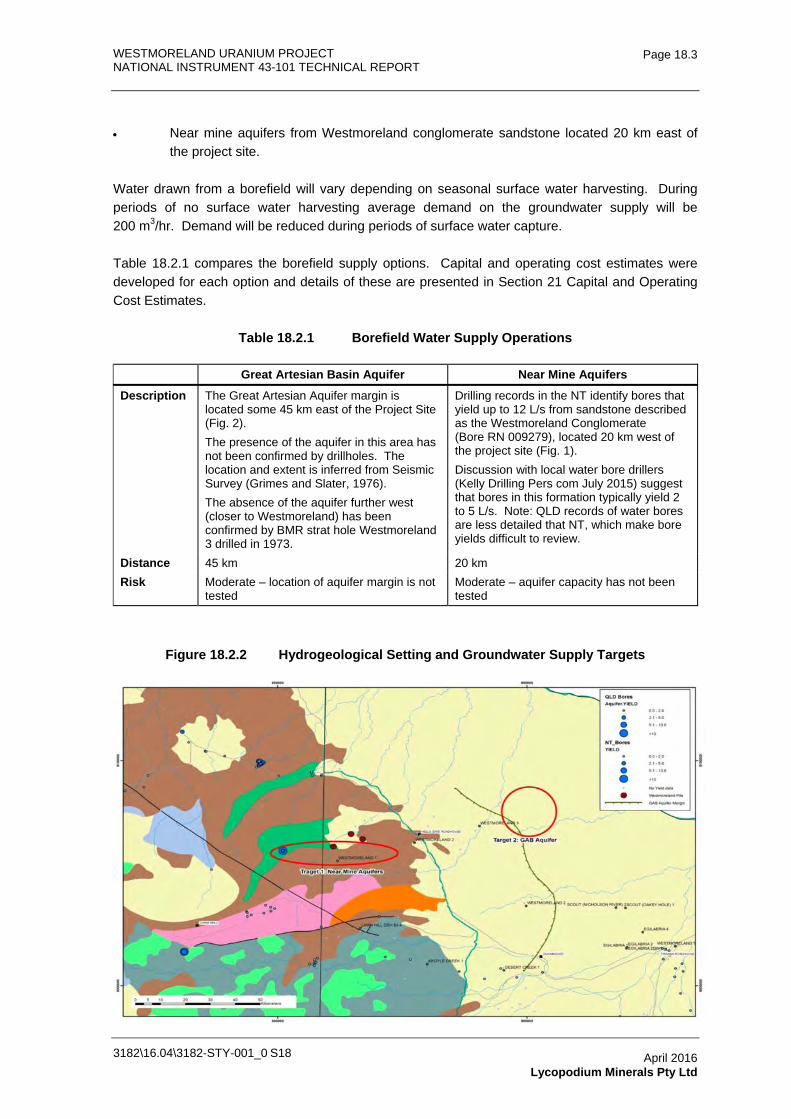
WESTMORELAND URANIUM PROJECT NATIONAL INSTRUMENT 43-101 TECHNICAL REPORT
3182\16.04\3182-STY-001_0 S18
Page 18.3
April 2016 Lycopodium Minerals Pty Ltd
• Near mine aquifers from Westmoreland conglomerate sandstone located 20 km east of the project site.
Water drawn from a borefield will vary depending on seasonal surface water harvesting. During periods of no surface water harvesting average demand on the groundwater supply will be 200 m3/hr. Demand will be reduced during periods of surface water capture.
Table 18.2.1 compares the borefield supply options. Capital and operating cost estimates were developed for each option and details of these are presented in Section 21 Capital and Operating Cost Estimates.
Table 18.2.1 Borefield Water Supply Operations
Great Artesian Basin Aquifer Near Mine Aquifers
Description The Great Artesian Aquifer margin is located some 45 km east of the Project Site (Fig. 2). The presence of the aquifer in this area has not been confirmed by drillholes. The location and extent is inferred from Seismic Survey (Grimes and Slater, 1976). The absence of the aquifer further west (closer to Westmoreland) has been confirmed by BMR strat hole Westmoreland 3 drilled in 1973.
Drilling records in the NT identify bores that yield up to 12 L/s from sandstone described as the Westmoreland Conglomerate (Bore RN 009279), located 20 km west of the project site (Fig. 1). Discussion with local water bore drillers (Kelly Drilling Pers com July 2015) suggest that bores in this formation typically yield 2 to 5 L/s. Note: QLD records of water bores are less detailed that NT, which make bore yields difficult to review.
Distance 45 km 20 km Risk Moderate – location of aquifer margin is not
tested Moderate – aquifer capacity has not been tested
Figure 18.2.2 Hydrogeological Setting and Groundwater Supply Targets

WESTMORELAND URANIUM PROJECT NATIONAL INSTRUMENT 43-101 TECHNICAL REPORT
3182\16.04\3182-STY-001_0 S18
Page 18.4
April 2016 Lycopodium Minerals Pty Ltd
Capital cost estimates for each option are presented in Table 18.2.2.
Table 18.2.2 Water Supply Option Capital Estimates
Source Option A
GAB (AUD)
Option B Near Mine
(AUD) Average (AUD)
DIRECT COSTS A Supply Consultant - 2,939,000 2,900,000 - B Installation Consultant - 635,000 420,000 - C Freight Consultant - 357,400 332,000 -
D = A + B + C Total Direct Costs Calculation 3,931,400 3,652,000 3,791,700 INDIRECT COSTS
E Contractors / construction indirect Consultant - 70,000 130,000 - F Other indirect costs as necessary Consultant - - - -
G = E + F Total Indirect Costs Calculation 70,000 130,000 100,000
H = D + G Project Cost before Contingency Calculation 4,001,400 3,782,000 3,891,700
I Contingency (=x% of H) Calculation 50% 2,000,700 1,891,000 1,945,850
K = H + I Total Project Installed Cost Calculation 6,002,100 5,673,000 5,837,550
18.3 Project Electric Power Supply
The main options are still at the conceptual evaluation stage, with no commercial undertakings being considered at this juncture. Possible synergies in the supply and distribution of regional power have also not being considered. For the purposes of a scoping study the alternatives have been investigated by LAM in sufficient depth to give a reasonable degree of confidence that the preferred alternative can be achieved within the cost parameters specified.
An assumed peak capacity of 15 MW, with an annual energy draw of 87 GWh is the basis for the estimated power requirements.
The alternatives considered were:
• Owner-operated diesel generation.
• Extension of the high voltage line that runs from Mount Isa to the Century zinc mine, an additional 150 km, and purchase of power from the gas fired generation at Mount Isa.
• A build, own, and operate gas-fired generator based on shale gas deposits roughly within 100 km of the project site.
18.3.1 Diesel Generation
Based on previous study work done on the Westmoreland project the capital cost of a 15 MW diesel generation facility would be in the order of AUD12M, with fuel and maintenance costs of around 23¢ /kWh.

WESTMORELAND URANIUM PROJECT NATIONAL INSTRUMENT 43-101 TECHNICAL REPORT
3182\16.04\3182-STY-001_0 S18
Page 18.5
April 2016 Lycopodium Minerals Pty Ltd
18.3.2 Extension of High Voltage Line from Century Zinc
The Century Zinc mine is supplied by a 220 kV line from Mount Isa. When Century’s operations commenced the Origin Energy (Queensland State Government) generation facility at Mica Creek was able to meet the needs of the Mount Isa region, and also supply Century at the prevailing Queensland wholesale rate. However, since then, the development of new mines in the Cloncurry / Mount Isa region has resulted in a power draw well in excess of the capacity of Mica Creek, and a private consortium, Diamantina Energy, constructed a new gas fired generation facility, with power sold at commercial rates. Although no clearly posted electricity prices are available from Diamantina Energy, industry sources have indicated prices of 14¢ /kWh in the Cloncurry area. The capital cost of extending the high voltage line from Century was estimated at AUD30M. For LAM, it would be necessary to fund the capital cost of the line extension and meet the prevailing electricity rates.
18.3.3 Gas-fired Generation
Recent interest in shale gas has resulted in Armour Energy estimating a Mean Prospective Resource (gas) of 22.5 trillion cubic feet of in the Lawn Hill Shale formation which lies approximately 100 km south-east of Westmoreland. This company is actively examining possible extensions of the geological formation to the west of their current resource, with a view to examining the underlying Riversleigh Shale formation. The existing Lawn Hill resource would be sufficient to ensure a gas supply well in excess of the planned Westmoreland project life.
LAM has examined the concept, and believes an economic case could be made for establishing a gas-fired station adjacent to the well-head, with a transmission line to the Westmoreland site. Based on the capital and operating parameters for gas turbines in the 12 MW to 16 MW range, and similar unit transmission line costs to those estimated for the extension of the Century Zinc transmission line, LAM believes gas-fired power could be provided to Westmoreland at an up-front capital cost of AUD31M and an energy cost of 8¢ /kWh.
The following table summarizes the three alternatives under consideration. Net Present Values are computed on pre-tax cashflows discounted at 8%, unescalated.
Table 18.3.1 Capital Cost Estimates of Power Supply Options
Diesel Line to Century Local Gas Fired
Capital Cost (AUDM) AUD12M AUD30M AUD31M Operation Cost (¢ /kWh) 23¢ 14¢ 8¢ NPV 8% (AUDM) AUD170M AUD124M AUD84M
Clearly the economic case favours the gas-fired alternative by a wide margin. As previously mentioned, substantial opportunities for regional electricity supply exist, which would add further synergies, but have not been factored into what is as yet only a conceptual alternative.

WESTMORELAND URANIUM PROJECT NATIONAL INSTRUMENT 43-101 TECHNICAL REPORT
3182\16.04\3182-STY-001_0 S18
Page 18.6
April 2016 Lycopodium Minerals Pty Ltd
18.4 Project Access Roads
Allowance has been made in the estimate for an access road from Savannah Way to the mine site and accommodation camp. Refer to Figure 18.4.1. The first half of the road follows an existing track, and the remainder of the roads are new. The existing part of the road travels along the Lagoon Creek and crosses the creek twice. Including the access road extensions to the mine site and accommodation camp, the total length of is approximately 29.2 km. Other options for the access roadway exist, but the option shown has been adopted for the purpose of the scoping study.
Figure 18.4.1 Site Access Road Route
18.5 Accommodation Camp and Airport
Allowance has been made in the capital and operating cost estimates, for an accommodation camp and associated airstrip. A total project workforce of 280, with 175 onsite at any particular time, has been allowed in estimating the size of the camp and airport. A fit for purpose accommodation camp reflecting conditions in the mining industry at the present time has been considered, and estimates are based on Lycopodium’s experience with similar facilities in similar locations. A total capital allowance for the camp and airport of AUD30.2M (excluding contingency) is included in the capital estimate.

WESTMORELAND URANIUM PROJECT NATIONAL INSTRUMENT 43-101 TECHNICAL REPORT
3182\16.04\3182-STY-001_0 S18
Page 18.7
April 2016 Lycopodium Minerals Pty Ltd
18.6 Administration, Mining and Process Buildings, Sewage Treatment
Allowance has been made in the capital estimate for the appropriate inclusion of building infrastructure covering administration, mining and exploration, process, including change rooms, ablutions, workshops, stores, explosives magazines, site roadways and carparks and reticulation of potable water, electric power and sewerage. Refer to the capital estimate details in Section 21 for more details.
18.7 Tailings Management
Process tailings will be washed and filtered to recover the pregnant leach solution prior to being discharged from the process plant. As such, the tailings will leave the plant in a semi dry state after the filtration process. This provides the opportunity to dispose of the tailings as a dry stacked product. The Scoping study assumes that the tailings will not need to be neutralised. Detailed geochemical studies will be required to assess the solubility of metals and radionuclides in the tailings during the next phase of design.
Recent reviews of tailings management practices have identified the disposal of tailings as a filtered (dry) material and elimination of the supernatant pond as being the Best Available Technology. This technology presents a significantly lower risk of failure compared to conventional tailings disposal, reduction in seepage potential and additionally leads to significant water savings for the project. The production of a filtered (dry) tailing product normally leads to significant increases in the capital cost (cost of filter plant construction) and operating cost (high power and reagent cost to run filters), compared to conventional or thickened tailings disposal. However, for the Westmoreland Project, as the tailings are being filtered in the plant as part of the process flow path, no additional cost will be incurred for the production of the filtered tailings. The Westmoreland Project therefore has the potential to adopt Best Available Technology of dry disposal method at minimal additional costs.
Knight Piésold examined options for disposal of filtered tailings at the Westmoreland Project. Following discussions with LAM Resources and their Mining Consultant (Mining Associates), it was determined that it will be feasible to dispose of the tailings as a dry stack with the stack being constructed within the Redtree Pit. This allows for backfilling the pit sequentially as the pit is being mined, eliminating the final void and reducing the disturbed footprint of operations at the site. Knight Piésold provided initial concepts to Mining Associates who then examined the mining schedule and provided a landform and staging which would allow for the Redtree Pit to be mined and progressively backfilled over the life of the operation. Knight Piésold have then provided the details of the water management, cover systems, and closure capping design.
Tailings will be conveyed to the disposal facility by a covered overland conveyor using a series of grasshopper conveyors and a final stacker conveyor to the disposal area within the facility. The stacking conveyors will be capable of stacking the tailings to a single 10 m high lift.
The Redtree Pit is relatively shallow over the majority of its footprint with a deep section which follows a dyke running north south across the pit. Prior to disposal of tailings in the pit the pit wall will, where possible be excavated and trimmed to a slope of less than 1V:3H to allow for construction of the basal liner directly on the slope. Where the pit wall cannot be excavated and trimmed to less than 1V:3H the basal liner will be constructed in horizontal layers against the pit

WESTMORELAND URANIUM PROJECT NATIONAL INSTRUMENT 43-101 TECHNICAL REPORT
3182\16.04\3182-STY-001_0 S18
Page 18.8
April 2016 Lycopodium Minerals Pty Ltd
wall or the pit wall reshaped with waste rock to provide the desired profile. The deeper dyke area will not be utilised for tailings disposal rather this deep narrow section of the pit will be backfilled with mine waste with the basal liner constructed on top of the mine waste backfill.
It is envisaged that an engineered basal liner would be constructed progressively across the base and sides of the pit in advance of tailings backfilling. The purpose of the liner is to reduce the potential for seepage into the underlying water table and to securely contain all tailings solids.
The tailings will be deposited as filtered tailings and therefore no bleed water during placement would be expected. However some water could be generated from the tailings as a result of consolidation of the placed tailings leading to drainage or through the infiltration of the surface water during the wet season. An internal drainage system is included to collect and recover this water.
Waste rock containment bunds will be constructed at the external face of the facility to provide a non-eroding and geotechnically stable outer facing. These bunds will be constructed to a height of 10 m with a crest width of 20 m to allow for truck access along the crest of the bunds.
For the purpose of this study, it was assumed that the waste rock bund will be constructed of blasted sandstone. It is assumed that the blasting and handling of the waste rock will result in a material with a moderate proportion of sand and gravel sized particles, which will be sufficient to prevent migration of tailings through the waste rock. However, this assumption will need to be verified at later stages of design.
Prior to placement of any tailings within the facility the pit would be reshaped, liners constructed to strict geotechnical standard, internal drainage installed and the containment waste rock bunds constructed to design.
On completion of an area of tailings placement, the top surface will be dozed smooth and graded to achieve a free draining surface. The surface of the tailings will then be compacted and a layer of waste rock of 0.5 m thickness will be placed over the tailings to reduce the risk of fugitive dust emissions and generation of sediment during rainfall events. This layer of waste rock will act as the running surface for the mining truck to dispose of waste rock within designated areas of the facility and to construct subsequent waste rock bunds for the next lift of the facility. It will additionally provide a solid working platform for the stacking conveyor to run on during the wet season when the tailings may wet up. Down-stream of each waste rock bund a surface drain will be constructed below the level of the tailings and will be lined with a geocomposite liner and a rip rap erosion protection layer. This drain will direct any surface run-off from the facility surface to engineered sumps located around the facility. These sumps will be designed in detailed at the next stage of design but it is envisaged the mine affected water management system will require capacity to contain all events up to a 1 in 1,000 year average recurrence interval.
The life of mine landform has been developed by Mining Associates based on the design requirement presented in the preceding sections. This landform can be constructed in parallel with mining operation and provides sufficient capacity for storage of tailings and a portion of waste rock to be generated as part of mining operations of the Redtree Pit and other pits at the project. The landform will be constructed from the base up over the life of mine which will allow for progressive rehabilitation of the facility.

WESTMORELAND URANIUM PROJECT NATIONAL INSTRUMENT 43-101 TECHNICAL REPORT
3182\16.04\3182-STY-001_0 S18
Page 18.9
April 2016 Lycopodium Minerals Pty Ltd
Estimated costs for the proposed in-pit disposal system (excluding pit reshaping, conveyor systems, tailings stacking, waste rock bund construction and waste rock running surface) were developed from Knight Piésolds design by Mining Associates and are included in the Mining costs presented in Section 16.

WESTMORELAND URANIUM PROJECT
NATIONAL INSTRUMENT 43-101 TECHNICAL REPORT
3182-STY-001
Table of Contents Page
19.0 MARKETING STUDIES AND CONTRACTS 19.1 19.1 Introduction 19.1 19.2 Demand 19.1 19.3 Supply 19.2 19.4 Pricing 19.4
FIGURES Figure 19.3.1 Uranium Supply and Demand – WNA Reference Scenario 19.2 Figure 19.3.2 Historical Role of Inventories 19.3 Figure 19.3.3 Uranium Mine Production Cost Curve 2010 19.4 Figure 19.4.1 Rise in Required Uranium Purchase by Global Utilities 19.5
3182\16.04\3182-STY-001_0 S19 April 2016 Lycopodium Minerals Pty Ltd

WESTMORELAND URANIUM PROJECT NATIONAL INSTRUMENT 43-101 TECHNICAL REPORT
3182\16.04\3182-STY-001_0 S19
Page 19.1
April 2016 Lycopodium Minerals Pty Ltd
19.0 MARKETING STUDIES AND CONTRACTS
19.1 Introduction
Laramide Resources Ltd. is one of the few advanced junior mining companies well placed to benefit from market requirements for new uranium production in the years ahead. Demand for uranium for use in nuclear fuel is slated to expand in the next five years driven by the world’s ever-growing energy demand. The present fossil fuel (coal, oil and natural gas) dependence associated with carbon dioxide emissions, foreign supply and security issues is not a desirable long-term option. With public discussion and education about fossil fuels, governments are taking historic steps in energy commitments toward non-fossil fuel technologies and creating policies to mitigate climate change. Particularly in China, the growing need for clean energy infrastructure is bringing nuclear technology to the fore. International cooperation and commerce in the field of nuclear science and technology continue to strengthen and provide the benefit of driving nuclear development as well. Nuclear energy remains firmly in place in the policy agendas of many countries around the world, with projections for new build similar to or exceeding those of the early years of nuclear power.
19.2 Demand
According to recent figures from the World Nuclear Association (WNA), there are currently 440 operable civil nuclear power reactors worldwide with over 380,000 MWe (384 GWe) of total capacity. This provides more than 11% of the world’s electricity as continuous, reliable base-load power, without carbon dioxide emissions. Approximately 31 countries use nuclear energy to generate up to three-quarters of their electricity. Nuclear power capacity worldwide is increasing steadily, with more than 65 reactors under construction in 15 countries notably China, South Korea, United Arab Emirates, the United States and Russia. A further 173 are on order, or planned.
While the events at the Fukushima accident in 2011 did set back public perception of nuclear safety, recent months have seen the restart of Japan’s nuclear energy production. Further, the Japanese government recently released plans stating that nuclear power would account for 20 to 22% of the country’s total electricity supply by 2030, compared with roughly 30% before the disaster at the Fukushima complex. In China eight reactors commenced in 2015, bringing total Chinese operating reactors to 30 with a further two reactors in operation by April 2016. The Chinese media recently unveiled plans to build six to eight nuclear power plants annually for the next five years and have 110 plants operable by 2030, a plan authorities believe would meet the urgent need for clean energy. India’s target is to add 20 to 30 new reactors by 2030. Operating nuclear reactors around the world today require approximately 66,883 t of uranium (tU) per year. Each gigawatt of increased new capacity will require about 150 tU/y of extra mine production, and about 300 to 450 tU for the first fuel load. Looking ten years ahead, the market is expected to grow steadily.
The WNA Global Nuclear Fuel Market 2015 to 2035 Report Reference Scenario (“WNA Reference Scenario”) shows a 31% increase in uranium demand 2013 to 2023. The WNA Reference Scenario factoring in older plants retired has a 25.6% increase in uranium demand for the decade 2020 to 2030.

WESTMORELAND URANIUM PROJECT NATIONAL INSTRUMENT 43-101 TECHNICAL REPORT
3182\16.04\3182-STY-001_0 S19
Page 19.2
April 2016 Lycopodium Minerals Pty Ltd
19.3 Supply
Current annual uranium requirements for operating reactors total approximately 66,883 tU/y, with total uranium mine supply estimated by the WNA at 56,252 t. After a decade of falling mine production to 1993, output of uranium started to rise since then and now meets approximately 85 to 90% of demand for nuclear power generation globally. The shortfall (global uranium demand minus uranium production) of 1.4 billion pounds of uranium between the years 1990 and 2015 was supplied by inventories and from secondary supply sources. Figure 19.3.1 below demonstrates current and projected reactor demand requirements in MWe compared to the supply side (both mine and secondary sources) based on the WNA Reference Scenario.
Figure 19.3.1 Uranium Supply and Demand – WNA Reference Scenario
Source: World Nuclear Association Symposium, 2015
Today, two-thirds of production from mines is from Kazakhstan, Canada, and Australia with the former having the largest share totalling 41% of world supply. With the recent downturn in the mining sector the numbers of mines under development, planned mines and prospective mines
MWe How Will Uranium Supply Match Requirements in the Reference Scenario

WESTMORELAND URANIUM PROJECT NATIONAL INSTRUMENT 43-101 TECHNICAL REPORT
3182\16.04\3182-STY-001_0 S19
Page 19.3
April 2016 Lycopodium Minerals Pty Ltd
have declined notably since 2013. According to the WNA Reference Scenario, the gap in demand and supply starts to be funded by new projects under development in 2018 to 2019.
The WNA Reference Scenario shows consistent secondary supply available until 2025 to manage the annual shortfall, but a drop-off significantly thereafter. Presently, the utilisation of inventories comes in various forms, including decommissioned weapons, and has enabled the supply / demand balance to be maintained. However, a large portion of these demilitarised secondary supplies came from Russia in the form of the “Megatons to Megawatts” program that ended in 2013. Figure 19.3.2 demonstrates the historical role secondary supplies and inventories have played.
Figure 19.3.2 Historical Role of Inventories
The below graph, from CRU Strategies, shows a cost curve for world uranium producers in 2010, and suggests that for the 53,500 tU/y production from mines in that year, USD40 /Ib is a marginal price. The cost curve will continue to rise steeply at higher uranium requirements.
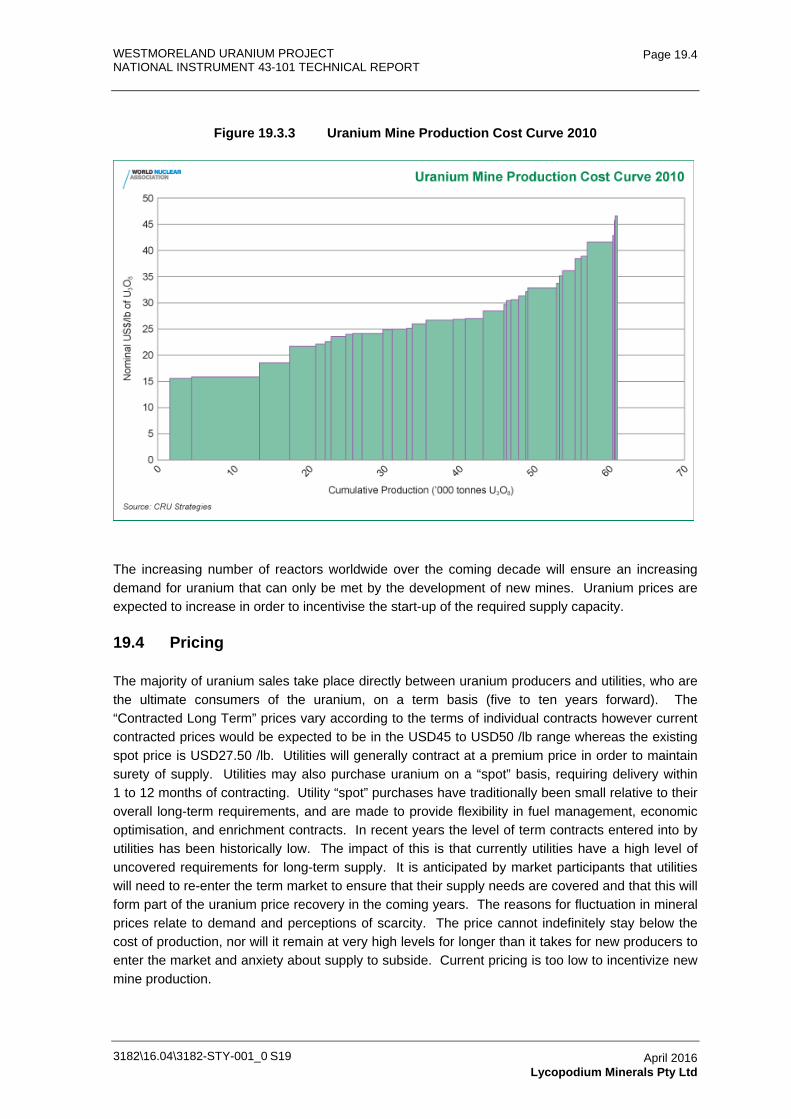
WESTMORELAND URANIUM PROJECT NATIONAL INSTRUMENT 43-101 TECHNICAL REPORT
3182\16.04\3182-STY-001_0 S19
Page 19.4
April 2016 Lycopodium Minerals Pty Ltd
Figure 19.3.3 Uranium Mine Production Cost Curve 2010
The increasing number of reactors worldwide over the coming decade will ensure an increasing demand for uranium that can only be met by the development of new mines. Uranium prices are expected to increase in order to incentivise the start-up of the required supply capacity.
19.4 Pricing
The majority of uranium sales take place directly between uranium producers and utilities, who are the ultimate consumers of the uranium, on a term basis (five to ten years forward). The “Contracted Long Term” prices vary according to the terms of individual contracts however current contracted prices would be expected to be in the USD45 to USD50 /lb range whereas the existing spot price is USD27.50 /lb. Utilities will generally contract at a premium price in order to maintain surety of supply. Utilities may also purchase uranium on a “spot” basis, requiring delivery within 1 to 12 months of contracting. Utility “spot” purchases have traditionally been small relative to their overall long-term requirements, and are made to provide flexibility in fuel management, economic optimisation, and enrichment contracts. In recent years the level of term contracts entered into by utilities has been historically low. The impact of this is that currently utilities have a high level of uncovered requirements for long-term supply. It is anticipated by market participants that utilities will need to re-enter the term market to ensure that their supply needs are covered and that this will form part of the uranium price recovery in the coming years. The reasons for fluctuation in mineral prices relate to demand and perceptions of scarcity. The price cannot indefinitely stay below the cost of production, nor will it remain at very high levels for longer than it takes for new producers to enter the market and anxiety about supply to subside. Current pricing is too low to incentivize new mine production.

WESTMORELAND URANIUM PROJECT NATIONAL INSTRUMENT 43-101 TECHNICAL REPORT
3182\16.04\3182-STY-001_0 S19
Page 19.5
April 2016 Lycopodium Minerals Pty Ltd
Figure 19.4.1 Rise in Required Uranium Purchase by Global Utilities
As shown above, 2018 to 2019 onwards (three to four years out), are particularly uncovered; and, utilities must resume normal levels of purchasing to cover these needs.
Laramide’s sales strategy is to focus, predominantly, on a mixture of fixed price and market related term contracts with a small number of major nuclear utilities complimented by a smaller quantity of spot or mid-term market sales depending on market forecasts. Australia imposes stringent controls over the export of uranium ensuring all such material, including its use and ultimate disposal, remains under the most rigorous safeguards and monitoring by the International Atomic Energy Agency. All sales by Laramide will only be to utilities in countries who are signatories to such formal, internationally-accepted, safeguard agreements.

WESTMORELAND URANIUM PROJECT
NATIONAL INSTRUMENT 43-101 TECHNICAL REPORT
3182-STY-001
Table of Contents Page
20.0 ENVIRONMENTAL STUDIES, PERMITTING AND SOCIAL OR COMMUNITY IMPACT 20.1 20.1 Environmental Considerations 20.1 20.2 Social and Community Considerations 20.2
3182\16.04\3182-STY-001_0 S20 April 2016 Lycopodium Minerals Pty Ltd

WESTMORELAND URANIUM PROJECT NATIONAL INSTRUMENT 43-101 TECHNICAL REPORT
3182\16.04\3182-STY-001_0 S20
Page 20.1
April 2016 Lycopodium Minerals Pty Ltd
20.0 ENVIRONMENTAL STUDIES, PERMITTING AND SOCIAL OR COMMUNITY IMPACT
20.1 Environmental Considerations
The Westmoreland Project (the Project) is situated in a sparsely populated region of northern Australia, straddling the Northern Territory (NT) and Queensland border. The region’s population is supported primarily by pastoralism, mining, commercial fishing and tourism, and consists of a high proportion of Aboriginal peoples. A few small towns (i.e. populations <3,000 people) are located within a few hundred kilometres of the Westmoreland Project area; the closest town is the Aboriginal community of Doomadgee, with an approximate population of 1,200 people, which is located roughly 80 km to the east. The majority of the land tenure around the Westmoreland Project is leasehold with minor freehold properties and Aboriginal Freehold, which is held by Aboriginal Land Trusts both in Queensland and in the NT.
The Project inhabits a region with a marked wet and dry season that is subject to monsoonal conditions and occasional cyclonic activity. The average Wet Season (November to March) rainfall is in the order of 172 mm/month, while the average Dry Season rainfall (April to October) is in the order of 10 mm/month. High rainfall intensities and durations do occur during cyclonic conditions. Mean Wet Season maximum temperature is 33°C, with no significant variation in Dry Season maximums.
The Project area spans two rainfall catchments, namely the Lagoon Creek Catchment and the Nicholson Catchment. No flood mapping is available for those areas of the catchments.
Groundwater occurs at relatively shallow depth below surface in the Project area (from 7 m to SWL). However, depth to groundwater is expected to vary with seasonal rainfall. As 88% of the rainfall occurs in the Wet Season, significant recharge is expected over that period. During the Dry Season, little to no recharge is expected and groundwater levels are expected to recede. Standing Water Level (SWL) variations of five metres or more may be expected in some areas.
In the broader area there are a wide range of aquifer types from high-yield, high-potential aquifers that are part of the Great Artesian Basin (GAB), to low-potential, local aquifers such as those associated with river alluvium or fractured rocks. There are three registered groundwater bores in immediate Westmoreland Project area and 230 in the wider area.
The soils in the Westmoreland Project area are mostly skeletal or shallow sands. These support native woodland vegetation with a spinifex and tussock grass understorey. Isolated patches of monsoon rainforests occur in gorges, with riparian vegetation along the rivers. This vegetation is typical of the broader region.
A number of environmental baseline studies have been undertaken on the Westmoreland project area. These have included investigations into the areas of:
• Surface water studies.
• Groundwater studies.

WESTMORELAND URANIUM PROJECT NATIONAL INSTRUMENT 43-101 TECHNICAL REPORT
3182\16.04\3182-STY-001_0 S20
Page 20.2
April 2016 Lycopodium Minerals Pty Ltd
• Aquatic biology studies.
• Terrestrial flora studies.
• Terrestrial fauna studies.
Prior to undertaking these studies, a range of expert advice was sought in relation to types of studies required and scopes of work and methodologies appropriate to those studies. Adopted methodologies, scopes of work, and study outputs needed to be scientifically rigorous and technically defensible. Consultants with particular expertise and experience in the north Australian environment and uranium mining issues were engaged to conduct the essential baseline studies.
The data for the baseline studies has been gathered at various times of the year and take into account both Wet Season and Dry Season impacts upon the environment within the project area. The information obtained by these studies will be integral in the Environmental Impact Statement that will be prepared when the project progresses through the permitting phase.
Roads of varying standards service the wider region in which the Westmoreland Project is situated. During the wet season, November to March, all major roads are closed for various amounts of time due to impassable river crossings. No rail lines currently service the area.
Two designated gulf ports lie within approximately 200 km of the Westmoreland Project Area.
This project will require a range of permits, licences and development applications covering the development in Queensland, as well as approvals under Commonwealth legislation.
20.2 Social and Community Considerations
There is one native title determination over the Westmoreland Project area. This is a determination that native title exists in the area and the native title holders are the Gangalidda and the Garawa Peoples. Right to negotiate agreements were entered into with the Gangalidda and the Garawa Peoples (who were then registered native title claimants) at the time of the grant of the exploration permits. Laramide recognises that the Gangalidda and the Garawa Peoples native title holders are key stakeholders in the project and, as part of the process towards a commencement of a mining operation, agreements will need to be negotiated under the Native Title Act. These agreements will provide for consents to mining grants and activities in return for commercial consideration, including training and employment of indigenous personnel. There are also 51 registered cultural heritage sites registered within the Westmoreland Project area. To meet the cultural heritage duty of care in relation to these and other sites in the project area, and in accordance with the Environmental Impact Assessment process, a Cultural Heritage Management Plan (CHMP) or its equivalent as part of any native title agreement, will be sought to be developed with the Gangalidda and the Garawa Peoples native title holders.
As part of the process working towards a mining operation Laramide intends to undertake a social impact assessment. A community consultation program will gather information and views from parties in the region who may be impacted by the operation. The assessment of these impacts is to identify possible beneficial and adverse impacts.

WESTMORELAND URANIUM PROJECT NATIONAL INSTRUMENT 43-101 TECHNICAL REPORT
3182\16.04\3182-STY-001_0 S20
Page 20.3
April 2016 Lycopodium Minerals Pty Ltd
Consideration is to be given to the following:
• The impact of the project on existing pastoral land uses and land holders.
• Any potential impacts on the surrounding community.
• The potential and mechanisms for local and statewide communities and businesses to tender contracts for services and supplies for any relevant components of the construction and operation of the project.
• The potential positive and negative social impacts that could result from an increased population.
• Impact on services or other development projects in the region that have relevance to this proposed operation.

WESTMORELAND URANIUM PROJECT
NATIONAL INSTRUMENT 43-101 TECHNICAL REPORT
3182-STY-001
Table of Contents Page
21.0 CAPITAL AND OPERATING COSTS 21.1 21.1 Capital Cost Estimate 21.1
21.1.1 Summary 21.1 21.1.2 Estimating Currency and Base Date 21.1 21.1.3 Mining Capital Costs 21.2 21.1.4 Infrastructure Capital Costs 21.2 21.1.5 Quantity Development 21.3 21.1.6 Pricing Basis 21.3 21.1.7 Temporary Construction Facilities 21.4 21.1.8 Heavy Lift Cranage 21.4 21.1.9 Mobilisation / Demobilisation 21.4 21.1.10 Earthworks 21.4 21.1.11 Concrete 21.4 21.1.12 Steelwork 21.5 21.1.13 Platework / Tankage 21.5 21.1.14 Mechanical Equipment 21.5 21.1.15 Plant Pipework 21.5 21.1.16 Overland Conveyor 21.6 21.1.17 Electrical and Instrumentation 21.6 21.1.18 Erection and Installation 21.6 21.1.19 Architectural / Buildings 21.6 21.1.20 Freight 21.6 21.1.21 Management (EPCM) 21.6 21.1.22 Vendor Commissioning 21.6 21.1.23 Contingency 21.6
21.2 Infrastructure Capital Costs 21.7 21.3 Owner’s Costs 21.7
21.3.1 Spares 21.7 21.3.2 First Fill Consumables and Opening Stocks 21.8
21.4 Exclusions and Qualifications 21.8 21.5 Operating Costs 21.9
21.5.1 Mining Costs 21.9 21.5.2 Plant and Administration Costs 21.9 21.5.3 Power 21.10 21.5.4 Operating Consumables 21.10 21.5.5 Labour (Processing / Maintenance and Administration) 21.11 21.5.6 General and Administration (Excluding G&A Labour) 21.12 21.5.7 Maintenance 21.12 21.5.8 Transport of UOC from Site to the Convertor 21.13 21.5.9 Exclusions 21.14
TABLES Table 21.1.1 Capital Estimate Summary (3Q15, ±35%) 21.1 Table 21.1.2 Mining Capital Costs 21.2 Table 21.5.1 Westmoreland Mine Operating Cost Summary 21.9 Table 21.5.2 Westmoreland Process Plant Operating Cost Summary 21.9 Table 21.5.3 Westmoreland Process Plant Power Cost by Plant Area 21.10 Table 21.5.4 Westmoreland Process Plant Consumables Cost 21.11
3182\16.04\3182-STY-001_0 S21 April 2016 Lycopodium Minerals Pty Ltd

WESTMORELAND URANIUM PROJECT
NATIONAL INSTRUMENT 43-101 TECHNICAL REPORT
3182-STY-001
Table of Contents (Continued)
Page
3182\16.04\3182-STY-001_0 S21
April 2016 Lycopodium Minerals Pty Ltd
Table 21.5.5 Westmoreland Processing Plant and Admin Manning Levels 21.11 Table 21.5.6 Westmoreland Plant General and Administration Summary 21.12 Table 21.5.7 Westmoreland Plant Annual Maintenance Materials Cost 21.13

WESTMORELAND URANIUM PROJECT NATIONAL INSTRUMENT 43-101 TECHNICAL REPORT
3182\16.04\3182-STY-001_0 S21
Page 21.1
April 2016 Lycopodium Minerals Pty Ltd
21.0 CAPITAL AND OPERATING COSTS
21.1 Capital Cost Estimate
The overall study capital cost estimate was compiled by Lycopodium and is presented here in summary format. The capital cost estimate reflects the Project scope as described in this study report. Mine capital costs (developed by Mining Associates for LAM) are included in the estimate tables below.
All costs are expressed in AUD unless otherwise stated and based on 3Q2015 pricing. The estimate is deemed to have an accuracy of ±35%.
The various elements of the Project estimate have been subject to internal peer review by Lycopodium and have been reviewed with LAM for scope and accuracy.
21.1.1 Summary
The capital estimate is summarised in Table 21.1.1. The initial project capital cost is estimated at AUD452M.
The estimate Work Breakdown Structure (WBS) is based on Lycopodium Minerals standard WBS for mineral projects.
Table 21.1.1 Capital Estimate Summary (3Q15, ±35%)
Main Area AUD
0 Construction Indirects 29,010,457 1 Treatment Plant Costs 120,678,769 2 Reagents and Plant Services 52,654,739 3 Infrastructure 40,313,339 4 Mining (pre-strip and equipment) 59,902,000 5 Management 33,074,268 6 Owners Project Costs (excl. mining) 46,689,436
Subtotal 382,323,008 Contingency 69,578,808 Fees, Taxes & Duties - Escalation -
Grand Total 451,901,816
21.1.2 Estimating Currency and Base Date
The estimate is expressed in AUD based on prices and market conditions current at third quarter 2015 (3Q2015). An AUD to USD exchange rate of AUD1.00 = USD0.70 is assumed.

WESTMORELAND URANIUM PROJECT NATIONAL INSTRUMENT 43-101 TECHNICAL REPORT
3182\16.04\3182-STY-001_0 S21
Page 21.2
April 2016 Lycopodium Minerals Pty Ltd
21.1.3 Mining Capital Costs
Mining capital costs were prepared by Mining Associates under contract to LAM on the basis of an owner operator mining strategy and include mining activities to the date of plant handover to operations. A summary of mining cost included in the capital cost estimate is provided in Table 21.1.2 below.
Table 21.1.2 Mining Capital Costs
Description AUD
Mining Fleet 28,162,000 Mine Pre-production, pre-stripping & Stockpiling 31,740,000
Total 59,902,000
21.1.4 Infrastructure Capital Costs
Water Supply
Groundwater Science Pty Ltd identified two borefield options for the supply of the projects raw water requirement, viz supply from the Great Artesian Basin aquifer, and supply from nearby local bore water sources. Capital costs for each option were estimated at AUD6M for supply from the great Artesian Basin and AUD5.7M from the near mine bore water source. Details are presented in Section 18.
Electric Power Supply
Laramide investigated options for the supply of electric power to the project viz diesel power generation, extension of the Mount Isa to Century Zinc transmission line and construction of a gas fired power station based on nearby shale gas resource. Based on this investigation, construction of a shale gas power station was selected as the preferred option. The capital cost for this option was estimated at AUD31M. Refer to Section 18 for further details.
Project Access Roads
An allowance has been made for the construction of 30 km of access road into the mine site and accommodation camp.
Accommodation Camp and Airstrip
The project workforce is 280 personnel with 175 personnel onsite at any particular time. The estimate includes a cost allowance of AUD17.7M for the inclusion of an accommodation camp to house an onsite work force of 175 personnel and AUD12.5M for an associated airstrip. A fit-for-purpose camp accommodation has been assumed in keeping with the current state of the Australian mining industry.

WESTMORELAND URANIUM PROJECT NATIONAL INSTRUMENT 43-101 TECHNICAL REPORT
3182\16.04\3182-STY-001_0 S21
Page 21.3
April 2016 Lycopodium Minerals Pty Ltd
Administration Mining and Process Buildings, Sewage Treatment
Allowance has been made in the capital estimate for the appropriate inclusion of building infrastructure covering administration, mining and exploration, process, including change rooms, ablutions, workshops, stores, explosives magazines, site roadways and carparks and reticulation of potable water, electric power, and sewerage.
21.1.5 Quantity Development
Quantity information has been derived from a recent reference project design and adjusted as appropriate for the Westmoreland specific project characteristics.
21.1.6 Pricing Basis
Estimate pricing was derived from a combination of the following sources:
• Budget Quotation: budget pricing solicited specifically for the study or project estimate.
• Database: historical database pricing that is less than six months old.
• Estimated: historical database pricing older than six months, escalated to the current estimate base date.
• Factored: factored from costs with a basis.
Pricing is inclusive of the following cost elements, as applicable, for the development of the estimate.
Plant Equipment
Represents prefabricated, pre-assembled, off-the-shelf types of mechanical or electrical equipment, either fixed or mobile. Pricing is inclusive of all costs necessary to purchase the goods ex-works, generally excluding delivery to site but including operating and maintenance manuals. The estimate is inclusive of vendor representation and commissioning spares.
Bulk Materials
Covers all other materials, normally purchased in bulk form, for installation on the project. Costs include the purchase price ex-works, any off-site fabrication, transport to site, and over-supply for anticipated wastage.
Installation
The cost to install the plant equipment and bulk materials on site or to perform site activities. Installation costs cover direct labour, equipment and contractors’ indirects.
The labour component includes the cost of the direct workforce required to construct the project scope. The labour cost is the product of the estimated work hours spent on site multiplied by the

WESTMORELAND URANIUM PROJECT NATIONAL INSTRUMENT 43-101 TECHNICAL REPORT
3182\16.04\3182-STY-001_0 S21
Page 21.4
April 2016 Lycopodium Minerals Pty Ltd
cost of labour to the contractor inclusive of overtime premiums, statutory overheads, payroll burden, and contractor margin.
The equipment component covers the cost of the construction equipment and running costs required to construct the project. The equipment cost also includes cranes, vehicles, small tools, consumables, PPE and the applicable contractor’s margin.
Contractors’ indirect costs encompass the remaining cost of installation and include items such as offsite management, onsite staff and supervision above trade level, crane drivers, mobilisation and demobilisation, R&Rs, meals and accommodation costs, and the applicable contractors’ margin.
21.1.7 Temporary Construction Facilities
Temporary construction facilities will be capable of servicing the Owners team, EPCM team and the construction subcontractor senior staff.
The estimate includes the cost of construction facilities for:
• Construction offices sized to accommodate the EPCM site based personnel.
• Construction offices sized to accommodate the Subcontractors site based personnel.
• Crib rooms.
• Computers and computing servers, telephones, printers, etc. and office furniture and equipment for the EPCM site based personnel.
21.1.8 Heavy Lift Cranage
The estimate includes the cost of heavy lift cranes for the SMP (Steel, Mechanical and Piping) and tankage installation.
21.1.9 Mobilisation / Demobilisation
The estimate includes the costs for mobilisation / demobilisation of labour and equipment to / from the project site, based on the project location.
21.1.10 Earthworks
Quantities for plant site bulk earthworks have been estimated from the layout. Rates were derived from Lycopodium’s recent experience for works of this type in similar locations.
21.1.11 Concrete
Quantities for concrete works were established using:
• Plant layout prepared for the study.

WESTMORELAND URANIUM PROJECT NATIONAL INSTRUMENT 43-101 TECHNICAL REPORT
3182\16.04\3182-STY-001_0 S21
Page 21.5
April 2016 Lycopodium Minerals Pty Ltd
• Benchmarking from detailed drawings for similar sized projects completed by Lycopodium.
Rates for this estimate are based on Lycopodium’s experience for this kind of work.
21.1.12 Steelwork
Quantities for structural steel were established using:
• The layout and equipment elevation drawings / sketches prepared for the study.
• Benchmarking from detailed drawings for similar sized projects completed by Lycopodium.
Rates for this estimate were based upon Lycopodium’s experience for this type of work in similar locations.
Site installation hours were estimated using Lycopodium’s database of experience and installation hours solicited from contractors on other projects.
21.1.13 Platework / Tankage
Platework and tankage quantities were determined using the sizing provided in the mechanical equipment list prepared for the Study as the basis. Lining materials, where applicable, were quantified separately.
Rates for this estimate were based upon Lycopodium’s experience for this type of work in similar locations.
21.1.14 Mechanical Equipment
The mechanical equipment list prepared for the Scoping Study provided the quantities and sizing for the cost estimate.
Budget quotations were sought from equipment vendors for major mechanical equipment based on data sheets or email enquiries.
Costs for all other items were derived from Lycopodium’s current in-house database.
Equipment installation hours were estimated using Lycopodium’s database of experience and installation hours. For each individual item of equipment due allowances were made for retrieval from the storage location, handling, placing, installing, and commissioning the equipment.
21.1.15 Plant Pipework
The supply and installation estimate for in-plant piping was derived using factors suitable for this project. These factors are a percentage of the mechanical equipment supply and installation costs, and are calculated per individual plant area. The plant piping costs allow for the supply and
WESTMORELAND URANIUM PROJECT NATIONAL INSTRUMENT 43-101 TECHNICAL REPORT
3182\16.04\3182-STY-001_0 S21
Page 21.6
April 2016 Lycopodium Minerals Pty Ltd
installation of pipe, fittings, mountings, manual valves and actuated valves. The connection of cabling to actuated valves is included in the electrical installation costs.
21.1.16 Overland Conveyor
The overland tailings conveyor was estimated from the conveyor length and elevation provided by Mining Associates and in-house database information was used for the pricing of the supply and install of components.
21.1.17 Electrical and Instrumentation
Costs were derived from Lycopodium’s current in-house database and referenced from a recent similar project.
21.1.18 Erection and Installation
Included in the discipline by discipline assessment of erection / installation costs detailed above, allowances were made for major construction cranage and equipment and construction costs such as site establishment, construction personnel meals, accommodation, flights, and fuel usage etc.
21.1.19 Architectural / Buildings
Pricing for plant and administration buildings were sourced from recent tenders for other Lycopodium projects.
21.1.20 Freight
Freight was derived based on the item category on similar past Lycopodium projects.
21.1.21 Management (EPCM)
The EPCM estimate was factored based upon Lycopodium’s recent experience with similar type and size of project.
Expenses such as catering and accommodation for the Engineer’s site personnel, as well as site telecommunications costs, are included in the estimate.
21.1.22 Vendor Commissioning
This is included in the estimate as part of the Owners cost general.
21.1.23 Contingency
The purpose of contingency is to make specific provision for uncertain elements of cost within the project scope. Contingencies do not include allowances for scope changes, escalation or exchange rate fluctuations. Contingency has been applied to all parts of the process plant estimate, and is taken as included appropriately in the mining cost estimates as advised by Mining Associates.

WESTMORELAND URANIUM PROJECT NATIONAL INSTRUMENT 43-101 TECHNICAL REPORT
3182\16.04\3182-STY-001_0 S21
Page 21.7
April 2016 Lycopodium Minerals Pty Ltd
21.2 Infrastructure Capital Costs
Plant and related infrastructure includes:
• Information technology.
• Site administration plant office.
• Accommodation camp.
• Site roads.
• Site access road.
• Site Power station.
• Supply of raw water, sewage removal and treatment, communications network for construction facilities.
• Sourcing and supply of construction (raw) water.
• Airport and related infrastructure.
21.3 Owner’s Costs
The owners’ costs for the project are estimated at AUD16.7M, excluding mining and power plant costs. The following items are included in the owners’ costs. In addition to spares, opening stocks and first fill, the owners’ costs make allowance for preproduction labour, training, consultants, project team, vendor representatives, and operational readiness.
In addition to the above, the following allowances have been made in the estimate:
• Pre-production costs.
• First fills (grinding media, lubricants, fuel, and reagents).
• Opening stocks.
• Plant mobile equipment.
• Project spares.
• Vendor representative and training costs for the process plant.
21.3.1 Spares
A minimalist approach has been assumed, with spares stocks progressively expanded during operations.

WESTMORELAND URANIUM PROJECT NATIONAL INSTRUMENT 43-101 TECHNICAL REPORT
3182\16.04\3182-STY-001_0 S21
Page 21.8
April 2016 Lycopodium Minerals Pty Ltd
21.3.2 First Fill Consumables and Opening Stocks
Quantities for opening stocks and first fill consumables have been assembled from basic principles and using the project design criteria. Unit rates are based on budget quotations solicited from suitable suppliers.
21.4 Exclusions and Qualifications
The following have been excluded from the overall project capital costs:
• Working capital (included in the financial model).
• Project insurances (plant insurance included under G&A in the operating cost estimate).
• Duties / taxes / fees (included in the financial model).
• Project sunk costs (no allowance made).
• Project escalation (no allowance for escalation beyond 2015).
• Sustaining capital expenditure (included in the financial model).
• Closure costs (included in the financial model).
• Permits and licences.
• Land purchase and relocation costs.
• Exchange rate variations (considered under sensitivity analysis in the financial model).
The estimate is qualified by the following assumptions:
• All labour rates, materials and equipment supply costs are current at 3Q15.
• The base estimate assumes that construction labour will be provided on a 12 hr, 13-day fortnight with a three-week-on, one-week-off work cycle.
• Accommodation, meals, and flights of sub-contractor personnel during the construction have been included in the contractor indirect labour rates. Accommodation and meals are based on a site construction / operations camp to be available at the commencement of construction.
• EPCM Meals and accommodation is included.
• Sub-contractor fuel is included in the direct hourly rate.

WESTMORELAND URANIUM PROJECT NATIONAL INSTRUMENT 43-101 TECHNICAL REPORT
3182\16.04\3182-STY-001_0 S21
Page 21.9
April 2016 Lycopodium Minerals Pty Ltd
• Sub-contractor rates include for mobile equipment, vehicles, construction power, and consumables for the duration of construction. Potable water and raw water supply is by the client and available at site for the use by contractors.
• PLC programming for the process plant has been allowed for in the EPCM estimate.
• Site supply of power, supply of raw water (for operations and construction), sewage removal and treatment, communications network for construction facilities are included in the infrastructure costs.
21.5 Operating Costs
21.5.1 Mining Costs
Mining Associates prepared the mining operating cost for Westmoreland based on an owner operator mining strategy. Table 21.5.1 compares the cost of owner and contractor mining strategies based over the Life of Mine (LOM), at a 2 Mtpa processing rate. Refer to Section 16 Mining Methods for a summary of mining operating cost.
Table 21.5.1 Westmoreland Mine Operating Cost Summary
Unit Rate Owner Operator Contractor
Mining Cost AUD/t AUD3.16 AUD4.48
21.5.2 Plant and Administration Costs
Process plant and administration operating costs have been developed by Lycopodium based on a design treatment rate of 2 Mtpa of ore with the plant operating 24 h/d, 365 d/y with a 91.3% plant utilisation (nominal 8,000 h/y) and a P80 grind size of 180 µm.
The operating cost estimate has been compiled from a variety of sources and is based on whole of ore treatment and a head grade of 1,000 ppm U3O8. Operating costs are presented in Australian dollars (AUD) and are based on prices obtained during the second quarter of 2015, to an accuracy of ± 35%. The process plant operating costs for the facilities are summarised in Table 21.5.2.
Table 21.5.2 Westmoreland Process Plant Operating Cost Summary
Cost Centre AUD /y AUD /t ore USD /lb U3O8
Processing Labour 14,077,413 7.04 2.36 Power 6,838,997 3.42 1.15 Consumables 39,091,621 19.55 6.55 Maintenance Materials 8,410,156 4.21 1.41 Laboratory 1,032,000 0.52 0.17 General & Administration 12,961,697 6.48 2.17 Total 82,411,884 41.22 13.81

WESTMORELAND URANIUM PROJECT NATIONAL INSTRUMENT 43-101 TECHNICAL REPORT
3182\16.04\3182-STY-001_0 S21
Page 21.10
April 2016 Lycopodium Minerals Pty Ltd
21.5.3 Power
The power requirements for the process plant were based on the mechanical equipment list with adjusted for equipment load factor and utilisation. The power cost assumes the construction of a gas fired power station (included in the capital cost estimate) and an all up operating cost of AUD0.08 /kWh as advised by LAM. A summary of the power cost for the plant by plant area is tabulated below in Table 21.5.3.
Table 21.5.3 Westmoreland Process Plant Power Cost by Plant Area
Plant Area AUD /y AUD /t
Primary Crushing 165,673 0.08 Mill Feed and Dust Scrubbing 119,649 0.06 Grinding Area (Excluding Mill) 328,585 0.16 Ginding - SAG Mill 4,005,546 2.00 Pebble Area Crushing 115,381 0.06 Pre-Leach Thickening 164,460 0.08 Leach 933,056 0.47 CIX 108,491 0.05 Acid Neutralisation 21,741 0.01 UOC Precipitation 205,261 0.10 Reagents Front End 8,523 0.00 Reagents Leach/CIX/Ptn 26,117 0.01 Tailings Area 173,763 0.09 Services - water, air 198,575 0.10 Services - Fuel 632 0.00 Services - Cooling water, steam, contam water 76,703 0.04 Services - Sewage Treatment and Lab Waste 64,883 0.03 Acid Plant 277,517 0.14 Plant Buildings 346,213 0.17 Camp and Camp Services 269,107 0.13 Turbo-Alternator supply -770,880 -0.39 Total 6,838,997 3.42
21.5.4 Operating Consumables
The consumables consumption requirements for the Westmoreland process plant were based on reference plant, testwork consumption rates, and industry standards. An allowance for wastage in crusher and mill liners has been included. Budget quotations for reagents and consumables were received from suppliers and adjusted to a DAP (Delivered at Place) price and include customs and duties. The diesel cost was supplied by LAM and diesel consumption for the plant mobile equipment was estimated. The consumables cost by plant area is summarised below in Table 21.5.4.

WESTMORELAND URANIUM PROJECT NATIONAL INSTRUMENT 43-101 TECHNICAL REPORT
3182\16.04\3182-STY-001_0 S21
Page 21.11
April 2016 Lycopodium Minerals Pty Ltd
Table 21.5.4 Westmoreland Process Plant Consumables Cost
Plant Area AUD /y AUD /t ore
Primary Jaw Crusher – Jaw liners 98735 0.05 SAG Mill – Liners 1585100 0.79 SAG Mill – Grinding Media 2929000 1.46 Pebble Crusher – Mantle/Concave 65887 0.03 Sulphur 7562024 3.78 Pyrolusite 3681720 1.84 Hydrogen Peroxide 552000 0.28 IX Resin 328529 0.16 Sodium Hydroxide (+99%) 19418532 9.71 Flocculant type 1 – Leach thickening 371000 0.19 Flocculant type 1 – De Sanding 371000 0.19 Flocculant type 2 – Neutralisation 1057 0.00 Flocculant type 2 – UOC Thickening 1057 0.00 Cooling Water Treatment 100000 0.05 BFW & Steam Treatment 100000 0.05 Mill Lubricants 40000 0.02 General Supplies 10000 0.01 Operator Consumables 11100 0.01 Product containers 649886 0.32 Product drums 457320 0.23 Strapping and buckles 50510 0.03 Diesel – Borefield Water Pumps 568000 0.28 Diesel – Mobile Equipment 139164 0.07 Total 39091621 19.55
21.5.5 Labour (Processing / Maintenance and Administration)
The labour costs for the process plant and administration are summarised in Table 21.5.5. Labour rates were based on a recent reference projects and the 2015 Hays Salary Guide. Mining salary costs were included in the mine operating cost provided by Mining Associates. The labour rates are based on a skill level and consist of a base salary and the required overhead allowances.
Table 21.5.5 Westmoreland Processing Plant and Admin Manning Levels
People Total Labour Cost (AUD /y)
Administration 36 4,476,575 Operations and Laboratory 51 6,079,225 Maintenance 24 3,521,613 Total 111 14,077,413
The roster is based on a three panel roster for shift personnel and 12 hrs per shift and salaries and wages take into account the project FIFO requirements.
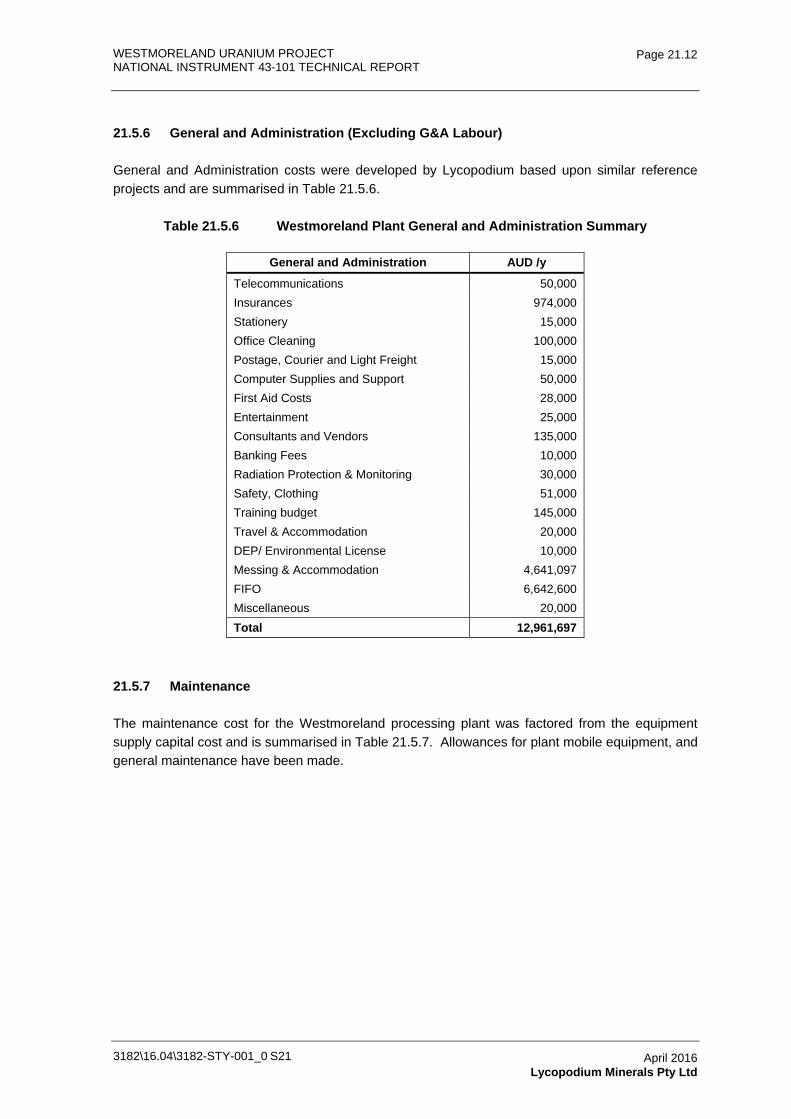
WESTMORELAND URANIUM PROJECT NATIONAL INSTRUMENT 43-101 TECHNICAL REPORT
3182\16.04\3182-STY-001_0 S21
Page 21.12
April 2016 Lycopodium Minerals Pty Ltd
21.5.6 General and Administration (Excluding G&A Labour)
General and Administration costs were developed by Lycopodium based upon similar reference projects and are summarised in Table 21.5.6.
Table 21.5.6 Westmoreland Plant General and Administration Summary
General and Administration AUD /y
Telecommunications 50,000 Insurances 974,000 Stationery 15,000 Office Cleaning 100,000 Postage, Courier and Light Freight 15,000 Computer Supplies and Support 50,000 First Aid Costs 28,000 Entertainment 25,000 Consultants and Vendors 135,000 Banking Fees 10,000 Radiation Protection & Monitoring 30,000 Safety, Clothing 51,000 Training budget 145,000 Travel & Accommodation 20,000 DEP/ Environmental License 10,000 Messing & Accommodation 4,641,097 FIFO 6,642,600 Miscellaneous 20,000 Total 12,961,697
21.5.7 Maintenance
The maintenance cost for the Westmoreland processing plant was factored from the equipment supply capital cost and is summarised in Table 21.5.7. Allowances for plant mobile equipment, and general maintenance have been made.

WESTMORELAND URANIUM PROJECT NATIONAL INSTRUMENT 43-101 TECHNICAL REPORT
3182\16.04\3182-STY-001_0 S21
Page 21.13
April 2016 Lycopodium Minerals Pty Ltd
Table 21.5.7 Westmoreland Plant Annual Maintenance Materials Cost
AUD /y AUD /t
Primary Crushing 253,230 0.13 Ore reclaim 103,763 0.05 Grinding Area Mill and Dust Scrubber 1,381,063 0.69 Pebble Area Crushing 165,911 0.08 Pre-Leach Thickening 426,371 0.21 Leach 1,392,890 0.70 CIX 307,616 0.15 Acid Neutralisation and UOC 651,480 0.33 Reagents 176,294 0.09 Tailings Area 98,749 0.05 Water services 142,178 0.07 Plant services 159,642 0.08 Air services 35,832 0.02 Services - Borefield 486,455 0.24 Acid Plant 1,344,376 0.67 Plant Buildings 172,282 0.09 Camp, Camp Services inc airport 452,788 0.23 Plant Mobile Equipment 88,675 0.04 Maintenance General (Licenses, manuals) 177,000 0.09 Contract Labour 393,560 0.20 Total 8,410,156 4.21
21.5.8 Transport of UOC from Site to the Convertor
A study of transport costs for the Westmoreland Uranium project was undertaken by Class 7 International Pty Ltd on behalf of Laramide. It was based upon and in line with operational best practices currently undertaken by Australian producers and shippers of uranium ore concentrates (UOC). Detailed information relating to those practices can be found within the “Guide to Safe Transport of UOC” (2012), developed by the Uranium Council Transport Working Group.
The study addresses transport and marketing distribution related back office costs and associated activates required to ensure compliance with national and international transport related safety, security, and overall safeguard requirements. The study adopted the port of Adelaide as being the point of export. Costs were based around all activities associated with transportation from the mine site to the point of export, sea freight, plus on-carriage to the three western converters located in Canada, the United States of America, and France.
The study concluded that the transport cost from the mine to the western converter was USD0.77 /lb of UOC.

WESTMORELAND URANIUM PROJECT NATIONAL INSTRUMENT 43-101 TECHNICAL REPORT
3182\16.04\3182-STY-001_0 S21
Page 21.14
April 2016 Lycopodium Minerals Pty Ltd
21.5.9 Exclusions
The operating costs stated above makes no allowance for the following:
• All LAM head office / corporate costs.
• All import duties, withholding taxes and other taxes (corporate tax included in the financial model).
• Project financing costs.
• Any impact of foreign exchange rate fluctuations (included in the financial model under sensitivity analysis).
• Any escalation from the date of the estimate.
• Any contingency allowance.
• Any rehabilitation or closure costs (included in the financial model).
• Any licence fees or royalties (included in the financial model).
• Government monitoring / compliance costs.
• Water extraction licensing costs (pumping power and installation has been allowed).

WESTMORELAND URANIUM PROJECT
NATIONAL INSTRUMENT 43-101 TECHNICAL REPORT
3182-STY-001
Table of Contents Page
22.0 ECONOMIC ANALYSIS 22.1 22.1 Introduction 22.1
22.1.1 Principal Assumptions 22.1 22.1.2 Uranium Sale Price 22.1 22.1.3 Product Sales 22.1 22.1.4 Exchange Rates 22.1 22.1.5 Taxes 22.1 22.1.6 Goods and Services Tax 22.2 22.1.7 Royalties 22.2 22.1.8 Other Royalties 22.2 22.1.9 Revenue Deductions 22.2 22.1.10 Reclamation 22.2 22.1.11 Project Financing 22.2
22.2 Financial Model 22.2 22.3 Model Inputs 22.3
22.3.1 Production summaries 22.3 22.3.2 Capital Cost Summary 22.3 22.3.3 Operating Cost Summary 22.3 22.3.4 Economic Results 22.3
TABLES Table 22.2.1 Key Economic Assumptions Used in the Financial Model 22.2 Table 22.3.1 Economic Analysis Results 22.3 FIGURES Figure 22.3.1 Annual and Cumulative After Tax Cash Flow 22.4 Figure 22.3.2 NPV Sensitivity Analysis 22.5
3182\16.04\3182-STY-001_0 S22 April 2016 Lycopodium Minerals Pty Ltd

WESTMORELAND URANIUM PROJECT NATIONAL INSTRUMENT 43-101 TECHNICAL REPORT
3182\16.04\3182-STY-001_0 S22
Page 22.1
April 2016 Lycopodium Minerals Pty Ltd
22.0 ECONOMIC ANALYSIS
22.1 Introduction
A financial model for evaluating the Project was developed in-house by LAM. Lycopodium reviewed the model logic, consistency of input assumptions, and integrity of the calculations. All costs are constant in 2015 Australian dollars with no provision for inflation escalation.
The annual cash flow projections were estimated over the Project’s production life based on production schedule, sales revenue, production costs, capital expenditures and corporate costs (taxation, royalties, etc.). The financial indicators examined included after-tax cash flow (ATCF), net present value (NPV) at 10% discount rate, internal rate of return (IRR) and payback period.
22.1.1 Principal Assumptions
The principal assumptions are detailed in this section.
The proposed mining inventory was based on the Mineral Reserves and mine schedule described in Sections 15 and 16 of this report. The annual throughput is at a rate of 2 Mtpa.
22.1.2 Uranium Sale Price
LAM used a selling price of USD65 /lb in the economic model.
Prices used are non-escalated real prices. Sensitivity analysis demonstrates financial returns for the Project at a range of uranium prices.
22.1.3 Product Sales
It is intended that crude uranium oxide (U3O8) will be produced and transported from the Westmoreland site to Adelaide before being shipped to overseas customers.
22.1.4 Exchange Rates
The financial model for the Project uses an AUD / USD exchange rate of 0.70.
22.1.5 Taxes
Australian corporate tax is payable on returns from the Project. The following assumptions have been applied when calculating corporate tax payable:
• 30% corporate tax rate (for the purpose of the financial model, this is applied to the Project cash flows only, i.e. the impact of any other LAM cash flows has been ignored).
• Project assets are depreciated over their useful life, according to Australian Taxation legislation.

WESTMORELAND URANIUM PROJECT NATIONAL INSTRUMENT 43-101 TECHNICAL REPORT
3182\16.04\3182-STY-001_0 S22
Page 22.2
April 2016 Lycopodium Minerals Pty Ltd
22.1.6 Goods and Services Tax
A Goods and Services Tax (GST) at a rate of 10% is levied by the Australian Federal Government on purchases by individuals and corporations on non-exempt goods and services. Businesses can claim back GST on most business inputs. As all product sales will be to overseas customers GST is not applicable.
22.1.7 Royalties
Queensland State Royalties apply to the Project. Queensland State Mineral legislation imposes a royalty on the sale of minerals. The royalty rate applicable to uranium is 5%.
The financial analysis of the Project has applied the royalty rates above, which are based on the calculations provided in Schedule 3 of the Mineral Resources Regulation 2013.
22.1.8 Other Royalties
A 1% Net Smelter Royalty (NSR) is payable to International Royalty Corporation with cumulative payments capped at AUD10M indexed to inflation.
22.1.9 Revenue Deductions
The cost of shipping and insurance is a revenue deduction for the purpose of determining Queensland State Royalties payable.
22.1.10 Reclamation
No assumptions about the salvage value on plant and equipment have been made in the financial model.
22.1.11 Project Financing
No assumptions have been made about the Project financing in the financial model.
22.2 Financial Model
Table 22.2.1 provides the key economic assumptions used in the financial model.
Table 22.2.1 Key Economic Assumptions Used in the Financial Model
Assumption Units Rate
Commodity Prices lb USD 65 Exchange Rates AUD:USUD exchange rate AUD:USD 0.70 Other Corporate tax rate % 30.0 Discount rate % 10.0

WESTMORELAND URANIUM PROJECT NATIONAL INSTRUMENT 43-101 TECHNICAL REPORT
3182\16.04\3182-STY-001_0 S22
Page 22.3
April 2016 Lycopodium Minerals Pty Ltd
22.3 Model Inputs
22.3.1 Production summaries
The production schedule for the Project is described in Section 16.
22.3.2 Capital Cost Summary
The capital costs for the Project are as described in Section 21.
22.3.3 Operating Cost Summary
The operating costs for the Project are as described in Section 21.
22.3.4 Economic Results
Error! Reference source not found. shows the production of uranium oxide and unit operating costs for the Westmoreland Project.
Table 22.3.1 Economic Analysis Results
AUD USD
Capital Cost 452M 316M Operating Cost /t 56.72 39.70 Operating Cost /lb 33.20 23.30 Pre-tax NPV 854M 598M Pre-tax IRR 45.4% - Post Tax NPV 571M 400M Post Tax IRR 35.8% -
The project has a 13 year mine-life. The mining is completed in 12 years (including pre-strip) and stockpiled lower grade ore is processed for the final two years. Project payback period is approximately 2.5 years into the mine-life as shown in Figure 22.3.1.

WESTMORELAND URANIUM PROJECT NATIONAL INSTRUMENT 43-101 TECHNICAL REPORT
3182\16.04\3182-STY-001_0 S22
Page 22.4
April 2016 Lycopodium Minerals Pty Ltd
Figure 22.3.1 Annual and Cumulative After Tax Cash Flow
The Project’s economics are most sensitive to commodity pricing assumptions and foreign exchange rate assumptions.
The NPV sensitivity for the Project under various scenarios where the following factors are increased or decreased by incremental percentages are shown in Figure 22.3.2.
The factors adjusted for the sensitivity analysis are
• Capital cost.
• Uranium Sales Price.
• Forex.
• Discount Rate.
• Operating costs.

WESTMORELAND URANIUM PROJECT NATIONAL INSTRUMENT 43-101 TECHNICAL REPORT
3182\16.04\3182-STY-001_0 S22
Page 22.5
April 2016 Lycopodium Minerals Pty Ltd
Figure 22.3.2 NPV Sensitivity Analysis

WESTMORELAND URANIUM PROJECT
NATIONAL INSTRUMENT 43-101 TECHNICAL REPORT
3182-STY-001
Table of Contents Page
23.0 ADJACENT PROPERTIES 23.1 23.1 Introduction 23.1
FIGURES Figure 23.1.1 LAM’s NT Tenements 23.1 Figure 23.1.2 LAM Holds a 50% Interest in EL 23573 23.2
3182\16.04\3182-STY-001_0 S23 April 2016 Mining Associates

WESTMORELAND URANIUM PROJECT NATIONAL INSTRUMENT 43-101 TECHNICAL REPORT
3182\16.04\3182-STY-001_0 S23
Page 23.1
April 2016 Mining Associates
23.0 ADJACENT PROPERTIES
23.1 Introduction
LAM holds an interest in a number of Northern Territory tenements immediately adjacent to the Queensland Westmoreland project tenements that have not been discussed in this report (Figure 23.1.1). The tenements are contiguous and cover a significant area of the Wearyan Shelf of the southern McArthur basin and the adjoining Murphy Inlier. Of particular importance is EL23573 (Figure 23.1.2) which hosts uranium occurrences in an identical setting to the Westmoreland deposits. The key features are:
• NE Westmoreland dyke zone (analogous to the Redtree dyke zone).
• Westmoreland Conglomerate host.
• Proximity of mafic Seigal Volcanics.
Figure 23.1.1 LAM’s NT Tenements

WESTMORELAND URANIUM PROJECT NATIONAL INSTRUMENT 43-101 TECHNICAL REPORT
3182\16.04\3182-STY-001_0 S23
Page 23.2
April 2016 Mining Associates
Figure 23.1.2 LAM Holds a 50% Interest in EL 23573
LAM drilled 23 reverse circulation (RC) holes for 2,818 m in late 2006 to test for mineralisation in flat lying zones and sub-vertical structures associated with the steeply westwards dipping NE Westmoreland Fault. Six holes were abandoned prior to reaching target depths and 105 samples were assayed. Significant results included:
• 5 m at 0.18 % U3O8 from 124 m in NEWM204, including 1 m at 0.42 % U3O8 from 127 m.
• 5 m at 0.06% U3O8 from 73 m in NEWM222.
• 4 m at 0.02% U3O8 from 61 m in NEWM217.
• 2 m at 0.05% U3O8 from 65 m in NEWM216.
The mineralised intervals in NEWM204 and NEWM222 are hosted by siltstone horizons in the Westmoreland Conglomerate some 30 to 50 m below the unconformity between the Conglomerate and the overlying Seigal Volcanics.
LAM’s 2006 drillholes did not intersect any sub-vertical structures as planned because the holes were terminated prematurely due to heavy water inflows.
LAM drilled 19 holes totalling 3,159 metres in July 2007, including completion of the terminated holes from 2006. These angled holes assisted with further interpretation of the geology of the prospect but appeared not to intersect significant mineralisation.

WESTMORELAND URANIUM PROJECT
NATIONAL INSTRUMENT 43-101 TECHNICAL REPORT
3182-STY-001
Table of Contents Page
24.0 OTHER RELEVANT DATA 24.1 24.1 Developing Northern Australia Initiative 24.1 24.2 Nuclear Fuel Cycle Royal Commission South Australia 24.1 24.3 Queensland State Government Policy on Uranium Mining 24.2
3182\16.04\3182-STY-001_0 S24 April 2016 Lycopodium Minerals Pty Ltd
WESTMORELAND URANIUM PROJECT NATIONAL INSTRUMENT 43-101 TECHNICAL REPORT
3182\16.04\3182-STY-001_0 S24
Page 24.1 DRAFT
April 2016 Lycopodium Minerals Pty Ltd
24.0 OTHER RELEVANT DATA
24.1 Developing Northern Australia Initiative
In August 2015 the Australian Federal Government released a white paper entitled “Our North, Our Future: White Paper on Developing Northern Australia”. The white paper outlines an action plan for the development of Northern Australia. The white paper sets out the government’s policy framework for addressing the following objectives:
• Facilitating the use of natural assets.
• Providing a welcome investment environment.
• Investing in infrastructure.
• Reducing barriers to employment.
• Improving governance.
This initiative is timely for the Westmoreland Project, offering the opportunity to engage with government in the provision and upgrading of infrastructure to facilitate project requirements including roads, port upgrades, power supply, water supply, and employment opportunities.
24.2 Nuclear Fuel Cycle Royal Commission South Australia
During the course of the Westmoreland Project Scoping Study, the government of South Australia released the interim findings of a Royal Commission into the opportunities for South Australia to expand and participate in the wider nuclear fuel cycle industry, Nuclear Fuel Cycle Royal Commission 2016. The tentative findings of this Royal Commission were as follows:
• South Australia can safely increase its participation in nuclear activities and, by doing so, significantly improve the economic welfare of the South Australian community.
• An expansion of uranium mining has the potential to be economically beneficial.
• In an already oversupplied and uncertain market there is no opportunity for the commercial development of further uranium processing capability in South Australia within the next decade.
• Taking account of future demand and anticipated costs of nuclear power under the existing electricity market structure, it would not be commercially viable to generate electricity from a nuclear power plant in South Australia in the foreseeable future.
• The storage and disposal of nuclear fuel in South Australia is likely to deliver substantial economic benefits to the South Australian community.

WESTMORELAND URANIUM PROJECT NATIONAL INSTRUMENT 43-101 TECHNICAL REPORT
3182\16.04\3182-STY-001_0 S24
Page 24.2 DRAFT
April 2016 Lycopodium Minerals Pty Ltd
The support for increased uranium mining in South Australia is also an endorsement for increased uranium mining in other Australian jurisdictions, including Westmoreland in NW Queensland.
24.3 Queensland State Government Policy on Uranium Mining
At the national level, both the Federal Labor Party and the Federal Coalition parties support development of the uranium industry. The granting of licences to mine uranium is, however, a decision made within the jurisdiction of each state government.
A state election held in Queensland on 21 January 2015 resulted in a change of government from the Liberal-National Party (LNP) to a Labor party government. The previous state LNP Government in Queensland was prepared to grant licences to mine uranium however the Labor Party has changed government policy and does support uranium mining although will continue to support exploration.
This would present an issue for the Westmoreland project if it was at an advanced stage of development; however, given that the project is only at an early stage of development, this is not currently considered to be an issue preventing the project from progressing to the next phase.

WESTMORELAND URANIUM PROJECT
NATIONAL INSTRUMENT 43-101 TECHNICAL REPORT
3182-STY-001
Table of Contents Page
25.0 CONCLUSIONS 25.1 25.1 Geology and Resource Estimate 25.1 25.2 Mining Methods 25.1 25.3 Metallurgical Testwork 25.2 25.4 Process Plant 25.2 25.5 Infrastructure 25.2 25.6 Risks and Opportunities 25.3 25.7 Capital and Operating Costs 25.3 25.8 Financial Analysis 25.3
3182\16.04\3182-STY-001_0 S25 April 2016 Lycopodium Minerals Pty Ltd

WESTMORELAND URANIUM PROJECT NATIONAL INSTRUMENT 43-101 TECHNICAL REPORT
3182\16.04\3182-STY-001_0 S25
Page 25.1
April 2016 Lycopodium Minerals Pty Ltd
25.0 CONCLUSIONS
25.1 Geology and Resource Estimate
The Westmoreland uranium deposits, Redtree, Junnagunna and Huarabagoo, are hosted largely within the shallow dipping Westmoreland Conglomerate. The Redtree uranium deposit flanks the Redtree dyke zone immediately north of the northwest-trending Namalangi fault. The deposit comprises horizontal mineralisation in the Jack, Garee, and Langi lenses and vertical mineralisation in the Namalangi lens with grades ranging from 0.15% to >2% U3O8. The Huarabagoo deposit is about 3 km NE of Redtree along the Redtree dyke zone and straddles the contact of the Seigal Volcanics with the Westmoreland Conglomerate. The deposit comprises a 3 km zone of vertical mineralisation associated with a complex dyke geometry with vertical and horizontal branches between the two principal dykes. The Junnagunna uranium deposit occurs at a fault intersection west of the Redtree dyke zone and south of the northwest trending Cliffdale fault. Mineralisation lies 0.5 to 10 m thick immediately beneath the Seigal-Westmoreland contact. Uranium mineralisation occurs on the northern side of the Cliffdale fault and the eastern side of the Redtree dolerite dyke zone. Drilling in 2010 at Long Pocket intersected horizontal uranium mineralisation over a 500 m strike length above a dolerite sill and immediately below the underlying sill contact
Mining Associates have reported an NI43-101 / JORC compliant Mineral Resource Estimate in May 2009 (Vigar & Jones, May 2009) made up of Indicated Mineral Resources of 18.7 Mt at an average grade of 0.089% U3O8 containing 36.0 Mlbs of uranium (U3O8) and an additional Inferred mineral resource of 9.0 Mt at an average grade of 0.083% U3O8 containing 15.9 Mlbs of U3O8. The resource has been re-stated to comply with JORC 2012 as is described in Section 14 of this report.
25.2 Mining Methods
The Westmoreland deposits are amenable to open pit mining using Excavator / FEL operation loading off-highway haul trucks. A mining approach using conventional drill and blast with truck and shovel operation, mining 5 m benches with 2.5 m flitches is practical. A total of 131 Mt (Total Material Moved) will be moved over 12 years of mining with 104.8 Mt of waste and 26.3 Mt of ore being produced. The mining schedule produces an average of 2.2 Mtpa ore and 8.7 Mtpa of waste. A mill feed of 2 Mtpa can be achieved in the 2nd year onwards for the full mine life. The mill throughput reduces to approximately 0.227 Mtpa in the final year of production.
Mining would commence in Garree start-up Pit 5 to establish an initial tailings emplacement area before moving to Garee Pit 4. The first seven years (pre-strip and six years of operation) focus on production from Garee (Pit 4) and Junnagunna (Pit 1) with mining production coming from Garee and up to 300,000 tpa of clay brought from Junnagunna to Garee Tailings dams for tailing containment and sealing operations. In Year 8, production is focused solely on Pit 3 Junnagunna, before being split between Junnagunna (Pit 3) and Huarabagoo (Pit 1) from Year 9 to the end of mining operations in Year 12.

WESTMORELAND URANIUM PROJECT NATIONAL INSTRUMENT 43-101 TECHNICAL REPORT
3182\16.04\3182-STY-001_0 S25
Page 25.2
April 2016 Lycopodium Minerals Pty Ltd
25.3 Metallurgical Testwork
The testwork results do not introduce any concerns regarding processing the Westmoreland materials. The following conclusions are noted:
• The Westmoreland material generally acid leaches very well with modest acid consumption and high U extractions. The leach times are relatively short.
• The Jack Lens material was the only exception and extraction was improved by adding ferric iron to assist oxidation of tetravalent uranium in the material.
• The grind size distribution is relatively coarse, but only very limited comminution testwork has been reported to date and the results are contradictory.
• Recovery of the U from the leached slurry by both Ion exchange and solvent extraction was investigated.
• Precipitation of the U as a concentrate to be sold to the market is good quality and can be treated by any of the three main converters that will be treating the material.
• Pulp settling is reasonable with a very high solids underflow density and a relatively clear overflow pregnant leach solution (PLS).
• The resin chosen for ion exchange testwork showed good loading and elution characteristics.
• Solvent extraction tests showed that the kinetics with a conventional amine extractant are good.
• Stripping the loaded SX organic is also conducted relatively easily using ammonium sulphate.
25.4 Process Plant
Based on the currently available metallurgical test data, processing Westmoreland ore at a rate of 2 Mtpa by a process that involves: crushing and grinding in a single stage SAG circuit; leaching with sulphuric acid at 40°C; separation of the leached ore from the pregnant liquor by pressure filtration; recovery of the U by continuous ion exchange and elution; production of a uranium oxide concentrate by neutralisation of the eluate; and precipitation of UOC with hydrogen peroxide; is a feasible treatment scheme at the scoping study level. Attention will need to be given to the control of impurities in the final UOC concentrate if the project moves forward to the next phase.
25.5 Infrastructure
The Westmoreland prospect is located in a remote region of NW Queensland and the provision of appropriate infrastructure will be required as part of the project. In particular the cost of provision of the projects water requirements and electric power requirements, while adequately addressed at

WESTMORELAND URANIUM PROJECT NATIONAL INSTRUMENT 43-101 TECHNICAL REPORT
3182\16.04\3182-STY-001_0 S25
Page 25.3
April 2016 Lycopodium Minerals Pty Ltd
the scoping study level, will require more detailed investigation if the project moves forward to the next phase.
The design of the Tailings Storage Facility has been developed as a conceptual level only with significant testing and verification of the design required at the next stage of study. Based on the assumption adopted by Knight Piesold and stated in the Scoping Study, it is considered that a dry stack facility will be feasible at the Westmorland Project.
25.6 Risks and Opportunities
The Westmoreland project is at an early (Scoping Study) level of evaluation. Only limited metallurgical testwork and associated sampling has been completed. In particular, recent testwork has been based on samples with higher than average head grade for the deposit. Only very limited comminution testwork has been performed and the results were contradictory. Significantly more sampling and metallurgical testwork is required in the next phase of the project to confirm the process design criteria and basis of design. This may result in changes to the process flowsheet and operating conditions with impacts on both the capital and operating cost estimates.
Similarly only very preliminary evaluations of project infrastructure provision have been undertaken. In the next phase of the project more detailed investigations into project water supply and electric power supply are required and these may impact both capital and operating cost estimates.
If the project moves forward with the ion exchange recovery flowsheet, then the opportunity exists to incorporate an acid recovery membrane plant. This will require further focused testwork to determine its applicability to Westmoreland. If successful, this flowsheet change may enable recovery / recycle of up to 65% of the sulphuric acid with significant savings in both capital and operating cost, both for sulphuric acid and caustic soda consumption (for acid neutralisation). However further testwork and engineering is required to define the capital and operating costs of the acid recovery plant, and the impact of recycled acid and the associated uranium and other impurities in the acid recycled to the remainder of the process.
25.7 Capital and Operating Costs
Total capital and operating cost estimates have been developed at the Scoping Study accuracy level of ±35%. Total capital investment for the project as at 3Q2015, subject to the limitations and provisions as stated in Section 21, is estimated to be AUD451,901,816.
Total operating cost as at 3Q2015, subject to the limitations and provisions as stated in Section 21, is estimated to be AUD56.72 /t ore.
25.8 Financial Analysis
At the scoping study level of analysis and based on a 13 year life the financial analysis indicates an economically sound project with an after tax NPV of AUD571M at a discount rate of 10% and an after tax IRR of 35.8%. The project payback period is approximately 2.5 years.

WESTMORELAND URANIUM PROJECT
NATIONAL INSTRUMENT 43-101 TECHNICAL REPORT
3182-STY-001
Table of Contents Page
26.0 RECOMMENDATIONS 26.1 26.1 Geological 26.1 26.2 Mining 26.1 26.3 Metallurgical Testing 26.1 26.4 Process Plant 26.1 26.5 Project Infrastructure 26.2
26.5.1 Project Water Supply 26.2 26.5.2 Project Electric Power Supply 26.2 26.5.3 Tailings Storage Facility 26.2
26.6 Project Development 26.3
3182\16.04\3182-STY-001_0 S26 April 2016 Lycopodium Minerals Pty Ltd

WESTMORELAND URANIUM PROJECT NATIONAL INSTRUMENT 43-101 TECHNICAL REPORT
3182\16.04\3182-STY-001_0 S26
Page 26.1
April 2016 Lycopodium Minerals Pty Ltd
26.0 RECOMMENDATIONS
26.1 Geological
Further resource definition and expansion work to be carried out proximal to the current resource to support a more detailed mine plan as the project progresses to PDS level. Field work will need to incorporate drilling and field mapping.
Continued regional exploration should be undertaken and is likely to yield further discoveries as the geological understanding of the resource geology develops.
26.2 Mining
Further key areas of work to be completed during the next project development stage include:
• Refinement of the mine scheduling plan.
• Further refinement of the in-pit tailings design and scheduling.
• Further geotechnical evaluation work to determine pit slopes, bench heights, berms, etc. This work will also confirm pit liner materials for the in-pit tailings plan.
• Further hydrological work to assess potential water issues relating to the pit design.
• Work to improve costing and planning relating to mine closure issues.
26.3 Metallurgical Testing
It will be necessary to conduct a thorough and exhaustive metallurgical testwork programme on Westmoreland materials that are representative of what would be mined and processed. This programme would be designed to test options and to determine metallurgical characteristics and parameters for proper detailed design. Such detail would be necessary for the next stage of study, which would be at a Prefeasibility Study level or a Definitive Feasibility Study level.
26.4 Process Plant
A significant reduction in plant capital cost and operating cost may be possible if an acid recovery plant (membrane plant) can be shown to be technically and economically feasible. This could result in significant reduction in acid consumption, possibly eliminating the need for an acid plant onsite, and reducing the caustic soda requirement for eluate neutralisation. It is recommended that this flowsheet option be investigated in the next project phase.

WESTMORELAND URANIUM PROJECT NATIONAL INSTRUMENT 43-101 TECHNICAL REPORT
3182\16.04\3182-STY-001_0 S26
Page 26.2
April 2016 Lycopodium Minerals Pty Ltd
26.5 Project Infrastructure
26.5.1 Project Water Supply
The two options for water supply to the project considered in the Scoping Study were from bores drawing water from the Great Artesian Basin Aquifer, (GAB) margin located 45 km east of the site and nearby aquifers located 20 km west of the site. However, there are risks associated with either option in that the location of the GAB margin has not been tested, and the aquifer capacity of the nearby aquifers has not been tested. Further work is thus required to confirm the preferred water source and firm up the capital and operating cost estimates.
26.5.2 Project Electric Power Supply
The Scoping Study capital and operating cost estimates for power supply to the project are based on a conceptual study for power generation from shale gas from the Lawn Hill, Riversleigh Shale formation, 100 km to the south east, and presently under exploration by Armour Energy. This is not currently a producing field and significant further exploration and development work is required to confirm its suitability. Possible synergies in the supply and distribution of regional power have not been considered in the Scoping Study but these should be taken as the project moves forward.
26.5.3 Tailings Storage Facility
The key aspects of the Tailings Management System which will need to be addressed as part of the next stage of study will be as follows:
• Initial consultation with the regulatory authorities to gain acceptance for the design concepts as no similar tailings disposal operations are present in Queensland.
• The geochemical characteristics of tailings and whether the facility can be approved without neutralisation of the tailings prior to disposal.
• The geotechnical properties of the filtered tailings including strength, permeability, consolidation, and liquefaction potential.
• Detailed mining and tailings disposal plans to be developed for the pit.
• Investigation of the availability of suitable low permeability liner and capping material at site.
• Determination of the gradation of blasted waste rock at site to assess the requirement for the geocomposite liner below the basal low permeability liner, any requirement for a filter blanket or geofabrics on the upstream side of the waste rock bunds and requirement for a filter blanket or geofabrics (or geocomposite) below the low permeability cap.
• Modelling of the thickness of the inert waste capping material to ensure that no erosion and minimal desiccation of the low permeability capping occurs.

WESTMORELAND URANIUM PROJECT NATIONAL INSTRUMENT 43-101 TECHNICAL REPORT
3182\16.04\3182-STY-001_0 S26
Page 26.3
April 2016 Lycopodium Minerals Pty Ltd
26.6 Project Development
Financial analysis at the scoping study level of accuracy has indicated that the project economics are sound and would justify progressing the project to the next phase of development (pre-feasibility ±25% accuracy level).

WESTMORELAND URANIUM PROJECT
NATIONAL INSTRUMENT 43-101 TECHNICAL REPORT
3182-STY-001
Table of Contents Page
27.0 REFERENCES 27.1
3182\16.04\3182-STY-001_0 S27 April 2016 Lycopodium Minerals Pty Ltd

WESTMORELAND URANIUM PROJECT NATIONAL INSTRUMENT 43-101 TECHNICAL REPORT
3182\16.04\3182-STY-001_0 S27
Page 27.1
April 2016 Lycopodium Minerals Pty Ltd
27.0 REFERENCES
• Battey G.C., 1956. Westmoreland Authority to Prospect, Final Report. Open File Report 3370 to the Qld Dept Mines. Mount Isa Mines Ltd. 24 pp.
• Brooks J.H., 1960. The Uranium Deposits of Northwest Queensland. Geol.Surv.Qld. Publication 297.
• Culpeper L.G., Denaro T.J., Burrows P.E. & Morwood D.A. 1999. Mines and Mineralisation of the Westmoreland 1:250,000 Sheet area, Northwest Queensland. Queensland Geological Record, 1999/6, 38p.
• Grimes, K.G., Sweet, I.P. 1979 Westmoreland, Queensland, 1:250 000 geological series explanatory notes. Sheet SE/54-05, 2nd edition. Bureau of Mineral Resources, Australia & Geological Survey of Qld 1v 31pp
• Huston, DL. (ed) 2010. An assessment of the uranium and geothermal potential of north Queensland. Geoscience Australia Record 2010/14
• Jackson M.J., Scott D.L. & Rawlings D.J., 2000. Stratigraphic framework for the Leichhardt and Calvert Superbasins: review and correlations of the pre-1700 Ma successions between Mt Isa and McArthur River. Australian Journal of Earth Sciences (2000) 47, 381–403.
• Jones D.G., 2008. Report on a field visit to the Westmoreland Project, Northern Territory/Northwest Queensland, for Lagoon Creek Resources Pty Ltd. Vidoro Pty Ltd.
• Lally JH and Bajwah ZU, 2006. Uranium deposits of the Northern Territory. Northern Territory Geological Survey, Report 20.
• McKay AD and Miezitis Y, 2001. ‘Australia’s uranium resources, geology and development of deposits.’ GSO–Geoscience Australia, Mineral Resource Report 1.
• Polito P.A., Kyser T.K., Rheinberger G. & Southgate P.N. 2005. A Paragenetic and Isotopic Study of the Proterozoic Westmoreland Uranium Deposits, Southern McArthur Basin, Northern Territory, Australia. Economic Geology; September 2005; v. 100; no. 6; p. 1243-1260.
• Polito P.A., Kyser T.K., & Jackson M.J. 2006. The Role of Sandstone Diagenesis and Aquifer Evolution in the Formation of Uranium and Zinc-Lead Deposits, Southern McArthur Basin, Northern Territory, Australia. Economic Geology, v. 101, pp. 1189–1209.
• Rawlings D.J., 1999. Stratigraphic resolution of a multiphase intracratonic basin system: the McArthur Basin, northern Australia. Australian Journal of Earth Sciences (1999) 46, 703–723.

WESTMORELAND URANIUM PROJECT NATIONAL INSTRUMENT 43-101 TECHNICAL REPORT
3182\16.04\3182-STY-001_0 S27
Page 27.2
April 2016 Lycopodium Minerals Pty Ltd
• Rheinberger G.M., Hallenstein C. & Stegman. C.L. 1998. Westmoreland uranium deposits, in Geology of Australian and Papua New Guinean Mineral Deposits (eds) DA Berkman & DH MacKenzie) The Australasian Institute of Mining and Metallurgy, pp 807-814.
• Scott, D.L., Rawlings, D.J., Page, R.W., Tarlowski, C.Z., M. Idnurm, Jackson, M.J. & Southgate, P.N., 2000. Basement framework and geodynamic evolution of the Palaeoproterozoic superbasins of north-central Australia: an integrated review of geochemical, geochronological and geophysical data. Australian Journal of Earth Sciences (2000) Vol.47, pp341–380.
• Skirrow, R.G., Jaireth, S., Huston, D.L., Bastrakov, E.N., Schofield, A., van der Wielen, S.E., Barnicoat, A.C., 2009. Uranium mineral systems: Processes, exploration criteria and a new deposit framework. Geoscience Australia Record 2009/20. 44p.
• Syvret, J.N., 1957 Report on the “Redtree” Mineralisation. Open File Report 140 to the Qld Dept Mines. Mount Isa Mines Ltd. 26pp.
• Vigar, A.J. & Jones D.G., 2006. A Review and Resource Estimate of the Redtree Group of Uranium Deposits, Westmoreland, Australia, Held by Laramide Resources Ltd. Mining Associates.
• Vigar, A.J & Jones D.G, May 2009, Westmoreland Uranium Project, Redtree Resource Update 134pp
• Laramide Resources Limited, 2006 A Review and Resource Estimate of the Redtree Group of Uranium Deposits – Westmoreland, Australia 16 October.
• Laramide Resources Limited, 2007 Westmoreland Resource Drilling Program Guide to Drilling, Logging and Sampling October
• ANSTO, 2011 Westmoreland Final Report 25 July
• ANSTO, 2011 Westmoreland - Thickening Filtration Testwork Report, Appendix J - May
• JKTech, 1993 Crushing Simulations for a Uranium Heap leach Project, JKTech, May.
• Laramide Resources Limited, 2009 Note on Cost Basis for Westmoreland Scoping Study, 06 August.
• SGS Advanced Mineralogical Facility Pty Ltd 2008 QEMSCAN Analysis of Uranium-Bearing Samples, #S0422, October.
• GRD Minproc Limited, 2007 Westmoreland Uranium Project – Conceptual Study, April.
• GRD Minproc Limited, 2007 Westmoreland Uranium Project, North West Queensland – Preliminary Assessment Report, June.

WESTMORELAND URANIUM PROJECT NATIONAL INSTRUMENT 43-101 TECHNICAL REPORT
3182\16.04\3182-STY-001_0 S27
Page 27.3
April 2016 Lycopodium Minerals Pty Ltd
• ANSTO 1995 Evaluation of Junnagunna and Huarabagoo Samples from the Westmoreland Uranium Deposit, CRAE Report #21842, November.
• ANSTO 1994 Westmoreland Project – Extraction of Uranium from Various Ores, #C362, CRAE Report #25758, March.
• ANSTO 1993 Location of Unleached Uranium in Conventional Agitation Leach Residues from CRA Westmoreland Ores, #C315, CRAE Report #25756, May.
• ANSTO 1993 Laboratory Testing of Redtree/Westmoreland Uranium Ore and Rainwater Leach Tests, CRAE Report #19504, October.
• JKTech 1993 Crushing Simulations for a Uranium Heap Leaching Project, #93046, CRAE Report #25762, May
• ANSTO 1993 Metallurgical Testing of Redtree/Westmoreland Uranium Ore, #326, CRAE Report #19503, May
• ANSTO 1992 Mineralogy of Westmoreland Uranium Ore Sample, #C305, CRAE Report # 25757, December.
• Minenco Pty Limited, 1991 Westmoreland Uranium Project, Redtree Deposit – Pre- Feasibility Study, June.
• AMDEL 1989 Metallurgical Testing of Redtree Uranium Ore by AMDEL, Report #06836/89, March.
• AMDEL 1989 Metallurgical Testing of Six Murphy Uranium Ore Samples by AMDEL, Report #07019/90, CRAE Report #16255, December.

WESTMORELAND URANIUM PROJECT
NATIONAL INSTRUMENT 43-101 TECHNICAL REPORT
3182-STY-001
Table of Contents Page
28.0 CERTIFICATES OF QUALIFIED PERSONS 28.1
3182\16.04\3182-STY-001_0 S28 April 2016 Lycopodium Minerals Pty Ltd

WESTMORELAND URANIUM PROJECT NATIONAL INSTRUMENT 43-101 TECHNICAL REPORT
3182\16.04\3182-STY-001_0 S28
Page 28.1
April 2016 Lycopodium Minerals Pty Ltd
28.0 CERTIFICATES OF QUALIFIED PERSONS
I, Geoffrey Alexander Duckworth, of Brisbane, Australia, do hereby certify that as the author of “NI 43-101 Technical Report, Westmoreland Uranium Scoping Study, Northwest Queensland, Australia” dated April 2016 that:
1. I am employed as a Study Manager with Lycopodium Minerals Pty Ltd, 163 Leichhardt Street, Spring Hill, Queensland, 4000, Australia.
2. I graduated from the Royal Melbourne Institute of Technology with a Bachelor of Engineering (Chemical) in 1973 and MEngSc and PhD degrees from the University of Queensland (Mining and Metallurgy) in 1981.
3. I am a professional engineer in good standing with the Board of Professional Engineers Qld RPEQ 02702, a Fellow of the Australian Institute of Mining and Metallurgy, a Fellow of the Institution of Chemical Engineers (UK) and a Member of the Institution of Engineers Australia.
4. I have practised my profession continuously for 42 years and with Lycopodium Minerals since 2008. .
5. I am responsible for compiling the overall technical report and responsible for sections 1 (part), 2, 3, 17, 18, 19, 20, 21, 22, 24, 25.3 – 25.8, 26.3 – 26.6 and 27.
6. I have read the definition of “qualified person” set out in National Instrument 43-101 (NI 43-101) and certify that, by reason of my education, affiliation with a professional association (as defined in NI 43-101) and past relevant work experience, I fulfil the requirements to be a “qualified person for the purpose of NI 43-101.
7. I visited the site and inspected the exploration tenement and core shed on 9th July 2015. .
8. I am independent of Laramide Resources Limited and Lagoon Creek Resources Pty Ltd. in accordance with the application of Section 1.5 of National Instrument 43-101.
9. I have not had any prior involvement with the Property.
10. I have read National Instrument 43-101 and Form 43-101F1 and the Technical Report has been prepared in compliance with same.
11. At the effective date of the Technical Report, to the best of my knowledge, information and belief, the Technical Report contains all scientific and technical information that is required to be disclosed to make the Technical Report not misleading.
Effective Date: 20th April, 2016 Signing Date: 20th April, 2016
Geoff Duckworth FAusIMM, FIChemE, MIEA, RPEQ 2702 Study Manager

Mining Associates Pty Ltd Level 4, 67 St Paul’s Terrace PO Box 161 Spring Hill QLD 4004 AUSTRALIA T 61 7 3831 9154 F 61 7 3831 6754 ABN 29 106 771 67
Brisbane | Hong Kong | London | Vancouver
CERTIFICATE OF AUTHOR I, Andrew Vigar, do hereby certify that as a co-author of “NI 43-101 Technical Report, Westmoreland Uranium Scoping Study, Northwest Queensland, Australia” dated April 2016 that:
1. I am an independent Consulting Geologist and Professional Geoscientist with my office at Level 4, 67 St Paul’s Terrace, Brisbane, Queensland 4001, Australia.
2. This certificate applies to the technical report titled “NI 43-101 Technical Report, Westmoreland Uranium Scoping Study, Northwest Queensland, Australia”, with an effective date of April 20, 2016 prepared for Laramide Resources Ltd.
3. I was elected a Fellow of the Australasian Institute of Mining and Metallurgy (FAusIMM) in 1993. My status as a Fellow of The AusIMM is current. I am a Member of the Society of Economic Geologists (Denver). I am recognized by the Australian Securities and Investments Commission and the Australian Stock Exchange as a Qualified Person for the submission of Independent Geologist’s Reports. I am an Adjunct Fellow at the School of Earth Sciences at the University of Queensland.
I graduated from the Queensland University of Technology, Brisbane, Australia in 1978 with a Bachelor Degree in Applied Science in the field of Geology.
4. I have read the definition of "qualified person" set out in National Instrument 43-101 (NI 43-101) and certify that by reason of my education, affiliation with a professional association (as defined in NI 43-101) and past relevant work experience, I fulfill the requirements to be a "qualified person" for the purposes of NI 43-101;
5. I have visited the Westmoreland Uranium Project site on the 9th of July 2016;
6. I am a responsible for Sections 1 (part), 4 to 12, 14 to 16, 23, 25.1, 25.2, 26.1 and 26.2 of the report;
7. I am independent of the Issuer and related companies applying all of the tests in Section 1.5 of the National Instrument 43-101;
8. I have read NI 43-101, and the Technical Report has been prepared in compliance with NI 43-101 and Form 43-101F1.
9. As of the date of this certificate, to the best of my knowledge, information and belief, this technical report contains all scientific and technical information that is required to be disclosed to make the technical report not misleading;
Effective Date: April 20, 2016 Signing Date: April 20, 2016
(original signed and sealed) “Andrew Vigar FAusIMM.”
Andrew Vigar (FAusIMM).