Cluster Ages Experiment (CASE): SX Phe stars from the globular cluster omega Centauri
13
arXiv:astro-ph/0412523v2 21 Jun 2005 Mon. Not. R. Astron. Soc. 000, 1–?? (2005) Printed 21 November 2013 (MN L A T E X style file v1.4) Cluster AgeS Experiment (CASE): SX Phe stars from the globular cluster ω Centauri A. Olech 1 , W.A. Dziembowski 2,1 , A.A. Pamyatnykh 1,3 , J. Kaluzny 1 , W. Pych 1 , A. Schwarzenberg-Czerny 1,4 and I.B. Thompson 5 1 Nicolaus Copernicus Astronomical Center, ul. Bartycka 18, 00-716 Warsaw, Poland (olech,wd,alosza,jka,pych,[email protected]) 2 Warsaw University Observatory, Al. Ujazdowskie 4, 00-487 Warszawa, Poland 3 Institute of Astronomy, Russian Academy of Sciences, Pyatnitskaya Str. 48, 109017 Moscow, Russia 4 Adam Mickiewicz University Observatory, ul. S loneczna 36, 60-286 Poznan, Poland 5 Carnegie Institution of Washington, 813 Santa Barbara Street, Pasadena,CA 91101, USA ([email protected]) Accepted .................. Received ................ in original form ............ ABSTRACT We present an analysis and interpretation of oscillation spectra for all 69 SX Phoenicis stars discovered in the field of the cluster. For most of the stars we have reliable absolute magnitudes and colors. Except of one, or perhaps two, objects, the stars are cluster members. Their pulsational behaviour is very diversified. Multiperi- odic variability with at least part of the excited modes being nonradial is most common but there are also many cases of high amplitude, presumably radial mode, pulsators. In a number of such cases we have evidence for two radial modes being excited. Param- eters of radial mode pulsators are in most cases consistent with standard evolutionary models for stars in the mass range 0.9 ÷ 1.15M ⊙ . However, in four cases we have evidence that the masses are significantly lower than expected. Three objects show frequency triplets that may be interpreted in terms of rotational frequency splitting of ℓ = 1 modes. Implied equatorial velocities of rotation are from 10 to over 100 km/s. Nearly all measured frequencies fall in the ranges predicted for unstable modes. Two cases of low frequency variability are interpreted as being caused by tidal distortion induced by close companions. Key words: stars: SX Phe - stars: variables – globular clusters: individual: ω Cen 1 INTRODUCTION SX Phoenicis stars (SXPS) are the Population II short pe- riod pulsators, in most respects similar to much more nu- merous δ Scuti stars, which are the Population I objects. Both types occupy the low luminosity end of the Cepheid instability strip in the H-R diagram. It is not clear whether there are any systematic differences in pulsation properties between the two types. The incidence of high amplitude pul- sation once seemed much higher among SXPS but now, with improved cluster photometry, many low amplitude SXPS are being detected (Pych et al. 2001, Mazur et al. 2003, Kaluzny & Thompson 2003, Kaluzny et al. 2004). What makes SXPS interesting in a wider context is that they are blue straggler stars (BSS) found in a large number in globular and old open clusters. This means that they have unusual life history which is not well understood as it cannot be explained in terms of the standard single star evolution scenario. The problem of BSS origin is being debated for decades. Historically, the first explanation was that the ob- jects are products of evolution of the mass receiving compo- nent in close binary systems (McCrea 1964). Later scenarios involving mergers of main sequence stars were mostly consid- ered. The scenarios included mergers of primordial binaries after a gradual decrease of the orbit (e.g. Carney et al. 2001) as well as direct stellar collisions in dense cluster cores (e.g. Lombardi et al. 2002). It is not clear how much imprints of the past evolution should be left in individual BSS. This depends on the efficiency of chemical element and angular momentum mixing - the processes still poorly understood in stellar interior physics. Understanding the origin and inter- nal structure of BSS is a challenging task for stellar evolution theory. The answer is of interest not only for this field but also for globular cluster research. As emphasized by Lom- bardi & Rasio (2002), collisions and mergers of stars which lead to BSS formation, play an important role in evolution of these systems. Pulsation data on SXPS are potential sources of accu- rate constraints on models of BSS. Each measured frequency c 2005 RAS
-
Upload
independent -
Category
Documents
-
view
3 -
download
0
Transcript of Cluster Ages Experiment (CASE): SX Phe stars from the globular cluster omega Centauri
arX
iv:a
stro
-ph/
0412
523v
2 2
1 Ju
n 20
05Mon. Not. R. Astron. Soc. 000, 1–?? (2005) Printed 21 November 2013 (MN LATEX style file v1.4)
Cluster AgeS Experiment (CASE): SX Phe stars from theglobular cluster ω Centauri
A. Olech1, W.A. Dziembowski2,1, A.A. Pamyatnykh1,3, J. Kaluzny1, W. Pych1,
A. Schwarzenberg-Czerny1,4 and I.B. Thompson5
1Nicolaus Copernicus Astronomical Center, ul. Bartycka 18, 00-716 Warsaw, Poland (olech,wd,alosza,jka,pych,[email protected])2Warsaw University Observatory, Al. Ujazdowskie 4, 00-487 Warszawa, Poland3Institute of Astronomy, Russian Academy of Sciences, Pyatnitskaya Str. 48, 109017 Moscow, Russia4Adam Mickiewicz University Observatory, ul. S loneczna 36, 60-286 Poznan, Poland5Carnegie Institution of Washington, 813 Santa Barbara Street, Pasadena,CA 91101, USA ([email protected])
Accepted .................. Received ................ in original form ............
ABSTRACT
We present an analysis and interpretation of oscillation spectra for all 69 SXPhoenicis stars discovered in the field of the cluster. For most of the stars we havereliable absolute magnitudes and colors. Except of one, or perhaps two, objects, thestars are cluster members. Their pulsational behaviour is very diversified. Multiperi-odic variability with at least part of the excited modes being nonradial is most commonbut there are also many cases of high amplitude, presumably radial mode, pulsators.In a number of such cases we have evidence for two radial modes being excited. Param-eters of radial mode pulsators are in most cases consistent with standard evolutionarymodels for stars in the mass range 0.9 ÷ 1.15M⊙. However, in four cases we haveevidence that the masses are significantly lower than expected. Three objects showfrequency triplets that may be interpreted in terms of rotational frequency splittingof ℓ = 1 modes. Implied equatorial velocities of rotation are from 10 to over 100 km/s.Nearly all measured frequencies fall in the ranges predicted for unstable modes. Twocases of low frequency variability are interpreted as being caused by tidal distortioninduced by close companions.
Key words: stars: SX Phe - stars: variables – globular clusters: individual: ω Cen
1 INTRODUCTION
SX Phoenicis stars (SXPS) are the Population II short pe-riod pulsators, in most respects similar to much more nu-merous δ Scuti stars, which are the Population I objects.Both types occupy the low luminosity end of the Cepheidinstability strip in the H-R diagram. It is not clear whetherthere are any systematic differences in pulsation propertiesbetween the two types. The incidence of high amplitude pul-sation once seemed much higher among SXPS but now, withimproved cluster photometry, many low amplitude SXPS arebeing detected (Pych et al. 2001, Mazur et al. 2003, Kaluzny& Thompson 2003, Kaluzny et al. 2004).
What makes SXPS interesting in a wider context is thatthey are blue straggler stars (BSS) found in a large numberin globular and old open clusters. This means that they haveunusual life history which is not well understood as it cannotbe explained in terms of the standard single star evolutionscenario. The problem of BSS origin is being debated fordecades. Historically, the first explanation was that the ob-
jects are products of evolution of the mass receiving compo-nent in close binary systems (McCrea 1964). Later scenariosinvolving mergers of main sequence stars were mostly consid-ered. The scenarios included mergers of primordial binariesafter a gradual decrease of the orbit (e.g. Carney et al. 2001)as well as direct stellar collisions in dense cluster cores (e.g.Lombardi et al. 2002). It is not clear how much imprintsof the past evolution should be left in individual BSS. Thisdepends on the efficiency of chemical element and angularmomentum mixing - the processes still poorly understood instellar interior physics. Understanding the origin and inter-nal structure of BSS is a challenging task for stellar evolutiontheory. The answer is of interest not only for this field butalso for globular cluster research. As emphasized by Lom-bardi & Rasio (2002), collisions and mergers of stars whichlead to BSS formation, play an important role in evolutionof these systems.
Pulsation data on SXPS are potential sources of accu-rate constraints on models of BSS. Each measured frequency
c© 2005 RAS
2 A. Olech et. al.
of an identified oscillation mode is such a constraint. Admit-tedly, mode identification is difficult unless we have evidencethat the excited modes are radial. Double mode radial pul-sators seem quite frequent among SXPS. The two accuratelymeasured numbers yield strong constraints on stellar massand heavy element content in the interior. Data on non-radial mode frequencies could be even more interesting. Inparticular, determination of the frequency splitting providescertain mean value of the rotation rate in the interior. Fur-thermore, there are nonradial modes whose frequencies arevery sensitive to the extent of the element mixing beyond theconvective core boundary. Of great interest in the contextof the debated BSS origin is seeking evidence for presenceof close companions manifesting themselves through cyclicperiod variations or tidally induced variability.
What makes SXPS interesting for stellar pulsation the-ory is the large diversity of their pulsation forms. In arelatively narrow period range, extending from less thanhalf to two hours, we encounter both the multimode low-amplitude pulsation, typical for main sequence dwarfs,and the monomode high-amplitude pulsation, typical forCepheids. According to linear nonadiabatic calculations,there are many unstable modes in SXPS. However, finiteamplitude development of the instability is not understood.This is the most outstanding unsolved problem of the theory.A sample of SXPS with well constrained mean parametersmay provide a key information what makes a star to becomea dwarf- or a giant-type pulsator.
The globular cluster ω Centauri houses the largest num-ber of SXPS of all systems in our Galaxy (Kaluzny et al.2004). Having a large number of objects with well deter-mined luminosities is an obvious advantage. The fact thatthe stars cannot be assumed coeval and of the same chem-ical composition (Rey et al. 2000) is a complicating factor.The cluster is atypical. Data on SXPS may prove useful indisentangling its evolution.
In the next section we survey observational data on allSXPS in ω Cen which includes frequency analysis. In sec-tion 3 we compare mean photometric parameters of SXPSwith the corresponding values calculated for standard evo-lutionary models. We also provide information on pulsationproperties of these models based on the linear nonadiabaticanalysis. Section 4 is a star by star analysis of individualobjects in which we compare their observational propertieswith theoretical models. In section 5 we summarize our re-sults.
2 PHOTOMETRY
ω Centauri contains the most numerous population of vari-able stars among globular clusters of the Galaxy (Clementet al. 2001). However until the mid 1990ies there was onlyone SX Phe-type variable known in the field of the cluster.It was V65, which in fact turned out later to be a foregroundstar. However, not much later Kaluzny et al. (1996, 1997)reported a discovery of 25 SXPS, most of which must bemembers of the cluster. Subsequent work done by Kaluznyet al. (2004) increased the number of SXPS in the field ofω Centauri to 69, making it the richest in these variablesamong all globular clusters of our Galaxy.
Kaluzny et al. (2004) provide extensive photometry for
Table 1. Basic properties of SX Phe-type variables in field of ω Cen.
Star Period Amp. < V > B − V MV (B − V )0
V65 0.0627235 0.18 14.922 0.361 0.832 0.231V194 0.0471777 0.51 17.016 0.330 2.926 0.200V195 0.0654912 0.38 16.780 0.371 2.690 0.241V196 0.05740 0.23 17.000 - 2.910 -V197 0.0471210 0.13 16.850 0.546 2.760 0.416V198 0.0481817 0.15 17.533 0.323 3.483 0.193V199 0.0622867 0.73 16.689 0.333 2.599 0.203V200 0.0495210 0.28 16.568 0.541 2.478 0.411V201 0.05065 0.19 17.200 - 3.110 -V202 0.04642 0.12 17.170 - 3.080 -V203 0.04178 0.25 16.750 - 2.660 -V204 0.0493757 0.40 16.881 0.363 2.791 0.233V217 0.0532609 0.10 17.038 0.429 2.948 0.299V218 0.0437393 0.07 17.095 0.330 3.005 0.200V219 0.0386680 0.08 17.303 0.337 3.213 0.207V220 0.0528868 0.12 16.986 0.357 2.896 0.227V221 0.0361336 0.05 16.680 0.451 2.590 0.321V222 0.03891 0.05 17.310 - 3.220 -V225 0.0486381 0.22 16.845 0.393 2.755 0.262V226 0.0378523 0.17 17.299 0.413 3.209 0.283V227 0.0382255 0.05 17.272 0.397 3.182 0.267V228 0.0398531 0.08 17.199 0.403 3.109 0.273V229 0.0375333 0.09 17.407 0.294 3.317 0.164V230 0.03388 0.03 16.550 - 2.460 -V231 0.0374845 0.05 17.419 0.341 3.329 0.211V232 0.03697 0.04 17.590 - 3.500 -V233 0.0365376 0.10 17.210 0.353 3.120 0.223V237 0.0656024 0.27 16.861 0.351 2.771 0.221V238 0.0408004 0.07 17.355 0.349 3.265 0.219V249 0.0349468 0.10 17.435 0.361 3.345 0.231V250 0.0406269 0.07 17.433 0.380 3.343 0.250V252 0.0466226 0.06 17.445 0.405 3.355 0.275V253 0.0399687 0.11 17.232 0.308 3.142 0.178V260 0.04626 0.05 17.080 - 2.990 -NV294 0.01773360 0.02 17.292 0.328 3.202 0.198NV295 0.01823127 0.01 17.283 0.357 3.193 0.227NV296 0.02212644 0.03 16.946 0.365 2.856 0.235NV297 0.03389566 0.02 16.628 0.301 2.538 0.171NV298 0.0330389 0.08 17.410 0.354 3.320 0.224NV299 0.0344409 0.04 17.325 0.432 3.235 0.302NV300 0.0347301 0.02 17.484 0.363 3.394 0.233NV301 0.0354431 0.03 16.974 0.439 2.884 0.309NV302 0.0355192 0.04 17.081 0.362 2.991 0.232NV303 0.0359503 0.01 16.932 0.322 2.842 0.192NV304 0.0361405 0.03 17.236 0.421 3.146 0.291NV305 0.0365672 0.04 17.384 0.391 3.294 0.261NV306 0.0384044 0.06 17.528 0.370 3.438 0.240NV307 0.0385032 0.07 17.069 0.519 2.979 0.389NV308 0.0389852 0.05 17.278 0.382 3.188 0.252NV309 0.0397455 0.04 16.591 0.362 2.501 0.232NV310 0.0401776 0.02 16.791 0.415 2.701 0.285NV311 0.0414132 - - - - -NV312 0.0433272 0.06 16.394 0.390 2.304 0.26NV313 0.0418484 0.16 17.678 0.348 3.588 0.218NV314 0.0421220 0.08 17.086 0.386 2.996 0.256NV315 0.0422811 0.10 16.392 0.518 2.302 0.388NV316 0.0424040 0.03 17.326 0.326 3.236 0.196NV317 0.0426396 0.05 16.968 0.453 2.878 0.323NV318 0.0437306 0.02 16.799 0.472 2.709 0.342NV319 0.0489421 0.10 17.239 0.465 3.149 0.335NV320 0.0471936 0.08 17.294 0.440 3.204 0.310NV321 0.0474854 0.10 16.409 0.136 2.319 0.006NV322 0.0479562 0.08 17.096 - 3.006 -NV323 0.0493547 0.03 16.638 0.436 2.548 0.307NV324 0.0512944 0.24 16.402 0.297 2.312 0.167NV325 0.0535445 0.10 16.410 0.501 2.320 0.371NV326 0.0569058 0.18 17.041 0.401 2.951 0.271NV327 0.0606414 0.09 16.642 0.274 2.552 0.144NV328 0.0899030 0.02 17.054 0.598 2.964 0.468
61 SXPS collected during two years. This photometry con-tains from 532 to 755 V and over 150 B measurements foreach variable. It is an excellent data base for analyzing multi-mode behavior and extracting information on physical prop-erties of individual objects.
In addition, ω Cen is the first globular cluster for whichthe CASE project (Thompson et al. 2001) determined thedistance. The analysis of photometric and spectroscopicdata for an eclipsing binary OGLE GC17 yielded an ap-parent distance modulus of (m − M)V = 14.09 ± 0.04 mag(Kaluzny et al. 2002). It is the most precise and reliabledistance determination for this cluster and will be used inour work for calculating the absolute magnitudes of SXPSbelonging to ω Cen. We will also use the mean color datadereddened with the color excess E(B − V ) = 0.13 mag(Schlegel, Finkbeiner & Davis, 1998) to place individual ob-jects in the H-R diagram.
The full list of SXPS located in the field of ω Centauricontaining main periods, amplitudes, mean magnitudes and
c© 2005 RAS, MNRAS 000, 1–??

CASE: SX Phe stars from the globular cluster ω Centauri 3
Figure 1. Color-magnitude diagram around blue stragglers re-gion of ω Cen. Points and open circles denote constant stars andSXPS, respectively.
0 .5 1
18
17
16
15
B-V
V
V65
colors is provided in Table 1. Fig. 1 shows color-magnitudediagram around blue stragglers region of ω Cen. Points andopen circles denote constant stars and SXPS, respectively.Not all stars in the SXPS region are variables. This is hardlysurprising, as we have the same situation in the δ Scutidomain. Presumably these apparently constant objects arevery low amplitude pulsators.
3 FREQUENCY ANALYSIS
Many SX Phe stars exhibit multiple periods hence theiranalysis poses specific challenges. Arguably the most ad-vanced project in terms of both extent of its photometryand multitude of detected periods, the Whole Earth Tele-scope (WET), employed either the prewhitening or synthesismethods in their analysis (Kepler, 1993). From the statisti-cal point of view the two methods correspond to Gauss-Seidel (G-S) and Newton-Raphson (N-R) solutions of theleast squares problem (LSQ). On one hand, a current as-tronomical practice favors the synthesis (N-R) method, em-ploying the covariance matrix with large extra-diagonal co-efficients. Presence of close frequencies and/or their combi-nations in the synthesis method yields near singular normalequations and may produce large near cancelling terms inthe solution, creating the ∞−∞ problem and yielding solu-tions with excess amplitudes. On the other hand, the methodrecommended to deal with singularity in least squares fit-ting (LSQ) is by means of the singular value decomposition(SVD, e.g. Press et al., 1986). In the SVD procedure the near
Figure 2. The uppermost panel shows the ANOVA periodogramof the raw light curve of NV324. The panels below show spectraafter consecutive prewhitenings.
c© 2005 RAS, MNRAS 000, 1–??
4 A. Olech et. al.
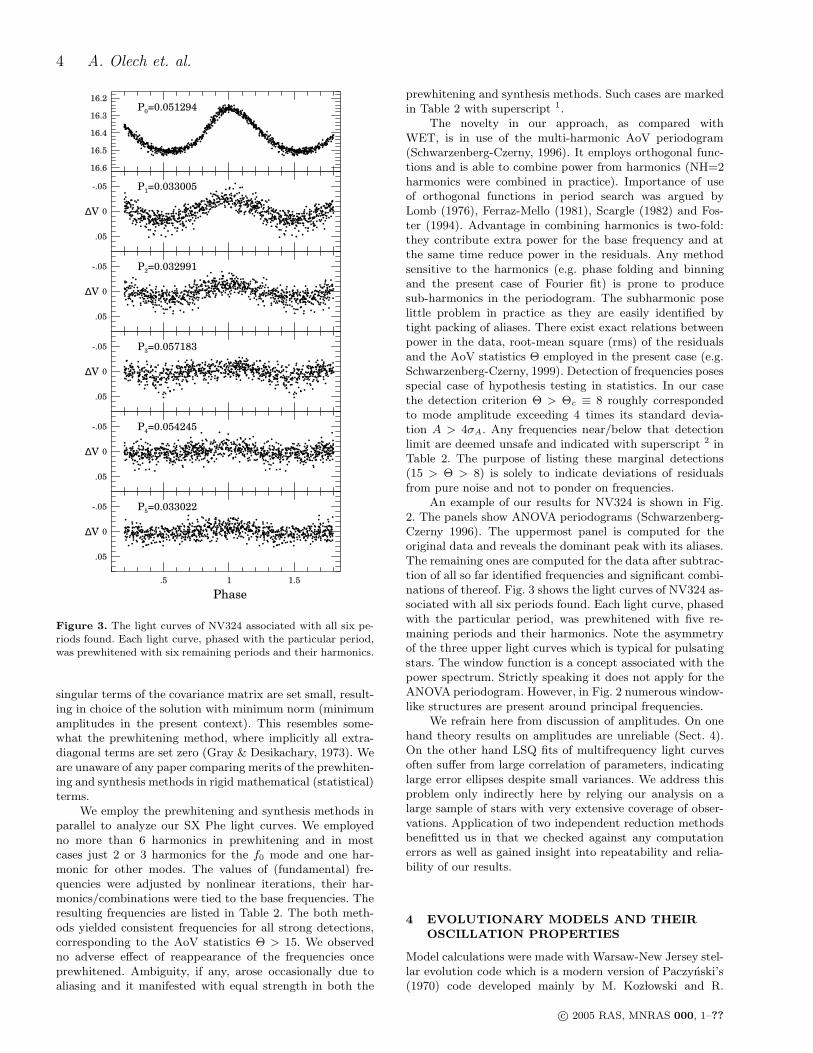
Figure 3. The light curves of NV324 associated with all six pe-riods found. Each light curve, phased with the particular period,was prewhitened with six remaining periods and their harmonics.
16.6
16.5
16.4
16.3
16.2
P0=0.051294
.05
0
-.05 P1=0.033005
∆V
.05
0
-.05 P2=0.032991
∆V
.05
0
-.05 P3=0.057183
∆V
.05
0
-.05 P4=0.054245
∆V
.5 1 1.5
.05
0
-.05 P5=0.033022
∆V
Phase
singular terms of the covariance matrix are set small, result-ing in choice of the solution with minimum norm (minimumamplitudes in the present context). This resembles some-what the prewhitening method, where implicitly all extra-diagonal terms are set zero (Gray & Desikachary, 1973). Weare unaware of any paper comparing merits of the prewhiten-ing and synthesis methods in rigid mathematical (statistical)terms.
We employ the prewhitening and synthesis methods inparallel to analyze our SX Phe light curves. We employedno more than 6 harmonics in prewhitening and in mostcases just 2 or 3 harmonics for the f0 mode and one har-monic for other modes. The values of (fundamental) fre-quencies were adjusted by nonlinear iterations, their har-monics/combinations were tied to the base frequencies. Theresulting frequencies are listed in Table 2. The both meth-ods yielded consistent frequencies for all strong detections,corresponding to the AoV statistics Θ > 15. We observedno adverse effect of reappearance of the frequencies onceprewhitened. Ambiguity, if any, arose occasionally due toaliasing and it manifested with equal strength in both the
prewhitening and synthesis methods. Such cases are markedin Table 2 with superscript 1.
The novelty in our approach, as compared withWET, is in use of the multi-harmonic AoV periodogram(Schwarzenberg-Czerny, 1996). It employs orthogonal func-tions and is able to combine power from harmonics (NH=2harmonics were combined in practice). Importance of useof orthogonal functions in period search was argued byLomb (1976), Ferraz-Mello (1981), Scargle (1982) and Fos-ter (1994). Advantage in combining harmonics is two-fold:they contribute extra power for the base frequency and atthe same time reduce power in the residuals. Any methodsensitive to the harmonics (e.g. phase folding and binningand the present case of Fourier fit) is prone to producesub-harmonics in the periodogram. The subharmonic poselittle problem in practice as they are easily identified bytight packing of aliases. There exist exact relations betweenpower in the data, root-mean square (rms) of the residualsand the AoV statistics Θ employed in the present case (e.g.Schwarzenberg-Czerny, 1999). Detection of frequencies posesspecial case of hypothesis testing in statistics. In our casethe detection criterion Θ > Θc ≡ 8 roughly correspondedto mode amplitude exceeding 4 times its standard devia-tion A > 4σA. Any frequencies near/below that detectionlimit are deemed unsafe and indicated with superscript 2 inTable 2. The purpose of listing these marginal detections(15 > Θ > 8) is solely to indicate deviations of residualsfrom pure noise and not to ponder on frequencies.
An example of our results for NV324 is shown in Fig.2. The panels show ANOVA periodograms (Schwarzenberg-Czerny 1996). The uppermost panel is computed for theoriginal data and reveals the dominant peak with its aliases.The remaining ones are computed for the data after subtrac-tion of all so far identified frequencies and significant combi-nations of thereof. Fig. 3 shows the light curves of NV324 as-sociated with all six periods found. Each light curve, phasedwith the particular period, was prewhitened with five re-maining periods and their harmonics. Note the asymmetryof the three upper light curves which is typical for pulsatingstars. The window function is a concept associated with thepower spectrum. Strictly speaking it does not apply for theANOVA periodogram. However, in Fig. 2 numerous window-like structures are present around principal frequencies.
We refrain here from discussion of amplitudes. On onehand theory results on amplitudes are unreliable (Sect. 4).On the other hand LSQ fits of multifrequency light curvesoften suffer from large correlation of parameters, indicatinglarge error ellipses despite small variances. We address thisproblem only indirectly here by relying our analysis on alarge sample of stars with very extensive coverage of obser-vations. Application of two independent reduction methodsbenefitted us in that we checked against any computationerrors as well as gained insight into repeatability and relia-bility of our results.
4 EVOLUTIONARY MODELS AND THEIR
OSCILLATION PROPERTIES
Model calculations were made with Warsaw-New Jersey stel-lar evolution code which is a modern version of Paczynski’s(1970) code developed mainly by M. Koz lowski and R.
c© 2005 RAS, MNRAS 000, 1–??
CASE: SX Phe stars from the globular cluster ω Centauri 5
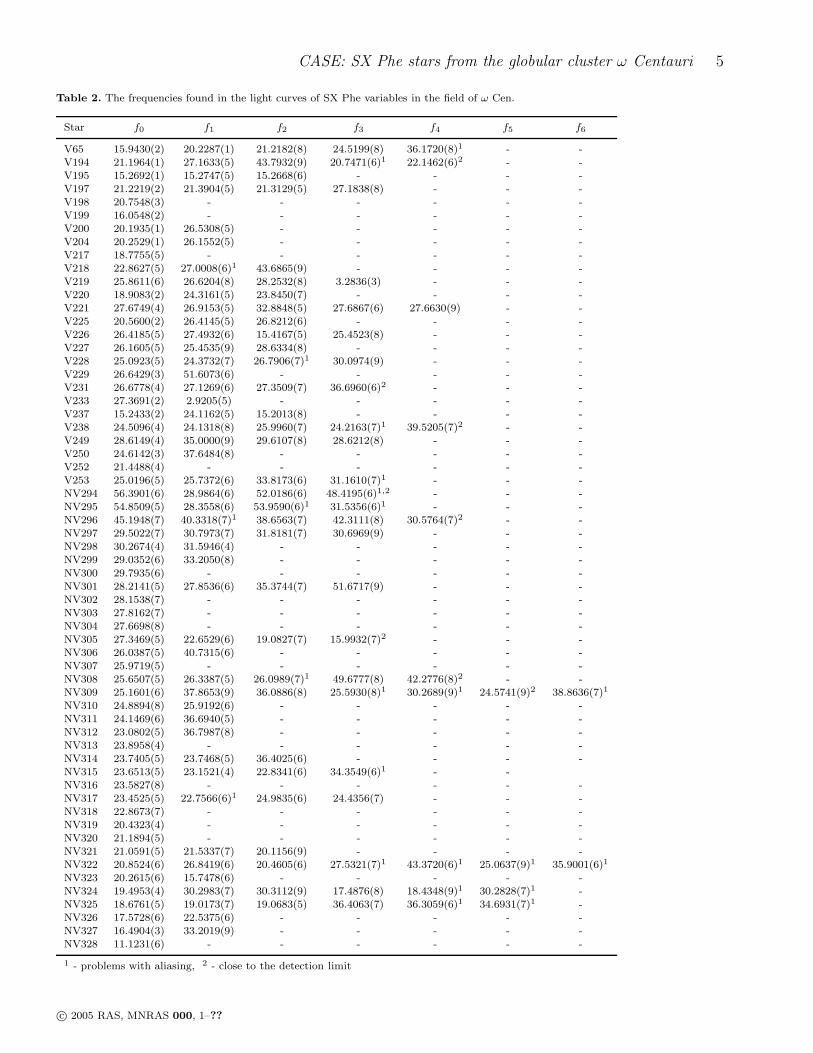
Table 2. The frequencies found in the light curves of SX Phe variables in the field of ω Cen.
Star f0 f1 f2 f3 f4 f5 f6
V65 15.9430(2) 20.2287(1) 21.2182(8) 24.5199(8) 36.1720(8)1 - -V194 21.1964(1) 27.1633(5) 43.7932(9) 20.7471(6)1 22.1462(6)2 - -V195 15.2692(1) 15.2747(5) 15.2668(6) - - - -V197 21.2219(2) 21.3904(5) 21.3129(5) 27.1838(8) - - -V198 20.7548(3) - - - - - -V199 16.0548(2) - - - - - -V200 20.1935(1) 26.5308(5) - - - - -V204 20.2529(1) 26.1552(5) - - - - -V217 18.7755(5) - - - - - -V218 22.8627(5) 27.0008(6)1 43.6865(9) - - - -V219 25.8611(6) 26.6204(8) 28.2532(8) 3.2836(3) - - -V220 18.9083(2) 24.3161(5) 23.8450(7) - - - -V221 27.6749(4) 26.9153(5) 32.8848(5) 27.6867(6) 27.6630(9) - -V225 20.5600(2) 26.4145(5) 26.8212(6) - - - -V226 26.4185(5) 27.4932(6) 15.4167(5) 25.4523(8) - - -V227 26.1605(5) 25.4535(9) 28.6334(8) - - - -V228 25.0923(5) 24.3732(7) 26.7906(7)1 30.0974(9) - - -V229 26.6429(3) 51.6073(6) - - - - -V231 26.6778(4) 27.1269(6) 27.3509(7) 36.6960(6)2 - - -V233 27.3691(2) 2.9205(5) - - - - -V237 15.2433(2) 24.1162(5) 15.2013(8) - - - -V238 24.5096(4) 24.1318(8) 25.9960(7) 24.2163(7)1 39.5205(7)2 - -V249 28.6149(4) 35.0000(9) 29.6107(8) 28.6212(8) - - -V250 24.6142(3) 37.6484(8) - - - - -V252 21.4488(4) - - - - - -V253 25.0196(5) 25.7372(6) 33.8173(6) 31.1610(7)1 - - -NV294 56.3901(6) 28.9864(6) 52.0186(6) 48.4195(6)1,2 - - -NV295 54.8509(5) 28.3558(6) 53.9590(6)1 31.5356(6)1 - - -NV296 45.1948(7) 40.3318(7)1 38.6563(7) 42.3111(8) 30.5764(7)2 - -NV297 29.5022(7) 30.7973(7) 31.8181(7) 30.6969(9) - - -NV298 30.2674(4) 31.5946(4) - - - - -NV299 29.0352(6) 33.2050(8) - - - - -
NV300 29.7935(6) - - - - - -NV301 28.2141(5) 27.8536(6) 35.3744(7) 51.6717(9) - - -NV302 28.1538(7) - - - - - -NV303 27.8162(7) - - - - - -NV304 27.6698(8) - - - - - -NV305 27.3469(5) 22.6529(6) 19.0827(7) 15.9932(7)2 - - -NV306 26.0387(5) 40.7315(6) - - - - -NV307 25.9719(5) - - - - - -NV308 25.6507(5) 26.3387(5) 26.0989(7)1 49.6777(8) 42.2776(8)2 - -NV309 25.1601(6) 37.8653(9) 36.0886(8) 25.5930(8)1 30.2689(9)1 24.5741(9)2 38.8636(7)1
NV310 24.8894(8) 25.9192(6) - - - - -NV311 24.1469(6) 36.6940(5) - - - - -NV312 23.0802(5) 36.7987(8) - - - - -NV313 23.8958(4) - - - - - -NV314 23.7405(5) 23.7468(5) 36.4025(6) - - - -NV315 23.6513(5) 23.1521(4) 22.8341(6) 34.3549(6)1 - -NV316 23.5827(8) - - - - - -NV317 23.4525(5) 22.7566(6)1 24.9835(6) 24.4356(7) - - -NV318 22.8673(7) - - - - - -NV319 20.4323(4) - - - - - -NV320 21.1894(5) - - - - - -NV321 21.0591(5) 21.5337(7) 20.1156(9) - - - -NV322 20.8524(6) 26.8419(6) 20.4605(6) 27.5321(7)1 43.3720(6)1 25.0637(9)1 35.9001(6)1
NV323 20.2615(6) 15.7478(6) - - - - -NV324 19.4953(4) 30.2983(7) 30.3112(9) 17.4876(8) 18.4348(9)1 30.2828(7)1 -NV325 18.6761(5) 19.0173(7) 19.0683(5) 36.4063(7) 36.3059(6)1 34.6931(7)1 -NV326 17.5728(6) 22.5375(6) - - - - -NV327 16.4904(3) 33.2019(9) - - - - -NV328 11.1231(6) - - - - - -
1 - problems with aliasing, 2 - close to the detection limit
c© 2005 RAS, MNRAS 000, 1–??
6 A. Olech et. al.
Sienkiewicz to include new opacity and EOS data -bothfrom the OPAL project (Iglesias & Rogers 1996, Rogers,Swenson & Iglesias 1996, respectively) - mean effect of ro-tation, and overshooting. Oscillation properties were cal-culated with modernized version of Dziembowski’s (1977)code, which includes effects of rotation.
Our default hypothesis is that stellar structure is ade-quately described by standard stellar models, that is thatthere is no imprints of mass exchange or merging in theircurrent structure. When discussing individual objects we askwhether the data are consistent with this hypothesis. Thetest is possible if we have a plausible identification of at leastone peak in the oscillation spectra with a radial mode. If ameasured period is found longer than that of fundamentalmode in the model consistent with the star position in theH-R diagram and this position also excludes driving of g-modes, then we may suspect that the object has lower massthan implied by its luminosity.
We consider interpretation of three close frequencies interms of rotational splitting of ℓ = 1 mode frequencies. Theself-consistency of the hypothesis is checked by comparingthe observed and calculated multiplet structures. The fre-quency distance between the extreme components is a mea-sure of mean rotation rate, which is mode-dependent be-cause different modes probe different parts of the star. Theconsistency test is possible if nearly uniform rotation is as-sumed. Then we can evaluate the departure from symmetryinduced by higher order effects of rotation and compare theresult with observations.
Even if we cannot identify individual peaks in oscil-lation spectra, still we can compare the frequency rangeswhere the peaks occur with the range of unstable modes inthe models. This is of interest because the presence of os-cillations left of the blue edge may indicate a substantialhelium enhancement, which is expected in certain models ofBSS formation.
Peaks at frequencies much lower than that of the fun-damental radial mode are of our interest too. These couldbe attributed to high order g-modes. It is now a debatedproblem whether such modes may be excited in δ Scutistars (Handler 1999, Breger et al. 2002, Dupret et al. 2004).Even more interesting possibility is that such peaks repre-sent tidally induced changes (Aerts et al. 2002, Handler etal. 2002).
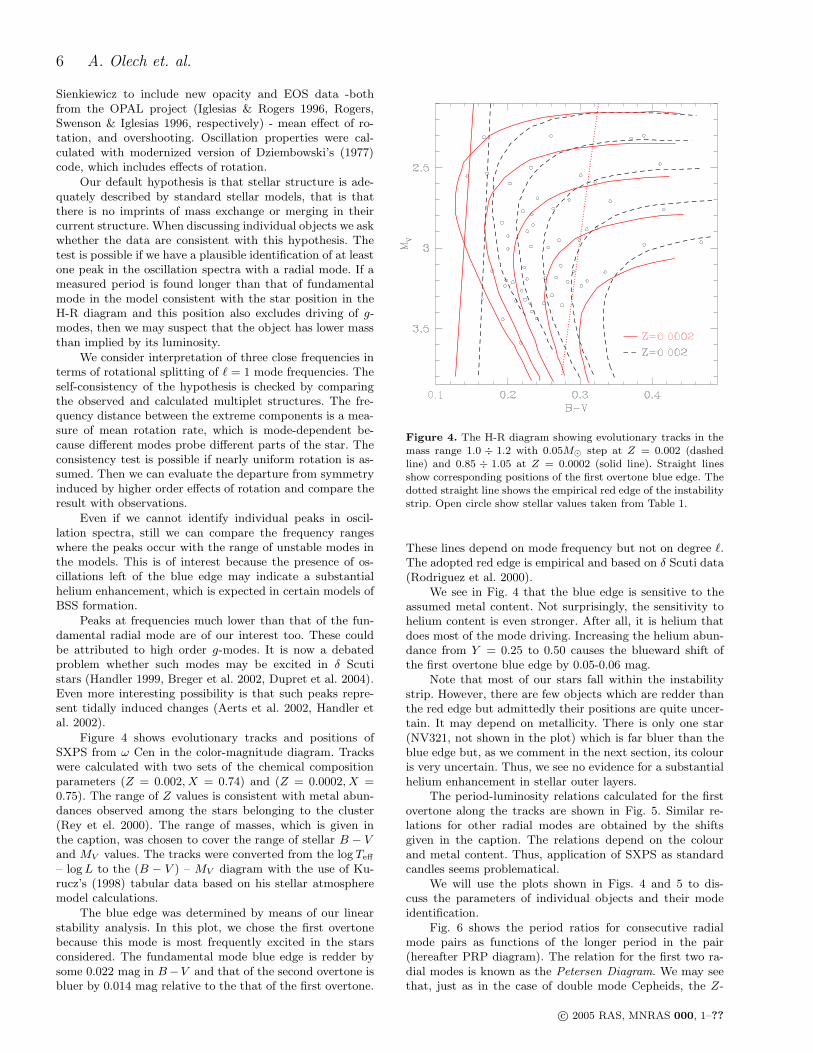
Figure 4 shows evolutionary tracks and positions ofSXPS from ω Cen in the color-magnitude diagram. Trackswere calculated with two sets of the chemical compositionparameters (Z = 0.002, X = 0.74) and (Z = 0.0002, X =0.75). The range of Z values is consistent with metal abun-dances observed among the stars belonging to the cluster(Rey et el. 2000). The range of masses, which is given inthe caption, was chosen to cover the range of stellar B − Vand MV values. The tracks were converted from the log Teff
– log L to the (B − V ) – MV diagram with the use of Ku-rucz’s (1998) tabular data based on his stellar atmospheremodel calculations.
The blue edge was determined by means of our linearstability analysis. In this plot, we chose the first overtonebecause this mode is most frequently excited in the starsconsidered. The fundamental mode blue edge is redder bysome 0.022 mag in B−V and that of the second overtone isbluer by 0.014 mag relative to the that of the first overtone.
Figure 4. The H-R diagram showing evolutionary tracks in themass range 1.0 ÷ 1.2 with 0.05M⊙ step at Z = 0.002 (dashedline) and 0.85 ÷ 1.05 at Z = 0.0002 (solid line). Straight linesshow corresponding positions of the first overtone blue edge. Thedotted straight line shows the empirical red edge of the instabilitystrip. Open circle show stellar values taken from Table 1.
These lines depend on mode frequency but not on degree ℓ.The adopted red edge is empirical and based on δ Scuti data(Rodriguez et al. 2000).
We see in Fig. 4 that the blue edge is sensitive to theassumed metal content. Not surprisingly, the sensitivity tohelium content is even stronger. After all, it is helium thatdoes most of the mode driving. Increasing the helium abun-dance from Y = 0.25 to 0.50 causes the blueward shift ofthe first overtone blue edge by 0.05-0.06 mag.
Note that most of our stars fall within the instabilitystrip. However, there are few objects which are redder thanthe red edge but admittedly their positions are quite uncer-tain. It may depend on metallicity. There is only one star(NV321, not shown in the plot) which is far bluer than theblue edge but, as we comment in the next section, its colouris very uncertain. Thus, we see no evidence for a substantialhelium enhancement in stellar outer layers.
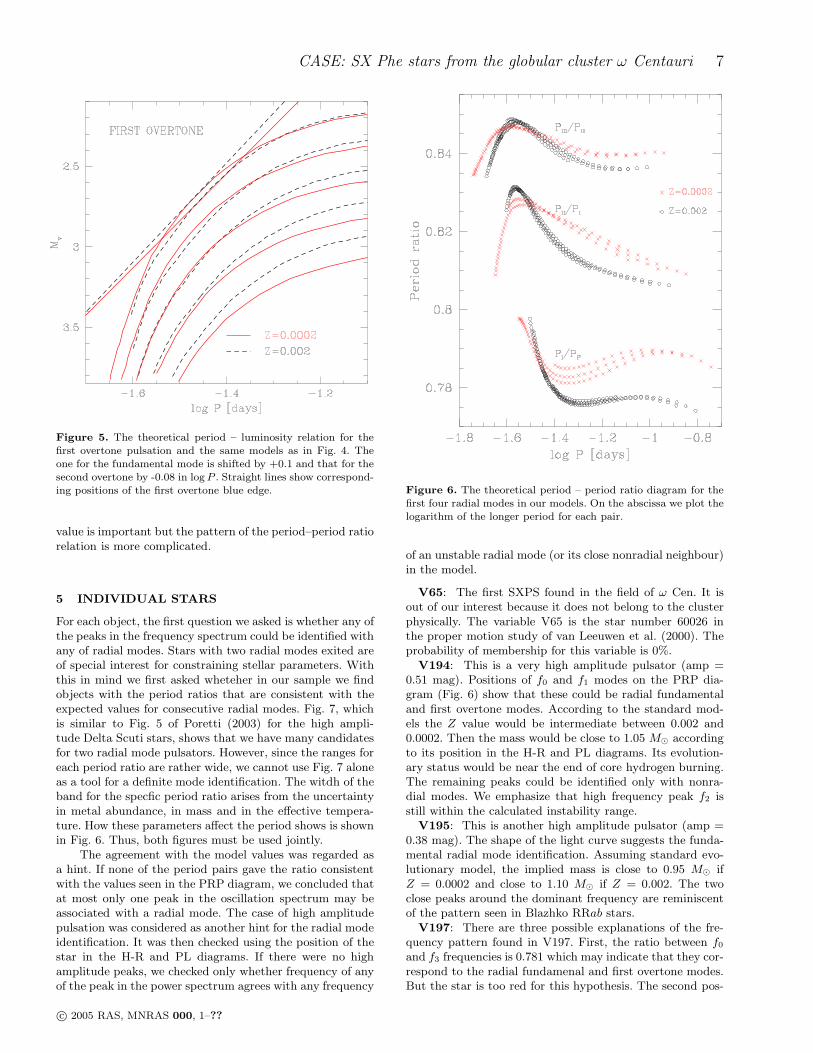
The period-luminosity relations calculated for the firstovertone along the tracks are shown in Fig. 5. Similar re-lations for other radial modes are obtained by the shiftsgiven in the caption. The relations depend on the colourand metal content. Thus, application of SXPS as standardcandles seems problematical.
We will use the plots shown in Figs. 4 and 5 to dis-cuss the parameters of individual objects and their modeidentification.
Fig. 6 shows the period ratios for consecutive radialmode pairs as functions of the longer period in the pair(hereafter PRP diagram). The relation for the first two ra-dial modes is known as the Petersen Diagram. We may seethat, just as in the case of double mode Cepheids, the Z-
c© 2005 RAS, MNRAS 000, 1–??
CASE: SX Phe stars from the globular cluster ω Centauri 7
Figure 5. The theoretical period – luminosity relation for thefirst overtone pulsation and the same models as in Fig. 4. Theone for the fundamental mode is shifted by +0.1 and that for thesecond overtone by -0.08 in log P . Straight lines show correspond-ing positions of the first overtone blue edge.
value is important but the pattern of the period–period ratiorelation is more complicated.
5 INDIVIDUAL STARS
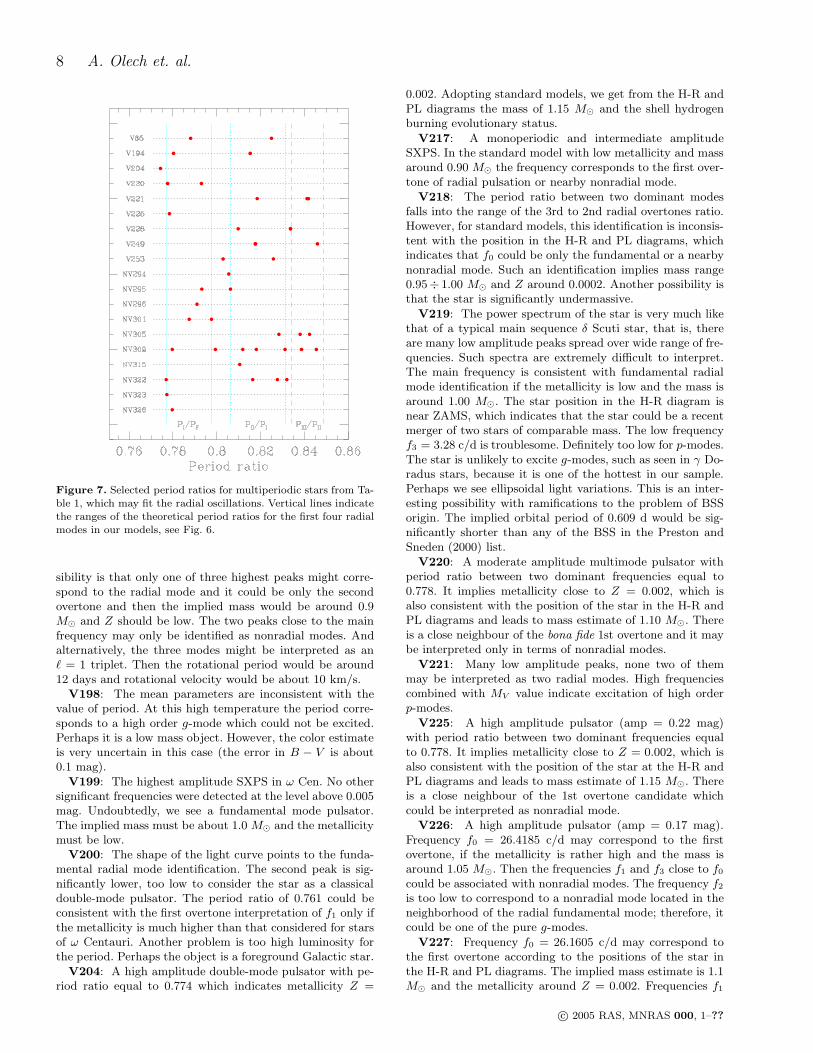
For each object, the first question we asked is whether any ofthe peaks in the frequency spectrum could be identified withany of radial modes. Stars with two radial modes exited areof special interest for constraining stellar parameters. Withthis in mind we first asked wheteher in our sample we findobjects with the period ratios that are consistent with theexpected values for consecutive radial modes. Fig. 7, whichis similar to Fig. 5 of Poretti (2003) for the high ampli-tude Delta Scuti stars, shows that we have many candidatesfor two radial mode pulsators. However, since the ranges foreach period ratio are rather wide, we cannot use Fig. 7 aloneas a tool for a definite mode identification. The witdh of theband for the specfic period ratio arises from the uncertaintyin metal abundance, in mass and in the effective tempera-ture. How these parameters affect the period shows is shownin Fig. 6. Thus, both figures must be used jointly.
The agreement with the model values was regarded asa hint. If none of the period pairs gave the ratio consistentwith the values seen in the PRP diagram, we concluded thatat most only one peak in the oscillation spectrum may beassociated with a radial mode. The case of high amplitudepulsation was considered as another hint for the radial modeidentification. It was then checked using the position of thestar in the H-R and PL diagrams. If there were no highamplitude peaks, we checked only whether frequency of anyof the peak in the power spectrum agrees with any frequency
Figure 6. The theoretical period – period ratio diagram for thefirst four radial modes in our models. On the abscissa we plot thelogarithm of the longer period for each pair.
of an unstable radial mode (or its close nonradial neighbour)in the model.
V65: The first SXPS found in the field of ω Cen. It isout of our interest because it does not belong to the clusterphysically. The variable V65 is the star number 60026 inthe proper motion study of van Leeuwen et al. (2000). Theprobability of membership for this variable is 0%.
V194: This is a very high amplitude pulsator (amp =0.51 mag). Positions of f0 and f1 modes on the PRP dia-gram (Fig. 6) show that these could be radial fundamentaland first overtone modes. According to the standard mod-els the Z value would be intermediate between 0.002 and0.0002. Then the mass would be close to 1.05 M⊙ accordingto its position in the H-R and PL diagrams. Its evolution-ary status would be near the end of core hydrogen burning.The remaining peaks could be identified only with nonra-dial modes. We emphasize that high frequency peak f2 isstill within the calculated instability range.
V195: This is another high amplitude pulsator (amp =0.38 mag). The shape of the light curve suggests the funda-mental radial mode identification. Assuming standard evo-lutionary model, the implied mass is close to 0.95 M⊙ ifZ = 0.0002 and close to 1.10 M⊙ if Z = 0.002. The twoclose peaks around the dominant frequency are reminiscentof the pattern seen in Blazhko RRab stars.
V197: There are three possible explanations of the fre-quency pattern found in V197. First, the ratio between f0
and f3 frequencies is 0.781 which may indicate that they cor-respond to the radial fundamenal and first overtone modes.But the star is too red for this hypothesis. The second pos-
c© 2005 RAS, MNRAS 000, 1–??
8 A. Olech et. al.
Figure 7. Selected period ratios for multiperiodic stars from Ta-ble 1, which may fit the radial oscillations. Vertical lines indicatethe ranges of the theoretical period ratios for the first four radialmodes in our models, see Fig. 6.
sibility is that only one of three highest peaks might corre-spond to the radial mode and it could be only the secondovertone and then the implied mass would be around 0.9M⊙ and Z should be low. The two peaks close to the mainfrequency may only be identified as nonradial modes. Andalternatively, the three modes might be interpreted as anℓ = 1 triplet. Then the rotational period would be around12 days and rotational velocity would be about 10 km/s.
V198: The mean parameters are inconsistent with thevalue of period. At this high temperature the period corre-sponds to a high order g-mode which could not be excited.Perhaps it is a low mass object. However, the color estimateis very uncertain in this case (the error in B − V is about0.1 mag).
V199: The highest amplitude SXPS in ω Cen. No othersignificant frequencies were detected at the level above 0.005mag. Undoubtedly, we see a fundamental mode pulsator.The implied mass must be about 1.0 M⊙ and the metallicitymust be low.
V200: The shape of the light curve points to the funda-mental radial mode identification. The second peak is sig-nificantly lower, too low to consider the star as a classicaldouble-mode pulsator. The period ratio of 0.761 could beconsistent with the first overtone interpretation of f1 only ifthe metallicity is much higher than that considered for starsof ω Centauri. Another problem is too high luminosity forthe period. Perhaps the object is a foreground Galactic star.
V204: A high amplitude double-mode pulsator with pe-riod ratio equal to 0.774 which indicates metallicity Z =
0.002. Adopting standard models, we get from the H-R andPL diagrams the mass of 1.15 M⊙ and the shell hydrogenburning evolutionary status.
V217: A monoperiodic and intermediate amplitudeSXPS. In the standard model with low metallicity and massaround 0.90 M⊙ the frequency corresponds to the first over-tone of radial pulsation or nearby nonradial mode.
V218: The period ratio between two dominant modesfalls into the range of the 3rd to 2nd radial overtones ratio.However, for standard models, this identification is inconsis-tent with the position in the H-R and PL diagrams, whichindicates that f0 could be only the fundamental or a nearbynonradial mode. Such an identification implies mass range0.95÷ 1.00 M⊙ and Z around 0.0002. Another possibility isthat the star is significantly undermassive.
V219: The power spectrum of the star is very much likethat of a typical main sequence δ Scuti star, that is, thereare many low amplitude peaks spread over wide range of fre-quencies. Such spectra are extremely difficult to interpret.The main frequency is consistent with fundamental radialmode identification if the metallicity is low and the mass isaround 1.00 M⊙. The star position in the H-R diagram isnear ZAMS, which indicates that the star could be a recentmerger of two stars of comparable mass. The low frequencyf3 = 3.28 c/d is troublesome. Definitely too low for p-modes.The star is unlikely to excite g-modes, such as seen in γ Do-radus stars, because it is one of the hottest in our sample.Perhaps we see ellipsoidal light variations. This is an inter-esting possibility with ramifications to the problem of BSSorigin. The implied orbital period of 0.609 d would be sig-nificantly shorter than any of the BSS in the Preston andSneden (2000) list.
V220: A moderate amplitude multimode pulsator withperiod ratio between two dominant frequencies equal to0.778. It implies metallicity close to Z = 0.002, which isalso consistent with the position of the star in the H-R andPL diagrams and leads to mass estimate of 1.10 M⊙. Thereis a close neighbour of the bona fide 1st overtone and it maybe interpreted only in terms of nonradial modes.
V221: Many low amplitude peaks, none two of themmay be interpreted as two radial modes. High frequenciescombined with MV value indicate excitation of high orderp-modes.
V225: A high amplitude pulsator (amp = 0.22 mag)with period ratio between two dominant frequencies equalto 0.778. It implies metallicity close to Z = 0.002, which isalso consistent with the position of the star at the H-R andPL diagrams and leads to mass estimate of 1.15 M⊙. Thereis a close neighbour of the 1st overtone candidate whichcould be interpreted as nonradial mode.
V226: A high amplitude pulsator (amp = 0.17 mag).Frequency f0 = 26.4185 c/d may correspond to the firstovertone, if the metallicity is rather high and the mass isaround 1.05 M⊙. Then the frequencies f1 and f3 close to f0
could be associated with nonradial modes. The frequency f2
is too low to correspond to a nonradial mode located in theneighborhood of the radial fundamental mode; therefore, itcould be one of the pure g-modes.
V227: Frequency f0 = 26.1605 c/d may correspond tothe first overtone according to the positions of the star inthe H-R and PL diagrams. The implied mass estimate is 1.1M⊙ and the metallicity around Z = 0.002. Frequencies f1
c© 2005 RAS, MNRAS 000, 1–??
CASE: SX Phe stars from the globular cluster ω Centauri 9
and f2 could be nonradial modes in the vicinity of the firstovertone radial mode.
V228: A moderate amplitude multimode pulsator withperiod ratio between the frequencies f0 and f3 equal to0.834. Looking at the PRP diagram one can find that theycan be the first and second overtone radial modes but onlyin the case of low metallicity. The frequencies f1 and f2 cor-respond then to nonradial modes in the vicinity of the firstovertone. Position of the star on the H-R and PL diagramsagrees with assumption of a low metallicity and indicatesthe mass of 0.90 M⊙.
V229: It is one of the bluest SXPS in our sample, muchbluer than Kaluzny et al. (1996) found. Since they relay onV − I colours, we checked the object carefully for blendingeffects and found none. Our colour implies that the dominantperiod is too long to correspond to the fundamental mode.The problem which is similar to the cases of V198 and V226,where we do not expect excitation of pure g-modes in so hotstar.
V231: The dominant frequency f0 = 26.6778 c/d couldbe due to the radial fundamental mode only for Z = 0.0002.In this case, the mass of the star is between 0.95 and 1.00M⊙. The frequencies f1 and f2 could be due the excitationof two nearby nonradial modes. The frequency f3 = 36.6960c/d is associated with nonradial mode placed between thefirst and the second overtone.
V233: The dominant frequency f0 = 27.3691 c/d couldbe due to the radial first overtone mode only if Z ≈ 0.0002.In this case, the mass of the star would be around 0.95 M⊙.The low frequency peak at f1 = 2.9205 c/d could indicatethat the star is, along with V219, a candidate for an ellip-soidal variable.
V237: The high amplitude (0.27 mag) peak at f0 =15.2433 c/d could be identified as the radial fundamentalmode. Such an identification is consistent with the positionsin the H-R and PL diagrams for low Z models. Then themass of the star is about 0.95 M⊙. If f0 is indeed the fun-damental mode then the expected position of the secondovertone radial mode is around 24 c/d. Thus, we concludethat the frequency f1 = 24.1162 c/d could correspond to thesecond overtone. The peak at f2 = 15.2013 c/d is due to anonradial mode in the vicinity of fundamental frequency.
V238: Again, the dominant frequency f0 = 24.5096 c/dcould be due to the excitation of the radial fundamentalmode only if Z is low and the mass of the star is 0.95M⊙. The frequencies f1, f2 and f3 may be attributed tonearby nonradial modes. The expected position of the sec-ond overtone radial mode is around 38 c/d thus the fre-quency f4 = 39.5205 c/d would be due to the nonradialp-mode.
V249: A moderate amplitude multimode pulsator withthe period ratio between two dominant frequencies equal to0.818. It is consistent with an assumption that f0 and f1
correspond to the first and second overtone radial modes.This requires high Z values, somewhat higher than Z =0.002. However this interpretation is inconsistent with thestar position in the H-R and PL diagrams.
V250: A double mode pulsator with f0 and f1 being theradial fundamental and the second overtone modes, respec-tively. The position at the H-R and PL diagrams indicatesa low metallicity and the mass between 0.90 and 0.95 M⊙.
V252: A monoperiodic and low amplitude star. The po-
sition of the star in the H-R and PL diagrams is consistentwith the fundamental radial mode identification only for alow metallicity and the mass between 0.85 and 0.90 M⊙.
V253: A moderate amplitude multimode pulsator. Thedominant frequency could be the fundamental radial modeonly for our low metallicity models. In this case, the starhas mass around 1.00 M⊙. The frequency f1 corresponds toa nonradial mode in the vicinity of fundamental peak andfrequencies f2 and f3 to some high order nonradial p modes.
NV294: This is the shortest period SXPS known. Upto now, the shortest period variable of this type was V10from NGC6397 (Kaluzny and Thompson 2003). NV294 is amultimode and very low amplitude object. With our H-Rand PL diagrams the frequency f1 = 28.9864 c/d may beassociated with the radial fundamental mode, in a model ofhigh metallicity and mass around 1.2 M⊙. In this picture,the frequencies f0, f2 and f3 correspond to the high ordernonradial p-modes.
NV295: This is another very short period, low ampli-tude and multimode object. The frequency f1 = 28.3558c/d could correspond to the radial second overtone modebut only for low values of Z. In this case, the position ofthe star at the H-R and PL diagrams indicates the massbetween 0.90 and 0.95 M⊙. The frequencies f0, f2 and f3
could correspond to nonradial modes.
NV296: Another object similar to NV294 and NV295.There are five frequencies present in the light curve of thestar. With our models only the lowest amplitude peak atfrequency f4 might be identified with a radial mode. It wouldbe the second overtone and in this case the metallicity ofthe star would be around Z = 0.002 and the mass would bebetween 1.10 and 1.15 M⊙. In such a case, other frequencieswould correspond to nonradial high order p-modes.
NV297: A low amplitude multimode object with fourrelatively close peaks. One of them could be identified withthe second overtone radial mode and then the star masswould be around 1.20 M⊙ at Z = 0.002 and about 1.05 M⊙
at Z = 0.0002. We consider possibility that three of the fourfrequencies represent a rotationally splitted ℓ = 1 triplet. Inthe plausible interpretation f1 would be a retrograde and f3
would be the prograde mode. Then the frequency separationwould imply rather fast rotation (over 100 km/s). However,the calculated position of the m = 0 component does notagree with the position of any of the two remaining peaks.It was much closer to the f3.
NV298: The dominant peak of the two observed in thestar may be identified, in our models, with the fundamentalradial mode if the metallicity is rather high and the massis between 1.15 and 1.20 M⊙. The second close frequencymust then be associated with a nonradial mode.
NV299: The dominant peak could be the radial firstovertone mode in a star of a relatively high metallicity andmass around 1.05 M⊙. Then the frequency f1 would corre-spond to a nonradial mode located between the radial firstand second overtones. The star is slightly too red for thisinterpretation but it is located in a crowded region of thecluster and its V magnitude zero point is determined withthe accuracy of around 0.04 mag. Thus the star may be infact even 0.05 mag bluer.
NV300: A monoperiodic and low amplitude SXPS. Thestar could be the radial fundamental mode pulsator only if
c© 2005 RAS, MNRAS 000, 1–??
10 A. Olech et. al.
we assume the high metallicity and the mass of around 1.15M⊙.
NV301: A multimode and low amplitude SXPS. Oneof the two dominant frequencies may be the radial secondovertone mode, according to our models. The star has then ahigh metallicity and the mass around 1.05 M⊙. The frequen-cies f2 and f3 should correspond to the high order nonradialp-modes.
NV302: A monoperiodic and low amplitude star. Thefrequency f0 = 28.1538 c/d could be the first overtone radialmode but only for our Z = 0.002 models. In this case, themass of the star is between 1.10 and 1.15 M⊙. It is alsopossible that f0 is the second overtone. This requires low Zand, in this case, the mass of the star is between 0.90 and0.95 M⊙.
NV303: A monoperiodic and very low amplitude star.The only frequency determined could be associated with thefirst radial overtone. Then the star has low metallicity andmass slightly less than 1.0 M⊙.
NV304: A similar pulsator to NV303. Again, the firstradial overtone interpretation possible, however in this casethe models imply high metallicity and mass around 1.05 M⊙.
NV305: A multiperiodic object with interesting powerspectrum. The amplitude increases systematically with thefrequency. The period ratio between two dominant peaks isequal to 0.828 - a value which could be the ratio betweenthe first and second radial overtones, but only for very lowmetallicity. It is supported by the position of the star inthe H-R and PL diagrams implying the mass in range of0.85÷0.90 M⊙. The frequencies f2 and f3 would correspondto nonradial peaks in the vicinity of the fundamental radialmode.
NV306: One of the faintest SXPS in our sample. Thedominant frequency could be due to the radial fundamentalmode. With this interpretation, the metallicity of the objectis low and its mass is between 0.90 and 0.95 M⊙. The ex-pected position of the second overtone radial mode is closeto 40 c/d, thus the second peak could be connected withthis mode.
NV307: A monoperiodic and moderate amplitude star.Our models imply that the excited mode must be of higherorder than two, which seems to be in conflict with the starrelatively low temperature.
NV308: A multiperiodic object. Of the three dominantpeaks at low frequency one could be identified with the firstovertone for our low metallicity models with the mass ofabout 0.90 M⊙. We also considered the possible interpre-tation of these three peaks in terms of rotationally splittedℓ = 1 mode. In this case, the problem is opposite to that ac-counted in NV297 - the observed asymmetry is too high forthe rotation rate of about 50 km/s implied by the distancebetween f0 and f1.
NV309: The star has one of the richest frequency spec-trum. We determined as many as seven frequencies. Thef5/f1 ratio could be the frequency ratio between the firstand second overtones of radial pulsations. This interpreta-tion is however in conflict with the H-R position, where thestar is too red. For this star we obtained a consistent in-terpretation of three peaks (f5, f0 and f3) as a rotationalsplitted ℓ = 1 triplet. For our model with Z = 0.0002 andmass of 0.95 M⊙ the separation between f3 and f5 impliesrotational velocity of 60 km/s. With this velocity the cen-
troid component, displaced from the center by the secondorder effect of rotation, comes close to f0. This triplet is notfar from the frequency of the first radial overtone. The peakf4 would then be located in the vicinity of the second over-tone while the highest frequency peaks (f2 and f1) of thethird overtone.
NV310: The only two frequencies are close to the ex-pected position of the radial second overtone, for our modelswith high metallicity and mass around 1.10 M⊙.
NV311: The two frequencies measured in this star, f0 =24.1469 c/d and f1 = 36.6940 c/d, may be due to the radialfundamental and the second overtone modes, respectively.Unfortunately, we can not verify this hypothesis because wedo not know the exact magnitude and color of the star, whichis located in very crowded region of the cluster.
NV312: One of the brightest SXPS in ω Cen. The fre-quency f0 = 23.0802 c/d could be associated with the radialsecond overtone mode but only for high metallicity. In thiscase, the mass of the star is around 1.2 M⊙. The peak atf1 = 36.8 c/d can be interpreted as the high order p-mode.
NV313: A monoperiodic, high amplitude and faintestSXPS in the field of ω Cen. The high amplitude may sug-gest that the star is a radial mode pulsator. The problemis that in our standard models, the star with the observedeffective temperature and luminosity would have the funda-mental radial mode period by factor 1.3 shorter. The staris also one of the hottest in our sample and we certainly donot expect excitation of g-modes in such a star. In fact, wewould rather expect higher order modes excitation, there-fore this object is likely to be undermassive by factor of 1.7or more.
NV314: The frequencies f0 = 23.7405 c/d and f2 =36.4036 c/d could be the radial fundamental and secondovertone modes, respectively, but only if the star would bebluer by 0.06 mag. It is possible, because the star is locatedin the crowded region (three bright companions) and zeropoint in V -band is poorly determined.
NV315: One of the brightest SXPS in ω Cen with a richoscillation spectrum. The photometric data combined withour model parameters imply that even the lowest frequency,f0, is higher than the second overtone radial mode. Thepreference to the high frequency mode excitation seems tobe in conflict with the low temperature of the star, the oneof the lowest in our sample.
NV316: A monoperiodic and low amplitude star. Theperiod is too long for fundamental radial mode, accordingto our models. Perhaps the star is another case of an under-massive object.
NV317: A low amplitude multiperiodic star. Assumingour standard models, the frequency f0 = 23.4525 c/d couldbe attributed to the radial second overtone mode in a starwith a rather high metallicity and mass of around 1.05 M⊙.Three other peaks (f1, f3 and f2) in this model can be inter-preted as a rotationally splitted ℓ = 1 triplet, which impliesrotational velocity of about 120 km/s. Alternatively, anothercombination of three peaks (f0, f3 and f2) might be inter-preted as an ℓ = 1 triplet, which would imply rotationalvelocity of about 80 km/s.
NV318: A low amplitude and monoperiodic star. Thefrequency f0 could be due to the radial second overtonemode in a model with high metallicity and mass between1.05 and 1.10 M⊙.
c© 2005 RAS, MNRAS 000, 1–??
CASE: SX Phe stars from the globular cluster ω Centauri 11
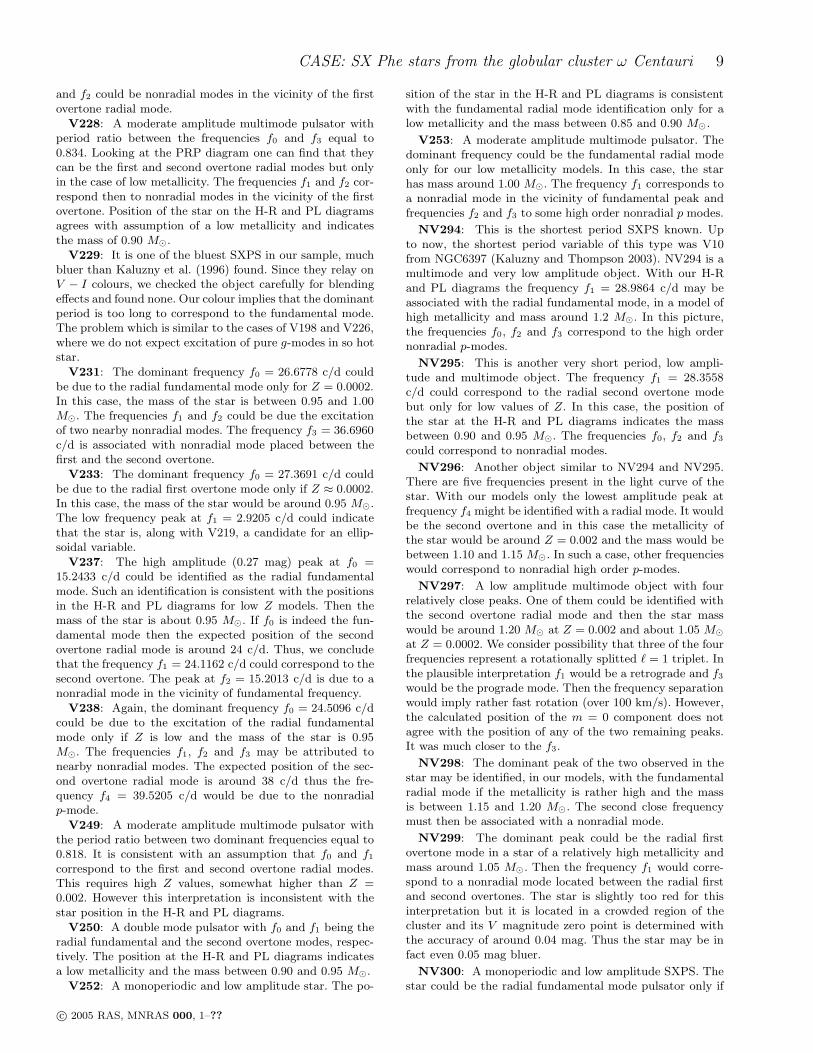
Figure 8. Phased light curves of monoperiodic SXPS in ω Centauri
NV319: A moderate amplitude and monoperiodic star.The only frequency could be that of the radial first overtonemode in a star of low metallicity and the mass between 0.85and 0.90 M⊙.
NV320: It is almost identical to the previous object.
NV321: A multiperiodic and moderate amplitude star.The frequencies f0, f1 and f2 form an asymmetric tripletwhich perhaps might be interpreted as rotationally splittedℓ = 1 mode. Unfortunately, the variable is located in verycrowded field and the mean B and V magnitudes are veryuncertain.
NV322: A moderate amplitude variable with one of therichest power spectrum. The ratio between two dominantfrequencies is 0.777 which may suggest that they are fun-damental and first overtone radial modes. We have no colordetermination for this star and we can not exploit this hy-pothesis.
NV323: A double mode and low amplitude pulsator.Surprisingly, we found the same period ratio of 0.777 as inprevious case. However, we have a problem with interpre-tation of the frequencies in terms of the fundamental andfirst overtone radial pulsations. The period ratio suggeststhe metallicity of Z ≈ 0.002. Our models imply the H-Rposition by some of 0.06 mag bluer than observed.
NV324: A high amplitude and multiperiodic star. Itsrich power spectrum is shown in Fig. 2. According to ourmodels, the dominant frequency is close to the radial firstovertone for low metallicity and mass of around 1.05 M⊙.The frequencies f1, f2 and f5 are all close to that of thethird radial overtone mode.
NV325: A moderate amplitude and multiperiodic ob-ject. The dominant frequency may be interpreted, accord-ing to our models, as due to the second radial overtone ina star with mass between 1.15 and 1.20 M⊙ if Z = 0.002or between 1.00 and 1.05 M⊙ if Z = 0.0002. Presence of
three high frequency modes is surprising in view of ratherlow temperature and high luminosity of the object.
NV326: This is a classical double mode star with f0 =17.5728 c/d as radial fundamental and f1 = 22.5375 c/das the first overtone modes. The frequency ratio of 0.780nicely agrees with that of fundamental and first overtone inan intermediate metallicity object. Further, the periods andthe metallicity agree with the position of the star in the H-R and PL diagrams. The implied mass is then between 0.95and 1.00 M⊙.
NV327: It is one of the bluest stars in our sample. Thefrequency f0 may be associated with the fundamental modebut only if the star is significantly undermassive.
NV328: A low amplitude and monoperiodic star. It is thereddest star in our sample. The only frequency, according toour models, may be interpreted as the fundamental radialmode, implying the mass around 1.00 M⊙ at Z = 0.0002 ormass between 0.85 and 0.90 M⊙ at Z = 0.002.
6 CONCLUSIONS
In most cases the observed properties of SXPS in ω Cen-tauri may be explained in terms of standard evolutionarymodels and their linear nonadiabatic properties. In a num-ber of cases, where the observational evidences pointed toradial mode excitation, we derived the masses of the objects.They all fall into the range 0.90÷1.15M⊙ . The implied evo-lutionary status covers both the main sequence and earlypost-main sequence evolutionary phases.
Only in four cases the observed parameters were incon-sistent with the standard models and could be reconciledwith the undermassive objects. Such objects could arise inseveral situations. They can appear as a result of mergers, ifthere is a mass loss or element mixing. They could also arise
c© 2005 RAS, MNRAS 000, 1–??
12 A. Olech et. al.
as the result of mass exchange in binary systems. This pos-sibility may be contemplated only in the case of very largemass loss on the lower red giant branch. Applicable modelswould have rather low mass (∼ 0.2M⊙), most of which con-tained in the helium core. Such models were once consideredby Dziembowski and Koz lowski (1974) for high amplitude δScuti stars, called then Dwarf Cepheids.
We found two cases of stars with long periodicities thatmay be interpreted as due to the tidally induced distortion.This could be an indirect evidence for binarity. Possible im-plications for the mechanism of BSS formation are interest-ing. Therefore, the two objects deserve further studies tocheck the interpretation. This could be done by searchingfor induced pulsation period changes (current data do notallow to reject nor confirm the proposal) or by means ofradial velocity measurements.
Our search for rotationally split triplets resulted inthree plausible cases. For NV309 the inferred equatorial ve-locity would be about 60 km/s, and for NV317 it would beabout 80 or 120 km/s, depending on three frequency peaksinvolved. For V197 the interpretation of all three close peaksas ℓ = 1 triplet results in equatorial rotational velocity ofabout 10 km/s.
We found considerable diversity in pulsational be-haviour ranging from that typical for main sequence δ Scutistars characterized by low amplitude and multimode vari-ability to high amplitude Cepheid-like monomode pulsa-tions. This is quite amazing bearing in mind the fact thatthe spread in V brightness is only about one magnitude. Togive the picture of the observed diversity, Fig. 8 shows thephased light curves of the monoperiodic pulsators from oursample.
Examples of δ Scuti-like behaviour are objects likeV219, NV294, NV295 and NV296. These are among thefaintest and the hottest stars in our sample. Amongst thefaintest objects there are also some relatively high ampli-tude pulsators (V198, V249 and NV313) but all of them aresuspected for being undermassive.
The star V199, whose light curve resembles those ofCepheids or RRab stars, is amongst most luminous objects.Other high amplitude objects are multiperiodic. Amongthem there are five classical double mode pulsators i.e. starswith fundamental and the first overtone excited. These ob-jects were crucial for deriving constrains on masses andmetallicities. In three of them we detected additional, ap-parently nonradial modes. Coexistence of high amplituderadial modes with low amplitude nonradial modes was firstseen by Walraven, Walraven and Balona (1992) in the δ Scutistar AI Vel (see also Poretti 2003). In some of our cases thenonradial modes are located close to radial modes in thefrequency spectrum but not in all, just like in AI Vel.
Three clean cases of spectra consisting of a dominantpeak surrounded by close low amplitude peaks are V195,V197 and NV321. These are possible analogs of BlazhkoRRab stars.
ACKNOWLEDGMENTS
We are thankful to Dr. Poretti, the referee, for pointing mis-identification of f0 + f1 frequency in NV324. This work wassupported by the KBN grants number 1 P03D 006 27 to A.
Olech, 5 P03D 030 20 to W.A. Dziembowski, 5 P03D 012 20to A.A. Pamyatnykh, and 5 P03D 004 21 to J. Kaluzny. A.Schwarzenberg-Czerny would like to acknowledge generousgrant by Clifford and Mary Corbridge Trust of Cambridge,England.
REFERENCES
Aerts C., Handler G., Arentoft T., Vandenbussche B., MedupeR., Sterken C. 2002, MNRAS, 333, L35
Breger M. et al. 2002, MNRAS, 329, 531Carney B.W., Latham D.W., Laird J.B., Grant C.E., Morse J.A.,
2001, AJ, 122, 3419
Dupret M.-A., Grigahcene A., Garrido R., Gabriel M., ScuflaireR. 2004, A&A, 414, L1
Dziembowski, W. & Koz lowski, 1974, Acta Astron., 24, 245.
Dziembowski W., 1977, Acta Astron., 27, 203Eadie W.T., Drijard D., James F.E., 1971, Statistical methods in
experimental physics, Amsterdam, North-Holland.
Ferraz-Mello, S., 1981, AJ, 86, 619Foster, G., 194, AJ, 109, 1889
Gray D. F. & Desikachary K., 1973, ApJ 181, 523.Handler G. 1999, MNRAS, 309, L19
Handler G. et al. 2002, MNRAS, 333, 262Iglesias C.A., Rogers F.J. 1996, ApJ, 464, 943Kaluzny J., Kubiak M., Szymanski M., Udalski A., Krzeminski
W., & Mateo M. 1996, A&AS, 120, 139
Kaluzny J., Kubiak M., Szymanski M., Udalski A., KrzeminskiW., & Mateo M., 1997a, A&AS, 122, 471
Kaluzny J., Thompson I.B., Krzeminski W., Olech A., Pych W.,Mochejska B., 2002, in van Leeuwen F., Hughes J.D., PiottoG., eds., ASP Conf. Ser. Vol. 265, ”Omega Centauri, A UniqueWindow into Astrophysics”, Astron. Soc. Pac., San Francisco,p. 155
Kaluzny J., Thompson I.B., 2003, AJ, 125, 2534Kaluzny J., Olech A., Thompson I.B., Pych W., Krzeminski W.,
Schwarzenberg-Czerny A., 2004, A&A, 424, 1101
Lomb, 1976, A&SS 39, 477Lombardi J.C., Jr., Rasio F.A., 2002, in Shara M.M. ed., ASP
Conference Proceedings, Vol. 263, ”Stellar Collisions, Mergersand their Consequences”, San Francisco: Astronomical Soci-ety of the Pacific, p. 35
Lombardi J.C., Warren J.S., Rasio F.A., Silla A., Warren A.R.,2002, ApJ, 568, 939
Kepler, S.O., 1993, in proceedings of Second WET Workshop,Baltic Astronomy, 2, 515
Kurucz R.L., 1998, in Bedding T.R., Booth A.J., Davis J. eds.,Proceedings of IAU Symposium 189, ”The Interaction be-tween Observation and Theory”, Kluwer, Dordrecht, p. 217
Mazur B., Krzeminski W., Thompson I.B., 2003, MNRAS, 340,1205
McCrea W.H., 1964, MNRAS, 128, 147Paczynski B., 1970, Acta Astron., 20, 47
Poretti E., 2003, A&A, 409, 1031Pych W., Kaluzny J., Krzeminski W. Schwarzenberg-Czerny A.,
Thompson, I. B., 2001, A&A, 367, 148
Rey S.-C., Lee Y.-W., Joo J.-M., Walker A., Baird S., 2000, AJ,119, 1824
Rodriguez E., Lopez-Gonzalez M.J., Lopez de Coca P., 2000, inBreger M., Montgomery M.H., eds., ASP Conf. Ser. Vol. 210,”Delta Scuti and Related Stars”, Astron. Soc. Pac., San Fran-cisco, p. 499
Rogers F.J., Swenson F.J., Iglesias C.A. 1996, ApJ, 456, 902Scargle, J.H., 1982, ApJ, 263, 835Schlegel D.J., Finkbeiner D.P., Davis M. 1998, ApJ, 500, 525
Schwarzenberg-Czerny A., 1996, ApJ Letters, 460, L107
c© 2005 RAS, MNRAS 000, 1–??
CASE: SX Phe stars from the globular cluster ω Centauri 13
Schwarzenberg-Czerny A., 1999, ApJ, 516, 315
Thompson I.B., Kaluzny J., Pych W., Burley G., Krzeminski W.,Paczynski B., Persson S.E., Preston G.W., 2001, AJ, 121, 3089
van Leeuwen F., Le Poole R.S., Reijns R.A., Freeman K.C., deZeeuw P.T. 2000, A&A, 360, 472
Walraven Th., Walraven J., Balona L.A., 1992, MNRAS, 254, 59
c© 2005 RAS, MNRAS 000, 1–??


![[Document title] - Food Security Cluster](https://static.fdokumen.com/doc/165x107/63150bb56ebca169bd0b096c/document-title-food-security-cluster.jpg)