Mass transfer coefficient and retention of PEGs in low pressure cross-flow ultrafiltration through...
20
journal of MEMBRANE SCIENCE E LS EV I ER Journal of Membrane Science 99 ( 1995 ) 1-20 Mass transfer coefficient and retention of PEGs in low pressure cross-flow ultrafiltration through asymmetric membranes P. Prddanos*, J.I. Arribas, A. Herndndez Dpto. de Ffsica Aplicada If, Facultad de Ciencias, Universidad de Valladolid, 47071 Valladolid, Spain Received 28 May 1994; accepted in revised form 19 August 1994 Abstract The flow and retention of 0.1% w/w aqueous solutions of several polyethylene glycols with molecular weights ranging from 300 to 12000 Daltons are studied when they are tangentially filtered through three commercially available asymmetric membranes, with transmembrane pressure differences up to 650 kPa. The mass transfer coefficients are obtained for low applied pressures below 60 kPa, within the frame of the film layer theory for the concentration polarization phenomena. The resulting variation of Kr~with the feed recirculation velocity and the molecular weight is analyzed. In the transition between laminar and turbulent regime, the experimental dependencies of Km are compared with those predicted by friction and non-friction models for the Sherwood equations. The mass transfer coefficient is used to compute the true retention standard curves, allowing estimate of the mean pore radii of the membranes. Keywords: Mass transfer; Polyethylene glycols; Ultrafiltration 1. Introduction Ultrafiltration is being used increasingly as a con- centration and separation process in a variety of indus- tries. Ultrafiltration is amenable to both continuous and batch operations and offers several advantages over more traditional separation methods. For example, because there is no heat added, ultrafiltration is suitable for heat labile substances. In addition, the products are not likely to suffer chemical denaturation which can be present with solvent extraction methods. The applica- tions of ultrafiltration are determined mainly by the permeability versus molecular weight characteristics of the membranes to be used. Manufacturers of ultrafilters generally specify a nominal "cut-off" for their products to be used in process design. However, in practice, there is not a sharply defined molecular weight below which all the 0376-7388/95/$09.50 © 1995 Elsevier Science B.V. All rights reserved SSDI0376-7388(94)00197-9 solutes pass the membrane while those above it are totally retained. On the contrary, in fact there is a grad- ual shift from free permeability to total retention as molecular weight increases. In practice, the permeation versus molecular weight characteristics depend on the process parameters and device characteristics; i.e. on the specific features of the process and cell where the membrane is going to be used. Polyethylene glycols are usually chosen to charac- terize a membrane-cell ensemble, because they are water soluble and can be readily obtained with narrow molecular weight distributions. In addition their adsorption is very low for almost every polymer sur- face. A tangential flow device has some advantages over the dead end design, mainly due to its capacity to reduce
-
Upload
independent -
Category
Documents
-
view
3 -
download
0
Transcript of Mass transfer coefficient and retention of PEGs in low pressure cross-flow ultrafiltration through...
j o u r n a l of MEMBRANE
SCIENCE
E LS EV I E R Journal of Membrane Science 99 ( 1995 ) 1-20
Mass transfer coefficient and retention of PEGs in low pressure cross-flow ultrafiltration through asymmetric membranes
P. Prddanos*, J.I. Arribas, A. Herndndez Dpto. de Ffsica Aplicada If, Facultad de Ciencias, Universidad de Valladolid, 47071 Valladolid, Spain
Received 28 May 1994; accepted in revised form 19 August 1994
Abstract
The flow and retention of 0.1% w/w aqueous solutions of several polyethylene glycols with molecular weights ranging from 300 to 12000 Daltons are studied when they are tangentially filtered through three commercially available asymmetric membranes, with transmembrane pressure differences up to 650 kPa.
The mass transfer coefficients are obtained for low applied pressures below 60 kPa, within the frame of the film layer theory for the concentration polarization phenomena. The resulting variation of Kr~ with the feed recirculation velocity and the molecular weight is analyzed. In the transition between laminar and turbulent regime, the experimental dependencies of Km are compared with those predicted by friction and non-friction models for the Sherwood equations. The mass transfer coefficient is used to compute the true retention standard curves, allowing estimate of the mean pore radii of the membranes.
Keywords: Mass transfer; Polyethylene glycols; Ultrafiltration
1. Introduction
Ultrafiltration is being used increasingly as a con- centration and separation process in a variety of indus- tries. Ultrafiltration is amenable to both continuous and batch operations and offers several advantages over more traditional separation methods. For example, because there is no heat added, ultrafiltration is suitable for heat labile substances. In addition, the products are not likely to suffer chemical denaturation which can be present with solvent extraction methods. The applica- tions of ultrafiltration are determined mainly by the permeability versus molecular weight characteristics of the membranes to be used.
Manufacturers of ultrafilters generally specify a nominal "cu t -of f" for their products to be used in process design. However, in practice, there is not a sharply defined molecular weight below which all the
0376-7388/95/$09.50 © 1995 Elsevier Science B.V. All rights reserved SSDI0376-7388(94)00197-9
solutes pass the membrane while those above it are totally retained. On the contrary, in fact there is a grad- ual shift from free permeability to total retention as molecular weight increases.
In practice, the permeation versus molecular weight characteristics depend on the process parameters and device characteristics; i.e. on the specific features of the process and cell where the membrane is going to be used.
Polyethylene glycols are usually chosen to charac- terize a membrane-cell ensemble, because they are water soluble and can be readily obtained with narrow molecular weight distributions. In addition their adsorption is very low for almost every polymer sur- face.
A tangential flow device has some advantages over the dead end design, mainly due to its capacity to reduce
2 P. Prddanos et al./Journal of Membrane Science 99 (1995) 1-20
IP
RP
1111 l , 9 , Mc
I .......................... ]
m
v o r
L
NV
DR
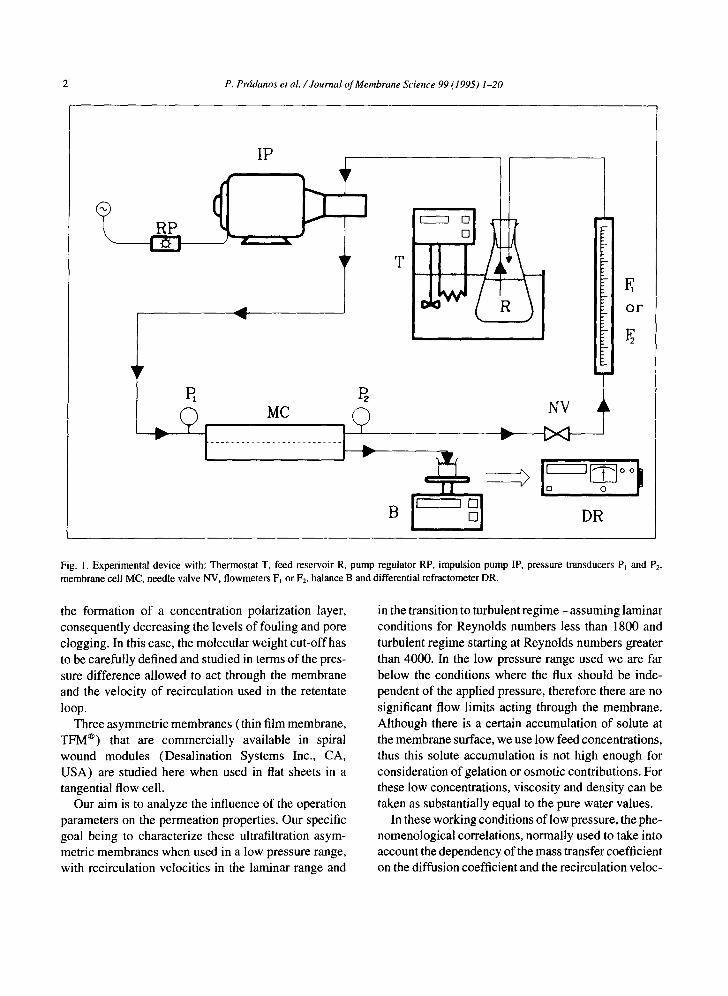
Fig. 1. Experimental device with: Thermostat T, feed reservoir R, pump regulator RP, impulsion pump IP, pressure transducers P~ and P2, membrane cell MC, needle valve NV, flowmeters F, or F2, balance B and differential refractometer DR.
the formation of a concentration polarization layer, consequently decreasing the levels of fouling and pore clogging. In this case, the molecular weight cut-off has to be carefully defined and studied in terms of the pres- sure difference allowed to act through the membrane and the velocity of recirculation used in the retentate loop.
Three asymmetric membranes (thin film membrane, TFM ®) that are commercially available in spiral wound modules (Desalination Systems Inc., CA, USA) are studied here when used in flat sheets in a tangential flow cell.
Our aim is to analyze the influence of the operation parameters on the permeation properties. Our specific goal being to characterize these ultrafiltration asym- metric membranes when used in a low pressure range, with recirculation velocities in the laminar range and
in the transition to turbulent reg ime- assuming laminar conditions for Reynolds numbers less than 1800 and turbulent regime starting at Reynolds numbers greater than 4000. In the low pressure range used we are far below the conditions where the flux should be inde- pendent of the applied pressure, therefore there are no significant flow limits acting through the membrane. Although there is a certain accumulation of solute at the membrane surface, we use low feed concentrations, thus this solute accumulation is not high enough for consideration of gelation or osmotic contributions. For these low concentrations, viscosity and density can be taken as substantially equal to the pure water values.
In these working conditions of low pressure, the phe- nomenological correlations, normally used to take into account the dependency of the mass transfer coefficient on the diffusion coefficient and the recirculation veloc-
P. Prrdanos et al. / Journal of Membrane Science 99 (1995) 1-20 3
. . . . . . . . . . . . . . . . . . . . . . . . . . . . . . . . . 4
f
/,,,," //llll/,ll//'II'III I IIII IIIIIIIIII ",,,\ /" ,11111111 Illllh I/ll]lll]l I I/////////\/\/\k, ",,,
/ \
U -UU--
4
- 5
2
:3
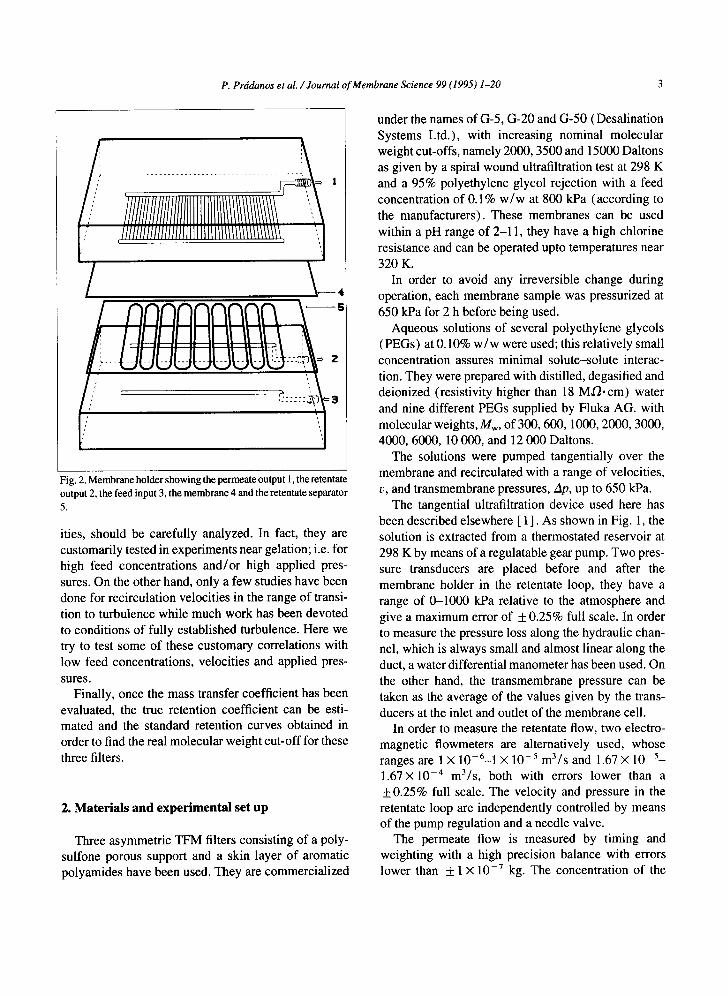
Fig. 2. Membrane holder showing the permeate output 1, the retentate output 2, the feed input 3, the membrane 4 and the retentate separator
5.
ities, should be carefully analyzed. In fact, they are customarily tested in experiments near gelation; i.e. for high feed concentrations and/or high applied pres- sures. On the other hand, only a few studies have been done for recirculation velocities in the range of transi- tion to turbulence while much work has been devoted to conditions of fully established turbulence. Here we try to test some of these customary correlations with low feed concentrations, velocities and applied pres- sures.
Finally, once the mass transfer coefficient has been evaluated, the true retention coefficient can be esti- mated and the standard retention curves obtained in order to find the real molecular weight cut-off for these three filters.
2. Materials and experimental set up
Three asymmetric TFM filters consisting of a poly- sulfone porous support and a skin layer of aromatic polyamides have been used. They are commercialized
under the names of G-5, G-20 and G-50 (Desalination Systems Ltd.), with increasing nominal molecular weight cut-offs, namely 2000, 3500 and 15000 Daltons as given by a spiral wound ultrafiltration test at 298 K and a 95% polyethylene glycol rejection with a feed concentration of 0.1% w/w at 800 kPa (according to the manufacturers). These membranes can be used within a pH range of 2-11, they have a high chlorine resistance and can be operated upto temperatures near 320 K.
In order to avoid any irreversible change during operation, each membrane sample was pressurized at 650 kPa for 2 h before being used.
Aqueous solutions of several polyethylene glycols (PEGs) at 0.10% w/w were used; this relatively small concentration assures minimal solute-solute interac- tion. They were prepared with distilled, degasified and deionized (resistivity higher than 18 M,O.cm) water and nine different PEGs supplied by Fluka AG. with molecular weights, Mw, of 300, 600, 1000, 2000, 3000, 4000, 6000, 10 000, and 12 000 Daltons.
The solutions were pumped tangentially over the membrane and recirculated with a range of velocities, v, and transmembrane pressures, Ap, up to 650 kPa.
The tangential ultrafiltration device used here has been described elsewhere [ 1 ]. As shown in Fig. 1, the solution is extracted from a thermostated reservoir at 298 K by means of a regulatable gear pump. Two pres- sure transducers are placed before and after the membrane holder in the retentate loop, they have a range of 0-1000 kPa relative to the atmosphere and give a maximum error of _ 0.25% full scale. In order to measure the pressure loss along the hydraulic chan- nel, which is always small and almost linear along the duct, a water differential manometer has been used. On the other hand, the transmembrane pressure can be taken as the average of the values given by the trans- ducers at the inlet and outlet of the membrane cell.
In order to measure the retentate flow, two electro- magnetic fiowmeters are alternatively used, whose ranges are 1 × 10⁻⁶-1 × 10 -5 m3/s and 1.67X 10 - 5 - 1 . 6 7 X 10 - 4 m 3 / s , both with errors lower than a +0.25% full scale. The velocity and pressure in the retentate loop are independently controlled by means of the pump regulation and a needle valve.
The permeate flow is measured by timing and weighting with a high precision balance with errors lower than + 1 x 10 - 7 kg. The concentration of the
P. Prddanos et al. / Journal of Membrane Science 99 (1995) 1-20
t q
,,,-4
X
.<3
5.8
5 . 3
4 . 8
4.3
' 1 ' I ~ } '
[f-] , 1 J I J I l I
0 I 2 3 4
(ml )
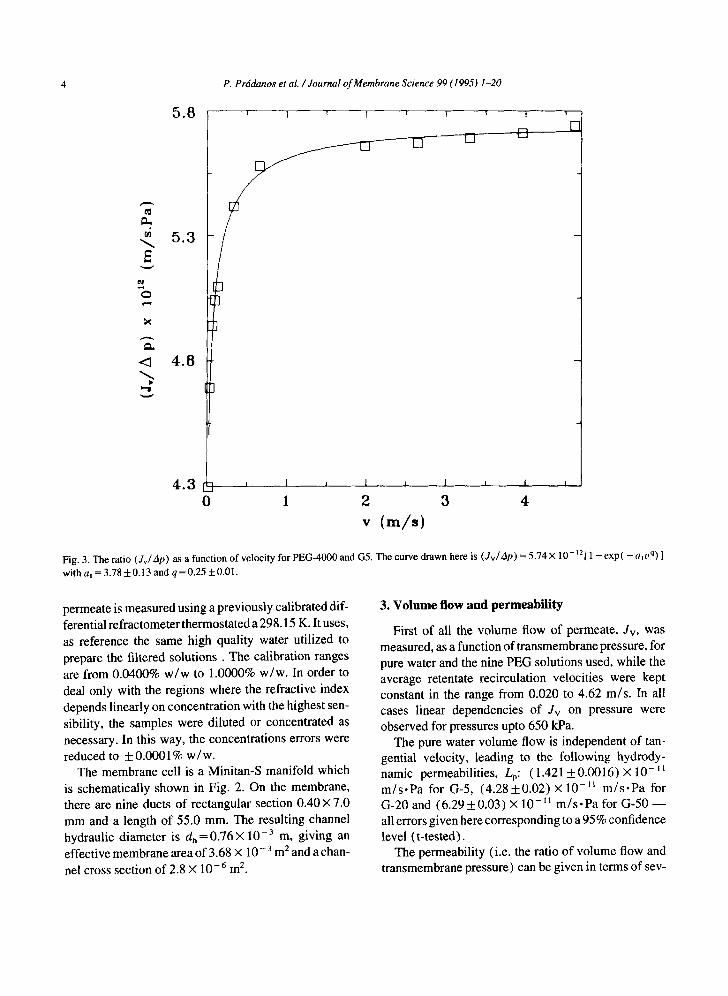
Fig . 3. T h e ra t io ( J v / A p ) as a f u n c t i o n o f ve loc i ty f o r P E G - 4 0 0 0 a n d G5 . T h e c u r v e d r a w n he re is ( J v / A p ) = 5 .74 × 1 0 - '2 l i - e x p ( - a to q ) ]
wi th a , = 3 .78 5 : 0 . 1 3 a n d q = 0 .25 + 0 .01 .
permeate is measured using a previously calibrated dif- ferential refractometer thermostated a 298.15 K. It uses, as reference the same high quality water utilized to prepare the filtered solutions. The calibration ranges are from 0.0400% w / w to 1.0000% w/w. In order to deal only with the regions where the refractive index depends linearly on concentration with the highest sen- sibility, the samples were diluted or concentrated as necessary. In this way, the concentrations errors were reduced to _ 0.0001% w/w.
The membrane cell is a Minitan-S manifold which is schematically shown in Fig. 2. On the membrane, there are nine ducts of rectangular section 0.40 X 7.0 mm and a length of 55.0 mm. The resulting channel hydraulic diameter is d h = 0 . 7 6 × 1 0 - 3 m , giving an effective membrane area of 3.68 X 10- 3 m 2 and a chan- nel cross section of 2.8 x 1 0 - 6 m 2.
3. Volume flow and permeability
First of all the volume flow of permeate, Jv, was measured, as a function of transmembrane pressure, for pure water and the nine PEG solutions used, while the average retentate recirculation velocities were kept constant in the range from 0.020 to 4.62 m/s. In all cases linear dependencies of Jv on pressure were observed for pressures upto 650 kPa.
The pure water volume flow is independent of tan- gential velocity, leading to the following hydrody- namic permeabilities, Lo: ( 1.421-4- 0.0016) x 10- ~ m / s . P a for G-5, ( 4 . 2 8 + 0 . 0 2 ) X 10 -~t m / s . P a for G-20 and (6 .29+0.03) X 10 - '1 m / s . P a for G-50 - - all errors given here corresponding to a 95% confidence level (t-tested).
The permeability (i.e. the ratio of volume flow and transmembrane pressure) can be given in terms of sev-

1 3 . 0
P. Prddanos et al. / Journal o f Membrane Science 99 (1995) 1-20
I ~ 1
1 1 . 0
9 . 0
7 . 0
t~
v
[]
I
5 . 0 ~ t ~ 1 ~ I
0 1 0 0 0 2 0 0 0 3 0 0 0 4 0 0 0
Mw ( D a l t o n )
Fig. 4. The ratio ( Jv /Ap) as a function of the molecular weight for a velocity v=4 .62 m/ s and the G-5 membrane. The fitted curve is (Jv / Ap) = a : +a3 exp[ - a 4 ( M w - 3 0 0 ) ~] with a2= (5 .74!0 .04) × 10 -tz, a3 = (7.27=1=0.08) × 10 -12, a4 =0.0365:0.007 and r = 0.51 4-0.12.
eral resistances in the membrane system [2] according to:
Jv 1
Ap ~ ( e m +Rd +Rb) (1)
with the molecular weight of the solute. As an example, (Jv/Ap) is shown for G-5 as a function of velocity for PEG-4000 in Fig. 3, and versus the molecular weight for v = 4.62 m/s in Fig. 4.
where Rm is the membrane resistance, Rd the deposited solute resistance and Rb the boundary layer resistance. Assuming that the solute resistances can be character- ised by means of "specific resistances", we have Rd = a,~/d(t) and R b = abmb, Md(t) being the mass of deposited solute per unit area of membrane at time t, while Mb is the mass of solute held in the boundary layer per unit area. Given that we deal with stationary situations we have that (Jv/Ap) is a constant for a given solute and a fixed recirculation velocity. In prac- tice, the permeability always increases with velocity for any solute while, for a constant velocity, it decreases
4. O b s e r v e d re tent ion
Concerning the output or permeate concentration, %, it is convenient to give it in terms of the input or feed concentration, Co, through the so called observed or apparent retention coefficient
Ro 1 c p = ( 2 ) Co
which, of course is always ~< 1.
P. Prddanos et al. / Journal of Membrane Science 99 (1995) 1-20
0.98 , r , t , i ,
Ro
0.96
0 . 9 4
0.92
0.90
0.88
0.86
o , 6 2 0 m / / : • 3.960 o 3. oo • 2 . 6 4 0
o , 9 6 o • 0 . 6 6 0
o 0 . 0 6 6 ¢, 0 . 0 3 3 • 0 . 0 2 0
0 . 8 4 t I ~ I ~ I , I 0 150 300 450 600
A p ( k P a )
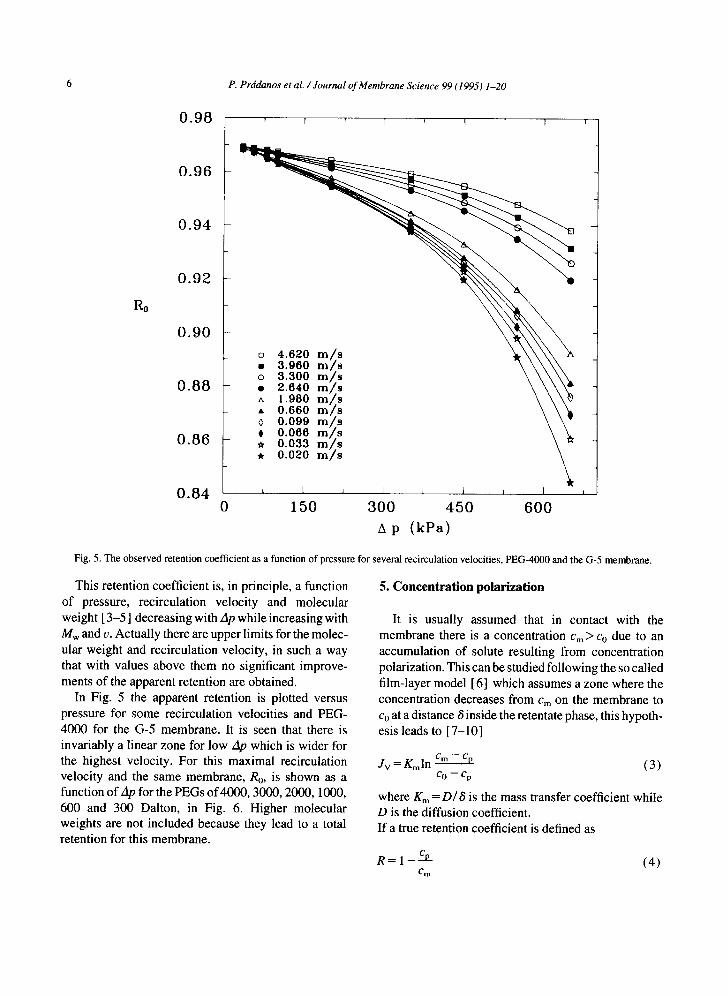
Fig. 5. The observed retention coefficient as a function of pressure for several recirculation velocities, PEG-4000 and the G-5 membrane.
This retention coefficient is, in principle, a function of pressure, recirculation velocity and molecular weight [ 3-5 ] decreasing with Ap while increasing with Mw and v. Actually there are upper limits for the molec- ular weight and recirculation velocity, in such a way that with values above them no significant improve- ments of the apparent retention are obtained.
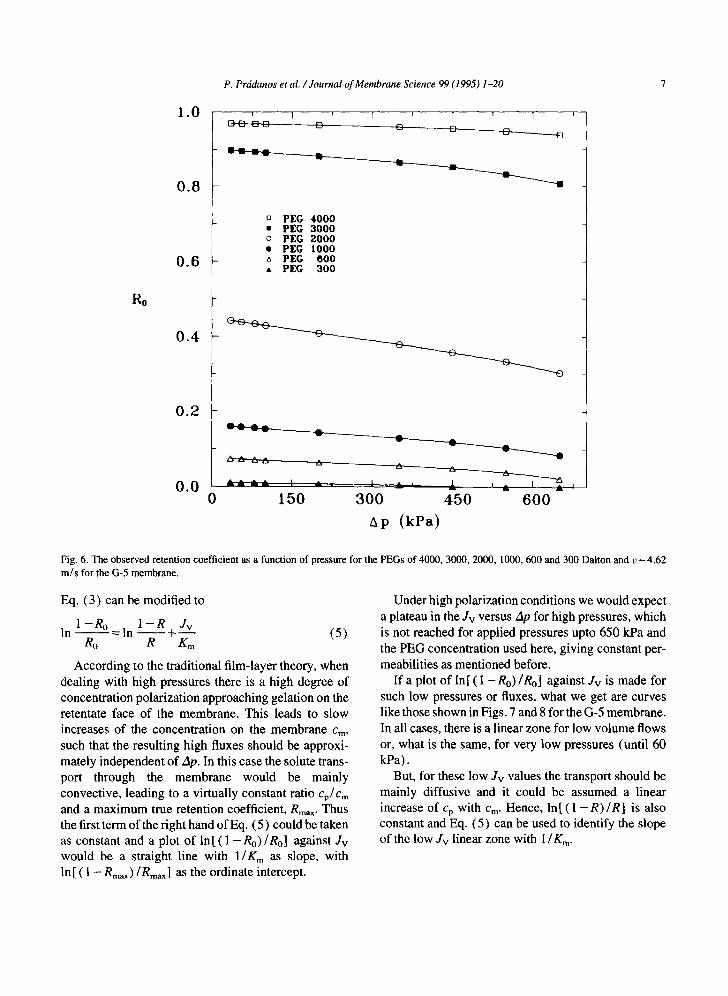
In Fig. 5 the apparent retention is plotted versus pressure for some recirculation velocities and PEG- 4000 for the G-5 membrane. It is seen that there is invariably a linear zone for low Ap which is wider for the highest velocity. For this maximal recirculation velocity and the same membrane, Ro, is shown as a function of Ap for the PEGs of 4000, 3000, 2000, I000, 600 and 300 Dalton, in Fig. 6. Higher molecular weights are not included because they lead to a total retention for this membrane.
5. C o n c e n t r a t i o n p o l a r i z a t i o n
It is usually assumed that in contact with the membrane there is a concentration Cm > CO due to an accumulation of solute resulting from concentration polarization. This can be studied following the so called film-layer model [6] which assumes a zone where the concentration decreases from Cm on the membrane to Co at a distance 8 inside the retentate phase, this hypoth- esis leads to [7-10]
j v = Kml n C m - - C p (3) c o - - Cp
where Km= D~ ~ is the mass transfer coefficient while D is the diffusion coefficient. I f a true retention coefficient is defined as
R = I - S Z (4) Cm
P. Prddanos et al. / Journal o f Membrane Science 99 (1995) 1-20 7
Ro
1.0
0.8
0.6
0.4
0.2
0.0
T 1 ' ! ~ 1 T I
G PEG 4000 • PEG 3 0 0 0 o PEG 8000 • PEG I 0 0 0 z~ PEG 6 0 0 • PEG 300
0 150 300 450 600 A p ( k P a )
Fig, 6. The observed retention coefficient as a function of pressure for the PEGs of 4000, 3000, 2000, 1000, 600 and 300 Dalton and v =4.62 m/s for the G-5 membrane.
Eq. (3) can be modified to
1-,% =In 1 -g+gv (5) In Ro R Km
According to the traditional film-layer theory, when dealing with high pressures there is a high degree of concentration polarization approaching gelation on the retentate face of the membrane. This leads to slow increases of the concentration on the membrane Cm, such that the resulting high fluxes should be approxi- mately independent of Ap. In this case the solute trans- port through the membrane would be mainly convective, leading to a virtually constant ratio Cp/Cm and a maximum true retention coefficient, Rrr~- Thus the first term of the right hand of Eq. (5) could be taken as constant and a plot of In [ ( 1 - Ro)/Ro] against Jv would be a straight line with 1/Km as slope, with In[ ( 1 - R m a x ) / R m a x ] as the ordinate intercept.
Under high polarization conditions we would expect a plateau in the Jv versus Ap for high pressures, which is not reached for applied pressures upto 650 kPa and the PEG concentration used here, giving constant per- meabilities as mentioned before.
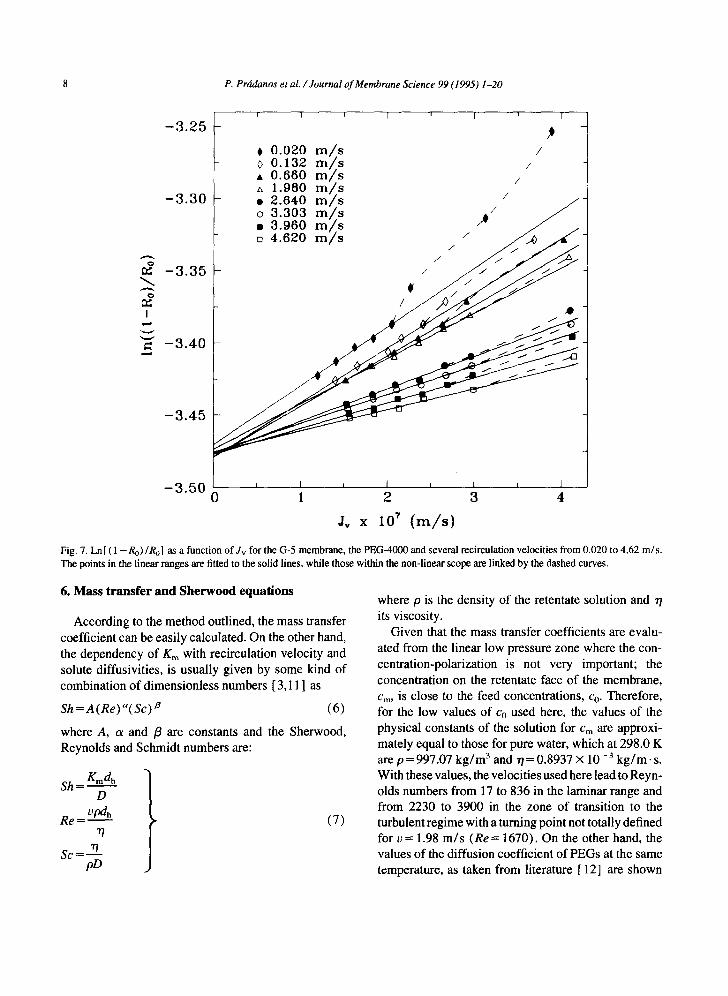
If a plot of In[ ( I - Ro)/Ro] against Jv is made for such low pressures or fluxes, what we get are curves like those shown in Figs. 7 and 8 for the G-5 membrane. In all cases, there is a linear zone for low volume flows or, what is the same, for very low pressures (until 60 kPa).
But, for these low Jv values the transport should be mainly diffusive and it could be assumed a linear increase of cp with Cm. Hence, ln[(1 -R)/R] is also constant and Eq. (5) can be used to identify the slope of the low Jv linear zone with 1/K,,.
8 P. Pr6danos et al./Journal of Membrane Science 99 (1995) 1-20
- 3 . 2 5
- 3 . 3 0
.-~
¢¢ - 3 . 3 5
I
- 3 . 4 0
- 3 . 4 5
- 3 . 5 0
i I i
,00 o (> 0 .132 :o.ooo m/i
1.980 • 2 .640
• 3 .960 o 4 . 6 2 0
I ' I
/
/ /
/
/ )
/
/ /
/
/
0 1 2 3 4
J , x 107 ( m / s )
,r t
Fig. 7. Ln[ ( 1 - R o ) / R o ] as a function of Jv for the G-5 membrane, the PEG-4000 and several recirculation velocities from 0.020 to 4.62 m/s .
The points in the linear ranges are fitted to the solid lines, while those within the non-linear scope are linked by the dashed curves.
6. Mass transfer and Sherwood equations
According to the method outlined, the mass transfer coefficient can be easily calculated. On the other hand, the dependency of Km with recirculation velocity and solute diffusivities, is usually given by some kind of combination of dimensionless numbers [ 3, I 1 ] as
S h = A ( R e ) ~ ( S c ) ~ (6)
where A, a and /3 are constants and the Sherwood, Reynolds and Schmidt numbers are:
Kma~ S h ~ m
D vpd~
R e = ~
Sc = rl po
(7)
where p is the density of the retentate solution and r/ its viscosity.
Given that the mass transfer coefficients are evalu- ated from the linear low pressure zone where the con- centration-polarization is not very important; the concentration on the retentate face of the membrane, Cm, is close to the feed concentrations, Co. Therefore, for the low values of Co used here, the values of the physical constants of the solution for Cm are approxi- mately equal to those for pure water, which at 298.0 K are p = 997.07 kg /m 3 and ,/=0.8937 × 10 -3 kg/m.s . With these values, the velocities used here lead to Reyn- olds numbers from 17 to 836 in the laminar range and from 2230 to 3900 in the zone of transition to the turbulent regime with a turning point not totally defined for v --- 1.98 m/s ( R e = 1670). On the other hand, the values of the diffusion coefficient of PEGs at the same temperature, as taken from literature [ 12] are shown

P. Prddanos et al. / Journal of Membrane Science 99 (1995) 1-20 9
I
4.0
2.0
0.0
- 2 . 0
I i 1 , I
A A A A A •
• PEG 300 PEG 400
• PEG I000 o PEG 2000 • PEG 3000 o PEG 4000
[ ] o {3 0 0 •
- 4 . 0 L t j I j I 0 2 4 6
J, x 10 7 ( m / s )
Fig. 8. Ln [ ( 1 - R o)/R o ] as a function of Jv for the G-5 membrane, PEGs from 300 to 4000 Dalton (only the PEGs that are not totally retained are shown) and v = 4.62 m/s. Just the linear zones are drawn here, the small solid circles correspond to the first experimental points out of the
linear dominions.
in Table 1 along with the corresponding Schmidt num- bers.
Tnble 1 The diffusion coefficients of PEGs as taken from literature. They can be fitted to D = a s M ~ with a 5 = ( 9 . 8 2 + 0 . 9 6 ) × 1 0 -9 and s = -(0.525:0.01)
Mw D Sc (Dalton) ( 10-,l m2/s)
300 37.65 2380 600 30.32 2960
1000 26.19 3420 2000 20.08 4460 3000 14.86 6030 4000 12.82 6990 6000 9.98 8980
10000 7.90 11350 12000 7.35 12190
For recirculation velocities from 0.020 to 0.99 m/s we are in the laminar region (Re = 17 to 836). In these conditions, the Sherwood equation to be used depends [ 3 ] on the recirculation velocities and channel lengths, L, in such a way that A =A' (dh/L)% The coefficients a, /3 and A' can be obtained by a non-linear fitting procedure. In this way, with the fitting parameters linked to a = / 3 = 1/3+_0.1, the values obtained are shown in Table 2. Several values are usually assumed
Table 2 The fitted parameters of the Chilton-Colbum correlation for the laminar regime
Membrane A a /3
G-5 1.06+0.12 0.255:0.09 0.27+0.10 G-20 2.03-t-0.34 0.25-t-0.08 0.335:0.08 G-50 2.38 + 0.38 0.25 4- 0.07 0.33 5:0.08
10 P. Prddanos et al. / Journal of Membrane Science 99 (1995) 1-20
Table 3 The fitted parameters of the Chilton-Colburn correlation for the turbulent regime
Membrane A ( 10 -3) ot /3
G-5 0.507+0.740 0.97+0.20 0.37+0.06 G-20 6.95 +2.20 0.82+0.35 0.315:0.14 G-50 1.51 5 :1 .48 0 .955 :0 .11 0.435:0.04
for these parameters: namely A' from 0.664 to 2.24, a from 0.33 to 0.5 and /3=0.33 [13,14]. Thus the obtained results are fairly close to the commonly used coefficients.
For a turbulent regime, the Chil ton-Colburn corre- lation is normally used. This correlation is based on momentum, mass and heat transfer analogies for smooth ducts and seems to be valid for R e > 105; i.e. for the fully developed turbulent regime. In its original
version due to Dittus-Boelter, it assumes that A =0.023, a = 0 .80 , /3= 0.33 [15], while other values for these constants have been proposed in the literature [15]: A from 0.0096 to 0.107, c~ from 0.75 to 0.931 and/3 from 0.25 to 0.6.
For recirculation velocities from 2.64 m / s (Re = 2230) to 4.62 m / s ( R e = 3900) we are in a lam- inar to turbulent transition range; i.e. two orders of magnitude below the appropriate Re range. Neverthe- less, a correlation of the Chil ton-Colburn type can be fitted for the mass transfer coefficient with a, A and/3 as free parameters to be calculated by a nonlinear regression of the Marquardt type. The experimental data lead to the values of the adjustable parameters shown in Table 3. It is worth noting here, that the errors for A are large, which means that the significance of the average values obtained for A is limited. The values obtained for the other parameters, ~ and/3, are close to
I0
8
6
Transi t ion to Turbulence
4
2
' I
G-5
Laminar Regime
0 L _ _ ~
0 1
r r r I ' I '
S v
co I O
H
2 3 4 5 v
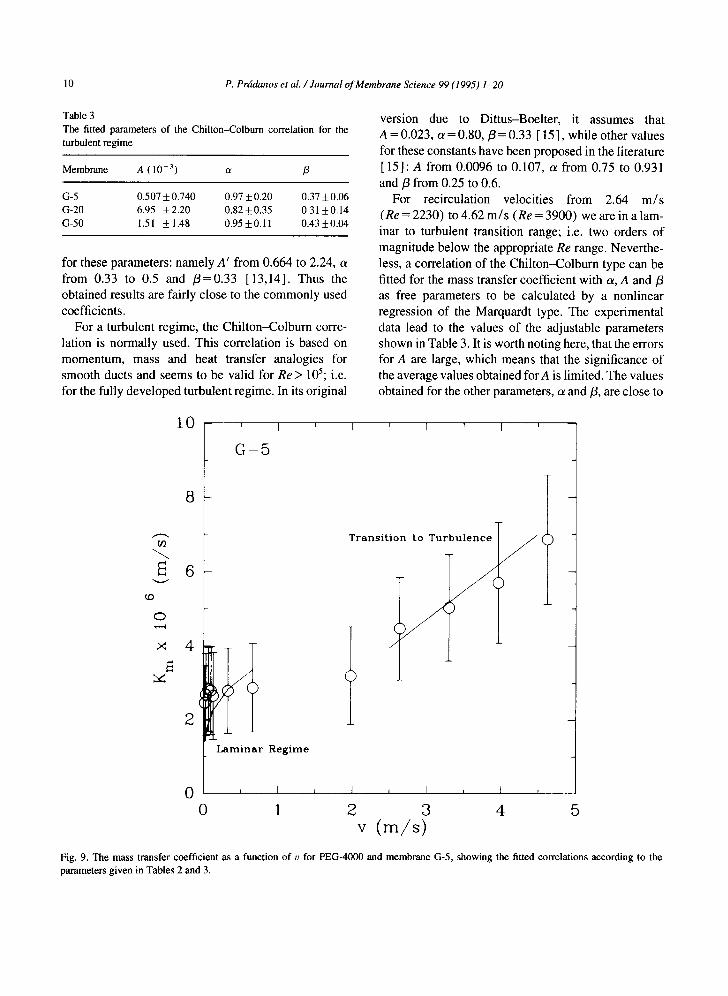
Fig. 9. The mass transfer coefficient as a function of v for PEG-4000 and membrane G-5, showing the fitted correlations according to the parameters given in Tables 2 and 3.

P. Prddanos et al. / Journal of Membrane Science 99 (1995) 1-20 11
20 ' I ' [ ' I ' I '
E v
G-20
16
12
8 E
Laminar Regime 4
Transition to _Turbule~
0 J I L I A I ~ I t
0 1 2 3 4 5 v ( m / s )
Fig. 10. The mass transfer coefficient as a function of v for PEG-6000 and membrane G-20, showing the fitted correlations according to the parameters given in Tables 2 and 3.
the ranges proposed in the literature as already noted for the laminar range.
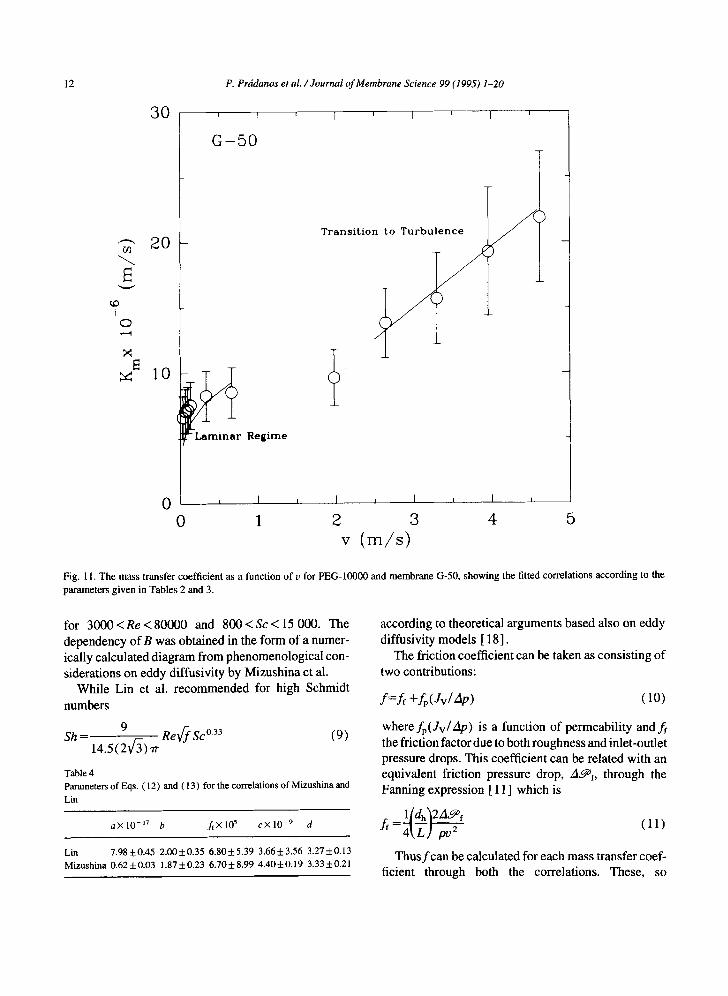
In Figs. 9, 10 and 11 the mass transfer coefficient is shown, as a function of the recirculation velocity, for the PEG of the highest molecular weight not totally retained for each membrane. In these figures the pro- gression from the laminar to the transition regime is clearly shown. It can also be seen that errors for K~ are relatively large, this should be due to the small driving force for mass transfer present for low volume flows. In the three figures it is seen a clear change of the Km versus v pattern for tangential velocities around 2 m/s (Re = 1670).
It is worth noting that the theoretical Chilton--Col- burn correlations systematically overestimate the mass transfer coefficient experimentally obtained for the three membranes possibly due to the low Reynolds
range used in the experiment. In any case there are some differences in the Km behaviour from one to another membrane and the same recirculation velocity and PEG. A correlation like Dittus-Boelter cannot account for the membrane roughness, which could be negligible, or for the effect of the different permeabil- ities of the membranes [ 16]. In our case the last phe- nomenon could be very significant taking into account the fact that the permeability of G-50 is close to five times that of G-5.
To account for friction in the hydraulic channel, Mizushina et al. [ 17] proposed a correlation
. . 1 / 2
Sh=O.827B1/3(f) Scl/3Re (8)
where f is the friction factor and B depends on the Reynolds number. This correlation appears to be valid
t2 P. Prddanos et al. / Journal of Membrane Science 99 (1995) 1-20
O0
E ¢.D
I ¢:D v..-4
30
20
10
1 ' I ' I ' I
G - 5 0
" L a m i n a r Regime
T r a n s i t i o n t o T u r b u l e n c e
0 I I L I I I J I l
0 1 2 3 4 5 v ( m / s )
Fig. 11. The mass transfer coefficient as a function of v for PEG-10000 and membrane G-50, showing the fitted correlations according to the parameters given in Tables 2 and 3.
for 3000 < Re < 80000 and 800 < Sc < 15 000. The dependency of B was obtained in the form of a numer- ically calculated diagram from phenomenological con- siderations on eddy diffusivity by Mizushina et al.
While Lin et al. recommended for high Schmidt numbers
9 Sh = Re~f Sc 0"33 (9)
14.5(2X/~) ~"
Table 4 Parameters of Eqs. ( 12 ) and (13) for the correlations of Mizushina and
Lin
a X 1 0 -~7 b f f × 1 0 ~ c × 1 0 -9 d
Lin 7.985:0.45 2.005:0.35 6.805:5.39 3.665:3.56 3.275:0.13 Mizushina 0.62+0.03 1.87+0.23 6.705:8.99 4.40+0.19 3.33+0,21
according to theoretical arguments based also on eddy diffusivity models [ 18].
The friction coefficient can be taken as consisting of two contributions:
f = f i +fr,(Jv/Ap) (lO)
where fp(Jv/Ap) is a function of permeability and f i the friction factor due to both roughness and inlet-outlet pressure drops. This coefficient can be related with an equivalent friction pressure drop, A~f , through the Fanning expression [ 11 ] which is
l [ d h ~ 2 ~ @ f
f r = ~ L J PV 2 (11)
Thus f can be calculated for each mass transfer coef- ficient through both the correlations. These, so

P. Prddanos et aL / Journal of Membrane Science 99 (1995) 1-20 13
I ', ' , / I , I , / I
_ : ', / 5 5 ,, : /
- ) / / /
: / , /¢~ - . ,
4 5 - ', / / 1 /
% --
2 5
5 i I J I
7 1 7 2 7 3 7
D x 10 n ( m Z / s )
~ig. 12. The mass transfer coefficient as a function of D for 0=4.62 m/s for all the membranes, showing the Chilton-Colbum zone, the :oincident Mizushina and Lin correlations (dashed lines) along with the fitted one corresponding to the parameters in Table 3 (solid lines hrough experimental points).
)btained, values for f can be fitted to a function of )ermeability, for example
+ a( Jv l b ~=ff [~pp) (12)
~here ff has been taken as equal for the three mem- branes assuming similar roughness. Then, fp can be lssumed to follow a potential dependency on the pres- ;ure loss due to the flow through the membrane
p = C ( ~ . ~ - - A , ~ f ) d (13)
:there A ~ is the total pressure loss along the channel ~hich can be measured, while Af~f can be calculated )y using Eq. ( 11 ). The so obtained values for the equiv- alent friction pressure drop are A ~ f = 2 1 0 Pa (Lin :orr.) and 207 Pa (Mizushina corr.) while the total
pressure drops are A ~ = 2 7 0 Pa (G-5), 800 Pa (G- 20) and 1100 Pa (G-50). In order to measure A~f , experiments have been performed for all the mem- branes and with applied pressures until 60 kPa but with the permeate line closed, in such a way that the second term in Eq. (10) should be zero because no permeation is allowed, leading to A,.~f= 2 0 0 + 3 0 in relatively good agreement with the calculated values. The values for the parameters in Eqs. (12) and ( 13 ), are computed through a non-linear regression of the Marquardt type and are shown in Table 4.
On the other hand, the fitted Mizushina et al. and Lin et al. correlations (which coincide in our case) along with the zone covered by the Chilton-Colburn corre- lations are drawn in Fig. 12 for all the membranes. The mass transfer coefficient is shown versus the diffusion coefficient for a constant almost turbulent velocity of
14 P. Pr6danos et al. / Journal of Membrane Science 99 (1995) 1-20
0 . 9 7 1 ' I I
0 . 9 6
R
0 . 9 5 D 4.620 m/~ss • 0 . 3 3 0 o o.,3 • 0 . 0 9 9 o.o°°mI • 0 . 0 3 3 0 0 .O2O
0 . 9 4 , I , 1 , I , 0 1 2 3 4
J,, x 1 0 6 ( m / s )
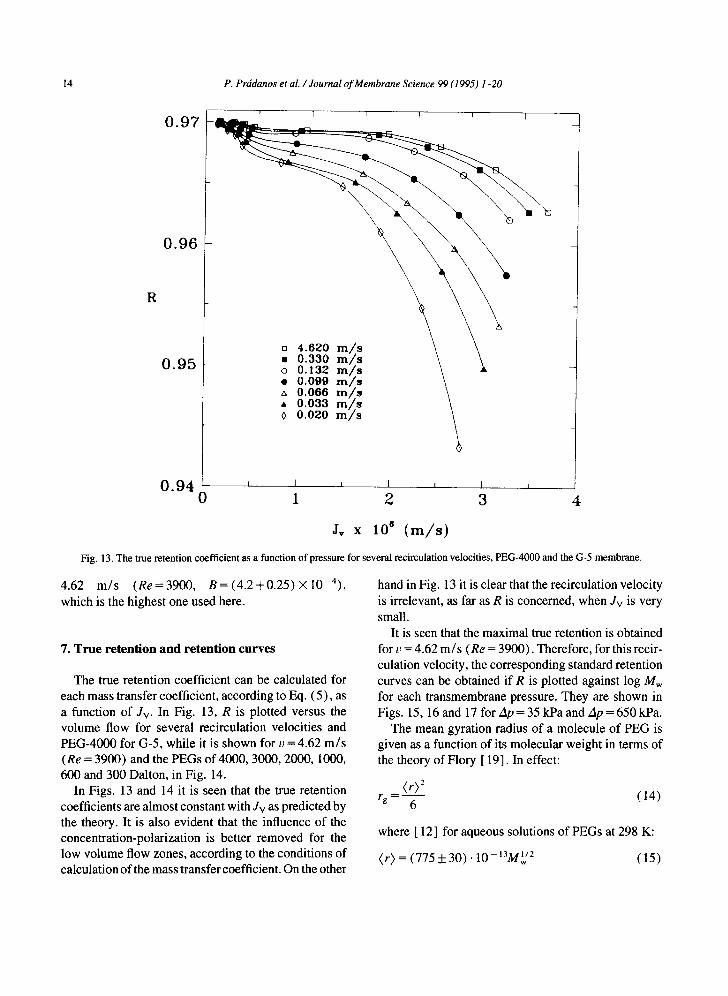
Fig. 13. The true retention coefficient as a function of pressure for several recirculation velocities, PEG-4000 and the G-5 membrane.
4.62 m/s (Re=3900 , B = (4 .2+0 .25) × |0-4) , which is the highest one used here.
7. T r u e r e t e n t i o n a n d r e t e n t i o n c u r v e s
The true retention coefficient can be calculated for each mass transfer coefficient, according to Eq. (5), as a function of Jv. In Fig. 13, R is plotted versus the volume flow for several recirculation velocities and PEG-4000 for G-5, while it is shown for v =4 .62 m/s (Re = 3900) and the PEGs of 4000, 3000, 2000, 1000, 600 and 300 Dalton, in Fig. 14.
In Figs. 13 and 14 it is seen that the true retention coefficients are almost constant with Jv as predicted by the theory. It is also evident that the influence of the concentration-polarization is better removed for the low volume flow zones, according to the conditions of calculation of the mass transfer coefficient. On the other
hand in Fig. 13 it is clear that the recirculation velocity is irrelevant, as far as R is concerned, when Jv is very small.
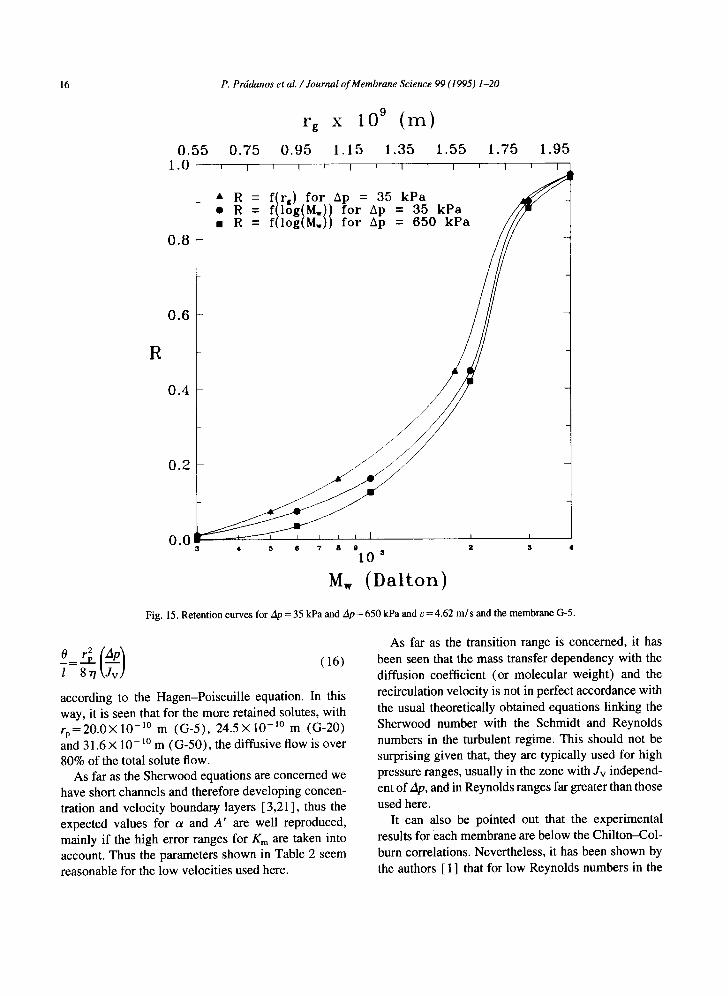
It is seen that the maximal true retention is obtained for v = 4.62 m/s (Re = 3900). Therefore, for this recir- culation velocity, the corresponding standard retention curves can be obtained if R is plotted against log Mw for each transmembrane pressure. They are shown in Figs. 15, 16 and 17 for Ap = 35 kPa and Ap = 650 kPa.
The mean gyration radius of a molecule of PEG is given as a function of its molecular weight in terms of the theory of Flory [ 19]. In effect:
(r)2 (14) r g = 6
where [ 12] for aqueous solutions of PEGs at 298 K:
_ . 1 0 M w ( 1 5 ) ( r ) = (775 + 30) -13 1/2
P. Prddanos et al. / Journal of Membrane Science 99 (1995) 1-20 15
R
1 . 0
0 . 8
0 . 6
0 . 4
0 . 2
o PEG 4000 • PEG 3000 o PEG 2000 • PEG 1000 zx PEG 600 • PEG 3 0 0
~ C O 0 0
w w v
, - " ~ . . " . :'. A
0 . 0 ...... "-'-" I • 0 2
i I
1 x , _ . I
4 6
J. x 10 6 ( m / s )
Fig. 14. The true retention coefficient as a funct ion o f pressure for the PEGs of 4000, 3000, 2000, 1000, 600 and 300 Dalton and v = 4 .62 m / s
for the G-5 membrane .
This has been used to include a rg axis in Figs. 15 to
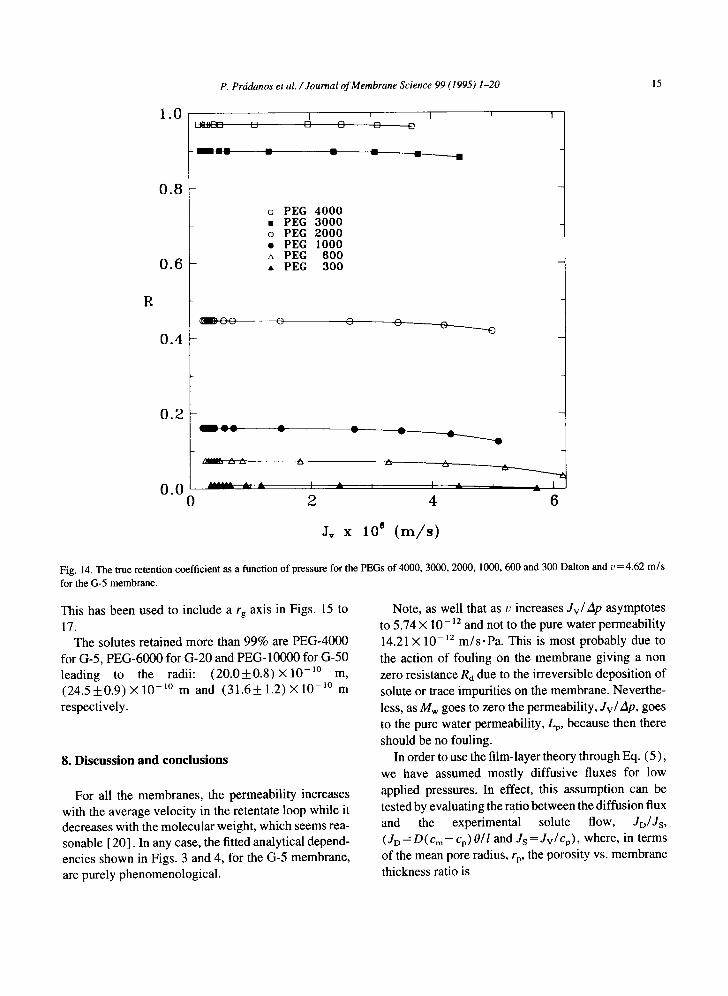
17. The solutes retained more than 99% are PEG-4000
for G-5, PEG-6000 for G-20 and PEG-10000 for G-50 leading to the radii: (20 .0+0 .8 ) × 1 0 -1° m, (24 .5+0 .9 ) × 10 -1° m and (31 .6+ 1.2) × 10 -1° m
respectively.
8. D i s c u s s i o n a n d c o n c l u s i o n s
For all the membranes, the permeability increases with the average velocity in the retentate loop while it decreases with the molecular weight, which seems rea- sonable [20]. In any case, the fitted analytical depend- encies shown in Figs. 3 and 4, for the G-5 membrane, are purely phenomenological.
Note, as well that as v increases Jv/Ap asymptotes to 5.74 × 10⁻¹² and not to the pure water permeability 14.21 × 10 -12 m/s .Pa . This is most probably due to
the action of fouling on the membrane giving a non zero resistance Ra due to the irreversible deposition of solute or trace impurities on the membrane. Neverthe- less, as Mw goes to zero the permeability, Jv/Ap, goes to the pure water permeability, Lp, because then there should be no fouling.
In order to use the film-layer theory through Eq. (5), we have assumed mostly diffusive fluxes for low applied pressures. In effect, this assumption can be tested by evaluating the ratio between the diffusion flux and the experimental solute flow, JD/Js, ( J D - - D ( c m - - Cp) Oil and Js = J v / c p ) , where, in terms of the mean pore radius, rp, the porosity vs. membrane thickness ratio is
16 P. Prddanos et al. /Journal of Membrane Science 99 (1995) 1-20
R
0 . 5 5 0 . 7 5 1 .0 , ,
• R = • R • R
0 . 8
0 . 6
0 . 4
0 . 2
0.• 3 ¢
rg x 10 9 ( m )
0 . 9 5 1 . 1 5 1 . 3 5 1 . 5 5 I I I I I I I I
f ( r : ) f o r £xp = 35 k P a f( log(Mw)) f o r Ap = 35 k P a f ( l o g ( M . ) ) f o r Ap = 650 k P a
1 . 7 5 1 . 9 5
' I ' I
7- t t , L I , J I 5 6 7 8 9 2 $ 4
10 s
M,, ( D a l t o n )
Fig. 15. Retention curves for Ap = 35 kPa and Ap = 650 kPa and v = 4.62 m/s and the membrane G-5.
-~ = '~ ' - (~-v) (16) I 8~7
according to the Hagen-Poiseuille equation. In this way, it is seen that for the more retained solutes, with r p = 2 0 . 0 × 1 0 -1° m (G-5), 2 4 . 5 × 1 0 - ' 0 m (G-20) and 31.6 × 10- lo m (G-50), the diffusive flow is over 80% of the total solute flow.
As far as the Sherwood equations are concerned we have short channels and therefore developing concen- tration and velocity boundary layers [3,21], thus the expected values for a and A' are well reproduced, mainly if the high error ranges for Km are taken into account. Thus the parameters shown in Table 2 seem reasonable for the low velocities used here.
As far as the transition range is concerned, it has been seen that the mass transfer dependency with the diffusion coefficient (or molecular weight) and the recirculation velocity is not in perfect accordance with the usual theoretically obtained equations linking the Sherwood number with the Schmidt and Reynolds numbers in the turbulent regime. This should not be surprising given that, they are typically used for high pressure ranges, usually in the zone with Jv independ- ent of Ap, and in Reynolds ranges far greater than those used here.
It can also be pointed out that the experimental results for each membrane are below the Chilton-Col- burn correlations. Nevertheless, it has been shown by the authors [ 1 ] that for low Reynolds numbers in the
P. Prddanos et al. / Journal of Membrane Science 99 (1995) 1-20 17
r, xlO 9 (m) 1 . 0 0 1 . 2 0 1 . 4 0 1 . 8 0 1 .80 2 . 0 0 2 . 2 0 2 . 4 0
1.0 I ' T , I ~ I , I l l F I t I I
0 . 8
A R = f(rs) f o r Ap = 35 k P a • R = f ( log(M.)) t o r 5p = 35 k P a I R = f ( log(M.)) f o r 5p = 650 k P a
R
0 .6
0 . 4
0 .2
/ "
/ / /
/
0 o 0 i L i I J 2 3 4 5
10 3
M,, (Dalton)
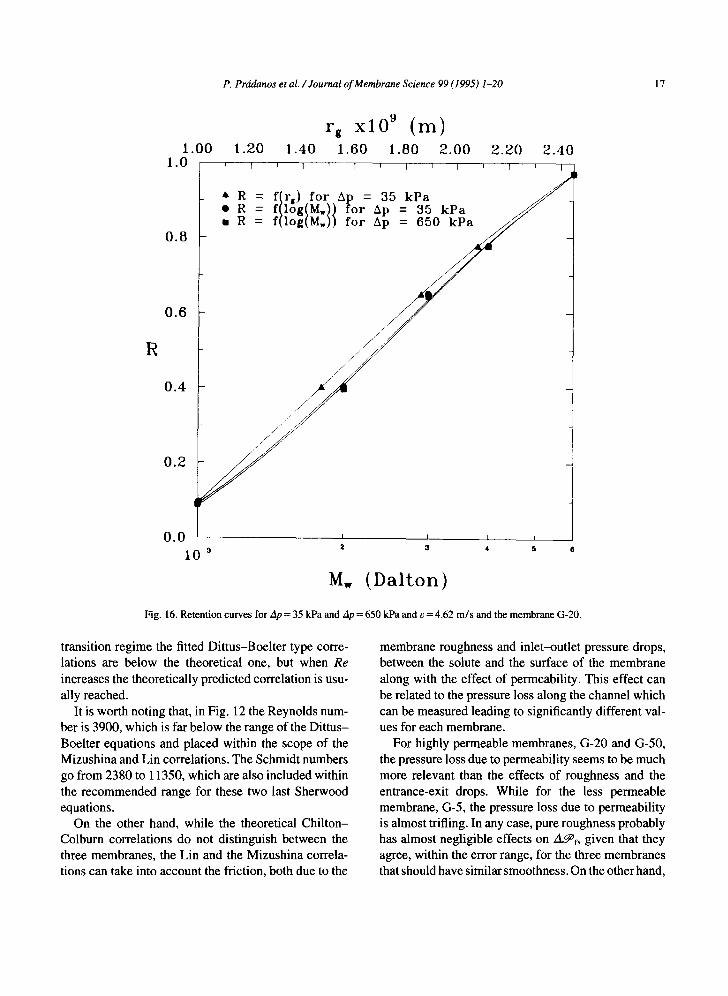
Fig. 16. Retention curves for Ap = 35 kPa and zip = 650 kPa and v = 4.62 m/s and the membrane G-20.
transition regime the fitted Dittus-Boelter type corre- lations are below the theoretical one, but when Re
increases the theoretically predicted correlation is usu- ally reached.
It is worth noting that, in Fig. 12 the Reynolds num- ber is 3900, which is far below the range of the Dittus- Boelter equations and placed within the scope of the Mizushina and Lin correlations. The Schmidt numbers go from 2380 to 11350, which are also included within the recommended range for these two last Sherwood equations.
On the other hand, while the theoretical Chilton- Colburn correlations do not distinguish between the three membranes, the Lin and the Mizushina correla- tions can take into account the friction, both due to the
membrane roughness and inlet-outlet pressure drops, between the solute and the surface of the membrane along with the effect of permeability. This effect can be related to the pressure loss along the channel which can be measured leading to significantly different val- ues for each membrane.
For highly permeable membranes, G-20 and G-50, the pressure loss due to permeability seems to be much more relevant than the effects of roughness and the entrance-exit drops. While for the less permeable membrane, G-5, the pressure loss due to permeability is almost trifling. In any case, pure roughness probably has almost negligible effects on A~f, given that they agree, within the error range, for the three membranes that should have similar smoothness. On the other hand,
18 P. Pr6danos et al. / Journal of Membrane Science 99 (1995) 1-20
R
rg x 10 9 (m) 1 . 4 1 1 . 6 1 1 . 8 1 2 . 0 1 2 . 2 1 2 . 4 1 2 . 6 1 2 . 8 1 3 . 0 1
'° I A R =
• R • R
0 .8
0 .6
0 . 4
0 .2
f ( r i ) f o r 5p = 35 k P a f ( log(M.) ) f o r 5p = 35 k P a f(log(Mw)) f o r hp 650 k P a
. 0 I I I 1 I I t I 2 3 4 5 6 7 II II
M,, (Dal ton) 1 0 '
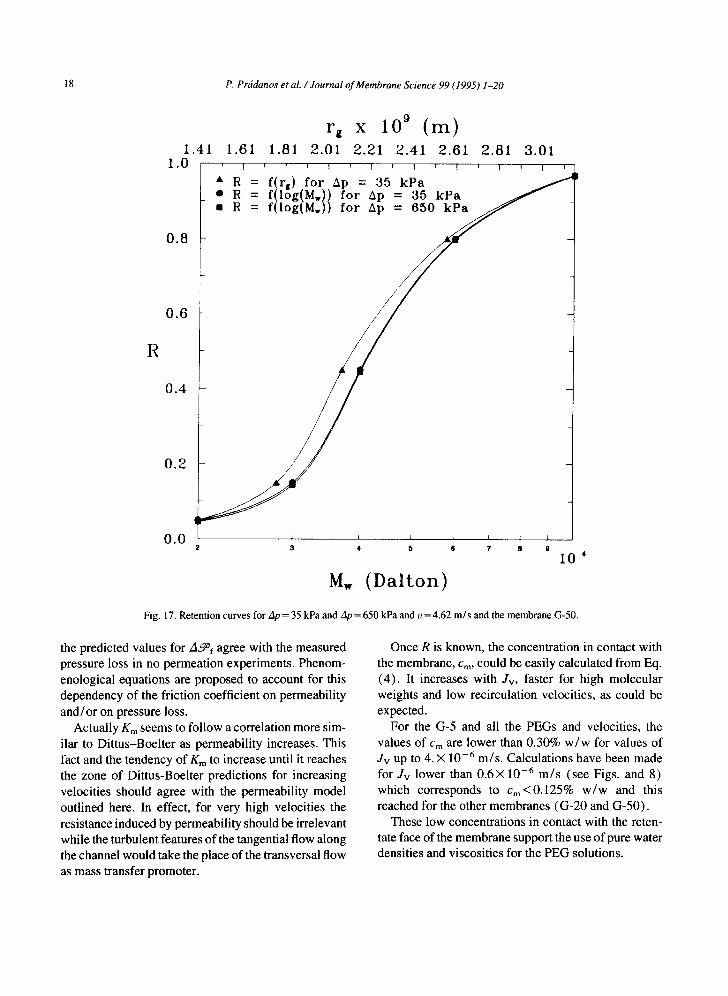
Fig. 17. Retent ion cu rves for Ap = 35 kPa and Ap = 650 kPa and v = 4 .62 m / s and the m e m b r a n e G-50 .
the predicted values for A~f agree with the measured pressure loss in no permeation experiments. Phenom- enological equations are proposed to account for this dependency of the friction coefficient on permeability and/or on pressure loss.
Actually Km seems to follow a correlation more sim- ilar to Dittus-Boelter as permeability increases. This fact and the tendency of Km to increase until it reaches the zone of Dittus-Boelter predictions for increasing velocities should agree with the permeability model outlined here. In effect, for very high velocities the resistance induced by permeability should be irrelevant while the turbulent features of the tangential flow along the channel would take the place of the transversal flow as mass transfer promoter.
Once R is known, the concentration in contact with the membrane, Cm, could be easily calculated from Eq. (4). It increases with Jv, faster for high molecular weights and low recirculation velocities, as could be expected.
For the G-5 and all the PEGs and velocities, the values of Cm are lower than 0.30% w/w for values of J v u p tO 4 . X 1 0 - 6 m / s . Calculations have been made for Jv lower than 0.6× 10 - 6 m/s (see Figs. and 8) which corresponds to Cm<0.125% w/w and this reached for the other membranes (G-20 and G-50).
These low concentrations in contact with the reten- tate face of the membrane support the use of pure water densities and viscosities for the PEG solutions.
P. Prddanos et al. / Journal of Membrane Science 99 (1995) 1-20 19
The standard retention curves are very flat which could be explained in terms of the distribution in pore radii, molecular shapes or sizes [22,23]. It can be seen that G-20 has a specially flat standard retention curve this should be due to a higher heteroporosity; i.e. a wider pore distribution. On the other hand, the molec- ular weight cut-offs obtained are different from the nominal values, as is often observed.
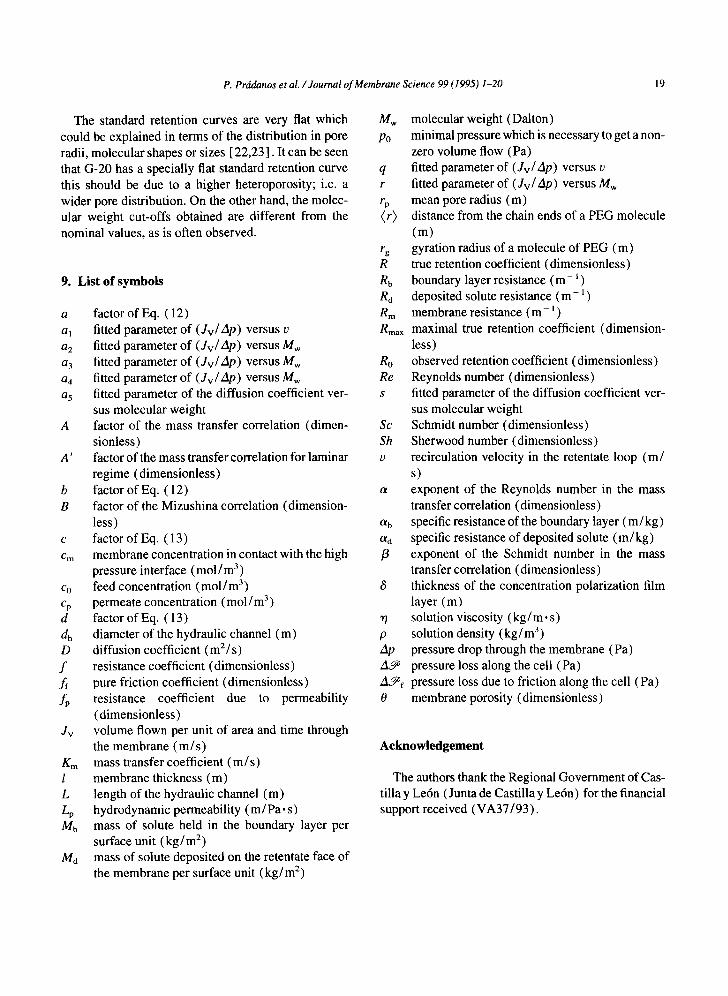
9. List of symbols
a factor of Eq. (12) al fitted parameter of (Jv lAp) versus v a2 fitted parameter of (Jv /Ap) versus Mw a3 fitted parameter of (Jv /Ap) versus Mw a4 fitted parameter of (Jv /Ap) versus Mw a5 fitted parameter of the diffusion coefficient ver-
sus molecular weight A factor of the mass transfer correlation (dimen-
sionless) A' factor of the mass transfer correlation for laminar
regime (dimensionless) b factor of Eq. (12) B factor of the Mizushina correlation (dimension-
less) c factor of Eq. (13) Cm membrane concentration in contact with the high
pressure interface (mol/m 3) Co feed concentration (mol/m 3) Cp permeate concentration (mol/m 3) d factor of Eq. (13) dh diameter of the hydraulic channel (m) D diffusion coefficient (m2/s) f resistance coefficient (dimensionless) ff pure friction coefficient (dimensionless) fp resistance coefficient due to permeability
(dimensionless) Jv volume flown per unit of area and time through
the membrane (m/s) Km mass transfer coefficient (m/s) l membrane thickness (m) L length of the hydraulic channel (m) Lp hydrodynamic permeability (m/Pa. s) Mb mass of solute held in the boundary layer per
surface unit (kg/m 2) Md mass of solute deposited on the retentate face of
the membrane per surface unit (kg/m z)
Mw molecular weight (Dalton) Po minimal pressure which is necessary to get a non-
zero volume flow (Pa) q fitted parameter of (Jv /Ap) versus v r fitted parameter of (Jv /Ap) versus Mw rp mean pore radius (m) (r) distance from the chain ends of a PEG molecule
(m) rg gyration radius of a molecule of PEG (m) R true retention coefficient (dimensionless) Rb boundary layer resistance (m - t ) Rd deposited solute resistance (m - l ) R m membrane resistance (m - ~) Rmax maximal true retention coefficient (dimension-
less) Ro observed retention coefficient (dimensionless) Re Reynolds number (dimensionless) s fitted parameter of the diffusion coefficient ver-
sus molecular weight Sc Schmidt number (dimensionless) Sh Sherwood number (dimensionless) v recirculation velocity in the retentate loop (m/
s) c~ exponent of the Reynolds number in the mass
transfer correlation (dimensionless) ab specific resistance of the boundary layer (m/kg) cto specific resistance of deposited solute (m/kg) /3 exponent of the Schmidt number in the mass
transfer correlation (dimensionless) 6 thickness of the concentration polarization film
layer (m) r/ solution viscosity (kg/m. s) p solution density (kg/m 3) Ap pressure drop through the membrane (Pa) A ~ pressure loss along the cell (Pa) A~f pressure loss due to friction along the cell (Pa) 0 membrane porosity (dimensionless)
Acknowledgement
The authors thank the Regional Government of Cas- tilla y Le6n (Junta de Castilla y Le6n) for the financial support received (VA37/93).
20 P. Pr6danos et al. / Journal of Membrane Science 99 (1995) 1-20
References
[1] P. Pr,'idanos, J.I. Arribas and A. Hermtndez, Hydraulic Permeability, mass transfer and retention of PEG's in cross- flow ultrafiltration through a symmetric microporous Membrane, Sep. Sci. Technol., 27 (1992) 2121.
[2] A. Suki, A.G. Fane and C.J.D. Fell, Flux decline in protein ultrafiltration, J. Membrane Sci., 21 (1984) 269.
[3] M. Cheryan, Ultrafiltration Handbook, Technomic, Lancaster, United Kingdom, 1986.
[41 S. Nakao and S. Kimura, Analysis of solutes rejection in ultraflltration, J. Chem. Eng. Jpn., 14 ( 1981 ) 32.
[5] S. Nakao, J.G. Wijmans and C.A. Smolders, Resistance to the permeate flux in unstirred ultrafiltration of dissolved macromolecular solutions, J. Membrane Sci., 26 (1986) 165.
[6] C.K. Colton, S. Friedman, D.E. Wilson and R.S. Lees, Ultrafiltration of lipoproteins through a synthetic membrane, J. Clin. Invest., 51 (1972) 2472.
[7] S. Kimura and S. Nakao, Fouling of cellulose acetate tubular reverse osmosis modules treating the industrial water in Tokyo, Desalination, 17 (1975) 267.
[ 8 ] G. Jonsson, Transport phenomena in ultrafiltration: membrane selectivity and boundary layer phenomena, Pure Appl. Chem., 58 (1986) 1647.
[9] G. Jonsson and C.E. Boesen, Concentration polarization in a reverse osmosis test cell, Desalination, 21 (1977) 1.
[ 10] G. Jonsson and P.M. Christensen, Separation characteristics of ultrafiltration membranes, in: E. Drioli and M. Nakagaki (Eds.), Membranes and Membrane Processes, Plenum, New York, USA, 1984.
[11] R.B. Bird, W.E. Stewart and E.N. Lightfoot, Transport Phenomena, Wiley, New York, USA, 1960.
[ 12] J. Bandrup and E,H. Immergut (Eds.), Polymer Handbook, Wiley, New York, USA, 1989.
[13] S. Grober, S. Erk and U, Grigull, Fundamentals of Heat Transfer, McGraw Hill, New York, USA, 1961.
[ 14] S. Sourirajan, Reverse Osmosis, Academic Press, New York, USA, 1970.
[ 15] V. Gekas and B. Hallst6m, Mass transfer in the membrane concentration polarization layer under turbulent cross flow. I. Critical literature review and adaptation of existing Sherwood correlation to membrane operations, J. Membrane Sci., 30 (1987) 153.
[161 A.G. Fane, C.J.D. Fell, D. Wiley and R. McDonogh, Concentration Polarization, Mass Transfer and Fluid Dynamics in Membrane Systems, Proc. Summer School on Engineering Aspects of Membrane Processes, Aarhus, Denmark, 1986.
[ 17 ] T. Mizushina, F. Ogino, Y. Oka and H. Fukuda, Turbulent heat and mass transfer between wall and fluid streams of large Prandtl and Schmidt numbers, Int. J. Heat Mass Transfer, 14 (1971) 1705.
1181 C,S. Lin, R.W. Moulton and G.L. Putnam, Mass transfer between solid wall and fluid streams, Ind. Eng. Chem., 45 (1953) 636.
[ 19] P.J. Flory, Principles of Polymer Chemistry, Cornell University Press, New York, USA, 1953.
120] R. Nobrega, H. de Balmann, P. Aimar and V. Sanchez, Transfer of dextran through ultrafiltration membranes. A study of rejection data analyzed by gel permeation chromatography, J. Membrane Sci., 45 (1989) 17.
[ 21 ] G.B. Van den Berg, I.G. Rficz and C.A. Smolders, Mass transfer coefficients in cross-flow ultrafiltration, J. Membrane Sci., 47 (1989) 25.
[221 A.E. Polotskii and A.N. Cherkasov, Approximation of retention curves of ultrafiltration membranes by log-normal distributions, Colloid J. USSR, 45 (1983) 407 (English translation ).
[23] C.M. Tam and A.Y. Tremblay, Membrane pore characterization - Comparison between single and multicomponent solute probe techniques, J. Membrane Sci., 57 (1991) 271.