Uncertainties in the Testing of the Coefficient of Thermal ...
13
energies Article Uncertainties in the Testing of the Coefficient of Thermal Expansion of Overhead Conductors Miren T. Bedialauneta 1, * , Igor Albizu 2, * , Elvira Fernandez 1, * and A. Javier Mazon 1, * 1 Department of Electrical Engineering, School of Engineering Bilbao, University of the Basque Country UPV/EHU, Plaza Ingeniero Torres Quevedo, 1, 48013-Bilbao, Spain 2 Department of Electrical Engineering, School of Engineering Gipuzkoa, University of the Basque Country UPV/EHU, Otaola Etorbidea, 29, 20600-Eibar, Spain * Correspondence: [email protected] (M.T.B.); [email protected] (I.A.); [email protected] (E.F.); [email protected] (A.J.M.) Received: 13 December 2019; Accepted: 13 January 2020; Published: 14 January 2020 Abstract: Overhead lines can be replaced by high temperature low sag (HTLS) conductors in order to increase their capacity. The coefficients of thermal expansion (CTE) of the HTLS conductors are lower than the CTE of conventional conductors. The utilities and conductor manufacturers usually carry out the verification of the CTE of the overhead conductors in an actual size span. The verification is based on the observation of the change of the conductor length as a result of the conductor temperature change. This process is influenced by the coefficient of thermal expansion to be verified. However, there are other factors that also affect it. This paper analyzes the effect of some of the uncertainty sources in the testing of the coefficient of thermal expansion of the overhead conductors. Firstly, the thermal expansion process is described and the uncertainty sources related to the conductor and the line section are identified. Then, the uncertainty sources and their effect on the CTE testing are quantified. Keywords: high temperature low sag conductor; coefficient of thermal expansion; overhead conductor; low sag performance 1. Introduction Overhead lines can be replaced by high temperature low sag (HTLS) conductors in order to increase their capacity without the need to reinforce the towers [1]. The conventional conductors work at lower temperatures than HTLS conductors, and their coefficients of thermal expansion (CTE) are higher than the CTE of the HTLS conductors [2,3]. CIGRÉ has written a guide providing suggestions for methods and testing for qualifying HTLS conductors [4]. One of the main characteristics to be checked is the low sag performance. The low sag performance of HTLS conductors is due to a lower thermal expansion of the conductor. The CTE value of the strands can be determined by tests that are carried out according to certain standards [5–7]. However, there is no standard test for checking the value of the whole conductor thermal expansion coefficient. Usually, no verification is carried out and it is calculated by the method given in [8]. The conductor thermal expansion coefficient α ( ◦ C -1 ) is obtained from the core and aluminum thermal expansion coefficients α core and α a ( ◦ C -1 ), the elastic modulus E core and E a (kg/m 2 ), and the areas A core and A a (m 2 ) (1). α =(E a × A a × α a + E core × A core × α core )/(E a A a + E core A core ) (1) The verification of the thermal expansion of the conductors requires changing the conductor temperature and measuring the related change of the conductor length. The conductor temperature increases with the current intensity due to the heat generated by Joule losses. The utilities and conductor Energies 2020, 13, 411; doi:10.3390/en13020411 www.mdpi.com/journal/energies
-
Upload
khangminh22 -
Category
Documents
-
view
5 -
download
0
Transcript of Uncertainties in the Testing of the Coefficient of Thermal ...
energies
Article
Uncertainties in the Testing of the Coefficientof Thermal Expansion of Overhead Conductors
Miren T. Bedialauneta 1,* , Igor Albizu 2,* , Elvira Fernandez 1,* and A. Javier Mazon 1,*1 Department of Electrical Engineering, School of Engineering Bilbao, University of the Basque Country
UPV/EHU, Plaza Ingeniero Torres Quevedo, 1, 48013-Bilbao, Spain2 Department of Electrical Engineering, School of Engineering Gipuzkoa, University of the Basque Country
UPV/EHU, Otaola Etorbidea, 29, 20600-Eibar, Spain* Correspondence: [email protected] (M.T.B.); [email protected] (I.A.);
[email protected] (E.F.); [email protected] (A.J.M.)
Received: 13 December 2019; Accepted: 13 January 2020; Published: 14 January 2020�����������������
Abstract: Overhead lines can be replaced by high temperature low sag (HTLS) conductors in orderto increase their capacity. The coefficients of thermal expansion (CTE) of the HTLS conductorsare lower than the CTE of conventional conductors. The utilities and conductor manufacturersusually carry out the verification of the CTE of the overhead conductors in an actual size span.The verification is based on the observation of the change of the conductor length as a result of theconductor temperature change. This process is influenced by the coefficient of thermal expansionto be verified. However, there are other factors that also affect it. This paper analyzes the effect ofsome of the uncertainty sources in the testing of the coefficient of thermal expansion of the overheadconductors. Firstly, the thermal expansion process is described and the uncertainty sources related tothe conductor and the line section are identified. Then, the uncertainty sources and their effect on theCTE testing are quantified.
Keywords: high temperature low sag conductor; coefficient of thermal expansion; overhead conductor;low sag performance
1. Introduction
Overhead lines can be replaced by high temperature low sag (HTLS) conductors in order toincrease their capacity without the need to reinforce the towers [1].
The conventional conductors work at lower temperatures than HTLS conductors, and theircoefficients of thermal expansion (CTE) are higher than the CTE of the HTLS conductors [2,3].
CIGRÉ has written a guide providing suggestions for methods and testing for qualifying HTLSconductors [4]. One of the main characteristics to be checked is the low sag performance. The lowsag performance of HTLS conductors is due to a lower thermal expansion of the conductor. The CTEvalue of the strands can be determined by tests that are carried out according to certain standards [5–7].However, there is no standard test for checking the value of the whole conductor thermal expansioncoefficient. Usually, no verification is carried out and it is calculated by the method given in [8].The conductor thermal expansion coefficient α (◦C−1) is obtained from the core and aluminum thermalexpansion coefficients αcore and αa (◦C−1), the elastic modulus Ecore and Ea (kg/m2), and the areas Acore
and Aa (m2) (1).α = (Ea ×Aa × αa + Ecore ×Acore × αcore)/(EaAa + EcoreAcore) (1)
The verification of the thermal expansion of the conductors requires changing the conductortemperature and measuring the related change of the conductor length. The conductor temperatureincreases with the current intensity due to the heat generated by Joule losses. The utilities and conductor
Energies 2020, 13, 411; doi:10.3390/en13020411 www.mdpi.com/journal/energies

Energies 2020, 13, 411 2 of 13
manufacturers usually carry out this verification with the conductor installed in an actual size span.This span could be indoors, but due to the required size, it is usually outdoors. There are two types ofoutdoor testing: the operating line tests and the outdoor laboratory tests. In an operating line test,the conductor is at the total line voltage and the current through the line depends on the fluctuations ofthe power consumed by the customers and cannot be controlled, whereas in an outdoor laboratory testthe conductor is at low voltage and it is possible to control the injected current. The best option for theverification of the low sag performance is an outdoor laboratory, because it is possible to control theinjected current. This test is short because in a few hours the whole temperature range can be obtained.An example of an outdoor laboratory is the Powerline Conductor Accelerated Testing facility (PCAT)at Oak Ridge National Laboratory in USA [9]. For this verification the operating line test is also useful.When a utility installs the HTLS conductor in a line, some sensors should be installed so that it canevaluate the conductor performance. Moreover, the information provided by the same dynamic linerating (DLR) systems that are installed for the evaluation of the ampacity can be used for the evaluationof the conductor performance [10]. The dynamic line rating systems measure weather magnitudessuch as wind speed, air temperature and solar radiation, as well as the conductor temperature and theconductor tension or sag values. The main disadvantage of the operating line test is that the currentintensity, and consequently the conductor temperature, depends on the power flow of the line. Someexamples of operating lines tests are shown in [11–14].
The estimation of the coefficient of thermal expansion requires quantifying the conductor lengthchange with temperature. It is difficult to measure directly the conductor length in the catenary.When the conductor length increases, the conductor tension decreases and the sag increases. Therefore,both the conductor tension and the sag can be used to quantify the conductor length change withtemperature. It is easier to measure the conductor tension, especially in an operating line. For thisreason, in the analysis presented in the paper, the tension is the chosen magnitude for representing theconductor length change.
The low sag performance evaluation is achieved by comparing the conductor tension andtemperature measured values with the theoretical tension–temperature performance. Besides the CTEinfluence of the conductor, other factors also affect the tension–temperature performance. For example,an error in the conductor weight or in the span length can result in a deviation of the tension–temperatureperformance that could be wrongly attributed to the CTE of the conductor if these errors are notconsidered. Because of this, it is necessary identify and quantify the influence of the factors that affectthe tension–temperature performance.
The conductor tension and temperature measured by a monitoring system in a line sectiondepends on several factors (Figure 1). Obviously, the characteristics of the line section are the mostdeterminant factors. The conductor characteristics such as the weight, the modulus of elasticity and thecoefficient of thermal expansion affect the sag–tension performance. The span length and the number ofsuspension towers between the two tension dead-ends also affect the sag–tension performance. Apartfrom the physical configuration of the line, other factors affect the measured performance. The weatherconditions during the measurement period affect the measured tension values because of the overloaddue to the wind, the rain and the ice. Finally, the uncertainties of the measurement systems influencethe measured performance.
Besides, some parameters such as the wind speed and the conductor temperature may vary alongthe line section and, for this reason, the limitation of a local measurement should be taken into account.Furthermore, midspan joints or conductor clamps may introduce a discontinuity in the conductortemperature due to a distortion in the thermal balance.
This paper presents the results of the first analysis towards the quantification of the effects of theuncertainties in the testing of the CTE of overhead conductors. It analyzes the effect of the uncertaintiesdue to the conductor and the line section in the testing of the CTE of the overhead conductors. Firstly,the thermal expansion process is described and the uncertainty sources related to the conductor andthe line section are identified. Then, the uncertainty sources and their effect on the CTE testing are

Energies 2020, 13, 411 3 of 13
quantified. The objective of the study is to quantify the effect of these uncertainties so that they areidentified as important uncertainty sources or sources that can be neglected.Energies 2020, 13, x FOR PEER REVIEW 3 of 13
Figure 1. Line section monitoring.
This paper presents the results of the first analysis towards the quantification of the effects of the uncertainties in the testing of the CTE of overhead conductors. It analyzes the effect of the uncertainties due to the conductor and the line section in the testing of the CTE of the overhead conductors. Firstly, the thermal expansion process is described and the uncertainty sources related to the conductor and the line section are identified. Then, the uncertainty sources and their effect on the CTE testing are quantified. The objective of the study is to quantify the effect of these uncertainties so that they are identified as important uncertainty sources or sources that can be neglected.
2. The Thermal Expansion Process
Thermal expansion is the result of a temperature change of the conductor. This temperature change is due to current intensity or weather magnitude changes. The thermal expansion process is shown in Figure 2. The first result is a change of the conductor length (first step). The consequence of the conductor length change is a change in the catenary shape that results in a tension change (second step). The tension change affects the conductor length because of the elastic performance of the conductor (third step). The elastic performance counteracts the thermal expansion length change. For example, when the temperature increases, the conductor length increases (first step), the tension decreases (second step) and the conductor length decreases (third step), reducing the initial conductor length increase. As a result of the conductor length change (first step), a change in the catenary shape occurs that results in a tension change (second step), that results in a conductor length change (third step), that results in a catenary shape change (second step), etc.; in other words, the second and third steps influence each other until some final tension and length values are obtained, where neither more conductor length change nor catenary shape change occurs.
Figure 2. Conductor tension and length change due to the conductor temperature change.
The described process depends on the conductor characteristics. The parameters that affect each step are shown in Table 1. The conductor characteristics that influence the thermal expansion process
Tension
Length
First step: Conductor thermal expansion
Second step: Catenary shape change
Third step: Conductor length change due to elastic performance
Initial tension and length Final tension and length
Tension-length curve: catenary shape Tension-length curve: conductor elastic performance
Figure 1. Line section monitoring.
2. The Thermal Expansion Process
Thermal expansion is the result of a temperature change of the conductor. This temperaturechange is due to current intensity or weather magnitude changes. The thermal expansion process isshown in Figure 2. The first result is a change of the conductor length (first step). The consequenceof the conductor length change is a change in the catenary shape that results in a tension change(second step). The tension change affects the conductor length because of the elastic performance ofthe conductor (third step). The elastic performance counteracts the thermal expansion length change.For example, when the temperature increases, the conductor length increases (first step), the tensiondecreases (second step) and the conductor length decreases (third step), reducing the initial conductorlength increase. As a result of the conductor length change (first step), a change in the catenaryshape occurs that results in a tension change (second step), that results in a conductor length change(third step), that results in a catenary shape change (second step), etc.; in other words, the second andthird steps influence each other until some final tension and length values are obtained, where neithermore conductor length change nor catenary shape change occurs.
Energies 2020, 13, x FOR PEER REVIEW 3 of 13
Figure 1. Line section monitoring.
This paper presents the results of the first analysis towards the quantification of the effects of the uncertainties in the testing of the CTE of overhead conductors. It analyzes the effect of the uncertainties due to the conductor and the line section in the testing of the CTE of the overhead conductors. Firstly, the thermal expansion process is described and the uncertainty sources related to the conductor and the line section are identified. Then, the uncertainty sources and their effect on the CTE testing are quantified. The objective of the study is to quantify the effect of these uncertainties so that they are identified as important uncertainty sources or sources that can be neglected.
2. The Thermal Expansion Process
Thermal expansion is the result of a temperature change of the conductor. This temperature change is due to current intensity or weather magnitude changes. The thermal expansion process is shown in Figure 2. The first result is a change of the conductor length (first step). The consequence of the conductor length change is a change in the catenary shape that results in a tension change (second step). The tension change affects the conductor length because of the elastic performance of the conductor (third step). The elastic performance counteracts the thermal expansion length change. For example, when the temperature increases, the conductor length increases (first step), the tension decreases (second step) and the conductor length decreases (third step), reducing the initial conductor length increase. As a result of the conductor length change (first step), a change in the catenary shape occurs that results in a tension change (second step), that results in a conductor length change (third step), that results in a catenary shape change (second step), etc.; in other words, the second and third steps influence each other until some final tension and length values are obtained, where neither more conductor length change nor catenary shape change occurs.
Figure 2. Conductor tension and length change due to the conductor temperature change.
The described process depends on the conductor characteristics. The parameters that affect each step are shown in Table 1. The conductor characteristics that influence the thermal expansion process
Tension
Length
First step: Conductor thermal expansion
Second step: Catenary shape change
Third step: Conductor length change due to elastic performance
Initial tension and length Final tension and length
Tension-length curve: catenary shape Tension-length curve: conductor elastic performance
Figure 2. Conductor tension and length change due to the conductor temperature change.
The described process depends on the conductor characteristics. The parameters that affect eachstep are shown in Table 1. The conductor characteristics that influence the thermal expansion processare the weight, the CTE and the modulus of elasticity. In the case of non-homogeneous conductors,the CTE and the modulus of elasticity have different values for the core and the outer aluminum.

Energies 2020, 13, 411 4 of 13
Table 1. Conductor parameters that affect the thermal expansion process.
Step Conductor Parameter Related to the Step
1. Conductor thermal expansion Coefficient of thermal expansion2. Catenary shape change Weight
3. Conductor elastic performance Modulus of elasticity
The higher the coefficient of thermal expansion, the higher the increase in length of the first step.As a result, the higher the coefficient of thermal expansion, the greater the influence of this parameterin the expansion process. For the modulus of elasticity, the higher the value is, the lower the lengthrecovery of the third step. As a result, the higher the modulus of elasticity is, the lower the influence ofthis parameter in the expansion process.
The catenary length L (m) is given by Equation (2). It depends on the horizontal tension H (kg),the conductor weight per unit length ω (kg/m) and the span length a (m).
L = 2× c× sin h(
a/2c
)(2)
c =Hω
(3)
The relation between the tension and the length of the catenary is not linear (Figure 3a). For acertain length change, the tension change is higher for high tension values. As a consequence,the same temperature change results in a lower tension decrease at lower tension values (Figure 3b).In Figures 2 and 3b, the tension–length curve of the catenary is linearized around the initialtension–length value in order to simplify the explanation of the process.
Energies 2020, 13, x FOR PEER REVIEW 4 of 13
are the weight, the CTE and the modulus of elasticity. In the case of non-homogeneous conductors, the CTE and the modulus of elasticity have different values for the core and the outer aluminum.
Table 1. Conductor parameters that affect the thermal expansion process.
Step Conductor Parameter Related to the Step 1. Conductor thermal expansion Coefficient of thermal expansion
2. Catenary shape change Weight 3. Conductor elastic performance Modulus of elasticity
The higher the coefficient of thermal expansion, the higher the increase in length of the first step. As a result, the higher the coefficient of thermal expansion, the greater the influence of this parameter in the expansion process. For the modulus of elasticity, the higher the value is, the lower the length recovery of the third step. As a result, the higher the modulus of elasticity is, the lower the influence of this parameter in the expansion process.
The catenary length L (m) is given by Equation (2). It depends on the horizontal tension H (kg), the conductor weight per unit length ω (kg/m) and the span length a (m).
22 sin h aL cc
= × ×
(2)
Hc =ω
(3)
The relation between the tension and the length of the catenary is not linear (Figure 3a). For a certain length change, the tension change is higher for high tension values. As a consequence, the same temperature change results in a lower tension decrease at lower tension values (Figure 3b). In Figures 2 and 3b, the tension–length curve of the catenary is linearized around the initial tension–length value in order to simplify the explanation of the process.
(a) (b)
Figure 3. (a) Length–tension curve for a catenary (a = 200 m, ACSR Hawk). (b) Tension change due to the same conductor temperature change.
3. Identifying Uncertainty Sources in the Tension–Temperature Performance
The measured tension and temperature values are compared with the values given by a theoretical model. There is a deviation between the measured and calculated values if the parameter values assumed in the model, such as the conductor weight or modulus of elasticity, differ from the actual values. There is also a deviation if the model does not take into account the factors that affect the tension–temperature performance.
200 200.1 200.2 200.3 200.4 200.5 200.6 200.7 200.8 200.9 201500
1000
1500
2000
Length (m)
Tens
ion
(kg)
Figure 3. (a) Length–tension curve for a catenary (a = 200 m, ACSR Hawk). (b) Tension change due tothe same conductor temperature change.
3. Identifying Uncertainty Sources in the Tension–Temperature Performance
The measured tension and temperature values are compared with the values given by a theoreticalmodel. There is a deviation between the measured and calculated values if the parameter valuesassumed in the model, such as the conductor weight or modulus of elasticity, differ from the actualvalues. There is also a deviation if the model does not take into account the factors that affect thetension–temperature performance.
3.1. Parameters
The parameters that are used in the sag–tension calculation methods are the conductor parameters(weight, modulus of elasticity, CTE) and the span length [15].

Energies 2020, 13, 411 5 of 13
The influence of the error of each conductor parameter can be analyzed by taking into account theprocess described in Figure 2. A higher CTE value (positive error) results in a higher change of theconductor length (first step). As a consequence, the tension change due to the catenary shape changeis higher too, and the final tension change is also higher. A positive error in the weight results ina lower change of the conductor tension due to a lower slope of the catenary length–tension curve.As a consequence, the final tension change is lower. A positive error in the modulus of elasticityresults in a lower change in the conductor length (third step). As a consequence, the tension changedue to the catenary shape change is lower and the final tension change is higher. Table 2 shows therelation between the positive and negative errors of the parameters and the lower and higher tensionchange result.
Table 2. Tension deviation as a function of the parameter error.
Positive Error(Higher Value)
Negative Error(Lower Value)
Weight Lower tension change Higher tension changeModulus of elasticity Higher tension change Lower tension change
CTE Higher tension change Lower tension changeSpan length Lower tension change Higher tension change
According to Equation (2), the relation between the tension and the length depends on the spanlength a. If there is an error in the assumed span length value, the observed tension change due to thethermal expansion is different from the expected value. The results show that the effect of the spanlength error is similar to the effect of the conductor weight (Table 2). This is because the same percentageerror in both cases causes a similar deviation of the slope of the catenary length–tension curve.
Supposing a tension–temperature reference, the tension value depends on the parameter error, at adifferent conductor temperature (Figure 4). The solid curve corresponds to the performance withouterrors. The dotted curve corresponds to a performance where the tension change with temperaturechange is lower. This performance can be for example due to a positive error in the weight or the spanlength. The dashed curve corresponds to a performance where the tension change with temperaturechange is higher.
Energies 2020, 13, x FOR PEER REVIEW 5 of 13
3.1. Parameters
The parameters that are used in the sag–tension calculation methods are the conductor parameters (weight, modulus of elasticity, CTE) and the span length [15].
The influence of the error of each conductor parameter can be analyzed by taking into account the process described in Figure 2. A higher CTE value (positive error) results in a higher change of the conductor length (first step). As a consequence, the tension change due to the catenary shape change is higher too, and the final tension change is also higher. A positive error in the weight results in a lower change of the conductor tension due to a lower slope of the catenary length–tension curve. As a consequence, the final tension change is lower. A positive error in the modulus of elasticity results in a lower change in the conductor length (third step). As a consequence, the tension change due to the catenary shape change is lower and the final tension change is higher. Table 2 shows the relation between the positive and negative errors of the parameters and the lower and higher tension change result.
According to Equation (2), the relation between the tension and the length depends on the span length a. If there is an error in the assumed span length value, the observed tension change due to the thermal expansion is different from the expected value. The results show that the effect of the span length error is similar to the effect of the conductor weight (Table 2). This is because the same percentage error in both cases causes a similar deviation of the slope of the catenary length–tension curve.
Table 2. Tension deviation as a function of the parameter error.
Positive Error
(Higher Value) Negative Error (Lower Value)
Weight Lower tension change Higher tension change Modulus of elasticity Higher tension change Lower tension change
CTE Higher tension change Lower tension change Span length Lower tension change Higher tension change
Supposing a tension–temperature reference, the tension value depends on the parameter error, at a different conductor temperature (Figure 4). The solid curve corresponds to the performance without errors. The dotted curve corresponds to a performance where the tension change with temperature change is lower. This performance can be for example due to a positive error in the weight or the span length. The dashed curve corresponds to a performance where the tension change with temperature change is higher.
Figure 4. Tension–temperature curve with conductor parameter errors.
3.2. Model
Usually, some assumptions are made in order to simplify the sag–tension models. One assumption assumes that the catenary end points are fixed: no movement of the strain towers is
Tension
Temperature
·············· Lower tension change - - - - - - - - - Higher tension change
Tension-temperature reference
Figure 4. Tension–temperature curve with conductor parameter errors.
3.2. Model
Usually, some assumptions are made in order to simplify the sag–tension models. One assumptionassumes that the catenary end points are fixed: no movement of the strain towers is assumed. Anotherassumption is the modelling of the whole catenary length with the conductor parameters: the insulatingstring, midspan joints and conductor clamps are not taken into account.

Energies 2020, 13, 411 6 of 13
3.2.1. Strain Tower Deflection
In the second step of the thermal expansion process, the catenary shape change results in aconductor tension change. This tension change is also noticed in the strain tower where the conductoris attached. Several conductors are attached in a strain tower, three conductors per circuit and span.The tension change can be different between contiguous spans due to different span lengths orinstallation tensions. As a result, small movements on the cross-arms can occur. These movementsaffect the catenary shape and the conductor tension.
3.2.2. Insulating Strings, Midspan Joints and Conductor Clamps
In the first step of the thermal expansion process, the conductor length changes as a result of atemperature change. The length change is proportional to the conductor length. In a simplified model,the conductor length is assumed to be the same as the catenary length. However, the insulating stringsare part of the catenary. As a result, the conductor length is lower than the catenary length. For thisreason, the length change that results from a temperature change is lower than that assumed in thesimplified model.
Besides, midspan joints or conductor clamps introduce a distortion in the temperature due to adifferent thermal performance compared with the conductor [16].
4. Quantifying the Source Errors
Besides identifying the uncertainty sources that affect the sag–tension performance, it is importantto quantify the value of the uncertainty so that their effect can be quantified.
4.1. Conductor Weight
According [15], the conductor weight is one of the basic error sources. Typically, the conductorweight exceeds the nominal value by 0.2% to 0.6%. Because of tarnishing effects, the conductor’sweight increases slightly during its lifetime.
The conductor manufacturing norms limit the conductor weight deviation. In accordance [17–19],the conductor linear weight cannot vary more than 2% from the nominal value. In the course of themanufacturing process, the conductor weight is tested. According to the information provided bydifferent manufacturers, the weight typically does not vary from the nominal value more than 0.5%.Besides, the deviation inside series production is around 0.2%.
4.2. Conductor Modulus of Elasticity
During the conductor manufacturing process, it is not mandatory to test the modulus of elasticity.It is calculated according the method given in [8]. The conductor elastic modulus E (kg/m2) is obtainedfrom core Ecore (kg/m2) and aluminum Ea (kg/m2) elastic modulus and their respective areas, Acore andAa (m2) (4).
E = (Ea ×Aa + Ecore ×Acore)/(Aa + Acore) (4)
The conductor modulus of elasticity depends on the modulus of elasticity of the wires. However,as the wires are helically wound, the strain in the conductor axis is higher than the strain in the wireaxis [8]. Therefore, the modulus of elasticity of the conductor is lower than the modulus of elasticity ofthe wires. The manufacturing norms define a maximum and a minimum value for the pitch diameterratio of each conductor layer. According to the information obtained from a manufacturer, the modulusof elasticity can vary 4% between two conductors with different pitch diameter ratios. The conductorwith the lower pitch diameter ratio has a lower modulus of elasticity value and vice versa.
The manufacturer and the purchaser, in order to verify the actual value of the modulus of elasticity,can accord to carry out a stress–strain test [17,20]. In this test, the conductor is loaded increasing anddecreasing the load in several cycles. The modulus of elasticity is obtained from the stress–strainslope of the load decreasing period. However, the obtained value of the modulus of elasticity is
Energies 2020, 13, 411 7 of 13
different depending on the load decreasing period chosen (30%, 50%, 70% or 80% of the Rated BreakingStrength, (RBS)). The slope is higher if the load value of the cycle is low. In other words, the modulus ofelasticity obtained from the unloading of the 30% RBS cycle is higher than that obtained from the 80%RBS cycle. Furthermore, it depends on the number of points taken in the decreasing period becausethe slope is not constant. According to the information obtained from a manufacturer, the modulus ofelasticity can vary 5% depending on the period of the test considered for the calculation.
4.3. Span Length
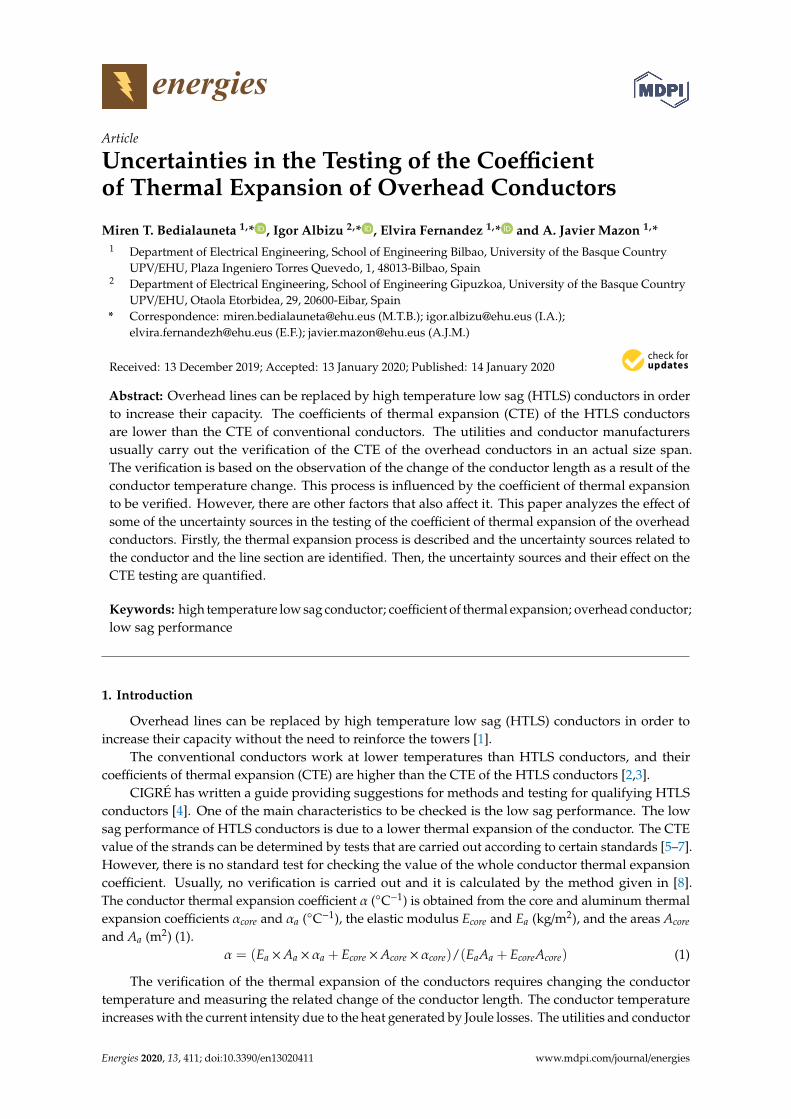
The error in the span length is another typical error source. Because of changes associated withthe installation process, the actual span length can differ from the length of the original project design.Therefore, it is recommended that a topographer measures the actual length and reflects it in a newdocument. For this reason, it could be an error if the span length is taken from the line projectinformation given by the utility and the topographer correction is not included.
In this project, in order to evaluate the uncertainties of the testing of the conductor CTE, threedifferent lines in operation have been monitored. The number of monitored spans is four because inone of the lines two contiguous spans have been monitored. Table 3 shows the span length values givenby the utility and the values measured by the topographer. In most of the cases the correspondence isgood but in one case an error of 16.8% has been obtained. This shows the assumed risk if the spanlength is not measured. There are uncertainties in tower placing and it is necessary to have GIS map ofall towers.
Table 3. Measured span lengths.
Span Length Given by the Utility (m) Measured Span Length (m) Span Length Error (%)
202 168 −16.8100 100.85 0.889 88.95 −0.1
284 282.49 −0.5
4.4. Strain Tower Deflection
Because of imbalances between adjacent spans the strain towers experience forces. These forcesorigin deflections that depend on the stiffness of the attachment point. The strain tower deflectioncalculation is complex. It depends on the design and characteristics of the tower and the characteristicsand operation performance of the conductors attached to it. It requires a detailed mechanical model ofthe tower and the use of advanced calculation tools such as the PLS-CADD.
4.5. Insulating String, Midspan Joints and Conductor Clamps
The length of the insulating strings depends on the line voltage. The higher the voltage is,the longer the insulation string. Similarly, the higher the voltage is, the longer the span. The relationbetween the insulating string and the span length depends of each case, but the insulating string lengthis usually around 2% of the span length.
The length of the midspan joints and conductor clamps is lower than the length of the insulatingstrings. Compared with the length of the conductor, the length of the midspan joints and conductorclamps is negligible.
5. Quantifying the Effect of the Source Errors: the Equivalent Coefficient of Thermal Expansion(CTE) Error
In order to quantify and compare the effect of the different error sources, the equivalent CTE erroris defined. The equivalent CTE error of an error source is the CTE error value that results in the sametension deviation. For example, the effect of a 2% positive error of the conductor weight is equivalentto the effect of a 1% negative error of the CTE if both errors result in the same tension deviation.
Energies 2020, 13, 411 8 of 13
The equivalent CTE error is not a constant value. It depends on the span length value, the tensionvalue and the characteristics of the conductor. In the case of the span length, the effect of a certainerror—for example a 5% positive error in the modulus of elasticity—is different if the span length is150 m or 300 m. The equivalent CTE error also depends on the tension value because when the tensionis low, the tension change is lower, as has been shown above (Figure 3) and this affects the effect ofthe error source. Finally, the effect of a certain error is different depending on the characteristics ofthe conductor.
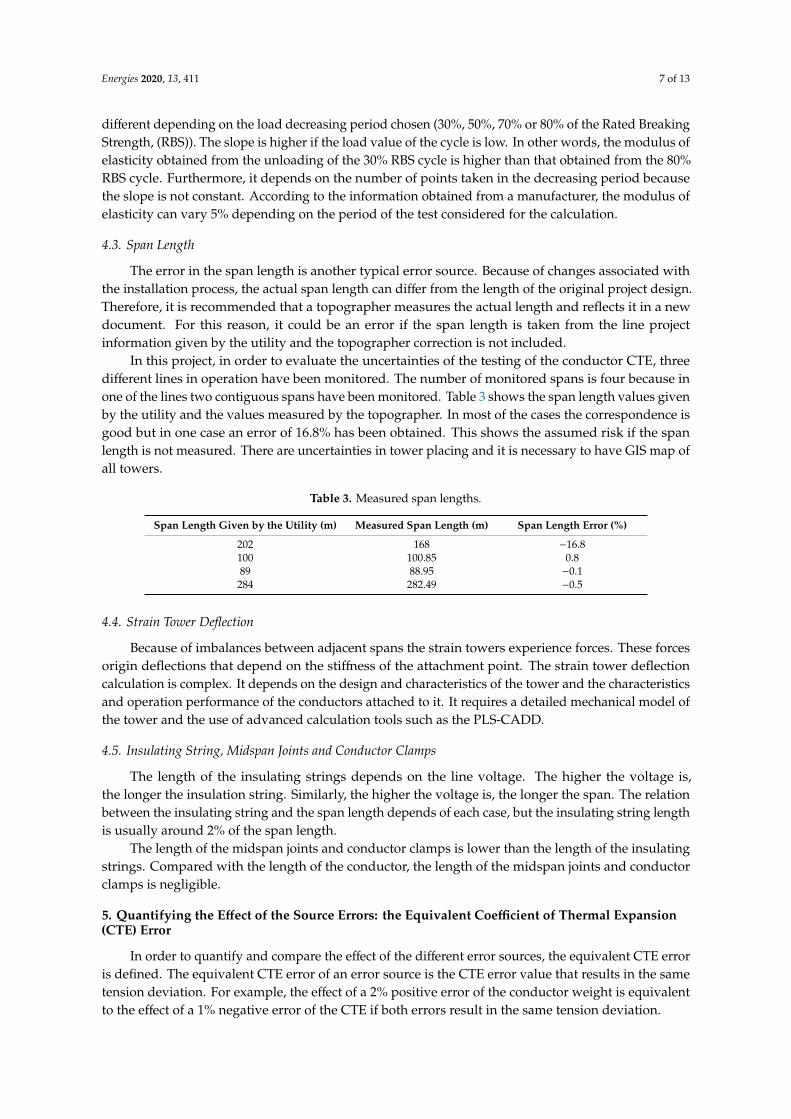
A span of 200 m with an ACSR Hawk conductor has been chosen as the base case for the analysis.Figure 5 shows the CTE equivalent error of the weight, the modulus of elasticity and the span lengtherrors, and the insulating string.
Energies 2020, 13, x FOR PEER REVIEW 8 of 13
5. Quantifying the Effect of the Source Errors: the Equivalent Coefficient of Thermal Expansion (CTE) Error
In order to quantify and compare the effect of the different error sources, the equivalent CTE error is defined. The equivalent CTE error of an error source is the CTE error value that results in the same tension deviation. For example, the effect of a 2% positive error of the conductor weight is equivalent to the effect of a 1% negative error of the CTE if both errors result in the same tension deviation.
The equivalent CTE error is not a constant value. It depends on the span length value, the tension value and the characteristics of the conductor. In the case of the span length, the effect of a certain error—for example a 5% positive error in the modulus of elasticity—is different if the span length is 150 m or 300 m. The equivalent CTE error also depends on the tension value because when the tension is low, the tension change is lower, as has been shown above (Figure 3) and this affects the effect of the error source. Finally, the effect of a certain error is different depending on the characteristics of the conductor.
A span of 200 m with an ACSR Hawk conductor has been chosen as the base case for the analysis. Figure 5 shows the CTE equivalent error of the weight, the modulus of elasticity and the span length errors, and the insulating string.
In Figure 5a, the equivalent CTE error for a 2% error in the weight is shown. The tension range corresponds to the tension values between −5 °C and 80 °C when the conductor is installed at the 15% of the Rated Breaking Strength at 15 °C. Therefore, the average CTE equivalent error is 3.1%. If the weight error is 0.2%, the average CTE equivalent error is 0.3%.
In this analysis, a value of 5% error has been assumed in order to quantify the effect of the modulus of elasticity error. In Figure 5b, the equivalent CTE error for a 5% error in the modulus of elasticity is shown. The average CTE equivalent error is 0.9%.
In Figure 5c, the equivalent CTE error for a 1% error in the span length is shown. The average CTE equivalent error is 1.6%.
In order to quantify the effect of the insulating string, a modified model where the conductor length and the catenary length are different is used. Then, the simplified model is used in order to calculate the equivalent CTE error that gives the same result. In Figure 5d, the equivalent CTE error for a 2% insulating string length is shown. The average equivalent CTE error is 1.6%.
(a) (b)
(c) (d)
900 1000 1100 1200 1300 1400 1500 16002.5
2.6
2.7
2.8
2.9
3
3.1
3.2
3.3
3.4
3.5
TENSION (kg)
EQ
UIV
ALE
NT
CTE
ER
RO
R (%
)
900 1000 1100 1200 1300 1400 1500 16000.4
0.6
0.8
1
1.2
1.4
1.6
1.8
2
TENSION (kg)E
QU
IVA
LEN
T C
TE E
RR
OR
(%)
900 1000 1100 1200 1300 1400 1500 1600
1.3
1.4
1.5
1.6
1.7
1.8
1.9
TENSION (kg)
EQ
UIV
ALE
NT
CTE
ER
RO
R (%
)
900 1000 1100 1200 1300 1400 1500 1600
1.3
1.4
1.5
1.6
1.7
1.8
1.9
2
TENSION (kg)
EQ
UIV
ALE
NT
CTE
ER
RO
R (%
)
Figure 5. Equivalent coefficients of thermal expansion (CTE) error. (a) 2% weight error; (b) 5% modulusof elasticity error; (c) 1% span length error; (d) 2% insulating string length.
In Figure 5a, the equivalent CTE error for a 2% error in the weight is shown. The tension rangecorresponds to the tension values between −5 ◦C and 80 ◦C when the conductor is installed at the 15%of the Rated Breaking Strength at 15 ◦C. Therefore, the average CTE equivalent error is 3.1%. If theweight error is 0.2%, the average CTE equivalent error is 0.3%.
In this analysis, a value of 5% error has been assumed in order to quantify the effect of the modulusof elasticity error. In Figure 5b, the equivalent CTE error for a 5% error in the modulus of elasticity isshown. The average CTE equivalent error is 0.9%.
In Figure 5c, the equivalent CTE error for a 1% error in the span length is shown. The averageCTE equivalent error is 1.6%.
In order to quantify the effect of the insulating string, a modified model where the conductorlength and the catenary length are different is used. Then, the simplified model is used in order tocalculate the equivalent CTE error that gives the same result. In Figure 5d, the equivalent CTE error fora 2% insulating string length is shown. The average equivalent CTE error is 1.6%.
Table 4 shows the equivalent CTE error for several error sources: weight error, modulus of elasticityerror, span length error, and insulating string length error. The average value and the change of theequivalent CTE error in the temperature range between −5 ◦C and 80 ◦C is shown. The equivalent CTEerrors obtained for the same weight and span length errors are the same. There is also a relationship

Energies 2020, 13, 411 9 of 13
between the effect of these errors and the effect of the insulating string length. In this case, the effect ofa 2% insulating string length is equivalent to the effect of a 1% weight or span error.
Table 4. Equivalent CTE error.
Error Sources (%) Average Equivalent CTE Error (%) Equivalent CTE Error Change inTemperature Range (%)
Weight error0.2 0.3 0.11 1.6 0.52 3.1 1
Modulus of elasticityerror
2.5 0.5 0.65 0.9 1.3
7.5 1.4 1.9
Span length error1 1.6 0.52 3.1 0.93 4.6 1.4
Insulating string length1 0.8 0.32 1.6 0.54 2.9 1.6
5.1. Equivalent CTE Error of the HTLS Conductors
The HTLS conductors have either low knee-point temperatures or core materials with low CTEvalues. The knee-point temperature is the temperature where the aluminum gets slack. Above theknee-point temperature, the modulus of elasticity and CTE values are those of the core. Hence, the CTEand the modulus of elasticity of a conductor changes depending on the temperature value. For thisreason, the equivalent CTE error has different values above and below the knee-point.
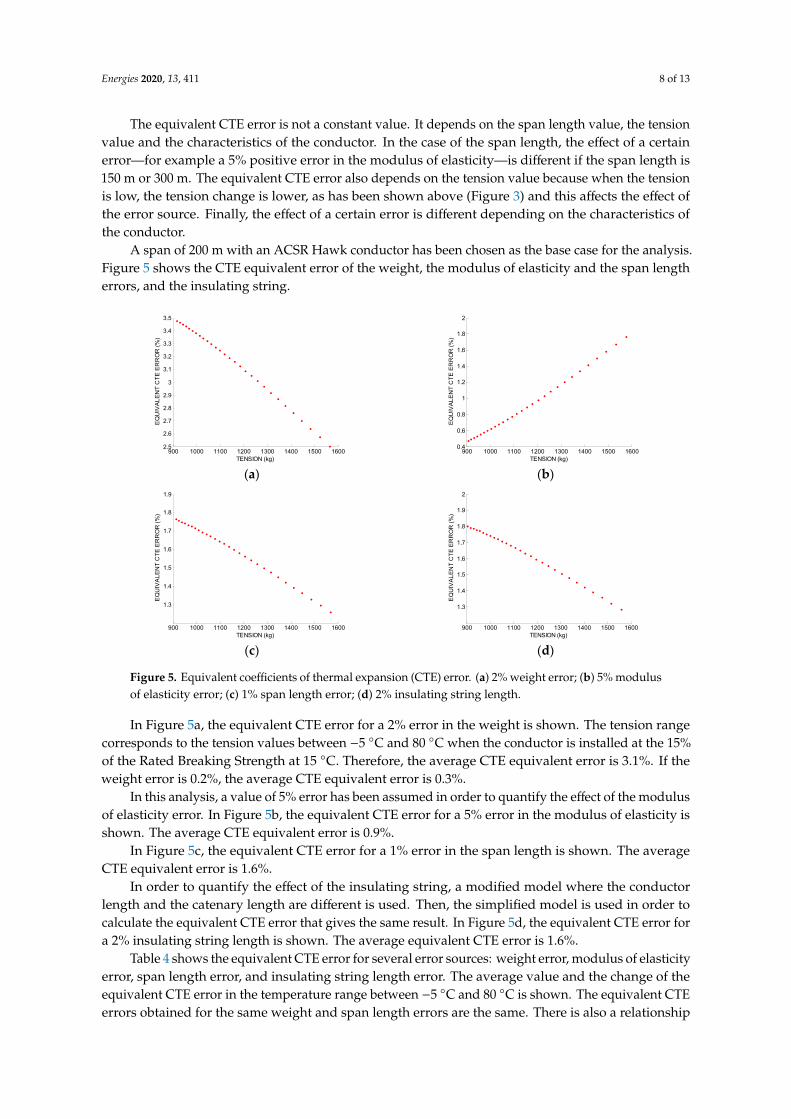
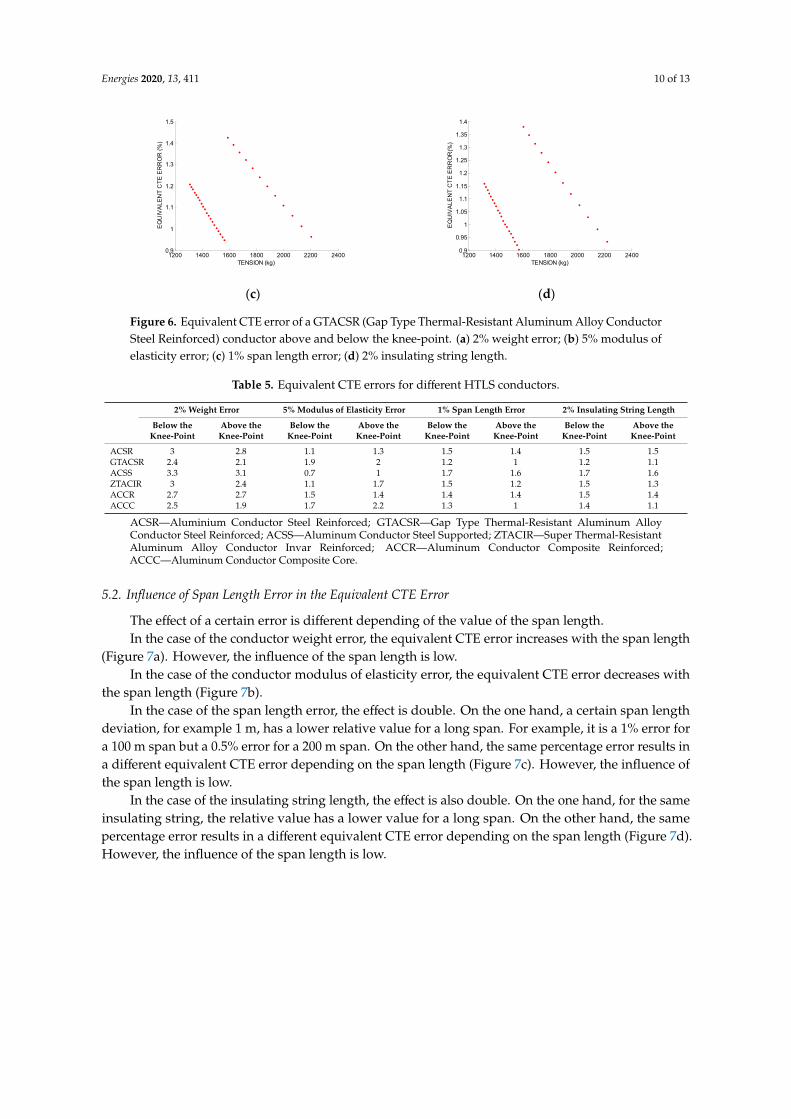
In the case of the weight error, above the knee-point, the equivalent CTE error decreases. Figure 6ashows the equivalent CTE error change for a GTACSR conductor in a 200 m span. The low tensionvalues correspond to the conductor above the knee-point temperature. Similar results are obtained forthe span length error and the insulating string (Figure 6c,d).
Figure 6b shows the equivalent CTE error change, assuming an error of 5% of the modulusof elasticity both above and below the knee-point. Above the knee-point, the equivalent CTEerror increases.
Table 5 shows the equivalent CTE errors for different HTLS conductors, when they are installed at15% RBS at 15 ◦C in a 200 m span. Although there are some differences, the obtained results are similarfor all the conductors.
Energies 2020, 13, x FOR PEER REVIEW 9 of 13
Figure 5. Equivalent coefficients of thermal expansion (CTE) error. (a) 2% weight error; (b) 5% modulus of elasticity error; (c) 1% span length error; (d) 2% insulating string length.
Table 4 shows the equivalent CTE error for several error sources: weight error, modulus of elasticity error, span length error, and insulating string length error. The average value and the change of the equivalent CTE error in the temperature range between −5 °C and 80 °C is shown. The equivalent CTE errors obtained for the same weight and span length errors are the same. There is also a relationship between the effect of these errors and the effect of the insulating string length. In this case, the effect of a 2% insulating string length is equivalent to the effect of a 1% weight or span error.
Table 4. Equivalent CTE error.
Error Sources (%) Average Equivalent CTE Error (%) Equivalent CTE Error Change
in Temperature Range (%)
Weight error 0.2 0.3 0.1 1 1.6 0.5 2 3.1 1
Modulus of elasticity error
2.5 0.5 0.6 5 0.9 1.3
7.5 1.4 1.9
Span length error 1 1.6 0.5 2 3.1 0.9 3 4.6 1.4
Insulating string length 1 0.8 0.3 2 1.6 0.5 4 2.9 1.6
5.1. Equivalent CTE Error of the HTLS Conductors
The HTLS conductors have either low knee-point temperatures or core materials with low CTE values. The knee-point temperature is the temperature where the aluminum gets slack. Above the knee-point temperature, the modulus of elasticity and CTE values are those of the core. Hence, the CTE and the modulus of elasticity of a conductor changes depending on the temperature value. For this reason, the equivalent CTE error has different values above and below the knee-point.
In the case of the weight error, above the knee-point, the equivalent CTE error decreases. Figure 6a shows the equivalent CTE error change for a GTACSR conductor in a 200 m span. The low tension values correspond to the conductor above the knee-point temperature. Similar results are obtained for the span length error and the insulating string (Figure 6c,d).
Figure 6b shows the equivalent CTE error change, assuming an error of 5% of the modulus of elasticity both above and below the knee-point. Above the knee-point, the equivalent CTE error increases.
(a) (b)
1200 1400 1600 1800 2000 2200 24001.8
1.9
2
2.1
2.2
2.3
2.4
2.5
2.6
2.7
2.8
TENSION (kg)
EQ
UIV
ALE
NT
CTE
ER
RO
R(%
)
1200 1400 1600 1800 2000 2200 24001.4
1.6
1.8
2
2.2
2.4
2.6
2.8
TENSION (kg)
EQ
UIV
ALE
NT
CTE
ER
RO
R(%
)
Figure 6. Cont.
Energies 2020, 13, 411 10 of 13Energies 2020, 13, x FOR PEER REVIEW 10 of 13
(c) (d)
Figure 6. Equivalent CTE error of a GTACSR (Gap Type Thermal-Resistant Aluminum Alloy Conductor Steel Reinforced) conductor above and below the knee-point. (a) 2% weight error; (b) 5% modulus of elasticity error; (c) 1% span length error; (d) 2% insulating string length.
Table 5 shows the equivalent CTE errors for different HTLS conductors, when they are installed at 15% RBS at 15 °C in a 200 m span. Although there are some differences, the obtained results are similar for all the conductors.
Table 5. Equivalent CTE errors for different HTLS conductors.
2% Weight Error 5% Modulus of Elasticity
Error 1% Span Length Error 2% Insulating String Length
Below the
Knee-Point Above the Knee-Point
Below the Knee-Point
Above the Knee-Point
Below the Knee-Point
Above the Knee-Point
Below the Knee-Point
Above the Knee-Point
ACSR 3 2.8 1.1 1.3 1.5 1.4 1.5 1.5 GTACSR 2.4 2.1 1.9 2 1.2 1 1.2 1.1
ACSS 3.3 3.1 0.7 1 1.7 1.6 1.7 1.6 ZTACIR 3 2.4 1.1 1.7 1.5 1.2 1.5 1.3 ACCR 2.7 2.7 1.5 1.4 1.4 1.4 1.5 1.4 ACCC 2.5 1.9 1.7 2.2 1.3 1 1.4 1.1
ACSR—Aluminium Conductor Steel Reinforced; GTACSR—Gap Type Thermal-Resistant Aluminum Alloy Conductor Steel Reinforced; ACSS—Aluminum Conductor Steel Supported; ZTACIR—Super Thermal-Resistant Aluminum Alloy Conductor Invar Reinforced; ACCR—Aluminum Conductor Composite Reinforced; ACCC—Aluminum Conductor Composite Core.
5.2. Influence of Span Length Error in the Equivalent CTE Error
The effect of a certain error is different depending of the value of the span length. In the case of the conductor weight error, the equivalent CTE error increases with the span length
(Figure 7a). However, the influence of the span length is low. In the case of the conductor modulus of elasticity error, the equivalent CTE error decreases with
the span length (Figure 7b). In the case of the span length error, the effect is double. On the one hand, a certain span length
deviation, for example 1 m, has a lower relative value for a long span. For example, it is a 1% error for a 100 m span but a 0.5% error for a 200 m span. On the other hand, the same percentage error results in a different equivalent CTE error depending on the span length (Figure 7c). However, the influence of the span length is low.
In the case of the insulating string length, the effect is also double. On the one hand, for the same insulating string, the relative value has a lower value for a long span. On the other hand, the same percentage error results in a different equivalent CTE error depending on the span length (Figure 7d). However, the influence of the span length is low.
1200 1400 1600 1800 2000 2200 24000.9
1
1.1
1.2
1.3
1.4
1.5
TENSION (kg)
EQ
UIV
ALE
NT
CTE
ER
RO
R (%
)
1200 1400 1600 1800 2000 2200 24000.9
0.95
1
1.05
1.1
1.15
1.2
1.25
1.3
1.35
1.4
TENSION (kg)
EQ
UIV
ALE
NT
CTE
ER
RO
R(%
)
Figure 6. Equivalent CTE error of a GTACSR (Gap Type Thermal-Resistant Aluminum Alloy ConductorSteel Reinforced) conductor above and below the knee-point. (a) 2% weight error; (b) 5% modulus ofelasticity error; (c) 1% span length error; (d) 2% insulating string length.
Table 5. Equivalent CTE errors for different HTLS conductors.
2% Weight Error 5% Modulus of Elasticity Error 1% Span Length Error 2% Insulating String Length
Below theKnee-Point
Above theKnee-Point
Below theKnee-Point
Above theKnee-Point
Below theKnee-Point
Above theKnee-Point
Below theKnee-Point
Above theKnee-Point
ACSR 3 2.8 1.1 1.3 1.5 1.4 1.5 1.5GTACSR 2.4 2.1 1.9 2 1.2 1 1.2 1.1ACSS 3.3 3.1 0.7 1 1.7 1.6 1.7 1.6ZTACIR 3 2.4 1.1 1.7 1.5 1.2 1.5 1.3ACCR 2.7 2.7 1.5 1.4 1.4 1.4 1.5 1.4ACCC 2.5 1.9 1.7 2.2 1.3 1 1.4 1.1
ACSR—Aluminium Conductor Steel Reinforced; GTACSR—Gap Type Thermal-Resistant Aluminum AlloyConductor Steel Reinforced; ACSS—Aluminum Conductor Steel Supported; ZTACIR—Super Thermal-ResistantAluminum Alloy Conductor Invar Reinforced; ACCR—Aluminum Conductor Composite Reinforced;ACCC—Aluminum Conductor Composite Core.
5.2. Influence of Span Length Error in the Equivalent CTE Error
The effect of a certain error is different depending of the value of the span length.In the case of the conductor weight error, the equivalent CTE error increases with the span length
(Figure 7a). However, the influence of the span length is low.In the case of the conductor modulus of elasticity error, the equivalent CTE error decreases with
the span length (Figure 7b).In the case of the span length error, the effect is double. On the one hand, a certain span length
deviation, for example 1 m, has a lower relative value for a long span. For example, it is a 1% error fora 100 m span but a 0.5% error for a 200 m span. On the other hand, the same percentage error results ina different equivalent CTE error depending on the span length (Figure 7c). However, the influence ofthe span length is low.
In the case of the insulating string length, the effect is also double. On the one hand, for the sameinsulating string, the relative value has a lower value for a long span. On the other hand, the samepercentage error results in a different equivalent CTE error depending on the span length (Figure 7d).However, the influence of the span length is low.

Energies 2020, 13, 411 11 of 13Energies 2020, 13, x FOR PEER REVIEW 11 of 13
(a) (b)
(c) (d)
Figure 7. Equivalent CTE error as a function of the span length. (a) Weight error; (b) Modulus of elasticity error; (c) Span length error; (d) Insulating string length.
5.3. Analysis of the Results
The results obtained for the conductor weight, modulus of elasticity and span length errors, and the insulating string length are analyzed in order to obtain some practical conclusions.
In the case of the weight, the equivalent CTE error of a 2% weight error is around 3%. The obtained result is similar for all the HTLS overhead conductors. The influence of the weight error increases at high temperature (low tension) values but decreases above the knee-point temperature. The maximum allowable temperature of high temperature conductor is between 150 and 250 °C [2]. Anyway, the change in the equivalent CTE error for these reasons is low, below 1%. The influence of the span length in the effect of the weight error is negligible. As a result, the only way to minimize the effect of the weight error is to minimize the source error. This can be achieved if the weight is measured in the manufacturing process. In this case, the source error is assumed to be around 0.2% and the equivalent CTE error is reduced in proportion to the source error reduction.
In the case of the modulus of elasticity, the equivalent CTE error of a 5% error is around 1%. The obtained result is similar for all the HTLS overhead conductors. The influence of the modulus of elasticity decreases at high temperature (low tension) values but increases above the knee-point temperature. Regardless, the change in the equivalent CTE error for these reasons is low, below 1%. The influence of the span length in the effect of the modulus of elasticity error is high. The effect of the modulus of elasticity error is reduced if a high span length is chosen for the test. Besides, a stress–strain test of the conductor can be carried out in order to reduce the uncertainty of the error source. In this case, the error is assumed to be around 5%.
In the case of the span length error, the influence is qualitatively and quantitatively the same as the weight error. As a result, the only way to minimize the effect is to minimize the source error. This can be achieved if the span length error is measured by a topographer. In this case, the source error and its effect are negligible.
In the case of the insulating string effect, its influence is removed if it is taken into account in the sag–tension model. Therefore, a model that takes it into account should be used. This model assumes that the conductor is shorter than the catenary.
As a result, if the conductor weight is tested (e.g., 0.2% error), the modulus of elasticity is tested (e.g., 5% error) and the span length is measured (0% error), if the span length is at least 200 m, and
0
1
2
3
4
5
6
0 200 400 600 800
Equi
vale
nt C
TE e
rror
(%)
Span length (m)
1%2%3%
Figure 7. Equivalent CTE error as a function of the span length. (a) Weight error; (b) Modulus ofelasticity error; (c) Span length error; (d) Insulating string length.
5.3. Analysis of the Results
The results obtained for the conductor weight, modulus of elasticity and span length errors,and the insulating string length are analyzed in order to obtain some practical conclusions.
In the case of the weight, the equivalent CTE error of a 2% weight error is around 3%. The obtainedresult is similar for all the HTLS overhead conductors. The influence of the weight error increases athigh temperature (low tension) values but decreases above the knee-point temperature. The maximumallowable temperature of high temperature conductor is between 150 and 250 ◦C [2]. Anyway,the change in the equivalent CTE error for these reasons is low, below 1%. The influence of the spanlength in the effect of the weight error is negligible. As a result, the only way to minimize the effect ofthe weight error is to minimize the source error. This can be achieved if the weight is measured in themanufacturing process. In this case, the source error is assumed to be around 0.2% and the equivalentCTE error is reduced in proportion to the source error reduction.
In the case of the modulus of elasticity, the equivalent CTE error of a 5% error is around 1%.The obtained result is similar for all the HTLS overhead conductors. The influence of the modulusof elasticity decreases at high temperature (low tension) values but increases above the knee-pointtemperature. Regardless, the change in the equivalent CTE error for these reasons is low, below 1%.The influence of the span length in the effect of the modulus of elasticity error is high. The effect of themodulus of elasticity error is reduced if a high span length is chosen for the test. Besides, a stress–straintest of the conductor can be carried out in order to reduce the uncertainty of the error source. In thiscase, the error is assumed to be around 5%.
In the case of the span length error, the influence is qualitatively and quantitatively the sameas the weight error. As a result, the only way to minimize the effect is to minimize the source error.This can be achieved if the span length error is measured by a topographer. In this case, the sourceerror and its effect are negligible.
In the case of the insulating string effect, its influence is removed if it is taken into account in thesag–tension model. Therefore, a model that takes it into account should be used. This model assumesthat the conductor is shorter than the catenary.

Energies 2020, 13, 411 12 of 13
As a result, if the conductor weight is tested (e.g., 0.2% error), the modulus of elasticity is tested(e.g., 5% error) and the span length is measured (0% error), if the span length is at least 200 m, and theinsulating string is included in the model, the equivalent CTE error is around 1%. Therefore, the influenceof these error sources is low. However, if the conductor weight is not measured (e.g., 2% error), the modulusof elasticity is not tested (e.g., 7.5% error), the span length is not measured (e.g., 1% error), if the spanlength is 100 m, and the insulating string is not included in the model (e.g., 2% insulating string length),then the equivalent CTE error is around 7%.
6. Conclusions
The thermal expansion process of an overhead conductor has been described in detail. As aresult, the uncertainty sources of the sag-tension performance related to the thermal expansion processhave been identified. The conductor weight, the conductor modulus of elasticity, the span length,the insulating string and the tower deflection affect the sag-tension performance.
Once they have been identified, the uncertainty sources have then been quantified. The conductoruncertainties are easy to quantify. The weight uncertainty is a manufacturing requirement.The maximum accepted deviation is 2%. The modulus of elasticity can be tested too. However,there is an uncertainty that is assumed to be below 5%. The span length uncertainty is removed ifa topographer measures its value. The tower deflection quantification requires a detailed model ofthe tower and it is the most difficult to quantify. The insulating string length is usually a 2% of thespan length.
Once they have been quantified, their effect in the sag-tension performance has been analyzed.The results related to the conductor weight, modulus of elasticity, span length and insulating string havebeen presented. The quantification of the effect of the tower deflection requires a specific modelling ofthe towers.
In order to quantify and compare the effect of the different error sources, the equivalent CTEerror of an error source is defined as the CTE error value that results in the same tension deviation.The equivalent CTE error depends on the tension value, the span length value, and the characteristicsof the conductor. The influence of the tension value is low—below 1%. The obtained results are similarfor all the analyzed HTLS conductors, and although there is an influence of the knee-point, its influenceis low—below 1%. The span length value considerably affects the effect of the modulus of elasticityerror, and long spans decrease the effect of the modulus of elasticity error.
The analysis presented in the paper is the first step in evaluating the uncertainties in the testing ofthe CTE of overhead conductors. The influence of the strain tower deflection, the weather and themonitoring system has to be considered in order to obtain a whole picture of the testing uncertainties.The authors have installed some pilot systems in order to address these issues. The obtained resultswill be presented in a future paper.
Author Contributions: Conceptualization, M.T.B., I.A. and E.F.; methodology, M.T.B., I.A. and E.F.; software,M.T.B.; validation, M.T.B., I.A., E.F. and A.J.M.; formal analysis, M.T.B., E.F. and I.A.; investigation, M.T.B., E.F.and I.A.; data curation, M.T.B.; writing—original draft preparation, M.T.B., E.F., I.A. and A.J.M.; writing—reviewand editing, M.T.B., I.A. and E.F.; supervision, M.T.B., E.F., I.A. and A.J.M.; funding acquisition, M.T.B., E.F., I.A.and A.J.M. All authors have read and agreed to the published version of the manuscript.
Funding: This research was funded by the MINISTERIO DE ECONOMÍA, INDUSTRIA Y COMPETITIVIDAD,Spain, DPI2016-77215-R (AEI/FEDER, UE).
Conflicts of Interest: The authors declare no conflict of interest.
References
1. CIGRE Brochure (Ref. No. 353): Guidelines for Increased Utilization of Existing Overhead Transmission Lines;CIGRE: Paris, France, 2008.
2. CIGRE Brochure (Ref. No. 763): Conductors for the Uprating of Existing Overhead Lines; CIGRE: Paris, France, 2019.
Energies 2020, 13, 411 13 of 13
3. Albizu, I.; Mazon, A.J.; Valverde, V.; Buigues, G. Aspects to take into account in the application of mechanicalcalculation to high-temperature low-sag conductors. IET Gener. Transm. Distrib. 2010, 4, 631–640. [CrossRef]
4. CIGRE Brochure (Ref. No. 426): Guide for Qualifying High Temperature Conductors for Use on OverheadTransmission Lines; CIGRE: Paris, France, 2010.
5. ASTM D696-08e1: Standard Test Method for Coefficient of Linear Thermal Expansion of Plastics Between −30 ◦C and30 ◦C with a Vitreous Silica Dilatometer; ASTM International: West Conshohocken, PA, USA, 2008.
6. ASTM E228-11: Standard Test Method for Linear Thermal Expansion of Solid Materials with a Push-Rod Dilatometer;American National Standards Institute: New York, NY, USA, 2007.
7. ASTM E831-12: Standard Test Method for Linear Thermal Expansion of Solid Materials by ThermomechanicalAnalysis; ASTM International: West Conshohocken, PA, USA, 2012.
8. IEC 61597: Overhead Electrical Conductors—Calculation Methods for Stranded Bare Conductors; IEC: Geneva, Switzerland,1995.
9. Powerline Conductor Accelerated Testing Facility (PCAT) at Oak Ridge National Laboratory. Available online:https://web.ornl.gov/sci/renewables/docs/factsheets/PCAT-factsheet.pdf (accessed on 13 December 2019).
10. Fernandez, E.; Albizu, I.; Bedialauneta, M.T.; de Arriba, S.; Mazon, A.J. System for ampacity monitoringand low sag overhead conductor evaluation. In Proceedings of the IEEE MELECON Conference,Yasmine Hammamet, Tunisia, 25–28 March 2012; IEEE: Piscataway, NJ, USA, 2012.
11. Clairmont, B. High-Temperature Low-Sag Transmission Conductors; EPRI: Palo Alto, CA, USA, 2008.12. Custer, L. DOE-3M demonstration project. In Proceedings of the IEEE TP & C Line Design Meeting,
Albuquerque, NM, USA, 15–19 October 2006.13. Goel, A. Hydro one networks. In Proceedings of the IEEE TP & C Line Design Meeting, Las Vegas, NV, USA,
1 February 2005.14. Kupke, S. Pilot project—High temperature low sag conductors. In Proceedings of the CIGRE WG B2.42,
Stockholm, Sweden, 21 May 2010.15. CIGRE Brochure (Ref. No. 324): Sag-Tension Calculation Methods for Overhead Lines; CIGRE: Paris, France, 2007.16. Olivieri, C.; de Paulis, F.; Orlandi, A.; Giannuzzi, G.; Salvati, R.; Zaottini, R.; Morandini, C.; Mocarelli, L.
Remote monitoring of joints status on in-service high-voltage overhead lines. Energies 2019, 12, 1004.[CrossRef]
17. EN 50182: Conductors for Overhead Lines—Round Wire Concentric Lay Stranded Conductors; CENELEC:Brussels, Belgium, 2001.
18. IEC 62420: Concentric Lay Stranded Overhead Electrical Conductors Containing One or More Gap(s); IEC: Geneva,Switzerland, 2008.
19. EN 50540: Conductors for Overhead Lines—Aluminium Conductors Steel Supported (ACSS); CENELEC:Brussels, Belgium, 2010.
20. A Method of Stress-Strain Testing of Aluminum Conductor and a Test for Determining the Long Time Tensile Creepof Aluminum Conductors in Overhead Lines; Electrical Technical Committee of the Aluminum Association:Arlington, TX, USA, 1999.
© 2020 by the authors. Licensee MDPI, Basel, Switzerland. This article is an open accessarticle distributed under the terms and conditions of the Creative Commons Attribution(CC BY) license (http://creativecommons.org/licenses/by/4.0/).