Prediction of ventilation coefficient, using a conjunction model ...
Upload
independentCategory
view
3download
0
Initial sticking coefficient of O2 on Ag(ll0) L. Vattuone, M. Rocca, C. Boragno, and U. Valbusa Centro di Fisica delle Superjci e delle Basse Temperature de1 C.N.R and INFM, Dipartimento di Fisica, via Dodecaneso 33, 16146 Genova, Italy
(Received 3 January 1994; accepted 18 March 1994)
We investigated the dynamics of the adsorption of 0, on Ag(ll0) with the molecular beam technique combined with EEL spectroscopy and with the method of King and Wells. The initial sticking coefficient So is reported for molecules impinging along both high symmetry azimuthal directions (001) and (110) as a function of total energy and angle of incidence of the molecules and crystal temperature. The initial sticking coefficient is anisotropic for low as well as for room temperature adsorption. The dependence of the sticking coefficient on the temperature of the saqle, T,, indicates that adsorption takes place directly into the molecular well. Dissociation is eventually induced thermally for TS> 150 K. The physisorbed state plays no role in the chemisorption process in the investigated impact energy range.
I. INTRODUCTION
The topics of the dynamics of the interaction of mol- ecules from the gas phase with surfaces is awaking more and more interest in the community of physicists and chemists.’ The adsorption of oxygen on Ag in particular has been in- tensively studied in the past by several groups2-6 because of the importance of Ag as a catalyst in ethylene epoxidation7 as well as for its fundamental interest. The system presents a potential energy surface (PES) characterized by three wells8 corresponding to physisorption for a crystal temperature T,<40 K,’ molecular chemisorption for 40 K<T,<150 K and dissociation at higher temperatures. The complexity of this PES makes this system a prototype for an adsorption reaction, where dissociation occurs already at low tempera- ture. Moreover the surface is strongly corrugated and azi- muthally anisotropic.“-l2 At room temperature oxygen forms (nX 1) structures5 which correspond to an adrow reconstruction’3’14 with 2< n C 8.15 No superstructure ap- pears for molecular adsorption.
We recently investigated the dynamics of the dissocia- tion process of this system by HREELS demonstrating that O2 dissociation and substrate reconstruction occur at 150 and 200 K respectively.16 Part of the data relative to the adsorp- tion process were already presented in a letter17 and in the proceedings of the conference Vibrations at Surfaces.” In those papers we showed that the initial sticking coefficient So depends strongly on the impact energy El and on the angle of incidence BI of the molecules and is anisotropic with respect to crystal azimuth, being larger for molecules im- pinging along the more corrugated (001) direction. The av- erage height (defined by a sticking coefficient=go ,,,/2) and width of the adsorbtion barrier distribution, however, came out to be isotropic. These results indicate that we are dealing with adsorption into a short lived molecular precursor state which is facilitated by the presence of corrugation. Dissocia- tion follows eventually if the crystal temperature is suffi- cently high.
In this paper we will give a broader overview on the experimental investigation of the initial stage of the O,-Ag( 110) interaction, comparing the results obtained with direct (King and Wellslg) and indirect (HREELS2’) methods
and discussing a model for the interpretation of the data. In the accompanying pape? we will analyze the coverage de- pendence of the O,-Ag( 110) interaction.
II. EXPERIMENTAL SETUP
A. Experimental apparatus
The experimental apparatus was already described in de- tail elsewhere.22 Here we will summarize the features which are essential to the discussion of the present experiment. A sketch of the experimental apparatus is shown in Fig. 1. The molecular beam is placed at the same level of the EEL spec- trometer. It can be flagged on and off either in the second stage of the differential pumping system or at the entrance of the main chamber to perform King and Wells” like measure- ments. A time of flight chain allows one to determine the velocity of the molecules while a spinning friction gauge allows one to measure the absolute intensity of the beam. The sample can be cooled to 83 K and heated to 1000 K. Its temperature is measured by a chrome1 alumel thermocouple with an accuracy of 5 K. An electron energy loss spectrom- eter (EELS), a CMA, a RFA, and a quadrupole mass spec- trometer are present in the chamber.
The sample is a single crystal with a diameter of 10 mm and a thickness of 2 mm cut to within 0.2” from the (110) plane. It has been cleaned in situ in UHV (base pressure in the main chamber 10 -’ Pa) by cycles of 2 kV Ne ions sput- tering followed by heating to 700 K. Sample cleanliness is tested by Auger spectroscopy, LEED and EELS. The most important contaminants of the Ag surface are sulfur and car- bon. The first element gives rise to an intense peak at 152 eV in the Auger spectrum, which is easily detectable. The sec- ond element has a peak at 272 eV, which overlaps with the silver peak at 266 eV; the absence of C is assumed when the intensity ratio for the 266 and 302 peaks of Ag is between 0.4 and 0.5 (Ref. 23) and no vibrational loss is observed with EELS. EELS analysis was performed before the experimen- tal runs to check for surface cleanliness and avoid any carbon contamination by the electron gun needed for AES and LEED.
Oxygen is supplied by a supersonic molecular beam. The
J. Chem. Phys. 101 (l), 1 July 1994 0021-9606/94/l 01(1)/713/13/$6.00 Q 1994 American Institute of Physics 713 Downloaded 25 Jan 2001 to 130.251.168.206. Redistribution subject to AIP copyright, see http://ojps.aip.org/jcpo/jcpcpyrts.html.

714 Vattuone et al.: Sticking of 0, on Ag(ll0)
FIG. 1. Sketch of the experimental apparatus: I, II, and III refer to the differential pumping stages of the molecular beam, N is the nozzle, CH the chopper, and S are the skimmers. The main chamber can be isolated by a valve and contains the sample, C, the EEL spectrometer and other facilities. SHl and SH2 are shutters needed for KW experiments. W is a window. The spinning rotor gauge, SRG, allows for a quantitative measurement of the flux in the molecular beam. A differentially pumped quadrupole mass spec- trometer permits to determine the energy of the molecules in the beam by time of flight analysis.
total energy of the molecules Ej was varied from 88 to 615 meV by seeding the beam in He and by changing the tem- perature of the nozzle from 293 to 605 K. The full width at half maximum of the energy distribution of the 0, molecules in the beam, AE,IE, , is 0.2. The length of the path between the chopper and the ionization stage of the mass spectrom- eter is 1.35 m so that the time of flight for He is 980 pus. To overcome the uncertainty caused by the finite length of the ionization zone we calibrated the flight path measuring the time of flight of a supersonic Ne molecular beam. For the seeded beam, mixtures at 3.5% and 5% 0s in He were used. The composition of the mixture was checked with the quad- rupole mass spectrometer of the time of flight chain.
In the experiment the angle of incidence of the molecu- lar beam 0, was varied from 0” to 75” with respect to the normal to the surface. The exposure dose to Oa, x, is given by the flux and the exposure time, normalized to the surface density of Ag(ll0) (8.4 1014 atoms/cm’) .
The population of excited vibrational levels in the beam is neghgible even for the highest nozzle temperature reached in our experiment (605 K). The separation of vibrational lev- els in the free oxygen molecule is in fact 196 meV, the popu- lation of the first excited vibrational level is thus 2X lo-’ at 600 K so that even admitting sticking of 1 for excited mol- ecules, their contribution to adsorption in the present experi- ment is marginal as Sa came out of the order of 1 at high impact energy. On the contrary the separation of rotational levels in the 0, molecule is such that, already for the nozzle at room temperature, values of J up to 14 are present.
EEL spectra were recorded with a new double pass CDA( 127 “) EEL spectrometer designed24 and constructed by our group following Ibach designs capable of the inten- sity vs resolution AE, curve reported in Fig. 2. Most of the data were recorded at AE,m 7 meV to reduce acquisition
10-10
10-11
10-12 2 3 4 5 6 78910
AE, (meV)
FIG. 2. Current at detector, I, vs resolution AE, for our HREEL spectrom- eter measured for the direct beam at E,=8.6 eV.
time, but the frequencies were-also measured at AE, =4 meV and no change was observed.
B. EELS method to measure sticking coefficient
The sticking coefficient can be estimated from the de- rivative of the oxygen coverage on the surface vs exposure. The O2 coverage can in principle be determined in many different ways as, e.g., by AE?Sz6 work function,5 thermal desorption,27Y28 etc. We chose to evaluate Sa by applying an intensity analysis of the EEL spectra.“’
Figure 3 shows a typical EELS spectrum measured after 60 s exposure to a 3.5% O2 beam seeded in He (Ei=305 meV) at 8,=66” corresponding to a dose of 3.65 monolay- ers. The spectrum was recorded with an electron beam en- ergy E, = 1.4 eV impinging on the surface along the ( 1 lo)
direction at an angle of incidence Be= 63 o with respect to the normal to the surface. A single peak at 40 meV is present in accord with literature3’4 which is attributed to the Ag-0
. . . . . -..*.p..., 0 ~r.I.i..“..‘.‘.““““‘~
-20 0 20 40 60 80
Energy loss (meV)
FIG. 3. EEL spectrum recorded for E,= 1.4 eV and @,= 63’. after an ex- posure of x=3.65 ML at 0r=66’ and Er=305 meV. The loss intensity, 140, is also shown.
J. Chem. Phys., Vol. 101, No. 1, 1 July 1994
Downloaded 25 Jan 2001 to 130.251.168.206. Redistribution subject to AIP copyright, see http://ojps.aip.org/jcpo/jcpcpyrts.html.

vibration. Similar spectra were recorded at different cover- ages. No frequency shift with increasing coverage 0, was found even at the highest applied resolution of 4 meV. We then usually acquired spectra at 7 meV resolution to reduce the acquisition time w 5 min which is required to record each spectrum. The choice of the low electron energy is mo- tivated by the enhancement of dipole scattering and by the larger acceptance angle aaCC of the spectrometer (cram= 6” at 1.4 eV) which allowed to enhance the sensitivity. A back- ground subtraction is necessary to evaluate the EELS inten- sities. This procedure was performed manually. The error connected to this operation resulted to be negligible com- pared to other uncertainties on the loss intensity.
As known from dipolar theory the coverage is propor- tional to the loss intensity Z&Z, (Ref. 29)
0.25
Zloss. - I,=Ap20,
where Z0 is the specular intensity, loss, 0 the coverage of the surface, of the dynamical dipole moment, function:
A= 4~~o(1-2eEj0~5
- F(kNl aOEe cos t9,eg +4w>>* (2)
Zloss the intensity of the p the normal component and A the instrumental
A depends on electron energy E,, electron incidence angle 0,) ~1~ is the surface density of substrate atoms, a0 is the Bohr radius, coo the dielectric constant, F@,) is a tabu- lated function” which debends on .the ratio GC== a&2 eE of the angular acceptanc&cra&-of the spectrometer and of the ._. width of the dipole lobe &= f~w/2E, , where w is the fre- quency of the loss, n(o)=[exp (hwlkT,)- 11-I iS~ the Bose factor and T, the surface temperature.
The intensity vs coverage relation has to be calibrated either by an independent determination of the dynamic&l di- pple moment or by the evaluation of ordered LEED patterns. A,u’ is obtained by assigning a coverage Oo=O.25 to the value of Z&IO which is observed in correspondence with the appearance of the (4X1) superstructure. Following this pro- cedure we were able to associate the corresponding coverage to each loss intensity. A typical coverage vs exposure curve is reported in Fig. 4. Finally the initial sticking -coefficient was determined by a third order polynomial fitting of the curve O. vs x. The (4X 1) structure is present over a rela- tively large range of x, but the loss intensity increases only by 20% in that range. The initial slope, i.e., the initial stick- ing coefficient, is thus affected by an uncertainty of +- 10%. The principal approximation in this analysis consists in ne- glecting depolarization effects which reduce Zl,,,$ZO at large coverage. They can be included in Eq. (1) following Ref. 29:
I p&2 00
(1 +cu,Q2 ’
Vattuone et a/.: Sticking of O2 on Ag(ll0)
0 1 2 3 X (monolayer)
FIG. 4. Oxygen coverage vs exposure for I?,=305 meV, ti1=30”, recorded along (1 TO) rkorded by EELS. The continuous line is the best fit with a thiid order polynomial. The initial sticking probability is given by the de- rivative of the curve at Oo=O, i.e., by its linear term which reads in this case S0=0.26. The exposures corresponding to the appearance of the (4X 1) structure in the LEED pattern are indicated by dashed lines.
structure we obtain a deviation from the linear behavior of 16%. Backx and co-workers give a similar value for the error on Iin&rify fof their EELS intensity vs coverage data.3 The mai&error on the data is however caused by the reproduc- ibility of the Ilos$Io values which was found to be of the order of 25%. This error dominates and an uncertainty of this magnitude was assumed in’ the further analysis of the data.
While performing EELS measurements a molecular beam with a diameter of 7 mm at the position of the sample was used. The dimensions of the electron beam are deter- shied by tin exit slit’of 6X0.3 mm’ so that the area illumi- nated by the electron beam is uniformIy covered by the ad- sorbate.
Low impact energy Ei and large angle of incidence were used in this experiment to enhance dipole scattering and scat- tering intensity. For dissociated oxygen, dipole scattering is indeed the main scattering mechanism as demonstrated in Fig. 5 by the proportionality of Z&Z0 with E, ’ . This rela- tion is however not essential for the application of our method, which requires in fact only a proportionality of loss intensity and coverage.
C. The method of King and Wells
(3)
where x is the sum X( l/r;), rij the distance between atoms at sites i and j and a, the electronic polarizability.
LY, for a free oxygen atom is 0.8 A3.3o We expect ae to be higher for an adsorbed atom.2g Assuming CY, = 1.5 A3 for the adatom and evaluating numerically x for a (4X1) over-
The sticking was also measured with the method of King and Wells (KW). A typical measurements is shown in Fig. 6. Along the path of the moIecular beam two shutters are present: the first in the second stage of the molecular beam and the second in the main chamber. When the first shutter is opened at time t, with the second closed the background partial pressure of 0, in the main chamber increases from po= 1o-8 Pa to p 1 = 8 X 10-s Pa with a time constant of 400 ms due to the dimensions of the vacuum chamber and the pumping speed. The time constant of the quadrupole mass spectrometer was set to suit the time constant of the vacuum chamber (400 ms). A 50% chopped beam was used to double the adsorption time and to reduce artifacts con-
J. Chem. Phys., Vol. 101, No. 1, 1 July 1994 Downloaded 25 Jan 2001 to 130.251.168.206. Redistribution subject to AIP copyright, see http://ojps.aip.org/jcpo/jcpcpyrts.html.

716
h m I 12.5 I-
10.0
7.5
5.0
2.5 i
0.0 L 0
Ag(ll0) <lie>
I L I I I I 1 , 1 I I 1 1 , , I cd
0.2 0.4 0.6 0.6 1 l/E, (eV-‘)
FIG. 5. I,OPJIo measured for the 40 meV peak in the specular direction at FIG. 7. S, vs E, along (1 IO), at T,=298 K, measured by EELS. Different 8,= 63” as a function of l/E,. A linear dependence is observed indicating symbols refer to different total energies: 0 El=88 meV, q Ei=305 meV, 0 pure dipole scattering. The line is a guide to the eye. Ei=605 meV.
netted to the long time constant. When the second shutter is opened, at time t2, the pressure drops to pZ due to the get- tering action of the surface. The ratio (pl--p2)I(pI -pO) is the initial sticking coefficient. In the region of high sticking it allows to determine So with an accuracy of 0.02 in abso- lute value and a reproducibility better than 12%, i.e., consid- erably better than with EELS, but the lowest value of So is 2.5 X 10 -2 considerably higher than the limit of EELS. The two methods are therefore complementary. In this case the diameter of the molecular beam at the sample was chosen of 4 mm so that all the molecules in the beam hit the sample also for nonvertical incidence and errors due to partial illu- mination are ruled out for 8$60”. The holder was covered with a silver foil whose sticking coefficient is known to be
Vattuone et a/.: Sticking of O2 on Ag(ll0)
T=298 K 4
10-4 L- I I J 5 10 50 100 500
Ei COS28i (meV)
less than 10m5 as mainly (111) faces are exposed3**32 thus preventing adsorption from the holder even for grazing inci- dence measurements.
III. INITIAL STICKING COEFFICIENT So
Oxygen adsorption occurs molecularly below the disso- ciation temperature T,= 145 K.16 To investigate the effect of dissociation on sticking the dependence of So on impact en- ergy and angle of incidence was measured near room tem- perature for dissociative adsorption and near 100 K for mo- lecular chemisorption along the high sYfnn-=try crystallographic directions (1 i0) and (001). The dependence of So on crystal temperature T, was then investigated for selected conditions of EL and 0,.
A. Dissociative adsorption
lo’ 2, CJ- 32 3 2 2’ a.6 *- 4% ld- . 3 2 2- a
Ag(ll0) <iTo>
it,
4 ---p .o 0 ““‘0 “, ‘I”“‘. ” ” ” “‘,, I -10 0
&ne2’(se$ 40 50
SD was measured along the high symmetry crystallo- graphic directions (ITO} and (001) as a function of normal energy E,=Ei cos 28i with EELS as shown in Figs. 7 and 8, respectively. EELS data were calibrated according to the assignment of @o=O.25 for the (4X1) LEED structure. As one can see in the figures, the process is activated: So in- creases by three orders of magnitude passing from 5 to 600 meV. No increase is present in the sticking coefficient at low energies contrary to what was -observed for similar systems as, e.g., for 02-Pt(111).33 Along (1 i0) the data clearly scale with normal energy within experimental errors. The situation is more complex along (001) where the data are more dis- perse and different values of sticking are obtained at the same E, but for different Ei . This indicates that along (001) also parallel momentum plays a role in adsorption. The stick- ing probability is thus azimuthally anisotropic.
FIG. 6. Typical KW trace recorded for E,=30.5- meV, 0,=0”, and TV=278 K showing the partial pressure of 0, in the main chamber as a function of time. At t=t, the beam enters the main chamber but is flagged off by the second shutter, at t=t2 the beam is allowed to impinge on the sample. The change in partial pressure is directly related to the initial stick- ing coefficient which comes out S0=0.27.
The effect is particularly evident from the angular de- pendence of the experimental data recorded at a given Ei as one can see in Fig. 9: Data recorded with the beam imping- ing along (001) are systematically higher than data recorded along (Ho).
The effect is clearly present also in the data recorded with the method KW at 278 K which are reported in Figs. 10
J. Chem. Phys., Vol. 101, No. 1, I July 1994
Downloaded 25 Jan 2001 to 130.251.168.206. Redistribution subject to AIP copyright, see http://ojps.aip.org/jcpo/jcpcpyrts.html.

m”
100
10-l
10-2
10-3
1 T=298 K
iI.LuLL -I
10-4 -2 -1 5 10 50 100 500
El cos20, (meV)
FIG. 8. Sc vs .E, along {OOl), at T,=298 K, measured by EELS. Symbols: 0 Ei= 88 meV, 0 Ep305 meV, 0 Ei=605 meV, X &=I76 meV, and + &=470 meV.
and 11 as a function of E, for (1 i0) and (001) respectively and in Fig. 12 as a function of the angle of incidence for the same energies as in Fig. 9. The reason for the choice of a temperature slightly lower than room temperature will be evident in the following, when we will discuss the depen- dence of So on T,. Note that S,,(0i=0,Ei=305 meV) is larger than S$8~=45",Ei=605 meV) although corre- sponding to the same E, . This result is beyond experimental error.
The KW method allows for a direct determination of the sticking coefficient. The values obtained by EELS disagree systematically by a factor a 2 with KW in the range where both methods can be applied. One major experimental differ- ence is in the time scale of both experiments, which is of the order of few seconds for KW, while a couple of hours are necessary to perform a complete measurement with EELS as
1.00 0.50
0.10 0.05
0.01 VP 1.00
0.50
0.10 0.05
0.01 0 20 40 60 80
4
FIG. 9. Sa vs 6’, at T,=278 K, measured by EELS for &=305 meV (upper panel) and El=605 meV (lower panel). Cl refers to molecules impinging along (1 IO), 0 along (001). The. continuous and dotted lines refer to the fitting described in the discussion of Sec. IV B. In the lower panel an inset shows the geometry of the experiment with the 0 atoms adsorbed in the two-fold sites between the Ag atoms (Ref. 5).
UT 0.10
0.05
Vattuone et a/.: Sticking of 0, on Ag(ll0) 717
0.01 LL._I 100 200 500
E, c0s2ei (meV)
FIG. 10. Sa vs E, along (1 TO) measured with KW method. The same convention of Fig. 8 is used to label the total energy. The lowest point was recorded at I?,=605 meV, Bi= 68”. No pressure drop was observed and a bar corresponding to the sensitivity of the method (2.5%) is reported.
several exposures and as many EEL spectra are required. A pollution of the sample during this time is ruled out as no loss peaks due to contaminants appear in the spectra. As the value of So given by the EELS method is mediated by the assignment of the (4X1) structure, the formation of oxygen islands could however affect the result making So appear higher. The calibration of the EELS intensities with a wrong coverage would change the absolute value of So by a scaling factor. Integrating the data under the KW curve of Fig. 6 up to the appearance of a well formed (4X 1) structure we obtain a coverage of 0.18. This value is lower than 0.25. The dis- crepancy could be due to underestimating the flux but this is unlikely as the spinning rotor used in our experiment is an international standard for pressure measurements. More probably a partial clustering of the 0 into islands takes place already in the time needed for LEED analysis after the ex- posure so that the (4X 1) structure appears before Oo=0.25. As the time needed to record the EELS spectra is even longer the effect might be even more important and this
1.00 7” 8 I I j c
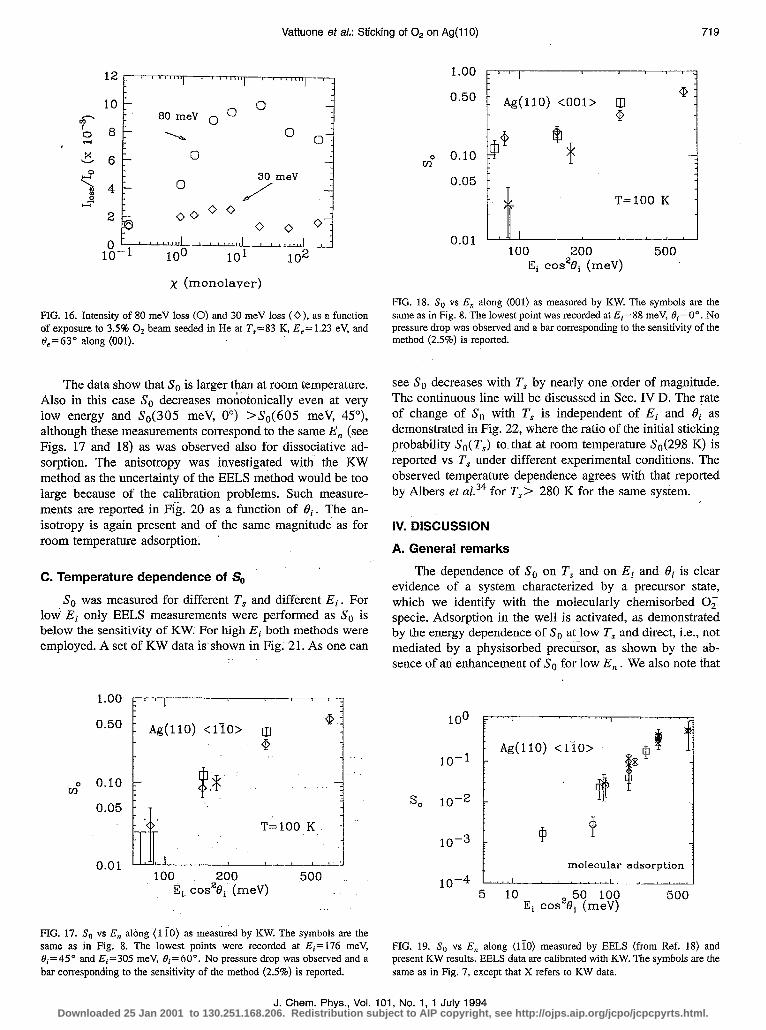
0.50 1 Ag(ll0) <OOl>
0 0.10
0.05 T=278
0.01 II,,1 , , 100 200 500
E, cos2e1 (meV)
FIG. 11. Sa vs E, along (OOl), at T,=278 K, measured with KW method. The same convention of Fig. 8 is used to label the total energy.
J. Chem. Phys., Vol. 101, No. 1, 1 July 1994 Downloaded 25 Jan 2001 to 130.251.168.206. Redistribution subject to AIP copyright, see http://ojps.aip.org/jcpo/jcpcpyrts.html.

718 Vattuone et a/.: Sticking of 0, on Ag(ll0)
100 7 ““1, . “1
10-l Ag(ll0) <OOl>. 08 O*: 7 80~ _
0+9< is
SO 10-2 Q xx 7 0 0
B + 8 10-3 cl 0
f dissociative 3
fk:i:.:.*.“+j,,,j
up Loo E
ei
FIG. 12. So vs 0, at T,=278 K, measured by KW for E,=30.5 meV (upper panel) a@ Ei=605 meV (lower panel). II refers to molecules impinging along (1 lo), 0 along (001). The lowest point .was recorded at El=605 meV and 8,=68”. The sticking is lower than sensitivity and the bar corre- sponding to it is reported. The continuous and dotted lines refer to the fitting described in the discussion of Sec. IV B.
could be the reason of the observed difference between So measured with EELS and KW. Judging KW more accurate than EELS for the absolute value of So we decided to nor- malize EELS data to KW data at Ei=605 meV and Bi = 0’. A fair overlap is then obtained in the range acces- sible to both methods as shown in Figs. 13 and 14 for mol- ecules impinging along (110) and (OOl), respectively.
__ B. Nondissociative adsorption
Molecular adsorption was investigated by EELS at 83 K. A spectrum recorded with 4 meV resolution is reported in Fig. 15. Two losses are present: at 30 meV corresponding to the Ag-0 vibration and at 80 meV corresponding to the O-O stretch in accord with literature.” The frequency of the losses came out to be independent of moleculti oxygen cov- erage Oo, . The measurement of So was therefore performed
100 j--r-----~““’
Ag(ll0) <liO> 8 Q Q
10-l @on D
F 0 Cl
10-3 0 dissociative
t adsorption
10-4 l-d.- ’ ’ ” ,,,I. . ’ 5 10
E, cos2t9~~rn:;~ 5ot
FIG. 13. SD vs E, along (110) at T,=298 K. The symbols are the same as in Fig. 7, big symbols refer to KW data, small symbols to EELS data.
1 1
0
adsorption
o-4 ,...I 8 .-I 5 10
Ei .o&~&$$j 500
FIG. 14. The same as Fig. 13, but along (001). ‘i%e symbols are the same as in Fig. 8, big symbols refer to KW data, small symbols to EELS data.
with A,?,=7 meV. The sticking coefficient can be evaluated by EELS in a way similar to that employed for room tem- perature adsorption. Depqlarization effects are however more Severe than for dissociative adsorption a8 shown in Fig. 16. The 80 meV loss intensity Iso was chosen to monitor Oo, because it is generally, more intense than I30 and it shows less depolarization with increasing coverage.
Due to the absence of overstructures it.is impossible to calibrate the coverage by LEED. LEED structures appear when dissociation occurs as soon as the crystal is heated, but a coverage dependent fraction -of the 0, molecules is then desorbed.” Desorption of. O2 is induced also by the high en- ergy electron beam of AES which is hence not applicable to monitor 0, . The dynamical dipole moment of the O2 vi- bration is unknown, too. The calibratibn problem was solved again by assigning to the sticking the value measured at high E, by KW.‘s The data measured by KW are reported as a function of E, in Figs. 17 and 18 for impact along (110) and (001). EELS and KW data along (1 i0) are summarized in Fig. 19.
0 25 50 75 100 125
Energy loss (meV)
FIG. 15. Typical EELS spectrum recorded after 120 s exbosure to pure oxygen beam, Et=88 meV, 0,=30”, T,‘=83 K, E,=4.5 eV, and 19,=63O along (1 i0).
I
I
J. Chem. Phys., Vol. 101, No. 1, 1 July 1994
Downloaded 25 Jan 2001 to 130.251.168.206. Redistribution subject to AIP copyright, see http://ojps.aip.org/jcpo/jcpcpyrts.html.
Vattuone et al.: Sticking of 0, on Ag(l IO) 719
Q 74 0 meV
l-7
/ 30 2 I5 00 o o
0 0 u i 0-e
10-l 100 101 102
x (monolayer)
0.50 - - Ag(ll0)
Q <OOl> Ql
Q
* @ *
0.05 - _
\I T=lOO K
0.01 1 - ’ 100 200 500
Ei cos20, (meV)
FIG. 16. Intensity of 80 meV loss (0) and 30 meV loss (0 j, as a function of exposure to 3.5% 0s beam seeded in He at T,=83 K, &=I.23 eV, and c),=63” along (001).
The data show that So is larger than at room temperature. .41so in this case So decreases monotonically even at very low energy and Ss(305 meV, 0’) >S,(605 meV, 45”), although these measurements correspond to the same E, (see Figs. 17 and 18) as was observed also for dissociative ad- sorption. The anisotropy was investigated with the KW method as the uncertainty of the EELS method would be too large because of the calibration problems. Such measure- ments are reported in Fig. 20 as a function of Bi. The an- isotropy is again present and of the same magnitude as for room temperature adsorption. A. General remarks
C. Temperature dependence of S,,
So was measured for different T, and different Ei. For low Et only EELS measurements were performed as So is below the sensitivity of KW: For high Ei both methods were employed. A set of KW data is shown in Fig; 21. As one can
The dependence of S,, on T, and on Ej and Oi is clear evidence of a system characterized by a precursor state, which we identify with the molecularly chemisorbed 0; specie. Adsorption in the well is activated, as demonstrated by the energy dependence of So at low T, and direct, i.e., not mediated by a physisorbed precursor, as shown by the ab- sence of an enhancement of So for low E, . We also note that
1.00 F’--1”’ ‘-7
0.50 Ag(ll0) <lie> rg Q
Q>
m” 0.10
0.05
J. Chem. Phys., Vol. 101, No. 1, 1 July 1994
100 200 E, dos28, (meV) 5 10
E, cos28~~rn~~~ 500
FIG. 17. Sc vs E, along (1 i0) as measured by KW: The symbols are the same as in Fig. 8. The lowest points were recorded at Ei=176 meV, 6ri=45” and I?,=305 meV, 0,=60”. No pressure drop was observed and a bar corresponding to the sensitivity of the method (2.5%) is reported.
FIG. 19. So vs E, along (li0) measured by EELS (from Ref. 18) and present KW results. EELS data are calibrated with KW. The symbols are the same as in Fig. 7, except that X refers to KW data.
FIG. 18. Sc vs E, along (001) as measured by KW. The symbols are the same as in Fig. 8. The lowest point was recorded at E,=88 meV, Bi= 0”. No pressure drop was observed and a bar corresponding to the sensitivity of the method (2.5%) is reported.
see So decreases with T, by nearly one ,order of magnitude. The continuous line will be discussed in Sec. IV D. The rate of change of So with T, is independent of Ei and Bi as demonstrated in Fig. 22, where the ratio of the initial sticking probability So(Ts) to that at room temperature Ss(29.8 K) is reported vs T, under different experimental conditions. The observed temperature dependence agrees with that reported by Albers et a1.34 for Ts> 280 K for the same system.
IV. DISCUSSION
molecular adsorption
Downloaded 25 Jan 2001 to 130.251.168.206. Redistribution subject to AIP copyright, see http://ojps.aip.org/jcpo/jcpcpyrts.html.

720 Vattuone et a/.: Sticking of 0, on Ag(llO)
olecular adsor
*i
FIG. 20. So vs 19, at T,= 100 K, measured by KW for El=305 meV (upper panel) and Et=605 meV (lower panel). 0 refers to molecules impinging aIong (110). 0 along (001). The. lowest point in the upper panel was recorded at E,=305 meV. Its value is lower than experimental sensitivity. The continuous and dotted lines refer to the curve fittings described in the discussion of Sec. IV B.
no dissociation was observed at T, = 83 K even for the Iarg- est impact energy. This indicates that the barrier for dissocia- tion cannot be overcome by increasing El and that the acti- vation of some other degree of freedom is needed as, e.g., the stretching of the 0, molecule. The maximum recorded value of so (So=0.6 recorded at 83 K, where desorption from the 0,: well is negligible) is lower than unity. Our apparatus prevents us however from measuring at E,>0.62 eV so that it is difficult to prove whether a saturation value was reached.
B. Anisotropy in the sticking coefficient and energy dependence
Along (1 i0) normal energy scaling is observed within experimental errors while along (001) parallel momentum
0.0 F,,... 100 200 300 400 500
Ts (K)
FIG. 21. So vs T, with KW. The continuous line is a fit described in the discussion of Sec. IV D.
2.0
s- 1.5
% cu “0 Y 1.0
-2 c VP 0.5
0.0
’ ’ -------I r!i
.--_ -.
‘\ ‘\
Ag(ll0) <lie>
\ ‘R \
y ‘4
-. 5. --.
,....,,...I,,,_
200 300 400 500
T, (K)
FIG. 22. Ratio S&“,)/S,,(298 K) as a function of T, . U Ei=305 meV, 8,=30”, + Ei=88 meV, and 0,=30”, measured by EELS. The tit to the data of Fig. 71 (KW method) is reported by the dashed line.
plays a role in overcoming the barrier to adsorption. To be more quantitative we fitted the experimental points with the function:35
SOtlX%X So=-
2 l+tanh
where SOmax is the maximum sticking coefficient and de- pends on steric effects during the interaction and on the tem- perature of the sample. Eo is a parameter which gives the average height of the adsorption barrier distribution, while W is linked to the width of the barrier. 12 considers the effect of parallel and normal momentum in the interaction: n=2 cor- responds to perfect normal energy scaling, n=O indicates a total energy dependence. Intermediate values correspond in this picture to some role of parallel momentum in adsorption. This functional form was frequently used in literature to de- scribe So(Ei , ei). Alternatively So(Ei ,0i) was fitted in literature36 by the error function:
- (EefF- EO)‘/W2dEeE (5)
with E,,= El cos” Bi where Eo and W have the same mean- ing as before and 17 is a normalization constant fixing the value of SOmax. Equation (5) reproduces the low energy data better than Eq. (4). The use of these functions is not justified by any particular theoretical model; they reproduce however the data quite accurately. The best fit curves with Eqs. (4) and (5) are reported in Fig. 23 for dissociative adsorption and in Fig. 24 for molecular adsorption. The fitting procedure was performed using a nonlinear minimization routine. The best fit values of the parameters are summarized in Table I for the different experimental methods and T,. The fitting procedure was not applied to the EELS data recorded at low temperature because of the too large uncertainties. The qual- ity of the fit was estimated by the evaluation of x2 defined as
x2’1~ - x,-x, 2 np--m ( 1 , us
(6)
J. Chem. Phys., Vol. 101, No. I,1 July 1994
Downloaded 25 Jan 2001 to 130.251.168.206. Redistribution subject to AIP copyright, see http://ojps.aip.org/jcpo/jcpcpyrts.html.

Vattuone et a/.: Sticking of 0, on Ag(l10) 721
10-3 Q
T=298 K 3
10-4 U-d 5 10 50 100 500
Ei cos’%, (meV)
T=298 K -
10-4 ,I 5 10 50 100 500
Ei cos’%, (meV)
FIG. 23. Best tit to data recorded near room temperature using EIq. (4). The data refer to: (a) Fig. 7, (b) Fig. 8, (c) Fig. 10. (d) Fig. 11. The data and the result are plotted as a function of cos” Bj , with n given by the fitting procedure.
where It,, is the number of experimental points, X, the mea- sured value and a, the extimated error, while X, is the cal- culated value and m the number of free parameters in the fit. x2=3.5 for (001) and x2=3.0 for (1 TO) EELS measurements when applying Eq. (4). A slightly better agreement is ob- tained using &. (5) which gives X2 =3.5 and x2 =2.1 respec- tively; in this case however n was kept fixed at n= 1.1 and n = 1.6 for simplicity. The errors on the parameters were es- timated by fitting the sticking values by increasing, or de- creasing, the central values by an amount equal to the error (25% for EELS measurements and 15% for KW). Using this procedure the largest change in fitting parameters Es, W, and n, was of the order of 10%.
The values for the barrier height obtained for the two investigated directions are in good agreement being the mean square deviation equal to 7%. The agreement is fair for W with a mean square deviation of 17% for data recorded with different methods. Note that the value of W is different if the data are fitted with EZq. (4) or with Eq. (5). For n the mean square deviation is 14%. The analysis confirms the presence of an anisotropy in So, as could be inferred by the inspection of the data.
100 200 E, COS"~~, (meV)
500
100 200 500 Et COS~‘~O, (meV)
The dispersion of the data along (001) is reduced drasti- cally if they are plotted as a function of Ei CO$’ t’i as shown in Fig. 23 confirming that non-normal energy scaling occurs. The values of n along (1 i0) differ slightly for EELS and KW. KW data along this direction are compatible with nor- mal energy scaling. The difference could be related to the different E, range probed by the two methods. Note that n > 2 would be more appropriate to describe the data at large E, recorded with KW as S0 (605 meV, 45”)<S0 (305 meV, 0°) contrary to , expectation for n 62. The anisotropy [n((OOl)>-n((liO))]/n((liO)) is 0.26 and 0.31 for KW and EELS, respectively. This value does not depend on T,y within experimental accuracy.
F0 as reported in Table I depends critically on the value of Somax and should therefore be regarded with caution. A higher saturation value of So would indeed imply a higher value of E. . Our conclusions on energy scaling and angular dependence would however remain unaffected.
Caution should be used in comparing our value for the barrier with values extrapolated from TDS data. E. is by definition the value at which So is So,,/2 , while TDS gives the minimum energy path for desorption, which corresponds
J. Chem. Phys., Vol. 101, No. 1, 1 July 1994 Downloaded 25 Jan 2001 to 130.251.168.206. Redistribution subject to AIP copyright, see http://ojps.aip.org/jcpo/jcpcpyrts.html.

_ Ag(ll0) <OOl>
T=lOO K
0.01 ’ ’ I 100 200 500
E, COS’.%~ (meV)
FIG. 24. Same as Fig. 23 for molecular adsorption. The data refer to (a) Fig. 17, and (b) Fig. 18.
to the lowest value of the distribution of barriers. The re- ported TDS value of 63 meV (Ref. 8) is, however, consider- ably higher than the lowest normal energy value at which we observe direct sticking, i.e., 5 meV (see Fig. 8).
The data were analyzed also with respect to the depen- dence of So on Bi at a given Ei. This kind of analysis is particularly illuminating in showing the presence of an an- isotropy in the adsorption process independently of any as- sumption on the Ei dependence of SD. To this purpose we fitted the data with a function of the form:
TABLE I. EO, W, v, and .$ for EELS and KW data at different T, and for molecules impinging along (li0) and (001) by use of the fitting function of flqs. (4) and (5).
Temperature Azimuth Ea (meV) W (meV) n Method EQ. x”
298 (iio) 262 88 1.6 EELS 4 3.0 298 (1 [O) 265 130 1.6 EELS 5 2.1 278 y{ 233 131 1.9 KW’ 4 100 266 113 1.7 KW 4 298 (001) 284 90 1.1 EELS 4 3.5 298 Kw 280 125 1.1 EELS 5 3.5 278 (001) 274 131 1.4 Kw 4 100 Kw 270 12% 1.1 KW 4
TABLE II. The parameter m for Eq. (7) for EELS and KW data, recorded at different total energies and temoeratures.
Energy (meV) Temperature m (001) m (lie) Method
305 298 4.1 5.3 EELS 60.5 298 3.0 3.5 EELS 605 278 2.8 3.7 KW 305 100 2.9 5.1. Kw 605 100 2.4 3.6 KW
S( Bi)=,~~~ - COP ( ei) . i
722 Vattuone et al.: Sticking of O2 on Ag(ll0)
(7)
Typically rn< 1 describes a precursor regime where ad- sorption tends to become independent of the angle of inci- dence, while m values larger than 1 describe an activated process.37 From detailed balance considerations it is possible to demonstrate that COP t’i describes the angular distribu- tions of the desorbed molecules.“8 The anisotropy causes thus different distributions for molecules desorbing along (001) and (00).
The values for m are summarized in Table II for all mea- surements. The fits to the data are shown by the continuous line in Figs. 9 and.12. For Ei=305 meV and T,=278 K no fit was tempted as the values of the sticking for grazing angles are at the limits of the sensitivity of the KW method and the large errors make the fit procedure unreliable. Also this procedure shows that the anisotropy is independent of energy within experimental error.
C. Role of defects
Our sample is aligned within 0.2” to the (110) crystal- lographic plane. The defect density due to steps is thus = 10w5. Even admitting sticking of 1 on such defects their density cannot explain the observed magnitude of So &t low E,. The interaction with defects would moreover imply a total energy dependence of So contrary to observations. We conclude therefore, that defects are not important forfhe in- terpretation of our data. -3.. ~.;
D. Dependence of S,, on T,
The data for So vs T, can be interpreted, as previously suggested by Campbell,s by a competion between dissocia- tion and desorption from a molecular precursor state: at low temperatures the desorption is less probable so that the dis- sociative sticking probability is larger, while at higher tem- peratures desorption from the molecular precursor is favored and the dissociative sticking probability decreases. Follow- ing Campbell we can write
So(T,)=a(Ei,Oi) l+$s’e-AE’krs -‘, ( ‘;- 1
’ (8)
where a( Ei , 0,) is the sticking probability in the molecular well, Vdesl Vdiss is the ratio of pm-exponentials for desorption, V&s, and dissociation, vdidi, and AE is the difference be- tween the desorption and the dissociation energy. By fitting the data of Fig. 21 we obtained a=&$ Vd~e$Vdiss = 40 and
J. Chem. Phys., Vol. 101, No. 1, 1 July 1994 Downloaded 25 Jan 2001 to 130.251.168.206. Redistribution subject to AIP copyright, see http://ojps.aip.org/jcpo/jcpcpyrts.html.

h E= 112 meV. The agreement between experimental points and theory is very good over the whole temperature range .
Our value for AE agrees reasonably with Campbell’s value (AE=131 meV), while’ the ratio of the pre- exponentials is lower by two orders of magnitude. We have no explanation for this disagreement. The pre-exponentials contain the dynamics of the process: they are linked to the mechanism by which the molecule gets rid of its excess en- ergy in the adsorption process or by which the molecule gains energy from the thermal bath and is desorbed.
E. The physisorbed precursor state and the PES
The effect of a physisorbed precursor on the adsorption in the molecular well is not considered ins the above de: scribed model. The good agreement between theory and ex- periment (shown in Fig. 21) suggests that the physisorbed state has little effects on So in the investigated range of T,. Moreover, the data show no increase in So at low Ei neither for dissociative nor, for molecular adsorption. This result is-quite intriguing since the opposite behavior is ob- served for most systems. A similar behavior was reported to our knowledge only for Nz-Fe(ll1). (Ref. 26) where the analysis of the data suggests direct adsorption into a molecu- lar precursor state followed by thermally induced dissocia- tion.
A temptative explanation of this finding could be con- nected to the fact that the physisorbed molecules are aligned, at very low temperature, with the molecular axis parallel to the (001) direction as demonstrated by NEXAFS.38 The mo- lecularly chemisorbed molecules lie on the contrary with the axis along (1 lo), i.e., 90” off the preferred orientation of the physisorbed specie. A dependence of the barrier between the physisorbed state and the molecular chemisorbed state on molecular orientation would largely reduce the effectiveness of the physisorbed precursor in promoting adsorption. From the value of So for the lowest values of E, we can estimate that the sticking contribution via the physisorbed precursor must be lower than 10 -3. In fact the residual sticking prob- ability for En=5 meV is still due to a direct mechanism, as So still depends on ei while a dependence on total energy would be expected if the mechanism based on the phys- isorbed precursor were dominant. Campbell’ suggested on the contrary that molecular adsorption proceeds through the physisorption well with a probability
n=pphe - E,lkTS
Vattuone et al.: Sticking of 0, on Ag(ll0) 723
F. Comparisons with SO measurements without energy and angle resolution
In the past, several measurements of the sticking coeffi- cent were performed by flooding the chamber with O$5,8Z34,3g It is ihteresting to evaluate the consistency of those values with our S,(E,) curve.
Assuming that the ,gas has ‘a temperature Tg equal to T, equal to room temperature because of thermalization with the walls of the vacuum chamber,- the main contribution to the sticking comes from the low energy tail of the energy distribution of the gas molecules. Disregarding the azimuthal anisotropy, modeling So with Eq. (5), and integrating over the Maxwell distribution of velocities, with E0=265 meV, W= 130 meV, and 17= 6.85~ low4 [determined by the ratio between So max=0.4 and the integral in Eq. (S), with E,pa] we obtain for T,=T,=298 K,‘Sa==6 X lo-“.
The function chosen to fit the data does not affect the order of magnitude of 3,: Fitting the data with a fourth de- gree polynomial we obtain S, = 3 X 10-s. The result is in reasonable agreement with two of the values of S, previ- ously reported in literature: So = 3 X 1 OU3 by Engelhardt and Menzel’ and between 10-z and low3 by Hall and King on evaporated filn-~s.~’ The value reported by Albers (6 X 1 Om4> (Ref. 34) is lower. Campbell’s value (2 X 1 Om4) (Ref. 8) is measured at a higher crystal temperature (490 K): at the same temperature of the surface and assuming the gas thermalized with the walls of the chamber at room tempera- ture we would obtain Sa=O.O02, which is still higher. A pos- sible explanation is that TDS experiments’do not give So but the middle value of S on a certain coverage range.
G. Dynamical dipole moment and charge transfer
From Eq. (1) it is possible to obtain also the dynamical dipole moment involved in the 40 meV loss at room tem- perature and in the 80 meV loss at 83 K as well as the charge transfer it implies. We obtained: ,LL~~ = (0.054’+ 0.0 15) De- bye for dissociative adsorption at Oo=0.25 and ~80=(0.099~0.046) Debye and p3u=(0.056+0.019) Debye,for molecular adsorption. The Oz-Ag stretching at 30 meV depolarizes strongly with Oo,. Applying Eq. (3) one obtains a,C=3tl.
From ,u an estimate of the charge transfer e* involved in the vibration2’ may be obtained:‘-
with pt,h i= 0.25) the trapping probability in the phys- isorbed state and E, is the energy required for a physisorbed molecule to move in the molecularly chemisorbed well. Our data indicate, however, that a(Ei ~ ei) is independent of T,y. The application of Eq. (9) led Campbell to the value of 63 meV for the barrier height. As we demonstrated that phys- isorbed molecules are not acting as a precursor state to chemisorption, Campbell’s value bares no meaning since it is based on a wrong assumption. According to the lowest E, values we investigated, the lowest barrier must be of the order of some 5-10 meV.
e*=pJyG;. : (10)
where M is the reduced mass of the O,-Ag system, o the frequency of the mode, and h Planck’s constant. We found e,*,=(0.14+0.05)e- in agreement with Ref. 3 and e,*,=(O. 16fO.O7)e- and e~o=(0.62+0.30)e-.40
H. Final comments
In view of the above described effects. we suggest the following picture for the. adsorption process. The O2 mol- ecules reach the surface and overcome the adsorption barrier if their energy is large enough. Since no 80 meV loss was ever observed for room temperature adsorption we know that
J. Chem. Phys., ,Vol. 101, No. 1, 1 July 1994 Downloaded 25 Jan 2001 to 130.251.168.206. Redistribution subject to AIP copyright, see http://ojps.aip.org/jcpo/jcpcpyrts.html.

724 Vattuone et al.: Sticking of 0s on Ag(ll0)
the residence time in the molecularly chemisorbed state is extremely short: In fact we expect it to be comparable with the inverse of the pre-exponential factors (- lo-” s). This direct mechanism explains the analogies between room and low temperature adsorption, as well as the temperature de- pendence on So in a quantitative way. The role of parallel momentum in promoting adsorption could appear surprising. Our data tell that molecules impinging with the same vertical momentum will stick more effectively if they have also momentum parallel to it, i.e., when a greater amount of en- ergy has to be dissipated. Other systems like Hz-Fe( 110) (Ref. 41) or rare gas physisorption on metal surfaces42 show the intuitively more obvious opposite behavior, i.e., parallel momentum inhibits adsorption. We do in fact observe n>2 at high Ei . This means that for 02-Ag(llO) the energy as- sociated with parallel momentum is used in the adsorption process at least in the lower energy range. Two mechanism could be responsible for this.
(2) The adsorption process in the molecular well is direct and not mediated by a physisorbed precursor as demon- strated by the low energy behavior of So vs E, . Molecular adsorption acts as a precursor to dissociative adsorption.
(3) The initial sticking coefficient is anisotropic for mol- ecules impinging along the (001) and (1 i0) crystallographic direction.
E. could be lowest for non-normal incidence as could be the case for a corrugated PES. In this latter case So should be however largest for trajectories colliding along the local nor- mal at the position of the lowest barrier. Such a behavior was observed for H, interaction with the reconstructed Pt( 110)(2X 1) surface.43 For our data however So is largest at normal incidence.
(4) The barrier to adsorption is nearly isotropic suggest- ing that the anisotropy is caused by the energy dissipation mechanism once the barrier is overcome.
We suggest that molecules impinging along the corru- gated (001) azimuthal direction are subject to a partial con- version of normal momentum to parallel momentum which is then easily dissipated by electron hole pair creation as soon as the negatively charged molecular specie is formed. Parallel momentum is also partially converted into vibra- tional energy which favors sticking because of the stretching of the molecule. The presence of a precursor state to adsorp- tion is thus essential for the existence of the effect. The be- havior of O2 on Ag(ll0) is similar to that of N2 on Fe(ll 1)F6 which we therefore suggest as a good candidate to observe effects connected to corrugation in the sticking process.
ACKNOWLEDGMENTS
Alternatively the energy associated to parallel momen- tum is employed during the collision with the corrugated surface to excite the vibrational degree of freedom. As the internuclear distance is larger for 0, than for Oz, chemi- sorption would be facilitated by a vibrational stretching of the molecule. Once the negative ion is formed the molecule can easily get rid of its parallel momentum by exciting electron-hole pairs.
PES surfaces reported so far for 02-Ag(l10) depend only on the distance between the molecule and the surface and on the intra-atomic distance44-46 and are therefore of little help to discuss the mechanism which causes the anisot- ropy. Normal energy scaling of So was observed for 02-Cu(110) (Ref. 47) where the corrugation is expected to be comparable to 02--Ag, as we are dealing in both cases with noble metals. Direct dissociation takes place however on Cu contrary to the case of 02-Ag. The presence of the molecular precursor state plays therefore a determinant role for the existence of the anisotropy in agreement with the above described mechanism involving the stretching of the 0, molecule. For a complete understanding of the phenom- enon a more complicated approach to the problem, involving nonadiabatic effects during the interaction is probably necessasy.48
G. P. Brivio, S. Holloway, T. S. Rahman, A. Levi, and M. Canepa are greatly acknowledged for stimulating discus- sions. We thank P. Restelli and M. Pupo for helping in the initial stage of the experiment. A. Gussoni, G. Maloberti, and A. Pozzo are acknowledged for help in the building and maintenance of the experimental apparatus. One of the au- thors, M.R., wants to acknowledge financial help from the British Council and from HIDEN during his stay in Cam- bridge during which part of this work was written.
V. CONCLUSIONS
The main features of the Ag(llO)-O2 system may be summarized as follows.
(1) The adsorption process is activated both for low as well as for high temperature adsorption. A barrier distribu- tion between the physisorbed and the molecular state is present. The smooth decrease of So with Ei is indicative of a multidimensional barrier.
‘G. P. Brivio and T. B. Grin&y, Surf. Sci. Rep. 17, No. 1 (1993). *M. A. Barteau and R. J. Madix, Surf. Sci. 97, 101 (1980). 3C. Backx, C. P M. de Groat, and P Biloen, Surf. Sci. 104, 300 (1981). 4B. A. Sexton and R. J. Madii, Chem. Phys. Lea. 76,294 (1980). ‘H. A. Engelhardt and D. Menzel, Surf. Sci. 57, 591 (1976). ‘E. M. Stuve, R. J. Madix, and B. A. Sexton, Surf. Sci. 111, 11 (1981). ‘R. A. Van Santen and H. P C. Kuipers, Adv. Catal. 35, 256 (1990). ‘C T. Campbell, Surf. Sci. 157, 43 (1985). ‘K. CPrince, G. Paolucci, and A. M. Bradshaw, Surf. Sci 175, 101 (1986).
“M Rocca, M. Lazzarino, and U. Valbusa, Phys. Rev. Lett. 69, 2122 (1992).
“Y Borenszteins, W. L. Mochan, J. Tarriba, R. G. Barrera, and A. Tadjed- dine, Phys. Rev. L&t. 71, 2334 (1993).
“A. Luntz L Mattera, M. Rocca, S. Terreni, F. Tommasini, and U. Valbusa, Surf. Sci: 126, 695 (1983).
13M Canepa, P Cantini, F. Fossa, L. Mattera, and S. Terreni, Phys. Rev. B 47; 15823 (1993).
14M. Taniguchi, K. Tanaka, T. Hashizume, and T. Sakurai, Surf. Sci. 262, L123 (1992).
“M Canepa P. Cantini, L. Mattera, S. Terreni, and F. Valdenazzi, Phys. Ser. Til, 226 (;992).
“L. Vattuone M. Rocca, P. Restelli, M. Pupa, C. Boragno, and U. Valbusa, Phys. Rev. B. 43, 5113 (1994).
t7L. Vattuone, C. Boragno, P Restelli, M. Pupo, M. Rocca, and U. Valbusa, Phys. Rev. Lett. 72, 510 (1994).
I’M. Rocca, L. Vattuone, C. Boragno, and U. Valbusa, J. Electron. Spec- trosc. Relat. Phenom. 64/65, 577 (1993). The data reported in this refer- ence are scaled by a factor 1.7 with respect to the data reported in this publication following a more accurate calibration.
19D. A. King and M. G. Wells, Surf. Sci. 29, 454 (1972).
J. Chem. Phys., Vol. 101, No. 1, 1 July 1994 Downloaded 25 Jan 2001 to 130.251.168.206. Redistribution subject to AIP copyright, see http://ojps.aip.org/jcpo/jcpcpyrts.html.

Vattuone et al.: Sticking of O2 on Ag(ll0) 725
“M. Rocca, P. Traversaro, and U. Vaibusa, J. Electron. Spectrosc. Relat. Phenom. 54/55, 13 1 (1990)
‘IL. Vattuone, M. Rocca, C. Boragno, and U. Valbusa, J. Chem. Phys. 101, 726 (1994).
“M. Rocca, U. Valbusa, A. Gussoni, G. Maloberti, and L. Racca, Rev. Sci. Instrum. 62, 2172 (1991).
=S. R. Kelemen and I. E. Wachs, Surf. Sci. 97, L370 (1980). 24L. Vattuone, M. Repetto, and M. Rocca, Compel 11, 85 (1992). =H. Ibach, in High Resolution Electron Spectrometers: The Technology of
High Performance, Springer Series in Optical Science, Vol. 63 (Springer Verlag, Bedin, 1991).
26C. T. Rettner and H. Stein, Phys. Rev. Lett. 59, 2768 (1987); J. Chem. Phys. 87, 770 (1987).
“D. I. Auerbach, H.E. Pfniir, C. T. Rettner, J. E. Schlaegel, J. Lee, and R. Madii, J. Chem. Phys. 81, 2515 (1984).
*sK. D. Rendulic, Surf. Sci. 272, 34 (1992). BH. Ibach and D. L. Mills, in EZecftin Energy Loss Spectroscopy and
Stclfnce Vibrations (Academic, New York, 1982). I0 CRC Handbook of Chemistry and Physics (CRC, Boca Raton, FL+ 19861
87). 3LThis is demonstrated by the fact that no adsorption is detected by the
method of King and Wells when the foil is exposed to the oxygen mo- lecular beam.
s2M. E. M. Spruit and A. W. Kleyn, Chem Phys. Lett. 159,342 (1989). s3A. C. Luntz, M. D. Williams, and D. S. Bethune, J. Chem. Phys. 89,438l
(1988); C T. Rettner and C. B. Mullins, ibid. 94, 1626 (1991).
34H. Albers W. J. J. van der Wal, 0. L. J. Gijzeman, and G. A. Bootsma, Surf. Sci ;7, 1 (1978).
35J. Harris, Surf. Sci. 221, 335 (1989). 36H. E. Pfniir, C. T. Rettner, J. Lee, R. J. Madix, and D. J. Auerbach, J.
Chem. Phys. 85, 7452 (1986). 37H F Berger Ch. Resch, E. Grosslinger, G. Eilmsteiner, A. Wtier, and
K: d. Rend&c, Surf. Sci. L&t. 275, L627 (1992). 38R. J. Guest, B. Hernnas, P. Bennich, G. Bjomeholm, A. Nilsson, R. E.
Palmer, and N. Martensson, Surf. Sci. 278, 239 (1992). 3gP G. Hall and D.A. King, Surf. Sci. 36, 810 (1973). 4oThe values previously reported in Ref. 18 are lower by 30% due to an
error in the calibration of S,,. 4’ A. Hodgson, A. Wight, G. Worthy, D. Butler, and B. E. Hayden, Faraday
Discuss. 96 (1993). “C. R. Arumainayagam, R. J. Madix, M. C. McMaster, V. M. Suzawa, and
J. C. Tully, Surf. Sci. 226, 180 (1990). “G. Anger H. E Berger, M. Luger, S. Feistritzer, A. Winkler, and K. D.
Rendulic,‘Surf. Sci. 219, L583 (1989). 44X Y. Shen, K. Q. Zhang, and Y. L. Tan, in Springer Series in Surface
Science, Vol. 24 The Structure of Surfaces III (Springer Verlag, Berlin, 1991).
4sR J. Van den Hoek and E. J. Baerends, Surf. Sci. 221, L791 (1989). 16H. Nakatsuji and H. Nakai, J. Chem. Phys. 98, 2423 (1993). 47A. Hodgson, A. Nesbitt, and A. Lewin, Surf Sci. 293, 211 (1993). 480. Citri and R. Kosloff, Surf. Sci. (in press).
J. Chem. Phys., Vol. 101, No. 1, I July 1994 Downloaded 25 Jan 2001 to 130.251.168.206. Redistribution subject to AIP copyright, see http://ojps.aip.org/jcpo/jcpcpyrts.html.
Copyright © 2022 FDOKUMEN