Final report on force key comparison CCM.F-K2.a and CCM.F-K2.b (50 kN and 100 kN)
Upload
khangminh22Category
view
1download
0
Nigerian Journal of Technology (NIJOTECH)Vol. 31, No. 2, July, 2012, pp. 174–180.Copyright c©2012 Faculty of Engineering,
University of Nigeria. ISSN 1115-8443
DETERMINATION OF REAERATION COEFFICIENT K2 FORPOLLUTED STREAM AS A FUNCTION OF DEPTH,
HYDRAULIC RADIUS, TEMPERATURE AND VELOCITY
J.N. Ugbebora, J.C. Agunwambab, V.E. Amahc
aDepartment of Civil and Environmental Engineering, University of Port Harcourt, Nigeria.Email: [email protected]
bDepartment of Civil Engineering, University of Nigeria Nsukka, Nigeria. Email: [email protected] Institute of Safety Professionals, Port Harcourt, Nigeria. Email: [email protected]
Abstract
A polluted stream was studied to determine the effect of geometric parameters like velocity, depth,hydraulic radius and temperature on water quality and its modeling. The data from sample stationsinclude velocity of flow, average depth of flow, DO, self purification ratio (f) and reaerationconstant (K2). The reaeration coefficient ranged from 0.01d−1 to 0.19d−1. Three new empiricalmodels for K21, K22 and K23 were derived from field data by multiple regression analysis. Thecoefficient of correlation between K2 observed and K21 predicted; K22 derived from hydraulic radiusand K23 predicted from model constructed with effect of temperature are 0.789, 0.808 and 0.914respectively. The predictions indicated significant relationship with the observed values at 95%level of significance.
Keywords: stream/lake, modelling, reaeration coefficient, standard error, self purication factor
1. Introduction
Recently, water quality studies are considered veryimportant because of the need to comply with guide-lines and standards for environmental pollution. It isenvisaged that if proper monitoring and enforcementof the guidelines for permissible water pollution lim-its are carried out on all rivers, stream and lakes, agreat deal of compliance on the part of the individuals,communities and industry will be achieved.
The study of pollution in natural ecosystem hasmany aspects, physical, chemical and biological [1].Pollutants affect marine organisms to different de-gree. Most physiological functions can be affectedwithout lethal effects and sub lethal physiological re-sponses[2],[3],[4] and [5]. It may reduce the fitnessof an organism through such processes as reproduc-tion impairment, suppressed immune responsiveness[6], diseases, energy deficits and untimely death.
In many studies of water quality, emphasis is placedon the source and path of the pollution spreads. Thisis enhanced through data collection from field survey.These data are analyzed statistically, tabulated andplotted on seasonal or monthly variation, which givesrise to estimates of water pollution level and forms the
basis for water quality forecasting at selected locationsbeyond point of generation.
Oxygen transfer at the surface of the stream as thewater flows gradually is an effective process for envi-ronmental quality of the aquatic ecosystems [7]. If dis-solved oxygen (DO) drops below recommended limits,aquatic ecosystem health could be seriously impairedand desirable uses of resources could be precluded [8].
As the stream water flows downstream it is influ-enced by dilution and other factors such as physical(gravity, sunlight and aeration), chemical (oxidation,reduction, and coagulation); biological (bacteria at-tack, algae, protozoa, rolifera and aquatic plants);hydrological (precipitation, landforms, flora, topog-raphy); and climatic conditions (wind, temperature,humidity) and general weather conditions of receiv-ing environment. These geometric factors affect selfpurification capacity of the lake/stream. The purifica-tion capacity of a lake/stream is directly proportionalto discharge. Therefore factors that normally influ-ence discharge such as wind, velocity, precipitation,landforms and vegetative cover, topography and tem-perature affect its assimilation capacity [9].
Changes in temperature can have a significant im-pact on DO depletion. The reactions governing BOD
Nigerian Journal of Technology Vol. 31, No. 2, July 2012.

Determination of Reaeration Reaeration Coefficient K2 for Polluted Stream 175
Table 1: Values of re-oxygenation co-efficient f at 20◦C [12].
Types of water body Value of f(day−1)
Small pond 0.05 - 1.0Sluggish streams/lakes 1.0 - 1.5Large stream with low velocity 1.5 - 2.0Large streams with moderate velocity 2.0 - 3.0Swift Streams 3.0 - 5.0Rapids > 5.0
exertion typically have a temperature dependence ofrate doubling for each 10◦C increase in temperature.This means that there will be a significantly increasedrate of BOD exertion when the temperature is thehighest [10].
Temperature also affects the rate of organic wasteassimilation. Increase in temperature means increasein rate of oxidation, decrease in oxygen saturation ca-pacity and rate of diffusion. Increase temperature maydestroy aquatic life [11].
1.1. Reoxygenation coefficient (K2)
[12] developed standard tables on range of accept-able values for values of reo-oxygenation coefficient fat 20◦C as follows:
The above values of re-oxygenation co-efficient fimplies that the higher the flow velocity, the higherthe re-oxygenation coefficient.
Determination of K2
Many researches have been carried out on mecha-nism of reaeration as influenced by temperature, rivergeometry and hydrodynamics factors [13] and [11].Generally, it is agreed that Streeter - Phelps equationis not a (true) representative of stream self purifica-tion model as it suffer a number of limitation. Apartfrom questions of stream geometry and flow regime,it ignores a number of mechanisms where BOD andDO concentrations are raised or lowered [14]. Someauthors have included other parameters in the formu-lation of their models [15] and [14].
1.2. Equations for determination of coefficientof reaeration K2
Many attempts have been made to relate empiri-cally the reaeration rate constant to key stream pa-rameters [16]. The most commonly used equation fordeterming K2 is that of [17] which states that
K2 =3.9V 1/2
H3/2(1)
Where K2 = reaeration coefficient at 20◦C (day−1); V= average stream velocity (m/s); H = average streamdepth (m).
[17] came up with the equation of reaeration con-stant for slight slope river to be
K2 =10.046V 2.696
H3.902(2)
[18] also produced a model for the determination ofreaeration constant of any medium slope river to be
K2 =1.923V 1.325
H2.006(3)
[18] later improved the equation by considering tem-perature as a factor which influences reaeration con-stant as follows.
K2 =5.06V 0.919
H1.673(1.024)T−20 (4)
[19] showed that
K2 =3.93V 0.5
H1/5(5)
[20] analyzed the polluted status of Amadi creek,considering the effect of hydraulic radius in place ofthe depth of the river at different location, and ob-tained
K2 =11.635V 1.0954
R0.016(6)
Where R is hydraulic radius.[16] confirmed in his work that reaeration rate con-
stants (K2) depend on the condition of the river. Afast moving shallow stream will have a higher reaera-tion rate constant than a sluggish stream of stagnantpond or lake. Also the rate of reaeration affects itpurification capacity. Rate of reaeration may be en-hanced by physical and hydrologic characteristics ofthe lake, depth of water temperature and rate of flowof lake during rainy season. Purification or assimila-tion ratio (f) can be computed by the following equa-tion:
F = K2/K1
Where K2 = is the reaeration constant; K1 = is theBOD rate constant.
1.3. Significance of water quality modelling
[21] stated that empirical relationships between pol-lutant concentration and stream flow or other hydro-logic variables in water quality modeling can be usedto describe water quality loading mechanisms thatcannot be obtained on a more theoretical basis. Itis often stressed that a model is as good as the dataand theory on which it is based. The result therefore,of study will help to confirm the influence of streamgeometric parameters on stream pollution which willin-turn form basis of any recommendations and willfurther restrict waste discharge within the lake selfpurification capacity and prevent the occurrence of
Nigerian Journal of Technology Vol. 31, No. 2, July 2012.

176 J.N. UGBEBOR, J.C. AGUNWAMBA & V.E. AMAH
pollution [11]. The required parameters for determi-nation of water quality in this study include temper-ature, velocity of flow at sample station, depth andhydraulic radius of stream.
To predict the DO levels in streams, some mathe-matical model have been proposed. The rate of BODdegradation K1 is expressed as
lnL
LA= −K1t (7)
K1 =1
tln
(LA
L
)(8)
Where LA and L are the BOD at time zero and trespectively.
To get LA (ultimate) = 1.46BOD5 [14] at temp20◦C. Therefore to get vary field or stream temper-ature, at stream conditions.
LA(T ) = LA(20)[1 + 0.002(T − 20)] (9)
Where LA(T ) and LA(20) are the ultimate BOD at T◦Cand 20◦C. The combination of the effects of temper-ature changes can cause considerable changes on thetotal load of the receiving water.
1.4. Study area
The area under study is the Oshika stream/lake.The stream is close to Oshika village located betweenAhoada and Mbiama in Ahoada West Local Govern-ment Area, at a distance of 75km from Port Harcourtalong East-West Road. The geographic location is atropical rain forest with Niger flood plains and sea-sonal swamp forest. It is a fresh water swamp withfarm land on dryland and patches of bush fallow withdisperse oil palm, oranges, pear and coconut trees.The soil around the area is loam or clay loam andis mixed with clay and silts in some areas. Duringthe rainy seasons the Lake flows and empties into afoodplain about 8km from Oshika village. During thedry periods of the year, when there is no surface wa-ter contribution, the water lies relatively quiescent inthe lake. In the dry season, the lake is stagnant anddry land containing isolated bodies of water mainly inevacuated ponds traditionally used for dry season fishharvest [22].
2. Methodology
2.1. Measurement of time and velocity
Twelve sampling stations were established, alongOshika stream/lake from Oshika downstream. Thestudy distance is 2,400metres and samples will be col-lected on monthly basis. The analysis covered the fol-lowing parameter: DO, velocity, temperature, depthand hydraulic radius. The time at which readings weretaken at every sample station was recorded using an
electronic clock. The time between two readings wasdetermined from the difference in time between thetwo readings. Velocity of the lake/Stream at each lo-cation was determined using a current meter.
2.2. Measurement of temperature
A laboratory thermometer was tied to a rope andlowered into the lake/stream such that half of the stemthermometer was submerged. The temperature of thelake/stream was read off the stem of the thermome-ter. Temperature readings were taken at every stationsimultaneously with the other readings.
2.3. Determination of distance, depth andwidth
A scaled map of study area was obtained from theRivers State land and Survey Bureau. The position ofOshika lake/Stream was located using GPS indicatinglandmarks and measurement. For the purpose of thisresearch, samples were collected at varying intervaldownstream. The depths were measured by droppinga loaded tape to the bottom of the lake and widthwere measured using a tape across the lake/stream.
2.4. Determination of dissolved oxygen
The following procedures were followed for dissolvedoxygen test by Winkler method using the digital titra-tor. First, samples were collected into BOD bottlealong the lake/stream. Sample was allowed to over-flow the bottle for 2-3 minutes to ensure air bubblewere not trapped. Immediately trapper was insertedso that air was not trapped in the bottle and invertedseveral times to mix. A floc precipitate was formedwhich settled out after five minutes. Then the stopperwas removed and the contents of one dissolved oxygenreagent powder pillow was added. The stopper was re-placed without trapping air in the bottle and invertedseveral times to mix. The floc dissolved, leaving a yel-low color if oxygen is present. 20ml of prepared samplewas measured accurately and transfered to 250ml Er-lenmeyer flask. Attached was a clean straight stemdelivery tube to a 0.2 sodium Thio-sulphate titrationcartridge. It was twisted into the titrator body. Thedelivery tube was flushed and the counter was resetto zero and the tip wiped. The prepared solution wastitrated with 0.2 sodium Thiosuphate until the sam-ples changed from yellow to colorless. The number ofdigits was recorded. Calculate digits required x 0.1 =mg/l dissolved oxygen.
2.5. Methods of obtaining field values of reaer-ation coefficients (K2)
The reaeration coefficient from field values were ob-tained using the equation
K2 =ln(DOinitial/Ddeficit)
time(days)(10)
Nigerian Journal of Technology Vol. 31, No. 2, July 2012.

Determination of Reaeration Reaeration Coefficient K2 for Polluted Stream 177
������������ �����������������������������������
�
Figure 1: Map showing Oshika Lake/Streams sampling stations.
Where K2 is the reaeration rate constant; DOinitial isthe initial dissolved oxygen; Ddeficit is the defferencebetween saturation dissolved oxygen and the observeddissolved oxygen.
2.6. Description of steps for obtaining modelK21, K22 and K23
The equations 11, 15 and 19 were constructed andderived by multiple regression analysis based on mea-sured data and its original equations are stated as fol-lows:
K21 =aVa1
Ha3(11)
Where V = velocity (m/s);H = depth (m) and a, a1and a3 are constants.
K22 =aV a1
Ra3(12)
Where V = velocity (m/s); R = Hydraulic radius; a,a1 and a3 are constants
K23 =aV a1b−(T−20)
Ra4(13)
Where V = velocity (m/s); T = Temperature (◦C); R= Hydraulic radius; a, a1, b and a4 are constants.
3. Results and Discussions
3.1. Prediction of K2 from stream data
The resulting equations for models K21, K22 andK23 obtained by solving the regression equations are
as follows:
K21 =5.77 × 10⁵V 1.6899
H4.2733(14)
Where K21 indicates the relationship between velocityand depth to reaeration coefficient of stream.
K22 =56974V 1.463228
R4.26585(15)
Where K22 indicates the relationship between velocityaand hydraulic radius to stream reaeration coefficient.
K23 =2.213E6 × V 1.2161.8355−(T−20)
R4.847(16)
Where K23 indicates the relationship between veloc-ity, temperature and hydraulic radius to reaerationcoefficient of stream.
The coefficient of correlations of observed and pre-dicted K2 for the various models were found to be0.789, 0.808 and 0.914 respectively and with standarderrors of 4.2%, 4% and 3.6% respectively. This in-dicated that the models K23 represents the streambetter than K21 and K22. Also, the different betweenK2 observed and K23 may be caused by some naturalconditions of the stream.
The study indicated that reaeration coefficient, K2
of Oshika stream/lake varied from 0.01 day−1 to 0.19day−1. The purification factor of Oshika stream/lakeis 0.44. The purification factor indicated that thelake/stream is polluted.
Nigerian Journal of Technology Vol. 31, No. 2, July 2012.
178 J.N. UGBEBOR, J.C. AGUNWAMBA & V.E. AMAH
�
����
���
����
���
����� ����� ����� �����
����
��� �����
���������
�����������������
Figure 2: Variation of K2 with velocity for wet season.
�
���
����� ����� ����� �������
��
��
��
��
�
� ��� � ����
����
���������
�����
����
����������������������������������
Figure 3: Variation of lnK2 with lnV for for wet season.
3.2. Variation of K2 with velocity
Figure 2 and 3 indicate variation of natural loga-rithm on K2 (lnK2) with natural logarithm of veloc-ity (lnV ). K2 seems to be independent of velocity inthe dry season because the stream is very slow flow-ing, but picks up speed in the wet season because ofincrease in rainfall. The coefficient of correlation be-tween lnK2 and (lnV is 0.534. This shows that K2
increases with increase in velocity.
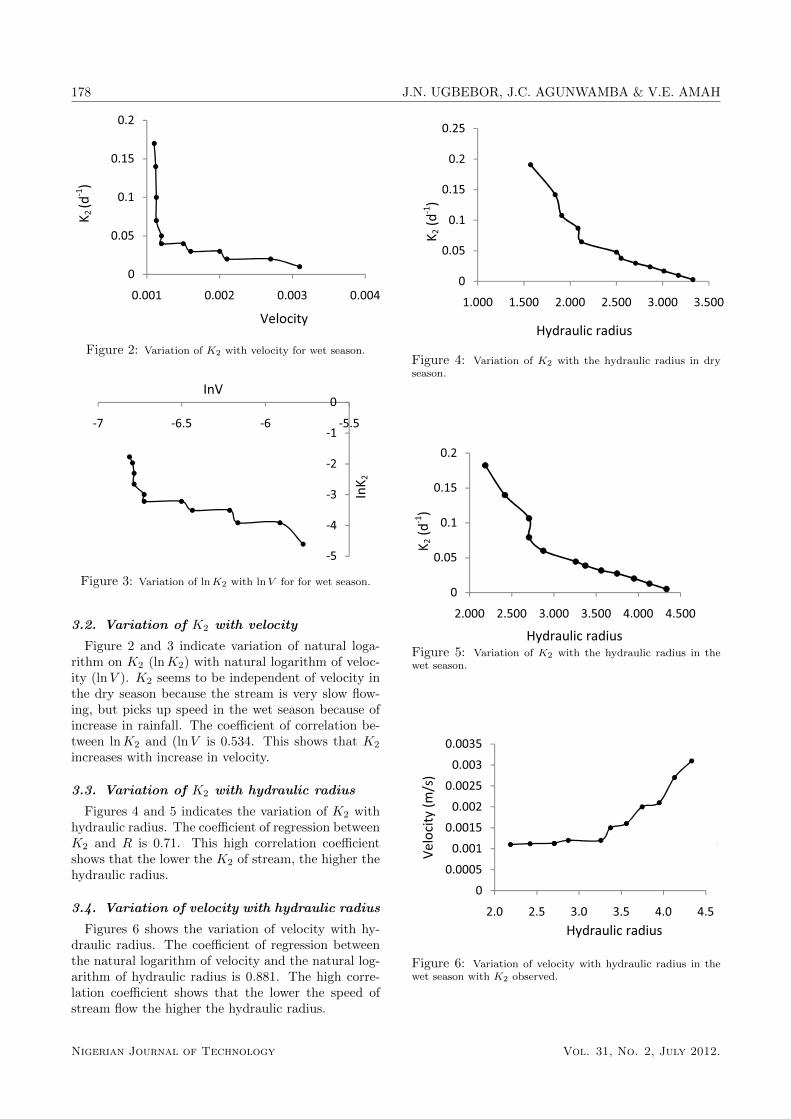
3.3. Variation of K2 with hydraulic radius
Figures 4 and 5 indicates the variation of K2 withhydraulic radius. The coefficient of regression betweenK2 and R is 0.71. This high correlation coefficientshows that the lower the K2 of stream, the higher thehydraulic radius.
3.4. Variation of velocity with hydraulic radius
Figures 6 shows the variation of velocity with hy-draulic radius. The coefficient of regression betweenthe natural logarithm of velocity and the natural log-arithm of hydraulic radius is 0.881. The high corre-lation coefficient shows that the lower the speed ofstream flow the higher the hydraulic radius.
�
����
���
����
���
����
����� ����� ����� ����� ����� �����
�����������������
��� �����
�� �����
Figure 4: Variation of K2 with the hydraulic radius in dryseason.
�
����
����� ����� ����� ����� ����� �����
�
����
���
����
���
����� ����� ����� ����� ����� �����
����������������������������������
��� �����
Figure 5: Variation of K2 with the hydraulic radius in thewet season.
�
������
�����
������
�����
������
�����
������
��� ��� ��� ��� ��� ���
�� �����"���������
��������� #$���
�����������������
Figure 6: Variation of velocity with hydraulic radius in thewet season with K2 observed.
Nigerian Journal of Technology Vol. 31, No. 2, July 2012.

Determination of Reaeration Reaeration Coefficient K2 for Polluted Stream 179
�
��� ��� ��� ��� ��� ���
������
������
������
������
������
������
������
������
������
� ��� ��� ���
��� ������ ���!���
��� �����"���������
�����������������
Figure 7: Variation of K2 predicted from various models.
Table 2: Derived models, their correlation coefficients (CC)and standard errors (SE).
S/No Dependentvariable, Y
Non-linear model (Y =aVa1Ha3 ),
(Y = aV a1
Ra3 ), (Y = aV a1 b−(T−20)
Ra4 ).
K21 Y = 5.77×10⁵V 1.6899
H4.2733 ; CC = 0.786;SE = 4.2%
K22 Y = 56974V 1.463228
R4.26585 ; CC = 0.808;SE = 4.0%
K23 Y = 2.213E6×V 1.2161.8355−(T−20)
R4.847 ;CC = 0.914; SE = 3.6%
3.5. Variation of K2 observed with K2 pre-dicted
The correlation coefficient of predicted K21, K22,and K23 from measured data is 0.789, 0.808, and0.914. Figure 7 shows that they have positive rela-tionship except for some natural conditions that mayhave contributed to a minor difference.
The hydraulic radius is given by R = AP , where A
is area and P is wetted perimeter.
4. Conclusion and Recommendation
The reaeration coefficient, K2 of Oshikastream/lake varied from 0.01 to 0.19. The cor-relation coefficients of K21, K22 and K23 are 0.789,0.808 and 0.914 respectively. Asides from otherfactors, the reaeration rate values are influenced bythe geometric parameters as seen in the determined
Table 3: Correlation Coefficients.
lnV lnH lnR K21 K22 K23
lnK2 -0.35 -0.73 -0.76 - -lnV - 0.76 0.881 - -K2 Ob-served
- - - 0.789 0.808 0.914
correlation coefficients in this study. Increase invelocity of stream water results in increase valueof K2 as high velocity means higher assimilatrycapacity of stream. Also, K2 increases with increasein temperature. The influence of depth, hydraulicradius, temperature and velocity is however necessaryin explaining the discrepancies between observedand estimated values. The results obtained can beused as a baseline for future studies. K23 wouldbe recommended because it incorporates the crucialparameters that describes the stream.
References
1. Obiukwu, C.E. Microbial ecology and physicochemicalquality of the Okirika sector of Bonny Estuary as af-fected by refinery effluents. PhD thesis, University ofPort Harcourt, Dept. Of Microbiology, August, 2000.
2. Lech, J.J., Vodnicnik, M.J. and Elcombe, C.R. In-duction of monooxygenase activity in fish. In Aquatictoxicology. Ed L J Weber, 1982, 107-48.
3. Sindermann, C.J., Lloyd, R., Vader, S.L. and Bourne,W.R.P. Implications of oil pollution in production ofdisease in marine organisms [and discussion]. Phil.Trans. R. Soc. Lond. B, Vol. 297, 1982, pp. 385-399.
4. Payne, J.F., Penrose, W.R. Induction of aryl hy-drocarbon (benzo[a]pyrene) hydroxylase in fish bypetroleum. Bull Environ Contam Toxicol.; 14(01),1975, pp. 112-6.
5. Rattner, B.A., Hoffman, D.J. and Marn, C.M. Use ofmixed-function oxygenases to monitor contaminantsexposure in wildlife. Environ. Toxicol. Chem., Vol.1, 1989, p 1093.
6. Anderson, D.P., Dixon, O.W., Bodammer, J.E andLizio, E.E. Suppression of antibody producing cellsin rain-bow trout spleen sections exposed to copperin vitro. J. Aquat. Ani. Health. 1: 1989, pp 57-61.
7. Gualtieri, C. and Gualteri, P. Hydrodynamic modelfor rearation estimation in surface waters (in italian).AIMETA 97, Siena, Italy, 29 September - 13 October1997 vol. 1, 155 - 164.
8. Nwidi, I.C. Determination of rearation coefficient(K2) of Adada River. M. Eng Thesis, Departmentof Civil Engineering, University of Nigeria, Nsukka,2008.
9. Agunwamba, J.C. Water Engineering Systems. De-Adroit Innovation, Enugu, Revised Edition, 2008.
10. Lee, G.F. and Jones-Lee, A. Synthesis and discussionof findings on the causes and factors influencing lowDO in the San Joaquin River deep water channel nearStockton, CA: including 2002 data. El Macero, CA.Prepared for SJR DO TMDL Steering Committeeand Technical Advisory Committee, CALFED Bay- Delta Program, Sacramento CA, 2003.
11. Agunwamba J.C. Waste Engineering and Manage-ment Tools. Immaculate publications limited, 1st edi-tion. 2001.
Nigerian Journal of Technology Vol. 31, No. 2, July 2012.

180 J.N. UGBEBOR, J.C. AGUNWAMBA & V.E. AMAH
12. Fair G.M., Gayer, J.C. and Okun, D.A. Ecology andmanagement of natural and receiving water in El-ements of water supply and waste water Disposal.John Wiley and Son Inc. London, 2nd Edition, 1971.
13. McBride, G.B. Nomographs for rapid solutions forthe streeter - Phelps equation. J. Water Pollutioncontrol Feder. 54, 1982, 375 - 384.
14. Leton, T.G. Pollution control Engineering, (selectedtopics). Pearl Publishers, Port Harcourt, Nigeria,2007.
15. Thomas, R.V. and Muller, J.A. Principles of sur-face water quality modelling and control. Harpers andRow, New York, 1987.
16. Ademoroti, C.M.A. Environmental Chemistry andToxicology. Foludex Press Ltd, Ibadan, 1996.
17. O’Connor, D. J and Dobbins W.E. Mechanisms ofrearation in natural streams. J. Sanitary Eng. Div.ASLE 83(6), 1958, 1 - 30.
18. Churchill, M.A., Elmore, H.L. and Buckingham, R.A.The prediction of stream Rearation Rates. Journal ofsanitary Engineering Div., ASCE, 88 (4) 1962, p 83.
19. Gualtieri, C. and Gualterie, P. Statistical analysisof reparation rate in streams . International Agri-cultural Engineering conference (ICAE) 99, Pechino,China December 14117, 1999.
20. Agunwamba, J.C, Maduka C.N., and Ofosaren A.M.Analysis of pollution status of Amadi Creek and itsmanagement. Journal of Water Supply Research andTechnology - AQUA 55(6) 2006, pp 2–3.
21. Steele, T.D. Seasonal variations in chemical qualityof surface water in Pescadro Creek watershed. SanMateo County, California, PhD dissertation, StanfordUniversity, 1968.
22. Ugbebor, J.N. Modelling the variation of water qual-ity of the Oshika lake. PhD thesis, Departmentof Civil Engineering, University of Nigeria Nsukka,March 2011.
Nigerian Journal of Technology Vol. 31, No. 2, July 2012.
Copyright © 2022 FDOKUMEN