Final report on force key comparison CCM.F-K2.a and CCM.F-K2.b (50 kN and 100 kN)
35
CCM.F-K2.a/b Final Report - 19.03.2012 Page 1 of 35 Force Key Comparison CCM.F-K2.a and CCM.F-K2.b (50 kN and 100 kN) Final Report 19 March 2012 Pilot: NPL, United Kingdom Co-authors: William Vincke (SMD, Belgium), Zhang Zhimin (NIM, China), Aimo Pusa (MIKES, Finland), Philippe Averlant (LNE, France), Rolf Kumme (PTB, Germany), Alessandro Germak (INRIM, Italy), Kazunaga Ueda (NMIJ, Japan), Yon-Kyu Park (KRISS, Korea), Jorge Torres (CENAM, Mexico), Ben Burke (NMISA, South Africa), Fredrik Langmead (SP, Sweden), Sinan Fank (UME, Turkey), Andy Knott (NPL, United Kingdom), and Tom Bartel (NIST, USA)
-
Upload
independent -
Category
Documents
-
view
0 -
download
0
Transcript of Final report on force key comparison CCM.F-K2.a and CCM.F-K2.b (50 kN and 100 kN)

CCM.F-K2.a/b Final Report - 19.03.2012 Page 1 of 35
Force Key Comparison CCM.F-K2.a and CCM.F-K2.b
(50 kN and 100 kN)
Final Report
19 March 2012
Pilot: NPL, United Kingdom
Co-authors: William Vincke (SMD, Belgium), Zhang Zhimin (NIM, China), Aimo Pusa (MIKES, Finland), Philippe Averlant (LNE, France), Rolf Kumme (PTB, Germany), Alessandro Germak (INRIM, Italy), Kazunaga Ueda (NMIJ, Japan), Yon-Kyu Park
(KRISS, Korea), Jorge Torres (CENAM, Mexico), Ben Burke (NMISA, South Africa), Fredrik Langmead (SP, Sweden), Sinan Fank (UME, Turkey), Andy Knott (NPL, United
Kingdom), and Tom Bartel (NIST, USA)

CCM.F-K2.a/b Final Report - 19.03.2012 Page 2 of 35
Contents 1 Foreword ......................................................................................... 2
2 Background to the comparison ................................................................ 2
3 Participants in the comparison ............................................................... 2
4 Principles of the comparison .................................................................. 3
5 Format of the comparison ..................................................................... 7
6 Limitations of the comparison ................................................................ 7
7 Instrumentation used in the comparison .................................................... 8
8 Stability of transducer sensitivity ............................................................ 9
9 Results obtained at participating laboratories ............................................ 18
10 Uncertainty analysis ........................................................................... 23
Appendix – Key Comparison Reference Values .................................................. 32
1 Foreword This report describes CIPM Key Comparison CCM.F-K2, for force values of 50 kN and 100 kN. 2 Background to the comparison The CCM Force Working Group met in October 1998 in Sydney and made decisions about CIPM Key Comparisons for the unit of force. These were to cover four force ranges, with four different pilot laboratories:
i) 5 kN – 10 kN Pilot: MIKES-Raute, Finland ii) 50 kN – 100 kN Pilot: NPL, United Kingdom iii) 500 kN – 1 MN Pilot: PTB, Germany iv) 2 MN – 4 MN Pilot: NIST, USA
This report gives the results for Key Comparison ii), piloted by NPL and officially designated CCM.F-K2.a (Scheme A) and CCM.F-K2.b (Scheme B) by CIPM (see Section 4 for details of Scheme A and Scheme B). 3 Participants in the comparison There were 14 laboratories including the pilot – these are listed in Table 1.

CCM.F-K2.a/b Final Report - 19.03.2012 Page 3 of 35
Country Institute Number Scheme Month
Belgium SMD 9 A 1 / 2006
China NIM 6 A 7 / 2005
Finland MIKES 14 A 4 / 2007
France LNE 3 B 1 / 2005
Germany PTB 8 A 11 / 2005
Italy INRIM 12 A 6 / 2006
Japan NMIJ 4 B 3 / 2005
Korea KRISS 5 A / B 5 / 2005
Mexico CENAM 13 A 3 / 2007
South Africa NMISA 2 B 12 / 2004
Sweden SP 10 A 2 / 2006
Turkey UME 7 A 9 / 2005
United Kingdom NPL 1 A / B Pilot
USA NIST 11 A 5 / 2006
Table 1. Participating countries and laboratories, including
the code number used in the report 4 Principles of the comparison The purpose of Key Comparisons is to compare the units of measurement as realised throughout the world. In the area of force, the way this is done is by the use of high quality force transducers subjected to similar loading profiles in national force standard machines, following a strict measurement protocol and using similar instrumentation. At the 1998 meeting in Sydney, the CCM Force Working Group proposed the two loading schemes shown in Figure 1.

CCM.F-K2.a/b Final Report - 19.03.2012 Page 4 of 35
Scheme A
Scheme B
1.
0 6 12 18 24 30 60 90 120
2. 3.
preload preload measurements
2. 3. 1. measure-
ment
3 preloads 0 degree 0 degree 60 degree
time in min.
F 1
Figure 1. Loading scheme for both sets of transducers, at 50 kN and
100 kN (Scheme A) and at 50 kN (Scheme B). The force transducer is rotated through a total of 720° in both schemes. One preload and one measurement (as at 60° in Figure 1) is carried out at 120°, 180°, 240°, 300°, 360°/0°, 60°, 120°, 180°, 240°, 300°, and 360°. The relatively long reading period of six minutes was selected to minimise the influence of creep. The comparison was carried out using four transducers, two with nominal capacity 100 kN for Scheme A and two with nominal capacity 50 kN for Scheme B. In addition, one of the 100 kN transducers was used at laboratories participating only in Scheme B, to gather additional information. The transducers used are detailed in Table 2.
1.
0 6 12 18 24 30 60 90 120 150
2. 3.
preload preloadmeasurements
2. 3.1.
measure-ment
3 preloads
0 degree 0 degree 60 degree
time in min.
F2
F1

CCM.F-K2.a/b Final Report - 19.03.2012 Page 5 of 35
Identification Code Manufacturer Serial Number Capacity Scheme
TrA GTM 42139 50 kN B
TrB HBM 054430051 50 kN B
TrC HBM 061030029 100 kN B
TrD GTM 42793 100 kN A
TrE HBM 061030029 100 kN A
Table 2. Transducers used in the comparison
At the conclusion of the comparison, the temperature sensitivities of the four transducers were determined, to enable corrections to be made for the effect of
calibration temperatures differing from the nominal value of 20 C. The results of these temperature tests are shown in Figures 2 to 5, and the assumption is made that the temperature sensitivity determined will be valid at any applied force.
Figure 2. Temperature sensitivity results for TrA at an applied load of 1 000 kg
y = 2.99E-06x + 3.92E-01
0.392 20
0.392 22
0.392 24
0.392 26
0.392 28
0.392 30
0.392 32
10 15 20 25 30 35
Deflection / mV/V
Temperature / °C
TrA (GTM 42139) : 1 000 kg applied

CCM.F-K2.a/b Final Report - 19.03.2012 Page 6 of 35
Figure 3. Temperature sensitivity results for TrB at an applied load of 1 000 kg
Figure 4. Temperature sensitivity results for TrC/TrE at an applied load of 1 000 kg
y = 4.74E-06x - 3.92E-01
-0.392 40
-0.392 38
-0.392 36
-0.392 34
-0.392 32
-0.392 30
-0.392 28
10 15 20 25 30 35
Deflection / mV/V
Temperature / °C
TrB (HBM 054430051) : 1 000 kg applied
y = 9.91E-08x - 1.96E-01
-0.196 36
-0.196 35
-0.196 34
-0.196 33
-0.196 32
-0.196 31
-0.196 30
10 15 20 25 30 35
Deflection / mV/V
Temperature / °C
TrC & TrE (HBM 061030029) : 1 000 kg applied

CCM.F-K2.a/b Final Report - 19.03.2012 Page 7 of 35
Figure 5. Temperature sensitivity results for TrD at an applied load of 1 000 kg
From these test results, relative temperature sensitivities for TrA, TrB, TrC/TrE, and TrD of +7.61 × 10⁻⁶ K-1, -12.07 × 10⁻⁶ K-1, -0.50 × 10⁻⁶ K-1, and -7.56 × 10⁻⁶ K-1 respectively were determined. The relative uncertainty estimates associated with these values were determined, from analysis of the linear fit results, to be 1.25 × 10⁻⁶ K-1, 1.40 × 10⁻⁶ K-1, 3.62 × 10⁻⁶ K-1, and 4.10 × 10⁻⁶ K-1 respectively, at a 95 % (k = 2) level of confidence.
5 Format of the comparison The comparison was made in a star format; the transducers came back to the pilot after each participating laboratory’s measurements. One complete measurement cycle (pilot – participating laboratory – pilot) is called a loop. The pilot’s first measurement is denoted the A-measurement and its second, after the participating laboratory, is called the B-measurement. The change at the pilot (B-measurement – A-measurement) is called the drift for that particular loop. The reference value for each loop is taken as the mean of the two pilot measurements – this is called the loop value. 6 Limitations of the comparison Due to the fact that there is no real reference value to circulate (as the sensitivity of the force transducers varies over time), the following conditions apply:
- each measurement loop is independent of the others - numerical values of different loops are not easily comparable - only relative deviations can be compared - there is no absolute numerical reference value
y = -1.48E-06x + 1.96E-01
0.196 10
0.196 11
0.196 12
0.196 13
0.196 14
0.196 15
0.196 16
10 15 20 25 30 35
Deflection / mV/V
Temperature / °C
TrD (GTM 42793) : 1 000 kg applied

CCM.F-K2.a/b Final Report - 19.03.2012 Page 8 of 35
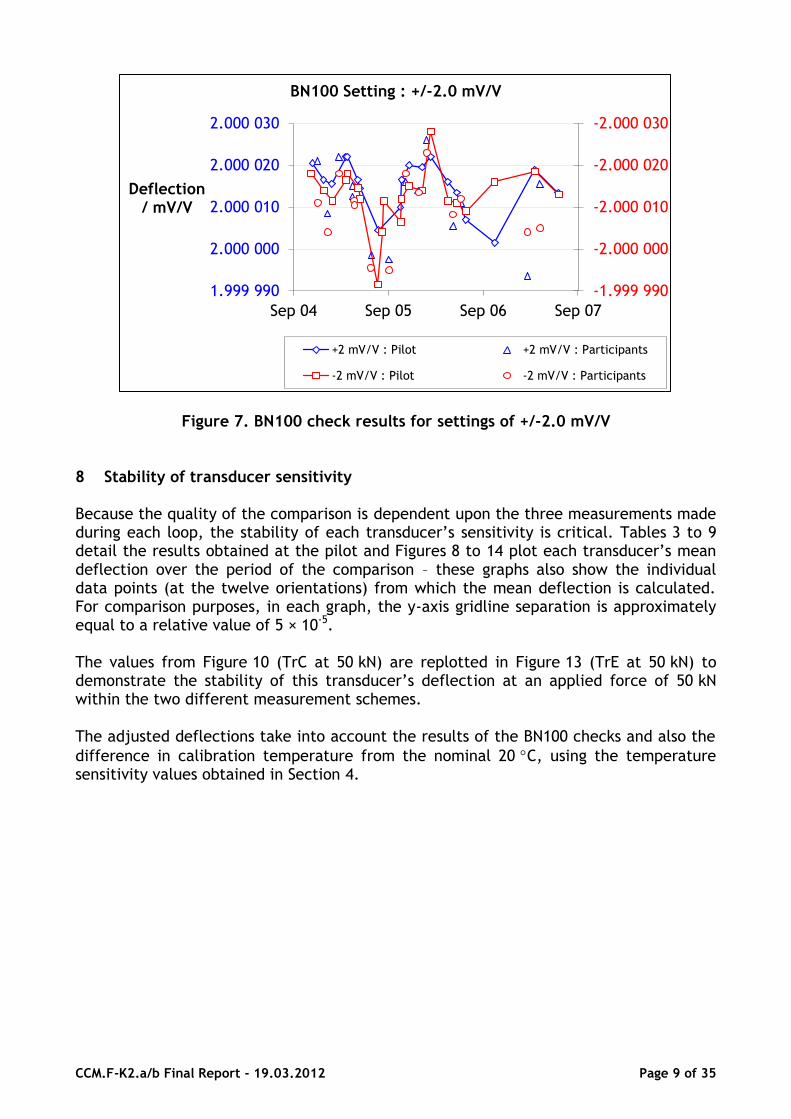
7 Instrumentation used in the comparison In practice, it is not possible to calibrate the DMP40 measurement instruments used (one at each laboratory) against a single reference standard. The uniformity of the DMP40s used was confirmed by comparison against the same BN100 calibrator unit, circulated with the transducers. Each participating laboratory measured the indication of their DMP40 against the signal of the BN100 at a number of representative voltage ratios. The deflections obtained at each laboratory, including the pilot, were adjusted using the assumption that the signal generated by the BN100 was absolutely correct. For example, if BN100 output settings of +0.0 mV/V and +2.0 mV/V resulted in DMP40 readings of +0.000 012 mV/V and +2.000 042 mV/V, giving a deflection of +2.000 030 mV/V instead of the nominal +2.000 000 mV/V, the assumption was made that the DMP40 was reading 1.5 × 10⁻⁵ too high and the measured deflection was reduced by this relative amount. Figures 6 and 7 show the DMP40 readings at both the pilot and at each participating laboratory, at four different BN100 settings, corresponding to the different transducer deflection levels. The values obtained at the pilot vary over the period of the comparison by between 1 × 10⁻⁵ and 2 × 10⁻⁵ - it is likely that this is due to drift in the BN100 rather than drift in the pilot’s DMP40, as the values from the participating laboratories seem to follow this trend.
Figure 6. BN100 check results for settings of +/-1.0 mV/V
-1.000015
-1.00001
-1.000005
-1
-0.9999950.999 995
1.000 000
1.000 005
1.000 010
1.000 015
Sep 04 Sep 05 Sep 06 Sep 07
Deflection / mV/V
BN100 Setting : +/-1.0 mV/V
+1 mV/V : Pilot +1 mV/V : Participants
-1 mV/V : Pilot -1 mV/V : Participants
CCM.F-K2.a/b Final Report - 19.03.2012 Page 9 of 35
Figure 7. BN100 check results for settings of +/-2.0 mV/V
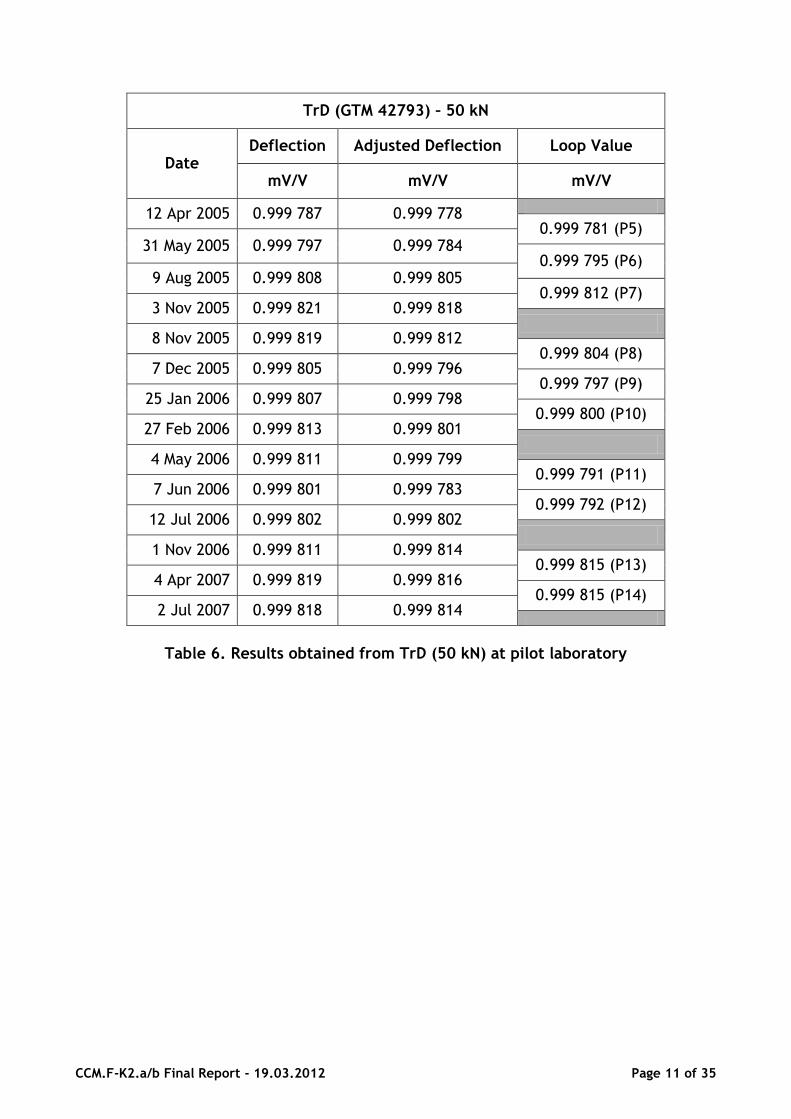
8 Stability of transducer sensitivity Because the quality of the comparison is dependent upon the three measurements made during each loop, the stability of each transducer’s sensitivity is critical. Tables 3 to 9 detail the results obtained at the pilot and Figures 8 to 14 plot each transducer’s mean deflection over the period of the comparison – these graphs also show the individual data points (at the twelve orientations) from which the mean deflection is calculated. For comparison purposes, in each graph, the y-axis gridline separation is approximately equal to a relative value of 5 × 10⁻⁵. The values from Figure 10 (TrC at 50 kN) are replotted in Figure 13 (TrE at 50 kN) to demonstrate the stability of this transducer’s deflection at an applied force of 50 kN within the two different measurement schemes. The adjusted deflections take into account the results of the BN100 checks and also the
difference in calibration temperature from the nominal 20 C, using the temperature sensitivity values obtained in Section 4.
-2.000 030
-2.000 020
-2.000 010
-2.000 000
-1.999 9901.999 990
2.000 000
2.000 010
2.000 020
2.000 030
Sep 04 Sep 05 Sep 06 Sep 07
Deflection / mV/V
BN100 Setting : +/-2.0 mV/V
+2 mV/V : Pilot +2 mV/V : Participants
-2 mV/V : Pilot -2 mV/V : Participants

CCM.F-K2.a/b Final Report - 19.03.2012 Page 10 of 35
TrA (GTM 42139) – 50 kN
Date Deflection Adjusted Deflection Loop Value
mV/V mV/V mV/V
29 Nov 2004 1.999 845 1.999 817
1.999 815 (P2) 11 Jan 2005 1.999 840 1.999 813
1.999 829 (P3) 11 Feb 2005 1.999 867 1.999 845
1.999 874 (P4) 7 Apr 2005 1.999 934 1.999 902
1.999 904 (P5) 23 May 2005 1.999 921 1.999 905
Table 3. Results obtained from TrA (50 kN) at pilot laboratory
TrB (HBM 054430051) – 50 kN
Date Deflection Adjusted Deflection Loop Value
mV/V mV/V mV/V
24 Nov 2004 -1.999 447 -1.999 450
-1.999 415 (P2) 12 Jan 2005 -1.999 375 -1.999 379
-1.999 436 (P3) 14 Feb 2005 -1.999 495 -1.999 493
-1.999 478 (P4) 8 Apr 2005 -1.999 466 -1.999 462
-1.999 441 (P5) 24 May 2005 -1.999 430 -1.999 419
Table 4. Results obtained from TrB (50 kN) at pilot laboratory
TrC (HBM 061030029) – 50 kN
Date Deflection Adjusted Deflection Loop Value
mV/V mV/V mV/V
3 Dec 2004 -1.000 399 -1.000 391
-1.000 376 (P2) 13 Jan 2005 -1.000 370 -1.000 362
-1.000 395 (P3) 15 Feb 2005 -1.000 436 -1.000 429
-1.000 459 (P4) 6 Apr 2005 -1.000 498 -1.000 490
Table 5. Results obtained from TrC (50 kN) at pilot laboratory
CCM.F-K2.a/b Final Report - 19.03.2012 Page 11 of 35
TrD (GTM 42793) – 50 kN
Date Deflection Adjusted Deflection Loop Value
mV/V mV/V mV/V
12 Apr 2005 0.999 787 0.999 778
0.999 781 (P5) 31 May 2005 0.999 797 0.999 784
0.999 795 (P6) 9 Aug 2005 0.999 808 0.999 805
0.999 812 (P7) 3 Nov 2005 0.999 821 0.999 818
8 Nov 2005 0.999 819 0.999 812
0.999 804 (P8) 7 Dec 2005 0.999 805 0.999 796
0.999 797 (P9) 25 Jan 2006 0.999 807 0.999 798
0.999 800 (P10) 27 Feb 2006 0.999 813 0.999 801
4 May 2006 0.999 811 0.999 799
0.999 791 (P11) 7 Jun 2006 0.999 801 0.999 783
0.999 792 (P12) 12 Jul 2006 0.999 802 0.999 802
1 Nov 2006 0.999 811 0.999 814
0.999 815 (P13) 4 Apr 2007 0.999 819 0.999 816
0.999 815 (P14) 2 Jul 2007 0.999 818 0.999 814
Table 6. Results obtained from TrD (50 kN) at pilot laboratory

CCM.F-K2.a/b Final Report - 19.03.2012 Page 12 of 35
TrD (GTM 42793) – 100 kN
Date Deflection Adjusted Deflection Loop Value
mV/V mV/V mV/V
12 Apr 2005 1.999 890 1.999 871
1.999 876 (P5) 31 May 2005 1.999 908 1.999 881
1.999 902 (P6) 9 Aug 2005 1.999 929 1.999 923
1.999 935 (P7) 3 Nov 2005 1.999 953 1.999 946
8 Nov 2005 1.999 947 1.999 931
1.999 915 (P8) 7 Dec 2005 1.999 915 1.999 898
1.999 900 (P9) 25 Jan 2006 1.999 921 1.999 903
1.999 903 (P10) 27 Feb 2006 1.999 929 1.999 903
4 May 2006 1.999 928 1.999 902
1.999 885 (P11) 7 Jun 2006 1.999 904 1.999 868
1.999 882 (P12) 12 Jul 2006 1.999 899 1.999 897
1 Nov 2006 1.999 923 1.999 926
1.999 928 (P13) 4 Apr 2007 1.999 937 1.999 929
1.999 931 (P14) 2 Jul 2007 1.999 942 1.999 932
Table 7. Results obtained from TrD (100 kN) at pilot laboratory

CCM.F-K2.a/b Final Report - 19.03.2012 Page 13 of 35
TrE (HBM 061030029) – 50 kN
Date Deflection Adjusted Deflection Loop Value
mV/V mV/V mV/V
13 Apr 2005 -1.000 482 -1.000 471
-1.000 450 (P5) 1 Jun 2005 -1.000 436 -1.000 429
-1.000 353 (P6) 8 Aug 2005 -1.000 279 -1.000 276
24 Aug 2005 -1.000 375 -1.000 365
31 Aug 2005 -1.000 386 -1.000 374
-1.000 370 (P7) 4 Nov 2005 -1.000 371 -1.000 366
7 Nov 2005 -1.000 378 -1.000 371
-1.000 387 (P8) 5 Dec 2005 -1.000 412 -1.000 403
-1.000 415 (P9) 26 Jan 2006 -1.000 436 -1.000 427
-1.000 428 (P10) 28 Feb 2006 -1.000 441 -1.000 429
5 May 2006 -1.000 490 -1.000 483
-1.000 467 (P11) 8 Jun 2006 -1.000 460 -1.000 452
-1.000 420 (P12) 13 Jul 2006 -1.000 392 -1.000 387
31 Oct 2006 -1.000 398 -1.000 389
-1.000 440 (P13) 5 Apr 2007 -1.000 501 -1.000 492
-1.000 497 (P14) 5 Jul 2007 -1.000 510 -1.000 503
Table 8. Results obtained from TrE (50 kN) at pilot laboratory

CCM.F-K2.a/b Final Report - 19.03.2012 Page 14 of 35
TrE (HBM 061030029) – 100 kN
Date Deflection Adjusted Deflection Loop Value
mV/V mV/V mV/V
13 Apr 2005 -2.001 195 -2.001 177
-2.001 134 (P5) 1 Jun 2005 -2.001 102 -2.001 090
-2.000 941 (P6) 8 Aug 2005 -2.000 783 -2.000 791
24 Aug 2005 -2.000 978 -2.000 974
31 Aug 2005 -2.000 998 -2.000 987
-2.000 979 (P7) 4 Nov 2005 -2.000 977 -2.000 971
7 Nov 2005 -2.000 987 -2.000 975
-2.001 008 (P8) 5 Dec 2005 -2.001 056 -2.001 041
-2.001 067 (P9) 26 Jan 2006 -2.001 106 -2.001 092
-2.001 094 (P10) 28 Feb 2006 -2.001 123 -2.001 095
5 May 2006 -2.001 217 -2.001 204
-2.001 173 (P11) 8 Jun 2006 -2.001 154 -2.001 141
-2.001 075 (P12) 13 Jul 2006 -2.001 018 -2.001 009
31 Oct 2006 -2.001 030 -2.001 014
-2.001 113 (P13) 5 Apr 2007 -2.001 229 -2.001 211
-2.001 227 (P14) 5 Jul 2007 -2.001 255 -2.001 243
Table 9. Results obtained from TrE (100 kN) at pilot laboratory

CCM.F-K2.a/b Final Report - 19.03.2012 Page 15 of 35
Figure 8. Stability of TrA throughout the comparison
Figure 9. Stability of TrB throughout the comparison
1.999 75
1.999 85
1.999 95
Oct 04 Dec 04 Feb 05 Apr 05 Jun 05
Deflection / mV/V
TrA (GTM 42139) : 50 kN
-1.999 55
-1.999 45
-1.999 35
-1.999 25
Oct 04 Dec 04 Feb 05 Apr 05 Jun 05
Deflection / mV/V
TrB (HBM 054430051) : 50 kN

CCM.F-K2.a/b Final Report - 19.03.2012 Page 16 of 35
Figure 10. Stability of TrC throughout the comparison
Figure 11. Stability of TrD at 50 kN throughout the comparison
-1.000 50
-1.000 45
-1.000 40
-1.000 35
Oct 04 Dec 04 Feb 05 Apr 05 Jun 05
Deflection / mV/V
TrC (HBM 061030029) : 50 kN
0.999 75
0.999 80
0.999 85
Mar 05 Sep 05 Mar 06 Sep 06 Mar 07 Sep 07
Deflection / mV/V
TrD (GTM 42793) : 50 kN

CCM.F-K2.a/b Final Report - 19.03.2012 Page 17 of 35
Figure 12. Stability of TrD at 100 kN throughout the comparison
Figure 13. Stability of TrE at 50 kN throughout the comparison
1.999 8
1.999 9
2.000 0
Mar 05 Sep 05 Mar 06 Sep 06 Mar 07 Sep 07
Deflection / mV/V
TrD (GTM 42793) : 100 kN
-1.000 55
-1.000 50
-1.000 45
-1.000 40
-1.000 35
-1.000 30
-1.000 25
Sep 04 Mar 05 Sep 05 Mar 06 Sep 06 Mar 07 Sep 07
Deflection / mV/V
TrE (HBM 061030029) : 50 kN

CCM.F-K2.a/b Final Report - 19.03.2012 Page 18 of 35
Figure 14. Stability of TrE at 100 kN throughout the comparison
These results demonstrate that, at the 50 kN level, TrA is the most stable transducer with all four relative drifts being of 3 × 10⁻⁵ or less. TrB is slightly better than TrC, with only one of the four relative drifts being above 5 × 10⁻⁵, as opposed to two of the three for TrC. At the 100 kN level, each transducer’s 50 kN and 100 kN relative drift values are virtually identical. TrD’s drift performance is significantly better than TrE’s – all TrD drift values are below 2 × 10⁻⁵, as opposed to TrE which has values as high as 15 × 10-5 (although only 3 of the 11 values exceed 5 × 10⁻⁵). 9 Results obtained at participating laboratories Tables 10 to 16 detail the results obtained at all participating laboratories and give the difference from each loop’s reference value (given in Tables 3 to 9) in both absolute and relative terms. Again, the adjusted deflections take into account the results of the
BN100 checks and also the difference in calibration temperature from the nominal 20 C, using the temperature sensitivity values obtained in Section 4. Additionally, for Labs 4 and 11 whose machines do not generate exact kilonewton multiples, the expected deflections at 50 kN and 100 kN are linearly interpolated.
-2.001 3
-2.001 2
-2.001 1
-2.001 0
-2.000 9
-2.000 8
-2.000 7
Mar 05 Sep 05 Mar 06 Sep 06 Mar 07 Sep 07
Deflection / mV/V
TrE (HBM 061030029) : 100 kN

CCM.F-K2.a/b Final Report - 19.03.2012 Page 19 of 35
TrA (GTM 42139) – 50 kN
Code Number
Date Deflection
Adjusted Deflection
Loop Value
Difference
mV/V mV/V mV/V mV/V Relative
2 18 Dec 2004 1.999 981 1.999 943 1.999 815 0.000 128 6.4E-5
3 26 Jan 2005 1.999 836 1.999 828 1.999 829 -0.000 001 -0.1E-5
4 10 Mar 2005 1.961 219 1.999 862 1.999 874 -0.000 011 -0.6E-5
5 3 May 2005 1.999 959 1.999 942 1.999 904 0.000 039 1.9E-5
Table 10. Results obtained from TrA (50 kN) at participating laboratories
TrB (HBM 054430051) – 50 kN
Code Number
Date Deflection
Adjusted Deflection
Loop Value
Difference
mV/V mV/V mV/V mV/V Relative
2 20 Dec 2004 -1.999 398 -1.999 412 -1.999 415 0.000 002 -0.1E-5
3 27 Jan 2005 -1.999 407 -1.999 402 -1.999 436 0.000 035 -1.7E-5
4 12 Mar 2005 -1.960 806 -1.999 449 -1.999 478 0.000 029 -1.4E-5
5 10 May 2005 -1.999 427 -1.999 419 -1.999 441 0.000 022 -1.1E-5
Table 11. Results obtained from TrB (50 kN) at participating laboratories
TrC (HBM 061030029) – 50 kN
Code Number
Date Deflection
Adjusted Deflection
Loop Value
Difference
mV/V mV/V mV/V mV/V Relative
2 21 Dec 2004 -1.000 322 -1.000 314 -1.000 376 0.000 063 -6.3E-5
3 31 Jan 2005 -1.000 399 -1.000 397 -1.000 395 -0.000 002 0.2E-5
4 12 Mar 2005 -0.981 095 -1.000 424 -1.000 459 0.000 036 -3.6E-5
Table 12. Results obtained from TrC (50 kN) at participating laboratories

CCM.F-K2.a/b Final Report - 19.03.2012 Page 20 of 35
TrD (GTM 42793) – 50 kN
Code Number
Date Deflection
Adjusted Deflection
Loop Value
Difference
mV/V mV/V mV/V mV/V Relative
5 2 May 2005 0.999 815 0.999 810 0.999 781 0.000 029 2.9E-5
6 14 Jul 2005 0.999 808 0.999 809 0.999 795 0.000 014 1.4E-5
7 19 Sep 2005 0.999 769 0.999 770 0.999 812 -0.000 042 -4.2E-5
8 23 Nov 2005 0.999 803 0.999 796 0.999 804 -0.000 008 -0.8E-5
9 10 Jan 2006 0.999 889 0.999 883 0.999 797 0.000 086 8.6E-5
10 11 Feb 2006 0.999 846 0.999 847 0.999 800 0.000 047 4.7E-5
11 25 May 2006 1.000 679 0.999 823 0.999 791 0.000 032 3.2E-5
12 26 Jun 2006 0.999 836 0.999 835 0.999 792 0.000 043 4.3E-5
13 6 Mar 2007 0.999 777 0.999 788 0.999 815 -0.000 027 -2.7E-5
14 24 Apr 2007 0.999 829 0.999 820 0.999 815 0.000 005 0.5E-5
Table 13. Results obtained from TrD (50 kN) at participating laboratories
TrD (GTM 42793) – 100 kN
Code Number
Date Deflection
Adjusted Deflection
Loop Value
Difference
mV/V mV/V mV/V mV/V Relative
5 2 May 2005 1.999 943 1.999 931 1.999 876 0.000 054 2.7E-5
6 14 Jul 2005 1.999 918 1.999 919 1.999 902 0.000 017 0.9E-5
7 19 Sep 2005 1.999 855 1.999 862 1.999 935 -0.000 073 -3.6E-5
8 23 Nov 2005 1.999 910 1.999 896 1.999 915 -0.000 019 -0.9E-5
9 10 Jan 2006 1.999 998 1.999 986 1.999 900 0.000 085 4.3E-5
10 11 Feb 2006 2.000 023 2.000 022 1.999 903 0.000 119 6.0E-5
11 25 May 2006 1.993 037 1.999 947 1.999 885 0.000 063 3.1E-5
12 26 Jun 2006 1.999 961 1.999 962 1.999 882 0.000 080 4.0E-5
13 6 Mar 2007 1.999 933 1.999 955 1.999 928 0.000 028 1.4E-5
14 24 Apr 2007 1.999 958 1.999 939 1.999 931 0.000 008 0.4E-5
Table 14. Results obtained from TrD (100 kN) at participating laboratories

CCM.F-K2.a/b Final Report - 19.03.2012 Page 21 of 35
TrE (HBM 061030029) – 50 kN
Code Number
Date Deflection
Adjusted Deflection
Loop Value
Difference
mV/V mV/V mV/V mV/V Relative
5 9 May 2005 -1.000 437 -1.000 432 -1.000 450 0.000 018 -1.8E-5
6 12 Jul 2005 -1.000 318 -1.000 322 -1.000 353 0.000 031 -3.0E-5
7 21 Sep 2005 -1.000 335 -1.000 335 -1.000 370 0.000 034 -3.4E-5
8 24 Nov 2005 -1.000 396 -1.000 386 -1.000 387 0.000 001 -0.1E-5
9 12 Jan 2006 -1.000 487 -1.000 480 -1.000 415 -0.000 065 6.5E-5
10 12 Feb 2006 -1.000 463 -1.000 452 -1.000 428 -0.000 024 2.4E-5
11 23 May 2006 -1.001 325 -1.000 475 -1.000 467 -0.000 007 0.7E-5
12 23 Jun 2006 -1.000 451 -1.000 446 -1.000 420 -0.000 027 2.7E-5
13 7 Mar 2007 -1.000 541 -1.000 542 -1.000 440 -0.000 101 10.1E-5
14 25 Apr 2007 -1.000 503 -1.000 499 -1.000 497 -0.000 002 0.2E-5
Table 15. Results obtained from TrE (50 kN) at participating laboratories
TrE (HBM 061030029) – 100 kN
Code Number
Date Deflection
Adjusted Deflection
Loop Value
Difference
mV/V mV/V mV/V mV/V Relative
5 9 May 2005 -2.001 106 -2.001 094 -2.001 134 0.000 039 -2.0E-5
6 12 Jul 2005 -2.000 859 -2.000 864 -2.000 941 0.000 077 -3.8E-5
7 21 Sep 2005 -2.000 915 -2.000 920 -2.000 979 0.000 059 -2.9E-5
8 24 Nov 2005 -2.001 016 -2.000 998 -2.001 008 0.000 010 -0.5E-5
9 12 Jan 2006 -2.001 128 -2.001 114 -2.001 067 -0.000 047 2.4E-5
10 12 Feb 2006 -2.001 137 -2.001 115 -2.001 094 -0.000 022 1.1E-5
11 23 May 2006 -1.994 252 -2.001 164 -2.001 173 0.000 009 -0.4E-5
12 23 Jun 2006 -2.001 118 -2.001 107 -2.001 075 -0.000 032 1.6E-5
13 7 Mar 2007 -2.001 323 -2.001 320 -2.001 113 -0.000 207 10.3E-5
14 25 Apr 2007 -2.001 233 -2.001 228 -2.001 227 -0.000 001 0.0E-5
Table 16. Results obtained from TrE (100 kN) at participating laboratories
Figure 15 summarises all participants’ results and Figure 16 shows the unweighted mean relative difference from the loop value obtained by each participant at forces of 50 kN and, where applicable, 100 kN. Note that the weighted mean difference cannot be calculated until estimates of uncertainty have been made.

CCM.F-K2.a/b Final Report - 19.03.2012 Page 22 of 35
Figure 15. Summary of participants’ results
Figure 16. Mean differences obtained from all transducers
-1.0E-04
-5.0E-05
0.0E+00
5.0E-05
1.0E-04
1.5E-04
2 3 4 5 6 7 8 9 10 11 12 13 14
Relative Difference
Laboratory Code Number
TrA - 50 kN TrB - 50 kN TrC - 50 kN TrD - 50 kN
TrD - 100 kN TrE - 50 kN TrE - 100 kN
-5.0E-05
0.0E+00
5.0E-05
1.0E-04
2 3 4 5 6 7 8 9 10 11 12 13 14
Relative Difference
Laboratory Code Number
50 kN
100 kN

CCM.F-K2.a/b Final Report - 19.03.2012 Page 23 of 35
10 Uncertainty analysis Table 17 calculates, for each mean deflection obtained in each participating laboratory, an expanded relative uncertainty value. Each uncertainty value is calculated in the same way, with contributions due to the applied force, the reproducibility of the readings (calculated as the standard deviation of the mean), and the resolution of the DMP40. Additionally, the value for Lab 4 includes a component due to interpolation, as a force of 5 000 kgf, rather than 50 kN, was applied. No allowance is made at this stage for the BN100 or temperature corrections – these will be dealt with in conjunction with the effect of drift at a later stage.
Code Number
Transducer / Force
Relative Standard Uncertainty Relative Expanded
Uncertainty (k=2) Force Reproducibility Resolution
1
TrA / 50 kN 5.00E-06 2.45E-06 2.04E-07 1.11E-05
TrB / 50 kN 5.00E-06 3.23E-06 2.04E-07 1.19E-05
TrC / 50 kN 5.00E-06 1.22E-06 4.08E-07 1.03E-05
TrD / 50 kN 5.00E-06 2.41E-06 4.08E-07 1.11E-05
TrD / 100 kN 5.00E-06 2.40E-06 2.04E-07 1.11E-05
TrE / 50 kN 5.00E-06 2.75E-06 4.08E-07 1.14E-05
TrE / 100 kN 5.00E-06 2.27E-06 2.04E-07 1.10E-05
2
TrA / 50 kN 3.00E-04 1.56E-05 2.04E-07 6.01E-04
TrB / 50 kN 3.00E-04 1.36E-05 2.04E-07 6.01E-04
TrC / 50 kN 3.00E-04 1.64E-05 4.08E-07 6.01E-04
3
TrA / 50 kN 5.00E-06 1.49E-06 2.04E-07 1.04E-05
TrB / 50 kN 5.00E-06 2.17E-06 2.04E-07 1.09E-05
TrC / 50 kN 5.00E-06 1.23E-06 4.08E-07 1.03E-05
4
TrA / 50 kN 5.40E-06 1.49E-06 2.04E-07 1.21E-05
TrB / 50 kN 5.40E-06 3.07E-06 2.04E-07 1.26E-05
TrC / 50 kN 5.40E-06 2.75E-06 4.08E-07 1.24E-05
5
TrA / 50 kN 1.00E-05 6.55E-06 2.04E-07 2.39E-05
TrB / 50 kN 1.00E-05 1.82E-06 2.04E-07 2.03E-05
TrD / 50 kN 1.00E-05 7.80E-06 4.08E-07 2.54E-05
TrD / 100 kN 1.00E-05 6.83E-06 2.04E-07 2.42E-05
TrE / 50 kN 1.00E-05 1.58E-06 4.08E-07 2.03E-05
TrE / 100 kN 1.00E-05 1.57E-06 2.04E-07 2.02E-05
6
TrD / 50 kN 6.67E-06 5.00E-06 4.08E-07 1.67E-05
TrD / 100 kN 6.67E-06 3.30E-06 2.04E-07 1.49E-05
TrE / 50 kN 6.67E-06 5.53E-06 4.08E-07 1.73E-05
TrE / 100 kN 6.67E-06 4.88E-06 2.04E-07 1.65E-05

CCM.F-K2.a/b Final Report - 19.03.2012 Page 24 of 35
7
TrD / 50 kN 1.00E-05 3.38E-06 4.08E-07 2.11E-05
TrD / 100 kN 1.00E-05 5.28E-06 2.04E-07 2.26E-05
TrE / 50 kN 1.00E-05 3.37E-06 4.08E-07 2.11E-05
TrE / 100 kN 1.00E-05 3.05E-06 2.04E-07 2.09E-05
8
TrD / 50 kN 1.00E-05 3.74E-06 4.08E-07 2.14E-05
TrD / 100 kN 1.00E-05 2.54E-06 2.04E-07 2.06E-05
TrE / 50 kN 1.00E-05 4.85E-06 4.08E-07 2.22E-05
TrE / 100 kN 1.00E-05 3.08E-06 2.04E-07 2.09E-05
9
TrD / 50 kN 2.50E-05 3.82E-06 4.08E-07 5.06E-05
TrD / 100 kN 2.50E-05 3.54E-06 2.04E-07 5.05E-05
TrE / 50 kN 2.50E-05 1.86E-05 4.08E-07 6.23E-05
TrE / 100 kN 2.50E-05 1.48E-05 2.04E-07 5.81E-05
10
TrD / 50 kN 2.50E-05 8.44E-06 4.08E-07 5.28E-05
TrD / 100 kN 2.50E-05 9.10E-06 2.04E-07 5.32E-05
TrE / 50 kN 2.50E-05 2.68E-05 4.08E-07 7.33E-05
TrE / 100 kN 2.50E-05 2.36E-05 2.04E-07 6.88E-05
11
TrD / 50 kN 5.00E-06 4.30E-06 4.08E-07 1.32E-05
TrD / 100 kN 5.00E-06 3.82E-06 2.04E-07 1.26E-05
TrE / 50 kN 5.00E-06 1.19E-05 4.08E-07 2.59E-05
TrE / 100 kN 5.00E-06 1.04E-05 2.04E-07 2.31E-05
12
TrD / 50 kN 1.00E-05 3.67E-06 4.08E-07 2.13E-05
TrD / 100 kN 1.00E-05 3.05E-06 2.04E-07 2.09E-05
TrE / 50 kN 1.00E-05 1.99E-06 4.08E-07 2.04E-05
TrE / 100 kN 1.00E-05 3.91E-07 2.04E-07 2.00E-05
13
TrD / 50 kN 1.00E-05 9.78E-07 4.08E-07 2.01E-05
TrD / 100 kN 1.00E-05 8.20E-07 2.04E-07 2.01E-05
TrE / 50 kN 1.00E-05 4.99E-06 4.08E-07 2.24E-05
TrE / 100 kN 1.00E-05 3.47E-06 2.04E-07 2.12E-05
14
TrD / 50 kN 2.50E-05 3.67E-06 4.08E-07 5.05E-05
TrD / 100 kN 2.50E-05 2.74E-06 2.04E-07 5.03E-05
TrE / 50 kN 2.50E-05 6.82E-06 4.08E-07 5.18E-05
TrE / 100 kN 2.50E-05 4.67E-06 2.04E-07 5.09E-05
Table 17. Relative expanded uncertainty value for each mean deflection
For each deflection value obtained by a participating laboratory, the difference between it and the loop value is calculated. The uncertainty associated with this difference is a combination of the participant’s uncertainty, the uncertainty of the loop value, and the uncertainty associated with the temperature corrections. The uncertainty of the loop value includes contributions due to the drift of the transducer, the effect of the BN100

CCM.F-K2.a/b Final Report - 19.03.2012 Page 25 of 35
corrections, and any change in the force applied at the pilot laboratory (note that this is smaller than the uncertainty of generated force, as the same masses are used for each pilot calibration – the main contribution will be a change in buoyancy force due to air pressure variation, and it is evident that this effect is negligible when compared to the magnitudes of the drift and BN100 effects). Considering Figures 6 and 7, an estimate of a relative standard uncertainty associated with the BN100 corrections of 5 × 10⁻⁶ would not seem unreasonable, and the uncertainty associated with the temperature corrections is simply taken as the difference between calibration temperatures at the pilot and the participating laboratory multiplied by the standard uncertainty associated with the sensitivity value, so the remaining question is how to deal with the drift of the transducer - three alternative methods are possible: 1) Base the drift uncertainty contribution solely on the difference between the two
pilot measurements, assuming a specific distribution. This has the disadvantage of basing the value on just two numbers – not a large sample. If the two pilot measurements are identical, this would lead to no contribution due to drift, even if the transducer displays significant values in other loops – it may just be chance that the two measurements are the same for one particular loop, and it does not mean that the transducer sensitivity is not different during the participant’s measurements.
2) Take a standard deviation or average value of drift throughout the complete exercise
as a common drift component. This has the disadvantage of possibly underestimating the contribution for some loops and overestimating it for others – it is possible that the stability of the transducer will vary throughout the comparison, particularly if significant environmental factors are present.
3) A combination of the above two approaches – using a rectangular distribution for the
two pilot values for a specific loop together with a proportion of the mean absolute drift added as a second rectangular distribution.
Using approach 3, with 50 % of the mean absolute drift used as the half-width of the second rectangular distribution, the expanded uncertainties due to drift for the loop values obtained in the two 100 kN exercises are as shown in Figures 17 and 18 – these contributions do not appear unreasonable.

CCM.F-K2.a/b Final Report - 19.03.2012 Page 26 of 35
Figure 17. Pilot values and loop values with associated expanded drift uncertainties for TrD (100 kN)
Figure 18. Pilot values and loop values with associated expanded drift uncertainties for TrE (100 kN)
When the drift, BN100, and temperature uncertainty contributions are incorporated with the uncertainty associated with the deflection at each laboratory, the results (for the two 100 kN calibrations) are as shown in Figures 19 and 20. Both the weighted and unweighted mean lines are based on the results from all laboratories including the pilot.
1.999 84
1.999 86
1.999 88
1.999 90
1.999 92
1.999 94
1.999 96
Mar 05 Sep 05 Mar 06 Sep 06 Mar 07 Sep 07
Deflection / mV/V
TrD (GTM 42793) : 100 kN
Pilot Value
Loop Value
-2.001 3
-2.001 2
-2.001 1
-2.001 0
-2.000 9
-2.000 8
-2.000 7
Mar 05 Sep 05 Mar 06 Sep 06 Mar 07 Sep 07
Deflection / mV/V
TrE (HBM 061030029) : 100 kN
Pilot Value
Loop Value

CCM.F-K2.a/b Final Report - 19.03.2012 Page 27 of 35
Figure 19. Differences from the loop value together with associated expanded uncertainties for TrD (100 kN)
Figure 20. Differences from the loop value together with associated expanded uncertainties for TrE (100 kN)
If a similar approach is applied to the five 50 kN exercises, the results shown in Figures 21 to 25 are obtained. In Figures 21 to 23, the ends of the expanded uncertainty bars for Lab 2 are not shown, as the expanded uncertainty value exceeds 6 × 10⁻⁴ – modifying the y-scale to display the ends would make the results at the other laboratories hard to assess visually.
5 6
7
8
9 10
11 12 13
14
-1.5E-04
-1.0E-04
-5.0E-05
0.0E+00
5.0E-05
1.0E-04
1.5E-04
2.0E-04
Mar 05 Sep 05 Mar 06 Sep 06 Mar 07 Sep 07
Relative Difference
TrD (GTM 42793) : 100 kN
Weighted Mean
Unweighted Mean
5 6 7
8
9 10
11
12
13
14
-1.5E-04
-1.0E-04
-5.0E-05
0.0E+00
5.0E-05
1.0E-04
1.5E-04
2.0E-04
Mar 05 Sep 05 Mar 06 Sep 06 Mar 07 Sep 07
Relative Difference
TrE (HBM 061030029) : 100 kN
Weighted Mean
Unweighted Mean

CCM.F-K2.a/b Final Report - 19.03.2012 Page 28 of 35
Figure 21. Differences from the loop value together with associated expanded uncertainties for TrA
Figure 22. Differences from the loop value together with associated expanded uncertainties for TrB
2
3 4
5
-1.5E-04
-1.0E-04
-5.0E-05
0.0E+00
5.0E-05
1.0E-04
1.5E-04
2.0E-04
Oct 04 Dec 04 Feb 05 Apr 05 Jun 05
Relative Difference
TrA (GTM 42139) : 50 kN
Weighted Mean
Unweighted Mean
2
3 4 5
-1.5E-04
-1.0E-04
-5.0E-05
0.0E+00
5.0E-05
1.0E-04
1.5E-04
2.0E-04
Oct 04 Dec 04 Feb 05 Apr 05 Jun 05
Relative Difference
TrB (HBM 054430051) : 50 kN
Weighted Mean
Unweighted Mean

CCM.F-K2.a/b Final Report - 19.03.2012 Page 29 of 35
Figure 23. Differences from the loop value together with associated expanded uncertainties for TrC
Figure 24. Differences from the loop value together with associated expanded uncertainties for TrD (50 kN)
2
3
4
-1.5E-04
-1.0E-04
-5.0E-05
0.0E+00
5.0E-05
1.0E-04
1.5E-04
2.0E-04
Oct 04 Dec 04 Feb 05 Apr 05 Jun 05
Relative Difference
TrC (HBM 061030029) : 50 kN
Weighted Mean
Unweighted Mean
5 6
7
8
9
10
11 12
13 14
-1.5E-04
-1.0E-04
-5.0E-05
0.0E+00
5.0E-05
1.0E-04
1.5E-04
2.0E-04
Mar 05 Sep 05 Mar 06 Sep 06 Mar 07 Sep 07
Relative Difference
TrD (GTM 42793) : 50 kN
Weighted Mean
Unweighted Mean

CCM.F-K2.a/b Final Report - 19.03.2012 Page 30 of 35
Figure 25. Differences from the loop value together with associated expanded uncertainties for TrE (50 kN)
In the calculation of each transducer’s weighted mean, the uncertainty associated with the pilot laboratory value is taken as a combination of the contributions due to applied force, reproducibility, resolution, and BN100 correction – the effects of drift are incorporated within the uncertainties of the other participants and should not be counted twice. The next step is to combine the results from each laboratory at each force and it seems reasonable that this should be done as a weighted mean of each laboratory’s results, giving more weight to the values with lower associated uncertainties. For some laboratories, however, the two (or more) differences from the loop value may themselves be different by a statistically significant amount, after consideration of their associated uncertainties – this can be determined by the use of a chi-squared test – and it is assumed that this is due to effects of interactions between the transducers and the laboratory’s machine which have not been incorporated in the calculated uncertainty budget. In these cases, the uncertainty associated with the weighted mean difference has been increased by a factor equal to the square root of the ratio between the calculated chi-squared statistic and the value of the chi-squared statistic, for the appropriate degrees of freedom, corresponding to the 95 % distribution limit. This should ensure that the value used for the uncertainty of the weighted mean at each laboratory, at each force, is not unrepresentatively low, and will therefore not disproportionately affect the calculation of the KCRV (Key Comparison Reference Value) – in practice, this only affects the measurements made at both 50 kN and 100 kN by Lab 13. The uncertainty associated with the pilot’s weighted mean difference (of 0.00 × 10⁻⁵) at each force is taken as the average of the uncertainties associated with the individual transducers used at the specific force levels – this is because using the calculated value associated with the weighted mean would result in an unrealistically low value, due to correlation between a number of the uncertainty contributions.
5 6 7
8
9
10
11
12
13
14
-1.5E-04
-1.0E-04
-5.0E-05
0.0E+00
5.0E-05
1.0E-04
1.5E-04
2.0E-04
Mar 05 Sep 05 Mar 06 Sep 06 Mar 07 Sep 07
Relative Difference
TrE (HBM 061030029) : 50 kN
Weighted Mean
Unweighted Mean

CCM.F-K2.a/b Final Report - 19.03.2012 Page 31 of 35
The resulting mean differences from the overall weighted mean values, and their associated expanded uncertainties, are shown in Figure 26 (for a force of 50 kN) and Figure 27 (for a force of 100 kN). The weighted mean deviations from the pilot of 0.47 × 10⁻⁵ (at 50 kN) and 0.52 × 10⁻⁵ (at 100 kN) have relative expanded uncertainties of 0.66 × 10⁻⁵ (at 50 kN) and 0.82 × 10⁻⁵ (at 100 kN).
Figure 26. Differences from the weighted mean value together with associated expanded uncertainties at 50 kN
Figure 27. Differences from the weighted mean value together with associated expanded uncertainties at 100 kN
-1.0E-04
-5.0E-05
0.0E+00
5.0E-05
1.0E-04
1 2 3 4 5 6 7 8 9 10 11 12 13 14
Relative Difference
Laboratory Code Number
50 kN Results
-1.0E-04
-5.0E-05
0.0E+00
5.0E-05
1.0E-04
1 2 3 4 5 6 7 8 9 10 11 12 13 14
Relative Difference
Laboratory Code Number
100 kN Results

CCM.F-K2.a/b Final Report - 19.03.2012 Page 32 of 35
Appendix – Key Comparison Reference Values If, for both the 50 kN and 100 kN force levels, the KCRV is taken as the weighted mean deviation from the pilot value, the degree of equivalence for each laboratory is expressed as (1) the deviation from the KCRV and (2) the uncertainty of this deviation – and this uncertainty is calculated as the sum in quadrature of the uncertainty associated with the deviation from the pilot value and the uncertainty of the KCRV, with the resulting values being given in Table 18. Figures for the calibrations in which the deviation exceeds the expanded uncertainty are shown in bold. Figure 28 illustrates these results in a graphical format and demonstrates that, in the 100 kN exercise, while most laboratories exhibit similar relative deviations at both 50 kN and 100 kN, there is a significant difference between the relative deviations at the two forces in Labs 9 and 13 – this may be worthy of further investigation (although, for Lab 13, it is apparent from Figure 15 that this difference results only from the measurements made with TrD). The degree of equivalence between a given pair of laboratories is expressed as the difference between their respective deviations from the KCRV and the uncertainty of this difference – this uncertainty is calculated as the sum in quadrature of the uncertainties associated with these two deviations, and the resulting values are given in Tables 19 and 20 for force levels of 50 kN and 100 kN respectively. Again, results in which the magnitude of the difference exceeds its expanded uncertainty are shown in bold. These results suggest that the values obtained at Labs 7, 9 (at 50 kN only), 11 (also only at 50 kN), and 12 may be statistically significantly different from the values obtained at the other laboratories.

CCM.F-K2.a/b Final Report - 19.03.2012 Page 33 of 35
50 kN 100 kN
Laboratory Deviation from KCRV
Expanded Uncertainty of Deviation
Deviation from KCRV
Expanded Uncertainty of Deviation
1 -0.5 1.6 -0.5 1.7
2 1.1 60.0
3 -0.7 1.8
4 -1.7 2.0
5 0.8 2.4 1.4 2.7
6 0.8 2.4 0.2 2.3
7 -4.5 2.5 -4.0 2.6
8 -1.1 2.6 -1.4 2.6
9 7.9 5.2 3.6 5.2
10 4.0 5.4 4.7 5.5
11 2.4 2.0 2.1 2.1
12 3.6 2.7 3.2 2.7
13 -2.8 4.3 1.1 3.1
14 -0.0 5.2 -0.2 5.2
Table 18. Degrees of equivalence of individual laboratories, all relative figures × 10-5
Figure 28. Deviations from KCRV with associated expanded uncertainties
-1.0E-04
-5.0E-05
0.0E+00
5.0E-05
1.0E-04
1 2 3 4 5 6 7 8 9 10 11 12 13 14
Relative deviation
from KCRV
Laboratory
50 kN
100 kN

CCM.F-K2.a/b Final Report - 19.03.2012 Page 34 of 35
1 2 3 4 5 6 7 8 9 10 11 12 13 14
1 1.5 -0.2 -1.2 1.3 1.2 -4.1 -0.7 8.4 4.5 2.9 4.1 -2.3 0.4
U 60.1 2.5 2.5 2.9 2.9 3.0 3.1 5.5 5.7 2.6 3.2 4.6 5.5
2 -1.5 -1.8 -2.7 -0.3 -0.3 -5.6 -2.2 6.9 2.9 1.3 2.5 -3.9 -1.1
U 60.1 60.1 60.1 60.1 60.1 60.1 60.1 60.3 60.3 60.1 60.1 60.2 60.3
3 0.2 1.8 -0.9 1.5 1.5 -3.8 -0.4 8.7 4.7 3.1 4.3 -2.1 0.7
U 2.5 60.1 2.7 3.0 3.1 3.1 3.2 5.5 5.7 2.7 3.3 4.7 5.5
4 1.2 2.7 0.9 2.5 2.4 -2.9 0.5 9.6 5.7 4.1 5.3 -1.1 1.6
U 2.5 60.1 2.7 3.1 3.1 3.2 3.2 5.6 5.8 2.8 3.3 4.7 5.6
5 -1.3 0.3 -1.5 -2.5 -0.1 -5.3 -2.0 7.1 3.2 1.6 2.8 -3.6 -0.8
U 2.9 60.1 3.0 3.1 3.4 3.5 3.5 5.7 5.9 3.1 3.6 4.9 5.7
6 -1.2 0.3 -1.5 -2.4 0.1 -5.3 -1.9 7.2 3.2 1.6 2.8 -3.5 -0.8
U 2.9 60.1 3.1 3.1 3.4 3.5 3.5 5.8 6.0 3.2 3.7 4.9 5.7
7 4.1 5.6 3.8 2.9 5.3 5.3 3.4 12.5 8.5 6.9 8.1 1.7 4.5
U 3.0 60.1 3.1 3.2 3.5 3.5 3.6 5.8 6.0 3.2 3.7 5.0 5.8
8 0.7 2.2 0.4 -0.5 2.0 1.9 -3.4 9.1 5.1 3.5 4.7 -1.6 1.1
U 3.1 60.1 3.2 3.2 3.5 3.5 3.6 5.8 6.0 3.3 3.8 5.0 5.8
9 -8.4 -6.9 -8.7 -9.6 -7.1 -7.2 -12.5 -9.1 -4.0 -5.6 -4.3 -10.7 -8.0
U 5.5 60.3 5.5 5.6 5.7 5.8 5.8 5.8 7.5 5.6 5.9 6.8 7.4
10 -4.5 -2.9 -4.7 -5.7 -3.2 -3.2 -8.5 -5.1 4.0 -1.6 -0.4 -6.8 -4.0
U 5.7 60.3 5.7 5.8 5.9 6.0 6.0 6.0 7.5 5.8 6.1 6.9 7.5
11 -2.9 -1.3 -3.1 -4.1 -1.6 -1.6 -6.9 -3.5 5.6 1.6 1.2 -5.2 -2.4
U 2.6 60.1 2.7 2.8 3.1 3.2 3.2 3.3 5.6 5.8 3.4 4.8 5.6
12 -4.1 -2.5 -4.3 -5.3 -2.8 -2.8 -8.1 -4.7 4.3 0.4 -1.2 -6.4 -3.6
U 3.2 60.1 3.3 3.3 3.6 3.7 3.7 3.8 5.9 6.1 3.4 5.1 5.9
13 2.3 3.9 2.1 1.1 3.6 3.5 -1.7 1.6 10.7 6.8 5.2 6.4 2.7
U 4.6 60.2 4.7 4.7 4.9 4.9 5.0 5.0 6.8 6.9 4.8 5.1 6.8
14 -0.4 1.1 -0.7 -1.6 0.8 0.8 -4.5 -1.1 8.0 4.0 2.4 3.6 -2.7
U 5.5 60.3 5.5 5.6 5.7 5.7 5.8 5.8 7.4 7.5 5.6 5.9 6.8
Table 19. Degrees of equivalence between laboratories at 50 kN
( = difference in deviations from KCRV, U = expanded uncertainty of difference),
all relative figures × 10-5

CCM.F-K2.a/b Final Report - 19.03.2012 Page 35 of 35
1 5 6 7 8 9 10 11 12 13 14
1
1.9 0.7 -3.5 -0.9 4.1 5.3 2.6 3.7 1.7 0.4
U 3.2 2.9 3.1 3.1 5.5 5.7 2.7 3.2 3.6 5.5
5 -1.9
-1.2 -5.4 -2.7 2.2 3.4 0.7 1.9 -0.2 -1.5
U 3.2 3.6 3.8 3.7 5.9 6.1 3.4 3.8 4.2 5.9
6 -0.7 1.2
-4.2 -1.6 3.4 4.6 1.9 3.0 1.0 -0.3
U 2.9 3.6 3.5 3.5 5.7 6.0 3.1 3.5 3.9 5.7
7 3.5 5.4 4.2
2.6 7.6 8.7 6.1 7.2 5.1 3.8
U 3.1 3.8 3.5 3.7 5.8 6.1 3.3 3.7 4.1 5.8
8 0.9 2.7 1.6 -2.6
5.0 6.1 3.4 4.6 2.5 1.2
U 3.1 3.7 3.5 3.7 5.8 6.1 3.3 3.7 4.1 5.8
9 -4.1 -2.2 -3.4 -7.6 -5.0
1.2 -1.5 -0.4 -2.4 -3.7
U 5.5 5.9 5.7 5.8 5.8 7.6 5.6 5.9 6.1 7.4
10 -5.3 -3.4 -4.6 -8.7 -6.1 -1.2
-2.7 -1.5 -3.6 -4.9
U 5.7 6.1 6.0 6.1 6.1 7.6 5.9 6.1 6.3 7.6
11 -2.6 -0.7 -1.9 -6.1 -3.4 1.5 2.7
1.2 -0.9 -2.2
U 2.7 3.4 3.1 3.3 3.3 5.6 5.9 3.4 3.8 5.6
12 -3.7 -1.9 -3.0 -7.2 -4.6 0.4 1.5 -1.2
-2.1 -3.4
U 3.2 3.8 3.5 3.7 3.7 5.9 6.1 3.4 4.1 5.8
13 -1.7 0.2 -1.0 -5.1 -2.5 2.4 3.6 0.9 2.1
-1.3
U 3.6 4.2 3.9 4.1 4.1 6.1 6.3 3.8 4.1 6.1
14 -0.4 1.5 0.3 -3.8 -1.2 3.7 4.9 2.2 3.4 1.3
U 5.5 5.9 5.7 5.8 5.8 7.4 7.6 5.6 5.8 6.1
Table 20. Degrees of equivalence between laboratories at 100 kN
( = difference in deviations from KCRV, U = expanded uncertainty of difference),
all relative figures × 10-5