50 mathematics - SelfStudys
60
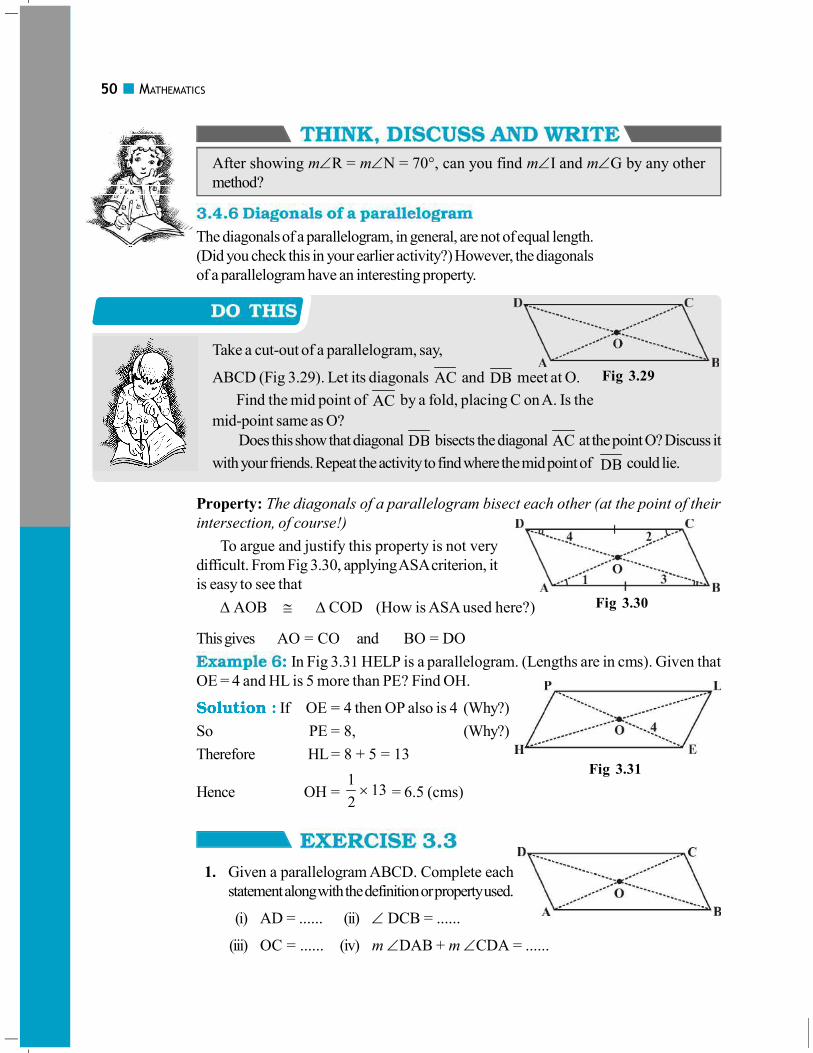
50 MATHEMATICS After showing mR = mN = 70°, can you find mI and mG by any other method? The diagonals of a parallelogram, in general, are not of equal length. (Did you check this in your earlier activity?) However, the diagonals of a parallelogram have an interesting property. Take a cut-out of a parallelogram, say, ABCD (Fig 3.29). Let its diagonals AC and DB meet at O. Find the mid point of AC by a fold, placing C on A. Is the mid-point same as O? Does this show that diagonal DB bisects the diagonal AC at the point O? Discuss it with your friends. Repeat the activity to find where the mid point of DB could lie. Property: The diagonals of a parallelogram bisect each other (at the point of their intersection, of course!) To argue and justify this property is not very difficult. From Fig 3.30, applying ASA criterion, it is easy to see that AOB COD (How is ASA used here?) This gives AO = CO and BO = DO In Fig 3.31 HELP is a parallelogram. (Lengths are in cms). Given that OE = 4 and HL is 5 more than PE? Find OH. If OE = 4 then OP also is 4 (Why?) So PE = 8, (Why?) Therefore HL = 8 + 5 = 13 Hence OH = 1 13 2 = 6.5 (cms) 1. Given a parallelogram ABCD. Complete each statement along with the definition or property used. (i) AD = ...... (ii) DCB = ...... (iii) OC = ...... (iv) m DAB + m CDA = ...... Fig 3.31 Fig 3.29 Fig 3.30
-
Upload
khangminh22 -
Category
Documents
-
view
0 -
download
0
Transcript of 50 mathematics - SelfStudys
50 MATHEMATICS
After showing m�R = m�N = 70°, can you find m�I and m�G by any other
method?
The diagonals of a parallelogram, in general, are not of equal length.
(Did you check this in your earlier activity?) However, the diagonals
of a parallelogram have an interesting property.
Take a cut-out of a parallelogram, say,
ABCD (Fig 3.29). Let its diagonals AC and DB meet at O.
Find the mid point of AC by a fold, placing C on A. Is the
mid-point same as O?
Does this show that diagonal DB bisects the diagonal AC at the point O? Discuss it
with your friends. Repeat the activity to find where the mid point of DB could lie.
Property: The diagonals of a parallelogram bisect each other (at the point of their
intersection, of course!)
To argue and justify this property is not very
difficult. From Fig 3.30, applying ASA criterion, it
is easy to see that
� AOB � � COD (How is ASA used here?)
This gives AO = CO and BO = DO
In Fig 3.31 HELP is a parallelogram. (Lengths are in cms). Given that
OE = 4 and HL is 5 more than PE? Find OH.
If OE = 4 then OP also is 4 (Why?)
So PE = 8, (Why?)
Therefore HL = 8 + 5 = 13
Hence OH =1
132� = 6.5 (cms)
1. Given a parallelogram ABCD. Complete each
statement along with the definition or property used.
(i) AD = ...... (ii) ��DCB = ......
(iii) OC = ...... (iv) m �DAB + m �CDA = ......
Fig 3.31
Fig 3.29
Fig 3.30

UNDERSTANDING QUADRILATERALS 51
2. Consider the following parallelograms. Find the values of the unknowns x, y, z.
(i) (ii)
(iii) (iv) (v)
3. Can a quadrilateral ABCD be a parallelogram if
(i) �D + �B = 180°? (ii) AB = DC = 8 cm, AD = 4 cm and BC = 4.4 cm?
(iii) �A = 70° and �C = 65°?
4. Draw a rough figure of a quadrilateral that is not a parallelogram but has exactly two opposite angles
of equal measure.
5. The measures of two adjacent angles of a parallelogram are in the ratio 3 : 2. Find the measure of each
of the angles of the parallelogram.
6. Two adjacent angles of a parallelogram have equal measure. Find the
measure of each of the angles of the parallelogram.
7. The adjacent figure HOPE is a parallelogram. Find the angle measures
x, y and z. State the properties you use to find them.
8. The following figures GUNS and RUNS are parallelograms.
Find x and y. (Lengths are in cm)
9.
In the above figure both RISK and CLUE are parallelograms. Find the value of x.
(i) (ii)
52 MATHEMATICS
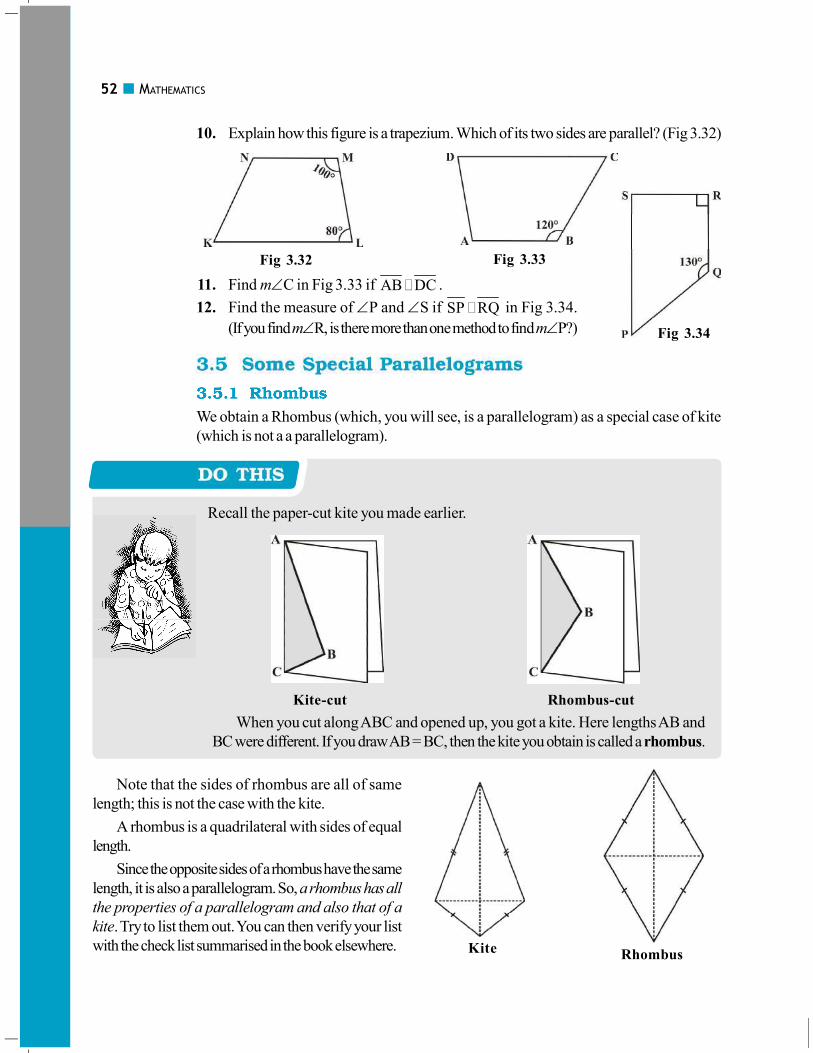
10. Explain how this figure is a trapezium. Which of its two sides are parallel? (Fig 3.32)
11. Find m�C in Fig 3.33 if AB DC� .
12. Find the measure of �P and �S if SP RQ� in Fig 3.34.
(If you find m�R, is there more than one method to find m�P?)
We obtain a Rhombus (which, you will see, is a parallelogram) as a special case of kite
(which is not a a parallelogram).
Recall the paper-cut kite you made earlier.
Kite-cut Rhombus-cut
When you cut along ABC and opened up, you got a kite. Here lengths AB and
BC were different. If you draw AB = BC, then the kite you obtain is called a rhombus.
Fig 3.33
Fig 3.34
Fig 3.32
Note that the sides of rhombus are all of same
length; this is not the case with the kite.
A rhombus is a quadrilateral with sides of equal
length.
Since the opposite sides of a rhombus have the same
length, it is also a parallelogram. So, a rhombus has all
the properties of a parallelogram and also that of a
kite. Try to list them out. You can then verify your list
with the check list summarised in the book elsewhere. Kite Rhombus

UNDERSTANDING QUADRILATERALS 53
The most useful property of a rhombus is that of its diagonals.
Property: The diagonals of a rhombus are perpendicular bisectors of one another.
Take a copy of rhombus. By paper-folding verify if the point of intersection is the
mid-point of each diagonal. You may also check if they intersect at right angles, using
the corner of a set-square.
Here is an outline justifying this property using logical steps.
ABCD is a rhombus (Fig 3.35). Therefore it is a parallelogram too.
Since diagonals bisect each other, OA = OC and OB = OD.
We have to show that m�AOD = m�COD = 90°
It can be seen that by SAS congruency criterion
� AOD � � COD
Therefore, m �AOD = m �COD
Since �AOD and �COD are a linear pair,
m �AOD = m �COD = 90°
RICE is a rhombus (Fig 3.36). Find x, y, z. Justify your findings.
x = OE y = OR z = side of the rhombus
= OI (diagonals bisect) = OC (diagonals bisect) = 13 (all sides are equal )
= 5 = 12
A rectangle is a parallelogram with equal angles (Fig 3.37).
What is the full meaning of this definition? Discuss with your friends.
If the rectangle is to be equiangular, what could be
the measure of each angle?
Let the measure of each angle be x°.
Then 4x° = 360° (Why)?
Therefore, x° = 90°
Thus each angle of a rectangle is a right angle.
So, a rectangle is a parallelogram in which every angle is a right angle.
Being a parallelogram, the rectangle has opposite sides of equal length and its diagonals
bisect each other.
Fig 3.35
Since AO = CO (Why?)
AD = CD (Why?)
OD = OD
Fig 3.36
Fig 3.37

54 MATHEMATICS
In a parallelogram, the diagonals can be of different lengths. (Check this); but surprisingly
the rectangle (being a special case) has diagonals of equal length.
Property: The diagonals of a rectangle are of equal length.
This is easy to justify. If ABCD is a rectangle (Fig 3.38), then looking at triangles
ABC and ABD separately [(Fig 3.39) and (Fig 3.40) respectively], we have
� ABC � � ABD
This is because AB = AB (Common)
BC = AD (Why?)
m �A = m �B = 90° (Why?)
The congruency follows by SAS criterion.
Thus AC = BD
and in a rectangle the diagonals, besides being equal in length bisect each other (Why?)
RENT is a rectangle (Fig 3.41). Its diagonals meet at O. Find x, if
OR = 2x + 4 and OT = 3x + 1.
OT is half of the diagonal TE ,
OR is half of the diagonal RN .
Diagonals are equal here. (Why?)
So, their halves are also equal.
Therefore 3x + 1 = 2x + 4
or x = 3
A square is a rectangle with equal sides.
This means a square has all the
properties of a rectangle with an additional
requirement that all the sides have equal
length.
The square, like the rectangle, has
diagonals of equal length.
In a rectangle, there is no requirement
for the diagonals to be perpendicular to
one another, (Check this).
Fig 3.40Fig 3.39Fig 3.38
Fig 3.41
BELT is a square, BE = EL = LT = TB�B, �E, �L, �T are right angles.
BL = ET and BL ET� .
OB = OL and OE = OT.
UNDERSTANDING QUADRILATERALS 55
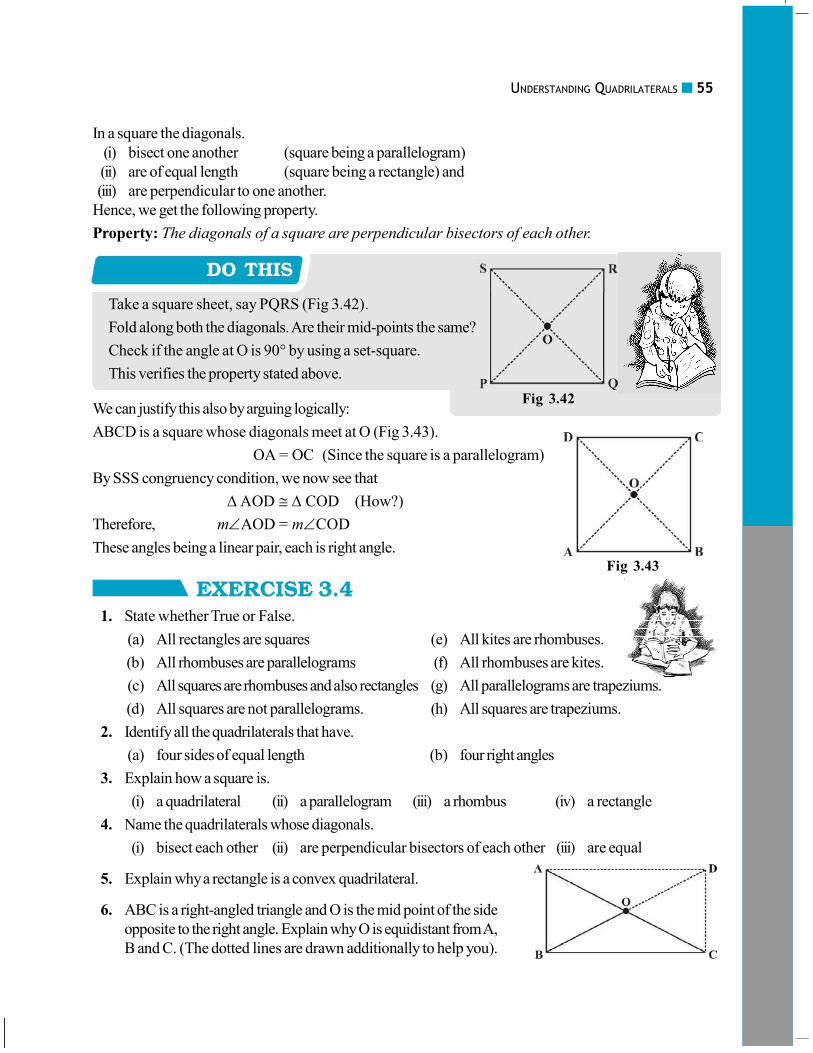
In a square the diagonals.
(i) bisect one another (square being a parallelogram)
(ii) are of equal length (square being a rectangle) and
(iii) are perpendicular to one another.
Hence, we get the following property.
Property: The diagonals of a square are perpendicular bisectors of each other.
Take a square sheet, say PQRS (Fig 3.42).
Fold along both the diagonals. Are their mid-points the same?
Check if the angle at O is 90° by using a set-square.
This verifies the property stated above.
We can justify this also by arguing logically:
ABCD is a square whose diagonals meet at O (Fig 3.43).
OA = OC (Since the square is a parallelogram)
By SSS congruency condition, we now see that
� AOD � � COD (How?)
Therefore, m�AOD = m�COD
These angles being a linear pair, each is right angle.
1. State whether True or False.
(a) All rectangles are squares (e) All kites are rhombuses.
(b) All rhombuses are parallelograms (f) All rhombuses are kites.
(c) All squares are rhombuses and also rectangles (g) All parallelograms are trapeziums.
(d) All squares are not parallelograms. (h) All squares are trapeziums.
2. Identify all the quadrilaterals that have.
(a) four sides of equal length (b) four right angles
3. Explain how a square is.
(i) a quadrilateral (ii) a parallelogram (iii) a rhombus (iv) a rectangle
4. Name the quadrilaterals whose diagonals.
(i) bisect each other (ii) are perpendicular bisectors of each other (iii) are equal
5. Explain why a rectangle is a convex quadrilateral.
6. ABC is a right-angled triangle and O is the mid point of the side
opposite to the right angle. Explain why O is equidistant from A,
B and C. (The dotted lines are drawn additionally to help you).
Fig 3.42
Fig 3.43
56 MATHEMATICS
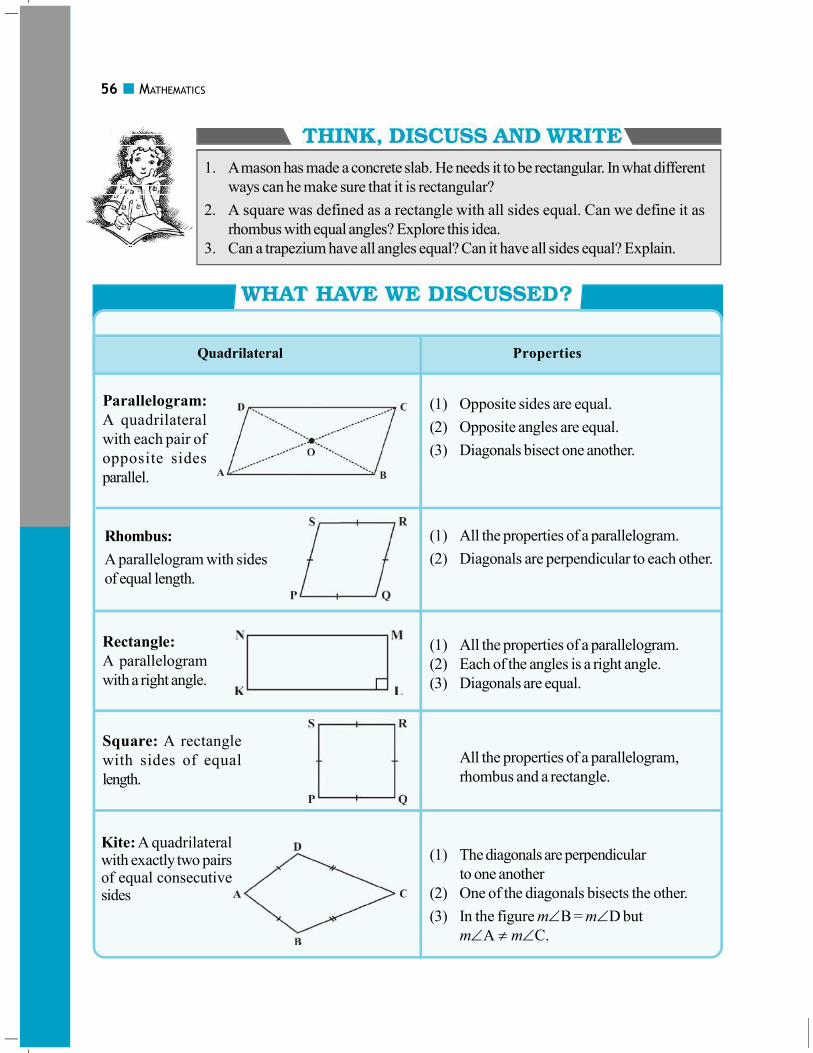
1. A mason has made a concrete slab. He needs it to be rectangular. In what different
ways can he make sure that it is rectangular?
2. A square was defined as a rectangle with all sides equal. Can we define it as
rhombus with equal angles? Explore this idea.
3. Can a trapezium have all angles equal? Can it have all sides equal? Explain.
Quadrilateral Properties
(1) Opposite sides are equal.
(2) Opposite angles are equal.
(3) Diagonals bisect one another.
(1) All the properties of a parallelogram.
(2) Diagonals are perpendicular to each other.
(1) All the properties of a parallelogram.
(2) Each of the angles is a right angle.
(3) Diagonals are equal.
All the properties of a parallelogram,
rhombus and a rectangle.
(1) The diagonals are perpendicular
to one another
(2) One of the diagonals bisects the other.
(3) In the figure m�B = m�D but
m�A � m�C.
Parallelogram:
A quadrilateral
with each pair of
opposite sides
parallel.
Rhombus:
A parallelogram with sides
of equal length.
Rectangle:
A parallelogram
with a right angle.
Square: A rectangle
with sides of equal
length.
Kite: A quadrilateralwith exactly two pairsof equal consecutivesides

PRACTICAL GEOMETRY 57
You have learnt how to draw triangles in Class VII. We require three measurements
(of sides and angles) to draw a unique triangle.
Since three measurements were enough to draw a triangle, a natural question arises
whether four measurements would be sufficient to draw a unique four sided closed figure,
namely, a quadrilateral.
Take a pair of sticks of equal lengths, say
10 cm. Take another pair of sticks of
equal lengths, say, 8 cm. Hinge them up
suitably to get a rectangle of length 10 cm
and breadth 8 cm.
This rectangle has been created with
the 4 available measurements.
Now just push along the breadth of
the rectangle. Is the new shape obtained,
still a rectangle (Fig 4.2)? Observe
that the rectangle has now become
a parallelogram. Have you altered the
lengths of the sticks? No! The
measurements of sides remain the same.
Give another push to the newly
obtained shape in a different direction;
what do you get? You again get a
parallelogram, which is altogether different
(Fig 4.3), yet the four measurements
remain the same.
This shows that 4 measurements of a quadrilateral cannot determine it uniquely.
Can 5 measurements determine a quadrilateral uniquely? Let us go back to the activity!
Practical Geometry
CHAPTER
Fig 4.1
Fig 4.2
Fig 4.3

58 MATHEMATICS
You have constructed a rectangle with
two sticks each of length 10 cm and other
two sticks each of length 8 cm. Now
introduce another stick of length equal to
BD and tie it along BD (Fig 4.4). If you
push the breadth now, does the shape
change? No! It cannot, without making the
figure open. The introduction of the fifth
stick has fixed the rectangle uniquely, i.e.,
there is no other quadrilateral (with the
given lengths of sides) possible now.
Thus, we observe that five measurements can determine a quadrilateral uniquely.
But will any five measurements (of sides and angles) be sufficient to draw a unique
quadrilateral?
Arshad has five measurements of a quadrilateral ABCD. These are AB = 5 cm,
�A = 50°, AC = 4 cm, BD = 5 cm and AD = 6 cm. Can he construct a unique
quadrilateral? Give reasons for your answer.
We shall learn how to construct a unique quadrilateral given the following
measurements:
� When four sides and one diagonal are given.
� When two diagonals and three sides are given.
� When two adjacent sides and three angles are given.
� When three sides and two included angles are given.
� When other special properties are known.
Let us take up these constructions one-by-one.
We shall explain this construction through an example.
Construct a quadrilateral PQRS
where PQ = 4 cm,QR = 6 cm, RS = 5 cm,
PS = 5.5 cm and PR = 7 cm.
[A rough sketch will help us in
visualising the quadrilateral. We draw this first and
mark the measurements.] (Fig 4.5)
Fig 4.4
Fig 4.5
PRACTICAL GEOMETRY 59
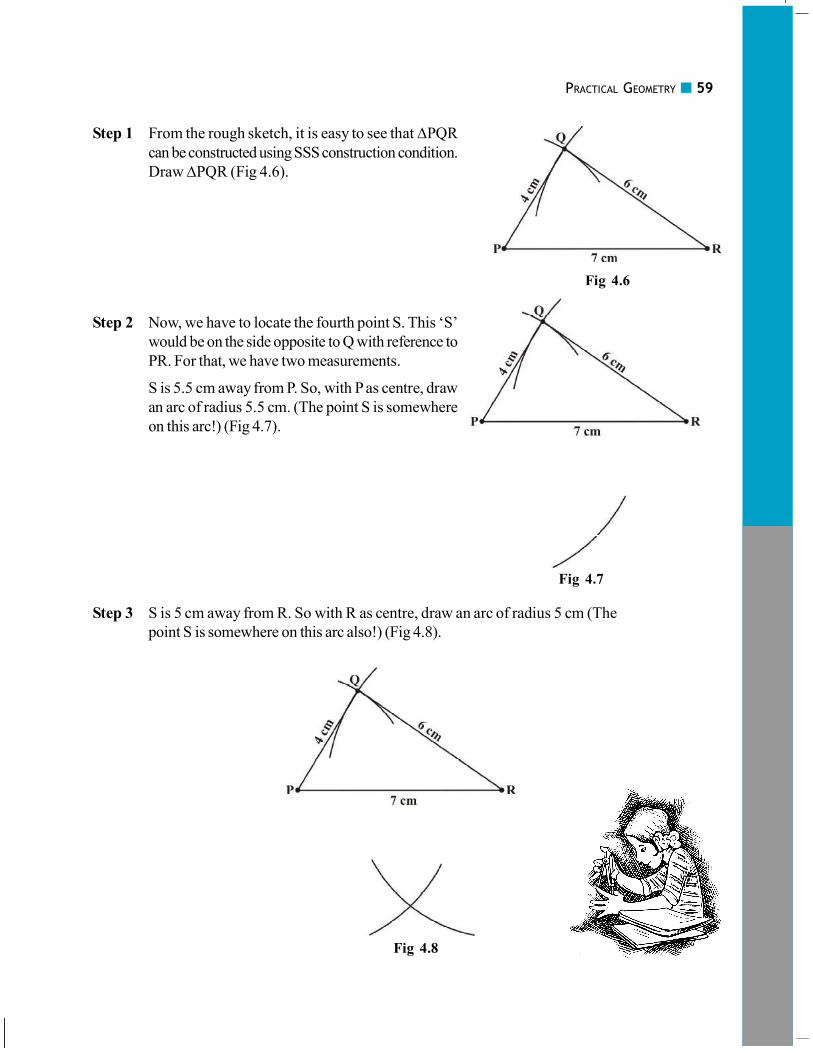
Step 1 From the rough sketch, it is easy to see that �PQR
can be constructed using SSS construction condition.
Draw �PQR (Fig 4.6).
Step 2 Now, we have to locate the fourth point S. This ‘S’
would be on the side opposite to Q with reference to
PR. For that, we have two measurements.
S is 5.5 cm away from P. So, with P as centre, draw
an arc of radius 5.5 cm. (The point S is somewhere
on this arc!) (Fig 4.7).
Step 3 S is 5 cm away from R. So with R as centre, draw an arc of radius 5 cm (The
point S is somewhere on this arc also!) (Fig 4.8).
Fig 4.6
Fig 4.7
Fig 4.8
60 MATHEMATICS
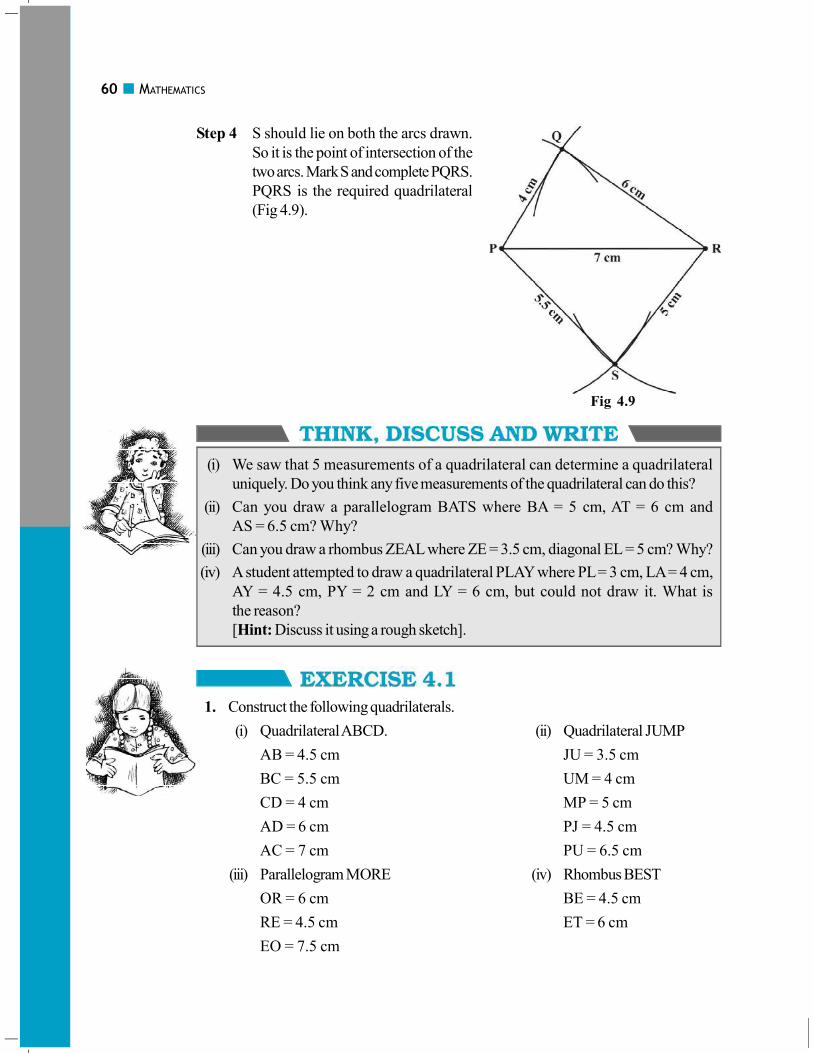
Step 4 S should lie on both the arcs drawn.
So it is the point of intersection of the
two arcs. Mark S and complete PQRS.
PQRS is the required quadrilateral
(Fig 4.9).
(i) We saw that 5 measurements of a quadrilateral can determine a quadrilateral
uniquely. Do you think any five measurements of the quadrilateral can do this?
(ii) Can you draw a parallelogram BATS where BA = 5 cm, AT = 6 cm and
AS = 6.5 cm? Why?
(iii) Can you draw a rhombus ZEAL where ZE = 3.5 cm, diagonal EL = 5 cm? Why?
(iv) A student attempted to draw a quadrilateral PLAY where PL = 3 cm, LA = 4 cm,
AY = 4.5 cm, PY = 2 cm and LY = 6 cm, but could not draw it. What is
the reason?
[Hint: Discuss it using a rough sketch].
1. Construct the following quadrilaterals.
(i) Quadrilateral ABCD. (ii) Quadrilateral JUMP
AB = 4.5 cm JU = 3.5 cm
BC = 5.5 cm UM = 4 cm
CD = 4 cm MP = 5 cm
AD = 6 cm PJ = 4.5 cm
AC = 7 cm PU = 6.5 cm
(iii) Parallelogram MORE (iv) Rhombus BEST
OR = 6 cm BE = 4.5 cm
RE = 4.5 cm ET = 6 cm
EO = 7.5 cm
Fig 4.9

PRACTICAL GEOMETRY 61
Fig 4.12
When four sides and a diagonal were given, we first drew a triangle with the available data
and then tried to locate the fourth point. The same technique is used here.
Construct a quadrilateral ABCD, given that BC = 4.5 cm, AD = 5.5 cm,
CD = 5 cm the diagonal AC = 5.5 cm and diagonal BD = 7 cm.
Here is the rough sketch of the quadrilateral ABCD
(Fig 4.10). Studying this sketch, we can easily see
that it is possible to draw � ACD first (How?).
Step 1 Draw � ACD using SSS
construction (Fig 4.11).
(We now need to find B at a distance
of 4.5 cm from C and 7 cm from D).
Step 2 With D as centre, draw an arc of radius 7 cm. (B is somewhere
on this arc) (Fig 4.12).
Step 3 With C as centre, draw an arc of
radius 4.5 cm (B is somewhere on
this arc also) (Fig 4.13).
Fig 4.13
Fig 4.11
Fig 4.10
62 MATHEMATICS
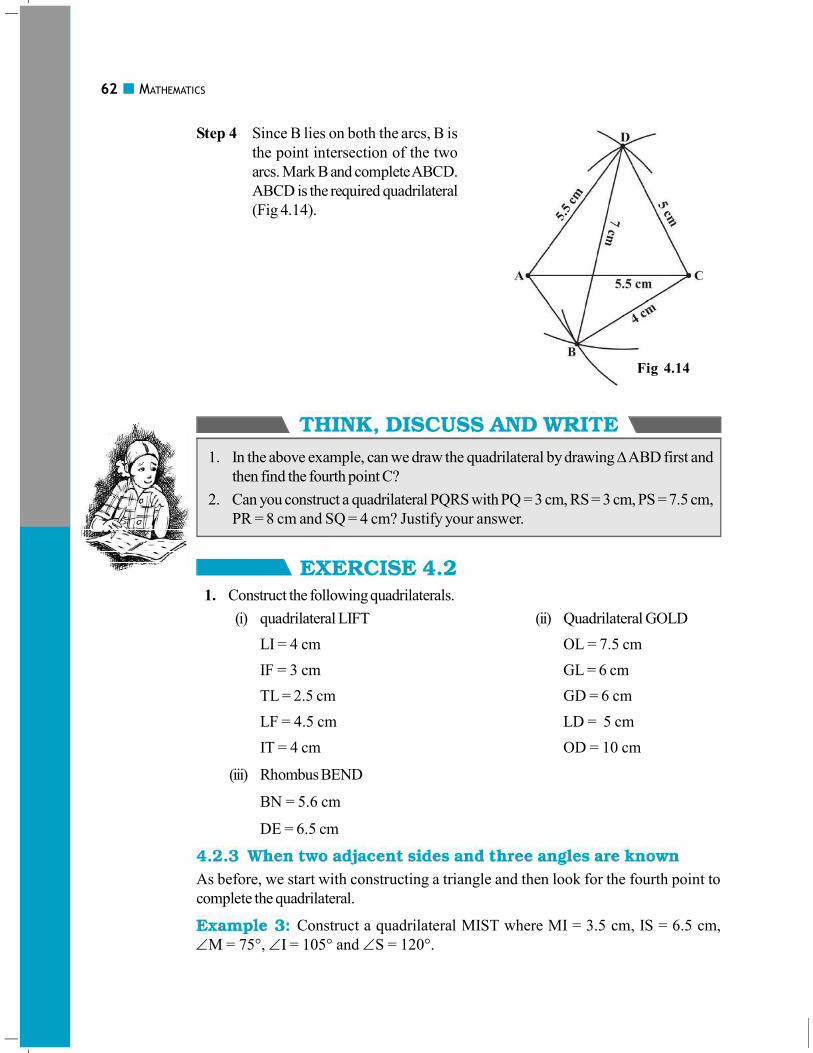
Step 4 Since B lies on both the arcs, B is
the point intersection of the two
arcs. Mark B and complete ABCD.
ABCD is the required quadrilateral
(Fig 4.14).
Fig 4.14
1. In the above example, can we draw the quadrilateral by drawing � ABD first and
then find the fourth point C?
2. Can you construct a quadrilateral PQRS with PQ = 3 cm, RS = 3 cm, PS = 7.5 cm,
PR = 8 cm and SQ = 4 cm? Justify your answer.
1. Construct the following quadrilaterals.
(i) quadrilateral LIFT (ii) Quadrilateral GOLD
LI = 4 cm OL = 7.5 cm
IF = 3 cm GL = 6 cm
TL = 2.5 cm GD = 6 cm
LF = 4.5 cm LD = 5 cm
IT = 4 cm OD = 10 cm
(iii) Rhombus BEND
BN = 5.6 cm
DE = 6.5 cm
As before, we start with constructing a triangle and then look for the fourth point to
complete the quadrilateral.
Construct a quadrilateral MIST where MI = 3.5 cm, IS = 6.5 cm,
�M = 75°, �I = 105° and �S = 120°.
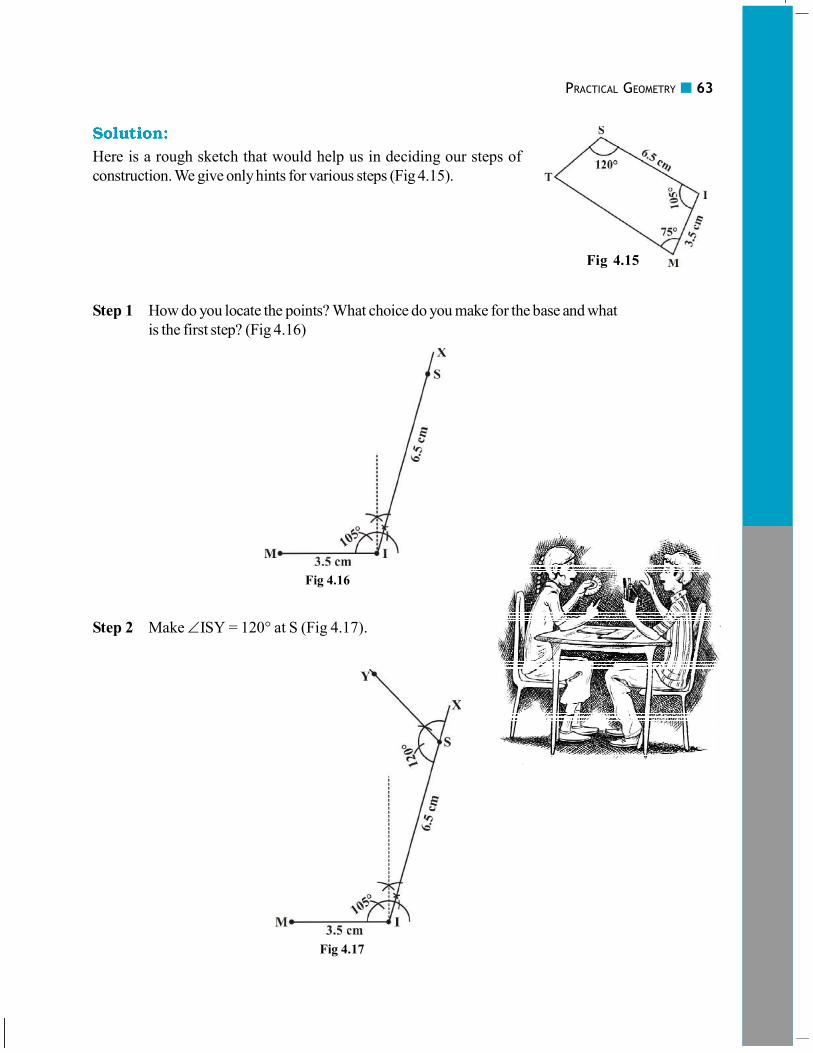
PRACTICAL GEOMETRY 63
Here is a rough sketch that would help us in deciding our steps of
construction. We give only hints for various steps (Fig 4.15).
Step 1 How do you locate the points? What choice do you make for the base and what
is the first step? (Fig 4.16)
Fig 4.16
Step 2 Make �ISY = 120° at S (Fig 4.17).
Fig 4.17
Fig 4.15
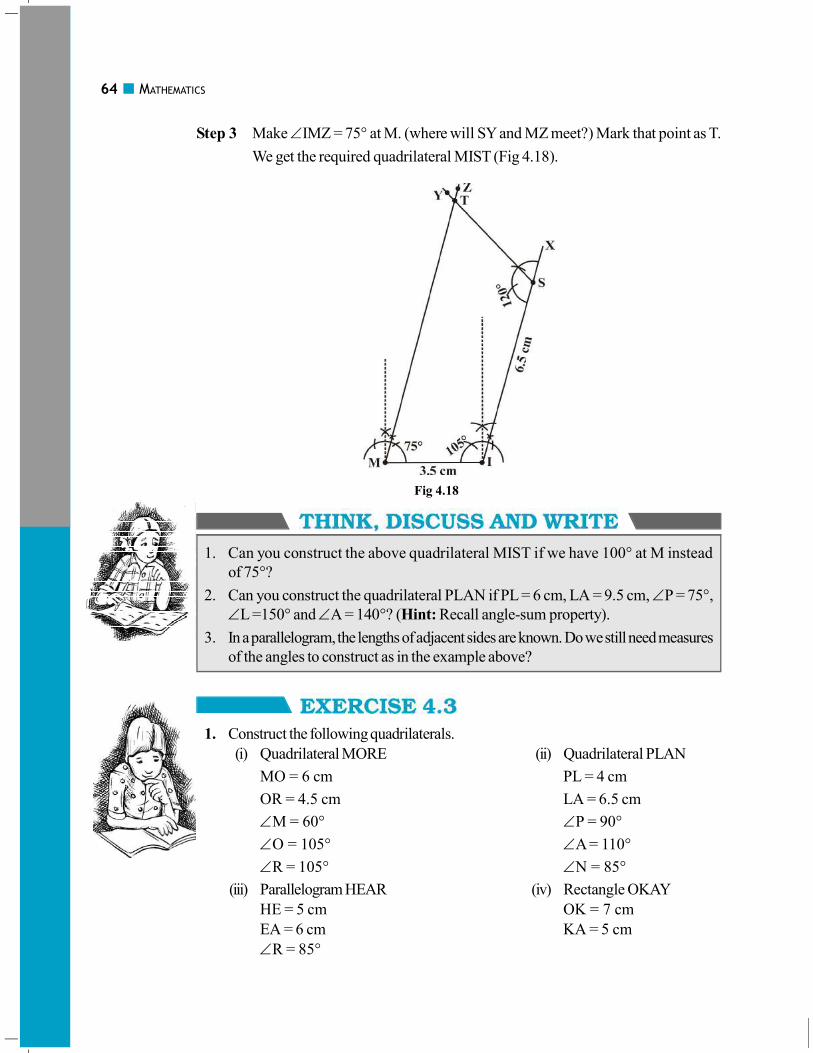
64 MATHEMATICS
Step 3 Make �IMZ = 75° at M. (where will SY and MZ meet?) Mark that point as T.
We get the required quadrilateral MIST (Fig 4.18).
Fig 4.18
1. Can you construct the above quadrilateral MIST if we have 100° at M instead
of 75°?
2. Can you construct the quadrilateral PLAN if PL = 6 cm, LA = 9.5 cm, �P = 75°,
�L =150° and �A = 140°? (Hint: Recall angle-sum property).
3. In a parallelogram, the lengths of adjacent sides are known. Do we still need measures
of the angles to construct as in the example above?
1. Construct the following quadrilaterals.
(i) Quadrilateral MORE (ii) Quadrilateral PLAN
MO = 6 cm PL = 4 cm
OR = 4.5 cm LA = 6.5 cm
�M = 60° �P = 90°
�O = 105° �A = 110°
�R = 105° �N = 85°
(iii) Parallelogram HEAR (iv) Rectangle OKAY
HE = 5 cm OK = 7 cm
EA = 6 cm KA = 5 cm
�R = 85°

PRACTICAL GEOMETRY 65
Under this type, when you draw a rough sketch, note carefully the “included” angles
in particular.
Construct a quadrilateral ABCD, where
AB = 4 cm, BC = 5 cm, CD = 6.5 cm and �B = 105° and
�C = 80°.
We draw a rough sketch, as usual, to get an idea of how we can
start off. Then we can devise a plan to locate the four points
(Fig 4.19). Fig 4.19
Fig 4.20
Step 2 The fourth point D is on CY which is inclined at 80° to BC. So make �BCY = 80°
at C on BC (Fig 4.21).
Step 1 Start with taking BC = 5 cm on B. Draw an angle of 105° along BX. Locate A
4 cm away on this. We now have B, C and A (Fig 4.20).
Fig 4.21
66 MATHEMATICS
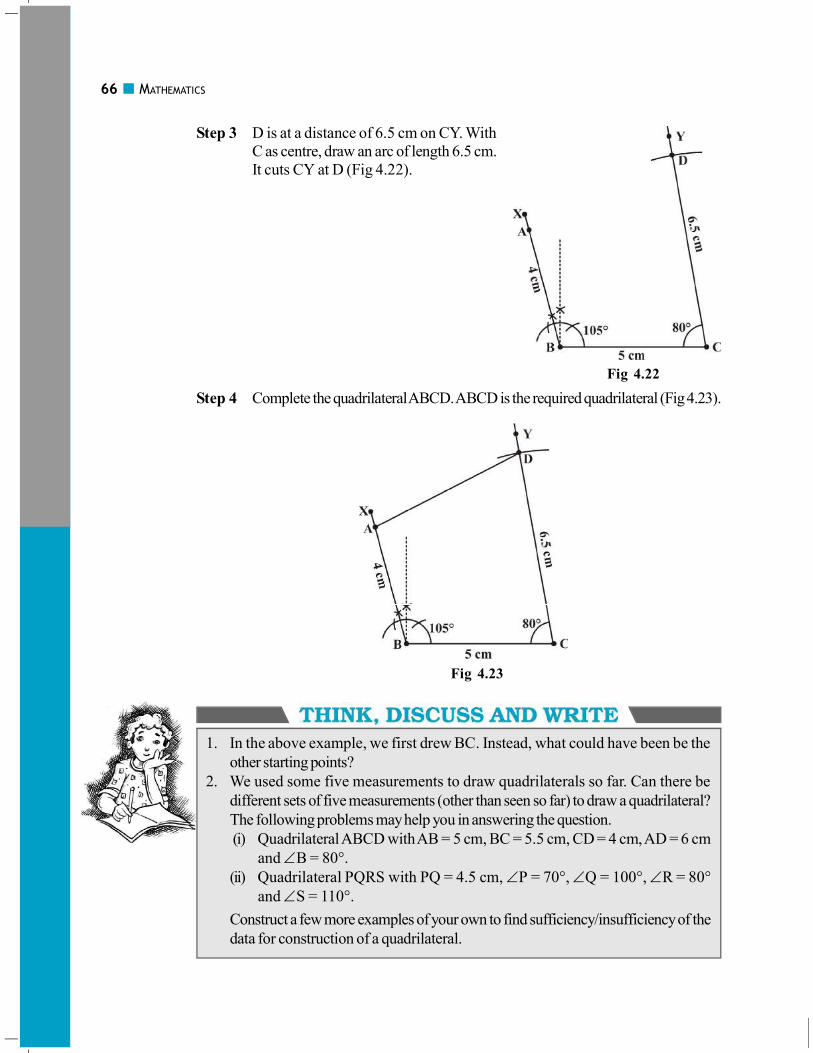
Step 3 D is at a distance of 6.5 cm on CY. With
C as centre, draw an arc of length 6.5 cm.
It cuts CY at D (Fig 4.22).
1. In the above example, we first drew BC. Instead, what could have been be the
other starting points?
2. We used some five measurements to draw quadrilaterals so far. Can there be
different sets of five measurements (other than seen so far) to draw a quadrilateral?
The following problems may help you in answering the question.
(i) Quadrilateral ABCD with AB = 5 cm, BC = 5.5 cm, CD = 4 cm, AD = 6 cm
and �B = 80°.
(ii) Quadrilateral PQRS with PQ = 4.5 cm, �P = 70°, �Q = 100°, �R = 80°
and �S = 110°.
Construct a few more examples of your own to find sufficiency/insufficiency of the
data for construction of a quadrilateral.
Fig 4.22
Step 4 Complete the quadrilateral ABCD. ABCD is the required quadrilateral (Fig 4.23).
Fig 4.23

PRACTICAL GEOMETRY 67
1. Construct the following quadrilaterals.
(i) Quadrilateral DEAR (ii) Quadrilateral TRUE
DE = 4 cm TR = 3.5 cm
EA = 5 cm RU = 3 cm
AR = 4.5 cm UE = 4 cm
�E = 60° �R = 75°
�A = 90° �U = 120°
To draw a quadrilateral, we used 5 measurements in our work. Is there any quadrilateral
which can be drawn with less number of available measurements? The following examples
examine such special cases.
Draw a square of side 4.5 cm.
Initially it appears that only one measurement has been given. Actually
we have many more details with us, because the figure is a special quadrilateral,
namely a square. We now know that each of its angles is a right angle. (See the
rough figure) (Fig 4.24)
This enables us to draw � ABC using SAS condition. Then D can be easily
located. Try yourself now to draw the square with the given measurements.
Is it possible to construct a rhombus ABCD where AC = 6 cm
and BD = 7 cm? Justify your answer.
Only two (diagonal) measurements of the rhombus are given. However,
since it is a rhombus, we can find more help from its properties.
The diagonals of a rhombus are perpendicular bisectors
of one another.
So, first draw AC = 7 cm and then construct its perpendicular bisector.
Let them meet at 0. Cut off 3 cm lengths on either side of the drawn
bisector. You now get B and D.
Draw the rhombus now, based on the method described above
(Fig 4.25).
1. How will you construct a rectangle PQRS if you know
only the lengths PQ and QR?
2. Construct the kite EASY if AY = 8 cm, EY = 4 cm
and SY = 6 cm (Fig 4.26). Which properties of the
kite did you use in the process?
Fig 4.24
Fig 4.25
Fig 4.26

68 MATHEMATICS
Draw the following.
1. The square READ with RE = 5.1 cm.
2. A rhombus whose diagonals are 5.2 cm and 6.4 cm long.
3. A rectangle with adjacent sides of lengths 5 cm and 4 cm.
4. A parallelogram OKAY where OK = 5.5 cm and KA = 4.2 cm. Is it unique?
1. Five measurements can determine a quadrilateral uniquely.
2. A quadrilateral can be constructed uniquely if the lengths of its four sides and a diagonal is given.
3. A quadrilateral can be constructed uniquely if its two diagonals and three sides are known.
4. A quadrilateral can be constructed uniquely if its two adjacent sides and three angles are known.
5. A quadrilateral can be constructed uniquely if its three sides and two included angles are given.

DATA HANDLING 69
In your day-to-day life, you might have come across information, such as:
(a) Runs made by a batsman in the last 10 test matches.
(b) Number of wickets taken by a bowler in the last 10 ODIs.
(c) Marks scored by the students of your class in the Mathematics unit test.
(d) Number of story books read by each of your friends etc.
The information collected in all such cases is called data. Data is usually collected in
the context of a situation that we want to study. For example, a teacher may like to know
the average height of students in her class. To find this, she will write the heights of all the
students in her class, organise the data in a systematic manner and then interpret it
accordingly.
Sometimes, data is represented graphically to give a clear idea of what it represents.
Do you remember the different types of graphs which we have learnt in earlier classes?
1. A Pictograph: Pictorial representation of data using symbols.
Data Handling
CHAPTER
= 100 cars � One symbol stands for 100 cars
July = 250 denotes 1
2 of 100
August = 300
September = ?
(i) How many cars were produced in the month of July?
(ii) In which month were maximum number of cars produced?
70 MATHEMATICS
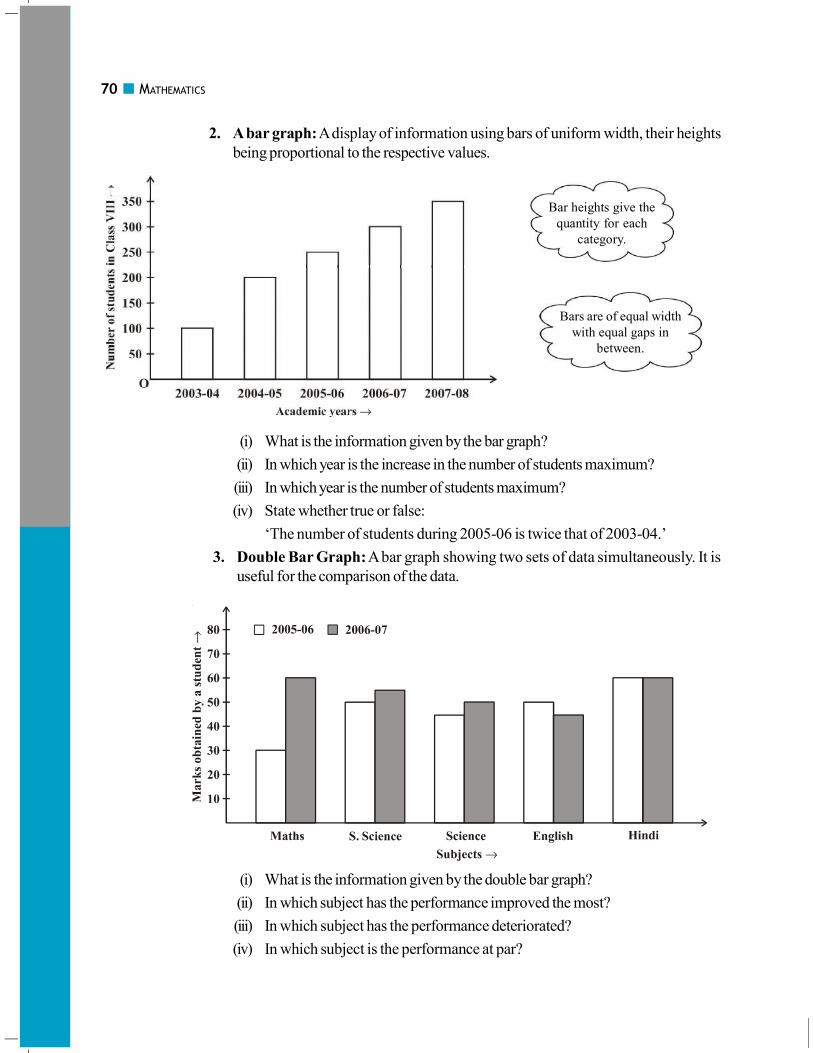
2. A bar graph: A display of information using bars of uniform width, their heights
being proportional to the respective values.
Bar heights give the
quantity for each
category.
Bars are of equal width
with equal gaps in
between.
(i) What is the information given by the bar graph?
(ii) In which year is the increase in the number of students maximum?
(iii) In which year is the number of students maximum?
(iv) State whether true or false:
‘The number of students during 2005-06 is twice that of 2003-04.’
3. Double Bar Graph: A bar graph showing two sets of data simultaneously. It is
useful for the comparison of the data.
(i) What is the information given by the double bar graph?
(ii) In which subject has the performance improved the most?
(iii) In which subject has the performance deteriorated?
(iv) In which subject is the performance at par?

DATA HANDLING 71
If we change the position of any of the bars of a bar graph, would it change the
information being conveyed? Why?
1. Month July August September October November December
Number of 1000 1500 1500 2000 2500 1500watches sold
2. Children who prefer School A School B School C
Walking 40 55 15
Cycling 45 25 35
3. Percentage wins in ODI by 8 top cricket teams.
Teams From Champions Last 10
Trophy to World Cup-06 ODI in 07
South Africa 75% 78%
Australia 61% 40%
Sri Lanka 54% 38%
New Zealand 47% 50%
England 46% 50%
Pakistan 45% 44%
West Indies 44% 30%
India 43% 56%
Draw an appropriate graph to represent the given information.
Usually, data available to us is in an unorganised form called raw data. To draw meaningful
inferences, we need to organise the data systematically. For example, a group of students
was asked for their favourite subject. The results were as listed below:
Art, Mathematics, Science, English, Mathematics, Art, English, Mathematics, English,
Art, Science, Art, Science, Science, Mathematics, Art, English, Art, Science, Mathematics,
Science, Art.
Which is the most liked subject and the one least liked?
72 MATHEMATICS
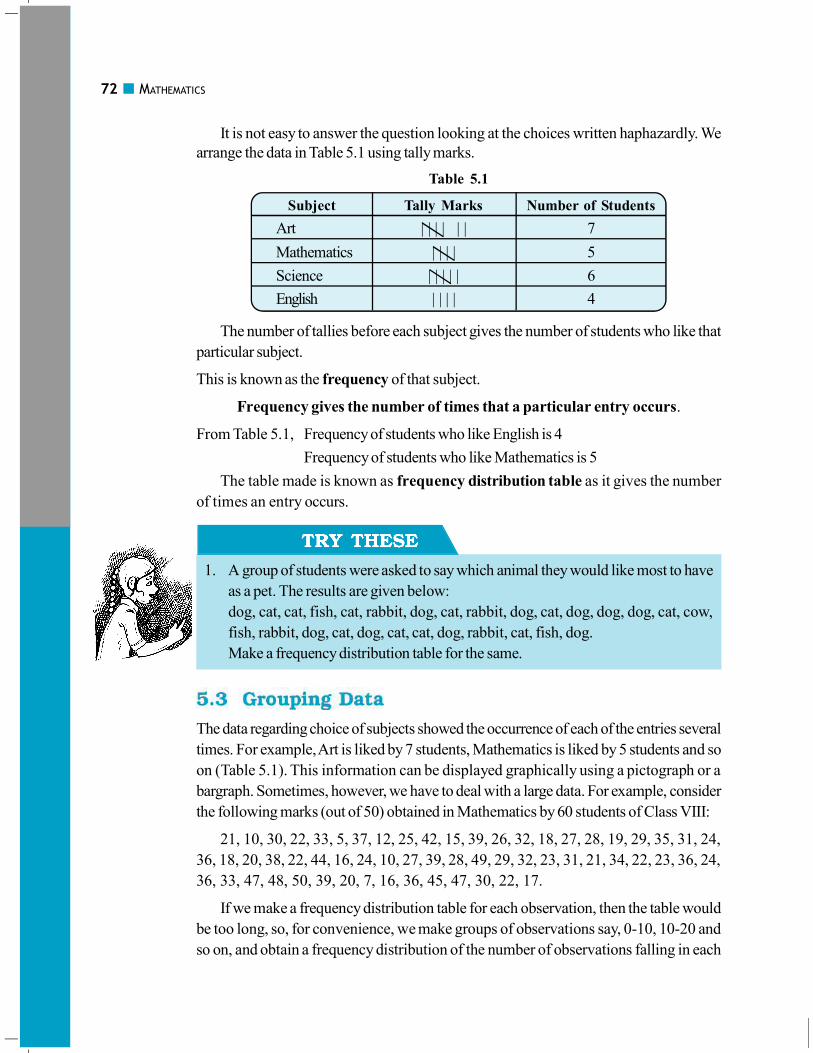
It is not easy to answer the question looking at the choices written haphazardly. We
arrange the data in Table 5.1 using tally marks.
Table 5.1
Subject Tally Marks Number of Students
Art | | | | | | 7
Mathematics | | | | 5
Science | | | | | 6
English | | | | 4
The number of tallies before each subject gives the number of students who like that
particular subject.
This is known as the frequency of that subject.
Frequency gives the number of times that a particular entry occurs.
From Table 5.1, Frequency of students who like English is 4
Frequency of students who like Mathematics is 5
The table made is known as frequency distribution table as it gives the number
of times an entry occurs.
1. A group of students were asked to say which animal they would like most to have
as a pet. The results are given below:
dog, cat, cat, fish, cat, rabbit, dog, cat, rabbit, dog, cat, dog, dog, dog, cat, cow,
fish, rabbit, dog, cat, dog, cat, cat, dog, rabbit, cat, fish, dog.
Make a frequency distribution table for the same.
The data regarding choice of subjects showed the occurrence of each of the entries several
times. For example, Art is liked by 7 students, Mathematics is liked by 5 students and so
on (Table 5.1). This information can be displayed graphically using a pictograph or a
bargraph. Sometimes, however, we have to deal with a large data. For example, consider
the following marks (out of 50) obtained in Mathematics by 60 students of Class VIII:
21, 10, 30, 22, 33, 5, 37, 12, 25, 42, 15, 39, 26, 32, 18, 27, 28, 19, 29, 35, 31, 24,
36, 18, 20, 38, 22, 44, 16, 24, 10, 27, 39, 28, 49, 29, 32, 23, 31, 21, 34, 22, 23, 36, 24,
36, 33, 47, 48, 50, 39, 20, 7, 16, 36, 45, 47, 30, 22, 17.
If we make a frequency distribution table for each observation, then the table would
be too long, so, for convenience, we make groups of observations say, 0-10, 10-20 and
so on, and obtain a frequency distribution of the number of observations falling in each
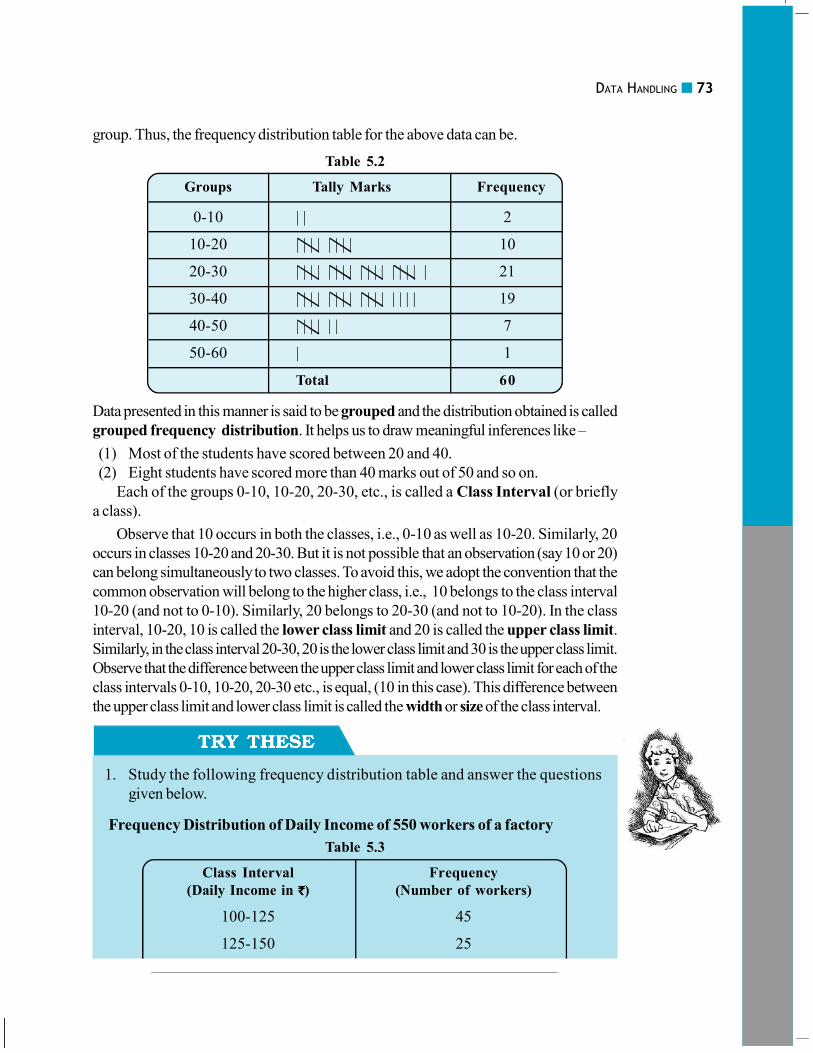
DATA HANDLING 73
group. Thus, the frequency distribution table for the above data can be.
Table 5.2
Groups Tally Marks Frequency
0-10 | | 2
10-20 | | | | | | | | 10
20-30 | | | | | | | | | | | | | | | | | 21
30-40 | | | | | | | | | | | | | | | | 19
40-50 | | | | | | 7
50-60 | 1
Total 60
Data presented in this manner is said to be grouped and the distribution obtained is called
grouped frequency distribution. It helps us to draw meaningful inferences like –
(1) Most of the students have scored between 20 and 40.
(2) Eight students have scored more than 40 marks out of 50 and so on.
Each of the groups 0-10, 10-20, 20-30, etc., is called a Class Interval (or briefly
a class).
Observe that 10 occurs in both the classes, i.e., 0-10 as well as 10-20. Similarly, 20
occurs in classes 10-20 and 20-30. But it is not possible that an observation (say 10 or 20)
can belong simultaneously to two classes. To avoid this, we adopt the convention that the
common observation will belong to the higher class, i.e., 10 belongs to the class interval
10-20 (and not to 0-10). Similarly, 20 belongs to 20-30 (and not to 10-20). In the class
interval, 10-20, 10 is called the lower class limit and 20 is called the upper class limit.
Similarly, in the class interval 20-30, 20 is the lower class limit and 30 is the upper class limit.
Observe that the difference between the upper class limit and lower class limit for each of the
class intervals 0-10, 10-20, 20-30 etc., is equal, (10 in this case). This difference between
the upper class limit and lower class limit is called the width or size of the class interval.
1. Study the following frequency distribution table and answer the questions
given below.
Frequency Distribution of Daily Income of 550 workers of a factory
Table 5.3
Class Interval Frequency
(Daily Income in `̀̀̀) (Number of workers)
100-125 45
125-150 25
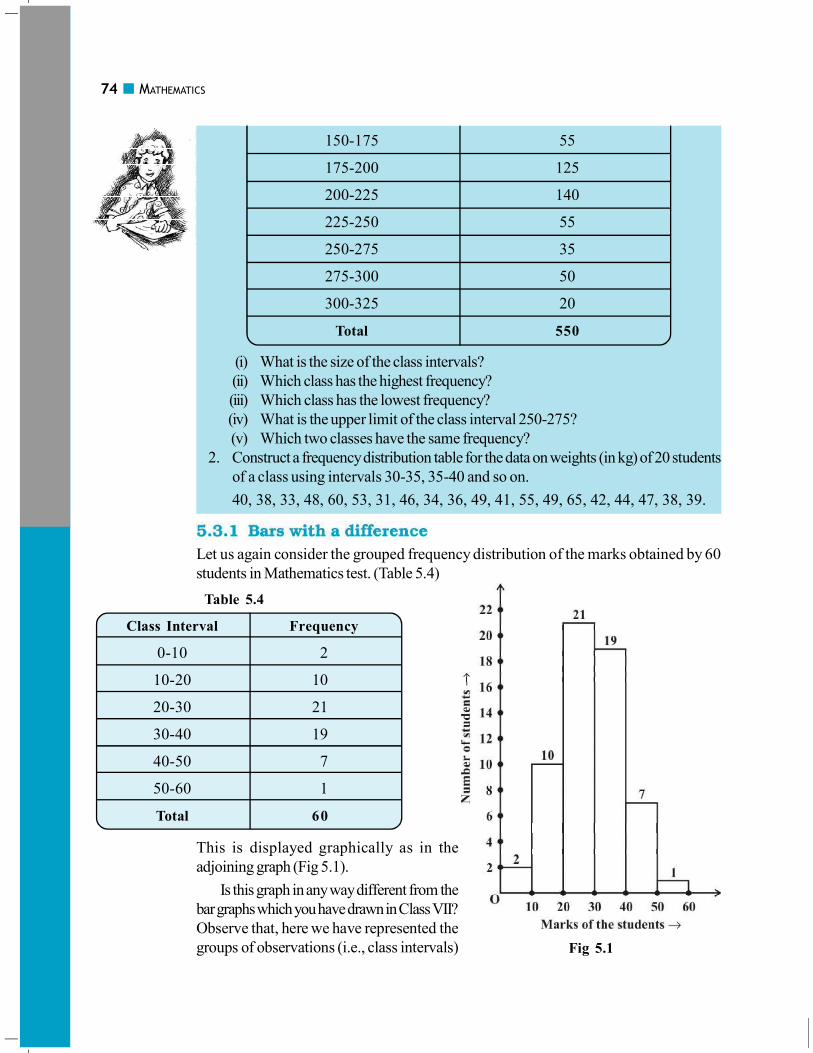
74 MATHEMATICS
150-175 55
175-200 125
200-225 140
225-250 55
250-275 35
275-300 50
300-325 20
Total 550
(i) What is the size of the class intervals?
(ii) Which class has the highest frequency?
(iii) Which class has the lowest frequency?
(iv) What is the upper limit of the class interval 250-275?
(v) Which two classes have the same frequency?
2. Construct a frequency distribution table for the data on weights (in kg) of 20 students
of a class using intervals 30-35, 35-40 and so on.
40, 38, 33, 48, 60, 53, 31, 46, 34, 36, 49, 41, 55, 49, 65, 42, 44, 47, 38, 39.
Let us again consider the grouped frequency distribution of the marks obtained by 60
students in Mathematics test. (Table 5.4)
Table 5.4
Class Interval Frequency
0-10 2
10-20 10
20-30 21
30-40 19
40-50 7
50-60 1
Total 60
This is displayed graphically as in the
adjoining graph (Fig 5.1).
Is this graph in any way different from the
bar graphs which you have drawn in Class VII?
Observe that, here we have represented the
groups of observations (i.e., class intervals) Fig 5.1
DATA HANDLING 75
on the horizontal axis. The height of the bars show the frequency of the class-interval.
Also, there is no gap between the bars as there is no gap between the class-intervals.
The graphical representation of data in this manner is called a histogram.
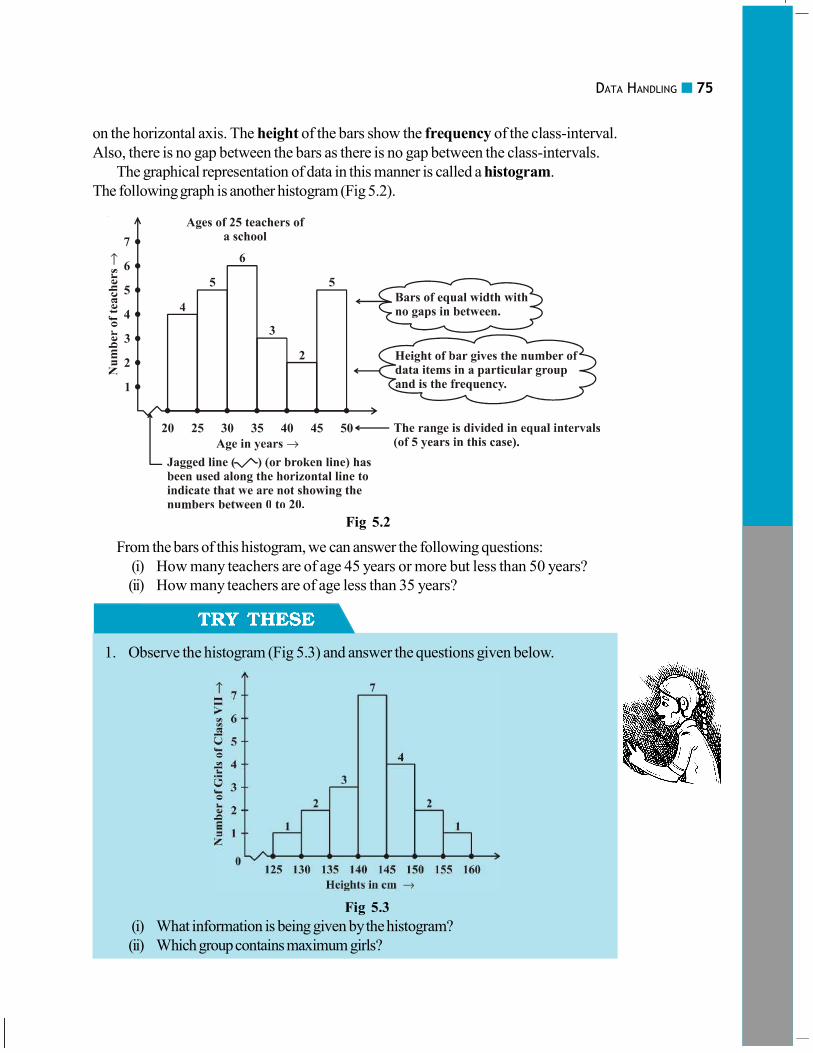
The following graph is another histogram (Fig 5.2).
From the bars of this histogram, we can answer the following questions:
(i) How many teachers are of age 45 years or more but less than 50 years?
(ii) How many teachers are of age less than 35 years?
1. Observe the histogram (Fig 5.3) and answer the questions given below.
Fig 5.3
(i) What information is being given by the histogram?
(ii) Which group contains maximum girls?
Fig 5.2

76 MATHEMATICS
(iii) How many girls have a height of 145 cms and more?
(iv) If we divide the girls into the following three categories, how many would
there be in each?
150 cm and more — Group A
140 cm to less than 150 cm — Group B
Less than 140 cm — Group C
1. For which of these would you use a histogram to show the data?
(a) The number of letters for different areas in a postman’s bag.
(b) The height of competitors in an athletics meet.
(c) The number of cassettes produced by 5 companies.
(d) The number of passengers boarding trains from 7:00 a.m. to 7:00 p.m. at a
station.
Give reasons for each.
2. The shoppers who come to a departmental store are marked as: man (M), woman
(W), boy (B) or girl (G). The following list gives the shoppers who came during the
first hour in the morning:
W W W G B W W M G G M M W W W W G B M W B G G M W W M M W W
W M W B W G M W W W W G W M M W W M W G W M G W M M B G G W
Make a frequency distribution table using tally marks. Draw a bar graph to illustrate it.
3. The weekly wages (in ̀ ) of 30 workers in a factory are.
830, 835, 890, 810, 835, 836, 869, 845, 898, 890, 820, 860, 832, 833, 855, 845,
804, 808, 812, 840, 885, 835, 835, 836, 878, 840, 868, 890, 806, 840
Using tally marks make a frequency table with intervals as 800–810, 810–820 and
so on.
4. Draw a histogram for the frequency table made for the data in Question 3, and
answer the following questions.
(i) Which group has the maximum number of workers?
(ii) How many workers earn ̀ 850 and more?
(iii) How many workers earn less than ̀ 850?
5. The number of hours for which students of a particular class watched television during
holidays is shown through the given graph.
Answer the following.
(i) For how many hours did the maximum number of students watch TV?
(ii) How many students watched TV for less than 4 hours?

DATA HANDLING 77
(iii) How many students spent more than 5 hours in watching TV?
Have you ever come across data represented in circular form as shown (Fig 5.4)?
The time spent by a child during a day Age groups of people in a town
(i) (ii)
These are called circle graphs. A circle graph shows the relationship between a
whole and its parts. Here, the whole circle is divided into sectors. The size of each sector
is proportional to the activity or information it represents.
For example, in the above graph, the proportion of the sector for hours spent in sleeping
= number of sleeping hours
whole day =
8 hours 1
24 hours 3�
So, this sector is drawn as 1
rd3
part of the circle. Similarly, the proportion of the sector
for hours spent in school = number of school hours
whole day =
6 hours 1
24 hours 4�
Fig 5.4
78 MATHEMATICS
So this sector is drawn 1
th4
of the circle. Similarly, the size of other sectors can be found.
Add up the fractions for all the activities. Do you get the total as one?
A circle graph is also called a pie chart.
Fig 5.5
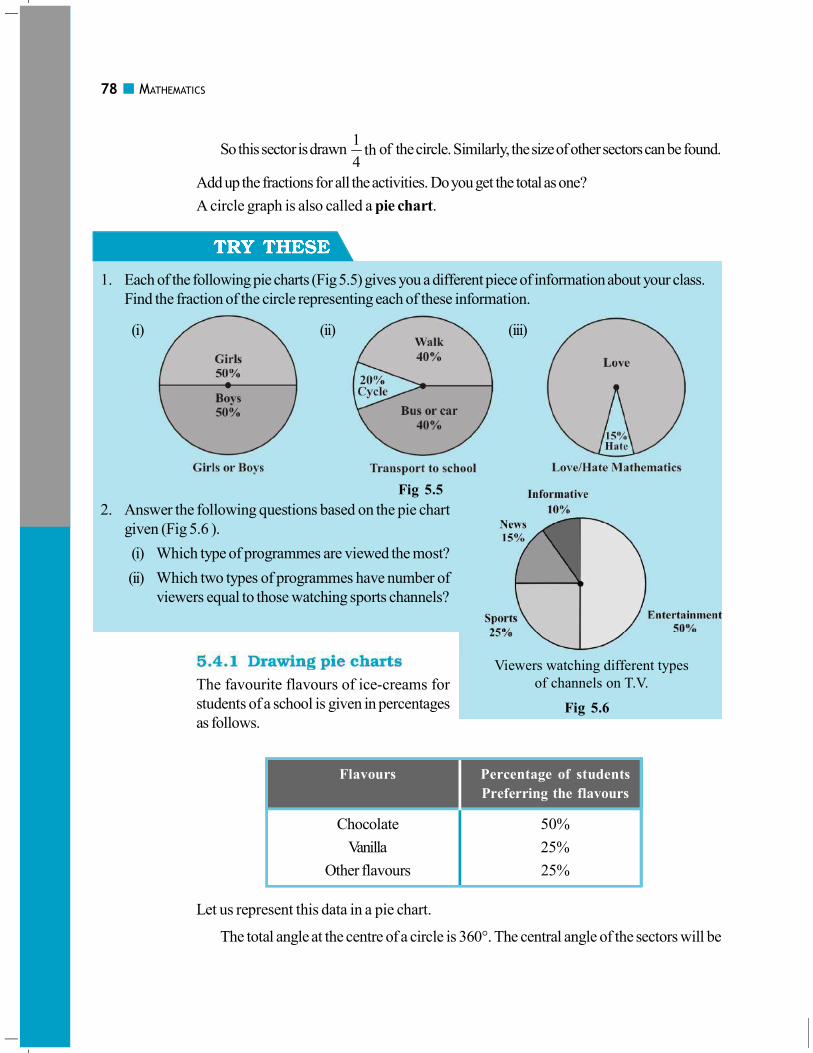
1. Each of the following pie charts (Fig 5.5) gives you a different piece of information about your class.
Find the fraction of the circle representing each of these information.
(i) (ii) (iii)
2. Answer the following questions based on the pie chart
given (Fig 5.6 ).
(i) Which type of programmes are viewed the most?
(ii) Which two types of programmes have number of
viewers equal to those watching sports channels?
Viewers watching different types
of channels on T.V.The favourite flavours of ice-creams for
students of a school is given in percentages
as follows.
Flavours Percentage of students
Preferring the flavours
Chocolate 50%
Vanilla 25%
Other flavours 25%
Let us represent this data in a pie chart.
The total angle at the centre of a circle is 360°. The central angle of the sectors will be
Fig 5.6

DATA HANDLING 79
a fraction of 360°. We make a table to find the central angle of the sectors (Table 5.5).
Table 5.5
Flavours Students in per cent In fractions Fraction of 360°
preferring the flavours
Chocolate 50%50 1
100 2�
1
2 of 360° = 180°
Vanilla 25%25 1
100 4�
1
4 of 360° = 90°
Other flavours 25%25 1
100 4�
1
4 of 360° = 90°
Fig 5.7
1. Draw a circle with any convenient radius.
Mark its centre (O) and a radius (OA).
2. The angle of the sector for chocolate is 180°.
Use the protractor to draw �AOB = 180°.
3. Continue marking the remaining sectors.
Adjoining pie chart (Fig 5.7) gives the expenditure (in percentage)
on various items and savings of a family during a month.
(i) On which item, the expenditure was maximum?
(ii) Expenditure on which item is equal to the total
savings of the family?
(iii) If the monthly savings of the family is ̀ 3000, what
is the monthly expenditure on clothes?
(i) Expenditure is maximum on food.
(ii) Expenditure on Education of children is the same
(i.e., 15%) as the savings of the family.

80 MATHEMATICS
(iii) 15% represents ̀ 3000
Therefore, 10% represents `3000
1015
� = ̀ 2000
On a particular day, the sales (in rupees) of different items of a baker’s
shop are given below.
ordinary bread : 320
fruit bread : 80
cakes and pastries : 160 Draw a pie chart for this data.
biscuits : 120
others : 40
Total : 720
We find the central angle of each sector. Here the total sale = ` 720. We
thus have this table.
Item Sales (in `̀̀̀) In Fraction Central Angle
Ordinary Bread 320320 4
720 9�
4360 160
9� � � �
Biscuits 120120 1
720 6�
1360 60
6� � � �
Cakes and pastries 160160 2
720 9�
2360 80
9� � � �
Fruit Bread 8080 1
720 9�
1360 40
9� � � �
Others 4040 1
720 18�
1360 20
18� � � �
Now, we make the pie chart (Fig 5.8):
Fig 5.8

DATA HANDLING 81
Draw a pie chart of the data given below.
The time spent by a child during a day.
Sleep — 8 hours
School — 6 hours
Home work — 4 hours
Play — 4 hours
Others — 2 hours
Which form of graph would be appropriate to display the following data.
1. Production of food grains of a state.
Year 2001 2002 2003 2004 2005 2006
Production 60 50 70 55 80 85
(in lakh tons)
2. Choice of food for a group of people.
Favourite food Number of people
North Indian 30
South Indian 40
Chinese 25
Others 25
Total 120
3. The daily income of a group of a factory workers.
Daily Income Number of workers
(in Rupees) (in a factory)
75-100 45
100-125 35
125-150 55
150-175 30
175-200 50
200-225 125
225-250 140
Total 480
82 MATHEMATICS
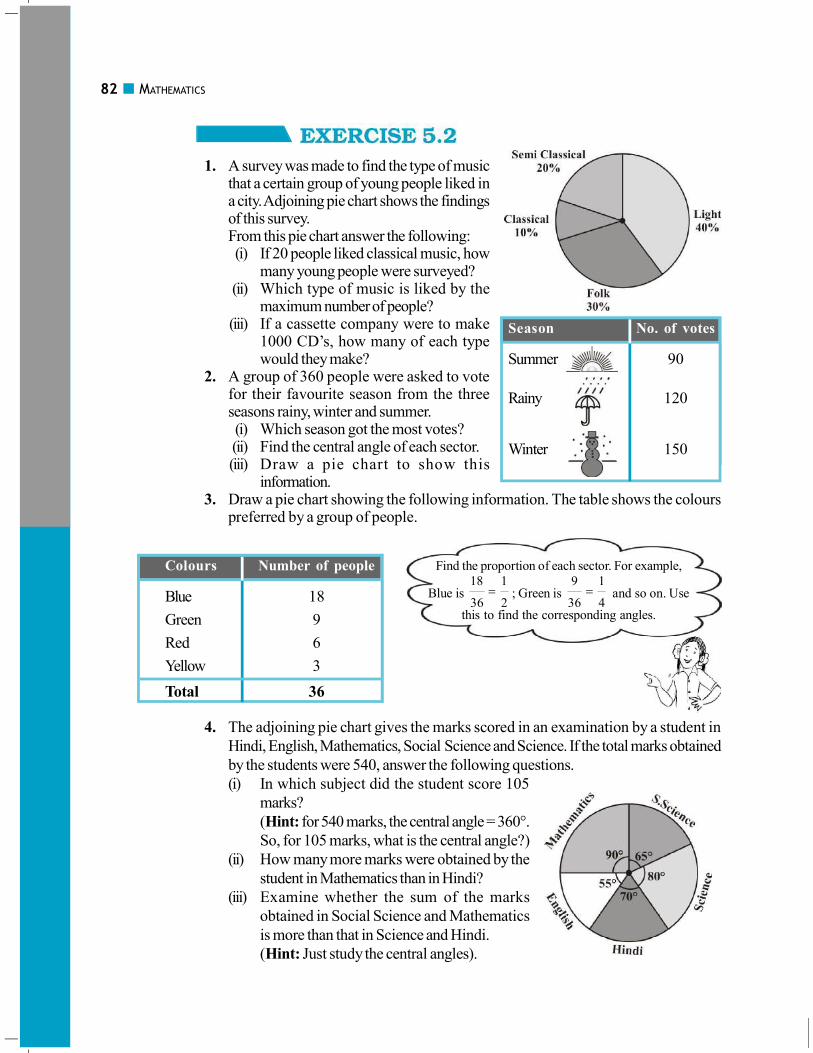
1. A survey was made to find the type of musicthat a certain group of young people liked ina city. Adjoining pie chart shows the findingsof this survey.From this pie chart answer the following:(i) If 20 people liked classical music, how
many young people were surveyed?(ii) Which type of music is liked by the
maximum number of people?(iii) If a cassette company were to make
1000 CD’s, how many of each typewould they make?
2. A group of 360 people were asked to votefor their favourite season from the threeseasons rainy, winter and summer.(i) Which season got the most votes?(ii) Find the central angle of each sector.(iii) Draw a pie chart to show this
information.3. Draw a pie chart showing the following information. The table shows the colours
preferred by a group of people.
Colours Number of people
Blue 18
Green 9
Red 6
Yellow 3
Total 36
4. The adjoining pie chart gives the marks scored in an examination by a student in
Hindi, English, Mathematics, Social Science and Science. If the total marks obtained
by the students were 540, answer the following questions.
(i) In which subject did the student score 105
marks?
(Hint: for 540 marks, the central angle = 360°.
So, for 105 marks, what is the central angle?)
(ii) How many more marks were obtained by the
student in Mathematics than in Hindi?
(iii) Examine whether the sum of the marks
obtained in Social Science and Mathematics
is more than that in Science and Hindi.
(Hint: Just study the central angles).
Find the proportion of each sector. For example,
Blue is 18 1
36 2� ; Green is
9 1
36 4� and so on. Use
this to find the corresponding angles.
Season No. of votes
Summer 90
Rainy 120
Winter 150
DATA HANDLING 83
5. The number of students in a hostel, speaking different languages is given below.
Display the data in a pie chart.
Language Hindi English Marathi Tamil Bengali Total
Number 40 12 9 7 4 72
of students
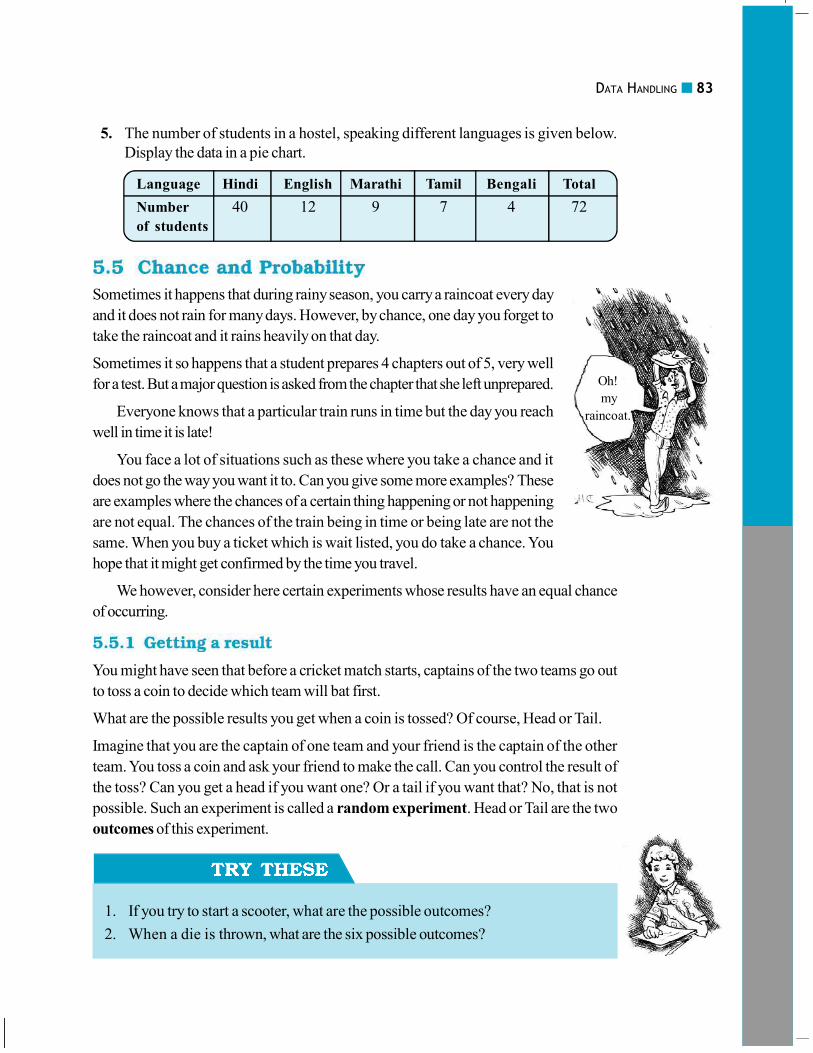
Sometimes it happens that during rainy season, you carry a raincoat every day
and it does not rain for many days. However, by chance, one day you forget to
take the raincoat and it rains heavily on that day.
Sometimes it so happens that a student prepares 4 chapters out of 5, very well
for a test. But a major question is asked from the chapter that she left unprepared.
Everyone knows that a particular train runs in time but the day you reach
well in time it is late!
You face a lot of situations such as these where you take a chance and it
does not go the way you want it to. Can you give some more examples? These
are examples where the chances of a certain thing happening or not happening
are not equal. The chances of the train being in time or being late are not the
same. When you buy a ticket which is wait listed, you do take a chance. You
hope that it might get confirmed by the time you travel.
We however, consider here certain experiments whose results have an equal chance
of occurring.
You might have seen that before a cricket match starts, captains of the two teams go out
to toss a coin to decide which team will bat first.
What are the possible results you get when a coin is tossed? Of course, Head or Tail.
Imagine that you are the captain of one team and your friend is the captain of the other
team. You toss a coin and ask your friend to make the call. Can you control the result of
the toss? Can you get a head if you want one? Or a tail if you want that? No, that is not
possible. Such an experiment is called a random experiment. Head or Tail are the two
outcomes of this experiment.
1. If you try to start a scooter, what are the possible outcomes?
2. When a die is thrown, what are the six possible outcomes?
Oh!
my
raincoat.
84 MATHEMATICS
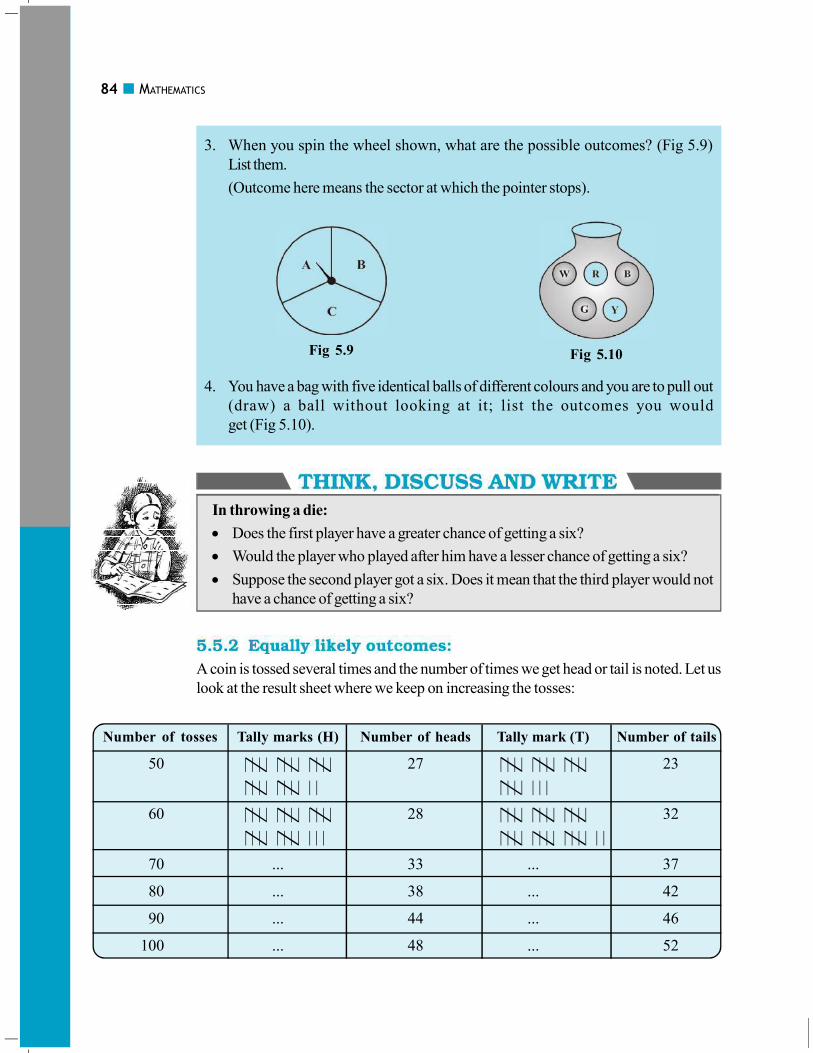
3. When you spin the wheel shown, what are the possible outcomes? (Fig 5.9)
List them.
(Outcome here means the sector at which the pointer stops).
4. You have a bag with five identical balls of different colours and you are to pull out
(draw) a ball without looking at it; list the outcomes you would
get (Fig 5.10).
In throwing a die:
� Does the first player have a greater chance of getting a six?
� Would the player who played after him have a lesser chance of getting a six?
� Suppose the second player got a six. Does it mean that the third player would not
have a chance of getting a six?
A coin is tossed several times and the number of times we get head or tail is noted. Let us
look at the result sheet where we keep on increasing the tosses:
Fig 5.10Fig 5.9
Number of tosses Tally marks (H) Number of heads Tally mark (T) Number of tails
50 | | | | | | | | | | | | 27 | | | | | | | | | | | | 23
| | | | | | | | | | | | | | | | |
60 | | | | | | | | | | | | 28 | | | | | | | | | | | | 32
| | | | | | | | | | | | | | | | | | | | | | | | |
70 ... 33 ... 37
80 ... 38 ... 42
90 ... 44 ... 46
100 ... 48 ... 52
DATA HANDLING 85
Observe that as you increase the number of tosses more and more, the number of
heads and the number of tails come closer and closer to each other.
This could also be done with a die, when tossed a large number of times. Number of
each of the six outcomes become almost equal to each other.
In such cases, we may say that the different outcomes of the experiment are equally
likely. This means that each of the outcomes has the same chance of occurring.
Consider the experiment of tossing a coin once. What are the outcomes? There are only
two outcomes – Head or Tail. Both the outcomes are equally likely. Likelihood of getting
a head is one out of two outcomes, i.e., 1
2. In other words, we say that the probability of
getting a head = 1
2. What is the probability of getting a tail?
Now take the example of throwing a die marked with 1, 2, 3, 4, 5, 6 on its faces (one
number on one face). If you throw it once, what are the outcomes?
The outcomes are: 1, 2, 3, 4, 5, 6. Thus, there are six equally likely outcomes.
What is the probability of getting the outcome ‘2’?
It is
What is the probability of getting the number 5? What is the probability of getting the
number 7? What is the probability of getting a number 1 through 6?
Each outcome of an experiment or a collection of outcomes make an event.
For example in the experiment of tossing a coin, getting a Head is an event and getting a
Tail is also an event.
In case of throwing a die, getting each of the outcomes 1, 2, 3, 4, 5 or 6 is an event.
� Number of outcomes giving 2
� Number of equally likely outcomes.
1
6

86 MATHEMATICS
Is getting an even number an event? Since an even number could be 2, 4 or 6, getting an
even number is also an event. What will be the probability of getting an even number?
It is
A bag has 4 red balls and 2 yellow balls. (The balls are identical in all
respects other than colour). A ball is drawn from the bag without looking into the bag.
What is probability of getting a red ball? Is it more or less than getting a yellow ball?
There are in all (4 + 2 =) 6 outcomes of the event. Getting a red ball
consists of 4 outcomes. (Why?)
Therefore, the probability of getting a red ball is 4
6=
2
3. In the same way the probability
of getting a yellow ball = 2 1
6 3� (Why?). Therefore, the probability of getting a red ball is
more than that of getting a yellow ball.
Suppose you spin the wheel
1. (i) List the number of outcomes of getting a green sector
and not getting a green sector on this wheel
(Fig 5.11).
(ii) Find the probability of getting a green sector.
(iii) Find the probability of not getting a green sector.
We talked about the chance that it rains just on the day when we do not carry a rain coat.
What could you say about the chance in terms of probability? Could it be one in 10
days during a rainy season? The probability that it rains is then 1
10. The probability that it
does not rain = 9
10. (Assuming raining or not raining on a day are equally likely)
The use of probability is made in various cases in real life.
1. To find characteristics of a large group by using a small
part of the group.
For example, during elections ‘an exit poll’ is taken.
This involves asking the people whom they have voted
for, when they come out after voting at the centres
which are chosen off hand and distributed over the
whole area. This gives an idea of chance of winning of
each candidate and predictions are made based on it
accordingly.
� Number of outcomes that make the event
� Total number of outcomes of the experiment.
3
6
Fig 5.11
DATA HANDLING 87
2. Metrological Department predicts weather by observing trends from the data over
many years in the past.
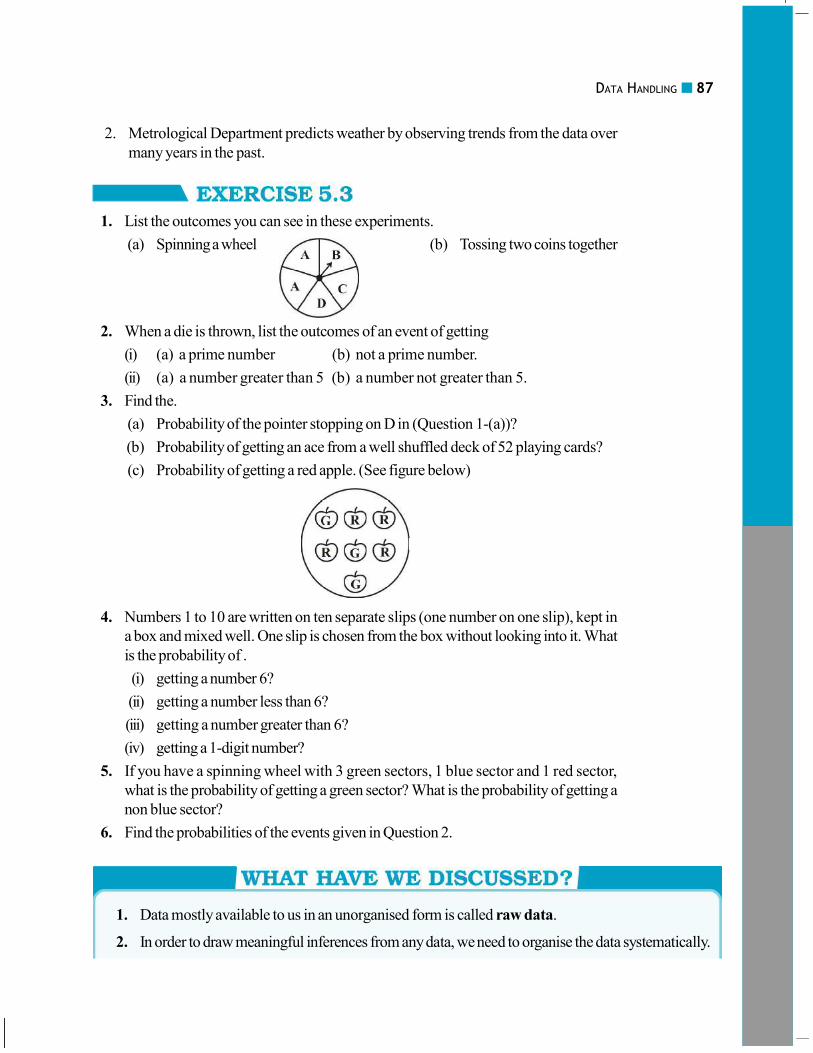
1. List the outcomes you can see in these experiments.
(a) Spinning a wheel (b) Tossing two coins together
2. When a die is thrown, list the outcomes of an event of getting
(i) (a) a prime number (b) not a prime number.
(ii) (a) a number greater than 5 (b) a number not greater than 5.
3. Find the.
(a) Probability of the pointer stopping on D in (Question 1-(a))?
(b) Probability of getting an ace from a well shuffled deck of 52 playing cards?
(c) Probability of getting a red apple. (See figure below)
4. Numbers 1 to 10 are written on ten separate slips (one number on one slip), kept in
a box and mixed well. One slip is chosen from the box without looking into it. What
is the probability of .
(i) getting a number 6?
(ii) getting a number less than 6?
(iii) getting a number greater than 6?
(iv) getting a 1-digit number?
5. If you have a spinning wheel with 3 green sectors, 1 blue sector and 1 red sector,
what is the probability of getting a green sector? What is the probability of getting a
non blue sector?
6. Find the probabilities of the events given in Question 2.
1. Data mostly available to us in an unorganised form is called raw data.
2. In order to draw meaningful inferences from any data, we need to organise the data systematically.

88 MATHEMATICS
3. Frequency gives the number of times that a particular entry occurs.
4. Raw data can be ‘grouped’ and presented systematically through ‘grouped frequency distribution’.
5. Grouped data can be presented using histogram.Histogram is a type of bar diagram, where the
class intervals are shown on the horizontal axis and the heights of the bars show the frequency of
the class interval. Also, there is no gap between the bars as there is no gap between the class
intervals.
6. Data can also presented using circle graph or pie chart. A circle graph shows the relationship
between a whole and its part.
7. There are certain experiments whose outcomes have an equal chance of occurring.
8. A random experiment is one whose outcome cannot be predicted exactly in advance.
9. Outcomes of an experiment are equally likely if each has the same chance of occurring.
10. Probability of an event = Number of outcomes that make an event
Total number of outcomes of the experiment, when the outcomes
are equally likely.
11. One or more outcomes of an experiment make an event.
12. Chances and probability are related to real life.

SQUARES AND SQUARE ROOTS 89
You know that the area of a square = side × side (where ‘side’ means ‘the length of
a side’). Study the following table.
Side of a square (in cm) Area of the square (in cm2)
1 1 × 1 = 1 = 12
2 2 × 2 = 4 = 22
3 3 × 3 = 9 = 32
5 5 × 5 = 25 = 52
8 8 × 8 = 64 = 82
a a × a = a2
What is special about the numbers 4, 9, 25, 64 and other such numbers?
Since, 4 can be expressed as 2 × 2 = 22, 9 can be expressed as 3 × 3 = 32, all such
numbers can be expressed as the product of the number with itself.
Such numbers like 1, 4, 9, 16, 25, ... are known as square numbers.
In general, if a natural number m can be expressed as n2, where n is also a natural
number, then m is a square number. Is 32 a square number?
We know that 52 = 25 and 62 = 36. If 32 is a square number, it must be the square of
a natural number between 5 and 6. But there is no natural number between 5 and 6.
Therefore 32 is not a square number.
Consider the following numbers and their squares.
Number Square
1 1 × 1 = 1
2 2 × 2 = 4
Squares and Square
Roots
CHAPTER
90 MATHEMATICS
3 3 × 3 = 9
4 4 × 4 = 16
5 5 × 5 = 25
6 -----------
7 -----------
8 -----------
9 -----------
10 -----------
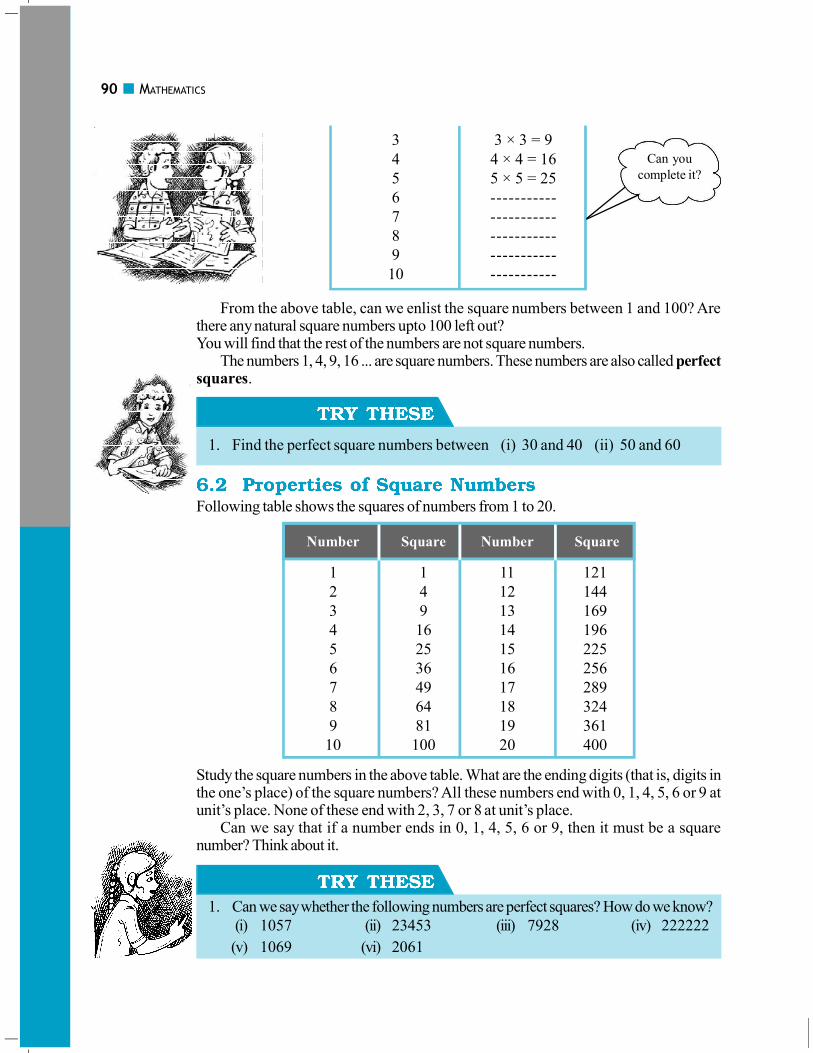
From the above table, can we enlist the square numbers between 1 and 100? Arethere any natural square numbers upto 100 left out?You will find that the rest of the numbers are not square numbers.
The numbers 1, 4, 9, 16 ... are square numbers. These numbers are also called perfectsquares.
1. Find the perfect square numbers between (i) 30 and 40 (ii) 50 and 60
Following table shows the squares of numbers from 1 to 20.
Number Square Number Square
1 1 11 121
2 4 12 144
3 9 13 169
4 16 14 196
5 25 15 225
6 36 16 256
7 49 17 289
8 64 18 324
9 81 19 361
10 100 20 400
Study the square numbers in the above table. What are the ending digits (that is, digits inthe one’s place) of the square numbers? All these numbers end with 0, 1, 4, 5, 6 or 9 atunit’s place. None of these end with 2, 3, 7 or 8 at unit’s place.
Can we say that if a number ends in 0, 1, 4, 5, 6 or 9, then it must be a squarenumber? Think about it.
1. Can we say whether the following numbers are perfect squares? How do we know?
(i) 1057 (ii) 23453 (iii) 7928 (iv) 222222
(v) 1069 (vi) 2061
Can you
complete it?

SQUARES AND SQUARE ROOTS 91
Write five numbers which you can decide by looking at their one’s digit that they
are not square numbers.
2. Write five numbers which you cannot decide just by looking at their unit’s digit
(or one’s place) whether they are square numbers or not.
� Study the following table of some numbers and their squares and observe the one’s
place in both.
Table 1
Number Square Number Square Number Square
1 1 11 121 21 441
2 4 12 144 22 484
3 9 13 169 23 529
4 16 14 196 24 576
5 25 15 225 25 625
6 36 16 256 30 900
7 49 17 289 35 1225
8 64 18 324 40 1600
9 81 19 361 45 2025
10 100 20 400 50 2500
The following square numbers end with digit 1.
Square Number
1 1
81 9
121 11
361 19
441 21
Write the next two square numbers which end in 1 and their corresponding numbers.
You will see that if a number has 1 or 9 in the unit’s place, then it’s square ends in 1.
� Let us consider square numbers ending in 6.
Square Number
16 4
36 6
196 14
256 16
Which of 1232, 772, 822,
1612, 1092 would end with
digit 1?
Which of the following numbers would have digit
6 at unit place.
(i) 192 (ii) 242 (iii) 262
(iv) 362 (v) 342

92 MATHEMATICS
We can see that when a square number ends in 6, the number whose square it is, will
have either 4 or 6 in unit’s place.
Can you find more such rules by observing the numbers and their squares (Table 1)?
What will be the “one’s digit” in the square of the following numbers?
(i) 1234 (ii) 26387 (iii) 52698 (iv) 99880
(v) 21222 (vi) 9106
� Consider the following numbers and their squares.
102 = 100
202 = 400
802 = 6400
1002 = 10000
2002 = 40000
7002 = 490000
9002 = 810000
If a number contains 3 zeros at the end, how many zeros will its square have ?
What do you notice about the number of zeros at the end of the number and the
number of zeros at the end of its square?
Can we say that square numbers can only have even number of zeros at the end?
� See Table 1 with numbers and their squares.
What can you say about the squares of even numbers and squares of odd numbers?
1. The square of which of the following numbers would be an odd number/an even
number? Why?
(i) 727 (ii) 158 (iii) 269 (iv) 1980
2. What will be the number of zeros in the square of the following numbers?
(i) 60 (ii) 400
1. Adding triangular numbers.Do you remember triangular numbers (numbers whose dot patterns can be arrangedas triangles)?
** * *
* ** * *** ** *** * ***
* ** *** **** * ****1 3 6 10 15
But we have
four zeros
But we have
two zeros
We have
one zero
We have
two zeros
SQUARES AND SQUARE ROOTS 93
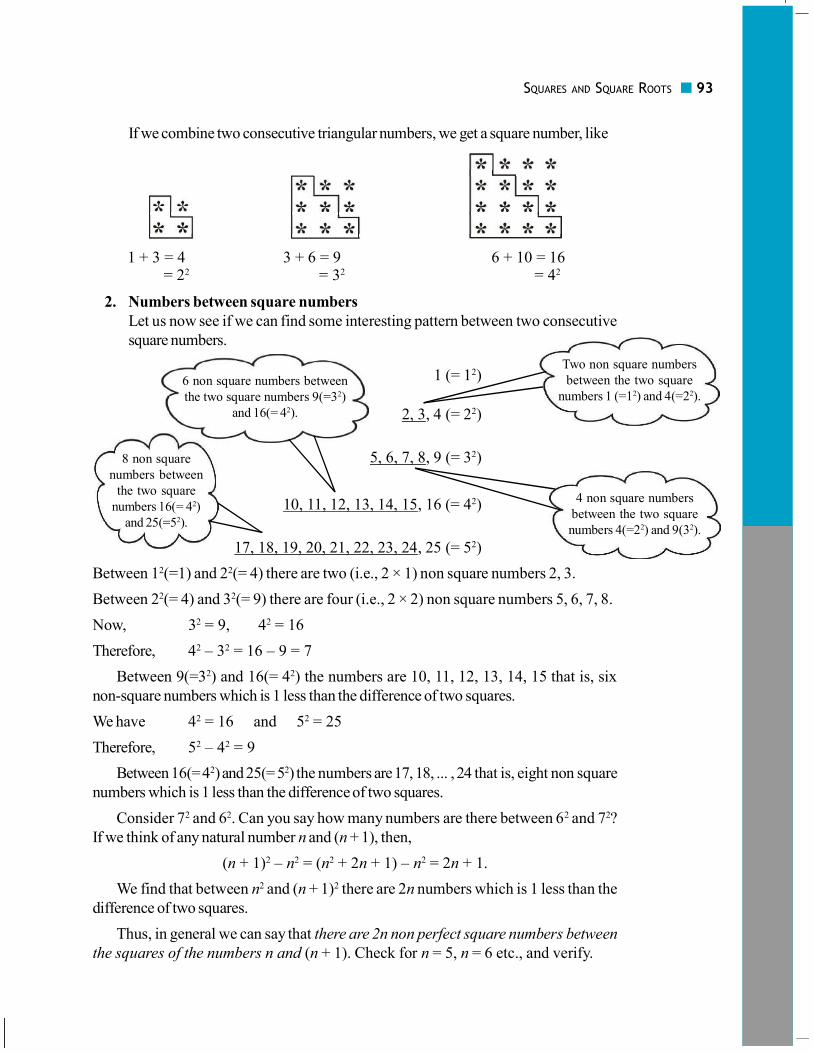
If we combine two consecutive triangular numbers, we get a square number, like
1 + 3 = 4 3 + 6 = 9 6 + 10 = 16 = 22 = 32 = 42
2. Numbers between square numbers
Let us now see if we can find some interesting pattern between two consecutive
square numbers.
1 (= 12)
2, 3, 4 (= 22)
5, 6, 7, 8, 9 (= 32)
10, 11, 12, 13, 14, 15, 16 (= 42)
17, 18, 19, 20, 21, 22, 23, 24, 25 (= 52)
Between 12(=1) and 22(= 4) there are two (i.e., 2 × 1) non square numbers 2, 3.
Between 22(= 4) and 32(= 9) there are four (i.e., 2 × 2) non square numbers 5, 6, 7, 8.
Now, 32 = 9, 42 = 16
Therefore, 42 – 32 = 16 – 9 = 7
Between 9(=32) and 16(= 42) the numbers are 10, 11, 12, 13, 14, 15 that is, six
non-square numbers which is 1 less than the difference of two squares.
We have 42 = 16 and 52 = 25
Therefore, 52 – 42 = 9
Between 16(= 42) and 25(= 52) the numbers are 17, 18, ... , 24 that is, eight non square
numbers which is 1 less than the difference of two squares.
Consider 72 and 62. Can you say how many numbers are there between 62 and 72?
If we think of any natural number n and (n + 1), then,
(n + 1)2 – n2 = (n2 + 2n + 1) – n2 = 2n + 1.
We find that between n2 and (n + 1)2 there are 2n numbers which is 1 less than the
difference of two squares.
Thus, in general we can say that there are 2n non perfect square numbers between
the squares of the numbers n and (n + 1). Check for n = 5, n = 6 etc., and verify.
Two non square numbers
between the two square
numbers 1 (=12) and 4(=22).
4 non square numbers
between the two square
numbers 4(=22) and 9(32).
8 non square
numbers between
the two square
numbers 16(= 42)
and 25(=52).
6 non square numbers between
the two square numbers 9(=32)
and 16(= 42).
94 MATHEMATICS
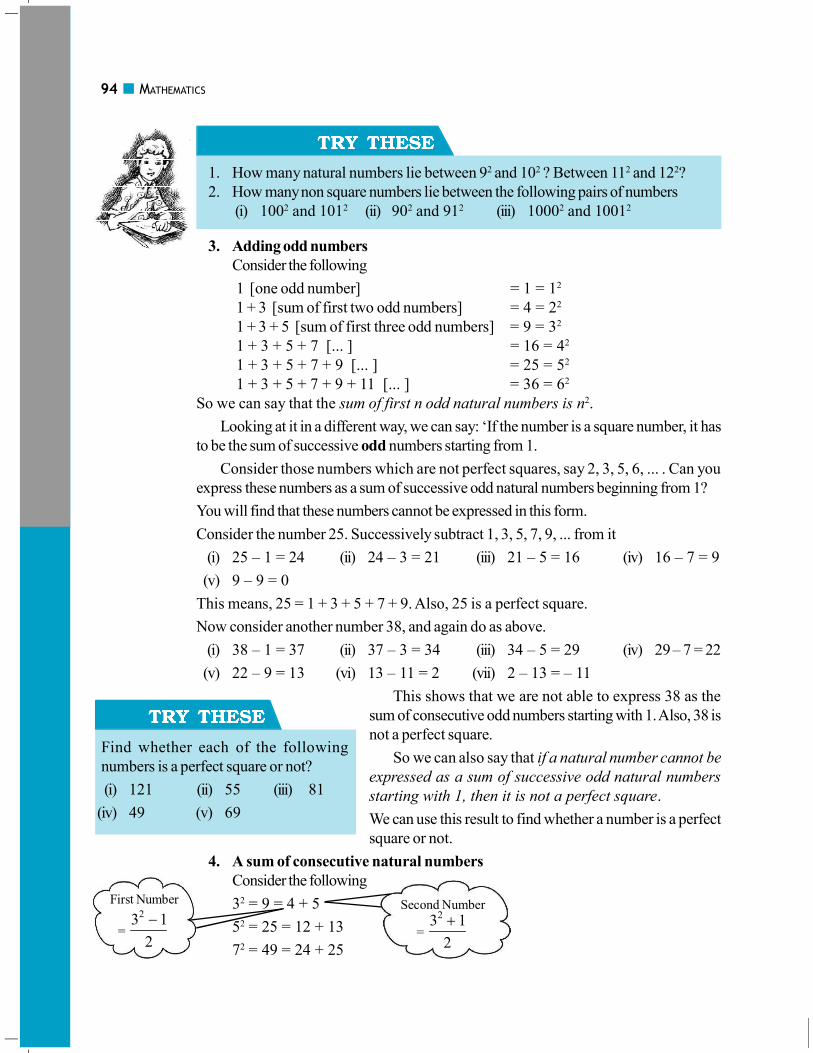
1. How many natural numbers lie between 92 and 102 ? Between 112 and 122?
2. How many non square numbers lie between the following pairs of numbers
(i) 1002 and 1012 (ii) 902 and 912 (iii) 10002 and 10012
3. Adding odd numbers
Consider the following
1 [one odd number] = 1 = 12
1 + 3 [sum of first two odd numbers] = 4 = 22
1 + 3 + 5 [sum of first three odd numbers] = 9 = 32
1 + 3 + 5 + 7 [... ] = 16 = 42
1 + 3 + 5 + 7 + 9 [... ] = 25 = 52
1 + 3 + 5 + 7 + 9 + 11 [... ] = 36 = 62
So we can say that the sum of first n odd natural numbers is n2.
Looking at it in a different way, we can say: ‘If the number is a square number, it has
to be the sum of successive odd numbers starting from 1.
Consider those numbers which are not perfect squares, say 2, 3, 5, 6, ... . Can you
express these numbers as a sum of successive odd natural numbers beginning from 1?
You will find that these numbers cannot be expressed in this form.
Consider the number 25. Successively subtract 1, 3, 5, 7, 9, ... from it
(i) 25 – 1 = 24 (ii) 24 – 3 = 21 (iii) 21 – 5 = 16 (iv) 16 – 7 = 9
(v) 9 – 9 = 0
This means, 25 = 1 + 3 + 5 + 7 + 9. Also, 25 is a perfect square.
Now consider another number 38, and again do as above.
(i) 38 – 1 = 37 (ii) 37 – 3 = 34 (iii) 34 – 5 = 29 (iv) 29 – 7 = 22
(v) 22 – 9 = 13 (vi) 13 – 11 = 2 (vii) 2 – 13 = – 11
This shows that we are not able to express 38 as the
sum of consecutive odd numbers starting with 1. Also, 38 is
not a perfect square.
So we can also say that if a natural number cannot be
expressed as a sum of successive odd natural numbers
starting with 1, then it is not a perfect square.
We can use this result to find whether a number is a perfect
square or not.
4. A sum of consecutive natural numbers
Consider the following
32 = 9 = 4 + 5
52 = 25 = 12 + 13
72 = 49 = 24 + 25
Find whether each of the following
numbers is a perfect square or not?
(i) 121 (ii) 55 (iii) 81
(iv) 49 (v) 69
First Number
=
23 1
2
�
Second Number
=
23 1
2
�

SQUARES AND SQUARE ROOTS 95
Vow! we can express the
square of any odd number as
the sum of two consecutive
positive integers.
92 = 81 = 40 + 41
112 = 121 = 60 + 61
152 = 225 = 112 + 113
1. Express the following as the sum of two consecutive integers.
(i) 212 (ii) 132 (iii) 112 (iv) 192
2. Do you think the reverse is also true, i.e., is the sum of any two consecutive positive
integers is perfect square of a number? Give example to support your answer.
5. Product of two consecutive even or odd natural numbers
11 × 13 = 143 = 122 – 1
Also 11 × 13 = (12 – 1) × (12 + 1)
Therefore, 11 × 13 = (12 – 1) × (12 + 1) = 122 – 1
Similarly, 13 × 15 = (14 – 1) × (14 + 1) = 142 – 1
29 × 31 = (30 – 1) × (30 + 1) = 302 – 1
44 × 46 = (45 – 1) × (45 + 1) = 452 – 1
So in general we can say that (a + 1) × (a – 1) = a2 – 1.
6. Some more patterns in square numbers
Write the square, making use of the above
pattern.
(i) 1111112 (ii) 11111112
Can you find the square of the following
numbers using the above pattern?
(i) 66666672 (ii) 666666672
Observe the squares of numbers; 1, 11, 111 ... etc. They give a beautiful pattern:
12 = 1
112 = 1 2 1
1112 = 1 2 3 2 1
11112 = 1 2 3 4 3 2 1
111112 = 1 2 3 4 5 4 3 2 1
111111112 = 1 2 3 4 5 6 7 8 7 6 5 4 3 2 1
Another interesting pattern.
72 = 49
672 = 4489
6672 = 444889
66672 = 44448889
666672 = 4444488889
6666672 = 444444888889
The fun is in being able to find out why this happens. May
be it would be interesting for you to explore and think about
such questions even if the answers come some years later.
96 MATHEMATICS
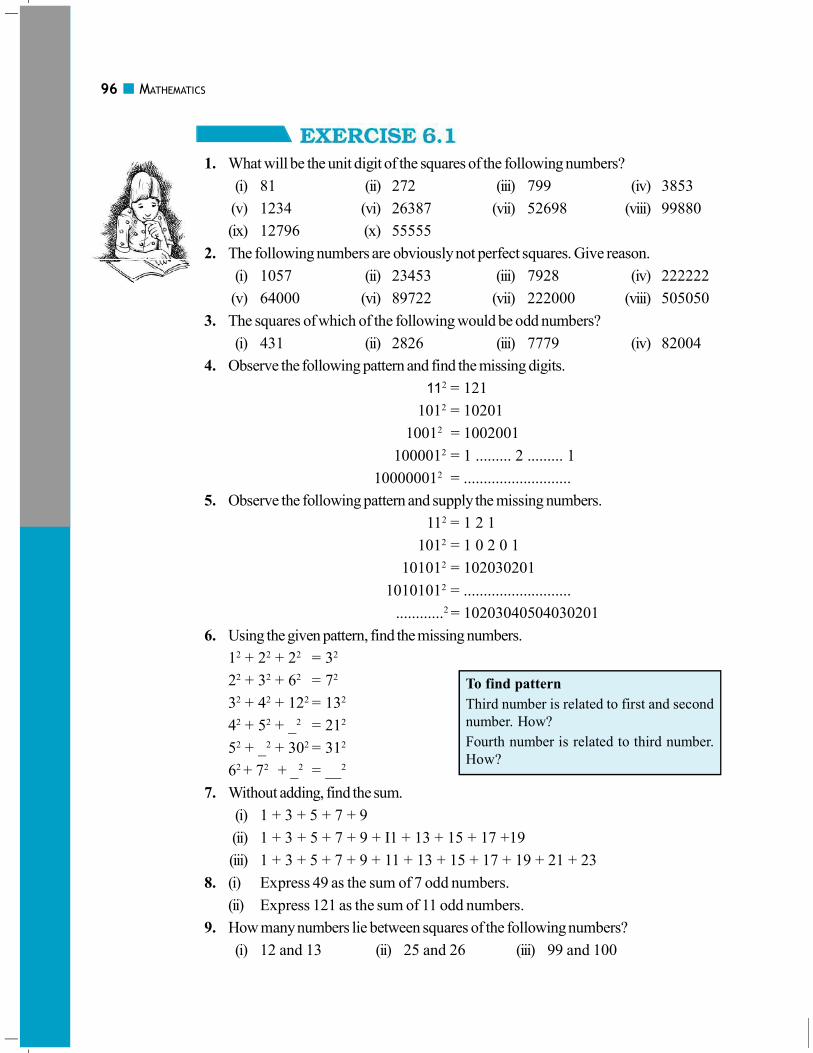
1. What will be the unit digit of the squares of the following numbers?
(i) 81 (ii) 272 (iii) 799 (iv) 3853
(v) 1234 (vi) 26387 (vii) 52698 (viii) 99880
(ix) 12796 (x) 55555
2. The following numbers are obviously not perfect squares. Give reason.
(i) 1057 (ii) 23453 (iii) 7928 (iv) 222222
(v) 64000 (vi) 89722 (vii) 222000 (viii) 505050
3. The squares of which of the following would be odd numbers?
(i) 431 (ii) 2826 (iii) 7779 (iv) 82004
4. Observe the following pattern and find the missing digits.
112 = 121
1012 = 10201
10012 = 1002001
1000012 = 1 ......... 2 ......... 1
100000012 = ...........................
5. Observe the following pattern and supply the missing numbers.
112 = 1 2 1
1012 = 1 0 2 0 1
101012 = 102030201
10101012 = ...........................
............2 = 10203040504030201
6. Using the given pattern, find the missing numbers.
12 + 22 + 22 = 32
22 + 32 + 62 = 72
32 + 42 + 122 = 132
42 + 52 + _2 = 212
52 + _2 + 302 = 312
62 + 72 + _2 = __2
7. Without adding, find the sum.
(i) 1 + 3 + 5 + 7 + 9
(ii) 1 + 3 + 5 + 7 + 9 + I1 + 13 + 15 + 17 +19
(iii) 1 + 3 + 5 + 7 + 9 + 11 + 13 + 15 + 17 + 19 + 21 + 23
8. (i) Express 49 as the sum of 7 odd numbers.
(ii) Express 121 as the sum of 11 odd numbers.
9. How many numbers lie between squares of the following numbers?
(i) 12 and 13 (ii) 25 and 26 (iii) 99 and 100
To find pattern
Third number is related to first and second
number. How?
Fourth number is related to third number.
How?

SQUARES AND SQUARE ROOTS 97
Squares of small numbers like 3, 4, 5, 6, 7, ... etc. are easy to find. But can we find the
square of 23 so quickly?
The answer is not so easy and we may need to multiply 23 by 23.
There is a way to find this without having to multiply 23 × 23.
We know 23 = 20 + 3
Therefore 232 = (20 + 3)2 = 20(20 + 3) + 3(20 + 3)
= 202 + 20 × 3 + 3 × 20 + 32
= 400 + 60 + 60 + 9 = 529
Find the square of the following numbers without actual multiplication.
(i) 39 (ii) 42
(i) 392 = (30 + 9)2 = 30(30 + 9) + 9(30 + 9)
= 302 + 30 × 9 + 9 × 30 + 92
= 900 + 270 + 270 + 81 = 1521
(ii) 422 = (40 + 2)2 = 40(40 + 2) + 2(40 + 2)
= 402 + 40 × 2 + 2 × 40 + 22
= 1600 + 80 + 80 + 4 = 1764
Consider the following pattern:
252 = 625 = (2 × 3) hundreds + 25
352 = 1225 = (3 × 4) hundreds + 25
752 = 5625 = (7 × 8) hundreds + 25
1252 = 15625 = (12 × 13) hundreds + 25
Now can you find the square of 95?
Find the squares of the following numbers containing 5 in unit’s place.
(i) 15 (ii) 95 (iii) 105 (iv) 205
Consider the following
32 + 42 = 9 + 16 = 25 = 52
The collection of numbers 3, 4 and 5 is known as Pythagorean triplet. 6, 8, 10 is
also a Pythagorean triplet, since
62 + 82 = 36 + 64 = 100 = 102
Again, observe that
52 + 122 = 25 + 144 = 169 = 132. The numbers 5, 12, 13 form another such triplet.
Consider a number with unit digit 5, i.e., a5
(a5)2 = (10a + 5)2
= 10a(10a + 5) + 5(10a + 5)
= 100a2 + 50a + 50a + 25
= 100a(a + 1) + 25
= a(a + 1) hundred + 25

98 MATHEMATICS
Can you find more such triplets?
For any natural number m > 1, we have (2m)2 + (m2 – 1)2 = (m2 + 1)2. So, 2m,
m2 – 1 and m2 + 1 forms a Pythagorean triplet.
Try to find some more Pythagorean triplets using this form.
Write a Pythagorean triplet whose smallest member is 8.
We can get Pythagorean triplets by using general form 2m, m2 – 1, m2 + 1.
Let us first take m2 – 1 = 8
So, m2 = 8 + 1 = 9
which gives m = 3
Therefore, 2m = 6 and m2 + 1 = 10
The triplet is thus 6, 8, 10. But 8 is not the smallest member of this.
So, let us try 2m = 8
then m = 4
We get m2 – 1 = 16 – 1 = 15
and m2 + 1 = 16 + 1 = 17
The triplet is 8, 15, 17 with 8 as the smallest member.
Find a Pythagorean triplet in which one member is 12.
If we take m2 – 1 = 12
Then, m2 = 12 + 1 = 13
Then the value of m will not be an integer.
So, we try to take m2 + 1 = 12. Again m2 = 11 will not give an integer value for m.
So, let us take 2m = 12
then m = 6
Thus, m2 – 1 = 36 – 1 = 35 and m
2 + 1 = 36 + 1 = 37
Therefore, the required triplet is 12, 35, 37.
Note: All Pythagorean triplets may not be obtained using this form. For example another
triplet 5, 12, 13 also has 12 as a member.
1. Find the square of the following numbers.
(i) 32 (ii) 35 (iii) 86 (iv) 93
(v) 71 (vi) 46
2. Write a Pythagorean triplet whose one member is.
(i) 6 (ii) 14 (iii) 16 (iv) 18
Study the following situations.
(a) Area of a square is 144 cm2. What could be the side of the square?

SQUARES AND SQUARE ROOTS 99
We know that the area of a square = side2
If we assume the length of the side to be ‘a’, then 144 = a2
To find the length of side it is necessary to find a number whose square is 144.
(b) What is the length of a diagonal of a square of side 8 cm (Fig 6.1)?
Can we use Pythagoras theorem to solve this ?
We have, AB2 + BC2 = AC2
i.e., 82 + 82 = AC2
or 64 + 64 = AC2
or 128 = AC2
Again to get AC we need to think of a number whose square is 128.
(c) In a right triangle the length of the hypotenuse and a side are
respectively 5 cm and 3 cm (Fig 6.2).
Can you find the third side?
Let x cm be the length of the third side.
Using Pythagoras theorem 52 = x2 + 32
25 – 9 = x2
16 = x2
Again, to find x we need a number whose square is 16.
In all the above cases, we need to find a number whose square is known. Finding the
number with the known square is known as finding the square root.
The inverse (opposite) operation of addition is subtraction and the inverse operation
of multiplication is division. Similarly, finding the square root is the inverse operation
of squaring.
We have, 12 = 1, therefore square root of 1 is 1
22 = 4, therefore square root of 4 is 2
32 = 9, therefore square root of 9 is 3
Fig 6.1
Fig 6.2
(i) 112 = 121. What is the square root of 121?
(ii) 142 = 196. What is the square root of 196?
Since 92 = 81,
and (–9)2 = 81
We say that square
roots of 81 are 9 and –9.
(–1)2 = 1. Is –1, a square root of 1? (–2)2 = 4. Is –2, a square root of 4?
(–9)2 = 81. Is –9 a square root of 81?
From the above, you may say that there are two integral square roots of a perfect square
number. In this chapter, we shall take up only positive square root of a natural number.
Positive square root of a number is denoted by the symbol .
For example: 4 = 2 (not –2); 9 = 3 (not –3) etc.
100 MATHEMATICS
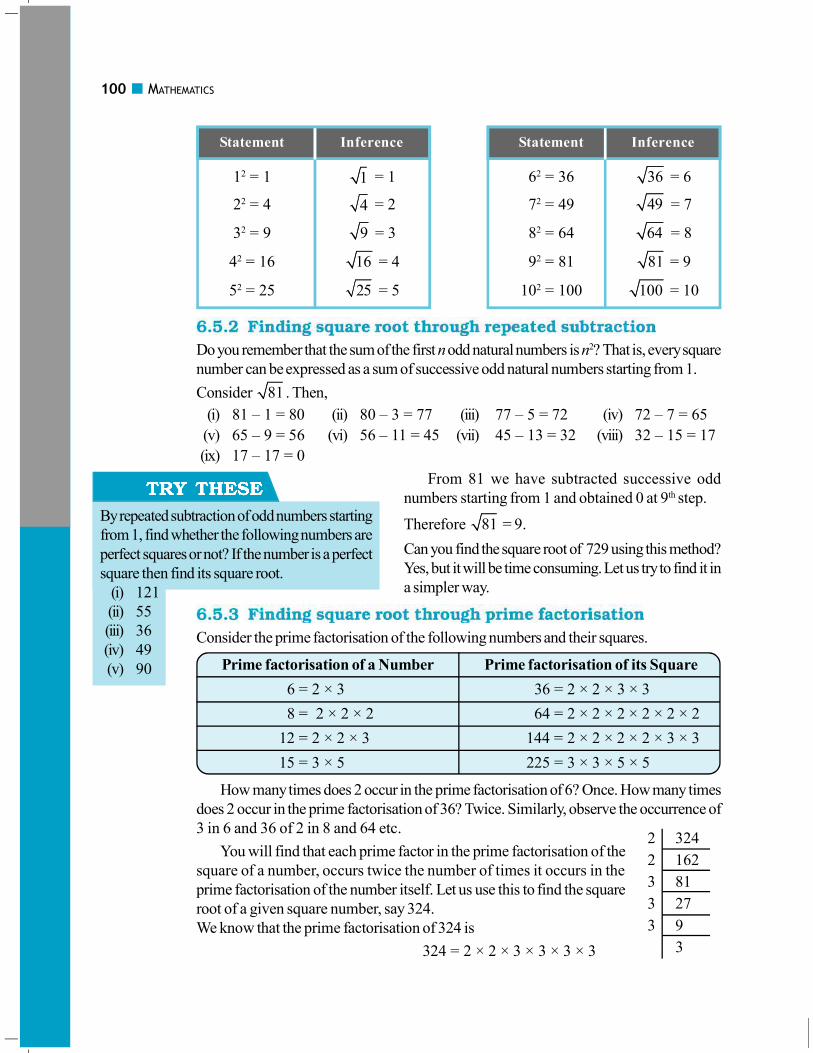
Statement Inference Statement Inference
12 = 1 1 = 1 62 = 36 36 = 6
22 = 4 4 = 2 72 = 49 49 = 7
32 = 9 9 = 3 82 = 64 64 = 8
42 = 16 16 = 4 92 = 81 81 = 9
52 = 25 25 = 5 102 = 100 100 = 10
Do you remember that the sum of the first n odd natural numbers is n2? That is, every square
number can be expressed as a sum of successive odd natural numbers starting from 1.
Consider 81 . Then,
(i) 81 – 1 = 80 (ii) 80 – 3 = 77 (iii) 77 – 5 = 72 (iv) 72 – 7 = 65
(v) 65 – 9 = 56 (vi) 56 – 11 = 45 (vii) 45 – 13 = 32 (viii) 32 – 15 = 17
(ix) 17 – 17 = 0
From 81 we have subtracted successive odd
numbers starting from 1 and obtained 0 at 9th step.
Therefore 81 = 9.
Can you find the square root of 729 using this method?
Yes, but it will be time consuming. Let us try to find it in
a simpler way.
Consider the prime factorisation of the following numbers and their squares.
Prime factorisation of a Number Prime factorisation of its Square
6 = 2 × 3 36 = 2 × 2 × 3 × 3
8 = 2 × 2 × 2 64 = 2 × 2 × 2 × 2 × 2 × 2
12 = 2 × 2 × 3 144 = 2 × 2 × 2 × 2 × 3 × 3
15 = 3 × 5 225 = 3 × 3 × 5 × 5
How many times does 2 occur in the prime factorisation of 6? Once. How many times
does 2 occur in the prime factorisation of 36? Twice. Similarly, observe the occurrence of
3 in 6 and 36 of 2 in 8 and 64 etc.
You will find that each prime factor in the prime factorisation of the
square of a number, occurs twice the number of times it occurs in the
prime factorisation of the number itself. Let us use this to find the square
root of a given square number, say 324.
We know that the prime factorisation of 324 is
324 = 2 × 2 × 3 × 3 × 3 × 3
By repeated subtraction of odd numbers starting
from 1, find whether the following numbers are
perfect squares or not? If the number is a perfect
square then find its square root.
(i) 121
(ii) 55
(iii) 36
(iv) 49
(v) 90
2 324
2 162
3 81
3 27
3 9
3

SQUARES AND SQUARE ROOTS 101
By pairing the prime factors, we get
324 = 2 × 2 × 3 × 3 × 3 × 3 = 22 × 32 × 32 = (2 × 3 × 3)2
So, 324 = 2 × 3 × 3 = 18
Similarly can you find the square root of 256? Prime factorisation of 256 is
256 = 2 × 2 × 2 × 2 × 2 × 2 × 2 × 2
By pairing the prime factors we get,
256 = 2 × 2 × 2 × 2 × 2 × 2 × 2 × 2 = (2 × 2 × 2 × 2)2
Therefore, 256 = 2 × 2 × 2 × 2 = 16
Is 48 a perfect square?
We know 48 = 2 × 2 × 2 × 2 × 3
Since all the factors are not in pairs so 48 is not a perfect square.
Suppose we want to find the smallest multiple of 48 that is a perfect square, how
should we proceed? Making pairs of the prime factors of 48 we see that 3 is the only
factor that does not have a pair. So we need to multiply by 3 to complete the pair.
Hence 48 × 3 = 144 is a perfect square.
Can you tell by which number should we divide 48 to get a perfect square?
The factor 3 is not in pair, so if we divide 48 by 3 we get 48 � 3 = 16 = 2 × 2 × 2 × 2
and this number 16 is a perfect square too.
Find the square root of 6400.
Write 6400 = 2 × 2 × 2 × 2 × 2 × 2 × 2 × 2 × 5 × 5
Therefore 6400 = 2 × 2 × 2 × 2 × 5 = 80
Is 90 a perfect square?
We have 90 = 2 × 3 × 3 × 5
The prime factors 2 and 5 do not occur in pairs. Therefore, 90 is not a perfect square.
That 90 is not a perfect square can also be seen from the fact that it has only one zero.
Is 2352 a perfect square? If not, find the smallest multiple of 2352 which
is a perfect square. Find the square root of the new number.
We have 2352 = 2 × 2 × 2 × 2 × 3 × 7 × 7
As the prime factor 3 has no pair, 2352 is not a perfect square.
If 3 gets a pair then the number will become perfect square. So, we multiply 2352 by 3 to get,
2352 × 3 = 2 × 2 × 2 × 2 × 3 × 3 × 7 × 7
Now each prime factor is in a pair. Therefore, 2352 × 3 = 7056 is a perfect square.
Thus the required smallest multiple of 2352 is 7056 which is a perfect square.
And, 7056 = 2 × 2 × 3 × 7 = 84
Find the smallest number by which 9408 must be divided so that the
quotient is a perfect square. Find the square root of the quotient.
2 256
2 128
2 64
2 32
2 16
2 8
2 4
2
2 90
3 45
3 15
5
2 2352
2 1176
2 588
2 294
3 147
7 49
7
2 6400
2 3200
2 1600
2 800
2 400
2 200
2 100
2 50
5 25
5
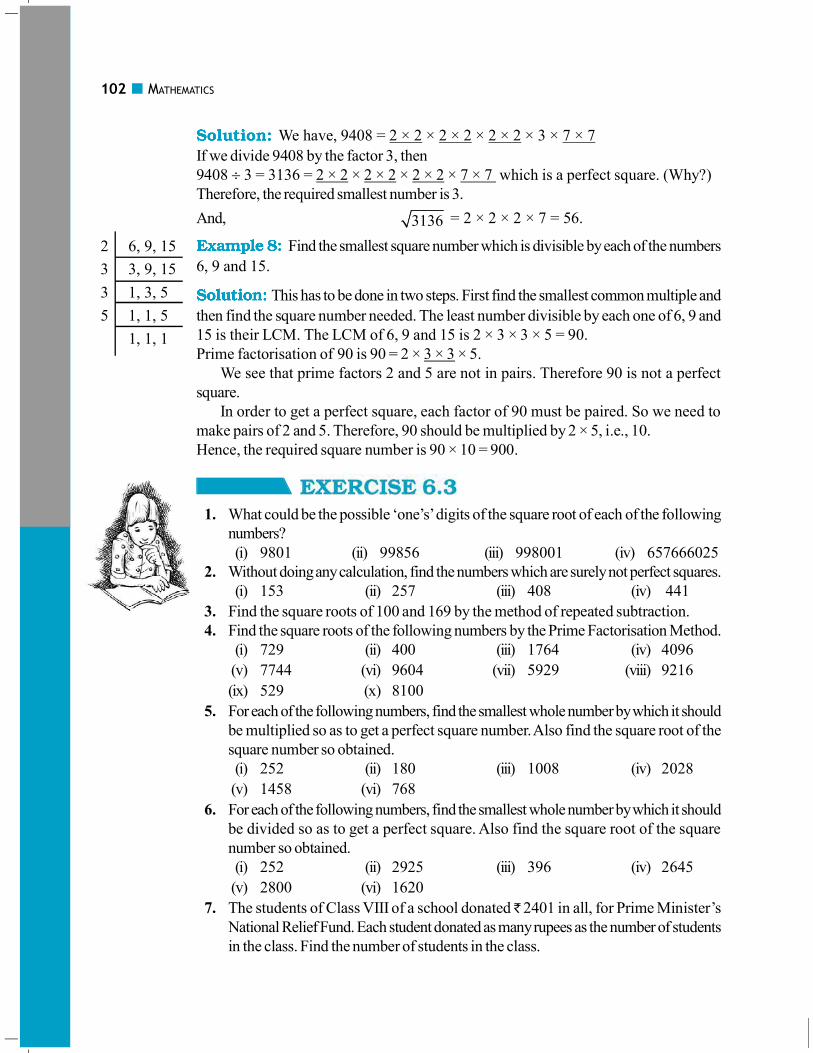
102 MATHEMATICS
We have, 9408 = 2 × 2 × 2 × 2 × 2 × 2 × 3 × 7 × 7
If we divide 9408 by the factor 3, then
9408 � 3 = 3136 = 2 × 2 × 2 × 2 × 2 × 2 × 7 × 7 which is a perfect square. (Why?)
Therefore, the required smallest number is 3.
And, 3136 = 2 × 2 × 2 × 7 = 56.
Find the smallest square number which is divisible by each of the numbers
6, 9 and 15.
This has to be done in two steps. First find the smallest common multiple and
then find the square number needed. The least number divisible by each one of 6, 9 and
15 is their LCM. The LCM of 6, 9 and 15 is 2 × 3 × 3 × 5 = 90.
Prime factorisation of 90 is 90 = 2 × 3 × 3 × 5.
We see that prime factors 2 and 5 are not in pairs. Therefore 90 is not a perfect
square.
In order to get a perfect square, each factor of 90 must be paired. So we need to
make pairs of 2 and 5. Therefore, 90 should be multiplied by 2 × 5, i.e., 10.
Hence, the required square number is 90 × 10 = 900.
1. What could be the possible ‘one’s’ digits of the square root of each of the following
numbers?
(i) 9801 (ii) 99856 (iii) 998001 (iv) 657666025
2. Without doing any calculation, find the numbers which are surely not perfect squares.
(i) 153 (ii) 257 (iii) 408 (iv) 441
3. Find the square roots of 100 and 169 by the method of repeated subtraction.
4. Find the square roots of the following numbers by the Prime Factorisation Method.
(i) 729 (ii) 400 (iii) 1764 (iv) 4096
(v) 7744 (vi) 9604 (vii) 5929 (viii) 9216
(ix) 529 (x) 8100
5. For each of the following numbers, find the smallest whole number by which it should
be multiplied so as to get a perfect square number. Also find the square root of the
square number so obtained.
(i) 252 (ii) 180 (iii) 1008 (iv) 2028
(v) 1458 (vi) 768
6. For each of the following numbers, find the smallest whole number by which it should
be divided so as to get a perfect square. Also find the square root of the square
number so obtained.
(i) 252 (ii) 2925 (iii) 396 (iv) 2645
(v) 2800 (vi) 1620
7. The students of Class VIII of a school donated ̀ 2401 in all, for Prime Minister’s
National Relief Fund. Each student donated as many rupees as the number of students
in the class. Find the number of students in the class.
2 6, 9, 15
3 3, 9, 15
3 1, 3, 5
5 1, 1, 5
1, 1, 1
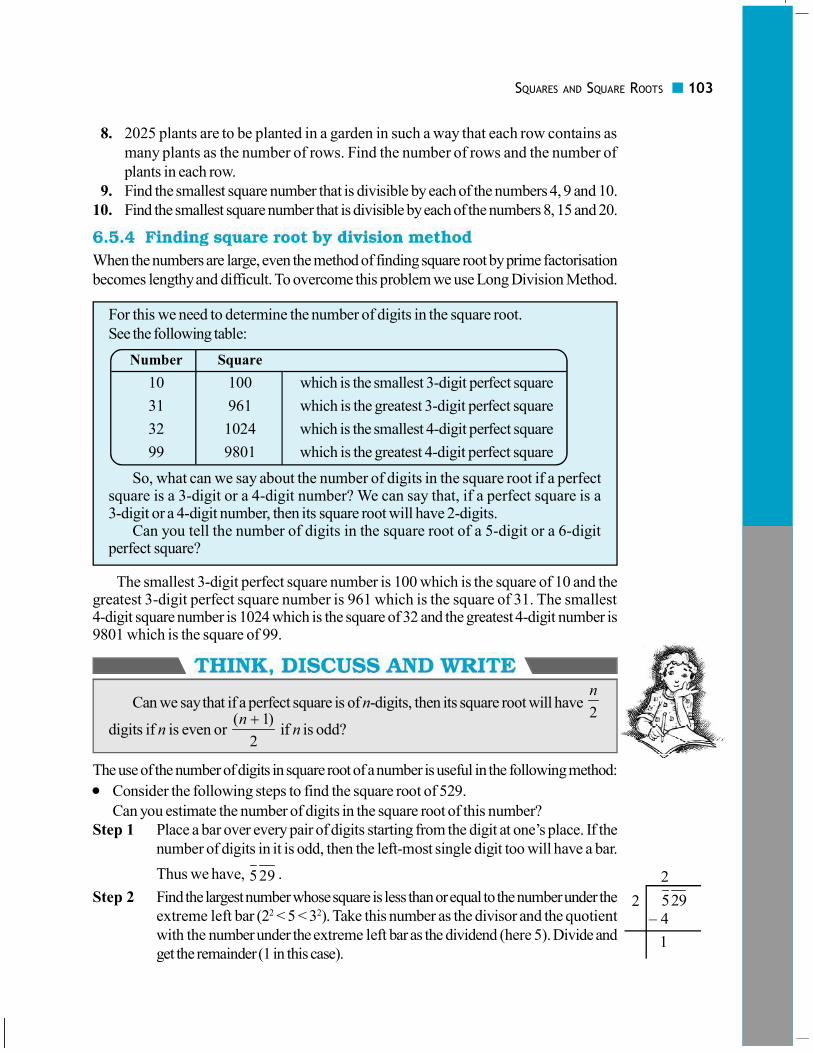
SQUARES AND SQUARE ROOTS 103
8. 2025 plants are to be planted in a garden in such a way that each row contains as
many plants as the number of rows. Find the number of rows and the number of
plants in each row.
9. Find the smallest square number that is divisible by each of the numbers 4, 9 and 10.
10. Find the smallest square number that is divisible by each of the numbers 8, 15 and 20.
When the numbers are large, even the method of finding square root by prime factorisation
becomes lengthy and difficult. To overcome this problem we use Long Division Method.
For this we need to determine the number of digits in the square root.
See the following table:
Number Square
10 100 which is the smallest 3-digit perfect square
31 961 which is the greatest 3-digit perfect square
32 1024 which is the smallest 4-digit perfect square
99 9801 which is the greatest 4-digit perfect square
So, what can we say about the number of digits in the square root if a perfectsquare is a 3-digit or a 4-digit number? We can say that, if a perfect square is a3-digit or a 4-digit number, then its square root will have 2-digits.
Can you tell the number of digits in the square root of a 5-digit or a 6-digitperfect square?
The smallest 3-digit perfect square number is 100 which is the square of 10 and thegreatest 3-digit perfect square number is 961 which is the square of 31. The smallest4-digit square number is 1024 which is the square of 32 and the greatest 4-digit number is9801 which is the square of 99.
Can we say that if a perfect square is of n-digits, then its square root will have 2
n
digits if n is even or ( 1)
2
n � if n is odd?
The use of the number of digits in square root of a number is useful in the following method:
� Consider the following steps to find the square root of 529.
Can you estimate the number of digits in the square root of this number?
Step 1 Place a bar over every pair of digits starting from the digit at one’s place. If the
number of digits in it is odd, then the left-most single digit too will have a bar.
Thus we have, 529 .
Step 2 Find the largest number whose square is less than or equal to the number under the
extreme left bar (22 < 5 < 32). Take this number as the divisor and the quotient
with the number under the extreme left bar as the dividend (here 5). Divide and
get the remainder (1 in this case).
2
2 529– 4
1
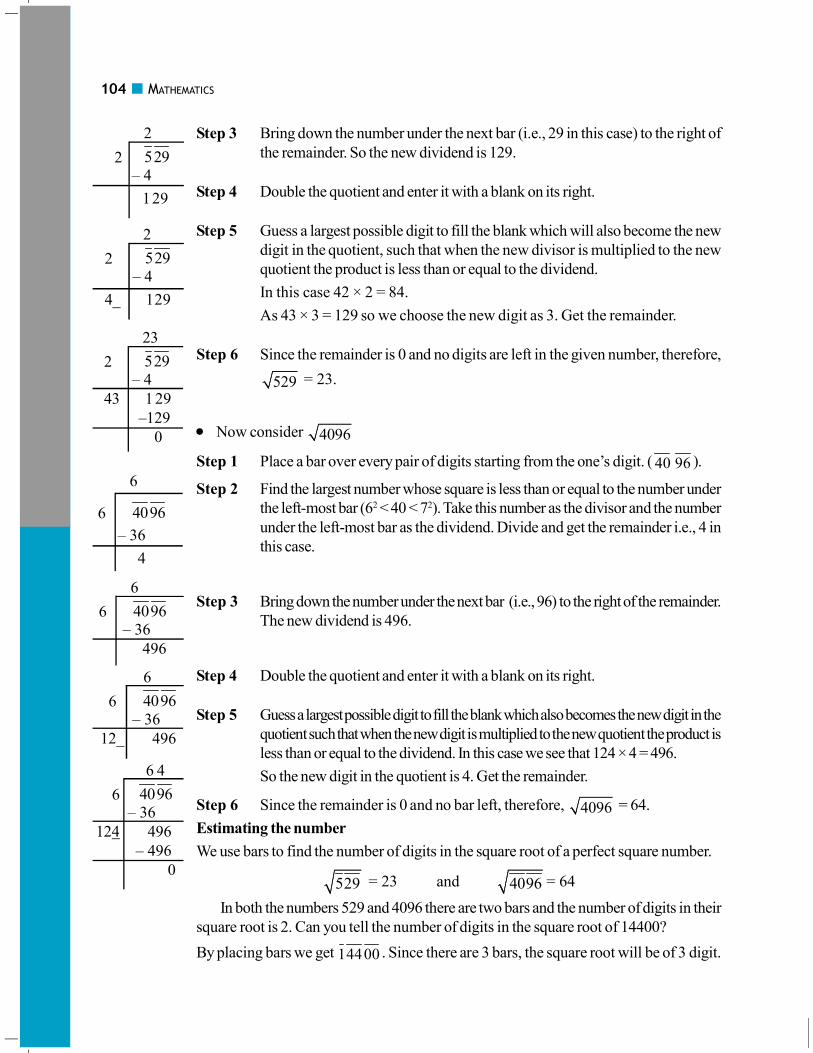
104 MATHEMATICS
Step 3 Bring down the number under the next bar (i.e., 29 in this case) to the right of
the remainder. So the new dividend is 129.
Step 4 Double the quotient and enter it with a blank on its right.
Step 5 Guess a largest possible digit to fill the blank which will also become the new
digit in the quotient, such that when the new divisor is multiplied to the new
quotient the product is less than or equal to the dividend.
In this case 42 × 2 = 84.
As 43 × 3 = 129 so we choose the new digit as 3. Get the remainder.
Step 6 Since the remainder is 0 and no digits are left in the given number, therefore,
529 = 23.
� Now consider 4096
Step 1 Place a bar over every pair of digits starting from the one’s digit. ( 40 96 ).
Step 2 Find the largest number whose square is less than or equal to the number under
the left-most bar (62 < 40 < 72). Take this number as the divisor and the number
under the left-most bar as the dividend. Divide and get the remainder i.e., 4 in
this case.
Step 3 Bring down the number under the next bar (i.e., 96) to the right of the remainder.
The new dividend is 496.
Step 4 Double the quotient and enter it with a blank on its right.
Step 5 Guess a largest possible digit to fill the blank which also becomes the new digit in the
quotient such that when the new digit is multiplied to the new quotient the product is
less than or equal to the dividend. In this case we see that 124 × 4 = 496.
So the new digit in the quotient is 4. Get the remainder.
Step 6 Since the remainder is 0 and no bar left, therefore, 4096 = 64.
Estimating the number
We use bars to find the number of digits in the square root of a perfect square number.
529 = 23 and 4096 = 64
In both the numbers 529 and 4096 there are two bars and the number of digits in their
square root is 2. Can you tell the number of digits in the square root of 14400?
By placing bars we get 14400 . Since there are 3 bars, the square root will be of 3 digit.
2
2 529– 4
129
6
6 4096
– 36
4
23
2 529– 4
43 1 29
–129
0
2
2 529– 4
4_ 129
6 4
6 4096 – 36
124 496
– 496
0
6
6 4096– 36
496
6
6 4096
– 36
12_ 496

SQUARES AND SQUARE ROOTS 105
Without calculating square roots, find the number of digits in the square root of the
following numbers.
(i) 25600 (ii) 100000000 (iii) 36864
Find the square root of : (i) 729 (ii) 1296
(i) (ii)
Find the least number that must be subtracted from 5607 so as to get
a perfect square. Also find the square root of the perfect square.
Let us try to find 5607 by long division method. We get the
remainder 131. It shows that 742 is less than 5607 by 131.
This means if we subtract the remainder from the number, we get a perfect square.
Therefore, the required perfect square is 5607 – 131 = 5476. And, 5476 = 74.
Find the greatest 4-digit number which is a perfect square.
Greatest number of 4-digits = 9999. We find 9999 by long division
method. The remainder is 198. This shows 992 is less than 9999 by 198.
This means if we subtract the remainder from the number, we get a perfect square.
Therefore, the required perfect square is 9999 – 198 = 9801.
And, 9801 = 99
Find the least number that must be added to 1300 so as to get a
perfect square. Also find the square root of the perfect square.
We find 1300 by long division method. The remainder is 4.
This shows that 362 < 1300.
Next perfect square number is 372 = 1369.
Hence, the number to be added is 372 – 1300 = 1369 – 1300 = 69.
Consider 17.64
Step 1 To find the square root of a decimal number we put bars on the integral part
(i.e., 17) of the number in the usual manner. And place bars on the decimal part
Therefore 1296 36�Therefore 729 27�
74
7 5607– 49
144 707
–576
131
99
9 9999
– 81
189 1899
– 1701
198
36
3 1300
– 9
66 400
– 396
4
27
2 729 – 4
47 329
329
0
36
3 1296
– 9
66 396
396
0

106 MATHEMATICS
(i.e., 64) on every pair of digits beginning with the first decimal place. Proceed
as usual. We get 17.64 .
Step 2 Now proceed in a similar manner. The left most bar is on 17 and 42 < 17 < 52.
Take this number as the divisor and the number under the left-most bar as the
dividend, i.e., 17. Divide and get the remainder.
Step 3 The remainder is 1. Write the number under the next bar (i.e., 64) to the right of
this remainder, to get 164.
Step 4 Double the divisor and enter it with a blank on its right.
Since 64 is the decimal part so put a decimal point in the
quotient.
Step 5 We know 82 × 2 = 164, therefore, the new digit is 2.
Divide and get the remainder.
Step 6 Since the remainder is 0 and no bar left, therefore 17.64 4.2� .
Find the square root of 12.25.
Which way to move
Consider a number 176.341. Put bars on both integral part and decimal part. In what way
is putting bars on decimal part different from integral part? Notice for 176 we start from
the unit’s place close to the decimal and move towards left. The first bar is over 76 and the
second bar over 1. For .341, we start from the decimal and move towards right. First bar
is over 34 and for the second bar we put 0 after 1 and make .3410 .
Area of a square plot is 2304 m2. Find the side of the square plot.
Area of square plot = 2304 m2
Therefore, side of the square plot = 2304 m
We find that, 2304 = 48
Thus, the side of the square plot is 48 m.
There are 2401 students in a school. P.T. teacher wants them to stand
in rows and columns such that the number of rows is equal to the number of columns. Find
the number of rows.
4
4 17.64– 16
1
4.
4 17.64
– 16
82 164
4.2
4 17.64
– 16
82 164
– 164
0
4
4 17.64– 16
8_ 1 64
Therefore, 12.25 3.5�
3.5
3 12.25
– 9
65 325
325
0
48
4 2304
–16
88 704
704
0
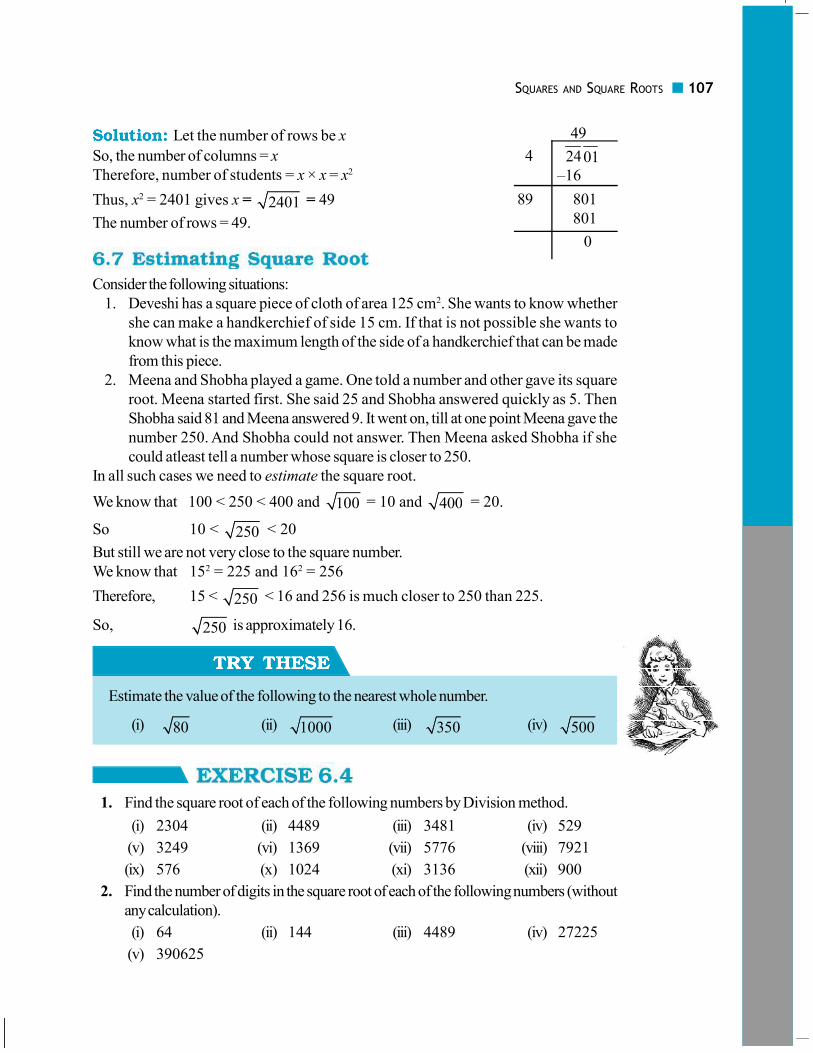
SQUARES AND SQUARE ROOTS 107
Let the number of rows be x
So, the number of columns = x
Therefore, number of students = x × x = x2
Thus, x2 = 2401 gives x = 2401 = 49
The number of rows = 49.
Consider the following situations:
1. Deveshi has a square piece of cloth of area 125 cm2. She wants to know whether
she can make a handkerchief of side 15 cm. If that is not possible she wants to
know what is the maximum length of the side of a handkerchief that can be made
from this piece.
2. Meena and Shobha played a game. One told a number and other gave its square
root. Meena started first. She said 25 and Shobha answered quickly as 5. Then
Shobha said 81 and Meena answered 9. It went on, till at one point Meena gave the
number 250. And Shobha could not answer. Then Meena asked Shobha if she
could atleast tell a number whose square is closer to 250.
In all such cases we need to estimate the square root.
We know that 100 < 250 < 400 and 100 = 10 and 400 = 20.
So 10 < 250 < 20
But still we are not very close to the square number.
We know that 152 = 225 and 162 = 256
Therefore, 15 < 250 < 16 and 256 is much closer to 250 than 225.
So, 250 is approximately 16.
Estimate the value of the following to the nearest whole number.
(i) 80 (ii) 1000 (iii) 350 (iv) 500
1. Find the square root of each of the following numbers by Division method.
(i) 2304 (ii) 4489 (iii) 3481 (iv) 529
(v) 3249 (vi) 1369 (vii) 5776 (viii) 7921
(ix) 576 (x) 1024 (xi) 3136 (xii) 900
2. Find the number of digits in the square root of each of the following numbers (without
any calculation).
(i) 64 (ii) 144 (iii) 4489 (iv) 27225
(v) 390625
49
4 2401–16
89 801
801
0

108 MATHEMATICS
3. Find the square root of the following decimal numbers.
(i) 2.56 (ii) 7.29 (iii) 51.84 (iv) 42.25
(v) 31.36
4. Find the least number which must be subtracted from each of the following numbers
so as to get a perfect square. Also find the square root of the perfect square so
obtained.
(i) 402 (ii) 1989 (iii) 3250 (iv) 825
(v) 4000
5. Find the least number which must be added to each of the following numbers so as
to get a perfect square. Also find the square root of the perfect square so obtained.
(i) 525 (ii) 1750 (iii) 252 (iv) 1825
(v) 6412
6. Find the length of the side of a square whose area is 441 m2.
7. In a right triangle ABC, �B = 90°.
(a) If AB = 6 cm, BC = 8 cm, find AC (b) If AC = 13 cm, BC = 5 cm, find AB
8. A gardener has 1000 plants. He wants to plant these in such a way that the number
of rows and the number of columns remain same. Find the minimum number of
plants he needs more for this.
9. There are 500 children in a school. For a P.T. drill they have to stand in such a
manner that the number of rows is equal to number of columns. How many children
would be left out in this arrangement.
1. If a natural number m can be expressed as n2, where n is also a natural number, then m is a
square number.
2. All square numbers end with 0, 1, 4, 5, 6 or 9 at unit’s place.
3. Square numbers can only have even number of zeros at the end.
4. Square root is the inverse operation of square.
5. There are two integral square roots of a perfect square number.
Positive square root of a number is denoted by the symbol .
For example, 32 = 9 gives 9 3�
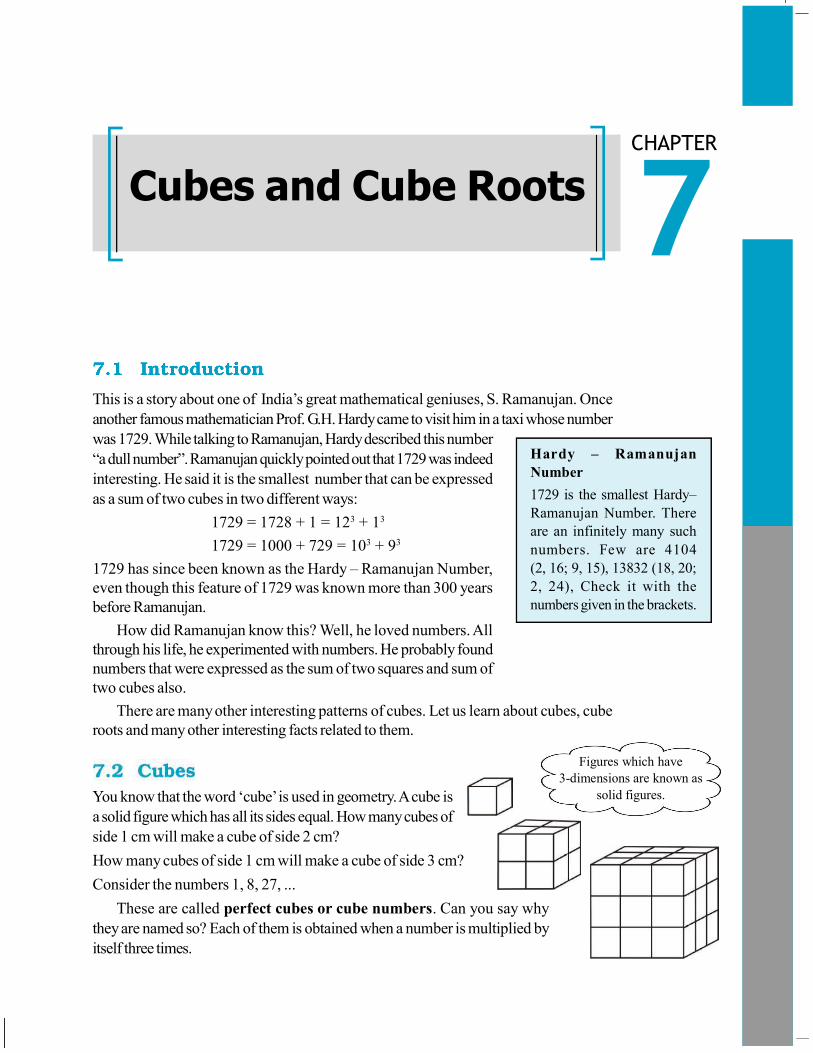
CUBES AND CUBE ROOTS 109
This is a story about one of India’s great mathematical geniuses, S. Ramanujan. Once
another famous mathematician Prof. G.H. Hardy came to visit him in a taxi whose number
was 1729. While talking to Ramanujan, Hardy described this number
“a dull number”. Ramanujan quickly pointed out that 1729 was indeed
interesting. He said it is the smallest number that can be expressed
as a sum of two cubes in two different ways:
1729 = 1728 + 1 = 123 + 13
1729 = 1000 + 729 = 103 + 93
1729 has since been known as the Hardy – Ramanujan Number,
even though this feature of 1729 was known more than 300 years
before Ramanujan.
How did Ramanujan know this? Well, he loved numbers. All
through his life, he experimented with numbers. He probably found
numbers that were expressed as the sum of two squares and sum of
two cubes also.
There are many other interesting patterns of cubes. Let us learn about cubes, cube
roots and many other interesting facts related to them.
You know that the word ‘cube’ is used in geometry. A cube is
a solid figure which has all its sides equal. How many cubes of
side 1 cm will make a cube of side 2 cm?
How many cubes of side 1 cm will make a cube of side 3 cm?
Consider the numbers 1, 8, 27, ...
These are called perfect cubes or cube numbers. Can you say why
they are named so? Each of them is obtained when a number is multiplied by
itself three times.
Cubes and Cube Roots
CHAPTER
Hardy – Ramanujan
Number
1729 is the smallest Hardy–
Ramanujan Number. There
are an infinitely many such
numbers. Few are 4104
(2, 16; 9, 15), 13832 (18, 20;
2, 24), Check it with the
numbers given in the brackets.
Figures which have
3-dimensions are known as
solid figures.