WiMAX Network Cluster Acceptance Certificate
37
1 of 37 WiMAX Network Cluster Acceptance Certificate (KHV-007, KHV-030, KHV-032) “GIRAFFE” 2.3GHz 802.16e-2005 WiMAX Network July 2012 KYIV, UKRAINE
-
Upload
independent -
Category
Documents
-
view
3 -
download
0
Transcript of WiMAX Network Cluster Acceptance Certificate
1 of 37
WiMAX Network
Cluster Acceptance Certificate
(KHV-007, KHV-030, KHV-032)
“GIRAFFE”
2.3GHz 802.16e-2005 WiMAX Network
July 2012
KYIV, UKRAINE
Network Cluster Acceptance Certificate
Page 2 of 37
Table of Contents
Table of Contents ............................................................................................................... 2
Key Performance Indicators (KPI) definitions and their benchmarks ........................ 3
Coverage validation ................................................................................................. 3
Sector antenna orientation and non-crossing verification ..................................... 13
Network Entry Success Rate ................................................................................. 13
Network Entry Setup Time ...................................................................................... x
Latency and packet loss ........................................................................................... x
Single User Cell Peak Throughput .......................................................................... x
Single User Cell Edge Throughput .......................................................................... x
Cell Peak Capacity Evaluation ................................................................................ x
KPI validity and test conditions ....................................................................................... x
Coverage validation rules ........................................................................................ x
Backhaul conditions ................................................................................................ x
RF conditions ........................................................................................................... x
Amount of measurement samples............................................................................ x
Test CPE and laptops ............................................................................................... x
Drive test vehicle configuration .............................................................................. x
Test server configuration ......................................................................................... x
QoS class of test CPE .............................................................................................. x
Exclusions Definition .............................................................................................. x
Network Cluster Description ............................................................................................ x
KHV-007 acceptance ......................................................................................................... x
Cell A location and configuration ........................................................................... x
Cell site backhaul link test ....................................................................................... x
Drive test routes of Cell A ....................................................................................... x
Coverage validation of Cell A ................................................................................. x
KPI report of Cell A ................................................................................................ x
Supplementary quality report of Cell A .................................................................. x
Network Cluster Acceptance Certificate ......................................................................... x

Network Cluster Acceptance Certificate
Page 3 of 37
Key Performance Indicators (KPI) definitions and their benchmarks
Coverage Validation
The coverage validation is performed by means of evaluating two statistical indicators - Standard
Deviation and Mean Error.
• KPI Calculation: Automatic data processing and resulting indicators dump by Atoll’s built-in
function.
• Number of measurement samples: at least 4,000 valid samples within a sector’s coverage area
• KPI pass criteria: Standard Deviation < ±10dB, Mean Error < ±1dB
Coverage validation procedure is as follows:
• Using XCAL drive test tool collect measurement samples by means of vast drive tests within
predicted coverage area of every sector (see Coverage validation rules part in KPI validity and
test conditions chapter)
• Export collected measurement samples from XCAP (csv-format, etc.)
• Import collected measurement samples into Atoll
• Filter and display valid measurement samples
• Creating coverage predictions from test mobile data paths
• Calculate and display predicted vs. measured coverage map
• Calculate and display predicted vs. measured data consistency statistics
Collect measurement samples
See Coverage validation rules part in KPI validity and test conditions chapter for the instructions.
Export collected measurement samples from XCAP
In Atoll you can import and analyze drive test measurement data. The measurement data should be
beforehand exported from XCAL tool in CSV format containing at least the following fields:
• Positioning data of test mobile measurement points (Latitude, Longitude)
• Serving cells’ BSID
• RSSI
• CINR
To export collected measurement samples from XCAP:
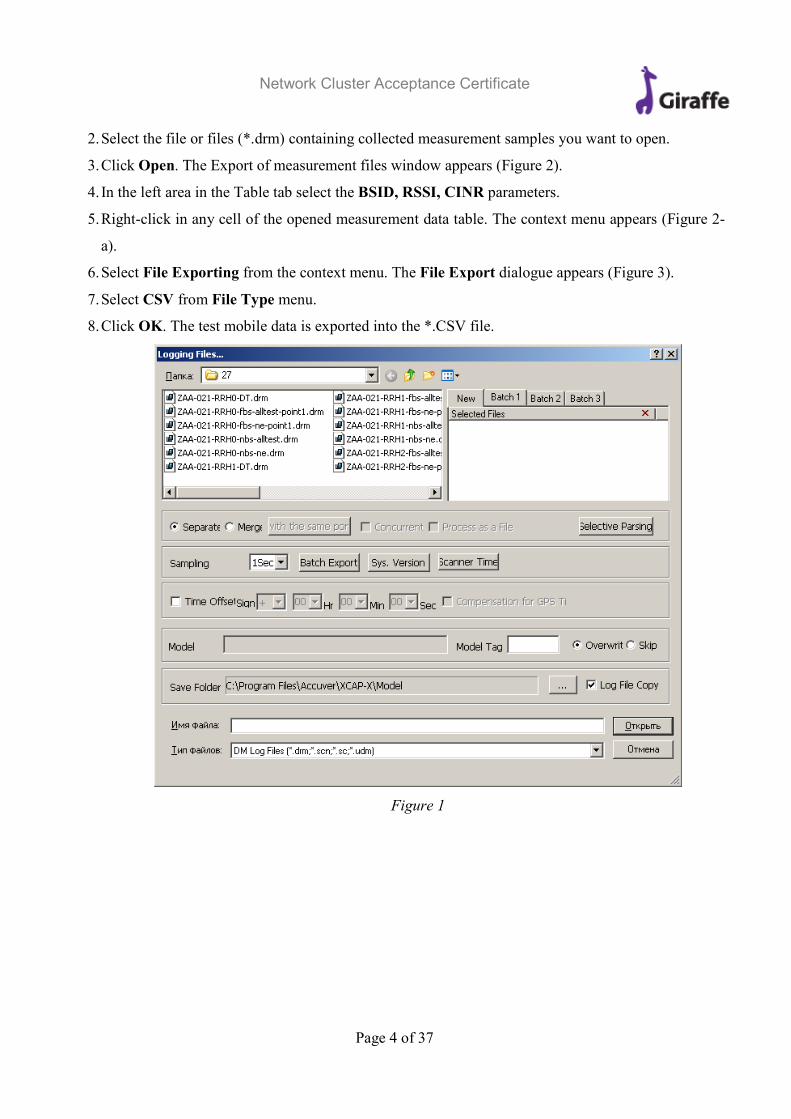
1. Click the Open file button to expand the Logging Files… window (Figure 1).
Network Cluster Acceptance Certificate
Page 4 of 37
2. Select the file or files (*.drm) containing collected measurement samples you want to open.
3. Click Open. The Export of measurement files window appears (Figure 2).
4. In the left area in the Table tab select the BSID, RSSI, CINR parameters.
5. Right-click in any cell of the opened measurement data table. The context menu appears (Figure 2-
a).
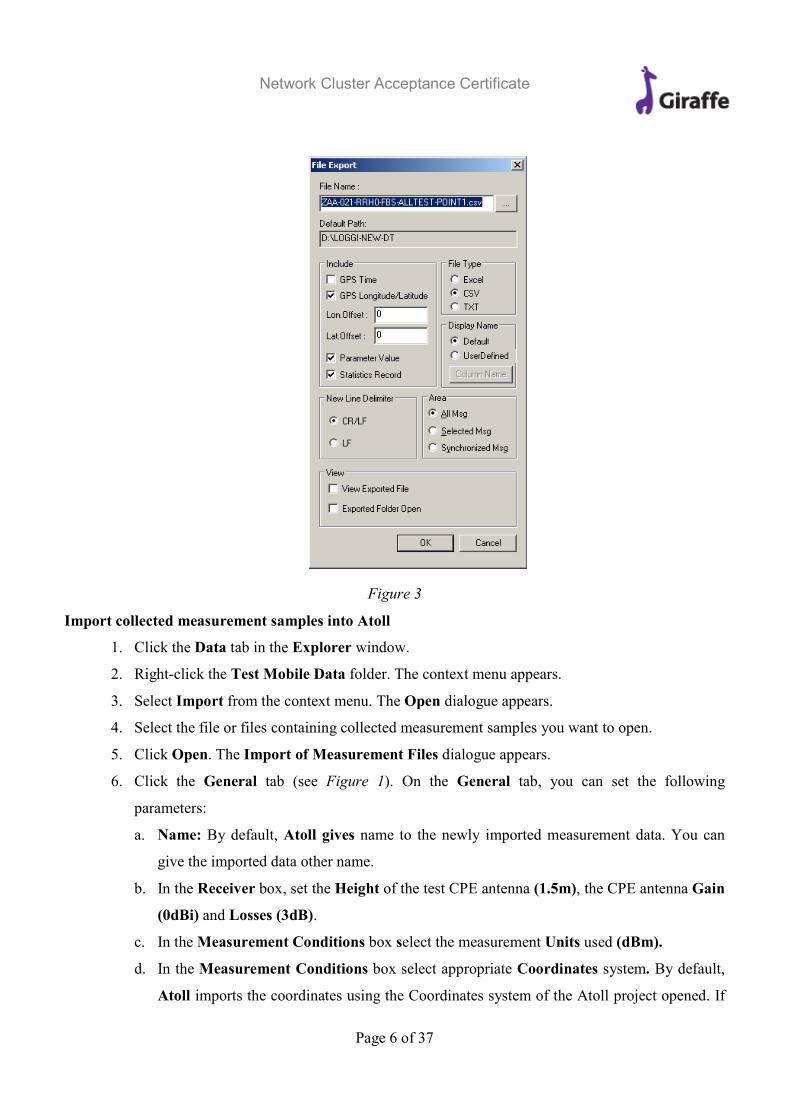
6. Select File Exporting from the context menu. The File Export dialogue appears (Figure 3).
7. Select CSV from File Type menu.
8. Click OK. The test mobile data is exported into the *.CSV file.
Figure 1

Network Cluster Acceptance Certificate
Page 5 of 37
Figure 2
Figure 2-a.
Network Cluster Acceptance Certificate
Page 6 of 37
Figure 3
Import collected measurement samples into Atoll
1. Click the Data tab in the Explorer window.
2. Right-click the Test Mobile Data folder. The context menu appears.
3. Select Import from the context menu. The Open dialogue appears.
4. Select the file or files containing collected measurement samples you want to open.
5. Click Open. The Import of Measurement Files dialogue appears.
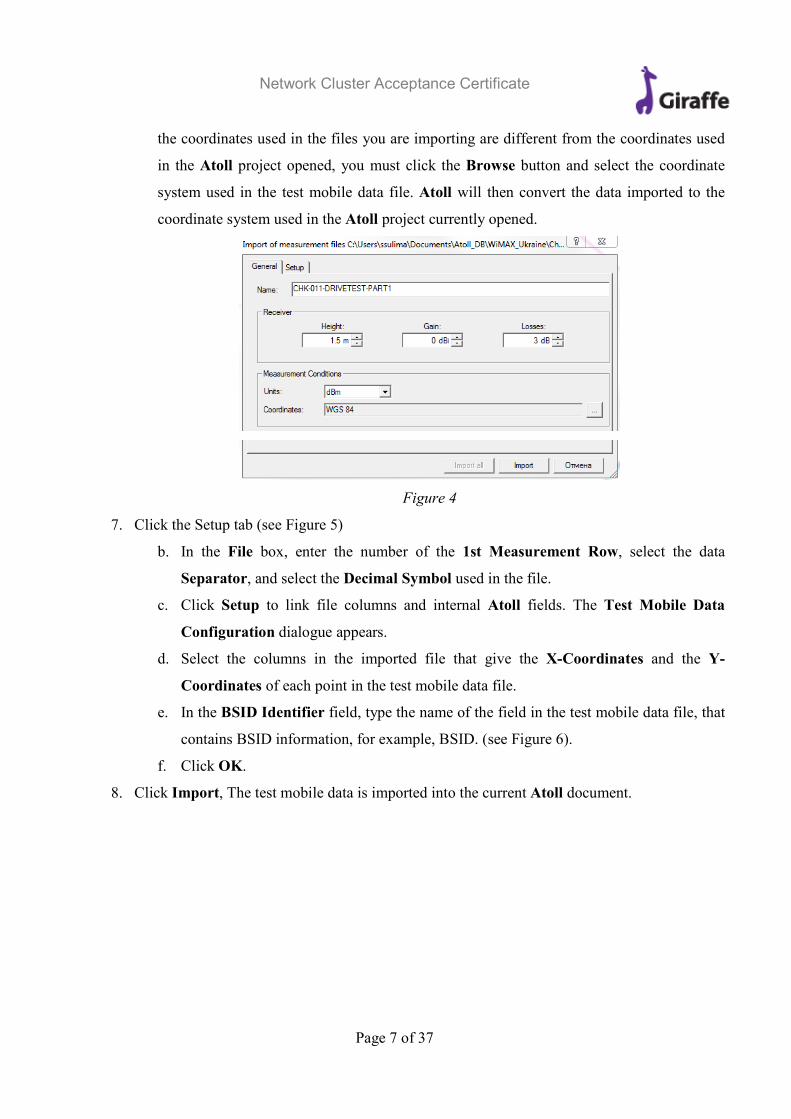
6. Click the General tab (see Figure 1). On the General tab, you can set the following
parameters:
a. Name: By default, Atoll gives name to the newly imported measurement data. You can
give the imported data other name.
b. In the Receiver box, set the Height of the test CPE antenna (1.5m), the CPE antenna Gain
(0dBi) and Losses (3dB).
c. In the Measurement Conditions box select the measurement Units used (dBm).
d. In the Measurement Conditions box select appropriate Coordinates system. By default,
Atoll imports the coordinates using the Coordinates system of the Atoll project opened. If
Network Cluster Acceptance Certificate
Page 7 of 37
the coordinates used in the files you are importing are different from the coordinates used
in the Atoll project opened, you must click the Browse button and select the coordinate
system used in the test mobile data file. Atoll will then convert the data imported to the
coordinate system used in the Atoll project currently opened.
Figure 4
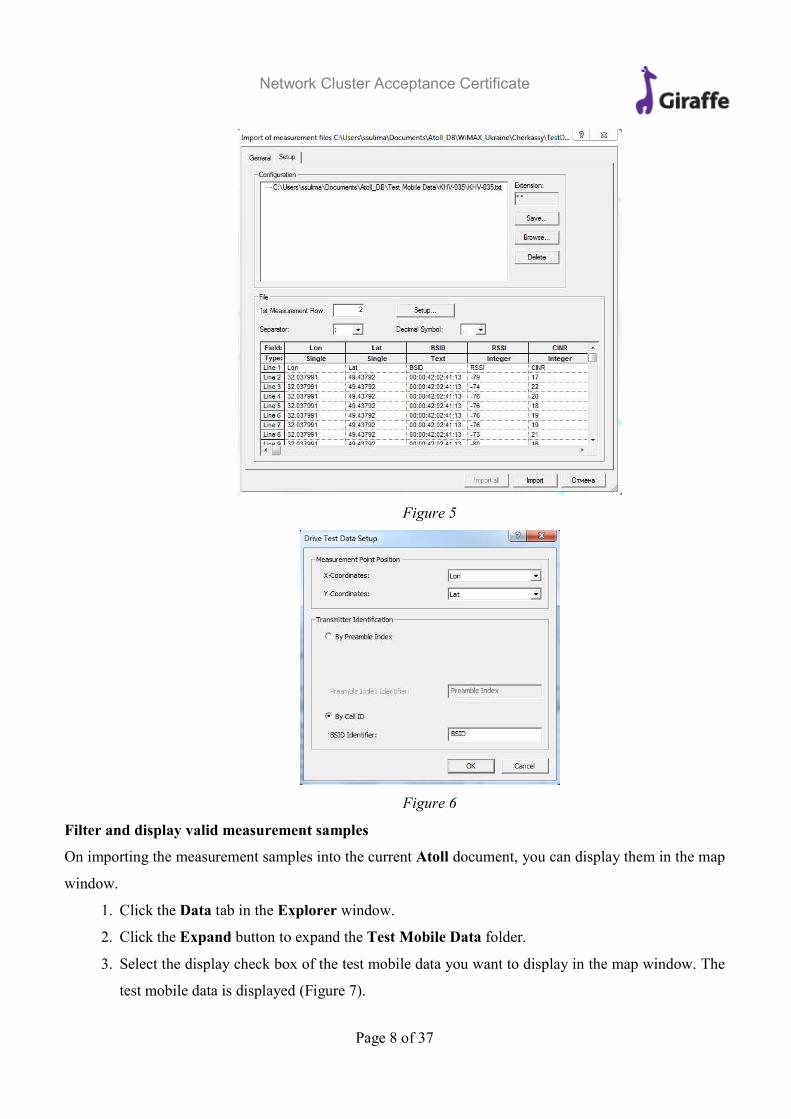
7. Click the Setup tab (see Figure 5)
b. In the File box, enter the number of the 1st Measurement Row, select the data
Separator, and select the Decimal Symbol used in the file.
c. Click Setup to link file columns and internal Atoll fields. The Test Mobile Data
Configuration dialogue appears.
d. Select the columns in the imported file that give the X-Coordinates and the Y-
Coordinates of each point in the test mobile data file.
e. In the BSID Identifier field, type the name of the field in the test mobile data file, that
contains BSID information, for example, BSID. (see Figure 6).
f. Click OK.
8. Click Import, The test mobile data is imported into the current Atoll document.
Network Cluster Acceptance Certificate
Page 8 of 37
Figure 5
Figure 6
Filter and display valid measurement samples
On importing the measurement samples into the current Atoll document, you can display them in the map
window.
1. Click the Data tab in the Explorer window.
2. Click the Expand button to expand the Test Mobile Data folder.
3. Select the display check box of the test mobile data you want to display in the map window. The
test mobile data is displayed (Figure 7).
Network Cluster Acceptance Certificate
Page 9 of 37
Defining the Display type and style of the measurement samples map
You can manage the display type and style of the measurement samples using the Display dialogue. The
samples points can be displayed according to any available attribute. You can also use the Display
dialogue to define labels, tool tips and the legend.
1. Click the Data tab in the Explorer window.
2. Click the Expand button to expand the Test Mobile Data folder.
3. Right-click the test mobile data file, whose display properties you want to manage. The context
menu appears.
4. Select Properties from the context menu. The test mobile data path’s properties dialogue appears.
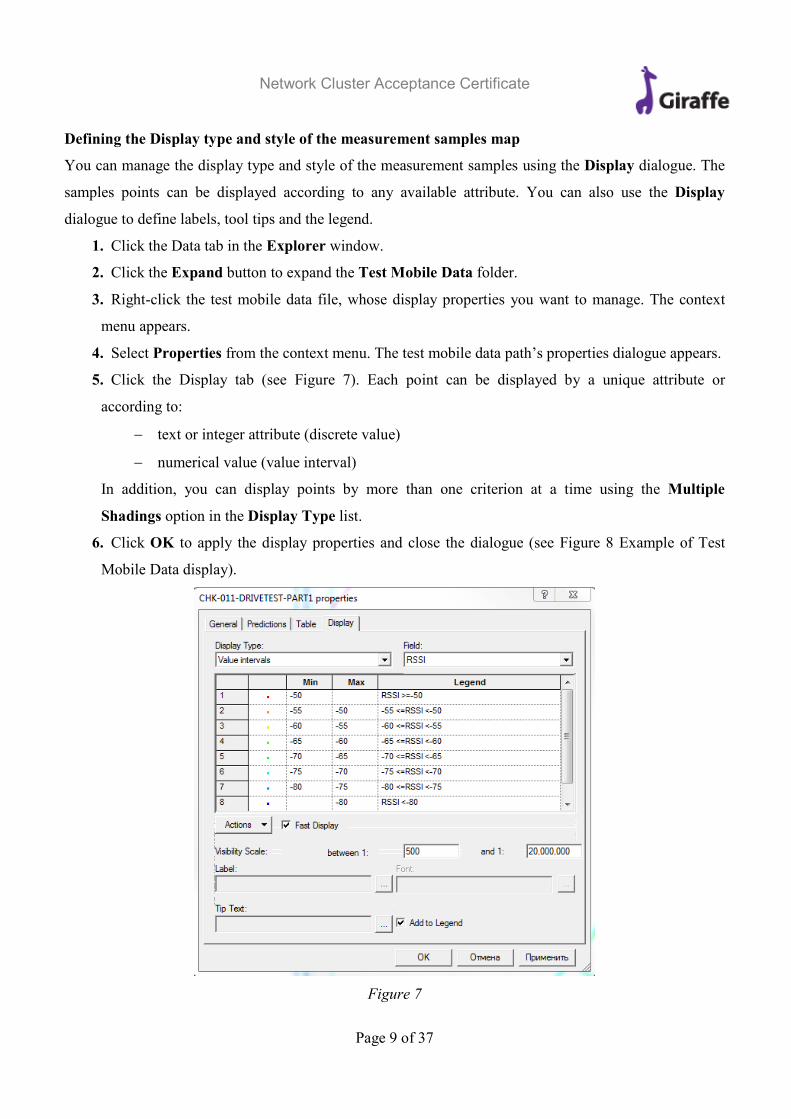
5. Click the Display tab (see Figure 7). Each point can be displayed by a unique attribute or
according to:
− text or integer attribute (discrete value)
− numerical value (value interval)
In addition, you can display points by more than one criterion at a time using the Multiple
Shadings option in the Display Type list.
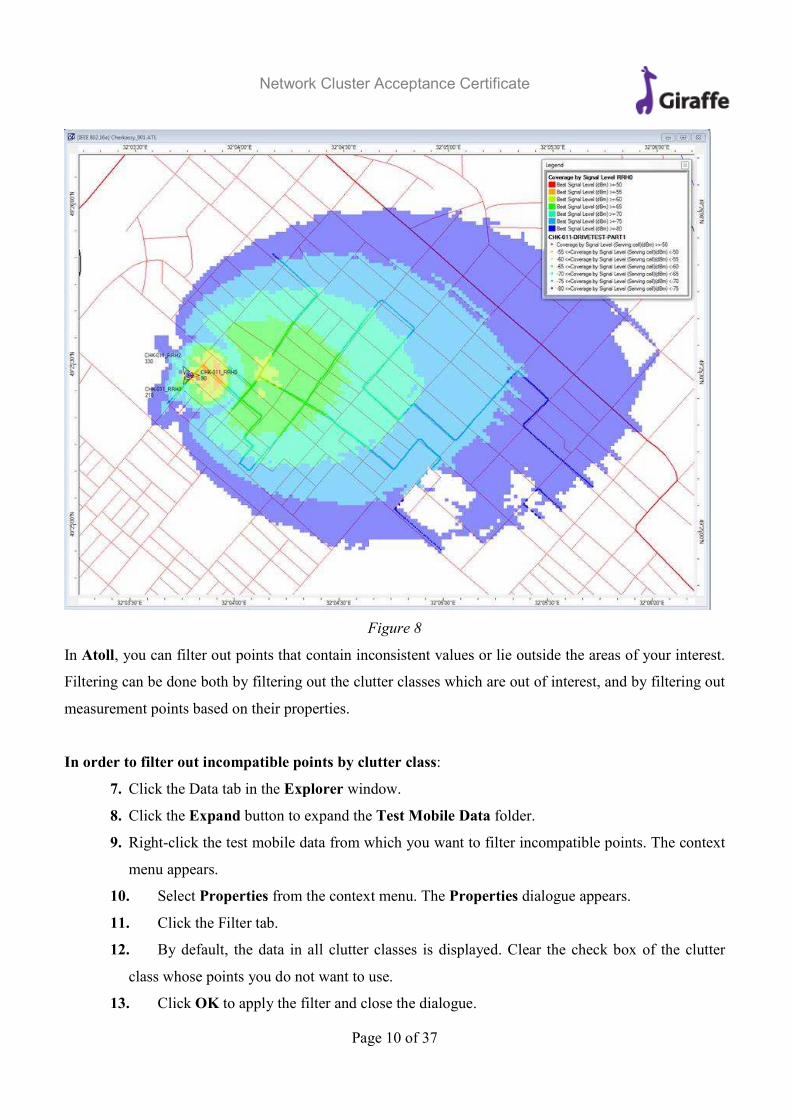
6. Click OK to apply the display properties and close the dialogue (see Figure 8 Example of Test
Mobile Data display).
Figure 7
Network Cluster Acceptance Certificate
Page 10 of 37
Figure 8
In Atoll, you can filter out points that contain inconsistent values or lie outside the areas of your interest.
Filtering can be done both by filtering out the clutter classes which are out of interest, and by filtering out
measurement points based on their properties.
In order to filter out incompatible points by clutter class:
7. Click the Data tab in the Explorer window.
8. Click the Expand button to expand the Test Mobile Data folder.
9. Right-click the test mobile data from which you want to filter incompatible points. The context
menu appears.
10. Select Properties from the context menu. The Properties dialogue appears.
11. Click the Filter tab.
12. By default, the data in all clutter classes is displayed. Clear the check box of the clutter
class whose points you do not want to use.
13. Click OK to apply the filter and close the dialogue.

Network Cluster Acceptance Certificate
Page 11 of 37
In order to filter out incompatible points using a filter:
1. Click the Data tab in the Explorer window.
2. Click the Expand button to expand the Test Mobile Data folder.
3. Right-click the test mobile data from which you want to filter incompatible points. The context
menu appears.
4. Select Properties from the context menu. The Properties dialogue appears.
5. Click the Filter tab.
6. Click More. The Filter dialogue appears.
7. Click the Filter tab:
a. Select a Field from the list.
b. Under Values to Include, you will find all the values represented in the selected field.
Select the check boxes next to the values you want to include in the filter. Click Clear All to
clear all check boxes.
8. Click the Advanced tab:
a. In the Column row, select the name of the column to be filtered on from the list. Select as
many columns as you want.
b. Underneath the name of each column, enter the criteria on which the column will be filtered
as explained in the following table.
9. Click OK to filter the data according to the criteria you have defined.
a. Filters are combined first horizontally, then vertically.
10. Click OK to apply the filter and close the dialogue.
Creating Coverage Predictions from Test Mobile Data Paths
To create a coverage prediction along a test mobile data path (Coverage by Signal Level):
1. Click the Data tab in the Explorer window.
2. Click the Expand button to expand the Test Mobile Data folder.
3. Right-click the test mobile data to which you want to add a coverage prediction. The context menu
appears.
4. Select Calculations > Create a New Study from the context menu. The Study Types dialogue
appears.
5. Under Standard Studies, select Coverage by Signal Level and click OK. The Coverage by
Signal Level properties dialogue appears.

Network Cluster Acceptance Certificate
Page 12 of 37
6. Click the Condition tab. At the top of the Condition tab, you can set the range of signal level to be
calculated.
7. When you have finished setting the parameters for the coverage prediction, click OK.
Calculate and display predicted vs. measured data consistency statistics
To display statistics of coverage prediction along a test mobile data path (Coverage by Signal Level and
RSSI):
1. Click the Data tab in the Explorer window.
2. Click the Expand button to expand the Test Mobile Data folder.
3. Right-click the test mobile data to which you want to display statistics. The context menu appears.
4. Select Display Statistics from the context menu. The Display Statistics dialogue appears (see Figure
5).
5. Under Select the predicted values, select Coverage by Signal Level, under Select the measured
values, select RSSI, and click OK.
The Predicted and Measured Value Fields appears (see Figure 6).
Figure 9
Network Cluster Acceptance Certificate
Page 13 of 37
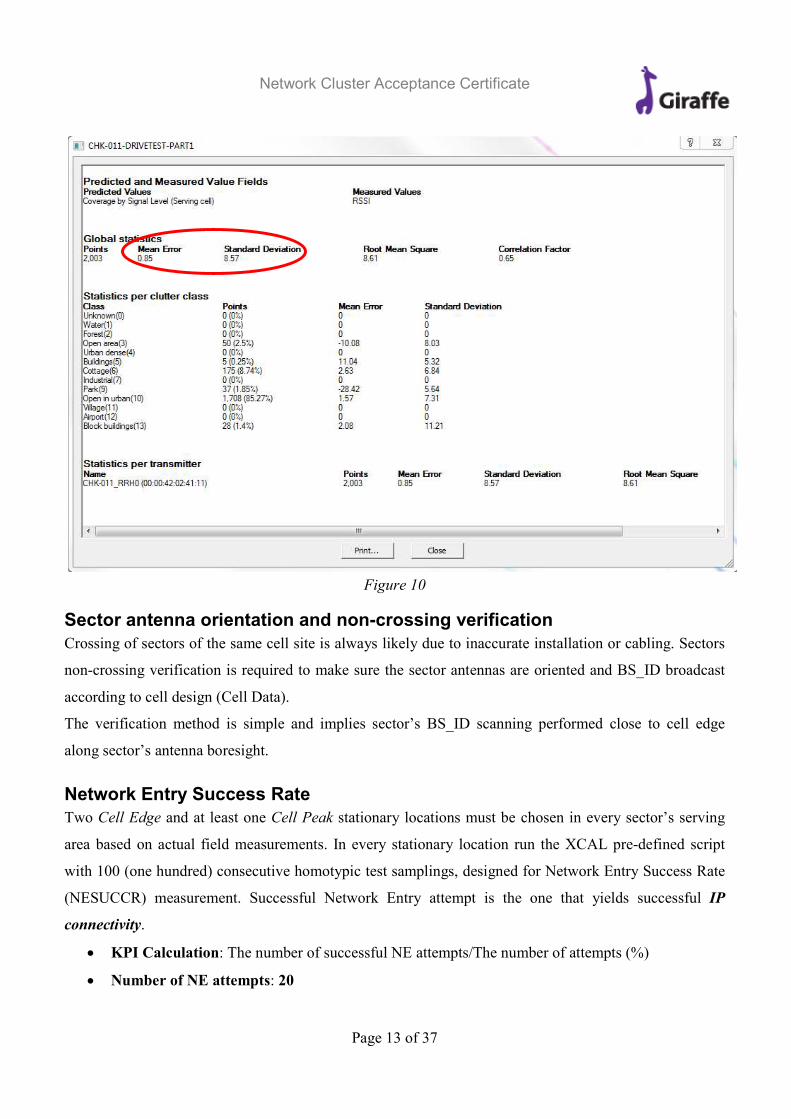
Figure 10
Sector antenna orientation and non-crossing verification
Crossing of sectors of the same cell site is always likely due to inaccurate installation or cabling. Sectors
non-crossing verification is required to make sure the sector antennas are oriented and BS_ID broadcast
according to cell design (Cell Data).
The verification method is simple and implies sector’s BS_ID scanning performed close to cell edge
along sector’s antenna boresight.
Network Entry Success Rate
Two Cell Edge and at least one Cell Peak stationary locations must be chosen in every sector’s serving
area based on actual field measurements. In every stationary location run the XCAL pre-defined script
with 100 (one hundred) consecutive homotypic test samplings, designed for Network Entry Success Rate
(NESUCCR) measurement. Successful Network Entry attempt is the one that yields successful IP
connectivity.
• KPI Calculation: The number of successful NE attempts/The number of attempts (%)
• Number of NE attempts: 20
Network Cluster Acceptance Certificate
Page 14 of 37
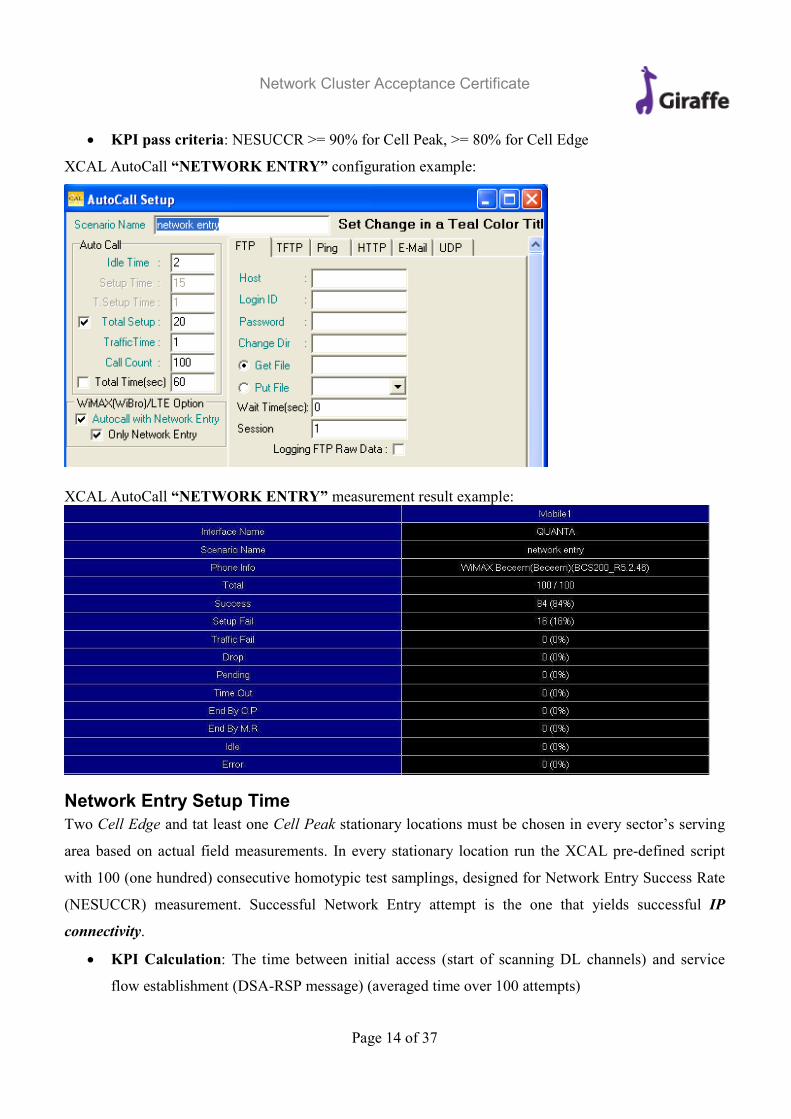
• KPI pass criteria: NESUCCR >= 90% for Cell Peak, >= 80% for Cell Edge
XCAL AutoCall “NETWORK ENTRY” configuration example:
XCAL AutoCall “NETWORK ENTRY” measurement result example:
Network Entry Setup Time
Two Cell Edge and tat least one Cell Peak stationary locations must be chosen in every sector’s serving
area based on actual field measurements. In every stationary location run the XCAL pre-defined script
with 100 (one hundred) consecutive homotypic test samplings, designed for Network Entry Success Rate
(NESUCCR) measurement. Successful Network Entry attempt is the one that yields successful IP
connectivity.
• KPI Calculation: The time between initial access (start of scanning DL channels) and service
flow establishment (DSA-RSP message) (averaged time over 100 attempts)
Network Cluster Acceptance Certificate
Page 15 of 37
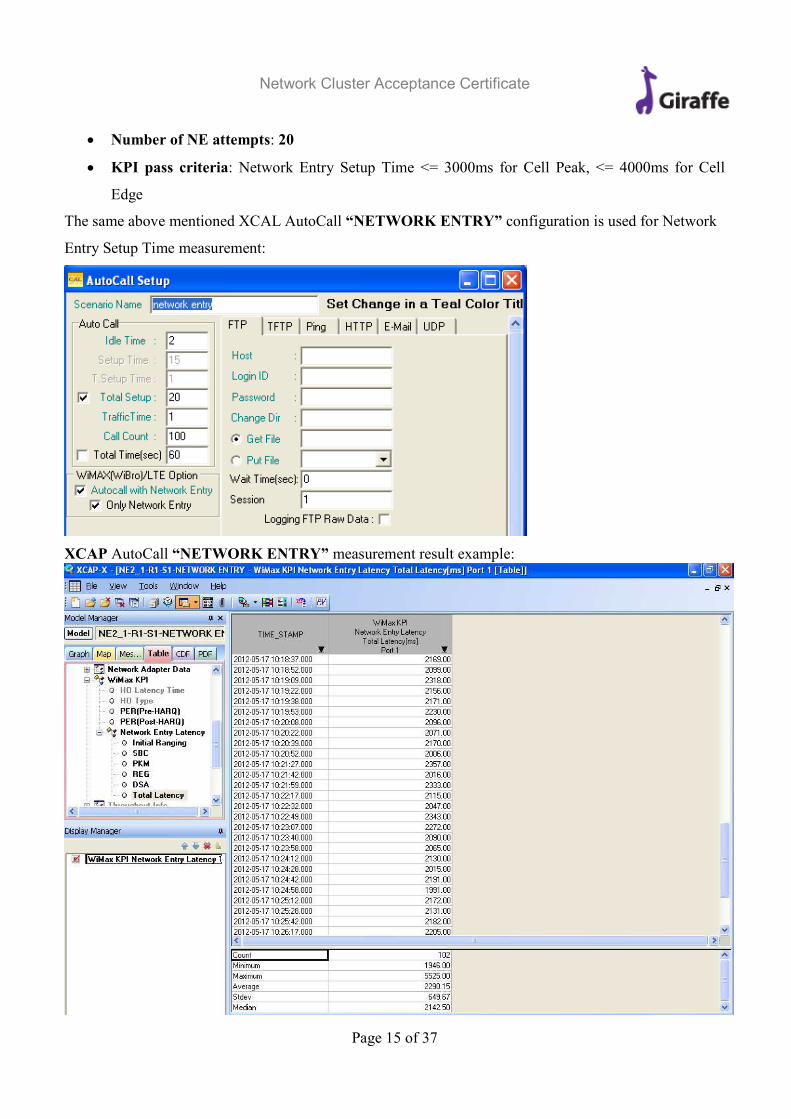
• Number of NE attempts: 20
• KPI pass criteria: Network Entry Setup Time <= 3000ms for Cell Peak, <= 4000ms for Cell
Edge
The same above mentioned XCAL AutoCall “NETWORK ENTRY” configuration is used for Network
Entry Setup Time measurement:
XCAP AutoCall “NETWORK ENTRY” measurement result example:
Network Cluster Acceptance Certificate
Page 16 of 37
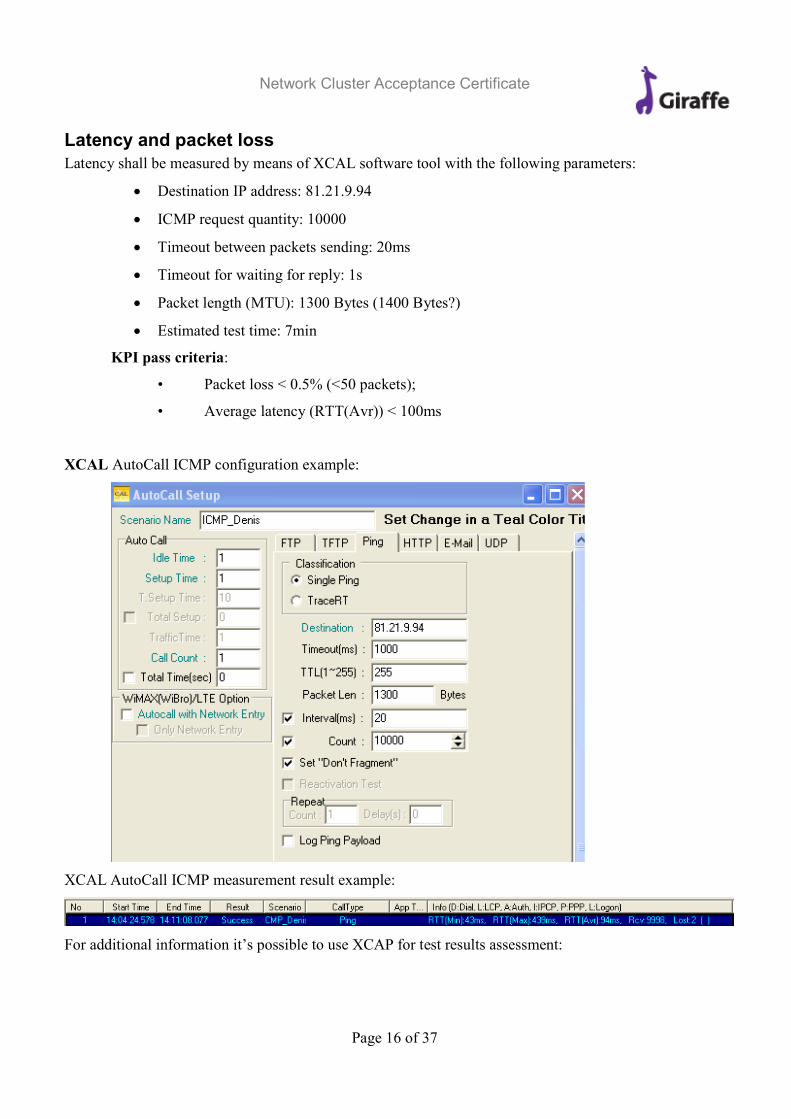
Latency and packet loss
Latency shall be measured by means of XCAL software tool with the following parameters:
• Destination IP address: 81.21.9.94
• ICMP request quantity: 10000
• Timeout between packets sending: 20ms
• Timeout for waiting for reply: 1s
• Packet length (MTU): 1300 Bytes (1400 Bytes?)
• Estimated test time: 7min
KPI pass criteria:
• Packet loss < 0.5% (<50 packets);
• Average latency (RTT(Avr)) < 100ms
XCAL AutoCall ICMP configuration example:
XCAL AutoCall ICMP measurement result example:
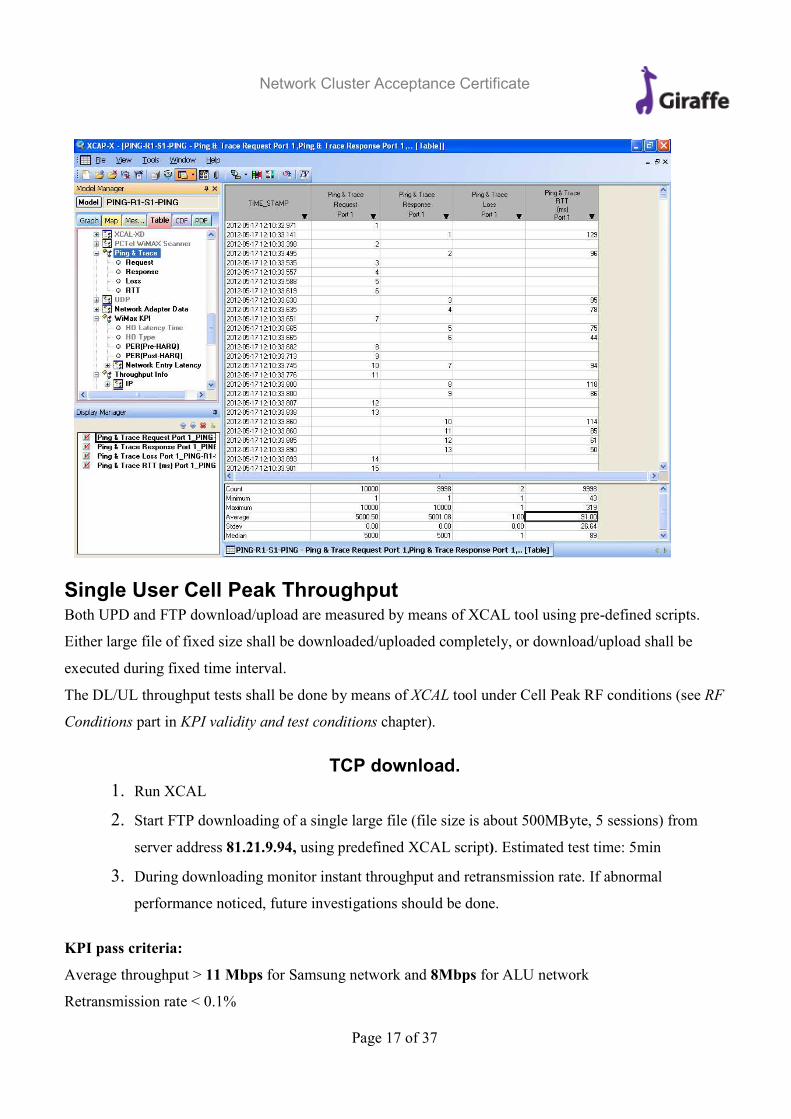
For additional information it’s possible to use XCAP for test results assessment:
Network Cluster Acceptance Certificate
Page 17 of 37
Single User Cell Peak Throughput Both UPD and FTP download/upload are measured by means of XCAL tool using pre-defined scripts.
Either large file of fixed size shall be downloaded/uploaded completely, or download/upload shall be
executed during fixed time interval.
The DL/UL throughput tests shall be done by means of XCAL tool under Cell Peak RF conditions (see RF
Conditions part in KPI validity and test conditions chapter).
TCP download.
1. Run XCAL
2. Start FTP downloading of a single large file (file size is about 500MByte, 5 sessions) from
server address 81.21.9.94, using predefined XCAL script). Estimated test time: 5min
3. During downloading monitor instant throughput and retransmission rate. If abnormal
performance noticed, future investigations should be done.
KPI pass criteria:
Average throughput > 11 Mbps for Samsung network and 8Mbps for ALU network
Retransmission rate < 0.1%
Network Cluster Acceptance Certificate
Page 18 of 37
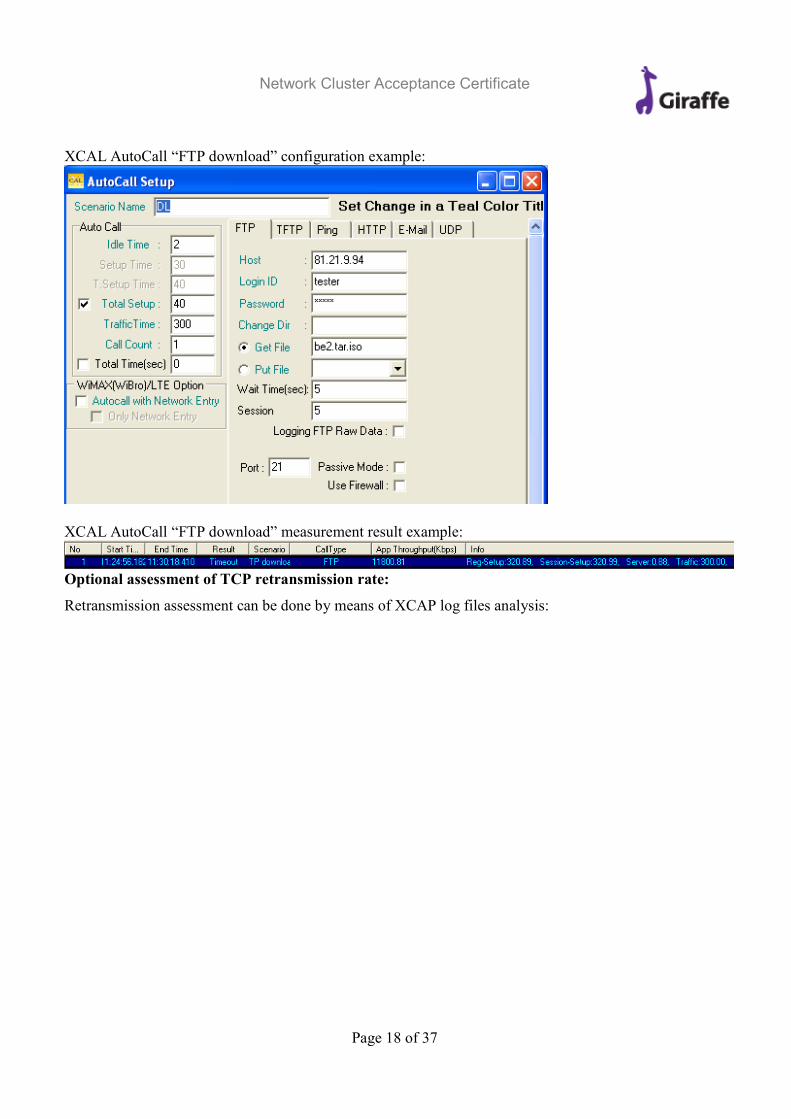
XCAL AutoCall “FTP download” configuration example:
XCAL AutoCall “FTP download” measurement result example:
Optional assessment of TCP retransmission rate:
Retransmission assessment can be done by means of XCAP log files analysis:

Network Cluster Acceptance Certificate
Page 19 of 37
Retransmission rate calculation:
Retransmission Rate = 100%*(TCP retransmissions)/(FTP Data packets)
In case of abnormal results of TCP testing it’s possible to lunch UDP testing to assess packet loss rate and
try to determine bottleneck:
1. Check throughput between WSM and RAS by using iperf (NOC)
2. Check UDP throughput between client and iperf server (81.21.9.94) (NOC and on-site engineer) a. Login on server
b. Launch iperf –c CLIENT_ADDRESS –u –b BANDWIDTH
c. Launch iperf –s –u on your laptop
BANDWIDTH: 1,2,5,8,10Mbps
TCP Upload.
1. Run XCAL
2. Start FTP uploading of a single large file (file size is 500M, 5 sessions) from server address
81.21.9.94, using predefined XCAL script). Estimated test time: 10min
Network Cluster Acceptance Certificate
Page 20 of 37
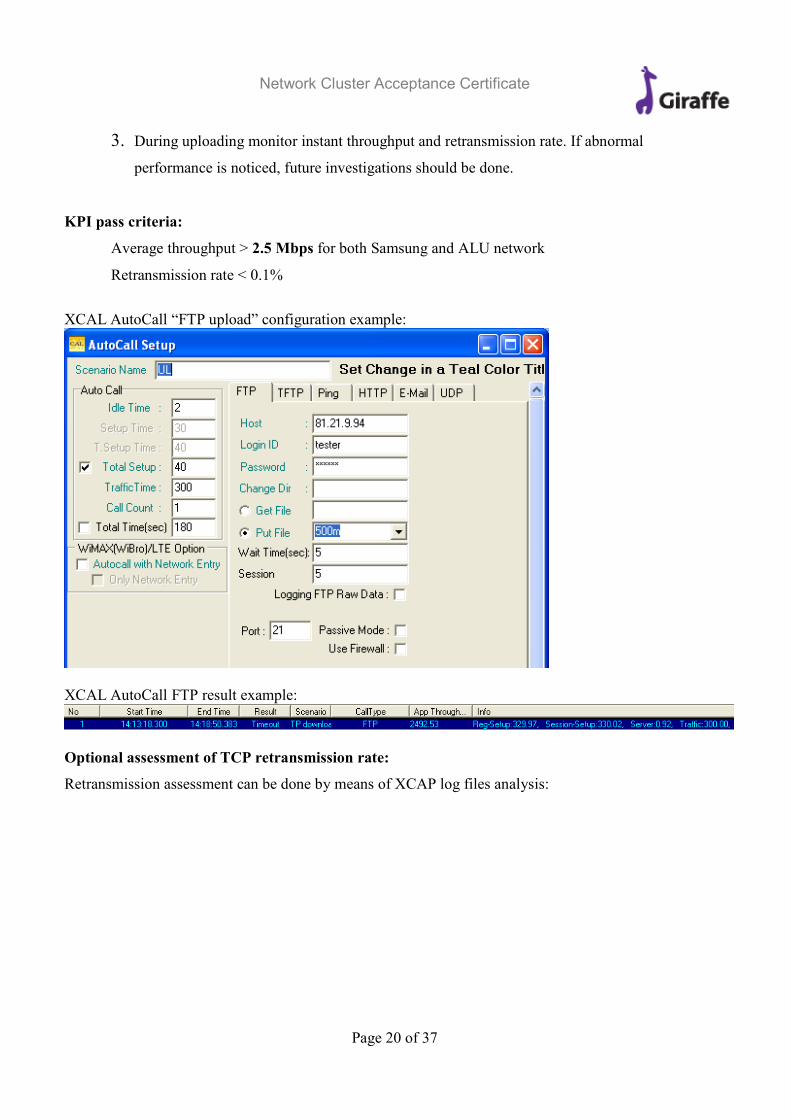
3. During uploading monitor instant throughput and retransmission rate. If abnormal
performance is noticed, future investigations should be done.
KPI pass criteria:
Average throughput > 2.5 Mbps for both Samsung and ALU network
Retransmission rate < 0.1%
XCAL AutoCall “FTP upload” configuration example:
XCAL AutoCall FTP result example:
Optional assessment of TCP retransmission rate:
Retransmission assessment can be done by means of XCAP log files analysis:

Network Cluster Acceptance Certificate
Page 21 of 37
Retransmission Rate calculation:
Retransmission rate = 100%*(TCP retransmission)/(FTP Data packets)
If some problems are found during TCP testing it’s possible to lunch UDP testing to assess packet loss
rate and try to determine bottleneck.
Additional UDP testing: 1. Check throughput between WSM and RAS by using iperf (NOC)
2. Check UDP throughput between client and iperf server (81.21.9.94) (NOC and on-site engineer) a. Login on server
b. Launch iperf –s -u c. Launch iperf –c 81.21.9.94 –u –b BANDWIDTH on your laptop
BANDWIDTH: 0.5,1,2,3Mbps
Network Cluster Acceptance Certificate
Page 22 of 37
Single User Cell Edge Throughput
Both UPD and FTP download/upload are measured by means of XCAL tool using pre-defined scripts.
Eithr large file of fixed size shall be download/uploaded completely, or download/upload shall be
executed during fixed time interval.
The throughput tests shall be done by means of XCAL tool under Cell Edge RF conditions (see RF
Conditions part in KPI validity and test conditions chapter).
TCP download.
The test procedure is identical to “Single User Cell Peak Throughput”, but under the Cell
Edge RF conditions. Estimated test time: 10min
KPI pass criteria:
Average throughput > 4 Mbps in at least one cell edge location
Retransmission rate < 0.5%
TCP upload.
The test procedure is identical to “Single User Cell Peak Throughput”, but under the Cell
Edge RF conditions. Estimated test time: 20min
KPI pass criteria:
Average throughput > 256 Kbps in at least one cell edge location
Retransmission rate < 0.5%
Cell Peak Capacity Evaluation
The network topology is depicted on the image below:
SWITCH – Dlink switch (it’s necessary to test if it is suitable)
GP – Green Packet Router with NAT enabled
WBS – Wimax Base Station
Server has four loopback addresses for downloading data through different GPs (according to NAT
translations and static routing configured on the test laptop):
L1: 81.21.9.96
L2: 81.21.9.97
L3: 81.21.9.98
L4: 81.21.9.99

Network Cluster Acceptance Certificate
Page 23 of 37
TCP Download.
1. Run Capsa
2. Enable filter in Capsa for denying all traffic except FTP
3. Restart monitoring Session in Capsa
4. Start FTP downloading of a single large file (file size is 500M) from each IP loopback server
address using Total Commander.
5. During downloading monitor instant throughput. If abnormal performance is noticed, future
investigations should be done.
6. To assess results take data from Capsa (maximum value on throughput graphic). In addition,
Kpi_hist_client.exe tool can be used as an alternative source of information as well, but until
after 15 minutes delay after the measurements.
KPI pass criteria:
1. Peak throughput > 30Mbps for Samsung network and 16Mbps for ALU network
2. Retransmission rate < 0.1% (see Test procedure of “Single User Cell Peak Throughput”)

Network Cluster Acceptance Certificate
Page 24 of 37
TCP Upload.
1. Run Capsa
2. Enable filter in Capsa for denying all traffic except FTP
3. Restart monitoring Session in Capsa
4. Start FTP uploading of four files (files size is 500M) to each IP loopback server address by
using Total Commander.
5. During downloading monitor instant throughput. If something abnormal is noticed, future
investigations should be done.
6. To assess results take data from Capsa (maximum value on throughput graphic). In addition,
Kpi_hist_client.exe tool can be used as an alternative source of information as well, but until
after 15 minutes delay after the measurements.
KPI pass criteria:
1. Peak throughput > 3.5Mbps for both Samsung and ALU networks
2. Retransmission rate < 0.1% (see Test procedure of “Single User Cell Peak Throughput”)
Optional assessment of TCP retransmission rate:
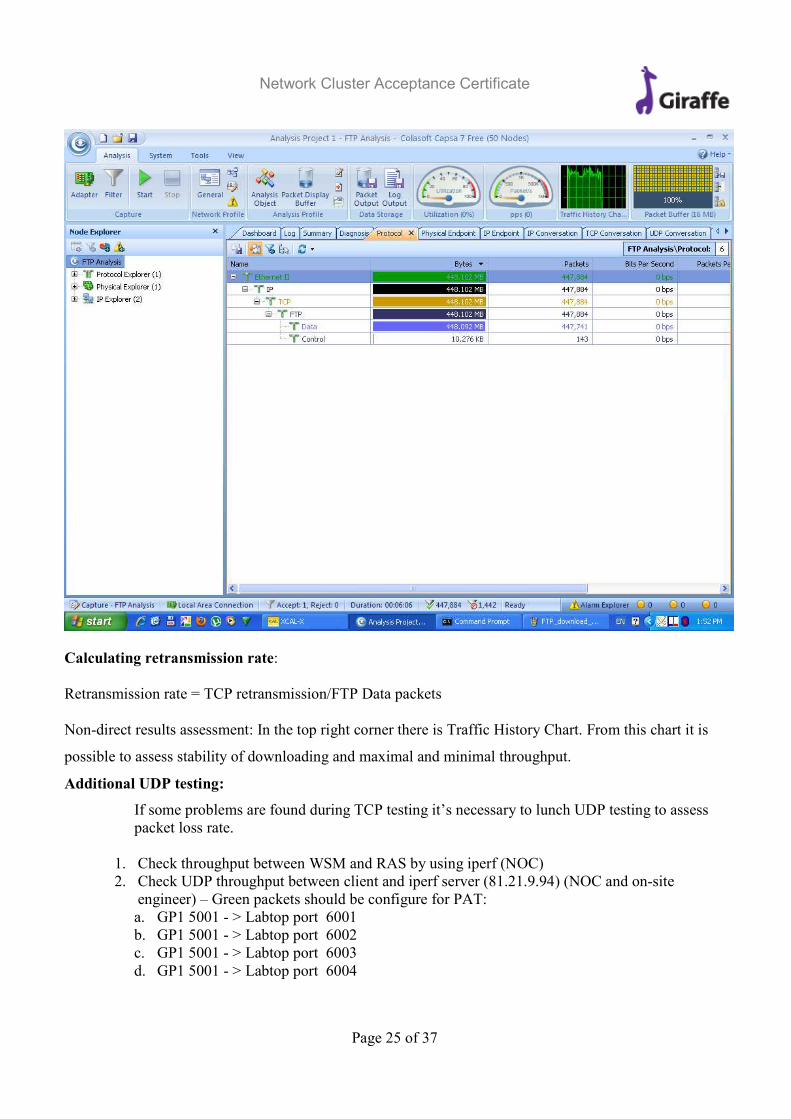
FTP download/upload and retransmission assessment can be done by means of Capsa results analysis:
Network Cluster Acceptance Certificate
Page 25 of 37
Calculating retransmission rate:
Retransmission rate = TCP retransmission/FTP Data packets
Non-direct results assessment: In the top right corner there is Traffic History Chart. From this chart it is
possible to assess stability of downloading and maximal and minimal throughput.
Additional UDP testing:
If some problems are found during TCP testing it’s necessary to lunch UDP testing to assess
packet loss rate.
1. Check throughput between WSM and RAS by using iperf (NOC)
2. Check UDP throughput between client and iperf server (81.21.9.94) (NOC and on-site engineer) – Green packets should be configure for PAT:
a. GP1 5001 - > Labtop port 6001
b. GP1 5001 - > Labtop port 6002 c. GP1 5001 - > Labtop port 6003
d. GP1 5001 - > Labtop port 6004
Network Cluster Acceptance Certificate
Page 26 of 37
KPI validity and test conditions
Coverage validation rules
The purpose of coverage validation is to make sure actual measured cell coverage meets the one predicted
at network planning stage. The correspondence between designed (predicted) and measured coverage, or
rather difference between them, is evaluated by means of coverage validation process. The evaluation is
performed typically based on two statistical criteria:
• Standard Deviation (http://en.wikipedia.org/wiki/Standard_deviation)
• Mean Error (http://en.wikipedia.org/wiki/Mean_absolute_error)
The overall objective is to minimize the error between the propagation model predictions and the field
measurement data. The metrics used to quantify the error are the mean and the standard deviation of the
error. The aim during the calibration process is to reach a null mean error and a low standard deviation for
all the measurement data taken as a whole and to minimize these two criteria for each single measurement
path. A common target value for standard deviation is 8dB, while mean error is 0dB. In the scope of this
coverage validation tests 10dB standard deviation and 1dB mean error are tolerated due to imperfectness
of the propagation models used.
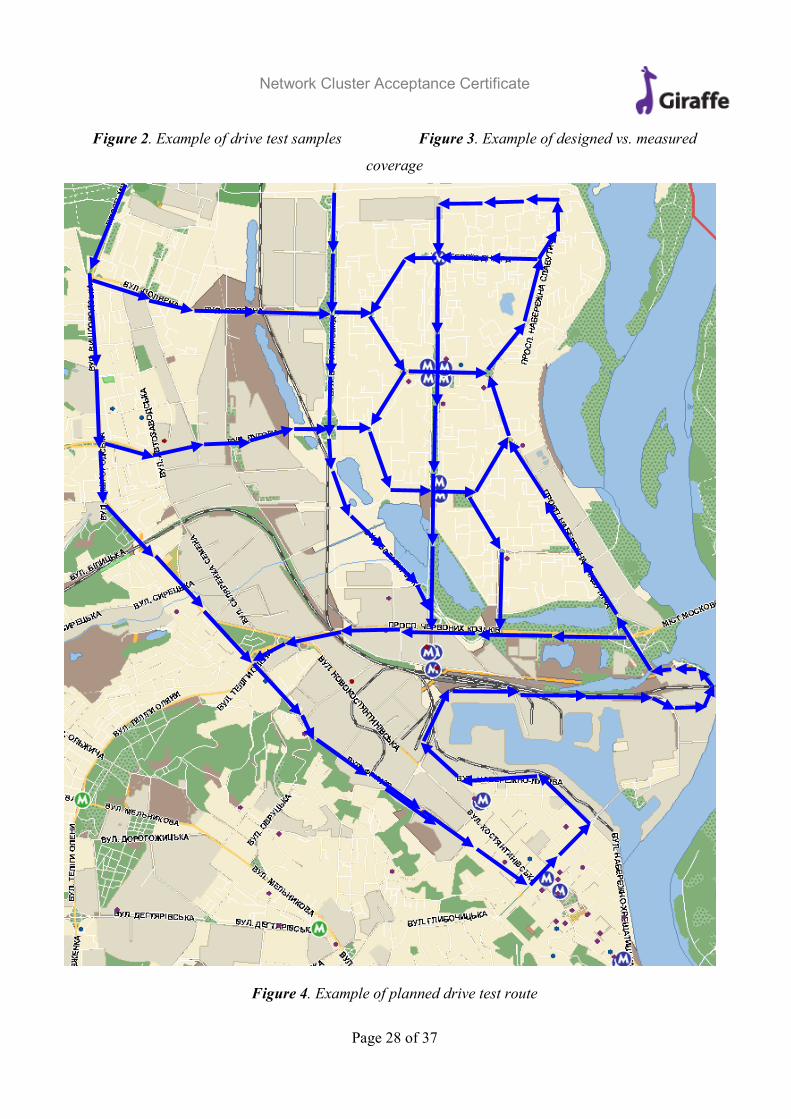
Coverage validation shall be performed by means of thoroughgoing drive tests over cell’s coverage area
so that to collect RSSI/CINR samples of any strength varying from Cell Peak to Cell Edge. Drive route
and driving speed should be planned so that not to favor area with certain field strength against areas with
other field strength (for example, favoring near-BS zones with high signal strength against near-cell-edge
zones with low signal strength). In other words, drive route and driving speed should be planned so that
RSSI/CNIR measurement samples were evenly distributed among all possible distances from test CPE to
BS, within cell’s coverage area, naturally.
The drive test route for coverage validation must be planned to include all beaten tracks within the cell’s
predicted serving area in order to accumulate as many as possible of measurement sample points from all
accessible locations. In other words, each and every drivable road within the predicted serving area must
be included in the drive test plan for coverage validation.
Better yet if the drive test routes of the same serving area make a path through various clutter types (e.g.
dense urban, urban, residential, industrial areas, etc.). This facilitates RF planning tool propagation model
calibration with higher accuracy and helps expose coverage prediction inconsistencies of any given area.
Examples of comprehensive drive test route, drive test samples and designed vs. measured coverage are
depicted on Figures 1-4 below.
Network Cluster Acceptance Certificate
Page 27 of 37
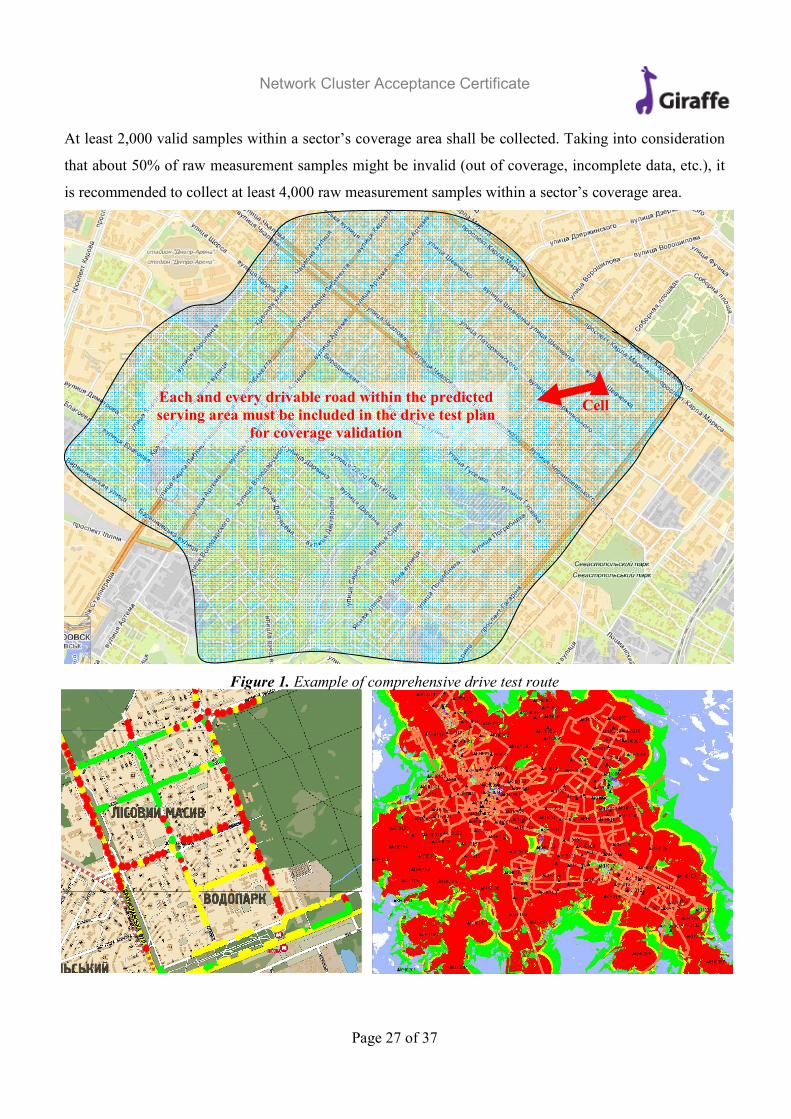
At least 2,000 valid samples within a sector’s coverage area shall be collected. Taking into consideration
that about 50% of raw measurement samples might be invalid (out of coverage, incomplete data, etc.), it
is recommended to collect at least 4,000 raw measurement samples within a sector’s coverage area.
Figure 1. Example of comprehensive drive test route
Cell
Each and every drivable road within the predicted
serving area must be included in the drive test plan
for coverage validation
Cell
Network Cluster Acceptance Certificate
Page 28 of 37
Figure 2. Example of drive test samples Figure 3. Example of designed vs. measured
coverage
Figure 4. Example of planned drive test route
Network Cluster Acceptance Certificate
Page 29 of 37
Backhaul conditions
Backhaul link test is the mandatory prerequisite for the following cell site RF acceptance and
certification. Poor backhaul parameters can undermine overall cell KPIs, especially when it comes to
throughput and capacity performance. Which is why backhaul link tests should be accomplished prior to
cell site RF acceptance procedures. Poor backhaul performance must be rectified first, since the following
RF tests make little sense without appropriate backhaul quality. Such precautions arose in the wake of
frequent unfortunate field experiences.
The backhaul is the virtual communication data line between an ASN-GW and the WiMAX base
station under measurements. The line may comprise both leased line(s) and in-house facilities (MW
links, routers, switches). Thus, a backhaul to a cell site is the complex series communication chain with
multiple heterogeneous links, which is why inconsistencies and error multiplications are highly likely.
The following backhaul KPIs are to be measured:
• Capacity: in compliance with contracted value or used H/W capacity
• RTT (ping delay): ≤10ms
• Packet loss: ≤1%
• MTU size: ≥1500 bytes
RF conditions
Coverage validation shall be performed by means of thoroughgoing drive tests over cell’s coverage area
so that to collect RSSI/CINR samples of any strength varying from Cell Peak to Cell Edge. Drive route
and driving speed should be planned so that not to favor area with certain field strength against areas with
other field strength (for example, favoring near-BS zones with high signal strength against near-cell-edge
zones with low signal strength). In other words, drive route and driving speed should be planned so that
RSSI/CNIR measurement samples were evenly distributed among all possible distances from test CPE to
BS, within cell’s coverage area, naturally.
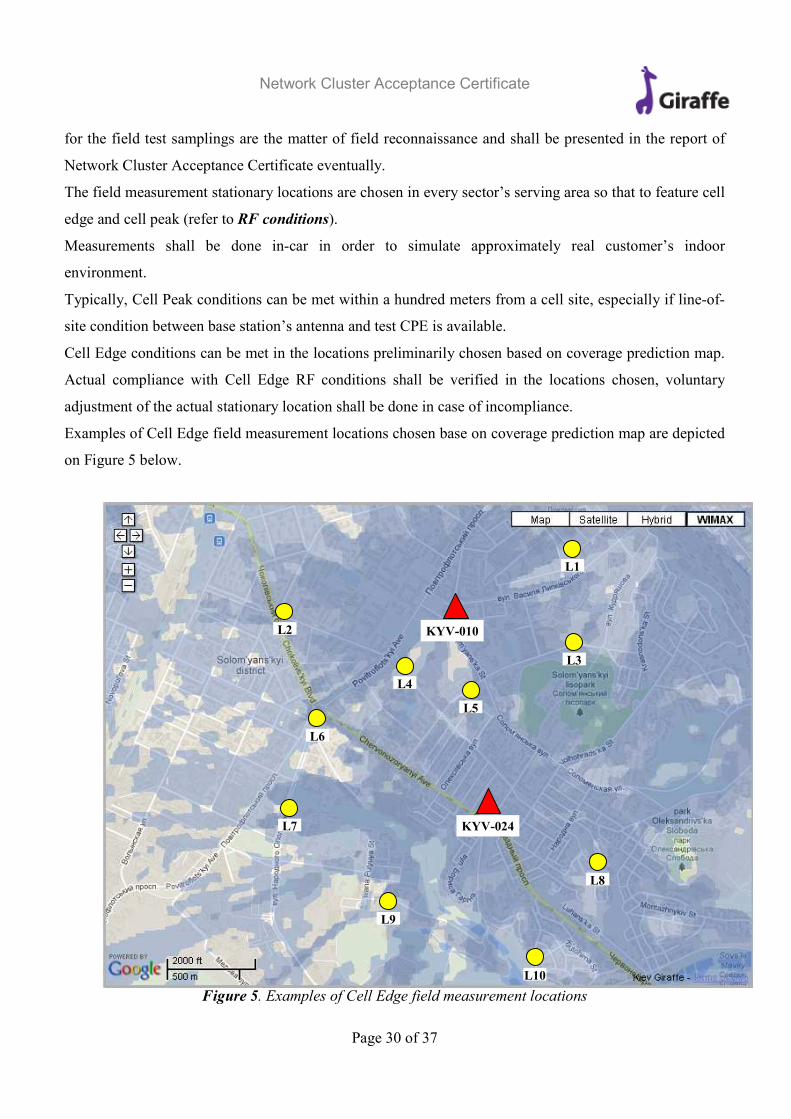
The stationary field measurement locations are chosen in every sector’s serving area so that to feature two
extremes of the coverage field strength - Cell Edge and Cell Peak.
An array of locations where RF conditions correspond to DL RSSI≈-85dBm and/or DL CINR≈8-10dB
and distance from the service cell is less than 8km, is referred to as Cell Edge. Exact cell edge locations
for the field test samplings are the matter of field reconnaissance and shall be presented in the report of
Network Cluster Acceptance Certificate eventually.
An array of locations where RF conditions correspond to DL RSSI≥-50dBm and/or DL CINR≥33dB
and distance from the service cell is less than 8km, is referred to as Cell Peak. Exact cell peak locations
Network Cluster Acceptance Certificate
Page 30 of 37
KYV-010
KYV-024
L10
L8
L9
L7
L6
L2
L4
L5
L3
L1
for the field test samplings are the matter of field reconnaissance and shall be presented in the report of
Network Cluster Acceptance Certificate eventually.
The field measurement stationary locations are chosen in every sector’s serving area so that to feature cell
edge and cell peak (refer to RF conditions).
Measurements shall be done in-car in order to simulate approximately real customer’s indoor
environment.
Typically, Cell Peak conditions can be met within a hundred meters from a cell site, especially if line-of-
site condition between base station’s antenna and test CPE is available.
Cell Edge conditions can be met in the locations preliminarily chosen based on coverage prediction map.
Actual compliance with Cell Edge RF conditions shall be verified in the locations chosen, voluntary
adjustment of the actual stationary location shall be done in case of incompliance.
Examples of Cell Edge field measurement locations chosen base on coverage prediction map are depicted
on Figure 5 below.
Figure 5. Examples of Cell Edge field measurement locations
Network Cluster Acceptance Certificate
Page 31 of 37
Amount of measurement samples
Amount of measurement samples collected for coverage validation purposes may vary and depends much
on drive test route and its path length. Drive test route and its path length are defined in Coverage
validation rules and are out of scope of Amount of measurement samples definition.
The field measurement stationary locations are chosen in every sector’s serving area so that to feature cell
edge and cell peak (refer to RF conditions).
The KPIs to be checked with field measurements in stationary locations are as follows:
1. Network Entry Success Rate
2. Network Entry Setup Time
3. Latency
4. Single User Cell Peak Downlink Throughput
5. Single User Cell Peak Uplink Throughput
6. Single User Cell Edge Downlink Throughput
7. Single User Cell Edge Uplink Throughput
8. Cell Peak Downlink Capacity Evaluation
9. Cell Peak Uplink Capacity Evaluation
The KPI field measurements shall be executed consequently – script by script (in best scenario) or manual
measurement by manual measurement (in worst scenario) in one and the same stationary location. Time
interval between consecutive measurements of the same stationary location shall be not more than one
calendar day to have approximately the same RF conditions.
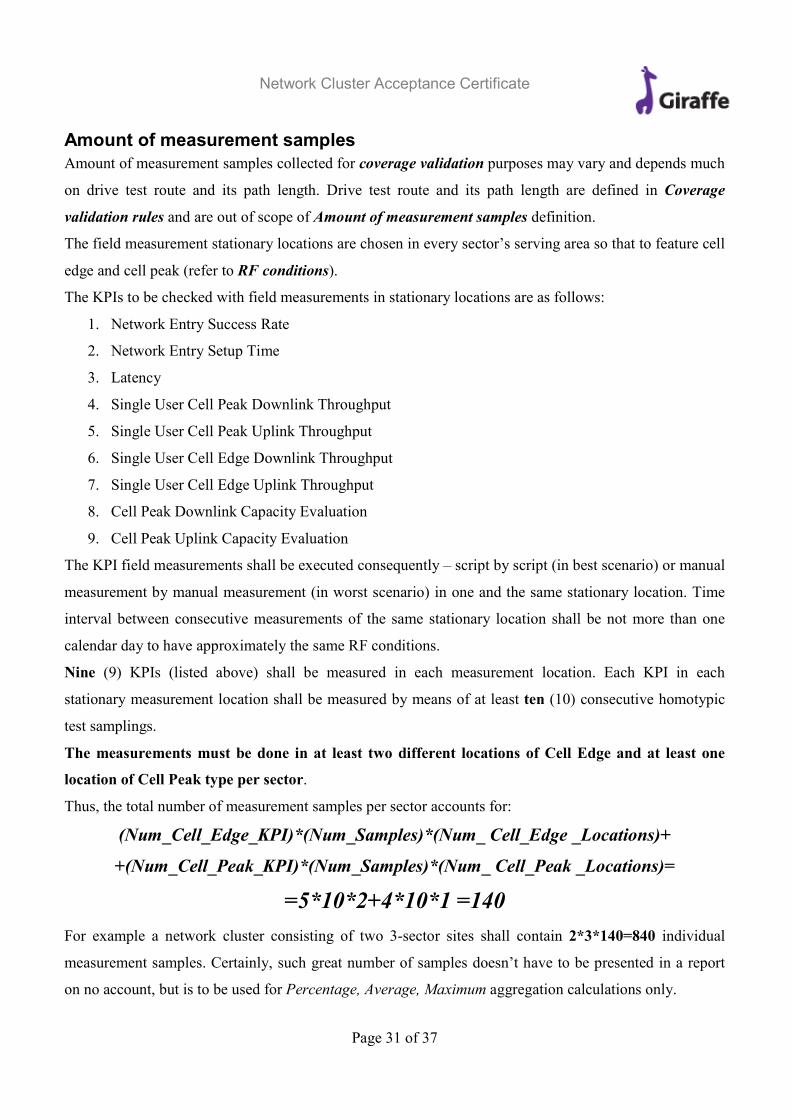
Nine (9) KPIs (listed above) shall be measured in each measurement location. Each KPI in each
stationary measurement location shall be measured by means of at least ten (10) consecutive homotypic
test samplings.
The measurements must be done in at least two different locations of Cell Edge and at least one
location of Cell Peak type per sector.
Thus, the total number of measurement samples per sector accounts for:
(Num_Cell_Edge_KPI)*(Num_Samples)*(Num_ Cell_Edge _Locations)+
+(Num_Cell_Peak_KPI)*(Num_Samples)*(Num_ Cell_Peak _Locations)=
=5*10*2+4*10*1 =140
For example a network cluster consisting of two 3-sector sites shall contain 2*3*140=840 individual
measurement samples. Certainly, such great number of samples doesn’t have to be presented in a report
on no account, but is to be used for Percentage, Average, Maximum aggregation calculations only.
Network Cluster Acceptance Certificate
Page 32 of 37
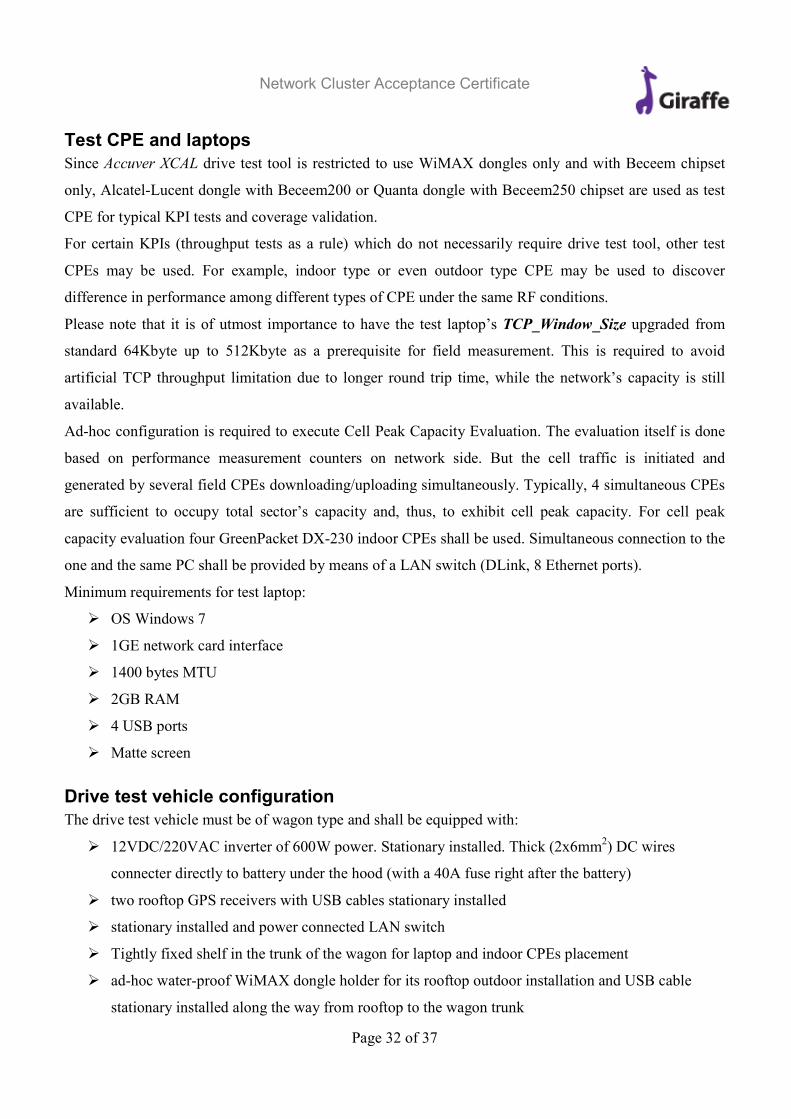
Test CPE and laptops
Since Accuver XCAL drive test tool is restricted to use WiMAX dongles only and with Beceem chipset
only, Alcatel-Lucent dongle with Beceem200 or Quanta dongle with Beceem250 chipset are used as test
CPE for typical KPI tests and coverage validation.
For certain KPIs (throughput tests as a rule) which do not necessarily require drive test tool, other test
CPEs may be used. For example, indoor type or even outdoor type CPE may be used to discover
difference in performance among different types of CPE under the same RF conditions.
Please note that it is of utmost importance to have the test laptop’s TCP_Window_Size upgraded from
standard 64Kbyte up to 512Kbyte as a prerequisite for field measurement. This is required to avoid
artificial TCP throughput limitation due to longer round trip time, while the network’s capacity is still
available.
Ad-hoc configuration is required to execute Cell Peak Capacity Evaluation. The evaluation itself is done
based on performance measurement counters on network side. But the cell traffic is initiated and
generated by several field CPEs downloading/uploading simultaneously. Typically, 4 simultaneous CPEs
are sufficient to occupy total sector’s capacity and, thus, to exhibit cell peak capacity. For cell peak
capacity evaluation four GreenPacket DX-230 indoor CPEs shall be used. Simultaneous connection to the
one and the same PC shall be provided by means of a LAN switch (DLink, 8 Ethernet ports).
Minimum requirements for test laptop:
� OS Windows 7
� 1GE network card interface
� 1400 bytes MTU
� 2GB RAM
� 4 USB ports
� Matte screen
Drive test vehicle configuration
The drive test vehicle must be of wagon type and shall be equipped with:
� 12VDC/220VAC inverter of 600W power. Stationary installed. Thick (2x6mm2) DC wires
connecter directly to battery under the hood (with a 40A fuse right after the battery)
� two rooftop GPS receivers with USB cables stationary installed
� stationary installed and power connected LAN switch
� Tightly fixed shelf in the trunk of the wagon for laptop and indoor CPEs placement
� ad-hoc water-proof WiMAX dongle holder for its rooftop outdoor installation and USB cable
stationary installed along the way from rooftop to the wagon trunk
Network Cluster Acceptance Certificate
Page 33 of 37
Test server configuration
The tests should not be impacted by any problem that may come from public Internet. Nor should they be
impacted by vulnerabilities of TCP protocol, especially while tested through remote test servers. The
typical vulnerabilities are as follows:
• TCP stack buffer size of devices (PC, servers, etc.)
• Bandwidth-delay product (BDP)
• Protocol Overhead
• MTU, RTT, Packet Loss
That is why one dedicated test server located in Intellecom’s internal network is used for performance
tests. It acts as a UDP, TCP and FTP server and mainly tuned to exhibit best possible TCP throughput.
The crucial requirement to the test server is that it should be used for field measurements only. No other
application or services must be run on it. TCP protocol stack of the server should not be occupied with
any traffic load other than that generated by field measurements.
Typical field tests are conducted by means of Accuver XCAL drive test tool. Pre-defined scripts are run to
perform consecutive KPI tests. Many of them like Latency, Single User DL/UL Peak Throughput, and
Single User Cell Edge DL/UL Throughput (except Cell Peak Capacity which is evaluated at network’s
side) require remote FTP test server.
As a matter of convenience Speedtest.net Mini is preferred method due to its simple and convenient
interface. It is accessible from public internet via DNS name http://speedtest.intellecom.net.ua. A person
who performs tests uses web-interface of the server.
Second option, IPERF, is permanently configured with IP-address 66.66.66.66 and accessible via DNS
name http://iperf.intellecom.net.ua. A person who performs tests uses customized executable Giraffe.bat
file to interact with the server in the background and generate test results dump file.
The test server hardware and software configuration must meet the following preferences:
� DELL 1850
� 1GE Ethernet network interface
� Linux/Unix/Windows OS
� HTTP server software
� At least 4 public IP-addresses allocated
� 1400 bytes MTU

Network Cluster Acceptance Certificate
Page 34 of 37
QoS class of test CPE
All Key Performance Indicators tests associated to the coverage validation, network entry, capacity tests
are performed with test CPE with Best Effort (BE) QoS class. Latency tests may optionally be performed
with UGS QoS class as well.
For BE, the service profile considered is 20000(DL, kbps)/3000(UL, kbps), Traffic Priority = 7.
Five unique user accounts (login/password) with above mentioned profile are required for the
measurements: 1 for USB dongle and 4 for indoor CPEs.
Exclusions Definition
External RF interference in 2.3GHz band is very likely. The sources of interference may be out-of-band
emission, spurious emission or illegal in-band operation in Intellecom’s licensed band (either malicious or
involuntary).
Occurrence of external interference in certain location can be easily detected by means of monitoring
Samsung base station UL noise floor rise (UL_NI_AVG, Average Uplink Noise and Interference level
counter). This is most direct measurement of external interference, but it can only exhibit a source close
to base station location mainly.
As an indirect measurement, DL_CINR_MIN/DL_CINR_MAX/DL_CINR_AVG counters can exhibit
occurrence of external interference with a source far from base station location, but with less accuracy.
In Alcatel-Lucent network judgment of occurrence of external interference can be made only based on
UL CINR/RSSI Matrix and DL CINR/RSSI Matrix statistics.
Alcatel-Lucent network performance evaluation may fall under more individual exclusions due to its
traditional inferiority of performance.
Either way, direct spectrum scanning with external spectrum analyzer can be the best tool to create
evidence of occurrence of external interference.
Uplink noise floor level of a base station and its KPI validity can be categorized as follows:
• below -100 dBm: normal. KPIs valid
• between -100dBm and -90dBm: tolerable external interference. KPIs may be provisionally valid
• above -90dBm: intolerable external interference. KPIs are invalid
Network Cluster Acceptance Certificate
Page 35 of 37
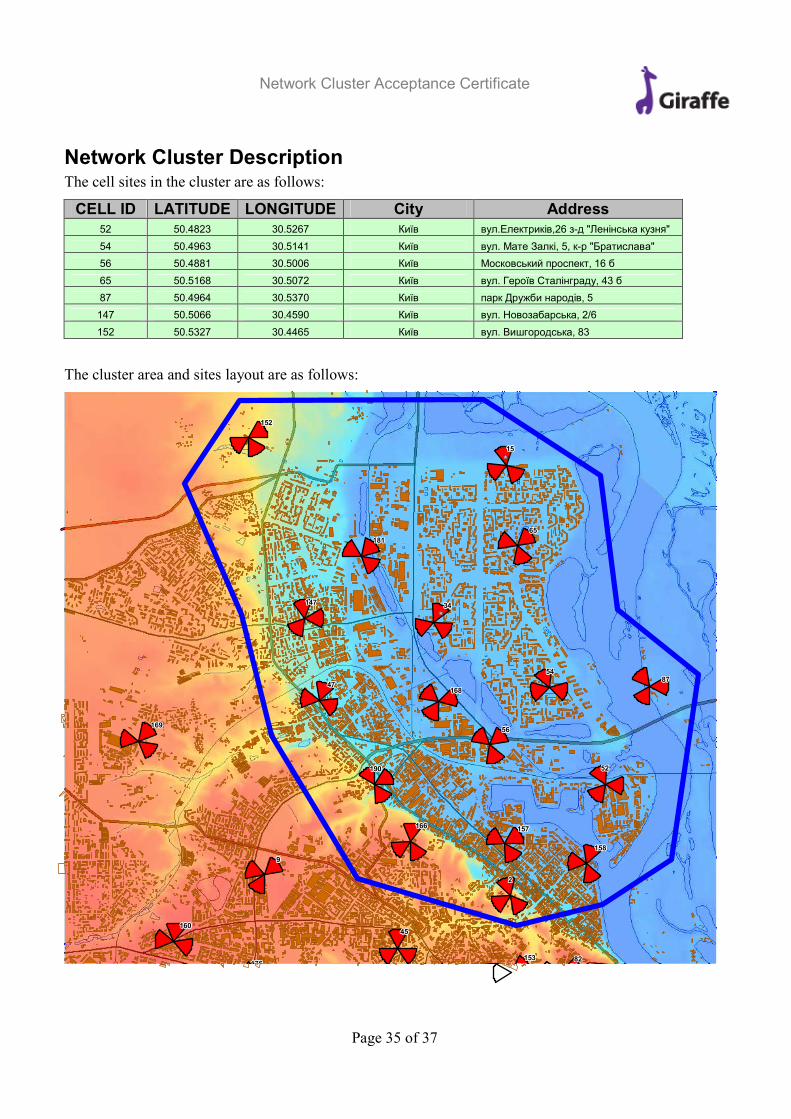
Network Cluster Description The cell sites in the cluster are as follows:
CELL ID LATITUDE LONGITUDE City Address
52 50.4823 30.5267 Київ вул.Електриків,26 з-д "Ленінська кузня"
54 50.4963 30.5141 Київ вул. Мате Залкі, 5, к-р "Братислава"
56 50.4881 30.5006 Київ Московський проспект, 16 б
65 50.5168 30.5072 Київ вул. Героїв Сталінграду, 43 б
87 50.4964 30.5370 Київ парк Дружби народів, 5
147 50.5066 30.4590 Київ вул. Новозабарська, 2/6
152 50.5327 30.4465 Київ вул. Вишгородська, 83
The cluster area and sites layout are as follows:
222222222
999999999
151515151515151515
343434343434343434
454545454545454545
474747474747474747
525252525252525252
545454545454545454
565656565656565656
656565656565656565
828282828282828282
878787878787878787
147147147147147147147147147
152152152152152152152152152
153153153153153153153153153
157157157157157157157157157
158158158158158158158158158
160160160160160160160160160
166166166166166166166166166
168168168168168168168168168
169169169169169169169169169
176176176176176176176176176
181181181181181181181181181
190190190190190190190190190

Network Cluster Acceptance Certificate
Page 36 of 37
KHV-007 acceptance
Cell A location and configuration
Drive test routes of Cell A
Coverage validation of Cell A
KPI report of Cell A
Supplementary quality report of Cell A
KHV-030 acceptance
Cell A location and configuration
Drive test routes of Cell A
Coverage validation of Cell A
KPI report of Cell A
Supplementary quality report of Cell A
KHV-032 acceptance
Cell A location and configuration
Drive test routes of Cell A
Coverage validation of Cell A
KPI report of Cell A
Supplementary quality report of Cell A
37 of 37
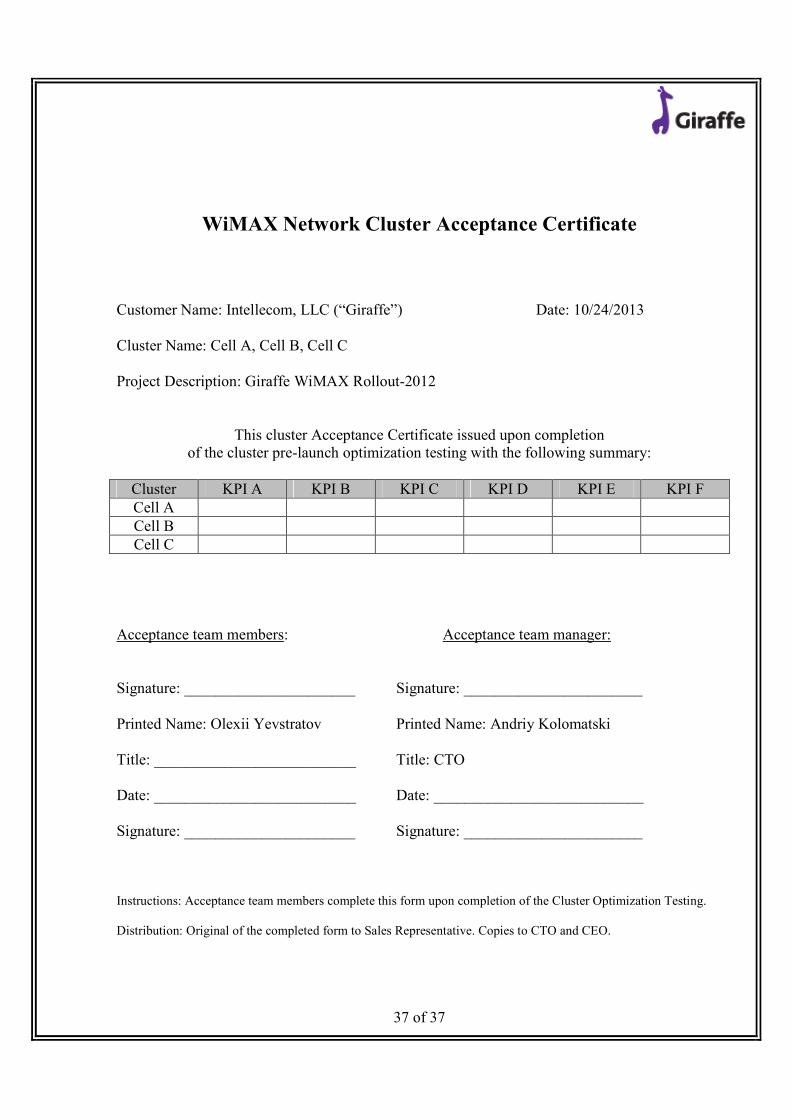
WiMAX Network Cluster Acceptance Certificate
Customer Name: Intellecom, LLC (“Giraffe”) Date: 10/24/2013
Cluster Name: Cell A, Cell B, Cell C
Project Description: Giraffe WiMAX Rollout-2012
This cluster Acceptance Certificate issued upon completion
of the cluster pre-launch optimization testing with the following summary:
Cluster KPI A KPI B KPI C KPI D KPI E KPI F
Cell A
Cell B
Cell C
Acceptance team members: Acceptance team manager:
Signature: ______________________ Signature: _______________________
Printed Name: Olexii Yevstratov Printed Name: Andriy Kolomatski
Title: __________________________ Title: CTO
Date: __________________________ Date: ___________________________
Signature: ______________________ Signature: _______________________
Instructions: Acceptance team members complete this form upon completion of the Cluster Optimization Testing.
Distribution: Original of the completed form to Sales Representative. Copies to CTO and CEO.