Positron confinement in embedded lithium nanoclusters
11
Positron confinement in embedded lithium nanoclusters M.A. van Huis, A. van Veen, H. Schut, C. V. Falub, S. W. H. Eijt, and P. E. Mijnarends Interfaculty Reactor Institute, Delft University of Technology, Mekelweg 15, NL-2629 JB Delft, The Netherlands J. Kuriplach Department of Low Temperature Physics, Charles University, V Holes ˇovic ˇka ´ch 2, CZ-180 00 Prague, Czech Republic ~Received 2 May 2001; revised manuscript received 4 October 2001; published 8 February 2002! Quantum confinement of positrons in nanoclusters offers the opportunity to obtain detailed information on the electronic structure of nanoclusters by application of positron annihilation spectroscopy techniques. In this work, positron confinement is investigated in lithium nanoclusters embedded in monocrystalline MgO. These nanoclusters were created by means of ion implantation and subsequent annealing. It was found from the results of Doppler broadening positron beam analysis that approximately 92% of the implanted positrons annihilate in lithium nanoclusters rather than in the embedding MgO, while the local fraction of lithium at the implantation depth is only 1.3 at. %. The results of two-dimensional angular correlation of annihilation radia- tion confirm the presence of crystalline bulk lithium. The confinement of positrons is ascribed to the difference in positron affinity between lithium and MgO. The nanocluster acts as a potential well for positrons, where the depth of the potential well is equal to the difference in the positron affinities of lithium and MgO. These affinities were calculated using the linear muffin-tin orbital atomic sphere approximation method. This yields a positronic potential step at the MgOi Li interface of 1.8 eV using the generalized gradient approximation and 2.8 eV using the insulator model. DOI: 10.1103/PhysRevB.65.085416 PACS number~s!: 61.46.1w, 71.60.1z, 78.70.Bj I. INTRODUCTION Metal and semiconductor nanoclusters are studied exten- sively because of their linear and nonlinear optical properties 1–3 and their electronic features as quantum dots. 4–6 The optical and electronic properties are strongly dependent on the nanocluster size, which is due to quantum size effects such as the confinement of surface plasmons and the discretization of energy levels below a certain cluster size. The engineering of quantum dots offers great opportu- nities for the future as the material properties, such as the band gap and melting temperature of semiconductor clusters, can be tuned by varying the cluster size. 7 Positron confinement is a newly investigated type of quantum confinement in nanoclusters and can serve as a powerful tool to investigate the electronic structure of nano- clusters. Positrons are known as sensitive self-seeking probes of defects in materials and can provide detailed information on the electronic structure of defects or bulk materials 8,9 such as the morphology of Fermi surfaces. 10,11 The concept of positron confinement was introduced by Nagai et al. 12 Under certain conditions, nanoclusters act as a potential well to pos- itrons; i.e., the wave function of the positron is spatially con- fined within the nanocluster in three dimensions. A positron confined in a nanocluster will annihilate there and will thus provide unique information on the electronic and crystal structure of the nanocluster, which can be quite different from the bulk material of the atoms constituting the nano- cluster. Previously, positron confinement in Cu nanoclusters embedded in Fe was investigated. 12 By analysis of the S and W parameters of the Doppler broadening curves these au- thors found that, after thermal aging, approximately 90% of all positrons annihilate in the Cu nanoclusters while Cu makes up only 1.0 wt % of the Fe:Cu composite material. The positron confinement was confirmed by coincidence Doppler broadening ~CDB! measurements and was ascribed to a difference in positron affinity between Cu and Fe of 1.0 eV. If the positron affinity of the cluster material is lower than the positron affinity of the host material, the cluster will act as a potential well to positrons, as will be explained in Sec. II. In this work, positron confinement is investigated in Li nanoclusters embedded in monocrystalline MgO. In order to study the material properties of nanoclusters, it can be useful to embed nanoclusters in stable and inert ceramics such as MgO, which can be achieved by ion implantation and sub- sequent annealing. 13 It is expected that the wide-band-gap material MgO ~7.8 eV! does not interact with the electronic structure of metal and semiconductor clusters. 14,7 It is also optically transparent in a large frequency band, which facili- tates optical studies. Furthermore, the high melting point of MgO ~3070 K! allows a study of phase transitions of nano- clusters. The optical and structural properties of Li nanoclus- ters embedded in MgO have been investigated previously by photoabsorption spectroscopy, transmission electron micros- copy, and electron diffraction. 15–17 It was found that small Li clusters ( ,20 nm) adopt the unusual fcc crystal structure while large Li clusters ( .40 nm) adopt the regular bcc crystal structure. This is a so-called extrinsic size effect: small Li clusters adopt a different phase in order to fit better in the MgO matrix. The lattice parameter of fcc lithium is closer to that of MgO, which reduces the formation energy of the MgOi Li interface. The fcc phase for bulk Li is otherwise only observed at low temperatures and high pressures. 18,19 A similar effect was reported in the work mentioned above 12 where the crystal structure of Cu nanoclusters embedded in Fe is expected, on the basis of lattice parameter similarity, to be bcc rather than fcc. PHYSICAL REVIEW B, VOLUME 65, 085416 0163-1829/2002/65~8!/085416~11!/$20.00 ©2002 The American Physical Society 65 085416-1
Transcript of Positron confinement in embedded lithium nanoclusters
PHYSICAL REVIEW B, VOLUME 65, 085416
Positron confinement in embedded lithium nanoclusters
M. A. van Huis, A. van Veen, H. Schut, C. V. Falub, S. W. H. Eijt, and P. E. MijnarendsInterfaculty Reactor Institute, Delft University of Technology, Mekelweg 15, NL-2629 JB Delft, The Netherlands
J. KuriplachDepartment of Low Temperature Physics, Charles University, V Holesˇovickach 2, CZ-180 00 Prague, Czech Republic
~Received 2 May 2001; revised manuscript received 4 October 2001; published 8 February 2002!
Quantum confinement of positrons in nanoclusters offers the opportunity to obtain detailed information onthe electronic structure of nanoclusters by application of positron annihilation spectroscopy techniques. In thiswork, positron confinement is investigated in lithium nanoclusters embedded in monocrystalline MgO. Thesenanoclusters were created by means of ion implantation and subsequent annealing. It was found from theresults of Doppler broadening positron beam analysis that approximately 92% of the implanted positronsannihilate in lithium nanoclusters rather than in the embedding MgO, while the local fraction of lithium at theimplantation depth is only 1.3 at. %. The results of two-dimensional angular correlation of annihilation radia-tion confirm the presence of crystalline bulk lithium. The confinement of positrons is ascribed to the differencein positron affinity between lithium and MgO. The nanocluster acts as a potential well for positrons, where thedepth of the potential well is equal to the difference in the positron affinities of lithium and MgO. Theseaffinities were calculated using the linear muffin-tin orbital atomic sphere approximation method. This yieldsa positronic potential step at the MgOiLi interface of 1.8 eV using the generalized gradient approximation and2.8 eV using the insulator model.
DOI: 10.1103/PhysRevB.65.085416 PACS number~s!: 61.46.1w, 71.60.1z, 78.70.Bj
team
glytua
tertth
te
oaso
obio
onoustaeno
te
ao
Cuia
ceed.0rillin
Lir toefulh asb-pc
ili-of
o-us-
byros-
recct:terisof
e
ed in, to
I. INTRODUCTION
Metal and semiconductor nanoclusters are studied exsively because of their linear and nonlinear opticproperties1–3 and their electronic features as quantudots.4–6 The optical and electronic properties are strondependent on the nanocluster size, which is due to quansize effects such as the confinement of surface plasmonsthe discretization of energy levels below a certain clussize. The engineering of quantum dots offers great opponities for the future as the material properties, such asband gap and melting temperature of semiconductor cluscan be tuned by varying the cluster size.7
Positron confinement is a newly investigated typequantum confinement in nanoclusters and can servepowerful tool to investigate the electronic structure of nanclusters. Positrons are known as sensitive self-seeking prof defects in materials and can provide detailed informaton the electronic structure of defects or bulk materials8,9 suchas the morphology of Fermi surfaces.10,11 The concept ofpositron confinement was introduced by Nagaiet al.12 Undercertain conditions, nanoclusters act as a potential well to pitrons; i.e., the wave function of the positron is spatially cofined within the nanocluster in three dimensions. A positrconfined in a nanocluster will annihilate there and will thprovide unique information on the electronic and crysstructure of the nanocluster, which can be quite differfrom the bulk material of the atoms constituting the nancluster. Previously, positron confinement in Cu nanoclusembedded in Fe was investigated.12 By analysis of theSandW parameters of the Doppler broadening curves thesethors found that, after thermal aging, approximately 90%all positrons annihilate in the Cu nanoclusters whilemakes up only 1.0 wt % of the Fe:Cu composite mater
0163-1829/2002/65~8!/085416~11!/$20.00 65 0854
n-l
mndr
u-e
rs,
fa
-esn
s--n
lt-rs
u-f
l.
The positron confinement was confirmed by coincidenDoppler broadening~CDB! measurements and was ascribto a difference in positron affinity between Cu and Fe of 1eV. If the positron affinity of the cluster material is lowethan the positron affinity of the host material, the cluster wact as a potential well to positrons, as will be explainedSec. II.
In this work, positron confinement is investigated innanoclusters embedded in monocrystalline MgO. In ordestudy the material properties of nanoclusters, it can be usto embed nanoclusters in stable and inert ceramics sucMgO, which can be achieved by ion implantation and susequent annealing.13 It is expected that the wide-band-gamaterial MgO~7.8 eV! does not interact with the electronistructure of metal and semiconductor clusters.14,7 It is alsooptically transparent in a large frequency band, which factates optical studies. Furthermore, the high melting pointMgO ~3070 K! allows a study of phase transitions of nanclusters. The optical and structural properties of Li nanoclters embedded in MgO have been investigated previouslyphotoabsorption spectroscopy, transmission electron miccopy, and electron diffraction.15–17It was found that small Liclusters (,20 nm) adopt the unusual fcc crystal structuwhile large Li clusters (.40 nm) adopt the regular bccrystal structure. This is a so-called extrinsic size effesmall Li clusters adopt a different phase in order to fit betin the MgO matrix. The lattice parameter of fcc lithiumcloser to that of MgO, which reduces the formation energythe MgOiLi interface. The fcc phase for bulk Li is otherwisonly observed at low temperatures and high pressures.18,19Asimilar effect was reported in the work mentioned abov12
where the crystal structure of Cu nanoclusters embeddeFe is expected, on the basis of lattice parameter similaritybe bcc rather than fcc.
©2002 The American Physical Society16-1
tew
sila-ht-il
hetani
oinoe
son
sci
aknut-ifks
ec
smp
vella
nangen
-
th
thOriodon
po
onur-
f-
-
ofsi-he
ons
dis-
n-ityionsu-be
-os-
M. A. van HUIS et al. PHYSICAL REVIEW B 65 085416
The nanoclusters investigated in this work were creaby ion implantation and subsequent annealing. It was shopreviously20 that Doppler broadening positron beam analy~PBA! and two-dimensional angular correlation of annihition radiation~2D-ACAR! measurements show a very higfraction of positron annihilations in Li nanoclusters, indicaing possible positron quantum confinement. Below we wfirst discuss the concepts of positron affinity and tpositronic potential well. After describing the experimentechniques and procedures, the results from positron anlation techniques are presented and analyzed in order totain a value for the fraction of positrons annihilatinglithium nanoclusters. Furthermore, the positron affinitiesMgO and fcc and bcc lithium are calculated in order to dtermine the drop of the positronic potential at the MgOiLiinterface. The confinement of positrons in Li nanoclusterthen discussed using the experimental and computatiresults.
II. THEORETICAL METHODS AND CONCEPTS
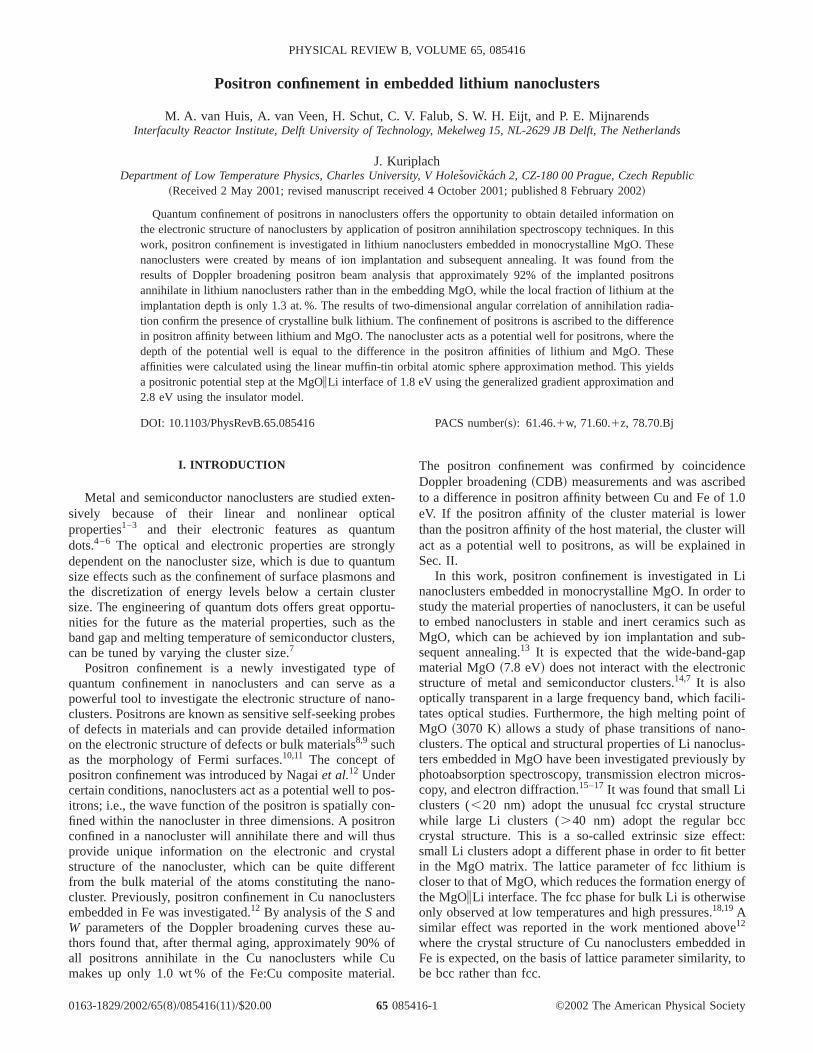
Annihilation of positrons with electrons in solids yieldinformation on the momentum distribution of these eletrons. The electronic momentum distribution is reflectedthe Doppler broadening of the 511 keV annihilation pePositron annihilation with low-momentum valence or coduction electrons results in a small Doppler shift, contribing to the center of the peak. Annihilation with highmomentum core electrons results in a large Doppler shcontributing to the wings of the 511 keV annihilation peaThe shape of the 511 keV peak is characterized by thecalledSandW parameters,21,22as defined in Fig. 1. Here thS parameter indicates the relative contribution from valenand conduction electrons while theW parameter representthe relative contribution from core electrons. When cobined with a slow positron beam, this method is called Dopler broadening positron beam analysis. TheSandW param-eters can be considered as a specific bulk property for ematerial. In the case of composite materials, e.g., metananoclusters embedded in insulating oxides, the overallnihilation distribution can be modeled as a linear combition of the annihilation distribution of each of the composimaterials. TheS parameter of the composite material thequals
Scomp5 f clusterScluster1 f hostShost, ~1!
whereSclusterandShost are the bulkSparameters of the nanoclusters and the embedding material, respectively.f clusterandf hostare the fractions of annihilation in the clusters and inembedding host material (f cluster1 f host51). Here it is as-sumed that the composite material is defect free andpositrons do not annihilate at the cluster-host interface.course, the principle of superposition of annihilation distbution can be applied to other positron annihilation methas well, including coincidence Doppler broadening and twdimensional angular correlation of annihilation radiatioEquation~1! applies to a ‘‘bulk’’ composite material. In thecase of, e.g., an ion-implanted layer investigated using a
08541
dn
s
l
lhi-b-
f-
isal
-n.--
t,.o-
e
--
ryicn--
e
atf
-s-.
s-
itron beam, theS parameter obtained at a certain positrimplantation energy consists of contributions from the sface and various layers,
S~E!5 f surf~E!Ssurf1 f 1~E!S11 f 2~E!S21•••1 f n~E!Sn .~2!
Here the material consists ofn layers and the distribution othe fractions (f surf1 f 11•••1 f n51) depends on the positron energy. Please note that Eq.~1! refers to defect~or ma-terial! fractions while Eq.~2! refers to layer fractions. Formulas analogous to Eqs.~1! and ~2! are valid for theWparameter. Fitting methods such asVEPFIT ~Ref. 23! andSWAN ~Ref. 24! exist, which yield accurate values for theSandW parameters of the various layers and the fractionspositrons annihilating in these layers as a function of potron implantation energy. This is achieved by solving ttime-averaged diffusion equation.23 Once theS parameter ofa certain layer has been found using theVEPFIT code, Eq.~1!can be used in order to analyze further the defect fractiwithin that layer.
Assuming that the nanoclusters are homogeneouslytributed, the annihilation fractionsf cluster and f host are deter-mined by the diffusion length of the positrons, the concetration of clusters, and the difference in positron affinbetween both materials. Although the overall concentratof atoms constituting the clusters in the host material is ually small, the annihilation fraction in the clusters can
FIG. 1. Definition of theS and W parameter with the corresponding energy windows used in the analysis of the 511 keV pitron annihilation peak.
6-2
ao
m
akreatil
e
te
erte
ic
tiath
e
o-
po-
us-stonis-
andinfor
lly
d
them
tial
onri-
eV,-
ofion
own
tici-osi-
inglts
os-a-
c-ted
s
re
gfl toofres
ty
o
POSITRON CONFINEMENT IN EMBEDDED LITHIUM . . . PHYSICAL REVIEW B65 085416
high with respect to the annihilation fraction in the host mterial when certain conditions with respect to the positraffinities are met.
Since the Fermi levels of the materials in contact becoequal,25 the positron affinity is defined as26
A15m21m152~f21f1!, ~3!
where m2 and m1 are the electron and positron chemicpotentials, andf2 and f1 the electron and positron worfunctions, respectively. Values for the positron affinity acommonly expressed in eV and are negative for most mrials. At the interface between two materials, positrons wencounter a potential step that is equal to the differencthe positron affinities of both materials,26
DE1AB5A1
A 2A1B . ~4!
A necessary condition for positron confinement in a clus~A! embedded in a host~B! is DE1
AB,0. Then the clusterrepresents a potential well for positrons. However, thmust be at least one bound state in such a well, which demines the minimum size of the cluster. Assuming a spherpotential well this condition reads26
Rmin.p\
A8m0DE1AB
, ~5!
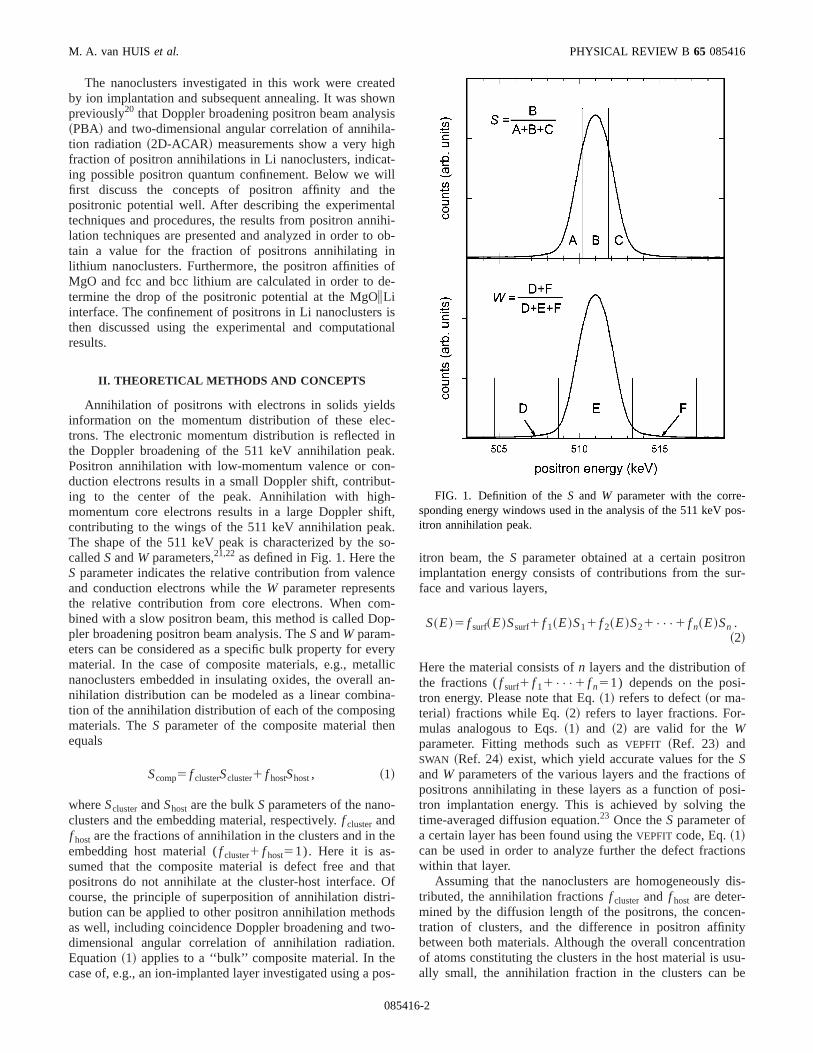
whereR is the radius of the cluster andm0 is the positronmass. In Fig. 2, several possibilities for the positron potenenergy as a function of the distance from the center ofnanocluster are plotted schematically. In Fig. 2~a!, DE1
AB
,0. Here the nanocluster acts as a positronic potential w
FIG. 2. Diagram of the positron potential energy as a functionthe distance from the center of the nanocluster.~a! Nanocluster actsas a positronic potential well with depthDE1 . ~b! Nanocluster actsas a potential barrier with step sizeDE1 . ~c! Positron trapping atdefects at the cluster-host interface.
08541
-n
e
l
e-lin
r
er-
al
le
ll
with depth DE1AB . Positrons can be confined in this nan
cluster provided that condition~5! is satisfied. In Fig. 2~b!,DE1
AB.0. The nanocluster acts as a three-dimensionaltential barrier and cannot confine positrons. Figure 2~c!shows a situation where the positron affinity of the nanoclter material is lower than the positron affinity of the homaterial, but positron confinement is unlikely as the positris trapped at the interface. Often there is some lattice mmatch due to the different crystal structures of the clusterthe embedding matrix. At the interface, this may resultstructural and electronic defects, which can act as a trappositrons. In the case of, e.g., a SiiSiO2 interface, there isevidence of preferential trapping at this interface.27
Usually, the positron affinity is determined experimentaby measuring the electron and positron work functions28 @seeEq. ~3!#. Alternatively, the positron affinity can be derivefrom the positronium~Ps! formation potential«Ps , whichcan be determined experimentally as the negative ofmaximum kinetic energy of positronium atoms ejected frothe sample into vacuum. The positronium formation potenis related to the positron affinity as26
«Ps5f11f226.8 eV52A126.8 eV, ~6!
where 6.8 eV is the binding energy of the positron-electrpair constituting a positronium atom in vacuum. Two expemental time-of-flight studies of MgO~Refs. 29 and 30! re-port positronium emission peak energies of 4.5 and 2.6respectively. Applying Eq.~6! then yields values for the positron affinity for MgO of 22.3 and24.2 eV, respectively.Apart from the quantitative discrepancy, the interpretationthese results is complicated by the fact that the emissenergy spectra are quite broad. Furthermore, the unknbinding energy of Ps at the MgO surface~MgO is too densea material for Ps to be formed in the bulk! and the uncer-tainty about whether valence or conduction electrons parpate in Ps formation obscure a direct translation to the ptron affinity for MgO.29,30 Summarizing, determiningpositronium formation potentials at the surface of insulatoxides such as MgO is experimentally difficult, which resuin the different values reported in the literature.
Therefore, we turn toab initio calculations to determinethe positron affinities. As the calculation of electron and pitron work functions requires a careful treatment of the mterial’s surface, we prefer to determineA1 through the elec-tron and positron chemical potentials@see Eq. ~3!#, thecalculation of which is a standard procedure in ‘‘bulk’’ eletronic structure computational methods. It should be nothatA1 is a bulk characteristic of a material~see Refs. 9 and26 for details!. For the calculation of the positron affinitieand lifetimes in the materials studied,9 the linear-muffin-tin-orbital ~LMTO! method was used within the atomic spheapproximation ~ASA!.31,32 Within the framework of thismethod the crystal is divided into slightly overlappinspheres~called atomic spheres! centered at the positions othe nuclei. The sum of the volumes of the spheres is equathe volume of the crystal. However, the rocksalt structureMgO is not as closely packed as the fcc and bcc structuconsidered for Li.16 Therefore we had to introduce emp
f
6-3

s-iath
foOoeath
nsio
-rt
ato
t
th
m
n
tye
sut
rK
andpyres-pthnofth-hichingentheare
therontroneV.lso
eon
.1s
y
ur-ofatdstheasmere,
f-
-
fnolidthe
ion
er-0 Kths15
ofofofob-
M. A. van HUIS et al. PHYSICAL REVIEW B 65 085416
spheres31 into the MgO lattice to describe properly the ditribution of the electron and positron densities and potentin the interstitial region. We considered the case whereempty spheres occupied 30% of the cell volume. In thelowing this case is referred to as MgO II, in contrast to MgI where no empty spheres were included for comparisChoosing the 30% filling with empty spheres leads to a rsonable overlap between neighboring Mg-O spheres inMgO lattice.31 The lattice constantsa0 used in our calcula-tions are collected in Table I. As for the positron calculatioin Li we used the parametrizations of the positron correlatpotential and enhancement factor given by Boron´ski andNieminen33 within the framework of the local density approximation ~LDA !. The corresponding results will furthebe denoted as LDA, whereas the results obtained usinggeneralized gradient approximation34 will be marked GGA.In the case of MgO we also employed the GGA, but insteof the LDA we made use of the so-called semiconduc~SM! and insulator~IM ! models,35 which take into accounincomplete positron screening in nonmetallic systems~i.e.,systems having a band gap; MgO is an insulator!. A high-frequency dielectric constant«`53.0 was employed in theSM and IM calculations. This constant was derived fromoptical constants of MgO~Ref. 36! in the visible spectrum(n,k)5(1.73,0.00) using the relationship«5n22k2. Fi-nally, the exchange-correlation potential for electrons paraetrized according to Von Barth and Hedin37 was used in thecalculations of the electronic structure of MgO and Li.
For completeness, the positron lifetime (t) in defect-freeMgO and Li was calculated employing the well-knowformula9
1/t5pr 02cE n2~r !n1~r !g@n2~r !#dr . ~7!
Here, n2 and n1 denote the electron and positron densirespectively, andg stands for the enhancement factor dscribing the pileup of electrons around a positron (r 0 is theclassical radius of the electron andc the speed of light!. Theform of g within the LDA, GGA, SM, and IM approachewas used in the corresponding calculations. Other comptional details are described in Ref. 38.
III. EXPERIMENT
Epi-polished monocrystals of MgO~100! of size 1031031 mm3 were implanted with 1.031016 cm22 6Li ions atan energy of 30 keV. After the implantation the crystals weannealed in air in steps from room temperature to 1200
TABLE I. Structural data.
Structure a0 ~Å! at. volume (Å3)
MgO rocksalt 4.212a –Li fcc 4.40b 21.3Li bcc 3.51b 21.6
aRef. 52.bRef. 16.
08541
lse
l-
n.-e
,n
he
dr
e
-
,-
a-
e.
The annealing temperatures were 550, 750, 950, 1100,1200 K for periods of 30 min. Photoabsorption spectroscowas used to detect Mie plasmon resonance due to the pence of lithium nanoclusters. Furthermore, the neutron deprofiling ~NDP! technique, using the nuclear reactio6Li(n,a)3H, was applied to determine the depth profile6Li after the annealing steps. The results of these two meods have already been discussed in an earlier paper, wfocused on the defect evolution during the annealprocedure.20 In the present work we address the confinemof positrons in lithium nanoclusters, and therefore only tpositron experimental techniques applied to the samplespresented in this paper.
After ion implantation and after each annealing step,samples were analyzed with Doppler broadening positbeam analysis using a monoenergetic 0–30 keV posibeam. The energy resolution of the PBA setup is 1.2 kAfter the 950 K annealing step, one of the samples was aanalyzed with 2D-ACAR. The 2D-ACAR setup of thAnger-camera type is coupled to a high-intensity positrbeam with a flux of 83107e1s21, allowing depth-selective2D-ACAR.39 The angular resolution of this system is 131.4 mrad2. The sample measured with 2D-ACAR waidentical to the other samples~which was ascertained bmeans of photoabsorption spectroscopy and PBA!, apartfrom a 15-nm-thick layer of Al deposited on the sample sface after the 950 K annealing step to prevent buildupelectric charge. The 2D-ACAR distribution was collecteda positron implantation energy of 4 keV, which corresponto a mean positron implantation depth at the center oflayer containing the lithium nanoclusters. This energy wchosen on the basis of depth profiling performed on the sasample by means of Doppler broadening PBA. Furthermoan MgO bulk 2D-ACAR distribution was collected for reerence purposes from an as-received sample of MgO~100!.The use of a conventional22Na source in this latter measurement renders any surface effects negligible.
IV. RESULTS
A. Positron beam analysis
Figure 3 shows theS andW parameters as a function opositron implantation energy after lithium ion implantatioand after annealing at the indicated temperatures. The slines represent the result of simulations performed withVEPFIT code, as will be discussed below. TheS parametershows a spectacular increase in the lithium ion implantatrange~corresponding to a positron energy of 3–4 keV! afterannealing at temperatures of 750 K and 950 K. At highannealing temperatures theS parameter in the ion implantation layer drops considerably and after annealing at 120the peak almost disappears in this range. At larger dep~corresponding to positron implantation energies of 7–keV in Fig. 3!, theSparameter drops below the bulk valueMgO ~i.e., 0.468! after annealing at 1200 K. Such a dropthe S parameter below the bulk value of MgO as a resultion implantation and subsequent annealing has not been
6-4

ihin
.
hetricsee
naropn
ionr
ins. In
iesf-pe-tra-tse
he
-er
em-d
s-ionysim-
hecon-o all
tedim-eld-erval-
s a
ndg tom
l or
rtainari-
d
gy
POSITRON CONFINEMENT IN EMBEDDED LITHIUM . . . PHYSICAL REVIEW B65 085416
served before and we attribute this effect to positron annlation in small Li-related defects, as will be discussedmore detail below.
The experimentalSandW parameter curves shown in Fig3 have been fitted using theVEPFIT code23 in order to gainmore insight into defect evolution and in order to derive tcontributions of the various layers to the annihilation disbution. A four-layer model was used. The principal defetypes and the corresponding diffusion lengths that were uas input to theVEPFIT code are listed in Table II. The choicfor this model is mainly based on defect analysis performon previously ion-implanted MgO samples that were alyzed with techniques such as transmission electron miccopy, positron annihilation spectroscopy, and neutron deprofiling.20,40,41In particular, there is a subsurface layer co
FIG. 3. S and W parameters as a function of positron enerThe solid lines are the result ofVEPFIT modeling.
08541
i-
-ted
d-s-th-
taining the ion implanted species and the main implantatdefects~layer 2!. Dislocation loops are formed at smalledepths in the MgO top layer~layer 1! and below the ionimplantation layer.40 The presence of dislocation loopsMgO does not affect theSparameter significantly, but it doeshorten the diffusion length compared to the bulk valuesthe layer below the ion implantation layer~layer 3! there arenot only dislocation loops but also a tail of implanted specas observed by NDP,20 possibly because of channeling efects. It was estimated that about 6% of the implanted scies end up in this range. Due to the low atomic concention of Li in this layer, we expect small Li-related defecrather than metallic Li clusters~see the discussion on thdefect evolution of layer 3 in Fig. 3 below!. The fourth layeris the MgO bulk. In order to monitor the defect evolution, tS and W parameters of layer 2~ion implantation layer! andlayer 3 ~ion implantation tail! were fitted. The layer boundaries determining the position of the ion implantation layhave been allowed to relax as theS parameter peak shifts tosomewhat lower positron energies when the annealing tperature increases~compare, for example, the 750 K an1100 KSparameter curves in Fig. 3!. This might be due to arecombination of implanted lithium atoms and lithium cluters with vacancies and small vacancy clusters created byimplantation. The main ion implantation damage is alwalocated at slightly smaller depths than the range of theplanted ions.
The fitted curves are depicted as solid lines in Fig. 3. Tagreement with the experimental results is reasonable,sidering the fact that the same model has been applied tdata sets. In the case of theSandW graphs corresponding tothe 1200 K annealing step the MgO top layer was omitsince it was not possible to distinguish between the ionplanted layer and the MgO top layer. The fitted results yiboundariesd1 andd2 of the ion implanted layer of approximately 45 and 115 nm, respectively, shifting to slightly lowvalues with increasing annealing temperature. The fittedues ofS andW are presented in Fig. 4~b!.
Figure 4 shows theS parameter plotted versus theW pa-rameter. Every bulk material and every defect type hacharacteristicSandW parameter. A few of these typicalS,Wcombinations are indicated in Fig. 4 with open circles aare called cluster points. The cluster points correspondinpure MgO and bcc Li were determined experimentally frobulk samples of these materials. By plotting experimentafitted S,W values in anS-W plot with, e.g., the positronenergy as the running parameter, the defect status at a cedepth in the material can be analyzed by means of compson with the characteristicS,W cluster points for defects an
.
TABLE II. VEPFIT model used to fit theS andW parameter curves shown in Fig. 3.
depth~nm! diff. length ~nm! S par. W par. Description
Layer 1a 0 –d1 50 0.468 0.078 MgO top layerLayer 2 d1–d2 15 fitted fitted MgO:LiLayer 3 d2–300 50 fitted fitted ion impl. tailLayer 4 .300 100 0.468 0.078 MgO bulk
aIn the case of the 1200 K annealing step, layer 1 was omitted (d150).
6-5
arepsed
M. A. van HUIS et al. PHYSICAL REVIEW B 65 085416
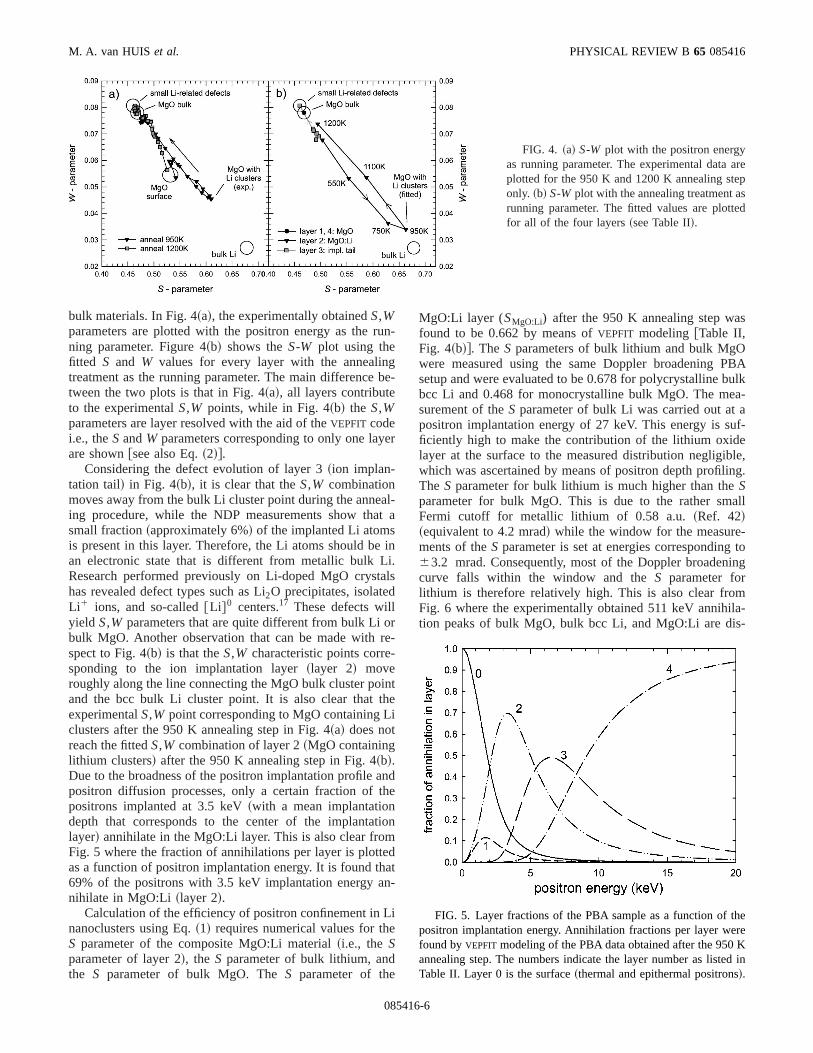
FIG. 4. ~a! S-W plot with the positron energyas running parameter. The experimental dataplotted for the 950 K and 1200 K annealing steonly. ~b! S-W plot with the annealing treatment arunning parameter. The fitted values are plottfor all of the four layers~see Table II!.
ru
gb
e
alt
ii.al
orre-
inhei
anth
tio
edan
Lie
s
BAulka-auf-ele,
ng.
all
-to
ing
mla--
hereKd in
bulk materials. In Fig. 4~a!, the experimentally obtainedS,Wparameters are plotted with the positron energy as thening parameter. Figure 4~b! shows theS-W plot using thefitted S and W values for every layer with the annealintreatment as the running parameter. The main differencetween the two plots is that in Fig. 4~a!, all layers contributeto the experimentalS,W points, while in Fig. 4~b! the S,Wparameters are layer resolved with the aid of theVEPFIT codei.e., theSandW parameters corresponding to only one layare shown@see also Eq.~2!#.
Considering the defect evolution of layer 3~ion implan-tation tail! in Fig. 4~b!, it is clear that theS,W combinationmoves away from the bulk Li cluster point during the anneing procedure, while the NDP measurements show thasmall fraction~approximately 6%! of the implanted Li atomsis present in this layer. Therefore, the Li atoms should bean electronic state that is different from metallic bulk LResearch performed previously on Li-doped MgO crysthas revealed defect types such as Li2O precipitates, isolatedLi1 ions, and so-called@Li #0 centers.17 These defects willyield S,W parameters that are quite different from bulk Libulk MgO. Another observation that can be made withspect to Fig. 4~b! is that theS,W characteristic points corresponding to the ion implantation layer~layer 2! moveroughly along the line connecting the MgO bulk cluster poand the bcc bulk Li cluster point. It is also clear that texperimentalS,W point corresponding to MgO containing Lclusters after the 950 K annealing step in Fig. 4~a! does notreach the fittedS,W combination of layer 2~MgO containinglithium clusters! after the 950 K annealing step in Fig. 4~b!.Due to the broadness of the positron implantation profilepositron diffusion processes, only a certain fraction ofpositrons implanted at 3.5 keV~with a mean implantationdepth that corresponds to the center of the implantalayer! annihilate in the MgO:Li layer. This is also clear fromFig. 5 where the fraction of annihilations per layer is plottas a function of positron implantation energy. It is found th69% of the positrons with 3.5 keV implantation energy anihilate in MgO:Li ~layer 2!.
Calculation of the efficiency of positron confinement innanoclusters using Eq.~1! requires numerical values for thS parameter of the composite MgO:Li material~i.e., theSparameter of layer 2!, the S parameter of bulk lithium, andthe S parameter of bulk MgO. TheS parameter of the
08541
n-
e-
r
-a
n
s
-
t
de
n
t-
MgO:Li layer (SMgO:Li) after the 950 K annealing step wafound to be 0.662 by means ofVEPFIT modeling @Table II,Fig. 4~b!#. The S parameters of bulk lithium and bulk MgOwere measured using the same Doppler broadening Psetup and were evaluated to be 0.678 for polycrystalline bbcc Li and 0.468 for monocrystalline bulk MgO. The mesurement of theS parameter of bulk Li was carried out atpositron implantation energy of 27 keV. This energy is sficiently high to make the contribution of the lithium oxidlayer at the surface to the measured distribution negligibwhich was ascertained by means of positron depth profiliThe S parameter for bulk lithium is much higher than theSparameter for bulk MgO. This is due to the rather smFermi cutoff for metallic lithium of 0.58 a.u.~Ref. 42!~equivalent to 4.2 mrad! while the window for the measurements of theS parameter is set at energies corresponding63.2 mrad. Consequently, most of the Doppler broadencurve falls within the window and theS parameter forlithium is therefore relatively high. This is also clear froFig. 6 where the experimentally obtained 511 keV annihition peaks of bulk MgO, bulk bcc Li, and MgO:Li are dis
FIG. 5. Layer fractions of the PBA sample as a function of tpositron implantation energy. Annihilation fractions per layer wefound byVEPFIT modeling of the PBA data obtained after the 950annealing step. The numbers indicate the layer number as listeTable II. Layer 0 is the surface~thermal and epithermal positrons!.
6-6
u
acthe
ne
thly
llyat-
d
tothe
theA.in
ular
ly
tralaar
dd
allica
ers
uivo-inn-
ings-
POSITRON CONFINEMENT IN EMBEDDED LITHIUM . . . PHYSICAL REVIEW B65 085416
played. The fraction of annihilations in lithium can be calclated rewriting Eq.~1! and usingf MgO1 f Li51:
f Li5SMgO:Li2SMgO
SLi 2SMgO. ~8!
Here it should be realized that contributions from the surfand any other layers have already been filtered out byVEPFIT code. Substituting theS parameters mentioned abovthen yields a fraction of annihilations in lithium,f Li , of 9265 %. This shows a very effective confinement of positroin Li nanoclusters, which occupy only 1.3 at. % of thMgO:Li layer. In the calculation above, it is assumed thatSparameters for bcc Li and fcc Li do not differ significantand that theSparameter of the lithium nanoclusters~withoutsurrounding MgO! is similar to theS parameter of lithiumbulk.
FIG. 6. Experimentally obtained 511 keV Doppler broadenpeaks for bulk MgO, bulk bcc Li, and MgO containing Li nanocluters ~after the 950 K annealing step!.
08541
-
ee
s
e
A question that now arises is whether the positron is reaconfined within the Li nanocluster or whether it is trappedthe MgOiLi interface prior to annihilation. We shall postpone the discussion of this point until Sec. V.
B. 2D-ACAR
The 2D-ACAR results are shown in Fig. 7. Part~a! showsthe anisotropic contribution43 of the MgO bulk distribution~total number of counts 6.43107) obtained from an as-received single crystal of MgO~100!. Part~b! of Fig. 7 showsthe anisotropic part of the 2D-ACAR distribution obtainefrom a Li-implanted sample after annealing at 950 K~totalnumber of counts 1.03107). This distribution was collectedat 4 keV positron implantation energy, which correspondsa mean positron implantation depth at the center oflithium nanocluster layer~MgO:Li material!. This energywas chosen on the basis of depth profiling performed on2D-ACAR sample by means of Doppler broadening PBBoth distributions have been corrected for the differenceresolution between the directions parallel and perpendicto the sample surface (1.131.4 mrad2) and were symme-trized by reflection with respect to the~100! and~001! mirrorplanes. The anisotropy plot of the MgO:Li layer is strikingdifferent from the bulk MgO anisotropy plot. The bulk MgOanisotropy is still observable in Fig. 7~b!, but another, verydominant anisotropic contribution is present in the cenpart of the figure. The major part of this contribution hasnearly perfect fourfold symmetry with peaks positioned nethe Fermi radius of lithium~see below!. Therefore, we at-tribute the 2D-ACAR anisotropy in the center of Fig. 7~b! toannihilation in bcc or fcc lithium clusters. Treilleux anChassagne16 found by means of electron diffraction ancross-sectional transmission electron microscopy~X-TEM!analysis that, depending on the nanocluster size, metlithium nanoclusters in MgO can adopt either the fcc orrotated bcc crystal structure. Whether the lithium clustfound in the 2D-ACAR distribution of Fig. 7~b! are in the fccor rotated bcc phase has not yet been established uneqcally. The fact that the anisotropic contributions displayedFigs. 7~a! and 7~b! both have the same symmetry and ide
y
-3ded
d
FIG. 7. Anisotropic part of the@010#-axis-projected momentum distribution obtained b2D-ACAR measurements for~a! bulk MgO~100!and ~b! MgO containing Li crystalline nanoclusters. The average Fermi cutoff for bulk Li of 4.mrad ~see Sec. IV. B! is displayed as a dashecircle. The distributions have been symmetrizby reflection with respect to the~100! and ~001!mirror planes. The contour interval is 10%~5%!of the peak height for solid~dotted! contours. Theprojection of the Brillouin zones is shown baseon the lattice parameters of MgO~a! and fcc Li~b!.
6-7

tials
M. A. van HUIS et al. PHYSICAL REVIEW B 65 085416
TABLE III. Calculated positron lifetime, positron affinity and electron and positron chemical potenfor bcc and fcc Li.
LDA GGAm2 ~eV! t ~ps! m1 ~eV! A1 ~eV! t ~ps! m1 ~eV! A1 ~eV!
bcc Li 22.8 299 25.2 28.0 283 25.0 27.8fcc Li 22.8 297 25.3 28.1 282 25.0 27.8
iogOn
thdthhetioL
eftri
thchbcD
rss
eon
se
Li9
efe
i-d ine,Lishat
ti--n-
ronr-p-to
teiceesd to
IMluesst ofgO
icbe-
i-ime
r-
lylue
tical mirror planes shows that there is a distinct orientatrelationship between the crystalline Li clusters and the Mhost matrix. Therefore, the lithium clusters will be cohereor semicoherent with the MgO crystal lattice. Comparingion implantation settings and annealing temperature usethis work with the experimental parameters of Ref. 16,presence of fcc lithium is most likely. In that case, tlithium nanoclusters are in a simple cube-on-cube orientarelationship with the MgO host matrix. Cube-on-cube bccis excluded by the anisotropy in Fig. 7~b! as it would pro-duce peaks along the100& directions. The anisotropy in thcentral part of Fig. 7~b! agrees very well with the results opreliminary calculations performed on the momentum disbution of fcc Li using the Korringa-Kohn-Rostoker~KKR!method. The free-electron Fermi sphere for fcc Li (a054.4 Å; cf. Table I! is displayed in Fig. 7~b! as a circle ofradius 0.591 a.u., equivalent to 4.3 mrad. The peaks inanisotropy then derive from bulges of the Fermi surfapointing towards the hexagonal Brillouin zone faces. Tresults of the momentum density calculations for fcc andLi and a more detailed analysis of the experimental 2ACAR distributions will be presented elsewhere.44
The fraction of positron annihilations in Li nanoclustef Li was also estimated from the 2D-ACAR distribution, uing Eq. ~1! in combination with aVEPFIT layer fractionanalysis~giving the relative contributions of the layers to thannihilation distribution at a certain positron implantatienergy!. The fraction found~90%! was not significantly dif-ferent from the one derived from the PBA results discusin Sec. IV A.
C. Positron affinities
Above it was found that the fraction of annihilations inas deduced from the Doppler broadening PBA spectra is65 % in the ion-implanted layer. It will be shown that theffective positron confinement can be ascribed to the dif
08541
n
teine
ni
-
eeec-
-
d
2
r-
ent positron affinities of MgO and Li. These positron affinties were calculated using the various models discusseSec. II. The results of calculations of the positron lifetimaffinity, and electron and positron chemical potentials forare shown in Table III. Very similar lifetimes and affinitieare obtained for bcc and fcc Li. This is related to the fact tthe atomic volumes of bcc and fcc Li are almost equal~TableI!. The affinities found are in good agreement with theorecal values from the literature.45,26To our knowledge, the positron affinity of Li has never been determined experimetally.
The electron and positron chemical potentials, positaffinity and lifetime for MgO determined using three diffeent models are given in Table IV. The IM and GGA aproaches yield values for the bulk lifetime that are closethe experimentally obtained lifetimet of 150–170 ps inMgO,46,47 which is not the case for the SM results. We nothat the incorporation of empty spheres into the MgO latt~MgO II case! leads to a slight increase of the lifetime valubecause the interstitial space is better described comparethe case without empty spheres~MgO I!. Table IV also in-cludes the calculated lifetimes by Puskaet al.35 In thepresent work, the lifetimes found using the SM and theare somewhat higher and lower, respectively, than the vareported by Puskaet al., while the same SM and IM modelhave been used. This is mainly due to a different treatmenthe core electrons. In addition, the electron density of Min Ref. 26 was approximated by the superposition of atomdensities without consideration of the charge transfertween Mg and O atoms. Anyhow, it turns out that the semconductor model does not describe reasonably the lifetexperiment~both in the present work and in Ref. 26! so thatwe will not consider this model when calculating the diffeence between positron affinities of MgO and Li.
The values ofA1 presented in Table IV depend obviouson the models used to calculate them. The lowest va
s fort
TABLE IV. Calculated lifetimes, positron affinities, and electron and positron chemical potentialMgO without empty spheres~MgO I! and including empty spheres~MgO II!. GGA: generalized gradienapproximation. SM: semiconductor model. IM: insulator model.
GGA SM IMm2 t m1 A1 t m1 A1 t m1 A1
~eV! ~ps! ~eV! ~eV! ~ps! ~eV! ~eV! ~ps! ~eV! ~eV!
MgO I 22.9 139 23.2 26.1 121 24.0 26.9 141 22.6 25.5MgO II 21.0 140 25.0 26.0 126 25.5 26.5 147 24.0 25.0MgOa 119 167
aRef. 35.
6-8

luheidicdsc-
Mis
ro
ee
r-thinlu
ly-
oicInrthnd
IIcaa
iaheain
ininrin
on
th
eh
-eso
ro
he
onattedbedh toree-he
alnsndan
er-ione
andif-
eentofl,
edtheellythe
he
ionan
Li
r.0
a
-O,
POSITRON CONFINEMENT IN EMBEDDED LITHIUM . . . PHYSICAL REVIEW B65 085416
comes from the SM, whereas the IM yields the largest vaAlso, the affinity results depend slightly on whether tempty spheres are included or not. In the following conserations we will employ the MgO II case. The positronenergy step at the MgOiLi interface can now be calculateusing Eq.~4!. Combining the GGA and IM positron affinitiefor MgO II ~Table IV! and the GGA results for bcc and fclithium ~Table III; LDA and GGA results differ only marginally!, the positronic potential drop at the MgOiLi interfaceequals 1.8 eV using the GGA and 2.8 eV using the IRegardless of this uncertainty in the affinity difference, itplausible to assume that clusters of Li in MgO act as posittraps.
In this context it is useful to mention recent work38 inwhich the positron affinity was studied in several polytypof SiC, which is a semiconductor. It was found that all thoretical approaches~GGA, SM, IM! overestimate~in magni-tude! the positron affinity in SiC. This was ascribed to cetain inadequacies in the theoretical description of bothelectron and the positron part of the problem. Considerthis conclusion and the above mentioned experimental vaof the positron affinity for MgO~Refs. 29 and 30! it turns outthat the values ofA1 calculated here for MgO are probabtoo large~in magnitude!. Further theoretical and experimental work is therefore needed to clarify this point.
A final remark in this section concerns the sensitivitythe values of the positron affinity with respect to the choof the LDA exchange-correlation potential for electrons.addition to the exchange-correlation potential of Von Baand Hedin37 we also examined the potential of Ceperley aAlder48 as parametrized by Perdew and Zunger.49 Surpris-ingly, the calculated positron affinities increase~magnitudesdecrease! by about 0.5 eV in all cases presented in Tablesand IV. The inspection of electron and positron chemipotentials leads to the conclusion that this effect can betributed to the change of the electron chemical potentonly. It shows that, although the resulting difference of tpositron affinity of MgO and Li remains unchanged, one hto be careful when comparing affinity results obtained usdifferent exchange-correlation potentials for electrons~cf.Ref. 50!.
V. DISCUSSION
Our results show a very high fraction of annihilationslithium, indicating a very effective positron confinementLi nanoclusters. Two aspects are important when considethe efficiency of positron confinement in nanoclusters:~a!the probability of trapping and reflection when a positrencounters a nanocluster acting as a potential well and~b!the probability of reaching a nanocluster, assuming thatpositron is thermalized in the embedding MgO material.
The kinetic energy of delocalized positrons is of the ordof tens of meV, while the size of the potential step at tMgOiLi interface is a few eV~1.8 eV using the GGA and 2.8eV using the insulator model!. Thus, the depth of the potential well as determined by the difference in positron affinitiis two orders of magnitude larger than the kinetic energythe positron after thermalization. Therefore, when a posit
08541
e.
-
.
n
s-
eges
fe
Ilt-
ls
sg
g
e
re
fn
is thermalized and diffuses within the embedding MgO, tprobability of reflection when encountering the MgOiLi in-terface is negligible at room temperature. Every positrreaching a lithium nanocluster will thus be confined in thcluster. Once inside the cluster, the positron will be reflecat the walls. A necessary condition for the process descriabove is that the size of the nanoclusters is large enougaccommodate at least one bound state. Applying the thdimensional spherical well model with a finite potential, tcritical radius is given by Eq.~5!. Substituting a value of 1.8eV for the depth of the potential well then yields a criticcluster diameter of 0.4 nm. As the confinement of positrois quite obvious from the results described in Secs. IV A aIV B, the actual size of the nanoclusters will be larger ththis value.
The probability of encountering a nanocluster is detmined by the positron diffusion length and the concentratand spatial distribution of the Li clusters. Trapping of thvast majority of the positrons is only possible if the medistance between the Li nanoclusters is smaller than thefusion length for positrons diffusing in MgO within thMgO:Li layer. Here it is assumed that the positron is presin MgO after thermalization, as Li occupies only 3 vol. %the MgO:Li layer. In the diffusion-limited trapping modedescribed by Hautoja¨rvi and Corbel,51 the diffusion to thedefect is slow compared to the transition to the localizstate. The depth of the nanocluster potential well is oforder of a few eV, so this condition is well satisfied. Thpossibility of detrapping is neglected. Assuming sphericashaped clusters, the fraction of positrons annihilating inclusters is given by
f Li5k
k1lMgO5
4pr clD1ccl
4pr clD1ccl1lMgO, ~9!
where k is the positron trapping rate with respect to tclusters (s21), lMgO is the annihilation rate in MgO (s21),r cl is the radius of the cluster~m!, ccl is the concentration ofclusters (m23), andD1 is the diffusion coefficient (m2 s21).The diffusion coefficient is related to the diffusion lengthL1
~m! and to the positron lifetimet ~s! as
L15AD1t. ~10!
By means of Eqs.~9! and ~10!, the fraction of annihilationsin lithium clusters can be estimated. No detailed informatis available on the size of the nanoclusters, so we performorder-of-magnitude calculation. The mass density of bulkis 543 kg m23, so the 1016 implanted Li atoms occupy atotal volume of 2.1310213 m3 independent of the clustesize. If the radius of the lithium nanoclusters is, e.g., 5nm,16 the total number of clusters is 4.131011 and the con-centration of clusters will be 5.831022 m23 considering thatall clusters are present in the ion implantation layer withthickness of 70 nm~estimated fromVEPFIT, Table II! and anarea of 1.031.0 cm2. At this concentration, the average intercluster distance is 26 nm. The annihilation rate in MglMgO, equals 6.53109 s21 as it is the inverse of the lifetimet in MgO, 155 ps.46 A value for the diffusion length forpositrons in MgO of 50 nm can be assumed~equal to the
6-9

l
chthoi
roerglFo.n
th
hes
D-cteeronohemnsaennaaiza-
th
ond-
ni
m
o-nm-
um.m-
sith
ofat
ar-
erehereec-he
is
theandtureinne-n-d-ies,eo-
em-stal-
2D-
ro-.Owl-os-the
M. A. van HUIS et al. PHYSICAL REVIEW B 65 085416
diffusion lengths for layers 1 and 3 in theVEPFIT model!.Substituting Eq.~10! into Eq. ~9! and using the numericavalues given above, the fraction of annihilations in Li,f Li ,can be calculated. This yields a fraction of 90%, whiagrees very well with the experimental results. Althoughcluster size and the diffusion length are estimated, the abcalculation demonstrates that the annihilation fractionlithium can be lower than 100% due to diffusion-related pcesses even if every positron encountering a nanoclusttrapped in that cluster. The calculated fraction is strondependent on the cluster size and the diffusion length.clusters with a radius of 3–7 nm and a diffusion length50–100 nm, the trapped fraction varies from 82% to 99%
Finally, the possibility should be discussed that positroare not present in either MgO or Li but are trapped atinterface, corresponding to the situation depicted in Fig. 2~c!.This phenomenon is observed, e.g., for the SiiSiO2interface.27 Open volume defects or lattice mismatch at tinterface can induce positron trapping. No evidence of potronium formation was found in the analysis of the 2ACAR distribution, showing that large vacancy-type defeare not present. Positrons can also trap in interface defthat are too small for the formation of positronium. Howevpositron annihilation distributions corresponding to positrannihilation at interfaces usually bear characteristics of bmaterials. Thus, if positron trapping would occur at tMgOiLi interface, a considerably higher contribution froMgO to the Doppler broadening and 2D-ACAR distributiowould be expected. Therefore, interface trapping in the cof the MgOiLi interface is not likely on the basis of thabove observations. On the other hand, the fraction of ahilations in Li nanoclusters might be influenced by locelectric fields near the interface. These can be presentresult of charge redistribution associated with the equaltion of the Fermi levels of MgO and Li in thermal equilibrium. We have, however, no means to investigate whethis last aspect plays a significant role.
VI. CONCLUSIONS
It has been shown that positrons are very effectively cfined in crystalline lithium nanoclusters that are embeddeMgO. The fraction of positron annihilations in lithium nanoclusters was deduced by analysis of the Doppler broadePBA spectra and found to be 9265 %. This annihilationfraction is very high, considering the fact that the lithiu
o
l
08541
even-is
yorf
se
i-
scts,
th
se
i-ls a-
er
-in
ng
content in the MgO:Li layer is only 1.3 at. %. The anistropic contribution of the 2D-ACAR distribution collected ithe layer containing Li nanoclusters shows a fourfold symetry ~most likely indicating an fcc crystal structure! withpeaks at positions near the average Fermi radius of lithiThis proves that crystalline bulk lithium is present. The symetry of the 2D-ACAR anisotropic contributions also showthat the lithium clusters are coherent or semicoherent wthe MgO host matrix. The difference in positron affinitieslithium and MgO yields a positronic potential step downthe MgOiLi interface. Therefore, the nanoclusters act aspotential well for positrons with a depth equal to the diffeence in the positron affinities. These positron affinities wcalculated using the LMTO-ASA method, and values for tdepth of the positronic potential well of 1.8 and 2.8 eV weobtained using the GGA and the insulator model, resptively. The depth of the potential well is so large that ttrapping probability of positrons meeting a nanoclusterapproximately equal to 1.
In future research, positron confinement can facilitateinvestigation of metal and semiconductor quantum dotsof unusual crystal structures, such as the electronic strucof fcc Li nanoclusters in MgO or of bcc Cu nanoclustersFe. In order to predict beforehand whether positron confiment is feasible, it would be useful to know the experimetally determined or calculated positron affinities of embeding transparent materials commonly used in optical studsuch as SiO2 , TiO2, and Al2O3. These affinities can then bcompared with the known positron affinities of many nancluster materials.
Note added in proof. Very recently, Nagaiet al. have in-vestigated successfully the Fermi surface of coherentlybedded Cu nanoclusters having the unusual bcc crystructure.53 Here the concept of position confinement in embedded nanoclusters was used in combination with theACAR technique.
ACKNOWLEDGMENTS
Thanks are due to O.K. Andersen and O. Jepsen for pviding their LMTO-ASA code. We are indebted to M.JPuska and T. Korhonen for permitting the use of their LMTpositron code and for stimulating discussions. We acknoedge Y. Nagai for valuable discussions on the subject of pitron confinement. Thanks are also due to F. Labohm forNDP measurements and a discussion of the results.
.
1P. Chakraborty, J. Mater. Sci.33, 2235~1998!.2U. Kreibig and M. Vollmer,Optical Properties of Metal Clusters,
Springer Series in Materials Science, Vol. 25~Springer, Berlin,1995!.
3K. Fukumi, A. Chayahara, K. Kodano, T. Sakaguchi, Y. HorinM. Miya, K. Jujii, J. Hayakawa, and M. Satou, J. Appl. Phys.75,3075 ~1994!.
4Metal Clusters, edited by W. Ekardt~Wiley, New York, 1999!.5Semiconductor Nanoclusters, edited by P.V. Kamat and D. Meise
,
~Elsevier, New York, 1997!.6D. Davidovic and M. Tinkham, Phys. Rev. Lett.83, 1644~1999!.7A.P. Alivisatos, Science271, 933 ~1996!.8Positron Spectroscopy of Solids, edited by A. Dupasquier and A.P
Mills, Jr. ~IOS Press, Amsterdam, 1995!.9M.J. Puska and R.M. Nieminen, Rev. Mod. Phys.66, 841~1994!.
10R. N. West, inPositron Spectroscopy of Solids~Ref. 8!, p. 75.11S.S. Rajput, R. Prasad, R.M. Singru, W. Triftha¨user, A. Eckert, G.
Kogel, S. Kaprzyk, and A. Bansil, J. Phys.: Condens. Matter5,
6-10
hi-
.AS
di
.
n,d
b,in
es-
n
R
. J
m
r-.
n
r,
T.
S
s.
,
.
H.
e-
t,ci.
ds,
r-reis
t,
.
an
ev.
s
a,
POSITRON CONFINEMENT IN EMBEDDED LITHIUM . . . PHYSICAL REVIEW B65 085416
6419 ~1993!.12Y. Nagai, M. Hasegawa, Z. Tang, A. Hempel, K. Yubuta, T. S
mamura, Y. Kawazoe, A. Kawai, and F. Kano, Phys. Rev. B61,6574 ~2000!.
13C.W. White, J.D. Budai, S.P. Withrow, J.G. Zhu, E. Sonder, RZuhr, A. Meldrum, D.M. Hembree, Jr., D.O. Henderson, andPrawer, Nucl. Instrum. Methods Phys. Res. B141, 228 ~1998!.
14A. Vom Felde, J. Fink, and W. Ekardt, Phys. Rev. Lett.61, 2249~1988!.
15G. Marichy, G. Chassagne, and D. Durand, Phys. Status Soli92, 221 ~1979!.
16M. Treilleux and G. Chassagne, J. Phys.~Paris! 40, L-283 ~1979!;J. Phys.~Paris!, Colloq. 41, C6-391~1980!.
17I. Vergara, R. Gonza´lez, R. Ramı´rez, J.E. Mun˜oz Santiuste, and YChen, Phys. Rev. B58, 5236~1998!.
18N.E. Christensen and D.L. Novikov, Phys. Rev. Lett.86, 1861~2001!.
19V.G. Vaks, M.I. Katsnelson, V.G. Koreshkov, A.I. LikhtensteiO.E. Parfenov, V.F. Skok, V.A. Sukhoparov, A.V. Trefilov, anA.A. Chernyshov, J. Phys.: Condens. Matter1, 5319~1989!.
20A. van Veen, M.A. van Huis, A.V. Fedorov, H. Schut, C.V. FaluS.W.H. Eijt, F. Labohm, B.J. Kooi, and J.Th.M. De Hosson,Ion Beam Synthesis and Processing of Advanced Materials, ed-ited by S. C. Moss, K.-H. Heining, and D. B. Poker, Mater. RSoc. Symp. Proc. No.647 ~Materials Research Society, Pittsburgh 2001!, p. O11.24.
21A. van Veen, H. Schut, and P. E. Mijnarends, inPositron Beamsand their Applications, edited by P. Coleman~World Scientific,Singapore, 2000!, p. 191.
22M. Clement, J.M.M. de Nijs, P. Balk, H. Schut, and A. van VeeJ. Appl. Phys.79, 9029~1996!.
23A. van Veen, H. Schut, J. de Vries, R.A. Hakvoort, and M.IJpma, inPositron Beams for Solids and Surfaces, AIP Conf.Proc. 218, edited by P. J. Schultz, G. R. Massoumi, and PSimpson~AIP, New York, 1990!, p. 171.
24A.V. Fedorov, A. van Veen, and H. Schut, Mater. Sci. Foru363-365, 646 ~2001!.
25A. Ueda, R. Mu, Y.-S. Tung, M. Wu, W.E. Collins, D.O. Hendeson, C.W. White, R.A. Zuhr, J.D. Budai, A. Meldrum, P.WWang, and Xi Li, Nucl. Instrum. Methods Phys. Res. B141, 261~1998!.
26M.J. Puska, P. Lanki, and R.M. Nieminen, J. Phys.: CondeMatter 1, 6081~1989!.
27P. Asoka-Kumar, K.G. Lynn, and D.O. Welch, J. Appl. Phys.76,4935 ~1994!.
28A. H. Weiss and P. G. Coleman, inPositron Beams and theiApplications, edited by P. Coleman~World Scientific, Singapore2000!, p. 129.
29P. Sferlazzo, S. Berko, and K.F. Canter, Phys. Rev. B35, 5315~1987!.
30Y. Nagashima, Y. Morinaka, T. Kurihara, Y. Nagai, T. Hyodo,Shidara, and K. Nakahara, Phys. Rev. B58, 12 676~1998!.
08541
..
B
.
,
.
.
s.
31For a recent review, see O. K. Andersen, O. Jepsen, and M.ˇob,in Electronic Band Structure and its Applications, edited by M.Yussouff ~Springer, Berlin, 1987!, p. 1.
32H. L. Skriver,The LMTO Method~Springer, Berlin, 1984!.33E. Boronski and R.M. Nieminen, Phys. Rev. B34, 3820~1986!.34B. Barbiellini, M.J. Puska, T. Torsti, and R.M. Nieminen, Phy
Rev. B 51, 7341 ~1995!; B. Barbiellini, M.J. Puska, T. Kor-honen, A. Harju, T. Torsti, and R.M. Nieminen,ibid. 53, 16 201~1996!.
35M.J. Puska, S. Ma¨kinen, M. Manninen, and R.M. NieminenPhys. Rev. B39, 7666~1989!.
36D. M. Roessler and D. R. Huffman, inHandbook of Optical Con-stants of Solids II, edited by E. D. Palik~Academic Press, Lon-don, 1991!, p. 919.
37U. Von Barth and L. Hedin, J. Phys. C5, 1629~1972!.38J. Kuriplach, M. Sob, G. Brauer, W. Anwand, E.-M. Nicht, P.G
Coleman, and N. Wagner, Phys. Rev. B59, 1948~1999!.39C.V. Falub, S.W.H. Eijt, A. van Veen, P.E. Mijnarends, and
Schut, Mater. Sci. Forum363-365, 561 ~2001!.40B.J. Kooi, A. van Veen, J.Th.M. De Hosson, H. Schut, A.V. F
dorov, and F. Labohm, Appl. Phys. Lett.76, 1110~2000!.41M.A. van Huis, A.V. Fedorov, A. van Veen, F. Labohm, H. Schu
P.E. Mijnarends, B.J. Kooi, and J.Th.M. De Hosson, Mater. SForum363-365, 448 ~2001!.
42Y. Tanaka, Y. Sakurai, A.T. Stewart, N. Shiotani, P.E. MijnarenS. Kaprzyk, and A. Bansil, Phys. Rev. B63, 045120~2001!.
43The anisotropic part of the 2D-ACAR distribution was detemined by subtracting an isotropic distribution that everywheremains within the measured distribution. The anisotropytherefore everywhere positive.
44C. V. Falub, S. W. H. Eijt, M. A. van Huis, A. van Veen, H. Schuand P. E. Mijnarends, Nucl. Instrum. Meth. Phys. Res. B~to bepublished!; C. V. Falubet al. ~unpublished!.
45M. Farjam and H.B. Shore, Phys. Rev. B36, 5089~1987!.46M. Forster, J. N. Mundy, and H.-E. Schaefer, inPositron Annihi-
lation, edited by L. Dorikens-Vanpraet, M. Dorikens, and DSegers~World Scientific, Singapore, 1989!, p. 833.
47R. Pareja, M.A. Pedrosa, and R. Gonzalez, inPositron Annihila-tion, edited by P. C. Jain, R. M. Singru, and K. P. Gopinath~World Scientific, Singapore, 1985!, p. 708.
48D.M. Ceperley and B.J. Alder, Phys. Rev. Lett.45, 566 ~1980!.49J.P. Perdew and A. Zunger, Phys. Rev. B23, 5048~1981!.50B.K. Panda, G. Brauer, W. Skorupa, and J. Kuriplach, Phys. R
B 61, 15 848~2000!.51P. Hautoja¨rvi and C. Corbel, inPositron Spectroscopy of Solid
~Ref. 8!, p. 491.52Handbook of Chemistry and Physics, 56th ed.~CRC Press, Boca
Raton, 1975!, p. B-214.53Y. Nagai, T. Chiba, Z. Tang, T. Akahane, T. Kanai, M. Hasegaw
M. Takenaka, and E. Kuramoto, Phys. Rev. Lett.87, 176402~2001!.
6-11