Tumour localisation in oncology using positron emitting radiopharmaceuticals and a multiwire...
9
Nuclear Instruments and Methods in Physics Research 221 (1984) 233-241 233 North-Holland, Amsterdam TUMOUR LOCALISATION IN ONCOLOGY USING POSITRON EMITrING RADIOPHARMACEUTICALS AND A MULTIWIRE PROPORTIONAL CHAMBER POSITRON CAMERA; TECHNIQUES FOR 3D DECONVOLUTION S. WEBB a, R.J. OTT 1, J.E. BATEMAN 2, A.C. FLESHER 2, M.A. FLOWER 1, M.O. LEACH 1, P. MARSDEN 1, O. KHAN 3 and V.R. McCREADY 3 t Physics Division, Institute of Cancer Research and Royal Marsden Hospital, Sutton, Surrey, UK e Rutherford Appleton Laboratory, S.E.R.C. Chilton, Didcot, Oxfordshire, UK 3 Department of Nuclear Medicine, Royal Marsden Hospital, Sutton, Surrey, UK Tomographic patient images have been produced with a prototype Multiwire Proportional Chamber (MWPC) Positron Camera built by the Rutherford Laboratory. The volume that may be imaged is 20 × 20 x 20 cm3 limiting patient studies to the skull, brain, thyroid, heart, liver and areas of the skeleton. Typical total count rates of 1-2 x 10³ c/s were achieved with 40-80 MBq of injected radionuclide and acceptable clinical images with 0.5-1 million counts were obtained in 15-30 min. The in-plane spatial resolution is 8-10 mm fwhm and the slice width is 2 cm with scattering material present. Longitudinal tomograms are reconstructed by back projection, followed by 2D deconvolution of the point source response function (PSRF) and Fourier filtering of the backprojected images to remove in-plane noise. The clinical images presented were produced in a clinical trial at the Royal Marsden Hospital, Sutton. The images generated in this way, whilst already clinically useful, suffer from the plane to plane interference common to all methods of longitudinal tomography. A 3D deconvolution technique has been developed which removes much of this interference. The technique is based on dividing the 3D Fourier Transform (FT) of the images by the 3D Transform of the PSRF but relies for its success on selecting a suitable set of "tuning" conditions under which this deconvolution can be successfully attempted in the presence of photon noise. These important tuning conditions are discussed and the improvement in the resulting images is illustrated. Finally the requirements for a clinically useful system are discussed. 1. Introduction Longitudinal tomographic imaging to detect tumours can be achieved using positron emitting radio- pharmaceuticals and a suitable positron detector. Most clinical positron emission tomography (PET) is per- formed using large volumes of scintillation detector with or without detector motion and employ collimation to produce transverse section tomograms [1]. Such positron cameras are expensive and can achieve adequate sensi- tivity and resolution only by surrounding the patient with a ring of detectors and by executing carefully controlled movements. An alternative approach is to perform longitudinal tomography using multiplanar multiwire proportional chambers in which adequate sensitivity is achieved by stacking chambers, and high spatial resolution is achieved by using closely spaced detector wires. Such a system can be used with both generator-produced and cyclotron-produced longer lived positron-emitting radionuclides. This, combined with the lower cost of a MWPC camera makes it a good choice for the widespread clinical application of positron emission tomography. In this paper we present some of the data obtained using a prototype MWPC Positron Camera, designed and built at the SERC Rutherford Laboratory (R.L.), which was installed for a 2½ month 0167-5087/84/$03.00 © Elsevier Science Publishers B.V. (North-Holland Physics Publishing Division) period of clinical use at the Royal Marsden Hospital (R.M.H.), Sutton. Subsequent improvements to the re- construction technique used during that period enable a proper deconvohition of plane-to-plane interference re- sulting in improved image quality. The details of the technique are presented in sections 4-6. 2. The imaging system The camera consists of two (30 x 30) cm 2 detectors which are placed on either side of the patient (fig. 1). Each detector comprises 20 MWPC planes which detect the 511 keV annihilation photons and determine the line along which the positron interaction took place. The sections of each detector have 125/~m thick lead-foil cathodes etched into 3 mm strips which form the pho- ton converters. The amplification occurs close to the 20 #m diameter gold plated tungsten anode wires, which are spaced at 2 mm intervals. The spacing between the anode and cathode is 2.5 mm. The transverse position of each photon interaction is determined by a delay line readout on each cathode plane. The directions of etched strips are arranged at 90 ° on alternate cathode planes in order to obtain both x and y localisation. The longitudi- VI. APPLICATIONS
-
Upload
independent -
Category
Documents
-
view
4 -
download
0
Transcript of Tumour localisation in oncology using positron emitting radiopharmaceuticals and a multiwire...
Nuclear Instruments and Methods in Physics Research 221 (1984) 233-241 233 North-Holland, Amsterdam
T U M O U R L O C A L I S A T I O N I N O N C O L O G Y U S I N G P O S I T R O N E M I T r I N G
R A D I O P H A R M A C E U T I C A L S A N D A M U L T I W I R E P R O P O R T I O N A L C H A M B E R P O S I T R O N
C A M E R A ; T E C H N I Q U E S F O R 3 D D E C O N V O L U T I O N
S. W E B B a, R.J . O T T 1, J .E. B A T E M A N 2, A .C . F L E S H E R 2, M . A . F L O W E R 1, M . O . L E A C H 1,
P. M A R S D E N 1, O. K H A N 3 a n d V.R. M c C R E A D Y 3
t Physics Division, Institute of Cancer Research and Royal Marsden Hospital, Sutton, Surrey, UK e Rutherford Appleton Laboratory, S.E.R.C. Chilton, Didcot, Oxfordshire, UK 3 Department of Nuclear Medicine, Royal Marsden Hospital, Sutton, Surrey, UK
Tomographic patient images have been produced with a prototype Multiwire Proportional Chamber (MWPC) Positron Camera built by the Rutherford Laboratory. The volume that may be imaged is 20 × 20 x 20 cm 3 limiting patient studies to the skull, brain, thyroid, heart, liver and areas of the skeleton. Typical total count rates of 1-2 x 10³ c /s were achieved with 40-80 MBq of injected radionuclide and acceptable clinical images with 0.5-1 million counts were obtained in 15-30 min. The in-plane spatial resolution is 8-10 mm fwhm and the slice width is 2 cm with scattering material present. Longitudinal tomograms are reconstructed by back projection, followed by 2D deconvolution of the point source response function (PSRF) and Fourier filtering of the backprojected images to remove in-plane noise. The clinical images presented were produced in a clinical trial at the Royal Marsden Hospital, Sutton. The images generated in this way, whilst already clinically useful, suffer from the plane to plane interference common to all methods of longitudinal tomography. A 3D deconvolution technique has been developed which removes much of this interference. The technique is based on dividing the 3D Fourier Transform (FT) of the images by the 3D Transform of the PSRF but relies for its success on selecting a suitable set of "tuning" conditions under which this deconvolution can be successfully attempted in the presence of photon noise. These important tuning conditions are discussed and the improvement in the resulting images is illustrated. Finally the requirements for a clinically useful system are discussed.
1. Introduction
Longitudinal tomographic imaging to detect tumours can be achieved using positron emitt ing radio- pharmaceuticals and a suitable positron detector. Most clinical positron emission tomography (PET) is per- formed using large volumes of scintillation detector with or without detector motion and employ collimation to produce transverse section tomograms [1]. Such positron cameras are expensive and can achieve adequate sensi- tivity and resolution only by surrounding the patient with a ring of detectors and by executing carefully controlled movements. An alternative approach is to perform longitudinal tomography using multiplanar multiwire proportional chambers in which adequate sensitivity is achieved by stacking chambers, and high spatial resolution is achieved by using closely spaced detector wires. Such a system can be used with both generator-produced and cyclotron-produced longer lived positron-emitting radionuclides. This, combined with the lower cost of a M W P C camera makes it a good choice for the widespread clinical application of positron emission tomography. In this paper we present some of the data obtained using a prototype MWPC Positron Camera, designed and built at the SERC Rutherford Laboratory (R.L.), which was installed for a 2½ month
0167-5087/84/$03.00 © Elsevier Science Publishers B.V. (North-Holland Physics Publishing Division)
period of clinical use at the Royal Marsden Hospital (R.M.H.), Sutton. Subsequent improvements to the re- construction technique used during that period enable a proper deconvohition of plane-to-plane interference re- sulting in improved image quality. The details of the technique are presented in sections 4-6.
2. The imaging system
The camera consists of two (30 x 30) cm 2 detectors which are placed on either side of the patient (fig. 1). Each detector comprises 20 MWPC planes which detect the 511 keV annihilation photons and determine the line along which the positron interaction took place. The sections of each detector have 125/~m thick lead-foil cathodes etched into 3 mm strips which form the pho- ton converters. The amplification occurs close to the 20 # m diameter gold plated tungsten anode wires, which are spaced at 2 mm intervals. The spacing between the anode and cathode is 2.5 mm. The transverse position of each photon interaction is determined by a delay line readout on each cathode plane. The directions of etched strips are arranged at 90 ° on alternate cathode planes in order to obtain both x and y localisation. The longitudi-
VI. APPLICATIONS
234 S. Webb et aL / Tumour localisation
Fig. l. The prototype positron camera during its clinical evaluation.
nal position (z) is determined by the anode signals. Each section has a detection efficiency for annihilation photons of about 0.5%, giving a detection efficiency of about 10% per stacked detector and hence a coincident efficiency of about 1%. This value has not been opti- mised for the positron system but is comparable with that of a typical gamma camera system at 140 keV. Each detector is surrounded by a lead shield to reduce background radiation. The separation of the two detec- tors was set at 59.2 cm. This is the smallest separation that can be obtained with shielded detectors whilst allowing adequate space for positioning the patient and maintaining a large stereoscopic angle of view. The prototype positron camera has been described in detail elsewhere [2].
The physical response of the camera has been mea- sured using point and line sources immersed in a (20 x 20 × 20) cm 3 volume of water. The in-plane spatial resolution is 8 + 1 mm fwhm and is constant to + 1 mm both within planes and between planes (Ott et al. [3]). The plane-to-plane resolution is - 2 cm fwhm and is currently limited by the small (cone angle = 28 °) stereo effect of the stationary detectors. By measuring the energy response, the detectors have been shown to be relatively insensitive to scattered photons [4].
The reconstruction technique used during the period of clinical evaluation at the R.M.H. was as follows. Data comprising the Cartesian coordinates of the posi- tions where the annihilation photons interact in the detectors are stored on a magnetic tape using an on line LSI 11-23 computer. Simple backprojection of the inter- action data into planes parallel to the detector faces provides blurred longitudinal tomograms where "in focus" information is degraded by the contribution of out of focus information from other reconstructed planes. Additionally there are contributions from slowly varying Compton background and accidental coinci- dences. The software provided by the R.L. enabled 5
backprojected tomograms per study to be recorded on floppy discs. The images are (128 × 128) pixels × 16 bits deep and represent planes spaced symmetrically about the midpoint between the detectors. The pixel size of the reconstructed images is 2.3 mm and the spacing between the image planes can be varied.
The R.L. Software also permitted the in-plane camera PSRF, which was assumed to be spatially invariant, to be deconvolved from each plane. During this second stage of data processing the frequency information in the data could be rolled-off using a Fermi-Dirac curve whose half-height roll-off-frequency (fl/2) could be chosen by the user. Typical values used for f l / 2 were between 0.2 and 0.25 of the Nyquist frequency (k N = 0.21 mm-1). The roll-off from maximum to minimum occurred within a range of +0.05k N either side of fl/2. Deconvolution was achieved by 2D Fourier methods (utilising an ANALOGIC AP400 array processor).
By utilising this technique the backprojected tomo- grams were substantially improved. The images pre- sented in section 3 have been processed to this stage. Other clinical images generated in this way during the trial period are presented elsewhere [4] together with a more detailed background to the clinical studies. The images contain plane-to-plane interference artefacts but have proved clinically useful. The techniques for full 3D deconvolution which have been developed at R.M.H. since the clinical evaluation period are presented in section 5.
3. Patient studies
The pilot study aimed to evaluate the feasibility of using the prototype detector for in-vivo imaging and for comparing the results obtained from conventional planar scintigraphy. The radiopharmaceuticals were provided by the MRC Cyclotron Unit, Hammersmith Q8F, 18F-2FDG and 52 Fe citrate), and the Birmingham Uni- versity Nuffield Cyclotron together with the Depart- ment of Medical Biophysics at Manchester University (Na-124I). Patients were chosen from those referred for routine screening for brain tumours, skeletal imaging, and thyroid disorders prior to therapy.
The study was performed with the approval of the RMH Ethical Committee and of ARSAC (Administra- tion of Radioactive Substances Advisory Committee). Individual patient consent was obtained before adminis- tration of the agents.
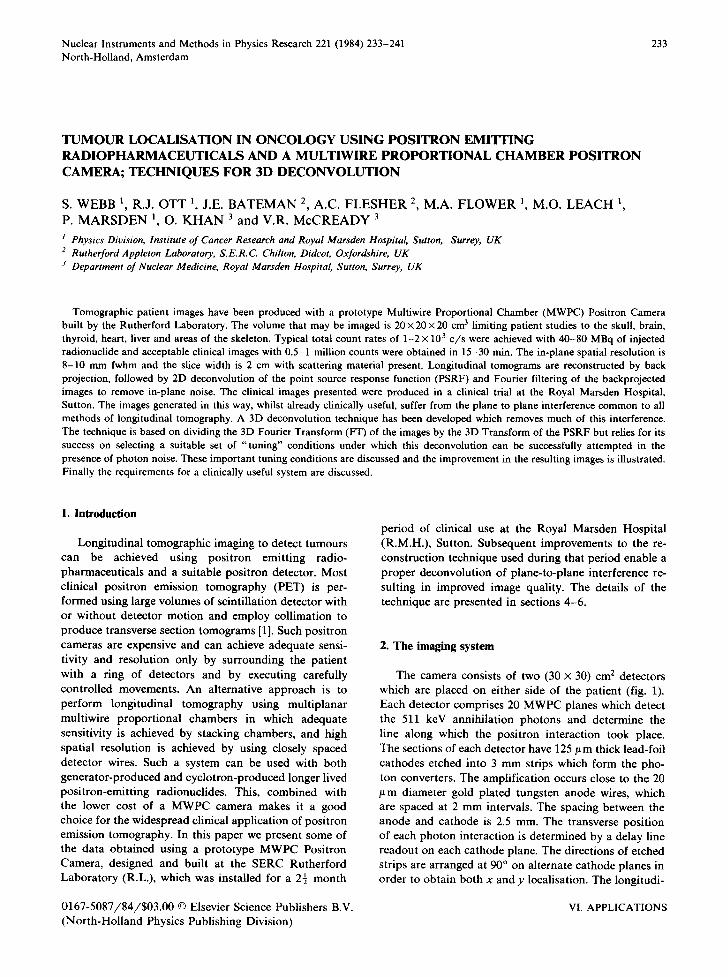
Each patient referred for routine skeletal imaging, and agreeing to have an extra examination using the prototype positron camera, had 40-80 MBq of Na-18F enabling positron images of various regions of the skele- ton to be taken. Data were acquired- one hour after intravenous injection of the 18F. Fig. 2, shows a typical bone image, namely a sagittal section through the left orbital region of the skull of a 49 year old female with a
S. Webb et al. / Turnout Iocalisation 235
Fig. 2. A sagittal section through the skull of a patient with metastatic disease from Ca breast (460000 events recorded in 32 min). (Note: the authors would like to point out that all figures are degraded during the photographic process. The originals seen on a TV monitor are vastly superior.)
known carcinoma of the breast. It shows a 1 cm lesion above the left orbit (confirmed by conventional imag- ing) as well as good definition of the skull and detail of the cervical spine not apparent on conventional images.
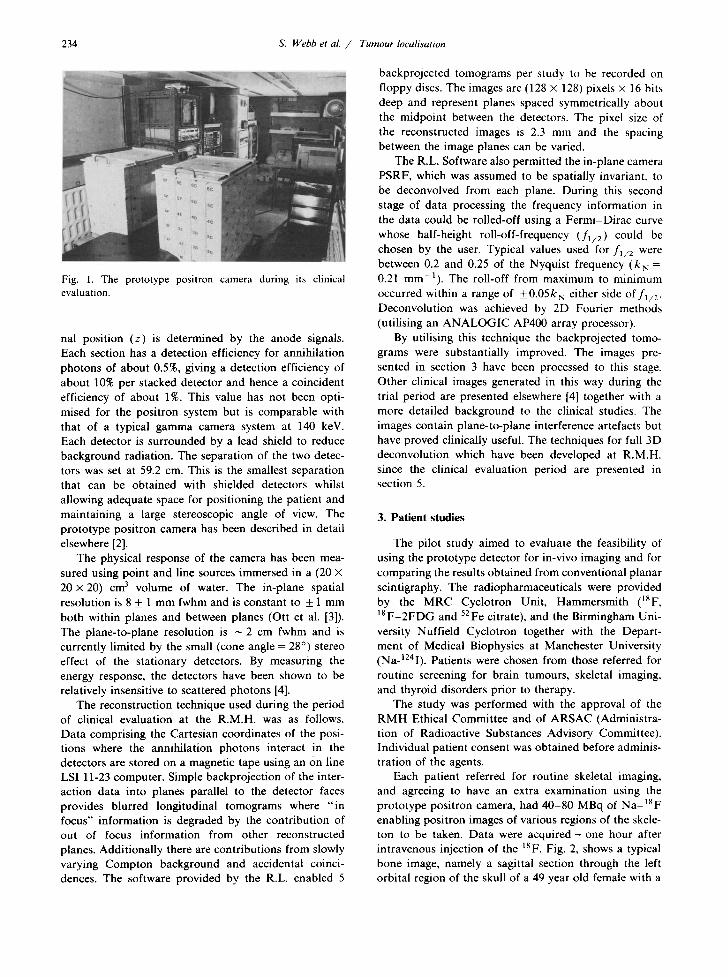
Fig. 3 shows a sagittal section through the right orbital region of the brain of a 61 year old male with a suspected metastasis from carcinoma of the bronchus. 40 M B q of 1 8 F - 2 - f l u o r o - 2 - d e o x y - D - g l u c o s e (18F-2FDG) were injected. The figure shows a region of high uptake in the occipital region of the brain.
Fig. 3. A sagittal section through the brain of a patient with metastatic disease from Ca bronchus (510000 events recorded in 26 min).
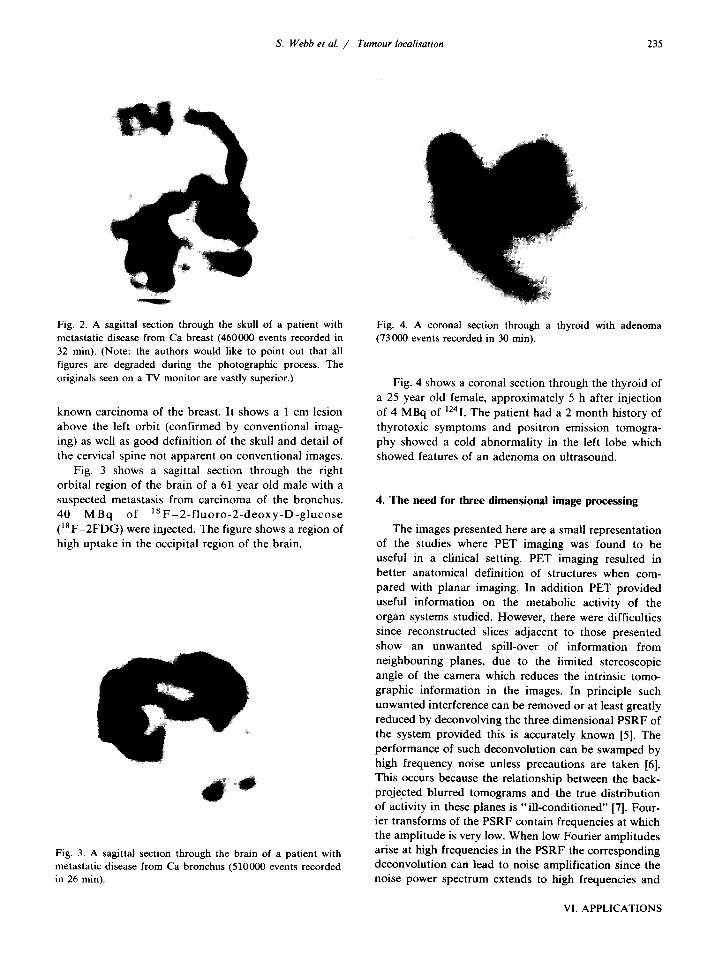
Fig. 4. A coronal section through a thyroid with adenoma (73000 events recorded in 30 min).
Fig. 4 shows a coronal section through the thyroid of a 25 year old female, approximately 5 h after injection of 4 MBq of 1241. The patient had a 2 month history of thyrotoxic symptoms and positron emission tomogra- phy showed a cold abnormality in the left lobe which showed features of an adenoma on ultrasound.
4. The need for three dimensional image processing
The images presented here are a small representation of the studies where PET imaging was found to be useful in a clinical setting. PET imaging resulted in better anatomical definition of structures when com- pared with planar imaging. In addition PET provided useful information on the metabolic activity of the organ systems studied. However, there were difficulties since reconstructed slices adjacent to those presented show an unwanted spill-over of information from neighbouring planes, due to the limited stereoscopic angle of the camera which reduces the intrinsic tomo- graphic information in the images. In principle such unwanted interference can be removed or at least greatly reduced by deconvolving the three dimensional PSRF of the system provided this is accurately known [5]. The performance of such deconvolution can be swamped by high frequency noise unless precautions are taken [6]. This occurs because the relationship between the back- projected blurred tomograms and the true distribution of activity in these planes is " i l l -condit ioned" [7]. Four- ier transforms of the PSRF contain frequencies at which the amplitude is very low. When low Fourier amplitudes arise at high frequencies in the PSRF the corresponding deconvolution can lead to noise amplification since the noise power spectrum extends to high frequencies and
VI. APPLICATIONS
236 S. Webb et al. / Tumour Iocalisation
can dominate signals at these frequencies [8]. Addition- ally for a positron camera with a limited stereoscopic angle there are some low frequencies where the FT of the PSRF is small or zero [9]. The problem of deblur- ring images via spatial frequency domain methods is common to many imaging modalities and techniques for coping with noisy data are numerous. Mostly these have been implemented for two dimensional images, e.g. den- tal X radiographs, infra-red satellite images, malad- justed lens systems [8], interplanetary satellite images [7], Home Office forensic science [10], satellite X-ray astronomy and ground based radioastronomy [11]. The noise problem in three dimensional imaging is in princi- ple similar and hence one expects some benefit from applying tested techniques from these fields to PET. The actual implementation is dependent on the applica- tion and in the next section we show that the method we choose to adopt requires careful "tuning" to produce acceptable results when applied to the three dimen- sional backprojected images from this prototype positron camera.
5. Three dimensional deconvolution technique
faces and 8z = 2 cm in the orthogonal direction. Sixteen planes of data using a (64 × 64) grid comprised ~( r ) and correspondingly q~0(r). The volume in which decon- volution takes place is thus (30 × 30 x 32) cm 3.
Prior to applying eq. (1), both the PSRF and the data to be deconvolved are windowed in real space by the function
a ( r ) = exp -1"/12)2 exp-~y/12)-' exp ~:/12~)2 (2)
where r = (x, y, z). This window reduces the leakage arising because q~(r) has non-compact support and is aperiodic. We also imply in eq. (1) that the origin of coordinates has been chosen in such a way that ~ ( p ) and ~o(P) have the correct phase relative to each other.
In our implementation of eq. (1) we have made two departures from the basic Chu and Tam technique which we find essential for successful deconvolution using experimental data. We shall refer to these as "tuning" the technique and in section 6 show how important they are. Firstly a frequency window W(p) is included in the numerator of eq. (1). The effect is to roll off the high frequency components of ~( r ) where signal may be dominated by noise. W(p) has the form of a three dimensional Hanning window in frequency space:
The technique adopted is a modified version of that described by Chu and Tam [12] which has previously been applied only to simulated data. The modifications concern the tuning we have found necessary to ensure a good result with experimental data.
Let the three dimensional PSRF of the camera be ~0(r) and the backprojected object data be q~(r). Then the deconvolved object data q~a(r) are given by the 3D inverse FFT of the function ~d(P), where
% ( t , ) = ~ ( p ) w ( p ) . (1)
~ 0 ( P ) { 1 + g(21rp)~4 } ~ 0 2 ( p )
In eq. (1), upper case letters represent the 3D FFT of the corresponding lower case quantity, i.e.
{ q~d(r), ~ a ( P ) } , {~b(r), ~b(p)}, { ~b0(r) ' ~ 0 ( P ) }
are Fourier pairs, W(p) is a 3D spatial frequency window which will be described later; r represents ra- dial distance, p represents spatial frequency and y is a Lagrange constant chosen by the user. Eq. (1) results from maximising the smoothness in the images for a constant error, (for proof see Chu and Tam, [12]). This Lagrange technique was first proposed by Phillips [13] for dealing with the problem of noise when inverting an unstable non-singular Fredholm equation of the first kind.
It is implicit in eq. (1) that q~(r), q~0(r) andq~d(r) are defined on a finite grid. The lattice spacings used were 8x = 8y = (30/64) cm in planes parallel to the detector
W( p)= ~ {l + cos~rP~ l ( l + cos~rPv }{l + cos~r& }, PxN i ~ Pv~ P'-N
(3)
where p = ( Px, Py, P~) and PxN, PyN' P~N are the Nyquist frequencies in the orthogonal frequency directions.lt will be seen that at the Nyquist frequency the window vanishes and at dc the window is unity.
Secondly we introduce the possibility of an ampli- tude threshold in frequency space applied to the func- tion ~0(P). The implementation involves specifying thresholds ~ r ( p ) and ~ i ( p ) on both the real and imaginary parts ofq~0(p) such that the amplitude of ~0(P) is set equal to the appropriate threshold ampli- tude if it falls beneath it. Notice that this specification is quite different from a window in frequency space since the criterion for applying a threshold is amplitude not frequency dependent. The motive for applying a threshold is twofold. Firstly it is to reduce the noise amplification which would have occurred because (at high frequency) the 3D FFT of the PSRF has small amplitudes. Secondly it is to reduce the deconvolution attempted at those (low) frequencies where the limited stereoscopic angle of the camera leads to a poor or vanishing specification of ~0(P) [9]. In the examples shown in section 6, a threshold was applied which set 21% of the values comprising ~0(P) to a constant threshold. This value was selected after carefully study- ing the histogram of amplitudes arising in ~0(P).
Thus the implementation of the deconvolution eq. (1) has been made highly versatile. The user is free to

S. Webb et al. / Turnout Iocalisation 237
choose whether or not to apply these tuning techniques and what values to set for the variables ~ r ( p ) , ~ , ( p ) . The method has been implemented on a P D P l l / 0 5 computer, operating under an RTl lSJ monitor with neither a floating point processor nor an array processor.
Despite these limitations the technique can generate 16 deconvolved planes from 16 backprojected images and from 16 PSRF planes in about 12 h. The 3D FFT algorithm is based on the 1D FFT routine of Brigham [14] and because of core limitations look-up tables are
1 0 2 4
- 2 d
- 1 1 2 4
l e 2 4
i [ I - 2 4
I i - 1 0 2 4
b
1 0 2 4
- 2 4
- 5 3 4
- | t 1 4
C
1 e 2 4
2 4
5 3 +
B 2 4
d
Fig. 5. Backprojected sections of a phantom comprising 2 line sources (planes 4(a), 6(b), 8(c), 10(d) and 12(e)).
1 8 2 4
- 2 4
" 5 3 6
- 1 # 2 4
e
VI. APPLICATIONS

238 S. Webb et al, / Tumour localisation
I O 0 •
2,4
5 1 4
1 0 0 0
2 4
5 2 4
It • 1 4
a
Fig. 6. Planes 6(a) and t0(b) after pure deconvolution.
! 0 2 4
b
not used. Some of the computation time is taken by the somewhat complicated method used to swap data from hard disc to core to overcome core limitations. All calculations were floating point and hence the imple- mentation necessitated handling three real arrays of size (64 x 64 x 16). This was achieved at the cost of over- writing the input data on hard disc by the output data. It can be seen from eq. (1) that the implementation necessitates computing three (64 x 64 x 16) forward or reverse FFTs. The speed of implementation was obvi- ously limited by the available equipment but this con- figuration allowed an investigation of the most ap- propriate choice of tuning conditions.
6. Results of three dimensional deconvolution
In order to illustrate the 3D deconvolution technique a pair of line sources was imaged by the positron
camera. The sources were placed 8 cm apart, one hori- zontal along the camera x axis and the other at 45 ° to x and y axes in a (20 x 20 x 20) cm 3 water bath. Sixteen planes were reconstructed by back projection such that the lines were in focus in planes 6 (diagonal) and 10 (horizontal). Fig. 5 shows the back projected planes 4, 6, 8, 10 and 12. The data shown are the full range in each plane. It is immediately apparent that there is substan- tial crosstalk between planes, for example, plane 10 contains unwanted diagonal shadow, plane 6 contains unanted horizontal shadow and the other planes which should be empty, contain interference. Moreover the resolution within each plane is not optimised and the lines appear too thick. Fig. 6 shows just two of the planes resulting from a pure deconvolution in which y is set to zero, the window W ( p ) is set to unity for all p and q~0(P) is not thresholded. The result is the familiar noise amplification which makes it almost impossible to distinguish the signal. ~0 (P) is an experimental rune-
O 0
2 4
1 4
Fig.7. Planes 6(a) and tO(b) after deconvolution, with a frequency window applied.
14;
b
S. Webb et al. /
: I
2 4
I I S:Z4
Tumour Iocalisation
: " : : t l 2 4 i i
!
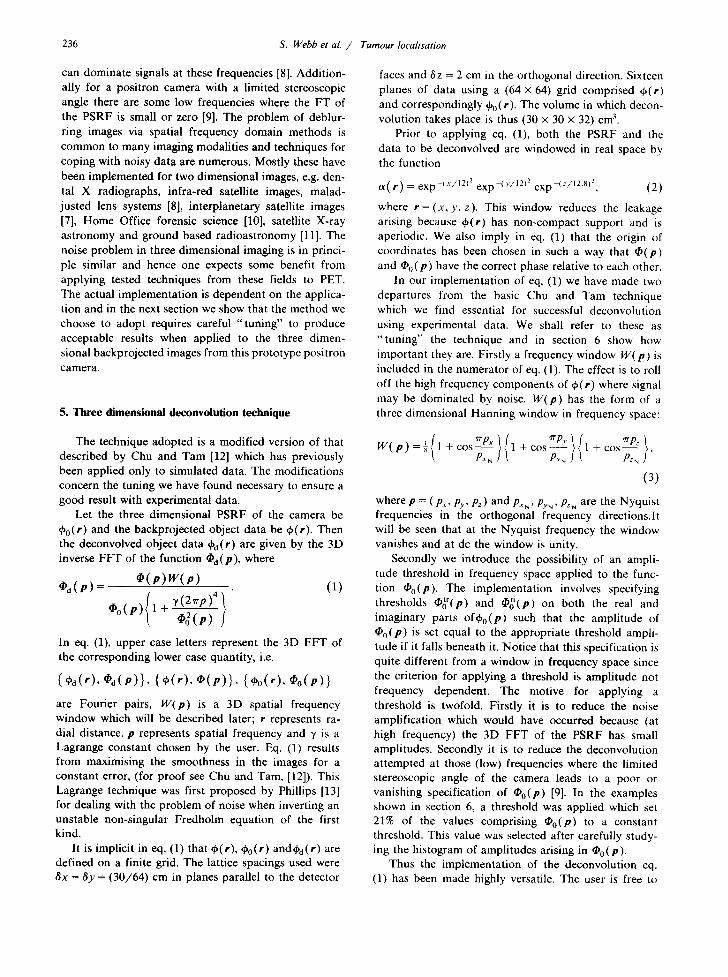
Fig. 8. Planes 6(a) and 10(b) after deconvolution, with an amplitude threshold set for ~0(P).
239
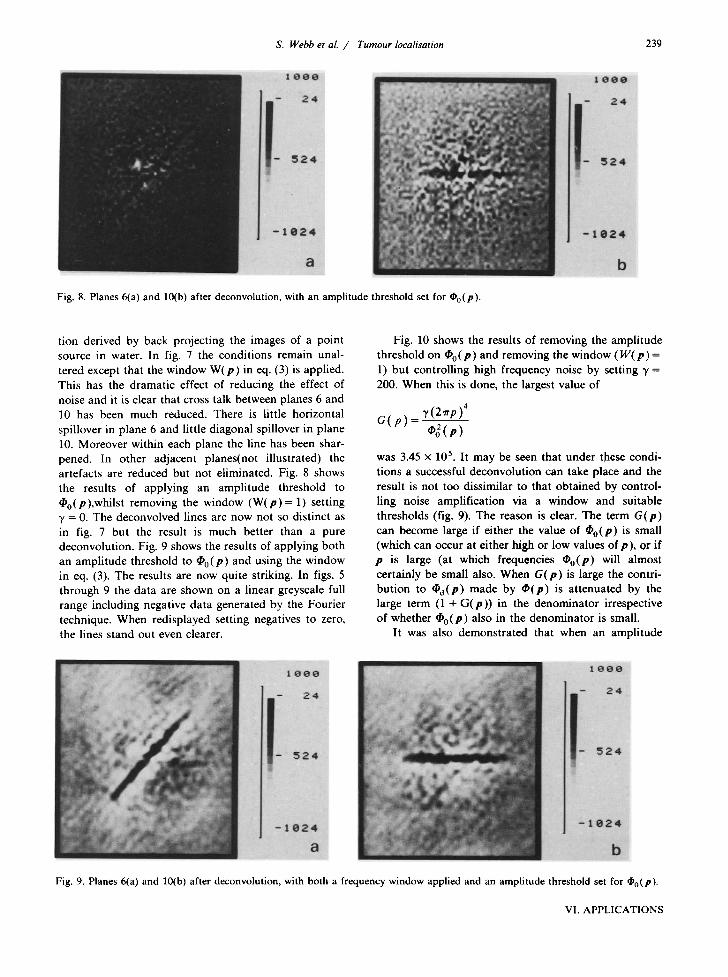
tion derived by back projecting the images of a point source in water. In fig. 7 the conditions remain unal- tered except that the window W ( p ) in eq. (3) is applied. This has the dramatic effect of reducing the effect of noise and it is clear that cross talk between planes 6 and 10 has been much reduced. There is little horizontal spillover in plane 6 and little diagonal spillover in plane 10. Moreover within each plane the line has been shar- pened. In other adjacent planes(not illustrated) the artefacts are reduced but not eliminated. Fig. 8 shows the results of applying an amplitude threshold to ~0(P),whilst removing the window ( W ( p ) = 1) setting "t = 0. The deconvolved lines are now not so distinct as in fig. 7 but the result is much better than a pure deconvolution. Fig. 9 shows the results of applying both an amplitude threshold to ~0(P) and using the window in eq. (3). The results are now quite striking. In figs. 5 through 9 the data are shown on a linear greyscale full range including negative data generated by the Fourier technique. When redisplayed setting negatives to zero, the lines stand out even clearer.
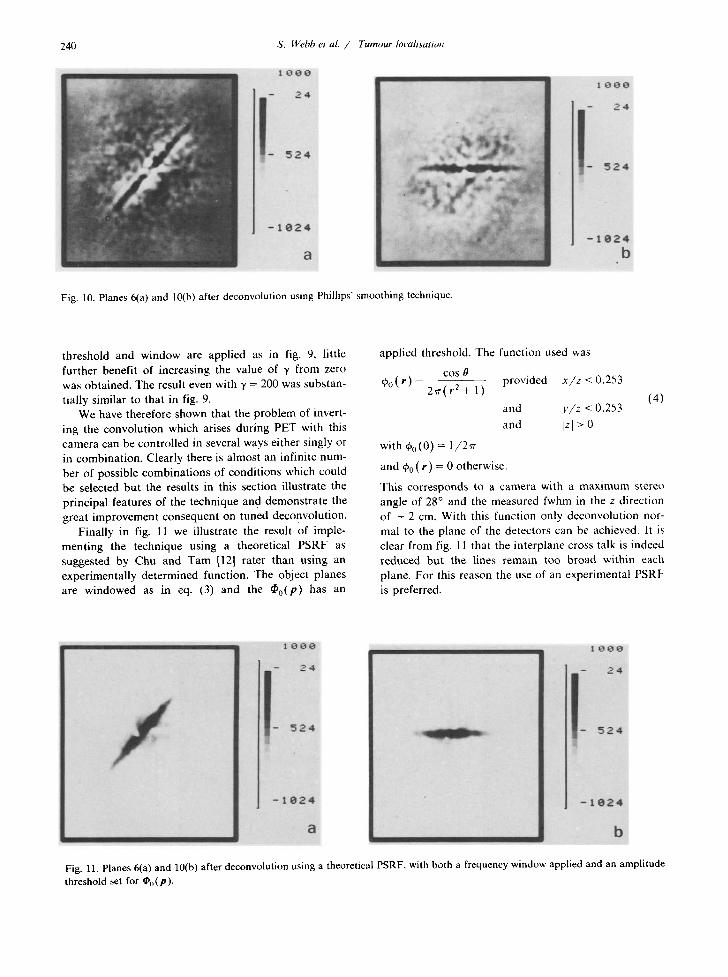
Fig. 10 shows the results of removing the amplitude threshold on ~0 (P ) and removing the window ( W ( p ) = 1) but controlling high frequency noise by setting 3' = 200. When this is done, the largest value of
G(p) ~, (2~rp)'
was 3.45 × 10⁵. It may be seen that under these condi- tions a successful deconvolution can take place and the result is not too dissimilar to that obtained by control- ling noise amplification via a window and suitable thresholds (fig. 9). The reason is clear. The term G ( p )
can become large if either the value of ~0(P) is small (which can occur at either high or low values of p), or if p is large (at which frequencies ~0(P) will almost certainly be small also. When G ( p ) is large the contri- but ion to ~d (P) made by ~ ( p ) is attenuated by the large term (1 + G(p ) ) in the denominator irrespective of whether ~0(P) also in the denominator is small.
It was also demonstrated that when an amplitude
Fig. 9. Planes 6(a) and 10(b) after deconvolution, with both a frequency window applied and an amplitude threshold set for ~0(P).
VI. APPLICATIONS
240 S. Webb et al. / Tumour Iocalisation
I O O O
2 4
J- 524
- 1 0 2 4
a
2 4
524
- 1 0 2 4 b
Fig. 10. Planes 6(a) and 10(b) after deconvolution using Phillips' smoothing technique.
threshold and window are applied as in fig. 9, little fur ther benefi t of increasing the value of ~, from zero was obtained. The result even with y = 200 was substan- tially similar to that in fig. 9.
We have therefore shown that the problem of invert- ing the convolut ion which arises during PET with this camera can be controlled in several ways either singly or in combinat ion. Clearly there is almost an infinite num- ber of possible combina t ions of condi t ions which could be selected but the results in this section illustrate the principal features of the technique and demonst ra te the great improvement consequent on tuned deconvolution.
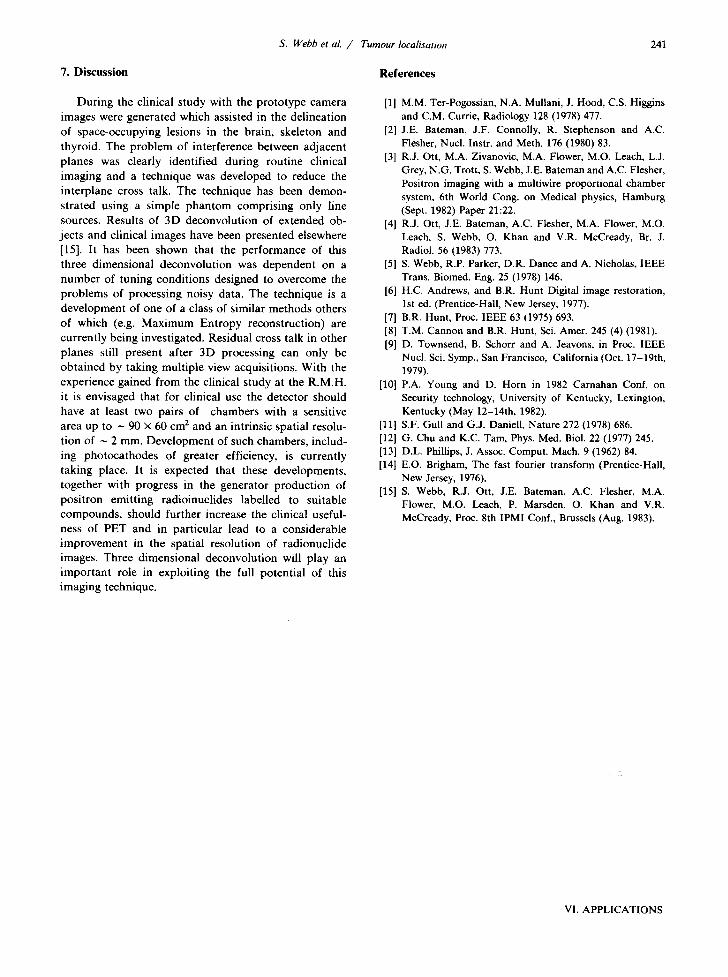
Finally in fig. 11 we illustrate the result of imple- ment ing the technique using a theoretical PSRF as suggested by Chu and T am [12] rater than using an experimental ly determined function. The object planes are windowed as in eq. (3) and the ~ 0 ( P ) has an
applied threshold. The function used was
cos 0 ~o ( r ) = provided x / z < 0.253
2 ~r ( r 2 + 1 )
and v / z < 0.253
and Izl > 0
with 4)0(0) = 1/2~r
(4)
and qS0(r ) = 0 otherwise.
This corresponds to a camera with a maximum stereo angle of 28 ° and the measured fwhm in the z direction of - 2 cm. With this function only deconvolut ion nor- mal to the plane of the detectors can be achieved. It is clear from fig. 11 that the interplane cross talk is indeed reduced but the lines remain too broad within each plane. For this reason the use of an experimental PSRF is preferred.
1 0 0 0
- 24
I - 524
1000 - 24
I - 524 iiii!
- : e 2 4 J - 1 $ 2 4
a b
Fig. ] ] . Planes 6(a) and lO(b) after deconvolution using a theoretical PSRF, with both a frequency window applied and an amplitude
threshold set for ~0(P)-
S. Webb et al. / Tumour localisation 241
7. Discussion References
During the clinical study with the prototype camera images were generated which assisted in the delineation of space-occupying lesions in the brain, skeleton and thyroid. The problem of interference between adjacent planes was clearly identified during routine clinical imaging and a technique was developed to reduce the interplane cross talk. The technique has been demon- strated using a simple phantom comprising only line sources. Results of 3D deconvolution of extended ob- jects and clinical images have been presented elsewhere [15]. It has been shown that the performance of this three dimensional deconvolution was dependent on a number of tuning conditions designed to overcome the problems of processing noisy data. The technique is a development of one of a class of similar methods others of which (e.g. Maximum Entropy reconstruction) are currently being investigated. Residual cross talk in other planes still present after 3D processing can only be obtained by taking multiple view acquisitions. With the experience gained from the clinical study at the R.M.H. it is envisaged that for clinical use the detector should have at least two pairs of chambers with a sensitive area up to - 90 X 60 cm 2 and an intrinsic spatial resolu- tion of - 2 mm. Development of such chambers, includ- ing photocathodes of greater efficiency, is currently taking place. It is expected that these developments, together with progress in the generator production of positron emitting radioinuclides labelled to suitable compounds, should further increase the clinical useful- ness of PET and in particular lead to a considerable improvement in the spatial resolution of radionuclide images. Three dimensional deconvolution will play an important role in exploiting the full potential of this imaging technique.
[1] M.M. Ter-Pogossian, N.A. Mullani, J. Hood, C.S. Higgins and C.M. Currie, Radiology 128 (1978) 477.
[2] J.E. Bateman, J.F. Connolly, R. Stephenson and A.C. Flesher, Nucl. Instr. and Meth. 176 (1980) 83.
[3] R.J. Ott, M.A. Zivanovic, M.A. Flower, M.O. Leach, L.J. Grey, N.G. Trott, S. Webb, J.E. Bateman and A.C. Flesher, Positron imaging with a multiwire proportional chamber system, 6th World Cong. on Medical physics, Hamburg (Sept. 1982) Paper 21:22.
[4] R.J. Ott, J.E. Bateman, A.C. Flesher, M.A. Flower, M.O. Leach, S. Webb, O. Khan and V.R. McCready, Br. J. Radiol. 56 (1983) 773.
[5] S. Webb, R.P. Parker, D.R. Dance and A. Nicholas, IEEE Trans. Biomed. Eng. 25 (1978) 146.
[6] H.C. Andrews, and B.R. Hunt Digital image restoration, 1st ed. (Prentice-Hall, New Jersey, 1977).
[7] B.R. Hunt, Proc. IEEE 63 (1975) 693. [8] T.M. Cannon and B.R. Hunt, Sci. Amer. 245 (4) (1981). [9] D. Townsend, B. Schorr and A. Jeavons, in Proc. IEEE
Nucl. Sci. Symp., San Francisco, California (Oct. 17-19th, 1979).
[10] P.A. Young and D. Horn in 1982 Carnahan Conf. on Security technology, University of Kentucky, Lexington, Kentucky (May 12-14th, 1982).
[11] S.F. Gull and G.J. Daniell, Nature 272 (1978) 686. [12] G. Chu and K.C. Tam, Phys. Med. Biol. 22 (1977) 245. [13] D.L Phillips, J. Assoc. Comput. Mach. 9 (1962) 84. [14] E.O. Brigham, The fast fourier transform (Prentice-Hall,
New Jersey, 1976). [15] S. Webb, R.J. Ott, J.E. Bateman, A.C. Flesher, M.A.
Flower, M.O. Leach, P. Marsden, O. Khan and V.R. McCready, Proc. 8th IPMI Conf., Brussels (Aug. 1983).
VI. APPLICATIONS