Excitation Pulse Deconvolution in Luminescence Lifetime Analysis for Oxygen Measurements In Vivo
158
-
Upload
independent -
Category
Documents
-
view
0 -
download
0
Transcript of Excitation Pulse Deconvolution in Luminescence Lifetime Analysis for Oxygen Measurements In Vivo
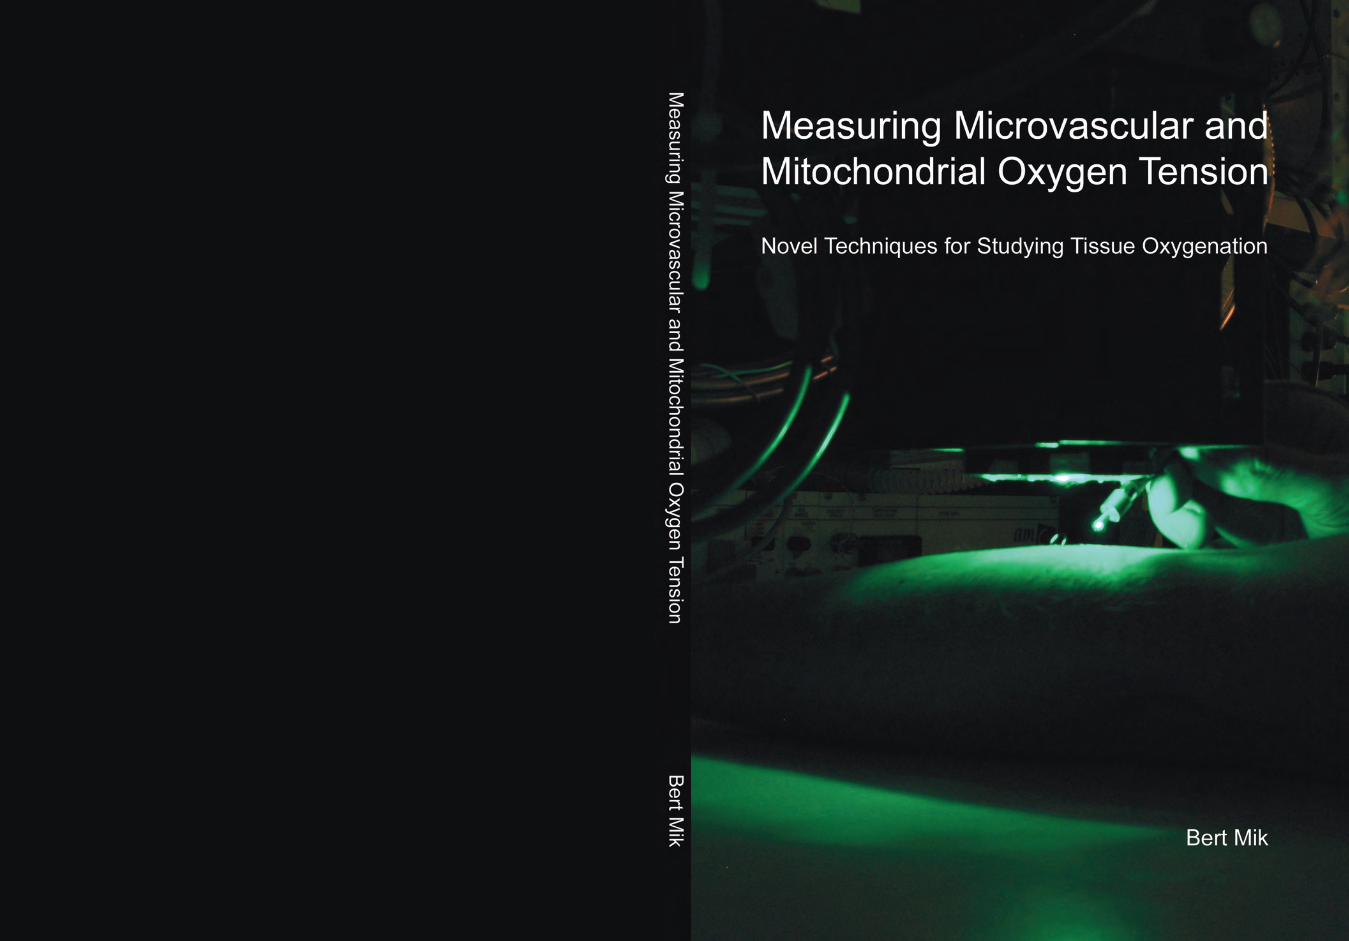

Measuring Microvascular and Mitochondrial Oxygen Tension Novel Techniques for Studying Tissue Oxygenation

Measuring Microvascular and Mitochondrial Oxygen Tension Novel Techniques for Studying Tissue Oxygenation
Thesis, University of Amsterdam, The Netherlands, with summary in Dutch
ISBN: 978-94-610-8136-0
Printed by Gildeprint Drukkerijen BV – www.gildeprint.nl
Copyright © 2011 by Egbert G Mik All studies described in this thesis were conducted at
Department of Translational Physiology and Laser Center, Academic Medical Center, University of Amsterdam, The Netherlands Publication of this thesis was financially supported by Photonics Healthcare BV, Utrecht, The Netherlands

Measuring Microvascular and Mitochondrial Oxygen Tension
Novel Techniques for Studying Tissue Oxygenation
ACADEMISCH PROEFSCHRIFT
ter verkrijging van de graad van doctor
aan de Universiteit van Amsterdam
op gezag van de Rector Magnificus
prof. dr. D.C. van den Boom
ten overstaan van een door het college voor promoties
ingestelde commissie,
in het openbaar te verdedigen
in de Agnietenkapel
op dinsdag 1 maart 2011, te 12:00 uur
door
Egbert Gezinus Mik geboren te ’s-Hertogenbosch

Promotiecommissie
Promotor Prof. dr. ir. C. Ince
Copromotor Dr. C.J. Zuurbier
Overige leden Prof. dr. J. Bakker
Prof. dr. T.G. van Leeuwen
Prof. dr. mr. dr. B.A.J.M. de Mol
Prof dr. R.N. Pittman Prof. dr. J.H. Ravesloot
Prof. dr. J.A.E. Spaan
Prof. dr. R.J. Stolker
Faculteit der Geneeskunde

“A designer knows he has achieved perfection not when there is nothing left to add, but when there is nothing left to take away”
Antoine de Saint-Exupéry
Voor Tanja & Maita


TABLE OF CONTENTS Chapter 1 General introduction 10
Chapter 2 Excitation Pulse Deconvolution in Luminescence Lifetime Analysis for Oxygen Measurements In Vivo Photochem. Photobiol. 76: 12-21, 2002
20
Chapter 3 Quantitative determination of localized tissue oxygen concentration in vivo by two-photon excitation phosphorescence lifetime measurements J. Appl. Physiol. 97: 1962-1969, 2004
38
Chapter 4 Dual-wavelength phosphorimetry for determination of cortical and subcortical microvascular oxygenation in rat kidney J. Appl. Physiol. 100: 1301-1310, 2006
54
Chapter 5 Monitoring of renal venous PO2 and kidney oxygen consumption in rats by a near-infrared phosphorescence lifetime technique Am. J. Physiol. Ren. Physiol. 294: F676-F681, 2008
70
Chapter 6 Mitochondrial PO2 measured by delayed fluorescence of endogenous protoporphyrin IX Nat. Meth. 3: 939-945, 2006
82
Chapter 7 In vivo mitochondrial oxygen tension measured by a delayed fluorescence lifetime technique Biophys. J. 95: 3977-3990, 2008
96
Chapter 8 Mitochondrial oxygen tension within the heart J. Mol. Cell. Cardiol. 46: 943-951, 2009
116
Chapter 9 Summary and conclusions 132
Appendices Samenvatting en conclusies 140
Dankwoord 148
List of publications 152
Curriculum Vitae 156


Chapter 1
General Introduction

CHAPTER 1
10
OXYGEN Molecular oxygen, dioxygen, or in short O2 is the prime requisite of aerobic life on earth. Diatomic oxygen gas, mostly spoken of simply as “oxygen”, constitutes approximately 21% of the volume of air. The electron configuration of the oxygen molecule has two unpaired electrons with the same spin in degenerate orbitals. Therefore, oxygen is paramagnetic and, in contrast to many other biochemically relevant molecules, the ground state of oxygen is a triplet state. The amount of oxygen dissolved in a liquid depends on the solubility coefficient of oxygen in the solvent and the partial oxygen pressure (PO2) above the solution. The dissolved amount of oxygen can be expressed as liters O2 per liters solvent, a concentration (mol/l) or as partial oxygen pressure (PO2), which is equivalent to oxygen tension. Since the solubility coefficients in biological compartments are not well known it is common to measure and report PO2 values in kPa, mmHg or Torr (1 kPa = 7.5 mmHg = 7.5 Torr).
The adequate supply of oxygen by inhalation and subsequent transport to tissues via the circulating blood is a conditio sine qua non for mammalian cells to sustain life. Molecular oxygen is the primary oxidant in biological systems and its ultimate destination in vivo is the mitochondria where it is used in oxidative phosphorylation. Besides being indispensible for the energy production of our cells, oxygen is known to play a role in many other biochemical processes and mammalian tissue contains a large number of oxygen consuming enzymes (20). For example, oxygen is used for the production of reactive oxygen species that are important in signal transduction (2, 25).
Because of the importance of adequate oxygen supply, many techniques have been developed for measuring oxygen in vivo (16, 18, 20), in order to gain insight into the mechanisms of oxygen delivery and use. These in vivo measurements of oxygen tension have generally demonstrated that in tissues really low PO2 levels (in the order of a few mmHg) are only observed under extreme pathophysiological circumstances (e.g. circulatory arrest). In the mean time, studies in isolated mitochondria had shown very high affinity of oxidative phosphorylation for oxygen (5, 8, 23), i.e. independency of respiratory rate on PO2 values as low as 0.2-0.5 mmHg. This led to the idea that under physiological conditions oxygen could not be a limiting or regulatory factor for oxygen metabolism in vivo (9). Due to this thinking, and the global trend towards molecular biology, physiological oxygen measurements have been in danger of becoming a superfluous and obsolete art.
However, recent studies have questioned the idea that oxygen only acts as a simple substrate over the physiological range of oxygen tensions, and have identified a mechanism in hepatocytes called ‘‘oxygen conformance of metabolism’’ (14, 17). Here oxygen consumption is downregulated when cells are subjected to moderate oxygen deprivation for extended periods of time (14). What this means for the in vivo situation is still unclear, but recent studies in climbers on the Mount Everest have shown a remarkable adaptation to very low oxygen levels (4). Based on these findings, it has very recently been hypothesized that therapeutic permissive hypoxia might lead to hypoxic cellular adaptation as seen in the fetus in utero (10). We still have a long way to go before doctors at the bedside should even consider to deliberately bringing patients in a state of global hypoxia to protect them from further harm (13), but the idea is exciting. And, while the paradigm seems to shifts in the direction of oxygen being a regulator rather than being a passive bystander, there is again real need to reliably measure oxygen in cells and tissues. We should continue to strive to perfect existing methods and develop novel techniques that allow better,and more detailed, quantification of oxygen levels in biological systems. PORPHYRINS Porphyrins belong to the most abundant molecules on Earth and are a group of organic compounds that appear in nature in a large variety. Porphyrins are essential for life as we know it, because of their key role in processes related to oxygen production, oxygen transport and oxygen utilization (6). Porphyrins are cyclic macromolecules composed of four modified pyrrole subunits that form a highly
GENERAL INTRODUCTION
11
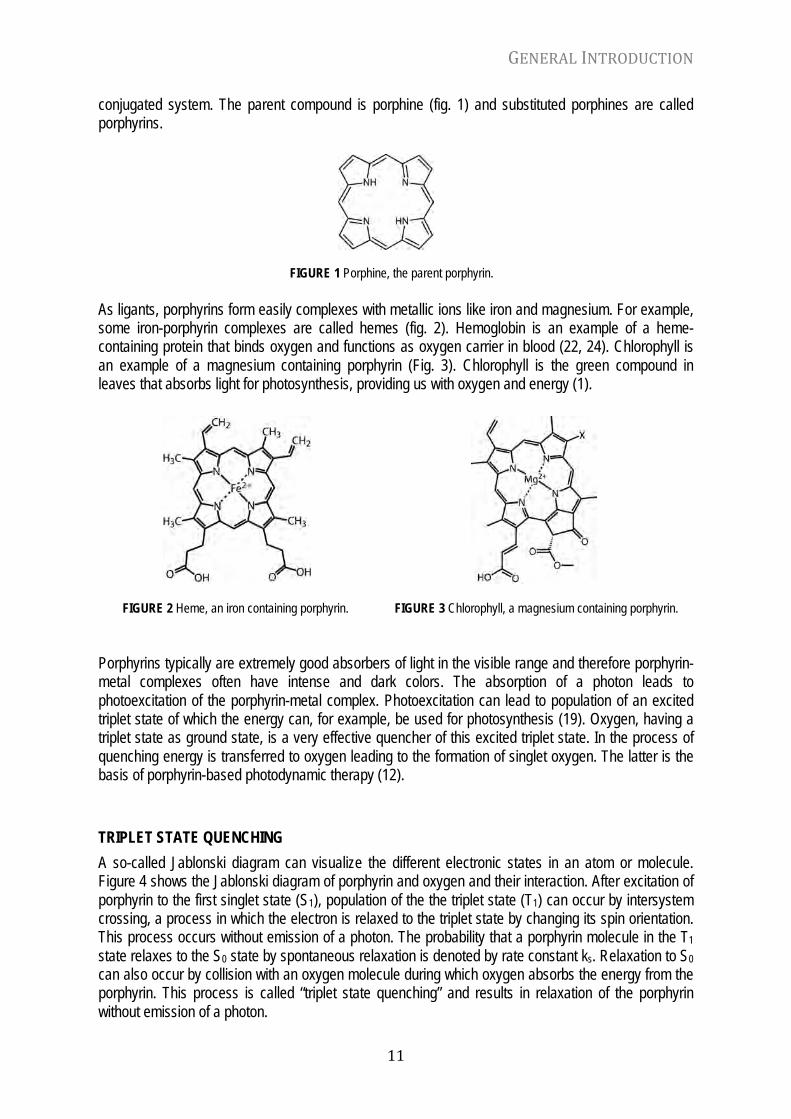
conjugated system. The parent compound is porphine (fig. 1) and substituted porphines are called porphyrins.
FIGURE 1 Porphine, the parent porphyrin. As ligants, porphyrins form easily complexes with metallic ions like iron and magnesium. For example, some iron-porphyrin complexes are called hemes (fig. 2). Hemoglobin is an example of a heme-containing protein that binds oxygen and functions as oxygen carrier in blood (22, 24). Chlorophyll is an example of a magnesium containing porphyrin (Fig. 3). Chlorophyll is the green compound in leaves that absorbs light for photosynthesis, providing us with oxygen and energy (1).
FIGURE 2 Heme, an iron containing porphyrin. FIGURE 3 Chlorophyll, a magnesium containing porphyrin. Porphyrins typically are extremely good absorbers of light in the visible range and therefore porphyrin-metal complexes often have intense and dark colors. The absorption of a photon leads to photoexcitation of the porphyrin-metal complex. Photoexcitation can lead to population of an excited triplet state of which the energy can, for example, be used for photosynthesis (19). Oxygen, having a triplet state as ground state, is a very effective quencher of this excited triplet state. In the process of quenching energy is transferred to oxygen leading to the formation of singlet oxygen. The latter is the basis of porphyrin-based photodynamic therapy (12). TRIPLET STATE QUENCHING A so-called Jablonski diagram can visualize the different electronic states in an atom or molecule. Figure 4 shows the Jablonski diagram of porphyrin and oxygen and their interaction. After excitation of porphyrin to the first singlet state (S1), population of the the triplet state (T1) can occur by intersystem crossing, a process in which the electron is relaxed to the triplet state by changing its spin orientation. This process occurs without emission of a photon. The probability that a porphyrin molecule in the T1 state relaxes to the S0 state by spontaneous relaxation is denoted by rate constant ks. Relaxation to S0 can also occur by collision with an oxygen molecule during which oxygen absorbs the energy from the porphyrin. This process is called “triplet state quenching” and results in relaxation of the porphyrin without emission of a photon.

CHAPTER 1
12
FIGURE 4 Jablonski diagram of states and state transitions of porphyrin and oxygen. Absorption (i), fluorescence (ii), radiationless transitions (iii), phosphorescence (iv), energy transfer (v), internal conversion (vi) and intersystemcrossing (vii).
Quenching of the triplet state is a process that makes the triplet state lifetime dependent on the collision frequency, and thus on oxygen concentration. The collision frequency is determined by the amount of oxygen and the chance that a single oxygen molecule causes a quenching event, defined by the Smoluochowski equation:
!
kq = 4"N#(Do + Df )(Ro + Rf ) (1)
In which kq is known as the quenching constant, N is Avogadro’s number, γ the quenching efficiency, Do and Df are the diffusion coefficient of oxygen and the porphyrin respectively and Ro and Rf are the quenching radius of oxygen and the porphyrin respectively. The rate of relaxation of T1 to S0 is thus determined by both the transition probability by spontaneous relaxation (ks) and the quenching probablility (kq). The decay rate of porphyrin molecules in the excited triplet state after excitation with a pulse of light is given by the following differential equation:
!
d[T1](t)dt
= "ks[T1](t) " kqPO2[T1] (2)
Where [T1] denotes the amount of porphyrin molecules in the excited triplet state and PO2 is the oxygen tension in the surrounding medium. Under ideal circumstances, i.e. when the excitation pulse duration is much shorter than the triplet decay time, the solution of this differential equation yields:
!
[T1](t) = [T1]0e"(ks +kqPO2 )t (3)
Where [T1]0 denotes the amount of porphyrin molecules in the excited triplet state at t=0, i.e. immediately after the excitation pulse. Equation 3 can be rewritten in the form:
!
[T1](t) = [T1]0e"
t#
$
% &
'
( ) (4)
In which

GENERAL INTRODUCTION
13
!
1"
=1"0
+ kqPO2 (5)
This last equation is known as the Stern-Volmer relationship, in which τ is the triplet state lifetime and τ0 = 1/ks is the time constant of the decay of the triplet state in the absence of oxygen, i.e. the decay time of spontaneous relaxation. MODES TO MEASURE THE TRIPLET STATE LIFETIME From the Stern-Volmer relationship (eq. 5) it is clear that if we are able to measure the triplet state lifetime, by any means, this actually allows measurement of the PO2 in the medium containing the porphyrin. Figure 5 shows an overview of optical modalities to measure state transitions that allow direct measurement of the triplet state lifetime. These modalities are phosphorescence, delayed fluorescence and triplet-triplet absorption.
FIGURE 5 Modalities to measure the triplet state lifetime.
If the T1 state relaxes directly to the S0 state through emission of a photon, this radiation is called phosphorescence. In contrast to fluorescence (emission of a photon due to relaxation of S1 to S0), phosphorescence is relatively long lived (typically several orders of magnitude longer than fluorescence) and its spectrum is shifted towards the red. The latter is due to the fact that in case of phosphorescence some energy is lost in the process of intersystem crossing and therefore the energy of the T1 state is lower than of the S1 state. Because of this red shift, phosphorescence can be optically separated from prompt fluorescence. This makes measurement of phosphorescence the least complicated way to measure the T1 lifetime. Unfortunately, not all porphyrins show detectable phosphorescence, but some metallo-porphyrins have high phosphorescence yield which makes them excellent probes for oxygen measurements (21).
If the T1 state relaxes to the S0 state via the S1 state by a process called bi-directional intersystem-crossing and the relaxation of S1 to S0 leads to emission of a photon, this radiation is called delayed-fluorescence. In contrast to phosphorescence, delayed fluorescence has the same spectrum as prompt fluorescence and cannot be optically separated from fluorescence. Prompt fluorescence tends to overwhelm delayed fluorescence in intensity and in practice this easily leads to saturation of detection systems. Nevertheless, with some precautions is delayed fluorescence a useable mode for measuring the T1 lifetime. A practical example is the measurement of mitochondrial PO2 by delayed fluorescence of protoporphyrin IX (11).
A method that does not rely on the detection of emitted photons but on transient changes in absorption is triplet-triplet absorption. The idea is that absorption from T1 to T2 can only take place during population of the T1 state. Therefore, an excitation pulse will temporarily increase absorption at

CHAPTER 1
14
the wavelength corresponding to T1-T2 transition and the transient change in absorption will decay according to the T1 lifetime. A drawback of this technique is that it requires an extra light source, making its application more cumbersome than the emission measurements. Nevertheless, triplet-triplet absorption is useful for non-radiating probes (3). MEASURING OXYGEN BY QUENCHING OF PHOSPHORESCENCE
The method of measuring PO2 in biological systems by means of oxygen-dependent quenching of phosphorescence was introduced by Vanderkooi and co-workers over two decades ago (21). Complexes of porphyrins with certain heavy metals show high phosphorescence yield and are very efficient oxygen probes. Palladium-meso-tetra(4-carboxyphenyl)porphine (Pd-porphyrin, fig. 6), bound to albumin before injection, has become a standard phosphorescent dye for microvascular PO2 measurements in vivo (7, 15).
FIGURE 6 Pd-porphyrin, the standard phosphor. Oxygen measurements by means of oxygen-dependent quenching of phosphorescence lifetimes are based on the principle that phosphorescence intensity is proportional to the amount of populated triplet states in a porphyrin solution. Therefore, equation 5 can be rewritten as:
!
I(t) = I0e"
t#
$
% &
'
( ) (6)
Where I(t) is the phosphorescence intensity over time, I0 is the initial phosphorescence intensity directly after the excitation pulse and τ now denotes the phosphorescence lifetime. The PO2 can be calculated from τ using the Stern-Volmer relationship (eq. 5). From this relationship it is clear that a higher PO2 results in more quenching and therefore a shorter lifetime (fig. 7)
FIGURE 7 Principle of phosphorescence lifetime measurements. Excitation with a pulse of green light in a sample containing Pd-porphyrin induces red phosphorescence of which the lifetime depends on the PO2 in the sample.

GENERAL INTRODUCTION
15
OUTLINE OF THIS THESIS
Chapter 2 Excitation pulse deconvolution In this chapter we analyze the effects of the shape of the excitation pulse on phosphorescence lifetime analysis in time domain phosphorimetry. The relatively long phosphorescence lifetime of phosphors used for oxygen measurements had favored the standard use of short-arc xenon flashlamps as excitation source. We hypothesized that the side effects of finite excitation pulse duration might be one of the causes of the unexpected variation in reported quenching constants of Pd-porphyrin probes. Besides a computer simulation based analysis also a method for deconvolution of the excitation pulse shape is proposed and tested. Chapter 3 Two-photon excitation In chapter three we describe a method for multidimensional oxygen scanning in tissues based on a non-linear optical technique. We hypothesized that two-photon excitation might be applicable to phosphorescence lifetime measurements in vivo. In analogy of multi-photon fluorescence microscopy this would allow PO2 measurements in a confined tissue volume and enable detailed measurement of PO2 heterogeneity. The concept of oxygen measurements based on two-photon excitation of Pd-porphyrin is tested and applied in rat kidney in vivo. Chapter 4 Dual wavelength phosphorimetry In chapter four we report the development of a technique for measurement of microvascular PO2 histograms in two different depths in tissue. The penetration depth of light in tissues depends on its wavelength and longer wavelengths tend to penetrate deeper. Most phosphorescent dyes can be excited at several wavelengths. We hypothesized that the use of multiple wavelengths could be a means to retrieve phosphorescence from distinctive tissue layers. A dual wavelength phosphorimeter for use with the Pd-porphyrin derivative Oxyphor G2 (excitation with blue and red light) is described, validated and used in rat kidney for retrieval of PO2 histograms from cortex and outer medulla. Chapter 5 Venous PO2 measurement In this chapter we explore an optical method for monitoring PO2 and oxygen content in full blood within large vessels of rats. The classical phosphor Pd-porphyrin can be excited with blue (~420 nm) and green (~530 nm) light and therefore cannot be used for PO2 measurements in full blood. This is because hemoglobin has very high absorption at these wavelengths. We hypothesized that the more recently introduced near-infrared phosphor Oxyphor G2 would be useful for this purpose. Oxyphor G2 has excitation and emission wavelengths in the red (~630 nm) and the infrared (~800 nm) respectively. A small frequency domain phosphorimeter is described and calibrated. The feasibility of venous PO2 measurements with subsequent calculation of venous oxygen content is tested in the renal vein of rats. Chapter 6 Mitochondrial PO2 Measurements Here we report the development of the first method to measure mitochondrial PO2 (mitoPO2) in intact living cells. The need for injection of exogenous phosphors obviously limits the use of phosphorescence lifetime measurements to the laboratory. Therefore we researched the feasibility of using endogenous porphyrins for oxygen measurements and hypothesized that protoporphyrin IX (PpIX) would be a good candidate. We searched for useful oxygen-dependent optical properties of PpIX, performed calibration experiments in solutions and cell suspensions, and researched the intracellular PpIX localization. The chapter ends with the description of an experiment aimed at determining the PO2 gradients between the extracellular milieu and the mitochondria of respiring cells.

CHAPTER 1
16
Chapter 7 Mitochondrial PO2 in vivo In this chapter we report the results of our testing whether delayed fluorescence of protoporphyrin IX can be used to measure mitoPO2 in vivo. We hypothesized that intravenous administration of δ-aminolevulinic acid would induce enough mitochondrial PpIX to observe delayed fluorescence in vivo, and that the delayed fluorescence lifetime would be quantitatively related to the PO2. The results of calibration experiments in freshly isolated rat liver cells and isolated perfused rat livers are shown. Based on these calibrations, the technique is used to measure mitoPO2 histograms in rat liver in vivo. Chapter 8 Mitochondrial PO2 in the heart In this chapter we provide the first measurements of mitoPO2 in rat heart, both in vivo and in vitro. The heart has always been an organ of prime interest concerning matters of oxygenation. The rat heart, both in situ and as isolated perfused organ, is widely used for studying oxygenation of the myocardium and phenomena like ischemia-reperfusion injury and preconditioning. We measured mitoPO2 histograms in isolated perfused rat hearts and in rat hearts in vivo by delayed fluorescence of PpIX. Chapter 9 Summary and conclusions The research presented in this thesis has been performed over an extended period of time. During this time our laboratory has applied the techniques described in this thesis in several pathophysiological models. Furthermore, other research groups have further developed PO2 measurement techniques based on ideas described in this thesis. In chapter 9 we look back at the presented results, discuss the usability of the described techniques based on recently performed studies, and review our work in the light of current international developments. REFERENCES 1. Bishop NI. Photosynthesis: the electron transport system of green plants. Annu Rev Biochem 40: 197-226, 1971. 2. Droge W. Free radicals in the physiological control of cell function. Physiol Rev 82: 47-95, 2002. 3. Geissbuehler M, Spielmann T, Formey A, Marki I, Leutenegger M, Hinz B, Johnsson K, Van De Ville D, and Lasser T.
Triplet imaging of oxygen consumption during the contraction of a single smooth muscle cell (A7r5). Biophys J 98: 339-349, 2010.
4. Grocott MP, Martin DS, Levett DZ, McMorrow R, Windsor J, and Montgomery HE. Arterial blood gases and oxygen content in climbers on Mount Everest. N Engl J Med 360: 140-149, 2009.
5. Jones DP and Mason HS. Gradients of O2 concentration in hepatocytes. J Biol Chem 253: 4874-4880, 1978. 6. Layer G, Reichelt J, Jahn D, and Heinz DW. Structure and function of enzymes in heme biosynthesis. Protein Sci 19:
1137-1161, 2010. 7. Lo LW, Koch CJ, and Wilson DF. Calibration of oxygen-dependent quenching of the phosphorescence of Pd-meso-
tetra (4-carboxyphenyl) porphine: a phosphor with general application for measuring oxygen concentration in biological systems. Anal Biochem 236: 153-160, 1996.
8. Longmuir IS. Respiration rate of rat-liver cells at low oxygen concentrations. Biochem J 65: 378-382, 1957. 9. Marcinek DJ, Ciesielski WA, Conley KE, and Schenkman KA. Oxygen regulation and limitation to cellular respiration in
mouse skeletal muscle in vivo. Am J Physiol Heart Circ Physiol 285: H1900-1908, 2003. 10. Martin DS, Khosravi M, Grocott MP, and Mythen MG. Concepts in hypoxia reborn. Crit Care 14: 315, 2010. 11. Mik EG, Stap J, Sinaasappel M, Beek JF, Aten JA, van Leeuwen TG, and Ince C. Mitochondrial PO2 measured by
delayed fluorescence of endogenous protoporphyrin IX. Nat Methods 3: 939-945, 2006. 12. O'Connor AE, Gallagher WM, and Byrne AT. Porphyrin and nonporphyrin photosensitizers in oncology: preclinical and
clinical advances in photodynamic therapy. Photochem Photobiol 85: 1053-1074, 2009. 13. Schumacker PT. Is enough oxygen too much? Crit Care 14: 191, 2010. 14. Schumacker PT, Chandel N, and Agusti AG. Oxygen conformance of cellular respiration in hepatocytes. Am J Physiol
265: L395-402, 1993. 15. Sinaasappel M and Ince C. Calibration of Pd-porphyrin phosphorescence for oxygen concentration measurements in
vivo. J Appl Physiol 81: 2297-2303, 1996. 16. Springett R and Swartz HM. Measurements of oxygen in vivo: overview and perspectives on methods to measure
oxygen within cells and tissues. Antioxid Redox Signal 9: 1295-1301, 2007.

GENERAL INTRODUCTION
17
17. Subramanian RM, Chandel N, Budinger GR, and Schumacker PT. Hypoxic conformance of metabolism in primary rat hepatocytes: a model of hepatic hibernation. Hepatology 45: 455-464, 2007.
18. Swartz HM and Dunn JF. Measurements of oxygen in tissues: overview and perspectives on methods. Adv Exp Med Biol 530: 1-12, 2003.
19. Uphaus RA, Norris JR, and Katz JJ. Triplet states in photosynthesis. Biochem Biophys Res Commun 61: 1057-1063, 1974.
20. Vanderkooi JM, Erecinska M, and Silver IA. Oxygen in mammalian tissue: methods of measurement and affinities of various reactions. Am J Physiol 260: C1131-1150, 1991.
21. Vanderkooi JM, Maniara G, Green TJ, and Wilson DF. An optical method for measurement of dioxygen concentration based upon quenching of phosphorescence. J Biol Chem 262: 5476-5482, 1987.
22. Waltemath CL. Oxygen, uptake, transport, and tissue utilization. Anesth Analg 49: 184-203, 1970. 23. Wilson DF, Rumsey WL, Green TJ, and Vanderkooi JM. The oxygen dependence of mitochondrial oxidative
phosphorylation measured by a new optical method for measuring oxygen concentration. J Biol Chem 263: 2712-2718, 1988.
24. Wilson MT and Reeder BJ. Oxygen-binding haem proteins. Exp Physiol 93: 128-132, 2008. 25. Xi Q, Cheranov SY, and Jaggar JH. Mitochondria-derived reactive oxygen species dilate cerebral arteries by activating
Ca2+ sparks. Circ Res 97: 354-362, 2005.

Chapter 2
Excitation Pulse Deconvolution in Luminescence
Lifetime Analysis for Oxygen Measurements in Vivo
E.G. Mik, C. Donkersloot, N.J.H. Raat and C. Ince
Photochemistry and Photobiology 76: 12-21, 2002

CHAPTER 2
20
ABSTRACT Oxygen-dependent quenching of phosphorescence has been proven to be a valuable tool for the measurement of oxygen concentrations both in vitro and in vivo. For biological measurements the relatively long lifetimes of phosphorescence have promoted time-domain–based devices using xenon arc flashlamps as the most common excitation light source. The resulting complex form of the excitation pulse leads to complications in the analysis of phosphorescence lifetimes and ultimately to errors in the recovered pO2 values. Although the problem has been recognized, the consequences on in vivo phosphorescence lifetime measurements have been neglected so far. In this study, the consequences of finite excitation flash duration are analyzed using computer simulations, and a method for the recovery of phosphorescence decay times from complex photometric signals is presented. The analysis provides an explanation as to why different calibration constants are reported in the literature and presents a unified explanation whereby calibration constants are not solely a property of the dye but also of the measuring device. It is concluded that complex excitation pulse patterns without appropriate analysis methods lead to device-specific calibration constants and nonlinearity and can be a potent source of errors when applied in vivo. The method of analysis presented in this article allows reliable phosphorescence lifetime measurements to be made for oxygen pressure measurements and can easily be applied to existing phosphorimeters. INTRODUCTION Direct, nondisruptive, oxygen concentration measurements in biological tissues can be achieved by the injection of dyes with oxygen-dependent optical or magnetic properties. The oxygen-dependent lifetime of long-lived fluorescence of, for example, pyrene derivatives has been successfully used for oxygen measurements in biological samples (1,2), but the specialized equipment needed for accurate measurements of short lifetimes has prevented widespread use. The use of oxygen-sensitive paramagnetic materials, by means of an oxygen-dependent broadening of the electron paramagnetic signal, is a promising technique for application in vivo (3), especially with the recently acquired improvements in probe stability (4). Alternatively, the introduction of suitable phosphorescent dyes in the late 1980s (5) provided a powerful method for oxygen measurements in vivo because of high sensitivity and relative ease of measurement.
Since its introduction by Vanderkooi et al. (5), oxygen-dependent quenching of phosphorescence of metallo-porphyrin–based dyes has proven to be a valuable tool for oxygen concentration measurements both in vitro and in vivo. Basically, the technique involves the injection of the dye in experimental animals or in vitro samples. Subsequently, the pO2 values can be calculated from the phosphorescence decay kinetics. Once calibrated, phosphorescence lifetime measurements do not require recalibration (6); this is a big advantage compared with the recalibration procedures that are imperative with the use of oxygen electrodes. This makes oxygen-dependent quenching of phosphorescence an attractive alternative for in vitro oxygen measurements using oxygen electrodes. Examples of this approach are oxygen consumption measurements of isolated mitochondria and cell suspensions (7-9) and the use of a phosphor as an extracellular pO2 sensor in single cell experiments (10). These in vitro experiments benefit from the fact that there is no need for calibration before each measurement and from the shorter response time of the phosphorescence lifetime measurement compared with oxygen electrodes, especially at lower oxygen concentrations (11). Another inherent advantage of the technique is its very high sensitivity at low to very low oxygen concentrations. Recently, the technique has been used for intracellular pO2 measurements in isolated skeletal muscle fibers after microinjection of the phosphor (12,13).
The most powerful use of the phosphorescence quenching technique, however, at least for oxygen measurements in biological applications, is in the use of an appropriate phosphor as an in vivo oxygen sensor. Metallo-porphyrins bound to albumin (5) are feasible as oxygen sensors and can also be injected into the blood circulation of animals. Phosphorescence lifetime measurements have been

EXCITATION PULSE DECONVOLUTION
21
implemented on intravital microscopes and in fiber-based systems for measurements on a macroscopic scale. An advantage over the use of oxygen electrodes in this respect is the larger catchments volume of phosphorescence lifetime measurements, with about 500 µm penetration depth at an excitation wavelength of 530 nm compared with about 20 µm for O2 electrodes (14,15). Examples of the use of this technique in vivo include pO2 measurements in skeletal muscle (16–18), brain (19,20), heart muscle (21,22), tumors (23,24), gut (25–28) and kidney (29). In this respect, palladium-meso-tetra(4-carboxyphenyl)porphine (Pd-porphyrin) has been the most widely used phosphor to date. However, new probes with advantageous features have become available. They provide longer wavelengths for excitation and emission and thus have favorable spectral properties for in vivo measurements (30,31) because of a larger penetration depth in tissue.
Although various research groups have applied the technique of oxygen-dependent quenching of phosphorescence in different kinds of experiments, the technique itself is still under development. Methods for the interpretation of the phosphorescence lifetime data to resolve the heterogeneity in oxygen concentrations (for in vivo measurements) have, in particular, been a subject of study (32–34). The hardware used ranges from commercially available devices (OXYSPOT and, more recently, PMOD-1000 and 2000, Harvard Apparatus, Inc., Holliston, MA) to newly developed frequency domain intravital microscopes (35). However, most phosphorimeters are time-domain–based systems using xenon flashlamps as excitation sources (26,36,37). Xenon flashlamps provide a pulse with a relative short duration compared with the phosphorescence lifetimes. The influence of the flashlamp has been traditionally taken into account by starting the fitting procedure after a certain delay (36), by gating of the photomultiplier (38) or by performing a dual exponential fit procedure. Although the calibration constants of the phosphorescent dyes should theoretically not differ among different laboratories (6), the reported values of, for example, Pd-porphyrin vary over a relatively wide range. For example, the reported values of the quenching constant have ranged from kq = 306 mm Hg-1s-1 (16) to kq = 386 mm Hg-1s-1 (24). A possible explanation for the variations in the reported values could lie in the combination of the equipment used and the analysis method applied. If this were the case, it would mean that calibration constants found in one laboratory may not necessarily be valid for another laboratory or even for different phosphorimeters within one laboratory, making calibration articles (6,38) less meaningful for a wider use. Another concern besides the interphosphorimeter differences in quenching constants may be, depending on the specific cause, that in vitro calibration constants may not necessarily hold for in vivo measurements. Because the extrapolation of in vitro calibration data to in vivo measurements is common practice, the latter implication is more important because this cannot be solved by careful calibration of specific equipment.
The complex excitation pattern generated by a xenon flashlamp can be expected to influence the observed kinetics of the oxygen-dependent quenching of phosphorescence. In physical chemistry the influence of the shape of the excitation pulse and instrument response and therefore the need for more advanced analysis methods has long been recognized (see for e.g. Ware (39), Wahl et al. (40), Zuker et al. (41) and Lakowicz (42)). In studies concerning phosphorescence lifetime measurements in vivo, these consequences have been overlooked. However, a recent study has shown that excitation by a xenon flashlamp does influence the results of a heterogeneity analysis in terms of lifetimes and pO2 values (37). Besides the reported adverse effects on lifetime distribution analysis, the influence of the excitation source could be more far reaching and, for example, possibly explain the large diversity of values reported for the calibration constants needed to convert lifetime values into pO2 values.
The aim of this study is to gain a better insight into the consequences of finite excitation pulse duration and to provide an easy-to-use method to remove excitation pulse shape-induced artifacts from the lifetime analysis. Five consecutive steps can be recognized in this study. First, a mathematical description of the photometric signal for in vivo situations was derived. Second, the influence of excitation light backscatter on lifetime analysis in conventional analysis methods was investigated by an in vivo experiment and by computer simulations. Third, computer simulations were

CHAPTER 2
22
also used to test the hypothesis that the excitation pulse profile, without appropriate analysis methods, leads to device-specific calibration constants. Fourth, the general effects predicted by the computer simulations are shown to occur in practice using a fiber-based phosphorimeter in a calibration setup. Fifth, a new algorithm for the phosphorescence lifetime analysis was developed, taking into account the excitation pulse profile and backscatter and background light, and its effectiveness is demonstrated practically. MATERIALS AND METHODS Theoretical background Phosphorescence after an impulse of light in a homogeneous system. After photoexcitation of a phosphorescent compound to the first singlet state (S1), the population of the first excited triplet state (T1) can occur by a process known as intersystem crossing. The spontaneous T1 → S0 (ground state) transition is spin disallowed, resulting in relatively long triplet state lifetimes of the order of microseconds to milliseconds. This is in contrast to the usually very quickly occurring S1 → S0 transition (causing fluorescence with lifetimes in the nanosecond range). From the T1 state, the molecule can relax to the ground state by two different modes of deactivation. One way to reduce its energy is by the emission of a photon (i.e. phosphorescence emission), whereas the other is by energy transfer to quencher molecules. In the latter process collision with a quencher molecule can result in absorption of the energy of the excited molecule by the quencher and subsequent relaxation to the ground state without the emission of a photon. This process is known as quenching of phosphorescence and results in a phosphorescence decay time that is dependent on the collision frequency between the quencher molecules and excited molecules. The rate of change of concentration of the excited molecules (in the T1 state) after excitation with an impulse of light at t = 0 is given by
!
d[P](t)dt
= "k0[P](t) " kq[Q][P](t) (1)
where [P](t) denotes the concentration of excited molecules at time t, k0 is the first-order rate constant for phosphorescent relaxation in the absence of the quencher, kq is the second-order rate constant in the presence of the quencher and [Q] is the quencher concentration. The solution of Eq. (1) (with oxygen considered to be the only quencher in a biological system) is given by the Stern–Volmer relationship:
!
1"
=1"0
+ kq' pO2 (2)
where τ is the measured phosphorescence lifetime, τ0 is the lifetime under zero oxygen conditions, pO2 is the partial oxygen pressure in the emission volume and kq’ the quenching constant (in mmHg-1
s-1). In the formula kq’ is used instead of kq to reflect the transformation from quencher concentration ([O2]) to partial oxygen pressure (pO2). Therefore, kq’ is equal to αkq, with α being the oxygen solubility coefficient (in mmHg M-1). In the following text we have omitted the apostrophe, and kq refers to the quenching constant measured for the partial oxygen pressure (in mmHg). Equation 2 gives the relationship between the phosphorescence lifetime and the partial oxygen pressure in the emission volume in the case of a homogeneously distributed phosphorescent dye and oxygen and after excitation with a pulse that can be considered as a unit impulse, δ(t) (Diracs’ delta function). A more

EXCITATION PULSE DECONVOLUTION
23
comprehensive introduction to the phenomenon of quenching and the derivation of the Stern–Volmer relationship can be found elsewhere, for example in Vanderkooi and Berger (43) and Lakowicz (44).
Excitation flash of short-arc xenon flashlamp. Xenon flashlamps are the most widely used excitation light sources in time-domain phosphorescence lifetime measurements. Despite their advantages of a relatively low cost and ease of use, flashlamps have certain serious drawbacks. Figure 1 shows an example of an excitation pulse shape obtained from a widely used short-arc xenon flashlamp (type FX249; EG&G, Salem, MA), measured at 530 ± 20 nm. The complex nature of the excitation pulse can be seen easily and depends not only on the type of flashlamp used but also on the specific nature of the discharge circuit, namely, its design and placement with respect to the flashlamp. The voltage, capacitance, resistance and inductance all influence the amplitude and duration of the pulse (45,46). Moreover, time jitter (with respect to the trigger pulse), amplitude jitter and flashlamp age are also complicating factors influencing the shape of the pulse.
FIGURE 1 Excitation pulse shape of the used xenon flashlamp. The dots represent the measured light output of an EG&G type FX249 short-arc xenon flashlamp sampled by a 1 MHz data acquisition board. The light output was measured at an excitation wavelength for Pd-porphyrin by passing the light through a 530 ± 20 nm interference filter (Omega Optical, Salem, MA) and using neutral density filters to prevent saturation of the detection system (PMT, broadband amplifier and DAQ-board).
Because of the large number of factors influencing the shape of the excitation pulse, the reproducibility of a specific combination of flashlamp and electronics is difficult to predict. A mathematical expression of the excitation pulse to model the photometric signal used for fitting of the data is therefore, in general, difficult to achieve. Our aim in this study was to develop a method for the elimination of the influence of the excitation pulse shape, based on deconvolution and not requiring a mathematical description of the excitation pulse.
Phosphorescence in a homogeneous system after an excitation flash of arbitrary shape. The process of excitation by an arbitrary flash can be described by the following differential equation (37):
!
dN(t)dt
= kxL(t)(NT " N(t)) " (k0 + kqPO2)N(t) (3)
where N(t) is the concentration of the excited dye molecules at time t, NT is the total dye concentration, kx is a rate coefficient of excitation (scaling parameter for linear condition N(t) << NT), L(t) is the function describing the excitation pulse, and k0 and kq are the Stern-Volmer parameters. Under nonsaturating conditions (i.e. when kx is small) the solution of Eq. (3) is described by the convolution of the monoexponential impulse response Y(t) of this system and the excitation pulse L(t):
!
N(t) = Y (t) * L(t) = kxNT exp("(t "#) /$ )L(#)d#0
t
% (4)

CHAPTER 2
24
The amount of light emitted is proportional to the number of excited dye molecules; therefore, the normalized phosphorescence signal Yn(t) is given by:
!
Yn (t) = Y" (t) * Ln (t) = nexp(#(t #$) /%)Ln ($)d$0
t
& (5)
where Yδ(t) is the impulse response of phosphorescence, Ln(t) is the normalized excitation pulse and n is a normalization constant.
Photometric signal and recovery of the impulse response function. Equation 5 accounts only for the phosphorescence part of the measured signal. The signal measured with a phosphorimeter (photometric signal) is more complex and consists of at least four parts. The most prominent part is the phosphorescence signal emitted by the dye. In the case of Pd-porphyrin also some prompt fluorescence is detectable (47). Prompt fluorescence has a decay time in the order of nanoseconds and can therefore be neglected from phosphorescence lifetime analysis if the excitation pulse is very short compared with the lifetimes of interest. However, as long as an excitation light is emitted, a fluorescent signal that is practically in phase with the excitation pulse will be present. If the excitation pulse cannot be neglected in the analysis, this prompt fluorescence also needs be taken into account. A third factor of influence is the very high level of excitation light compared with the phosphorescence signal. Despite optical filtering at the appropriate wavelengths, some backscattering of excitation light is detected. Finally because of the background light and dark current of the equipment used, a baseline signal is superimposed on the overall signal. The photometric signal can therefore be described by:
!
S(t) = "Yn (t) + #Ln (t) + $ (6)
where S(t) is the photometric signal, Yn(t) the normalized phosphorescence signal (Eq. 5), Ln(t) the normalized excitation waveform, α the phosphorescence weight factor, β the combined weight factor for fluorescence and backscattered excitation light and γ the baseline. Equation 6 can be rewritten in the form:
!
S(t) = " Ln (#)Y$ (t %#)d# + & Ln (#)$(t %#)d# + '0
t
(0
t
( (7)
where δ(t) denotes Dirac’s Delta function. Taking the first two terms of Eq. (7) together yields:
!
S(t) = Ln (")[#Y$ + %$](t &")d" + '0
t
( (8)
Thus, the photometric signal can be written as a convolution integral. The task is now to recover the impulse response function Yδ(t) to make the fit procedures independent of the excitation source used. A convenient method to achieve this is by Fourier transformation (see for e.g. Ifeachor and Jervis (48)), giving the final result:
!
Y" (t) =1#$%1 $(S(t) % & )
$(Ln (t))' ( )
* + , %-#"(t) (9)
EXCITATION PULSE DECONVOLUTION
25
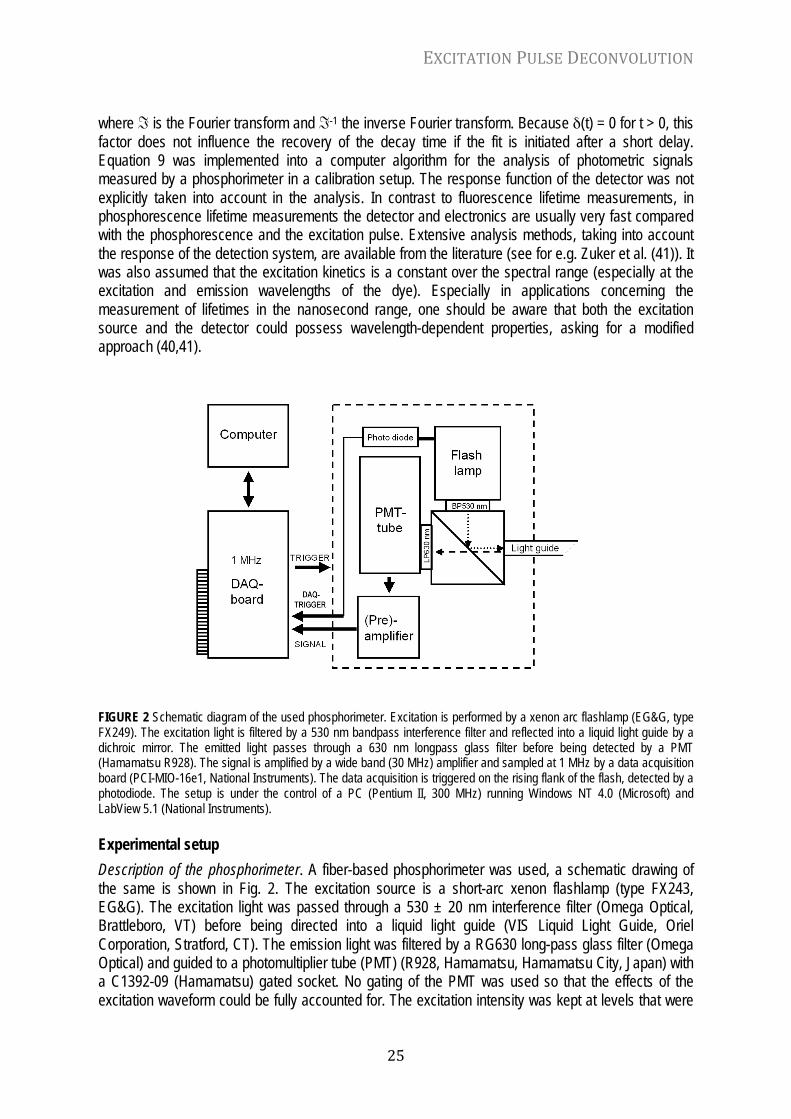
where ℑ is the Fourier transform and ℑ-1 the inverse Fourier transform. Because δ(t) = 0 for t > 0, this factor does not influence the recovery of the decay time if the fit is initiated after a short delay. Equation 9 was implemented into a computer algorithm for the analysis of photometric signals measured by a phosphorimeter in a calibration setup. The response function of the detector was not explicitly taken into account in the analysis. In contrast to fluorescence lifetime measurements, in phosphorescence lifetime measurements the detector and electronics are usually very fast compared with the phosphorescence and the excitation pulse. Extensive analysis methods, taking into account the response of the detection system, are available from the literature (see for e.g. Zuker et al. (41)). It was also assumed that the excitation kinetics is a constant over the spectral range (especially at the excitation and emission wavelengths of the dye). Especially in applications concerning the measurement of lifetimes in the nanosecond range, one should be aware that both the excitation source and the detector could possess wavelength-dependent properties, asking for a modified approach (40,41). FIGURE 2 Schematic diagram of the used phosphorimeter. Excitation is performed by a xenon arc flashlamp (EG&G, type FX249). The excitation light is filtered by a 530 nm bandpass interference filter and reflected into a liquid light guide by a dichroic mirror. The emitted light passes through a 630 nm longpass glass filter before being detected by a PMT (Hamamatsu R928). The signal is amplified by a wide band (30 MHz) amplifier and sampled at 1 MHz by a data acquisition board (PCI-MIO-16e1, National Instruments). The data acquisition is triggered on the rising flank of the flash, detected by a photodiode. The setup is under the control of a PC (Pentium II, 300 MHz) running Windows NT 4.0 (Microsoft) and LabView 5.1 (National Instruments). Experimental setup Description of the phosphorimeter. A fiber-based phosphorimeter was used, a schematic drawing of the same is shown in Fig. 2. The excitation source is a short-arc xenon flashlamp (type FX243, EG&G). The excitation light was passed through a 530 ± 20 nm interference filter (Omega Optical, Brattleboro, VT) before being directed into a liquid light guide (VIS Liquid Light Guide, Oriel Corporation, Stratford, CT). The emission light was filtered by a RG630 long-pass glass filter (Omega Optical) and guided to a photomultiplier tube (PMT) (R928, Hamamatsu, Hamamatsu City, Japan) with a C1392-09 (Hamamatsu) gated socket. No gating of the PMT was used so that the effects of the excitation waveform could be fully accounted for. The excitation intensity was kept at levels that were

CHAPTER 2
26
low enough to prevent saturation of the PMT and subsequent electronics. A digital oscilloscope, running at a sample rate of 50 Megasamples per second (Ms s-1), was used to monitor any clipping caused by the peak of the excitation flash.
The signal from the PMT was amplified by a wide-band (>30 MHz) amplifier and sampled at the rate of 1 MHz by a data acquisition board (PCI-MIO-16e1, National Instruments, Austin, TX). The high rate of data acquisition was chosen to ensure accurate sampling of the excitation waveform. The data acquisition was triggered on the rising flank of the flash, detected by a separate photodiode (see Fig. 2). Because of this approach, the influence of the time jitter occurring between the trigger pulse and the actual occurrence of the flash (5–8 µs in this device) was minimized. The whole setup was under the control of a PC (Pentium II, 300 MHz) running Windows NT 4.0 (Microsoft, Bellevue, WA) and Labview 5.1 (National Instruments). The recorded traces (averaged over 50 flashes of excitation light at a repetition rate of 50 Hz) were stored and analyzed off-line, both with a standard monoexponential fit as well as with the Excitation Pulse Deconvolution-algorithm (EPD-algorithm) described subsequently.
Description of the EPD-algorithm. A practically useful implementation of the EPD based on Eq. (9) was developed. Before the experiment the flashlamp trace L(t) was recorded by averaging the backscattered excitation light of 1000 shots from the sample without phosphorescent dye in order to allow deconvolution of L(t) from the photometric signal. A monoexponential fit was performed on the raw photometric signal for baseline determination and to determine a first rough estimate of the phosphorescence lifetime. After the removal of the baseline the flashlamp waveform L(t) was deconvolved from the photometric signal according to Eq. (9), using the discrete Fourier transform standard available in the LabView software. Hereafter, a monoexponential fit was performed to recover the phosphorescence decay time. The estimated phosphorescence lifetime obtained from the fit on the raw photometric signal was used as an initial guess in the Marquard–Levenberg algorithm used to determine the lifetime of the deconvolved phosphorescence signal. The start of the fit could be varied. The end point of the fit was, arbitrarily, defined as 10 times the decay time resulting from the first monoexponential fit in the preprocess step, with a minimum of 400 µs. Large variations in the chosen end point did not influence the results of the fit procedure, indicating that this end point was well chosen and not critical. Experimental procedures In vivo experiments. To investigate whether different organ tissues cause different amounts of backscattered excitation light, the photometric signal was recorded in the absence of Pd-porphyrin in different organs in a mouse (sacrificed for an experimental protocol, approved by the Animal Ethics Committee of our institution). Anesthesia was induced with an intraperitoneal injection of ketamine (1.25 mg per 10 g body weight [BW]) and medetomidine (2 µg per 10 g BW), followed by a continuous intraperitoneal infusion of ketamine (0.35 mg per 10 g BW per h) and medetomidine (0.35 µg per 10 g BW per h).
The amount of backscatter was measured relative to the amount of internal backscatter in the phosphorimeter. The latter was recorded with an open-ended fiber in the dark. Both the peak intensity of the backscattered signal (Ipeak) and the total signal content (defined as the sum of the intensities over the first 100 µs, further referred to as Isum) were analyzed as a measure of the amount of backscatter.
Computer simulations. To investigate the consequences of flashlamp excitation, computer simulations were performed using the LabView graphical programming software (version 5.1, National Instruments). Monoexponential photometric signals were simulated according to Eqs. (3) and (6). The flashlamp pulse shape L(t) was recorded at the excitation wavelength with a 1 µs time resolution, as shown in Fig. 1. The Runge–Kutta method was used to obtain solutions of a normalized form of Eq. (3) in which pO2, rather than [Q], was used. The value for kx was set to 0.01, producing results that could

EXCITATION PULSE DECONVOLUTION
27
indeed be matched by Eq. (5). For the generation and recovery of the pO2 values of the simulated traces, the quenching constant was assumed to be kq = 316 mm Hg-1s-1 and τ0 = 576 µs (38).
In the in vivo measurements variations in phosphorescence yield and backscattered light intensities can be expected; therefore, the effect of variations in the relative flashlamp and phosphorescence intensities on the photometric signal were investigated. The flashlamp to phosphorescence intensity ratio, β/α (parameters α, β in Eq. [13]), was varied in a range from β/α = 0 to β/α = 5. A monoexponential and dual exponential fit procedure was performed on the simulated photometric signals using the Marquardt–Levenberg nonlinear least squares fit algorithm, conventionally used to analyze the photometric signal (6,38). The dual exponential fit procedure was started after a 6 µs delay. The start of the fit in the case of the monoexponential fit procedure was varied in the range of 15–50 µs to show its effect on the outcome of the fit procedure.
The hypothesis that the use of different excitation waveforms can lead to variations in calibration constants was furthermore tested by computer simulations. In these simulations the excitation waveform was generated according to the following empirical formula in which the parameters A and B were varied:
!
L(t) = exp "tA
#
$ %
&
' ( " exp "
tB
#
$ %
&
' (
#
$ % %
&
' ( (
2
(10)
The simulated phosphorescence signals were fitted by a monoexponential Marquard–Levenberg fit procedure. The fit was started at the time point where the simulated phosphorescence intensity had decreased to 90% of its maximal value (38).
In vitro experiments. A computer algorithm based on Eq. (16) was tested practically using the phosphorescent probe Pd-porphyrin (Porphyrin Products, Logan, UT). The Pd-porphyrin was bound to bovine serum albumin (BSA) (Sigma Chemical Co., St. Louis, MO) as is usual in the in vivo use of this probe. The final working solution consisted of 30 µM Pd-porphyrin (approximately 27 mg L-1) and 2% BSA in a buffer containing 0.42 mM NaH2PO4 and 20.2 mM NaHCO3 (Merck, Darmstadt, Germany) with a pH of 7.4 after bubbling with gas mixtures containing 5% CO2. The solution was kept at 38°C in a water-jacketed reservoir in which it was bubbled with various gas mixtures of oxygen and nitrogen containing a constant amount of 5% CO2. Two mass flow controllers (Type F201-C, Bronkhorst Hightech, Ruurlo, The Netherlands) were used to vary the amount of oxygen in the gas mixtures in a calibrated way. The actual pO2 and pH values were checked during the measurements by analyzing samples of the solution with an ABL505 (Radiometer, Copenhagen, Denmark) blood gas analyzer. Because the ABL505 is calibrated for pO2 measurements in blood, the measured pO2 values were corrected assuming the oxygen solubility of the serum to be 10% lower than that of water (49). Phosphorescence was measured by placing the liquid light guide of the phosphorimeter in close proximity to the Pd-porphyrin solution in a glass reaction vessel. RESULTS Backscatter is tissue dependent The measured photometric signals from different organs are presented showing the in vivo variation in the intensity of backscattered light. Figure 3 shows two examples of recorded photometric signals normalized to the photometric signal recorded in the absence of a sample (internal reflection and scatter in the phosphorimeter). The peak intensity (Ipeak) of the signal recorded from the heart was 92% compared with the peak intensity of the internal backscatter, but the normalized total signal content (Isum) was 101%. Backscattering from the gut, however, resulted in an Ipeak of 151% and an Isum of 244%. The values measured for other tissues were: Ipeak = 107% and Isum = 119% for the liver, Ipeak =

CHAPTER 2
28
102% and Isum = 102% for the lung and Ipeak = 101% and Isum = 103% for the skeletal muscle. Reflection of the excitation light into the fiber using an optical mirror resulted only in a slight increase in backscatter, comparable to the values measured for the lung and skeletal muscle. These results show that backscattered light intensities can vary from organ to organ.
FIGURE 3 Backscattered excitation light obtained from different tissues. The amount of backscattered excitation light in experiments performed in vivo depends on the tissue studied. Here, two examples of backscatter from the gut () and the heart () of a mouse are shown.
O2 measurements made by conventional lifetime analysis methods are affected by oxygen-independent factors The effects of flashlamp excitation, backscatter of excitation light and the start point of the fit procedure on monoexponential and dual exponential lifetime analyses were investigated using computer simulations. To simulate variations in backscatter, the composition of the simulated photometric signal was varied using different flashlamp to phosphorescence intensity ratios (β/α in Eq. [6]). The results of these simulations are shown in Fig. 4. Figure 4A shows the result of the monoexponential fit, starting after different delays, in the case of a flashlamp to phosphorescence ratio of 1.0. Starting the fit after a delay of 20 µs gives an almost perfect correlation between the recovered pO2 values and the simulated pO2 values (R = 0.997). This fit procedure, however, results in a systematic underestimation of the simulated pO2 by approximately 20% over the whole range (indicating that the recovered lifetimes are longer than the simulated lifetimes). Starting the fit after 30 µs gives similar results, but increasing the delay to 40 or 50 µs results in a clear deterioration of the results at pO2 values above 60 mm Hg. Figure 4B shows the results of the monoexponential fit when the ratio β/α is 5.0. Both delays of 20 and 30 µs showed a good correlation with the simulated pO2 (R being 0.999 and 0.998, respectively). However, a quantitative difference was found to exist between the fit procedures. A delay of 20 µs results in an underestimation of the simulated pO2 by approximately 16%. In the case of a delay of 30 µs this value increased to approximately 28% at a pO2 of 150 mm Hg. The correlation between simulated and recovered pO2 decreases markedly when the fit is started at delays of 40 and 50 µs. Figure 4C shows the results of the monoexponential fit (performed after a delay of 20 µs) with different β/α ratios. No significant difference between the delays in terms of correlation with the simulated pO2 values was found (R > 0.999 in all cases), although a quantitative difference in the recovered pO2 values was present. The maximum difference between the recovered pO2 values could be as large as 15% (between β/α = 0 and β/α = 5.0 at a pO2 of 90 mm Hg). Figure 4D shows the result of a dual exponential fit started at a delay of 6 µs, performed on the same simulated data as in Fig. 4C. The fit procedure shows instabilities when the β/α ratio is 1.0. For the other b/a ratios (β/α = 0, β/α = 2.0 and β/α = 5.0) the correlation between recovered and simulated pO2 is good (R > 0.999). The dual exponential fit results in a maximal underestimation of 30% of the simulated pO2. The

EXCITATION PULSE DECONVOLUTION
29
maximum difference between the recovered pO2 values for the different β/α ratios was 9% (between β/α = 0 and β/α = 5.0 at a pO2 of 80 mm Hg).
FIGURE 4 Results of the computer simulations. (a) shows the dependency of the monoexponential fit on the chosen start of fit when the flash to phosphorescence ratio β/α = 1.0. : startfit = 20 µs, : startfit = 30 µs, : startfit = 40 µs, x: startfit = 50 µs. (b) is the same as Fig. 4A but with β/α = 5.0. (c) shows the effect of a change in flashlamp reflection while the startfit is kept constant at 20 µs. : β/α = 0.0, : β/α = 1.0, : β/α = 2.0, x: β/α = 5.0. (d) shows the result of fitting a dual exponential function with a startfit of 6 µs. β/α ratios as in Fig. 4c.
FIGURE 5 Influence of the excitation pulse on the calibration constants kq and τ0. The excitation pulse shape was simulated according to Eq. (10). Simulated values for the calibration constants were kq = 316 mmHg-1s-1 and τ0 = 576 µs.
CHAPTER 2
30
The excitation pulse affects the quenching constants To test the hypothesis that the excitation source may lead to device-specific quenching constants a second set of computer simulations was run in which Eq. (10) was used to generate excitation pulse shapes of varying duration. The results of these simulations, shown in Fig. 5, show that there is indeed a dependency of the quenching constants (especially kq) on the excitation pulse (shape and duration). Generally, an overestimation of the simulated lifetimes occurred, resulting in an underestimation of kq.
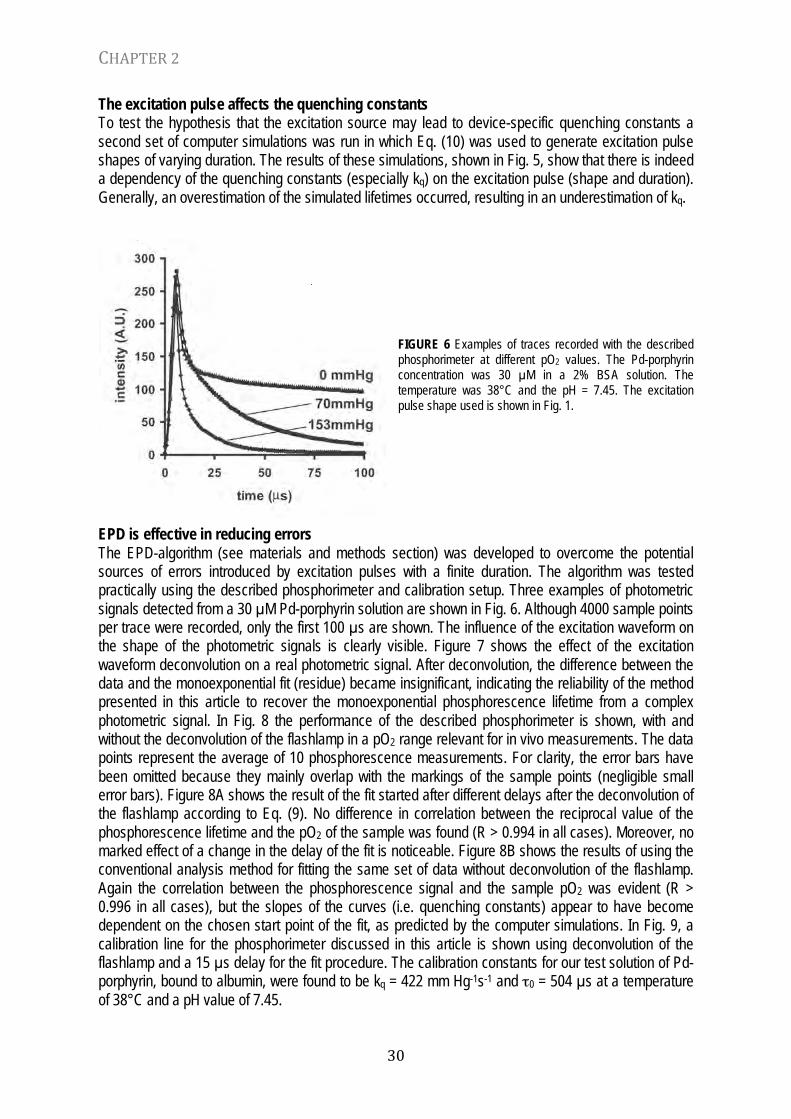
FIGURE 6 Examples of traces recorded with the described phosphorimeter at different pO2 values. The Pd-porphyrin concentration was 30 µM in a 2% BSA solution. The temperature was 38°C and the pH = 7.45. The excitation pulse shape used is shown in Fig. 1.
EPD is effective in reducing errors The EPD-algorithm (see materials and methods section) was developed to overcome the potential sources of errors introduced by excitation pulses with a finite duration. The algorithm was tested practically using the described phosphorimeter and calibration setup. Three examples of photometric signals detected from a 30 µM Pd-porphyrin solution are shown in Fig. 6. Although 4000 sample points per trace were recorded, only the first 100 µs are shown. The influence of the excitation waveform on the shape of the photometric signals is clearly visible. Figure 7 shows the effect of the excitation waveform deconvolution on a real photometric signal. After deconvolution, the difference between the data and the monoexponential fit (residue) became insignificant, indicating the reliability of the method presented in this article to recover the monoexponential phosphorescence lifetime from a complex photometric signal. In Fig. 8 the performance of the described phosphorimeter is shown, with and without the deconvolution of the flashlamp in a pO2 range relevant for in vivo measurements. The data points represent the average of 10 phosphorescence measurements. For clarity, the error bars have been omitted because they mainly overlap with the markings of the sample points (negligible small error bars). Figure 8A shows the result of the fit started after different delays after the deconvolution of the flashlamp according to Eq. (9). No difference in correlation between the reciprocal value of the phosphorescence lifetime and the pO2 of the sample was found (R > 0.994 in all cases). Moreover, no marked effect of a change in the delay of the fit is noticeable. Figure 8B shows the results of using the conventional analysis method for fitting the same set of data without deconvolution of the flashlamp. Again the correlation between the phosphorescence signal and the sample pO2 was evident (R > 0.996 in all cases), but the slopes of the curves (i.e. quenching constants) appear to have become dependent on the chosen start point of the fit, as predicted by the computer simulations. In Fig. 9, a calibration line for the phosphorimeter discussed in this article is shown using deconvolution of the flashlamp and a 15 µs delay for the fit procedure. The calibration constants for our test solution of Pd-porphyrin, bound to albumin, were found to be kq = 422 mm Hg-1s-1 and τ0 = 504 µs at a temperature of 38°C and a pH value of 7.45.

EXCITATION PULSE DECONVOLUTION
31
FIGURE 7 Example of excitation waveform deconvolution on a real photometric signal. (a) shows the photometric signal. (b) shows the difference between the monoexponential fit and the measured data (residue of the fit) without deconvolution. (c) shows the resulting curve after application of EPD on the trace in Fig. 7A. (d) shows the residue of the monoexponential fit after application of the EPD-algorithm. The first 20 µs were rejected from the fit procedure. The time t = 0 µs in Fig. 7b,d therefore corresponds to t = 20 µs in Fig. 7a,c, respectively.
FIGURE 8 Performance of the described phosphorimeter. This figure shows (a) the minimized dependency on the choice of the start of the fit with the EPD-algorithm compared with (b) a simple monoexponential fit. : startfit = 20 µs, : startfit = 30 µs, : startfit = 40 µs, x: startfit = 50 µs. Data obtained from a 30 µM Pd-porphyrin solution in 2% BSA, temperature kept at 38°C and pH = 7.45. Reference pO2 values on the x-axis were obtained using an ABL505 bloodgas analyzer (Radiometer).

CHAPTER 2
32
FIGURE 9 Calibration line of Pd-porphyrin after deconvolution of the excitation waveform. The solution consisted of 30 µM Pd-porphyrin, 2% BSA, 0.42 mM NaH2PO4 and 20.2 mM NaHCO3. The solution was bubbled with gas mixtures containing different oxygen concentrations and 5% CO2. The temperature was kept at 38°C and the pH = 7.45. The quenching constants were found to be kq = 422 mmHg-1 s-1 and τ0 = 504 µs. The error bars denote the SD of 10 measurements.
DISCUSSION
The main findings of this study may be summarized as follows: (1) the complex excitation pattern provided by xenon flashlamps for oxygen-dependent quenching of phosphorescence measurements may lead to errors in pO2 measurements; (2) the calibration constants for the conversion of phosphorescence lifetimes to pO2 values are influenced by the excitation pulse shape thereby providing an explanation for the variations of reported values in the literature; and (3) the interpretation of photometric signals obtained with flashlamp excitation from in vivo measurements is furthermore complicated by optical properties of the tissue, such as backscatter and absorption. On the basis of these findings an algorithm for the deconvolution of the excitation pulse profile was developed. The present study showed this algorithm to be a powerful and easy to use method to resolve problems introduced by complex excitation patterns, both in vitro and in vivo. The analysis presented in this study is based on the characteristics of our specific phosphorimeter, but the qualitative results and analysis concepts are generally applicable.
The nonlinearity occurring in the relationship between oxygen concentrations and phosphorescence lifetime measurements has been reported previously. In an analysis of this phenomenon, Gewehr and Delpy (50) showed that heterogeneity in the dye and quencher compartment (with the dye molecules embedded in a synthetic membrane) can result in nonlinearity and that this effect can be diminished by a modification of the Stern-Volmer relationship. However, the phosphorescence of porphyrin compounds in homogeneous solutions with albumin shows very narrow lifetime distributions and is very close to a pure single exponential (32), indicating that another explanation for the nonlinearity is needed. Both Vinogradov and Wilson (32) and Lo et al. (6) mention that the lifetime analysis may be influenced by the decay of the excitation flash. The authors suggested that the use of a flash of shorter duration or the inclusion of all the phosphorescence data and mathematical correction for the flashlamp effect could improve the measurements at higher oxygen pressures but made no attempt to do so (6). In a more recent study Knopp et al. (10) measured a calibration line that deviated from the ideal over the whole measured range from 0 to 150 mmHg and concluded that their system is only useful for oxygen tensions below 70 mmHg. The present study suggests that the origin of this may lie in the complex and uncorrected excitation kinetics, especially at higher oxygen concentrations.
Although the calibration constants needed for the conversion of phosphorescence lifetimes to oxygen quantities, kq and τ0, should be absolute and depend only on the dye used and not on specific

EXCITATION PULSE DECONVOLUTION
33
laboratory conditions (see for e.g. Lo et al. [6]), a wide variety of values for both kq and τ0 have been reported in the literature for Pd-porphyrin, the most widely used probe to date. Probably the most striking example is the difference between the two studies that were specifically carried out for the precise calibration of Pd-porphyrin. At an albumin concentration of 0.5%, a value for which the studies are comparable, Lo et al. (6) reported values of 413 mmHg-1s-1 and 617 µs for kq and τ0, respectively, whereas Sinaasappel and Ince (38) found values of 316 mmHg-1s-1 and 576 µs. Other studies reported values over this whole range. Some examples are: kq = 306 mmHg-1s-1 and τ0 = 625 µs (17), kq = 306 mmHg-1s-1 and τ0 = 546 µs (16), kq = 370 mm Hg-1s-1 and τ0 = 550 µs (10), kq = 386 mmHg-
1s-1 and τ0 = 502 µs (24). This study shows, both by computer simulations and in practice, that although a good to very good correlation between pO2 values and phosphorescence lifetimes can be obtained after excitation with a complex excitation pulse and relatively simple analysis methods (after the choice of an appropriate delay time), the values for kq and τ0 are altered when a complex excitation pattern is combined with a relatively simple fit procedure. With the excitation profile used here, a monoexponential fit results in an underestimation of the quenching constant by approximately 20%. Moreover, this effect depended on the chosen fit parameters and the exact properties of the photometric signal. It is therefore likely that the relatively large differences in calibration constants found in the literature are caused, at least in part, by the specific type of excitation source used. This finding underscores the need to determine calibration constants for each specific device and argues against using calibration constants determined in other phosphorimeters. The situation for in vivo measurements is even more complicated because of the tissue-specific backscatter of excitation light, also influencing the conventional lifetime analysis. The computer simulations show that a change in the recovered pO2 values occurs when the intensity of the backscattered excitation light is varied from 0 to 83.3% of the total photometric signal. It is therefore not at all evident that a carefully (in vitro) calibrated device will provide accurate pO2 measurements in vivo. The EPD-algorithm, presented in this study and discussed subsequently, is able to overcome these complications.
From Fig. 6 it was estimated that for the in vitro experiments the β/α ratio was approximately 1. The in vivo experiment showed a more than two-fold increase in backscatter for the gut, causing a corresponding increase in the β/α ratio. Besides variations in backscatter, light absorption will also vary from tissue to tissue, causing a tissue-specific reduction of the phosphorescence part of the photometric signal. This will add to the effect of increased backscatter and therefore the β/α ratio becomes even larger. The β/α ratio for the computer simulations was therefore chosen to range from 0 to 5. These values are also in correspondence with our experiences with other phosphorimeters used for in vivo experiments in our laboratory.
The relatively long lifetime of the oxygen-dependent phosphorescence using metallo-porphyrin probes bound to albumin has favored the use of xenon flashlamps because the relatively short decay time of the flash was not expected to influence the phosphorescence lifetime analysis. This required the analysis (or data acquisition) to be started after a certain delay, omitting the influence of the flashlamp from the signal. This study, however, shows that the pulse shape can influence the photometric signal considerably. Choosing a different excitation source, such as pulsed lasers, could circumvent this effect of the use of xenon flashlamps on the photometric signal and lifetime analysis. An alternative would be a change to frequency-domain measurements. Both options imply new investments or the loss of current expertise (or both) with customized devices like intravital microscopes or multifiber phosphorimeters and may introduce new complications that were not present when flashlamp excitation was used. This study has presented a convenient and robust method for the deconvolution of the excitation pulse shape from the photometric signal (EPD-algorithm). With this method errors introduced by a complex excitation pulse shape (irrespective of the phosphorimeter being used) can now be circumvented. To this end, the excitation pulse shape is recorded and deconvolved from the photometric signal, as described in our study, resulting in the recovery of the pure phosphorescence signal. The phosphorescence signal can afterwards be analyzed with an

CHAPTER 2
34
appropriate model without the adverse effects of the excitation pulse present. The method can be easily implemented in current phosphorimeters. The use of flashlamps may become less frequent when lasers become prevalent excitation sources. However, the derivation of the EPD-algorithm is very general, making no assumptions about excitation pulse shape or duration. Therefore, the EPD-algorithm could also be very useful for laser based systems with shorter excitation pulses. Moreover, the EPD-algorithm allows, in theory, application in heterogeneity analysis that would be otherwise hampered by finite excitation pulse duration (37). The necessary adaptation would be the replacement of the monoexponential impulse response by an impulse response describing a heterogeneous system (see for e.g. the studies of Vinogradov and Wilson [32,34]). The EPD-algorithm should have the potential to remove the differences in quenching constants between different phosphorimeters. However, we recommend a careful calibration for every device, despite the use of EPD, because it will reveal other device-specific problems or limitations (or both). Because the EPD-algorithm eliminates the effects of the tissue optical properties on the lifetime analysis, it removes the uncertainties introduced when applying the in vitro measured quenching constants to in vivo measurements. REFERENCES 1. Knopp, J. A. and I. S. Longmuir (1972) Intracellular measurement of oxygen by quenching of fluorescence of pyrene
butyric acid. Biochim. Biophys. Acta 279, 393–397. 2. Benson, D. M., J. A. Knopp and I. S. Longmuir (1980) Intracellular oxygen measurements of mouse liver cells using
quantitativefluorescence video microscopy. Biochim. Biophys. Acta 591, 187–197. 3. Swartz, H. M. and R. B. Clarkson (1998) The measurement of oxygen in vivo using EPR techniques. Phys. Med. Biol.
43, 1957–1975. 4. He, J., N. Beghein, R. B. Clarkson, H. M. Swartz and B. Gallez (2001) Microencapsulation of carbon particles used as
oxygen sensors in EPR oximetry to stabilize their responsiveness to oxygen in vitro and in vivo. Phys. Med. Biol. 46, 3323–3329.
5. Vanderkooi, J. M., G. Maniara, T. J. Green and D. F. Wilson (1987) An optical method for measurement of dioxygen concentration based upon quenching of phosphorescence. J. Biol. Chem. 262, 5476–5482.
6. Lo, L. W., C. J. Koch and D. F. Wilson (1996) Calibration of oxygen-dependent quenching of the phosphorescence of Pdmeso-tetra (4-carboxyphenyl) porphine: a phosphor with general application for measuring oxygen concentration in biological systems. Anal. Biochem. 236, 153–160.
7. Wilson, D. F., W. L. Rumsey, T. J. Green and J. M. Vanderkooi (1988) The oxygen dependence of mitochondrial oxidative phosphorylation measured by a new optical method for measuring oxygen concentration. J. Biol. Chem. 263, 2712–2718.
8. Robiolio, M., W. L. Rumsey and D. F. Wilson (1989) Oxygen diffusion and mitochondrial respiration in neuroblastoma cells. Am. J. Physiol. 256, C1207–C1213.
9. Motterlini, R., H. Kerger, C. J. Green, R. M. Winslow and M. Intaglietta (1998) Depression of endothelial and smooth muscle cell oxygen consumption by endotoxin. Am. J. Physiol. 275, H776–H782.
10. Knopp, A., S. Thierfelder, R. Koopmann, C. Biskup, T. Bohle and K. Benndorf (1999) Anoxia generates rapid and massive opening of KATP channels in ventricular cardiac myocytes. Cardiovasc. Res. 41, 629–640.
11. Chandel, N. S., G. R. Budinger and P. T. Schumacker (1996) Molecular oxygen modulates cytochrome c oxidase function. J. Biol. Chem. 271, 18 672–18 677.
12. Hogan, M. C. (1999) Phosphorescence quenching method for measurement of intracellular pO2 in isolated skeletal muscle fibers. J. Appl. Physiol. 86, 720–724.
13. Hogan, M. C. (2001) Fall in intracellular pO2 at the onset of contractions in Xenopus single skeletal muscle fibers. J. Appl. Physiol. 90, 1871–1876.
14. Sinaasappel, M., M. van Iterson and C. Ince (1999) Microvascular oxygen pressure in the pig intestine during hemorrhagic shock and resuscitation. J. Physiol. 514(Pt. 1), 245–253.
15. Siegemund, M., J. van Bommel and C. Ince (1999) Assessment of regional tissue oxygenation. Intensive Care Med. 25, 1044–1060.
16. Zheng, L., A. S. Golub and R. N. Pittman (1996) Determination of pO2 and its heterogeneity in single capillaries. Am. J. Physiol. 271, H365–H372.
17. Shonat, R. D. and P. C. Johnson (1997) Oxygen tension gradients and heterogeneity in venous microcirculation: a phosphorescence quenching study. Am. J. Physiol. 272, H2233–H2240.

EXCITATION PULSE DECONVOLUTION
35
18. Richmond, K. N., R. D. Shonat, R. M. Lynch and P. C. Johnson (1999) Critical pO2 of skeletal muscle in vivo. Am. J. Physiol. 277, H1831–H1840.
19. Wilson, D. F., S. Gomi, A. Pastuszko and J. H. Greenberg (1993) Microvascular damage in the cortex of cat brain from middle cerebral artery occlusion and reperfusion. J. Appl. Physiol. 74, 580–589.
20. Tammela, O. K., N. Lajevardi, C. C. Huang, D. F. Wilson, M. Delivoria-Papadopoulos and A. Pastuszko (1996) The effects of induced apneic episodes on cerebral cortical oxygenation in newborn piglets. Brain Res. 741, 160–165.
21. Ince, C., J. F. Ashruf, J. A. Avontuur, P. A. Wieringa, J. A. Spaan and H. A. Bruining (1993) Heterogeneity of the hypoxic state in rat heart is determined at capillary level. Am. J. Physiol. 264, H294–H301.
22. Rumsey, W. L., M. Pawlowski, N. Lejavardi and D. F. Wilson (1994) Oxygen pressure distribution in the heart in vivo and evaluation of the ischemic ‘‘border zone.’’ Am. J. Physiol. 266, H1676–H1680.
23. Cerniglia, G. J., D. F. Wilson, M. Pawlowski, S. Vinogradovand J. Biaglow (1997) Intravascular oxygen distribution in subcutaneous 9L tumors and radiation sensitivity. J. Appl. Physiol. 82, 1939–1945.
24. Helmlinger, G., F. Yuan, M. Dellian and R. K. Jain (1997) Interstitial pH and pO2 gradients in solid tumors in vivo: highresolution measurements reveal a lack of correlation. Nat. Med. 3, 177–182.
25. van Iterson, M., M. Sinaasappel, K. Burhop, A. Trouwborst and C. Ince (1998) Low-volume resuscitation with a hemoglobinbased oxygen carrier after hemorrhage improves gut microvascular oxygenation in swine. J. Lab. Clin. Med. 132, 421–431.
26. Tsai, A. G., B. Friesenecker, M. C. Mazzoni, H. Kerger, D. G. Buerk, P. C. Johnson and M. Intaglietta (1998) Microvascular and tissue oxygen gradients in the rat mesentery. Proc. Natl. Acad. Sci. USA 95, 6590–6595.
27. Sinaasappel, M., C. Donkersloot, J. van Bommel and C. Ince (1999) PO2 measurements in the rat intestinal microcirculation. Am. J. Physiol. 276, G1515–G1520.
28. van Bommel, J., M. Siegemund, H. C. Pieter, A. Trouwborst and C. Ince (2001) Critical hematocrit in intestinal tissue oxygenation during severe normovolemic hemodilution. Anesthesiology 94, 152–160.
29. Rumsey, W. L., B. Abbott, L. W. Lo, S. A. Vinogradov and D. F. Wilson (1997) Imaging of oxygen distribution in the surface and deep areas of the kidney. Adv. Exp. Med. Biol. 411, 591–595.
30. Vinogradov, S. A., L. W. Lo, W. T. Jenkins, S. M. Evans, C. Koch and D. F. Wilson (1996) Noninvasive imaging of the distribution in oxygen in tissue in vivo using near-infrared phosphors. Biophys. J. 70, 1609–1617.
31. Lo, L. W., S. A. Vinogradov, C. J. Koch and D. F. Wilson (1997) A new, water soluble, phosphor for oxygen measurements in vivo. Adv. Exp. Med. Biol. 428, 651–656.
32. Vinogradov, S. A. and D. F. Wilson (1994) Phosphorescence lifetime analysis with a quadratic programming algorithm for determining quencher distributions in heterogeneous systems. Biophys. J. 67, 2048–2059.
33. Golub, A. S., A. S. Popel, L. Zheng and R. N. Pittman (1997) Analysis of phosphorescence in heterogeneous systems using distributions of quencher concentration. Biophys. J. 73, 452– 465.
34. Vinogradov, S. A. and D. F. Wilson (2000) Recursive maximum entropy algorithm and its application to the luminescence lifetime distribution recovery. Appl. Spectrosc. 54, 849–855.
35. Shonat, R. D., E. S. Wachman, W. Niu, A. P. Koretsky and D. L. Farkas (1997) Near-simultaneous hemoglobin saturation and oxygen tension maps in mouse brain using an AOTF microscope. Biophys. J. 73, 1223–1231.
36. Green, T. J., D. F. Wilson, J. M. Vanderkooi and S. P. DeFeo (1988) Phosphorimeters for analysis of decay profiles and real time monitoring of exponential decay and oxygen concentrations. Anal. Biochem. 174, 73–79.
37. Golub, A. S., A. S. Popel, L. Zheng and R. N. Pittman (1999) Analysis of phosphorescence decay in heterogeneous systems: consequences of finite excitation flash duration. Photochem. Photobiol. 69, 624–632.
38. Sinaasappel, M. and C. Ince (1996) Calibration of Pd-porphyrin phosphorescence for oxygen concentration measurements in vivo. J. Appl. Physiol. 81, 2297–2303.
39. Ware, W. R. (1973) Deconvolution of fluorescence and phosphorescence decay curves. A least-squares method. J. Phys. Chem. 77, 2038–2048.
40. Wahl, P., J. C. Auchet and B. Donzel (1974) The wavelength dependence of the response of a pulse fluorometer using the single photoelectron counting method. Rev. Sci. Instrum. 45, 28–32.
41. Zuker, M., A. G. Szabo, L. Bramall and D. T. Krajcarski (1985) Delta function convolution method (DFCM) for fluorescence decay experiments. Rev. Sci. Instrum. 56, 14–22.
42. Lakowicz, J. R. (1999) Time-domain lifetime measurements. In Principles of Fluorescence Spectroscopy (Edited by J. R. Lakowicz), pp. 95–140. Kluwer Academic/Plenum Publishers, New York.
43. Vanderkooi, J. M. and J. W. Berger (1989) Excited triplet states used to study biological macromolecules at room temperature. Biochim. Biophys. Acta 976, 1–27.
44. Lakowicz, J. R. (1999) Quenching of fluorescence. In Principles of Fluorescence Spectroscopy, pp. 237–65. Kluwer Academic/ Plenum Publishers, New York.
45. EG&G (1988) Short-arc xenon flashlamps and power supplies, DATA SHEET F1022B-1. EG&G electro-optics, Salem, MA.
46. Hamamatsu (1993) Xenon flash lamps, DATA SHEET TLSX9001E01. Hamamatsu Photonics, Shimokanzo, Japan. 47. Sinaasappel, M. (1997) Microvascular pO2 in models of shock. Ph.D. thesis, University of Amsterdam.

CHAPTER 2
36
48. Ifeachor, E. C. and B. W. Jervis (1993) Digital signal processing, a practical approach. Addison-Wesley Publishing Company, Wokingham, England.
49. Christoforides, C., L. H. Laasberg and J. Hedley-Whyte (1969) Effect of temperature on solubility of O2 in human plasma. J. Appl. Physiol. 26, 56–60.
50. Gewehr, P. M. and D. T. Delpy (1994) Analysis of non-linearity of optical oxygen sensors based upon phosphorescence lifetime quenching. Med. Biol. Eng. Comput. 32, 659–664.

Chapter 3
Quantitative Determination of Localized Tissue Oxygen Concentration in vivo by Two-Photon
Excitation Phosphorescence Lifetime Measurements
E.G. Mik, T.G. van Leeuwen, N.J.H. Raat and C. Ince
Journal of Applied Physiology 97: 1962-1969, 2004
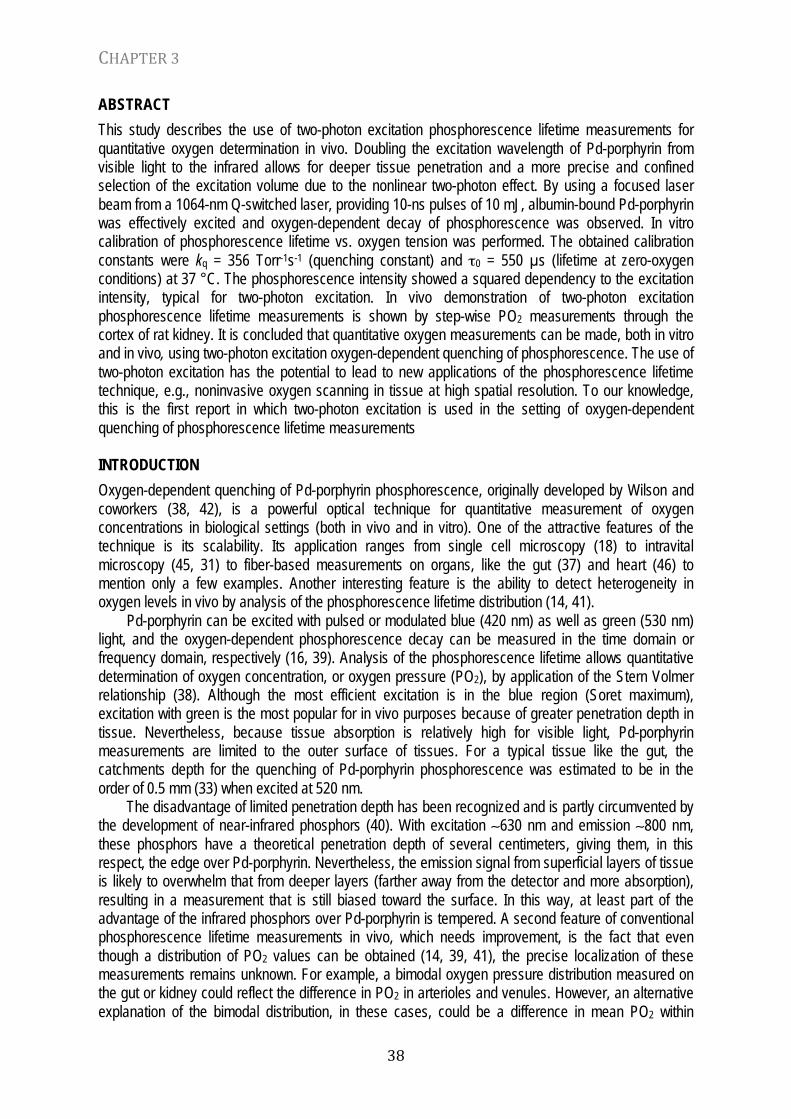
CHAPTER 3
38
ABSTRACT This study describes the use of two-photon excitation phosphorescence lifetime measurements for quantitative oxygen determination in vivo. Doubling the excitation wavelength of Pd-porphyrin from visible light to the infrared allows for deeper tissue penetration and a more precise and confined selection of the excitation volume due to the nonlinear two-photon effect. By using a focused laser beam from a 1064-nm Q-switched laser, providing 10-ns pulses of 10 mJ, albumin-bound Pd-porphyrin was effectively excited and oxygen-dependent decay of phosphorescence was observed. In vitro calibration of phosphorescence lifetime vs. oxygen tension was performed. The obtained calibration constants were kq = 356 Torr-1s-1 (quenching constant) and τ0 = 550 µs (lifetime at zero-oxygen conditions) at 37 °C. The phosphorescence intensity showed a squared dependency to the excitation intensity, typical for two-photon excitation. In vivo demonstration of two-photon excitation phosphorescence lifetime measurements is shown by step-wise PO2 measurements through the cortex of rat kidney. It is concluded that quantitative oxygen measurements can be made, both in vitro and in vivo, using two-photon excitation oxygen-dependent quenching of phosphorescence. The use of two-photon excitation has the potential to lead to new applications of the phosphorescence lifetime technique, e.g., noninvasive oxygen scanning in tissue at high spatial resolution. To our knowledge, this is the first report in which two-photon excitation is used in the setting of oxygen-dependent quenching of phosphorescence lifetime measurements INTRODUCTION Oxygen-dependent quenching of Pd-porphyrin phosphorescence, originally developed by Wilson and coworkers (38, 42), is a powerful optical technique for quantitative measurement of oxygen concentrations in biological settings (both in vivo and in vitro). One of the attractive features of the technique is its scalability. Its application ranges from single cell microscopy (18) to intravital microscopy (45, 31) to fiber-based measurements on organs, like the gut (37) and heart (46) to mention only a few examples. Another interesting feature is the ability to detect heterogeneity in oxygen levels in vivo by analysis of the phosphorescence lifetime distribution (14, 41).
Pd-porphyrin can be excited with pulsed or modulated blue (420 nm) as well as green (530 nm) light, and the oxygen-dependent phosphorescence decay can be measured in the time domain or frequency domain, respectively (16, 39). Analysis of the phosphorescence lifetime allows quantitative determination of oxygen concentration, or oxygen pressure (PO2), by application of the Stern Volmer relationship (38). Although the most efficient excitation is in the blue region (Soret maximum), excitation with green is the most popular for in vivo purposes because of greater penetration depth in tissue. Nevertheless, because tissue absorption is relatively high for visible light, Pd-porphyrin measurements are limited to the outer surface of tissues. For a typical tissue like the gut, the catchments depth for the quenching of Pd-porphyrin phosphorescence was estimated to be in the order of 0.5 mm (33) when excited at 520 nm.
The disadvantage of limited penetration depth has been recognized and is partly circumvented by the development of near-infrared phosphors (40). With excitation ∼630 nm and emission ∼800 nm, these phosphors have a theoretical penetration depth of several centimeters, giving them, in this respect, the edge over Pd-porphyrin. Nevertheless, the emission signal from superficial layers of tissue is likely to overwhelm that from deeper layers (farther away from the detector and more absorption), resulting in a measurement that is still biased toward the surface. In this way, at least part of the advantage of the infrared phosphors over Pd-porphyrin is tempered. A second feature of conventional phosphorescence lifetime measurements in vivo, which needs improvement, is the fact that even though a distribution of PO2 values can be obtained (14, 39, 41), the precise localization of these measurements remains unknown. For example, a bimodal oxygen pressure distribution measured on the gut or kidney could reflect the difference in PO2 in arterioles and venules. However, an alternative explanation of the bimodal distribution, in these cases, could be a difference in mean PO2 within

TWO-‐PHOTON EXCITATION
39
different anatomical compartments, like the serosa and mucosa of the gut (44, 33) and the cortex and medulla of the kidney (24). Therefore, oxygen pressure distributions from phosphorescence lifetime distribution analysis can be quite difficult to interpret.
Finding an alternative method to improve penetration depth and simultaneously increase the in-depth differentiating power of the measurement might provide new possibilities and applications for measurements based on both conventional Pd-porphyrin and the more recently developed near-infrared phosphors. Two-photon excitation is a technique that could be a potential candidate for this purpose. Instead of excitation with a single photon [single-photon excitation (SPE)] having an appropriate energy (ESPE), it is possible to achieve excitation with two photons having energy of 1⁄2ESPE, under the restriction that they collide with the molecule simultaneously (7). In the case of Pd-porphyrin, successful application of two-photon excitation would allow excitation at wavelengths ~840 nm and 1060 nm. Both wavelengths lie in the so-called “tissue optical window”, which is that part of the spectrum where tissue absorption is relatively low (6, 21, 25, 28). Because the emission wavelength (~700 nm) also lies in the tissue optical window, the use of two-photon excitation could significantly increase the measurement depth. The fact that the phosphorescent probe emits light in the near-infrared region is very advantageous, as can be seen from the field of near-infrared fluorescence imaging (27). Moreover, because of the nonlinear nature of two-photon excitation, measurements with a high spatial resolution in three-dimensional space in thick tissue are possible (34, 43). Successful two-photon excitation of porphyrins and production of singlet oxygen by interaction of oxygen with the excited triplet state has been reported (3, 4, 8, 15). Because photosensitized production of singlet oxygen and oxygen measurements by triplet-state quenching have much in common, it is likely that quantitative oxygen measurement with two-photon excitation should be possible. If feasible, two-photon excitation of oxygen-dependent quenching of Pd-porphyrin could result in the development of new methods for the study of tissue oxygenation. For example, stepwise oxygen measurements, in a confocal type of manner, would allow axial oxygen measurements to be made in different anatomical compartments.
This study was aimed to investigate the possibility of using two-photon excitation for quantitative oxygen measurements based on oxygen-dependent quenching of Pd-porphyrin. To this end four steps were undertaken. First, it was determined whether Pd-porphyrin could be effectively excited by using a focused laser beam from a pulsed infrared laser (1064 nm). Second, the oxygen dependence of the phosphorescence lifetime was studied by performing calibration experiments. Third, the nonlinear behavior of the two-photon excitation was investigated by measurements of emission light as a function of excitation intensity. Fourth, the possibility of using two-photon excitation phosphorescence lifetime measurements in vivo was studied by applying it to oxygen measurements in rat kidney, where it was applied for longitudinal oxygen scanning through the cortex of the kidney. MATERIALS AND METHODS Principle of oxygen-dependent quenching of phosphorescence. Molecular oxygen is a well-known quencher of excited triplet states. Under zero-oxygen conditions, excitation of a solution of phosphor molecules, like Pd-porphyrin, results in a transient emission of phosphorescent light with decay time τ0. Collision of excited molecules with oxygen leads to energy transfer without light emission (quenching), resulting in a shortening of the overall phosphorescence decay time. The relationship between oxygen concentration and phosphorescence lifetime is given by the Stern-Volmer relationship:
!
PO2 =
1"#
1"0
kq
(1)

CHAPTER 3
40
where τ is the measured phosphorescence lifetime and kq is the so-called quenching constant. Equation 1 can be applied directly to the lifetime of the measured phosphorescence signal if the excitation pulse can be considered as a Dirac delta pulse [δ(t)]. Otherwise deconvolution of the excitation pulse shape from the photometric signal is necessary before the lifetime determination (26). Principle of two-photon excitation. In contrast to single-photon excitation, two-photon excitation is a nonlinear optical process in which a molecule is excited by two photons instead of a single photon with a double energy (or half the wavelength). By considering the excitation as the rate-limiting step in a chemical reaction consisting of a single-step termolecular process involving one molecule and two photons, one can derive the rate of production of excited-state molecules, RTPE (11):
!
RTPE ="2
lA
CP 2 (2)
where δ is the two-photon cross section, l is the path-length, A is the cross-sectional area of the beam (multiplying l by A defines the interaction volume), C is the molar concentration of the excitable molecules, and P is the power of the excitation beam. In phosphorescence measurements, the intensity of the signal is proportional to RTPE; therefore Eq. 2 can be rewritten in terms of signal intensity vs. excitation power:
!
I0 "CP 2 (3)
where I0 is the measured phosphorescence intensity at time zero, i.e., directly after the excitation pulse. In Eq. 3, constants influencing the absolute value of I0, like the molecular constants, excitation geometry, and detection efficiency, are omitted. These constants are intensity independent so that the proportionality sign describes the relation between I0 and P2. The nonlinear behavior of two-photon excitation provides a means of selective excitation within a three-dimensional space, and the quadratic dependence of emission intensity vs. excitation power is regarded as proof of the two-photon nature of the studied phenomena (4, 12, 17). Description of the two-photon setup. A schematic diagram of the used experimental two-photon setup is given in Fig. 1. Excitation was achieved by using a Q-switched laser operating at 1064 nm (Laser 1-2-3, Schartz Electro-Optics, Orlando, FL). The laser provided pulses of ~10-ns duration and an energy ranging from 10 mJ per pulse for the in vitro experiments to 100 mJ per pulse in the in vivo experiments. The bundle diameter of the laser beam was slightly expanded to a final diameter of 5 mm by a beam expander before being directed to the focusing lens by an optical mirror with an enhanced silver reflection surface (Opto Sigma, Santa Anna, CA). The focusing lens was a single-plan convex lens with a focal length of 2.0 cm. On the basis of Gaussian beam optics, the bundle diameter of 5 mm combined with a lens with a focal length of 2.0 cm results in a focal spot size of 8 µm and a focus length of 94 µm (in air). Assuming a refractive index in tissue of 1.4, the measurement volume is approximately a cylinder with diameter of 10 µm and a length of 130 µm. The focusing lens was connected to a micrometer screw for manual adjustment of the focal plane, thereby allowing longitudinal measurements to be made. For in vivo application, the reading of the micrometer screw was multiplied by the refractive index of tissue, assumed to be 1.4. Emission light was collected by the same lens and directed toward the photo detector by two mirrors. Selection of the phosphorescence light was achieved by two 700 ± 20-nm band-pass filters (Oriel, Stratford, CT), positioned in series

TWO-‐PHOTON EXCITATION
41
before the cathode of the photomultiplier tube (PMT, type R928, Hamamatsu, Hamamatsu City, Japan). The output of the PMT was voltage converted by a current-to-voltage converter with subsequent wide-band amplifier (30 MHz) and fed into a digital oscilloscope (Tektronix 2440, Tektronix, Beaverton, OR). The used oscilloscope was featured with 8-bit vertical sampling with onboard averaging of up to 256 traces and provided the averaged data as 16-bit output on a RS-232 interface. To increase signal-to-noise ratio, phosphorescent traces were averaged on the oscilloscope. Unless stated otherwise, the average of 32 traces was used. The resulting averaged traces were transferred to a computer by serial bus for data collection and analysis by software written in LabView (National Instruments, Austin, TX); see Data analysis. FIGURE 1 Schematic diagram of the experimental setup. The laser provided pulses of 10 ns with a wavelength of 1064 nm at a repetition rate of 10 Hz. F1 is a 1064-nm laser line band-pass filter. L1 and L2 form a beam expander resulting in a beam width of ~5 mm. Mirror M1 is a standard optical mirror with a central borehole for passing of the laser beam. Mirror M2 has an enhanced silver surface. L3 is a lens with a focal length of 2 cm. The distance of this lens to the sample can be varied in the z-plane (Z) for adjustment of the measurement depth. Filters F2 and F3 are 700-nm band-pass filters. The detector is a red-sensitive photomultiplier tube. Further details are provided in the main text. In vitro calibration experiments. To test the hypothesis that two-photon excitation can be used for oxygen measurements by phosphorescence lifetime measurements with Pd-porphyrin, experiments were performed in a clear Pd-porphyrin solution with varying oxygen concentrations. Pd-meso-tetra(4-carboxyphenyl)porphine (Porphyrin Products, Logan, UT) was bound to BSA (Sigma, St. Louis, MO), as is usual for in vivo use of the probe. Therefore, the Pd-porphyrin was dissolved in DMSO (6 mg/ml) before being added to a buffer solution containing 128.3 mM NaCl, 4.7 mM KCl, 1.0 mM MgCl2, 0.4 mM NaH2PO4, 20.2 mM NaHCO3, 20.2 mM CaCl2 (chemicals from Merck, Darmstad, Germany) and 2% BSA. The final Pd-porphyrin concentration in the working solution was 500 µM (~450 mg/l). The laser beam was focused into the lumen of a glass flow-through cuvette (custom made) of 1 x 1 x 10 cm that was part of a recirculation system. This system consisted of a water-jacketed reservoir, a hollow fiber oxygenator (Minimax PLUS, Medtronic, Minneapolis, MN), a water-jacketed heat exchanger, the flow-through cuvette, and a peristaltic roller pump (Minipuls 3, Gilson, Middleton, WI). The oxygen concentration was controlled by two mass flow controllers (type F201-C, Bronkhorst Hightech, Ruurlo, The Netherlands) allowing the precise mixture of two gases, N2 with 5% CO2 and air with 5% CO2, to obtain different oxygen levels in the gas flowing through the oxygenator. Gas mixtures with 5% CO2 were used to obtain a constant 5% CO2 content of the final gas mixture, needed for the used

CHAPTER 3
42
bicarbonate buffer. The recirculation system allowed rapid changes of oxygen concentration in the sample volume. Zero-oxygen conditions were created via the chemical removal of oxygen by an enzymatic reaction using ascorbate-oxidase and ascorbic acid (23). Experiments were performed at 37°C. The pH value of the solution was checked during the experiments and remained at 7.4 ± 0.1. Testing the two-photon nature of the excitation. For testing the quadratic dependence of emission intensity on the excitation power, as described by Eq. 3, the intensity of the excitation pulse was varied in small steps with microscopic object slides with a thickness of 1 mm (Rofa-Mavi, Beverwijk, The Netherlands). Calibration of the laser light attenuation vs. the number of slides was done with a laser power meter (model DGX, Ophir Optronics, Danvers, MA). For ease of measurement, phosphorescence was measured under zero-oxygen conditions at room temperature. Because the phosphorescence signal decays relatively slowly under these conditions (lifetime 0.6 ms), the average of the first 10 µs of the transient signal was taken as the value for I0 (in Eq. 3) without introducing significant error. Testing for local hyperthermia. A direct comparison of two-photon excitation and one-photon excitation was performed in a closed cuvette. One-photon excitation was achieved by a blue diode-laser (Power Technology, PMT-series laser module with a 4-mW 405-nm laser diode) providing 50-µs pulses at a repetition rate of 10 Hz. The diode laser was focused into the same spot as the two-photon laser. Measurements were performed under zero-oxygen conditions at room temperature. Two-photon excitation and one-photon excitation measurements were performed alternately. For each measurement 128 laser pulses were averaged. The measurements were repeated 10 times. In vivo experimental protocol. Rats were anesthetized with an intraperitoneal injection of a mixture of ketamine (Nimatek, Eurovet, Bladel, The Netherlands; 90 mg/kg), medetomidine (Domitor, Pfizer, Capelle a/d Yssel, 0.5 mg/kg) and atropine-sulfate (Centrafarm, Ettenleur, The Netherlands; 0.05 mg/kg). The body temperature of the rat was kept between 36.5 and 37.5°C by using a heating pad that was thermocontrolled by a temperature probe placed in the rectum. For mechanical ventilation, a tracheotomy was performed and a 6-Fr polyvinyl chloride tube (Enteral feeding tube, Vycon, Ecouen, France), cut at 3.5 cm, was placed 0.5 cm in the trachea and secured with a suture. A modified infant ventilator MK-78 (Medec, Wormerveer, The Netherlands) was used to ventilate the animals. To minimize ventilatory fluid loss, a humidity filter (Humid-Vent Micro, Gibeck, Helsingborg, Sweden) was placed before the ventilation tube. Two vessels were cannulated using 0.5 x 0.9 mm polyethylene vein catheter (Braun). Catheters were filled with 0.9% NaCl solution (Baxter, Utrecht, The Netherlands) with 25 IU of heparin (Leo Pharma, Breda, The Netherlands). The right carotid artery was catheterized for continuous monitoring of mean arterial blood pressure and heart rate. In addition, the jugular vein was cannulated for administration of Pd-porphyrin solution. Pd-meso-tetra(4-carboxyphenyl) porphine (Porphyrin Products) coupled to human serum albumin solution (50 mg in 10 ml 4% albumin solution, 4 mM Pd-porphyrin solution, pH adjusted to 7.4 with HCl) was infused to a final dose of 2 ml solution in 20 min. A midline laparotomy was performed for exposure of the right kidney. To achieve variations in the global oxygen concentration in the kidney, the fraction of inhaled oxygen (FiO2) was varied from 37 to 10%. All investigations were carried out in accordance with the guidelines of the animal ethical committee of our institution after approval of the experimental protocol. For the in vivo experiments, 64 traces were averaged per measurement at a repetition rate of 10 laser pulses per second. The data-acquisition time was 6.4 s per measurement. Data analysis. Software for data transfer from the oscilloscope and lifetime analysis of phosphores-cence decay curves was written by use of Labview 5.1 (National Instruments, Austin, TX) running on a personal computer (Pentium II, 300 MHz) with Windows NT 4.0 (Microsoft, Bellevue, WA). For
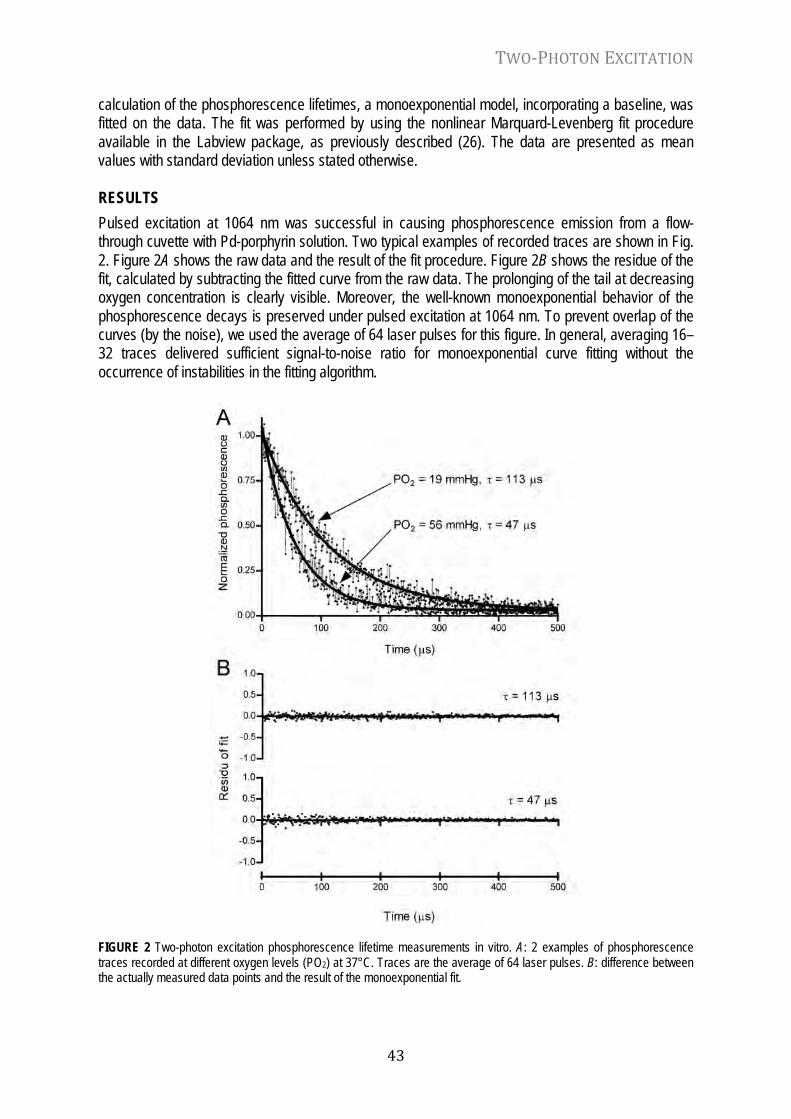
TWO-‐PHOTON EXCITATION
43
calculation of the phosphorescence lifetimes, a monoexponential model, incorporating a baseline, was fitted on the data. The fit was performed by using the nonlinear Marquard-Levenberg fit procedure available in the Labview package, as previously described (26). The data are presented as mean values with standard deviation unless stated otherwise. RESULTS Pulsed excitation at 1064 nm was successful in causing phosphorescence emission from a flow- through cuvette with Pd-porphyrin solution. Two typical examples of recorded traces are shown in Fig. 2. Figure 2A shows the raw data and the result of the fit procedure. Figure 2B shows the residue of the fit, calculated by subtracting the fitted curve from the raw data. The prolonging of the tail at decreasing oxygen concentration is clearly visible. Moreover, the well-known monoexponential behavior of the phosphorescence decays is preserved under pulsed excitation at 1064 nm. To prevent overlap of the curves (by the noise), we used the average of 64 laser pulses for this figure. In general, averaging 16–32 traces delivered sufficient signal-to-noise ratio for monoexponential curve fitting without the occurrence of instabilities in the fitting algorithm. FIGURE 2 Two-photon excitation phosphorescence lifetime measurements in vitro. A: 2 examples of phosphorescence traces recorded at different oxygen levels (PO2) at 37°C. Traces are the average of 64 laser pulses. B: difference between the actually measured data points and the result of the monoexponential fit.

CHAPTER 3
44
For quantitative measurement of oxygen concentrations by use of two-photon excitation, it is essential to demonstrate good correlation between the oxygen concentration and the reciprocal value of the lifetime, as seen with single-photon excitation. Figure 3 shows the results of the calibration experiments, performed to determine the oxygen dependence of the lifetime with two-photon excitation. An excellent correlation between reciprocal lifetime and oxygen concentration exists. The calibration constants at 37°C were determined to be kq = 356 Torr-1s-1 (result of linear fit, 95% confident interval ranging from 332 to 381) and τ0 = 550 µs (direct measurement under zero-oxygen conditions).
FIGURE 3 Reciprocal phosphorescence lifetime of Pd-porphyrin vs. the partial oxygen pressure. Pulsed excitation at 1064 nm, emission at 700 nm. The solid line represents the result of a linear fit on the data (n = 10). The quenching constants are kq = 356 Torr-1s-1, τ0 = 550 µs. The correlation coefficient r2 = 0.997.
FIGURE 4 Intensity of phosphorescence emission, normalized to the maximum value, vs. the excitation intensity, also normalized. Values are presented as percentage of the maximum values. The solid line represents the theoretical squared dependency from Eq. 3.

TWO-‐PHOTON EXCITATION
45
To make sure that the observed phosphorescence was due to two-photon excitation, the squared dependence of intensity vs. excitation power (Eq. 3) was tested. Attenuation of the laser light in small steps was achieved by varying the number of microscope slides put in series in the laser bundle. Light attenuation per slide was determined to be 6.7% (data not shown). The relative initial intensity of phosphorescence as function of the relative laser power is shown in Fig. 4. Both values are relative to the maximum values measured without attenuation. The solid line is the theoretical squared curve. It is clear that the phosphorescence intensity is well described by Eq. 3, proving that we achieved true two-photon excitation.
Possible contributions of leakage of green laser light (532 nm) to the phosphorescence yield were excluded by two additional tests. We started with the direct measurement of spectrum of the laser output, using an Ocean Optics SD2000 spectrograph. No evidence of 532-nm leakage was present (data not shown). In a second test, we compared the phosphorescence yield before and after placing a 720-nm long-passfilter (95% transmission for wavelengths > 720 nm, < 1% transmission for wavelengths < 720 nm) into the laser beam. Measurements were performed at room temperature and under zero-oxygen conditions. Placing the long-pass filter resulted in only a small decrease in phosphorescence yield. The remaining phosphorescence yield was 88 ± 11% (n = 10) of the original signal, proving the hypothesis of two-photon excitation. We therefore have excluded significant contribution of 532-nm leakage as explanation of our apparently high phosphorescence yield.
Because of the high power density in the measurement volume (on the order of TW/cm2) and significant one-photon absorption at 1064 nm (7), a concern about the possible occurrence of local hyperthermia inside the measurement volume exists. Therefore, direct comparison between lifetimes at two-photon and one-photon excitation was performed. The hypothesis was that a significant temperature jump would cause disturbance of the phosphorescence signal and a decrease in lifetime. Both two-photon and one-photon excitation resulted in visibly undistorted single-exponential phospho-rescence traces. Two-photon excitation resulted in a phosphorescence lifetime of 699.1 ± 8.7 µs. One-photon excitation resulted in a lifetime of 705.4 ± 6.6 µs. Therefore, a small, but nonsignificant (P = 0.08), difference in τ0 exists. The shortening of τ0 under two-photon excitation could be caused by a small thermal effect. If the difference of ~6 µs is assumed to be real, this would indicate a temperature elevation of ~1.5 °C (32).
As an example of the use of two-photon excitation phosphorescence lifetime measurements for in vivo applications, we tested our setup on rat kidney in vivo. On a fixed focus depth of 280 µm, lowering the FiO2 from 37 to 10% demonstrated the existence of two-photon excited oxygen-dependent phosphorescence. Examples of obtained phosphorescence traces under these circumstances are shown in Fig. 5A. While the rat breathed 37% oxygen, the measured lifetime was 58 µs, correspon-ding to a PO2 value of 43 Torr. Lowering the FiO2 to 10% results in an extreme PO2 drop to 3.6 Torr, as can be derived from the prolonging of the lifetime to 323 µs. Once it was clear that two-photon excitation was feasible in the rat kidney, a longitudinal oxygen scan was performed. The focusing depth was manually adjusted in small steps from the organ surface to a measurement depth of ~2.2 mm. Starting with the focus point above the organ surface, the surface was easily identified by a sudden appearance of phosphorescence at the moment the focus point entered the tissue. Although at a depth of 2.2 mm still more than sufficient phosphorescence could be detected, deeper measurements were not possible with our specific setup because of collision of the focusing arm with anatomical structures. The resultant PO2 measurements as function of measurement depth are shown in Fig. 5B. The first 600 µm is a zone with marked variations in oxygen pressure around an average of 50 Torr. At a depth of more than 600 µm, there is a zone with a lower average PO2 of 35 Torr and less variation in oxygen pressure.
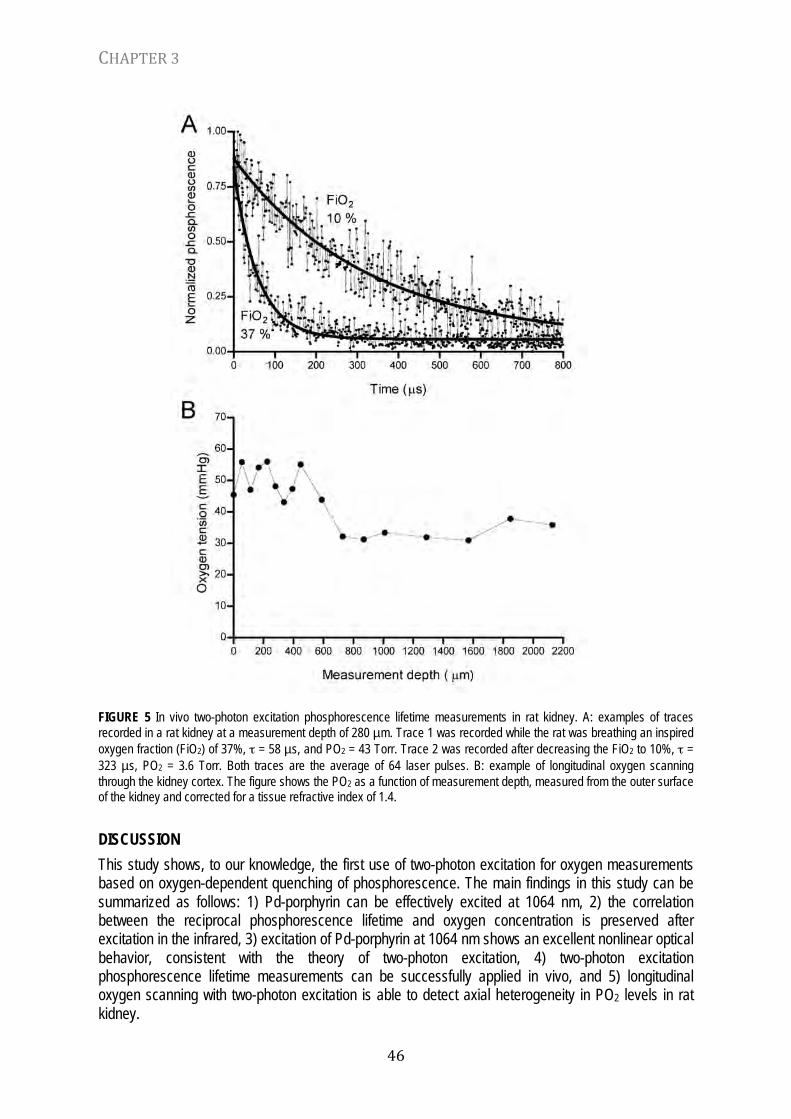
CHAPTER 3
46
FIGURE 5 In vivo two-photon excitation phosphorescence lifetime measurements in rat kidney. A: examples of traces recorded in a rat kidney at a measurement depth of 280 µm. Trace 1 was recorded while the rat was breathing an inspired oxygen fraction (FiO2) of 37%, τ = 58 µs, and PO2 = 43 Torr. Trace 2 was recorded after decreasing the FiO2 to 10%, τ = 323 µs, PO2 = 3.6 Torr. Both traces are the average of 64 laser pulses. B: example of longitudinal oxygen scanning through the kidney cortex. The figure shows the PO2 as a function of measurement depth, measured from the outer surface of the kidney and corrected for a tissue refractive index of 1.4.
DISCUSSION This study shows, to our knowledge, the first use of two-photon excitation for oxygen measurements based on oxygen-dependent quenching of phosphorescence. The main findings in this study can be summarized as follows: 1) Pd-porphyrin can be effectively excited at 1064 nm, 2) the correlation between the reciprocal phosphorescence lifetime and oxygen concentration is preserved after excitation in the infrared, 3) excitation of Pd-porphyrin at 1064 nm shows an excellent nonlinear optical behavior, consistent with the theory of two-photon excitation, 4) two-photon excitation phosphorescence lifetime measurements can be successfully applied in vivo, and 5) longitudinal oxygen scanning with two-photon excitation is able to detect axial heterogeneity in PO2 levels in rat kidney.

TWO-‐PHOTON EXCITATION
47
In vitro, emission of phosphorescent light could be readily detected after pulsed excitation at 1064 nm. This wavelength was imposed by the available laser system, but 1064 nm is likely to be not the most optimal excitation wavelength (see discussion in the next paragraph). Nevertheless, the phosphorescence yield was adequate to be detected by analog detection, whereas in two-photon microscopy photon-counting methods are mandatory (7). The relatively high phosphorescence yield in our study is most likely due to the relatively large measurement volume in our study. We calculated our measurement volume to be more than 3000 times larger than would be the case in a diffraction-limited setup in which the laser bundle is focused into a spot of ~1 µm diameter. There is an excellent correlation between PO2 and reciprocal lifetime, as predicted by the Stern-Volmer relationship. Moreover, the determined quenching constants at 37 °C (kq = 356 Torr-1s-1 and τ0 = 550 µs) with the described setup correspond very well to previously reported values measured with a pulsed laser system operating at 535 nm (29). The true two-photon nature of the excitation at 1064 nm is clearly demonstrated by the quadratic dependence of phosphorescence intensity against the excitation intensity, a criterion generally used to prove two-photon excitation (2, 4, 12, 17, 22). Contributions to the phosphorescence yield by leakage of visible light from the laser were excluded by additional tests. These results show the feasibility of quantitative oxygen measurements with two-photon excitation phosphorescence lifetime measurements.
In the mid 1980s, Bodaness and King (4) demonstrated that hematoporphyrin derivative could be effectively two-photon excited with a 20-ns Q-switched Nd-YAG laser. However, one year later they demonstrated a 100-fold increase in two-photon efficiency in hematoporphyrin derivative with excitation at 750 nm (3). They attributed this 100-fold enhancement in the effective two-photon excitation cross section to a resonant enhancement contribution from the S1 state. Recently, Karotki et al. (19) also showed that tuning the excitation wavelength from λex = 1100–1400 nm to λex = 700–800 nm enhances the two-photon cross section by almost two orders of magnitude as a result of near-resonant Q transition. Our laser system was limited to 1064 nm output, but it appears that probably a major improvement in performance can be achieved by choosing a more effective excitation wavelength. For our application of in vivo oxygen measurements, it is relevant to note that a change of wavelength could indeed improve performance while keeping the advantage of making use of the tissue optical window (6, 21, 25, 28).
Another gain in performance can be expected by using shorter laser pulses to increase photon flux per time unit. Although several reports on two-photon excitation in porphyrins by nanosecond pulsed laser sources exist (3, 4, 22), more recent studies make use of femtosecond pulsed laser systems (see, e.g., Refs. 7–9, 15), providing effective two-photon excitation with a reduced average laser power. This is of importance for reduction of hyperthermia caused by high power densities and local light absorption, a factor that is attributed to at least a part of the reported tissue damage in two-photon excitation photodynamic therapy (15). For our application of oxygen measurements, occurrence of hyperthermia could have a second important consequence. Temperature is known to have a significant influence on phosphorescence quenching, leading to temperature dependency of the calibration constants (32). A short local temperature jump could therefore disturb the phosphores-cence signal and lead to erroneous oxygen measurements. In our study, hyperthermia appears to be a factor of limited importance (no significant difference between τ0 with two-photon excitation vs. one-photon excitation). From our results we calculated an increase in local temperature of at most 1.5 °C. This allows oxygen measurements to be made within the accepted 5% overall error of phosphores-cence quenching measurements (32). Also, it is not likely that this mild increase in temperature will cause tissue destruction with our relatively short (compared to photodynamic therapy) illumination of tissue.
In our study, Pd-meso-tetra(4-carboxyphenyl)porphine was used because to date it is the most widely used porphyrin for in vivo oxygen measurements. However, it is a metalloporphyrin with a centrosymmetrical chemical structure. Centrosymmetrical molecules have in general low two-photon

CHAPTER 3
48
cross sections (see, e.g., Ref. 19). Two-photon excitation is of relevance not only for biomedical applications, such as two-photon fluorescence microscopy (7), but also for other applications in which an increase in three-dimensional spatial selectivity is advantageous, like high-density optical data storage and microfabrication (5). Recent reports on designing molecules with increased two-photon cross sections were published (1, 9). Efforts are also being made to increase the two-photon cross section of porphyrins by changing the chemical structure to increase its asymmetry (19). These efforts could lead to phosphorescent porphyrins with large two-photon cross sections, leading to a major performance gain in our application of in vivo oxygen measurements.
Several reports of in vivo use of two-photon excitation are available in literature. A recent example is cortical imaging in a mouse through the intact skull (43). In an earlier study, studying the feasibility of two-photon excitation in photodynamic therapy, Lenz (22) demonstrates two-photon excited fluorescence from hematoporphyrin derivative in a rat ear. In his study, Lenz used a relatively simple setup and Q-switched Nd:YAG laser providing pulses of 10 ns at 1064 nm (i.e., comparable to our laser system). Therefore, we felt confident that successful use of our two-photon excitation setup in vivo should be possible. Indeed, the experiments performed on rat kidneys clearly demonstrated the feasibility of two-photon excitation phosphorescence lifetime measurements in vivo. After intravenous administration of Pd-porphyrin, phosphorescence could be detected in the kidney. Variations in FiO2 prove the oxygen-measuring capability of our technique, because lowering the FiO2 from 37 to 10% results in prolonging of the phosphorescence lifetime. The typical two-photon excitation phenomenon of selective excitation within a three-dimensional space is shown by the longitudinal oxygen scan through the cortex. The two-photon excitation scan shows significant heterogeneity in PO2 values, of which the most striking is the sudden decrease in PO2 at a depth of more than 600 µm. Both the absolute PO2 values as the heterogeneity pattern compare very well to previously reported results, measured with micro oxygen electrodes (24).
Methodological limitations. Two-photon excitation is generally used for its deeper penetration in tissue, and, indeed, in this study we readily achieved oxygen measurements at a depth of 2 mm in kidney. Signal intensity and the quality of focused laser light rapidly decline with increasing depth of measurement because of disturbances in vivo. Scattering and absorption lead to a decrease of two-photon-generated emission. Furthermore, the nonideal optical conditions in vivo are likely to have their impact on the resolution of the measurement in deeper layers of tissue. We therefore expect the method to be limited to a measurement depth of several millimeters. Further research is needed to explore the possibilities and limitations of this technique, e.g., by Monte Carlo simulations (10).
Advantages and applications of this technique. Several techniques have been described in the literature to measure quantitative tissue oxygen levels in vivo. These techniques vary from the polaro-graphic oxygen electrode to more recently developed techniques like electron paramagnetic resonance, recently reviewed by Swartz (36). Each technique has its own advantages and disadvantages. Although oxygen electrodes can be miniaturized and are capable of measuring tissue oxygen levels at high spatial resolution and penetration depths of centimeters (24), some tissue destruction is inevitable. Electron paramagnetic resonance on the other hand is relatively noninvasive but is limited in spatial resolution to the size of the paramagnetic particles, typically one hundred to several hundred micrometers (35, 36). Oxygen-dependent quenching of phosphorescence has its strength in its scalability, ranging from single-cell measurements in vitro (18, 20) to measurements in single microvessels in intravital microscopy (13, 30, 31, 45) to macroscopic oxygen measurements on organ surfaces (33, 37, 42). Its main limitations are that 1) the lack of discriminating power in the z-plane in intravital microscopy leads to complications in the interpretation of PO2 measurements due to contributions to the signal of out of focus regions, as discussed by Golub and Pittman (13), and 2) the limited penetration depth of the excitation light leads to a bias toward the outer surface in macroscopic measurements (33). The proposed two-photon excitation phosphorescence lifetime technique essentially overcomes these limitations. Combined with intravital microscopy it potentially provides a

TWO-‐PHOTON EXCITATION
49
tool for high-resolution measurements (34), allowing true three-dimensional measurements of oxygen profiles around (and inside) microvessels. On a more macroscopic scale, improved penetration depth and discrimination power allow for an oxygen electrode-like capability of oxygen profile measurements (as demonstrated), without the disadvantage of tissue damage. This can be applied, e.g., for PO2 measurements in a selective part of an organ like the kidney or the gut. This is of relevance because, e.g., in the gut it has been shown that the mucosa responses differently to shock and resuscitation than the serosa (44). Two-photon excitation phosphorescence lifetime measurements provide a means to measure PO2 in the gut mucosa without disturbing the integrity of the tissue.
Our results demonstrate that quantitative oxygen measurements by means of two-photon excited oxygen-dependent quenching of phosphorescence are feasible. The quenching constants found with two-photon excitation are similar to the values reported for conventional excitation methods. Oxygen measurements performed on kidney in vivo provide PO2 values consistent with previous reported values, measured with oxygen electrodes. This technique provides a new tool for quantitative oxygen measurements in biological samples, with high spatial resolution and a penetration depth of several millimeters.
ACKNOWLEDGMENTS The authors would like to thank Anneke Koeman of the department of Physiology of the Academic Medical Center in Amsterdam, The Netherlands for help with the animal experiments. REFERENCES 1. Albota M, Beljonne D, Brédas JL, Ehrlich JE, Fu JY, Heikal AA, Hess SE, Kogej T, Levin MD, Marder SR, McCord-
Maughon D, Perry JW, Röckel H, Rumi M, Subramaniam G, Webb WW, Wu XL, and Xu C. Design of organic molecules with large two-photon absorption cross sections. Science 281: 1653–1656, 1998.
2. Bird D and Gu M. Compact two-photon fluorescence microscope based on a single-mode fiber coupler. Optics Lett 27: 1031–1033, 2002.
3. Bodaness RS, Heller DF, Krasinski J, and King DS. The two-photon laser-induced fluorescence of the tumor-localizing photosensitizer hematoporphyrin derivative. Resonance-enhanced 750 nm two-photon excitation into the near-UV Soret band. J Biol Chem 261: 12098–12101, 1986.
4. Bodaness RS and King DS. The two-photon induced fluorescence of the tumor localizing photo-sensitizer hematoporphyrin derivative via 1064 nm photons from a 20 ns Q-switched Nd-YAG laser. Biochem Biophys Res Commun 126: 346–351, 1985.
5. Cumpston BH, Ananthavel SP, Barlow S, Dyer DL, Ehrlich JE, Erskine LL, Heikal AA, Kuebler SM, Lee IYS, McCord-Maughon D, Qin J, Röckel H, Rumi M, Wu XL, Marder SR, and Perry JW. Two-photon polymerization initiators for three-dimensional optical data storage and microfabrication. Nature 398: 51–54, 1999.
6. Delpy DT, Cope M, van der Zee P, Arridge SR, Wray S, and Wyatt JS. Estimation of optical pathlength through tissue from direct time of flight measurements. Phys Med Biol 33: 1433–1442, 1988.
7. Denk W, Piston DW, and Webb WW. Two-photon molecular excitation in laser-scanning microscopy. In: Handbook of Biological Confocal Microscopy, edited by Pawley JB. New York: Plenum, 1995, chapt. 28, p. 445–458.
8. Drobizhev M, Karotki A, Kruk M, Krivokapic A, Anderson HL, and Rebane A. Photon energy upconversion in porphyrins: one-photon hotband absorption versus two-photon absorption. Chem Phys Lett 370: 690–699, 2003.
9. Drobizhev M, Karotki A, and Rebane A. Dendrimer molecules with record large two-photon absorption cross section. Opt Lett 26: 1081–1083, 2001.
10. Dunn AK, Wallace VP, Coleno M, Berns MW, and Tromberg BJ. Influence of optical properties on two-photon fluorescence imaging in turbid samples. Appl Optics 39: 1194–1201, 2000.
11. Fisher WG, Partridge WP Jr, Dees C, and Wachter EA. Simultaneous two-photon activation of type-I photodynamic therapy agents. Photochem Photobiol 66: 141–155, 1997.
12. Florin EL, Heinrich Ho¨rber JK, and Stelzer EHK. High-resolution axial and lateral position sensing using two-photon excitation of fluorophores by a continuous-wave Nd:YAG laser. Appl Phys Lett 69: 446–448, 1996.
13. Golub AS and Pittman RN. Recovery of radial PO2 profiles from phosphorescence quenching measurements in microvessels. Comp Biochem Physiol A 132: 169–176, 2002.

CHAPTER 3
50
14. Golub AS, Popel AS, Zheng L, and Pittman RN. Analysis of phosphorescence in heterogeneous systems using distributions of quencher concentration. Biophys J 73: 452–465, 1997.
15. Goyan RL and Cramb DT. Near-infrared two-photon excitation of protoporphyrin IX: photodynamics and photoproduct generation. Photochem Photobiol 72: 821–827, 2000.
16. Green TJ, Wilson DF, Vanderkooi JM, and DeFeo SP. Phosphorimeters for analysis of decay profiles and real time monitoring of exponential decay and oxygen concentrations. Anal Biochem 174: 73–79, 1988.
17. Hell SW, Booth M, and Wilms S. Two-photon near- and far-field fluorescence microscopy with continuous-wave excitation. Optics Lett 23: 1238–1240, 1998.
18. Hogan MC. Fall in intracellular PO2 at the onset of contractions in Xenopus single skeletal muscle fibers. J Appl Physiol 90: 1871–1876, 2001.
19. Karotki A, Drobizhev M, Kruk M, Spangler C, Nickel E, Mamardashvili N, and Rebane A. Enhancement of two-photon absorption in tetrapyrrolic compounds. J Opt Soc Am B 20: 321–332.
20. Kindig CA, Kelley KM, Howlett RA, Stary CM, and Hogan MC. Assessment of O2 uptake dynamics in isolated single skeletal myocytes. J Appl Physiol 94: 353–357, 2003.
21. König K. Multiphoton microscopy in life sciences. J Microsc 200: 83–104, 2000. 22. Lenz P. In vivo excitation of photosensitizers by infrared light. Photochem Photobiol 62: 333–338, 1995. 23. Lo LW, Koch CJ, and Wilson DF. Calibration of oxygen-dependent quenching of the phospho-rescence of Pd-meso-
tetra (4-carboxyphenyl) porphine: a phosphor with general application for measuring oxygen concentration in biological systems. Anal Biochem 236: 153–160, 1996.
24. Lübbers DW and Baumgärt H. Heterogeneities and profiles of oxygen pressure in brain and kidney as examples of the PO2 distribution in the living tissue. Kidney Int 51: 372–380, 1997.
25. McCormick PW, Stewart M, Lewis G, Dujovny M, and Ausman JI. Intracerebral penetration of infrared light. Technical note. J Neurosurg 76: 315–318, 1992.
26. Mik EG, Donkersloot C, Raat NJH, and Ince C. Excitation pulse deconvolution in luminescence lifetime analysis for oxygen measurements in vivo. Photochem Photobiol 76: 12–21, 2002.
27. Ntziachristos V, Bremer C, and Weissleder R. Fluorescence imaging with near-infrared light: new technological advances that enable in vivo molecular imaging. Eur Radiol 13: 195–208, 2003.
28. Rolfe P. In vivo near-infrared spectroscopy. Annu Rev Biomed Eng 02: 715–754, 2000. 29. Shibata M, Ichioka S, Ando J, and Kamiya A. Microvascular and interstitial PO2 measurements in rat skeletal muscle by
phosphorescence quenching. J Appl Physiol 91: 321–327, 2001. 30. Shonat RD and Johnson PC. Oxygen tension gradients and heterogeneity in venous microcirculation: a
phosphorescence quenching study. Am J Physiol Heart Circ Physiol 272: H2233–H2240, 1997. 31. Sinaasappel M, Donkersloot C, Van Bommel J, and Ince C. PO2 measurements in the rat intestinal microcirculation.
Am J Physiol Gastrointest Liver Physiol 276: G1515–G1520, 1999. 32. SinaasappelMand Ince C. Calibration of Pd-porphyrin phosphorescence for oxygen concentration measurements in
vivo. J Appl Physiol 81: 2297–2303, 1996. 33. Sinaasappel M, Van Iterson M, and Ince C. Microvascular oxygen pressure in the pig intestine during haemorrhagic
shock and resuscitation. J Physiol 514: 245–253, 1999. 34. So PTC, Dong CY, Masters BR, and Berland KM. Two-photon excitation fluorescence microscopy. Annu Rev Biomed
Eng 02: 399–429, 2000. 35. Swartz HM and Clarkson RB. The measurement of oxygen in vivo using EPR techniques. Phys Med Biol 43: 1957–
1975, 1998. 36. Swartz HM. Measuring real levels of oxygen in vivo: opportunities and challenges. Biochem Soc Trans 30: 248–252,
2002. 37. Van Bommel J, Siegemund M, Pieter HC, Trouwborst A, and Ince C. Critical hematocrit in intestinal tissue oxygenation
during severe normovolemic hemodilution. Anesthesiology 94: 152–160, 2001. 38. Vanderkooi JM, Maniara G, Green TJ, and Wilson DF. An optical method for measurement of dioxygen concentration
based upon quenching of phosphorescence. J Biol Chem 262: 5476–5482, 1987. 39. Vinogradov SA, Fernandez-Seara MA, Dupan BW, and Wilson DF. A method for measuring oxygen distributions in
tissue using frequency domain phosphorometry. Comp Biochem Physiol A 132: 147–152, 2002. 40. Vinogradov SA, Lo LW, Jenkins WT, Evans SM, Koch C, and Wilson DF. Noninvasive imaging of the distribution in
oxygen in tissue in vivo using near-infrared phosphors. Biophys J 70: 1609–1617, 1996. 41. Vinogradov SA and Wilson DF. Recursive maximum entropy algorithm and its application to the luminescence lifetime
distribution recovery. Appl Spectroscopy 54: 849–855, 2000. 42. Wilson DF, Pastuszko A, DiGiacomo JE, Pawlowski M, Schneiderman R, and Delivoria Papadopoulos M. Effect of
hyperventilation on oxygenation of the brain cortex of newborn piglets. J Appl Physiol 70: 2691–2696, 1991. 43. Yoder EJ and Kleinfeld D. Cortical imaging through the intact mouse skull using two-photon excitation laser scanning
microscopy. Microsc Res Tech 56: 304–305, 2002.

TWO-‐PHOTON EXCITATION
51
44. Zabel DD, Hopf HW, and Hunt TK. Transmural gut oxygen gradients in shocked rats resuscitated with heparan. Arch Surg 130: 59–63, 1995.
45. Zheng L, Golub AS, and Pittman RN. Determination of PO2 and its heterogeneity in single capillaries. Am J Physiol Heart Circ Physiol 271: H365–H372, 1996.
46. Zuurbier CJ, van Iterson M, and Ince C. Functional heterogeneity of oxygen supply-consumption ratio in the heart. Cardiovasc Res 44: 488–497, 1999.


Chapter 4
Dual-Wavelength Phosphorimetry for Determination
of Cortical and Subcortical Microvascular Oxygenation in Rat Kidney
T. Johannes, E.G. Mik and C. Ince
Journal of Applied Physiology 100: 1301-1310, 2006

CHAPTER 4
54
ABSTRACT This study presents a dual-wavelength phosphorimeter developed to measure microvascular PO2 (µPO2) in different depths in tissue and demonstrates its use in rat kidney. The used phosphorescent dye is Oxyphor G2 with excitation bands at 440 and 632 nm. The broad spectral gap between the excitation bands combined with a relatively low light absorption of 632 nm light by tissue results in a marked difference in penetration depths of both excitation wavelengths. In rat kidney, we determine the catchments depth of the 440-nm excitation to be 700 µm, whereas the catchments depth of 632 nm is as much as 4 mm. Therefore, the measurements differentiate between cortex and outer medulla, respectively. In vitro, no difference in PO2 readings between both channels was found. On the rat kidney in vivo, the measured cortical µPO2 was on average 20 Torr higher than the medullary µPO2 over a wide PO2 range induced by variations in inspired oxygen fraction. Examples provided from endotoxemia and resuscitation show differences in responses of mean cortical and medullary PO2 readings as well as in the shape of the PO2 histograms. It can be concluded that oxygen-dependent quenching of phosphorescence of Oxyphor G2 allows quantitative measurement of µPO2 noninvasively in two different depths in vivo. Oxygen levels measured by this technique in the rat renal cortex and outer medulla are consistent with previously published values detected by Clark-type oxygen electrodes. Dualwavelength phosphorimetry is excellently suited for monitoring µPO2 changes in two different anatomical layers under pathophysiological conditions with the characteristics of providing oxygen histograms from two depths and having a penetration depth of several millimeters. INTRODUCTION Due to limitations in available technical methods, not much is known about the distribution of tissue oxygenation within different organs. The oxygen-dependent quenching of Pd-porphyrin phosphorescence first introduced by Wilson and coworkers in 1987 (29) gives the unique possibility to quantitatively determine oxygen pressures within living tissues in a nondestructive way. Oxygen detection by this method includes measurements in intravital microscopy (24) up to fiber-based measurements on organ surfaces like the heart (30, 38), brain (36), gut (25, 28), or kidney (17) in animal models.
Pd-meso-tetra-(4-carboxyphenyl)-tetrabenzoporphyrin (Oxyphor G2) is a relatively new phosphor that is excellently suited for oxygen measurements in vivo (5). It is highly soluble in blood plasma, where it binds to albumin and confines to the circulation, as demonstrated recently for Oxyphor R2 in rat skeletal muscle (18). Oxyphor G2 has its absorptions maxima at 440 and 632 nm and its emission near 800 nm. The excitation wavelength of 632 nm combined with emission in the infrared spectrum allows much deeper tissue penetration than could be achieved with the most widely used phosphor to date, Pd-porphyrin [Pd-meso-tetra(4-carboxyphenyl)porphine]. A very recent example of the usability of Oxyphor G2 has been the measurement of the distribution of microvascular oxygen pressures in solid tumors by Wilson and coworkers (37).
Although the measurement of the distribution of microvascular oxygen pressures is a powerful means to gain insight into the heterogeneity in oxygen levels within a tissue or organ, we recently argued that the interpretation can be quite difficult (16). Especially in tissues with different anatomical layers, one can never be sure whether the found distribution reflects heterogeneity in microvascular PO2 (µPO2) within a layer or a difference in oxygenation between the two anatomical layers. Additional information could then be retrieved from measurements from different depths. A convenient way to do this is by using different excitation wavelengths (35). Other than the deeper penetration depth, another advantage of Oxyphor G2 is the huge spectral difference in excitation wavelengths. Considering the fact that 440-nm light in contrast to 632-nm light is highly absorbed by tissue, this would allow excellent discrimination between superficial and deeper tissue layers. Although the idea of using different wavelengths for obtaining information from different tissue depths in itself is not new (21, 35), it has not been applied for continuous and simultaneous monitoring of µPO2 at different tissue depths. If

DUAL-‐WAVELENGTH PHOSPHORIMETRY
55
feasible, it could provide a very useful extension to the already powerful method of oxygen-dependent quenching of phosphorescence.
To profit from the above-mentioned possibilities, we designed and constructed a dual-wavelength phosphorimeter. The hypothesis was that application of this phosphorimeter in combination with Oxyphor G2 would allow the measurement of µPO2 in two different depths. This study was designed to validate and show the feasibility of dual-wavelength phosphorimetry to examine changes in oxygenation in two different anatomical layers: the kidney cortex and medulla. Therefore, four steps were undertaken. First, we developed a dual-wavelength phosphorimeter that allows exciting Oxyphor G2 at 440 and 632 nm near simultaneously. Second, in vitro calibration experiments were done to exclude hardware-induced inter-channel differences. Third, the real penetration depth of both excitation channels was determined by ex vivo experiments in rat kidneys. Fourth, for evaluation of the accuracy of the oxygen measurements in vivo, experiments in rats were carried out in which the fractional inspired oxygen concentration (FiO2) was stepwise reduced. Finally, to demonstrate the usability of this method to detect changes in µPO2 in a pathophysiological relevant setting, we report on cortical and medullar PO2 values and oxygen distributions in rats during endotoxemia and resuscitation. MATERIALS AND METHODS Phosphorescence lifetime measurements. Oxygen-dependent quenching of phosphorescence allows the nondestructive detection of changes in µPO2. Oxyphor G2 [Pd-meso-tetra-(4-carboxyphenyl)-tetrabenzoporphyrin; Oxygen Enterprises, Philadelphia, PA] is a water-soluble phosphorescent dye that binds to albumin. Oxyphor G2 is a large molecule (2.4 kDa), has a strong negative charge, and therefore stays primarily in the microcirculation (18, 37). When excited by a light pulse, the phosphorescence (~800 nm) intensity decreases at a rate dependent on the surrounding oxygen pressure. The relationship between the measured decay time and the PO2 is given by the Stern-Volmer relation:
!
PO2 =
1"#
1"0
kq
(1)
where τ is the measured decay time, τ0 is the decay time at an oxygen pressure of zero and kq is the quenching constant.
Equation 1 describes the relationship between the PO2 and the phosphorescence lifetime in case of a homogeneous oxygen distribution. However, large nonuniformities in oxygen pressure exist in vivo, resulting in a phosphorescence signal that in general can be described by an integral over an exponential kernel (6, 32, 33).
!
y(t) = exp("#t) f (#)0
t
$ (2)
where f(λ) denotes the spectrum of reciprocal lifetimes that should be determined from the finite data set y(t). Several different approaches for retrieving information about the spectrum f(λ) in the case of phosphorescence lifetime measurements have been described (6, 32, 33). In this paper, we use the approach published by Golub et al. (6) in which the heterogeneity in oxygen pressure is analyzed by fitting distributions of quencher concentration to the phosphorescence data. According to their work, the fitting function for a simple rectangular distribution with a mean PO2 Qm and a PO2 range from Qm – δ to Qm + δ is
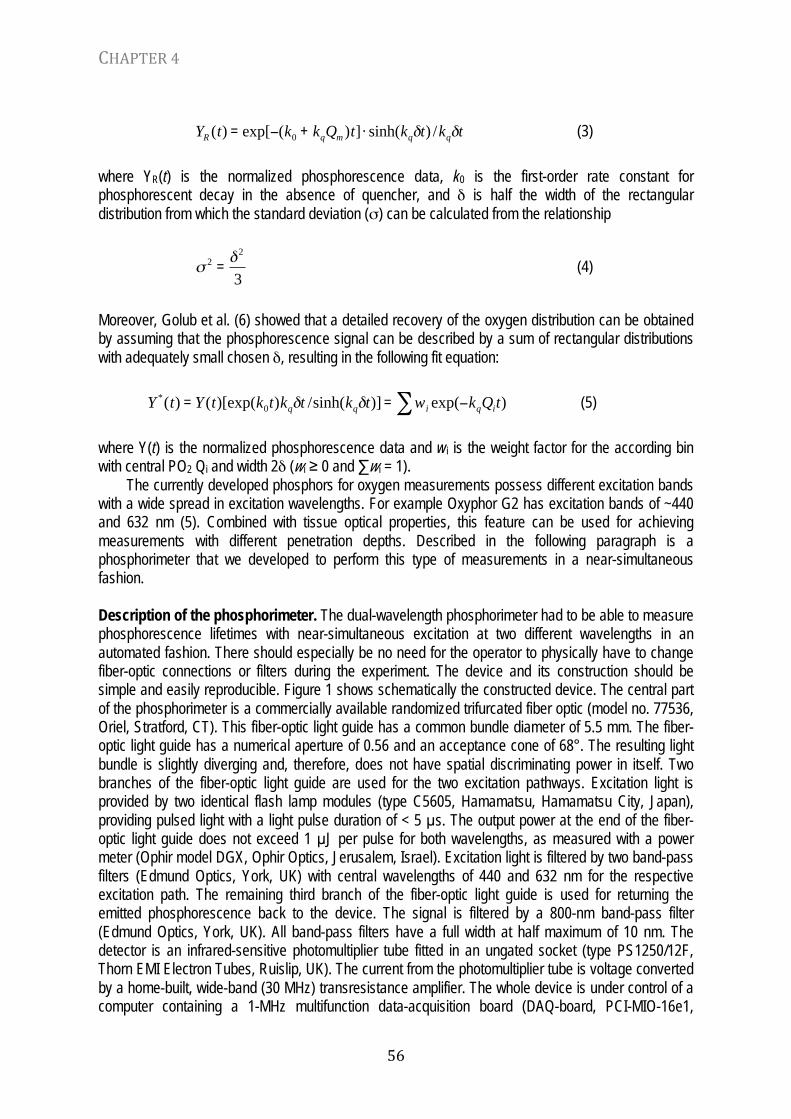
CHAPTER 4
56
!
YR (t) = exp["(k0 + kqQm )t] # sinh(kq$t) /kq$t (3)
where YR(t) is the normalized phosphorescence data, k0 is the first-order rate constant for phosphorescent decay in the absence of quencher, and δ is half the width of the rectangular distribution from which the standard deviation (σ) can be calculated from the relationship
!
" 2 =# 2
3 (4)
Moreover, Golub et al. (6) showed that a detailed recovery of the oxygen distribution can be obtained by assuming that the phosphorescence signal can be described by a sum of rectangular distributions with adequately small chosen δ, resulting in the following fit equation:
!
Y *(t) = Y (t)[exp(k0t)kq"t /sinh(kq"t)] = wi exp(#kqQit)$ (5)
where Y(t) is the normalized phosphorescence data and wi is the weight factor for the according bin with central PO2 Qi and width 2δ (wi ≥ 0 and ∑wi = 1).
The currently developed phosphors for oxygen measurements possess different excitation bands with a wide spread in excitation wavelengths. For example Oxyphor G2 has excitation bands of ~440 and 632 nm (5). Combined with tissue optical properties, this feature can be used for achieving measurements with different penetration depths. Described in the following paragraph is a phosphorimeter that we developed to perform this type of measurements in a near-simultaneous fashion. Description of the phosphorimeter. The dual-wavelength phosphorimeter had to be able to measure phosphorescence lifetimes with near-simultaneous excitation at two different wavelengths in an automated fashion. There should especially be no need for the operator to physically have to change fiber-optic connections or filters during the experiment. The device and its construction should be simple and easily reproducible. Figure 1 shows schematically the constructed device. The central part of the phosphorimeter is a commercially available randomized trifurcated fiber optic (model no. 77536, Oriel, Stratford, CT). This fiber-optic light guide has a common bundle diameter of 5.5 mm. The fiber-optic light guide has a numerical aperture of 0.56 and an acceptance cone of 68°. The resulting light bundle is slightly diverging and, therefore, does not have spatial discriminating power in itself. Two branches of the fiber-optic light guide are used for the two excitation pathways. Excitation light is provided by two identical flash lamp modules (type C5605, Hamamatsu, Hamamatsu City, Japan), providing pulsed light with a light pulse duration of < 5 µs. The output power at the end of the fiber-optic light guide does not exceed 1 µJ per pulse for both wavelengths, as measured with a power meter (Ophir model DGX, Ophir Optics, Jerusalem, Israel). Excitation light is filtered by two band-pass filters (Edmund Optics, York, UK) with central wavelengths of 440 and 632 nm for the respective excitation path. The remaining third branch of the fiber-optic light guide is used for returning the emitted phosphorescence back to the device. The signal is filtered by a 800-nm band-pass filter (Edmund Optics, York, UK). All band-pass filters have a full width at half maximum of 10 nm. The detector is an infrared-sensitive photomultiplier tube fitted in an ungated socket (type PS1250/12F, Thorn EMI Electron Tubes, Ruislip, UK). The current from the photomultiplier tube is voltage converted by a home-built, wide-band (30 MHz) transresistance amplifier. The whole device is under control of a computer containing a 1-MHz multifunction data-acquisition board (DAQ-board, PCI-MIO-16e1,

DUAL-‐WAVELENGTH PHOSPHORIMETRY
57
National Instruments, Austin, TX). The data-acquisition board controls the triggers to the flashlamps and samples the phosphorescence signal with a sampling frequency of 1 MHz. The trigger pulse that triggers the flashlamp is internally directed to the data-acquisition clock (the used DAQ-board allows for this), meaning that data acquisition is started at the rising flank of this trigger pulse. A short delay of 3 µs exists before the flashlamp is actually fired. The resulting three data points without signal are omitted from the analysis. The used flashlamp units have a very stable time delay and moreover show only a time jitter of < 300 ns between the triggering and the flash occurrence. For our purposes, we regard this as insignificant, and therefore we allowed ourselves to omit the optical trigger feedback system used in our laboratory’s previously described phosphorimeter (15). To improve signal-to-noise ratio, the average signal of 50 flashes is used for analysis. The flashlamps fire with a frequency of 50 Hz, so the duration of one measurement on one wavelength is 1 s. The acquisition of the 632-nm excitation is started immediately after the acquisition of the 440-nm excitation has finished, so no more than a 1-s time interval exists between the two measurements. Before phosphorescence lifetime analysis, the adverse effect of the excitation pulse shape was removed using excitation pulse deconvolution, of which the details can be found in a previous study (15). For the excitation pulse deconvolution, both the blue and red backscattered flashlamp signals were recorded from the kidney before infusion of Oxyphor G2 into the animal. This results in a correction for a difference in flashlamp profile at 440 and 632 nm and also corrects for aging of the flashlamp. The phosphorescence lifetime analysis was performed by nonlinear monoexponential fitting (Eq. 1), nonlinear fitting of the rectangular distribution (Eq. 3), and the PO2 histogram recovery method from Eq. 5. Analysis software for the monoexponential and rectangular distribution fit procedures was written in LabView (version 6.1, National Instruments, Austin, TX). The PO2 histogram recovery was performed with GraphPad Prism (version 4, GraphPad Software, San Diego, CA) using a nonlinear fit procedure with constrained parameters (wi ≥ 0). FIGURE 1 Schematic drawing of the dual-wavelength phosphorimeter. A detailed description can be found in MATERIALS AND METHODS. BP1, BP2, and BP3 are band-pass filters with the shown central wavelength. L1, L2, and L3 are coupling lenses. PMT is an infrared sensitive photomultiplier tube, I/V CONV AMP is a wide-band current-to-voltage converting amplifier, and DAQ-board is a 12-bit data-acquisition board. The optical fiber is a randomly distributed trifurcated fiber-optic light guide.

CHAPTER 4
58
In vitro calibration. In vitro calibrations were performed in a bicarbonate buffer containing 2% bovine serum albumin (Sigma, St. Louis, MO) and a final concentration of 10 µM Oxyphor G2. PO2 values were regulated using a system consisting of gas-flow controllers, an oxygenator, and a closed-loop recirculation system. A detailed description of this system can be found in a previous publication (16). Experiments were performed at 37°C. The pH value of the solution was checked during the experiments and remained at 7.4 ± 0.1. Ex vivo penetration depths experiments. To demonstrate that exciting Oxyphor G2 at 440 and 632 nm results in PO2 reading from different tissue layers in the rat kidney and can ultimately be used to gain information from the cortex and medulla, respectively, experiments were performed ex vivo. The idea was to determine the actual capability of exciting the phosphor at a certain depth for both wavelengths by placing slices of kidney tissue between the fiber-optic light guide and an Oxyphor G2-containing chamber. To this end, the vessels close to the hilus of the rat kidney were ligated, and the kidney was removed directly after the animal died. Either 500- or 1000-µm longitudinal kidney slices were made by using a razor blade-like cutting device. For measurements of the penetration depth of the two different wavelengths (440 and 632 nm), a slice of kidney tissue was placed on top of a chamber filled with Oxyphor G2 (50 µM concentration in a 4% albumin solution). Zero-oxygen conditions within the chamber were created by an enzymatic oxygen removal by using ascorbate-oxidase and ascorbic acid (13). The experiments were performed at room temperature. The kidney slices were placed on top of each other following the anatomy from cortex toward the medulla. The actual thickness of the total reconstructed tissue was always measured using a micrometer. Phosphorescence returning through the kidney tissue after excitation with either 440 or 632 nm was measured for each additional piled-up slice to a total thickness of 5 mm. To take into account the fact that the kidney slices contained no phosphor that would clearly contribute to the overall absorption, the extinction coefficient of Oxyphor G2 at 440, 632, and 800 nm was measured using a Specord UV VIS S10 absorption meter (Carl Zeiss, Oberkochen, Germany). The measured extinction coefficients were used to calculate estimations of additional attenuation of the overall signal due to the presence of the phosphor using Beer’s law:
!
I(d) = I0 " exp(#µt z)
!
z = a " d
!
a >1.0 (6)
where I(d) is the remaining signal at depth d, I0 is the signal without attenuation, µ t is the extinction coefficient, and z is the actual path length traveled by the light. Because of multiple scattering in tissue, z is several times longer than d. Animal preparation for in vivo experiments. The experiments of this study were approved by the ethical committee for animal subjects of the Academic Medical Center at the University of Amsterdam. Care and handling of the animals were in accordance with the guidelines for Institutional and Animal Care and Use Committees. The measurements were performed in seven Wistar male rats (Charles River) with a body weight of 357 ± 35 g (mean ± SD).
Rats were anesthetized, mechanically ventilated, and monitored as described recently by our group (20). In short, induction of anesthesia was performed by intraperitoneal injection of a mixture of ketamine (90 mg/kg, Nimatek, Eurovet, Bladel, The Netherlands), medetomidine (0.5 mg/kg, Domitor, Pfizer, Capelle a/d Ijssel, The Netherlands), and atropine (0.05 mg/kg, Centrafarm, Ettenleur, The Netherlands), and anesthesia was maintained by continuous intravenous infusion of ketamine (50 mg•kg-1•h-1). To compensate for fluid loss, Ringer lactate (Freeflex, Fresenius Kabi, The Netherlands) was administered continuously at a rate of 15 ml•kg-1•h-1. Kidney preparation was performed via a 3-cm incision of the left flank. The kidney was exposed, decapsulated, and immobilized in a Lucite kidney cup (K. Effenberger, Geraetebau, Pfaffing, Germany), a perivascular flow probe (type 0.7 mm

DUAL-‐WAVELENGTH PHOSPHORIMETRY
59
V-Series, Transonic Systems, Ithaca, NY) was placed around the left renal artery and connected to a flowmeter (T206; Transonic Systems). Throughout the entire experiment, the operation field was covered with Saran wrap (Downbrands) to prevent evaporation of body fluids. The temperature of the kidney surface was measured and kept at ~37°C.
After surgery, the fiber-optic light guide for phosphorescence lifetime measurements was placed 1 mm above decapsulated kidney surface, and a 15-min intravenous infusion of Oxyphor G2 (1.2 ml/kg of a 5 mg/ml stock solution) was started. After a stabilization time of 50 min, the renal µPO2 was continuously measured during the entire experiment. In vivo feasibility testing. For testing the reproducibility of renal oxygen measurements over a wide range of different PO2 in five animals, the FiO2 was reduced in three steps from 1.0 to 0.1. Changes in FiO2 have previously been shown to be an effective means to change µPO2 values (19). Each step comprised an equilibration time of 10 min. In vivo experiment during lipopolysaccharide bolus injection. It is well known that lipopolysac-charide (LPS) infusion leads to marked reduction in blood flow to the kidney and possibly to redistribution of flow from cortex to medulla (8, 9). To test the relevance of simultaneous measurements in two different depths, we studied the response of cortical and medullary PO2 in a rat receiving an intravenous bolus injection of LPS (20 mg/kg; serotype 0127:B8, Sigma) to induce septic shock. In vivo experiment during fluid resuscitation. For demonstration of the time course of the oxygen measurements under clinically relevant conditions, one rat received fluid resuscitation with 200-kDa hydroxyethyl starch (HAES-steril 6%, 20 ml/h, Fresenius Kabi, The Netherlands) directly after a 1-h intravenous LPS infusion was stopped (15 ml•kg-1•h-1; serotype 0127:B8, Sigma). Data analysis. Labview 6.1 (National Instruments, Austin, TX) was used to develop a software environment to allow data acquisition and analysis of the phosphorescence decay curves. Oxygen histograms were analyzed using the GraphPad Prism package (version 4, GraphPad Software, San Diego, CA). Values are presented as means ± SD, unless otherwise indicated.
FIGURE 2 Calibration of both channels. Shown is the reciprocal lifetime v.s the applied PO2. ■ Blue channel exciting at 440 nm ▲ Red channel exciting at 632 nm. The solid line is calculated from the determined quenching constants kq = 270 mmHg-1 s-1 and t0 = 240 µs.

CHAPTER 4
60
RESULTS Figure 2 shows the results of the in vitro calibrations performed in a 10 µM Oxyphor G2 solution. An excellent correlation between the reciprocal lifetime and PO2 was found for both channels measuring at different excitation wavelengths. Moreover, over the physiological oxygen range, no significant differences in lifetime readings in both channels were found. The determined calibration constants were kq = 270 mmHg-1s-1 and τ0 = 240 µs, which are in good agreement with previous reported values (5).
The next step was to get a reasonable estimation of the real measurement depths that could be achieved with our device in the rat kidney. This was performed by measuring the phosphorescence intensity as a function of amount of attenuating kidney tissue between the fiber-optic light guide and an Oxyphor G2 containing chamber. Pulsed excitation of either 440 or 632 nm was able to cause phosphorescence emission while penetrating the different slices of rat kidney tissue (Fig. 3). By using excitation light of 440 nm already, 90% of the phosphorescence signal vanished after placing the first kidney slice between the Oxyphor G2-containing chamber and the fiber optics. No significant phosphorescence could be measured after the tissue reached a thickness of 1000 µm. In contrast, excitation with near-infrared light of 632 nm allowed a much deeper penetration. The phosphorescence derived from those measurements could be easily detected to a depth of 4000 µm of kidney tissue. From the area under the curve, it can be seen that at least 50% of the total signal comes from a depth of more than 800 µm and 25–30% comes from tissue deeper than 1500 µm.
FIGURE 3 A: phosphorescence emission intensity, normalized to the maximum value, vs. the penetration depth (in µm). Solid line represents the phosphorescence intensity after pulsed excitation with 632 nm, and the broken line represents the phosphorescence intensity after excitation with 440 nm. Inset: rat kidney slice next to a millimeter scale. B: calculated additional effects of Oxyphor G2 on the attenuation of the signal measured in A. Parameter a denotes the multiplication factor of the tissue depth used in Eq. 6.
Although the experiment described above clearly demonstrates the difference in penetration
depth of the two wavelengths, it provides only a rough estimation of the penetration depth under measurement circumstances and no true quantitative determination. This is because the kidney slices
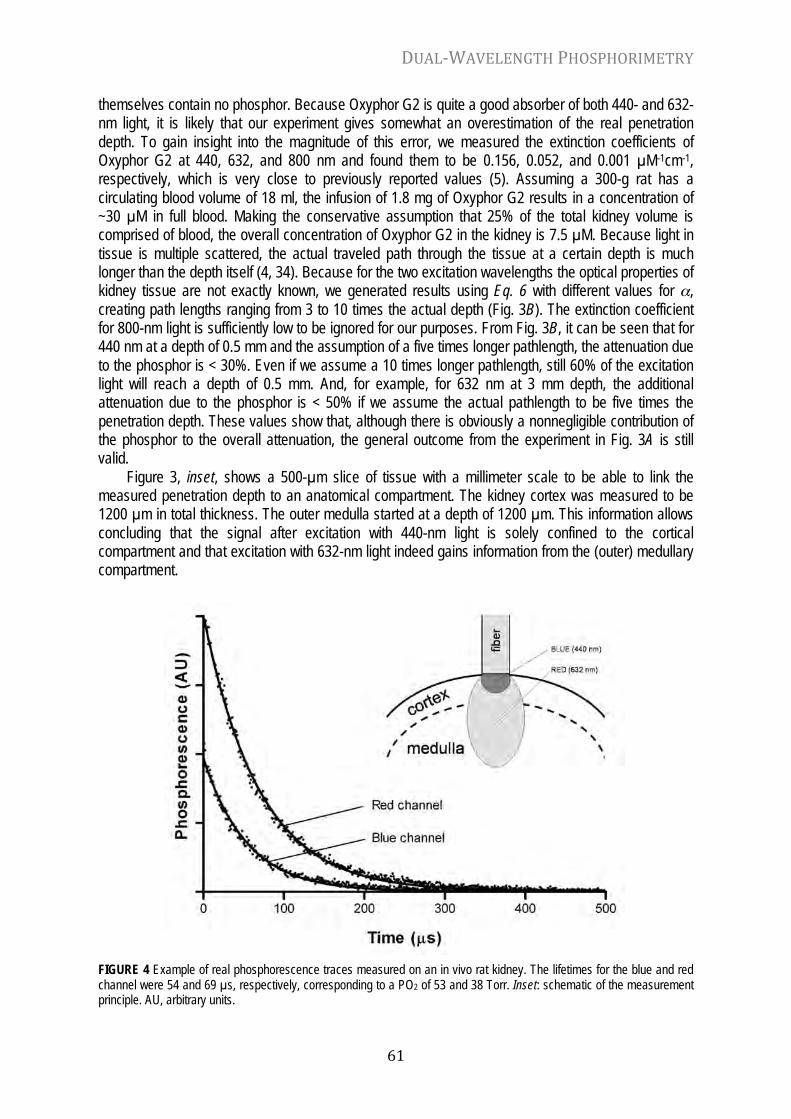
DUAL-‐WAVELENGTH PHOSPHORIMETRY
61
themselves contain no phosphor. Because Oxyphor G2 is quite a good absorber of both 440- and 632-nm light, it is likely that our experiment gives somewhat an overestimation of the real penetration depth. To gain insight into the magnitude of this error, we measured the extinction coefficients of Oxyphor G2 at 440, 632, and 800 nm and found them to be 0.156, 0.052, and 0.001 µM-1cm-1, respectively, which is very close to previously reported values (5). Assuming a 300-g rat has a circulating blood volume of 18 ml, the infusion of 1.8 mg of Oxyphor G2 results in a concentration of ~30 µM in full blood. Making the conservative assumption that 25% of the total kidney volume is comprised of blood, the overall concentration of Oxyphor G2 in the kidney is 7.5 µM. Because light in tissue is multiple scattered, the actual traveled path through the tissue at a certain depth is much longer than the depth itself (4, 34). Because for the two excitation wavelengths the optical properties of kidney tissue are not exactly known, we generated results using Eq. 6 with different values for α, creating path lengths ranging from 3 to 10 times the actual depth (Fig. 3B). The extinction coefficient for 800-nm light is sufficiently low to be ignored for our purposes. From Fig. 3B, it can be seen that for 440 nm at a depth of 0.5 mm and the assumption of a five times longer pathlength, the attenuation due to the phosphor is < 30%. Even if we assume a 10 times longer pathlength, still 60% of the excitation light will reach a depth of 0.5 mm. And, for example, for 632 nm at 3 mm depth, the additional attenuation due to the phosphor is < 50% if we assume the actual pathlength to be five times the penetration depth. These values show that, although there is obviously a nonnegligible contribution of the phosphor to the overall attenuation, the general outcome from the experiment in Fig. 3A is still valid.
Figure 3, inset, shows a 500-µm slice of tissue with a millimeter scale to be able to link the measured penetration depth to an anatomical compartment. The kidney cortex was measured to be 1200 µm in total thickness. The outer medulla started at a depth of 1200 µm. This information allows concluding that the signal after excitation with 440-nm light is solely confined to the cortical compartment and that excitation with 632-nm light indeed gains information from the (outer) medullary compartment.
FIGURE 4 Example of real phosphorescence traces measured on an in vivo rat kidney. The lifetimes for the blue and red channel were 54 and 69 µs, respectively, corresponding to a PO2 of 53 and 38 Torr. Inset: schematic of the measurement principle. AU, arbitrary units.

CHAPTER 4
62
After the in vitro and ex vivo experiments, the dual-wavelength device was tested in vivo. Figure 4 shows a cartoon of the principle behind the measurement and examples of real phosphorescence traces measured in an anesthetized rat. Clearly, a difference in signal can be seen in lifetime as well as in overall phosphorescence intensity. The solid line is the resulting monoexponential fit. The lifetimes in this example are τ = 54 and 69 µs for the blue and red channels, respectively. The corresponding PO2 readings are 53 and 38 Torr, indicating that indeed two different compartments were measured. Moreover, although the efficiency of excitation with 632-nm light is much lower than with 440-nm light (5), the phosphorescence yield in vivo appears to be much higher. Although this can partly be explained by the fact that a lower PO2 results in more phosphorescence yield, it is more likely that it indicates a much larger excitation volume in the case of the red channel. The fact that both channels are measuring different physical volumes is also underscored by the observation that, under certain experimental circumstances, the cortical µPO2 reading drops below the medullary µPO2. For example, application of the mitochondrial uncoupler carbonyl cyanide trifluoromethoxyphenyl-hydrazone (a single drop of a 10 mM stock solution) to the kidney surface led to a rapid decline in cortical µPO2 (higher oxygen consumption) and a much slower decline in medullary µPO2. Over 25 min, the cortical µPO2 dropped from 60 to 15 Torr, whereas the medullary µPO2 dropped from 45 to 30 Torr.
To test whether photochemical oxygen consumption influenced the PO2 reading in vivo, we changed the repetition frequency of the flashlamps from 50 to 10 Hz. No significant difference in PO2 reading could be observed, indicating that photochemical oxygen consumption does not interfere with our measurements.
FIGURE 5 A: stepwise reduction in inspired oxygen fraction (FiO2) resulted in a decline in cortical (solid bars) and medullary (shaded bars) microvascular PO2 (µPO2). B: table showing differences in results of 2 distinct fit models on the same phosphorescence data. Data are presented as means ± SD; n = 5. σ, Standard deviation.

DUAL-‐WAVELENGTH PHOSPHORIMETRY
63
To test the dual-wavelength technique in vivo and to evaluate the different fitting models, the device was used in a simple experimental model in which the oxygenation of the rat kidney tissue was changed by reducing FiO2 stepwise from 1.0 to 0.1. The results of the monoexponential and rectangular distribution fit procedures are given in Fig. 5. Figure 5A shows a bar diagram of the mean cortical and mean medullar PO2 resulting from the rectangular distribution fit. During ventilation with 100% oxygen, the mean µPO2 of the cortex was 97 ± 10 Torr and the mean PO2 of the medulla was 68 ± 6 Torr. During ventilation with an FiO2 of 0.4, the average cortical oxygenation was 88 ± 7 Torr and the average medullary PO2 was 59 ± 4 Torr. Ventilation with room air (21% oxygen) resulted in a mean PO2 of 61 ± 9 Torr in the cortex and a mean PO2 of 39 ± 5 Torr in the medulla. During hypoxia (FiO2 = 0.1), the cortical oxygenation decreased to a mean PO2 of 33 ± 7 Torr and the medullary mean PO2 was 15 ± 2 Torr. The experiments were performed in n = 5 rats. Oxygen tensions of the rat cortex and medulla during stepwise reduction in FiO2 compare well with reported PO2 values in previous studies using invasive Clark-type oxygen electrodes (1, 14, 22).
Figure 5B shows the existence of a considerable difference in results of the monoexponential fit procedure compared with the fit of the rectangular distribution. This denotes the presence of significant heterogeneity in oxygen pressure and also shows the tendency of the monoexponential fit procedure to bias toward low oxygen pressures, i.e., long lifetimes (6). This heterogeneity is also reflected in the values for the standard deviation (σ). It is very interesting to see how the mean PO2 values and estimated standard deviations determined by the rectangular distribution fit correspond to the PO2 histograms recovered using Eq. 5. Figure 6 shows the PO2 histograms of FiO2 variations in one rat. The width of the bins was chosen to be 15 Torr so that 10 bins covered the PO2 region from 0 to 150 Torr. From each stable period after an FiO2 step, seven histograms were calculated. Each presented histogram contains the means and standard deviations of these seven histograms. The signal-to-noise ratio of both channels was well above 20, and the histogram recovery was remarkably reproducible, corresponding very well to the results obtained in computer simulations (6). From direct comparison with Fig. 5B, it is clear that the rectangular distribution fit gives adequate mean PO2 values and that the values for σ give a good indication for the underlying heterogeneity. The monoexponential fit indeed has the tendency to report too-low values for the average PO2 and moreover gives no indication of heterogeneity at all. The histogram recovery, however, gives most detailed information. For example, the rectangular distribution fit gives a mean cortical PO2 of 33 Torr when the FiO2 is 0.1, whereas from the PO2 histogram it is clear that a large part of the measurement volume has a PO2 below 15 Torr.
FIGURE 6 Histograms showing oxygen distributions in the cortex (top) and outer medulla (bottom) of the rat kidney for 4 different FiO2.

CHAPTER 4
64
The changes in FiO2 caused a more or less parallel drop in PO2 values for both cortex and medulla, as was expected. Therefore, the true value of the technique is better demonstrated in a model in which the response is less predictable. Figure 7A shows the response of a rat to a bolus injection of 20 mg/kg LPS. The solid line is a running average of the measurement values. Both cortical and medullary PO2 values decline, but the time course of the events is completely different. The mean medullary PO2 drops acutely after the bolus LPS, whereas the mean cortical PO2 shows a much slower decline. Figure 7C shows PO2 histograms calculated at the time points corresponding to numbers 1–3 in Fig. 7A. From the PO2 histograms in Fig. 7C, it can be seen that the acute drop in mean PO2 at the medullary level is due to a homogeneous low PO2 value since 90% of the signal corresponds to lifetimes from PO2 values below 15 Torr. At the same time point after LPS infusion, the cortical PO2 is highly heterogeneous with a large fraction of low PO2 values that was not existent before the bolus LPS. The shown rat is a typical example of a small study performed in six rats that was reported elsewhere (12).
FIGURE 7 Examples of cortical and medullary PO2 (cµPO2 and mµPO2, respectively) readings in different pathophysio-logical circumstances. A: effect of a bolus of 20 mg/kg LPS on the mean cµPO2 and mµPO2 values. The time point of injection is denoted by the arrow. B: differing responses of mean cµPO2 and mµPO2 on resuscitation after a 1-h continuous LPS infusion (15 mg/kg) was stopped. Start of resuscitation and termination of the experiment by injection of 1 ml of 3 M KCl are denoted by the arrows. C: oxygen histograms corresponding to A. Histogram 1c corresponds to the cortical signal at indicated time point 1, histogram 1m to the medullary signal, and so on. Data were calculated for 3 different time points (1–3). D: oxygen histograms corresponding to B. The labeling is according to the same systematic as in C.
Another example of a different pattern in cortical and medullary PO2 responses to an intervention is given in Fig. 7, B and D. This example shows the response during fluid resuscitation with a starch solution (HES 200; rate: 20 ml/h) after stop of a 1-h continuous infusion of 15 mg/kg LPS. Resuscitation has an initial beneficial effect on both mean cortical and medullary PO2 values (Fig. 7B). However, after a short time, the mean cortical PO2 value declines rapidly to become almost equal to the medullary PO2. The PO2 histograms in Fig. 7D show us in more detail what happens. In the medulla, the infusion of LPS induced a fraction with very low PO2 values that is substantially reduced following resuscitation. In the cortex, however, resuscitation appears to have the opposite effect. Here, the fluid resuscitation actually induces a fraction with very low PO2 values, explaining the decline in
DUAL-‐WAVELENGTH PHOSPHORIMETRY
65
mean cortical PO2. These last two examples clearly demonstrate the additional information that can be gained from PO2 readings at different depths. DISCUSSION This study shows for the first time the use of a dual-wavelength phosphorimeter to detect changes in oxygenation in two different depths in the rat kidney by oxygen-dependent quenching of phosphorescence of Oxyphor G2. The main findings of this study are that 1) excitation of Oxyphor G2 in vitro at 440 and 632 nm results in the same calibration constants and the same PO2 reading in each channel; 2) excitation light of 440 nm penetrates the kidney tissue 700 µm, whereas excitation light of 632 nm penetrates up to 4000 µm of tissue; 3) in contrast to the in vitro situation, placing the detection fiber-optic light guide on a kidney in vivo results in different PO2 readings, with the deeper PO2 value generally being less than the superficial PO2; 4) the dual-wavelength device is able to record PO2 values over a wide oxygen range in vivo, giving values similar to those reported by oxygen electrode measurements; and 5) this method is suitable to detect differences in responses in the cortical and outer medullary microvascular oxygenation in different pathophysiologically relevant models.
To detect reliable heterogeneity in PO2 levels in the depth, it is obvious that in a homogeneous in vitro situation no differences in PO2 readings over the physiological relevant PO2 range should exist. It is already known that different excitation wavelengths per se do not cause differences in phosphorescence lifetime readings in Oxyphor G2 (5). Also, the excitation pulse deconvolution algorithm (15) should cancel out differences in measured lifetimes caused by variation in flashlamp decays. Our calibration experiment shows indeed that over a wide oxygen range no differences in PO2 readings in both channels exist. For the in vivo situation with heterogeneous µPO2 values, the rectangular distribution fit is clearly preferable over the monoexponential fit procedure because it lacks the tendency to bias toward low PO2 values and provides an indication of the level of heterogeneity. Furthermore, the PO2 histogram recovery method suggested by Golub et al. (6) appeared to be easy to implement and very robust with the signal-to-noise ratios achieved with our phosphorimeter. An alternative method would have been the maximum entropy method (33). The latter method allows the recovery of even more detailed PO2 histograms, but this comes at the expense of longer computation times (especially in the time domain), and it requires fairly high signal-to-noise ratios (33). The PO2 histogram recovery method reveals details that otherwise remain unseen. For example, in Fig. 6, some small contributions of high PO2 regions can be seen even at an FiO2 of 0.1. Because some PO2 values are higher than the possible arterial PO2, these values probably are the result of oxygen diffusion from air into the outer surface of the kidney or caused by small contamination of the kidney surface with Oxyphor G2-containing blood.
In a previous study (25), our laboratory calculated, using Monte-Carlo simulations, that green (520 nm) light results in a catchments depth of ~0.5 mm in gut tissue. For near-infrared Oxyphor G2, a general penetration depth of several centimeters has been claimed (31). In the present study, we made an attempt to determine the catchments depth of the 440 and 632 nm in a direct manner since no sound estimations of the needed tissue optical properties of kidney (i.e., absorption coefficient, scatter coefficient, and anisotropy factor) at the specific wavelengths could be found, preventing Monte-Carlo simulations. We show that 440 nm is limited to a penetration depth of 700 µm and is therefore confined to the kidney cortex. In contrast, the 632-nm light easily reaches 3-mm depth and even excites phosphorescence at a depth of 4 mm, and therefore catchments volume includes the outer medullary region of the rat kidney. A drawback of our kidney-slice experiment is that the kidney slices contained no phosphor that would contribute to a higher overall absorbance and thus lower penetration depth. However, even very conservative assumptions about phosphor concentration and actual pathlength calculations show that the results of the kidney-slice experiment are a very reasonable estimation. This finding is confirmed by the fact that in vivo the red channel reports substantially lower PO2 values than the blue channel. The latter observation is known for the kidney as

CHAPTER 4
66
due to its anatomy; within the kidney, there is a diffusion of oxygen from arterial to venous vasa recta, thus leading to a relatively low PO2 within the renal medulla (1). In the superficial kidney cortex, PO2 ranges from 50 to 70 Torr (2), whereas the medullary PO2 from 10 to 20 Torr (3). These reported values, measured by Clark-type oxygen electrodes in rats (where penetration of the kidney is needed), are similar to our findings with the two-wavelength technique. Deviations (especially in the medullary PO2) may be explained by differences in FiO2, deeper penetration with oxygen electrodes, or even tissue destruction by oxygen electrodes.
Advantages and applications of this technique. The presented method has as its main advantage that it allows continuous and nondisruption measurements of the cortical and outer medullary microvascular oxygenation in the rat kidney. In addition to measurement of lifetime distributions (35, 37), it gives information about the in-depth heterogeneity of µPO2 levels, although not to such a detailed extent as two-photon excitation (16). The given examples in this paper demonstrate that the combination of dual-wavelength phosphorimetry and lifetime deconvolution (retrieval of PO2 histograms) provides a very powerful tool for in vivo oxygen measurements. Compared with oxygen electrodes (1, 14, 22), the obvious advantage is in its nondisruptiveness, which allows monitoring changes in time. In this study, the method allowed us to monitor different behavior in oxygenation in cortex and medulla. Oxygen measurements in the kidney in superficial and deep tissue using a method based on the same principal of using different excitation wavelengths have been reported by Rumsey et al. (21). For imaging of oxygen distributions, they had to inject two different oxygen probes in different rats. Although their PO2 readings were similar to our findings, our technique has the clear advantage of continuous and simultaneous measurements in two different depths. Furthermore, ease of handling and cost effectiveness are advantages of our method over the application of blood oxygenation level-dependent magnetic resonance imaging for the noninvasive detection of changes in intrarenal oxygenation in vivo, reviewed recently by Swartz and Dunn (27). The same counts for electron paramagnetic resonance with magnetic resonance imaging (11) where an additional advantage of our technique is that no injection of relatively large particles is needed (7).
Regarding the above-mentioned advantages, our method can be applied for PO2 readings not only in the kidney but also on different organs like the gut, heart, or skin. This is of special relevance as, for example, in the gut it has been shown that the mucosa responds differently to shock and resuscitation than the serosa (23). The calculation of PO2 histograms adds a certain complexity to the results, and straightforward interpretation of the distribution in terms of anatomical or microcirculatory compartments is not possible. However, the example of resuscitation after a period of endotoxemia clearly shows the additional value compared with only an average µPO2 reading. The increase in medullary µPO2 following resuscitation appears to be the result of only disappearance of very hypoxic regions instead of a right shift of the total histogram, probably indicating recruitment. In contrast, the drop in cortical µPO2 seems to be the result of the appearance of a hypoxic fraction that is actually induced by the treatment. In research concerning optimization of treatment strategies in septic shock, this could prove to be valuable information, since microcirculatory dysfunction is considered to be a major contributor to the pathophysiology of sepsis (10, 25).
Methodological limitations. The use of the near-infrared phosphor Oxyphor G2 allows a deeper penetration into the tissue than the conventional Pd-porphyrin dye. In this study, we could measure oxygenation at a depth of 4 mm in the outer medulla of the rat kidney. Although this is an improvement, this is much less than the originally acclaimed penetration depth of centimeters (31). Apparently in kidney with increasing depth of the measurement, a rapid decline of excitation and emission intensity occurs. For our current application, this means that, although readings of the outer medullary µPO2 can be performed, the inner medulla cannot be reached. Furthermore, in the recording of the deep signal, a substantial part of the total signal is superficial in origin. Nevertheless, our measured values for cortical and medullary PO2 compare well with previously reported values by other groups using oxygen electrodes (14) and are very comparable to the values we found using two-

DUAL-‐WAVELENGTH PHOSPHORIMETRY
67
photon excitation phosphorescence lifetime measurements (16). Moreover, we demonstrate differences in the behavior of cortical and medullary PO2, indicating that the deeper signal is not overwhelmed by the superficial signal. This can also be seen from Fig. 3, where a substantially higher amount of phosphorescence is measured in the red channel, although excitation at 632 nm has lower efficiency than excitation at 440 nm. This also indicates a much larger catchment volume in the case of red excitation. However, since the contribution of the cortex to the medullary signal could be a potential source of error, we will investigate possibilities to improve the presented method either by changing the fiber geometry or by mathematical deconvolution algorithms.
One other general point of concern regarding phosphorescence lifetime measurements in vivo is the issue of phototoxicity. The collision of oxygen with an excited phosphor molecule results in the production of oxygen radials that can potentially harm the tissue under investigation (26). Therefore, the light dose and phosphor concentration used for oxygen measurements should be kept as low as possible. Although we cannot exclude phototoxicity in our application, no macroscopic alterations to the kidney surface are observable after hours of measurement. Moreover, in long-lasting time control experiments, no changes in µPO2 values are observed. Furthermore, it is very unlikely that the excitation light itself influenced the physiological function of the tissue because of the relatively low excitation energy used (<1 µJ per flash). The power density is <0.06 µJ/mm2, and this is in orders of magnitude less than the power density used in, for example, two-photon approaches (16).
Our results demonstrate that oxygen-dependent quenching of phosphorescence of Oxyphor G2 is excellently suited for quantitative µPO2 measurements in two different depths in vivo. Oxygen levels measured in the renal cortex and outer medullary region are consistent with previous reported values detected by oxygen electrodes in the rat kidney. This technique provides a new tool for quantitative measurements of oxygen levels under physiological and pathophysiological conditions with the characteristics of providing spatial information and a penetration depth of several millimeters. GRANTS This study was supported in part by a grant of the fortune program to Tanja Johannes (no. 1168-0-0, Medical Faculty, University of Tuebingen, Tuebingen, Germany). REFERENCES 1. Baumgartl H, Leichtweiss HP, Lubbers DW, Weiss C, and Huland H. The oxygen supply of the dog kidney:
measurements of intrarenal PO2. Microvasc Res 4: 247–257, 1972. 2. Brezis M, Heyman SN, and Epstein FH. Determinants of intrarenal oxygenation. II. Hemodynamic effects. Am J Physiol
Renal Fluid Electrolyte Physiol 267: F1063–F1068, 1994. 3. Brezis M and Rosen S. Hypoxia of the renal medulla—its implications for disease. N Engl J Med 332: 647–655, 1995. 4. Delpy DT, Cope M, van der ZP, Arridge S, Wray S, and Wyatt J. Estimation of optical pathlength through tissue from
direct time of flight measurement. Phys Med Biol 33: 1433–1442, 1988. 5. Dunphy I, Vinogradov SA, and Wilson DF. Oxyphor R2 and G2: phosphors for measuring oxygen by oxygen-dependent
quenching of phosphorescence. Anal Biochem 310: 191–198, 2002. 6. Golub AS, Popel AS, Zheng L, and Pittman RN. Analysis of phosphorescence in heterogeneous systems using
distributions of quencher concentration. Biophys J 73: 452–465, 1997. 7. Grinberg OY, Smirnov AI, and Swartz HM. High spatial resolution multi-site EPR oximetry. The use of convolution-
based fitting method. J Magn Reson 152: 247–258, 2001. 8. Gullichsen E, Nelimarkka O, Halkola L, and Niinikoski J. Renal oxygenation in endotoxin shock in dogs. Crit Care Med
17: 547–550, 1989. 9. Heyman SN, Darmon D, Goldfarb M, Bitz H, Shina A, Rosen S, and Brezis M. Endotoxin-induced renal failure. I. A role
for altered renal microcirculation. Exp Nephrol 8: 266–274, 2000. 10. Ince C. The microcirculation is the motor of sepsis. Crit Care 9, Suppl 4: 13–19, 2005. 11. James PE, Bacic G, Grinberg OY, Goda F, Dunn JF, Jackson SK, and Swartz HM. Endotoxin induced changes in
intrarenal PO2, measured by in vivo electron paramagnetic resonance oximetry and magnetic resonance imaging. Free Radic Biol Med 21: 25–34, 1996.

CHAPTER 4
68
12. Johannes T, Mik EG, Nohe B, and Ince C. Measurement of renal microvascular PO2 by using a dual wavelength phosphorimeter. J Vasc Res 41: 462, 2004.
13. Lo LW, Koch CJ, and Wilson DF. Calibration of oxygen-dependent quenching of the phosphorescence of Pd-meso-tetra (4-carboxyphenyl) porphine: a phosphor with general application for measuring oxygen concentration in biological systems. Anal Biochem 236: 153–160, 1996.
14. Lubbers DW and Baumgartl H. Heterogeneities and profiles of oxygen pressure in brain and kidney as examples of the PO2 distribution in the living tissue. Kidney Int 51: 372–380, 1997.
15. Mik EG, Donkersloot C, Raat NJ, and Ince C. Excitation pulse deconvolution in luminescence lifetime analysis for oxygen measurements in vivo. Photochem Photobiol 76: 12–21, 2002.
16. Mik EG, van Leeuwen TG, Raat NJ, and Ince C. Quantitative determination of localized tissue oxygen concentration in vivo by two-photon excitation phosphorescence lifetime measurements. J Appl Physiol 97: 1962–1969, 2004.
17. Norman JT, Stidwill R, Singer M, and Fine LG. Angiotensin II blockade augments renal cortical microvascular PO2 indicating a novel, potentially renoprotective action. Nephron 94: 39–46, 2003.
18. Poole DC, Behnke BJ, McDonough P, McAllister RM, and Wilson DF. Measurement of muscle microvascular oxygen pressures: compartmentalization of phosphorescent probe. Microcirculation 11: 317–326, 2004.
19. Poole DC, Wagner PD, and Wilson DF. Diaphragm microvascular plasma PO2 measured in vivo. J Appl Physiol 79: 2050–2057, 1995.
20. Raat NJ, Verhoeven AJ, Mik EG, Gouwerok CW, Verhaar R, Goedhart PT, de Korte D, and Ince C. The effect of storage time of human red cells on intestinal microcirculatory oxygenation in a rat isovolemic exchange model. Crit Care Med 33: 39–45, 2005.
21. Rumsey WL, Abbott B, Lo LW, Vinogradov SA, and Wilson DF. Imaging of oxygen distribution in the surface and deep areas of the kidney. Adv Exp Med Biol 411: 591–595, 1997.
22. Schurek HJ, Jost U, Baumgartl H, Bertram H, and Heckmann U. Evidence for a preglomerular oxygen diffusion shunt in rat renal cortex. Am J Physiol Renal Fluid Electrolyte Physiol 259: F910–F915, 1990.
23. Siegemund M, van Bommel J, Schwarte LA, Studer W, Girard T, Marsch S, Radermacher P, and Ince C. Inducible nitric oxide synthase inhibition improves intestinal microcirculatory oxygenation and CO2 balance during endotoxemia in pigs. Intensive Care Med 31: 985–992, 2005.
24. Sinaasappel M, Donkersloot C, van Bommel J, and Ince C. PO2 measurements in the rat intestinal microcirculation. Am J Physiol Gastrointest Liver Physiol 276: G1515–G1520, 1999.
25. Sinaasappel M, van Iterson M, and Ince C. Microvascular oxygen pressure in the pig intestine during haemorrhagic shock and resuscitation. J Physiol 514: 245–253, 1999.
26. Stepinac TK, Chamot SR, Rungger-Brandle E, Ferrez P, Munoz JL, van den BH, Riva CE, Pournaras CJ, and Wagnieres GA. Lightinduced retinal vascular damage by Pd-porphyrin luminescent oxygen probes. Invest Ophthalmol Vis Sci 46: 956–966, 2005.
27. Swartz HM and Dunn JF. Measurements of oxygen in tissues: overview and perspectives on methods. Adv Exp Med Biol 530: 1–12, 2003.
28. Van Bommel J, Siegemund M, Henny CP, Trouwborst A, and Ince C. Critical hematocrit in intestinal tissue oxygenation during severe normovolemic hemodilution. Anesthesiology 94: 152–160, 2001.
29. Vanderkooi JM, Maniara G, Green TJ, and Wilson DF. An optical method for measurement of dioxygen concentration based upon quenching of phosphorescence. J Biol Chem 262: 5476–5482, 1987.
30. Van Iterson M, Siegemund M, Burhop K, and Ince C. Hemoglobinbased oxygen carrier provides heterogeneous microvascular oxygenation in heart and gut after hemorrhage in pigs. J Trauma 55: 1111–1124, 2003.
31. Vinogradov SA, Lo LW, Jenkins WT, Evans SM, Koch C, and Wilson DF. Noninvasive imaging of the distribution in oxygen in tissue in vivo using near-infrared phosphors. Biophys J 70: 1609–1617, 1996.
32. Vinogradov SA and Wilson DF. Phosphorescence lifetime analysis with a quadratic programming algorithm for determining quencher distributions in heterogeneous systems. Biophys J 67: 2048–2059, 1994.
33. Vinogradov SA and Wilson DF. Recursive maximum entropy algorithm and its application to the luminescence lifetime distribution recovery. Appl Spectroscopy 54: 849–855, 2000.
34. Welch AJ and van Gemert MJC. Optical-Thermal Response of Laser-Irradiated Tissue. New York: Plenum, 1995. 35. Wilson DF, Evans SM, Jenkins WT, Vinogradov SA, Ong E, and Dewhirst MW. Oxygen distributions within R3230Ac
tumors growing in dorsal flap window chambers in rats. Adv Exp Med Biol 454: 603–609, 1998. 36. Wilson DF, Pastuszko A, DiGiacomo JE, Pawlowski M, Schneiderman R, and Delivoria-Papadopoulos M. Effect of
hyperventilation on oxygenation of the brain cortex of newborn piglets. J Appl Physiol 70: 2691–2696, 1991. 37. Ziemer LS, Lee WM, Vinogradov SA, Sehgal C, and Wilson DF. Oxygen distribution in murine tumors: characterization
using oxygendependent quenching of phosphorescence. J Appl Physiol 98: 1503–1510, 2005. 38. Zuurbier CJ, van Iterson M, and Ince C. Functional heterogeneity of oxygen supply-consumption ratio in the heart.
Cardiovasc Res 44: 488–497, 1999.

Chapter 5
Monitoring of Renal Venous PO2 and Kidney Oxygen
Consumption in Rats by a Near-Infrared Phosphorescence Lifetime Technique
E.G. Mik, T. Johannes and C. Ince
American Journal of Physiology Renal Physiology 294: F676-F681, 2008

CHAPTER 5
70
ABSTRACT Renal oxygen consumption (VO2,ren) is an important parameter that has been shown to be influenced by various pathophysiological circumstances. VO2,ren has to be repeatedly measured during an experiment to gain insight in the dynamics of (dys)regulation of oxygen metabolism. In small animals, the classical approach of blood gas analysis of arterial and venous blood samples is only limitedly applicable due to fragile vessels and a low circulating blood volume. We present a phosphorescence lifetime technique that allows near-continuous measurement of renal venous PO2 (vPO2) and VO2,ren in rats. The technique does not rely on penetration of the blood vessel, but uses a small reflection probe. This probe is placed in close proximity to the renal vein for detection of the oxygen-dependent phosphorescence of the injected water-soluble near-infrared phosphor Oxyphor G2. The technique was calibrated in vitro and the calibration constants were validated in vivo in anesthetized and mechanically ventilated male Wistar rats. The hemoglobin saturation curve and its pH dependency were determined for calculation of renal venous oxygen content. The phosphorescence technique was in good agreement with blood gas analysis of renal venous blood samples, for both PO2 and hemoglobin saturation. To demonstrate its feasibility in practice, the technique was used in four rats during endotoxin infusion (10 mg•kg-1•h-1 during 1 h). Renal vPO2 reduced by 40% upon reduction in oxygen delivery to 30% of baseline, but VO2 remained unchanged. This study documents the feasibility of near-continuous, nondestructive measurement of renal vPO2 and VO2 by oxygen-dependent quenching of phosphorescence. INTRODUCTION The measurement of oxygen in blood within arteries and veins is mandatory for the study of oxygen supply and demand of organs. For example, the oxygen delivery (DO2) to an organ is calculated by the arterial oxygen content of the blood per volume times the blood flow to the organ. To also determine the oxygen utilization (VO2) by an organ, the venous oxygen content has to be known. Another example of a situation where knowledge of the venous oxygenation over time is necessary is monitoring of the “PO2-gap,” i.e., the discrepancy between capillary PO2 and venous PO2 when the capillary PO2 drops below the venous PO2 (9, 22, 23). The latter occurs under certain pathophysiological conditions, such as sepsis and shock (5), and is a valuable parameter when studying resuscitation protocols and treatments.
Classically, the oxygen content of the blood is measured by taking blood samples for determination of blood gasses and the hemoglobin oxygen saturation. Although this is the most accurate way of measuring the oxygen content of the blood, it has several drawbacks when used in small animals like rats. Due to the small circulating volumes, repeatedly taking blood samples can rapidly lead to hypovolemia and hemodynamic alterations. Furthermore, the limited intraluminal space in the blood vessels prevents catheterization making repeated puncture mandatory. Since the latter is cumbersome and can easily lead to irreversible damage to the vessel, it is contraindicated in experiments where during a certain time course repeated measurements are needed.
The mentioned drawbacks of blood sampling in small animals have been recognized in the literature and have encouraged investigators to search for alternative methods. Recently, for example, Pakulla et al. (13) tested the possibility of using a continuous intravascular blood gas monitor in rats with a favorable outcome. However, the physical dimensions of such a catheter limit its use to the relatively large vessels (i.e., aorta and vena cava). For selective measurement of the PO2 in small veins of single organs, other techniques must be explored.
In small animals, nondestructive optical techniques to determine intravascular oxygenation could very well be a good alternative to the more invasive methods. The thin vessel wall and overall small proportions of the animal effectively counterbalance the in general small penetration depth of light. The use of phosphorescence lifetime measurement (25, 26) could be an attractive option. For almost two decades, oxygen-dependent quenching of phosphorescence has been used for quantitative oxygen

MONITORING RENAL VENOUS PO2
71
measurements in micro vessels (4, 18–20, 24, 29). However, until now it has not been used for oxygen measurements in larger vessels. An explanation can probably be found in the fact that the first widely used phosphor, Palladium-porphyrin, is excited with green light (10, 21). This excitation wavelength is in a part of the optical spectrum where the absorbance of blood is very high (16), preventing the use of Pd-porphyrin for oxygen measurements in full blood due to low excitation efficiency and low signal levels.
In recent years, however, Vinogradov and co-workers (2, 15, 17, 28) developed techniques to tune the quenching and optical properties of phosphorescent dyes. This has led to a new generation of phosphors for oxygen measurements with favorable spectral properties. Oxyphor G2, for example, is a water-soluble phosphor with excitation and emission wavelengths in the (near-)infrared spectrum (2). This allows much deeper tissue penetration because of the low absorbance of tissue in this so-called “tissue optical window” (12, 16). Recently, we demonstrated that Oxyphor G2 can be used to measure PO2 in dense, blood-rich tissue to a depth of several millimetres (6). The optical properties of Oxyphor G2 open the possibility to use this probe for oxygen measurements in full blood and therefore in large blood vessels.
The aim of this study was to test the possibility of measuring the PO2 inside a large blood vessel of a rat by using oxygen-dependent quenching of phosphorescence of the near-infrared phosphor Oxyphor G2. The following steps were undertaken. First, a frequency-domain phosphorimeter using a special probe with small tip for easy placement on a blood vessel was developed. Second, calibration experiments in vitro were performed to test the device. Third, the hemoglobin saturation characteristics of rat blood were determined for calculation of oxygen content from PO2 values. Fourth, the proposed method was evaluated by comparing phosphorescence lifetime measurements on the renal vein with blood samples drawn from the renal vein in a series of rats. Fifth, the practical use of the technique was demonstrated on the rat renal vein during an experimental protocol. MATERIALS AND METHODS Phosphorescence lifetime measurements. Oxyphor G2 [Pd-meso-tetra-(4-carboxyphenyl) tetra-benzo-porphyrin; Oxygen Enterprises, Philadelphia, PA] is a water-soluble phosphorescent dye that is injected into the circulation where it binds to albumin. The phosphor-albumin complex is well confined to the circulation (14) and emits phosphorescence with a wavelength ~800 nm (i.e., infrared light) if excited with light of a wavelength ~630 nm (i.e., red light). The lifetime of the phosphorescence is oxygen dependent (2) and is quantitatively related to the oxygen level by the Stern-Volmer relationship
!
PO2 =
1"#
1"0
kq
(1)
where τ is the measured phosphorescence lifetime, τ0 is the phosphorescence lifetime at zero oxygen, and kq is the quenching constant. The calibration constants kq and τ0 are characteristic properties of the used phosphorescent compound and once determined the method needs no recalibration.
Phosphorescence lifetimes can be measured either in the time domain or in the frequency domain. In the time domain an actual decay of the light output can be observed, and the lifetime can be determined by applying a monoexponential fit procedure after taking the excitation pulse shape into account (11). In the frequency domain, the phosphor is excited by a modulated light source (27). The emitted phosphorescence shows the same modulation frequency as the excitation source. Since the phosphorescence emission is somewhat delayed compared with the excitation, the phosphorescence is detected with a phase shift. A longer phosphorescence lifetime results in a larger phase shift. The
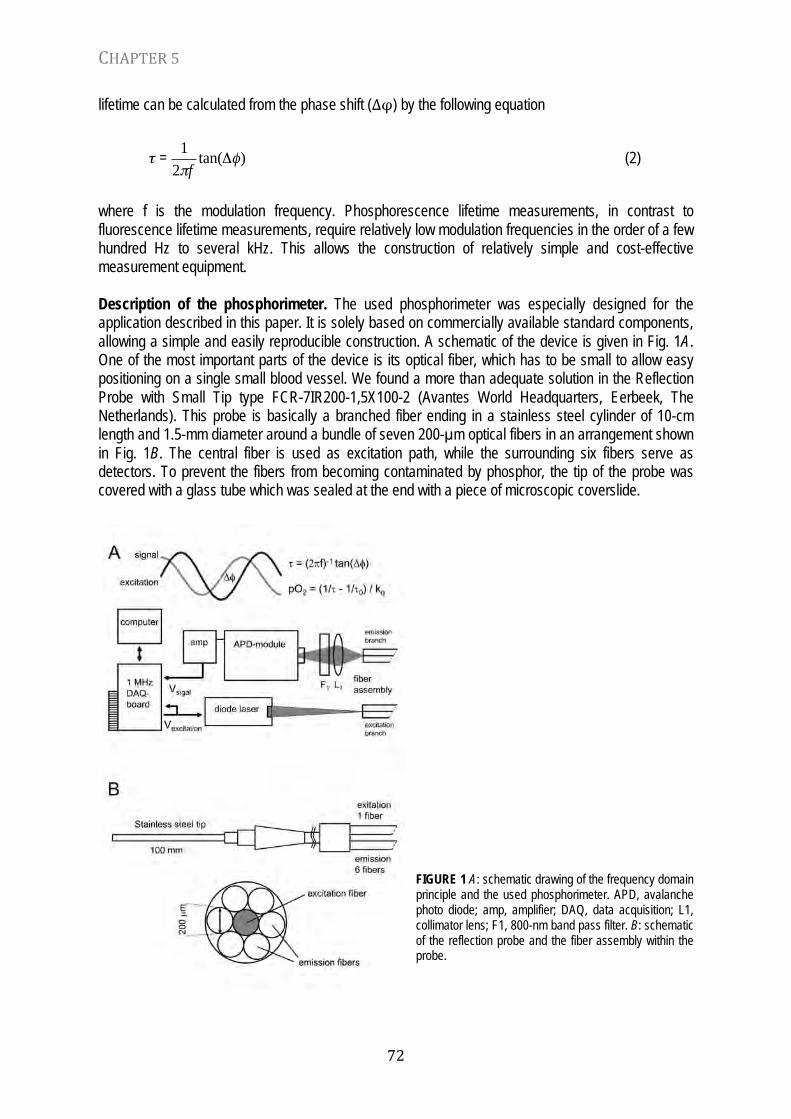
CHAPTER 5
72
lifetime can be calculated from the phase shift (Δφ) by the following equation
!
" =1
2#ftan($%) (2)
where f is the modulation frequency. Phosphorescence lifetime measurements, in contrast to fluorescence lifetime measurements, require relatively low modulation frequencies in the order of a few hundred Hz to several kHz. This allows the construction of relatively simple and cost-effective measurement equipment. Description of the phosphorimeter. The used phosphorimeter was especially designed for the application described in this paper. It is solely based on commercially available standard components, allowing a simple and easily reproducible construction. A schematic of the device is given in Fig. 1A. One of the most important parts of the device is its optical fiber, which has to be small to allow easy positioning on a single small blood vessel. We found a more than adequate solution in the Reflection Probe with Small Tip type FCR-7IR200-1,5X100-2 (Avantes World Headquarters, Eerbeek, The Netherlands). This probe is basically a branched fiber ending in a stainless steel cylinder of 10-cm length and 1.5-mm diameter around a bundle of seven 200-µm optical fibers in an arrangement shown in Fig. 1B. The central fiber is used as excitation path, while the surrounding six fibers serve as detectors. To prevent the fibers from becoming contaminated by phosphor, the tip of the probe was covered with a glass tube which was sealed at the end with a piece of microscopic coverslide.
FIGURE 1 A: schematic drawing of the frequency domain principle and the used phosphorimeter. APD, avalanche photo diode; amp, amplifier; DAQ, data acquisition; L1, collimator lens; F1, 800-nm band pass filter. B: schematic of the reflection probe and the fiber assembly within the probe.

MONITORING RENAL VENOUS PO2
73
The excitation light source is a focusable laser diode module operating at a wavelength of 635 nm (Lasiris DLS laser module, StockerYale, Salem, NH). The laser output is modulated by a sinusoidal voltage with a frequency of 2000 Hz which is generated by a data-acquisition board (PCI-MIO-16E1, National Instruments, Austin, TX). The laser bundle is focussed into the fiber branch containing the single central excitation fiber. The output of the other fiber branch is filtered by an 800-nm band pass filter and focused onto the cathode of an avalanche photo-diode. This diode is part of an avalanche photo-diode module (APD-module C5460, Hamamatsu, Hamamatsu City, Japan) containing a high-voltage generator, voltage controller, and a current-to-voltage converter with a 10-MHz bandwidth. The signal from the APD-module is amplified to a level that is adequate for analog-to-digital conversion by the data-acquisition board using an amplifier module from a NeuroLog system (Automate Scientific, San Francisco, CA). Both the modulation signal and the phosphorescence signal are sampled by the data-acquisition board and both are fed into a standard frequency analysis algorithm of the LabView Full Development System software (Version 6.1, National Instruments). This algorithm determines the frequency and phase of each signal. From the returned phases, the phase shift between both signals is calculated allowing subsequent lifetime and PO2 calculation by equations 2 and 1, respectively. In vitro calibration. In vitro calibrations were performed in a bicarbonate buffer containing 2% bovine serum albumin (Sigma, St. Louis, MO) and a final concentration of 10 µM Oxyphor G2. PO2 values were regulated using a system consisting of gas flow controllers, an oxygenator, and a closed-loop recirculation system. A detailed description of this system can be found in a previous publication (12). Experiments were performed at 37°C. The pH value of the solution was checked during the experiments and remained at 7.4 ± 0.1. Hemoglobin saturation curves. Rat hemoglobin saturation curves were constructed by pooling all blood samples drawn in rat experimental protocols in our laboratory over a 3-mo period. Blood samples were analyzed to determine blood gas values (ABL505, Radiometer, Copenhagen, Denmark), as well as hematocrit, hemoglobin concentration, and hemoglobin oxygen saturation (OSM 3, Radiometer). This resulted in a total number of 102 analyzed samples. The data set was subdivided in different pH ranges and subsequently analyzed by fitting Hill’s equation
!
HbO2 =
PO2
P50
"
# $
%
& '
n
1+PO2
P50
"
# $
%
& '
n (3)
where HbO2 is the hemoglobin oxygen saturation, PO2 is the partial oxygen pressure, P50 is the partial oxygen pressure at 50% saturation, and n is the Hill’s coefficient. The fit was performed using the nonlinear Marquart-Levenberg fit procedure available in LabView. Animals. The protocol of the present study was approved by the Animal Research Committee of the Academic Medical Center at the University of Amsterdam. Animal care and handling were performed in accordance with the guidelines for Institutional and Animal Care and Use Committees (IACUC). The experiments were performed in a total of 12 male Wistar rats (Charles River, The Netherlands) with a mean (±SD) body weight of 313 ± 38 g. The rats were kept in cages with water and food given ad libitum. Animal preparation. Animals were anesthetized by an intraperitoneal injection of a mixture of ketamine (90 mg/kg), medetomidine (0.5 mg/kg), and atropine (0.05 mg/kg). Ketamine (50 mg•kg-1•h-1)

CHAPTER 5
74
was infused intravenously to maintain anesthesia. To compensate for fluid loss, crystalloid solution (saline; 5 ml•kg-1•h-1) was administered continuously. A thermocouple probe placed in the rectum and a heating pad under the animal allowed controlling and maintaining body temperature at 37 ± 0.5°C.
The animal underwent a tracheotomy to enable mechanical ventilation with a mixture of 40% oxygen and 60% nitrogen. To diminish loss of fluid by the mechanical ventilation, a heat and moisture exchanger (Humid-Vent Micro, Gibeck, Sweden) was placed between the tracheal tube (Ch 6) and the ventilator. Measurements of the end-tidal PCO2 allowed maintaining the arterial PCO2 between 35 and 40 mmHg.
For intravenous administration of drugs and fluids, a polyethylene catheter (outer diameter 0.9 mm) was inserted into the right jugular vein. For continuous monitoring of arterial blood pressure and heart rate, a catheter of the same size was placed into the right carotid artery and connected to a pressure transducer. Two additional catheters were placed into both the right femoral artery and vein for withdrawal of blood and administration of fluid.
The left kidney was exposed after a flank incision, decapsulated, and immobilized in a Lucite kidney cup. In the following, the renal vein was isolated from the artery and the surrounding tissue and a 0.5 x 1.0-cm piece of aluminium foil was placed behind the vessel to prevent contribution of underlying tissue to the phosphorescence signal in the venous PO2 measurement. For urine collection, the left ureter was ligated and cannulated. In animals receiving LPS infusion, a perivascular ultrasonic transient time flow probe (type 0.7 RB; Transonic Systems, Ithaca, NY) was placed around the left renal artery and connected to a flow meter (T206; Transonic Systems) to allow continuous measurement of renal blood flow (RBF). Throughout the entire experiment, the surface of the kidney was covered by saline-wetted cotton wool. Hemodynamic and blood gas measurements. During the surgical and experimental procedures, systolic and diastolic arterial pressures were measured in the carotid artery. Mean arterial pressure was calculated as MAP (mmHg) = diastolic pressure + (systolic pressure - diastolic pressure)/3. The amplitude of the arterial blood pressure was calculated as pulse pressure (Ppuls) = systolic pressure - diastolic pressure. For continuous measurement of the renal venous oxygen content, the optical fiber of the phosphorimeter was placed 1 mm above the surface of the isolated left renal vein. Arterial blood samples of 0.2 ml each were collected from the femoral artery catheter. Venous blood samples of 0.2 ml each were collected by means of repetitive venous puncture of the renal vein. Great care was taken not to damage the renal vein or its surroundings (especially the renal artery). The samples were used to determine blood gas values (ABL505, Radiometer), as well as hematocrit, hemoglobin concentration, and hemoglobin oxygen saturation (OSM 3, Radiometer). Calculation of renal DO2, VO2, and O2ER. Renal oxygen delivery was calculated as DO2,ren (ml/min) = RBF * arterial oxygen content (1.31 * Hb * SaO2) + (0.003 * PaO2). Renal oxygen consumption was calculated as VO2,ren (ml/min) = RBF * (arterial - renal venous oxygen content difference). Renal venous oxygen content was calculated as (1.31 * Hb * vHbO2) + (0.003 * vPO2). Renal venous hemoglobin saturation (vHbO2) was calculated from the renal venous PO2 (vPO2) using Hill’s equation. The oxygen extraction ratio (in percentage) was calculated as (VO2,ren/DO2,ren) * 100%. Experimental protocol. To get a broad range of different renal venous PO2 values, eight animals were ventilated with variations in the fractional inspired oxygen content (FiO2). Therefore, FiO2 of 0.2, 0.4, and 1.0 were adjusted with a flow meter. After each change in FiO2, the animals were allowed to adapt for 15 min before the renal vein was punctured for collection of a venous blood sample. The puncture was performed by using a 27-gauge cannula. Hemolysis due to the small diameter of the needle was excluded by preceding centrifugation of several blood samples. The LPS protocol was performed in four animals. Thirty minutes after stabilization from surgery, the animals received a 1-h

MONITORING RENAL VENOUS PO2
75
infusion of LPS (10 mg/kg, serotype 0127:B8; Sigma-Aldrich, Zwijndrecht, The Netherlands) to induce endotoxemia.
FIGURE 2 A: phase shift in detected phosphorescence signal vs. the PO2 in a clear sample consisting of 10 µM Oxyphor G2 in 2% BSA at 37°C and pH 7.4. B: reciprocal phosphorescence lifetime calculated from the phase shift vs. PO2. The solid line is a fit through the data points providing the quenching constant kq and the lifetime at zero oxygen τ0.
RESULTS AND DISCUSSION To test the technical performance of the described device, an in vitro calibration was performed. The results from measurements in a 10 µM Oxyphor G2 solution in 2% bovine serum albumin are shown in Fig. 2. Figure 2A shows the phosphorescence phase shift relative to the excitation light as function of the applied PO2 in the sample solution. The reciprocal lifetime shows excellent linearity to PO2 over the physiological PO2 range, as shown in Fig. 2B. Calibration constants were determined to be kq = 267 mmHg-1s-1 and τ0 = 252 µs. Those calibration constants are in agreement with previously reported values (2, 6).
To calculate the venous oxygen content from the vPO2 (venous PO2) reading, one has to be able to make a sound estimation of the hemoglobin saturation. However, the relationship between the PO2 and the saturation is influenced by other factors of which in our case the pH value of the blood is the most important. Figure 3A shows the results from 102 different blood gasses measured in samples from rats. The raw data are categorized in four different pH ranges. Figure 3B shows the corresponding fits of Hill’s equation to the four data sets. The values for the Hill coefficients obtained from the nonlinear fitting procedure are given in the table (Fig. 3C). For pH values above 7.15 the influence of pH variations is relatively small and the effect of pH on HbO2 calculation is overall well below 10%. However, for pH values below 7.15 the pH-introduced deviation of calculated HbO2 (i.e., at P50) can be as large as 40%. Although this potential for error should always be kept in mind when applying this technique, it is important to consider that the blood gasses with pH <7.15 were drawn from rats in an exceptionally bad state just before the termination of a severe sepsis protocol. Over a broad range of pathophysiological conditions conversion of vPO2 to vHbO2 will not be severely affected by this pH dependency. In this context, it is also important to note that the quenching constants of Oxyphor G2 are pH independent (2).

CHAPTER 5
76
FIGURE 3 A: hemoglobin saturation vs. PO2 determined by blood gas analysis in fresh drawn blood samples. B: result of fitting Hill’s equation to the data. The corresponding values for recovered P50 and n coefficient are provided in the table.
FIGURE 4 A: vPO2 determined in vivo with phosphores-cence quenching vs. the PO2 determined by blood gas analysis in samples drawn from the renal vein. The solid line is the line of equality. B: vHbO2 calculated from phosphorescence lifetime measurements vs. HbO2 determined by blood gas analysis.
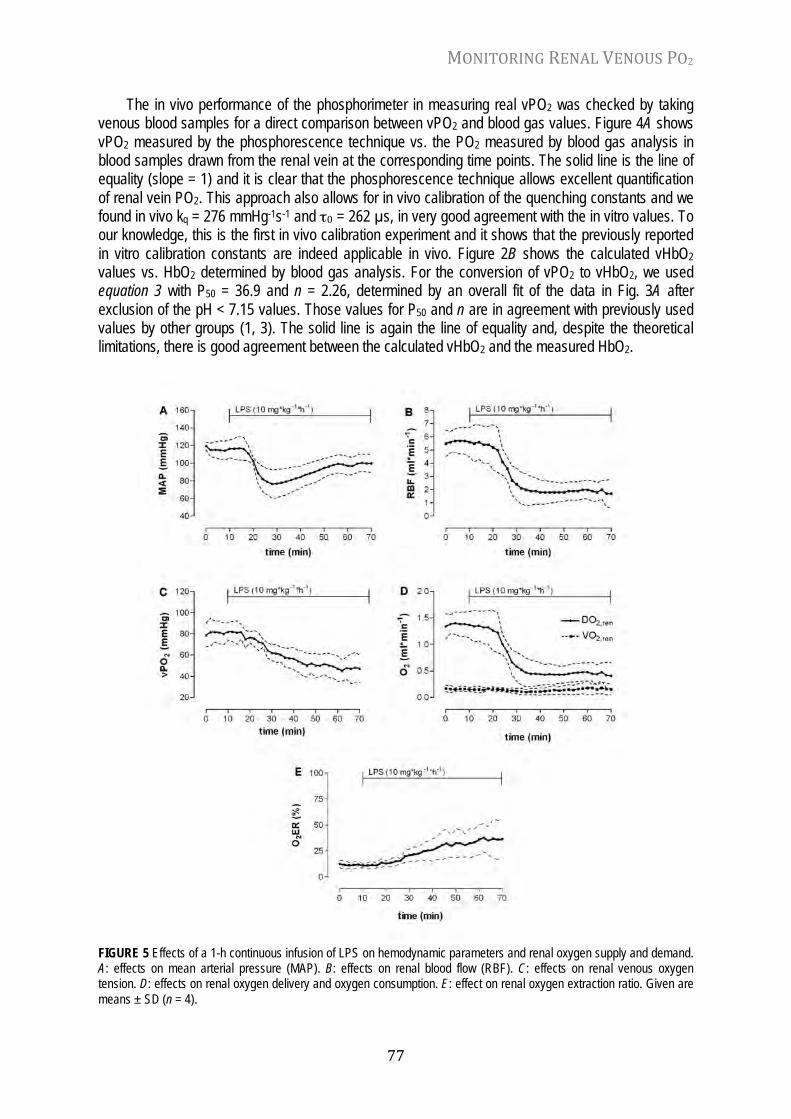
MONITORING RENAL VENOUS PO2
77
The in vivo performance of the phosphorimeter in measuring real vPO2 was checked by taking venous blood samples for a direct comparison between vPO2 and blood gas values. Figure 4A shows vPO2 measured by the phosphorescence technique vs. the PO2 measured by blood gas analysis in blood samples drawn from the renal vein at the corresponding time points. The solid line is the line of equality (slope = 1) and it is clear that the phosphorescence technique allows excellent quantification of renal vein PO2. This approach also allows for in vivo calibration of the quenching constants and we found in vivo kq = 276 mmHg-1s-1 and τ0 = 262 µs, in very good agreement with the in vitro values. To our knowledge, this is the first in vivo calibration experiment and it shows that the previously reported in vitro calibration constants are indeed applicable in vivo. Figure 2B shows the calculated vHbO2 values vs. HbO2 determined by blood gas analysis. For the conversion of vPO2 to vHbO2, we used equation 3 with P50 = 36.9 and n = 2.26, determined by an overall fit of the data in Fig. 3A after exclusion of the pH < 7.15 values. Those values for P50 and n are in agreement with previously used values by other groups (1, 3). The solid line is again the line of equality and, despite the theoretical limitations, there is good agreement between the calculated vHbO2 and the measured HbO2.
FIGURE 5 Effects of a 1-h continuous infusion of LPS on hemodynamic parameters and renal oxygen supply and demand. A: effects on mean arterial pressure (MAP). B: effects on renal blood flow (RBF). C: effects on renal venous oxygen tension. D: effects on renal oxygen delivery and oxygen consumption. E: effect on renal oxygen extraction ratio. Given are means ± SD (n = 4).

CHAPTER 5
78
To demonstrate the feasibility of our method in practice, it was applied in a number of rats receiving a short continuous infusion of endotoxin. Figure 5 shows the mean and standard deviation of DO2, VO2, and O2ER measurements in four rats. LPS infusion induces a transient reduction in MAP together with a reduction in RBF (to ~30% of the baseline value). The drop in RBF causes an analog drop in oxygen delivery. The VO2 is calculated from the vPO2 measurements and despite a drop in vPO2 and increased oxygen extraction the VO2 did not change. Overall, the measurement is very steady and reproducible and this experiment showed that the VO2 in the kidney is highly independent from the DO2. Even a drop in DO2 to 30% of the baseline value did not lead to a decrease in VO2. Two studies where our approach did detect changes in renal VO2 were recently published and concerned fluid resuscitation in normotensive endotoxemia (7) and normovolemic hemodilution (8).
In summary, this study demonstrated the feasibility of using the near-infrared phosphor oxyphor G2 to measure PO2 and oxygen content in the renal vein of the rat. The concept of the measurement is not limited to the renal vein and should equally well work in any other average-sized blood vessel. The method has the advantage that it allows quantitative, real-time, and near-continuous monitoring of intravascular oxygenation. Furthermore, over standard blood sampling it has the advantage that there is no risk of damaging the blood vessel or depletion of blood upon repeated measurements. Because of the good agreement in renal venous oxygen content measurements between the phosphorescence technique and a blood gas analyzer, it is now possible to monitor renal oxygen consumption online. In an experimental study where Oxyphor G2 is already used for measurement of microvascular PO2, it extends the possibilities of the phosphorescence quenching technique. For example, combining this new approach with the recently published dual-wavelength phosphorescence technique (6), which allows near-simultaneous measurement of cortical and outer medullary microvascular PO2, oxygen-dependent quenching of Oxyphor G2 becomes a powerful means for comprehensive assessment of renal oxygenation and oxygen consumption.
REFERENCES 1. Crawford JH, Isbell TS, Huang Z, Shiva S, Chacko BK, Schechter AN, Darley-Usmar VM, Kerby JD, Lang JD Jr, Kraus
D, Ho C, Gladwin MT, Patel RP. Hypoxia, red blood cells, and nitrite regulate NO-dependent hypoxic vasodilation. Blood 107: 566–574, 2006.
2. Dunphy I, Vinogradov SA, Wilson DF. Oxyphor R2 and G2: phosphors for measuring oxygen by oxygen-dependent quenching of phosphorescence. Anal Biochem 310: 191–198, 2002.
3. Ellis CG, Bateman RM, Sharpe MD, Sibbald WJ, Gill R. Effect of a maldistribution of microvascular blood flow on capillary O2 extraction in sepsis. Am J Physiol Heart Circ Physiol 282: H156–H164, 2002.
4. Golub AS, Barker MC, Pittman RN. PO2 profiles near arterioles and tissue oxygen consumption in rat mesentery. Am J Physiol Heart Circ Physiol 293: H1097–H1106, 2007.
5. Ince C, Sinaasappel M. Microcirculatory oxygenation and shunting in sepsis and shock. Crit Care Med 27: 1369–1377, 1999.
6. Johannes T, Mik EG, Ince C. Dual-wavelength phosphorimetry for determination of cortical and subcortical microvascular oxygenation in rat kidney. J Appl Physiol 100: 1301–1310, 2006.
7. Johannes T, Mik EG, Nohe B, Raat NJ, Unertl KE, Ince C. Influence of fluid resuscitation on renal microvascular PO2 in a normotensive rat model of endotoxemia. Crit Care 10: R88, 2006.
8. Johannes T, Mik EG, Nohe B, Unertl KE, Ince C. Acute decrease in renal microvascular PO2 during acute normovolemic hemodilution. Am J Physiol Renal Physiol 292: F796–F803, 2007.
9. Kerger H, Saltzman DJ, Menger MD, Messmer K, Intaglietta M. Systemic and subcutaneous microvascular PO2 dissociation during 4-h hemorrhagic shock in conscious hamsters. Am J Physiol Heart Circ Physiol 270: H827–H836, 1996.
10. Lo LW, Koch CJ, Wilson DF. Calibration of oxygen-dependent quenching of the phosphorescence of Pd-meso-tetra (4-carboxyphenyl) porphine: a phosphor with general application for measuring oxygen concentration in biological systems. Anal Biochem 236: 153–160, 1996.
11. Mik EG, Donkersloot C, Raat NJ, Ince C. Excitation pulse deconvolution in luminescence lifetime analysis for oxygen measurements in vivo. Photochem Photobiol 76: 12–21, 2002.
MONITORING RENAL VENOUS PO2
79
12. Mik EG, van Leeuwen TG, Raat NJ, Ince C. Quantitative determination of localized tissue oxygen concentration in vivo by two-photon excitation phosphorescence lifetime measurements. J Appl Physiol 97: 1962–1969, 2004.
13. Pakulla MA, Obal D, Loer SA. Continuous intra-arterial blood gas monitoring in rats. Lab Anim 38: 133–137, 2004. 14. Poole DC, Behnke BJ, McDonough P, McAllister RM, Wilson DF. Measurement of muscle microvascular oxygen
pressures: compartmentalization of phosphorescent probe. Microcirculation 11: 317–326, 2004. 15. Rietveld IB, Kim E, Vinogradov SA. Dendrimers with tetrabenzoporphyrin cores: near infrared phosphors for in vivo
oxygen imaging. Tetrahedron 59: 3821–3831, 2003. 16. Rolfe P. In vivo near-infrared spectroscopy. Annu Rev Biomed Eng 2: 715–754, 2000. 17. Rozhkov V, Wilson D, Vinogradov S. Phosphorescent Pd porphyrindendrimers: tuning core accessibility by varying the
hydrophobicity of the dendritic matrix. Macromolecules 35: 1991–1993, 2002. 18. Rumsey WL, Iturriaga R, Spergel D, Lahiri S, Wilson DF. Optical measurements of the dependence of chemoreception
on oxygen pressure in the cat carotid body. Am J Physiol Cell Physiol 261: C614–C622, 1991. 19. Schwarte LA, Fournell A, van Bommel J, Ince C. Redistribution of intestinal microcirculatory oxygenation during acute
hemodilution in pigs. J Appl Physiol 98: 1070–1075, 2005. 20. Shibata M, Ichioka S, Ando J, Kamiya A. Microvascular and interstitial PO2 measurements in rat skeletal muscle by
phosphorescence quenching. J Appl Physiol 91: 321–327, 2001. 21. Sinaasappel M, Ince C. Calibration of Pd-porphyrin phosphorescence for oxygen concentration measurements in vivo.
J Appl Physiol 81: 2297–2303, 1996. 22. Sinaasappel M, van Iterson M, Ince C. Microvascular oxygen pressure in the pig intestine during haemorrhagic shock
and resuscitation. J Physiol 514: 245–253, 1999. 23. Stein JC, Ellis CG, Ellsworth ML. Relationship between capillary and systemic venous PO2 during nonhypoxic and
hypoxic ventilation. Am J Physiol Heart Circ Physiol 265: H537–H542, 1993. 24. Torres F, I, Kerger H, Intaglietta M. PO2 measurements in arteriolar networks. Microvasc Res 51: 202–212, 1996. 25. Vanderkooi JM, Maniara G, Green TJ, Wilson DF. An optical method for measurement of dioxygen concentration
based upon quenching of phosphorescence. J Biol Chem 262: 5476–5482, 1987. 26. Vanderkooi JM, Wilson DF. A new method for measuring oxygen concentration in biological systems. Adv Exp Med
Biol 200: 189–193, 1986. 27. Vinogradov SA, Fernandez-Seara MA, Dupan BW, Wilson DF. A method for measuring oxygen distributions in tissue
using frequency domain phosphorometry. Comp Biochem Physiol A 132: 147-152, 2002. 28. Vinogradov SA, Lo LW, Wilson DF. Dendritic polyglutamic porphyrins: probing porphyrin protection by oxygen-
dependent quenching of phosphorescence. Chem Eur J 5: 1338–1347, 1999. 29. Wilson DF, Lee WM, Makonnen S, Finikova O, Apreleva S, Vinogradov SA. Oxygen pressures in the interstitial space
and their relationship to those in the blood plasma in resting skeletal muscle. J Appl Physiol 101: 1648–1656, 2006.


Chapter 6
Mitochondrial PO2 Measured by Delayed Fluorescence
Of Endogenous Protoporphyrin IX
E.G. Mik, J. Stap, M. Sinaasappel, J.F. Beek, J.A. Aten,
T.G. van Leeuwen and C. Ince
Nature Methods 3: 939-945, 2006

CHAPTER 6
82
ABSTRACT Molecular oxygen is the primary oxidant in biological systems. The ultimate destination of oxygen in vivo is the mitochondria where it is used in oxidative phosphorylation. The ability of this process to produce an amount of high-energy phosphates adequate to sustain life highly depends on the available amount of oxygen. Despite a vast array of techniques to measure oxygen, major (patho)physiological questions remain unanswered because of the unavailability of quantitative techniques to measure mitochondrial oxygen in situ. Here we demonstrate that mitochondrial PO2 can be directly measured in living cells by harnessing the delayed fluorescence of endogenous protoporphyrin IX (PpIX), thereby providing a technique with the potential for a wide variety of applications. We applied this technique to different cell lines (V-79 Chinese hamster lung fibroblasts, HeLa cells and IMR 32-K1 neuroblastoma cells) and present the first direct measurements of the oxygen gradient between the mitochondria and the extracellular volume. INTRODUCTION Molecular oxygen is the primary oxidant in life. One of its most important functions is its role as an oxidant in the mitochondrial respiratory chain (1) for production of energy-rich phosphates. Insufficient amounts of intramitochondrial oxygen result in an inability of aerobic metabolism to sustain energy requiring processes, ultimately leading to cell death. Furthermore, oxygen is used for the production of reactive oxygen species that are important in signal transduction (2,3).
Many techniques have been developed to gain insight into the mechanisms of oxygen delivery and use (4,5). Although the amounts of intracellular oxygen in vitro can be measured by either invasive (6) or semiquantitative (7) means, the ultimate goal of making widely applicable direct mitochondrial oxygen measurements in cells or tissues has not been achieved to date.
Almost two decades ago the technique of oxygen-dependent quenching of phosphorescence was introduced (8) providing a new optical technique for measuring microcirculatory PO2 in vivo. As the microcirculation in capillaries is the place where the oxygen is offloaded to the surrounding cells and tissues, microcirculatory PO2 provides a close but indirect estimation of the actual mitochondrial oxygen availability. This technique has found widespread application in fundamental and preclinical research. But for intracellular use metalloporphyrins require microinjection, limiting the technique to large cells and single-cell techniques (6), and the use of fluorescent nanosensors requires a Gene Gun system (9).
Here we present a method that uses the endogenous PpIX for oxygen measurements. PpIX is synthesized inside the mitochondria and therefore provides a potential method for making intramito-chondrial oxygen measurements. In this study we validated the use of PpIX delayed fluorescence to directly measure mitochondrial oxygen pressures in cells. We applied this technique to obtain the first direct measurements of the oxygen gradient between mitochondria and the extracellular medium in intact living cells. RESULTS Delayed fluorescence of protoporphyrin IX Phosphorescence and delayed fluorescence are well-known phenomena that can occur after photo-excitation of a compound. Their lifetimes reflect the lifetime of the first excited triplet state and are therefore generally much longer than prompt fluorescence lifetimes. Because the presence of oxygen influences the triplet-state lifetime, phosphorescence and delayed fluorescence can be used for quantitative oxygen measurements (8). PpIX is an endogenously present porphyrin that is synthesized inside the mitochondria (10). Application of its precursor 5-aminolevulinic acid hydrochloride (ALA) to cells, tissues and complete organisms substantially enhances the PpIX concentration (11). Moreover, PpIX possesses a triplet state that reacts strongly with oxygen (12), making it a potential

MEASURING MITOCHONDRIAL PO2
83
intramitochondrial oxygen sensor. Unfortunately, PpIX shows no detectable phosphorescence (13), and although its triplet-state
lifetime has been measured by alternative methods (14), PpIX has not been used for oxygen measurements. To this end we first investigated the emission properties of PpIX (Sigma) using a LS50B luminescence spectrometer (Perkin-Elmer). We measured the prompt fluorescence spectrum using the fluorescence mode with excitation-source correction (Fig. 1a). The two-peaked emission with maxima around 630 and 700 nm is typical of PpIX fluorescence. We recorded delayed luminescence in the phosphorescence mode, using varying delay times with respect to the excitation flash and a gate width of 100 µs. We recorded spectra in either air-saturated samples or samples containing zero oxygen, achieved by chemical oxygen consumption (15) (Fig. 1b,c). Under air-saturated conditions, delayed luminescence was hardly detectable 30 µs after the excitation flash and had totally vanished after a delay of 100 µs. In contrast, under zero-oxygen conditions we detected delayed luminescence even after a 1-ms delay. The spectrum of the delayed luminescence resembled the spectrum of prompt fluorescence, especially in the absence of the red shift that is typical for phosphorescence. Therefore our data showed that PpIX emitted delayed fluorescence that was very effectively quenched by oxygen.
FIGURE 1 Spectra of prompt and delayed luminescence of PpIX. (a) Prompt fluorescence. (b) Delayed luminescence from an air-saturated sample measured at 30 µs and 100 µs after the excitation flash. (c) Delayed luminescence measured in an anoxic sample at 30 µs, 100 µs and 1 ms after the excitation flash. All spectra were measured in a 10 µM PpIX solution containing 2% bovine serum albumin. Excitation at 405 nm.
Measuring oxygen with delayed fluorescence The above observations provided the working model of states and state transitions of PpIX (Fig. 2a). If a collision between excited PpIX and molecular oxygen occurs, the energy of the first excited triplet state of PpIX (T1) is transferred to the triplet ground state (T0) of molecular oxygen leading to the creation of singlet oxygen. Collisions with molecular oxygen therefore shorten the T1 lifetime (τT1) compared to the lifetime of spontaneous relaxation and ultimately the partial oxygen pressure (PO2) can be calculated from τT1 using the Stern-Volmer relationship (8):
!
PO2 = 1 "T1 #1 "0( ) /kq

CHAPTER 6
84
where kq is the quenching constant and τ0 the lifetime under zero-oxygen conditions. To study the oxygen-dependence of the delayed PpIX fluorescence, we used a previously
described (16) calibration system based on gas flow-controllers. Although the delayed fluorescence lifetime was oxygen-dependent (Fig. 2b) one should be careful when using the Stern-Volmer relationship to quantify oxygen pressure. This is because unlike phosphorescence, delayed fluorescence is not due to direct relaxation of the T1 to the S0 state, but occurs indirectly via the S1 state by the process of bidirectional intersystem crossing.
Several mechanisms for the repopulation of the singlet state are possible (17). In the case of E-type (thermal type) delayed fluorescence the lifetime is independent of concentration and excitation light intensity (18), and can therefore be used for quantitative oxygen measurements. Other mechanisms, such as P-type delayed fluorescence, involve bimolecular mechanisms that make the delayed fluorescence lifetime highly dependent on porphyrin concentration and excitation light intensity (17). The delayed fluorescence lifetimes of PpIX in a 2% albumin solution appeared to be independent of the PpIX concentration over the range of 100 nM to 10 µM (Fig. 2c). Furthermore, placing neutral density filters in the excitation path led to a linear reduction in emission intensity, which further confirmed that we observed E-type PpIX delayed fluorescence. FIGURE 2 In vitro calibration experiments. (a) Jablonski diagram of states and state transitions of PpIX and its interaction with oxygen. (b) Two examples of delayed fluorescence traces recorded at different oxygen concentrations. The solid line is the mono-exponential fit of the data. (c) Delayed fluorescence lifetime versus PpIX concentration at two different oxygen concentrations (n = 6). (d) Reciprocal delayed fluorescence lifetime versus measured partial oxygen pressure (n = 6). The solid line represents a linear fit. Experiments in b–d were performed in a 1 µM PpIX solution containing 2% bovine serum albumin at 37 °C and pH 7.4. (e) pH-dependency of τ0 and kq measured in a 1 µM PpIX solution containing 2% bovine serum albumin at 37 °C (n = 5). In c–e the means are plotted, and error bars represent s.d.

MEASURING MITOCHONDRIAL PO2
85
We performed calibration experiments in a PpIX solution by changing the amount of oxygen in small increments at a temperature of 37 °C and a pH of 7.4. The reciprocal lifetime and partial oxygen pressure (PO2) correlated strongly over a broad PO2 range (Fig. 2d). The calibration constants under the conditions of measurement were τ0 = 1.2 ± 0.1 ms and kq = 398 ± 7 mmHg–1s–1.We further studied the pH-dependency of τ0 and kq (Fig. 2e). Over the full pH range (5.0–8.0) the increase of kq was limited to 8% and the overall pH dependency was comparable to phosphorescent dyes (15,19) and considered negligible over the physiological pH range. FIGURE 3 Fluorescence microscopy. (a) PpIX fluorescence, MitoTracker Green fluorescence, colocalization of PpIX and MitoTracker Green fluorescence and the phase-contrast images of the indicated cells incubated with ALA for 4 h and co- stained with MitoTracker Green for the last 30 min before observation. (b) PpIX fluorescence in IMR 32-K1 neuroblastoma cells without ALA and after 2, 4 and 8 h of incubation with ALA. Scale bars, 10 µm.

CHAPTER 6
86
Subcellular origin of the PpIX signal Administration of ALA leads to the endogenous synthesis of porphyrins via the heme biosynthetic pathway and ultimately to the synthesis of PpIX in mitochondria (20). The effect of ALA administration on PpIX levels has found application in clinical practice of photodynamic diagnosis (21) and photodynamic therapy (22). Because PpIX is naturally synthesized inside the mitochondria (10), it is generally assumed that ALA-enhanced PpIX is located in the mitochondria (23). However, previous attempts to experimentally demonstrate the subcellular distribution of PpIX led to inconsistent results ranging from almost exclusive mitochondrial (24) to diffuse cytosolic (25) localization. These inconsistencies were likely due to redistribution related to the wide range of incubation times (ranging from less than 1 h up to 48 h), and the diversity of imaging and staining methods used (24-26).
Here we investigated the subcellular distribution of the PpIX signal in ALA-stimulated cells using wide-field fluorescence microscopy. We used photobleaching as a contrast-enhancement technique for the PpIX signal, and we identified mitochondria by co-staining with MitoTracker Green (Fig. 3a). After 4 h of incubation with ALA, we observed a nonhomogeneous cytosolic localization of PpIX fluorescence in all cell types. There was a large variation in local intensities of the PpIX and the MitoTracker Green signals. There was, however, a very high degree of colocalization between the two signals. Additionally, the hot-spots in PpIX signal intensity corresponded to a mitochondrial localization.
Experiments with incubation times between 0–16 h revealed that after 8 h incubation the PpIX signal was distributed more homogeneously through the cytosol. We still observed a mitochondrial pattern, but it was combined with diffuse fluorescence distribution in the cytoplasm, as demonstrated in IMR 32-K1 neuroblastoma cells (Fig. 3b). Results in HeLa and V-79 lung fibroblasts were similar. These observations were in agreement with a previous report (24) and with the general consensus that PpIX is produced inside the mitochondria and then slowly diffuses from the mitochondria into the cytosol (22). Thus, our results showed that after administration of ALA to several cell lines, a time window of several hours existed in which the PpIX signal was solely of mitochondrial origin. Calibration of the mitochondrial signal The calibration experiment performed with PpIX bound to albumin showed excellent correlation between the applied partial oxygen pressure and the delayed fluorescence measurement (Fig. 2d). For other porphyrin compounds, however, it is well known that the quenching constants are affected by the particular environment, that is, binding to macromolecules and acidity of the environment (15,19), indicating that the albumin environment may not adequately mimic conditions in a living cell. Therefore, we conducted calibration experiments in cell suspensions. To obtain homogeneous conditions we constructed a ‘rotational cell oxygenator’ consisting of a quartz cuvette with an inner diameter of 1.3 cm and a length of 12 cm mounted upright on a small electric engine. We placed 2 ml of cell suspension into the cuvette, and high-speed rotation increased the diffusion surface by centrifugal force. To maintain homogeneous mixing of the suspension, we alternated the direction of rotation every 15 s. A gas-mixture of O2, N2 and 5% CO2 was blown over the suspension through a second concentric quartz cuvette inside the rotating cuvette. Cell viability tests showed that more than 90% of all cells were still intact after 30 min rotation, the end of the observation period.
Incubation of HeLa cells with ALA led to readily detectable delayed fluorescence (Fig. 4a). The delayed fluorescence originating from cells was oxygen-dependent as demonstrated in neuroblastoma cells (Fig. 4b). Altering mitochondrial respiration by adding rotenone (a blocker of mitochondrial respiration) and FCCP (a mitochondrial uncoupler, which abolishes the linkage between the respiratory chain and the phosphorylation system in mitochondria) under continuous application of 2% oxygen to the sample influenced the delayed-fluorescence lifetime (Fig. 4c). Blocking mitochondrial respiration with rotenone shortened the lifetime, corresponding to a higher intramitochondrial PO2 (PO2,mito). We used rotenone in the calibration experiments to abolish the oxygen gradient in the cells. Uncoupling
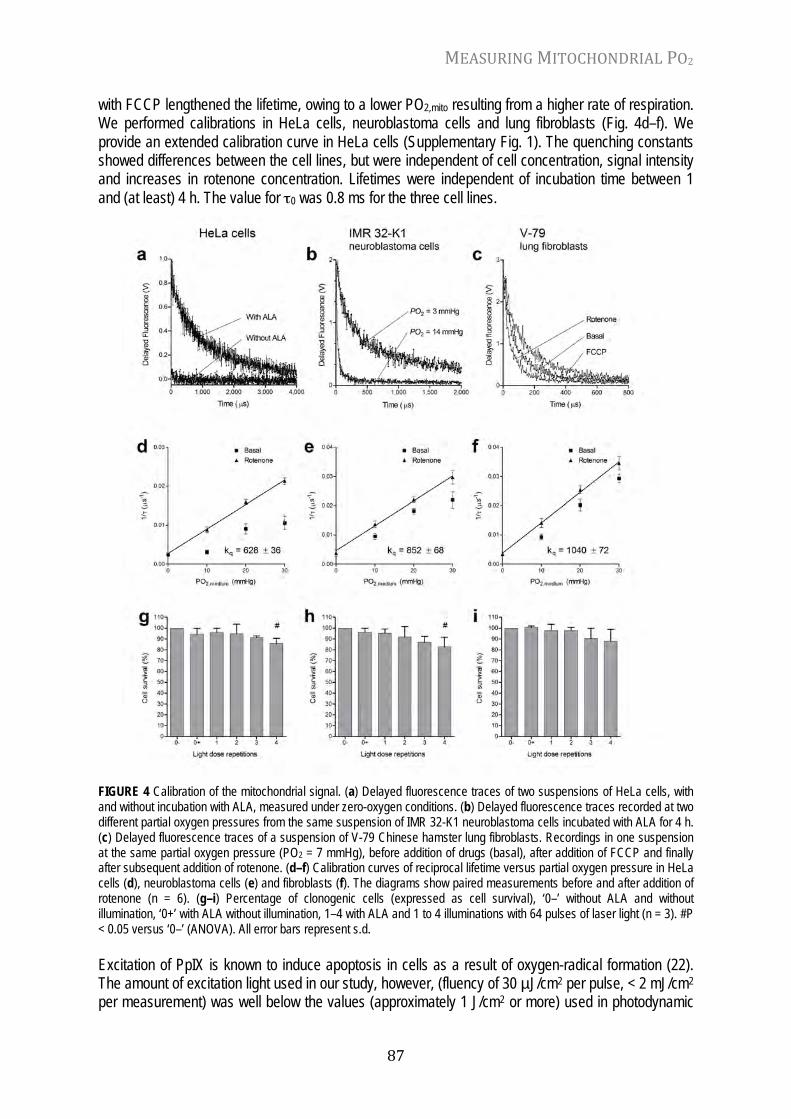
MEASURING MITOCHONDRIAL PO2
87
with FCCP lengthened the lifetime, owing to a lower PO2,mito resulting from a higher rate of respiration. We performed calibrations in HeLa cells, neuroblastoma cells and lung fibroblasts (Fig. 4d–f). We provide an extended calibration curve in HeLa cells (Supplementary Fig. 1). The quenching constants showed differences between the cell lines, but were independent of cell concentration, signal intensity and increases in rotenone concentration. Lifetimes were independent of incubation time between 1 and (at least) 4 h. The value for τ0 was 0.8 ms for the three cell lines.
FIGURE 4 Calibration of the mitochondrial signal. (a) Delayed fluorescence traces of two suspensions of HeLa cells, with and without incubation with ALA, measured under zero-oxygen conditions. (b) Delayed fluorescence traces recorded at two different partial oxygen pressures from the same suspension of IMR 32-K1 neuroblastoma cells incubated with ALA for 4 h. (c) Delayed fluorescence traces of a suspension of V-79 Chinese hamster lung fibroblasts. Recordings in one suspension at the same partial oxygen pressure (PO2 = 7 mmHg), before addition of drugs (basal), after addition of FCCP and finally after subsequent addition of rotenone. (d–f) Calibration curves of reciprocal lifetime versus partial oxygen pressure in HeLa cells (d), neuroblastoma cells (e) and fibroblasts (f). The diagrams show paired measurements before and after addition of rotenone (n = 6). (g–i) Percentage of clonogenic cells (expressed as cell survival), ‘0–’ without ALA and without illumination, ‘0+’ with ALA without illumination, 1–4 with ALA and 1 to 4 illuminations with 64 pulses of laser light (n = 3). #P < 0.05 versus ‘0–’ (ANOVA). All error bars represent s.d. Excitation of PpIX is known to induce apoptosis in cells as a result of oxygen-radical formation (22). The amount of excitation light used in our study, however, (fluency of 30 µJ/cm2 per pulse, < 2 mJ/cm2 per measurement) was well below the values (approximately 1 J/cm2 or more) used in photodynamic

CHAPTER 6
88
therapy studies (24,25). We determined the effect of these low light doses on cell-proliferation using a clonogenic assay (Fig. 4g–i). Our data suggested a slight decline in proliferation upon repeated illumination, but this effect did not reach significance (P > 0.05) compared to ALA administration alone. Cell viability assessed by propidium iodide exclusion showed no increase in the fraction of dead cells during the delayed fluorescence measurements. Although our data showed that measurements with single low-light doses are safe in terms of acute cell survival and long-term proliferation, they do suggest that cumulative light doses should be kept to a minimum as in all such measurements.
Direct measurement of the oxygen gradient Although it has long been clear that the local PO2 drop around an individual oxygen-consuming mitochondria must be very small (on the order of one-tenth mmHg) (27), attempts to determine the oxygen gradient between mitochondria and the extracellular volume have led to contradictory results. Reported values range from well below one mmHg, measured by indirect means (28), to several mmHg, by intracellular oxygen measurements based on injection of phosphorescent dyes (6) or nanoparticles (9). As our technique allows the measurement of mitochondrial PO2, it is very well suited for direct measurement of the intracellular oxygen gradient between mitochondria and the extracellular medium (ΔPO2).
FIGURE 5 PO2 difference between the mitochondria and the extracellular medium. (a–c) Simultaneous measured PpIX delayed fluorescence (PO2,mito) and Oxyphor G2 phosphorescence (PO2,medium) in one sample of V-79 lung fibroblasts. Measurement at basal respiration (a), maximal respiration (b) and blocked respiration (c). (d–f) Histograms showing ΔPO2 between the PO2,mito and the PO2,medium for the indicated cell lines. Shown are the mean and s.d.; n = 8 (d), n = 6 (e) and n = 7 (f). #P < 0.05 versus basal, *P < 0.05 versus FCCP, ^NS nonsignificant from zero (ANOVA).
For this, we simultaneously measured the PO2 in the medium (PO2,medium) and the mitochondrial
PO2 (PO2,mito). For measurement of PO2,medium we used the oxygen probe Oxyphor G2 (Oxygen Enterprises) in combination with a fiber-based phosphorimeter (16). The emission wavelength of Oxyphor G2 is around 800 nm (19), and at the concentration of 0.5 µM this allowed simultaneous measurement of PO2,medium and PO2,mito without cross-talk between the two signals. We tested the accuracy of this method in homogenous albumin solutions containing 500 nM PpIX and 500 nM

MEASURING MITOCHONDRIAL PO2
89
Oxyphor (Supplementary Fig. 2). Increasing pulse frequency from 20 to 50 Hz resulted in no decrease in PO2, excluding influence of oxygen consumption by the measurements.
We demonstrated the ΔPO2 induced in a sample of V-79 lung fibroblasts by addition of FCCP and rotenone (Fig. 5a–c). We maintained the PO2,medium at around 15 mmHg by applying 2% oxygen to the measurement cuvette. We measured the ΔPO2 for the three cell lines under similar circumstances (Fig. 5d–f). Addition of FCCP caused a significant increase in PO2 consistent with an increase in oxygen consumption (P < 0.05). In the small V-79 lung fibroblast cells the PO2 increased to 5 mmHg. As cell shape might influence the diffusional transport resistance, it is important to recognize that the experiments were performed in suspended (spherically shaped) cells. DISCUSSION
Here we describe the first method to measure mitochondrial oxygen pressures in living cells. Because our technique harnesses the delayed fluorescence properties of a porphyrin that is synthesized in situ, it has several advantages over previous techniques for intracellular oxygen measurements. The use of ALA-enhanced PpIX is ideally suited for measurements in large quantities of cells, cell cultures or cell suspensions. In cell suspensions we directly demonstrated the presence of a considerable barrier to oxygen diffusion, caused either by the cellular membrane or by the nonconvective cytosol, in agreement with data from recent studies (6,9).
The use of an endogenous porphyrin could also facilitate mitochondrial PO2 measurements in tissue cultures or in vivo. The signal from ALA-stimulated cells was similar to that obtained from a 500 nM PpIX solution. Previous studies have shown that ALA administration increases the PpIX levels in tissues to levels of several micromolars (29,30), clearly in the range of our method. Encouraged by these findings, we performed a proof-of-concept experiment in which we were able to detect oxygen-dependent delayed fluorescence from several tissues in a rat after intravenous administration of ALA (data not shown).
Although ALA is nontoxic and is used in daily clinical practice in photodynamic therapy (22) and photodynamic diagnosis (21) in human beings, high levels of PpIX are not harmless. The effects of phototoxicity after PpIX induction should always be considered as a potential risk requiring a risk and safety assessment in any intended application. In general, one should strive to minimize the total (cumulative) dose of excitation light to avoid induction of apoptosis. If proven to be feasible in vivo, mitochondrial PO2 measurements using the delayed fluorescence of endogenous PpIX could have a potentially wide use ranging from fundamental research in cells and animals to applications in clinical medicine.
METHODS Delayed fluorescence setup. The pulsed laser system consisted of a Quanta-Ray DCR-3D (Spectra Physics) pumping a tunable optical parametric oscillator OPO-A355 (GWU Lasertechnik Vertriebs GmbH) containing a β-barium-borate crystal. The pulse length of this system was 2–4 ns. The detector was a gated R928 redsensitive photomultiplier tube (Hamamatsu) combined with a monochromator (Model 77320; Oriel). An in-house-built integrator with an integration time of 3.5 µs and a reset time of 0.5 µs converted the current of the photomultiplier tube to voltage. We sampled the signal at 250 kHz using a PCI-MIO-16E1 data-acquisition board (National Instruments) and averaged the traces of 32–64 laser pulses at a frequency of 20 Hz. We performed analysis with LabView (Version 6.1; National Instruments). Cell culture. We cultured HeLa cells in Dulbecco’s minimal essential medium (Gibco BRL), supplemented with 10% fetal calf serum (FCS). We incubated the cells in a 37 °C incubator in an atmosphere of 10% CO2 in air. We cultured V-79 Chinese hamster lung fibroblasts in Eagle’s minimum essential medium with Hank’s salts (Gibco BRL), supplemented with 10% FCS, and incubated them in
CHAPTER 6
90
a 37 °C incubator in an atmosphere of 2% CO2 in air. We cultured IMR 32-K1 neuroblastoma cells in RPMI 1640 medium (Gibco BRL), supplemented with 10% FCS and incubated them in a 37 °C incubator in an atmosphere of 5% CO2 in air. Cells grew as monolayers in culture flasks (Corning). In all experiments we used exponentially growing cultures. Incubation and cell collection. We added ALA (Sigma) to cell cultures to a final concentration of 0.2 mg/ml. We incubated cells for 4 h, trypsinized them and, without centrifugation, collected the cells in appropriate medium without Phenol Red. For each measurement, we used ~ 106 cells/ml. Suspensions of Chinese hamster and HeLa cells contained less than 5% dead cells, and suspensions of neuroblastoma cells contained less than 10% dead cells. We assessed cell viability by propidium iodide exclusion and by observation under a phase-contrast microscope. The fraction of dead cells did not increase during oxygen measurements. We added Rotenone (Sigma) and carbonyl cyanide 4-(trifluoromethoxy) phenylhydrazone (FCCP; Sigma) to the medium at a final concentration of 1 µM. Microscopy analysis. We cultured cells on round (diameter 15 mm) coverslips (Menzel), which we placed in 25-well replica dishes (Greiner). After incubation with ALA for 3.5 h, we added MitoTracker Green FM (Molecular Probes) to a final concentration of 26.5 nM to stain mitochondria. Finally after another 30 min of incubation at 37 °C, we removed the coverslips from the dishes and placed them on slides with the living cells between slide and coverslip in a droplet of medium. We sealed the coverslips with rubber cement and observed the preparations immediately using a Leica fluorescence microscope (DM RA HC). We recorded micrographs using a cooled charge-coupled device camera (KX1400; Apogee Instruments). We used a CY3 band pass filter set to detect PpIX and a FITC band pass filter set to detect MitoTracker. PpIX photobleaches rapidly (26), and we used this to our advantage to eliminate auto fluorescence. Image acquisition and processing. For fluorescence microscopy we used a Leica fluorescence microscope (DM RA HC) with a plan apo 100×/1.40-oil Phaco3 objective lens. We used filter cube type Y3 "Cy3" (excitation filter BP 545/30, dichromatic mirror 565, emission filter BP 610/75) for detection of the PpIX signal and filter cube type L5 "FITC" (excitation filter BP 480/40, dichromatic mirror 505, emission filter BP 527/30) to detect MitoTracker Green. We recorded micrographs using a cooled CCD camera (KX1400, Apogee Instruments). The pixel-size of the detector was 6.7 × 6.7 µm giving in combination with the 100× objective a resolution of 67 nm. The dynamic range of the sensor was 14-bit. For image acquisition we used custom made software based on a software development kit from Apogee. For our observations we used an area of interest of 512 × 512 pixels. Protoporphyrin IX bleaches rapidly and we used this to separate PpIX fluorescence from other sources of auto fluorescence. To this end we performed two successive illuminations of 30 seconds while integrating the fluorescence images on the cooled CCD during the illumination time. The second image was now subtracted from the first image using Image Pro Plus software (Mediacybernetics). The resulting “bleached image” represented the true PpIX part of the fluorescence signal. We recorded the MitoTracker Green images using an integration time of 2 seconds. To optimize visual presentation of the acquired photomicrographs we improved the dynamic range of the images using linear scaling before converting the 14-bit images into 8-bit images. We did not perform deconvolution algorithms or non-linear processing. Clonogenic assay. We investigated phototoxicity of the PpIX technique using the cloning technique for the assessment of cell reproductive capacity. We used cells from exponentially growing cultures. After trypsinization, we counted and plated the cells in appropriate dilutions in cluster dishes. Immediately after trypsinization we added 0.2 mg/ml ALA. After 4 h we repeatedly illuminated (0–4 times) the cells with 64 pulses of laser light with a power density of 30 mJ/cm2 (similar to the delayed

MEASURING MITOCHONDRIAL PO2
91
fluorescence experiments). After illumination we refreshed the medium and incubated the cell cultures for 6 d (V-79 Chinese hamster lung fibroblasts) or 10 d (HeLa and IMR 32-K1 neuroblastoma cells). Subsequently we fixed and stained the cell cultures, and estimated the fraction of clonogenic cells (colony forming units) by counting clones containing 50 cells or more. We repeated all experiments three times. ACKNOWLEDGEMENTS This work was in part supported by the Technological Collaboration Grant (TSGE 1048) of the Dutch Ministry of Economic Affairs. As part of this collaboration, K. Boller (Department of Laser Physics, University of Twente, Enschede, The Netherlands) kindly provided the pulsed laser system and tunable optical parametric oscillator. A. van Kuilenburg (Laboratory for Genetic Metabolic Diseases, Academic Medical Center, Amsterdam, The Netherlands) kindly provided IMR 32-K1 Neuroblastoma cells. J.S. and J.A.A. were funded in part by a grant from the Dutch Cancer Society (KWF). The authors thank C. van Oven, K. Pos and P. Goedhart for technical assistance. AUTHOR CONTRIBUTIONS E.G.M. conceived and designed the study, performed experiments and wrote the manuscript; J.S. cultured the cells and performed fluorescence microscopy; M.S. contributed to the biological idea; J.F.B. and T.G.L. were involved in the construction of the delayed fluorescence setup; J.A.A. advised on biological experiments; C.I. facilitated the study and supervised the work. COMPETING INTERESTS STATEMENT The authors' institution (The Academic Medical Center in Amsterdam, the Netherlands) has filed a European patent application (number 05076565.0), which covers some of the work described in this article.
REFERENCES 1. Mitchell, P. & Moyle, J. Chemiosmotic hypothesis of oxidative phosphorylation. Nature 213, 137–139 (1967). 2. Droge, W. Free radicals in the physiological control of cell function. Physiol. Rev. 82, 47–95 (2002). 3. Xi, Q., Cheranov, S.Y. & Jaggar, J.H. Mitochondria-derived reactive oxygen species dilate cerebral arteries by
activating Ca2+ sparks. Circ. Res. 97, 354–362 (2005). 4. Swartz, H.M. Measuring real levels of oxygen in vivo: opportunities and challenges. Biochem. Soc. Trans. 30, 248–252
(2002). 5. Vanderkooi, J.M., Erecinska, M. & Silver, I.A. Oxygen in mammalian tissue: methods of measurement and affinities of
various reactions. Am. J. Physiol. 260, C1131–C1150 (1991). 6. Hogan, M.C. Phosphorescence quenching method for measurement of intracellular PO2 in isolated skeletal muscle
fibers. J. Appl. Physiol. 86, 720–724 (1999). 7. Takahashi, E., Sato, K., Endoh, H., Xu, Z.L. & Doi, K. Direct observation of radial intracellular PO2 gradients in a single
cardiomyocyte of the rat. Am. J. Physiol. 275, H225–H233 (1998). 8. Vanderkooi, J.M., Maniara, G., Green, T.J. & Wilson, D.F. An optical method for measurement of dioxygen
concentration based upon quenching of phosphorescence. J. Biol. Chem. 262, 5476–5482 (1987). 9. Koo, Y.E. et al. Real-time measurements of dissolved oxygen inside live cells by organically modified silicate
fluorescent nanosensors. Anal. Chem. 76, 2498–2505 (2004). 10. Poulson, R. The enzymic conversion of protoporphyrinogen IX to protoporphyrin IX in mammalian mitochondria. J. Biol.
Chem. 251, 3730–3733 (1976). 11. Fukuda, H., Casas, A. & Batlle, A. Aminolevulinic acid: from its unique biological function to its star role in
photodynamic therapy. Int. J. Biochem. Cell Biol. 37, 272–276 (2005). 12. Dalton, J., McAuliffe, C.A. & Slater, D.H. Reaction between molecular oxygen and photo-excited protoporphyrin IX.
Nature 235, 388 (1972).
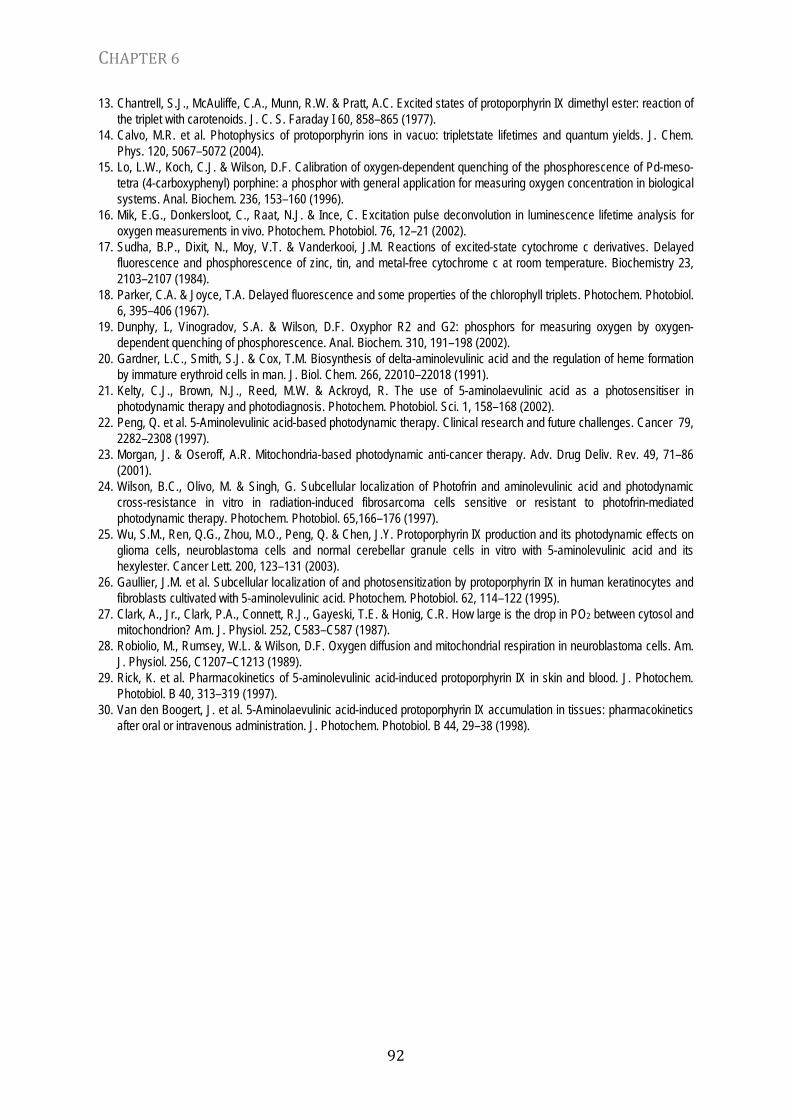
CHAPTER 6
92
13. Chantrell, S.J., McAuliffe, C.A., Munn, R.W. & Pratt, A.C. Excited states of protoporphyrin IX dimethyl ester: reaction of the triplet with carotenoids. J. C. S. Faraday I 60, 858–865 (1977).
14. Calvo, M.R. et al. Photophysics of protoporphyrin ions in vacuo: tripletstate lifetimes and quantum yields. J. Chem. Phys. 120, 5067–5072 (2004).
15. Lo, L.W., Koch, C.J. & Wilson, D.F. Calibration of oxygen-dependent quenching of the phosphorescence of Pd-meso-tetra (4-carboxyphenyl) porphine: a phosphor with general application for measuring oxygen concentration in biological systems. Anal. Biochem. 236, 153–160 (1996).
16. Mik, E.G., Donkersloot, C., Raat, N.J. & Ince, C. Excitation pulse deconvolution in luminescence lifetime analysis for oxygen measurements in vivo. Photochem. Photobiol. 76, 12–21 (2002).
17. Sudha, B.P., Dixit, N., Moy, V.T. & Vanderkooi, J.M. Reactions of excited-state cytochrome c derivatives. Delayed fluorescence and phosphorescence of zinc, tin, and metal-free cytochrome c at room temperature. Biochemistry 23, 2103–2107 (1984).
18. Parker, C.A. & Joyce, T.A. Delayed fluorescence and some properties of the chlorophyll triplets. Photochem. Photobiol. 6, 395–406 (1967).
19. Dunphy, I., Vinogradov, S.A. & Wilson, D.F. Oxyphor R2 and G2: phosphors for measuring oxygen by oxygen-dependent quenching of phosphorescence. Anal. Biochem. 310, 191–198 (2002).
20. Gardner, L.C., Smith, S.J. & Cox, T.M. Biosynthesis of delta-aminolevulinic acid and the regulation of heme formation by immature erythroid cells in man. J. Biol. Chem. 266, 22010–22018 (1991).
21. Kelty, C.J., Brown, N.J., Reed, M.W. & Ackroyd, R. The use of 5-aminolaevulinic acid as a photosensitiser in photodynamic therapy and photodiagnosis. Photochem. Photobiol. Sci. 1, 158–168 (2002).
22. Peng, Q. et al. 5-Aminolevulinic acid-based photodynamic therapy. Clinical research and future challenges. Cancer 79, 2282–2308 (1997).
23. Morgan, J. & Oseroff, A.R. Mitochondria-based photodynamic anti-cancer therapy. Adv. Drug Deliv. Rev. 49, 71–86 (2001).
24. Wilson, B.C., Olivo, M. & Singh, G. Subcellular localization of Photofrin and aminolevulinic acid and photodynamic cross-resistance in vitro in radiation-induced fibrosarcoma cells sensitive or resistant to photofrin-mediated photodynamic therapy. Photochem. Photobiol. 65,166–176 (1997).
25. Wu, S.M., Ren, Q.G., Zhou, M.O., Peng, Q. & Chen, J.Y. Protoporphyrin IX production and its photodynamic effects on glioma cells, neuroblastoma cells and normal cerebellar granule cells in vitro with 5-aminolevulinic acid and its hexylester. Cancer Lett. 200, 123–131 (2003).
26. Gaullier, J.M. et al. Subcellular localization of and photosensitization by protoporphyrin IX in human keratinocytes and fibroblasts cultivated with 5-aminolevulinic acid. Photochem. Photobiol. 62, 114–122 (1995).
27. Clark, A., Jr., Clark, P.A., Connett, R.J., Gayeski, T.E. & Honig, C.R. How large is the drop in PO2 between cytosol and mitochondrion? Am. J. Physiol. 252, C583–C587 (1987).
28. Robiolio, M., Rumsey, W.L. & Wilson, D.F. Oxygen diffusion and mitochondrial respiration in neuroblastoma cells. Am. J. Physiol. 256, C1207–C1213 (1989).
29. Rick, K. et al. Pharmacokinetics of 5-aminolevulinic acid-induced protoporphyrin IX in skin and blood. J. Photochem. Photobiol. B 40, 313–319 (1997).
30. Van den Boogert, J. et al. 5-Aminolaevulinic acid-induced protoporphyrin IX accumulation in tissues: pharmacokinetics after oral or intravenous administration. J. Photochem. Photobiol. B 44, 29–38 (1998).
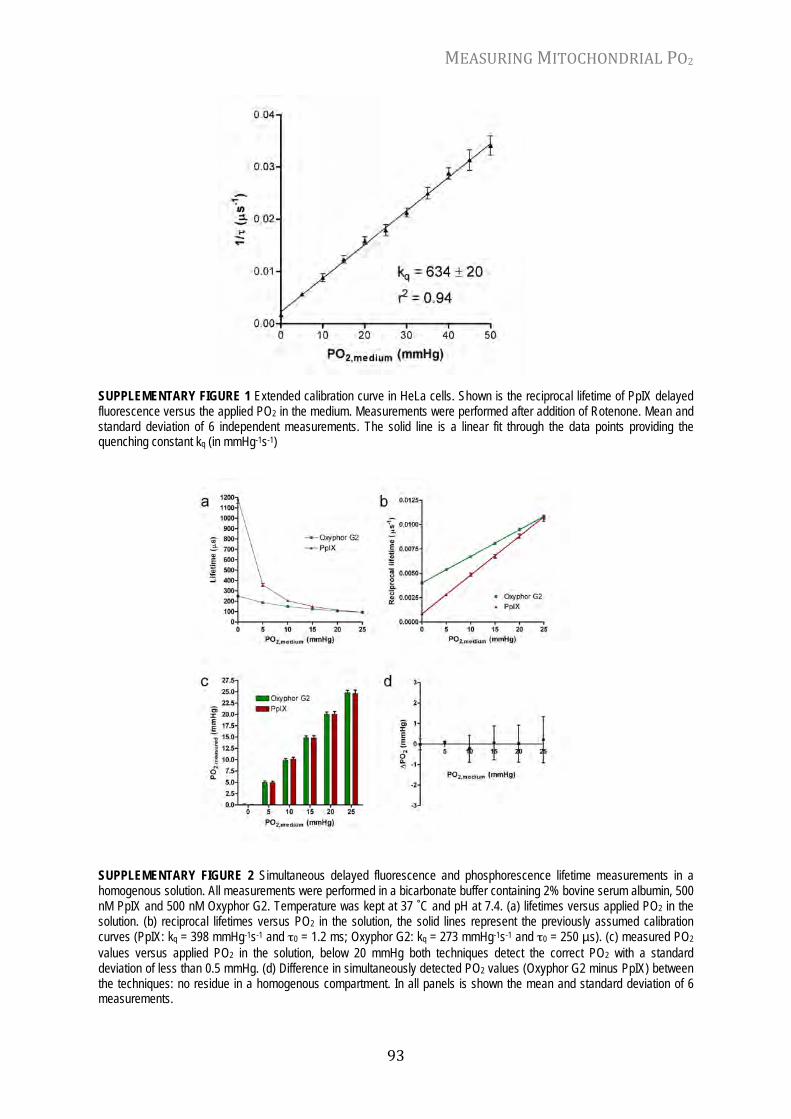
MEASURING MITOCHONDRIAL PO2
93
SUPPLEMENTARY FIGURE 1 Extended calibration curve in HeLa cells. Shown is the reciprocal lifetime of PpIX delayed fluorescence versus the applied PO2 in the medium. Measurements were performed after addition of Rotenone. Mean and standard deviation of 6 independent measurements. The solid line is a linear fit through the data points providing the quenching constant kq (in mmHg-1s-1) SUPPLEMENTARY FIGURE 2 Simultaneous delayed fluorescence and phosphorescence lifetime measurements in a homogenous solution. All measurements were performed in a bicarbonate buffer containing 2% bovine serum albumin, 500 nM PpIX and 500 nM Oxyphor G2. Temperature was kept at 37 ˚C and pH at 7.4. (a) lifetimes versus applied PO2 in the solution. (b) reciprocal lifetimes versus PO2 in the solution, the solid lines represent the previously assumed calibration curves (PpIX: kq = 398 mmHg-1s-1 and τ0 = 1.2 ms; Oxyphor G2: kq = 273 mmHg-1s-1 and τ0 = 250 µs). (c) measured PO2 values versus applied PO2 in the solution, below 20 mmHg both techniques detect the correct PO2 with a standard deviation of less than 0.5 mmHg. (d) Difference in simultaneously detected PO2 values (Oxyphor G2 minus PpIX) between the techniques: no residue in a homogenous compartment. In all panels is shown the mean and standard deviation of 6 measurements.


Chapter 7
In Vivo Mitochondrial Oxygen Tension Measured by a
Delayed Fluorescence Lifetime Technique
E.G. Mik, T. Johannes, C.J. Zuurbier, A. Heinen, J.H.P.M. Houben-Weerts,
G.M. Balestra, J Stap, J.F. Beek and C. Ince
Biophysical Journal 95: 3977-3990, 2008
CHAPTER 7
96
ABSTRACT Mitochondrial oxygen tension (mitoPO2) is a key parameter for cellular function, which is considered to be affected under various pathophysiological circumstances. Although many techniques for assessing in vivo oxygenation are available, no technique for measuring mitoPO2 in vivo exists. Here we report in vivo measurement of mitoPO2 and the recovery of mitoPO2 histograms in rat liver by a novel optical technique under normal and pathological circumstances. The technique is based on oxygen-dependent quenching of the delayed fluorescence lifetime of protoporphyrin IX. Application of 5-aminolevulinic acid enhanced mitochondrial protoporphyrin IX levels and induced oxygen-dependent delayed fluorescence in various tissues, without affecting mitochondrial respiration. Using fluorescence microscopy, we demonstrate in isolated hepatocytes that the signal is of mitochondrial origin. The delayed fluorescence lifetime was calibrated in isolated hepatocytes and isolated perfused livers. Ultimately, the technique was applied to measure mitoPO2 in rat liver in vivo. The results demonstrate mitoPO2 values of ~30-40mmHg. mitoPO2 was highly sensitive to small changes in inspired oxygen concentration around atmospheric oxygen level. Ischemia-reperfusion interventions showed altered mitoPO2 distribution, which flattened overall compared to baseline conditions. The reported technology is scalable from microscopic to macroscopic applications, and its reliance on an endogenous compound greatly enhances its potential field of applications. INTRODUCTION Mitochondrial oxygen tension (mitoPO2) is a key parameter for cellular function. This is not only because oxygen is indispensable as an oxidant in the mitochondrial respiratory chain (1). Mitochondria are also thought to play a major role in cellular oxygen sensing (2,3) and oxygen-regulated gene expression (4). Because of its importance, many techniques have been developed to measure oxygen tension in vivo (5). The available techniques are, however, limited in several respects: either they are locally destructive, such as the use of oxygen electrodes (6), or they rely on the injection of a foreign compound, such as in phosphorescence quenching (7,8) and electron paramagnetic resonance oximetry (9). Although these techniques make it possible to directly measure interstitial or microvascular PO2, they provide only an indirect estimate of mitoPO2. Thus there is a real need for in vivo techniques that can quantitatively and noninvasively measure mitoPO2 to elucidate cellular oxygenation under various pathophysiological circumstances.
Recently we reported that the delayed fluorescence lifetime of endogenous protoporphyrin IX (PpIX) can be used to measure mitoPO2 in cultured cells (10). Such an approach might also work in vivo and provide a breakthrough technique with a real potential for clinical application. A major advantage of such a technique would be that the basic setup for delayed fluorescence lifetime measurements is relatively simple and straightforward. Furthermore, since the technique relies on the optical properties of an endogenously synthesized compound, it potentially has a wide field of applications. Being an optical technique, it would be downscalable from macroscopic to microscopic measurements, even further increasing its versatility. Since delayed fluorescence has much in common with phosphorescence, it shares the useful ability to recover oxygen histograms from a volume of tissue with high temporal resolution (11,12). For in vivo measurements, another crucial factor is that lifetime measurements are not disturbed by changes in tissue optical properties (such as scatter and absorption) as can occur with, e.g., changes in hemoglobin content or saturation. This allows true quantitative measurements to be made instead of relative or semi-quantitative measurements.
Accordingly, we have developed a novel in vivo delayed fluorescence lifetime technique that quantitatively measures mitoPO2 using the oxygen-dependent optical properties of endogenously synthesized PpIX. In this article, we describe the development and applicability of this technique for direct measurements of mitoPO2 in the intact organism. We report that delayed fluorescence can be obtained from various tissues in the rat, and demonstrate that the signal is of mitochondrial origin and

MITOCHONDRIAL PO2 IN VIVO
97
can be calibrated in rat liver. Ultimately, we provide the first direct measurements of both global and regional mitoPO2 within the liver in vivo in healthy and pathological conditions. MATERIALS AND METHODS The concept: from PpIX accumulation to mitoPO2 histogram PpIX is the final precursor of heme in the heme biosynthetic pathway. PpIX is synthesized in the mitochondria (13), and administration of its precursor 5-aminolevulinic acid (ALA) to cells and organisms substantially enhances PpIX concentration (14). Since the conversion of PpIX to heme is a
FIGURE 1 Principle of mitoPO2 measurement by oxygen-dependent quenching of ALA enhanced PpIX. (a) Principle by which ALA administration enhances mitochondrial PpIX levels. ALA, 5-aminolevulinic acid; PBG, porphobilinogen; UPIII, uroporphyrinogen III; CPIII, coporporphyrinogen III; and PpIX, protoporphyrin IX. (b) Jablonski diagram of states and state transitions of PpIX and its interaction with oxygen. S0, S1, and S2 represent the ground state and first and second excited singlet states, respectively. T0, T1, and T2 represent the ground (triplet) state and first and second excited triplet states, respectively. kq is the rate constant of T1 quenching by oxygen. (c) PpIX emits delayed fluorescence after excitation by a pulse of green (510 nm) light. The delayed fluorescence lifetime is oxygen-dependent according to the Stern-Volmer equation (inset), in which kq is the quenching constant and τ0 is the lifetime at zero oxygen. (d) Example of the delayed fluorescence setup. PMT denotes photomultiplier, and DAQ denotes data acquisition. Details are provided in the Materials and Methods section. (e) Tissue comprised of regions with different mitoPO2s, each with a different delayed fluorescence lifetime. The overall signal therefore contains a lifetime distribution that can be mathematically converted into a mitoPO2 histogram.

CHAPTER 7
98
rate-limiting step, administration of ALA causes accumulation of PpIX in the mitochondria (10) (Fig. 1 a). PpIX possesses a triplet state (T1) that reacts strongly with oxygen (15), making the T1 lifetime oxygen-dependent (Fig. 1 b). Population of T1 occurs upon excitation with a pulse of blue or green light, and bidirectional intersystem crossing causes the emission of red delayed fluorescence (10). The lifetime of the delayed fluorescence reflects the T1 lifetime and can therefore be used to measure oxygen (Fig. 1 c).
The basic setup for delayed fluorescence lifetime measurements in the in vivo condition consists of an excitation source, an optical flexible fiber to excite the organ/tissue of choice, a detector, a means to discriminate emission from excitation and background light, and a data-acquisition system with subsequent signal processing and analysis. A block diagram of the time-domain device used in this study is shown in Fig. 1 d. In the case of heterogeneity in mitoPO2, as is expected to occur in intact tissue, locations with different mitoPO2 emit delayed fluorescence with different lifetimes. Therefore, the observed overall delayed fluorescence signal does not decay monoexponentially, but contains a lifetime distribution (Fig. 1 e). This allows mathematical recovery of the underlying mitoPO2 distribution, providing detailed insight into the heterogeneity. Details of the setup and the lifetime deconvolution algorithm are provided below. Delayed fluorescence setup The setup was an adapted version of the previously described delayed fluorescence system (10). The pulsed laser system consisted of a Quanta-Ray DCR-3D (Spectra-Physics, Mountain View, CA) pumping a tunable optical parametric oscillator OPO-A355 (GWU Lasertechnik Vertriebs GmbH, Erftstadt-Friesheim, Germany) containing a β-barium-borate crystal and providing pulses of 2–4 ns (510 nm, 0.2 mJ/pulse output at fiber ending). The laser light was directed to the tissue by a multimode fiber with core diameter of 400 mm. The detector was a gated R928 red-sensitive photomultiplier tube (Hamamatsu, Hamamatsu City, Japan) combined with a monochromator (model 77320; Oriel Corp., Stratford, CT) set at a wavelength of 635 nm. Signal processing was performed by an in-house-built integrator with an integration time of 3.5 µs and a reset time of 0.5 µs. A PC-based data-acquisition system using a PCI-MIO-16E1 data acquisition board (National Instruments, Austin, TX) sampled the signal at 250 kHz and averaged 64 laser pulses (repetition rate 20 Hz) before analysis. Control of the setup and analysis of the data were performed with software written in LabView (National Instruments, Austin, TX). Recovery of mitoPO2 histograms In the case of a nonhomogeneous mitoPO2, the delayed fluorescence signal generally can be described by an integral over an exponential kernel:
!
y(t) = exp("#t) f (#)0
t
$
where ƒ(λ) denotes the spectrum of reciprocal lifetimes that should be determined from the finite data set y(t). According to Golub et al. (11), a detailed recovery of the underlying oxygen distribution can be obtained by assuming that the delayed fluorescence signal can be described by a sum of rectangular distributions with an adequately small chosen width (2δ), resulting in the following fit equation:
!
Y *(t) = Y (t)[exp(k0t)kq"t /sinh(kq"t)] = wi exp(#kqQit)$

MITOCHONDRIAL PO2 IN VIVO
99
where Y(t) is the normalized delayed fluorescence data, k0 is the first-order rate constant for delayed fluorescence decay in the absence of oxygen, kq is the quenching constant, and wi is the weight factor for the according bin with central PO2 Qi and width 2δ (wi ≥ 0 and ∑wi = 1). Recently, this approach was successfully used by our group for the recovery of microvascular PO2 histograms from phosphorescence lifetime measurements (12).
For our analysis we chose δ to be 5 mmHg since this allows detailed resolution of PO2 histograms while keeping the transformation factor for Y*(t) below 1, diminishing the influence of noise in the tail of the delayed fluorescence signal (11). Using a 10-bin histogram, this allows the recovery of oxygen histograms over the physiological range of 0–100 mmHg. Recovery of oxygen histograms from the photometric signal was performed with the GraphPad Prism package (Version 4, GraphPad Software, San Diego, CA) using the Marquart-Levenberg nonlinear fit procedure. Animals The protocol was approved by the Animal Research Committee of the Academic Medical Center at the University of Amsterdam. Animal care and handling were performed in accordance with the guidelines for Institutional and Animal Care and Use Committees. Animal preparation A total of 26 male Wistar rats (Charles River, Wilmington, MA), with body weights between 300 and 400 g, were anesthetized by an intraperitoneal injection of a mixture of ketamine 90 mg kg-1, medetomidine 0.5 mg kg-1, and atropine 0.05 mg kg-1. Ketamine 50 mg kg-1 h-1 was infused intravenously to maintain anesthesia. Mechanical ventilation was performed via tracheotomy. Ventilation was adjusted on end-tidal PCO2, keeping the arterial PCO2 between 35 and 40 mmHg. Variations in FiO2 were made by mixtures of oxygen and nitrogen. Unless stated otherwise, FiO2 was set at 40%. For intravenous administration of drugs and fluids (NaCl as solvent for ALA, and Ringer’s lactate for maintenance), a polyethylene catheter (outer diameter 0.9 mm) was inserted into the right jugular vein. Arterial blood pressure and heart rate were monitored with a similar catheter in the right carotid artery. Crystalloid solution 5 mL kg-1 h-1 was administered continuously. Body temperature was rectally measured and kept at 37ºC ± 0.5 ºC by means of a heating pad.
The liver was exposed by midline laparotomy. Ischemia-reperfusion was performed by a method inducing partial hepatic ischemia (70%) as described elsewhere (16). In short, after dissection of the falciform ligament, the afferent vessels to the median and left lateral lobes were exposed by inverting the hepatic lobes upward. An atraumatic vascular clip was applied to these vessels to induce partial hepatic ischemia. In this way, cessation of the blood flow to the clipped lobes was complete, but the remaining perfused lobes prevented mesenteric congestion by allowing drainage of the portal vein. Delayed fluorescence signals during ischemia-reperfusion were obtained from the nonperfused lobes.
In a separate group of animals (n = 5), ALA was administered 2 h before the experiment by injection into the tail vein during pentobarbital anesthesia (60 mg/kg). After the ALA injection, the rats were allowed to recover for 2 h in the cage before being anesthetized with ketamine, medetomedine, and atropine as described above. Mechanical ventilation was performed via tracheotomy, and anesthesia was maintained with ketamine. Ventilation was adjusted on end-tidal PCO2 as described above and the liver was exposed by midline laparotomy. In these rats we performed experiments in which the oxygen concentration of the ambient atmosphere at the surface of the liver was altered using a previously described gas flow system (17). This system allowed application of gas mixtures (N2/O2) with varying oxygen concentrations to the organ surface at a rate of 250 mL/min. The gas was humidified and prewarmed so that it would not cool down or dry out the surface of the liver. Furthermore, the abdomen was loosely covered with Saran Wrap to shield the liver from convective air. The actual oxygen concentration at the surface (the site of measurement) was measured using a needle-type fiber-optic microsensor (OxyMicro System, World Precision Instruments, Sarasota, FL).

CHAPTER 7
100
Isolated hepatocytes Rat liver parenchymal cells were isolated according to a classic method (18). Cells were stored in Krebs-Henseleit solution and continuously gassed with 95% oxygen and 5% carbon dioxide until used for analysis. Calibration experiments were performed using a rotational cell oxygenator as described elsewhere (10). Oxygen consumption was blocked by a mixture of 2 mM sodium cyanide, 1 µM rotenone, and 10 µM diphenyleneiodonium chloride (all chemicals from Sigma, St. Louis, MO). Isolated liver After isolation the livers were retrograde-perfused via the vena porta with Krebs-Henseleit buffer at a continuous flow (35 mL/min). The oxygen content of the buffer was adjusted while keeping the carbon dioxide at 5% as previously described (17). Inhibition of cellular respiration was performed as described for isolated hepatocytes. Isolated mitochondria Mitochondria were isolated from the livers of animals treated with ALA (200 mg/kg) dissolved in 0.9% NaCl (n = 4) or with normal saline only (n = 4), 2–3 h before isolation. The isolation procedures were performed as reported previously (19). In short, the livers were placed in isolation buffer (200 mM mannitol, 50 mM sucrose, 5 mM KH2PO4, 5 mM MOPS, 1 mM EGTA, and 0.1% bovine serum albumin), minced into small pieces, and homogenized. The homogenate was centrifuged at 3220 g for 10 min. The pellet was resuspended in isolation buffer and centrifuged at 800 g for 10 min, and the remaining supernatant was centrifuged at 3220 g for 10 min. The final pellet was resuspended in isolation buffer and kept on ice, and the protein content was determined by the Bradford method. All procedures were performed at 4ºC. Mitochondrial oxygen consumption was measured polarographically at 37ºC in a respirometer, using mitochondria (1.0 mg protein/mL) resuspended in respiration buffer. Respiration was initiated with 10 mM succinate + 10 µM rotenone (state 2 respiration), followed by addition of 400 µM ADP (state 3 respiration). The respiratory control index (RCI) was calculated as the state 3 to state 4 ratio. All chemicals were obtained from Sigma (St. Louis, MO). Fluorescence microscopy Fluorescence microscopy was performed using a Leica fluorescence microscope (DM RA HC, Leica Microsystems GmbH, Wetzlar, Germany) with a cooled charge-coupled device camera (KX1400, Apogee Instruments, Roseville, CA) and CY3 band-pass filter set. We observed freshly isolated hepatocytes and used the rapid photobleaching of PpIX as the contrast-enhancing technique (10). Simulation of the photometric signal LabView (Version 7.1, National Instruments, Austin, TX) was used for simulation of delayed fluorescence emission in heterogeneous systems. Oxygen distributions were generated by a Monte Carlo approach for Gaussian distributions. Either a single Gaussian distribution or, to simulate more complex distributions, a combination of two Gaussian distributions was used to simulate an overall oxygen distribution. The mean and standard deviation (SD) of the individual Gaussian distributions, as well as relative contribution of the two Gaussian distributions to the overall oxygen distribution, could be freely chosen. The eventual oxygen distributions consisted of 200 equally wide bins over a range of 0–200 mmHg. The simulated oxygen distributions were used to generate a simulated photometric signal. To this end, a sum of 200 exponentials was generated with weight factors determined by the oxygen distribution, and lifetimes dictated by the quenching constants of protoporphyrin IX. The resulting trace was normalized and noise was added with varying signal/noise ratio (SNR). Here, SNR is defined as the ratio of maximum signal amplitude to the peak-to-peak noise (noise for a single

MITOCHONDRIAL PO2 IN VIVO
101
simulated event is equal to the total amplitude of noise times a random number on the symmetrical interval [–0.5, 0.5]). Statistical analysis Data are expressed as the mean ± SD. RESULTS ALA administration induced delayed fluorescence in vivo To enhance tissue PpIX levels in vivo, ALA (Sigma, St. Louis, MO; 200 mg/kg in 10 min) was administered intravenously via a jugular vein catheter to anesthetized and mechanically ventilated rats. Two hours after ALA administration, delayed fluorescence was observed in various tissues. To test the oxygen dependency of the delayed fluorescence lifetime, interventions that either globally (changes in the fraction of inspired oxygen (FiO2)) or locally (cessation of blood flow) altered oxygen delivery to the tissue were undertaken. Lowering of the FiO2 resulted invariably in a prolonging of the delayed fluorescence lifetime, e.g., in rectus abdominis muscle (Fig. 2 a). In the skin of the back paw, cessation of blood flow by ligation of the limb also resulted in prolonging of the lifetime (Fig. 2 b) in accordance with a reduction in PO2. ALA administration induced oxygen-dependent delayed fluorescence in all observed tissues, including gut, kidney, liver, heart, lung, skin, and muscle. No delayed fluorescence was observed in blood.
FIGURE 2 Intravenous ALA administration induces oxygen-dependent delayed fluorescence in tissues. (a) Delayed fluorescence signals from rat abdominal muscle at different FiO2 concentrations. (b) Delayed fluorescence signals from the skin of a rat paw before and 2 min after cessation (tourniquet) of blood supply to the limb.

CHAPTER 7
102
Calibration of the PpIX signal in isolated hepatocytes
To establish the mitochondrial localization of the ALA-induced PpIX and the usability of the delayed fluorescence lifetime for quantitative PO2 measurements, we further focused our experiments on the liver. This is because the liver provides all the components needed for our proof of principle: a high signal level, a standard technique for isolation of hepatocytes, and the possibility of obtaining measurements in an isolated perfused organ.
The mitochondrial origin of the delayed fluorescence signal was confirmed by fluorescence microscopy on isolated hepatocytes (Fig. 3 a). PpIX fluorescence had an intracellular origin and showed an inhomogeneous spot-like appearance (Fig. 3 a), as found in other cell types for which colocalization of the PpIX and mitochondria has been demonstrated (10).
Delayed fluorescence was measured in suspensions of freshly isolated hepatocytes subjected to various levels of oxygen. The calibration experiments showed excellent correlation between reciprocal lifetime and PO2 (Fig. 1 b), as described by the Stern-Volmer relation. The calibration constants were kq = 832 mmHg-1s-1 and τ0 = 0.8 ms, and were similar to previously reported values in cultured cell types (10).
FIGURE 3 PpIX is induced in the mitochondria by intravenous ALA administration, and its delayed fluorescence lifetime can be used to measure mitochondrial PO2. (a) Microscopic image of a single isolated hepatocyte, phase contrast (upper panel) and PpIX fluorescence (lower panel). The scale bar denotes 10 µm. The patchy pattern is typical for mitochondrial localization (10). (b) Reciprocal delayed fluorescence lifetime (1/τ) versus PO2 in suspensions of isolated hepatocytes. Inserted are the quenching constants from the Stern-Volmer equation in which kq is the quenching constant and τ0 is the lifetime at zero oxygen. The error bars indicate SD (n = 6). Performance of the deconvolution method For the recovery of oxygen distributions from the delayed fluorescence signals, we used an existing deconvolution method that was introduced by Golub et al. (11). In their original article, Golub et al. extensively described the background of the method and analyzed its performance in application to phosphorescence lifetime measurements with the oxygen-sensitive dye Pd-meso-tetra (4-carboxyphenyl) porphine. Their analysis showed that the method was able to provide accurate recovery of oxygen distributions and, moreover, had the very favorable property of being relatively

MITOCHONDRIAL PO2 IN VIVO
103
insensitive to noise. However, the performance of the deconvolution algorithm is dependent on the quenching constants and lifetime range. Therefore, based on the original approach of Golub et al., we extensively tested the method for the quenching constants of protoporphyrin IX by using computer simulations.
To test the sensitivity of the deconvolution method for noise, we performed recovery of the oxygen histogram from the same oxygen distribution with varying SNR in the simulated photometric signal. The detrimental effects of decreasing SNR on the deconvolution appear to be modest (Fig. 4), and there is a good resemblance between the theoretical histogram and recovered histograms for SNRs of 20 and higher. In practice, SNR is dependent on the number of averaged laser pulses. For the in vivo condition we used an averaged photometric signal consisting of 64 delayed fluorescence traces, resulting in an SNR that easily exceeded a value of 40. The SNR for the isolated liver experiments was ~30.
FIGURE 4 Effect of altered SNR on the ability of the histogram fitting procedure to recover the original computer-generated Gaussian distribution of PO2. (a) The simulated Gaussian oxygen distribution (mean = 43 mmHg; SD = 13 mmHg). (b) The theoretical oxygen histogram (result from dividing the oxygen distribution into 10 bins). (c) Effect of decreasing SNR on the shape of recovered oxygen histograms.

CHAPTER 7
104
To test the stability of the histogram fitting procedure in terms of reproducibility with slightly altered noise, several simulated photometric signals from the same underlying oxygen distribution (but with newly generated noise patterns) were sequentially analyzed (Fig. 5). The fitting procedure is stable and does not show severe deformations of the histogram in sequential runs, and the SD in the bins of the mean histogram is very small (even at n = 3).
FIGURE 5 Stability of the histogram fitting procedure in recovery of the underlying PO2 histogram with altered random noise. (a) Sequential runs at an SNR of 100. (b) Sequential runs at an SNR of 20. The underlying oxygen distribution is the same as in Fig. 1.
FIGURE 6 Recovery of various shapes of oxygen histograms and the effect of altered SNR.

MITOCHONDRIAL PO2 IN VIVO
105
Mitochondrial oxygen distributions in vivo are unknown and cannot a priori be assumed to be Gaussian. Therefore, it is essential for the histogram fitting procedure to be capable of recovering complex distributions. Although the deconvolution method in itself does not assume any underlying distribution, the Marquart-Levenberg algorithm requires an initial guess of the fitting parameters. To avoid biasing the outcome of the fit in any particular direction, the initial guess parameters for the weight factors were all set to 0.1 (i.e., corresponding to a flat distribution). Examples of several simulated complex oxygen distributions and their retrieval by the deconvolution method are provided in Fig. 6. It is clear that the histogram fitting procedure is not limited to Gaussian distributions and can provide insight into complex underlying oxygen distributions. In vitro calibration constants are valid in intact tissue We tested the validity of the calibration in isolated cells for intact liver tissue. To this end, isolated perfused rat livers were used 2 h after ALA infusion. The oxygen dependence of the delayed fluorescence signal is clearly demonstrated in a liver that was unintentionally inhomogeneously perfused (Fig. 7 a). One lobe appeared lighter than the rest of the liver with a surface temperature that was 2ºC lower, indicative of inadequate perfusion. During perfusion with carbogen-saturated (95% oxygen, 5% carbon dioxide) perfusate, the delayed fluorescence lifetime in the less-perfused part of the liver was much longer (205 µs) than that in the well-perfused part (74 µs). Blockage of oxygen consumption consistently led to a decrease in delayed fluorescence lifetime corresponding to an increase in PO2 (see Fig. 7 b for an example).
FIGURE 7 PpIX delayed fluorescence from intact rat liver has the same oxygen-dependent properties as in isolated cells. (a) Delayed fluorescence traces from a normally perfused and a hypoperfused area of an isolated rat liver. (b) Delayed fluorescence traces from an isolated liver before and after blockage of cellular respiration. (c) Mitochondrial PO2 measured in isolated rat liver before (baseline) and after blocking of cellular respiration using the calibration constants from the cell suspension experiments. Shown are the results of four individual livers. *Lifetime too short to be accurately measured with current setup. (d–f) Distributions of mitoPO2 after blockage of respiration at 3% oxygen (d), 6% oxygen (e), and 9% oxygen (f) in the perfusate. The shaded line denotes the theoretically expected value.
CHAPTER 7
106
To test the calibration constants, delayed fluorescence was measured at various fixed oxygen concentrations in the perfusate, before and after blockage of cellular oxygen consumption in a series of isolated liver experiments. Regardless of the oxygen concentration in the perfusate, the baseline mitochondrial PO2 (mitoPO2) was ~20 mmHg (Fig. 7 c). The relatively low PO2 values at baseline reflect the PO2 gradient between the perfusate and the mitochondria. The PO2 values measured after blockage of cellular respiration corresponded well to theoretically expected values. These experiments also demonstrate that the measurement is not dependent on the presence of blood, indicating that the signal truly originates from the tissue. This is in concordance with our observation that no delayed fluorescence was detected from whole blood or plasma, in agreement with the time course of previously reported PpIX kinetics (20).
The isolated organ is also a valuable model to test the algorithm for recovery of oxygen distributions in practice, since blockage of cellular respiration should ideally lead to a small distribution around the preset PO2 value. The applied method for lifetime deconvolution was very effective in indicating the correct PO2 bin (Fig. 7, d–f). The slight broadening of the peak can be attributed to residual noise in the signal, and it is likely that some residual oxygen heterogeneity was present in the tissue. The surface of the livers was not isolated from air, so it is likely that a contribution to higher PO2 bins is due to the presence of atmospheric oxygen.
In vivo measurement of mitoPO2 and its heterogeneity To test the sensitivity and applicability of the delayed fluorescence lifetime technique under relevant pathophysiological conditions, we varied FiO2 in one group of rats and induced ischemia-reperfusion in another group of animals. Two hours after ALA administration, we observed a clear oxygen-dependent delayed fluorescence signal from rat liver in vivo (Fig. 8 a). We performed a series of experiments with stepwise variation in FiO2 concentration (Fig. 8 b). The average measurements, obtained by monoexponential fitting of the signal, were highly reproducible in value, with low variance between rats. Notably, mitoPO2 was especially sensitive to small changes in FiO2 around atmospheric oxygen levels (20% inspired oxygen). The recovery of mitoPO2 histograms (Fig. 8, c–h) provides a more detailed view on the effects of FiO2 on cellular oxygenation. At FiO2 ≥ 20%, mitoPO2 is approximately normally distributed, in good agreement with previous invasive micro oxygen electrode measurements (21). However, even a mild reduction of FiO2 to 18% resulted in severe skewing of the mitoPO2 distribution toward low PO2. It is interesting that although further reduction of FiO2 results in overall lower mitoPO2, mitoPO2 is relatively preserved in the 15 mmHg bin (representing 10–20 mmHg) (Fig. 8, g and h).
In another group of animals we performed a short ischemia-reperfusion protocol consisting of 30 min of ischemia followed by 15 min of reperfusion (Fig. 9 a). Overall mitoPO2 dropped to ~10 mmHg during ischemia, and then recovered to approximately baseline after the 15-min reperfusion (Fig. 9 b). Again the mitoPO2 histograms provide valuable additional information (Fig. 9, c–g). Similar to the condition of breathing a low FiO2, a large part of the signal originated from mitochondria in the 15 mmHg bin. Apparently, the liver in vivo was not completely anoxic during ischemia. Since this appears counterintuitive, it should be stressed that this finding was not caused by a limitation of our technique: longer lifetimes (lower PO2) were measured in both isolated hepatocytes and isolated liver under forced oxygen depletion. Moreover, in previously reported tissue PO2 measurements, ischemia did not reduce tissue PO2 under 14 mmHg (21). Reperfusion led to complete alteration of the mitoPO2 distribution, which flattened overall compared to the baseline situation (Fig. 9, f and g). Both low- and high-mitoPO2 regions were more prominently present, with some development toward higher PO2 during progress of reperfusion.

MITOCHONDRIAL PO2 IN VIVO
107
FIGURE 8 Delayed fluorescence lifetime measurements can be used for quantitative assessment of in vivo mitoPO2. Measurements in rat liver in vivo are shown. (a) Normalized delayed fluorescence lifetime signals different FiO2 concentrations. (b) Average mitoPO2 measured versus the FiO2. Error bars indicate the SD (n = 6). (c–h) Distributions of mitoPO2 at different FiO2 concentrations: 100% O2 (c), 40% O2 (d), 20% O2 (e), 18% O2 (f), 15% O2 (g), and 10% O2 (h).

CHAPTER 7
108
FIGURE 9 Effect of ischemia-reperfusion on mitoPO2 in rat liver in vivo. (a) Ischemia-reperfusion protocol and times of measurement: baseline (B), 15 (I 15) and 25 (I 25) min ischemia, and 5 (R 5) and 15 (R 15) min reperfusion. (b) Average mitoPO2. (c–g) Distributions of mitoPO2 at time points B (c), I 15 (d), I 25 (e), R 5(f), and R 15 (g). Error bars indicate the SD (n = 3).

MITOCHONDRIAL PO2 IN VIVO
109
Influence of out-of-range PO2 on histogram recovery
The choice of bin width and number of bins limits our current implementation of the deconvolution method to PO2 values between 0 and 100 mmHg. For in vivo application of the delayed fluorescence lifetime technique under physiological circumstances, this can be considered an adequate range. However, a contribution of room air to the oxygenation of superficial tissue layers cannot be excluded, and therefore it is possible that PO2 values above 100 mmHg are present in the measurement volume. The short lifetimes from regions with a PO2 above 100 mmHg are not represented in the fit algorithm and therefore might lead to instability or an adverse effect on the shape of recovered histograms. Therefore, we tested in computer simulations the effect of adding high PO2 values (around those of room air) on the histogram fitting procedure. PO2 values outside the range of the deconvolution method induce the occurrence of small peaks at the high PO2 bins (Fig. 10). The accurate recovery of the remaining distribution is not affected.
FIGURE 10 Effect of the presence of a region with PO2 outside the range covered by the deconvolution method. (a) Two simulated PO2 distributions and their recovery from the simulated photometric signal. (b) Effect of the presence of a small peak at ~150 mmHg (mimicking the effect of room air). Effect of ambient oxygen on mitoPO2 histograms in vivo The previous computer simulations demonstrated that PO2 values outside the range of the deconvolution method are represented as contributions to the highest PO2 bins. It is important that the recovery of the ‘‘true’’ oxygen histogram was not affected. However, the situation in real life is more complex. Here, exposure of the organ surface to ambient air could cause the presence of nonphysiological high oxygen concentrations. Diffusion of oxygen out of this high-PO2 region into low- PO2 regions could cause disturbance of the oxygen distribution in the tissue and therefore affect the recovered mitoPO2 histogram. To investigate the occurrence of this effect and to quantify its possible influence, we performed in vivo experiments (n = 5) in which the surface oxygen concentration was altered by blowing prewarmed and humidified gas mixtures over the surface of the liver at a rate of 250 mL/min (Fig. 11). The presence of 10% and 20% oxygen at the surface is visible as small contributions to the highest PO2 bins. However, the remaining mitoPO2 histograms are not affected, indicating that only a small (the most superficial) part of the measurement volume is influenced by the oxygen concentration at the organ surface.
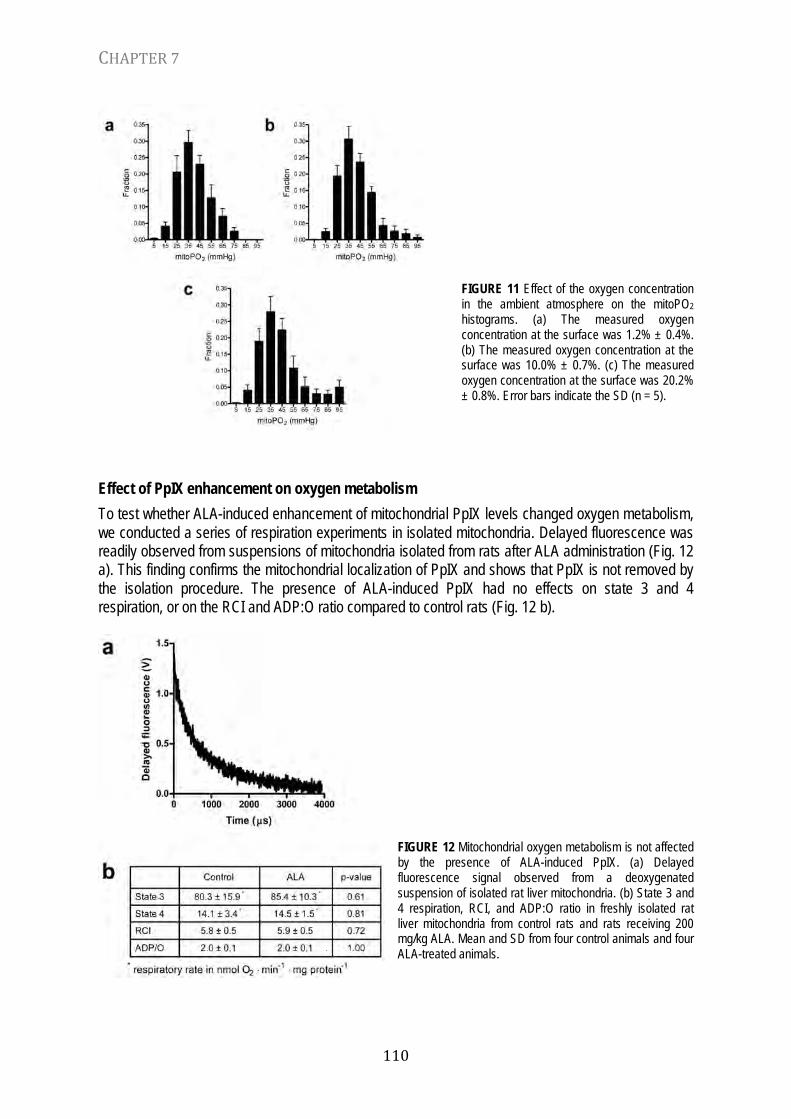
CHAPTER 7
110
FIGURE 11 Effect of the oxygen concentration in the ambient atmosphere on the mitoPO2 histograms. (a) The measured oxygen concentration at the surface was 1.2% ± 0.4%. (b) The measured oxygen concentration at the surface was 10.0% ± 0.7%. (c) The measured oxygen concentration at the surface was 20.2% ± 0.8%. Error bars indicate the SD (n = 5).
Effect of PpIX enhancement on oxygen metabolism To test whether ALA-induced enhancement of mitochondrial PpIX levels changed oxygen metabolism, we conducted a series of respiration experiments in isolated mitochondria. Delayed fluorescence was readily observed from suspensions of mitochondria isolated from rats after ALA administration (Fig. 12 a). This finding confirms the mitochondrial localization of PpIX and shows that PpIX is not removed by the isolation procedure. The presence of ALA-induced PpIX had no effects on state 3 and 4 respiration, or on the RCI and ADP:O ratio compared to control rats (Fig. 12 b).
FIGURE 12 Mitochondrial oxygen metabolism is not affected by the presence of ALA-induced PpIX. (a) Delayed fluorescence signal observed from a deoxygenated suspension of isolated rat liver mitochondria. (b) State 3 and 4 respiration, RCI, and ADP:O ratio in freshly isolated rat liver mitochondria from control rats and rats receiving 200 mg/kg ALA. Mean and SD from four control animals and four ALA-treated animals.

MITOCHONDRIAL PO2 IN VIVO
111
DISCUSSION
We have reported the development and application of a technique that enables the measurement of mitoPO2 and the assessment of its heterogeneity in vivo by delayed fluorescence quenching of endogenously synthesized PpIX. The power of the technique and its potential for a broad field of applications are due to the combination of a specific and robust lifetime technique with reliance on an endogenous compound.
This approach has several distinct advantages. In the context of oxygen measurements, it is the first technique that allows quantitative PO2 measurements to be obtained at the mitochondrial level in vivo. Unlike existing techniques for in vivo oxygen measurements (5), it does not require tissue destruction or injection of exogenous oxygen-sensitive compounds. The ability to recover mitoPO2 histograms with high temporal resolution (on the order of seconds) is clearly advantageous. There are several deconvolution techniques available, each of which has specific advantages and disadvantages. For example, the maximum entropy method (22) allows very detailed recovery of oxygen histograms (resolving typically 200 lifetimes) but requires very high SNR levels for stable operation. The use of such a deconvolution technique for the recovery of oxygen histograms in the setting of phosphorescence lifetime measurements was recently questioned due to the occurrence of nonphysiological high PO2 values (23); however, this effect was proposed to result from blurring of the high-PO2 region due to diminished contribution of short lifetimes to the overall phosphorescence signal (24,25) (decreasing the SNR for high-PO2 regions). The method we chose operates stably at modest SNRs, but at the expense of a reduced resolving power (11). Nevertheless, this approach allows insight into complex oxygen distributions in tissue samples, as demonstrated by its practical application and in computer simulations. Since the isolated and in vivo livers were not shielded from room air, it is likely that atmospheric oxygen caused some of the high values for mitoPO2. Indeed, in computer simulations, the addition of room air caused high PO2 bins to occur without affecting the underlying PO2 distribution. Furthermore, in vivo experiments clearly demonstrated the influence of ambient oxygen concentration on mitoPO2. Although in our current setting this had no detrimental effects on the underlying mitoPO2 distribution, it is important to note that the influence of ambient oxygen might be present in any type of (oxygen) measurement that is limited in penetration depth. It should be noted, however, that covering the organ surface with Saran Wrap or keeping the oxygen concentration at the surface artificially low might equally well deviate from the physiological in vivo situation.
Although deconvolution techniques allow measurement of oxygen heterogeneity with high temporal resolution, for insights into the nature of this heterogeneity, and its relation to localization, other techniques have to be explored. Since it is an optical technique, delayed fluorescence of PpIX could well be combined with microscopic setups to increase the spatial resolution to allow the unraveling of tissue oxygenation on the micron scale. For example, two-photon excitation (26) provides three-dimensional insight into oxygen distributions, and intravital microscopy (27–30) provides anatomical information. Finally, for in vivo measurements, another crucial factor is that lifetime measurements are not disturbed by changes in tissue optical properties.
Although PpIX is endogenously present, its normal levels are very low. Therefore, to improve its detection our current approach relies on the application of its precursor, ALA, to enhance mitochondrial PpIX levels. Although ALA is nontoxic and is used in daily clinical practice in photodynamic therapy (31) and photodynamic diagnosis (32), high levels of PpIX are not harmless. Under the conditions in our study, we found no effects of ALA-induced PpIX levels on mitochondrial respiration. However, in general, the concentrations of ALA or incubation times that can be used safely without changing tissue metabolism remain to be determined. Excitation of PpIX is known to induce apoptosis in cells as a result of oxygen-radical formation (31). We did not detect any significant changes in cell survival after repeated illumination in ALA-treated cell cultures (10). The excitation light levels needed for mitoPO2 measurements are orders of magnitude less than light levels used in photodynamic therapy, and

CHAPTER 7
112
therefore tissue damage due to phototoxicity may not be a problem in practice. Nevertheless, we would like to point out that for any intended application (especially if aimed at clinical use), an appropriate risk and safety assessment is required because of potential phototoxicity. Especially, one should strive to minimize the cumulative dose of excitation light to avoid induction of apoptosis.
It is interesting that the values of in vivo mitoPO2 are in the range of reported hepatic tissue PO2 values (21,33). This indicates that in the liver in vivo, the final diffusion gradient from the microcirculation to the mitochondria is quite small. Apparently, the hepatic architecture does not induce a profound diffusion barrier, since the intracellular oxygen gradient is only a few mmHg (10). Indeed, a sinusoidal-to-cell PO2 gradient of ~5 mmHg was previously reported (34).
The finding of high hepatic mitoPO2 values in vivo is of significant interest. Whether molecular oxygen plays a role in the regulation of cellular metabolism has long been a subject of debate. Classical studies in isolated mitochondria and cells have shown that the respiration rate is unaffected by oxygen levels until PO2 levels drop below 2–3 mmHg (35–38). This indicates a lack of metabolic control, under the assumption that normal physiological intracellular PO2 may be well above this threshold level. Alternatively, it has been stated that the general view of mitochondrial function is biased owing to the excessively high PO2 (air-saturated, i.e., ~150 mmHg) range in most in vitro experiments (39), assuming physiological normoxic mitochondrial PO2 to be below 1 kPa (7.5 mmHg). In skeletal muscle, a combination of myoglobin saturation, phosphorylation state, and intracellular pH measurements led to the rejection of the hypothesis that oxygen plays a regulatory role in cellular respiration (40). However, recent studies have questioned the idea that oxygen acts as a simple substrate over the physiological range of oxygen tensions, and have identified a mechanism in hepatocytes called the ‘‘oxygen conformance of metabolism’’ (41,42). Here oxygen consumption is downregulated when cells are subjected to moderate oxygen deprivation for extended periods of time (41). Of interest is that this phenomenon already occurs at relatively high PO2 values of ~70 mmHg (4,42). The data presented here provide new insights into this possible mechanism by identifying the hepatic mitochondrial PO2 in vivo to be in the range of this oxygen conformance of metabolism. This makes it very likely that metabolic control by oxygen, as demonstrated in vitro, is a cellular regulation mechanism acting under normal physiological circumstances and is not limited to pathophysiological states of hypoxia. Since the mitochondria are considered to play a major role in cellular oxygen sensing (3), knowledge of in vivo mitochondrial PO2 levels provides a sound basis for future in vitro experiments. CONCLUSIONS This delayed fluorescence lifetime approach manifests potent abilities for the quantitative assessment of mitochondrial oxygen tension in vivo. In ALA-treated rats, oxygen-dependent delayed fluorescence was emitted by many tissues and was calibrated in isolated hepatocytes and isolated livers. In combination with a lifetime-deconvolution algorithm, this allowed the measurement of mitoPO2 histograms in rat liver in vivo. Because the technique relies on enhancement of an endogenously synthesized porphyrin, it is in principle usable in humans. If its safety in terms of phototoxicity can be proven, it may be possible to assess mitoPO2 in the clinical setting. The technique is expected to provide the basis of many new applications for mitochondrial PO2 measurements, including transplantation research, intensive-care research, and tissue engineering. This work was supported in part by a Technological Collaboration Grant (TSGE 1048) from the Dutch Ministry of Economic Affairs. As part of this collaboration, K. Boller and A.F. Niewenhuis (Department of Laser Physics and Non-linear Optics, University of Twente, Enschede, The Netherlands) kindly provided the pulsed laser system, the tunable optical parametric oscillator, and technical assistance. J. Stap was funded in part by a grant from the Dutch Cancer Society. E.G.M. conceived and designed the study, performed experiments, programmed the software, performed the computer simulations, and wrote the manuscript; T.J. and C.J.Z. were involved in the design of biological experiments, performed

MITOCHONDRIAL PO2 IN VIVO
113
experiments, and assisted with the interpretation of data and drafting of the manuscript. A.H. and C.J.Z. performed the mitochondrial respiration experiments. J.H.P.M.H.-W. assisted with the isolated liver experiments and performed the isolation of hepatocytes; G.M.B. assisted with in vivo experiments; J.S. performed fluorescence microscopy; J.F.B. was involved in the construction of the delayed fluorescence setup; and C.I. facilitated the study and supervised the work. REFERENCES 1. Mitchell, P., and J. Moyle. 1967. Chemiosmotic hypothesis of oxidative phosphorylation. Nature. 213:137–139. 2. Chandel, N. S., G. R. Budinger, S. H. Choe, and P. T. Schumacker. 1997. Cellular respiration during hypoxia. Role of
cytochrome oxidase as the oxygen sensor in hepatocytes. J. Biol. Chem. 272:18808–18816. 3. Kemp, P. J. 2006. Detecting acute changes in oxygen: will the real sensor please stand up? Exp. Physiol. 91:829–834. 4. Rissanen, E., H. K. Tranberg, and M. Nikinmaa. 2006. Oxygen availability regulates metabolism and gene expression
in trout hepatocytes cultures. Am. J. Physiol. Regul. Integr. Comp. Physiol. 291: R1507–R1515. 5. Springett, R., and H. M. Swartz. 2007. Measurements of oxygen in vivo: overview and perspectives on methods to
measure oxygen within cells and tissues. Antioxid. Redox Signal. 9:1295–1301. 6. Whalen, W. J., P. Nair, and R. A. Ganfield. 1973. Measurements of oxygen tension in tissues with a micro oxygen
electrode. Microvasc. Res. 5:254–262. 7. Rumsey, W. L., J. M. Vanderkooi, and D. F. Wilson. 1988. Imaging of phosphorescence: a novel method for measuring
oxygen distribution inperfused tissue. Science. 241:1649–1651. 8. Vanderkooi, J. M., G. Maniara, T. J. Green, and D. F. Wilson. 1987. An optical method for measurement of dioxygen
concentration based upon quenching of phosphorescence. J. Biol. Chem. 262:5476–5482. 9. Swartz, H. M., and R. B. Clarkson. 1998. The measurement of oxygen in vivo using EPR techniques. Phys. Med. Biol.
43:1957–1975. 10. Mik, E. G., J. Stap, M. Sinaasappel, J. F. Beek, J. A. Aten, T. G. van Leeuwen, and C. Ince. 2006. Mitochondrial PO2
measured by delayed fluorescence of endogenous protoporphyrin IX. Nat. Methods. 3:939–945. 11. Golub, A. S., A. S. Popel, L. Zheng, and R. N. Pittman. 1997. Analysis of phosphorescence in heterogeneous systems
using distributions of quencher concentration. Biophys. J. 73:452–465. 12. Johannes, T., E. G. Mik, and C. Ince. 2006. Dual-wavelength phosphorimetry for determination of cortical and
subcortical microvascular oxygenation in rat kidney. J. Appl. Physiol. 100:1301–1310. 13. Poulson, R. 1976. The enzymic conversion of protoporphyrinogen IX to protoporphyrin IX in mammalian mitochondria.
J. Biol. Chem. 251:3730–3733. 14. Fukuda, H., A. Casas, and A. Batlle. 2005. Aminolevulinic acid: from its unique biological function to its star role in
photodynamic therapy. Int. J. Biochem. Cell Biol. 37:272–276. 15. Dalton, J., C. A. McAuliffe, and D. H. Slater. 1972. Reaction between molecular oxygen and photo excited
protoporphyrin IX. Nature. 235:388. 16. Heijnen, B. H., S. Q. van Veen, I. H. Straatsburg, and T. M. van Gulik. 2001. Pronounced effect of minor changes in
body temperature on ischemia and reperfusion injury in rat liver. J. Appl. Physiol. 91:265–268. 17. Mik, E. G., C. Donkersloot, N. J. Raat, and C. Ince. 2002. Excitation pulse deconvolution in luminescence lifetime
analysis for oxygen measurements in vivo. Photochem. Photobiol. 76:12–21. 18. Groen, A. K., H. J. Sips, R. C. Vervoorn, and J. M. Tager. 1982. Intracellular compartmentation and control of alanine
metabolism in rat liver parenchymal cells. Eur. J. Biochem. 122:87–93. 19. Heinen, A., A. K. Camara, M. Aldakkak, S. S. Rhodes, M. L. Riess, and D. F. Stowe. 2007. Mitochondrial Ca2+-induced
K+ influx increases respiration and enhances ROS production while maintaining membrane potential. Am. J. Physiol. Cell Physiol. 292:C148–C156.
20. van den Boogert, J., R. van Hillegersberg, F. W. de Rooij, R. W. de Bruin, A. Edixhoven-Bosdijk, A. B. Houtsmuller, P. D. Siersema, J. H. Wilson, and H. W. Tilanus. 1998. 5-Aminolaevulinic acid-induced protoporphyrin IX accumulation in tissues: pharmacokinetics after oral or intravenous administration. J. Photochem. Photobiol. B. 44:29–38.
21. van Wagensveld, B. A., T. M. van Gulik, E. E. Gabeler, A. J. van der Kleij, H. Obertop, and D. J. Gouma. 1998. Intrahepatic tissue PO2 during continuous or intermittent vascular inflow occlusion in a pig liver resection model. Eur. Surg. Res. 30:13–25.
22. Vinogradov, S. A., and D. F. Wilson. 2000. Recursive maximum entropy algorithm and its application to the luminescence lifetime distribution recovery. Appl. Spectrosc. 54:849–855.
23. Tsai, A. G., P. Cabrales, P. C. Johnson, and M. Intaglietta. 2007. New phosphorescence quenching oxygen measurements technique yields unusual tissue and plasma PO2 distributions. J. Appl. Physiol. 102: 2081–2082.
24. Wilson, D. F., W. M. F. Lee, S. Makonnen, O. Finikova, S. Apreleva, and S. A. Vinogradov. 2007. Reply to Tsai, Cabrales, Johnson, and Intaglietta. J. Appl. Physiol. 102:2083.
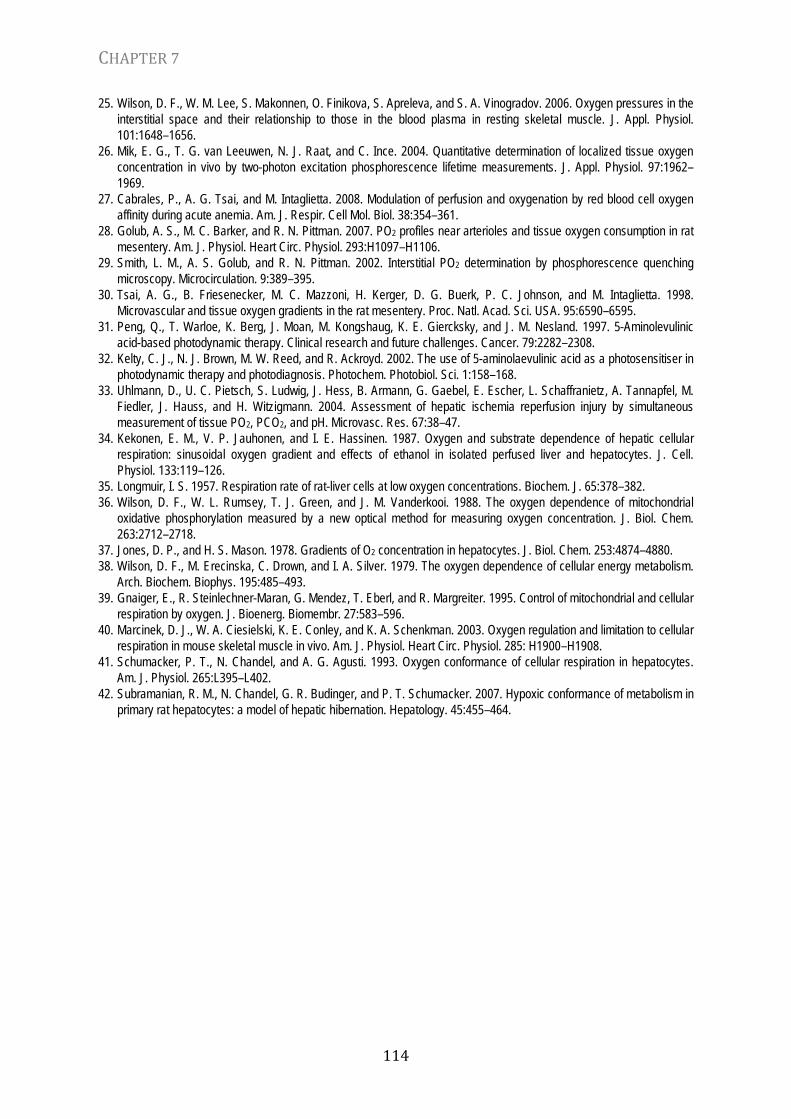
CHAPTER 7
114
25. Wilson, D. F., W. M. Lee, S. Makonnen, O. Finikova, S. Apreleva, and S. A. Vinogradov. 2006. Oxygen pressures in the interstitial space and their relationship to those in the blood plasma in resting skeletal muscle. J. Appl. Physiol. 101:1648–1656.
26. Mik, E. G., T. G. van Leeuwen, N. J. Raat, and C. Ince. 2004. Quantitative determination of localized tissue oxygen concentration in vivo by two-photon excitation phosphorescence lifetime measurements. J. Appl. Physiol. 97:1962–1969.
27. Cabrales, P., A. G. Tsai, and M. Intaglietta. 2008. Modulation of perfusion and oxygenation by red blood cell oxygen affinity during acute anemia. Am. J. Respir. Cell Mol. Biol. 38:354–361.
28. Golub, A. S., M. C. Barker, and R. N. Pittman. 2007. PO2 profiles near arterioles and tissue oxygen consumption in rat mesentery. Am. J. Physiol. Heart Circ. Physiol. 293:H1097–H1106.
29. Smith, L. M., A. S. Golub, and R. N. Pittman. 2002. Interstitial PO2 determination by phosphorescence quenching microscopy. Microcirculation. 9:389–395.
30. Tsai, A. G., B. Friesenecker, M. C. Mazzoni, H. Kerger, D. G. Buerk, P. C. Johnson, and M. Intaglietta. 1998. Microvascular and tissue oxygen gradients in the rat mesentery. Proc. Natl. Acad. Sci. USA. 95:6590–6595.
31. Peng, Q., T. Warloe, K. Berg, J. Moan, M. Kongshaug, K. E. Giercksky, and J. M. Nesland. 1997. 5-Aminolevulinic acid-based photodynamic therapy. Clinical research and future challenges. Cancer. 79:2282–2308.
32. Kelty, C. J., N. J. Brown, M. W. Reed, and R. Ackroyd. 2002. The use of 5-aminolaevulinic acid as a photosensitiser in photodynamic therapy and photodiagnosis. Photochem. Photobiol. Sci. 1:158–168.
33. Uhlmann, D., U. C. Pietsch, S. Ludwig, J. Hess, B. Armann, G. Gaebel, E. Escher, L. Schaffranietz, A. Tannapfel, M. Fiedler, J. Hauss, and H. Witzigmann. 2004. Assessment of hepatic ischemia reperfusion injury by simultaneous measurement of tissue PO2, PCO2, and pH. Microvasc. Res. 67:38–47.
34. Kekonen, E. M., V. P. Jauhonen, and I. E. Hassinen. 1987. Oxygen and substrate dependence of hepatic cellular respiration: sinusoidal oxygen gradient and effects of ethanol in isolated perfused liver and hepatocytes. J. Cell. Physiol. 133:119–126.
35. Longmuir, I. S. 1957. Respiration rate of rat-liver cells at low oxygen concentrations. Biochem. J. 65:378–382. 36. Wilson, D. F., W. L. Rumsey, T. J. Green, and J. M. Vanderkooi. 1988. The oxygen dependence of mitochondrial
oxidative phosphorylation measured by a new optical method for measuring oxygen concentration. J. Biol. Chem. 263:2712–2718.
37. Jones, D. P., and H. S. Mason. 1978. Gradients of O2 concentration in hepatocytes. J. Biol. Chem. 253:4874–4880. 38. Wilson, D. F., M. Erecinska, C. Drown, and I. A. Silver. 1979. The oxygen dependence of cellular energy metabolism.
Arch. Biochem. Biophys. 195:485–493. 39. Gnaiger, E., R. Steinlechner-Maran, G. Mendez, T. Eberl, and R. Margreiter. 1995. Control of mitochondrial and cellular
respiration by oxygen. J. Bioenerg. Biomembr. 27:583–596. 40. Marcinek, D. J., W. A. Ciesielski, K. E. Conley, and K. A. Schenkman. 2003. Oxygen regulation and limitation to cellular
respiration in mouse skeletal muscle in vivo. Am. J. Physiol. Heart Circ. Physiol. 285: H1900–H1908. 41. Schumacker, P. T., N. Chandel, and A. G. Agusti. 1993. Oxygen conformance of cellular respiration in hepatocytes.
Am. J. Physiol. 265:L395–L402. 42. Subramanian, R. M., N. Chandel, G. R. Budinger, and P. T. Schumacker. 2007. Hypoxic conformance of metabolism in
primary rat hepatocytes: a model of hepatic hibernation. Hepatology. 45:455–464.

Chapter 8
Mitochondrial Oxygen Tension
within the Heart
E.G. Mik, C. Ince, O. Eerbeek, A. Heinen, J. Stap, B. Hooibrink,
C.A. Schumacher,G.M. Balestra, T. Johannes, J.F. Beek,
A.F. Nieuwenhuis, P. van Horssen, J.A. Spaan
and C.J. Zuurbier
Journal of Molecular and Cellular Cardiology 46: 943-951, 2009

CHAPTER 8
116
ABSTRACT By using a newly developed optical technique which enables non-invasive measurement of mitochondrial oxygenation (mitoPO2) in the intact heart, we addressed three long-standing oxygenation questions in cardiac physiology: 1) what is mitoPO2 within the in vivo heart?, 2) is mitoPO2 heterogeneously distributed?, and 3) how does mitoPO2 of the isolated Langendorff-perfused heart compare with that in the in vivo working heart? Following calibration and validation studies of the optical technique in isolated cardiomyocytes, mitochondria and intact hearts, we show that in the in vivo condition mean mitoPO2 was 35±5 mmHg. The mitoPO2 was highly heterogeneous, with the largest fraction (26%) of mitochondria having a mitoPO2 between 10 and 20 mmHg, and 10% between 0 and 10 mmHg. Hypoxic ventilation (10% oxygen) increased the fraction of mitochondria in the 0–10 mmHg range to 45%, whereas hyperoxic ventilation (100% oxygen) had no major effect on mitoPO2. For Langendorff-perfused rat hearts, mean mitoPO2 was 29±5 mmHg with the largest fraction of mitochondria (30%) having a mitoPO2 between 0 and 10 mmHg. Only in the maximally vasodilated condition, did the isolated heart compare with the in vivo heart (11% of mitochondria between 0 and 10 mmHg). These data indicate 1) that the mean oxygen tension at the level of the mitochondria within the heart in vivo is higher than generally considered, 2) that mitoPO2 is considerably heterogeneous, and 3) that mitoPO2 of the classic buffer-perfused Langendorff heart is shifted to lower values as compared to the in vivo heart. INTRODUCTION Mitochondria figure prominently in cardiac physiology by powering virtually all forms of mechanical and chemical work of the heart. These organelles can also play a decisive role in cell death and survival signaling. Oxygen is the underlying, ultimate molecule used by the mitochondria, thus giving it the essential role in dictating life or death. The partial pressure of oxygen within the mitochondria (mitoPO2) is hypothesized to have a regulatory function in important physiological processes such as energy production, radical production, oxygen sensing, and gene expression (1–5). Surprisingly, no direct quantitative data concerning the in vivo mitoPO2 within the intact heart are available in the literature.
MitoPO2 can be estimated from PO2 values reported for other compartments such as the cytosolic, tissue or vascular compartments. Interestingly, most studies report rather low PO2 values ranging from 10–17 mmHg for vascular and interstitial compartments (6–8) to 3–7 mmHg for the cytosolic compartment (9–11). Such low values suggest that the oxygen tension at the mitochondria, being at the lowest end of the diffusion pathway which oxygen must travel, is below 5 mmHg, making it likely that oxygen regulates energy production (1,3,5). These values deviate largely from other studies, however, which report cardiac microvascular PO2 values of 50–70 mmHg (12) or interstitial values of 45 mmHg (13). Using these latter, higher values, mitoPO2 is estimated to be between 20 and 40 mmHg. To resolve these conflicting estimated data on such an important (patho)physiological parameter of the heart, our first goal of the present study was to provide a direct determination of mitoPO2 within the intact heart. To this end, we employed a novel optical technique using oxygen-dependent quenching of the delayed fluorescence lifetime from mitochondrial protoporphyrin IX (PpIX) (14,15).
In addition, although spatial heterogeneity of blood flow, oxygen delivery and oxygen metabolism within the heart is well accepted (12,16,17), it is not known whether such heterogeneity extends to the oxygenation status of mitochondria. Aside from heterogeneity dictated by blood flow distribution, heterogeneity may also exist due to the distribution of mitochondria within the cardiomyocyte, i.e., subsarcolemmal and interfibrillar mitochondria (18). When mitoPO2 heterogeneity is present, the determination of a single averaged mitoPO2 for the whole heart is misleading in that a significant, albeit small, part of all mitochondria within the heart may still be oxygen limited. Thus, a second goal of the present study entailed the determination of mitoPO2 heterogeneity using a lifetime-deconvolution

MITOCHONDRIAL PO2 WITHIN THE HEART
117
algorithm developed by Golub et al. (19). Finally, we wanted to compare the mitochondrial oxygenation status in the isolated, Langendorff-
perfused heart with that in the in vivo working heart. Investigations with isolated hearts are numerous, and the results obtained have been used to further our understanding of heart physiology, so that the validity of this model is of utmost importance (20). We are not aware of other studies that have directly compared the mitochondrial oxygenation status of the isolated heart with that of the in vivo heart, and as such, this direct comparison will aid in answering questions concerning the validity of the isolated heart model.
In the present study we used a novel optical technique (14,15), which allowed for the first time quantitative and non-invasive measurements of mitoPO2 in the intact heart. Following validation of our technique for determination of mitoPO2 within the heart, our observations demonstrated rather high mean mitoPO2 values of 35 mmHg in the in vivo heart. However, cardiac mitoPO2 was considerably heterogeneous, such that 10% of mitochondria in the in vivo condition and 30% of mitochondria in the isolated Langendorff-perfused condition still had a mitoPO2 between 0 and 10 mmHg, despite the relatively high mean mitoPO2. Only in the maximal vasodilated condition did the mitochondrial oxygenation status of the isolated heart mimic that of the in vivo heart. MATERIALS AND METHODS Animals Male Wistar rats (Charles River, Wilmington, MA), 38 animals in total with body weight of 351±7 g, were anesthetized with 60 mg/kg pentobarbital and received 5-aminolevulinic acid (ALA; 200 mg/kg dissolved in PBS (100 mg/ml)) through the tail vein, 2–5 h before experimentation or saline (controls). The protocol was approved by the Animal Research Committee of the Academic Medical Center at the University of Amsterdam. Animal care and handling were performed in accordance with the guidelines for Institutional and Animal Care and Use Committees (IACUC).
Isolated cardiomyocytes Hearts (n=4) were excised from pentobarbital-anesthetized animals and cardiomyocytes isolated according to previous reports (21). Cardiomyocytes were kept in albumin-free, low Ca2+-containing Krebs–Henseleit solution until measurements. Fluorescence microscopy Fluorescence microscopy was performed using a Leica fluorescence microscope (DM RA HC) with a cooled CCD camera (KX1400, Apogee Instruments, Roseville, CA) and CY3 band pass filter set. Detection of protoporphyrin IX (PpIX) and MitoTracker Green was similar to that previously reported (15). Cardiomyocytes were incubated with MitoTracker Green (27 nM for 30 min) and contraction inhibited with butanedione monoxime (BDM; 20 mM). PpIX bleaches rapidly, and we used this property to separate PpIX fluorescence from other sources of autofluorescence (15). Two successive illuminations of 30 s were performed while integrating the fluorescence images on the cooled CCD. The second image was subtracted from the first image using Image-Pro Plus software (Media Cybernetics, Bethesda, MD). The resulting “bleached image” represented the true PpIX signal. MitoTracker Green images were acquired with a 2 s integration time. Flow cytometry Cardiomyocytes were isolated from hearts of either ALA-treated or saline-treated animals (control). The PpIX fluorescence was studied in control and ALA cells with a LSRII flowcytometer (LSRII, BDbioscience San Jose, CA). To study PpIX fluorescence, the viable cardiomyocytes were gated from a FSC (forward scatter) and SSC (side scatter) dotplot, and PpIX was excited by the blue laser (488 nm) and fluorescence was detected at 695 nm.
CHAPTER 8
118
Imaging cryomicrotome Hearts from ALA-treated and saline-treated animals were rinsed with saline solution and submerged together in a solution of carboxymethylcellulose sodium solvent (Brunschwig Chemie, Amsterdam) and Indian ink (Royal Talens, Apeldoorn) and frozen at −20 °C in an imaging cryomicrotome (22). The frozen hearts were serially sectioned from base to apex into 17 µm slices. After each cut, images were taken from the cutting plane of the remaining bulk using a 4000–4000 pixel camera (ALTA U16, Apogee Instruments, Roseville, CA) equipped with a 70–180 mm Nikon lens, with excitation set at 510/20 nm and fluorescence detected at 635/30 nm. Calibration of the PpIX delayed fluorescence lifetime with partial oxygen tension in cardiomyocytes A cardiomyocyte suspension of 2 ml was placed in a custom-made cell oxygenator (15). An adjustable gas-mixture of O2, N2 and 5% CO2 was blown over the cell suspension with %O2 set at 0, 1, 2, 3, 4 or 5%. Oxygen consumption was inhibited using KCN (10 mM), rotenone (4 µM) and diphenyleneio-donium (DPI; 40 µM). Evaluation of the calibration of the PpIX delayed fluorescence lifetime in isolated hearts To test the feasibility of the calibration of PpIX delayed fluorescence lifetime obtained in isolated cardiomyocytes for use in the intact heart, we performed PpIX lifetime measurements in Langendorff-perfused hearts (n=3) perfused with 2 mM potassium cyanide, 25 mM KCl and 0 mM CaCl2 to prevent contraction and oxygen consumption of the heart. For each heart, the perfusate was equilibrated with two different %O2 levels between 0 and 7%, balanced with N2 and 5% CO2. Oxygen tension was measured in the inflow just above the heart using a needle-type fiber-optic microsensor (World Precision Instruments, Sarasota, FL). Isolated mitochondria and effects of ALA administration Mitochondria were isolated from hearts of animals treated with ALA (200 mg/kg) dissolved in PBS (n=3) or with PBS only (n=3), 3–5 h before isolation. Procedures of isolation were as reported previously (23). In short, hearts were placed in isolation buffer (200 mM mannitol, 50 mM sucrose, 5 mM KH2PO4, 5 mM MOPS, 1 mM EGTA, and 0.1% BSA) and minced into small pieces; then 5 U/ml protease was added, and the mixture was homogenized. The homogenate was centrifuged at 3220 g for 10 min, and the pellet was resuspended in isolation buffer and centrifuged at 800 g for 10 min. The remaining supernatant was centrifuged at 3220 g for 10 min. The final pellet was resuspended in isolation buffer and kept on ice, and the protein content was determined by the Bradford method.
All procedures were performed at 4 °C. Mitochondrial oxygen consumption was measured polarographically at 37 °C in a respirometer using mitochondria (0.3 mg protein/ml) resuspended in respiration buffer (23). Respiration was initiated with 10 mM succinate + 10 µM rotenone (state 2 respiration), followed by the addition of 200 µM ADP (state 3 respiration). The respiratory control index (RCI) was calculated as the state-3 to state-4 ratio. In vivo hearts Animals (n=5) were anesthetized with s-ketamine (150 mg/kg) and diazepam (1.5 mg/kg), and maintenance anesthesia was provided through i.v. administration of α-chloralose (30 mg/kg/h). Mechanical ventilation (70 breaths per min, 0.4 inspiration phase, 5 mm Hg PEEP) was started following intubation, and a left thoracotomy was performed to expose the heart (24). Mean arterial pressure and heart rate were monitored through a fluid-filled catheter positioned in the cannulated carotid artery. Body temperature was maintained at 37 °C. Inspiration oxygen fraction was initially set at 40% and subsequently switched to 100% and finally 10% O2. The 40% FiO2 step was deliberately chosen instead of 20% FiO2 to ensure compensation for ventilation-perfusion defects due to
MITOCHONDRIAL PO2 WITHIN THE HEART
119
mechanical ventilation (25) resulting in arterial PO2 values in the physiological range reported for spontaneously air-breathing animals (∼120 mm Hg). Microvascular PO2 of the in vivo hearts To compare the mitoPO2 with other indices of cardiac oxygenation, cardiac microvascular PO2 (µPO2) of the in vivo heart was determined in separate animals (n=4) by the method of oxygen-dependent quenching of the phosphorescence lifetime of intravenously injected Pd-porphyrin (Pd-meso-tetra(4-carboxyphenyl)porphine, Frontier Scientific Inc, Logan, UT). To this end Pd-porphyrin was bound to albumin according to Sinaasappel et al. (26) and intravenously injected (12 mg/kg). Phosphorescence signals were obtained from the in vivo rat heart using a fiber based phosphorimeter (27). These measurements were performed in a similar in vivo heart model as used for the PpIX determinations, at FiO2 of 40%, 100% and 10%, respectively (see description above). Isolated Langendorff-perfused hearts Hearts were isolated from pentobarbital-anesthetized animals and perfused at constant flow at 80 mm Hg according to previous reports (28). Hearts (n=6) were paced at 300 beats/min, and a balloon was inserted in the left ventricle to record left ventricular pressure. The perfusate contained glucose (10 mM/l), pyruvate (0.1 mM/l), lactate (1 mM/l), and glutamine (0.5 mM/l) as substrates. Venous oxygen tension was measured in the pulmonary artery using a needle-type fiber-optic microsensor (World Precision Instruments, Sarasota, FL). Perfusate was equilibrated with either 95%/0%/5%, 70%/25%/5% or 45%/50%/5% of O2/N2/CO2, respectively, using separate calibrated gas bottles. In a separate series (n=6), the effect of maximal vasodilatation (100 µM adenosine and 1 µM nitroprusside) on the oxygenation status was studied. Delayed fluorescence setup The setup was essentially the same as that described previously (14). In short, the excitation source was a tunable laser providing pulses of 2–4 ns (510 nm, 0.2 mJ/pulse). The detector was a red-sensitive photomultiplier tube combined with a monochromator set at 640 nm. Signal processing was done with a home-built integrator with an integration time of 3.5 µs and a reset time of 0.5 µs. A PC-base data-acquisition system sampled the signal at 250 kHz and averaged 64 laser pulses (repetition rate 20 Hz) prior to analysis. Controller and data-acquisition software was written in LabView (Version 7.1, National Instruments, Austin, TX). Recovery of mitoPO2 histograms In case of a non-homogenous mitoPO2, the delayed fluorescence signal can be described generally by an integral over an exponential kernel:
!
y(t) = exp("#t) f (#)0
t
$
where f(λ) denotes the spectrum of reciprocal lifetimes that should be determined from the finite data set y(t). According to Golub et al. (19), a detailed recovery of the underlying oxygen distribution can be obtained by assuming that the delayed fluorescence signal can be described by a sum of rectangular distributions with adequately small chosen width (2δ), resulting in the following fit equation:
!
Y *(t) = Y (t)[exp(k0t)kq"t /sinh(kq"t)] = wi exp(#kqQit)$
where Y(t) is the normalized phosphorescence data, k0 is the firstorder rate constant for delayed fluorescence decay in the absence of oxygen, kq is the quenching constant, and wi is the weight factor for the according bin with central PO2 Qi and width 2δ (wi≥0 and Σwi=1). Recently, this approach was

CHAPTER 8
120
successfully used by our group for the recovery of microvascular PO2 histograms from phosphorescence lifetime measurements (29) and mitoPO2 histograms from delayed fluorescence lifetime measurements in rat liver in vivo (14). Recovery of oxygen histograms from the photometric signal was performed with the GraphPad Prism package (Version 4, GraphPad Software Inc, San Diego, CA). Mean mitoPO2 values were calculated from the retrieved mitoPO2 histograms.
FIGURE 1 PpIX in cardiomyocytes and mitochondria. (A) Fluorescence microscopy showing (from left to right) PpIX fluorescence, MitoTracker Green fluorescence and colocalization of PpIX and Mitotracker Green fluorescence in isolated cardiomyocyte. (B) In vitro calibration experiments showing two examples of delayed fluorescence traces recorded at two different oxygen concentrations and the reciprocal delayed fluorescence lifetime (1/τ) versus PO2 in suspensions of isolated cardiomyocytes. Inserted is the Stern–Volmer equation in which kq is the quenching constant and τ0 is the lifetime at zero oxygen. Lifetimes were retrieved from the data by a mono-exponential non-linear Marquart–Levenberg fitting procedure. Shown are the mean and SD. (C) Function of mitochondria isolated from hearts of control or ALA-treated animal showing state 3 and 4 respiration, respiratory control index (RCI) and the P/O ratio.

MITOCHONDRIAL PO2 WITHIN THE HEART
121
Chemicals Mitotracker Green was obtained from Invitrogen (Carlsbad, CA). Pentobarbital was obtained from Ceva (Sante Animale B.V., Maassluis, The Netherlands), Diazepam from Centrafarm (Etten-Leur, The Netherlands), S-ketamine from Pfizer B.V. (Capelle a/d IJssel, The Netherlands) and PBS was obtained from Baxter. ALA, α-chloralose, KCN, rotenone, DPI, BDM, KH2PO4, MOPS, EGTA, BSA, protease, mannitol, succinate, pyruvate, sucrose, lactate, glucose, glutamine, adenosine, nitroprusside and the compounds for the Krebs–Henseleit buffer were all obtained from Sigma (St. Louis, MO). Presentation of data The data are presented as mean ± SEM, unless stated otherwise. RESULTS Subcellular location of PpIX Four hours after ALA administration, we observed a similar nonhomogeneous cellular distribution of PpIX fluorescence and MitoTracker Green signals in isolated cardiomyocytes (Fig. 1A). The very high colocalization of both images indicates the mitochondrial localization of the PpIX signal. Calibration of the mitochondrial signal Oxygen-dependent delayed fluorescence traces were clearly detectable from cardiomyocyte suspensions subjected to various oxygen levels. The calibration curve of reciprocal lifetime versus partial oxygen pressure for cardiomyocytes demonstrated a quenching constant (kq) that was similar to the kq obtained in hepatocytes (14), indicating the general applicability of the calibration constant across organs (Fig. 1B). Lifetime under zero oxygen conditions (τ0) was 0.8 ms. ALA treatment does not affect mitochondrial oxygen consumption (Fig. 1C) In order to examine whether ALA-induced mitochondrial accumulation of PpIX affected mitochondrial oxygen consumption, mitochondria were isolated from ALA-treated and vehicle-treated animals. PpIX accumulation had no effect on respiration, coupling ratio or oxidative phosphorylation of the mitochondria, demonstrating that ALA-treatment did not disturb oxygen consumption. FIGURE 2 Evaluation of the calibration constants in isolated rat heart. (A) Measured delayed fluorescence lifetime versus the PO2 in the perfusate after cessation of mitochondrial oxygen consumption by addition of cyanide. Lifetimes were retrieved from the data by a mono-exponential non-linear Marquart–Levenberg fitting procedure. (B) MitoPO2 versus the PO2 in the perfusate. MitoPO2 was calculated from the delayed fluorescence lifetimes in panel A using the quenching constants obtained in suspensions of cardiomyocytes. The solid line is the line of equality.
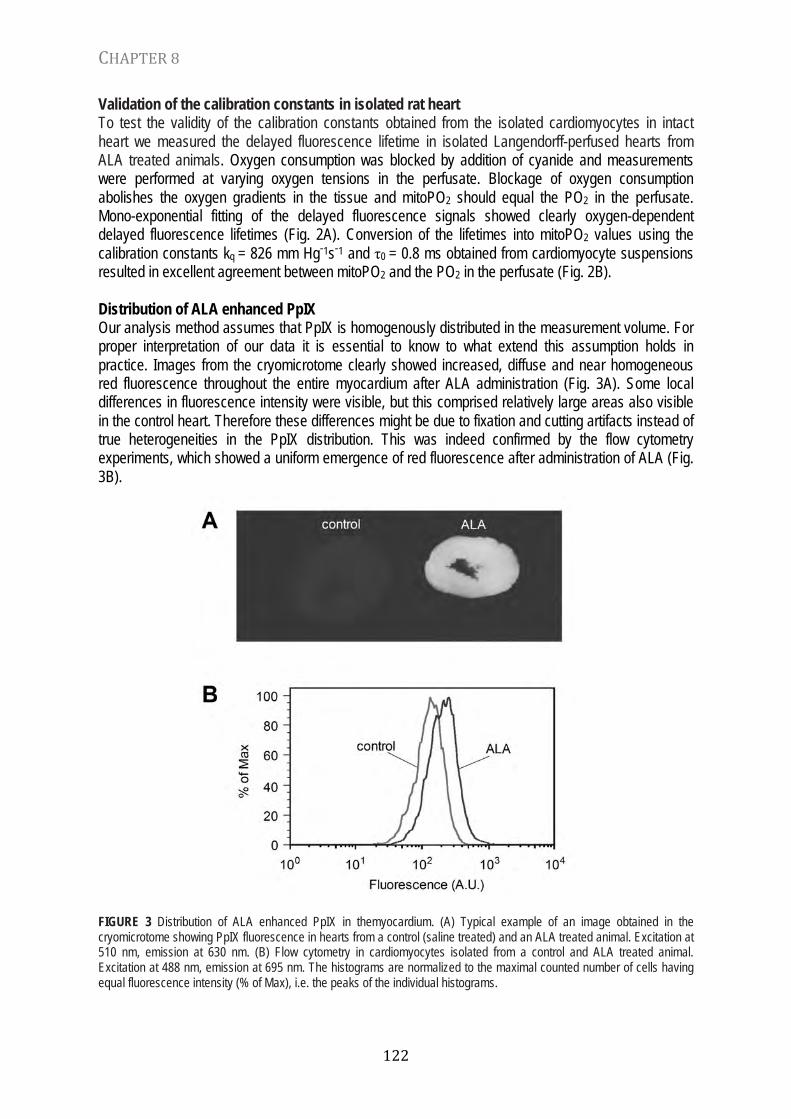
CHAPTER 8
122
Validation of the calibration constants in isolated rat heart To test the validity of the calibration constants obtained from the isolated cardiomyocytes in intact heart we measured the delayed fluorescence lifetime in isolated Langendorff-perfused hearts from ALA treated animals. Oxygen consumption was blocked by addition of cyanide and measurements were performed at varying oxygen tensions in the perfusate. Blockage of oxygen consumption abolishes the oxygen gradients in the tissue and mitoPO2 should equal the PO2 in the perfusate. Mono-exponential fitting of the delayed fluorescence signals showed clearly oxygen-dependent delayed fluorescence lifetimes (Fig. 2A). Conversion of the lifetimes into mitoPO2 values using the calibration constants kq = 826 mm Hg-1s-1 and τ0 = 0.8 ms obtained from cardiomyocyte suspensions resulted in excellent agreement between mitoPO2 and the PO2 in the perfusate (Fig. 2B). Distribution of ALA enhanced PpIX Our analysis method assumes that PpIX is homogenously distributed in the measurement volume. For proper interpretation of our data it is essential to know to what extend this assumption holds in practice. Images from the cryomicrotome clearly showed increased, diffuse and near homogeneous red fluorescence throughout the entire myocardium after ALA administration (Fig. 3A). Some local differences in fluorescence intensity were visible, but this comprised relatively large areas also visible in the control heart. Therefore these differences might be due to fixation and cutting artifacts instead of true heterogeneities in the PpIX distribution. This was indeed confirmed by the flow cytometry experiments, which showed a uniform emergence of red fluorescence after administration of ALA (Fig. 3B).
FIGURE 3 Distribution of ALA enhanced PpIX in themyocardium. (A) Typical example of an image obtained in the cryomicrotome showing PpIX fluorescence in hearts from a control (saline treated) and an ALA treated animal. Excitation at 510 nm, emission at 630 nm. (B) Flow cytometry in cardiomyocytes isolated from a control and ALA treated animal. Excitation at 488 nm, emission at 695 nm. The histograms are normalized to the maximal counted number of cells having equal fluorescence intensity (% of Max), i.e. the peaks of the individual histograms.

MITOCHONDRIAL PO2 WITHIN THE HEART
123
MitoPO2 in the in vivo heart FiO2-dependent delayed fluorescence signals were obtained from in vivo rat heart (Fig. 4A). At 40% FiO2, the largest fraction (26%) of mitochondria was found in the range of 10–20 mmHg, with a mean mitoPO2 of 35±5 mmHg (Fig. 4B). Increasing FiO2 to 100% had no major effect on the mitoPO2
distribution; however, reducing FiO2 to 10% resulted in large changes: 46% of the mitochondria were in the lowest oxygen range of 0–10 mmHg (Fig. 4B). The imposed FiO2 changes were accompanied by alterations in arterial oxygen tension and blood pressure, without changes in arterial CO2 tension (Table 1). In separate experiments, we measured microvascular PO2 (µPO2) using the exogenous dye Pd-porphyrin for the three different FiO2. µPO2 amounted to 67±3, 108±9 and 22±4mmHg, at 40%, 100% and 10% FiO2, respectively.
FIGURE 4 MitoPO2 in the in vivo heart. (A) Delayed fluorescence traces from the heart of an animal ventilated with 10% oxygen (left panel) and 40% oxygen (right panel). (B) Distributions of mitoPO2 at different FiO2 (n=5). The grey lines denote the mean mitoPO2. TABLE 1 Hemodynamics and blood gas values of rats in vivo (n = 5). FiO2 = inspiration oxygen %; MAP = mean arterial pressure; PaO2 = partial arterial oxygen tension; PaCO2 = partial arterial carbon dioxide tension; tHb = total hemoglobin. Values are given as mean ± SEM.

CHAPTER 8
124
MitoPO2 in the Langendorff-perfused heart Delayed fluorescence signals were obtained from isolated hearts, showing decreasing decay times (shorter τ) with increasing percentage of oxygen (%O2) in the perfusate or with increased flow (going from the normal vasodilated to the maximal vasodilated condition) (Fig. 5A). The recovery of mitoPO2 histograms provides a detailed view of the effects of %O2 and vasodilatation on mitochondrial oxygenation (Fig. 5B). Only at maximal oxygenation (95%) and maximal vasodilatation did mitoPO2
start to approach a normal distribution in the isolated heart, with a mean mitoPO2 of 40±3 mmHg. The normally perfused Langendorff-condition had a mean mitoPO2 of 29±5 mmHg (at 95% oxygen). A dichotomous distribution was observed, with the largest fraction of mitochondria falling into the lowest oxygen range (0–10 mm Hg). The fraction of mitochondria in the lowest oxygen range increased further as the % O2 was decreased to 70% and 45%.
FIGURE 5 MitoPO2 in the isolated Langendorff-perfused heart. (A) Examples of delayed fluorescence traces for 95%, 45%, and 6% oxygen saturated perfusate in a vasodilated heart (left panel) and delayed fluorescence traces of a normal and maximally vasodilated heart (right panel). (B) Distributions of mitoPO2 at different %O2 in perfusate for normal (n=6) and maximally vasodilated hearts (n=6). The grey lines denote the mean mitoPO2.

MITOCHONDRIAL PO2 WITHIN THE HEART
125
TABLE 2 Functional characteristics of isolated Langendorff-perfused rat hearts. Values are given for hearts (n=6) perfused at normal vasodilatation (normal flow) and at maximal vasodilatation (n=6; high flow) for different % oxygen in the perfusate. Gww = gram, wet weight; Pperf = perfusion pressure; Psys = systolic pressure; Pdia = diastolic pressure; VPO2 = venous oxygen tension; MVO2 = oxygen consumption, RPP = rate pressure product (Psys × heart rate). Values are given as mean ± SEM.
Decreasing %O2 was associated with decreased mechanical performance and oxygen
consumption of the hearts, whereas maximal vasodilatation increased mechanical performance and oxygen consumption (Table 2). It should be noted that oxygen consumption increased with vasodilation due to the large coronary flow increases, despite the increase in venous PO2 with vasodilation for each level of %O2 perfusate. Increasing the heart rate from 300 to 400 BPM did not change the mitoPO2 distribution in hearts without vasodilation (Fig. 6). In hearts with maximal vasodilation there appeared to be a tendency towards lower mitoPO2 values at higher heart rate without reaching significance in any of the bins (paired non-parametric testing). FIGURE 6 Response of mitoPO2 to a heart rate step in the Langendorff-perfused heart. Distributions of mitoPO2 at 300 and 400 beats per minute (BPM) with and without maximal vasodilation and with 95% oxygen saturated perfusate.
CHAPTER 8
126
DISCUSSION This study is, to our knowledge, the first to describe direct measurements of mitochondrial oxygen tension within the intact heart. The main findings provide evidence that mean cardiac mitoPO2 in vivo has a relatively high value of 35 mmHg. Importantly, we found that mitoPO2 was heterogeneously distributed within the rat heart in vivo, such that even when mean mitoPO2 was 35 mmHg, 10% of mitochondria still had a low PO2 between 0 and 10 mmHg. In addition, the frequently used isolated heart preparation operates at a lower mitochondrial oxygenation status than that of the in vivo heart. In vivo myocardial PO2 and mitoPO2 heterogeneity Because oxygen transport to the mitochondria is driven by a concentration gradient determined by consumption in the mitochondria, the oxygen tension in the mitochondrial compartment should be at the lowest end of oxygen tensions present compared to other (4) compartments (vascular, interstitial, cytosolic) of the intact heart. The mean mitoPO2 value of 35±5 mmHg reported here is in accordance with tissue PO2 values of 45±8 mmHg (13) and microvascular PO2 values of 50–70 mmHg found in the present and past studies (12), but is much higher than anticipated from estimates derived from cytosolic/interstitial/vascular measurements of 3–17 mmHg (6–11). Interestingly, this observation coincides with recent findings of oxygen pressure in tissues other than heart (30). Myoglobin saturation studies in in vivo pig hearts, using either optical reflectance spectroscopy (31) or 1H NMR (32), were unable to detect desaturation of myoglobin. Knowing that these techniques can detect myoglobin desaturation only when intracellular PO2 falls below 22 mmHg (32), and that only an average myoglobin saturation is detected, these studies indicate an average cytosolic PO2 above 22 mmHg. Thus, the values obtained with myoglobin saturation techniques are commensurate with our averaged mitoPO2 of 35 mmHg. Only recently has consensus been reached that the levels of oxygen in the tissue are much higher than originally thought of, due to the development of new techniques with increased accuracy (30). The present study with the use of a novel technique clearly indicates that this new consensus may also hold for the heart.
Although the averaged mitoPO2 observed in vivo was higher than anticipated, it is important to take into account the heterogeneity of mitoPO2 within the heart. The observed heterogeneity in mitoPO2 in the present study extends previously observed heterogeneities in, for example, blood flow and oxygen consumption down to the level of the mitochondria (12,16,17). In addition, the mitoPO2 heterogeneity indicates that approximately 10% of the mitochondria in the in vivo heart are exposed to a PO2 between 0 and 10 mmHg. Isolated mitochondria studies have demonstrated that mitochondrial oxidative phosphorylation is dependent on oxygen concentrations at PO2 < 12–15 mmHg (1,3,5). This implies that some fraction of the mitochondria within the in vivo heart may well be partially controlled by the prevailing oxygen tension. That myocardial oxygen may be limiting is also supported by studies in myoglobin-knockout mice. Although the first studies in these mice concluded that myoglobin is of no physiological consequence for cardiac function (33), subsequent studies demonstrated that multiple compensatory mechanism in these mice were present (34), indicating an important role for myoglobin in oxygen delivery. Considering the major role that mitochondria play in cellular oxygen sensing (4), the quantitative determination of mitoPO2 in the in vivo condition provides important information for the design of oxygen critical experiments. Isolated versus in vivo hearts In non-vasodilated Langendorff-perfused isolated hearts, the fraction of mitochondria with oxygen tensions between 0 and 10 mmHg increased to 30%, as compared to the 10% observed in the in vivo condition. Interestingly, studies using three-dimensional microvascular modeling together with myoglobin saturation information (35,36) have also concluded that approximately 15–30% of the myocardium in the Langendorff-perfused heart was hypoxic. Alleviating the 30% “hypoxic mitochondrial area” to 10% by increasing perfusate flow was indeed accompanied by increased

MITOCHONDRIAL PO2 WITHIN THE HEART
127
myocardial oxygen consumption and mechanical performance, suggesting at least that the normal perfused isolated heart was oxygen limited. This data agree with older literature suggesting that the isolated heart is partially hypoxic (37,38). Our data indicate that the oxygenation status of the isolated Langendorff-perfused heart model is comparable to that of the in vivo heart only in the maximally vasodilated condition. Methodological considerations The PpIX delayed fluorescence technique provides a powerful tool for monitoring mitoPO2 in cardiac muscle. The underlying lifetime technology is highly robust in that it needs no recalibration and is immune to changes in tissue optical properties and tissue geometry, important features in a beating heart. A practical advantage is also that the technique does not need a physical contact with the heart, like oxygen electrodes, and is not locally destructive. As an optical technique it is scalable from microscopic to macroscopic implementations providing extensive opportunities for study of the heterogeneity of mitoPO2 and its cause. Because of its resemblance to phosphorescence lifetime measurements further technological developments could provide e.g. imaging (39), 3-dimensional scanning by two-photon excitation (40) and multi-wavelength excitation (29). The main disadvantage is the relatively small penetration depth of light in tissues. Therefore the technique is not non-invasive for the whole organism (like e.g. MRI), but one always needs to make the organ or tissue accessible to the optical device.
In the present study we converted lifetime distribution to oxygen histograms, based on the assumption that the heterogeneity in delayed fluorescence lifetimes arises from a volume with homogeneous distribution of PpIX and heterogeneous concentration of oxygen (19). Such an assumption is generally relied on when converting phosphorescence lifetime distributions into quencher distributions (19,41,42). In the present study, fluorescence microscopy of freshly isolated cardiomyocytes from ALA-treated animals showed the typical mitochondrial fluorescence patterns well known from NADH autofluorescence microscopy (43,44), indicating that PpIX synthesis is not sequestered within a cardiomyocyte. On a more macroscopic level, ALA administration induces a diffuse and near homogenous PpIX fluorescence throughout the heart as observed by the cryomicrotome and flow cytometry experiments.
Based on the work of Gandjbakhche et al. (45) the measurement depth with excitation at 510 nm is estimated to be between 400 and 500 µm, due to absorption and scatter of the excitation light. Sinaasappel et al. (46) estimated a catchment depth of 500 µm, using Monte-Carlo simulations on the penetration depth of 520 nm excitation light in phosphorescence lifetime measurements in the intestine. Assuming a left ventricular free wall thickness of 1.5 mm during diastole and 2.5–3.0 mm during systole, our mitoPO2 measurements mainly reflect the oxygenation of the epicardium. Therefore, the mitoPO2 distributions are unlikely to be caused by differences in endocardial and epicardial oxygenation. We previously demonstrated in rat liver that diffusion of ambient oxygen into the tissue has limited influence on the shape of mitoPO2 histograms (14). Oxygen in the ambient atmosphere marginally contributes to the highest PO2 bins without altering the overall shape of the histograms. Exposure of epicardial surface to air is therefore very likely not the cause of the observed heterogeneity in mitoPO2.
The delayed fluorescence lifetime in vivo may also be affected by bound versus unbound PpIX and pH. Theoretically, unbound PpIX could mimic a very high PO2 and distort the mitoPO2 histograms. Unbound PpIX has a lifetime which is too short to be resolved with our current setup and therefore will not contribute to our signal. Furthermore, binding of PpIX with different environments could affect the lifetime measurements by introducing additional lifetimes at a homogenous PO2. However, the linear relationship between reciprocal delayed fluorescence lifetime and PO2 after abolishing oxygen gradients by addition of cyanide, as predicted by the Stern–Volmer equation (26,47) and obtained by monoexponential fitting on the data, argues against such influence. Physiological changes in pH have

CHAPTER 8
128
in general only minor effects on the quenching constants of phosphorescence (26,48,49) and delayed fluorescence (15). Overall, despite the assumptions made in the current analysis and the possible caveats this introduces into the interpretation of the data, we regard PpIX delayed fluorescence as a valuable addition to the arsenal of techniques that allows new insight into myocardial oxygenation.
In summary, the data of the present study revealed that the amount of oxygen present within the mitochondria of the intact heart is higher than previously anticipated, is heterogeneously distributed and is lower in the often-used tyrode perfused isolated heart model as compared to the in vivo heart. Together, these results provide a first quantitative characterization of mitochondrial oxygenation within the intact heart in both the in vivo and isolated condition. This work was partly sponsored by The Netherlands Organization for Scientific Research (ZON-MW 911-05-008) and in part by a Technological Collaboration Grant (TSGE 1048) from the Dutch Ministry of Economic Affairs. J. Stap was funded in part by a grant from the Dutch Cancer Society. REFERENCES 1. Hoffman DL, Salter JD, Brookes PS. Response of mitochondrial reactive oxygen species generation to steady-state
oxygen tension: implications for hypoxic cell signaling. Am J Physiol, Heart Circ Physiol 2007; 292:H101–8. 2. Maxwell PH, Wiesener MS, Chang GW, Clifford SC, Vaux EC, Cockman ME, et al. The tumour suppressor protein VHL
targets hypoxia-inducible factors for oxygendependent proteolysis. Nature 1999; 399:271–5. 3. Rumsey WL, Schlosser C, Nuutinen EM, Robiolio M, Wilson DF. Cellular energetics and the oxygen dependence of
respiration in cardiac myocytes isolated from adult rat. J Biol Chem 1990; 265:15392–402. 4. Ward JP. Oxygen sensors in context. Biochim Biophys Acta 2008; 1777:1–14. 5. Wilson DF, Rumsey WL, Green TJ, Vanderkooi JM. The oxygen dependence of mitochondrial oxidative
phosphorylation measured by a new optical method for measuring oxygen concentration. J Biol Chem 1988; 263:2712–8.
6. Rumsey WL, Pawlowski M, Lejavardi N, Wilson DF. Oxygen pressure distribution in the heart in vivo and evaluation of the ischemic “border zone”. Am J Physiol 1994; 266:H1676–80.
7. Trochu JN, Bouhour JB, Kaley G, Hintze TH. Role of endothelium-derived nitric oxide in the regulation of cardiac oxygen metabolism: implications in health and disease. Circ Res 2000; 87:1108–17.
8. Zhao X, He G, Chen YR, Pandian RP, Kuppusamy P, Zweier JL. Endothelium-derived nitric oxide regulates postischemic myocardial oxygenation and oxygen consumption by modulation of mitochondrial electron transport Circulation 2005; 111:2966–72.
9. Gayeski TE, Honig CR. Intracellular PO2 in individual cardiacmyocytes in dogs, cats, rabbits, ferrets, and rats. Am J Physiol 1991; 260:H522–31.
10. Gnaiger E, Lassnig B, Kuznetsov A, Rieger G, Margreiter R. Mitochondrial oxygen affinity, respiratory flux control and excess capacity of cytochrome c oxidase. J Exp Biol 1998; 201:1129–39.
11. Wittenberg BA, Wittenberg JB. Transport of oxygen in muscle. Annu Rev Physiol 1989; 51:857–78. 12. Zuurbier CJ, van Iterson M, Ince C. Functional heterogeneity of oxygen supply–consumption ratio in the heart.
Cardiovasc Res 1999; 44:488–97. 13. Al-Obaidi MK, Etherington PJ, Barron DJ, Winlove CP, Pepper JR. Myocardial tissue oxygen supply and utilization
during coronary artery bypass surgery: evidence of microvascular no-reflow. Clin Sci (Lond) 2000; 98:321–8. 14. Mik EG, Johannes T, Zuurbier CJ, Heinen A, Houben-Weerts JH, Balestra GM, et al. In vivo mitochondrial oxygen
tension measured by a delayed fluorescence lifetime technique. Biophys J 2008; 95:3977–90. 15. Mik EG, Stap J, Sinaasappel M, Beek JF, Aten JA, van Leeuwen TG, et al. Mitochondrial PO2 measured by delayed
fluorescence of endogenous protoporphyrin IX. Nat Methods 2006; 3:939–45. 16. Decking UK. Spatial heterogeneity in the heart: recent insights and open questions. News Physiol Sci 2002; 17:246–50. 17. Yipintsoi T, Dobbs Jr WA, Scanlon PD, Knopp TJ, Bassingthwaighte JB. Regional distribution of diffusible tracers and
carbonized microspheres in the left ventricle of isolated dog hearts. Circ Res 1973; 33:573–87. 18. Takahashi E. Anoxic cell core can promote necrotic cell death in cardiomyocytes at physiological extracellular PO2. Am
J Physiol, Heart Circ Physiol 2008; 294: H2507–15. 19. Golub AS, Popel AS, Zheng L, Pittman RN. Analysis of phosphorescence in heterogeneous systems using distributions
of quencher concentration. Biophys J 1997; 73:452–65. 20. Kammermeier H. Isolated, (Langendorff) hearts perfused with an aqueous buffer (should) have excess oxygen
availability. Basic Res Cardiol 1994; 89:545–8.

MITOCHONDRIAL PO2 WITHIN THE HEART
129
21. ter Welle HF, Baartscheer A, Fiolet JW, Schumacher CA. The cytoplasmic free energy of ATP hydrolysis in isolated rod-shaped rat ventricular myocytes. J Mol Cell Cardiol 1988; 20:435–41.
22. Spaan JA, ter Wee R, van Teeffelen JW, Streekstra G, Siebes M, Kolyva C, et al. Visualisation of intramural coronary vasculature by an imaging cryomicrotome suggests compartmentalisation of myocardial perfusion areas. Med Biol Eng Comput 2005; 43:431–5.
23. Heinen A, Camara AK, Aldakkak M, Rhodes SS, Riess ML, Stowe DF. Mitochondrial Ca2+-induced K+ influx increases respiration and enhances ROS productionwhile maintaining membrane potential. Am J Physiol, Cell Physiol 2007; 292:C148–56.
24. Heinen A, Huhn R, Smeele KM, Zuurbier CJ, Schlack W, Preckel B, et al. Heliuminduced preconditioning in young and old rat heart: impact of mitochondrial Ca2+-sensitive potassium channel activation. Anesthesiology 2008; 109:830–6.
25. Nunn JF, Bergmann NA, Coleman AJ. Factors influencing the arterial oxygen tension during anaesthesia with artificial ventilation. 1965. Br J Anaesth 1998; 80:860–76.
26. Sinaasappel M, Ince C. Calibration of Pd-porphyrin phosphorescence for oxygen concentration measurements in vivo. J Appl Physiol 1996; 81:2297–303.
27. Mik EG, Donkersloot C, Raat NJ, Ince C. Excitation pulse deconvolution in luminescence lifetime analysis for oxygen measurements in vivo. Photochem Photobiol 2002; 76:12–21.
28. Zuurbier CJ, Ince C. Post-ischaemic changes in the response time of oxygen consumption to demand in the isolated rat heart are mediated partly by calcium and glycolysis. Pflugers Arch 2002; 443:908–16.
29. Johannes T, Mik EG, Ince C. Dual-wavelength phosphorimetry for determination of cortical and subcortical microvascular oxygenation in rat kidney. J Appl Physiol 2006; 100(4):1301–10.
30. Wilson DF. Quantifying the role of oxygen pressure in tissue function. Am J Physiol, Heart Circ Physiol 2008; 294:H11–3.
31. Arai AE, Kasserra CE, Territo PR, Gandjbakhche AH, Balaban RS. Myocardial oxygenation in vivo: optical spectroscopy of cytoplasmic myoglobin and mitochondrial cytochromes. Am J Physiol 1999; 277:H683–97.
32. Murakami Y, Zhang Y, Cho YK, Mansoor AM, Chung JK, Chu C, et al. Myocardial oxygenation during high work states in hearts with postinfarction remodeling. Circulation 1999; 99:942–8.
33. Garry DJ, Ordway GA, Lorenz JN, Radford NB, Chin ER, Grange RW, et al. Mice without myoglobin. Nature 1998; 395:905–8.
34. Godecke A, Flogel U, Zanger K, Ding Z, Hirchenhain J, Decking UK, et al. Disruption of myoglobin in mice induces multiple compensatory mechanisms. Proc Natl Acad Sci U S A 1999; 96:10495–500.
35. Beard DA, Schenkman KA, Feigl EO. Myocardial oxygenation in isolated hearts predicted by an anatomically realistic microvascular transport model. Am J Physiol, Heart Circ Physiol 2003; 285:H1826–36.
36. Ejike JC, Arakaki LS, Beard DA, CiesielskiWA, Feigl EO, Schenkman KA. Myocardial oxygenation and adenosine release in isolated guinea pig hearts during changes in contractility. Am J Physiol, Heart Circ Physiol 2005; 288:H2062–7.
37. Heineman FW, Kupriyanov VV, Marshall R, Fralix TA, Balaban RS. Myocardial oxygenation in the isolated working rabbit heart as a function of work. Am J Physiol 1992; 262:H255–67.
38. van Beek JH, Bouma P,Westerhof N. Oxygen uptake in saline-perfused rabbit heart is decreased to a similar extent during reductions in flow and in arterial oxygen concentration. Pflugers Arch 1989; 414:82–8.
39. Rumsey WL, Vanderkooi JM, Wilson DF. Imaging of phosphorescence: a novel method for measuring oxygen distribution in perfused tissue. Science 1988; 241: 1649–51.
40. Mik EG, van Leeuwen TG, Raat NJ, Ince C. Quantitative determination of localized tissue oxygen concentration in vivo by two-photon excitation phosphorescence lifetime measurements. J Appl Physiol 2004; 97:1962–9.
41. Vinogradov SA, Fernandez-Seara MA, Dupan BW, Wilson DF. A method for measuring oxygen distributions in tissue using frequency domain phosphorometry. Comp Biochem Physiol A Mol Integr Physiol 2002; 132:147–52.
42. Vinogradov SA, Wilson DF. Phosphorescence lifetime analysis with a quadratic programming algorithm for determining quencher distributions in heterogeneous systems. Biophys J 1994; 67:2048–59.
43. Eng J, Lynch RM, Balaban RS. Nicotinamide adenine dinucleotide fluorescence spectroscopy and imaging of isolated cardiacmyocytes. Biophys J 1989; 55:621–30.
44. Takahashi E, Endoh H, Doi K. Intracellular gradients of O2 supply to mitochondria in actively respiring single cardiomyocyte of rats. Am J Physiol 1999; 276: H718–24.
45. Gandjbakhche AH, Bonner RF, Arai AE, Balaban RS. Visible-light photon migration through myocardium in vivo. Am J Physiol 1999; 277:H698–704.
46. Sinaasappel M, van Iterson M, Ince C. Microvascular oxygen pressure in the pig intestine during haemorrhagic shock and resuscitation. J Physiol 1999; 514: 245–53.
47. Vanderkooi JM, Berger JW. Excited triplet states used to study biological macromolecules at room temperature. Biochim Biophys Acta 1989; 976:1–27.

CHAPTER 8
130
48. Dunphy I, Vinogradov SA, Wilson DF. Oxyphor R2 and G2: phosphors for measuring oxygen by oxygen-dependent quenching of phosphorescence. Anal Biochem 2002; 310:191–8.
49. Lo LW, Koch CJ, Wilson DF. Calibration of oxygen-dependent quenching of the phosphorescence of Pd-meso-tetra (4-carboxyphenyl) porphine: a phosphor with general application for measuring oxygen concentration in biological systems. Anal Biochem 1996; 236:153–60.

Chapter 9
Summary and Conclusions

CHAPTER 9
132
Molecular oxygen is the primary oxidant in biological systems and its ultimate destination in vivo is the mitochondria where it is used in oxidative phosphorylation. Besides being indispensible for the energy production, oxygen and its radicals are playing key roles in many other biochemical processes and signal transduction in our cells (2, 42, 45). Because of the importance of adequate oxygen supply many techniques have been developed for oxygen measurements in vivo (34, 37, 42). Oxygen-dependent quenching of phosphorescence, introduced as a means to measure oxygen in biological systems in the late 80s by Vanderkooi et al. (43), has proven itself to be a particularly flexible and powerful technology. The technique relies on insertion of an oxygen-dependent phosphorescent dye, typically a metallo-porphyrin like Pd-porphyrin (23, 32), into the system of interest. For example, the intravascular injection of albumin-bound Pd-porphyrin has become a standard technique for measurement of microvascular PO2 (µPO2) in vivo. Phosporescence lifetime measurements are scalable from applications in microscopes on single cells (12, 13) and capillaries (30, 47) to imaging of PO2 in the surface of whole organs (14, 27). Combined with a relatively easy and robust technology these are major ingredients for the success of this technique. The introduction of novel phosphorescent dyes in recent years (3) has even further enhanced its applicability, especially in thick tissue (48).
As with any novel technology, the introduction of phosphorescence lifetime measurements into the realm of scientists interested in PO2 measurements was not without hiccups. Since the phosphorescence lifetime of the used phosphorescent probes is orders of magnitude longer than fluorescence lifetimes, typically tens of microseconds to several milliseconds, the use of short arc xenon flashlamps as excitation source had been advocated in construction of early phosphorimeters (9, 33). The excitation pulse produced by these flashlamps (with a typical pulse width of several microseconds) was considered short enough to be of no influence on phosphorescence lifetime recovery. However, although theory predicted otherwise, the early days showed a considerable variability in calibration constants reported by various laboratories and deviations of calibration lines from the linear Stern-Volmer relationship. For example, reported values for the quenching constant of Pd-porphyrin have ranged from kq = 306 mmHg-1s-1 (47) to 386 mmHg-1s-1 (11). In chapter 2 we evaluate the consequences of finite excitation pulse duration and the complex excitation patterns of flashlamps on phosphorescence lifetime recovery. We demonstrate that variations in flashlamp characteristics largely account for the reported differences between laboratories and that finite excitation pulse duration leads to non-linearity of the calibration curves. Furthermore, we present a method for deconvolution of the excitation pulse shape out of the photometric signal that neutralizes adverse effects of the use of flashlamps.
Due to the presence of oxygen gradients, among other things resulting from e.g. cellular respiration and variations in diffusion distances to the capillary network, the PO2 in tissues is highly heterogeneous. Phosphorescence lifetime measurements are very well suited for gaining insight in this heterogeneity. For example intravital microscopy (31, 47) and surface imaging on organs (14, 27) has been used to demonstrate heterogeneity in PO2 in two-dimensional (x-y) direction. However, for some organs, like gut and kidney, it is of interest to gain insight in heterogeneity in the depth because of the anatomical structure of the organs. Multi-photon excitation has become a well known non-linear optical technology used to image fluorescence in three dimensions and has been demonstrated to be useful in vivo (36). In chapter 3 we demonstrate that two-photon excitation can in principle be used for quantitative PO2 measurements using classical Pd-porphyrin. Calibration constants are similar as with normal single photon excitation and the quadratic dependence on excitation intensity is excellent. Two-photon excitation scanning in the z-direction through the renal cortex clearly identifies an abrupt PO2 drop at a depth corresponding to the transition from cortex to outer medulla. Our work represents the first demonstration of the feasibility of measuring PO2 by means of two-photon excitation phosphorescence lifetime measurements. Indeed, others have applied the principle in two-photon microscopy but the low two-photon absorption cross-section of Pd-porphyrin requires impractically high

SUMMARY AND CONCLUSIONS
133
excitation intensities and scan times (4). Very recently, novel phosphorescent probes with much larger two-photon absorption cross-section have been developed (5). The addition of two-photon absorption antennas to a metallo-porphyrin core has now brought practical implementation of PO2 measurements based on two-photon microscopy within reach (28).
The two-photon approach did not bring the speed and versatility we needed for monitoring of microvascular PO2 (µPO2) in organs of animals during experimental models of (septic) shock and resuscitation. Another potential way to discriminate between layers of tissue is the use of different excitation wavelengths. This idea is based on the principle that longer wavelengths of light tend to penetrate deeper into tissue because of less absorption. Although classical Pd-porphyrin can be excited at two different wavelengths (~ 420 nm and 530 nm, i.e. blue and green light respectively) both are very well absorbed by hemoglobin, limiting the penetration depth in both cases to very superficial tissue layers. However, the introduction of the near-infrared phosphor Oxyphor G2 (3) allowed us to explore this principle in practice. In chapter 4 we describe the development and use of a dual-wavelength phosphorimeter that alternately excites Oxyphor G2 with blue (440 nm) or red (632 nm) light. In rat kidney we demonstrate that the blue excitation confines the measurement volume to the cortex, while the red excitation extends the measurement volume to the (outer) medulla. Although some overlap between the measurement volumes exists (this single photon approach lacks the true discriminating power of two-photon excitation), in practice the channels behave surprisingly independent. In addition to measuring µPO2 at two different depths we demonstrate that additionally calculating the PO2 histograms out of the phosphorescence data instead of the average PO2 provides even better insight in heterogeneity. Dual-wavelength phosphorimetry as described in chapter 4 has now been extensively used in our laboratory and has proven to be a valuable tool for studying microvascular oxygenation in the rat kidney in various pathophysiological models (15-19, 21, 22).
For a more comprehensive understanding of the oxygenation of an organ adding global measurements like oxygen delivery (DO2) and oxygen consumption (VO2) to the more local µPO2 measurements is required. To this end, one needs to measure the blood flow to the organ and the oxygen content of the arterial and venous blood. The classical way of determining the oxygen content of blood, i.e. by means of drawing blood samples, easily leads to volume depletion in small experimental animals and furthermore the risk of damaging vital blood vessels. To allow near-continuous measurement of renal venous oxygen content we developed a technique based on oxygen-dependent quenching of phosphorescence. In chapter 5 we describe a frequency domain phosphorimeter that allows online monitoring of renal venous PO2 by extravascular placement of a small fiber-optic assembly. Renal venous oxygen content is calculated with a mathematical model based on hemoglobin saturation curves measured in blood samples from rats and using the hemoglobin concentration determined by arterial blood sampling. This approach allows monitoring of renal venous oxygen content with an error of less than 10% over a wide pH range. However, due to the well-known pH dependency of hemoglobin saturation, the technology cannot completely replace blood sampling under all circumstances. Nevertheless, just as dual-wavelength phosphorimetry, the technique has become a standard in our laboratory. It allows for near continuous monitoring of renal VO2 and guides for appropriate time points when more invasive measurements are needed.
The previously described techniques are obviously limited to preclinical use in experimental animals because of the need of injection of an exogenous phosphorescent dye. In order to circumvent this drawback we looked into possibilities to use endogenous porphyrins for oxygen measurements. The result of this quest has been quite astonishing and has resulted in the first method to measure mitochondrial oxygen tension (mitoPO2) in living cells. In chapter 6 we describe the development of these mitoPO2 measurements based on oxygen-dependent quenching of the delayed fluorescence of protoporphyrin IX (PpIX), the final precursor in the heme biosynthetic pathway. We demonstrate that 5-aminolevulinic acid (ALA) induced PpIX is located in the mitochondria and exhibits oxygen-dependent delayed fluorescence of which the lifetime is quantitatively related to mitoPO2. We calibrate the PpIX

CHAPTER 9
134
delayed fluorescence signal to PO2 in various cell lines and provide the first direct measurement of the oxygen difference between the extracellular compartment and the intracellular mitochondria. The latter has been a topic of long standing debate since reported values range from well below one mmHg by indirect means (24, 26) to several mmHg in intracellular oxygen measurements based on injection of phosphorescent dyes (13) or nano-particles (20). We found the PO2 difference between the mitochondria and the extracellular medium to be dependent on the respiration rate and be typically in the order of several mmHg.
The method of measuring mitoPO2 by means of delayed fluorescence of ALA induced protoporphyrin IX, as described in chapter 6, would come to full potential if it would not only be useful in cultured cells but also in tissues and organs in vitro and in vivo. Indeed, in chapter 7 we describe the use of this method for the first in vivo measurement of mitoPO2. To this end the delayed fluorescence lifetime of PpIX is calibrated in isolated hepatocytes harvested from ALA treated rats. We report a quenching constant kq = 832 ± 25 mmHg-1s-1 and a lifetime under zero oxygen conditions τ0 = 0.8 ± 0.1 ms. The validity of the found calibration constants for intact tissue has been verified in isolated perfused liver, also obtained from ALA treated rats. Ultimately we report mitoPO2 values and mitoPO2 histograms measured on rat liver in vivo at different inspired oxygen fractions and in ischemia-reperfusion. The reported mitoPO2 values are typically an order of magnitude larger than generally anticipated (8). Average mitoPO2 is around 30-40 mmHg and differs not much from tissue PO2 measured by micro oxygen electrodes (39, 41). Under baseline conditions hypoxic fractions of mitochondria (mitoPO2 in the range 0-10 mmHg) are not present in the mitoPO2 histograms. They become evident during breathing of gas mixtures with low oxygen content and during ischemia-reperfusion. Interestingly, we found that mitoPO2 values in vivo are within the PO2 range that is of interest in the concept of oxygen conformance of metabolism (29, 35).
The heart is an organ that has been classically of prime interest concerning matters of oxygenation. Both in situ and as isolated perfused organ, the rat heart is widely used for studying oxygenation of the myocardium and phenomena like ischemia-reperfusion injury and preconditioning. In chapter 8 we report mitoPO2 histograms measured in isolated perfused and in vivo rat hearts by delayed fluorescence of PpIX. Here calibration of the technique is performed in isolated cardiomyocytes from rats pre-treated with ALA. The quenching constants kq = 826 ± 51 mmHg-1s-1 and τ0 = 0.8 ms are similar to the values found for rat liver and are shown to be valid for the intact heart. The mean mitoPO2 value of 35 ± 5 mmHg found in vivo is in accordance with tissue PO2 values of 45 ± 8 mm Hg (1) and microvascular PO2 values of 50–70 mmHg reported in the present and past studies (49). However, we report mitoPO2 values that are much higher than anticipated from estimates derived from cytosolic/interstitial/vascular measurements of 3–17 mmHg (6, 7, 25, 38, 44, 46). In addition, the mitoPO2 heterogeneity indicates that approximately 10% of the mitochondria in the in vivo heart are exposed to a PO2 between 0 and 10 mmHg. This implies that some fraction of the mitochondria within the in vivo heart may be partially controlled by the prevailing oxygen tension. This fraction of mitochondria with a mitoPO2 between 0 and 10 mmHg is as large as 30% in the isolated perfused rat heart and decreased to 10% by vasodilation. Our data suggest that the normally perfused isolated heart is oxygen limited and this is in agreement with older literature suggesting that the isolated heart is partially hypoxic (10, 40).
Overall, this thesis describes the implementation of novel approaches for measuring tissue oxygenation based on oxygen-dependent quenching of the triplet-state lifetime of porphyrins. Ultimately we created a tool for assessment of mitochondrial oxygen tension in vivo. The first measurements indicate much higher mitoPO2 values than generally expected. These findings come in an era of new insights in cellular oxygen sensing and oxygen-dependence of gene expression and metabolism. The described methods are expected to be a valuable addition to the arsenal of tools available to scientist for unraveling the mechanisms of oxygen delivery and consumption under various pathophysiological circumstances. Oxygen is again important, as it has always been …

SUMMARY AND CONCLUSIONS
135
REFERENCES 1. Al-Obaidi MK, Etherington PJ, Barron DJ, Winlove CP, and Pepper JR. Myocardial tissue oxygen supply and utilization
during coronary artery bypass surgery: evidence of microvascular no-reflow. Clin Sci (Lond) 98: 321-328, 2000. 2. Droge W. Free radicals in the physiological control of cell function. Physiol Rev 82: 47-95, 2002. 3. Dunphy I, Vinogradov SA, and Wilson DF. Oxyphor R2 and G2: phosphors for measuring oxygen by oxygen-
dependent quenching of phosphorescence. Anal Biochem 310: 191-198, 2002. 4. Estrada AD, Ponticorvo A, Ford TN, and Dunn AK. Microvascular oxygen quantification using two-photon microscopy.
Opt Lett 33: 1038-1040, 2008. 5. Finikova OS, Chen P, Ou Z, Kadish KM, and Vinogradov SA. Dynamic Quenching of Porphyrin Triplet States by Two-
Photon Absorbing Dyes: Towards Two-Photon-Enhanced Oxygen Nanosensors. J Photochem Photobiol A Chem 198: 75-84, 2008.
6. Gayeski TE and Honig CR. Intracellular PO2 in individual cardiac myocytes in dogs, cats, rabbits, ferrets, and rats. Am J Physiol 260: H522-531, 1991.
7. Gnaiger E, Lassnig B, Kuznetsov A, Rieger G, and Margreiter R. Mitochondrial oxygen affinity, respiratory flux control and excess capacity of cytochrome c oxidase. J Exp Biol 201: 1129-1139, 1998.
8. Gnaiger E, Steinlechner-Maran R, Mendez G, Eberl T, and Margreiter R. Control of mitochondrial and cellular respiration by oxygen. J Bioenerg Biomembr 27: 583-596, 1995.
9. Green TJ, Wilson DF, Vanderkooi JM, and DeFeo SP. Phosphorimeters for analysis of decay profiles and real time monitoring of exponential decay and oxygen concentrations. Anal Biochem 174: 73-79, 1988.
10. Heineman FW, Kupriyanov VV, Marshall R, Fralix TA, and Balaban RS. Myocardial oxygenation in the isolated working rabbit heart as a function of work. Am J Physiol 262: H255-267, 1992.
11. Helmlinger G, Yuan F, Dellian M, and Jain RK. Interstitial pH and pO2 gradients in solid tumors in vivo: high-resolution measurements reveal a lack of correlation. Nat Med 3: 177-182, 1997.
12. Hogan MC. Fall in intracellular PO2 at the onset of contractions in Xenopus single skeletal muscle fibers. J Appl Physiol 90: 1871-1876, 2001.
13. Hogan MC. Phosphorescence quenching method for measurement of intracellular PO2 in isolated skeletal muscle fibers. J Appl Physiol 86: 720-724, 1999.
14. Ince C, Ashruf JF, Avontuur JA, Wieringa PA, Spaan JA, and Bruining HA. Heterogeneity of the hypoxic state in rat heart is determined at capillary level. Am J Physiol 264: H294-301, 1993.
15. Johannes T, Ince C, Klingel K, Unertl KE, and Mik EG. Iloprost preserves renal oxygenation and restores kidney function in endotoxemia-related acute renal failure in the rat. Crit Care Med 37: 1423-1432, 2009.
16. Johannes T, Mik EG, and Ince C. Nonresuscitated endotoxemia induces microcirculatory hypoxic areas in the renal cortex in the rat. Shock 31: 97-103, 2009.
17. Johannes T, Mik EG, Klingel K, Dieterich HJ, Unertl KE, and Ince C. Low-dose dexamethasone-supplemented fluid resuscitation reverses endotoxin-induced acute renal failure and prevents cortical microvascular hypoxia. Shock 31: 521-528, 2009.
18. Johannes T, Mik EG, Klingel K, Goedhart PT, Zanke C, Nohe B, Dieterich HJ, Unertl KE, and Ince C. Effects of 1400W and/or nitroglycerin on renal oxygenation and kidney function during endotoxaemia in anaesthetised rats. Clin Exp Pharmacol Physiol, 2009.
19. Johannes T, Mik EG, Nohe B, Unertl KE, and Ince C. Acute decrease in renal microvascular PO2 during acute normovolemic hemodilution. Am J Physiol Renal Physiol 292: F796-803, 2007.
20. Koo YE, Cao Y, Kopelman R, Koo SM, Brasuel M, and Philbert MA. Real-time measurements of dissolved oxygen inside live cells by organically modified silicate fluorescent nanosensors. Anal Chem 76: 2498-2505, 2004.
21. Legrand M, Almac E, Mik EG, Johannes T, Kandil A, Bezemer R, Payen D, and Ince C. L-NIL prevents renal microvascular hypoxia and increase of renal oxygen consumption after ischemia-reperfusion in rats. Am J Physiol Renal Physiol 296: F1109-1117, 2009.
22. Legrand M, Mik EG, Balestra GM, Lutter R, Pirracchio R, Payen D, and Ince C. Fluid resuscitation does not improve renal oxygenation during hemorrhagic shock in rats. Anesthesiology 112: 119-127.
23. Lo LW, Koch CJ, and Wilson DF. Calibration of oxygen-dependent quenching of the phosphorescence of Pd-meso-tetra (4-carboxyphenyl) porphine: a phosphor with general application for measuring oxygen concentration in biological systems. Anal Biochem 236: 153-160, 1996.
24. Robiolio M, Rumsey WL, and Wilson DF. Oxygen diffusion and mitochondrial respiration in neuroblastoma cells. Am J Physiol 256: C1207-1213, 1989.
25. Rumsey WL, Pawlowski M, Lejavardi N, and Wilson DF. Oxygen pressure distribution in the heart in vivo and evaluation of the ischemic "border zone". Am J Physiol 266: H1676-1680, 1994.
26. Rumsey WL, Robiolio M, and Wilson DF. Contribution of diffusion to the oxygen dependence of energy metabolism in human neuroblastoma cells. Adv Exp Med Biol 248: 829-833, 1989.
27. Rumsey WL, Vanderkooi JM, and Wilson DF. Imaging of phosphorescence: a novel method for measuring oxygen distribution in perfused tissue. Science 241: 1649-1651, 1988.

CHAPTER 9
136
28. Sakadzic S, Roussakis E, Yaseen MA, Mandeville ET, Srinivasan VJ, Arai K, Ruvinskaya S, Devor A, Lo EH, Vinogradov SA, and Boas DA. Two-photon high-resolution measurement of partial pressure of oxygen in cerebral vasculature and tissue. Nat Methods 7: 755-759, 2010.
29. Schumacker PT, Chandel N, and Agusti AG. Oxygen conformance of cellular respiration in hepatocytes. Am J Physiol 265: L395-402, 1993.
30. Shonat RD, Wilson DF, Riva CE, and Pawlowski M. Oxygen distribution in the retinal and choroidal vessels of the cat as measured by a new phosphorescence imaging method. Appl Opt 31: 3711-3718, 1992.
31. Sinaasappel M, Donkersloot C, van Bommel J, and Ince C. PO2 measurements in the rat intestinal microcirculation. Am J Physiol 276: G1515-1520, 1999.
32. Sinaasappel M and Ince C. Calibration of Pd-porphyrin phosphorescence for oxygen concentration measurements in vivo. J Appl Physiol 81: 2297-2303, 1996.
33. Sinaasappel M, Ince C, van der Sluijs JP, and Bruining HA. A new phosphorimeter for the measurement of oxygen pressures using Pd-porphine phosphorescence. Adv Exp Med Biol 361: 75-81, 1994.
34. Springett R and Swartz HM. Measurements of oxygen in vivo: overview and perspectives on methods to measure oxygen within cells and tissues. Antioxid Redox Signal 9: 1295-1301, 2007.
35. Subramanian RM, Chandel N, Budinger GR, and Schumacker PT. Hypoxic conformance of metabolism in primary rat hepatocytes: a model of hepatic hibernation. Hepatology 45: 455-464, 2007.
36. Svoboda K, Denk W, Kleinfeld D, and Tank DW. In vivo dendritic calcium dynamics in neocortical pyramidal neurons. Nature 385: 161-165, 1997.
37. Swartz HM and Dunn JF. Measurements of oxygen in tissues: overview and perspectives on methods. Adv Exp Med Biol 530: 1-12, 2003.
38. Trochu JN, Bouhour JB, Kaley G, and Hintze TH. Role of endothelium-derived nitric oxide in the regulation of cardiac oxygen metabolism: implications in health and disease. Circ Res 87: 1108-1117, 2000.
39. Uhlmann D, Pietsch UC, Ludwig S, Hess J, Armann B, Gaebel G, Escher E, Schaffranietz L, Tannapfel A, Fiedler M, Hauss J, and Witzigmann H. Assessment of hepatic ischemia-reperfusion injury by simultaneous measurement of tissue PO2, pCO2, and pH. Microvasc Res 67: 38-47, 2004.
40. van Beek JH, Bouma P, and Westerhof N. Oxygen uptake in saline-perfused rabbit heart is decreased to a similar extent during reductions in flow and in arterial oxygen concentration. Pflugers Arch 414: 82-88, 1989.
41. van Wagensveld BA, van Gulik TM, Gabeler EE, van der Kleij AJ, Obertop H, and Gouma DJ. Intrahepatic tissue PO2 during continuous or intermittent vascular inflow occlusion in a pig liver resection model. Eur Surg Res 30: 13-25, 1998.
42. Vanderkooi JM, Erecinska M, and Silver IA. Oxygen in mammalian tissue: methods of measurement and affinities of various reactions. Am J Physiol 260: C1131-1150, 1991.
43. Vanderkooi JM, Maniara G, Green TJ, and Wilson DF. An optical method for measurement of dioxygen concentration based upon quenching of phosphorescence. J Biol Chem 262: 5476-5482, 1987.
44. Wittenberg BA and Wittenberg JB. Transport of oxygen in muscle. Annu Rev Physiol 51: 857-878, 1989. 45. Xi Q, Cheranov SY, and Jaggar JH. Mitochondria-derived reactive oxygen species dilate cerebral arteries by activating
Ca2+ sparks. Circ Res 97: 354-362, 2005. 46. Zhao X, He G, Chen YR, Pandian RP, Kuppusamy P, and Zweier JL. Endothelium-derived nitric oxide regulates
postischemic myocardial oxygenation and oxygen consumption by modulation of mitochondrial electron transport. Circulation 111: 2966-2972, 2005.
47. Zheng L, Golub AS, and Pittman RN. Determination of PO2 and its heterogeneity in single capillaries. Am J Physiol 271: H365-372, 1996.
48. Ziemer LS, Lee WM, Vinogradov SA, Sehgal C, and Wilson DF. Oxygen distribution in murine tumors: characterization using oxygen-dependent quenching of phosphorescence. J Appl Physiol 98: 1503-1510, 2005.
49. Zuurbier CJ, van Iterson M, and Ince C. Functional heterogeneity of oxygen supply-consumption ratio in the heart. Cardiovasc Res 44: 488-497, 1999.

Appendices
Samenvatting en Conclusies
Dankwoord
List of Publications
Curriculum Vitae


Appendix 1
Samenvatting en Conclusies

SAMENVATTING EN CONCLUSIES
140
Moleculair zuurstof is de belangrijkste oxidans in biologische systemen en de voornaamste bestemming ervan in vivo zijn de mitochondria waar zuurstof wordt verbruikt in de oxidatieve fosforylering. Naast haar belang voor de energieproductie spelen zuurstof en haar radicalen belangrijke rollen in vele andere biochemische processen en in de signaaltransductie in onze cellen (2, 42, 45). Vanwege de relevantie van adequate zuurstoftoevoer naar weefsels zijn vele technieken ontwikkeld om zuurstofspanning in vivo te meten (34, 37, 42). Zuurstofafhankelijke uitdoving van fosforescentie, in de jaren 80 van de vorige eeuw door Vanderkooi et al. geïntroduceerd als methode om zuurstof te meten in biologische systemen (43), heeft zichzelf bewezen als een buitengewoon flexibele en krachtige technologie. De techniek is gebaseerd op toediening van een chemische substantie met zuurstofafhankelijke fosforescerende eigenschappen, typisch een metalloporfyrine zoals Palladium-porfyrine (Pd-porfyrine) (23, 32), aan het te bestuderen systeem. De intravasculaire injectie van aan albumine gebonden Pd-porfyrine is bijvoorbeeld een standaard techniek geworden voor meting van microvasculaire zuurstofspanning (µPO2) in vivo. Metingen van fosforescentie uitdooftijden zijn schaalbaar van toepassingen in microscopen bij de bestudering van cellen (12, 13) en capillairen (30, 47) tot visualisering van PO2 verdelingen in de oppervlakte van intacte organen (14, 27). Gecombineerd met een relatief eenvoudige en robuuste technologie zijn dit belangrijke ingrediënten voor het succes van deze techniek. De recente introductie van nieuwe fosforescerende kleurstoffen (3) heeft de toepasbaarheid ervan nog verder vergroot, met name in dikke weefsels (48).
Zoals bij bijna elke nieuwe methode verliep de introductie van de fosforescentie technologie in het domein van de in PO2 metingen geïnteresseerde wetenschappers niet zonder kinderziektes. Omdat de uitdooftijden van de fosforescentie van de gebruikte fosforescerende kleurstoffen ordes van grootte langer zijn dan fluorescentie uitdooftijden, typisch tientallen microseconden tot enkele milliseconden, werd het gebruik van xenon flitslampen als excitatiebron in de constructie van vroege fosforimeters gepropageerd (9, 33). Er werd aangenomen dat de excitatiepuls van deze flitslampen, met een typische pulsbreedte van enkele microseconden, kort genoeg zou zijn om geen invloed te hebben op de uitdooftijd van het gemeten fosforescentie signaal. Echter, in tegenstelling tot wat de theorie voorspelde, werden er in de begindagen door verschillende laboratoria behoorlijke variaties in calibratieconstanten gerapporteerd en vond men calibratielijnen die devieerden van de Stern-Volmer relatie. De gerapporteerde waarden voor de uitdovingsconstante van Pd-porfyrine lagen in het bereik van kq = 306 mmHg-1s-1 (47) tot 386 mmHg-1s-1 (11). In hoofdstuk 2 evalueren we de effecten van de eindige duur en de complexe vorm van de excitatiepuls van flitslampen op de meting en analyse van de fosforescentie uitdooftijden. We tonen aan dat variaties in de flitslampkarakteristieken voor een groot deel verantwoordelijk kunnen zijn voor de verschillen tussen laboratoria. Verder tonen we aan dat de eindige duur van de excitatiepuls leidt tot niet-lineariteit van de calibratiecurves. Daarnaast presenteren we een methode voor deconvolutie van de vorm van de excitatiepuls uit het fotometrische signaal. Hiermee wordt het negatieve effect van het gebruik van flitslampen grotendeels geneutraliseerd.
Vanwege de aanwezigheid van zuurstofgradiënten, onder andere veroorzaakt door cellulaire respiratie en variaties in diffusieafstanden vanaf het capillaire netwerk tot het mitochondrion, is de PO2 in weefsels heterogeen. Metingen van fosforescentie uitdooftijden zijn zeer geschikt om inzicht te krijgen in deze heterogeniteit. Als voorbeelden hiervoor gelden intravitaal microscopie (31, 47) en beeldvorming aan de oppervlakte van organen (14, 27), die duidelijk heterogeniteit in zuurstofspanning in de twee-dimensionale (x-y) richting hebben aangetoond. Echter, de anatomische structuur van sommige organen met verschillende functionele compartimenten, zoals de darm en de nier, maakt het zeer interessant om ook inzicht te krijgen in de heterogeniteit van zuurstofspanning naar diepte in het weefsel. Multi-foton excitatie is een inmiddels welbekende niet-lineare optische techniek die bruikbaar is voor het driedimensionaal visualiseren van fluorescentie in vivo (36). In hoofstuk 3 tonen we aan dat twee-foton excitatie in principe gebruikt kan worden voor kwantitatieve PO2 metingen met de klassieke Pd-porfyrine. De calibratieconstanten zijn hetzelfde als met normale enkel-foton excitatie en
SAMENVATTING EN CONCLUSIES
141
de kwadratische afhankelijkheid van de excitatie intensiteit is excellent. Twee-foton scanning in de z-richting door de renale cortex liet een abrupte PO2 daling zien op een diepte die correspondeert met de transitie van cortex naar de buitenste medulla. Ons werk is de eerste demonstratie van de bruikbaarheid van twee-foton excitatie voor meten van PO2 middels fosforescentie. Inmiddels hebben anderen het principe toegepast in twee-foton microscopie, maar de lage twee-photon absorptie van Pd-porfyrine leidt hierbij tot onpraktisch hoge excitatie energieën en lange scan tijden (4). Zeer recent zijn nieuwe fosforescerende kleurstoffen met veel efficiëntere twee-foton absorptie ontwikkeld (5). De toevoeging van “twee-foton absorptie antennes” aan een metallo-porfyrine kern heeft nu praktische implementatie van PO2 metingen m.b.v. twee-foton microscopie binnen bereik gebracht (28).
De twee-foton aanpak heeft niet de snelheid en het gemak gebracht die we nodig hadden voor monitoring van de microvasculaire PO2 (µPO2) in organen van proefdieren tijdens experimentele modellen van (septische) shock en resuscitatie. Een andere, potentieel geschikte, manier om onderscheid te kunnen maken tussen verschillende weefsellagen is het gebruik van verschillende excitatie golflengten. Dit idee is gebaseerd op het principe dat licht met langere golflengtes dieper in weefsels doordringt door verminderde absorptie. Hoewel klassiek Pd-porfyrine geëxciteerd kan worden met licht van twee verschillende golflengtes (~ 420 nm en 530 nm, respectievelijk blauw en groen licht) worden beide zeer goed geabsorbeerd door hemoglobine, waardoor de penetratiediepte gelimiteerd is tot zeer oppervlakkige weefsellagen. Echter, de introductie van de nabij-infrarood fosfor Oxyphor G2 (3) gaf ons de mogelijkheid het principe van verschillende golflengtes in de praktijk te toetsen. In hoofdstuk 4 beschrijven we de ontwikkeling en het gebruik van een tweegolflengten fosforimeter die Oxyphor G2 alternerend met blauw (440 nm) of rood (632 nm) licht exciteert. In rattennieren tonen we aan dat de blauwe excitatie leidt tot een meetvolume dat is beperkt tot de cortex, terwijl de rode excitatie het meetvolume uitbreidt tot de buitenste medulla. Hoewel er enig overlap tussen de meetvolumina bestaat (deze aanpak heeft niet de absolute onderscheidende kracht van twee-foton excitatie) gedragen beide kanalen zich verrassend onafhankelijk van elkaar. In toevoeging op de meting van µPO2 in twee verschillende dieptes demonstreren we dat het additioneel berekenen van PO2 histogrammen een nog beter inzicht in de heterogeniteit geeft. Tweegolflengten fosforimetrie, zoals beschreven in hoofdstuk 4, is inmiddels uitgebreid toegepast in ons laboratorium voor de studie naar microvasculaire oxygenatie in de rattennier in verschillende pathofysiologische modellen (15-19, 21, 22).
Voor een meer compleet begrip van de oxygenatie van een orgaan is de combinatie van globale, hele orgaan, metingen zoals zuurstofaanbod (DO2) en zuurstofverbruik (VO2) met meer locale, orgaanregionale, µPO2 metingen nodig. Hiervoor moet men de hoeveelheid bloed die per tijdseenheid door het orgaan stroomt meten en ook de hoeveelheid zuurstof die het arteriële en veneuze bloed bevat. De klassieke manier om het zuurstofgehalte van bloed te meten, d.m.v. het nemen van bloedmonsters, leidt bij kleine proefdieren snel tot volumedepletie en daarnaast bestaat het risico op beschadiging van vitale bloedvaten. Voor de monitoring van het zuurstofgehalte in de vena renalis hebben we een techniek ontwikkeld die is gebaseerd op zuurstofafhankelijke uitdoving van fosforescentie. In hoofdstuk 5 beschrijven we een frequentiedomein fosforimeter die het mogelijk maakt om online de PO2 van het opgeloste, ongebonden, zuurstof in het bloed van de vena renalis te monitoren door extravasculaire positionering van een kleine fiberoptische probe. Het totale zuurstofgehalte in de vena renalis wordt vervolgens berekend m.b.v. een mathematisch model dat gebaseerd is op hemoglobine saturatiecurves die zijn gemeten in bloedmonsters van ratten en door gebruik te maken van de hemoglobineconcentratie die is bepaald d.m.v. arteriële bloedmonsters. Deze aanpak staat toe om het zuurstofgehalte in de vena renalis te monitoren met een meetfout kleiner dan 10% over een groot pH bereik. Vanwege de bekende pH-afhankelijkheid van de hemoglobine saturatie curve kan deze techniek echter niet volledig het nemen van veneuze bloedmonsters onder alle omstandigheden vervangen. Desalniettemin is deze meetmethode, evenals tweegolflengten fosforimetrie, een standaard aanpak geworden in ons laboratorium. Het geeft de mogelijkheid om bijna

SAMENVATTING EN CONCLUSIES
142
continu de renale VO2 te meten en dient als leidraad om, indien nodig, gericht meer invasieve metingen te doen.
De hiervoor beschreven technieken zijn uiteraard alleen bruikbaar voor preklinisch gebruik vanwege de noodzaak om een exogene fosforescerence kleurstof te injecteren. In een poging om deze beperking te omzeilen hebben we gekeken naar mogelijkheden om endogene porfyrines te gebruiken voor zuurstofmetingen. Het resultaat van deze zoektocht is tamelijk opmerkelijk en heeft geleid tot de eerste methode om mitochondriale zuurstofspanning (mitoPO2) te meten in levende cellen. In hoofdstuk 6 beschrijven we de ontwikkeling van deze mitoPO2 metingen op basis van zuurstofafhankelijke uitdoving van de vertraagde fluorescentie van protoporfyrine IX (PpIX), de laatste precursor in de biosynthese van heem. We tonen aan dat 5-aminolevuline zuur (ALA) geïnduceerde PpIX gelokaliseerd is in de mitochondria en een zuurstofafhankelijke vertraagde fluorescentie bezit, waarvan de uitdooftijd kwantitatief afhangt van de mitoPO2. We kalibreren het vertraagde fluorescentie signaal van PpIX tegen de PO2 in verschillende cellijnen en voeren de eerste directe meting uit van het verschil in zuurstofspanning tussen het extracellulaire compartiment en de intracellulaire mitochondria. Dit laatste is een lang bestaand onderwerp van discussie geweest, aangezien gerapporteerde waardes varieerden van onder de een mmHg d.m.v. indirecte methoden (24, 26) tot enkele mmHg door intracellulaire zuurstofmetingen gebaseerd op injectie van fosforescerende kleurstoffen (13) of nanopartikels (20). Wij vonden dat het PO2 verschil tussen de mitochondria en het extracellulaire compartiment afhankelijk is van de zuurstofconsumptie en dat de grootte van het verschil typisch in de orde van enkele mmHg is.
De methode voor meting van mitoPO2 d.m.v. vertraagde fluorescentie van ALA geïnduceerde protoporfyrine IX, zoals beschreven in hoofdstuk 6, zou natuurlijk sterk aan kracht winnen als deze niet alleen zou werken in gekweekte cellen maar ook in weefsels en organen in vitro en in vivo. In hoofdstuk 7 beschrijven we de eerste succesvolle toepassing van deze techniek voor metingen van mitoPO2 in vivo. Hiervoor wordt de vertraagde fluorescentie van PpIX gekalibreerd in primair geïsoleerde hepatocyten uit ALA voorbehandelde ratten. We rapporteren een uitdovingsconstante kq = 832 ± 25 mmHg-1s-1 en een uitdooftijd in de afwezigheid van zuurstof τ0 = 0.8 ± 0.1 ms. De geldigheid van de gevonden calibratieconstanten voor intact weefsel is geverifieerd in geïsoleerde geperfundeerde levers, ook afkomstig uit ALA voorbehandelde ratten. We meten mitoPO2 waarden en mitoPO2 histogrammen in de rattenlever in vivo bij verschillende inspiratoire zuurstoffracties en tijdens ischemie-reperfusie. De gevonden mitoPO2 waarden zijn typisch een orde van grootte hoger dan algemeen aangenomen en voorspeld (8). De gemiddelde mitoPO2 is rond 30-40 mmHg en verschilt niet veel van weefsel PO2 metingen gedaan met micro zuurstof-electrodes (39, 41). Onder basale omstandigheden zijn er geen hypoxische fracties van mitochondria (mitoPO2 in het bereik 0-10 mmHg) aanwezig in de mitoPO2 histogrammen. Deze worden echter duidelijk zichtbaar gedurende beademing met gasmengsels met verminderde zuurstofconcentratie en tijdens ischemie-reperfusie. Als interessant gegeven vonden we dat de mitoPO2 waarden in vivo in het PO2 bereik liggen dat van belang is in het concept van zuurstofafhankelijke adaptatie van metabolisme, genaamd “oxygen conformance of metabolism” (29, 35).
Het hart is een orgaan dat van oudsher van groot belang is voor wat betreft studies naar oxygenatie. Zowel in situ als in de vorm van geïsoleerd gepeefundeerd orgaan wordt het rattenhart veel gebruikt voor bestudering van de oxygenatie van het myocard en de studie naar fenomenen als ischemie-reperfusie schade en preconditionering. In hoofdstuk 8 beschrijven we mitoPO2 histogrammen die gemeten zijn d.m.v. vertraagde fluorescentie van PpIX in zowel geïsoleerde geperfundeerde als in vivo rattenharten. Hier is de kalibratie van de techniek gedaan in geïsoleerde cardiomyocyten uit ALA voorbehandelde ratten. De calibratieconstanten kq = 826 ± 51 mmHg-1s-1 en τ0 = 0.8 ms zijn hetzelfde als die gevonden voor de rattenlever en de toepasbaarheid voor het intacte hart wordt gedemonstreerd. De gemiddelde in vivo mitoPO2 waarde van 35 ± 5 mm Hg is in overeenstemming met weefsel PO2 waarden van 45 ± 8 mm Hg (1) en microvasculaire PO2 waarden

SAMENVATTING EN CONCLUSIES
143
van 50–70 mmHg zoals gevonden in deze en eerdere studies (49). Wij rapporteren echter mitoPO2 waarden die veel hoger zijn dan verwacht uitgaande van schattingen afkomstig van cytosolische/interstitiële/vasculare metingen van 3–17 mmHg (6, 7, 25, 38, 44, 46). Verder laten de mitoPO2 histogrammen zien dat ongeveer 10% van de mitochondria in het in vivo hart zijn blootgesteld aan PO2 waarden tussen 0 en 10 mmHg. Dit impliceert dat een fractie van de mitochondria in het in vivo hart mogelijk gedeeltelijk gereguleerd wordt door de aanwezige zuurstofspanning. Deze fractie van mitochondria met een mitoPO2 tussen 0 en 10 mmHg is toegenomen tot 30% in het geïsoleerde geperfundeerde rattenhart, waarbij maximale vasodilatatie deze fractie weer tot 10% laat afnemen. Onze data suggereert dat het normaal geperfundeerde geïsoleerde hart zuurstof gelimiteerd is. Dit is in overeenstemming met oudere literatuur die stelt dat het geïsoleerde hart deels hypoxisch is (10, 40).
Dit proefschrift beschrijft de implementatie van nieuwe technieken voor de meting van weefsel-oxygenatie gebaseerd op zuurstofafhankelijke uitdoving van de levensduur van de geëxciteerde triplet state van porfyrines. Uiteindelijk hebben we een methode ontwikkeld voor meting van mitochondriale zuurstofspanning in vivo. De eerste metingen wijzen erop dat mitoPO2 veel hoger is dan algemeen verondersteld dan wel verwacht. Deze vindingen komen in een tijdperk van nieuwe inzichten omtrent zuurstofgereguleerde cellulaire adaptatie, zoals zuurstofafhankelijke genexpressie en metabolisme. Het is de verwachting dat de beschreven methoden een waardevolle aanvulling zijn op het arsenaal van technieken die de wetenschapper tot zijn beschikking heeft voor de ontrafeling van de mechanismen van zuurstoftransport en zuurstofconsumptie onder verscheidene pathofysiologische omstandigheden. Zuurstof is weer belangrijk, zoals ze altijd is geweest … REFERENCES 1. Al-Obaidi MK, Etherington PJ, Barron DJ, Winlove CP, and Pepper JR. Myocardial tissue oxygen supply and utilization
during coronary artery bypass surgery: evidence of microvascular no-reflow. Clin Sci (Lond) 98: 321-328, 2000. 2. Droge W. Free radicals in the physiological control of cell function. Physiol Rev 82: 47-95, 2002. 3. Dunphy I, Vinogradov SA, and Wilson DF. Oxyphor R2 and G2: phosphors for measuring oxygen by oxygen-
dependent quenching of phosphorescence. Anal Biochem 310: 191-198, 2002. 4. Estrada AD, Ponticorvo A, Ford TN, and Dunn AK. Microvascular oxygen quantification using two-photon microscopy.
Opt Lett 33: 1038-1040, 2008. 5. Finikova OS, Chen P, Ou Z, Kadish KM, and Vinogradov SA. Dynamic Quenching of Porphyrin Triplet States by Two-
Photon Absorbing Dyes: Towards Two-Photon-Enhanced Oxygen Nanosensors. J Photochem Photobiol A Chem 198: 75-84, 2008.
6. Gayeski TE and Honig CR. Intracellular PO2 in individual cardiac myocytes in dogs, cats, rabbits, ferrets, and rats. Am J Physiol 260: H522-531, 1991.
7. Gnaiger E, Lassnig B, Kuznetsov A, Rieger G, and Margreiter R. Mitochondrial oxygen affinity, respiratory flux control and excess capacity of cytochrome c oxidase. J Exp Biol 201: 1129-1139, 1998.
8. Gnaiger E, Steinlechner-Maran R, Mendez G, Eberl T, and Margreiter R. Control of mitochondrial and cellular respiration by oxygen. J Bioenerg Biomembr 27: 583-596, 1995.
9. Green TJ, Wilson DF, Vanderkooi JM, and DeFeo SP. Phosphorimeters for analysis of decay profiles and real time monitoring of exponential decay and oxygen concentrations. Anal Biochem 174: 73-79, 1988.
10. Heineman FW, Kupriyanov VV, Marshall R, Fralix TA, and Balaban RS. Myocardial oxygenation in the isolated working rabbit heart as a function of work. Am J Physiol 262: H255-267, 1992.
11. Helmlinger G, Yuan F, Dellian M, and Jain RK. Interstitial pH and pO2 gradients in solid tumors in vivo: high-resolution measurements reveal a lack of correlation. Nat Med 3: 177-182, 1997.
12. Hogan MC. Fall in intracellular PO2 at the onset of contractions in Xenopus single skeletal muscle fibers. J Appl Physiol 90: 1871-1876, 2001.
13. Hogan MC. Phosphorescence quenching method for measurement of intracellular PO2 in isolated skeletal muscle fibers. J Appl Physiol 86: 720-724, 1999.
14. Ince C, Ashruf JF, Avontuur JA, Wieringa PA, Spaan JA, and Bruining HA. Heterogeneity of the hypoxic state in rat heart is determined at capillary level. Am J Physiol 264: H294-301, 1993.
15. Johannes T, Ince C, Klingel K, Unertl KE, and Mik EG. Iloprost preserves renal oxygenation and restores kidney function in endotoxemia-related acute renal failure in the rat. Crit Care Med 37: 1423-1432, 2009.
SAMENVATTING EN CONCLUSIES
144
16. Johannes T, Mik EG, and Ince C. Nonresuscitated endotoxemia induces microcirculatory hypoxic areas in the renal cortex in the rat. Shock 31: 97-103, 2009.
17. Johannes T, Mik EG, Klingel K, Dieterich HJ, Unertl KE, and Ince C. Low-dose dexamethasone-supplemented fluid resuscitation reverses endotoxin-induced acute renal failure and prevents cortical microvascular hypoxia. Shock 31: 521-528, 2009.
18. Johannes T, Mik EG, Klingel K, Goedhart PT, Zanke C, Nohe B, Dieterich HJ, Unertl KE, and Ince C. Effects of 1400W and/or nitroglycerin on renal oxygenation and kidney function during endotoxaemia in anaesthetised rats. Clin Exp Pharmacol Physiol, 2009.
19. Johannes T, Mik EG, Nohe B, Unertl KE, and Ince C. Acute decrease in renal microvascular PO2 during acute normovolemic hemodilution. Am J Physiol Renal Physiol 292: F796-803, 2007.
20. Koo YE, Cao Y, Kopelman R, Koo SM, Brasuel M, and Philbert MA. Real-time measurements of dissolved oxygen inside live cells by organically modified silicate fluorescent nanosensors. Anal Chem 76: 2498-2505, 2004.
21. Legrand M, Almac E, Mik EG, Johannes T, Kandil A, Bezemer R, Payen D, and Ince C. L-NIL prevents renal microvascular hypoxia and increase of renal oxygen consumption after ischemia-reperfusion in rats. Am J Physiol Renal Physiol 296: F1109-1117, 2009.
22. Legrand M, Mik EG, Balestra GM, Lutter R, Pirracchio R, Payen D, and Ince C. Fluid resuscitation does not improve renal oxygenation during hemorrhagic shock in rats. Anesthesiology 112: 119-127.
23. Lo LW, Koch CJ, and Wilson DF. Calibration of oxygen-dependent quenching of the phosphorescence of Pd-meso-tetra (4-carboxyphenyl) porphine: a phosphor with general application for measuring oxygen concentration in biological systems. Anal Biochem 236: 153-160, 1996.
24. Robiolio M, Rumsey WL, and Wilson DF. Oxygen diffusion and mitochondrial respiration in neuroblastoma cells. Am J Physiol 256: C1207-1213, 1989.
25. Rumsey WL, Pawlowski M, Lejavardi N, and Wilson DF. Oxygen pressure distribution in the heart in vivo and evaluation of the ischemic "border zone". Am J Physiol 266: H1676-1680, 1994.
26. Rumsey WL, Robiolio M, and Wilson DF. Contribution of diffusion to the oxygen dependence of energy metabolism in human neuroblastoma cells. Adv Exp Med Biol 248: 829-833, 1989.
27. Rumsey WL, Vanderkooi JM, and Wilson DF. Imaging of phosphorescence: a novel method for measuring oxygen distribution in perfused tissue. Science 241: 1649-1651, 1988.
28. Sakadzic S, Roussakis E, Yaseen MA, Mandeville ET, Srinivasan VJ, Arai K, Ruvinskaya S, Devor A, Lo EH, Vinogradov SA, and Boas DA. Two-photon high-resolution measurement of partial pressure of oxygen in cerebral vasculature and tissue. Nat Methods 7: 755-759, 2010.
29. Schumacker PT, Chandel N, and Agusti AG. Oxygen conformance of cellular respiration in hepatocytes. Am J Physiol 265: L395-402, 1993.
30. Shonat RD, Wilson DF, Riva CE, and Pawlowski M. Oxygen distribution in the retinal and choroidal vessels of the cat as measured by a new phosphorescence imaging method. Appl Opt 31: 3711-3718, 1992.
31. Sinaasappel M, Donkersloot C, van Bommel J, and Ince C. PO2 measurements in the rat intestinal microcirculation. Am J Physiol 276: G1515-1520, 1999.
32. Sinaasappel M and Ince C. Calibration of Pd-porphyrin phosphorescence for oxygen concentration measurements in vivo. J Appl Physiol 81: 2297-2303, 1996.
33. Sinaasappel M, Ince C, van der Sluijs JP, and Bruining HA. A new phosphorimeter for the measurement of oxygen pressures using Pd-porphine phosphorescence. Adv Exp Med Biol 361: 75-81, 1994.
34. Springett R and Swartz HM. Measurements of oxygen in vivo: overview and perspectives on methods to measure oxygen within cells and tissues. Antioxid Redox Signal 9: 1295-1301, 2007.
35. Subramanian RM, Chandel N, Budinger GR, and Schumacker PT. Hypoxic conformance of metabolism in primary rat hepatocytes: a model of hepatic hibernation. Hepatology 45: 455-464, 2007.
36. Svoboda K, Denk W, Kleinfeld D, and Tank DW. In vivo dendritic calcium dynamics in neocortical pyramidal neurons. Nature 385: 161-165, 1997.
37. Swartz HM and Dunn JF. Measurements of oxygen in tissues: overview and perspectives on methods. Adv Exp Med Biol 530: 1-12, 2003.
38. Trochu JN, Bouhour JB, Kaley G, and Hintze TH. Role of endothelium-derived nitric oxide in the regulation of cardiac oxygen metabolism: implications in health and disease. Circ Res 87: 1108-1117, 2000.
39. Uhlmann D, Pietsch UC, Ludwig S, Hess J, Armann B, Gaebel G, Escher E, Schaffranietz L, Tannapfel A, Fiedler M, Hauss J, and Witzigmann H. Assessment of hepatic ischemia-reperfusion injury by simultaneous measurement of tissue PO2, pCO2, and pH. Microvasc Res 67: 38-47, 2004.
40. van Beek JH, Bouma P, and Westerhof N. Oxygen uptake in saline-perfused rabbit heart is decreased to a similar extent during reductions in flow and in arterial oxygen concentration. Pflugers Arch 414: 82-88, 1989.
41. van Wagensveld BA, van Gulik TM, Gabeler EE, van der Kleij AJ, Obertop H, and Gouma DJ. Intrahepatic tissue PO2 during continuous or intermittent vascular inflow occlusion in a pig liver resection model. Eur Surg Res 30: 13-25, 1998.

SAMENVATTING EN CONCLUSIES
145
42. Vanderkooi JM, Erecinska M, and Silver IA. Oxygen in mammalian tissue: methods of measurement and affinities of various reactions. Am J Physiol 260: C1131-1150, 1991.
43. Vanderkooi JM, Maniara G, Green TJ, and Wilson DF. An optical method for measurement of dioxygen concentration based upon quenching of phosphorescence. J Biol Chem 262: 5476-5482, 1987.
44. Wittenberg BA and Wittenberg JB. Transport of oxygen in muscle. Annu Rev Physiol 51: 857-878, 1989. 45. Xi Q, Cheranov SY, and Jaggar JH. Mitochondria-derived reactive oxygen species dilate cerebral arteries by activating
Ca2+ sparks. Circ Res 97: 354-362, 2005. 46. Zhao X, He G, Chen YR, Pandian RP, Kuppusamy P, and Zweier JL. Endothelium-derived nitric oxide regulates
postischemic myocardial oxygenation and oxygen consumption by modulation of mitochondrial electron transport. Circulation 111: 2966-2972, 2005.
47. Zheng L, Golub AS, and Pittman RN. Determination of PO2 and its heterogeneity in single capillaries. Am J Physiol 271: H365-372, 1996.
48. Ziemer LS, Lee WM, Vinogradov SA, Sehgal C, and Wilson DF. Oxygen distribution in murine tumors: characterization using oxygen-dependent quenching of phosphorescence. J Appl Physiol 98: 1503-1510, 2005.
49. Zuurbier CJ, van Iterson M, and Ince C. Functional heterogeneity of oxygen supply-consumption ratio in the heart. Cardiovasc Res 44: 488-497, 1999.


Appendix 2
Dankwoord

DANKWOORD
148
Vele mensen hebben, bewust of onbewust, een bijdrage geleverd aan de totstandkoming van dit proefschrift. Het dankwoord zou vele bladzijden kunnen omvatten maar ik ga me houden aan de voorgenomen twee. Mocht u zich onterecht niet terugvinden, mijn erkentelijkheid is er niet minder om. Dit proefschrift was er zeker niet geweest zonder mijn natuurkundeleraar, Arie v.d. Linden, die helaas veel te jong overleden is. Hij was het die me overhaalde natuurkunde te gaan studeren, een stap zonder welke ik dit proefschrift niet had kunnen schrijven. Mijn latere overstap naar geneeskunde lag absoluut niet aan hem. Grote dank gaat uit naar mijn promotor, professor Can Ince. Can, jij was het die me bewust maakte van het feit dat geneeskunde niet alleen maar bestaat uit rijtjes uit het hoofd leren. Gelukkig valt er ook veel te ontwikkelen en te ontdekken zonder tussenkomst van dikke boeken of zelfs patiënten. Wat wij in de loop van de jaren samen hebben beleeft valt met geen pen te beschrijven. Grote bewondering heb ik voor jouw onverzettelijkheid, veerkracht en gave om in barre tijden de moed er in te houden. Je hebt me wel eens een ongeleide projectiel genoemd, omdat ik me nauwelijks liet sturen, om daarbij vervolgens op te merken dat ik toch wel ergens doel zou raken. Hopelijk heb ik je niet teleurgesteld. Ik dank je voor de genoten vrijheid en kijk met trots terug op onze publicaties en dit proefschrift. Wat te schrijven over mijn copromotor, dr. Coert Zuurbier? De quote “He is the gooey, sticky... stuff that holds us together. He made this herd, and we'd be nothing without him”, van wat Diego zegt over Sid in de film “Ice Age”, zegt eigenlijk alles. Coert, naast jouw kwaliteiten als rasechte en integere wetenschapper heb ik vooral veel aan jou te danken als luisterend oor en klankbord. Als kamergenoot wist je me altijd te bedaren en moed in te praten als de emoties weer eens de overhand kregen. Ondanks dat we nu in verschillende instituten werken doe je dat op gezette tijden gelukkig nog steeds; “It is the science, stupid!” Van alle dierbare collegae van de Celfysiologie, later omgedoopt tot “Klinische Fysiologie” en weer later getransformeerd tot “Translationele Fysiologie”, die ik in de loop der jaren heb mogen meemaken is Otto Eerbeek wel de meest bijzondere. Lieve Otto, zelden heb ik iemand gezien met zo’n klein ego en zo’n groot hart. Je stond altijd voor me klaar, of het nu was met je fenomenale parate kennis bij een wetenschappelijk probleem of met een glas wijn bij een gebroken hart. Heel erg bedankt. Veel heb ik ook te danken aan professor Ravesloot. Beste Jan, als hoofd van de afdeling fysiologie heb je me ooit op het hart gedrukt dat ik hoe dan ook mijn coschappen moest gaan doen. In een tijd waarin ik tabak had van alles wat maar enigszins riekte naar geneeskunde heeft jouw overredings-kracht gezegevierd. De klinische praktijk bleek veel leuker dan ik dacht en nu mag ik ten overstaan van jou mijn proefschrift verdedigen als medisch specialist. Ik ben blij dat ik nooit tegen je heb hoeven debatteren, maar vind het geweldig dat je in mijn promotiecommissie hebt willen plaatsnemen. Professor van Leeuwen, beste Ton, zonder het enthousiasme van jou en de medewerkers van het vroegere “Lasercentrum” was dit proefschrift een stuk dunner geweest. Gelukkig vond je altijd tijd om me aan te horen als ik weer eens met een wild idee bij je kwam binnenvallen. Nog prettiger was het dat je altijd bereid was mee te denken en vooral ook mee te doen. Het is een eer dat je in mijn promotiecommissie wilt deelnemen. Professor Pittman, dear Roland, your willingness to participate in my PhD ceremony is a true honor. You are one of the early adopters of the phosphorescence quenching technique. The importance of your work to our field of research is evident by the many times you are cited in this thesis. Thank you for traveling such a long distance to be part of this, for me, important event.

DANKWOORD
149
Professor Bakker, beste Jan, dank voor de steun in de afgelopen jaren. Ook hartelijk dank dat je tijdens je sabattical leave toch mijn proefschrift wilde beoordelen. Professor Stolker, beste Robert Jan, of toch maar gewoon “professor”, mijn dank jegens jou behelst niet zozeer de inhoud van dit proefschrift, maar veel meer dat wat in het verlengde ervan ligt. Dank voor jouw streven tot behoud van het laboratorium voor experimentele anesthesiologie in het ErasmusMC. De overige commissieleden, professor Spaan en professor de Mol wil ik bedanken voor deelname aan de promotiecommissie, maar bovenal ook voor de steun die jullie altijd hebben gegeven aan de groep van professor Ince. In de kleine, maar zeer dynamische, groep van Can Ince heb ik vele zeer gewaardeerde collegae mee mogen maken. Van het eerste uur waren daar met name Albert Lind, die me leerde pipetteren en me de beginselen van de microscopie bijbracht en Cees Donkersloot, van wie ik mijn elektronica kennis en LabView expertise heb afgekeken. Max Hardeman, Paul Elbers, Joyce Kempes, Keshen Mathura, Harold Raat, Michiel Sinaasappel, Jasper van Bommel, Maringa en Anneke, en al hun opvolgers en buitenlandse gasten, hartelijk dank voor de leuke tijd. Peter Goedhart wil ik hierbij postuum bedanken, hij was jaren lang de ruggengraat van de afdeling. De jonge garde, Dan Milstein en Rick Bezemer wens ik veel succes toe. Uiteraard ben ik veel dank verschuldigd aan al diegenen die direct bij mijn onderzoek betrokken waren en als coauteurs mee hebben gepubliceerd, met name Jan Stap. Jan, het enthousiasme en de energie waarmee jij op industriële schaal voor mij celsuspensies hebt gecreëerd waren essentieel voor de ontwikkeling van de mitoPO2 metingen. De onderzoekers van het voormalige Lasercentrum waren altijd bereikbaar voor raad en daad. Dirk, Freek, Maurice, Johan, Ton, Martin en Anne, hartelijk dank voor jullie inzet met humor. Zonder de mannen van het MTO was dit proefschrift onmogelijk geweest. Glasblazers, elektronici en fijnmechanici, dank voor jullie tomeloze inzet en vaak zeer snelle resultaten. Zeer prettige herinneringen heb ik ook aan de heren van de fotografie, de meest multifunctionele afdeling van het AMC. Peter Lowie en John Nunumete, dank voor de koffie, de gastvrijheid in de doka en jullie inzet bij het drukken van de posters. John, ik hoop dat het goed met je gaat. Geen promotie zonder paranimfen en ik ben Floor Harms en Sander Bodmer zeer erkentelijk voor hun bereidheid met mij op het podium te staan. Dank ook dat jullie het hebben aangedurfd om enige jaren van jullie leven bezig te zijn met mijn hersenspinsels. Het komt allemaal goed. Pa en ma, jullie vonden het maar niks dat ik Eindhoven inruilde voor Amsterdam. Misschien hadden jullie wel een beetje gelijk. Hopelijk zijn jullie toch wel trots op wat ik in de medische wereld heb bereikt. Bedankt voor jullie liefde en steun. Lieve Tanja, ergens tijdens het promotietraject kwam jij in mijn leven. Daarna was niks meer hetzelfde, zowel thuis als op het werk. Tanja en Maita, ik hou van jullie.


Appendix 3
List of Publications
LIST OF PUBLICATIONS
152
Mik EG, Donkersloot C, Raat NJ, and Ince C. Excitation pulse deconvolution in luminescence lifetime analysis for oxygen measurements in vivo. Photochem Photobiol 76: 12-21, 2002. Zuurbier CJ, Kruyver B, Eerbeek O, Mik EG, and Ince C. Commonly used numbers of microspheres affect cardiac vascular resistance. J Cardiovasc Pharmacol 41: 223-232, 2003. Faber DJ, Mik EG, Aalders MC, and van Leeuwen TG. Light absorption of (oxy-)hemoglobin assessed by spectroscopic optical coherence tomography. Opt Lett 28: 1436-1438, 2003. Eerbeek O, Mik EG, Zuurbier CJ, van 't Loo M, Donkersloot C, and Ince C. Ratiometric intracellular calcium imaging in the isolated beating rat heart using indo-1 fluorescence. J Appl Physiol 97: 2042-2050, 2004. Mik EG, van Leeuwen TG, Raat NJ, and Ince C. Quantitative determination of localized tissue oxygen concentration in vivo by two-photon excitation phosphorescence lifetime measurements. J Appl Physiol 97: 1962-1969, 2004. Faber DJ, Aalders MC, Mik EG, Hooper BA, van Gemert MJ, and van Leeuwen TG. Oxygen saturation-dependent absorption and scattering of blood. Phys Rev Lett 93: 028102, 2004. Raat NJ, Verhoeven AJ, Mik EG, Gouwerok CW, Verhaar R, Goedhart PT, de Korte D, and Ince C. The effect of storage time of human red cells on intestinal microcirculatory oxygenation in a rat isovolemic exchange model. Crit Care Med 33: 39-45; discussion 238-239, 2005. Faber DJ, Mik EG, Aalders MC, and van Leeuwen TG. Toward assessment of blood oxygen saturation by spectroscopic optical coherence tomography. Opt Lett 30: 1015-1017, 2005. Johannes T, Mik EG, and Ince C. Dual-wavelength phosphorimetry for determination of cortical and subcortical microvascular oxygenation in rat kidney. J Appl Physiol 100: 1301-1310, 2006. Johannes T, Mik EG, Nohe B, Raat NJ, Unertl KE, and Ince C. Influence of fluid resuscitation on renal microvascular PO2 in a normotensive rat model of endotoxemia. Crit Care 10: R88, 2006. Mik EG, Stap J, Sinaasappel M, Beek JF, Aten JA, van Leeuwen TG, and Ince C. Mitochondrial PO2 measured by delayed fluorescence of endogenous protoporphyrin IX. Nat Methods 3: 939-945, 2006. Johannes T, Mik EG, Nohe B, Unertl KE, and Ince C. Acute decrease in renal microvascular PO2 during acute normovolemic hemodilution. Am J Physiol Renal Physiol 292: F796-803, 2007. Mik EG, Johannes T, and Ince C. Monitoring of renal venous PO2 and kidney oxygen consumption in rats by a near-infrared phosphorescence lifetime technique. Am J Physiol Renal Physiol 294: F676-681, 2008. Legrand M, Mik EG, Johannes T, Payen D, and Ince C. Renal hypoxia and dysoxia after reperfusion of the ischemic kidney. Mol Med 14: 502-516, 2008. Fries M, Ince C, Rossaint R, Bleilevens C, Bickenbach J, Rex S, and Mik EG. Levosimendan but not norepinephrine improves microvascular oxygenation during experimental septic shock. Crit Care Med 36: 1886-1891, 2008.

LIST OF PUBLICATIONS
153
Mik EG, Johannes T, Zuurbier CJ, Heinen A, Houben-Weerts JH, Balestra GM, Stap J, Beek JF, and Ince C. In vivo mitochondrial oxygen tension measured by a delayed fluorescence lifetime technique. Biophys J 95: 3977-3990, 2008. Johannes T, Mik EG, Klingel K, Dieterich HJ, Unertl KE, and Ince C. Low-dose dexamethasone-supplemented fluid resuscitation reverses endotoxin-induced acute renal failure and prevents cortical microvascular hypoxia. Shock 31: 521-528, 2009. Johannes T, Mik EG, and Ince C. Nonresuscitated endotoxemia induces microcirculatory hypoxic areas in the renal cortex in the rat. Shock 31: 97-103, 2009. Legrand M, Almac E, Mik EG, Johannes T, Kandil A, Bezemer R, Payen D, and Ince C. L-NIL prevents renal microvascular hypoxia and increase of renal oxygen consumption after ischemia-reperfusion in rats. Am J Physiol Renal Physiol 296: F1109-1117, 2009. Mik EG, Ince C, Eerbeek O, Heinen A, Stap J, Hooibrink B, Schumacher CA, Balestra GM, Johannes T, Beek JF, Nieuwenhuis AF, van Horssen P, Spaan JA, and Zuurbier CJ. Mitochondrial oxygen tension within the heart. J Mol Cell Cardiol 46: 943-951, 2009. Johannes T, Ince C, Klingel K, Unertl KE, and Mik EG. Iloprost preserves renal oxygenation and restores kidney function in endotoxemia-related acute renal failure in the rat. Crit Care Med 37: 1423-1432, 2009. Johannes T, Mik EG, Klingel K, Goedhart PT, Zanke C, Nohe B, Dieterich HJ, Unertl KE, and Ince C. Effects of 1400W and/or nitroglycerin on renal oxygenation and kidney function during endotoxaemia in anaesthetised rats. Clin Exp Pharmacol Physiol 36: 870-879, 2009. Mik EG, Johannes T, and Fries M. Clinical microvascular monitoring: a bright future without a future? Crit Care Med 37: 2980-2981, 2009. Legrand M, Mik EG, Balestra GM, Lutter R, Pirracchio R, Payen D, and Ince C. Fluid resuscitation does not improve renal oxygenation during hemorrhagic shock in rats. Anesthesiology 112: 119-127, 2010.


Appendix 4
Curriculum Vitae

CURRICULUM VITAE
156
Bert Mik was born on the 10th of March 1974 in ‘s-Hertogenbosch, the Netherlands. After finishing the Gymnasium in 1992 he started his studies in applied physics and applied mathematics at the Technical University Eindhoven. In 1994 he attended medical school at the Academic Medical Center, University of Amsterdam. He finished his graduation thesis at the Department of Clinical Physiology at the AMC in 1998. After that he became PhD student in the same department, later renamed as “Translational Physiology”. In 2003 he started with medical rotations and received his medical degree in 2005. Thereafter he left Amsterdam to work as a medical doctor on de intensive care unit of the ErasmusMC, University Medical Center Rotterdam. In the period 2006-2010 he received his training in anesthesiology in the Department of Anesthesiology of the ErasmusMC. Currently he is working as fellow intensive care in the same hospital and he will finish his training as anesthesiologist-intensivist mid 2011. The author is married with Tanja Johannes with whom he has a little daughter, Maita.

Now this is not the end. It is not even the beginning of the end.
But it is, perhaps, the end of the beginning. Sir Winston Churchill