Color deconvolution and support vector machines - Charles ...
10
Color deconvolution and support vector machines Charles E.H. Berger 1 , Cor J. Veenman 1,2 1 Netherlands Forensic Institute, The Hague, The Netherlands 2 Intelligent Systems Lab, University of Amsterdam, Amsterdam, The Netherlands Methods for machine learning (support vector machines) and image processing (color deconvolution) are combined in this paper for the purpose of separating colors in images of documents. After determining the background color, samples from the image that are representative of the colors to be separated are mapped to a feature space. Given the clusters of samples of either color the support vector machine (SVM) method is used to find an optimal separating line between the clusters in feature space. Deconvolution image processing parameters are determined from the separating line. A number of examples of applications in forensic casework are presented. 1 Introduction Machine learning methods offer two main promises for the forensic scientist. They can increase both the quality and the objectivity of their analysis. In this paper we use support vector machines [1,2] to determine the parameters for subsequent image processing to separate colors. Separating colors is a task often needed to improve the clarity of images when colors interfere with a feature of interest in the foreground or background. This can greatly enhance the visibility of faded, erased, or obscured features, or demonstrate that two written entries have a different color (suspected additions). For an overview of optical methods like IR/visible/UV
-
Upload
khangminh22 -
Category
Documents
-
view
0 -
download
0
Transcript of Color deconvolution and support vector machines - Charles ...

Color deconvolution and support vector machines
Charles E.H. Berger1, Cor J. Veenman1,2 1Netherlands Forensic Institute, The Hague, The Netherlands
2Intelligent Systems Lab, University of Amsterdam, Amsterdam, The Netherlands
Methods for machine learning (support vector machines) and image
processing (color deconvolution) are combined in this paper for the
purpose of separating colors in images of documents. After
determining the background color, samples from the image that are
representative of the colors to be separated are mapped to a feature
space. Given the clusters of samples of either color the support vector
machine (SVM) method is used to find an optimal separating line
between the clusters in feature space. Deconvolution image
processing parameters are determined from the separating line. A
number of examples of applications in forensic casework are
presented.
1 Introduction
Machine learning methods offer two main promises for the forensic scientist.
They can increase both the quality and the objectivity of their analysis. In this paper
we use support vector machines [1,2] to determine the parameters for subsequent
image processing to separate colors. Separating colors is a task often needed to
improve the clarity of images when colors interfere with a feature of interest in the
foreground or background. This can greatly enhance the visibility of faded, erased, or
obscured features, or demonstrate that two written entries have a different color
(suspected additions). For an overview of optical methods like IR/visible/UV

luminescence and reflectance, or destructive methods such as thin-layer
chromatography, high-performance liquid chromatography, and capillary
electrophoresis see, e.g., Ref. 3.
2 Methods
Images were obtained by scanning the original documents with a high quality
scanner (CreoScitex Eversmart Jazz). All the image processing and computational
work was carried out in MATLAB® (The Mathworks, Inc., Bioinformatics
Toolbox™).
2.1 Color deconvolution
In an earlier paper [4], color deconvolution was introduced as a way to achieve
color separation, but an abbreviated explanation will be given here. In the RGB (red,
green, blue) color-space we can see additive color mixing as the vector addition of
RGB components to black. Equivalently, subtractive color mixing can be seen as the
vector addition of CMY (cyan, magenta, yellow) components to white. For our
purposes it is helpful to model the colors in an image as the vector addition of a
desired (D) and undesired (U) component to a background color ( p
). The
transformation of the RB components to those components allows us to separate the
desired and undesired components (with a vector n
perpendicular to u
and d
so they
span the 3D space):
c r r g g b b u u d d n n p
with n u d
. (1)
By setting u to zero we remove the undesired component, after which we can
transform back to RGB color space to find the new color 'c
.
' ' ' 'c r r g g b b d d n n p
(2)
The complex solution for 'c
is given in Ref. 4.

A similar calculation can be carried out when the purpose is not to remove a
color, but to demonstrate a color difference. In this case the undesired and desired
components can be shown in a false-color image to demonstrate the color differences
and to evaluate how they correlate with features in the image.
2.2 Defining the feature vector
The analysis of the colors is based on the three-dimensional color histogram
(see Figure 1). This histogram shows the distribution of all colors present in an image
in the RGB color space. Histogram bins are represented by spherical halos that extend
in proportion to the number of pixels with colors within that bin.
Note how the colors of the inks form elongated shapes, extending linearly
from the large spherical cloud of colors associated with the paper background. This is
due to differences in ink coverage in the pixels in and along the edge of the ink line.
For our purposes these colors should share the same feature vector. Therefore, the
spatial angles of the elongated cloud – with the center of the spherical cloud
associated with the background as the origin – are a good choice for the feature
vector. The feature vector of any color c
in the image is given by the spatial angles x
and y of the vector from the background color p
to c
:
atan2 , and / 2 atan2 , ,g r bx v v y v
2 2 2with and .r
g r g b
b
v
v c p v v v v
v
(3)

Fig. 1. 3D color histogram showing the colors of a blue and a black ballpoint ink on
paper. Histogram bins are represented by spherical halos that extend in proportion to
the number of pixels with colors within that bin.
2.3 Sampling colors from the image
It is possible to determine the background color and the undesired and desired
components by sampling colors in 3 corresponding spots in the image [4]. In Ref. 5
these values were determined from the R, G, and B histograms of the complete image.
For this paper we have sampled areas of the image by making masks manually,
simply by painting over the image in an image editor. Instead of deriving our
parameters for color deconvolution directly from the average color of sampled areas,
we look at the pixels of the masked areas in the previously defined feature space. For
clarity of presentation and to speed up the support vector machine calculations, the
number of samples was limited to 200 per cluster (desired, undesired) by random
selection. Using more samples did not change the results.
2.4 Support Vector Machine
In Fig. 3 an example is shown of an image of handwritten entries with
different blue ballpoints on the left and right, with overlapping parts in the middle.
Parts of the image with either ink and with the background paper were masked. After

determining the average background color, all colors can be mapped into feature
space. Fig. 2 shows 200 samples representative of either ink in feature space.
The support vector machine (implemented in MATLAB®) finds a linear
maximum margin classifier: a straight line dividing both clusters with the items in the
clusters as far away from the separating line as possible for separable clusters. For
non-separable clusters the SVM method also finds the optimal separating line,
minimizing the number of miss-classified items and their distance to the separating
line.
Fig. 2. The desired (+) and undesired (×) clusters associated with 2 blue ballpoint pen
colors in an image (see Fig. 3). The SVM separation line is shown together with the
feature vectors that form the parameters for the subsequent color deconvolution
processing. On the right side the 3D color histogram shows both blue ink colors.
The parameters for color deconvolution are given by 2 points in feature space,
with the SVM separating line going perpendicularly through the middle of the line
that connects them (see Fig. 2). For the present work the averages of both clusters
were calculated, as well as the crossing point of the line connecting the cluster
averages and the SVM separating line. From that crossing point the 2 points that give
the color deconvolution parameters were determined by moving perpendicularly away
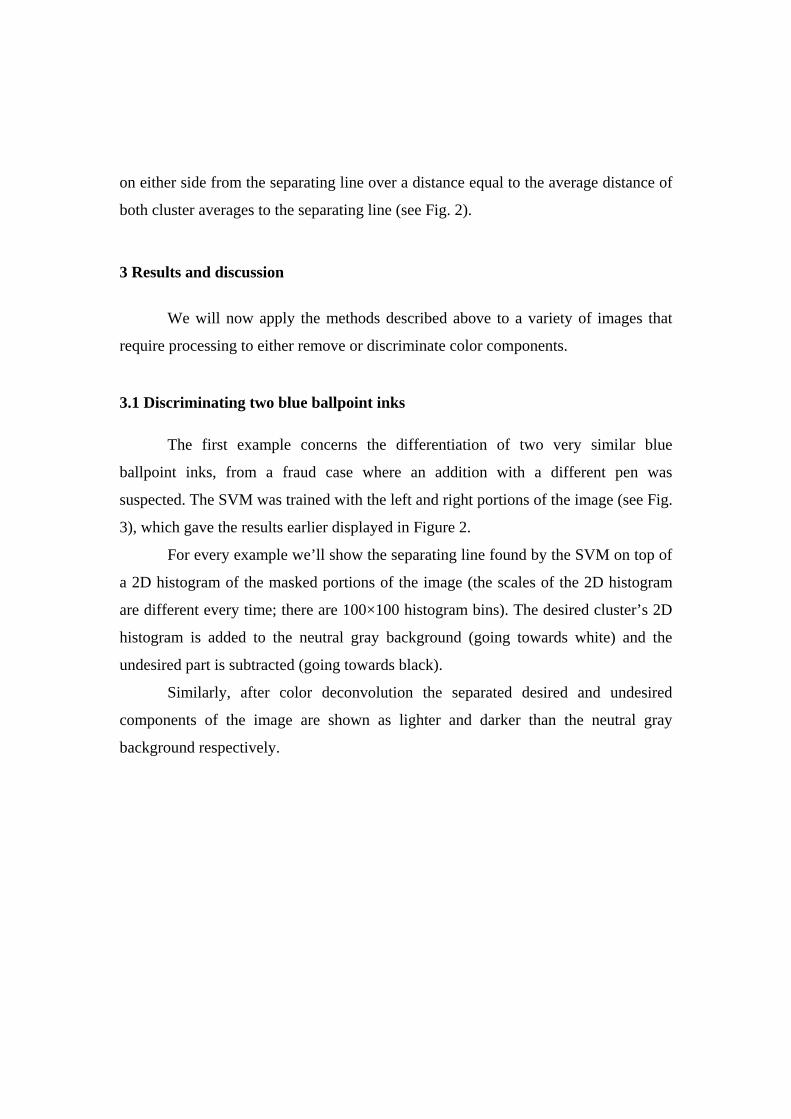
on either side from the separating line over a distance equal to the average distance of
both cluster averages to the separating line (see Fig. 2).
3 Results and discussion
We will now apply the methods described above to a variety of images that
require processing to either remove or discriminate color components.
3.1 Discriminating two blue ballpoint inks
The first example concerns the differentiation of two very similar blue
ballpoint inks, from a fraud case where an addition with a different pen was
suspected. The SVM was trained with the left and right portions of the image (see Fig.
3), which gave the results earlier displayed in Figure 2.
For every example we’ll show the separating line found by the SVM on top of
a 2D histogram of the masked portions of the image (the scales of the 2D histogram
are different every time; there are 100×100 histogram bins). The desired cluster’s 2D
histogram is added to the neutral gray background (going towards white) and the
undesired part is subtracted (going towards black).
Similarly, after color deconvolution the separated desired and undesired
components of the image are shown as lighter and darker than the neutral gray
background respectively.

Fig. 3. Original writing in ballpoint ink, and both colors of blue ballpoint ink
separated by the SVM and color deconvolution, as shown in the 2D histogram on the
right.
The two blue ballpoint ink colors are successfully separated and the processing
clearly reveals the original entry as “C”.
3.2 Address on a label
In the following examples components will be differentiated with the purpose
of removing the undesired component while maintaining as much as possible of the
desired component. Figure 4 shows a portion of an address label from a fraud case
that had been rendered impossible to read. Fortunately, the blue that covers the
address is not exactly the same as that of the original blue handwriting.
Fig. 4. A portion of an address label before and after processing.
After processing the image shows the blue component associated with the
original writing, except for some small regions where the covering blue was
completely opaque. The name of the town of “GRUBBEN VORST” can now be read.

3.3 Handwriting on an old postcard
The paper of this old postcard had been damaged and discolored over the
years. The parts masked were: some of the lightest areas as background; the dark
discolorations as undesired; and the most visible fragments of the handwriting as
desired.
Fig. 5. The handwriting on this old postcard was hard to read because of extensive
yellowing in some parts and structural damage as well.
The removal of the undesired component greatly enhances the visibility of the
handwriting. The structural damage (visible as the light patches in the original image)
is also much less apparent, though this improvement is of a more cosmetic nature
since parts that were physically detached from the document can not be recovered.
3.4 Date stamp in a passport
The date stamp in this passport shows signs of mechanical erasure, making it
very hard to read the date. The original image in Figure 6 is from a scan with
amplified contrast, which amplified the stamp impression as well as the smudged
background. Color deconvolution was used to selectively remove the smudge
component of the image, while preserving the color of the stamp ink. The revealed
text reads: “13 MARS 2006”.

Fig. 6. Partly erased date stamp from a passport.
While simply increasing the contrast does not enhance clarity by itself, it is a
good first step because it makes sure the data in the image has a larger dynamic range.
3.4 Date stamp on an envelope
A stamp impression indicating the date of reception on an envelope was
crossed out with a ballpoint pen, making it difficult to discern the date. Color
deconvolution was used in combination with the SVM again to separate the color
components of the stamp ink and the blue ballpoint ink, revealing the text:
“INGEKOMEN 08 JULI 2004”.
Fig. 7. Crossed out stamp impression on an envelope.
For this example the ballpoint lines from the original image are practically white in
the processed image. Though preferably the background color should remain in those
areas, it does enhance the clarity of the stamp impression.

4 Conclusion
We introduced a method for estimating optimal parameters for color
deconvolution using a linear support vector machine. With several examples from
forensic casework, we showed that the method indeed gave good color separation
results. Interfering colors were successfully removed, which made it possible to
discern features of interest to the case.
In a next paper, the work on discriminating blue ballpoint inks with the
combination of SVM methods and color deconvolution will be extended. More
specifically, the value of the evidence for two inks coming from the same source or
not [5] will be correlated with the success of color separation in the image processing.
References
[1.] V. Vapnik, The Nature of Statistical Learning Theory. Springer-Verlag, New
York, 1995.
[2.] V. Kecman, Learning and soft computing: support vector machines, neural
networks, and fuzzy logic models. MIT Press, Cambridge, MA, 2001.
[3.] H.S. Chen, H.H. Meng, K.C. Cheng, A survey of methods used for the
identification and characterization of inks. Forensic Science Journal 1 (2002) 1–
14.
[4.] C.E.H. Berger, J.A. de Koeijer, W. Glas and H.T. Madhuizen, Color Separation
in Forensic Image Processing. Journal of Forensic Sciences 51 (2006) 100–102.
[5.] C.E.H. Berger, Inference of identity of source using univariate and bivariate
methods, Science and Justice, in Press (2009)
[doi:10.1016/j.scijus.2009.03.003].