Deconvolution and Quantification of Hydrocarbon-like and ...
15
Deconvolution and Quantification of Hydrocarbon-like and Oxygenated Organic Aerosols Based on Aerosol Mass Spectrometry QI ZHANG, M. RAMI ALFARRA, §, ⊥ DOUGLAS R. WORSNOP, | JAMES D. ALLAN, § HUGH COE, § MANJULA R. CANAGARATNA, | AND JOSE L. JIMENEZ* , ,‡ Cooperative Institute for Research in Environmental Sciences (CIRES) and Department of Chemistry and Biochemistry, 216 UCB, University of Colorado-Boulder, Boulder, Colorado 80309-0216, School of Earth, Atmospheric and Environmental Science, Main Building, Sackville Street, University of Manchester, Manchester M60 1QD, U.K., and Aerodyne Research Inc., Billerica, Massachusetts 01821-3976 A new technique has been developed to deconvolve and quantify the mass concentrations of hydrocarbon-like and oxygenated organic aerosols (HOA and OOA) using highly time-resolved organic mass spectra obtained with an Aerodyne Aerosol Mass Spectrometer (AMS). This technique involves a series of multivariate linear regressions that use mass-to-charge ratios (m/z’s) 57 (mostly C 4 H 9 + ) and 44 (mostly CO 2 + )sthe identified AMS mass spectral tracers for HOA and OOA, respectivelysas the initial principal components. Two algorithms have been developed: algorithm 1 is based solely on m/z 44 and m/z 57, and algorithm 2 is an iterative procedure expanded from algorithm 1. This technique was applied to the AMS organic aerosol data acquired at the EPA Pittsburgh Supersite during September 2002. The reconstructed organic concentrations () HOA + OOA) agree well with the measured values (r 2 ) 0.997, slope ) 0.998), and the reconstructed organic data matrix (size ) 3199 time steps × 300 m/z’s) explains 99% of the variance in the measured time series. In addition, the extracted mass spectrum of HOA shows high similarity to those of diesel exhaust, lubricating oil, and freshly emitted traffic aerosols observed in urban areas, while the spectrum of OOA closely resembles those of aged organic aerosols sampled in rural areas and also shows similarity with the spectrum of fulvic acids a humic-like substance that is ubiquitous in the environment and has previously been used as an analogue to represent polyacid components found in highly processed and oxidized atmospheric organic aerosols. There is evidence for the presence of a third component, although its contribution to the total organic signal appears to be small in this study. The most important result is that m/z 44 and m/z 57 are reliable AMS mass spectral “markers” that provide the “first guess” for algorithm 2 which allows the quantitative description of the organic aerosol concentration and mass spectra over a period of 16 days in a major urban area and allows the extraction of mass spectra of OOA and HOA that can be interpreted chemically. These findings indicate the potential of performing organic source apportionment on the basis of total particle mass, rather than on the basis of organic tracer compounds that contribute a small fraction of this mass. Introduction Organic material comprises a significant, yet poorly char- acterized, fraction of the fine particles in the atmosphere (1-4). The number and complexity of particulate organic compounds make it a significant challenge to fully charac- terize their molecular identities (1, 2). Analysis of a large number of molecules, for example, typically accounts for only a minor fraction of the organic carbon in aerosols (5-7). As a result, there is only a limited understanding of the chemistry, sources, and processing of organic aerosols, and assessments of their impacts on climate, visibility, and human health remain notably uncertain (1, 6, 8, 9). Organic aerosols originate from many different natural and anthropogenic sources and processes. Primary organic aerosols (POA) are those emitted directly into the atmosphere in particle form, e.g., from fossil fuel and biomass combustion, while secondary organic aerosols (SOA) are formed from gaseous precursors through gas-phase (1, 2, 6), particle-phase (10), or aqueous-phase reactions (11, 12). Due to their different origins and formation mechanisms, POA and SOA usually demonstrate very different chemical and micro- physical properties (13-18). Therefore, to design effective fine particle control strategies and to better evaluate the roles of organic aerosols in regional and global climate we must understand the concentrations, properties, and sources of these two organic aerosol types (6). Three general techniques are available to estimate the relative contributions of POA and SOA to ambient particle mass. One is “source-oriented” chemical transport models (CTMs) that simulate atmospheric transport and chemical reactions (6, 19-21). Another is “source-receptor” methods that interpret ambient measurements with a mathematical model that uses distinctive tracers and previous knowledge of the tracer concentrations in all known sources (6, 22, 23). Commonly applied organic source-receptor methods include the organic molecular marker chemical mass balance (CMB) method (22-24) and the organic carbon (OC) to elemental carbon (EC) ratio method (25-29). The third is receptor- only methods, which are conceptually similar to principal component analysis (30) and use statistical multivariate techniques to extract source information from the time series of multiple simultaneous measurements. Commonly used receptor methods for air pollution studies include Positive Matrix Factorization (PMF) (31) and UNMIX (32). Unlike “source-oriented” CTMs, source-receptor and receptor methods do not require detailed information on meteorology or emission inventories but instead perform source apportionment using ambient measurements as inputs (6). So far, receptor methods have been relatively successful with POA applications but show limited capability to distinguish the sources of SOA components unless * Corresponding author phone: (303)492-3557; fax: (303)492-1149; e-mail: [email protected]. Cooperative Institute for Research in Environmental Sciences (CIRES), University of Colorado-Boulder. ‡ Department of Chemistry and Biochemistry, University of Colorado-Boulder. § University of Manchester. | Aerodyne Research Inc. ⊥ Present address: Paul Scherrer Institute, 5232 Villigen PSI, Switzerland. Environ. Sci. Technol. 2005, 39, 4938-4952 4938 9 ENVIRONMENTAL SCIENCE & TECHNOLOGY / VOL. 39, NO. 13, 2005 10.1021/es048568l CCC: $30.25 2005 American Chemical Society Published on Web 05/27/2005
-
Upload
khangminh22 -
Category
Documents
-
view
1 -
download
0
Transcript of Deconvolution and Quantification of Hydrocarbon-like and ...

Deconvolution and Quantification ofHydrocarbon-like and OxygenatedOrganic Aerosols Based on AerosolMass SpectrometryQ I Z H A N G , † M . R A M I A L F A R R A , § , ⊥
D O U G L A S R . W O R S N O P , |
J A M E S D . A L L A N , § H U G H C O E , §
M A N J U L A R . C A N A G A R A T N A , | A N DJ O S E L . J I M E N E Z * , † , ‡
Cooperative Institute for Research in Environmental Sciences(CIRES) and Department of Chemistry and Biochemistry,216 UCB, University of Colorado-Boulder, Boulder, Colorado80309-0216, School of Earth, Atmospheric and EnvironmentalScience, Main Building, Sackville Street, University ofManchester, Manchester M60 1QD, U.K., and AerodyneResearch Inc., Billerica, Massachusetts 01821-3976
A new technique has been developed to deconvolve andquantify the mass concentrations of hydrocarbon-like andoxygenated organic aerosols (HOA and OOA) usinghighly time-resolved organic mass spectra obtained withan Aerodyne Aerosol Mass Spectrometer (AMS). Thistechnique involves a series of multivariate linear regressionsthat use mass-to-charge ratios (m/z’s) 57 (mostly C4H9
+)and 44 (mostly CO2
+)sthe identified AMS mass spectraltracers for HOA and OOA, respectivelysas the initial principalcomponents. Two algorithms have been developed:algorithm 1 is based solely on m/z 44 and m/z 57, andalgorithm 2 is an iterative procedure expanded from algorithm1. This technique was applied to the AMS organicaerosol data acquired at the EPA Pittsburgh Supersiteduring September 2002. The reconstructed organicconcentrations () HOA + OOA) agree well with themeasured values (r2 ) 0.997, slope ) 0.998), and thereconstructed organic data matrix (size ) 3199 time steps× 300 m/z’s) explains 99% of the variance in the measuredtime series. In addition, the extracted mass spectrum of HOAshows high similarity to those of diesel exhaust, lubricatingoil, and freshly emitted traffic aerosols observed inurban areas, while the spectrum of OOA closely resemblesthose of aged organic aerosols sampled in rural areasand also shows similarity with the spectrum of fulvic acidsa humic-like substance that is ubiquitous in the environmentand has previously been used as an analogue to representpolyacid components found in highly processed and oxidizedatmospheric organic aerosols. There is evidence for thepresence of a third component, although its contribution tothe total organic signal appears to be small in this
study. The most important result is that m/z 44 and m/z 57are reliable AMS mass spectral “markers” that providethe “first guess” for algorithm 2 which allows the quantitativedescription of the organic aerosol concentration andmass spectra over a period of 16 days in a major urbanarea and allows the extraction of mass spectra of OOA andHOA that can be interpreted chemically. These findingsindicate the potential of performing organic sourceapportionment on the basis of total particle mass, ratherthan on the basis of organic tracer compounds that contributea small fraction of this mass.
IntroductionOrganic material comprises a significant, yet poorly char-acterized, fraction of the fine particles in the atmosphere(1-4). The number and complexity of particulate organiccompounds make it a significant challenge to fully charac-terize their molecular identities (1, 2). Analysis of a largenumber of molecules, for example, typically accounts foronly a minor fraction of the organic carbon in aerosols(5-7). As a result, there is only a limited understanding ofthe chemistry, sources, and processing of organic aerosols,and assessments of their impacts on climate, visibility, andhuman health remain notably uncertain (1, 6, 8, 9).
Organic aerosols originate from many different naturaland anthropogenic sources and processes. Primary organicaerosols (POA) are those emitted directly into the atmospherein particle form, e.g., from fossil fuel and biomass combustion,while secondary organic aerosols (SOA) are formed fromgaseous precursors through gas-phase (1, 2, 6), particle-phase(10), or aqueous-phase reactions (11, 12). Due to theirdifferent origins and formation mechanisms, POA and SOAusually demonstrate very different chemical and micro-physical properties (13-18). Therefore, to design effectivefine particle control strategies and to better evaluate the rolesof organic aerosols in regional and global climate we mustunderstand the concentrations, properties, and sources ofthese two organic aerosol types (6).
Three general techniques are available to estimate therelative contributions of POA and SOA to ambient particlemass. One is “source-oriented” chemical transport models(CTMs) that simulate atmospheric transport and chemicalreactions (6, 19-21). Another is “source-receptor” methodsthat interpret ambient measurements with a mathematicalmodel that uses distinctive tracers and previous knowledgeof the tracer concentrations in all known sources (6, 22, 23).Commonly applied organic source-receptor methods includethe organic molecular marker chemical mass balance (CMB)method (22-24) and the organic carbon (OC) to elementalcarbon (EC) ratio method (25-29). The third is receptor-only methods, which are conceptually similar to principalcomponent analysis (30) and use statistical multivariatetechniques to extract source information from the time seriesof multiple simultaneous measurements. Commonly usedreceptor methods for air pollution studies include PositiveMatrix Factorization (PMF) (31) and UNMIX (32).
Unlike “source-oriented” CTMs, source-receptor andreceptor methods do not require detailed information onmeteorology or emission inventories but instead performsource apportionment using ambient measurements asinputs (6). So far, receptor methods have been relativelysuccessful with POA applications but show limited capabilityto distinguish the sources of SOA components unless
* Corresponding author phone: (303)492-3557; fax: (303)492-1149;e-mail: [email protected].
† Cooperative Institute for Research in Environmental Sciences(CIRES), University of Colorado-Boulder.
‡ Department of Chemistry and Biochemistry, University ofColorado-Boulder.
§ University of Manchester.| Aerodyne Research Inc.⊥ Present address: Paul Scherrer Institute, 5232 Villigen PSI,
Switzerland.
Environ. Sci. Technol. 2005, 39, 4938-4952
4938 9 ENVIRONMENTAL SCIENCE & TECHNOLOGY / VOL. 39, NO. 13, 2005 10.1021/es048568l CCC: $30.25 2005 American Chemical SocietyPublished on Web 05/27/2005
combined with CTMs (6). For these reasons, in both CMB(20, 23, 33) and OC/EC methods (25-29), the SOA concen-tration is usually inferred as the difference between observedorganic aerosol mass concentrations and estimated POA. Amajor drawback of this approach is that the accuracy ofpredicted SOA concentration is poor when POA values areuncertain. Recently, tracers for SOA, such as aromatic diacids,have been proposed (24, 34, 35), but the ability to use themto quantitatively estimate SOA concentrations has not yetbeen demonstrated.
Methods that are capable of estimating the contributionsof SOA and POA independently are needed. In this study wehave developed a new technique that can determine the massconcentrations of hydrocarbon-like and oxygenated organicaerosols based on the mass spectra of ambient particlesacquired by an Aerodyne Aerosol Mass Spectrometer (AMS).The AMS is a real-time aerosol instrument that samples, sizes,and analyzes nonrefractory submicron particles (NR-PM1)with high sensitivity and time and size resolution (18,36-44). It is currently the only real-time instrument with thepotential to provide quantitative and size-resolved organicaerosol data with a time resolution of minutes.
The quantitative capabilities of the AMS arise from thecombination of a quantitative aerosol sampling using anaerodynamic lens (38, 45-47) and the separation of particlevaporization and vapor ionization processes (36, 38). TheAMS employs thermal vaporization (usually at 600 °C) on aporous tungsten conical surface operated under high vacuum,followed by 70 eV electron impact (EI) ionization. Matrixeffects due to charge-transfer reactions occurring duringcollisions between vapor molecules and ions (48) areeliminated due to the high vacuum conditions under whichionization takes place. If the species are vaporized intact,their AMS spectra are generally similar to the standard EIspectra such as in the NIST database (49). However, thermallylabile species may undergo decomposition upon vaporizationor greater fragmentation due to the higher internal energy
acquired during vaporization. For these reasons the spectraobserved in the AMS may show greater fragmentation thanstandard EI spectra (50) (and unpublished data from PhilipSilva, Utah State University).
The ion signal recorded by the AMS at each mass-to-charge ratio (m/z) is a linear combination of those fromindividual vaporized species in the analyte (36, 40). As such,an AMS mass spectrum, which is a distribution of ion signalswith unit m/z resolution, typically between 1 and 300 m/z,is essentially the linear superposition of the distinctive massspectra of individual species that produce signals. Currently,a standard AMS data analysis method is available tosystematically deconvolve the ensemble AMS mass spectrainto partial mass spectra for distinct species or groups ofspecies, such as NO3
-, NH4+, SO4
2-, Cl-, and organics (40).The inputs to this mathematical method are isotopic ratiosof elements and laboratory-measured AMS fragmentationpatterns, e.g., for major gaseous species (N2, O2, Ar, H2O, andCO2) and aerosol inorganic species. The fragmentationpatterns approach, however, only allows the extraction ofthe mass spectra for total organics and provides no informa-tion about subcomponents of organic aerosols.
The linearity inherent in the AMS organic mass spectra,together with the high time resolution of their measurements,provide the foundation for a multivariate “receptor-only”analysis approach to unravel the main types of organicaerosols present in the atmosphere. We present here atechnique of this nature. Our technique allows quantitativedeconvolution of AMS organic aerosol data from urban areasinto two major componentsshydrocarbon-like and oxygen-atedsand provides information on their characteristics (massspectra, time evolution, and size distributions). This paperfocuses on the development and validation of the methodby applying the technique to the Pittsburgh Supersite dataset. The major findings regarding these two types of organicaerosols in Pittsburgh will be presented separately (Zhanget al., in preparation for Atmos. Chem. Phys.). Future papers
FIGURE 1. Time trends of (a) m/z 57 and typical combustion emission tracers (CO, NOx, EC) and (b) m/z 44 and PM1 SO42- (both from the
AMS) and (c) the average size distributions of m/z 44, m/z 57 and SO42- during the AMS deployment at the Pittsburgh Supersite.
VOL. 39, NO. 13, 2005 / ENVIRONMENTAL SCIENCE & TECHNOLOGY 9 4939

will extend the application of the technique to other urban,rural, and remote locations in which AMS data has beenacquired.
MethodsData Preparation. The AMS data set used in this study wasacquired during September 7th-22nd, 2002 from the mainsite of the Pittsburgh Air Quality Study (PAQS) and EPASupersite. Detailed information on sampling, AMS operation,and analysis for this data set is presented in two previouspapers (18, 51). The theory, underlying assumptions, andtechnical details of the data analysis procedures have beendescribed previously (36, 39-41). The standard AMS dataanalysis software and the computational codes for datareduction and numerical analysis developed for this studywere written in Igor Pro 5 (Wavemetrics, Inc., Lake Oswego,Oregon).
A total number of ∼3200 aerosol organic mass spectra(averaging time ) 10 min initially and ) 5 min after September12) were acquired in Pittsburgh. Each of them is expressedas a 300-element vector, corresponding to the number ofmass-to-charge ratio channels scanned (i.e., m/z 1-300).Note that only 270 out of the 300 m/z’s contain organicsignals. The other 30 (m/z’s 1-11, 14, 21-23, 28, 32-36,39-40, 46-47, 149, 182-184, and 186) were omitted due toeither the lack of plausible organic fragments (e.g. m/z 3),the overwhelming contributions from inorganic (e.g.,m/z 39) or gaseous species (e.g., m/z 32), or the highbackground level in the instrument (e.g., m/z 149) (40). Inaddition, values of m/z’s 16, 17, 18, and 20 in the organicmass spectral matrix were not calculated from the raw signalsat these channels due to the excessive interfering signalsfrom water but rather set to be proportional to the organicsignals at m/z 44, based on laboratory experiments (un-
published data from Philip Silva, Utah State University). Theintensity of each peak in a mass spectrum is expressed inorganic-equivalent mass concentration (org-eq, in µg m-3)calculated from the raw signals in ions per second (Hz)(36, 39-41). The org-eq concentration is defined here as themass concentration of organics that would produce the samesignal intensity (summed over all 270 m/z’s) as that observedat one individual m/z. It differs from the nitrate-equivalentmass concentration (NO3
--eq) in that the relative ionizationefficiency factor (RIE) for organics (36, 41) is applied toNO3
--eq to yield org-eq concentrations. The sum of org-eqconcentrations of all m/z’s in an organic mass spectrum yieldsthe total organic mass concentration. We observed goodagreement between the AMS organic mass concentrationsand 2 h-averaged organic carbon data from a collocatedthermal optical transmittance carbon analyzer (Sunset Labs;r2 ) 0.88; Slope (S) ) 1.69; N ) 82) and 24 h-averaged OCdata from filter samples post-analyzed with the thermal-optical technique (r2 ) 0.64; S ) 1.45; N ) 14) (18). Similaragreement has been observed in studies in Houston andTokyo (52, 53).
(a) Pretreatment for Organic Mass Spectral Data. Minorfiltering was performed on the raw organic mass spectraldata to reduce high-frequency noise. First, 6 mass spectra(∼1 h worth of data) sampled during 18:50-19:40 onSeptember 8 were excluded from this study since they werestrongly influenced by a narrow organic plume of highconcentration (peak ≈ 50 µg m-3 vs 4 µg m-3 for the averageorganic mass concentration of the entire study) (18). Theaverage mass spectrum of the component represented bythis plume shows more similarity to HOA than OOA (Sup-porting Information, Figure S1).
We also reduced sporadic spikes in isolated m/z’s(i.e., sudden surges in signal) for this study. A spike is
FIGURE 2. Covariance plots of (a) CO to organic m/z’s (orgi); (b) NOx to orgi; and (c) SO42- to orgi. The red triangles are the average
signal-to-noise ratios for orgi (SNRi). See section entitled “Notation” for notation.
4940 9 ENVIRONMENTAL SCIENCE & TECHNOLOGY / VOL. 39, NO. 13, 2005

identified when a signal is at least 2 times larger than thelarger one of its two immediate neighbors in the time series.Two reasons are likely responsible for the observed infrequentspikes in some organic m/z’s. One is poor sampling statisticsof the AMS for particles with high mass but low numberconcentration (∼1 cm-3) in the air. These particles producea spike in only one or a few m/z’s during an AMS averagingtime step (∼5 min) because the AMS scans only one m/z ata time (see Table 2 of Bahreini et al. (54) for details on AMSsampling statistics). Since the average mass spectrum andtime variation of the spikes look similar to the componentmass spectrum of hydrocarbon-like organic aerosols (seesection entitled “Linear Covariance Analysis” and SupportingInformation Figure S2), these particles appear to mainlyassociate with combustion sources (e.g., traffic), which issupported by results from AMS “chase-mode” sampling ofindividual vehicles that show a larger mode in vehicle exhaust(55). Another possible (less likely) reason for the occurrenceof the spikes is the bounce of larger particles in the AMSdetection region so that some could land on the electronemission filament, evaporate, and be ionized with higherefficiency. This phenomenon may explain some infrequentlarger signals observed during the AMS size calibration withlarge (>800 nm) polystyrene latex spheres (PSLs) but has notyet been conclusively observed in ambient sampling. Overall,we found that these spikes occur rather infrequently(<1% of the total data points) and account for only ∼1% ofthe total organic signal. For these reasons they are un-important for general applications, when only the massconcentrations of total organics is concerned. However, theyrepresent a significant source of high-frequency variabilityin the time series of some individual m/z’s and need to bedealt with for improved statistical analysis. To do so, wereplaced these spikes with linear interpolation of the two
adjacent values. Finally we applied a 3-point boxcar smooth-ing to the time series of each m/z to further reduce high-frequency noise in the data.
These three filtering operations were validated by per-forming exactly the same analysis on the treated anduntreated data sets (see the Supporting Information FiguresS3-S9 for analysis results on the untreated data set). Thefirst step, i.e., removing the 1-h organic spike on September8, produces a small but noticeable change in the results ofthis procedure, since the very high concentrations duringthis spike resulted in large ø2 values that are weighed heavilyin the analysis. Removing this spike allows us to better capturethe characteristics of the HOA and OOA components duringmost of the study. Significant (∼5-10%) improvements onø2’s and r2’s have been observed for the data set treated forsporadic spikes compared to the untreated. The time trendsand mass spectra of HOA and OOA derived from the filteredand unfiltered data are in good agreement (see Figure S10in the Supporting Information), indicating that these pre-treatments have effectively reduced artifacts due to limitedsampling statistics yet preserved most of the informationcontent of the data.
(b) Quantification of Particle Signal at m/z 28. A key featureof the AMS is that it uses a thermal vaporizer, on which thenonrefractory components of particles evaporate under highvacuum (∼10-8 Torr) before electron impact (EI) ionization.In field studies, the vaporizer is often operated at ∼600 °C,a temperature required for the fast evaporation of ammoniumsulfate that is necessary to measure its size distribution. Atthis temperature, thermally labile oxygenated organic com-pounds may undergo pyrolysis, forming CO, CO2, H2O, andother vaporized species that diffuse into the EI ionizationregion (40, 50).
FIGURE 3. (a) Hourly averaged signal intensities (org-eq µg m-3) of m/z 44 and m/z 28 derived from the AMS P-TOF data. (b) Scatter plotcomparing the hourly averaged signal intensities of m/z 28 and m/z 44, the red line is the least-squares linear fit with the intercept forcedto zero. (c) Average size distribution of m/z’s 28 and 44 during a high signal-to-noise ratio period. A similar size distribution comparison,albeit typically noisier, is observed during other time periods.
VOL. 39, NO. 13, 2005 / ENVIRONMENTAL SCIENCE & TECHNOLOGY 9 4941

Both CO and CO2 may produce signals at m/z 28 (CO+)(49). However, gas-phase N2 also produces m/z 28 signal(N2
+) and generally at an intensity more than 2 orders ofmagnitude larger than particle signals during typical ambientstudies (40). Note that since the AMS inlet reduces gaseousspecies by a factor of 107 (relative to the particles) gas-phaseCO is not detectable and gas-phase CO2 represents a verysmall contribution to m/z 28 at their typical ambientconcentrations (40). Since the m/z 28 signals are almost pureN2
+ they are typically used as the “internal standard” in AMSquantification to correct for variations in sampling flow rateand detector sensitivity. For these reasons, the entire m/z 28signal is conventionally assigned to gaseous N2
+ signals andis not reported in the AMS spectra of particles.
The particulate CO+ signals (produced from oxygenatedspecies) can be separated from the gaseous N2
+ signals basedon their very different flight velocities in the AMS (18). Wetherefore extracted the size distribution and mass concen-tration of particulate m/z 28 signals from the AMS particletime-of-flight (P-TOF) data using the technique developedby Zhang et al. (18). Because of the substantial tailing of thegaseous N2
+ signals into the particle region, the subtractedparticulate m/z 28 signals are much noisier than the otherorganic signals.
(c) Error Estimation and Signal-to-Noise Ratio Calcula-tions. Errors associated with the mass spectral signals wereestimated based on electronic noise and ion countingstatistics (36, 39). As the mass spectral signals, the unit oferrors is expressed as org-eq (µg m-3). The signal-to-noiseratio (SNR) of a given signal is defined as the ratio of itsintensity to the corresponding estimated error. The SNR ofthe total organic mass concentration is calculated based onthe detection limit of the organic measurement (D.L. )0.15 µg m-3), which was estimated from several periods inwhich particle-free ambient air was sampled into the AMSduring the study (18).
Mathematical Deconvolution Techniques. (a) Notation.Throughout this text, the following mathematical notationis used (30). Matrices are symbolized with bold uppercaseletters and vectors with bold lowercase letters. Row vectorsare marked with a prime (′) in order to be distinguished fromcolumn vectors. Scalar quantities and elements of vectors ormatrices are represented by lowercase italic letters. The hat,“∧”, above a quantity (vector, matrix, or scalar) indicatesthat it is calculated or estimated, rather than measured.
The entire organic mass spectral data set is expressed asa matrix of Nt rows by Ni columns (designated as ORG; inorg-eq µg m-3), in which each row corresponds to a timestep (t) and each column corresponds to a mass-to-chargeratio (i). In other words, each row in ORG is a mass spectrumat a given point in time, and each column the time series ofthe org-eq mass concentration of a specific m/z. Specificquantities related to the ORG matrix are denoted as follows:
ORGt,i is the tth row and the ith column element in ORG,containing the org-eq concentration (µg m-3) of the fragmentm/z ) i measured at time step t.
orgt′ is the tth row vector (also called “m/z vector”) inORG, i.e., the mass spectrum of organic aerosols measuredat time t. For example, org′1000 is the organic mass spectrumrecorded in time step 1000 (i.e., 10:00 A.M. - 10:05 A.M. on9/12/2002 for the Pittsburgh study). The factor space of orgt′,i.e., the number of m/z channels scanned, is Ni dimensional(Ni ) 270 for the Pittsburgh data set).
orgi is the ith column vector (also called “time seriesvector”) in ORG, i.e., the time series of the fragmentm/z ) i of the entire study. For example org44 and org57
denote the time series of m/z 44 and m/z 57, respectively.The factor space of orgi, i.e., the number of mass spectra(time steps) measured, is Nt dimensional (Nt ) 3199 for thePittsburgh data set).
om is the time series of total organic mass concentrations;it equals the sum of orgi, i.e.
ms′ is the average mass spectrum of organics of the entireperiod
OR̂G is an estimation of ORG, e.g., calculated using alinear model. Similarly, or̂gi and or̂gt′ are the estimates oforgi and orgt′, respectively, from the linear model.
(b) Mathematical Formulation. Given the linearity inher-ent in the organic mass spectra from an AMS, multivariatefactor analysis can be used to investigate the major com-ponents that contribute to the total signals. The physicalbasis of this type of analysis is mass conservation (30). Themass balance equation for ORG (the Nt by Ni mass spectralmatrix) is expressed as
where C is an Nt by Nc matrix containing the time series ofthe mass concentration of each of Nc components, MS is anNc by Ni matrix containing the component mass spectra,and E is the error (residual) matrix. Therefore, by solving forC and MS, one may be able to extract the mass concentrationsand mass spectra of major organic aerosol “factors”, each ofwhich may be due to an individual source or to several sourcesthat covary in time or that have very similar chemicalcompositions.
(c) Custom Solution Procedure. Several multivariatetechniques such as factor analysis (FA)/principal componentanalysis (PCA) (30, 56), positive matrix factorization (PMF)(31), and/or UNMIX (32) can be used to estimate C and MS.PCA has been used previously in the analysis of an AMS labstudy (57). However, to yield physically meaningful results,factor analysis techniques usually involve a rather arbitraryproceduresrotation of the principal factor axis (e.g. “varimax”rotation)sthat potentially makes the results questionableand has been the subject of much debate (30, 58, 59). In thisstudy, instead of running a standard PCA-type technique,we take advantage of our a priori understanding of the AMSorganic data and use two mass spectral marker peaks(m/z’s 44 and 57) as the first-guess principal components.Iterative multiple multivariate linear regressions along therow and column dimensions of the organic matrix are thenused to extract the component mass spectra and refine thecomponent time series. Note that the major assumptions forfactor analysis modeling listed in section 24.1.2 (p 1262) ofSeinfeld and Pandis (58) also hold for this study.
Two simple multivariate linear regression algorithms havebeen developed. Algorithm 1 performs least-squares fits tothe time series of organics mass concentration (om) and tothe time series of individual m/z’s (orgi), as a linearcombination of the measured time series of m/z’s 44 and 57(i.e., org44 and org57, respectively)
where, a, b, ai, and bi are the fitted parameters, E and Ei arethe residual vectors (of dimension Nt), and the subscript irepresents any m/z from 1 to Nm. We observe that a ≈ Σi)1
Ni ai
and b ≈ Σi)1Ni bi for this study.
om ) ∑i)1
Ni
orgi (1)
ms′ )1
Nt∑t)1
Nt
(orgt′) (2)
ORG ) C ‚ MS + E (3)
om ) a ‚ org44 + b ‚ org57 + E (4)
orgi ) ai ‚ org44 + bi ‚ org57 + Ei (5)
4942 9 ENVIRONMENTAL SCIENCE & TECHNOLOGY / VOL. 39, NO. 13, 2005

Row vectors a′ and b′ are obtained by compiling ai andbi
where Ni is the number of m/z’s in the matrix. We derive thecomponent mass spectra of OOA and HOA by normalizinga′ and b′ to the sum of their respective elements (i.e., Σi)1
Ni ai
and Σi)1Ni bi, respectively). Note that the numeric intensity of
an m/z peak in these mass spectra is its percentage of thesummed intensity of all peaks (i.e., % of Σm/z). This is differentfrom scaling the largest (“base”) peak to 100 (i.e., relativeintensity), as is commonly done in mass spectrometry(49, 60).
In algorithm 2, a′ and b′ are subsequently used toreconstruct each measured mass spectrum and thus producetwo column vectors, c and d
where ct and dt are the fitted parameters, the subscript tsignifies a time step, and Et′ is the residual vector. In principle,c and d are the improved time series of OOA and HOA,respectively, and therefore supersede org44 and org57 to deriveimproved OOA and HOA component mass spectra
Equations 8 and 10 are the building blocks of algorithm2, which iteratively generates a sequence of a′, b′, c, and dvectors by performing least-squares linear regressions onORG alternatively along the row dimension and the columndimension:
where n indicates the number of iterations.The performance of both algorithms is evaluated by
comparing E, Ei, and Et′ to the corresponding analyticaluncertainties, which are defined as the detection limits or 3times the estimated errors (see section entitled “ErrorEstimation and Signal to-Noise Ratio Calculations”).
(d) Calculations of Reconstructed Matrix and Residuals.The organic matrix reconstructed for a given iteration (n),OR̂G(n), is calculated from the corresponding row vectors,c(n) and d(n), and column vectors, a′(n) and b′(n):
The tth row and the ith column element of OR̂G(n) is calculatedas
where, respectively, ct(n) and dt
(n) are the tth elements in c(n)
and d(n), and ai(n) and bi
(n) are the ith elements in a′(n) and
b′(n). org44 and org57 are equivalent to c(1) and d(1). The residualof a fit is calculated as the difference between measured andreconstructed values. To avoid possible under-representationof the residual of organic mass concentration, which is causedby the cancellation of positive and negative values, we alsocalculated the absolute residual of the reconstructed vsmeasured organic mass concentration as the sum of theabsolute values of the errors at each m/z (Organicst
resid):
(e) Statistical Evaluation. Pearson’s r is used extensivelyin this study to evaluate the strength of an observedcorrelation. However, since r is ignorant of the individualdistributions of the two variables, by itself is a rather poorstatistic for deciding the statistical significance of a correlation(61). We therefore calculated p-values, the probability of anull hypothesis, to evaluate the statistical significance of eachobserved r (61). A small p-value indicates that the degree ofcorrelation signified by r is statistically significant (61). Forthis study all calculated p-values are substantially less than10-3 (,0.1%), indicating that every r value reported isstatistically significant. The p-values are thus not reportedto avoid clutter.
Results and DiscussionIdentification of Mass Spectral Tracers for Hydrocarbon-like and Oxygenated Organics. (a) Summary of PreviousEvidence. According to laboratory and field studies, m/z 44(most likely CO2
+) is frequently a major peak in the AMSmass spectra of oxygenated organic species, (41, 50) andm/z 57 (mostly likely C4H9
+) is a major peak in the spectraof hydrocarbons and is typically associated with combustionexhaust (41, 44, 51, 55, 62). m/z 57 in AMS aerosol spectraoften increases during the rush hours in urban areas, whilem/z 44 usually dominates the spectra of heavily oxidizedorganic particles from rural areas and increases in theafternoon when photochemistry is more intense (18, 41, 51).In addition, the size distribution of m/z 44 in ambient particlesis generally dominated by the accumulation mode and closelyresembles that of sulfate (18, 41, 51, 62, 63), whereas that ofm/z 57 in urban areas almost always displays a prominentultrafine mode that is clearly associated with vehicularemissions (18, 41, 44, 51, 55, 62, 63). In view of these factsm/z 57 appears to be an AMS mass spectral fingerprint forparticles from primary combustion sources and m/z 44 foroxygenated organic particles that are potentially associatedwith secondary organic aerosols or oxygen-containing pri-mary organic aerosols.
(b) Additional Evidence for Tracer m/z’s from PittsburghSupersite Data. To further justify the use of these two tracerm/z’s, we present in Figure 1a the time series of m/z 57 andCO, NOx, and elemental carbon (EC)sall well-known markersof combustion exhaust (64). Figure 1b shows the time seriesof m/z 44 and sulfatesa particulate species that is mainlyformed through gas-phase and aqueous-phase oxidation ofSO2. Good correlations are observed between m/z 57 andCO (r2 ) 0.75), NOx (r2 ) 0.83), and EC (r2 ) 0.78), supportingthe use of m/z 57 as a first-order tracer for combustion relatedhydrocarbon-like organic particles. Good correlation is alsoobserved between m/z 44 and SO4
2- (r2 ) 0.75) which suggeststhat similar sources and/or processes over regional scalesproduce SO4
2- and the parent organic species of m/z 44.These observations are consistent with the size distributions(Figure 1c)sthose of m/z 44 and sulfate are both dominatedby the accumulation mode, while that of m/z 57 demonstratesa prominent ultrafine mode that is commonly associatedwith combustion aerosols.
a′ ) a1 ‚‚‚ ai ‚‚‚ aNi (6)
b′ ) b1 ‚‚‚ bi ‚‚‚ bNi (7)
orgt′ ) ct × a′ + dt × b′ + Et′ (8)
c ) [c1
lct
lcNt
] and d ) [d1
ldt
ldNt
] (9)
orgi ) ai ‚ c + bi ‚ d + Ei (10)
OR̂G(n) ) c(n) ‚ a′(n) + d(n) ‚ b′(n) (12)
OR̂Gt,i(n) ) ct
(n) ‚ ai(n) + dt
(n) ‚ bi(n) (13)
Organicstresid ) ∑
i)1
300
|(OR̂Gt,i(n) - ORGt,i)| (14)
VOL. 39, NO. 13, 2005 / ENVIRONMENTAL SCIENCE & TECHNOLOGY 9 4943
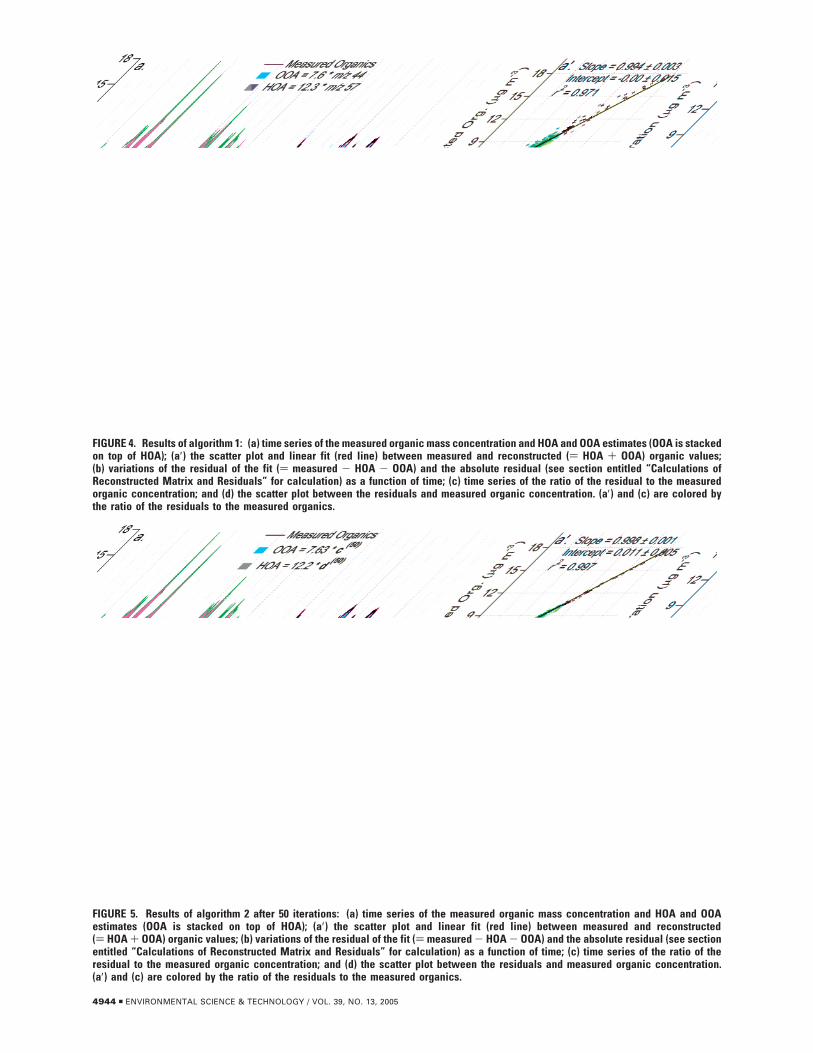
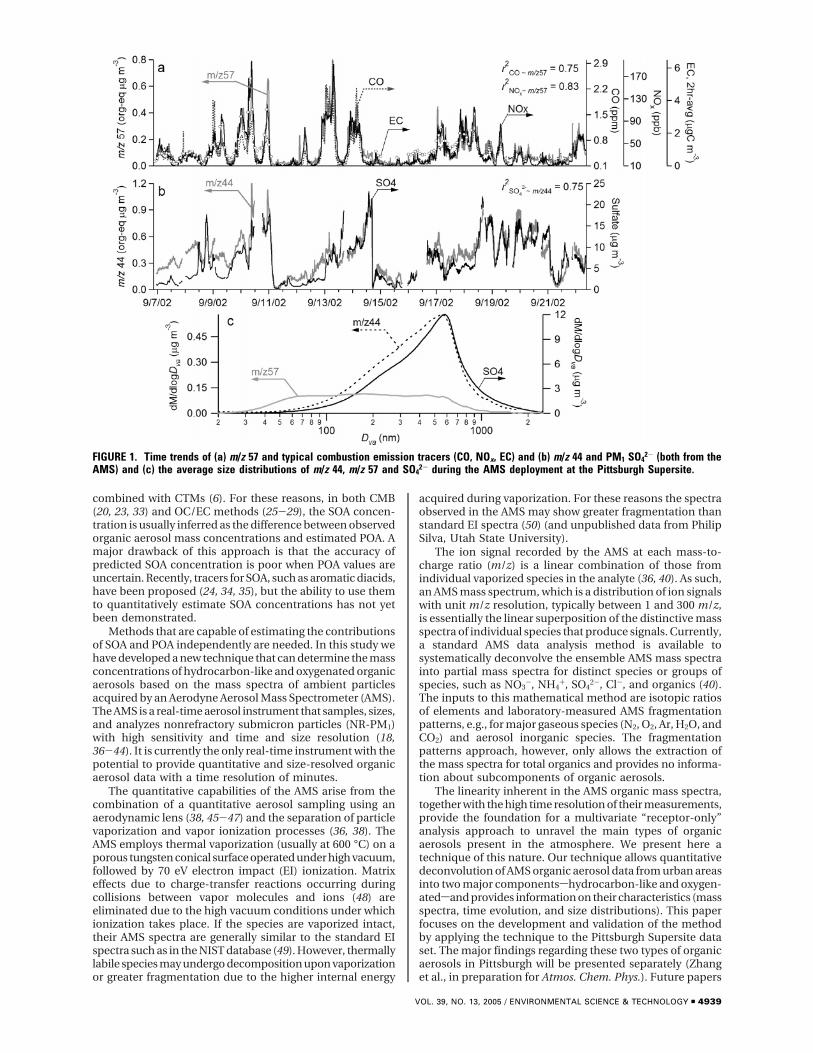
FIGURE 4. Results of algorithm 1: (a) time series of the measured organic mass concentration and HOA and OOA estimates (OOA is stackedon top of HOA); (a′) the scatter plot and linear fit (red line) between measured and reconstructed () HOA + OOA) organic values;(b) variations of the residual of the fit () measured - HOA - OOA) and the absolute residual (see section entitled “Calculations ofReconstructed Matrix and Residuals” for calculation) as a function of time; (c) time series of the ratio of the residual to the measuredorganic concentration; and (d) the scatter plot between the residuals and measured organic concentration. (a′) and (c) are colored bythe ratio of the residuals to the measured organics.
FIGURE 5. Results of algorithm 2 after 50 iterations: (a) time series of the measured organic mass concentration and HOA and OOAestimates (OOA is stacked on top of HOA); (a′) the scatter plot and linear fit (red line) between measured and reconstructed() HOA + OOA) organic values; (b) variations of the residual of the fit () measured - HOA - OOA) and the absolute residual (see sectionentitled “Calculations of Reconstructed Matrix and Residuals” for calculation) as a function of time; (c) time series of the ratio of theresidual to the measured organic concentration; and (d) the scatter plot between the residuals and measured organic concentration.(a′) and (c) are colored by the ratio of the residuals to the measured organics.
4944 9 ENVIRONMENTAL SCIENCE & TECHNOLOGY / VOL. 39, NO. 13, 2005
Note that m/z’s 55 (C4H7+) and 43 (C3H7
+) are two otherprominent peaks in the AMS mass spectra of combustionexhausts and generally at intensities slightly higher than thatof m/z 57 (41, 44, 51, 55, 62). Yet, m/z 57 is likely a better HOAmass spectral tracer since m/z’s 55 and 43 tend to be moreinfluenced by oxygenated organics, e.g., due to C3H3O+ andC2H3O+, respectively (65). One indication is that by com-parison a relatively larger fraction of the m/z 57 signals arefound to associate with the small mode particles in ambientair (51, 62). Further evidence is based on the Pearson’s rvalues of the correlations of NOx, CO, and SO4
2- with eachindividual m/z’s (Figure 2). Compared to those of m/z 57(r2
m/z57 vs CO ) 0.75, r2m/z57 vs NOx ) 0.83) both m/z 55 and m/z
43 show lower r values with NOx and CO (r2m/z55 vs CO ) 0.65,
r2m/z55 vs NOx ) 0.72, r2
m/z43 vs CO ) 0.54, r2m/z43 vs NOx ) 0.57; Figure
2a,b) yet somehow higher r with SO42- (Figure 2d).
(c) Association of m/z 44 with Oxygenated Organics.According to laboratory studies, the CO2
+ ion (m/z 44) isobserved intensely in the AMS mass spectra of di- andpolyacids. The spectra of monoacids and other oxygenatedorganic compounds, including carboxylic acids, esters,carbonyls, and alcohols, also show signals at m/z 44, althoughat significantly lower intensity (50) (and unpublished datafrom Philip Silva, Utah State University). This is consistentwith standard electron impact (EI) mass spectra of oxygenatedorganics (49), except that the corresponding AMS spectragenerally show greater fragmentation (as described above)
and more pronounced m/z 44 and 18 peaks (50) (andunpublished data from Philip Silva, Utah State University).Small dicarboxylic acids, for example, clearly undergodecarboxylation in the AMS and produce considerable signalsat m/z’s 18 (H2O+) and 44 (CO2
+) (50).In addition to m/z 44, significant m/z 28 signals are also
observed in the standard EI mass spectra of organics thatcontain carboxyl, carbonyl, and hydroxyl functional groups(49). However, the AMS mass spectra of particles are oftenpresented without the m/z 28 peak due to the difficulty ofremoving the overwhelming gaseous N2
+ signals (40) (seesection entitled “Quantification of Particle Signal at m/z 28”).In this study, we applied a recently developed procedure(18) to subtract the particulate m/z 28 signals from the AMSP-TOF data and compared them to the m/z 44 signals (Figure3). Good correlations are observed between these two m/z’sin signal intensity (r2 ) 0.71; Figure 3a) as well as in sizedistributions (e.g., Figure 3c), despite the comparativelynoisier signals resulting from larger background subtractionat m/z 28 (see section entitled “Quantification of ParticleSignal at m/z 28”). These findings, together with theobservations that m/z 44 signals progressively increase duringSOA formation according to smog chamber studies (66, 67)and that the relative intensity of m/z 44 signal increasesalmost linearly with the O:C ratio of a range of organicmolecules (50) (and personal communication of Philip Silva,Utah State University), indicate a strong association ofm/z 44 with oxygenated organic compounds in aerosols.
Note that although amino compounds may producesignificant m/z 44 (C2H6N+) and m/z 28 (CH2N+) peaks aswell (65), these compounds are unlikely to have madesignificant contributions to the m/z’s 28 and 44 signalsobserved in Pittsburgh particles. For example, the massspectra from this study do not show obvious CnH2n+1NH+
ion series pattern, which is characteristic of alkylamines (65)(e.g., the intensities of m/z 58 and m/z 72 signals are 1-2orders of magnitude lower than that of m/z 44) (18) and m/z30 appears to be mostly associated with NO3
- (i.e., beingNO+ rather than CH2NH2
+) (49). This conclusion is consistentwith findings from previous studies that amino compoundsare generally a minor component of atmospheric fine particlemass (68-72). In addition, the relative intensity ofm/z 44 to m/z 43 signals is ∼1:1 for Pittsburgh aerosols (18)and thus rules out the possibility of a significant fraction of
FIGURE 6. Scatter plots of (a) the d vector calculated using algorithm2 after 50 iterations vs org57; and (c) the c vector calculated usingalgorithm 2 after 50 iterations vs org44. The red line is the least-squares linear fit.
FIGURE 7. Scatter plot that compares reconstructed organic massspectral signal intensities using algorithm 2 after 50 iterations(OR̂Gt,i, eq 13) with the measured ones (ORGt,i). ORGt,i and OR̂Gt,i arethe tth row and the ith column elements of measured organic matrix(ORG) and reconstructed matrix (OR̂G), respectively. See sectionentitled “Notation” for details on notation. The red line is the least-squares linear fit.
VOL. 39, NO. 13, 2005 / ENVIRONMENTAL SCIENCE & TECHNOLOGY 9 4945

the m/z 44 signals being 13C12C2H7+, which is expected from
alkyl chains (65).In summary, m/z 57 and m/z 44 appear to be valid first-
order mass spectral tracers for combustion-related hydro-carbon-like organic aerosols (HOA) and oxygenated organicaerosols (OOA), respectively. Note that m/z 44 is linked tothe more broadly defined OOA, instead of secondary organicaerosols (SOA) because aged POA (73-76) and oxygenatedorganic species from primary emissions (77) may be part ofthis component. Biomass burning aerosols, for example, oftencontain significant amounts of oxygenated organic com-pounds as a result of oxidation in the burning process or dueto burning of cellulose (1, 78-81). Oxygenated organiccompounds may also be directly emitted from vehicles, buttheir mass fraction is very low (a few percent or less of thetotal organic mass in the vehicle exhaust) (77) and thus makea very small contribution to the m/z 44 signal. Nevertheless,given the good correlations between m/z 44 and sulfate insize distribution and mass concentration, a significantfraction of the OOA in Pittsburgh appears to be SOA.
Apportionment of Pittsburgh Organic Mass SpectralData. We first attempted to reconstruct the mass concentra-tions of total organics based on a linear combination ofm/z’s 44 and 57sthe first-order tracers for two major organicaerosol components. Application of the first step of algorithm1 (eq 4) yields a ) 7.6 and b ) 12.3, which are multiplied withthe org-eq concentrations of m/z’s 44 and 57, respectively,to give estimates of OOA () 7.6 ‚ m/z 44) and HOA() 12.3 ‚ m/z 57; Figure 4a). Excellent agreement is observedbetween the measured and reconstructed organic concen-trations () HOA + OOA), with a linear regression slope (S)
) 0.99, intercept (I) ) -0.01, and r2 ) 0.97 (Figure 4a′). Theratio of the residual to the measured organics concentrationsvaries from -0.61 to 0.58 with an average value of 0.02. Theaverage ratio of the absolute residual to concentration is0.08 (Figure 4c).
As shown in Figure 4d, although high residual-to-organic-ratios are generally associated with low organic concentra-tions, periods with high residual-to-organic-ratios alsopresent when the organics loading is high. There are twopossible reasons to explain these deviations: (1) m/z’s 44and 57 are not perfect HOA and OOA tracers; and (2) particlesfrom these periods may contain other organic componentsthat are not well represented by the HOA and OOA categories.The former possibility may be due to m/z 44 containing somecontributions from organic particles from primary sources,such as the isotopic peak of m/z 43 (13C12C2H7
+), oxygenatedspecies in vehicle emissions (77), and oxidized primaryorganic aerosols, or m/z 57 may be produced by someoxygenated organic species such as long chain alcohols oracids (see section entitled “Identification of Mass SpectralTracers for Hydrocarbon-like and Oxygenated Organics”).
We therefore used algorithm 2 (eq 11; section entitled“Mathematical Formulation”) to mathematically “distill” thetime series and component mass spectra of HOA and OOA.During the iterations, we observed modest improvement inø2’s and r2’s of the fits, but the trends of these figures-of-merit quickly stabilize after only 3 iterations (i.e., n ) 3 ineq 11). The comparisons between the improved OOA andHOA spectral tracers after 50 iterations (i.e., c(50) and d(50))vs org44 and org57 vectors, respectively, are shown in Figure6. There is a very high similarity between c(50) and org44
FIGURE 8. Output of the linear covariance analysis that compares the reconstructed organic mass spectral data based on algorithm 2after 50 iterations with the measured data. (a) Variations of rt
2 and SNRt as a function of time; (a′) the scatter plot that compares rt2 vs
SNRt; (b) variations of ri2 and SNRi as a function of m/z; and (b′) the scatter plot that compares ri
2 vs SNRi. rt2 is the r2 of the correlation
between the organic mass spectrum measured at time t (i.e., orgt′) and the corresponding reconstructed spectrum (or̂gt′). SNRt is the ratioof the total measured organic signal to the detection limit for organic concentration measurement (D.L. ) 0.15 µg m-3). ri
2 is the r2 of thecorrelation between the measured time series of organic signal at m/z ) i (i.e., orgi) and the corresponding reconstructed time series(i.e., or̂gi). SNRi is the average signal-to-noise ratio for organic fragment m/z ) i. See section entitled “Notation” for notation. Note thatthe reason that ri
2’s of m/z’s 16, 17, 18, and 20 are the same as that of m/z 44 is that these signals were set to proportional to the organicsignals at m/z 44 in the current organic analysis procedure (see section entitled “Data Preparation”).
4946 9 ENVIRONMENTAL SCIENCE & TECHNOLOGY / VOL. 39, NO. 13, 2005

(S ) 0.999; I ) 0; r2 ) 0.989). The correlation between d(50)
and org57 is slightly lower (S ) 0.974; I ) 0; r2 ) 0.943). Inaddition, the biggest discrepancies between d(50) and org57
are observed when the reconstructed organic mass concen-trations using algorithm 1 show the largest disagreementswith the measured values. These results suggest that whileit is valid to use m/z 57 as a HOA tracer the contribution ofm/z 57 to the mass spectra of HOA is somewhat variableacross sources and/or time periods.
The coefficients from algorithm 2 after 50 iterations (eq11), i.e., a(50) ) 7.63 and b(50) ) 12.2 (Figure 5a), are verysimilar to those from algorithm 1. However, significantimprovements in the fit of the total organic concentrationare observed (Figure 5a,d), indicating a fraction of the residualin algorithm 1 is due to the imperfect correlation betweenthe m/z tracers and HOA and OOA mass, especially betweenm/z 57 and HOA. Figure 5c,d shows that the residual-to-organic ratio is almost always below 10%. The values of theabsolute residues between measured and reconstructedvalues (eq 14) range from 0.13 to 2.7 µg m-3 (average )0.48 µg m-3). Since on average the total absolute signal in anorganic mass spectrum of particle-free air is 0.25 µg m-3, thisvalue sets the lower limit of whether an absolute residue isstatistically different from noise. The absolute residuegenerally correlates with the mass concentration of organics,which is consistent with the expected increase in the noise
with the magnitude of the measurement. However, there areperiods when reconstructed organic values (from algorithm2) show differences with the measured values and theabsolute residuals are relatively significant. It is likely thatparticles from these periods contain a small fraction of themass from organic components that are not well representedby the HOA and OOA categories (e.g. biomass burning ormeat cooking). It is also possible that the mass spectra of themajor components undergo small variations during the study.
We subsequently reconstruct the entire organic matrix(OR̂G) based on a′(50), b′(50), c(50), and d(50) (eqs 12 and 13).Shown in Figure 7 is the good correlation between thereconstructed (OR̂Gt,i) and the measured mass spectral data(ORGt,i). For a sample size of 8.6 × 10⁵, the linear regressionfit yields an r2 of 0.99 (S ) 0.99 and I ≈ 0). This same plotalso reveals a small population of data points that significantlydepart from the 1:1 line. Since they were observed duringthe periods that show the largest discrepancies betweenmeasured and reconstructed total organic concentrations(Figure 5d), it supports the hypothesis that during certaintime periods additional components are required to fullyaccount for the variance in the mass spectral signals.However, the overall contribution of the additional com-ponents to the total organic signal appears to be small forthis Pittsburgh data set.
FIGURE 9. AMS mass spectra of (a-1) Pittsburgh HOA component, (a-2) diesel bus exhaust (55), (a-3) lubricating oil (55), (a-4) diesel fuel(55), (a-5) fresh organic aerosol components from Manchester, U.K. (41), (a-6) fresh organic aerosol components from Vancouver, Canada(41), (b-1) Pittsburgh OOA components (the m/z 28 peak was manually added; see section), (b-2) and (b-3) aged organic aerosols fromLangley, Canada (41), (b-4) oxidize organic aerosols from Vancouver, Canada (41), (b-5) humic acid (50), and (b-6) fulvic acid (50). Samplingtimes and locations for these mass spectra are marked. The unit of the mass spectra is percent intensity (% of Σm/zi), i.e., the contributionof each peak to the total signal (not including m/z 28 for (b-1)) in the corresponding mass spectrum. The right y-axis of (b-1) indicatesthe percent intensity of OOA when the m/z 28 peak is included.
VOL. 39, NO. 13, 2005 / ENVIRONMENTAL SCIENCE & TECHNOLOGY 9 4947

Note that although not shown here, we were able toreproduce 98% of the variance in the organic spectral databy using algorithm 1 only. In addition, as will be discussedin section entitled “Implications”, the extracted HOA andOOA mass spectra from algorithm 1 also changed little duringthe iteration (Figure 12). In other words, despite its simplicity,algorithm 1 has demonstrated the capability to successfullycapture most of the variance in the time and m/z-resolvedAMS organic data over a period of 16 days in a major urbanarea and thus highlights its usefulness for ambient aerosolstudies.
Linear Covariance Analysis. We performed a series oflinear covariance analyses between the organic mass spectraldata and the results of algorithm 2 after 50 iterations, in anattempt to systematically evaluate the performance of thismethod. Figure 8a shows the time series of r2
t (Nt ) 3199)between measured and reconstructed mass spectra, togetherwith the signal-to-noise ratios (SNRt) for the correspondingmass concentration measurements. SNRt were calculated asthe ratio of the measured organic mass concentration duringa time step to the average detection limit () 0.15 µg m-3) ofthe AMS measurement for organics during this campaign(18). SNR > 3 is a standard criterion to distinguish the signalfrom noise.
As shown in Figure 8a,a′, the r2t values are generally higher
than 0.9. Lower r2t values are observed but mainly associate
with very low SNRt during periods when the organic massconcentrations are very low. However, there is a small packetof data (e.g., 19:45-20:45 on September 13th, 2002) withhigh SNRt but relatively low r2
t (although still > 0.8; Figure8a′). Again, particles from these lower r2
t but high SNRt periodslikely contain significant contributions from componentsother than the HOA and OOA extracted using these methods.
We then performed the same covariance analysis alongthe other dimension of the organic matrix. Figure 8b showsthe r-squares for the correlation between the time series ofmeasured and reconstructed m/z signal intensities, i.e., r2
i
as a function of m/z (Ni ) 270), together with the averagesignal-to-noise ratios of each m/z over the entire period(SNRi). Similar to the results for r2
t, there is a general trendfor the r2
i values to be higher for the m/z channels that havehigher signal-to-noise ratios. r2
i’s at m/z > 260 are close tozero since these m/z channels contain extremely low signalsand are almost entirely noise. On the other hand, severalm/z channels, such as m/z’s 60, 75, 101, and 169, show goodSNRi (> 6) but relatively low r2
i (<0.85), possibly due toassociation with other components. In principle, the r-squareplots shown in Figure 8 provide an overview of the perfor-mance of the fit model we developed from this study. Thisanalysis may be used as guidance for studies with data fromother locations and to help resolve more components in theparticles.
The Mass Spectra of HOA and OOA. Algorithms 1 and 2also allow us to derive a first and a refined approximation,respectively, to the component mass spectra of HOA andOOA (eqs 6 and 7). The word “component” is used sincethese two mass spectra are expected to represent mixturesof many individual organic species associated with the samesources (or group of sources) and atmospheric processes,rather than individual species or functional groups. As shownin Figure 9a-1, the extracted mass spectrum of HOAdemonstrates prominent ion series for hydrocarbons, whichare major components identified in diesel and gasoline engineexhaust particles, and fuel and lubricating oil, e.g., theCnH2n+1
+ sequence (m/z 29, 43, 57, 71, 85...) that is particularlyprevalent for alkanes, the CnH2n-1
+ sequence (m/z 27, 41, 55,69, 83, 97...) that can be produced from H2 neutral loses fromalkyl fragments and/or alkenes, and the CnH2n-3
+ sequence(m/z 67, 81, 95, 107...) that can arise from cycloalkanes(41, 55, 65, 82, 83). The ion series that can be associated witharomatic species (m/z 77, 91, 105, 119) (65) is also observed.
The component HOA mass spectrum is remarkably similarto the AMS mass spectra of diesel bus exhaust aerosolssampled during “vehicle chasing” experiments in New YorkCity (Figure 9a-2) (55). The r2 between these two mass spectrais 0.98 (S ) 1.02; I ) 0.01; Figure 10a). In addition, the HOAspectrum also closely resembles those of the more volatilefraction of lubricating oil and fuel aerosols that weregenerated in the lab through nucleation and condensationof the vapors from hot oil or fuel (55) (Figure 9a-3,9a-4) andfreshly emitted traffic aerosols in two urban locationssManchester, U.K. (62) and Vancouver, Canada (41) (Figure9a-5,9a-6).
The derived component mass spectrum of OOA (Figure9b-1) demonstrates a starkly different fragmentation patternthan that of HOA (Figure 9a-1). First of all, the OOA massspectrum is dominated by smaller fragments and containsvery little signal at m/z > 55 (60% of the total signal is abovem/z 55 for HOA vs 15% for OOA). Second, the OOA spectrumis dominated by m/z 44 (CO2
+). The signal at m/z 18 (H2O+)is set equal to that of m/z 44 in the current organic analysisprocedure based on laboratory studies of carboxylic anddicarboxylic acids (Philip Silva, personal communication)and since it is not possible to directly measure this signaldue to interferences with particle-phase water, and with H2Omolecules arising due to the decomposition of ammonium
FIGURE 10. Scatter plots comparing the mass spectrum of (a) derivedHOA from Pittsburgh vs fresh diesel bus exhaust aerosols sampledduring New York vehicle chase study (55) and (b) derived OOA forPittsburgh vs aged rural organic aerosols sampled from Vancouver,Canada (41). The red line is the least-squares linear fit. Interceptsfor both plots are close to zero and thus not shown. Y axes are inpercent intensity (% of Σm/z), i.e., the contribution of each peak tothe total signal in the corresponding mass spectrum. Values markedadjacent to the data points are the corresponding m/z’s.
4948 9 ENVIRONMENTAL SCIENCE & TECHNOLOGY / VOL. 39, NO. 13, 2005

sulfate or sulfuric acid during their evaporation in the AMS(40). In addition, the OOA spectrum displays a significantm/z 45 signal (COOH+), a fragment observed from carboxylicacids (49, 50) and that is nearly zero in the HOA spectrum(Figure 9a-1). All of these features have been observed forhighly processed organic aerosols in ambient air at severallocations (18, 36, 41, 54, 62).
The derived OOA mass spectrum demonstrates closesimilarity in the overall pattern with those of aged/oxidizedorganic aerosols in rural and urban areas (Figure 9b-2-9b-4). A linear regression between the mass spectra of OOAfrom this study and that of aged rural organic aerosols fromLangley (the rural site of Vancouver), Canada (41), inparticular, yields S ) 1.02, I ) - 0.01, and r2 ) 0.93 (Figure10b). In addition, the OOA mass spectrum is qualitativelysimilar to the AMS mass spectra of the fulvic and humicacids (50)sclasses of highly oxygenated organic compoundsthat have been proposed as models of the highly oxidizedorganic aerosols that are ubiquitous in the atmosphere, basedon their responses to analytical procedures such as protonnuclear magnetic resonance and Fourier transform infraredspectroscopy (84) (Figure 9b-5,9b-6).
Figure 11 shows the same set of mass spectra on a logscale, with the purpose to illustrate the differences betweenthese mass spectra at high m/z’s. Again, the differencebetween OOA and HOA for large m/z is dramatic. The HOAcomponents produce at least 1 order of magnitude moresignal for the high m/z fragments than the OOA components
do. This is consistent with the correlations shown in Figure2, which shows that the high m/z fragments correlated betterwith CO than with sulfate. Also, among all the spectra, theextracted OOA spectrum from Pittsburgh contains the leastamount of high m/z fragments, suggesting that the OOAcomponents in Pittsburgh are either relatively lower inmolecular weight or more prone to fragmentation.
Finally, we compared the HOA and OOA mass spectraobtained from algorithm 1 vs those from algorithm 2 after50 iterations (Figure 12). Only minor differences are observed,but again the changes in the HOA spectrum were larger thanthose in the OOA spectrum, indicating that m/z 57 is a lessoptimum HOA tracer than m/z 44 is for OOA. As shown inFigure 9b-1, an important change is a small m/z 57 peak thatappeared in the OOA mass spectrum, which fits the patternsof the surrounding peaks on the OOA spectrum. Thecontribution of m/z 57 to the total signal in the OOA massspectrum is ∼0.3%. Although we expect that there should bean isotopic peak of 13C1
12C2H7+ (m/z 44) present at an
abundance of 3.3% of the signal intensity of 12C3H7+ (m/z 43)
(65), the calculated m/z 44 peak in HOA remains close tozero after iteration. This is due to the very low intensity of13C1
12C2H7+ signals (e.g., estimated org-eq concentration of
13C112C2H7
+ in HOA is 0.005 µg m-3), which is indistinguishablefrom noise.
Implications. The key result of the procedures presentedhere is that m/z 44 and m/z 57 are reliable AMS mass spectral“markers” which allow the quantification of HOA and OOA
FIGURE 11. The log scale AMS mass spectra, corresponding to those shown in Figure 8. Two lines have been added to the mass spectrato guide the eye: the blue line is an approximate fit to the envelope of the m/z 40-250 range of the log scale mass spectra of PittsburghHOA and the red line to that of Pittsburgh OOA.
VOL. 39, NO. 13, 2005 / ENVIRONMENTAL SCIENCE & TECHNOLOGY 9 4949

and the extraction of mass spectra that can be interpretedchemically. Algorithm 1 yields most of the information whileproviding the “first guess” for algorithm 2 which is morequantitative. This simple linear superposition model of onlytwo components with constant mass spectra reduces thecomplexity of aerosol mass spectrometry data by a factor of∼150 while accounting for most of the variance in theconcentrations and mass spectra of organic aerosols in amajor urban area for a period of 16 days. In addition, themass spectra of the two components are remarkably invariantin time. This contrasts with other apportionment studiesusing molecular tracers that identify large numbers of sources,e.g., ref 23, and may be due to multiple combustion relatedsources being lumped under HOA in this study, if their bulkchemical compositions (as opposed to their tracer concen-trations) are quite similar. In other words, we believe thatunderneath the apparent simplicity of each of the twocomponents there likely lies considerable complexityse.g.,compounds that have similar temporal variations or similarmass spectra are likely grouped together. Aerosols havingsignificantly different sources/precursors, e.g., biogenic vsanthropogenic SOA, or traffic vs power plant emission POA,may not be discriminated by the technique presented here.We plan to address this point by further developing thetechnique so that more components can be extracted andby comparing with other source apportionment techniquesfor simultaneously collected data as part of a currently fundedproject.
In a separate paper we interpret the results obtained withthe method described here (algorithm 2) in terms of theproperties of HOA and OOA in the Pittsburgh Supersite data
set, including their diurnal profiles, and compare to previousresults at this and other locations. We also derive the highlytime-resolved size distributions of HOA and OOA by usinga procedure based on these results and explore the implica-tions of the time series, diurnal profiles, and size distributionson the sources and process responsible for the observed HOAand OOA (Zhang et al., in preparation for Atmos. Chem. Phys.).
AcknowledgmentsThis research was partially supported by EPA STAR GrantsR831080 and RD832161010, by NSF CAREER grant ATM0449815, and by NASA Grant NNG04GA67G. Although thiswork has been partly funded by EPA, it has not been subjectedto the Agency’s review and therefore does not necessarilyreflect the views of the Agency and no official endorsementshould be inferred. The authors thank Dr. Beth Wittig (CMU)for gas phase and meteorology data, Drs. R. Subramanian,Juan Cabada-Amaya, and Allen Robinson (CMU), AndreaPolidori, and Dr. Barbara Turpin (Rutgers University) for ECdata. The authors also thank Dr. Meinrat O. Andreae (MaxPlanck Institute for Chemistry) and one anonymous reviewerfor their constructive suggestions on organic aerosol ter-minology. Finally we thank the Jimenez group and the AMScommunity for many helpful discussions.
Supporting Information AvailableFigures S1-S10. This material is available free of charge viathe Internet at http://pubs.acs.org.
Literature Cited(1) Jacobson, M. C.; Hansson, H. C.; Noone, K. J.; Charlson, R. J.
Organic atmospheric aerosols: Review and state of the science.Rev. Geophys. 2000, 38, 267-294.
(2) Seinfeld, J. H.; Pankow, J. F. Organic atmospheric particulatematerial. Annu. Rev. Phys. Chem. 2003, 54, 121-140.
(3) Andreae, M. O.; Crutzen, P. J. Atmospheric aerosols: Bio-geochemical sources and role in atmospheric chemistry. Science1997, 276, 1052-1058.
(4) Cass, G. R.; Hughes, L. A.; Bhave, P.; Kleeman, M. J.; Allen, J. O.;Salmon, L. G. The chemical composition of atmospheric ultrafineparticles. Philos. Trans. R. Soc. London Ser. A-Math. Phys. Eng.Sci 2000, 358, 2581-2592.
(5) Rogge, W. F.; Mazurek, M. A.; Hildemann, L. M.; Cass, G. R.;Simoneit, B. R. T. Quantification of urban organic aerosols ata molecular level - Identification, abundance and seasonalvariation. Atmos. Environ. A 1993, 27, 1309-1330.
(6) NARSTO. Particulate Matter Science for Policy Makers: ANARSTO Assessment; EPRI 1007735; 2003.
(7) Turpin, B. J.; Saxena, P.; Andrews, E. Measuring and simulatingparticulate organics in the atmosphere: problems and prospects.Atmos. Environ. 2000, 34, 2983-3013.
(8) IPCC. Climate Change 2001: The Scientific Basis, Contributionof Working Group I to the Third Assessment Report of theIntergovernmental Panel on Climate Change; Houghton, J. T.,et al., Ed.; Cambridge University Press: New York, 2001.
(9) Watson, J. G. Visibility: Science and regulation. J. Air WasteManage. Assoc. 2002, 52, 628-713.
(10) Jang, M. S.; Czoschke, N. M.; Lee, S.; Kamens, R. M. Hetero-geneous atmospheric aerosol production by acid-catalyzedparticle-phase reactions. Science 2002, 298, 814-817.
(11) Claeys, M.; Wang, W.; Ion, A. C.; Kourtchev, I.; Gelencser, A.;Maenhaut, W. Formation of secondary organic aerosols fromisoprene and its gas-phase oxidation products through reactionwith hydrogen peroxide. Atmos. Environ. 2004, 38, 4093-4098.
(12) Blando, J. D.; Turpin, B. J. Secondary organic aerosol formationin cloud and fog droplets: a literature evaluation of plausibility.Atmos. Environ. 2000, 34, 1623-1632.
(13) Corrigan, C. E.; Novakov, T. Cloud condensation nucleus activityof organic compounds: a laboratory study. Atmos. Environ.1999, 33, 2661-2668.
(14) Mircea, M.; Facchini, M. C.; Decesari, S.; Fuzzi, S.; Charlson, R.J. The influence of the organic aerosol component on CCNsupersaturation spectra for different aerosol types. Tellus Ser.B-Chem. Phys. Meteorol. 2002, 54, 74-81.
FIGURE 12. Scatter plots comparing the mass spectra of (a)Pittsburgh HOA components and (b) Pittsburgh OOA componentsobtained by algorithm 2 after 50 iterations to those obtained byalgorithm 1. The red line is the least-squares linear fit. Interceptsfor both plots are close to zero and thus not shown. Y axes are inpercent intensity (% of Σm/z), i.e., the contribution of each peak tothe total signal in the corresponding mass spectrum. Values markedadjacent to the data points are the corresponding m/z’s.
4950 9 ENVIRONMENTAL SCIENCE & TECHNOLOGY / VOL. 39, NO. 13, 2005
(15) Kerminen, V. M.; Virkkula, A.; Hillamo, R.; Wexler, A. S.; Kulmala,M. Secondary organics and atmospheric cloud condensationnuclei production. J. Geophys. Res., [Atmos.] 2000, 105, 9255-9264.
(16) Cruz, C. N.; Pandis, S. N. A study of the ability of pure secondaryorganic aerosol to act as cloud condensation nuclei. Atmos.Environ. 1997, 31, 2205-2214.
(17) Kavouras, I. G.; Stephanou, E. G. Particle size distribution oforganic primary and secondary aerosol constituents in urban,background marine, and forest atmosphere. J. Geophys. Res.,[Atmos.] 2002, 107.
(18) Zhang, Q.; Canagaratna, M. C.; Jayne, J. T.; Worsnop, D. R.;Jimenez, J. L. Time and size-resolved chemical composition ofsubmicron particles in Pittsburgh - Implications for aerosolsources and processes. J. Geophys. Res. 2005, 110, doi:10.1029/2004JD004649.
(19) Russell, A.; Dennis, R. NARSTO critical review of photochemicalmodels and modeling. Atmos. Environ. 2000, 34, 2283-2324.
(20) Strader, R.; Lurmann, F.; Pandis, S. N. Evaluation of secondaryorganic aerosol formation in winter. Atmos. Environ. 1999, 33,4849-4863.
(21) Pandis, S. N.; Harley, R. A.; Cass, G. R.; Seinfeld, J. H. Secondaryorganic aerosol formation and transport. Atmos. Environ. A 1992,26, 2269-2282.
(22) Cass, G. R. Organic molecular tracers for particulate air pollutionsources. TrAC, Trends Anal. Chem. 1998, 17, 356-366.
(23) Schauer, J. J.; Rogge, W. F.; Hildemann, L. M.; Mazurek, M. A.;Cass, G. R. Source apportionment of airborne particulate matterusing organic compounds as tracers. Atmos. Environ. 1996, 30,3837-3855.
(24) Zheng, M.; Cass, G. R.; Schauer, J. J.; Edgerton, E. S. Sourceapportionment of PM2.5 in the southeastern United States usingsolvent-extractable organic compounds as tracers. Environ. Sci.Technol. 2002, 36, 2361-2371.
(25) Turpin, B. J.; Huntzicker, J. J. Secondary formation of organicaerosol in the Los Angeles basin: A descriptive analysis of organicand elemental carbon concentrations. Atmos. Environ. Part AGeneral Topics 1991, 25, 207-215.
(26) Turpin, B. J.; Huntzicker, J. J. Identification of secondary organicaerosol episodes and quantitation of primary and secondaryorganic aerosol concentrations during SCAQS. Atmos. Environ.1995, 29, 3527-3544.
(27) Castro, L. M.; Pio, C. A.; Harrison, R. M.; Smith, D. J. T.Carbonaceous aerosol in urban and rural European atmo-spheres: estimation of secondary organic carbon concentra-tions. Atmos. Environ. 1999, 33, 2771-2781.
(28) Cabada, J. C.; Pandis, S. N.; Robinson, A. L. Sources ofatmospheric carbonaceous particulate matter in Pittsburgh,Pennsylvania. J. Air Waste Manage. Assoc. 2002, 52, 732-741.
(29) Cabada, J. C.; Pandis, S. N.; Subramanian, R.; Robinson, A. L.;Polidori, A.; Turpin, B. Estimating the secondary organic aerosolcontribution to PM2.5 using the EC tracer method. Aerosol Sci.Technol. 2004, 38(S1), 140-155.
(30) Malinowski, E. R. Factor Analysis in Chemistry, 3rd ed.; Wiley-Interscience: New York, 2002.
(31) Paatero, P.; Tapper, U. Positive matrix factorization: A non-negative factor model with optimal utilization of error estimatesof data values. Environmetrics 1994, 5, 111-126.
(32) Henry, R. C.; Lewis, C. W.; Collins, J. F. Vehicle-relatedhydrocarbon source composition from ambient data: TheGRACE/SAFER method. Environ. Sci. Technol. 1994, 28, 823-832.
(33) Schauer, J. J.; Cass, G. R. Source apportionment of wintertimegas-phase and particle-phase air pollutants using organiccompounds as tracers. Environ. Sci. Technol. 2000, 34, 1821-1832.
(34) Fine, P. M.; Chakrabarti, B.; Krudysz, M.; Schauer, J. J.; Sioutas,C. Diurnal variations of individual organic compound con-stituents of ultrafine and accumulation mode particulate matterin the Los Angeles Basin. Environ. Sci. Technol. 2004, 38, 1296-1304.
(35) Schauer, J. J.; Fraser, M. P.; Cass, G. R.; Simoneit, B. R. T. Sourcereconciliation of atmospheric gas-phase and particle-phasepollutants during a severe photochemical smog episode.Environ. Sci. Technol. 2002, 36, 3806-3814.
(36) Jimenez, J. L.; Jayne, J. T.; Shi, Q.; Kolb, C. E.; Worsnop, D. R.;Yourshaw, I.; Seinfeld, J. H.; Flagan, R. C.; Zhang, X.; Smith, K.A.; Morris, J. W.; Davidovits, P. Ambient aerosol sampling withan Aerosol Mass Spectrometer. J. Geophys. Res. 2003, 108, 8425,doi: 8410:1029/2001JD001213.
(37) Jimenez, J. L.; Bahreini, R.; Cocker, D. R.; Zhuang, H.; Varut-bangkul, V.; Flagan, R. C.; Seinfeld, J. H.; O’Dowd, C.; Hoffmann,
T. New particle formation from photooxidation of diiodo-methane (CH2I2). J. Geophys. Res., [Atmos.] 2003, 108, 4318, doi:4310.1029/2002JD002452.
(38) Jayne, J. T.; Leard, D. C.; Zhang, X.; Davidovits, P.; Smith, K. A.;Kolb, C. E.; Worsnop, D. R. Development of an aerosol massspectrometer for size and composition analysis of submicronparticles. Aerosol. Sci. Technol. 2000, 33, 49-70.
(39) Allan, J. D.; Jimenez, J. L.; Williams, P. I.; Alfarra, M. R.; Bower,K. N.; Jayne, J. T.; Coe, H.; Worsnop, D. R. Quantitative samplingusing an Aerodyne Aerosol Mass Spectrometer. Part 1: Tech-niques of data interpretation and error analysis. J. Geophys.Res., [Atmos.] 2003, 108, 4090, doi: 4010.1029/2002JD002358.
(40) Allan, J. D.; Delia, A. E.; Coe, H.; Bower, K. N.; Alfarra, M. R.;Jimenez, J. L.; Middlebrook, A. M.; Drewnick, F.; Onasch, T. B.;Canagaratna, M. R.; Jayne, J. T.; Worsnop, D. R. A generalisedmethod for the extraction of chemically resolved mass spectrafrom Aerodyne aerosol mass spectrometer data. J. Aerosol Sci.2004, 35, 909-922, doi: 910.1016/j.jaerosci.2004.1002.1007.
(41) Alfarra, M. R.; Coe, H.; Allan, J. D.; Bower, K. N.; Boudries, H.;Canagaratna, M. R.; Jimenez, J. L.; Jayne, J. T.; Garforth, A.; Li,S.-M.; Worsnop, D. R. Characterization of urban and regionalorganic aerosols in the lower Fraser Valley using two AerodyneAerosol Mass Spectrometers. Atmos. Environ. 2004, 5745-5758.
(42) Drewnick, F.; Schwab, J. J.; Hogrefe, O.; Peters, S.; Husain, L.;Diamond, D.; Weber, R.; Demerjian, K. L. Intercomparison andevaluation of four semi-continuous PM2.5 sulfate instruments.Atmos. Environ. 2004, 37, 3335-3350.
(43) Drewnick, F.; Schwab, J. J.; Jayne, J. T.; Canagaratna, M.;Worsnop, D. R.; Demerjian, K. L. Measurement of ambientaerosol composition during the PMTACS-NY 2001 using anAerosol Mass Spectrometer. Part I: Mass concentrations. AerosolSci. Technol. 2004, 38, 92-103.
(44) Allan, J. D.; Bower, K. N.; Coe, H.; Boudries, H.; Jayne, J. T.;Canagaratna, M. R.; Millet, D. B.; Goldstein, A. H.; Quinn, P. K.;Weber, R. J.; Worsnop, D. R. Submicron aerosol compositionat Trinidad Head, California, during ITCT 2K2: Its relationshipwith gas-phase volatile organic carbon and assessment ofinstrument performance. J. Geophys. Res., [Atmos.] 2004, 109,D23S24, doi: 10.1029/2003JD004208.
(45) Liu, B. Y. H.; Ziemman, P. J.; Kittelson, D. B.; McMurry, P. H.Generating particle beams of controlled dimensions anddivergence: II. experimental evaluation of particle motion inaerodynamic lenses and nozzle expansions. Aerosol Sci. Technol.1995, 22, 314-324.
(46) Zhang, X.; Smith, K. A.; Worsnop, D. R.; Jimenez, J. L.; Jayne, J.T.; Kolb, C. E. A numerical characterization of particle beamcollimation by an aerodynamic lens-nozzle system. Part I: Anindividual lens or nozzle. Aerosol Sci. Technol. 2002, 36, 617-631.
(47) Zhang, X.; Smith, K. A.; Worsnop, D. R.; Jimenez, J. L.; Jayne, J.T.; Kolb, C. E.; Morris, J.; Davidovits, P. Characterization ofparticle beam collimation: Part II Integrated aerodynamic lens-nozzle system. Aerosol Sci. Technol. 2004, 38, 619-638.
(48) Reilly, P. T. A.; Lazar, A. C.; Gieray, R. A.; Whitten, W. B.; Ramsey,J. M. The elucidation of charge-transfer-induced matrix effectsin environmental aerosols via real-time aerosol mass spectralanalysis of individual airborne particles. Aerosol Sci. Technol.2000, 33, 135-152.
(49) Stein, S.; Mirokhin, Y.; Tchekhovskoi, D.; Mallard, G. The NISTMass Spectral Search Program for the NIST/EPA/NIH MassSpectral Library (Version 2.0); The Standard Reference DataProgram of NIST, 2001.
(50) Alfarra, M. R. Ph.D. Dissertation, Insights into AtmosphericOrganic Aerosols Using an Aerosol Mass Spectrometer, Uni-versity of Manchester, 2004.
(51) Zhang, Q.; Stanier, C. O.; Canagaratna, M. R.; Jayne, J. T.;Worsnop, D. R.; Pandis, S. N.; Jimenez, J. L. Insights into thechemistry of new particle formation and growth events inPittsburgh based on Aerosol Mass Spectrometry. Environ. Sci.Technol. 2004, 38, 4797-4809.
(52) Takegawa, N.; Miyazaki, Y.; Kondo, Y.; Komazaki, Y.; Miyakawa,T.; Jimenez, J. L.; Jayne, J. T.; Worsnop, D. R.; Allan, J. D.; Weber,R. J. Characterization of an Aerodyne Aerosol Mass Spectrometer(AMS): Intercomparison with other aerosol instruments. AerosolSci. Technol. 2005, in press.
(53) Canagaratna et al. Ambient Aerosol Analysis with the AerodyneAMS in the Houston 2000 Study. J. Geophys. Res., [Atmos.] 2005,manuscript in preparation.
(54) Bahreini, R.; Jimenez, J. L.; Wang, J.; Flagan, R. C.; Seinfeld, J.H.; Jayne, J. T.; Worsnop, D. R. Aircraft-based aerosol size andcomposition measurements during ACE-Asia using an Aerodyne
VOL. 39, NO. 13, 2005 / ENVIRONMENTAL SCIENCE & TECHNOLOGY 9 4951

aerosol mass spectrometer. J. Geophys. Res., [Atmos.] 2003, 108,8645, doi: 8610.1029/2002JD003226.
(55) Canagaratna, M. R.; Jayne, J. T.; Ghertner, D. A.; Herndon, S.;Shi, Q.; Jimenez, J. L.; Silva, P. J.; Williams, P.; Lanni, T.; Drewnick,F.; Demerjian, K. L.; Kolb, C. E.; Worsnop, D. R. Chase studiesof particulate emissions from in-use New York cityvehicles. Aerosol Sci. Technol. 2004, 38, 555-573, 510.1080/02786820490465504.
(56) Jackson, J. E. A User’s Guide to Principal Components; John Wiley& Son, Inc.: Hoboken, NJ, 2003.
(57) Katrib, Y.; Martin, S. T.; Hung, H. M.; Rudich, Y.; Zhang, H.;Slowik, J.; Davidovits, P.; Jayne, J. T.; Worsnop, D. R. Productsand mechanisms of ozone reactions with oleic acid for aerosolparticles having core-shell morphologies. J. Phys. Chem. A 2004,108, 6686-6695.
(58) Seinfeld, J. H.; Pandis, S. N. Atmospheric Chemistry and Physics:From Air Pollution to Climate Change; Wiley: New York, 1998.
(59) Paatero, P.; Hopke, P. K.; Begum, B. A.; Biswas, S. K. A graphicaldiagnostic method for assessing the rotation in factor analyticalmodels of atmospheric pollution. Atmos. Environ. 2005, 39, 193-201.
(60) Stein, S. E.; Scott, D. R. Optimization and testing of mass-spectrallibrary search algorithms for compound identification. J. Am.Soc. Mass Spectrom. 1994, 5, 859-866.
(61) Press: W. H.; Teukolsky, S. A.; Vetterling, W. T.; Flannery, B. P.Numerical Recipes in C: The Art of Scientific Computing, 2nded.; Cambridge University Press: Cambridge, New York, PortChester, Melbourne, Sydney, 1992.
(62) Allan, J. D.; Alfarra, M. R.; Bower, K. N.; Williams, P. I.; Gallagher,M. W.; Jimenez, J. L.; McDonald, A. G.; Nemitz, E.; Canagaratna,M. R.; Jayne, J. T.; Coe, H.; Worsnop, D. R. Quantitative samplingusing an Aerodyne Aerosol Mass Spectrometer. Part 2: Mea-surements of fine particulate chemical composition in two UKCities. J. Geophys. Res., [Atmos.] 2003, 108, 4091, doi: 4010.1029/2002JD002359.
(63) Dzepina et al. Characterization of ambient aerosol in MexicoCity: The organic component. Atmos. Chem. Phys. 2005,manuscript in preparation.
(64) Baumgardner, D.; Raga, G.; Peralta, O.; Rosas, I.; Castro, T.;Kuhlbusch, T.; John, A.; Petzold, A. Diagnosing black carbontrends in large urban areas using carbon monoxide measure-ments. J. Geophys. Res., [Atmos.] 2002, 107.
(65) McLafferty, F. W.; Turecek, F. Interpretation of Mass Spectra;University Science Books: Mill Valley, CA, 1993.
(66) Alfarra, M. R.; Paulsen, D.; Gysel, M.; Garforth, A. A.; Dommen,J.; Prevot, A. S. H.; Worsnop, D. R.; Baltensperger, U.; Coe, H.A Mass Spectrometric study of secondary organic aerosolsformed from the photooxidation of anthropogenic and biogenicprecursors in a reaction chamber. Environ. Sci. Technol. 2004,submitted for publication.
(67) Bahreini, R.; Keywood, M.; Ng, N. L.; Varutbangkul, V.; Gao, S.;Flagan, R. C.; Seinfeld, J. H.; Worsnop, D. R.; Jimenez, J. L.Measurements of secondary organic aerosols (SOA) fromoxidation of cycloalkanes, terpenes, and m-xylene using theAerodyne Aerosol Mass Spectrometer (AMS). Environ. Sci.Technol. 2005, in press.
(68) Zhang, Q.; Anastasio, C. Free and combined amino compoundsin atmospheric fine particles (PM2.5) and fogwaters fromNorthern California. Atmos. Environ. 2003, 37, 2247-2258.
(69) Zhang, Q.; Anastasio, C.; Jimenez-Cruz, M. Water-soluble organicnitrogen in atmospheric fine particles (PM2.5) from NorthernCalifornia. J. Geophys. Res. 2002, 107(D11), 4112, doi: 4110.1029/2001JD000870.
(70) Milne, P. J.; Zika, R. G. Amino acid nitrogen in atmosphericaerosols - Occurrence, sources and photochemical modifica-tion. J. Atmos. Chem. 1993, 16, 361-398.
(71) Cornell, S. E.; Jickells, T. D.; Thornton, C. A. Urea in rainwaterand atmospheric aerosol. Atmos. Environ. 1998, 32, 1903-1910.
(72) Gorzelska, K.; Talbot, R. W.; Klemm, K.; Lefer, B.; Klemm, O.;Gregory, G. L.; Anderson, B.; Barrie, L. A. Chemical compositionof the atmospheric aerosol in the troposphere over the HudsonBay lowlands and Quebec-Labrador regions of Canada. J.Geophys. Res., [Atmos.] 1994, 99, 1763-1779.
(73) Donahue, N.; Robinson, A. Theoretical, in situ, and laboratoryconstraints on organic aerosol oxidation, AAAR 2004 AnnualConference, 2004.
(74) Eliason, T. L.; Gilman, J. B.; Vaida, V. Oxidation of organic filmsrelevant to atmospheric aerosols. Atmos. Environ. 2004, 38,1367-1378.
(75) Bertram, A. K.; Ivanov, A. V.; Hunter, M.; Molina, L. T.; Molina,M. J. The reaction probability of OH on organic surfaces oftropospheric interest. J. Phys. Chem. A 2001, 105, 9415-9421.
(76) Molina, M. J.; Ivanov, A. V.; Trakhtenberg, S.; Molina, L. T.Atmospheric evolution of organic aerosol. Geophys. Res. Lett.2004, 31, doi:10.1029/2004GL020910.
(77) Jakober, C.; Destaillats, H.; Green, P.; Charles, J. Oxygenatedorganics compounds present in motor vehicle emissions, AAARAnnual Conference 2003.
(78) Novakov, T.; Corrigan, C. E. Cloud condensation nucleus activityof the organic component of biomass smoke particles. Geophys.Res. Lett. 1996, 23, 2141-2144.
(79) Andreae, M. O.; Merlet, P. Emission of trace gases and aerosolsfrom biomass burning. Global Biogeochem. Cycle 2001, 15, 955-966.
(80) Mayol-Bracero, O. L.; Guyon, P.; Graham, B.; Roberts, G.;Andreae, M. O.; Decesari, S.; Facchini, M. C.; Fuzzi, S.; Artaxo,P. Water-soluble organic compounds in biomass burningaerosols over Amazonia - 2. Apportionment of the chemicalcomposition and importance of the polyacidic fraction - art.no. 8091. J. Geophys. Res., [Atmos.] 2002, 107, 8091.
(81) Reid, J. S.; Koppmann, R.; Eck, T. F.; Eleuterio, D. P. A reviewof biomass burning emissions part II: intensive physicalproperties of biomass burning particles. Atmos. Chem. Phys.2005, 5, 799-825.
(82) Sakurai, H.; Tobias, H. J.; Park, K.; Zarling, D.; Docherty, S.;Kittelson, D. B.; McMurry, P. H.; Ziemann, P. J. On-linemeasurements of diesel nanoparticle composition and volatility.Atmos. Environ. 2003, 37, 1199-1210.
(83) Tobias, H. J.; Beving, D. E.; Ziemann, P. J.; Sakurai, H.; Zuk, M.;McMurry, P. H.; Zarling, D.; Waytulonis, R.; Kittelson, D. B.Chemical analysis of diesel engine nanoparticles using a nano-DMA/thermal desorption particle beam mass spectrometer.Environ. Sci. Technol. 2001, 35, 2233-2243.
(84) Decesari, S.; Facchini, M. C.; Matta, E.; Mircea, M.; Fuzzi, S.;Chughtai, A. R.; Smith, D. M. Water soluble organic compoundsformed by oxidation of soot. Atmos. Environ. 2002, 36, 1827-1832.
Received for review September 14, 2004. Revised manuscriptreceived April 11, 2005. Accepted April 26, 2005.
ES048568L
4952 9 ENVIRONMENTAL SCIENCE & TECHNOLOGY / VOL. 39, NO. 13, 2005