Denoising of multispectral images via nonlocal groupwise spectrum-PCA

IEEE TRANSACTIONS ON INSTRUMENTATION AND MEASUREMENT, VOL. 58, NO. 2, FEBRUARY 2009 303
Application of Blind DeconvolutionDenoising in Failure Prognosis
Bin Zhang, Senior Member, IEEE, Taimoor Khawaja, Romano Patrick, George Vachtsevanos, Senior Member, IEEE,Marcos E. Orchard, and Abhinav Saxena, Member, IEEE
Abstract—Fault diagnosis and failure prognosis are essentialtechniques in improving the safety of many mechanical systems.However, vibration signals are often corrupted by noise; there-fore, the performance of diagnostic and prognostic algorithms isdegraded. In this paper, a novel denoising structure is proposedand applied to vibration signals collected from a testbed of thehelicopter main gearbox subjected to a seeded fault. The proposedstructure integrates a denoising algorithm, feature extraction, fail-ure prognosis, and vibration modeling into a synergistic system.Performance indexes associated with the quality of the extractedfeatures and failure prognosis are addressed, before and afterdenoising, for validation purposes.
Index Terms—Blind deconvolution, decision support system, de-convolution, denoising, failure prognosis, fault diagnosis, gearboxvibration signal, signal processing.
I. INTRODUCTION
THE performance of failure prognostic algorithms isclosely related to features (also known as condition in-
dicators) derived from sensor data, which reveal the evolutionand propagation of a failure in the system [1]–[3]. For manymechanical systems, features are typically extracted from vi-bration data [4]. Noise, however, often corrupts the vibrationsignals and masks the indication of faults, particularly in theirearly stages, thus curtailing the ability to accurately diagnoseand predict failures. Therefore, it is important to develop agood denoising scheme for improving the signal-to-noise ratio(SNR) and making the characteristics of the fault perceptiblein the vibration data. This process will improve the quality
Manuscript received October 30, 2007; revised April 22, 2008. First pub-lished October 28, 2008; current version published January 5, 2009. Thiswork was supported in part by the Defense Advanced Research ProjectsAgency Structural Integrity Prognosis Program (SIPS) under the direction ofDr. L. Christodoulou. The Associate Editor coordinating the review process forthis paper was Dr. John Sheppard.
B. Zhang and T. Khawaja are with the School of Electrical and ComputerEngineering, Georgia Institute of Technology, Atlanta, GA 30332 USA (e-mail:[email protected]).
R. Patrick is with Impact Technologies, LLC, Rochester, NY 14623 USA(e-mail: [email protected]).
G. Vachtsevanos is with the Georgia Institute of Technology, Atlanta, GA30332 USA, and also with Impact Technologies, LLC, Rochester, NY 14623USA (e-mail: [email protected]).
M. Orchard is with the Department of Electrical Engineering, University ofChile, Santiago 837-0451, Chile (e-mail: [email protected]).
A. Saxena is with Research Institute for Advanced Computer Science,Prognostics Center of Excellence, NASA Ames Research Center, Moffett Field,CA 94035 USA (e-mail: [email protected]).
Color versions of one or more of the figures in this paper are available onlineat http://ieeexplore.ieee.org.
Digital Object Identifier 10.1109/TIM.2008.2005963
of the features, potentially lower the fault-detection threshold,and thus increase the accuracy of the diagnostic and prognosticalgorithms.
The main transmission of Blackhawk and Seahawk heli-copters employs an epicyclic gear system [4], [5]. Recently, acrack in the planetary carrier plate was discovered and resultedin a major overhaul and replacement of gear plates at a highcost. Therefore, many research efforts toward designing andimplementing condition-based maintenance (CBM) on heli-copters, such as signal preprocessing [2], [6], vibration signalmodeling [7], feature extraction [2], [3], detection of cracks,and prediction of crack length [8], [13], have been carriedout. The objective of this paper is to propose a new vibrationpreprocessing structure, which synergizes vibration denoising,vibration modeling, feature extraction, and failure prognosis, toenhance the performance of CBM. The planetary gear systemwith a seeded crack on the gear carrier plate will be used toverify the proposed method.
For an epicyclic gear system, the widely used denoisingtechnique is time synchronous averaging (TSA), which canbe implemented in the time or frequency domain [2]–[4].Other denoising algorithms include blind source separation [9],stochastic resonance [10], and adaptive schemes [11]. Sinceprevious research [7] has provided a good understanding ofthe true vibration signals, a blind deconvolution algorithmdeveloped for a similarly formulated image processing problem[12] will be modified and employed to recover the actualvibration signal [14]. This paper addresses in detail the struc-ture of the overall denoising scheme, the analysis of vibra-tion mechanisms, the blind deconvolution algorithm, and itsexperimental verification. The results show that the proposeddenoising scheme can substantially improve the SNR, featureperformance, and the precision of the failure prognostic algo-rithm. The developed algorithm has successfully been appliedto real-time fault diagnosis and failure prognosis [15].
II. DENOISING SCHEME ARCHITECTURE
The proposed denoising scheme is shown in Fig. 1. Anaccelerometer mounted on the gearbox frame collects vibra-tion signals, which, in turn, are preprocessed to obtain TSAsignal s(t). The blind deconvolution denoising algorithm iscarried out in the frequency domain. Thus, the denoising al-gorithm is applied to S(f), which outputs the denoised vibra-tion data in the frequency domain B(f). If the time-domainsignal is required, B(f) can be inverse Fourier transformed toobtain b(t).
0018-9456/$25.00 © 2009 IEEE
Authorized licensed use limited to: Universidad de chile. Downloaded on January 27, 2009 at 14:51 from IEEE Xplore. Restrictions apply.

304 IEEE TRANSACTIONS ON INSTRUMENTATION AND MEASUREMENT, VOL. 58, NO. 2, FEBRUARY 2009
Fig. 1. Overall structure of the denoising scheme.
Fig. 2. Blind deconvolution denoising scheme.
From B(f) and b(t), features can be extracted and fused tosubsequently be used in fault-diagnostic and failure-prognosticroutines. The failure-prognostic algorithm not only predicts theremaining useful life (RUL) of the system but also providesan estimate of the crack length on the planet gear carrierplate as a function of time [8], [13]. Both the estimated cracklength and load profile of the helicopter serve as inputs to thevibration model [7], which generates the modeled vibrationsignal m(t). The frequency spectra of m(t) are normalizedto obtain weighting factor vector W (f), which is used in anonlinear projection of the algorithm.
The blind deconvolution algorithm is shown in Fig. 2. Thenonlinear projection, which is based on vibration analysis in thefrequency domain, and the cost function minimization blocksare critical components. Initially, an inverse filter Z ′(f) mustbe defined. This filter is an initial estimate of the inversemodulating signal in the frequency domain and converges toa filter, through an optimization algorithm, that recovers thevibration signal from the noisy measured data S(f). Inversefilter Z ′(f) is convoluted with S(f) to obtain a rough estimateof vibration signal B′(f). Signal B′(f) passes through thenonlinear projection, which maps B′(f) to a subspace thatcontains only known characteristics of the vibration signal, toyield Bnl(f). The difference between B′(f) and Bnl(f) isdenoted as E(f). By iteratively adjusting Z ′(f) to minimizeE(f) and when the difference of E(f) in two successiveiterations reach a threshold value or, in the real-time case, theiteration number reaches a given value, it can be said that signalB′(f) approaches B(f), which can be regarded as the denoisedvibration signal. At the same time, Z ′(f) approaches Z(f),which is close enough to a real inverse filter.
Fig. 3. Configuration of an epicyclic gear system.
III. VIBRATION DATA ANALYSIS
The vibration signals are derived from a main transmis-sion gearbox with five planet gears, as shown in Fig. 3. Thegearbox has a seeded crack fault on the planetary gear plate.The succeeding sections intend to describe the expected vibra-tion data.
A. Healthy Gearbox
Ideally, planetary gears are evenly spaced. The accelerometeris mounted at a fixed point at position θ = 0. Then, the modu-lating signal for planetary gear p has the form
ap(t) =N∑
n=−N
αn cos(nθp) (1)
where θp is the position of gear p, fs is the carrier rotationfrequency, N is the number of sidebands under consideration,and αn is the amplitude of the frequency component at fre-quency nfs.
Mesh vibrations generated from different gears are of thesame amplitude but different phase shifts. Since the teeth mesh-ing speed is proportional to the angular velocity of the planetarycarrier, the meshing vibration appears at frequencies Ntf
s [5],[7], with Nt being the number of annulus gear teeth. Then, thevibration signal from gear p can be written as
bp(t) =M∑
m=1
βm sin(mNtθp) (2)
where M is the number of harmonics under consideration, andβm is the harmonic amplitude of the meshing vibration.
Then, the observed vibration signal of planetary gear p, withrespect to the static accelerometer, is given as the productof the meshing vibration signal and the amplitude-modulating
Authorized licensed use limited to: Universidad de chile. Downloaded on January 27, 2009 at 14:51 from IEEE Xplore. Restrictions apply.

ZHANG et al.: APPLICATION OF BLIND DECONVOLUTION DENOISING IN FAILURE PROGNOSIS 305
Fig. 4. Superposition for a faulty gear plate. (a) mNt + n �= kNp (non-RMC). (b) mNt + n = kNp (RMC).
signal. This signal, which is denoted by yp(t) = ap(t)bp(t), isgiven by
yp(t) =12
M∑m=1
N∑n=−N
αnβm sin(mNt + n)θp). (3)
The position of the frequency components around themeshing vibration harmonics (or sidebands) are located at(mNt + n)fs.
When there are Np planetary gears, the vibration signalobserved by the accelerometer is the superposition of the vibra-tion signals generated from Np different planetary gears. Thissuperposed vibration signal has the form
y(t) =12
Np∑p=1
M∑m=1
N∑n=−N
αnβm sin(
2π(p − 1)mNt + n
Np
).
(4)
Since the planetary gears are evenly spaced, the phase angleof the sidebands will be evenly spaced along 2π [5]. Thus,it is obvious that, if sideband mNt + n is not a multiple ofNp and (mNt + n)/Np has a remainder of γ, the vibrationcomponents from different gears are evenly spaced by an angle2γπ/Np. In this case, when the vibrations generated fromdifferent planetary gears are combined, these sidebands adddestructively and become zero. Those frequency componentsappear at sidebands where mNt + n �= kNp are termed as non-regular meshing components (non-RMC). This case is shown inFig. 4(a).
On the contrary, if sideband mNt + n is a multiple of Np,the remainder of (mNt + n)/Np will be zero. In this case, thevibration components from different gears do not have a phasedifference. When the vibration signals from different planetarygears are combined, these sidebands add constructively and arereinforced. These frequency components that appear at side-bands where mNt + n = kNp are referred to as regular mesh-ing components (RMCs) or apparent sidebands. This processof frequency components adding destructively/constructivelyfinally generates asymmetrical sidebands [5], [7]. This case isshown in Fig. 4(b).
According to the aforementioned vibration analysis in thefrequency domain as well as from previous research results for
an ideal system [4], [5], [7], only the spectra at frequenciesthat are multiples of the number of planetary gears (i.e., RMC)survive, whereas the spectra at other frequencies (i.e., non-RMC) vanish. With this understanding, the vibration data in thefrequency domain can be written as
Y (f) = fhea (γm,n ((mNt + n)fs))) (5)
where γm,n is the magnitude of the spectral amplitude at(mNt + n)fs, and fhea is the nonlinear projection for an idealhealthy gearbox given by
fhea ={
1, if mNt + n is a multiple of Np
0, otherwise.(6)
B. Faulty Gearbox
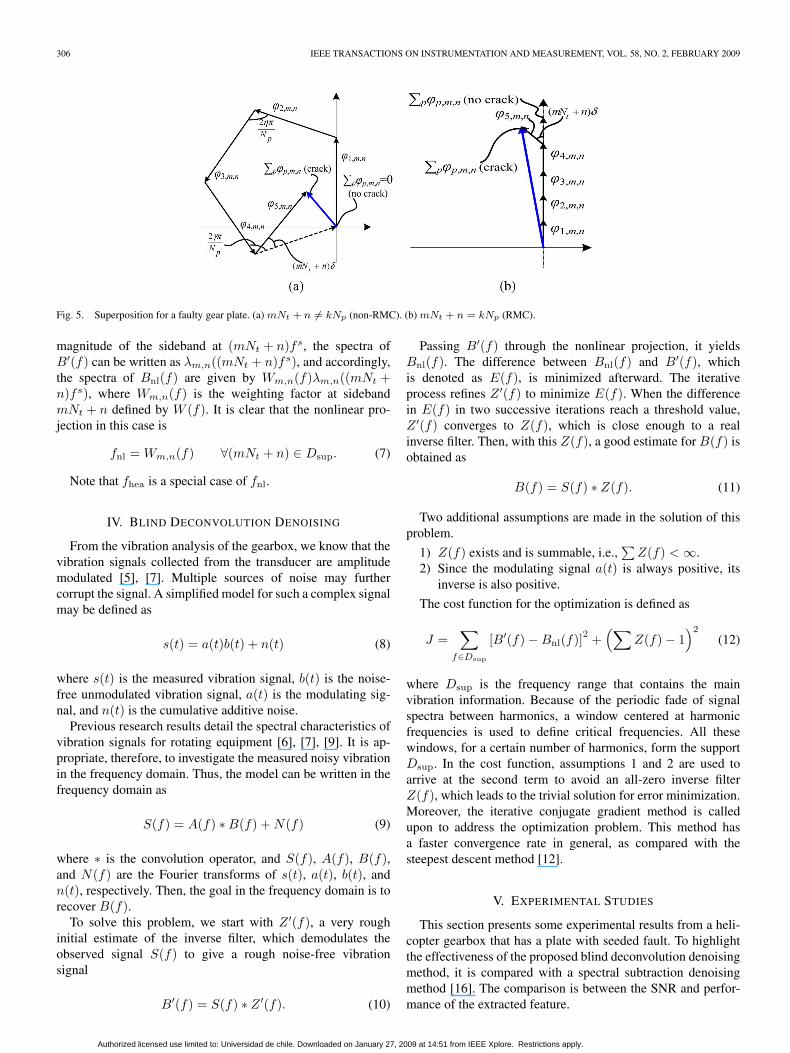
When the planetary gear carrier has a crack, the gears are nolonger being evenly separated along 2π. For analysis simplicity,suppose that only one planetary gear has an angle shift. Due tothis phase shift, when mNt + n is not a multiple of Np, thevibration components from different gears will not be canceledin destructive adding, as shown in Fig. 5(a), where ϕp,m,n,with 1 ≤ p,≤ 5 indicates the frequency components of gearp at frequency (mNt + n)fs. This results in higher non-RMCfrequency components.
On the other hand, when mNt + n is a multiple of Np, thevibration components from different gears are not exactly inphase, which results in lower RMC frequency components, asshown in Fig. 5(b).
Therefore, the nonlinear projection for a healthy gearbox isnot suitable for a faulty gearbox. A modification of the non-linear projection is given as follows: From previous researchin [7], a vibration model in the frequency domain has beenestablished, with the load profile and the crack size beingtwo of the inputs. Note that the load profile is known andthat the crack size can be estimated from the prognostic algo-rithm [8], [13]. Then, the modeled noise-free vibration signalm(t) generated from the vibration model is Fourier transformedin the frequency domain to arrive at M(f). The magnitude ofM(f) is normalized to obtain weighting factors W (f).
When a frequency-domain signal B′(f) is fed into the non-linear projection, it yields Bnl(f). Supposing that λm,n is the
Authorized licensed use limited to: Universidad de chile. Downloaded on January 27, 2009 at 14:51 from IEEE Xplore. Restrictions apply.
306 IEEE TRANSACTIONS ON INSTRUMENTATION AND MEASUREMENT, VOL. 58, NO. 2, FEBRUARY 2009
Fig. 5. Superposition for a faulty gear plate. (a) mNt + n �= kNp (non-RMC). (b) mNt + n = kNp (RMC).
magnitude of the sideband at (mNt + n)fs, the spectra ofB′(f) can be written as λm,n((mNt + n)fs), and accordingly,the spectra of Bnl(f) are given by Wm,n(f)λm,n((mNt +n)fs), where Wm,n(f) is the weighting factor at sidebandmNt + n defined by W (f). It is clear that the nonlinear pro-jection in this case is
fnl = Wm,n(f) ∀(mNt + n) ∈ Dsup. (7)
Note that fhea is a special case of fnl.
IV. BLIND DECONVOLUTION DENOISING
From the vibration analysis of the gearbox, we know that thevibration signals collected from the transducer are amplitudemodulated [5], [7]. Multiple sources of noise may furthercorrupt the signal. A simplified model for such a complex signalmay be defined as
s(t) = a(t)b(t) + n(t) (8)
where s(t) is the measured vibration signal, b(t) is the noise-free unmodulated vibration signal, a(t) is the modulating sig-nal, and n(t) is the cumulative additive noise.
Previous research results detail the spectral characteristics ofvibration signals for rotating equipment [6], [7], [9]. It is ap-propriate, therefore, to investigate the measured noisy vibrationin the frequency domain. Thus, the model can be written in thefrequency domain as
S(f) = A(f) ∗ B(f) + N(f) (9)
where ∗ is the convolution operator, and S(f), A(f), B(f),and N(f) are the Fourier transforms of s(t), a(t), b(t), andn(t), respectively. Then, the goal in the frequency domain is torecover B(f).
To solve this problem, we start with Z ′(f), a very roughinitial estimate of the inverse filter, which demodulates theobserved signal S(f) to give a rough noise-free vibrationsignal
B′(f) = S(f) ∗ Z ′(f). (10)
Passing B′(f) through the nonlinear projection, it yieldsBnl(f). The difference between Bnl(f) and B′(f), whichis denoted as E(f), is minimized afterward. The iterativeprocess refines Z ′(f) to minimize E(f). When the differencein E(f) in two successive iterations reach a threshold value,Z ′(f) converges to Z(f), which is close enough to a realinverse filter. Then, with this Z(f), a good estimate for B(f) isobtained as
B(f) = S(f) ∗ Z(f). (11)
Two additional assumptions are made in the solution of thisproblem.
1) Z(f) exists and is summable, i.e.,∑
Z(f) < ∞.2) Since the modulating signal a(t) is always positive, its
inverse is also positive.
The cost function for the optimization is defined as
J =∑
f∈Dsup
[B′(f) − Bnl(f)]2 +(∑
Z(f) − 1)2
(12)
where Dsup is the frequency range that contains the mainvibration information. Because of the periodic fade of signalspectra between harmonics, a window centered at harmonicfrequencies is used to define critical frequencies. All thesewindows, for a certain number of harmonics, form the supportDsup. In the cost function, assumptions 1 and 2 are used toarrive at the second term to avoid an all-zero inverse filterZ(f), which leads to the trivial solution for error minimization.Moreover, the iterative conjugate gradient method is calledupon to address the optimization problem. This method hasa faster convergence rate in general, as compared with thesteepest descent method [12].
V. EXPERIMENTAL STUDIES
This section presents some experimental results from a heli-copter gearbox that has a plate with seeded fault. To highlightthe effectiveness of the proposed blind deconvolution denoisingmethod, it is compared with a spectral subtraction denoisingmethod [16]. The comparison is between the SNR and perfor-mance of the extracted feature.
Authorized licensed use limited to: Universidad de chile. Downloaded on January 27, 2009 at 14:51 from IEEE Xplore. Restrictions apply.

ZHANG et al.: APPLICATION OF BLIND DECONVOLUTION DENOISING IN FAILURE PROGNOSIS 307
A. Data and Feature
The initial length of the seeded crack on the carrier is 1.344 inand grows with the evolving operation of the gearbox. Thegearbox operates over a large number of ground–air–ground(GAG) cycles at different torque levels. In each GAG cycle thetorque increases from 20% to 40%, then to 100%, and, finally,to 120%; it then decreases to 20% for the next cycle. Each GAGcycle is about 3 min.
In each GAG cycle, the torque levels at 20%, 40%, and100% are investigated. This way, vibration data are acquiredat different torque levels and different crack lengths. Analysisin Section III shows that the ratio of the non-RMC to theRMC sidebands may indicate the presence of a fault on theplanetary carrier. Based on this notion, the feature sidebandratio (SBR) [2] will be used to demonstrate the effectiveness ofthe denoising algorithm. Let X denote the number of sidebandsin consideration on both sides of the dominant harmoniccomponents; SBR is then defined as
SBR(X) =
∑mh=1
∑Xg=−X non-RMC∑m
h=1
∑Xg=−X(non-RMC + RMC)
. (13)
B. Performance on Signal and Feature
The first performance index is an overall accuracy measuredefined as the linear correlation coefficient between the rawfeature values and the crack length growth (CCR) [7]. In theexperiment, the ground truth crack length data at discrete GAGcycles are available. With these data, the crack growth curve canbe obtained through interpolation. Suppose that x is the featurevector and that y is the crack growth curve, with x and y beingtheir means, respectively. The correlation coefficient betweenx and y is given as
CCR(x, y) =
√ss2
xy
ssxxssyy(14)
where ssxy =∑lx
i=1(xi−xi)(yi−yi), ssxx =
∑lxi=1(xi−xi)2,
and ssyy =∑lx
i=1(yi − yi)2, respectively, and lx is the length
of feature vector x.Because of the changes in operating conditions and other
disturbances, the feature values along the GAG axis are verynoisy and need to be smoothed through a low-pass filteringoperation. Then, an accuracy performance index is obtained bycalculating the correlation coefficient based on the smoothedfeature curve x′ (CCS) [7]. The calculation of CCS is the sameas that of CCR in (14), except that x is being replaced by x′. Toobtain x′, a Butterworth low-pass filter with a cutoff frequencyof 0.2π is used.
The third performance index is a precision measure corre-sponding to a normalized measure of the signal dispersion. It isreferred to as percent mean deviation (PMD) [7], i.e.,
PMD(x, x̃) =
∑lxi=1
xi−x′i
x′i
lx× 100. (15)
The SNRs, before and after denoising, at 100% torque levelsare shown in Fig. 6(a). It is clear that the signal after the blinddeconvolution denoising routine enjoys the highest SNR, whichis desirable. The feature of SBR(12) at 100% torque level isshown in Fig. 6(b). The correlation coefficient and PMD for thisfeature at different torque levels are summarized in Table I. Atthe 100% torque level, the CCR, CCS, and PMD of the featurefrom the spectral subtraction routine are 0.947%, 0.961%,and 3.55%, respectively, compared with 0.983%, 0.991%, and3.57% of the feature from the blind deconvolution routine. Thelatter has better correlation with the crack growth curve thanthe former, whereas the precision is almost the same. From thecomparison of the three defined performance indexes, it is clearthat substantial feature improvements have been achieved viathe application of the denoising algorithm. In the tables, “D.N”stands for denoised.
C. Performance on Failure Prognosis
A fault detection/failure prognosis framework based on par-ticle filtering algorithms has successfully been developed andapplied to the prediction of the RUL of the critical components[8], [13]. The approach provides a particle-filter-based esti-mate of the state probability density function (PDF), generatesp-step-ahead long-term predictions, and uses available empir-ical information about hazard thresholds to estimate the RULPDF. The algorithm implementation requires a process modelto incorporate the information present in the feature data.Therefore, the following crack growth state model (based on theParis equation) has been established for online state and modelparameter estimation, as well as RUL PDF estimation:
⎧⎨⎩
L(t + 1) = L(t) + C · α(t) · (ΔK(t))m + ω1(t)α(t + 1) = α(t) + ω2(t)ΔK(t) = f (Load(t), L(t))
Feature(t) = h (L(t)) + v(t) (16)
where L(t) is the total crack length estimation at GAG cyclet contaminated by non-Gaussian white noise ω1(t), α(t) isan unknown time-varying model parameter to be estimatedcontaminated by another non-Gaussian white noise ω2(t),C and m are constants related to material properties, ΔK(t)is the variation in crack tip stress due to the load profile and thecurrent crack length, f is a nonlinear function to map the loadprofile and the crack length to stress, and h estimates the cracklength based on the value of feature, which is contaminatedby non-Gaussian white noise v(t). As a result, two loops arerunning in parallel in this algorithm: An inner loop updates thecrack length and the RUL PDF estimate using the feature dataand the previous state PDF estimates, whereas an outer loopupdates the nonlinear mapping h every GAG cycle. This way,in long-term prediction, each particle generates a trajectory ofthe states. The statistical information of all these trajectoriescan be transferred into an RUL PDF at any given time instant.More details about this prognosis framework can be found in[8] and [13].
Authorized licensed use limited to: Universidad de chile. Downloaded on January 27, 2009 at 14:51 from IEEE Xplore. Restrictions apply.

308 IEEE TRANSACTIONS ON INSTRUMENTATION AND MEASUREMENT, VOL. 58, NO. 2, FEBRUARY 2009
Fig. 6. SBR(12) before and after denoising. (a) SNR at 100% torque. (b) SBR(12) at 100% torque.
TABLE IPERFORMANCE OF FEATURE SBR
In this experiment, failure is defined when the crack reaches6.21 in, i.e., the crack reaches the edge of the carrier plate. Theground truth data show that the crack reaches this value at the714th GAG cycle. Therefore, the RUL PDF of the crack lengthat 6.21 in will be analyzed. In this section, results are shownto compare the algorithm performance when using the featuresderived in the previous section, before and after denoising. Thiswill illustrate the efficiency of the proposed algorithm on theprediction of RUL in the helicopter testbed.
To evaluate the performance of the prognosis, statistics suchas 95% confidence intervals (CIs) and RUL expectations areused. Since the gearbox operates based on GAG cycles, theyare also given in units of “GAG cycle.” Statistics such as 95%CI provide the accuracy of prognosis and therefore should bea range that contains the ground truth value of the GAG cycle,which is the 714th GAG cycle. Moreover, a small 95% CI ismore accurate than a large 95% CI. On the other hand, theRUL expectation gives the precision of prognosis, and a valueclose to the 714th GAG cycle is more precise than a value farfrom it. It is important to note that, in real applications, an RULexpectation lower than the actual expectation is preferred sinceit only makes a conservative decision to schedule maintenanceearlier. However, a higher value of RUL expectation in theprediction might postpone the timely maintenance and involvethe risk of operating beyond safety, resulting in damage or lossof vehicle.
Authorized licensed use limited to: Universidad de chile. Downloaded on January 27, 2009 at 14:51 from IEEE Xplore. Restrictions apply.

ZHANG et al.: APPLICATION OF BLIND DECONVOLUTION DENOISING IN FAILURE PROGNOSIS 309
Fig. 7. Prognosis results from the 365th GAG cycle.
TABLE IIPERFORMANCE OF FAILURE PROGNOSIS
In this experiment, at each GAG cycle, the current estimateof the state PDF is used as an initial condition. The result atthe 365th GAG cycle from the denoised case is also shown inFig. 7. More scenarios are summarized in Table II, where theaccuracy CI improvement is the CI length with the TSA fea-ture minus the CI length with denoised feature. The precisionimprovement is given as the ground truth value of 714 minusthe expectation. Therefore, a positive value close to zero ispreferred.
At the 365th GAG cycle, the accuracy and precision oftwo cases are very similar. At the 400th GAG cycle, bothaccuracy and precision have remarkable improvement. The CIlength reduces 41 GAG cycles, which is about 125 min. Asfor the precision, the result based on the TSA feature gives anexpectation of 747, which is beyond the 714th GAG cycle. Ifmaintenance is scheduled based on this result, it will require theoperation of the helicopter beyond its safety margin and riskthe lives of the pilots. On the other hand, the results based on
the denoised feature give a value very close to the 714th GAGcycle. At the 450th GAG cycle, the result is quite similar tothe case at the 400th GAG cycle, except that the result of thedenoised case is more conservative.
VI. CONCLUSION
The implementation of failure prognosis requires a high-quality feature to propagate the failure. Good features are oftenextracted from vibration signals, and noise might mask thesignatures of the faults/failures. Therefore, preprocessing anddenoising are important. This paper introduces the develop-ment of a new vibration signal blind deconvolution denoisingscheme in synergy with feature extraction, failure prognosis,and vibration modeling to improve the SNR, the quality ofthe features, and the accuracy and precision of the failureprognostic algorithms. The proposed scheme is applied to thefailure prognosis of a helicopter gearbox testbed for verificationpurposes.
REFERENCES
[1] G. Vachtsevanos, F. Lewis, M. Roemer, A. Hess, and B. Wu, IntelligentFault Diagnosis and Prognosis for Engineering Systems. Hoboken, NJ:Wiley, 2006.
[2] B. Wu, A. Saxena, T. Khawaja, R. Patrick, G. Vachtsevanos, and R. Sparis,“An approach to fault diagnosis of helicopter planetary gears,” in Proc.IEEE AUTOTESTCON, San Antonio, TX, Sep. 2004, pp. 475–481.
[3] M. Lebold, K. McClintic, R. Campbell, C. Byington, and K. Maynard,“Review of vibration analysis methods for gearbox diagnostics and prog-nostics,” in Proc. Soc. Mach. Failure Prevention Tech. 54th Meeting,Virginia Beach, VA, May 2000, pp. 623–634.
[4] J. Keller and P. Grabill, “Vibration monitoring of UH-60A main transmis-sion planetary carrier fault,” in Proc. Amer. Helicopter Soc. 59th Annu.Forum, Phoenix, AZ, 2003, pp. 1–11.
Authorized licensed use limited to: Universidad de chile. Downloaded on January 27, 2009 at 14:51 from IEEE Xplore. Restrictions apply.

310 IEEE TRANSACTIONS ON INSTRUMENTATION AND MEASUREMENT, VOL. 58, NO. 2, FEBRUARY 2009
[5] P. McFadden and J. Smith, “An explanation for the asymmetry of themodulation sidebands about the tooth meshing frequency in epicyclic gearvibration,” in Proc. Inst. Mech. Eng. C, Mech. Eng. Sci., 1985, vol. 199,pp. 65–70.
[6] A. Szczepanik, “Time synchronous averaging of ball mill vibrations,”Mech. Syst. Signal Process., vol. 3, no. 1, pp. 99–107, Jan. 1989.
[7] R. Patrick, “A model-based framework for fault diagnosis andprognosis of dynamical system with an application to helicoptertransmissions,” Ph.D. dissertation, Georgia Inst. Technol., Atlanta, GA,May 2007.
[8] M. Orchard, “A particle filtering-based framework for on-line fault diag-nosis and failure prognosis,” Ph.D. dissertation, Georgia Inst. Technol.,Atlanta, GA, Nov. 2007.
[9] J. Antoni, “Blind separation of vibration components: Principles anddemonstrations,” Mech. Syst. Signal Process., vol. 19, no. 6, pp. 1166–1180, Nov. 2005.
[10] B. Klamecki, “Use of stochastic resonance for enhancement of low-levelvibration signal components,” Mech. Syst. Signal Process., vol. 19, no. 2,pp. 223–237, Mar. 2005.
[11] J. Antoni and R. Randall, “Unsupervised noise cancellation for vibrationsignals: Part I—Evaluation of adaptive algorithms,” Mech. Syst. SignalProcess., vol. 18, no. 1, pp. 89–101, Jan. 2004.
[12] D. Kundur and D. Hatzinakos, “A novel blind deconvolution scheme forimage restoration using recursive filtering,” IEEE Trans. Signal Process.,vol. 46, no. 2, pp. 375–390, Feb. 1998.
[13] M. Orchard, B. Wu, and G. Vachtsevanos, “A particle filter frameworkfor failure prognosis,” in Proc. WTC III, Washington, DC, Sep. 12–16,2005.
[14] B. Zhang, T. Khawaja, R. Patrick, G. Vachtsevanos, M. Orchard, andA. Saxena, “Use of blind deconvolution de-noising scheme in failureprognosis,” in Proc. IEEE AUTOTESTCON, Baltimore, MD, 2007,pp. 561–566.
[15] R. Patrick, M. Orchard, B. Zhang, G. Kacprzynski, M. Koelemay, andG. Vachtsevanos, “An integrated approach to helicopter planetary gearfault diagnosis and failure prognosis,” in Proc. IEEE AUTOTESTCON,Baltimore, MD, 2007, pp. 547–552.
[16] S. Boll, “Suppression of acoustic noise in speech using spectral subtrac-tion,” IEEE Trans. Acoust., Speech, Signal Process., vol. ASSP-27, no. 3,pp. 113–120, Apr. 1979.
Bin Zhang (SM’08) received the B.E. and M.S.E.degrees from Nanjing University of Science andTechnology, Nanjing, China, in 1993 and 1999, re-spectively, and the Ph.D. degree from Nanyang Tech-nological University, Singapore, in 2007.
Since 2005, he has been a Postdoctoral Researcherwith the School of Electrical and Computer Engi-neering, Georgia Institute of Technology, Atlanta.His current research interests are fault diagnosis andfailure prognosis, systems and control, digital sig-nal processing, learning control, intelligent systems
and their applications to robotics, power electronics, and various mechanicalsystems.
Taimoor Khawaja is currently working toward thePh.D. degree with the School of Electrical and Com-puter Engineering, Georgia Institute of Technology(Georgia Tech), Atlanta.
He is currently investigating the blind deconvolu-tion theory for designing efficient methods for signaldenoising and exploring data-driven methods basedon support vector machines and Bayesian inferencefor online fault detection and identification and fail-ure prognosis at Georgia Tech. His research will con-tribute largely toward the autonomous monitoring of
manufacturing systems and mission-critical equipment. His research interestsinclude the design and implementation of real-time architectures for PHMsystems.
Romano Patrick received the M.B.A. degree fromGeorgia Institute of Technology (Georgia Tech),Atlanta, the B.S. degree from the University ofPanamericana, Mexico, the M.S. degree from theUniversity of Texas, Arlington, and the Ph.D. degreein electrical and computer engineering, with special-ization in model-based machine health diagnosticsand prognostics, from Georgia Tech in 2007.
He is currently a Project Manager with ImpactTechnologies, Rochester, NY. His practice and aca-demic studies focus on the interdisciplinary integra-
tion of hardware, software, and techniques to support cost-effective design andimplementation of engineering systems. His past work and experience haveinvolved electronic, mechanical, and software design; state-of-the-art processautomation and novel machine health monitoring for a variety of industrialand government sponsors, including DARPA, Lockheed Martin, and NorthropGrumman; a three-year appointment as a Graduate Professor and ProgramCoordinator at the University of Panamericana; and some entrepreneurial R&D.
George Vachtsevanos (SM’89) received theB.E.E. degree from the City College of New York,New York, NY, in 1962, the M.E.E. degree fromNew York University, in 1963, and the Ph.D. degreein electrical engineering from the City University ofNew York in 1970.
He is a Professor Emeritus of electrical and com-puter engineering with the School of Electrical andComputer Engineering, Georgia Institute of Technol-ogy (Georgia Tech), Atlanta, where he directs the In-telligent Control Systems Laboratory, where faculty
and students are conducting research on intelligent control, neurotechnologyand cardiotechnology, fault diagnosis and prognosis of large-scale dynamicalsystems, and control technologies for unmanned aerial vehicles. His workis funded by government agencies and industry. He has authored more than240 technical papers.
Dr. Vachtsevanos was a recipient of the 2002–2003 Control Systems Mag-azine Outstanding Paper Award (with L. Wills and B. Heck), the 2002–2003Georgia Tech School of Electrical and Computer Engineering DistinguishedProfessor Award, and the 2003–2004 Georgia Tech Outstanding Interdiscipli-nary Activities Award.
Marcos E. Orchard received the B.Sc. degree andthe Civil Industrial Engineering degree with Elec-trical Major from Catholic University of Chile,Santiago, Chile, in 1999 and 2001, respectively, andthe M.S. and Ph.D. degrees from the Georgia Insti-tute of Technology (Georgia Tech), Atlanta, in 2005and 2007, respectively.
He is currently an Assistant Professor with theDepartment of Electrical Engineering, Universityof Chile. His current research interests include thedesign, implementation, and testing of real-time
frameworks for fault diagnosis and failure prognosis.
Abhinav Saxena (M’08) received the B.Tech. de-gree in 2001 from the Indian Institute of Technology(IIT), Delhi, India, and the M.S. and Ph.D. degreesin electrical and computer engineering from theGeorgia Institute of Technology, Atlanta.
He is a Staff Scientist with the Research Institutefor Advanced Computer Science at the PrognosticsCenter of Excellence, NASA Ames Research Center,Moffett Field, CA. His research focus lies in devel-oping prognostic algorithms for engineering systemsand developing standard methods for evaluating per-
formance of prognostic techniques.
Authorized licensed use limited to: Universidad de chile. Downloaded on January 27, 2009 at 14:51 from IEEE Xplore. Restrictions apply.
Copyright © 2022 FDOKUMEN